UNITED STATES
SECURITIES AND EXCHANGE COMMISSION
Washington, D.C. 20549
FORM N-CSR
CERTIFIED SHAREHOLDER REPORT OF REGISTERED
MANAGEMENT INVESTMENT COMPANIES
Investment Company Act file number (811-23226)
Listed Funds Trust
(Exact name of registrant as specified in charter)
615 East Michigan Street
Milwaukee, WI 53202
(Address of principal executive offices) (Zip code)
Kent P. Barnes, Secretary
Listed Funds Trust
c/o U.S. Bancorp Fund Services, LLC
777 East Wisconsin Avenue, 10th Floor
Milwaukee, WI 53202
(Name and address of agent for service)
(414) 765-6511
Registrant's telephone number, including area code
Date of fiscal year end: August 31
Date of reporting period: August 31, 2021
Item 1. Reports to Stockholders.
(a)

Overlay Shares ETFs
Overlay Shares Large Cap Equity ETF (OVL)
Overlay Shares Small Cap Equity ETF (OVS)
Overlay Shares Foreign Equity ETF (OVF)
Overlay Shares Hedged Large Cap Equity ETF (OVLH)
Overlay Shares Core Bond ETF (OVB)
Overlay Shares Short Term Bond ETF (OVT)
Overlay Shares Municipal Bond ETF (OVM)
ANNUAL REPORT
August 31, 2021
Overlay Shares ETFs
Table of Contents
| | |
Letter to Shareholders (Unaudited) | 2 |
Performance Overviews (Unaudited) | 6 |
Schedule of Investments and Written Options | 9 |
Overlay Shares Large Cap Equity ETF | 9 |
Overlay Shares Small Cap Equity ETF | 11 |
Overlay Shares Foreign Equity ETF | 13 |
Overlay Shares Hedged Large Cap Equity ETF | 15 |
Overlay Shares Core Bond ETF | 17 |
Overlay Shares Short Term Bond ETF | 19 |
Overlay Shares Municipal Bond ETF | 21 |
Statements of Assets and Liabilities | 23 |
Statements of Operations | 25 |
Statements of Changes in Net Assets | 27 |
Overlay Shares Large Cap Equity ETF | 27 |
Overlay Shares Small Cap Equity ETF | 28 |
Overlay Shares Foreign Equity ETF | 29 |
Overlay Shares Hedged Large Cap Equity ETF | 30 |
Overlay Shares Core Bond ETF | 31 |
Overlay Shares Short Term Bond ETF | 32 |
Overlay Shares Municipal Bond ETF | 33 |
Financial Highlights | 34 |
Notes to Financial Statements | 36 |
Report of Independent Registered Public Accounting Firm | 48 |
Board Consideration and Approval of Advisory Agreement (Unaudited) | 49 |
Shareholder Expense Example (Unaudited) | 52 |
Review of Liquidity Risk Management Program (Unaudited) | 54 |
Board of Trustees and Officers (Unaudited) | 55 |
Supplemental Information (Unaudited) | 57 |
Privacy Policy (Unaudited) | 59 |
1
Overlay Shares ETFs
Shareholder Letter
August 31, 2021 (Unaudited)
The Fiscal Year ended 8/31/2021 for the Overlay Shares Large Cap Equity ETF (“OVL”), Overlay Shares Small Cap Equity ETF (“OVS”), Overlay Shares Foreign Equity ETF (“OVF”), Overlay Shares Hedged Large Cap Equity ETF (“OVLH”), Overlay Shares Core Bond ETF (“OVB”), Overlay Shares Short Term Bond ETF (“OVT”) and Overlay Shares Municipal Bond ETF (“OVM”) (each a “Fund” and collectively, the “Funds”) saw periods of elevated volatility in equities and bonds, with equities finishing with strong positive returns while bonds finished mostly flat. The Overlay Strategy that is designed to add incremental return to low-cost passive beta sources produced just over 4% in gross return for the year, positioning the funds to compare favorably to their peers and respective benchmarks. Since the inception of the five original funds (OVL, OVS, OVF, OVB and OVM) on 9/30/2019, the Overlay Strategy has produced cumulative gross incremental return of nearly 7%, tracking above our target of 3% a year over the long term.
Fund and Benchmark Annualized Returns |
Fund | Fiscal Year
(9/1/2020 to
8/31/2021) | Since Inception* |
OVL NAV Returns | 35.36% | 29.64% |
OVL Market Price Returns | 34.77% | 29.67% |
S&P 500 TR Index | 31.17% | 26.47% |
OVS NAV Returns | 58.12% | 25.66% |
OVS Market Price Returns | 58.46% | 25.84% |
S&P SmallCap 600 TR Index | 53.97% | 22.72% |
OVF NAV Returns | 19.82% | 9.85% |
OVF Market Price Returns | 20.24% | 9.84% |
MSCI AC World Index ex USA Net (USD) | 24.87% | 15.49% |
OVLH NAV Returns | N/A | 15.89% |
OVLH Market Price Returns | N/A | 16.05% |
S&P 500 TR Index | | 20.23% |
OVB NAV Returns | 3.13% | 6.39% |
OVB Market Price Returns | 3.25% | 6.54% |
Bloomberg U.S. Aggregate Bond Index | -0.08% | 3.56% |
OVT NAV Returns | N/A | 2.95% |
OVT Market Price Returns | N/A | 2.96% |
Bloomberg U.S. Corporate 1-5 Years Bond Index | | 0.52% |
OVM NAV Returns | 6.32% | 6.37% |
OVM Market Price Returns | 6.60% | 6.42% |
Bloomberg Municipal Bond Index | 3.40% | 3.89% |
* | Fund inception dates are 9/30/2019 for OVL, OVS, OVF, OVB and OVM and 1/14/2021 for OVT and OVLH |
Performance of less than one year is cumulative. You cannot invest directly in an index. Performance data quoted represents past performance and is no guarantee of future results. Investment return and principal value of an investment will fluctuate so that an investor’s shares, when redeemed, may be worth more or less than their original cost. Current performance may be lower or higher than the performance data quoted. For the most recent month-end performance, please call 1-866-704-OVLS. Shares are bought and sold at market price (not NAV) and are not individually redeemed from the Funds. Total Returns are calculated using
2
Overlay Shares ETFs
Shareholder Letter
August 31, 2021 (Unaudited) (Continued)
the daily 4:00pm EST net asset value (NAV). Market price returns reflect the midpoint of the bid/ask spread as of the close of trading on the exchange where Fund shares are listed. Market price returns do not represent the returns you would receive if you traded shares at other times.
Indexes are unmanaged and the returns shown do not reflect any management fees, transaction costs or expenses. One cannot invest directly in an index. Past performance does not guarantee future results.
The key themes during the course of the fiscal year were as follows:
| | 1. | Inflation Concerns – The 1st quarter of 2021 saw a sharp spike in interest rates and a corresponding drop in bond prices as high inflation numbers raised concern that the Federal Open Market Committee (“FOMC”) would have to take hawkish measures sooner than expected. The FOMC continued to steadfastly characterize the inflations gains as transitory, comforting the market and stabilizing interest rates and bond prices. |
| | 2. | Corporate Earnings – Earnings optimism began to spike in the final quarter of 2020 as investors began to see pent up demand for goods and services creating a potential boom in revenue and earnings for companies hard hit in the early part of the pandemic. In the 1st half of 2021, corporate earnings routinely beat expectations from comparisons to a very low base from the depths of the pandemic shutdown. As the year came to a close, investors began to debate whether equity valuations supported stock valuations, particularly as the comps to the previous year become more challenging. |
| | 3. | Meme Mania – While our strategy only focuses on broad market beta rather than individual stocks and bonds, there were periods in the early stage of Meme Stock Mania where worries about the overall market stability surfaced as some large hedge funds took on disastrous losses from short positions, which put strain on the balance sheets of some brokerage firms that needed to meet margin requirements with the clearing houses. These concerns gradually dissipated as further rounds of Meme volatility did not result in the same levels of balance sheet stress for brokers, partially due to tighter margin requirements implemented by those firms. |
| | 4. | Taper/Tightening Timing – The markets are rooting for a Goldilocks scenario where growth is robust while inflation remains in check, thus allowing the Fed to maintain the extreme levels of liquidity they have added to the financial system. While there were brief periods of volatility related to high inflation readings and strong jobs growth (the usual recipe for tightening), by the end of the year, the FOMC was not even committing to the timing of tapering bond purchases, let alone the timing of interest rate hikes. Given this backdrop, equity bulls followed the mantra of “Don’t fight the Fed!” and continued to buy stocks. |
| | 5. | “Where Else Do You Go?” – A very popular sentiment today for investors is that bonds offer an inferior risk/reward profile relative to equities given historically low interest rates, very tight credit spreads, and the risk of loss associated with a spike in interest rates. With a yield of roughly 2% in a broad bond portfolio, many investors have preferred a bit lower dividend yield but further appreciation potential offered by equities. This sentiment has made most of the pullbacks in stocks during the year brief and shallow. |
The Overlay Strategy
The returns of the Overlay Shares ETFs are based on a combination of the returns of passive index beta exposure and the return generated from our option writing strategy (the “Overlay”). As such, the Overlay is the only active component of the Funds and is managed the same way across all seven of the Overlay Shares. The Overlay aims to generate positive returns in a wide variety of markets but could experience short-term losses during times of market stress. As such, the strategy was designed with multiple layers of risk management to help mitigate losses during those environments. Our risk management process served the Overlay and the Funds well during two periods are high equity volatility in the Fall of 2020 as well as through a series of smaller market pullbacks during the ensuing 10 months. Outside of the occasional bouts of volatility, a relatively quiet, stable and upward moving equity market were very supportive of the Overlay, allowing it to exceed the target long-term return of 3% per annum in incremental return both during the Fiscal Year and Since Inception of the 5 original funds. This incremental return, when added to the underlying passive beta return of each Fund, increases the total return for the Funds.
3
Overlay Shares ETFs
Shareholder Letter
August 31, 2021 (Unaudited) (Continued)
Overlay Shares Large Cap Equity ETF (OVL)
OVL (at NAV) continued to outperform the S&P 500 Index Total Return in the fiscal year, returning 35.36% compared to 31.17% for the index. This outperformance was driven solely by the positive incremental return generated by the Overlay. The portion of the Fund’s returns driven by the S&P 500 Index were attributable to the overall strong backdrop for the equity markets such as very accommodative monetary policy and extremely low interest rates. A strong demand for the FAANG (Facebook, Apple, Amazon, Netflix, and Google) stocks heavily influenced the index’s returns given the large weighting the stocks have in the index. Since inception, the Fund is up 29.64% on an annualized basis versus 26.47% for the index due to the value added by the Overlay.
Overlay Shares Small Cap Equity ETF (OVS)
OVS (at NAV) posted significant positive returns for the fiscal year, up 58.12% compared with 53.97% for the S&P SmallCap 600 Index Total Return. This outperformance was driven solely by the positive incremental return generated by the Overlay. Small Cap stocks were one of the main benefactors of the reopening trades, partially due to the significant benefits smaller stocks got from low interest rates. This allowed small cap stocks to significantly outperform large cap stocks during the year. As with large cap stocks, the S&P SmallCap 600 Index blew through the previous pre-pandemic highs in the index. Since inception, the Fund is up 25.66% on an annualized basis versus 22.72% for the index due to the value added by the Overlay.
Overlay Shares Foreign Equity ETF (OVF)
Despite strong performance on an absolute basis, OVF (at NAV) underperformed the MSCI AC World Index ex USA Index for the fiscal year, returning 19.82% compared to 24.87% for the index. While the Overlay contributed positively to the Fund, the use of iShares MinVol factor versions of the MSCI EAFE Index (EFAV) and MSCI Emerging Markets Index (EEMV) continued to generate underperformance. EFAV and EEMV are generally expected to outperform the standard indices during times of market stress but possibly underperform during rapidly rising markets. This was the case in the fiscal year and since inception of the Fund, as EFAV and EEMV dampened volatility relative to the benchmark during the times of market stress but lagged overall. Over the long term, the MinVol approach aims to produce returns comparable to the primary MSCI AC World Index ex USA Index but with less volatility. Towards the end of the fiscal year, the MinVol approach began to outperform as investors took a more cautious approach to non-US equities. Since inception, the Fund is up 9.85% on an annualized basis versus 15.49% for the index.
Overlay Shares Hedged Large Cap Equity ETF (OVLH)
OVLH was launched 1/14/2021 to offer investors the ability to participate in a rising equity market while constantly holding downside market protection to potentially offset losses in a significant market decline. As expected in a rapidly rising equity market, the Fund underperformed the S&P 500 Index during the partial year, returning 15.89% compared to 20.23% for the index. However, the Fund had very favorable performance relative to other hedged equity funds in the marketplace as the incremental return provided by the Overlay helped to offset some of the costs of the portfolio hedges.
Looking forward, the path for the next Fiscal Year will be highly dependent on the impact that inflation and economic/earnings growth have on Fed monetary policy. A positive outcome would be continued steady growth with inflation returning closer to the Fed’s long-term target, thus allowing the FOMC to be patient in tightening monetary policy. A poor outcome for equities and bonds would be inflation that continues to accelerate without corresponding economic growth, forcing the Fed to act aggressively to stamp out inflation while trying not to do too much harm to the economy. This would be a very difficult scenario for them to manage through given the massive liquidity injected into the system. As always, there are also other risk factors that will likely present themselves that investors are not thinking about today.
Overlay Shares Core Bond ETF (OVB)
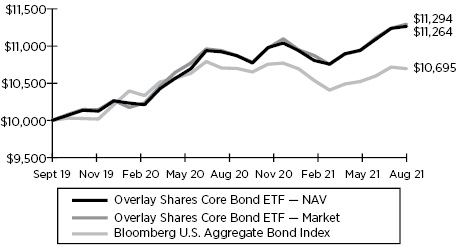
OVB (at NAV) outperformed the Bloomberg U.S. Aggregate Bond Index for the fiscal year, returning 3.13% compared to -0.08% for the index. The incremental income from the Overlay allowed Fund investors to have positive returns while holders of just the iShares Core U.S. Aggregate Bond ETF (AGG) experienced small losses. During the year, bonds experienced periods of heightened volatility due to heightened interest rate volatility due to rapidly changing expectations around future inflation and potential changes in monetary policy. Since inception, the Fund is up 6.39% on an annualized basis versus 3.56% for the index due to the value added by the Overlay.
4
Overlay Shares ETFs
Shareholder Letter
August 31, 2021 (Unaudited) (Continued)
Overlay Shares Short-Term Bond ETF (OVT)
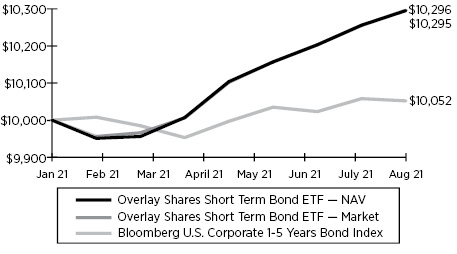
With an inception date of 1/14/2021, OVT was only open for just over half of the fiscal year. During this period, OVT (at NAV) outperformed the Bloomberg U.S. Corporate 1-5 Years Bond Index, returning 2.95% compared to 0.52% for the index. This outperformance was driven solely by the positive income generated by the Overlay. Given the lower duration of the bonds held, the underlying Vanguard Short-Term Corporate Bond ETF (VCSH) has less sensitivity to changes in interest rates, and as such the Fund experienced less volatility than longer duration funds with comparable performance during this period. The Fund is designed to provide a competitive income stream to investors who are concerned about the risk of rising interest rates.
Overlay Shares Municipal Bond ETF (OVM)
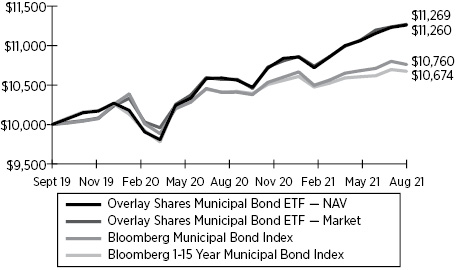
OVM (at NAV) outperformed the Bloomberg Municipal Bond Index for the fiscal year, returning 6.32% compared to 3.40% for the index. This outperformance was driven solely by the positive income generated by the Overlay. The underlying iShares National Muni Bond ETF (MUB) outperformed corporate bonds as investors bid up municipal bonds in expectation of potential future tax hikes (higher taxes increases the tax equivalent yield of munis relative to corporate bonds). Since inception, the Fund is up 6.37% on an annualized basis versus 3.89% for the index due to the value added by the Overlay.
Risk Factors
The Funds invest in options that derive their performance from the performance of the S&P 500 Index. Selling (writing) and buying options are speculative activities and entail greater than ordinary investment risks. The Funds’ use of put options can lead to losses because of adverse movements in the price or value of the underlying asset, which may be magnified by certain features of the options. When selling a put option, the Fund will receive a premium; however, this premium may not be enough to offset a loss incurred by the Fund if the price of the underlying asset is below the strike price by an amount equal to or greater than the premium. Purchased put options may expire worthless and the Fund would lose the premium it paid for the option. The Fund may lose significantly more than the premiums it receives in highly volatile market conditions. OVS: Investments made in small-capitalization companies may be more volatile and less liquid due to limited resources or product lines and more sensitive to economic factors. OVF: Investing in foreign securities may involve certain additional risks, exchange rate fluctuations, less liquidity, greater volatility and less regulation. OVB and OVT: The Fund is subject to the same risks as the underlying bonds in the portfolio such as credit, call and interest rate risk. As interest rates rise the value of bond prices will decline. OVM: Funds that invest primarily in state-specific municipal obligations of issuers and therefore will be affected by economic, political or other events affecting municipal issuers.
The Funds will invest in short term put options which are financial derivatives that give buyers the right, but not the obligation, to sell (put) an underlying asset at an agreed-upon price and date. The Funds’ use of options may reduce the Funds’ ability to profit from increases in the value of the underlying asset. The Funds could experience a loss or increased volatility if its derivatives do not perform as anticipated or are not correlated with the performance of their underlying asset or if the Funds are unable to purchase or liquidate a position.
OVLH and OVT were recently organized and have less than 1 year of operating history. As a result, investors have a limited track record on which to base their investment decision. Investments involve risk including the possible loss of principal.
5
Overlay Shares ETFs
Performance Overviews
August 31, 2021 (Unaudited)
Hypothetical Growth of $10,000 Investment
(Since Commencement through 8/31/2021)
ANNUALIZED TOTAL RETURN
FOR THE PERIODS ENDED AUGUST 31, 2021 |
Total Returns | 1 Year | Since
Commencement1 |
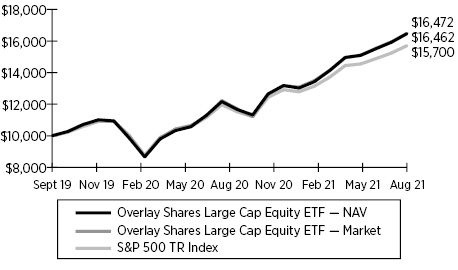
Overlay Shares Large Cap Equity ETF — NAV | 35.36% | 29.64% |
Overlay Shares Large Cap Equity ETF — Market | 34.77% | 29.67% |
S&P 500 TR Index | 31.17% | 26.47% |
ANNUALIZED TOTAL RETURN
FOR THE PERIODS ENDED AUGUST 31, 2021 |
Total Returns | 1 Year | Since
Commencement1 |
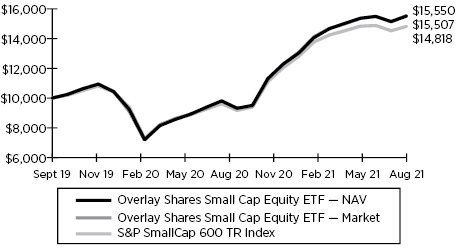
Overlay Shares Small Cap Equity ETF — NAV | 58.12% | 25.66% |
Overlay Shares Small Cap Equity ETF — Market | 58.46% | 25.84% |
S&P SmallCap 600 TR Index | 53.97% | 22.72% |
ANNUALIZED TOTAL RETURN
FOR THE PERIODS ENDED AUGUST 31, 2021 |
Total Returns | 1 Year | Since
Commencement1 |
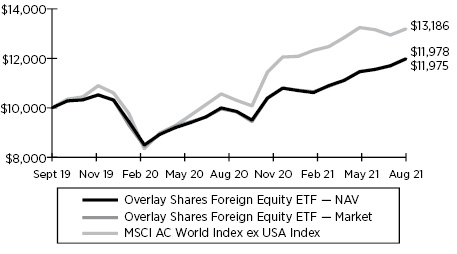
Overlay Shares Foreign Equity ETF — NAV | 19.82% | 9.85% |
Overlay Shares Foreign Equity ETF — Market | 20.24% | 9.84% |
MSCI AC World Index ex USA Index | 24.87% | 15.49% |
6
Overlay Shares ETFs
Performance Overviews
August 31, 2021 (Unaudited) (Continued)
Hypothetical Growth of $10,000 Investment
(Since Commencement through 8/31/2021)
CUMULATIVE TOTAL RETURN
FOR THE PERIOD ENDED AUGUST 31, 2021 |
Total Returns | Since
Commencement2 |
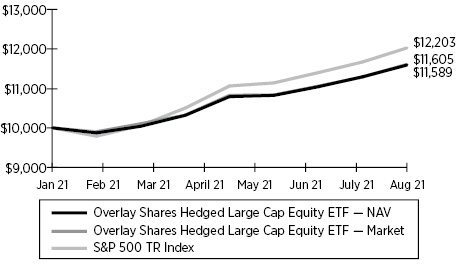
Overlay Shares Hedged Large Cap Equity ETF — NAV | 15.89% |
Overlay Shares Hedged Large Cap Equity ETF — Market | 16.05% |
S&P 500 TR Index | 20.23% |
ANNUALIZED TOTAL RETURN
FOR THE PERIODS ENDED AUGUST 31, 2021 |
Total Returns | 1 Year | Since
Commencement1 |
Overlay Shares Core Bond ETF — NAV | 3.13% | 6.39% |
Overlay Shares Core Bond ETF — Market | 3.25% | 6.54% |
Bloomberg U.S. Aggregate Bond Index | (0.08)% | 3.56% |
CUMULATIVE TOTAL RETURN
FOR THE PERIOD ENDED AUGUST 31, 2021 |
Total Returns | Since
Commencement2 |
Overlay Shares Short Term Bond ETF — NAV | 2.95% |
Overlay Shares Short Term Bond ETF — Market | 2.96% |
Bloomberg U.S. Corporate 1-5 Years TR Index | 0.52% |
7
Overlay Shares ETFs
Performance Overviews
August 31, 2021 (Unaudited) (Continued)
Hypothetical Growth of $10,000 Investment
(Since Commencement through 8/31/2021)
ANNUALIZED TOTAL RETURN
FOR THE PERIODS ENDED AUGUST 31, 2021 |
Total Returns | 1 Year | Since
Commencement1 |
Overlay Shares Municipal Bond ETF — NAV | 6.32% | 6.37% |
Overlay Shares Municipal Bond ETF — Market | 6.60% | 6.42% |
Bloomberg Municipal Bond Index | 3.40% | 3.89% |
Bloomberg 1-15 Year Municipal Bond Index | 2.53% | 3.46% |
1 | The Fund commenced operations on September 30, 2019. |
2 | The Fund commenced operations on January 14, 2021. |
The performance data quoted represents past performance. Past performance does not guarantee future results. Current performance may be lower or higher than the performance data quoted. The investment return and principal value of an investment will fluctuate so that an investor’s shares, when sold or redeemed, may be worth more or less than their original cost. For the most recent month-end performance, please call (866) 704-6857. You cannot invest directly in an index. Shares are bought and sold at market price (closing price), not net asset value (“NAV”), and are not individually redeemed from the Fund. Market performance is determined using the bid/ask midpoint at 4:00 p.m. Eastern time when the NAV is typically calculated. Brokerage commissions will reduce returns. Returns shown include the reinvestment of all dividends and distributions. Returns shown do not reflect the deduction of taxes that a shareholder would pay on fund distributions or the redemption of fund shares.
The S&P 500 TR Index is a market-value weighted index consisting of 500 stocks chosen for market size, liquidity, and industry group representation, with each stock’s weight in the Index proportionate to its market value. The S&P SmallCap 600 TR Index seeks to measure the small-cap segment of the U.S. equity market. The index is designed to track companies that meet specific inclusion criteria to ensure that they are liquid and financially viable. The MSCI AC World Index ex USA Index captures large and mid-cap representation across 22 of 23 developed markets countries (excluding the U.S.) and 26 emerging markets countries. The Bloomberg U.S. Aggregate Bond Index is a broad-based flagship benchmark that measures the investments grade, U.S. dollar-denominated, fixed-rate taxable bond market. The index includes Treasuries, government-related and corporate securities, MBS (agency fixed-rate and hybrid ARM passthroughs), ABS and CMBS (agency and non-agency). The Bloomberg U.S. Corporate 1-5 Years Bond Index measures the investment grade, fixed-rate, taxable corporate bond market with 1-5 year maturities. The Bloomberg Municipal Bond Index covers the USD-denominated long-term tax-exempt bond market. The index has four main sectors: state and local general obligation bonds, revenue bonds, insured bonds and prerefunded bonds. The Bloomberg 1-15 Year Municipal Bond index is the 1-15 year component of the Municipal Bond index, a rules-based, market-value-weighted index engineered for the long-term tax-exempt bond market. The index is a broad measure of the municipal bond market with maturities of at least one year.
8
Overlay Shares Large Cap Equity ETF
Schedule of Investments
August 31, 2021
| | Shares | | | Value | | | | |
INVESTMENT COMPANIES — 99.8% | | | | |
Exchange Traded Funds — 99.8% |
Vanguard S&P 500 ETF (a)(b) | | | 483,220 | | | $ | 200,560,461 | | | | | |
TOTAL EXCHANGE TRADED FUNDS (Cost $158,267,607) | | | | | | | 200,560,461 | | | | | |
| | | | | | | | | | | | | |
MONEY MARKET FUNDS — 0.1% | | | | | | | | |
First American Government Obligations Fund - Class X, 0.03% (c) | | | 121,625 | | | | 121,625 | | | | | |
TOTAL MONEY MARKET FUNDS (Cost $121,625) | | | | | | | 121,625 | | | | | |
| | | | | | | | | | | | | |
| | Number of
Contracts (d) | | | | | | Notional
Value | |
PURCHASED OPTIONS — 0.0% (e) | | | | | | | | |
PURCHASED PUT OPTIONS — 0.0% (e) | | | | | | | | |
CBOE S&P 500 Index | | | | | | | | | | | | |
Expiration: September 2021, Exercise Price: $4,335 (f) | | | 110 | | | | 18,425 | | | $ | 49,749,480 | |
Expiration: September 2021, Exercise Price: $4,355 (f) | | | 110 | | | | 30,800 | | | | 49,749,480 | |
TOTAL PURCHASED OPTIONS (Cost $78,218) | | | | | | | 49,225 | | | | | |
| | | | | | | | | | | | | |
TOTAL INVESTMENTS (Cost $158,467,450) — 99.9% | | | | | | | 200,731,311 | | | | | |
Other Assets in Excess of Liabilities — 0.1% | | | | | | | 227,832 | | | | | |
TOTAL NET ASSETS — 100.0% | | | | | | $ | 200,959,143 | | | | | |
Percentages are stated as a percent of net assets.
CBOE | Chicago Board Options Exchange |
(a) | Fair value of this security exceeds 25% of the Fund’s net assets. Additional information for this security, including the financial statements, is available from the SEC’s EDGAR database at www.sec.gov. |
(b) | All or a portion of this security is segregated as collateral for the written options. The value of the security segregated as collateral for written options is $80,272,745. |
(c) | The rate shown is the annualized seven-day yield at period end. |
(d) | Each contract has a multiplier of 100. |
(f) | Held in connection with written option, see Schedule of Written Options for more detail. |
The accompanying notes are an integral part of the financial statements.
9
Overlay Shares Large Cap Equity ETF
Schedule of Written Options
August 31, 2021
| | Number of
Contracts (a) | | | Value | | | Notional
Value | |
WRITTEN OPTIONS — (0.1)% | | | | |
WRITTEN PUT OPTIONS — (0.1)% |
CBOE S&P 500 Index | | | | | | | | | | | | |
Expiration: September 2021, Exercise Price: $4,470 | | | 110 | | | $ | 74,250 | | | $ | 49,749,480 | |
Expiration: September 2021, Exercise Price: $4,495 | | | 110 | | | | 134,750 | | | | 49,749,480 | |
TOTAL WRITTEN OPTIONS (Premiums Received $288,961) | | | | | | $ | 209,000 | | | | | |
Percentages are stated as a percent of net assets.
CBOE | Chicago Board Options Exchange |
(a) | Each contract has a multiplier of 100. |
The accompanying notes are an integral part of the financial statements.
10
Overlay Shares Small Cap Equity ETF
Schedule of Investments
August 31, 2021

| | Shares | | | Value | | | | |
INVESTMENT COMPANIES — 99.8% | | | | |
Exchange Traded Funds — 99.8% |
iShares Core S&P Small-Cap ETF (a)(b) | | | 57,802 | | | $ | 6,495,211 | | | | | |
TOTAL EXCHANGE TRADED FUNDS (Cost $5,796,608) | | | | | | | 6,495,211 | | | | | |
| | | | | | | | | | | | | |
MONEY MARKET FUNDS — 0.1% | | | | | | | | |
First American Government Obligations Fund - Class X, 0.03% (c) | | | 9,013 | | | | 9,013 | | | | | |
TOTAL MONEY MARKET FUNDS (Cost $9,013) | | | | | | | 9,013 | | | | | |
| | | | | | | | | | | | | |
| | Number of
Contracts (d) | | | | | | Notional
Value | |
PURCHASED OPTIONS — 0.0% (e) | | | | | | | | |
PURCHASED PUT OPTIONS — 0.0% (e) | | | | | | | | |
CBOE S&P 500 Index | | | | | | | | | | | | |
Expiration: September 2021, Exercise Price: $4,335 (f) | | | 4 | | | | 670 | | | $ | 1,809,072 | |
Expiration: September 2021, Exercise Price: $4,355 (f) | | | 4 | | | | 1,120 | | | | 1,809,072 | |
TOTAL PURCHASED OPTIONS (Cost $2,844) | | | | | | | 1,790 | | | | | |
| | | | | | | | | | | | | |
TOTAL INVESTMENTS (Cost $5,808,465) — 99.9% | | | | | | | 6,506,014 | | | | | |
Other Assets in Excess of Liabilities — 0.1% | | | | | | | 3,915 | | | | | |
TOTAL NET ASSETS — 100.0% | | | | | | $ | 6,509,929 | | | | | |
Percentages are stated as a percent of net assets.
CBOE | Chicago Board Options Exchange |
(a) | Fair value of this security exceeds 25% of the Fund’s net assets. Additional information for this security, including the financial statements, is available from the SEC’s EDGAR database at www.sec.gov. |
(b) | All or a portion of the security is segregated as collateral for written options. The value of the security segregated as collateral for written options is $3,306,937. |
(c) | The rate shown is the annualized seven-day yield at period end. |
(d) | Each contract has a multiplier of 100. |
(f) | Held in connection with a written option, see Schedule of Written Options for more detail. |
The accompanying notes are an integral part of the financial statements.
11
Overlay Shares Small Cap Equity ETF
Schedule of Written Options
August 31, 2021
| | Number of
Contracts (a) | | | Value | | | Notional
Value | |
WRITTEN OPTIONS — (0.1)% | | | | |
WRITTEN PUT OPTIONS — (0.1)% |
CBOE S&P 500 Index | | | | | | | | | | | | |
Expiration: September 2021, Exercise Price: $4,470 | | | 4 | | | $ | 2,700 | | | $ | 1,809,072 | |
Expiration: September 2021, Exercise Price: $4,495 | | | 4 | | | | 4,900 | | | | 1,809,072 | |
TOTAL WRITTEN OPTIONS (Premiums Received $10,508) | | | | | | $ | 7,600 | | | | | |
Percentages are stated as a percent of net assets.
CBOE | Chicago Board Options Exchange |
(a) | Each contract has a multiplier of 100. |
The accompanying notes are an integral part of the financial statements.
12
Overlay Shares Foreign Equity ETF
Schedule of Investments
August 31, 2021
| | Shares | | | Value | | | | |
INVESTMENT COMPANIES — 99.8% | | | | |
Exchange Traded Funds — 99.8% |
iShares MSCI EAFE Min Vol Factor ETF (a)(b) | | | 70,406 | | | $ | 5,526,167 | | | | | |
iShares MSCI Emerging Markets Min Vol Factor ETF (b) | | | 22,185 | | | | 1,417,177 | | | | | |
TOTAL EXCHANGE TRADED FUNDS (Cost $6,669,387) | | | | | | | 6,943,344 | | | | | |
| | | | | | | | | | | | | |
MONEY MARKET FUNDS — 0.1% | | | | | | | | |
First American Government Obligations Fund - Class X, 0.03% (c) | | | 6,025 | | | | 6,025 | | | | | |
TOTAL MONEY MARKET FUNDS (Cost $6,025) | | | | | | | 6,025 | | | | | |
| | | | | | | | | | | | | |
| | Number of
Contracts (d) | | | | | | Notional
Value | |
PURCHASED OPTIONS — 0.0% (e) | | | | | | | | |
PURCHASED PUT OPTIONS — 0.0% (e) | | | | | | | | |
CBOE S&P 500 Index | | | | | | | | | | | | |
Expiration: September 2021, Exercise Price: $4,335 (f) | | | 4 | | | | 670 | | | $ | 1,809,072 | |
Expiration: September 2021, Exercise Price: $4,355 (f) | | | 4 | | | | 1,120 | | | | 1,809,072 | |
TOTAL PURCHASED OPTIONS (Cost $2,844) | | | | | | | 1,790 | | | | | |
| | | | | | | | | | | | | |
TOTAL INVESTMENTS (Cost $6,678,256) — 99.9% | | | | | | | 6,951,159 | | | | | |
Other Assets in Excess of Liabilities — 0.1% | | | | | | | 8,488 | | | | | |
TOTAL NET ASSETS — 100.0% | | | | | | $ | 6,959,647 | | | | | |
Percentages are stated as a percent of net assets.
CBOE | Chicago Board Options Exchange |
(a) | Fair value of this security exceeds 25% of the Fund’s net assets. Additional information for this security, including the financial statements, is available from the SEC’s EDGAR database at www.sec.gov. |
(b) | All or a portion of the security is segregated as collateral for written options. The value of the securities segregated as collateral for written options is $1,558,829. |
(c) | The rate shown is the annualized seven-day yield at period end. |
(d) | Each contract has a multiplier of 100. |
(f) | Held in connection with a written option, see Schedule of Written Options for more detail. |
The accompanying notes are an integral part of the financial statements.
13
Overlay Shares Foreign Equity ETF
Schedule of Written Options
August 31, 2021
| | Number of
Contracts (a) | | | Value | | | Notional
Value | |
WRITTEN OPTIONS — (0.1)% | | | | |
WRITTEN PUT OPTIONS — (0.1)% |
CBOE S&P 500 Index | | | | | | | | | | | | |
Expiration: September 2021, Exercise Price: $4,470 | | | 4 | | | $ | 2,700 | | | $ | 1,809,072 | |
Expiration: September 2021, Exercise Price: $4,495 | | | 4 | | | | 4,900 | | | | 1,809,072 | |
TOTAL WRITTEN OPTIONS (Premiums Received $10,508) | | | | | | $ | 7,600 | | | | | |
Percentages are stated as a percent of net assets.
CBOE | Chicago Board Options Exchange |
(a) | Each contract has a multiplier of 100. |
The accompanying notes are an integral part of the financial statements.
14
Overlay Shares Hedged Large Cap Equity ETF
Schedule of Investments
August 31, 2021
| | | Shares | | | Value | | | | | |
| INVESTMENT COMPANIES — 100.1% |
| Exchange Traded Funds — 100.1% | | | | | | | | | | | | |
Vanguard S&P 500 ETF (a)(b) | | | 29,696 | | | $ | 12,325,325 | | | | | |
TOTAL EXCHANGE TRADED FUNDS (Cost $11,330,467) | | | | | | | 12,325,325 | | | | | |
| | | | | | | | | | | | | |
| MONEY MARKET FUNDS — 1.6% | | | | | | | | | | | | |
First American Government Obligations Fund - Class X, 0.03% (c) | | | 195,053 | | | | 195,053 | | | | | |
TOTAL MONEY MARKET FUNDS (Cost $195,053) | | | | | | | 195,053 | | | | | |
| | Number of
Contracts (d) | | | Value | | | Notional
Value | |
PURCHASED OPTIONS — 3.4% | | | | | | | | |
PURCHASED PUT OPTIONS — 3.4% | | | | | | | | |
CBOE S&P 500 Index | | | | | | | | | | | | |
Expiration: September 2021, Exercise Price: $4,335 (e) | | | 7 | | | $ | 1,173 | | | $ | 3,165,876 | |
Expiration: September 2021, Exercise Price: $4,355 (e) | | | 7 | | | | 1,960 | | | | 3,165,876 | |
Expiration: June 2022, Exercise Price: $3,950 | | | 4 | | | | 60,120 | | | | 1,809,072 | |
Expiration: January 2023, Exercise Price: $4,100 | | | 4 | | | | 110,260 | | | | 1,809,072 | |
SPDR S&P 500 ETF Trust | | | | | | | | | | | | |
Expiration: December 2021, Exercise Price: $395 | | | 39 | | | | 19,637 | | | | 1,761,084 | |
Expiration: January 2022, Exercise Price: $395 | | | 39 | | | | 26,890 | | | | 1,761,084 | |
Expiration: March 2022, Exercise Price: $395 | | | 39 | | | | 40,696 | | | | 1,761,084 | |
Expiration: September 2022, Exercise Price: $395 | | | 39 | | | | 75,601 | | | | 1,761,084 | |
Expiration: December 2022, Exercise Price: $395 | | | 38 | | | | 88,027 | | | | 1,715,928 | |
TOTAL PURCHASED OPTIONS (Cost $510,788) | | | | | | | 424,364 | | | | | |
| | | | | | | | | | | | | |
TOTAL INVESTMENTS (Cost $12,036,308) — 105.1% | | | | | | | 12,944,742 | | | | | |
Liabilities in Excess of Other Assets — (5.1)% | | | | | | | (631,926 | ) | | | | |
TOTAL NET ASSETS — 100.0% | | | | | | $ | 12,312,816 | | | | | |
Percentages are stated as a percent of net assets.
CBOE | Chicago Board Options Exchange |
SPDR | Standard & Poor’s Depositary Receipt |
(a) | Fair value of this security exceeds 25% of the Fund’s net assets. Additional information for this security, including the financial statements, is available from the SEC’s EDGAR database at www.sec.gov. |
(b) | All or a portion of the security is segregated as collateral for written options. The value of the security segregated as collateral for written options is $2,973,418. |
(c) | The rate shown is the annualized seven-day yield at period end. |
(d) | Each contract has a multiplier of 100. |
(e) | Held in connection with a written option, see Schedule of Written Options for more detail. |
The accompanying notes are an integral part of the financial statements.
15
Overlay Shares Hedged Large Cap Equity ETF
Schedule of Written Options
August 31, 2021
| | Number of
Contracts (a) | | | Value | | | Notional
Value | |
WRITTEN OPTIONS — (0.1)% | | | | |
WRITTEN PUT OPTIONS — (0.1)% |
CBOE S&P 500 Index | | | | | | | | | | | | |
Expiration: September 2021, Exercise Price: $4,470 | | | 7 | | | $ | 4,725 | | | $ | 3,165,876 | |
Expiration: September 2021, Exercise Price: $4,495 | | | 7 | | | | 8,575 | | | | 3,165,876 | |
TOTAL WRITTEN OPTIONS (Premiums Received $18,388) | | | | | | $ | 13,300 | | | | | |
Percentages are stated as a percent of net assets.
CBOE | Chicago Board Options Exchange |
(a) | Each contract has a multiplier of 100. |
The accompanying notes are an integral part of the financial statements.
16
Overlay Shares Core Bond ETF
Schedule of Investments
August 31, 2021

| | Shares | | | Value | | | | |
INVESTMENT COMPANIES — 99.8% | | | | | | | | |
Exchange Traded Funds — 99.8% | | | | | | | | |
iShares Core U.S. Aggregate Bond ETF (a)(b) | | | 1,237,219 | | | $ | 143,591,638 | | | | | |
TOTAL EXCHANGE TRADED FUNDS (Cost $142,385,768) | | | | | | | 143,591,638 | | | | | |
| | | | | | | | | | | | | |
MONEY MARKET FUNDS — 0.1% | | | | | | | | |
First American Government Obligations Fund - Class X, 0.03% (c) | | | 144,796 | | | | 144,796 | | | | | |
TOTAL MONEY MARKET FUNDS (Cost $144,796) | | | | | | | 144,796 | | | | | |
| | | | | | | | | | | | | |
| | Number of
Contracts (d) | | | | | | Notional
Value | |
PURCHASED OPTIONS — 0.0% (e) | | | | | | | | |
PURCHASED PUT OPTIONS — 0.0% (e) | | | | | | | | |
CBOE S&P 500 Index | | | | | | | | | | | | |
Expiration: September 2021, Exercise Price: $4,335 (f) | | | 80 | | | | 13,400 | | | $ | 36,181,440 | |
Expiration: September 2021, Exercise Price: $4,355 (f) | | | 80 | | | | 22,400 | | | | 36,181,440 | |
TOTAL PURCHASED OPTIONS (Cost $56,886) | | | | | | | 35,800 | | | | | |
| | | | | | | | | | | | | |
TOTAL INVESTMENTS (Cost $142,587,450) — 99.9% | | | | | | | 143,772,234 | | | | | |
Other Assets in Excess of Liabilities — 0.1% | | | | | | | 128,574 | | | | | |
TOTAL NET ASSETS — 100.0% | | | | | | $ | 143,900,808 | | | | | |
Percentages are stated as a percent of net assets.
CBOE | Chicago Board Options Exchange |
(a) | Fair value of this security exceeds 25% of the Fund’s net assets. Additional information for this security, including the financial statements, is available from the SEC’s EDGAR database at www.sec.gov. |
(b) | All or a portion of the security is segregated as collateral for written options. The value of the security segregated as collateral for written options is $56,143,329. |
(c) | The rate shown is the annualized seven-day yield at period end. |
(d) | Each contract has a multiplier of 100. |
(f) | Held in connection with a written option, see Schedule of Written Options for more detail. |
The accompanying notes are an integral part of the financial statements.
17
Overlay Shares Core Bond ETF
Schedule of Written Options
August 31, 2021
| | Number of
Contracts (a) | | | Value | | | Notional
Value | |
WRITTEN OPTIONS — (0.1)% | | | | |
WRITTEN PUT OPTIONS — (0.1)% |
CBOE S&P 500 Index | | | | | | | | | | | | |
Expiration: September 2021, Exercise Price: $4,470 | | | 80 | | | $ | 54,000 | | | $ | 36,181,440 | |
Expiration: September 2021, Exercise Price: $4,495 | | | 80 | | | | 98,000 | | | | 36,181,440 | |
TOTAL WRITTEN OPTIONS (Premiums Received $210,153) | | | | | | $ | 152,000 | | | | | |
Percentages are stated as a percent of net assets.
CBOE | Chicago Board Options Exchange |
(a) | Each contract has a multiplier of 100. |
The accompanying notes are an integral part of the financial statements.
18
Overlay Shares Short Term Bond ETF
Schedule of Investments
August 31, 2021

| | Shares | | | Value | | | | |
INVESTMENT COMPANIES — 99.8% | | | | | | | | |
Exchange Traded Funds — 99.8% | | | | | | | | |
Vanguard Short-Term Corporate Bond ETF (a)(b) | | | 511,114 | | | $ | 42,269,128 | | | | | |
TOTAL EXCHANGE TRADED FUNDS (Cost $42,382,794) | | | | | | | 42,269,128 | | | | | |
| | | | | | | | | | | | | |
MONEY MARKET FUNDS — 0.0%(e) | | | | | | | | |
First American Government Obligations Fund - Class X, 0.03% (c) | | | 5,372 | | | | 5,372 | | | | | |
TOTAL MONEY MARKET FUNDS (Cost $5,372) | | | | | | | 5,372 | | | | | |
| | | | | | | | | | | | | |
| | Number of
Contracts (d) | | | | | | Notional
Value | |
PURCHASED OPTIONS — 0.0% (e) | | | | | | | | |
PURCHASED PUT OPTIONS — 0.0% (e) | | | | | | | | |
CBOE S&P 500 Index | | | | | | | | | | | | |
Expiration: September 2021, Exercise Price: $4,335 (f) | | | 24 | | | | 4,020 | | | $ | 10,854,432 | |
Expiration: September 2021, Exercise Price: $4,355 (f) | | | 24 | | | | 6,720 | | | | 10,854,432 | |
TOTAL PURCHASED OPTIONS (Cost $17,066) | | | | | | | 10,740 | | | | | |
| | | | | | | | | | | | | |
TOTAL INVESTMENTS (Cost $42,405,232) — 99.8% | | | | | | | 42,285,240 | | | | | |
Other Assets in Excess of Liabilities — 0.2% | | | | | | | 87,111 | | | | | |
TOTAL NET ASSETS — 100.0% | | | | | | $ | 42,372,351 | | | | | |
Percentages are stated as a percent of net assets.
CBOE | Chicago Board Options Exchange |
(a) | Fair value of this security exceeds 25% of the Fund’s net assets. Additional information for this security, including the financial statements, is available from the SEC’s EDGAR database at www.sec.gov. |
(b) | All or a portion of the security is segregated as collateral for written options. The value of the security segregated as collateral for written options is $17,823,256. |
(c) | The rate shown is the annualized seven-day yield at period end. |
(d) | Each contract has a multiplier of 100. |
(f) | Held in connection with a written option, see Schedule of Written Options for more detail. |
The accompanying notes are an integral part of the financial statements.
19
Overlay Shares Short Term Bond ETF
Schedule of Written Options
August 31, 2021
| | Number of
Contracts (a) | | | Value | | | Notional
Value | |
WRITTEN OPTIONS — (0.1)% | | | | |
WRITTEN PUT OPTIONS — (0.1)% |
CBOE S&P 500 Index | | | | | | | | | | | | |
Expiration: September 2021, Exercise Price: $4,470 | | | 24 | | | $ | 16,200 | | | $ | 10,854,432 | |
Expiration: September 2021, Exercise Price: $4,495 | | | 24 | | | | 29,400 | | | | 10,854,432 | |
TOTAL WRITTEN OPTIONS (Premiums Received $63,046) | | | | | | $ | 45,600 | | | | | |
Percentages are stated as a percent of net assets.
CBOE | Chicago Board Options Exchange |
(a) | Each contract has a multiplier of 100. |
The accompanying notes are an integral part of the financial statements.
20
Overlay Shares Municipal Bond ETF
Schedule of Investments
August 31, 2021

| | Shares | | | Value | | | | |
INVESTMENT COMPANIES — 99.8% | | | | |
Exchange Traded Funds — 99.8% |
iShares National Muni Bond ETF (a)(b) | | | 95,464 | | | $ | 11,184,562 | | | | | |
TOTAL EXCHANGE TRADED FUNDS (Cost $11,034,009) | | | | | | | 11,184,562 | | | | | |
| | | | | | | | | | | | | |
MONEY MARKET FUNDS — 0.1% | | | | | | | | |
First American Government Obligations Fund - Class X, 0.03% (c) | | | 11,694 | | | | 11,694 | | | | | |
TOTAL MONEY MARKET FUNDS (Cost $11,694) | | | | | | | 11,694 | | | | | |
| | | | | | | | | | | | | |
| | Number of
Contracts (d) | | | | | | Notional
Value | |
PURCHASED OPTIONS — 0.0% (e) | | | | | | | | |
PURCHASED PUT OPTIONS — 0.0% (e) | | | | | | | | |
CBOE S&P 500 Index | | | | | | | | | | | | |
Expiration: September 2021, Exercise Price: $4,335 (f) | | | 6 | | | | 1,005 | | | $ | 2,713,608 | |
Expiration: September 2021, Exercise Price: $4,355 (f) | | | 6 | | | | 1,680 | | | | 2,713,608 | |
TOTAL PURCHASED OPTIONS (Cost $4,266) | | | | | | | 2,685 | | | | | |
| | | | | | | | | | | | | |
TOTAL INVESTMENTS (Cost $11,049,969) — 99.9% | | | | | | | 11,198,941 | | | | | |
Other Assets in Excess of Liabilities — 0.1% | | | | | | | 8,969 | | | | | |
TOTAL NET ASSETS — 100.0% | | | | | | $ | 11,207,910 | | | | | |
Percentages are stated as a percent of net assets.
CBOE | Chicago Board Options Exchange |
(a) | Fair value of this security exceeds 25% of the Fund’s net assets. Additional information for this security, including the financial statements, is available from the SEC’s EDGAR database at www.sec.gov. |
(b) | All or a portion of this security is segregated as collateral for written options. The value of the security segregated as collateral for written options is $9,254,703. |
(c) | The rate shown is the annualized seven-day yield at period end. |
(d) | Each contract has a multiplier of 100. |
(f) | Held in connection with a written option, see Schedule of Written Options for more detail. |
The accompanying notes are an integral part of the financial statements.
21
Overlay Shares Municipal Bond ETF
Schedule of Written Options
August 31, 2021
| | Number of
Contracts (a) | | | Value | | | Notional
Value | |
WRITTEN OPTIONS — (0.1)% | | | | |
WRITTEN PUT OPTIONS — (0.1)% |
CBOE S&P 500 Index | | | | | | | | | | | | |
Expiration: September 2021, Exercise Price: $4,470 | | | 6 | | | $ | 4,050 | | | $ | 2,713,608 | |
Expiration: September 2021, Exercise Price: $4,495 | | | 6 | | | | 7,350 | | | | 2,713,608 | |
TOTAL WRITTEN OPTIONS (Premiums Received $15,761) | | | | | | $ | 11,400 | | | | | |
Percentages are stated as a percent of net assets.
CBOE | Chicago Board Options Exchange |
(a) | Each contract has a multiplier of 100. |
The accompanying notes are an integral part of the financial statements.
22
Overlay Shares ETFs
Statements of Assets and Liabilities
August 31, 2021
| | | Overlay Shares
Large Cap
Equity ETF | | | Overlay Shares
Small Cap
Equity ETF | | | Overlay
Shares Foreign
Equity ETF | | | Overlay Shares
Hedged Large
Cap Equity ETF | |
Assets | | | | | | | | | | | | | | | | |
Investments, at value (cost $158,467,450, $5,808,465, $6,678,256, and $12,036,308 respectively) | | $ | 200,731,311 | | | $ | 6,506,014 | | | $ | 6,951,159 | | | $ | 12,944,742 | |
Deposits at broker for options | | | 561,624 | | | | 15,573 | | | | 20,477 | | | | — | |
Interest receivable | | | 3 | | | | — | | | | — | | | | 4 | |
Total assets | | | 201,292,938 | | | | 6,521,587 | | | | 6,971,636 | | | | 12,944,746 | |
| | | | | | | | | | | | | | | | | |
Liabilities | | | | | | | | | | | | | | | | |
Payable to Adviser | | | 124,795 | | | | 4,058 | | | | 4,389 | | | | 7,140 | |
Written options, at value (premiums received $288,961, $10,508, $10,508, and $18,388 respectively) | | | 209,000 | | | | 7,600 | | | | 7,600 | | | | 13,300 | |
Payable to broker for options | | | — | | | | — | | | | — | | | | 611,490 | |
Total liabilities | | | 333,795 | | | | 11,658 | | | | 11,989 | | | | 631,930 | |
Net Assets | | $ | 200,959,143 | | | $ | 6,509,929 | | | $ | 6,959,647 | | | $ | 12,312,816 | |
| | | | | | | | | | | | | | | | | |
Net Assets Consists of: | | | | | | | | | | | | | | | | |
Paid-in capital | | $ | 155,556,623 | | | $ | 5,744,623 | | | $ | 6,658,346 | | | $ | 11,503,176 | |
Total distributable earnings | | | 45,402,520 | | | | 765,306 | | | | 301,301 | | | | 809,640 | |
Net Assets | | $ | 200,959,143 | | | $ | 6,509,929 | | | $ | 6,959,647 | | | $ | 12,312,816 | |
| | | | | | | | | | | | | | | | | |
Shares of beneficial interest outstanding (unlimited number of shares authorized, no par value) | | | 5,125,000 | | | | 175,000 | | | | 250,000 | | | | 425,000 | |
Net asset value, redemption price and offering price per share | | $ | 39.21 | | | $ | 37.20 | | | $ | 27.84 | | | $ | 28.97 | |
The accompanying notes are an integral part of the financial statements.
23
Overlay Shares ETFs
Statements of Assets and Liabilities
August 31, 2021
| | | Overlay Shares
Core Bond ETF | | | Overlay Shares
Short Term
Bond ETF | | | Overlay Shares
Municipal
Bond ETF | |
Assets | | | | | | | | | | | | |
Investments, at value (cost $142,587,450, $42,405,232 and $11,049,969 respectively) | | $ | 143,772,234 | | | $ | 42,285,240 | | | $ | 11,198,941 | |
Deposits at broker for options | | | 368,565 | | | | 159,612 | | | | 27,498 | |
Interest receivable | | | 3 | | | | 1 | | | | — | |
Total assets | | | 144,140,802 | | | | 42,444,853 | | | | 11,226,439 | |
| | | | | | | | | | | | | |
Liabilities | | | | | | | | | | | | |
Payable to Adviser | | | 87,992 | | | | 26,902 | | | | 7,129 | |
Written options, at value (premiums received $210,153, $63,046 and $15,761 respectively) | | | 152,000 | | | | 45,600 | | | | 11,400 | |
Payable to broker for options | | | 2 | | | | — | | | | — | |
Total liabilities | | | 239,994 | | | | 72,502 | | | | 18,529 | |
Net Assets | | $ | 143,900,808 | | | $ | 42,372,351 | | | $ | 11,207,910 | |
| | | | | | | | | | | | | |
Net Assets Consists of: | | | | | | | | | | | | |
Paid-in capital | | $ | 140,396,215 | | | $ | 41,911,713 | | | $ | 10,641,438 | |
Total distributable earnings | | | 3,504,593 | | | | 460,638 | | | | 566,472 | |
Net Assets | | $ | 143,900,808 | | | $ | 42,372,351 | | | $ | 11,207,910 | |
| | | | | | | | | | | | | |
Shares of beneficial interest outstanding (unlimited number of shares authorized, no par value) | | | 5,450,000 | | | | 1,675,000 | | | | 425,000 | |
Net asset value, redemption price and offering price per share | | $ | 26.40 | | | $ | 25.30 | | | $ | 26.37 | |
The accompanying notes are an integral part of the financial statements.
24
Overlay Shares ETFs
Statements of Operations
For the Period Ended August 31, 2021
| | | Overlay Shares
Large Cap
Equity ETF | | | Overlay Shares
Small Cap
Equity ETF | | | Overlay
Shares Foreign
Equity ETF | | | Overlay Shares
Hedged
Large Cap
Equity ETF(1) | |
Investment Income | | | | | | | | | | | | | | | | |
Dividend income | | $ | 2,084,134 | | | $ | 47,433 | | | $ | 104,729 | | | $ | 48,361 | |
Interest income | | | 280 | | | | 17 | | | | 16 | | | | 31 | |
Total investment income | | | 2,084,414 | | | | 47,450 | | | | 104,745 | | | | 48,392 | |
| | | | | | | | | | | | | | | | | |
Expenses | | | | | | | | | | | | | | | | |
Investment advisory fees | | | 1,093,116 | | | | 34,822 | | | | 38,284 | | | | 33,813 | |
Interest expense | | | 30,103 | | | | 1,010 | | | | 1,130 | | | | 2,913 | |
Total expenses | | | 1,123,219 | | | | 35,832 | | | | 39,414 | | | | 36,726 | |
Net Investment Income | | | 961,195 | | | | 11,618 | | | | 65,331 | | | | 11,666 | |
| | | | | | | | | | | | | | | | | |
Realized and Unrealized Gain (Loss) on Investments | | | | | | | | | | | | | | | | |
Net realized gain (loss) on: | | | | | | | | | | | | | | | | |
Investments | | | 6,599,127 | | | | 520,910 | | | | (23,556 | ) | | | 288,706 | |
Purchased options | | | (5,627,970 | ) | | | (171,350 | ) | | | (197,144 | ) | | | (494,564 | ) |
Written options | | | 11,813,960 | | | | 361,844 | | | | 399,601 | | | | 378,383 | |
Net realized gain | | | 12,785,117 | | | | 711,404 | | | | 178,901 | | | | 172,525 | |
Net change in unrealized appreciation/depreciation on: | | | | | | | | | | | | | | | | |
Investments | | | 32,224,838 | | | | 1,103,181 | | | | 660,165 | | | | 994,858 | |
Purchased options | | | (32,161 | ) | | | (1,146 | ) | | | (1,192 | ) | | | (86,424 | ) |
Written options | | | 87,741 | | | | 3,133 | | | | 3,246 | | | | 5,088 | |
Net change in unrealized appreciation/depreciation | | | 32,280,418 | | | | 1,105,168 | | | | 662,219 | | | | 913,522 | |
Net realized and unrealized gain on investments | | | 45,065,535 | | | | 1,816,572 | | | | 841,120 | | | | 1,086,047 | |
Net increase in net assets from operations | | $ | 46,026,730 | | | $ | 1,828,190 | | | $ | 906,451 | | | $ | 1,097,713 | |
(1) | The Fund commenced operations on January 14, 2021. |
The accompanying notes are an integral part of the financial statements.
25
Overlay Shares ETFs
Statements of Operations
For the Period Ended August 31, 2021
| | | Overlay Shares
Core Bond ETF | | | Overlay Shares
Short Term
Bond ETF(1) | | | Overlay Shares
Municipal
Bond ETF | |
Investment Income | | | | | | | | | | | | |
Dividend income | | $ | 2,267,957 | | | $ | 301,900 | | | $ | 442,280 | |
Interest income | | | 290 | | | | 54 | | | | 55 | |
Total investment income | | | 2,268,247 | | | | 301,954 | | | | 442,335 | |
| | | | | | | | | | | | | |
Expenses | | | | | | | | | | | | |
Investment advisory fees | | | 942,627 | | | | 153,109 | | | | 169,016 | |
Interest expense | | | 26,648 | | | | 3,978 | | | | 5,368 | |
Total expenses | | | 969,275 | | | | 157,087 | | | | 174,384 | |
Net Investment Income | | | 1,298,972 | | | | 144,867 | | | | 267,951 | |
| | | | | | | | | | | | | |
Realized and Unrealized Gain (Loss) on Investments | | | | | | | | | | | | |
Net realized gain (loss) on: | | | | | | | | | | | | |
Investments | | | 58,817 | | | | (8,685 | ) | | | 217,786 | |
Purchased options | | | (4,926,057 | ) | | | (737,378 | ) | | | (918,385 | ) |
Written options | | | 10,005,363 | | | | 1,752,955 | | | | 1,714,840 | |
Net realized gain | | | 5,138,123 | | | | 1,006,892 | | | | 1,014,241 | |
Net change in unrealized appreciation/depreciation on: | | | | | | | | | | | | |
Investments | | | (2,643,362 | ) | | | (113,666 | ) | | | (187,806 | ) |
Purchased options | | | (24,805 | ) | | | (6,326 | ) | | | (2,499 | ) |
Written options | | | 67,286 | | | | 17,446 | | | | 6,616 | |
Net change in unrealized appreciation/depreciation | | | (2,600,881 | ) | | | (102,546 | ) | | | (183,689 | ) |
Net realized and unrealized gain on investments | | | 2,537,242 | | | | 904,346 | | | | 830,552 | |
Net increase in net assets from operations | | $ | 3,836,214 | | | $ | 1,049,213 | | | $ | 1,098,503 | |
(1) | The Fund commenced operations on January 14, 2021. |
The accompanying notes are an integral part of the financial statements.
26
Overlay Shares Large Cap Equity ETF
Statements of Changes in Net Assets
| | Year
ended
August 31,
2021 | | | Period
ended
August 31,
2020(1) | |
From Operations | | | | | | | | |
Net investment income | | $ | 961,195 | | | $ | 389,717 | |
Net realized gain on investments, purchased options and written options | | | 12,785,117 | | | | 1,611,409 | |
Net change in unrealized appreciation/depreciation on investments, purchased options and written options | | | 32,280,418 | | | | 10,063,404 | |
Net increase in net assets resulting from operations | | | 46,026,730 | | | | 12,064,530 | |
| | | | | | | | | |
From Distributions | | | | | | | | |
Distributable earnings | | | (5,264,196 | ) | | | (484,488 | ) |
Total distributions | | | (5,264,196 | ) | | | (484,488 | ) |
| | | | | | | | | |
From Capital Share Transactions | | | | | | | | |
Proceeds from shares sold | | | 90,796,765 | | | | 88,656,335 | |
Cost of shares redeemed | | | (28,368,453 | ) | | | (2,468,080 | ) |
Net increase in net assets resulting from capital share transactions | | | 62,428,312 | | | | 86,188,255 | |
| | | | | | | | | |
Total Increase in Net Assets | | | 103,190,846 | | | | 97,768,297 | |
| | | | | | | | | |
Net Assets | | | | | | | | |
Beginning of period | | | 97,768,297 | | | | — | |
End of period | | $ | 200,959,143 | | | $ | 97,768,297 | |
| | | | | | | | | |
Changes in Shares Outstanding | | | | | | | | |
Shares outstanding, beginning of period | | | 3,250,000 | | | | — | |
Shares sold | | | 2,725,000 | | | | 3,350,000 | |
Shares redeemed | | | (850,000 | ) | | | (100,000 | ) |
Shares outstanding, end of period | | | 5,125,000 | | | | 3,250,000 | |
(1) | The Fund commenced operations on September 30, 2019. |
The accompanying notes are an integral part of the financial statements.
27
Overlay Shares Small Cap Equity ETF
Statements of Changes in Net Assets
| | | Year
ended
August 31,
2021 | | | Period
ended
August 31,
2020(1) | |
From Operations | | | | | | | | |
Net investment income | | $ | 11,618 | | | $ | 83,397 | |
Net realized gain (loss) on investments, purchased options and written options | | | 711,404 | | | | (1,331,292 | ) |
Net change in unrealized appreciation/depreciation on investments, purchased options and written options | | | 1,105,168 | | | | (404,711 | ) |
Net increase (decrease) in net assets resulting from operations | | | 1,828,190 | | | | (1,652,606 | ) |
| | | | | | | | | |
From Distributions | | | | | | | | |
Distributable earnings | | | (135,610 | ) | | | (116,448 | ) |
Total distributions | | | (135,610 | ) | | | (116,448 | ) |
| | | | | | | | | |
From Capital Share Transactions | | | | | | | | |
Proceeds from shares sold | | | 4,341,838 | | | | 16,504,828 | |
Cost of shares redeemed | | | (2,558,460 | ) | | | (11,701,803 | ) |
Net increase in net assets resulting from capital share transactions | | | 1,783,378 | | | | 4,803,025 | |
| | | | | | | | | |
Total Increase in Net Assets | | | 3,475,958 | | | | 3,033,971 | |
| | | | | | | | | |
Net Assets | | | | | | | | |
Beginning of period | | | 3,033,971 | | | | — | |
End of period | | $ | 6,509,929 | | | $ | 3,033,971 | |
| | | | | | | | | |
Changes in Shares Outstanding | | | | | | | | |
Shares outstanding, beginning of period | | | 125,000 | | | | — | |
Shares sold | | | 125,000 | | | | 650,000 | |
Shares redeemed | | | (75,000 | ) | | | (525,000 | ) |
Shares outstanding, end of period | | | 175,000 | | | | 125,000 | |
(1) | The Fund commenced operations on September 30, 2019. |
The accompanying notes are an integral part of the financial statements.
28
Overlay Shares Foreign Equity ETF
Statements of Changes in Net Assets
| | | Year
ended
August 31,
2021 | | | Period
ended
August 31,
2020(1) | |
From Operations | | | | | | | | |
Net investment income | | $ | 65,331 | | | $ | 575,692 | |
Net realized gain (loss) on investments, purchased options and written options | | | 178,901 | | | | (2,552,149 | ) |
Net change in unrealized appreciation/depreciation on investments, purchased options and written options | | | 662,219 | | | | (386,407 | ) |
Net increase (decrease) in net assets resulting from operations | | | 906,451 | | | | (2,362,864 | ) |
| | | | | | | | | |
From Distributions | | | | | | | | |
Distributable earnings | | | (206,437 | ) | | | (603,912 | ) |
Return of capital | | | — | | | | (12,224 | ) |
Total distributions | | | (206,437 | ) | | | (616,136 | ) |
| | | | | | | | | |
From Capital Share Transactions | | | | | | | | |
Proceeds from shares sold | | | 3,317,585 | | | | 33,871,680 | |
Cost of shares redeemed | | | (1,281,097 | ) | | | (26,669,535 | ) |
Net increase in net assets resulting from capital share transactions | | | 2,036,488 | | | | 7,202,145 | |
| | | | | | | | | |
Total Increase in Net Assets | | | 2,736,502 | | | | 4,223,145 | |
| | | | | | | | | |
Net Assets | | | | | | | | |
Beginning of period | | | 4,223,145 | | | | — | |
End of period | | $ | 6,959,647 | | | $ | 4,223,145 | |
| | | | | | | | | |
Changes in Shares Outstanding | | | | | | | | |
Shares outstanding, beginning of period | | | 175,000 | | | | — | |
Shares sold | | | 125,000 | | | | 1,325,000 | |
Shares redeemed | | | (50,000 | ) | | | (1,150,000 | ) |
Shares outstanding, end of period | | | 250,000 | | | | 175,000 | |
(1) | The Fund commenced operations on September 30, 2019. |
The accompanying notes are an integral part of the financial statements.
29
Overlay Shares Hedged Large Cap Equity ETF
Statement of Changes in Net Assets
| | | Period
ended
August 31,
2021(1) | |
From Operations | | | | |
Net investment income | | $ | 11,666 | |
Net realized gain on investments, purchased options and written options | | | 172,525 | |
Net change in unrealized appreciation/depreciation on investments, purchased options and written options | | | 913,522 | |
Net increase in net assets resulting from operations | | | 1,097,713 | |
| | | | | |
From Capital Share Transactions | | | | |
Proceeds from shares sold | | | 13,932,513 | |
Cost of shares redeemed | | | (2,717,410 | ) |
Net increase in net assets resulting from capital share transactions | | | 11,215,103 | |
| | | | | |
Total Increase in Net Assets | | | 12,312,816 | |
| | | | | |
Net Assets | | | | |
Beginning of period | | | — | |
End of period | | $ | 12,312,816 | |
| | | | | |
Changes in Shares Outstanding | | | | |
Shares outstanding, beginning of period | | | — | |
Shares sold | | | 525,000 | |
Shares redeemed | | | (100,000 | ) |
Shares outstanding, end of period | | | 425,000 | |
(1) | The Fund commenced operations on January 14, 2021. |
The accompanying notes are an integral part of the financial statements.
30
Overlay Shares Core Bond ETF
Statements of Changes in Net Assets
| | | Year
ended
August 31,
2021 | | | Period
ended
August 31,
2020(1) | |
From Operations | | | | | | | | |
Net investment income | | $ | 1,298,972 | | | $ | 953,250 | |
Net realized gain on investments, purchased options and written options | | | 5,138,123 | | | | 2,004,813 | |
Net change in unrealized appreciation/depreciation on investments, purchased options and written options | | | (2,600,881 | ) | | | 3,843,818 | |
Net increase in net assets resulting from operations | | | 3,836,214 | | | | 6,801,881 | |
| | | | | | | | | |
From Distributions | | | | | | | | |
Distributable earnings | | | (4,741,382 | ) | | | (2,116,180 | ) |
Total distributions | | | (4,741,382 | ) | | | (2,116,180 | ) |
| | | | | | | | | |
From Capital Share Transactions | | | | | | | | |
Proceeds from shares sold | | | 51,638,382 | | | | 110,304,293 | |
Cost of shares redeemed | | | (20,576,440 | ) | | | (1,245,960 | ) |
Net increase in net assets resulting from capital share transactions | | | 31,061,942 | | | | 109,058,333 | |
| | | | | | | | | |
Total Increase in Net Assets | | | 30,156,774 | | | | 113,744,034 | |
| | | | | | | | | |
Net Assets | | | | | | | | |
Beginning of period | | | 113,744,034 | | | | — | |
End of period | | $ | 143,900,808 | | | $ | 113,744,034 | |
| | | | | | | | | |
Changes in Shares Outstanding | | | | | | | | |
Shares outstanding, beginning of period | | | 4,275,000 | | | | — | |
Shares sold | | | 1,975,000 | | | | 4,325,000 | |
Shares redeemed | | | (800,000 | ) | | | (50,000 | ) |
Shares outstanding, end of period | | | 5,450,000 | | | | 4,275,000 | |
(1) | The Fund commenced operations on September 30, 2019. |
The accompanying notes are an integral part of the financial statements.
31
Overlay Shares Short Term Bond ETF
Statement of Changes in Net Assets
| | | Period
ended
August 31,
2021(1) | |
From Operations | | | | |
Net investment income | | $ | 144,867 | |
Net realized gain on investments, purchased options and written options | | | 1,006,892 | |
Net change in unrealized appreciation/depreciation on investments, purchased options and written options | | | (102,546 | ) |
Net increase in net assets resulting from operations | | | 1,049,213 | |
| | | | | |
From Distributions | | | | |
Distributable earnings | | | (589,612 | ) |
Total distributions | | | (589,612 | ) |
| | | | | |
From Capital Share Transactions | | | | |
Proceeds from shares sold | | | 45,039,500 | |
Cost of shares redeemed | | | (3,126,750 | ) |
Net increase in net assets resulting from capital share transactions | | | 41,912,750 | |
| | | | | |
Total Increase in Net Assets | | | 42,372,351 | |
| | | | | |
Net Assets | | | | |
Beginning of period | | | — | |
End of period | | $ | 42,372,351 | |
| | | | | |
Changes in Shares Outstanding | | | | |
Shares outstanding, beginning of period | | | — | |
Shares sold | | | 1,800,000 | |
Shares redeemed | | | (125,000 | ) |
Shares outstanding, end of period | | | 1,675,000 | |
(1) | The Fund commenced operations on January 14, 2021. |
The accompanying notes are an integral part of the financial statements.
32
Overlay Shares Municipal Bond ETF
Statements of Changes in Net Assets
| | | Year
ended
August 31,
2021 | | | Period
ended
August 31,
2020(1) | |
From Operations | | | | | | | | |
Net investment income | | $ | 267,951 | | | $ | 263,950 | |
Net realized gain on investments, purchased options and written options | | | 1,014,241 | | | | 506,862 | |
Net change in unrealized appreciation/depreciation on investments, purchased options and written options | | | (183,689 | ) | | | 337,022 | |
Net increase in net assets resulting from operations | | | 1,098,503 | | | | 1,107,834 | |
| | | | | | | | | |
From Distributions | | | | | | | | |
Distributable earnings | | | (823,491 | ) | | | (617,811 | ) |
Total distributions | | | (823,491 | ) | | | (617,811 | ) |
| | | | | | | | | |
From Capital Share Transactions | | | | | | | | |
Proceeds from shares sold | | | 7,134,485 | | | | 29,124,958 | |
Cost of shares redeemed | | | (25,222,065 | ) | | | (594,503 | ) |
Net increase (decrease) in net assets resulting from capital share transactions | | | (18,087,580 | ) | | | 28,530,455 | |
| | | | | | | | | |
Total Increase (Decrease) in Net Assets | | | (17,812,568 | ) | | | 29,020,478 | |
| | | | | | | | | |
Net Assets | | | | | | | | |
Beginning of period | | | 29,020,478 | | | | — | |
End of period | | $ | 11,207,910 | | | $ | 29,020,478 | |
| | | | | | | | | |
Changes in Shares Outstanding | | | | | | | | |
Shares outstanding, beginning of period | | | 1,125,000 | | | | — | |
Shares sold | | | 275,000 | | | | 1,150,000 | |
Shares redeemed | | | (975,000 | ) | | | (25,000 | ) |
Shares outstanding, end of period | | | 425,000 | | | | 1,125,000 | |
(1) | The Fund commenced operations on September 30, 2019. |
The accompanying notes are an integral part of the financial statements.
33
Overlay Shares ETFs
Financial Highlights
| | | Per Share Operating Performance
(For a share outstanding throughout each period) | |
| | | | | | | Income (Loss) from Investment Operations: | | | Less Distributions Paid: | |
| | | Net Asset Value,
Beginning
of Period | | | Net investment
income (loss)(1) | | | Net realized
and unrealized
gain (loss) on
investments | | | Total from
investment
operations | | | From Net
investment
income | | | From Net
realized
gains | |
Overlay Shares Large Cap Equity ETF | | | | | | | | | | | | | | | | | | | | |
For the period 09/01/2020 — 08/31/2021 | | $ | 30.08 | | | | 0.22 | | | | 10.16 | | | | 10.38 | | | | (0.87 | ) | | | (0.38 | ) |
For the period 09/30/2019(11) — 08/31/2020 | | $ | 25.00 | | | | 0.20 | | | | 5.15 | | | | 5.35 | | | | (0.23 | ) | | | (0.04 | ) |
Overlay Shares Small Cap Equity ETF | | | | | | | | | | | | | | | | | | | | |
For the period 09/01/2020 — 08/31/2021 | | $ | 24.27 | | | | 0.08 | | | | 13.83 | | | | 13.91 | | | | (0.89 | ) | | | (0.09 | ) |
For the period 09/30/2019(11) — 08/31/2020 | | $ | 25.00 | | | | 0.19 | | | | (0.68 | )(12) | | | (0.49 | ) | | | (0.18 | ) | | | (0.06 | ) |
Overlay Shares Foreign Equity ETF | | | | | | | | | | | | | | | | | | | | |
For the period 09/01/2020 — 08/31/2021 | | $ | 24.13 | | | | 0.33 | | | | 4.39 | | | | 4.71 | | | | (1.01 | ) | | | — | |
For the period 09/30/2019(11) — 08/31/2020 | | $ | 25.00 | | | | 0.73 | | | | (0.73 | )(12) | | | 0.00 | | | | (0.80 | ) | | | (0.05 | ) |
Overlay Shares Hedged Large Cap Equity ETF | | | | | | | | | | | | | | | | | | | | |
For the period 01/14/2021(11) — 08/31/2021 | | $ | 25.00 | | | | 0.04 | | | | 3.93 | | | | 3.97 | | | | — | | | | — | |
Overlay Shares Core Bond ETF | | | | | | | | | | | | | | | | | | | | |
For the period 09/01/2020 — 08/31/2021 | | $ | 26.61 | | | | 0.27 | | | | 0.52 | | | | 0.79 | | | | (0.83 | ) | | | (0.17 | ) |
For the period 09/30/2019(11) — 08/31/2020 | | $ | 25.00 | | | | 0.35 | | | | 1.92 | | | | 2.27 | | | | (0.62 | ) | | | (0.04 | ) |
Overlay Shares Short Term Bond ETF | | | | | | | | | | | | | | | | | | | | |
For the period 01/14/2021(11) — 08/31/2021 | | $ | 25.00 | | | | 0.11 | | | | 0.62 | | | | 0.73 | | | | (0.43 | ) | | | — | |
Overlay Shares Municipal Bond ETF | | | | | | | | | | | | | | | | | | | | |
For the period 09/01/2020 — 08/31/2021 | | $ | 25.80 | | | | 0.31 | | | | 1.28 | | | | 1.59 | | | | (0.87 | ) | | | (0.15 | ) |
For the period 09/30/2019(11) — 08/31/2020 | | $ | 25.00 | | | | 0.32 | | | | 1.14 | | | | 1.46 | | | | (0.61 | ) | | | (0.05 | ) |
(1) | Per share net investment income (loss) was calculated using average shares outstanding. |
(2) | Annualized for periods less than one year. |
(3) | Does not include income and expenses of investment companies in which the Fund invests. |
(4) | Total return in the table represents the rate that the investor would have earned or lost on an investment in the Fund, assuming reinvestment of dividends. |
(5) | Not annualized for periods less than one year. |
(6) | Excludes in-kind transactions associated with creations and redemptions of the Fund. |
(7) | The returns reflect the actual performance for the period and do not include the impact of trades executed on the last business day of the period that were recorded on the first business day of the next period. |
The accompanying notes are an integral part of the financial statements.
34
Overlay Shares ETFs
Financial Highlights
| | Per Share Operating Performance
(For a share outstanding throughout each period) | | | Ratios/Supplemental Data | |
| | Less Distributions Paid: | | | | | | | | | | | | | | | | | | | Ratios to Average
Net Assets of:(2)(3) | | | | | |
| | From Return
of capital | | | Total
distributions
paid | | | Net Asset Value,
End of Period | | | Total return,
at NAV(4)(5) | | | Total return,
at Market(4)(5) | | | Net assets,
end of period
(000’s) | | | Expenses | | | Net
investment
income (loss) | | | Portfolio
turnover
rate(5)(6) | |
| | | | | | | | | | | | | | | | | | | | | | | | | | | | | | | | | | | | |
| | | — | | | | (1.25 | ) | | $ | 39.21 | | | | 35.36 | % | | | 34.77 | % | | $ | 200,959 | | | | 0.77 | %(9) | | | 0.66 | % | | | 6 | % |
| | | — | | | | (0.27 | ) | | $ | 30.08 | | | | 21.62 | % | | | 22.22 | % | | $ | 97,768 | | | | 0.76 | %(8) | | | 0.85 | % | | | 4 | % |
| | | | | | | | | | | | | | | | | | | | | | | | | | | | | | | | | | | | |
| | | — | | | | (0.98 | ) | | $ | 37.20 | | | | 58.12 | % | | | 58.46 | % | | $ | 6,510 | | | | 0.77 | %(9) | | | 0.25 | % | | | 6 | % |
| | | — | | | | (0.24 | ) | | $ | 24.27 | | | | (1.93 | )% | | | (1.87 | )% | | $ | 3,034 | | | | 0.76 | %(8) | | | 0.90 | % | | | 6 | % |
| | | | | | | | | | | | | | | | | | | | | | | | | | | | | | | | | | | | |
| | | — | | | | (1.01 | ) | | $ | 27.84 | | | | 19.82 | % | | | 20.24 | % | | $ | 6,960 | | | | 0.77 | %(9) | | | 1.28 | % | | | 10 | % |
| | | (0.02 | ) | | | (0.87 | ) | | $ | 24.13 | | | | (0.03 | )% | | | (0.41 | )% | | $ | 4,223 | | | | 0.76 | %(8) | | | 3.42 | % | | | 8 | % |
| | | | | | | | | | | | | | | | | | | | | | | | | | | | | | | | | | | | |
| | | — | | | | — | | | $ | 28.97 | | | | 15.89 | %(7) | | | 16.05 | %(7) | | $ | 12,313 | | | | 0.81 | %(10) | | | 0.26 | % | | | 13 | % |
| | | | | | | | | | | | | | | | | | | | | | | | | | | | | | | | | | | | |
| | | — | | | | (1.00 | ) | | $ | 26.40 | | | | 3.13 | % | | | 3.25 | % | | $ | 143,901 | | | | 0.77 | %(9) | | | 1.03 | % | | | 7 | % |
| | | — | | | | (0.66 | ) | | $ | 26.61 | | | | 9.22 | % | | | 9.38 | % | | $ | 113,744 | | | | 0.76 | %(8) | | | 1.46 | % | | | 5 | % |
| | | | | | | | | | | | | | | | | | | | | | | | | | | | | | | | | | | | |
| | | — | | | | (0.43 | ) | | $ | 25.30 | | | | 2.95 | %(7) | | | 2.96 | %(7) | | $ | 42,372 | | | | 0.77 | %(9) | | | 0.71 | % | | | 3 | % |
| | | | | | | | | | | | | | | | | | | | | | | | | | | | | | | | | | | | |
| | | — | | | | (1.02 | ) | | $ | 26.37 | | | | 6.32 | % | | | 6.60 | % | | $ | 11,208 | | | | 0.77 | %(9) | | | 1.19 | % | | | 7 | % |
| | | — | | | | (0.66 | ) | | $ | 25.80 | | | | 5.92 | % | | | 5.71 | % | | $ | 29,020 | | | | 0.76 | %(8) | | | 1.38 | % | | | 4 | % |
(8) | Includes interest expense of 0.01%. |
(9) | Includes interest expense of 0.02%. |
(10) | Includes interest expense of 0.06%. |
(12) | Realized and unrealized gains and losses per share in this caption are balancing amounts necessary to reconcile the change in net asset value per share for the period, and may not reconcile with the aggregate gains and losses in the Statements of Operations due to share transactions for the period. |
The accompanying notes are an integral part of the financial statements.
35
Overlay Shares ETFs
Notes to Financial Statements
August 31, 2021
Overlay Shares Large Cap Equity ETF (“OVL”), Overlay Shares Small Cap Equity ETF (“OVS”), Overlay Shares Foreign Equity ETF (“OVF”), Overlay Shares Hedged Large Cap Equity ETF (“OVLH”), Overlay Shares Core Bond ETF (“OVB”), Overlay Shares Short Term Bond ETF (“OVT”) and Overlay Shares Municipal Bond ETF (“OVM”) (each a “Fund” and collectively, the “Funds”) are each a diversified series of Listed Funds Trust (the “Trust”), formerly Active Weighting Funds ETF Trust. The Trust was organized as a Delaware statutory trust on August 26, 2016, under a Declaration of Trust amended on December 21, 2018, and is registered with the U.S. Securities and Exchange Commission (the “SEC”) as an open-end management investment company under the Investment Company Act of 1940, as amended (the “1940 Act”).
Each Fund is an actively-managed exchange-traded fund (“ETF”) that seeks to achieve its total return investment objective by investing in one or more other ETFs that seek to obtain exposure based on the following:
Fund | Investment Objectives |
OVL | U.S. large cap equity securities |
OVS | U.S. small cap equity securities |
OVF | Non-U.S. equity securities (from both developed and emerging markets) |
OVLH | Hedged U.S. large cap equity securities |
OVB | Investment grade, U.S. dollar-denominated, fixed-rate taxable bonds |
OVT | Short-term, investment grade, U.S. dollar-denominated, fixed-rate taxable bonds with dollar-weighted average maturity of no more than three years with a maximum maturity of five years |
OVM | Investment grade municipal bonds and below investment grade municipal bonds |
The Funds may invest directly in the securities held by such ETFs and sell and purchase listed short-term put options to generate income to the Funds (the “Overlay Strategy”).
The Funds’ Overlay Strategy seeks to generate income for the Funds by utilizing a “put spread” consisting of the sale of exchange-listed short-term put options with a notional value (strike price times the value of the shares) up to 100% of each Fund’s net assets and the purchase of an identical number of short-term put options with a lower strike price. Each Fund seeks to generate income from the sale and purchase of put options with a lower strike price to hedge against a decline in the options’ underlying asset, the S&P 500 Index, which consists of approximately 500 leading U.S.-listed companies representing approximately 80% of the U.S. equity market capitalization.
OVLH and OVT commenced operations on January 14, 2021. Cost incurred by OVLH and OVT in connection with the organization, registration and the initial public offering of shares were paid by Liquid Strategies, LLC (“Liquid Strategies” or the “Adviser”), the Funds’ Investment Adviser.
2. | SIGNIFICANT ACCOUNTING POLICIES |
Each Fund is an investment company and accordingly follows the investment company accounting and reporting guidance of the Financial Accounting Standards Board (“FASB”) Accounting Standards Codification (“ASC”) Topic 946, Financial Services — Investment Companies. Each Fund prepares its financial statements in accordance with accounting principles generally accepted in the United States of America (“U.S. GAAP”) and follows the significant accounting policies described below.
Use of Estimates
The preparation of the financial statements in conformity with U.S. GAAP requires management to make estimates and assumptions that affect the reported amounts of assets and liabilities and disclosures of contingent assets and liabilities at the date of the financial statements and the reported amounts of increases and decreases in net assets from operations during the reporting period. Actual results could differ from these estimates.
36
Overlay Shares ETFs
Notes to Financial Statements
August 31, 2021 (Continued)
Share Transactions
The net asset value (“NAV”) per share of each Fund will be equal to a Fund’s total assets minus a Fund’s total liabilities divided by the total number of shares outstanding. The NAV that is published will be rounded to the nearest cent. The NAV is determined as of the close of trading (generally, 4:00 p.m. Eastern Time) on each day the New York Stock Exchange (“NYSE”) is open for trading.
Fair Value Measurement
In calculating the NAV, each Fund’s exchange-traded equity securities will be valued at fair value, which will generally be determined using the last reported official closing or last trading price on the exchange or market on which the security is primarily traded at the time of valuation. Such valuations are typically categorized as Level 1 in the fair value hierarchy described below.
Securities listed on the NASDAQ Stock Market, Inc. are generally valued at the NASDAQ official closing price.
If market quotations are not readily available, or if it is determined that a quotation of a security does not represent fair value, then the security is valued at fair value as determined in good faith by the Adviser using procedures adopted by the Board of Trustees of the Trust (the “Board”). The circumstances in which a security may be fair valued include, among others: the occurrence of events that are significant to a particular issuer, such as mergers, restructurings or defaults; the occurrence of events that are significant to an entire market, such as natural disasters in a particular region or government actions; trading restrictions on securities; thinly traded securities; and market events such as trading halts and early market closings. Due to the inherent uncertainty of valuations, fair values may differ significantly from the values that would have been used had an active market existed. Fair valuation could result in a different NAV than a NAV determined by using market quotations. Such valuations are typically categorized as Level 2 or Level 3 in the fair value hierarchy described below.
Money market funds are valued at NAV. If NAV is not readily available the securities will be valued at fair value.
FASB ASC Topic 820, Fair Value Measurements and Disclosures (“ASC 820”) defines fair value, establishes a framework for measuring fair value in accordance with U.S. GAAP, and requires disclosure about fair value measurements. It also provides guidance on determining when there has been a significant decrease in the volume and level of activity for an asset or liability, when a transaction is not orderly, and how that information must be incorporated into fair value measurements. Under ASC 820, various inputs are used in determining the value of the Funds’ investments. These inputs are summarized in the following hierarchy:
| | ● | Level 1 — Unadjusted quoted prices in active markets for identical assets or liabilities that the Funds have the ability to access. |
| | ● | Level 2 — Observable inputs other than quoted prices included in Level 1 that are observable for the asset or liability, either directly or indirectly. These inputs may include quoted prices for the identical instrument on an inactive market, prices for similar securities, interest rates, prepayment speeds, credit risk, yield curves, default rates and similar data. |
| | ● | Level 3 — Unobservable inputs for the asset or liability, to the extent relevant observable inputs are not available; representing the Funds’ own assumptions about the assumptions a market participant would use in valuing the asset or liability, and would be based on the best information available. |
The fair value hierarchy gives the highest priority to quoted prices (unadjusted) in active markets for identical assets or liabilities (Level 1) and the lowest priority to unobservable inputs (Level 3).
The availability of observable inputs can vary from security to security and is affected by a wide variety of factors, including, for example, the type of security, whether the security is new and not yet established in the marketplace, the liquidity of markets, and other characteristics particular to the security. To the extent that valuation is based on models or inputs that are less observable or unobservable in the market, the determination of fair value requires more judgment. Accordingly, the degree of judgment exercised in determining fair value is greatest for instruments categorized in Level 3.
37
Overlay Shares ETFs
Notes to Financial Statements
August 31, 2021 (Continued)
Exchange-traded options are valued at the composite mean price, which calculates the mean of the highest bid price and lowest asked price across the exchange. On the last trading day prior to expiration, expiring options may be priced at intrinsic value. The premium a fund pays when purchasing a call option or receives when writing a call option will reflect, among other things, the market price of the security, the relationship of the exercise price to the market price of the security, the relationship of the exercise price to the volatility of the security, the length of the option period and supply and demand factors. The premium is the value of an option at the date of purchase.
All other securities and investments for which market values are not readily available, including restricted securities, and those securities for which it is inappropriate to determine prices in accordance with the aforementioned procedures, are valued at fair value as determined in good faith under procedures adopted by the Board, although the actual calculations may be done by others. Factors considered in making this determination may include, but are not limited to, information obtained by contacting the issuer, analysts, or the appropriate stock exchange (for exchange-traded securities), analysis of the issuer’s financial statements or other available documents and, if necessary, available information concerning other securities in similar circumstances.
The inputs or methodology used for valuing securities are not necessarily an indication of the risk associated with investing in those securities. The hierarchy classification of inputs used to value the Funds’ investments at August 31, 2021 are as follows:
Overlay Shares Large Cap Equity ETF
| | | Level 1 | | | Level 2 | | | Level 3 | | | Total | |
Investments - Assets: | | | | | | | | | | | | | | | | |
Exchange Traded Funds | | $ | 200,560,461 | | | $ | — | | | $ | — | | | $ | 200,560,461 | |
Money Market Funds | | | 121,625 | | | | — | | | | — | | | | 121,625 | |
Purchased Put Options | | | 49,225 | | | | — | | | | — | | | | 49,225 | |
Total Investments - Assets | | $ | 200,731,311 | | | $ | — | | | $ | — | | | $ | 200,731,311 | |
Other Financial Instruments - Liabilities: | | | | | | | | | | | | | | | | |
Written Put Options | | $ | 209,000 | | | $ | — | | | $ | — | | | $ | 209,000 | |
Overlay Shares Small Cap Equity ETF
| | | Level 1 | | | Level 2 | | | Level 3 | | | Total | |
Investments - Assets: | | | | | | | | | | | | | | | | |
Exchange Traded Funds | | $ | 6,495,211 | | | $ | — | | | $ | — | | | $ | 6,495,211 | |
Money Market Funds | | | 9,013 | | | | — | | | | — | | | | 9,013 | |
Purchased Put Options | | | 1,790 | | | | — | | | | — | | | | 1,790 | |
Total Investments - Assets | | $ | 6,506,014 | | | $ | — | | | $ | — | | | $ | 6,506,014 | |
Other Financial Instruments - Liabilities: | | | | | | | | | | | | | | | | |
Written Put Options | | $ | 7,600 | | | $ | — | | | $ | — | | | $ | 7,600 | |
38
Overlay Shares ETFs
Notes to Financial Statements
August 31, 2021 (Continued)
Overlay Shares Foreign Equity ETF
| | | Level 1 | | | Level 2 | | | Level 3 | | | Total | |
Investments - Assets: | | | | | | | | | | | | | | | | |
Exchange Traded Funds | | $ | 6,943,344 | | | $ | — | | | $ | — | | | $ | 6,943,344 | |
Money Market Funds | | | 6,025 | | | | — | | | | — | | | | 6,025 | |
Purchased Put Options | | | 1,790 | | | | — | | | | — | | | | 1,790 | |
Total Investments - Assets | | $ | 6,951,159 | | | $ | — | | | $ | — | | | $ | 6,951,159 | |
Other Financial Instruments - Liabilities: | | | | | | | | | | | | | | | | |
Written Put Options | | $ | 7,600 | | | $ | — | | | $ | — | | | $ | 7,600 | |
Overlay Shares Hedged Large Cap Equity ETF
| | | Level 1 | | | Level 2 | | | Level 3 | | | Total | |
Investments - Assets: | | | | | | | | | | | | | | | | |
Exchange Traded Funds | | $ | 12,325,325 | | | $ | — | | | $ | — | | | $ | 12,325,325 | |
Money Market Funds | | | 195,053 | | | | — | | | | — | | | | 195,053 | |
Purchased Put Options | | | 424,364 | | | | — | | | | — | | | | 424,364 | |
Total Investments - Assets | | $ | 12,944,742 | | | $ | — | | | $ | — | | | $ | 12,944,742 | |
Other Financial Instruments - Liabilities: | | | | | | | | | | | | | | | | |
Written Put Options | | $ | 13,300 | | | $ | — | | | $ | — | | | $ | 13,300 | |
Overlay Shares Core Bond ETF
| | | Level 1 | | | Level 2 | | | Level 3 | | | Total | |
Investments - Assets: | | | | | | | | | | | | | | | | |
Exchange Traded Funds | | $ | 143,591,638 | | | $ | — | | | $ | — | | | $ | 143,591,638 | |
Money Market Funds | | | 144,796 | | | | — | | | | — | | | | 144,796 | |
Purchased Put Options | | | 35,800 | | | | — | | | | — | | | | 35,800 | |
Total Investments - Assets | | $ | 143,772,234 | | | $ | — | | | $ | — | | | $ | 143,772,234 | |
Other Financial Instruments - Liabilities: | | | | | | | | | | | | | | | | |
Written Put Options | | $ | 152,000 | | | $ | — | | | $ | — | | | $ | 152,000 | |
Overlay Shares Short Term Bond ETF
| | | Level 1 | | | Level 2 | | | Level 3 | | | Total | |
Investments - Assets: | | | | | | | | | | | | | | | | |
Exchange Traded Funds | | $ | 42,269,128 | | | $ | — | | | $ | — | | | $ | 42,269,128 | |
Money Market Funds | | | 5,372 | | | | — | | | | — | �� | | | 5,372 | |
Purchased Put Options | | | 10,740 | | | | — | | | | — | | | | 10,740 | |
Total Investments - Assets | | $ | 42,285,240 | | | $ | — | | | $ | — | | | $ | 42,285,240 | |
Other Financial Instruments - Liabilities: | | | | | | | | | | | | | | | | |
Written Put Options | | $ | 45,600 | | | $ | — | | | $ | — | | | $ | 45,600 | |
39
Overlay Shares ETFs
Notes to Financial Statements
August 31, 2021 (Continued)
Overlay Shares Municipal Bond ETF
| | | Level 1 | | | Level 2 | | | Level 3 | | | Total | |
Investments - Assets: | | | | | | | | | | | | | | | | |
Exchange Traded Funds | | $ | 11,184,562 | | | $ | — | | | $ | — | | | $ | 11,184,562 | |
Money Market Funds | | | 11,694 | | | | — | | | | — | | | | 11,694 | |
Purchased Put Options | | | 2,685 | | | | — | | | | — | | | | 2,685 | |
Total Investments - Assets | | $ | 11,198,941 | | | $ | — | | | $ | — | | | $ | 11,198,941 | |
Other Financial Instruments - Liabilities: | | | | | | | | | | | | | | | | |
Written Put Options | | $ | 11,400 | | | $ | — | | | $ | — | | | $ | 11,400 | |
Security Transactions
Investment transactions are recorded as of the date that the securities are purchased or sold (trade date). Realized gains and losses from the sale or disposition of securities are calculated based on the specific identification basis.
Investment Income
Dividend income is recognized on the ex-dividend date. Interest income is accrued daily. An amortized cost method of valuation may be used with respect to debt obligations with sixty days or less remaining to maturity, unless the Adviser determines in good faith that such method does not represent fair value.
Tax Information, Dividends and Distributions to Shareholders and Uncertain Tax Positions
The Funds are treated as separate entities for Federal income tax purposes. Each Fund intends to qualify as a regulated investment company (“RIC”) under Subchapter M of the Internal Revenue Code of 1986, as amended (the “Internal Revenue Code”). To qualify and remain eligible for the special tax treatment accorded to RICs, each Fund must meet certain annual income and quarterly asset diversification requirements and must distribute annually at least 90% of the sum of (i) its investment company taxable income (which includes dividends, interest and net short-term capital gains) and (ii) certain net tax-exempt income, if any. If so qualified, each Fund will not be subject to Federal income tax.
Distributions to shareholders are recorded on the ex-dividend date. The Funds, with the exception of OVLH, generally pay out dividends from net investment income, if any, quarterly. OVLH will distribute net investment income, if any, annually. Each Fund will distribute their net capital gains, if any, to shareholders at least annually. The Funds may also pay a special distribution at the end of the calendar year to comply with Federal tax requirements. The amount of dividends and distributions from net investment income and net realized capital gains are determined in accordance with Federal income tax regulations, which may differ from U.S. GAAP. These “book/tax” differences are either considered temporary or permanent in nature. To the extent these differences are permanent in nature, such amounts are reclassified within the components of net assets based on their Federal tax basis treatment; temporary differences do not require reclassification. Dividends and distributions which exceed earnings and profit for tax purposes are reported as a tax return of capital.
Management evaluates the Funds’ tax positions to determine if the tax positions taken meet the minimum recognition threshold in connection with accounting for uncertainties in income tax positions taken or expected to be taken for the purposes of measuring and recognizing tax liabilities in the financial statements. Recognition of tax benefits of an uncertain tax position is required only when the position is “more likely than not” to be sustained assuming examination by taxing authorities. Interest and penalties related to income taxes would be recorded as income tax expense. The Funds’ Federal income tax returns are subject to examination by the Internal Revenue Service (the “IRS”) for a period of three fiscal years after they are filed. State and local tax returns may be subject to examination for an additional fiscal year depending on the jurisdiction. As of August 31, 2021, the Funds’ most recent fiscal period end, the Funds had no material uncertain tax positions and did not have a
40
Overlay Shares ETFs
Notes to Financial Statements
August 31, 2021 (Continued)
liability for any unrecognized tax benefits. As of August 31, 2021, the Funds’ most recent fiscal period end, the Funds had no examination in progress and management is not aware of any tax positions for which it is reasonably possible that the amounts of unrecognized tax benefits will significantly change in the next twelve months.
The Funds recognized no interest or penalties related to uncertain tax benefits in the fiscal period 2021. At August 31, 2021, the Funds’ most recent fiscal period end, the tax periods from commencement of operations remained open to examination in the Funds’ major tax jurisdictions.
Indemnification
In the normal course of business, the Funds expect to enter into contracts that contain a variety of representations and warranties and which provide general indemnifications. The Funds’ maximum exposure under these anticipated arrangements is unknown, as this would involve future claims that may be made against the Funds that have not yet occurred. However, the Adviser expects the risk of loss to be remote.
Derivatives
Each Fund may purchase and write put and call options on indices and enter into related closing transactions. All options written on indices or securities must be covered, each Fund will segregate cash and/or other liquid assets in an amount equal to the Fund’s obligations. Put and call options on indices give the holder the right to receive, upon exercise of the option, an amount of cash if the closing level of the underlying index is greater than (or less than, in the case of puts) the exercise price of the option. This amount of cash is equal to the difference between the closing price of the index and the exercise price of the option, expressed in dollars multiplied by a specified number. The premium paid to the writer is the consideration for undertaking the obligations under the option contract.
The Funds invest in derivatives in order to protect against a possible decline in the market value of securities in its portfolio, to anticipate an increase in the market value of securities that the Funds may seek to purchase in the future and as a means of increasing the yield on its assets. The Funds purchasing put and call options pay a premium; therefore, if price movements in the underlying securities are such that exercise of the options would not be profitable for the Funds, loss of the premium paid may be offset by an increase in the value of the Funds’ securities or by a decrease in the cost of acquisition of securities by the Funds. When the Funds write an option, if the underlying securities do not increase or decrease to a price level that would make the exercise of the option profitable to the holder thereof, the option generally will expire without being exercised and the Funds will realize as profit the premium received for such option. When a call option of which the Funds are the writer is exercised, the Funds will be required to sell the underlying securities to the option holder at the strike price and will not participate in any increase in the price of such securities above the strike price. When a put option of which the Funds are the writer is exercised, the Funds will be required to purchase the underlying securities at a price in excess of the market value of such securities. The Funds maintain minimal counterparty risk through contracts bought or sold on an exchange. As of August 31, 2021, the Funds’ derivative instruments are not subject to a master netting arrangement.
41
Overlay Shares ETFs
Notes to Financial Statements
August 31, 2021 (Continued)
Derivative Instruments
The average monthly value outstanding of purchased and written options during the year or period ended August 31, 2021 were as follows:
| | | Overlay Shares
Large Cap
Equity ETF | | | Overlay Shares
Small Cap
Equity ETF | | | Overlay
Shares Foreign
Equity ETF | | | Overlay Shares
Hedged Large
Cap Equity ETF | |
Purchased Put Options | | $ | 101,914 | | | $ | 3,248 | | | $ | 3,620 | | | $ | 319,513 | |
Written Put Options | | | (351,173 | ) | | | (11,569 | ) | | | (12,386 | ) | | | (15,059 | ) |
| | | Overlay Shares
Core Bond ETF | | | Overlay Shares
Short Term
Bond ETF | | | Overlay Shares
Municipal
Bond ETF | |
Purchased Put Options | | $ | 97,305 | | | $ | 19,670 | | | $ | 21,836 | |
Written Put Options | | | (327,066 | ) | | | (73,785 | ) | | | (70,296 | ) |
The following is a summary of the effect of derivative instruments on the Funds’ Statements of Assets and Liabilities as of August 31, 2021:
| | | Equity Risk
Contracts | | | Asset
Derivatives,
Investments,
at value | | | Liability
Derivatives,
Written
options,
at value | |
Overlay Shares Large Cap Equity ETF | Purchased Options | | $ | 49,225 | | | $ | — | |
| | Written Options | | | — | | | | 209,000 | |
Overlay Shares Small Cap Equity ETF | Purchased Options | | | 1,790 | | | | — | |
| | Written Options | | | — | | | | 7,600 | |
Overlay Shares Foreign Equity ETF | Purchased Options | | | 1,790 | | | | — | |
| | Written Options | | | — | | | | 7,600 | |
Overlay Shares Hedged Large Cap Equity ETF | Purchased Options | | | 424,364 | | | | — | |
| | Written Options | | | — | | | | 13,300 | |
Overlay Shares Core Bond ETF | Purchased Options | | | 35,800 | | | | — | |
| | Written Options | | | — | | | | 152,000 | |
Overlay Shares Short Term Bond ETF | Purchased Options | | | 10,740 | | | | — | |
| | Written Options | | | — | | | | 45,600 | |
Overlay Shares Municipal Bond ETF | Purchased Options | | | 2,685 | | | | — | |
| | Written Options | | | — | | | | 11,400 | |
42
Overlay Shares ETFs
Notes to Financial Statements
August 31, 2021 (Continued)
The following is a summary of the effect of derivative instruments on the Funds’ Statements of Operations for the year or period ended August 31, 2021:
| | | | | | | Realized Gain (Loss) | | | Change in Unrealized
Appreciation/Depreciation | |
| | | | | | | Purchased
Options | | | Written
Options | | | Purchased
Options | | | Written
Options | |
Overlay Shares Large Cap Equity ETF | Equity Risk Contracts | | $ | (5,627,970 | ) | | $ | 11,813,960 | | | $ | (32,161 | ) | | $ | 87,741 | |
Overlay Shares Small Cap Equity ETF | Equity Risk Contracts | | | (171,350 | ) | | | 361,844 | | | | (1,146 | ) | | | 3,133 | |
Overlay Shares Foreign Equity ETF | Equity Risk Contracts | | | (197,144 | ) | | | 399,601 | | | | (1,192 | ) | | | 3,246 | |
Overlay Shares Hedged Large Cap Equity ETF | Equity Risk Contracts | | | (494,564 | ) | | | 378,383 | | | | (86,424 | ) | | | 5,088 | |
Overlay Shares Core Bond ETF | Equity Risk Contracts | | | (4,926,057 | ) | | | 10,005,363 | | | | (24,805 | ) | | | 67,286 | |
Overlay Shares Short Term Bond ETF | Equity Risk Contracts | | | (737,378 | ) | | | 1,752,955 | | | | (6,326 | ) | | | 17,446 | |
Overlay Shares Municipal Bond ETF | Equity Risk Contracts | | | (918,385 | ) | | | 1,714,840 | | | | (2,499 | ) | | | 6,616 | |
3. | INVESTMENT ADVISORY AND OTHER AGREEMENTS |
Investment Advisory Agreement
The Trust has entered into an Investment Advisory Agreement (the “Advisory Agreement”) with the Adviser. Under the Advisory Agreement, the Adviser provides a continuous investment program for the Funds’ assets in accordance with its investment objectives, policies and limitations, and oversees the day-to-day operations of the Funds subject to the supervision of the Board, including the Trustees who are not “interested persons” of the Trust as defined in the 1940 Act.
Pursuant to the Advisory Agreement between the Trust, on behalf of the Funds, and Liquid Strategies, each Fund pays a unified management fee to the Adviser, which is calculated daily and paid monthly, at an annual rate of 0.75% of each Fund’s average daily net assets. Liquid Strategies has agreed to pay all expenses of the Funds except the fee paid to Liquid Strategies under the Advisory Agreement, interest charges on any borrowings, dividends and other expenses on securities sold short, taxes, brokerage commissions and other expenses incurred in placing orders for the purchase and sale of securities and other investment instruments, acquired fund fees and expenses, accrued deferred tax liability, extraordinary expenses, and distribution (12b-1) fees and expenses (if any).
Distribution Agreement and 12b-1 Plan
Foreside Fund Services, LLC (the “Distributor”) serves as each Fund’s distributor pursuant to a Distribution Services Agreement. The Distributor receives compensation for the statutory underwriting services it provides to the Funds. The Distributor enters into agreements with certain broker-dealers and others that will allow those parties to be “Authorized Participants” and to subscribe for and redeem shares of the Funds. The Distributor will not distribute shares in less than whole Creation Units and does not maintain a secondary market in shares.
On July 7, 2021, Foreside, the parent company of the Funds’ distributor, announced that it had entered into a definitive purchase and sale agreement with Genstar Capital (“Genstar”) such that Genstar would acquire a majority stake in Foreside. The transaction closed at the end of the third quarter of 2021. Foreside will remain the Funds’ distributor at the close of the transaction, as approved by the Board.
The Board has adopted a Distribution and Service Plan pursuant to Rule 12b-1 under the 1940 Act (“Rule 12b-1 Plan”). In accordance with the Rule 12b-1 Plan, each Fund is authorized to pay an amount up to 0.25% of the Fund’s average daily net assets each year for certain distribution-related activities. As authorized by the Board, no Rule 12b-1 fees are currently paid by
43
Overlay Shares ETFs
Notes to Financial Statements
August 31, 2021 (Continued)
the Funds and there are no plans to impose these fees. However, in the event Rule 12b-1 fees are charged in the future, they will be paid out of each Fund’s assets. The Adviser and its affiliates may, out of their own resources, pay amounts to third parties for distribution or marketing services on behalf of the Funds.
Administrator, Custodian and Transfer Agent
U.S. Bancorp Fund Services LLC, doing business as U.S. Bank Global Fund Services (“Fund Services” or “Administrator”) serves as administrator, transfer agent and fund accounting agent of the Funds pursuant to a Fund Servicing Agreement. U.S. Bank N.A. (the “Custodian”), an affiliate of Fund Services, serves as the Funds’ custodian pursuant to a Custody Agreement. Under the terms of these agreements, the Adviser pays each Fund’s administrative, custody and transfer agency fees.
A Trustee and all officers of the Trust are affiliated with the Administrator and Custodian.
4. | CREATION AND REDEMPTION TRANSACTIONS |
Shares of the Funds are listed and traded on the NYSE Arca, Inc. (the “Exchange”). Each Fund issues and redeems shares on a continuous basis at NAV only in large blocks of shares called “Creation Units.” A Creation Unit generally consists of 25,000 shares. Creation Units are to be issued and redeemed principally in kind for a basket of securities and a balancing cash amount. Shares generally will trade in the secondary market in amounts less than a Creation Unit at market prices that change throughout the day. Market prices for the shares may be different from their NAV. The NAV is determined as of the close of trading (generally, 4:00 p.m. Eastern Time) on each day the NYSE is open for trading. The NAV of the shares of each Fund will be equal to a Fund’s total assets minus a Fund’s total liabilities divided by the total number of shares outstanding. The NAV that is published will be rounded to the nearest cent; however, for purposes of determining the price of Creation Units, the NAV will be calculated to five decimal places.
Creation Unit Transaction Fee
Authorized Participants will be required to pay to the Custodian a fixed transaction fee (the “Creation Unit Transaction Fee”) in connection with the issuance or redemption of Creation Units. The standard Creation Unit Transaction Fee will be the same regardless of the number of Creation Units purchased or redeemed by an investor on the applicable business day. The Creation Unit Transaction Fee charged by each Fund for each creation order is $250.
An additional variable fee of up to a maximum of 2% of the value of the Creation Units subject to the transaction may be imposed for (1) creations effected outside the Clearing Process and (2) creations made in an all cash amount (to offset the Trust’s brokerage and other transaction costs associated with using cash to purchase or redeem the requisite Deposit Securities). Investors are responsible for the costs of transferring the securities constituting the Deposit Securities to the account of the Trust. Each Fund may determine to not charge a variable fee on certain orders when the Adviser has determined that doing so is in the best interests of Fund shareholders. Variable fees, if any, received by the Funds are displayed in the Capital Share Transactions section on the Statements of Changes in Net Assets.
Only “Authorized Participants” may purchase or redeem shares directly from the Funds. An Authorized Participant is either (1) a broker-dealer or other participant in the clearing process through the Continuous Net Settlement System of National Securities Clearing Corporation or (2) a DTC participant and, in each case, must have executed a Participant Agreement with the Distributor. Most retail investors will not qualify as Authorized Participants or have the resources to buy and sell whole Creation Units. Therefore, they will be unable to purchase or redeem the shares directly from the Funds. Rather, most retail investors will purchase shares in the secondary market with the assistance of a broker and will be subject to customary brokerage commissions or fees. Securities received or delivered in connection with in-kind creates and redeems are valued as of the close of business on the effective date of the creation or redemption.
A creation unit will generally not be issued until the transfer of good title of the deposit securities to the Funds and the payment of any cash amounts have been completed. To the extent contemplated by the applicable participant agreement, Creation Units of the Funds will be issued to such authorized participant notwithstanding the fact that the Funds’ deposits have not been received in part or in whole, in reliance on the undertaking of the authorized participant to deliver the missing deposit securities as soon as possible. If the Funds or their agents do not receive all of the deposit securities, or the required cash amounts, by such time, then the order may be deemed rejected and the authorized participant shall be liable to the Fund for losses, if any.
44
Overlay Shares ETFs
Notes to Financial Statements
August 31, 2021 (Continued)
5. FEDERAL INCOME TAX
The tax character of distributions paid was as follows:
| | | Year or Period Ended August 31, 2021 | |
| | | Ordinary
Income(1) | | | Tax-Exempt
Income | | | Long-Term
Capital Gain | | | Return of Capital | |
Overlay Shares Large Cap Equity ETF | | $ | 3,928,078 | | | $ | — | | | $ | 1,336,118 | | | $ | — | |
Overlay Shares Small Cap Equity ETF | | | 78,038 | | | | — | | | | 57,572 | | | | — | |
Overlay Shares Foreign Equity ETF | | | 117,794 | | | | — | | | | 88,643 | | | | — | |
Overlay Shares Hedged Large Cap Equity ETF | | | — | | | | — | | | | — | | | | — | |
Overlay Shares Core Bond ETF | | | 3,080,791 | | | | — | | | | 1,660,591 | | | | — | |
Overlay Shares Short Term Bond ETF | | | 555,524 | | | | — | | | | 34,088 | | | | — | |
Overlay Shares Municipal Bond ETF | | | 316,819 | | | | 267,374 | | | | 239,298 | | | | — | |
| | | Period Ended August 31, 2020 | |
| | | Ordinary
Income(1) | | | Tax-Exempt
Income | | | Long-Term
Capital Gain | | | Return of Capital | |
Overlay Shares Large Cap Equity ETF | | $ | 456,959 | | | $ | — | | | $ | 27,529 | | | $ | — | |
Overlay Shares Small Cap Equity ETF | | | 83,397 | | | | — | | | | 33,051 | | | | — | |
Overlay Shares Foreign Equity ETF | | | 575,692 | | | | — | | | | 28,220 | | | | 12,224 | |
Overlay Shares Core Bond ETF | | | 1,758,480 | | | | — | | | | 357,700 | | | | — | |
Overlay Shares Municipal Bond ETF | | | 213,521 | | | | 263,076 | | | | 141,214 | | | | — | |
(1) | Ordinary income includes short-term capital gains. |
At August 31, 2021, the Funds’ most recent fiscal period end, the components of distributable earnings (accumulated losses) and the cost of investments on a tax basis, including the adjustments for financial reporting purposes as of the most recently completed Federal income tax reporting year for the Funds were as follows:
| | | Overlay
Shares
Large Cap
Equity ETF | | | Overlay
Shares
Small Cap
Equity ETF | | | Overlay
Shares
Foreign
Equity ETF | | | Overlay
Shares
Hedged
Large Cap
Equity ETF | | | Overlay
Shares
Core Bond
ETF | | | Overlay
Shares
Short Term
Bond ETF | | | Overlay
Shares
Municipal
Bond ETF | |
Federal Tax Cost of Investments(1) | | $ | 158,455,291 | | | $ | 5,808,108 | | | $ | 6,688,055 | | | $ | 12,010,515 | | | $ | 142,610,293 | | | $ | 42,360,933 | | | $ | 11,041,748 | |
Gross Tax Unrealized Appreciation | | $ | 42,380,956 | | | $ | 699,954 | | | $ | 280,355 | | | $ | 1,009,854 | | | $ | 1,845,148 | | | $ | 36,337 | | | $ | 158,240 | |
Gross Tax Unrealized Depreciation | | | (313,936 | ) | | | (1,648 | ) | | | (24,850 | ) | | | (88,927 | ) | | | (835,207 | ) | | | (156,629 | ) | | | (12,447 | ) |
Net Tax Unrealized Appreciation (Depreciation) | | | 42,067,020 | | | | 698,306 | | | | 255,505 | | | | 920,927 | | | | 1,009,941 | | | | (121,292 | ) | | | 145,793 | |
Undistributed Ordinary Income | | | — | | | | — | | | | — | | | | 11,666 | | | | — | | | | — | | | | — | |
Undistributed Long-Term Gains | | | 3,335,500 | | | | 68,919 | | | | 45,796 | | | | — | | | | 2,494,652 | | | | 581,930 | | | | 420,679 | |
Other Accumulated Gain (Loss) | | | — | | | | (1,919 | ) | | | — | | | | (122,953 | ) | | | — | | | | — | | | | — | |
Total Distributable Earnings / (Accumulated Losses) | | $ | 45,402,520 | | | $ | 765,306 | | | $ | 301,301 | | | $ | 809,640 | | | $ | 3,504,593 | | | $ | 460,638 | | | $ | 566,472 | |
(1) | Federal Tax Cost of Investments includes written option premiums. |
The difference between book-basis and tax-basis unrealized appreciation/(depreciation) is attributable primarily to the tax deferral of losses on wash sales and Mark-to-Market of Section 1256 Contracts.
45
Overlay Shares ETFs
Notes to Financial Statements
August 31, 2021 (Continued)
Under current tax law, net capital losses realized after October 31st and net ordinary losses incurred after December 31st may be deferred and treated as occurring on the first day of the following fiscal year. The Funds’ carryforward losses, post-October losses and post-December losses are determined only at the end of each fiscal year. At August 31, 2021, the Overlay Hedged Large Cap Equity ETF had short-term capital losses of $122,953 remaining which will be carried forward indefinitely to offset future realized capital gains. At August 31, 2021, the Overlay Shares Small Cap Equity ETF deferred, on a tax basis, late year ordinary losses of $1,919.
U.S. GAAP requires that certain components of net assets relating to permanent differences be reclassified between financial and tax reporting. These reclassifications have no effect on net assets or NAV per share. The permanent differences primarily relate to redemptions in-kind. For the fiscal year or period ended August 31, 2021, the following reclassifications were made for permanent tax differences on the Statements of Assets and Liabilities.
| | | Total
Distributable
Earnings
(Accumulated
Losses) | | | Paid-In Capital | |
Overlay Shares Large Cap Equity ETF | | $ | (6,759,295 | ) | | $ | 6,759,295 | |
Overlay Shares Small Cap Equity ETF | | | (506,991 | ) | | | 506,991 | |
Overlay Shares Foreign Equity ETF | | | 30,525 | | | | (30,525 | ) |
Overlay Shares Hedged Large Cap Equity ETF | | | (288,073 | ) | | | 288,073 | |
Overlay Shares Core Bond ETF | | | (258,947 | ) | | | 258,947 | |
Overlay Shares Short Term Bond ETF | | | 1,037 | | | | (1,037 | ) |
Overlay Shares Municipal Bond ETF | | | (222,939 | ) | | | 222,939 | |
6. | INVESTMENT TRANSACTIONS |
During the fiscal year or period ended August 31, 2021, the Funds realized net capital gains and losses resulting from in-kind redemptions, in which shareholders exchanged Fund shares for securities held by the Funds rather than for cash. Because such gains are not taxable to the Funds, and are not distributed to shareholders, they have been reclassified from distributable earnings (accumulated losses) to paid in-capital. The amounts of realized gains and losses from in-kind redemptions included in realized gain/(loss) on investments in the Statements of Operations is as follows:
| | | Realized Gains | | | Realized Losses | |
Overlay Shares Large Cap Equity ETF | | $ | 6,759,295 | | | $ | — | |
Overlay Shares Small Cap Equity ETF | | | 533,636 | | | | — | |
Overlay Shares Foreign Equity ETF | | | 19,487 | | | | (30,035 | ) |
Overlay Shares Hedged Large Cap Equity ETF | | | 288,073 | | | | — | |
Overlay Shares Core Bond ETF | | | 258,947 | | | | — | |
Overlay Shares Short Term Bond ETF | | | — | | | | (1,048 | ) |
Overlay Shares Municipal Bond ETF | | | 291,632 | | | | (65,099 | ) |
46
Overlay Shares ETFs
Notes to Financial Statements
August 31, 2021 (Continued)
Purchases and sales of investments (excluding short-term investments), creations in-kind and redemptions in-kind for the year or period ended August 31, 2021 were as follows:
| | | Purchases | | | Sales | | | Creations
In-Kind | | | Redemptions
In-Kind | |
Overlay Shares Large Cap Equity ETF | | $ | 10,252,611 | | | $ | 8,411,518 | | | $ | 90,622,828 | | | $ | 28,322,895 | |
Overlay Shares Small Cap Equity ETF | | | 333,497 | | | | 266,732 | | | | 4,341,184 | | | | 2,564,834 | |
Overlay Shares Foreign Equity ETF | | | 584,148 | | | | 520,860 | | | | 3,311,919 | | | | 1,282,416 | |
Overlay Shares Hedged Large Cap Equity ETF | | | 1,321,601 | | | | 995,567 | | | | 13,909,698 | | | | 2,713,176 | |
Overlay Shares Core Bond ETF | | | 9,775,600 | | | | 8,175,445 | | | | 51,587,189 | | | | 20,551,365 | |
Overlay Shares Short Term Bond ETF | | | 1,671,013 | | | | 1,164,410 | | | | 44,994,601 | | | | 3,109,725 | |
Overlay Shares Municipal Bond ETF | | | 1,723,479 | | | | 1,455,572 | | | | 7,126,843 | | | | 25,200,491 | |
As with all ETFs, shareholders of the Funds are subject to the risk that their investment could lose money. Each Fund is subject to the principal risks, any of which may adversely affect a Fund’s NAV, trading price, yield, total return and ability to meet its investment objective.
The global outbreak of COVID-19 (commonly referred to as “coronavirus”) has disrupted economic markets and the prolonged economic impact is uncertain. The ultimate economic fallout from the pandemic, and the long-term impact on economies, markets, industries and individual issuers, are not known. The operational and financial performance of the issuers of securities in which the Funds invest depends on future developments, including the duration and spread of the outbreak, and such uncertainty may in turn adversely affect the value and liquidity of the Funds’ investments, impair the Funds’ ability to satisfy redemption requests, and negatively impact the Funds’ performance.
A complete description of principal risks is included in the Funds’ prospectuses under the heading ‘’Principal Investment Risks’’.
On October 6, 2021, the following Funds paid a distribution to shareholders of record on October 5, 2021 as follows:
| | | Ordinary
Income Rate | | | Ordinary Income
Distribution Paid | |
Overlay Shares Large Cap Equity ETF | | $ | 0.31 | | | $ | 1,599,253 | |
Overlay Shares Small Cap Equity ETF | | | 0.35 | | | | 60,451 | |
Overlay Shares Foreign Equity ETF | | | 0.13 | | | | 33,205 | |
Overlay Shares Core Bond ETF | | | 0.24 | | | | 1,341,800 | |
Overlay Shares Short Term Bond ETF | | | 0.22 | | | | 388,815 | |
Overlay Shares Municipal Bond ETF | | | 0.24 | | | | 107,777 | |
Other than as disclosed, there were no other subsequent events requiring recognition or disclosure through the date the financial statements were issued.
47
Overlay Shares ETFs
Report of Independent Registered Public Accounting Firm
To the Shareholders of Overlay Shares Large Cap Equity ETF, Overlay Shares Small Cap Equity ETF, Overlay Shares Foreign Equity ETF, Overlay Shares Hedged Large Cap Equity ETF, Overlay Shares Core Bond ETF, Overlay Shares Short Term Bond ETF, and Overlay Shares Municipal Bond ETF and Board of Trustees of Listed Funds Trust
Opinion on the Financial Statements
We have audited the accompanying statements of assets and liabilities, including the schedules of investments and written options, of Overlay Shares Large Cap Equity ETF, Overlay Shares Small Cap Equity ETF, Overlay Shares Foreign Equity ETF, Overlay Shares Hedged Large Cap Equity ETF, Overlay Shares Core Bond ETF, Overlay Shares Short Term Bond ETF, and Overlay Shares Municipal Bond ETF (the “Funds”), each a series of Listed Funds Trust, as of August 31, 2021, the related statements of operations, the statements of changes in net assets, the related notes, and the financial highlights for each of the periods indicated below (collectively referred to as the “financial statements”). In our opinion, the financial statements present fairly, in all material respects, the financial position of each of the Funds as of August 31, 2021, the results of their operations, the changes in net assets, and the financial highlights for each of the periods indicated below in conformity with accounting principles generally accepted in the United States of America.
Fund Name | Statement of
Operations | Statement(s) of
Changes in Net
Assets | Financial Highlights |
Overlay Shares Large Cap Equity ETF,
Overlay Shares Small Cap Equity ETF,
Overlay Shares Foreign Equity ETF,
Overlay Shares Core Bond ETF, and
Overlay Shares Municipal Bond ETF | For the year ended August 31, 2021 | For the year ended August 31, 2021 and for the period from September 30, 2019 (commencement of operations) through August 31, 2020 |
Overlay Shares Hedged Large Cap Equity ETF and Overlay Shares Short Term Bond ETF | For the period from January 14, 2021 (commencement of operations) through August 31, 2021 |
Basis for Opinion
These financial statements are the responsibility of the Funds’ management. Our responsibility is to express an opinion on the Funds’ financial statements based on our audits. We are a public accounting firm registered with the Public Company Accounting Oversight Board (United States) (“PCAOB”) and are required to be independent with respect to the Funds in accordance with the U.S. federal securities laws and the applicable rules and regulations of the Securities and Exchange Commission and the PCAOB.
We conducted our audits in accordance with the standards of the PCAOB. Those standards require that we plan and perform the audit to obtain reasonable assurance about whether the financial statements are free of material misstatement whether due to error or fraud.
Our audits included performing procedures to assess the risks of material misstatement of the financial statements, whether due to error or fraud, and performing procedures that respond to those risks. Such procedures included examining, on a test basis, evidence regarding the amounts and disclosures in the financial statements. Our procedures included confirmation of securities owned as of August 31, 2021, by correspondence with the custodian and broker. Our audits also included evaluating the accounting principles used and significant estimates made by management, as well as evaluating the overall presentation of the financial statements. We believe that our audits provide a reasonable basis for our opinion.
We have served as the Funds’ auditor since 2019.

COHEN & COMPANY, LTD.
Cleveland, Ohio
October 29, 2021
48
Overlay Shares ETFs
Board Consideration and Approval of Advisory Agreement
August 31, 2021 (Unaudited)
At a meeting held on June 22-23, 2021 (the “Meeting”), the Board of Trustees (the “Board”) of Listed Funds Trust (the “Trust”), including those trustees who are not “interested persons” of the Trust, as defined in the Investment Company Act of 1940 (the “1940 Act”) (the “Independent Trustees”), considered the approval of the continuation of the investment advisory agreement (the “Agreement”) between Liquid Strategies, LLC (the “Adviser”) and the Trust, on behalf of the Overlay Shares Large Cap Equity ETF, Overlay Shares Small Cap Equity ETF, Overlay Shares Foreign Equity ETF, Overlay Shares Core Bond ETF, and Overlay Shares Municipal Bond ETF (each, a “Fund” and together, the “Funds”).
Pursuant to Section 15 of the 1940 Act and related exemptive relief, to continue after its initial two-year term, the Agreement must be approved annually: (i) by the vote of the Board or by a vote of the shareholders of a Fund and (ii) by the vote of a majority of the Independent Trustees cast at a meeting called for the purpose of voting on such approval. Each year, the Board calls and holds a meeting to decide whether to renew the Agreement for an additional one-year term. In preparation for the meeting, the Board requests and reviews a wide variety of information from the Adviser. The Board uses this information, as well as other information that the Adviser and other service providers may submit to the Board at the meeting and over the course of the prior year, to help evaluate the Adviser’s fee and other aspects of the Agreement and decide whether to renew the Agreement for an additional year. In addition, rules under the 1940 Act require an investment company to disclose in its shareholder reports the material factors and the conclusions with respect thereto that formed the basis for the Board’s approval of an investment advisory agreement.
As discussed in further detail below, prior to and at the Meeting, the Board was presented with information to help it evaluate the Adviser’s fee and other aspects of the Agreement. In addition to the written materials provided to the Board, representatives from the Adviser provided an oral overview of each Fund’s strategy, the services provided to each Fund by the Adviser, and additional information about the Adviser’s personnel and operations. During the Meeting, the Board discussed the materials it received, including memoranda from legal counsel to the Trust on the responsibilities of the Trustees in considering the approval of the Agreement under the 1940 Act, considered the written materials that it received before the Meeting and the oral presentations, and deliberated on the approval of the Agreement in light of this information. Throughout the process, the Trustees were afforded the opportunity to ask questions of, and request additional materials from, the Adviser. The Independent Trustees also met in executive session with counsel to the Trust to further discuss the advisory arrangement and the Trustees’ responsibilities relating thereto. The consideration of the continuation of the Agreement was conducted by both the full Board and the Independent Trustees, who also voted separately.
At the Meeting, the Board and the Independent Trustees evaluated a number of factors, including, among other things: (i) the nature, extent, and quality of the services provided by the Adviser to the Funds; (ii) each Fund’s expenses and performance; (iii) the cost of the services provided and profits to be realized by the Adviser from the relationship with each Fund; (iv) comparative fee and expense data for each Fund and other investment companies with similar investment objectives; (v) the extent to which the advisory fee for each Fund reflects economies of scale shared its respective Fund shareholders; (vi) any benefits derived by the Adviser from the relationship with each Fund, including any fall-out benefits enjoyed by the Adviser; and (vii) other factors the Board deemed relevant. The Board deliberated on the renewal of the Agreement in light of the written materials that it received before the Meeting, information it received at the Meeting, and information it had received at prior board meetings. In its deliberations, the Board considered the factors and reached the conclusions described below relating to the advisory arrangement and the renewal of the Agreement. In its deliberations, the Board did not identify any single piece of information that was paramount or controlling and the individual Trustees may have attributed different weights to various factors.
Nature, Extent, and Quality of Services Provided. The Trustees considered the scope of services provided under the Agreement, noting that the Adviser would continue to provide investment management services to the Funds. In considering the nature, extent, and quality of the services provided by the Adviser, the Board considered the quality of the Adviser’s compliance infrastructure and past reports from the Trust’s Chief Compliance Officer (“CCO”). The Board also considered its previous experience with the Adviser providing investment management services to the Funds. The Board noted that it had received a copy of the Adviser’s registration form (“Form ADV”), as well as the response of the Adviser to a detailed series of questions which included, among other things, information about the background and experience of the firm’s key personnel, the firm’s cybersecurity policy, and the services provided by the Adviser.
49
Overlay Shares ETFs
Board Consideration and Approval of Advisory Agreement
August 31, 2021 (Unaudited) (Continued)
The Board also considered other services currently provided by the Adviser to the Funds, such as monitoring adherence to each Fund’s investment restrictions, monitoring compliance with various policies and procedures and with applicable securities regulations, and monitoring the extent to which each Fund achieved its investment objective as an actively-managed fund. The Board further considered the oral information provided by the Adviser with respect to the impact of the COVID-19 pandemic on the Adviser’s operations.
Historical Performance. The Board noted that it had received information regarding each Fund’s performance for various time periods in the Materials and primarily considered each Fund’s performance for period ended May 31, 2021.
Overlay Shares Large Cap Equity ETF: The Board noted that, for the one-year and since inception periods, the Fund outperformed the S&P 500 Index, before fees and expenses. The Board further noted that, for the one-year period, the Fund outperformed the median for funds in the universe of Large Blend ETFs as reported by Morningstar (the “Category Peer Group”).
The Board also considered the Fund’s performance relative to its competitors identified by the Adviser which are actively managed and seek to add incremental income above their respective benchmarks (the “Selected Peer Group”). The Board noted the Fund’s performance was within the range of such returns for the one-year period.
Overlay Shares Small Cap Equity ETF: The Board noted that, for the one-year and since inception periods, the Fund outperformed the S&P SmallCap 600 Index, before fees and expenses. The Board further noted that, for the one-year period, the Fund outperformed the median for funds in the universe of Small Blend ETFs as reported by Morningstar (the “Category Peer Group”).
The Board also considered the Fund’s performance relative to its competitors identified by the Adviser which are actively managed small cap equity funds (the “Selected Peer Group”). The Board noted the Fund outperformed the Selected Peer Group for the one-year period.
Overlay Shares Foreign Equity ETF: The Board noted that, for the one-year and since inception periods, the Fund underperformed the MSCI All Country Index ex USA, before fees and expenses. The Board further noted that, for the one-year period, the Fund underperformed the median for funds in the universe of Foreign Large Blend ETFs as reported by Morningstar (the “Category Peer Group”).
The Board also considered the Fund’s performance relative to its competitors identified by the Adviser which are actively managed international equity funds (the “Selected Peer Group”). The Board noted the Fund’s performance was within the range of such returns for the one-year period.
Overlay Shares Core Bond ETF: The Board noted that, for the one-year and since inception periods, the Fund outperformed the Bloomberg Barclays US Aggregate Bond Index, before fees and expenses. The Board further noted that, for the one-year period, the Fund outperformed the median for funds in the universe of Intermediate Core Bond ETFs as reported by Morningstar (the “Category Peer Group”).
The Board also considered the Fund’s performance relative to its competitors identified by the Adviser which are actively managed aggregate bond funds (the “Selected Peer Group”). The Board noted the Fund’s performance was within the range of such returns for the one-year period.
Overlay Shares Municipal Bond ETF: The Board noted that, for the one-year and since inception periods, the Fund outperformed both the Bloomberg Barclays 1-15 Year Municipal Blend Index and Bloomberg Barclays Municipal Bond Index, before fees and expenses. The Board further noted that, for the one-year period, the Fund outperformed the median for funds in the universe of Municipal National Intermediate Term Bond ETFs as reported by Morningstar (the “Category Peer Group”).
The Board also considered the Fund’s performance relative to its competitors identified by the Adviser which are actively managed municipal bond funds (the “Selected Peer Group”). The Board noted the Fund outperformed the Selected Peer Group for the one-year period.
Cost of Services Provided and Profitability. The Board reviewed the expense ratio for each of the Funds and compared each Fund’s expense ratio to its respective Category Peer Group and Selected Peer Group as follows:
50
Overlay Shares ETFs
Board Consideration and Approval of Advisory Agreement
August 31, 2021 (Unaudited) (Continued)
Overlay Shares Large Cap Equity ETF: The Board noted that the expense ratio for the Fund, which consists entirely of the “unified fee” described below, was slightly higher than the median of its Category Peer Group, but within the range of expense ratios for the Category Peer Group. The Board further noted that the Fund’s expense ratio was within the range of expense ratios for the Selected Peer Group.
Overlay Shares Small Cap Equity ETF: The Board noted that the expense ratio for the Fund, which consists entirely of the “unified fee” described below, was slightly lower than the median of its Category Peer Group. The Board further noted that the Fund’s expense ratio was within the range of expense ratios for the Selected Peer Group.
Overlay Shares Foreign Equity ETF: The Board noted that the expense ratio for the Fund, which consists entirely of the “unified fee” described below, was higher than the median of its Category Peer Group. The Board also noted that, because the Category Peer Group included actively-managed funds of large fund complexes where economies of scale are more easily attainable, the Category Peer Group may not allow for an apt comparison by which to judge the Fund’s expense ratio. The Board further noted that the Fund’s expense ratio was also higher than expense ratios for the Selected Peer Group, which also included large fund complexes where economies of scale are more easily attainable.
Overlay Shares Core Bond ETF: The Board noted that the expense ratio for the Fund, which consists entirely of the “unified fee” described below, was significantly higher than the median of its Category Peer Group. The Board also noted that, because the Category Peer Group included actively-managed funds of large fund complexes where economies of scale are more easily attainable, the Category Peer Group may not allow for an apt comparison by which to judge the Fund’s expense ratio. The Board further noted that the Fund’s expense ratio was also higher than expense ratios for the Selected Peer Group, which also included large fund complexes where economies of scale are more easily attainable.
Overlay Shares Municipal Bond ETF: The Board noted that the expense ratio for the Fund, which consists entirely of the “unified fee” described below, was significantly higher than the median of its Category Peer Group, but within the range of expense ratios for the Category Peer Group. The Board also noted that, because the Category Peer Group included actively-managed funds of large fund complexes where economies of scale are more easily attainable, the Category Peer Group may not allow for an apt comparison by which to judge the Fund’s expense ratio. The Board further noted that the Fund’s expense ratio was also higher than expense ratios for the Selected Peer Group, which also included large fund complexes where economies of scale are more easily attainable.
With respect to each Fund, the Board took into consideration that the Adviser charges a “unified fee,” meaning each Fund pays no expenses other than its advisory fee or certain other costs such as interest, brokerage, acquired fund fees and expenses, extraordinary expenses, and, to the extent it is implemented, fees pursuant to a Distribution and/or Shareholder Servicing (12b-1) Plan. The Board noted that the Adviser continued to be responsible for compensating the Trust’s other service providers and paying each Fund’s other expenses out of its own fee and resources. The Board also evaluated the compensation and benefits received by the Adviser from its relationship with each Fund, taking into account analyses of the Adviser’s profitability with respect to each Fund.
Economies of Scale. The Board expressed the view that it currently appeared that the Adviser might realize economies of scale in managing the Funds as assets grow in size. The Board further determined that, based on the amount and structure of each Fund’s unitary fee, such economies of scale would be shared with each Fund’s respective shareholders, although the Board intends to monitor fees as each Fund grows in size and assess whether fee breakpoints may be warranted.
Conclusion. No single factor was determinative of the Board’s decision to approve the continuation of the Agreement; rather, the Board based its determination on the total mix of information available to it. Based on a consideration of all the factors in their totality, the Board, including a majority of the Independent Trustees, determined that the Agreement, including the compensation payable under the agreement, was fair and reasonable to each Fund. The Board, including a majority of the Independent Trustees, therefore determined that the approval of the continuation of the Agreement was in the best interests of each Fund and its respective shareholders.
51
Overlay Shares ETFs
Shareholder Expense Example
(Unaudited)
As a shareholder of a Fund you incur two types of costs: (1) transaction costs for purchasing and selling shares; and (2) ongoing costs, including management fees and other fund expenses. The following example is intended to help you understand your ongoing costs (in dollars and cents) of investing in a Fund and to compare these costs with the ongoing costs of investing in other funds. The examples are based on an investment of $1,000 invested at the beginning of the period and held throughout the entire period (March 1, 2021 to August 31, 2021).
ACTUAL EXPENSES
The first line under each Fund in the table below provides information about actual account values and actual expenses. You may use the information in this line, together with the amount you invested, to estimate the expenses that you paid over the period. Simply divide your account value by $1,000 (for example, an $8,600 account value divided by $1,000 = 8.6), then multiply the result by the number in the first line for your Fund under the heading entitled “Expenses Paid During Period” to estimate the expenses you paid on your account during this period.
HYPOTHETICAL EXAMPLE FOR COMPARISON PURPOSES
The second line in the table provides information about hypothetical account values and hypothetical expenses based on each Fund’s actual expense ratio and an assumed rate of return of 5% per year before expenses, which is not the Fund’s actual return. The hypothetical account values and expenses may not be used to estimate the actual ending account balance or expenses you paid for the period. You may use this information to compare the ongoing costs of investing in the Fund and other funds. To do so, compare this 5% hypothetical example with the 5% hypothetical examples that appear in the shareholder reports of the other funds. Please note that the expenses shown in the table are meant to highlight your ongoing costs only and do not reflect any transactional costs, such as brokerage commissions paid on purchases and sales of Fund shares. Therefore, the second line in the table is useful in comparing ongoing Fund costs only and will not help you determine the relative total costs of owning different funds. In addition, if these transactional costs were included, your costs would have been higher.
52
Overlay Shares ETFs
Shareholder Expense Example
(Unaudited) (Continued)
| | Beginning
Account Value
3/1/21 | Ending
Account Value
8/31/21 | Annualized
Expense
Ratios | Expenses
Paid During
the Period(1) |
Overlay Shares Large Cap Equity ETF | | | | |
Actual | $ 1,000.00 | $ 1,226.70 | 0.77% | $ 4.32 |
Hypothetical (5% return before expenses) | $ 1,000.00 | $ 1,021.32 | 0.77% | $ 3.92 |
Overlay Shares Small Cap Equity ETF | | | | |
Actual | $ 1,000.00 | $ 1,102.60 | 0.77% | $ 4.08 |
Hypothetical (5% return before expenses) | $ 1,000.00 | $ 1,021.32 | 0.77% | $ 3.92 |
Overlay Shares Foreign Equity ETF | | | | |
Actual | $ 1,000.00 | $ 1,128.60 | 0.77% | $ 4.13 |
Hypothetical (5% return before expenses) | $ 1,000.00 | $ 1,021.32 | 0.77% | $ 3.92 |
Overlay Shares Hedged Large Cap Equity ETF | | | | |
Actual | $ 1,000.00 | $ 1,154.20 | 0.81% | $ 4.40 |
Hypothetical (5% return before expenses) | $ 1,000.00 | $ 1,021.12 | 0.81% | $ 4.13 |
Overlay Shares Core Bond ETF | | | | |
Actual | $ 1,000.00 | $ 1,042.40 | 0.77% | $ 3.96 |
Hypothetical (5% return before expenses) | $ 1,000.00 | $ 1,021.32 | 0.77% | $ 3.92 |
Overlay Shares Short Term Bond ETF | | | | |
Actual | $ 1,000.00 | $ 1,034.00 | 0.77% | $ 3.95 |
Hypothetical (5% return before expenses) | $ 1,000.00 | $ 1,021.32 | 0.77% | $ 3.92 |
Overlay Shares Municipal Bond ETF | | | | |
Actual | $ 1,000.00 | $ 1,050.40 | 0.77% | $ 3.98 |
Hypothetical (5% return before expenses) | $ 1,000.00 | $ 1,021.32 | 0.77% | $ 3.92 |
(1) | Expenses are calculated using the Fund’s annualized expense ratio, multiplied by the average account value for the period, multiplied by the 184/365 (to reflect the six-month period). |
53
Overlay Shares ETFs
Review of Liquidity Risk Management Program
(Unaudited)
Pursuant to Rule 22e-4 under the Investment Company Act of 1940, the Trust, on behalf of the series of the Trust covered by this shareholder report (the “Series”), has adopted a liquidity risk management program to govern the Trust’s approach to managing liquidity risk. Rule 22e-4 seeks to promote effective liquidity risk management, thereby reducing the risk that a fund will be unable to meet its redemption obligations and mitigating dilution of the interests of fund shareholders. The Trust’s liquidity risk management program is tailored to reflect the Series’ particular risks, but not to eliminate all adverse impacts of liquidity risk, which would be incompatible with the nature of such Series.
The investment adviser to the Series has adopted and implemented its own written liquidity risk management program (the “Program”) tailored specifically to assess and manage the liquidity risk of the Series. At a recent meeting of the Board of Trustees of the Trust, the Trustees received a report pertaining to the operation, adequacy, and effectiveness of implementation of the Program for the period ended December 31, 2020. The report concluded that the Program is reasonably designed to assess and manage the Series’ liquidity risk and has operated adequately and effectively to manage such risk. The report reflected that there were no liquidity events that impacted the Series’ ability to timely meet redemptions without dilution to existing shareholders. The report further noted that no material changes have been made to the Program since its implementation.
There can be no assurance that the Program will achieve its objectives in the future. Please refer to the prospectus for more information regarding the Series’ exposure to liquidity risk and other principal risks to which an investment in the Series may be subject.
54
Overlay Shares ETFs
Board of Trustees and Officers
August 31, 2021 (Unaudited)
The Funds’ Statement of Additional Information includes additional information about the Funds’ Trustees and Officers, and is available, without charge upon request by calling 1-866-704-6857, or by visiting the Funds’ website at www.overlayshares.com.
Name and Year of Birth | Position Held
with the Trust | Term of Office
and Length of
Time Served | Principal Occupation(s)
During Past 5 Years | Number of
Portfolios in
Fund Complex
Overseen
by Trustee | Other
Directorships Held
by Trustee During
Past 5 Years |
Independent Trustees | | | | | |
John L. Jacobs Year of birth: 1959 | Trustee and Audit Committee Chair | Indefinite term; since 2017 | Chairman of Alerian, Inc. (since June 2018); Executive Director of Center for Financial Markets and Policy (since 2016); Founder and CEO of Q3 Advisors, LLC (financial consulting firm) (since 2015); Distinguished Policy Fellow and Executive Director, Center for Financial Markets and Policy, Georgetown University (since 2015); Senior Advisor, Nasdaq OMX Group (2015–2016); Executive Vice President, Nasdaq OMX Group (2013–2015). | 38 | Director, tZERO Group, Inc. (since 2020); Independent Trustee, Procure ETF Trust II (since 2018) (1 portfolio); Horizons ETF Trust I (2015-2019). |
Koji Felton Year of birth: 1961 | Trustee | Indefinite term; since 2019 | Counsel, Kohlberg Kravis Roberts & Co. L.P. (investment firm) (2013–2015); Counsel, Dechert LLP (law firm) (2011–2013). | 38 | Independent Trustee, Series Portfolios Trust (since 2015) (8 portfolios). |
Pamela H. Conroy Year of birth: 1961 | Trustee and Nominating and Governance Committee Chair | Indefinite term; since 2019 | Retired; formerly Executive Vice President, Chief Operating Officer & Chief Compliance Officer, Institutional Capital Corporation (investment firm) (1994–2008). | 38 | Independent Trustee, Frontier Funds, Inc. (since 2020) (7 portfolios). |
Interested Trustee | | | | | |
Paul R. Fearday, CPA Year of birth: 1979 | Trustee and Chairman | Indefinite term; since 2019 | Senior Vice President, U.S. Bancorp Fund Services, LLC (since 2008). | 38 | None. |
55
Overlay Shares ETFs
Board of Trustees and Officers
August 31, 2021 (Unaudited) (Continued)
Name and Year of Birth | Position(s) Held
with the Trust | Term of Office
and Length of
Time Served | Principal Occupation(s) During Past 5 Years |
Officers | | | |
Gregory Bakken Year of birth: 1983 | President and Principal Executive Officer | Indefinite term, February 2019 | Vice President, U.S. Bancorp Fund Services, LLC (since 2006). |
Travis G. Babich Year of birth: 1980 | Treasurer and Principal Financial Officer | Indefinite term, September 2019 | Vice President, U.S. Bancorp Fund Services, LLC (since 2005). |
Kacie M. Gronstal Year of birth: 1992 | Assistant Treasurer | Indefinite term, March 2019 | Assistant Vice President, U.S. Bancorp Fund Services, LLC (since 2021); Officer, U.S. Bancorp Fund Services, LLC (2014 to 2021). |
Kent Barnes Year of birth: 1968 | Secretary | Indefinite term, February 2019 | Vice President, U.S. Bancorp Fund Services, LLC (since 2018); Chief Compliance Officer, Rafferty Asset Management, LLC (2016 to 2018); Vice President, U.S. Bancorp Fund Services, LLC (2007 to 2016). |
Alia Vasquez Year of birth: 1980 | Assistant Secretary | Indefinite term, June 2021 | Vice President, U.S. Bancorp Fund Services, LLC (since 2017, and 2015 to 2016); Corporate Counsel, Johnson Outdoors (2017); Assistant Vice President, U.S. Bancorp Fund Services, LLC (2010 to 2015); Secretary, Series Portfolios Trust (2015 to 2017). |
Steve Jensen Year of birth: 1957 | Chief Compliance Officer and Anti-Money Laundering Officer | Indefinite term, February 2019 | Senior Vice President, U.S. Bancorp Fund Services, LLC (since 2011). |
56
Overlay Shares ETFs
Supplemental Information
(Unaudited)
Investors should consider the investment objective and policies, risk considerations, charges and ongoing expenses of an investment carefully before investing. The prospectus contains this and other information relevant to an investment in the Funds. Please read the prospectus carefully before investing. A copy of the prospectus for the Funds may be obtained without charge by writing to the Funds, c/o U.S. Bank Global Fund Services, P.O. Box 701, Milwaukee, Wisconsin 53201-0701, by calling 1-866-704-6857, or by visiting the Funds’ website at www.overlayshares.com.
QUARTERLY PORTFOLIO HOLDING INFORMATION
Each Fund files its complete schedule of portfolio holdings for its first and third fiscal quarters with the Securities and Exchange Commission (“SEC”) on Part F of Form N-PORT. The Funds’ Part F of Form N-PORT is available without charge, upon request, by calling toll-free at 1-866-704-6857. Furthermore, you may obtain the Part F of Form N-PORT on the SEC’s website at www.sec.gov.
PROXY VOTING INFORMATION
Each Fund is required to file a Form N-PX, with the Fund’s complete proxy voting record for the 12 months ended June 30, no later than August 31 of each year. The Fund’s proxy voting record will be available without charge, upon request, by calling toll-free 1-866-704-6857 and on the SEC’s website at www.sec.gov.
FREQUENCY DISTRIBUTION OF PREMIUMS AND DISCOUNTS
Information regarding how often shares of the Funds trade on an exchange at a price above (i.e., at a premium) or below (i.e., at a discount) the NAV of the Funds is available without charge, on the Funds’ website at www.overlayshares.com.
TAX INFORMATION
For the fiscal period ended August 31, 2021, certain dividends paid by the Fund may be subject to a maximum tax rate of 20%, as provided for by the Jobs and Growth Tax Relief Reconciliation Act of 2003. The percentage of dividends declared from ordinary income designated as qualified dividend income was as follows:
Overlay Shares Large Cap Equity ETF | 63.43% |
Overlay Shares Small Cap Equity ETF | 43.57% |
Overlay Shares Foreign Equity ETF | 46.73% |
Overlay Shares Hedged Large Cap Equity ETF | 0.00% |
Overlay Shares Core Bond ETF | 0.00% |
Overlay Shares Short Term Bond ETF | 0.00% |
Overlay Shares Municipal Bond ETF | 0.00% |
For corporate shareholders, the percent of ordinary income distributions qualifying for the corporate dividends received deduction for the fiscal period ended August 31, 2021 was as follows:
Overlay Shares Large Cap Equity ETF | 59.00% |
Overlay Shares Small Cap Equity ETF | 43.00% |
Overlay Shares Foreign Equity ETF | 0.25% |
Overlay Shares Hedged Large Cap Equity ETF | 0.00% |
Overlay Shares Core Bond ETF | 0.00% |
Overlay Shares Short Term Bond ETF | 0.00% |
Overlay Shares Municipal Bond ETF | 0.00% |
57
Overlay Shares ETFs
Supplemental Information
(Unaudited) (Continued)
For the fiscal period ended August 31, 2021, the Percentage of taxable ordinary income distributions that are designated as short-term capital gain distributions under Internal Revenue Code Section 871(k)(2)(C) for the Funds was as follows:
Overlay Shares Large Cap Equity ETF | 75.53% |
Overlay Shares Small Cap Equity ETF | 82.65% |
Overlay Shares Foreign Equity ETF | 44.54% |
Overlay Shares Hedged Large Cap Equity ETF | 0.00% |
Overlay Shares Core Bond ETF | 57.84% |
Overlay Shares Short Term Bond ETF | 73.92% |
Overlay Shares Municipal Bond ETF | 99.81% |
For the fiscal year ended August 31, 2021, the Overlay Shares Foreign Equity ETF earned foreign source income and paid foreign taxes, which the Fund intends to pass through to its shareholders pursuant to Section 853 of the Internal Revenue Code as follows:
| | | Foreign Source Income Earned | | | Foreign
Taxes Paid | |
| Overlay Shares Foreign Equity ETF | | $ | 104,729 | | | $ | 2,315 | |
58
Overlay Shares ETFs
Privacy Policy
August 31, 2021 (Unaudited)
We are committed to respecting the privacy of personal information you entrust to us in the course of doing business with us.
The Funds collect non-public information about you from the following sources:
| | ● | Information we receive about you on applications or other forms; |
| | ● | Information you give us orally; and/or |
| | ● | Information about your transactions with us or others. |
We do not disclose any non-public personal information about our customers or former customers without the customer’s authorization, except as permitted by law or in response to inquiries from governmental authorities. We may share information with affiliated and unaffiliated third parties with whom we have contracts for servicing the Funds. We will provide unaffiliated third parties with only the information necessary to carry out their assigned responsibilities. We maintain physical, electronic and procedural safeguards to guard your non-public personal information and require third parties to treat your personal information with the same high degree of confidentiality.
In the event that you hold shares of a Fund through a financial intermediary, including, but not limited to, a broker-dealer, bank, or trust company, the privacy policy of your financial intermediary would govern how your non-public personal information would be shared by those entities with unaffiliated third parties.
59
THIS PAGE INTENTIONALLY LEFT BLANK
THIS PAGE INTENTIONALLY LEFT BLANK
Investment Adviser:
Liquid Strategies, LLC
3550 Lenox Road, Suite 2550
Atlanta, GA 30326
Legal Counsel:
Morgan, Lewis & Bockius LLP
1111 Pennsylvania Avenue, N.W.
Washington, D.C. 20004
Independent Registered Public Accounting Firm:
Cohen & Company, Ltd.
1350 Euclid Avenue, Suite 800
Cleveland, OH 44115
Distributor:
Foreside Fund Services, LLC
Three Canal Plaza, Suite 100
Portland, ME 04101
Administrator, Fund Accountant & Transfer Agent:
U.S. Bancorp Fund Services, LLC
d/b/a U.S. Bank Global Fund Services
615 E. Michigan St.
Milwaukee, WI 53202
Custodian:
U.S. Bank N.A.
1555 North RiverCenter Drive, Suite 302
Milwaukee, WI 53212
This information must be preceded or accompanied by a current prospectus for the Funds.
Item 2. Code of Ethics.
The registrant has adopted a code of ethics that applies to the registrant’s principal executive officer and principal financial officer. The Registrant has not made any substantive amendments to its code of ethics during the period covered by this report. The registrant has not granted any waivers from any provisions of the code of ethics during the period covered by this report.
A copy of the registrant’s Code of Ethics is filed herewith.
Item 3. Audit Committee Financial Expert.
The registrant’s Board of Trustees has determined that there is at least one audit committee financial expert serving on its audit committee. Mr. John Jacobs is the “audit committee financial expert” and is considered to be “independent” as each term is defined in Item 3 of Form N-CSR.
Item 4. Principal Accountant Fees and Services.
The registrant has engaged its principal accountant to perform audit services, audit-related services, tax services and other services during the past two fiscal years. “Audit services” refer to performing an audit of the registrant's annual financial statements or services that are normally provided by the accountant in connection with statutory and regulatory filings or engagements for those fiscal years. “Audit-related services” refer to the assurance and related services by the principal accountant that are reasonably related to the performance of the audit. “Tax services” refer to professional services rendered by the principal accountant for tax compliance, tax advice, and tax planning. There were no “Other services” provided by the principal accountant. The following table details the aggregate fees billed or expected to be billed for the last two fiscal years for audit fees, audit-related fees, tax fees and other fees by the principal accountant.
| | FYE 08/31/2021 | FYE 08/31/2020 |
| Audit Fees | $87,500 | $67,500 |
| Audit-Related Fees | $0 | $0 |
| Tax Fees | $21,000 | $15,000 |
| All Other Fees | $0 | $0 |
(e)(1) The audit committee has adopted pre-approval policies and procedures that require the audit committee to pre-approve all audit and non-audit services of the registrant, including services provided to any entity affiliated with the registrant.
(e)(2) The percentage of fees billed by Cohen & Company, Ltd. applicable to non-audit services pursuant to waiver of pre-approval requirement were as follows:
| | FYE 08/31/2021 | FYE 08/31/2020 |
| Audit-Related Fees | 0% | 0% |
| Tax Fees | 0% | 0% |
| All Other Fees | 0% | 0% |
(f) All of the principal accountant’s hours spent on auditing the registrant’s financial statements were attributed to work performed by full-time permanent employees of the principal accountant.
(g) The following table indicates the non-audit fees billed or expected to be billed by the registrant’s accountant for services to the registrant and to the registrant’s investment adviser (and any other controlling entity, etc.—not sub-adviser) for the last two years.
| Non-Audit Related Fees | FYE 08/31/2021 | FYE 08/31/2020 |
| Registrant | N/A | N/A |
| Registrant’s Investment Adviser | N/A | N/A |
(h) The audit committee of the board of trustees/directors has considered whether the provision of non-audit services that were rendered to the registrant's investment adviser is compatible with maintaining the principal accountant's independence and has concluded that the provision of such non-audit services by the accountant has not compromised the accountant’s independence.
The registrant has not been identified by the U.S. Securities and Exchange Commission as having filed an annual report issued by a registered public accounting firm branch or office that is located in a foreign jurisdiction where the Public Company Accounting Oversight Board is unable to inspect or completely investigate because of a position taken by an authority in that jurisdiction.
The registrant is not a foreign issuer.
Item 5. Audit Committee of Listed Registrants.
| (a) | The registrant is an issuer as defined in Rule 10A-3 under the Securities Exchange Act of 1934, (the “Act”) and has a separately-designated standing audit committee established in accordance with Section 3(a)(58)(A) of the Act. The entire Board of Trustees is acting as the registrant’s audit committee. |
Item 6. Investments.
| (a) | Schedule of Investments is included as part of the report to shareholders filed under Item 1 of this Form. |
Item 7. Disclosure of Proxy Voting Policies and Procedures for Closed-End Management Investment Companies.
Not applicable to open-end investment companies.
Item 8. Portfolio Managers of Closed-End Management Investment Companies.
Not applicable to open-end investment companies.
Item 9. Purchases of Equity Securities by Closed-End Management Investment Company and Affiliated Purchasers.
Not applicable to open-end investment companies.
Item 10. Submission of Matters to a Vote of Security Holders.
There have been no material changes to the procedures by which shareholders may recommend nominees to the registrant’s Board of Trustees.
Item 11. Controls and Procedures.
| (a) | The Registrant’s President and Treasurer have reviewed the Registrant's disclosure controls and procedures (as defined in Rule 30a-3(c) under the Investment Company Act of 1940 (the “Act”)) as of a date within 90 days of the filing of this report, as required by Rule 30a-3(b) under the Act and Rules 13a-15(b) or 15d-15(b) under the Securities Exchange Act of 1934. Based on their review, such officers have concluded that the disclosure controls and procedures are effective in ensuring that information required to be disclosed in this report is appropriately recorded, processed, summarized and reported and made known to them by others within the Registrant and by the Registrant’s service provider. |
| (b) | There were no changes in the Registrant's internal control over financial reporting (as defined in Rule 30a-3(d) under the Act) that occurred during the period covered by this report that have materially affected, or are reasonably likely to materially affect, the Registrant's internal control over financial reporting. |
Item 12. Disclosure of Securities Lending Activities for Closed-End Management Investment Companies
Not applicable to open-end investment companies.
Item 13. Exhibits.
| (a) | (1) Any code of ethics or amendment thereto, that is the subject of the disclosure required by Item 2, to the extent that the registrant intends to satisfy Item 2 requirements through filing an exhibit. Filed herewith. |
(2) A separate certification for each principal executive officer and principal financial officer pursuant to Section 302 of the Sarbanes-Oxley Act of 2002. Filed herewith.
(3) Any written solicitation to purchase securities under Rule 23c-1 under the Act sent or given during the period covered by the report by or on behalf of the registrant to 10 or more persons. Not applicable to open-end investment companies.
(4) Change in the registrant’s independent public accountant. There was no change in the registrant’s independent public accountant for the period covered by this report.
| (b) | Certifications pursuant to Section 906 of the Sarbanes-Oxley Act of 2002. Furnished herewith. |
SIGNATURES
Pursuant to the requirements of the Securities Exchange Act of 1934 and the Investment Company Act of 1940, the registrant has duly caused this report to be signed on its behalf by the undersigned, thereunto duly authorized.
| (Registrant) | Listed Funds Trust | |
| | | |
| By (Signature and Title)* | /s/ Gregory C. Bakken | |
| | Gregory C. Bakken, President/Principal Executive Officer | |
| | | |
| Date | 11/4/21 | |
Pursuant to the requirements of the Securities Exchange Act of 1934 and the Investment Company Act of 1940, this report has been signed below by the following persons on behalf of the registrant and in the capacities and on the dates indicated.
| By (Signature and Title)* | /s/ Gregory C. Bakken | |
| | Gregory C. Bakken, President/Principal Executive Officer | |
| | | |
| Date | 11/4/21 | |
| | | |
| By (Signature and Title)* | /s/ Travis G. Babich | |
| | Travis G. Babich, Treasurer/Principal Financial Officer | |
| | | |
| Date | 11/4/21 | |
| * | Print the name and title of each signing officer under his or her signature. |