UNITED STATES
SECURITIES AND EXCHANGE COMMISSION
Washington, D.C. 20549
FORM N-CSR
CERTIFIED SHAREHOLDER REPORT OF REGISTERED MANAGEMENT INVESTMENT COMPANIES
Investment Company Act file number (811-23226)
Listed Funds Trust
(Exact name of registrant as specified in charter)
615 East Michigan Street
Milwaukee, WI 53202
(Address of principal executive offices) (Zip code)
Kent P. Barnes, Secretary
Listed Funds Trust
c/o U.S. Bancorp Fund Services, LLC
777 East Wisconsin Avenue, 10th Floor
Milwaukee, WI 53202
(Name and address of agent for service)
(414) 765-6511
Registrant's telephone number, including area code
Date of fiscal year end: October 31
Date of reporting period: October 31, 2021
Item 1. Reports to Stockholders.
(a)

Changebridge ETFs
Changebridge Capital Long/Short Equity ETF (CBLS)
Changebridge Capital Sustainable Equity ETF (CBSE)
ANNUAL REPORT
October 31, 2021
Changebridge ETFs
Table of Contents
| | |
Shareholder Letter (Unaudited) | 2 |
Shareholder Expense Example (Unaudited) | 6 |
Performance Overviews (Unaudited) | 7 |
Schedules of Investments and Securities Sold Short | 8 |
Changebridge Capital Long/Short Equity ETF | 8 |
Changebridge Capital Sustainable Equity ETF | 11 |
Statements of Assets and Liabilities | 13 |
Statements of Operations | 14 |
Statements of Changes in Net Assets | 15 |
Statement of Cash Flows | 16 |
Financial Highlights | 17 |
Notes to Financial Statements | 18 |
Report of Independent Registered Public Accounting Firm | 26 |
Supplemental Information (Unaudited) | 27 |
Review of Liquidity Risk Management Program (Unaudited) | 28 |
Board of Trustees and Officers (Unaudited) | 29 |
Privacy Policy (Unaudited) | 31 |
1
Changebridge ETFs
Shareholder Letter
October 31, 2021 (Unaudited)
Dear Shareholders:
Changebridge Capital LLC (“Changebridge”), the investment advisor to the Changebridge ETFs, is pleased to release its annual report for 2021. Changebridge was founded on the belief that capital markets include areas of inefficiency, which can be identified through both our quantitative methodologies and rigorous fundamental research. Our core values of transparency, sustainability, efficiency, and conviction are inherent in our approach to active management.
Changebridge’s founding vision was to bridge the space that existed between foundational aspects of active management and the demands of modern investors. This pursuit is evident in Changebridge’s investment process, which is best described as a quantamental approach that integrates sustainability.
| | ● | Quantitative Analysis is repeatable, capable of processing large amounts of data, and is helpful in reducing behavioral biases. Changebridge harnesses quantitative capabilities and applies them in a unique way. Instead of letting quantitative factors dictate portfolio decisions (buy/sell/hold), the team uses quantitative tools to highlight areas of inefficiency. The team believes focusing fundamental research efforts upon securities that are more likely to exhibit pricing inefficiencies is an important step in delivering a high active share and risk-adjusted returns above broader indices and benchmarks. |
| | ● | Fundamental Research is directed towards securities that exhibit pricing inefficiency, and it enables the team to analyze individual securities. The team engages with management teams, reviews financial statements, and develops risk/reward profiles for every security held in the Funds. Fundamental research facilitates a deeper understanding of each business and confers conviction. |
| | ● | Sustainability Assessments are manifest throughout the research process because the team believes companies that navigate the responsibility they have to their stakeholders, are in a better position to maximize risk-adjusted returns for their investors. The team actively engages with management teams to determine where they are, as it relates to their environmental, social, and governance responsibilities. |
The culmination of this quantamental approach that integrates sustainability is a portfolio of high conviction investments that are intended to deliver alpha, which is the excess return of an investment relative to the return of a benchmark index, for our shareholders. With a client-centric approach and a recognition of the expectations that modern investors share, Changebridge has embraced ETFs as the ideal structure to deliver actively managed, high conviction portfolios to those seeking intraday liquidity, daily transparency, and tax efficiency.
We have summarized the fiscal year performance contributors/detractors for each of the two strategies in the following pages.
We appreciate the opportunity to help you meet your investment goals and thank you for your trust.
Ross Klein and Vince Lorusso, Portfolio Managers

2
Changebridge ETFs
Shareholder Letter
October 31, 2021 (Unaudited) (Continued)
Changebridge Capital Long/Short Equity ETF (CBLS)
Strategy Overview:
The Changebridge Capital Long/Short Equity ETF (the “Fund”) seeks long-term capital appreciation while minimizing volatility. The fund also strives to generate positive alpha via both the long portfolio (owned securities) and short portfolio (securities borrowed and sold but not owned) over the course of an entire investment cycle. We believe the Fund has the potential to enhance an investor’s return profile while reducing risk.
The Fund is a U.S. focused, liquid alternative ETF that takes both a quantitative and fundamental approach to security selection, identifying both long and short investments that are expected to outperform and underperform, respectively. The Fund’s strategy is centered around the belief that within the broad market, ample opportunities for mispricing exist, especially among smaller cap companies. The Fund targets long positions trading at a discount to current and future cash flows, that generate returns on invested capital in excess of their cost of capital. We look for short positions that erode shareholder value over time.
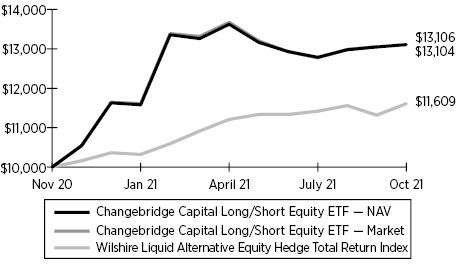
For the fiscal period ended October 31, 2021, CBLS returned 31.06% on a NAV basis and 31.04% on a market price basis. This compares to its benchmark, the Wilshire Liquid Alternative Equity Hedge Total Return Index, which returned 16.09% over the same time period. (CBLS was incepted on November 12, 2020).
Top 5 Contributors:
| | ● | Magnite Inc (MGNI) - In late 2020 and early 2021, MGNI reported better than expected earnings results, made a transformative acquisition, and largely began to be recognized as a leading provider of programmatic advertising for Connected TV’s. |
| | ● | Skyline Champion (SKY) which benefited from offering consumers a more affordable option to buy a new home. Demand for their manufactured houses grew throughout the year, and the company consistently outperformed earnings expectations. |
| | ● | Criteo (CRTO) which has been managing an impressive transition from a legacy cookie-based advertising model to one that enables e-commerce retailers to better monetize their own internet real estate. |
| | ● | Scientific Games (SGMS) has undergone a transformation of sorts: from a slot machine designer and lottery operator to a digital gaming leader enabling responsible gaming activities. |
| | ● | Transmedics (TMDX) which hit important milestones is in the process of revolutionizing the way organs are transplanted. The company received critical FDA approvals for both their heart and liver transplant systems in the last year. |
Top 5 Detractors:
| | ● | National Beverage (FIZZ) had a relatively benign year, except for a period of euphoria driven by social-network/meme-based investing, which created a temporary surge in the stock price. |
| | ● | 8x8 Inc. (EGHT) benefited from the announcement of a new CEO, brought in from RingCentral, who comes with a strong pedigree. Optimism abounds that he may turn around this underperforming business. |
| | ● | Solaris Oilfield (SOI) struggled to meet expectations as their end customers have been reluctant to increase capital expenditures without longer term market visibility. |
| | ● | Intel Corp (INTC), despite losing customers, ceding share, and struggling to manufacture next generation chips, did benefit from an overall supply shortage of semiconductor chips, allowing the company to obfuscate what was an otherwise dismal year. |
| | ● | Smith and Wesson (SWBI) benefitted early in 2021 from continued demand for guns, and a subsequent meme-based surge in the stock price, however demand has since abated and the stock price has declined from its mid-year highs. |
3
Changebridge ETFs
Shareholder Letter
October 31, 2021 (Unaudited) (Continued)
Changebridge Capital Sustainable Equity (CBSE)
Strategy Overview:
The Changebridge Capital Sustainable Equity ETF (the “Fund”) seeks capital appreciation and lower volatility than the broader market.
The strategy incorporates a combination of quantitative and fundamental research to identify equity securities that it believes are undervalued. Integrating sustainable investing considerations such as Environmental, social, and governance (ESG) criteria into the investment process helps uncover businesses that are creating a long-term competitive advantage. ESG criteria are a set of standards for a company’s operations that socially conscious investors use to screen potential investments. Environmental criteria consider how a company performs as a steward of nature. Social criteria examine how it manages relationships with employees, suppliers, customers, and the communities where it operates. Governance deals with a company’s leadership, executive pay, audits, internal controls, and shareholder rights. This holistic approach to understanding quantitative and fundamental factors with an assessment of sustainability are the foundations for value creation.
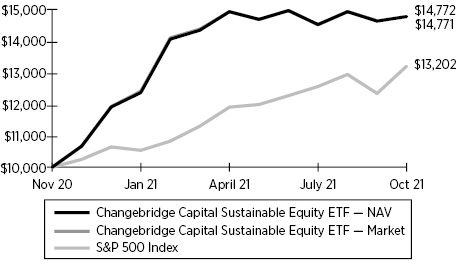
For the fiscal period ended October 31, 2021, CBSE returned 47.72% on a NAV basis and 47.71% on a market price basis. This compares to its benchmark, the S&P 500 Index, which returned 32.02% over the same time period. (CBSE was incepted on November 12, 2020).
Top 5 Contributors:
| | ● | Magnite Inc (MGNI) - In late 2021 and early 2022, MGNI reported better than expected earnings results, made a transformative acquisition, and largely began to be recognized as a leading provider of programmatic advertising for Connected TV’s. |
| | ● | Skyline Champion (SKY) which benefited from offering consumers a more affordable option to buy a new home. Demand for their manufactured houses grew throughout the year, and the company consistently outperformed earnings expectations. |
| | ● | Progyny (PGNY) which has grown rapidly over the year, and continues to improve outcomes for couples navigating IVF, and provide employers with the resources to support their employees. |
| | ● | Criteo (CRTO) which has been managing an impressive transition from a legacy cookie-based advertising model to one that enables e-commerce retailers to better monetize their own internet real estate. |
| | ● | Transmedics (TMDX) which hit important milestones is in the process of revolutionizing the way organs are transplanted. The company received critical FDA approvals for both their heart and liver transplant systems in the last year. |
Top 5 Detractors:
| | ● | Solaris Oilfield (SOI) struggled to meet expectations as their end customers have been reluctant to increase capital expenditures without longer term market visibility. |
| | ● | Peloton International (PTON) has had difficulty keeping up the impressive growth rates they experienced during the widespread lockdowns caused by Covid-19; however, they have continued to grow their library, improve their content, and maintain high customer renewal rates. |
| | ● | Alibaba (BABA) despite a relatively steady core business performance, has been hampered by regulatory actions by the Chinese government, and an unclear landscape has left investors lacking the long-term visibility needed to maintain conviction in the company. |
| | ● | WM Technology (MAPS) has been hampered by its own efforts to remove unregulated dispensaries from its customer base. We believe this has temporarily hurt revenue growth, but sets the company up well to reaccelerate growth in the upcoming year. |
| | ● | Cinemark Holdings (CNK) has had an uneven recovery from Covid-19, as moviegoers are now offered the opportunity to stream movies much sooner after theatrical release than ever before. |
4
Changebridge ETFs
Shareholder Letter
October 31, 2021 (Unaudited) (Continued)
Investing involves risk. Principal loss is possible. As ETFs, the funds may trade at a premium or discount to NAV. Shares of any ETF are bought and sold at market price (not NAV) and are not individually redeemed from the Funds. The equity securities held in a portfolio may experience sudden, unpredictable drops in value or long periods of decline in value. This may occur because of factors that affect securities markets generally or factors affecting specific issuers, industries, or sectors in which the Funds invest.
Short selling involves the sale of securities borrowed from a third party. The short seller profits if the borrowed security’s price declines. If a shorted security increases in value, a higher price must be paid to buy the stock back to cover the short sale, resulting in a loss. The Funds may incur expenses related to short selling, including compensation, interest or dividends, and transaction costs payable to the security lender, whether the price of the shorted security increases or decreases. The amount the Funds could lose on a short sale is theoretically unlimited. Short selling also involves counterparty risk – the risk associated with the third party ceasing operations or failing to sell the security back.
Applying ESG criteria to the investment process may exclude securities of certain issuers for non-investment reasons and therefore the Funds may forgo some market opportunities available to funds that do not use ESG criteria. The Funds’ incorporation of ESG considerations may affect its exposure to certain sectors and/or types of investments, and may adversely impact the Funds’ performance depending on whether such sectors or investments are in or out of favor in the market.
The Changebridge ETFs are distributed by Foreside Fund Services, LLC.
5
Changebridge ETFs
Shareholder Expense Example
(Unaudited)
As a shareholder of a Fund you incur two types of costs: (1) transaction costs for purchasing and selling shares; and (2) ongoing costs, including management fees and other fund expenses. The following example is intended to help you understand your ongoing costs (in dollars and cents) of investing in a Fund and to compare these costs with the ongoing costs of investing in other funds. The examples are based on an investment of $1,000 invested at the beginning of the period and held throughout the entire period (May 1, 2021 to October 31, 2021).
ACTUAL EXPENSES
The first line under each Fund in the table below provides information about actual account values and actual expenses. You may use the information in this line, together with the amount you invested, to estimate the expenses that you paid over the period. Simply divide your account value by $1,000 (for example, an $8,600 account value divided by $1,000 = 8.6), then multiply the result by the number in the first line for your Fund under the heading entitled “Expenses Paid During Period” to estimate the expenses you paid on your account during this period.
HYPOTHETICAL EXAMPLE FOR COMPARISON PURPOSES
The second line in the table provides information about hypothetical account values and hypothetical expenses based on each Fund’s actual expense ratio and an assumed rate of return of 5% per year before expenses, which is not the Fund’s actual return. The hypothetical account values and expenses may not be used to estimate the actual ending account balance or expenses you paid for the period. You may use this information to compare the ongoing costs of investing in the Funds and other funds. To do so, compare this 5% hypothetical example with the 5% hypothetical examples that appear in the shareholder reports of the other funds. Please note that the expenses shown in the table are meant to highlight your ongoing costs only and do not reflect any transactional costs, such as brokerage commissions paid on purchases and sales of fund shares. Therefore, the second line in the table is useful in comparing ongoing fund costs only and will not help you determine the relative total costs of owning different funds. In addition, if these transactional costs were included, your costs would have been higher.
| | Beginning
Account Value
5/01/21 | Ending
Account Value
10/31/21 | Annualized
Expense
Ratios | Expenses
Paid During
the Period(1) |
Changebridge Capital Long/Short Equity ETF | | | | |
Actual | $ 1,000.00 | $ 962.10 | 2.16% | $ 10.68 |
Hypothetical (5% return before expenses) | $ 1,000.00 | $ 1,014.32 | 2.16% | $ 10.97 |
Changebridge Capital Sustainable Equity ETF | | | | |
Actual | $ 1,000.00 | $ 989.70 | 0.85% | $ 4.26 |
Hypothetical (5% return before expenses) | $ 1,000.00 | $ 1,020.92 | 0.85% | $ 4.33 |
(1) | Expenses are calculated using the Funds’ annualized expense ratio, multiplied by the average account value for the period, multiplied by 184/365 (to reflect the six-month period). |
6
Changebridge ETFs
Performance Overviews
October 31, 2021 (Unaudited)
Hypothetical Growth of $10,000 Investment
(Since Commencement through 10/31/2021)
CUMULATIVE TOTAL RETURN
FOR THE PERIOD ENDED October 31, 2021 |
Total Returns | Since
Commencement1 |
Changebridge Capital Long/Short Equity ETF — NAV | 31.06% |
Changebridge Capital Long/Short Equity ETF — Market | 31.04% |
Wilshire Liquid Alternative Equity Hedge Total Return Index | 16.09% |
CUMULATIVE TOTAL RETURN
FOR THE PERIOD ENDED October 31, 2021 |
Total Returns | Since
Commencement1 |
Changebridge Capital Sustainable Equity ETF — NAV | 47.72% |
Changebridge Capital Sustainable Equity ETF — Market | 47.71% |
S&P 500 Index | 32.02% |
1 | The Fund commenced operations on November 12, 2020. |
The performance data quoted represents past performance. Past performance does not guarantee future results. Current performance may be lower or higher than the performance data quoted. The investment return and principal value of an investment will fluctuate so that an investor’s shares, when sold or redeemed, may be worth more or less than their original cost. For the most recent month-end performance, please call (617) 717-2912. You cannot invest directly in an index. Shares are bought and sold at market price (closing price), not net asset value (“NAV”), and are not individually redeemed from the Fund. Market performance is determined using the bid/ask midpoint at 4:00 p.m. Eastern time when the NAV is typically calculated. Brokerage commissions will reduce returns. Returns shown include the reinvestment of all dividends and distribution. Returns shown do not reflect the deduction of taxes that a shareholder would pay on fund distributions or the redemption of fund shares.
The Wilshire Liquid Alternative Equity Hedge Total Return Index measures the performance of the equity hedge strategy component of the Wilshire Liquid Alternative Index. The S&P 500 Index is a market-value weighted index consisting of 500 stocks chosen for market size, liquidity, and industry group representation, with each stock’s weight in the Index proportionate to its market value.
7
Changebridge Capital Long/Short Equity ETF
Schedule of Investments
October 31, 2021
| | Shares | | | Value | |
COMMON STOCKS — 98.4% | | | | | | | | |
Banking — 3.1% | | | | | | | | |
First Republic Bank (d) | | | 1,138 | | | $ | 246,184 | |
| | | | | | | | | |
Consumer Discretionary Products — 12.2% | | | | | | | | |
LCI Industries (d) | | | 1,533 | | | | 214,068 | |
Peloton Interactive, Inc. — Class A (a) | | | 1,663 | | | | 152,065 | |
Skechers USA, Inc. — Class A (a) | | | 4,483 | | | | 207,159 | |
Skyline Champion Corp. (a)(d) | | | 6,074 | | | | 384,606 | |
| | | | | | | | 957,898 | |
Consumer Discretionary Services — 5.4% | | | | | | | | |
Flutter Entertainment PLC — ADR (a)(b)(d) | | | 2,013 | | | | 190,711 | |
Planet Fitness, Inc. — Class A (a)(d) | | | 2,896 | | | | 230,377 | |
| | | | | | | | 421,088 | |
Consumer Staple Products — 2.3% | | | | | | | | |
Spectrum Brands Holdings, Inc. | | | 1,965 | | | | 184,219 | |
| | | | | | | | | |
Health Care — 25.9% (e) | | | | | | | | |
Caribou Biosciences, Inc. (a) | | | 6,870 | | | | 151,896 | |
CRISPR Therapeutics AG (a)(b) | | | 531 | | | | 48,496 | |
CVS Health Corp. (d) | | | 3,189 | | | | 284,714 | |
ModivCare, Inc. (a) | | | 1,301 | | | | 211,764 | |
Progyny, Inc. (a)(d) | | | 3,429 | | | | 210,643 | |
Quipt Home Medical Corp. (a)(b) | | | 38,993 | | | | 216,411 | |
Recro Pharma, Inc. (a) | | | 23,945 | | | | 46,693 | |
Semler Scientific, Inc. (a)(d) | | | 2,340 | | | | 350,976 | |
The Joint Corp. (a) | | | 2,633 | | | | 230,335 | |
TransMedics Group, Inc. (a)(d) | | | 10,534 | | | | 288,948 | |
| | | | | | | | 2,040,876 | |
Industrial Products — 2.7% | | | | | | | | |
Luxfer Holdings PLC (b)(d) | | | 10,592 | | | | 213,005 | |
| | | | | | | | | |
Industrial Services — 14.3% | | | | | | | | |
BrightView Holdings, Inc. (a)(d) | | | 16,059 | | | | 254,696 | |
Civeo Corp. (a)(b)(d) | | | 16,442 | | | | 371,096 | |
H&R Block, Inc. (d) | | | 8,646 | | | | 199,463 | |
Sterling Construction Co., Inc. (a)(d) | | | 12,477 | | | | 299,947 | |
| | | | | | | | 1,125,202 | |
Media — 10.2% | | | | | | | | |
Criteo SA — ADR (a)(b)(d) | | | 7,913 | | | | 261,445 | |
Expedia Group, Inc. (a)(d) | | | 1,846 | | | | 303,501 | |
Liberty Latin America Ltd. — Class C (a)(b)(d) | | | 19,497 | | | | 234,549 | |
| | | | | | | | 799,495 | |
Oil & Gas — 4.0% | | | | | | | | |
Chesapeake Energy Corp. | | | 4,906 | | | | 312,708 | |
| | | | | | | | | |
Software & Technology Services — 8.1% | | | | | | | | |
ICF International, Inc. (d) | | | 2,635 | | | | 264,791 | |
Sprout Social, Inc. — Class A (a)(d) | | | 1,462 | | | | 186,668 | |
WM Technology, Inc. (a) | | | 14,966 | | | | 183,184 | |
| | | | | | | | 634,643 | |
Technology Hardware & Semiconductors — 10.2% | | | | | | | | |
ASML Holding NV (b) | | | 270 | | | | 219,478 | |
Sony Group Corp. — ADR (a)(b)(d) | | | 2,634 | | | | 304,991 | |
Taiwan Semiconductor Manufacturing Co. Ltd. — ADR (b) | | | 1,751 | | | | 199,089 | |
TransAct Technologies, Inc. (a)(d) | | | 5,311 | | | | 74,991 | |
| | | | | | | | 798,549 | |
Total Common Stocks (Cost $6,639,917) | | | | | | | 7,733,867 | |
The accompanying notes are an integral part of the financial statements.
8
Changebridge Capital Long/Short Equity ETF
Schedule of Investments
October 31, 2021 (Continued)
| | Shares | | | Value | |
MONEY MARKET FUNDS — 7.6% | | | | | | | | |
First American Government Obligations Fund — Class X, 0.03% (c) | | | 601,740 | | | $ | 601,740 | |
Total Money Market Funds (Cost $601,740) | | | | | | | 601,740 | |
| | | | | | | | | |
Total Investments (Cost $7,241,657) — 106.0% | | | | | | | 8,335,607 | |
Other Assets and Liabilities, net — (6.0)% | | | | | | | (472,232 | ) |
Net Assets — 100.0% | | | | | | $ | 7,863,375 | |
Percentages are stated as a percent of net assets.
ADR | American Depositary Receipt |
PLC | Public Limited Company |
(a) | Non-income producing security. |
(b) | Foreign issued security. |
(c) | The rate shown is the seven-day yield at period end. |
(d) | All or a portion of the security has been pledged to cover short positions. As of October 31, 2021, the value of these securities amounts to $3,102,285 or 39.5% of net assets. |
(e) | To the extent the Fund invests more heavily in particular sectors of the economy, its performance will be especially sensitive to developments that significantly affect those sectors. |
The accompanying notes are an integral part of the financial statements.
9
Changebridge Capital Long/Short Equity ETF
Schedule of Securities Sold Short
October 31, 2021
| | Shares | | | Value | |
COMMON STOCKS — (24.5)% |
Consumer Discretionary Products — (6.6)% |
Carter’s, Inc. | | | 1,556 | | | $ | 153,297 | |
Dorman Products, Inc. | | | 1,250 | | | | 130,475 | |
iRobot Corp. | | | 1,950 | | | | 162,669 | |
Smith & Wesson Brands, Inc. | | | 3,325 | | | | 71,488 | |
| | | | | | | | 517,929 | |
Consumer Discretionary Services — (3.1)% | | | | | | | | |
AMC Entertainment Holdings, Inc. - Class A | | | 1,838 | | | | 65,010 | |
Dave & Buster’s Entertainment, Inc. | | | 4,904 | | | | 182,086 | |
| | | | | | | | 247,096 | |
Consumer Staple Products — (3.5)% | | | | | | | | |
Campbell Soup Co. | | | 4,014 | | | | 160,359 | |
Hormel Foods Corp. | | | 2,615 | | | | 110,667 | |
| | | | | | | | 271,026 | |
Media — (1.6)% | | | | | | | | |
DISH Network Corp. - Class A | | | 3,134 | | | | 128,713 | |
| | | | | | | | | |
Retail & Wholesale, Discretionary — (0.9)% | | | | | | | | |
GameStop Corp. - Class A | | | 375 | | | | 68,816 | |
| | | | | | | | | |
Software & Technology Services — (7.6)% | | | | | | | | |
Fastly, Inc. - Class A | | | 2,866 | | | | 145,048 | |
International Business Machines Corp. | | | 1,453 | | | | 181,770 | |
PubMatic, Inc. - Class A | | | 5,441 | | | | 155,504 | |
Wix.com Ltd. (a) | | | 621 | | | | 115,481 | |
| | | | | | | | 597,803 | |
Technology Hardware & Semiconductors — (1.2)% | | | | | | | | |
Logitech International SA (a) | | | 1,098 | | | | 91,167 | |
Total Common Stocks (Proceeds $1,979,997) | | | | | | | 1,922,550 | |
Total Securities Sold Short (Proceeds $1,979,997) — (24.5)% | | | | | | $ | 1,922,550 | |
Percentages are stated as a percent of net assets.
(a) | Foreign issued security. |
The accompanying notes are an integral part of the financial statements.
10
Changebridge Capital Sustainable Equity ETF
Schedule of Investments
October 31, 2021
| | Shares | | | Value | |
COMMON STOCKS — 99.1% |
Banking — 3.1% |
First Republic Bank | | | 1,454 | | | $ | 314,544 | |
| | | | | | | | | |
Consumer Discretionary Products — 12.0% | | | | | | | | |
LCI Industries | | | 1,902 | | | | 265,595 | |
Peloton Interactive, Inc. - Class A (a) | | | 2,124 | | | | 194,219 | |
Skechers USA, Inc. - Class A (a) | | | 5,719 | | | | 264,275 | |
Skyline Champion Corp. (a) | | | 7,567 | | | | 479,142 | |
| | | | | | | | 1,203,231 | |
Consumer Discretionary Services — 6.6% | | | | | | | | |
Planet Fitness, Inc. - Class A (a) | | | 3,581 | | | | 284,869 | |
Service Corp. International | | | 5,507 | | | | 377,174 | |
| | | | | | | | 662,043 | |
Consumer Staple Products — 5.3% | | | | | | | | |
Spectrum Brands Holdings, Inc. | | | 3,365 | | | | 315,469 | |
The Estee Lauder Cos., Inc. - Class A | | | 680 | | | | 220,544 | |
| | | | | | | | 536,013 | |
Health Care — 26.1% (c) | | | | | | | | |
Caribou Biosciences, Inc. (a) | | | 8,737 | | | | 193,175 | |
CRISPR Therapeutics AG (a)(b) | | | 861 | | | | 78,635 | |
CVS Health Corp. | | | 4,185 | | | | 373,637 | |
ModivCare, Inc. (a) | | | 1,680 | | | | 273,454 | |
Progyny, Inc. (a) | | | 4,760 | | | | 292,407 | |
Quipt Home Medical Corp. (a)(b) | | | 50,280 | | | | 279,054 | |
Recro Pharma, Inc. (a) | | | 30,899 | | | | 60,253 | |
Semler Scientific, Inc. (a) | | | 2,802 | | | | 420,272 | |
The Joint Corp. (a) | | | 3,346 | | | | 292,708 | |
TransMedics Group, Inc. (a) | | | 13,047 | | | | 357,879 | |
| | | | | | | | 2,621,474 | |
Industrial Products — 2.6% | | | | | | | | |
Luxfer Holdings PLC (b) | | | 12,746 | | | | 256,322 | |
| | | | | | | | | |
Industrial Services — 13.7% | | | | | | | | |
BrightView Holdings, Inc. (a) | | | 19,609 | | | | 310,999 | |
Civeo Corp. (a)(b) | | | 20,717 | | | | 467,583 | |
H&R Block, Inc. | | | 10,286 | | | | 237,298 | |
Sterling Construction Co., Inc. (a) | | | 14,823 | | | | 356,345 | |
| | | | | | | | 1,372,225 | |
Media — 9.6% | | | | | | | | |
Criteo SA - ADR (a)(b) | | | 9,483 | | | | 313,318 | |
Expedia Group, Inc. (a) | | | 2,255 | | | | 370,745 | |
Liberty Latin America Ltd. - Class C (a)(b) | | | 23,581 | | | | 283,679 | |
| | | | | | | | 967,742 | |
Oil & Gas — 3.9% | | | | | | | | |
Chesapeake Energy Corp. | | | 6,182 | | | | 394,041 | |
| | | | | | | | | |
Software & Technology Services — 7.8% | | | | | | | | |
ICF International, Inc. | | | 3,143 | | | | 315,840 | |
Sprout Social, Inc. - Class A (a) | | | 1,888 | | | | 241,060 | |
WM Technology, Inc. (a) | | | 18,734 | | | | 229,304 | |
| | | | | | | | 786,204 | |
Technology Hardware & Semiconductors — 8.4% | | | | | | | | |
ASML Holding NV (b) | | | 318 | | | | 258,496 | |
Sony Group Corp. - ADR (a)(b) | | | 3,026 | | | | 350,380 | |
Taiwan Semiconductor Manufacturing Co. Ltd. - ADR (b) | | | 2,087 | | | | 237,292 | |
| | | | | | | | 846,168 | |
Total Common Stocks (Cost $8,508,532) | | | | | | | 9,960,007 | |
| | | | | | | | | |
The accompanying notes are an integral part of the financial statements.
11
Changebridge Capital Sustainable Equity ETF
Schedule of Investments
October 31, 2021 (Continued)
| | Shares | | | Value | |
MONEY MARKET FUNDS — 0.9% | | | | | | | | |
First American Government Obligations Fund - Class X, 0.03% (d) | | | 88,317 | | | $ | 88,317 | |
Total Money Market Funds (Cost $88,317) | | | | | | | 88,317 | |
| | | | | | | | | |
Total Investments (Cost $8,596,849) — 100.0% | | | | | | | 10,048,324 | |
Other assets and liabilities, net — (0.0)% (e) | | | | | | | (3,177 | ) |
Net Assets — 100.0% | | | | | | $ | 10,045,147 | |
Percentages are stated as a percent of net assets.
ADR | American Depositary Receipt |
PLC | Public Limited Company |
(a) | Non-income producing security. |
(b) | Foreign issued security. |
(c) | To the extent the Fund invests more heavily in particular sectors of the economy, its performance will be especially sensitive to developments that significantly affect those sectors. |
(d) | The rate shown is the seven-day yield at period end. |
(e) | Amount is less than (0.05)%. |
The accompanying notes are an integral part of the financial statements.
12
Changebridge ETFs
Statements of Assets and Liabilities
October 31, 2021
| | | Changebridge
Capital
Long/Short
Equity ETF | | | Changebridge
Capital
Sustainable
Equity ETF | |
Assets | | | | | | | �� | |
Investments, at value (cost $7,241,657, and $8,596,849, respectively) | | $ | 8,335,607 | | | $ | 10,048,324 | |
Cash held as collateral | | | 16,980 | | | | — | |
Deposits with broker for securities sold short | | | 1,165,346 | | | | — | |
Receivable for investment securities sold | | | 278,191 | | | | — | |
Dividend and interest receivable | | | 3,192 | | | | 4,017 | |
Total assets | | | 9,799,316 | | | | 10,052,341 | |
| | | | | | | | | |
Liabilities | | | | | | | | |
Securities sold short, at value (Proceeds $1,979,997 and $—, respectively) | | | 1,922,550 | | | | — | |
Payable to Adviser | | | 11,290 | | | | 7,194 | |
Dividend and interest payable | | | 2,101 | | | | — | |
Total liabilities | | | 1,935,941 | | | | 7,194 | |
Net Assets | | $ | 7,863,375 | | | $ | 10,045,147 | |
| | | | | | | | | |
Net Assets Consists of: | | | | | | | | |
Paid-in capital | | $ | 7,281,477 | | | $ | 8,687,483 | |
Total distributable earnings (accumulated losses) | | | 581,898 | | | | 1,357,664 | |
Net Assets | | $ | 7,863,375 | | | $ | 10,045,147 | |
| | | | | | | | | |
Shares of beneficial interest outstanding (unlimited number of shares authorized, no par value) | | | 300,000 | | | | 340,000 | |
Net Asset Value, redemption price and offering price per share | | $ | 26.21 | | | $ | 29.54 | |
The accompanying notes are an integral part of the financial statements.
13
Changebridge ETFs
Statements of Operations
For the Period Ended October 31, 2021(1)
| | | Changebridge
Capital
Long/Short
Equity ETF | | | Changebridge
Capital
Sustainable
Equity ETF | |
Investment Income | | | | | | | | |
Dividend income (net of withholding tax and issuance fees of $581 and $631, respectively) | | $ | 34,230 | | | $ | 42,054 | |
Interest income | | | 159 | | | | 115 | |
Total investment income | | | 34,389 | | | | 42,169 | |
| | | | | | | | | |
Expenses | | | | | | | | |
Investment advisory fees | | | 103,882 | | | | 60,213 | |
Dividend and interest expense | | | 26,828 | | | | — | |
Total expenses | | | 130,710 | | | | 60,213 | |
Net investment loss | | | (96,321 | ) | | | (18,044 | ) |
| | | | | | | | | |
Realized and Unrealized Gain (Loss) on Investments and Securities Sold Short | | | | | | | | |
Net realized gain (loss) on investments | | | 321,519 | | | | (76,167 | ) |
Net realized loss on securities sold short | | | (634,681 | ) | | | — | |
Net realized loss | | | (313,162 | ) | | | (76,167 | ) |
Net change in unrealized appreciation/depreciation on investments | | | 1,093,950 | | | | 1,451,475 | |
Net change in unrealized appreciation/depreciation on securities sold short | | | 57,447 | | | | — | |
Net change in unrealized appreciation/depreciation | | | 1,151,397 | | | | 1,451,475 | |
Net realized and unrealized gain | | | 838,235 | | | | 1,375,308 | |
Net increase in net assets from operations | | $ | 741,914 | | | $ | 1,357,264 | |
(1) | The Funds commenced operations on November 12, 2020. |
The accompanying notes are an integral part of the financial statements.
14
Changebridge ETFs
Statements of Changes in Net Assets
| | | Changebridge
Capital
Long/Short
Equity ETF | | | Changebridge
Capital
Sustainable
Equity ETF | |
| | | Period Ended
October 31,
2021(1) | | | Period Ended
October 31,
2021(1) | |
From Operations | | | | | | | | |
Net investment loss | | $ | (96,321 | ) | | $ | (18,044 | ) |
Net realized loss on investments and securities sold short | | | (313,162 | ) | | | (76,167 | ) |
Net change in unrealized appreciation/depreciation on investments and securities sold short | | | 1,151,397 | | | | 1,451,475 | |
Net increase in net assets resulting from operations | | | 741,914 | | | | 1,357,264 | |
| | | | | | | | | |
From Capital Share Transactions | | | | | | | | |
Proceeds from shares sold | | | 7,885,530 | | | | 8,687,883 | |
Cost of shares redeemed | | | (764,069 | ) | | | — | |
Net increase in net assets resulting from capital share transactions | | | 7,121,461 | | | | 8,687,883 | |
| | | | | | | | | |
Total Increase in Net Assets | | | 7,863,375 | | | | 10,045,147 | |
| | | | | | | | | |
Net Assets | | | | | | | | |
Beginning of period | | | — | | | | — | |
End of period | | $ | 7,863,375 | | | $ | 10,045,147 | |
| | | | | | | | | |
Changes in Shares Outstanding | | | | | | | | |
Shares outstanding, beginning of period | | | — | | | | — | |
Shares sold | | | 330,000 | | | | 340,000 | |
Shares redeemed | | | (30,000 | ) | | | — | |
Shares outstanding, end of period | | | 300,000 | | | | 340,000 | |
(1) | The Fund commenced operations on November 12, 2020. |
The accompanying notes are an integral part of the financial statements.
15
Changebridge ETFs
Statement of Cash Flows
For the Period Ended October 31, 2021(1)
| | | Changebridge
Capital
Long/Short
Equity ETF | |
Cash Provided by (Used in) Operating Activites | | | | |
Net increase in net assets from operations | | $ | 741,914 | |
Adjustments to reconcile net increase in net assets resulting from operations: | | | | |
Purchases of investment securities | | | (6,507,907 | ) |
Sales of investment securities | | | 7,068,828 | |
Proceeds from securities sold short | | | 7,231,690 | |
Purchases to cover securites sold short | | | (5,886,365 | ) |
Purchase and sales of short-term investments, net | | | (601,740 | ) |
Net realized losses on investments and securities sold short | | | 313,151 | |
Net change in unrealized appreciation/depreciation on investments and securities sold short | | | (1,151,397 | ) |
(Increase) Decrease in Assets: | | | | |
Receivables: | | | | |
Dividend and interest receivable | | | (3,192 | ) |
Receivable for investment securities sold | | | (278,191 | ) |
Increase (Decrease) in Liabilities: | | | | |
Payables: | | | | |
Payable to Adviser | | | 11,290 | |
Dividends and interest expense | | | 2,101 | |
Net cash provided by (used in) operating activities | | | 940,182 | |
| | | | | |
Cash Provided by (Used in) Financing Activities | | | | |
Proceeds from shares sold | | | 259,150 | |
Cost of shares redeemed | | | (17,006 | ) |
Net cash provided by (used in) financing activities | | | 242,144 | |
Net increase (decrease) in cash and restricted cash | | | 1,182,326 | |
| | | | | |
Cash and Restricted Cash(2) | | | | |
Beginning Balance | | | — | |
Ending Balance | | $ | 1,182,326 | |
| | | | | |
Supplemental information | | | | |
Cash paid for interest | | $ | 8,145 | |
| | | | | |
Supplemental Disclosure for Non-Cash Operating Activities: | | | | |
Purchases of investment securities in-kind | | $ | (7,626,380 | ) |
Sales of investment securities in-kind | | $ | 747,063 | |
| | | | | |
Supplemental Disclosure for Non-Cash Financing Activities: | | | | |
Proceeds from shares sold in-kind | | $ | 7,626,380 | |
Payment on shares redeemed in-kind | | $ | (747,063 | ) |
(1) | The Fund commenced operations on November 12, 2020. |
(2) | Includes cash of $16,980 and deposits at broker for securities sold short of $1,165,346. |
The accompanying notes are an integral part of the financial statements.
16
Changebridge ETFs
Financial Highlights
For a Share Outstanding Throughout the Period
| | | Changebridge
Capital
Long/Short
Equity ETF | | | Changebridge
Capital
Sustainable
Equity ETF | |
| | | Period Ended
October 31,
2021(1) | | | Period Ended
October 31,
2021(1) | |
Net Asset Value, Beginning of Period | | $ | 20.00 | | | $ | 20.00 | |
| | | | | | | | | |
Income (Loss) from investment operations: | | | | | | | | |
Net investment income (loss)(2) | | | (0.39 | ) | | | (0.07 | ) |
Net realized and unrealized gain (loss) | | | 6.60 | | | | 9.61 | |
Total from investment operations | | | 6.21 | | | | 9.54 | |
| | | | | | | | | |
Net Asset Value, End of Period | | $ | 26.21 | | | $ | 29.54 | |
| | | | | | | | | |
Total return, at NAV(3) | | | 31.06 | %(4) | | | 47.72 | %(4) |
Total return, at Market(3) | | | 31.04 | %(4) | | | 47.71 | %(4) |
| | | | | | | | | |
Supplemental Data and Ratios: | | | | | | | | |
Net assets, end of period (000’s) | | $ | 7,863 | | | $ | 10,045 | |
| | | | | | | | | |
Ratio of expenses to average net assets, including dividends and interest expense on short positions | | | 2.14 | %(5) | | | 0.85 | %(5) |
Ratio of expenses to average net assets, excluding dividends and interest expense on short positions | | | 1.70 | %(5) | | | 0.85 | %(5) |
Ratio of net investment income (loss) to average net assets, including dividends and interest expense on short positions | | | (1.58 | )%(5) | | | (0.25 | )%(5) |
Ratio of net investment income (loss) to average net assets, excluding dividends and interest expense on short positions | | | (1.14 | )%(5) | | | (0.25 | )%(5) |
Portfolio turnover rate (6) | | | 160 | %(4) | | | 105 | %(4) |
(1) | The Fund commenced operations on November 12, 2020. |
(2) | Per share net investment income (loss) was calculated using average shares outstanding. |
(3) | Total return in the table represents the rate that the investor would have earned or lost on an investment in the Fund, assuming reinvestment of dividends. |
(4) | Not annualized for periods less than one year. |
(5) | Annualized for periods less than one year. |
(6) | Excludes in-kind transactions associated with creations and redemptions of the Fund. |
The accompanying notes are an integral part of the financial statements.
17
Changebridge ETFs
Notes to Financial Statements
October 31, 2021
The Changebridge Capital Long/Short Equity ETF (“CBLS”) and Changebridge Capital Sustainable Equity ETF (“CBSE”) (each a “Fund” and collectively, the “Funds”) are non-diversified series of Listed Funds Trust (the “Trust”), formerly Active Weighting Funds ETF Trust. The Trust was organized as a Delaware statutory trust on August 26, 2016, under a Declaration of Trust amended on December 21, 2018, and is registered with the U.S. Securities and Exchange Commission (the “SEC”) as an open-end management investment company under the Investment Company Act of 1940, as amended (the “1940 Act”).
CBLS is an actively-managed exchange-traded fund (“ETF”) that seeks to achieve its investment objective by purchasing securities Changebridge Capital, LLC (“Changebridge” or the “Adviser”), the Fund’s investment adviser, believes to be undervalued and taking short positions in securities the Adviser believes will decline in price. The Fund will generally have net long exposure of between 30%-70% of net assets.
CBSE is an actively-managed ETF that seeks to achieve its investment objective by purchasing securities the Adviser believes to have above-average financial characteristics and growth potential that exhibit positive environmental, social, and governance (“ESG”) attributes.
Costs incurred by the Funds in connection with the organization, registration and the initial public offering of shares were paid by the Adviser.
2. | SIGNIFICANT ACCOUNTING POLICIES |
Each Fund is an investment company and accordingly follows the investment company accounting and reporting guidance of the Financial Accounting Standards Board (“FASB”) Accounting Standards Codification (“ASC”) Topic 946, Financial Services — Investment Companies. Each Fund prepares its financial statements in accordance with accounting principles generally accepted in the United States of America (“U.S. GAAP”) and follows the significant accounting policies described below.
Use of Estimates
The preparation of the financial statements in conformity with U.S. GAAP requires management to make estimates and assumptions that affect the reported amounts of assets and liabilities and disclosures of contingent assets and liabilities at the date of the financial statements and the reported amounts of increases and decreases in net assets from operations during the reporting period. Actual results could differ from these estimates.
Share Transactions
The net asset value (“NAV”) per share of each Fund is equal to a Fund’s total assets minus a Fund’s total liabilities divided by the total number of shares outstanding. The NAV that is published will be rounded to the nearest cent. The NAV is determined as of the close of trading (generally, 4:00 p.m. Eastern Time) on each day the New York Stock Exchange (“NYSE”) is open for trading.
Fair Value Measurement
In calculating the NAV, each Fund’s exchange-traded equity securities will be valued at fair value, which will generally be determined using the last reported official closing or last trading price on the exchange or market on which the security is primarily traded at the time of valuation. Such valuations are typically categorized as Level 1 in the fair value hierarchy described below.
Securities listed on the NASDAQ Stock Market, Inc. are generally valued at the NASDAQ official closing price. Foreign securities will be priced at their local currencies as of the close of their primary exchange or market or as of the time each Fund calculates its NAV on the valuation date, whichever is earlier.
18
Changebridge ETFs
Notes to Financial Statements
October 31, 2021 (Continued)
If market quotations are not readily available, or if it is determined that a quotation of a security does not represent fair value, then the security is valued at fair value as determined in good faith by the Adviser using procedures adopted by the Board of Trustees of the Trust (the “Board”). The circumstances in which a security may be fair valued include, among others: the occurrence of events that are significant to a particular issuer, such as mergers, restructurings or defaults; the occurrence of events that are significant to an entire market, such as natural disasters in a particular region or government actions; trading restrictions on securities; thinly traded securities; and market events such as trading halts and early market closings. Due to the inherent uncertainty of valuations, fair values may differ significantly from the values that would have been used had an active market existed. Fair valuation could result in a different NAV than a NAV determined by using market quotations. Such valuations are typically categorized as Level 2 or Level 3 in the fair value hierarchy described below.
Money market funds are valued at NAV. If NAV is not readily available, the securities will be valued at fair value.
An amortized cost method of valuation may be used with respect to debt obligations with sixty days or less remaining to maturity, unless the Adviser determines in good faith that such method does not represent fair value.
FASB ASC Topic 820, Fair Value Measurements and Disclosures (“ASC 820”) defines fair value, establishes a framework for measuring fair value in accordance with U.S. GAAP, and requires disclosure about fair value measurements. It also provides guidance on determining when there has been a significant decrease in the volume and level of activity for an asset or liability, when a transaction is not orderly, and how that information must be incorporated into fair value measurements. Under ASC 820, various inputs are used in determining the value of the Funds’ investments. These inputs are summarized in the following hierarchy:
| | ● | Level 1 — Unadjusted quoted prices in active markets for identical assets or liabilities that the Funds have the ability to access. |
| | ● | Level 2 — Observable inputs other than quoted prices included in Level 1 that are observable for the asset or liability, either directly or indirectly. These inputs may include quoted prices for the identical instrument on an inactive market, prices for similar securities, interest rates, prepayment speeds, credit risk, yield curves, default rates and similar data. |
| | ● | Level 3 — Unobservable inputs for the asset or liability, to the extent relevant observable inputs are not available; representing the Funds’ own assumptions about the assumptions a market participant would use in valuing the asset or liability, and would be based on the best information available. |
The fair value hierarchy gives the highest priority to quoted prices (unadjusted) in active markets for identical assets or liabilities (Level 1) and the lowest priority to unobservable inputs (Level 3).
The availability of observable inputs can vary from security to security and is affected by a wide variety of factors, including, for example, the type of security, whether the security is new and not yet established in the marketplace, the liquidity of markets, and other characteristics particular to the security. To the extent that valuation is based on models or inputs that are less observable or unobservable in the market, the determination of fair value requires more judgment. Accordingly, the degree of judgment exercised in determining fair value is greatest for instruments categorized in Level 3.
Foreign securities, currencies and other assets denominated in foreign currencies are translated into U.S. dollars at the exchange rate of such currencies against the U.S. dollar using the applicable currency exchange rates as of the close of the NYSE, generally 4:00 p.m. Eastern Time.
All other securities and investments for which market values are not readily available, including restricted securities, and those securities for which it is inappropriate to determine prices in accordance with the aforementioned procedures, are valued at fair value as determined in good faith under procedures adopted by the Board, although the actual calculations may be done by others. Factors considered in making this determination may include, but are not limited to, information obtained by contacting the issuer, analysts, or the appropriate stock exchange (for exchange-traded securities), analysis of the issuer’s financial statements or other available documents and, if necessary, available information concerning other securities in similar circumstances.
19
Changebridge ETFs
Notes to Financial Statements
October 31, 2021 (Continued)
The inputs or methodology used for valuing securities are not necessarily an indication of the risk associated with investing in those securities. The hierarchy classification of inputs used to value the Funds’ investments at October 31, 2021 are as follows:
CBLS
| | | Level 1 | | | Level 2 | | | Level 3 | | | Total | |
Investments - Assets: | | | | | | | | | | | | | | | | |
Common Stocks* | | $ | 7,733,867 | | | $ | — | | | $ | — | | | $ | 7,733,867 | |
Money Market Funds | | | 601,740 | | | | — | | | | — | | | | 601,740 | |
Total Investments - Assets | | $ | 8,335,607 | | | $ | — | | | $ | — | | | $ | 8,335,607 | |
| | | | | | | | | | | | | | | | | |
Securities Sold Short - Liabilities: | | | | | | | | | | | | | | | | |
Common Stocks* | | $ | (1,922,550 | ) | | $ | — | | | $ | — | | | $ | (1,922,550 | ) |
Total Securities Sold Short - Liabilities | | $ | (1,922,550 | ) | | $ | — | | | $ | — | | | $ | (1,922,550 | ) |
CBSE
| | | Level 1 | | | Level 2 | | | Level 3 | | | Total | |
Investments - Assets: | | | | | | | | | | | | | | | | |
Common Stocks* | | $ | 9,960,007 | | | $ | — | | | $ | — | | | $ | 9,960,007 | |
Money Market Funds | | | 88,317 | | | | — | | | | — | | | | 88,317 | |
Total Investments - Assets | | $ | 10,048,324 | | | $ | — | | | $ | — | | | $ | 10,048,324 | |
* | See the Schedules of Investments and Securities Sold Short for industry classifications. |
Short Sales
CBLS engages in short sales and CBSE may engage in short sales. Short sales are transactions in which a Fund sells an instrument it does not own in anticipation of a decline in the market value of that instrument. To complete a short sale transaction, a Fund must borrow the instrument to make delivery to the buyer. A Fund then is obligated to replace the instrument borrowed by purchasing it at the market price at the time of replacement. The price at such time may be more or less than the price at which the instrument was sold by a Fund. Until the instrument is replaced, a Fund is required to pay to the lender amounts equal to any interest or dividends which accrue during the period of the loan. To borrow the instrument, a Fund also may be required to pay a premium, which would increase the cost of the instrument sold. There will also be other costs associated with short sales.
Dividends declared on open short positions are recorded on ex-date and shown as an expense for financial reporting purposes. To borrow the security, a Fund also may be required to pay fees, which is shown as an expense for financial reporting purposes.
A Fund will incur a loss as a result of the short sale if the price of the instrument increases between the date of the short sale and the date on which a Fund replaces the borrowed instrument. Unlike taking a long position in an instrument by purchasing the instrument, where potential losses are limited to the purchase price, short sales have unlimited potential losses. A Fund will realize a gain if the instrument declines in price between the date of the short sale and the date on which a Fund replaces the borrowed instrument. This result is the opposite of what one would expect from a cash purchase of a long position in an instrument. Gains or losses from closed positions of securities sold short are presented as net realized gain or loss on securities sold short on the Statements of Operations.
Until a Fund replaces a borrowed instrument in connection with a short sale, a Fund will (a) designate on its records as collateral cash or liquid assets at such a level that the designated assets plus any amount deposited with the broker as collateral will equal the current value of the instrument sold short or (b) otherwise cover its short position in accordance with applicable law. The amount designated on a Fund’s records will be marked to market daily. This may limit a Fund’s investment flexibility, as well as its ability to meet redemption requests or other current obligations.
20
Changebridge ETFs
Notes to Financial Statements
October 31, 2021 (Continued)
There is no guarantee that a Fund will be able to close out a short position at any particular time or at an acceptable price. During the time that a Fund is short an instrument, it is subject to the risk that the lender of the instrument will terminate the loan at a time when a Fund is unable to borrow the same instrument from another lender. If that occurs, a Fund may be “bought in” at the price required to purchase the instrument needed to close out the short position, which may be a disadvantageous price. Thus, there is a risk that a Fund may be unable to fully implement its investment strategy due to a lack of available instruments or for some other reason. It is possible that the market value of the instruments a Fund holds in long positions will decline at the same time that the market value of the instruments a Fund has sold short increases, thereby increasing a Fund’s potential volatility. Short sales also involve other costs. A Fund must normally repay to the lender an amount equal to any dividends or interest that accrues while the loan is outstanding. In addition, to borrow the instrument, a Fund may be required to pay a premium. A Fund also will incur transaction costs in effecting short sales. The amount of any ultimate gain for a Fund resulting from a short sale will be decreased, and the amount of any ultimate loss will be increased, by the amount of premiums, dividends, interest or expenses a Fund may be required to pay in connection with the short sale.
At October 31, 2021, CBLS had cash on deposit with the broker-dealer in the amount of $1,165,346 and securities held as collateral in the amount of $3,102,285.
Security Transactions
Investment transactions are recorded as of the date that the securities are purchased or sold (trade date). Realized gains and losses from the sale or disposition of securities are calculated based on the specific identification basis.
The Funds do not isolate that portion of the results of operations resulting from changes in foreign exchange rates on investments and currency gains or losses realized between the trade and settlement dates on securities transactions from the fluctuations arising from changes in market prices of securities held. Such fluctuations are included with the net realized and unrealized gain or loss from investments.
The Funds report net realized foreign exchange gains or losses that arise from sales of foreign currencies, currency gains or losses realized between the trade and settlement dates on foreign currency transactions, and the difference between the amounts of dividends, interest, and foreign withholding taxes recorded on each Fund’s books and the U.S. dollar equivalent of the amounts actually received or paid. Net unrealized foreign exchange gains or losses arise from changes in the values of assets and liabilities, other than investments in securities at period end, resulting from changes in exchange rates.
Investment Income
Dividend income is recognized on the ex-dividend date. Interest income is accrued daily. Withholding taxes on foreign dividends has been provided for in accordance with Funds’ understanding of the applicable tax rules and regulations.
Tax Information, Dividends and Distributions to Shareholders and Uncertain Tax Positions
The Funds are treated as separate entities for Federal income tax purposes. Each Fund intends to qualify as a regulated investment company (“RIC”) under Subchapter M of the Internal Revenue Code of 1986, as amended (the “Internal Revenue Code”). To qualify and remain eligible for the special tax treatment accorded to RICs, each Fund must meet certain annual income and quarterly asset diversification requirements and must distribute annually at least 90% of the sum of (i) its investment company taxable income (which includes dividends, interest and net short-term capital gains) and (ii) certain net tax-exempt income, if any. If so qualified, each Fund will not be subject to Federal income tax.
Distributions to shareholders are recorded on the ex-dividend date. The Funds generally pay out dividends from net investment income, if any, annually, and distribute its net capital gains, if any, to shareholders at least annually. The Funds may also pay a special distribution at the end of the calendar year to comply with Federal tax requirements. The amount of dividends and distributions from net investment income and net realized capital gains are determined in accordance with Federal income tax regulations, which may differ from U.S. GAAP. These “book/tax” differences are either considered temporary or permanent
21
Changebridge ETFs
Notes to Financial Statements
October 31, 2021 (Continued)
in nature. To the extent these differences are permanent in nature, such amounts are reclassified within the components of net assets based on their Federal tax basis treatment; temporary differences do not require reclassification. Dividends and distributions which exceed earnings and profit for tax purposes are reported as a tax return of capital.
Management evaluates the Funds’ tax positions to determine if the tax positions taken meet the minimum recognition threshold in connection with accounting for uncertainties in income tax positions taken or expected to be taken for the purposes of measuring and recognizing tax liabilities in the financial statements. Recognition of tax benefits of an uncertain tax position is required only when the position is “more likely than not” to be sustained assuming examination by taxing authorities. Interest and penalties related to income taxes would be recorded as income tax expense. The Funds’ Federal income tax returns are subject to examination by the Internal Revenue Service (the “IRS”) for a period of three fiscal years after they are filed. State and local tax returns may be subject to examination for an additional fiscal year depending on the jurisdiction. As of October 31, 2021, the Funds’ most recent fiscal period end, the Funds had no examination in progress and management is not aware of any tax positions for which it is reasonably possible that the amounts of unrecognized tax benefits will significantly change in the next twelve months.
The Funds recognized no interest or penalties related to uncertain tax benefits in the 2021 fiscal period. At October 31, 2021, the Funds’ most recent fiscal period end, the tax periods from commencement of operations remained open to examination in the Funds’ major tax jurisdictions.
Indemnification
In the normal course of business, the Funds expect to enter into contracts that contain a variety of representations and warranties and which provide general indemnifications. The Funds’ maximum exposure under these anticipated arrangements is unknown, as this would involve future claims that may be made against the Funds that have not yet occurred. However, the Adviser expects the risk of loss to be remote.
3. | INVESTMENT ADVISORY AND OTHER AGREEMENTS |
Investment Advisory Agreement
The Trust has entered into an Investment Advisory Agreement (the “Advisory Agreement”) with the Adviser. Under the Advisory Agreement, the Adviser provides a continuous investment program for the Funds’ assets in accordance with their investment objectives, policies and limitations, and oversees the day-to-day operations of the Funds subject to the supervision of the Board, including the Trustees who are not “interested persons” of the Trust as defined in the 1940 Act.
Pursuant to the Advisory Agreement between the Trust, on behalf of the Funds, and Changebridge, each Fund pays a unified management fee to the Adviser, which is calculated daily and paid monthly, at an annual rate of 1.70% of CBLS’s average daily net assets and at an annual rate of 0.85% of CBSE’s average daily net assets. Changebridge has agreed to pay all expenses of the Funds except the fee paid to Changebridge under the Advisory Agreement, interest charges on any borrowings, dividends and other expenses on securities sold short, taxes, brokerage commissions and other expenses incurred in placing orders for the purchase and sale of securities and other investment instruments, acquired fund fees and expenses, accrued deferred tax liability, extraordinary expenses, and distribution (12b-1) fees and expenses (if any).
Distribution Agreement and 12b-1 Plan
Foreside Fund Services, LLC (the “Distributor”) serves as each Fund’s distributor pursuant to a Distribution Services Agreement. The Distributor receives compensation for the statutory underwriting services it provides to the Funds. The Distributor enters into agreements with certain broker-dealers and others that will allow those parties to be “Authorized Participants” and to subscribe for and redeem shares of the Funds. The Distributor will not distribute shares in less than whole Creation Units and does not maintain a secondary market in shares.
22
Changebridge ETFs
Notes to Financial Statements
October 31, 2021 (Continued)
The Board has adopted a Distribution and Service Plan pursuant to Rule 12b-1 under the 1940 Act (“Rule 12b-1 Plan”). In accordance with the Rule 12b-1 Plan, each Fund is authorized to pay an amount up to 0.25% of each Fund’s average daily net assets each year for certain distribution-related activities. As authorized by the Board, no Rule 12b-1 fees are currently paid by the Funds and there are no plans to impose these fees. However, in the event Rule 12b-1 fees are charged in the future, they will be paid out of each Fund’s assets. The Adviser and its affiliates may, out of their own resources, pay amounts to third parties for distribution or marketing services on behalf of the Funds.
Administrator, Custodian and Transfer Agent
U.S. Bancorp Fund Services, LLC, doing business as U.S. Bank Global Fund Services (“Fund Services” or “Administrator”) serves as administrator, transfer agent and fund accounting agent of the Funds pursuant to a Fund Servicing Agreement. U.S. Bank N.A. (the “Custodian”), an affiliate of Fund Services, serves as the Funds’ custodian pursuant to a Custody Agreement. Under the terms of these agreements, the Adviser pays each Fund’s administrative, custody and transfer agency fees.
A Trustee and all officers of the Trust are affiliated with the Administrator and Custodian.
4. | CREATION AND REDEMPTION TRANSACTIONS |
Shares of the Funds are listed and traded on the NYSE Arca, Inc. (the “Exchange”). Each Fund issues and redeems shares on a continuous basis at NAV only in large blocks of shares called “Creation Units.” A Creation Unit generally consists of 10,000 shares. Creation Units are to be issued and redeemed principally in kind for a basket of securities and a balancing cash amount. Shares generally will trade in the secondary market in amounts less than a Creation Unit at market prices that change throughout the day. Market prices for the shares may be different from their NAV. The NAV is determined as of the close of trading (generally, 4:00 p.m. Eastern Time) on each day the NYSE is open for trading. The NAV of the shares of each Fund will be equal to a Fund’s total assets minus a Fund’s total liabilities divided by the total number of shares outstanding. The NAV that is published will be rounded to the nearest cent; however, for purposes of determining the price of Creation Units, the NAV will be calculated to five decimal places.
Creation Unit Transaction Fee
Authorized Participants will be required to pay to the Custodian a fixed transaction fee (the “Creation Unit Transaction Fee”) in connection with the issuance or redemption of Creation Units. The standard Creation Unit Transaction Fee will be the same regardless of the number of Creation Units purchased or redeemed by an investor on the applicable business day. The Creation Unit Transaction Fee charged by each Fund for each creation order is $250.
An additional variable fee of up to a maximum of 2% of the value of the Creation Units subject to the transaction may be imposed for (i) creations effected outside the Clearing Process and (ii) creations made in an all cash amount (to offset the Trust’s brokerage and other transaction costs associated with using cash to purchase the requisite Deposit Securities). Investors are responsible for the costs of transferring the securities constituting the Deposit Securities to the account of the Trust. Each Fund may determine to not charge a variable fee on certain orders when the Adviser has determined that doing so is in the best interests of Fund shareholders. Variable fees, if any, received by the Funds are displayed in the Capital Share Transactions section on the Statements of Changes in Net Assets.
Only “Authorized Participants” may purchase or redeem shares directly from the Funds. An Authorized Participant is either (i) a broker-dealer or other participant in the clearing process through the Continuous Net Settlement System of National Securities Clearing Corporation or (ii) a DTC participant and, in each case, must have executed a Participant Agreement with the Distributor. Most retail investors will not qualify as Authorized Participants or have the resources to buy and sell whole Creation Units. Therefore, they will be unable to purchase or redeem the shares directly from the Funds. Rather, most retail investors will purchase shares in the secondary market with the assistance of a broker and will be subject to customary brokerage commissions or fees. Securities received or delivered in connection with in-kind creates and redeems are valued as of the close of business on the effective date of the creation or redemption.
23
Changebridge ETFs
Notes to Financial Statements
October 31, 2021 (Continued)
A Creation Unit will generally not be issued until the transfer of good title of the deposit securities to the Funds and the payment of any cash amounts have been completed. To the extent contemplated by the applicable participant agreement, Creation Units of the Funds will be issued to such authorized participant notwithstanding the fact that the Funds’ deposits have not been received in part or in whole, in reliance on the undertaking of the authorized participant to deliver the missing deposit securities as soon as possible. If the Funds or their agents do not receive all of the deposit securities, or the required cash amounts, by such time, then the order may be deemed rejected and the authorized participant shall be liable to the Funds for losses, if any.
5. FEDERAL INCOME TAX
At October 31, 2021, the Funds’ most recent fiscal period end, the components of distributable earnings (accumulated losses) and the cost of investments on a tax basis, including the adjustments for financial reporting purposes as of the most recently completed Federal income tax reporting year for the Funds were as follows:
| | | CBLS | | | CBSE | |
Federal Tax Cost of Investments(1) | | $ | 5,338,486 | | | $ | 8,637,226 | |
Gross Tax Unrealized Appreciation | | $ | 1,313,832 | | | $ | 1,563,530 | |
Gross Tax Unrealized Depreciation | | | (239,261 | ) | | | (152,432 | ) |
Net Tax Unrealized Appreciation | | | 1,074,571 | | | | 1,411,098 | |
Other Accumulated Loss | | | (492,673 | ) | | | (53,434 | ) |
Total Distributable Earnings | | $ | 581,898 | | | $ | 1,357,664 | |
(1) | Includes proceeds from securities sold short. |
The different between book-basis and tax-basis unrealized appreciation/(depreciation) is attributable primarily to the tax deferral of losses on wash sales.
Under current tax law, net ordinary losses incurred after December 31st may be deferred and treated as occurring on the first day of the following fiscal year. The Funds’ carryforward losses and post-December losses are determined only at the end of each fiscal year. At October 31, 2021, CBLS and CBSE had short term capital losses remaining of $419,515 and $47,968, respectively, which will be carried forward indefinitely to offset future realized capital gains. At October 31, 2021, CBLS and CBSE deferred, on a tax basis, late year ordinary losses of $73,158 and $5,466, respectively.
U.S. GAAP requires that certain components of net assets relating to permanent differences be reclassified between financial and tax reporting. These reclassifications have no effect on net assets or NAV per share. The permanent differences primarily relate to redemptions in-kind. For the fiscal period ended October 31, 2021, the following reclassifications were made for permanent tax differences on the Statements of Assets and Liabilities.
| | | Total
Distributable
Earnings
(Accumulated
Losses) | | | Paid-In Capital | |
CBLS | | $ | (160,016 | ) | | $ | 160,016 | |
CBSE | | | 400 | | | | (400 | ) |
24
Changebridge ETFs
Notes to Financial Statements
October 31, 2021 (Continued)
6. | INVESTMENT TRANSACTIONS |
During the fiscal period ended October 31, 2021, the Funds realized net capital gains and losses resulting from in-kind redemptions, in which shareholders exchanged Fund shares for securities held by the Funds rather than for cash. Because such gains are not taxable to the Funds, and are not distributed to shareholders, they have been reclassified from distributable earnings (accumulated losses) to paid in-capital. The amounts of realized gains and losses from in-kind redemptions included in realized gain/(loss) on investments in the Statements of Operations is as follows:
| | | Realized Gains | | | Realized Losses | |
CBLS | | $ | 180,614 | | | $ | (8,739 | ) |
CBSE | | | — | | | | — | |
Purchases and sales of investments (excluding short-term investments), creations in-kind and redemptions in-kind for the period ended October 31, 2021 were as follows:
| | | Purchases | | | Sales | | | Creations
In-Kind | | | Redemptions
In-Kind | |
CBLS | | $ | 13,739,597 | | | $ | 12,955,193 | | | $ | 7,626,380 | | | $ | 747,063 | |
CBSE | | | 8,095,633 | | | | 7,599,214 | | | | 8,088,279 | | | | — | |
As with all ETFs, shareholders of the Funds are subject to the risk that their investment could lose money. Each Fund is subject to the principal risks, any of which may adversely affect a Fund’s NAV, trading price, yield, total return and ability to meet its investment objective.
The global outbreak of COVID-19 (commonly referred to as “coronavirus”) has disrupted economic markets and the prolonged economic impact is uncertain. The ultimate economic fallout from the pandemic, and the long-term impact on economies, markets, industries and individual issuers, are not known. The operational and financial performance of the issuers of securities in which the Funds invest depends on future developments, including the duration and spread of the outbreak, and such uncertainty may in turn adversely affect the value and liquidity of the Funds’ investments, impair the Funds’ ability to satisfy redemption requests, and negatively impact the Funds’ performance.
A complete description of the principal risks is included in the prospectus under the heading “Principal Investment Risks.”
Management has evaluated the Funds’ related events and transactions that occurred subsequent to October 31, 2021, through the date of issuance of the Funds’ financial statements. Management has determined that there were no subsequent events requiring recognition or disclosure in the financial statements.
25
Changebridge ETFs
Report of Independent Registered Public Accounting Firm
To the Shareholders of Changebridge ETFs and
Board of Trustees of Listed Funds Trust
Opinion on the Financial Statements
We have audited the accompanying statements of assets and liabilities, including the schedules of investments and securities sold short, of Changebridge Capital Long/Short Equity ETF and Changebridge Capital Sustainable Equity ETF (the “Funds”), each a series of Listed Funds Trust, as of October 31, 2021, the related statements of operations, cash flows, and changes in net assets, the related notes, and the financial highlights for the period from November 12, 2020 (commencement of operations) through October 31, 2021 (collectively referred to as the “financial statements”). In our opinion, the financial statements present fairly, in all material respects, the financial position of each of the Funds as of October 31, 2021, the results of their operations, cash flows, the changes in net assets, and the financial highlights for the period then ended, in conformity with accounting principles generally accepted in the United States of America.
Basis for Opinion
These financial statements are the responsibility of the Funds’ management. Our responsibility is to express an opinion on the Funds’ financial statements based on our audits. We are a public accounting firm registered with the Public Company Accounting Oversight Board (United States) (“PCAOB”) and are required to be independent with respect to the Funds in accordance with the U.S. federal securities laws and the applicable rules and regulations of the Securities and Exchange Commission and the PCAOB.
We conducted our audits in accordance with the standards of the PCAOB. Those standards require that we plan and perform the audit to obtain reasonable assurance about whether the financial statements are free of material misstatement whether due to error or fraud.
Our audits included performing procedures to assess the risks of material misstatement of the financial statements, whether due to error or fraud, and performing procedures that respond to those risks. Such procedures included examining, on a test basis, evidence regarding the amounts and disclosures in the financial statements. Our procedures included confirmation of securities owned as of October 31, 2021, by correspondence with the custodian and brokers; when replies were not received from brokers, we performed other auditing procedures. Our audits also included evaluating the accounting principles used and significant estimates made by management, as well as evaluating the overall presentation of the financial statements. We believe that our audits provide a reasonable basis for our opinion.
We have served as the Funds’ auditor since 2020.

COHEN & COMPANY, LTD.
Cleveland, Ohio
December 22, 2021
26
Changebridge ETFs
Supplemental Information
(Unaudited)
Investors should consider the investment objective and policies, risk considerations, charges and ongoing expenses of an investment carefully before investing. The prospectus contains this and other information relevant to an investment in the Funds. Please read the prospectus carefully before investing. A copy of the prospectus for the Funds may be obtained without charge by writing to the Funds, c/o U.S. Bank Global Fund Services, P.O. Box 701, Milwaukee, Wisconsin 53201-0701 or by calling 1-800-617-0004, or by visiting the Funds’ website at www.changebridgefunds.com.
QUARTERLY PORTFOLIO HOLDING INFORMATION
Each Fund files its complete schedule of portfolio holdings for its first and third fiscal quarters with the Securities and Exchange Commission (“SEC”) on Part F of Form N-PORT. The Funds’ Part F of Form N-PORT is available without charge, upon request, by calling toll-free at 1-800-617-0004. Furthermore, you may obtain the Part F of Form N-PORT on the SEC’s website at www.sec.gov.
PROXY VOTING INFORMATION
Each Fund is required to file a Form N-PX, with the Fund’s complete proxy voting record for the 12 months ended June 30, no later than August 31 of each year. The Fund’s proxy voting record will be available without charge, upon request, by calling toll-free 1-800-617-0004 and on the SEC’s website at www.sec.gov.
FREQUENCY DISTRIBUTION OF PREMIUMS AND DISCOUNTS
Information regarding how often shares of the Funds trade on an exchange at a price above (i.e., at a premium) or below (i.e., at a discount) the NAV of the Funds is available without charge, on the Funds’ website at www.changebridgefunds.com.
27
Changebridge ETFs
Review of Liquidity Risk Management Program
(Unaudited)
Pursuant to Rule 22e-4 under the Investment Company Act of 1940, the Trust, on behalf of the series of the Trust covered by this shareholder report (the “Series”), has adopted a liquidity risk management program to govern the Trust’s approach to managing liquidity risk. Rule 22e-4 seeks to promote effective liquidity risk management, thereby reducing the risk that a fund will be unable to meet its redemption obligations and mitigating dilution of the interests of fund shareholders. The Trust’s liquidity risk management program is tailored to reflect the Series’ particular risks, but not to eliminate all adverse impacts of liquidity risk, which would be incompatible with the nature of such Series.
The investment adviser to the Series has adopted and implemented its own written liquidity risk management program (the “Program”) tailored specifically to assess and manage the liquidity risk of the Series. At a recent meeting of the Board of Trustees of the Trust, the Trustees received a report pertaining to the operation, adequacy, and effectiveness of implementation of the Program for the period ended December 31, 2020. The report concluded that the Program is reasonably designed to assess and manage the Series’ liquidity risk and has operated adequately and effectively to manage such risk. The report reflected that there were no liquidity events that impacted the Series’ ability to timely meet redemptions without dilution to existing shareholders. The report further noted that no material changes have been made to the Program since its implementation.
There can be no assurance that the Program will achieve its objectives in the future. Please refer to the prospectus for more information regarding the Series’ exposure to liquidity risk and other principal risks to which an investment in the Series may be subject.
28
Changebridge ETFs
Board of Trustees and Officers
October 31, 2021 (Unaudited)
The Funds’ Statement of Additional Information includes additional information about the Funds’ Trustees and Officers, and is available, without charge upon request by calling 1-800-617-0004, or by visiting the Funds’ website at www.changebridgefunds.com.
Name and Year of Birth | Position Held
with the Trust | Term of Office
and Length of
Time Served | Principal Occupation(s)
During Past 5 Years | Number of
Portfolios in
Fund Complex
Overseen
by Trustee | Other
Directorships Held
by Trustee During
Past 5 Years |
Independent Trustees | | | | | |
John L. Jacobs Year of birth: 1959 | Trustee and Audit Committee Chair | Indefinite term; since 2017 | Chairman of Alerian, Inc. (since June 2018); Executive Director of Center for Financial Markets and Policy (since 2016); Founder and CEO of Q3 Advisors, LLC (financial consulting firm) (since 2015); Distinguished Policy Fellow and Executive Director, Center for Financial Markets and Policy, Georgetown University (since 2015); Senior Advisor, Nasdaq OMX Group (2015–2016); Executive Vice President, Nasdaq OMX Group (2013–2015). | 39 | Director, tZERO Group, Inc. (since 2020); Independent Trustee, Procure ETF Trust II (since 2018) (1 portfolio); Horizons ETF Trust I (2015-2019). |
Koji Felton Year of birth: 1961 | Trustee | Indefinite term; since 2019 | Counsel, Kohlberg Kravis Roberts & Co. L.P. (investment firm) (2013–2015); Counsel, Dechert LLP (law firm) (2011–2013). | 39 | Independent Trustee, Series Portfolios Trust (since 2015) (8 portfolios). |
Pamela H. Conroy Year of birth: 1961 | Trustee and Nominating and Governance Committee Chair | Indefinite term; since 2019 | Retired; formerly Executive Vice President, Chief Operating Officer & Chief Compliance Officer, Institutional Capital Corporation (investment firm) (1994–2008). | 39 | Independent Trustee, Frontier Funds, Inc. (since 2020) (7 portfolios). |
Interested Trustee | | | | | |
Paul R. Fearday, CPA Year of birth: 1979 | Trustee and Chairman | Indefinite term; since 2019 | Senior Vice President, U.S. Bancorp Fund Services, LLC (since 2008). | 39 | None. |
29
Changebridge ETFs
Board of Trustees and Officers
October 31, 2021 (Unaudited) (Continued)
Name and Year of Birth | Position(s) Held
with the Trust | Term of Office
and Length of
Time Served | Principal Occupation(s) During Past 5 Years |
Officers | | | |
Gregory Bakken Year of birth: 1983 | President and Principal Executive Officer | Indefinite term, February 2019 | Vice President, U.S. Bancorp Fund Services, LLC (since 2006). |
Travis G. Babich Year of birth: 1980 | Treasurer and Principal Financial Officer | Indefinite term, September 2019 | Vice President, U.S. Bancorp Fund Services, LLC (since 2005). |
Kacie M. Gronstal Year of birth: 1992 | Assistant Treasurer | Indefinite term, March 2019 | Assistant Vice President, U.S. Bancorp Fund Services, LLC (since 2021); Officer, U.S. Bancorp Fund Services, LLC (2014 to 2021). |
Kent Barnes Year of birth: 1968 | Secretary | Indefinite term, February 2019 | Vice President, U.S. Bancorp Fund Services, LLC (since 2018); Chief Compliance Officer, Rafferty Asset Management, LLC (2016 to 2018); Vice President, U.S. Bancorp Fund Services, LLC (2007 to 2016). |
Alia Vasquez
Year of birth: 1980 | Assistant Secretary | Indefinite term, June 2021 | Vice President, U.S. Bancorp Fund Services, LLC (since 2017, and 2015 to 2016); Corporate Counsel, Johnson Outdoors (2017); Assistant Vice President, U.S. Bancorp Fund Services, LLC (2010 to 2015); Secretary, Series Portfolios Trust (2015 to 2017). |
Steve Jensen Year of birth: 1957 | Chief Compliance Officer and Anti-Money Laundering Officer | Indefinite term, February 2019 | Senior Vice President, U.S. Bancorp Fund Services, LLC (since 2011). |
30
Changebridge ETFs
Privacy Policy
October 31, 2021 (Unaudited)
We are committed to respecting the privacy of personal information you entrust to us in the course of doing business with us.
The Funds collect non-public information about you from the following sources:
| | ● | Information we receive about you on applications or other forms; |
| | ● | Information you give us orally; and/or |
| | ● | Information about your transactions with us or others. |
We do not disclose any non-public personal information about our customers or former customers without the customer’s authorization, except as permitted by law or in response to inquiries from governmental authorities. We may share information with affiliated and unaffiliated third parties with whom we have contracts for servicing the Funds. We will provide unaffiliated third parties with only the information necessary to carry out their assigned responsibilities. We maintain physical, electronic and procedural safeguards to guard your non-public personal information and require third parties to treat your personal information with the same high degree of confidentiality.
In the event that you hold shares of a Fund through a financial intermediary, including, but not limited to, a broker-dealer, bank, or trust company, the privacy policy of your financial intermediary would govern how your non-public personal information would be shared by those entities with unaffiliated third parties.
31
THIS PAGE INTENTIONALLY LEFT BLANK
THIS PAGE INTENTIONALLY LEFT BLANK
Investment Adviser:
Changebridge Capital, LLC
180 Canal Street, Suite 600
Boston, MA 02114
Legal Counsel:
Morgan, Lewis & Bockius LLP
1111 Pennsylvania Avenue, N.W.
Washington, D.C. 20004
Independent Registered Public Accounting Firm:
Cohen & Company, Ltd.
1350 Euclid Avenue, Suite 800
Cleveland, OH 44115
Distributor:
Foreside Fund Services, LLC
Three Canal Plaza, Suite 100
Portland, ME 04101
Administrator, Fund Accountant & Transfer Agent:
U.S. Bancorp Fund Services, LLC
d/b/a U.S. Bank Global Fund Services
615 E. Michigan St.
Milwaukee, WI 53202
Custodian:
U.S. Bank N.A.
1555 North RiverCenter Drive, Suite 302
Milwaukee, WI 53212
This information must be preceded or accompanied by a current prospectus for the Funds.
Item 2. Code of Ethics.
The registrant has adopted a code of ethics that applies to the registrant's principal executive officer and principal financial officer. The registrant has not made any substantive amendments to its code of ethics during the period covered by this report. The registrant has not granted any waivers from any provisions of the code of ethics during the period covered by this report.
A copy of the registrant's Code of Ethics is filed herewith.
Item 3. Audit Committee Financial Expert.
The registrant's Board of Trustees has determined that there is at least one audit committee financial expert serving on its audit committee. Mr. John Jacobs is the "audit committee financial expert" and is considered to be "independent" as each term is defined in Item 3 of Form N-CSR.
Item 4. Principal Accountant Fees and Services.
The registrant has engaged its principal accountant to perform audit services, audit-related services, tax services and other services during the past two fiscal years. "Audit services" refer to performing an audit of the registrant's annual financial statements or services that are normally provided by the accountant in connection with statutory and regulatory filings or engagements for those fiscal years. "Audit-related services" refer to the assurance and related services by the principal accountant that are reasonably related to the performance of the audit. "Tax services" refer to professional services rendered by the principal accountant for tax compliance, tax advice, and tax planning. There were no other "Other services" provided by the principal accountant. The following table details the aggregate fees billed or expected to be billed for each of the last two fiscal years for audit fees, audit-related fees, tax fees and other fees by the principal accountant.
| | FYE 10/31/2021 | FYE 10/31/2020 |
| Audit Fees | $27,500 | N/A |
| Audit-Related Fees | $0 | N/A |
| Tax Fees | $6,000 | N/A |
| All Other Fees | $0 | N/A |
(e)(1) The audit committee has adopted pre-approval policies and procedures that require the audit committee to pre-approve all audit and non-audit services of the registrant, including services provided to any entity affiliated with the registrant.
(e)(2) The percentage of fees billed by Cohen & Company, Ltd. applicable to non-audit services pursuant to waiver of pre-approval requirement were as follows:
| | FYE 10/31/2021 | FYE 10/31/2020 |
| Audit-Related Fees | 0% | N/A |
| Tax Fees | 0% | N/A |
| All Other Fees | 0% | N/A |
(f) All of the principal accountant's hours spent on auditing the registrant's financial statements were attributed to work performed by full-time permanent employees of the principal accountant.
(g) The following table indicates the non-audit fees billed or expected to be billed by the registrant's accountant for services to the registrant and to the registrant's investment adviser (and any other controlling entity, etc.—not sub-adviser) for the last two years.
| Non-Audit Related Fees | FYE 10/31/2021 | FYE 10/31/2020 |
| Registrant | N/A | N/A |
| Registrant's Investment Adviser | N/A | N/A |
(h) The audit committee of the board of trustees/directors has considered whether the provision of non-audit services that were rendered to the registrant's investment adviser is compatible with maintaining the principal accountant's independence and has concluded that the provision of such non-audit services by the accountant has not compromised the accountant's independence.
The registrant has not been identified by the U.S. Securities and Exchange Commission as having filed an annual report issued by a registered public accounting firm branch or office that is located in a foreign jurisdiction where the Public Company Accounting Oversight Board is unable to inspect or completely investigate because of a position taken by an authority in that jurisdiction.
The registrant is not a foreign issuer.
Item 5. Audit Committee of Listed Registrants.
| (a) | The registrant is an issuer as defined in Rule 10A-3 under the Securities Exchange Act of 1934, (the "Act") and has a separately-designated standing audit committee established in accordance with Section 3(a)(58)(A) of the Act. The entire Board of Trustees is acting as the registrant's audit committee. |
Item 6. Investments.
| (a) | Schedule of Investments is included as part of the report to shareholders filed under Item 1 of this Form. |
Item 7. Disclosure of Proxy Voting Policies and Procedures for Closed-End Management Investment Companies.
Not applicable to open-end investment companies.
Item 8. Portfolio Managers of Closed-End Management Investment Companies.
Not applicable to open-end investment companies.
Item 9. Purchases of Equity Securities by Closed-End Management Investment Company and Affiliated Purchasers.
Not applicable to open-end investment companies.
Item 10. Submission of Matters to a Vote of Security Holders.
There have been no material changes to the procedures by which shareholders may recommend nominees to the registrant's Board of Trustees.
Item 11. Controls and Procedures.
| (a) | The Registrant's President and Treasurer have reviewed the Registrant's disclosure controls and procedures (as defined in Rule 30a-3(c) under the Investment Company Act of 1940 (the "Act")) as of a date within 90 days of the filing of this report, as required by Rule 30a-3(b) under the Act and Rules 13a-15(b) or 15d 15(b) under the Securities Exchange Act of 1934. Based on their review, such officers have concluded that the disclosure controls and procedures are effective in ensuring that information required to be disclosed in this report is appropriately recorded, processed, summarized and reported and made known to them by others within the Registrant and by the Registrant's service provider. |
| (b) | There were no changes in the Registrant's internal control over financial reporting (as defined in Rule 30a-3(d) under the Act) that occurred during the period covered by this report that have materially affected, or are reasonably likely to materially affect, the Registrant's internal control over financial reporting. |
Item 12. Disclosure of Securities Lending Activities for Closed-End Management Investment Companies
Not applicable to open-end investment companies.
Item 13. Exhibits.
| (a) | (1) Any code of ethics or amendment thereto, that is the subject of the disclosure required by Item 2, to the extent that the registrant intends to satisfy Item 2 requirements through filing an exhibit. Filed herewith. |
| (2) | A separate certification for each principal executive officer and principal financial officer pursuant to Section 302 of the Sarbanes-Oxley Act of 2002. Filed herewith. |
| (3) | Any written solicitation to purchase securities under Rule 23c-1 under the Act sent or given during the period covered by the report by or on behalf of the registrant to 10 or more persons. Not applicable to open-end investment companies. |
| (4) | Change in the registrant's independent public accountant. There was no change in the registrant's independent public accountant for the period covered by this report. |
| (b) | Certifications pursuant to Section 906 of the Sarbanes-Oxley Act of 2002. Furnished herewith. |
SIGNATURES
Pursuant to the requirements of the Securities Exchange Act of 1934 and the Investment Company Act of 1940, the registrant has duly caused this report to be signed on its behalf by the undersigned, thereunto duly authorized.
| (Registrant) | Listed Funds Trust | |
| | | |
| By (Signature and Title)* | /s/ Gregory C. Bakken | |
| | Gregory C. Bakken, President/Principal Executive Officer | |
| | | |
| Date | 1/4/2022 | | |
Pursuant to the requirements of the Securities Exchange Act of 1934 and the Investment Company Act of 1940, this report has been signed below by the following persons on behalf of the registrant and in the capacities and on the dates indicated.
| By (Signature and Title)* | /s/ Gregory C. Bakken | |
| | Gregory C. Bakken, President/Principal Executive Officer | |
| | | |
| Date | 1/4/2022 | | |
| By (Signature and Title)* | /s/ Travis G. Babich | |
| | Travis G. Babich, Treasurer/Principal Financial Officer | |
| | | |
| Date | 1/4/2022 | | |
* Print the name and title of each signing officer under his or her signature.