UNITED STATES
SECURITIES AND EXCHANGE COMMISSION
Washington, D.C. 20549
FORM N-CSR
CERTIFIED SHAREHOLDER REPORT OF REGISTERED
MANAGEMENT INVESTMENT COMPANIES
Investment Company Act file number (811-23226)
Listed Funds Trust
(Exact name of registrant as specified in charter)
615 East Michigan Street
Milwaukee, WI 53202
(Address of principal executive offices) (Zip code)
Kent P. Barnes, Secretary
Listed Funds Trust
c/o U.S. Bancorp Fund Services, LLC
777 East Wisconsin Avenue, 10th Floor
Milwaukee, WI 53202
(Name and address of agent for service)
(414) 516-1681
Registrant's telephone number, including area code
Date of fiscal year end: December 31
Date of reporting period: December 31, 2022
Item 1. Reports to Stockholders.
(a)

TrueShares ETFs
TrueShares Technology, AI & Deep Learning ETF (LRNZ)
TrueShares ESG Active Opportunities ETF (ECOZ)
TrueShares Low Volatility Equity Income ETF (DIVZ)
TrueShares Eagle Global Renewable Energy Income ETF (RNWZ)
RiverNorth Patriot ETF (FLDZ)
RiverNorth Enhanced Pre-Merger SPAC ETF (SPCZ)
ANNUAL REPORT
December 31, 2022
This report is submitted for the general information of shareholders of the Funds. It is not authorized for distribution unless preceded or accompanied by a current prospectus for the Funds.
TrueShares ETFs
Table of Contents
| | |
Shareholder Letter (Unaudited) | 2 |
Shareholder Expense Example (Unaudited) | 5 |
Performance Overviews (Unaudited) | 7 |
Schedules of Investments | 10 |
Statements of Assets and Liabilities | 22 |
Statements of Operations | 24 |
Statements of Changes in Net Assets | 26 |
Financial Highlights | 30 |
Notes to Financial Statements | 34 |
Report of Independent Registered Public Accounting Firm | 45 |
Board of Trustees and Officers (Unaudited) | 47 |
Board Consideration and Approval of Advisory and Sub-Advisory Agreements (Unaudited) | 49 |
Supplemental Information (Unaudited) | 60 |
Privacy Policy (Unaudited) | 61 |
1
TrueShares ETFs
Shareholder Letter
December 31, 2022 (Unaudited)
Dear Shareholder,
At TrueShares, we strive to provide our investors with strategically positioned ETF portfolios developed to cultivate a variety of investment opportunities. An outsourced approach allows our team the flexibility to seek out partnerships with investment managers that possess industry specific investment acumen and the ability to become best-in-class Sub-Advisors. Regardless of near-term economic conditions, we maintain an unwavering long-term mindset in an effort to capitalize on the true potential of the investment themes represented by our ETFs. We thank you for your support and look forward to the road ahead.
As we reflect upon 2022, the markets seem to be left searching for direction. In the years since 2020, we’ve encountered a pandemic, unprecedented fiscal stimulus, a bull market, and a subsequent bear market. The resulting volatility, combined with macro headwinds ranging from supply chain issues, to inflation and finally a fed tightening cycle, have produced conflicting forecasts and a widespread, meaningful correction in the broader equity markets. Simply put, it’s been quite some time since investors have faced such a myriad of variables in play, at least for a prolonged period.
The most influential macro players of 2022 were inflation and the Federal Reserve. Economists, portfolio managers and investors alike expected a series of significant interest rate hikes to combat what seemed to be runaway inflation…and we most certainly got them! While these measures were intended to battle rising inflation, many wondered how effective they would prove to be in the near-term. As the portfolio manager of DIVZ, Austin Graff, often opines: “Inflation isn’t just a light switch that can be turned off, it takes time.” To his point, although we have seen mild relative improvement in CPI metrics, commodity prices, and other risk-off assets, the long-term effects have yet to be fully digested. As we enter 2023, there are certainly asset class specific reasons for both continued skepticism and focused optimism, but we feel that this will be a “stock-pickers market” for the foreseeable future.
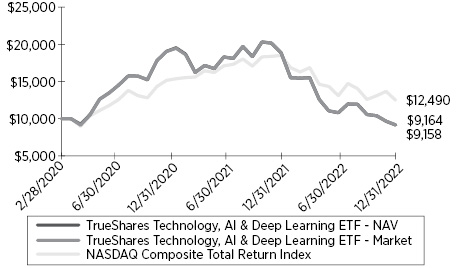
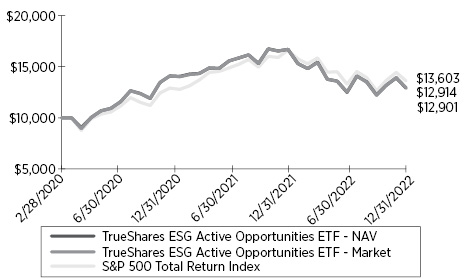
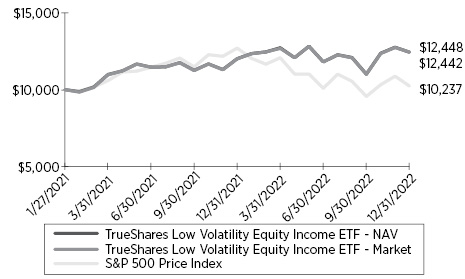
A year in review suggests the aforementioned macroeconomic conditions had a material impact on portfolio performance and positioning across several strategies and asset classes. However, not all of these impacts produced negative results. In fact, the TrueShares Low Volatility Equity Income ETF (DIVZ) was able to adeptly navigate the turbulent economic waters of 2022, outperforming the S&P 500 Index (SPX) by over 22% (3.65% vs -19.44%). The Fund’s investment process relies on a backbone of identifying companies with proven business models and high levels of free cash flow that pay consistent (and growing) dividends. An approach that would seem to be well suited moving forward as the current market environment persists. The TrueShares Technology, AI & Deep Learning ETF (LRNZ) experienced underperformance (-18.9%) relative to the NASDAQ Composite Total Return Index (CCMP). Having faced a similar fate as its tech focused peers, LRNZ still remains firmly positioned, with high conviction, in companies with distinct competitive advantages in the AI & Deep Learning space, preparing for what many consider to be an inevitable wave of AI-centric initiatives in the year ahead. The TrueShares ESG Active Opportunities ETF (ECOZ) generally tracked the S&P 500 Total Return Index in the midst of growing interest across sectors. While government policy is always an unknown, ECOZ continues to shine amongst its peers (and broader index) on carbon intensity metrics.
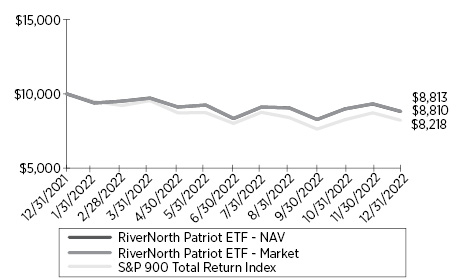
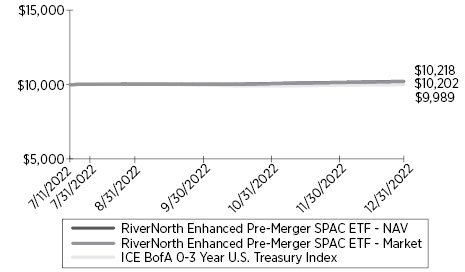
The past year also saw the debut of the RiverNorth Patriot ETF (FLDZ) and RiverNorth Enhanced Pre-Merger SPAC ETF (SPCZ) in the TrueShares lineup. Since its inception on December 31, 2021, FLDZ has produced a net total return of -11.89% versus the S&P 900 gross total return of -17.82%, and consistently stayed atop the S&P 900 throughout 2022. We believe the portfolio’s tilt toward core and value stocks has been a strength in the Fund’s inaugural year, and that this tilt will likely add some protection to the portfolio should a US recession occur. Furthermore, over 100% of the sub-advisory fee was donated to Folds of Honor Foundation! SPCZ brings RiverNorth Capital’s approach to the widely covered segment of SPAC securities into the ETF world. Although the space has seen mixed performance, this uniquely constructed fund represents pre-merger opportunities to capture potential discount, equity upside, and interest income of SPACS. In 2022, increasing interest rates contributed to higher earnings on the underlying SPACs’ trust accounts, while the acquisition market remained relatively muted in the face of volatile equity markets.
2
TrueShares ETFs
Shareholder Letter
December 31, 2022 (Unaudited) (Continued)
Lastly, TrueShares wrapped up 2022 with the recent listing of our newest fund, TrueShares Eagle Global Renewable Energy Income ETF (RNWZ). This fund aims to support global innovation within the development, production, transmission, storage, and sale of renewable energy. We are excited to onboard our latest partner, Eagle Global Advisors, and add a well-positioned industry to our ETF lineup.
As always, please don’t hesitate to contact us at any time; we would love to hear from you!
Wishing health, happiness, and success to all in 2023!
Sincerely,

Michael N. Loukas
Chief Executive Officer
Investment Risks
Investing involves risk including possible loss of principal.
LRNZ - TrueShares Technology, AI & Deep Learning ETF is subject to the following risks: Artificial Intelligence, Machine Learning and Deep Learning Investment Risk - the extent of such technologies’ versatility has not yet been fully explored. There is no guarantee that these products or services will be successful and the securities of such companies, especially smaller, start-up companies, are typically more volatile than those of companies that do not rely heavily on technology.
ECOZ - TrueShares ESG Active Opportunities ETF is subject to the following risks : Environmental, Social, Governance Risk - Applying ESG and sustainability criteria to the investment process may exclude securities of certain issuers for non-investment reasons and may cause the Fund to forgo some market opportunities available to funds that do not use ESG or sustainability criteria. ESG considerations may affect its exposure to certain sectors and/or types of investments, and may adversely impact the Fund’s performance depending on whether such sectors or investments are in or out of favor in the market.
DIVZ - TrueShares Low Volatility Equity Income ETF is subject to the following risks: Dividend Paying Security Risk. Securities that pay high dividends as a group can fall out of favor with the market, causing these companies to underperform companies that do not pay high dividends. Dividends may also be reduced or discontinued. Equity Market Risk. Common stocks are susceptible to general stock market fluctuations and to volatile increases and decreases in value as market confidence in and perceptions of their issuers change based on various and unpredictable factors.
RNWZ - TrueShares Eagle Global Renewable Energy Income ETF is subject to the following risks: Associated Risk of Investing in Renewable Infrastructure Companies. Because the Fund invests in Renewable infrastructure Companies, the value of Fund shares may be affected by events that adversely affect companies in that industry. These can include contract counterparty defaults, adverse political and regulatory changes, poor weather conditions for renewable power generation, falling power prices, losses on financial hedges, technological obsolescence, competition and general economic conditions. Currency Exchange Rate Risk. Changes in currency exchange rates and the relative value of non-U.S. currencies will affect the value of the Fund’s investment and the value of your Shares. Foreign Securities Risk. Investments in non-U.S. securities involve certain risks that may not be present with investments in U.S. securities. For example, investments in non-U.S. securities may be subject to risk of loss due to foreign currency fluctuations or to political or economic instability.
3
TrueShares ETFs
Shareholder Letter
December 31, 2022 (Unaudited) (Continued)
FLDZ - RiverNorth Patriot ETF is subject to the following risks: Equity Market Risk - The equity securities held in the Fund’s portfolio may experience sudden, unpredictable drops in value or long periods of decline in value. This may occur because of factors that affect securities markets generally or factors affecting specific issuers, industries, sectors or companies in which the Fund invests. Common stocks are generally exposed to greater risk than other types of securities, such as preferred stocks and debt obligations, because common stockholders generally have inferior rights to receive payment from issuers.
SPCZ - RiverNorth Enhanced Pre-Merger SPAC ETF is subject to the following risks: New Fund Risk – The Fund is a recently organized investment company with no operating history. As a result, prospective investors have no track record or history on which to base their investment decision. Leverage Risk – The use of leverage is speculative could magnify the Fund’s gains or losses and increase risk. This is the speculative factor known as leverage. Borrowing also may cause the Fund to liquidate positions under adverse market conditions to satisfy its repayment obligations. Borrowing increases the risk of loss and may increase the volatility of the Fund. Pre-Combination (Pre-Merger) SPAC Risk – The Fund invests in equity securities and warrants of SPACs. Pre-combination SPACs have no operating history or ongoing business other than seeking Combinations, and the value of their securities is particularly dependent on the ability of the entity’s management to identify and complete a profitable Combination. There is no guarantee that the SPACs in which the Fund invests will complete a Combination or that any Combination that is completed will be profitable. Unless and until a Combination is completed, a SPAC generally invests its assets in U.S. government securities, money market securities, and cash. Public stockholders of SPACs may not be afforded a meaningful opportunity to vote on a proposed initial Combination because certain stockholders, including stockholders affiliated with the management of the SPAC, may have sufficient voting power, and a financial incentive, to approve such a transaction without support from public stockholders. Some SPACs may pursue Combinations only within certain industries or regions, which may increase the volatility of their prices. In addition, the Fund may invest in vehicles formed by SPAC sponsors to hold founder shares, which may be subject to forfeiture or expire worthless and which generally have more limited liquidity than SPAC shares issued in an IPO. In addition, the Fund may invest in vehicles formed by SPAC sponsors to hold founder shares, which may be subject to forfeiture or expire worthless and which generally have more limited liquidity than SPAC shares issued in an IPO. Foreign Securities Risk – Foreign SPACs Investments in SPACs domiciled or listed outside of the U.S. may involve risks not generally associated with investments in the securities of U.S. SPACs, such as risks relating to political, social, and economic developments abroad and differences between U.S. and foreign regulatory requirements and market practices. Further, tax treatment may differ from U.S. SPACs and securities may be subject to foreign withholding taxes. Small-Cap Risk – SPACs will have a more limited pool of companies with which they can pursue a business combination relative to larger capitalization companies. That may make it more difficult for a small capitalization SPAC to consummate a business combination.
4
TrueShares ETFs
Shareholder Expense Example
December 31, 2022 (Unaudited)
As a shareholder of a fund you incur two types of costs: (1) transaction costs, including brokerage commissions on purchases and sales of fund shares; and (2) ongoing costs, including management fees and other fund expenses. The following example is intended to help you understand your ongoing costs (in dollars and cents) of investing in the Funds and to compare these costs with the ongoing costs of investing in other funds. The examples are based on an investment of $1,000 invested at the beginning of the period and held throughout the entire period (July 1, 2022 to December 31, 2022).
ACTUAL EXPENSES
The following table provides information about actual account values and actual expenses. You may use the information in this line, together with the amount you invested, to estimate the expenses that you paid over the period. Simply divide your account value by $1,000 (for example, an $8,600 account value divided by $1,000 = 8.6), then multiply the result by the number in the applicable line under the heading entitled “Expenses Paid During Period” to estimate the expenses you paid on your account during this period.
��
| | Beginning
Account
Value
(07/01/2022) | Ending
Account
Value
(12/31/2022) | Annualized
Expense
Ratios | Expenses
Paid
During the
Period(1) |
TrueShares Technology, AI & Deep Learning ETF | $ 1,000.00 | $ 846.80 | 0.68% | $ 3.17 |
TrueShares ESG Active Opportunities ETF | 1,000.00 | 1,031.30 | 0.58 | 2.97 |
TrueShares Low Volatility Equity Income ETF | 1,000.00 | 1,053.70 | 0.65 | 3.36 |
TrueShares Eagle Global Renewable Energy Income ETF | 1,000.00 | 991.70 | 0.75 | 0.49(2) |
RiverNorth Patriot ETF | 1,000.00 | 1,055.60 | 0.70 | 3.63 |
RiverNorth Enhanced Pre-Merger SPAC ETF | 1,000.00 | 1,020.20 | 0.89 | 4.29(3) |
(1) | Expenses are calculated using the Fund’s annualized expense ratio, multiplied by the average account value for the period, multiplied by 184/365 (to reflect the six-month period). |
(2) | Expenses are calculated using the Fund’s annualized expense ratio, multiplied by the average account value for the period, multiplied by 24/365 (to reflect the period since the Fund’s inception). |
(3) | Expenses are calculated using the Fund’s annualized expense ratio, multiplied by the average account value for the period, multiplied by 174/365 (to reflect the period since the Fund’s inception). |
5
TrueShares ETFs
Shareholder Expense Example
December 31, 2022 (Unaudited) (Continued)
HYPOTHETICAL EXAMPLE FOR COMPARISON PURPOSES
The following table provides information about hypothetical account values and hypothetical expenses based on the Funds’ actual expense ratios and an assumed rate of return of 5% per year before expenses, which are not the Funds’ actual returns. The hypothetical account values and expenses may not be used to estimate the actual ending account balance or expenses you paid for the period. You may use this information to compare the ongoing costs of investing in the Funds and other funds. To do so, compare this 5% hypothetical example with the 5% hypothetical examples that appear in the shareholder reports of the other funds. Please note that the expenses shown in the table are meant to highlight your ongoing costs only and do not reflect any transactional costs, such as brokerage commissions paid on purchases and sales of Fund shares with respect to the Funds. Therefore, the table below is useful in comparing ongoing costs only and will not help you determine the relative total costs of owning different funds. In addition, if these transactional costs were included, your costs would have been higher.
| | Beginning
Account
Value
(07/01/2022) | Ending
Value
(12/31/2022) | Annualized
Expense
Ratios | Expenses
Paid
During the
Period(1) |
TrueShares Technology, AI & Deep Learning ETF | $ 1,000.00 | $ 1,021.78 | 0.68% | $ 3.47 |
TrueShares ESG Active Opportunities ETF | 1,000.00 | 1,022.28 | 0.58 | 2.96 |
TrueShares Low Volatility Equity Income ETF | 1,000.00 | 1,021.42 | 0.65 | 3.31 |
TrueShares Eagle Global Renewable Energy Income ETF | 1,000.00 | 1,021.42 | 0.75 | 3.82(2) |
RiverNorth Patriot ETF | 1,000.00 | 1,021.68 | 0.70 | 3.57 |
RiverNorth Enhanced Pre-Merger SPAC ETF | 1,000.00 | 1,020.72 | 0.89 | 4.53(2) |
(1) | Expenses are calculated using the Fund’s annualized expense ratio, multiplied by the average account value for the period, multiplied by 184/365 (to reflect the six-month period). |
(2) | For comparative purposes only as the Fund was not in operation for the full six-month period. |
6
TrueShares ETFs
Performance Overviews
December 31, 2022 (Unaudited)
Hypothetical Growth of $10,000 Investment
(Since Commencement through 12/31/2022)
1 | The Fund has an inception date and commenced operations on February 28, 2020. |
1 | The Fund has an inception date and commenced operations on February 28, 2020. |
1 | The Fund has an inception date and commenced operations on January 27, 2021. |
ANNUALIZED TOTAL RETURN
FOR THE PERIODS ENDED
DECEMBER 31, 2022 |
Total Returns | 1 Year | Since
Commencement1 |
TrueShares Technology, AI & Deep Learning ETF — NAV | (51.44)% | (3.03)% |
TrueShares Technology, AI & Deep Learning ETF — Market | (51.46)% | (3.05)% |
NASDAQ Composite Total Return Index | (32.54)% | 8.14% |
ANNUALIZED TOTAL RETURN
FOR THE PERIODS ENDED
DECEMBER 31, 2022 |
Total Returns | 1 Year | Since
Commencement1 |
TrueShares ESG Active Opportunities ETF — NAV | (22.61)% | 9.42% |
TrueShares ESG Active Opportunities ETF — Market | (22.70)% | 9.38% |
S&P 500 Total Return Index | (18.11)% | 11.44% |
ANNUALIZED TOTAL RETURN
FOR THE PERIODS ENDED
DECEMBER 31, 2022 |
Total Returns | 1 Year | Since
Commencement1 |
TrueShares Low Volatility Equity Income ETF — NAV | 3.65% | 12.04% |
TrueShares Low Volatility Equity Income ETF — Market | 3.54% | 12.01% |
S&P 500 Price Index | (19.44)% | 1.22% |
7
TrueShares ETFs
Performance Overviews
December 31, 2022 (Unaudited) (Continued)
Hypothetical Growth of $10,000 Investment
(Since Commencement through 12/31/2022)
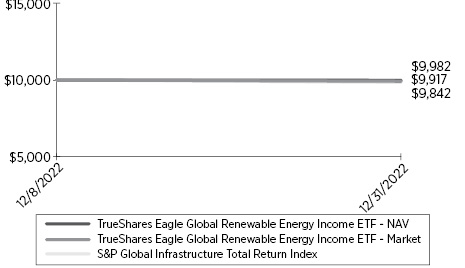
1 | The Fund has an inception date and commenced operations on December 8, 2022. |
1 | The Fund has an inception date and commenced operations on December 31, 2021. |
CUMULATIVE TOTAL RETURN
FOR THE PERIOD ENDED
DECEMBER 31, 2022 |
Total Returns | Since
Commencement1 |
TrueShares Eagle Global Renewable Energy Income ETF — NAV | (0.83)% |
TrueShares Eagle Global Renewable Energy Income ETF — Market | (0.18)% |
S&P Global Infrastructure Total Return Index | (1.58)% |
ANNUALIZED TOTAL RETURN
FOR THE PERIODS ENDED
DECEMBER 31, 2022 |
Total Returns | 1 Year | Since
Commencement1 |
RiverNorth Patriot ETF — NAV | (11.89)% | (11.89)% |
RiverNorth Patriot ETF — Market | (11.90)% | (11.90)% |
S&P 900 Total Return Index | (17.82)% | (17.82)% |
| | | |
8
TrueShares ETFs
Performance Overviews
December 31, 2022 (Unaudited) (Continued)
Hypothetical Growth of $10,000
(Since Commencement through 12/31/2022)
1 | The Fund has an inception date and commenced operations on July 11, 2022. |
CUMULATIVE TOTAL RETURN
FOR THE PERIOD ENDED
DECEMBER 31, 2022 |
Total Returns | Since
Commencement1 |
RiverNorth Enhanced Pre-Merger SPAC ETF — NAV | 2.02% |
RiverNorth Enhanced Pre-Merger SPAC ETF — Market | 2.18% |
ICE BofA 0-3 Year U.S. Treasury Index | (0.11)% |
The performance data quoted represents past performance. Past performance does not guarantee future results. Current performance may be lower or higher than the performance data quoted. The investment return and principal value of an investment will fluctuate so that an investor’s shares, when sold or redeemed, may be worth more or less than their original cost. For the most recent month-end performance, please call (877) 774-8789. You cannot invest directly in an index. Shares are bought and sold at market price (closing price), not net asset value (NAV), and are individually redeemed from the Fund. Market performance is determined using the bid/ask midpoint at 4:00pm Eastern time when the NAV is typically calculated. Brokerage commissions will reduce returns. Returns shown include the reinvestment of all dividends and distribution. Returns shown do not reflect the deduction of taxes that a shareholder would pay on fund distributions or the redemption of fund shares. In the absence of fee waivers and reimbursements, total returns would be reduced.
The NASDAQ Total Return Composite Index is a stock market index of the common stocks and similar securities listed on the NASDAQ stock market. The index measures the performance of all domestic and international based common type stocks listed on the NASDAQ Stock Market. It includes common stocks, ordinary shares, ADRs, shares of beneficial interest or limited partnership interests and tracking stocks. The index is market capitalization-weighted. The composition of the NASDAQ Composite is heavily weighted towards information technology companies. The total return index includes reinvestment of all cash dividends on the ex-date.
The S&P 500 Index is a widely recognized capitalization-weighted index that measures the performance of the large-capitalization sector of the U.S. stock market. The S&P 500 Price Index does not include reinvestment of dividends.
The S&P Global Infrastructure Total Return Index is designed to track 75 companies from around the world chosen to represent the listed infrastructure industry while maintaining liquidity and tradability. To create diversified exposure, the index includes three distinct infrastructure clusters: energy, transportation, and utilities.
The S&P 900 Index is a stock market index that measures the stock performance of 900 large companies listed on stock exchanges in the United States.
The ICE BofA 0-3 Year U.S. Treasury Index tracks the performance of U.S. dollar denominated sovereign debt publicly issued by the U.S. government in its domestic market with maturities less than three years.
9
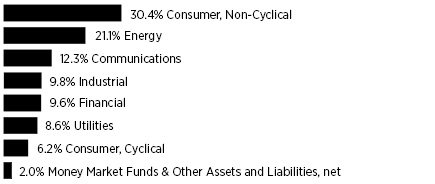
TrueShares Technology, AI & Deep Learning ETF
Schedule of Investments
December 31, 2022
Sector Diversification *
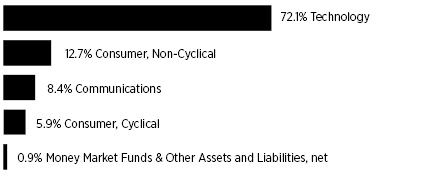
* | Percentages are stated as a percent of net assets. |
| | Shares | | | Value | |
COMMON STOCKS — 99.1% | | | | | | | | |
Auto Parts & Equipment — 5.9% | | | | | | | | |
Mobileye Global, Inc. - Class A (a) | | | 24,157 | | | $ | 846,944 | |
| | | | | | | | | |
Biotechnology — 9.2% | | | | | | | | |
Prime Medicine, Inc. (a) | | | 40,375 | | | | 750,168 | |
Relay Therapeutics, Inc. (a) | | | 37,466 | | | | 559,742 | |
| | | | | | | | 1,309,910 | |
Computers — 12.9% | | | | | | | | |
Crowdstrike Holdings, Inc. - Class A (a) | | | 9,304 | | | | 979,618 | |
Zscaler, Inc. (a) | | | 7,715 | | | | 863,309 | |
| | | | | | | | 1,842,927 | |
Internet — 8.3% | | | | | | | | |
Amazon.com, Inc. (a) | | | 6,558 | | | | 550,872 | |
Okta, Inc. (a) | | | 9,389 | | | | 641,550 | |
| | | | | | | | 1,192,422 | |
Pharmaceuticals — 3.6% | | | | | | | | |
AbCellera Biologics, Inc. (a)(b) | | | 50,081 | | | | 507,321 | |
| | | | | | | | | |
Semiconductors — 14.0% | | | | | | | | |
Advanced Micro Devices, Inc. (a) | | | 14,121 | | | | 914,617 | |
NVIDIA Corp. | | | 7,473 | | | | 1,092,104 | |
| | | | | | | | 2,006,721 | |
Software — 45.2% (c) | | | | | | | | |
Datadog, Inc. - Class A (a) | | | 11,880 | | | | 873,180 | |
Elastic N.V. (a)(b) | | | 11,573 | | | | 596,009 | |
ROBLOX Corp. - Class A (a) | | | 15,474 | | | | 440,390 | |
Samsara, Inc. - Class A (a) | | | 65,339 | | | | 812,164 | |
Schrodinger, Inc. (a) | | | 19,482 | | | | 364,119 | |
SentinelOne, Inc. (a) | | | 22,991 | | | | 335,439 | |
ServiceNow, Inc. (a) | | | 1,770 | | | | 687,238 | |
Snowflake, Inc. - Class A (a) | | | 9,806 | | | | 1,407,553 | |
Twilio, Inc. - Class A (a) | | | 4,614 | | | | 225,901 | |
UiPath, Inc. (a) | | | 27,976 | | | | 355,575 | |
Unity Software, Inc. (a) | | | 12,859 | | | | 367,639 | |
| | | | | | | | 6,465,207 | |
TOTAL COMMON STOCKS (Cost $27,841,225) | | | | | | | 14,171,452 | |
| | Shares | | | Value | |
MONEY MARKET FUNDS — 1.0% | | | | | | | | |
First American Treasury Obligations Fund - Class X, 4.18% (d) | | | 136,736 | | | $ | 136,736 | |
MONEY MARKET FUNDS (Cost $136,736) | | | | | | | 136,736 | |
| | | | | | | | | |
TOTAL INVESTMENTS (Cost $27,977,961) — 100.1% | | | | | | | 14,308,188 | |
Other assets and liabilities, net — (0.1)% | | | | | | | (8,316 | ) |
TOTAL NET ASSETS — 100.0% | | | | | | $ | 14,299,872 | |
Percentages are stated as a percent of net assets.
(a) | Non-income producing security. |
(b) | Foreign issued security. |
(c) | To the extent the Fund invests more heavily in particular sectors of the economy, its performance will be especially sensitive to developments that significantly affect those sectors. |
(d) | The rate shown is the seven day yield at period end. |
The accompanying notes are an integral part of the financial statements.
10
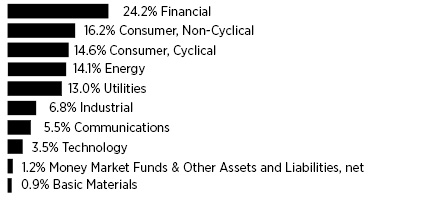
TrueShares ESG Active Opportunities ETF
Schedule of Investments
December 31, 2022
Sector Diversification *
* | Percentages are stated as a percent of net assets. |
| | Shares | | | Value | |
COMMON STOCKS — 95.1% | | | | | | | | |
Apparel — 1.8% | | | | | | | | |
NIKE, Inc. - Class B | | | 1,016 | | | $ | 118,882 | |
| | | | | | | | | |
Auto Manufacturers — 2.2% | | | | | | | | |
Tesla, Inc. (a) | | | 1,150 | | | | 141,657 | |
| | | | | | | | | |
Banks — 3.5% | | | | | | | | |
JPMorgan Chase & Co. | | | 912 | | | | 122,299 | |
Truist Financial Corp. | | | 2,235 | | | | 96,172 | |
| | | | | | | | 218,471 | |
Beverages — 1.8% | | | | | | | | |
PepsiCo, Inc. | | | 640 | | | | 115,622 | |
| | | | | | | | | |
Biotechnology — 1.6% | | | | | | | | |
Amgen, Inc. | | | 184 | | | | 48,326 | |
Gilead Sciences, Inc. | | | 601 | | | | 51,596 | |
| | | | | | | | 99,922 | |
Chemicals — 1.8% | | | | | | | | |
International Flavors & Fragrances, Inc. | | | 1,064 | | | | 111,550 | |
| | | | | | | | | |
Commercial Services — 3.5% | | | | | | | | |
Block, Inc. (a) | | | 818 | | | | 51,403 | |
Moody’s Corp. | | | 192 | | | | 53,495 | |
PayPal Holdings, Inc. (a) | | | 565 | | | | 40,239 | |
S&P Global, Inc. | | | 232 | | | | 77,707 | |
| | | | | | | | 222,844 | |
Computers — 2.8% | | | | | | | | |
Apple, Inc. | | | 1,383 | | | | 179,693 | |
| | | | | | | | | |
Cosmetics & Personal Care — 0.6% | | | | | | | | |
Colgate-Palmolive Co. | | | 439 | | | | 34,589 | |
| | | | | | | | | |
Distribution & Wholesale — 3.5% | | | | | | | | |
WW Grainger, Inc. | | | 397 | | | | 220,831 | |
| | | | | | | | | |
| | Shares | | | Value | |
Diversified Financial Services — 6.2% | | | | | | | | |
American Express Co. | | | 1,152 | | | $ | 170,207 | |
BlackRock, Inc. | | | 136 | | | | 96,374 | |
Mastercard, Inc. - Class A | | | 360 | | | | 125,183 | |
| | | | | | | | 391,764 | |
Electric — 1.1% | | | | | | | | |
Eversource Energy | | | 832 | | | | 69,755 | |
| | | | | | | | | |
Energy, Alternate Sources — 4.6% | | | | | | | | |
Enphase Energy, Inc. (a) | | | 1,103 | | | | 292,251 | |
| | | | | | | | | |
Food — 2.9% | | | | | | | | |
Sysco Corp. | | | 2,390 | | | | 182,715 | |
| | | | | | | | | |
Healthcare Products — 4.1% | | | | | | | | |
Abbott Laboratories | | | 1,273 | | | | 139,763 | |
Thermo Fisher Scientific, Inc. | | | 222 | | | | 122,253 | |
| | | | | | | | 262,016 | |
Healthcare Services — 1.8% | | | | | | | | |
UnitedHealth Group, Inc. | | | 219 | | | | 116,109 | |
| | | | | | | | | |
Insurance — 2.4% | | | | | | | | |
The Allstate Corp. | | | 1,114 | | | | 151,058 | |
| | | | | | | | | |
Internet — 7.4% | | | | | | | | |
Alphabet, Inc. - Class A (a) | | | 1,867 | | | | 164,725 | |
Amazon.com, Inc. (a) | | | 1,032 | | | | 86,688 | |
Booking Holdings, Inc. (a) | | | 49 | | | | 98,749 | |
Netflix, Inc. (a) | | | 152 | | | | 44,822 | |
Uber Technologies, Inc. (a) | | | 3,043 | | | | 75,253 | |
| | | | | | | | 470,237 | |
Machinery Diversified — 3.3% | | | | | | | | |
Rockwell Automation, Inc. | | | 819 | | | | 210,950 | |
| | | | | | | | | |
Media — 1.5% | | | | | | | | |
The Walt Disney Co. (a) | | | 1,077 | | | | 93,570 | |
| | | | | | | | | |
Miscellaneous Manufacturing — 1.6% | | | | | | | | |
Illinois Tool Works, Inc. | | | 471 | | | | 103,761 | |
| | | | | | | | | |
Pharmaceuticals — 8.3% | | | | | | | | |
AbbVie, Inc. | | | 754 | | | | 121,854 | |
AmerisourceBergen Corp. | | | 1,095 | | | | 181,452 | |
Cardinal Health, Inc. | | | 1,277 | | | | 98,163 | |
Johnson & Johnson | | | 264 | | | | 46,636 | |
Merck & Co., Inc. | | | 449 | | | | 49,816 | |
Zoetis, Inc. | | | 192 | | | | 28,138 | |
| | | | | | | | 526,059 | |
The accompanying notes are an integral part of the financial statements.
11
TrueShares ESG Active Opportunities ETF
Schedule of Investments
December 31, 2022 (Continued)
| | Shares | | | Value | |
Real Estate — 0.5% | | | | | | | | |
CBRE Group, Inc. - Class A (a) | | | 426 | | | $ | 32,785 | |
| | | | | | | | | |
Retail — 8.1% | | | | | | | | |
Costco Wholesale Corp. | | | 383 | | | | 174,840 | |
Starbucks Corp. | | | 1,264 | | | | 125,389 | |
Target Corp. | | | 434 | | | | 64,683 | |
The Home Depot, Inc. | | | 234 | | | | 73,911 | |
Tractor Supply Co. | | | 336 | | | | 75,590 | |
| | | | | | | | 514,413 | |
Semiconductors — 5.7% | | | | | | | | |
Advanced Micro Devices, Inc. (a) | | | 941 | | | | 60,949 | |
Lam Research Corp. | | | 194 | | | | 81,538 | |
NVIDIA Corp. | | | 1,008 | | | | 147,309 | |
QUALCOMM, Inc. | | | 656 | | | | 72,121 | |
| | | | | | | | 361,917 | |
Software — 9.2% | | | | | | | | |
Adobe, Inc. (a) | | | 243 | | | | 81,777 | |
Electronic Arts, Inc. | | | 660 | | | | 80,639 | |
Intuit, Inc. | | | 184 | | | | 71,617 | |
Microsoft Corp. | | | 877 | | | | 210,321 | |
MSCI, Inc. | | | 265 | | | | 123,270 | |
Zoom Video Communications, Inc. - Class A (a) | | | 244 | | | | 16,529 | |
| | | | | | | | 584,153 | |
Telecommunications — 1.8% | | | | | | | | |
AT&T, Inc. | | | 2,876 | | | | 52,947 | |
Verizon Communications, Inc. | | | 1,586 | | | | 62,489 | |
| | | | | | | | 115,436 | |
Transportation — 1.5% | | | | | | | | |
Expeditors International of Washington, Inc. | | | 926 | | | | 96,230 | |
| | | | | | | | | |
TOTAL COMMON STOCKS (Cost $5,467,951) | | | | | | | 6,039,240 | |
| | Shares | | | Value | |
REAL ESTATE INVESTMENT TRUSTS — 3.6% | | | | | | | | |
AvalonBay Communities, Inc. | | | 561 | | | $ | 90,613 | |
Prologis, Inc. | | | 1,222 | | | | 137,756 | |
TOTAL REAL ESTATE INVESTMENT TRUSTS (Cost $244,634) | | | | | | | 228,369 | |
| | | | | | | | | |
MONEY MARKET FUNDS — 2.1% | | | | | | | | |
First American Treasury Obligations Fund - Class X, 4.18% (b) | | | 136,553 | | | | 136,553 | |
TOTAL MONEY MARKET FUNDS (Cost $136,553) | | | | | | | 136,553 | |
| | | | | | | | | |
TOTAL INVESTMENTS (Cost $5,849,138) — 100.8% | | | | | | | 6,404,162 | |
Other assets and liabilities, net — (0.8)% | | | | | | | (53,374 | ) |
TOTAL NET ASSETS — 100.0% | | | | | | $ | 6,350,788 | |
Percentages are stated as a percent of net assets.
(a) | Non-income producing security. |
(b) | The rate shown is the seven day yield at period end. |
The accompanying notes are an integral part of the financial statements.
12
TrueShares Low Volatility Equity Income ETF
Schedule of Investments
December 31, 2022
Sector Diversification *
* | Percentages are stated as a percent of net assets. |
| | Shares | | | Value | |
COMMON STOCKS — 98.0% | | | | | | | | |
Aerospace & Defense — 7.9% | | | | | | | | |
Lockheed Martin Corp. | | | 7,040 | | | $ | 3,424,890 | |
Raytheon Technologies Corp. | | | 27,148 | | | | 2,739,776 | |
| | | | | | | | 6,164,666 | |
Agriculture — 10.6% | | | | | | | | |
Altria Group, Inc. | | | 63,227 | | | | 2,890,106 | |
British American Tobacco PLC - ADR (a) | | | 57,301 | | | | 2,290,894 | |
Philip Morris International, Inc. | | | 30,472 | | | | 3,084,071 | |
| | | | | | | | 8,265,071 | |
Banks — 8.4% | | | | | | | | |
JPMorgan Chase & Co. | | | 19,981 | | | | 2,679,452 | |
The PNC Financial Services Group, Inc. | | | 14,962 | | | | 2,363,098 | |
U.S. Bancorp | | | 35,862 | | | | 1,563,942 | |
| | | | | | | | 6,606,492 | |
Electric — 8.6% | | | | | | | | |
American Electric Power Co., Inc. | | | 35,547 | | | | 3,375,187 | |
FirstEnergy Corp. | | | 80,389 | | | | 3,371,515 | |
| | | | | | | | 6,746,702 | |
Healthcare Products — 2.5% | | | | | | | | |
Medtronic PLC (a) | | | 25,390 | | | | 1,973,311 | |
| | | | | | | | | |
Healthcare Services — 4.9% | | | | | | | | |
UnitedHealth Group, Inc. | | | 7,170 | | | | 3,801,390 | |
| | | | | | | | | |
Insurance — 1.2% | | | | | | | | |
Aflac, Inc. | | | 12,579 | | | | 904,933 | |
| | | | | | | | | |
Internet — 3.8% | | | | | | | | |
Gen Digital, Inc. | | | 138,151 | | | | 2,960,576 | |
| | | | | | | | | |
Oil & Gas — 15.8% | | | | | | | | |
Chevron Corp. | | | 17,734 | | | | 3,183,076 | |
Coterra Energy, Inc. | | | 95,687 | | | | 2,351,030 | |
Devon Energy Corp. | | | 34,185 | | | | 2,102,719 | |
Exxon Mobil Corp. | | | 42,680 | | | | 4,707,604 | |
| | | | | | | | 12,344,429 | |
| | Shares | | | Value | |
Pharmaceuticals — 12.4% | | | | | | | | |
AbbVie, Inc. | | | 22,479 | | | $ | 3,632,831 | |
Johnson & Johnson | | | 19,496 | | | | 3,443,968 | |
Viatris, Inc. | | | 239,876 | | | | 2,669,820 | |
| | | | | | | | 9,746,619 | |
Pipelines — 5.3% | | | | | | | | |
Enbridge, Inc. (a) | | | 53,857 | | | | 2,105,809 | |
Kinder Morgan, Inc. | | | 115,154 | | | | 2,081,984 | |
| | | | | | | | 4,187,793 | |
Retail — 6.2% | | | | | | | | |
Genuine Parts Co. | | | 19,879 | | | | 3,449,206 | |
Target Corp. | | | 9,483 | | | | 1,413,346 | |
| | | | | | | | 4,862,552 | |
Telecommunications — 8.5% | | | | | | | | |
AT&T, Inc. | | | 181,997 | | | | 3,350,565 | |
Verizon Communications, Inc. | | | 83,570 | | | | 3,292,658 | |
| | | | | | | | 6,643,223 | |
Transportation — 1.9% | | | | | | | | |
Union Pacific Corp. | | | 3,531 | | | | 731,164 | |
United Parcel Service, Inc. - Class B | | | 4,458 | | | | 774,979 | |
| | | | | | | | 1,506,143 | |
TOTAL COMMON STOCKS (Cost $71,892,466) | | | | | | | 76,713,900 | |
| | | | | | | | | |
MONEY MARKET FUNDS — 5.5% | | | | | | | | |
First American Treasury Obligations Fund - Class X, 4.18% (b) | | | 4,294,571 | | | | 4,294,571 | |
TOTAL MONEY MARKET FUNDS (Cost $4,294,571) | | | | | | | 4,294,571 | |
| | | | | | | | | |
TOTAL INVESTMENTS (Cost $76,187,037) — 103.5% | | | | | | | 81,008,471 | |
Other assets and liabilities, net — (3.5)% | | | | | | | (2,737,169 | ) |
TOTAL NET ASSETS — 100.0% | | | | | | $ | 78,271,302 | |
Percentages are stated as a percent of net assets.
ADR — American Depositary Receipt
PLC — Public Limited Company
(a) | Foreign issued security. |
(b) | The rate shown is the seven day yield at period end. |
The accompanying notes are an integral part of the financial statements.
13
TrueShares Eagle Global Renewable Energy Income ETF
Schedule of Investments
December 31, 2022
Sector Diversification *

* | Percentages are stated as a percent of net assets. |
| | Shares | | | Value | |
COMMON STOCKS — 96.1% | | | | | | | | |
Electric — 91.5% (c) | | | | | | | | |
AGL Energy Ltd. (b) | | | 8,848 | | | $ | 48,615 | |
Atlantica Sustainable Infrastructure PLC (b) | | | 1,840 | | | | 47,656 | |
Boralex, Inc. - Class A (a)(b) | | | 1,724 | | | | 50,956 | |
Brookfield Renewable Corp. - Class A (b) | | | 2,112 | | | | 58,164 | |
Clearway Energy, Inc. - Class C | | | 2,196 | | | | 69,987 | |
EDP - Energias de Portugal SA (b) | | | 31,116 | | | | 155,082 | |
Electric Power Development Co. Ltd. (b) | | | 3,114 | | | | 49,733 | |
Endesa SA (b) | | | 3,316 | | | | 62,597 | |
Enel SpA (b) | | | 21,654 | | | | 116,592 | |
Fortum Oyj (b) | | | 5,284 | | | | 87,898 | |
Iberdrola SA (b) | | | 10,066 | | | | 117,772 | |
IDACORP, Inc. | | | 580 | | | | 62,553 | |
Mercury NZ Ltd. (b) | | | 13,744 | | | | 48,517 | |
National Grid PLC (b) | | | 5,060 | | | | 61,014 | |
NextEra Energy, Inc. | | | 3,524 | | | | 294,606 | |
Northland Power, Inc. (b) | | | 2,668 | | | | 73,163 | |
Ormat Technologies, Inc. | | | 820 | | | | 70,914 | |
Orsted AS (b) | | | 1,612 | | | | 146,493 | |
PG&E Corp. (a) | | | 3,049 | | | | 49,577 | |
RWE AG (b) | | | 5,152 | | | | 229,366 | |
SSE PLC (b) | | | 5,627 | | | | 116,464 | |
The AES Corp. | | | 6,168 | | | | 177,392 | |
TransAlta Corp. (b) | | | 5,743 | | | | 51,365 | |
| | | | | | | | 2,246,476 | |
Energy, Alternate Sources — 4.6% | | | | | | | | |
Enviva, Inc. | | | 1,064 | | | | 56,360 | |
NextEra Energy Partners LP | | | 792 | | | | 55,511 | |
| | | | | | | | 111,871 | |
TOTAL COMMON STOCKS (Cost $2,389,180) | | | | | | | 2,358,347 | |
| | Shares | | | Value | |
REAL ESTATE INVESTMENT TRUSTS — 1.8% | | | | | | | | |
Hannon Armstrong Sustainable Infrastructure Capital, Inc. | | | 1,576 | | | $ | 45,673 | |
TOTAL REITS (Cost $50,744) | | | | | | | 45,673 | |
| | | | | | | | | |
MONEY MARKET FUNDS — 8.0% | | | | | | | | |
First American Treasury Obligations Fund - Class X, 4.18% (d) | | | 196,750 | | | | 196,750 | |
TOTAL MONEY MARKET FUNDS (Cost $196,750) | | | | | | | 196,750 | |
| | | | | | | | | |
TOTAL INVESTMENTS (Cost $2,636,674) — 105.9% | | | | | | | 2,600,770 | |
Other assets and liabilities, net — (5.9)% | | | | | | | (145,501 | ) |
TOTAL NET ASSETS — 100.0% | | | | | | $ | 2,455,269 | |
Percentages are stated as a percent of net assets.
PLC — Public Limited Company
(a) | Non-income producing security. |
(b) | Foreign issued security. |
(c) | To the extent the Fund invests more heavily in particular sectors of the economy, its performance will be especially sensitive to developments that significantly affect those sectors. |
(d) | The rate shown is the seven day yield at period end. |
COUNTRY | | Percentage of
Net Assets | |
United States | | | 35.9 | % |
Canada | | | 9.5 | % |
Germany | | | 9.3 | % |
United Kingdom | | | 9.2 | % |
Spain | | | 7.4 | % |
Portugal | | | 6.3 | % |
Denmark | | | 6.0 | % |
Italy | | | 4.7 | % |
Finland | | | 3.6 | % |
Japan | | | 2.0 | % |
Australia | | | 2.0 | % |
New Zealand | | | 2.0 | % |
Total Country | | | 97.9 | % |
MONEY MARKET FUNDS | | | 8.0 | % |
TOTAL INVESTMENTS | | | 105.9 | % |
Other assets and liabilities, net | | | (5.9 | )% |
NET ASSETS | | | 100.0 | % |
The accompanying notes are an integral part of the financial statements.
14
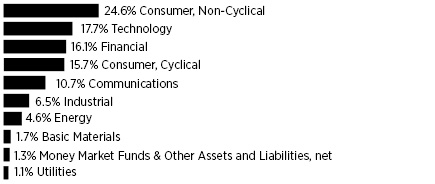
RiverNorth Patriot ETF
Schedule of Investments
December 31, 2022
Sector Diversification *
* | Percentages are stated as a percent of net assets. |
| | Shares | | | Value | |
COMMON STOCKS — 86.3% | | | | | | | | |
Advertising — 0.3% | | | | | | | | |
The Trade Desk, Inc. - Class A (a) | | | 228 | | | $ | 10,221 | |
| | | | | | | | | |
Agriculture — 0.5% | | | | | | | | |
Altria Group, Inc. | | | 370 | | | | 16,913 | |
| | | | | | | | | |
Airlines — 0.4% | | | | | | | | |
Southwest Airlines Co. (a) | | | 433 | | | | 14,579 | |
| | | | | | | | | |
Banks — 7.4% | | | | | | | | |
Bank OZK | | | 143 | | | | 5,729 | |
BOK Financial Corp. | | | 81 | | | | 8,407 | |
Citizens Financial Group, Inc. | | | 213 | | | | 8,386 | |
Comerica, Inc. | | | 98 | | | | 6,551 | |
Commerce Bancshares, Inc. | | | 110 | | | | 7,505 | |
Cullen/Frost Bankers, Inc. | | | 52 | | | | 6,952 | |
East West Bancorp, Inc. | | | 105 | | | | 6,919 | |
Fifth Third Bancorp | | | 221 | | | | 7,251 | |
First Citizens BancShares, Inc. - Class A | | | 9 | | | | 6,825 | |
First Financial Bankshares, Inc. | | | 168 | | | | 5,779 | |
First Horizon Corp. | | | 308 | | | | 7,546 | |
First Republic Bank | | | 53 | | | | 6,460 | |
Glacier Bancorp, Inc. | | | 140 | | | | 6,919 | |
Huntington Bancshares, Inc. | | | 546 | | | | 7,699 | |
KeyCorp | | | 442 | | | | 7,700 | |
M&T Bank Corp. | | | 40 | | | | 5,802 | |
Old National Bancorp | | | 333 | | | | 5,987 | |
Pinnacle Financial Partners, Inc. | | | 87 | | | | 6,386 | |
Prosperity Bancshares, Inc. | | | 105 | | | | 7,631 | |
Regions Financial Corp. | | | 343 | | | | 7,395 | |
Signature Bank of New York | | | 47 | | | | 5,415 | |
SouthState Corp. | | | 91 | | | | 6,949 | |
SVB Financial Group (a) | | | 21 | | | | 4,833 | |
Synovus Financial Corp. | | | 190 | | | | 7,135 | |
The PNC Financial Services Group, Inc. | | | 58 | | | | 9,161 | |
| | Shares | | | Value | |
Banks (continued) | | | | | | | | |
Truist Financial Corp. | | | 200 | | | $ | 8,606 | |
United Bankshares, Inc. | | | 153 | | | | 6,195 | |
U.S. Bancorp | | | 211 | | | | 9,202 | |
Valley National Bancorp | | | 642 | | | | 7,261 | |
Webster Financial Corp. | | | 157 | | | | 7,432 | |
Wells Fargo & Co. | | | 217 | | | | 8,960 | |
Western Alliance Bancorp | | | 103 | | | | 6,135 | |
Wintrust Financial Corp. | | | 68 | | | | 5,747 | |
Zions Bancorp NA | | | 133 | | | | 6,538 | |
| | | | | | | | 239,398 | |
Beverages — 0.4% | | | | | | | | |
Constellation Brands, Inc. - Class A | | | 59 | | | | 13,673 | |
| | | | | | | | | |
Biotechnology — 1.3% | | | | | | | | |
Ionis Pharmaceuticals, Inc. (a) | | | 326 | | | | 12,313 | |
Sarepta Therapeutics, Inc. (a) | | | 126 | | | | 16,327 | |
Seagen, Inc. (a) | | | 100 | | | | 12,851 | |
| | | | | | | | 41,491 | |
Building Materials — 2.3% | | | | | | | | |
Builders FirstSource, Inc. (a) | | | 253 | | | | 16,415 | |
Martin Marietta Materials, Inc. | | | 44 | | | | 14,871 | |
MDU Resources Group, Inc. | | | 495 | | | | 15,018 | |
Trex Co., Inc. (a) | | | 280 | | | | 11,852 | |
Vulcan Materials Co. | | | 89 | | | | 15,585 | |
| | | | | | | | 73,741 | |
Commercial Services — 2.6% | | | | | | | | |
ADT, Inc. | | | 1,473 | | | | 13,360 | |
Affirm Holdings, Inc. (a) | | | 276 | | | | 2,669 | |
Block, Inc. (a) | | | 128 | | | | 8,044 | |
Booz Allen Hamilton Holding Corp. | | | 148 | | | | 15,469 | |
HealthEquity, Inc. (a) | | | 192 | | | | 11,835 | |
Paylocity Holding Corp. (a) | | | 58 | | | | 11,267 | |
R1 RCM, Inc. (a) | | | 739 | | | | 8,092 | |
Toast, Inc. - Class A (a) | | | 767 | | | | 13,829 | |
| | | | | | | | 84,565 | |
Computers — 0.9% | | | | | | | | |
CACI International, Inc. - Class A (a) | | | 51 | | | | 15,330 | |
Science Applications International Corp. | | | 136 | | | | 15,087 | |
| | | | | | | | 30,417 | |
Distribution & Wholesale — 0.4% | | | | | | | | |
SiteOne Landscape Supply, Inc. (a) | | | 117 | | | | 13,726 | |
| | | | | | | | | |
Diversified Financial Services — 2.8% | | | | | | | | |
Ally Financial, Inc. | | | 249 | | | | 6,088 | |
Ameriprise Financial, Inc. | | | 28 | | | | 8,718 | |
Apollo Global Management, Inc. | | | 145 | | | | 9,249 | |
Capital One Financial Corp. | | | 77 | | | | 7,158 | |
Cboe Global Markets, Inc. | | | 61 | | | | 7,654 | |
The accompanying notes are an integral part of the financial statements.
15
RiverNorth Patriot ETF
Schedule of Investments
December 31, 2022 (Continued)
| | Shares | | | Value | |
Diversified Financial Services (continued) | | | | | | | | |
Credit Acceptance Corp. (a) | | | 16 | | | $ | 7,590 | |
Discover Financial Services | | | 78 | | | | 7,631 | |
LPL Financial Holdings, Inc. | | | 33 | | | | 7,134 | |
SoFi Technologies, Inc. (a) | | | 1,069 | | | | 4,928 | |
Synchrony Financial | | | 252 | | | | 8,281 | |
The Charles Schwab Corp. | | | 121 | | | | 10,074 | |
T. Rowe Price Group, Inc. | | | 66 | | | | 7,198 | |
| | | | | | | | 91,703 | |
Electric — 11.4% |
Alliant Energy Corp. | | | 217 | | | | 11,981 | |
Ameren Corp. | | | 145 | | | | 12,894 | |
American Electric Power Co., Inc. | | | 132 | | | | 12,533 | |
Avangrid, Inc. | | | 281 | | | | 12,077 | |
CenterPoint Energy, Inc. | | | 413 | | | | 12,386 | |
CMS Energy Corp. | | | 199 | | | | 12,603 | |
Consolidated Edison, Inc. | | | 135 | | | | 12,867 | |
Constellation Energy Corp. | | | 148 | | | | 12,759 | |
Dominion Energy, Inc. | | | 187 | | | | 11,467 | |
DTE Energy Co. | | | 102 | | | | 11,988 | |
Duke Energy Corp. | | | 141 | | | | 14,522 | |
Edison International | | | 200 | | | | 12,724 | |
Entergy Corp. | | | 116 | | | | 13,050 | |
Evergy, Inc. | | | 197 | | | | 12,397 | |
Eversource Energy | | | 149 | | | | 12,492 | |
Exelon Corp. | | | 310 | | | | 13,401 | |
FirstEnergy Corp. | | | 323 | | | | 13,547 | |
IDACORP, Inc. | | | 104 | | | | 11,216 | |
NextEra Energy, Inc. | | | 172 | | | | 14,379 | |
NRG Energy, Inc. | | | 313 | | | | 9,960 | |
OGE Energy Corp. | | | 322 | | | | 12,735 | |
PG&E Corp. (a) | | | 986 | | | | 16,032 | |
Pinnacle West Capital Corp. | | | 181 | | | | 13,763 | |
PPL Corp. | | | 456 | | | | 13,324 | |
Public Service Enterprise Group, Inc. | | | 207 | | | | 12,683 | |
The Southern Co. | | | 194 | | | | 13,854 | |
Vistra Corp. | | | 562 | | | | 13,038 | |
WEC Energy Group, Inc. | | | 130 | | | | 12,189 | |
Xcel Energy, Inc. | | | 180 | | | | 12,620 | |
| | | | | | | | 371,481 | |
Energy, Alternate Sources — 0.3% | | | | | | | | |
Sunrun, Inc. (a) | | | 403 | | | | 9,680 | |
| | | | | | | | | |
Engineering & Construction — 0.5% | | | | | | | | |
MasTec, Inc. (a) | | | 192 | | | | 16,383 | |
| | | | | | | | | |
Entertainment — 1.0% | | | | | | | | |
Caesars Entertainment, Inc. (a) | | | 398 | | | | 16,557 | |
| | Shares | | | Value | |
Entertainment (continued) | | | | | | | | |
Churchill Downs, Inc. | | | 75 | | | $ | 15,857 | |
| | | | | | | | 32,414 | |
Environmental Control — 0.8% | | | | | | | | |
Republic Services, Inc. | | | 98 | | | | 12,641 | |
Waste Management, Inc. | | | 93 | | | | 14,590 | |
| | | | | | | | 27,231 | |
Food — 2.3% | | | | | | | | |
Albertsons Cos., Inc. - Class A | | | 550 | | | | 11,407 | |
Flowers Foods, Inc. | | | 481 | | | | 13,824 | |
Performance Food Group Co. (a) | | | 308 | | | | 17,984 | |
The Kroger Co. | | | 307 | | | | 13,686 | |
US Foods Holding Corp. (a) | | | 508 | | | | 17,282 | |
| | | | | | | | 74,183 | |
Gas — 1.2% | | | | | | | | |
Atmos Energy Corp. | | | 115 | | | | 12,888 | |
National Fuel Gas Co. | | | 219 | | | | 13,863 | |
NiSource, Inc. | | | 459 | | | | 12,586 | |
| | | | | | | | 39,337 | |
Healthcare Services — 6.2% | | | | | | | | |
Acadia Healthcare Co., Inc. (a) | | | 179 | | | | 14,735 | |
agilon health, Inc. (a) | | | 587 | | | | 9,474 | |
Centene Corp. (a) | | | 176 | | | | 14,434 | |
Chemed Corp. | | | 31 | | | | 15,823 | |
Elevance Health, Inc. | | | 34 | | | | 17,441 | |
HCA Healthcare, Inc. | | | 82 | | | | 19,677 | |
Humana, Inc. | | | 31 | | | | 15,878 | |
LHC Group, Inc. (a) | | | 74 | | | | 11,965 | |
Molina Healthcare, Inc. (a) | | | 42 | | | | 13,869 | |
Oak Street Health, Inc. (a) | | | 531 | | | | 11,422 | |
Quest Diagnostics, Inc. | | | 111 | | | | 17,365 | |
Signify Health, Inc. - Class A (a) | | | 421 | | | | 12,066 | |
Tenet Healthcare Corp. (a) | | | 270 | | | | 13,173 | |
UnitedHealth Group, Inc. | | | 30 | | | | 15,906 | |
| | | | | | | | 203,228 | |
Home Builders — 2.0% | | | | | | | | |
D.R. Horton, Inc. | | | 201 | | | | 17,917 | |
Lennar Corp. - Class A | | | 185 | | | | 16,742 | |
NVR, Inc. (a) | | | 3 | | | | 13,838 | |
PulteGroup, Inc. | | | 362 | | | | 16,482 | |
| | | | | | | | 64,979 | |
Household Products & Wares — 0.5% | | | | | | | | |
Reynolds Consumer Products, Inc. | | | 506 | | | | 15,170 | |
| | | | | | | | | |
Insurance — 3.9% | | | | | | | | |
American Financial Group, Inc. | | | 59 | | | | 8,099 | |
Brown & Brown, Inc. | | | 119 | | | | 6,779 | |
Cincinnati Financial Corp. | | | 79 | | | | 8,089 | |
Equitable Holdings, Inc. | | | 267 | | | | 7,663 | |
The accompanying notes are an integral part of the financial statements.
16
RiverNorth Patriot ETF
Schedule of Investments
December 31, 2022 (Continued)
| | Shares | | | Value | |
Insurance (continued) | | | | | | | | |
Erie Indemnity Co. - Class A | | | 33 | | | $ | 8,208 | |
F&G Annuities & Life, Inc. (a) | | | 13 | | | | 260 | |
Fidelity National Financial, Inc. | | | 203 | | | | 7,637 | |
Globe Life, Inc. | | | 72 | | | | 8,680 | |
Kinsale Capital Group, Inc. | | | 29 | | | | 7,584 | |
Lincoln National Corp. | | | 161 | | | | 4,946 | |
Loews Corp. | | | 143 | | | | 8,341 | |
Markel Corp. (a) | | | 7 | | | | 9,222 | |
Old Republic International Corp. | | | 345 | | | | 8,332 | |
The Allstate Corp. | | | 58 | | | | 7,865 | |
The Hartford Financial Services Group, Inc. | | | 116 | | | | 8,796 | |
The Progressive Corp. | | | 73 | | | | 9,469 | |
Voya Financial, Inc. | | | 120 | | | | 7,379 | |
| | | | | | | | 127,349 | |
Internet — 1.7% | | | | | | | | |
DoorDash, Inc. - Class A (a) | | | 265 | | | | 12,937 | |
Lyft, Inc. - Class A (a) | | | 977 | | | | 10,767 | |
Robinhood Markets, Inc. - Class A (a) | | | 743 | | | | 6,048 | |
Roku, Inc. (a) | | | 229 | | | | 9,320 | |
Zillow Group, Inc. - Class C (a) | | | 463 | | | | 14,913 | |
| | | | | | | | 53,985 | |
Investment Companies — 0.4% |
Ares Capital Corp. | | | 415 | | | | 7,665 | |
FS KKR Capital Corp. | | | 308 | | | | 5,390 | |
| | | | | | | | 13,055 | |
Iron & Steel — 0.6% | | | | | | | | |
Steel Dynamics, Inc. | | | 194 | | | | 18,953 | |
| | | | | | | | | |
Leisure Time — 0.5% | | | | | | | | |
Planet Fitness, Inc. - Class A (a) | | | 209 | | | | 16,469 | |
| | | | | | | | | |
Lodging — 0.9% | | | | | | | | |
Boyd Gaming Corp. | | | 254 | | | | 13,851 | |
Choice Hotels International, Inc. | | | 128 | | | | 14,418 | |
| | | | | | | | 28,269 | |
Media — 2.5% | | | | | | | | |
Cable One, Inc. | | | 15 | | | | 10,678 | |
Charter Communications, Inc. - Class A (a) | | | 50 | | | | 16,955 | |
Fox Corp. - Class A | | | 436 | | | | 13,241 | |
Liberty Broadband Corp. - Class C (a) | | | 179 | | | | 13,652 | |
Nexstar Media Group, Inc. - Class A | | | 80 | | | | 14,002 | |
Sirius XM Holdings, Inc. | | | 2,341 | | | | 13,672 | |
| | | | | | | | 82,200 | |
Mining — 0.3% | | | | | | | | |
MP Materials Corp. (a) | | | 431 | | | | 10,465 | |
| | Shares | | | Value | |
Oil & Gas — 8.1% | | | | | | | | |
Antero Resources Corp. (a) | | | 456 | | | $ | 14,131 | |
Chesapeake Energy Corp. | | | 149 | | | | 14,061 | |
Chord Energy Corp. | | | 109 | | | | 14,912 | |
Civitas Resources, Inc. | | | 226 | | | | 13,092 | |
Coterra Energy, Inc. | | | 531 | | | | 13,047 | |
Devon Energy Corp. | | | 243 | | | | 14,947 | |
Diamondback Energy, Inc. | | | 120 | | | | 16,414 | |
EOG Resources, Inc. | | | 144 | | | | 18,651 | |
EQT Corp. | | | 341 | | | | 11,536 | |
Marathon Oil Corp. | | | 635 | | | | 17,190 | |
Marathon Petroleum Corp. | | | 148 | | | | 17,226 | |
Matador Resources Co. | | | 297 | | | | 17,000 | |
PDC Energy, Inc. | | | 257 | | | | 16,314 | |
Pioneer Natural Resources Co. | | | 73 | | | | 16,673 | |
Range Resources Corp. | | | 572 | | | | 14,311 | |
SM Energy Co. | | | 349 | | | | 12,156 | |
Southwestern Energy Co. (a) | | | 2,225 | | | | 13,016 | |
Texas Pacific Land Corp. | | | 4 | | | | 9,377 | |
| | | | | | | | 264,054 | |
Pharmaceuticals — 2.4% | | | | | | | | |
Cardinal Health, Inc. | | | 208 | | | | 15,989 | |
Cigna Corp. | | | 55 | | | | 18,224 | |
CVS Health Corp. | | | 156 | | | | 14,538 | |
Neurocrine Biosciences, Inc. (a) | | | 135 | | | | 16,124 | |
Option Care Health, Inc. (a) | | | 403 | | | | 12,126 | |
| | | | | | | | 77,001 | |
Pipelines — 2.4% | | | | | | | | |
DT Midstream, Inc. | | | 236 | | | | 13,041 | |
Kinder Morgan, Inc. | | | 831 | | | | 15,025 | |
ONEOK, Inc. | | | 265 | | | | 17,411 | |
Targa Resources Corp. | | | 232 | | | | 17,052 | |
The Williams Cos., Inc. | | | 476 | | | | 15,660 | |
| | | | | | | | 78,189 | |
Private Equity — 0.5% | | | | | | | | |
Ares Management Corp. - Class A | | | 111 | | | | 7,597 | |
Blackstone, Inc. | | | 104 | | | | 7,716 | |
| | | | | | | | 15,313 | |
Retail — 9.4% | | | | | | | | |
AutoNation, Inc. (a) | | | 128 | | | | 13,734 | |
BJ’s Wholesale Club Holdings, Inc. (a) | | | 183 | | | | 12,107 | |
Burlington Stores, Inc. (a) | | | 118 | | | | 23,926 | |
CarMax, Inc. (a) | | | 169 | | | | 10,291 | |
Casey’s General Stores, Inc. | | | 68 | | | | 15,256 | |
Chipotle Mexican Grill, Inc. (a) | | | 9 | | | | 12,487 | |
Darden Restaurants, Inc. | | | 110 | | | | 15,216 | |
Dick’s Sporting Goods, Inc. | | | 126 | | | | 15,157 | |
Dollar General Corp. | | | 64 | | | | 15,760 | |
Five Below, Inc. (a) | | | 101 | | | | 17,864 | |
The accompanying notes are an integral part of the financial statements.
17
RiverNorth Patriot ETF
Schedule of Investments
December 31, 2022 (Continued)
| | Shares | | | Value | |
Retail (continued) | | | | | | | | |
Floor & Decor Holdings, Inc. - Class A (a) | | | 192 | | | $ | 13,369 | |
Lithia Motors, Inc. | | | 61 | | | | 12,489 | |
Murphy USA, Inc. | | | 51 | | | | 14,257 | |
O’Reilly Automotive, Inc. (a) | | | 20 | | | | 16,881 | |
RH (a) | | | 55 | | | | 14,695 | |
Ross Stores, Inc. | | | 164 | | | | 19,035 | |
Target Corp. | | | 102 | | | | 15,202 | |
Texas Roadhouse, Inc. | | | 159 | | | | 14,461 | |
Tractor Supply Co. | | | 73 | | | | 16,423 | |
Ulta Beauty, Inc. (a) | | | 35 | | | | 16,417 | |
| | | | | | | | 305,027 | |
Shipbuilding — 0.4% | | | | | | | | |
Huntington Ingalls Industries, Inc. | | | 60 | | | | 13,841 | |
| | | | | | | | | |
Software — 2.6% | | | | | | | | |
Bill.com Holdings, Inc. (a) | | | 106 | | | | 11,550 | |
Black Knight, Inc. (a) | | | 109 | | | | 6,731 | |
CCC Intelligent Solutions Holdings, Inc. (a) | | | 644 | | | | 5,603 | |
Intuit, Inc. | | | 38 | | | | 14,790 | |
Jack Henry & Associates, Inc. | | | 39 | | | | 6,847 | |
Paychex, Inc. | | | 121 | | | | 13,983 | |
Paycom Software, Inc. (a) | | | 42 | | | | 13,033 | |
Paycor HCM, Inc. (a) | | | 431 | | | | 10,546 | |
| | | | | | | | 83,083 | |
Telecommunications — 1.0% | | | | | | | | |
Frontier Communications Parent, Inc. (a) | | | 621 | | | | 15,823 | |
Verizon Communications, Inc. | | | 390 | | | | 15,366 | |
| | | | | | | | 31,189 | |
Transportation — 2.8% | | | | | | | | |
CSX Corp. | | | 560 | | | | 17,349 | |
JB Hunt Transport Services, Inc. | | | 84 | | | | 14,646 | |
Knight-Swift Transportation Holdings, Inc. | | | 279 | | | | 14,622 | |
Landstar System, Inc. | | | 84 | | | | 13,684 | |
Norfolk Southern Corp. | | | 64 | | | | 15,771 | |
Old Dominion Freight Line, Inc. | | | 55 | | | | 15,608 | |
| | | | | | | | 91,680 | |
Water — 0.4% | | | | | | | | |
Essential Utilities, Inc. | | | 291 | | | | 13,889 | |
| | | | | | | | | |
TOTAL COMMON STOCKS (Cost $3,044,092) | | | | | | | 2,808,524 | |
| | | | | | | | | |
PARTNERSHIPS — 3.7% | | | | | | | | |
Investment Companies — 0.5% | | | | | | | | |
Icahn Enterprises LP | | | 292 | | | | 14,790 | |
| | | | | | | | | |
Pipelines — 3.2% | | | | | | | | |
Cheniere Energy Partners LP | | | 259 | | | | 14,729 | |
DCP Midstream LP | | | 380 | | | | 14,740 | |
| | Shares | | | Value | |
Pipelines (continued) | | | | | | | | |
Energy Transfer LP | | | 1,290 | | | $ | 15,312 | |
Enterprise Products Partners LP | | | 651 | | | | 15,702 | |
Magellan Midstream Partners LP | | | 293 | | | | 14,712 | |
MPLX LP | | | 470 | | | | 15,435 | |
Western Midstream Partners LP | | | 568 | | | | 15,251 | |
| | | | | | | | 105,881 | |
TOTAL PARTNERSHIPS (Cost $102,357) | | | | | | | 120,671 | |
| | | | | | | | | |
REAL ESTATE INVESTMENT TRUSTS — 8.8% |
AGNC Investment Corp. | | | 764 | | | | 7,907 | |
Agree Realty Corp. | | | 81 | | | | 5,745 | |
Alexandria Real Estate Equities, Inc. | | | 52 | | | | 7,575 | |
American Homes 4 Rent - Class A | | | 217 | | | | 6,540 | |
Apartment Income REIT Corp. | | | 187 | | | | 6,416 | |
AvalonBay Communities, Inc. | | | 39 | | | | 6,299 | |
Boston Properties, Inc. | | | 96 | | | | 6,488 | |
Brixmor Property Group, Inc. | | | 389 | | | | 8,819 | |
Camden Property Trust | | | 60 | | | | 6,713 | |
Crown Castle International Corp. | | | 58 | | | | 7,867 | |
CubeSmart | | | 180 | | | | 7,245 | |
EastGroup Properties, Inc. | | | 49 | | | | 7,255 | |
Equity LifeStyle Properties, Inc. | | | 110 | | | | 7,106 | |
Equity Residential | | | 108 | | | | 6,372 | |
Essex Property Trust, Inc. | | | 30 | | | | 6,358 | |
Extra Space Storage, Inc. | | | 42 | | | | 6,182 | |
Federal Realty Investment Trust | | | 81 | | | | 8,184 | |
First Industrial Realty Trust, Inc. | | | 155 | | | | 7,480 | |
Gaming and Leisure Properties, Inc. | | | 157 | | | | 8,178 | |
Healthcare Realty Trust, Inc. | | | 338 | | | | 6,513 | |
Healthpeak Properties, Inc. | | | 308 | | | | 7,722 | |
Host Hotels & Resorts, Inc. | | | 448 | | | | 7,190 | |
Invitation Homes, Inc. | | | 208 | | | | 6,165 | |
Kilroy Realty Corp. | | | 136 | | | | 5,259 | |
Kimco Realty Corp. | | | 393 | | | | 8,324 | |
Lamar Advertising Co. - Class A | | | 86 | | | | 8,118 | |
Life Storage, Inc. | | | 66 | | | | 6,501 | |
Mid-America Apartment Communities, Inc. | | | 47 | | | | 7,379 | |
National Retail Properties, Inc. | | | 175 | | | | 8,008 | |
Prologis, Inc. | | | 68 | | | | 7,666 | |
Public Storage | | | 25 | | | | 7,005 | |
Regency Centers Corp. | | | 134 | | | | 8,375 | |
Rexford Industrial Realty, Inc. | | | 131 | | | | 7,158 | |
Simon Property Group, Inc. | | | 80 | | | | 9,398 | |
Spirit Realty Capital, Inc. | | | 191 | | | | 7,627 | |
STAG Industrial, Inc. | | | 193 | | | | 6,236 | |
STORE Capital Corp. | | | 226 | | | | 7,246 | |
UDR, Inc. | | | 174 | | | | 6,739 | |
The accompanying notes are an integral part of the financial statements.
18
RiverNorth Patriot ETF
Schedule of Investments
December 31, 2022 (Continued)
| | Shares | | | Value | |
REAL ESTATE INVESTMENT TRUSTS (continued) | | | | |
VICI Properties, Inc. | | | 232 | | | $ | 7,517 | |
Vornado Realty Trust | | | 241 | | | | 5,015 | |
TOTAL REAL ESTATE INVESTMENT TRUSTS (Cost $361,682) | | | | | | | 285,890 | |
| | | | | | | | | |
MONEY MARKET FUNDS — 2.5% | | | | | | | | |
First American Treasury Obligations Fund - Class X, 4.18% (b) | | | 82,374 | | | | 82,374 | |
TOTAL MONEY MARKET FUNDS (Cost $82,374) | | | | | | | 82,374 | |
| | | | | | | | | |
Total Investments (Cost $3,590,505) — 101.3% | | | | | | | 3,297,459 | |
Other assets and liabilities, net — (1.3)% | | | | | | | (42,430 | ) |
TOTAL NET ASSETS — 100.0% | | | | | | $ | 3,255,029 | |
Percentages are stated as a percent of net assets.
(a) | Non-income producing security. |
(b) | The rate shown is the seven day yield at period end. |
The accompanying notes are an integral part of the financial statements.
19
RiverNorth Enhanced Pre-Merger SPAC ETF
Schedule of Investments
December 31, 2022
Sector Diversification *
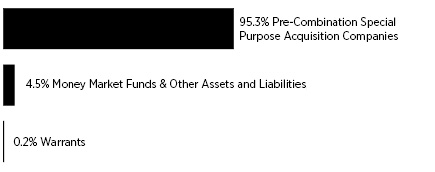
* | Percentages are stated as a percent of net assets. |
| | Shares | | | Value | |
COMMON STOCKS — 95.3% | | | | | | | | |
Pre-Combination Special Purpose Acquisition Companies — 95.3% (a) |
Apollo Strategic Growth Capital II - Class A (b) | | | 11,406 | | | $ | 114,288 | |
Ares Acquisition Corp. - Class A (b) | | | 8,684 | | | | 87,448 | |
Bite Acquisition Corp. | | | 7,602 | | | | 76,552 | |
Cascadia Acquisition Corp. - Class A | | | 13,387 | | | | 135,476 | |
CC Neuberger Principal Holdings III - Class A (b) | | | 7,566 | | | | 76,417 | |
CF Acquisition Corp. IV - Class A | | | 15,172 | | | | 154,148 | |
Churchill Capital Corp. V - Class A | | | 11,394 | | | | 113,256 | |
Churchill Capital Corp. VI - Class A | | | 11,418 | | | | 114,123 | |
Churchill Capital Corp. VII - Class A | | | 11,442 | | | | 114,077 | |
Conyers Park III Acquisition Corp. - Class A | | | 11,532 | | | | 114,052 | |
Direct Selling Acquisition Corp. - Class A | | | 11,500 | | | | 118,335 | |
FAST Acquisition Corp. II - Class A | | | 7,626 | | | | 76,336 | |
FinServ Acquisition Corp. II - Class A | | | 11,400 | | | | 114,570 | |
Fintech Evolution Acquisition Group - Tracking Stock (b) | | | 14,000 | | | | 140,980 | |
Fortress Capital Acquisition Corp. - Class A (b) | | | 7,560 | | | | 76,356 | |
Fusion Acquisition Corp. II - Class A | | | 11,400 | | | | 114,456 | |
Goal Acquisitions Corp. | | | 7,620 | | | | 76,657 | |
Gores Holdings IX, Inc. - Class A | | | 9,624 | | | | 95,470 | |
Graf Acquisition Corp. IV | | | 11,478 | | | | 114,206 | |
Hennessy Capital Investment Corp. VI - Class A | | | 7,722 | | | | 76,293 | |
Horizon Space Acquisition I Corp. - Tracking Stock (b) | | | 3,744 | | | | 37,814 | |
Jaws Hurricane Acquisition Corp. - Class A | | | 11,502 | | | | 115,020 | |
Jaws Juggernaut Acquisition Corp. - Class A (b) | | | 11,502 | | | | 115,595 | |
Jaws Mustang Acquisition Corp. - Class A (b) | | | 15,144 | | | | 153,030 | |
Live Oak Crestview Climate Acquisition Corp. - Class A | | | 7,734 | | | | 76,953 | |
Live Oak Mobility Acquisition Corp. - Class A | | | 15,270 | | | | 153,540 | |
New Vista Acquisition Corp. - Class A (b) | | | 13,302 | | | | 134,284 | |
| | Shares | | | Value | |
Pre-Combination Special Purpose Acquisition Companies (continued) |
OCA Acquisition Corp. - Class A | | | 14,948 | | | $ | 153,367 | |
Post Holdings Partnering Corp. - Class A | | | 11,514 | | | | 114,334 | |
Rice Acquisition Corp. II - Class A (b) | | | 11,430 | | | | 116,243 | |
Screaming Eagle Acquisition Corp. - Class A (b) | | | 13,584 | | | | 135,093 | |
SVF Investment Corp. - Class A (b) | | | 7,566 | | | | 76,492 | |
Tech and Energy Transition Corp. - Class A | | | 3,822 | | | | 38,335 | |
Twelve Seas Investment Co. II - Tracking Stock | | | 11,502 | | | | 115,595 | |
TOTAL COMMON STOCKS (Cost $3,575,033) | | | | | | | 3,639,191 | |
| | | | | | | | | |
WARRANTS — 0.2% (a) | | | | | | | | |
Apollo Strategic Growth Capital II - Class A, Expiration: December 2027, Exercise Price: $11.50 (b) | | | 1,592 | | | | 223 | |
Ares Acquisition Corp. - Class A, Expiration: December 2027, Exercise Price: $11.50 (b) | | | 838 | | | | 391 | |
Bite Acquisition Corp., Expiration: December 2027, Exercise Price: $11.50 | | | 2,531 | | | | 152 | |
Carney Technology Acquisition Corp. II, Expiration: November 2027, Exercise Price: $11.50 | | | 1,191 | | | | 83 | |
CC Neuberger Principal Holdings III, Expiration: December 2027, Exercise Price: $11.50 (b) | | | 497 | | | | 25 | |
CF Acquisition Corp. IV, Expiration: December 2025, Exercise Price: $11.50 | | | 2,314 | | | | 178 | |
Churchill Capital Corp. V - Class A, Expiration: October 2027, Exercise Price: $11.50 | | | 1,288 | | | | 104 | |
Churchill Capital Corp. VI - Class A, Expiration: December 2027, Exercise Price: $11.50 | | | 1,537 | | | | 92 | |
Churchill Capital Corp. VII, Expiration: February 2028, Exercise Price: $11.50 | | | 1,686 | | | | 83 | |
Conyers Park III Acquisition Corp., Expiration: August 2028, Exercise Price: $11.50 | | | 2,376 | | | | 354 | |
FAST Acquisition Corp. II - Class A, Expiration: March 2026, Exercise Price: $11.50 | | | 2,922 | | | | 1,958 | |
Fortress Capital Acquisition Corp. - Class A, Expiration: December 2027, Exercise Price: $11.50 (b) | | | 1,176 | | | | 5 | |
Goal Acquisitions Corp., Expiration: February 2026, Exercise Price: $11.50, | | | 3,104 | | | | 150 | |
Gores Holdings IX, Inc., Expiration: January 2029, Exercise Price: $11.50 | | | 1,047 | | | | 257 | |
Graf Acquisition Corp. IV, Expiration: May 2028, Exercise Price: $11.50 | | | 1,913 | | | | 162 | |
| | | | | | | | | |
The accompanying notes are an integral part of the financial statements.
20
RiverNorth Enhanced Pre-Merger SPAC ETF
Schedule of Investments
December 31, 2022 (Continued)
| | Shares | | | Value | |
WARRANTS (continued) | | | | | | | | |
Hennessy Capital Investment Corp. VI - Class A, Expiration: December 2027, Exercise Price: $11.50 | | | 1,731 | | | $ | 167 | |
Jaws Hurricane Acquisition Corp., Expiration: February 2023, Exercise Price: $11.50 | | | 1,694 | | | | 272 | |
Jaws Juggernaut Acquisition Corp., Expiration: February 2026, Exercise Price: $11.50 (b) | | | 1,979 | | | | 124 | |
Jaws Mustang Acquisition Corp., Expiration: January 2026, Exercise Price: $11.50 (b) | | | 2,243 | | | | 146 | |
Live Oak Crestview Climate Acquisition Corp., Expiration: March 2026, Exercise Price: $11.50 | | | 1,556 | | | | 280 | |
Live Oak Mobility Acquisition Corp., Expiration: March 2028, Exercise Price: $11.50 | | | 1,164 | | | | 163 | |
Post Holdings Partnering Corp., Expiration: February 2023, Exercise Price: $11.50 | | | 1,324 | | | | 106 | |
Rice Acquisition Corp. II, Expiration: March 2026, Exercise Price: $11.50 (b) | | | 1,197 | | | | 1,496 | |
Screaming Eagle Acquisition Corp. - Class A, Expiration: December 2027, Exercise Price: $11.50 (b) | | | 2,663 | | | | 628 | |
SVF Investment Corp. - Class A, Expiration: December 2027, Exercise Price: $11.50 (b) | | | 805 | | | | 20 | |
Tech and Energy Transition Corp., Expiration: December 2027, Exercise Price: $11.50 | | | 796 | | | | 26 | |
USHG Acquisition Corp. - Class A, Expiration: December 2028, Exercise Price: $11.50 | | | 1,266 | | | | 2 | |
TOTAL WARRANTS (Cost $10,224) | | | | | | | 7,647 | |
| | Shares | | | Value | |
MONEY MARKET FUNDS — 5.8% | | | | | | | | |
First American Treasury Obligations Fund - Class X, 4.18% (c) | | | 222,763 | | | $ | 222,763 | |
TOTAL MONEY MARKET FUNDS (Cost $222,763) | | | | | | | 222,763 | |
| | | | | | | | | |
TOTAL INVESTMENTS (Cost $3,808,020) — 101.3% | | | | | | | 3,869,601 | |
Other assets and liabilities, net — (1.3)% | | | | | | | (51,482 | ) |
TOTAL NET ASSETS — 100.0% | | | | | | $ | 3,818,119 | |
Percentages are stated as a percent of net assets.
(a) | Non-income producing security. |
(b) | Foreign issued security. |
(c) | The rate shown is the seven day yield at period end. |
COUNTRY | | Percentage of
Net Assets | |
United States | | | 62.1 | % |
Cayman Islands | | | 33.2 | %* |
Total Country | | | 95.3 | % |
WARRANTS | | | 0.2 | % |
MONEY MARKET FUNDS | | | 5.8 | % |
TOTAL INVESTMENTS | | | 101.3 | % |
Other assets and liabilities, net | | | (1.3 | )% |
NET ASSETS | | | 100.0 | % |
* | To the extent the Fund invests more heavily in particular countries, its performance will be especially sensitive to developments that significantly affect those countries. |
The accompanying notes are an integral part of the financial statements.
21
TrueShares ETFs
Statements of Assets and Liabilities
December 31, 2022
| | | TrueShares
Technology,
AI & Deep
Learning ETF | | | TrueShares
ESG Active
Opportunities
ETF | | | TrueShares Low
Volatility Equity
Income ETF | | | TrueShares
Eagle Global
Renewable
Energy
Income ETF | |
Assets | | | | | | | | | | | | | | | | |
Investments, at value(1) | | $ | 14,308,188 | | | $ | 6,404,162 | | | $ | 81,008,471 | | | $ | 2,600,770 | |
Foreign currency, at value(2) | | | — | | | | — | | | | — | | | | 19,276 | |
Receivable for investment securities sold | | | — | | | | — | | | | 990,043 | | | | — | |
Dividends and interest receivable | | | 528 | | | | 5,865 | | | | 191,278 | | | | 1,177 | |
Total assets | | | 14,308,716 | | | | 6,410,027 | | | | 82,189,792 | | | | 2,621,223 | |
| | | | | | | | | | | | | | | | | |
Liabilities | | | | | | | | | | | | | | | | |
Foreign currency payable(3) | | | — | | | | — | | | | — | | | | 15,893 | |
Payable to Adviser | | | 8,844 | | | | 3,259 | | | | 43,893 | | | | 940 | |
Payable for investment securities purchased | | | — | | | | — | | | | 3,165,934 | | | | 148,883 | |
Distributions payable | | | — | | | | 55,980 | | | | 708,663 | | | | 238 | |
Total liabilities | | | 8,844 | | | | 59,239 | | | | 3,918,490 | | | | 165,954 | |
Net Assets | | $ | 14,299,872 | | | $ | 6,350,788 | | | $ | 78,271,302 | | | $ | 2,455,269 | |
| | | | | | | | | | | | | | | | | |
Net Assets Consists of: | | | | | | | | | | | | | | | | |
Paid-in capital | | $ | 31,930,138 | | | $ | 5,885,577 | | | $ | 77,055,655 | | | $ | 2,493,755 | |
Total distributable earnings (accumulated losses) | | | (17,630,266 | ) | | | 465,211 | | | | 1,215,647 | | | | (38,486 | ) |
Net Assets | | $ | 14,299,872 | | | $ | 6,350,788 | | | $ | 78,271,302 | | | $ | 2,455,269 | |
| | | | | | | | | | | | | | | | | |
Shares of beneficial interest outstanding (unlimited number of shares authorized, no par value) | | | 625,000 | | | | 200,000 | | | | 2,700,000 | | | | 100,000 | |
Net Asset Value, redemption price and offering price per share | | $ | 22.88 | | | $ | 31.75 | | | | 28.99 | | | | 24.55 | |
| | | | | | | | | | | | | | | | | |
(1) Cost of investments | | $ | 27,977,961 | | | $ | 5,849,138 | | | $ | 76,187,037 | | | $ | 2,636,674 | |
(2) Cost of foreign currency | | | — | | | | — | | | | — | | | | 19,240 | |
(3) Cost of foreign currency payable | | | — | | | | — | | | | — | | | | 15,891 | |
The accompanying notes are an integral part of the financial statements.
22
TrueShares ETFs
Statements of Assets and Liabilities
December 31, 2022 (Continued)
| | | RiverNorth
Patriot ETF | | | RiverNorth
Enhanced
Pre-Merger
SPAC ETF | |
Assets | | | | | | | | |
Investments, at value(1) | | $ | 3,297,459 | | | $ | 3,869,601 | |
Cash | | | — | | | | 77,135 | |
Dividends and interest receivable | | | 8,902 | | | | 840 | |
Total assets | | | 3,306,361 | | | | 3,947,576 | |
| | | | | | | | | |
Liabilities | | | | | | | | |
Payable to Adviser | | | 1,993 | | | | 2,882 | |
Payable for investment securities purchased | | | — | | | | 118,220 | |
Distributions payable | | | 49,339 | | | | 8,355 | |
Total liabilities | | | 51,332 | | | | 129,457 | |
Net Assets | | $ | 3,255,029 | | | $ | 3,818,119 | |
| | | | | | | | | |
Net Assets Consists of: | | | | | | | | |
Paid-in capital | | $ | 3,739,933 | | | $ | 3,747,726 | |
Total distributable earnings (accumulated losses) | | | (484,904 | ) | | | 70,393 | |
Net Assets | | $ | 3,255,029 | | | $ | 3,818,119 | |
| | | | | | | | | |
Shares of beneficial interest outstanding (unlimited number of shares authorized, no par value) | | | 150,000 | | | | 150,000 | |
Net Asset Value, redemption price and offering price per share | | $ | 21.70 | | | $ | 25.45 | |
| | | | | | | | | |
(1) Cost of investments | | $ | 3,590,505 | | | $ | 3,808,020 | |
The accompanying notes are an integral part of the financial statements.
23
TrueShares ETFs
Statements of Operations
For the Year or Period Ended December 31, 2022
| | | TrueShares
Technology,
AI & Deep
Learning ETF | | | TrueShares
ESG Active
Opportunities
ETF | | | TrueShares Low
Volatility Equity
Income ETF | | | TrueShares
Eagle Global
Renewable
Energy Income
ETF(1) | |
Investment Income | | | | | | | | | | | | | | | | |
Dividend income (net of withholding taxes and issuance fees of $-, $-, $31,992 and $29, respectively) | | $ | 5,363 | | | $ | 99,081 | | | $ | 2,426,463 | | | $ | 250 | |
Interest income | | | 12,041 | | | | 1,522 | | | | 44,656 | | | | 419 | |
Total investment income | | | 17,404 | | | | 100,603 | | | | 2,471,119 | | | | 669 | |
| | | | | | | | | | | | | | | | | |
Expenses | | | | | | | | | | | | | | | | |
Investment advisory fees | | | 148,516 | | | | 44,089 | | | | 394,808 | | | | 940 | |
Tax expense | | | 185 | | | | — | | | | 185 | | | | — | |
Total expenses | | | 148,701 | | | | 44,089 | | | | 394,993 | | | | 940 | |
Net investment income (loss) | | | (131,297 | ) | | | 56,514 | | | | 2,076,126 | | | | (271 | ) |
| | | | | | | | | | | | | | | | | |
Realized and Unrealized Gain (Loss) on Investments and Foreign Currency | | | | | | | | | | | | | | | | |
Net realized gain (loss) on: | | | | | | | | | | | | | | | | |
Investments | | | (1,688,095 | ) | | | 518,697 | | | | (1,788,554 | ) | | | (1,747 | ) |
Foreign currency transactions | | | — | | | | — | | | | (229 | ) | | | — | |
Net realized gain (loss) on investments and foreign currency transactions | | | (1,688,095 | ) | | | 518,697 | | | | (1,788,783 | ) | | | (1,747 | ) |
Net change in unrealized appreciation/depreciation on: | | | | | | | | | | | | | | | | |
Investments | | | (16,195,089 | ) | | | (2,722,553 | ) | | | 1,890,609 | | | | (35,904 | ) |
Foreign currency translation | | | — | | | | — | | | | (96 | ) | | | (836 | ) |
Net change in unrealized appreciation/depreciation on investments and foreign currency translation | | | (16,195,089 | ) | | | (2,722,553 | ) | | | 1,890,513 | | | | (36,740 | ) |
Net realized and unrealized gain (loss) on investments and foreign currency | | | (17,883,184 | ) | | | (2,203,856 | ) | | | 101,730 | | | | (38,487 | ) |
Net increase (decrease) in net assets from operations | | $ | (18,014,481 | ) | | $ | (2,147,342 | ) | | $ | 2,177,856 | | | $ | (38,758 | ) |
(1) | The Fund commenced operations on December 8, 2022. |
The accompanying notes are an integral part of the financial statements.
24
TrueShares ETFs
Statements of Operations
For the Year or Period Ended December 31, 2022 (Continued)
| | | RiverNorth
Patriot ETF | | | RiverNorth
Enhanced
Pre-Merger
SPAC ETF(1) | |
Investment Income | | | | | | | | |
Dividend income | | $ | 71,213 | | | $ | — | |
Interest income | | | 615 | | | | 2,298 | |
Total investment income | | | 71,828 | | | | 2,298 | |
| | | | | | | | | |
Expenses | | | | | | | | |
Investment advisory fees | | | 22,896 | | | | 15,399 | |
Total expenses | | | 22,896 | | | | 15,399 | |
Net investment income (loss) | | | 48,932 | | | | (13,101 | ) |
| | | | | | | | | |
Realized and Unrealized Gain (Loss) on Investments | | | | | | | | |
Net realized gain (loss) on investments | | | (163,346 | ) | | | 31,432 | |
Net change in unrealized appreciation/depreciation on investments | | | (293,046 | ) | | | 61,581 | |
Net realized and unrealized gain (loss) on investments | | | (456,392 | ) | | | 93,013 | |
Net increase (decrease) in net assets from operations | | $ | (407,460 | ) | | $ | 79,912 | |
(1) | The Fund commenced operations on July 11, 2022. |
The accompanying notes are an integral part of the financial statements.
25
TrueShares ETFs
Statements of Changes in Net Assets
| | | TrueShares Technology, AI
& Deep Learning ETF | | | TrueShares ESG Active
Opportunities ETF | |
| | | Year Ended
December 31,
2022 | | | Year Ended
December 31,
2021 | | | Year Ended
December 31,
2022 | | | Year Ended
December 31,
2021 | |
From Operations | | | | | | | | | | | | | | | | |
Net investment income (loss) | | $ | (131,297 | ) | | $ | (195,050 | ) | | $ | 56,514 | | | $ | 40,323 | |
Net realized gain (loss) on investments | | | (1,688,095 | ) | | | 2,175,206 | | | | 518,697 | | | | 103,780 | |
Net change in unrealized appreciation/depreciation on investments | | | (16,195,089 | ) | | | (3,572,155 | ) | | | (2,722,553 | ) | | | 1,445,350 | |
Net increase (decrease) in net assets resulting from operations | | | (18,014,481 | ) | | | (1,591,999 | ) | | | (2,147,342 | ) | | | 1,589,453 | |
| | | | | | | | | | | | | | | | | |
From Distributions | | | | | | | | | | | | | | | | |
Distributable earnings | | | — | | | | (37,530 | ) | | | (55,980 | ) | | | (41,282 | ) |
Total distributions | | | — | | | | (37,530 | ) | | | (55,980 | ) | | | (41,282 | ) |
| | | | | | | | | | | | | | | | | |
From Capital Share Transactions | | | | | | | | | | | | | | | | |
Proceeds from shares sold | | | 5,630,240 | | | | 19,803,940 | | | | — | | | | 1,779,840 | |
Cost of shares redeemed | | | (11,009,818 | ) | | | (7,854,945 | ) | | | (1,793,493 | ) | | | — | |
Net increase (decrease) in net assets resulting from capital share transactions | | | (5,379,578 | ) | | | 11,948,995 | | | | (1,793,493 | ) | | | 1,779,840 | |
| | | | | | | | | | | | | | | | | |
Total Increase (Decrease) in Net Assets | | | (23,394,059 | ) | | | 10,319,466 | | | | (3,996,815 | ) | | | 3,328,011 | |
| | | | | | | | | | | | | | | | | |
Net Assets | | | | | | | | | | | | | | | | |
Beginning of year | | | 37,693,931 | | | | 27,374,465 | | | | 10,347,603 | | | | 7,019,592 | |
End of year | | $ | 14,299,872 | | | $ | 37,693,931 | | | $ | 6,350,788 | | | $ | 10,347,603 | |
| | | | | | | | | | | | | | | | | |
Changes in Shares Outstanding | | | | | | | | | | | | | | | | |
Shares outstanding, beginning of year | | | 800,000 | | | | 575,000 | | | | 250,000 | | | | 200,000 | |
Shares sold | | | 150,000 | | | | 400,000 | | | | — | | | | 50,000 | |
Shares redeemed | | | (325,000 | ) | | | (175,000 | ) | | | (50,000 | ) | | | — | |
Shares outstanding, end of year | | | 625,000 | | | | 800,000 | | | | 200,000 | | | | 250,000 | |
The accompanying notes are an integral part of the financial statements.
26
TrueShares ETFs
Statements of Changes in Net Assets
(Continued)
| | | TrueShares Low Volatility
Equity Income ETF | | | TrueShares
Eagle Global
Renewable
Energy
Income ETF | |
| | | Year Ended
December 31,
2022 | | | Period Ended
December 31,
2021(1) | | | Period Ended
December 31,
2022(2) | |
From Operations | | | | | | | | | | | | |
Net investment income (loss) | | $ | 2,076,126 | | | $ | 940,452 | | | $ | (271 | ) |
Net realized gain (loss) on investments and foreign currency | | | (1,788,783 | ) | | | 412,287 | | | | (1,747 | ) |
Net change in unrealized appreciation/depreciation on investments and foreign currency | | | 1,890,513 | | | | 2,930,921 | | | | (36,740 | ) |
Net increase (decrease) in net assets resulting from operations | | | 2,177,856 | | | | 4,283,660 | | | | (38,758 | ) |
| | | | | | | | | | | | | |
From Distributions | | | | | | | | | | | | |
Distributable earnings | | | (2,075,345 | ) | | | (1,612,854 | ) | | | — | |
Return of capital | | | (693 | ) | | | — | | | | (238 | ) |
Total distributions | | | (2,076,038 | ) | | | (1,612,854 | ) | | | (238 | ) |
| | | | | | | | | | | | | |
From Capital Share Transactions | | | | | | | | | | | | |
Proceeds from shares sold | | | 39,931,580 | | | | 43,554,475 | | | | 2,494,265 | |
Cost of shares redeemed | | | (7,987,377 | ) | | | — | | | | — | |
Net increase in net assets resulting from capital share transactions | | | 31,944,203 | | | | 43,554,475 | | | | 2,494,265 | |
| | | | | | | | | | | | | |
Total Increase in Net Assets | | | 32,046,021 | | | | 46,225,281 | | | | 2,455,269 | |
| | | | | | | | | | | | | |
Net Assets | | | | | | | | | | | | |
Beginning of period | | | 46,225,281 | | | | — | | | | — | |
End of period | | $ | 78,271,302 | | | $ | 46,225,281 | | | $ | 2,455,269 | |
| | | | | | | | | | | | | |
Changes in Shares Outstanding | | | | | | | | | | | | |
Shares outstanding, beginning of period | | | 1,600,000 | | | | — | | | | — | |
Shares sold | | | 1,375,000 | | | | 1,600,000 | | | | 100,000 | |
Shares redeemed | | | (275,000 | ) | | | — | | | | — | |
Shares outstanding, end of period | | | 2,700,000 | | | | 1,600,000 | | | | 100,000 | |
(1) | The Fund commenced operations on January 27, 2021. |
(2) | The Fund commenced operations on December 8, 2022. |
The accompanying notes are an integral part of the financial statements.
27
TrueShares ETFs
Statements of Changes in Net Assets
(Continued)
| | | RiverNorth Patriot ETF | | | RiverNorth
Enhanced
Pre-Merger
SPAC ETF | |
| | | Year Ended
December 31,
2022 | | | Period Ended
December 31,
2021(1) | | | Period Ended
December 31,
2022(2) | |
From Operations | | | | | | | | | | | | |
Net investment income (loss) | | $ | 48,932 | | | $ | — | | | $ | (13,101 | ) |
Net realized gain (loss) on investments | | | (163,346 | ) | | | — | | | | 31,432 | |
Net change in unrealized appreciation/depreciation on investments | | | (293,046 | ) | | | — | | | | 61,581 | |
Net increase (decrease) in net assets resulting from operations | | | (407,460 | ) | | | — | | | | 79,912 | |
| | | | | | | | | | | | | |
From Distributions | | | | | | | | | | | | |
Distributable earnings | | | (48,932 | ) | | | — | | | | (8,355 | ) |
Return of capital | | | (407 | ) | | | — | | | | — | |
Total distributions | | | (49,339 | ) | | | — | | | | (8,355 | ) |
| | | | | | | | | | | | | |
From Capital Share Transactions | | | | | | | | | | | | |
Proceeds from shares sold | | | 3,691,633 | | | | 1,250,000 | | | | 4,372,345 | |
Cost of shares redeemed | | | (1,229,805 | ) | | | — | | | | (625,783 | ) |
Net increase in net assets resulting from capital share transactions | | | 2,461,828 | | | | 1,250,000 | | | | 3,746,562 | |
| | | | | | | | | | | | | |
Total Increase in Net Assets | | | 2,005,029 | | | | 1,250,000 | | | | 3,818,119 | |
| | | | | | | | | | | | | |
Net Assets | | | | | | | | | | | | |
Beginning of period | | | 1,250,000 | | | | — | | | | — | |
End of period | | $ | 3,255,029 | | | $ | 1,250,000 | | | $ | 3,818,119 | |
| | | | | | | | | | | | | |
Changes in Shares Outstanding | | | | | | | | | | | | |
Shares outstanding, beginning of period | | | 50,000 | | | | — | | | | — | |
Shares sold | | | 150,000 | | | | 50,000 | | | | 175,000 | |
Shares redeemed | | | (50,000 | ) | | | — | | | | (25,000 | ) |
Shares outstanding, end of period | | | 150,000 | | | | 50,000 | | | | 150,000 | |
(1) | The Fund commenced operations on December 31, 2021. |
(2) | The Fund commenced operations on July 11, 2022. |
The accompanying notes are an integral part of the financial statements.
28
THIS PAGE INTENTIONALLY LEFT BLANK
TrueShares ETFs
Financial Highlights
For a Share Outstanding Throughout each Period
| | | Per Share Operating Performance (For a share outstanding throughout each period) | |
| | | | | | | Income from Investment Operations | | | Less Distributions Paid From | |
| | | Net Asset
Value,
Beginning
of Period | | | Net
investment
income
(loss)(1) | | | Net realized
and
unrealized
gain
(loss) on
investments | | | Total from
investment
operations | | | Net
investment
income | | | Return of
capital | | | Net realized
gains | | | Total
distributions
paid | |
TrueShares Technology, AI & Deep Learning ETF | | | | | | | | | | | | | | | | | | | | | | | | | | | | |
For the year 01/01/2022 - 12/31/2022 | | $ | 47.12 | | | | (0.19 | ) | | | (24.05 | ) | | | (24.24 | ) | | | — | | | | — | | | | — | | | | — | |
For the year 01/01/2021 - 12/31/2021 | | $ | 47.61 | | | | (0.31 | ) | | | (0.12 | )(8) | | | (0.43 | ) | | | — | | | | — | | | | (0.06 | ) | | | (0.06 | ) |
For the period 02/28/2020(7) - 12/31/2020 | | $ | 25.00 | | | | (0.19 | ) | | | 22.80 | | | | 22.61 | | | | — | | | | — | | | | — | | | | — | |
TrueShares ESG Active Opportunities ETF | | | | | | | | | | | | | | | | | | | | | | | | | | | | |
For the year 01/01/2022 - 12/31/2022 | | $ | 41.39 | | | | 0.26 | | | | (9.62 | ) | | | (9.36 | ) | | | (0.28 | ) | | | — | | | | — | | | | (0.28 | ) |
For the year 01/01/2021 - 12/31/2021 | | $ | 35.10 | | | | 0.16 | | | | 6.29 | | | | 6.45 | | | | (0.16 | ) | | | — | | | | — | | | | (0.16 | ) |
For the period 02/28/2020(7) - 12/31/2020 | | $ | 25.00 | | | | 0.17 | | | | 10.07 | | | | 10.24 | | | | (0.14 | ) | | | (0.00 | )(9) | | | — | | | | (0.14 | ) |
TrueShares Low Volatility Equity Income ETF | | | | | | | | | | | | | | | | | | | | | | | | | | | | |
For the year 01/01/2022 - 12/31/2022 | | $ | 28.89 | | | | 0.99 | | | | 0.04 | | | | 1.03 | | | | (0.93 | ) | | | (0.00 | )(9) | | | — | | | | (0.93 | ) |
For the period 01/27/2021(7) - 12/31/2021 | | $ | 25.00 | | | | 0.81 | | | | 4.19 | | | | 5.00 | | | | (0.69 | ) | | | — | | | | (0.42 | ) | | | (1.11 | ) |
TrueShares Eagle Global Renewal Energy Income ETF | | | | | | | | | | | | | | | | | | | | | | | | | | | | |
For the period 12/08/2022(7) - 12/31/2022 | | $ | 24.76 | | | | (0.00 | )(9) | | | (0.21 | ) | | | (0.21 | ) | | | — | | | | (0.00 | )(9) | | | — | | | | (0.00 | )(9) |
(1) | Per share net investment income (loss) was calculated using average shares outstanding. |
(2) | Annualized for periods less than one year. |
(3) | Total return in the table represents the rate that the investor would have earned or lost on an investment in the Fund, assuming reinvestment of dividends. |
(4) | Not annualized for periods less than one year. |
(5) | Excludes in-kind transactions associated with creations and redemptions of the Fund. |
The accompanying notes are an integral part of the financial statements.
30
TrueShares ETFs
Financial Highlights
For a Share Outstanding Throughout each Period (Continued)
| | Per Share
Operating
Performance
(For a share
outstanding
throughout
each period) | | | Ratios/Supplemental Data | |
| | | | | | | | | | | | | | | | | | Ratios to Average Net Assets of: (2) | | | | | |
| | Net Asset Value,
End of Period | | | Total return,
at NAV(3)(4) | | | Total return,
at Market(3)(4) | | | Net assets,
end of period
(000’s) | | | Expenses | | | Net investment
income (loss) | | | Portfolio
turnover
rate(4)(5) | |
| | | | | | | | | | | | | | | | | | | | | | | | | | | | |
| | $ | 22.88 | | | | (51.44 | )% | | | (51.46 | )% | | $ | 14,300 | | | | 0.68 | % | | | (0.60 | )% | | | 25 | % |
| | $ | 47.12 | | | | (0.90 | )% | | | (0.96 | )% | | $ | 37,694 | | | | 0.68 | % | | | (0.67 | )% | | | 14 | % |
| | $ | 47.61 | | | | 90.43 | % | | | 90.52 | % | | $ | 27,374 | | | | 0.68 | % | | | (0.59 | )% | | | 30 | % |
| | | | | | | | | | | | | | | | | | | | | | | | | | | | |
| | $ | 31.75 | | | | (22.61 | )% | | | (22.70 | )% | | $ | 6,351 | | | | 0.58 | % | | | 0.74 | % | | | 4 | % |
| | $ | 41.39 | | | | 18.40 | % | | | 18.42 | % | | $ | 10,348 | | | | 0.58 | % | | | 0.42 | % | | | 14 | % |
| | $ | 35.10 | | | | 40.94 | % | | | 40.93 | % | | $ | 7,020 | | | | 0.58 | % | | | 0.70 | % | | | 29 | % |
| | | | | | | | | | | | | | | | | | | | | | | | | | | | |
| | $ | 28.99 | | | | 3.65 | % | | | 3.54 | % | | $ | 78,271 | | | | 0.65 | % | | | 3.42 | % | | | 41 | % |
| | $ | 28.89 | | | | 20.10 | %(6) | | | 20.17 | %(6) | | $ | 46,225 | | | | 0.65 | % | | | 3.08 | % | | | 55 | % |
| | | | | | | | | | | | | | | | | | | | | | | | | | | | |
| | $ | 24.55 | | | | (0.83 | )% | | | (0.18 | )% | | $ | 2,455 | | | | 0.75 | % | | | (0.22 | )% | | | 2 | % |
(6) | The returns reflect the actual performance for the period and do not include the impact of trades executed on the last business day of the period that were recorded on the first business day of the next period. |
(7) | Commencement of Operations. |
(8) | Realized and unrealized gains and losses per share in this caption are balancing amounts necessary to reconcile the change in net asset value per share for the period, and may not reconcile with the aggregate gains and losses in the Statements of Operations due to share transactions for the period. |
The accompanying notes are an integral part of the financial statements.
31
TrueShares ETFs
Financial Highlights
For a Share Outstanding Throughout each Period (Continued)
| | | Per Share Operating Performance (For a share outstanding throughout each period) | |
| | | | | | | Income from Investment Operations | | | Less Distributions Paid From | |
| | | Net Asset
Value,
Beginning
of Period | | | Net
investment
income
(loss)(1) | | | Net realized
and
unrealized
gain
(loss) on
investments | | | Total from
investment
operations | | | Net
investment
income | | | Return of
capital | | | Net realized
gains | | | Total
distributions
paid | |
RiverNorth Patriot ETF | | | | | | | | | | | | | | | | | | | | | | | | | | | | | | | | |
For the year 01/01/2022 - 12/31/2022 | | $ | 25.00 | | | | 0.34 | | | | (3.31 | ) | | | (2.97 | ) | | | (0.33 | ) | | | (0.00 | )(7) | | | — | | | | (0.33 | ) |
For the period 12/31/2021(6) - 12/31/2021 | | $ | 25.00 | | | | — | | | | — | | | | — | | | | — | | | | — | | | | — | | | | — | |
RiverNorth Enhanced Pre-Merger SPAC ETF | | | | | | | | | | | | | | | | | | | | | | | | | | | | | | | | |
For the period 07/11/2022(6) - 12/31/2022 | | $ | 25.00 | | | | (0.09 | ) | | | 0.60 | | | | 0.51 | | | | (0.06 | ) | | | — | | | | — | | | | (0.06 | ) |
(1) | Per share net investment income (loss) was calculated using average shares outstanding. |
(2) | Annualized for periods less than one year. |
(3) | Total return in the table represents the rate that the investor would have earned or lost on an investment in the Fund, assuming reinvestment of dividends. |
(4) | Not annualized for periods less than one year. |
(5) | Excludes in-kind transactions associated with creations and redemptions of the Fund. |
(6) | Commencement of Operations. |
The accompanying notes are an integral part of the financial statements.
32
TrueShares ETFs
Financial Highlights
For a Share Outstanding Throughout each Period (Continued)
| | Per Share
Operating
Performance
(For a share
outstanding
throughout
each period) | | | Ratios/Supplemental Data | |
| | | | | | | | | | | | | | | | | | Ratios to Average Net Assets of: (2) | | | | | |
| | Net Asset Value,
End of Period | | | Total return,
at NAV(3)(4) | | | Total return,
at Market(3)(4) | | | Net assets,
end of period
(000’s) | | | Expenses | | | Net investment
income (loss) | | | Portfolio
turnover
rate(4)(5) | |
| | | | | | | | | | | | | | | | | | | | | | | | | | | | |
| | $ | 21.70 | | | | (11.89 | )% | | | (11.90 | )% | | $ | 3,255 | | | | 0.70 | % | | | 1.50 | % | | | 31 | % |
| | $ | 25.00 | | | | — | % | | | — | % | | $ | 1,250 | | | | 0.70 | % | | | — | % | | | — | % |
| | | | | | | | | | | | | | | | | | | | | | | | | | | | |
| | $ | 25.45 | | | | 2.02 | % | | | 2.18 | % | | $ | 3,818 | | | | 0.89 | % | | | (0.76 | )% | | | 43 | % |
The accompanying notes are an integral part of the financial statements.
33
TrueShares ETFs
Notes to Financial Statements
December 31, 2022
1. ORGANIZATION
The TrueShares ETFs are a series of Listed Funds Trust (the “Trust”), formerly Active Weighting Funds ETF Trust. The Trust was organized as a Delaware statutory trust on August 26, 2016, under a Declaration of Trust amended on December 21, 2018 and is registered with the U.S. Securities and Exchange Commission (the “SEC”) as an open-end management investment company under the Investment Company Act of 1940, as amended (the “1940 Act”). As of December 31, 2022, the TrueShares ETFs consist of eighteen active series, six of which are covered in this report (each a “Fund,” and collectively, the “Funds”).
Fund Name | Ticker | Diversified/
Non-Diversified | Commencement
of Operations |
TrueShares Technology, AI & Deep Learning ETF (“AI ETF”) | LRNZ | Non-diversified | February 28, 2020 |
TrueShares ESG Active Opportunities ETF (“ESG ETF”) | ECOZ | Diversified | February 28, 2020 |
TrueShares Low Volatility Equity Income ETF (“DIVZ ETF”) | DIVZ | Non-diversified | January 27, 2021 |
TrueShares Eagle Global Renewal Energy Income ETF (“RNWZ ETF”) | RNWZ | Non-diversified | December 8, 2022 |
RiverNorth Patriot ETF (“FLDZ ETF”) | FLDZ | Non-diversified | December 31, 2021 |
RiverNorth Enhanced Pre-Merger SPAC ETF (“SPCZ ETF”) | SPCZ | Non-diversified | July 11, 2022 |
The operational TrueShares ETFs covered outside of this report consists of:
Fund Name | Ticker | Diversified/
Non-Diversified | Commencement
of Operations |
TrueShares Structured Outcome (July) ETF (“JULZ ETF”) | JULZ | Non-diversified | July 1, 2020 |
TrueShares Structured Outcome (August) ETF (“AUGZ ETF”) | AUGZ | Non-diversified | August 3, 2020 |
TrueShares Structured Outcome (September) ETF (“SEPZ ETF”) | SEPZ | Non-diversified | September 1, 2020 |
TrueShares Structured Outcome (October) ETF (“OCTZ ETF”) | OCTZ | Non-diversified | October 1, 2020 |
TrueShares Structured Outcome (November) ETF (“NOVZ ETF”) | NOVZ | Non-diversified | November 2, 2020 |
TrueShares Structured Outcome (December) ETF (“DECZ ETF”) | DECZ | Non-diversified | December 1, 2020 |
TrueShares Structured Outcome (January) ETF (“JANZ ETF”) | JANZ | Non-diversified | January 4, 2021 |
TrueShares Structured Outcome (February) ETF (“FEBZ ETF”) | FEBZ | Non-diversified | February 1, 2021 |
TrueShares Structured Outcome (March) ETF (“MARZ ETF”) | MARZ | Non-diversified | March 1, 2021 |
TrueShares Structured Outcome (April) ETF (“APRZ ETF”) | APRZ | Non-diversified | April 1, 2021 |
TrueShares Structured Outcome (May) ETF (“MAYZ ETF”) | MAYZ | Non-diversified | May 3, 2021 |
TrueShares Structured Outcome (June) ETF (“JUNZ ETF”) | JUNZ | Non-diversified | June 1, 2021 |
34
TrueShares ETFs
Notes to Financial Statements
December 31, 2022 (Continued)
Each Fund is an actively-managed exchange-traded fund (“ETF”) that seeks to achieve its following investment objectives:
Fund | Investment Objective |
AI ETF | Seeks to achieve its total return investment objective by investing in Common stock of technology, artificial intelligence and deep learning companies. |
ESG ETF | Seeks to achieve its total return investment objective by investing in Common stock of environmental, social and governance (“ESG”) companies. |
DIVZ ETF | Seeks to provide capital appreciation with lower volatility and a higher dividend yield compared to the S&P 500 Index by investing common stocks with the best combination of dividend yield with potential for dividend growth and are currently under-valued in the market. |
RNWZ ETF | Seeks to achieve its long-term growth of capital objective by investing in Common stock that primarily own or operate assets used in the development, generation, production, transmission, storage and sale of alternative and renewable energy such as solar power, wind power, biofuels, hydropower, nuclear or geothermal power. |
FLDZ ETF | Seeks capital appreciation by investing in mid to large cap companies that are domiciled in, and with revenues which are primarily generated in, the United States of America. FLDZ is designed to provide an alternative approach to charity and seeks to delivers true impact investing. |
SPCZ ETF | Seeks to preserve capital and provide incremental total return by investing primarily in units made up of common stock, warrants and rights of U.S.-listed special purpose acquisition companies (“SPACs”). |
Costs incurred by the Funds in connection with the organization, registration and the initial public offering of shares were paid by TrueMark Investments, LLC (“TrueMark” or the “Adviser”), the Funds’ Investment Adviser.
2. SIGNIFICANT ACCOUNTING POLICIES
Each Fund is an investment company and accordingly follows the investment company accounting and reporting guidance of the Financial Accounting Standards Board (“FASB”) Accounting Standards Codification (“ASC”) Topic 946, Financial Services — Investment Companies. Each Fund prepares its financial statements in accordance with accounting principles generally accepted in the United States of America (“U.S. GAAP”) and follows the significant accounting policies described below.
Use of Estimates
The preparation of the financial statements in conformity with U.S. GAAP requires management to make estimates and assumptions that affect the reported amounts of assets and liabilities and disclosures of contingent assets and liabilities at the date of the financial statements and the reported amounts of increases and decreases in net assets from operations during the reporting period. Actual results could differ from these estimates.
Share Transactions
The net asset value (“NAV”) per share of each Fund will be equal to a Fund’s total assets minus a Fund’s total liabilities divided by the total number of shares outstanding. The NAV that is published will be rounded to the nearest cent. The NAV is determined as of the close of trading (generally, 4:00 p.m. Eastern Time) on each day the New York Stock Exchange (“NYSE”) is open for trading.
Fair Value Measurement
In calculating the NAV, each Fund’s exchange-traded equity securities will be valued at fair value, which will generally be determined using the last reported official closing or last trading price on the exchange or market on which the security is primarily traded at the time of valuation. Such valuations are typically categorized as Level 1 in the fair value hierarchy described below.
Securities listed on the NASDAQ Stock Market, Inc. are generally valued at the NASDAQ official closing price.
35
TrueShares ETFs
Notes to Financial Statements
December 31, 2022 (Continued)
If market quotations are not readily available, or if it is determined that a quotation of a security does not represent fair value, then the security is valued at fair value as determined in good faith by the Adviser using procedures adopted by the Board of Trustees of the Trust (the “Board”). The circumstances in which a security may be fair valued include, among others: the occurrence of events that are significant to a particular issuer, such as mergers, restructurings or defaults; the occurrence of events that are significant to an entire market, such as natural disasters in a particular region or government actions; trading restrictions on securities; thinly traded securities; and market events such as trading halts and early market closings. Due to the inherent uncertainty of valuations, fair values may differ significantly from the values that would have been used had an active market existed. Fair valuation could result in a different NAV than a NAV determined by using market quotations. Such valuations are typically categorized as Level 2 or Level 3 in the fair value hierarchy described below.
Money market funds are valued at NAV. If NAV is not readily available the securities will be valued at fair value.
FASB ASC Topic 820, Fair Value Measurements and Disclosures (“ASC 820”) defines fair value, establishes a framework for measuring fair value in accordance with U.S. GAAP, and requires disclosure about fair value measurements. It also provides guidance on determining when there has been a significant decrease in the volume and level of activity for an asset or liability, when a transaction is not orderly, and how that information must be incorporated into fair value measurements. Under ASC 820, various inputs are used in determining the value of the Funds’ investments. These inputs are summarized in the following hierarchy:
| | ● | Level 1 — Unadjusted quoted prices in active markets for identical assets or liabilities that the Funds have the ability to access. |
| | ● | Level 2 — Observable inputs other than quoted prices included in Level 1 that are observable for the asset or liability, either directly or indirectly. These inputs may include quoted prices for the identical instrument on an inactive market, prices for similar securities, interest rates, prepayment speeds, credit risk, yield curves, default rates and similar data. |
| | ● | Level 3 — Unobservable inputs for the asset or liability, to the extent relevant observable inputs are not available; representing the Funds’ own assumptions about the assumptions a market participant would use in valuing the asset or liability, and would be based on the best information available. |
The fair value hierarchy gives the highest priority to quoted prices (unadjusted) in active markets for identical assets or liabilities (Level 1) and the lowest priority to unobservable inputs (Level 3).
The availability of observable inputs can vary from security to security and is affected by a wide variety of factors, including, for example, the type of security, whether the security is new and not yet established in the marketplace, the liquidity of markets, and other characteristics particular to the security. To the extent that valuation is based on models or inputs that are less observable or unobservable in the market, the determination of fair value requires more judgment. Accordingly, the degree of judgment exercised in determining fair value is greatest for instruments categorized in Level 3.
Debt securities, including short-term debt instruments having a maturity of less than 60 days, are generally valued using the last available bid prices or current market quotations provided by dealers or prices (including evaluated prices) supplied by approved independent third-party pricing services. Pricing services may use matrix pricing or valuation models that utilize certain inputs and assumptions to derive values. Due to the inherent uncertainty of valuations, fair values may differ significantly from the values that would have been used had an active market existed. An amortized cost method of valuation may be used with respect to debt obligations with sixty days or less remaining to maturity, unless the Adviser determines in good faith that such method does not represent fair value.
Foreign securities, currencies and other assets denominated in foreign currencies are translated into U.S. dollars at the exchange rate of such currencies against the U.S. dollar using the applicable currency exchange rates as of the close of the NYSE, generally 4:00 p.m. Eastern Time.
All other securities and investments for which market values are not readily available, including restricted securities, and those securities for which it is inappropriate to determine prices in accordance with the aforementioned procedures, are valued at fair value as determined in good faith under procedures adopted by the Board, although the actual calculations may be done by others. Factors considered in making this determination may include, but are not limited to, information obtained
36
TrueShares ETFs
Notes to Financial Statements
December 31, 2022 (Continued)
by contacting the issuer, analysts, or the appropriate stock exchange (for exchange-traded securities), analysis of the issuer’s financial statements or other available documents and, if necessary, available information concerning other securities in similar circumstances.
The inputs or methodology used for valuing securities are not necessarily an indication of the risk associated with investing in those securities. The hierarchy classification of inputs used to value the Funds’ investments at December 31, 2022, are as follows:
| | | Level 1 | | | Level 2 | | | Level 3 | | | Total | |
TrueShares Technology, AI & Deep Learning ETF | | | | | | | | | | | | | | | | |
Investments - Assets: | | | | | | | | | | | | | | | | |
Common Stocks* | | $ | 14,171,452 | | | $ | — | | | $ | — | | | $ | 14,171,452 | |
Money Market Funds | | | 136,736 | | | | — | | | | — | | | | 136,736 | |
Total Investments - Assets | | $ | 14,308,188 | | | $ | — | | | $ | — | | | $ | 14,308,188 | |
* See the Schedule of Investments for industry classifications.
| | | Level 1 | | | Level 2 | | | Level 3 | | | Total | |
TrueShares ESG Active Opportunities ETF | | | | | | | | | | | | | | | | |
Investments - Assets: | | | | | | | | | | | | | | | | |
Common Stocks* | | $ | 6,039,240 | | | $ | — | | | $ | — | | | $ | 6,039,240 | |
Real Estate Investment Trusts | | | 228,369 | | | | — | | | | — | | | | 228,369 | |
Money Market Funds | | | 136,553 | | | | — | | | | — | | | | 136,553 | |
Total Investments - Assets | | $ | 6,404,162 | | | $ | — | | | $ | — | | | $ | 6,404,162 | |
* See the Schedule of Investments for industry classifications.
| | | Level 1 | | | Level 2 | | | Level 3 | | | Total | |
TrueShares Low Volatility Equity Income ETF | | | | | | | | | | | | | | | | |
Investments - Assets: | | | | | | | | | | | | | | | | |
Common Stocks* | | $ | 76,713,900 | | | $ | — | | | $ | — | | | $ | 76,713,900 | |
Money Market Funds | | | 4,294,571 | | | | — | | | | — | | | | 4,294,571 | |
Total Investments - Assets | | $ | 81,008,471 | | | $ | — | | | $ | — | | | $ | 81,008,471 | |
* See the Schedule of Investments for industry classifications.
| | | Level 1 | | | Level 2 | | | Level 3 | | | Total | |
True Shares Eagle Global Renewable Energy Income ETF | | | | | | | | | | | | | | | | |
Investments - Assets: | | | | | | | | | | | | | | | | |
Common Stocks* | | $ | 2,358,347 | | | $ | — | | | $ | — | | | $ | 2,358,347 | |
Real Estate Investment Trusts | | | 45,673 | | | | — | | | | — | | | | 45,673 | |
Money Market Funds | | | 196,750 | | | | — | | | | — | | | | 196,750 | |
Total Investments - Assets | | $ | 2,600,770 | | | $ | — | | | $ | — | | | $ | 2,600,770 | |
* See the Schedule of Investments for industry classifications.
37
TrueShares ETFs
Notes to Financial Statements
December 31, 2022 (Continued)
| | | Level 1 | | | Level 2 | | | Level 3 | | | Total | |
RiverNorth Patriot ETF | | | | | | | | | | | | | | | | |
Investments - Assets: | | | | | | | | | | | | | | | | |
Common Stocks* | | $ | 2,808,524 | | | $ | — | | | $ | — | | | $ | 2,808,524 | |
Partnerships* | | | 120,671 | | | | — | | | | — | | | | 120,671 | |
Real Estate Investment Trusts | | | 285,890 | | | | — | | | | — | | | | 285,890 | |
Money Market Funds | | | 82,374 | | | | — | | | | — | | | | 82,374 | |
Total Investments - Assets | | $ | 3,297,459 | | | $ | — | | | $ | — | | | $ | 3,297,459 | |
* See the Schedule of Investments for industry classifications.
| | | Level 1 | | | Level 2 | | | Level 3 | | | Total | |
RiverNorth Enhanced Pre- Merger SPAC ETF | | | | | | | | | | | | | | | | |
Investments - Assets: | | | | | | | | | | | | | | | | |
Common Stocks* | | $ | 3,276,286 | | | $ | 362,905 | | | $ | — | | | $ | 3,639,191 | |
Warrants* | | | 7,079 | | | | 568 | | | | — | | | | 7,647 | |
Money Market Funds | | | 222,763 | | | | — | | | | — | | | | 222,763 | |
Total Investments - Assets | | | 3,506,128 | | | $ | 363,473 | | | $ | — | | | $ | 3,869,601 | |
* See the Schedule of Investments for industry classifications.
Security Transactions
Investment transactions are recorded as of the date that the securities are purchased or sold (trade date). Realized gains and losses from the sale or disposition of securities are calculated based on the specific identification basis.
The Funds do not isolate the portion of the results of operations resulting from changes in foreign exchange rates on investments and currency gains or losses realized between the trade and settlement dates on securities transactions from the fluctuations arising from changes in market prices of securities held. Such fluctuations are included with the net realized and unrealized gain or loss from investments.
The Funds report net realized foreign exchange gains or losses that arise from sales of foreign currencies, currency gains or losses realized between the trade and settlement dates on foreign currency transactions, and the difference between the amounts of dividends, interest, and foreign withholding taxes recorded on the Funds’ books and the U.S. dollar equivalent of the amounts actually received or paid. Net unrealized foreign exchange gains or losses arise from changes in the values of assets and liabilities, other than investments in securities at period end, resulting from changes in exchange rates.
Investment Income
Dividend income is recognized on the ex-dividend date. Interest income is accrued daily. Withholding taxes on foreign dividends has been provided for in accordance with the Funds’ understanding of the applicable tax rules and regulations.
Tax Information, Dividends and Distributions to Shareholders and Uncertain Tax Positions
The Funds are treated as separate entities for Federal income tax purposes. Each Fund intends to qualify as a regulated investment company (“RIC”) under Subchapter M of the Internal Revenue Code of 1986, as amended (the “Internal Revenue Code”). To qualify and remain eligible for the special tax treatment accorded to RICs, each Fund must meet certain annual income and quarterly asset diversification requirements and must distribute annually at least 90% of the sum of (i) its investment company taxable income (which includes dividends, interest and net short-term capital gains) and (ii) certain net tax-exempt income, if any. If so qualified, each Fund will not be subject to Federal income tax.
38
TrueShares ETFs
Notes to Financial Statements
December 31, 2022 (Continued)
Distributions to shareholders are recorded on the ex-dividend date. The AI ETF, the ESG ETF, RNWZ, FLDZ and SPCZ ETF generally pay out dividends from net investment income, if any, at least annually, and distribute its net capital gains, if any, to shareholders at least annually. The DIVZ ETF intends to pay out dividends from net investment income, if any, quarterly. The Funds will declare and pay capital gain distributions, if any, in cash at least annually. The Funds may also pay a special distribution at the end of the calendar year to comply with Federal tax requirements. The amount of dividends and distributions from net investment income and net realized capital gains are determined in accordance with Federal income tax regulations, which may differ from U.S. GAAP. These “book/tax” differences are either considered temporary or permanent in nature. To the extent these differences are permanent in nature, such amounts are reclassified within the components of net assets based on their Federal tax basis treatment; temporary differences do not require reclassification. Dividends and distributions which exceed earnings and profit for tax purposes are reported as a tax return of capital.
Management evaluates the Funds’ tax positions to determine if the tax positions taken meet the minimum recognition threshold in connection with accounting for uncertainties in income tax positions taken or expected to be taken for the purposes of measuring and recognizing tax liabilities in the financial statements. Recognition of tax benefits of an uncertain tax position is required only when the position is “more likely than not” to be sustained assuming examination by taxing authorities. Interest and penalties related to income taxes would be recorded as income tax expense. The Funds’ Federal income tax returns are subject to examination by the Internal Revenue Service (the “IRS”) for a period of three fiscal years after they are filed. State and local tax returns may be subject to examination for an additional fiscal year depending on the jurisdiction. As of December 31, 2022, the Funds’ fiscal year or period end, the Funds had no material uncertain tax positions and did not have a liability for any unrecognized tax benefits. As of December 31, 2022, the Funds’ fiscal year or period end, the Funds had no examination in progress and management is not aware of any tax positions for which it is reasonably possible that the amounts of unrecognized tax benefits will significantly change in the next twelve months.
The Funds recognized no interest or penalties related to uncertain tax benefits in the 2022 fiscal period. At December 31, 2022, the Funds’ fiscal year or period end, the tax periods from commencement of operations remained open to examination in the Funds’ major tax jurisdiction.
Indemnification
In the normal course of business, the Funds expect to enter into contracts that contain a variety of representations and warranties and which provide general indemnifications. The Funds’ maximum exposure under these anticipated arrangements is unknown, as this would involve future claims that may be made against the Funds that have not yet occurred. However, based on experience, the Funds expect the risk of loss to be remote.
3. INVESTMENT ADVISORY AND OTHER AGREEMENTS
Investment Advisory Agreement
The Trust has entered into an Investment Advisory Agreement (the “Advisory Agreement”) with the Adviser. Under the Advisory Agreement, the Adviser provides a continuous investment program for the Funds’ assets in accordance with its investment objectives, policies and limitations, and oversees the day-to-day operations of the Funds subject to the supervision of the Board, including the Trustees who are not “interested persons” of the Trust as defined in the 1940 Act (the “Independent Trustees”).
Pursuant to the Advisory Agreement between the Trust, on behalf of the Funds, and TrueMark, each Fund pays a unified management fee to the Adviser, which is calculated daily and paid monthly, at an annual rate of each Fund’s respective average daily net assets, as follows:
TrueShares Technology, AI & Deep Learning ETF | 0.68% |
TrueShares ESG Active Opportunities ETF | 0.58% |
TrueShares Low Volatility Equity Income ETF | 0.65% |
TrueShares Eagle Global Renewal Energy Income ETF | 0.75% |
RiverNorth Patriot ETF | 0.70% |
RiverNorth Enhanced Pre- Merger SPAC ETF | 0.89% |
39
TrueShares ETFs
Notes to Financial Statements
December 31, 2022 (Continued)
TrueMark has agreed to pay all expenses of the Funds except the fee paid to TrueMark under the Advisory Agreement, interest charges on any borrowings, dividends and other expenses on securities sold short, taxes, brokerage commissions and other expenses incurred in placing orders for the purchase and sale of securities and other investment instruments, acquired fund fees and expenses, accrued deferred tax liability, extraordinary expenses, and distribution (12b-1) fees and expenses (if any). TrueMark, in turn, compensates the Sub-Advisers from the management fee it receives.
Black Hill Capital Partners, LLC (the “AI ETF Sub-Adviser”), a Delaware limited liability company serves as the sub-adviser to the AI ETF. Pursuant to a Sub-Advisory Agreement between the Adviser and the AI ETF Sub-Adviser, the AI ETF Sub-Adviser is responsible for trading portfolio securities on behalf of the Fund, including selecting broker-dealers to execute purchase and sale transactions, subject to the supervision of the Adviser and the Board, including the Independent Trustees. For its services, the AI ETF Sub-Adviser is entitled to a sub-advisory fee paid by the Adviser, which is 50% of the Adviser’s net profits. “Net profits” means, the total Adviser’s fees received by the Adviser from the ETF during a fiscal period, less the cumulative direct expenses incurred or paid by the Adviser during that period in relation to the ETF, which expenses include, without limitation: expense waivers and reimbursements; commissions; legal, administrative and custodial expenses; ntf/platform/omnibus fees; filing and registration fees; proxy solicitation expenses; taxes; interest.
Opal Capital LLC (the “DIVZ ETF Sub-Advisor”), a Florida limited liability company serves as sub-adviser to the DIVZ ETF. Pursuant to a Sub-Advisory Agreement between the Adviser and the DIVZ ETF Sub-Adviser, the DIVZ ETF Sub-Adviser is responsible for trading portfolio securities on behalf of the Fund, including selecting broker-dealers to execute purchase and sale transactions, subject to the supervision of the Adviser and the Board, including the Independent Trustees. The DIVZ ETF Sub-Advisor is entitled to a sub-advisory fee paid by the Adviser, which is 70% the net profits of the DIVZ ETF, calculated monthly.
Eagle Global Advisors LLC (the “RNWZ ETF Sub-Advisor”), a Texas limited liability company serves as sub-adviser to the RNWZ ETF. Pursuant to a Sub-Advisory Agreement between the Adviser and the RNWZ ETF Sub-Adviser, the RNWZ ETF Sub-Adviser is responsible for trading portfolio securities on behalf of the Fund, including selecting broker-dealers to execute purchase and sale transactions, subject to the supervision of the Adviser and the Board, including the Independent Trustees. The RNWZ ETF Sub-Advisor is entitled to a sub-advisory fee paid by the Adviser, which is 50% the net profits of the RNWZ ETF, calculated monthly.
RiverNorth Capital Management, LLC (the “RiverNorth ETF’s Sub-Adviser”), a Delaware limited liability company serves as the sub-adviser to FLDZ and SPCZ. Pursuant to a Sub-Advisory Agreement between the Adviser and the RiverNorth ETF’s Sub-Adviser, the RiverNorth ETF’s Sub-Adviser is responsible for trading portfolio securities on behalf of the Funds, including selecting broker-dealers to execute purchase and sale transactions, subject to the supervision of the Adviser and the Board, including the Independent Trustees. For its services, the RiverNorth ETF’s Sub-Adviser is entitled to a sub-advisory fee paid by the Adviser, which is calculated daily and paid monthly at an annual rate as follows:
Fund | Sub-Advisory Fee |
RiverNorth Patriot ETF | 0.60% based on the daily net assets of the Fund |
RiverNorth Enhanced Pre- Merger SPAC ETF | 75% of the Net Profits |
The RiverNorth ETF’s Sub-Adviser will donate a majority of its sub-advisory fee from FLDZ or 100% of the profit derived from its management of the Fund, whichever is greater, to the Folds of Honor Foundation, a charity focused on providing scholarships to families of veterans.
Distribution Agreement and 12b-1 Plan
Foreside Fund Services, LLC (the “Distributor”) serves as each Fund’s distributor pursuant to a Distribution Agreement. The Distributor receives compensation from the Adviser for certain statutory underwriting services it provides to the Funds. The Distributor enters into agreements with certain broker-dealers and others that will allow those parties to be “Authorized Participants” and to subscribe for and redeem shares of the Funds. The Distributor will not distribute shares in less than whole Creation Units and does not maintain a secondary market in shares.
40
TrueShares ETFs
Notes to Financial Statements
December 31, 2022 (Continued)
The Board has adopted a Distribution and Service Plan pursuant to Rule 12b-1 under the 1940 Act (“Rule 12b-1 Plan”). In accordance with the Rule 12b-1 Plan, each Fund is authorized to pay an amount up to 0.25% of the Fund’s average daily net assets each year for certain distribution-related activities. As authorized by the Board, no Rule 12b-1 fees are currently paid by the Funds and there are no plans to impose these fees. However, in the event Rule 12b-1 fees are charged in the future, they will be paid out of each Fund’s assets. The Adviser and its affiliates may, out of their own resources, pay amounts to third parties for distribution or marketing services on behalf of the Funds.
Administrator, Custodian and Transfer Agent
U.S. Bancorp Fund Services LLC, doing business as U.S. Bank Global Fund Services (“Fund Services” or “Administrator”) serves as administrator, transfer agent and fund accountant of the Funds pursuant to a Fund Servicing Agreement. U.S. Bank N.A. (the “Custodian”), an affiliate of Fund Services, serves as the Funds’ custodian pursuant to a Custody Agreement. Under the terms of these agreements, the Adviser pays each Fund’s administrative, custody and transfer agency fees.
A Trustee and all officers of the Trust are affiliated with the Administrator and Custodian.
4. CREATION AND REDEMPTION TRANSACTIONS
Shares of the AI ETF, the ESG ETF, the DIVZ ETF and the RNWZ ETF are listed and traded on the NYSE Arca, Inc. Shares of the FLDZ ETF and SPCZ ETF are listed and traded on the CBOE BXZ Exchange, Inc. Each Fund issues and redeems shares on a continuous basis at NAV only in large blocks of shares called “Creation Units”. Creation Units are to be issued and redeemed principally in kind for a basket of securities and a balancing cash amount. Shares generally will trade in the secondary market in amounts less than a Creation Unit at market prices that change throughout the day. Market prices for the shares may be different from their NAV. The NAV is determined as of the close of trading (generally, 4:00 p.m. Eastern Time) on each day the NYSE is open for trading. The NAV of the shares of each Fund will be equal to a Fund’s total assets minus a Fund’s total liabilities divided by the total number of shares outstanding. The NAV that is published will be rounded to the nearest cent; however, for purposes of determining the price of Creation Units, the NAV will be calculated to four decimal places.
Creation Unit Transaction Fee
Authorized Participants will be required to pay to the Custodian a fixed transaction fee (the “Creation Unit Transaction Fee”) in connection with the issuance or redemption of Creation Units. The standard Creation Unit Transaction Fee will be the same regardless of the number of Creation Units purchased or redeemed by an investor on the applicable business day. Effective April 30, 2022, the Creation Unit Transaction Fee charged by the AI ETF, ESG ETF and DIVZ ETF for each creation order is $300. Prior to this date, the Creation Unit Transaction fee was $250. The Creation Unit Transaction Fee charged by the RNWZ ETF, FLDZ ETF and SPCZ ETF for each creation order is $500.
An additional variable fee of up to a maximum of 2% of the value of the Creation Units subject to the transaction may be imposed for (1) creations effected outside the clearing process and (2) creations made in an all cash amount (to offset the Trust’s brokerage and other transaction costs associated with using cash to purchase the requisite Deposit Securities). Investors are responsible for the costs of transferring the securities constituting the Deposit Securities to the account of the Trust. Each Fund may determine to not charge a variable fee on certain orders when the Adviser has determined that doing so is in the best interests of Fund shareholders. Variable fees, if any, received by the Funds are displayed in the Capital Share Transactions section on the Statements of Changes in Net Assets.
Only “Authorized Participants” may purchase or redeem shares directly from the Funds. An Authorized Participant is either (i) a broker-dealer or other participant in the clearing process through the Continuous Net Settlement System of National Securities Clearing Corporation or (ii) a DTC participant and, in each case, must have executed a Participant Agreement with the Distributor. Most retail investors will not qualify as Authorized Participants or have the resources to buy and sell whole Creation Units. Therefore, they will be unable to purchase or redeem the shares directly from the Funds. Rather, most retail investors will purchase shares in the secondary market with the assistance of a broker and will be subject to customary brokerage commissions or fees. Securities received or delivered in connection with in-kind creates and redeems are valued as of the close of business on the effective date of the creation or redemption.
41
TrueShares ETFs
Notes to Financial Statements
December 31, 2022 (Continued)
A creation unit will generally not be issued until the transfer of good title of the deposit securities to the Funds and the payment of any cash amounts have been completed. To the extent contemplated by the applicable participant agreement, Creation Units of the Funds will be issued to such authorized participant notwithstanding the fact that the Funds’ deposits have not been received in part or in whole, in reliance on the undertaking of the authorized participant to deliver the missing deposit securities as soon as possible. If the Funds or their agents do not receive all of the deposit securities, or the required cash amounts, by such time, then the order may be deemed rejected and the authorized participant shall be liable to the Funds for losses, if any.
5. FEDERAL INCOME TAX
The tax character of distributions paid was as follows:
| | | Year or Period Ended
December 31, 2022 | | | Year or Period Ended
December 31, 2021 | |
| | | Ordinary
Income(1) | | | Return of
Capital | | | Ordinary
Income(1) | | | Long-Term
Capital Gain | |
TrueShares Technology, AI & Deep Learning ETF | | $ | — | | | $ | — | | | $ | 37,530 | | | $ | — | |
TrueShares ESG Active Opportunities ETF | | | 55,980 | | | | — | | | | 40,352 | | | | 930 | |
TrueShares Low Volatility Equity Income ETF | | | 2,075,345 | | | | 693 | | | | 1,609,680 | | | | 3,174 | |
TrueShares Eagle Global Renewable Energy Income ETF | | | — | | | | 238 | | | | — | | | | — | |
RiverNorth Patriot ETF | | | 48,932 | | | | 407 | | | | — | | | | — | |
RiverNorth Enhanced Pre-Merger SPAC ETF | | | 8,355 | | | | — | | | | — | | | | — | |
(1) | Ordinary income includes short-term capital gains. |
At December 31, 2022, the Funds’ fiscal year or period end, the components of distributable earnings (accumulated losses) and cost of investments on a tax basis, including the adjustments for financial reporting purposes as of the most recently completed Federal income tax reporting year, were as follows:
| | | TrueShares
Technology,
AI & Deep
Learning ETF | | | TrueShares
ESG Active
Opportunities
ETF | | | TrueShares Low
Volatility Equity
Income ETF | | | TrueShares
Eagle Global
Renewable
Energy
Income ETF | | | RiverNorth
Patriot ETF | | | RiverNorth
Enhanced
Pre-Merger
SPAC ETF | |
Federal Tax Cost of Investments | | $ | 28,812,084 | | | $ | 5,851,425 | | | $ | 76,599,690 | | | $ | 2,638,420 | | | $ | 3,604,178 | | | $ | 3,836,354 | |
Gross Tax Unrealized Appreciation | | $ | 534,508 | | | $ | 1,168,174 | | | $ | 7,706,818 | | | $ | 14,592 | | | $ | 180,603 | | | $ | 67,142 | |
Gross Tax Unrealized Depreciation | | | (15,038,404 | ) | | | (615,437 | ) | | | (3,298,037 | ) | | | (53,078 | ) | | | (487,322 | ) | | | (33,895 | ) |
Net Tax Unrealized Appreciation (Depreciation) | | | (14,503,896 | ) | | | 552,737 | | | | 4,408,781 | | | | (38,486 | ) | | | (306,719 | ) | | | 33,247 | |
Undistributed Ordinary Income | | | — | | | | 534 | | | | — | | | | — | | | | — | | | | 37,146 | |
Other Accumulated Gain (Loss) | | | (3,126,370 | ) | | | (88,060 | ) | | | (3,193,134 | ) | | | — | | | | (178,185 | ) | | | — | |
Total Distributable Earnings / (Accumulated Losses) | | $ | (17,630,266 | ) | | $ | 465,211 | | | $ | 1,215,647 | | | $ | (38,486 | ) | | $ | (484,904 | ) | | $ | 70,393 | |
The difference between book-basis and tax-basis unrealized appreciation/(depreciation) is attributable primarily to the tax deferral of losses on wash sales.
42
TrueShares ETFs
Notes to Financial Statements
December 31, 2022 (Continued)
Under current tax law, net capital losses realized and specified ordinary losses after October 31st may be deferred and treated as occurring on the first day of the following fiscal year. The Funds’ carryforward losses and post-October losses are determined only at the end of each fiscal year. At December 31, 2022, the Funds’ fiscal year or period end, the Funds had carryforward losses which will be carried forward indefinitely to offset future realized capital gains as follows:
| | | Indefinite Short-
Term Capital
Loss Carryover | | | Indefinite Long-
Term Capital
Loss Carryover | |
TrueShares Technology, AI & Deep Learning ETF | | $ | 1,069,946 | | | $ | 2,056,424 | |
TrueShares ESG Active Opportunities ETF | | | 7,868 | | | | 80,192 | |
TrueShares Low Volatility Equity Income ETF | | | 1,951,943 | | | | 1,241,191 | |
TrueShares Eagle Global Renewable Energy Income ETF | | | — | | | | — | |
RiverNorth Patriot ETF | | | 178,185 | | | | — | |
RiverNorth Enhanced Pre-Merger SPAC ETF | | | — | | | | — | |
U.S. GAAP requires that certain components of net assets relating to permanent differences be reclassified between financial and tax reporting. These reclassifications have no effect on net assets or NAV per share. The permanent differences primarily relate to redemptions in-kind and write-off of net operating losses. For the fiscal year or period ended December 31, 2022, the following reclassifications were made for permanent tax differences on the Statements of Assets and Liabilities.
| | | Total
Distributable
Earnings
(Accumulated
Losses) | | | Paid-In Capital | |
TrueShares Technology, AI & Deep Learning ETF | | $ | (1,511,100 | ) | | $ | 1,511,100 | |
TrueShares ESG Active Opportunities ETF | | | (602,826 | ) | | | 602,826 | |
TrueShares Low Volatility Equity Income ETF | | | (1,560,151 | ) | | | 1,560,151 | |
TrueShares Eagle Global Renewable Energy Income ETF | | | 510 | | | | (510 | ) |
RiverNorth Patriot ETF | | | (28,105 | ) | | | 28,105 | |
RiverNorth Enhanced Pre-Merger SPAC ETF | | | (1,164 | ) | | | 1,164 | |
6. INVESTMENT TRANSACTIONS
During the fiscal year or period ended December 31, 2022, the Funds realized amounts in net capital gains resulting from in-kind redemptions, in which shareholders exchanged Fund shares for securities held by the Funds rather than for cash. Because such gains are not taxable to the Funds, and are not distributed to shareholders, they have been reclassified from distributable earnings (accumulated losses) to paid in-capital. The amounts of realized gains and losses from in-kind redemptions included in realized gain/(loss) on investments in the Statements of Operations is as follows:
| | | Realized Gains | | | Realized Losses | |
TrueShares Technology, AI & Deep Learning ETF | | $ | 2,414,653 | | | $ | (765,005 | ) |
TrueShares ESG Active Opportunities ETF | | | 638,777 | | | | (32,020 | ) |
TrueShares Low Volatility Equity Income ETF | | | 1,634,291 | | | | (40,190 | ) |
TrueShares Eagle Global Renewable Energy Income ETF | | | — | | | | — | |
RiverNorth Patriot ETF | | | 95,848 | | | | (69,457 | ) |
RiverNorth Enhanced Pre-Merger SPAC ETF | | | 1,961 | | | | (16 | ) |
43
TrueShares ETFs
Notes to Financial Statements
December 31, 2022 (Continued)
Purchases and sales of investments (excluding short-term investments), creations in-kind and redemptions in-kind for the year or period ended December 31, 2022, were as follows:
| | | Purchases | | | Sales | | | Creations
In-Kind | | | Redemptions
In-Kind | |
TrueShares Technology, AI & Deep Learning ETF | | $ | 7,835,403 | | | $ | 5,318,753 | | | $ | 4,387,969 | | | $ | 10,512,349 | |
TrueShares ESG Active Opportunities ETF | | | 341,111 | | | | 387,265 | | | | — | | | | 1,762,862 | |
TrueShares Low Volatility Equity Income ETF | | | 24,321,774 | | | | 23,933,437 | | | | 38,338,709 | | | | 7,369,764 | |
TrueShares Eagle Global Renewable Energy Income ETF | | | 193,129 | | | | 45,334 | | | | 2,294,383 | | | | — | |
RiverNorth Patriot ETF | | | 1,052,635 | | | | 1,119,733 | | | | 3,659,651 | | | | 1,148,769 | |
RiverNorth Enhanced Pre-Merger SPAC ETF | | | 1,564,051 | | | | 1,695,919 | | | | 4,290,464 | | | | 604,771 | |
7. PRINCIPAL RISKS
As with all ETFs, shareholders of the Funds are subject to the risk that their investment could lose money. Each Fund is subject to the principal risks, any of which may adversely affect a Fund’s NAV, trading price, yield, total return and ability to meet its investment objective.
The global outbreak of COVID-19 (commonly referred to as “coronavirus”) has disrupted economic markets and the prolonged economic impact is uncertain. The ultimate economic fallout from the pandemic, and the long-term impact on economies, markets, industries and individual issuers, are not known. The operational and financial performance of the issuers of securities in which the Funds invest depends on future developments, including the duration and spread of the outbreak, and such uncertainty may in turn adversely affect the value and liquidity of the Funds’ investments, impair the Funds’ ability to satisfy redemption requests, and negatively impact the Funds’ performance.
On February 24, 2022, Russia commenced a military attack on Ukraine. The outbreak of hostilities between the two countries could result in more widespread conflict and could have a severe adverse effect on the region and the markets. In addition, sanctions imposed on Russia by the United States and other countries, and any sanctions imposed in the future could have a significant adverse impact on the Russian economy and related markets. The price and liquidity of investments may fluctuate widely as a result of the conflict and related events. How long such conflict and related events will last and whether it will escalate further cannot be predicted, nor its effect on the Fund.
A complete description of principal risks is included in the prospectus under the heading “Principal Investment Risks.”
8. SUBSEQUENT EVENTS
Management has evaluated the Funds’ related events and transactions that occurred subsequent to December 31, 2022, through the date of issuance of the Funds’ financial statements. Management has determined that there were no subsequent events requiring recognition or disclosure in the financial statements.
44
TrueShares ETFs
Report of Independent Registered Public Accounting Firm
To the Shareholders of TrueShares ETFs and
Board of Trustees of Listed Funds Trust
Opinion on the Financial Statements
We have audited the accompanying statements of assets and liabilities, including the schedules of investments, of TrueShares Technology, AI & Deep Learning ETF, TrueShares ESG Active Opportunities ETF, TrueShares Low Volatility Equity Income ETF, TrueShares Eagle Global Renewable Energy Income ETF, RiverNorth Patriot ETF, and RiverNorth Enhanced Pre-Merger SPAC ETF (“TrueShares ETFs” or the “Funds”), each a series of Listed Funds Trust, as of December 31, 2022, the related statements of operations, the statements of changes in net assets, the related notes, and the financial highlights for each of the periods indicated below (collectively referred to as the “financial statements”). In our opinion, the financial statements present fairly, in all material respects, the financial position of each of the Funds as of December 31, 2022, the results of their operations, the changes in net assets, and the financial highlights for each of the periods indicated below in conformity with accounting principles generally accepted in the United States of America.
Fund Name | Statements of
Operations | Statements of Changes
in Net Assets | Financial Highlights |
TrueShares Technology, AI & Deep Learning ETF | For the year ended December 31, 2022 | For the years ended December 31, 2022 and 2021 | For the years ended December 31, 2022 and 2021 and for the period from February 28, 2020 (commencement of operations) through December 31, 2020 |
TrueShares ESG Active Opportunities ETF | For the year ended December 31, 2022 | For the years ended December 31, 2022 and 2021 | For the years ended December 31, 2022 and 2021 and for the period from February 28, 2020 (commencement of operations) through December 31, 2020 |
TrueShares Low Volatility Equity Income ETF | For the year ended December 31, 2022 | For the year ended December 31, 2022 and for the period from January 27, 2021 (commencement of operations) through December 31, 2021 |
TrueShares Eagle Global Renewal Energy Income ETF | For the period from December 8, 2022 (commencement of operations) through December 31, 2022 |
RiverNorth Patriot ETF | For the year ended December 31, 2022 | For the year ended December 31, 2022 and for the one day ended December 31, 2021 (commencement of operations) |
RiverNorth Enhanced Pre-Merger SPAC ETF | For the period from July 11, 2022 (commencement of operations) through December 31, 2022 |
Basis for Opinion
These financial statements are the responsibility of the Funds’ management. Our responsibility is to express an opinion on the Funds’ financial statements based on our audits. We are a public accounting firm registered with the Public Company Accounting Oversight Board (United States) (“PCAOB”) and are required to be independent with respect to the Funds in accordance with the U.S. federal securities laws and the applicable rules and regulations of the Securities and Exchange Commission and the PCAOB.
We conducted our audits in accordance with the standards of the PCAOB. Those standards require that we plan and perform the audit to obtain reasonable assurance about whether the financial statements are free of material misstatement whether due to error or fraud.
45
TrueShares ETFs
Report of Independent Registered Public Accounting Firm
(Continued)
Our audits included performing procedures to assess the risks of material misstatement of the financial statements, whether due to error or fraud, and performing procedures that respond to those risks. Such procedures included examining, on a test basis, evidence regarding the amounts and disclosures in the financial statements. Our procedures included confirmation of securities owned as of December 31, 2022, by correspondence with the custodian and brokers. Our audits also included evaluating the accounting principles used and significant estimates made by management, as well as evaluating the overall presentation of the financial statements. We believe that our audits provide a reasonable basis for our opinion.
We have served as the Funds’ auditor since 2019.

COHEN & COMPANY, LTD.
Cleveland, Ohio
March 1, 2023
46
TrueShares ETFs
Board of Trustees and Officers
December 31, 2022 (Unaudited)
The Fund’s Statement of Additional Information includes additional information about the Fund’s Trustees and Officers, and is available, without charge upon request by calling 1-800-617-0004, or by visiting the Fund’s website at www.true-shares.com.
Name and Year of Birth | Position Held
with the Trust | Term of Office
and Length of
Time Served | Principal Occupation(s)
During Past 5 Years | Number of
Portfolios in
Fund Complex
Overseen by
Trustee | Other
Directorships Held
by Trustee During
Past 5 Years |
Independent Trustees | | | | | |
John L. Jacobs
Year of birth: 1959 | Trustee and Audit Committee Chair | Indefinite term; since 2017 | Chairman of Alerian, Inc. (since June 2018); Founder and CEO of Q3 Advisors, LLC (financial consulting firm) (since 2015); Executive Director of Center for Financial Markets and Policy (2016–2022); Distinguished Policy Fellow and Executive Director, Center for Financial Markets and Policy, Georgetown University (2015–2022); Senior Advisor, Nasdaq OMX Group (2015–2016); Executive Vice President, Nasdaq OMX Group (2013–2015) | 53 | Independent Trustee, SHP ETF Trust (since 2021) (2 portfolios); Director, tZERO Group, Inc. (since 2020); Independent Trustee, Procure ETF Trust II (since 2018) (1 portfolio); Independent Trustee, Horizons ETF Trust I (2015-2019) |
Koji Felton
Year of birth: 1961 | Trustee | Indefinite term; since 2019 | Retired; formerly Counsel, Kohlberg Kravis Roberts & Co. L.P. (investment firm) (2013–2015); Counsel, Dechert LLP (law firm) (2011–2013) | 53 | Independent Trustee, Series Portfolios Trust (since 2015) (10 portfolios) |
Pamela H. Conroy Year of birth: 1961 | Trustee and Nominating and Governance Committee Chair | Indefinite term; since 2019 | Retired; formerly Executive Vice President, Chief Operating Officer & Chief Compliance Officer, Institutional Capital Corporation (investment firm) (1994–2008) | 53 | Independent Trustee, Frontier Funds, Inc. (since 2020) (6 portfolios) |
Interested Trustee | | | | | |
Paul R. Fearday, CPA*
Year of birth: 1979 | Trustee and Chairman | Indefinite term; since 2019 | Senior Vice President, U.S. Bancorp Fund Services, LLC (since 2008) | 53 | None |
* | This Trustee is considered an “Interested Trustee” as defined in the 1940 Act because of his affiliation with U.S. Bancorp Fund Services, d/b/a U.S. Bank Global Fund Services and U.S. Bank N.A., which provide fund accounting, administration, transfer agency and custodian services to the Funds. |
47
TrueShares ETFs
Board of Trustees and Officers
December 31, 2022 (Unaudited) (Continued)
Name and Year of Birth | Position(s)
Held with
the Trust | Term of Office
and Length of
Time Served | Principal Occupation(s) During Past 5 Years |
Officers | | | |
Gregory Bakken Year of birth: 1983 | President and Principal Executive Officer | Indefinite term, February 2019 | Vice President, U.S. Bancorp Fund Services, LLC (since 2006) |
Travis G. Babich Year of birth: 1980 | Treasurer and Principal Financial Officer | Indefinite term, September 2019 | Vice President, U.S. Bancorp Fund Services, LLC (since 2005) |
Kacie G. Briody Year of birth: 1992 | Assistant Treasurer | Indefinite term, March 2019 | Assistant Vice President, U.S. Bancorp Fund Services, LLC (since 2021); Officer, U.S. Bancorp Fund Services, LLC (2014 to 2021) |
Kent Barnes Year of birth: 1968 | Secretary | Indefinite term, February 2019 | Vice President, U.S. Bancorp Fund Services, LLC (since 2018); Chief Compliance Officer, Rafferty Asset Management, LLC (2016 to 2018); Vice President, U.S. Bancorp Fund Services, LLC (2007 to 2016) |
Christi C. James Year of birth: 1974 | Chief Compliance Officer and Anti-Money Laundering Officer | Indefinite term, July 2022 | Senior Vice President, U.S. Bancorp Fund Services, LLC (since 2022); Principal Consultant, ACA Group (2021 to 2022); Lead Manager, Communications Compliance, T. Rowe Price Investment Services, Inc. (2018 to 2021); Compliance & Legal Manager, CR Group LP (2017 to 2018). |
Joshua J. Hinderliter Year of birth: 1983 | Assistant Secretary | Indefinite term, May 2022 | Assistant Vice President, U.S. Bancorp Fund Services, LLC (since 2022); Managing Associate, Thompson Hine LLP (2016 to 2022) |
48
TrueShares Technology, AI & Deep Learning ETF
TrueShares ESG Active Opportunities ETF
TrueShares Low Volatility Equity Income ETF
Board Consideration and Approval of Advisory and Sub-Advisory Agreements
December 31, 2022 (Unaudited)
At a meeting held on September 14, 2022 (the “Meeting”), the Board of Trustees (the “Board”) of Listed Funds Trust (the “Trust”), including those trustees who are not “interested persons” of the Trust, as defined in the Investment Company Act of 1940 (the “1940 Act”) (the “Independent Trustees”), considered the following agreements (collectively, the “Agreements”):
| | ● | the approval of the continuation of the advisory agreement (the “Advisory Agreement”) between TrueMark Investments, LLC (the “Adviser”) and the Trust, on behalf of TrueShares Technology, AI & Deep Learning ETF, TrueShares ESG Active Opportunities ETF, and TrueShares Low Volatility Equity Income ETF (each, a “Fund” and together, the “Funds”); |
| | ● | the approval of the continuation of the sub-advisory agreement (the “Black Hill Agreement”) between the Adviser, the Trust, on behalf of TrueShares Technology, AI & Deep Learning ETF (“LRNZ”), and Black Hill Capital Partners, LLC (“Black Hill Capital” or “Sub-Adviser”); and |
| | ● | the approval of the sub-advisory agreement (the “Opal Agreement”) between the Adviser, the Trust, on behalf of TrueShares Low Volatility Equity Income ETF (“DIVZ”), and Opal Capital, LLC (the “Opal” or Sub-Adviser”). |
Pursuant to Section 15 of the 1940 Act, the initial approval, or the continuation of each of the Advisory Agreement and Sub-Advisory Agreement after its initial two-year term, must be approved annually by: (i) the vote of the Board or shareholders of a Fund and (ii) the vote of a majority of the Independent Trustees cast at a meeting called for the purpose of voting on such approval. As discussed in greater detail below, in preparation for the Meeting, the Board requested from, and reviewed a wide variety of information provided by, the Adviser and the Sub-Advisers.
In addition to the written materials provided to the Board in advance of the Meeting, representatives from the Adviser and Sub-Advisers provided the Board with an overview, during the Meeting, of each Fund’s strategy, the services provided to each Fund by the Adviser and respective Sub-Adviser, and additional information about the Adviser’s and the Sub-Advisers’ personnel and operations. The Board considered the Adviser’s and Sub-Adviser’s presentations and the materials it received in advance of the Meeting, including a memorandum from legal counsel to the Trust regarding the responsibilities of the Trustees in considering the approval of the Advisory and Sub-Advisory Agreements. The Board also considered the information about the Fund, the Adviser and the Sub-Advisers provided over the course of the prior year. The Board deliberated on the approval of the Advisory and Sub-Advisory Agreements for an additional one-year period in light of this information, if applicable. Throughout the process, the Trustees were afforded the opportunity to ask questions of, and request additional materials from, the Adviser and Sub-Advisers. The Independent Trustees also met in executive session with counsel to the Trust to further discuss the Advisory and Sub-Advisory Agreements and the Independent Trustees’ responsibilities relating thereto.
At the Meeting, the Board, including a majority of the Independent Trustees, evaluated a number of factors, including, among other things: (i) the nature, extent, and quality of the services provided by the Adviser and Sub-Advisers to the Funds; (ii) each Fund’s expenses and performance; (iii) the cost of the services provided and profits to be realized by the Adviser and Sub-Advisers from the relationship with each Fund; (iv) comparative fee and expense data for each Fund and other investment companies with similar investment objectives; (v) the extent to which the advisory fee for each Fund reflects economies of scale shared with its respective Fund shareholders; (vi) any benefits derived by the Adviser and Sub-Advisers from the relationship with each Fund, including any fall-out benefits enjoyed by the Adviser and Sub-Advisers; and (vii) other factors the Board deemed relevant. In its deliberations, the Board considered the factors and reached the conclusions described below relating to the advisory and sub-advisory arrangements and the approval or renewal of the Agreements. In its deliberations, the Board did not identify any single piece of information that was paramount or controlling and the individual Trustees may have attributed different weights to various factors.
Approval of the Continuation of the Advisory Agreement with the Adviser
Nature, Extent, and Quality of Services Provided. The Board considered the scope of services provided under the Advisory Agreement, noting that the Adviser expected to continue to provide substantially similar investment management services to the Funds. In considering the nature, extent, and quality of the services provided by the Adviser, the Board considered the quality of the Adviser’s compliance infrastructure and past reports from the Trust’s Chief Compliance Officer (“CCO”). The Board also considered its previous experience with the Adviser and the investment management services it has provided to
49
TrueShares Technology, AI & Deep Learning ETF
TrueShares ESG Active Opportunities ETF
TrueShares Low Volatility Equity Income ETF
Board Consideration and Approval of Advisory and Sub-Advisory Agreements
December 31, 2022 (Unaudited) (Continued)
the Funds, as well as other series of the Trust. The Board noted that it had received a copy of the Adviser’s registration form on Form ADV, as well as the response of the Adviser to a detailed series of questions which included, among other things, information about the background and experience of the firm’s key personnel, the firm’s cybersecurity policy, and the services provided by the Adviser.
In addition to the Adviser’s responsibilities with respect to implementing the Funds’ investment programs, the Board also considered other services currently provided by the Adviser to the Funds, such as monitoring adherence to each Fund’s investment restrictions, overseeing the activities of each Sub-Adviser, compliance with various policies and procedures and with applicable securities regulations, and the extent to which each Fund achieved its investment objective. The Board further considered the information provided by the Adviser with respect to the ongoing impact of the COVID-19 pandemic on the Adviser’s operations.
Historical Performance. The Board noted that it had received information regarding each Fund’s performance for various time periods in the materials and primarily considered each Fund’s performance for period ended June 30, 2022, unless otherwise noted.
TrueShares Technology, AI & Deep Learning ETF: The Board noted that, for the one-year and since inception periods, the Fund underperformed the NASDAQ Composite Total Return Index, before Fund fees and expenses. The Board also noted that, for the one-year period as of August 31, 2022, the Fund slightly underperformed the median for funds in the universe of Technology ETFs as reported by Morningstar (the “Category Peer Group”).
The Board also considered the Fund’s performance relative to the most direct competitors as identified by the Adviser which are either actively or passively managed Technology and Artificial Intelligence ETFs (the “Selected Peer Group”). The Board noted that, for the one-year period, the Fund performed within the range of returns of the Selected Peer Group.
TrueShares ESG Active Opportunities ETF: The Board noted that, for the one-year and since inception periods, the Fund underperformed the S&P 500 Total Return Index (the “Benchmark”), before Fund fees and expenses. The Board also noted that, for the one-year period as of August 31, 2022, the Fund outperformed the median for funds in the universe of Large Growth ETFs as reported by Morningstar (the “Category Peer Group”).
The Board also considered the Fund’s performance relative to the most direct competitors as identified by the Adviser which are passively managed ESG-themed ETFs (the “Selected Peer Group”). The Board noted that, for the one-year period, the Fund performed within the range of returns of the Selected Peer Group.
TrueShares Low Volatility Equity Income ETF: The Board noted that, for the one-year and since inception periods, the Fund underperformed the S&P 500 Total Return Index (the “Benchmark”), before Fund fees and expenses. The Board also noted that, for the one-year period as of August 31, 2022, the Fund outperformed the median for funds in the universe of Large Cap Value ETFs as reported by Morningstar (the “Category Peer Group”).
The Board also considered the Fund’s performance relative to the most direct competitors as identified by the Adviser which are passively managed Equity Income ETFs (the “Selected Peer Group”). The Board noted that, for the one-year period, the Fund performed within the range of returns of the Selected Peer Group.
Cost of Services Provided and Profitability. The Board reviewed the expense ratio for each Fund and compared each Fund’s expense ratio to those of its Category Peer Group and Selected Peer Group. The Board took into consideration that the Adviser charges a “unitary fee,” meaning a Fund pays no expenses except for the advisory fee paid to the Adviser pursuant to the Advisory Agreement and certain expenses excluded from the unitary fee arrangement, including interest charges on any borrowings, dividends and other expenses on securities sold short, taxes, brokerage commissions and other expenses incurred in placing orders for the purchase and sale of securities and other investment instruments, acquired fund fees and expenses, accrued deferred tax liability, extraordinary expenses, and distribution fees and expenses paid by the Trust under any distribution plan adopted pursuant to Rule 12b-1 under the 1940 Act. The Board noted that the Adviser continues to be
50
TrueShares Technology, AI & Deep Learning ETF
TrueShares ESG Active Opportunities ETF
TrueShares Low Volatility Equity Income ETF
Board Consideration and Approval of Advisory and Sub-Advisory Agreements
December 31, 2022 (Unaudited) (Continued)
responsible for compensating each Fund’s other service providers and paying each Fund’s other expenses out of its own revenue and resources. The Board also evaluated the compensation and benefits received by the Adviser from its relationship with the Funds, taking into account of the Adviser’s profitability analysis with respect to each Fund.
TrueShares Technology, AI & Deep Learning ETF: The Board noted that the expense ratio for the Fund, which consists entirely of the “unified fee” described below, was lower than the median of its Category Peer Group. The Board further noted that the Fund’s expense ratio was within the range of expense ratios for the Selected Peer Group.
TrueShares ESG Active Opportunities ETF: The Board noted that the expense ratio for the Fund, which consists entirely of the “unified fee” described below, was lower than the median of its Category Peer Group. The Board also noted that, because the Category Peer Group included actively-managed funds of large fund complexes where economies of scale are more easily attainable, the Category Peer Group may not allow for an apt comparison by which to judge the Fund’s expense ratio. The Board further noted that the Fund’s expense ratio was also higher than expense ratios for the Selected Peer Group, which also included large fund complexes where economies of scale are more easily attainable.
TrueShares Low Volatility Equity Income ETF: The Board noted that the expense ratio for the Fund, which consists entirely of the “unified fee” described below, was significantly higher than the median of its Category Peer Group. The Board also noted that, because the Category Peer Group included actively-managed funds of large fund complexes where economies of scale are more easily attainable, the Category Peer Group may not allow for an apt comparison by which to judge the Fund’s expense ratio. The Board further noted that the Fund’s expense ratio was also higher than expense ratios for the Selected Peer Group, which also included large fund complexes where economies of scale are more easily attainable.
Economies of Scale. The Board noted that it is not yet evident that the Funds have reached the size at which they have begun to realize economies of scale, but acknowledged that breakpoints might be warranted if the Funds’ assets continue to grow. However, the Board further determined that, based on the amount and structure of each Fund’s unitary fee, any such economies of scale would be shared with each Fund’s respective shareholders. The Board stated that it would monitor fees as each Fund grows and consider whether fee breakpoints may be warranted in the future.
Conclusion. No single factor was determinative of the Board’s decision to approve the continuation of the Advisory Agreement; rather, the Board based its determination on the total mix of information available to it. Based on a consideration of all the factors in their totality, the Board, including a majority of the Independent Trustees, determined that the terms of the Advisory Agreement, including the compensation payable thereunder, were fair and reasonable to each Fund. The Board, including a majority of the Independent Trustees, therefore determined that the approval of the continuation of the Advisory Agreement was in the best interests of each Fund and its respective shareholders.
Approval of Continuation of the Sub-Advisory Agreement with Black Hill Capital Partners, LLC
Nature, Extent, and Quality of Services Provided. The Board considered the scope of services provided to LRNZ under the Black Hill Agreement, noting that the Sub-Adviser expected to continue to provide substantially similar investment management services to the Fund. The Board noted the responsibilities that the Sub-Adviser has as the Fund’s investment sub-adviser, including: responsibility for the management of the securities and other assets of the Fund, subject to the supervision and oversight of the Adviser; determining the assets to be purchased, retained or sold by the Fund; executing placement of orders and selection of brokers or dealers for such orders; general portfolio compliance with relevant law; responsibility for quarterly reporting to the Board; and implementation of Board directives as they relate to the Fund.
In considering the nature, extent, and quality of the services provided by the Sub-Adviser, the Board considered past and current reports of the Trust’s CCO with respect to Sub-Adviser’s compliance program and noted that it had received a copy of the Sub-Adviser’s registration form on Form ADV, as well as the response of the Sub-Adviser to a detailed series of questions which included, among other things, information about the background and experience of the firm’s key personnel, the firm’s cybersecurity policy, and the services provided by the Sub-Adviser. The Board also considered the Sub-Adviser’s resources
51
TrueShares Technology, AI & Deep Learning ETF
TrueShares ESG Active Opportunities ETF
TrueShares Low Volatility Equity Income ETF
Board Consideration and Approval of Advisory and Sub-Advisory Agreements
December 31, 2022 (Unaudited) (Continued)
and capacity with respect to portfolio management, compliance, and operations and its previous experience with the Sub-Adviser providing investment management services to the Fund. The Board further considered information provided by the Sub-Adviser with respect to the impact of the COVID-19 pandemic on its operations.
Historical Performance. The Board noted that it had received information regarding the Fund’s performance for various time periods in the materials and considered the Fund’s performance for the periods ended June 30, 2022 and August 31, 2022.
Costs of Services Provided and Economies of Scale. The Board reviewed the sub-advisory fees paid by the Adviser to the Sub-Adviser for its services to the Fund. The Board considered that the fees paid to the Sub-Adviser are paid by the Adviser rather than the Fund, and noted that the fees reflect an arm’s-length negotiation between the Adviser and the Sub-Adviser. The Board also took into account analyses of the Sub-Adviser’s profitability with respect to the Fund.
The Board noted that it is not yet evident that the Fund has reached the size at which it has begun to realize economies of scale, but acknowledged that breakpoints might be warranted if the Fund’s assets continue to grow. The Board further noted that because each Fund pays the Adviser a unitary fee, any benefits from breakpoints in the sub-advisory fee schedule would accrue to the Adviser, rather than to each Fund’s shareholders. The Board stated it would monitor fees as each Fund grows and consider whether fee breakpoints might be warranted in the future.
Conclusion. No single factor was determinative of the Board’s decision to approve the Sub-Advisory Agreement; rather, the Board based its determination on the total mix of information available to it. Based on a consideration of all the factors in their totality, the Board, including a majority of the Independent Trustees, determined that the terms of the Sub-Advisory Agreement, including the compensation payable thereunder, were fair and reasonable to each Fund. The Board, including a majority of the Independent Trustees, therefore determined that the approval of the continuation of the Sub-Advisory Agreement was in the best interests of each Fund and its respective shareholders.
Approval of the Sub-Advisory Agreement with Opal Capital, LLC
Nature, Extent, and Quality of Services Provided. The Board considered the scope of services to be provided to DIVZ under the Opal Agreement, noting that the Sub-Adviser is a newly-created investment adviser and an affiliate of Titleist Asset Management, Ltd., the Fund’s current sub-adviser. In addition, the Board considered that the Portfolio Manager would remain the same under the Opal Agreement. The Board expected the Sub-Adviser to continue to provide substantially similar investment management services to the Fund. The Board noted the responsibilities that the Sub-Adviser has as the Fund’s investment sub-adviser, including: responsibility for the management of the securities and other assets of the Fund, subject to the supervision and oversight of the Adviser; determining the assets to be purchased, retained or sold by the Fund; executing placement of orders and selection of brokers or dealers for such orders; general portfolio compliance with relevant law; responsibility for quarterly reporting to the Board; and implementation of Board directives as they relate to the Fund.
In considering the nature, extent, and quality of the services to be provided by the Sub-Adviser, the Board considered the quality of the Sub-Adviser’s compliance program. The Trustees further noted that they had received and reviewed the materials with regard to the Sub-Adviser, including its Form ADV and its responses to a detailed series of questions that included, among other things, information about the Sub-Adviser’s decision making process, details about the Fund, and information about the services to be provided by the Sub-Adviser. The Board also considered the Sub-Adviser’s resources and capacity with respect to portfolio management, compliance, and operations. The Board also considered, among other things, the professional experience and qualifications of the senior management and key professional personnel of the Sub-Adviser, including those individuals responsible for portfolio management. The Board concluded that, within the context of its full deliberations, it was satisfied with the nature, extent, and quality of the services to be provided to the Fund by the Sub-Adviser.
Historical Performance. The Board noted that it had received information regarding the Fund’s performance for various time periods in the materials and considered the Fund’s performance for the periods ended June 30, 2022 and August 31, 2022.
52
TrueShares Technology, AI & Deep Learning ETF
TrueShares ESG Active Opportunities ETF
TrueShares Low Volatility Equity Income ETF
Board Consideration and Approval of Advisory and Sub-Advisory Agreements
December 31, 2022 (Unaudited) (Continued)
Costs of Services Provided and Economies of Scale. The Board reviewed the sub-advisory fees paid by the Adviser to the Sub-Adviser for its services to the Fund. The Board considered that the fees paid to the Sub-Adviser are paid by the Adviser rather than the Fund, and noted that the fees reflect an arm’s-length negotiation between the Adviser and the Sub-Adviser. The Board also took into account analyses of the Sub-Adviser’s profitability with respect to the Fund.
The Board noted that it is not yet evident that the Fund has reached the size at which it has begun to realize economies of scale, but acknowledged that breakpoints might be warranted if the Fund’s assets continue to grow. The Board further noted that because each Fund pays the Adviser a unitary fee, any benefits from breakpoints in the sub-advisory fee schedule would accrue to the Adviser, rather than to each Fund’s shareholders. The Board stated it would monitor fees as each Fund grows and consider whether fee breakpoints might be warranted in the future.
Conclusion. No single factor was determinative of the Board’s decision to approve the Sub-Advisory Agreement; rather, the Board based its determination on the total mix of information available to it. Based on a consideration of all the factors in their totality, the Board, including a majority of the Independent Trustees, determined that the terms of the Sub-Advisory Agreement, including the compensation payable thereunder, were fair and reasonable to each Fund. The Board, including a majority of the Independent Trustees, therefore determined that the approval of the continuation of the Sub-Advisory Agreement was in the best interests of each Fund and its respective shareholders.
53
TrueShares Eagle Global Renewables Income ETF
Board Consideration and Approval of Advisory and Sub-Advisory Agreements
December 31, 2022 (Unaudited)
At a meeting held on September 14, 2022 (the “Meeting”), the Board of Trustees (the “Board”) of Listed Funds Trust (the “Trust”), including those trustees who are not “interested persons” of the Trust, as defined in the Investment Company Act of 1940 (the “1940 Act”) (the “Independent Trustees”), considered the approval of an advisory agreement (the “Advisory Agreement”) between TrueMark Investment, LLC (the “Adviser”) and the Trust, on behalf of TrueShares Eagle Global Renewables ETF (the “Fund”), and a sub-advisory agreement (the “Sub-Advisory Agreement” and, together with the Advisory Agreement, the “Agreements”) between the Adviser, the Trust, and Eagle Global Advisors LLC (the “Sub-Adviser”) with respect to the Fund.
Pursuant to Section 15 of the 1940 Act, the Agreements must be approved by: (i) the vote of the Board or shareholders of the Fund; and (ii) the vote of a majority of the Independent Trustees, cast at a meeting called for the purpose of voting on such approval. As discussed in greater detail below, in preparation for the Meeting, the Board requested from and reviewed a wide variety of information provided by the Adviser.
In addition to the written materials provided to the Board in advance of the Meeting, during the Meeting representatives from the Adviser and Sub-Adviser each provided the Board with an overview of their advisory businesses, including information about its investment personnel, financial resources, experience, investment processes, and compliance program. The representatives discussed the services to be provided by the Adviser and Sub-Adviser, as well as the rationale for launching the Fund, the Fund’s proposed fees, and information with respect to the Fund’s strategy and certain operational aspects of the Fund. The Board considered the Adviser’s and Sub-Adviser’s presentations and the materials it received in advance of the Meeting, including a memorandum from legal counsel to the Trust regarding the responsibilities of the Board in considering the approval of the Agreements. The Board also considered the information about the Fund and the Adviser provided over the course of the prior year. The Board deliberated on the approval of the Agreements in light of this information. Throughout the process, the Board was afforded the opportunity to ask questions of, and request additional materials from, the Adviser and Sub-Adviser. The Independent Trustees also met in executive session with counsel to the Trust to further discuss the proposed Agreements and the Independent Trustees’ responsibilities relating thereto.
At the Meeting, the Board, including a majority of the Independent Trustees, evaluated a number of factors, including, among other things: (i) the nature, extent, and quality of the services to be provided by the Adviser and Sub-Adviser to the Fund; (ii) Fund expenses and performance; (iii) the cost of the services to be provided and profits to be realized by the Adviser and Sub-Adviser from its relationship with the Trust and the Fund; (iv) comparative fee and expense data for the Fund and other investment companies with similar investment objectives; (v) the extent to which the advisory and sub-advisory fees reflect economies of scale to be shared with Fund shareholders; (vi) any benefits to be derived by the Adviser or Sub-Adviser from the relationship with the Trust and the Fund, including any fall-out benefits enjoyed by the Adviser or Sub-Adviser; and (vii) other factors the Board deemed relevant. In its deliberations, the Board considered the factors and reached the conclusions described below relating to the advisory arrangements and the approval of the Agreements. In its deliberations, the Board did not identify any single piece of information that was paramount or controlling and the individual Trustees may have attributed different weights to various factors.
Approval of the Advisory Agreement with the Adviser
Nature, Extent, and Quality of Services to be Provided. The Board considered the scope of services to be provided under the Advisory Agreement, noting that the Adviser will be providing a continuous investment program for the Fund, including arranging for, or implementing, the purchase and sale of portfolio securities, the provision of related services such as portfolio management compliance services, and the preparation and filing of certain reports on behalf of the Trust. The Board reviewed the extensive responsibilities that the Adviser will have as investment adviser to the Fund, including the oversight of the activities and operations of the Sub-Adviser and other service providers, oversight of general fund compliance with federal and state laws, and the implementation of Board directives as they relate to the Fund. In considering the nature, extent, and quality of the services to be provided by the Adviser, the Board considered the quality of the Adviser’s compliance infrastructure and past and current reports from the Trust’s Chief Compliance Officer regarding her review of the Adviser’s compliance program, as well as the Board’s experience with the Adviser as the investment adviser to other series of the Trust. The Board noted that it had received a copy of the Adviser’s registration form on Form ADV, as well as the response of the Adviser to a detailed series of questions which included, among other things, information about background and experience of the firm’s key personnel, the firm’s cybersecurity policy, and the services to be provided by the Adviser.
54
TrueShares Eagle Global Renewables Income ETF
Board Consideration and Approval of Advisory and Sub-Advisory Agreements
December 31, 2022 (Unaudited) (Continued)
Fund Expenses and Performance. Because the Fund had not yet commenced operations, the Board noted that there were no historical performance records to consider. Instead, the Board was presented with information about the Fund’s investment strategy and expected break-even expense analyses. The Board then reviewed the proposed expense ratio for the Fund and compared it to its peer funds in the universe of Equity Energy ETFs, as reported by Morningstar (the “Category Peer Group”) and certain funds identified by the Adviser as the Fund’s most similar peer funds (the “Selected Peer Group”). The Board noted that the proposed expense ratio for the Fund was significantly higher than the median for the Category Peer Group, and was in the range of expense ratios for the Selected Peer Group. The Board also noted that, because the Category Peer Group included passively-managed funds of large fund complexes where economies of scale are more easily attainable, the Category Peer Group may not allow for an apt comparison by which to judge the Fund’s expense ratio.
Cost of Services to be Provided and Profitability. The Board considered the cost of the services to be provided by the Adviser, the proposed advisory and sub-advisory fees, and the estimated profitability projected by the Adviser, including the methodology underlying such projection. The Board took into consideration that the Fund would pay the Adviser a “unitary fee,” meaning the Fund would pay no expenses except the fee paid to the Adviser pursuant to the Advisory Agreement, interest charges on any borrowings, dividends and other expenses on securities sold short, taxes, brokerage commissions and other expenses incurred in placing orders for the purchase and sale of securities and other investment instruments, acquired fund fees and expenses, accrued deferred tax liability, extraordinary expenses and, to the extent it is implemented, fees pursuant to a Distribution and/or Shareholder Servicing (12b-1) Plan. The Adviser would be responsible for compensating the Fund’s other service providers, including the Sub-Adviser, and paying the Fund’s other expenses out of its own fee and resources. The Board considered the Adviser’s projected break-even point for the Fund or the level of the Fund’s assets under management at which the Adviser may earn revenue from its unitary fee in excess of the expenses necessary to operate the Fund on a day-to-day basis. The Board also evaluated the compensation and benefits expected to be received by the Adviser from its relationship with the Fund. Based on the projected profitability information presented and the comparability of the Funds’ proposed fees and expenses to those of its peer funds, the Board concluded that the Adviser’s anticipated profitability appears reasonable at this time.
Economies of Scale. The Board noted that the Adviser might realize economies of scale in managing the Fund and acknowledged that breakpoints might be warranted as the Fund’s assets grow in size. However, the Board determined that, based on the amount and structure of the Fund’s unitary fee, any such economies of scale would be shared with the Fund’s respective shareholders. The Board stated that it would monitor fees as the Fund grows and consider whether fee breakpoints may be warranted in the future.
Conclusion. No single factor was determinative of the Board’s decision to approve the Advisory Agreement; rather, the Board based its determination on the total mix of information available to it. Based on a consideration of all the factors in their totality, the Board, including a majority of the Independent Trustees, determined that the terms of the Advisory Agreement, including the compensation payable thereunder, were fair and reasonable to the Fund. The Board, including a majority of the Independent Trustees, therefore determined that the approval of the Advisory Agreement for an initial term of two years was in the best interests of the Fund and its shareholders.
Approval of the Sub-Advisory Agreement with the Sub-Adviser
Nature, Extent, and Quality of Services to be Provided. The Board considered the scope of services to be provided to the Fund under the Sub-Advisory Agreement, noting that the Sub-Adviser would provide investment management services to the Fund. The Board noted the responsibilities that the Sub-Adviser would have as the Fund’s investment sub-adviser, including: responsibility for the management of the securities and other assets of the Fund, subject to the supervision and oversight of the Adviser; determining the assets to be purchased, retained or sold by the Fund; executing placement of orders and selection of brokers or dealers for such orders; general portfolio compliance with relevant law; responsibility for daily monitoring of portfolio exposures and quarterly reporting to the Board; proxy voting with respect to securities held by the Fund; and implementation of Board directives as they relate to the Fund.
In considering the nature, extent, and quality of the services to be provided by the Sub-Adviser, the Board considered the quality of the Sub-Adviser’s compliance program, and the Sub-Adviser’s experience providing investment management services to other 1940 Act regulated investment vehicles. The Board further noted that they had received and reviewed materials with regard to the Sub-Adviser, including its responses to a detailed series of questions that included, among other things, information
55
TrueShares Eagle Global Renewables Income ETF
Board Consideration and Approval of Advisory and Sub-Advisory Agreements
December 31, 2022 (Unaudited) (Continued)
about the Sub-Adviser’s decision making process, details about the Fund, and information about the services to be provided by the Sub-Adviser. The Board also considered the Sub-Adviser’s resources and capacity with respect to portfolio management, compliance, and operations. The Board also considered, among other things, the professional experience and qualifications of the senior management and key professional personnel of the Sub-Adviser, including those individuals responsible for portfolio management. The Board concluded, within the context of its full deliberations, it was satisfied with the nature, extent, and quality of the services to be provided to the Fund by the Sub-Adviser.
Fund Expenses and Performance. Because the Fund had not yet commenced operations, the Board noted that there were no historical performance records to consider. The Board was presented with information about the Fund’s investment strategy and expected break-even expense analyses. The Board also reviewed information regarding the Fund’s proposed advisory and sub-advisory fees, including advisory fees and total expense ratios of those funds that might be considered peers of the Fund. Based on its review, the Board concluded that the sub-advisory fee and expense ratios appeared to be competitive and are otherwise reasonable in light of the information provided.
Costs of Services to be Provided and Profitability. The Board considered the cost of the services to be provided by the Adviser, the proposed advisory and sub-advisory fees, and the estimated profitability projected by the Adviser and Sub-Adviser, including the methodology underlying such projection. The Board considered the fees to be paid to the Sub-Adviser would be paid by the Adviser from the fee the Adviser received from the Fund and noted that the fee reflected an arm’s-length negotiation between the Adviser and the Sub-Adviser. The Board further determined the sub-advisory fee reflected an appropriate allocation of the advisory fee paid to the Adviser given the work performed by each firm. The Board also evaluated the compensation and benefits expected to be received by the Sub-Adviser from its relationship with the Fund, taking into account an analysis of the Sub-Adviser’s estimated profitability with respect to the Fund.
Economies of Scale. The Board expressed the view that it currently appeared that the Sub-Adviser might realize economies of scale in managing the Fund as assets grow in size. The Board determined that it would monitor fees as the Fund’s assets grow to determine whether economies of scale were being effectively shared with the Fund and its shareholders.
Conclusion. No single factor was determinative of the Board’s decision to approve the Sub-Advisory Agreement; rather, the Board based its determination on the total mix of information available to it. Based on a consideration of all the factors in their totality, the Board, including a majority of the Independent Trustees, determined that the terms of the Sub-Advisory Agreement, including the compensation payable thereunder, were fair and reasonable to the Fund. The Board, including a majority of the Independent Trustees, therefore determined that the approval of the Sub-Advisory Agreement for an initial two-year term was in the best interests of the Fund and its shareholders.
56
RiverNorth Enhanced Pre-Merger SPAC ETF
Board Consideration and Approval of Advisory and Sub-Advisory Agreements
December 31, 2022 (Unaudited)
At a meeting held on March 16-17, 2022 (the “Meeting”), the Board of Trustees (the “Board”) of Listed Funds Trust (the “Trust”), including those trustees who are not “interested persons” of the Trust, as defined in the Investment Company Act of 1940 (the “1940 Act”) (the “Independent Trustees”), considered the approval of an advisory agreement (the “Advisory Agreement”) between TrueMark Investments, LLC (the “Adviser”) and the Trust, on behalf of RiverNorth Enhanced Pre-Merger SPAC ETF (the “Fund”), and a sub-advisory agreement (the “Sub-Advisory Agreement” and, together with the Advisory Agreement, the “Agreements”) between the Adviser, the Trust, and RiverNorth Capital Management, LLC (the “Sub-Adviser”) with respect to the Fund.
Pursuant to Section 15 of the 1940 Act, the Agreements must be approved by: (i) the vote of the Board or shareholders of the Fund and (ii) the vote of a majority of the Independent Trustees, cast at a meeting called for the purpose of voting on such approval.
As discussed in greater detail below, in preparation for the Meeting, the Board requested from and reviewed a wide variety of information provided by the Adviser. In addition to the written materials provided to the Board in advance of the Meeting, during the Meeting representatives from the Adviser and Sub-Adviser each provided the Board with an overview of its advisory business, including information about its investment personnel, financial resources, experience, investment processes, quality control and compliance program. The representatives discussed the services to be provided by the Adviser and Sub-Adviser, as well as the rationale for launching the Fund, the Fund’s proposed fees, and information with respect to the Fund’s strategy and certain operational aspects of the Fund. The Board considered the materials it received in advance of the Meeting, including a memorandum from legal counsel to the Trust regarding the responsibilities of the Trustees in considering the approval of the Agreements under the 1940 Act and information conveyed during the Adviser’s and Sub-Adviser’s oral presentations. The Board deliberated on the approval of the Agreements in light of this information. Throughout the process, the Trustees were afforded the opportunity to ask questions of, and request additional materials from, the Adviser and Sub-Adviser. The Independent Trustees also met in executive session with counsel to the Trust to further discuss the proposed advisory and sub-advisory arrangements and the Independent Trustees’ responsibilities relating thereto.
At the Meeting, the Board, including a majority of the Independent Trustees, evaluated a number of factors, including, among other things: (i) the nature, extent, and quality of the services to be provided by the Adviser and Sub-Adviser to the Fund; (ii) Fund anticipated expenses and performance; (iii) the cost of the services to be provided and anticipated profits to be realized by the Adviser and Sub-Adviser from the relationship with the Fund; (iv) comparative fee and expense data for the Fund and other investment companies with similar investment objectives; (v) the extent to which the advisory fee reflects economies of scale to be shared with Fund shareholders; (vi) any benefits to be derived by the Adviser or Sub-Adviser from the relationship with the Fund, including any fall-out benefits enjoyed by the Adviser or Sub-Adviser; and (vii) other factors the Board deemed relevant. In its deliberations, the Board did not identify any single piece of information that was paramount or controlling and the individual Trustees may have attributed different weights to various factors.
Approval of the Advisory Agreement with the Adviser
Nature, Extent, and Quality of Services to be Provided. The Board considered the scope of services to be provided under the Advisory Agreement, noting that the Adviser will be providing a continuous investment program for the Fund, including arranging for, or implementing, the purchase and sale of portfolio securities. The Board also considered other services to be provided by the Adviser to the Fund, including monitoring adherence to the Fund’s investment restrictions, overseeing the activities of the Sub-Adviser and other service providers, monitoring compliance with various policies and procedures with applicable securities regulations, and monitoring the extent to which the Fund achieves its investment objective as an actively-managed fund. In considering the nature, extent, and quality of the services to be provided by the Adviser, the Board considered the quality of the Adviser’s compliance infrastructure and past and current reports from the Trust’s Chief Compliance Officer (“CCO”) regarding his review of the Adviser’s compliance program, as well as the Board’s experience with the Adviser as the investment adviser to other series of the Trust. The Board noted that it had received a copy of the Adviser’s registration on Form ADV, as well as the response of the Adviser to a detailed series of questions which included, among other things, information about the background and experience of the firm’s key personnel, the firm’s cybersecurity policy, and the services to be provided by the Adviser.
57
RiverNorth Enhanced Pre-Merger SPAC ETF
Board Consideration and Approval of Advisory and Sub-Advisory Agreements
December 31, 2022 (Unaudited) (Continued)
Fund Expenses and Performance. Because the Fund had not yet commenced operations, the Board noted that there were no historical performance records to consider. Instead, the Board was presented with information about the Fund’s investment strategies and expected break-even expense analyses. The Board considered that the Fund’s advisory fee consists entirely of the “unified fee” described below. The Board reviewed the proposed expense ratio for the Fund and compared it to the universe of Small Growth ETFs and an Event Driven ETF, as reported by Morningstar (the “Category Peer Group”) and its closest competitors as identified by the Adviser (the “Selected Peer Group”). The Board noted that the proposed expense ratio for the Fund was slightly higher than the median for the Category Peer Group, but was within the range of expense ratios for both Peer Groups.
Cost of Services to be Provided and Profitability. The Board considered the cost of the services to be provided by the Adviser, the proposed advisory and sub-advisory fees, and the estimated profitability projected by the Adviser, including the methodology underlying such projection. The Board took into consideration that the Fund would pay the Adviser a “unitary fee,” meaning the Fund would pay no expenses except for the fee paid to the Adviser pursuant to the Advisory Agreement, interest charges on any borrowings, dividends and other expenses on securities sold short, taxes, brokerage commissions and other expenses incurred in placing orders for the purchase and sale of securities and other investment instruments, acquired fund fees and expenses, accrued deferred tax liability, extraordinary expenses and distribution fees and expenses paid by the Fund under any distribution plan adopted pursuant to Rule 12b-1 under the 1940 Act. The Adviser would be responsible for compensating the Fund’s other service providers, including the Sub-Adviser, and paying the Fund’s other expenses out of its own fee and resources. The Board considered the Adviser’s projected break-even point for the Fund or the level of the Fund’s assets under management at which the Adviser may earn revenue from its unitary fee in excess of the expenses necessary to operate the Fund on a day-to-day basis. The Board also evaluated the compensation and benefits expected to be received by the Adviser from its relationship with the Fund. Based on the projected profitability information presented and the comparability of the Fund’s proposed fees and expenses to those of its peer funds, the Board concluded that the Adviser’s anticipated profitability appears reasonable at this time.
Economies of Scale. The Board noted that the Adviser might realize economies of scale in managing the Fund and acknowledged that breakpoints might be warranted as the Fund’s assets grow in size. However, the Board determined that, based on the amount and structure of the Fund’s unitary fee, any such economies of scale would be shared with the Fund’s shareholders. The Board stated it would monitor fees as the Fund grows and consider whether fee breakpoints may be warranted in the future.
Conclusion. No single factor was determinative of the Board’s decision to approve the Advisory Agreement; rather, the Board based its determination on the total mix of information available to it. Based on a consideration of all the factors in their totality, the Board, including a majority of the Independent Trustees, determined that the terms of the Advisory Agreement, including the compensation payable thereunder, were fair and reasonable to the Fund. The Board, including a majority of the Independent Trustees, therefore determined that the approval of the Advisory Agreement for an initial term of two years was in the best interests of the Fund and its shareholders.
Approval of the Sub-Advisory Agreement with the Sub-Adviser
Nature, Extent, and Quality of Services to be Provided. The Board considered the scope of services to be provided to the Fund under the Sub-Advisory Agreement, noting that the Sub-Adviser would provide investment management services to the Fund. The Board noted the responsibilities that the Sub-Adviser would have as the Fund’s investment sub-adviser, including: responsibility for the management of the securities and other assets of the Fund, subject to the supervision and oversight of the Adviser; determining the assets to be purchased, retained or sold by the Fund; executing placement of orders and selection of brokers or dealers for such orders; general portfolio compliance with relevant law; responsibility for daily monitoring of portfolio exposures and quarterly reporting to the Board; proxy voting with respect to securities held by the Fund; and implementation of Board directives as they relate to the Fund.
In considering the nature, extent, and quality of the services to be provided by the Sub-Adviser, the Board considered the quality of the Sub-Adviser’s compliance infrastructure and past and current reports from the Trust’s CCO regarding his review of the Sub-Adviser’s compliance program, as well as the Board’s experience with the Sub-Adviser as the investment sub-adviser to other series of the Trust. The Trustees further noted that they had received and reviewed the Materials with regard to the Sub-Adviser, including its Form ADV and its responses to a detailed series of questions that included, among other things, information
58
RiverNorth Enhanced Pre-Merger SPAC ETF
Board Consideration and Approval of Advisory and Sub-Advisory Agreements
December 31, 2022 (Unaudited) (Continued)
about the Sub-Adviser’s decision making process, details about the Fund, and information about the services to be provided by the Sub-Adviser. The Board also considered the Sub-Adviser’s resources and capacity with respect to portfolio management, compliance, and operations. The Board also considered, among other things, the professional experience and qualifications of the senior management and key professional personnel of the Sub-Adviser, including those individuals responsible for portfolio management. The Board concluded that, within the context of its full deliberations, it was satisfied with the nature, extent, and quality of the services to be provided to the Fund by the Sub-Adviser.
Fund Expenses and Performance. Because the Fund had not yet commenced operations, the Board noted that there were no historical performance records to consider. The Board was presented with information about the Fund’s investment strategies and expected break-even expense analyses. The Board also reviewed information regarding the Fund’s proposed advisory and sub-advisory fees, including advisory fees and total expense ratios of those funds that might be considered peers of the Fund. Based on its review, the Board concluded that the sub-advisory fee and expense ratios appeared to be competitive and are otherwise reasonable in light of the information provided.
Costs of Services to be Provided and Profitability. The Board considered the cost of the services to be provided by the Adviser, the proposed advisory and sub-advisory fees, and the estimated profitability projected by the Adviser and Sub-Adviser, including the methodology underlying such projection. The Board considered the fees to be paid to the Sub-Adviser would be paid by the Adviser from the fee the Adviser received from the Fund and noted that the fee reflected an arm’s-length negotiation between the Adviser and the Sub-Adviser. The Board further determined the sub-advisory fee reflected an appropriate allocation of the advisory fee paid to the Adviser given the work performed by each firm. The Board also evaluated the compensation and benefits expected to be received by the Sub-Adviser from its relationship with the Fund, taking into account an analysis of the Sub-Adviser’s estimated profitability with respect to the Fund.
Economies of Scale. The Board expressed the view that it currently appeared that the Sub-Adviser might realize economies of scale in managing the Fund as assets grow in size. However, the Board determined that, based on the amount and structure of the Fund’s unitary fee, any such economies of scale would be shared with the Fund’s shareholders. The Board determined that it would monitor fees as the Fund’s assets grow to determine whether economies of scale were being effectively shared with the Fund and its shareholders.
Conclusion. No single factor was determinative of the Board’s decision to approve the Sub-Advisory Agreement; rather, the Board based its determination on the total mix of information available to it. Based on a consideration of all the factors in their totality, the Board, including a majority of the Independent Trustees, determined that the terms of the Sub-Advisory Agreement, including the compensation payable thereunder, were fair and reasonable to the Fund. The Board, including a majority of the Independent Trustees, therefore determined that the approval of the Sub-Advisory Agreement for an initial two-year term was in the best interests of the Fund and its shareholders.
59
TrueShares ETFs
Supplemental Information
(Unaudited)
Investors should consider the investment objective and policies, risk considerations, charges and ongoing expenses of an investment carefully before investing. The prospectus contains this and other information relevant to an investment in the Funds. Please read the prospectus carefully before investing. A copy of the Prospectus for the Funds may be obtained without charge by writing to the Funds, c/o U.S. Bank Global Fund Services, P.O. Box 701, Milwaukee, Wisconsin 53201-0701, by calling 1-800-617-0004, or by visiting the Funds’ website at www.true-shares.com
QUARTERLY PORTFOLIO HOLDING INFORMATION
Each Fund files its complete schedule of portfolio holdings for its first and third fiscal quarters with the Securities and Exchange Commission (“SEC”) on Part F of Form N-PORT. The Funds’ Part F of Form N-PORT is available without charge, upon request, by calling toll-free at 1-800-617-0004. Furthermore, you may obtain the Part F of Form N-PORT on the SEC’s website at www.sec.gov, or by visiting the Funds’ website at www.true-shares.com
PROXY VOTING INFORMATION
Each Fund is required to file a Form N-PX, with the Fund’s complete proxy voting record for the 12 months ended June 30, no later than August 31 of each year. The Fund’s proxy voting record will be available without charge, upon request, by calling toll-free 1-800-617-0004 and on the SEC’s website at www.sec.gov.
FREQUENCY DISTRIBUTION OF PREMIUMS AND DISCOUNTS
Information regarding how often shares of the Funds trade on an exchange at a price above (i.e., at a premium) or below (i.e., at a discount) the NAV of the Funds is available without charge, on the Funds’ website at www.true-shares.com
TAX INFORMATION
For the fiscal year or period end December 31, 2022, certain dividends paid by the Funds may be subject to a maximum tax rate of 20%, as provided for by the Jobs and Growth Tax Relief Reconciliation Act 2003. The percentage of dividends declared from ordinary income designated as qualified dividend income was as follows:
TrueShares Technology, AI & Deep Learning ETF | 0.00% |
TrueShares ESG Active Opportunities ETF | 100.00% |
TrueShares Low Volatility Equity Income ETF | 100.00% |
TrueShares Eagle Global Renewable Energy ETF | 0.00% |
RiverNorth Patriot ETF | 0.00% |
RiverNorth Enhanced Pre-Merger SPAC ETF | 0.00% |
For corporate shareholders, the percent of ordinary income distributions qualifying for the corporate dividends received deduction for the Funds’ fiscal year or period end December 31, 2022 was as follows:
TrueShares Technology, AI & Deep Learning ETF | 0.00% |
TrueShares ESG Active Opportunities ETF | 100.00% |
TrueShares Low Volatility Equity Income ETF | 100.00% |
TrueShares Eagle Global Renewable Energy ETF | 0.00% |
RiverNorth Patriot ETF | 0.00% |
RiverNorth Enhanced Pre-Merger SPAC ETF | 0.00% |
60
TrueShares ETFs
Privacy Policy
(Unaudited)
We are committed to respecting the privacy of personal information you entrust to us in the course of doing business with us.
The Fund collects non-public information about you from the following sources:
| | ● | Information we receive about you on applications or other forms; |
| | ● | Information you give us orally; and/or |
| | ● | Information about your transactions with us or others. |
We do not disclose any non-public personal information about our customers or former customers without the customer’s authorization, except as permitted by law or in response to inquiries from governmental authorities. We may share information with affiliated and unaffiliated third parties with whom we have contracts for servicing the Fund. We will provide unaffiliated third parties with only the information necessary to carry out their assigned responsibilities. We maintain physical, electronic and procedural safeguards to guard your non-public personal information and require third parties to treat your personal information with the same high degree of confidentiality.
In the event that you hold shares of the Fund through a financial intermediary, including, but not limited to, a broker-dealer, bank, or trust company, the privacy policy of your financial intermediary would govern how your non-public personal information would be shared by those entities with unaffiliated third parties.
61
Investment Adviser:
TrueMark Investments, LLC
433 W. Van Buren St., 1150-E
Chicago, IL 60607
Investment Sub-Adviser:
Black Hill Capital Partners, LLC
101 California St.
San Francisco, CA 94111
Eagle Global Advisors, LLC
1330 Post Oak Boulevard, Suite 3000
Houston, TX 77056
Opal Capital LLC
1919 Flower Drive
Palm Beach Gardens, FL 33410
RiverNorth Capital Management, LLC
433 W. Van Buren St., 1150-N
Chicago, IL 60607
Legal Counsel:
Morgan, Lewis & Bockius LLP
1111 Pennsylvania Avenue, N.W.
Washington, D.C. 20004
Independent Registered Public Accounting Firm:
Cohen & Company, Ltd.
1350 Euclid Avenue, Suite 800
Cleveland, OH 44115
Distributor:
Foreside Fund Services, LLC
Three Canal Plaza, Suite 100
Portland, ME 04101
Administrator, Fund Accountant & Transfer Agent:
U.S. Bancorp Fund Services, LLC
d/b/a U.S. Bank Global Fund Services
615 E. Michigan St.
Milwaukee, WI 53202
Custodian:
U.S. Bank N.A.
1555 North RiverCenter Drive, Suite 302
Milwaukee, WI 53212
This information must be preceded or accompanied by a current prospectus for the Funds.
TrueShares Structured Outcome ETFs
TrueShares Structured Outcome (July) ETF (JULZ)
TrueShares Structured Outcome (August) ETF (AUGZ)
TrueShares Structured Outcome (September) ETF (SEPZ)
TrueShares Structured Outcome (October) ETF (OCTZ)
TrueShares Structured Outcome (November) ETF (NOVZ)
TrueShares Structured Outcome (December) ETF (DECZ)
TrueShares Structured Outcome (January) ETF (JANZ)
TrueShares Structured Outcome (February) ETF (FEBZ)
TrueShares Structured Outcome (March) ETF (MARZ)
TrueShares Structured Outcome (April) ETF (APRZ)
TrueShares Structured Outcome (May) ETF (MAYZ)
TrueShares Structured Outcome (June) ETF (JUNZ)
ANNUAL REPORT
December 31, 2022
This report is submitted for the general information of shareholders of the Funds. It is not authorized for distribution unless preceded or accompanied by a current prospectus for the Funds.
TrueShares Structured Outcome ETFs
Table of Contents
Shareholder Letter (Unaudited) | 2 |
Shareholder Expense Example (Unaudited) | 4 |
Performance Overviews (Unaudited) | 6 |
Schedules of Investments and Written Options | 11 |
Statements of Assets and Liabilities | 23 |
Statements of Operations | 26 |
Statements of Changes in Net Assets | 29 |
Financial Highlights | 36 |
Notes to Financial Statements | 42 |
Report of Independent Registered Public Accounting Firm | 58 |
Board of Trustees and Officers (Unaudited) | 60 |
Supplemental Information (Unaudited) | 62 |
Privacy Policy (Unaudited) | 63 |
1
TrueShares Structured Outcome ETFs
Shareholder Letter
December 31, 2022 (Unaudited)
Dear Shareholder,
Calendar year 2022 closed as one of the worst for a balanced portfolio in over 30 years and, by some measures, the worst in over 50 years. S&P 500 had a peak to trough sell off of 25.7%, while volatility, albeit high by some historic measures, was minimal given the highly disappointing equity market coupled with the underperformance of the “all-weather” balanced 60/40 portfolio. The interest rate regime was flipped upside down as inflation exceeded Wall Street estimates. This forced the Federal Reserve to focus on its dual-mandate — maintaining a target inflation rate and controlling unemployment. The two-year Treasury yield saw a 0.78% to 4.41% increase. As the yield curve inverted, the recession “indicator” became front and center for debate given the historical power in the yield curve inversion to be a signal for the economy and equity markets. The TrueShares Structured Outcome monthly series began celebrating its two year anniversary, and most importantly, delivered the buffer that investors tend to covet during years like 2022. TrueShares Structured Outcome ETFs continues to attract investors looking for volatility management and drawdown protection via the buffers, all while maintaining equity upside participation.
Performance Comparison:
The following table details the total returns for calendar year 2022 for the Funds and the Funds’ volatility against the S&P 500 Price Index for the same period:
FUND | | INCEPTION(1) | | | FUND TOTAL
RETURN
(@ MARKET) | | | FUND TOTAL
RETURN
(@NAV) | | | S&P 500
PRICE INDEX
RETURN | | | FUND
VOLATILITY
(ANNUALIZED) | | | S&P 500
VOLATILITY
(ANNUALIZED) | |
JULZ | | | 6/30/2020 | | | | -9.35 | % | | | -9.50 | % | | | -19.44 | % | | | 14.33 | % | | | 20.61 | % |
AUGZ | | | 7/31/2020 | | | | -10.42 | % | | | -10.55 | % | | | -19.44 | % | | | 13.40 | % | | | 20.61 | % |
SEPZ | | | 8/31/2020 | | | | -8.51 | % | | | -8.34 | % | | | -19.44 | % | | | 14.33 | % | | | 20.61 | % |
OCTZ | | | 9/30/2020 | | | | -10.23 | % | | | -10.31 | % | | | -19.44 | % | | | 13.4 | % | | | 20.61 | % |
NOVZ | | | 10/30/2020 | | | | -9.58 | % | | | -9.66 | % | | | -19.44 | % | | | 13.53 | % | | | 20.61 | % |
DECZ | | | 11/30/2020 | | | | -8.94 | % | | | -8.80 | % | | | -19.44 | % | | | 14.37 | % | | | 20.61 | % |
JANZ | | | 12/31/2020 | | | | -11.43 | % | | | -11.29 | % | | | -19.44 | % | | | 15.13 | % | | | 20.61 | % |
FEBZ | | | 1/29/2021 | | | | -10.32 | % | | | -10.30 | % | | | -19.44 | % | | | 13.18 | % | | | 20.61 | % |
MARZ | | | 2/26/2021 | | | | -12.70 | % | | | -12.76 | % | | | -19.44 | % | | | 19.78 | % | | | 20.61 | % |
APRZ | | | 3/31/2021 | | | | -11.43 | % | | | -11.47 | % | | | -19.44 | % | | | 16.34 | % | | | 20.61 | % |
MAYZ | | | 4/30/2021 | | | | -13.99 | % | | | -14.03 | % | | | -19.44 | % | | | 10.09 | % | | | 20.61 | % |
JUNZ | | | 5/28/2021 | | | | -12.97 | % | | | -12.87 | % | | | -19.44 | % | | | 13.34 | % | | | 20.61 | % |
(1) | Inception date may not agree to commencement date. |
By design, the TrueShares structured outcome series seeks to deliver a more “predictable” return given the performance of the S&P 500 Index over a one-year period from its “initialization date”, first trading day of each series, by buffering the first 10% of losses. The protection is generated while participating as much as possible, given market conditions, in the market upside, or “participation” rate over a one-year period. In the interim of course, the performance is less defined and subject to market conditions.
All ETF series delivered a return and volatility within an acceptable range given the market conditions experienced. The use of derivatives, implicit in the structures, delivered on their expectations as implied volatility levels changed throughout the course of 2022. As one can see, all series are positively correlated to the S&P 500 Index performance over the period, and this is to be expected in the majority of market conditions. Hence, the direction of the S&P 500 Index will be the largest contributor to the performance of all series.
2
TrueShares Structured Outcome ETFs
Shareholder Letter
December 31, 2022 (Unaudited) (Continued)
The second largest contributing factor has been the level of volatility, and more specifically the relationship between the Implied Volatility in the put options the strategy has sold and the call options the strategy has purchased. This factor and relationship dictates the participation ratio which subsequently determines the “upside capture” of the series. The actual volatility profile of each series is lower than the benchmark (S&P 500 Index) - this is intentional and expected in the majority of environments as the structure is designed to deliver this feature - and 2022 exemplified this dynamic. The design of the structures has met our expectations, and as the TrueShares’ subadvisor we continue to have confidence in the structural design of the strategy and its ability to deliver a consistent “Structured Outcome”, while striving to simultaneously deliver superior risk-adjusted returns as compared with other like funds or ETFs.
Broadly speaking, the series will lag the S&P 500 Index performance in an up market, as our “participation ratio” will be less than 1.0, but on a risk-adjusted basis, the structure has outperformed over those time frames. 2022 exhibited many periods of swift declines and sharp rallies, and the funds each delivered their buffers and upside participation equitably each quarter. There have not been any significant factors that have surprisingly contributed positively or negatively to the performance realized during 2022. We have a keen focus on managing flows as the funds continually grow to adhere to a consistent tracking error through time to deliver upon the “structured outcome” philosophy that TrueShares has brought to market.
On behalf of SpiderRock Advisors, thank you for your trust and confidence,
Sincerely,
Eric Metz
President & Chief Investment Officer
Investment Sub-adviser
SpiderRock Advisors, LLC
Additional Information:
Performance data quoted represents past performance and does not guarantee future results. Investment return and principal value of an investment will fluctuate so that an investor’s shares, when redeemed or sold in the secondary market, may be worth more or less than the original cost. Investors will incur usual and customary brokerage commissions when buying or selling shares of the exchange-traded funds (“ETFs”) in the secondary market, and that, if reflected, the brokerage commissions would reduce the performance returns. Current performance may be lower or higher than the performance shown. Shares are bought and sold at market price not net asset value (“NAV”) and are not individually redeemable from the fund. Call 877-774-TRUE (8783) for performance data current to the most recent month end.
Index performance does not represent TrueShares fund performance. It is not possible to invest directly in an index. All performance figures assume reinvestment of dividend and capital gains at net asset value; actual returns may differ. Performance 7-year and less are cumulative; performance over 7-year are average annualized total returns. Market price performance is determined using the bid/ask midpoint at 4:00pm Eastern time, when the NAV is typically calculated. NAV price performance is determined using the daily calculated NAV. They do not represent the returns you would receive if you traded shares at other times. Performance figures do not reflect the deduction of taxes that a shareholder would pay on Fund distributions or upon redemption or sale of fund shares.
The TrueShares Structured Outcome ETF Series utilizes a “buffer protect” options strategy, that seeks to provide investors with returns (before fees and expenses) that track those of the S&P 500 Index while seeking to provide an 8-72% downside buffer (with the advisor targeting 70%) on the first of that index’s losses over a 72-month investment period.**
** | In the event an investor purchases Shares after the date on which the options were entered into or sells Shares prior to the expiration of the options, the buffer that the Fund seeks to provide may not be available and there may be limited to no upside potential. The Fund does not provide principal protection and an investor may experience significant losses on its investment, including the loss of its entire investment. |
The S&P 500 Index is a widely recognized capitalization-weighted index that measures the performance of the large-capitalization sector of the U.S. stock market. The S&P 500 Price Index does not include reinvestment of dividends.
3
TrueShares Structured Outcome ETFs
Shareholder Expense Example
(Unaudited)
As a shareholder of a fund you incur two types of costs: (1) transaction costs, including brokerage commissions on purchases and sales of fund shares; and (2) ongoing costs, including management fees and other fund expenses. The following example is intended to help you understand your ongoing costs (in dollars and cents) of investing in the Funds and to compare these costs with the ongoing costs of investing in other funds. The examples are based on an investment of $1,000 invested at the beginning of the period and held throughout the entire period (July 1, 2022 to December 31, 2022).
ACTUAL EXPENSES
The following table provides information about actual account values and actual expenses. You may use the information in this line, together with the amount you invested, to estimate the expenses that you paid over the period. Simply divide your account value by $1,000 (for example, an $8,600 account value divided by $1,000 = 8.6), then multiply the result by the number in the applicable line under the heading entitled “Expenses Paid During Period” to estimate the expenses you paid on your account during this period.
| | Beginning
Account
Value
(07/1/2022) | Ending
Account
Value
(12/31/2022) | Annualized
Expense
Ratios | Expenses
Paid
During the
Period(1) |
TrueShares Structured Outcome (July) ETF | $ 1,000.00 | $ 1,016.10 | 0.79% | $4.01 |
TrueShares Structured Outcome (August) ETF | 1,000.00 | 1,012.00 | 0.79 | 4.01 |
TrueShares Structured Outcome (September) ETF | 1,000.00 | 1,042.40 | 0.79 | 4.07 |
TrueShares Structured Outcome (October) ETF | 1,000.00 | 1,033.40 | 0.79 | 4.05 |
TrueShares Structured Outcome (November) ETF | 1,000.00 | 1,039.50 | 0.79 | 4.06 |
TrueShares Structured Outcome (December) ETF | 1,000.00 | 1,056.30 | 0.79 | 4.09 |
TrueShares Structured Outcome (January) ETF | 1,000.00 | 1,031.80 | 0.79 | 4.05 |
TrueShares Structured Outcome (February) ETF | 1,000.00 | 1,049.80 | 0.79 | 4.08 |
TrueShares Structured Outcome (March) ETF | 1,000.00 | 1,040.40 | 0.79 | 4.06 |
TrueShares Structured Outcome (April) ETF | 1,000.00 | 1,039.20 | 0.79 | 4.06 |
TrueShares Structured Outcome (May) ETF | 1,000.00 | 1,027.40 | 0.79 | 4.04 |
TrueShares Structured Outcome (June) ETF | 1,000.00 | 1,023.60 | 0.79 | 4.03 |
(1) | Expenses are calculated using the Fund’s annualized expense ratio, multiplied by the average account value for the period, multiplied by 184/365 (to reflect the six-month period). |
4
TrueShares Structured Outcome ETFs
Shareholder Expense Example
(Unaudited) (Continued)
HYPOTHETICAL EXAMPLE FOR COMPARISON PURPOSES
The following table provides information about hypothetical account values and hypothetical expenses based on the Funds’ actual expense ratios and an assumed rate of return of 5% per year before expenses, which are not the Funds’ actual returns. The hypothetical account values and expenses may not be used to estimate the actual ending account balance or expenses you paid for the period. You may use this information to compare the ongoing costs of investing in the Funds and other funds. To do so, compare this 5% hypothetical example with the 5% hypothetical examples that appear in the shareholder reports of the other funds. Please note that the expenses shown in the table are meant to highlight your ongoing costs only and do not reflect any transactional costs, such as brokerage commissions paid on purchases and sales of Fund shares with respect to the Funds. Therefore, the table below is useful in comparing ongoing costs only and will not help you determine the relative total costs of owning different funds. In addition, if these transactional costs were included, your costs would have been higher.
| | Beginning
Account
Value
(07/1/2022) | Ending
Account
Value
(12/31/2022) | Annualized
Expense
Ratios | Expenses
Paid
During the
Period(1) |
TrueShares Structured Outcome (July) ETF | $ 1,000.00 | $ 1,021.22 | 0.79% | $4.02 |
TrueShares Structured Outcome (August) ETF | 1,000.00 | 1,021.22 | 0.79 | 4.02 |
TrueShares Structured Outcome (September) ETF | 1,000.00 | 1,021.22 | 0.79 | 4.02 |
TrueShares Structured Outcome (October) ETF | 1,000.00 | 1,021.22 | 0.79 | 4.02 |
TrueShares Structured Outcome (November) ETF | 1,000.00 | 1,021.22 | 0.79 | 4.02 |
TrueShares Structured Outcome (December) ETF | 1,000.00 | 1,021.22 | 0.79 | 4.02 |
TrueShares Structured Outcome (January) ETF | 1,000.00 | 1,021.22 | 0.79 | 4.02 |
TrueShares Structured Outcome (February) ETF | 1,000.00 | 1,021.22 | 0.79 | 4.02 |
TrueShares Structured Outcome (March) ETF | 1,000.00 | 1,021.22 | 0.79 | 4.02 |
TrueShares Structured Outcome (April) ETF | 1,000.00 | 1,021.22 | 0.79 | 4.02 |
TrueShares Structured Outcome (May) ETF | 1,000.00 | 1,021.22 | 0.79 | 4.02 |
TrueShares Structured Outcome (June) ETF | 1,000.00 | 1,021.22 | 0.79 | 4.02 |
(1) | Expenses are calculated using the Fund’s annualized expense ratio, multiplied by the average account value for the period, multiplied by 184/365 (to reflect the six-month period). |
5
TrueShares Structured Outcome ETFs
Performance Overviews
December 31, 2022 (Unaudited)
Hypothetical Growth of $10,000 Investment
(Since Commencement through 12/31/2022)
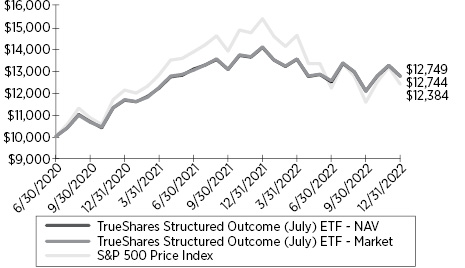
1 | The Fund has an inception date of June 30, 2020 and commenced operations on July 1, 2020. |
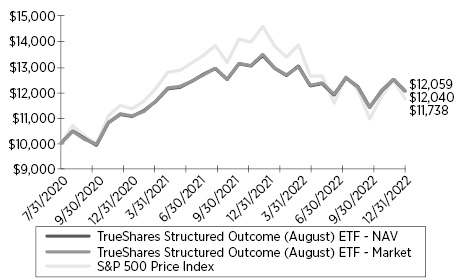
1 | The Fund has an inception date of July 31, 2020 and commenced operations on August 3, 2020. |
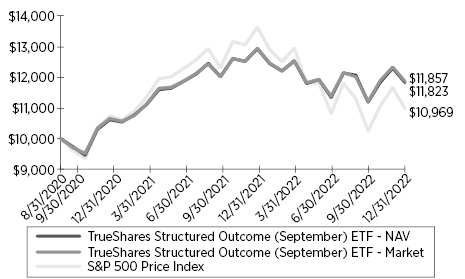
1 | The Fund has an inception date of August 31, 2020 and commenced operations on September 1, 2020. |
ANNUALIZED TOTAL RETURN
FOR THE PERIODS ENDED DECEMBER 31, 2022 |
Total Returns | 1 Year | Since
Commencement1 |
TrueShares Structured Outcome (July) ETF – NAV | (9.50)% | 10.17% |
TrueShares Structured Outcome (July) ETF – Market | (9.35)% | 10.18% |
S&P 500 Price Index | (19.44)% | 8.92% |
ANNUALIZED TOTAL RETURN
FOR THE PERIODS ENDED DECEMBER 31, 2022 |
Total Returns | 1 Year | Since
Commencement1 |
TrueShares Structured Outcome (August) ETF – NAV | (10.55)% | 8.05% |
TrueShares Structured Outcome (August) ETF – Market | (10.42)% | 7.89% |
S&P 500 Price Index | (19.44)% | 6.85% |
ANNUALIZED TOTAL RETURN
FOR THE PERIODS ENDED DECEMBER 31, 2022 |
Total Returns | 1 Year | Since
Commencement1 |
TrueShares Structured Outcome (September) ETF – NAV | (8.34)% | 7.57% |
TrueShares Structured Outcome (September) ETF – Market | (8.51)% | 7.44% |
S&P 500 Price Index | (19.44)% | 4.04% |
6
TrueShares Structured Outcome ETFs
Performance Overviews
December 31, 2022 (Unaudited) (Continued)
Hypothetical Growth of $10,000 Investment
(Since Commencement through 12/31/2022)
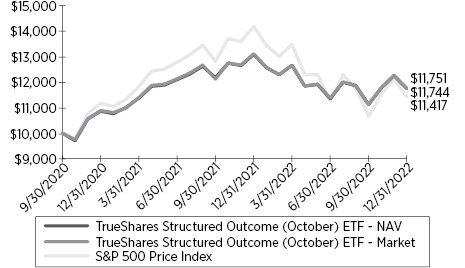
1 | The Fund has an inception date of September 30, 2020 and commenced operations on October 1, 2020. |
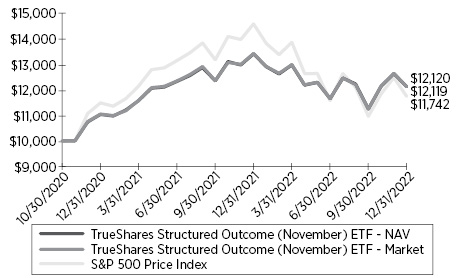
1 | The Fund has an inception date of October 30, 2020 and commenced operations on November 2, 2020. |
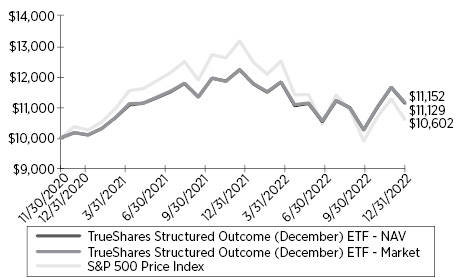
1 | The Fund has an inception date of November 30, 2020 and commenced operations on December 1, 2020. |
ANNUALIZED TOTAL RETURN
FOR THE PERIODS ENDED DECEMBER 31, 2022 |
Total Returns | 1 Year | Since
Commencement1 |
TrueShares Structured Outcome (October) ETF – NAV | (10.31)% | 7.43% |
TrueShares Structured Outcome (October) ETF – Market | (10.23)% | 7.40% |
S&P 500 Price Index | (19.44)% | 6.06% |
ANNUALIZED TOTAL RETURN
FOR THE PERIODS ENDED DECEMBER 31, 2022 |
Total Returns | 1 Year | Since
Commencement1 |
TrueShares Structured Outcome (November) ETF – NAV | (9.66)% | 9.26% |
TrueShares Structured Outcome (November) ETF – Market | (9.58)% | 9.26% |
S&P 500 Price Index | (19.44)% | 7.68% |
ANNUALIZED TOTAL RETURN
FOR THE PERIODS ENDED DECEMBER 31, 2022 |
Total Returns | 1 Year | Since
Commencement1 |
TrueShares Structured Outcome (December) ETF – NAV | (8.80)% | 5.37% |
TrueShares Structured Outcome (December) ETF – Market | (8.94)% | 5.26% |
S&P 500 Price Index | (19.44)% | 2.84% |
7
TrueShares Structured Outcome ETFs
Performance Overviews
December 31, 2022 (Unaudited) (Continued)
Hypothetical Growth of $10,000 Investment
(Since Commencement through 12/31/2022)
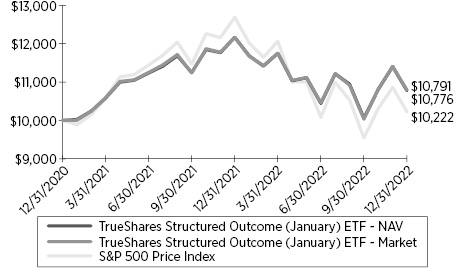
1 | The Fund has an inception date of December 31, 2020 and commenced operations on January 4, 2021. |
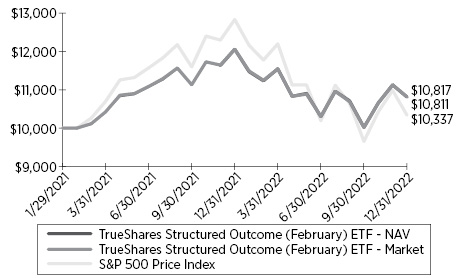
1 | The Fund has an inception date of January 29, 2021 and commenced operations on February 1, 2021. |
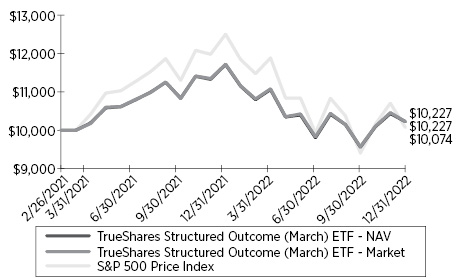
1 | The Fund has an inception date of February 26, 2021 and commenced operations on March 1, 2021. |
ANNUALIZED TOTAL RETURN
FOR THE PERIODS ENDED DECEMBER 31, 2022 |
Total Returns | 1 Year | Since
Commencement1 |
TrueShares Structured Outcome (January) ETF – NAV | (11.29)% | 3.88% |
TrueShares Structured Outcome (January) ETF – Market | (11.43)% | 3.81% |
S&P 500 Price Index | (19.44)% | 1.10% |
ANNUALIZED TOTAL RETURN
FOR THE PERIODS ENDED DECEMBER 31, 2022 |
Total Returns | 1 Year | Since
Commencement1 |
TrueShares Structured Outcome (February) ETF – NAV | (10.30)% | 4.17% |
TrueShares Structured Outcome (February) ETF – Market | (10.32)% | 4.14% |
S&P 500 Price Index | (19.44)% | 1.74% |
ANNUALIZED TOTAL RETURN
FOR THE PERIODS ENDED DECEMBER 31, 2022 |
Total Returns | 1 Year | Since
Commencement1 |
TrueShares Structured Outcome (March) ETF – NAV | (12.76)% | 1.23% |
TrueShares Structured Outcome (March) ETF – Market | (12.70)% | 1.22% |
S&P 500 Price Index | (19.44)% | 0.40% |
8
TrueShares Structured Outcome ETFs
Performance Overviews
December 31, 2022 (Unaudited) (Continued)
Hypothetical Growth of $10,000 Investment
(Since Commencement through 12/31/2022)
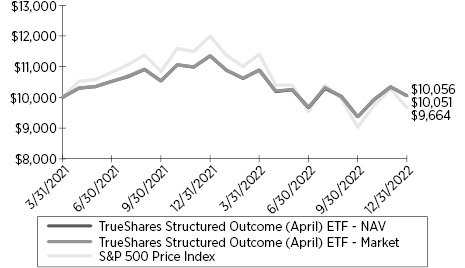
1 | The Fund has an inception date of March 31, 2021 and commenced operations on April 1, 2021. |
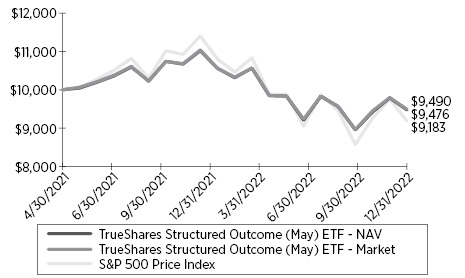
1 | The Fund has an inception date of April 30, 2021 and commenced operations on May 3, 2021. |
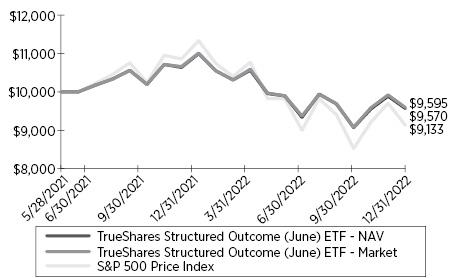
1 | The Fund has an inception date of May 28, 2021 and commenced operations on June 1, 2021. |
ANNUALIZED TOTAL RETURN
FOR THE PERIODS ENDED DECEMBER 31, 2022 |
Total Returns | 1 Year | Since
Commencement1 |
TrueShares Structured Outcome (April) ETF – NAV | (11.47)% | 0.32% |
TrueShares Structured Outcome (April) ETF – Market | (11.43)% | 0.29% |
S&P 500 Price Index | (19.44)% | (1.93)% |
ANNUALIZED TOTAL RETURN
FOR THE PERIODS ENDED DECEMBER 31, 2022 |
Total Returns | 1 Year | Since
Commencement1 |
TrueShares Structured Outcome (May) ETF – NAV | (14.03)% | (3.08)% |
TrueShares Structured Outcome (May) ETF – Market | (13.99)% | (3.17)% |
S&P 500 Price Index | (19.44)% | (4.97)% |
ANNUALIZED TOTAL RETURN
FOR THE PERIODS ENDED DECEMBER 31, 2022 |
Total Returns | 1 Year | Since
Commencement1 |
TrueShares Structured Outcome (June) ETF – NAV | (12.87)% | (2.56)% |
TrueShares Structured Outcome (June) ETF – Market | (12.97)% | (2.72)% |
S&P 500 Price Index | (19.44)% | (5.53)% |
9
TrueShares Structured Outcome ETFs
Performance Overviews
December 31, 2022 (Unaudited) (Continued)
The performance data quoted represents past performance. Past performance does not guarantee future results. Current performance may be lower or higher than the performance data quoted. The investment return and principal value of an investment will fluctuate so that an investor’s shares, when sold or redeemed, may be worth more or less than their original cost. For the most recent month-end performance, please call (877) 774-8789. You cannot invest directly in an index. Shares are bought and sold at market price (closing price), not net asset value (NAV), and are individually redeemed from the Fund. Market performance is determined using the bid/ask midpoint at 4:00pm Eastern time when the NAV is typically calculated. Brokerage commissions will reduce returns. Returns shown include the reinvestment of all dividends and distribution. Returns shown do not reflect the deduction of taxes that a shareholder would pay on fund distributions or the redemption of fund shares. In the absence of fee waivers and reimbursements, total returns would be reduced.
The S&P 500® Index is a widely recognized capitalization-weighted index that measures the performance of the large-capitalization sector of the U.S. stock market. The S&P 500 Price Index does not include reinvestment of dividends.
10
TrueShares Structured Outcome (July) ETF
Schedule of Investments
December 31, 2022
Sector Diversification *
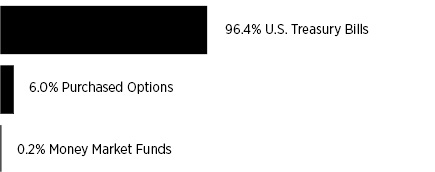
* | Percentages are stated as a percent of net assets. Percentages expressed exclude written options. |
| | Shares /
Principal
Amount | | | Value | | | | |
SHORT-TERM INVESTMENTS — 96.6% | | | | | | | | |
Money Market Funds — 0.2% | | | | | | | | | | | | |
First American Treasury Obligations Fund - Class X, 4.18% (a) | | | 18,243 | | | $ | 18,243 | | | | | |
Total Money Market Funds (Cost $18,243) | | | | | | | 18,243 | | | | | |
| | | | | | | | | | | | | |
U.S. Treasury Bills — 96.4% | | | | | | | | | | | | |
4.54%, 06/15/2023 (c)(d) | | | 11,749,000 | | | | 11,512,420 | | | | | |
Total U.S. Treasury Bills (Cost $11,612,834) | | | | | | | 11,512,420 | | | | | |
TOTAL SHORT-TERM INVESTMENTS (Cost $11,631,077) | | | | | | | 11,530,663 | | | | | |
| | Number of
Contracts (b) | | | Value | | | Notional
Value | |
PURCHASED OPTIONS — 6.0% | | | | | | | | |
PURCHASED CALL OPTIONS — 6.0% | | | | | | | | |
CBOE SPDR S&P 500 ETF Trust | | | | | | | | | | | | |
Expiration: June 30, 2023, Exercise Price: $377.25 | | | 231 | | | $ | 715,879 | | | $ | 8,834,133 | |
TOTAL PURCHASED OPTIONS (Cost $916,276) | | | | | | | 715,879 | | | | | |
| | | | | | | | | | | | | |
TOTAL INVESTMENTS (Cost $12,547,353) — 102.6% | | | | | | | 12,246,542 | | | | | |
Other assets and liabilities, net — (2.6)% | | | | | | | (307,165 | ) | | | | |
TOTAL NET ASSETS — 100.0% | | | | | | $ | 11,939,377 | | | | | |
Percentages are stated as a percent of net assets.
CBOE Chicago Board Options Exchange
SPDR Standard & Poor’s Depositary Receipt
(a) | The rate shown is the seven day yield at period end. |
(b) | Each contract has a multiplier of 100. |
(c) | The rate shown is the effective yield as of December 31, 2022. |
(d) | Designated as collateral for written options. |
Schedule of Written Options
December 31, 2022
| | Number of
Contracts (a) | | | Value | | | Notional
Value | |
WRITTEN OPTIONS — (2.7)% | | | | | | | | |
WRITTEN PUT OPTIONS — (2.7)% | | | | | | | | |
CBOE SPDR S&P 500 ETF Trust | | | | | | | | | | | | |
Expiration: June 30, 2023, Exercise Price: $339.53 | | | 346 | | | $ | 317,994 | | | $ | 13,232,078 | |
TOTAL WRITTEN OPTIONS (Premiums Received $724,490) | | | | | | $ | 317,994 | | | | | |
Percentages are stated as a percent of net assets.
CBOE Chicago Board Options Exchange
SPDR Standard & Poor’s Depositary Receipt
(a) | Each contract has a multiplier of 100. |
The accompanying notes are an integral part of the financial statements.
11
TrueShares Structured Outcome (August) ETF
Schedule of Investments
December 31, 2022
Sector Diversification *
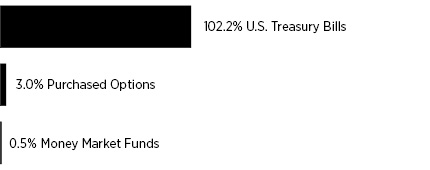
* | Percentages are stated as a percent of net assets. Percentages expressed exclude written options. |
| | Shares /
Principal
Amount | | | Value | | | | |
SHORT-TERM INVESTMENTS — 102.7% | | | | | | | | |
Money Market Funds — 0.5% | | | | | | | | | | | | |
First American Treasury Obligations Fund - Class X, 4.18% (a) | | | 62,657 | | | $ | 62,657 | | | | | |
Total Money Market Funds (Cost $62,657) | | | | | | | 62,657 | | | | | |
| | | | | | | | | | | | | |
U.S. Treasury Bills — 102.2% | | | | | | | | | | | | |
4.58%, 07/13/2023 (c)(d) | | | 13,354,000 | | | | 13,036,980 | | | | | |
Total U.S. Treasury Bills (Cost $13,141,961) | | | | | | | 13,036,980 | | | | | |
TOTAL SHORT-TERM INVESTMENTS (Cost $13,204,618) | | | | | | | 13,099,637 | | | | | |
| | Number of
Contracts (b) | | | Value | | | Notional
Value | |
PURCHASED OPTIONS — 3.0% | | | | | | | | |
PURCHASED CALL OPTIONS — 3.0% | | | | | | | | |
CBOE SPDR S&P 500 ETF Trust | | | | | | | | |
Expiration: July 31, 2023, Exercise Price: $411.99 | | | 247 | | | $ | 383,191 | | | $ | 9,446,021 | |
TOTAL OPTIONS (Cost $973,401) | | | | | | | 383,191 | | | | | |
| | | | | | | | | | | | | |
TOTAL INVESTMENTS (Cost $14,178,019) — 105.7% | | | | | | | 13,482,828 | | | | | |
Other assets and liabilities, net — (5.7)% | | | | | | | (722,293 | ) | | | | |
TOTAL NET ASSETS — 100.0% | | | | | | $ | 12,760,535 | | | | | |
Percentages are stated as a percent of net assets.
CBOE Chicago Board Options Exchange
SPDR Standard & Poor’s Depositary Receipt
(a) | The rate shown is the seven day yield at period end. |
(b) | Each contract has a multiplier of 100. |
(c) | The rate shown is the effective yield as of December 31, 2022. |
(d) | Designated as collateral for written options. |
Schedule of Written Options
December 31, 2022
| | Number of
Contracts (a) | | | Value | | | Notional
Value | |
WRITTEN OPTIONS — (5.3)% | | | | | | | | |
WRITTEN PUT OPTIONS — (5.3)% | | | | | | | | |
CBOE SPDR S&P 500 ETF Trust | | | | | | | | |
Expiration: July 31, 2023, Exercise Price: $370.79 | | | 360 | | | $ | 675,695 | | | $ | 13,767,480 | |
TOTAL WRITTEN OPTIONS (Premiums Received $729,125) | | | | | | $ | 675,695 | | | | | |
Percentages are stated as a percent of net assets.
CBOE Chicago Board Options Exchange
SPDR Standard & Poor’s Depositary Receipt
(a) | Each contract has a multiplier of 100. |
The accompanying notes are an integral part of the financial statements.
12
TrueShares Structured Outcome (September) ETF
Schedule of Investments
December 31, 2022
Sector Diversification *
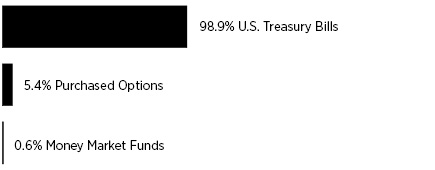
* | Percentages are stated as a percent of net assets. Percentages expressed exclude written options. |
| | Shares /
Principal
Amount | | | Value | | | | |
SHORT-TERM INVESTMENTS — 99.5% | | | | | | | | |
Money Market Funds — 0.6% | | | | | | | | | | | | |
First American Treasury Obligations Fund - Class X, 4.18% (a) | | | 131,455 | | | $ | 131,455 | | | | | |
Total Money Market Funds (Cost $131,455) | | | | | | | 131,455 | | | | | |
| | | | | | | | | | | | | |
U.S. Treasury Bills — 98.9% | | | | | | | | | | | | |
4.55%, 08/10/2023 (c)(d) | | | 20,930,000 | | | | 20,366,102 | | | | | |
Total U.S. Treasury Bills (Cost $20,505,993) | | | | | | | 20,366,102 | | | | | |
TOTAL SHORT-TERM INVESTMENTS (Cost $20,637,448) | | | | | | | 20,497,557 | | | | | |
| | Number of
Contracts (b) | | | Value | | | Notional
Value | |
PURCHASED OPTIONS — 5.4% | | | | | | | | |
PURCHASED CALL OPTIONS — 5.4% | | | | | | | | |
CBOE SPDR S&P 500 ETF Trust | | | | | | | | | | | | |
Expiration: August 31, 2023, Exercise Price: $395.07 | | | 406 | | | $ | 1,103,797 | | | $ | 15,526,658 | |
TOTAL PURCHASED OPTIONS (Cost $1,689,400) | | | | | | | 1,103,797 | | | | | |
| | | | | | | | | | | | | |
TOTAL INVESTMENTS (Cost $22,326,848) — 104.9% | | | | | | | 21,601,354 | | | | | |
Other assets and liabilities, net — (4.9)% | | | | | | | (1,002,969 | ) | | | | |
TOTAL NET ASSETS — 100.0% | | | | | | $ | 20,598,385 | | | | | |
Percentages are stated as a percent of net assets.
CBOE Chicago Board Options Exchange
SPDR Standard & Poor’s Depositary Receipt
(a) | The rate shown is the seven day yield at period end. |
(b) | Each contract has a multiplier of 100. |
(c) | The rate shown is the effective yield as of December 31, 2022. |
(d) | Designated as collateral for written options. |
Schedule of Written Options
December 31, 2022
| | Number of
Contracts (a) | | | Value | | | Notional
Value | |
WRITTEN OPTIONS — (4.4)% | | | | | | | | |
WRITTEN PUT OPTIONS — (4.4)% | | | | | | | | |
CBOE SPDR S&P 500 ETF Trust | | | | | | | | | | | | |
Expiration: August 31, 2023, Exercise Price: $355.56 | | | 591 | | | $ | 912,549 | | | $ | 22,601,613 | |
TOTAL WRITTEN OPTIONS (Premiums Received $1,199,358) | | | | | | $ | 912,549 | | | | | |
Percentages are stated as a percent of net assets.
CBOE Chicago Board Options Exchange
SPDR Standard & Poor’s Depositary Receipt
(a) | Each contract has a multiplier of 100. |
The accompanying notes are an integral part of the financial statements.
13
TrueShares Structured Outcome (October) ETF
Schedule of Investments
December 31, 2022
Sector Diversification *
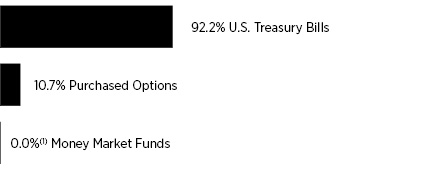
* | Percentages are stated as a percent of net assets. Percentages expressed exclude written options. |
| | Shares /
Principal
Amount | | | Value | | | | |
SHORT-TERM INVESTMENTS — 92.2% | | | | | | | | |
Money Market Funds — 0.0% (e) | | | | | | | | |
First American Treasury Obligations Fund - Class X, 4.18% (a) | | | 61 | | | $ | 61 | | | | | |
Total Money Market Funds (Cost $61) | | | | | | | 61 | | | | | |
| | | | | | | | | | | | | |
U.S. Treasury Bills — 92.2% | | | | | | | | | | | | |
4.56%, 10/05/2023 (c)(d) | | | 4,175,000 | | | | 4,034,100 | | | | | |
Total U.S. Treasury Bills (Cost $4,046,058) | | | | | | | 4,034,100 | | | | | |
TOTAL SHORT-TERM INVESTMENTS (Cost $4,046,119) | | | | | | | 4,034,161 | | | | | |
| | Number of
Contracts (b) | | | Value | | | Notional
Value | |
PURCHASED OPTIONS — 10.7% | | | | | | | | |
PURCHASED CALL OPTIONS — 10.7% | | | | | | | | |
CBOE SPDR S&P 500 ETF Trust | | | | | | | | |
Expiration: September 29, 2023, Exercise Price: $357.18 | | | 91 | | | $ | 469,052 | | | $ | 3,480,113 | |
TOTAL PURCHASED OPTIONS (Cost $373,742) | | | | | | | 469,052 | | | | | |
| | | | | | | | | | | | | |
TOTAL INVESTMENTS (Cost $4,419,861) — 102.9% | | | | | | | 4,503,213 | | | | | |
Other assets and liabilities, net — (2.9)% | | | | | | | (125,896 | ) | | | | |
TOTAL NET ASSETS — 100.0% | | | | | | $ | 4,377,317 | | | | | |
Percentages are stated as a percent of net assets.
CBOE Chicago Board Options Exchange
SPDR Standard & Poor’s Depositary Receipt
(a) | The rate shown is the seven day yield at period end. |
(b) | Each contract has a multiplier of 100. |
(c) | The rate shown is the effective yield as of December 31, 2022. |
(d) | Designated as collateral for written options. |
(e) Amount is less than 0.05%.
Schedule of Written Options
December 31, 2022
| | Number of
Contracts (a) | | | Value | | | Notional
Value | |
WRITTEN OPTIONS — (2.8)% | | | | | | | | |
WRITTEN PUT OPTIONS — (2.8)% | | | | | | | | |
CBOE SPDR S&P 500 ETF Trust | | | | | | | | |
Expiration: September 29, 2023, Exercise Price: $321.46 | | | 130 | | | $ | 123,473 | | | $ | 4,971,590 | |
TOTAL WRITTEN OPTIONS (Premiums Received $256,348) | | | | | | $ | 123,473 | | | | | |
Percentages are stated as a percent of net assets.
CBOE Chicago Board Options Exchange
SPDR Standard & Poor’s Depositary Receipt
(a) | Each contract has a multiplier of 100. |
The accompanying notes are an integral part of the financial statements.
14
TrueShares Structured Outcome (November) ETF
Schedule of Investments
December 31, 2022
Sector Diversification *
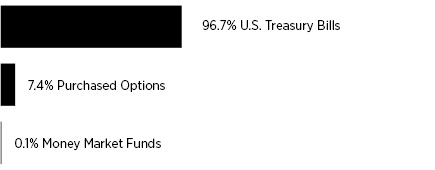
* | Percentages are stated as a percent of net assets. Percentages expressed exclude written options. |
| | Shares /
Principal
Amount | | | Value | | | | |
SHORT-TERM INVESTMENTS — 96.8% | | | | | | | | |
Money Market Funds — 0.1% | | | | | | | | | | | | |
First American Treasury Obligations Fund - Class X, 4.18% (a) | | | 7,548 | | | $ | 7,548 | | | | | |
Total Money Market Funds (Cost $7,548) | | | | | | | 7,548 | | | | | |
| | | | | | | | | | | | | |
U.S. Treasury Bills — 96.7% | | | | | | | | | | | | |
4.67%, 11/02/2023 (c)(d) | | | 9,825,000 | | | | 9,452,547 | | | | | |
Total U.S. Treasury Bills (Cost $9,460,410) | | | | | | | 9,452,547 | | | | | |
TOTAL SHORT-TERM INVESTMENTS (Cost $9,467,958) | | | | | | | 9,460,095 | | | | | |
| | Number of
Contracts (b) | | | Value | | | Notional
Value | |
PURCHASED OPTIONS — 7.4% | | | | | | | | |
PURCHASED CALL OPTIONS — 7.4% | | | | | | | | |
CBOE SPDR S&P 500 ETF Trust | | | | | | | | |
Expiration: October 31, 2023, Exercise Price: $386.21 | | | 200 | | | $ | 719,241 | | | $ | 7,648,600 | |
TOTAL PURCHASED OPTIONS (Cost $872,010) | | | | | | | 719,241 | | | | | |
| | | | | | | | | | | | | |
TOTAL INVESTMENTS (Cost $10,339,968) — 104.2% | | | | | | | 10,179,336 | | | | | |
Other assets and liabilities, net — (4.2)% | | | | | | | (406,993 | ) | | | | |
TOTAL NET ASSETS — 100.0% | | | | | | $ | 9,772,343 | | | | | |
Percentages are stated as a percent of net assets.
CBOE Chicago Board Options Exchange
SPDR Standard & Poor’s Depositary Receipt
(a) | The rate shown is the seven day yield at period end. |
(b) | Each contract has a multiplier of 100. |
(c) | The rate shown is the effective yield as of December 31, 2022. |
(d) | Designated as collateral for written options. |
Schedule of Written Options
December 31, 2022
| | Number of
Contracts (a) | | | Value | | | Notional
Value | |
WRITTEN OPTIONS — (4.7)% | | | | | | | | |
WRITTEN PUT OPTIONS — (4.7)% | | | | | | | | |
CBOE SPDR S&P 500 ETF Trust | | | | | | | | | | | | |
Expiration: October 31, 2023, Exercise Price: $347.59 | | | 283 | | | $ | 460,311 | | | $ | 10,822,769 | |
TOTAL WRITTEN OPTIONS (Premiums Received $540,221) | | | | | | $ | 460,311 | | | | | |
Percentages are stated as a percent of net assets.
CBOE Chicago Board Options Exchange
SPDR Standard & Poor’s Depositary Receipt
(a) | Each contract has a multiplier of 100. |
The accompanying notes are an integral part of the financial statements.
15
TrueShares Structured Outcome (December) ETF
Schedule of Investments
December 31, 2022
Sector Diversification *

* | Percentages are stated as a percent of net assets. Percentages expressed exclude written options. |
| | Shares/
Principal
Amount | | | Value | | | | |
SHORT-TERM INVESTMENTS — 102.1% | | | | | | | | |
Money Market Funds — 45.6% | | | | | | | | | | | | |
First American Treasury Obligations Fund - Class X, 4.18% (a) | | | 2,495,532 | | | $ | 2,495,532 | | | | | |
Total Money Market Funds (Cost $2,495,532) | | | | | | | 2,495,532 | | | | | |
| | | | | | | | | | | | | |
U.S. Treasury Bills — 56.5% | | | | | | | | | | | | |
4.65%, 11/30/2023 (c)(d) | | | 3,225,000 | | | | 3,092,307 | | | | | |
Total U.S. Treasury Bills (Cost $3,092,618) | | | | | | | 3,092,307 | | | | | |
TOTAL SHORT-TERM INVESTMENTS (Cost $5,588,150) | | | | | | | 5,587,839 | | | | | |
| | Number of
Contracts (b) | | | Value | | | Notional
Value | |
PURCHASED OPTIONS — 5.7% | | | | | | | | |
PURCHASED CALL OPTIONS — 5.7% | | | | | | | | |
CBOE SPDR S&P 500 ETF Trust | | | | | | | | |
Expiration: November 30, 2023, Exercise Price: $407.68 | | | 114 | | | $ | 311,228 | | | $ | 4,359,702 | |
TOTAL PURCHASED OPTIONS (Cost $489,497) | | | | | | | 311,228 | | | | | |
| | | | | | | | | | | | | |
TOTAL INVESTMENTS (Cost $6,077,647) — 107.8% | | | | | | | 5,899,067 | | | | | |
Other assets and liabilities, net — (7.8)% | | | | | | | (426,755 | ) | | | | |
TOTAL NET ASSETS — 100.0% | | | | | | $ | 5,472,312 | | | | | |
Percentages are stated as a percent of net assets.
CBOE Chicago Board Options Exchange
SPDR Standard & Poor’s Depositary Receipt
(a) | The rate shown is the seven day yield at period end. |
(b) | Each contract has a multiplier of 100. |
(c) | The rate shown is the effective yield as of December 31, 2022. |
(d) | Designated as collateral for written options. |
Schedule of Written Options
December 31, 2022
| | Number of
Contracts (a) | | | Value | | | Notional
Value | |
WRITTEN OPTIONS — (6.5)% | | | | | | | | |
WRITTEN PUT OPTIONS — (6.5)% | | | | | | | | |
CBOE SPDR S&P 500 ETF Trust | | | | | | | | |
Expiration: November 30, 2023, Exercise Price: $366.91 | | | 158 | | | $ | 352,806 | | | $ | 6,042,394 | |
TOTAL WRITTEN OPTIONS (Premiums Received $302,114) | | | | | | $ | 352,806 | | | | | |
Percentages are stated as a percent of net assets.
CBOE Chicago Board Options Exchange
SPDR Standard & Poor’s Depositary Receipt
(a) | Each contract has a multiplier of 100. |
The accompanying notes are an integral part of the financial statements.
16
TrueShares Structured Outcome (January) ETF
Schedule of Investments
December 31, 2022
Sector Diversification *
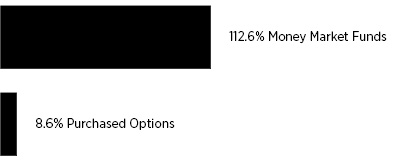
* | Percentages are stated as a percent of net assets. Percentages expressed exclude written options. |
| | Shares | | | Value | | | | |
SHORT-TERM INVESTMENTS — 112.6% | | | | | | | | |
Money Market Funds — 112.6% | | | | | | | | |
First American Treasury Obligations Fund - Class X, 4.18% (a) | | | 4,355,318 | | | $ | 4,355,318 | | | | | |
Total Money Market Funds (Cost $4,355,318) | | | | | | | 4,355,318 | | | | | |
| | Number of
Contracts (b) | | | Value | | | Notional
Value | |
PURCHASED OPTIONS — 8.6% | | | | | | | | |
PURCHASED CALL OPTIONS — 8.6% | | | | | | | | |
CBOE SPDR S&P 500 ETF Trust | | | | | | | | |
Expiration: December 29, 2023, Exercise Price: $382.43 | | | 79 | | | $ | 331,484 | | | $ | 3,021,197 | |
TOTAL PURCHASED OPTIONS (Cost $331,566) | | | | | | | 331,484 | | | | | |
| | | | | | | | | | | | | |
TOTAL INVESTMENTS (Cost $4,686,884) — 121.2% | | | | | | | 4,686,802 | | | | | |
Other assets and liabilities, net — (21.2)% | | | | | | | (820,943 | ) | | | | |
TOTAL NET ASSETS — 100.0% | | | | | | $ | 3,865,859 | | | | | |
Percentages are stated as a percent of net assets.
CBOE Chicago Board Options Exchange
SPDR Standard & Poor’s Depositary Receipt
(a) | The rate shown is the seven day yield at period end. |
(b) | Each contract has a multiplier of 100. |
Schedule of Written Options
December 31, 2022
| | Number of
Contracts (a) | | | Value | | | Notional
Value | |
WRITTEN OPTIONS — (4.9)% | | | | | | | | |
WRITTEN PUT OPTIONS — (4.9)% | | | | | | | | |
CBOE SPDR S&P 500 ETF Trust | | | | | | | | |
Expiration: December 29, 2023, Exercise Price: $344.19 | | | 112 | | | $ | 190,512 | | | $ | 4,283,216 | |
TOTAL WRITTEN OPTIONS (Premiums Received $190,391) | | | | | | $ | 190,512 | | | | | |
Percentages are stated as a percent of net assets.
CBOE Chicago Board Options Exchange
SPDR Standard & Poor’s Depositary Receipt
(a) | Each contract has a multiplier of 100. |
The accompanying notes are an integral part of the financial statements.
17
TrueShares Structured Outcome (February) ETF
Schedule of Investments
December 31, 2022
Sector Diversification *

* | Percentages are stated as a percent of net assets. Percentages expressed exclude written options. |
| | Shares /
Principal
Amount | | | Value | | | | |
SHORT-TERM INVESTMENTS — 106.6% | | | | | | | | |
Money Market Funds — 0.1% | | | | | | | | | | | | |
First American Treasury Obligations Fund - Class X, 4.18% (a) | | | 2,431 | | | $ | 2,431 | | | | | |
Total Money Market Funds (Cost $2,431) | | | | | | | 2,431 | | | | | |
| | | | | | | | | | | | | |
U.S. Treasury Bills — 106.5% | | | | | | | | | | | | |
3.63%, 1/26/2023 (c)(d) | | | 2,888,000 | | | | 2,880,849 | | | | | |
Total U.S. Treasury Bills (Cost $2,886,576) | | | | | | | 2,880,849 | | | | | |
TOTAL SHORT-TERM INVESTMENTS (Cost $2,889,007) | | | | | | | 2,883,280 | | | | | |
| | Number of
Contracts (b) | | | Value | | | Notional
Value | |
PURCHASED OPTIONS — 0.0% (e) | | | | | | | | |
PURCHASED CALL OPTIONS — 0.0% (e) | | | | | | | | |
CBOE SPDR S&P 500 ETF Trust | | | | | | | | |
Expiration: January 31, 2023, Exercise Price: $453.00 | | | 45 | | | $ | 131 | | | $ | 1,720,935 | |
TOTAL PURCHASED OPTIONS (Cost 6,302) | | | | | | | 131 | | | | | |
| | | | | | | | | | | | | |
TOTAL INVESTMENTS (Cost $2,895,309) — 106.6% | | | | | | | 2,883,411 | | | | | |
Other assets and liabilities, net — (6.6)% | | | | | | | (179,195 | ) | | | | |
TOTAL NET ASSETS — 100.0% | | | | | | $ | 2,704,216 | | | | | |
Percentages are stated as a percent of net assets.
CBOE Chicago Board Options Exchange
SPDR Standard & Poor’s Depositary Receipt
(a) | The rate shown is the seven day yield at period end. |
(b) | Each contract has a multiplier of 100. |
(c) | The rate shown is the effective yield as of December 31, 2022. |
(d) | Designated as collateral for written options. |
(e) | Amount is less than 0.05%. |
Schedule of Written Options
December 31, 2022
| | Number of
Contracts (a) | | | Value | | | Notional
Value | |
WRITTEN OPTIONS — (6.6)% | | | | | | | | |
WRITTEN PUT OPTIONS — (6.6)% | | | | | | | | |
CBOE SPDR S&P 500 ETF Trust | | | | | | | | |
Expiration: January 31, 2023, Exercise Price: $407.70 | | | 71 | | | $ | 177,786 | | | $ | 2,715,253 | |
TOTAL WRITTEN OPTIONS (Premiums Received $192,828) | | | | | | $ | 177,786 | | | | | |
Percentages are stated as a percent of net assets.
CBOE Chicago Board Options Exchange
SPDR Standard & Poor’s Depositary Receipt
(a) | Each contract has a multiplier of 100. |
The accompanying notes are an integral part of the financial statements.
18
TrueShares Structured Outcome (March) ETF
Schedule of Investments
December 31, 2022
Sector Diversification *

* | Percentages are stated as a percent of net assets. Percentages expressed exclude written options. |
| | Shares /
Principal
Amount | | | Value | | | | |
SHORT-TERM INVESTMENTS — 104.6% | | | | | | | | |
Money Market Funds — 0.2% | | | | | | | | | | | | |
First American Treasury Obligations Fund - Class X, 4.18% (a) | | | 6,765 | | | $ | 6,765 | | | | | |
Total Money Market Funds (Cost $6,765) | | | | | | | 6,765 | | | | | |
| | | | | | | | | | | | | |
U.S. Treasury Bills — 104.4% | | | | | | | | | | | | |
4.18%, 2/23/2023 (c)(d) | | | 3,903,000 | | | | 3,879,539 | | | | | |
Total U.S. Treasury Bills (Cost $3,897,378) | | | | | | | 3,879,539 | | | | | |
TOTAL SHORT-TERM INVESTMENTS (Cost $3,904,143) | | | | | | | 3,886,304 | | | | | |
| | Number of
Contracts (b) | | | Value | | | Notional
Value | |
PURCHASED OPTIONS — 0.2% | | | | | | | | |
PURCHASED CALL OPTIONS — 0.2% | | | | | | | | |
CBOE SPDR S&P 500 ETF Trust | | | | | | | | |
Expiration: February 28, 2023, Exercise Price: $430.00 | | | 67 | | | $ | 6,247 | | | $ | 2,562,281 | |
TOTAL PURCHASED OPTIONS (Cost $44,826) | | | | | | | 6,247 | | | | | |
| | | | | | | | | | | | | |
TOTAL INVESTMENTS (Cost $3,948,969) — 104.8% | | | | | | | 3,892,551 | | | | | |
Other assets and liabilities, net — (4.8)% | | | | | | | (176,875 | ) | | | | |
TOTAL NET ASSETS — 100.0% | | | | | | $ | 3,715,676 | | | | | |
Percentages are stated as a percent of net assets.
CBOE Chicago Board Options Exchange
SPDR Standard & Poor’s Depositary Receipt
(a) | The rate shown is the seven day yield at period end. |
(b) | Each contract has a multiplier of 100. |
(c) | The rate shown is the effective yield as of December 31, 2022. |
(d) | Designated as collateral for written options. |
Schedule of Written Options
December 31, 2022
| | Number of
Contracts (a) | | | Value | | | Notional
Value | |
WRITTEN OPTIONS — (3.9)% | | | | | | | | |
WRITTEN PUT OPTIONS — (3.9)% | | | | | | | | |
CBOE SPDR S&P 500 ETF Trust | | | | | | | | |
Expiration: February 28, 2023, Exercise Price: $387.00 | | | 102 | | | $ | 145,483 | | | $ | 3,900,786 | |
TOTAL WRITTEN OPTIONS (Premiums Received $193,281) | | | | | | $ | 145,483 | | | | | |
Percentages are stated as a percent of net assets.
CBOE Chicago Board Options Exchange
SPDR Standard & Poor’s Depositary Receipt
(a) | Each contract has a multiplier of 100. |
The accompanying notes are an integral part of the financial statements.
19
TrueShares Structured Outcome (April) ETF
Schedule of Investments
December 31, 2022
Sector Diversification *
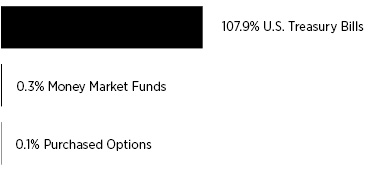
* | Percentages are stated as a percent of net assets. Percentages expressed exclude written options. |
| | Shares /
Principal
Amount | | | Value | | | | |
SHORT-TERM INVESTMENTS — 108.2% | | | | | | | | |
Money Market Funds — 0.3% | | | | | | | | | | | | |
First American Treasury Obligations Fund - Class X, 4.18% (a) | | | 15,610 | | | $ | 15,610 | | | | | |
Total Money Market Funds (Cost $15,610) | | | | | | | 15,610 | | | | | |
| | | | | | | | | | | | | |
U.S. Treasury Bills — 107.9% | | | | | | | | | | | | |
4.24%, 03/23/2023 (c)(d) | | | 6,128,000 | | | | 6,071,031 | | | | | |
Total U.S. Treasury Bills (Cost $6,105,861) | | | | | | | 6,071,031 | | | | | |
TOTAL SHORT-TERM INVESTMENTS (Cost $6,121,471) | | | | | | | 6,086,641 | | | | | |
| | Number of
Contracts (b) | | | Value | | | Notional
Value | |
PURCHASED OPTIONS — 0.1% | | | | | | | | |
PURCHASED CALL OPTIONS — 0.1% | | | | | | | | |
CBOE SPDR S&P 500 ETF Trust | | | | | | | | |
Expiration: March 31, 2023, Exercise Price: $452.92 | | | 101 | | | $ | 4,769 | | | $ | 3,862,543 | |
TOTAL PURCHASED OPTIONS (Cost $368,203) | | | | | | | 4,769 | | | | | |
| | | | | | | | | | | | | |
TOTAL INVESTMENTS (Cost $6,489,674) — 108.3% | | | | | | | 6,091,410 | | | | | |
Other assets and liabilities, net — (8.3)% | | | | | | | (467,769 | ) | | | | |
TOTAL NET ASSETS — 100.0% | | | | | | $ | 5,623,641 | | | | | |
Percentages are stated as a percent of net assets.
CBOE Chicago Board Options Exchange
SPDR Standard & Poor’s Depositary Receipt
(a) | The rate shown is the seven day yield at period end. |
(b) | Each contract has a multiplier of 100. |
(c) | The rate shown is the effective yield as of December 31, 2022. |
(d) | Designated as collateral for written options. |
Schedule of Written Options
December 31, 2022
| | Number of
Contracts (a) | | | Value | | | Notional
Value | |
WRITTEN OPTIONS — (7.7)% | | | | | | | | |
WRITTEN PUT OPTIONS — (7.7)% | | | | | | | | |
CBOE SPDR S&P 500 ETF Trust | | | | | | | | |
Expiration: March 31, 2023, Exercise Price: $407.63 | | | 150 | | | $ | 431,135 | | | $ | 5,736,450 | |
TOTAL WRITTEN OPTIONS (Premiums Received $351,348) | | | | | | $ | 431,135 | | | | | |
Percentages are stated as a percent of net assets.
CBOE Chicago Board Options Exchange
SPDR Standard & Poor’s Depositary Receipt
(a) | Each contract has a multiplier of 100. |
The accompanying notes are an integral part of the financial statements.
20
TrueShares Structured Outcome (May) ETF
Schedule of Investments
December 31, 2022
Sector Diversification *
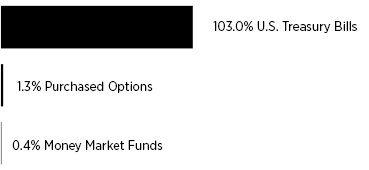
* | Percentages are stated as a percent of net assets. Percentages expressed exclude written options. |
| | Shares /
Principal
Amount | | | Value | | | | |
SHORT-TERM INVESTMENTS — 103.4% | | | | | | | | |
Money Market Funds — 0.4% | | | | | | | | | | | | |
First American Treasury Obligations Fund - Class X, 4.18% (a) | | | 12,921 | | | $ | 12,921 | | | | | |
Total Money Market Funds (Cost $12,921) | | | | | | | 12,921 | | | | | |
| | | | | | | | | | | | | |
U.S. Treasury Bills — 103.0% | | | | | | | | | | | | |
4.42%, 4/20/2023 (c)(d) | | | 3,619,000 | | | | 3,571,870 | | | | | |
Total U.S. Treasury Bills (Cost $3,597,523) | | | | | | | 3,571,870 | | | | | |
TOTAL SHORT-TERM INVESTMENTS (Cost $3,610,444) | | | | | | | 3,584,791 | | | | | |
| | Number of
Contracts (b) | | | Value | | | Notional
Value | |
PURCHASED OPTIONS — 1.3% | | | | | | | | |
PURCHASED CALL OPTIONS — 1.3% | | | | | | | | |
CBOE SPDR S&P 500 ETF Trust | | | | | | | | |
Expiration: April 28, 2023, Exercise Price: $414.48 | | | 65 | | | $ | 46,767 | | | $ | 2,485,795 | |
TOTAL PURCHASED OPTIONS (Cost $274,628) | | | | | | | 46,767 | | | | | |
| | | | | | | | | | | | | |
TOTAL INVESTMENTS (Cost $3,885,072) — 104.7% | | | | | | | 3,631,558 | | | | | |
Other assets and liabilities, net — (4.7)% | | | | | | | (162,469 | ) | | | | |
TOTAL NET ASSETS — 100.0% | | | | | | $ | 3,469,089 | | | | | |
Percentages are stated as a percent of net assets.
CBOE Chicago Board Options Exchange
SPDR Standard & Poor’s Depositary Receipt
(a) | The rate shown is the seven day yield at period end. |
(b) | Each contract has a multiplier of 100. |
(c) | The rate shown is the effective yield as of December 31, 2022. |
(d) | Designated as collateral for written options. |
Schedule of Written Options
December 31, 2022
| | Number of
Contracts (a) | | | Value | | | Notional
Value | |
WRITTEN OPTIONS — (3.9)% | | | | | | | | |
WRITTEN PUT OPTIONS — (3.9)% | | | | | | | | |
CBOE SPDR S&P 500 ETF Trust | | | | | | | | |
Expiration: April 28, 2023, Exercise Price: $373.03 | | | 97 | | | $ | 136,314 | | | $ | 3,709,571 | |
TOTAL WRITTEN OPTIONS (Premiums Received $231,630) | | | | | | $ | 136,314 | | | | | |
Percentages are stated as a percent of net assets.
CBOE Chicago Board Options Exchange
SPDR Standard & Poor’s Depositary Receipt
(a) | Each contract has a multiplier of 100. |
The accompanying notes are an integral part of the financial statements.
21
TrueShares Structured Outcome (June) ETF
Schedule of Investments
December 31, 2022
Sector Diversification *
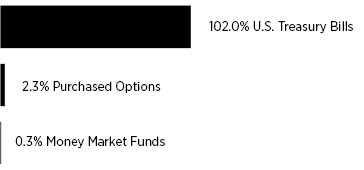
* | Percentages are stated as a percent of net assets. Percentages expressed exclude written options. |
| | Shares /
Principal
Amount | | | Value | | | | |
SHORT-TERM INVESTMENTS — 102.3% | | | | | | | | |
Money Market Funds — 0.3% | | | | | | | | | | | | |
First American Treasury Obligations Fund - Class X, 4.18% (a) | | | 9,012 | | | $ | 9,012 | | | | | |
Total Money Market Funds (Cost $9,012) | | | | | | | 9,012 | | | | | |
| | | | | | | | | | | | | |
U.S. Treasury Bills — 102.0% | | | | | | | | | | | | |
4.58%, 5/18/2023 (c)(d) | | | 3,084,000 | | | | 3,031,849 | | | | | |
Total U.S. Treasury Bills (Cost $3,060,527) | | | | | | | 3,031,849 | | | | | |
TOTAL SHORT-TERM INVESTMENTS (Cost $3,069,539) | | | | | | | 3,040,861 | | | | | |
| | Number of
Contracts (b) | | | Value | | | Notional
Value | |
PURCHASED OPTIONS — 2.3% | | | | | | | | |
PURCHASED CALL OPTIONS — 2.3% | | | | | | | | |
CBOE SPDR S&P 500 ETF Trust | | | | | | | | |
Expiration: May 31, 2023, Exercise Price: $409.59 | | | 54 | | | $ | 67,087 | | | $ | 2,065,122 | |
TOTAL PURCHASED OPTIONS (Cost $215,571) | | | | | | | 67,087 | | | | | |
| | | | | | | | | | | | | |
TOTAL INVESTMENTS (Cost $3,285,110) — 104.6% | | | | | | | 3,107,948 | | | | | |
Other assets and liabilities, net — (4.6)% | | | | | | | (135,628 | ) | | | | |
TOTAL NET ASSETS — 100.0% | | | | | | $ | 2,972,320 | | | | | |
Percentages are stated as a percent of net assets.
CBOE Chicago Board Options Exchange
SPDR Standard & Poor’s Depositary Receipt
(a) | The rate shown is the seven day yield at period end. |
(b) | Each contract has a multiplier of 100. |
(c) | The rate shown is the effective yield as of December 31, 2022. |
(d) | Designated as collateral for written options. |
Schedule of Written Options
December 31, 2022
| | Number of
Contracts (a) | | | Value | | | Notional
Value | |
WRITTEN OPTIONS — (4.1)% | | | | | | | | |
WRITTEN PUT OPTIONS — (4.1)% | | | | | | | | |
CBOE SPDR S&P 500 ETF Trust | | | | | | | | |
Expiration: May 31, 2023, Exercise Price: $368.63 | | | 84 | | | $ | 121,399 | | | $ | 3,212,412 | |
TOTAL WRITTEN OPTIONS (Premiums Received $180,676) | | | | | | $ | 121,399 | | | | | |
Percentages are stated as a percent of net assets.
CBOE Chicago Board Options Exchange
SPDR Standard & Poor’s Depositary Receipt
(a) | Each contract has a multiplier of 100. |
The accompanying notes are an integral part of the financial statements.
22
TrueShares Structured Outcome ETFs
Statements of Assets and Liabilities
December 31, 2022
| | | TrueShares
Structured
Outcome
(July) ETF | | | TrueShares
Structured
Outcome
(August) ETF | | | TrueShares
Structured
Outcome
(September) ETF | | | TrueShares
Structured
Outcome
(October) ETF | |
Assets | | | | | | | | | | | | | | | | |
Investments, at value(1) | | $ | 12,246,542 | | | $ | 13,482,828 | | | $ | 21,601,354 | | | $ | 4,503,213 | |
Deposits at broker for options | | | 27,181 | | | | 14,602 | | | | 65,436 | | | | 29,986 | |
Interest receivable | | | 141 | | | | 271 | | | | 656 | | | | 209 | |
Total assets | | | 12,273,864 | | | | 13,497,701 | | | | 21,667,446 | | | | 4,533,408 | |
| | | | | | | | | | | | | | | | | |
Liabilities | | | | | | | | | | | | | | | | |
Payable to Adviser | | | 8,124 | | | | 9,069 | | | | 14,340 | | | | 3,116 | |
Written options, at value(2) | | | 317,994 | | | | 675,695 | | | | 912,549 | | | | 123,473 | |
Distribution payable | | | 8,369 | | | | 52,402 | | | | 142,172 | | | | 29,502 | |
Total liabilities | | | 334,487 | | | | 737,166 | | | | 1,069,061 | | | | 156,091 | |
Net Assets | | $ | 11,939,377 | | | $ | 12,760,535 | | | $ | 20,598,385 | | | $ | 4,377,317 | |
| | | | | | | | | | | | | | | | | |
Net Assets Consists of: | | | | | | | | | | | | | | | | |
Paid-in capital | | $ | 12,224,360 | | | $ | 13,529,087 | | | $ | 21,878,854 | | | $ | 4,736,360 | |
Total distributable earnings (accumulated losses) | | | (284,983 | ) | | | (768,552 | ) | | | (1,280,469 | ) | | | (359,043 | ) |
Net Assets | | $ | 11,939,377 | | | $ | 12,760,535 | | | $ | 20,598,385 | | | $ | 4,377,317 | |
| | | | | | | | | | | | | | | | | |
Shares of beneficial interest outstanding (unlimited number of shares authorized, no par value) | | | 375,000 | | | | 425,000 | | | | 700,000 | | | | 150,000 | |
Net Asset Value, redemption price and offering price per share | | $ | 31.84 | | | $ | 30.02 | | | $ | 29.43 | | | $ | 29.18 | |
| | | | | | | | | | | | | | | | | |
(1) Cost of investments | | $ | 12,547,353 | | | $ | 14,178,019 | | | $ | 22,326,848 | | | $ | 4,419,861 | |
(2) Premiums received | | | (724,490 | ) | | | (729,125 | ) | | | (1,199,358 | ) | | | (256,348 | ) |
The accompanying notes are an integral part of the financial statements.
23
TrueShares Structured Outcome ETFs
Statements of Assets and Liabilities
December 31, 2022 (Continued)
| | | TrueShares
Structured
Outcome
(November) ETF | | | TrueShares
Structured
Outcome
(December) ETF | | | TrueShares
Structured
Outcome
(January) ETF | | | TrueShares
Structured
Outcome
(February) ETF | |
Assets | | | | | | | | | | | | | | | | |
Investments, at value(1) | | $ | 10,179,336 | | | $ | 5,899,067 | | | $ | 4,686,802 | | | $ | 2,883,411 | |
Deposits at broker for options | | | 83,023 | | | | 357 | | | | 496 | | | | 414 | |
Interest receivable | | | 1,333 | | | | 8,206 | | | | 1,037 | | | | 9 | |
Receivable for investment securities sold | | | — | | | | — | | | | 4,052,745 | | | | — | |
Total assets | | | 10,263,692 | | | | 5,907,630 | | | | 8,741,080 | | | | 2,883,834 | |
| | | | | | | | | | | | | | | | | |
Liabilities | | | | | | | | | | | | | | | | |
Payable to Adviser | | | 6,923 | | | | 3,672 | | | | 2,651 | | | | 1,832 | |
Written options, at value(2) | | | 460,311 | | | | 352,806 | | | | 190,512 | | | | 177,786 | |
Distribution payable | | | 24,115 | | | | 78,840 | | | | 8,073 | | | | — | |
Payable for investment securities purchased | | | — | | | | — | | | | 4,673,985 | | | | — | |
Total liabilities | | | 491,349 | | | | 435,318 | | | | 4,875,221 | | | | 179,618 | |
Net Assets | | $ | 9,772,343 | | | $ | 5,472,312 | | | $ | 3,865,859 | | | $ | 2,704,216 | |
| | | | | | | | | | | | | | | | | |
Net Assets Consists of: | | | | | | | | | | | | | | | | |
Paid-in capital | | $ | 10,995,358 | | | $ | 5,997,030 | | | $ | 4,385,385 | | | $ | 2,739,300 | |
Total distributable earnings (accumulated losses) | | | (1,223,015 | ) | | | (524,718 | ) | | | (519,526 | ) | | | (35,084 | ) |
Net Assets | | $ | 9,772,343 | | | $ | 5,472,312 | | | $ | 3,865,859 | | | $ | 2,704,216 | |
| | | | | | | | | | | | | | | | | |
Shares of beneficial interest outstanding (unlimited number of shares authorized, no par value) | | | 325,000 | | | | 200,000 | | | | 150,000 | | | | 100,000 | |
Net Asset Value, redemption price and offering price per share | | $ | 30.07 | | | $ | 27.36 | | | $ | 25.77 | | | $ | 27.04 | |
| | | | | | | | | | | | | | | | | |
(1) Cost of investments | | $ | 10,339,968 | | | $ | 6,077,647 | | | $ | 4,686,884 | | | $ | 2,895,309 | |
(2) Premiums received | | | (540,221 | ) | | | (302,114 | ) | | | (190,391 | ) | | | (192,828 | ) |
The accompanying notes are an integral part of the financial statements.
24
TrueShares Structured Outcome ETFs
Statements of Assets and Liabilities
December 31, 2022 (Continued)
| | | TrueShares
Structured
Outcome
(March) ETF | | | TrueShares
Structured
Outcome
(April) ETF | | | TrueShares
Structured
Outcome
(May) ETF | | | TrueShares
Structured
Outcome
(June) ETF | |
Assets | | | | | | | | | | | | | | | | |
Investments, at value(1) | | $ | 3,892,551 | | | $ | 6,091,410 | | | $ | 3,631,558 | | | $ | 3,107,948 | |
Deposits at broker for options | | | 166 | | | | 202 | | | | 220 | | | | 4,411 | |
Interest receivable | | | 24 | | | | 56 | | | | 35 | | | | 44 | |
Total assets | | | 3,892,741 | | | | 6,091,668 | | | | 3,631,813 | | | | 3,112,403 | |
| | | | | | | | | | | | | | | | | |
Liabilities | | | | | | | | | | | | | | | | |
Payable to Adviser | | | 2,527 | | | | 3,828 | | | | 2,634 | | | | 2,026 | |
Written options, at value(2) | | | 145,483 | | | | 431,135 | | | | 136,314 | | | | 121,399 | |
Distribution payable | | | 29,055 | | | | 33,064 | | | | 23,776 | | | | 16,658 | |
Total liabilities | | | 177,065 | | | | 468,027 | | | | 162,724 | | | | 140,083 | |
Net Assets | | $ | 3,715,676 | | | $ | 5,623,641 | | | $ | 3,469,089 | | | $ | 2,972,320 | |
| | | | | | | | | | | | | | | | | |
Net Assets Consists of: | | | | | | | | | | | | | | | | |
Paid-in capital | | $ | 3,724,296 | | | $ | 6,241,626 | | | $ | 3,929,089 | | | $ | 3,124,744 | |
Total distributable earnings (accumulated losses) | | | (8,620 | ) | | | (617,985 | ) | | | (460,000 | ) | | | (152,424 | ) |
Net Assets | | $ | 3,715,676 | | | $ | 5,623,641 | | | $ | 3,469,089 | | | $ | 2,972,320 | |
| | | | | | | | | | | | | | | | | |
Shares of beneficial interest outstanding (unlimited number of shares authorized, no par value) | | | 150,000 | | | | 225,000 | | | | 150,000 | | | | 125,000 | |
Net Asset Value, redemption price and offering price per share | | $ | 24.77 | | | $ | 24.99 | | | $ | 23.13 | | | $ | 23.78 | |
| | | | | | | | | | | | | | | | | |
(1) Cost of investments | | $ | 3,948,969 | | | $ | 6,489,674 | | | $ | 3,885,072 | | | $ | 3,285,110 | |
(2) Premiums received | | | (193,281 | ) | | | (351,348 | ) | | | (231,630 | ) | | | (180,676 | ) |
The accompanying notes are an integral part of the financial statements.
25
TrueShares Structured Outcome ETFs
Statements of Operations
For the Year Ended December 31, 2022
| | | TrueShares
Structured
Outcome
(July) ETF | | | TrueShares
Structured
Outcome
(August) ETF | | | TrueShares
Structured
Outcome
(September) ETF | | | TrueShares
Structured
Outcome
(October) ETF | |
Investment Income | | | | | | | | | | | | | | | | |
Interest income | | $ | 169,493 | | | $ | 200,367 | | | $ | 330,960 | | | $ | 78,448 | |
Total investment income | | | 169,493 | | | | 200,367 | | | | 330,960 | | | | 78,448 | |
| | | | | | | | | | | | | | | | | |
Expenses | | | | | | | | | | | | | | | | |
Investment advisory fees | | | 104,691 | | | | 121,115 | | | | 188,713 | | | | 48,877 | |
Interest expense | | | 25 | | | | 825 | | | | 87 | | | | 107 | |
Total expenses | | | 104,716 | | | | 121,940 | | | | 188,800 | | | | 48,984 | |
Net investment income | | | 64,777 | | | | 78,427 | | | | 142,160 | | | | 29,464 | |
| | | | | | | | | | | | | | | | | |
Realized and Unrealized Gain (Loss) on Investments | | | | | | | | | | | | | | | | |
Net realized gain (loss) on: | | | | | | | | | | | | | | | | |
Investments | | | 180,745 | | | | (21,908 | ) | | | 556,969 | | | | (160,914 | ) |
Purchased options | | | (662,472 | ) | | | (901,102 | ) | | | (1,373,043 | ) | | | (395,699 | ) |
Written options | | | 34,651 | | | | 770,194 | | | | (25,710 | ) | | | 56,075 | |
Net realized loss | | | (447,076 | ) | | | (152,816 | ) | | | (841,784 | ) | | | (500,538 | ) |
Net change in unrealized appreciation/depreciation on: | | | | | | | | | | | | | | | | |
Investments | | | (90,491 | ) | | | (104,997 | ) | | | (139,373 | ) | | | (11,538 | ) |
Purchased options | | | (885,484 | ) | | | (1,250,405 | ) | | | (1,172,707 | ) | | | (212,523 | ) |
Written options | | | (17,970 | ) | | | (426,814 | ) | | | (234,658 | ) | | | (43,799 | ) |
Net change in unrealized appreciation/depreciation | | | (993,945 | ) | | | (1,782,216 | ) | | | (1,546,738 | ) | | | (267,860 | ) |
Net realized and unrealized loss on investments | | | (1,441,021 | ) | | | (1,935,032 | ) | | | (2,388,522 | ) | | | (768,398 | ) |
Net decrease in net assets from operations | | $ | (1,376,244 | ) | | $ | (1,856,605 | ) | | $ | (2,246,362 | ) | | $ | (738,934 | ) |
The accompanying notes are an integral part of the financial statements.
26
TrueShares Structured Outcome ETFs
Statements of Operations
For the Year Ended December 31, 2022 (Continued)
| | | TrueShares
Structured
Outcome
(November) ETF | | | TrueShares
Structured
Outcome
(December) ETF | | | TrueShares
Structured
Outcome
(January) ETF | | | TrueShares
Structured
Outcome
(February) ETF | |
Investment Income | | | | | | | | | | | | | | | | |
Interest income | | $ | 122,794 | | | $ | 42,899 | | | $ | 20,648 | | | $ | 23,106 | |
Total investment income | | | 122,794 | | | | 42,899 | | | | 20,648 | | | | 23,106 | |
| | | | | | | | | | | | | | | | | |
Expenses | | | | | | | | | | | | | | | | |
Investment advisory fees | | | 94,974 | | | | 53,905 | | | | 34,562 | | | | 26,127 | |
Interest expense | | | 227 | | | | 558 | | | | 22 | | | | 5 | |
Total expenses | | | 95,201 | | | | 54,463 | | | | 34,584 | | | | 26,132 | |
Net investment income (loss) | | | 27,593 | | | | (11,564 | ) | | | (13,936 | ) | | | (3,026 | ) |
| | | | | | | | | | | | | | | | | |
Realized and Unrealized Gain (Loss) on Investments | | | | | | | | | | | | | | | | |
Net realized gain (loss) on: | | | | | | | | | | | | | | | | |
Investments | | | (192,009 | ) | | | (11,719 | ) | | | (207,160 | ) | | | 224,291 | |
Purchased options | | | (794,566 | ) | | | (588,465 | ) | | | (238,425 | ) | | �� | (197,096 | ) |
Written options | | | (159,196 | ) | | | 304,738 | | | | (50,118 | ) | | | 95,893 | |
Net realized gain (loss) | | | (1,145,771 | ) | | | (295,446 | ) | | | (495,703 | ) | | | 123,088 | |
Net change in unrealized appreciation/depreciation on: | | | | | | | | | | | | | | | | |
Investments | | | (7,903 | ) | | | 144 | | | | 9,920 | | | | (5,749 | ) |
Purchased options | | | (306,086 | ) | | | (261,814 | ) | | | (82 | ) | | | (339,091 | ) |
Written options | | | (33,534 | ) | | | (134,684 | ) | | | (121 | ) | | | (120,355 | ) |
Net change in unrealized appreciation/depreciation | | | (347,523 | ) | | | (396,354 | ) | | | 9,717 | | | | (465,195 | ) |
Net realized and unrealized loss on investments | | | (1,493,294 | ) | | | (691,800 | ) | | | (485,986 | ) | | | (342,107 | ) |
Net decrease in net assets from operations | | $ | (1,465,701 | ) | | $ | (703,364 | ) | | $ | (499,922 | ) | | $ | (345,133 | ) |
The accompanying notes are an integral part of the financial statements.
27
TrueShares Structured Outcome ETFs
Statements of Operations
For the Year Ended December 31, 2022 (Continued)
| | | TrueShares
Structured
Outcome
(March) ETF | | | TrueShares
Structured
Outcome
(April) ETF | | | TrueShares
Structured
Outcome
(May) ETF | | | TrueShares
Structured
Outcome
(June) ETF | |
Investment Income | | | | | | | | | | | | | | | | |
Interest income | | $ | 41,416 | | | $ | 80,385 | | | $ | 59,003 | | | $ | 45,550 | |
Total investment income | | | 41,416 | | | | 80,385 | | | | 59,003 | | | | 45,550 | |
| | | | | | | | | | | | | | | | | |
Expenses | | | | | | | | | | | | | | | | |
Investment advisory fees | | | 39,827 | | | | 47,286 | | | | 35,081 | | | | 28,873 | |
Interest expense | | | 6 | | | | 37 | | | | 15 | | | | 13 | |
Total expenses | | | 39,833 | | | | 47,323 | | | | 35,096 | | | | 28,886 | |
Net investment income | | | 1,583 | | | | 33,062 | | | | 23,907 | | | | 16,664 | |
| | | | | | | | | | | | | | | | | |
Realized and Unrealized Gain (Loss) on Investments | | | | | | | | | | | | | | | | |
Net realized gain (loss) on: | | | | | | | | | | | | | | | | |
Investments | | | 73,584 | | | | (41,239 | ) | | | (9,441 | ) | | | (7,606 | ) |
Purchased options | | | (279,912 | ) | | | 189,673 | | | | (394,498 | ) | | | (217,766 | ) |
Written options | | | 393,948 | | | | 260,722 | | | | 239,319 | | | | 190,843 | |
Net realized gain (loss) | | | 187,620 | | | | 409,156 | | | | (164,620 | ) | | | (34,529 | ) |
Net change in unrealized appreciation/depreciation on: | | | | | | | | | | | | | | | | |
Investments | | | (17,900 | ) | | | (34,646 | ) | | | (25,782 | ) | | | (28,724 | ) |
Purchased options | | | (658,463 | ) | | | (792,729 | ) | | | (582,727 | ) | | | (398,157 | ) |
Written options | | | (261,154 | ) | | | (332,492 | ) | | | (112,066 | ) | | | (69,534 | ) |
Net change in unrealized appreciation/depreciation | | | (937,517 | ) | | | (1,159,867 | ) | | | (720,575 | ) | | | (496,415 | ) |
Net realized and unrealized loss on investments | | | (749,897 | ) | | | (750,711 | ) | | | (885,195 | ) | | | (530,944 | ) |
Net decrease in net assets from operations | | $ | (748,314 | ) | | $ | (717,649 | ) | | $ | (861,288 | ) | | $ | (514,280 | ) |
The accompanying notes are an integral part of the financial statements.
28
TrueShares Structured Outcome ETFs
Statements of Changes in Net Assets
| | | TrueShares Structured
Outcome (July) ETF | | | TrueShares Structured
Outcome (August) ETF | |
| | | Year Ended
December 31,
2022 | | | Year Ended
December 31,
2021 | | | Year Ended
December 31,
2022 | | | Year Ended
December 31,
2021 | |
From Operations | | | | | | | | | | | | | | | | |
Net investment income (loss) | | $ | 64,777 | | | $ | (87,190 | ) | | $ | 78,427 | | | $ | (101,477 | ) |
Net realized gain (loss) on investments, purchased options and written options | | | (447,076 | ) | | | 1,876,262 | | | | (152,816 | ) | | | 2,165,479 | |
Net change in unrealized appreciation/depreciation on investments, purchased options and written options | | | (993,945 | ) | | | 177,938 | | | | (1,782,216 | ) | | | 197,318 | |
Net increase (decrease) in net assets resulting from operations | | | (1,376,244 | ) | | | 1,967,010 | | | | (1,856,605 | ) | | | 2,261,320 | |
| | | | | | | | | | | | | | | | | |
From Distributions | | | | | | | | | | | | | | | | |
Distributable earnings | | | (8,369 | ) | | | — | | | | (52,402 | ) | | | — | |
Total distributions | | | (8,369 | ) | | | — | | | | (52,402 | ) | | | — | |
| | | | | | | | | | | | | | | | | |
From Capital Share Transactions | | | | | | | | | | | | | | | | |
Proceeds from shares sold | | | 825,110 | | | | 20,985,980 | | | | 1,552,810 | | | | 19,761,993 | |
Cost of shares redeemed | | | (2,464,597 | ) | | | (14,565,157 | ) | | | (5,421,015 | ) | | | (12,554,495 | ) |
Transaction fees (Note 4) | | | 658 | | | | 4,172 | | | | 1,395 | | | | 2,335 | |
Net increase (decrease) in net assets resulting from capital share transactions | | | (1,638,829 | ) | | | 6,424,995 | | | | (3,866,810 | ) | | | 7,209,833 | |
| | | | | | | | | | | | | | | | | |
Total Increase (Decrease) in Net Assets | | | (3,023,442 | ) | | | 8,392,005 | | | | (5,775,817 | ) | | | 9,471,153 | |
| | | | | | | | | | | | | | | | | |
Net Assets | | | | | | | | | | | | | | | | |
Beginning of year | | | 14,962,819 | | | | 6,570,814 | | | | 18,536,352 | | | | 9,065,199 | |
End of year | | $ | 11,939,377 | | | $ | 14,962,819 | | | $ | 12,760,535 | | | $ | 18,536,352 | |
| | | | | | | | | | | | | | | | | |
Changes in Shares Outstanding | | | | | | | | | | | | | | | | |
Shares outstanding, beginning of year | | | 425,000 | | | | 225,000 | | | | 550,000 | | | | 325,000 | |
Shares sold | | | 25,000 | | | | 650,000 | | | | 50,000 | | | | 625,000 | |
Shares redeemed | | | (75,000 | ) | | | (450,000 | ) | | | (175,000 | ) | | | (400,000 | ) |
Shares outstanding, end of year | | | 375,000 | | | | 425,000 | | | | 425,000 | | | | 550,000 | |
The accompanying notes are an integral part of the financial statements.
29
TrueShares Structured Outcome ETFs
Statements of Changes in Net Assets
(Continued)
| | | TrueShares Structured
Outcome (September) ETF | | | TrueShares Structured
Outcome (October) ETF | |
| | | Year Ended
December 31,
2022 | | | Year Ended
December 31,
2021 | | | Year Ended
December 31,
2022 | | | Year Ended
December 31,
2021 | |
From Operations | | | | | | | | | | | | | | | | |
Net investment income (loss) | | $ | 142,160 | | | $ | (114,587 | ) | | $ | 29,464 | | | $ | (39,225 | ) |
Net realized gain (loss) on investments, purchased options and written options | | | (841,784 | ) | | | 2,461,185 | | | | (500,538 | ) | | | 765,467 | |
Net change in unrealized appreciation/depreciation on investments, purchased options and written options | | | (1,546,738 | ) | | | 304,133 | | | | (267,860 | ) | | | 173,524 | |
Net increase (decrease) in net assets resulting from operations | | | (2,246,362 | ) | | | 2,650,731 | | | | (738,934 | ) | | | 899,766 | |
| | | | | | | | | | | | | | | | | |
From Distributions | | | | | | | | | | | | | | | | |
Distributable earnings | | | (142,172 | ) | | | (12,776 | ) | | | (29,502 | ) | | | — | |
Total distributions | | | (142,172 | ) | | | (12,776 | ) | | | (29,502 | ) | | | — | |
| | | | | | | | | | | | | | | | | |
From Capital Share Transactions | | | | | | | | | | | | | | | | |
Proceeds from shares sold | | | 5,282,900 | | | | 24,834,405 | | | | 710,545 | | | | 7,794,455 | |
Cost of shares redeemed | | | (8,159,950 | ) | | | (12,264,850 | ) | | | (3,754,253 | ) | | | (4,588,095 | ) |
Transaction fees (Note 4) | | | 2,689 | | | | 3,068 | | | | 893 | | | | 625 | |
Net increase (decrease) in net assets resulting from capital share transactions | | | (2,874,361 | ) | | | 12,572,623 | | | | (3,042,815 | ) | | | 3,206,985 | |
| | | | | | | | | | | | | | | | | |
Total Increase (Decrease) in Net Assets | | | (5,262,895 | ) | | | 15,210,578 | | | | (3,811,251 | ) | | | 4,106,751 | |
| | | | | | | | | | | | | | | | | |
Net Assets | | | | | | | | | | | | | | | | |
Beginning of year | | | 25,861,280 | | | | 10,650,702 | | | | 8,188,568 | | | | 4,081,817 | |
End of year | | $ | 20,598,385 | | | $ | 25,861,280 | | | $ | 4,377,317 | | | $ | 8,188,568 | |
| | | | | | | | | | | | | | | | | |
Changes in Shares Outstanding | | | | | | | | | | | | | | | | |
Shares outstanding, beginning of year | | | 800,000 | | | | 400,000 | | | | 250,000 | | | | 150,000 | |
Shares sold | | | 175,000 | | | | 800,000 | | | | 25,000 | | | | 250,000 | |
Shares redeemed | | | (275,000 | ) | | | (400,000 | ) | | | (125,000 | ) | | | (150,000 | ) |
Shares outstanding, end of year | | | 700,000 | | | | 800,000 | | | | 150,000 | | | | 250,000 | |
The accompanying notes are an integral part of the financial statements.
30
TrueShares Structured Outcome ETFs
Statements of Changes in Net Assets
(Continued)
| | | TrueShares Structured
Outcome (November) ETF | | | TrueShares Structured
Outcome (December) ETF | |
| | | Year Ended
December 31,
2022 | | | Year Ended
December 31,
2021 | | | Year Ended
December 31,
2022 | | | Year Ended
December 31,
2021 | |
From Operations | | | | | | | | | | | | | | | | |
Net investment income (loss) | | $ | 27,593 | | | $ | (33,149 | ) | | $ | (11,564 | ) | | $ | (30,739 | ) |
Net realized gain (loss) on investments, purchased options and written options | | | (1,145,771 | ) | | | 650,918 | | | | (295,446 | ) | | | 629,671 | |
Net change in unrealized appreciation/depreciation on investments, purchased options and written options | | | (347,523 | ) | | | 131,826 | | | | (396,354 | ) | | | 70,208 | |
Net increase (decrease) in net assets resulting from operations | | | (1,465,701 | ) | | | 749,595 | | | | (703,364 | ) | | | 669,140 | |
| | | | | | | | | | | | | | | | | |
From Distributions | | | | | | | | | | | | | | | | |
Distributable earnings | | | (24,115 | ) | | | (69,396 | ) | | | (78,840 | ) | | | (24,407 | ) |
Total distributions | | | (24,115 | ) | | | (69,396 | ) | | | (78,840 | ) | | | (24,407 | ) |
| | | | | | | | | | | | | | | | | |
From Capital Share Transactions | | | | | | | | | | | | | | | | |
Proceeds from shares sold | | | 769,145 | | | | 15,384,297 | | | | 2,907,555 | | | | 6,041,427 | |
Cost of shares redeemed | | | (3,688,620 | ) | | | (3,267,210 | ) | | | (2,739,967 | ) | | | (6,324,773 | ) |
Transaction fees (Note 4) | | | 1,058 | | | | 2,258 | | | | 1,130 | | | | 980 | |
Net increase (decrease) in net assets resulting from capital share transactions | | | (2,918,417 | ) | | | 12,119,345 | | | | 168,718 | | | | (282,366 | ) |
| | | | | | | | | | | | | | | | | |
Total Increase (Decrease) in Net Assets | | | (4,408,233 | ) | | | 12,799,544 | | | | (613,486 | ) | | | 362,367 | |
| | | | | | | | | | | | | | | | | |
Net Assets | | | | | | | | | | | | | | | | |
Beginning of year | | | 14,180,576 | | | | 1,381,032 | | | | 6,085,798 | | | | 5,723,431 | |
End of year | | $ | 9,772,343 | | | $ | 14,180,576 | | | $ | 5,472,312 | | | $ | 6,085,798 | |
| | | | | | | | | | | | | | | | | |
Changes in Shares Outstanding | | | | | | | | | | | | | | | | |
Shares outstanding, beginning of year | | | 425,000 | | | | 50,000 | | | | 200,000 | | | | 225,000 | |
Shares sold | | | 25,000 | | | | 475,000 | | | | 100,000 | | | | 200,000 | |
Shares redeemed | | | (125,000 | ) | | | (100,000 | ) | | | (100,000 | ) | | | (225,000 | ) |
Shares outstanding, end of year | | | 325,000 | | | | 425,000 | | | | 200,000 | | | | 200,000 | |
The accompanying notes are an integral part of the financial statements.
31
TrueShares Structured Outcome ETFs
Statements of Changes in Net Assets
(Continued)
| | | TrueShares Structured
Outcome (January) ETF | | | TrueShares Structured
Outcome (February) ETF | |
| | | Year Ended
December 31,
2022 | | | Period Ended
December 31,
2021(1) | | | Year Ended
December 31,
2022 | | | Period Ended
December 31,
2021(2) | |
From Operations | | | | | | | | | | | | | | | | |
Net investment loss | | $ | (13,936 | ) | | $ | (23,330 | ) | | $ | (3,026 | ) | | $ | (18,329 | ) |
Net realized gain (loss) on investments, purchased options and written options | | | (495,703 | ) | | | 610,195 | | | | 123,088 | | | | — | |
Net change in unrealized appreciation/depreciation on investments, purchased options and written options | | | 9,717 | | | | (9,920 | ) | | | (465,195 | ) | | | 468,339 | |
Net increase (decrease) in net assets resulting from operations | | | (499,922 | ) | | | 576,945 | | | | (345,133 | ) | | | 450,010 | |
| | | | | | | | | | | | | | | | | |
From Distributions | | | | | | | | | | | | | | | | |
Distributable earnings | | | (8,073 | ) | | | (98,735 | ) | | | — | | | | — | |
Total distributions | | | (8,073 | ) | | | (98,735 | ) | | | — | | | | — | |
| | | | | | | | | | | | | | | | | |
From Capital Share Transactions | | | | | | | | | | | | | | | | |
Proceeds from shares sold | | | 2,823,720 | | | | 5,331,918 | | | | 3,537,113 | | | | 3,317,822 | |
Cost of shares redeemed | | | (632,698 | ) | | | (3,628,405 | ) | | | (4,256,143 | ) | | | — | |
Transaction fees (Note 4) | | | 691 | | | | 418 | | | | 133 | | | | 414 | |
Net increase (decrease) in net assets resulting from capital share transactions | | | 2,191,713 | | | | 1,703,931 | | | | (718,897 | ) | | | 3,318,236 | |
| | | | | | | | | | | | | | | | | |
Total Increase (Decrease) in Net Assets | | | 1,683,718 | | | | 2,182,141 | | | | (1,064,030 | ) | | | 3,768,246 | |
| | | | | | | | | | | | | | | | | |
Net Assets | | | | | | | | | | | | | | | | |
Beginning of period | | | 2,182,141 | | | | — | | | | 3,768,246 | | | | — | |
End of period | | $ | 3,865,859 | | | $ | 2,182,141 | | | $ | 2,704,216 | | | $ | 3,768,246 | |
| | | | | | | | | | | | | | | | | |
Changes in Shares Outstanding | | | | | | | | | | | | | | | | |
Shares outstanding, beginning of period | | | 75,000 | | | | — | | | | 125,000 | | | | — | |
Shares sold | | | 100,000 | | | | 200,000 | | | | 125,000 | | | | 125,000 | |
Shares redeemed | | | (25,000 | ) | | | (125,000 | ) | | | (150,000 | ) | | | — | |
Shares outstanding, end of period | | | 150,000 | | | | 75,000 | | | | 100,000 | | | | 125,000 | |
(1) | The Fund commenced operations on January 4, 2021. |
(2) | The Fund commenced operations on February 1, 2021. |
The accompanying notes are an integral part of the financial statements.
32
TrueShares Structured Outcome ETFs
Statements of Changes in Net Assets
(Continued)
| | | TrueShares Structured
Outcome (March) ETF | | | TrueShares Structured
Outcome (April) ETF | |
| | | Year Ended
December 31,
2022 | | | Period Ended
December 31,
2021(1) | | | Year Ended
December 31,
2022 | | | Period Ended
December 31,
2021(2) | |
From Operations | | | | | | | | | | | | | | | | |
Net investment income (loss) | | $ | 1,583 | | | $ | (43,611 | ) | | $ | 33,062 | | | $ | (30,393 | ) |
Net realized gain (loss) on investments, purchased options and written options | | | 187,620 | | | | 289,886 | | | | 409,156 | | | | (127 | ) |
Net change in unrealized appreciation/depreciation on investments, purchased options and written options | | | (937,517 | ) | | | 928,897 | | | | (1,159,867 | ) | | | 681,816 | |
Net increase (decrease) in net assets resulting from operations | | | (748,314 | ) | | | 1,175,172 | | | | (717,649 | ) | | | 651,296 | |
| | | | | | | | | | | | | | | | | |
From Distributions | | | | | | | | | | | | | | | | |
Distributable earnings | | | (29,055 | ) | | | (139,114 | ) | | | (33,064 | ) | | | — | |
Total distributions | | | (29,055 | ) | | | (139,114 | ) | | | (33,064 | ) | | | — | |
| | | | | | | | | | | | | | | | | |
From Capital Share Transactions | | | | | | | | | | | | | | | | |
Proceeds from shares sold | | | 5,942,770 | | | | 9,433,670 | | | | 7,484,830 | | | | 5,737,252 | |
Cost of shares redeemed | | | (7,174,000 | ) | | | (4,748,812 | ) | | | (7,500,717 | ) | | | — | |
Transaction fees (Note 4) | | | 773 | | | | 2,586 | | | | 796 | | | | 897 | |
Net increase (decrease) in net assets resulting from capital share transactions | | | (1,230,457 | ) | | | 4,687,444 | | | | (15,091 | ) | | | 5,738,149 | |
| | | | | | | | | | | | | | | | | |
Total Increase (Decrease) in Net Assets | | | (2,007,826 | ) | | | 5,723,502 | | | | (765,804 | ) | | | 6,389,445 | |
| | | | | | | | | | | | | | | | | |
Net Assets | | | | | | | | | | | | | | | | |
Beginning of period | | | 5,723,502 | | | | — | | | | 6,389,445 | | | | — | |
End of period | | $ | 3,715,676 | | | $ | 5,723,502 | | | $ | 5,623,641 | | | $ | 6,389,445 | |
| | | | | | | | | | | | | | | | | |
Changes in Shares Outstanding | | | | | | | | | | | | | | | | |
Shares outstanding, beginning of period | | | 200,000 | | | | — | | | | 225,000 | | | | — | |
Shares sold | | | 225,000 | | | | 375,000 | | | | 275,000 | | | | 225,000 | |
Shares redeemed | | | (275,000 | ) | | | (175,000 | ) | | | (275,000 | ) | | | — | |
Shares outstanding, end of period | | | 150,000 | | | | 200,000 | | | | 225,000 | | | | 225,000 | |
(1) | The Fund commenced operations on March 1, 2021. |
(2) | The Fund commenced operations on April 1, 2021. |
The accompanying notes are an integral part of the financial statements.
33
TrueShares Structured Outcome ETFs
Statements of Changes in Net Assets
(Continued)
| | | TrueShares Structured
Outcome (May) ETF | | | TrueShares Structured
Outcome (June) ETF | |
| | | Year Ended
December 31,
2022 | | | Period Ended
December 31,
2021(1) | | | Year Ended
December 31,
2022 | | | Period Ended
December 31,
2021(2) | |
From Operations | | | | | | | | | | | | | | | | |
Net investment income (loss) | | $ | 23,907 | | | $ | (33,978 | ) | | $ | 16,664 | | | $ | (18,856 | ) |
Net realized gain (loss) on investments, purchased options and written options | | | (164,620 | ) | | | 177,898 | | | | (34,529 | ) | | | 34,568 | |
Net change in unrealized appreciation/depreciation on investments, purchased options and written options | | | (720,575 | ) | | | 562,377 | | | | (496,415 | ) | | | 378,530 | |
Net increase (decrease) in net assets resulting from operations | | | (861,288 | ) | | | 706,297 | | | | (514,280 | ) | | | 394,242 | |
| | | | | | | | | | | | | | | | | |
From Distributions | | | | | | | | | | | | | | | | |
Distributable earnings | | | (23,776 | ) | | | (102,682 | ) | | | (16,658 | ) | | | (13,047 | ) |
Total distributions | | | (23,776 | ) | | | (102,682 | ) | | | (16,658 | ) | | | (13,047 | ) |
| | | | | | | | | | | | | | | | | |
From Capital Share Transactions | | | | | | | | | | | | | | | | |
Proceeds from shares sold | | | 5,598,692 | | | | 8,134,860 | | | | 584,553 | | | | 4,404,820 | |
Cost of shares redeemed | | | (6,662,275 | ) | | | (3,323,267 | ) | | | (1,198,208 | ) | | | (669,990 | ) |
Transaction fees (Note 4) | | | 486 | | | | 2,042 | | | | 123 | | | | 765 | |
Net increase (decrease) in net assets resulting from capital share transactions | | | (1,063,097 | ) | | | 4,813,635 | | | | (613,532 | ) | | | 3,735,595 | |
| | | | | | | | | | | | | | | | | |
Total Increase (Decrease) in Net Assets | | | (1,948,161 | ) | | | 5,417,250 | | | | (1,144,470 | ) | | | 4,116,790 | |
| | | | | | | | | | | | | | | | | |
Net Assets | | | | | | | | | | | | | | | | |
Beginning of period | | | 5,417,250 | | | | — | | | | 4,116,790 | | | | — | |
End of period | | $ | 3,469,089 | | | $ | 5,417,250 | | | $ | 2,972,320 | | | $ | 4,116,790 | |
| | | | | | | | | | | | | | | | | |
Changes in Shares Outstanding | | | | | | | | | | | | | | | | |
Shares outstanding, beginning of period | | | 200,000 | | | | — | | | | 150,000 | | | | — | |
Shares sold | | | 225,000 | | | | 325,000 | | | | 25,000 | | | | 175,000 | |
Shares redeemed | | | (275,000 | ) | | | (125,000 | ) | | | (50,000 | ) | | | (25,000 | ) |
Shares outstanding, end of period | | | 150,000 | | | | 200,000 | | | | 125,000 | | | | 150,000 | |
(1) | The Fund commenced operations on May 3, 2021. |
(2) | The Fund commenced operations on June 1, 2021. |
The accompanying notes are an integral part of the financial statements.
34
THIS PAGE INTENTIONALLY LEFT BLANK
TrueShares Structured Outcome ETFs
Financial Highlights
For a Share Outstanding Throughout each Period
| | | Per Share Operating Performance (For a share outstanding throughout each period) | |
| | | | | | | Income from Investment Operations | | | Less Distributions Paid From: | |
| | | Net Asset
Value,
Beginning
of Period | | | Net
investment
income
(loss)(1) | | | Net realized
and
unrealized
gain (loss) on
investments | | | Total from
investment
operations | | | Net
Investment
Income | | | Net realized
gains | | | Total
distributions
paid | |
TrueShares Structured Outcome (July) ETF | | | | | | | | | | | | | | | | | | | | | | | | |
For the year 01/01/2022 - 12/31/2022 | | $ | 35.21 | | | | 0.16 | | | | (3.51 | ) | | | (3.35 | ) | | | (0.02 | ) | | | — | | | | (0.02 | ) |
For the year 01/01/2021 - 12/31/2021 | | $ | 29.20 | | | | (0.25 | ) | | | 6.25 | | | | 6.00 | | | | — | | | | — | | | | — | |
For the period 7/01/2020(7) - 12/31/2020 | | $ | 25.00 | | | | (0.09 | ) | | | 4.29 | | | | 4.20 | | | | — | | | | — | | | | — | |
TrueShares Structured Outcome (August) ETF | | | | | | | | | | | | | | | | | | | | | | | | |
For the year 01/01/2022 - 12/31/2022 | | $ | 33.70 | | | | 0.16 | | | | (3.72 | ) | | | (3.56 | ) | | | (0.12 | ) | | | — | | | | (0.12 | ) |
For the year 01/01/2021 - 12/31/2021 | | $ | 27.89 | | | | (0.24 | ) | | | 6.04 | | | | 5.80 | | | | — | | | | — | | | | — | |
For the period 8/03/2020(7) - 12/31/2020 | | $ | 25.00 | | | | (0.08 | ) | | | 2.96 | | | | 2.88 | | | | — | | | | — | | | | — | |
TrueShares Structured Outcome (September) ETF | | | | | | | | | | | | | | | | | | | | | | | | |
For the year 01/01/2022 - 12/31/2022 | | $ | 32.33 | | | | 0.18 | | | | (2.88 | ) | | | (2.70 | ) | | | (0.20 | ) | | | — | | | | (0.20 | ) |
For the year 01/01/2021 - 12/31/2021 | | $ | 26.63 | | | | (0.23 | ) | | | 5.94 | | | | 5.71 | | | | — | | | | (0.02 | ) | | | (0.02 | ) |
For the period 9/01/2020(7) - 12/31/2020 | | $ | 25.00 | | | | (0.06 | ) | | | 1.68 | | | | 1.62 | | | | — | | | | — | | | | — | |
TrueShares Structured Outcome (October) ETF | | | | | | | | | | | | | | | | | | | | | | | | |
For the year 01/01/2022 - 12/31/2022 | | $ | 32.75 | | | | 0.14 | | | | (3.51 | ) | | | (3.37 | ) | | | (0.20 | ) | | | — | | | | (0.20 | ) |
For the year 01/01/2021 - 12/31/2021 | | $ | 27.21 | | | | (0.23 | ) | | | 5.77 | | | | 5.54 | | | | — | | | | — | | | | — | |
For the period 10/01/2020(7) - 12/31/2020 | | $ | 25.00 | | | | (0.05 | ) | | | 2.26 | | | | 2.21 | | | | — | | | | — | | | | — | |
(1) | Per share net investment income (loss) was calculated using average shares outstanding. |
(2) | Annualized for periods less than one year. |
(3) | Total return in the table represents the rate that the investor would have earned or lost on an investment in the Fund, assuming reinvestment of dividends. |
(4) | Not annualized for periods less than one year. |
(5) | Excludes in-kind transactions associated with creations and redemptions of the Fund. |
(6) | The returns reflect the actual performance for the period and do not include the impact of trades executed on the last business day of the period that were recorded on the first business day of the next period. |
(7) | Commencement of operations. |
(9) | Includes interest expense of 0.01%. |
The accompanying notes are an integral part of the financial statements.
36
TrueShares Structured Outcome ETFs
Financial Highlights
For a Share Outstanding Throughout each Period (Continued)
| | Per Share Operating Performance (For a share outstanding throughout each period) | | | Ratios/Supplemental Data | |
| | Capital Share
Transactions: | | | | | | | | | | | | | | | | | | | Ratios to Average Net Assets of: (2) | | | | | |
| | Transaction
fees
(see Note 4) | | | Net Asset Value,
End of Period | | | Total return,
at NAV(3)(4) | | | Total return,
at Market(3)(4) | | | Net assets,
end of period
(000’s) | | | Expenses | | | Net investment
income (loss) | | | Portfolio
turnover
rate(4)(5) | |
| | | | | | | | | | | | | | | | | | | | | | | | | | | | | | | | |
| | | 0.00 | (8) | | $ | 31.84 | | | | (9.50 | )% | | | (9.35 | )% | | $ | 11,939 | | | | 0.79 | % | | | 0.49 | % | | | 0 | % |
| | | 0.01 | | | $ | 35.21 | | | | 20.56 | % | | | 20.66 | % | | $ | 14,963 | | | | 0.79 | % | | | (0.76 | )% | | | 1307 | % |
| | | 0.00 | (8) | | $ | 29.20 | | | | 16.81 | % | | | 16.55 | % | | $ | 6,571 | | | | 0.79 | % | | | (0.68 | )% | | | 0 | % |
| | | | | | | | | | | | | | | | | | | | | | | | | | | | | | | | |
| | | 0.00 | (8) | | $ | 30.02 | | | | (10.55 | )% | | | (10.42 | )% | | $ | 12,761 | | | | 0.80 | %(9) | | | 0.51 | % | | | 134 | % |
| | | 0.01 | | | $ | 33.70 | | | | 20.83 | % | | | 20.74 | % | | $ | 18,536 | | | | 0.79 | % | | | (0.77 | )% | | | 1297 | % |
| | | 0.01 | | | $ | 27.89 | | | | 11.57 | % | | | 11.31 | % | | $ | 9,065 | | | | 0.79 | % | | | (0.73 | )% | | | 0 | % |
| | | | | | | | | | | | | | | | | | | | | | | | | | | | | | | | |
| | | 0.00 | (8) | | $ | 29.43 | | | | (8.34 | )% | | | (8.51 | )% | | $ | 20,598 | | | | 0.79 | % | | | 0.60 | % | | | 0 | % |
| | | 0.01 | | | $ | 32.33 | | | | 21.47 | % | | | 21.83 | % | | $ | 25,861 | | | | 0.79 | % | | | (0.76 | )% | | | 1301 | % |
| | | 0.01 | | | $ | 26.63 | | | | 6.51 | % | | | 6.08 | % | | $ | 10,651 | | | | 0.79 | % | | | (0.73 | )% | | | 0 | % |
| | | | | | | | | | | | | | | | | | | | | | | | | | | | | | | | |
| | | 0.00 | (8) | | $ | 29.18 | | | | (10.31 | )% | | | (10.23 | )% | | $ | 4,377 | | | | 0.79 | % | | | 0.48 | % | | | 0 | % |
| | | 0.00 | (8) | | $ | 32.75 | | | | 20.37 | % | | | 20.49 | % | | $ | 8,189 | | | | 0.79 | % | | | (0.77 | )% | | | 1021 | % |
| | | 0.00 | (8) | | $ | 27.21 | | | | 8.85 | % | | | 8.57 | % | | $ | 4,082 | | | | 0.79 | % | | | (0.73 | )% | | | 0 | % |
The accompanying notes are an integral part of the financial statements.
37
TrueShares Structured Outcome ETFs
Financial Highlights
For a Share Outstanding Throughout each Period (Continued)
| | | Per Share Operating Performance (For a share outstanding throughout each period) | |
| | | | | | | Income from Investment Operations | | | Less Distributions Paid From: | |
| | | Net Asset
Value,
Beginning
of Period | | | Net
investment
income
(loss)(1) | | | Net realized
and
unrealized
gain on
investments | | | Total from
investment
operations | | | Net
Investment
Income | | | Net realized
gains | | | Total
distributions
paid | |
TrueShares Structured Outcome (November) ETF | | | | | | | | | | | | | | | | | | | | | | | | |
For the year 01/01/2022 - 12/31/2022 | | $ | 33.37 | | | | 0.07 | | | | (3.30 | ) | | | (3.23 | ) | | | (0.07 | ) | | | — | | | | (0.07 | ) |
For the year 01/01/2021 - 12/31/2021 | | $ | 27.62 | | | | (0.24 | ) | | | 6.14 | | | | 5.90 | | | | — | | | | (0.17 | ) | | | (0.17 | ) |
For the period 11/02/2020(7) - 12/31/2020 | | $ | 25.00 | | | | (0.03 | ) | | | 2.65 | | | | 2.62 | | | | — | | | | — | | | | — | |
TrueShares Structured Outcome (December) ETF | | | | | | | | | | | | | | | | | | | | | | | | |
For the year 01/01/2022 - 12/31/2022 | | $ | 30.43 | | | | (0.05 | ) | | | (2.63 | ) | | | (2.68 | ) | | | — | | | | (0.39 | ) | | | (0.39 | ) |
For the year 01/01/2021 - 12/31/2021 | | $ | 25.44 | | | | (0.21 | ) | | | 5.33 | | | | 5.12 | | | | — | | | | (0.14 | ) | | | (0.14 | ) |
For the period 12/01/2020(7) - 12/31/2020 | | $ | 25.00 | | | | (0.02 | ) | | | 0.46 | | | | 0.44 | | | | — | | | | — | | | | — | |
TrueShares Structured Outcome (January) ETF | | | | | | | | | | | | | | | | | | | | | | | | |
For the year 01/01/2022 - 12/31/2022 | | $ | 29.10 | | | | (0.08 | ) | | | (3.20 | ) | | | (3.28 | ) | | | — | | | | (0.05 | ) | | | (0.05 | ) |
For the period 01/04/2021(7) - 12/31/2021 | | $ | 25.00 | | | | (0.19 | ) | | | 5.61 | | | | 5.42 | | | | — | | | | (1.32 | ) | | | (1.32 | ) |
TrueShares Structured Outcome (February) ETF | | | | | | | | | | | | | | | | | | | | | | | | |
For the year 01/01/2022 - 12/31/2022 | | $ | 30.15 | | | | (0.02 | ) | | | (3.09 | ) | | | (3.11 | ) | | | — | | | | — | | | | — | |
For the period 02/01/2021(7) - 12/31/2021 | | $ | 25.00 | | | | (0.20 | ) | | | 5.35 | | | | 5.15 | | | | — | | | | — | | | | — | |
TrueShares Structured Outcome (March) ETF | | | | | | | | | | | | | | | | | | | | | | | | |
For the year 01/01/2022 - 12/31/2022 | | $ | 28.62 | | | | 0.01 | | | | (3.67 | ) | | | (3.66 | ) | | | (0.01 | ) | | | (0.18 | ) | | | (0.19 | ) |
For the period 03/01/2021(7) - 12/31/2021 | | $ | 25.00 | | | | (0.17 | ) | | | 4.48 | | | | 4.31 | | | | | | | | (0.70 | ) | | | (0.70 | ) |
(1) | Per share net investment income (loss) was calculated using average shares outstanding. |
(2) | Annualized for periods less than one year. |
(3) | Total return in the table represents the rate that the investor would have earned or lost on an investment in the Fund, assuming reinvestment of dividends. |
(4) | Not annualized for periods less than one year. |
(5) | Excludes in-kind transactions associated with creations and redemptions of the Fund. |
(6) | The returns reflect the actual performance for the period and do not include the impact of trades executed on the last business day of the period that were recorded on the first business day of the next period. |
(7) | Commencement of operations. |
(9) | Includes interest expense of 0.01%. |
The accompanying notes are an integral part of the financial statements.
38
TrueShares Structured Outcome ETFs
Financial Highlights
For a Share Outstanding Throughout each Period (Continued)
| | Per Share Operating Performance (For a share outstanding throughout each period) | | | Ratios/Supplemental Data | |
| | Capital Share
Transactions: | | | | | | | | | | | | | | | | | | | Ratios to Average Net Assets of: (2) | | | | | |
| | Transaction
fees
(see Note 4) | | | Net Asset Value,
End of Period | | | Total return,
at NAV(3)(4) | | | Total return,
at Market(3)(4) | | | Net assets,
end of period
(000’s) | | | Expenses | | | Net investment
income (loss) | | | Portfolio
turnover
rate(4)(5) | |
| | | | | | | | | | | | | | | | | | | | | | | | | | | | | | | | |
| | | 0.00 | (8) | | $ | 30.07 | | | | (9.66 | )% | | | (9.58 | )% | | $ | 9,772 | | | | 0.79 | % | | | 0.23 | % | | | 0 | % |
| | | 0.02 | | | $ | 33.37 | | | | 21.40 | % | | | 21.46 | % | | $ | 14,181 | | | | 0.79 | % | | | (0.76 | )% | | | 1302 | % |
| | | 0.00 | (8) | | $ | 27.62 | | | | 10.51 | %(6) | | | 10.35 | %(6) | | $ | 1,381 | | | | 0.79 | % | | | (0.75 | )% | | | 0 | % |
| | | | | | | | | | | | | | | | | | | | | | | | | | | | | | | | |
| | | 0.00 | (8) | | $ | 27.36 | | | | (8.80 | )% | | | (8.94 | )% | | $ | 5,472 | | | | 0.80 | %(9) | | | (0.17 | )% | | | 0 | % |
| | | 0.01 | | | $ | 30.43 | | | | 20.17 | % | | | 20.15 | % | | $ | 6,086 | | | | 0.79 | % | | | (0.77 | )% | | | 1286 | % |
| | | 0.00 | (8) | | $ | 25.44 | | | | 1.75 | % | | | 1.72 | % | | $ | 5,723 | | | | 0.79 | % | | | (0.74 | )% | | | 0 | % |
| | | | | | | | | | | | | | | | | | | | | | | | | | | | | | | | |
| | | 0.00 | (8) | | $ | 25.77 | | | | (11.29 | )% | | | (11.43 | )% | | $ | 3,866 | | | | 0.79 | % | | | (0.32 | )% | | | 2899 | % |
| | | 0.00 | (8) | | $ | 29.10 | | | | 21.65 | % | | | 21.66 | % | | $ | 2,182 | | | | 0.79 | % | | | (0.77 | )% | | | 0 | % |
| | | | | | | | | | | | | | | | | | | | | | | | | | | | | | | | |
| | | 0.00 | (8) | | $ | 27.04 | | | | (10.30 | )% | | | (10.32 | )% | | $ | 2,704 | | | | 0.79 | % | | | (0.09 | )% | | | 1309 | % |
| | | 0.00 | (8) | | $ | 30.15 | | | | 20.58 | % | | | 20.56 | % | | $ | 3,768 | | | | 0.79 | % | | | (0.77 | )% | | | 0 | % |
| | | | | | | | | | | | | | | | | | | | | | | | | | | | | | | | |
| | | 0.00 | (8) | | $ | 24.77 | | | | (12.76 | )% | | | (12.70 | )% | | $ | 3,716 | | | | 0.79 | % | | | 0.03 | % | | | 1280 | % |
| | | 0.01 | | | $ | 28.62 | | | | 17.24 | % | | | 17.14 | % | | $ | 5,724 | | | | 0.79 | % | | | (0.76 | )% | | | 0 | % |
The accompanying notes are an integral part of the financial statements.
39
TrueShares Structured Outcome ETFs
Financial Highlights
For a Share Outstanding Throughout each Period (Continued)
| | | Per Share Operating Performance (For a share outstanding throughout each period) | |
| | | | | | | Income from Investment Operations | | | Less Distributions Paid From: | |
| | | Net Asset
Value,
Beginning
of Period | | | Net
investment
income
(loss)(1) | | | Net realized
and
unrealized
gain on
investments | | | Total from
investment
operations | | | Net
Investment
Income | | | Net realized
gains | | | Total
distributions
paid | |
TrueShares Structured Outcome (April) ETF | | | | | | | | | | | | | | | | | | | | | | | | |
For the year 01/01/2022 - 12/31/2022 | | $ | 28.40 | | | | 0.14 | | | | (3.40 | ) | | | (3.26 | ) | | | (0.15 | ) | | | — | | | | (0.15 | ) |
For the period 04/01/2021(7) - 12/31/2021 | | $ | 25.00 | | | | (0.16 | ) | | | 3.56 | | | | 3.40 | | | | — | | | | — | | | | — | |
TrueShares Structured Outcome (May) ETF | | | | | | | | | | | | | | | | | | | | | | | | |
For the year 01/01/2022 - 12/31/2022 | | $ | 27.09 | | | | 0.13 | | | | (3.93 | ) | | | (3.80 | ) | | | (0.16 | ) | | | — | | | | (0.16 | ) |
For the period 05/03/2021(7) - 12/31/2021 | | $ | 25.00 | | | | (0.13 | ) | | | 2.72 | | | | 2.59 | | | | — | | | | (0.51 | ) | | | (0.51 | ) |
TrueShares Structured Outcome (June) ETF | | | | | | | | | | | | | | | | | | | | | | | | |
For the year 01/01/2022 - 12/31/2022 | | $ | 27.45 | | | | 0.11 | | | | (3.65 | ) | | | (3.54 | ) | | | (0.13 | ) | | | — | | | | (0.13 | ) |
For the period 06/01/2021(7) - 12/31/2021 | | $ | 25.00 | | | | (0.12 | ) | | | 2.66 | | | | 2.54 | | | | — | | | | (0.09 | ) | | | (0.09 | ) |
(1) | Per share net investment income (loss) was calculated using average shares outstanding. |
(2) | Annualized for periods less than one year. |
(3) | Total return in the table represents the rate that the investor would have earned or lost on an investment in the Fund, assuming reinvestment of dividends. |
(4) | Not annualized for periods less than one year. |
(5) | Excludes in-kind transactions associated with creations and redemptions of the Fund. |
(7) | Commencement of operations. |
The accompanying notes are an integral part of the financial statements.
40
TrueShares Structured Outcome ETFs
Financial Highlights
For a Share Outstanding Throughout each Period (Continued)
| | Per Share Operating Performance (For a share outstanding throughout each period) | | | Ratios/Supplemental Data | |
| | Capital Share
Transactions: | | | | | | | | | | | | | | | | | | | Ratios to Average Net Assets of: (2) | | | | | |
| | Transaction
fees
(see Note 4) | | | Net Asset Value,
End of Period | | | Total return,
at NAV(3)(4) | | | Total return,
at Market(3)(4) | | | Net assets,
end of period
(000’s) | | | Expenses | | | Net investment
income (loss) | | | Portfolio
turnover
rate(4)(5) | |
| | | | | | | | | | | | | | | | | | | | | | | | | | | | | | | | |
| | | 0.00 | (6) | | $ | 24.99 | | | | (11.47 | )% | | | (11.43 | )% | | $ | 5,624 | | | | 0.79 | % | | | 0.55 | % | | | 1153 | % |
| | | 0.00 | (6) | | $ | 28.40 | | | | 13.59 | % | | | 13.49 | % | | $ | 6,389 | | | | 0.79 | % | | | (0.77 | )% | | | 0 | % |
| | | | | | | | | | | | | | | | | | | | | | | | | | | | | | | | |
| | | 0.00 | (6) | | $ | 23.13 | | | | (14.03 | )% | | | (13.99 | )% | | $ | 3,469 | | | | 0.79 | % | | | 0.54 | % | | | 0 | % |
| | | 0.01 | | | $ | 27.09 | | | | 10.39 | % | | | 10.17 | % | | $ | 5,417 | | | | 0.79 | % | | | (0.77 | )% | | | 0 | % |
| | | | | | | | | | | | | | | | | | | | | | | | | | | | | | | | |
| | | 0.00 | (6) | | $ | 23.78 | | | | (12.87 | )% | | | (12.97 | )% | | $ | 2,972 | | | | 0.79 | % | | | 0.46 | % | | | 0 | % |
| | | 0.00 | (6) | | $ | 27.45 | | | | 10.13 | % | | | 9.96 | % | | $ | 4,117 | | | | 0.79 | % | | | (0.77 | )% | | | 0 | % |
The accompanying notes are an integral part of the financial statements.
41
TrueShares Structured Outcome ETFs
Notes to Financial Statements
December 31, 2022
1. ORGANIZATION
The TrueShares ETFs are a series of Listed Funds Trust (the “Trust”), formerly Active Weighting Funds ETF Trust. The Trust was organized as a Delaware statutory trust on August 26, 2016, under a Declaration of Trust amended on December 21, 2018 and is registered with the U.S. Securities and Exchange Commission (the “SEC”) as an open-end management investment company under the Investment Company Act of 1940, as amended (the “1940 Act”). As of December 31, 2022, the TrueShares ETFs consist of eighteen active series identified below, twelve of which are covered in this report (each a “Fund,” and collectively, the “Funds” or “Structured Outcome ETFs”).
Fund Name | Ticker | Diversified/
Non-Diversified | Commencement
of Operations |
TrueShares Structured Outcome (July) ETF (“JULZ ETF”) | JULZ | Non-Diversified | July 1, 2020 |
TrueShares Structured Outcome (August) ETF (“AUGZ ETF”) | AUGZ | Non-Diversified | August 3, 2020 |
TrueShares Structured Outcome (September) ETF (“SEPZ ETF”) | SEPZ | Non-Diversified | September 1, 2020 |
TrueShares Structured Outcome (October) ETF (“OCTZ ETF”) | OCTZ | Non-Diversified | October 1, 2020 |
TrueShares Structured Outcome (November) ETF (“NOVZ ETF”) | NOVZ | Non-Diversified | November 2, 2020 |
TrueShares Structured Outcome (December) ETF (“DECZ ETF”) | DECZ | Non-Diversified | December 1, 2020 |
TrueShares Structured Outcome (January) ETF (“JANZ ETF”) | JANZ | Non-Diversified | January 4, 2021 |
TrueShares Structured Outcome (February) ETF (“FEBZ ETF”) | FEBZ | Non-Diversified | February 1, 2021 |
TrueShares Structured Outcome (March) ETF (“MARZ ETF”) | MARZ | Non-Diversified | March 1, 2021 |
TrueShares Structured Outcome (April) ETF (“APRZ ETF”) | APRZ | Non-Diversified | April 1, 2021 |
TrueShares Structured Outcome (May) ETF (“MAYZ ETF”) | MAYZ | Non-Diversified | May 3, 2021 |
TrueShares Structured Outcome (June) ETF (“JUNZ ETF”) | JUNZ | Non-Diversified | June 1, 2021 |
The operational TrueShares ETFs covered outside of this report consists of:
Fund Name | Ticker | Diversified/
Non-Diversified | Commencement
of Operations |
TrueShares Technology, AI & Deep Learning ETF (“AI ETF”) | LRNZ | Non-diversified | February 28, 2020 |
TrueShares ESG Active Opportunities ETF (“ESG ETF”) | ECOZ | Diversified | February 28, 2020 |
TrueShares Low Volatility Equity Income ETF (“DIVZ ETF”) | DIVZ | Non-diversified | January 27, 2021 |
TrueShares Eagle Global Renewable Energy Income ETF (“RNWZ ETF”) | RNWZ | Non-diversified | December 8, 2022 |
RiverNorth Patriot ETF (“FLDZ ETF”) | FLDZ | Non-diversified | December 31, 2021 |
RiverNorth Enhanced Pre-Merger SPAC ETF (“SPCZ ETF”) | SPCZ | Non-diversified | July 11, 2022 |
Each Fund is an actively-managed exchange-traded fund (“ETF”) that seeks to achieve its total return investment objective by investing in Options that reference the S&P 500® Price Index, employing a “buffer protect” options strategies that uses such options to seek to achieve exposure to the S&P 500® Price Index while mitigating the first 8% to 12% decline in the S&P 500® Price Index over a 12-month period.
Costs incurred by the Funds in connection with the organization, registration and the initial public offering of shares were paid by TrueMark Investments, LLC (“TrueMark” or the “Adviser”), the Funds’ Investment Adviser.
2. SIGNIFICANT ACCOUNTING POLICIES
Each Fund is an investment company and accordingly follows the investment company accounting and reporting guidance of the Financial Accounting Standards Board (“FASB”) Accounting Standards Codification (“ASC”) Topic 946, Financial Services — Investment Companies. Each Fund prepares its financial statements in accordance with accounting principles generally accepted in the United States of America (“U.S. GAAP”) and follows the significant accounting policies described below.
42
TrueShares Structured Outcome ETFs
Notes to Financial Statements
December 31, 2022 (Continued)
Use of Estimates
The preparation of the financial statements in conformity with U.S. GAAP requires management to make estimates and assumptions that affect the reported amounts of assets and liabilities and disclosures of contingent assets and liabilities at the date of the financial statements and the reported amounts of increases and decreases in net assets from operations during the reporting period. Actual results could differ from these estimates.
Share Transactions
The net asset value (“NAV”) per share of each Fund will be equal to a Fund’s total assets minus a Fund’s total liabilities divided by the total number of shares outstanding. The NAV that is published will be rounded to the nearest cent. The NAV is determined as of the close of trading (generally, 4:00 p.m. Eastern Time) on each day the New York Stock Exchange (“NYSE”) is open for trading.
Fair Value Measurement
In calculating the NAV, each Fund’s exchange-traded equity securities will be valued at fair value, which will generally be determined using the last reported official closing or last trading price on the exchange or market on which the security is primarily traded at the time of valuation. Such valuations are typically categorized as Level 1 in the fair value hierarchy described below.
Securities listed on the NASDAQ Stock Market, Inc. are generally valued at the NASDAQ official closing price.
If market quotations are not readily available, or if it is determined that a quotation of a security does not represent fair value, then the security is valued at fair value as determined in good faith by the Adviser using procedures adopted by the Board of Trustees of the Trust (the “Board”). The circumstances in which a security may be fair valued include, among others: the occurrence of events that are significant to a particular issuer, such as mergers, restructurings or defaults; the occurrence of events that are significant to an entire market, such as natural disasters in a particular region or government actions; trading restrictions on securities; thinly traded securities; and market events such as trading halts and early market closings. Due to the inherent uncertainty of valuations, fair values may differ significantly from the values that would have been used had an active market existed. Fair valuation could result in a different NAV than a NAV determined by using market quotations. Such valuations are typically categorized as Level 2 or Level 3 in the fair value hierarchy described below.
Money market funds are valued at NAV. If NAV is not readily available the securities will be valued at fair value.
FASB ASC Topic 820, Fair Value Measurements and Disclosures (“ASC 820”) defines fair value, establishes a framework for measuring fair value in accordance with U.S. GAAP, and requires disclosure about fair value measurements. It also provides guidance on determining when there has been a significant decrease in the volume and level of activity for an asset or liability, when a transaction is not orderly, and how that information must be incorporated into fair value measurements. Under ASC 820, various inputs are used in determining the value of the Funds’ investments. These inputs are summarized in the following hierarchy:
| | ● | Level 1 — Unadjusted quoted prices in active markets for identical assets or liabilities that the Funds have the ability to access. |
| | ● | Level 2 — Observable inputs other than quoted prices included in Level 1 that are observable for the asset or liability, either directly or indirectly. These inputs may include quoted prices for the identical instrument on an inactive market, prices for similar securities, interest rates, prepayment speeds, credit risk, yield curves, default rates and similar data. |
| | ● | Level 3 — Unobservable inputs for the asset or liability, to the extent relevant observable inputs are not available; representing the Funds’ own assumptions about the assumptions a market participant would use in valuing the asset or liability, and would be based on the best information available. |
The fair value hierarchy gives the highest priority to quoted prices (unadjusted) in active markets for identical assets or liabilities (Level 1) and the lowest priority to unobservable inputs (Level 3).
43
TrueShares Structured Outcome ETFs
Notes to Financial Statements
December 31, 2022 (Continued)
The availability of observable inputs can vary from security to security and is affected by a wide variety of factors, including, for example, the type of security, whether the security is new and not yet established in the marketplace, the liquidity of markets, and other characteristics particular to the security. To the extent that valuation is based on models or inputs that are less observable or unobservable in the market, the determination of fair value requires more judgment. Accordingly, the degree of judgment exercised in determining fair value is greatest for instruments categorized in Level 3.
Debt securities, including short-term debt instruments having a maturity of less than 60 days, are generally valued using the last available bid prices or current market quotations provided by dealers or prices (including evaluated prices) supplied by approved independent third-party pricing services. Pricing services may use matrix pricing or valuation models that utilize certain inputs and assumptions to derive values. Due to the inherent uncertainty of valuations, fair values may differ significantly from the values that would have been used had an active market existed. An amortized cost method of valuation may be used with respect to debt obligations with sixty days or less remaining to maturity, unless the Adviser determines in good faith that such method does not represent fair value.
Exchange-traded options are valued at the composite mean price, which calculates the mean of the highest bid price and lowest asked price across the exchange. On the last trading day prior to expiration, expiring options may be priced at intrinsic value. The premium a fund pays when purchasing a call or put option or receives when writing a call or put option will reflect, among other things, the market price of the security, the relationship of the exercise price to the market price of the security, the relationship of the exercise price to the volatility of the security, the length of the option period and supply and demand factors. The premium is the value of an option at the date of purchase.
FLexible EXchange Options (“FLEX Options”) are valued at a model-based price provided by the exchange on which the option is traded. If the exchange on which the option is traded is unable to provide a price, FLEX Options are valued at a model-based price provided by an approved secondary pricing service.
All other securities and investments for which market values are not readily available, including restricted securities, and those securities for which it is inappropriate to determine prices in accordance with the aforementioned procedures, are valued at fair value as determined in good faith under procedures adopted by the Board, although the actual calculations may be done by others. Factors considered in making this determination may include, but are not limited to, information obtained by contacting the issuer, analysts, or the appropriate stock exchange (for exchange-traded securities), analysis of the issuer’s financial statements or other available documents and, if necessary, available information concerning other securities in similar circumstances.
The inputs or methodology used for valuing securities are not necessarily an indication of the risk associated with investing in those securities. The hierarchy classification of inputs used to value the Funds’ investments at December 31, 2022, are as follows:
| | | Level 1 | | | Level 2 | | | Level 3 | | | Total | |
TrueShares Structured Outcome (July) ETF | | | | | | | | | | | | | | | | |
Investments - Assets: | | | | | | | | | | | | | | | | |
Money Market Funds | | $ | 18,243 | | | $ | — | | | $ | — | | | $ | 18,243 | |
U.S. Treasury Bills | | | — | | | | 11,512,420 | | | | — | | | | 11,512,420 | |
Purchased Call Options | | | — | | | | 715,879 | | | | — | | | | 715,879 | |
Total Investments - Assets | | $ | 18,243 | | | $ | 12,228,299 | | | $ | — | | | $ | 12,246,542 | |
Other Financial Instruments - Liabilities: | | | | | | | | | | | | | | | | |
Written Put Options | | $ | — | | | $ | 317,994 | | | $ | — | | | $ | 317,994 | |
44
TrueShares Structured Outcome ETFs
Notes to Financial Statements
December 31, 2022 (Continued)
| | | Level 1 | | | Level 2 | | | Level 3 | | | Total | |
TrueShares Structured Outcome (August) ETF | | | | | | | | | | | | | | | | |
Investments - Assets: | | | | | | | | | | | | | | | | |
Money Market Funds | | $ | 62,657 | | | $ | — | | | $ | — | | | $ | 62,657 | |
U.S. Treasury Bills | | | — | | | | 13,036,980 | | | | — | | | | 13,036,980 | |
Purchased Call Options | | | — | | | | 383,191 | | | | — | | | | 383,191 | |
Total Investments - Assets | | $ | 62,657 | | | $ | 13,420,171 | | | $ | — | | | $ | 13,482,828 | |
Other Financial Instruments - Liabilities: | | | | | | | | | | | | | | | | |
Written Put Options | | $ | — | | | $ | 675,695 | | | $ | — | | | $ | 675,695 | |
| | | Level 1 | | | Level 2 | | | Level 3 | | | Total | |
TrueShares Structured Outcome (September) ETF | | | | | | | | | | | | | | | | |
Investments - Assets: | | | | | | | | | | | | | | | | |
Money Market Funds | | $ | 131,455 | | | $ | — | | | $ | — | | | $ | 131,455 | |
U.S. Treasury Bills | | | — | | | | 20,366,102 | | | | — | | | | 20,366,102 | |
Purchased Call Options | | | — | | | | 1,103,797 | | | | — | | | | 1,103,797 | |
Total Investments - Assets | | $ | — | | | $ | 21,469,899 | | | $ | — | | | $ | 21,601,354 | |
Other Financial Instruments - Liabilities: | | | | | | | | | | | | | | | | |
Written Put Options | | $ | — | | | $ | 912,549 | | | $ | — | | | $ | 912,549 | |
| | | Level 1 | | | Level 2 | | | Level 3 | | | Total | |
TrueShares Structured Outcome (October) ETF | | | | | | | | | | | | | | | | |
Investments - Assets: | | | | | | | | | | | | | | | | |
Money Market Funds | | $ | 61 | | | $ | — | | | $ | — | | | $ | 61 | |
U.S. Treasury Bills | | | — | | | | 4,034,100 | | | | — | | | | 4,034,100 | |
Purchased Call Options | | | — | | | | 469,052 | | | | — | | | | 469,052 | |
Total Investments - Assets | | $ | 61 | | | $ | 4,503,152 | | | $ | — | | | $ | 4,503,213 | |
Other Financial Instruments - Liabilities: | | | | | | | | | | | | | | | | |
Written Put Options | | $ | — | | | $ | 123,473 | | | $ | — | | | $ | 123,473 | |
| | | Level 1 | | | Level 2 | | | Level 3 | | | Total | |
TrueShares Structured Outcome (November) ETF | | | | | | | | | | | | | | | | |
Investments - Assets: | | | | | | | | | | | | | | | | |
Money Market Funds | | $ | 7,548 | | | $ | — | | | $ | — | | | $ | 7,548 | |
U.S. Treasury Bills | | | — | | | | 9,452,547 | | | | — | | | | 9,452,547 | |
Purchased Call Options | | | — | | | | 719,241 | | | | — | | | | 719,241 | |
Total Investments - Assets | | $ | 7,548 | | | $ | 10,171,788 | | | $ | — | | | $ | 10,179,336 | |
Other Financial Instruments - Liabilities: | | | | | | | | | | | | | | | | |
Written Put Options | | $ | — | | | $ | 460,311 | | | $ | — | | | $ | 460,311 | |
45
TrueShares Structured Outcome ETFs
Notes to Financial Statements
December 31, 2022 (Continued)
| | | Level 1 | | | Level 2 | | | Level 3 | | | Total | |
TrueShares Structured Outcome (December) ETF | | | | | | | | | | | | | | | | |
Investments - Assets: | | | | | | | | | | | | | | | | |
Money Market Funds | | $ | 2,495,532 | | | $ | — | | | $ | — | | | $ | 2,495,532 | |
U.S. Treasury Bills | | | — | | | | 3,092,307 | | | | — | | | | 3,092,307 | |
Purchased Call Options | | | — | | | | 311,228 | | | | — | | | | 311,228 | |
Total Investments - Assets | | $ | 2,495,532 | | | $ | 3,403,535 | | | $ | — | | | $ | 5,899,067 | |
Other Financial Instruments - Liabilities: | | | | | | | | | | | | | | | | |
Written Put Options | | $ | — | | | $ | 352,806 | | | $ | — | | | $ | 352,806 | |
| | | Level 1 | | | Level 2 | | | Level 3 | | | Total | |
TrueShares Structured Outcome (January) ETF | | | | | | | | | | | | | | | | |
Investments - Assets: | | | | | | | | | | | | | | | | |
Money Market Funds | | $ | 4,355,318 | | | $ | — | | | $ | — | | | $ | 4,355,318 | |
Purchased Call Options | | | — | | | | 331,484 | | | | — | | | | 331,484 | |
Total Investments - Assets | | $ | 4,355,318 | | | | 331,484 | | | | — | | | $ | 4,686,802 | |
Other Financial Instruments - Liabilities: | | | | | | | | | | | | | | | | |
Written Put Options | | $ | — | | | $ | 190,512 | | | $ | — | | | $ | 190,512 | |
| | | Level 1 | | | Level 2 | | | Level 3 | | | Total | |
TrueShares Structured Outcome (February) ETF | | | | | | | | | | | | | | | | |
Investments - Assets: | | | | | | | | | | | | | | | | |
Money Market Funds | | $ | 2,431 | | | $ | — | | | $ | — | | | $ | 2,431 | |
U.S. Treasury Bills | | | — | | | | 2,880,849 | | | | — | | | | 2,880,849 | |
Purchased Call Options | | | — | | | | 131 | | | | — | | | | 131 | |
Total Investments - Assets | | $ | 2,431 | | | $ | 2,880,980 | | | $ | — | | | $ | 2,883,411 | |
Other Financial Instruments - Liabilities: | | | | | | | | | | | | | | | | |
Written Put Options | | $ | — | | | $ | 177,786 | | | $ | — | | | $ | 177,786 | |
| | | Level 1 | | | Level 2 | | | Level 3 | | | Total | |
TrueShares Structured Outcome (March) ETF | | | | | | | | | | | | | | | | |
Investments - Assets: | | | | | | | | | | | | | | | | |
Money Market Funds | | $ | 6,765 | | | $ | — | | | $ | — | | | $ | 6,765 | |
U.S. Treasury Bills | | | — | | | | 3,879,539 | | | | — | | | | 3,879,539 | |
Purchased Call Options | | | — | | | | 6,247 | | | | — | | | | 6,247 | |
Total Investments - Assets | | $ | 6,765 | | | $ | 3,885,786 | | | $ | — | | | $ | 3,892,551 | |
Other Financial Instruments - Liabilities: | | | | | | | | | | | | | | | | |
Written Put Options | | $ | — | | | $ | 145,483 | | | $ | — | | | $ | 145,483 | |
46
TrueShares Structured Outcome ETFs
Notes to Financial Statements
December 31, 2022 (Continued)
| | | Level 1 | | | Level 2 | | | Level 3 | | | Total | |
TrueShares Structured Outcome (April) ETF | | | | | | | | | | | | | | | | |
Investments - Assets: | | | | | | | | | | | | | | | | |
Money Market Funds | | $ | 15,610 | | | $ | — | | | $ | — | | | $ | 15,610 | |
U.S. Treasury Bills | | | — | | | | 6,071,031 | | | | — | | | | 6,071,031 | |
Purchased Call Options | | | — | | | | 4,769 | | | | — | | | | 4,769 | |
Total Investments - Assets | | $ | 15,610 | | | $ | 6,075,800 | | | $ | — | | | $ | 6,091,410 | |
Other Financial Instruments - Liabilities: | | | | | | | | | | | | | | | | |
Written Put Options | | $ | — | | | $ | 431,135 | | | $ | — | | | $ | 431,135 | |
| | | Level 1 | | | Level 2 | | | Level 3 | | | Total | |
TrueShares Structured Outcome (May) ETF | | | | | | | | | | | | | | | | |
Investments - Assets: | | | | | | | | | | | | | | | | |
Money Market Funds | | $ | 12,921 | | | $ | — | | | $ | — | | | $ | 12,921 | |
U.S. Treasury Bills | | | — | | | | 3,571,870 | | | | — | | | | 3,571,870 | |
Purchased Call Options | | | — | | | | 46,767 | | | | — | | | | 46,767 | |
Total Investments - Assets | | $ | 12,921 | | | $ | 3,618,637 | | | $ | — | | | $ | 3,631,558 | |
Other Financial Instruments - Liabilities: | | | | | | | | | | | | | | | | |
Written Put Options | | $ | — | | | $ | 136,314 | | | $ | — | | | $ | 136,314 | |
| | | Level 1 | | | Level 2 | | | Level 3 | | | Total | |
TrueShares Structured Outcome (June) ETF | | | | | | | | | | | | | | | | |
Investments - Assets: | | | | | | | | | | | | | | | | |
Money Market Funds | | $ | 9,012 | | | $ | — | | | $ | — | | | $ | 9,012 | |
U.S. Treasury Bills | | | — | | | | 3,031,849 | | | | — | | | | 3,031,849 | |
Purchased Call Options | | | — | | | | 67,087 | | | | — | | | | 67,087 | |
Total Investments - Assets | | $ | 9,012 | | | $ | 3,098,936 | | | $ | — | | | $ | 3,107,948 | |
Other Financial Instruments - Liabilities: | | | | | | | | | | | | �� | | | | |
Written Put Options | | $ | — | | | $ | 121,399 | | | $ | — | | | $ | 121,399 | |
Security Transactions
Investment transactions are recorded as of the date that the securities are purchased or sold (trade date). Realized gains and losses from the sale or disposition of securities are calculated based on the specific identification basis.
Investment Income
Interest income is accrued daily. Discounts and premiums on fixed income securities purchased are accreted or amortized using the effective interest method.
Tax Information, Dividends and Distributions to Shareholders and Uncertain Tax Positions
The Funds are treated as separate entities for Federal income tax purposes. Each Fund intends to qualify as a regulated investment company (“RIC”) under Subchapter M of the Internal Revenue Code of 1986, as amended (the “Internal Revenue Code”). To qualify and remain eligible for the special tax treatment accorded to RICs, each Fund must meet certain annual
47
TrueShares Structured Outcome ETFs
Notes to Financial Statements
December 31, 2022 (Continued)
income and quarterly asset diversification requirements and must distribute annually at least 90% of the sum of (i) its investment company taxable income (which includes dividends, interest and net short-term capital gains) and (ii) certain net tax-exempt income, if any. If so qualified, each Fund will not be subject to Federal income tax.
Distributions to shareholders are recorded on the ex-dividend date. The Funds will declare and pay capital gain distributions, if any, in cash at least annually. The Funds may also pay a special distribution at the end of the calendar year to comply with Federal tax requirements. The amount of dividends and distributions from net investment income and net realized capital gains are determined in accordance with Federal income tax regulations, which may differ from U.S. GAAP. These “book/tax” differences are either considered temporary or permanent in nature. To the extent these differences are permanent in nature, such amounts are reclassified within the components of net assets based on their Federal tax basis treatment; temporary differences do not require reclassification. Dividends and distributions which exceed earnings and profit for tax purposes are reported as a tax return of capital.
Management evaluates the Funds’ tax positions to determine if the tax positions taken meet the minimum recognition threshold in connection with accounting for uncertainties in income tax positions taken or expected to be taken for the purposes of measuring and recognizing tax liabilities in the financial statements. Recognition of tax benefits of an uncertain tax position is required only when the position is “more likely than not” to be sustained assuming examination by taxing authorities. Interest and penalties related to income taxes would be recorded as income tax expense. The Funds’ Federal income tax returns are subject to examination by the Internal Revenue Service (the “IRS”) for a period of three fiscal years after they are filed. State and local tax returns may be subject to examination for an additional fiscal year depending on the jurisdiction. As of December 31, 2022, the Funds’ fiscal year end, the Funds had no material uncertain tax positions and did not have a liability for any unrecognized tax benefits. As of December 31, 2022, the Funds’ fiscal year end, the Funds had no examination in progress and management is not aware of any tax positions for which it is reasonably possible that the amounts of unrecognized tax benefits will significantly change in the next twelve months.
The Funds recognized no interest or penalties related to uncertain tax benefits in the 2022 fiscal period. At December 31, 2022, the Funds’ fiscal year end, the tax periods from commencement of operations remained open to examination in the Funds’ major tax jurisdiction.
Indemnification
In the normal course of business, the Funds expect to enter into contracts that contain a variety of representations and warranties and which provide general indemnifications. The Funds’ maximum exposure under these anticipated arrangements is unknown, as this would involve future claims that may be made against the Funds that have not yet occurred. However, based on experience, the Funds expect the risk of loss to be remote.
Derivatives
The Structured Outcome ETFs employ a “buffer protect” options strategy that uses such options to seek to achieve exposure to the S&P 500® Price Index while mitigating the first 8% to 12% decline in the S&P 500® Price Index (the “Buffer”) over a 12-month period beginning on a specified day (each, a “Roll Date”). The period from one Roll Date to the next Roll Date is referred to as the “Investment Period,” and the first day of the Investment Period is referred to as the initial investment day. In the event an investor purchases shares after the date on which the options were entered into or sells shares prior to the expiration of the options, the Buffer that the Structured Outcome ETFs seeks to provide may not be available. The Structured Outcome ETFs are not designed to protect against declines of more than 8% to 12% in the level of the S&P 500® Price Index, and there can be no guarantee that the Structured Outcome ETFs will be successful in implementing the buffer protect options strategy to avoid the first 8% to 12% decline.
In general, the Structured Outcome ETFs invest in exchange-traded FLEX Options only. FLEX Options are customized option contracts made available by the Cboe Options Exchange with the ability to customize key contract terms like exercise price, style and expiration date while achieving price discovery in competitive, transparent auctions markets and avoiding the counterparty exposure of over–the–counter options positions. Like traditional exchange–traded options, FLEX Options are guaranteed for settlement by the Options Clearing Corporation, a market clearinghouse that guarantees performance by counterparties to
48
TrueShares Structured Outcome ETFs
Notes to Financial Statements
December 31, 2022 (Continued)
certain derivatives contracts. The FLEX Options in which the Structured Outcome ETFs invest generally have a term of up to one year and are all European style options (options that are exercisable only on the expiration date) based on the S&P 500® Price Index or an ETF that tracks the S&P 500® Price Index and have an expiration date that is the last day of the Investment Period.
The Structured Outcome ETFs will purchase and sell call and put FLEX Options. In general, put and call options on indices give the holder the right to receive, upon exercise of the option, an amount of cash if the closing level of the underlying index is greater than (or less than, in the case of puts) the exercise price of the option. This amount of cash is equal to the difference between the closing price of the index and the exercise price of the option, expressed in dollars multiplied by a specified number. The premium paid to the writer is the consideration for undertaking the obligations under the option contract.
The Structured Outcome ETFs purchasing put and call options pay a premium; therefore, if price movements in the underlying securities are such that exercise of the options would not be profitable for the Structured Outcome ETFs, loss of the premium paid may be offset by an increase in the value of the Structured Outcome ETFs’ securities or by a decrease in the cost of acquisition of securities by the Structured Outcome ETFs. When the Structured Outcome ETFs write an option, if the underlying securities do not increase or decrease to a price level that would make the exercise of the option profitable to the holder thereof, the option generally will expire without being exercised and the Structured Outcome ETFs will realize as profit the premium received for such option. When a call option of which the Structured Outcome ETFs are the writer is exercised, the Structured Outcome ETFs will be required to sell the underlying securities to the option holder at the strike price and will not participate in any increase in the price of such securities above the strike price. When a put option of which the Structured Outcome ETFs are the writer is exercised, the Structured Outcome ETFs will be required to purchase the underlying securities at a price in excess of the market value of such securities. The Structured Outcome ETFs maintain minimal counterparty risk through contracts bought or sold on an exchange. As of December 31, 2022, the Structured Outcome ETFs’ derivative instruments are not subject to a master netting arrangement.
Derivative Investments
The average monthly value outstanding of purchased and written options during the year ended December 31, 2022, were as follows:
| | | TrueShares
Structured
Outcome
(July) ETF | | | TrueShares
Structured
Outcome
(August) ETF | | | TrueShares
Structured
Outcome
(September)
ETF | | | TrueShares
Structured
Outcome
(October) ETF | | | TrueShares
Structured
Outcome
(November) ETF | | | TrueShares
Structured
Outcome
(December) ETF | |
Purchased Options | | $ | 795,858 | | | $ | 591,630 | | | $ | 908,390 | | | $ | 347,540 | | | $ | 396,419 | | | $ | 210,058 | |
Written Options | | | 417,273 | | | | 705,836 | | | | 1,157,230 | | | | 233,674 | | | | 795,670 | | | | 441,621 | |
| | | TrueShares
Structured
Outcome
(January) ETF | | | TrueShares
Structured
Outcome
(February) ETF | | | TrueShares
Structured
Outcome
(March) ETF | | | TrueShares
Structured
Outcome
(April) ETF | | | TrueShares
Structured
Outcome
(May) ETF | | | TrueShares
Structured
Outcome
(June) ETF | |
Purchased Options | | $ | 72,500 | | | $ | 50,345 | | | $ | 181,478 | | | $ | 145,059 | | | $ | 186,624 | | | $ | 154,489 | |
Written Options | | | 432,639 | | | | 227,160 | | | | 247,383 | | | | 408,917 | | | | 166,256 | | | | 131,963 | |
49
TrueShares Structured Outcome ETFs
Notes to Financial Statements
December 31, 2022 (Continued)
The following is a summary of the effect of derivative instruments on the Funds’ Statements of Assets and Liabilities as of December 31, 2022:
| | Equity Risk
Contracts | | Asset
Derivatives,
Investments,
at value | | | Liability
Derivatives,
Written options,
at value | |
TrueShares Structured Outcome (July) ETF | Purchased Options | | $ | 715,879 | | | $ | — | |
| | Written Options | | | — | | | | 317,994 | |
TrueShares Structured Outcome (August) ETF | Purchased Options | | | 383,191 | | | | — | |
| | Written Options | | | — | | | | 675,695 | |
TrueShares Structured Outcome (September) ETF | Purchased Options | | | 1,103,797 | | | | — | |
| | Written Options | | | — | | | | 912,549 | |
TrueShares Structured Outcome (October) ETF | Purchased Options | | | 469,052 | | | | — | |
| | Written Options | | | — | | | | 123,473 | |
TrueShares Structured Outcome (November) ETF | Purchased Options | | | 719,241 | | | | — | |
| | Written Options | | | — | | | | 460,311 | |
TrueShares Structured Outcome (December) ETF | Purchased Options | | | 311,228 | | | | — | |
| | Written Options | | | — | | | | 352,806 | |
TrueShares Structured Outcome (January) ETF | Purchased Options | | | 331,484 | | | | — | |
| | Written Options | | | — | | | | 190,512 | |
TrueShares Structured Outcome (February) ETF | Purchased Options | | | 131 | | | | — | |
| | Written Options | | | — | | | | 177,786 | |
TrueShares Structured Outcome (March) ETF | Purchased Options | | | 6,247 | | | | — | |
| | Written Options | | | — | | | | 145,483 | |
TrueShares Structured Outcome (April) ETF | Purchased Options | | | 4,769 | | | | — | |
| | Written Options | | | — | | | | 431,135 | |
TrueShares Structured Outcome (May) ETF | Purchased Options | | | 46,767 | | | | — | |
| | Written Options | | | — | | | | 136,314 | |
TrueShares Structured Outcome (June) ETF | Purchased Options | | | 67,087 | | | | — | |
| | Written Options | | | — | | | | 121,399 | |
50
TrueShares Structured Outcome ETFs
Notes to Financial Statements
December 31, 2022 (Continued)
The following is a summary of the effect of derivative instruments on the Funds’ Statements of Operations for the year ended December 31, 2022:
| | | | Net Realized Gain (Loss) | | | Change in Unrealized
Appreciation/Depreciation | |
| | | | Purchased
Options | | | Written
Options | | | Purchased
Options | | | Written
Options | |
TrueShares Structured Outcome (July) ETF | Equity Risk Contracts | | $ | (662,472 | ) | | $ | 34,651 | | | $ | (885,484 | ) | | $ | (17,970 | ) |
TrueShares Structured Outcome (August) ETF | Equity Risk Contracts | | | (901,102 | ) | | | 770,194 | | | | (1,250,405 | ) | | | (426,814 | ) |
TrueShares Structured Outcome (September) ETF | Equity Risk Contracts | | | (1,373,043 | ) | | | (25,710 | ) | | | (1,172,707 | ) | | | (234,658 | ) |
TrueShares Structured Outcome (October) ETF | Equity Risk Contracts | | | (395,699 | ) | | | 56,075 | | | | (212,523 | ) | | | (43,799 | ) |
TrueShares Structured Outcome (November) ETF | Equity Risk Contracts | | | (794,566 | ) | | | (159,196 | ) | | | (306,086 | ) | | | (33,534 | ) |
TrueShares Structured Outcome (December) ETF | Equity Risk Contracts | | | (588,465 | ) | | | 304,738 | | | | (261,814 | ) | | | (134,684 | ) |
TrueShares Structured Outcome (January) ETF | Equity Risk Contracts | | | (238,425 | ) | | | (50,118 | ) | | | (82 | ) | | | (121 | ) |
TrueShares Structured Outcome (February) ETF | Equity Risk Contracts | | | (197,096 | ) | | | 95,893 | | | | (339,091 | ) | | | (120,355 | ) |
TrueShares Structured Outcome (March) ETF | Equity Risk Contracts | | | (279,912 | ) | | | 393,948 | | | | (658,463 | ) | | | (261,154 | ) |
TrueShares Structured Outcome (April) ETF | Equity Risk Contracts | | | 189,673 | | | | 260,722 | | | | (792,729 | ) | | | (332,492 | ) |
TrueShares Structured Outcome (May) ETF | Equity Risk Contracts | | | (394,498 | ) | | | 239,319 | | | | (582,727 | ) | | | (112,066 | ) |
TrueShares Structured Outcome (June) ETF | Equity Risk Contracts | | | (217,766 | ) | | | 190,843 | | | | (398,157 | ) | | | (69,534 | ) |
3. INVESTMENT ADVISORY AND OTHER AGREEMENTS
Investment Advisory Agreement
The Trust has entered into an Investment Advisory Agreement (the “Advisory Agreement”) with the Adviser. Under the Advisory Agreement, the Adviser provides a continuous investment program for the Funds’ assets in accordance with its investment objectives, policies and limitations, and oversees the day-to-day operations of the Funds subject to the supervision of the Board, including the Trustees who are not “interested persons” of the Trust as defined in the 1940 Act (the “Independent Trustees”).
Pursuant to the Advisory Agreement between the Trust, on behalf of the Funds, and TrueMark, each Fund pays a unified management fee to the Adviser, which is calculated daily and paid monthly, at an annual rate of 0.79% of the Structured Outcome ETF’s average daily net assets, respectively. TrueMark has agreed to pay all expenses of the Funds except the fee paid to TrueMark under the Advisory Agreement, interest charges on any borrowings, dividends and other expenses on securities sold short, taxes, brokerage commissions and other expenses incurred in placing orders for the purchase and sale of securities and other investment instruments, acquired fund fees and expenses, accrued deferred tax liability, extraordinary expenses, and distribution (12b-1) fees and expenses (if any). TrueMark, in turn, compensates the Sub-Advisers from the management fee it receives.
51
TrueShares Structured Outcome ETFs
Notes to Financial Statements
December 31, 2022 (Continued)
SpiderRock Advisors, LLC (the “Sub-Adviser”), a Delaware limited liability company serves as the sub-adviser to the Structured Outcome ETFs. Pursuant to a Sub-Advisory Agreement between the Adviser and the Sub-Adviser, the Sub-Adviser is responsible for trading portfolio securities on behalf of the Funds, including selecting broker-dealers to execute purchase and sale transactions, subject to the supervision of the Adviser and the Board, including the Independent Trustees. For its services, the Sub-Adviser is entitled to a sub-advisory fee paid by the Adviser, which is calculated daily and paid monthly at an annual rate based on the Fund assets under management of the Structured Outcome ETFs as follows:
Assets Under Management | Sub-Advisory Fee Rate |
<$200,000,000 | The lesser of 0.34% annually or $32,500 per month |
$200,000,001-$350,000,000 | 0.285% |
>$350,000,000 | 0.375% |
Distribution Agreement and 12b-1 Plan
Foreside Fund Services, LLC (the “Distributor”) serves as each Fund’s distributor pursuant to a Distribution Agreement. The Distributor receives compensation from the Adviser for certain statutory underwriting services it provides to the Funds. The Distributor enters into agreements with certain broker-dealers and others that will allow those parties to be “Authorized Participants” and to subscribe for and redeem shares of the Funds. The Distributor will not distribute shares in less than whole Creation Units and does not maintain a secondary market in shares.
The Board has adopted a Distribution and Service Plan pursuant to Rule 12b-1 under the 1940 Act (“Rule 12b-1 Plan”). In accordance with the Rule 12b-1 Plan, each Fund is authorized to pay an amount up to 0.25% of the Fund’s average daily net assets each year for certain distribution-related activities. As authorized by the Board, no Rule 12b-1 fees are currently paid by the Funds and there are no plans to impose these fees. However, in the event Rule 12b-1 fees are charged in the future, they will be paid out of each Fund’s assets. The Adviser and its affiliates may, out of their own resources, pay amounts to third parties for distribution or marketing services on behalf of the Funds.
Administrator, Custodian and Transfer Agent
U.S. Bancorp Fund Services LLC, doing business as U.S. Bank Global Fund Services (“Fund Services” or “Administrator”) serves as administrator, transfer agent and fund accountant of the Funds pursuant to a Fund Servicing Agreement. U.S. Bank N.A. (the “Custodian”), an affiliate of Fund Services, serves as the Funds’ custodian pursuant to a Custody Agreement. Under the terms of these agreements, the Adviser pays each Fund’s administrative, custody and transfer agency fees.
A Trustee and all officers of the Trust are affiliated with the Administrator and Custodian.
4. CREATION AND REDEMPTION TRANSACTIONS
Shares of the Structured Outcome ETFs are listed and traded on the Cboe BZX Exchange, Inc. Each Fund issues and redeems shares on a continuous basis at NAV only in large blocks of shares called “Creation Units”. Creation Units are to be issued and redeemed principally in kind for a basket of securities and a balancing cash amount. Shares generally will trade in the secondary market in amounts less than a Creation Unit at market prices that change throughout the day. Market prices for the shares may be different from their NAV. The NAV is determined as of the close of trading (generally, 4:00 p.m. Eastern Time) on each day the NYSE is open for trading. The NAV of the shares of each Fund will be equal to a Fund’s total assets minus a Fund’s total liabilities divided by the total number of shares outstanding. The NAV that is published will be rounded to the nearest cent; however, for purposes of determining the price of Creation Units, the NAV will be calculated to four decimal places.
52
TrueShares Structured Outcome ETFs
Notes to Financial Statements
December 31, 2022 (Continued)
Creation Unit Transaction Fee
Authorized Participants will be required to pay to the Custodian a fixed transaction fee (the “Creation Unit Transaction Fee”) in connection with the issuance or redemption of Creation Units. The standard Creation Unit Transaction Fee will be the same regardless of the number of Creation Units purchased or redeemed by an investor on the applicable business day. Effective April 30, 2022, the Creation Unit Transaction Fee charged by the Fund for each creation order is $300. Prior to this date, the Creation Unit Transaction fee was $250.
An additional variable fee of up to a maximum of 2% of the value of the Creation Units subject to the transaction may be imposed for (1) creations effected outside the clearing process and (2) creations made in an all cash amount (to offset the Trust’s brokerage and other transaction costs associated with using cash to purchase the requisite Deposit Securities). Investors are responsible for the costs of transferring the securities constituting the Deposit Securities to the account of the Trust. Each Fund may determine to not charge a variable fee on certain orders when the Adviser has determined that doing so is in the best interests of Fund shareholders. Variable fees, if any, received by the Funds are displayed in the Capital Share Transactions section on the Statements of Changes in Net Assets.
Only “Authorized Participants” may purchase or redeem shares directly from the Funds. An Authorized Participant is either (i) a broker-dealer or other participant in the clearing process through the Continuous Net Settlement System of National Securities Clearing Corporation or (ii) a DTC participant and, in each case, must have executed a Participant Agreement with the Distributor. Most retail investors will not qualify as Authorized Participants or have the resources to buy and sell whole Creation Units. Therefore, they will be unable to purchase or redeem the shares directly from the Funds. Rather, most retail investors will purchase shares in the secondary market with the assistance of a broker and will be subject to customary brokerage commissions or fees. Securities received or delivered in connection with in-kind creates and redeems are valued as of the close of business on the effective date of the creation or redemption.
A creation unit will generally not be issued until the transfer of good title of the deposit securities to the Funds and the payment of any cash amounts have been completed. To the extent contemplated by the applicable participant agreement, Creation Units of the Funds will be issued to such authorized participant notwithstanding the fact that the Funds’ deposits have not been received in part or in whole, in reliance on the undertaking of the authorized participant to deliver the missing deposit securities as soon as possible. If the Funds or their agents do not receive all of the deposit securities, or the required cash amounts, by such time, then the order may be deemed rejected and the authorized participant shall be liable to the Funds for losses, if any.
5. FEDERAL INCOME TAX
The tax character of distributions paid was as follows:
| | | Year Ended December 31, 2022 | | | Period Ended December 31, 2021 | |
| | | Ordinary
Income(1) | | | Long-Term
Capital Gain | | | Ordinary
Income(1) | | | Long-Term
Capital Gain | |
TrueShares Structured Outcome (July) ETF | | $ | 8,369 | | | $ | — | | | $ | — | | | $ | — | |
TrueShares Structured Outcome (August) ETF | | $ | 52,402 | | | | — | | | | — | | | | — | |
TrueShares Structured Outcome (September) ETF | | $ | 142,172 | | | | — | | | | 12,776 | | | | — | |
TrueShares Structured Outcome (October) ETF | | $ | 29,502 | | | | — | | | | — | | | | — | |
TrueShares Structured Outcome (November) ETF | | $ | 24,115 | | | | — | | | | 69,396 | | | | — | |
TrueShares Structured Outcome (December) ETF | | $ | 78,840 | | | | — | | | | 24,407 | | | | — | |
TrueShares Structured Outcome (January) ETF | | $ | 8,073 | | | | — | | | | 98,735 | | | | — | |
TrueShares Structured Outcome (February) ETF | | $ | — | | | | — | | | | — | | | | — | |
TrueShares Structured Outcome (March) ETF | | $ | 29,055 | | | | — | | | | 139,114 | | | | — | |
TrueShares Structured Outcome (April) ETF | | $ | 33,064 | | | | — | | | | — | | | | — | |
TrueShares Structured Outcome (May) ETF | | $ | 23,776 | | | | — | | | | 102,682 | | | | — | |
TrueShares Structured Outcome (June) ETF | | $ | 16,658 | | | | — | | | | 13,047 | | | | — | |
(1) | Ordinary income includes short-term capital gains. |
53
TrueShares Structured Outcome ETFs
Notes to Financial Statements
December 31, 2022 (Continued)
At December 31, 2022, the Funds’ fiscal year end, the components of distributable earnings (accumulated losses) and cost of investments on a tax basis, including the adjustments for financial reporting purposes as of the most recently completed Federal income tax reporting year, were as follows:
| | | TrueShares
Structured
Outcome
(July)
ETF | | | TrueShares
Structured
Outcome
(August)
ETF | | | TrueShares
Structured
Outcome
(September)
ETF | | | TrueShares
Structured
Outcome
(October)
ETF | | | TrueShares
Structured
Outcome
(November)
ETF | | | TrueShares
Structured
Outcome
(December)
ETF | |
Federal Tax Cost of Investments* | | $ | 11,825,278 | | | $ | 13,450,754 | | | $ | 21,133,184 | | | $ | 4,163,513 | | | $ | 9,799,747 | | | $ | 5,809,355 | |
Gross Tax Unrealized Appreciation | | $ | 406,496 | | | $ | 53,430 | | | $ | 286,809 | | | $ | 228,185 | | | $ | 79,910 | | | $ | 2,422 | |
Gross Tax Unrealized Depreciation | | | (303,226 | ) | | | (697,051 | ) | | | (731,188 | ) | | | (11,958 | ) | | | (160,632 | ) | | | (265,516 | ) |
Net Tax Unrealized Appreciation (Depreciation) | | | 103,270 | | | | (643,621 | ) | | | (444,379 | ) | | | 216,227 | | | | (80,722 | ) | | | (263,094 | ) |
Undistributed Ordinary Income | | | 56,408 | | | | 26,025 | | | | — | | | | — | | | | 3,478 | | | | — | |
Other Accumulated Gain (Loss) | | | (444,661 | ) | | | (150,956 | ) | | | (836,090 | ) | | | (575,270 | ) | | | (1,145,771 | ) | | | (261,624 | ) |
Total Distributable Earnings / (Accumulated Losses) | | $ | (284,983 | ) | | $ | (768,552 | ) | | $ | (1,280,469 | ) | | $ | (359,043 | ) | | $ | (1,223,015 | ) | | $ | (524,718 | ) |
| | | | | | | | | | | | | | | | | | | | | | | | | |
| | | TrueShares
Structured
Outcome
(January)
ETF | | | TrueShares
Structured
Outcome
(February)
ETF | | | TrueShares
Structured
Outcome
(March)
ETF | | | TrueShares
Structured
Outcome
(April)
ETF | | | TrueShares
Structured
Outcome
(May)
ETF | | | TrueShares
Structured
Outcome
(June)
ETF | |
| Federal Tax Cost of Investments* | | $ | 4,496,493 | | | $ | 2,702,481 | | | $ | 3,755,688 | | | $ | 6,138,326 | | | $ | 3,653,442 | | | $ | 3,104,434 | |
| Gross Tax Unrealized Appreciation | | $ | — | | | $ | 15,042 | | | $ | 47,798 | | | $ | — | | | $ | 95,316 | | | $ | 59,277 | |
| Gross Tax Unrealized Depreciation | | | (203 | ) | | | (11,898 | ) | | | (56,418 | ) | | | (478,051 | ) | | | (253,514 | ) | | | (177,162 | ) |
| Net Tax Unrealized Appreciation (Depreciation) | | | (203 | ) | | | 3,144 | | | | (8,620 | ) | | | (478,051 | ) | | | (158,198 | ) | | | (117,885 | ) |
| Undistributed Ordinary Income | | | — | | | | — | | | | — | | | | — | | | | 131 | | | | 6 | |
| Other Accumulated Gain (Loss) | | | (519,323 | ) | | | (38,228 | ) | | | — | | | | (139,934 | ) | | | (301,933 | ) | | | (34,545 | ) |
| Total Distributable Earnings / (Accumulated Losses) | | $ | (519,526 | ) | | $ | (35,084 | ) | | $ | (8,620 | ) | | $ | (617,985 | ) | | $ | (460,000 | ) | | $ | (152,424 | ) |
* | Includes written option premiums. |
54
TrueShares Structured Outcome ETFs
Notes to Financial Statements
December 31, 2022 (Continued)
The difference between book-basis and tax-basis unrealized appreciation/(depreciation) is attributable primarily to the tax deferral of losses on wash sales.
Under current tax law, net capital losses realized and specified ordinary losses after October 31st may be deferred and treated as occurring on the first day of the following fiscal year. The Funds’ carryforward losses and post-October losses are determined only at the end of each fiscal year. During the fiscal year ended December 31, 2022, the Funds’ fiscal year end, the Funds had carryforward losses and post-October losses which will be carried forward indefinitely to offset future realized capital gains as follows:
| | | Indefinite Short-
Term Capital
Loss Carryover | | | Post-October
Losses | |
TrueShares Structured Outcome (July) ETF | | $ | 444,661 | | | $ | — | |
TrueShares Structured Outcome (August) ETF | | | 150,956 | | | | — | |
TrueShares Structured Outcome (September) ETF | | | 836,090 | | | | — | |
TrueShares Structured Outcome (October) ETF | | | 575,270 | | | | — | |
TrueShares Structured Outcome (November) ETF | | | 1,145,771 | | | | — | |
TrueShares Structured Outcome (December) ETF | | | 261,624 | | | | — | |
TrueShares Structured Outcome (January) ETF | | | — | | | | 519,323 | |
TrueShares Structured Outcome (February) ETF | | | 38,228 | | | | — | |
TrueShares Structured Outcome (March) ETF | | | — | | | | — | |
TrueShares Structured Outcome (April) ETF | | | 139,934 | | | | — | |
TrueShares Structured Outcome (May) ETF | | | 301,933 | | | | — | |
TrueShares Structured Outcome (June) ETF | | | 34,545 | | | | — | |
U.S. GAAP requires that certain components of net assets relating to permanent differences be reclassified between financial and tax reporting. These reclassifications have no effect on net assets or NAV per share. The permanent differences primarily relate to redemptions in-kind and write-off of net operating losses. For the fiscal year ended December 31, 2022, the following reclassifications were made for permanent tax differences on the Statements of Assets and Liabilities:
| | | Total
Distributable
Earnings
(Accumulated
Losses) | | | Paid-In
Capital | |
TrueShares Structured Outcome (July) ETF | | $ | — | | | $ | — | |
TrueShares Structured Outcome (August) ETF | | | — | | | | — | |
TrueShares Structured Outcome (September) ETF | | | 12 | | | | (12 | ) |
TrueShares Structured Outcome (October) ETF | | | 38 | | | | (38 | ) |
TrueShares Structured Outcome (November) ETF | | | — | | | | — | |
TrueShares Structured Outcome (December) ETF | | | 11,564 | | | | (11,564 | ) |
TrueShares Structured Outcome (January) ETF | | | (1,611 | ) | | | 1,611 | |
TrueShares Structured Outcome (February) ETF | | | (158,290 | ) | | | 158,290 | |
TrueShares Structured Outcome (March) ETF | | | (187,618 | ) | | | 187,618 | |
TrueShares Structured Outcome (April) ETF | | | (548,961 | ) | | | 548,961 | |
TrueShares Structured Outcome (May) ETF | | | (137,313 | ) | | | 137,313 | |
TrueShares Structured Outcome (June) ETF | | | — | | | | — | |
55
TrueShares Structured Outcome ETFs
Notes to Financial Statements
December 31, 2022 (Continued)
6. INVESTMENT TRANSACTIONS
During the year ended December 31, 2022, the Funds realized amounts in net capital gains resulting from in-kind redemptions, in which shareholders exchanged Fund shares for securities held by the Funds rather than for cash. Because such gains are not taxable to the Funds, and are not distributed to shareholders, they have been reclassified from distributable earnings (accumulated losses) to paid in-capital. The amounts of realized gains and losses from in-kind redemptions included in realized gain/(loss) on investments in the Statements of Operations is as follows:
| | | Realized Gains | | | Realized Losses | |
TrueShares Structured Outcome (July) ETF | | $ | — | | | $ | — | |
TrueShares Structured Outcome (August) ETF | | | — | | | | — | |
TrueShares Structured Outcome (September) ETF | | | — | | | | — | |
TrueShares Structured Outcome (October) ETF | | | — | | | | — | |
TrueShares Structured Outcome (November) ETF | | | — | | | | — | |
TrueShares Structured Outcome (December) ETF | | | — | | | | — | |
TrueShares Structured Outcome (January) ETF | | | — | | | | — | |
TrueShares Structured Outcome (February) ETF | | | 161,316 | | | | — | |
TrueShares Structured Outcome (March) ETF | | | 175,590 | | | | — | |
TrueShares Structured Outcome (April) ETF | | | 1,371,395 | | | | 822,432 | |
TrueShares Structured Outcome (May) ETF | | | 507,422 | | | | 370,108 | |
TrueShares Structured Outcome (June) ETF | | | — | | | | — | |
Purchases and sales of investments (excluding short-term investments), creations in-kind and redemptions in-kind for the year ended December 31, 2022, were as follows:
| | | Purchases | | | Sales | | | Creations
In-Kind | | | Redemptions
In-Kind | |
TrueShares Structured Outcome (July) ETF | | $ | 13,829,863 | | | $ | 13,467,160 | | | $ | — | | | $ | — | |
TrueShares Structured Outcome (August) ETF | | | 1,207,254 | | | | 929,253 | | | | — | | | | — | |
TrueShares Structured Outcome (September) ETF | | | 23,949,943 | | | | 23,274,980 | | | | — | | | | — | |
TrueShares Structured Outcome (October) ETF | | | 5,276,095 | | | | 4,821,685 | | | | — | | | | — | |
TrueShares Structured Outcome (November) ETF | | | 11,344,721 | | | | 10,581,638 | | | | — | | | | — | |
TrueShares Structured Outcome (December) ETF | | | — | | | | — | | | | — | | | | — | |
TrueShares Structured Outcome (January) ETF | | | 4,342,419 | | | | 5,820,914 | | | | — | | | | — | |
TrueShares Structured Outcome (February) ETF | | | 5,485,439 | | | | 3,034,683 | | | | — | | | | 3,014,397 | |
TrueShares Structured Outcome (March) ETF | | | 8,111,404 | | | | 4,213,685 | | | | — | | | | 4,278,974 | |
TrueShares Structured Outcome (April) ETF | | | 3,806,105 | | | | 4,302,623 | | | | — | | | | — | |
TrueShares Structured Outcome (May) ETF | | | — | | | | — | | | | — | | | | — | |
TrueShares Structured Outcome (June) ETF | | | — | | | | — | | | | — | | | | — | |
7. PRINCIPAL RISKS
As with all ETFs, shareholders of the Funds are subject to the risk that their investment could lose money. Each Fund is subject to the principal risks, any of which may adversely affect a Fund’s NAV, trading price, yield, total return and ability to meet its investment objective.
The global outbreak of COVID-19 (commonly referred to as “coronavirus”) has disrupted economic markets and the prolonged economic impact is uncertain. The ultimate economic fallout from the pandemic, and the long-term impact on economies, markets, industries and individual issuers, are not known. The operational and financial performance of the issuers of securities
56
TrueShares Structured Outcome ETFs
Notes to Financial Statements
December 31, 2022 (Continued)
in which the Funds invest depends on future developments, including the duration and spread of the outbreak, and such uncertainty may in turn adversely affect the value and liquidity of the Funds’ investments, impair the Funds’ ability to satisfy redemption requests, and negatively impact the Funds’ performance.
On February 24, 2022, Russia commenced a military attack on Ukraine. The outbreak of hostilities between the two countries could result in more widespread conflict and could have a severe adverse effect on the region and the markets. In addition, sanctions imposed on Russia by the United States and other countries, and any sanctions imposed in the future could have a significant adverse impact on the Russian economy and related markets. The price and liquidity of investments may fluctuate widely as a result of the conflict and related events. How long such conflict and related events will last and whether it will escalate further cannot be predicted, nor its effect on the Fund.
A complete description of principal risks is included in the prospectus under the heading “Principal Investment Risks.”
8. SUBSEQUENT EVENTS
Management has evaluated the Funds’ related event and transactions that occurred subsequent to December 31, 2022, through the date of issuance of the Funds’ financials statements. Management has determined that there were no subsequent events requiring recognition or disclosure in the financial statements.
57
TrueShares Structured Outcome ETFs
Report of Independent Registered Public Accounting Firm
To the Shareholders of TrueShares Structured Outcomes ETFs and
Board of Trustees of Listed Funds Trust
Opinion on the Financial Statements
We have audited the accompanying statements of assets and liabilities, including the schedules of investments and written options, of TrueShares Structured Outcome (July) ETF, TrueShares Structured Outcome (August) ETF, TrueShares Structured Outcome (September) ETF, TrueShares Structured Outcome (October) ETF, TrueShares Structured Outcome (November) ETF, TrueShares Structured Outcome (December) ETF, TrueShares Structured Outcome (January) ETF, TrueShares Structured Outcome (February) ETF, TrueShares Structured Outcome (March) ETF, TrueShares Structured Outcome (April) ETF, TrueShares Structured Outcome (May) ETF, and TrueShares Structured Outcome (June) ETF (“TrueShares Structured Outcome ETFs” or the “Funds”), each a series of Listed Funds Trust, as of December 31, 2022, the related statements of operations, the statements of changes in net assets, the related notes, and the financial highlights for each of the periods indicated below (collectively referred to as the “financial statements”). In our opinion, the financial statements present fairly, in all material respects, the financial position of each of the Funds as of December 31, 2022, the results of their operations, the changes in net assets, and the financial highlights for each of the periods indicated below in conformity with accounting principles generally accepted in the United States of America.
Fund Name | Statements of
Operations | Statements of Changes
in Net Assets | Financial Highlights |
TrueShares Structured Outcome (July) ETF | For the year ended December 31, 2022 | For the years ended December 31, 2022 and 2021 | For the years ended December 31, 2022 and 2021 and for the period from July 1, 2020 (commencement of operations) through December 31, 2020 |
TrueShares Structured Outcome (August) ETF | For the year ended December 31, 2022 | For the years ended December 31, 2022 and 2021 | For the years ended December 31, 2022 and 2021 and for the period from August 3, 2020 (commencement of operations) through December 31, 2020 |
TrueShares Structured Outcome (September) ETF | For the year ended December 31, 2022 | For the years ended December 31, 2022 and 2021 | For the years ended December 31, 2022 and 2021 and for the period from September 1, 2020 (commencement of operations) through December 31, 2020 |
TrueShares Structured Outcome (October) ETF | For the year ended December 31, 2022 | For the years ended December 31, 2022 and 2021 | For the years ended December 31, 2022 and 2021 and for the period from October 1, 2020 (commencement of operations) through December 31, 2020 |
TrueShares Structured Outcome (November) ETF | For the year ended December 31, 2022 | For the years ended December 31, 2021 and 2022 | For the years ended December 31, 2022 and 2021 and for the period from November 2, 2020 (commencement of operations) through December 31, 2020 |
TrueShares Structured Outcome (December) ETF | For the year ended December 31, 2022 | For the years ended December 31, 2022 and 2021 | For the years ended December 31, 2022 and 2021 and for the period from December 1, 2020 (commencement of operations) through December 31, 2020 |
TrueShares Structured Outcome (January) ETF | For the year ended December 31, 2022 | For the year ended December 31, 2022 and for the period from January 4, 2021 (commencement of operations) through December 31, 2021 |
58
TrueShares Structured Outcome ETFs
Report of Independent Registered Public Accounting Firm
(Continued)
Fund Name | Statements of
Operations | Statements of Changes
in Net Assets | Financial Highlights |
TrueShares Structured Outcome (February) ETF | For the year ended December 31, 2022 | For the year ended December 31, 2022 and for the period from February 1, 2021 (commencement of operations) through December 31, 2021 |
TrueShares Structured Outcome (March) ETF | For the year ended December 31, 2022 | For the year ended December 31, 2022 and for the period from March 1, 2021 (commencement of operations) through December 31, 2021 |
TrueShares Structured Outcome (April) ETF | For the year ended December 31, 2022 | For the year ended December 31, 2022 and for the period from April 1, 2021 (commencement of operations) through December 31, 2021 |
TrueShares Structured Outcome (May) ETF | For the year ended December 31, 2022 | For the year ended December 31, 2022 and for the period from May 3, 2021 (commencement of operations) through December 31, 2021 |
TrueShares Structured Outcome (June) ETF | For the year ended December 31, 2022 | For the year ended December 31, 2022 and for the period from June 1, 2021 (commencement of operations) through December 31, 2021 |
Basis for Opinion
These financial statements are the responsibility of the Funds’ management. Our responsibility is to express an opinion on the Funds’ financial statements based on our audits. We are a public accounting firm registered with the Public Company Accounting Oversight Board (United States) (“PCAOB”) and are required to be independent with respect to the Funds in accordance with the U.S. federal securities laws and the applicable rules and regulations of the Securities and Exchange Commission and the PCAOB.
We conducted our audits in accordance with the standards of the PCAOB. Those standards require that we plan and perform the audit to obtain reasonable assurance about whether the financial statements are free of material misstatement whether due to error or fraud.
Our audits included performing procedures to assess the risks of material misstatement of the financial statements, whether due to error or fraud, and performing procedures that respond to those risks. Such procedures included examining, on a test basis, evidence regarding the amounts and disclosures in the financial statements. Our procedures included confirmation of securities owned as of December 31, 2022, by correspondence with the custodian and brokers. Our audits also included evaluating the accounting principles used and significant estimates made by management, as well as evaluating the overall presentation of the financial statements. We believe that our audits provide a reasonable basis for our opinion.
We have served as the Funds’ auditor since 2019.

COHEN & COMPANY, LTD.
Cleveland, Ohio
March 1, 2023
59
TrueShares Structured Outcome ETFs
Board of Trustees and Officers
December 31, 2022 (Unaudited)
Each Fund’s Statement of Additional Information includes additional information about the Funds’ Trustees and Officers, and is available, without charge upon request by calling 1-800-617-0004, or by visiting the Funds’ website at www.true-shares.com.
Name and Year of Birth | Position Held
with the Trust | Term of Office
and Length of
Time Served | Principal Occupation(s)
During Past 5 Years | Number of
Portfolios in
Fund Complex
Overseen by
Trustee | Other
Directorships Held
by Trustee During
Past 5 Years |
Independent Trustees | | | | | |
John L. Jacobs
Year of birth: 1959 | Trustee and Audit Committee Chair | Indefinite term; since 2017 | Chairman of Alerian, Inc. (since June 2018); Founder and CEO of Q3 Advisors, LLC (financial consulting firm) (since 2015); Executive Director of Center for Financial Markets and Policy (2016–2022); Distinguished Policy Fellow and Executive Director, Center for Financial Markets and Policy, Georgetown University (2015–2022); Senior Advisor, Nasdaq OMX Group (2015–2016); Executive Vice President, Nasdaq OMX Group (2013–2015) | 53 | Independent Trustee, SHP ETF Trust (since 2021) (2 portfolios); Director, tZERO Group, Inc. (since 2020); Independent Trustee, Procure ETF Trust II (since 2018) (1 portfolio); Independent Trustee, Horizons ETF Trust I (2015-2019) |
Koji Felton
Year of birth: 1961 | Trustee | Indefinite term; since 2019 | Retired; formerly Counsel, Kohlberg Kravis Roberts & Co. L.P. (investment firm) (2013–2015); Counsel, Dechert LLP (law firm) (2011–2013) | 53 | Independent Trustee, Series Portfolios Trust (since 2015) (10 portfolios) |
Pamela H. Conroy Year of birth: 1961 | Trustee and Nominating and Governance Committee Chair | Indefinite term; since 2019 | Retired; formerly Executive Vice President, Chief Operating Officer & Chief Compliance Officer, Institutional Capital Corporation (investment firm) (1994–2008) | 53 | Independent Trustee, Frontier Funds, Inc. (since 2020) (6 portfolios) |
Interested Trustee | | | | | |
Paul R. Fearday, CPA*
Year of birth: 1979 | Trustee and Chairman | Indefinite term; since 2019 | Senior Vice President, U.S. Bancorp Fund Services, LLC (since 2008). | 53 | None. |
* | This Trustee is considered an “Interested Trustee” as defined in the 1940 Act because of his affiliation with U.S. Bancorp Fund Services, d/b/a U.S. Bank Global Fund Services and U.S. Bank N.A., which provide fund accounting, administration, transfer agency and custodian services to the Funds. |
60
TrueShares Structured Outcome ETFs
Board of Trustees and Officers
December 31, 2022 (Unaudited) (Continued)
Name and Year of Birth | Position(s)
Held with
the Trust | Term of Office
and Length of
Time Served | Principal Occupation(s) During Past 5 Years |
Officers | | | |
Gregory Bakken Year of birth: 1983 | President and Principal Executive Officer | Indefinite term, February 2019 | Vice President, U.S. Bancorp Fund Services, LLC (since 2006) |
Travis G. Babich Year of birth: 1980 | Treasurer and Principal Financial Officer | Indefinite term, September 2019 | Vice President, U.S. Bancorp Fund Services, LLC (since 2005) |
Kacie G. Briody Year of birth: 1992 | Assistant Treasurer | Indefinite term, March 2019 | Assistant Vice President, U.S. Bancorp Fund Services, LLC (since 2021); Officer, U.S. Bancorp Fund Services, LLC (2014 to 2021) |
Kent Barnes Year of birth: 1968 | Secretary | Indefinite term, February 2019 | Vice President, U.S. Bancorp Fund Services, LLC (since 2018); Chief Compliance Officer, Rafferty Asset Management, LLC (2016 to 2018); Vice President, U.S. Bancorp Fund Services, LLC (2007 to 2016) |
Christi C. James Year of birth: 1974 | Chief Compliance Officer and Anti-Money Laundering Officer | Indefinite term, July 2022 | Senior Vice President, U.S. Bancorp Fund Services, LLC (since 2022); Principal Consultant, ACA Group (2021 to 2022); Lead Manager, Communications Compliance, T. Rowe Price Investment Services, Inc. (2018 to 2021); Compliance & Legal Manager, CR Group LP (2017 to 2018). |
Joshua J. Hinderliter
Year of birth: 1983 | Assistant Secretary | Indefinite term, May 2022 | Assistant Vice President, U.S. Bancorp Fund Services, LLC (since 2022); Managing Associate, Thompson Hine LLP (2016 to 2022) |
61
TrueShares Structured Outcome ETFs
Supplemental Information
(Unaudited)
Investors should consider the investment objective and policies, risk considerations, charges and ongoing expenses of an investment carefully before investing. The prospectus contains this and other information relevant to an investment in the Funds. Please read the prospectus carefully before investing. A copy of the Prospectus for the Funds may be obtained without charge by writing to the Funds, c/o U.S. Bank Global Fund Services, P.O. Box 701, Milwaukee, Wisconsin 53201-0701, by calling 1-800-617-0004, or by visiting the Funds’ website at www.true-shares.com
QUARTERLY PORTFOLIO HOLDING INFORMATION
Each Fund files its complete schedule of portfolio holdings for its first and third fiscal quarters with the Securities and Exchange Commission (“SEC”) on Part F of Form N-PORT. The Funds’ Part F of Form N-PORT is available without charge, upon request, by calling toll-free at 1-800-617-0004. Furthermore, you may obtain the Part F of Form N-PORT on the SEC’s website at www.sec.gov, or by visiting the Funds’ website at www.true-shares.com.
PROXY VOTING INFORMATION
Each Fund is required to file a Form N-PX, with the Fund’s complete proxy voting record for the 12 months ended June 30, no later than August 31 of each year. The Fund’s proxy voting record will be available without charge, upon request, by calling toll-free 1-800-617-0004 and on the SEC’s website at www.sec.gov.
FREQUENCY DISTRIBUTION OF PREMIUMS AND DISCOUNTS
Information regarding how often shares of the Funds trade on an exchange at a price above (i.e., at a premium) or below (i.e., at a discount) the NAV of the Funds is available without charge, on the Funds’ website at www.true-shares.com.
TAX INFORMATION
The percent of taxable ordinary income distributions that are designated as short-term capital gain distributions under Internal Revenue Section 871(k)(2)(C) for the fiscal year ended December 31, 2022, was as follows:
TrueShares Structured Outcome (July) ETF | 0.00% |
TrueShares Structured Outcome (August) ETF | 0.00% |
TrueShares Structured Outcome (September) ETF | 0.00% |
TrueShares Structured Outcome (October) ETF | 0.00% |
TrueShares Structured Outcome (November) ETF | 0.00% |
TrueShares Structured Outcome (December) ETF | 0.00% |
TrueShares Structured Outcome (January) ETF | 0.00% |
TrueShares Structured Outcome (February) ETF | 0.00% |
TrueShares Structured Outcome (March) ETF | 94.55% |
TrueShares Structured Outcome (April) ETF | 0.00% |
TrueShares Structured Outcome (May) ETF | 0.00% |
TrueShares Structured Outcome (June) ETF | 0.00% |
62
TrueShares Structured Outcome ETFs
Privacy Policy
(Unaudited)
We are committed to respecting the privacy of personal information you entrust to us in the course of doing business with us.
The Funds collect non-public information about you from the following sources:
| | ● | Information we receive about you on applications or other forms; |
| | ● | Information you give us orally; and/or |
| | ● | Information about your transactions with us or others. |
We do not disclose any non-public personal information about our customers or former customers without the customer’s authorization, except as permitted by law or in response to inquiries from governmental authorities. We may share information with affiliated and unaffiliated third parties with whom we have contracts for servicing the Funds. We will provide unaffiliated third parties with only the information necessary to carry out their assigned responsibilities. We maintain physical, electronic and procedural safeguards to guard your non-public personal information and require third parties to treat your personal information with the same high degree of confidentiality.
In the event that you hold shares of the Funds through a financial intermediary, including, but not limited to, a broker-dealer, bank, or trust company, the privacy policy of your financial intermediary would govern how your non-public personal information would be shared by those entities with unaffiliated third parties.
63
THIS PAGE INTENTIONALLY LEFT BLANK
THIS PAGE INTENTIONALLY LEFT BLANK
Investment Adviser:
TrueMark Investments, LLC
433 W. Van Buren St., 1150-E
Chicago, IL 60607
Investment Sub-Adviser:
SpiderRock Advisors, LLC
300 South Wacker Drive, Suite 2840
Chicago, IL 60606
Legal Counsel:
Morgan, Lewis & Bockius LLP
1111 Pennsylvania Avenue, N.W.
Washington, D.C. 20004
Independent Registered Public Accounting Firm:
Cohen & Company, Ltd.
1350 Euclid Avenue, Suite 800
Cleveland, OH 44115
Distributor:
Foreside Fund Services, LLC
Three Canal Plaza, Suite 100
Portland, ME 04101
Administrator, Fund Accountant & Transfer Agent:
U.S. Bancorp Fund Services, LLC
d/b/a U.S. Bank Global Fund Services
615 E. Michigan St.
Milwaukee, WI 53202
Custodian:
U.S. Bank N.A.
1555 North RiverCenter Drive, Suite 302
Milwaukee, WI 53212
This information must be preceded or accompanied by a current prospectus for the Funds.
(b) Not applicable.
Item 2. Code of Ethics.
The registrant has adopted a code of ethics that applies to the registrant’s principal executive officer and principal financial officer. The Registrant has not made any substantive amendments to its code of ethics during the period covered by this report. The registrant has not granted any waivers from any provisions of the code of ethics during the period covered by this report.
A copy of the registrant’s Code of Ethics is filed herewith.
Item 3. Audit Committee Financial Expert.
The registrant’s Board of Trustees has determined that there is at least one audit committee financial expert serving on its audit committee. Mr. John Jacobs is the “audit committee financial expert” and is considered to be “independent” as each term is defined in Item 3 of Form N-CSR.
Item 4. Principal Accountant Fees and Services.
The registrant has engaged its principal accountant to perform audit services, audit-related services, tax services and other services during the past fiscal year. “Audit services” refer to performing an audit of the registrant's annual financial statements or services that are normally provided by the accountant in connection with statutory and regulatory filings or engagements for the fiscal year. “Audit-related services” refer to the assurance and related services by the principal accountant that are reasonably related to the performance of the audit. “Tax services” refer to professional services rendered by the principal accountant for tax compliance, tax advice, and tax planning. There were no “Other services” provided by the principal accountant. The following table details the aggregate fees billed or expected to be billed for the last two fiscal years for audit fees, audit-related fees, tax fees and other fees by the principal accountant.
| | FYE 12/31/2022 | FYE 12/31/2022 |
| Audit Fees | $155,000 | $121,000 |
| Audit-Related Fees | $0 | $0 |
| Tax Fees | $54,000 | $48,000 |
| All Other Fees | $0 | $0 |
(e)(1) The audit committee has adopted pre-approval policies and procedures that require the audit committee to pre-approve all audit and non-audit services of the registrant, including services provided to any entity affiliated with the registrant.
(e)(2) The percentage of fees billed by Cohen & Company, Ltd. applicable to non-audit services pursuant to waiver of pre-approval requirement were as follows:
| | FYE 12/31/2022 | FYE 12/31/2021 |
| Audit-Related Fees | 0% | 0% |
| Tax Fees | 0% | 0% |
| All Other Fees | 0% | 0% |
(f) All of the principal accountant’s hours spent on auditing the registrant’s financial statements were attributed to work performed by full-time permanent employees of the principal accountant.
(g) The following table indicates the non-audit fees billed or expected to be billed by the registrant’s accountant for services to the registrant and to the registrant’s investment adviser (and any other controlling entity, etc.—not sub-adviser) for the last two years.
| Non-Audit Related Fees | FYE 12/31/2022 | FYE 12/31/2021 |
| Registrant | N/A | N/A |
| Registrant’s Investment Adviser | N/A | N/A |
(h) The audit committee of the board of trustees/directors has considered whether the provision of non-audit services that were rendered to the registrant's investment adviser is compatible with maintaining the principal accountant's independence and has concluded that the provision of such non-audit services by the accountant has not compromised the accountant’s independence.
The registrant has not been identified by the U.S. Securities and Exchange Commission as having filed an annual report issued by a registered public accounting firm branch or office that is located in a foreign jurisdiction where the Public Company Accounting Oversight Board is unable to inspect or completely investigate because of a position taken by an authority in that jurisdiction.
The registrant is not a foreign issuer.
Item 5. Audit Committee of Listed Registrants.
| (a) | The registrant is an issuer as defined in Rule 10A-3 under the Securities Exchange Act of 1934, (the “Act”) and has a separately-designated standing audit committee established in accordance with Section 3(a)(58)(A) of the Act. The entire Board of Trustees is acting as the registrant’s audit committee. |
Item 6. Investments.
| (a) | Schedule of Investments is included as part of the report to shareholders filed under Item 1 of this Form. |
Item 7. Disclosure of Proxy Voting Policies and Procedures for Closed-End Management Investment Companies.
Not applicable to open-end investment companies.
Item 8. Portfolio Managers of Closed-End Management Investment Companies.
Not applicable to open-end investment companies.
Item 9. Purchases of Equity Securities by Closed-End Management Investment Company and Affiliated Purchasers.
Not applicable to open-end investment companies.
Item 10. Submission of Matters to a Vote of Security Holders.
There have been no material changes to the procedures by which shareholders may recommend nominees to the registrant’s Board of Trustees.
Item 11. Controls and Procedures.
| (a) | The Registrant’s President and Treasurer have reviewed the Registrant's disclosure controls and procedures (as defined in Rule 30a-3(c) under the Investment Company Act of 1940 (the “Act”)) as of a date within 90 days of the filing of this report, as required by Rule 30a-3(b) under the Act and Rules 13a-15(b) or 15d-15(b) under the Securities Exchange Act of 1934. Based on their review, such officers have concluded that the disclosure controls and procedures are effective in ensuring that information required to be disclosed in this report is appropriately recorded, processed, summarized and reported and made known to them by others within the Registrant and by the Registrant’s service provider. |
| (b) | There were no changes in the Registrant's internal control over financial reporting (as defined in Rule 30a-3(d) under the Act) that occurred during the period covered by this report that have materially affected, or are reasonably likely to materially affect, the Registrant's internal control over financial reporting. |
Item 12. Disclosure of Securities Lending Activities for Closed-End Management Investment Companies
Not applicable to open-end investment companies.
Item 13. Exhibits.
| (a) | (1) Any code of ethics or amendment thereto, that is the subject of the disclosure required by Item 2, to the extent that the registrant intends to satisfy Item 2 requirements through filing an exhibit. Filed herewith. |
(2) A separate certification for each principal executive officer and principal financial officer pursuant to Section 302 of the Sarbanes-Oxley Act of 2002. Filed herewith.
(3) Any written solicitation to purchase securities under Rule 23c-1 under the Act sent or given during the period covered by the report by or on behalf of the registrant to 10 or more persons. Not applicable to open-end investment companies.
(4) Change in the registrant’s independent public accountant. There was no change in the registrant’s independent public accountant for the period covered by this report.
| (b) | Certifications pursuant to Section 906 of the Sarbanes-Oxley Act of 2002. Furnished herewith. |
SIGNATURES
Pursuant to the requirements of the Securities Exchange Act of 1934 and the Investment Company Act of 1940, the registrant has duly caused this report to be signed on its behalf by the undersigned, thereunto duly authorized.
| (Registrant) | Listed Funds Trust | |
| | | |
| By (Signature and Title)* | /s/ Gregory C. Bakken | |
| | Gregory C. Bakken, President/Principal Executive Officer | |
| | | |
| Date | March 9, 2023 | |
Pursuant to the requirements of the Securities Exchange Act of 1934 and the Investment Company Act of 1940, this report has been signed below by the following persons on behalf of the registrant and in the capacities and on the dates indicated.
| By (Signature and Title)* | /s/ Gregory C. Bakken | |
| | Gregory C. Bakken, President/Principal Executive Officer | |
| | | |
| Date | March 9, 2023 | |
| | | |
| By (Signature and Title)* | /s/ Travis G. Babich | |
| | Travis G. Babich, Treasurer/Principal Financial Officer | |
| | | |
| Date | March 9, 2023 | |
* Print the name and title of each signing officer under his or her signature.