UNITED STATES
SECURITIES AND EXCHANGE COMMISSION
Washington, D.C. 20549
FORM N-CSR
CERTIFIED SHAREHOLDER REPORT OF REGISTERED
MANAGEMENT INVESTMENT COMPANIES
Investment Company Act file number (811-23226)
Listed Funds Trust
(Exact name of registrant as specified in charter)
615 East Michigan Street
Milwaukee, WI 53202
(Address of principal executive offices) (Zip code)
Kent P. Barnes, Secretary
Listed Funds Trust
c/o U.S. Bancorp Fund Services, LLC
777 East Wisconsin Avenue, 10th Floor
Milwaukee, WI 53202
(Name and address of agent for service)
(414) 516-1681
Registrant's telephone number, including area code
Date of fiscal year end: December 31
Date of reporting period: December 31, 2022
Item 1. Reports to Stockholders.
(a)

Roundhill ETFs
Roundhill Video Games ETF (NERD)
Roundhill Sports Betting & iGaming ETF (BETZ)
Roundhill Ball Metaverse ETF (METV)
Roundhill IO Digital Infrastructure ETF (BYTE)
Roundhill MEME ETF (MEME)
Roundhill Cannabis ETF (WEED)
ANNUAL REPORT
December 31, 2022
Roundhill ETFs
Table of Contents
Shareholder Letter (Unaudited) | 2 |
Performance Overview (Unaudited) | 9 |
Schedules of Investments and Total Return Swaps | 15 |
Statements of Assets and Liabilities | 27 |
Statements of Operations | 29 |
Statements of Changes in Net Assets | 31 |
Financial Highlights | 38 |
Notes to Financial Statements | 40 |
Report of Independent Registered Public Accounting Firm | 53 |
Shareholder Expense Example (Unaudited) | 55 |
Trustees and Officers of the Trust (Unaudited) | 57 |
Supplemental Information (Unaudited) | 59 |
Privacy Policy (Unaudited) | 61 |
1
Roundhill Video Games ETF
Shareholder Letter
December 31, 2022 (Unaudited)
Dear Shareholders,
The Roundhill Video Games ETF (“NERD” or the “Fund”) seeks to track the total return performance, before fees and expenses, of the Nasdaq CTA Global Video Games Software Index (the “Index”). The Index is a rules-based index that tracks the performance of a group of globally-listed stocks that are involved in the video games industry. Effective at close of business on September 26, 2022, the NERD ETF’s name changed to the Roundhill Video Games ETF, reflecting its revised focus on pure-play gaming software. Meanwhile, the fund’s underlying index transitioned to the Nasdaq CTA Global Video Games Software Index, which offers targeted exposure for investors looking to invest in the potential growth of video games globally. The Index, which was developed and is maintained by both Nasdaq and the Consumer Technology Association (the “CTA”), is a modified theme-adjusted free float market capitalization index designed to track the performance of the common stock (or corresponding depositary receipts) of exchange-listed companies engaged in video game publishing and/or video game development (the “Video Games Industry”). The companies are selected for inclusion in the Index based on a classification scheme developed by the CTA. Specifically, the companies are selected for inclusion in the Index based on (1) their classification within the Developer/Publisher Sector developed by the CTA, which includes companies that design and execute the creation of video games (game developer companies) and companies that finance the development and distribution of video games (game publisher companies), and (2) the fact that they derive at least 50% of their revenue (at least 40% for companies already included in the Index) from such activities. Such companies also must not be classified by the CTA as a Social Casino Gaming company.
The following information pertains to the fiscal period of January 1, 2022 through December 31, 2022 (the “current fiscal period”).
The Fund had negative performance during the current fiscal period. The market price and NAV for NERD decreased by -43.28% and -43.49%, respectively, while the Fund’s Index decreased by -43.25%*. The Solactive GBS Developed Markets Large & Mid Cap USD Index decreased by -17.87% over the same period.
For the current fiscal period, the largest positive contributors to returns were Modern Times Group, Capcom Co. Ltd., and Nexon Co. Ltd., which added 1.87%, 0.65%, and 0.52% to the return of the Fund, respectively.
For the current fiscal period, the largest negative contributors to returns were Skillz Inc., DouYu International Holdings, and Huya Inc., which detracted 4.32%, 4.29%, and 3.68% from the return of the Fund, respectively.
Regards,
Will Hershey, CFA
Roundhill Financial Inc.
* | The Fund’s objective and strategies changed effective at the close on September 26, 2022. Prior to September 26, Fund performance reflects the investment objective of the Fund when it was the Roundhill BITKRAFT Esports & Digital Entertainment ETF and tracked the performance, before fees and expenses, of the Roundhill BITKRAFT Esports Index. Since September 27, the Fund tracks the performance, before fees and expenses, of the Nasdaq CTA Global Video Games Software Index. |
2
Roundhill Sports Betting & iGaming ETF
Shareholder Letter
December 31, 2022 (Unaudited)
Dear Shareholders,
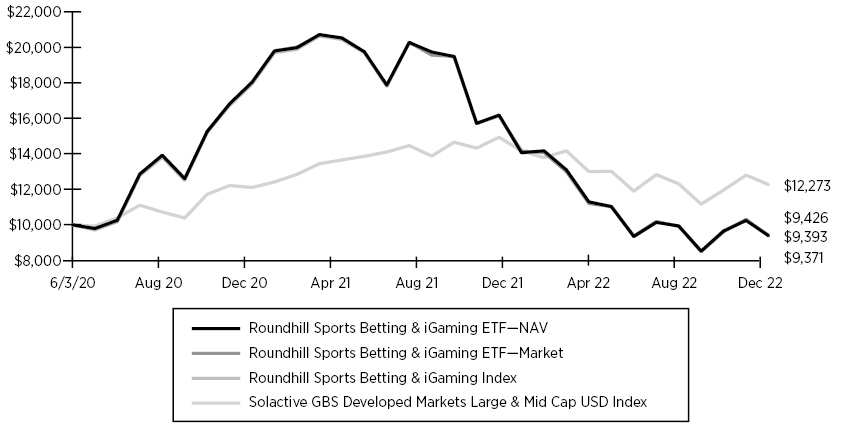
The Roundhill Sports Betting & iGaming ETF (“BETZ” or the “Fund”) seeks to track the total return performance, before fees and expenses, of the Roundhill Sports Betting & iGaming Index (the “Index”). The Index is a rules-based index that tracks the performance of a group of globally-listed stocks that are involved in the sports betting and iGaming industries. This classification includes, but is not limited to: (i) companies that operate in-person and/or online sports books (ii) companies that operate online/internet gambling platforms and (iii) companies that provide infrastructure or technology to such companies in (i) or (ii).
The following information pertains to the fiscal period of January 1, 2022 through December 31, 2022 (the “current fiscal period”).
The Fund had negative performance during the current fiscal period. The market price and NAV for BETZ decreased by -42.00% and -41.99%, respectively, while the Fund’s Index decreased by -41.69%. The Solactive GBS Developed Markets Large & Mid Cap USD Index decreased by -17.87% over the same period.
For the current fiscal period, the largest positive contributors to returns were Betsson AB, Tabcorp, and LeoVegas AB, which added 0.95%, 0.65%, and 0.49% to the return of the Fund, respectively.
For the current fiscal period, the largest negative contributors to returns were PointsBet, Rush Street Interactive, and GAN Ltd., which detracted 4.86%, 4.61%, and 3.11% from the return of the Fund, respectively.
Regards,
Will Hershey, CFA
Roundhill Financial Inc.
3
Roundhill Ball Metaverse ETF
Shareholder Letter
December 31, 2022 (Unaudited)
Dear Shareholders,
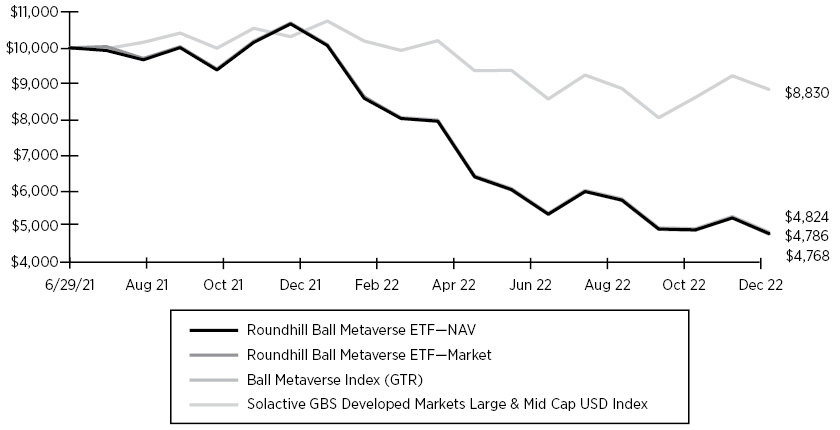
The Roundhill Ball Metaverse ETF (“METV” or the “Fund”) seeks to track the total return performance, before fees and expenses, of the Ball Metaverse Index (the “Index”). The Index is a rules-based index that tracks the performance of a group of globally-listed stocks that are involved in the metaverse. The “Metaverse” may be defined as a successor to the current internet that will be interoperable, persistent, synchronous, open to unlimited participants with a fully functioning economy, and an experience that spans the virtual and ‘real’ world. The Index includes companies involved in the following seven categories: (i) compute, (ii) networking, (iii) virtual platforms, (iv) interchange standards, (v) payments, (vi) content, assets, and identity services, and (vii) hardware.
The following information pertains to the fiscal period of January 1, 2022 through December 31, 2022 (the “current fiscal period”).
The Fund had negative performance during the current fiscal period. The market price and NAV for METV decreased by -52.66% and -52.44%, respectively, while the Fund’s Index decreased by -52.20%. The Solactive GBS Developed Markets Large & Mid Cap USD Index decreased by -17.87% over the same period.
For the current fiscal period, the largest positive contributors to returns were Activision Blizzard Inc., Broadcom Inc., and PTC Inc., which added 0.07%, 0.01%, and 0.00% to the return of the Fund, respectively.
For the current fiscal period, the largest negative contributors to returns were Unity Software Inc., Meta Platforms Inc., and Roblox Corp., which detracted 5.98%, 5.61%, and 5.14% from the return of the Fund, respectively.
Regards,
Will Hershey, CFA
Roundhill Financial Inc.
4
Roundhill IO Digital Infrastructure ETF
Shareholder Letter
December 31, 2022 (Unaudited)
Dear Shareholders,
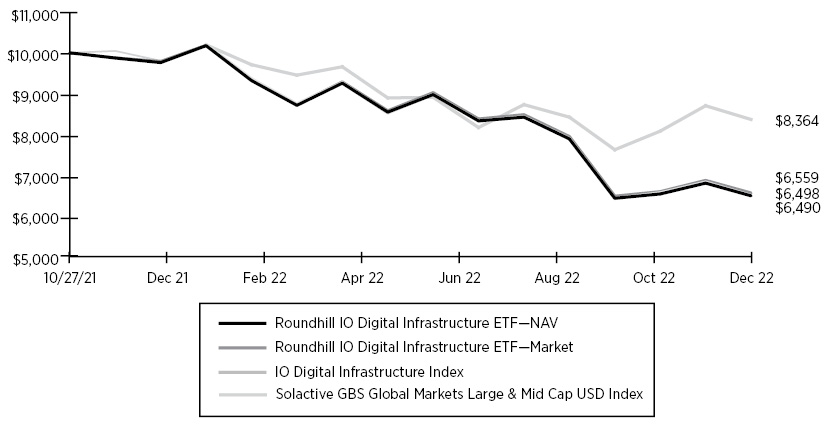
The Roundhill IO Digital Infrastructure ETF (“BYTE” or the “Fund”) seeks to track the total return performance, before fees and expenses, of the IO Digital Infrastructure Index (the “Index”). The Index is a rules-based index that tracks the performance of a group of globally-listed stocks that are involved in digital infrastructure. This classification includes, but is not limited to companies involved in: fixed-line, high-speed data transmission technology (such as fiber optic cable and certain “last-mile” technologies that bring data to and from the end-user), data centers, mobile towers and related infrastructure, and other long-lived physical infrastructure assets.
The following information pertains to the fiscal period of January 1, 2022 through December 31, 2022 (the “current fiscal period”).
The Fund had negative performance during the current fiscal period. The market price and NAV for BYTE decreased by -36.30% and -36.22%, respectively, while the Fund’s Index decreased by -35.60%. The Solactive GBS Global Markets Large & Mid Cap USD Index decreased by -17.96% over the same period.
For the current fiscal period, the largest positive contributors to returns were Uniti Group Ltd., Switch Inc., and Chindata Group Holdings, which added 0.55%, 0.43%, and 0.20% to the return of the Fund, respectively.
For the current fiscal period, the largest negative contributors to returns were Altice USA Inc., Cable One Inc., and Charter Communications Inc., which detracted 4.90%, 3.26%, and 3.17% from the return of the Fund, respectively.
Regards,
Will Hershey, CFA
Roundhill Financial Inc.
5
Roundhill MEME ETF
Shareholder Letter
December 31, 2022 (Unaudited)
Dear Shareholders,
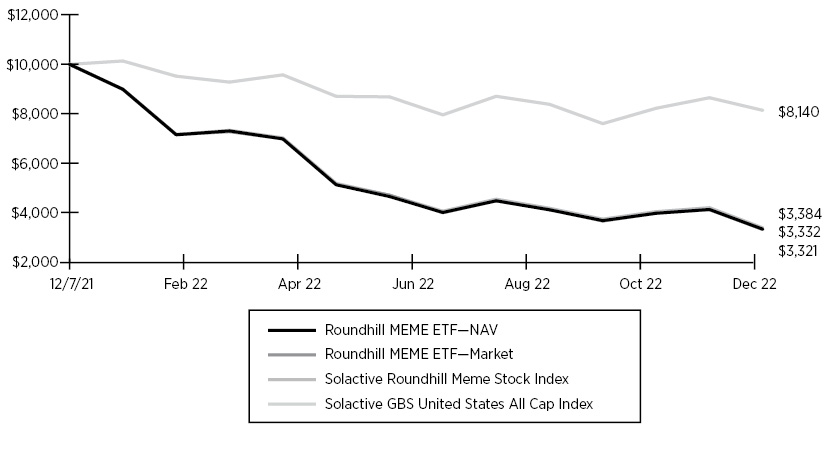
The Roundhill MEME ETF (“MEME” or the “Fund”) seeks to track the total return performance, before fees and expenses, of the Solactive Roundhill MEME Stock Index (the “Index”). The Index is a rules-based index that tracks the performance of 25 equally-weighted U.S. listed equity securities that exhibit a combination of elevated social media activity and high short interest. Due to the MEME Index’s focus on stocks that are both highly shorted and subject to increased retail sentiment, as well as the fund’s high turnover, MEME may experience significantly greater volatility than conventional equity ETFs or mutual funds.
The following information pertains to the fiscal period of January 1, 2022 through December 31, 2022 (the “current fiscal period”).
The Fund had negative performance during the current fiscal period. The market price and NAV for MEME decreased by -63.06% and -62.94%, respectively, while the Fund’s Index decreased by -62.37%. The Solactive GBS United States All Cap Index decreased by -19.70% over the same period.
For the current fiscal period, the largest positive contributors to returns were Microstrategy Inc., Cleveland-Cliffs Inc., and Occidental Petroleum, which added 1.82%, 1.50%, and 1.00% to the return of the Fund, respectively.
For the current fiscal period, the largest negative contributors to returns were Upstart Holdings Inc., Tilray Brands Inc., and Blackberry Ltd., which detracted 3.71%, 3.29%, and 3.02% from the return of the Fund, respectively.
Regards,
Will Hershey, CFA
Roundhill Financial Inc.
6
Roundhill Cannabis ETF
Shareholder Letter
December 31, 2022 (Unaudited)
Dear Shareholders,
The Roundhill Cannabis ETF (“WEED” or the “Fund”) seeks to achieve its investment objective by investing primarily in exchange-listed equity securities and total return swaps intended to provide exposure to the cannabis and hemp ecosystem, this classification includes, but is not limited to: cannabis and hemp ecosystem encompasses businesses involved in the production, distribution and marketing of cannabis and hemp and products derived therefrom. As of October 11, 2022, the sponsor has re-focused the exposure of WEED to exclusively target the largest and most-liquid U.S. multi-state operators (“MSOs”). Due to current macroeconomic conditions, including high interest rates and persistent inflation, Roundhill believes that the cannabis companies with the lowest costs of capital and strongest relative balance sheets are best positioned to survive a downturn and increase market share.
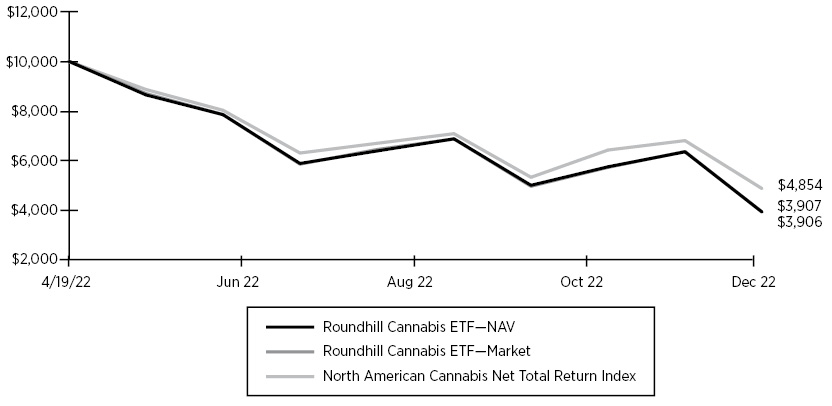
The following information pertains to the period from inception on April 20, 2022 through December 31, 2022 (the “current fiscal period”).
The Fund had negative performance during the current fiscal period. The market price and NAV for WEED decreased by -60.94% and -60.93%, respectively. The North American Cannabis Net Total Return Index decreased by -51.46% over the same period.
During the current fiscal period, the cannabis industry underperformed broader equity markets due to a lack of meaningful regulatory reform and continued challenges regarding access to capital markets.
Regards,
Will Hershey, CFA
Roundhill Financial Inc.
7
Roundhill ETFs
Shareholder Letter
December 31, 2022 (Unaudited)
NERD Risks Esports gaming companies face intense competition, both domestically and internationally, may have limited product lines, markets, financial resources, or personnel, may have products that face rapid obsolescence, and are heavily dependent on the protection of patent and intellectual property rights. Such factors may adversely affect the profitability and value of video gaming companies. Investments made in small and mid-capitalization companies may be more volatile and less liquid due to limited resources or product lines and more sensitive to economic factors. For a complete list of risks see the prospectus.
BETZ Risks include those related to investments in the highly-competitive sports betting industry, including from illegal or unregulated companies. Expansion of sports betting (both regulated and unregulated), including the award of additional licenses or expansion or relocation of existing sports betting companies, and competition from other leisure and entertainment activities, could impact these companies’ finances. Small and mid-capitalization companies may be more volatile and less liquid due to limited resources or product lines and more sensitive to economic factors. For a complete list of risks see the prospectus.
METV Risks Metaverse Companies and other companies that rely heavily on technology are particularly vulnerable to research and development costs, substantial capital requirements, product and services obsolescence, government regulation, and domestic and international competition, including competition from foreign competitors with lower production costs. Stocks of such companies, especially smaller, less-seasoned companies, may be more volatile than the overall market. Metaverse Companies may face dramatic and unpredictable changes in growth rates. Metaverse Companies may be targets of hacking and theft of proprietary or consumer information or disruptions in service, which could have a material adverse effect on their businesses. For a complete list of risks see the prospectus.
BYTE Risks Digital Infrastructure Companies are exposed to the risks specific to the real estate market as well as the risks that relate specifically to the way in which Digital Infrastructure Companies are utilized and operated. Digital Infrastructure Companies may be affected by unique supply and demand factors that do not apply to other real estate sectors, such as changes in demand for communications infrastructure, consolidation of tower sites, and new technologies that may affect demand for data centers. Digital Infrastructure Companies are also subject to a variety of factors that may adversely affect their business or operations including high interest costs, costs associated with compliance with and changes in environmental and other regulations, difficulty in raising capital in adequate amounts on reasonable terms in periods of high inflation and unsettled markets, the effects of surplus capacity, increased competition from other providers of services, the effects of energy conservation policies, and other factors. Investments made in small and mid-capitalization companies may be more volatile and less liquid due to limited resources or product lines and more sensitive to economic factors. For a complete list of risks see the prospectus.
MEME Risks Meme stocks are stocks whose trading volume increases because of social media attention. Social media attention may result from a variety of factors, including the reputation of the issuer, marketing efforts, and the timing of the release of publicly available information, which may be unrelated to the company’s performance, financial position, or other business fundamentals. As a result, meme stocks are prone to high volatility, which may be a result of panic selling or loss of general interest or popularity. The Fund may invest in equity securities of SPACs, which raise assets to seek potential acquisition opportunities. Unless and until an acquisition is completed, a SPAC generally invests its assets in U.S. government securities, money market securities, and cash. Because SPACs have no operating history or ongoing business other than seeking acquisitions, the value of their securities is particularly dependent on the ability of the entity’s management to identify and complete a profitable acquisition and involve greater risks. For a complete list of risks see the prospectus.
WEED Risks Cannabis Companies may face litigation, formal or informal complaints, enforcement actions, and inquiries by various federal, state, or local governmental authorities. Litigation, complaints, and enforcement actions could consume considerable amounts of financial and other corporate resources, which could have a negative impact on sales, revenue, profitability, and growth prospects. Similarly, certain companies may not be able to obtain or maintain the necessary licenses, permits, authorizations, or accreditations, or may only be able to do so at great cost, to engage in medical marijuana research or to otherwise cultivate, possess or distribute marijuana. Small and mid-capitalization companies may be more volatile and less liquid due to limited resources or product lines and more sensitive to economic factors. For a complete list of risks see the prospectus.
8
Roundhill ETFs
Performance Overview
December 31, 2022 (Unaudited)
Hypothetical Growth of $10,000 Investment
(Since Commencement through 12/31/2022)

9
Roundhill ETFs
Performance Overview
December 31, 2022 (Unaudited) (Continued)
10
Roundhill ETFs
Performance Overview
December 31, 2022 (Unaudited) (Continued)
11
Roundhill ETFs
Performance Overview
December 31, 2022 (Unaudited) (Continued)
| | ANNUALIZED TOTAL RETURN FOR THE
PERIODS ENDED DECEMBER 31, 2022 |
Total Returns | 1 Year | Since
Commencement1 |
Roundhill Video Games ETF—NAV | -43.49% | -1.03% |
Roundhill Video Games ETF—Market | -43.28% | -1.10% |
Roundhill Video Game Blended Index* | -43.25% | -0.44% |
Solactive GBS Developed Markets Large & Mid Cap USD Index | -17.87% | 9.04% |
1 | The Fund commenced operations on June 3, 2019. |
* | The Fund’s objective and strategies changed effective at the close on September 26, 2022. Prior to September 26, Fund performance reflects the investment objective of the Fund when it was the Roundhill BITKRAFT Esports & Digital Entertainment ETF and tracked the performance, before fees and expenses, of the Roundhill BITKRAFT Esports Index. Since September 27, the Fund tracks the performance, before fees and expenses, of the Nasdaq CTA Global Video Games Software Index. |
| | ANNUALIZED TOTAL RETURN FOR THE
PERIODS ENDED DECEMBER 31, 2022 |
Total Returns | 1 Year | Since
Commencement2 |
Roundhill Sports Betting & iGaming ETF—NAV | -41.99% | -2.40% |
Roundhill Sports Betting & iGaming ETF—Market | -42.00% | -2.49% |
Roundhill Sports Betting & iGaming Index | -41.69% | -2.27% |
Solactive GBS Developed Markets Large & Mid Cap USD Index | -17.87% | 8.27% |
2 | The Fund commenced operations on June 3, 2020. |
| | ANNUALIZED TOTAL RETURN FOR THE
PERIODS ENDED DECEMBER 31, 2022 |
Total Returns | 1 Year | Since
Commencement3 |
Roundhill Ball Metaverse ETF—NAV | -52.44% | -38.68% |
Roundhill Ball Metaverse ETF—Market | -52.66% | -38.83% |
Ball Metaverse Index | -52.20% | -38.35% |
Solactive GBS Developed Markets Large & Mid Cap USD Index | -17.87% | -7.92% |
3 | The Fund commenced operations on June 29, 2021. |
12
Roundhill ETFs
Performance Overview
December 31, 2022 (Unaudited) (Continued)
| | ANNUALIZED TOTAL RETURN FOR THE
PERIODS ENDED DECEMBER 31, 2022 |
Total Returns | 1 Year | Since
Commencement4 |
Roundhill IO Digital Infrastructure ETF—NAV | -36.22% | -30.71% |
Roundhill IO Digital Infrastructure ETF—Market | -36.30% | -30.65% |
IO Digital Infrastructure Index | -35.60% | -30.10% |
Solactive GBS Global Markets Large & Mid Cap USD Index | -17.96% | -14.07% |
4 | The Fund commenced operations on October 27, 2021. |
| | ANNUALIZED TOTAL RETURN FOR THE
PERIODS ENDED DECEMBER 31, 2022 |
Total Returns | 1 Year | Since
Commencement5 |
Roundhill MEME ETF—NAV | -62.94% | -64.34% |
Roundhill MEME ETF—Market | -63.06% | -64.45% |
Solactive Roundhill Meme Stock Index | -62.37% | -63.82% |
Solactive GBS United States All Cap Index | -19.70% | -17.56% |
5 | The Fund commenced operations on December 7, 2021. |
| | CUMULATIVE TOTAL RETURN FOR THE
PERIOD ENDED DECEMBER 31, 2022 |
Total Returns | Since Commencement6 |
Roundhill Cannabis ETF—NAV | -60.93% |
Roundhill Cannabis ETF—Market | -60.94% |
North American Cannabis Net Total Return Index | -51.46% |
6 | The Fund commenced operations on April 20, 2022. |
The performance data quoted represents past performance. Past performance does not guarantee future results. Current performance may be lower or higher than the performance data quoted. The investment return and principal value of an investment will fluctuate so that an investor’s shares, when sold or redeemed, may be worth more or less than their original cost. For the most recent month-end performance, please call (855) 561-5728. You cannot invest directly in an index. Shares are bought and sold at market price (closing price), not net asset value (NAV), and are individually redeemed from the Fund. Market performance is determined using the bid/ask midpoint at 4:00pm Eastern time when the NAV is typically calculated. Brokerage commissions will reduce returns. Returns shown include the reinvestment of all dividends and distribution. Returns shown do not reflect the deduction of taxes that a shareholder would pay on fund distributions or the redemption of fund shares. In the absence of fee waivers and reimbursements, total returns would be reduced.
The Roundhill Video Games ETF is designed to offer retail and institutional investors exposure to the video game sector by providing investment results that closely correspond, before fees and expenses, to the performance of the Nasdaq CTA Global Video Games Software Index. The Nasdaq CTA Global Video Games Software Index is a modified theme-adjusted free float market capitalization index designed to track the performance of the common stock (or corresponding depositary receipts) of exchange-listed companies engaged in video game publishing and/or video game development. The companies are selected for inclusion in the Index based on a classification scheme developed by the Consumer Technology Association. The index excludes companies domiciled in China or Russia. An index is unmanaged and is not available for direct investment.
13
Roundhill ETFs
Performance Overview
December 31, 2022 (Unaudited) (Continued)
The Roundhill Sports Betting & iGaming ETF is designed to offer retail and institutional investors exposure to sports betting and gaming industries by providing investment results that closely correspond, before fees and expenses, to the performance of the Roundhill Sports Betting & iGaming Index. The Roundhill Sports Betting & iGaming Index is the first rules-based index designed to track the performance of the growing market of online sports betting and gaming, or “iGaming”. The Index consists of a tiered weight portfolio of globally-listed companies who are actively involved in the sports betting & iGaming industry. This classification includes, but is not limited to: companies that operate in-person and/or online/internet sports books; companies that operate online/internet gambling platforms; and companies that provide infrastructure or technology to such companies. An index is unmanaged and is not available for direct investment.
The Roundhill Ball Metaverse ETF is designed to offer retail and institutional investors exposure to the Metaverse by providing investment results that closely correspond, before fees and expenses, to the performance of the Ball Metaverse Index. The “Metaverse” may be defined as a successor to the current internet that will be interoperable, persistent, synchronous, open to unlimited participants with a fully functioning economy, and an experience that spans the virtual and ‘real’ world. An index is unmanaged and is not available for direct investment.
The Roundhill IO Digital Infrastructure ETF is designed to offer retail and institutional investors exposure to digital infrastructure by seeking to provide investment results that track, before fees and expenses, the performance of the IO Digital Infrastructure Index. Digital infrastructure is comprised of the high-tech physical assets that support the efficient storage and transmission of data, powering the internet. These assets include fixed-line, high-speed data transmission technology (such as fiber optic cable and certain “last-mile” technologies that bring data to and from the end-user); data centers; mobile towers and related infrastructure; and other long-lived physical infrastructure assets. An index is unmanaged and is not available for direct investment.
The Roundhill MEME ETF is designed to offer retail and institutional investors exposure to “meme stocks” by providing investment results that closely track the performance, before fees and expenses, of the Solactive Roundhill Meme Stock Index (“MEME Index”). The MEME ETF is the first ETF globally explicitly designed to track the performance of meme stocks. The MEME Index consists of 25 equal-weighted U.S. listed equity securities that exhibit a combination of elevated social media activity and high short interest. Short interest is calculated by the percentage of a security’s float which are currently sold short. Social media activity and short interest data are supplied by third-party data providers. The index is rebalanced every two weeks, in order to best attempt to capture trending stocks as they emerge. Due to the MEME Index’s focus on stocks that are both highly shorted and subject to increased retail sentiment, as well as the fund’s high turnover given bi-weekly rebalances, MEME may experience significantly greater volatility than conventional equity ETFs or mutual funds. An index is unmanaged and is not available for direct investment.
The Roundhill Cannabis ETF is designed to offer retail and institutional investors exposure to the cannabis and hemp ecosystem by providing investment results that reflect capital growth. The cannabis and hemp ecosystem encompasses businesses involved in the production, distribution and marketing of cannabis and hemp and products derived therefrom. The cannabis and hemp ecosystem spans a wide variety of sectors and industries including the agriculture, biotechnology, pharmaceuticals, real estate, retail, and finance sectors and industries.
The Solactive GBS Developed Markets Large & Mid Cap USD and the Solactive GBS Global Markets Large & Mid Cap USD Index are part of the Solactive Global Benchmark Series which includes benchmark indices for developed and emerging market countries. The index intends to track the performance of the large and mid cap segment covering approximately the largest 85% of the free-float market capitalization in the Developed Markets and Global Markets, respectively. It is calculated as a Total Return index in USD and weighted by free-float market capitalization.
The Solactive GBS United States All Cap Index is part of the Solactive Global Benchmark Series which includes benchmark indices for developed and emerging market countries. The index intends to track the performance of the all cap covering approximately the largest 100% of the free-float market capitalization in the United States. It is calculated as a total return index in USD and weighted by free-float market capitalization.
The North American Cannabis Net Total Return Index tracks the performance of a basket of North American publicly listed companies with significant business activities in the marijuana industry. A company is deemed to be eligible for inclusion in the index by the Index Provider if the company is a producer and/or supplier of marijuana and/or cannabis, biotechnology companies that are engaged in research and development of cannabinoids, companies that offer hydroponics supplies and equipment clearly aiming to increase efficiency in marijuana cultivation and companies mainly engaged in leasing property to cannabis growers. The index is calculated as a net total return index in US Dollar and adjusted quarterly.
14
Roundhill Video Games ETF
Schedule of Investments
December 31, 2022
Description | | Shares | | | Value | |
COMMON STOCKS — 99.8% | | | | | | | | |
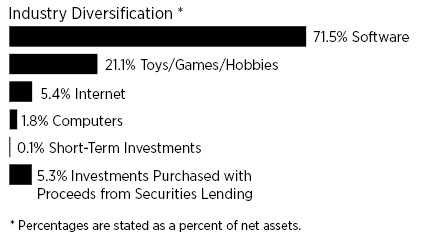
Computers — 1.8% | | | | | | | | |
Keywords Studios PLC (b) | | | 14,101 | | | $ | 462,050 | |
| | | | | | | | | |
Internet — 5.4% | | | | | | | | |
NCSoft Corp. (b) | | | 2,395 | | | | 848,525 | |
Webzen, Inc. (a)(b) | | | 24,885 | | | | 300,116 | |
Wemade Co., Ltd. (b) | | | 8,495 | | | | 211,955 | |
| | | | | | | | 1,360,596 | |
Software — 71.5% (d) | | | | | | | | |
AppLovin Corp. - Class A (a)(e) | | | 31,154 | | | | 328,052 | |
Capcom Co., Ltd. (b) | | | 24,200 | | | | 772,155 | |
CD Projekt SA (b) | | | 14,452 | | | | 427,143 | |
COLOPL, Inc. (b) | | | 59,800 | | | | 284,622 | |
Com2uS Corp. (b) | | | 6,653 | | | | 313,577 | |
DeNA Co., Ltd. (b) | | | 26,800 | | | | 358,701 | |
Electronic Arts, Inc. | | | 21,832 | | | | 2,667,434 | |
Embracer Group AB (a)(b)(e) | | | 125,280 | | | | 568,597 | |
Frontier Developments PLC (a)(b) | | | 20,286 | | | | 234,505 | |
Gree, Inc. (b) | | | 51,500 | | | | 271,659 | |
GungHo Online Entertainment, Inc. (b) | | | 24,200 | | | | 391,030 | |
IGG, Inc. (a)(b) | | | 890,000 | | | | 330,687 | |
International Games System Co., Ltd. (b) | | | 33,101 | | | | 466,863 | |
Kakao Games Corp. (a)(b) | | | 12,565 | | | | 443,675 | |
Koei Tecmo Holdings Co., Ltd. (b) | | | 25,400 | | | | 460,471 | |
Konami Group Corp. (b) | | | 12,100 | | | | 547,478 | |
Krafton, Inc. (a)(b) | | | 4,212 | | | | 559,601 | |
MIXI, Inc. (b) | | | 18,300 | | | | 342,020 | |
Netmarble Corp. (b)(f) | | | 9,012 | | | | 430,466 | |
Nexon Co., Ltd. (b) | | | 43,300 | | | | 972,031 | |
Paradox Interactive AB (b) | | | 18,469 | | | | 376,133 | |
Pearl Abyss Corp. (a)(b) | | | 11,604 | | | | 384,965 | |
ROBLOX Corp. - Class A (a) | | | 47,091 | | | | 1,340,210 | |
Rovio Entertainment Oyj (b)(f) | | | 49,275 | | | | 319,476 | |
Sega Sammy Holdings, Inc. (b) | | | 30,000 | | | | 454,053 | |
Square Enix Holdings Co., Ltd. (b) | | | 11,300 | | | | 524,984 | |
Stillfront Group AB (a)(b) | | | 211,622 | | | | 355,834 | |
Software (Continued) | | | | | | | | |
Take-Two Interactive Software, Inc. (a) | | | 14,793 | | | $ | 1,540,395 | |
Team17 Group PLC (a)(b) | | | 54,975 | | | | 290,971 | |
Ubisoft Entertainment SA (a)(b) | | | 17,868 | | | | 503,627 | |
Unity Software, Inc. (a)(e) | | | 21,648 | | | | 618,916 | |
Wemade Max Co., Ltd. (a)(b) | | | 22,049 | | | | 167,046 | |
| | | | | | | | 18,047,377 | |
Toys/Games/Hobbies — 21.1% | | | | | | | | |
Bandai Namco Holdings, Inc. (b) | | | 13,500 | | | | 850,650 | |
Nintendo Co., Ltd. (b) | | | 106,600 | | | | 4,469,371 | |
| | | | | | | | 5,320,021 | |
TOTAL COMMON STOCKS (Cost $29,217,484) | | | | | | | 25,190,044 | |
| | | | | | | | | |
SHORT-TERM INVESTMENTS — 0.1% | | | | | | | | |
Money Market Fund — 0.1% | | | | | | | | |
First American Government Obligations Fund, Class X, 4.08% (c) | | | 14,842 | | | | 14,842 | |
TOTAL SHORT-TERM INVESTMENTS (Cost $14,842) | | | | | | | 14,842 | |
| | | | | | | | | |
INVESTMENTS PURCHASED WITH PROCEEDS FROM SECURITIES LENDING — 5.3% | | | | | | | | |
Mount Vernon Liquid Assets Portfolio, LLC, 4.49% (c) | | | 1,354,091 | | | | 1,354,091 | |
TOTAL INVESTMENTS PURCHASED WITH PROCEEDS FROM SECURITIES LENDING (Cost $1,354,091) | | | | | | | 1,354,091 | |
| | | | | | | | | |
TOTAL INVESTMENTS (Cost $30,586,417) — 105.2% | | | | | | | 26,558,977 | |
Other assets and liabilities, net — (5.2)% | | | | | | | (1,309,091 | ) |
NET ASSETS — 100.0% | | | | | | $ | 25,249,886 | |
PLC Public Limited Company
(a) | Non-income producing security. |
(b) | Foreign issued security, or represents a foreign issued security. |
(c) | The rate shown is the seven day yield at period end. |
(d) | To the extent the Fund invests more heavily in particular sectors of the economy, its performance will be especially sensitive to developments that significantly affect those sectors. |
(e) | All or a portion of this security is on loan as of December 31, 2022. The market value of securities out on loan is $1,288,861. |
(f) | Security exempt from registration pursuant to Rule 144a under the Securities Act of 1933, as amended. These securities may be resold in transactions exempt from registration to qualified institutional investors. |
Percentages are stated as a percent of net assets.
The accompanying notes are an integral part of the financial statements.
15
Roundhill Video Games ETF
Schedule of Investments
December 31, 2022 (Continued)
COUNTRY | Percentage
of Net
Assets |
Japan | 42.4% |
United States | 25.8% |
Republic of Korea | 14.5% |
Sweden | 5.1% |
United Kingdom | 3.9% |
France | 2.0% |
Taiwan | 1.8% |
Poland | 1.7% |
Cayman Islands | 1.3% |
Finland | 1.3% |
Total Country | 99.8% |
SHORT-TERM INVESTMENTS | 0.1% |
INVESTMENTS PURCHASED WITH PROCEEDS FROM SECURITIES LENDING | 5.3% |
TOTAL INVESTMENTS | 105.2% |
Other assets and liabilities, net | -5.2% |
NET ASSETS | 100.0% |
The accompanying notes are an integral part of the financial statements.
16
Roundhill Sports Betting & iGaming ETF
Schedule of Investments
December 31, 2022
Description | | Shares | | | Value | |
COMMON STOCKS — 99.8% | | | | | | | | |
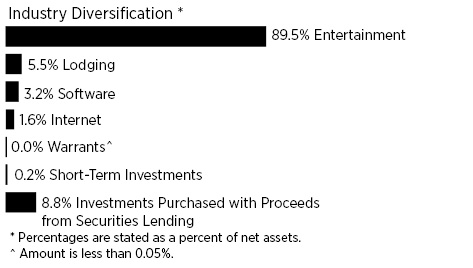
Entertainment — 89.5% (e) | | | | | | | | |
888 Holdings PLC (a)(b) | | | 3,432,484 | | | $ | 3,590,128 | |
Aristocrat Leisure, Ltd. (b) | | | 117,314 | | | | 2,428,064 | |
Bally’s Corp. (a)(f) | | | 125,211 | | | | 2,426,590 | |
Betmakers Technology Group, Ltd. (a)(b)(f) | | | 11,845,157 | | | | 2,209,018 | |
Betsson AB (a)(b) | | | 364,428 | | | | 2,964,880 | |
Caesars Entertainment, Inc. (a) | | | 100,268 | | | | 4,171,148 | |
Churchill Downs, Inc. | | | 18,743 | | | | 3,962,832 | |
Codere Online Luxembourg SA (a)(b)(f) | | | 24,757 | | | | 63,874 | |
DraftKings, Inc. - Class A (a)(f) | | | 430,620 | | | | 4,904,762 | |
Entain PLC (b) | | | 422,496 | | | | 6,716,168 | |
Evolution Gaming Group AB (b)(c) | | | 44,796 | | | | 4,365,456 | |
Flutter Entertainment PLC (a)(b) | | | 46,210 | | | | 6,275,692 | |
Gaming Realms PLC (a)(b) | | | 321,008 | | | | 96,536 | |
GAN, Ltd. (a)(b) | | | 799,821 | | | | 1,199,732 | |
Genius Sports, Ltd. (a)(b)(f) | | | 877,930 | | | | 3,134,210 | |
International Game Technology PLC (b) | | | 136,779 | | | | 3,102,148 | |
Intralot SA-Integrated Information Systems & Gaming Services (a)(b) | | | 269,459 | | | | 163,920 | |
Kambi Group PLC (a)(b) | | | 178,851 | | | | 3,257,064 | |
Kindred Group PLC - SDR (b) | | | 685,831 | | | | 7,148,256 | |
La Francaise des Jeux SAEM (b)(c) | | | 80,445 | | | | 3,226,420 | |
Light & Wonder, Inc. (a)(f) | | | 51,721 | | | | 3,030,850 | |
NEOGAMES SA (a)(b) | | | 145,898 | | | | 1,778,496 | |
OPAP SA (b) | | | 201,872 | | | | 2,850,368 | |
Penn National Gaming, Inc. (a)(f) | | | 194,727 | | | | 5,783,392 | |
PointsBet Holdings, Ltd. (a)(b) | | | 3,759,542 | | | | 3,786,057 | |
Rush Street Interactive, Inc. (a) | | | 1,366,933 | | | | 4,907,289 | |
Sportradar Holding AG - Class A (a)(b) | | | 359,340 | | | | 3,579,026 | |
STS Holding SA (b) | | | 84,137 | | | | 331,848 | |
Super Group SGHC, Ltd. (a)(b)(f) | | | 506,696 | | | | 1,520,088 | |
Tabcorp Holdings, Ltd. (b) | | | 9,530,372 | | | | 6,947,748 | |
The Lottery Corp., Ltd. (a)(b) | | | 1,010,797 | | | | 3,070,914 | |
Tokyotokeiba Co., Ltd. (b) | | | 92,300 | | | | 2,647,736 | |
| | | | | | | | 105,640,710 | |
Internet — 1.6% | | | | | | | | |
Catena Media PLC (a)(b)(f) | | | 669,242 | | | $ | 1,223,898 | |
Gambling.com Group, Ltd. (a)(b)(f) | | | 58,314 | | | | 533,574 | |
Gaming Innovation Group, Inc. (a) | | | 57,579 | | | | 152,904 | |
| | | | | | | | 1,910,376 | |
Lodging — 5.5% | | | | | | | | |
Boyd Gaming Corp. | | | 47,747 | | | | 2,603,644 | |
MGM Resorts International | | | 117,057 | | | | 3,924,921 | |
| | | | | | | | 6,528,565 | |
Software — 3.2% | | | | | | | | |
Better Collective AS (a)(b) | | | 48,065 | | | | 586,772 | |
Bragg Gaming Group, Inc. (a)(b)(f) | | | 83,609 | | | | 323,958 | |
Playtech PLC (a)(b) | | | 464,188 | | | | 2,842,127 | |
| | | | | | | | 3,752,857 | |
TOTAL COMMON STOCKS (Cost $220,460,862) | | | | | | | 117,832,508 | |
| | | | | | | | | |
WARRANTS — 0.0% (h) | | | | | | | | |
PointsBet Holdings, Ltd., Expiration: July 2024, Exercise Price: $10.00 (a)(b)(g) | | | 151,840 | | | | — | |
TOTAL WARRANTS (Cost $0) | | | | | | | — | |
| | | | | | | | | |
SHORT-TERM INVESTMENTS — 0.2% | | | | | | | | |
Money Market Fund — 0.2% | | | | | | | | |
First American Government Obligations Fund, Class X, 4.08% (d) | | | 182,822 | | | | 182,822 | |
TOTAL SHORT-TERM INVESTMENTS (Cost $182,822) | | | | | | | 182,822 | |
| | | | | | | | | |
INVESTMENTS PURCHASED WITH PROCEEDS FROM SECURITIES LENDING — 8.8% | | | | | | | | |
Mount Vernon Liquid Assets Portfolio, LLC, 4.49% (d) | | | 10,436,821 | | | | 10,436,821 | |
TOTAL INVESTMENTS PURCHASED WITH PROCEEDS FROM SECURITIES LENDING (Cost $10,436,821) | | | | | | | 10,436,821 | |
| | | | | | | | | |
TOTAL INVESTMENTS (Cost $231,080,505) — 108.8% | | | | | | | 128,452,151 | |
Other assets and liabilities, net — (8.8)% | | | | | | | (10,424,068 | ) |
NET ASSETS — 100.0% | | | | | | $ | 118,028,083 | |
PLC Public Limited Company
SDR Special Drawing Rights
(a) | Non-income producing security. |
(b) | Foreign issued security, or represents a foreign issued security. |
The accompanying notes are an integral part of the financial statements.
17
Roundhill Sports Betting & iGaming ETF
Schedule of Investments
December 31, 2022 (Continued)
(c) | Security exempt from registration pursuant to Rule 144a under the Securities Act of 1933, as amended. These securities may be resold in transactions exempt from registration to qualified institutional investors. |
(d) | The rate shown is the seven day yield at period end. |
(e) | To the extent the Fund invests more heavily in particular sectors of the economy, its performance will be especially sensitive to developments that significantly affect those sectors. |
(f) | All or a portion of this security is on loan as of December 31, 2022. The market value of securities out on loan is $9,807,072. |
(g) | Value determined based on estimated fair value. The value of these securities total $0, which represents 0.00% of net assets. Classified as Level 3 in the fair value hierarchy. |
(h) | Amount is less than 0.05%. |
Percentages are stated as a percent of net assets.
COUNTRY | Percentage
of Net
Assets |
United States | 30.4% |
Australia | 15.6% |
Malta | 9.9% |
Isle of Man | 8.1% |
Sweden | 6.2% |
Ireland | 5.3% |
Guernsey | 3.9% |
Gibraltar | 3.0% |
Switzerland | 3.0% |
France | 2.7% |
United Kingdom | 2.7% |
Greece | 2.6% |
Japan | 2.2% |
Luxembourg | 1.6% |
Bermuda | 1.0% |
Denmark | 0.5% |
Jersey | 0.5% |
Poland | 0.3% |
Canada | 0.3% |
Total Country | 99.8% |
WARRANTS | 0.0%* |
SHORT-TERM INVESTMENTS | 0.2% |
INVESTMENTS PURCHASED WITH PROCEEDS FROM SECURITIES LENDING | 8.8% |
TOTAL INVESTMENTS | 108.8% |
Other assets and liabilities, net | -8.8% |
NET ASSETS | 100.0% |
* | Amount is less than 0.05%. |
The accompanying notes are an integral part of the financial statements.
18
Roundhill Ball Metaverse ETF
Schedule of Investments
December 31, 2022
Description | | Shares | | | Value | |
COMMON STOCKS — 99.2% | | | | | | | | |
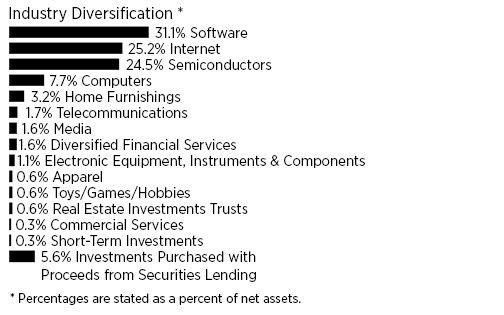
Apparel — 0.6% | | | | | | | | |
NIKE, Inc. - Class B | | | 20,276 | | | $ | 2,372,495 | |
| | | | | | | | | |
Commercial Services — 0.3% | | | | | | | | |
Block, Inc. (a) | | | 8,079 | | | | 507,684 | |
PayPal Holdings, Inc. (a) | | | 7,239 | | | | 515,562 | |
| | | | | | | | 1,023,246 | |
Computers — 7.7% | | | | | | | | |
Apple, Inc. | | | 220,283 | | | | 28,621,370 | |
| | | | | | | | | |
Diversified Financial Services — 1.6% | | | | | | | | |
Coinbase Global, Inc. - Class A (a)(e) | | | 108,899 | | | | 3,853,936 | |
Galaxy Digital Holdings, Ltd. (a)(b)(e) | | | 755,285 | | | | 2,157,240 | |
| | | | | | | | 6,011,176 | |
Electronic Equipment, Instruments & Components — 1.1% | | | | | | | | |
HEXAGON AB (b) | | | 380,028 | | | | 3,975,532 | |
| | | | | | | | | |
Home Furnishings — 3.2% | | | | | | | | |
Sony Group Corp. (b) | | | 152,900 | | | | 11,628,720 | |
| | | | | | | | | |
Internet — 25.2% (d) | | | | | | | | |
Alibaba Group Holding, Ltd. (a)(b) | | | 478,500 | | | | 5,287,750 | |
Alphabet, Inc. - Class C (a) | | | 122,164 | | | | 10,778,530 | |
Amazon.com, Inc. (a) | | | 132,867 | | | | 11,160,828 | |
Baidu, Inc. - ADR (a)(b) | | | 84,898 | | | | 9,710,633 | |
Edgio, Inc. (a) | | | 1,812,583 | | | | 2,048,219 | |
Meta Platforms, Inc. - Class A (a) | | | 174,608 | | | | 21,012,327 | |
NAVER Corp. (b) | | | 30,365 | | | | 4,262,386 | |
Sea, Ltd. - ADR (a)(b) | | | 109,991 | | | | 5,722,832 | |
Snap, Inc. - Class A (a)(e) | | | 982,134 | | | | 8,790,099 | |
Tencent Holdings, Ltd. (b) | | | 340,100 | | | | 14,554,020 | |
| | | | | | | | 93,327,624 | |
Media — 1.6% | | | | | | | | |
The Walt Disney Co. (a)(e) | | | 69,864 | | | $ | 6,069,784 | |
| | | | | | | | | |
Semiconductors — 24.5% | | | | | | | | |
Advanced Micro Devices, Inc. (a) | | | 108,091 | | | | 7,001,054 | |
Applied Materials, Inc. | | | 35,192 | | | | 3,426,997 | |
ASML Holding NV (b) | | | 10,038 | | | | 5,484,763 | |
Broadcom, Inc. | | | 4,169 | | | | 2,331,013 | |
Intel Corp. | | | 134,153 | | | | 3,545,664 | |
Marvell Technology, Inc. (e) | | | 54,502 | | | | 2,018,754 | |
NVIDIA Corp. | | | 181,520 | | | | 26,527,333 | |
QUALCOMM, Inc. | | | 117,905 | | | | 12,962,476 | |
Samsung Electronics Co., Ltd. (b) | | | 188,617 | | | | 8,248,731 | |
Skyworks Solutions, Inc. | | | 47,361 | | | | 4,316,008 | |
Taiwan Semiconductor Manufacturing Co., Ltd. - ADR (b) | | | 151,186 | | | | 11,261,845 | |
Texas Instruments, Inc. | | | 21,699 | | | | 3,585,109 | |
| | | | | | | | 90,709,747 | |
Software — 31.1% (d) | | | | | | | | |
Activision Blizzard, Inc. | | | 29,349 | | | | 2,246,666 | |
Adobe, Inc. (a) | | | 12,787 | | | | 4,303,209 | |
Akamai Technologies, Inc. (a) | | | 50,586 | | | | 4,264,400 | |
Autodesk, Inc. (a) | | | 64,684 | | | | 12,087,499 | |
Bentley Systems, Inc. - Class B | | | 55,069 | | | | 2,035,350 | |
Cloudflare, Inc. - Class A (a) | | | 89,977 | | | | 4,067,860 | |
Electronic Arts, Inc. | | | 46,032 | | | | 5,624,190 | |
Krafton, Inc. (a)(b) | | | 16,374 | | | | 2,175,431 | |
Matterport, Inc. (a)(e) | | | 2,386,833 | | | | 6,683,132 | |
Microsoft Corp. | | | 92,148 | | | | 22,098,933 | |
NetEase, Inc. - ADR (b) | | | 64,613 | | | | 4,692,842 | |
PTC, Inc. (a) | | | 17,671 | | | | 2,121,227 | |
ROBLOX Corp. - Class A (a) | | | 924,225 | | | | 26,303,444 | |
Take-Two Interactive Software, Inc. (a)(e) | | | 69,019 | | | | 7,186,948 | |
Unity Software, Inc. (a)(e) | | | 325,749 | | | | 9,313,164 | |
| | | | | | | | 115,204,295 | |
Telecommunications — 1.7% | | | | | | | | |
Lumen Technologies, Inc. (e) | | | 823,876 | | | | 4,300,633 | |
Planet Labs PBC (a)(e) | | | 424,287 | | | | 1,845,648 | |
| | | | | | | | 6,146,281 | |
Toys/Games/Hobbies — 0.6% | | | | | | | | |
Nintendo Co., Ltd. (b) | | | 55,000 | | | | 2,305,961 | |
| | | | | | | | | |
TOTAL COMMON STOCKS (Cost $618,951,613) | | | | | | | 367,396,231 | |
| | | | | | | | | |
REAL ESTATE INVESTMENT TRUSTS — 0.6% | | | | | | | | |
Equinix, Inc. (e) | | | 3,427 | | | | 2,244,788 | |
TOTAL REAL ESTATE INVESTMENT TRUSTS (Cost $2,713,291) | | | | | | | 2,244,788 | |
The accompanying notes are an integral part of the financial statements.
19
Roundhill Ball Metaverse ETF
Schedule of Investments
December 31, 2022 (Continued)
Description | | Shares | | | Value | |
SHORT-TERM INVESTMENTS — 0.3% | | | | | | | | |
Money Market Fund — 0.3% | | | | | | | | |
First American Government Obligations Fund, Class X, 4.08% (c) | | | 655,679 | | | $ | 655,679 | |
TOTAL SHORT-TERM INVESTMENTS (Cost $655,679) | | | | | | | 655,679 | |
| | | | | | | | | |
INVESTMENTS PURCHASED WITH PROCEEDS FROM SECURITIES LENDING — 5.6% | | | | | | | | |
Mount Vernon Liquid Assets Portfolio, LLC, 4.49% (c) | | | 20,899,790 | | | | 20,899,790 | |
TOTAL INVESTMENTS PURCHASED WITH PROCEEDS FROM SECURITIES LENDING (Cost $20,899,790) | | | | | | | 20,899,790 | |
| | | | | | | | | |
TOTAL INVESTMENTS (Cost $643,220,373) — 105.7% | | | | | | | 391,196,488 | |
Other assets and liabilities, net — (5.7)% | | | | | | | (20,954,613 | ) |
NET ASSETS — 100.0% | | | | | | $ | 370,241,875 | |
ADR American Depositary Receipt
(a) | Non-income producing security. |
(b) | Foreign issued security, or represents a foreign issued security. |
(c) | The rate shown is the seven day yield at period end. |
(d) | To the extent the Fund invests more heavily in particular sectors of the economy, its performance will be especially sensitive to developments that significantly affect those sectors. |
(e) | All or a portion of this security is on loan as of December 31, 2022. The market value of securities out on loan is $20,434,910. |
Percentages are stated as a percent of net assets.
COUNTRY | Percentage
of Net
Assets |
United States | 74.4% |
Cayman Islands | 10.8% |
Republic of Korea | 4.0% |
Japan | 3.8% |
Taiwan | 3.0% |
Netherlands | 1.5% |
Sweden | 1.1% |
Canada | 0.6% |
Total Country | 99.2% |
REAL ESTATE INVESTMENT TRUSTS | 0.6% |
SHORT-TERM INVESTMENTS | 0.3% |
INVESTMENTS PURCHASED WITH PROCEEDS FROM SECURITIES LENDING | 5.6% |
TOTAL INVESTMENTS | 105.7% |
Other assets and liabilities, net | -5.7% |
NET ASSETS | 100.0% |
The accompanying notes are an integral part of the financial statements.
20
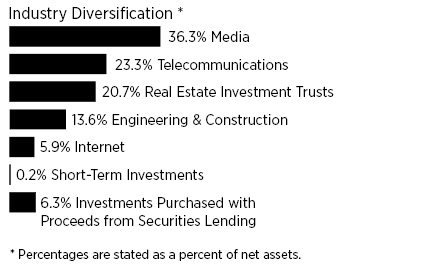
Roundhill IO Digital Infrastructure ETF
Schedule of Investments
December 31, 2022
Description | | Shares | | | Value | |
COMMON STOCKS — 79.1% | | | | | | | | |
Engineering & Construction — 13.6% | | | | | | | | |
Cellnex Telecom SA (b)(c) | | | 5,455 | | | $ | 180,011 | |
China Tower Corp., Ltd. (b)(c) | | | 1,138,000 | | | | 122,476 | |
Infrastrutture Wireless Italiane SpA (b)(c) | | | 2,669 | | | | 26,816 | |
Sarana Menara Nusantara Tbk PT (b) | | | 834,600 | | | | 58,973 | |
| | | | | | | | 388,276 | |
Internet — 5.9% | | | | | | | | |
ARTERIA Networks Corp. (b) | | | 2,600 | | | | 24,494 | |
Cogent Communications Holdings, Inc. | | | 1,960 | | | | 111,877 | |
Vnet Group, Inc. - ADR (a)(b)(f) | | | 5,512 | | | | 31,253 | |
| | | | | | | | 167,624 | |
Media — 36.3% (e) | | | | | | | | |
Altice USA, Inc. - Class A (a) | | | 18,135 | | | | 83,421 | |
Cable One, Inc. | | | 143 | | | | 101,796 | |
Charter Communications, Inc. - Class A (a) | | | 603 | | | | 204,477 | |
Cogeco Communications, Inc. (b) | | | 4,032 | | | | 228,508 | |
Comcast Corp. - Class A | | | 6,390 | | | | 223,458 | |
Converge Information and Communications Technology Solutions, Inc. (a)(b) | | | 84,100 | | | | 23,965 | |
Liberty Global PLC - Class A (a)(b) | | | 1,289 | | | | 24,401 | |
Liberty Latin America, Ltd. - Class C (a)(b) | | | 3,640 | | | | 27,664 | |
NOS SGPS SA (b) | | | 7,095 | | | | 28,653 | |
Quebecor, Inc. - Class B (b) | | | 1,181 | | | | 26,323 | |
Telenet Group Holding NV (b) | | | 1,770 | | | | 28,808 | |
WideOpenWest, Inc. (a) | | | 3,773 | | | | 34,372 | |
| | | | | | | | 1,035,846 | |
Telecommunications — 23.3% | | | | | | | | |
Chindata Group Holdings, Ltd. - ADR (a)(b) | | | 2,953 | | | | 23,535 | |
Chorus, Ltd. (b) | | | 5,212 | | | | 26,898 | |
Consolidated Communications Holdings, Inc. (a) | | | 14,874 | | | | 53,249 | |
Cyxtera Technologies, Inc. (a)(f) | | | 12,699 | | | | 24,382 | |
DigitalBridge Group, Inc. | | | 5,712 | | | | 62,489 | |
GDS Holdings, Ltd. - ADR (a)(b)(f) | | | 1,084 | | | | 22,352 | |
Telecommunications (Continued) | | | | | | | | |
Gogo, Inc. (a) | | | 10,162 | | | $ | 149,991 | |
HKBN, Ltd. (b) | | | 26,000 | | | | 16,756 | |
Lumen Technologies, Inc. | | | 17,580 | | | | 91,768 | |
NetLink NBN Trust (b) | | | 37,886 | | | | 23,446 | |
NEXTDC, Ltd. (a)(b) | | | 3,854 | | | | 23,784 | |
Telekom Malaysia Berhad (b) | | | 81,411 | | | | 99,800 | |
TIME dotCom Berhad (b) | | | 23,969 | | | | 26,662 | |
Tower Bersama Infrastructure Tbk PT (b) | | | 129,000 | | | | 19,059 | |
| | | | | | | | 664,171 | |
TOTAL COMMON STOCKS (Cost $2,817,782) | | | | | | | 2,255,917 | |
| | | | | | | | | |
REAL ESTATE INVESTMENT TRUSTS — 20.7% | | | | | | | | |
American Tower Corp. | | | 799 | | | | 169,276 | |
Crown Castle International Corp. | | | 498 | | | | 67,549 | |
Digital Realty Trust, Inc. (f) | | | 701 | | | | 70,289 | |
Equinix, Inc. | | | 184 | | | | 120,525 | |
Keppel DC REIT (b) | | | 18,544 | | | | 24,473 | |
SBA Communications Corp. | | | 315 | | | | 88,298 | |
Uniti Group, Inc. (f) | | | 9,157 | | | | 50,638 | |
TOTAL REAL ESTATE INVESTMENT TRUSTS (Cost $691,841) | | | | | | | 591,048 | |
| | | | | | | | | |
SHORT-TERM INVESTMENTS — 0.2% | | | | | | | | |
Money Market Fund — 0.2% | | | | | | | | |
First American Government Obligations Fund, Class X, 4.08% (d) | | | 6,344 | | | | 6,344 | |
TOTAL SHORT-TERM INVESTMENTS (Cost $6,344) | | | | | | | 6,344 | |
| | | | | | | | | |
INVESTMENTS PURCHASED WITH PROCEEDS FROM SECURITIES LENDING — 6.3% | | | | | | | | |
Mount Vernon Liquid Assets Portfolio, LLC, 4.49% (d) | | | 178,993 | | | | 178,993 | |
TOTAL INVESTMENTS PURCHASED WITH PROCEEDS FROM SECURITIES LENDING (Cost $178,993) | | | | | | | 178,993 | |
| | | | | | | | | |
TOTAL INVESTMENTS (Cost $3,694,960) — 106.3% | | | | | | | 3,032,302 | |
Other assets and liabilities, net — (6.3)% | | | | | | | (178,433 | ) |
NET ASSETS — 100.0% | | | | | | $ | 2,853,869 | |
ADR American Depositary Receipt
PLC Public Limited Company
(a) | Non-income producing security. |
The accompanying notes are an integral part of the financial statements.
21
Roundhill IO Digital Infrastructure ETF
Schedule of Investments
December 31, 2022 (Continued)
(b) | Foreign issued security, or represents a foreign issued security. |
(c) | Security exempt from registration pursuant to Rule 144a under the Securities Act of 1933, as amended. These securities may be resold in transactions exempt from registration to qualified institutional investors. |
(d) | The rate shown is the seven day yield at period end. |
(e) | To the extent the Fund invests more heavily in particular sectors of the economy, its performance will be especially sensitive to developments that significantly affect those sectors. |
(f) | All or a portion of this security is on loan as of December 31, 2022. The market value of securities out on loan is $169,957. |
Percentages are stated as a percent of net assets.
COUNTRY | Percentage
of Net
Assets |
United States | 40.1% |
Canada | 8.9% |
Spain | 6.3% |
Malaysia | 4.4% |
China | 4.3% |
Cayman Islands | 3.3% |
Indonesia | 2.7% |
Belgium | 1.0% |
Portugal | 1.0% |
Bermuda | 1.0% |
New Zealand | 1.0% |
Italy | 0.9% |
Japan | 0.9% |
United Kingdom | 0.9% |
Philippines | 0.8% |
Australia | 0.8% |
Singapore | 0.8% |
Total Country | 79.1% |
REAL ESTATE INVESTMENT TRUSTS | 20.7% |
SHORT-TERM INVESTMENTS | 0.2% |
INVESTMENTS PURCHASED WITH PROCEEDS FROM SECURITIES LENDING | 6.3% |
TOTAL INVESTMENTS | 106.3% |
Other assets and liabilities, net | -6.3% |
NET ASSETS | 100.0% |
The accompanying notes are an integral part of the financial statements.
22
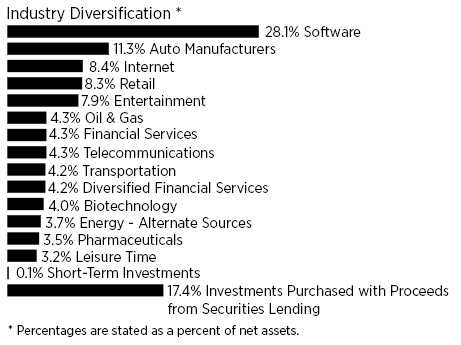
Roundhill MEME ETF
Schedule of Investments
December 31, 2022
Description | | Shares | | | Value | |
COMMON STOCKS — 99.7% | | | | | | | | |
Auto Manufacturers — 11.3% | | | | | | | | |
NIO, Inc. - ADR (a)(b) | | | 2,829 | | | $ | 27,583 | |
Tesla, Inc. (a) | | | 218 | | | | 26,853 | |
XPeng, Inc. - ADR (a)(b)(d) | | | 3,186 | | | | 31,669 | |
| | | | | | | | 86,105 | |
Biotechnology — 4.0% | | | | | | | | |
Moderna, Inc. (a) | | | 170 | | | | 30,535 | |
| | | | | | | | | |
Diversified Financial Services — 4.2% | | | | | | | | |
Coinbase Global, Inc. - Class A (a)(d) | | | 897 | | | | 31,745 | |
| | | | | | | | | |
Energy - Alternate Sources — 3.7% | | | | | | | | |
Enphase Energy, Inc. (a) | | | 108 | | | | 28,616 | |
| | | | | | | | | |
Entertainment — 7.9% | | | | | | | | |
AMC Entertainment Holdings, Inc. - Class A (a)(d) | | | 6,179 | | | | 25,148 | |
Manchester United PLC - Class A (b) | | | 1,502 | | | | 35,042 | |
| | | | | | | | 60,190 | |
Financial Services — 4.3% | | | | | | | | |
Sofi Technologies, Inc. (a) | | | 7,072 | | | | 32,602 | |
| | | | | | | | | |
Internet — 8.4% | | | | | | | | |
Alibaba Group Holding, Ltd. - ADR (a)(b) | | | 378 | | | | 33,298 | |
Robinhood Markets, Inc. - Class A (a) | | | 3,811 | | | | 31,022 | |
| | | | | | | | 64,320 | |
Leisure Time — 3.2% | | | | | | | | |
Peloton Interactive, Inc. - Class A (a) | | | 3,064 | | | | 24,328 | |
| | | | | | | | | |
Oil & Gas — 4.3% | | | | | | | | |
Occidental Petroleum Corp. | | | 525 | | | | 33,070 | |
Pharmaceuticals — 3.5% | | | | | | | | |
Tilray Brands, Inc. (a)(d) | | | 10,065 | | | $ | 27,075 | |
| | | | | | | | | |
Retail — 8.3% | | | | | | | | |
GameStop Corp. - Class A (a)(d) | | | 1,578 | | | | 29,130 | |
Ulta Beauty, Inc. (a) | | | 73 | | | | 34,242 | |
| | | | | | | | 63,372 | |
Software — 28.1% (e) | | | | | | | | |
Blackberry, Ltd. (a)(b) | | | 7,775 | | | | 25,346 | |
Cloudfare, Inc. - Class A (a) | | | 690 | | | | 31,195 | |
DocuSign, Inc. (a) | | | 583 | | | | 32,310 | |
Gitlab, Inc. - Class A (a) | | | 659 | | | | 29,945 | |
MongoDB, Inc. (a) | | | 162 | | | | 31,888 | |
Palantir Technologies, Inc. - Class A (a) | | | 4,755 | | | | 30,527 | |
Snowflake, Inc. - Class A (a) | | | 230 | | | | 33,014 | |
| | | | | | | | 214,225 | |
Telecommunications — 4.3% | | | | | | | | |
Ubiquiti, Inc. | | | 119 | | | | 32,550 | |
| | | | | | | | | |
Transportation — 4.2% | | | | | | | | |
ZIM Integrated Shipping Services, Ltd. (b)(d) | | | 1,870 | | | | 32,145 | |
| | | | | | | | | |
TOTAL COMMON STOCKS (Cost $855,203) | | | | | | | 760,878 | |
| | | | | | | | | |
SHORT-TERM INVESTMENTS — 0.1% | | | | | | | | |
Money Market Fund — 0.1% | | | | | | | | |
First American Government Obligations Fund, Class X, 4.08% (c) | | | 813 | | | | 813 | |
TOTAL SHORT-TERM INVESTMENTS (Cost $813) | | | | | | | 813 | |
| | | | | | | | | |
INVESTMENTS PURCHASED WITH PROCEEDS FROM SECURITIES LENDING — 17.4% | | | | | | | | |
Mount Vernon Liquid Assets Portfolio, LLC, 4.49% (c) | | | 132,687 | | | | 132,687 | |
TOTAL INVESTMENTS PURCHASED WITH PROCEEDS FROM SECURITIES LENDING (Cost $132,687) | | | | | | | 132,687 | |
| | | | | | | | | |
TOTAL INVESTMENTS (Cost $988,703) — 117.2% | | | | | | | 894,378 | |
Other assets and liabilities, net — (17.2)% | | | | | | | (131,579 | ) |
NET ASSETS — 100.0% | | | | | | $ | 762,799 | |
ADR American Depositary Receipt
PLC Public Limited Company
(a) | Non-income producing security. |
The accompanying notes are an integral part of the financial statements.
23
Roundhill MEME ETF
Schedule of Investments
December 31, 2022 (Continued)
(b) | Foreign issued security, or represents a foreign issued security. |
(c) | The rate shown is the seven day yield at period end. |
(d) | All or a portion of this security is on loan as of December 31, 2022. The market value of securities out on loan is $129,460. |
(e) | To the extent the Fund invests more heavily in particular sectors of the economy, its performance will be especially sensitive to developments that significantly affect those sectors. |
Percentages are stated as a percent of net assets.
COUNTRY | Percentage
of Net
Assets |
United States | 75.5% |
Cayman Islands | 16.7% |
Israel | 4.2% |
Canada | 3.3% |
Total Country | 99.7% |
SHORT-TERM INVESTMENTS | 0.1% |
INVESTMENTS PURCHASED WITH PROCEEDS FROM SECURITIES LENDING | 17.4% |
TOTAL INVESTMENTS | 117.2% |
Other assets and liabilities, net | -17.2% |
NET ASSETS | 100.0% |
The accompanying notes are an integral part of the financial statements.
24
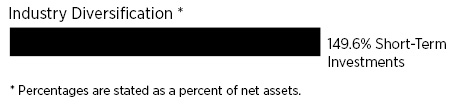
Roundhill Cannabis ETF
Schedule of Investments
December 31, 2022
Description | | Shares | | | Value | |
SHORT-TERM INVESTMENTS — 149.6% | | | | | | | | |
Money Market Fund — 23.9% | | | | | | | | |
First American Government Obligations Fund, Class X, 4.08% (a) | | | 356,814 | | | $ | 356,814 | |
Total Money Market Fund (Cost $356,814) | | | | | | | 356,814 | |
| | | | | | | | | |
U.S. Treasury Bills — 125.7% | | | | | | | | |
4.11%, 02/02/2023 (b)(c) | | | 1,888,000 | | | | 1,881,254 | |
Total U.S. Treasury Bills (Cost $1,881,254) | | | | | | | 1,881,254 | |
TOTAL SHORT-TERM INVESTMENTS (Cost $2,238,068) | | | | | | | 2,238,068 | |
| | | | | | | | | |
TOTAL INVESTMENTS (Cost $2,238,068) — 149.6% | | | | | | | 2,238,068 | |
Other assets and liabilities, net — (49.6)% | | | | | | | (741,654 | ) |
NET ASSETS — 100.0% | | | | | | $ | 1,496,414 | |
(a) | The rate shown is the seven day yield at period end. |
(b) | The rate shown is the effective yield as of December 31, 2022. |
(c) | Held as collateral for total return swaps. |
Percentages are stated as a percent of net assets.
| Percentage
of Net
Assets |
SHORT-TERM INVESTMENTS | 149.6% |
TOTAL INVESTMENTS | 149.6% |
Other assets and liabilities, net | -49.6% |
NET ASSETS | 100.0% |
The accompanying notes are an integral part of the financial statements.
25
Roundhill Cannabis ETF
Schedule of Total Return Swaps
December 31, 2022
Long Total Return
Equity Swaps | Fund Pays/
Receives
Reference
Entity | Counterparty | Payment
Frequency | Financing Rate | | Expiration
Date | | | Upfront
Premiums
Paid/Received | | | Notional
Amount | | | Value/
Unrealized
Appreciation
(Depreciation) | |
Columbia Care, Inc. Swap | Receives | Nomura Securities International, Inc. | Monthly | Overnight Bank Funding Rate Index + 1.50% | May 17, 2023 | | $ | — | | | $ | 46,898 | | | $ | — | |
Cresco Labs, Inc. Swap | Receives | Nomura Securities International, Inc. | Monthly | Overnight Bank Funding Rate Index + 1.50% | May 17, 2023 | | | — | | | | 103,406 | | | | — | |
Curaleaf Holdings, Inc. Swap | Receives | Nomura Securities International, Inc. | Monthly | Overnight Bank Funding Rate Index + 1.50% | May 17, 2023 | | | — | | | | 552,989 | | | | — | |
Green Thumb Industries, Inc. Swap | Receives | Nomura Securities International, Inc. | Monthly | Overnight Bank Funding Rate Index + 1.50% | May 17, 2023 | | | — | | | | 346,352 | | | | — | |
Trulieve Cannabis Corp. Swap | Receives | Nomura Securities International, Inc. | Monthly | Overnight Bank Funding Rate Index + 1.50% | May 17, 2023 | | | — | | | | 257,100 | | | | — | |
Verano Holdings Corp. Swap | Receives | Nomura Securities International, Inc. | Monthly | Overnight Bank Funding Rate Index + 1.50% | May 17, 2023 | | | — | | | | 188,077 | | | | — | |
| | | | | | | | | | | $ | — | | | $ | 1,494,822 | | | $ | — | |
The accompanying notes are an integral part of the financial statements.
26
Roundhill ETFs
Statements of Assets and Liabilities
December 31, 2022
| | | Roundhill Video
Games ETF | | | Roundhill
Sports Betting
& iGaming ETF | | | Roundhill Ball
Metaverse ETF | |
Assets | | | | | | | | | | | | |
Investments, at value (Cost $30,586,417, $231,080,505 and $643,220,373, respectively)(1) | | $ | 26,558,977 | | | $ | 128,452,151 | | | $ | 391,196,488 | |
Dividends and interest receivable | | | 54,276 | | | | 72,726 | | | | 115,333 | |
Securities lending income receivable | | | 1,505 | | | | 15,741 | | | | 26,967 | |
Total Assets | | | 26,614,758 | | | | 128,540,618 | | | | 391,338,788 | |
| | | | | | | | | | | | | |
Liabilities | | | | | | | | | | | | |
Payable for collateral on securities loaned (Note 7) | | | 1,354,091 | | | | 10,436,821 | | | | 20,899,790 | |
Payable to Adviser | | | 10,781 | | | | 75,714 | | | | 197,123 | |
Total Liabilities | | | 1,364,872 | | | | 10,512,535 | | | | 21,096,913 | |
Net Assets | | $ | 25,249,886 | | | $ | 118,028,083 | | | $ | 370,241,875 | |
| | | | | | | | | | | | | |
Net Assets Consists of: | | | | | | | | | | | | |
Paid-in capital | | $ | 68,887,755 | | | $ | 301,020,106 | | | $ | 889,147,588 | |
Total distributable earnings (accumulated losses) | | | (43,637,869 | ) | | | (182,992,023 | ) | | | (518,905,713 | ) |
Net Assets | | $ | 25,249,886 | | | $ | 118,028,083 | | | $ | 370,241,875 | |
| | | | | | | | | | | | | |
Shares of beneficial interest outstanding (unlimited number of shares authorized, no par value) | | | 1,800,000 | | | | 8,225,000 | | | | 51,375,000 | |
Net Asset Value, redemption price and offering price per share | | $ | 14.03 | | | $ | 14.35 | | | $ | 7.21 | |
| | | | | | | | | | | | | |
(1) Includes loaned securities with a value of: | | $ | 1,288,861 | | | $ | 9,807,072 | | | $ | 20,434,910 | |
The accompanying notes are an integral part of the financial statements.
27
Roundhill ETFs
Statements of Assets and Liabilities
December 31, 2022 (Continued)
| | | Roundhill
IO Digital
Infrastructure
ETF | | | Roundhill
MEME ETF | | | Roundhill
Cannabis ETF | |
Assets | | | | | | | | | | | | |
Investments, at value (Cost $3,694,960, $988,703 and $2,238,068, respectively)(1) | | $ | 3,032,302 | | | $ | 894,378 | | | $ | 2,238,068 | |
Deposits at broker for total return swap contracts | | | — | | | | — | | | | 100,000 | |
Dividends and interest receivable | | | 3,741 | | | | 7 | | | | 874 | |
Securities lending income receivable | | | 66 | | | | 1,610 | | | | — | |
Total Assets | | | 3,036,109 | | | | 895,995 | | | | 2,338,942 | |
| | | | | | | | | | | | | |
Liabilities | | | | | | | | | | | | |
Payable for collateral on securities loaned (Note 7) | | | 178,993 | | | | 132,687 | | | | — | |
Foreign currency payable to custodian, at value (Cost $1,387, $0, and $0, respectively) | | | 1,401 | | | | — | | | | — | |
Payable for open swap contracts | | | — | | | | — | | | | 841,890 | |
Payable for investment securities purchased | | | — | | | | — | | | | 64 | |
Payable to Adviser | | | 1,846 | | | | 509 | | | | 574 | |
Total Liabilities | | | 182,240 | | | | 133,196 | | | | 842,528 | |
Net Assets | | $ | 2,853,869 | | | $ | 762,799 | | | $ | 1,496,414 | |
| | | | | | | | | | | | | |
Net Assets Consists of: | | | | | | | | | | | | |
Paid-in capital | | $ | 3,689,779 | | | $ | 2,152,025 | | | $ | 2,541,027 | |
Total distributable earnings (accumulated losses) | | | (835,910 | ) | | | (1,389,226 | ) | | | (1,044,613 | ) |
Net Assets | | $ | 2,853,869 | | | $ | 762,799 | | | $ | 1,496,414 | |
| | | | | | | | | | | | | |
Shares of beneficial interest outstanding (unlimited number of shares authorized, no par value) | | | 300,000 | | | | 150,000 | | | | 250,000 | |
Net Asset Value, redemption price and offering price per share | | $ | 9.51 | | | $ | 5.09 | | | $ | 5.99 | |
| | | | | | | | | | | | | |
(1) Includes loaned securities with a value of: | | $ | 169,957 | | | $ | 129,460 | | | $ | — | |
The accompanying notes are an integral part of the financial statements.
28
Roundhill ETFs
Statements of Operations
For the Year or Period Ended December 31, 2022
| | | Roundhill Video
Games ETF | | | Roundhill
Sports Betting
& iGaming ETF | | | Roundhill Ball
Metaverse ETF | |
Investment Income | | | | | | | | | | | | |
Dividend income (net of withholding taxes and issuance fees of $93,069, $117,372 and $168,685, respectively) | | $ | 424,031 | | | $ | 1,562,259 | | | $ | 3,551,501 | |
Securities lending income, net | | | 55,324 | | | | 218,212 | | | | 247,684 | |
Interest income | | | 538 | | | | 4,573 | | | | 9,109 | |
Total investment income | | | 479,893 | | | | 1,785,044 | | | | 3,808,294 | |
| | | | | | | | | | | | | |
Expenses | | | | | | | | | | | | |
Advisory fees | | | 187,134 | | | | 1,180,405 | | | | 3,454,804 | |
Tax expense | | | 185 | | | | 185 | | | | 185 | |
Total expenses | | | 187,319 | | | | 1,180,590 | | | | 3,454,989 | |
Net investment income | | | 292,574 | | | | 604,454 | | | | 353,305 | |
| | | | | | | | | | | | | |
Realized and Unrealized Gain (Loss) on Investments and Foreign Currency | | | | | | | | | | | | |
Net realized gain (loss) from: | | | | | | | | | | | | |
Investments | | | (37,434,720 | ) | | | (67,265,524 | ) | | | (289,899,477 | ) |
Foreign currency transactions | | | (35,947 | ) | | | (242,380 | ) | | | (136,782 | ) |
Net realized loss on investments and foreign currency transactions | | | (37,470,667 | ) | | | (67,507,904 | ) | | | (290,036,259 | ) |
Net change in unrealized appreciation/depreciation on: | | | | | | | | | | | | |
Investments | | | 13,822,750 | | | | (41,814,630 | ) | | | (211,467,833 | ) |
Foreign currency translation | | | (553 | ) | | | (2,302 | ) | | | 2,257 | |
Net change in unrealized appreciation/depreciation on investments and foreign currency translation | | | 13,822,197 | | | | (41,816,932 | ) | | | (211,465,576 | ) |
Net realized and unrealized loss on investments and foreign currency transactions | | | (23,648,470 | ) | | | (109,324,836 | ) | | | (501,501,835 | ) |
Net decrease in net assets from operations | | $ | (23,355,896 | ) | | $ | (108,720,382 | ) | | $ | (501,148,530 | ) |
The accompanying notes are an integral part of the financial statements.
29
Roundhill ETFs
Statements of Operations
For the Year or Period Ended December 31, 2022 (Continued)
| | | Roundhill
IO Digital
Infrastructure
ETF | | | Roundhill
MEME ETF | | | Roundhill
Cannabis ETF(1) | |
Investment Income | | | | | | | | | | | | |
Dividend income (net of withholding taxes and issuance fees of $3,104, $3,306 and $0, respectively) | | $ | 49,015 | | | $ | 17,769 | | | $ | 5,364 | |
Securities lending income, net | | | 112 | | | | 5,783 | | | | 56 | |
Interest income | | | 200 | | | | 44 | | | | 15,090 | |
Total investment income | | | 49,327 | | | | 23,596 | | | | 20,510 | |
| | | | | | | | | | | | | |
Expenses | | | | | | | | | | | | |
Advisory fees | | | 16,443 | | | | 8,039 | | | | 8,377 | |
Tax expense | | | 185 | | | | — | | | | — | |
Total expenses | | | 16,628 | | | | 8,039 | | | | 8,377 | |
Less waivers and reimbursement by Adviser | | | — | | | | — | | | | (2,624 | ) |
Net expenses | | | 16,628 | | | | 8,039 | | | | 5,753 | |
Net investment income | | | 32,699 | | | | 15,557 | | | | 14,757 | |
| | | | | | | | | | | | | |
Realized and Unrealized Gain (Loss) on Investments, Foreign Currency and Total Return Swap Contracts | | | | | | | | | | | | |
Net realized gain (loss) from: | | | | | | | | | | | | |
Investments | | | (174,589 | ) | | | (1,511,460 | ) | | | (379,583 | ) |
Foreign currency transactions | | | (3,553 | ) | | | — | | | | — | |
Total return swap contracts | | | — | | | | — | | | | (926,708 | ) |
Net realized loss on investments, foreign currency transactions and total return swap contracts | | | (178,142 | ) | | | (1,511,460 | ) | | | (1,306,291 | ) |
Net change in unrealized appreciation/depreciation on: | | | | | | | | | | | | |
Investments | | | (693,878 | ) | | | 108,396 | | | | — | |
Foreign currency translation | | | 41 | | | | — | | | | — | |
Net change in unrealized appreciation/depreciation on investments and foreign currency translation | | | (693,837 | ) | | | 108,396 | | | | — | |
Net realized and unrealized loss on investments, foreign currency transactions and total return swap contracts | | | (871,979 | ) | | | (1,403,064 | ) | | | (1,306,291 | ) |
Net decrease in net assets from operations | | $ | (839,280 | ) | | $ | (1,387,507 | ) | | $ | (1,291,534 | ) |
(1) | The Fund commenced operations on April 20, 2022. |
The accompanying notes are an integral part of the financial statements.
30
Roundhill Video Games ETF
Statements of Changes in Net Assets
| | | Year
Ended
December 31,
2022 | | | Year
Ended
December 31,
2021 | |
From Operations | | | | | | | | |
Net investment income | | $ | 292,574 | | | $ | 147,487 | |
Net realized gain (loss) on investments and foreign currency transactions | | | (37,470,667 | ) | | | 9,593,128 | |
Net change in net unrealized appreciation/depreciation on investments and foreign currency translation | | | 13,822,197 | | | | (31,265,305 | ) |
Net decrease in net assets resulting from operations | | | (23,355,896 | ) | | | (21,524,690 | ) |
| | | | | | | | | |
From Distributions | | | | | | | | |
Distributable earnings | | | (173,639 | ) | | | (13,010 | ) |
Total distributions | | | (173,639 | ) | | | (13,010 | ) |
| | | | | | | | | |
From Capital Share Transactions | | | | | | | | |
Proceeds from shares sold | | | 2,186,870 | | | | 70,936,003 | |
Cost of shares redeemed | | | (15,895,572 | ) | | | (60,721,313 | ) |
Transaction fees (Note 4) | | | 12,714 | | | | 81,181 | |
Net increase (decrease) in net assets resulting from capital share transactions | | | (13,695,988 | ) | | | 10,295,871 | |
| | | | | | | | | |
Total Decrease in Net Assets | | | (37,225,523 | ) | | | (11,241,829 | ) |
| | | | | | | | | |
Net Assets | | | | | | | | |
Beginning of year | | | 62,475,409 | | | | 73,717,238 | |
End of year | | $ | 25,249,886 | | | $ | 62,475,409 | |
| | | | | | | | | |
Changes in Shares Outstanding | | | | | | | | |
Shares outstanding, beginning of year | | | 2,500,000 | | | | 2,450,000 | |
Shares sold | | | 100,000 | | | | 2,150,000 | |
Shares redeemed | | | (800,000 | ) | | | (2,100,000 | ) |
Shares outstanding, end of year | | | 1,800,000 | | | | 2,500,000 | |
The accompanying notes are an integral part of the financial statements.
31
Roundhill Sports Betting & iGaming ETF
Statements of Changes in Net Assets
| | | Year
Ended
December 31,
2022 | | | Year
Ended
December 31,
2021 | |
From Operations | | | | | | | | |
Net investment income | | $ | 604,454 | | | $ | 1,011,979 | |
Net realized gain (loss) on investments and foreign currency transactions | | | (67,507,904 | ) | | | 81,858,219 | |
Net change in net unrealized appreciation/depreciation on investments and foreign currency translation | | | (41,816,932 | ) | | | (112,322,895 | ) |
Net decrease in net assets resulting from operations | | | (108,720,382 | ) | | | (29,452,697 | ) |
| | | | | | | | | |
From Distributions | | | | | | | | |
Distributable earnings | | | (309,837 | ) | | | — | |
Return of capital | | | (470,671 | ) | | | — | |
Total distributions | | | (780,508 | ) | | | — | |
| | | | | | | | | |
From Capital Share Transactions | | | | | | | | |
Proceeds from shares sold | | | 53,179,428 | | | | 441,244,838 | |
Cost of shares redeemed | | | (116,157,365 | ) | | | (328,186,713 | ) |
Transaction fees (Note 4) | | | — | | | | 10,185 | |
Net increase (decrease) in net assets resulting from capital share transactions | | | (62,977,937 | ) | | | 113,068,310 | |
| | | | | | | | | |
Total Increase (Decrease) in Net Assets | | | (172,478,827 | ) | | | 83,615,613 | |
| | | | | | | | | |
Net Assets | | | | | | | | |
Beginning of year | | | 290,506,910 | | | | 206,891,297 | |
End of year | | $ | 118,028,083 | | | $ | 290,506,910 | |
| | | | | | | | | |
Changes in Shares Outstanding | | | | | | | | |
Shares outstanding, beginning of year | | | 11,675,000 | | | | 8,000,000 | |
Shares sold | | | 2,950,000 | | | | 14,650,000 | |
Shares redeemed | | | (6,400,000 | ) | | | (10,975,000 | ) |
Shares outstanding, end of year | | | 8,225,000 | | | | 11,675,000 | |
The accompanying notes are an integral part of the financial statements.
32
Roundhill Ball Metaverse ETF
Statements of Changes in Net Assets
| | | Year
Ended
December 31,
2022 | | | Period
Ended
December 31,
2021(1) | |
From Operations | | | | | | | | |
Net investment income (loss) | | $ | 353,305 | | | $ | (178,353 | ) |
Net realized loss on investments and foreign currency transactions | | | (290,036,259 | ) | | | (6,889,591 | ) |
Net change in net unrealized appreciation/depreciation on investments and foreign currency translation | | | (211,465,576 | ) | | | (40,558,298 | ) |
Net decrease in net assets resulting from operations | | | (501,148,530 | ) | | | (47,626,242 | ) |
| | | | | | | | | |
From Distributions | | | | | | | | |
Distributable earnings | | | (325,056 | ) | | | — | |
Return of capital | | | (7,036 | ) | | | — | |
Total distributions | | | (332,092 | ) | | | — | |
| | | | | | | | | |
From Capital Share Transactions | | | | | | | | |
Proceeds from shares sold | | | 133,681,117 | | | | 1,051,713,977 | |
Cost of shares redeemed | | | (195,090,255 | ) | | | (71,116,640 | ) |
Transaction fees (Note 4) | | | 72,625 | | | | 87,915 | |
Net increase (decrease) in net assets resulting from capital share transactions | | | (61,336,513 | ) | | | 980,685,252 | |
| | | | | | | | | |
Total Increase (Decrease) in Net Assets | | | (562,817,135 | ) | | | 933,059,010 | |
| | | | | | | | | |
Net Assets | | | | | | | | |
Beginning of period | | | 933,059,010 | | | | — | |
End of period | | $ | 370,241,875 | | | $ | 933,059,010 | |
| | | | | | | | | |
Changes in Shares Outstanding | | | | | | | | |
Shares outstanding, beginning of period | | | 61,525,000 | | | | — | |
Shares sold | | | 11,500,000 | | | | 66,300,000 | |
Shares redeemed | | | (21,650,000 | ) | | | (4,775,000 | ) |
Shares outstanding, end of period | | | 51,375,000 | | | | 61,525,000 | |
(1) | The Fund commenced operations on June 29, 2021. |
The accompanying notes are an integral part of the financial statements.
33
Roundhill IO Digital Infrastructure ETF
Statements of Changes in Net Assets
| | | Year
Ended
December 31,
2022 | | | Period
Ended
December 31,
2021(1) | |
From Operations | | | | | | | | |
Net investment income | | $ | 32,699 | | | $ | 3,200 | |
Net realized gain (loss) on investments and foreign currency transactions | | | (178,142 | ) | | | 5,408 | |
Net change in net unrealized appreciation/depreciation on investments and foreign currency translation | | | (693,837 | ) | | | 31,173 | |
Net increase (decrease) in net assets resulting from operations | | | (839,280 | ) | | | 39,781 | |
| | | | | | | | | |
From Distributions | | | | | | | | |
Distributable earnings | | | (31,809 | ) | | | (4,602 | ) |
Total distributions | | | (31,809 | ) | | | (4,602 | ) |
| | | | | | | | | |
From Capital Share Transactions | | | | | | | | |
Proceeds from shares sold | | | 1,840,133 | | | | 1,849,012 | |
Transaction fees (Note 4) | | | 498 | | | | 136 | |
Net increase in net assets resulting from capital share transactions | | | 1,840,631 | | | | 1,849,148 | |
| | | | | | | | | |
Total Increase in Net Assets | | | 969,542 | | | | 1,884,327 | |
| | | | | | | | | |
Net Assets | | | | | | | | |
Beginning of period | | | 1,884,327 | | | | — | |
End of period | | $ | 2,853,869 | | | $ | 1,884,327 | |
| | | | | | | | | |
Changes in Shares Outstanding | | | | | | | | |
Shares outstanding, beginning of period | | | 125,000 | | | | — | |
Shares sold | | | 175,000 | | | | 125,000 | |
Shares outstanding, end of period | | | 300,000 | | | | 125,000 | |
(1) | The Fund commenced operations on October 27, 2021. |
The accompanying notes are an integral part of the financial statements.
34
Roundhill MEME ETF
Statements of Changes in Net Assets
| | | Year
Ended
December 31,
2022 | | | Period
Ended
December 31,
2021(1) | |
From Operations | | | | | | | | |
Net investment income (loss) | | $ | 15,557 | | | $ | (1,038 | ) |
Net realized loss on investments and foreign currency transactions | | | (1,511,460 | ) | | | (11,129 | ) |
Net change in net unrealized appreciation/depreciation on investments and foreign currency translation | | | 108,396 | | | | (202,721 | ) |
Net decrease in net assets resulting from operations | | | (1,387,507 | ) | | | (214,888 | ) |
| | | | | | | | | |
From Distributions | | | | | | | | |
Distributable earnings | | | (15,557 | ) | | | — | |
Return of capital | | | (5,264 | ) | | | — | |
Total distributions | | | (20,821 | ) | | | — | |
| | | | | | | | | |
From Capital Share Transactions | | | | | | | | |
Proceeds from shares sold | | | 2,446,145 | | | | 3,018,945 | |
Cost of shares redeemed | | | (2,384,240 | ) | | | (694,835 | ) |
Net increase in net assets resulting from capital share transactions | | | 61,905 | | | | 2,324,110 | |
| | | | | | | | | |
Total Increase (Decrease) in Net Assets | | | (1,346,423 | ) | | | 2,109,222 | |
| | | | | | | | | |
Net Assets | | | | | | | | |
Beginning of period | | | 2,109,222 | | | | — | |
End of period | | $ | 762,799 | | | $ | 2,109,222 | |
| | | | | | | | | |
Changes in Shares Outstanding | | | | | | | | |
Shares outstanding, beginning of period | | | 150,000 | | | | — | |
Shares sold | | | 350,000 | | | | 200,000 | |
Shares redeemed | | | (350,000 | ) | | | (50,000 | ) |
Shares outstanding, end of period | | | 150,000 | | | | 150,000 | |
(1) | The Fund commenced operations on December 7, 2021. |
The accompanying notes are an integral part of the financial statements.
35
Roundhill Cannabis ETF
Statement of Changes in Net Assets
| | | Period
Ended
December 31,
2022(1) | |
From Operations | | | | |
Net investment income | | $ | 14,757 | |
Net realized loss on investments, foreign currency transactions and swap contracts | | | (1,306,291 | ) |
Net decrease in net assets resulting from operations | | | (1,291,534 | ) |
| | | | | |
From Capital Share Transactions | | | | |
Proceeds from shares sold | | | 2,786,382 | |
Transaction fees (Note 4) | | | 1,566 | |
Net increase in net assets resulting from capital share transactions | | | 2,787,948 | |
| | | | | |
Total Increase in Net Assets | | | 1,496,414 | |
| | | | | |
Net Assets | | | | |
Beginning of period | | | — | |
End of period | | $ | 1,496,414 | |
| | | | | |
Changes in Shares Outstanding | | | | |
Shares outstanding, beginning of period | | | — | |
Shares sold | | | 250,000 | |
Shares outstanding, end of period | | | 250,000 | |
(1) | The Fund commenced operations on April 20, 2022. |
The accompanying notes are an integral part of the financial statements.
36
THIS PAGE INTENTIONALLY LEFT BLANK
Roundhill ETFs
Financial Highlights
| | | Per Share Operating Performance
(For a share outstanding throughout each period) | |
| | | | | | | Income from Investment Operations: | | | Less Distributions Paid From: | |
| | Net Asset
Value,
Beginning
of Period | | | Net
investment
income
(loss)(1) | | | Net realized
and
unrealized
gain
(loss) on
investments | | | Total from
investment
operations | | | Net
investment
income | | | Net realized
gains | | | Return of
capital | | | Total
distributions
paid | |
Roundhill Video Games ETF | | | | | | | | | | | | | | | | | | | | | | | | |
For the year 01/01/2022 - 12/31/2022 | | $ | 24.99 | | | | 0.14 | | | | (11.01 | ) | | | (10.87 | ) | | | (0.10 | ) | | | — | | | | — | | | | (0.10 | ) |
For the year 01/01/2021 - 12/31/2021 | | $ | 30.09 | | | | 0.05 | | | | (5.17 | ) | | | (5.12 | ) | | | (0.01 | ) | | | — | | | | — | | | | (0.01 | ) |
For the year 01/01/2020 - 12/31/2020 | | $ | 16.01 | | | | 0.04 | | | | 14.34 | | | | 14.38 | | | | (0.10 | ) | | | (0.22 | ) | | | — | | | | (0.32 | ) |
For the period 06/03/2019(7) - 12/31/2019 | | $ | 14.86 | | | | 0.08 | | | | 1.11 | | | | 1.19 | | | | (0.05 | ) | | | — | | | | (0.00 | )(8) | | | (0.05 | ) |
Roundhill Sports Betting & iGaming ETF | | | | | | | | | | | | | | | | | | | | | | | | | | | | |
For the year 01/01/2022 - 12/31/2022 | | $ | 24.88 | | | | 0.07 | | | | (10.51 | ) | | | (10.44 | ) | | | (0.04 | ) | | | — | | | | (0.05 | ) | | | (0.09 | ) |
For the year 01/01/2021 - 12/31/2021 | | $ | 25.86 | | | | 0.08 | | | | (1.06 | ) | | | (0.98 | ) | | | — | | | | — | | | | — | | | | — | |
For the period 06/03/2020(7) - 12/31/2020 | | $ | 15.41 | | | | 0.11 | | | | 10.41 | | | | 10.52 | | | | (0.07 | ) | | | — | | | | (0.00 | )(8) | | | (0.07 | ) |
Roundhill Ball Metaverse ETF | | | | | | | | | | | | | | | | | | | | | | | | | | | | |
For the year 01/01/2022 - 12/31/2022 | | $ | 15.17 | | | | 0.01 | | | | (7.96 | ) | | | (7.95 | ) | | | (0.01 | ) | | | — | | | | (0.00 | )(8) | | | (0.01 | ) |
For the period 06/29/2021(7) - 12/31/2021 | | $ | 15.07 | | | | (0.01 | ) | | | 0.10 | (9) | | | 0.09 | | | | — | | | | — | | | | — | | | | — | |
Roundhill IO Digital Infrastructure ETF | | | | | | | | | | | | | | | | | | | | | | | | | | | | |
For the year 01/01/2022 - 12/31/2022 | | $ | 15.07 | | | | 0.17 | | | | (5.62 | ) | | | (5.45 | ) | | | (0.11 | ) | | | (0.00 | )(8) | | | — | | | | (0.11 | ) |
For the period 10/27/2021(7) - 12/31/2021 | | $ | 14.85 | | | | 0.03 | | | | 0.23 | | | | 0.26 | | | | (0.04 | ) | | | — | | | | — | | | | (0.04 | ) |
Roundhill MEME ETF | | | | | | | | | | | | | | | | | | | | | | | | | | | | |
For the year 01/01/2022 - 12/31/2022 | | $ | 14.06 | | | | 0.11 | | | | (8.94 | ) | | | (8.83 | ) | | | (0.10 | ) | | | — | | | | (0.04 | ) | | | (0.14 | ) |
For the period 12/07/2021(7) - 12/31/2021 | | $ | 15.64 | | | | (0.01 | ) | | | (1.57 | ) | | | (1.58 | ) | | | — | | | | — | | | | — | | | | — | |
Roundhill Cannabis ETF | | | | | | | | | | | | | | | | | | | | | | | | |
For the period 04/20/2022(7) - 12/31/2022 | | $ | 15.32 | | | | 0.09 | | | | (9.43 | ) | | | (9.34 | ) | | | — | | | | — | | | | — | | | | — | |
(1) | Per share net investment income (loss) was calculated using average shares outstanding. |
(2) | Annualized for periods less than one year. |
(3) | Total return in the table represents the rate that the investor would have earned or lost on an investment in the Fund, assuming reinvestment of dividends. |
(4) | Not annualized for periods less than one year. |
(5) | Excludes in-kind transactions associated with creations and redemptions of the Fund. |
The accompanying notes are an integral part of the financial statements.
38
Roundhill ETFs
Financial Highlights
Per Share Operating
Performance (For a share outstanding
throughout each period) | | Ratios/Supplemental Data | |
Capital Share
Transactions: | | | | | | | | | | | | | | | | | | Ratios to Average Net Assets of: (2) | | | | | |
Transaction
fees
(see Note 4) | | Net Asset
Value, End
of Period | | | Total return,
at NAV(3)(4) | | | Total return,
at Market(3)(4) | | | Net assets,
end of period
(000’s) | | | Expenses,
before
waivers | | | Expenses,
after
waivers | | | Net
investment
income
(loss), before
waivers | | | Net
investment
income
(loss), after
waivers | | | Portfolio
turnover
rate(4)(5) | |
| | | | | | | | | | | | | | | | | | | | | | | | | | | | | | | | | | | | | |
0.01 | | $ | 14.03 | | | | -43.49 | % | | | -43.28 | % | | $ | 25,250 | | | | 0.50 | % | | | 0.50 | % | | | 0.78 | % | | | 0.78 | % | | | 83 | % |
0.03 | | $ | 24.99 | | | | -16.93 | % | | | -17.57 | % | | $ | 62,475 | | | | 0.50 | % | | | 0.50 | % | | | 0.16 | % | | | 0.16 | % | | | 52 | % |
0.02 | | $ | 30.09 | | | | 89.88 | %(6) | | | 89.62 | %(6) | | $ | 73,717 | | | | 0.50 | % | | | 0.44 | % | | | 0.12 | % | | | 0.18 | % | | | 93 | % |
0.01 | | $ | 16.01 | | | | 8.11 | %(6) | | | 8.42 | %(6) | | $ | 10,810 | | | | 0.50 | % | | | 0.25 | % | | | 0.65 | % | | | 0.90 | % | | | 34 | % |
| | | | | | | | | | | | | | | | | | | | | | | | | | | | | | | | | | | | | |
— | | $ | 14.35 | | | | -41.99 | % | | | -42.00 | % | | $ | 118,028 | | | | 0.75 | % | | | 0.75 | % | | | 0.38 | % | | | 0.38 | % | | | 43 | % |
0.00(8) | | $ | 24.88 | | | | -3.78 | % | | | -3.91 | % | | $ | 290,507 | | | | 0.75 | % | | | 0.75 | % | | | 0.26 | % | | | 0.26 | % | | | 52 | % |
0.00(8) | | $ | 25.86 | | | | 68.28 | % | | | 68.15 | % | | $ | 206,891 | | | | 0.75 | % | | | 0.75 | % | | | 0.92 | % | | | 0.92 | % | | | 43 | % |
| | | | | | | | | | | | | | | | | | | | | | | | | | | | | | | | | | | | | |
0.00(8) | | $ | 7.21 | | | | -52.44 | % | | | -52.66 | % | | $ | 370,242 | | | | 0.60 | % | | | 0.60 | % | | | 0.06 | % | | | 0.06 | % | | | 47 | % |
0.01 | | $ | 15.17 | | | | 0.63 | % | | | 0.73 | % | | $ | 933,059 | | | | 0.75 | % | | | 0.75 | % | | | -0.13 | % | | | -0.13 | % | | | 41 | % |
| | | | | | | | | | | | | | | | | | | | | | | | | | | | | | | | | | | | | |
0.00(8) | | $ | 9.51 | | | | -36.22 | % | | | -36.30 | % | | $ | 2,854 | | | | 0.76 | %(10) | | | 0.76 | %(10) | | | 1.49 | % | | | 1.49 | % | | | 61 | % |
0.00(8) | | $ | 15.07 | | | | 1.76 | % | | | 2.01 | % | | $ | 1,884 | | | | 0.81 | %(10) | | | 0.81 | %(10) | | | 1.16 | % | | | 1.16 | % | | | 3 | % |
| | | | | | | | | | | | | | | | | | | | | | | | | | | | | | | | | | | | | |
— | | $ | 5.09 | | | | -62.94 | % | | | -63.06 | % | | $ | 763 | | | | 0.69 | % | | | 0.69 | % | | | 1.34 | % | | | 1.34 | % | | | 1075 | % |
— | | $ | 14.06 | | | | -10.09 | % | | | -10.10 | % | | $ | 2,109 | | | | 0.69 | % | | | 0.69 | % | | | -0.69 | % | | | -0.69 | % | | | 32 | % |
| | | | | | | | | | | | | | | | | | | | | | | | | | | | | | | | | | | | | |
0.01 | | $ | 5.99 | | | | -60.93 | % | | | -60.94 | % | | $ | 1,496 | | | | 0.75 | % | | | 0.52 | % | | | 1.09 | % | | | 1.32 | % | | | 65 | % |
(6) | The returns reflect the actual performance for the period and do not include the impact of trades executed on the last business day of the period that were recorded on the first business day of the next period. |
(7) | Commencement of operations. |
(9) | Realized and unrealized gains and losses per share in this caption are balancing amounts necessary to reconcile the change in net asset value per share for the period, and may not reconcile with the aggregate gains and losses in the Statements of Operations due to share transactions for the period. |
(10) | Includes tax expense of 0.01% and 0.06% for periods ended December 31, 2022 and December 31, 2021, respectively. |
The accompanying notes are an integral part of the financial statements.
39
Roundhill ETFs
Notes to Financial Statements
December 31, 2022
Roundhill Video Games ETF (“NERD”), Roundhill Sports Betting & iGaming ETF (“BETZ”), Roundhill Ball Metaverse ETF (“METV”), Roundhill IO Digital Infrastructure ETF (“BYTE”), Roundhill MEME ETF (“MEME”) and Roundhill Cannabis ETF (“WEED”) (each a “Fund” and collectively, the “Funds”) are non-diversified series of Listed Funds Trust (the “Trust”), formerly Active Weighting Funds ETF Trust. The Trust was organized as a Delaware statutory trust on August 26, 2016, under a Declaration of Trust amended on December 21, 2018, and is registered with the U.S. Securities and Exchange Commission (the “SEC”) as an open-end management investment company under the Investment Company Act of 1940, as amended (the “1940 Act”).
NERD is a passively-managed exchange-traded fund (“ETF”). NERD’s objective is to track the total return performance, before fees and expenses, of the Nasdaq CTA Global Video Games Software Index (the “NERD Index”). The NERD Index, which was developed and is maintained by both Nasdaq and the Consumer Technology Association, is a modified theme-adjusted free float market capitalization index designed to track the performance of the common stock (or corresponding depositary receipts) of exchange-listed companies engaged in video game publishing and/or video game development.
BETZ is a passively-managed ETF. BETZ’s objective is to track the total return performance, before fees and expenses, of the Roundhill Sports Betting & iGaming Index (the “BETZ Index”). The BETZ Index tracks the performance of the common stock (or corresponding ADRs or GDRs) of exchange-listed companies that earn revenue from online gaming (“iGaming”). iGaming is broadly defined as the wagering of money or some other value on the outcome of an event or a game, using the internet. The BETZ Index includes: companies that operate in-person and/or online/internet sports books; companies that operate online/internet gambling platforms; and companies that provide infrastructure or technology to such companies.
METV is a passively-managed ETF. METV’s objective is to track the performance, before fees and expenses, of the Ball Metaverse Index (the “METV Index”). The META Index tracks the performance of globally-listed equity securities of companies that engage in activities or provide products, services, technologies, or technological capabilities to enable the Metaverse, and benefit from its generated revenues (“Metaverse Companies”). “Metaverse” is a term used to refer to a future iteration of the Internet. Users will primarily engage with the Metaverse through persistent, simultaneous, and shared three-dimensional virtual simulations and spaces. The Metaverse will also connect to physical spaces, two-dimensional Internet experiences (e.g., standard apps, webpages), and finite simulations (e.g., a game). The Metaverse will be supported by a wide range of technologies, tools, and standards that enable high volumes of concurrent users, a rich virtual-only economy of labor, goods, and services, and wide-ranging interoperability of data, digital assets, and content.
BYTE is a passively-managed ETF. BYTE’s objective seeks to track the performance, before fees and expenses, of the IO Digital Infrastructure Index (the “BYTE Index”), which tracks the performance of digital infrastructure companies. Digital infrastructure is comprised of the high-tech physical assets that support the efficient storage and transmission of data, powering the internet.
MEME is a passively-managed ETF. MEME’s objective seeks to track the performance, before fees and expenses, of the Solactive Roundhill Meme Stock Index (the “MEME Index”), which, in turn, seeks to track the performance of “meme stocks”. Meme stocks are equity securities of companies that exhibit a combination of elevated social media activity and high short interest both of which are indicators of market sentiment.
WEED is an actively managed ETF. WEED’s seeks to achieve its investment objective by investing primarily in exchange-listed equity securities and total return swaps intended to provide exposure to the cannabis and hemp ecosystem. The cannabis and hemp ecosystem encompasses businesses involved in the production, distribution and marketing of cannabis and hemp and products derived therefrom.
Costs incurred by WEED in connection with the organization, registration and the initial public offering of shares were paid by Roundhill Financial Inc. (“Roundhill” or the “Adviser”), the Funds’ Investment Adviser.
40
Roundhill ETFs
Notes to Financial Statements
December 31, 2022 (Continued)
2. | SIGNIFICANT ACCOUNTING POLICIES |
Each Fund is an investment company and accordingly follows the investment company accounting and reporting guidance of the Financial Accounting Standards Board (“FASB”) Accounting Standards Codification (“ASC”) Topic 946, Financial Services — Investment Companies. Each Fund prepares its financial statements in accordance with accounting principles generally accepted in the United States of America (“U.S. GAAP”) and follows the significant accounting policies described below.
Use of Estimates
The preparation of the financial statements in conformity with U.S. GAAP requires management to make estimates and assumptions that affect the reported amounts of assets and liabilities and disclosures of contingent assets and liabilities at the date of the financial statements and the reported amounts of increases and decreases in net assets from operations during the reporting period. Actual results could differ from these estimates.
Share Transactions
The net asset value (“NAV”) per share of each Fund will be equal to a Fund’s total assets minus a Fund’s total liabilities divided by the total number of shares outstanding. The NAV that is published will be rounded to the nearest cent. The NAV is determined as of the close of trading (generally, 4:00 p.m. Eastern Time) on each day the New York Stock Exchange (“NYSE”) is open for trading.
Fair Value Measurement
In calculating the NAV, each Fund’s exchange-traded equity securities will be valued at fair value, which will generally be determined using the last reported official closing or last trading price on the exchange or market on which the security is primarily traded at the time of valuation. Such valuations are typically categorized as Level 1 in the fair value hierarchy described below.
Securities listed on the NASDAQ Stock Market, Inc. are generally valued at the NASDAQ official closing price. Foreign securities will be priced in their local currencies as of the close of their primary exchange or market or as of the time each Fund calculates its NAV on the valuation date, whichever is earlier.
If market quotations are not readily available, or if it is determined that a quotation of a security does not represent fair value, then the security is valued at fair value as determined in good faith by the Adviser using procedures adopted by the Board of Trustees of the Trust (the “Board”). The circumstances in which a security may be fair valued include, among others: the occurrence of events that are significant to a particular issuer, such as mergers, restructurings or defaults; the occurrence of events that are significant to an entire market, such as natural disasters in a particular region or government actions; trading restrictions on securities; thinly traded securities; and market events such as trading halts and early market closings. Due to the inherent uncertainty of valuations, fair values may differ significantly from the values that would have been used had an active market existed. Fair valuation could result in a different NAV than a NAV determined by using market quotations. Such valuations are typically categorized as Level 2 or Level 3 in the fair value hierarchy described below.
Money market funds are valued at NAV. If NAV is not readily available, the securities will be valued at fair value.
FASB ASC Topic 820, Fair Value Measurements and Disclosures (“ASC 820”) defines fair value, establishes a framework for measuring fair value in accordance with U.S. GAAP, and requires disclosure about fair value measurements. It also provides guidance on determining when there has been a significant decrease in the volume and level of activity for an asset or liability, when a transaction is not orderly, and how that information must be incorporated into fair value measurements. Under ASC 820, various inputs are used in determining the value of the Funds’ investments. These inputs are summarized in the following hierarchy:
| | ● | Level 1 — Unadjusted quoted prices in active markets for identical assets or liabilities that the Funds have the ability to access. |
41
Roundhill ETFs
Notes to Financial Statements
December 31, 2022 (Continued)
| | ● | Level 2 — Observable inputs other than quoted prices included in Level 1 that are observable for the asset or liability, either directly or indirectly. These inputs may include quoted prices for the identical instrument on an inactive market, prices for similar securities, interest rates, prepayment speeds, credit risk, yield curves, default rates and similar data. |
| | ● | Level 3 — Unobservable inputs for the asset or liability, to the extent relevant observable inputs are not available; representing the Funds’ own assumptions about the assumptions a market participant would use in valuing the asset or liability, and would be based on the best information available. |
The fair value hierarchy gives the highest priority to quoted prices (unadjusted) in active markets for identical assets or liabilities (Level 1) and the lowest priority to unobservable inputs (Level 3).
The availability of observable inputs can vary from security to security and is affected by a wide variety of factors, including, for example, the type of security, whether the security is new and not yet established in the marketplace, the liquidity of markets, and other characteristics particular to the security. To the extent that valuation is based on models or inputs that are less observable or unobservable in the market, the determination of fair value requires more judgment. Accordingly, the degree of judgment exercised in determining fair value is greatest for instruments categorized in Level 3.
Foreign securities, currencies and other assets denominated in foreign currencies are translated into U.S. dollars at the exchange rate of such currencies against the U.S. dollar using the applicable currency exchange rates as of the close of the NYSE, generally 4:00 p.m. Eastern Time.
All other securities and investments for which market values are not readily available, including restricted securities, and those securities for which it is inappropriate to determine prices in accordance with the aforementioned procedures, are valued at fair value as determined in good faith under procedures adopted by the Board, although the actual calculations may be done by others. Factors considered in making this determination may include, but are not limited to, information obtained by contacting the issuer, analysts, or the appropriate stock exchange (for exchange-traded securities), analysis of the issuer’s financial statements or other available documents and, if necessary, available information concerning other securities in similar circumstances.
The inputs or methodology used for valuing securities are not necessarily an indication of the risk associated with investing in those securities. The hierarchy classification of inputs used to value the Funds’ investments at December 31, 2022 are as follows:
| | | Level 1 | | | Level 2 | | | Level 3 | | | Total | |
NERD | | | | | | | | | | | | | | | | |
Investments - Assets: | | | | | | | | | | | | | | | | |
Common Stocks* | | $ | 25,190,044 | | | $ | — | | | $ | — | | | $ | 25,190,044 | |
Money Market Fund | | | 14,842 | | | | — | | | | — | | | | 14,842 | |
Investments Purchased With Proceeds From Securities Lending** | | | — | | | | — | | | | — | | | | 1,354,091 | |
Total Investments - Assets | | $ | 25,204,886 | | | $ | — | | | $ | — | | | $ | 26,558,977 | |
| | | | | | | | | | | | | | | | | |
BETZ | | | | | | | | | | | | | | | | |
Investments - Assets: | | | | | | | | | | | | | | | | |
Common Stocks* | | $ | 117,832,508 | | | $ | — | | | $ | — | | | $ | 117,832,508 | |
Warrants | | | — | | | | — | | | | — | ^ | | | — | |
Money Market Fund | | | 182,822 | | | | — | | | | — | | | | 182,822 | |
Investments Purchased With Proceeds From Securities Lending** | | | — | | | | — | | | | — | | | | 10,436,821 | |
Total Investments - Assets | | $ | 118,015,330 | | | $ | — | | | $ | — | | | $ | 128,452,151 | |
42
Roundhill ETFs
Notes to Financial Statements
December 31, 2022 (Continued)
| | | Level 1 | | | Level 2 | | | Level 3 | | | Total | |
METV | | | | | | | | | | | | | | | | |
Investments - Assets: | | | | | | | | | | | | | | | | |
Common Stocks* | | $ | 367,396,231 | | | $ | — | | | $ | — | | | $ | 367,396,231 | |
Real Estate Investment Trusts | | | 2,244,788 | | | | — | | | | — | | | | 2,244,788 | |
Money Market Fund | | | 655,679 | | | | — | | | | — | | | | 655,679 | |
Investments Purchased With Proceeds From Securities Lending** | | | — | | | | — | | | | — | | | | 20,899,790 | |
Total Investments - Assets | | $ | 370,296,698 | | | $ | — | | | $ | — | | | $ | 391,196,488 | |
| | | | | | | | | | | | | | | | | |
BYTE | | | | | | | | | | | | | | | | |
Investments - Assets: | | | | | | | | | | | | | | | | |
Common Stocks* | | $ | 2,255,917 | | | $ | — | | | $ | — | | | $ | 2,255,917 | |
Real Estate Investment Trusts | | | 591,048 | | | | — | | | | — | | | | 591,048 | |
Money Market Fund | | | 6,344 | | | | — | | | | — | | | | 6,344 | |
Investments Purchased With Proceeds From Securities Lending** | | | — | | | | — | | | | — | | | | 178,993 | |
Total Investments - Assets | | $ | 2,853,309 | | | $ | — | | | $ | — | | | $ | 3,032,302 | |
| | | | | | | | | | | | | | | | | |
MEME | | | | | | | | | | | | | | | | |
Investments - Assets: | | | | | | | | | | | | | | | | |
Common Stocks* | | $ | 760,878 | | | $ | — | | | $ | — | | | $ | 760,878 | |
Money Market Fund | | | 813 | | | | — | | | | — | | | | 813 | |
Investments Purchased With Proceeds From Securities Lending** | | | — | | | | — | | | | — | | | | 132,687 | |
Total Investments - Assets | | $ | 761,691 | | | $ | — | | | $ | — | | | $ | 894,378 | |
| | | | | | | | | | | | | | | | | |
WEED | | | | | | | | | | | | | | | | |
Investments - Assets: | | | | | | | | | | | | | | | | |
Money Market Fund | | $ | 356,814 | | | $ | — | | | $ | — | | | $ | 356,814 | |
U.S. Treasury Bills | | | — | | | | 1,881,254 | | | | — | | | | 1,881,254 | |
Total Investments - Assets | | $ | 356,814 | | | $ | 1,881,254 | | | $ | — | | | $ | 2,238,068 | |
| | | | | | | | | | | | | | | | | |
Swap Contracts*** | | | | | | | | | | | | | | | | |
Long Total Return Equity Swap Contracts | | $ | — | | | $ | — | | | $ | — | | | $ | — | |
Total Swap Contracts | | $ | — | | | $ | — | | | $ | — | | | $ | — | |
* | See the Schedule of Investments for industry classifications. |
** | Certain investments that are measured at fair value using the net asset value per share (or its equivalent) practical expedient have not been categorized in the fair value hierarchy. The fair value amounts presented in the table are intended to permit reconciliation of the fair value hierarchy to the amounts presented in the Schedule of Investments. |
*** | Swap contracts are derivative instruments, which are presented at the unrealized appreciation/depreciation on the instrument. |
^ | The Fund held a Level 3 security at the end of the year valued at $0. |
43
Roundhill ETFs
Notes to Financial Statements
December 31, 2022 (Continued)
Security Transactions
Investment transactions are recorded as of the date that the securities are purchased or sold (trade date). Realized gains and losses from the sale or disposition of securities are calculated based on the specific identification basis.
The Funds do not isolate that portion of the results of operations resulting from changes in foreign exchange rates on investments and currency gains or losses realized between the trade and settlement dates on securities transactions from the fluctuations arising from changes in market prices of securities held. Such fluctuations are included with the net realized and unrealized gain or loss from investments.
The Funds report net realized foreign exchange gains or losses that arise from sales of foreign currencies, currency gains or losses realized between the trade and settlement dates on foreign currency transactions, and the difference between the amounts of dividends, interest, and foreign withholding taxes recorded on each Fund’s books and the U.S. dollar equivalent of the amounts actually received or paid. Net unrealized foreign exchange gains or losses arise from changes in the values of assets and liabilities, other than investments in securities at period end, resulting from changes in exchange rates.
Investment Income
Dividend income is recognized on the ex-dividend date. Interest income is accrued daily. Withholding taxes on foreign dividends has been provided for in accordance with Funds’ understanding of the applicable tax rules and regulations. An amortized cost method of valuation may be used with respect to debt obligations with sixty days or less remaining to maturity, unless the Adviser determines in good faith that such method does not represent fair value.
Tax Information, Dividends and Distributions to Shareholders and Uncertain Tax Positions
The Funds are treated as separate entities for Federal income tax purposes. Each Fund intends to qualify as a regulated investment company (“RIC”) under Subchapter M of the Internal Revenue Code of 1986, as amended (the “Internal Revenue Code”). To qualify and remain eligible for the special tax treatment accorded to RICs, each Fund must meet certain annual income and quarterly asset diversification requirements and must distribute annually at least 90% of the sum of (i) its investment company taxable income (which includes dividends, interest and net short-term capital gains) and (ii) certain net tax-exempt income, if any. If so qualified, each Fund will not be subject to Federal income tax.
Distributions to shareholders are recorded on the ex-dividend date. The Funds generally pay out dividends from net investment income, if any, at least annually, and distribute their net capital gains, if any, to shareholders at least annually. The Funds may also pay a special distribution at the end of the calendar year to comply with Federal tax requirements. The amount of dividends and distributions from net investment income and net realized capital gains are determined in accordance with Federal income tax regulations, which may differ from U.S. GAAP. These “book/tax” differences are either considered temporary or permanent in nature. To the extent these differences are permanent in nature, such amounts are reclassified within the components of net assets based on their Federal tax basis treatment; temporary differences do not require reclassification. Dividends and distributions which exceed earnings and profit for tax purposes are reported as a tax return of capital.
Management evaluates the Funds’ tax positions to determine if the tax positions taken meet the minimum recognition threshold in connection with accounting for uncertainties in income tax positions taken or expected to be taken for the purposes of measuring and recognizing tax liabilities in the financial statements. Recognition of tax benefits of an uncertain tax position is required only when the position is “more likely than not” to be sustained assuming examination by taxing authorities. Interest and penalties related to income taxes would be recorded as income tax expense. The Funds’ Federal income tax returns are subject to examination by the Internal Revenue Service (the “IRS”) for a period of three fiscal years after they are filed. State and local tax returns may be subject to examination for an additional fiscal year depending on the jurisdiction. As of December 31, 2022, the Funds’ fiscal period end, the Funds had no material uncertain tax positions and did not have a liability for any unrecognized tax benefits. As of December 31, 2022, the Funds’ fiscal period end, the Funds had no examination in progress and management is not aware of any tax positions for which it is reasonably possible that the amounts of unrecognized tax benefits will significantly change in the next twelve months.
44
Roundhill ETFs
Notes to Financial Statements
December 31, 2022 (Continued)
The Funds’ recognized no interest or penalties related to uncertain tax benefits in the fiscal period 2022. At December 31, 2022, the Funds’ fiscal period end, the tax periods from commencement of operations remained open to examination in the Funds’ major tax jurisdictions.
Indemnification
In the normal course of business, the Funds expect to enter into contracts that contain a variety of representations and warranties and which provide general indemnifications. The Funds’ maximum exposure under these anticipated arrangements is unknown, as this would involve future claims that may be made against the Funds that have not yet occurred. However, the Adviser expects the risk of loss to be remote.
Derivatives
WEED may enter into total return swap agreements. A total return swap is a contract in which one party agrees to make periodic payments to another party based on the change in market value of the assets underlying the contract, which may include a specified security, basket of securities, or securities indices during the specified period, in return for periodic payments based on a fixed or variable interest rate or the total return from other underlying assets. Swap agreements will usually be done on a net basis, i.e., where the two parties make net payments with the Fund receiving or paying, as the case may be, only the net amount of the two payments. The net amount of the excess, if any, of the Fund’s obligations over its entitlements with respect to each swap is accrued on a daily basis and an amount of cash or equivalents having an aggregate value at least equal to the accrued excess is maintained by the Fund.
The total return swap contracts are subject to master netting agreements, which are agreements between the Fund and its counterparties that provide for the net settlement of all transactions and collateral with the Fund through a single payment, in the event of default or termination. Amounts presented on the schedule of total return swaps are gross settlement amounts.
The following table presents the Fund’s gross derivative assets and liabilities by counterparty and contract type, net of amounts available for offset under a master netting agreement and the related collateral received or pledged by the Fund as of December 31, 2022.
Roundhill Cannabis ETF
| | | | | Gross Amounts
of Recognized
Assets/
Liabilities
Presented in
the Statements | | | Gross Amounts
Offset in the
Statements | | | | | | | Gross Amounts not offset in the
Statements of Assets & Liabilities | | | | | |
Counterparty | | Investment Type | | of Assets &
Liabilities | | | of Assets &
Liabilities | | | Net
Amount | | | Financial
Instruments | | | Collateral
Paid | | | Net
Amount | |
Nomura Securities International Inc. | | Total Return Swap Contracts | | $ | (841,890) | | | $ | — | | | $ | (841,890) | | | $ | 741,890 | | | $ | 100,000 | | | $ | — | |
The average monthly notional amount of the swap contracts during the period ended December 31, 2022 for WEED was $1,193,045.
The following is a summary of the effect of swap contracts on the Funds’ Statements of Assets and Liabilities as of December 31, 2022:
| | | | Assets | | | Liabilities | | | Net Unrealized
Gain (Loss) | |
Roundhill Cannabis ETF | Equity Risk Swap Contracts | | $ | — | | | $ | (841,890 | ) | | $ | — | |
45
Roundhill ETFs
Notes to Financial Statements
December 31, 2022 (Continued)
The following is a summary of the effect of swap contracts on the Funds’ Statements of Operations for the period ended December 31, 2022:
| | | | Realized Gain
(Loss) | | | Change in
Unrealized
Appreciation/
Depreciation | |
Roundhill Cannabis ETF | Equity Risk Swap Contracts | | $ | (926,708 | ) | | $ | — | |
3. | INVESTMENT ADVISORY AND OTHER AGREEMENTS |
Investment Advisory Agreement
The Trust has entered into an Investment Advisory Agreement (the “Advisory Agreement”) with the Adviser. Under the Advisory Agreement, the Adviser provides a continuous investment program for the Funds’ assets in accordance with its investment objectives, policies and limitations, and oversees the day-to-day operations of the Funds subject to the supervision of the Board, including the Trustees who are not “interested persons” of the Trust as defined in the 1940 Act.
Pursuant to the Advisory Agreement between the Trust, on behalf of the Funds, and Roundhill, each Fund pays a unified management fee to the Adviser, which is calculated daily and paid monthly, at an annual rate of 0.50% of NERD’s average daily net assets, at an annual rate of 0.75% of BETZ, BYTE and WEED’s average daily net assets, at an annual rate of 0.69% of MEME’s average daily net assets and at an annual rate of 0.59% of METV’s average daily net assets. Prior to February 4, 2022, the METV management fee was 0.75%. Roundhill has agreed to pay all expenses of the Funds except the fee paid to Roundhill under the Advisory Agreement, interest charges on any borrowings, dividends and other expenses on securities sold short, taxes, brokerage commissions and other expenses incurred in placing orders for the purchase and sale of securities and other investment instruments, acquired fund fees and expenses, accrued deferred tax liability, extraordinary expenses, and distribution (12b-1) fees and expenses (if any). Roundhill, in turn, compensates Exchange Traded Concepts, LLC as the Sub-Adviser from the management fee it receives.
Exchange Traded Concepts, LLC (the “Sub-Adviser”), an Oklahoma limited liability company serves as the sub-adviser to the Funds. The Sub-Adviser is majority owned by Cottonwood ETF Holdings LLC. Pursuant to a Sub-Advisory Agreement between the Adviser and the Sub-Adviser (the “Sub-Advisory Agreement”), the Sub-Adviser is responsible for trading portfolio securities on behalf of the Funds, including selecting broker-dealers to execute purchase and sale transactions as instructed by the Adviser or in connection with any rebalancing or reconstitution of a Fund’s Index, subject to the supervision of the Adviser and the Board, including the independent Trustees. For its services, the Sub-Adviser is entitled to a sub-advisory fee paid by the Adviser, which is calculated daily and paid monthly, at an annual rate based on the average daily net assets of each Fund, and subject to a minimum annual fee as follows:
Minimum Annual Fee | | Asset-Based Fee |
$15,000 | | 4 bps (0.04%) on the first $200 million 3.5 bps (0.035%) on the next $800 million 3 bps (0.03%) on the next $1 billion 2.5 bps (0.025%) on the balance over $2 billion |
Fee Waiver Agreement
For WEED, the Adviser contractually agreed to waive 0.16% of its management fees of the Fund until at least April 30, 2023. Effective October 12, 2022, the agreement was amended to further waive 0.20% of the management fee, until at least April 30, 2023. The Adviser waived $2,624 during the period ended December 31, 2022 for a total of 0.36%. Pursuant to the Fee Waiver Agreement, waived fees are not subject to recoupment by the Adviser.
46
Roundhill ETFs
Notes to Financial Statements
December 31, 2022 (Continued)
Distribution Agreement and 12b-1 Plan
Foreside Fund Services, LLC (the “Distributor”) serves as each Fund’s distributor pursuant to a Distribution Agreement. The Distributor receives compensation from the Adviser for certain statutory underwriting services it provides to the Funds. The Distributor enters into agreements with certain broker-dealers and others that will allow those parties to be “Authorized Participants” and to subscribe for and redeem shares of the Funds. The Distributor will not distribute shares in less than whole Creation Units and does not maintain a secondary market in shares.
The Board has adopted a Distribution and Service Plan pursuant to Rule 12b-1 under the 1940 Act (“Rule 12b-1 Plan”). In accordance with the Rule 12b-1 Plan, each Fund is authorized to pay an amount up to 0.25% of the Fund’s average daily net assets each year for certain distribution-related activities. As authorized by the Board, no Rule 12b-1 fees are currently paid by the Funds and there are no plans to impose these fees. However, in the event Rule 12b-1 fees are charged in the future, they will be paid out of each Fund’s assets. The Adviser and its affiliates may, out of their own resources, pay amounts to third parties for distribution or marketing services on behalf of the Funds.
Administrator, Custodian and Transfer Agent
U.S. Bancorp Fund Services, LLC, doing business as U.S. Bank Global Fund Services (“Fund Services” or “Administrator”) serves as administrator, transfer agent and fund accounting agent of the Funds pursuant to a Fund Servicing Agreement. U.S. Bank N.A. (the “Custodian”), an affiliate of Fund Services, serves as the Funds’ custodian pursuant to a Custody Agreement. Under the terms of these agreements, the Adviser pays each Fund’s administrative, custody and transfer agency fees.
A Trustee and all officers of the Trust are affiliated with the Administrator and Custodian.
4. | CREATION AND REDEMPTION TRANSACTIONS |
Shares of the Funds, except WEED, are listed and traded on the NYSE Arca, Inc. (the “Exchange”). Shares of WEED are listed on the CBOE BZX Exchange, Inc. Each Fund issues and redeems shares on a continuous basis at NAV only in large blocks of shares called “Creation Units.” Creation Units are to be issued and redeemed principally in kind for a basket of securities and a balancing cash amount. Shares generally will trade in the secondary market in amounts less than a Creation Unit at market prices that change throughout the day. Market prices for the shares may be different from their NAV. The NAV is determined as of the close of trading (generally, 4:00 p.m. Eastern Time) on each day the NYSE is open for trading. The NAV of the shares of each Fund will be equal to a Fund’s total assets minus a Fund’s total liabilities divided by the total number of shares outstanding. The NAV that is published will be rounded to the nearest cent; however, for purposes of determining the price of Creation Units, the NAV will be calculated to four decimal places.
Creation Unit Transaction Fee
Authorized Participants will be required to pay to the Custodian a fixed transaction fee (the “Creation Unit Transaction Fee”) in connection with the issuance or redemption of Creation Units. The standard Creation Unit Transaction Fee will be the same regardless of the number of Creation Units purchased or redeemed by an investor on the applicable business day. The Creation Unit Transaction Fee charged by each Fund for each creation order is as follows:
| | NERD | | | $ | 500 | |
| | BETZ | | | $ | 500 | |
| | METV | | | $ | 500 | |
| | BYTE | | | $ | 750 | |
| | MEME | | | $ | 300 | |
| | WEED | | | $ | 300 | |
Prior to April 30, 2022, the Creation Unit Transaction Fee for MEME was $250.
47
Roundhill ETFs
Notes to Financial Statements
December 31, 2022 (Continued)
The fixed creation unit transaction fee may be waived on certain orders if the applicable Fund’s custodian has determined to waive some or all of the Creation Order Costs associated with the order or another party, such as the Adviser, has agreed to pay such fee.
An additional variable fee of up to a maximum of 2% of the value of the Creation Units subject to the transaction may be imposed for (i) creations effected outside the Clearing Process and (ii) creations made in an all cash amount (to offset the Trust’s brokerage and other transaction costs associated with using cash to purchase or redeem the requisite Deposit Securities). Investors are responsible for the costs of transferring the securities constituting the Deposit Securities to the account of the Trust. Each Fund may determine to not charge a variable fee on certain orders when the Adviser has determined that doing so is in the best interests of Fund shareholders. Variable fees, if any, received by the Funds are displayed in the Capital Share Transactions section on the Statements of Changes in Net Assets.
Only “Authorized Participants” may purchase or redeem shares directly from the Funds. An Authorized Participant is either (i) a broker-dealer or other participant in the clearing process through the Continuous Net Settlement System of National Securities Clearing Corporation or (ii) a DTC participant and, in each case, must have executed a Participant Agreement with the Distributor. Most retail investors will not qualify as Authorized Participants or have the resources to buy and sell whole Creation Units. Therefore, they will be unable to purchase or redeem the shares directly from the Funds. Rather, most retail investors will purchase shares in the secondary market with the assistance of a broker and will be subject to customary brokerage commissions or fees. Securities received or delivered in connection with in-kind creates and redeems are valued as of the close of business on the effective date of the creation or redemption.
A creation unit will generally not be issued until the transfer of good title of the deposit securities to the Funds and the payment of any cash amounts have been completed. To the extent contemplated by the applicable participant agreement, Creation Units of the Funds will be issued to such authorized participant notwithstanding the fact that the Funds’ deposits have not been received in part or in whole, in reliance on the undertaking of the authorized participant to deliver the missing deposit securities as soon as possible. If the Funds or their agents do not receive all of the deposit securities, or the required cash amounts, by such time, then the order may be deemed rejected and the authorized participant shall be liable to the Funds for losses, if any.
The tax character of distributions paid was as follows:
| | | Ordinary
Income(1) | | | Long-Term
Capital Gain | | | Return of
Capital | |
| | | Fiscal period ended December 31, 2022 | |
NERD | | $ | 173,639 | | | $ | — | | | $ | — | |
BETZ | | | 309,837 | | | | — | | | | 470,671 | |
METV | | | 325,056 | | | | — | | | | 7,036 | |
BYTE | | | 31,253 | | | | 556 | | | | — | |
MEME | | | 15,557 | | | | — | | | | 5,264 | |
WEED | | | — | | | | — | | | | — | |
48
Roundhill ETFs
Notes to Financial Statements
December 31, 2022 (Continued)
| | | Ordinary
Income(1) | | | Long-Term
Capital Gain | | | Return of
Capital | |
| | | Fiscal period ended December 31, 2021 | |
NERD | | $ | 13,010 | | | $ | — | | | $ | — | |
BETZ | | | — | | | | — | | | | — | |
METV | | | — | | | | — | | | | — | |
BYTE | | | 4,602 | | | | — | | | | — | |
MEME | | | — | | | | — | | | | — | |
WEED | | | — | | | | — | | | | — | |
(1) | Ordinary income includes short-term capital gains. |
At December 31, 2022, the Funds’ fiscal period end, the components of distributable earnings (accumulated losses) and cost of investments on a tax basis, including the adjustments for financial reporting purposes as of the most recently completed Federal income tax reporting year, were as follows:
| | | NERD | | | BETZ | | | METV | |
Federal Tax Cost of Investments | | $ | 31,459,547 | | | $ | 236,777,004 | | | $ | 658,506,573 | |
Gross Tax Unrealized Appreciation | | $ | 1,159,411 | | | $ | 2,299,363 | | | $ | 1,602,298 | |
Gross Tax Unrealized Depreciation | | | (6,059,981 | ) | | | (110,624,216 | ) | | | (268,912,383 | ) |
Net Tax Unrealized Appreciation (Depreciation) | | | (4,900,570 | ) | | | (108,324,853 | ) | | | (267,310,085 | ) |
Undistributed Ordinary Income | | | 33,576 | | | | — | | | | — | |
Other Accumulated Gain (Loss) | | | (38,770,875 | ) | | | (74,667,170 | ) | | | (251,595,628 | ) |
Total Distributable Earnings / (Accumulated Losses) | | $ | (43,637,869 | ) | | $ | (182,992,023 | ) | | $ | (518,905,713 | ) |
| | | BYTE | | | MEME | | | WEED | |
Federal Tax Cost of Investments | | $ | 3,695,562 | | | $ | 1,228,515 | | | $ | 2,238,068 | |
Gross Tax Unrealized Appreciation | | $ | 72,509 | | | $ | 8,063 | | | | — | |
Gross Tax Unrealized Depreciation | | | (735,769 | ) | | | (342,200 | ) | | | — | |
Net Tax Unrealized Appreciation (Depreciation) | | | (663,260 | ) | | | (334,137 | ) | | | — | |
Undistributed Ordinary Income | | | 4,606 | | | | — | | | | — | |
Other Accumulated Gain (Loss) | | | (177,256 | ) | | | (1,055,089 | ) | | | (1,044,613 | ) |
Total Distributable Earnings / (Accumulated Losses) | | $ | (835,910 | ) | | $ | (1,389,226 | ) | | $ | (1,044,613 | ) |
49
Roundhill ETFs
Notes to Financial Statements
December 31, 2022 (Continued)
The difference between book-basis and tax-basis unrealized appreciation/(depreciation) is attributable primarily to the tax deferral of losses on wash sales and mark-to-market treatment of passive foreign investment companies.
Under current tax law, net capital losses realized after October 31 as well as certain specified ordinary losses incurred after October 31, may be deferred and treated as occurring on the first day of the following fiscal year. The Funds’ carryforward losses and post-October losses are determined only at the end of each fiscal year. At December 31, 2022, the Funds had carryforward losses and post-October losses which will be carried forward indefinitely to offset future realized capital gains as follows:
| | | Indefinite
Long-Term
Capital Loss
Carryover | | | Indefinite
Short-Term
Capital Loss
Carryover | | | Late-Year
Losses | | | Post-October
Losses | |
Roundhill Video Games ETF | | $ | 31,526,896 | | | $ | 7,243,155 | | | $ | — | | | $ | — | |
Roundhill Sports Betting & iGaming ETF | | | 36,118,361 | | | | 38,536,279 | | | | 6,841 | | | | — | |
Roundhill Ball Metaverse ETF | | | 53,995,715 | | | | 197,589,220 | | | | 7,541 | | | | — | |
Roundhill IO Digital Infrastructure ETF | | | 1,273 | | | | 175,977 | | | | — | | | | — | |
Roundhill MEME ETF | | | 346 | | | | 1,011,437 | | | | — | | | | — | |
Roundhill Cannabis ETF | | | — | | | | 401,040 | | | | 637,409 | | | | 6,165 | |
U.S. GAAP requires that certain components of net assets relating to permanent differences be reclassified between financial and tax reporting. These reclassifications have no effect on net assets or NAV per share. The permanent differences primarily relate to redemptions in-kind and the write-off of net operating losses. For the fiscal period ended December 31, 2022, the following reclassifications were made for permanent tax differences on the Statements of Assets and Liabilities.
| | | Total Distributable
Earnings
(Accumulated
Losses) | | | Paid-in Capital | |
Roundhill Video Games ETF | | $ | 1,510,755 | | | $ | (1,510,755 | ) |
Roundhill Sports Betting & iGaming ETF | | | 12,709,833 | | | | (12,709,833 | ) |
Roundhill Ball Metaverse ETF | | | 41,149,146 | | | | (41,149,146 | ) |
Roundhill IO Digital Infrastructure ETF | | | — | | | | — | |
Roundhill MEME ETF | | | 228,117 | | | | (228,117 | ) |
Roundhill Cannabis ETF | | | 246,921 | | | | (246,921 | ) |
6. | INVESTMENT TRANSACTIONS |
During the year or period ended December 31, 2022, the Funds realized net capital gains and losses resulting from in-kind redemptions, in which shareholders exchanged Fund shares for securities held by the Funds rather than for cash. The amount of realized gains and losses from in-kind redemptions included in realized gain/(loss) on investments in the Statements of Operations is as follows:
| | | Realized Gains | | | Realized Losses | |
NERD | | $ | 833,370 | | | | (1,020,833 | ) |
BETZ | | | 12,286,681 | | | | (15,027,239 | ) |
METV | | | 12,136,703 | | | | (28,657,975 | ) |
BYTE | | | — | | | | — | |
MEME | | | 165,702 | | | | (64,395 | ) |
WEED | | | — | | | | — | |
50
Roundhill ETFs
Notes to Financial Statements
December 31, 2022 (Continued)
Purchases and sales of investments (excluding short-term investments), creations in-kind and redemptions in-kind for the year or period ended December 31, 2022 were as follows:
| | | Purchases | | | Sales | | | Creations
In-Kind | | | Redemptions
In-Kind | |
NERD | | $ | 31,368,569 | | | $ | 33,475,464 | | | $ | 1,790,444 | | | $ | 13,232,258 | |
BETZ | | | 69,854,447 | | | | 70,869,164 | | | | 52,797,295 | | | | 114,434,846 | |
METV | | | 271,788,102 | | | | 273,844,992 | | | | 120,023,817 | | | | 178,145,613 | |
BYTE | | | 1,502,239 | | | | 1,321,028 | | | | 1,661,806 | | | | — | |
MEME | | | 12,831,395 | | | | 13,308,081 | | | | 2,437,869 | | | | 1,901,298 | |
WEED | | | 222,359 | | | | 625,061 | | | | 782,285 | | | | — | |
The Funds may lend domestic and foreign securities in their portfolios to approved brokers, dealers and financial institutions (but not individuals) under terms of participation in a securities lending program effective November 19, 2020, which is administered by the Custodian. The securities lending agreement requires that loans are initially collateralized in an amount equal to at least 105% of the then current market value of any loaned securities that are foreign securities, or 102% of the then current market value of any other loaned securities. The custodian performs on a daily basis marking to market loaned securities and collateral. Each borrower is required, if necessary, to deliver additional collateral so that the total collateral held in the account for all loans of the Funds to the borrower will equal at least 100% of the market value of the loaned securities. The cash collateral is invested by the Custodian in accordance with approved investment guidelines. Those guidelines allow the cash collateral to be invested in readily marketable, high quality, short-term obligations issued or guaranteed by the United States Government; however, such investments are subject to risk of payment delays, declines in the value of collateral provided, default on the part of the issuer or counterparty, or otherwise may not generate sufficient interest to support the costs associated with securities lending. The Funds could also experience delays in recovering their securities and possible loss of income or value if the borrower fails to return the borrowed securities, although the Funds are indemnified from this risk by contract with the securities lending agent.
The collateral invested in the Funds, if any, is reflected in each Fund’s Schedule of Investments and is included in the Statements of Assets and Liabilities in the line item labeled “Investments, at value.” A liability of equal value to the cash collateral received and subsequently invested in the Funds is included on the Statements of Assets and Liabilities as “Payable for collateral on securities loaned.” During the period ended December 31, 2022, the Funds loaned securities and received cash collateral for the loans, which was invested in the Mount Vernon Liquid Assets Portfolio, LLC. The Funds receive compensation in the form of loan fees owed by borrowers and income earned on collateral investments. A portion of the interest received on the loan collateral is retained by the Funds and the remainder is rebated to the borrower of the securities. Pursuant to the securities lending agreement between the Trust, on behalf of the Funds, and the Custodian, each Fund pays a fee to the Custodian, which is calculated daily and paid monthly, at a rate of 20% of the Funds’ aggregate net income. The net amount of interest earned, after the interest rebate and the allocation to the Custodian, is included in the Statements of Operations as “Securities lending income, net.” The Funds continue to receive interest payments or dividends on the securities loaned during the borrowing period.
51
Roundhill ETFs
Notes to Financial Statements
December 31, 2022 (Continued)
As of December 31, 2022, the value of the securities on loan and payable for collateral due to broker were as follows:
Value of Securities on Loan and Collateral Received
Fund | | Values of
Securities
on Loan | | | Fund Collateral
Received* | |
NERD | | $ | 1,288,861 | | | $ | 1,354,091 | |
BETZ | | | 9,807,072 | | | | 10,436,821 | |
METV | | | 20,434,910 | | | | 20,899,790 | |
BYTE | | | 169,957 | | | | 178,993 | |
MEME | | | 129,460 | | | | 132,687 | |
WEED | | | — | | | | — | |
* | The cash collateral received was invested in the Mount Vernon Liquid Assets Portfolio, LLC, an investment with an overnight and continuous maturity, as shown on the Schedules of Investments. |
Due to the absence of a master netting agreement related to the Funds’ participation in securities lending, no additional offsetting disclosures have been made on behalf of the Funds for the total borrowings listed above.
As with all ETFs, shareholders of the Funds are subject to the risk that their investment could lose money. Each Fund is subject to the principal risks, any of which may adversely affect a Fund’s NAV, trading price, yield, total return and ability to meet its investment objective.
The global outbreak of COVID-19 (commonly referred to as “coronavirus”) has disrupted economic markets and the prolonged economic impact is uncertain. The ultimate economic fallout from the pandemic, and the long-term impact on economies, markets, industries and individual issuers, are not known. The operational and financial performance of the issuers of securities in which the Funds invest depends on future developments, including the duration and spread of the outbreak, and such uncertainty may in turn adversely affect the value and liquidity of the Funds’ investments, impair the Funds’ ability to satisfy redemption requests, and negatively impact the Funds’ performance.
On February 24, 2022, Russia commenced a military attack on Ukraine. The outbreak of hostilities between the two countries could result in more widespread conflict and could have a severe adverse effect on the region and the markets. In addition, sanctions imposed on Russia by the United States and other countries, and any sanctions imposed in the future could have a significant adverse impact on the Russian economy and related markets. The price and liquidity of investments may fluctuate widely as a result of the conflict and related events. How long such conflict and related events will last and whether it will escalate further cannot be predicted, nor its effect on the Funds.
A complete description of the principal risks is included in the Funds’ prospectuses under the heading “Principal Investment Risks.”
The Adviser filed a registration statement for the Roundhill BIG Tech ETF, Roundhill BIG Airlines ETF, Roundhill BIG Defense ETF, Roundhill BIG Bank ETF, Roundhill BIG Oil ETF and Roundhill BIG Railroad ETF (collectively the “Funds”). The Funds’ investment objective is to seek growth of capital by seeking investment exposure to the largest companies assigned to each Fund’s respective industry.
Other than as disclosed, there were no other subsequent events requiring recognition or disclosure through the date the financial statements were issued.
52
Roundhill ETFs
Report of Independent Registered Public Accounting Firm
To the Shareholders of Roundhill ETFs and
Board of Trustees of Listed Funds Trust
Opinion on the Financial Statements
We have audited the accompanying statements of assets and liabilities, including the schedules of investments and total return swaps (as applicable), of Roundhill Video Games ETF (formerly known as Roundhill BITKRAFT Esports & Digital Entertainment ETF), Roundhill Sports Betting & iGaming ETF, Roundhill Ball Metaverse ETF, Roundhill IO Digital Infrastructure ETF, Roundhill MEME ETF, and Roundhill Cannabis ETF (the “Funds”), each a series of Listed Funds Trust, as of December 31, 2022, the related statements of operations, the statements of changes in net assets, the related notes, and the financial highlights for each of the periods indicated below (collectively referred to as the “financial statements”). In our opinion, the financial statements present fairly, in all material respects, the financial position of each of the Funds as of December 31, 2022, the results of their operations, the changes in net assets, and the financial highlights for each of the periods indicated below in conformity with accounting principles generally accepted in the United States of America.
Fund Name | Statements of
Operations | Statements of
Changes in Net Assets | Financial
Highlights |
Roundhill Video Games ETF (formerly known as Roundhill BITKRAFT Esports & Digital Entertainment ETF) | For the year ended December 31, 2022 | For the years ended December 31, 2022 and 2021 | For the years ended December 31, 2022, 2021 and 2020 and for the period from June 3, 2019 (commencement of operations) through December 31, 2019 |
Roundhill Sports Betting & iGaming ETF | For the year ended December 31, 2022 | For the years ended December 31, 2022 and 2021 | For the years ended December 31, 2022 and 2021 and for the period from June 3, 2020 (commencement of operations) through December 31, 2020. |
Roundhill Ball Metaverse ETF | For the year ended December 31, 2022 | For the year ended December 31, 2022 and for the period from June 29, 2021 (commencement of operations) through December 31, 2021. |
Roundhill IO Digital Infrastructure ETF | For the year ended December 31, 2022 | For the year ended December 31, 2022 and for the period from October 27, 2021 (commencement of operations) through December 31, 2021 |
Roundhill MEME ETF | For the year ended December 31, 2022 | For the year ended December 31, 2022 and for the period from December 7, 2021 (commencement of operations) through December 31, 2021 |
Roundhill Cannabis ETF | For the period from April 20, 2022 (commencement of operations) through December 31, 2022 |
Basis for Opinion
These financial statements are the responsibility of the Funds’ management. Our responsibility is to express an opinion on the Funds’ financial statements based on our audits. We are a public accounting firm registered with the Public Company Accounting Oversight Board (United States) (“PCAOB”) and are required to be independent with respect to the Funds in accordance with the U.S. federal securities laws and the applicable rules and regulations of the Securities and Exchange Commission and the PCAOB.
We conducted our audits in accordance with the standards of the PCAOB. Those standards require that we plan and perform the audit to obtain reasonable assurance about whether the financial statements are free of material misstatement whether due to error or fraud.
53
Roundhill ETFs
Report of Independent Registered Public Accounting Firm
(Continued)
Our audits included performing procedures to assess the risks of material misstatement of the financial statements, whether due to error or fraud, and performing procedures that respond to those risks. Such procedures included examining, on a test basis, evidence regarding the amounts and disclosures in the financial statements. Our procedures included confirmation of securities owned as of December 31, 2022, by correspondence with the custodian and brokers. Our audits also included evaluating the accounting principles used and significant estimates made by management, as well as evaluating the overall presentation of the financial statements. We believe that our audits provide a reasonable basis for our opinion.
We have served as the Funds’ auditor since 2019.

COHEN & COMPANY, LTD.
Cleveland, Ohio
March 1, 2023
54
Roundhill ETFs
Shareholder Expense Example
(Unaudited)
As a shareholder of a Fund you incur two types of costs: (1) transaction costs for purchasing and selling shares; and (2) ongoing costs, including management fees and other fund expenses. The following example is intended to help you understand your ongoing costs (in dollars and cents) of investing in a Fund and to compare these costs with the ongoing costs of investing in other funds. The examples are based on an investment of $1,000 invested at the beginning of the period and held throughout the entire period (July 1, 2022 to December 31, 2022).
ACTUAL EXPENSES
The first line under each Fund in the table below provides information about actual account values and actual expenses. You may use the information in this line, together with the amount you invested, to estimate the expenses that you paid over the period. Simply divide your account value by $1,000 (for example, an $8,600 account value divided by $1,000 = 8.6), then multiply the result by the number in the first line for your Fund under the heading entitled “Expenses Paid During Period” to estimate the expenses you paid on your account during this period.
HYPOTHETICAL EXAMPLE FOR COMPARISON PURPOSES
The second line in the table provides information about hypothetical account values and hypothetical expenses based on each Fund’s actual expense ratio and an assumed rate of return of 5% per year before expenses, which is not the Fund’s actual return. The hypothetical account values and expenses may not be used to estimate the actual ending account balance or expenses you paid for the period. You may use this information to compare the ongoing costs of investing in the Fund and other funds. To do so, compare this 5% hypothetical example with the 5% hypothetical examples that appear in the shareholder reports of the other funds. Please note that the expenses shown in the table are meant to highlight your ongoing costs only and do not reflect any transactional costs, such as brokerage commissions paid on purchases and sales of Fund shares. Therefore, the second line in the table is useful in comparing ongoing Fund costs only and will not help you determine the relative total costs of owning different funds. In addition, if these transactional costs were included, your costs would have been higher.
| | | Beginning
Account Value
7/1/22 | | | Ending
Account Value
12/31/22 | | | Annualized
Expense
Ratios | | | Expenses
Paid During
the Period(1) | |
| Roundhill Video Games ETF | | | | | | | | | | | | | | | | |
| Actual | | $ | 1,000.00 | | | $ | 853.80 | | | | 0.50% | | | | $2.34 | |
| Hypothetical (5% return before expenses) | | $ | 1,000.00 | | | $ | 1,022.68 | | | | 0.50% | | | | $2.55 | |
| Roundhill Sports Betting & iGaming ETF | | | | | | | | | | | | | | | | |
| Actual | | $ | 1,000.00 | | | $ | 1,004.90 | | | | 0.75% | | | | $3.79 | |
| Hypothetical (5% return before expenses) | | $ | 1,000.00 | | | $ | 1,021.42 | | | | 0.75% | | | | $3.82 | |
| Roundhill Ball Metaverse ETF | | | | | | | | | | | | | | | | |
| Actual | | $ | 1,000.00 | | | $ | 897.90 | | | | 0.60% | | | | $2.87 | |
| Hypothetical (5% return before expenses) | | $ | 1,000.00 | | | $ | 1,022.18 | | | | 0.60% | | | | $3.06 | |
| Roundhill IO Digital Infrastructure ETF | | | | | | | | | | | | | | | | |
| Actual | | $ | 1,000.00 | | | $ | 779.20 | | | | 0.76% | | | | $3.41 | |
| Hypothetical (5% return before expenses) | | $ | 1,000.00 | | | $ | 1,021.37 | | | | 0.76% | | | | $3.87 | |
| Roundhill MEME ETF | | | | | | | | | | | | | | | | |
| Actual | | $ | 1,000.00 | | | $ | 831.30 | | | | 0.69% | | | | $3.18 | |
| Hypothetical (5% return before expenses) | | $ | 1,000.00 | | | $ | 1,021.73 | | | | 0.69% | | | | $3.52 | |
55
Roundhill ETFs
Shareholder Expense Example
(Unaudited) (Continued)
| | | Beginning
Account Value
7/1/22 | | | Ending
Account Value
12/31/22 | | | Annualized
Expense
Ratios | | | Expenses
Paid During
the Period(1) | |
| Roundhill Cannabis ETF | | | | | | | | | | | | | | | | |
| Actual | | $ | 1,000.00 | | | $ | 665.40 | | | | 0.52% | | | | $2.18 | |
| Hypothetical (5% return before expenses) | | $ | 1,000.00 | | | $ | 1,022.58 | | | | 0.52% | | | | $2.65 | |
(1) | Expenses are calculated using the Fund’s annualized expense ratio, multiplied by the average account value during the period, multiplied by 184/365 days (to reflect the six-month period). |
56
Roundhill ETFs
Trustees and Officers of the Trust
December 31, 2022 (Unaudited)
The Funds’ Statement of Additional Information includes additional information about the Funds’ Trustees and Officers, and is available, without charge upon request by calling 1-800-617-0004, or by visiting the Funds’ website at www.roundhillinvestments.com.
Name and Year of Birth | Position Held
with the Trust | Term of Office
and Length of
Time Served | Principal Occupation(s)
During Past 5 Years | Number of
Portfolios in
Fund Complex
Overseen
by Trustee | Other
Directorships Held
by Trustee During
Past 5 Years |
Independent Trustees | | | | | |
John L. Jacobs Year of birth: 1959 | Trustee and Audit Committee Chair | Indefinite term; since 2017 | Chairman of Alerian, Inc. (since June 2018); Founder and CEO of Q3 Advisors, LLC (financial consulting firm) (since 2015); Executive Director of Center for Financial Markets and Policy (2016–2022); Distinguished Policy Fellow and Executive Director, Center for Financial Markets and Policy, Georgetown University (2015–2022); Senior Advisor, Nasdaq OMX Group (2015–2016); Executive Vice President, Nasdaq OMX Group (2013–2015) | 53 | Independent Trustee, SHP ETF Trust (since 2021) (2 portfolios); Director, tZERO Group, Inc. (since 2020); Independent Trustee, Procure ETF Trust II (since 2018) (1 portfolio); Independent Trustee, Horizons ETF Trust I (2015-2019). |
Koji Felton Year of birth: 1961 | Trustee | Indefinite term; since 2019 | Retired; formerly Counsel, Kohlberg Kravis Roberts & Co. L.P. (investment firm) (2013–2015); Counsel, Dechert LLP (law firm) (2011–2013) | 53 | Independent Trustee, Series Portfolios Trust (since 2015) (10 portfolios). |
Pamela H. Conroy Year of birth: 1961 | Trustee and Nominating and Governance Committee Chair | Indefinite term; since 2019 | Retired; formerly Executive Vice President, Chief Operating Officer & Chief Compliance Officer, Institutional Capital Corporation (investment firm) (1994–2008) | 53 | Independent Trustee, Frontier Funds, Inc. (since 2020) (6 portfolios). |
Interested Trustee | | | | | |
Paul R. Fearday, CPA* Year of birth: 1979 | Trustee and Chairman | Indefinite term; since 2019 | Senior Vice President, U.S. Bancorp Fund Services, LLC (since 2008) | 53 | None. |
* | This Trustee is considered an “Interested Trustee” as defined in the 1940 Act because of his affiliation with U.S. Bancorp Fund Services, d/b/a U.S. Bank Global Fund Services and U.S. Bank N.A., which provide fund accounting, administration, transfer agency and custodian services to the Funds. |
57
Roundhill ETFs
Trustees and Officers of the Trust
December 31, 2022 (Unaudited) (Continued)
Name and Year of Birth | Position(s) Held
with the Trust | Term of Office
and Length of
Time Served | Principal Occupation(s) During Past 5 Years |
Officers | | | |
Gregory Bakken Year of birth: 1983 | President and Principal Executive Officer | Indefinite term, February 2019 | Vice President, U.S. Bancorp Fund Services, LLC (since 2006). |
Travis G. Babich Year of birth: 1980 | Treasurer and Principal Financial Officer | Indefinite term, September 2019 | Vice President, U.S. Bancorp Fund Services, LLC (since 2005). |
Kacie G. Briody Year of birth: 1992 | Assistant Treasurer | Indefinite term, March 2019 | Assistant Vice President, U.S. Bancorp Fund Services, LLC (since 2021); Officer, U.S. Bancorp Fund Services, LLC (2014 to 2021). |
Kent Barnes Year of birth: 1968 | Secretary | Indefinite term, February 2019 | Vice President, U.S. Bancorp Fund Services, LLC (since 2018); Chief Compliance Officer, Rafferty Asset Management, LLC (2016 to 2018); Vice President, U.S. Bancorp Fund Services, LLC (2007 to 2016). |
Christi C. James Year of birth: 1974 | Chief Compliance Officer and Anti-Money Laundering Officer | Indefinite term, July 2022 | Senior Vice President, U.S. Bancorp Fund Services, LLC (since 2022); Principal Consultant, ACA Group (2021 to 2022); Lead Manager, Communications Compliance, T. Rowe Price Investment Services, Inc. (2018 to 2021); Compliance & Legal Manager, CR Group LP (2017 to 2018). |
Joshua J. Hinderliter Year of birth: 1983 | Assistant Secretary | Indefinite term, May 2022 | Assistant Vice President, U.S. Bancorp Fund Services, LLC (since 2022); Managing Associate, Thompson Hine LLP (2016 to 2022). |
58
Roundhill ETFs
Supplemental Information
(Unaudited)
Investors should consider the investment objective and policies, risk considerations, charges and ongoing expenses of an investment carefully before investing. The prospectus contains this and other information relevant to an investment in the Funds. Please read the prospectus carefully before investing. A copy of the prospectus for the Funds may be obtained without charge by writing to the Funds, c/o U.S. Bank Global Fund Services, P.O. Box 701, Milwaukee, Wisconsin 53201-0701, by calling 1-800-617-0004, or by visiting the Funds’ website at www.roundhillinvestments.com.
QUARTERLY PORTFOLIO HOLDING INFORMATION
Each Fund files its complete schedule of portfolio holdings for its first and third fiscal quarters with the Securities and Exchange Commission (“SEC”) on Part F of Form N-PORT. The Funds’ Part F of Form N-PORT is available without charge, upon request, by calling toll-free at 1-800-617-0004. Furthermore, you may obtain the Part F of Form N-PORT on the SEC’s website at www.sec.gov.
PROXY VOTING INFORMATION
Each Fund is required to file a Form N-PX, with the Fund’s complete proxy voting record for the 12 months ended June 30, no later than August 31 of each year. The Funds’ proxy voting record will be available without charge, upon request, by calling toll-free 1-800-617-0004 and on the SEC’s website at www.sec.gov.
FREQUENCY DISTRIBUTION OF PREMIUMS AND DISCOUNTS
Information regarding how often shares of the Funds trade on an exchange at a price above (i.e., at a premium) or below (i.e., at a discount) the NAV of the Funds is available without charge, on the Funds’ website at www.roundhillinvestments.com.
TAX INFORMATION
For the fiscal period ended December 31, 2022, certain dividends paid by the Funds may be subject to a maximum tax rate of 15%, as provided for by the Jobs and Growth Tax Relief Reconciliation Act 2003.
The percentage of dividends declared from ordinary income designated as qualified dividend income was as follows:
Roundhill Video Games ETF | | | 100.00 | % |
Roundhill Sports Betting & iGaming ETF | | | 100.00 | % |
Roundhill Ball Metaverse ETF | | | 100.00 | % |
Roundhill IO Digital Infrastructure ETF | | | 96.18 | % |
Roundhill MEME ETF | | | 54.99 | % |
Roundhill Cannabis ETF | | | 0.00 | % |
For corporate shareholders, the percent of ordinary income distributions qualifying for the corporate dividends received deduction for the fiscal period ended December 31, 2022 was as follows:
Roundhill Video Games ETF | | | 4.54 | % |
Roundhill Sports Betting & iGaming ETF | | | 7.70 | % |
Roundhill Ball Metaverse ETF | | | 100.00 | % |
Roundhill IO Digital Infrastructure ETF | | | 51.14 | % |
Roundhill MEME ETF | | | 2.70 | % |
Roundhill Cannabis ETF | | | 0.00 | % |
59
Roundhill ETFs
Supplemental Information
(Unaudited) (Continued)
For the fiscal period ended December 31, 2022, the percentage of taxable ordinary income distributions that are designated as short-term capital gain distributions under Internal Revenue Code Section 871(k)(2)(C) for the Funds was as follows:
Roundhill Video Games ETF | | | 0.00 | % |
Roundhill Sports Betting & iGaming ETF | | | 0.00 | % |
Roundhill Ball Metaverse ETF | | | 0.00 | % |
Roundhill IO Digital Infrastructure ETF | | | 12.87 | % |
Roundhill MEME ETF | | | 0.00 | % |
Roundhill Cannabis ETF | | | 0.00 | % |
For the fiscal period ended December 31, 2022, the Funds earned foreign source income and paid foreign taxes, which the Funds intend to pass through to its shareholders pursuant to Section 853 of the Internal Revenue Code as follows:
| | | Foreign Source
Income Earned | | | Foreign
Taxes Paid | |
Roundhill Video Games ETF | | $ | 494,373 | | | $ | 61,178 | |
Roundhill Sports Betting & iGaming ETF | | | 2,221,732 | | | | 115,301 | |
60
Roundhill ETFs
Privacy Policy
(Unaudited)
We are committed to respecting the privacy of personal information you entrust to us in the course of doing business with us.
The Funds collect non-public information about you from the following sources:
| | ● | Information we receive about you on applications or other forms; |
| | ● | Information you give us orally; and/or |
| | ● | Information about your transactions with us or others. |
We do not disclose any non-public personal information about our customers or former customers without the customer’s authorization, except as permitted by law or in response to inquiries from governmental authorities. We may share information with affiliated and unaffiliated third parties with whom we have contracts for servicing the Funds. We will provide unaffiliated third parties with only the information necessary to carry out their assigned responsibilities. We maintain physical, electronic and procedural safeguards to guard your non-public personal information and require third parties to treat your personal information with the same high degree of confidentiality.
In the event that you hold shares of the Funds through a financial intermediary, including, but not limited to, a broker-dealer, bank, or trust company, the privacy policy of your financial intermediary would govern how your non-public personal information would be shared by those entities with unaffiliated third parties.
61
Investment Adviser:
Roundhill Financial Inc.
154 W. 14th St., 2nd Floor
New York, NY 10011
Investment Sub-Adviser:
Exchange Traded Concepts, LLC
10900 Hefner Pointe Drive, Suite 400
Oklahoma City, OK 73120
Legal Counsel:
Morgan, Lewis & Bockius LLP
1111 Pennsylvania Avenue, N.W.
Washington, D.C. 20004
Independent Registered Public Accounting Firm:
Cohen & Company, Ltd.
1350 Euclid Avenue, Suite 800
Cleveland, OH 44115
Distributor:
Foreside Fund Services, LLC
Three Canal Plaza, Suite 100
Portland, ME 04101
Administrator, Fund Accountant & Transfer Agent:
U.S. Bancorp Fund Services, LLC
d/b/a U.S. Bank Global Fund Services
615 E. Michigan St.
Milwaukee, WI 53202
Custodian:
U.S. Bank N.A.
1555 North RiverCenter Drive, Suite 302
Milwaukee, WI 53212
This information must be preceded or accompanied by a current prospectus for the Funds.
(b) Not applicable.
Item 2. Code of Ethics.
The registrant has adopted a code of ethics that applies to the registrant’s principal executive officer and principal financial officer. The Registrant has not made any substantive amendments to its code of ethics during the period covered by this report. The registrant has not granted any waivers from any provisions of the code of ethics during the period covered by this report.
A copy of the registrant’s Code of Ethics is filed herewith.
Item 3. Audit Committee Financial Expert.
The registrant’s Board of Trustees has determined that there is at least one audit committee financial expert serving on its audit committee. Mr. John Jacobs is the “audit committee financial expert” and is considered to be “independent” as each term is defined in Item 3 of Form N-CSR.
Item 4. Principal Accountant Fees and Services.
The registrant has engaged its principal accountant to perform audit services, audit-related services, tax services and other services during the past two fiscal years. “Audit services” refer to performing an audit of the registrant's annual financial statements or services that are normally provided by the accountant in connection with statutory and regulatory filings or engagements for those fiscal years. “Audit-related services” refer to the assurance and related services by the principal accountant that are reasonably related to the performance of the audit. “Tax services” refer to professional services rendered by the principal accountant for tax compliance, tax advice, and tax planning. There were no “Other services” provided by the principal accountant. The following table details the aggregate fees billed or expected to be billed for the last two fiscal years for audit fees, audit-related fees, tax fees and other fees by the principal accountant.
| | FYE 12/31/2022 | FYE 12/31/2021 |
| Audit Fees | $79,500 | $89,500 |
| Audit-Related Fees | $0 | $0 |
| Tax Fees | $18,000 | $21,000 |
| All Other Fees | $0 | $0 |
(e)(1) The audit committee has adopted pre-approval policies and procedures that require the audit committee to pre-approve all audit and non-audit services of the registrant, including services provided to any entity affiliated with the registrant.
(e)(2) The percentage of fees billed by Cohen & Company, Ltd. applicable to non-audit services pursuant to waiver of pre-approval requirement were as follows:
| | FYE 12/31/2022 | FYE 12/31/2021 |
| Audit-Related Fees | 0% | 0% |
| Tax Fees | 0% | 0% |
| All Other Fees | 0% | 0% |
(f) All of the principal accountant’s hours spent on auditing the registrant’s financial statements were attributed to work performed by full-time permanent employees of the principal accountant.
(g) The following table indicates the non-audit fees billed or expected to be billed by the registrant’s accountant for services to the registrant and to the registrant’s investment adviser (and any other controlling entity, etc.—not sub-adviser) for the last two years.
| Non-Audit Related Fees | FYE 12/31/2022 | FYE 12/31/2021 |
| Registrant | N/A | N/A |
| Registrant’s Investment Adviser | N/A | N/A |
(h) The audit committee of the board of trustees/directors has considered whether the provision of non-audit services that were rendered to the registrant's investment adviser is compatible with maintaining the principal accountant's independence and has concluded that the provision of such non-audit services by the accountant has not compromised the accountant’s independence.
The registrant has not been identified by the U.S. Securities and Exchange Commission as having filed an annual report issued by a registered public accounting firm branch or office that is located in a foreign jurisdiction where the Public Company Accounting Oversight Board is unable to inspect or completely investigate because of a position taken by an authority in that jurisdiction.
The registrant is not a foreign issuer.
Item 5. Audit Committee of Listed Registrants.
| (a) | The registrant is an issuer as defined in Rule 10A-3 under the Securities Exchange Act of 1934, (the “Act”) and has a separately-designated standing audit committee established in accordance with Section 3(a)(58)(A) of the Act. The entire Board of Trustees is acting as the registrant’s audit committee. |
Item 6. Investments.
| (a) | Schedule of Investments is included as part of the report to shareholders filed under Item 1 of this Form. |
Item 7. Disclosure of Proxy Voting Policies and Procedures for Closed-End Management Investment Companies.
��
Not applicable to open-end investment companies.
Item 8. Portfolio Managers of Closed-End Management Investment Companies.
Not applicable to open-end investment companies.
Item 9. Purchases of Equity Securities by Closed-End Management Investment Company and Affiliated Purchasers.
Not applicable to open-end investment companies.
Item 10. Submission of Matters to a Vote of Security Holders.
There have been no material changes to the procedures by which shareholders may recommend nominees to the registrant’s Board of Trustees.
Item 11. Controls and Procedures.
| (a) | The Registrant’s President and Treasurer have reviewed the Registrant's disclosure controls and procedures (as defined in Rule 30a-3(c) under the Investment Company Act of 1940 (the “Act”)) as of a date within 90 days of the filing of this report, as required by Rule 30a-3(b) under the Act and Rules 13a-15(b) or 15d-15(b) under the Securities Exchange Act of 1934. Based on their review, such officers have concluded that the disclosure controls and procedures are effective in ensuring that information required to be disclosed in this report is appropriately recorded, processed, summarized and reported and made known to them by others within the Registrant and by the Registrant’s service provider. |
| (b) | There were no changes in the Registrant's internal control over financial reporting (as defined in Rule 30a-3(d) under the Act) that occurred during the period covered by this report that have materially affected, or are reasonably likely to materially affect, the Registrant's internal control over financial reporting. |
Item 12. Disclosure of Securities Lending Activities for Closed-End Management Investment Companies
Not applicable to open-end investment companies.
Item 13. Exhibits.
(2) A separate certification for each principal executive officer and principal financial officer pursuant to Section 302 of the Sarbanes-Oxley Act of 2002. Filed herewith.
(3) Any written solicitation to purchase securities under Rule 23c-1 under the Act sent or given during the period covered by the report by or on behalf of the registrant to 10 or more persons. Not applicable to open-end investment companies.
(4) Change in the registrant’s independent public accountant. There was no change in the registrant’s independent public accountant for the period covered by this report.
SIGNATURES
Pursuant to the requirements of the Securities Exchange Act of 1934 and the Investment Company Act of 1940, the registrant has duly caused this report to be signed on its behalf by the undersigned, thereunto duly authorized.
| | (Registrant) | Listed Funds Trust | |
| | | | |
| | By (Signature and Title)* | /s/ Gregory C. Bakken | |
| | | Gregory C. Bakken, President/Principal Executive Officer | |
| | | | |
| | Date | March 9, 2023 | |
Pursuant to the requirements of the Securities Exchange Act of 1934 and the Investment Company Act of 1940, this report has been signed below by the following persons on behalf of the registrant and in the capacities and on the dates indicated.
| | By (Signature and Title)* | /s/ Gregory C. Bakken | |
| | | Gregory C. Bakken, President/Principal Executive Officer | |
| | | | |
| | Date | March 9, 2023 | |
| | | | |
| | | | |
| | By (Signature and Title)* | /s/ Travis G. Babich | |
| | | Travis G. Babich, Treasurer/Principal Financial Officer | |
| | | | |
| | Date | March 9, 2023 | |
| * | Print the name and title of each signing officer under his or her signature. |