UNITED STATES
SECURITIES AND EXCHANGE COMMISSION
Washington, D.C. 20549
FORM N-CSR
CERTIFIED SHAREHOLDER REPORT OF REGISTERED
MANAGEMENT INVESTMENT COMPANIES
Investment Company Act file number (811-23226)
Listed Funds Trust
(Exact name of registrant as specified in charter)
615 East Michigan Street
Milwaukee, WI 53202
(Address of principal executive offices) (Zip code)
Gregory C. Bakken, President
Listed Funds Trust
c/o U.S. Bancorp Fund Services, LLC
777 East Wisconsin Avenue, 6th Floor
Milwaukee, WI 53202
(Name and address of agent for service)
(414) 516-3097
Registrant's telephone number, including area code
Date of fiscal year end: September 30
Date of reporting period: September 30, 2023
Item 1. Reports to Stockholders.
(a)

Innovative ETFs
Dividend Performers ETF (IPDP)
Preferred-Plus ETF (IPPP)
ANNUAL REPORT
September 30, 2023
Innovative ETFs
Table of Contents
| | |
Management Discussion of Fund Performance (Unaudited) | 2 |
Dividend Performers ETF | 2 |
Preferred-Plus ETF | 3 |
Shareholder Expense Example (Unaudited) | 4 |
Performance Overview (Unaudited) | 5 |
Dividend Performers ETF | 5 |
Preferred-Plus ETF | 6 |
Schedules of Investments and Written Options | 7 |
Dividend Performers ETF | 7 |
Preferred-Plus ETF | 10 |
Statements of Assets and Liabilities | 14 |
Statements of Operations | 15 |
Statements of Changes in Net Assets | 16 |
Financial Highlights | 18 |
Notes to Financial Statements | 21 |
Report of Independent Registered Public Accounting Firm | 31 |
Trustees and Officers of the Trust (Unaudited) | 32 |
Supplemental Information (Unaudited) | 34 |
Review of Liquidity Risk Management Program (Unaudited) | 35 |
Privacy Policy (Unaudited) | 36 |
1
Dividend Performers ETF
Management Discussion of Fund Performance
September 30, 2023 (Unaudited)
Market Review
Over the last year, the stock market has rebounded off the lows of October 2022 and into a new bull market. The rally was fueled by falling inflation, low unemployment, and a resilient economy which boosted investors’ belief of a potential ‘soft landing’ by the Federal Reserve (the “Fed”). Additionally, enthusiasm for anything Artificial Intelligence (AI) provided a catalyst for many growth companies. However, since July, inflation readings have been a little higher than in recent months and oil prices have increased. While Wall Street is happy with the Fed slowing (maybe pausing rate increases), investors are finally waking up to the ‘higher for longer’ likelihood for short-term interest rates. Lastly, long-term rates have increased materially to adjust for the new paradigm which has kept the fixed-income market firmly in a bear market.
Performance Discussion
Performance ending September 30, 2023 | 1-Year
Annualized | 3-Year
Annualized | Since Inception
Annualized
(12/24/18) |
Dividend Performers - NAV | 33.45% | 12.88% | 15.01% |
Dividend Performers - Market Price | 33.88% | 12.85% | 14.99% |
NASDAQ U.S. Broad Dividend Achievers™ Index | 15.94% | 9.08% | 12.66% |
S&P 500 Index | 21.62% | 10.15% | 15.39% |
Early in fiscal 2023, the market finished its bear market with a new bull stock market beginning. With a strong market tailwind, Dividend Performers again beat its benchmark (NASDAQ U.S. Broad Dividend Achievers™ Index). The Fund has beaten its benchmark and S&P 500 Index in calendar years 2019-2021, through the first 9 months of 2023, and annualized 1- and 3-year returns ending September 30, 2023. Since the Fund’s inception, it has beaten the benchmark and only slightly trails the S&P 500 Index. The strong performance stems from the merger of its two investment focuses: equities and option overlay.
The 50 stocks are selected for their history of raising dividends and quality downside risk quantitative scores from Revelation Investment Research. This selection approach has had a history of quality performance in multiple investing environments; something that we have witnessed over the last several years. Since its launch, the Fund has weathered a lot of market changes such as a pandemic, an escalating geopolitical environment, the highest inflation in 40 years, a rapid increase in interest rates, and obsession about AI. From a sector allocation perspective, overweight industrials and health care contributed to performance while underweight financials and energy detracted from performance relative to the benchmark.
The option overlay has returned to providing alpha to the Fund. Through the increased market exposure, the Fund was able to rebound faster than the overall stock market early in the fiscal year. While the options detracted from performance in fiscal 2022, the patience and belief in the long-term strategy implementation paid off in fiscal 2023.
Portfolio Activity
Over the last year, the Fund sold 17 out of the 50 positions. Stocks fell out of the portfolio either for failing to raise dividends or weakening quantitative downside risk scores. They were replaced by the top ranked stocks of the NASDAQ U.S. Broad Dividend Achievers™ Index. As of September 30, 2023, the largest overweight sectors compared to the NASDAQ U.S. Broad Dividend Achievers™ Index were Industrials and Health Care, while the largest underweight were Consumer Staples and Financials. Over the year, the option positions changed numerous times with new positions or rolling existing ones into the future.
Investing Outlook
Despite the many challenges and dire predictions, the U.S. economy and consumer have been surprisingly resilient. There have been many turns and head fakes over the last few years, and more are likely to come. The ever-evolving conditions have investors repeatedly tweaking near-term expectations while also being tepid about making changes to longer term predictions. The stocks selected in the Fund are those believed to show stability, growth, and shareholder returns through the cycle. This focus on quality and downside risk protection has performed well since inception and hopefully should continue in the future. Also, the option overlay should continue producing alpha over the long-term.
2
Preferred-Plus ETF
Management Discussion of Fund Performance
September 30, 2023 (Unaudited)
Performance of the Fund
The total return for the Preferred-Plus ETF (the “Fund”) and its comparative benchmarks for the year ending September 30, 2023 were:
Performance ending September 30, 2023 | 1-Year
Annualized | 3-Year
Annualized | Since Inception
Annualized
(12/24/18) |
Preferred-Plus ETF – NAV | 5.12% | -0.55% | 3.64% |
Preferred-Plus ETF – Market Price | 5.27% | -0.57% | 3.62% |
ICE BofA Core Plus Fixed Rate Preferred Securities Index | -1.77% | -3.98% | 1.74% |
S&P U.S. Preferred Stock Index | 3.50% | -0.77% | 3.70% |
Market Review
Preferred securities, as measured by the S&P U.S. Preferred Stock Index (the “Index”), had a gain for the 12-month period ending September 30, 2023. The last twelve months can best be described as volatile. After an ugly 2022, preferred equity started off the new year with a bang. January saw the Index return 11.99% on thoughts that the Federal Reserve (the “Fed”) was nearing the end of rate hikes and that rate cuts were soon to follow. Those thoughts quickly evaporated as the January job data surpassed expectations pushing the interest rates higher. March brought banks, the largest issuing sector of preferred securities, a crisis of confidence and liquidity due to three small- to mid-size banks failing. Preferred securities finished the first half of the fiscal year up 2.03%. The second half of the fiscal year was a marked by a steady rise of the yield on the 10-year Treasury as market participants began to accept Fed Chairman Powell’s mantra of “higher for longer”.
Portfolio Activity
The preferred security market is inefficient due to its small market capitalization, complexity, and variety of security structures available. We believe that a comprehensive analysis of the different structures, credit quality, economic and interest rate outlook can result in outperformance.
For the period ending September 30, 2023, contributors to the Fund’s performance were the security selection in the banking sector and an underweight to the Real Estate Investment Trust (“REIT”) sector. The Fund has been maintaining a lower duration versus the benchmark during this era of rising interest rates, however we feel that the major rise in rates is behind us and have been slowly adding duration during the past fiscal year. The S&P 500 Index positive performance translated in the option overlay adding to the Fund’s outperformance.
Detractors to the Fund’s performance was security selection in the REIT sector along with increasing the Fund’s duration. While we believe rates will eventually normalize and then start to retreat, we might have been early in extending duration.
Investment Outlook
New issue preferred securities are coming to market with coupons in the 6-7% range, well above recent averages. In addition, most preferred securities pay Qualified Dividends meaning they are taxed at a lower rate than ordinary income. Supply is expected to shrink going forward as most preferred issuers took advantage of the recent low rates to issue needed preferred capital, while demand should remain strong given investors’ continuing search for yield. With most of the interest rate increases behind us we expect to see continued strong returns from the dividends. If or when rates start to decline, the additional price appreciation should boost preferred total returns.
3
Innovative ETFs
Shareholder Expense Example
(Unaudited)
As a shareholder of the Funds you incur two types of costs: (1) transaction costs, including brokerage commissions on purchases and sales of fund shares; and (2) ongoing costs, including management fees and other fund expenses. The following example is intended to help you understand your ongoing costs (in dollars and cents) of investing in the Funds and to compare these costs with the ongoing costs of investing in other funds. The examples are based on an investment of $1,000 invested at the beginning of the period and held throughout the entire period (April 1, 2023 to September 30, 2023).
ACTUAL EXPENSES
The first line under the Funds in the table below provides information about actual account values and actual expenses. You may use the information in this line, together with the amount you invested, to estimate the expenses that you paid over the period. Simply divide your account value by $1,000 (for example, an $8,600 account value divided by $1,000 = 8.6), then multiply the result by the number in the first line for your Fund under the heading entitled “Expenses Paid During Period” to estimate the expenses you paid on your account during this period.
HYPOTHETICAL EXAMPLE FOR COMPARISON PURPOSES
The second line in the table provides information about hypothetical account values and hypothetical expenses based on each Fund’s actual expense ratio and an assumed rate of return of 5% per year before expenses, which is not the Fund’s actual return. The hypothetical account values and expenses may not be used to estimate the actual ending account balance or expenses you paid for the period. You may use this information to compare the ongoing costs of investing in the Funds and other funds. To do so, compare this 5% hypothetical example with the 5% hypothetical examples that appear in the shareholder reports of the other funds. Please note that the expenses shown in the table are meant to highlight your ongoing costs only and do not reflect any transactional costs, such as brokerage commissions paid on purchases and sales of Fund shares. Therefore, the second line in the table is useful in comparing ongoing Fund costs only and will not help you determine the relative total costs of owning different funds. In addition, if these transactional costs were included, your costs would have been higher.
| | Beginning
Account Value
4/1/23 | Ending
Account Value
9/30/23 | Annualized
Expense
Ratios | Expenses
Paid During
the Period(1) |
Dividend Performers ETF | | | | |
Actual | $ 1,000.00 | $ 1,058.00 | 1.18% | $6.08 |
Hypothetical (5% return before expenses) | $ 1,000.00 | $ 1,019.16 | 1.18% | $5.97 |
Preferred-Plus ETF | | | | |
Actual | $ 1,000.00 | $ 1,042.70 | 1.04% | $5.35 |
Hypothetical (5% return before expenses) | $ 1,000.00 | $ 1,019.83 | 1.04% | $5.29 |
(1) | Expenses are calculated using each Fund’s annualized expense ratio, multiplied by the average account value for the period, multiplied by 183/365 (to reflect the six-month period). |
4
Dividend Performers ETF
Performance Overview
September 30, 2023 (Unaudited)
Hypothetical Growth of $10,000 Investment
(Since Commencement through 09/30/2023)
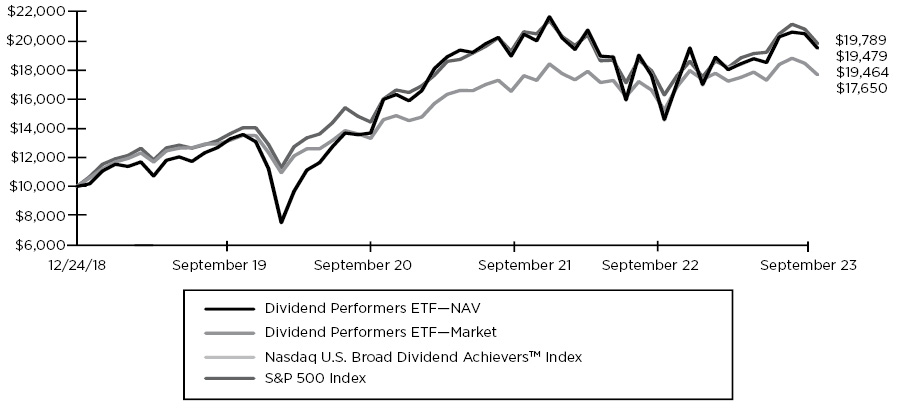
ANNUALIZED TOTAL RETURN FOR THE PERIODS ENDED SEPTEMBER 30, 2023 |
Total Returns | One
Year | Three
Year | Since
Commencement1 |
Dividend Performers ETF—NAV | 33.45% | 12.88% | 15.01% |
Dividend Performers ETF—Market | 33.88% | 12.85% | 14.99% |
Nasdaq U.S. Broad Dividend AchieversTM Index | 15.94% | 9.08% | 12.66% |
S&P 500 Index | 21.62% | 10.15% | 15.39% |
1 | The Fund commenced operations on December 24, 2018. |
The Fund is the successor to the investment performance of the Dividend Performers (the “Predecessor Fund”) as a result of the reorganization of the Predecessor Fund into the Fund before the start of business on March 7, 2022. Accordingly, the performance information shown in the chart and table above for the periods prior to before the start of business on March 7, 2022, is that of the Predecessor Fund’s shares for the Fund. The Predecessor Fund was managed by the same portfolio managers as the Fund and had substantially the same investment objectives, policies, and strategies as the Fund.
The performance data quoted represents past performance. Past performance does not guarantee future results. Current performance may be lower or higher than the performance data quoted. The investment return and principal value of an investment will fluctuate so that an investor’s shares, when sold or redeemed, may be worth more or less than their original cost. For the most recent month-end performance, please call (800) 617-0004. You cannot invest directly in an index. Shares are bought and sold at market price, not net asset value (NAV), and are individually redeemed from the Fund. Market performance is determined using the bid/ask midpoint at 4:00pm Eastern time when the NAV is typically calculated. Brokerage commissions will reduce returns. Returns shown include the reinvestment of all dividends and distribution. Returns shown do not reflect the deduction of taxes that a shareholder would pay on fund distributions or the redemption of fund shares.
The NASDAQ U.S. Broad Dividend AchieversTM Index is comprised of U.S. accepted securities with at least ten consecutive years of increasing annual regular dividend payments.
The S&P 500 Index is a market-value weighted index consisting of 500 stocks chosen for market size, liquidity, and industry group representation, with each stock’s weight in the Index proportionate to its market value.
5
Preferred-Plus ETF
Performance Overview
September 30, 2023 (Unaudited)
Hypothetical Growth of $10,000 Investment
(Since Commencement through 09/30/2023)
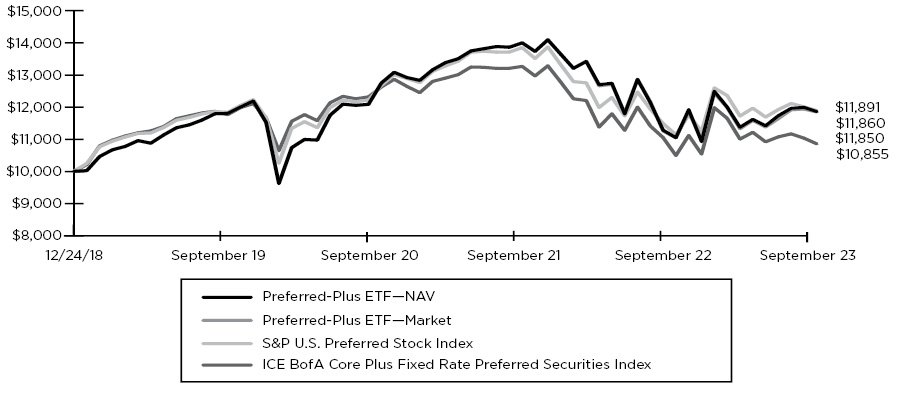
ANNUALIZED TOTAL RETURN FOR THE PERIODS ENDED SEPTEMBER 30, 2023 |
Total Returns | One
Year | Three
Year | Since
Commencement1 |
Preferred-Plus ETF—NAV | 5.12% | -0.55% | 3.64% |
Preferred-Plus ETF—Market | 5.27% | -0.57% | 3.62% |
ICE BofA Core Plus Fixed Rate Preferred Securities Index | -1.77% | -3.98% | 1.74% |
S&P U.S. Preferred Stock Index | 3.50% | -0.77% | 3.70% |
1 | The Fund commenced operations on December 24, 2018. |
The Fund is the successor to the investment performance of the Preferred-Plus (the “Predecessor Fund”) as a result of the reorganization of the Predecessor Fund into the Fund before the start of business on March 7, 2022. Accordingly, the performance information shown in the chart and table above for the periods prior to before the start of business on March 7, 2022, is that of the Predecessor Fund’s shares for the Fund. The Predecessor Fund was managed by the same portfolio managers as the Fund and had substantially the same investment objectives, policies, and strategies as the Fund.
The performance data quoted represents past performance. Past performance does not guarantee future results. Current performance may be lower or higher than the performance data quoted. The investment return and principal value of an investment will fluctuate so that an investor’s shares, when sold or redeemed, may be worth more or less than their original cost. For the most recent month-end performance, please call (800) 617-0004. You cannot invest directly in an index. Shares are bought and sold at market price, not net asset value (NAV), and are individually redeemed from the Fund. Market performance is determined using the bid/ask midpoint at 4:00pm Eastern time when the NAV is typically calculated. Brokerage commissions will reduce returns. Returns shown include the reinvestment of all dividends and distribution. Returns shown do not reflect the deduction of taxes that a shareholder would pay on fund distributions or the redemption of fund shares.
The ICE BofA Core Plus Fixed Rate Preferred Securities Index is an index designed to measure the performance of fixed rate U.S. dollar denominated preferred securities issued in the U.S domestic market with a rating of at least B3 (based on an average of Moody’s, S&P and Fitch) and an investment-grade country risk profile.
The S&P U.S. Preferred Securities Index is an index designed to measure the performance of the U.S. preferred stock market and consists of U.S. preferred stocks with a market cap greater than $100 million and a maturity of at least one year or longer.
6
Dividend Performers ETF
Schedule of Investments
September 30, 2023
Description | | Shares | | | Value | |
COMMON STOCKS — 99.6% | | | | | | | | |
Building Materials — 2.4% | | | | | | | | |
Apogee Enterprises, Inc. | | | 8,914 | | | $ | 419,671 | |
| | | | | | | | | |
Chemicals — 2.1% | | | | | | | | |
The Sherwin—Williams Co. (a) | | | 1,494 | | | | 381,045 | |
| | | | | | | | | |
Commercial Services — 8.3% | | | | | | | | |
ABM Industries, Inc. (a) | | | 7,860 | | | | 314,479 | |
Automatic Data Processing, Inc. | | | 1,615 | | | | 388,537 | |
Booz Allen Hamilton Holdings Corp. | | | 3,754 | | | | 410,200 | |
Cintas Corp. (a) | | | 737 | | | | 354,504 | |
| | | | | | | | 1,467,720 | |
Computers — 4.0% | | | | | | | | |
Accenture PLC — Class A (a)(b) | | | 1,210 | | | | 371,603 | |
Apple, Inc. | | | 1,986 | | | | 340,023 | |
| | | | | | | | 711,626 | |
Distribution & Wholesale — 3.9% | | | | | | | | |
Fastenal Co. (a) | | | 6,297 | | | | 344,068 | |
WW Grainger, Inc. (a) | | | 512 | | | | 354,222 | |
| | | | | | | | 698,290 | |
Diversified Financial Services — 2.0% | | | | | | | | |
SEI Investments Co. | | | 5,958 | | | | 358,850 | |
| | | | | | | | | |
Electrical Components & Equipment — 2.3% | | | | | | | | |
Emerson Electric Co. (a) | | | 4,226 | | | | 408,105 | |
| | | | | | | | | |
Electronics — 8.1% | | | | | | | | |
Agilent Technologies, Inc. | | | 2,699 | | | | 301,802 | |
Amphenol Corp. — Class A | | | 4,568 | | | | 383,666 | |
Brady Corp. — Class A | | | 6,657 | | | | 365,602 | |
Hubbell, Inc. (a) | | | 1,240 | | | | 388,628 | |
| | | | | | | | 1,439,698 | |
Food — 1.8% | | | | | | | | |
The Kroger Co. | | | 7,051 | | | | 315,532 | |
| | | | | | | | | |
Hand & Machine Tools — 4.0% | | | | | | | | |
Lincoln Electric Holdings, Inc. (a) | | | 2,041 | | | | 371,033 | |
Snap—on, Inc. (a) | | | 1,331 | | | | 339,485 | |
| | | | | | | | 710,518 | |
Healthcare — Products — 3.6% | | | | | | | | |
Abbott Laboratories (a) | | | 3,207 | | | | 310,598 | |
Stryker Corp. | | | 1,219 | | | | 333,116 | |
| | | | | | | | 643,714 | |
Healthcare — Services — 7.7% | | | | | | | | |
Chemed Corp. | | | 649 | | | | 337,285 | |
Elevance Health, Inc. | | | 764 | | | | 332,661 | |
Humana, Inc. | | | 677 | | | | 329,374 | |
UnitedHealth Group, Inc. (a) | | | 726 | | | | 366,042 | |
| | | | | | | | 1,365,362 | |
Insurance — 7.7% | | | | | | | | |
Globe Life, Inc. | | | 3,194 | | | | 347,284 | |
Marsh & McLennan Cos., Inc. | | | 1,939 | | | | 368,992 | |
The Hartford Financial Services Group, Inc. | | | 4,883 | | | | 346,254 | |
The Travelers Cos., Inc. | | | 1,893 | | | | 309,146 | |
| | | | | | | | 1,371,676 | |
Machinery — Diversified — 6.2% | | | | | | | | |
Applied Industrial Technologies, Inc. (a) | | | 2,672 | | | | 413,118 | |
Dover Corp. (a) | | | 2,470 | | | | 344,590 | |
Rockwell Automation, Inc. | | | 1,237 | | | | 353,621 | |
| | | | | | | | 1,111,329 | |
Miscellaneous Manufacturing — 7.8% | | | | | | | | |
A. O. Smith Corp. | | | 5,084 | | | | 336,205 | |
Donaldson Co., Inc. (a) | | | 5,416 | | | | 323,010 | |
Eaton Corp PLC (a)(b) | | | 1,992 | | | | 424,854 | |
Hillenbrand, Inc. | | | 7,169 | | | | 303,320 | |
| | | | | | | | 1,387,389 | |
Pharmaceuticals — 8.0% | | | | | | | | |
Cardinal Health, Inc. | | | 4,048 | | | | 351,447 | |
Cencora, Inc. (a) | | | 1,990 | | | | 358,140 | |
Johnson & Johnson (a) | | | 2,186 | | | | 340,469 | |
McKesson Corp. (a) | | | 874 | | | | 380,059 | |
| | | | | | | | 1,430,115 | |
Retail — 5.7% | | | | | | | | |
Genuine Parts Co. (a) | | | 2,116 | | | | 305,508 | |
The accompanying notes are an integral part of the financial statements.
7
Dividend Performers ETF
Schedule of Investments
September 30, 2023 (Continued)
Description | | Shares | | | Value | |
Retail (Continued) | | | | | | | | |
Lowe’s Cos., Inc. | | | 1,663 | | | $ | 345,638 | |
The Home Depot, Inc. | | | 1,178 | | | | 355,944 | |
| | | | | | | | 1,007,090 | |
Semiconductors — 2.4% | | | | | | | | |
Broadcom, Inc. (a) | | | 513 | | | | 426,088 | |
| | | | | | | | | |
Software — 4.0% | | | | | | | | |
Microsoft Corp. | | | 1,092 | | | | 344,799 | |
Paychex, Inc. (a) | | | 3,202 | | | | 369,287 | |
| | | | | | | | 714,086 | |
Telecommunications — 4.0% | | | | | | | | |
Cisco Systems, Inc. | | | 7,216 | | | | 387,932 | |
Motorola Solutions, Inc. | | | 1,173 | | | | 319,338 | |
| | | | | | | | 707,270 | |
Transportation — 3.6% | | | | | | | | |
CSX Corp. | | | 10,765 | | | | 331,024 | |
United Parcel Service, Inc. — Class B | | | 2,034 | | | | 317,040 | |
| | | | | | | | 648,064 | |
TOTAL COMMON STOCKS (Cost $15,748,485) | | | | | | | 17,723,238 | |
| | | | | | | | | |
MONEY MARKET FUND — 0.3% | | | | | | | | |
First American Government Obligations Fund — Class X, 5.26% (d) | | | 61,616 | | | | 61,616 | |
TOTAL MONEY MARKET FUND (Cost $61,616) | | | | | | | 61,616 | |
| | Number of
Contracts (c) | | | Value | | | Notional
Value | |
PURCHASED OPTIONS — 0.0% (f) | | | | | | | | |
PURCHASED PUT OPTIONS — 0.0% (f) | | | | | | | | |
CBOE Mini S&P 500 Index | | | | | | | | | | | | |
Expiration: October 2023, Exercise Price: $370 (e) | | | 146 | | | $ | 2,044 | | | $ | 5,402,000 | |
Expiration: October 2023, Exercise Price: $370 (e) | | | 140 | | | | 4,200 | | | | 5,180,000 | |
TOTAL PURCHASED OPTIONS (Cost $6,507) | | | | | | | 6,244 | | | | | |
| | | | | | | | | | | | | |
TOTAL INVESTMENTS (Cost $15,816,608) — 99.9% | | | | | | | 17,791,098 | | | | | |
Other Assets and Liabilities, net — 0.1% | | | | | | | 9,254 | | | | | |
NET ASSETS — 100.0% | | | | | | $ | 17,800,352 | | | | | |
Percentages are stated as a percent of net assets.
CBOE Chicago Board Options Exchange
PLC Public Limited Company
(a) | A portion or all of the security has been segregated or earmarked as collateral for written options. As of September 30, 2023, the value of these securities amounts to $7,022,483 or 39.5% of net assets. |
(b) | Foreign issued security. |
(c) | Each contract has a multiplier of 100. |
(d) | The rate shown is the seven-day yield at period end. |
(e) | Held in connection with a written option, see Schedule of Written Options for more detail. |
The accompanying notes are an integral part of the financial statements.
8
Dividend Performers ETF
Schedule of Written Options
September 30, 2023
| | Number of
Contracts (a) | | | Value | | | Notional
Value | |
WRITTEN OPTIONS — (1.3)% | | | | | | | | |
WRITTEN PUT OPTIONS — (1.3)% | | | | | | | | |
CBOE Mini S&P 500 Index | | | | | | | | | | | | |
Expiration: October 2023, Exercise Price: $433 | | | 140 | | | $ | 115,850 | | | $ | 6,062,000 | |
Expiration: October 2023, Exercise Price: $435 | | | 146 | | | | 113,880 | | | | 6,351,000 | |
TOTAL WRITTEN OPTIONS (Premiums Received $64,889) | | | | | | $ | 229,730 | | | | | |
Percentages are stated as a percent of net assets.
CBOE Chicago Board Options Exchange
(a) Each contract has a multiplier of 100.
The accompanying notes are an integral part of the financial statements.
9
Preferred-Plus ETF
Schedule of Investments
September 30, 2023
Description | | Shares | | | Value | |
CLOSED-END FUND — 0.2% | | | | | | | | |
Cohen & Steers Limited Duration Preferred and Income Fund, Inc. (a) | | | 1,220 | | | $ | 20,825 | |
TOTAL CLOSED-END FUND (Cost $28,539) | | | | | | | 20,825 | |
| | | | | | | | | |
PREFERRED STOCKS — 99.2% (j) | | | | | | | | |
Agriculture — 2.0% | | | | | | | | |
CHS, Inc. | | | | | | | | |
Series 2, 7.100% (3 Month LIBOR USD + 4.298%), 03/31/2024 (a)(f)(g) | | | 4,190 | | | | 106,845 | |
Series 4, 7.500%, 01/21/2025 (a)(g) | | | 4,863 | | | | 123,131 | |
| | | | | | | | 229,976 | |
Auto Manufacturers — 2.6% | | | | | | | | |
Ford Motor Co. | | | | | | | | |
6.000%, 12/01/2059 (a)(h) | | | 6,773 | | | | 150,902 | |
6.200%, 06/01/2059 (a)(h) | | | 6,142 | | | | 139,362 | |
| | | | | | | | 290,264 | |
Banks — 37.7% (e) | | | | | | | | |
Bank of America Corp. | | | | | | | | |
Series HH, 5.875%, 10/30/2023 (g) | | | 4,291 | | | | 99,465 | |
Series LL, 5.000%, 09/17/2024 (g) | | | 6,260 | | | | 127,266 | |
Series PP, 4.125%, 02/02/2026 (g) | | | 5,438 | | | | 91,141 | |
Series QQ, 4.250%, 11/17/2026 (g) | | | 5,474 | | | | 93,332 | |
Series SS, 4.750%, 02/17/2027 (g) | | | 6,564 | | | | 125,898 | |
Banks (Continued) | | | | | | | | |
Citigroup Capital XIII | | | | | | | | |
12.001% (SOFR + 6.632%), 10/30/2040 (a)(f)(h) | | | 4,282 | | | | 125,591 | |
Citigroup, Inc. | | | | | | | | |
Series J, 7.125% (SOFR + 4.302%), 12/30/2023 (f)(g) | | | 1,224 | | | | 31,408 | |
Series K, 6.875% (SOFR + 4.392%), 11/15/2023 (a)(f)(g) | | | 2,239 | | | | 56,468 | |
Citizens Financial Group, Inc. | | | | | | | | |
Series D, 6.350% (SOFR + 3.904%), 04/06/2024 (f)(g) | | | 6,386 | | | | 149,943 | |
ConnectOne Bancorp, Inc. | | | | | | | | |
Series A, 5.250% (5 Year CMT Rate + 4.420%), 09/01/2026 (f)(g) | | | 5,206 | | | | 88,606 | |
Fifth Third Bancorp | | | | | | | | |
Series I, 6.625% (SOFR + 3.972%), 12/31/2023 (f)(g) | | | 1,877 | | | | 48,051 | |
Series K, 4.950%, 09/30/2024 (a)(g) | | | 4,162 | | | | 86,778 | |
First Citizens BancShares, Inc. | | | | | | | | |
Series A, 5.375%, 03/15/2025 (a)(g) | | | 4,685 | | | | 93,325 | |
JPMorgan Chase & Co. | | | | | | | | |
Series DD, 5.750%, 12/01/2023 (g) | | | 9,414 | | | | 224,147 | |
Series EE, 6.000%, 03/01/2024 (g) | | | 4,703 | | | | 116,587 | |
Series LL, 4.625%, 06/01/2026 (g) | | | 5,608 | | | | 109,749 | |
KeyCorp | | | | | | | | |
6.200% (5 Year CMT Rate + 3.132%), 12/15/2027 (f)(g) | | | 6,616 | | | | 130,600 | |
Series E, 6.125% (SOFR + 4.154%), 12/15/2026 (a)(f)(g) | | | 5,216 | | | | 115,795 | |
Merchants Bancorp | | | | | | | | |
8.250% (5 Year CMT Rate + 4.340%), 10/01/2027 (f)(g) | | | 2,886 | | | | 66,580 | |
Midland States Bancorp, Inc. | | | | | | | | |
7.750% (5 Year CMT Rate + 4.713%), 09/30/2027 (f)(g) | | | 4,609 | | | | 110,847 | |
Morgan Stanley | | | | | | | | |
Series F, 6.875%, 01/15/2024 (a)(g) | | | 6,569 | | | | 164,225 | |
Series K, 5.850%, 04/15/2027 (a)(g) | | | 7,415 | | | | 172,251 | |
Series P, 6.500%, 10/15/2027 (g) | | | 5,000 | | | | 125,700 | |
Old National Bancorp | | | | | | | | |
Series C, 7.000%, 08/20/2025 (a)(g) | | | 6,260 | | | | 149,927 | |
PacWest Bancorp | | | | | | | | |
Series A, 7.750% (5 Year CMT Rate + 4.820%), 09/01/2027 (f)(g) | | | 8,894 | | | | 182,238 | |
Regions Financial Corp. | | | | | | | | |
Series C, 5.700% (3 Month LIBOR USD + 3.148%), 05/15/2029 (a)(f)(g) | | | 6,260 | | | | 122,696 | |
State Street Corp. | | | | | | | | |
Series D, 5.900%, 03/15/2024 (g) | | | 5,216 | | | | 130,713 | |
The accompanying notes are an integral part of the financial statements.
10
Preferred-Plus ETF
Schedule of Investments
September 30, 2023 (Continued)
Description | | Shares | | | Value | |
Banks (Continued) | | | | | | | | |
Series G, 5.350%, 03/15/2026 (g) | | | 4,109 | | | $ | 95,329 | |
Synovus Financial Corp. | | | | | | | | |
Series E, 5.875% (5 Year CMT Rate + 4.127%), 07/01/2024 (f)(g) | | | 10,272 | | | | 221,156 | |
The Goldman Sachs Group, Inc. | | | | | | | | |
Series K, 6.375% (SOFR + 3.812%), 05/10/2024 (f)(g) | | | 1,276 | | | | 32,091 | |
Truist Financial Corp. | | | | | | | | |
Series R, 4.750%, 09/01/2025 (a)(g) | | | 6,664 | | | | 124,417 | |
US Bancorp | | | | | | | | |
Series K, 5.500%, 10/30/2023 (g) | | | 6,260 | | | | 135,091 | |
Wells Fargo & Co. | | | | | | | | |
Series DD, 4.250%, 09/15/2026 (g) | | | 3,000 | | | | 50,070 | |
Series R, 6.625%, 03/15/2024 (g) | | | 3,317 | | | | 84,185 | |
WesBanco, Inc. | | | | | | | | |
Series A, 6.750% (5 Year CMT Rate + 6.557%), 11/15/2025 (f)(g) | | | 5,216 | | | | 121,011 | |
Western Alliance Bancorp | | | | | | | | |
Series A, 4.250% (5 Year CMT Rate + 3.452%), 09/30/2026 (f)(g) | | | 7,692 | | | | 125,995 | |
Wintrust Financial Corp. | | | | | | | | |
Series E, 6.875% (5 Year CMT Rate + 6.507%), 07/15/2025 (f)(g) | | | 6,386 | | | | 147,836 | |
| | | | | | | | 4,276,508 | |
Distribution & Wholesale — 1.7% | | | | | | | | |
WESCO International, Inc. | | | | | | | | |
Series A, 10.625% (5 Year CMT Rate + 10.325%), 06/22/2025 (a)(f)(g) | | | 7,258 | | | | 191,684 | |
| | | | | | | | | |
Diversified Financial Services — 7.4% | | | | | | | | |
Air Lease Corp. | | | | | | | | |
Series A, 6.150% (SOFR + 3.912%), 03/15/2024 (a)(f)(g) | | | 6,260 | | | | 150,240 | |
B. Riley Financial, Inc. | | | | | | | | |
5.000%, 12/31/2026 (h) | | | 3,661 | | | | 74,867 | |
Capital One Financial Corp. | | | | | | | | |
Series I, 5.000%, 12/01/2024 (a)(g) | | | 5,283 | | | | 98,898 | |
Series J, 4.800%, 06/01/2025 (a)(g) | | | 3,175 | | | | 56,166 | |
Stifel Financial Corp. | | | | | | | | |
Series D, 4.500%, 08/15/2026 (g) | | | 9,303 | | | | 153,220 | |
Synchrony Financial | | | | | | | | |
Series A, 5.625%, 11/15/2024 (a)(g) | | | 9,230 | | | | 148,234 | |
Voya Financial, Inc. | | | | | | | | |
Series B, 5.350% (5 Year CMT Rate + 3.210%), 09/15/2029 (f)(g) | | | 6,715 | | | | 160,891 | |
| | | | | | | | 842,516 | |
Electric — 9.2% | | | | | | | | |
Algonquin Power & Utilities Corp. (b) | | | | | | | | |
6.875% (3 Month LIBOR USD + 3.677%), 10/17/2078 (f)(h) | | | 3,194 | | | | 81,671 | |
Series 19—A, 6.200% (3 Month LIBOR USD + 4.010%), 07/01/2079 (f)(h) | | | 6,386 | | | | 156,649 | |
Brookfield BRP Holdings Canada, Inc. (b) | | | | | | | | |
4.625%, 04/30/2026 (g) | | | 3,500 | | | | 51,310 | |
CMS Energy Corp. | | | | | | | | |
5.875%, 03/01/2079 (h) | | | 3,131 | | | | 72,138 | |
National Rural Utilities Cooperative Finance Corp. | | | | | | | | |
Series US, 5.500%, 05/15/2064 (a)(h) | | | 5,216 | | | | 121,376 | |
SCE Trust III | | | | | | | | |
Series H, 5.750% (3 Month LIBOR USD + 2.990%), 03/15/2024 (f)(g) | | | 5,226 | | | | 125,476 | |
SCE Trust IV | | | | | | | | |
Series J, 5.375% (3 Month LIBOR USD + 3.132%), 09/15/2025 (a)(f)(g) | | | 5,216 | | | | 108,076 | |
SCE Trust V | | | | | | | | |
Series K, 5.450% (3 Month LIBOR USD + 3.790%), 03/15/2026 (a)(f)(g) | | | 5,322 | | | | 116,552 | |
Sempra | | | | | | | | |
5.750%, 07/01/2079 (h) | | | 6,260 | | | | 142,665 | |
The Southern Co. | | | | | | | | |
Series 2020, 4.950%, 01/30/2080 (h) | | | 3,131 | | | | 65,908 | |
| | | | | | | | 1,041,821 | |
Gas — 1.3% | | | | | | | | |
NiSource, Inc. | | | | | | | | |
Series B, 6.500% (5 Year CMT Rate + 3.632%), 03/15/2024 (a)(f)(g) | | | 5,809 | | | | 145,806 | |
| | | | | | | | | |
Insurance — 17.6% | | | | | | | | |
American Equity Investment Life Holding Co. | | | | | | | | |
Series A, 5.950% (5 Year CMT Rate + 4.322%), 12/01/2024 (a)(f)(g) | | | 7,765 | | | | 174,945 | |
Series B, 6.625% (5 Year CMT Rate + 6.297%), 09/01/2025 (a)(f)(g) | | | 7,314 | | | | 177,438 | |
Aspen Insurance Holdings Ltd. (b) | | | | | | | | |
5.625%, 10/01/2024 (g) | | | 3,131 | | | | 56,890 | |
Athene Holding Ltd. (b) | | | | | | | | |
Series A, 6.350% (3 Month LIBOR USD + 4.253%), 06/30/2029 (a)(f)(g) | | | 10,415 | | | | 225,485 | |
Series C, 6.375% (5 Year CMT Rate + 5.970%), 06/30/2025 (f)(g) | | | 4,145 | | | | 99,687 | |
Brighthouse Financial, Inc. | | | | | | | | |
6.250%, 09/15/2058 (a)(h) | | | 3,542 | | | | 83,202 | |
Series B, 6.750%, 06/25/2025 (a)(g) | | | 7,458 | | | | 183,840 | |
Series C, 5.375%, 12/25/2025 (g) | | | 3,774 | | | | 67,932 | |
The accompanying notes are an integral part of the financial statements.
11
Preferred-Plus ETF
Schedule of Investments
September 30, 2023 (Continued)
Description | | Shares | | | Value | |
Insurance (Continued) | | | | | | | | |
Enstar Group Ltd. (b) | | | | | | | | |
Series D, 7.000% (3 Month LIBOR USD + 4.015%), 09/01/2028 (a)(f)(g) | | | 6,260 | | | $ | 155,811 | |
Equitable Holdings, Inc. | | | | | | | | |
Series A, 5.250%, 12/15/2024 (a)(g) | | | 7,153 | | | | 140,914 | |
Jackson Financial, Inc. | | | | | | | | |
8.000% (5 Year CMT Rate + 3.728%), 03/30/2028 (f)(g) | | | 5,386 | | | | 134,919 | |
Kemper Corp. | | | | | | | | |
5.875% (5 Year CMT Rate + 4.140%), 03/15/2062 (f)(h) | | | 4,685 | | | | 88,828 | |
MetLife, Inc. | | | | | | | | |
Series E, 5.625%, 10/30/2023 (g) | | | 5,798 | | | | 136,659 | |
Series F, 4.750%, 03/15/2025 (g) | | | 6,350 | | | | 128,842 | |
Prudential Financial, Inc. | | | | | | | | |
5.625%, 08/15/2058 (h) | | | 3,010 | | | | 72,360 | |
Unum Group | | | | | | | | |
6.250%, 06/15/2058 (h) | | | 3,131 | | | | 69,633 | |
| | | | | | | | 1,997,385 | |
Investment Companies — 0.6% | | | | | | | | |
Oaktree Capital Group, LLC | | | | | | | | |
Series B, 6.550%, 10/30/2023 (g) | | | 3,131 | | | | 66,002 | |
| | | | | | | | | |
Pipelines — 2.5% | | | | | | | | |
Energy Transfer LP | | | | | | | | |
Series E, 7.600% (3 Month LIBOR USD + 5.161%), 05/15/2024 (a)(f)(g) | | | 7,314 | | | | 178,681 | |
NuStar Logistics LP | | | | | | | | |
12.304% (SOFR + 6.996%), 01/15/2043 (f)(h) | | | 4,081 | | | | 104,923 | |
| | | | | | | | 283,604 | |
Real Estate Investment Trusts — 11.9% | | | | | | | | |
AGNC Investment Corp. | | | | | | | | |
Series F, 6.125% (3 Month LIBOR USD + 4.697%), 04/15/2025 (f)(g) | | | 7,308 | | | | 158,072 | |
Annaly Capital Management, Inc. | | | | | | | | |
Series F, 10.645% (3 Month LIBOR USD + 4.993%), 10/31/2023 (f)(g) | | | 3,042 | | | | 77,053 | |
Series I, 6.750% (3 Month LIBOR USD + 4.989%), 06/30/2024 (f)(g) | | | 3,096 | | | | 73,530 | |
Arbor Realty Trust, Inc. | | | | | | | | |
Series F, 6.250% (SOFR + 5.440%), 10/12/2026 (f)(g) | | | 7,251 | | | | 133,781 | |
Digital Realty Trust, Inc. | | | | | | | | |
Series L, 5.200%, 10/10/2024 (g) | | | 6,000 | | | | 121,500 | |
Hudson Pacific Properties, Inc. | | | | | | | | |
Series C, 4.750%, 11/16/2026 (g) | | | 3,073 | | | | 38,228 | |
KKR Real Estate Finance Trust, Inc. | | | | | | | | |
Series A, 6.500%, 04/16/2026 (a)(g) | | | 5,320 | | | | 86,716 | |
Real Estate Investments Trusts (Continued) | | | | | | | | |
MFA Financial, Inc. | | | | | | | | |
Series C, 6.500% (3 Month LIBOR USD + 5.345%), 03/31/2025 (f)(g) | | | 2,618 | | | | 49,899 | |
Pebblebrook Hotel Trust | | | | | | | | |
Series G, 6.375%, 05/13/2026 (a)(g) | | | 6,260 | | | | 123,259 | |
Public Storage Operating Co. | | | | | | | | |
Series M, 4.125%, 08/14/2025 (a)(g) | | | 1,096 | | | | 19,695 | |
Series S, 4.100%, 01/13/2027 (g) | | | 3,654 | | | | 62,045 | |
Sachem Capital Corp. | | | | | | | | |
6.000%, 12/30/2024 (h) | | | 3,013 | | | | 64,599 | |
6.875%, 12/30/2026 (a)(h) | | | 3,013 | | | | 73,065 | |
Series A, 7.750%, 06/29/2026 (a)(g) | | | 6,260 | | | | 125,513 | |
Vornado Realty Trust | | | | | | | | |
Series N, 5.250%, 11/24/2025 (a)(g) | | | 8,352 | | | | 121,772 | |
Series O, 4.450%, 09/22/2026 (g) | | | 1,814 | | | | 22,657 | |
| | | | | | | | 1,351,384 | |
Savings & Loans — 1.5% | | | | | | | | |
New York Community Bancorp, Inc. | | | | | | | | |
Series A, 6.375% (3 Month LIBOR USD + 3.821%), 03/17/2027 (f)(g) | | | 7,414 | | | | 166,741 | |
| | | | | | | | | |
Telecommunications — 3.2% | | | | | | | | |
AT&T, Inc. | | | | | | | | |
5.625%, 08/01/2067 (h) | | | 3,073 | | | | 70,925 | |
Series A, 5.000%, 12/12/2024 (a)(g) | | | 1,223 | | | | 24,729 | |
Series C, 4.750%, 02/18/2025 (a)(g) | | | 5,929 | | | | 113,718 | |
Telephone and Data Systems, Inc. | | | | | | | | |
Series UU, 6.625%, 03/31/2026 (a)(g) | | | 6,260 | | | | 98,595 | |
U.S. Cellular Corp. | | | | | | | | |
5.500%, 03/01/2070 (h) | | | 3,631 | | | | 59,766 | |
| | | | | | | | 367,733 | |
TOTAL PREFERRED STOCKS (Cost $13,054,162) | | | | | | | 11,251,424 | |
| | | | | | | | | |
MONEY MARKET FUND — 0.1% | | | | | | | | |
First American Government Obligations Fund — Class X, 5.26% (d) | | | 13,809 | | | | 13,809 | |
TOTAL MONEY MARKET FUND (Cost $13,809) | | | | | | | 13,809 | |
The accompanying notes are an integral part of the financial statements.
12
Preferred-Plus ETF
Schedule of Investments
September 30, 2023 (Continued)
| | Number of
Contracts (c) | | | Value | | | Notional
Value | |
PURCHASED OPTIONS — 0.0% (k) | | | | | | | | |
PURCHASED PUT OPTIONS — 0.0% (k) | | | | | | | | |
CBOE Mini S&P 500 Index | | | | | | | | | | | | |
Expiration: October 2023, Exercise Price: $370 (i) | | | 45 | | | $ | 630 | | | $ | 1,665,000 | |
Expiration: October 2023, Exercise Price: $370 (i) | | | 46 | | | | 1,380 | | | | 1,702,000 | |
TOTAL PURCHASED OPTIONS (Cost $2,073) | | | | | | | 2,010 | | | | | |
| | | | | | | | | | | | | |
TOTAL INVESTMENTS (Cost $13,098,583) — 99.5% | | | | | | | 11,288,068 | | | | | |
Other Assets and Liabilities, net — 0.5% | | | | | | | 56,292 | | | | | |
NET ASSETS — 100.0% | | | | | | $ | 11,344,360 | | | | | |
Percentages are stated as a percent of net assets.
CBOE Chicago Board Options Exchange
CMT Constant Maturity Treasury Rate
LIBOR London Interbank Offered Rate
SOFR Secured Overnight Financing Rate
(a) | A portion or all of the security has been segregated or earmarked as collateral for written options. As of September 30, 2023, the value of these securities amounts to $3,976,917 or 35.1% of net assets. |
(b) | Foreign issued security. |
(c) | Each contract has a multiplier of 100. |
(d) | The rate shown is the seven-day yield at period end. |
(e) | To the extent the Fund invests more heavily in particular sectors or asset classes, its performance will be especially sensitive to developments that significantly affect those sectors or asset classes. |
(f) | Variable rate securities. The coupon is based on a reference index and spread. The rate reported is the rate in effect as of September 30, 2023. |
(g) | Perpetual security. Perpetual securities have no stated maturity date, but they may be called/redeemed by the issuer as of the date indicated. |
(h) | Security may be called/redeemed by the issuer as of an earlier date. |
(i) | Held in connection with a written option, see Schedule of Written Options for more detail. |
(j) | Variable rate Preferred Stocks will typically have interest rates that redetermine periodically by reference to a base lending rate plus a spread. Preferred Stocks that reference SOFR may be subject to a credit spread adjustment, particularly to legacy LIBOR Preferred Stocks that have transitioned to SOFR as the base lending rate. |
Preferred-Plus ETF
Schedule of Written Options
September 30, 2023
| | Number of
Contracts (a) | | | Value | | | Notional
Value | |
WRITTEN OPTIONS — (0.6)% | | | | | | | | |
WRITTEN PUT OPTIONS — (0.6)% | | | | | | | | |
CBOE Mini S&P 500 Index | | | | | | | | | | | | |
Expiration: October 2023, Exercise Price: $433 | | | 46 | | | $ | 38,065 | | | $ | 1,991,800 | |
Expiration: October 2023, Exercise Price: $435 | | | 45 | | | | 35,100 | | | | 1,957,500 | |
TOTAL WRITTEN OPTIONS (Premiums Received $20,625) | | | | | | $ | 73,165 | | | | | |
Percentages are stated as a percent of net assets.
CBOE Chicago Board Options Exchange
(a) | Each contract has a multiplier of 100. |
The accompanying notes are an integral part of the financial statements.
13
Innovative ETFs
Statements of Assets and Liabilities
September 30, 2023
| | | Dividend
Performers ETF | | | Preferred-Plus
ETF | |
Assets | | | | | | | | |
Investments, at value (cost $15,816,608 and $13,098,583, respectively) | | $ | 17,791,098 | | | $ | 11,288,068 | |
Cash | | | 2,341 | | | | 159 | |
Deposit with broker for options | | | 241,035 | | | | 66,549 | |
Dividend and interest receivable | | | 12,283 | | | | 72,368 | |
Total assets | | | 18,046,757 | | | | 11,427,144 | |
| | | | | | | | | |
Liabilities | | | | | | | | |
Written options, at value (premiums received $64,889 and $20,625, respectively) | | | 229,730 | | | | 73,165 | |
Payable to Adviser | | | 12,897 | | | | 8,084 | |
Interest payable | | | 3,778 | | | | 1,535 | |
Total liabilities | | | 246,405 | | | | 82,784 | |
Net Assets | | $ | 17,800,352 | | | $ | 11,344,360 | |
| | | | | | | | | |
Net Assets Consists of: | | | | | | | | |
Paid-in capital | | $ | 17,696,977 | | | $ | 14,288,670 | |
Total distributable earnings (accumulated losses) | | | 103,375 | | | | (2,944,310 | ) |
Net Assets | | $ | 17,800,352 | | | $ | 11,344,360 | |
| | | | | | | | | |
Shares of beneficial interest outstanding (unlimited number of shares authorized, no par value) | | | 1,173,877 | | | | 1,247,107 | |
Net Asset Value, redemption price and offering price per share | | $ | 15.16 | | | $ | 9.10 | |
The accompanying notes are an integral part of the financial statements.
14
Innovative ETFs
Statements of Operations
For the Year Ended September 30, 2023
| | | Dividend
Performers ETF | | | Preferred-Plus
ETF | |
Investment Income | | | | | | | | |
Dividend income | | $ | 324,104 | | | $ | 872,327 | |
Interest income | | | 4,459 | | | | 7,762 | |
Total investment income | | | 328,563 | | | | 880,089 | |
| | | | | | | | | |
Expenses | | | | | | | | |
Investment advisory fees | | | 143,492 | | | | 101,892 | |
Interest expense | | | 113,102 | | | | 48,876 | |
Total expenses | | | 256,594 | | | | 150,768 | |
Net investment income | | | 71,969 | | | | 729,321 | |
| | | | | | | | | |
Realized and Unrealized Gain (Loss) on Investments | | | | | | | | |
Net realized gain (loss) on: | | | | | | | | |
Investments | | | 816,379 | | | | (393,535 | ) |
Purchased options | | | (1,452,629 | ) | | | (446,105 | ) |
Written options | | | 1,930,464 | | | | 394,332 | |
Net realized gain (loss) | | | 1,294,214 | | | | (445,308 | ) |
Net change in unrealized appreciation/depreciation on: | | | | | | | | |
Investments | | | 2,075,155 | | | | (129,804 | ) |
Purchased options | | | (375,349 | ) | | | (143,120 | ) |
Written options | | | 1,331,101 | | | | 516,415 | |
Net change in unrealized appreciation/depreciation | | | 3,030,907 | | | | 243,491 | |
Net realized and unrealized gain (loss) on investments | | | 4,325,121 | | | | (201,817 | ) |
Net increase in net assets from operations | | $ | 4,397,090 | | | $ | 527,504 | |
The accompanying notes are an integral part of the financial statements.
15
Dividend Performers ETF
Statements of Changes in Net Assets
| | | Year Ended
September 30,
2023 | | | Year Ended
September 30,
2022(1) | |
From Operations | | | | | | | | |
Net investment income | | $ | 71,969 | | | $ | 141,866 | |
Net realized gain (loss) on investments, purchased options and written options | | | 1,294,214 | | | | (928,592 | ) |
Net change in unrealized appreciation/depreciation on investments, purchased options and written options | | | 3,030,907 | | | | (3,214,160 | ) |
Net increase (decrease) in net assets resulting from operations | | | 4,397,090 | | | | (4,000,886 | ) |
| | | | | | | | | |
From Distributions | | | | | | | | |
Distributable earnings | | | (71,969 | ) | | | (1,263,814 | ) |
Return of capital | | | (177,270 | ) | | | (767,321 | ) |
Total distributions | | | (249,239 | ) | | | (2,031,135 | ) |
| | | | | | | | | |
From Capital Share Transactions | | | | | | | | |
Proceeds from shares sold | | | 8,220,102 | | | | 5,572,101 | |
Reinvestment of dividends | | | — | | | | 1,671,990 | |
Cost of shares redeemed | | | (7,234,360 | ) | | | (3,719,629 | ) |
Net increase in net assets resulting from capital share transactions | | | 985,742 | | | | 3,524,462 | |
| | | | | | | | | |
Total Increase (Decrease) in Net Assets | | | 5,133,593 | | | | (2,507,559 | ) |
| | | | | | | | | |
Net Assets | | | | | | | | |
Beginning of year | | | 12,666,759 | | | | 15,174,318 | |
End of year | | $ | 17,800,352 | | | $ | 12,666,759 | |
| | | | | | | | | |
Changes in Shares Outstanding | | | | | | | | |
Shares outstanding, beginning of year | | | 1,098,877 | | | | 896,257 | |
Shares sold | | | 575,000 | | | | 371,329 | |
Shares reinvested | | | — | | | | 96,382 | |
Shares redeemed | | | (500,000 | ) | | | (265,091 | ) |
Shares outstanding, end of year | | | 1,173,877 | | | | 1,098,877 | |
(1) | Prior to the start of business on March 7, 2022, financial and other information shown herein for the Fund is that of the Predecessor Fund. See Note 1. |
The accompanying notes are an integral part of the financial statements.
16
Preferred-Plus ETF
Statements of Changes in Net Assets
| | | Year Ended
September 30,
2023 | | | Year Ended
September 30,
2022(1) | |
From Operations | | | | | | | | |
Net investment income | | $ | 729,321 | | | $ | 594,334 | |
Net realized loss on investments, purchased options and written options | | | (445,308 | ) | | | (655,546 | ) |
Net change in unrealized appreciation/depreciation on investments, purchased options and written options | | | 243,491 | | | | (2,681,698 | ) |
Net increase (decrease) in net assets resulting from operations | | | 527,504 | | | | (2,742,910 | ) |
| | | | | | | | | |
From Distributions | | | | | | | | |
Distributable earnings | | | (689,633 | ) | | | (739,387 | ) |
Return of capital | | | — | | | | (93,765 | ) |
Total distributions | | | (689,633 | ) | | | (833,152 | ) |
| | | | | | | | | |
From Capital Share Transactions | | | | | | | | |
Proceeds from shares sold | | | 941,417 | | | | 2,065,498 | |
Reinvestment of dividends | | | — | | | | 459,283 | |
Cost of shares redeemed | | | (1,817,965 | ) | | | (558,243 | ) |
Net increase (decrease) in net assets resulting from capital share transactions | | | (876,548 | ) | | | 1,966,538 | |
| | | | | | | | | |
Total Decrease in Net Assets | | | (1,038,677 | ) | | | (1,609,524 | ) |
| | | | | | | | | |
Net Assets | | | | | | | | |
Beginning of year | | | 12,383,037 | | | | 13,992,561 | |
End of year | | $ | 11,344,360 | | | $ | 12,383,037 | |
| | | | | | | | | |
Changes in Shares Outstanding | | | | | | | | |
Shares outstanding, beginning of year | | | 1,347,107 | | | | 1,162,051 | |
Shares sold | | | 100,000 | | | | 193,443 | |
Shares reinvested | | | — | | | | 39,814 | |
Shares redeemed | | | (200,000 | ) | | | (48,201 | ) |
Shares outstanding, end of year | | | 1,247,107 | | | | 1,347,107 | |
(1) | Prior to the start of business on March 7, 2022, financial and other information shown herein for the Fund is that of the Predecessor Fund. See Note 1. |
The accompanying notes are an integral part of the financial statements.
17
Dividend Performers ETF
Financial Highlights
For a Share Outstanding Throughout Each Period
| | | Year Ended
September 30,
2023 | | | Year Ended
September 30,
2022 | | | Year Ended
September 30,
2021 | | | Year Ended
September 30,
2020 | | | Period Ended
September 30,
2019(1) | |
Net Asset Value, Beginning of Period | | $ | 11.53 | | | $ | 16.93 | | | $ | 12.91 | | | $ | 12.16 | | | $ | 10.00 | |
Income (Loss) from investment operations: | | | | | | | | | | | | | | | | | | | | |
Net investment income (2) | | | 0.06 | | | | 0.14 | | | | 0.07 | | | | 0.12 | | | | 0.07 | |
Net realized and unrealized gain (loss) | | | 3.79 | | | | (3.45 | ) | | | 5.06 | | | | 1.06 | (8) | | | 2.23 | |
Total from investment operations | | | 3.85 | | | | (3.31 | ) | | | 5.13 | | | | 1.18 | | | | 2.30 | |
Less distributions paid: | | | | | | | | | | | | | | | | | | | | |
From net investment income | | | (0.07 | ) | | | (0.24 | ) | | | (0.07 | ) | | | (0.13 | ) | | | (0.06 | ) |
From net realized and unrealized gain (loss) | | | — | | | | (1.08 | ) | | | (1.04 | ) | | | (0.23 | ) | | | (0.08 | ) |
From return of capital | | | (0.15 | ) | | | (0.77 | ) | | | — | | | | (0.07 | ) | | | — | |
Total distributions paid | | | (0.22 | ) | | | (2.09 | ) | | | (1.11 | ) | | | (0.43 | ) | | | (0.14 | ) |
Net Asset Value, End of Period | | $ | 15.16 | | | $ | 11.53 | | | $ | 16.93 | | | $ | 12.91 | | | $ | 12.16 | |
| | | | | | | | | | | | | | | | | | | | | |
Total return, at NAV(3)(5) | | | 33.45 | % | | | -22.92 | % | | | 39.80 | % | | | 10.08 | % | | | 23.04 | % |
Total return, at Market(4)(5) | | | 33.88 | % | | | -22.31 | % | | | N/A | (11) | | | N/A | (11) | | | N/A | (11) |
Supplemental Data and Ratios: | | | | | | | | | | | | | | | | | | | | |
Net assets, end of period (000’s) | | $ | 17,800 | | | $ | 12,667 | | | $ | 15,174 | | | $ | 9,581 | | | $ | 11,749 | |
Ratio of expenses to average net assets before reimbursements (excluding interest expense)(6)(9)(10) | | | 0.85 | % | | | 1.30 | % | | | 2.08 | % | | | 2.50 | % | | | 2.48 | % |
Ratio of expenses to average net assets before reimbursements (including interest expense)(6)(9)(10) | | | 1.52 | % | | | 1.52 | % | | | 2.12 | % | | | 2.66 | % | | | 2.56 | % |
Ratio of expenses to average net assets after reimbursements (excluding interest expense)(6)(9)(10) | | | 0.85 | % | | | 1.13 | % | | | 1.50 | % | | | 1.50 | % | | | 1.50 | % |
Ratio of expenses to average net assets after reimbursements (including interest expense)(6)(9)(10) | | | 1.52 | % | | | 1.35 | % | | | 1.54 | % | | | 1.66 | % | | | 1.56 | % |
Ratio of net investment income to average net assets after reimbursement(6)(9)(10) | | | 0.43 | % | | | 0.86 | % | | | 0.41 | % | | | 1.04 | % | | | 0.80 | % |
Portfolio Turnover rate(5) | | | 42 | %(7) | | | 74 | %(7) | | | 58 | % | | | 129 | % | | | 15 | % |
(1) | The Fund commenced operations on December 24, 2018. |
(2) | Per share net investment income was calculated using average shares outstanding. |
(3) | Net asset value total return is calculated assuming an initial investment made at the net asset value at the beginning of the period, reinvestment of all dividends and distributions at net asset value during the period, if any, and redemption on the last day of the period at net asset value. This percentage is not an indication of the performance of a shareholder’s investment in the Fund based on market value due to the differences between the market price of the shares and the net asset value per share of the Fund. |
(4) | Market value total return is calculated assuming an initial investment made at market value at the beginning of the period, reinvestment of all dividends and distributions at market value during the period, if any, and redemption on the last day of the period at market value. Market value is determined by the composite closing price. Composite closing security price is defined as the last reported sale price on the Cboe BZX Exchange, Inc. The composite closing price is the last reported sale, regardless of volume, and not an average price, and may have occurred on a date prior to the close of the reporting period. Market value may be greater or less than net asset value, depending on the Fund’s closing price on the Cboe BZX Exchange, Inc. |
(5) | Not annualized for periods less than one year. |
(6) | Annualized for periods less than one year. |
(7) | Excludes in-kind transactions associated with creations and redemptions of the Fund. |
(8) | The amount of net realized and unrealized gain on investment per share for the period does not accord with the amounts in the Statements of Operations due to share transactions for the period. |
(9) | Expense waived or reimbursed reflect reductions to total expenses, as discussed in the notes to the financial statements. These amounts would increase the net investment loss ratio or decrease the net investment income ratio, as applicable, had such reductions not occurred. |
(10) | Does not include income and expenses of investment companies in which the Fund invests. |
(11) | Market value total return was not calculated for the Predecessor Funds (see Note 1), as market value for mutual funds does not differ from net asset value. |
The accompanying notes are an integral part of the financial statements.
18
Preferred-Plus ETF
Financial Highlights
For a Share Outstanding Throughout Each Period
| | | Year Ended
September 30,
2023 | | | Year Ended
September 30,
2022 | | | Year Ended
September 30,
2021 | | | Year Ended
September 30,
2020 | | | Period Ended
September 30,
2019(1) | |
Net Asset Value, Beginning of Period | | $ | 9.19 | | | $ | 12.04 | | | $ | 11.09 | | | $ | 11.21 | | | $ | 10.00 | |
Income (Loss) from investment operations: | | | | | | | | | | | | | | | | | | | | |
Net investment income (2) | | | 0.56 | | | | 0.49 | | | | 0.40 | | | | 0.41 | | | | 0.34 | |
Net realized and unrealized gain (loss) | | | (0.12 | ) | | | (2.66 | ) | | | 1.25 | | | | — | (8) | | | 1.24 | |
Total from investment operations | | | 0.44 | | | | (2.17 | ) | | | 1.65 | | | | 0.41 | | | | 1.58 | |
Less distributions paid: | | | | | | | | | | | | | | | | | | | | |
From net investment income | | | (0.53 | ) | | | (0.38 | ) | | | (0.38 | ) | | | (0.41 | ) | | | (0.29 | ) |
From net realized and unrealized gain (loss) | | | — | | | | (0.23 | ) | | | (0.32 | ) | | | (0.05 | ) | | | (0.08 | ) |
From return of capital | | | — | | | | (0.07 | ) | | | — | | | | (0.07 | ) | | | — | |
Total distributions paid | | | (0.53 | ) | | | (0.68 | ) | | | (0.70 | ) | | | (0.53 | ) | | | (0.37 | ) |
Net Asset Value, End of Period | | $ | 9.10 | | | $ | 9.19 | | | $ | 12.04 | | | $ | 11.09 | | | $ | 11.21 | |
| | | | | | | | | | | | | | | | | | | | | |
Total return, at NAV(3)(5) | | | 5.12 | % | | | -18.64 | % | | | 15.01 | % | | | 3.95 | % | | | 15.97 | % |
Total return, at Market(4)(5) | | | 5.27 | % | | | -18.88 | % | | | N/A | (12) | | | N/A | (12) | | | N/A | (12) |
Supplemental Data and Ratios: | | | | | | | | | | | | | | | | | | | | |
Net assets, end of period (000’s) | | $ | 11,344 | | | $ | 12,383 | | | $ | 13,993 | | | $ | 10,595 | | | $ | 7,270 | |
Ratio of expenses to average net assets before reimbursements (excluding interest expense)(6)(9)(10) | | | 0.85 | % | | | 1.37 | % | | | 2.13 | % | | | 2.43 | % | | | 2.70 | % |
Ratio of expenses to average net assets before reimbursements (including interest expense)(6)(9)(10) | | | 1.26 | % | | | 1.48 | % | | | 2.15 | % | | | 2.48 | % | | | 2.76 | % |
Ratio of expenses to average net assets after reimbursements (excluding interest expense)(6)(9)(10) | | | 0.85 | % | | | 1.14 | % | | | 1.50 | % | | | 1.50 | % | | | 1.50 | % |
Ratio of expenses to average net assets after reimbursements (including interest expense)(6)(9)(10) | | | 1.26 | % | | | 1.25 | % | | | 1.52 | % | | | 1.55 | % | | | 1.56 | % |
Ratio of net investment income to average net assets after reimbursement(6)(9)(10) | | | 6.08 | % | | | 4.45 | % | | | 3.31 | % | | | 3.90 | % | | | 3.96 | % |
Portfolio Turnover rate(5) | | | 16 | %(7) | | | 65 | %(7)(11) | | | 27 | % | | | 70 | % | | | 6 | % |
(1) | The Fund commenced operations on December 24, 2018. |
(2) | Per share net investment income was calculated using average shares outstanding. |
(3) | Net asset value total return is calculated assuming an initial investment made at the net asset value at the beginning of the period, reinvestment of all dividends and distributions at net asset value during the period, if any, and redemption on the last day of the period at net asset value. This percentage is not an indication of the performance of a shareholder’s investment in the Fund based on market value due to the differences between the market price of the shares and the net asset value per share of the Fund. |
(4) | Market value total return is calculated assuming an initial investment made at market value at the beginning of the period, reinvestment of all dividends and distributions at market value during the period, if any, and redemption on the last day of the period at market value. Market value is determined by the composite closing price. Composite closing security price is defined as the last reported sale price on the Cboe BZX Exchange, Inc. The composite closing price is the last reported sale, regardless of volume, and not an average price, and may have occurred on a date prior to the close of the reporting period. Market value may be greater or less than net asset value, depending on the Fund’s closing price on the Cboe BZX Exchange, Inc. |
(5) | Not annualized for periods less than one year. |
(6) | Annualized for periods less than one year. |
(7) | Excludes in-kind transactions associated with creations and redemptions of the Fund. |
The accompanying notes are an integral part of the financial statements.
19
Preferred-Plus ETF
Financial Highlights (Continued)
For a Share Outstanding Throughout Each Period
(8) | The amount of net realized and unrealized gain on investment per share for the period does not accord with the amounts in the Statements of Operations due to share transactions for the period. |
(9) | Expense waived or reimbursed reflect reductions to total expenses, as discussed in the notes to the financial statements. These amounts would increase the net investment loss ratio or decrease the net investment income ratio, as applicable, had such reductions not occurred. |
(10) | Does not include income and expenses of investment companies in which the Fund invests. |
(11) | The proceeds from sales of securities incurred by the Fund related to the alignment of the Predecessor Fund’s portfolio with the Fund’s investment style are excluded from the portfolio turnover rate calculation. If such amounts had not been excluded, the portfolio turnover rate would have been 114% for the year ended September 30, 2022. |
(12) | Market value total return was not calculated for the Predecessor Funds (see Note 1), as market value for mutual funds does not differ from net asset value. |
The accompanying notes are an integral part of the financial statements.
20
Innovative ETFs
Notes to Financial Statements
September 30, 2023
Dividend Performers ETF (“Dividend Performers” or “IPDP”) and Preferred-Plus ETF (“Preferred-Plus” or “IPPP”) (each a “Fund” and collectively, the “Funds”) are each a diversified series of Listed Funds Trust (the “Trust”), formerly Active Weighting Funds ETF Trust. The Trust was organized as a Delaware statutory trust on August 26, 2016, under a Declaration of Trust amended on December 21, 2018, and is registered with the U.S. Securities and Exchange Commission (the “SEC”) as an open-end management investment company under the Investment Company Act of 1940, as amended (the “1940 Act”).
IPDP is an actively-managed exchange-traded fund (“ETF”) that seeks to achieve its primary investment objective to provide income and secondary objective of capital appreciation by investing in dividend paying U.S. equity securities, and credit spread options on an S&P 500 ETF or Index.
IPPP is an actively-managed ETF that seeks to achieve its investment objective to provide income by investing in issues of preferred securities and debt securities that Innovative Portfolios, LLC (“Innovative” or the “Adviser”), the Fund’s investment adviser, believes to be undervalued and credit spread options on an S&P 500 ETF or Index.
IPDP and IPPP are the successors in interest to the Dividend Performers and Preferred-Plus mutual funds, respectively, each a series of Collaborative Investment Series Trust, (the “Predecessor Funds”) pursuant to a tax-free reorganization that took place before the start of business on March 7, 2022. The Funds are the accounting and performance information successors of the Predecessor Funds. Costs incurred by the Funds in connection with the reorganization were paid by the Adviser.
2. | SIGNIFICANT ACCOUNTING POLICIES |
Each Fund is an investment company and accordingly follows the investment company accounting and reporting guidance of the Financial Accounting Standards Board (“FASB”) Accounting Standards Codification (“ASC”) Topic 946, Financial Services — Investment Companies. Each Fund prepares its financial statements in accordance with accounting principles generally accepted in the United States of America (“U.S. GAAP”) and follows the significant accounting policies described below.
Use of Estimates
The preparation of the financial statements in conformity with U.S. GAAP requires management to make estimates and assumptions that affect the reported amounts of assets and liabilities and disclosures of contingent assets and liabilities at the date of the financial statements and the reported amounts of increases and decreases in net assets from operations during the reporting period. Actual results could differ from these estimates.
New Accounting Pronouncements
In December 2022, the Financial Accounting Standards Board issued an Accounting Standards Update, ASU 2022-06, Reference Rate Reform (Topic 848) – Deferral of the Sunset Date of Topic 848 (“ASU 2022-06”). ASU 2022-06 is an amendment to ASU 2020-04, which provided optional guidance to ease the potential accounting burden due to the discontinuation of the LIBOR and other interbank-offered based reference rates and which was effective as of March 12, 2020 through December 31, 2022. ASU 2022-06 extends the effective period through December 31, 2024. Management is currently evaluating the impact, if any, of applying this ASU.
Share Transactions
The net asset value (“NAV”) per share of each Fund will be equal to a Fund’s total assets minus a Fund’s total liabilities divided by the total number of shares outstanding. The NAV that is published will be rounded to the nearest cent. The NAV is determined as of the close of trading (generally, 4:00 p.m. Eastern Time) on each day the New York Stock Exchange (“NYSE”) is open for trading.
21
Innovative ETFs
Notes to Financial Statements
September 30, 2023 (Continued)
Fair Value Measurement
In calculating the NAV, each Fund’s exchange-traded equity securities will be valued at fair value, which will generally be determined using the last reported official closing or last trading price on the exchange or market on which the security is primarily traded at the time of valuation. Such valuations are typically categorized as Level 1 in the fair value hierarchy described below.
Securities listed on the NASDAQ Stock Market, Inc. are generally valued at the NASDAQ official closing price.
If market quotations are not readily available, or if it is determined that a quotation of a security does not represent fair value, then the security is valued at fair value as determined in good faith by the Adviser using procedures adopted by the Board of Trustees of the Trust (the “Board”). The valuation of each Fund’s investments is performed in accordance with the principles found in Rule 2a-5 of the 1940 Act. The Board has designated a fair valuation committee at the Adviser as the valuation designee of the Funds. The circumstances in which a security may be fair valued include, among others: the occurrence of events that are significant to a particular issuer, such as mergers, restructurings, or defaults; the occurrence of events that are significant to an entire market, such as natural disasters in a particular region or government actions; trading restrictions on securities; thinly traded securities; and market events such as trading halts and early market closings. Due to the inherent uncertainty of valuations, fair values may differ significantly from the values that would have been used had an active market existed. Fair valuation could result in a different NAV than a NAV determined by using market quotations. Such valuations are typically categorized as Level 2 or Level 3 in the fair value hierarchy described below.
Money market funds are valued at NAV. If NAV is not readily available, the securities will be valued at fair value.
Exchange-traded options are valued at the composite mean price, which calculates the mean of the highest bid price and lowest asked price across the exchange. On the last trading day prior to expiration, expiring options may be priced at intrinsic value. The premium a fund pays when purchasing a put option or receives when writing a put option will reflect, among other things, the market price of the security, the relationship of the exercise price to the market price of the security, the relationship of the exercise price to the volatility of the security, the length of the option period and supply and demand factors. The premium is the value of an option at the date of purchase.
All other securities and investments for which market values are not readily available, including restricted securities, and those securities for which it is inappropriate to determine prices in accordance with the aforementioned procedures, are valued at fair value as determined in good faith under procedures adopted by the Board. Factors considered in making this determination may include, but are not limited to, information obtained by contacting the issuer, analysts, or the appropriate stock exchange (for exchange-traded securities), analysis of the issuer’s financial statements or other available documents and, if necessary, available information concerning other securities in similar circumstances.
FASB ASC Topic 820, Fair Value Measurements and Disclosures (“ASC 820”) defines fair value, establishes a framework for measuring fair value in accordance with U.S. GAAP, and requires disclosure about fair value measurements. It also provides guidance on determining when there has been a significant decrease in the volume and level of activity for an asset or liability, when a transaction is not orderly, and how that information must be incorporated into fair value measurements. Under ASC 820, various inputs are used in determining the value of the Funds’ investments. These inputs are summarized in the following hierarchy:
| | ● | Level 1 — Unadjusted quoted prices in active markets for identical assets or liabilities that the Funds have the ability to access. |
| | ● | Level 2 — Observable inputs other than quoted prices included in Level 1 that are observable for the asset or liability, either directly or indirectly. These inputs may include quoted prices for the identical instrument on an inactive market, prices for similar securities, interest rates, prepayment speeds, credit risk, yield curves, default rates and similar data. |
| | ● | Level 3 — Unobservable inputs for the asset or liability, to the extent relevant observable inputs are not available; representing the Funds’ own assumptions about the assumptions a market participant would use in valuing the asset or liability and would be based on the best information available. |
22
Innovative ETFs
Notes to Financial Statements
September 30, 2023 (Continued)
The fair value hierarchy gives the highest priority to quoted prices (unadjusted) in active markets for identical assets or liabilities (Level 1) and the lowest priority to unobservable inputs (Level 3).
The availability of observable inputs can vary from security to security and is affected by a wide variety of factors, including, for example, the type of security, whether the security is new and not yet established in the marketplace, the liquidity of markets, and other characteristics particular to the security. To the extent that valuation is based on models or inputs that are less observable or unobservable in the market, the determination of fair value requires more judgment. Accordingly, the degree of judgment exercised in determining fair value is greatest for instruments categorized in Level 3.
The inputs or methodology used for valuing securities are not necessarily an indication of the risk associated with investing in those securities. The hierarchy classification of inputs used to value the Funds’ investments at September 30, 2023, are as follows:
Dividend Performers ETF
| | | Level 1 | | | Level 2 | | | Level 3 | | | Total | |
Investments - Assets: | | | | | | | | | | | | | | | | |
Common Stocks* | | $ | 17,723,238 | | | $ | — | | | $ | — | | | $ | 17,723,238 | |
Money Market Fund | | | 61,616 | | | | — | | | | — | | | | 61,616 | |
Purchased Put Options | | | — | | | | 6,244 | | | | — | | | | 6,244 | |
Total Investments - Assets | | $ | 17,784,854 | | | $ | 6,244 | | | $ | — | | | $ | 17,791,098 | |
Other Financial Instruments - Liabilities: | | | | | | | | | | | | | | | | |
Written Put Options | | $ | — | | | $ | 229,730 | | | $ | — | | | $ | 229,730 | |
Preferred-Plus ETF
| | | Level 1 | | | Level 2 | | | Level 3 | | | Total | |
Investments - Assets: | | | | | | | | | | | | | | | | |
Closed-End Fund | | $ | 20,825 | | | $ | — | | | $ | — | | | $ | 20,825 | |
Preferred Stocks* | | | 11,251,424 | | | | — | | | | — | | | | 11,251,424 | |
Money Market Fund | | | 13,809 | | | | — | | | | — | | | | 13,809 | |
Purchased Put Options | | | — | | | | 2,010 | | | | — | | | | 2,010 | |
Total Investments - Assets | | $ | 11,286,058 | | | $ | 2,010 | | | $ | — | | | $ | 11,288,068 | |
Other Financial Instruments - Liabilities: | | | | | | | | | | | | | | | | |
Written Put Options | | $ | — | | | $ | 73,165 | | | $ | — | | | $ | 73,165 | |
* | See the Schedules of Investments for industry classifications. |
Security Transactions
Investment transactions are recorded as of the date that the securities are purchased or sold (trade date). Realized gains and losses from the sale or disposition of securities are calculated based on the specific identification basis.
Investment Income
Dividend income is recognized on the ex-dividend date. Withholding taxes on foreign dividends, a portion of which may be reclaimable, has been provided for in accordance with the Funds’ understanding of the applicable tax rules and regulations. Interest income is accrued daily. An amortized cost method of valuation may be used with respect to debt obligations with sixty days or less remaining to maturity, unless the Adviser determines in good faith that such method does not represent fair value. Discounts and premiums on fixed income securities purchased are accreted or amortized using the effective interest method.
23
Innovative ETFs
Notes to Financial Statements
September 30, 2023 (Continued)
Distributions received from each Fund’s investments in real estate investment trusts (“REITs”) may be characterized as ordinary income, net capital gain, or a return of capital. The proper characterization of REIT distributions is generally not known until after the end of each calendar year. As such, the Funds must use estimates in reporting the character of its income and distributions received during the current calendar year for financial statement purposes. The actual character of distributions to each Fund’s shareholders will be reflected on the Form 1099 received by shareholders after the end of the calendar year. Due to the nature of REIT investments, a portion of the distributions received by each Fund’s shareholders may represent a return of capital.
Tax Information, Dividends and Distributions to Shareholders and Uncertain Tax Positions
The Funds are treated as separate entities for Federal income tax purposes. Each Fund intends to qualify as a regulated investment company (“RIC”) under Subchapter M of the Internal Revenue Code of 1986, as amended (the “Internal Revenue Code”). To qualify and remain eligible for the special tax treatment accorded to RICs, each Fund must meet certain annual income and quarterly asset diversification requirements and must distribute annually at least 90% of the sum of (i) its investment company taxable income (which includes dividends, interest, and net short-term capital gains) and (ii) certain net tax-exempt income, if any. If so qualified, each Fund will not be subject to Federal income tax.
Distributions to shareholders are recorded on the ex-dividend date. The Funds generally pay out dividends from net investment income, if any, quarterly. Each Fund will distribute their net capital gains, if any, to shareholders at least annually. The Funds may also pay a special distribution at the end of the calendar year to comply with Federal tax requirements. The amount of dividends and distributions from net investment income and net realized capital gains are determined in accordance with Federal income tax regulations, which may differ from U.S. GAAP. These “book/tax” differences are either considered temporary or permanent in nature. To the extent these differences are permanent in nature, such amounts are reclassified within the components of net assets based on their Federal tax basis treatment; temporary differences do not require reclassification. Dividends and distributions which exceed earnings and profit for tax purposes are reported as a tax return of capital.
Management evaluates the Funds’ tax positions to determine if the tax positions taken meet the minimum recognition threshold in connection with accounting for uncertainties in income tax positions taken or expected to be taken for the purposes of measuring and recognizing tax liabilities in the financial statements. Recognition of tax benefits of an uncertain tax position is required only when the position is “more likely than not” to be sustained assuming examination by taxing authorities. Interest and penalties related to income taxes would be recorded as income tax expense. The Funds’ Federal income tax returns are subject to examination by the Internal Revenue Service (the “IRS”) for a period of three fiscal years after they are filed. State and local tax returns may be subject to examination for an additional fiscal year depending on the jurisdiction. As of September 30, 2023, the Funds’ fiscal year end, the Funds had no material uncertain tax positions and did not have a liability for any unrecognized tax benefits. As of September 30, 2023, the Funds’ fiscal year end, the Funds had no examination in progress and management is not aware of any tax positions for which it is reasonably possible that the amounts of unrecognized tax benefits will significantly change in the next twelve months.
The Funds recognized no interest or penalties related to uncertain tax benefits in the 2023 fiscal year. At September 30, 2023, the Funds’ fiscal year end, the tax periods for the prior three years are open to examination in the Funds’ major tax jurisdictions.
Indemnification
In the normal course of business, the Funds expect to enter into contracts that contain a variety of representations and warranties, and which provide general indemnifications. The Funds’ maximum exposure under these anticipated arrangements is unknown, as this would involve future claims that may be made against the Funds that have not yet occurred. However, based on experience, the Funds expect the risk of loss to be remote.
24
Innovative ETFs
Notes to Financial Statements
September 30, 2023 (Continued)
Derivatives
The Funds may purchase and write put options on indices or securities and enter into related closing transactions. Put options on indices give the holder the right to receive, upon exercise of the option, an amount of cash if the closing level of the underlying index is less than the exercise price of the option. This amount of cash is equal to the difference between the closing price of the index and the exercise price of the option, expressed in dollars multiplied by a specified number. The premium paid to the writer is the consideration for undertaking the obligations under the option contract.
The Funds seek to achieve credit spread on an S&P 500 ETF or Index by selling/writing an out-of-the-money (an out-of-the-money put option is one whose strike price is lower than the market price of the underlying reference asset of the option) short put option each month while simultaneously purchasing an out-of-the-money long put option below the short option position. A credit spread is an options strategy that involves the purchase of one option and a sale of another option in the same class and with the same expiration but different strike prices. The strategy objective is a net credit for entering the option position and is profitable when the spreads narrow or expire. By buying a protective long put option, the Funds seek to hedge any significant downside risk posed by the short put option.
Selling (writing) and buying options are speculative activities and entail greater than ordinary investment risks. Each Fund’s use of put options can lead to losses because of adverse movements in the price or value of the underlying asset, which may be magnified by certain features of the options. When selling a put option, the Funds will receive a premium; however, this premium may not be enough to offset a loss incurred by the Funds if the price of the underlying asset is below the strike price by an amount equal to or greater than the premium. Purchasing of put options involves the payment of premiums, which may adversely affect the Funds’ performance. Purchasing a put option gives the purchaser of the option the right to sell a specified quantity of an underlying asset at a fixed exercise price over a defined period. Purchased put options may expire worthless resulting in the Funds’ loss of the premium it paid for the option.
The value of an option may be adversely affected if the market for the option becomes less liquid or smaller and will be affected by changes in the value or yield of the option’s underlying asset, an increase in interest rates, a change in the actual or perceived volatility of the stock market or the underlying asset and the remaining time to expiration. Additionally, the value of an option does not increase or decrease at the same rate as the underlying asset. The Funds’ use of options may reduce the Funds’ ability to profit from increases in the value of the underlying asset. If the price of the underlying asset of an option is above the strike price of a written put option, the value of the option, and consequently of the Funds, may decline significantly more than if the Funds invested directly in the underlying asset instead of using options. While the Funds may segregate liquid assets at least equal in value to the maximum potential loss for the Funds, the Funds could still lose a significant amount or nearly all of its value if the price of an underlying asset changes significantly enough.
As of September 30, 2023, the Funds’ derivative instruments are not subject to a master netting arrangement.
The average monthly value outstanding of purchased and written options during the year ended September 30, 2023, were as follows:
| | | Dividend
Performers ETF | | | Preferred-Plus
ETF | |
Purchased Options | | $ | 60,472 | | | $ | 27,616 | |
Written Options | | | (1,038,788 | ) | | | (444,563 | ) |
25
Innovative ETFs
Notes to Financial Statements
September 30, 2023 (Continued)
The following is a summary of the effect of derivative instruments on the Funds’ Statements of Assets and Liabilities as of September 30, 2023:
| | Equity Risk Contracts | | Asset Derivatives,
Investments,
at value | | | Liability
Derivatives,
Written options,
at value | |
Dividend Performers ETF | Purchased Options | | $ | 6,244 | | | $ | — | |
| | Written Options | | | — | | | | 229,730 | |
Preferred-Plus ETF | Purchased Options | | | 2,010 | | | | — | |
| | Written Options | | | — | | | | 73,165 | |
The following is a summary of the effect of derivative instruments on the Funds’ Statements of Operations for the year ended September 30, 2023:
| | | | Net Realized Gain (Loss) | | | Net Change in Unrealized
Appreciation/Depreciation | |
| | | | Purchased
Options | | | Written Options | | | Purchased
Options | | | Written Options | |
Dividend Performers ETF | Equity Risk Contracts | | $ | (1,452,629 | ) | | $ | 1,930,464 | | | $ | (375,349 | ) | | $ | 1,331,101 | |
Preferred-Plus ETF | Equity Risk Contracts | | | (446,105 | ) | | | 394,332 | | | | (143,120 | ) | | | 516,415 | |
3. | INVESTMENT ADVISORY AND OTHER AGREEMENTS |
Investment Advisory Agreement
The Trust has entered into an Investment Advisory Agreement (the “Advisory Agreement”) with the Adviser. Under the Advisory Agreement, the Adviser provides a continuous investment program for the Funds’ assets in accordance with their investment objectives, policies and limitations, and oversees the day-to-day operations of the Funds subject to the supervision of the Board, including the Trustees who are not “interested persons” of the Trust as defined in the 1940 Act.
Pursuant to the Advisory Agreement between the Trust, on behalf of the Funds, and Innovative, each Fund pays a unified management fee to the Adviser, which is calculated daily and paid monthly, at an annual rate of 0.85% of each Fund’s average daily net assets. Innovative has agreed to pay all expenses of the Funds except the fee paid to Innovative under the Advisory Agreement, interest charges on any borrowings, dividends and other expenses on securities sold short, taxes, brokerage commissions and other expenses incurred in placing orders for the purchase and sale of securities and other investment instruments, acquired fund fees and expenses, accrued deferred tax liability, extraordinary expenses, and distribution (12b-1) fees and expenses (if any).
Distribution Agreement and 12b-1 Plan
Foreside Fund Services, LLC, a wholly-owned subsidiary of Foreside Financial Group, LLC (dba ACA Group) (the “Distributor”) serves as each Fund’s distributor pursuant to a Distribution Services Agreement. The Distributor receives compensation for the statutory underwriting services it provides to the Funds. The Distributor enters into agreements with certain broker-dealers and others that will allow those parties to be “Authorized Participants” and to subscribe for and redeem shares of the Funds. The Distributor will not distribute shares in less than whole Creation Units and does not maintain a secondary market in shares.
The Board has adopted a Distribution and Service Plan pursuant to Rule 12b-1 under the 1940 Act (“Rule 12b-1 Plan”). In accordance with the Rule 12b-1 Plan, each Fund is authorized to pay an amount up to 0.25% of the Fund’s average daily net assets each year for certain distribution-related activities. As authorized by the Board, no Rule 12b-1 fees are currently paid by
26
Innovative ETFs
Notes to Financial Statements
September 30, 2023 (Continued)
the Funds and there are no plans to impose these fees. However, in the event Rule 12b-1 fees are charged in the future, they will be paid out of each Fund’s assets. The Adviser and its affiliates may, out of their own resources, pay amounts to third parties for distribution or marketing services on behalf of the Funds.
Administrator, Custodian and Transfer Agent
U.S. Bancorp Fund Services LLC, doing business as U.S. Bank Global Fund Services (“Fund Services” or “Administrator”) serves as administrator, transfer agent and fund accounting agent of the Funds pursuant to a Fund Servicing Agreement. U.S. Bank N.A. (the “Custodian”), an affiliate of Fund Services, serves as the Funds’ custodian pursuant to a Custody Agreement. Under the terms of these agreements, the Adviser pays each Fund’s administrative, custody and transfer agency fees.
A Trustee and all officers of the Trust are affiliated with the Administrator and the Custodian.
4. | CREATION AND REDEMPTION TRANSACTIONS |
Shares of the Funds are listed and traded on the Cboe BZX Exchange, Inc. (the “Exchange”). Each Fund issues and redeems shares on a continuous basis at NAV only in large blocks of shares called “Creation Units.” Creation Units are to be issued and redeemed principally in kind for a basket of securities and a balancing cash amount. Shares generally will trade in the secondary market in amounts less than a Creation Unit at market prices that change throughout the day. Market prices for the shares may be different from their NAV. The NAV is determined as of the close of trading (generally, 4:00 p.m. Eastern Time) on each day the NYSE is open for trading. The NAV of the shares of each Fund will be equal to a Fund’s total assets minus a Fund’s total liabilities divided by the total number of shares outstanding. The NAV that is published will be rounded to the nearest cent; however, for purposes of determining the price of Creation Units, the NAV will be calculated to four decimal places.
Creation Unit Transaction Fee
Authorized Participants will be required to pay to the Custodian a fixed transaction fee (the “Creation Unit Transaction Fee”) in connection with the issuance or redemption of Creation Units. The standard Creation Unit Transaction Fee will be the same regardless of the number of Creation Units purchased or redeemed by an investor on the applicable business day. The Creation Unit Transaction Fee charged for each creation order is $300 for Dividend Performers and $500 for Preferred-Plus.
An additional variable fee of up to a maximum of 2% of the value of the Creation Units subject to the transaction may be imposed for (1) creations effected outside the Clearing Process and (2) creations made in an all cash amount (to offset the Trust’s brokerage and other transaction costs associated with using cash to purchase or redeem the requisite Deposit Securities). Investors are responsible for the costs of transferring the securities constituting the Deposit Securities to the account of the Trust. Each Fund may determine to not charge a variable fee on certain orders when the Adviser has determined that doing so is in the best interests of Fund shareholders. Variable fees, if any, received by the Funds are displayed in the Capital Share Transactions section on the Statements of Changes in Net Assets.
Only “Authorized Participants” may purchase or redeem shares directly from the Funds. An Authorized Participant is either (1) a broker-dealer or other participant in the clearing process through the Continuous Net Settlement System of National Securities Clearing Corporation or (2) a DTC participant and, in each case, must have executed a Participant Agreement with the Distributor. Most retail investors will not qualify as Authorized Participants or have the resources to buy and sell whole Creation Units. Therefore, they will be unable to purchase or redeem the shares directly from the Funds. Rather, most retail investors will purchase shares in the secondary market with the assistance of a broker and will be subject to customary brokerage commissions or fees. Securities received or delivered in connection with in-kind creates and redeems are valued as of the close of business on the effective date of the creation or redemption.
A Creation Unit will generally not be issued until the transfer of good title of the deposit securities to the Funds and the payment of any cash amounts have been completed. To the extent contemplated by the applicable participant agreement, Creation Units of the Funds will be issued to such authorized participant notwithstanding the fact that the Funds’ deposits have not been received in part or in whole, in reliance on the undertaking of the authorized participant to deliver the missing deposit securities as soon as possible. If the Funds or their agents do not receive all of the deposit securities, or the required cash amounts, by such time, then the order may be deemed rejected and the authorized participant shall be liable to the Funds for losses, if any.
27
Innovative ETFs
Notes to Financial Statements
September 30, 2023 (Continued)
The tax character of distributions paid was as follows:
| | | Year Ended September 30, 2023 | |
| | | Ordinary
Income(1) | | | Return of Capital | |
Dividend Performers ETF | | $ | 71,969 | | | $ | 177,270 | |
Preferred-Plus ETF | | | 689,633 | | | | — | |
| | | Year Ended September 30, 2022 | |
| | | Ordinary
Income(1) | | | Long-Term
Capital Gain | | | Return of Capital | |
Dividend Performers ETF | | $ | 270,727 | | | $ | 993,087 | | | $ | 767,321 | |
Preferred-Plus ETF | | | 681,747 | | | | 57,640 | | | | 93,765 | |
(1) | Ordinary income includes short-term capital gains. |
At September 30, 2023, the Funds’ fiscal year end, the components of distributable earnings (accumulated losses) and the cost of investments on a tax basis, including the adjustments for financial reporting purposes as of the most recently completed Federal income tax reporting year for the Funds were as follows:
| | | Dividend
Performers ETF | | | Preferred-Plus
ETF | |
Federal Tax Cost of Investments(1) | | $ | 15,668,078 | | | $ | 13,037,860 | |
Gross Tax Unrealized Appreciation | | $ | 2,427,998 | | | $ | 63,691 | |
Gross Tax Unrealized Depreciation | | | (534,708 | ) | | | (1,886,648 | ) |
Net Tax Unrealized Appreciation (Depreciation) | | | 1,893,290 | | | | (1,822,957 | ) |
Other Accumulated Gain (Loss) | | | (1,789,915 | ) | | | (1,149,730 | ) |
Undistributed Ordinary Income | | | — | | | | 28,377 | |
Total Distributable Earnings / (Accumulated Losses) | | $ | 103,375 | | | $ | (2,944,310 | ) |
(1) | Federal Tax Cost of Investments includes written option premiums. |
The primary reason for the difference between the book and tax cost of investments and premiums from written options is the tax deferral of losses on wash sales and mark-to-market treatment of index options.
Under current tax law, net capital losses realized after October 31 and net ordinary losses incurred after December 31 may be deferred and treated as occurring on the first day of the following fiscal year. The Funds’ carryforward losses and post-October losses are determined only at the end of each fiscal year. At September 30, 2023, the Funds’ fiscal year end, the Funds had carryforward losses which will be carried forward indefinitely to offset future realized capital gains as follows:
| | | Indefinite Long-
Term Capital
Loss Carryover | | | Indefinite Short-
Term Capital
Loss Carryover | |
Dividend Performers ETF | | $ | — | | | $ | 1,789,915 | |
Preferred-Plus ETF | | | 254,259 | | | | 895,470 | |
28
Innovative ETFs
Notes to Financial Statements
September 30, 2023 (Continued)
U.S. GAAP requires that certain components of net assets relating to permanent differences be reclassified between financial and tax reporting. These reclassifications have no effect on net assets or NAV per share. The permanent differences primarily relate to redemptions in-kind. For the year ended September 30, 2023, the following reclassifications were made for permanent tax differences on the Statements of Assets and Liabilities.
| | | Total
Distributable
Earnings
(Accumulated
Losses) | | | Paid-in Capital | |
Dividend Performers ETF | | $ | (1,459,103 | ) | | $ | 1,459,103 | |
Preferred-Plus ETF | | | 42,173 | | | | (42,173 | ) |
6. | INVESTMENT TRANSACTIONS |
During the year ended September 30, 2023, the Funds realized net capital gains and losses resulting from in-kind redemptions, in which shareholders exchanged Fund shares for securities held by the Funds rather than for cash. The amount of realized gains and losses from in-kind redemptions included in realized gain/(loss) on investments in the Statements of Operations is as follows:
| | | Realized Gains | | | Realized Losses | |
Dividend Performers ETF | | $ | 1,548,555 | | | $ | 9,474 | |
Preferred-Plus ETF | | | 26,283 | | | | 100,542 | |
Purchases and sales of investments (excluding short-term investments), creations in-kind and redemptions in-kind for the year ended September 30, 2023, were as follows:
| | | Purchases | | | Sales | | | Creations
In-Kind | | | Redemptions
In-Kind | |
Dividend Performers ETF | | $ | 7,577,449 | | | $ | 9,296,984 | | | $ | 8,194,072 | | | $ | 7,378,091 | |
Preferred-Plus ETF | | | 1,946,045 | | | | 2,716,854 | | | | 993,237 | | | | 1,923,156 | |
As with all ETFs, shareholders of the Funds are subject to the risk that their investment could lose money. Each Fund is subject to the principal risks, any of which may adversely affect a Fund’s NAV, trading price, yield, total return, and ability to meet its investment objective.
LIBOR is used extensively in the U.S. and globally as a “benchmark” or “reference rate” for various commercial and financial contracts, including CLOs. Instruments in which the Fund invests may pay interest at floating rates based on LIBOR or may be subject to interest caps or floors based on LIBOR. The industry currently anticipates the conversion of all LIBOR based instruments to SOFR based instruments in December 2024 or sooner.
Since 2017, the United Kingdom’s Financial Conduct Authority has been working towards the cessation of LIBOR at the end of December 2021. In November 2020, though, the administrator of the U.S. Dollar LIBOR benchmarks, the ICE Benchmark Administration, extended the retirement date for most U.S. Dollar LIBOR rates until December 2024. Regulators and industry working groups have suggested numerous alternative reference rates to LIBOR. Leading alternatives include Sonia in the United Kingdom, €STR in the European Union, Tonar in Japan, and in the U.S., the New York Fed has been working to develop the Secured Overnight Financing Rate (SOFR). Global consensus is still coalescing around the transition to a new reference rate and the process for amending existing contracts. Abandonment of or modifications to LIBOR could have adverse impacts on newly issued financial instruments and existing financial instruments which reference LIBOR. There also remains uncertainty and risk
29
Innovative ETFs
Notes to Financial Statements
September 30, 2023 (Continued)
regarding the willingness and ability of issuers to include enhanced provisions in new and existing contracts or instruments. The transition away from LIBOR may lead to increased volatility and illiquidity in markets that are tied to LIBOR, reduced values of LIBOR-related investments, and reduced effectiveness of hedging strategies, adversely affecting the Fund’s performance or NAV. In addition, the alternative reference rate may be an ineffective substitute resulting in prolonged adverse market conditions for the Funds.
A complete description of principal risks is included in the Funds’ prospectuses under the heading ‘’Principal Investment Risks’’.
8. | OTHER REGULATORY MATTERS |
In October 2022, the Securities and Exchange Commission (the “SEC”) adopted a final rule relating to Tailored Shareholder Reports for Mutual Funds and Exchange-Traded Funds; Fee Information in Investment Company Advertisements. The rule and form amendments will, among other things, require the Funds to transmit concise and visually engaging shareholder reports that highlight key information. The amendments will require that funds tag information in a structured data format and that certain more in-depth information be made available online and available for delivery free of charge to investors on request. The amendments became effective January 24, 2023. There is an 18-month transition period after the effective date of the amendment.
Management has evaluated the Funds’ related events and transactions that occurred subsequent to September 30, 2023, through the date of issuance of the Funds’ financial statements. Management has determined that there were no subsequent events requiring recognition or disclosure in the financial statements.
30
Innovative ETFs
Report of Independent Registered Public Accounting Firm
To the Shareholders of Dividend Performers ETF and Preferred-Plus ETF and
Board of Trustees of Listed Funds Trust
Opinion on the Financial Statements
We have audited the accompanying statements of assets and liabilities, including the schedules of investments and written options, of Dividend Performers ETF and Preferred-Plus ETF (the “Funds”), each a series of Listed Funds Trust, as of September 30, 2023, the related statements of operations for the year then ended, the statements of changes in net assets for each of the two years in the period then ended, the related notes, and the financial highlights for each of the four years in the period then ended (collectively referred to as the “financial statements”). In our opinion, the financial statements present fairly, in all material respects, the financial position of each of the Funds as of September 30, 2023, the results of their operations for the year then ended, the changes in net assets for each of the two years in the period then ended, and the financial highlights for each of the four years in the period then ended, in conformity with accounting principles generally accepted in the United States of America.
The Funds’ financial highlights for the period ended September 30, 2019, were audited by other auditors whose report dated November 25, 2019, expressed an unqualified opinion on those financial highlights.
Basis for Opinion
These financial statements are the responsibility of the Funds’ management. Our responsibility is to express an opinion on the Funds’ financial statements based on our audits. We are a public accounting firm registered with the Public Company Accounting Oversight Board (United States) (“PCAOB”) and are required to be independent with respect to the Funds in accordance with the U.S. federal securities laws and the applicable rules and regulations of the Securities and Exchange Commission and the PCAOB.
We conducted our audits in accordance with the standards of the PCAOB. Those standards require that we plan and perform the audit to obtain reasonable assurance about whether the financial statements are free of material misstatement whether due to error or fraud.
Our audits included performing procedures to assess the risks of material misstatement of the financial statements, whether due to error or fraud, and performing procedures that respond to those risks. Such procedures included examining, on a test basis, evidence regarding the amounts and disclosures in the financial statements. Our procedures included confirmation of securities owned as of September 30, 2023, by correspondence with the custodian and broker. Our audits also included evaluating the accounting principles used and significant estimates made by management, as well as evaluating the overall presentation of the financial statements. We believe that our audits provide a reasonable basis for our opinion.
We have served as the Funds’ auditor since 2019.

COHEN & COMPANY, LTD.
Cleveland, Ohio
November 28, 2023
31
Innovative ETFs
Trustees and Officers of the Trust
September 30, 2023 (Unaudited)
The Funds’ Statement of Additional Information includes additional information about the Funds’ Trustees and Officers, and is available, without charge upon request by calling 1-866-704-6857, or by visiting the Funds’ website at www.innovativeportfolios.com. The address of each Trustee of the Trust is c/o U.S. Bank Global Fund Services, 615 East Michigan Street, Milwaukee, Wisconsin 53202.
Name and Year of Birth | Position Held
with the Trust | Term of Office
and Length of
Time Served | Principal Occupation(s)
During Past 5 Years | Number of
Portfolios in
Fund Complex
Overseen
by Trustee | Other
Directorships Held
by Trustee During
Past 5 Years |
Independent Trustees | | | | | |
John L. Jacobs
Year of birth: 1959 | Trustee and Audit Committee Chair | Indefinite term; since 2017 | Chairman of Alerian, Inc. (since June 2018); Founder and CEO of Q3 Advisors, LLC (financial consulting firm) (since 2015); Executive Director of Center for Financial Markets and Policy (2016–2022); Distinguished Policy Fellow and Executive Director, Center for Financial Markets and Policy, Georgetown University (2015–2022); Senior Advisor, Nasdaq OMX Group (2015–2016); Executive Vice President, Nasdaq OMX Group (2013–2015) | 56 | Independent Trustee, SHP ETF Trust (since 2021) (2 portfolios); Director, tZERO Group, Inc. (since 2020); Independent Trustee, Procure ETF Trust II (since 2018) (1 portfolio); Independent Trustee, Horizons ETF Trust I (2015-2019) |
Koji Felton
Year of birth: 1961 | Trustee | Indefinite term; since 2019 | Retired; formerly Counsel, Kohlberg Kravis Roberts & Co. L.P. (investment firm) (2013–2015); Counsel, Dechert LLP (law firm) (2011–2013) | 56 | Independent Trustee, Series Portfolios Trust (since 2015) (10 portfolios) |
Pamela H. Conroy
Year of birth: 1961 | Trustee and Nominating and Governance Committee Chair | Indefinite term; since 2019 | Retired; formerly Executive Vice President, Chief Operating Officer & Chief Compliance Officer, Institutional Capital Corporation (investment firm) (1994–2008) | 56 | Independent Trustee, Frontier Funds, Inc. (since 2020) (6 portfolios) |
Interested Trustee | | | | | |
Paul R. Fearday, CPA*
Year of birth: 1979 | Trustee and Chairman | Indefinite term; since 2019 | Senior Vice President, U.S. Bancorp Fund Services, LLC (since 2008) | 56 | None |
* | This Trustee is considered an “Interested Trustee” as defined in the 1940 Act because of his affiliation with U.S. Bancorp Fund Services, d/b/a U.S. Bank Global Fund Services and U.S. Bank N.A., which provide fund accounting, administration, transfer agency and custodian services to the Funds. |
32
Innovative ETFs
Trustees and Officers of the Trust
September 30, 2023 (Unaudited) (Continued)
The officers of the Trust conduct and supervise the Trust’s and each Fund’s daily business. The address of each officer of the Trust is c/o U.S. Bank Global Fund Services, 615 East Michigan Street, Milwaukee, Wisconsin 53202. Additional information about each officer of the Trust is as follows:
Name and Year of Birth | Position(s) Held
with the Trust | Term of Office
and Length of
Time Served | Principal Occupation(s) During Past 5 Years |
Officers | | | |
Gregory Bakken
Year of birth: 1983 | President and Principal Executive Officer | Indefinite term, February 2019 | Vice President, U.S. Bancorp Fund Services, LLC (since 2006) |
Travis G. Babich
Year of birth: 1980 | Treasurer and Principal Financial Officer | Indefinite term, September 2019 | Vice President, U.S. Bancorp Fund Services, LLC (since 2005) |
Kacie G. Briody
Year of birth: 1992 | Assistant Treasurer | Indefinite term,
March 2019 | Assistant Vice President, U.S. Bancorp Fund Services, LLC (since 2021); Officer, U.S. Bancorp Fund Services, LLC (2014 to 2021) |
Kent Barnes
Year of birth: 1968 | Secretary | Indefinite term, February 2019 (Resigned, effective November 2023) | Vice President, U.S. Bancorp Fund Services, LLC (since 2018); Chief Compliance Officer, Rafferty Asset Management, LLC (2016 to 2018); Vice President, U.S. Bancorp Fund Services, LLC (2007 to 2016) |
Rachel A. Spearo
Year of birth: 1979 | Secretary | Indefinite term, November 2023 | Vice President, U.S. Bancorp Fund Services, LLC (since 2021), Vice President, U.S. Bancorp Fund Services, LLC (2004 to 2019) |
Christi C. James
Year of birth: 1974 | Chief Compliance Officer and
Anti-Money Laundering Officer | Indefinite term, July 2022 | Senior Vice President, U.S. Bancorp Fund Services, LLC (since 2022); Principal Consultant, ACA Group (2021 to 2022); Lead Manager, Communications Compliance, T. Rowe Price Investment Services, Inc. (2018 to 2021); Compliance & Legal Manager, CR Group LP (2017 to 2018). |
Jay S. Fitton Year of birth: 1970 | Assistant Secretary | Indefinite term, May 2023 | Vice President, U.S. Bancorp Fund Services, LLC (since 2022); Assistant Vice President, U.S. Bancorp Fund Services, LLC (2019 to 2022); Partner, Practus (2018 to 2019); Counsel, Drinker Biddle & Rather LLP (2016-2018). |
33
Innovative ETFs
Supplemental Information
(Unaudited)
Investors should consider the investment objective and policies, risk considerations, charges and ongoing expenses of an investment carefully before investing. The prospectus contains this and other information relevant to an investment in the Funds. Please read the prospectus carefully before investing. A copy of the prospectus for the Funds may be obtained without charge by writing to the Funds, c/o U.S. Bank Global Fund Services, P.O. Box 701, Milwaukee, Wisconsin 53201-0701, by calling 1-866-704-6857, or by visiting the Funds’ website at www.innovativeportfolios.com.
QUARTERLY PORTFOLIO HOLDING INFORMATION
Each Fund files its complete schedule of portfolio holdings for its first and third fiscal quarters with the Securities and Exchange Commission (“SEC”) on Part F of Form N-PORT. The Funds’ Part F of Form N-PORT is available without charge, upon request, by calling toll-free at 1-866-704-6857. Furthermore, you may obtain the Part F of Form N-PORT on the SEC’s website at www.sec.gov.
PROXY VOTING INFORMATION
Each Fund is required to file a Form N-PX, with the Funds’ complete proxy voting record for the 12 months ended June 30, no later than August 31 of each year. Information regarding how the Funds voted proxies relating to portfolio securities during the most recent 12-month period ended June 30 is available without charge, upon request, by calling toll-free 1-866-704-6857; and on the SEC’s website at www.sec.gov.
FREQUENCY DISTRIBUTION OF PREMIUMS AND DISCOUNTS
Information regarding how often shares of the Funds trade on an exchange at a price above (i.e., at a premium) or below (i.e., at a discount) the NAV of the Funds is available without charge, on the Funds’ website at www.innovativeportfolios.com.
TAX INFORMATION
For the fiscal year ended September 30, 2023, certain dividends paid by the Funds may be subject to a maximum tax rate of 15%, as provided for by the Jobs and Growth Tax Relief Reconciliation Act of 2003. The percentage of dividends declared from ordinary income designated as qualified dividend income was as follows:
Dividend Performers ETF | | | 100 | % |
Preferred-Plus ETF | | | 100 | % |
For corporate shareholders, the percent of ordinary income distributions qualifying for the corporate dividends received deduction for the fiscal year ended September 30, 2023, was as follows:
Dividend Performers ETF | | | 100 | % |
Preferred-Plus ETF | | | 100 | % |
34
Innovative ETFs
Review of Liquidity Risk Management Program
(Unaudited)
Pursuant to Rule 22e-4 under the Investment Company Act of 1940, the Trust, on behalf of the series of the Trust covered by this shareholder report (the “Series”), has adopted a liquidity risk management program to govern the Trust’s approach to managing liquidity risk. Rule 22e-4 seeks to promote effective liquidity risk management, thereby reducing the risk that a fund will be unable to meet its redemption obligations and mitigating dilution of the interests of fund shareholders. The Trust’s liquidity risk management program is tailored to reflect the Series’ particular risks, but not to eliminate all adverse impacts of liquidity risk, which would be incompatible with the nature of such Series.
The investment adviser to the Series has adopted and implemented its own written liquidity risk management program (the “Program”) tailored specifically to assess and manage the liquidity risk of the Series. At a recent meeting of the Board of Trustees of the Trust, the Trustees received a report pertaining to the operation, adequacy, and effectiveness of implementation of the Program for the period ended December 31, 2022. The report concluded that the Program is reasonably designed to assess and manage the Series’ liquidity risk and has operated adequately and effectively to manage such risk. The report reflected that there were no liquidity events that impacted the Series’ ability to timely meet redemptions without dilution to existing shareholders. The report further noted that no material changes have been made to the Program since its implementation.
There can be no assurance that the Program will achieve its objectives in the future. Please refer to the prospectus for more information regarding the Series’ exposure to liquidity risk and other principal risks to which an investment in the Series may be subject.
35
Innovative ETFs
Privacy Policy
September 30, 2023 (Unaudited)
We are committed to respecting the privacy of personal information you entrust to us in the course of doing business with us.
The Funds collect non-public information about you from the following sources:
| | ● | Information we receive about you on applications or other forms; |
| | ● | Information you give us orally; and/or |
| | ● | Information about your transactions with us or others. |
We do not disclose any non-public personal information about our customers or former customers without the customer’s authorization, except as permitted by law or in response to inquiries from governmental authorities. We may share information with affiliated and unaffiliated third parties with whom we have contracts for servicing the Funds. We will provide unaffiliated third parties with only the information necessary to carry out their assigned responsibilities. We maintain physical, electronic and procedural safeguards to guard your non-public personal information and require third parties to treat your personal information with the same high degree of confidentiality.
In the event that you hold shares of the Funds through a financial intermediary, including, but not limited to, a broker-dealer, bank, or trust company, the privacy policy of your financial intermediary would govern how your non-public personal information would be shared by those entities with unaffiliated third parties.
36
THIS PAGE INTENTIONALLY LEFT BLANK
Investment Adviser:
Innovative Portfolios, LLC
8801 River Crossing Boulevard, Suite 100
Indianapolis, IN 46240
Legal Counsel:
Morgan, Lewis & Bockius LLP
1111 Pennsylvania Avenue, N.W.
Washington, D.C. 20004
Independent Registered Public Accounting Firm:
Cohen & Company, Ltd.
1350 Euclid Avenue, Suite 800
Cleveland, OH 44115
Distributor:
Foreside Fund Services, LLC
Three Canal Plaza, Suite 100
Portland, ME 04101
Administrator, Fund Accountant & Transfer Agent:
U.S. Bancorp Fund Services, LLC
d/b/a U.S. Bank Global Fund Services
615 E. Michigan St.
Milwaukee, WI 53202
Custodian:
U.S. Bank N.A.
1555 North RiverCenter Drive, Suite 302
Milwaukee, WI 53212
This information must be preceded or accompanied by a current prospectus for the Funds.
(b) Not applicable.
Item 2. Code of Ethics.
The registrant has adopted a code of ethics that applies to the registrant’s principal executive officer and principal financial officer. The Registrant has not made any substantive amendments to its code of ethics during the period covered by this report. The registrant has not granted any waivers from any provisions of the code of ethics during the period covered by this report.
A copy of the registrant’s Code of Ethics is filed herewith.
Item 3. Audit Committee Financial Expert.
The registrant’s Board of Trustees has determined that there is at least one audit committee financial expert serving on its audit committee. Mr. John Jacobs is the “audit committee financial expert” and is considered to be “independent” as each term is defined in Item 3 of Form N-CSR.
Item 4. Principal Accountant Fees and Services.
The registrant has engaged its principal accountant to perform audit services, audit-related services, tax services and other services during the past fiscal year. “Audit services” refer to performing an audit of the registrant's annual financial statements or services that are normally provided by the accountant in connection with statutory and regulatory filings or engagements for the fiscal year. “Audit-related services” refer to the assurance and related services by the principal accountant that are reasonably related to the performance of the audit. “Tax services” refer to professional services rendered by the principal accountant for tax compliance, tax advice, and tax planning. There were no “Other services” provided by the principal accountant. The following table details the aggregate fees billed or expected to be billed for the last two fiscal years for audit fees, audit-related fees, tax fees and other fees by the principal accountant.
| | FYE 09/30/2023 | FYE 09/30/2022 |
| Audit Fees | $28,000 | $28,000 |
| Audit-Related Fees | $0 | $0 |
| Tax Fees | $6,000 | $6,000 |
| All Other Fees | $0 | $0 |
(e)(1) The audit committee has adopted pre-approval policies and procedures that require the audit committee to pre-approve all audit and non-audit services of the registrant, including services provided to any entity affiliated with the registrant.
(e)(2) The percentage of fees billed by Cohen & Company, Ltd. applicable to non-audit services pursuant to waiver of pre-approval requirement were as follows:
| | FYE 09/30/2023 | FYE 09/30/2022 |
| Audit-Related Fees | 0% | 0% |
| Tax Fees | 0% | 0% |
| All Other Fees | 0% | 0% |
(f) All of the principal accountant’s hours spent on auditing the registrant’s financial statements were attributed to work performed by full-time permanent employees of the principal accountant.
(g) The following table indicates the non-audit fees billed or expected to be billed by the registrant’s accountant for services to the registrant and to the registrant’s investment adviser (and any other controlling entity, etc.—not sub-adviser) for the last two years.
| Non-Audit Related Fees | FYE 09/30/2023 | FYE 09/30/2022 |
| Registrant | N/A | N/A |
| Registrant’s Investment Adviser | N/A | N/A |
(h) The audit committee of the board of trustees/directors has considered whether the provision of non-audit services that were rendered to the registrant's investment adviser is compatible with maintaining the principal accountant's independence and has concluded that the provision of such non-audit services by the accountant has not compromised the accountant’s independence.
The registrant has not been identified by the U.S. Securities and Exchange Commission as having filed an annual report issued by a registered public accounting firm branch or office that is located in a foreign jurisdiction where the Public Company Accounting Oversight Board is unable to inspect or completely investigate because of a position taken by an authority in that jurisdiction.
The registrant is not a foreign issuer.
Item 5. Audit Committee of Listed Registrants.
| (a) | The registrant is an issuer as defined in Rule 10A-3 under the Securities Exchange Act of 1934, (the “Act”) and has a separately-designated standing audit committee established in accordance with Section 3(a)(58)(A) of the Act. The entire Board of Trustees is acting as the registrant’s audit committee. |
Item 6. Investments.
| (a) | Schedule of Investments is included as part of the report to shareholders filed under Item 1 of this Form. |
Item 7. Disclosure of Proxy Voting Policies and Procedures for Closed-End Management Investment Companies.
Not applicable to open-end investment companies.
Item 8. Portfolio Managers of Closed-End Management Investment Companies.
Not applicable to open-end investment companies.
Item 9. Purchases of Equity Securities by Closed-End Management Investment Company and Affiliated Purchasers.
Not applicable to open-end investment companies.
Item 10. Submission of Matters to a Vote of Security Holders.
There have been no material changes to the procedures by which shareholders may recommend nominees to the registrant’s Board of Trustees.
Item 11. Controls and Procedures.
| (a) | The Registrant’s President and Treasurer have reviewed the Registrant's disclosure controls and procedures (as defined in Rule 30a-3(c) under the Investment Company Act of 1940 (the “Act”)) as of a date within 90 days of the filing of this report, as required by Rule 30a-3(b) under the Act and Rules 13a-15(b) or 15d-15(b) under the Securities Exchange Act of 1934. Based on their review, such officers have concluded that the disclosure controls and procedures are effective in ensuring that information required to be disclosed in this report is appropriately recorded, processed, summarized and reported and made known to them by others within the Registrant and by the Registrant’s service provider. |
| (b) | There were no changes in the Registrant's internal control over financial reporting (as defined in Rule 30a-3(d) under the Act) that occurred during the period covered by this report that have materially affected, or are reasonably likely to materially affect, the Registrant's internal control over financial reporting. |
Item 12. Disclosure of Securities Lending Activities for Closed-End Management Investment Companies
Not applicable to open-end investment companies.
Item 13. Exhibits.
| (a) | (1) Any code of ethics or amendment thereto, that is the subject of the disclosure required by Item 2, to the extent that the registrant intends to satisfy Item 2 requirements through filing an exhibit. Filed herewith. |
(2) A separate certification for each principal executive officer and principal financial officer pursuant to Section 302 of the Sarbanes-Oxley Act of 2002. Filed herewith.
(3) Any written solicitation to purchase securities under Rule 23c-1 under the Act sent or given during the period covered by the report by or on behalf of the registrant to 10 or more persons. Not applicable to open-end investment companies.
(4) Change in the registrant’s independent public accountant. There was no change in the registrant’s independent public accountant for the period covered by this report.
| (b) | Certifications pursuant to Section 906 of the Sarbanes-Oxley Act of 2002. Furnished herewith. |
SIGNATURES
Pursuant to the requirements of the Securities Exchange Act of 1934 and the Investment Company Act of 1940, the registrant has duly caused this report to be signed on its behalf by the undersigned, thereunto duly authorized.
| (Registrant) | Listed Funds Trust | |
| | | |
| By (Signature and Title)* | /s/ Gregory C. Bakken | |
| | Gregory C. Bakken, President/Principal Executive Officer | |
| | | |
| Date | 12/4/2023 | |
Pursuant to the requirements of the Securities Exchange Act of 1934 and the Investment Company Act of 1940, this report has been signed below by the following persons on behalf of the registrant and in the capacities and on the dates indicated.
| By (Signature and Title)* | /s/ Gregory C. Bakken | |
| | Gregory C. Bakken, President/Principal Executive Officer | |
| | | |
| Date | 12/4/2023 | |
| | | |
| By (Signature and Title)* | /s/ Travis G. Babich | |
| | Travis G. Babich, Treasurer/Principal Financial Officer | |
| | | |
| Date | 12/4/2023 | |
| * | Print the name and title of each signing officer under his or her signature. |