UNITED STATES
SECURITIES AND EXCHANGE COMMISSION
Washington, D.C. 20549
FORM N-CSR
CERTIFIED SHAREHOLDER REPORT OF REGISTERED
MANAGEMENT INVESTMENT COMPANIES
| | |
| Investment Company Act file number | | 811-23195 |
Nuveen Credit Opportunities 2022 Target Term Fund
(Exact name of registrant as specified in charter)
Nuveen Investments
333 West Wacker Drive, Chicago, IL 60606
(Address of principal executive offices) (Zip code)
Gifford R. Zimmerman
Nuveen Investments
333 West Wacker Drive, Chicago, IL 60606
(Name and address of agent for service)
Registrant’s telephone number, including area code: (312) 917-7700
Date of fiscal year end: December 31
Date of reporting period: June 30, 2017
Form N-CSR is to be used by management investment companies to file reports with the Commission not later than 10 days after the transmission to stockholders of any report that is required to be transmitted to stockholders under Rule 30e-1 under the Investment Company Act of 1940 (17 CFR 270.30e-1). The Commission may use the information provided on Form N-CSR in its regulatory, disclosure review, inspection, and policy making roles.
A registrant is required to disclose the information specified by Form N-CSR, and the Commission will make this information public. A registrant is not required to respond to the collection of information contained in Form N-CSR unless the Form displays a currently valid Office of Management and Budget (“OMB”) control number. Please direct comments concerning the accuracy of the information collection burden estimate and any suggestions for reducing the burden to Secretary, Securities and Exchange Commission, 450 Fifth Street, NW, Washington, DC 20549-0609. The OMB has reviewed this collection of information under the clearance requirements of 44 U.S.C. ss.3507.
ITEM 1. REPORTS TO STOCKHOLDERS.
| | |
| | |  |
| Closed-End Funds | |
| | | | | | |
| | | | | | | Semi-Annual Report June 30, 2017 |
| | | |
| | | | | | |
| | | | | | | |
| JCO | | | | | | |
| Nuveen Credit Opportunities 2022 Target Term Fund | | |
| | | | | | | | | | | | |
| | | | |
| | | | |
| | | | | | | | |
| |
| | Life is Complex |
| |
| | Nuveen makes things e-simple. It only takes a minute to sign up for e-Reports. Once enrolled, you’ll receive an e-mail as soon as your Nuveen Fund information is ready – no more waiting for delivery by regular mail. Just click on the link within the e-mail to see the report and save it on your computer if you wish. |
| | |
| | Free e-Reports right to your e-mail! |
| |
| | www.investordelivery.com If you receive your Nuveen Fund distributions and statements from your financial advisor or brokerage account. |
| |
| or | | www.nuveen.com/accountaccess If you receive your Nuveen Fund distributions and statements directly from Nuveen. |
Table
of Contents
Chairman’s Letter
to Shareholders

Dear Shareholders,
Some of the key assumptions driving the markets higher at the beginning of 2017 have recently come into question. Following the collapse of the health care reform bill in the Senate, progress on the rest of the White House’s pro-growth fiscal agenda, including tax reform and large infrastructure projects, is expected to be delayed. Economic growth projections, in turn, have been lowered, and with inflation recently waning, the markets are expecting fewer rate hikes from the Federal Reserve (Fed) than the Fed itself had predicted. Yet, asset prices continued to rise.
Investors have largely looked beyond policy disappointments and focused instead on the healthy profits reported by U.S. companies during the first two quarters of 2017. U.S. growth has remained slow and steady, European growth has surprised to the upside and concern that China would decelerate too rapidly has eased, further contributing to an optimistic tone in the markets. Additionally, political risk in Europe has moderated, with the election of mainstream candidates in the Dutch and French elections earlier this year.
The remainder of the year could bring challenges to this benign macro environment. The debt ceiling looms, with a vote needed from Congress to raise or suspend the nation’s borrowing limit before the Treasury is unable to pay its bills in full or on time (likely in early October). The mechanics of the U.K.’s separation from the European Union remain to be seen, as “Brexit” negotiations develop. A tightening of financial conditions in China or a more aggressive-than-expected policy action from the Fed, European Central Bank or Bank of Japan could also turn into headwinds.
Market volatility readings have been remarkably low lately, but conditions can change quickly. As market conditions evolve, Nuveen remains committed to rigorously assessing opportunities and risks. If you’re concerned about how resilient your investment portfolio might be, we encourage you to talk to your financial advisor. On behalf of the other members of the Nuveen Fund Board, we look forward to continuing to earn your trust in the months and years ahead.
Sincerely,

William J. Schneider
Chairman of the Board
August 23, 2017
Portfolio Managers’
Comments
Nuveen Credit Opportunities 2022 Target Term Fund (JCO)
The Fund’s investment portfolio is managed by Symphony Asset Management, LLC (Symphony), an affiliate of Nuveen, LLC. Gunther Stein, who serves as the firm’s Chief Investment Officer and Chief Executive Officer, Jenny Rhee and Scott Caraher manage the Fund.
Here the team discusses their management strategies and the performance of the Fund for the abbreviated reporting period since the Fund’s inception on March 28, 2017 through June 30, 2017.
What strategies were used to manage the Fund during the abbreviated reporting period since the Fund’s inception March 28, 2017 through June 31, 2017?
The Fund seeks to provide a high level of current income from a portfolio of shorter maturity, high yield corporate debt and return the original $9.85 net asset value per common share on or about June 1, 2022.
The Fund generally invests in a portfolio of below investment grade corporate bonds and senior loans. The Fund may invest in other types of securities including convertible securities and other types of debt instruments and derivatives that provide comparable economic exposure to the corporate debt market. At least 80% of its managed assets will be in corporate debt securities and separately, at least 80% in securities that, at the time of investment, are rated below investment grade or unrated but judged by the managers to be of comparable quality. No more than 15% will be in securities rated CCC+/Caa1 or lower at the time of investment. Up to 30% may be in securities on non-U.S. issuers, including up to 20% in emerging market issuers, but 100% of managed assets will be in U.S. dollar denominated securities.
In seeking to return the original net asset value on or about June 1, 2022, the Fund intends to utilize various portfolio and cash flow management techniques, including setting aside a portion of its net investment income, possibly retaining gains and limiting the longest maturity on any holdings to no later than December 1, 2022.
How did the Funds perform during this abbreviated reporting period ended June 30, 2017?
The table in the Performance Overview and Holding Summaries section of this report provides total return performance for the Fund for the abbreviated reporting period from the Fund’s inception on March 28, 2017 through June 30, 2017. The Fund’s total returns at net asset value (NAV) are compared with the performance of a corresponding market index. For the abbreviated reporting period ended June 30, 2017, the Fund underperformed the Bloomberg Barclays U.S. High Yield 1-5 Year Cash Pay 2% Issuer Capped Index on the Fund’s total return at NAV.
This material is not intended to be a recommendation or investment advice, does not constitute a solicitation to buy or sell securities, and is not provided in a fiduciary. The information provided does not take into account the specific objectives or circumstances of any particular investor, or suggest any specific course of action. Investment decisions should be made based on an investor’s objectives or circumstances and in consultation with his or her advisors.
Certain statements in this report are forward-looking statements. Discussions of specific investments are for illustration only and are not intended as recommendations of individual investments. The forward-looking statements and other views expressed herein are those of the portfolio managers as of the date of this report. Actual future results or occurrences may differ significantly from those anticipated in any forward-looking statements and the views expressed herein are subject to change at any time, due to numerous market and other factors. The Fund disclaims any obligation to update publicly or revise any forward-looking statements or views expressed herein.
For financial reporting purposes, the ratings disclosed are the highest rating given by one of the following national rating agencies: Standard & Poor’s (S&P), Moody’s Investors Service, Inc. (Moody’s) or Fitch, Inc. (Fitch). This treatment of split-rated securities may differ from that used for other purposes, such as for Fund investment policies. Credit ratings are subject to change. AAA, AA, A and BBB are investment grade ratings; BB, B, CCC, CC, C and D are below investment grade ratings. Certain bonds backed by U.S. Government or agency securities are regarded as having an implied rating equal to the rating of such securities. Holdings designated N/R are not rated by these national rating agencies.
Refer to the Glossary of Terms Used in this Report for further definition of the terms used within this section.
Portfolio Managers’ Comments (continued)
During the abbreviated reporting period all sectors positively contributed to performance, with the exception of the energy sector. In particular, the consumer discretionary, industrials, telecommunication services and health care sectors contributed to relative performance.
Specific holdings that contributed to performance included the corporate bonds of consumer discretionary holdings Scientific Games International Inc. The leading provider of gaming and lottery systems rallied on the combination of high yield market momentum, modest operating gains and the company’s buyback of unsecured debt. We believe the company will benefit further from its corporate restructuring and continue to own the bonds. Also positively contributing were the telecommunication services bonds of Intelsat, S.A. and Sprint Communications Inc. The satellite company Intelsat strongly benefitted returns as the company’s bonds rose on better than expected earnings and refinancing on 2019 maturities. Lastly, Sprint bonds moved up in anticipation of merger and acquisition activity in the wireless space.
Specific holdings that detracted were mostly contained in the energy sector. Bristow Group Inc., the leading global industrial aviation services provider, was a key detractor. During the reporting period, the company missed analyst expectations by a wide margin on both revenue and adjusted earnings per share basis. EP Energy Corporation and Fieldwood Energy LLC. also detracted from performance. Energy related companies continue to be pressured by oil prices. Oil prices fell below $43, before recovering to $46.5, per barrel despite an announcement by the Organization of the Petroleum Exporting Countries (OPEC) to extend its production cut through March 2018.
Fund
Leverage
IMPACT OF THE FUND’S LEVERAGE STRATEGY ON PERFORMANCE
One important factor impacting the return of the Fund relative to its benchmark was the Fund’s utilization of leverage through the use of bank borrowings. The Fund uses leverage because our research has shown that, over time, leveraging provides opportunities for additional income and total return for shareholders. However, the use of leverage also can expose shareholders to additional volatility. For example, as the prices of securities held by the Fund decline, the negative impact of these valuation changes on NAV and shareholder total return is magnified by the use of leverage. Conversely, leverage may enhance returns during periods when the prices of securities held by the Fund generally are rising. The Fund’s use of leverage had a positive impact on the performance of the Fund over the reporting period.
As of June 30, 2017, the Fund’s percentages of leverage are as shown in the accompanying table.
| | | | |
| | | JCO | |
Effective Leverage* | | | 25.03 | % |
Regulatory Leverage* | | | 25.03 | % |
| * | Effective leverage is the Fund’s effective economic leverage, and includes both regulatory leverage and the leverage effects of certain derivative and other investments in the Fund’s portfolio that increase the Fund’s investment exposure. Regulatory leverage consists of borrowings of the Fund, which is part of the Fund’s capital structure. The Fund, however, may from time to time borrow on a typically transient basis in connection with its day-to-day operations, primarily in connection with the need to settle portfolio trades. Such incidental borrowings are excluded from the calculation of the Fund’s effective leverage ratio. Regulatory leverage is subject to asset coverage limits set forth in the Investment Company Act of 1940. |
THE FUND’S REGULATORY LEVERAGE
Bank Borrowings
As noted above the Fund employs leverage through the use of bank borrowings. The Fund’s bank borrowing activities are as shown in the accompanying table.
| | | | | | | | | | | | | | | | | | | | | | | | | | | | | | | | | | |
| Current Reporting Period | | | | | | Subsequent to the Close of
the Reporting Period | |
| March 28, 2017** | | | Draws | | | Paydowns | | | June 30, 2017 | | | Average Balance
Outstanding*** | | | | | | Draws | | | Paydowns | | | August 25, 2017 | |
| | $ — | | | $ | 91,400,000 | | | $ | — | | | $ | 91,400,000 | | | $ | 89,392,593 | | | | | | | $ | — | | | $ | — | | | $ | 91,400,000 | |
| ** | Commencement of operations. |
| *** | For the period April 11, 2017 (initial draw on borrowings) through June 30, 2017. |
Refer to Notes to Financial Statements, Note 8 – Borrowing Arrangements for further details.
Share
Information
DISTRIBUTION INFORMATION
The following information regarding the Funds’ distributions is current as of June 30, 2017. The Fund’s distribution levels may vary over time based on the Fund’s investment activity and portfolio investment value changes.
During the current reporting period, the Fund’s distributions to shareholders were as shown in the accompanying table.
| | | | |
| Monthly Distributions (Ex-Dividend Date) | | Per
Share
Amounts | |
May 2017* | | $ | 0.0470 | |
June 2017 | | | 0.0470 | |
Total Distributions | | $ | 0.0940 | |
| |
Current Distribution Rate** | | | 5.70 | % |
| * | Initial distribution declared by the Fund. |
| ** | Current distribution rate is based on the Fund’s current annualized monthly distribution divided by the Fund’s current market price. The Fund’s monthly distributions to its shareholders may be comprised of ordinary income, net realized capital gains and, if at the end of the fiscal year the Fund’s cumulative net ordinary income and net realized gains are less than the amount of the Fund’s distributions, a return of capital for tax purposes. |
The Fund seeks to pay regular monthly dividends out of its net investment income at a rate that reflects its past and projected net income performance. To permit the Fund to maintain a more stable monthly dividend, the Fund may pay dividends at a rate that may be more or less than the amount of net income actually earned by the Fund during the period. If the Fund has cumulatively earned more than it has paid in dividends, it will hold the excess in reserve as undistributed net investment income (UNII) as part of the Fund’s net asset value. Conversely, if the Fund has cumulatively paid in dividends more than it has earned, the excess will constitute a negative UNII that will likewise be reflected in the Fund’s net asset value. The Fund will, over time, pay all its net investment income as dividends to shareholders.
As of June 30, 2017, the Fund had a positive UNII balance, based upon our best estimate, for tax purposes and positive UNII balance for financial reporting purposes.
All monthly dividends paid by the Fund during the current reporting period were paid from net investment income. If a portion of the Fund’s monthly distributions was sourced from or comprised of elements other than net investment income, including capital gains and/or a return of capital, shareholders would have received a notice to that effect. For financial reporting purposes, the composition and per share amounts of the Fund’s dividends for the reporting period are presented in this report’s Statement of Changes in Net Assets and Financial Highlights, respectively. For income tax purposes, distribution information for the Fund as of its most recent tax year end is presented in Note 6 – Income Tax Information within the Notes to Financial Statements of this report.
SHARE REPURCHASES
During August 2017 (subsequent to the close of this reporting period) the Fund’s Board of Trustees authorized the Fund to participate in Nuveen’s closed-end fund complexwide share repurchase program. Under the share repurchase program, the Fund may repurchase up to 10% of its outstanding shares as of the authorization date (approximately 2,770,000 shares) in open-market transactions at the Adviser’s discretion.
OTHER SHARE INFORMATION
As of June 30, 2017, and during the current reporting period, the Fund’s share price was trading at a premium/(discount) to its NAV as shown in the accompanying table.
| | | | |
NAV | | $ | 9.89 | |
Share price | | $ | 10.04 | |
Premium/(Discount) to NAV | | | 1.52 | % |
Since inception average premium/(discount) to NAV | | | 1.74 | % |
The Fund has an investment objective to return $9.85 (the original net asset value following the Fund’s initial public offering (the “Original NAV”)) to shareholders on or about the end of the Fund’s term. There can be no assurance that the Fund will be able to return the Original NAV to shareholders, and such return is not backed or otherwise guaranteed by the Fund’s investment adviser, Nuveen Fund Advisors, LLC (the “Adviser”), or any other entity.
The Fund’s ability to return Original NAV to shareholders on or about its termination date will depend on market conditions and the success of various portfolio and cash flow management techniques. The Fund currently intends to set aside and retain in its net assets a portion of its net investment income and possibly all or a portion of its gains. This will reduce the amounts otherwise available for distribution prior to the liquidation of the Fund, and the Fund may incur taxes on such retained amount, which will reduce the overall amounts that the Fund would have otherwise been able to distribute. Such retained income or gains, net of any taxes, would constitute a portion of the liquidating distribution returned to investors at the end of the Fund’s term. In addition, the Fund’s investment in shorter term and lower yielding securities, especially as the Fund nears the end of its term, may reduce investment income and, therefore, the monthly dividends during the period prior to termination. Investors that purchase shares in the secondary market (particularly if their purchase price differs meaningfully from the Original NAV) may receive more or less than their original investment.
Risk
Considerations
Fund shares are not guaranteed or endorsed by any bank or other insured depository institution, and are not federally insured by the Federal Deposit Insurance Corporation.
Nuveen Credit Opportunities 2022 Target Term Fund (JCO)
Investing in closed-end funds involves risk; principal loss is possible. There is no guarantee the Fund’s investment objectives will be achieved. Closed-end fund shares may frequently trade at a discount or premium to their net asset value. Lower credit debt securities may be more likely to fail to make timely interest or principal payments. Adjustable Rate Senior Loans may not be fully secured by collateral, generally do not trade on exchanges, and are typically issued by unrated or below-investment grade companies, and therefore are subject to greater liquidity and credit risk. Leverage increases return volatility and magnifies the Fund’s potential return and its risks; there is no guarantee a fund’s leverage strategy will be successful. These and other risk considerations such as limited term, interest rate risk and concentration risk are described in more detail on the Fund’s web page at www.nuveen.com/JCO.
THIS PAGE INTENTIONALLY LEFT BLANK
JCO
Nuveen Credit Opportunities 2022 Target Term Fund
Performance Overview and Holding Summaries as of June 30, 2017
Refer to the Glossary of Terms Used in this Report for further definition of the terms used within this section.
Cumulative Total Returns as of June 30, 2017
| | | | |
| | | Since
Inception | |
| JCO at NAV | | | 1.36% | |
| JCO at Share Price | | | 1.35% | |
| Bloomberg Barclays U.S. High Yield 1-5 Year Cash Pay 2% Issuer Capped Index | | | 2.41% | |
Since inception returns are from 3/28/17. Past performance is not predictive of future results. Current performance may be higher or lower than the data shown. Returns do not reflect the deduction of taxes that shareholders may have to pay on Fund distributions or upon the sale of Fund shares. Returns at NAV are net of Fund expenses, and assume reinvestment of distributions. Comparative index return information is provided for the Fund’s shares at NAV only. Indexes are not available for direct investment.
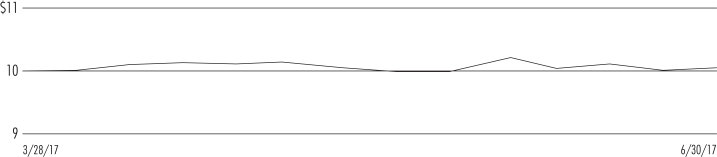
Share Price Performance — Weekly Closing Price
This data relates to the securities held in the Fund’s portfolio of investments as of the end of the reporting period. It should not be construed as a measure of performance for the Fund itself. Holdings are subject to change.
For financial reporting purposes, the ratings shown are the highest rating given by one of the following national rating agencies: Standard & Poor’s Group, Moody’s Investors Service, Inc. or Fitch, Inc. This treatment of split-rated securities may differ from that used for other purposes, such as Fund investment policies. Credit ratings are subject to change. AAA, AA, A and BBB are investment grade ratings; BB, B, CCC, CC, C and D are below-investment grade ratings. Certain bonds backed by U.S. Government or agency securities are regarded as having an implied rating equal to the rating of such securities. Holdings designated N/R are not rated by these national rating agencies.
Fund Allocation
(% of net assets)
| | | | |
| Variable Rate Senior Loan Interests | | | 30.5% | |
| Corporate Bonds | | | 100.0% | |
| Investment Companies | | | 6.5% | |
| Other Assets Less Liabilities | | | (3.6)% | |
Net Assets Plus Borrowings | | | 133.4% | |
| Borrowings | | | (33.4)% | |
Net Assets | | | 100% | |
Portfolio Composition
(% of total investments)
| | | | |
| Diversified Financial Services | | | 8.1% | |
| Software | | | 7.4% | |
| Media | | | 6.9% | |
| Oil, Gas & Consumable Fuels | | | 6.1% | |
| Wireless Telecommunication Services | | | 6.0% | |
| Commercial Services & Supplies | | | 5.9% | |
| Hotels, Restaurants & Leisure | | | 5.2% | |
| Diversified Telecommunication Services | | | 4.6% | |
| Chemicals | | | 4.5% | |
| Health Care Providers & Services | | | 4.5% | |
| Aerospace & Defense | | | 4.3% | |
| Health Care Equipment & Supplies | | | 3.6% | |
| Metals & Mining | | | 3.0% | |
| Technology Hardware, Storage & Peripherals | | | 2.6% | |
| Professional Services | | | 2.2% | |
| Equity Real Estate Investment Trusts | | | 2.1% | |
| Semiconductors & Semiconductor Equipment | | | 1.7% | |
| Construction & Engineering | | | 1.6% | |
| Other | | | 19.7% | |
Total | | | 100% | |
Portfolio Credit Quality
(% of total long-term investments)
| | | | |
| BBB | | | 3.1% | |
| BB or Lower | | | 96.4% | |
| N/R (not rated) | | | 0.5% | |
Total | | | 100% | |
Top Five Issuers
(% of total long-term investments)
| | | | |
| Sprint Corporation | | | 2.0% | |
| Tenet Healthcare Corporation | | | 1.8% | |
| APX Group, Inc. | | | 1.8% | |
| Rite Aid Corporation | | | 1.6% | |
| IntelSat Jackson Holdings | | | 1.6% | |
JCO
| | |
Nuveen Credit Opportunities 2022 Target Term Fund | | |
Portfolio of Investments | | June 30, 2017 (Unaudited) |
| | | | | | | | | | | | | | | | | | | | |
Principal
Amount (000) | | | Description (1) | | Coupon (2) | | | Maturity (3) | | | Ratings (4) | | | Value | |
| |
| | | | LONG-TERM INVESTMENTS – 130.5% (95.2% of Total Investments) | |
| |
| | | | VARIABLE RATE SENIOR LOAN INTERESTS – 30.5% (22.2% of Total Investments) (2) | |
| |
| | | | Aerospace & Defense – 3.2% (2.3% of Total Investments) | |
| | | | | |
| $ | 2,665 | | | Sequa Corporation, Term Loan, First Lien | | | 6.672% | | | | 11/28/21 | | | | B | | | $ | 2,685,185 | |
| | 1,918 | | | Sequa Corporation, Term Loan, Second Lien | | | 10.172% | | | | 4/26/22 | | | | CCC | | | | 1,960,807 | |
| | 3,982 | | | Transdigm, Inc., Tranche D, Term Loan | | | 4.292% | | | | 6/4/21 | | | | Ba2 | | | | 3,984,792 | |
| | 8,565 | | | Total Aerospace & Defense | | | | | | | | | | | | | | | 8,630,784 | |
| |
| | | | Auto Components – 1.9% (1.3% of Total Investments) | |
| | | | | |
| | 1,995 | | | American Tire Distributors, Inc., Term Loan, First Lien | | | 5.476% | | | | 9/1/21 | | | | B– | | | | 2,007,994 | |
| | 3,000 | | | Federal-Mogul Corporation, Tranche C, Term Loan, (WI/DD) | | | TBD | | | | TBD | | | | B1 | | | | 3,012,495 | |
| | 4,995 | | | Total Auto Components | | | | | | | | | | | | | | | 5,020,489 | |
| |
| | | | Commercial Services & Supplies – 4.1% (3.0% of Total Investments) | |
| | | | | |
| | 3,491 | | | iQor US, Inc., Term Loan, First Lien | | | 6.148% | | | | 4/1/21 | | | | B | | | | 3,474,880 | |
| | 3,491 | | | Monitronics International, Inc., Term Loan B2, First Lien | | | 6.796% | | | | 9/30/22 | | | | B2 | | | | 3,528,667 | |
| | 4,468 | | | Skillsoft Corporation, Initial Term Loan, First Lien, (WI/DD) | | | TBD | | | | TBD | | | | B– | | | | 4,234,040 | |
| | 11,450 | | | Total Commercial Services & Supplies | | | | | | | | | | | | | | | 11,237,587 | |
| |
| | | | Diversified Consumer Services – 0.9% (0.6% of Total Investments) | |
| | | | | |
| | 2,493 | | | Weight Watchers International, Inc., Term Loan B2 | | | 4.549% | | | | 4/2/20 | | | | B– | | | | 2,406,853 | |
| |
| | | | Diversified Financial Services – 1.3% (0.9% of Total Investments) | |
| | | | | |
| | 3,456 | | | Ocwen Financial Corporation, Term Loan B, First Lien | | | 6.000% | | | | 12/5/20 | | | | B+ | | | | 3,434,824 | |
| |
| | | | Equity Real Estate Investment Trusts – 1.3% (1.0% of Total Investments) | |
| | | | | |
| | 4,000 | | | Walter Investment Management Corporation, Tranche B, Term Loan, First Lien | | | 4.976% | | | | 12/18/20 | | | | Caa1 | | | | 3,642,500 | |
| |
| | | | Food & Staples Retailing – 0.9% (0.7% of Total Investments) | |
| | | | | |
| | 2,500 | | | Rite Aid Corporation, Tranche 1, Term Loan, Second Lien | | | 5.980% | | | | 8/21/20 | | | | BB | | | | 2,527,088 | |
| |
| | | | Health Care Equipment & Supplies – 1.5% (1.1% of Total Investments) | |
| | | | | |
| | 3,938 | | | Onex Carestream Finance LP, Term Loan, First Lien | | | 5.275% | | | | 6/7/19 | | | | B+ | | | | 3,922,058 | |
| |
| | | | Hotels, Restaurants & Leisure – 0.9% (0.7% of Total Investments) | |
| | | | | |
| | 2,500 | | | LA Fitness International LLC, Term Loan B | | | 5.549% | | | | 7/1/20 | | | | BB– | | | | 2,536,713 | |
| |
| | | | Insurance – 0.7% (0.5% of Total Investments) | |
| | | | | |
| | 1,994 | | | Hub International Holdings, Inc., Initial Term Loan | | | 4.422% | | | | 10/2/20 | | | | B+ | | | | 2,001,933 | |
| |
| | | | Machinery – 0.7% (0.5% of Total Investments) | |
| | | | | |
| | 1,995 | | | NN, Inc., 5 Year Term Loan | | | 5.476% | | | | 10/19/22 | | | | B+ | | | | 1,994,078 | |
| |
| | | | Media – 3.3% (2.4% of Total Investments) | |
| | | | | |
| | 1,995 | | | Affinion Group Holdings, Inc., Term Loan, First Lien | | | 8.935% | | | | 5/10/22 | | | | CCC+ | | | | 2,023,429 | |
| | 1,995 | | | Getty Images, Inc., Term Loan B, First Lien | | | 4.796% | | | | 10/18/19 | | | | B3 | | | | 1,843,933 | |
| | 2,992 | | | McGraw-Hill Education Holdings LLC, Term Loan B, (WI/DD) | | | TBD | | | | TBD | | | | BB | | | | 2,949,651 | |
| | 2,261 | | | Springer Science & Business Media, Inc., Term Loan B9, First Lien | | | 4.796% | | | | 8/14/20 | | | | B | | | | 2,267,158 | |
| | 9,243 | | | Total Media | | | | | | | | | | | | | | | 9,084,171 | |
| |
| | | | Oil, Gas & Consumable Fuels – 0.9% (0.6% of Total Investments) | |
| | | | | |
| | 3,000 | | | Fieldwood Energy LLC, Term Loan, Second Lien, (WI/DD) | | | TBD | | | | TBD | | | | B– | | | | 2,400,000 | |
| | | | | | | | | | | | | | | | | | | | |
Principal
Amount (000) | | | Description (1) | | Coupon (2) | | | Maturity (3) | | | Ratings (4) | | | Value | |
| |
| | | | Professional Services – 0.7% (0.5% of Total Investments) | |
| | | | | |
| $ | 2,000 | | | Ceridian Corporation, Term Loan B2, (WI/DD) | | | TBD | | | | TBD | | | | Ba3 | | | $ | 1,988,760 | |
| |
| | | | Software – 5.0% (3.7% of Total Investments) | |
| | | | | |
| | 1,990 | | | Blackboard, Inc., Term Loan B4 | | | 6.158% | | | | 6/30/21 | | | | B+ | | | | 1,985,000 | |
| | 3,645 | | | Compuware Corporation, Term Loan B2, First Lien | | | 5.550% | | | | 12/15/21 | | | | B | | | | 3,677,179 | |
| | 2,000 | | | Ellucian, Term Loan B, First Lien | | | 4.546% | | | | 9/30/22 | | | | B | | | | 1,997,500 | |
| | 2,992 | | | Informatica Corp., Term Loan B | | | 4.796% | | | | 8/5/22 | | | | B | | | | 2,994,491 | |
| | 3,107 | | | Tibco Software, Inc., Term Loan B | | | 5.730% | | | | 12/4/20 | | | | B1 | | | | 3,127,673 | |
| | 13,734 | | | Total Software | | | | | | | | | | | | | | | 13,781,843 | |
| |
| | | | Specialty Retail – 0.9% (0.7% of Total Investments) | |
| | | | | |
| | 2,545 | | | Gardner Denver, Inc., Term Loan | | | 4.546% | | | | 7/30/20 | | | | B+ | | | | 2,551,753 | |
| |
| | | | Technology Hardware, Storage & Peripherals – 0.9% (0.7% of Total Investments) | |
| | | | | |
| | 2,494 | | | Dell Software Group, Term Loan B | | | 7.314% | | | | 10/31/22 | | | | B1 | | | | 2,536,048 | |
| |
| | | | Wireless Telecommunication Services – 1.4% (1.0% of Total Investments) | |
| | | | | |
| | 4,000 | | | Syniverse Holdings, Inc., Initial Term Loan B, First Lien, (WI/DD) | | | TBD | | | | TBD | | | | B | | | | 3,756,680 | |
| $ | 84,902 | | | Total Variable Rate Senior Loan Interests (cost $83,484,434) | | | | | | | | | | | | | | | 83,454,162 | |
| | | | | |
Principal
Amount (000) | | | Description (1) | | Coupon | | | Maturity | | | Ratings (4) | | | Value | |
| | | | | |
| | | | CORPORATE BONDS – 100.0% (73.0% of Total Investments) | | | | | | | | | | | | | | | | |
| |
| | | | Aerospace & Defense – 2.7% (2.0% of Total Investments) | |
| | | | | |
| $ | 3,000 | | | Bombardier Inc., 144A | | | 8.750% | | | | 12/01/21 | | | | B | | | $ | 3,330,000 | |
| | 4,000 | | | CBC Ammo LLC/ CBC FinCo, Inc., 144A | | | 7.250% | | | | 11/15/21 | | | | BB– | | | | 4,030,000 | |
| | 7,000 | | | Total Aerospace & Defense | | | | | | | | | | | | | | | 7,360,000 | |
| |
| | | | Airlines – 0.6% (0.4% of Total Investments) | |
| | | | | |
| | 1,500 | | | American Airlines Group Inc., 144A | | | 4.625% | | | | 3/01/20 | | | | BB– | | | | 1,551,405 | |
| |
| | | | Beverages – 0.6% (0.4% of Total Investments) | |
| | | | | |
| | 1,500 | | | Cott Beverages Inc. | | | 5.375% | | | | 7/01/22 | | | | B– | | | | 1,554,375 | |
| |
| | | | Chemicals – 6.2% (4.5% of Total Investments) | |
| | | | | |
| | 2,250 | | | CF Industries Inc. | | | 7.125% | | | | 5/01/20 | | | | BB+ | | | | 2,486,250 | |
| | 1,500 | | | Huntsman International LLC | | | 4.875% | | | | 11/15/20 | | | | B1 | | | | 1,575,000 | |
| | 2,000 | | | Kissner Group Holdings LP, 144A | | | 8.375% | | | | 12/01/22 | | | | B | | | | 2,075,000 | |
| | 2,000 | | | Momentive Performance Materials Inc. | | | 3.880% | | | | 10/24/21 | | | | B– | | | | 1,985,000 | |
| | 3,500 | | | Platform Specialty Products Corporation, 144A | | | 6.500% | | | | 2/01/22 | | | | B+ | | | | 3,613,750 | |
| | 3,000 | | | TPC Group Inc., 144A | | | 8.750% | | | | 12/15/20 | | | | B3 | | | | 2,700,000 | |
| | 2,500 | | | Tronox Finance LLC, 144A | | | 7.500% | | | | 3/15/22 | | | | B– | | | | 2,575,000 | |
| | 16,750 | | | Total Chemicals | | | | | | | | | | | | | | | 17,010,000 | |
| |
| | | | Commercial Services & Supplies – 3.9% (2.9% of Total Investments) | |
| | | | | |
| | 4,000 | | | ADT Corporation | | | 6.250% | | | | 10/15/21 | | | | BB– | | | | 4,355,000 | |
| | 2,000 | | | APX Group, Inc. | | | 8.750% | | | | 12/01/20 | | | | CCC+ | | | | 2,065,000 | |
| | 4,000 | | | APX Group, Inc. | | | 7.875% | | | | 12/01/22 | | | | B1 | | | | 4,340,000 | |
| | 10,000 | | | Total Commercial Services & Supplies | | | | | | | | | | | | | | | 10,760,000 | |
| |
| | | | Construction & Engineering – 2.2% (1.6% of Total Investments) | |
| | | | | |
| | 2,000 | | | Great Lakes Dredge & Dock Corporation, 144A | | | 8.000% | | | | 5/15/22 | | | | B– | | | | 2,037,500 | |
| | 4,000 | | | Michael Baker International LLC / CDL Acquisition Company Inc., 144A | | | 8.250% | | | | 10/15/18 | | | | B– | | | | 3,980,000 | |
| | 6,000 | | | Total Construction & Engineering | | | | | | | | | | | | | | | 6,017,500 | |
| |
| | | | Construction Materials – 1.1% (0.8% of Total Investments) | |
| | | | | |
| | 3,000 | | | Gates Global LLC, 144A | | | 6.000% | | | | 7/15/22 | | | | B | | | | 3,007,500 | |
| | | | |
| JCO | | Nuveen Credit Opportunities 2022 Target Term Fund |
| | Portfolio of Investments (continued) | | June 30, 2017 (Unaudited) |
| | | | | | | | | | | | | | | | | | | | |
Principal
Amount (000) | | | Description (1) | | Coupon | | | Maturity | | | Ratings (4) | | | Value | |
| |
| | | | Consumer Finance – 1.5% (1.1% of Total Investments) | |
| | | | | |
| $ | 2,000 | | | Navient Corporation | | | 6.500% | | | | 6/15/22 | | | | BB | | | $ | 2,122,500 | |
| | 2,000 | | | TMX Finance LLC, 144A | | | 8.500% | | | | 9/15/18 | | | | B– | | | | 1,900,000 | |
| | 4,000 | | | Total Consumer Finance | | | | | | | | | | | | | | | 4,022,500 | |
| |
| | | | Containers & Packaging – 1.6% (1.2% of Total Investments) | |
| | | | | |
| | 4,303 | | | Cascades Inc., 144A | | | 5.500% | | | | 7/15/22 | | | | BB– | | | | 4,389,060 | |
| |
| | | | Diversified Consumer Services – 0.6% (0.4% of Total Investments) | |
| | | | | |
| | 1,500 | | | Harland Clarke Holdings, 144A | | | 6.875% | | | | 3/01/20 | | | | BB– | | | | 1,548,750 | |
| |
| | | | Diversified Financial Services – 3.4% (2.4% of Total Investments) | |
| | | | | |
| | 2,000 | | | Abe Investment Holdings Inc./ Getty Images, Inc., 144A | | | 10.500% | | | | 10/16/20 | | | | B3 | | | | 2,040,000 | |
| | 3,500 | | | Jefferies Finance LLC Corporation, 144A | | | 7.375% | | | | 4/01/20 | | | | B1 | | | | 3,587,500 | |
| | 1,000 | | | Ladder Capital Finance Holdings LLLP/ Ladder Capital Finance Corp., 144A | | | 5.250% | | | | 3/15/22 | | | | BB | | | | 1,027,500 | |
| | 1,500 | | | Nationstar Mortgage LLC Capital Corporation | | | 7.875% | | | | 10/01/20 | | | | B+ | | | | 1,541,250 | |
| | 1,000 | | | Nationstar Mortgage LLC Capital Corporation | | | 6.500% | | | | 7/01/21 | | | | B+ | | | | 1,022,500 | |
| | 9,000 | | | Total Diversified Financial Services | | | | | | | | | | | | | | | 9,218,750 | |
| |
| | | | Diversified Telecommunication Services – 6.3% (4.6% of Total Investments) | |
| | | | | |
| | 3,500 | | | CenturyLink Inc. | | | 6.450% | | | | 6/15/21 | | | | BB+ | | | | 3,780,000 | |
| | 500 | | | Cogent Communications Finance Inc., 144A | | | 5.625% | | | | 4/15/21 | | | | B– | | | | 513,750 | |
| | 985 | | | Frontier Communications Corporation | | | 8.500% | | | | 4/15/20 | | | | B+ | | | | 1,035,481 | |
| | 3,000 | | | IntelSat Jackson Holdings | | | 7.250% | | | | 10/15/20 | | | | CCC+ | | | | 2,835,000 | |
| | 3,000 | | | IntelSat Jackson Holdings | | | 7.500% | | | | 4/01/21 | | | | CCC+ | | | | 2,767,500 | |
| | 2,000 | | | Level 3 Communications Inc. | | | 5.750% | | | | 12/01/22 | | | | BB– | | | | 2,075,000 | |
| | 4,500 | | | Windstream Corporation | | | 7.750% | | | | 10/01/21 | | | | BB– | | | | 4,230,000 | |
| | 17,485 | | | Total Diversified Telecommunication Services | | | | | | | | | | | | | | | 17,236,731 | |
| |
| | | | Electrical Equipment – 1.5% (1.1% of Total Investments) | |
| | | | | |
| | 4,000 | | | Park Aerospace Holdings Limited, 144A | | | 5.250% | | | | 8/15/22 | | | | BB | | | | 4,181,280 | |
| |
| | | | Electronic Equipment, Instruments & Components – 0.7% (0.5% of Total Investments) | |
| | | | | |
| | 2,000 | | | Belden, Inc., 144A | | | 5.500% | | | | 9/01/22 | | | | BB– | | | | 2,060,000 | |
| |
| | | | Energy Equipment & Services – 2.1% (1.5% of Total Investments) | |
| | | | | |
| | 3,000 | | | Bristow Group, Inc. | | | 6.250% | | | | 10/15/22 | | | | B– | | | | 1,920,000 | |
| | 2,000 | | | Parker Drilling Company | | | 7.500% | | | | 8/01/20 | | | | B– | | | | 1,740,000 | |
| | 2,000 | | | SESI, LLC | | | 6.375% | | | | 5/01/19 | | | | BB– | | | | 1,980,000 | |
| | 7,000 | | | Total Energy Equipment & Services | | | | | | | | | | | | | | | 5,640,000 | |
| |
| | | | Equity Real Estate Investment Trusts – 1.5% (1.1% of Total Investments) | |
| | | | | |
| | 4,000 | | | iStar Inc. | | | 6.000% | | | | 4/01/22 | | | | BB | | | | 4,100,000 | |
| |
| | | | Food & Staples Retailing – 1.1% (0.8% of Total Investments) | |
| | | | | |
| | 3,000 | | | Rite Aid Corporation | | | 6.750% | | | | 6/15/21 | | | | B | | | | 3,081,000 | |
| |
| | | | Food Products – 0.4% (0.3% of Total Investments) | |
| | | | | |
| | 1,000 | | | B&G Foods Inc. | | | 4.625% | | | | 6/01/21 | | | | B+ | | | | 1,021,250 | |
| |
| | | | Health Care Equipment & Supplies – 3.5% (2.6% of Total Investments) | |
| | | | | |
| | 3,000 | | | Kinetics Concept/KCI USA, Inc., 144A | | | 7.875% | | | | 2/15/21 | | | | B1 | | | | 3,172,500 | |
| | 6,000 | | | Tenet Healthcare Corporation | | | 6.000% | | | | 10/01/20 | | | | BB– | | | | 6,427,500 | |
| | 9,000 | | | Total Health Care Equipment & Supplies | | | | | | | | | | | | | | | 9,600,000 | |
| |
| | | | Health Care Providers & Services – 6.1% (4.5% of Total Investments) | |
| | | | | |
| | 3,000 | | | Centene Corporation | | | 4.750% | | | | 5/15/22 | | | | BB+ | | | | 3,131,250 | |
| | 4,000 | | | Community Health Systems, Inc. | | | 5.125% | | | | 8/01/21 | | | | BB | | | | 4,050,000 | |
| | 4,500 | | | HCA Inc. | | | 6.500% | | | | 2/15/20 | | | | BBB– | | | | 4,910,625 | |
| | | | | | | | | | | | | | | | | | | | |
Principal
Amount (000) | | | Description (1) | | Coupon | | | Maturity | | | Ratings (4) | | | Value | |
| |
| | | | Health Care Providers & Services (continued) | |
| | | | | |
| $ | 4,600 | | | Iasis Healthcare Capital Corporation | | | 8.375% | | | | 5/15/19 | | | | CCC+ | | | $ | 4,623,000 | |
| | 16,100 | | | Total Health Care Providers & Services | | | | | | | | | | | | | | | 16,714,875 | |
| |
| | | | Hotels, Restaurants & Leisure – 6.2% (4.5% of Total Investments) | |
| | | | | |
| | 2,005 | | | CCM Merger Inc., 144A | | | 6.000% | | | | 3/15/22 | | | | B– | | | | 2,055,125 | |
| | 2,750 | | | Jack Ohio Finance LLC / Jack Ohio Finance 1 Corp., 144A | | | 6.750% | | | | 11/15/21 | | | | B+ | | | | 2,873,750 | |
| | 4,000 | | | MGM Resorts International Inc. | | | 6.625% | | | | 12/15/21 | | | | BB | | | | 4,490,000 | |
| | 2,000 | | | Scientific Games Corporation, 144A | | | 7.000% | | | | 1/01/22 | | | | Ba3 | | | | 2,130,000 | |
| | 5,000 | | | Scientific Games International Inc. | | | 10.000% | | | | 12/01/22 | | | | B– | | | | 5,481,250 | |
| | 15,755 | | | Total Hotels, Restaurants & Leisure | | | | | | | | | | | | | | | 17,030,125 | |
| |
| | | | Household Durables – 1.6% (1.2% of Total Investments) | |
| | | | | |
| | 4,000 | | | Beazer Homes USA, Inc. | | | 8.750% | | | | 3/15/22 | | | | B3 | | | | 4,460,000 | |
| |
| | | | Independent Power & Renewable Electricity Producers – 1.5% (1.1% of Total Investments) | |
| | | | | |
| | 4,000 | | | Dynegy Inc. | | | 6.750% | | | | 11/01/19 | | | | B+ | | | | 4,125,000 | |
| |
| | | | Insurance – 0.4% (0.3% of Total Investments) | |
| | | | | |
| | 1,000 | | | Fidelity & Guaranty Life Holdings Inc., 144A | | | 6.375% | | | | 4/01/21 | | | | Ba2 | | | | 1,030,000 | |
| |
| | | | Internet and Direct Marketing Retail – 0.8% (0.6% of Total Investments) | |
| | | | | |
| | 2,000 | | | Netflix Incorporated | | | 5.500% | | | | 2/15/22 | | | | B+ | | | | 2,171,860 | |
| |
| | | | Machinery – 0.8% (0.6% of Total Investments) | |
| | | | | |
| | 2,000 | | | CNH Industrial Capital LLC | | | 4.375% | | | | 4/05/22 | | | | BBB– | | | | 2,093,000 | |
| |
| | | | Media – 6.1% (4.5% of Total Investments) | |
| | | | | |
| | 2,000 | | | Altice S.A, 144A | | | 7.750% | | | | 5/15/22 | | | | B | | | | 2,122,500 | |
| | 5,013 | | | Cablevision Systems Corporation | | | 5.875% | | | | 9/15/22 | | | | B– | | | | 5,269,916 | |
| | 4,000 | | | Cequel Communication Holdings I, 144A | | | 5.125% | | | | 12/15/21 | | | | B | | | | 4,073,720 | |
| | 5,000 | | | Dish DBS Corporation | | | 5.875% | | | | 7/15/22 | | | | Ba3 | | | | 5,375,000 | |
| | 16,013 | | | Total Media | | | | | | | | | | | | | | | 16,841,136 | |
| |
| | | | Metals & Mining – 4.2% (3.0% of Total Investments) | |
| | | | | |
| | 2,000 | | | Cliffs Natural Resources Inc., 144A | | | 8.250% | | | | 3/31/20 | | | | BB– | | | | 2,180,000 | |
| | 2,500 | | | First Quantum Minerals Limited, 144A | | | 7.250% | | | | 5/15/22 | | | | B | | | | 2,550,000 | |
| | 4,000 | | | Freeport McMoRan, Inc. | | | 6.750% | | | | 2/01/22 | | | | BB+ | | | | 4,140,000 | |
| | 2,500 | | | United States Steel Corporation | | | 6.875% | | | | 4/01/21 | | | | B | | | | 2,581,250 | |
| | 11,000 | | | Total Metals & Mining | | | | | | | | | | | | | | | 11,451,250 | |
| |
| | | | Mortgage Real Estate Investment Trusts – 0.8% (0.5% of Total Investments) | |
| | | | | |
| | 2,000 | | | Starwood Property Trust, 144A | | | 5.000% | | | | 12/15/21 | | | | BB– | | | | 2,080,000 | |
| |
| | | | Oil, Gas & Consumable Fuels – 7.4% (5.4% of Total Investments) | |
| | | | | |
| | 2,000 | | | Cobalt International Energy, Inc., 144A | | | 10.750% | | | | 12/01/21 | | | | N/R | | | | 1,890,000 | |
| | 2,000 | | | Comstock Resources Inc. | | | 10.000% | | | | 3/15/20 | | | | B3 | | | | 1,995,000 | |
| | 2,000 | | | Everest Acquisition LLC Finance | | | 9.375% | | | | 5/01/20 | | | | Caa2 | | | | 1,577,500 | |
| | 3,000 | | | FTS International Inc., 144A | | | 8.746% | | | | 6/15/20 | | | | B | | | | 3,007,500 | |
| | 3,000 | | | Oasis Petroleum Inc. | | | 6.500% | | | | 11/01/21 | | | | B+ | | | | 2,910,000 | |
| | 3,000 | | | Peabody Securities Finance Corporation, 144A | | | 6.000% | | | | 3/31/22 | | | | Ba3 | | | | 2,977,500 | |
| | 2,000 | | | Ultra Resources, Inc., 144A | | | 6.875% | | | | 4/15/22 | | | | BB | | | | 1,985,000 | |
| | 4,000 | | | Whiting Petroleum Corporation | | | 5.000% | | | | 3/15/19 | | | | BB– | | | | 3,975,000 | |
| | 21,000 | | | Total Oil, Gas & Consumable Fuels | | | | | | | | | | | | | | | 20,317,500 | |
| |
| | | | Pharmaceuticals – 1.8% (1.4% of Total Investments) | |
| | | | | |
| | 3,000 | | | Valeant Pharmaceuticals International, 144A | | | 6.500% | | | | 3/15/22 | | | | BB– | | | | 3,146,250 | |
| | 2,000 | | | VP Escrow Corporation, 144A | | | 6.375% | | | | 10/15/20 | | | | B– | | | | 1,937,500 | |
| | 5,000 | | | Total Pharmaceuticals | | | | | | | | | | | | | | | 5,083,750 | |
| | | | |
| JCO | | Nuveen Credit Opportunities 2022 Target Term Fund |
| | Portfolio of Investments (continued) | | June 30, 2017 (Unaudited) |
| | | | | | | | | | | | | | | | | | | | |
Principal
Amount (000) | | | Description (1) | | Coupon | | | Maturity | | | Ratings (4) | | | Value | |
| |
| | | | Professional Services – 2.3% (1.7% of Total Investments) | |
| | | | | |
| $ | 2,000 | | | Ceridian HCN Holding Inc., 144A | | | 11.000% | | | | 3/15/21 | | | | CCC | | | $ | 2,112,500 | |
| | 4,000 | | | Nielsen Finance LLC Co, 144A | | | 5.000% | | | | 4/15/22 | | | | BB+ | | | | 4,150,000 | |
| | 6,000 | | | Total Professional Services | | | | | | | | | | | | | | | 6,262,500 | |
| |
| | | | Road & Rail – 1.5% (1.1% of Total Investments) | |
| | | | | |
| | 4,000 | | | Herc Rentals, Inc., 144A | | | 7.500% | | | | 6/01/22 | | | | B+ | | | | 4,220,000 | |
| |
| | | | Semiconductors & Semiconductor Equipment – 2.4% (1.7% of Total Investments) | |
| | | | | |
| | 3,000 | | | Advanced Micro Devices, Inc. | | | 7.500% | | | | 8/15/22 | | | | B– | | | | 3,330,000 | |
| | 3,000 | | | Amkor Technology Inc. | | | 6.375% | | | | 10/01/22 | | | | BB | | | | 3,123,750 | |
| | 6,000 | | | Total Semiconductors & Semiconductor Equipment | | | | | | | | | | | | | | | 6,453,750 | |
| |
| | | | Software – 5.2% (3.8% of Total Investments) | |
| | | | | |
| | 3,500 | | | Balboa Merger Sub Inc., 144A | | | 11.375% | | | | 12/01/21 | | | | CCC+ | | | | 3,858,750 | |
| | 2,000 | | | Blackboard Inc., 144A | | | 9.750% | | | | 10/15/21 | | | | CCC+ | | | | 1,880,000 | |
| | 1,000 | | | BMC Software Finance Inc., 144A | | | 8.125% | | | | 7/15/21 | | | | CCC+ | | | | 1,035,320 | |
| | 4,500 | | | Boxer Parent Company Inc./BMC Software, 144A | | | 9.000% | | | | 10/15/19 | | | | CCC+ | | | | 4,505,625 | |
| | 2,800 | | | Infor Software Parent LLC and Infor Software Parent Inc., 144A | | | 7.125% | | | | 5/01/21 | | | | CCC | | | | 2,884,000 | |
| | 13,800 | | | Total Software | | | | | | | | | | | | | | | 14,163,695 | |
| |
| | | | Technology Hardware, Storage & Peripherals – 2.6% (1.9% of Total Investments) | |
| | | | | |
| | 3,000 | | | Diamond 1 Finance Corporation / Diamond 2 Finance Corporation, 144A | | | 5.875% | | | | 6/15/21 | | | | BB+ | | | | 3,142,500 | |
| | 4,000 | | | Seagate HDD Cayman, 144A | | | 4.250% | | | | 3/01/22 | | | | BBB– | | | | 4,065,624 | |
| | 7,000 | | | Total Technology Hardware, Storage & Peripherals | | | | | | | | | | | | | | | 7,208,124 | |
| |
| | | | Wireless Telecommunication Services – 6.8% (5.0% of Total Investments) | |
| | | | | |
| | 3,000 | | | Hughes Satellite Systems Corporation | | | 7.625% | | | | 6/15/21 | | | | BB– | | | | 3,408,750 | |
| | 5,000 | | | Inmarsat Finance PLC, 144A | | | 4.875% | | | | 5/15/22 | | | | BB+ | | | | 5,075,000 | |
| | 6,500 | | | Sprint Corporation | | | 7.250% | | | | 9/15/21 | | | | B+ | | | | 7,223,125 | |
| | 3,000 | | | Syniverse Foreign Holdings Corporation, 144A | | | 9.125% | | | | 1/15/22 | | | | B | | | | 2,988,750 | |
| | 17,500 | | | Total Wireless Telecommunication Services | | | | | | | | | | | | | | | 18,695,625 | |
| $ | 266,206 | | | Total Corporate Bonds (cost $273,270,219) | | | | | | | | | | | | | | | 273,762,291 | |
| | | | Total Long-Term Investments (cost $356,754,654) | | | | | | | | | | | | | | | 357,216,453 | |
| | | | | |
Shares | | | Description (1), (5) | | | | | | | | | | | Value | |
| |
| | | | SHORT-TERM INVESTMENTS – 6.5% (4.8% of Total Investments) | |
| |
| | | | INVESTMENT COMPANIES – 6.5% (4.8% of Total Investments) | |
| | | | | |
| | 17,911,827 | | | BlackRock Liquidity Funds T-Fund Portfolio | | | | | | | | | | | | | | $ | 17,911,827 | |
| | | | Total Short-Term Investments (cost $17,911,827) | | | | | | | | | | | | | | | 17,911,827 | |
| | | | Total Investments (cost $374,666,481) – 137.0% | | | | | | | | | | | | | | | 375,128,280 | |
| | | | Borrowings – (33.4)% (6), (7) | | | | | | | | | | | | | | | (91,400,000 | ) |
| | | | Other Assets Less Liabilities – (3.6%) | | | | | | | | | | | | | | | (9,959,988 | ) |
| | | | Net Assets – 100% | | | | | | | | | | | | | | $ | 273,768,292 | |
For Fund portfolio compliance purposes, the Fund’s industry classifications refer to any one or more of the industry sub-classifications used by one or more widely recognized market indexes or ratings group indexes, and/or as defined by Fund management. This definition may not apply for purposes of this report, which may combine industry sub-classifications into sectors for reporting ease.
| (1) | All percentages shown in the Portfolio of Investments are based on net assets unless otherwise noted. |
| (2) | Senior loans generally pay interest at rates which are periodically adjusted by reference to a base short-term, floating lending rate plus an assigned fixed rate. These floating lending rates are generally (i) the lending rate referenced by the London Inter-Bank Offered Rate (“LIBOR”), or (ii) the prime rate offered by one or more major United States banks. Senior loans may be considered restricted in that the Fund ordinarily is contractually obligated to receive approval from the agent bank and/or borrower prior to the disposition of a senior loan. The rate shown is the coupon as of the end of the reporting period. |
| (3) | Senior loans generally are subject to mandatory and/or optional prepayment. Because of these mandatory prepayment conditions and because there may be significant economic incentives for a borrower to prepay, prepayments of senior loans may occur. As a result, the actual remaining maturity of senior loans held may be substantially less than the stated maturities shown. |
| (4) | For financial reporting purposes, the ratings disclosed are the highest of Standard & Poor’s Group (“Standard & Poor’s”), Moody’s Investors Service, Inc. (“Moody’s”) or Fitch, Inc. (“Fitch”) rating. This treatment of split-rated securities may differ from that used for other purposes, such as for Fund investment policies. Ratings below BBB by Standard & Poor’s, Baa by Moody’s or BBB by Fitch are considered to be below investment grade. Holdings designated N/R are not rated by any of these national rating agencies. |
| (5) | A copy of the most recent financial statements for these investment companies can be obtained directly from the Securities and Exchange Commission on its website at http://www.sec.gov. |
| (6) | Borrowings as a percentage of Total Investments is 24.4%. |
| (7) | The Fund segregates 100% of its eligible investments (excluding any investments separately pledged as collateral for specific investments in derivatives, when applicable) in the Portfolio of Investments as collateral for Borrowings. |
| (WI/DD) | Purchased on a when-issued or delayed delivery basis. |
| 144A | Investment is exempt from registration under Rule 144A of the Securities Act of 1933, as amended. These investments may only be resold in transactions exempt from registration, which are normally those transactions with qualified institutional buyers. |
| TBD | Senior loan purchased on a when-issued or delayed-delivery basis. Certain details associated with this purchase are not known prior to the settlement date of the transaction. In addition, senior loans typically trade without accrued interest and therefore a coupon rate is not available prior to settlement. At settlement, if still unknown, the borrower or counterparty will provide the Fund with the final coupon rate and maturity date. |
See accompanying notes to financial statements.
| | | | | | |
Statement of Assets and Liabilities | | June 30, 2017 (Unaudited) |
| | | | |
Assets | | | | |
Long-term investments, at value (cost $356,754,654) | | $ | 357,216,453 | |
Short-term investments, at value (cost approximates value) | | | 17,911,827 | |
Cash | | | 5,806 | |
Receivable for: | | | | |
Interest | | | 4,664,860 | |
Investments sold | | | 11,039,597 | |
Other assets | | | 2,128 | |
Total assets | | | 390,840,671 | |
Liabilities | | | | |
Borrowings | | | 91,400,000 | |
Payable for: | | | | |
Dividends | | | 1,286,760 | |
Investments purchased | | | 24,122,838 | |
Accrued expenses: | | | | |
Interest on borrowings | | | 38 | |
Management fees | | | 198,619 | |
Trustees fees | | | 2,780 | |
Other | | | 61,344 | |
Total liabilities | | | 117,072,379 | |
Net assets | | $ | 273,768,292 | |
Shares outstanding | | | 27,680,845 | |
Net asset value (“NAV”) per share outstanding | | $ | 9.89 | |
Net assets consist of: | | | | |
Shares, $.01 par value per share | | $ | 276,808 | |
Paid-in surplus | | | 271,826,183 | |
Undistributed (Over-distribution of) net investment income | | | 1,027,694 | |
Accumulated net realized gain (loss) | | | 175,808 | |
Net unrealized appreciation (depreciation) | | | 461,799 | |
Net assets | | $ | 273,768,292 | |
Authorized shares | | | Unlimited | |
See accompanying notes to financial statements.
| | | | | | |
Statement of Operations | | For the period March 28, 2017 (commencement of operations) through June 30, 2017 (Unaudited) |
| | | | |
Investment Income | | $ | 4,649,978 | |
Expenses | | | | |
Management fees | | | 571,435 | |
Interest expense on borrowings | | | 360,489 | |
Custodian fees | | | 14,700 | |
Trustees fees | | | 2,780 | |
Professional fees | | | 42,928 | |
Shareholder reporting expenses | | | 18,395 | |
Shareholder servicing agent fees | | | 39 | |
Investor relations expense | | | 6,008 | |
Other | | | 3,543 | |
Total expenses | | | 1,020,317 | |
Net investment income (loss) | | | 3,629,661 | |
Realized and Unrealized Gain (Loss) | | | | |
Net realized gain (loss) from investments | | | 175,808 | |
Change in net unrealized appreciation (depreciation) of investments | | | 461,799 | |
Net realized and unrealized gain (loss) | | | 637,607 | |
Net increase (decrease) in net assets from operations | | $ | 4,267,268 | |
See accompanying notes to financial statements.
| | | | | | |
Statement of Changes in Net Assets | | (Unaudited) |
| | | | |
| | | For the period March 28, 2017
(commencement of operations)
through June 30, 2017 | |
Operations | | | | |
Net investment income (loss) | | $ | 3,629,661 | |
Net realized gain (loss) from investments | | | 175,808 | |
Change in net unrealized appreciation (depreciation) of investments | | | 461,799 | |
Net increase (decrease) in net assets from operations | | | 4,267,268 | |
Distributions to Shareholders | | | | |
From net investment income | | | (2,601,967 | ) |
Decrease in net assets from distributions to shareholders | | | (2,601,967 | ) |
Capital Share Transactions | | | | |
Proceeds from sale of shares, net of offering costs | | | 271,996,100 | |
Net proceeds from shares issued to shareholders due to reinvestment of distributions | | | 6,815 | |
Net increase (decrease) in net assets from capital share transactions | | | 272,002,915 | |
Net increase (decrease) in net assets | | | 273,668,216 | |
Net assets at the beginning of period | | | 100,076 | |
Net assets at the end of period | | $ | 273,768,292 | |
Undistributed (Over-distribution of) net investment income at the end of period | | $ | 1,027,694 | |
See accompanying notes to financial statements.
| | | | | | |
Statement of Cash Flows | | For the period March 28, 2017 (commencement of operations) through June 30, 2017 (Unaudited) |
| | | | |
Cash Flows from Operating Activities: | | | | |
Net Increase (Decrease) in Net Assets from Operations | | $ | 4,267,268 | |
Adjustments to reconcile the net increase (decrease) in net assets from operations to net cash provided by (used in) operating activities: | | | | |
Purchases of investments | | | (410,107,314 | ) |
Proceeds from sales and maturities of investments | | | 53,231,786 | |
Proceeds from (Purchases of) short-term investments, net | | | (17,911,827 | ) |
Amortization (Accretion) of premiums and discounts, net | | | 296,682 | |
(Increase) Decrease in: | | | | |
Receivable for interest | | | (4,664,860 | ) |
Receivable for investments sold | | | (11,039,597 | ) |
Other assets | | | (2,128 | ) |
Increase (Decrease) in: | | | | |
Payable for investments purchased | | | 24,122,838 | |
Accrued management fees | | | 198,619 | |
Accrued interest on borrowings | | | 38 | |
Accrued Trustees fees | | | 2,780 | |
Accrued other expenses | | | 61,344 | |
Net realized (gain) loss from investments | | | (175,808 | ) |
Change in net unrealized (appreciation) depreciation of investments | | | (461,799 | ) |
Net cash provided by (used in) operating activities | | | (362,181,978 | ) |
Cash Flows from Financing Activities | | | | |
Proceeds from borrowings | | | 91,400,000 | |
Cash distributions paid to shareholders | | | (1,308,392 | ) |
Proceeds from sale of shares, net of offering costs | | | 271,996,100 | |
Net cash provided by (used in) financing activities | | | 362,087,708 | |
Net Increase (Decrease) in Cash | | | (94,270 | ) |
Cash at the beginning of period | | | 100,076 | |
Cash at the end of period | | $ | 5,806 | |
| |
| Supplemental Disclosure of Cash Flow Information | | | |
Cash paid for interest on borrowings (excluding borrowing costs) | | $ | 360,451 | |
Non-cash financing activities not included herein consists of reinvestments of share distributions | | | 6,815 | |
See accompanying notes to financial statements.
Financial
Highlights (Unaudited)
Selected data for a share outstanding throughout each period:
| | | | | | | | | | | | | | | | | | | | | | | | | | | | | | | | | | | | | | | | |
| | | | | | |
| | | | | | Investment Operations | | | Less Distributions | | | | | | | | | | |
| | | Beginning
NAV | | | Net
Investment
Income (Loss)(a) | | | Net
Realized/
Unrealized
Gain (Loss) | | | Total | | | From Net
Investment
Income | | | From
Accumulated
Net Realized
Gains | | | Total | | | Offering
Costs | | | Ending
NAV | | | Ending
Share
Price | |
Year Ended 12/31: | |
2017(b) | | $ | 9.85 | | | $ | 0.14 | | | $ | 0.01 | | | $ | 0.15 | | | $ | (0.09 | ) | | $ | — | | | $ | (0.09 | ) | | $ | (0.02 | ) | | $ | 9.89 | | | $ | 10.04 | |
| | | | | | | | |
| | | Borrowings at the End of Period | |
| | | Aggregate
Amount
Outstanding
(000) | | | Asset Coverage Per $1,000 | |
Year Ended 12/31: | | | | | | | | |
2017(b) | | $ | 91,400 | | | $ | 3,995 | |
| | | | | | | | | | | | | | | | | | | | | | |
| | | | | | | Ratios/Supplemental Data | |
| Total Returns | | | | | | Ratios to Average Net Assets(d) | | | | |
Based
on
NAV(c) | | | Based
on
Share
Price(c) | | | Ending
Net
Assets
(000) | | | Expenses | | | Net
Investment
Income (Loss) | | | Portfolio
Turnover
Rate(e) | |
| | | | | | | | | | | | | | | | | | | | | | |
| | 1.36 | % | | | 1.35 | % | | $ | 273,768 | | | | 1.49 | %* | | | 5.32 | %* | | | 15 | % |
| (a) | Per share Net Investment Income (Loss) is calculated using the average daily shares method. |
| (b) | For the period March 28, 2017 (commencement of operations) through June 30, 2017. |
| (c) | Total Return Based on NAV is the combination of changes in NAV, reinvested dividend income at NAV and reinvested capital gains distributions at NAV, if any. The last dividend declared in the period, which is typically paid on the first business day of the following month, is assumed to be reinvested at the ending NAV. The actual reinvest price for the last dividend declared in the period may often be based on the Fund’s market price (and not its NAV), and therefore may be different from the price used in the calculation. Total returns are not annualized. |
Total Return Based on Share Price is the combination of changes in the market price per share and the effect of reinvested dividend income and reinvested capital gains distributions, if any, at the average price paid per share at the time of reinvestment. The last dividend declared in the period, which is typically paid on the first business day of the following month, is assumed to be reinvested at the ending market price. The actual reinvestment for the last dividend declared in the period may take place over several days, and in some instances may not be based on the market price, so the actual reinvestment price may be different from the price used in the calculation. Total returns are not annualized.
| (d) • | Net Investment Income (Loss) ratios reflect income earned and expenses incurred on assets attributable to borrowings (as described in Note 8 – Borrowing Arrangements). |
| | • | Each ratio includes the effect of all interest expense paid and other costs related to borrowings, as follows: |
| | | | |
Ratios of Borrowings Interest Expense
to Average Net Assets | |
Year Ended 12/31: | |
2017(b) | | | 0.53 | %* |
| (e) | Portfolio Turnover Rate is calculated based on the lesser of long-term purchases or sales (as disclosed in Note 5 – Investment Transactions) divided by the average long-term market value during the period. |
See accompanying notes to financial statements.
Notes to
Financial Statements (Unaudited)
1. General Information and Significant Accounting Policies
General Information
Fund Information
Nuveen Credit Opportunities 2022 Target Term Fund (the “Fund”) is registered under the Investment Company Act of 1940, as amended, as a diversified, closed-end management investment company. The Fund’s shares are listed on the New York Stock Exchange (“NYSE”) and trade under the ticker symbol “JCO.” The Fund was organized as a Massachusetts business trust on September 28, 2016.
The end of the reporting period for the Fund is June 30, 2017, and the period covered by these Notes to Financial Statements is for the fiscal period March 28, 2017 (commencement of operations) through June 30, 2017 (the “current fiscal period”).
Investment Adviser
The Fund’s investment adviser is Nuveen Fund Advisors, LLC (the “Adviser”), a subsidiary of Nuveen, LLC (“Nuveen”). Nuveen is the investment management arm of Teachers Insurance and Annuity Association of America (TIAA). The Adviser has overall responsibility for management of the Fund, oversees the management of the Fund’s portfolio, manages the Fund’s business affairs and provides certain clerical, bookkeeping and other administrative services, and, if necessary, asset allocation decisions. The Adviser has entered into a sub-advisory agreement with Symphony Asset Management, LLC (the “Sub-Adviser”), an affiliate of Nuveen, under which the Sub-Adviser manages the investment portfolio of the Fund.
Investment Objectives and Principal Investment Strategies
The Fund seeks to provide a high level of current income and return the original $9.85 net asset value (“NAV”) per common share on or about June 1, 2022 (the “Termination Date”). The Fund generally invests in a portfolio of below investment grade corporate bonds and senior loans. The Fund may invest in other types of securities including convertible securities and other types of debt instruments and derivatives that provide comparable economic exposure to the corporate debt market. At least 80% of the Fund’s managed assets (as defined in Note 7 – Management Fees) will be in corporate debt securities and separately, at least 80% in securities that, at the time of investment, are rated below investment grade or unrated but judged by the Sub-Adviser to be of comparable quality. No more than 15% of the Fund’s managed assets will be in securities rated CCC+/Caa1 or lower at the time of investment. Up to 30% may be in securities of non-U.S. issuers, including up to 20% in emerging market issuers, but 100% of managed assets will be in U.S. dollar denominated securities.
Investment Transactions
Investment transactions are recorded on a trade date basis. Realized gains and losses from investment transactions are determined on the specific identification method, which is the same basis used for federal income tax purposes. Investments purchased on a when-issued/delayed delivery basis may have extended settlement periods. Any investments so purchased are subject to market fluctuation during this period. The Fund has earmarked securities in its portfolio with a current value at least equal to the amount of the when-issued/delayed delivery purchase commitments.
As of the end of the reporting period, the Fund’s outstanding when-issued/delayed delivery purchase commitments were as follows:
| | | | |
Outstanding when-issued/delayed delivery purchase commitments | | | $11,312,581 | |
Investment Income
Interest income, which reflects the amortization of premiums and accretion of discounts for financial reporting purposes, is recorded on an accrual basis. Fee income consists primarily of amendment fees. Amendment fees are earned as compensation for evaluating and accepting changes to an original senior loan agreement and are recognized when received. Fee income and amendment fees, if any, are recognized as a component of “Investment Income” on the Statement of Operations.
Professional Fees
Professional fees presented on the Statement of Operations consist of legal fees incurred in the normal course of operations, audit fees, tax consulting fees and, in some cases, workout expenditures. Workout expenditures are incurred in an attempt to protect or enhance an investment or to pursue other claims or legal actions on behalf of Fund shareholders. If a refund is received for workout expenditures paid in a prior reporting period, such amounts will be recognized as “Legal fee refund” on the Statement of Operations.
Dividends and Distributions to Shareholders
Dividends to shareholders, if any, are declared monthly. Net realized capital gains from investment transactions, if any, are declared and distributed to shareholders at least annually. However, in seeking to achieve its investment objectives, the Fund currently intends to set aside and retain in its net assets (and therefore its NAV) a portion of its net investment income, and possibly all or a portion of its gains. This will reduce the amounts otherwise available for distribution prior to the liquidation of the Fund, and the Fund may incur taxes on such retained amount. Such retained income or gains, net of any taxes, would constitute a portion of the liquidating distribution returned to investors on or about the Termination Date. Furthermore, capital gains are distributed only to the extent they exceed available capital loss carryforwards.
Distributions to shareholders are recorded on the ex-dividend date. The amount and timing of distributions are determined in accordance with federal income tax regulations, which may differ from U.S. GAAP.
Compensation
The Fund pays no compensation directly to those of its trustees who are affiliated with the Adviser or to its officers, all of whom receive renumeration for their services to the Fund from the Adviser or its affiliates. The Fund’s Board of Trustees (the “Board”) has adopted a deferred compensation plan for independent trustees that enables trustees to elect to defer receipt of all or a portion of the annual compensation they are entitled to receive from certain Nuveen-advised funds. Under the plan, deferred amounts are treated as though equal dollar amounts had been invested in shares of select Nuveen-advised funds.
Indemnifications
Under the Fund’s organizational documents, its officers and trustees are indemnified against certain liabilities arising out of the performance of their duties to the Fund. In addition, in the normal course of business, the Fund enters into contracts that provide general indemnifications to other parties. The Fund’s maximum exposure under these arrangements is unknown as this would involve future claims that may be made against the Fund that have not yet occurred. However, the Fund has not had prior claims or losses pursuant to these contracts and expects the risk of loss to be remote.
Netting Agreements
In the ordinary course of business, the Fund may enter into transactions subject to enforceable master repurchase agreements, International Swaps and Derivatives Association, Inc. (“ISDA”) master agreements or other similar arrangements (“netting agreements”). Generally, the right to offset in netting agreements allows the Fund to offset certain securities and derivatives with a specific counterparty, when applicable, as well as any collateral received or delivered to that counterparty based on the terms of the agreements. Generally, the Fund manages its cash collateral and securities collateral on a counterparty basis.
The Fund’s investments subject to netting agreements as of the end of the reporting period, if any, are further described in Note 3 – Portfolio Securities and Investments in Derivatives.
Use of Estimates
The preparation of financial statements in conformity with U.S. GAAP requires management to make estimates and assumptions that affect the reported amounts of assets and liabilities at the date of the financial statements and the reported amounts of increases and decreases in net assets from operations during the current fiscal period. Actual results may differ from those estimates.
2. Investment Valuation and Fair Value Measurements
The fair valuation input levels as described below are for fair value measurement purposes.
Fair value is defined as the price that would be received upon selling an investment or transferring a liability in an orderly transaction to an independent buyer in the principal or most advantageous market for the investment. A three-tier hierarchy is used to maximize the use of observable market data and minimize the use of unobservable inputs and to establish classification of fair value measurements for disclosure purposes. Observable inputs reflect the assumptions market participants would use in pricing the asset or liability. Observable inputs are based on market data obtained from sources independent of the reporting entity. Unobservable inputs reflect the reporting entity’s own assumptions about the assumptions market participants would use in pricing the asset or liability. Unobservable inputs are based on the best information available in the circumstances. The following is a summary of the three-tiered hierarchy of valuation input levels.
| | |
| Level 1 – | | Inputs are unadjusted and prices are determined using quoted prices in active markets for identical securities. |
| Level 2 – | | Prices are determined using other significant observable inputs (including quoted prices for similar securities, interest rates, prepayment speeds, credit risk, etc.). |
| Level 3 – | | Prices are determined using significant unobservable inputs (including management’s assumptions in determining the fair value of investments). |
Notes to Financial Statements (Unaudited) (continued)
Prices of fixed-income securities are provided by an independent pricing service (“pricing service”) approved by the Board. The pricing service establishes a security’s fair value using methods that may include consideration of the following: yields or prices of investments of comparable quality, type of issue, coupon, maturity and rating, market quotes or indications of value from security dealers, evaluations of anticipated cash flows or collateral, general market conditions and other information and analysis, including the obligor’s credit characteristics considered relevant. These securities are generally classified as Level 2. In pricing certain securities, particularly less liquid and lower quality securities, the pricing service may consider information about a security, its issuer or market activity provided by the Adviser. These securities are generally classified as Level 2 or Level 3 depending on the observability of the significant inputs.
Like most fixed-income securities, the senior and subordinated loans in which the Fund invests are not listed on an organized exchange. The secondary market of such investments may be less liquid relative to markets for other fixed-income securities. Consequently, the value of senior and subordinated loans, determined as described above, may differ significantly from the value that would have been determined had there been an active market for that senior loan. These securities are generally classified as Level 2.
Investments in investment companies are valued at their respective NAVs on valuation date and are generally classified as Level 1.
Certain securities may not be able to be priced by the pre-established pricing methods as described above. Such securities may be valued by the Board and/or its appointee at fair value. These securities generally include, but are not limited to, restricted securities (securities which may not be publicly sold without registration under the Securities Act of 1933, as amended) for which a pricing service is unable to provide a market price; securities whose trading has been formally suspended; debt securities that have gone into default and for which there is no current market quotation; a security whose market price is not available from a pre-established pricing source; a security with respect to which an event has occurred that is likely to materially affect the value of the security after the market has closed but before the calculation of the Fund’s NAV (as may be the case in non-U.S. markets on which the security is primarily traded) or make it difficult or impossible to obtain a reliable market quotation; and a security whose price, as provided by the pricing service, is not deemed to reflect the security’s fair value. As a general principle, the fair value of a security would appear to be the amount that the owner might reasonably expect to receive for it in a current sale. A variety of factors may be considered in determining the fair value of such securities, which may include consideration of the following: yields or prices of investments of comparable quality, type of issue, coupon, maturity and rating, market quotes or indications of value from security dealers, evaluations of anticipated cash flows or collateral, general market conditions and other information and analysis, including the obligor’s credit characteristics considered relevant. These securities are generally classified as Level 2 or Level 3 depending on the observability of the significant inputs. Regardless of the method employed to value a particular security, all valuations are subject to review by the Board and/or its appointee.
The inputs or methodologies used for valuing securities are not an indication of the risks associated with investing in those securities. The following is a summary of the Fund’s fair value measurements as of the end of the reporting period:
| | | | | | | | | | | | | | | | |
| | | Level 1 | | | Level 2 | | | Level 3 | | | Total | |
Long-Term Investments*: | | | | | | | | | | | | | | | | |
Variable Rate Senior Loan Interests | | $ | — | | | $ | 83,454,162 | | | $ | — | | | $ | 83,454,162 | |
Corporate Bonds | | | — | | | | 273,762,291 | | | | — | | | | 273,762,291 | |
| | | | |
Short-Term Investments: | | | | | | | | | | | | | | | | |
Investment Companies | | | 17,911,827 | | | | — | | | | — | | | | 17,911,827 | |
Total | | $ | 17,911,827 | | | $ | 357,216,453 | | | $ | — | | | $ | 375,128,280 | |
| * | Refer to the Fund’s Portfolio of Investments for industry classifications. |
The Board is responsible for the valuation process and has appointed the oversight of the daily valuation process to the Adviser’s Valuation Committee. The Valuation Committee, pursuant to the valuation policies and procedures adopted by the Board, is responsible for making fair value determinations, evaluating the effectiveness of the Fund’s pricing policies and reporting to the Board. The Valuation Committee is aided in its efforts by the Adviser’s dedicated Securities Valuation Team, which is responsible for administering the daily valuation process and applying fair value methodologies as approved by the Valuation Committee. When determining the reliability of independent pricing services for investments owned by the Fund, the Valuation Committee, among other things, conducts due diligence reviews of the pricing services and monitors the quality of security prices received through various testing reports conducted by the Securities Valuation Team.
The Valuation Committee will consider pricing methodologies it deems relevant and appropriate when making a fair value determination, based on the facts and circumstances specific to the portfolio instrument. Fair value determinations generally will be derived as follows, using public or private market information:
| | (i) | If available, fair value determinations shall be derived by extrapolating from recent transactions or quoted prices for identical or comparable securities. |
| | (ii) | If such information is not available, an analytical valuation methodology may be used based on other available information including, but not limited to: analyst appraisals, research reports, corporate action information, issuer financial statements and shelf registration statements. Such analytical valuation methodologies may include, but are not limited to: multiple of earnings, discount from market value of a similar freely-traded security, discounted cash flow analysis, book value or a multiple thereof, risk premium/yield analysis, yield to maturity and/or fundamental investment analysis. |
The purchase price of a portfolio instrument will be used to fair value the instrument only if no other valuation methodology is available or deemed appropriate, and it is determined that the purchase price fairly reflects the instrument’s current value.
For each portfolio security that has been fair valued pursuant to the policies adopted by the Board, the fair value price is compared against the last available and next available market quotations. The Valuation Committee reviews the results of such testing and fair valuation occurrences are reported to the Board.
3. Portfolio Securities and Investments in Derivatives
Portfolio Securities
Zero Coupon Securities
A zero coupon security does not pay a regular interest coupon to its holders during the life of the security. Income to the holder of the security comes from accretion of the difference between the original purchase price of the security at issuance and the par value of the security at maturity and is effectively paid at maturity. The market prices of zero coupon securities generally are more volatile than the market prices of securities that pay interest periodically.
Investments in Derivatives
The Fund is authorized to invest in certain derivative instruments, such as futures, options and swap contracts. The Fund limits its investments in futures, options on futures and swap contracts to the extent necessary for the Adviser to claim the exclusion from registration by the Commodity Futures Trading Commission as a commodity pool operator with respect to the Fund. The Fund records derivative instruments at fair value, with changes in fair value recognized on the Statement of Operations, when applicable. Even though the Fund’s investments in derivatives may represent economic hedges, they are not considered to be hedge transactions for financial reporting purposes.
Although the Fund is authorized to invest in derivative instruments, and may do so in the future, it did not make any such investments during the current fiscal period.
Market and Counterparty Credit Risk
In the normal course of business the Fund may invest in financial instruments and enter into financial transactions where risk of potential loss exists due to changes in the market (market risk) or failure of the other party to the transaction to perform (counterparty credit risk). The potential loss could exceed the value of the financial assets recorded on the financial statements. Financial assets, which potentially expose the Fund to counterparty credit risk, consist principally of cash due from counterparties on forward, option and swap transactions, when applicable. The extent of the Fund’s exposure to counterparty credit risk in respect to these financial assets approximates their carrying value as recorded on the Statement of Assets and Liabilities.
The Fund helps manage counterparty credit risk by entering into agreements only with counterparties the Adviser believes have the financial resources to honor their obligations and by having the Adviser monitor the financial stability of the counterparties. Additionally, counterparties may be required to pledge collateral daily (based on the daily valuation of the financial asset) on behalf of the Fund with a value approximately equal to the amount of any unrealized gain above a pre-determined threshold. Reciprocally, when the Fund has an unrealized loss, the Fund has instructed the custodian to pledge assets of the Fund as collateral with a value approximately equal to the amount of the unrealized loss above a pre-determined threshold. Collateral pledges are monitored and subsequently adjusted if and when the valuations fluctuate, either up or down, by at least the pre-determined threshold amount.
4. Fund Shares
Share Transactions
Transactions in shares during the Funds’ current fiscal period were as follows:
| | | | |
| | | For the Period 3/28/17
(commencement of operations)
through 6/30/17 | |
Shares:* | | | | |
Sold | | | 27,670,000 | |
Issued to shareholders due to reinvestment of distributions | | | 685 | |
Total | | | 27,670,685 | |
| * | Prior to the commencement of operations, the Adviser purchased 10,160 shares, which are still held as of the end of the reporting period. |
Notes to Financial Statements (Unaudited) (continued)
5. Investment Transactions
Long-term purchases and sales (including maturities) during the current fiscal period aggregated $410,107,314 and $53,231,786, respectively.
6. Income Tax Information
The Fund intends to distribute substantially all of its net investment company taxable income to shareholders and to otherwise comply with the requirements of Subchapter M of the Internal Revenue Code applicable to regulated investment companies. In any year when the Fund realizes net capital gains, the Fund may choose to distribute all or a portion of its net capital gains to shareholders, or alternatively, to retain all or a portion of its net capital gains and pay federal corporate income taxes on such retained gains.
For all open tax years and all major taxing jurisdictions, management of the Fund has concluded that there are no significant uncertain tax positions that would require recognition in the financial statements. Open tax years are those that are open for examination by taxing authorities (i.e., generally the last four tax year ends and the interim tax period since then). Furthermore, management of the Fund is also not aware of any tax positions for which it is reasonably possible that the total amounts of unrecognized tax benefits will significantly change in the next twelve months.
The following information is determined in accordance with income tax regulations, which may differ from U.S. GAAP.
As of June 30, 2017, the cost and unrealized appreciation (depreciation) of investments, as determined on a federal income tax basis, were as follows:
| | | | |
Cost of investments | | $ | 374,666,481 | |
Gross unrealized: | | | | |
Appreciation | | $ | 2,912,285 | |
Depreciation | | | (2,450,486 | ) |
Net unrealized appreciation (depreciation) of investments | | $ | 461,799 | |
7. Management Fees
Management Fees
The Fund’s management fee compensates the Adviser for overall investment advisory and administrative services and general office facilities. The Sub-Adviser is compensated for its services to the Fund from the management fees paid to the Adviser.
The Fund’s management fee consists of two components – a fund-level fee, based only on the amount of assets within the Fund, and a complex-level fee, based on the aggregate amount of all eligible fund assets managed by the Adviser. This pricing structure enables Fund shareholders to benefit from growth in the assets within the Fund as well as from growth in the amount of complex-wide assets managed by the Adviser.
The annual Fund-level fee, payable monthly, is calculated according to the following schedule:
| | | | |
| Average Daily Managed Assets* | | Fund-Level Fee | |
For the first $500 million | | | 0.5000 | % |
For the next $250 million | | | 0.4875 | |
For managed assets over $750 million | | | 0.4750 | |
The annual complex-level fee, payable monthly, is calculated by multiplying the current complex-wide fee rate, determined according to the following schedule by the Fund’s daily managed assets:
| | | | |
| Complex-Level Managed Asset Breakpoint Level* | | Effective Rate at Breakpoint Level | |
$55 billion | | | 0.2000 | % |
$56 billion | | | 0.1996 | |
$57 billion | | | 0.1989 | |
$60 billion | | | 0.1961 | |
$63 billion | | | 0.1931 | |
$66 billion | | | 0.1900 | |
$71 billion | | | 0.1851 | |
$76 billion | | | 0.1806 | |
$80 billion | | | 0.1773 | |
$91 billion | | | 0.1691 | |
$125 billion | | | 0.1599 | |
$200 billion | | | 0.1505 | |
$250 billion | | | 0.1469 | |
$300 billion | | | 0.1445 | |
| * | For the complex-level fees, managed assets include closed-end fund assets managed by the Adviser that are attributable to certain types of leverage. For these purposes, leverage includes the funds’ use of preferred stock and borrowings and certain investments in the residual interest certificates (also called inverse floating rate securities) in tender option bond (TOB) trusts, including the portion of assets held by a TOB trust that has been effectively financed by the trust’s issuance of floating rate securities, subject to an agreement by the Adviser as to certain funds to limit the amount of such assets for determining managed assets in certain circumstances. The complex-level fee is calculated based upon the aggregate daily managed assets of all Nuveen funds that constitute “eligible assets.” Eligible assets do not include assets attributable to investments in other Nuveen funds or assets in excess of a determined amount (originally $2 billion) added to the Nuveen fund complex in connection with the Adviser’s assumption of the management of the former First American Funds effective January 1, 2011. As of June 30, 2017, the complex-level fee for the Fund was 0.1606%. |
8. Senior Loan Commitments
Unfunded Commitments
Pursuant to the terms of certain of the variable rate senior loan agreements, the Fund may have unfunded senior loan commitments. The Fund will maintain with its custodian, cash, liquid securities and/or liquid senior loans having an aggregate value at least equal to the amount of unfunded senior loan commitments. As of the end of the reporting period, the Fund had no such unfunded senior loan commitments.
Participation Commitments
With respect to the senior loans held in the Fund’s portfolio, the Fund may: 1) invest in assignments; 2) act as a participant in primary lending syndicates; or 3) invest in participations. If the Fund purchases a participation of a senior loan interest, the Fund would typically enter into a contractual agreement with the lender or other third party selling the participation, rather than directly with the borrower. As such, the Fund not only assumes the credit risk of the borrower, but also that of the selling participant or other persons interpositioned between the Fund and the borrower. As of the end of the reporting period, the Fund had no such outstanding participation commitments.
9. Borrowing Arrangements
Borrowings
During the current fiscal period, the Fund entered into 364-day $95,000,000 (maximum commitment amount) Revolving Line of Credit (the “Borrowings”) with a bank as a means of leverage. As of the end of the reporting period, the outstanding balance on these Borrowings was $91,400,000.
Interest is charged on the Borrowings at 1-Month LIBOR (London Inter-Bank Offered Rate) plus 0.80% per annum on the amount borrowed. In addition to interest, the Fund also accrues a 0.25% per annum commitment fee on the undrawn balance if the undrawn portion of the Borrowings on a particular day is more than 25% of the maximum commitment amount. During the current fiscal period, the average daily balance outstanding and average annual interest rate on these Borrowings were $89,392,593 and 1.87%, respectively.
In order to maintain these Borrowings, the Fund must meet certain collateral, asset coverage and other requirements. Borrowings outstanding are fully secured by assets held in the Fund’s portfolio of investments.
Borrowings outstanding are recognized as “Borrowings” on the Statement of Assets and Liabilities. Interest expense incurred on the drawn amount and undrawn balance are recognized as a component of “Interest expense on borrowings” on the Statement of Operations.
Notes to Financial Statements (Unaudited) (continued)
Inter-Fund Borrowing and Lending
The Securities Exchange Commission (“SEC”) has granted an exemptive order permitting registered open-end and closed-end Nuveen funds to participate in an inter-fund lending facility whereby the Nuveen funds may directly lend to and borrow money from each other for temporary purposes (e.g., to satisfy redemption requests or when a sale of securities “fails,” resulting in an unanticipated cash shortfall) (the “Inter-Fund Program”). The closed-end Nuveen funds, including the Fund covered by this shareholder report, will participate only as lenders, and not as borrowers, in the Inter-Fund Program because such closed-end funds rarely, if ever, need to borrow cash to meet redemptions. The Inter-Fund Program is subject to a number of conditions, including, among other things, the requirements that (1) no fund may borrow or lend money through the Inter-Fund Program unless it receives a more favorable interest rate than is typically available from a bank or other financial institution for a comparable transaction; (2) no fund may borrow on an unsecured basis through the Inter-Fund Program unless the fund’s outstanding borrowings from all sources immediately after the inter-fund borrowing total 10% or less of its total assets; provided that if the borrowing fund has a secured borrowing outstanding from any other lender, including but not limited to another fund, the inter-fund loan must be secured on at least an equal priority basis with at least an equivalent percentage of collateral to loan value; (3) if a fund’s total outstanding borrowings immediately after an inter-fund borrowing would be greater than 10% of its total assets, the fund may borrow through the inter-fund loan on a secured basis only; (4) no fund may lend money if the loan would cause its aggregate outstanding loans through the Inter-Fund Program to exceed 15% of its net assets at the time of the loan; (5) a fund’s inter-fund loans to any one fund shall not exceed 5% of the lending fund’s net assets; (6) the duration of inter-fund loans will be limited to the time required to receive payment for securities sold, but in no event more than seven days; and (7) each interfund loan may be called on one business day’s notice by a lending fund and may be repaid on any day by a borrowing fund. In addition, a Nuveen fund may participate in the Inter-Fund Program only if and to the extent that such participation is consistent with the fund’s investment objective and investment policies. The Board is responsible for overseeing the Inter-Fund Program.
The limitations detailed above and the other conditions of the SEC exemptive order permitting the Inter-Fund Program are designed to minimize the risks associated with Inter-Fund Program for both the lending fund and the borrowing fund. However, no borrowing or lending activity is without risk. When a fund borrows money from another fund, there is a risk that the loan could be called on one day’s notice or not renewed, in which case the fund may have to borrow from a bank at a higher rate or take other actions to payoff such loan if an inter-fund loan is not available from another fund. Any delay in repayment to a lending fund could result in a lost investment opportunity or additional borrowing costs.
During May 2017, the Board approved the Nuveen funds participation in the Inter-Fund Program. During the current reporting period, the Fund did not enter into any inter-fund loan activity.
10. New Accounting Pronouncements
Amendments to Regulation S-X
In October 2016, the Securities and Exchange Commission (“SEC”) adopted new rules and amended existing rules (together, the “final rules”) intended to modernize the reporting and disclosure of information by registered investment companies. In part, the final rules amend Regulation S-X and require standardized, enhanced disclosure about derivatives in investment company financial statements, as well as other amendments. The compliance date of the amendments to Regulation S-X is August 1, 2017. Management is still evaluating the impact of the final rules, if any.
Accounting Standards Update (“ASU”) 2017-08 (“ASU 2017-08”) Premium Amortization on Purchased Callable Debt Securities
During March 2017, the Financial Accounting Standards Board (“FASB”) issued ASU 2017-08, which shortens the premium amortization period for purchased non-contingently callable debt securities. ASU 2017-08 specifies that the premium amortization period ends at the earliest call date, for purchased non-contingently callable debt securities. ASU 2017-08 is effective for fiscal years, and interim periods within those fiscal years, beginning after December 15, 2018. Management is currently evaluating the implications of ASU 2017-08, if any.
Additional
Fund Information
| | | | | | | | | | |
| Board of Trustees | | | | | | | | | | |
Margo Cook* | | Jack B. Evans | | William C. Hunter | | David J. Kundert | | Albin F. Moschner | | John K. Nelson |
| William J. Schneider | | Judith M. Stockdale | | Carole E. Stone | | Terence J. Toth | | Margaret L. Wolff | | Robert L. Young** |
| * | Interested Board Member. |
| ** | Effective July 1, 2017. |
| | | | | | | | |
| | | | | |
Fund Manager Nuveen Fund Advisors, LLC 333 West Wacker Drive Chicago, IL 60606 | | Custodian State Street Bank
& Trust Company One Lincoln Street Boston, MA 02111 | | Legal Counsel Chapman and Cutler LLP Chicago, IL 60603 | | Independent Registered
Public Accounting Firm KPMG LLP 200 East Randolph Drive Chicago, IL 60601 | | Transfer Agent and
Shareholder Services Computershare Trust Company, N.A. 250 Royal 1 Street Lanton, MA 02021 (800) 257-8787 |
Quarterly Form N-Q Portfolio of Investments Information
The Fund is required to file its complete schedule of portfolio holdings with the Securities and Exchange Commission (SEC) for the first and third quarters of each fiscal year on Form N-Q. You may obtain this information directly from the SEC. Visit the SEC on-line at http://www.sec.gov or in person at the SEC’s Public Reference Room in Washington, D.C. Call the SEC toll-free at (800) SEC-0330 for room hours and operation.
Nuveen Funds’ Proxy Voting Information
You may obtain (i) information regarding how each fund voted proxies relating to portfolio securities held during the most recent twelve-month period ended June 30, without charge, upon request, by calling Nuveen toll-free at (800) 257-8787 or on Nuveen’s website at www.nuveen.com and (ii) a description of the policies and procedures that each fund used to determine how to vote proxies relating to portfolio securities without charge, upon request, by calling Nuveen toll free at (800) 257-8787. You may also obtain this information directly from the SEC. Visit the SEC on-line at http://www.sec.gov.
CEO Certification Disclosure
The Fund’s Chief Executive Officer (CEO) has submitted to the New York Stock Exchange (NYSE) the annual CEO certification as required by Section 303A.12(a) of the NYSE Listed Company Manual. The Fund has filed with the SEC the certification of its CEO and Chief Financial Officer required by Section 302 of the Sarbanes-Oxley Act.
Share Repurchases
The Fund intends to repurchase, through its open-market share repurchase program, shares of its own common stock at such times and in such amounts as is deemed advisable. During the period covered by this report, the Fund repurchased shares of its common stock, as shown in the accompanying table. Any future repurchases will be reported to shareholders in the next annual or semi-annual report.
FINRA BrokerCheck
The Financial Industry Regulatory Authority (FINRA) provides information regarding the disciplinary history of FINRA member firms and associated investment professionals. This information as well as an investor brochure describing FINRA BrokerCheck is available to the public by calling the FINRA BrokerCheck Hotline number at (800) 289-9999 or by visiting www.FINRA.org.
Glossary of Terms
Used in this Report
| ∎ | | Average Annual Total Return: This is a commonly used method to express an investment’s performance over a particular, usually multi-year time period. It expresses the return that would have been necessary each year to equal the investment’s actual cumulative performance (including change in NAV or market price and reinvested dividends and capital gains distributions, if any) over the time period being considered. |
| ∎ | | Bloomberg Barclays U.S. High Yield 1-5 Year Cash Pay 2% Issuer Capped Index: An index that tracks the performance of U.S. non-investment grade bonds with maturities of one to 4.99 years and limits each issue to 2% of the index. Benchmark returns assume reinvestment of distributions, but do not reflect any applicable sales charges or management fees. |
| ∎ | | Duration: Duration is a measure of the expected period over which a bond’s principal and interest will be paid, and consequently is a measure of the sensitivity of a bond’s or bond fund’s value to changes when market interest rates change. Generally, the longer a bond’s or fund’s duration, the more the price of the bond or fund will change as interest rates change. |
| ∎ | | Effective Leverage: Effective leverage is a fund’s effective economic leverage, and includes both regulatory leverage (see below) and the leverage effects of certain derivative investments in the fund’s portfolio that increase the fund’s investment exposure. |
| ∎ | | Leverage: Leverage is created whenever a fund has investment exposure (both reward and/or risk) equivalent to more than 100% of the investment capital. |
| ∎ | | Net Asset Value (NAV) Per Share: A fund’s Net Assets is equal to its total assets (securities, cash, accrued earnings and receivables) less its total liabilities. NAV per share is equal to the fund’s Net Assets divided by its number of shares outstanding. |
| ∎ | | Regulatory Leverage: Regulatory leverage consists of preferred shares issued by or borrowings of a fund. Both of these are part of a fund’s capital structure. Regulatory leverage is subject to asset coverage limits set in the Investment Company Act of 1940. |
Reinvest Automatically,
Easily and Conveniently
Nuveen makes reinvesting easy. A phone call is all it takes to set up your reinvestment account.
Nuveen Closed-End Funds Automatic Reinvestment Plan
Your Nuveen Closed-End Fund allows you to conveniently reinvest distributions in additional Fund shares.
By choosing to reinvest, you’ll be able to invest money regularly and automatically, and watch your investment grow through the power of compounding. Just like distributions in cash, there may be times when income or capital gains taxes may be payable on distributions that are reinvested.
It is important to note that an automatic reinvestment plan does not ensure a profit, nor does it protect you against loss in a declining market.
Easy and convenient
To make recordkeeping easy and convenient, each quarter you’ll receive a statement showing your total distributions, the date of investment, the shares acquired and the price per share, and the total number of shares you own.
How shares are purchased
The shares you acquire by reinvesting will either be purchased on the open market or newly issued by the Fund. If the shares are trading at or above net asset value at the time of valuation, the Fund will issue new shares at the greater of the net asset value or 95% of the then-current market price. If the shares are trading at less than net asset value, shares for your account will be purchased on the open market. If the Plan Agent begins purchasing Fund shares on the open market while shares are trading below net asset value, but the Fund’s shares subsequently trade at or above their net asset value before the Plan Agent is able to complete its purchases, the Plan Agent may cease open-market purchases and may invest the uninvested portion of the distribution in newly-issued Fund shares at a price equal to the greater of the shares’ net asset value or 95% of the shares’ market value on the last business day immediately prior to the purchase date. Distributions received to purchase shares in the open market will normally be invested shortly after the distribution payment date. No interest will be paid on distributions awaiting reinvestment. Because the market price of the shares may increase before purchases are completed, the average purchase price per share may exceed the market price at the time of valuation, resulting in the acquisition of fewer shares than if the distribution had been paid in shares issued by the Fund. A pro rata portion of any applicable brokerage commissions on open market purchases will be paid by Plan participants. These commissions usually will be lower than those charged on individual transactions.
Flexible
You may change your distribution option or withdraw from the Plan at any time, should your needs or situation change.
You can reinvest whether your shares are registered in your name, or in the name of a brokerage firm, bank, or other nominee. Ask your investment advisor if his or her firm will participate on your behalf. Participants whose shares are registered in the name of one firm may not be able to transfer the shares to another firm and continue to participate in the Plan.
The Fund reserves the right to amend or terminate the Plan at any time. Although the Fund reserves the right to amend the Plan to include a service charge payable by the participants, there is no direct service charge to participants in the Plan at this time.
Call today to start reinvesting distributions
For more information on the Nuveen Automatic Reinvestment Plan or to enroll in or withdraw from the Plan, speak with your financial advisor or call us at (800) 257-8787.
Annual Investment
Management Agreement Approval Process
At a meeting held on February 23, 2017 (the “Meeting”), the Board of Trustees (the “Board,” and each Trustee, a “Board Member”) of the Fund, including the Independent Board Members (as defined below), considered and approved the investment management agreement (the “Investment Management Agreement”) between the Fund and Nuveen Fund Advisors, LLC (the “Adviser”), and the investment sub-advisory agreement (the “Sub-Advisory Agreement”) between the Adviser and Symphony Asset Management LLC (the “Sub-Adviser”). The Adviser and the Sub-Adviser are each hereafter a “Fund Adviser.” The Investment Management Agreement and the Sub-Advisory Agreement are each hereafter an “Advisory Agreement” and collectively, the “Advisory Agreements.” The Board Members who are not parties to the Fund’s Investment Management Agreement or Sub-Advisory Agreement or “interested persons” of any such parties are hereafter the “Independent Board Members.”
To assist the Board in its evaluation of an Advisory Agreement with a Fund Adviser at the Meeting, the Independent Board Members had received, in adequate time in advance of the Meeting or at prior meetings, materials which outlined, among other things:
| | • | | the nature, extent and quality of the services expected to be provided by the Fund Adviser; |
| | • | | the organization of the Fund Adviser, including the responsibilities of various departments and key personnel; |
| | • | | the expertise and background of the Fund Adviser with respect to the Fund’s investment strategy; |
| | • | | certain performance-related information (as described below); |
| | • | | the profitability of Nuveen and its affiliates for their advisory activities; |
| | • | | the proposed management fees of the Fund Adviser, including comparisons of such fees with the management fees of comparable funds; |
| | • | | the expected expenses of the Fund, including comparisons of the Fund’s expected expense ratio with the expense ratios of comparable funds; and |
| | • | | the soft dollar practices of the Fund Adviser, if any. |
At the Meeting and/or prior meetings, the Adviser made presentations to and responded to questions from the Board. During the Meeting and/or prior meetings, the Independent Board Members also met privately with their legal counsel to, among other things, review the Board’s duties under the Investment Company Act of 1940 (the “1940 Act”), the general principles of state law in reviewing and approving advisory contracts, the standards used by courts in determining whether investment company boards of directors have fulfilled their duties, factors to be considered in voting on advisory contracts and an adviser’s fiduciary duty with respect to advisory agreements and compensation. It is with this background that the Independent Board Members considered the Advisory Agreements. As outlined in more detail below, the Independent Board Members considered all factors they believed relevant with respect to the Fund, including, among other things: (a) the nature, extent and quality of the services expected to be provided by the Fund Advisers; (b) investment performance, as described below; (c) the advisory fees and costs of the services expected to be provided to the Fund and the profitability of the Fund Advisers; (d) the extent of any anticipated economies of scale; (e) any benefits expected to be derived by the Fund Advisers from their relationships with the Fund; and (f) other factors. Each Board Member may have accorded different weight to the various factors in reaching his or her conclusions with respect to the Fund’s Advisory Agreements.
| A. | | Nature, Extent and Quality of Services |
The Independent Board Members considered the nature, extent and quality of the respective Fund Adviser’s services, including portfolio management services and administrative services. Given that the Adviser and the Sub-Adviser already serve as adviser and sub-adviser, respectively, to other Nuveen funds overseen by the Board Members, the Board has a good understanding of each such Fund Adviser’s organization, operations, personnel and services. As the Independent Board Members meet regularly throughout the year to oversee the Nuveen funds, including funds currently advised by the Fund
Advisers, the Independent Board Members have relied upon their knowledge from their meetings and any other interactions throughout the year with the respective Fund Adviser in evaluating the Advisory Agreements.
At the Meeting and/or at prior meetings, the Independent Board Members reviewed materials outlining, among other things, the respective Fund Adviser’s organization and business; the types of services that such Fund Adviser or its affiliates provide to the Nuveen funds (as applicable) and are expected to provide to the Fund; and the experience of the respective Fund Adviser with applicable investment strategies. Further, at the Meeting and/or at prior meetings, the Independent Board Members have evaluated the background and experience of the relevant investment personnel.
With respect to services, the Board noted that the Fund would be a registered investment company that would operate in a regulated industry. In considering the services that were expected to be provided by the Fund Advisers, the Board recognized that the Adviser provides a comprehensive set of services to manage and operate the Nuveen funds, including: (a) product management (such as setting dividends; positioning the product in the marketplace; maintaining and enhancing shareholder communications; and reporting to the Board); (b) investment services (such as overseeing sub-advisers and other service providers; analyzing investment performance and risks; overseeing risk management and disclosure; developing and interpreting investment policies; assisting in the development of products; helping to prepare financial statements and marketing disclosures; and overseeing trade execution); (c) fund administration (such as helping to prepare fund tax returns and complete other tax compliance matters; and helping to prepare regulatory filings and shareholder reports); (d) fund Board administration (such as preparing Board materials and organizing and providing assistance for Board meetings); (e) compliance (such as helping to devise and maintain the Nuveen funds’ compliance program and related testing); (f) legal support (such as helping to prepare registration statements and proxy statements; interpreting regulations and policies; and overseeing fund activities); and (g) with respect to certain closed-end funds, providing leverage management.
In addition, the Independent Board Members have considered the quality and breadth of Nuveen’s investment relations program through which Nuveen seeks to build awareness of, and educate investors and financial advisers with respect to, Nuveen closed-end funds which may help to build an active secondary market for the closed-end fund product line.
The Independent Board Members noted that the Adviser would oversee the Sub-Adviser, which was expected to primarily provide the portfolio advisory services to the Fund. In addition, the Board Members recognized the Sub-Adviser’s relevant experience and expertise.
Based on their review, the Independent Board Members found that, overall, the nature, extent and quality of services expected to be provided to the Fund under each Advisory Agreement were satisfactory.
| B. | | Investment Performance |
The Fund was new and, therefore, did not have its own performance history. The Independent Board Members, however, were familiar with the performance records of other Nuveen funds advised by the Adviser and sub-advised by the Sub-Adviser, including the Nuveen Symphony Credit Opportunities Fund (the “Credit Opportunities Fund”), a Nuveen open-end fund with strategies similar to those of the contemplated Fund that was launched in 2010. In this regard, the Independent Board Members reviewed certain performance information relating to the Credit Opportunities Fund for various time periods (i.e., 3 months, 6 months, year-to-date, one year, two years, three years and since inception) as of January 31, 2017.
| C. | | Fees, Expenses and Profitability |
In evaluating the management fees and expenses that the Fund was expected to bear, the Independent Board Members considered, among other things, the Fund’s proposed management fee structure, the rationale for its proposed fee levels, and its expected expense ratio in absolute terms as well as compared with the fees and expense ratios of comparable funds. Accordingly, the Independent Board Members reviewed, among other things, the proposed advisory fee and estimated net total expense ratio for the Fund (based on both common assets and total managed assets), as well as comparative fee and expense data pertaining to the Fund’s peers in the Lipper category in which the Fund is expected to be classified. In considering the Fund’s advisory fees, the Board noted the differences between the Fund’s investment strategies and those of
Annual Investment Management Agreement Approval Process (continued)
the Credit Opportunities Fund. Further, the Independent Board Members considered the proposed sub-advisory fee rate for the Fund and noted that the proposed management fee structure for the Fund was in-line with certain other Nuveen closed-end target term funds.
The Independent Board Members recognized that assets attributable to the Fund’s use of leverage would be included in the amount of assets upon which the advisory fee is calculated. In this regard, the Independent Board Members noted that the advisory fee is based on a percentage of average daily “Managed Assets.” “Managed Assets” generally means the total assets of the Fund, minus the sum of its accrued liabilities (other than Fund liabilities incurred for the express purpose of creating leverage). “Total assets” for this purpose includes assets attributable to the Fund’s use of leverage. The Independent Board Members recognized that the fact that a decision to employ or increase the Fund’s leverage will have the effect, all other things being equal, of increasing Managed Assets (and therefore increasing the Adviser’s and the Sub-Adviser’s fees), means that the Adviser may have a conflict of interest in determining whether to use or increase leverage. The Independent Board Members noted, however, that the Adviser would seek to manage that potential conflict by recommending to the Board to leverage the Fund (or increase such leverage) when it determines that such action would be in the best interests of the Fund, and by periodically reviewing the Fund’s performance and use of leverage with the Board.
The Independent Board Members considered the proposed management fee rate as a percentage of Managed Assets before any fund-level and complex-wide breakpoints. In addition, the Independent Board Members considered that the Fund would have a fund-level breakpoint schedule as well as the complex-wide breakpoint schedule (described in further detail below). Based on their review of the fee and expense information provided, the Independent Board Members determined that the Fund’s management fees (as applicable) to a Fund Adviser were reasonable in light of the nature, extent and quality of services to be provided to the Fund.
| | 2. | | Comparisons with the Fees of Other Clients |
At the Meeting and/or at prior meetings, the Board considered information regarding the fees that the Fund Advisers assess to the Nuveen funds compared to those of other clients, as described in further detail below. With respect to non-municipal funds, such other clients of the Adviser and/or its affiliated sub-advisers may include: separately managed accounts (such as retail, institutional or wrap accounts), hedge funds, other investment companies that are not offered by Nuveen but are sub-advised by one of Nuveen’s affiliated sub-advisers, foreign investment companies offered by Nuveen, and collective investment trusts.
The Board recognized that the Fund would have an affiliated sub-adviser. With respect to affiliated sub-advisers the Board has previously reviewed, among other things, the range of advisory fee rates and average fee rate assessed for the different types of clients. With respect to the Sub-Adviser, such other clients include equity and taxable fixed-income hedge funds and the Board has reviewed the average fee rate and range of fee rates along with the performance fee assessed such clients. The Board has also reviewed information regarding the different types of services expected to be provided to the Fund compared to those provided to other clients which typically do not require the same breadth of day-to-day services required for registered funds. Further, the Board has previously considered information regarding the differences in, among other things, investment policies, investor profiles, and account sizes between the Nuveen funds and the other types of clients. In addition, the Independent Board Members have also previously recognized that the management fee rates of the foreign funds advised by the Adviser may also vary due to, among other things, differences in the client base, governing bodies, operational complexities and services covered by the management fee. The Independent Board Members have recognized that the foregoing variations result in different economics among the product structures and culminate in varying management fees among the types of clients and funds.
The Board also was aware that, since the Fund would have a sub-adviser, its management fee reflected two components, the fee that would be retained by the Adviser for its services and the fee the Adviser would pay to the Sub-Adviser. The Board noted that many of the administrative services that the Adviser was expected to provide to support the Fund may not be required to the same extent or at all for the institutional clients or other clients. In general, the Board has noted that higher fee levels reflect higher levels of service provided by the Fund Adviser, increased investment management complexity, greater product management requirements and higher levels of business risk or some combination of the foregoing. Given the inherent differences in the various products, particularly the extensive services expected to be provided to the Fund, the Independent Board Members concluded such facts justify the different levels of fees.
| | 3. | | Profitability of Fund Advisers |
In conjunction with their review of fees at the Meeting and/or at prior meetings, the Independent Board Members have considered the profitability of Nuveen for its advisory activities on an absolute basis and in comparison to other investment advisers. At the Meeting and/or at prior meetings, the Independent Board Members have reviewed, among other things, Nuveen’s adjusted operating margins, the gross and net revenue margins (pre-tax and after-tax) for advisory activities for the Nuveen funds, and the revenues, expenses, and net income (pre-tax and after-tax) of Nuveen. The Independent Board Members have also reviewed an analysis of the key drivers behind the changes in revenues and expenses that impacted profitability. Additionally, the Independent Board Members noted that the sub-advisory fee for the Fund would be paid by the Adviser, however, the Board recognized that the Sub-Adviser is affiliated with Nuveen. At the Meeting and/or at prior meetings, the Independent Board Members have recognized that profitability data is rather subjective as various allocation methodologies may be reasonable to employ but yet yield different results. The Board has also reviewed the results of certain alternative methodologies. The Board has considered the allocation methodology employed to prepare the profitability data as well as a summary of the refinements to the methodology that had been adopted over the years which may limit some of the comparability of Nuveen’s revenue margins over time. Two Independent Board Members have also served as point persons for the Board to review and discuss the methodology employed to develop the profitability analysis and any proposed changes thereto and to keep the Board apprised of such changes.
At the Meeting and/or at prior meetings, the Board has also considered Nuveen’s adjusted operating margins compared to that of other comparable investment advisers (based on asset size and composition) with publicly available data. The Independent Board Members have recognized, however, the limitations of the comparative data as the other advisers may have a different business mix, employ different allocation methodologies, have different capital structure and costs, may not be representative of the industry or other factors that limit the comparability of the profitability information. Nevertheless, the Independent Board Members have noted that Nuveen’s adjusted operating margins appeared comparable to the adjusted margins of the peers.
Further, as the Adviser is a subsidiary of Nuveen, LLC, the investment management arm of Teachers Insurance and Annuity Association of America (“TIAA”), the Board has reviewed a balance sheet for TIAA reflecting its assets, liabilities and capital and contingency reserves to have a fuller understanding of the financial condition and strength of the TIAA complex, together with Nuveen.
Based on the information provided, the Independent Board Members have noted that the Adviser appeared to be sufficiently profitable to operate as a viable investment management firm and to honor its obligations as a sponsor of the Nuveen funds.
With respect to the Sub-Adviser, the Independent Board Members have also considered the profitability of the Sub-Adviser from its relationship with the Nuveen funds. The Independent Board Members have previously reviewed the Sub-Adviser’s revenues, expenses and revenue margins (pre- and post-tax) for its advisory activities.
In evaluating the reasonableness of the compensation, the Independent Board Members also considered other amounts expected to be paid to a Fund Adviser by the Fund as well as indirect benefits (such as soft dollar arrangements), if any, the Fund Adviser and its affiliates are expected to receive that would be directly attributable to the management of the Fund. See Section E below for additional information on indirect benefits a Fund Adviser may receive as a result of its relationship with the Fund.
Based on their review, the Independent Board Members have determined that the Adviser’s and the Sub-Adviser’s levels of profitability are reasonable in light of the respective services provided.
| D. | | Economies of Scale and Whether Fee Levels Reflect These Economies of Scale |
With respect to economies of scale, the Independent Board Members have recognized that, in general, as the assets of a particular fund or the Nuveen complex in the aggregate increase over time, economies of scale may be realized with respect to the management of the funds, although economies of scale are difficult to measure with precision. The Independent Board Members considered whether the Fund could be expected to benefit from any economies of scale. One method to help ensure that the shareholders share in these benefits is to include breakpoints in the management fee schedule. Subject to certain exceptions, the funds in the Nuveen complex pay a management fee to the Adviser which is generally comprised of a
Annual Investment Management Agreement Approval Process (continued)
fund-level component and a complex-level component. Generally, the fund level fee component declines as the assets of a particular fund grow. Accordingly, the Independent Board Members reviewed and considered the proposed management fee for the Fund, taking into account that there would be fund-level breakpoints. In this regard, however, given that the Fund is a closed-end fund, the Independent Board Members recognized that although closed-end funds (such as the Fund) may from time to time make additional share offerings, the growth of their assets will occur primarily through the appreciation of such funds’ investment portfolios.
In addition, at the Meeting and/or at prior meetings, the Board has also considered the Nuveen funds’ complex-wide fee arrangement. Pursuant to the complex-wide fee arrangement, generally, the complex-level fee component declines when eligible assets of the funds in the Nuveen complex combined grow. In evaluating the complex-wide fee arrangement, the Independent Board Members have considered that such arrangement was designed to capture economies of scale achieved when total fund complex assets increase, even if the assets of a particular fund are unchanged or have decreased. The approach reflects the notion that some of Nuveen’s costs are attributable to services provided to all its funds in the complex, and therefore all funds should benefit if these costs are spread over a larger asset base.
Further, the Board has noted that economies of scale may be shared through the Adviser’s investment in its business and, at the Meeting and/or at prior meetings, the Independent Board Members have recognized the Adviser’s ongoing investment in its business to expand or enhance the services provided to the Nuveen funds. In this regard, the Independent Board Members have noted, among other things, the additions to groups who play a key role in supporting the funds including in closed-end funds/structured products, fund administration, operations, fund governance, investment services, compliance, product management, and technology. The Independent Board Members have also recognized the investments in systems necessary to manage the funds including in areas of risk oversight, information technology and compliance.
Based on their review, the Independent Board Members concluded that the proposed fee structure was acceptable and reflected economies of scale to be shared with the Fund’s shareholders when assets under management increase.
In evaluating fees, the Independent Board Members considered information received at the Meeting and/or at prior meetings regarding other additional benefits that a Fund Adviser or its affiliates may receive as a result of their relationship with the Fund, including compensation paid to affiliates and research received in connection with brokerage transactions (i.e., soft dollar arrangements). In this regard, with respect to closed-end funds, the Independent Board Members recognized that affiliates of the Adviser may receive revenues for serving as co-manager in an initial public offering of new closed-end funds as well as revenues received in connection with secondary offerings.
In addition to the above, the Independent Board Members considered that the Fund’s portfolio transactions will be allocated by the Sub-Adviser and the Sub-Adviser may benefit from research received through soft dollar arrangements. The Board has noted, however, that with respect to transactions in fixed income securities, such securities generally trade on a principal basis and do not generate soft dollar credits. Although the Board recognized that the Sub-Adviser may benefit from a soft dollar arrangement if it does not have to pay for this research out of its own assets, the Board also recognized that any such research may benefit the Fund to the extent it enhances the ability of the Sub-Adviser to manage the Fund.
Based on their review, the Independent Board Members concluded that any indirect benefits expected to be received by a Fund Adviser as a result of its relationship with the Fund were reasonable and within acceptable parameters.
The Independent Board Members did not identify any single factor discussed previously as all-important or controlling. The Board Members, including a majority of the Independent Board Members, concluded that the terms of the Investment Management Agreement and the Sub-Advisory Agreement were fair and reasonable, that the respective Fund Adviser’s fees were reasonable in light of the services to be provided to the Fund and that the Investment Management Agreement and Sub-Advisory Agreement should be and were approved on behalf of the Fund.
Notes
Notes
Notes
| | | | | | | | | | | | | | |
| | | | | | | | |
| | | | |
| | | | | | | | |
| | | | | | | | |
| | |
| | Nuveen: | | |
| | | | Serving Investors for Generations | | |
| | |
| | | | |
| | | | Since 1898, financial advisors and their clients have relied on Nuveen to provide dependable investment solutions through continued adherence to proven, long-term investing principles. Today, we offer a range of high quality solutions designed to be integral components of a well-diversified core portfolio. | | |
| | | |
| | | | | | |
| | | | | | Focused on meeting investor needs. Nuveen is the investment management arm of TIAA. We have grown into one of world’s premier global asset managers, with specialist knowledge across all major asset classes and particular strength in solutions that provide income for investors and that draw on our expertise in alternatives and responsible investing. Nuveen is driven not only by the independent investment processes across the firm, but also the insights, risk management, analytics and other tools and resources that a truly world-class platform provides. As a global asset manager, our mission is to work in partnership with our clients to create solutions which help them secure their financial future. | | |
| | | | |
| | | | | | | | |
| | | | | | Find out how we can help you. To learn more about how the products and services of Nuveen may be able to help you meet your financial goals, talk to your financial advisor, or call us at (800) 257-8787. Please read the information provided carefully before you invest. Investors should consider the investment objective and policies, risk considerations, charges and expenses of any investment carefully. Where applicable, be sure to obtain a prospectus, which contains this and other relevant information. To obtain a prospectus, please contact your securities representative or Nuveen, 333 W. Wacker Dr., Chicago, IL 60606. Please read the prospectus carefully before you invest or send money. Learn more about Nuveen Funds at: www.nuveen.com/cef | | |
| | | | | | |
| | | | | | | | | | | | |
| | Securities offered through Nuveen Securities, LLC, member FINRA and SIPC | 333 West Wacker Drive Chicago, IL 60606 | www.nuveen.com | | |
ESA-O-0617D 243995-INV-B-08/18
Item 2. Code of Ethics.
Not applicable to this filing.
Item 3. Audit Committee Financial Expert.
Not applicable to this filing.
Item 4. Principal Accountant Fees and Services.
Not applicable to this filing.
Item 5. Audit Committee of Listed Registrants.
Not applicable to this filing.
Item 6. Schedule of Investments.
(a) See Portfolio of Investments in Item 1.
(b) Not applicable.
Item 7. Disclosure of Proxy Voting Policies and Procedures for Closed-End Management Investment Companies.
Not applicable to this filing.
Item 8. Portfolio Managers of Closed-End Management Investment Companies.
Not applicable to this filing.
Item 9. Purchases of Equity Securities by Closed-End Management Investment Company and Affiliated Purchasers.
Not applicable.
Item 10. Submission of Matters to a Vote of Security Holders.
There have been no material changes to the procedures by which shareholders may recommend nominees to the registrant’s Board implemented after the registrant last provided disclosure in response to this item.
Item 11. Controls and Procedures.
| (a) | The registrant’s principal executive and principal financial officers, or persons performing similar functions, have concluded that the registrant’s disclosure controls and procedures (as defined in Rule 30a-3(c) under the Investment Company Act of 1940, as amended (the “1940 Act”) (17 CFR 270.30a-3(c))) are effective, as of a date within 90 days of the filing date of this report that includes the disclosure required by this paragraph, based on their evaluation of the controls and procedures required by Rule 30a-3(b) under the 1940 Act (17 CFR 270.30a-3(b)) and Rules 13a-15(b) or 15d-15(b) under the Securities Exchange Act of 1934, as amended (the “Exchange Act”) (17 CFR 240.13a-15(b) or 240.15d-15(b)). |
| (b) | There were no changes in the registrant’s internal control over financial reporting (as defined in Rule 30a-3(d) under the 1940 Act (17 CFR 270.30a-3(d)) that occurred during the second fiscal quarter of the period covered by this report that has materially affected, or is reasonably likely to materially affect, the registrant’s internal control over financial reporting. |
Item 12. Exhibits.
File the exhibits listed below as part of this Form.
(a)(1) Any code of ethics, or amendment thereto, that is the subject of the disclosure required by Item 2, to the extent that the registrant intends to satisfy the Item 2 requirements through filing of an exhibit: Not applicable to this filing.
(a)(2) A separate certification for each principal executive officer and principal financial officer of the registrant as required by Rule 30a-2(a) under the 1940 Act (17 CFR 270.30a-2(a)) in the exact form set forth below: See EX-99.CERT attached hereto.
(a)(3) Any written solicitation to purchase securities under Rule 23c-1 under the 1940 Act (17 CFR 270.23c-1) sent or given during the period covered by the report by or on behalf of the registrant to 10 or more persons: Not applicable.
(b) If the report is filed under Section 13(a) or 15(d) of the Exchange Act, provide the certifications required by Rule 30a-2 (b) under the 1940 Act (17 CFR 270.30a-2(b)), Rule 13a-14(b) or Rule 15d-14(b) under the Exchange Act (17 CFR 240.13a-14(b) or 240.15d-14(b)), and Section 1350 of Chapter 63 of Title 18 of the United States Code (18 U.S.C. 1350) as an Exhibit. A certification furnished pursuant to this paragraph will not be deemed “filed” for purposes of Section 18 of the Exchange Act (15 U.S.C. 78r), or otherwise subject to the liability of that section. Such certification will not be deemed to be incorporated by reference into any filing under the Securities Act of 1933 or the Exchange Act, except to the extent that the registration specifically incorporates it by reference: See EX-99.906 CERT attached hereto.
SIGNATURES
Pursuant to the requirements of the Securities Exchange Act of 1934 and the Investment Company Act of 1940, the registrant has duly caused this report to be signed on its behalf by the undersigned, thereunto duly authorized.
(Registrant) Nuveen Credit Opportunities 2022 Target Term Fund
| | | | |
| By (Signature and Title) | | /s/ Gifford R. Zimmerman | | |
| | Gifford R. Zimmerman | | |
| | Vice President and Secretary | | |
Date: September 7, 2017
Pursuant to the requirements of the Securities Exchange Act of 1934 and the Investment Company Act of 1940, this report has been signed below by the following persons on behalf of the registrant and in the capacities and on the dates indicated.
| | | | |
| By (Signature and Title) | | /s/ Cedric H. Antosiewicz | | |
| | Cedric H. Antosiewicz | | |
| | Chief Administrative Officer | | |
| | (principal executive officer) | | |
Date: September 7, 2017
| | | | |
| By (Signature and Title) | | /s/ Stephen D. Foy | | |
| | Stephen D. Foy | | |
| | Vice President and Controller | | |
| | (principal financial officer) | | |
Date: September 7, 2017