UNITED STATES
SECURITIES AND EXCHANGE COMMISSION
Washington, D.C. 20549
FORM N-CSR
CERTIFIED SHAREHOLDER REPORT OF REGISTERED
MANAGEMENT INVESTMENT COMPANIES
| | |
| Investment Company Act file number | | 811-23195 |
Nuveen Credit Opportunities 2022 Target Term Fund
(Exact name of registrant as specified in charter)
Nuveen Investments
333 West Wacker Drive, Chicago, IL 60606
(Address of principal executive offices) (Zip code)
Gifford R. Zimmerman
Nuveen Investments
333 West Wacker Drive, Chicago, IL 60606
(Name and address of agent for service)
Registrant’s telephone number, including area code: (312) 917-7700
Date of fiscal year end: December 31
Date of reporting period: June 30, 2019
Form N-CSR is to be used by management investment companies to file reports with the Commission not later than 10 days after the transmission to stockholders of any report that is required to be transmitted to stockholders under Rule 30e-1 under the Investment Company Act of 1940 (17 CFR 270.30e-1). The Commission may use the information provided on Form N-CSR in its regulatory, disclosure review, inspection, and policy making roles.
A registrant is required to disclose the information specified by Form N-CSR, and the Commission will make this information public. A registrant is not required to respond to the collection of information contained in Form N-CSR unless the Form displays a currently valid Office of Management and Budget (“OMB”) control number. Please direct comments concerning the accuracy of the information collection burden estimate and any suggestions for reducing the burden to Secretary, Securities and Exchange Commission, 450 Fifth Street, NW, Washington, DC 20549-0609. The OMB has reviewed this collection of information under the clearance requirements of 44 U.S.C. ss.3507.
ITEM 1. REPORTS TO STOCKHOLDERS.

Closed-End Funds
30 June 2019
Nuveen Closed-End Funds
| | |
| JCO | | Nuveen Credit Opportunities 2022 Target Term Fund |
Beginning on January 1, 2021, as permitted by regulations adopted by the Securities and Exchange Commission, paper copies of the Fund’s annual and semi-annual shareholder reports will no longer be sent by mail, unless you specifically request paper copies of the reports. Instead, the reports will be made available on the Fund’s website (www.nuveen.com), and you will be notified by mail each time a report is posted and provided with a website link to access the report.
If you have already elected to receive shareholder reports electronically, you will not be affected by this change and you need not take any action. You may elect to receive shareholder reports and other communications from the Fund electronically anytime by contacting the financial intermediary (such as a broker-dealer or bank) through which you hold your Fund shares or, if you are a direct investor, by enrolling at www.nuveen.com/e-reports.
You may elect to receive all future shareholder reports in paper free of charge at any time by contacting your financial intermediary or, if you are a direct investor, (i) by calling 800-257-8787 and selecting option #2 or (ii) by logging into your Investor Center account atwww.computershare.com/investor and clicking on “Communication Preferences.” Your election to receive reports in paper will apply to all funds held in your account with your financial intermediary or, if you are a direct investor, to all your directly held Nuveen Funds and any other directly held funds within the same group of related investment companies.
Semiannual Report
Life is Complex.
Nuveen makes things e-simple.
It only takes a minute to sign up fore-Reports. Once enrolled, you’ll receive ane-mail as soon as your Nuveen Fund information is ready. No more waiting for delivery by regular mail. Just click on the link within thee-mail to see the report and save it on your computer if you wish.
Free e-Reports right to your email!
www.investordelivery.com
If you receive your Nuveen Fund distributions and statements from your financial advisor or brokerage account.
or
www.nuveen.com/client-access
If you receive your Nuveen Fund distributions and statements directly from Nuveen.
NOT FDIC INSURED MAY LOSE VALUE NO BANK GUARANTEE
Table of Contents
3
Chairman’s Letter to Shareholders

Dear Shareholders,
The worries weighing on markets at the end of 2018 appeared to dissipate in early 2019 as positive economic and corporate earnings news, more dovish signals from central banks and trade progress boosted investor confidence. However, political noise and trade disputes continue to drive short-term market volatility and weigh on longer-term outlooks. Investors are concerned that increased tariffs and a protracted stalemate between the U.S. and its trading partners could dampen business and consumer sentiment, weakening spending and potentially impacting the global economy. Acknowledging similar concerns, the U.S. Federal Reserve recently lowered its benchmark interest rate 0.25% for the first time in a decade and will stop reducing its bond portfolio sooner than planned to help stimulate the U.S. economy. As the current U.S. economic expansion has reached the10-year mark this summer, it’s important to note that economic expansions don’t die of old age, but mature economic cycles can be more vulnerable to an exogenous shock.
Until a clearer picture on trade emerges, more bouts of market turbulence are likely in the meantime. While the downside risks warrant careful monitoring, we believe the likelihood of a near-term recession remains low. Global economic growth is moderating but still expanding, with demand driven by the historically low unemployment in the U.S., Japan and across Europe. Some central banks have begun to adjust monetary policy to help sustain growth and others continue to emphasize their readiness to act, while China’s authorities remain committed to keeping economic growth rates steady with fiscal and monetary policy.
The opportunity set may be narrower, but we believe there is still scope for gains in this environment. Patience and maintaining perspective can help you weather periodic market volatility. We encourage you to work with your financial advisor to assess short-term market movements in the context of your time horizon, risk tolerance and investment goals. On behalf of the other members of the Nuveen Fund Board, we look forward to continuing to earn your trust in the months and years ahead.
Sincerely,

Terence J. Toth
Chairman of the Board
August 23, 2019
4
Portfolio Managers’ Comments
Nuveen Credit Opportunities 2022 Target Term Fund (JCO)
The Fund’s investment portfolio is managed by Symphony Asset Management, LLC (Symphony), an affiliate of Nuveen, LLC. The Symphony management team for the Fund is led by Jenny Rhee and Scott Caraher.
Here the team discusses their management strategies and the performance of the Fund for thesix-month reporting period ended June 30, 2019.
What key strategies were used to manage the Fund during thissix-month reporting period ended June 30, 2019?
The Fund seeks to provide a high level of current income from a portfolio of shorter maturity, high yield corporate debt and return the original $9.85 net asset value per common share on or about June 1, 2022.
The Fund generally invests in a portfolio of below investment grade corporate bonds and senior loans. The Fund may invest in other types of securities including convertible securities and other types of debt instruments and derivatives that provide comparable economic exposure to the corporate debt market. At least 80% of its managed assets will be in corporate debt securities and separately, at least 80% in securities that, at the time of investment, are rated below investment grade or unrated but judged by the managers to be of comparable quality. No more than 15% will be in securities rated CCC+/Caa1 or lower at the time of investment. Up to 30% may be in securities onnon-U.S. issuers, including up to 20% in emerging market issuers, but 100% of managed assets will be in U.S. dollar denominated securities.
In seeking to return the original net asset value on or about June 1, 2022, the Fund intends to utilize various portfolio and cash flow management techniques, including setting aside a portion of its net investment income, possibly retaining gains and limiting the longest maturity on any holdings to no later than December 1, 2022.
How did the Fund perform during thissix-month reporting period June 30, 2019?
The table in the Performance Overview and Holding Summaries section of this report provides total returns for thesix-month,one-year and since-inception periods ended June 30, 2019. The Fund’s total returns at net asset value (NAV) are compared with the performance of a corresponding market index. For thesix-month reporting period June 30, 2019, the Fund’s common share at NAV outperformed the Bloomberg Barclays U.S. High Yield1-5 Year Cash Pay 2% Issuer Capped Index and its secondary Blended Benchmark.
This material is not intended to be a recommendation or investment advice, does not constitute a solicitation to buy, sell or hold a security or an investment strategy and is not provided in a fiduciary capacity. The information provided does not take into account the specific objectives or circumstances of any particular investor, or suggest any specific course of action. Investment decisions should be made based on an investor’s objectives and circumstances and in consultation with his or her advisors.
Certain statements in this report are forward-looking statements. Discussions of specific investments are for illustration only and are not intended as recommendations of individual investments. The forward-looking statements and other views expressed herein are those of the portfolio managers as of the date of this report. Actual future results or occurrences may differ significantly from those anticipated in any forward-looking statements and the views expressed herein are subject to change at any time, due to numerous market and other factors. The Fund disclaims any obligation to update publicly or revise any forward-looking statements or views expressed herein.
For financial reporting purposes, the ratings disclosed are the highest rating given by one of the following national rating agencies: Standard & Poor’s (S&P), Moody’s Investors Service, Inc. (Moody’s) or Fitch, Inc. (Fitch). This treatment of split-rated securities may differ from that used for other purposes, such as for Fund investment policies. Credit ratings are subject to change. AAA, AA, A and BBB are investment grade ratings; BB, B, CCC, CC, C and D are below investment grade ratings. Holdings designated N/R are not rated by these national rating agencies.
Refer to the Glossary of Terms Used in this Report for further definition of the terms used within this section.
5
Portfolio Managers’ Comments(continued)
The Fund invests in a combination of high yield bonds and senior loans with maturity profiles that are consistent with the Fund’s target term in an effort to maximize current income and return while protecting capital, consistent with the investment objective. During the reporting period, we increased exposure to senior loans as high yield prices moved higher and loans lagged.
The high yield market and leveraged loan market both staged a recovery during the reporting period following a difficult fourth quarter of 2018. High yield has enjoyed consistent inflows from both mutual funds and exchange-traded funds (ETFs) as investors have become more comfortable with fixed income assets amid a more benign environment for interest rate risk and rising equity markets. While loans have seen outflows as retail investors have become focused on potential rate cuts by the U.S. Federal Reserve, institutional demand has been strong. Much of this demand has come from the collateralized loan obligation (CLO) market.
During the reporting period, higher quality assets outperformed lower quality assets within high yield. Much of this is attributable to the fact that higher quality assets tend to be more rate-sensitive and respond more favorably to lower interest rate and duration risk. However, an argument could also be made that investors in the credit market (both loans and high yield) have adopted a more defensive posture. It should be noted however that U.S. credit conditions remain largely in check and a modest slowdown in growth is not necessarily a large risk to high yield issuers. Security selection within the CCC credit rating bucket benefited performance. Security selection in the BB and B credit rating buckets also made a positive impact, albeit to a lesser extent.
Sectors benefitting performance included technology and energy, both of which included gains from security selection. Securities benefitting performance during the reporting period included Calumet Specialty Products, which produces hydrocarbon products for industrial uses. The Fund had exposure to two different Calumet Specialty Products securities during the reporting period that rose on two quarters of strong earnings. Also, the bonds of education technology issuer Blackboard Inc. rose in early March 2019 following the news of an asset sale.
Detracting from performance was security selection within the financials sector. In particular, the loan of mortgage service company, Walter Investment Management Corporation, detracted from performance. The distressed issuer has most recently been in the process of looking for buyers for its reverse mortgage business. We continue to hold this security in the Fund. Also detracting from performance were the bonds of Pioneer Energy Services Corp. The bondssold-off during May 2019 following earnings.
6
Fund Leverage
IMPACT OF THE FUND’S LEVERAGE STRATEGIES ON PERFORMANCE
One important factor impacting the returns of the Fund’s common shares relative to its comparative benchmark was the Fund’s use of leverage through bank borrowings. The Fund uses leverage because our research has shown that, over time, leveraging provides opportunities for additional income and total return, particularly in the recent market environment where short-term market rates are at or near historical lows, meaning that the short-term rates the Fund has been paying on its leveraging instruments in recent years have been much lower than the interest the Fund has been earning on its portfolio securities that it has bought with the proceeds of that leverage.
However, use of leverage can expose Fund common shares to additional price volatility. When the Fund uses leverage, the Fund common shares will experience a greater increase in their net asset value if the securities acquired through the use of leverage increase in value, but will also experience a correspondingly larger decline in their net asset value if the securities acquired through leverage decline in value, which will make the shares’ net asset value more volatile, and total return performance more variable, over time.
In addition, common share income in levered funds will typically decrease in comparison to unlevered funds when short-term interest rates increase and increase when short-term interest rates decrease. Over the last few quarters, short-term interest rates have indeed increased from their extended lows after the 2007-09 financial crisis. This increase has reduced common share net income, and also reduced potential for long-term total returns. Nevertheless, the ability to effectively borrow at current short-term rates is still resulting in enhanced common share income, and management believes that the advantages of continuation of leverage outweigh the associated increase in risk and volatility described above.
The Fund’s use of leverage had a positive impact on the total return performance during this reporting period.
As of June 30, 2019, the Fund’s percentages of leverage are as shown in the accompanying table.
| | | | |
| | | JCO | |
Effective Leverage* | | | 29.05 | % |
Regulatory Leverage* | | | 29.05 | % |
| * | Effective leverage is the Fund’s effective economic leverage, and includes both regulatory leverage and the leverage effects of certain derivative and other investments in the Fund’s portfolio that increase the Fund’s investment exposure. Regulatory leverage consists of preferred shares issued or borrowings of the Fund. Both of these are part of the Fund’s capital structure. The Fund, however, may from time to time borrow on a typically transient basis in connection with its day-to-day operations, primarily in connection with the need to settle portfolio trades. Such incidental borrowings are excluded from the calculation of the Fund’s effective leverage ratio. Regulatory leverage is subject to asset coverage limits set forth in the Investment Company Act of 1940. |
THE FUND’S REGULATORY LEVERAGE
Bank Borrowings
As noted above, the Fund employs leverage through the use of bank borrowings. The Fund’s bank borrowing activities are as shown in the accompanying table.
| | | | | | | | | | | | | | | | | | | | | | | | | | | | | | | | | | |
| Current Reporting Period | | | | | | Subsequent to the Close of
the Reporting Period | |
| January 1, 2019 | | | Draws | | | Paydowns | | | June 30, 2019 | | | Average Balance
Outstanding | | | | | | Draws | | | Paydowns | | | August 27, 2019 | |
| | $110,000,000 | | | | $ — | | | | $ — | | | | $110,000,000 | | | | $110,000,000 | | | | | | | | $ — | | | | $ — | | | | $110,000,000 | |
Refer to Notes to Financial Statements, Note 9 – Borrowing Arrangements for further details.
7
Common Share Information
COMMON SHARE DISTRIBUTION INFORMATION
The following information regarding the Fund’s distributions is current as of June 30, 2019. The Fund’s distribution levels may vary over time based on the Fund’s investment activity and portfolio investment value changes.
During the current reporting period, the Fund’s distributions to common shareholders were as shown in the accompanying table.
| | | | |
| Monthly Distributions(Ex-Dividend Date) | | Per Common
Share Amounts | |
January 2019 | | $ | 0.0470 | |
February | | | 0.0470 | |
March | | | 0.0470 | |
April | | | 0.0470 | |
May | | | 0.0470 | |
June 2019 | | | 0.0470 | |
Total Distribution from Net Investment Income | | $ | 0.2820 | |
| |
Current Distribution Rate* | | | 5.91 | % |
| * | Current distribution rate is based on the Fund’s current annualized monthly distribution divided by the Fund’s current market price. The Fund’s monthly distributions to its shareholders may be comprised of ordinary income, net realized capital gains and, if at the end of the fiscal year the Fund’s cumulative net ordinary income and net realized gains are less than the amount of the Fund’s distributions, a return of capital for tax purposes. |
The Fund seeks to pay regular monthly dividends out of its net investment income at a rate that reflects its past and projected net income performance. To permit the Fund to maintain a more stable monthly dividend, the Fund may pay dividends at a rate that may be more or less than the amount of net income actually earned by the Fund during the period. Distributions to shareholders are determined on a tax basis, which may differ from amounts recorded in the accounting records. In instances where the monthly dividend exceeds the earned net investment income, the Fund would report a negative undistributed net ordinary income. Refer to Note 6 – Income Tax Information for additional information regarding the amounts of undistributed net ordinary income and undistributed net long-term capital gains and the character of the actual distributions paid by the Fund during the period.
All monthly dividends paid by the Fund during the current reporting period were paid from net investment income. If a portion of the Fund’s monthly distributions is sourced from or comprised of elements other than net investment income, including capital gains and/or a return of capital, shareholders will be notified of those sources. For financial reporting purposes, per share amounts of the Fund’s distributions for the reporting period are presented in this report’s Financial Highlights. For income tax purposes, distribution information for the Fund as of its most recent tax year end is presented in Note 6 – Income Tax Information within the Notes to Financial Statements of this report.
Change in Method of Publishing Nuveen Closed-End Fund Distribution Amounts
Beginning on or about November 1, 2019, the NuveenClosed-End Funds will be discontinuing the practice of announcing Fund distribution amounts and timing via press release. Instead, information about the NuveenClosed-End Funds’ monthly and quarterly periodic distributions to shareholders will be posted and can be found on Nuveen’s enhanced closed-end fund resource page, which is atwww.nuveen.com/closed-end-fund-distributions, along with other Nuveen closed-end fund product updates. Shareholders can expect regular distribution information to be posted on www.nuveen.com on the first business day of each month. To ensure that our shareholders have timely access to the latest information, a subscribe function can be activated at this link here, or at this web page(www.nuveen.com/en-us/people/about-nuveen/for-the-media).
8
Common Share Information(continued)
COMMON SHARE REPURCHASES
During August 2019 (subsequent to the close of the reporting period), the Fund’s Board of Trustees reauthorized an open-market share repurchase program, allowing the Fund to repurchase an aggregate of up to approximately 10% of its outstanding shares.
As of June 30, 2019, and since the inception of the Fund’s repurchase program, the Fund has cumulatively repurchased and retired its outstanding common shares as shown in the accompanying table.
| | | | |
| | | JCO | |
Common shares cumulatively repurchased and retired | | | — | |
Common shares authorized for repurchase | | | 2,770,000 | |
During the current reporting period, the Fund did not repurchase any of its outstanding common shares.
OTHER COMMON SHARE INFORMATION
As of June 30, 2019, and during the current reporting period, the Fund’s common share price was trading at a premium/(discount) to its common share NAV as shown in the accompanying table.
| | | | |
Common share NAV | | $ | 9.70 | |
Common share price | | $ | 9.55 | |
Premium/(Discount) to NAV | | | (1.55 | )% |
6-month average premium/(discount) to NAV | | | (0.27 | )% |
The Fund has an investment objective to return $9.85 (the original net asset value following the Fund’s initial public offering (the “Original NAV”)) to shareholders on or about the end of the Fund’s term. There can be no assurance that the Fund will be able to return the Original NAV to shareholders, and such return is not backed or otherwise guaranteed by the Fund’s investment adviser, Nuveen Fund Advisors, LLC (the “Adviser”), or any other entity.
The Fund’s ability to return Original NAV to shareholders on or about its termination date will depend on market conditions and the success of various portfolio and cash flow management techniques. The Fund currently intends to set aside and retain in its net assets a portion of its net investment income and possibly all or a portion of its gains. This will reduce the amounts otherwise available for distribution prior to the liquidation of the Fund, and the Fund may incur taxes on such retained amount, which will reduce the overall amounts that the Fund would have otherwise been able to distribute. Such retained income or gains, net of any taxes, would constitute a portion of the liquidating distribution returned to investors at the end of the Fund’s term. In addition, the Fund’s investment in shorter term and lower yielding securities, especially as the Fund nears the end of its term, may reduce investment income and, therefore, the monthly dividends during the period prior to termination. Investors that purchase shares in the secondary market (particularly if their purchase price differs meaningfully from the Original NAV) may receive more or less than their original investment.
9
Risk Considerations
Fund shares are not guaranteed or endorsed by any bank or other insured depository institution, and are not federally insured by the Federal Deposit Insurance Corporation.
Nuveen Credit Opportunities 2022 Target Term Fund (JCO)
Investing in closed-end funds involves risk; principal loss is possible. There is no guarantee the Fund’s investment objectives will be achieved. Closed-end fund shares may frequently trade at a discount or premium to their net asset value.Lower credit debt securities may be more likely to fail to make timely interest or principal payments.Adjustable Rate Senior Loans may not be fully secured by collateral, generally do not trade on exchanges, and are typically issued by unrated or below-investment grade companies, and therefore are subject to greater liquidity and credit risk.Leverage increases return volatility and magnifies the Fund’s potential return and its risks; there is no guarantee a fund’s leverage strategy will be successful. These and other risk considerations such aslimited term, interest rate risk and concentration risk are described in more detail on the Fund’s web page atwww.nuveen.com/JCO.
10
THIS PAGE INTENTIONALLY LEFT BLANK
11
| | |
| JCO | | Nuveen Credit Opportunities 2022 Target Term Fund Performance Overview and Holding Summaries as of June 30, 2019 |
Refer to the Glossary of Terms Used in this Report for further definition of the terms used within this section.
Average Annual Total Returns as of June 30, 2019
| | | | | | | | | | | | |
| | | Cumulative | | | Average Annual | |
| | | 6-Month | | | 1-Year | | | Since
Inception | |
| JCO at Common Share NAV | | | 10.24% | | | | 4.93% | | | | 4.96% | |
| JCO at Common Share Price | | | 16.25% | | | | 7.40% | | | | 3.67% | |
| Bloomberg Barclays U.S. High Yield 1-5 Year Cash Pay 2% Issuer Capped Index | | | 7.24% | | | | 5.33% | | | | 5.17% | |
Since inception returns are from 3/28/17. Past performance is not predictive of future results. Current performance may be higher or lower than the data shown. Returns do not reflect the deduction of taxes that shareholders may have to pay on Fund distributions or upon the sale of Fund shares. Returns at NAV are net of Fund expenses, and assume reinvestment of distributions. Comparative index return information is provided for the Fund’s shares at NAV only. Indexes are not available for direct investment.
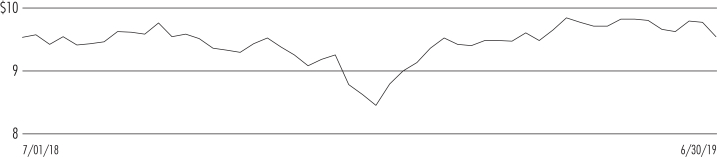
Common Share Price Performance —Weekly Closing Price
12
This data relates to the securities held in the Fund’s portfolio of investments as of the end of the reporting period. It should not be construed as a measure of performance for the Fund itself. Holdings are subject to change.
For financial reporting purposes, the ratings disclosed are the highest rating given by one of the following national rating agencies: Standard & Poor’s Group, Moody’s Investors Service, Inc. or Fitch, Inc. This treatment of split-rated securities may differ from that used for other purposes, such as for Fund investment policies. Credit ratings are subject to change. AAA, AA, A and BBB are investment grade ratings; BB, B, CCC, CC, C and D are below investment grade ratings. Holdings designated N/R are not rated by these national rating agencies.
Fund Allocation
(% of net assets)
| | | | |
| Corporate Bonds | | | 100.3% | |
| Variable Rate Senior Loan Interests | | | 39.2% | |
| Investment Companies | | | 3.9% | |
| Other Assets Less Liabilities | | | (2.5)% | |
Net Assets Plus Borrowings | | | 140.9% | |
| Borrowings | | | (40.9)% | |
Net Assets | | | 100% | |
Portfolio Composition
(% of total investments)
| | | | |
| Oil, Gas & Consumable Fuels | | | 7.7% | |
| Software | | | 7.5% | |
| Media | | | 7.5% | |
| Health Care Providers & Services | | | 7.2% | |
| Diversified Telecommunication Services | | | 5.2% | |
| Household Durables | | | 4.8% | |
| Aerospace & Defense | | | 4.8% | |
| Hotels, Restaurants & Leisure | | | 4.7% | |
| Wireless Telecommunication Services | | | 4.5% | |
| Energy Equipment & Services | | | 4.5% | |
| Commercial Services & Supplies | | | 4.3% | |
| Specialty Retail | | | 4.2% | |
| Health Care Equipment & Supplies | | | 2.7% | |
| Metals & Mining | | | 2.6% | |
| Personal Products | | | 2.0% | |
| Technology Hardware, Storage & Peripherals | | | 2.0% | |
| Machinery | | | 1.9% | |
| Other | | | 19.2% | |
| Investment Companies | | | 2.7% | |
Total | | | 100% | |
Portfolio Credit Quality
(% of total long-term investments)
| | | | |
| BBB | | | 5.3% | |
| BB or Lower | | | 90.8% | |
| N/R (not rated) | | | 3.9% | |
Total | | | 100% | |
Top Five Issuers
(% of total investments)
| | | | |
| Blackboard Inc. | | | 3.0% | |
| CenturyLink Inc. | | | 3.0% | |
| Sprint Corp | | | 2.6% | |
| Bombardier Inc. | | | 2.4% | |
| PetSmart Inc. | | | 2.3% | |
13
Shareholder Meeting Report
The annual meeting of shareholders was held in the offices of Nuveen on April 10, 2019 for JCO; at this meeting the shareholders were asked to elect Board Members.
| | | | |
| | | JCO | |
| | | Common
Shares | |
Approval of the Board Members was reached as follows: | | | | |
Judith M. Stockdale | | | | |
For | | | 24,612,483 | |
Withhold | | | 227,718 | |
Total | | | 24,840,201 | |
Carole E. Stone | | | | |
For | | | 24,636,935 | |
Withhold | | | 203,266 | |
Total | | | 24,840,201 | |
Margaret L. Wolff | | | | |
For | | | 24,634,860 | |
Withhold | | | 205,341 | |
Total | | | 24,840,201 | |
William C. Hunter | | | | |
For | | | 24,544,200 | |
Withhold | | | 296,001 | |
Total | | | 24,840,201 | |
14
| | |
| JCO | | Nuveen Credit Opportunities
2022 Target Term Fund Portfolio of Investments June 30, 2019 |
| | | (Unaudited) |
| | | | | | | | | | | | | | | | | | | | | | | | | | | | |
Principal
Amount (000) | | | Description (1) | | | | | Coupon | | | Maturity | | | Ratings (2) | | | | | | Value | |
| |
| | | | LONG-TERM INVESTMENTS – 139.5% (97.3% of Total Investments) | |
| |
| | | | CORPORATE BONDS – 100.3% (69.9% of Total Investments) | |
| | | | | | | |
| | | | Aerospace & Defense – 4.6% | | | | | | | | | | | | | | | | | | |
| | | | | | | |
| $ | 3,000 | | | Bombardier Inc, 144A | | | | | | | 8.750% | | | | 12/01/21 | | | | B | | | | | | | $ | 3,270,000 | |
| | 6,000 | | | Bombardier Inc, 144A | | | | | | | 6.000% | | | | 10/15/22 | | | | B | | | | | | | | 6,025,740 | |
| | 3,000 | | | TransDigm Inc | | | | | | | 6.000% | | | | 7/15/22 | | | | B– | | | | | | | | 3,030,000 | |
| | 12,000 | | | Total Aerospace & Defense | | | | | | | | | | | | | | | | | | | | | | | 12,325,740 | |
| | | | | | | |
| | | | Airlines – 1.2% | | | | | | | | | | | | | | | | | | |
| | | | | | | |
| | 3,250 | | | American Airlines Group Inc, 144A | | | | | | | 5.000% | | | | 6/01/22 | | | | BB– | | | | | | | | 3,348,475 | |
| | | | | | | |
| | | | Building Products – 0.2% | | | | | | | | | | | | | | | | | | |
| | | | | | | |
| | 650 | | | Hillman Group Inc/The, 144A | | | | | | | 6.375% | | | | 7/15/22 | | | | CCC | | | | | | | | 576,875 | |
| | | | | | | |
| | | | Chemicals – 2.3% | | | | | | | | | | | | | | | | | | |
| | | | | | | |
| | 2,250 | | | CF Industries Inc | | | | | | | 7.125% | | | | 5/01/20 | | | | BB+ | | | | | | | | 2,326,095 | |
| | 2,000 | | | Kissner Holdings LP, 144A | | | | 8.375% | | | | 12/01/22 | | | | B | | | | | | | | 2,080,000 | |
| | 1,850 | | | TPC Group Inc, 144A | | | | | | | 8.750% | | | | 12/15/20 | | | | B2 | | | | | | | | 1,843,063 | |
| | 6,100 | | | Total Chemicals | | | | | | | | | | | | | | | | | | | | | | | 6,249,158 | |
| |
| | | | Commercial Services & Supplies – 3.8% | |
| | | | | | | |
| | 4,000 | | | ADT Security Corp/The | | | | | | | 6.250% | | | | 10/15/21 | | | | BB– | | | | | | | | 4,230,000 | |
| | 502 | | | APX Group Inc | | | | | | | 8.750% | | | | 12/01/20 | | | | CCC | | | | | | | | 475,645 | |
| | 4,000 | | | APX Group Inc | | | | | | | 7.875% | | | | 12/01/22 | | | | B2 | | | | | | | | 3,835,000 | |
| | 955 | | | Harland Clarke Holdings Corp, 144A | | | | | | | 6.875% | | | | 3/01/20 | | | | B | | | | | | | | 941,869 | |
| | 715 | | | Tervita Escrow Corp, 144A | | | | | | | 7.625% | | | | 12/01/21 | | | | B+ | | | | | | | | 727,305 | |
| | 10,172 | | | Total Commercial Services & Supplies | | | | | | | | | | | | | | | | | | | | | | | 10,209,819 | |
| |
| | | | Construction & Engineering – 0.8% | |
| | | | | | | |
| | 2,000 | | | Great Lakes Dredge & Dock Corp | | | | | | | 8.000% | | | | 5/15/22 | | | | B | | | | | | | | 2,117,500 | |
| | | | | | | |
| | | | Construction Materials – 0.5% | | | | | | | | | | | | | | | | | | |
| | | | | | | |
| | 1,431 | | | Gates Global LLC / Gates Global Co, 144A | | | | | | | 6.000% | | | | 7/15/22 | | | | B | | | | | | | | 1,431,894 | |
| |
| | | | Consumer Finance – 1.8% | |
| | | | | | | |
| | 600 | | | DAE Funding LLC, 144A | | | | | | | 5.250% | | | | 11/15/21 | | | | BB+ | | | | | | | | 623,250 | |
| | 2,000 | | | DAE Funding LLC, 144A | | | | | | | 4.500% | | | | 8/01/22 | | | | BB+ | | | | | | | | 2,030,000 | |
| | 2,000 | | | Navient Corp | | | | | | | 6.500% | | | | 6/15/22 | | | | BB | | | | | | | | 2,124,480 | |
| | 4,600 | | | Total Consumer Finance | | | | | | | | | | | | | | | | | | | | | | | 4,777,730 | |
| |
| | | | Containers & Packaging – 1.6% | |
| | | | | | | |
| | 4,303 | | | Cascades Inc, 144A | | | | | | | 5.500% | | | | 7/15/22 | | | | BB– | | | | | | | | 4,319,136 | |
| |
| | | | Diversified Financial Services – 0.8% | |
| | | | | | | |
| | 2,000 | | | Avation Capital SA, 144A | | | | | | | 6.500% | | | | 5/15/21 | | | | BB– | | | | | | | | 2,045,000 | |
| |
| | | | Diversified Telecommunication Services – 7.4% | |
| | | | | | | |
| | 4,000 | | | CenturyLink Inc | | | | | | | 6.450% | | | | 6/15/21 | | | | BB | | | | | | | | 4,230,000 | |
| | 3,000 | | | CenturyLink Inc | | | | | | | 5.800% | | | | 3/15/22 | | | | BB | | | | | | | | 3,127,500 | |
| | 500 | | | Cogent Communications Group Inc, 144A | | | | | | | 5.625% | | | | 4/15/21 | | | | B– | | | | | | | | 506,875 | |
| | 8,410 | | | Intelsat Luxembourg SA | | | | | | | 7.750% | | | | 6/01/21 | | | | Ca | | | | | | | | 8,052,575 | |
| | 4,000 | | | Level 3 Parent LLC | | | | | | | 5.750% | | | | 12/01/22 | | | | BB | | | | | | | | 4,035,000 | |
| | 19,910 | | | Total Diversified Telecommunication Services | | | | | | | | | | | | | | | | | | | | | | | 19,951,950 | |
15
| | |
| |
| JCO | | Nuveen Credit Opportunities 2022 Target Term Fund(continued) |
| | Portfolio of Investments June 30, 2019 |
| | (Unaudited) |
| | | | | | | | | | | | | | | | | | | | | | | | | | | | |
Principal
Amount (000) | | | Description (1) | | | | | Coupon | | | Maturity | | | Ratings (2) | | | | | | Value | |
| | | | | | | |
| | | | Electrical Equipment – 0.8% | | | | | | | | | | | | | | | | | | |
| | | | | | | |
| $ | 2,000 | | | Park Aerospace Holdings Ltd, 144A | | | | | | | 5.250% | | | | 8/15/22 | | | | BBB– | | | | | | | $ | 2,111,220 | |
| | | | | | | |
| | | | Energy Equipment & Services – 4.6% | | | | | | | | | | | | | | | | | | |
| | | | | | | |
| | 8,600 | | | FTS International Inc | | | | | | | 6.250% | | | | 5/01/22 | | | | B | | | | | | | | 7,976,500 | |
| | 4,500 | | | Nabors Industries Inc | | | | | | | 4.625% | | | | 9/15/21 | | | | BB | | | | | | | | 4,387,500 | |
| | 13,100 | | | Total Energy Equipment & Services | | | | | | | | | | | | | | | | | | | | | | | 12,364,000 | |
| | | | | | | |
| | | | Entertainment – 0.8% | | | | | | | | | | | | | | | | | | |
| | | | | | | |
| | 2,000 | | | Netflix Inc | | | | | | | 5.500% | | | | 2/15/22 | | | | BB– | | | | | | | | 2,102,500 | |
| | | | | | | |
| | | | Equity Real Estate Investment Trust – 2.4% | | | | | | | | | | | | | | | | | | |
| | | | | | | |
| | 4,000 | | | iStar Inc | | | | | | | 6.000% | | | | 4/01/22 | | | | BB | | | | | | | | 4,100,000 | |
| | 2,375 | | | SBA Communications Corp | | | | | | | 4.000% | | | | 10/01/22 | | | | BB– | | | | | | | | 2,407,656 | |
| | 6,375 | | | Total Equity Real Estate Investment Trust | | | | | | | | | | | | | | | | | | | | | | | 6,507,656 | |
| | | | | | | |
| | | | Food Products – 1.9% | | | | | | | | | | | | | | | | | | |
| | | | | | | |
| | 5,000 | | | B&G Foods Inc | | | | | | | 4.625% | | | | 6/01/21 | | | | BB– | | | | | | | | 5,006,250 | |
| | | | | | | |
| | | | Health Care Equipment & Supplies – 3.3% | | | | | | | | | | | | | | | | | | |
| | | | | | | |
| | 4,814 | | | Kinetic Concepts Inc / KCI USA Inc, 144A | | | | | | | 7.875% | | | | 2/15/21 | | | | B+ | | | | | | | | 4,935,168 | |
| | 4,000 | | | Ortho–Clinical Diagnostics Inc / Ortho–Clinical Diagnostics SA, 144A | | | | 6.625% | | | | 5/15/22 | | | | CCC | | | | | | | | 3,820,000 | |
| | 8,814 | | | Total Health Care Equipment & Supplies | | | | | | | | | | | | | | | | | | | | | | | 8,755,168 | |
| | | | | | | |
| | | | Health Care Providers & Services – 8.5% | | | | | | | | | | | | | | | | | | |
| | | | | | | |
| | 1,000 | | | Acadia Healthcare Co Inc | | | | | | | 5.125% | | | | 7/01/22 | | | | B– | | | | | | | | 1,005,000 | |
| | 4,000 | | | CHS/Community Health Systems Inc | | | | | | | 5.125% | | | | 8/01/21 | | | | BB | | | | | | | | 3,910,000 | |
| | 4,000 | | | HCA Inc | | | | | | | 5.875% | | | | 3/15/22 | | | | BBB– | | | | | | | | 4,370,486 | |
| | 6,800 | | | Molina Healthcare Inc | | | | | | | 5.375% | | | | 11/15/22 | | | | BB– | | | | | | | | 7,072,000 | |
| | 2,900 | | | Polaris Intermediate Corp, (cash 8.500%, PIK 8.500%), 144A | | | | 8.500% | | | | 12/01/22 | | | | B– | | | | | | | | 2,559,250 | |
| | 4,000 | | | Select Medical Corp | | | | | | | 6.375% | | | | 6/01/21 | | | | B– | | | | | | | | 4,005,400 | |
| | 22,700 | | | Total Health Care Providers & Services | | | | | | | | | | | | | | | | | | | | | | | 22,922,136 | |
| | | | | | | |
| | | | Hotels, Restaurants & Leisure – 5.7% | | | | | | | | | | | | | | | | | | |
| | | | | | | |
| | 2,005 | | | CCM Merger Inc, 144A | | | | | | | 6.000% | | | | 3/15/22 | | | | BB– | | | | | | | | 2,055,125 | |
| | 3,000 | | | International Game Technology PLC, 144A | | | | | | | 6.250% | | | | 2/15/22 | | | | BB+ | | | | | | | | 3,168,750 | |
| | 2,750 | | | Jack Ohio Finance LLC / Jack Ohio Finance 1 Corp, 144A | | | | 6.750% | | | | 11/15/21 | | | | B+ | | | | | | | | 2,824,800 | |
| | 4,000 | | | MGM Resorts International | | | | | | | 6.625% | | | | 12/15/21 | | | | BB | | | | | | | | 4,320,000 | |
| | 2,727 | | | Scientific Games International Inc | | | | | | | 10.000% | | | | 12/01/22 | | | | B– | | | | | | | | 2,859,941 | |
| | 14,482 | | | Total Hotels, Restaurants & Leisure | | | | | | | | | | | | | | | | | | | | | | | 15,228,616 | |
| | | | | | | |
| | | | Household Durables – 4.1% | | | | | | | | | | | | | | | | | | |
| | | | | | | |
| | 4,000 | | | Beazer Homes USA Inc | | | | | | | 8.750% | | | | 3/15/22 | | | | B3 | | | | | | | | 4,160,000 | |
| | 6,500 | | | Lennar Corp | | | | | | | 4.750% | | | | 11/15/22 | | | | BBB– | | | | | | | | 6,800,625 | |
| | 10,500 | | | Total Household Durables | | | | | | | | | | | | | | | | | | | | | | | 10,960,625 | |
| | | | | | | |
| | | | IT Services – 1.1% | | | | | | | | | | | | | | | | | | |
| | | | | | | |
| | 3,000 | | | Alliance Data Systems Corp, 144A | | | | | | | 5.375% | | | | 8/01/22 | | | | N/R | | | | | | | | 3,039,000 | |
| | | | | | | |
| | | | Media – 7.8% | | | | | | | | | | | | | | | | | | |
| | | | | | | |
| | 439 | | | Altice Luxembourg SA, 144A | | | | | | | 7.750% | | | | 5/15/22 | | | | B– | | | | | | | | 446,134 | |
| | 5,013 | | | Cablevision Systems Corp | | | | | | | 5.875% | | | | 9/15/22 | | | | B | | | | | | | | 5,307,514 | |
| | 1,500 | | | Clear Channel International BV, 144A | | | | | | | 8.750% | | | | 12/15/20 | | | | BB– | | | | | | | | 1,533,750 | |
| | 3,500 | | | CSC Holdings LLC, 144A | | | | | | | 5.125% | | | | 12/15/21 | | | | B | | | | | | | | 3,500,000 | |
| | 5,000 | | | DISH DBS Corp | | | | | | | 5.875% | | | | 7/15/22 | | | | BB– | | | | | | | | 5,075,000 | |
| | 4,000 | | | Nielsen Finance LLC / Nielsen Finance Co, 144A | | | | 5.000% | | | | 4/15/22 | | | | BB | | | | | | | | 3,995,000 | |
| | 1,000 | | | Sirius XM Radio Inc, 144A | | | | | | | 3.875% | | | | 8/01/22 | | | | BB | | | | | | | | 1,002,500 | |
| | 20,452 | | | Total Media | | | | | | | | | | | | | | | | | | | | | | | 20,859,898 | |
| | | | | | | |
| | | | Metals & Mining – 1.8% | | | | | | | | | | | | | | | | | | |
| | | | | | | |
| | 4,900 | | | First Quantum Minerals Ltd, 144A | | | | | | | 7.250% | | | | 5/15/22 | | | | B | | | | | | | | 4,857,125 | |
16
| | | | | | | | | | | | | | | | | | | | | | | | | | | | |
Principal
Amount (000) | | | Description (1) | | | | | | | | Coupon | | | Maturity | | | Ratings (2) | | | Value | |
| | | | | | |
| | | | Mortgage Real Estate Investment Trust – 0.8% | | | | | | | | | | | | | | | | |
| | | | | | | |
| $ | 2,000 | | | Starwood Property Trust Inc | | | | | | | | | | | 5.000% | | | | 12/15/21 | | | | BB– | | | $ | 2,055,000 | |
| | | | | | |
| | | | Oil, Gas & Consumable Fuels – 10.1% | | | | | | | | | | | | | | | | |
| | | | | | | |
| | 3,000 | | | California Resources Corp | | | | | | | | | | | 5.500% | | | | 9/15/21 | | | | CCC– | | | | 2,040,000 | |
| | 3,615 | | | Calumet Specialty Products Partners LP / Calumet Finance Corp | | | | | | | | 6.500% | | | | 4/15/21 | | | | B– | | | | 3,596,925 | |
| | 4,900 | | | Calumet Specialty Products Partners LP / Calumet Finance Corp | | | | | | | | 7.625% | | | | 1/15/22 | | | | B– | | | | 4,740,750 | |
| | 2,000 | | | Chesapeake Energy Corp | | | | | | | | | | | 6.125% | | | | 2/15/21 | | | | B+ | | | | 2,030,000 | |
| | 2,675 | | | Denbury Resources Inc | | | | | | | | | | | 6.375% | | | | 8/15/21 | | | | Caa2 | | | | 2,113,250 | |
| | 3,000 | | | Denbury Resources Inc | | | | | | | | | | | 5.500% | | | | 5/01/22 | | | | Caa2 | | | | 1,725,000 | |
| | 3,000 | | | NGPL PipeCo LLC, 144A | | | | | | | | | | | 4.375% | | | | 8/15/22 | | | | BBB– | | | | 3,090,000 | |
| | 4,000 | | | Peabody Energy Corp, 144A | | | | | | | | | | | 6.000% | | | | 3/31/22 | | | | BB | | | | 4,095,000 | |
| | 1,800 | | | QEP Resources Inc | | | | | | | | | | | 5.375% | | | | 10/01/22 | | | | BB– | | | | 1,750,500 | |
| | 2,000 | | | SM Energy Co | | | | | | | | | | | 6.125% | | | | 11/15/22 | | | | BB– | | | | 1,985,000 | |
| | 29,990 | | | Total Oil, Gas & Consumable Fuels | | | | | | | | | | | | | | | | | | | | | | | 27,166,425 | |
| | | | | | | |
| | | | Personal Products – 2.9% | | | | | | | | | | | | | | | | | | |
| | | | | | |
| | 2,000 | | | Avon International Capital PLC, 144A, (WI/DD) | | | | | | | | 6.500% | | | | 8/15/22 | | | | Ba1 | | | | 2,015,000 | |
| | 6,550 | | | Revlon Consumer Products Corp | | | | | | | | | | | 5.750% | | | | 2/15/21 | | | | CCC | | | | 5,862,250 | |
| | 8,550 | | | Total Personal Products | | | | | | | | | | | | | | | | | | | | | | | 7,877,250 | |
| | | | | | | |
| | | | Pharmaceuticals – 0.6% | | | | | | | | | | | | | | | | | | |
| | | | | | |
| | 1,500 | | | Eagle Holding Co II LLC, (cash 7.625%, PIK 8.375%), 144A | | | | | | | | 7.625% | | | | 5/15/22 | | | | CCC+ | | | | 1,507,500 | |
| | | | | | | |
| | | | Road & Rail – 1.2% | | | | | | | | | | | | | | | | | | |
| | | | | | | |
| | 3,112 | | | Herc Rentals Inc, 144A | | | | | | | | | | | 7.500% | | | | 6/01/22 | | | | B+ | | | | 3,231,812 | |
| | | | | | |
| | | | Semiconductors & Semiconductor Equipment – 2.0% | | | | | | | | | | | | | | | | |
| | | | | | | |
| | 4,816 | | | Advanced Micro Devices Inc | | | | | | | | | | | 7.500% | | | | 8/15/22 | | | | BB– | | | | 5,442,080 | |
| | | | | | | |
| | | | Software – 2.2% | | | | | | | | | | | | | | | | | | |
| | | | | | | |
| | 6,000 | | | Blackboard Inc, 144A | | | | | | | | | | | 9.750% | | | | 10/15/21 | | | | CCC– | | | | 5,790,000 | |
| | | | | | | |
| | | | Specialty Retail – 2.7% | | | | | | | | | | | | | | | | | | |
| | | | | | | |
| | 7,250 | | | Rent–A-Center Inc. | | | | | | | | | | | 4.750% | | | | 5/01/21 | | | | B | | | | 7,240,938 | |
| | | | | | |
| | | | Technology Hardware, Storage & Peripherals – 2.9% | | | | | | | | | | | | | | | | |
| | | | | | |
| | 3,600 | | | Dell International LLC / EMC Corp, 144A | | | | | | | | 5.875% | | | | 6/15/21 | | | | BB+ | | | | 3,659,742 | |
| | 4,000 | | | Seagate HDD Cayman | | | | | | | | | | | 4.250% | | | | 3/01/22 | | | | Baa3 | | | | 4,066,631 | |
| | 7,600 | | | Total Technology Hardware, Storage & Peripherals | | | | | | | | | | | | | | | | | | | | 7,726,373 | |
| | | | | | |
| | | | Thrifts & Mortgage Finance – 0.7% | | | | | | | | | | | | | | | | |
| | | | | |
| | 1,000 | | | Ladder Capital Finance Holdings LLLP / Ladder Capital Finance Corp, 144A | | | | 5.250% | | | | 3/15/22 | | | | BB | | | | 1,020,000 | |
| | 1,000 | | | Nationstar Mortgage LLC / Nationstar Capital Corp | | | | | | | | 6.500% | | | | 7/01/21 | | | | B | | | | 1,001,520 | |
| | 2,000 | | | Total Thrifts & Mortgage Finance | | | | | | | | | | | | | | | | | | | | | | | 2,021,520 | |
| | | | | | |
| | | | Wireless Telecommunication Services – 6.4% | | | | | | | | | | | | | | | | |
| | | | | | | |
| | 3,000 | | | Hughes Satellite Systems Corp | | | | | | | | | | | 7.625% | | | | 6/15/21 | | | | BB– | | | | 3,210,000 | |
| | 4,000 | | | Inmarsat Finance PLC, 144A | | | | | | | | | | | 4.875% | | | | 5/15/22 | | | | BB | | | | 4,025,000 | |
| | 2,000 | | | Sprint Communications Inc | | | | | | | | | | | 6.000% | | | | 11/15/22 | | | | B+ | | | | 2,085,000 | |
| | 7,500 | | | Sprint Corp | | | | | | | | | | | 7.250% | | | | 9/15/21 | | | | B+ | | | | 7,968,750 | |
| | 16,500 | | | Total Wireless Telecommunication Services | | | | | | | | | | | | | | | | | | | | 17,288,750 | |
| $ | 269,057 | | | Total Corporate Bonds (cost $270,058,020) | | | | | | | | | | | | | | | | | | | | 269,415,119 | |
| | | | | | | |
Principal
Amount (000) | | | Description (1) | | Coupon (3) | | | Reference
Rate (3) | | | Spread (3) | | | Maturity (4) | | | Ratings (2) | | | Value | |
| |
| | | | VARIABLE RATE SENIOR LOAN INTERESTS – 39.2% (27.4% of Total Investments) (3) | |
| | | | |
| | | | Aerospace & Defense – 2.3% | | | | | | | | | | |
| | | | | | | |
| $ | 4,688 | | | Sequa Corporation, Term Loan, B | | | 7.560% | | | | 3-Month LIBOR | | | | 5.000% | | | | 11/28/21 | | | | B | | | $ | 4,595,764 | |
17
| | |
| |
| JCO | | Nuveen Credit Opportunities 2022 Target Term Fund(continued) |
| | Portfolio of Investments June 30, 2019 |
| | (Unaudited) |
| | | | | | | | | | | | | | | | | | | | | | | | | | | | |
Principal
Amount (000) | | | Description (1) | | Coupon (3) | | | Reference
Rate (3) | | | Spread (3) | | | Maturity (4) | | | Ratings (2) | | | Value | |
| | | | | | | |
| | | | Aerospace & Defense(continued) | | | | | | | | | | | | | | | | | | |
| | | | | | | |
| $ | 1,542 | | | Sequa Corporation, Term Loan, Second Lien | | | 11.583% | | | | 3-Month LIBOR | | | | 9.000% | | | | 4/28/22 | | | | Caa2 | | | $ | 1,480,734 | |
| | 6,230 | | | Total Aerospace & Defense | | | | | | | | | | | | | | | | | | | | | | | 6,076,498 | |
| | | | | | |
| | | | Commercial Services & Supplies – 2.3% | | | | | | | | | | | | | | | | |
| | | | | | | |
| | 6,406 | | | iQor US, Inc., Term Loan, First Lien, (DD1) | | | 7.592% | | | | 3-Month LIBOR | | | | 5.000% | | | | 4/01/21 | | | | Caa1 | | | | 6,259,340 | |
| | | | | | | |
| | | | Diversified Consumer Services – 0.7% | | | | | | | | | | | | | | | | | | |
| | | | | | | |
| | 1,990 | | | Houghton Mifflin, Term Loan B, First Lien | | | 5.402% | | | | 1-Month LIBOR | | | | 3.000% | | | | 5/29/21 | | | | B | | | | 1,883,689 | |
| | | | | | | |
| | | | Diversified Financial Services – 0.4% | | | | | | | | | | | | | | | | | | |
| | | | | | | |
| | 2,703 | | | Walter Investment Management Corporation, Tranche B, Term Loan, First Lien, (5) | | | 0.000% | | | | N/A | | | | N/A | | | | 6/30/22 | | | | Ca | | | | 986,487 | |
| | | | | | | |
| | | | Energy Equipment & Services – 1.8% | | | | | | | | | | | | | | | | | | |
| | | | | | | |
| | 4,987 | | | PGS Finance, Inc., Term Loan, (DD1) | | | 4.830% | | | | 3-Month LIBOR | | | | 2.500% | | | | 3/11/21 | | | | B3 | | | | 4,808,737 | |
| | | | | |
| | | | Health Care Equipment & Supplies – 0.6% | | | | | | | | | | | | | |
| | | | | | | |
| | 1,799 | | | Onex Carestream Finance LP, Term Loan, First Lien | | | 8.152% | | | | 1-Month LIBOR | | | | 5.750% | | | | 2/28/21 | | | | B1 | | | | 1,745,044 | |
| | | | | |
| | | | Health Care Providers & Services – 1.8% | | | | | | | | | | | | | |
| | | | | | | |
| | 4,951 | | | Pharmaceutical Product Development, Inc., Term Loan B | | | 4.902% | | | | 1-Month LIBOR | | | | 2.500% | | | | 8/18/22 | | | | Ba3 | | | | 4,930,026 | |
| | | | | | | |
| | | | Hotels, Restaurants & Leisure – 1.1% | | | | | | | | | | | | | | | | | | |
| | | | | | | |
| | 2,985 | | | Life Time Fitness, Inc., Term Loan B | | | 5.272% | | | | 3-Month LIBOR | | | | 2.750% | | | | 6/15/22 | | | | BB- | | | | 2,976,512 | |
| | | | | | | |
| | | | Household Durables – 2.8% | | | | | | | | | | | | | | | | | | |
| | | | | | | |
| | 7,731 | | | Apex Tool Group LLC, Term Loan B | | | 6.152% | | | | 1-Month LIBOR | | | | 3.750% | | | | 2/23/22 | | | | B2 | | | | 7,453,915 | |
| | | | | | | |
| | | | IT Services – 0.6% | | | | | | | | | | | | | | | | | | |
| | | | | | | |
| | 1,587 | | | First Data Corporation, Term Loan, First Lien | | | 4.404% | | | | 1-Month LIBOR | | | | 2.000% | | | | 7/10/22 | | | | BB+ | | | | 1,587,062 | |
| | | | | | | |
| | | | Machinery – 2.6% | | | | | | | | | | | | | | | | | | |
| | | | | | | |
| | 1,510 | | | NN, Inc., Term Loan | | | 6.152% | | | | 1-Month LIBOR | | | | 3.750% | | | | 10/19/22 | | | | B | | | | 1,490,676 | |
| | 5,932 | | | TNT Crane and Rigging Inc., Initial Term Loan, First Lien | | | 6.830% | | | | 3-Month LIBOR | | | | 4.500% | | | | 11/27/20 | | | | CCC+ | | | | 5,633,616 | |
| | 7,442 | | | Total Machinery | | | | | | | | | | | | | | | | | | | | | | | 7,124,292 | |
| | | | | | | |
| | | | Media – 2.9% | | | | | | | | | | | | | | | | | | |
| | | | | | | |
| | 652 | | | Affinion Group Holdings, Inc., Term Loan, First Lien (cash 8.404%, PIK 1.750%) | | | 10.154% | | | | 1-Month LIBOR | | | | 7.750% | | | | 5/10/22 | | | | N/R | | | | 636,984 | |
| | 1,492 | | | Cumulus Media, Inc., Exit Term Loan, (WI/DD) | | | TBD | | | | TBD | | | | TBD | | | | TBD | | | | B | | | | 1,493,087 | |
| | 4,368 | | | McGraw-Hill Education Holdings LLC, Term Loan B | | | 6.402% | | | | 1-Month LIBOR | | | | 4.000% | | | | 5/04/22 | | | | BB+ | | | | 4,177,467 | |
| | 1,638 | | | Springer Science & Business Media, Inc., Term Loan B13, First Lien | | | 5.904% | | | | 1-Month LIBOR | | | | 3.500% | | | | 8/24/22 | | | | B+ | | | | 1,640,874 | |
| | 8,150 | | | Total Media | | | | | | | | | | | | | | | | | | | | | | | 7,948,412 | |
| | | | | | | |
| | | | Metals & Mining – 1.9% | | | | | | | | | | | | | | | | | | |
| | | | | | | |
| | 5,000 | | | Zekelman Industries Inc, (DD1) | | | 4.652% | | | | 1-Month LIBOR | | | | 2.250% | | | | 6/14/21 | | | | BB– | | | | 4,995,825 | |
| | | | | | | |
| | | | Multiline Retail – 1.5% | | | | | | | | | | | | | | | | | | |
| | | | | | | |
| | 42 | | | 99 Cents Only Stores, Tranche B2, Term Loan, Second Lien, (cash 5.830%, PIK 1.500%) | | | 7.330% | | | | 3-Month LIBOR | | | | 5.000% | | | | 1/13/22 | | | | CCC+ | | | | 38,313 | |
| | 992 | | | 99 Cents Only Stores, Tranche B2, Term Loan, Second Lien, (cash 7.651%, PIK 1.500%) | | | 9.151% | | | | 6-Month LIBOR | | | | 6.500% | | | | 1/13/22 | | | | CCC+ | | | | 912,840 | |
| | 775 | | | 99 Cents Only Stores, Tranche B2, Term Loan, Second Lien, (cash 7.522%, PIK 1.500%) | | | 9.129% | | | | 3-Month LIBOR | | | | 6.500% | | | | 1/13/22 | | | | CCC+ | | | | 714,613 | |
| | 2,653 | | | Neiman Marcus Group, Inc., Term Loan | | | 5.671% | | | | 1-Month LIBOR | | | | 3.250% | | | | 10/25/20 | | | | Ca | | | | 2,275,189 | |
| | 4,462 | | | Total Multiline Retail | | | | | | | | | | | | | | | | | | | | | | | 3,940,955 | |
| | | | | | | |
| | | | Oil, Gas & Consumable Fuels – 0.9% | | | | | | | | | | | | | | | | | | |
| | | | | | | |
| | 2,500 | | | Fieldwood Energy LLC, Exit Term Loan | | | 7.652% | | | | 1-Month LIBOR | | | | 5.250% | | | | 4/11/22 | | | | BB– | | | | 2,328,512 | |
18
| | | | | | | | | | | | | | | | | | | | | | | | | | | | |
Principal
Amount (000) | | | Description (1) | | Coupon (3) | | | Reference
Rate (3) | | | Spread (3) | | | Maturity (4) | | | Ratings (2) | | | Value | |
| | | | | | | |
| | | | Professional Services – 1.6% | | | | | | | | | | | | | | | | | | |
| | | | | | | |
| $ | 4,916 | | | Skillsoft Corporation, Initial Term Loan, First Lien | | | 7.152% | | | | 1-Month LIBOR | | | | 4.750% | | | | 4/28/21 | | | | Caa2 | | | $ | 4,260,792 | |
| | | | | |
| | | | Real Estate Management & Development – 1.5% | | | | | | | | | | | | | |
| | | | | | | |
| | 3,970 | | | GGP, Initial Term Loan A1 | | | 4.652% | | | | 1-Month LIBOR | | | | 2.250% | | | | 8/24/21 | | | | BB+ | | | | 3,952,278 | |
| | | | | | | |
| | | | Software – 8.6% | | | | | | | | | | | | | | | | | | |
| | | | | | | |
| | 5,638 | | | Blackboard, Inc., Term Loan B4 | | | 7.601% | | | | 3-Month LIBOR | | | | 5.000% | | | | 6/18/21 | | | | B– | | | | 5,621,430 | |
| | 7,669 | | | Ellucian, Term Loan B, First Lien | | | 5.580% | | | | 3-Month LIBOR | | | | 3.250% | | | | 9/30/22 | | | | B | | | | 7,656,537 | |
| | 998 | | | Epicor Software Corporation, Term B, (WI/DD) | | | TBD | | | | TBD | | | | TBD | | | | TBD | | | | B2 | | | | 992,813 | |
| | 3,345 | | | Informatica, Term Loan B | | | 5.652% | | | | 1-Month LIBOR | | | | 3.250% | | | | 8/06/22 | | | | B1 | | | | 3,352,505 | |
| | 5,649 | | | Micro Focus International PLC, Term Loan B2 | | | 4.652% | | | | 1-Month LIBOR | | | | 2.250% | | | | 11/30/21 | | | | BB– | | | | 5,603,006 | |
| | 23,299 | | | Total Software | | | | | | | | | | | | | | | | | | | | | | | 23,226,291 | |
| | | | | | | |
| | | | Specialty Retail – 3.3% | | | | | | | | | | | | | | | | | | |
| | | | | | | |
| | 9,172 | | | Petsmart Inc., Term Loan B, First Lien, (DD1) | | | 6.670% | | | | 1-Month LIBOR | | | | 4.250% | | | | 3/11/22 | | | | B | | | | 8,952,353 | |
| $ | 110,280 | | | Total Variable Rate Senior Loan Interests (cost $107,659,728) | | | | | | | | | | | | | | | | 105,437,020 | |
| | | | Total Long-Term Investments (cost $377,717,748) | | | | | | | | | | | | | | | | 374,852,139 | |
| | | | | | | |
| Shares | | | Description (1), (6) | | | | | | | | Coupon | | | | | | | | | Value | |
| | | |
| | | | SHORT-TERM INVESTMENTS – 3.9% (2.7% of Total Investments) | | | | | | | |
| |
| | | | INVESTMENT COMPANIES – 3.9% (2.7% of Total Investments) | |
| | | | | | | |
| | 10,363,251 | | | BlackRock Liquidity FundsT-Fund Portfolio | | | | | | | | | | | 2.218% (7) | | | | | | | | | | | $ | 10,363,251 | |
| | | | Total Short-Term Investments (cost $10,363,251) | | | | | | | | | | | | | | | | 10,363,251 | |
| | | | Total Investments (cost $388,080,999) – 143.4% | | | | | | | | | | | | | | | | 385,215,390 | |
| | | | Borrowings – (40.9)% (8), (9) | | | | | | | | | | | | | | | | (110,000,000 | ) |
| | | | Other Assets Less Liabilities – (2.5)% | | | | | | | | | | | | | | | | (6,535,532 | ) |
| | | | Net Assets Applicable to Common Shares – 100% | | | | | | | | | | | | | | | $ | 268,679,858 | |
19
| | |
| |
| JCO | | Nuveen Credit Opportunities 2022 Target Term Fund(continued) |
| | Portfolio of Investments June 30, 2019 |
| | (Unaudited) |
For Fund portfolio compliance purposes, the Fund’s industry classifications refer to any one or more of the industrysub-classifications used by one or more widely recognized market indexes or ratings group indexes, and/or as defined by Fund management. This definition may not apply for purposes of this report, which may combine industrysub-classifications into sectors for reporting ease.
| (1) | All percentages shown in the Portfolio of Investments are based on net assets applicable to common shares unless otherwise noted. |
| (2) | For financial reporting purposes, the ratings disclosed are the highest of Standard & Poor’s Group (“Standard & Poor’s”), Moody’s Investors Service, Inc. (“Moody’s”) or Fitch, Inc. (“Fitch”) rating. This treatment of split-rated securities may differ from that used for other purposes, such as for Fund investment policies. Ratings below BBB by Standard & Poor’s, Baa by Moody’s or BBB by Fitch are considered to be below investment grade. Holdings designated N/R are not rated by any of these national rating agencies. |
| (3) | Senior loans generally pay interest at rates which are periodically adjusted by reference to a base short-term, floating lending rate (Reference Rate) plus an assigned fixed rate (Spread). These floating lending rates are generally (i) the lending rate referenced by the London Inter-Bank Offered Rate (“LIBOR”), or (ii) the prime rate offered by one or more major United States banks. Senior loans may be considered restricted in that the Fund ordinarily is contractually obligated to receive approval from the agent bank and/or borrower prior to the disposition of a senior loan. The rate shown is the coupon as of the end of the reporting period. |
| (4) | Senior loans generally are subject to mandatory and/or optional prepayment. Because of these mandatory prepayment conditions and because there may be significant economic incentives for a borrower to prepay, prepayments of senior loans may occur. As a result, the actual remaining maturity of senior loans held may be substantially less than the stated maturities shown. |
| (5) | Defaulted security. A security whose issuer has failed to fully pay principal and/or interest when due, or is under the protection of bankruptcy. |
| (6) | A copy of the most recent financial statements for these investment companies can be obtained directly from the Securities and Exchange Commission on its website at http://www.sec.gov. |
| (7) | The rate shown is the annualized seven-day subsidized yield as of the end of the reporting period. |
| (8) | Borrowings as a percentage of Total Investments is 28.6%. |
| (9) | The Fund segregates 100% of its eligible investments (excluding any investments separately pledged as collateral for specific investments in derivatives, when applicable) in the Portfolio of Investments as collateral for Borrowings. |
| 144A | Investment is exempt from registration under Rule 144A of the Securities Act of 1933, as amended. These investments may only be resold in transactions exempt from registration, which are normally those transactions with qualified institutional buyers. |
| DD1 | Portion of investment purchased on a delayed delivery basis. |
| LIBOR | London Inter-Bank Offered Rate |
| PIK | Payment-in-kind (“PIK”) security. Depending on the terms of the security, income may be received in the form of cash, securities, or a combination of both. The PIK rate shown, where applicable, represents the annualized rate of the last PIK payment made by the issuer as of the end of the reporting period. |
| TBD | Senior loan purchased on a when-issued or delayed-delivery basis. Certain details associated with this purchase are not known prior to the settlement date of the transaction. In addition, senior loans typically trade without accrued interest and therefore a coupon rate is not available prior to settlement. At settlement, if still unknown, the borrower or counterparty will provide the Fund with the final coupon rate and maturity date. |
| WI/DD | Purchased on a when-issued or delayed delivery basis. |
See accompanying notes to financial statements.
20
Statement of Assets and Liabilities
Six Months Ended June 30, 2019
(Unaudited)
| | | | |
Assets | | | | |
Long-term investments, at value (cost $377,717,748) | | $ | 374,852,139 | |
Short-term investments, at value (cost approximates value) | | | 10,363,251 | |
Cash | | | 186,824 | |
Receivables for: | | | | |
Interest | | | 4,329,372 | |
Investments sold | | | 5,178,742 | |
Other assets | | | 11,336 | |
Total assets | | | 394,921,664 | |
Liabilities | | | | |
Borrowings | | | 110,000,000 | |
Payable for: | | | | |
Dividends | | | 1,265,708 | |
Investments purchased | | | 14,676,615 | |
Accrued expenses: | | | | |
Interest on borrowings | | | 19,485 | |
Management fees | | | 204,572 | |
Trustees fees | | | 8,585 | |
Other | | | 66,841 | |
Total liabilities | | | 126,241,806 | |
Net assets applicable to common shares | | $ | 268,679,858 | |
Common shares outstanding | | | 27,691,509 | |
Net asset value (“NAV”) per common share outstanding | | $ | 9.70 | |
Net assets applicable to common shares consist of: | | | | |
Common shares, $0.01 par value per share | | $ | 276,915 | |
Paid-in-surplus | | | 271,663,299 | |
Total distributable earnings | | | (3,260,356 | ) |
Net assets applicable to common shares | | $ | 268,679,858 | |
Authorized common shares | | | Unlimited | |
See accompanying notes to financial statements.
21
Statement of Operations
Six Months Ended June 30, 2019
(Unaudited)
| | | | |
Investment Income | | $ | 11,421,318 | |
Expenses | | | | |
Management fees | | | 1,226,256 | |
Interest expense on borrowings | | | 1,805,673 | |
Custodian fees | | | 28,722 | |
Trustees fees | | | 5,616 | |
Professional fees | | | 30,377 | |
Shareholder reporting expenses | | | 16,895 | |
Shareholder servicing agent fees | | | 62 | |
Stock exchange listing fees | | | 3,863 | |
Investor relations expense | | | 5,994 | |
Other | | | 22,224 | |
Total expenses | | | 3,145,682 | |
Net investment income (loss) | | | 8,275,636 | |
Realized and Unrealized Gain (Loss) | | | | |
Net realized gain (loss) from investments | | | (5,159,660 | ) |
Change in net unrealized appreciation (depreciation) of investments | | | 22,348,517 | |
Net realized and unrealized gain (loss) | | | 17,188,857 | |
Net increase (decrease) in net assets applicable to common shares from operations | | $ | 25,464,493 | |
See accompanying notes to financial statements.
22
Statement of Changes in Net Assets
(Unaudited)
| | | | | | | | |
| | | Six Months
Ended
6/30/19 | | | Year
Ended
12/31/18 | |
Operations | | | | | | | | |
Net investment income (loss) | | $ | 8,275,636 | | | $ | 18,405,076 | |
Net realized gain (loss) from investments | | | (5,159,660 | ) | | | (398,575 | ) |
Change in net unrealized appreciation (depreciation) of investments | | | 22,348,517 | | | | (26,390,465 | ) |
Net increase (decrease) in net assets applicable to common shares from operations | | | 25,464,493 | | | | (8,383,964 | ) |
Distributions to Common Shareholders | | | | | | | | |
Dividends | | | (7,807,937 | ) | | | (15,613,674 | ) |
Decrease in net assets applicable to common shares from distributions to common shareholders | | | (7,807,937 | ) | | | (15,613,674 | ) |
Capital Share Transactions | | | | | | | | |
Net proceeds from common shares issued to shareholders due to reinvestment of distributions | | | 73,360 | | | | — | |
Net increase (decrease) in net assets applicable to common shares from capital share transactions | | | 73,360 | | | | — | |
Net increase (decrease) in net assets applicable to common shares | | | 17,729,916 | | | | (23,997,638 | ) |
Net assets applicable to common shares at the beginning of period | | | 250,949,942 | | | | 274,947,580 | |
Net assets applicable to common shares at the end of period | | $ | 268,679,858 | | | $ | 250,949,942 | |
See accompanying notes to financial statements.
23
Statement of Cash Flows
Six Months Ended June 30, 2019
(Unaudited)
| | | | |
Cash Flows from Operating Activities: | | | | |
Net Increase (Decrease) in Net Assets Applicable to Common Shares from Operations | | $ | 25,464,493 | |
Adjustments to reconcile the net increase (decrease) in net assets applicable to common shares from operations to net cash provided by (used in) operating activities: | | | | |
Purchases of investments | | | (122,172,037 | ) |
Proceeds from sales and maturities of investments | | | 120,420,006 | |
Proceeds from (Purchases of) short-term investments, net | | | (9,051,475 | ) |
Payment-in-kind distributions | | | (3,118 | ) |
Taxes paid | | | (186,527 | ) |
Amortization (Accretion) of premiums and discounts, net | | | 632,754 | |
(Increase) Decrease in: | | | | |
Receivable for interest | | | 362,055 | |
Receivable for investments sold | | | (2,699,553 | ) |
Other assets | | | (4,146 | ) |
Increase (Decrease) in: | | | | |
Payable for investments purchased | | | 10,800,244 | |
Accrued management fees | | | (1,002 | ) |
Accrued interest on borrowings | | | 19,485 | |
Accrued Trustees fees | | | 925 | |
Accrued other expenses | | | (30,116 | ) |
Net realized (gain) loss from investments | | | 5,159,660 | |
Change in net unrealized (appreciation) depreciation of investments | | | (22,348,517 | ) |
Net cash provided by (used in) operating activities | | | 6,363,131 | |
Cash Flows from Financing Activities: | | | | |
Cash distributions paid to common shareholders | | | (6,468,869 | ) |
Net cash provided by (used in) financing activities | | | (6,468,869 | ) |
Net Increase (Decrease) in Cash | | | (105,738 | ) |
Cash at the beginning of period | | | 292,562 | |
Cash at the end of period | | $ | 186,824 | |
| |
| Supplemental Disclosure of Cash Flow Information | | | |
Cash paid for interest on borrowings (excluding borrowing costs) | | $ | 1,786,188 | |
Non-cash financing activities not included herein consists of reinvestment of common share distributions | | | 73,360 | |
See accompanying notes to financial statements.
24
THIS PAGE INTENTIONALLY LEFT BLANK
��
25
Financial Highlights
(Unaudited)
Selected data for a share outstanding throughout each period:
| | | | | | | | | | | | | | | | | | | | | | | | | | | | | | | | | | | | | | | | |
| | | | |
| | | | | | Investment Operations | | | Less Distributions to
Common Shareholders | | | Common Share | |
| | | Beginning
Common
Share
NAV | | | Net
Investment
Income (Loss)(a) | | | Net
Realized/
Unrealized
Gain (Loss) | | | Total | | | From
Net
Investment
Income | | | From
Accumulated
Net Realized
Gains | | | Total | | | Offering
Costs | | | Ending
NAV | | | Ending
Share
Price | |
Year Ended 12/31: | |
2019(f) | | $ | 9.06 | | | $ | 0.30 | | | $ | 0.62 | | | $ | 0.92 | | | $ | (0.28 | ) | | $ | — | | | $ | (0.28 | ) | | $ | — | | | $ | 9.70 | | | $ | 9.55 | |
2018 | | | 9.93 | | | | 0.66 | | | | (0.97 | ) | | | (0.31 | ) | | | (0.56 | ) | | | — | | | | (0.56 | ) | | | — | | | | 9.06 | | | | 8.46 | |
2017(b) | | | 9.85 | | | | 0.46 | | | | 0.02 | | | | 0.48 | | | | (0.38 | ) | | | — | | | | (0.38 | ) | | | (0.02 | ) | | | 9.93 | | | | 9.49 | |
| | | | | | | | |
| | | Borrowings at the End of Period | |
| | | Aggregate
Amount
Outstanding
(000) | | | Asset Coverage Per $1,000 | |
Year Ended 12/31: | | | | | | | | |
2019(f) | | $ | 110,000 | | | $ | 3,443 | |
2018 | | | 110,000 | | | | 3,281 | |
2017(b) | | | 91,400 | | | | 4,008 | |
26
| | | | | | | | | | | | | | | | | | | | | | |
| | | | | | | Common Share Supplemental Data/
Ratios Applicable to Common Shares | |
Common Share
Total Returns | | | | | | Ratios to Average Net Assets(d) | | | | |
Based
on
NAV(c) | | | Based
on
Share
Price(c) | | | Ending
Net
Assets
(000) | | | Expenses | | | Net
Investment
Income (Loss) | | | Portfolio
Turnover
Rate(e) | |
| | | | | | | | | | | | | | | | | | | | | | |
| | 10.24 | % | | | 16.25 | % | | $ | 268,680 | | | | 2.39 | %* | | | 6.29 | %* | | | 32 | % |
| | (3.33 | ) | | | (5.33 | ) | | | 250,950 | | | | 2.11 | | | | 6.80 | | | | 42 | |
| | 4.69 | | | | (1.42 | ) | | | 274,948 | | | | 1.62 | * | | | 6.14 | * | | | 35 | |
| (a) | Per share Net Investment Income (Loss) is calculated using the average daily shares method. |
| (b) | For the period March 28, 2017 (commencement of operations) through December 31, 2017. |
| (c) | Total Return Based on Common Share NAV is the combination of changes in common share NAV, reinvested dividend income at NAV and reinvested capital gains distributions at NAV, if any. The last dividend declared in the period, which is typically paid on the first business day of the following month, is assumed to be reinvested at the ending NAV. The actual reinvest price for the last dividend declared in the period may often be based on the Fund’s market price (and not its NAV), and therefore may be different from the price used in the calculation. Total returns are not annualized. |
Total Return Based on Common Share Price is the combination of changes in the market price per share and the effect of reinvested dividend income and reinvested capital gains distributions, if any, at the average price paid per share at the time of reinvestment. The last dividend declared in the period, which is typically paid on the first business day of the following month, is assumed to be reinvested at the ending market price. The actual reinvestment for the last dividend declared in the period may take place over several days, and in some instances may not be based on the market price, so the actual reinvestment price may be different from the price used in the calculation. Total returns are not annualized.
| | | | |
| (d) | | • | | Net Investment Income (Loss) ratios reflect income earned and expenses incurred on assets attributable to borrowings (as described in Note 9– Borrowing Arrangements). |
| | • | | Each ratio includes the effect of all interest expense paid and other costs related to borrowings, as follows: |
| | | | |
Ratios of Borrowings Interest Expense
to Average Net Assets
Applicable to Common Shares | |
Year Ended 12/31: | |
2019(f) | | | 1.37 | %* |
2018 | | | 1.10 | |
2017(b) | | | 0.64 | * |
| (e) | Portfolio Turnover Rate is calculated based on the lesser of long-term purchases or sales (as disclosed in Note 5 – Investment Transactions) divided by the average long-term market value during the period. |
| (f) | For the six months ended June 30, 2019. |
See accompanying notes to financial statements.
27
Notes to Financial Statements
(Unaudited)
1. General Information and Significant Accounting Policies
General Information
Fund Information
Nuveen Credit Opportunities 2022 Target Term Fund (the “Fund”) is registered under the Investment Company Act of 1940 (the “1940 Act”), as amended, as a diversified,closed-end management investment company. The Fund’s shares are listed on the New York Stock Exchange (“NYSE”) and trade under the ticker symbol “JCO.” The Fund was organized as a Massachusetts business trust on September 28, 2016.
The end of the reporting period for the Fund is June 30, 2019, and the period covered by these Notes to Financial Statements is the six months ended June 30, 2019 (the “current fiscal period”).
Investment Adviser
The Fund’s investment adviser is Nuveen Fund Advisors, LLC (the “Adviser”), a subsidiary of Nuveen, LLC (“Nuveen”). Nuveen is the investment management arm of Teachers Insurance and Annuity Association of America (TIAA). The Adviser has overall responsibility for management of the Fund, oversees the management of the Fund’s portfolio, manages the Fund’s business affairs and provides certain clerical, bookkeeping and other administrative services, and, if necessary, asset allocation decisions. The Adviser has entered into asub-advisory agreement with Symphony Asset Management, LLC (the“Sub-Adviser”), an affiliate of Nuveen, under which theSub-Adviser manages the investment portfolio of the Fund.
Investment Objectives and Principal Investment Strategies
The Fund seeks to provide a high level of current income and return the original $9.85 net asset value (“NAV”) per common share on or about June 1, 2022 (the “Termination Date”). The Fund generally invests in a portfolio of below investment grade corporate bonds and senior loans. The Fund may invest in other types of securities including convertible securities and other types of debt instruments and derivatives that provide comparable economic exposure to the corporate debt market. At least 80% of the Fund’s managed assets (as defined in Note 7 – Management Fees) will be in corporate debt securities and separately, at least 80% in securities that, at the time of investment, are rated below investment grade or unrated but judged by the Sub-Adviser to be of comparable quality. No more than 15% of the Fund’s managed assets will be in securities rated CCC+/Caa1 or lower at the time of investment. Up to 30% may be in securities of non-U.S. issuers, including up to 20% in emerging market issuers, but 100% of managed assets will be in U.S. dollar denominated securities.
Significant Accounting Policies
The Fund is an investment company and follows accounting and reporting guidance under Financial Accounting Standards Board (“FASB”) Accounting Standards Codification (ASC) Topic 946 “Financial Services-Investment Companies.” The following is a summary of significant accounting policies followed by the Fund in the preparation of its financial statements in accordance with U.S. generally accepted accounting principles (“U.S. GAAP”).
Investment Transactions
Investment transactions are recorded on a trade date basis. Trade date for senior and subordinated loans purchased in the “primary market” is considered the date on which the loan allocations are determined. Trade date for senior and subordinated loans purchased in the “secondary market” is the date on which the transaction is entered into. Realized gains and losses from investment transactions are determined on the specific identification method, which is the same basis used for federal income tax purposes. Investments purchased on a when-issued/delayed delivery basis may have extended settlement periods. Any investments so purchased are subject to market fluctuation during this period. The Fund has earmarked securities in its portfolio with a current value at least equal to the amount of the when-issued/delayed delivery purchase commitments.
As of the end of the reporting period, the Fund’s outstanding when-issued/delayed delivery purchase commitments were as follows:
| | | | |
Outstanding when-issued/delayed delivery purchase commitments | | | $14,676,615 | |
Investment Income
Investment income is comprised of interest income, which reflects the amortization of premiums and accretion of discounts for financial reporting purposes, and is recorded on an accrual basis. Investment income also reflects payment-in-kind (“PIK”) interest and fee income, if any. PIK interest represents income received in the form of securities in lieu of cash. Fee income consists primarily of amendment fees. Amendment fees are earned as compensation for evaluating and accepting changes to an original senior loan agreement and are recognized when received.
28
Professional Fees
Professional fees presented on the Statement of Operations consist of legal fees incurred in the normal course of operations, audit fees, tax consulting fees and, in some cases, workout expenditures. Workout expenditures are incurred in an attempt to protect or enhance an investment or to pursue other claims or legal actions on behalf of Fund shareholders. If a refund is received for workout expenditures paid in a prior reporting period, such amounts will be recognized as “Legal fee refund” on the Statement of Operations.
Dividends and Distributions to Common Shareholders
Dividends to common shareholders, if any, are declared monthly. Net realized capital gains from investment transactions, if any, are declared and distributed to shareholders at least annually. However, in seeking to achieve its investment objectives, the Fund currently intends to set aside and retain in its net assets (and therefore its NAV) a portion of its net investment income, and possibly all or a portion of its gains. This will reduce the amounts otherwise available for distribution prior to the liquidation of the Fund, and the Fund may incur taxes on such retained amount. Such retained income or gains, net of any taxes, would constitute a portion of the liquidating distribution returned to investors on or about the Termination Date. Furthermore, capital gains are distributed only to the extent they exceed available capital loss carryforwards.
Distributions to common shareholders are recorded on theex-dividend date. The amount and timing of distributions are determined in accordance with federal income tax regulations, which may differ from U.S. GAAP.
Compensation
The Fund pays no compensation directly to those of its trustees who are affiliated with the Adviser or to its officers, all of whom receive renumeration for their services to the Fund from the Adviser or its affiliates. The Fund’s Board of Trustees (the “Board”) has adopted a deferred compensation plan for independent trustees that enables trustees to elect to defer receipt of all or a portion of the annual compensation they are entitled to receive from certain Nuveen-advised funds. Under the plan, deferred amounts are treated as though equal dollar amounts had been invested in shares of select Nuveen-advised funds.
Indemnifications
Under the Fund’s organizational documents, its officers and trustees are indemnified against certain liabilities arising out of the performance of their duties to the Fund. In addition, in the normal course of business, the Fund enters into contracts that provide general indemnifications to other parties. The Fund’s maximum exposure under these arrangements is unknown as this would involve future claims that may be made against the Fund that have not yet occurred. However, the Fund has not had prior claims or losses pursuant to these contracts and expects the risk of loss to be remote.
Netting Agreements
In the ordinary course of business, the Fund may enter into transactions subject to enforceable International Swaps and Derivatives Association, Inc. (ISDA) master agreements or other similar arrangements (“netting agreements”). Generally, the right to offset in netting agreements allows the Fund to offset certain securities and derivatives with a specific counterparty, when applicable, as well as any collateral received or delivered to that counterparty based on the terms of the agreements. Generally, the Fund manages its cash collateral and securities collateral on a counterparty basis.
The Fund’s investments subject to netting agreements as of the end of the reporting period, if any, are further described in Note 3 – Portfolio Securities and Investments in Derivatives.
Use of Estimates
The preparation of financial statements in conformity with U.S. GAAP requires management to make estimates and assumptions that affect the reported amounts of assets and liabilities at the date of the financial statements and the reported amounts of increases and decreases in net assets applicable to common shares from operations during the current fiscal period. Actual results may differ from those estimates.
2. Investment Valuation and Fair Value Measurements
The fair valuation input levels as described below are for fair value measurement purposes.
Fair value is defined as the price that would be received upon selling an investment or transferring a liability in an orderly transaction to an independent buyer in the principal or most advantageous market for the investment. A three-tier hierarchy is used to maximize the use of observable market data and minimize the use of unobservable inputs and to establish classification of fair value measurements for disclosure purposes. Observable inputs reflect the assumptions market participants would use in pricing the asset or liability. Observable inputs are based on market data obtained from sources independent of the reporting entity. Unobservable inputs reflect the reporting entity’s own assumptions about the assumptions market participants would use in pricing the asset or liability. Unobservable inputs are based on the best information available in the circumstances. The following is a summary of the three-tiered hierarchy of valuation input levels.
29
Notes to Financial Statements(Unaudited) (continued)
| | |
| Level 1 – | | Inputs are unadjusted and prices are determined using quoted prices in active markets for identical securities. |
| Level 2 – | | Prices are determined using other significant observable inputs (including quoted prices for similar securities, interest rates, credit spreads, etc.). |
| Level 3 – | | Prices are determined using significant unobservable inputs (including management’s assumptions in determining the fair value of investments). |
Prices of fixed-income securities are provided by an independent pricing service (“pricing service”) approved by the Board. The pricing service establishes a security’s fair value using methods that may include consideration of the following: yields or prices of investments of comparable quality, type of issue, coupon, maturity and rating, market quotes or indications of value from security dealers, evaluations of anticipated cash flows or collateral, general market conditions and other information and analysis, including the obligor’s credit characteristics considered relevant. These securities are generally classified as Level 2. In pricing certain securities, particularly less liquid and lower quality securities, the pricing service may consider information about a security, its issuer or market activity provided by the Adviser. These securities are generally classified as Level 2 or Level 3 depending on the observability of the significant inputs.
Like most fixed-income securities, the senior and subordinated loans in which the Fund invests are not listed on an organized exchange. The secondary market of such investments may be less liquid relative to markets for other fixed-income securities. Consequently, the value of senior and subordinated loans, determined as described above, may differ significantly from the value that would have been determined had there been an active market for that senior loan. These securities are generally classified as Level 2.
Investments in investment companies are valued at their respective NAVs on valuation date and are generally classified as Level 1.
Certain securities may not be able to be priced by thepre-established pricing methods as described above. Such securities may be valued by the Board and/or its appointee at fair value. These securities generally include, but are not limited to, restricted securities (securities which may not be publicly sold without registration under the Securities Act of 1933, as amended) for which a pricing service is unable to provide a market price; securities whose trading has been formally suspended; debt securities that have gone into default and for which there is no current market quotation; a security whose market price is not available from apre-established pricing source; a security with respect to which an event has occurred that is likely to materially affect the value of the security after the market has closed but before the calculation of the Fund’s NAV (as may be the case innon-U.S. markets on which the security is primarily traded) or make it difficult or impossible to obtain a reliable market quotation; and a security whose price, as provided by the pricing service, is not deemed to reflect the security’s fair value. As a general principle, the fair value of a security would appear to be the amount that the owner might reasonably expect to receive for it in a current sale. A variety of factors may be considered in determining the fair value of such securities, which may include consideration of the following: yields or prices of investments of comparable quality, type of issue, coupon, maturity and rating, market quotes or indications of value from security dealers, evaluations of anticipated cash flows or collateral, general market conditions and other information and analysis, including the obligor’s credit characteristics considered relevant. These securities are generally classified as Level 2 or Level 3 depending on the observability of the significant inputs. Regardless of the method employed to value a particular security, all valuations are subject to review by the Board and/or its appointee.
The inputs or methodologies used for valuing securities are not an indication of the risks associated with investing in those securities. The following is a summary of the Fund’s fair value measurements as of the end of the reporting period:
| | | | | | | | | | | | | | | | |
| | | Level 1 | | | Level 2 | | | Level 3 | | | Total | |
Long-Term Investments*: | | | | | | | | | | | | | | | | |
Corporate Bonds | | $ | — | | | $ | 269,415,119 | | | $ | — | | | $ | 269,415,119 | |
Variable Rate Senior Loan Interests | | | — | | | | 105,437,020 | | | | — | | | | 105,437,020 | |
| | | | |
Short-Term Investments: | | | | | | | | | | | | | | | | |
Investment Companies | | | 10,363,251 | | | | — | | | | — | | | | 10,363,251 | |
Total | | $ | 10,363,251 | | | $ | 374,852,139 | | | $ | — | | | $ | 385,215,390 | |
| * | Refer to the Fund’s Portfolio of Investments for industry classifications. |
3. Portfolio Securities and Investments in Derivatives
Portfolio Securities
Zero Coupon Securities
A zero coupon security does not pay a regular interest coupon to its holders during the life of the security. Income to the holder of the security comes from accretion of the difference between the original purchase price of the security at issuance and the par value of the security at maturity and is effectively paid at maturity. The market prices of zero coupon securities generally are more volatile than the market prices of securities that pay interest periodically.
30
Investments in Derivatives
The Fund is authorized to invest in certain derivative instruments such as futures, options and swap contracts. The Fund limits its investments in futures, options on futures and swap contracts to the extent necessary for the Adviser to claim the exclusion from registration by the Commodity Futures Trading Commission as a commodity pool operator with respect to the Fund. The Fund records derivative instruments at fair value, with changes in fair value recognized on the Statement of Operations, when applicable. Even though the Fund’s investments in derivatives may represent economic hedges, they are not considered to be hedge transactions for financial reporting purposes.
Although the Fund is authorized to invest in derivative instruments, and may do so in the future, it did not make any such investments during the current fiscal period.
Market and Counterparty Credit Risk
In the normal course of business the Fund may invest in financial instruments and enter into financial transactions where risk of potential loss exists due to changes in the market (market risk) or failure of the other party to the transaction to perform (counterparty credit risk). The potential loss could exceed the value of the financial assets recorded on the financial statements. Financial assets, which potentially expose the Fund to counterparty credit risk, consist principally of cash due from counterparties on forward, option and swap transactions, when applicable. The extent of the Fund’s exposure to counterparty credit risk in respect to these financial assets approximates their carrying value as recorded on the Statement of Assets and Liabilities.
The Fund helps manage counterparty credit risk by entering into agreements only with counterparties the Adviser believes have the financial resources to honor their obligations and by having the Adviser monitor the financial stability of the counterparties. Additionally, counterparties may be required to pledge collateral daily (based on the daily valuation of the financial asset) on behalf of the Fund with a value approximately equal to the amount of any unrealized gain above apre-determined threshold. Reciprocally, when the Fund has an unrealized loss, the Fund has instructed the custodian to pledge assets of the Fund as collateral with a value approximately equal to the amount of the unrealized loss above apre-determined threshold. Collateral pledges are monitored and subsequently adjusted if and when the valuations fluctuate, either up or down, by at least thepre-determined threshold amount.
4. Fund Shares
Common Share Transactions
Transactions in common shares during the Fund’s current and prior fiscal period were as follows:
| | | | | | | | |
| | | Six Months
Ended
6/30/19 | | | Year
Ended
12/31/18 | |
Common Shares: | | | | | | | | |
Issued to shareholders due to reinvestment of distributions | | | 7,690 | | | | — | |
5. Investment Transactions
Long-term purchases and sales (including maturities) during the current fiscal period aggregated $122,172,037 and $120,420,006, respectively.
6. Income Tax Information
The Fund intends to distribute substantially all of its net investment company taxable income to shareholders and to otherwise comply with the requirements of Subchapter M of the Internal Revenue Code applicable to regulated investment companies. In any year when the Fund realizes net capital gains, the Fund may choose to distribute all or a portion of its net capital gains to shareholders, or alternatively, to retain all or a portion of its net capital gains and pay federal corporate income taxes on such retained gains.
For all open tax years and all major taxing jurisdictions, management of the Fund has concluded that there are no significant uncertain tax positions that would require recognition in the financial statements. Open tax years are those that are open for examination by taxing authorities (i.e., generally the last four tax year ends and the interim tax period since then). Furthermore, management of the Fund is also not aware of any tax positions for which it is reasonably possible that the total amounts of unrecognized tax benefits will significantly change in the next twelve months.
The following information is presented on an income tax basis. Differences between amounts for financial statement and federal income tax purposes are primarily due to the recognition of premium amortization and timing differences in recognizing certain gains and losses on investment transactions. To the extent that differences arise that are permanent in nature, such amounts are reclassified within the capital accounts as detailed below. Temporary differences do not require reclassification. Temporary and permanent differences do not impact the NAV of the Fund.
31
Notes to Financial Statements(Unaudited) (continued)
The table below presents the cost and unrealized appreciation (depreciation) of the Fund’s investment portfolio, as determined on a federal income tax basis as of June 30, 2019.
| | | | |
Tax cost of investments | | $ | 388,601,010 | |
Gross unrealized: | | | | |
Appreciation | | $ | 4,475,767 | |
Depreciation | | | (7,861,387 | ) |
Net unrealized appreciation (depreciation) of investments | | $ | (3,385,620 | ) |
|
| Permanent differences, primarily due to federal taxes paid and bond premium amortization adjustments, resulted in reclassifications among the Fund’s components of common share net assets as of December 31, 2018, the Fund’s last tax year end. | |
| The tax components of undistributed net ordinary income and net long-term capital gains as of December 31, 2018, the Fund’s last tax year end, were as follows: | |
Undistributed net ordinary income1 | | $ | 5,031,418 | |
Undistributed net long-term capital gains | | | — | |
|
1 Net ordinary income consists of net taxable income derived from dividends, interest, and net short-term capital gains, if any. | |
|
| The tax character of distributions paid during the Fund’s last tax year ended December 31, 2018 was designated for purposes of the dividends paid deduction as follows: | |
Distributions from net ordinary income1 | | $ | 15,613,674 | |
Distributions from net long-term capital gains | | | — | |
|
1 Net ordinary income consists of net taxable income derived from dividends, interest, and net short-term capital gains, if any. | |
|
| As of December 31, 2018, the Fund’s last tax year end, the Fund had unused capital losses carrying forward available for federal income tax purposes to be applied against future capital gains, if any. The capital losses are not subject to expiration. | |
Not subject to expiration: | | | | |
Short-term | | $ | 280,494 | |
Long-term | | | 634,972 | |
Total | | $ | 915,466 | |
7. Management Fees
The Fund’s management fee compensates the Adviser for overall investment advisory and administrative services and general office facilities. TheSub-Adviser is compensated for its services to the Fund from the management fees paid to the Adviser.
The Fund’s management fee consists of two components – a fund-level fee, based only on the amount of assets within the Fund, and a complex-level fee, based on the aggregate amount of all eligible fund assets managed by the Adviser. This pricing structure enables Fund shareholders to benefit from growth in the assets within the Fund as well as from growth in the amount of complex-wide assets managed by the Adviser.
The annual fund-level fee, payable monthly, is calculated according to the following schedule:
| | | | |
| Average Daily Managed Assets* | | Fund-Level Fee Rate | |
For the first $500 million | | | 0.5000 | % |
For the next $250 million | | | 0.4875 | |
For managed assets over $750 million | | | 0.4750 | |
32
The annual complex-level fee, payable monthly, is calculated by multiplying the current complex-wide fee rate, determined according to the following schedule by the Fund’s daily managed assets:
| | | | |
| Complex-Level Eligible Asset Breakpoint Level* | | Effective Complex-Level Fee Rate at Breakpoint Level | |
$55 billion | | | 0.2000 | % |
$56 billion | | | 0.1996 | |
$57 billion | | | 0.1989 | |
$60 billion | | | 0.1961 | |
$63 billion | | | 0.1931 | |
$66 billion | | | 0.1900 | |
$71 billion | | | 0.1851 | |
$76 billion | | | 0.1806 | |
$80 billion | | | 0.1773 | |
$91 billion | | | 0.1691 | |
$125 billion | | | 0.1599 | |
$200 billion | | | 0.1505 | |
$250 billion | | | 0.1469 | |
$300 billion | | | 0.1445 | |
| * | For the complex-level fees, managed assets includeclosed-end fund assets managed by the Adviser that are attributable to certain types of leverage. For these purposes, leverage includes the funds’ use of preferred stock and borrowings and certain investments in the residual interest certificates (also called inverse floating rate securities) in tender option bond (TOB) trusts, including the portion of assets held by a TOB trust that has been effectively financed by the trust’s issuance of floating rate securities, subject to an agreement by the Adviser as to certain funds to limit the amount of such assets for determining managed assets in certain circumstances. The complex-level fee is calculated based upon the aggregate daily managed assets of all Nuveen open-end and closed-end Funds that constitute “eligible assets.” Eligible assets do not include assets attributable to investments in other Nuveen funds or assets in excess of a determined amount (originally $2 billion) added to the Nuveen fund complex in connection with the Adviser’s assumption of the management of the former First American Funds effective January 1, 2011. As of June 30, 2019, the complex-level fee for the Fund was 0.1577%. |
8. Senior Loan Commitments
Unfunded Commitments
Pursuant to the terms of certain of the variable rate senior loan agreements, the Fund may have unfunded senior loan commitments. The Fund will maintain with its custodian, cash, liquid securities and/or liquid senior loans having an aggregate value at least equal to the amount of unfunded senior loan commitments. As of the end of the reporting period, the Fund had no such unfunded senior loan commitments.
Participation Commitments
With respect to the senior loans held in the Fund’s portfolio, the Fund may: 1) invest in assignments; 2) act as a participant in primary lending syndicates; or 3) invest in participations. If the Fund purchases a participation of a senior loan interest, the Fund would typically enter into a contractual agreement with the lender or other third party selling the participation, rather than directly with the borrower. As such, the Fund not only assumes the credit risk of the borrower, but also that of the selling participant or other persons interpositioned between the Fund and the borrower. As of the end of the reporting period, the Fund had no such outstanding participation commitments.
9. Borrowing Arrangements
Borrowings
The Fund has entered into a borrowing arrangement as a means of leverage.
As of the end of the reporting period, the Fund has a $110,000,000 (maximum commitment amount) revolving line of credit (“Borrowings”). As of the end of the reporting period, the outstanding balance on these Borrowings was $110,000,000.
Interest is charged on these Borrowings at 1-Month LIBOR (London Inter-Bank Offered Rate) plus 0.75% (0.80% prior to April 3, 2019) per annum on the amount borrowed and 0.25% per annum on the undrawn balance. The Fund is only charged the 0.25% per annum undrawn fee if the undrawn portion of the Borrowings on that day is more than 25% of the maximum commitment amount. During the current fiscal period, the daily balance outstanding and average annual interest rate on these Borrowings were $110,000,000 and 3.25%, respectively.
In order to maintain these Borrowings, the Fund must meet certain collateral, asset coverage and other requirements. Borrowings outstanding are fully secured by securities held in the Fund’s portfolio of investments.
Borrowings outstanding are recognized as “Borrowings” on the Statement of Assets and Liabilities. Interest expense incurred on the drawn amount and undrawn balance are recognized as a component of “Interest expense on borrowings” on the Statement of Operations.
33
Notes to Financial Statements(Unaudited) (continued)
Inter-Fund Borrowing and Lending
The Securities Exchange Commission (“SEC”) has granted an exemptive order permitting registered open-end and closed-end Nuveen funds to participate in an inter-fund lending facility whereby the Nuveen funds may directly lend to and borrow money from each other for temporary purposes (e.g., to satisfy redemption requests or when a sale of securities “fails,” resulting in an unanticipated cash shortfall) (the “Inter-Fund Program”). The closed-end Nuveen funds, including the Fund covered by this shareholder report, will participate only as lenders, and not as borrowers, in the Inter-Fund Program because such closed-end funds rarely, if ever, need to borrow cash to meet redemptions. The Inter-Fund Program is subject to a number of conditions, including, among other things, the requirements that (1) no fund may borrow or lend money through the Inter-Fund Program unless it receives a more favorable interest rate than is typically available from a bank or other financial institution for a comparable transaction; (2) no fund may borrow on an unsecured basis through the Inter-Fund Program unless the fund’s outstanding borrowings from all sources immediately after the inter-fund borrowing total 10% or less of its total assets; provided that if the borrowing fund has a secured borrowing outstanding from any other lender, including but not limited to another fund, the inter-fund loan must be secured on at least an equal priority basis with at least an equivalent percentage of collateral to loan value; (3) if a fund’s total outstanding borrowings immediately after an inter-fund borrowing would be greater than 10% of its total assets, the fund may borrow through the inter-fund loan on a secured basis only; (4) no fund may lend money if the loan would cause its aggregate outstanding loans through the Inter-Fund Program to exceed 15% of its net assets at the time of the loan; (5) a fund’s inter-fund loans to any one fund shall not exceed 5% of the lending fund’s net assets; (6) the duration of inter-fund loans will be limited to the time required to receive payment for securities sold, but in no event more than seven days; and (7) each inter-fund loan may be called on one business day’s notice by a lending fund and may be repaid on any day by a borrowing fund. In addition, a Nuveen fund may participate in the Inter-Fund Program only if and to the extent that such participation is consistent with the fund’s investment objective and investment policies. The Board is responsible for overseeing the Inter-Fund Program.
The limitations detailed above and the other conditions of the SEC exemptive order permitting the Inter-Fund Program are designed to minimize the risks associated with Inter-Fund Program for both the lending fund and the borrowing fund. However, no borrowing or lending activity is without risk. When a fund borrows money from another fund, there is a risk that the loan could be called on one day’s notice or not renewed, in which case the fund may have to borrow from a bank at a higher rate or take other actions to payoff such loan if an inter-fund loan is not available from another fund. Any delay in repayment to a lending fund could result in a lost investment opportunity or additional borrowing costs.
During the current reporting period, the Fund did not enter into any inter-fund loan activity.
10. New Accounting Pronouncements
FASB Accounting Standards Update (“ASU”) 2017-08 (“ASU 2017-08”) Premium Amortization on Purchased Callable Debt Securities
The FASB has issued ASU 2017-08, which shortens the premium amortization period for purchased non-contingently callable debt securities.ASU 2017-08 specifies that the premium amortization period ends at the earliest call date, for purchased non-contingently callable debt securities. ASU 2017-08 is effective for fiscal years, and interim periods within those fiscal years, beginning after December 15, 2018. During the current fiscal period, ASU 2017-08 became effective for the Funds and it did not have a material impact on the Fund’s financial statements.
Fair Value Measurement: Disclosure Framework
During August 2018, the FASB issued ASU 2018-13 (“ASU 2018-13”),Fair Value Measurement: Disclosure Framework – Changes to the Disclosure Requirements for Fair Value Measurements. ASU 2018-13 modifies the disclosures required by Topic 820,Fair Value Measurements. The amendments in ASU 2018-13 are effective for all entities for fiscal years, and interim periods within those fiscal years, beginning after December 15, 2019. Management has early implemented this guidance and it did not have a material impact on the Fund’s financial statements.
11. Subsequent Events
Complex-Level Management Fee
Effective August 1, 2019 (subsequent to the close of the reporting period), “eligible assets” of the complex-level management fee will include certain assets of certain Nuveen funds that were reorganized into funds advised by an affiliate of the Adviser during the 2019 calendar year.
34
Additional Fund Information
| | | | | | | | |
| Board of Trustees | | | | | | | | |
| Margo Cook* | | Jack B. Evans | | William C. Hunter | | Albin F. Moschner | | John K. Nelson |
Judith M. Stockdale | | Carole E. Stone | | Terence J. Toth | | Margaret L. Wolff | | Robert L. Young |
| * | Interested Board Member. |
| | | | | | | | |
| | | | | |
Fund Manager Nuveen Fund Advisors, LLC 333 West Wacker Drive Chicago, IL 60606 | | Custodian State Street Bank
& Trust Company One Lincoln Street Boston, MA 02111 | | Legal Counsel Chapman and Cutler LLP Chicago, IL 60603 | | Independent Registered
Public Accounting Firm KPMG LLP 200 East Randolph Street Chicago, IL 60601 | | Transfer Agent and
Shareholder Services Computershare Trust Company, N.A. 250 Royall Street Canton, MA 02021 (800) 257-8787 |
Portfolio of Investments Information
The Fund is required to file its complete schedule of portfolio holdings with the Securities and Exchange Commission (SEC) for the first and third quarters of each fiscal year as an exhibit to its report on Form N-PORT. You may obtain this information directly from the SEC’s website at http://www.sec.gov.
Nuveen Funds’ Proxy Voting Information
You may obtain (i) information regarding how each fund voted proxies relating to portfolio securities held during the most recent twelve-month period ended June 30, without charge, upon request, by calling Nuveen toll-free at (800) 257-8787 or on Nuveen’s website at www.nuveen.com and (ii) a description of the policies and procedures that each fund used to determine how to vote proxies relating to portfolio securities without charge, upon request, by calling Nuveen toll free at (800) 257-8787. You may also obtain this information directly from the SEC. Visit the SEC on-line at http://www.sec.gov.
CEO Certification Disclosure
The Fund’s Chief Executive Officer (CEO) has submitted to the New York Stock Exchange (NYSE) the annual CEO certification as required by Section 303A.12(a) of the NYSE Listed Company Manual. The Fund has filed with the SEC the certification of its CEO and Chief Financial Officer required by Section 302 of the Sarbanes-Oxley Act.
Common Share Repurchases
The Fund intends to repurchase, through its open-market share repurchase program, shares of its own common stock at such times and in such amounts as is deemed advisable. During the period covered by this report, the Fund repurchased shares of its common stock, as shown in the accompanying table. Any future repurchases will be reported to shareholders in the next annual or semi-annual report.
| | | | |
| | | JCO | |
Common shares repurchased | | | — | |
FINRA BrokerCheck
The Financial Industry Regulatory Authority (FINRA) provides information regarding the disciplinary history of FINRA member firms and associated investment professionals. This information as well as an investor brochure describing FINRA BrokerCheck is available to the public by calling the FINRA BrokerCheck Hotline number at (800) 289-9999 or by visiting www.FINRA.org.
35
Glossary of Terms Used in this Report
| ∎ | | Average Annual Total Return: This is a commonly used method to express an investment’s performance over a particular, usually multi-year time period. It expresses the return that would have been necessary each year to equal the investment’s actual cumulative performance (including change in NAV or market price and reinvested dividends and capital gains distributions, if any) over the time period being considered. |
| ∎ | | Blended Benchmark: A blended return comprised of: 1) 75% Bloomberg Barclays U.S. High Yield1-5 Year Cash Pay 2% Issue Capped Index, which tracks the performance of U.S.non-investment grade bonds with maturities of one to 4.99 years and limits each issue to 2% of the index and, 2) 25% Credit Suisse Leveraged Loan, which consists of approximately $150 billion of tradable term loans with at least one year to maturity and rated BBB or lower. Index returns assume reinvestment of distributions, but do not include the effects of any applicable sales charges or management fees. |
| ∎ | | Bloomberg Barclays U.S. High Yield 1-5 Year Cash Pay 2% Issuer Capped Index: An index that tracks the performance of U.S. non-investment grade bonds with maturities of one to 4.99 years and limits each issue to 2% of the index. Benchmark returns assume reinvestment of distributions, but do not reflect any applicable sales charges or management fees. |
| ∎ | | Collateralized Loan Obligation (CLO): A security backed by a pool of debt, often low rated corporate loans. Collateralized loan obligations (CLOs) are similar to collateralized mortgage obligations, except for the different type of underlying loan. |
| ∎ | | Duration: Duration is a measure of the expected period over which a bond’s principal and interest will be paid, and consequently is a measure of the sensitivity of a bond’s or bond fund’s value to changes when market interest rates change. Generally, the longer a bond’s or fund’s duration, the more the price of the bond or fund will change as interest rates change. |
| ∎ | | Effective Leverage: Effective leverage is a fund’s effective economic leverage, and includes both regulatory leverage (see below) and the leverage effects of certain derivative investments in the fund’s portfolio that increase the fund’s investment exposure. |
| ∎ | | Leverage: Leverage is created whenever a fund has investment exposure (both reward and/or risk) equivalent to more than 100% of the investment capital. |
| ∎ | | Net Asset Value (NAV) Per Share: A fund’s Net Assets is equal to its total assets (securities, cash, accrued earnings and receivables) less its total liabilities. NAV per share is equal to the fund’s Net Assets divided by its number of shares outstanding. |
| ∎ | | Regulatory Leverage: Regulatory leverage consists of preferred shares issued by or borrowings of a fund. Both of these are part of a fund’s capital structure. Regulatory leverage is subject to asset coverage limits set in the Investment Company Act of 1940. |
36
Reinvest Automatically, Easily and Conveniently
Nuveen makes reinvesting easy. A phone call is all it takes to set up your reinvestment account.
Nuveen Closed-End Funds Automatic Reinvestment Plan
Your Nuveen Closed-End Fund allows you to conveniently reinvest distributions in additional Fund shares.
By choosing to reinvest, you’ll be able to invest money regularly and automatically, and watch your investment grow through the power of compounding. Just like distributions in cash, there may be times when income or capital gains taxes may be payable on distributions that are reinvested.
It is important to note that an automatic reinvestment plan does not ensure a profit, nor does it protect you against loss in a declining market.
Easy and convenient
To make recordkeeping easy and convenient, each quarter you’ll receive a statement showing your total distributions, the date of investment, the shares acquired and the price per share, and the total number of shares you own.
How shares are purchased
The shares you acquire by reinvesting will either be purchased on the open market or newly issued by the Fund. If the shares are trading at or above net asset value at the time of valuation, the Fund will issue new shares at the greater of the net asset value or 95% of the then-current market price. If the shares are trading at less than net asset value, shares for your account will be purchased on the open market. If the Plan Agent begins purchasing Fund shares on the open market while shares are trading below net asset value, but the Fund’s shares subsequently trade at or above their net asset value before the Plan Agent is able to complete its purchases, the Plan Agent may cease open-market purchases and may invest the uninvested portion of the distribution in newly-issued Fund shares at a price equal to the greater of the shares’ net asset value or 95% of the shares’ market value on the last business day immediately prior to the purchase date. Distributions received to purchase shares in the open market will normally be invested shortly after the distribution payment date. No interest will be paid on distributions awaiting reinvestment. Because the market price of the shares may increase before purchases are completed, the average purchase price per share may exceed the market price at the time of valuation, resulting in the acquisition of fewer shares than if the distribution had been paid in shares issued by the Fund. A pro rata portion of any applicable brokerage commissions on open market purchases will be paid by Plan participants. These commissions usually will be lower than those charged on individual transactions.
Flexible
You may change your distribution option or withdraw from the Plan at any time, should your needs or situation change.
You can reinvest whether your shares are registered in your name, or in the name of a brokerage firm, bank, or other nominee. Ask your investment advisor if his or her firm will participate on your behalf. Participants whose shares are registered in the name of one firm may not be able to transfer the shares to another firm and continue to participate in the Plan.
The Fund reserves the right to amend or terminate the Plan at any time. Although the Fund reserves the right to amend the Plan to include a service charge payable by the participants, there is no direct service charge to participants in the Plan at this time.
Call today to start reinvesting distributions
For more information on the Nuveen Automatic Reinvestment Plan or to enroll in or withdraw from the Plan, speak with your financial advisor or call us at (800) 257-8787.
37
Annual Investment Management Agreement Approval Process
(Unaudited)
At a meeting held onMay 21-23, 2019 (the“May Meeting”), the Board of Trustees (the“Board” and each Trustee, a“Board Member”) of the Fund, including the Board Members who are not “interested persons” (as defined under the Investment Company Act of 1940 (the“1940 Act”)) (the“Independent Board Members”), approved the renewal of the management agreement (the“Investment Management Agreement”) with Nuveen Fund Advisors, LLC (the“Adviser”) pursuant to which the Adviser serves as investment adviser to the Fund and thesub-advisory agreement (the“Sub-Advisory Agreement”) with Symphony Asset Management LLC (the“Sub-Adviser”) pursuant to which theSub-Adviser serves as thesub-adviser to the Fund. Following an initialtwo-year period, the Board, including the Independent Board Members, is required under the 1940 Act to review and approve the Investment Management Agreement andSub-Advisory Agreement on behalf of the Fund on an annual basis. The Investment Management Agreement andSub-Advisory Agreement are collectively referred to as the“Advisory Agreements”and the Adviser and theSub-Adviser are collectively, the“Fund Advisers” and each, a“Fund Adviser.”
In response to a request on behalf of the Independent Board Members by independent legal counsel, the Board received and reviewed prior to the May Meeting extensive materials specifically prepared for the annual review of Advisory Agreements by the Adviser as well as by Broadridge Financial Solutions, Inc. (“Broadridge”), an independent provider of investment company data. The materials provided in connection with the annual review covered a breadth of subject matter including, but not limited to, a description of the nature, extent and quality of services provided by the Fund Advisers; a review of theSub-Adviser and investment team; an analysis of fund performance in absolute terms and as compared to the performance of certain peer funds and benchmarks with a focus on any performance outliers; an analysis of the fees and expense ratios of the Nuveen funds in absolute terms and as compared to those of certain peer funds with a focus on any expense outliers; a description of portfolio manager compensation; a review of the secondary market trading of shares of the Nuveenclosed-end funds (including, among other things, an analysis of performance, distribution and valuation and capital raising trends in the broaderclosed-end fund market and in particular with respect to Nuveenclosed-end funds; a review of the leverage management actions taken on behalf of the Nuveenclosed-end funds and their resulting impact on performance; and a description of the distribution management process and any capital management activities); a review of the performance of various service providers; a description of various initiatives Nuveen had undertaken or continued during the year for the benefit of particular fund(s) and/or the complex; a description of the profitability or financial data of Nuveen and theSub-Adviser; and a description of indirect benefits received by the Fund Advisers as a result of their relationships with the Nuveen funds. The Board Members held anin-person meeting onApril 17-18, 2019 (the“April Meeting”), in part, to review and discuss the performance of the Nuveen funds and the Adviser’s evaluation of the varioussub-advisers to the Nuveen funds. The Independent Board Members asked questions and requested additional information that was provided for the May Meeting.
The information prepared specifically for the annual review of the Advisory Agreements supplemented the information provided to the Board and its committees throughout the year. The Board and its committees met regularly during the year and the information provided and topics discussed were relevant to the review of the Advisory Agreements. Some of these reports and other data included, among other things, materials that outlined the investment performance of the Nuveen funds; strategic plans of the Adviser which may impact the services it provides to the Nuveen funds; the review of the Nuveen funds and applicable investment teams; the management of leverage financing forclosed-end funds; the secondary market trading of theclosed-end funds and any actions to address discounts; compliance, regulatory and risk management matters; the trading practices of the varioussub-advisers; valuation of securities; fund expenses; and overall market and regulatory developments. The Board further continued its practice of seeking to meet periodically with the varioussub-advisers to the Nuveen funds and their investment teams, when feasible. The Independent Board Members considered the review of the Advisory Agreements to be an ongoing process and employed the accumulated information, knowledge, and experience the Board Members had gained during their tenure on the boards governing the Nuveen funds and working with the Fund Advisers in their review of the Advisory Agreements. The contractual arrangements are a result of multiple years of review, negotiation and information provided in connection with the boards’ annual review of the Nuveen funds’ advisory arrangements and oversight of the Nuveen funds.
The Independent Board Members were advised by independent legal counsel during the annual review process as well as throughout the year, including meeting in executive sessions with such counsel at which no representatives from the Adviser or
38
theSub-Adviser were present. In connection with their annual review, the Independent Board Members also received a memorandum from independent legal counsel outlining their fiduciary duties and legal standards in reviewing the Advisory Agreements.
In deciding to renew the Advisory Agreements, the Independent Board Members did not identify a particular factor or information as determinative or controlling, but rather the decision reflected the comprehensive consideration of all the information provided, and each Board Member may have attributed different levels of importance to the various factors and information considered in connection with the approval process. The following summarizes the principal factors and information, but not all the factors, the Board considered in deciding to renew the Advisory Agreements and its conclusions.
| A. | | Nature, Extent and Quality of Services |
In evaluating the renewal of the Advisory Agreements, the Independent Board Members received and considered information regarding the nature, extent and quality of the applicable Fund Adviser’s services provided to the Fund with particular focus on the services and enhancements to such services provided during the last year. The Board recognized that the Adviser provides a comprehensive set of services necessary to operate the Nuveen funds in a highly regulated industry and noted that the scope of such services has expanded over the years as a result of regulatory, market and other developments, such as the development of the liquidity management program and expanded compliance programs. Some of the functions the Adviser is responsible for include, but are not limited to: product management (such as analyzing a fund’s position in the marketplace, setting dividends, preparing shareholder and intermediary communications and other due diligence support); investment oversight (such as analyzing fund performance,sub-advisers and investment teams and analyzing trade executions of portfolio transactions, soft dollar practices and securities lending activities); securities valuation services (such as executing the daily valuation process for portfolio securities and developing and recommending changes to valuation policies and procedures); risk management (such as overseeing operational and investment risks, including stress testing); fund administration (such as preparing fund tax returns and other tax compliance services, overseeing the Nuveen funds’ independent public accountants and other service providers; managing fund budgets and expenses; and helping to fulfill the funds’ regulatory filing requirements); oversight of shareholder services and transfer agency functions (such as oversight and liaison of transfer agent service providers which include registered shareholder customer service and transaction processing); Board relations services (such as organizing and administering Board and committee meetings, preparing various reports to the Board and committees and providing other support services); compliance and regulatory oversight services (such as developing and maintaining a compliance program to ensure compliance with applicable laws and regulations, monitoring compliance with applicable fund policies and procedures and adherence to investment restrictions, and evaluating the compliance programs of the Nuveen fundsub-advisers and certain other service providers); legal support and oversight of outside law firms (such as with respect to filing and updating registration statements; maintaining various regulatory registrations; and providing legal interpretations regarding fund activities, applicable regulations and implementation of policies and procedures); and leverage, capital and distribution management services. In reviewing the scope and quality of services, the Board recognized the continued efforts and resources the Adviser and its affiliates have employed to continue to enhance their services for the benefit of the complex as well as particular Nuveen funds over recent years. Such service enhancements have included, but are not limited to:
| | • | | Fund Improvements and Product Management Initiatives – continuing to proactively manage the Nuveen fund complex as a whole and at the individual fund level with an aim to enhance the shareholder outcomes through, among other things, repositioning funds, merging funds, reviewing and updating investment policies and benchmarks, modifying the composition of certain portfolio management teams and analyzing various data to help devise such improvements; |
| | • | | Capital Initiatives – continuing to invest capital to support new funds with initial capital as well as to facilitate modifications to the strategies or structure of existing funds; |
| | • | | Compliance Program Initiatives– continuing efforts to enhance the compliance program through, among other things, internally integrating various portfolio management teams and aligning compliance support accordingly, completing a comprehensive review of existing policies and procedures and revising such policies and procedures as appropriate, enhancingcompliance-related technologies and workflows, and optimizing compliance shared services across the organization and affiliates; |
39
Annual Investment Management Agreement Approval Process(continued)
(Unaudited)
| | • | | Risk Management and Valuation Services – continuing efforts to strengthen the risk management functions, including through, among other things, enhancing the interaction and reporting between the investment risk management team and various affiliates, increasing the efficiency of risk monitoring performed on the Nuveen funds through improved reporting, continuing to implement risk programs designed to provide a more disciplined and consistent approach to identifying and mitigating operational risks, continuing progress on implementing a liquidity program that complies with the new liquidity regulatory requirements and continuing to oversee the daily valuation process; |
| | • | | Additional Compliance Services – continuing investment of time and resources necessary to develop the compliance policies and procedures and other related tools necessary to meet the various new regulatory requirements affecting the Nuveen funds that have been adopted over recent years; |
| | • | | Government Relations – continuing efforts of various Nuveen teams and affiliates to advocate and communicate their positions with lawmakers and other regulatory bodies on issues that will impact the Nuveen funds; |
| | • | | Business Continuity, Disaster Recovery and Information Services – establishing an information security program to help identify and manage information security risks, periodically testing disaster recovery plans, maintaining and updating business continuity plans and providing reports to the Board, at least annually, addressing, among other things, management’s security risk assessment, cyber risk profile, incident tracking and other relevant information technologyrisk-related reports; |
| | • | | Expanded Dividend Management Services – continuing to expand the services necessary to manage the dividends among the varying types of Nuveen funds that have developed as the Nuveen complex has grown in size and scope; and |
| | • | | with respect specifically toclosed-end funds, such initiatives also included: |
| | • | | Leverage Management Services – continuing to actively manage leverage including developing new leverage instruments, refinancing existing leverage and negotiating reductions in associated leverage expenses; |
| | • | | Capital Management Services – ongoing capital management efforts through a share repurchase program as well as a shelf offering program that raises additional equity capital in seeking to enhance shareholder value; |
| | • | | Data and Market Analytics – continuing focus on analyzing data and market analytics to better understand the ownership cycles and secondary market experience ofclosed-end funds; and |
| | • | | Closed-end Fund Investor Relations Program – maintaining theclosed-end fund investor relations program which, among other things, raises awareness, provides educational materials and cultivates advocacy forclosed-end funds and the Nuveenclosed-end fund product line. |
In addition to the services provided by the Adviser, the Board also considered the risks borne by the Adviser and its affiliates in managing the Nuveen funds, including entrepreneurial, operational, reputational, regulatory and litigation risks.
The Board further considered the division of responsibilities between the Adviser and theSub-Adviser and recognized that theSub-Adviser and its investment personnel generally are responsible for the management of the Fund’s portfolio. The Board noted that the Adviser oversees theSub-Adviser and considered an analysis of theSub-Adviser provided by the Adviser which included, among other things, theSub-Adviser’s assets under management and changes thereto, a summary of the investment team and changes thereto, the investment approach of the team and the performance of the fundssub-advised by theSub-Adviser over various periods. The Board further considered at the May Meeting or prior meetings evaluations of theSub-Adviser’s compliance program and trade execution. The Board noted that the Adviser recommended the renewal of theSub-Advisory Agreement.
Based on its review, the Board determined, in the exercise of its reasonable business judgment, that it was satisfied with the nature, extent and quality of services provided to the Fund under each applicable Advisory Agreement.
| B. | | The Investment Performance of the Fund and Fund Advisers |
In evaluating the quality of the services provided by the Fund Advisers, the Board also received and considered the investment performance of the Nuveen funds they advise. In this regard, the Board reviewed Fund performance over the
40
quarter andone-year periods ending December 31, 2018 as well as performance data for the first quarter of 2019 ending March 29, 2019. Unless otherwise indicated, the performance data referenced below reflects the periods ended December 31, 2018. The Board considered the Adviser’s analysis of each fund’s performance, with particular focus on funds that were considered performance outliers and the factors contributing to their performance. The Board also noted that it received performance data of the Nuveen funds during its quarterly meetings throughout the year and took into account the discussions that occurred at these Board meetings regarding fund performance. In this regard, in its evaluation of Nuveen fund performance at meetings throughout the year, the Board considered performance information for the funds for different time periods, both absolute and relative to appropriate benchmarks and peers, with particular attention to information indicating underperformance of the respective funds and discussed with the Adviser the reasons for such underperformance.
The Board reviewed both absolute and relative fund performance during the annual review. With respect to the latter, the Board considered fund performance in comparison to the performance of peer funds (the“Performance Peer Group”) and recognized and/or customized benchmarks (i.e., generally benchmarks derived from multiple recognized benchmarks). In considering performance data, the Board is aware of certain inherent limitations with such data, including that differences between the objective(s), strategies and other characteristics of the Nuveen funds compared to the respective Performance Peer Group and/or benchmark(s) (such as differences in the use of leverage) will necessarily contribute to differences in performance results and limit the value of the comparative information. To assist the Board in its review of the comparability of the relative performance, the Adviser has ranked the relevancy of the peer group to the funds as low, medium or high. Depending on the facts and circumstances, however, the Board may be satisfied with a fund’s performance notwithstanding that its performance may be below its benchmark or peer group for certain periods. In addition, the performance data may vary significantly depending on the end date selected, and shareholders may evaluate fund performance based on their own holding period which may differ from the performance periods reviewed by the Board leading to different results. Further, the Board considered a fund’s performance in light of the overall financial market conditions during the respective periods. As noted above, the Board reviewed, among other things, Nuveen fund performance over various periods ended December 31, 2018, and the Board was aware of the market decline in the fourth quarter of 2018 and considered performance from the first quarter of 2019 as well. The Board also noted that a shorter period of underperformance may significantly impact longer term performance.
In addition to the foregoing, the Board recognized the importance of secondary market trading to shareholders and considered the evaluation of premiums and discounts at which the shares of the Nuveenclosed-end funds trade to be a continuing priority for the Board. The Board and/or itsClosed-end Fund committee consider premium and discount data at each quarterly meeting throughout the year as well as during the annual review.
In their review of performance, the Independent Board Members focused, in particular, on the Adviser’s analysis of Nuveen funds determined to be underperforming performance outliers. The Board recognized that some periods of underperformance may only be temporary while other periods of underperformance may indicate a broader issue that may require a corrective action. Accordingly, with respect to any Nuveen funds for which the Board had identified performance issues, the Board monitors such funds closely until performance improves, discusses with the Adviser the reasons for such results, considers whether any steps are necessary or appropriate to address such issues, and reviews the results of any efforts undertaken.
The Board recognized that although the Fund’s performance was below the performance of its benchmark in theone-year period, the Fund ranked in the second quartile of its Performance Peer Group for such period. In its review, the Board recognized that the Performance Peer Group was classified as low for relevancy. The Board further recognized that the Fund was a target term fund with investment objectives which seek to provide a high level of current income and to return its original net asset value per common share on or about its termination date. The Board noted that as of March 31, 2019, the Fund was on track to return the original net asset value to investors and provided current income consistent with expectations. The Board also considered that the Fund was relatively new with a limited performance history available, limiting the ability for a meaningful assessment of performance. Nevertheless, the Board was satisfied with the Fund’s overall performance.
41
Annual Investment Management Agreement Approval Process(continued)
(Unaudited)
| C. | | Fees, Expenses and Profitability |
In its annual review, the Board considered the fees paid to the Fund Advisers and the total operating expense ratio of each Nuveen fund. More specifically, the Independent Board Members reviewed, among other things, each fund’s gross and net management fee rates and net total expense ratio in relation to those of a comparable universe of funds (the“Peer Universe”) established by Broadridge. The Independent Board Members reviewed the methodology Broadridge employed to establish its Peer Universe and recognized that differences between the applicable fund and its respective Peer Universe as well as changes to the composition of the Peer Universe from year to year may limit some of the value of the comparative data. The Independent Board Members also considered a fund’s operating expense ratio as it more directly reflected the shareholder’s costs in investing in the respective fund.
In their review, the Independent Board Members considered, in particular, each fund with a net expense ratio (excludinginvestment-related costs of leverage) of six basis points or higher compared to that of its peer average (each, an“Expense Outlier Fund”), and an analysis as to the factors contributing to each such fund’s higher relative net expense ratio. In addition, although the Board reviewed a fund’s total net expenses both including and excludinginvestment-related expenses (i.e., leverage costs) and taxes for certain of theclosed-end funds, the Board recognized that leverage expenses will vary across the Nuveen funds and in comparison to peers because of differences in the forms and terms of leverage employed by the respective fund. Accordingly, in reviewing the comparative data between a fund and its peers, the Board generally considered the fund’s net expense ratio and fees (excluding leverage costs and leveraged assets) to be higher if they were over 10 basis points higher, slightly higher if they were 6 to 10 basis points higher, in line if they were within approximately 5 basis points higher than the peer average and below if they were below the peer average of the Peer Universe. The Independent Board Members also considered, in relevant part, a fund’s net management fee and net total expense ratio in light of its performance history.
In their review of the fee arrangements for the Nuveen funds, the Independent Board Members considered the management fee schedules, including thecomplex-wide andfund-level breakpoint schedules, as applicable. The Board noted that across the Nuveen fund complex, thecomplex-wide fee breakpoints reduced fees by $51.5 million andfund-level breakpoints reduced fees by $55.1 million in 2018.
With respect to theSub-Adviser, the Board considered thesub-advisory fee paid to theSub-Adviser, including any breakpoint schedule, and as described below, comparative data of the fees theSub-Adviser charges to other clients, if any.
The Independent Board Members noted that the Fund had a net management fee and a net expense ratio that were below the respective peer averages. Based on its review of the information provided, the Board determined that the Fund’s management fees (as applicable) to a Fund Adviser were reasonable in light of the nature, extent and quality of services provided to the Fund.
| | 2. | | Comparisons with the Fees of Other Clients |
In determining the appropriateness of fees, the Board also reviewed information regarding the fee rates the respective Fund Advisers charged to certain other types of clients and the type of services provided to these other clients. For the Adviser and/or theSub-Adviser, such other clients may include retail and institutional managed accounts, hedge funds andsub-advised funds outside the Nuveen family. The Board further noted that the Adviser also advised certainexchange-traded funds (“ETFs”) sponsored by Nuveen.
The Board recognized that the Fund had an affiliatedsub-adviser and, with respect to affiliatedsub-advisers, reviewed, among other things, the range of fees assessed for managed accounts and hedge funds (along with their performance fee). The Board also reviewed the fee range and average fee rate of certain selected investment strategies offered in retail and institutional managed accounts by theSub-Adviser and the hedge funds advised by theSub-Adviser (along with their performance fee) and of thenon-Nuveen investment companiessub-advised by affiliatedsub-advisers.
In addition to the comparative fee data, the Board also reviewed, among other things, a description of the different levels of services provided to certain other clients compared to the services provided to the Nuveen funds as well as the differences in
42
portfolio investment policies, investor profiles, account sizes and regulatory requirements, all of which contribute to the variations in the fee schedules. The Board noted, among other things, the wide range of services in addition to investment management services provided to the Nuveen funds when the Adviser is principally responsible for all aspects of operating the funds, including the increased regulatory requirements that must be met in managing the funds, the larger account sizes of managed accounts and hedge funds and the increased entrepreneurial, legal and regulatory risks that the Adviser incurs in sponsoring and managing the funds. Further, with respect to ETFs, the Board considered that Nuveen ETFs are passively managed compared to the active management of other Nuveen funds which contributed to the differences in fee levels between the Nuveen ETFs and other Nuveen funds. In general, higher fee levels reflect higher levels of service provided by the Adviser, increased investment management complexity, greater product management requirements, and higher levels of business risk or some combination of these factors. The Board further considered that theSub-Adviser’s fee is essentially for portfolio management services and therefore more comparable to the fees it receives for retail wrap accounts and other externalsub-advisory mandates. The Board concluded the varying levels of fees were justified given, among other things, the inherent differences in the products and the level of services provided to the Nuveen funds versus other clients, the differing regulatory requirements and legal liabilities and the entrepreneurial, legal and regulatory risks incurred in sponsoring and advising a registered investment company.
| | 3. | | Profitability of Fund Advisers |
In conjunction with their review of fees, the Independent Board Members considered information regarding Nuveen’s level of profitability for its advisory services to the Nuveen funds for the calendar years 2018 and 2017. The Board reviewed, among other things, Nuveen’s net margins(pre-tax) (both including and excluding distribution expenses); gross and net revenue margins(pre- andpost-tax); revenues, expenses, and net income(pre-tax andafter-tax and before distribution) of Nuveen for fund advisory services; and comparative profitability data comparing the adjusted margins of Nuveen compared to the adjusted margins of certain peers with publicly available data and with the most comparable assets under management (based on asset size and asset composition) for each of the last two calendar years. The Board also reviewed the revenues and expenses the Adviser derived from its ETF product line that was launched in 2016. The Independent Board Members noted that Nuveen’s net margins were higher in 2018 than the previous year and considered the key drivers behind the revenue and expense changes that impacted Nuveen’s net margins between the years. The Board considered the costs of investments in the Nuveen business, including the investment of seed capital in certain Nuveen funds and additional investments in infrastructure and technology. The Independent Board Members also noted that Nuveen’s adjusted margins from its relationships with the Nuveen funds were on the low range compared to the adjusted margins of the peers; however, the Independent Board Members recognized the inherent limitations of the comparative data of other publicly traded peers given that the calculation of profitability is rather subjective and numerous factors (such as types of funds, business mix, cost of capital, methodology to allocate expenses and other factors) can have a significant impact on the results.
The Independent Board Members also reviewed a description of the expense allocation methodology employed to develop the financial information and a summary of the history of changes to the methodology over theten-year period from 2008 to 2018, and recognized that other reasonable allocation methodologies could be employed and lead to significantly different results. The Board noted that two Independent Board Members, along with independent counsel, serve as the Board’s liaisons to review profitability and discuss any proposed changes to the methodology prior to the full Board’s review.
Aside from Nuveen’s profitability, the Board recognized that the Adviser is a subsidiary of Nuveen, LLC, the investment management arm of Teachers Insurance and Annuity Association of America (“TIAA”). As such, the Board also reviewed a balance sheet for TIAA reflecting its assets, liabilities and capital and contingency reserves for the 2018 and 2017 calendar years to consider the financial strength of TIAA having recognized the importance of having an adviser with significant resources.
In addition to Nuveen, the Independent Board Members also considered the profitability of theSub-Adviser from its relationships with the Nuveen funds. In this regard, the Independent Board Members reviewed theSub-Adviser’s revenues, expenses and revenue margins(pre- andpost-tax) for its advisory activities for the calendar year ended December 31, 2018.
In evaluating the reasonableness of the compensation, the Independent Board Members also considered any other ancillary benefits derived by the respective Fund Adviser from its relationship with the Nuveen funds as discussed in further detail below.
43
Annual Investment Management Agreement Approval Process(continued)
(Unaudited)
Based on a consideration of all the information provided, the Board noted that Nuveen’s and theSub-Adviser’s level of profitability was acceptable and not unreasonable in light of the services provided.
| D. | | Economies of Scale and Whether Fee Levels Reflect These Economies of Scale |
With respect to economies of scale, the Independent Board Members noted that although economies of scale are difficult to measure, the Adviser shares the benefits of economies of scale in various ways including breakpoints in the management fee schedule (subject to limited exceptions), fee waivers and/or expense limitations, the pricing of Nuveen funds at scale at inception and investments in its business which can enhance the services provided to the funds for the fees paid. With respect to breakpoint schedules, because the Board had previously recognized that economies of scale may occur not only when the assets of a particular Nuveen fund grow but also when the assets in the complex grow, the Nuveen funds generally pay the Adviser a management fee comprised of afund-level component and acomplex-level component each with its own breakpoint schedule, subject to certain exceptions. In general terms, the breakpoint schedule at the fund level reduces fees as assets in the particular fund pass certain thresholds and the breakpoint schedule at the complex level reduces fees on the Nuveen funds as the eligible assets in the complex pass certain thresholds. The Independent Board Members reviewed, among other things, thefund-level andcomplex-level fee schedules. With respect to the Nuveenclosed-end funds, the Independent Board Members noted that, although such funds may fromtime-to-time make additional share offerings, the growth of their assets would occur primarily through the appreciation of such funds’ investment portfolios.
In addition, the Independent Board Members recognized the Adviser’s continued reinvestment in its business through, among other things, investments in its business infrastructure and information technology, portfolio accounting system as well as other systems and platforms that will, among other things, support growth, simplify and enhance information sharing, and enhance the investment process to the benefit of all of the Nuveen funds.
Based on its review, the Board concluded that the current fee arrangements together with the Adviser’s reinvestment in its business appropriately shared any economies of scale with shareholders.
The Independent Board Members received and considered information regarding other benefits the respective Fund Adviser or its affiliates may receive as a result of their relationship with the Nuveen funds. The Board considered that an affiliate of the Adviser serves asco-manager in the initial public offerings of newclosed-end funds for which it may receive revenue and serves as an underwriter on shelf offerings of existingclosed-end funds for which it receives compensation. In addition, the Independent Board Members also noted that theSub-Adviser engages in soft dollar transactions pursuant to which it may receive the benefit of research products and other services provided bybroker-dealers executing portfolio transactions on behalf of the applicable Nuveen funds.
The Board, however, noted that the benefits for theSub-Adviser when transacting infixed-income securities may be more limited as such securities generally trade on a principal basis and therefore do not generate brokerage commissions. Further, the Board noted that although theSub-Adviser may benefit from the receipt of research and other services that it may otherwise have to pay for out of its own resources, the research may also benefit the Nuveen funds to the extent it enhances the ability of theSub-Adviser to manage such funds or is acquired through the commissions paid on portfolio transactions of other clients.
Based on their review, the Board concluded that any indirect benefits received by a Fund Adviser as a result of its relationship with the Fund were reasonable and within acceptable parameters.
The Board Members did not identify any single factor discussed previously asall-important or controlling. The Board Members, including the Independent Board Members, concluded that the terms of each Advisory Agreement were fair and reasonable, that the respective Fund Adviser’s fees were reasonable in light of the services provided to the Fund and that the Advisory Agreements be renewed.
44
Notes
45
Notes
46
Notes
47
Nuveen:
Serving Investors for Generations
Since 1898, financial advisors and their clients have relied on Nuveen to provide
dependable investment solutions through continued adherence to proven, long-term investing
principles. Today, we offer a range of high quality solutions designed to
be integral components of a well-diversified core portfolio.
Focused on meeting investor needs.
Nuveen is the investment manager of TIAA. We have grown into one of the world’s premier global asset managers, with specialist knowledge across all major asset classes and particular strength in solutions that provide income for investors and that draw on our expertise in alternatives and responsible investing. Nuveen is driven not only by the independent investment processes across the firm, but also the insights, risk management, analytics and other tools and resources that a truly world-class platform provides. As a global asset manager, our mission is to work in partnership with our clients to create solutions which help them secure their financial future.
Find out how we can help you.
To learn more about how the products and services of Nuveen may be able to help you meet your financial goals, talk to your financial advisor, or call us at(800) 257-8787. Please read the information provided carefully before you invest. Investors should consider the investment objective and policies, risk considerations, charges and expenses of any investment carefully. Where applicable, be sure to obtain a prospectus, which contains this and other relevant information. To obtain a prospectus, please contact your securities representative or Nuveen, 333 W. Wacker Dr., Chicago, IL 60606. Please read the prospectus carefully before you invest or send money.
Learn more about Nuveen Funds at:www.nuveen.com/closed-end-funds
| | | | |
| Nuveen Securities, LLC, member FINRA and SIPC | 333 West Wacker Drive Chicago, IL 60606 | www.nuveen.com | | | | ESA-K-0619D
915399-INV-B-08/20 |
Item 2. Code of Ethics.
Not applicable to this filing.
Item 3. Audit Committee Financial Expert.
Not applicable to this filing.
Item 4. Principal Accountant Fees and Services.
Not applicable to this filing.
Item 5. Audit Committee of Listed Registrants.
Not applicable to this filing.
Item 6. Schedule of Investments.
(a) See Portfolio of Investments in Item 1.
(b) Not applicable.
Item 7. Disclosure of Proxy Voting Policies and Procedures for Closed-End Management Investment Companies.
Not applicable to this filing.
Item 8. Portfolio Managers of Closed-End Management Investment Companies.
Not applicable to this filing.
Item 9. Purchases of Equity Securities by Closed-End Management Investment Company and Affiliated Purchasers.
Not applicable.
Item 10. Submission of Matters to a Vote of Security Holders.
There have been no material changes to the procedures by which shareholders may recommend nominees to the registrant’s Board implemented after the registrant last provided disclosure in response to this item.
Item 11. Controls and Procedures.
| (a) | The registrant’s principal executive and principal financial officers, or persons performing similar functions, have concluded that the registrant’s disclosure controls and procedures (as defined in Rule 30a-3(c) under the Investment Company Act of 1940, as amended (the “1940 Act”) (17 CFR 270.30a-3(c))) are effective, as of a date within 90 days of the filing date of this report that includes the disclosure required by this paragraph, based on their evaluation of the controls and procedures required by Rule 30a-3(b) under the 1940 Act (17 CFR 270.30a-3(b)) and Rules 13a-15(b) or 15d-15(b) under the Securities Exchange Act of 1934, as amended (the “Exchange Act”) (17 CFR 240.13a-15(b) or 240.15d-15(b)). |
| (b) | There were no changes in the registrant’s internal control over financial reporting (as defined in Rule 30a-3(d) under the 1940 Act (17 CFR 270.30a-3(d)) that occurred during the period covered by this report that has materially affected, or is reasonably likely to materially affect, the registrant’s internal control over financial reporting. |
Item 12. Disclosure of Securities Lending Activities for Closed-End Management Investment Companies.
Not applicable.
Item 13. Exhibits.
File the exhibits listed below as part of this Form.
(a)(1) Any code of ethics, or amendment thereto, that is the subject of the disclosure required by Item 2, to the extent that the registrant intends to satisfy the Item 2 requirements through filing of an exhibit: Not applicable to this filing.
(a)(2) A separate certification for each principal executive officer and principal financial officer of the registrant as required by Rule 30a-2(a) under the 1940 Act (17 CFR 270.30a-2(a)) in the exact form set forth below: See EX-99.CERT attached hereto.
(a)(3) Any written solicitation to purchase securities under Rule 23c-1 under the 1940 Act (17 CFR 270.23c-1) sent or given during the period covered by the report by or on behalf of the registrant to 10 or more persons: Not applicable.
(a)(4) Change in the registrant’s independent public accountant. Not applicable.
(b) If the report is filed under Section 13(a) or 15(d) of the Exchange Act, provide the certifications required by Rule 30a-2 (b) under the 1940 Act (17 CFR 270.30a-2(b)), Rule 13a-14(b) or Rule 15d-14(b) under the Exchange Act (17 CFR 240.13a-14(b) or 240.15d-14(b)), and Section 1350 of Chapter 63 of Title 18 of the United States Code (18 U.S.C. 1350) as an Exhibit. A certification furnished pursuant to this paragraph will not be deemed “filed” for purposes of Section 18 of the Exchange Act (15 U.S.C. 78r), or otherwise subject to the liability of that section. Such certification will not be deemed to be incorporated by reference into any filing under the Securities Act of 1933 or the Exchange Act, except to the extent that the registration specifically incorporates it by reference: See EX-99.906 CERT attached hereto.
SIGNATURES
Pursuant to the requirements of the Securities Exchange Act of 1934 and the Investment Company Act of 1940, the registrant has duly caused this report to be signed on its behalf by the undersigned, thereunto duly authorized.
(Registrant) Nuveen Credit Opportunities 2022 Target Term Fund
| | | | |
| By (Signature and Title) | | /s/ Gifford R. Zimmerman | | |
| | Gifford R. Zimmerman | | |
| | Vice President and Secretary | | |
Date: September 5, 2019
Pursuant to the requirements of the Securities Exchange Act of 1934 and the Investment Company Act of 1940, this report has been signed below by the following persons on behalf of the registrant and in the capacities and on the dates indicated.
| | | | |
| By (Signature and Title) | | /s/ Cedric H. Antosiewicz | | |
| | Cedric H. Antosiewicz | | |
| | Chief Administrative Officer | | |
| | (principal executive officer) | | |
Date: September 5, 2019
| | | | |
| By (Signature and Title) | | /s/ E. Scott Wickerham | | |
| | E. Scott Wickerham | | |
| | Vice President and Controller | | |
| | (principal financial officer) | | |
Date: September 5, 2019