Wells Fargo Commercial Mortgage Trust 2016-C36
Filed: 18 Oct 16, 12:00am
| FREE WRITING PROSPECTUS | ||
| FILED PURSUANT TO RULE 433 | ||
| REGISTRATION FILE NO.: 333-206677-10 | ||
 |  |
Free Writing Prospectus
Structural and Collateral Term Sheet
$858,177,959
(Approximate Initial Pool Balance)
$757,342,000
(Approximate Aggregate Certificate Balance of Offered Certificates)
Wells Fargo Commercial Mortgage Trust 2016-C36
as Issuing Entity
Wells Fargo Commercial Mortgage Securities, Inc.
as Depositor
Barclays Bank PLC
Wells Fargo Bank, National Association
C-III Commercial Mortgage LLC
Rialto Mortgage Finance, LLC
National Cooperative Bank, N.A.
The Bancorp Bank
Basis Real Estate Capital II, LLC
as Sponsors and Mortgage Loan Sellers
Commercial Mortgage Pass-Through Certificates
Series 2016-C36
October 18, 2016
WELLS FARGO SECURITIES | BARCLAYS | |
Co-Lead Manager and Joint | Co-Lead Manager and Joint | |
Academy Securities Co-Manager | Citigroup Co-Manager |
STATEMENT REGARDING THIS FREE WRITING PROSPECTUS
The depositor has filed a registration statement (including a prospectus) with the Securities and Exchange Commission (‘‘SEC’’) (SEC File No. 333-206677) for the offering to which this communication relates. Before you invest, you should read the prospectus in the registration statement and other documents the depositor has filed with the SEC for more complete information about the depositor, the issuing entity and this offering. You may get these documents for free by visiting EDGAR on the SEC Web site at www.sec.gov. Alternatively, the depositor, any underwriter, or any dealer participating in the offering will arrange to send you the prospectus after filing if you request it by calling toll free 1-800-745-2063 (8 a.m. – 5 p.m. EST) or by emailing wfs.cmbs@wellsfargo.com.
Nothing in this document constitutes an offer of securities for sale in any jurisdiction where the offer or sale is not permitted. The information contained herein is preliminary as of the date hereof, supersedes any such information previously delivered to you and will be superseded by any such information subsequently delivered and ultimately by the final prospectus relating to the securities. These materials are subject to change, completion, supplement or amendment from time to time.
This free writing prospectus has been prepared by the underwriters for information purposes only and does not constitute, in whole or in part, a prospectus for the purposes of Directive 2003/71/EC (as amended) and/or Part VI of the Financial Services and Markets Act 2000, as amended, or other offering document.
STATEMENT REGARDING ASSUMPTIONS AS TO SECURITIES, PRICING ESTIMATES AND OTHER INFORMATION
The attached information contains certain tables and other statistical analyses (the “Computational Materials”) which have been prepared in reliance upon information furnished by the Mortgage Loan Sellers. Numerous assumptions were used in preparing the Computational Materials, which may or may not be reflected herein. As such, no assurance can be given as to the Computational Materials’ accuracy, appropriateness or completeness in any particular context; or as to whether the Computational Materials and/or the assumptions upon which they are based reflect present market conditions or future market performance. The Computational Materials should not be construed as either projections or predictions or as legal, tax, financial or accounting advice. You should consult your own counsel, accountant and other advisors as to the legal, tax, business, financial and related aspects of a purchase of these securities. Any weighted average lives, yields and principal payment periods shown in the Computational Materials are based on prepayment and/or loss assumptions, and changes in such prepayment and/or loss assumptions may dramatically affect such weighted average lives, yields and principal payment periods. In addition, it is possible that prepayments or losses on the underlying assets will occur at rates higher or lower than the rates shown in the attached Computational Materials. The specific characteristics of the securities may differ from those shown in the Computational Materials due to differences between the final underlying assets and the preliminary underlying assets used in preparing the Computational Materials. The principal amount and designation of any security described in the Computational Materials are subject to change prior to issuance. None of Wells Fargo Securities, LLC, Barclays Capital Inc., Academy Securities, Inc., Citigroup Global Markets Inc., or any of their respective affiliates, make any representation or warranty as to the actual rate or timing of payments or losses on any of the underlying assets or the payments or yield on the securities. The information in this presentation is based upon management forecasts and reflects prevailing conditions and management’s views as of this date, all of which are subject to change. In preparing this presentation, we have relied upon and assumed, without independent verification, the accuracy and completeness of all information available from public sources or which was provided to us by or on behalf of the Mortgage Loan Sellers or which was otherwise reviewed by us.
This free writing prospectus contains certain forward-looking statements. If and when included in this free writing prospectus, the words “expects”, “intends”, “anticipates”, “estimates” and analogous expressions and all statements that are not historical facts, including statements about our beliefs or expectations, are intended to identify forward-looking statements. Any forward-looking statements are made subject to risks and uncertainties which could cause actual results to differ materially from those stated. Those risks and uncertainties include, among other things, declines in general economic and business conditions, increased competition, changes in demographics, changes in political and social conditions, regulatory initiatives and changes in customer preferences, many of which are beyond our control and the control of any other person or entity related to this offering. The forward-looking statements made in this free writing prospectus are made as of the date stated on the cover. We have no obligation to update or revise any forward-looking statement.
Wells Fargo Securities is the trade name for the capital markets and investment banking services of Wells Fargo & Company and its subsidiaries, including but not limited to Wells Fargo Securities, LLC, a member of NYSE, FINRA, NFA and SIPC, Wells Fargo Prime Services, LLC, a member of FINRA, NFA and SIPC, and Wells Fargo Bank, N.A. Wells Fargo Securities, LLC and Wells Fargo Prime Services, LLC are distinct entities from affiliated banks and thrifts.
IMPORTANT NOTICE REGARDING THE OFFERED CERTIFICATES
The information herein is preliminary and may be supplemented or amended prior to the time of sale. In addition, the Offered Certificates referred to in these materials and the asset pool backing them are subject to modification or revision (including the possibility that one or more classes of certificates may be split, combined or eliminated at any time prior to issuance or availability of a final prospectus) and are offered on a “when, as and if issued” basis.
The underwriters described in these materials may from time to time perform investment banking services for, or solicit investment banking business from, any company named in these materials. The underwriters and/or their affiliates or respective employees may from time to time have a long or short position in any security or contract discussed in these materials.
The information contained herein supersedes any previous such information delivered to any prospective investor and will be superseded by information delivered to such prospective investor prior to the time of sale.
IMPORTANT NOTICE RELATING TO AUTOMATICALLY-GENERATED EMAIL DISCLAIMERS
Any legends, disclaimers or other notices that may appear at the bottom of any email communication to which this free writing prospectus is attached relating to (1) these materials not constituting an offer (or a solicitation of an offer), (2) any representation that these materials are accurate or complete and may not be updated or (3) these materials possibly being confidential, are not applicable to these materials and should be disregarded. Such legends, disclaimers or other notices have been automatically generated as a result of these materials having been sent via Bloomberg or another system.
THE INFORMATION IN THIS STRUCTURAL AND COLLATERAL TERM SHEET IS NOT COMPLETE AND MAY BE AMENDED PRIOR TO THE TIME OF SALE. THIS TERM SHEET IS NOT AN OFFER TO SELL THESE SECURITIES AND IT IS NOT A SOLICITATION OF AN OFFER TO BUY THESE SECURITIES IN ANY JURISDICTION WHERE THE OFFER OR SALE IS NOT PERMITTED.
2
| Wells Fargo Commercial Mortgage Trust 2016-C36 | Certificate Structure |
I. Certificate Structure
| Class | Expected Ratings (Fitch/Moody’s/Morningstar)(1) | Approximate Initial Certificate Balance or Notional Amount(2) | Approx. Initial Credit | Pass-Through Rate Description | Weighted Average Life (Years)(4) | Expected Principal Window(4) | Certificate Principal to Value Ratio(5) | Certificate Principal U/W NOI Debt Yield(6) | |||||||||
| Offered Certificates | |||||||||||||||||
| A-1 | AAAsf/Aaa(sf)/AAA | $41,947,000 | 30.000% | (7) | 2.44 | 12/16 – 05/21 | 41.2% | 17.6% | |||||||||
| A-2 | AAAsf/Aaa(sf)/AAA | $39,657,000 | 30.000% | (7) | 4.79 | 05/21 – 10/21 | 41.2% | 17.6% | |||||||||
| A-3 | AAAsf/Aaa(sf)/AAA | $220,000,000 | 30.000% | (7) | 9.70 | 11/25 – 09/26 | 41.2% | 17.6% | |||||||||
| A-4 | AAAsf/Aaa(sf)/AAA | $250,203,000 | 30.000% | (7) | 9.91 | 09/26 – 10/26 | 41.2% | 17.6% | |||||||||
| A-SB | AAAsf/Aaa(sf)/AAA | $48,917,000 | 30.000% | (7) | 7.05 | 10/21 – 11/25 | 41.2% | 17.6% | |||||||||
| A-S | AAAsf/Aa3(sf)/AAA | $77,236,000 | 21.000% | (7) | 9.95 | 10/26 – 10/26 | 46.5% | 15.6% | |||||||||
| X-A | AAAsf/Aaa(sf)/AAA | $600,724,000(8) | N/A | Variable(9) | N/A | N/A | N/A | N/A | |||||||||
| X-B | AA-sf/NR/AAA | $120,145,000(10) | N/A | Variable(11) | N/A | N/A | N/A | N/A | |||||||||
| B | AA-sf/NR/AA | $42,909,000 | 16.000% | (7) | 9.95 | 10/26 – 10/26 | 49.5% | 14.7% | |||||||||
| C | A-sf/NR/A | $36,473,000 | 11.750% | (7) | 9.95 | 10/26 – 10/26 | 52.0% | 14.0% | |||||||||
| Non-Offered Certificates | |||||||||||||||||
| X-D | BBB-sf/NR/AAA | $41,836,000(12) | N/A | Variable(13) | N/A | N/A | N/A | N/A | |||||||||
| D | BBB-sf/NR/BBB | $41,836,000 | 6.875% | (7) | 9.95 | 10/26 – 10/26 | 54.8% | 13.2% | |||||||||
| E-1(14)(20)(26) | BB+sf/NR/BBB | $9,118,000(15)(21)(27) | 5.813% | (7) | 9.95 | 10/26 – 10/26 | 55.5% | 13.1% | |||||||||
| E-2(14)(20)(26) | BB-sf/NR/BB+ | $9,118,000(15)(21)(27) | 4.750% | (7) | 9.95 | 10/26 – 10/26 | 56.1% | 12.9% | |||||||||
| E(14) | BB-sf/NR/BB+ | $18,236,000(15) | 4.750% | N/A(16) | 9.95 | 10/26 – 10/26 | 56.1% | 12.9% | |||||||||
| F-1(17)(20)(26) | NR/NR/BB | $4,291,000(18)(21)(27) | 4.250% | (7) | 9.95 | 10/26 – 10/26 | 56.4% | 12.9% | |||||||||
| F-2(17)(20)(26) | NR/NR/BB- | $4,291,000(18)(21)(27) | 3.750% | (7) | 9.95 | 10/26 – 10/26 | 56.7% | 12.8% | |||||||||
| F(17) | B-sf/NR/BB- | $8,582,000(18) | 3.750% | N/A(19) | 9.95 | 10/26 – 10/26 | 56.7% | 12.8% | |||||||||
| EF(20) | B-sf/NR/BB- | $26,818,000(21) | 3.750% | N/A(22) | 9.95 | 10/26 – 10/26 | 56.7% | 12.8% | |||||||||
| G-1(23)(26) | NR/NR/B | $6,098,000(24)(27) | 3.039% | (7) | 9.95 | 10/26 – 10/26 | 57.1% | 12.7% | |||||||||
| G-2(23)(26) | NR/NR/B- | $6,098,000(24)(27) | 2.329% | (7) | 9.95 | 10/26 – 10/26 | 57.5% | 12.6% | |||||||||
| G(23) | NR/NR/B- | $12,196,000(24) | 2.329% | N/A(25) | 9.95 | 10/26 – 10/26 | 57.5% | 12.6% | |||||||||
| EFG(26) | NR/NR/B- | $39,014,000(27) | 2.329% | N/A(28) | 9.95 | 10/26 – 10/26 | 57.5% | 12.6% | |||||||||
| H-1(29) | NR/NR/NR | $9,992,979(30) | 1.164% | (7) | 9.95 | 10/26 – 10/26 | 58.2% | 12.5% | |||||||||
| H-2(29) | NR/NR/NR | $9,992,979(30) | 0.000% | (7) | 9.97 | 10/26 – 11/26 | 58.9% | 12.3% | |||||||||
| H(29) | NR/NR/NR | $19,985,958(30) | 0.000% | N/A(31) | 9.96 | 10/26 – 11/26 | 58.9% | 12.3% | |||||||||
Notes:
| (1) | The expected ratings presented are those of Fitch Ratings, Inc. (“Fitch”), Moody’s Investors Service, Inc. (“Moody’s”) and Morningstar Credit Ratings, LLC (“Morningstar”) which the depositor hired to rate the offered certificates. One or more other nationally recognized statistical rating organizations that were not hired by the depositor may use information they receive pursuant to Rule 17g-5 under the Securities Exchange Act of 1934, as amended (the “Exchange Act”) or otherwise, to rate or provide market reports and/or published commentary related to the offered certificates. We cannot assure you as to what ratings a non-hired nationally recognized statistical rating organization would assign or that its reports will not express differing, possibly negative, views of the mortgage loans and/or the offered certificates. The ratings of each class of offered certificates address the likelihood of the timely distribution of interest and, except in the case of the Class X-A and X-B Certificates, the ultimate distribution of principal due on those classes on or before the Rated Final Distribution Date. See “Risk Factors—Other Risks Relating to the Certificates—Nationally Recognized Statistical Rating Organizations May Assign Different Ratings to the Certificates; Ratings of the Certificates Reflect Only the Views of the Applicable Rating Agencies as of the Dates Such Ratings Were Issued; Ratings May Affect ERISA Eligibility; Ratings May Be Downgraded” and “Ratings” in the Preliminary Prospectus, expected to be dated October 18, 2016 (the “Preliminary Prospectus”). Fitch and Moody’s have informed us that the “sf” designation in their ratings represents an identifier for structured finance product ratings. |
| (2) | The certificate balances and notional amounts set forth in the table are approximate. The actual initial certificate balances and notional amounts may be larger or smaller depending on the initial pool balance of the mortgage loans definitively included in the pool of mortgage loans, which aggregate cut-off date balance may be as much as 5% larger or smaller than the amount presented in the Preliminary Prospectus. |
| (3) | The approximate initial credit support with respect to the Class A-1, A-2, A-3, A-4 and A-SB Certificates represents the approximate credit enhancement for the Class A-1, A-2, A-3, A-4 and A-SB Certificates in the aggregate. |
| (4) | Weighted Average Lives and Expected Principal Windows are calculated based on an assumed prepayment rate of 0% CPR and the “Structuring Assumptions” described under “Yield and Maturity Considerations—Weighted Average Life” in the Preliminary Prospectus. |
| (5) | The Certificate Principal to Value Ratio for each Class of Certificates (other than the Class A-1, A-2, A-3, A-4 and A-SB Certificates) is calculated as the product of (a) the weighted average Cut-off Date LTV Ratio for the mortgage loans and (b) a fraction, the numerator of which is the total initial Certificate Balance of such Class of Certificates and all Classes of Principal Balance Certificates senior to such Class of Certificates and the denominator of which is the total initial Certificate Balance of all of the Principal Balance Certificates. The Certificate Principal to Value Ratio for each of the Class A-1, A-2, A-3, A-4 and A-SB Certificates is calculated in the aggregate for those Classes as if they were a single Class and is calculated as the product of (a) the weighted average Cut-off Date LTV Ratio for the mortgage loans and (b) a fraction, the numerator of which is the total initial aggregate Certificate Balances of such Classes of Certificates and the denominator of which is the total initial Certificate Balance of all of the Principal Balance Certificates. In any event, however, excess mortgaged property value associated with a mortgage loan will not be available to offset losses on any other mortgage loan. |
THE INFORMATION IN THIS STRUCTURAL AND COLLATERAL TERM SHEET IS NOT COMPLETE AND MAY BE AMENDED PRIOR TO THE TIME OF SALE. THIS TERM SHEET IS NOT AN OFFER TO SELL THESE SECURITIES AND IT IS NOT A SOLICITATION OF AN OFFER TO BUY THESE SECURITIES IN ANY JURISDICTION WHERE THE OFFER OR SALE IS NOT PERMITTED.
3
| Wells Fargo Commercial Mortgage Trust 2016-C36 | Certificate Structure |
| (6) | The Certificate Principal U/W NOI Debt Yield for each Class of Certificates (other than the Class A-1, A-2, A-3, A-4 and A-SB Certificates) is calculated as the product of (a) the weighted average U/W NOI Debt Yield for the mortgage loans and (b) a fraction, the numerator of which is the total initial Certificate Balance of all of the Classes of Principal Balance Certificates and the denominator of which is the total initial Certificate Balance for such Class of Certificates and all Classes of Principal Balance Certificates senior to such Class of Certificates. The Certificate Principal U/W NOI Debt Yield for each of the Class A-1, A-2, A-3, A-4 and A-SB Certificates is calculated in the aggregate for those Classes as if they were a single Class and is calculated as the product of (a) the weighted average U/W NOI Debt Yield for the mortgage loans and (b) a fraction, the numerator of which is the total initial Certificate Balance of all of the Classes of Principal Balance Certificates and the denominator of which is the total aggregate initial Certificate Balances for the Class A-1, A-2, A-3, A-4 and A-SB Certificates. In any event, however, cash flow from each mortgaged property supports only the related mortgage loan and will not be available to support any other mortgage loan. |
| (7) | The pass-through rates for the Class A-1, A-2, A-3, A-4, A-SB, A-S, B, C, D, E-1, E-2, F-1, F-2, G-1, G-2, H-1 and H-2 Certificates in each case will be one of the following: (i) a fixed rateper annum, (ii) a variable rate per annum equal to the weighted average of the net mortgage interest rates on the mortgage loans for the related distribution date, (iii) a variable rateper annum equal to the lesser of (a) a fixed rate and (b) the weighted average of the net mortgage interest rates on the mortgage loans for the related distribution date or (iv) a variable rateper annum equal to the weighted average of the net mortgage interest rates on the mortgage loans for the related distribution date minus a specified percentage. For purposes of the calculation of the weighted average of the net mortgage interest rates on the mortgage loans for each distribution date, the mortgage interest rates will be adjusted as necessary to a 30/360 basis. |
| (8) | The Class X-A Certificates are notional amount certificates. The Notional Amount of the Class X-A Certificates will be equal to the aggregate Certificate Balance of the Class A-1, A-2, A-3, A-4 and A-SB Certificates outstanding from time to time. The Class X-A Certificates will not be entitled to distributions of principal. |
| (9) | The pass-through rate for the Class X-A Certificates for any distribution date will be aper annum rate equal to the excess, if any, of (a) the weighted average of the net mortgage interest rates on the mortgage loans for the related distribution date, over (b) the weighted average of the pass-through rates on the Class A-1, A-2, A-3, A-4 and A-SB Certificates for the related distribution date, weighted on the basis of their respective aggregate Certificate Balances outstanding immediately prior to that distribution date. For purposes of the calculation of the weighted average of the net mortgage interest rates on the mortgage loans for each distribution date, the mortgage interest rates will be adjusted as necessary to a 30/360 basis. |
| (10) | The Class X-B Certificates are notional amount certificates. The Notional Amount of the Class X-B Certificates will be equal to the aggregate Certificate Balance of the Class A-S and B Certificates outstanding from time to time. The Class X-B Certificates will not be entitled to distributions of principal. |
| (11) | The pass-through rate for the Class X-B Certificates for any distribution date will be aper annum rate equal to the excess, if any, of (a) the weighted average of the net mortgage interest rates on the mortgage loans for the related distribution date, over (b) the weighted average of the pass-through rates on the Class A-S and B Certificates for the related distribution date, weighted on the basis of their respective aggregate Certificate Balances outstanding immediately prior to that distribution date. For purposes of the calculation of the weighted average of the net mortgage interest rates on the mortgage loans for each distribution date, the mortgage interest rates will be adjusted as necessary to a 30/360 basis. |
| (12) | The Class X-D Certificates are notional amount certificates. The Notional Amount of the Class X-D Certificates will be equal to the Certificate Balance of the Class D Certificates outstanding from time to time. The Class X-D Certificates will not be entitled to distributions of principal. |
| (13) | The pass-through rate for the Class X-D Certificates for any distribution date will be a per annum rate equal to the excess, if any, of (a) the weighted average of the net mortgage interest rates on the mortgage loans for the related distribution date, over (b) the pass-through rate on the Class D Certificates for the related distribution date. For purposes of the calculation of the weighted average of the net mortgage interest rates on the mortgage loans for each distribution date, the mortgage interest rates will be adjusted as necessary to a 30/360 basis. |
| (14) | A holder of Class E-1 and E-2 Certificates may exchange such classes of certificates in the required proportion for a related amount of Class E Certificates, and a holder of Class E Certificates may exchange that class for a ratable portion of each class of the Class E-1 and E-2 Certificates. |
| (15) | On the closing date, the issuing entity will issue the Class E-1 and E-2 trust components (collectively, the “Class E Trust Components”), which will have outstanding certificate balances on the closing date of $9,118,000 and $9,118,000, respectively. The Class E-1 and E-2 Certificates and the Class E Certificates will, at all times, represent undivided beneficial ownership interests in a grantor trust that will hold such trust components. Each class of the Class E-1, E-2 and E Certificates will, at all times, represent a beneficial interest in a percentage of the outstanding certificate balance of the Class E-1 and E-2 trust components. Following any exchange of Class E-1 and E-2 Certificates for Class E Certificates or any exchange of Class E Certificates for Class E-1 and E-2 Certificates, the portion of the outstanding certificate balances of the Class E-1 and E-2 trust components that is represented by the Class E-1 and E-2 Certificates and the Class E Certificates will be increased or decreased accordingly. The initial balance of each class of the Class E-1 and E-2 Certificates shown in the table above represents the maximum principal balance of such class without giving effect to any issuance of Class E Certificates (and assuming no Class EF or EFG Certificates are issued). The initial certificate balance of the Class E Certificates shown in the table above is equal to the aggregate of the maximum initial certificate balances of the Class E-1 and E-2 Certificates, representing the maximum certificate balance of the Class E Certificates that could be issued in an exchange. The principal balance of the Class E-1 and E-2 Certificates to be issued on the closing date will be reduced, in required proportions, by an amount equal to the principal balance of the Class E Certificates issued on the closing date. |
| (16) | The Class E Certificates will not have a pass-through rate, but will be entitled to receive the sum of the interest distributable on its allocable share in the Class E-1 and Class E-2 trust components. The pass-through rates on the Class E-1 and E-2 trust components will at all times be the same as the pass-through rates of the Class E-1 and E-2 Certificates, respectively. Any distribution of interest to the Class E Certificates on the first distribution date is expected to be in an amount that would produce an effective pass-through rate equal to the weighted average of the pass-through rates of the Class E-1 and E-2 trust components for the first distribution date, weighted on the basis of their respective aggregate certificate balances outstanding immediately prior to that distribution date. |
| (17) | A holder of Class F-1 and F-2 Certificates may exchange such classes of certificates in the required proportion for a related amount of Class F Certificates, and a holder of Class F Certificates may exchange that class for a ratable portion of each class of the Class F-1 and F-2 Certificates. |
| (18) | On the closing date, the issuing entity will issue the Class F-1 and F-2 trust components (collectively, the “Class F Trust Components”), which will have outstanding certificate balances on the closing date of $4,291,000 and $4,291,000, respectively. The Class F-1 and F-2 Certificates and the Class F Certificates will, at all times, represent undivided beneficial ownership interests in a grantor trust that will hold such trust components. Each class of the Class F-1, F-2 and F Certificates will, at all times, represent a beneficial interest in a percentage of the outstanding certificate balance of the Class F-1 and F-2 trust components. Following any exchange of Class F-1 and F-2 Certificates for Class F Certificates or any exchange of Class F Certificates for Class F-1 and F-2 Certificates, the portion of the outstanding certificate balances of the Class F-1 and F-2 trust components that is represented by the Class F-1 and F-2 Certificates and the Class F Certificates will be increased or decreased accordingly. The initial balance of each class of the Class F-1 and F-2 Certificates shown in the table above represents the maximum principal balance of such class without giving effect to any issuance of Class F Certificates (and assuming no Class EF or EFG Certificates are issued). The initial certificate balance of the Class F Certificates shown in the table above is equal to the aggregate of the maximum initial certificate balances of the Class F-1 and F-2 Certificates, representing the maximum certificate balance of the Class F Certificates that could be issued in an exchange. The principal balance of the Class F-1 and F-2 Certificates to be issued on the closing date will be reduced, in required proportions, by an amount equal to the principal balance of the Class F Certificates issued on the closing date. |
| (19) | The Class F Certificates will not have a pass-through rate, but will be entitled to receive the sum of the interest distributable on its allocable share in the Class F-1 and F-2 trust components. The pass-through rates on the Class F-1 and F-2 trust components will at all times be the same as the pass-through rates of the Class F-1 and F-2 Certificates, respectively. Any distribution of interest to the Class F Certificates on the first distribution date is expected to be in an amount that would produce an effective pass-through rate equal to the weighted average of the pass-through rates of the Class F-1 and F-2 trust components for the first distribution date, weighted on the basis of their respective aggregate certificate balances outstanding immediately prior to that distribution date. |
| (20) | A holder of Class E-1, E-2, F-1 and F-2 Certificates may exchange such classes of certificates in the required proportion for a related amount of Class EF Certificates, and a holder of Class EF Certificates may exchange that class for a ratable portion of each class of the Class E-1, E-2, F-1 and F-2 Certificates. |
| (21) | Each class of the Class E-1, E-2, F-1, F-2 and EF Certificates will, at all times, represent a beneficial interest in a percentage of the outstanding certificate balance of the Class E-1, Class E-2, Class F-1 and Class F-2 trust components. Following any exchange of Class E-1, E-2, F-1 and F-2 Certificates for Class EF Certificates or any exchange of Class EF Certificates for Class E-1, E-2, F-1 and F-2 Certificates, the portion of the outstanding certificate balances of the Class E-1, Class E-2, Class F-1 and Class F-2 trust components that is represented by the Class E-1, E-2, F-1 and F-2 Certificates and the Class EF Certificates will be increased or decreased accordingly. |
THE INFORMATION IN THIS STRUCTURAL AND COLLATERAL TERM SHEET IS NOT COMPLETE AND MAY BE AMENDED PRIOR TO THE TIME OF SALE. THIS TERM SHEET IS NOT AN OFFER TO SELL THESE SECURITIES AND IT IS NOT A SOLICITATION OF AN OFFER TO BUY THESE SECURITIES IN ANY JURISDICTION WHERE THE OFFER OR SALE IS NOT PERMITTED.
4
| Wells Fargo Commercial Mortgage Trust 2016-C36 | Certificate Structure |
The initial balance of each class of the Class E-1, E-2, F-1 and F-2 Certificates shown in the table above represents the maximum principal balance of such class without giving effect to any issuance of Class EF Certificates (and assuming no Class E, F or EFG Certificates are issued). The initial certificate balance of the Class EF Certificates shown in the table above is equal to the aggregate of the maximum initial certificate balances of the Class E-1, E-2, F-1 and F-2 Certificates, representing the maximum certificate balance of the Class EF Certificates that could be issued in an exchange. The principal balance of the Class E-1, E-2, F-1 and F-2 Certificates to be issued on the closing date will be reduced, in required proportions, by an amount equal to the principal balance of the Class EF Certificates issued on the closing date.
| (22) | The Class EF Certificates will not have a pass-through rate, but will be entitled to receive the sum of the interest distributable on its allocable share in the Class E-1, Class E-2, Class F-1 and Class F-2 trust components. Any distribution of interest to the Class EF Certificates on the first distribution date is expected to be in an amount that would produce an effective pass-through rate equal to the weighted average of the pass-through rates of the Class E-1, Class E-2, Class F-1 and Class F-2 trust components for the first distribution date, weighted on the basis of their respective aggregate certificate balances outstanding immediately prior to that distribution date. |
| (23) | A holder of Class G-1 and Class G-2 Certificates may exchange such classes of certificates in the required proportion for a related amount of Class G Certificates, and a holder of Class G Certificates may exchange that class for a ratable portion of each class of the Class G-1 and G-2 Certificates. |
| (24) | On the closing date, the issuing entity will issue the Class G-1 and Class G-2 trust components (collectively, the “Class G Trust Components”), which will have outstanding certificate balances on the closing date of $6,098,000 and $6,098,000, respectively. The Class G-1 and G-2 Certificates and the Class G Certificates will, at all times, represent undivided beneficial ownership interests in a grantor trust that will hold such trust components. Each class of the Class G-1, G-2 and G Certificates will, at all times, represent a beneficial interest in a percentage of the outstanding certificate balance of the Class G-1 and Class G-2 trust components. Following any exchange of Class G-1 and G-2 Certificates for Class G Certificates or any exchange of Class G Certificates for G-1 and G-2 Certificates, the portion of the outstanding certificate balances of the Class G-1 and Class G-2 trust components that is represented by the Class G-1 and G-2 Certificates and the Class G Certificates will be increased or decreased accordingly. The initial balance of each class of the Class G-1 and G-2 Certificates shown in the table above represents the maximum principal balance of such class without giving effect to any issuance of Class G Certificates (and assuming no Class EFG Certificates are issued). The initial certificate balance of the Class G Certificates shown in the table above is equal to the aggregate of the maximum initial certificate balances of the Class G-1 and G-2 Certificates, representing the maximum certificate balance of the Class G Certificates that could be issued in an exchange. The principal balance of the Class G-1 and G-2 Certificates to be issued on the closing date will be reduced, in required proportions, by an amount equal to the principal balance of the Class G Certificates issued on the closing date. |
| (25) | The Class G Certificates will not have a pass-through rate, but will be entitled to receive the sum of the interest distributable on its allocable share in the Class G-1 and Class G-2 trust components. The pass-through rates on the Class G-1 and Class G-2 trust components will at all times be the same as the pass-through rates of the Class G-1 and G-2 Certificates, respectively. Any distribution of interest to the Class G Certificates on the first distribution date is expected to be in an amount that would produce an effective pass-through rate equal to the weighted average of the pass-through rates of the Class G-1 and Class G-2 trust components for the first distribution date, weighted on the basis of their respective aggregate certificate balances outstanding immediately prior to that distribution date. |
| (26) | A holder of Class E-1, E-2, F-1, F-2, G-1 and G-2 Certificates may exchange such classes of certificates in the required proportion for a related amount of Class EFG Certificates, and a holder of Class EFG Certificates may exchange that Class EFG for a ratable portion of each class of the Class E-1, E-2, F-1, F-2, G-1 and G-2 Certificates. |
| (27) | Each class of the Class E-1, E-2, F-1, F-2, G-1, G-2 and EFG Certificates will, at all times, represent a beneficial interest in a percentage of the outstanding certificate balance of the Class E-1, Class E-2, Class F-1, Class F-2, Class G-1 and Class G-2 trust components. Following any exchange of Class E-1, E-2, F-1, F-2, G-1 and G-2 Certificates for Class EFG Certificates or any exchange of Class EFG Certificates for Class E-1, E-2, F-1, F-2, G-1 and G-2 Certificates, the portion of the outstanding certificate balances of the Class E-1, Class E-2, Class F-1, Class F-2, Class G-1 and Class G-2 trust components that is represented by the Class E-1, E-2, F-1, F-2, G-1 and G-2 Certificates and the EFG Certificates will be increased or decreased accordingly. The initial balance of each class of the Class E-1, E-2, F-1, F-2, G-1 and G-2 Certificates shown in the table above represents the maximum principal balance of such class without giving effect to any issuance of Class EFG Certificates (and assuming no Class E, F, EF or G Certificates are issued). The initial certificate balance of the Class EFG Certificates shown in the table above is equal to the aggregate of the maximum initial certificate balances of the Class E-1, E-2, F-1, F-2, G-1 and G-2 Certificates, representing the maximum certificate balance of the Class EFG Certificates that could be issued in an exchange. The principal balance of the Class E-1, E-2, F-1, F-2, G-1 and G-2 Certificates to be issued on the closing date will be reduced, in required proportions, by an amount equal to the principal balance of the Class EFG Certificates issued on the closing date. |
| (28) | The Class EFG Certificates will not have a pass-through rate, but will be entitled to receive the sum of the interest distributable on its allocable share in the Class E-1, Class E-2, Class F-1, Class F-2, Class G-1 and Class G-2 trust components. Any distribution of interest to the Class EFG Certificates on the first distribution date is expected to be in an amount that would produce an effective pass-through rate equal to the weighted average of the pass-through rates of the Class E-1, Class E-2, Class F-1, Class F-2, Class G-1 and Class G-2 trust components for the first distribution date, weighted on the basis of their respective aggregate certificate balances outstanding immediately prior to that distribution date. |
| (29) | A holder of Class H-1 and H-2 Certificates may exchange such classes of certificates in the required proportion for a related amount of Class H Certificates, and a holder of Class H Certificates may exchange that class for a ratable portion of each class of the Class H-1 and H-2 Certificates. |
| (30) | On the closing date, the issuing entity will issue the Class H-1 and Class H-2 trust components (collectively, the “Class H Trust Components”), which will have outstanding certificate balances on the closing date of $9,992,979 and $9,992,979, respectively. The Class H-1 and H-2 Certificates and the Class H Certificates will, at all times, represent undivided beneficial ownership interests in a grantor trust that will hold such trust components. Each class of the Class H-1, H-2 and H Certificates will, at all times, represent a beneficial interest in a percentage of the outstanding certificate balance of the Class H-1 and Class H-2 trust components. Following any exchange of Class H-1 and H-2 Certificates for Class H Certificates or any exchange of Class H Certificates for Class H-1 and H-2 Certificates, the portion of the outstanding certificate balances of the Class H-1 and Class H-2 trust components that is represented by the Class H-1 and H-2 Certificates and the Class H Certificates will be increased or decreased accordingly. The initial balance of each class of the Class H-1 and H-2 Certificates shown in the table above represents the maximum principal balance of such class without giving effect to any issuance of Class H Certificates. The initial certificate balance of the Class H Certificates shown in the table above is equal to the aggregate of the maximum initial certificate balances of the Class H-1 and H-2 Certificates, representing the maximum certificate balance of the Class H Certificates that could be issued in an exchange. The principal balance of the Class H-1 and H-2 Certificates to be issued on the closing date will be reduced, in required proportions, by an amount equal to the principal balance of the Class H Certificates issued on the closing date. |
| (31) | The Class H Certificates will not have a pass-through rate, but will be entitled to receive the sum of the interest distributable on its allocable share in the Class H-1 and Class H-2 trust components. The pass-through rates on the Class H-1 and Class H-2 trust components will at all times be the same as the pass-through rates of the Class H-1 and H-2 Certificates, respectively. Any distribution of interest to the Class H Certificates on the first distribution date is expected to be in an amount that would produce an effective pass-through rate equal to the weighted average of the pass-through rates of the Class H-1 and H-2 trust components for the first distribution date, weighted on the basis of their respective aggregate certificate balances outstanding immediately prior to that distribution date. |
THE INFORMATION IN THIS STRUCTURAL AND COLLATERAL TERM SHEET IS NOT COMPLETE AND MAY BE AMENDED PRIOR TO THE TIME OF SALE. THIS TERM SHEET IS NOT AN OFFER TO SELL THESE SECURITIES AND IT IS NOT A SOLICITATION OF AN OFFER TO BUY THESE SECURITIES IN ANY JURISDICTION WHERE THE OFFER OR SALE IS NOT PERMITTED.
5
| Wells Fargo Commercial Mortgage Trust 2016-C36 | Transaction Highlights |
II. Transaction Highlights
Mortgage Loan Sellers:
Mortgage Loan Seller | Number of | Number of | Aggregate Cut-off Date Balance | % of Initial Pool | ||||
| Barclays Bank PLC(1) | 11 | 35 | $266,192,284 | 31.0% | ||||
| Wells Fargo Bank, National Association(2) | 9 | 9 | 241,981,505 | 28.2 | ||||
| C-III Commercial Mortgage LLC | 19 | 20 | 102,618,218 | 12.0 | ||||
| Rialto Mortgage Finance, LLC | 15 | 15 | 97,829,277 | 11.4 | ||||
| National Cooperative Bank, N.A. | 10 | 10 | 72,468,927 | 8.4 | ||||
| The Bancorp Bank | 7 | 7 | 46,590,624 | 5.4 | ||||
| Basis Real Estate Capital II, LLC | 2 | 2 | 30,497,124 | 3.6 | ||||
Total | 73 | 98 | $858,177,959 | 100.0% | ||||
| ||||||||
| (1) | One mortgage loan secured by the mortgaged property identified on Annex A-1 to the Preliminary Prospectus as Easton Town Center, representing approximately 5.2% of the aggregate principal balance of the pool of mortgage loans as of the cut-off date, is part of a whole loan that was co-originated by Barclays and Morgan Stanley Mortgage Capital Bank, N.A (“MS”). One mortgage loan secured by the mortgaged property identified on Annex A-1 to the Preliminary Prospectus as Gas Company Tower & World Trade Center Parking Garage, representing approximately 1.7% of the aggregate principal balance of the pool of mortgage loans as of the cut-off date, is part of a whole loan that was co-originated by Barclays and Deutsche Bank AG, New York Branch (“DB”). |
| (2) | One mortgage loan secured by the mortgaged property identified on Annex A-1 to the Preliminary Prospectus as Gurnee Mills, representing approximately 9.3% of the aggregate principal balance of the pool of mortgage loans as of the cut-off date, is part of a whole loan that was co-originated by WFB, Column Financials, Inc. (“Column”) and Regions Bank (“Regions”). In addition, one mortgage loan secured by the mortgaged property identified on Annex A-1 to the Preliminary Prospectus as 101 Hudson Street, representing approximately 7.9% of the aggregate principal balance of the pool of mortgage loans as of the cut-off date, is part of a whole loan that was co-originated by WFB, Bank of America, N.A. (“BANA”) and Barclays. |
Loan Pool:
| Initial Pool Balance: | $858,177,959 |
| Number of Mortgage Loans: | 73 |
| Average Cut-off Date Balance per Mortgage Loan: | $11,755,862 |
| Number of Mortgaged Properties: | 98 |
| Average Cut-off Date Balance per Mortgaged Property(1): | $8,756,918 |
| Weighted Average Mortgage Interest Rate: | 4.218% |
| Ten Largest Mortgage Loans as % of Initial Pool Balance: | 50.8% |
| Weighted Average Original Term to Maturity (months): | 118 |
| Weighted Average Remaining Term to Maturity (months): | 116 |
| Weighted Average Original Amortization Term (months)(2): | 357 |
| Weighted Average Remaining Amortization Term (months)(2): | 355 |
| Weighted Average Seasoning (months): | 2 |
| |
| (1) | Information regarding mortgage loans secured by multiple properties is based on an allocation according to relative appraised values or the allocated loan amounts or property-specific release prices set forth in the related loan documents or such other allocation as the related mortgage loan seller deemed appropriate. |
| (2) | Excludes any mortgage loan that does not amortize. |
Credit Statistics:
| Weighted Average U/W Net Cash Flow DSCR(1): | 2.30x |
| Weighted Average U/W Net Operating Income Debt Yield(1): | 12.3% |
| Weighted Average Cut-off Date Loan-to-Value Ratio(1): | 58.9% |
| Weighted Average Balloon Loan-to-Value Ratio(1): | 50.9% |
| % of Mortgage Loans with Additional Subordinate Debt(2): | 19.3% |
| % of Mortgage Loans with Single Tenants(3): | 1.2% |
| |
| (1) | With respect to any mortgage loan that is part of a whole loan, loan-to-value ratio, debt service coverage ratio and debt yield calculations include the relatedpari passu companion loan(s) but exclude any related subordinate companion loan(s) (unless otherwise stated). For mortgaged properties securing residential cooperative mortgage loans, the debt service coverage ratio and debt yield for each such mortgaged property is calculated using U/W Net Operating Income or U/W Net Cash Flow, as applicable, for the related residential cooperative property which is the projected net operating income or net cash flow, as applicable, reflected in the most recent appraisal obtained by or otherwise in the possession of the related mortgage loan seller as of the cut-off date, and the loan-to-value ratio is calculated based upon the appraised value of the residential cooperative property determined as if such residential cooperative property is operated as a residential cooperative. The debt service coverage ratio, debt yield and loan-to-value ratio information do not take into account any subordinate debt (whether or not secured by the related mortgaged property), that currently exists or is allowed under the terms of any mortgage loan. |
| (2) | Five (5) of the mortgage loans, each of which is secured by a residential cooperative property, currently have in place subordinate secured lines of credit to the related mortgage borrowers that permit future advances (such loans, collectively, the “Subordinate Coop LOCs”). The percentage figure expressed as “% of Mortgage Loans with Additional Subordinate Debt” is determined as a percentage of the initial pool balance and does not take into account any future subordinate debt (whether or not secured by the mortgaged property), if any, that may be permitted under the terms of any mortgage loan or the pooling and servicing agreement. See “Description of the Mortgage Pool—Additional Indebtedness—Other Unsecured Indebtedness” and “Description of the Mortgage Pool—Additional Debt Financing for Mortgage Loans Secured by Residential Cooperatives” in the Preliminary Prospectus. |
| (3) | Excludes mortgage loans that are secured by multiple single tenant properties. |
THE INFORMATION IN THIS STRUCTURAL AND COLLATERAL TERM SHEET IS NOT COMPLETE AND MAY BE AMENDED PRIOR TO THE TIME OF SALE. THIS TERM SHEET IS NOT AN OFFER TO SELL THESE SECURITIES AND IT IS NOT A SOLICITATION OF AN OFFER TO BUY THESE SECURITIES IN ANY JURISDICTION WHERE THE OFFER OR SALE IS NOT PERMITTED.
6
| Wells Fargo Commercial Mortgage Trust 2016-C36 | Transaction Highlights |
Loan Structural Features:
Amortization:Based on the Initial Pool Balance, 69.4% of the mortgage pool (61 mortgage loans) has scheduled amortization, as follows:
56.8% (49 mortgage loans) requires amortization during the entire loan term; and
12.5% (12 mortgage loans) provides for an interest-only period followed by an amortization period.
Interest-Only:Based on the Initial Pool Balance, 30.6% of the mortgage pool (12 mortgage loans) provides for interest-only payments during the entire loan term. The Weighted Average Cut-off Date Loan-to-Value Ratio and Weighted Average U/W Net Cash Flow DSCR for those mortgage loans are 48.8% and 3.20x, respectively.
Hard Lockboxes: Based on the Initial Pool Balance, 48.9% of the mortgage pool (14 mortgage loans) have hard lockboxes in place.
Reserves: The mortgage loans require amounts to be escrowed monthly as follows (excluding any mortgage loans with springing provisions):
| Real Estate Taxes: | 74.8% of the pool | |
| Insurance: | 34.9% of the pool | |
| Capital Replacements: | 61.8% of the pool | |
| TI/LC: | 51.0% of the pool(1) | |
| (1) The percentage of Initial Pool Balance for mortgage loans with TI/LC reserves is based on the aggregate principal balance allocable to loans that include retail, office, mixed use and industrial properties. | ||
Call Protection/Defeasance: Based on the Initial Pool Balance, the mortgage pool has the following call protection and defeasance features:
73.3% of the mortgage pool (57 mortgage loans) features a lockout period, then defeasance only until an open period;
11.0% of the mortgage pool (four mortgage loans) features a lockout period, then the greater of a prepayment premium or yield maintenance until an open period;
8.4% of the mortgage pool (10 mortgage loans) features no lockout period, but requires the greater of a prepayment premium or yield maintenance, then a prepayment premium until an open period;
5.2% of the mortgage pool (one mortgage loan) features no lockout period, but requires the greater of a prepayment premium or yield maintenance, then defeasance or the greater of a prepayment premium or yield maintenance until an open period; and
2.0% of the mortgage pool (one mortgage loan) features a lockout period, then defeasance or the greater of a prepayment premium or yield maintenance until an open period.
Please refer to Annex A-1 and the footnotes related thereto to the Preliminary Prospectus for further information regarding individual loan call protection.
THE INFORMATION IN THIS STRUCTURAL AND COLLATERAL TERM SHEET IS NOT COMPLETE AND MAY BE AMENDED PRIOR TO THE TIME OF SALE. THIS TERM SHEET IS NOT AN OFFER TO SELL THESE SECURITIES AND IT IS NOT A SOLICITATION OF AN OFFER TO BUY THESE SECURITIES IN ANY JURISDICTION WHERE THE OFFER OR SALE IS NOT PERMITTED.
7
| Wells Fargo Commercial Mortgage Trust 2016-C36 | Issue Characteristics |
| III. | Issue Characteristics | ||
| Securities Offered: | $757,342,000 approximate monthly pay, multi-class, commercial mortgage REMIC pass-through certificates consisting of ten classes (Classes A-1, A-2, A-3, A-4, A-SB, A-S, B, C, X-A and X-B), which are offered pursuant to a registration statement filed with the SEC (such classes of certificates, the “Offered Certificates”). | ||
| Mortgage Loan Sellers: | Barclays Bank PLC (“Barclays”), Wells Fargo Bank, National Association (“WFB”), C-III Commercial Mortgage LLC (“CIIICM”), Rialto Mortgage Finance, LLC (“RMF”), National Cooperative Bank, N.A. (“NCB”), The Bancorp Bank (“Bancorp”) and Basis Real Estate Capital II, LLC (“Basis”). | ||
| Joint Bookrunners and Co-Lead Managers: | Wells Fargo Securities, LLC and Barclays Capital Inc. | ||
| Co-Managers: | Academy Securities, Inc. and Citigroup Global Markets Inc. | ||
| Rating Agencies: | Fitch Ratings, Inc., Moody’s Investors Service, Inc. and Morningstar Credit Ratings, LLC | ||
| Master Servicers: | Wells Fargo Bank, National Association and National Cooperative Bank, N.A. | ||
| Special Servicers: | C-III Asset Management LLC and National Cooperative Bank, N.A. | ||
| Certificate Administrator: | Wells Fargo Bank, National Association | ||
| Trustee: | Wilmington Trust, National Association | ||
| Operating Advisor: | Park Bridge Lender Services LLC | ||
| Asset Representations Reviewer: | Park Bridge Lender Services LLC | ||
| Initial Majority Controlling Class Certificateholder: | C-III Investment Management LLC or an affiliate | ||
| Cut-off Date: | The Cut-off Date with respect to each mortgage loan is the due date for the monthly debt service payment that is due in November 2016 (or, in the case of any mortgage loan that has its first due date in December 2016, the date that would have been its due date in November 2016 under the terms of that mortgage loan if a monthly debt service payment were scheduled to be due in that month). | ||
| Expected Closing Date: | On or about November 3, 2016. | ||
| Determination Dates: | The 11th day of each month (or if that day is not a business day, the next succeeding business day), commencing in December 2016. | ||
| Distribution Dates: | The fourth business day following the Determination Date in each month, commencing in December 2016. | ||
| Rated Final Distribution Date: | The Distribution Date in November 2059. | ||
| Interest Accrual Period: | With respect to any Distribution Date, the calendar month immediately preceding the month in which such Distribution Date occurs. | ||
| Day Count: | The Offered Certificates will accrue interest on a 30/360 basis. | ||
| Minimum Denominations: | $10,000 for each Class of Offered Certificates (other than the Class X-A and X-B Certificates) and $1,000,000 for the Class X-A and X-B Certificates. Investments may also be made in any whole dollar denomination in excess of the applicable minimum denomination. | ||
| Clean-up Call: | 1.0% | ||
| Delivery: | DTC, Euroclear and Clearstream Banking | ||
| ERISA/SMMEA Status: | Each Class of Offered Certificates is expected to be eligible for exemptive relief under ERISA. No Class of Offered Certificates will be SMMEA eligible. | ||
| Risk Factors: | THE CERTIFICATES INVOLVE CERTAIN RISKS AND MAY NOT BE SUITABLE FOR ALL INVESTORS. SEE THE “RISK FACTORS” SECTION OF THE PRELIMINARY PROSPECTUS. | ||
| Bond Analytics Information: | The Certificate Administrator will be authorized to make distribution date statements, CREFC® reports and certain supplemental reports (other than confidential information) available to certain financial modeling and data provision services, including Bloomberg, L.P., Trepp, LLC, Intex Solutions, Inc., Moody’s Analytics, Markit Group Limited, Interactive Data Corp., BlackRock Financial Management, Inc., CMBS.com, Inc. and Thomson Reuters Corporation. |
THE INFORMATION IN THIS STRUCTURAL AND COLLATERAL TERM SHEET IS NOT COMPLETE AND MAY BE AMENDED PRIOR TO THE TIME OF SALE. THIS TERM SHEET IS NOT AN OFFER TO SELL THESE SECURITIES AND IT IS NOT A SOLICITATION OF AN OFFER TO BUY THESE SECURITIES IN ANY JURISDICTION WHERE THE OFFER OR SALE IS NOT PERMITTED.
8
| Wells Fargo Commercial Mortgage Trust 2016-C36 | Characteristics of the Mortgage Pool |
| IV. | Characteristics of the Mortgage Pool(1) |
| A. | Ten Largest Mortgage Loans |
| Mortgage Loan Seller | Mortgage Loan Name | City | State | Number of Mortgage Loans / Mortgaged Properties | Mortgage Loan Cut-off Date Balance ($) | % of Initial Pool Balance (%) | Property Type | Number of Rooms / | Cut-off Date Balance Per SF /Room/ Unit | Cut-off Date LTV Ratio (%) | Balloon LTV Ratio (%) | U/W NCF DSCR (x) | U/W NOI Debt Yield (%) | |||||||||||||||||||
| WFB | Gurnee Mills | Gurnee | IL | 1 / 1 | $79,893,396 | 9.3 | % | Retail | 1,683,915 | $163 | 65.9 | % | 52.4 | % | 1.60 | x | 9.7 | % | ||||||||||||||
| WFB | 101 Hudson Street | Jersey City | NJ | 1 / 1 | 67,500,000 | 7.9 | Office | 1,341,649 | 186 | 51.8 | 51.8 | 3.68 | 12.9 | |||||||||||||||||||
| Barclays | Plaza America I & II | Reston | VA | 1 / 1 | 65,000,000 | 7.6 | Office | 514,615 | 243 | 64.1 | 64.1 | 1.96 | 9.3 | |||||||||||||||||||
| NCB | North Isle Village, Inc. | Coram | NY | 1 / 1 | 45,933,875 | 5.4 | Multifamily | 763 | 60,202 | 52.8 | 41.5 | 2.65 | 14.8 | |||||||||||||||||||
| Barclays | Easton Town Center | Columbus | OH | 1 / 1 | 45,000,000 | 5.2 | Retail | 1,303,073 | 259 | 28.5 | 28.5 | 4.02 | 15.4 | |||||||||||||||||||
| WFB | Conrad Indianapolis | Indianapolis | IN | 1 / 1 | 31,962,031 | 3.7 | Hospitality | 247 | 225,239 | 64.8 | 52.5 | 1.71 | 12.6 | |||||||||||||||||||
| Barclays | Mall at Turtle Creek | Jonesboro | AR | 1 / 1 | 29,683,636 | 3.5 | Retail | 329,398 | 217 | 55.0 | 45.1 | 1.57 | 10.7 | |||||||||||||||||||
| Basis | Home2 Suites - Long Island City | Long Island City | NY | 1 / 1 | 24,973,745 | 2.9 | Hospitality | 115 | 217,163 | 61.2 | 50.5 | 1.53 | 11.0 | |||||||||||||||||||
| Barclays | ExchangeRight Net Leased Portfolio 13 | Various | Various | 1 / 20 | 24,485,000 | 2.9 | Retail | 233,055 | 105 | 54.1 | 54.1 | 2.74 | 11.1 | |||||||||||||||||||
| Barclays | Sheraton Towson Baltimore North | Towson | MD | 1 / 1 | 21,949,866 | 2.6 | Hospitality | 283 | 77,561 | 62.7 | 51.6 | 1.57 | 12.4 | |||||||||||||||||||
| Top Three Total/Weighted Average | 3 / 3 | $212,393,396 | 24.7 | % | 60.9 | % | 55.8 | % | 2.37 | x | 10.6 | % | ||||||||||||||||||||
| Top Five Total/Weighted Average | 5 / 5 | $303,327,271 | 35.3 | % | 54.8 | % | 49.6 | % | 2.66 | x | 11.9 | % | ||||||||||||||||||||
| Top Ten Total/Weighted Average | 10 / 29 | $436,381,549 | 50.8 | % | 56.3 | % | 49.9 | % | 2.40 | x | 11.8 | % | ||||||||||||||||||||
| Non-Top Ten Total/Weighted Average | 63 / 69 | $421,796,410 | 49.2 | % | 61.6 | % | 51.9 | % | 2.19 | x | 12.8 | % | ||||||||||||||||||||
| (1) | With respect to any mortgage loan that is part of a whole loan, Cut-off Date Balance Per SF/Room/Unit, loan-to-value ratio, debt service coverage ratio and debt yield calculations include the relatedpari passu companion loan(s) but exclude any related subordinate companion loan(s) (unless otherwise stated). For mortgaged properties securing residential cooperative mortgage loans, the debt service coverage ratio and debt yield for each such mortgaged property is calculated using U/W Net Operating Income or U/W Net Cash Flow, as applicable, for the related residential cooperative property, which is the projected net operating income or net cash flow, as applicable, reflected in the most recent appraisal obtained by or otherwise in the possession of the related mortgage loan seller as of the cut-off date, and the loan-to-value ratio, is calculated based upon the appraised value of the residential cooperative property determined as if such residential cooperative property is operated as a residential cooperative. With respect to each mortgage loan, debt service coverage ratio, debt yield and loan-to-value ratio information do not take into account subordinate debt (whether or not secured by the related mortgaged property), if any, that currently exists or is allowed under the terms of such mortgage loan. |
THE INFORMATION IN THIS STRUCTURAL AND COLLATERAL TERM SHEET IS NOT COMPLETE AND MAY BE AMENDED PRIOR TO THE TIME OF SALE. THIS TERM SHEET IS NOT AN OFFER TO SELL THESE SECURITIES AND IT IS NOT A SOLICITATION OF AN OFFER TO BUY THESE SECURITIES IN ANY JURISDICTION WHERE THE OFFER OR SALE IS NOT PERMITTED.
9
| Wells Fargo Commercial Mortgage Trust 2016-C36 | Characteristics of the Mortgage Pool |
| B. | Summary of thePari PassuWhole Loans |
| Property Name | Mortgage Loan Originator | Note(s) | Related Notes in Loan Group (Original Balance) | Holder of Note | Lead Servicer for Whole loan | Current Master Servicer Under Related Securitization Servicing Agreement | Current Special Servicer Under Related Securitization Servicing Agreement |
| Gurnee Mills | Column | A-1A & A-1B | $110,000,000 | (1) | Yes(2) | TBD | TBD |
| WFB | A-2A | $80,000,000 | WFCM 2016-C36 | No(2) | Wells Fargo Bank, National Association | C-III Asset Management LLC | |
| WFB | A-2B | $25,000,000 | (3) | No | TBD | TBD | |
| Regions | A-3 & A-4 | $60,000,000 | (4) | No | TBD | TBD | |
| 101 Hudson Street | WFB | A-1 | $70,000,000 | (5) | Yes(6) | TBD | TBD |
| WFB | A-2 | $67,500,000 | WFCM 2016-C36 | No(6) | Wells Fargo Bank, National Association | C-III Asset Management LLC | |
| BANA | A-3 & A-4 | $56,250,000 | (7) | No | TBD | TBD | |
| Barclays | A-5 | $56,250,000 | (8) | No | TBD | TBD | |
| Plaza America I & II | Barclays | A-1 | $65,000,000 | WFCM 2016-C36 | Yes | Wells Fargo Bank, National Association | C-III Asset Management LLC |
| Barclays | A-2 | $60,000,000 | CGCMT 2016-P5 | No | Midland Loan Services, a Division of PNC Bank, National Association | LNR Partners, LLC | |
| Easton Town Center(9) | Barclays/MS | A-1-A & A-2-A | $150,000,000 | BBCMS 2016-ETC | Yes | Wells Fargo Bank, National Association | AEGON USA Realty Advisors, LLC |
| Barclays | A-1-B-1 | $45,000,000 | CGCMT 2016-P5 | No | Wells Fargo Bank, National Association | LNR Partners, LLC | |
| Barclays | A-1-B-2 | $45,000,000 | WFCM 2016-C36 | No | Wells Fargo Bank, National Association | C-III Asset Management LLC | |
| Barclays | A-1-B-3 | $22,500,000 | (10) | No | TBD | TBD | |
| MS | A-2-B | $75,000,000 | MSBAM 2016-C30 | No | Wells Fargo Bank, National Association | LNR Partners, LLC | |
| Conrad Indianapolis | WFB | A-1 | $32,000,000 | WFCM 2016-C36 | Yes | Wells Fargo Bank, National Association | C-III Asset Management LLC |
| WFB | A-2 | $23,700,000 | (11) | No | TBD | TBD | |
| Mall At Turtle Creek | Barclays | A-1 | $42,000,000 | WFCM 2016-C35 | Yes | Wells Fargo Bank, National Association | CWCapital Asset Management LLC |
| Barclays | A-2 | $29,860,000 | WFCM 2016-C36 | No | Wells Fargo Bank, National Association | C-III Asset Management LLC | |
| Central Park Retail | WFB | A-1 | $70,000,000 | WFCM 2016-LC24 | Yes | Wells Fargo Bank, National Association | Midland Loan Services, a Division of PNC Bank, National Association |
| WFB | A-2 | $20,000,000 | WFCM 2016-C36 | No | Wells Fargo Bank, National Association | C-III Asset Management LLC | |
| Gas Company Tower & World Trade Center Parking Garage(12) | DB / Barclays | A-1-S1, A-1-S2, A-1-S3 & A-2-S | $89,000,000 | COMM 2016-GCT | Yes | Wells Fargo Bank, National Association | Strategic Asset Services LLC |
| DB | A-1-C | $40,000,000 | CD 2016-CD1 | No | Wells Fargo Bank, National Association | Rialto Capital Advisors, LLC | |
| Barclays | A-2-C | $15,000,000 | WFCM 2016-C36 | No | Wells Fargo Bank, National Association | C-III Asset Management LLC | |
| One & Two Corporate Plaza | RMF | A-1 | $20,000,000 | WFCM 2016-LC24 | Yes | Wells Fargo Bank, National Association | Midland Loan Services, a Division of PNC Bank, National Association |
| RMF | A-2 | $7,000,000 | WFCM 2016-C36 | No | Wells Fargo Bank, National Association | C-III Asset Management LLC |
THE INFORMATION IN THIS STRUCTURAL AND COLLATERAL TERM SHEET IS NOT COMPLETE AND MAY BE AMENDED PRIOR TO THE TIME OF SALE. THIS TERM SHEET IS NOT AN OFFER TO SELL THESE SECURITIES AND IT IS NOT A SOLICITATION OF AN OFFER TO BUY THESE SECURITIES IN ANY JURISDICTION WHERE THE OFFER OR SALE IS NOT PERMITTED.
10
| Wells Fargo Commercial Mortgage Trust 2016-C36 | Characteristics of the Mortgage Pool |
| (1) | The relatedpari passu Notes A-1A & A-1B are currently held by Column and is expected to be contributed to a future securitization. No assurance can be provided that the Note A-1A or A-1B will not be split further. |
| (2) | The Gurnee Mills whole loan is expected to initially be serviced under the WFCM 2016-C36 pooling and servicing agreement until the securitization of the related controllingpari passu Note A-1A (the “Gurnee Mills Servicing Shift Securitization Date”), after which the Gurnee Mills whole loan will be serviced under the pooling and servicing agreement related to the securitization of the related controllingpari passu Note A-1A (the “Gurnee Mills Servicing Shift PSA”). The master servicer and special servicer under the Gurnee Mills Servicing Shift PSA will be identified in a notice, report or statement to holders of the WFCM 2016-C36 certificates after the securitization of the related controllingpari passu Note A-1A. |
| (3) | The relatedpari passu Note A-2B is currently held by WFB and is expected to be contributed to a future securitization. No assurance can be provided that the Note A-2B will not be split further. |
| (4) | The relatedpari passu Notes A-3 and A-4 are currently held by Regions and are expected to be contributed to one or more future securitizations. No assurance can be provided that the Note A-3 or A-4 will not be split further. |
| (5) | The relatedpari passu Note A-1 is currently held by WFB and is expected to be contributed to a future securitization. No assurance can be provided that the Note A-1 will not be split further. |
| (6) | The 101 Hudson Street whole loan is expected to initially be serviced under the WFCM 2016-C36 pooling and servicing agreement until the securitization of the related controllingpari passu Note A-1 (the “101 Hudson Street Servicing Shift Securitization Date”), after which the 101 Hudson Street whole loan will be serviced under the pooling and servicing agreement related to the securitization of the related controllingpari passu Note A-1 (the “101 Hudson Street Servicing Shift PSA”). The master servicer and special servicer under the 101 Hudson Street Servicing Shift PSA will be identified in a notice, report or statement to holders of the WFCM 2016-C36 certificates after the securitization of the related controllingpari passu Note A-1. |
| (7) | The relatedpari passu Notes A-3 and A-4 are currently held by BANA and are expected to be contributed to one or more future securitizations. No assurance can be provided that the Note A-3 or A-4 will not be split further. |
| (8) | The relatedpari passu Note A-5 is currently held by Barclays and is expected to be contributed to a future securitization. No assurance can be provided that the Note A-5 will not be split further. |
| (9) | The Easton Town Center whole loan includes two junior companion loans with an aggregate original principal balance of $362,500,000. Such junior companion loans are not reflected in, and are subordinate to all of the notes listed in the “Related Notes in Loan Group (Original Balance)” column. The junior companion loans were securitized in the BBCMS 2016-ETC transaction. |
| (10) | The relatedpari passu Note A-1-B-3 is currently held by Barclays and is expected to be contributed to a future securitization. No assurance can be provided that the Note A-1-B-3 will not be split further. |
| (11) | The relatedpari passu Note A-2 is currently held by WFB and is expected to be contributed to a future securitization. No assurance can be provided that Note A-2 will not be split further. |
| (12) | The Gas Company Tower & World Trade Center Parking Garage whole loan includes two junior companion loans with an aggregate original principal balance of $175,000,000. Such junior companion loans are not reflected in, and are subordinate to all of the notes listed in the “Related Notes in Loan Group (Original Balance)” column. |
C. Mortgage Loans with Additional Secured and Mezzanine Financing(1)
| Loan No. | Mortgage Loan Seller | Mortgage Loan Name | Mortgage Loan Cut-off Date Balance ($) | % of Initial Pool Balance (%) | Subordinate Debt Cut-off Date Balance ($) | Mezzanine Debt Cut-off Date Balance ($) | Total Debt Interest Rate (%)(2) | Mortgage Loan U/W NCF DSCR (x)(3) | Total Debt (x) | Mortgage Loan Cut-off Date U/W NOI Debt Yield (%)(3) | Total Debt Cut-off Date U/W NOI Debt Yield (%) | Mortgage Loan Cut-off Date LTV Ratio (%)(3) | Total Debt Cut-off Date LTV Ratio (%) | |||||||||||||||||||||
| 3 | Barclays | Plaza America I & II | $65,000,000 | 7.6 | % | NAP | $20,000,000 | 4.557 | % | 1.96 | x | 1.55 | x | 9.3 | % | 8.0 | % | 64.1 | % | 74.4 | % | |||||||||||||
| 5 | Barclays | Easton Town Center | 45,000,000 | 5.2 | 362,500,000 | NAP | 3.616 | 4.02 | 1.94 | 15.4 | 7.4 | 28.5 | 59.0 | |||||||||||||||||||||
| 18 | Barclays | Gas Company Tower & World Trade Center Parking Garage | 15,000,000 | 1.7 | 175,000,000 | 131,000,000 | 4.354 | 5.23 | 1.34 | 19.9 | 6.4 | 23.6 | 73.6 | |||||||||||||||||||||
| Total/Weighted Average | $125,000,000 | 14.6 | % | $537,500,000 | $151,000,000 | 4.194 | % | 3.09 | x | 1.67 | x | 12.8 | % | 7.6 | % | 46.4 | % | 68.8 | % | |||||||||||||||
| (1) | In addition, five (5) of the mortgage loans, each of which is secured by a residential cooperative property, currently have in place Subordinate Coop LOCs, that permit future advances. See “Description of the Mortgage Pool—Additional Indebtedness—Other Unsecured Indebtedness” and “Description of the Mortgage Pool—Additional Debt Financing for Mortgage Loans Secured by Residential Cooperatives” in the Preliminary Prospectus. |
| (2) | Total Debt Interest Rate for any specified mortgage loan reflects the weighted average of the interest rates on the respective components of the total debt. |
| (3) | With respect to Plaza America I & II mortgage loan, the Easton Town Center mortgage loan and the Gas Company Tower & World Trade Center Parking Garage mortgage loan, each of which is part of a whole loan, the loan-to-value ratio, debt service coverage ratio and debt yield calculations include the relatedpari passu companion loan(s), but does not take into account subordinate debt, if any. |
THE INFORMATION IN THIS STRUCTURAL AND COLLATERAL TERM SHEET IS NOT COMPLETE AND MAY BE AMENDED PRIOR TO THE TIME OF SALE. THIS TERM SHEET IS NOT AN OFFER TO SELL THESE SECURITIES AND IT IS NOT A SOLICITATION OF AN OFFER TO BUY THESE SECURITIES IN ANY JURISDICTION WHERE THE OFFER OR SALE IS NOT PERMITTED.
11
| Wells Fargo Commercial Mortgage Trust 2016-C36 | Characteristics of the Mortgage Pool |
D. Previous Securitization History(1)
| Loan No. | Mortgage Loan Seller | Mortgage Loan or Mortgaged Property Name | City | State | Property | Mortgage Loan or Mortgaged Property Cut-off Date Balance ($) | % of | Previous Securitization | ||
| 1 | WFB | Gurnee Mills | Gurnee | IL | Retail | $79,893,396 | 9.3 | % | JPMCC 2007-C1; JPMCC 2007-CB20 | |
| 3 | Barclays | Plaza America I & II | Reston | VA | Office | $65,000,000 | 7.6 | % | GCCFC 2007-GG9 | |
| 5 | Barclays | Easton Town Center | Columbus | OH | Retail | 45,000,000 | 5.2 | MSC 2007-IQ16; BSCMS 2007-T28 | ||
| 6 | WFB | Conrad Indianapolis | Indianapolis | IN | Hospitality | 31,962,031 | 3.7 | CSMC 2007-C1 | ||
| 9.02 | Barclays | Walgreens - Panama City | Panama City | FL | Retail | 3,165,000 | 0.4 | MLCFC 2007-5 | ||
| 10 | Barclays | Sheraton Towson Baltimore North | Towson | MD | Hospitality | 21,949,866 | 2.6 | WBCMT 2006-C27 | ||
| 11.01 | Barclays | Emmott Business Center | Houston | TX | Industrial | 7,188,439 | 0.8 | MSC 1997-HF1 | ||
| 11.05 | Barclays | Aldine Westfield | Houston | TX | Industrial | 1,497,591 | 0.2 | SBM7 1999-C1 | ||
| 12 | WFB | Central Park Retail(2) | Fredericksburg | VA | Retail | 19,948,500 | 2.3 | MLCFC 2006-4 | ||
| 16 | CIIICM | Spanish Fort Town Center Apartments | Spanish Fort | AL | Multifamily | 15,750,000 | 1.8 | COMM 2014-UBS4 | ||
| 18 | Barclays | Gas Company Tower & World Trade Center Parking Garage | Los Angeles | CA | Office | 15,000,000 | 1.7 | JPMCC 2006-LDP8 | ||
| 20 | RMF | Consumer Square West | Columbus | OH | Retail | 13,584,151 | 1.6 | GSMS 2011-GC5 | ||
| 21 | RMF | Northtowne Meadows | Erie | MI | Manufactured Housing Community | 12,717,625 | 1.5 | MLCFC 2006-4 | ||
| 22 | WFB | Central Self Storage - Daly City, CA | Daly City | CA | Self Storage | 11,850,000 | 1.4 | BACM 2006-4 | ||
| 25 | RMF | Holiday Inn Express & Suites Cooperstown | Cooperstown | NY | Hospitality | 8,678,812 | 1.0 | UBSC 2011-C1 | ||
| 28 | RMF | One & Two Corporate Plaza | Houston | TX | Office | 6,984,312 | 0.8 | CD 2006-CD3; CD 2007-CD4 | ||
| 31 | Barclays | Pacific Rancho Business Park | Spring Valley | CA | Industrial | 6,350,000 | 0.7 | SBM7 2001-C1 | ||
| 35 | NCB | Fillmore Gardens Co-operative, Inc. a/k/a The Fillmore Gardens Co-operative, Inc. | Brooklyn | NY | Multifamily | 5,991,303 | 0.7 | WFCM 2015-LC22 | ||
| 37 | RMF | Hampton Inn Richmond Hill | Richmond Hill | GA | Hospitality | 5,543,649 | 0.6 | CSMC 2007-C2 | ||
| 38 | Basis | 4119 Syracuse Holding (Camillus Plaza) | Camillus | NY | Retail | 5,523,379 | 0.6 | MSC 2006-1Q12 | ||
| 40 | CIIICM | Lock Ur Own Self Storage | Aurora | CO | Self Storage | 5,281,080 | 0.6 | LBUBS 2007-C6 | ||
| 44 | RMF | Comfort Inn & Suites Market Center Dallas | Dallas | TX | Hospitality | 4,495,229 | 0.5 | BACM 2006-5 | ||
| 46 | CIIICM | Sun Lake Estates MHP | San Angelo | TX | Manufactured Housing Community | 4,229,889 | 0.5 | BACM 2006-5 | ||
| 48 | The Bancorp Bank | Best Western - Westgate | York | PA | Hospitality | 4,118,381 | 0.5 | CSMC 2007-C5 | ||
| 49 | RMF | Courthouse Square | Stafford | VA | Office | 4,075,846 | 0.5 | WBCMT 2006-C29 | ||
| 50 | The Bancorp Bank | Pokegama Mobile Home & R.V. Park | Pine City | MN | Manufactured Housing Community | 3,979,396 | 0.5 | LBUBS 2006-C3 | ||
| 55 | CIIICM | Guardian Self Storage San Antonio | San Antonio | TX | Self Storage | 3,491,272 | 0.4 | LBUBS 2006-C6 | ||
| 58 | CIIICM | Pleasant Ridge | Evansville | IN | Manufactured Housing Community | 3,242,234 | 0.4 | BSCMS 2006-PW13 | ||
| 59 | NCB | Bayview Owners Corp. | Brooklyn | NY | Multifamily | 2,997,388 | 0.3 | MSC 2003-IQ6 | ||
| 63 | CIIICM | Belle Grove MHP | Bradenton | FL | Manufactured Housing Community | 2,697,022 | 0.3 | CD 2007-CD4 | ||
| 67 | CIIICM | Newtown Self Storage | Newtown | CT | Self Storage | 2,097,452 | 0.2 | MSC 2006-IQ12 | ||
| 71 | NCB | 1122 Yonkers Avenue Ltd. a/k/a 1122 Yonkers Avenue, Ltd. | Yonkers | NY | Multifamily | 1,248,196 | 0.1 | MSC 2007-IQ13 | ||
| Total | $425,531,440 | 49.6 | % | |||||||
| (1) | The table above represents the most recent securitization with respect to the mortgaged property securing the related mortgage loan, based on information provided by the related borrower or obtained through searches of a third-party database. While loans secured by the above mortgaged properties may have been securitized multiple times in prior transactions, mortgage loans in this securitization are only listed in the above chart if the mortgage loan paid off a loan in another securitization. The information has not otherwise been confirmed by the mortgage loan sellers. |
| (2) | The Central Park Retail whole loan was used to pay off a portion of the previous $125,000,000 mortgage loan, which also included debt secured by a 229,611 square foot office complex that was refinanced separately. Approximately $90,451,770 of the previous $125,000,000 loan is allocated to the Central Park Retail property. |
THE INFORMATION IN THIS STRUCTURAL AND COLLATERAL TERM SHEET IS NOT COMPLETE AND MAY BE AMENDED PRIOR TO THE TIME OF SALE. THIS TERM SHEET IS NOT AN OFFER TO SELL THESE SECURITIES AND IT IS NOT A SOLICITATION OF AN OFFER TO BUY THESE SECURITIES IN ANY JURISDICTION WHERE THE OFFER OR SALE IS NOT PERMITTED.
12
| Wells Fargo Commercial Mortgage Trust 2016-C36 | Characteristics of the Mortgage Pool |
E. Mortgage Loans with Scheduled Balloon Payments and Related Classes
| Class A-2(1) | ||||||||||||||||
| Loan No. | Mortgage Loan Seller | Mortgage Loan Name | State | Property Type | Mortgage Loan Cut-off Date Balance ($) | % of Initial Pool Balance (%) | Balloon Balance ($) | % of Class A-2 Certificate Balance (%)(2) | SF/ Pads / Units | Loan per SF/ Pad / Unit($)(3) | U/W NCF DSCR (x)(3) | U/W NOI Debt Yield (%)(3) | Cut-off Date LTV Ratio (%)(3) | Balloon LTV Ratio (%)(3) | Rem. IO Period (mos.) | Rem. Term to Maturity (mos.) |
| 18 | Barclays | Gas Company Tower & World Trade Center Parking Garage | CA | Office | $15,000,000 | 1.7% | $15,000,000 | 37.8% | 1,372,329 | $105 | 5.23x | 19.9% | 23.6% | 23.6% | 57 | 57 |
| 30 | The Bancorp Bank | Paradise Ranch MHP | CA | Manufactured Housing Community | 6,492,847 | 0.8 | 5,980,764 | 15.1 | 94 | 69,073 | 1.53 | 9.8 | 57.6 | 53.0 | 0 | 59 |
| 36 | CIIICM | Village at Fairplain | MI | Multifamily | 5,615,689 | 0.7 | 5,047,960 | 12.7 | 178 | 31,549 | 1.41 | 11.1 | 59.7 | 53.7 | 0 | 56 |
| 42 | CIIICM | Country Aire MHP | LA | Manufactured Housing Community | 4,595,112 | 0.5 | 4,242,238 | 10.7 | 192 | 23,933 | 1.54 | 10.2 | 74.2 | 68.5 | 0 | 59 |
| 50 | The Bancorp Bank | Pokegama Mobile Home & R.V. Park | MN | Manufactured Housing Community | 3,979,396 | 0.5 | 3,750,821 | 9.5 | 337 | 11,808 | 1.66 | 12.7 | 53.3 | 50.3 | 0 | 54 |
| Total/Weighted Average | $35,683,044 | 4.2% | $34,021,783 | 85.8% | 3.08x | 14.6% | 45.3% | 42.4% | 24 | 57 | ||||||
| (1) | The table above presents the mortgage loan(s) whose balloon payments would be applied to pay down the principal balance of the Class A-2 Certificates, assuming a 0% CPR and applying the “Structuring Assumptions” described in the Preliminary Prospectus, including the assumptions that (i) none of the mortgage loans in the pool experience prepayments prior to maturity, defaults or losses; (ii) there are no extensions of maturity dates of any mortgage loans in the pool; and (iii) each mortgage loan in the pool is paid in full on its stated maturity date. Each Class of Certificates evidences undivided ownership interests in the entire pool of mortgage loans. Debt service coverage ratio, debt yield and loan-to-value ratio information do not take into account subordinate debt (whether or not secured by the related mortgaged property), if any, that currently exists or is allowed under the terms of any mortgage loan. See Annex A-1 to the Preliminary Prospectus. |
| (2) | Reflects the percentage equal to the Balloon Balance divided by the initial Class A-2 Certificate Balance. |
| (3) | With respect to the Gas Company Tower & World Trade Center Parking Garage mortgage loan, which is part of a whole loan, the Loan per SF/Pad/Unit, loan-to-value ratio, debt service coverage ratio and debt yield calculations include the relatedpari passu companion loan(s), but does not take into account any junior companion loans. |
THE INFORMATION IN THIS STRUCTURAL AND COLLATERAL TERM SHEET IS NOT COMPLETE AND MAY BE AMENDED PRIOR TO THE TIME OF SALE. THIS TERM SHEET IS NOT AN OFFER TO SELL THESE SECURITIES AND IT IS NOT A SOLICITATION OF AN OFFER TO BUY THESE SECURITIES IN ANY JURISDICTION WHERE THE OFFER OR SALE IS NOT PERMITTED.
13
| Wells Fargo Commercial Mortgage Trust 2016-C36 | Characteristics of the Mortgage Pool |
F. Property Type Distribution(1)
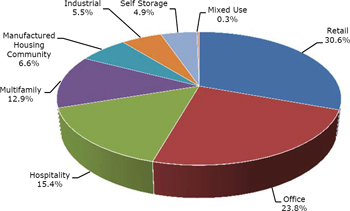
| Property Type | Number of Mortgaged Properties | Aggregate Cut-off Date Balance ($) | % of Initial Pool Balance (%) | Weighted Average Cut- off Date LTV Ratio (%) | Weighted Average Balloon LTV Ratio (%) | Weighted Average U/W NCF DSCR (x) | Weighted Average U/W NOI Debt Yield (%) | Weighted Average U/W NCF Debt Yield (%) | Weighted Average Mortgage Rate (%) | ||||||||
| Retail | 32 | $262,965,576 | 30.6 | % | 56.9 | % | 48.7 | % | 2.19 | x | 11.1 | % | 10.5 | % | 4.104 | % | |
| Super Regional Mall | 1 | 79,893,396 | 9.3 | 65.9 | 52.4 | 1.60 | 9.7 | 9.1 | 3.990 | ||||||||
| Anchored | 4 | 54,982,651 | 6.4 | 71.4 | 58.9 | 1.44 | 9.4 | 8.6 | 4.405 | ||||||||
| Urban | 1 | 45,000,000 | 5.2 | 28.5 | 28.5 | 4.02 | 15.4 | 14.7 | 3.616 | ||||||||
| Single Tenant | 22 | 35,185,000 | 4.1 | 50.6 | 50.6 | 2.79 | 11.8 | 11.4 | 3.997 | ||||||||
| Regional Mall | 1 | 29,683,636 | 3.5 | 55.0 | 45.1 | 1.57 | 10.7 | 9.9 | 4.780 | ||||||||
| Unanchored | 3 | 18,220,893 | 2.1 | 59.5 | 54.2 | 2.39 | 11.3 | 10.7 | 4.003 | ||||||||
| Office | 9 | 203,846,055 | 23.8 | 58.6 | 55.8 | 2.67 | 11.7 | 10.6 | 3.939 | ||||||||
| Suburban | 7 | 121,346,055 | 14.1 | 66.8 | 61.9 | 1.78 | 10.1 | 9.0 | 4.454 | ||||||||
| CBD | 2 | 82,500,000 | 9.6 | 46.7 | 46.7 | 3.96 | 14.2 | 12.8 | 3.182 | ||||||||
| Hospitality | 10 | 132,278,767 | 15.4 | 63.0 | 50.6 | 1.71 | 12.8 | 11.0 | 4.769 | ||||||||
| Full Service | 3 | 72,889,252 | 8.5 | 63.3 | 51.6 | 1.65 | 12.4 | 10.2 | 4.653 | ||||||||
| Limited Service | 6 | 34,415,770 | 4.0 | 63.6 | 48.5 | 1.97 | 14.8 | 13.3 | 4.812 | ||||||||
| Extended Stay | 1 | 24,973,745 | 2.9 | 61.2 | 50.5 | 1.53 | 11.0 | 10.0 | 5.050 | ||||||||
| Multifamily | 15 | 110,420,009 | 12.9 | 48.9 | 40.1 | 3.49 | 18.9 | 18.3 | 3.874 | ||||||||
| Cooperative | 10 | 72,468,927 | 8.4 | 39.8 | 31.8 | 4.51 | 23.5 | 23.0 | 3.584 | ||||||||
| Garden | 4 | 34,455,052 | 4.0 | 65.9 | 55.5 | 1.55 | 10.0 | 9.4 | 4.398 | ||||||||
| Mid Rise | 1 | 3,496,031 | 0.4 | 72.8 | 59.4 | 1.51 | 9.9 | 9.4 | 4.720 | ||||||||
| Manufactured Housing Community | 13 | 56,647,485 | 6.6 | 68.5 | 57.8 | 1.48 | 9.7 | 9.5 | 4.877 | ||||||||
| Manufactured Housing Community | 13 | 56,647,485 | 6.6 | 68.5 | 57.8 | 1.48 | 9.7 | 9.5 | 4.877 | ||||||||
| Industrial | 9 | 47,158,588 | 5.5 | 67.4 | 55.3 | 1.65 | 10.5 | 9.4 | 4.293 | ||||||||
| Flex | 8 | 40,808,588 | 4.8 | 69.2 | 55.3 | 1.47 | 10.4 | 9.3 | 4.385 | ||||||||
| Light Industrial | 1 | 6,350,000 | 0.7 | 55.7 | 55.7 | 2.79 | 11.4 | 10.5 | 3.707 | ||||||||
| Self Storage | 9 | 42,127,264 | 4.9 | 63.1 | 55.6 | 1.77 | 9.8 | 9.5 | 4.455 | ||||||||
| Self Storage | 9 | 42,127,264 | 4.9 | 63.1 | 55.6 | 1.77 | 9.8 | 9.5 | 4.455 | ||||||||
| Mixed Use | 1 | 2,734,215 | 0.3 | 60.1 | 48.6 | 1.80 | 12.0 | 10.9 | 4.470 | ||||||||
| Self Storage/Retail | 1 | 2,734,215 | 0.3 | 60.1 | 48.6 | 1.80 | 12.0 | 10.9 | 4.470 | ||||||||
| Total/Weighted Average: | 98 | $858,177,959 | 100.0 | % | 58.9 | % | 50.9 | % | 2.30 | x | 12.3 | % | 11.4 | % | 4.218 | % | |
| (1) | Because this table presents information relating to the mortgaged properties and not the mortgage loans, the information for mortgage loans secured by more than one mortgaged property is based on allocated amounts (allocating the principal balance of the mortgage loan to each of those properties according to the relative appraised values of the mortgaged properties or the allocated loan amounts or property-specific release prices set forth in the related mortgage loan documents or such other allocation as the related mortgage loan seller deemed appropriate). For mortgaged properties securing residential cooperative mortgage loans, the debt service coverage ratio and debt yield for each such mortgaged property is calculated using U/W Net Operating Income or U/W Net Cash Flow, as applicable, for the related residential cooperative property which is the projected net operating income or net cash flow, as applicable, reflected in the most recent appraisal obtained by or otherwise in the possession of the related mortgage loan seller as of the cut-off date and the loan-to-value ratio, is calculated based upon the appraised value of the residential cooperative property determined as if such residential cooperative property is operated as a residential cooperative. With respect to any mortgage loan that is part of a whole loan, the loan-to-value ratio, debt service coverage ratio and debt yield calculations include the relatedpari passu companion loan(s) but exclude any related subordinate companion loan(s) (unless otherwise stated). With respect to each mortgage loan, debt service coverage ratio, debt yield and loan-to-value ratio information do not take into account of any subordinate debt (whether or not secured by the related mortgaged property) that currently exists or is allowed under the terms of such mortgage loan. See Annex A-1 to the Preliminary Prospectus. |
THE INFORMATION IN THIS STRUCTURAL AND COLLATERAL TERM SHEET IS NOT COMPLETE AND MAY BE AMENDED PRIOR TO THE TIME OF SALE. THIS TERM SHEET IS NOT AN OFFER TO SELL THESE SECURITIES AND IT IS NOT A SOLICITATION OF AN OFFER TO BUY THESE SECURITIES IN ANY JURISDICTION WHERE THE OFFER OR SALE IS NOT PERMITTED.
14
| Wells Fargo Commercial Mortgage Trust 2016-C36 | Characteristics of the Mortgage Pool |
G. Geographic Distribution(1)(2)
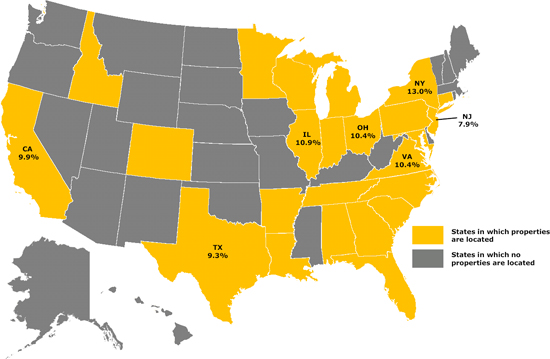
| Location | Number of Mortgaged Properties | Aggregate Cut-off Date Balance ($) | % of Initial Pool Balance (%) | Weighted Average Cut- off Date LTV Ratio (%) | Weighted Average Balloon LTV Ratio (%) | Weighted Average U/W NCF DSCR (x) | Weighted Average U/W NOI Debt Yield (%) | Weighted Average U/W NCF Debt Yield (%) | Weighted Average Mortgage Rate (%) | ||||||||
| New York | 13 | $111,644,862 | 13.0 | % | 48.0 | % | 38.0 | % | 3.48 | x | 19.3 | % | 18.6 | % | 4.032 | % | |
| Illinois | 4 | 93,139,427 | 10.9 | 66.5 | 53.4 | 1.57 | 9.6 | 9.1 | 4.097 | ||||||||
| Ohio | 10 | 89,340,543 | 10.4 | 47.1 | 42.2 | 2.92 | 13.3 | 12.6 | 4.105 | ||||||||
| Virginia | 3 | 89,024,345 | 10.4 | 66.6 | 62.8 | 1.79 | 9.2 | 8.3 | 4.278 | ||||||||
| California | 9 | 84,604,045 | 9.9 | 54.8 | 49.1 | 2.55 | 12.2 | 11.6 | 4.089 | ||||||||
| Southern | 6 | 52,519,829 | 6.1 | 50.0 | 44.6 | 2.97 | 13.7 | 13.0 | 4.109 | ||||||||
| Northern | 3 | 32,084,215 | 3.7 | 62.6 | 56.6 | 1.85 | 9.9 | 9.3 | 4.057 | ||||||||
| Texas | 19 | 80,150,285 | 9.3 | 64.7 | 51.8 | 1.62 | 11.5 | 10.1 | 4.680 | ||||||||
| New Jersey | 1 | 67,500,000 | 7.9 | 51.8 | 51.8 | 3.68 | 12.9 | 11.6 | 3.117 | ||||||||
| Other(3) | 39 | 242,774,451 | 28.3 | 64.0 | 54.7 | 1.75 | 11.1 | 10.1 | 4.567 | ||||||||
| Total/Weighted Average | 98 | $858,177,959 | 100.0 | % | 58.9 | % | 50.9 | % | 2.30 | x | 12.3 | % | 11.4 | % | 4.218 | % | |
| (1) | The mortgaged properties are located in 24 states. |
| (2) | Because this table presents information relating to the mortgaged properties and not the mortgage loans, the information for mortgage loans secured by more than one mortgaged property is based on allocated amounts (allocating the principal balance of the mortgage loan to each of those properties according to the relative appraised values of the mortgaged properties or the allocated loan amounts or property-specific release prices set forth in the related mortgage loan documents or such other allocation as the related mortgage loan seller deemed appropriate). For mortgaged properties securing residential cooperative mortgage loans, the debt service coverage ratio and debt yield for each such mortgaged property is calculated using U/W Net Operating Income or U/W Net Cash Flow, as applicable, for the related residential cooperative property, which is the projected net operating income or net cash flow, as applicable, reflected in the most recent appraisal obtained by or otherwise in the possession of the related mortgage loan seller as of the cut-off date, and the loan-to-value ratio, is calculated based upon the appraised value of the residential cooperative property determined as if such residential cooperative property is operated as a residential cooperative. With respect to any mortgage loan that is part of a whole loan, the loan-to-value ratio, debt service coverage ratio and debt yield calculations include the relatedpari passu companion loan(s) but exclude any related subordinate companion loan(s) (unless otherwise stated). With respect to each mortgage loan, debt service coverage ratio, debt yield and loan-to-value ratio information do not take into account of any subordinate debt (whether or not secured by the related mortgaged property) that currently exists or is allowed under the terms of such mortgage loan. See Annex A-1 to the Preliminary Prospectus. |
| (3) | Includes 17 other states. |
THE INFORMATION IN THIS STRUCTURAL AND COLLATERAL TERM SHEET IS NOT COMPLETE AND MAY BE AMENDED PRIOR TO THE TIME OF SALE. THIS TERM SHEET IS NOT AN OFFER TO SELL THESE SECURITIES AND IT IS NOT A SOLICITATION OF AN OFFER TO BUY THESE SECURITIES IN ANY JURISDICTION WHERE THE OFFER OR SALE IS NOT PERMITTED.
15
| Wells Fargo Commercial Mortgage Trust 2016-C36 | Characteristics of the Mortgage Pool |
H. Characteristics of the Mortgage Pool(1)
| CUT-OFF DATE BALANCE | ||||
| Range of Cut-off Date Balances ($) | Number of Mortgage Loans | Aggregate Cut- off Date Balance | % of Initial Pool Balance | |
| 1,158,605 - 2,000,000 | 6 | $8,397,100 | 1.0 | % |
| 2,000,001 - 3,000,000 | 9 | 22,879,104 | 2.7 | |
| 3,000,001 - 4,000,000 | 9 | 31,975,722 | 3.7 | |
| 4,000,001 - 5,000,000 | 8 | 34,680,632 | 4.0 | |
| 5,000,001 - 6,000,000 | 8 | 44,349,187 | 5.2 | |
| 6,000,001 - 7,000,000 | 6 | 38,992,772 | 4.5 | |
| 7,000,001 - 8,000,000 | 1 | 7,989,362 | 0.9 | |
| 8,000,001 - 9,000,000 | 2 | 16,903,812 | 2.0 | |
| 9,000,001 - 10,000,000 | 1 | 9,977,306 | 1.2 | |
| 10,000,001 - 15,000,000 | 6 | 78,832,674 | 9.2 | |
| 15,000,001 - 20,000,000 | 7 | 126,818,739 | 14.8 | |
| 20,000,001 - 30,000,000 | 4 | 101,092,246 | 11.8 | |
| 30,000,001 - 50,000,000 | 3 | 122,895,907 | 14.3 | |
| 50,000,001 - 70,000,000 | 2 | 132,500,000 | 15.4 | |
| 70,000,001 - 79,893,396 | 1 | 79,893,396 | 9.3 | |
| Total: | 73 | $858,177,959 | 100.0 | % |
| Average: | $11,755,862 | |||
| UNDERWRITTEN NOI DEBT SERVICE COVERAGE RATIO | ||||
| Range of U/W NOI DSCRs (x) | Number of Mortgage Loans | Aggregate Cut- off Date Balance | % of Initial Pool Balance | |
| 1.35 - 1.40 | 4 | $37,164,647 | 4.3 | % |
| 1.41 - 1.50 | 6 | 41,544,351 | 4.8 | |
| 1.51 - 1.60 | 12 | 69,231,407 | 8.1 | |
| 1.61 - 1.70 | 9 | 202,170,126 | 23.6 | |
| 1.71 - 1.80 | 2 | 8,209,285 | 1.0 | |
| 1.81 - 1.90 | 6 | 34,082,306 | 4.0 | |
| 1.91 - 2.00 | 4 | 48,762,892 | 5.7 | |
| 2.01 - 2.50 | 12 | 167,311,503 | 19.5 | |
| 2.51 - 3.00 | 4 | 83,116,389 | 9.7 | |
| 3.01 - 3.50 | 2 | 12,550,000 | 1.5 | |
| 3.51 - 4.00 | 1 | 2,515,000 | 0.3 | |
| 4.01 -12.62 | 11 | 151,520,051 | 17.7 | |
| Total: | 73 | $858,177,959 | 100.0 | % |
| Weighted Average: | 2.47x | |||
| UNDERWRITTEN NCF DEBT SERVICE COVERAGE RATIO | ||||
| Range of U/W NCF DSCRs (x) | Number of Mortgage Loans | Aggregate Cut- off Date Balance | % of Initial Pool Balance | |
| 1.31 - 1.40 | 9 | $71,966,003 | 8.4 | % |
| 1.41 - 1.50 | 12 | 103,592,025 | 12.1 | |
| 1.51 - 1.60 | 10 | 180,682,174 | 21.1 | |
| 1.61 - 1.70 | 8 | 71,711,689 | 8.4 | |
| 1.71 - 1.80 | 6 | 64,152,510 | 7.5 | |
| 1.81 - 1.90 | 2 | 10,780,843 | 1.3 | |
| 1.91 - 2.00 | 1 | 65,000,000 | 7.6 | |
| 2.01 - 2.25 | 4 | 20,122,893 | 2.3 | |
| 2.26 - 2.50 | 3 | 20,468,381 | 2.4 | |
| 2.51 - 2.75 | 3 | 72,416,389 | 8.4 | |
| 2.76 - 3.00 | 2 | 17,050,000 | 2.0 | |
| 3.01 - 3.50 | 1 | 6,200,000 | 0.7 | |
| 3.51 - 4.00 | 2 | 70,015,000 | 8.2 | |
| 4.01 - 12.34 | 10 | 84,020,051 | 9.8 | |
| Total: | 73 | $858,177,959 | 100.0 | % |
| Weighted Average: | 2.30x | |||
| LOAN PURPOSE | ||||
| Loan Purpose | Number of Mortgage Loans | Aggregate Cut- off Date Balance | % of Initial Pool Balance | |
| Refinance | 61 | $770,581,576 | 89.8 | % |
| Acquisition | 11 | 72,615,486 | 8.5 | |
| Recapitalization | 1 | 14,980,897 | 1.7 | |
| Total: | 73 | $858,177,959 | 100.0 | % |
| MORTGAGE RATE | ||||
| Range of Mortgage Rates (%) | Number of Mortgage Loans | Aggregate Cut- off Date Balance | % of Initial Pool Balance | |
| 3.117 - 3.250 | 1 | $67,500,000 | 7.9 | % |
| 3.251 - 3.500 | 5 | 28,898,562 | 3.4 | |
| 3.501 - 3.750 | 9 | 120,620,364 | 14.1 | |
| 3.751 - 4.000 | 4 | 129,867,758 | 15.1 | |
| 4.001 - 4.250 | 6 | 118,946,600 | 13.9 | |
| 4.251 - 4.500 | 12 | 93,464,645 | 10.9 | |
| 4.501 - 4.750 | 12 | 94,106,720 | 11.0 | |
| 4.751 - 5.000 | 15 | 147,059,914 | 17.1 | |
| 5.001 - 5.750 | 7 | 51,558,999 | 6.0 | |
| 5.751 - 6.000 | 1 | 2,175,000 | 0.3 | |
| 6.001 - 6.180 | 1 | 3,979,396 | 0.5 | |
| Total: | 73 | $858,177,959 | 100.0 | % |
| Weighted Average: | 4.218% | |||
| UNDERWRITTEN NOI DEBT YIELD | ||||
| Range of U/W NOI Debt Yields (%) | Number of Mortgage Loans | Aggregate Cut- off Date Balance | % of Initial Pool Balance | |
| 8.2 - 9.0 | 8 | $82,335,606 | 9.6 | % |
| 9.1 - 10.0 | 14 | 224,033,133 | 26.1 | |
| 10.1 - 11.0 | 14 | 112,456,262 | 13.1 | |
| 11.1 - 12.0 | 10 | 103,206,303 | 12.0 | |
| 12.1 - 13.0 | 6 | 159,768,648 | 18.6 | |
| 13.1 - 14.0 | 3 | 13,295,843 | 1.5 | |
| 14.1 - 15.0 | 4 | 61,452,132 | 7.2 | |
| 15.1 - 16.0 | 2 | 50,294,086 | 5.9 | |
| 16.1 - 17.0 | 1 | 6,200,000 | 0.7 | |
| 17.1 - 19.0 | 2 | 6,115,895 | 0.7 | |
| 19.1 - 20.0 | 1 | 15,000,000 | 1.7 | |
| 20.1 - 58.9 | 8 | 24,020,051 | 2.8 | |
| Total: | 73 | $858,177,959 | 100.0 | % |
| Weighted Average: | 12.3% | |||
| UNDERWRITTEN NCF DEBT YIELD | ||||
| Range of U/W NCF Debt Yields (%) | Number of Mortgage Loans | Aggregate Cut- off Date Balance | % of Initial Pool Balance | |
| 7.8 - 8.0 | 3 | $48,416,125 | 5.6 | % |
| 8.1 - 9.0 | 11 | 133,581,863 | 15.6 | |
| 9.1 - 10.0 | 21 | 270,079,344 | 31.5 | |
| 10.1 - 11.0 | 14 | 150,253,862 | 17.5 | |
| 11.1 - 12.0 | 3 | 81,774,976 | 9.5 | |
| 12.1 - 13.0 | 4 | 16,533,274 | 1.9 | |
| 13.1 - 14.0 | 2 | 13,972,897 | 1.6 | |
| 14.1 - 15.0 | 3 | 92,229,671 | 10.7 | |
| 15.1 - 16.0 | 1 | 6,200,000 | 0.7 | |
| 16.1 - 18.0 | 2 | 6,115,895 | 0.7 | |
| 18.1 - 19.0 | 1 | 15,000,000 | 1.7 | |
| 19.1 - 20.0 | 1 | 3,900,000 | 0.5 | |
| 20.1 - 57.8 | 7 | 20,120,051 | 2.3 | |
| Total: | 73 | $858,177,959 | 100.0 | % |
| Weighted Average: | 11.4% | |||
| ORIGINAL TERM TO MATURITY | ||||
| Original Terms to Maturity(months) | Number of Mortgage Loans | Aggregate Cut- off Date Balance | % of Initial Pool Balance | |
| 60 | 5 | $35,683,044 | 4.2 | % |
| 120 | 68 | 822,494,915 | 95.8 | |
| Total: | 73 | $858,177,959 | 100.0 | % |
| Weighted Average: | 118 months | |||
| REMAINING TERM TO MATURITY | ||||
| Range of Remaining Terms to Maturity (months) | Number of Mortgage Loans | Aggregate Cut- off Date Balance | % of Initial Pool Balance | |
| 54 - 60 | 5 | $35,683,044 | 4.2 | % |
| 85 - 120 | 68 | 822,494,915 | 95.8 | |
| Total | 73 | $858,177,959 | 100.0 | % |
| Weighted Average: | 116 months | |||
| (1) | For mortgaged properties securing residential cooperative mortgage loans, the debt service coverage ratio and debt yield for each such mortgaged property is calculated using U/W Net Operating Income or U/W Net Cash Flow, as applicable, for the related residential cooperative property, which is the projected net operating income or net cash flow, as applicable, reflected in the most recent appraisal obtained by or otherwise in the possession of the related mortgage loan seller as of the cut-off date, and the loan-to-value ratio is calculated based upon the appraised value of the residential cooperative property determined as if such residential cooperative property is operated as a residential cooperative. With respect to any mortgage loan that is part of a whole loan, the loan-to-value ratio, debt service coverage ratio and debt yield calculations include the relatedpari passucompanion loan(s) but exclude any related subordinate companion loan(s) (unless otherwise stated). With respect to each mortgage loan, debt service coverage ratio, debt yield and loan-to-value ratio information do not take into account any subordinate debt (whether or not secured by the related mortgaged property), that currently exists or is allowed under the terms of such mortgage loan. See Annex A-1 to the Preliminary Prospectus. Prepayment provisions for each mortgage loan reflects the entire life of the loan (from origination to maturity) |
THE INFORMATION IN THIS STRUCTURAL AND COLLATERAL TERM SHEET IS NOT COMPLETE AND MAY BE AMENDED PRIOR TO THE TIME OF SALE. THIS TERM SHEET IS NOT AN OFFER TO SELL THESE SECURITIES AND IT IS NOT A SOLICITATION OF AN OFFER TO BUY THESE SECURITIES IN ANY JURISDICTION WHERE THE OFFER OR SALE IS NOT PERMITTED.
16
| Wells Fargo Commercial Mortgage Trust 2016-C36 | Characteristics of the Mortgage Pool |
| ORIGINAL AMORTIZATION TERM(2) | ||||
| Original Amortization Terms (months) | Number of Mortgage Loans | Aggregate Cut- off Date Balance | % of Initial Pool Balance | |
| Non-Amortizing | 12 | $263,000,000 | 30.6 | % |
| 240 | 1 | 8,678,812 | 1.0 | |
| 300 | 3 | 29,701,956 | 3.5 | |
| 360 | 54 | 549,650,997 | 64.0 | |
| 480 | 3 | 7,146,194 | 0.8 | |
| Total/Weighted Average: | 73 | $858,177,959 | 100.0 | % |
| Weighted Average(3): | 357 months | |||
(2) The original amortization term shown for any mortgage loan that is interest-only for part of its term does not include the number of months in its interest-only period and reflects only the number of months as of the commencement of amortization remaining from the end of such interest-only period. (3) Excludes the non-amortizing mortgage loans. | ||||
| REMAINING AMORTIZATION TERM(4) | ||||
| Range of Remaining Amortization Terms (months) | Number of Mortgage Loans | Aggregate Cut- off Date Balance | % of Initial Pool Balance | |
| Non-Amortizing | 12 | $263,000,000 | 30.6 | % |
| 239 - 240 | 1 | 8,678,812 | 1.0 | |
| 241 - 300 | 3 | 29,701,956 | 3.5 | |
| 301 - 420 | 54 | 549,650,997 | 64.0 | |
| 421 - 480 | 3 | 7,146,194 | 0.8 | |
| Total/Weighted Average: | 73 | $858,177,959 | 100.0 | % |
| Weighted Average(5): | 355 months | |||
(4) The remaining amortization term shown for any mortgage loan that is interest-only for part of its term does not include the number of months in its interest-only period and reflects only the number of months as of the commencement of amortization remaining from the end of such interest-only period. (5) Excludes the non-amortizing mortgage loans. | ||||
| LOCKBOXES | ||||
| Type of Lockbox | Number of Mortgage Loans | Aggregate Cut- off Date Balance | % of Initial Pool Balance | |
| Hard/Springing Cash Management | 12 | $334,810,962 | 39.0 | % |
| Springing | 45 | 334,631,797 | 39.0 | |
| Hard/Upfront Cash Management | 2 | 84,948,500 | 9.9 | |
| None | 12 | 82,455,802 | 9.6 | |
| Soft/Springing Cash Management | 2 | 21,330,897 | 2.5 | |
| Total: | 73 | $858,177,959 | 100.0 | % |
| PREPAYMENT PROVISION SUMMARY | ||||
| Prepayment Provision | Number of Mortgage Loans | Aggregate Cut- off Date Balance | % of Initial Pool Balance | |
| Lockout / Def / Open | 57 | $629,228,397 | 73.3 | % |
| Lockout / GRTR 1% or YM / Open | 4 | 93,980,635 | 11.0 | |
| GRTR 1% or YM / 1% Penalty/Open | 10 | 72,468,927 | 8.4 | |
| GRTR 1% or YM /Def or GRTR 1% or YM / Open | 1 | 45,000,000 | 5.2 | |
| Lockout /Def or GRTR 1% or YM / Open | 1 | 17,500,000 | 2.0 | |
| Total: | 73 | $858,177,959 | 100.0 | % |
| CUT-OFF DATE LOAN-TO-VALUE RATIO | ||||
| Range of Cut-off Date LTV Ratios (%) | Number of Mortgage Loans | Aggregate Cut- off Date Balance | % of Initial Pool Balance | |
| 6.8 - 20.0 | 4 | $14,923,671 | 1.7 | % |
| 20.1 - 25.0 | 4 | 21,396,380 | 2.5 | |
| 25.1 - 30.0 | 2 | 47,700,000 | 5.6 | |
| 30.1 - 35.0 | 1 | 2,515,000 | 0.3 | |
| 35.1 - 45.0 | 1 | 6,200,000 | 0.7 | |
| 45.1 - 50.0 | 3 | 7,793,310 | 0.9 | |
| 50.1 - 55.0 | 7 | 185,773,179 | 21.6 | |
| 55.1 - 60.0 | 5 | 38,297,898 | 4.5 | |
| 60.1 - 65.0 | 17 | 232,794,638 | 27.1 | |
| 65.1 - 70.0 | 8 | 132,635,173 | 15.5 | |
| 70.1 - 75.0 | 21 | 168,148,709 | 19.6 | |
| Total/Weighted Average: | 73 | $858,177,959 | 100.0 | % |
| Weighted Average: | 58.9% | |||
| BALLOON LOAN-TO-VALUE RATIO | ||||
| Range of Balloon LTV Ratios (%) | Number of Mortgage Loans | Aggregate Cut- off Date Balance | % of Initial Pool Balance | |
| 5.9 - 20.0 | 6 | $17,420,051 | 2.0 | % |
| 20.1 - 25.0 | 3 | 21,600,000 | 2.5 | |
| 25.1 - 30.0 | 1 | 45,000,000 | 5.2 | |
| 30.1 - 35.0 | 1 | 2,515,000 | 0.3 | |
| 35.1 - 40.0 | 4 | 18,172,121 | 2.1 | |
| 40.1 - 45.0 | 2 | 49,425,148 | 5.8 | |
| 45.1 - 50.0 | 7 | 72,232,839 | 8.4 | |
| 50.1 - 55.0 | 20 | 351,030,900 | 40.9 | |
| 55.1 - 60.0 | 16 | 121,045,475 | 14.1 | |
| 60.1 - 65.0 | 12 | 155,141,312 | 18.1 | |
| 65.1 - 68.5 | 1 | 4,595,112 | 0.5 | |
| Total: | 73 | $858,177,959 | 100.0 | % |
| Weighted Average: | 50.9% | |||
| AMORTIZATION TYPE | ||||
| Type of Amortization | Number of Mortgage Loans | Aggregate Cut- off Date Balance | % of Initial Pool Balance | |
| Amortizing Balloon | 49 | $487,862,959 | 56.8 | % |
| Interest-only, Balloon | 12 | 263,000,000 | 30.6 | |
| Interest-only, Amortizing Balloon | 12 | 107,315,000 | 12.5 | |
| Total: | 73 | $858,177,959 | 100.0 | % |
ORIGINAL TERM OF INTEREST-ONLY PERIOD FOR PARTIAL IO LOANS | ||||
| IO Terms (months) | Number of Mortgage Loans | Aggregate Cut- off Date Balance | % of Initial Pool Balance | |
| 12 | 3 | $13,275,000 | 1.5 | % |
| 24 | 2 | 35,025,000 | 4.1 | |
| 36 | 7 | 59,015,000 | 6.9 | |
| Total: | 12 | $107,315,000 | 12.5 | % |
| Weighted Average: | 29 months | |||
SEASONING | ||||
| Seasoning (months) | Number of Mortgage Loans | Aggregate Cut- off Date Balance | % of Initial Pool Balance | |
| 0 | 1 | $2,700,000 | 0.3 | % |
| 1 | 41 | 480,930,621 | 56.0 | |
| 2 | 16 | 159,707,792 | 18.6 | |
| 3 | 7 | 139,442,443 | 16.2 | |
| 4 | 1 | 5,615,689 | 0.7 | |
| 5 | 1 | 29,683,636 | 3.5 | |
| 6 | 3 | 27,604,396 | 3.2 | |
| 7 | 1 | 2,175,000 | 0.3 | |
| 10 | 1 | 6,200,000 | 0.7 | |
| 12 | 1 | 4,118,381 | 0.5 | |
| Total: | 73 | $858,177,959 | 100.0 | % |
| Weighted Average: | 2 months | |||
THE INFORMATION IN THIS STRUCTURAL AND COLLATERAL TERM SHEET IS NOT COMPLETE AND MAY BE AMENDED PRIOR TO THE TIME OF SALE. THIS TERM SHEET IS NOT AN OFFER TO SELL THESE SECURITIES AND IT IS NOT A SOLICITATION OF AN OFFER TO BUY THESE SECURITIES IN ANY JURISDICTION WHERE THE OFFER OR SALE IS NOT PERMITTED.
17
| Wells Fargo Commercial Mortgage Trust 2016-C36 | Certain Terms and Conditions |
V. Certain Terms and Conditions
| Interest Entitlements: | The interest entitlement of each Class of Offered Certificates on each Distribution Date generally will be the interest accrued during the related Interest Accrual Period on the related Certificate Balance or Notional Amount at the related pass-through rate, net of any prepayment interest shortfalls allocated to that Class for such Distribution Date as described below. If prepayment interest shortfalls arise from voluntary prepayments (without applicable Master Servicer consent) on particular non-specially serviced loans during any collection period, the applicable Master Servicer is required to make a compensating interest payment to offset those shortfalls, generally up to an amount equal to the portion of its master servicing fees that accrue at 0.25 basis pointsper annum. The remaining amount of prepayment interest shortfalls will be allocated to reduce the interest entitlement on all Classes of Certificates,pro rata, based on their respective amounts of accrued interest for the related Distribution Date. If a Class receives less than the entirety of its interest entitlement on any Distribution Date, then the shortfall (excluding any shortfall due to prepayment interest shortfalls), together with interest thereon, will be added to its interest entitlement for the next succeeding Distribution Date. |
| Principal Distribution Amount: | The Principal Distribution Amount for each Distribution Date generally will be the aggregate amount of principal received or advanced in respect of the mortgage loans, net of any non-recoverable advances and interest thereon and workout-delayed reimbursement amounts that are reimbursed to the applicable Master Servicer, the applicable Special Servicer or the Trustee during the related collection period. Non-recoverable advances and interest thereon are reimbursable from principal collections and advances before reimbursement from other amounts. Workout-delayed reimbursement amounts are reimbursable from principal collections. |
| Distributions: | On each Distribution Date, funds available for distribution from the mortgage loans, net of specified trust fees, expenses and reimbursements will generally be distributed in the following amounts and order of priority (in each case to the extent of remaining available funds): |
| 1. Class A-1, A-2, A-3, A-4, A-SB, X-A, X-B and X-D Certificates: To interest on the Class A-1, A-2, A-3, A-4, A-SB, X-A, X-B and X-D Certificates,pro rata, according to their respective interest entitlements. | |
| 2. Class A-1, A-2, A-3, A-4 and A-SB Certificates: To principal on the Class A-1, A-2, A-3, A-4 and A-SB Certificates in the following amounts and order of priority: (i) first, to principal on the Class A-SB Certificates, in an amount up to the Principal Distribution Amount for such Distribution Date until their Certificate Balance is reduced to the Class A-SB Planned Principal Balance for such Distribution Date; (ii) second, to principal on the Class A-1 Certificates until their Certificate Balance is reduced to zero, up to the remainder of the Principal Distribution Amount for such Distribution Date; (iii) third, to principal on the Class A-2 Certificates until their Certificate Balance is reduced to zero, up to the remainder of the Principal Distribution Amount for such Distribution Date; (iv) fourth, to principal on the Class A-3 Certificates, until their Certificate Balance is reduced to zero, up to the remainder of the Principal Distribution Amount for such Distribution Date; (v) fifth, to principal on the Class A-4 Certificates until their Certificate Balance is reduced to zero, up to the remainder of the Principal Distribution Amount for such Distribution Date; and (vi) sixth, to principal on the Class A-SB Certificates until their Certificate Balance is reduced to zero, up to the remainder of the Principal Distribution Amount for such Distribution Date. However, if the Certificate Balance of each and every Class of Principal Balance Certificates, other than the Class A-1, A-2, A-3, A-4 and A-SB Certificates, has been reduced to zero as a result of the allocation of Mortgage Loan losses and expenses and any of the Class A-1, A-2, A-3, A-4 and A-SB Certificates remains outstanding, then the Principal Distribution Amount will be distributed to the Class A-1, A-2, A-3, A-4 and A-SB Certificates,pro rata, based on their respective outstanding Certificate Balances, until their Certificate Balances have been reduced to zero. | |
| 3. Class A-1, A-2, A-3, A-4 and A-SB Certificates: To reimburse the holders of the Class A-1, A-2, A-3, A-4 and A-SB Certificates,pro rata, on the basis of previously allocated unreimbursed losses, for any previously unreimbursed losses (plus interest thereon) on the mortgage loans that were previously allocated in reduction of the Certificate Balances of such Classes. |
THE INFORMATION IN THIS STRUCTURAL AND COLLATERAL TERM SHEET IS NOT COMPLETE AND MAY BE AMENDED PRIOR TO THE TIME OF SALE. THIS TERM SHEET IS NOT AN OFFER TO SELL THESE SECURITIES AND IT IS NOT A SOLICITATION OF AN OFFER TO BUY THESE SECURITIES IN ANY JURISDICTION WHERE THE OFFER OR SALE IS NOT PERMITTED.
18
| Wells Fargo Commercial Mortgage Trust 2016-C36 | Certain Terms and Conditions |
4. Class A-S Certificates: To make distributions on the Class A-S Certificates as follows: (a) first, to interest on the Class A-S Certificates in the amount of the interest entitlement for that Class; (b) next, to the extent of the portion of the Principal Distribution Amount remaining after distributions in respect of principal to each Class with a higher distribution priority (in this case, the Class A-1, A-2, A-3, A-4 and A-SB Certificates), to principal on the Class A-S Certificates until their Certificate Balance is reduced to zero; and (c) next, to reimburse the holders of the Class A-S Certificates for any previously unreimbursed losses (plus interest thereon) on the mortgage loans that were previously allocated to that Class in reduction of their Certificate Balance. 5. Class B Certificates: To make distributions on the Class B Certificates as follows: (a) first, to interest on the Class B Certificates in the amount of the interest entitlement for that Class; (b) next, to the extent of the portion of the Principal Distribution Amount remaining after distributions in respect of principal to each Class with a higher distribution priority (in this case, the Class A-1, A-2, A-3, A-4, A-SB and A-S Certificates), to principal on the Class B Certificates until their Certificate Balance is reduced to zero; and (c) next, to reimburse the holders of the Class B Certificates for any previously unreimbursed losses (plus interest thereon) on the mortgage loans that were previously allocated to that Class in reduction of their Certificate Balance. 6. Class C Certificates: To make distributions on the Class C Certificates as follows: (a) first, to interest on the Class C Certificates in the amount of the interest entitlement for that Class; (b) next, to the extent of the portion of the Principal Distribution Amount remaining after distributions in respect of principal to each Class with a higher distribution priority (in this case, the Class A-1, A-2, A-3, A-4, A-SB, A-S and B Certificates), to principal on the Class C Certificates until their Certificate Balance is reduced to zero; and (c) next, to reimburse the holders of the Class C Certificates for any previously unreimbursed losses (plus interest thereon) on the mortgage loans that were previously allocated to that Class in reduction of their Certificate Balance. 7. After the Class A-1, A-2, A-3, A-4, A-SB, A-S, B and C Certificates are paid all amounts to which they are entitled, the remaining funds available for distribution will be used to pay interest, principal and loss reimbursement amounts on the Class D Certificates and the E-1, E-2, F-1, F-2, G-1, G-2, H-1 and H-2 trust components sequentially in that order in a manner analogous to the Class C Certificates. |
| Exchangeable Certificates: | The Class E-1, E-2, F-1, F-2, G-1, G-2, H-1 and H-2 Certificates are collectively referred to herein as the “Exchangeable Certificates”, and the Class E, F, EF, G, EFG and H Certificates are collectively referred to herein as the “Exchangeable Combined Certificates.” On the closing date, the upper-tier REMIC of the issuing entity will issue the Class E-1, E-2, F-1, F-2, G-1, G-2, H-1 and H-2 trust components (each a “trust component”), which will have outstanding balances on the closing date set forth in the table below and will be held in the grantor trust for the benefit of the holders of the Exchangeable Certificates and the Exchangeable Combined Certificates. The Exchangeable Certificates and the Exchangeable Combined Certificates will be entitled to distributions in the manner described in “Certificate Structure”. |
| Trust Component | Closing Date Balance | |
| Class E-1 trust component | $9,118,000 | |
| Class E-2 trust component | $9,118,000 | |
| Class F-1 trust component | $4,291,000 | |
| Class F-2 trust component | $4,291,000 | |
| Class G-1 trust component | $6,098,000 | |
| Class G-2 trust component | $6,098,000 | |
| Class H-1 trust component | $9,992,979 | |
| Class H-2 trust component | $9,992,979 |
| Each class of Exchangeable Combined Certificates may be exchanged for the corresponding classes of Exchangeable Certificates, and vice versa, in accordance with the related exchange percentage, as set forth in the Preliminary Prospectus. | |
| Allocation of Yield Maintenance and Prepayment Premiums: | If any yield maintenance charge or prepayment premium is collected during any particular collection period with respect to any mortgage loan, then on the Distribution Date corresponding to that collection period, the certificate administrator will pay that yield maintenance charge or prepayment premium (net of liquidation fees payable therefrom) in the following manner: (1) to each of the Class A-1, A-2, A-3, A-4, A-SB, A-S, B, C and D Certificates, the product of (a) such yield maintenance charge or prepayment premium, (b) the related Base Interest Fraction (as defined in the Preliminary Prospectus) for such Class, and (c) a fraction, the numerator of which is equal to the amount of principal distributed to such Class for that Distribution Date, and the denominator of which is the total amount of principal distributed to all Principal Balance Certificates for that Distribution Date, and (2) to the Class X-A Certificates, the excess, if any, of (a) the product of (i) such yield maintenance charge or |
THE INFORMATION IN THIS STRUCTURAL AND COLLATERAL TERM SHEET IS NOT COMPLETE AND MAY BE AMENDED PRIOR TO THE TIME OF SALE. THIS TERM SHEET IS NOT AN OFFER TO SELL THESE SECURITIES AND IT IS NOT A SOLICITATION OF AN OFFER TO BUY THESE SECURITIES IN ANY JURISDICTION WHERE THE OFFER OR SALE IS NOT PERMITTED.
19
| Wells Fargo Commercial Mortgage Trust 2016-C36 | Certain Terms and Conditions |
| prepayment premium and (ii) a fraction, the numerator of which is equal to the amount of principal distributed to the Class A-1, A-2, A-3, A-4 and A-SB Certificates for that Distribution Date, and the denominator of which is the total amount of principal distributed to all Principal Balance Certificates for that Distribution Date, over (b) the amount of such yield maintenance charge or prepayment premium distributed to the Class A-1, A-2, A-3, A-4 and A-SB Certificates as described above, and (3) to the Class X-B Certificates, any remaining yield maintenance charge or prepayment premium not distributed as described above. No Prepayment Premiums or Yield Maintenance Charges will be distributed to the holders of the Class X-D, Class E-1, Class E-2, Class E, Class F-1, Class F-2, Class F, Class EF, Class G-1, Class G-2, Class G, Class EFG, Class H-1, Class H-2 or Class H certificates (or on any of the Trust Components). For a description of when prepayment premiums and yield maintenance charges are generally required on the mortgage loans, see Annex A-1 to the Preliminary Prospectus. See also “Risk Factors—Risks Relating to the Mortgage Loans—Risks Relating to Enforceability of Yield Maintenance Charges, Prepayment Premiums or Defeasance Provisions” and “Risk Factors—Other Risks Relating to the Certificates—Your Yield May Be Affected by Defaults, Prepayments and Other Factors” in the Preliminary Prospectus. Prepayment premiums and yield maintenance charges will be distributed on each Distribution Date only to the extent they are actually received on the mortgage loans as of the related Determination Date. | |
| Realized Losses: | The Certificate Balances of the Class A-1, A-2, A-3, A-4, A-SB, A-S, B, C and D Certificates and the E-1, E-2, F-1, F-2, G-1, G-2, H-1 and H-2 trust components (and the corresponding classes of Exchangeable Certificates and Exchangeable Combined Certificates) will be reduced without distribution on any Distribution Date as a write-off to the extent of any losses realized on the mortgage loans allocated to such Class on such Distribution Date. Such losses will be applied in the following order, in each case until the related Certificate Balance is reduced to zero: first, to the Class H-2 Trust Component; second, to the Class H-1 Trust Component; third, to the Class G-2 Trust Component; fourth, to the Class G-1 Trust Component; fifth, to the Class F-2 Trust Component; sixth, to the Class F-1 Trust Component; seventh, to the Class E-2 Trust Component; eighth, to the Class E-1 Trust Component; ninth, to the Class D Certificates; tenth, to the Class C Certificates; eleventh, to the Class B Certificates; twelfth, to the Class A-S Certificates; and, finally,pro rata, to the Class A-1, A-2, A-3, A-4 and A-SB Certificates based on their outstanding Certificate Balances.
The notional amount of the Class X-A Certificates will be reduced by the amount of all losses that are allocated to the Class A-1, A-2, A-3, A-4 or A-SB Certificates as write-offs in reduction of their Certificate Balances. The notional amount of the Class X-B Certificates will be reduced by the amount of all losses that are allocated to the Class A-S or B Certificates as write-offs in reduction of their Certificate Balances. The notional amount of the Class X-D Certificates will be reduced by the amount of all losses that are allocated to the Class D Certificates as write-offs in reduction of its Certificate Balance.
|
| P&I Advances: | Each Master Servicer or, if such Master Servicer fails to do so, the Trustee, will be obligated to advance delinquent debt service payments with respect to the mortgage loans it services (other than balloon payments, excess interest and default interest) and assumed debt service payments on mortgage loans with delinquent balloon payments (excluding any related companion loan), except to the extent any such advance is deemed non-recoverable from collections on the related mortgage loan. In addition, if an Appraisal Reduction Amount exists for a given mortgage loan, the interest portion of any P&I advance for such mortgage loan will be reduced, which will have the effect of reducing the amount of interest available for distribution to the Certificates in reverse alphabetical order of their Class designations (except that interest payments on the Class A-1, A-2, A-3, A-4, A-SB, X-A, X-B and X-D Certificates would be affected on apari passu basis). |
| Servicing Advances: | Each Master Servicer or, if such Master Servicer fails to do so, the Trustee, will be obligated to make servicing advances with respect to each mortgage loan it services, including the payment of delinquent property taxes, insurance premiums and ground rent, except to the extent that those advances are deemed non-recoverable from collections on the related mortgage loan. The applicable Master Servicer or the Trustee, as applicable, will have the primary obligation to make any required servicing advances with respect to the Plaza America I & II whole loan and the Conrad Indianapolis whole loan. The servicer or trustee, as applicable, under the BBCMS 2016-ETC securitization will have the primary obligation to make any required servicing advances with respect to Easton Town Center whole loan. The servicer or trustee, as applicable, under the COMM 2016-GCT securitization will have the primary obligation to make any required servicing advances with respect to Gas Company Tower & World Trade Center Parking Garage whole loan. The master servicer or trustee, as applicable, under the WFCM 2016-C35 securitization will have the primary obligation to make any required servicing advances with respect to the Mall at Turtle Creek whole loan. The master servicer or trustee, as applicable, under the WFCM 2016-LC24 securitization will have the primary obligation to make any required servicing advances with respect to the Central Park Retail whole loan and the One & Two Corporate Plaza whole loan. Prior to the applicable Servicing Shift Securitization Date, the |
THE INFORMATION IN THIS STRUCTURAL AND COLLATERAL TERM SHEET IS NOT COMPLETE AND MAY BE AMENDED PRIOR TO THE TIME OF SALE. THIS TERM SHEET IS NOT AN OFFER TO SELL THESE SECURITIES AND IT IS NOT A SOLICITATION OF AN OFFER TO BUY THESE SECURITIES IN ANY JURISDICTION WHERE THE OFFER OR SALE IS NOT PERMITTED.
20
| Wells Fargo Commercial Mortgage Trust 2016-C36 | Certain Terms and Conditions |
| applicable Master Servicer under the WFCM 2016-C36 securitization is expected to have the primary obligation to make any servicing advances with respect to each of the Gurnee Mills whole loan and the 101 Hudson Street whole loan. With respect to each of the Gurnee Mills whole loan and the 101 Hudson Street whole loan, after the applicable Servicing Shift Securitization Date, the respective master servicer under the applicable Servicing Shift PSA will have the primary obligation to make any servicing advances with respect to such whole loan. The Special Servicers will have no obligation to make servicing advances but may do so in an emergency situation. | |
Appraisal Reduction Amounts and Collateral Deficiency Amounts:
| An Appraisal Reduction Amount generally will be created in the amount, if any, by which the principal balance of a required appraisal loan (which is a mortgage loan with respect to which certain defaults, modifications or insolvency events have occurred as further described in the Preliminary Prospectus) plus other amounts overdue or advanced in connection with such mortgage loan exceeds 90% of the appraised value of the related mortgaged property plus certain escrows and reserves (including letters of credit) held with respect to the mortgage loan. With respect to any whole loan, any Appraisal Reduction Amount will be allocated first to the related subordinate companion loan, if any, and then to the related mortgage loan and the relatedpari passu companion loan(s).
A mortgage loan will cease to be a required appraisal loan when the same has ceased to be a specially serviced loan (if applicable), has been brought current for at least three consecutive months and no other circumstances exist that would cause such mortgage loan to be a required appraisal loan.
A Collateral Deficiency Amount will exist with respect to any mortgage loan that is modified into an AB loan structure and remains a corrected mortgage loan and will generally equal the excess of (i) the stated principal balance of such AB modified loan (taking into account the related junior note(s) and anypari passu notes included therein), over (ii) the sum of (in the case of a whole loan, solely to the extent allocable to the subject mortgage loan) (x) the appraised value of the related mortgaged property plus (y) any capital or additional collateral contributed by the related borrower at the time the loan became an AB modified loan plus (z) certain escrows or reserves (including letters of credit) in addition to any amounts set forth in the immediately preceding clause (y)) held with respect to the mortgage loan.
A “Cumulative Appraisal Reduction Amount” with respect to any mortgage loan will be the sum of any Appraisal Reduction Amount and any Collateral Deficiency Amount.
Appraisal Reduction Amounts will affect the amount of debt service advances in respect of the related mortgage loan. Cumulative Appraisal Reduction Amounts will also be taken into account in the determination of the identity of the Class whose majority constitutes the “majority controlling class certificateholder” and is entitled to appoint the directing certificateholder.
|
Clean-Up Call and Exchange Termination:
| On each Distribution Date occurring after the aggregate unpaid principal balance of the mortgage loans is reduced below 1% of the initial aggregate principal balance of the mortgage loans as of the Cut-off Date, certain specified persons will have the option to purchase all of the remaining mortgage loans (and the trust’s interest in all property acquired through exercise of remedies in respect of any mortgage loan) at the price specified in the Preliminary Prospectus. Exercise of the option will terminate the trust and retire the then-outstanding certificates.
If the aggregate Certificate Balances of each of the Class A-1, A-2, A-3, A-4, A-SB, A-S, B, C and D Certificates have been reduced to zero, the trust may also be terminated in connection with an exchange of all the then-outstanding certificates (other than the Class R Certificates) for the mortgage loans and REO properties then remaining in the issuing entity, but all of the holders of those Classes (other than the Class R Certificates) of outstanding certificates would have to voluntarily participate in the exchange.
|
| Liquidation Loan Waterfall: | Following the liquidation of any loan or property, the net liquidation proceeds generally will be applied (after reimbursement of advances and certain trust fund expenses), first, as a recovery of accrued interest, other than delinquent interest that was not advanced as a result of Appraisal Reduction Amounts, second, as a recovery of principal until all principal has been recovered, and then as a recovery of delinquent interest that was not advanced as a result of Appraisal Reduction Amounts. Please see “Description of the Certificates—Distributions—Application Priority of Mortgage Loan Collections or Whole Loan Collections” in the Preliminary Prospectus. |
| Control Eligible Certificates: | The “Control Eligible Certificates” will be all classes of certificates, collectively, within each of the following four groupings of certificates: (i) the classes of certificates related to the Class E Trust Components, being the Class E-1, E-2, E, EF and EFG Certificates, in the case of each such class, only to the extent evidencing an interest in the Class E Trust Components (and the aggregate certificate balance of this grouping of certificates will only take into account the portion of the certificate balance of each such class representing an interest in the Class E Trust Components); (ii) the classes of certificates related to the Class F Trust Components, being the Class F-1, F-2, F, EF and EFG Certificates, in the case of each such class, only to the extent |
THE INFORMATION IN THIS STRUCTURAL AND COLLATERAL TERM SHEET IS NOT COMPLETE AND MAY BE AMENDED PRIOR TO THE TIME OF SALE. THIS TERM SHEET IS NOT AN OFFER TO SELL THESE SECURITIES AND IT IS NOT A SOLICITATION OF AN OFFER TO BUY THESE SECURITIES IN ANY JURISDICTION WHERE THE OFFER OR SALE IS NOT PERMITTED.
21
| Wells Fargo Commercial Mortgage Trust 2016-C36 | Certain Terms and Conditions |
| evidencing an interest in the Class F Trust Components (and the aggregate certificate balance of this grouping of certificates will only take into account the portion of the certificate balance of each such class representing an interest in the Class F Trust Components); (iii) the classes of certificates related to the Class G Trust Components, being the Class G-1, G-2, G and EFG Certificates, in the case of each such class, only to the extent evidencing an interest in the Class G Trust Components (and the aggregate certificate balance of this grouping of certificates will only take into account the portion of the certificate balance of each such class representing an interest in the Class G Trust Components); and (iv) the classes of certificates related to the Class H Trust Components, being the Class H-1, H-2 and H Certificates. | |
| Directing Certificateholder/ Controlling Class: | An affiliated fund of, or an entity controlled by affiliated funds of, C-III High Yield Real Estate Debt Fund IV Tier Holdings Inc. is expected to be appointed the initial Directing Certificateholder.
The “Controlling Class” will be, as of any time of determination, all classes of certificates, collectively, within the grouping of Control Eligible Certificates that relates to the Controlling Trust Components. The “Controlling Trust Components” are, collectively, the most subordinate pair of trust components with the same alphabetical designation having an aggregate certificate balance, as notionally reduced by any Cumulative Appraisal Reduction Amounts allocable to such trust components, at least equal to 25% of the aggregate initial certificate balance of such trust components; provided, however, that if at any time the certificate balances of the certificates other than the Control Eligible Certificates have been reduced to zero as a result of principal payments on the Mortgage Loans, then the Controlling Class will be the most subordinate grouping of Control Eligible Certificates as to which the related trust components, collectively, have an aggregate certificate balance greater than zero without regard to any Appraisal Reduction Amounts.
The Controlling Trust Components as of the closing date will be the Class H Trust Components, and the Controlling Class as of the closing date will be, collectively, the Class H-1 and H-2 Certificates and, to the extent any Class H-1 and H-2 Certificates have been exchanged for Class H Certificates, the Class H Certificates.
|
| Control and Consultation: | The rights of various parties to replace each Special Servicer and approve or consult with respect to major actions of each Special Servicer will vary according to defined periods.
A “Control Termination Event” occurs when (i) the Class E-1 Trust Component and the Class E-2 Trust Component have an aggregate certificate balance (taking into account the application of any Cumulative Appraisal Reduction Amounts to notionally reduce the certificate balance of such Trust Components) of less than 25% of the initial aggregate certificate balance of such Trust Components or (ii) the holder of a majority of the aggregate certificate balance of the Class E-1, E-2, E, EF and EFG certificates (such majority determined counting only the portion of the certificate balance of each such class evidencing an interest in the Class E Trust Components) has irrevocably waived its right, in writing, to exercise any of the rights of the Controlling Class Certificateholder and such rights have not been reinstated to a successor controlling class certificateholder as described below; provided, however, that a Control Termination Event will be deemed not continuing in the event that the certificate balances of the certificates other than the Control Eligible Certificates have been reduced to zero as a result of principal payments on the Mortgage Loans.
A “Consultation Termination Event” occurs when (i) there is no grouping of Control Eligible Certificates as to which the related Trust Components, collectively, have a then-outstanding certificate balance at least equal to 25% of the initial aggregate certificate balance of such Trust Components, in each case, without regard to the application of any Cumulative Appraisal Reduction Amounts; or (ii) the holder of a majority of the aggregate certificate balance of the Class E-1, E-2, E, EF and EFG certificates (such majority determined counting only the portion of the certificate balance of each such Class evidencing an interest in the Class E Trust Components) has irrevocably waived its right, in writing, to exercise any of the rights of the Controlling Class Certificateholder and such rights have not been reinstated to a successor controlling class certificateholder pursuant to the terms of the PSA; provided that no Consultation Termination Event resulting solely from the operation of clause (ii) will be deemed to have existed or be in continuance with respect to a successor holder of any such class of certificates that has not irrevocably waived its right to exercise any of the rights of the Controlling Class Certificateholder; provided, however, that a Consultation Termination Event will be deemed not continuing in the event that the certificate balances of the certificates other than the Control Eligible Certificates have been reduced to zero as a result of principal payments on the Mortgage Loans.
If no Control Termination Event has occurred and is continuing, except with respect to the Excluded Loans (as defined below) and Servicing Shift Whole Loans (as defined below), (i) the directing certificateholder will be entitled to grant or withhold approval of asset status reports prepared, and material servicing actions proposed, by each Special Servicer, and (ii) the directing certificateholder will be entitled to terminate and replace each Special Servicer with or without cause, and appoint itself or another person as the successor special servicer. It will be
|
THE INFORMATION IN THIS STRUCTURAL AND COLLATERAL TERM SHEET IS NOT COMPLETE AND MAY BE AMENDED PRIOR TO THE TIME OF SALE. THIS TERM SHEET IS NOT AN OFFER TO SELL THESE SECURITIES AND IT IS NOT A SOLICITATION OF AN OFFER TO BUY THESE SECURITIES IN ANY JURISDICTION WHERE THE OFFER OR SALE IS NOT PERMITTED.
22
| Wells Fargo Commercial Mortgage Trust 2016-C36 | Certain Terms and Conditions |
a condition to such appointment that Fitch, Moody’s and Morningstar (and any Rating Agency rating any securities backed by any pari passu companion loan(s) serviced under this transaction) confirm that the appointment would not result in a qualification, downgrade or withdrawal of any of their then-current ratings of certificates (and any certificates backed by any pari passu companion loan(s) serviced under this transaction).
If a Control Termination Event has occurred and is continuing but no Consultation Termination Event has occurred and is continuing, each Special Servicer will be required to consult with the directing certificateholder (other than with respect to Excluded Loans) and the Operating Advisor in connection with asset status reports and material special servicing actions.
If a Consultation Termination Event has occurred and is continuing, each Special Servicer must seek to consult with the Operating Advisor in connection with asset status reports and material special servicing actions, and, in general, no directing certificateholder will be recognized or have any right to terminate the Special Servicers or approve, direct or consult with respect to servicing matters.
With respect to the Plaza America I & II mortgage loan and the Conrad Indianapolis mortgage loan, the rights of the directing certificateholder described above will be subject to the consultation rights of the holder of the relatedpari passucompanion loan(s) as described below. With respect to the Gurnee Mills whole loan and the 101 Hudson Street whole loan (each a “Servicing Shift Whole Loan”), the rights of the directing certificateholder described above will be subject to the control rights of the related controllingpari passu companion loan as described below.
Notwithstanding any contrary description set forth above, with respect to the Plaza America I & II mortgage loan and the Conrad Indianapolis mortgage loan, the holder of the relatedpari passu companion loan(s) in the related whole loan (or its representative, including any directing certificateholder under any securitization of suchpari passu companion loan(s)) will have consultation rights with respect to asset status reports and material special servicing actions involving the related whole loan, as provided for in the related intercreditor agreement and as described in the Preliminary Prospectus, and those rights will be in addition to the rights of the directing certificateholder in this transaction described above.
For purposes of the servicing of the Plaza America I & II whole loan and the Conrad Indianapolis whole loan, the occurrence and continuance of a Control Termination Event or Consultation Termination Event under this securitization will not limit the consultation and other rights of the holder of the relatedpari passu companion loan(s).
Notwithstanding any contrary description set forth above, with respect to Easton Town Center mortgage loan, in general the related whole loan will be serviced under the BBCMS 2016-ETC trust and servicing agreement, which grants the directing certificateholder under the BBCMS 2016-ETC securitization control rights that may include the right to approve or disapprove various material servicing actions involving the related whole loan. The directing certificateholder for this securitization (so long as no Consultation Termination Event has occurred and is occurring) will have the right to be consulted on a non-binding basis with respect to such actions, provided that such rights will only be exercisable upon and during the termination of a subordinate control period under the BBCMS 2016-ETC trust and servicing agreement. For purposes of the servicing of Easton Town Center whole loan, the occurrence and continuance of a Control Termination Event or Consultation Termination Event under this securitization will not limit the control or other rights of the directing certificateholder (or equivalent) under the BBCMS 2016-ETC securitization.
Notwithstanding any contrary description set forth above, with respect to Gas Company Tower & World Trade Center Parking Garage mortgage loan, in general the related whole loan will be serviced under the COMM 2016-GCT trust and servicing agreement, which grants the directing certificateholder under the COMM 2016-GCT securitization control rights that may include the right to approve or disapprove various material servicing actions involving the related whole loan. The directing certificateholder for this securitization (so long as no Consultation Termination Event has occurred and is occurring) will have the right to be consulted on a non-binding basis with respect to such actions, provided that such rights will only be exercisable upon and during the termination of a subordinate control period under the COMM 2016-GCT trust and servicing agreement. For purposes of the servicing of Gas Company Tower & World Trade Center Parking whole loan, the occurrence and continuance of a Control Termination Event or Consultation Termination Event under this securitization will not limit the control or other rights of the directing certificateholder (or equivalent) under the COMM 2016-GCT securitization.
Also, notwithstanding any contrary description set forth above, with respect to the Mall At Turtle Creek mortgage loan, in general the related whole loan will be serviced under the WFCM 2016-C35 pooling and servicing agreement, which grants the directing certificateholder under the WFCM 2016-C35 securitization control rights that may include the right to approve or disapprove various material servicing actions involving the related whole loan. The directing |
THE INFORMATION IN THIS STRUCTURAL AND COLLATERAL TERM SHEET IS NOT COMPLETE AND MAY BE AMENDED PRIOR TO THE TIME OF SALE. THIS TERM SHEET IS NOT AN OFFER TO SELL THESE SECURITIES AND IT IS NOT A SOLICITATION OF AN OFFER TO BUY THESE SECURITIES IN ANY JURISDICTION WHERE THE OFFER OR SALE IS NOT PERMITTED.
23
| Wells Fargo Commercial Mortgage Trust 2016-C36 | Certain Terms and Conditions |
certificateholder for this securitization (so long as no Consultation Termination Event has occurred and is occurring) will nonetheless have the right to be consulted on a non-binding basis with respect to such actions. For purposes of the servicing of the Mall At Turtle Creek whole loan, the occurrence and continuance of a Control Termination Event or Consultation Termination Event under this securitization will not limit the control or other rights of the directing certificateholder (or equivalent) under the WFCM 2016-C35 securitization.
Also, notwithstanding any contrary description set forth above, with respect to the Central Park Retail mortgage loan, in general the related whole loan will be serviced under the WFCM 2016-LC24 pooling and servicing agreement, which grants the directing certificateholder (or equivalent) under the WFCM 2016-LC24 securitization control rights that may include the right to approve or disapprove various material servicing actions involving the related whole loan. The directing certificateholder for this securitization (so long as no Consultation Termination Event has occurred and is occurring) will nonetheless have the right to be consulted on a non-binding basis with respect to such actions. For purposes of the servicing of the Central Park Retail whole loan, the occurrence and continuance of a Control Termination Event or Consultation Termination Event under this securitization will not limit the control or other rights of the directing certificateholder (or equivalent) under the WFCM 2016-LC24 securitization.
Also, notwithstanding any contrary description set forth above, with respect to the One & Two Corporate Plaza mortgage loan, in general the related whole loan will be serviced under the WFCM 2016-LC24 pooling and servicing agreement, which grants the directing certificateholder under the WFCM 2016-LC24 securitization control rights that may include the right to approve or disapprove various material servicing actions involving the related whole loan. The directing certificateholder for this securitization (so long as no Consultation Termination Event has occurred and is occurring) will nonetheless have the right to be consulted on a non-binding basis with respect to such actions. For purposes of the servicing of the the One & Two Corporate Plaza whole loan, the occurrence and continuance of a Control Termination Event or Consultation Termination Event under this securitization will not limit the control or other rights of the directing certificateholder (or equivalent) under the WFCM 2016-LC24 securitization.
Also, notwithstanding any contrary description set forth above, with respect to the Gurnee Mills mortgage loan and the 101 Hudson Street mortgage loan, in general, each such mortgage loan (as applicable) will be serviced (i) prior to the applicable Servicing Shift Securitization Date, under the WFCM 2016-C36 pooling and servicing agreement, and (ii) after the applicable Servicing Shift Securitization Date, under the related Servicing Shift PSA, each of which grants, or is expected to grant, to the related controlling noteholder control rights that include the right to approve or disapprove various material servicing actions involving the Gurnee Mills mortgage loan or the 101 Hudson Street mortgage loan, as applicable. The directing certificateholder for this securitization will nonetheless have the right to be consulted on a nonbinding basis with respect to such actions. For purposes of the servicing of each of the Gurnee Mills whole loan and the 101 Hudson Street mortgage loan, the occurrence and continuance of a Control Termination Event or Consultation Termination Event under this securitization will not limit the control or other rights of the related controlling noteholder. The securitization of each related controllingpari passucompanion loan will not limit the consultation rights of the directing certificateholder under this securitization.
Notwithstanding any contrary description set forth above, in the event that, with respect to any mortgage loan, the majority controlling class certificateholder or the directing certificateholder is (i) a borrower, a mortgagor or a manager of a mortgaged property, or the holder of a mezzanine loan that has been accelerated or as to which foreclosure or enforcement proceedings have been commenced against the equity collateral pledged to secure the related mezzanine loan or any affiliate thereof, (ii) with respect to borrower, a mortgagor, a manager of a Mortgaged Property or a mezzanine lender that has been accelerated or as to which foreclosure or enforcement proceedings have been commenced against the equity collateral pledged to secure the related mezzanine loan, (x) any other person controlling or controlled by or under common control with such borrower, mortgagor, manager or mezzanine lender, as applicable, or (y) any other person owning, directly or indirectly, 25% or more of the beneficial interests in such borrower, mortgagor, manager or mezzanine lender (each, a “borrower party”), the majority controlling class certificateholder and the directing certificateholder will have no right to receive asset status reports or such other information as may be specified in the pooling and servicing agreement, to grant or withhold approval of, or consult with respect to, asset status reports prepared, and material servicing actions proposed, by the applicable Special Servicer, with respect to such mortgage loan, and such mortgage loan will be referred to as an “Excluded Loan”.
In addition, notwithstanding any contrary description set forth above, in the event that, with respect to any mortgage loan, a controlling class certificateholder is a borrower party, such controlling class certificateholder will have no right to receive asset status reports or such other information as may be specified in the pooling and servicing agreement with respect to such mortgage loan, and such controlling class certificateholder will be referred to as an “excluded |
THE INFORMATION IN THIS STRUCTURAL AND COLLATERAL TERM SHEET IS NOT COMPLETE AND MAY BE AMENDED PRIOR TO THE TIME OF SALE. THIS TERM SHEET IS NOT AN OFFER TO SELL THESE SECURITIES AND IT IS NOT A SOLICITATION OF AN OFFER TO BUY THESE SECURITIES IN ANY JURISDICTION WHERE THE OFFER OR SALE IS NOT PERMITTED.
24
| Wells Fargo Commercial Mortgage Trust 2016-C36 | Certain Terms and Conditions |
| controlling class holder”. | |
| Replacement of Special Servicer by General Vote of Certificateholders: | If a Control Termination Event has occurred and is continuing, the applicable Special Servicer (other than with respect to a Servicing Shift Whole Loan) may be removed and replaced without cause upon the affirmative direction of certificate owners holding not less than 66-2/3% of a certificateholder quorum, following a proposal from certificate owners holding not less than 25% of the appraisal-reduced voting rights of all Certificates. The certificateholders who initiate a vote on a termination and replacement of the applicable Special Servicer without cause must cause Fitch, Moody’s and Morningstar to confirm the then-current ratings of the certificates (or decline to review the matter) and cause the payment of the fees and expenses incurred in the replacement. If no Control Termination Event has occurred and is continuing, either Special Servicer (other than with respect to a Servicing Shift Whole Loan) may be replaced by the directing certificateholder, subject to Fitch, Moody’s and Morningstar (and any Rating Agency rating any securities backed by any pari passu companion loan(s) serviced under this transaction) confirming the then-current ratings of the Certificates (and any certificates backed by anypari passucompanion loans serviced under this transaction) or declining to review the matter. |
| Excluded Special Servicer: | In the event that, with respect to any mortgage loan, a Special Servicer is a borrower party, such Special Servicer will be required to resign as special servicer of such mortgage loan (referred to as an “excluded special servicer loan”). If no Control Termination Event has occurred and is continuing, the directing certificateholder will be entitled to appoint (and may replace with or without cause) a separate special servicer that is not a borrower party (referred to as an “excluded special servicer”) with respect to such excluded special servicer loan unless such excluded special servicer loan is also an excluded loan. Otherwise, upon resignation of the applicable Special Servicer with respect to an excluded special servicer loan, such resigning Special Servicer will be required to appoint the excluded special servicer. |
| Appraisal Remedy: | If the Class of Certificates comprising the controlling class loses its status as controlling class because of the application of an Appraisal Reduction Amount or Collateral Deficiency Amount, the holders of a majority of the Voting Rights of such Class may require the applicable Special Servicer to order a second appraisal for any mortgage loan in respect of which an Appraisal Reduction Amount or Collateral Deficiency Amount has been applied. Such Special Servicer must thereafter determine whether, based on its assessment of such second appraisal, any recalculation of the Appraisal Reduction Amount or Collateral Deficiency Amount is warranted. Such Class will not be able to exercise any direction, control, consent and/or similar rights of the controlling class unless and until reinstated as the controlling class through such determination; and pending such determination, the rights of the controlling class will be exercised by the Control Eligible Certificates, if any, that would be the controlling class taking into account the subject appraisal reduction amount. |
| Sale of Defaulted Assets: | There will be no “fair value” purchase option. Instead, the pooling and servicing agreement will authorize each Special Servicer to sell defaulted mortgage loans serviced by such Special Servicer to the highest bidder in a manner generally similar to sales of REO properties.
The sale of a defaulted loan (other than with respect to Gurnee Mills whole loan, the 101 Hudson Street whole loan, the Easton Town Center whole loan, the Mall at Turtle Creek whole loan, the Central Park Retail whole loan, the Gas Company Tower and World Trade Center Parking Garage whole loan and the One & Two Corporate Plaza whole loan) for less than par plus accrued interest and certain other fees and expenses owed on the loan will be subject to consent or consultation rights of the directing certificateholder and/or Operating Advisor and, in the case of the Central Park Retail whole loan and the One & Two Corporate Plaza whole loan, consultation rights of the holders of the relatedpari passu companion loan(s), as described in the Preliminary Prospectus.
In the case of the Plaza America I & II whole loan and the Conrad Indianapolis whole loan, pursuant to the related intercreditor agreements and the pooling and servicing agreement, if the applicable Special Servicer offers to sell to any person (or offers to purchase) for cash either such mortgage loan during such time as the related whole loan constitutes a defaulted mortgage loan, then in connection with any such sale, the applicable Special Servicer is required to sell both the mortgage loan and the relatedpari passu companion loan(s) as a single whole loan
In the case of Easton Town Center whole loan, pursuant to the BBCMS 2016-ETC trust and servicing agreement and the related intercreditor agreement, the BBCMS 2016-ETC special servicer may offer to sell to any person (or may offer to purchase) for cash the related whole loan during such time as the applicable companion loans constitute a defaulted mortgage loan under the BBCMS 2016-ETC trust and servicing agreement, and, in connection with any such sale, the BBCMS 2016-ETC special servicer is required to sell both the mortgage loan and the relatedpari passu companion loan(s) and subordinate companion loans as a whole loan. The directing certificateholder for this securitization will have consultation rights as the holder of an interest in the related mortgage loan, as described in the Preliminary Prospectus. |
THE INFORMATION IN THIS STRUCTURAL AND COLLATERAL TERM SHEET IS NOT COMPLETE AND MAY BE AMENDED PRIOR TO THE TIME OF SALE. THIS TERM SHEET IS NOT AN OFFER TO SELL THESE SECURITIES AND IT IS NOT A SOLICITATION OF AN OFFER TO BUY THESE SECURITIES IN ANY JURISDICTION WHERE THE OFFER OR SALE IS NOT PERMITTED.
25
| Wells Fargo Commercial Mortgage Trust 2016-C36 | Certain Terms and Conditions |
In the case of Gas Company Tower & World Trade Center Parking Garage whole loan, pursuant to the COMM 2016-GCT trust and servicing agreement and the related intercreditor agreement, the COMM 2016-GCT special servicer may offer to sell to any person (or may offer to purchase) for cash the related whole loan during such time as the applicable companion loans constitute a defaulted mortgage loan under the COMM 2016-GCT trust and servicing agreement, and, in connection with any such sale, the COMM 2016-GCT special servicer is required to sell both the mortgage loan and the relatedpari passucompanion loan(s) and subordinate companion loans as a whole loan. The directing certificateholder for this securitization will have consultation rights as the holder of an interest in the related mortgage loan, as described in the Preliminary Prospectus.
In the case of the Mall at Turtle Creek mortgage loan, the Central Park Retail mortgage loan and the One & Two Corporate Plaza mortgage loan, pursuant to the WFCM 2016-C35 pooling and servicing agreement, the WFCM 2016-LC24 pooling and servicing agreement or the WFCM 2016-LC24 pooling and servicing agreement, respectively, the related special servicer may offer to sell to any person (or may offer to purchase) for cash the related whole loan during such time as the applicable companion loan(s) constitute a defaulted mortgage loan under the related pooling and servicing agreement, and, in connection with any such sale, the related special servicer is required to sell both the mortgage loan and the relatedpari passu companion loan(s) as a whole loan. The directing certificateholder for this securitization will have consultation rights as the holder of an interest in the related mortgage loan, provided that such rights will only be exercisable prior to a consultation termination event under the related pooling and servicing agreement for this securitization, as described in the Preliminary Prospectus.
In the case of the Gurnee Mills mortgage loan and the 101 Hudson Street mortgage loan, prior to the Servicing Shift Securitization Date, pursuant to the related intercreditor agreement and the WFCM 2016-C36 pooling and servicing agreement, the applicable Special Servicer may, at the direction or upon the advice of the holder of the related controllingpari passu companion loan, offer to sell to any person (or may offer to purchase) for cash the related whole loan during such time as the related mortgage loan constitutes a defaulted mortgage loan under the WFCM 2016-C36 pooling and servicing agreement, and, in connection with any such sale, the applicable Special Servicer is required to sell both the applicable mortgage loan and the relatedpari passu companion loans as a whole loan. After the Servicing Shift Securitization Date, pursuant to the related intercreditor agreement, the party acting as special servicer with respect to the related whole loan pursuant to the related Servicing Shift PSA, may offer to sell to any person (or may offer to purchase) for cash such loan, and, in connection with any such sale, such special servicer is required to sell both the related mortgage loan and the relatedpari passucompanion loans as a whole loan. The directing certificateholder for this securitization will have consultation rights as the holder of an interest in the related mortgage loan, as described in the Preliminary Prospectus.
| |
| “As-Is” Appraisals: | Appraisals must be conducted on an “as-is” basis, and must be no more than 9 months old, for purposes of determining Appraisal Reduction Amounts and market value in connection with REO sales. Required appraisals may consist of updates of prior appraisals. Internal valuations by the applicable Special Servicer are permitted if the principal balance of a mortgage loan is less than $2,000,000. |
| Operating Advisor: | The Operating Advisor will perform certain review duties if a Control Termination Event has occurred and is continuing, which will generally include a limited annual review of, and the delivery of a report regarding, certain actions of each Special Servicer with respect to the resolution and/or liquidation of specially serviced loans to the Certificate Administrator. The review and report generally will be based on any asset status reports and additional information delivered to the Operating Advisor by each Special Servicer. In addition, if a Control Termination Event has occurred and is continuing, each Special Servicer must seek to consult with the Operating Advisor (in addition to the directing certificateholder if no Consultation Termination Event has occurred and is continuing) in connection with material special servicing actions with respect to specially serviced loans serviced by such Special Servicer. Furthermore, under certain circumstances, but only if a Consultation Termination Event has occurred and is continuing, the Operating Advisor may recommend the replacement of a Special Servicer, in which case the Certificate Administrator will deliver notice of such recommendation to the certificateholders, and certificateholders with specified percentages of the voting rights may direct the replacement of such Special Servicer at their expense. The Operating Advisor will not have any rights or powers with respect to a Servicing Shift Whole Loan.
If a Consultation Termination Event has occurred and is continuing, the Operating Advisor may be removed and replaced without cause upon the affirmative direction of certificate owners holding not less than 75% of the appraisal-reduced voting rights of all Principal Balance Certificates, following a proposal from certificate owners holding not less than 25% of the appraisal-reduced voting rights of all certificates. The certificateholders who initiate a vote on a termination and replacement of the Operating Advisor without cause must cause Fitch, Moody’s |
THE INFORMATION IN THIS STRUCTURAL AND COLLATERAL TERM SHEET IS NOT COMPLETE AND MAY BE AMENDED PRIOR TO THE TIME OF SALE. THIS TERM SHEET IS NOT AN OFFER TO SELL THESE SECURITIES AND IT IS NOT A SOLICITATION OF AN OFFER TO BUY THESE SECURITIES IN ANY JURISDICTION WHERE THE OFFER OR SALE IS NOT PERMITTED.
26
| Wells Fargo Commercial Mortgage Trust 2016-C36 | Certain Terms and Conditions |
and Morningstar to confirm the then-current ratings of the certificates (or decline to review the matter) and cause the payment of the fees and expenses incurred in the replacement. The Operating Advisor generally may be discharged from its duties if and when the Class A-1, A-2, A-3, A-4, A-SB, A-S, B, C and D Certificates are retired.
| |
| Asset Representations Reviewer: | The Asset Representations Reviewer will be required to review certain delinquent mortgage loans after a specified delinquency threshold has been exceeded (an “Asset Review Trigger”) and the required percentage of certificateholders vote to direct a review of such delinquent loans. An Asset Review Trigger will occur when either (1) mortgage loans with an aggregate outstanding principal balance of 25.0% or more of the aggregate outstanding principal balance of all of the mortgage loans (including any REO loans (or a portion of any REO loan in the case of a whole loan) held by the issuing entity as of the end of the applicable collection period are delinquent loans or (2) at least 15 mortgage loans are delinquent loans as of the end of the applicable collection period and the outstanding principal balance of such delinquent loans in the aggregate constitutes at least 20.0% of the aggregate outstanding principal balance of all of the mortgage loans (including any REO loans (or a portion of any REO loan in the case of a whole loan)) held by the issuing entity as of the end of the applicable collection period. See “Pooling and Servicing Agreement—The Asset Representations Reviewer—Asset Review” in the Preliminary Prospectus.
The Asset Representations Reviewer may be terminated and replaced without cause. Upon (i) the written direction of certificateholders evidencing not less than 25% of the voting rights (without regard to the application of any Appraisal Reduction Amounts) requesting a vote to terminate and replace the Asset Representations Reviewer with a proposed successor Asset Representations Reviewer that is an eligible asset reviewer, and (ii) payment by such holders to the certificate administrator of the reasonable fees and expenses to be incurred by the certificate administrator in connection with administering such vote, the certificate administrator will promptly provide notice to all certificateholders and the Asset Representations Reviewer of such request by posting such notice on its internet website, and by mailing such notice to all certificateholders and the Asset Representations Reviewer. Upon the written direction of certificateholders evidencing at least 75% of a certificateholder quorum (without regard to the application of any Appraisal Reduction Amounts), the Trustee will terminate all of the rights and obligations of the Asset Representations Reviewer under the pooling and servicing agreement by written notice to the Asset Representations Reviewer, and the proposed successor Asset Representations Reviewer will be appointed. See “Pooling and Servicing Agreement—The Asset Representations Reviewer” in the Preliminary Prospectus.
|
| Dispute Resolution Provisions: | The mortgage loan sellers will be subject to the dispute resolution provisions set forth in the pooling and servicing agreement to the extent those provisions are triggered with respect to any mortgage loan sold to the depositor by a mortgage loan seller and such mortgage loan seller will be obligated under the related mortgage loan purchase agreement to comply with all applicable provisions and to take part in any mediation or arbitration proceedings that may result.
Generally, in the event that a Repurchase Request (as defined in the Preliminary Prospectus) is not “Resolved” (as defined below) within 180 days after the related mortgage loan seller receives such Repurchase Request, then the enforcing servicer will be required to send a notice to the “Initial Requesting Certificateholder” (if any) and the Certificate Administrator indicating the enforcing servicer’s intended course of action with respect to the Repurchase Request. If (a) the enforcing servicer’s intended course of action with respect to the Repurchase Request does not involve pursuing further action to exercise rights against the related mortgage loan seller with respect to the Repurchase Request and the Initial Requesting Certificateholder, if any, or any other certificateholder or certificate owner wishes to exercise its right to refer the matter to mediation (including nonbinding arbitration) or arbitration, or (b) the enforcing servicer’s intended course of action is to pursue further action to exercise rights against the related mortgage loan seller with respect to the Repurchase Request but the Initial Requesting Certificateholder, if any, or any other certificateholder or certificate owner does not agree with the dispute resolution method selected by the enforcing servicer, then the Initial Requesting Certificateholder, if any, or such other certificateholder or certificate owner may deliver a written notice to the applicable Special Servicer indicating its intent to exercise its right to refer the matter to either mediation or arbitration.
|
| “Resolved” means, with respect to a Repurchase Request, (i) that the related Material Defect has been cured, (ii) the related mortgage loan has been repurchased in accordance with the related mortgage loan purchase agreement, (iii) a mortgage loan has been substituted for the related mortgage loan in accordance with the related mortgage loan purchase agreement, (iv) the applicable mortgage loan seller makes a Loss of Value Payment (as defined in the Preliminary Prospectus), (v) a contractually binding agreement is entered into between the enforcing servicer, on behalf of the issuing entity, and the related mortgage loan seller that settles the related mortgage loan seller’s obligations under the related mortgage loan purchase agreement, or (vi) the related mortgage loan is no longer property of the issuing entity as a result of a sale or other disposition in accordance with the pooling and servicing agreement. |
THE INFORMATION IN THIS STRUCTURAL AND COLLATERAL TERM SHEET IS NOT COMPLETE AND MAY BE AMENDED PRIOR TO THE TIME OF SALE. THIS TERM SHEET IS NOT AN OFFER TO SELL THESE SECURITIES AND IT IS NOT A SOLICITATION OF AN OFFER TO BUY THESE SECURITIES IN ANY JURISDICTION WHERE THE OFFER OR SALE IS NOT PERMITTED.
27
| Wells Fargo Commercial Mortgage Trust 2016-C36 | Certain Terms and Conditions |
See “Pooling and Servicing Agreement—Dispute Resolution Provisions” in the Preliminary Prospectus. | |
| Investor Communications: | The certificate administrator is required to include on any Form 10–D any request received from a certificateholder to communicate with other certificateholders related to certificateholders exercising their rights under the terms of the pooling and servicing agreement. Any certificateholder wishing to communicate with other certificateholders regarding the exercise of its rights under the terms of the Pooling and Servicing Agreement will be able to deliver a written request signed by an authorized representative of the requesting investor to the certificate administrator. |
| Certain Fee Offsets: | If a workout fee is earned by a Special Servicer following a loan default with respect to any mortgage loan that it services, then certain limitations will apply based on modification fees paid by the borrower. The modification fee generally must not exceed 1% of the principal balance of the loan as modified in any 12-month period. In addition, if the loan re-defaults, any subsequent workout fee on that loan must be reduced by a portion of the modification fees paid by the borrower in the previous 12-months. Likewise, liquidation fees collected in connection with a liquidation or partial liquidation of a mortgage loan must be reduced by a portion of the modification fees paid by the borrower in the previous 12 months. |
| Deal Website: | The Certificate Administrator will be required to maintain a deal website which will include, among other items: (a) summaries of asset status reports prepared by each Special Servicer, (b) inspection reports, (c) appraisals, (d) various “special notices” described in the Preliminary Prospectus, (e) the “Investor Q&A Forum” and (f) a voluntary “Investor Registry”. Investors may access the deal website following execution of a certification and confidentiality agreement. |
| Initial Majority Controlling Class Certificateholder: | It is expected that C-III Investment Management LLC or an affiliate will be the initial majority controlling class certificateholder. |
| Whole Loans: | The mortgaged properties identified on Annex A-1 to the Preliminary Prospectus as Gurnee Mills, 101 Hudson Street, Plaza America I & II, Easton Town Center, Conrad Indianapolis, Mall at Turtle Creek, Central Park Retail, Gas Company Tower & World Trade Center Parking Garage and One & Two Corporate Plaza secure both a mortgage loan to be included in the trust fund and one or more other mortgage loans that will not be included in the trust fund, each of which will bepari passu or subordinate in right of payment with the mortgage loan included in the trust fund. We refer to each such group of mortgage loans as a “whole loan”. The Plaza America I & II whole loan and the Conrad Indianapolis whole loan will each be principally serviced under the pooling and servicing agreement for this securitization. The Easton Town Center whole loan will be principally serviced under the trust and servicing agreement for the BBCMS 2016-ETC securitization. The Gas Company Tower & World Trade Center Parking Garage whole loan will be principally serviced under the trust and servicing agreement for the COMM 2016-GCT securitization. The Mall at Turtle Creek whole loan, the Central Park Retail whole loan and the One & Two Corporate Plaza whole loan will be principally serviced under the pooling and servicing agreement for the WFCM 2016-C35 securitization, WFCM 2016-LC24 securitization and WFCM 2016-LC24 securitization, respectively. It is expected that prior to the applicable Servicing Shift Securitization Date, each of the Servicing Shift Whole Loans will be serviced under the pooling and servicing agreement for this securitization, and after the applicable Servicing Shift Securitization Date, each Servicing Shift Whole Loan will be serviced under the related Servicing Shift PSA.
As of the closing date, each companion loan in each whole loan will be held by the party identified above under “IV. Characteristics of the Mortgage Pool—B. Summary of thePari PassuWhole Loans”. |
THE INFORMATION IN THIS STRUCTURAL AND COLLATERAL TERM SHEET IS NOT COMPLETE AND MAY BE AMENDED PRIOR TO THE TIME OF SALE. THIS TERM SHEET IS NOT AN OFFER TO SELL THESE SECURITIES AND IT IS NOT A SOLICITATION OF AN OFFER TO BUY THESE SECURITIES IN ANY JURISDICTION WHERE THE OFFER OR SALE IS NOT PERMITTED.
28
(THIS PAGE INTENTIONALLY LEFT BLANK)
THE INFORMATION IN THIS STRUCTURAL AND COLLATERAL TERM SHEET IS NOT COMPLETE AND MAY BE AMENDED PRIOR TO THE TIME OF SALE. THIS TERM SHEET IS NOT AN OFFER TO SELL THESE SECURITIES AND IT IS NOT A SOLICITATION OF AN OFFER TO BUY THESE SECURITIES IN ANY JURISDICTION WHERE THE OFFER OR SALE IS NOT PERMITTED.
29
(THIS PAGE INTENTIONALLY LEFT BLANK)
THE INFORMATION IN THIS STRUCTURAL AND COLLATERAL TERM SHEET IS NOT COMPLETE AND MAY BE AMENDED PRIOR TO THE TIME OF SALE. THIS TERM SHEET IS NOT AN OFFER TO SELL THESE SECURITIES AND IT IS NOT A SOLICITATION OF AN OFFER TO BUY THESE SECURITIES IN ANY JURISDICTION WHERE THE OFFER OR SALE IS NOT PERMITTED.
30
| GURNEE MILLS |
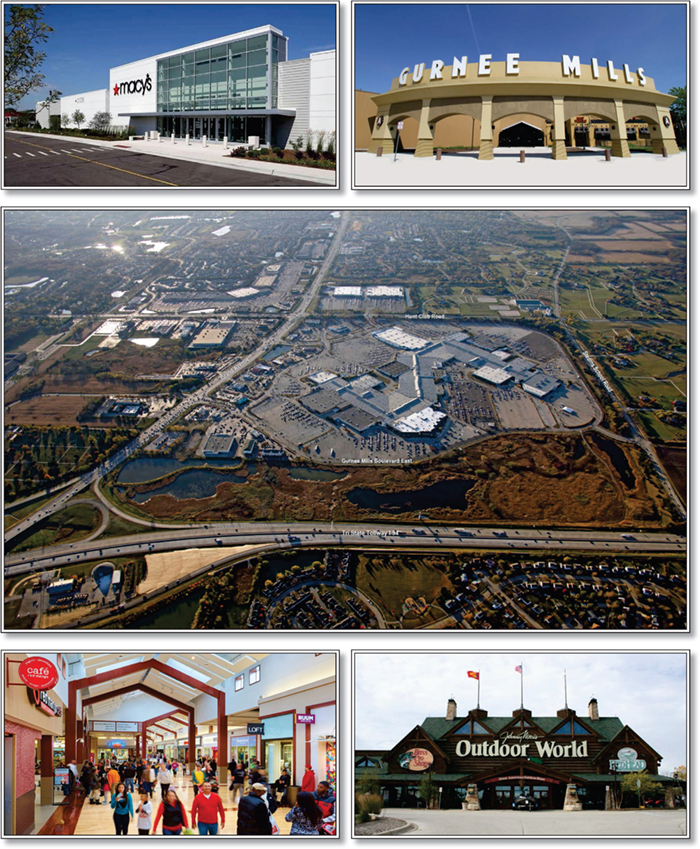
THE INFORMATION IN THIS STRUCTURAL AND COLLATERAL TERM SHEET IS NOT COMPLETE AND MAY BE AMENDED PRIOR TO THE TIME OF SALE. THIS TERM SHEET IS NOT AN OFFER TO SELL THESE SECURITIES AND IT IS NOT A SOLICITATION OF AN OFFER TO BUY THESE SECURITIES IN ANY JURISDICTION WHERE THE OFFER OR SALE IS NOT PERMITTED.
31
| GURNEE MILLS |
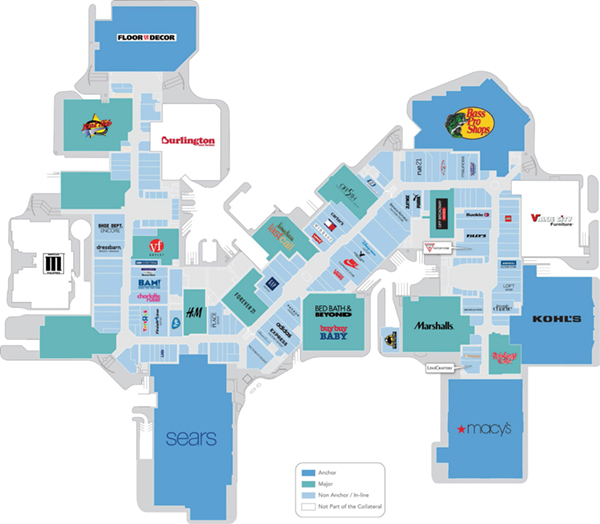
THE INFORMATION IN THIS STRUCTURAL AND COLLATERAL TERM SHEET IS NOT COMPLETE AND MAY BE AMENDED PRIOR TO THE TIME OF SALE. THIS TERM SHEET IS NOT AN OFFER TO SELL THESE SECURITIES AND IT IS NOT A SOLICITATION OF AN OFFER TO BUY THESE SECURITIES IN ANY JURISDICTION WHERE THE OFFER OR SALE IS NOT PERMITTED.
32
| GURNEE MILLS |
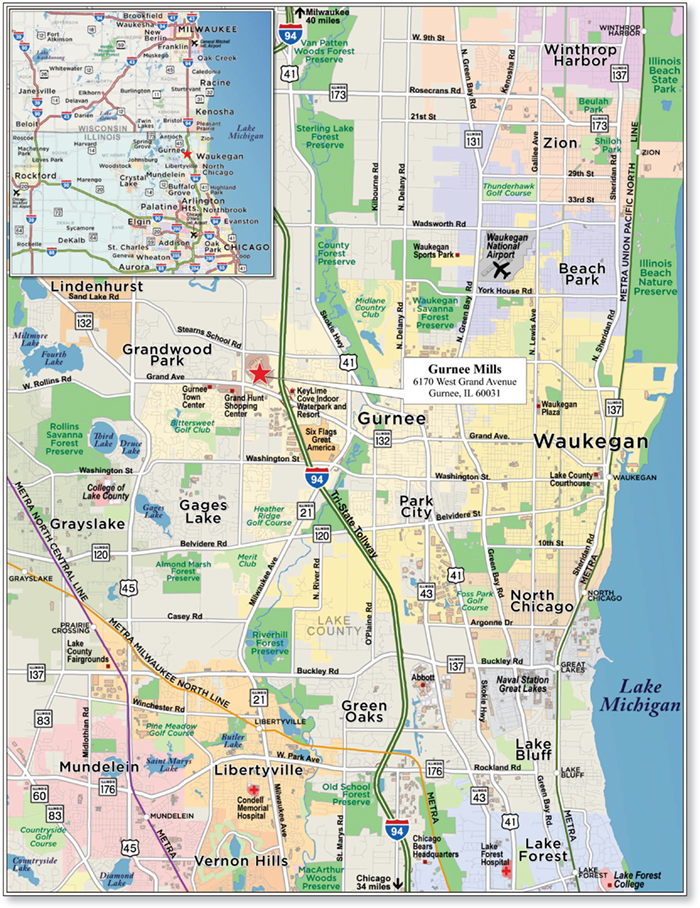
THE INFORMATION IN THIS STRUCTURAL AND COLLATERAL TERM SHEET IS NOT COMPLETE AND MAY BE AMENDED PRIOR TO THE TIME OF SALE. THIS TERM SHEET IS NOT AN OFFER TO SELL THESE SECURITIES AND IT IS NOT A SOLICITATION OF AN OFFER TO BUY THESE SECURITIES IN ANY JURISDICTION WHERE THE OFFER OR SALE IS NOT PERMITTED.
33
| No. 1 - Gurnee Mills | |||||||
| Loan Information | Property Information | ||||||
| Mortgage Loan Seller: | Wells Fargo Bank, National Association | Single Asset/Portfolio: | Single Asset | ||||
| Credit Assessment (Fitch/Moody’s/Morningstar): | NR/NR/NR | Property Type: | Retail | ||||
| Original Principal Balance(1): | $80,000,000 | Specific Property Type: | Super Regional Mall | ||||
| Cut-off Date Balance(1): | $79,893,396 | Location: | Gurnee, IL | ||||
| % of Initial Pool Balance: | 9.3% | Size(3): | 1,683,915 SF | ||||
| Loan Purpose: | Refinance | Cut-off Date Balance Per SF(1): | $163.09 | ||||
| Borrower Name: | Mall at Gurnee Mills, LLC | Year Built/Renovated: | 1991/2014 | ||||
| Sponsor: | Simon Property Group, L.P. | Title Vesting: | Fee | ||||
| Mortgage Rate: | 3.990% | Property Manager: | Self-managed | ||||
| Note Date: | September 27, 2016 | 4thMost Recent Occupancy (As of)(3): | 94.0% (12/31/2012) | ||||
| Anticipated Repayment Date: | NAP | 3rdMost Recent Occupancy (As of): | 95.2% (12/31/2013) | ||||
| Maturity Date: | October 1, 2026 | 2ndMost Recent Occupancy (As of): | 95.8% (12/31/2014) | ||||
| IO Period: | 0 months | Most Recent Occupancy (As of): | 95.1% (12/31/2015) | ||||
| Loan Term (Original): | 120 months | Current Occupancy (As of)(4): | 91.1% (9/22/2016) | ||||
| Seasoning: | 1 month | ||||||
| Amortization Term (Original): | 360 months | Underwriting and Financial Information: | |||||
| Loan Amortization Type: | Amortizing Balloon | ||||||
| Interest Accrual Method: | Actual/360 | 4thMost Recent NOI (As of): | $25,964,013 (12/31/2013) | ||||
| Call Protection: | L(25),D(88),O(7) | 3rdMost Recent NOI (As of): | $27,475,772 (12/31/2014) | ||||
| Lockbox Type: | Hard/Springing Cash Management | 2ndMost Recent NOI (As of): | $27,801,962 (12/31/2015) | ||||
| Additional Debt(1): | Yes | Most Recent NOI (As of): | $28,050,715 (TTM 7/31/2016) | ||||
| Additional Debt Type(1): | Pari Passu | ||||||
| U/W Revenues: | $40,778,955 | ||||||
| U/W Expenses: | $14,098,029 | ||||||
| U/W NOI: | $26,680,926 | ||||||
| U/W NCF: | $25,099,266 | ||||||
| U/W NOI DSCR(1): | 1.70x | ||||||
| Escrows and Reserves(2): | U/W NCF DSCR(1): | 1.60x | |||||
| U/W NOI Debt Yield(1): | 9.7% | ||||||
| Type: | Initial | Monthly | Cap (If Any) | U/W NCF Debt Yield(1): | 9.1% | ||
| Taxes | $0 | Springing | NAP | As-Is Appraised Value: | $417,000,000 | ||
| Insurance | $0 | Springing | NAP | As-Is Appraisal Valuation Date: | August 23, 2016 | ||
| Replacement Reserves | $0 | Springing | NAP | Cut-off Date LTV Ratio(1): | 65.9% | ||
| TI/LC Reserve | $0 | Springing | NAP | LTV Ratio at Maturity or ARD(1): | 52.4% | ||
(1) | See “The Mortgage Loan” section. All statistical financial information related to balance per square foot, loan-to-value ratios, debt service coverage ratios and debt yields are based on the funded outstanding principal balance of the Gurnee Mills Whole Loan (as defined below) as of the Cut-off Date. |
| (2) | See “Escrows” section. |
| (3) | See “Historical Occupancy” section. |
| (4) | See “Cash Flow Analysis” section. As of September 22, 2016, the Gurnee Mills Mortgaged Property (as defined below) was 91.1% leased and 81.9% occupied. The leased percentage includes the Simon Master Lease (as defined below) (2.8% of net rentable area), Floor & Décor and three other tenants who have not yet taken occupancy, all totaling 9.2% of net rentable area combined. Current occupancy and leased percentages do not include any temporary tenants or non-collateral tenants. Including temporary tenants, occupancy in 2013, 2014, 2015 and as of September 22, 2016 was 98.2%, 98.9%, 97.6% and 94.8%, respectively. |
The Mortgage Loan. The mortgage loan (the “Gurnee Mills Mortgage Loan”) is part of a whole loan (the “Gurnee Mills Whole Loan”) that is evidenced by sixpari passu promissory notes (Notes A-1A, A-1B, A-2A, A-2B, A-3 and A-4) secured by a first mortgage encumbering a super-regional mall located in Gurnee, Illinois (the “Gurnee Mills Property”). The Gurnee Mills Whole Loan was co-originated on September 27, 2016 by Wells Fargo Bank, National Association, Column Financial, Inc. and Regions Bank. The Gurnee Mills Whole Loan had an original principal balance of $275,000,000, has an outstanding principal balance as of the Cut-off Date of $274,633,547 and accrues interest at an interest rate of 3.990%per annum. The Gurnee Mills Whole Loan had an initial term of 120 months, has a remaining term of 119 months as of the Cut-off Date and requires payments of principal and interest based on a 30-year amortization schedule through the term of the Gurnee Mills Whole Loan. The Gurnee Mills Whole Loan matures on October 1, 2026.
Note A-2A, which will be contributed to the WFCM 2016-C36 Trust, had an original principal balance of $80,000,000, has an outstanding principal balance as of the Cut-off Date of $79,893,396 and represents a non-controlling interest in the Gurnee Mills Whole Loan. The controlling Note A-1A, which had an original principal balance of $75,000,000, is expected to be contributed to a future trust. The remaining non-controlling notes, which had an aggregate original principal balance of $120,000,000, are expected to be contributed to future securitization trusts (referred to herein collectively as the “Gurnee Mills Companion Loans”). The lender provides no assurances that any non-securitizedpari passu note will not be split further. See “Description of the Mortgage Pool—The Whole Loans—The Serviced Whole Loans—The Gurnee Mills Whole Loan” in the Preliminary Prospectus.
THE INFORMATION IN THIS STRUCTURAL AND COLLATERAL TERM SHEET IS NOT COMPLETE AND MAY BE AMENDED PRIOR TO THE TIME OF SALE. THIS TERM SHEET IS NOT AN OFFER TO SELL THESE SECURITIES AND IT IS NOT A SOLICITATION OF AN OFFER TO BUY THESE SECURITIES IN ANY JURISDICTION WHERE THE OFFER OR SALE IS NOT PERMITTED.
34
| GURNEE MILLS |
Note Summary(1)
| Notes | Original Balance | Note Holder | Controlling Interest | |
| A-1A | $75,000,000 | Column Financial, Inc. | Yes | |
| A-1B | $35,000,000 | Column Financial, Inc. | No | |
| A-2A | $80,000,000 | WFCM 2016-C36 | No | |
| A-2B | $25,000,000 | Wells Fargo Bank, National Association | No | |
| A-3 | $30,000,000 | Regions Bank | No | |
| A-4 | $30,000,000 | Regions Bank | No | |
| Total | $275,000,000 |
| (1) | The lender provides no assurances that any non-securitized pari passu note will not be split further. |
Following the lockout period, the borrower has the right to defease the Gurnee Mills Mortgage Loan in whole, but not in part, on any date before April 1, 2026. In addition, the Gurnee Mills Mortgage Loan is prepayable without penalty on or after April 1, 2026. The lockout period will expire on the earlier to occur of (i) two years after the closing date of the securitization that includes the last note to be securitized and (ii) November 1, 2019.
Sources and Uses
| Sources | Uses | |||||||
| Original whole loan amount | $275,000,000 | 85.1% | Loan payoff(1) | $322,543,428 | 99.8% | |||
| Sponsor’s new cash contribution | 48,328,282 | 14.9 | Closing costs | 784,854 | 0.2 | |||
| Total Sources | $323,328,282 | 100.0% | Total Uses | $323,328,282 | 100.0% |
| (1) | The Gurnee Mills Property was previously securitized in the JPMCC 2007-CB20 and JPMCC 2007-C1 transactions. |
The Property.The Gurnee Mills Property is a single-story, super-regional mall located at the intersection of Grand Avenue and Interstate-94 in Gurnee, Illinois, approximately 42.5 miles northwest of Chicago, Illinois. According to the appraisal, together with the adjacent Six Flag Great America (“Six Flags”) amusement park (located just across Interstate-94 approximately 2.8 miles southeast), the Gurnee Mills Property draws over 26 million visitors annually to the area. The Gurnee Mills Property contains 1,934,721 square feet of retail space, of which 1,683,915 square feet (the “Gurnee Mills Mortgaged Property”) serves as collateral for the Gurnee Mills Whole Loan. The Gurnee Mills Mortgaged Property is situated on a 233.5-acre parcel of land. Developed in 1991 by the Mills Corporation, the Gurnee Mills Property is anchored by Marcus Cinema (not part of the collateral), Burlington Coat Factory (not part of the collateral) and Value City Furniture (not part of the collateral), Bass Pro Shops Outdoor, Sears Grand, Floor & Décor, Kohl’s and Macy’s. Major tenants at the Gurnee Mills Mortgaged Property include Forever 21, Marshalls Homegoods, Rink Side, Last Call Neiman Marcus, Bed Bath & Beyond / Buy Buy Baby, Off Broadway Shoes, Rainforest Café and Saks Fifth Avenue Off 5th, among others. In 2013, the Macy’s anchor space was constructed at a reported cost to the tenant of $20.0 million and the borrower simultaneously invested $2.7 million in renovations to the Macy’s wing of the Gurnee Mills Mortgaged Property. Further, the borrower negotiated a buyout of a prior tenant and executed a lease with Floor & Décor in 2016 for 105,248 square feet (6.3% of net rentable area). Floor & Décor, which specializes in the hard surface flooring market, offering a broad in-stock selection of tile, wood, stone and flooring accessories straight from the manufacturers, began paying rent October 2016 and is expected to open in January 2017. Sports Authority previously occupied 46,892 square feet (2.8% of net rentable area) but declared bankruptcy and vacated the Gurnee Mills Mortgaged Property in 2016. Simon Property Group, Inc. (“SPG”) (rated A2/A by Moody’s and S&P) has executed a 10-year master lease for this space at a rent of $700,000 ($14.93 per square foot), which will burn off once they have a signed lease or leases and a tenant (or tenants) is in occupancy and paying full, unabated rent (the “Simon Master Lease”).
As of July 31, 2016, tenants occupying 10,000 square feet or less had trailing 12-month in-line sales of $347 per square foot, which is up 3.0% from 2014, with an average occupancy cost of 15.2%. 2015 total sales (for all tenants who reported) at the Gurnee Mills Property were $304.6 million. Further, according to servicer-reported information, the Gurnee Mills Mortgaged Property has exhibited increasing cash flow, with net operating income increasing 27.6% from approximately $22.0 million in 2007 to $28.1 million as of the trailing-twelve months July 2016 operating statement. As of September 22, 2016, the Gurnee Mills Mortgaged Property was 91.1% leased and 81.9% occupied by 159 tenants. The leased percentage includes the Simon Master Lease (2.8% of net rentable area), Floor & Décor and three other tenants who have not yet taken occupancy, all totaling 9.2% of net rentable area combined.
THE INFORMATION IN THIS STRUCTURAL AND COLLATERAL TERM SHEET IS NOT COMPLETE AND MAY BE AMENDED PRIOR TO THE TIME OF SALE. THIS TERM SHEET IS NOT AN OFFER TO SELL THESE SECURITIES AND IT IS NOT A SOLICITATION OF AN OFFER TO BUY THESE SECURITIES IN ANY JURISDICTION WHERE THE OFFER OR SALE IS NOT PERMITTED.
35
| GURNEE MILLS |
The following table presents certain information relating to the tenancy at the Gurnee Mills Property:
Major Tenants
| Tenant Name | Credit Rating (Fitch/Moody’s/ S&P)(1) | Tenant NRSF | % of NRSF | Annual U/W Base Rent PSF(2) | Annual U/W Base Rent(2) | % of Total Annual U/W Base Rent | Sales PSF(3) | Occupancy Cost(3) | Lease Expiration Date |
| Anchor Tenant – Not Part of Collateral | |||||||||
| Marcus Cinema | NR/NR/NR | 88,707 | ANCHOR OWNED – NOT PART OF THE COLLATERAL | ||||||
| Burlington Coat Factory | NR/NR/BB- | 82,320 | ANCHOR OWNED – NOT PART OF THE COLLATERAL | ||||||
| Value City Furniture | NR/NR/NR | 79,779 | ANCHOR OWNED – NOT PART OF THE COLLATERAL | ||||||
| Anchor Tenants | |||||||||
| Bass Pro Shops Outdoor | NR/Ba3/BB- | 137,201 | 8.1% | $10.15 | $1,392,590 | 6.3% | $189 | 5.4% | 8/31/2018 |
| Sears Grand | CC/Caa1/CCC+ | 201,439 | 12.0% | $5.00 | $1,007,195 | 4.6% | $71 | 8.6% | 4/30/2019(4) |
| Floor & Décor(5) | NR/NR/NR | 105,248 | 6.3% | $9.25 | $974,000 | 4.4% | NAP | NAP | 9/30/2026(6) |
| Kohl’s(7) | BBB/Baa2/BBB | 111,675 | 6.6% | $5.95(7) | $664,466 | 3.0% | $176(8) | 4.3%(8) | 9/2/2024(9) |
| Macy’s | BBB/Baa2/BBB | 130,000 | 7.7% | $0(10) | $0(10) | 0.0% | $134(8) | 0.4%(8) | 1/31/2039(11) |
| Total Anchor Tenants | 685,563 | 40.7% | $7.27(12) | $4,038,251 | 18.3% | ||||
| Major Tenants | |||||||||
| Forever 21 | NR/NR/NR | 24,107 | 1.4% | $28.82 | $694,764 | 3.1% | $183 | 16.8% | 1/31/2024 |
| Marshalls Homegoods | NR/A2/A+ | 60,000 | 3.6% | $9.75 | $585,000 | 2.7% | $212 | 5.2% | 1/31/2022 |
| Rink Side | NR/NR/NR | 55,970 | 3.3% | $8.58 | $480,000 | 2.2% | NAP | NAP | 12/31/2016(13) |
| Last Call Neiman Marcus | NR/NR/NR | 30,462 | 1.8% | $15.00 | $456,930 | 2.1% | $166 | 9.1% | 1/31/2020 |
| Bed Bath & Beyond / Buy Buy Baby | NR/Baa1/BBB+ | 60,317 | 3.6% | $7.50 | $452,378 | 2.1% | $143 | 8.9% | 1/31/2023 |
| Off Broadway Shoes | NR/NR/NR | 21,000 | 1.2% | $17.00 | $357,000 | 1.6% | $110 | 20.8% | 4/30/2021 |
| Rainforest Cafe | NR/NR/NR | 20,003 | 1.2% | $14.90 | $298,000 | 1.4% | $174 | 11.6% | 12/31/2018(14) |
| Saks Fifth Avenue Off 5 | NR/B1/B+ | 28,108 | 1.7% | $9.10 | $255,783 | 1.2% | $105 | 11.0% | 6/30/2019 |
| Total Major Tenants | 299,967 | 17.8% | $11.93 | $3,579,854 | 16.2% | ||||
| Non-Major Tenants(15) | 548,621 | 32.6% | $26.32 | $14,438,249 | 65.5% | ||||
| Occupied Collateral Total | 1,534,151 | 91.1%(16) | $14.38 | $22,056,354 | 100.0% | ||||
| Vacant Space | 149,764 | 8.9% | |||||||
| Collateral Total | 1,683,915 | 100.0% | |||||||
| (1) | Certain ratings are those of the parent company whether or not the parent guarantees the lease. |
| (2) | Annual U/W Base Rent PSF and Annual U/W Base Rent include contractual rent steps through August 2017 totaling $315,690. |
| (3) | Sales PSF and Occupancy Costs are for the trailing 12-month period ending July 31, 2016. |
| (4) | Sears Grand has six, five-year lease extension options. |
| (5) | Floor & Décor is still completing its buildout and is not yet in occupancy but began paying rent on October 1, 2016. They are scheduled to open for business in January 2017. |
| (6) | Floor & Decor has three, five-year lease extension options. |
| (7) | Kohl’s owns their own improvements; Annual U/W Base Rent is reflective of ground rent. |
| (8) | Sales PSF and Occupancy cost are for the trailing 12-month period ending December 31, 2015. |
| (9) | Kohl’s has four, five-year lease extension options. |
| (10) | Macy’s pays solely reimbursements currently. They are also required to pay percentage rent, which is calculated based on a percentage of sales above $26.0 million. |
| (11) | Macy’s has ten, five-year lease extension options. |
| (12) | The Total Anchor Tenants Annual U/W Base Rent PSF excludes Macy’s square footage. Including Macy’s, the Annual U/W Base Rent PSF is $5.89. |
| (13) | Rink Side recently exercised their automatic five-year lease renewal option, extending their lease to December 2021. |
| (14) | Rainforest Café has the right to terminate its lease at any time with twelve months prior written notice and payment of a termination fee equal to the greater of one year of then current rent or $500,000. |
| (15) | Non-Major Tenants includes $700,000 attributed to the Simon Master Lease and $4,563 attributed to Marcus Cinema’s common area maintenance reimbursements. Marcus Cinema’s square footage is excluded from the calculation. |
| (16) | As of September 22, 2016, the Gurnee Mills Mortgaged Property was 81.9% occupied and 91.1% leased. The leased percentage includes the Simon Master Lease (2.8% of net rentable area), Floor & Décor and three other tenants who have not yet taken occupancy, all totaling 9.2% of net rentable area combined. |
THE INFORMATION IN THIS STRUCTURAL AND COLLATERAL TERM SHEET IS NOT COMPLETE AND MAY BE AMENDED PRIOR TO THE TIME OF SALE. THIS TERM SHEET IS NOT AN OFFER TO SELL THESE SECURITIES AND IT IS NOT A SOLICITATION OF AN OFFER TO BUY THESE SECURITIES IN ANY JURISDICTION WHERE THE OFFER OR SALE IS NOT PERMITTED.
36
| GURNEE MILLS |
The following table presents certain information relating to the historical sales and occupancy costs at the Gurnee Mills Mortgaged Property:
Historical Sales (PSF) and Occupancy Costs(1)
| Tenant Name | 2014 | 2015 | TTM 7/31/2016 | Current Occupancy Cost(2) |
| Bass Pro Shops Outdoor | $188 | $187 | $189 | 5.4% |
| Sears Grand | $86 | $76 | $71 | 8.6% |
| Kohl’s | $174 | $176 | NAV | 4.3% |
| Macy’s | $141 | $134 | NAV | 0.4%(3) |
| Forever 21 | $195 | $172 | $183 | 16.8% |
| Marshalls Homegoods | $192 | $211 | $212 | 5.2% |
| Last Call Neiman Marcus | $195 | $182 | $166 | 9.1% |
| Bed Bath & Beyond / Buy Buy Baby | $159 | $150 | $143 | 8.9% |
| Off Broadway Shoes | $115 | $114 | $110 | 20.8% |
| Rainforest Cafe | $175 | $186 | $174 | 11.6% |
| Saks Fifth Avenue Off 5 | NAV | $106 | $105 | 11.0% |
| Total Comparable In-line Sales (< 10,000 square feet) | $337 | $353 | $347 | |
| Occupancy Costs | 15.0% | 14.5% | 15.2% |
| (1) | Historical Sales (PSF) and Occupancy Costs were provided by the borrower. Current Occupancy Cost is based on the most recent available Historical Sales. |
| (2) | Current Occupancy Costs are based on the Annual U/W Base Rent and reimbursements and historical sales. |
| (3) | Macy’s pays solely reimbursements currently. They are also required to pay percentage rent, which is calculated based on a percentage of sales above $26.0 million. |
The following table presents certain information relating to the lease rollover schedule at the Gurnee Mills Mortgaged Property:
Lease Expiration Schedule(1)(2)
| Year Ending December 31, | No. of Leases Expiring | Expiring NRSF | % of Total NRSF | Cumulative Expiring NRSF | Cumulative % of Total NRSF | Annual U/W Base Rent | % of Total Annual U/W Base Rent | Annual U/W Base Rent PSF(3) |
| MTM | 3 | 11,475 | 0.7% | 11,475 | 0.7% | $311,601 | 1.4% | $27.15 |
| 2016 | 3 | 79,477 | 4.7% | 90,952 | 5.4% | $516,766 | 2.3% | $6.50 |
| 2017 | 26 | 69,784 | 4.1% | 160,736 | 9.5% | $2,515,793 | 11.4% | $36.05 |
| 2018 | 23 | 199,595 | 11.9% | 360,331 | 21.4% | $3,392,943 | 15.4% | $17.00 |
| 2019 | 16 | 278,979 | 16.6% | 639,310 | 38.0% | $2,716,434 | 12.3% | $9.74 |
| 2020 | 14 | 77,358 | 4.6% | 716,668 | 42.6% | $1,645,599 | 7.5% | $21.27 |
| 2021 | 15 | 73,185 | 4.3% | 789,853 | 46.9% | $1,957,735 | 8.9% | $26.75 |
| 2022 | 4 | 72,578 | 4.3% | 862,431 | 51.2% | $939,095 | 4.3% | $12.94 |
| 2023 | 15 | 107,168 | 6.4% | 969,599 | 57.6% | $1,853,045 | 8.4% | $17.29 |
| 2024 | 23 | 223,371 | 13.3% | 1,192,970 | 70.8% | $3,667,843 | 16.6% | $16.42 |
| 2025 | 8 | 20,126 | 1.2% | 1,213,096 | 72.0% | $522,412 | 2.4% | $25.96 |
| 2026 | 6 | 181,193 | 10.8% | 1,394,289 | 82.8% | $1,912,525 | 8.7% | $10.56 |
| Thereafter | 3 | 139,862 | 8.3% | 1,534,151 | 91.1% | $104,563 | 0.5% | $0.75 |
| Vacant | 0 | 149,764 | 8.9% | 1,683,915 | 100.0% | $0 | 0.0% | $0.00 |
| Total/Weighted Average | 159 | 1,683,915 | 100.0% | $22,056,354 | 100.0% | $14.38 |
| (1) | Information obtained from the underwritten rent roll. |
| (2) | Certain tenants may have lease termination options that are exercisable prior to the originally stated expiration date of the subject lease and that are not considered in the Lease Expiration Schedule. |
| (3) | Weighted Average Annual U/W Base Rent PSF excludes vacant space. |
The following table presents historical occupancy percentages at the Gurnee Mills Mortgaged Property:
Historical Occupancy
12/31/2012(1) | 12/31/2013(2) | 12/31/2014(2) | 12/31/2015(2) | 9/22/2016(3)(4) | ||||
| 94.0% | 95.2% | 95.8% | 95.1% | 91.1% |
| (1) | Information obtained from the servicer. |
| (2) | Information obtained from the borrower. |
| (3) | Information obtained from the underwritten rent roll. |
| (4) | As of September 22, 2016, the Gurnee Mills Property was 81.9% occupied and 91.1% leased. The leased percentage includes the Simon Master Lease, Floor & Décor and three other tenants who have not yet taken occupancy, all totaling 9.2% of net rentable area combined. |
THE INFORMATION IN THIS STRUCTURAL AND COLLATERAL TERM SHEET IS NOT COMPLETE AND MAY BE AMENDED PRIOR TO THE TIME OF SALE. THIS TERM SHEET IS NOT AN OFFER TO SELL THESE SECURITIES AND IT IS NOT A SOLICITATION OF AN OFFER TO BUY THESE SECURITIES IN ANY JURISDICTION WHERE THE OFFER OR SALE IS NOT PERMITTED.
37
| GURNEE MILLS |
Operating History and Underwritten Net Cash Flow. The following table presents certain information relating to the historical operating performance and the underwritten net cash flow at the Gurnee Mills Mortgaged Property:
Cash Flow Analysis
| 2013 | 2014 | 2015 | TTM 7/31/2016 | U/W | % of U/W Effective Gross Income | U/W $ per SF | |||||||||
| Base Rent | $20,520,014 | $22,641,489 | $22,716,688 | $22,207,409 | $22,056,354(1) | 54.1% | $13.10(1) | ||||||||
| Grossed Up Vacant Space | 0 | 0 | 0 | 0 | 6,159,895(2) | 15.1 | 3.66 | ||||||||
| Percentage Rent | 542,881 | 339,800 | 599,424 | 989,722 | 979,159 | 2.4 | 0.58 | ||||||||
| Total Reimbursables | 12,522,737 | 13,642,927 | 13,955,041 | 14,065,465 | 13,088,291 | 32.1 | 7.77 | ||||||||
| Specialty Leasing Income(3) | 4,339,492 | 3,638,788 | 3,421,783 | 3,392,678 | 3,523,393 | 8.6 | 2.09 | ||||||||
| Other Income | 1,200,144 | 1,201,801 | 1,068,511 | 1,111,763 | 1,131,757 | 2.8 | 0.67 | ||||||||
| Less Vacancy & Credit Loss | 0 | 0 | 0 | 0 | (6,159,895)(4) | (15.1) | (3.66) | ||||||||
| Effective Gross Income | $39,125,268 | $41,464,805 | $41,761,447 | $41,767,037 | $40,778,955 | 100.0% | $24.22 | ||||||||
| Total Operating Expenses | $13,161,255 | $13,989,033 | $13,959,485 | $13,716,322 | $14,098,029 | 34.6% | $8.37 | ||||||||
| Net Operating Income | $25,964,013 | $27,475,772 | $27,801,962 | $28,050,715 | $26,680,926 | 65.4% | $15.84 | ||||||||
| TI/LC | 0 | 0 | 0 | 0 | 1,160,681 | 2.8 | 0.69 | ||||||||
| Capital Expenditures | 0 | 0 | 0 | 0 | 420,979 | 1.0 | 0.25 | ||||||||
| Net Cash Flow | $25,964,013 | $27,475,772 | $27,801,962 | $28,050,715 | $25,099,266 | 61.5% | $14.91 | ||||||||
| NOI DSCR(5) | 1.65x | 1.75x | 1.77x | 1.78x | 1.70x | ||||||||||
| NCF DSCR(5) | 1.65x | 1.75x | 1.77x | 1.78x | 1.60x | ||||||||||
| NOI DY(5) | 9.5% | 10.0% | 10.1% | 10.2% | 9.7% | ||||||||||
| NCF DY(5) | 9.5% | 10.0% | 10.1% | 10.2% | 9.1% |
| (1) | Annual U/W Base Rent PSF and Annual U/W Base Rent include contractual rent steps through August 2017 totaling $315,690. |
| (2) | Grossed up vacant space includes gross-up rent and recoveries. |
| (3) | Specialty leasing income includes income from temporary tenants, kiosks and signage at the Gurnee Mills Mortgaged Property. |
| (4) | The underwritten economic vacancy is 13.4%. The Gurnee Mills Property was 81.9% occupied and 91.1% leased as of September 22, 2016. The leased percentage includes the Simon Master Lease (2.8% of net rentable area), Floor & Décor and three other tenants who have not yet taken occupancy, all totaling 9.2% of net rentable area combined. Excluding the $700,000 in Simon Master Lease income results in a net cash flow debt service coverage ratio and debt yield of 1.53x and 8.7%, respectively. |
| (5) | The debt service coverage ratios and debt yields are based on the Gurnee Mills Whole Loan. |
Appraisal.As of the appraisal valuation date of August 23, 2016, the Gurnee Mills Property had an “as-is” appraised value of $417,000,000. The appraiser also concluded to an “as-stabilized” value of $430,000,000 as of September 1, 2017, which equates to an “as-stabilized” loan-to-value-ratio of 63.9%.
Environmental Matters. According to a Phase I environmental site assessment dated August 26, 2016, there was no evidence of any recognized environmental conditions at the Gurnee Mills Property.
Market Overview and Competition.The Gurnee Mills Property is located in Gurnee, Illinois, located at the intersection of Grand Avenue and Interstate-94 in Gurnee, Illinois, approximately 42.5 miles northwest of Chicago, Illinois and 48.2 miles south of Milwaukee. Located in Lake County, the Gurnee Mills Property has excellent visibility and direct access off of Interstate-94, the major north/south thoroughfare connecting Chicago and Milwaukee. Additional demand drivers in the area include Six Flags and KeyLime Cove Indoor Waterpark and Resort (“KeyLime Cove”), which are located directly southeast of the Gurnee Mills Property on the opposite side of Interestate-94. Six Flags is one of the Midwest’s largest theme and amusement/outdoor water parks, with over 100 rides and attractions that generate approximately 3.0 million visitors per year. KeyLime Cove includes a 65,000 square foot waterpark, seven restaurants, two spas and 414 resort style guestrooms and suites. KeyLime Cove was recently named among the top 10 water parks in the United States by two major news publications. The average daily traffic along Interestate-94 is 86,600 and 39,600 along Grand Avenue, which runs eight miles east to Lake Michigan and is the main access point for the Gurnee Mills Property. The area also benefits from the Naval Station Great Lakes, located eight miles southeast of the Gurnee Mills Property. The campus is home to the United States Navy’s only recruit training base, which graduates nearly 40,000 recruits annually.
According to the appraisal, the Gurnee Mills Property is located in the Lake/McHenry County submarket and has a primary trade area that encompasses a ten-mile radius. The 2015 population within a five- and 10-mile radius were reported at approximately 122,401 and 454,466, respectively, and average household income within the same radii were reported at approximately $102,298 and $94,579, respectively. The population is expected to grow 0.8% and 0.9% within the same five- and ten-mile radius from 2015 to 2020.
The appraiser estimated market rent for Gurnee Mills Property to be $15.95 per square foot on a triple net basis, compared to the Annual U/W Base Rent PSF of $14.38 per square foot at the Gurnee Mills Mortgaged Property. The appraiser concluded to a vacancy rate of 5.0% and a third party market research report indicated a second quarter 2016 retail vacancy rate within a 3-mile radius of the Gurnee Mills Mortgaged Property of 1.7% and a competitive set vacancy of 5.4%.
THE INFORMATION IN THIS STRUCTURAL AND COLLATERAL TERM SHEET IS NOT COMPLETE AND MAY BE AMENDED PRIOR TO THE TIME OF SALE. THIS TERM SHEET IS NOT AN OFFER TO SELL THESE SECURITIES AND IT IS NOT A SOLICITATION OF AN OFFER TO BUY THESE SECURITIES IN ANY JURISDICTION WHERE THE OFFER OR SALE IS NOT PERMITTED.
38
| GURNEE MILLS |
The following table presents certain information relating to comparable properties to the Gurnee Mills Property:
Competitive Set(1)
Gurnee Mills | Fashion Outlets of Chicago | Chicago Premium Outlets | Pleasant Prairie Premium Outlets | Huntley Outlet Center | Hawthorn Center | Woodfield Mall | Old Orchard | |
| Location | Gurnee, IL | Rosemont, IL | Aurora, IL | Pleasant Prairie, WI | Huntley, IL | Vernon Hills, IL | Schaumburg, IL | Skokie, IL |
| Distance from Subject | -- | 29.0 miles | 44.0 miles | 8.7 miles | 30.3 miles | 10.0 miles | 24.0 miles | 25.0 miles |
| Property Type | Super-Regional Center/Outlet Mall | Super-Regional Center/Outlet Mall | Outlet Center | Outlet Center | Outlet Center | Super-Regional Center/Mall | Enclosed Regional Mall | Enclosed Regional Mall |
| Year Built/Renovated | 1991/2014 | 2013/NAP | 2004/2015 | 1988/2006 | 1994/2005 | 1973/2015 | 1999/2016 | 1956/1995 |
| Anchors | Sears Grand, Bass Pro Shops, Macy’s, Kohl’s, Floor & Décor | Bloomingdale’s Outlet, Forever 21, Last Call Neiman Marcus, Nike, Saks Fifth Avenue Off 5th | Nike, Polo, Ann Taylor, Adidas, Timberland, Eddie Bauer, Gap, Saks Fifth Avenue – Off 5th, J.Crew, Coach, Old Navy, Under Armour | Nike, Gap, Hilfiger, Under Armour, Coach Adidas, Timberland, Jockey, Bass, Polo, J. Crew, Banana | Eddie Bauer, Reebok, Carters, Gap, Bose, Banana, Aeropostale | Sears, Macy’s, JCPenney, Carson Pirie Scott | Nordstrom, Lord & Taylor, JCPenney, Sears, Macy’s | Nordstrom, Lord & Taylor, Macy’s, Bloomingdale’s, Cinema, Barnes & Noble |
| Total GLA | 1,683,915 SF | 528,112 SF | 690,000 SF | 776,000 SF | 279,387 SF | 1,329,555 SF | 2,208,000 SF | 1,740,000 SF |
| Total Occupancy | 91%(2) | 98% | 97% | 98% | 80% | 93% | 95% | 94% |
| (1) | Information obtained from the appraisal. |
| (2) | As of September 22, 2016, the Gurnee Mills Mortgaged Property was 81.9% occupied and 91.1% leased. See “Cash Flow Analysis” section. |
The Borrower.The borrower is Mall at Gurnee Mills, LLC, a Delaware limited liability company and single purpose entity with two independent directors. Legal counsel to the borrower delivered a non-consolidation opinion in connection with the origination of the Gurnee Mills Whole Loan. Simon Property Group, L.P. is the guarantor of certain nonrecourse carveouts under the Gurnee Mills Whole Loan. The liability of the guarantor under the non-recourse carveout and environmental indemnification provisions in the loan documents is capped at $55.0 million plus reasonable collection costs. See“Description of the Mortgage Pool—Certain Terms of the Mortgage Loans—Non-Recourse Obligations”in the Preliminary Prospectus.
The Sponsor.The sponsor is Simon Property Group, L.P. Simon Property Group, L.P. is an affiliate of SPG. SPG was founded in 1960 and is headquartered in Indianapolis, Indiana. SPG (NYSE: SPG, rated A2/A by Moody’s and S&P) is an S&P 100 company and the largest public real estate company in the world. SPG currently owns or has an interest in 231 retail real estate properties in North America, Europe and Asia comprising 191 million square feet. SPG has sponsored other real estate projects that have been the subject of mortgage loan defaults, foreclosure proceedings and deeds-in-lieu of foreclosure. See “Description of the Mortgage Pool—Default History, Bankruptcy Issues and Other Proceedings” in the Preliminary Prospectus.
Escrows.No upfront escrows were collected at origination.
Ongoing reserves for taxes are not required as long as (i) no Cash Trap Event Period (as defined below) exists; and (ii) the borrower (a) pays all taxes prior to the assessment of any late payment penalty and the date that such taxes become delinquent and (b) upon request, provides the lender with satisfactory evidence of such payment of taxes. Ongoing reserves for insurance are only required during a Cash Trap Event Period if the borrower does not provide satisfactory evidence that the Gurnee Mills Mortgaged Property is insured under an acceptable blanket policy.
Ongoing replacement reserves are not required as long as no Cash Trap Event Period exists. Following the occurrence and during the continuance of a Cash Trap Event Period, the borrower is required to deposit $29,926 per month for replacement reserves.
Ongoing reserves for tenant improvements and leasing commissions (“TI/LC”) are not required as long as no Cash Trap Event Period exists. Following the occurrence and during the continuance of a Cash Trap Event Period, the borrower is required to deposit $94,204 per month for TI/LC reserves.
Lockbox and Cash Management.The Gurnee Mills Whole Loan requires a lender-controlled lockbox account, which is already in place, and that the borrower direct tenants to pay their rents directly into such lockbox account. The loan documents also require that all rents received by the borrower or the property manager be deposited into the lockbox account within two business days of receipt. Prior to the occurrence of a Cash Trap Event Period, all cash flow is distributed to the borrower. During a Cash Trap Event Period, all cash flow is swept to a lender-controlled cash management account.
A “Cash Trap Event Period” means the occurrence of (i) an event of default; (ii) any bankruptcy or insolvency action of the borrower; (iii) any bankruptcy or insolvency action of the property manager if the property manager is affiliated with the borrower (provided that the property manager is not replaced within 60 days with a qualified manager); or (iv) a DSCR Reserve Trigger Event (as defined below).
A “DSCR Reserve Trigger Event” means the debt service coverage ratio for the Gurnee Mills Whole Loan based on the trailing four calendar quarter period immediately preceding the date of determination is less than 1.20x for two consecutive calendar quarters.
THE INFORMATION IN THIS STRUCTURAL AND COLLATERAL TERM SHEET IS NOT COMPLETE AND MAY BE AMENDED PRIOR TO THE TIME OF SALE. THIS TERM SHEET IS NOT AN OFFER TO SELL THESE SECURITIES AND IT IS NOT A SOLICITATION OF AN OFFER TO BUY THESE SECURITIES IN ANY JURISDICTION WHERE THE OFFER OR SALE IS NOT PERMITTED.
39
| GURNEE MILLS |
A Cash Trap Event Period may be cured (a) if the Cash Trap Event Period is caused solely by the occurrence of a DSCR Reserve Trigger Event, the achievement of a debt service coverage ratio of 1.20x or greater for two consecutive calendar quarters based upon the trailing four calendar quarter period immediately preceding the date of determination; (b) if the Cash Trap Event Period is caused solely by clause (i) above, by the acceptance of the lender of a cure of such event of default, provided that the lender has not accelerated the loan, moved for a receiver or commenced foreclosure proceedings; or (c) if the Cash Trap Event Period is caused solely by clause (iii) above, if the borrower replaces the property manager or such bankruptcy or insolvency action is discharged or dismissed without any adverse consequences to the property or the loan. The cures in this paragraph are also subject to the following conditions: (i) no other Cash Trap Event Period has occurred and is continuing; (ii) the borrower pays all of the lender’s reasonable out-of-pocket expenses incurred in connection with curing such Cash Trap Event Period including reasonable attorney’s fees and expenses; and (iii) the borrower may not cure a Cash Trap Event Period (x) more than a total of five times in the aggregate during the term of the loan or (y) triggered by a bankruptcy or insolvency action of the borrower.
Property Management. The Gurnee Mills Property is managed by an affiliate of the borrower.
Assumption.The borrower has the right to transfer the Gurnee Mills Mortgaged Property provided that certain conditions are satisfied, including (i) no event of default has occurred and is continuing; (ii) in the event that in connection with such transfer, the manager will not thereafter continue to manage the Gurnee Mills Mortgaged Property, then a replacement management agreement with a qualified manager must be executed acceptable to lender; (iii) the transferee must not have been a party to any bankruptcy action within the previous seven years and there is no material litigation or regulatory action pending against the transferee unreasonable to lender; and (iv) the transferee is a qualified transferee meeting the requirements set forth in the loan documents or the lender receives rating agency confirmation that the sale and assumption will not result in a downgrade, withdrawal or qualification of the respective ratings assigned to the Series 2016-C36 certificates and similar confirmations from each rating agency rating any securities backed by any of the Gurnee Mills Companion Loans with respect to the ratings of such securities.
Partial Release. Not permitted.
Additional Indebtedness. SPG and certain affiliates are permitted to pledge their indirect ownership of the borrower subject to certain conditions, including: (i) the credit facility must be secured by a substantial portion of SPG’s or such affiliate’s assets; (ii) no such corporate loan will be secured by a pledge from a party whose sole asset is its ownership interest in the borrower or Gurnee Mills Mortgage Property; and (iii) no event of default has occurred or is continuing. See “Description of the Mortgage Pool—Subordinate and/or Other Financing” in the Preliminary Prospectus.
Real Estate Substitution.Not permitted.
Subordinate and Mezzanine Indebtedness.Not permitted.
Ground Lease. None.
Terrorism Insurance.The loan documents require that the “all risk” insurance policy required to be maintained by the borrower provide coverage for terrorism in an amount equal to the full replacement cost of Gurnee Mills Mortgaged Property. The loan documents also require business interruption insurance covering no less than the 24-month period following the occurrence of a casualty event, together with a 365-day extended period of indemnity. Should the policy contain an exclusion for acts of terrorism, the loan documents require the borrower to obtain to the extent available a stand-alone policy providing the same coverage as previously in place prior to the exclusion, with a premium cap of two times the then current annual insurance premiums for the policy insuring the Gurnee Mills Mortgaged Property only (excluding the wind, flood and earthquake components of the premiums) on a stand-alone basis, with a deductible no greater than $5,000,000.
THE INFORMATION IN THIS STRUCTURAL AND COLLATERAL TERM SHEET IS NOT COMPLETE AND MAY BE AMENDED PRIOR TO THE TIME OF SALE. THIS TERM SHEET IS NOT AN OFFER TO SELL THESE SECURITIES AND IT IS NOT A SOLICITATION OF AN OFFER TO BUY THESE SECURITIES IN ANY JURISDICTION WHERE THE OFFER OR SALE IS NOT PERMITTED.
40
(THIS PAGE INTENTIONALLY LEFT BLANK)
THE INFORMATION IN THIS STRUCTURAL AND COLLATERAL TERM SHEET IS NOT COMPLETE AND MAY BE AMENDED PRIOR TO THE TIME OF SALE. THIS TERM SHEET IS NOT AN OFFER TO SELL THESE SECURITIES AND IT IS NOT A SOLICITATION OF AN OFFER TO BUY THESE SECURITIES IN ANY JURISDICTION WHERE THE OFFER OR SALE IS NOT PERMITTED.
41
(THIS PAGE INTENTIONALLY LEFT BLANK)
THE INFORMATION IN THIS STRUCTURAL AND COLLATERAL TERM SHEET IS NOT COMPLETE AND MAY BE AMENDED PRIOR TO THE TIME OF SALE. THIS TERM SHEET IS NOT AN OFFER TO SELL THESE SECURITIES AND IT IS NOT A SOLICITATION OF AN OFFER TO BUY THESE SECURITIES IN ANY JURISDICTION WHERE THE OFFER OR SALE IS NOT PERMITTED.
42
101 HUDSON STREET |
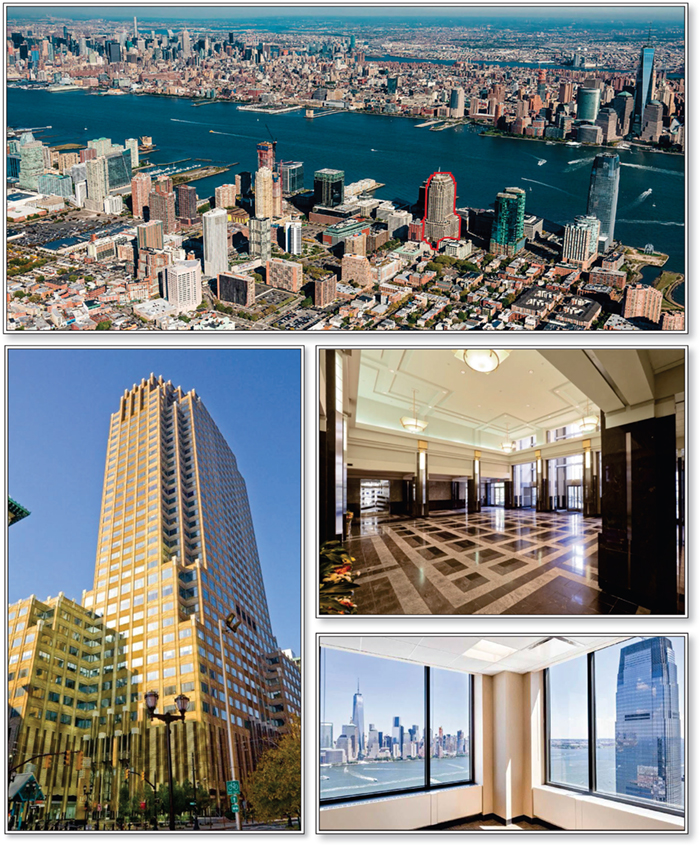
THE INFORMATION IN THIS STRUCTURAL AND COLLATERAL TERM SHEET IS NOT COMPLETE AND MAY BE AMENDED PRIOR TO THE TIME OF SALE. THIS TERM SHEET IS NOT AN OFFER TO SELL THESE SECURITIES AND IT IS NOT A SOLICITATION OF AN OFFER TO BUY THESE SECURITIES IN ANY JURISDICTION WHERE THE OFFER OR SALE IS NOT PERMITTED.
43
101 HUDSON STREET |
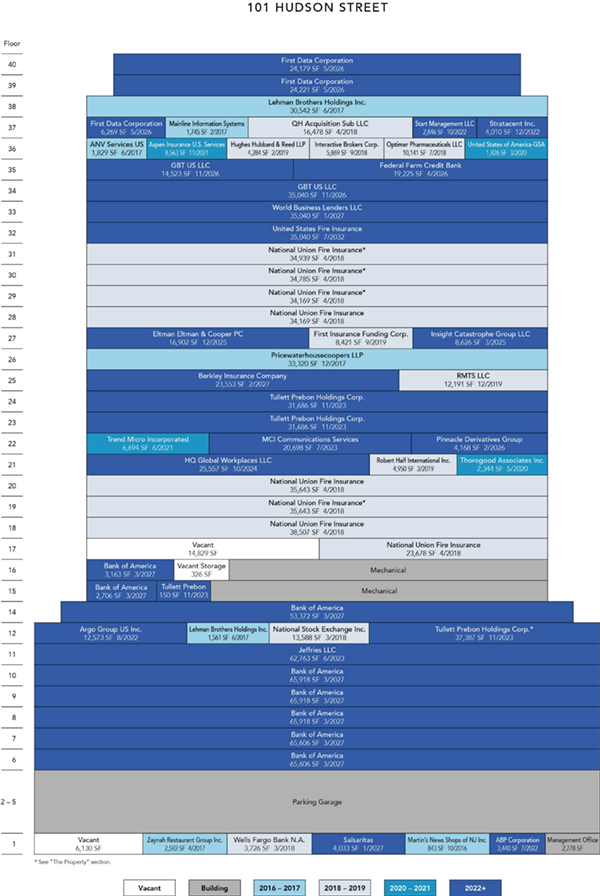
THE INFORMATION IN THIS STRUCTURAL AND COLLATERAL TERM SHEET IS NOT COMPLETE AND MAY BE AMENDED PRIOR TO THE TIME OF SALE. THIS TERM SHEET IS NOT AN OFFER TO SELL THESE SECURITIES AND IT IS NOT A SOLICITATION OF AN OFFER TO BUY THESE SECURITIES IN ANY JURISDICTION WHERE THE OFFER OR SALE IS NOT PERMITTED.
44
101 HUDSON STREET |
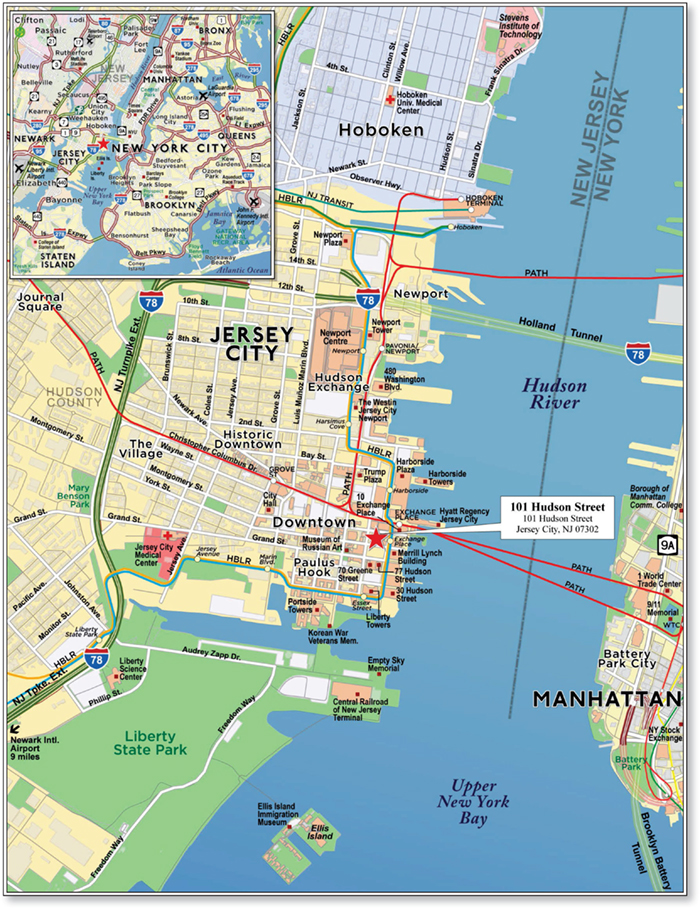
THE INFORMATION IN THIS STRUCTURAL AND COLLATERAL TERM SHEET IS NOT COMPLETE AND MAY BE AMENDED PRIOR TO THE TIME OF SALE. THIS TERM SHEET IS NOT AN OFFER TO SELL THESE SECURITIES AND IT IS NOT A SOLICITATION OF AN OFFER TO BUY THESE SECURITIES IN ANY JURISDICTION WHERE THE OFFER OR SALE IS NOT PERMITTED.
45
| No. 2 – 101 Hudson Street | ||||||
| Loan Information | Property Information | |||||
| Mortgage Loan Seller: | Wells Fargo Bank, National Association | Single Asset/Portfolio: | Single Asset | |||
Credit Assessment (Fitch/Moody’s/Morningstar): | NR/NR/BBB | Property Type: | Office | |||
| Original Principal Balance(1): | $67,500,000 | Specific Property Type: | CBD | |||
| Cut-off Date Balance(1): | $67,500,000 | Location: | Jersey City, NJ | |||
| % of Initial Pool Balance: | 7.9% | Size: | 1,341,649 SF | |||
| Loan Purpose: | Refinance | Cut-off Date Balance Per SF(1): | $186.34 | |||
| Borrower Name: | 101 Hudson Realty L.L.C. | Year Built/Renovated: | 1992/2015 | |||
| Sponsor: | Mack-Cali Realty, L.P. | Title Vesting: | Fee | |||
| Mortgage Rate: | 3.117% | Property Manager: | Self-managed | |||
| Note Date: | September 30, 2016 | 4thMost Recent Occupancy (As of): | 89.0% (12/31/2012) | |||
| Anticipated Repayment Date: | NAP | 3rdMost Recent Occupancy (As of): | 83.4% (12/31/2013) | |||
| Maturity Date: | October 11, 2026 | 2ndMost Recent Occupancy (As of): | 87.0% (12/31/2014) | |||
| IO Period: | 120 months | Most Recent Occupancy (As of): | 90.2% (12/31/2015) | |||
| Loan Term (Original): | 120 months | Current Occupancy (As of)(3): | 98.3% (9/21/2016) | |||
| Seasoning: | 1 month | |||||
| Amortization Term (Original): | None | Underwriting and Financial Information: | ||||
| Loan Amortization Type: | Interest-only, Balloon | |||||
| Interest Accrual Method: | Actual/360 | 4thMost Recent NOI (As of)(4): | $16,510,717 (12/31/2013) | |||
| Call Protection: | L(25),GRTR 1% or YM(88),O(7) | 3rdMost Recent NOI (As of)(4): | $20,587,281 (12/31/2014) | |||
| Lockbox Type: | Hard/Springing Cash Management | 2ndMost Recent NOI (As of)(4): | $21,296,669 (12/31/2015) | |||
| Additional Debt(1): | Yes | Most Recent NOI (As of)(4): | $23,104,804 (TTM 7/31/2016) | |||
| Additional Debt Type(1): | Pari Passu | |||||
| U/W Revenues: | $50,810,573 | |||||
| U/W Expenses: | $18,681,652 | |||||
| Escrows and Reserves(2): | U/W NOI: | $32,128,921 | ||||
| U/W NCF: | $29,075,403 | |||||
| Type: | Initial | Monthly | Cap (If Any) | U/W NOI DSCR(1): | 4.07x | |
| Taxes | $0 | Springing | NAP | U/W NCF DSCR(1): | 3.68x | |
| Insurance | $0 | Springing | NAP | U/W NOI Debt Yield(1): | 12.9% | |
| Replacement Reserves | $0 | Springing | NAP | U/W NCF Debt Yield(1): | 11.6% | |
| TI/LC Reserve | $0 | Springing | NAP | As-Is Appraised Value: | $482,500,000 | |
| Deferred Maintenance | $104,000 | $0 | NAP | As-Is Appraisal Valuation Date: | September 6, 2016 | |
| Outstanding TI/LC Reserve | $16,270,684 | $0 | NAP | Cut-off Date LTV Ratio(1): | 51.8% | |
| Rent Concession Reserve | $2,779,153 | $0 | NAP | LTV Ratio at Maturity or ARD(1): | 51.8% | |
| (1) | See “The Mortgage Loan” section. All statistical financial information related to balances per square foot, loan-to-value ratios, debt service coverage ratios and debt yields are based on the 101 Hudson Street Whole Loan (as defined below). |
| (2) | See “Escrows” section. |
| (3) | Two tenants are dark and not currently in occupancy of 176,923 square feet (13.2% of net rentable area). Current occupancy excluding this space is 85.1%. See “The Property” and “Cash Flow Analysis” sections. |
| (4) | See “Cash Flow Analysis” section. |
The Mortgage Loan. The mortgage loan (the “101 Hudson Street Mortgage Loan”) is part of a whole loan (the “101 Hudson Street Whole Loan”) that is evidenced by fivepari passu promissory notes (Notes A-1, A-2, A-3, A-4 and A-5) secured by a first mortgage encumbering an office building located in Jersey City, New Jersey (the “101 Hudson Street Property”). The 101 Hudson Street Whole Loan was co-originated on September 30, 2016 by Wells Fargo Bank, National Association, Bank of America, N.A. and Barclays Bank PLC. The 101 Hudson Street Whole Loan had an original principal balance of $250,000,000, has an outstanding principal balance as of the Cut-off Date of $250,000,000 and accrues interest at an interest rate of 3.117%per annum. The 101 Hudson Street Whole Loan had an initial term of 120 months, has a remaining term of 119 months as of the Cut-off Date and requires payments of interest only through the term of the 101 Hudson Street Mortgage Loan. The 101 Hudson Street Whole Loan matures on October 11, 2026.
The 101 Hudson Street Mortgage Loan, evidenced by the non-controlling Note A-2, which will be contributed to the WFCM 2016-C36 Trust, had an original principal balance of $67,500,000 and has an outstanding principal balance as of the Cut-off Date of $67,500,000. The controlling Note A-1, with an original principal balance of $70,000,000, is currently held by Wells Fargo Bank, National Association and is expected to be contributed to a future trust or trusts. The non-controlling Note A-3 and Note A-4, with an aggregate original principal balance of $56,250,000, are currently held by Bank of America, N.A. and are expected to be contributed to a future trust or trusts. The non-controlling Note A-5, with an original principal balance of $56,250,000, is currently held by Barclays Bank PLC and is expected to be contributed to a future trust or trusts. The lender provides no assurances that any non-
THE INFORMATION IN THIS STRUCTURAL AND COLLATERAL TERM SHEET IS NOT COMPLETE AND MAY BE AMENDED PRIOR TO THE TIME OF SALE. THIS TERM SHEET IS NOT AN OFFER TO SELL THESE SECURITIES AND IT IS NOT A SOLICITATION OF AN OFFER TO BUY THESE SECURITIES IN ANY JURISDICTION WHERE THE OFFER OR SALE IS NOT PERMITTED.
46
101 HUDSON STREET |
securitizedpari passu note will not be split further. See “Description of the Mortgage Pool—The Whole Loans—The Servicing Shift Whole Loans—The 101 Hudson Street Whole Loan” and “Pooling and Servicing Agreement” in the Preliminary Prospectus.
Note Summary
| Notes | Original Balance | Note Holder | Controlling Interest | |
| A-1 | $70,000,000 | Wells Fargo Bank, National Association | Yes | |
| A-2 | $67,500,000 | WFCM 2016-C36 | No | |
| A-3 | $30,000,000 | Bank of America, N.A. | No | |
| A-4 | $26,250,000 | Bank of America, N.A. | No | |
| A-5 | $56,250,000 | Barclays Bank PLC | No | |
| Total | $250,000,000 |
Following the lockout period, the borrower has the right to prepay the 101 Hudson Street Mortgage Loan in whole, but not in part, on any date before April 11, 2026, provided that the borrower pay the greater of a yield maintenance premium or a prepayment premium equal to 1.0% of the principal amount being prepaid. In addition, the 101 Hudson Street Mortgage Loan is prepayable without penalty on or after April 11, 2026.
Sources and Uses
| Sources | Uses | |||||||
| Original whole loan amount | $250,000,000 | 100.0% | Loan payoff(1) | $0 | 0.0% | |||
| Reserves | 19,153,837 | 7.7 | ||||||
| Closing costs | 1,733,229 | 0.7 | ||||||
| Return of equity | 229,112,934 | 91.6 | ||||||
| Total Sources | $250,000,000 | 100.0% | Total Uses | $250,000,000 | 100.0% |
| (1) | The 101 Hudson Street Property was previously unencumbered by debt. |
The Property. The 101 Hudson Street Property is a 42-story, class A office tower totaling approximately 1,341,649 square feet located in Jersey City, New Jersey within the center of Jersey City’s Waterfront district. The 101 Hudson Street Property is the second tallest office building in Jersey City and features views of the New York City Harbor and Manhattan skyline, 17-foot ceiling heights, ground floor retail, a landscaped courtyard area and an attached 900-space parking garage resulting in a parking ratio of 0.7 spaces per 1,000 feet of rentable area. Additionally, the 101 Hudson Street Property is Wired Certified Platinum, a certification awarded to buildings with the fastest, most reliable internet connections and telecom infrastructures. Built in 1992 and renovated in 2015, the 101 Hudson Street Property features investment-grade tenancy that accounts for approximately 58.1% of net rentable area and approximately 53.0% of in-place underwritten base rent. The 101 Hudson Street Property features a diverse tenant roster comprising 39 tenants with the largest tenant, Bank of America (rated A/Baa1/BBB+ by Fitch, Moody’s and S&P), representing 28.9% of the net rentable area and 21.8% of the underwritten base rent. Bank of America executed a 10-year lease renewal in March 2016, extending their lease through March 2027. In addition to the lease extension, Bank of America expanded into an additional 53,372 square feet (4.0% of net rentable area). The 101 Hudson Street Property has benefited from recent leasing activity with approximately 359,225 square feet (26.8% of net rentable area) having signed a new lease or renewal since 2015. Over the past eleven years, the 101 Hudson Street Property has averaged 92.9% occupancy and as of September 21, 2016, the 101 Hudson Street Property was 98.3% occupied by 39 tenants subject to 57 leases. National Union Fire Insurance is not currently in occupancy of 139,536 square feet (10.4% of net rentable area) and Tullett Prebon Holdings Corp. is not currently in occupancy of 37,387 square feet (2.8% of net rentable area). Current occupancy excluding these spaces is 85.1%.
THE INFORMATION IN THIS STRUCTURAL AND COLLATERAL TERM SHEET IS NOT COMPLETE AND MAY BE AMENDED PRIOR TO THE TIME OF SALE. THIS TERM SHEET IS NOT AN OFFER TO SELL THESE SECURITIES AND IT IS NOT A SOLICITATION OF AN OFFER TO BUY THESE SECURITIES IN ANY JURISDICTION WHERE THE OFFER OR SALE IS NOT PERMITTED.
47
101 HUDSON STREET |
The following table presents certain information relating to the tenancies at the 101 Hudson Street Property:
Major Tenants
| Tenant Name | Credit Rating (Fitch/Moody’s/ S&P)(1) | Tenant NRSF | % of NRSF | Annual U/W Base Rent PSF(2) | Annual U/W Base Rent(2) | % of Total Annual U/W Base Rent | Lease Expiration Date |
| Major Tenants | |||||||
| Bank of America | A/Baa1/BBB+ | 388,207 | 28.9% | $22.26(3) | $8,641,488 | 21.8% | 3/31/2027(4) |
| National Union Fire Insurance | NR/A2/A+ | 271,533(5) | 20.2% | $30.00 | $8,145,990 | 20.5% | 4/30/2018(6) |
| Tullett Prebon Holdings Corp. | BBB-/Ba1/NR | 100,909(7) | 7.5% | $31.05(3) | $3,132,809 | 7.9% | 11/30/2023(8) |
| Jeffries LLC | BBB-/Baa3/BBB- | 62,763 | 4.7% | $34.00 | $2,133,942 | 5.4% | 6/30/2023(9) |
| First Data Corporation | CCC+/B3/B+ | 54,669 | 4.1% | $35.14 | $1,921,135 | 4.8% | 5/31/2026(10)(11) |
| GBT US LLC | NR/NR/NR | 49,563 | 3.7% | $38.75 | $1,920,566 | 4.8% | 11/30/2026(12) |
| United States Fire Insurance | NR/Baa1/A- | 35,040 | 2.6% | $38.00 | $1,331,520 | 3.4% | 7/31/2032 |
| World Business Lenders LLC | NR/NR/NR | 35,040 | 2.6% | $37.00 | $1,296,480 | 3.3% | 1/31/2027(13) |
| Total Major Tenants | 997,724 | 74.4% | $28.59 | $28,523,930 | 71.8% | ||
| Non-Major Tenants | 321,566(14) | 24.0% | $34.82(14) | $11,197,678 | 28.2% | ||
| Occupied Collateral Total | 1,319,290(14) | 98.3% | $30.11(14) | $39,721,608 | 100.0% | ||
| Vacant Space | 22,359 | 1.7% | |||||
| Collateral Total | 1,341,649 | 100.0% | |||||
| (1) | Certain ratings are those of the parent company whether or not the parent guarantees the lease. |
| (2) | Annual U/W Base Rent PSF and Annual U/W Base Rent include contractual rent steps through October 2017 totalling $1,648,952. |
| (3) | Annual U/W Base Rent is a triple-net rent. |
| (4) | Bank of America has two, five-year lease extension options for 53,372 square feet. |
| (5) | National Union Fire Insurance is not currently in occupancy of 139,536 square feet (10.4% of net rentable area). See “Cash Flow Analysis” section. |
| (6) | National Union Fire Insurance has two, five-year lease extension options for 133,471 square feet. |
| (7) | Tullett Prebon Holdings Corp. is not currently in occupancy of 37,387 square feet (2.8% of net rentable area). See “Cash Flow Analysis” section. |
| (8) | Tullett Prebon Holdings Corp. has one, five-year lease extension option. |
| (9) | Jeffries LLC has two, five-year lease extension options. |
| (10) | First Data Corporation has the option to terminate its lease effective December 31, 2023 with required notice by June 30, 2022 and a termination fee of approximately $2,107,496. |
| (11) | First Data Corporation has one, five-year lease extension option. |
| (12) | GBT US LLC has one, five-year lease extension option. |
| (13) | World Business Lenders LLC has one, five-year lease extension option. |
| (14) | Includes two units occupied as a management office (2,778 square feet) and management storage (1,650 square feet), each with no attributed underwritten base rent. The Non-Major Tenants Annual U/W Base Rent PSF and Occupied Collateral Total Annual U/W Base Rent PSF excluding these spaces are $35.31 per square foot and $30.21 per square foot, respectively. |
THE INFORMATION IN THIS STRUCTURAL AND COLLATERAL TERM SHEET IS NOT COMPLETE AND MAY BE AMENDED PRIOR TO THE TIME OF SALE. THIS TERM SHEET IS NOT AN OFFER TO SELL THESE SECURITIES AND IT IS NOT A SOLICITATION OF AN OFFER TO BUY THESE SECURITIES IN ANY JURISDICTION WHERE THE OFFER OR SALE IS NOT PERMITTED.
48
101 HUDSON STREET |
The following table presents certain information relating to the lease rollover schedule at the 101 Hudson Street Property:
Lease Expiration Schedule(1)(2)
| Year Ending December 31, | No. of Leases Expiring | Expiring NRSF | % of Total NRSF | Cumulative Expiring NRSF | Cumulative % of Total NRSF | Annual U/W Base Rent | % of Total Annual U/W Base Rent | Annual U/W Base Rent PSF(3) |
| MTM(4) | 3 | 5,271 | 0.4% | 5,271 | 0.4% | $38,778 | 0.1% | $7.36 |
| 2016 | 0 | 0 | 0.0% | 5,271 | 0.4% | $0 | 0.0% | $0.00 |
| 2017 | 6 | 71,589 | 5.3% | 76,860 | 5.7% | $2,649,476 | 6.7% | $37.01 |
| 2018 | 14 | 321,335 | 24.0% | 398,195 | 29.7% | $10,127,523 | 25.5% | $31.52 |
| 2019 | 4 | 29,846 | 2.2% | 428,041 | 31.9% | $1,074,568 | 2.7% | $36.00 |
| 2020 | 2 | 4,170 | 0.3% | 432,211 | 32.2% | $158,719 | 0.4% | $38.06 |
| 2021 | 2 | 15,257 | 1.1% | 447,468 | 33.4% | $551,665 | 1.4% | $36.16 |
| 2022 | 5 | 22,869 | 1.7% | 470,337 | 35.1% | $873,064 | 2.2% | $38.18 |
| 2023 | 6 | 184,370 | 13.7% | 654,707 | 48.8% | $5,997,183 | 15.1% | $32.53 |
| 2024 | 2 | 25,557 | 1.9% | 680,264 | 50.7% | $513,696 | 1.3% | $20.10 |
| 2025 | 2 | 25,528 | 1.9% | 705,792 | 52.6% | $867,952 | 2.2% | $34.00 |
| 2026 | 7 | 127,625 | 9.5% | 833,417 | 62.1% | $4,639,147 | 11.7% | $36.35 |
| Thereafter | 6 | 485,873 | 36.2% | 1,319,290 | 98.3% | $12,229,837 | 30.8% | $25.17 |
| Vacant | 0 | 22,359 | 1.7% | 1,341,649 | 100.0% | $0 | 0.0% | $0.00 |
| Total/Weighted Average | 59(5) | 1,341,649 | 100.0% | $39,721,608 | 100.0% | $30.11(4) |
| (1) | Information obtained from the underwritten rent roll. |
| (2) | Certain tenants may have lease termination options that are exercisable prior to the stated expiration date of the subject lease and that are not considered in the Lease Expiration Schedule. |
| (3) | Weighted Average Annual U/W Base Rent PSF excludes vacant space. |
| (4) | Includes two units occupied as a management office (2,778 square feet) and management storage (1,650 square feet), each with no attributed underwritten base rent. The Total Annual U/W Base Rent PSF excluding these spaces is $30.21 per square foot. |
| (5) | The 101 Hudson Street Property is occupied by 39 tenants subject to 57 leases. |
The following table presents historical occupancy percentages at the 101 Hudson Street Property:
Historical Occupancy
12/31/2012(1)(2) | 12/31/2013(1)(2) | 12/31/2014(1)(2) | 12/31/2015(1)(2) | 9/21/2016(3) | ||||
| 89.0% | 83.4% | 87.0% | 90.2% | 98.3% |
| (1) | Information obtained from the borrower. |
| (2) | See “Cash Flow Analysis” section. |
| (3) | Information obtained from the underwritten rent roll. |
THE INFORMATION IN THIS STRUCTURAL AND COLLATERAL TERM SHEET IS NOT COMPLETE AND MAY BE AMENDED PRIOR TO THE TIME OF SALE. THIS TERM SHEET IS NOT AN OFFER TO SELL THESE SECURITIES AND IT IS NOT A SOLICITATION OF AN OFFER TO BUY THESE SECURITIES IN ANY JURISDICTION WHERE THE OFFER OR SALE IS NOT PERMITTED.
49
101 HUDSON STREET |
Operating History and Underwritten Net Cash Flow.The following table presents certain information relating to the historical operating performance and the underwritten net cash flow at the 101 Hudson Street Property:
Cash Flow Analysis
| 2013(1) | 2014(1) | 2015(1) | TTM 7/31/2016(1) | U/W(1)(2) | % of U/W Effective Gross Income | U/W $ per SF | |||||||||
| Base Rent | $28,311,298 | $29,284,205 | $30,453,201 | $31,975,694 | $38,568,810(3) | 75.9% | $28.75 | ||||||||
| Grossed Up Vacant Space | 0 | 0 | 0 | 0 | 2,098,929 | 4.1 | 1.56 | ||||||||
| Straight Line Average Rent | 0 | 0 | 0 | 0 | 1,106,341(4) | 2.2 | 0.82 | ||||||||
| Percentage Rent | 381,069 | 154,426 | 209,962 | 139,808 | 204,500 | 0.4 | 0.15 | ||||||||
| Free Rent Adjustment | (4,153,515) | (319,825) | (822,438) | (1,383,837) | 0 | 0.0 | 0.00 | ||||||||
| Total Reimbursables | 7,856,996 | 8,407,351 | 7,696,085 | 7,964,296 | 9,584,061 | 18.9 | 7.14 | ||||||||
| Other Income | 805,904 | 702,221 | 1,034,201 | 1,264,812 | 1,346,861 | 2.7 | 1.00 | ||||||||
| Less Vacancy & Credit Loss | 0 | 0 | 0 | 0 | (2,098,929)(5) | (4.1) | (1.56) | ||||||||
| Effective Gross Income | $33,201,752 | $38,228,378 | $38,571,011 | $39,960,773 | $50,810,573 | 100.0% | $37.87 | ||||||||
| Total Operating Expenses | $16,691,035 | $17,641,097 | $17,274,342 | $16,855,969 | $18,681,652 | 36.8% | $13.92 | ||||||||
| Net Operating Income | $16,510,717 | $20,587,281 | $21,296,669 | $23,104,804 | $32,128,921 | 63.2% | $23.95 | ||||||||
| TI/LC | 0 | 0 | 0 | 0 | 2,771,771 | 5.5 | 2.07 | ||||||||
| Capital Expenditures | 0 | 0 | 0 | 0 | 281,746 | 0.6 | 0.21 | ||||||||
| Net Cash Flow | $16,510,717 | $20,587,281 | $21,296,669 | $23,104,804 | $29,075,403 | 57.2% | $21.67 | ||||||||
| NOI DSCR(6) | 2.09x | 2.61x | 2.70x | 2.92x | 4.07x | ||||||||||
| NCF DSCR(6) | 2.09x | 2.61x | 2.70x | 2.92x | 3.68x | ||||||||||
| NOI DY(6) | 6.6% | 8.2% | 8.5% | 9.2% | 12.9% | ||||||||||
| NCF DY(6) | 6.6% | 8.2% | 8.5% | 9.2% | 11.6% |
| (1) | The increase in Base Rent and Effective Gross Income from 2013 through U/W was due to continued increases in occupancy from 83.4% as of December 31, 2013 to 98.3% as of September 21, 2016, along with free rent burn-off and the Bank of America expansion, among others. |
| (2) | National Union Fire Insurance is not currently in occupancy of 139,536 square feet (10.4% of net rentable area). Additionally, Tullett Prebon Holdings Corp. is not currently in occupancy of 37,387 square feet (2.8% of net rentable area). Current occupancy excluding these spaces is 85.1%, and the U/W NOI DSCR and U/W NCF DSCR are 3.52x and 3.17x, respectively, and the U/W NOI DY and U/W NCF DY are 11.1% and 10.0%, respectively. |
| (3) | U/W Base Rent includes contractual rent steps through October 2017 totaling $1,648,952. |
| (4) | U/W Straight Line Average Rent represents the average rent over the lease term in excess of the U/W Base Rent for the following tenants, all of which are rated investment grade by Fitch, Moody’s and/or S&P: Federal Farm Credit Banks, United States Fire Insurance, Berkley Insurance Company, MCI Communications Services, Jeffries LLC and Bank of America. |
| (5) | The underwritten economic vacancy is 5.0%. The 101 Hudson Street Property was 98.3% physically occupied as of September 21, 2016. |
| (6) | The debt service coverage ratios and debt yields are based on the 101 Hudson Street Whole Loan. |
Appraisal.As of the appraisal valuation date of September 6, 2016, the 101 Hudson Street Property had an “as-is” appraised value of $482,500,000.
Environmental Matters.According to the Phase I environmental site assessment dated August 30, 2016, there was evidence of one recognized environmental condition at the 101 Hudson Street Property.
The Phase I environmental consultant identified two 10,000-gallon underground storage tanks (“USTs”) at the 101 Hudson Street Property, containing heating oil that is used to fuel the dual boilers for heating the building. The USTs are double-walled tanks constructed of fiberglass reinforced plastic and were installed at the 101 Hudson Street Property in 1991. Although there was no evidence of leaks or spills, the Phase I environmental consultant considered the USTs a recognized environmental condition due to their age. The USTs are registered and compliant through June 30, 2017. The Sponsor (as defined below) has obtained a $1.0 million Storage Tank Third-Party Liability, Corrective Action and Clean-Up Costs Insurance Policy from AIG. See “Description of the Mortgage Pool—Environmental Considerations” in the Preliminary Prospectus.
Market Overview and Competition. The 101 Hudson Street Property is located in Jersey City’s Waterfront District, situated on the west side of the Hudson River across from Manhattan. The Waterfront District is comprised of a number of high-rise office buildings as well as new residential developments. There are currently 18 major residential developments under construction in the Waterfront District that, if completed, is expected to bring more than 5,900 units to market by the end of 2018. The 101 Hudson Street Property is located in the ongoing development known as the Colgate Center, a 42-acre, mixed-use development. Currently, there are 3.5 million square feet of office space in the Colgate Center in four office towers, plus 1,733 residential units within four properties. The 2016 population and average household income within a one-mile radius of the 101 Hudson Street Property was 48,701 and $153,350, respectively.
The Port Authority Trans-Hudson (“PATH”) system provides subway and train lines to New York City, and maintains three of its seven New Jersey train stations within the Waterfront District including the Exchange Place Station, which is located one block from the 101 Hudson Street Property. The PATH encompasses a total of 13.9 miles of rail lines and currently serves over 200,000 passengers daily. Additionally, the Hudson-Bergen Light Rail Transit System, Hudson County’s 34.1-mile light rail system, has a station directly adjacent to the 101 Hudson Street Property.
According to the appraisal, the 101 Hudson Street Property is located in the Waterfront submarket of the New Jersey office market, which is defined as the area along the Hudson River that extends from Jersey City to the George Washington Bridge. As of the second quarter of 2016, the Waterfront submarket contained approximately 19.3 million square feet (12.3% of the New Jersey office market) and reported a vacancy rate of 8.7%. For that same period, the Waterfront submarket reported positive net absorption of 121,013 square feet and an average asking rent of $35.33 per square foot, gross.
THE INFORMATION IN THIS STRUCTURAL AND COLLATERAL TERM SHEET IS NOT COMPLETE AND MAY BE AMENDED PRIOR TO THE TIME OF SALE. THIS TERM SHEET IS NOT AN OFFER TO SELL THESE SECURITIES AND IT IS NOT A SOLICITATION OF AN OFFER TO BUY THESE SECURITIES IN ANY JURISDICTION WHERE THE OFFER OR SALE IS NOT PERMITTED.
50
101 HUDSON STREET |
The following table presents certain information relating to comparable office leases for the 101 Hudson Street Property:
Comparable Leases(1)
| Property Name/Location | Year Built/ Renovated | Stories | Total GLA (SF) | Total Occupancy | Distance from Subject | Tenant Name | Lease Date/Term | Lease Area (SF) | Annual Base Rent PSF | Lease Type |
Waterfront Corporate Center III Hoboken, NJ | 2014/NAP | 14 | 507,781 | 100% | 2.0 miles | Jet.com | March 2016/ 12.0 Yrs | 39,900 | $51.50 | MG |
Waterfront Corporate Center III Hoboken, NJ | 2014/NAP | 14 | 507,781 | 100% | 2.0 miles | Newell Rubbermaid | March 2016 / 10.5 Yrs | 99,960 | $51.00 | MG |
Waterfront Corporate Center III Hoboken, NJ | 2014/NAP | 14 | 507,781 | 100% | 2.0 miles | NICE Systems | October 2015 / 11.0 Yrs | 59,990 | $44.00 | MG |
Exchange Place Centre Jersey City, NJ | 1988/NAP | 30 | 748,005 | 86% | 0.1 miles | Confidential | May 2017 / 10.0 Yrs | 17,840 | $39.00 | MG |
Exchange Place Centre Jersey City, NJ | 1988/NAP | 30 | 748,005 | 86% | 0.1 miles | Confidential | May 2017 / 10.0 Yrs | 12,960 | $39.00 | MG |
Exchange Place Centre Jersey City, NJ | 1988/NAP | 30 | 748,005 | 86% | 0.1 miles | Confidential | April 2017 / 10.8 Yrs | 20,221 | $37.50 | MG |
Harborside Financial Center 5 Jersey City, NJ | 2002/NAP | 34 | 977,225 | 94% | 0.2 miles | Ishi Systems, Inc. | March 2013 / 10.6 Yrs | 12,365 | $37.00 | MG |
Harborside Plaza Two Jersey City, NJ | 1930/1990 | 10 | 900,000 | 63% | 0.4 miles | Zurich Insurance | August 2016 / 15.0 Yrs | 64,414 | $41.00 | MG |
Harborside Plaza Two Jersey City, NJ | 1930/1990 | 10 | 900,000 | 63% | 0.4 miles | Cardinia Real Estate | July 2016 / 15.0 Yrs | 79,771 | $37.50 | MG |
Newport Office Tower Jersey City, NJ | 1990/NAP | 36 | 1,099,768 | 77% | 0.8 miles | FX Direct Dealer LLC | March 2016 / 10.7 Yrs | 15,912 | $35.00 | MG |
Newport Office Tower Jersey City, NJ | 1990/NAP | 36 | 1,099,768 | 77% | 0.8 miles | Golden Pear Funding | April 2016 / 6.3 Yrs | 3,842 | $38.00 | MG |
| (1) | Information obtained from the appraisal and a third party market report. |
The Borrower.The borrower is 101 Hudson Realty L.L.C., a Delaware limited liability company and single purpose entity with two independent directors. Legal counsel to the borrower delivered a non-consolidation opinion in connection with the origination of the 101 Hudson Street Whole Loan. Mack-Cali Realty, L.P., is the guarantor of certain nonrecourse carveouts under the 101 Hudson Street Whole Loan.
The Sponsor.The sponsor is Mack-Cali Realty, L.P. (“Mack-Cali”). As of June 30, 2016, Mack-Cali (NYSE: CLI, rated BB+/Ba1/BB+ by Fitch, Moody’s and S&P) owned or had interests in 269 properties, including 142 office and 109 flex properties, totaling approximately 29.1 million square feet, leased to approximately 1,700 commercial tenants, and 18 multifamily rental properties containing 5,434 residential units. Mack-Cali has sponsored other real estate projects that have been the subject of mortgage loan defaults, foreclosure proceedings and deeds-in-lieu of foreclosure. See “Description of the Mortgage Pool—Default History, Bankruptcy Issues and Other Proceedings” in the Preliminary Prospectus.
Escrows.The loan documents provide for an upfront escrow at closing in the amount of $104,000 for deferred maintenance, $16,270,684 for tenant improvements and leasing commissions (“TI/LCs”) associated with eleven tenants, and $2,779,153 for rent concessions related to six tenants. The loan documents provide for the borrower to post a $19,049,837 upfront letter of credit, which encompasses the combined amount of the aforementioned reserves in lieu of any cash deposits. The loan documents do not require monthly deposits for real estate taxes, TI/LCs and replacement reserves as long as (i) no event of default has occurred or is continuing and (ii) the debt service coverage ratio is at least 1.25x. The loan documents do not require monthly deposits for insurance premiums as long as (i) no event of default has occurred or is continuing; (ii) the debt service coverage ratio is at least 1.25x; (iii) the 101 Hudson Street Property is insured via an acceptable blanket insurance policy; and (iv) the borrower provides the lender with timely proof of payment of insurance premiums and renewals.
Lockbox and Cash Management.The 101 Hudson Street Whole Loan requires a lender-controlled lockbox account, which is already in place, and that the borrower directs all tenants to pay their rents directly to such lockbox account. The loan documents also require that all rents received by the borrower or the property manager be deposited into the lockbox account within one business days of receipt. Prior to the occurrence of Cash Trap Event Period (as defined below), all funds are required to be distributed to the borrower. During a Cash Trap Event Period, all excess cash flow is required to be swept to a lender-controlled cash management account.
A “Cash Trap Event Period” will commence upon the earlier of (i) the occurrence and continuance of an event of default or (ii) the debt service coverage ratio being less than 1.25x. A Cash Trap Event Period will end, with respect to clause (i), upon the cure of such event of default; or, with respect to clause (ii), upon the debt service coverage ratio being at least 1.25x for two consecutive calendar quarters.
Property Management.The 101 Hudson Street Property is managed by an affiliate of the borrower.
THE INFORMATION IN THIS STRUCTURAL AND COLLATERAL TERM SHEET IS NOT COMPLETE AND MAY BE AMENDED PRIOR TO THE TIME OF SALE. THIS TERM SHEET IS NOT AN OFFER TO SELL THESE SECURITIES AND IT IS NOT A SOLICITATION OF AN OFFER TO BUY THESE SECURITIES IN ANY JURISDICTION WHERE THE OFFER OR SALE IS NOT PERMITTED.
51
101 HUDSON STREET |
Assumption.The borrower has the right to transfer the 101 Hudson Street Property, provided that certain other conditions are satisfied, including, but not limited to: (i) no event of default has occurred and is continuing; (ii) the lender’s reasonable determination that the proposed transferee and guarantor satisfy the lender’s credit review and underwriting standards, taking into consideration transferee experience, financial strength and general business standing; and (iii) if requested by the lender, rating agency confirmation from Fitch, Moody’s and Morningstar that the transfer will not result in a downgrade, withdrawal or qualification of the respective ratings assigned to the Series 2016-C36 Certificates and similar confirmations from each rating agency rating any securities backed by the 101 Hudson Street companion loans with respect to the ratings of such securities.
Partial Release.Not permitted.
Real Estate Substitution.Not permitted.
Subordinate and Mezzanine Indebtedness.Not permitted.
Ground Lease.None.
Terrorism Insurance.The loan documents require that the “all risk” insurance policy required to be maintained by the borrower provide coverage for terrorism in an amount equal to the full replacement cost of the 101 Hudson Street Property, as well as business interruption insurance covering no less than the 18-month period following the occurrence of a casualty event, together with a six-month extended period of indemnity and subject to a cap equal to two times the premium for the casualty coverage on a stand-alone basis.
THE INFORMATION IN THIS STRUCTURAL AND COLLATERAL TERM SHEET IS NOT COMPLETE AND MAY BE AMENDED PRIOR TO THE TIME OF SALE. THIS TERM SHEET IS NOT AN OFFER TO SELL THESE SECURITIES AND IT IS NOT A SOLICITATION OF AN OFFER TO BUY THESE SECURITIES IN ANY JURISDICTION WHERE THE OFFER OR SALE IS NOT PERMITTED.
52
(THIS PAGE INTENTIONALLY LEFT BLANK)
THE INFORMATION IN THIS STRUCTURAL AND COLLATERAL TERM SHEET IS NOT COMPLETE AND MAY BE AMENDED PRIOR TO THE TIME OF SALE. THIS TERM SHEET IS NOT AN OFFER TO SELL THESE SECURITIES AND IT IS NOT A SOLICITATION OF AN OFFER TO BUY THESE SECURITIES IN ANY JURISDICTION WHERE THE OFFER OR SALE IS NOT PERMITTED.
53
PLAZA AMERICA I & II
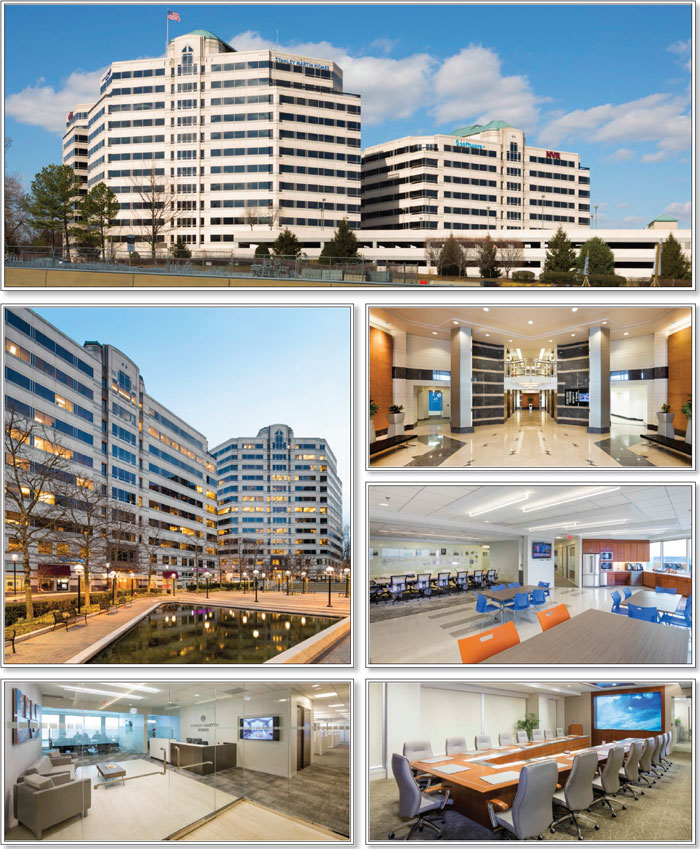
THE INFORMATION IN THIS STRUCTURAL AND COLLATERAL TERM SHEET IS NOT COMPLETE AND MAY BE AMENDED PRIOR TO THE TIME OF SALE. THIS TERM SHEET IS NOT AN OFFER TO SELL THESE SECURITIES AND IT IS NOT A SOLICITATION OF AN OFFER TO BUY THESE SECURITIES IN ANY JURISDICTION WHERE THE OFFER OR SALE IS NOT PERMITTED.
54
PLAZA AMERICA I & II

THE INFORMATION IN THIS STRUCTURAL AND COLLATERAL TERM SHEET IS NOT COMPLETE AND MAY BE AMENDED PRIOR TO THE TIME OF SALE. THIS TERM SHEET IS NOT AN OFFER TO SELL THESE SECURITIES AND IT IS NOT A SOLICITATION OF AN OFFER TO BUY THESE SECURITIES IN ANY JURISDICTION WHERE THE OFFER OR SALE IS NOT PERMITTED.
55
PLAZA AMERICA I & II

THE INFORMATION IN THIS STRUCTURAL AND COLLATERAL TERM SHEET IS NOT COMPLETE AND MAY BE AMENDED PRIOR TO THE TIME OF SALE. THIS TERM SHEET IS NOT AN OFFER TO SELL THESE SECURITIES AND IT IS NOT A SOLICITATION OF AN OFFER TO BUY THESE SECURITIES IN ANY JURISDICTION WHERE THE OFFER OR SALE IS NOT PERMITTED.
56
PLAZA AMERICA I & II

THE INFORMATION IN THIS STRUCTURAL AND COLLATERAL TERM SHEET IS NOT COMPLETE AND MAY BE AMENDED PRIOR TO THE TIME OF SALE. THIS TERM SHEET IS NOT AN OFFER TO SELL THESE SECURITIES AND IT IS NOT A SOLICITATION OF AN OFFER TO BUY THESE SECURITIES IN ANY JURISDICTION WHERE THE OFFER OR SALE IS NOT PERMITTED.
57
| No. 3 – Plaza America I & II | |||||||
| Loan Information | Property Information | ||||||
| Mortgage Loan Seller: | Barclays Bank PLC | Single Asset/Portfolio: | Single Asset | ||||
| Credit Assessment (Fitch/Moody’s/Morningstar): | NR/NR/NR | Property Type: | Office | ||||
| Original Principal Balance(1): | $65,000,000 | Specific Property Type: | Suburban | ||||
| Cut-off Date Balance(1): | $65,000,000 | Location: | Reston, VA | ||||
| % of Initial Pool Balance: | 7.6% | Size: | 514,615 SF | ||||
| Loan Purpose: | Refinance | Cut-off Date Balance Per SF(1): | $242.90 | ||||
| Borrower Name: | Plaza Office Realty I, LLC | Year Built/Renovated: | 1999/NAP | ||||
| Sponsors: | Tamares Real Estate Holdings, Inc.; Atlantic Realty Companies | Title Vesting: | Fee | ||||
| Mortgage Rate: | 4.19012% | Property Manager: | Self-managed | ||||
| Note Date: | July 20, 2016 | 4thMost Recent Occupancy (As of)(4): | 75.1% (12/31/2012) | ||||
| Anticipated Repayment Date: | NAP | 3rdMost Recent Occupancy (As of)(4): | 82.2% (12/31/2013) | ||||
| Maturity Date: | August 6, 2026 | 2ndMost Recent Occupancy (As of)(4): | 83.7% (12/31/2014) | ||||
| IO Period: | 120 months | Most Recent Occupancy (As of)(4): | 91.9% (12/31/2015) | ||||
| Loan Term (Original): | 120 months | Current Occupancy (As of)(4): | 88.4% (7/1/2016) | ||||
| Seasoning: | 3 months | ||||||
| Amortization Term (Original): | NAP | Underwriting and Financial Information: | |||||
| Loan Amortization Type: | Interest-only, Balloon | ||||||
| Interest Accrual Method: | Actual/360 | 4thMost Recent NOI: (As of)(5): | $8,380,359 (12/31/2013) | ||||
| Call Protection: | L(27),D(86),O(7) | 3rdMost Recent NOI (As of)(5): | $9,433,492 (12/31/2014) | ||||
| Lockbox Type: | Hard/Upfront Cash Management | 2ndMost Recent NOI (As of)(5): | $10,004,976 (12/31/2015) | ||||
| Additional Debt(1)(2): | Yes | Most Recent NOI (As of)(5): | $10,725,423 (TTM 7/31/2016) | ||||
| Additional Debt Type(1)(2): | Pari Passu; Mezzanine | ||||||
| U/W Revenues: | $17,034,804 | ||||||
| U/W Expenses: | $5,460,995 | ||||||
| U/W NOI: | $11,573,809 | ||||||
| Escrows and Reserves(3): | U/W NCF: | $10,382,024 | |||||
| U/W NOI DSCR(1): | 2.18x | ||||||
| Type: | Initial | Monthly | Cap (If Any) | U/W NCF DSCR(1): | 1.96x | ||
| Taxes | $166,997 | $166,997 | NAP | U/W NOI Debt Yield(1): | 9.3% | ||
| Insurance | $0 | Springing | NAP | U/W NCF Debt Yield(1): | 8.3% | ||
| Replacement Reserves | $0 | $8,660 | $311,769 | As-Is Appraised Value: | $195,000,000 | ||
| TI/LC Reserve | $4,118,237 | $64,327 | $2,315,770 | As-Is Appraisal Valuation Date: | June 9, 2016 | ||
| CapTech/BB&T Reserve | $3,600,000 | $0 | NAP | Cut-off Date LTV Ratio(1): | 64.1% | ||
| Free Rent/Gap Rent Reserve | $2,464,798 | $0 | NAP | LTV Ratio at Maturity or ARD(1): | 64.1% | ||
| (1) | See “The Mortgage Loan” section. All statistical financial information related to balances per square foot, loan-to-value ratios, debt service coverage ratios and debt yields are based on the Plaza America I & II Whole Loan (as defined below). |
| (2) | See “Subordinate and Mezzanine Indebtedness” section. The equity interest in the borrower has been pledged to secure mezzanine indebtedness with an original principal balance of $20,000,000. All statistical information related to the balances per square foot, loan-to-value ratios, debt service coverage ratios and debt yields are based solely on the Plaza America I & II Whole Loan. As of the Cut-off Date, the Cut-off Date Balance per SF, U/W NCF DSCR, U/W NCF Debt Yield, Cut-off Date LTV Ratio and LTV Ratio at Maturity or ARD based on the Plaza America I & II Whole Loan and the Plaza America I & II Mezzanine Loan (as defined below) were $281.76, 1.55x, 7.2%, 74.4% and 74.4%, respectively. |
| (3) | See “Escrows” section. |
| (4) | See “Historical Occupancy” section. |
| (5) | See “Cash Flow Analysis” section. |
The Mortgage Loan.The mortgage loan (the “Plaza America I & II Mortgage Loan”) is part of a whole loan (the “Plaza America I & II Whole Loan”) that is evidenced by twopari passu promissory notes (Notes A-1 and A-2) secured by a first mortgage encumbering the fee interest in two adjacent class A office buildings located in Reston, Virginia (the “Plaza America I & II Property”). The Plaza America I & II Whole Loan was originated on July 20, 2016 by Barclays Bank PLC. The Plaza America I & II Whole Loan had an original principal balance of $125,000,000, has an outstanding principal balance as of the Cut-off Date of $125,000,000 and accrues interest at an interest rate of 4.19012%per annum. The Plaza America I & II Whole Loan had an initial term of 120 months, has a remaining term of 117 months as of the Cut-off Date and requires payments of interest only through the term of the Plaza America I & II Whole Loan. The Plaza America I & II Whole Loan matures on August 6, 2026. See “Description of the Mortgage Pool—The Whole Loans—The Serviced Pari Passu Whole Loans—the Plaza America I & II Whole Loan” and “Pooling and Servicing Agreement” in the Preliminary Prospectus.
THE INFORMATION IN THIS STRUCTURAL AND COLLATERAL TERM SHEET IS NOT COMPLETE AND MAY BE AMENDED PRIOR TO THE TIME OF SALE. THIS TERM SHEET IS NOT AN OFFER TO SELL THESE SECURITIES AND IT IS NOT A SOLICITATION OF AN OFFER TO BUY THESE SECURITIES IN ANY JURISDICTION WHERE THE OFFER OR SALE IS NOT PERMITTED.
58
PLAZA AMERICA I & II
Note Summary
| Notes | Original Balance | Note Holder | Controlling Interest | |
| A-1 | $65,000,000 | WFCM 2016-C36 | Yes | |
| A-2 | $60,000,000 | CGCMT 2016-P5 | No | |
| Total | $125,000,000 |
Following the lockout period, the borrower has the right to defease the Plaza America I & II Whole Loan in whole, but not in part, on any date before February 6, 2026. In addition, the Plaza America I & II Whole Loan is prepayable without penalty on or after February 6, 2026. The lockout period will expire two years after the closing date of the securitization that includes the last note to be securitized.
Sources and Uses
| Sources | Uses | |||||
| Original whole loan amount | $125,000,000 | 80.7% | Loan payoff | $142,633,123 | 92.1% | |
| Mezzanine loan | 20,000,000 | 12.9 | Reserves | 10,350,032 | 6.7 | |
| Sponsor’s new cash contribution | 9,932,681 | 6.4 | Closing costs | 1,949,526 | 1.3 | |
| Total Sources | $154,932,681 | 100.0% | Total Uses | $154,932,681 | 100.0% |
The Property.The Plaza America I & II Property consists of two class A office towers totaling 514,615 square feet and a 1,689-space parking garage located in Reston, Virginia, approximately 15 miles northwest of Washington D.C. central business district. The Plaza America I & II Property was constructed in 1999 and is part of the larger 27-acre Plaza America development which also includes two additional class A office buildings with a separate parking garage (Plaza America III & IV) and a 164,400 square foot Whole Foods-anchored shopping center.
From 2005 through 2015, occupancy at the Plaza America I & II Property averaged approximately 90.1%. As of July 1, 2016, the Plaza America I & II Property was 88.4% leased to 48 tenants. With the exception of Software AG and NVR, Inc., no tenant represents more than 4.4% of the net rentable area or 5.2% of the underwritten base rent at the Plaza America I & II Property.
The largest tenant, Software AG, leases 14.2% of the net rentable area through February 2024 with two, five-year extension options remaining and has been a tenant at the Plaza America I & II Property since 2005. Software AG is a global infrastructure software company founded in 1969 and headquartered in Darmstadt, Germany. Software AG products help companies combine existing systems on-premises and in the cloud into a single platform to optimize and digitize their businesses. Software AG’s customers include nine of the 10 largest banks in the United States, numerous governments and governmental entities, and leading companies in the chemicals, education, energy, insurance, manufacturing, retail, telecom and transportation/logistics sectors. Software AG has more than 4,300 employees across 70 countries and generated revenues of €873.1 million in 2015.
The second largest tenant, NVR, Inc. (NYSE: NVR), leases 11.9% of the net rentable area through April 2026. NVR, Inc. is headquartered at the Plaza America I & II Property and has been a tenant since 2005. NVR, Inc. operates in two business segments, homebuilding and mortgage banking. The homebuilding unit sells and builds homes under the Ryan Homes, NVHomes and Heartland Homes trade names and operates in 28 metropolitan areas in 14 states and Washington D.C. NVR, Inc. is rated BBB+, Baa2 and BBB+ by Fitch, Moody’s and S&P, respectively, and generated revenues in excess of $5.1 billion in 2015.
THE INFORMATION IN THIS STRUCTURAL AND COLLATERAL TERM SHEET IS NOT COMPLETE AND MAY BE AMENDED PRIOR TO THE TIME OF SALE. THIS TERM SHEET IS NOT AN OFFER TO SELL THESE SECURITIES AND IT IS NOT A SOLICITATION OF AN OFFER TO BUY THESE SECURITIES IN ANY JURISDICTION WHERE THE OFFER OR SALE IS NOT PERMITTED.
59
PLAZA AMERICA I & II
The following table presents certain information relating to the tenancy at the Plaza America I & II Property:
Major Tenants
| Tenant Name | Credit Rating (Fitch/Moody’s/S&P)(1) | Tenant NRSF | % of NRSF | Annual U/W Base Rent PSF(2) | Annual U/W Base Rent(2) | % of Total Annual U/W Base Rent | Lease Expiration Date | |
| Major Tenants | ||||||||
| Software AG(3)(4) | NR/NR/NR | 73,235 | 14.2% | $34.99 | $2,562,615 | 15.4% | 2/28/2024(5) | |
| NVR, Inc.(6) | BBB+/Baa2/BBB+ | 61,113 | 11.9% | $32.66 | $1,996,205 | 12.0% | 4/30/2026 | |
| Veris Consulting(7) | NR/NR/NR | 22,303 | 4.3% | $39.23 | $874,872 | 5.2% | 5/31/2020(8) | |
| Metro Offices | NR/NR/NR | 22,303 | 4.3% | $38.04 | $848,360 | 5.1% | 2/28/2021(9) | |
| Federal Network Systems(10) | NR/NR/NR | 22,631 | 4.4% | $35.25 | $797,743 | 4.8% | 8/31/2024(11) | |
| Lockheed Martin | BBB+/Baa1/BBB+ | 20,910 | 4.1% | $37.69 | $788,123 | 4.7% | 1/31/2019(12) | |
| SMC(13)(14)(15) | NR/NR/NR | 21,173 | 4.1% | $36.62 | $775,353 | 4.7% | 10/31/2026(16) | |
| Keller Williams Realty | NR/NR/NR | 18,502 | 3.6% | $39.06 | $722,686 | 4.3% | 7/31/2024(17) | |
| Informatica(18) | NR/NR/NR | 12,887 | 2.5% | $40.13 | $517,108 | 3.1% | 3/31/2023(19) | |
| Softeon | NR/NR/NR | 12,557 | 2.4% | $36.69 | $460,685 | 2.8% | 6/30/2018(20) | |
| Total Major Tenants | 287,614 | 55.9% | $35.96 | $10,343,749 | 62.0% | |||
| Non-Major Tenants | 167,336 | 32.5% | $37.82 | $6,327,953 | 38.0% | |||
| Occupied Collateral Total | 454,950 | 88.4% | $36.65 | $16,671,702 | 100.0% | |||
| Vacant Space | 59,665 | 11.6% | ||||||
| Collateral Total | 514,615 | 100.0% | ||||||
| (1) | Certain ratings are those of the parent company whether or not the parent guarantees the lease. |
| (2) | Annual U/W Base Rent PSF and Annual U/W Base Rent include contractual rent steps through September 2017 totaling $444,269. |
| (3) | Software AG leases (i) 72,347 square feet of office space at an underwritten annual rent of $35.23 per square foot, inclusive of a July 2017 contractual rent step, and (ii) 888 square feet of storage space at an underwritten annual rent of $15.36 per square foot. |
| (4) | Software AG has the one-time right to reduce its office space by up to 20.0% on February 28, 2020 with nine months’ notice and the payment of a reduction fee equal to the product of (i) $20.00 and (ii) the number of square feet to be reduced. |
| (5) | Software AG has two, five-year lease extension options. |
| (6) | NVR, Inc. leases (i) 57,731 square feet of office space at an underwritten annual rent of $33.09 per square foot, inclusive of a May 2017 contractual rent step, (ii) 2,842 square feet of office space at an underwritten annual rent of $27.61 per square foot, inclusive of a May 2017 contractual rent step, and (iii) 540 square feet of storage space at an underwritten annual rent of $13.25 per square foot, inclusive of a July 2017 contractual rent step. |
| (7) | Veris Consulting subleases 7,200 square feet of its space to Vault Consulting, a corporate spin-off, through the remainder of its lease term at an annual rent of $33.00 per square foot pursuant to a sublease agreement dated January 1, 2016. The annual rent under the Veris Consulting lease of $39.23 per square foot was underwritten for the sublease space, inclusive of a June 2017 contractual rent step. Both Veris Consulting and Vault Consulting have the right to terminate the sublease on December 31, 2017 or December 31, 2018 with six months’ notice. |
| (8) | Veris Consulting has one, five-year lease extension option. |
| (9) | Metro Offices has one, ten-year lease extension option. |
| (10) | Federal Network Systems has the one-time right to terminate its lease on August 31, 2022 with ten months’ notice and the payment of a termination fee. |
| (11) | Federal Network Systems has one, five-year lease extension option. |
| (12) | Lockheed Martin has one, five-year lease extension option. |
| (13) | Stanley Martin Communities (“SMC”) leases (i) 20,914 square feet of office space at an underwritten annual rent of $36.90 per square foot, inclusive of a February 2017 contractual rent step, and (ii) 259 square feet of storage space at an underwritten annual rent of $14.00 per square foot. |
| (14) | SMC has the one-time right to terminate its lease on August 31, 2023 with 12 months’ notice and the payment of a termination fee. |
| (15) | SMC subleases 4,160 square feet of its office space to Digital Insurance, Inc. through June 30, 2021 at an annual rent of $34.00 per square foot pursuant to a sublease agreement dated January 5, 2016. The annual office rent under the SMC lease of $36.90 per square foot was underwritten for the sublease space, inclusive of a February 2017 contractual rent step. Digital Insurance, Inc. has the right to terminate the sublease on June 30, 2019 with 12 months’ notice and the payment of a termination fee. |
| (16) | SMC has one, five-year lease extension option. |
| (17) | Keller Williams Realty has one, five-year lease extension option. |
| (18) | Informatica subleases its space to Acuity, Inc. for the remainder of its lease term at an annual rent of $24.00 per square foot pursuant to a sublease agreement dated June 30, 2016. The annual rent under the Informatica lease of $40.13 per square foot was underwritten for the sublease space, inclusive of a December 2016 contractual rent step. |
| (19) | Informatica has one, five-year lease extension option, however, the subtenant Acuity, Inc. is not entitled to the lease extension option provided for in the Informatica lease. |
| (20) | Softeon has one, five-year lease extension option. |
THE INFORMATION IN THIS STRUCTURAL AND COLLATERAL TERM SHEET IS NOT COMPLETE AND MAY BE AMENDED PRIOR TO THE TIME OF SALE. THIS TERM SHEET IS NOT AN OFFER TO SELL THESE SECURITIES AND IT IS NOT A SOLICITATION OF AN OFFER TO BUY THESE SECURITIES IN ANY JURISDICTION WHERE THE OFFER OR SALE IS NOT PERMITTED.
60
PLAZA AMERICA I & II
The following table presents certain information relating to the lease rollover schedule at the Plaza America I & II Property:
Lease Expiration Schedule(1)(2)
| Year Ending December 31, | No. of Leases Expiring | Expiring NRSF | % of Total NRSF | Cumulative Expiring NRSF | Cumulative % of Total NRSF | Annual U/W Base Rent | % of Total Annual U/W Base Rent | Annual U/W Base Rent PSF(3) |
| MTM(4) | 1 | 300 | 0.1% | 300 | 0.1% | $0 | 0.0% | $0.00 |
| 2016 | 2 | 2,195 | 0.4% | 2,495 | 0.5% | $105,477 | 0.6% | $48.05 |
| 2017 | 3 | 4,694 | 0.9% | 7,189 | 1.4% | $222,940 | 1.3% | $47.49 |
| 2018 | 7 | 34,923 | 6.8% | 42,112 | 8.2% | $1,427,781 | 8.6% | $40.88 |
| 2019 | 5 | 39,354 | 7.6% | 81,466 | 15.8% | $1,456,160 | 8.7% | $37.00 |
| 2020 | 5 | 48,434 | 9.4% | 129,900 | 25.2% | $1,865,299 | 11.2% | $38.51 |
| 2021 | 5 | 35,774 | 7.0% | 165,674 | 32.2% | $1,340,017 | 8.0% | $37.46 |
| 2022 | 4 | 31,805 | 6.2% | 197,479 | 38.4% | $1,139,385 | 6.8% | $35.82 |
| 2023 | 6 | 32,699 | 6.4% | 230,178 | 44.7% | $1,241,764 | 7.4% | $37.98 |
| 2024 | 7 | 131,621 | 25.6% | 361,799 | 70.3% | $4,701,795 | 28.2% | $35.72 |
| 2025 | 0 | 0 | 0.0% | 361,799 | 70.3% | $0 | 0.0% | $0.00 |
| 2026 | 3 | 93,151 | 18.1% | 454,950 | 88.4% | $3,171,084 | 19.0% | $34.04 |
| Thereafter | 0 | 0 | 0.0% | 454,950 | 88.4% | $0 | 0.0% | $0.00 |
| Vacant | 0 | 59,665 | 11.6% | 514,615 | 100.0% | $0 | 0.0% | $0.00 |
| Total/Weighted Average | 48 | 514,615 | 100.0% | $16,671,702 | 100.0% | $36.65 |
| (1) | Information obtained from the underwritten rent roll. |
| (2) | Certain tenants may have lease termination options that are exercisable prior to the originally stated expiration date of the subject lease and that are not considered in the Lease Expiration Schedule. |
| (3) | Weighted Average Annual U/W Base Rent PSF excludes vacant space. |
| (4) | Comprised of the building engineer’s office. |
The following table presents historical occupancy percentages at the Plaza America I & II Property:
Historical Occupancy
12/31/2012(1)(2) | 12/31/2013(1)(2) | 12/31/2014(1)(2) | 12/31/2015(1)(2)(3) | 7/1/2016(3)(4)(5) |
| 75.1% | 82.2% | 83.7% | 91.9% | 88.4% |
| (1) | Information obtained from the borrower. |
| (2) | Occupancy increased from 2012 to 2015 due to the re-leasing of floors six through 12 in the Plaza America II building (154,979 square feet, 30.1% of the net rentable area) that were previously leased to DynCorp who vacated the space upon lease expiration on December 31, 2011. Since 2012, the sponsor has leased up 96.4% of the previous DynCorp space to 13 unique tenants at a weighted average rental rate equal to $36.74 per square foot. DynCorp’s rental rate prior to expiration was $27.35 per square foot. |
| (3) | Occupancy decreased from 2015 to July 1, 2016 as a result of the December 31, 2015 expiration of a Software AG lease for 18,173 square feet located on the second floor of the Plaza America I building, however, in 2014, Software AG executed an early lease renewal for eight years and two months that commenced January 1, 2016 for 72,347 square feet comprising the entire sixth, seventh and eight floors in the Plaza America I building. |
| (4) | Information obtained from the underwrittenrent roll. |
| (5) | Current Occupancy includes the tenants CapTech Ventures (8,566 square feet) and BB&T (3,371 square feet), each of which executed a lease but has not taken occupancy or commenced paying rent. On the origination date, a $3,600,000 escrow was collected for CapTech Ventures ($2,000,000) and BB&T ($1,600,000), and all gap rent, outstanding free rent, and outstanding tenant improvements and leasing commissions related to the two tenants were deposited into escrow. See “Escrows” section. |
THE INFORMATION IN THIS STRUCTURAL AND COLLATERAL TERM SHEET IS NOT COMPLETE AND MAY BE AMENDED PRIOR TO THE TIME OF SALE. THIS TERM SHEET IS NOT AN OFFER TO SELL THESE SECURITIES AND IT IS NOT A SOLICITATION OF AN OFFER TO BUY THESE SECURITIES IN ANY JURISDICTION WHERE THE OFFER OR SALE IS NOT PERMITTED.
61
PLAZA AMERICA I & II
Operating History and Underwritten Net Cash Flow. The following table presents certain information relating to the historical operating performance and underwritten net cash flow at the Plaza America I & II Property:
Cash Flow Analysis
| 2013(1) | 2014(1) | 2015(1) | TTM 7/31/2016 | U/W | % of U/W Effective Gross Income | U/W $ per SF | |||||||||||||||
| Base Rent | $12,625,062 | $14,443,912 | $14,655,962 | $15,472,736 | $16,671,702 | (2) | 97.9 | % | $32.40 | ||||||||||||
| Grossed Up Vacant Space | 0 | 0 | 0 | 0 | 2,184,853 | 12.8 | 4.25 | ||||||||||||||
| Total Reimbursables | 421,836 | 371,544 | 520,735 | 387,256 | 295,838 | 1.7 | 0.57 | ||||||||||||||
| Other Income | 37,387 | 73,587 | 90,818 | 113,848 | 67,264 | 0.4 | 0.13 | ||||||||||||||
| Less Vacancy & Credit Loss | 0 | 0 | 0 | 0 | (2,184,853) | (3) | (12.8 | ) | (4.25) | ||||||||||||
| Effective Gross Income | $13,084,285 | $14,889,043 | $15,267,515 | $15,973,840 | $17,034,804 | 100.0 | % | $33.10 | |||||||||||||
| Total Operating Expenses | $4,703,926 | $5,455,551 | $5,262,539 | $5,248,417 | $5,460,995 | 32.1 | % | $10.61 | |||||||||||||
| Net Operating Income | $8,380,359 | $9,433,492 | $10,004,976 | $10,725,423 | $11,573,809 | 67.9 | % | $22.49 | |||||||||||||
| TI/LC | 0 | 0 | 0 | 0 | 1,088,862 | 6.4 | 2.12 | ||||||||||||||
| Capital Expenditures | 0 | 0 | 0 | 0 | 102,923 | 0.6 | 0.20 | ||||||||||||||
| Net Cash Flow | $8,380,359 | $9,433,492 | $10,004,976 | $10,725,423 | $10,382,024 | 60.9 | % | $20.17 | |||||||||||||
| NOI DSCR(4) | 1.58x | 1.78x | 1.88x | 2.02x | 2.18x | ||||||||||||||||
| NCF DSCR(4) | 1.58x | 1.78x | 1.88x | 2.02x | 1.96x | ||||||||||||||||
| NOI DY(4) | 6.7% | 7.5% | 8.0% | 8.6% | 9.3% | ||||||||||||||||
| NCF DY(4) | 6.7% | 7.5% | 8.0% | 8.6% | 8.3% | ||||||||||||||||
| (1) | Net Operating Income increased from 2013 to 2015 due to the re-leasing of floors six through 12 in the Plaza America II building (154,979 square feet, 30.1% of the net rentable area) that were previously leased to DynCorp who vacated the space upon lease expiration on December 31, 2011. Since 2012, the sponsor has leased up 96.4% of the previous DynCorp space to 13 unique tenants at a weighted average rental rate equal to $36.74 per square foot. DynCorp’s rental rate prior to expiration was $27.35 per square foot. |
| (2) | U/W Base Rent includes contractual rent steps through September 2017 totaling $446,269. U/W Base Rent also includes the tenants CapTech Ventures (8,566 square feet) and BB&T (3,371 square feet), each of which executed a lease but has not taken occupancy or commenced paying rent. On the origination date a $3,600,000 escrow was collected for CapTech Ventures ($2,000,000) and BB&T ($1,600,000), and all gap rent, outstanding free rent, and outstanding tenant improvements and leasing commissions related to the two tenants were deposited into escrow. See “Escrows” section. |
| (3) | The underwritten economic vacancy is 11.4%. Current occupancy at the Plaza America I & II Property was 88.4%, as of July 1, 2016. See “Historical Occupancy” section. |
| (4) | The debt service coverage ratios and debt yields are based on the Plaza America I & II Whole Loan. |
Appraisal.As of the appraisal valuation date of June 9, 2016, the Plaza America I & II Property had an “as-is” appraised value of $195,000,000. In addition, the appraiser concluded to an “as-stabilized” appraised value of $204,000,000 as of June 9, 2018.
Environmental Matters. According to the Phase I environmental site assessment dated June 15, 2016, there are no recognized environmental conditions at the Plaza America I & II Property.
Market Overview and Competition.The Plaza America I & II Property is located in Reston, Virginia—approximately six miles west of Tyson’s Corner and 15 miles northwest of the Washington D.C. central business district. The Plaza America I & II Property is located on Plaza America Drive with frontage along Route 267 (Dulles Airport Access Road/Dulles Toll Road), a major thoroughfare connecting the Dulles International Airport (and points west) to Washington D.C. According to the appraisal, 2016 median household income within a one, three and five mile radius of the Plaza America I & II Property is $106,835, $116,464 and $123,205, respectively.
According to a third party provider, the Reston class A office submarket comprised approximately 8.6 million square feet with a 9.3% vacancy rate and average asking rents of $34.62 per square foot on a gross basis, as of the first quarter of 2016. Additionally, the Reston submarket has not received new deliveries of office space since 2008 and has continued to absorb existing market inventory during the same period.
The appraisal identified seven class A office buildings totaling approximately 1.2 million square feet that are considered to be directly competitive with the Plaza America I & II Property. The competitive set properties are located within two miles of the Plaza America I & II Property and range in size from 134,615 square feet to 244,568 square feet with a weighted average occupancy rate of 89.3%.
THE INFORMATION IN THIS STRUCTURAL AND COLLATERAL TERM SHEET IS NOT COMPLETE AND MAY BE AMENDED PRIOR TO THE TIME OF SALE. THIS TERM SHEET IS NOT AN OFFER TO SELL THESE SECURITIES AND IT IS NOT A SOLICITATION OF AN OFFER TO BUY THESE SECURITIES IN ANY JURISDICTION WHERE THE OFFER OR SALE IS NOT PERMITTED.
62
PLAZA AMERICA I & II
The following table presents certain information relating to comparable office leases for the Plaza America I & II Property:
Comparable Leases(1)
| Property Name/Location | Year Built/ Renovated | Number of Stories | Total GLA (SF) | Total Occupancy | Distance from Subject | Tenant Name | Lease Date/Term | Lease Area (SF) | Annual Base Rent PSF | Lease Type |
| Reston International Center, Reston, VA | 1974/NAV | 15 | 185,822 | 77% | 1.4 miles | Virginia Spine Institute | Apr 2017 / 13.2 Yrs | 32,779 | $33.50 | Base Year Stop |
| 1881 at Wiehle Metro, Reston, VA | 1999/NAV | 5 | 244,568 | 100% | 1.5 miles | Seimens | Apr 2016 / 11.0 Yrs; Jul 2015 / 5.0 Yrs; July 2015 / 11.0 Yrs | 21,000; 7,525; 20,769 | $32.00 $31.50 $32.00 | Base Year Stop |
| Reston Town Center West II, Reston, VA | 1989/NAV | 6 | 139,176 | 94% | 0.9 miles | Palo Alto Networks, Inc.; UberOffices | Dec 2015 / 5.3 Yrs; Apr 2015 / 10.7 Yrs | 19,618; 20,759 | $36.00 $38.00 | Base Year Stop |
| Reston Crossing West, Reston, VA | 1998/NAV | 5 | 152,124 | 79% | 1.2 miles | Visionary Integration Pro | Oct 2015 / 9.0 Yrs | 32,481 | $33.00 | Base Year Stop |
RTC West III, | 1989/NAV | 6 | 139,453 | 91% | 1.1 miles | Perfect Sense Digital | Apr 2015 / 10.7 Yrs | 20,772 | $35.00 | Base Year Stop |
RTC West I, | 1988/NAV | NAV | 210,533 | 84% | 0.9 miles | Clear Path | Feb 2015 / 6.5 Yrs | 11,327 | $35.00 | Base Year Stop |
| Two Reston Overlook, Reston, VA | 1999/NAV | NAV | 134,615 | 100% | 0.7 miles | Bechtel | Feb 2015 / 7.4 Yrs | 16,811 | $38.00 | Base Year Stop |
| (1) | Information obtained from the appraisal. |
The Borrower.The borrower is Plaza Office Realty I, LLC, a Delaware limited liability company and single purpose entity with two independent directors. Legal counsel to the borrower delivered a non-consolidation opinion in connection with the origination of the Plaza America I & II Whole Loan. Tamares Real Estate Holdings, Inc. is the guarantor of certain nonrecourse carveouts under the Plaza America I & II Whole Loan.
The Sponsors. The sponsors are Tamares Real Estate Holdings, Inc. (“Tamares”) and Atlantic Realty Companies (“ARC”). Tamares is a private investment group focused on real estate, technology, leisure and entertainment and the Finnish mining industry with teams in London, New York, Las Vegas, Silicon Valley, Liechtenstein and Israel. Tamares owns properties and land across the United States valued at approximately $1.3 billion. Tamares reported that it was involved in a discounted payoff and loan workout on one of its other properties located in Las Vegas in May 2011. Tamares also reported that it is under examination by the US Internal Revenue Service for 2009 through 2011 tax year returns. See“Risk Factors—Litigation Regarding the Mortgaged Properties or Borrowers May Impair Your Distributions”, “Description of the Mortgage Pool—Litigation and Other Considerations” and“Description of the Mortgage Pool—Loan Purpose; Default History, Bankruptcy Issues and Other Proceedings”in the Preliminary Prospectus. ARC is a full-service commercial real estate firm based in Northern Virginia. ARC currently owns and manages more than four million square feet of office and retail properties and is one of the largest commercial real estate developers in the Washington D.C. metropolitan area.
Escrows.The loan documents provide for an upfront escrow at closing in the amount of $166,997 for real estate taxes, $4,118,237 for outstanding tenant improvements and leasing commissions (“TI/LCs”) associated with eight tenants, $2,357,469 for rent concessions related to ten tenants, $107,328 for gap rent associated with four tenants and $3,600,000 for a reserve related to two tenants (BB&T and CapTech Ventures) who have executed leases but have not taken occupancy of their respective spaces or commenced paying rent. The release of the upfront escrow collected for CapTech Ventures ($2,000,000) is conditioned upon, among other things, the receipt of an officer’s certificate stating that the tenant is in possession and occupancy of the space, and is open for business. The release of the upfront escrow collected for BB&T ($1,600,000) is conditioned upon the receipt of an executed lease, which, as of the origination date, was out to the tenant for signature. BB&T delivered an executed lease dated August 31, 2016 and the conditions for the release of the upfront escrow collected for BB&T have been satisfied. Additionally, on the origination date, all outstanding TI/LCs, rent concessions and gap rent related to BB&T and CapTech Ventures were deposited into escrow and are included in each of the respective figures detailed in the first sentence of this “Escrows” section.
The loan documents provide for ongoing monthly escrows of $166,997 for real estate taxes, $64,327 for TI/LCs (capped at $2,315,770) and $8,660 for replacement reserves (capped at $311,769). The loan documents do not require ongoing monthly escrows for insurance premiums as long as (i) no event of default has occurred and is continuing and (ii) borrower provides the lender with evidence that the Plaza America I & II Property is insured via an acceptable blanket insurance policy and such policy is in full force and effect.
Lockbox and Cash Management. The Plaza America I & II Whole Loan requires a lender-controlled lockbox account, which is already in place and that the borrower directs all tenants to pay their rents directly to such lockbox account. The loan documents also require that all rents received by the borrower or the property manager be deposited into the lockbox account. Prior to the occurrence of a Cash Trap Event Period (as defined below), all excess funds are distributed to the borrower. During a Cash Trap Event Period, all excess cash flow is required to be swept to a lender-controlled cash management account.
THE INFORMATION IN THIS STRUCTURAL AND COLLATERAL TERM SHEET IS NOT COMPLETE AND MAY BE AMENDED PRIOR TO THE TIME OF SALE. THIS TERM SHEET IS NOT AN OFFER TO SELL THESE SECURITIES AND IT IS NOT A SOLICITATION OF AN OFFER TO BUY THESE SECURITIES IN ANY JURISDICTION WHERE THE OFFER OR SALE IS NOT PERMITTED.
63
PLAZA AMERICA I & II
A “Cash Trap Event Period” will commence upon the earlier of (i) the occurrence and continuance of an event of default, (ii) the debt service coverage ratio (inclusive of debt service on the Plaza America I & II Mezzanine Loan (see “Subordinate and Mezzanine Indebtedness” section)) falling below 1.10x for two consecutive calendar quarters, (iii) any bankruptcy action of the borrower, (iv) any bankruptcy action of the guarantor or sponsor, (v) any bankruptcy action of the property manager or (vi) occurrence and continuance of an event of default under the Plaza America I & II Mezzanine Loan documents. A Cash Trap Event Period will end,with respect to clause (i), upon the cure of such event of default; with respect to clause (ii), upon the debt service coverage ratio (inclusive of debt service on the Plaza America I & II Mezzanine Loan) being equal to or greater than 1.15x for two consecutive calendar quarters or the borrower deposits into escrow in the form of cash or letter of credit, an amount that, if applied to the then outstanding principal balance of the Plaza America I & II Whole Loan, would result in a debt service coverage ratio (inclusive of debt service on the Plaza America I & II Mezzanine Loan) being equal to or greater than 1.15x; with respect to clause (iii), upon such bankruptcy petition being discharged, stayed or dismissed within 30 days of such filing, provided that (a) the lender believes such filing does not materially increase the borrower’s monetary obligations and (b) the borrower is not in default under the loan documents; with respect to clause (iv), upon such bankruptcy petition being discharged, stayed or dismissed within 30 days of such filing, provided that (a) the lender believes such filing does not materially increase the guarantor’s or sponsor’s monetary obligations or (b) the mezzanine lender has delivered a written notice to the lender that the mezzanine lender has determined that such filing does not materially and adversely affect the guarantor’s and sponsor’s ability to perform its obligations under the Plaza America I & II Mezzanine Loan documents; with respect to clause (v), upon such bankruptcy petition being discharged, stayed or dismissed within 120 days of such filing, provided that the lender believes such filing does not (a) materially increase the property manager’s monetary obligations or (b) materially and adversely affect the property manager’s ability to perform its obligations under the property management agreement; and with respect to clause (vi), upon the cure of such event of default under the Plaza America I & II Mezzanine Loan documents, provided that the mezzanine lender has not exercised any of its rights under the Plaza America I & II Mezzanine Loan documents to accelerate the Plaza America I & II Mezzanine Loan or commence a foreclosure action.
Property Management. The Plaza America I & II Property is managed by an affiliate of the borrower.
Assumption.The borrower has a one-time right to transfer the Plaza America I & II Property provided that certain conditions are satisfied, including (i) no event of default has occurred and is continuing; (ii) the lender has reasonably determined that the proposed transferee and guarantor satisfy the lender’s credit review and underwriting standards, taking into consideration transferee experience, financial strength and general business standing; and (iii) the lender has received confirmation from Moody’s, Fitch, Morningstar and KBRA that such assumption will not result in a downgrade, withdrawal or qualification of the respective ratings assigned to the Series 2016-C36 and Series 2016-P5 Certificates.
Partial Release. None permitted.
Real Estate Substitution.Not permitted.
Subordinate and Mezzanine Indebtedness.Concurrently with the origination of the Plaza America I & II Whole Loan, Barclays Bank PLC funded a $20,000,000 mezzanine loan (the “Plaza America I & II Mezzanine Loan”) to Plaza Office Realty I Mezz, LLC, a Delaware limited liability company (the “Plaza America I & II Mezzanine Borrower”), which is currently held by the third-party investor. The Plaza America I & II Mezzanine Loan is secured by a pledge of the Plaza America I & II Mezzanine Borrower’s interest in the borrower under the Plaza America I & II Whole Loan. The Plaza America I & II Mezzanine Loan is subject to an intercreditor agreement between the lender under the Plaza America Whole Loan and the holder of the Plaza America I & II Mezzanine Loan. The Plaza America I & II Mezzanine Loan had an initial term of 120 months and has a remaining term as of the Cut-off Date of 117 months. The Plaza America I & II Mezzanine Loan accrues interest at an interest rate of 6.85000%per annum and requires interest-only payments through the term of the Plaza America I & II Mezzanine Loan.
Ground Lease.None.
Terrorism Insurance.The loan documents require that the “all risk” insurance policy required to be maintained by the borrower provide coverage for terrorism in an amount equal to the full replacement cost of the Plaza America I & II Property, as well as loss of rents and/or business interruption insurance for a period beginning on the date of casualty and continuing until the restoration of the Plaza America I & II Property is completed or the expiration of 18 months, whichever first occurs as well as an extended period of indemnity covering the 365 days following restoration.
THE INFORMATION IN THIS STRUCTURAL AND COLLATERAL TERM SHEET IS NOT COMPLETE AND MAY BE AMENDED PRIOR TO THE TIME OF SALE. THIS TERM SHEET IS NOT AN OFFER TO SELL THESE SECURITIES AND IT IS NOT A SOLICITATION OF AN OFFER TO BUY THESE SECURITIES IN ANY JURISDICTION WHERE THE OFFER OR SALE IS NOT PERMITTED.
64
(THIS PAGE INTENTIONALLY LEFT BLANK)
THE INFORMATION IN THIS STRUCTURAL AND COLLATERAL TERM SHEET IS NOT COMPLETE AND MAY BE AMENDED PRIOR TO THE TIME OF SALE. THIS TERM SHEET IS NOT AN OFFER TO SELL THESE SECURITIES AND IT IS NOT A SOLICITATION OF AN OFFER TO BUY THESE SECURITIES IN ANY JURISDICTION WHERE THE OFFER OR SALE IS NOT PERMITTED.
65
NORTH ISLE VILLAGE, INC.
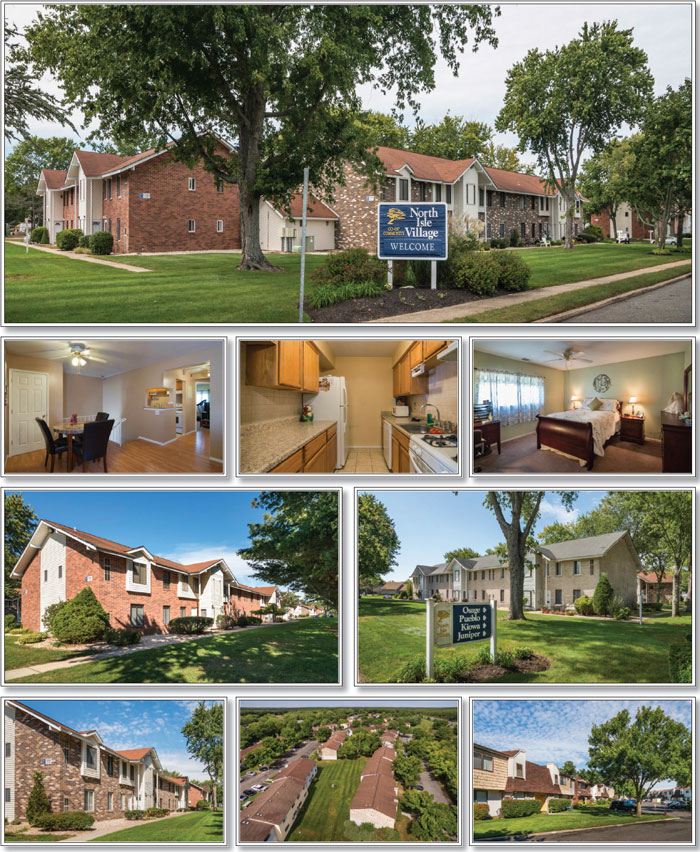
THE INFORMATION IN THIS STRUCTURAL AND COLLATERAL TERM SHEET IS NOT COMPLETE AND MAY BE AMENDED PRIOR TO THE TIME OF SALE. THIS TERM SHEET IS NOT AN OFFER TO SELL THESE SECURITIES AND IT IS NOT A SOLICITATION OF AN OFFER TO BUY THESE SECURITIES IN ANY JURISDICTION WHERE THE OFFER OR SALE IS NOT PERMITTED.
66
NORTH ISLE VILLAGE, INC.
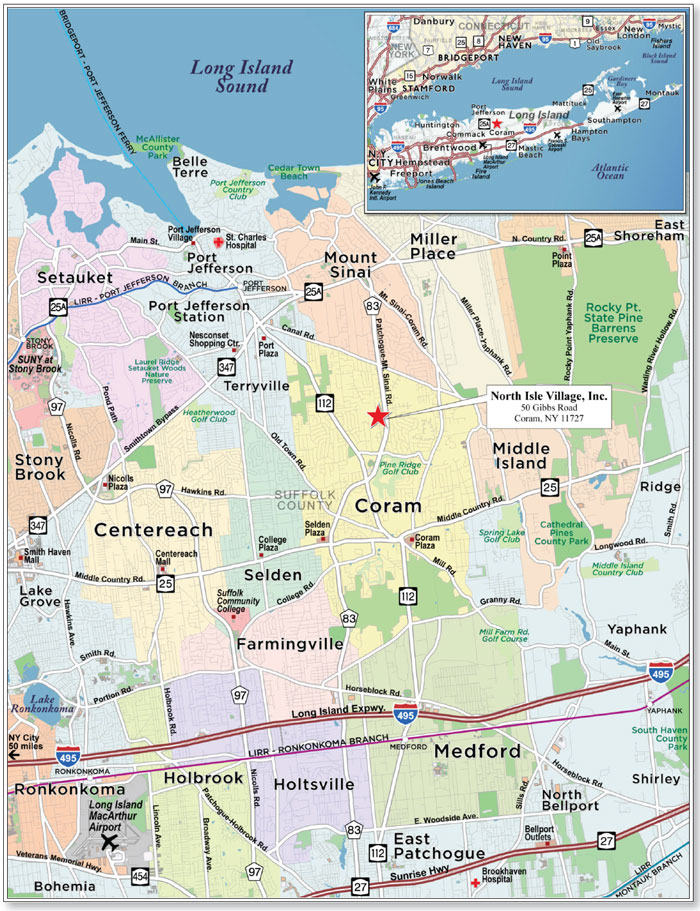
THE INFORMATION IN THIS STRUCTURAL AND COLLATERAL TERM SHEET IS NOT COMPLETE AND MAY BE AMENDED PRIOR TO THE TIME OF SALE. THIS TERM SHEET IS NOT AN OFFER TO SELL THESE SECURITIES AND IT IS NOT A SOLICITATION OF AN OFFER TO BUY THESE SECURITIES IN ANY JURISDICTION WHERE THE OFFER OR SALE IS NOT PERMITTED.
67
No. 4 – North Isle Village, Inc. |
| Loan Information | Property Information | |||||
| Mortgage Loan Seller: | National Cooperative Bank, N.A. | Single Asset/Portfolio: | Single Asset | |||
Credit Assessment (Fitch/Moody’s/Morningstar): | NR/A3/AAA | Property Type: | Multifamily | |||
| Original Principal Balance: | $46,000,000 | Specific Property Type: | Cooperative | |||
| Cut-off Date Balance: | $45,933,875 | Location: | Coram, NY | |||
| % of Initial Pool Balance: | 5.4% | Size: | 763 Units | |||
| Loan Purpose: | Refinance | Cut-off Date Balance Per Unit: | $60,202 | |||
| Borrower Name: | North Isle Village, Inc. | Year Built/Renovated: | 1973/1996 | |||
| Sponsor(1): | NAP | Title Vesting: | Fee | |||
| Mortgage Rate: | 3.630% | Property Manager: | Alexander Wolf & Co., Inc. | |||
| Note Date: | September 29, 2016 | 4thMost Recent Occupancy(4): | NAP | |||
| Anticipated Repayment Date: | NAP | 3rdMost Recent Occupancy(4): | NAP | |||
| Maturity Date: | October 1, 2026 | 2ndMost Recent Occupancy(4): | NAP | |||
| IO Period: | None | Most Recent Occupancy(4): | NAP | |||
| Loan Term (Original): | 120 months | Current Occupancy (As of)(4): | 95.0% (6/9/2016) | |||
| Seasoning: | 1 month | |||||
| Amortization Term (Original): | 360 months | Underwriting and Financial Information: | ||||
| Loan Amortization Type: | Amortizing Balloon | 4thMost Recent NOI(5): | NAP | |||
| Interest Accrual Method: | Actual/360 | 3rdMost Recent NOI(5): | NAP | |||
| Call Protection: | GRTR 1% or YM(113),1%(3),O(4) | 2ndMost Recent NOI(5): | NAP | |||
| Lockbox Type: | None | Most Recent NOI(5): | NAP | |||
| Additional Debt(2): | None | |||||
| Additional Debt Type(2): | NAP | U/W Revenues(5): | $11,507,236 | |||
| U/W Expenses(5): | $4,719,467 | |||||
| U/W NOI(5): | $6,787,769 | |||||
| U/W NCF(5): | $6,665,469 | |||||
| U/W NOI DSCR(5): | 2.69x | |||||
| U/W NCF DSCR(5): | 2.65x | |||||
| U/W NOI Debt Yield(5): | 14.8% | |||||
| Escrows and Reserves(3): | U/W NCF Debt Yield(5): | 14.5% | ||||
| As-Is Appraised Value(6): | $86,920,000 | |||||
| Type: | Initial | Monthly | Cap (If Any) | As-Is Appraisal Valuation Date: | June 9, 2016 | |
| Taxes | $936,413 | $133,773 | NAP | Cut-off Date LTV Ratio(6): | 52.8% | |
| Insurance | $0 | Springing | NAP | LTV Ratio at Maturity or ARD(6): | 41.5% | |
| Replacement Reserves | $0 | $0 | NAP | Coop-Rental Value(7): | $121,000,000 | |
| Capital Improvements | $6,750,000 | $0 | NAP | Coop-LTV as Rental(7): | 38.0% | |
| (1) | See “The Sponsor” section. |
| (2) | See “Subordinate and Mezzanine Indebtedness” section. |
| (3) | See “Escrows” section. |
| (4) | See “Historical Occupancy” section. |
| (5) | See “Cash Flow Analysis” section. |
| (6) | For purposes of determining the As-Is Appraised Value, the Cut-off Date LTV Ratio and the LTV Ratio at Maturity or ARD, see “Certain Characteristics of Mortgage Loans Secured by Residential Cooperatives” in the Preliminary Prospectus. |
| (7) | The Coop-Rental Value and the Coop-LTV as Rental assumes the North Isle Village, Inc. Property (as defined below) is operated as a multifamily rental property. |
The Mortgage Loan. The mortgage loan (the “North Isle Village, Inc. Mortgage Loan”) is evidenced by a single promissory note that is secured by a first mortgage encumbering a multifamily residential cooperative building located in Coram, New York (the “North Isle Village, Inc. Property”). The North Isle Village, Inc. Mortgage Loan was originated on September 29, 2016 by National Cooperative Bank, N.A. The North Isle Village, Inc. Mortgage Loan had an original principal balance of $46,000,000, has an outstanding principal balance as of the Cut-off Date of $45,933,875, and accrues interest at a rate of 3.630%per annum. The North Isle Village, Inc. Mortgage Loan had an initial term of 120 months, has a remaining term of 119 months as of the Cut-off Date and requires payments of principal and interest based on a 30-year amortization schedule through the term of the North Isle Village, Inc. Mortgage Loan. The North Isle Village, Inc. Mortgage Loan matures on October 1, 2026.
The North Isle Village, Inc. Mortgage Loan is prepayable at any time in whole, but not in part, provided that such prepayment is accompanied by a prepayment premium in an amount equal to (i) if the prepayment occurs prior to March 31, 2026, the greater of (A) 1.0% of the outstanding principal balance of the note at the time of the prepayment or (B) a yield maintenance charge and (ii) if the prepayment occurs on or after March 31, 2026 and prior to June 30, 2026, 1.0% of the outstanding principal balance of the note at the time of the prepayment. The North Isle Village, Inc. Mortgage Loan is prepayable without penalty on or after June 30, 2026.
THE INFORMATION IN THIS STRUCTURAL AND COLLATERAL TERM SHEET IS NOT COMPLETE AND MAY BE AMENDED PRIOR TO THE TIME OF SALE. THIS TERM SHEET IS NOT AN OFFER TO SELL THESE SECURITIES AND IT IS NOT A SOLICITATION OF AN OFFER TO BUY THESE SECURITIES IN ANY JURISDICTION WHERE THE OFFER OR SALE IS NOT PERMITTED.
68
NORTH ISLE VILLAGE, INC.
Sources and Uses
| Sources | Uses | ||||
| Original loan amount | $46,000,000 | 100.0% | Loan payoff | $37,724,139 | 82.0% |
| Reserves | 7,686,413 | 16.7 | |||
| Closing costs | 429,786 | 0.9 | |||
| Proceeds to borrower | 159,661 | 0.3 | |||
| Total Sources | $46,000,000 | 100.0% | Total Uses | $46,000,000 | 100.0% |
The Property. The North Isle Village, Inc. Property consists of 763 units in 53 two-story walk-up garden style residential cooperative apartment buildings located in Coram, New York, approximately 62.2 miles east of New York City. The North Isle Village, Inc. Property was constructed between 1973 and 1985 and converted to cooperative ownership in 1987. The North Isle Village, Inc. Property is located on two non-contiguous lots, one of which is situated on the east side of Gibbs Road and one of which is situated on the west side of Gibbs Road. The apartment buildings situated on the east side of Gibbs Road were constructed in 1985 and are identified as “East Pointe.” The apartment buildings situated on the west of Gibbs Road were constructed in 1973 and are identified as “North Isle.” East Pointe consists of 21 two-story buildings and 244 apartments and North Isle consists of 32 two-story buildings and 518 apartments. One additional residential unit is located within the clubhouse. The North Isle Village, Inc. Property is 80.7% (616 units) shareholder-owned and 19.3% (147 units) sponsor and/or investor owned (see “Ownership Structure” section).
The North Isle Village, Inc. Property features an outdoor in-ground pool, three tennis courts, basketball court, playground, outdoor sitting areas, paved jogging trail, picnic/barbecue area and clubhouse which contains a recreation room, indoor swimming pool, fitness center, management office, leasing office and one apartment unit. A sewage treatment plant was recently replaced in 2016, located on the south-western section of the North Isle Village, Inc. Property. Parking is provided via 1,700 on-site striped-surface parking spaces, resulting in a parking ratio of approximately 2.2 spaces per unit.
Ownership Structure. At the time of the cooperative conversion, certain residential units were not purchased by eligible existing residents. Those unsold units, and their appurtenant cooperative shares and proprietary leases, were acquired by the cooperative sponsor, Coram Associates, pursuant to the cooperative offering documents. Subsequent to the cooperative conversion, the unsold units have been conveyed to certain transferees of Coram Associates and to certain investors. As of the Cut-off Date, 81 unsold units are owned by Coram Isle, LLC (known as the cooperative sponsor) and 66 unsold units are owned by five different investment entities for investment purposes (known as investors).
The following table presents certain information relating to the residential unit mix of the North Isle Village, Inc. Property:
Unit Mix Summary(1)
Unit Type | No. of Units | % of Total Units | Unit Size (SF)(2) | Total Net SF |
| Studio | 96 | 12.6 | 515 | 49,440 |
| 1 Bedroom - 3.0 Rooms | 384 | 50.3 | 715 | 274,560 |
| 1 Bedroom - 3.5 Rooms | 33 | 4.3 | 825 | 27,225 |
| 1 Bedroom w/Den- 4.0 Rooms | 196 | 25.7 | 910 | 178,360 |
| 2 Bedroom - 4.5 Rooms | 48 | 6.3 | 970 | 46,560 |
| 2 Bedroom – 6.0 Rooms | 6 | 0.8 | 1,430 | 8,580 |
| Total/Weighted Average | 763 | 100.0 | 766 | 584,725 |
| (1) | Information obtained from the appraisal. |
| (2) | Unit sizes are reflective of average sizes for each of the respective unit types. |
The following table presents historical occupancy percentages at the North Isle Village, Inc. Property:
Historical Occupancy
| 12/31/2012(1) | 12/31/2013(1) | 12/31/2014(1) | 12/31/2015(1) | 6/9/2016(2) | ||||
| NAP | NAP | NAP | NAP | 95.0% |
| (1) | Historical occupancy is not reported as all units are owned either by tenant-shareholders, the cooperative sponsor or investors. See “Ownership Structure” section. |
| (2) | Occupancy reported as of June 9, 2016 reflects the vacancy assumption in the related appraisal for purposes of determining the appraised value of the North Isle Village, Inc. Property as a multifamily rental property (i.e., the Coop - Rental Value) as of the appraisal valuation date. |
THE INFORMATION IN THIS STRUCTURAL AND COLLATERAL TERM SHEET IS NOT COMPLETE AND MAY BE AMENDED PRIOR TO THE TIME OF SALE. THIS TERM SHEET IS NOT AN OFFER TO SELL THESE SECURITIES AND IT IS NOT A SOLICITATION OF AN OFFER TO BUY THESE SECURITIES IN ANY JURISDICTION WHERE THE OFFER OR SALE IS NOT PERMITTED.
69
NORTH ISLE VILLAGE, INC.
Operating History and Underwritten Net Cash Flow. The following table presents certain information relating to underwritten net cash flow at the North Isle Village, Inc. Property:
Cash Flow Analysis(1)
| U/W | % of U/W Effective Gross Income | U/W $ per Unit | |||||
| Gross Rental Income | $12,105,876 | 105.2% | $15,866 | ||||
| Laundry Income | 7,000 | 0.1 | 9 | ||||
| Less Vacancy & Credit Loss(2) | (605,640) | (5.3) | (794) | ||||
| Effective Gross Income | $11,507,236 | 100.0% | $15,082 | ||||
| Total Operating Expenses | $4,719,467 | 41.0% | $6,185 | ||||
| Net Operating Income | $6,787,769 | 59.0% | $8,896 | ||||
| Reserves | 122,300 | 1.1 | 160 | ||||
| Net Cash Flow | $6,665,469 | 57.9% | $8,736 | ||||
| NOI DSCR | 2.69x | ||||||
| NCF DSCR | 2.65x | ||||||
| NOI DY | 14.8% | ||||||
| NCF DY | 14.5% |
| (1) | Residential cooperatives are generally organized and operated as not-for-profit entities that set maintenance fees to cover current expenses and plan for future capital needs. The U/W Net Operating Income and the U/W Net Cash Flow for the North Isle Village, Inc. Property are the projected net operating income and the projected net cash flow, respectively, reflected in the appraisal. The projected net operating income, in general, equals projected effective gross income at the property assuming such property is operated as a rental property with rents and other income set at the prevailing market rates, reduced by underwritten property operating expenses and a market-rate vacancy assumption – in each case as determined by the appraiser. The projected net cash flow equals the projected net operating income reduced by the projected replacement reserves – as determined by the appraiser. The projected rental income used in such determinations differs materially from the scheduled monthly maintenance payments from the tenant-shareholders at such property. |
| (2) | The vacancy reported reflects the vacancy assumption in the related appraisal for purposes of determining the appraised value of the North Isle Village, Inc. Property as a multifamily rental property. |
Appraisal.As of the appraisal valuation date of June 9, 2016, the North Isle Village, Inc. Property had an “as-is” appraised value of $86,920,000. The “as-is” appraised value is the value estimate reflected in the appraisal of the North Isle Village, Inc. Property determined as if the North Isle Village, Inc. Property is operated as a residential cooperative, inclusive of the amount of the underlying debt encumbering such residential cooperative property. See“Certain Characteristics of Mortgage Loans Secured by Residential Cooperatives” in the Preliminary Prospectus.
Environmental Matters. According to a Phase I environmental assessment dated June 15, 2016, there was no evidence of any recognized environmental conditions at the North Isle Village, Inc. Property.
Market Overview and Competition. The North Isle Village, Inc. Property is located in the hamlet of Coram in the Town of Brookhaven, New York, and is within the Long Island metropolitan statistical area. Coram is located approximately 62.2 miles east of New York City.
The Town of Brookhaven has access to the Long Island Expressway (Interstate-495), Middle Country Road and Sunrise Highway, which are the primary east/west arteries, and Route 112 and Nicholls Road, which are the primary north/south arteries. The area immediately surrounding the North Isle Village, Inc. Property is primarily a residential community with supporting retail and industry. The area consists primarily of single-family homes and low-rise, garden-style apartment building complexes. Middle Country Road and Route 112 are the primary commercial thoroughfares. Approximately 2.8 miles south of the North Isle Village, Inc. Property is the Coram Plaza Shopping Center, which is a neighborhood retail center that includes a Home Depot. Approximately 8.9 miles west of the North Isle Village, Inc. Property is the Smith Haven Mall, which is a regional mall with retailers such as Macy’s, Sear’s, H&M, Abercrombie & Fitch, The Apple Store, Banana Republic, Dick’s Sporting Goods, Forever 21, Victoria’s Secret and Zales.
According to the appraisal, the North Isle Village, Inc. Property is located in the Brookhaven/East Suffolk multifamily submarket within the Long Island metropolitan statistical area. According to a third-party market research report, the Brookhaven/East Suffolk multifamily submarket reported a 4.1% vacancy rate as of the second quarter of 2016.
THE INFORMATION IN THIS STRUCTURAL AND COLLATERAL TERM SHEET IS NOT COMPLETE AND MAY BE AMENDED PRIOR TO THE TIME OF SALE. THIS TERM SHEET IS NOT AN OFFER TO SELL THESE SECURITIES AND IT IS NOT A SOLICITATION OF AN OFFER TO BUY THESE SECURITIES IN ANY JURISDICTION WHERE THE OFFER OR SALE IS NOT PERMITTED.
70
NORTH ISLE VILLAGE, INC.
The following table presents certain information relating to comparable multifamily properties for the North Isle Village, Inc. Property:
Competitive Set(1)
| Average Rent (per unit)(2) | |||||||||
| Location | Distance to Subject | Property Type | Number of Units | Studio | 1 BR | 2 BR | Overall Average Rent Per Unit | Total Occupancy | |
| North Isle Village, Inc. (Subject) | Coram, NY | -- | Garden | 763 | $1,083 | $1,270 | $1,466 | $1,273 | 95%(3) |
| Rocky Point Owners Corp. | Rocky Point, NY | 7.3 miles | Garden | 183 | NAP | $1,075 | $1,350 | $1,213 | NAP |
| Fairfield Gardens at Port Jefferson | Port Jefferson Station, NY | 4.5 miles | Garden | 50 | NAP | $1,375 | $1,675 | $1,525 | 96% |
| Lake Point Circle | Middle Island, NY | 6.7 miles | Garden | 180 | NAP | $1,425 | $1,575 | $1,500 | 97% |
| Sylvan Gardens | Miller Place, NY | 4.9 miles | Garden | 54 | $1,100 | $1,250 | $1,550 | $1,300 | NAP |
| (1) | Information obtained from the appraisal and a third party research report. |
| (2) | The average rents for the North Isle Village, Inc. Property are derived from rents collected from the units owned and rented out by the cooperative sponsor and investors at the North Isle Village, Inc. Property. |
| (3) | See “Historical Occupancy” section. |
The Borrower. The borrower is North Isle Village, Inc., a cooperative housing corporation organized under the laws of the State of New York.
The Sponsor. The North Isle Village, Inc. Property is owned in fee simple by the borrower. No individual or entity (other than the borrower) has recourse obligations with respect to the North Isle Village, Inc. Mortgage Loan, including pursuant to any guaranty or environmental indemnity.
Escrows. An upfront escrow in the amount of $936,413 was collected for real estate taxes. The loan documents also provide for ongoing monthly reserves for real estate taxes. The loan documents do not require initial or ongoing monthly reserves for insurance so long as there is no event of default.
The loan documents also provide for a collateral security agreement for capital improvements (“CSA”), which established a collateral security account in the total amount of $6,750,000 at closing. Pursuant to the terms of the CSA, funds on account in the collateral security account are available for disbursement to the borrower in connection with the performance of certain specified capital improvement work at the North Isle Village, Inc. Property. Upon completion of the specified capital improvement work, any funds remaining in the collateral security account are disbursed to the borrower for deposit into the borrower’s general operating reserve account, which is not controlled by the lender.
Lockbox and Cash Management.None.
Property Management. The North Isle Village, Inc. Property is managed by Alexander Wolf & Co., Inc.
Assumption. Not permitted.
Partial Release. Not permitted.
Real Estate Substitution. Not permitted.
Subordinate and Mezzanine Indebtedness. The North Isle Village, Inc. Property does not, as of the Cut-off Date, have any additional secured indebtedness. However, National Cooperative Bank, N.A., the applicable master servicer of the North Isle Village, Inc. Mortgage Loan, will be permitted to waive the enforcement of the “due-on-encumbrance” clause in the related mortgage instrument to permit subordinate debt secured by the North Isle Village, Inc. Property, subject to the satisfaction of various conditions and certain parameters set forth in the Series 2016-C36 Pooling and Servicing Agreement. See “Additional Debt Financing For Mortgage Loans Secured by Residential Cooperatives” in the Preliminary Prospectus.
Ground Lease. None.
Terrorism Insurance. The loan documents require an “all risk” insurance policy to be maintained by the borrower to provide coverage for terrorism in an amount equal to the full replacement cost of the North Isle Village, Inc. Property, as well as business income insurance covering no less than the 12-month period following the occurrence of a casualty event.
Windstorm Insurance. The loan documents require an “all risk” insurance policy to be maintained by the borrower which provides coverage for windstorm damage in an amount equal to the full replacement cost of the North Isle Village, Inc. Property.
THE INFORMATION IN THIS STRUCTURAL AND COLLATERAL TERM SHEET IS NOT COMPLETE AND MAY BE AMENDED PRIOR TO THE TIME OF SALE. THIS TERM SHEET IS NOT AN OFFER TO SELL THESE SECURITIES AND IT IS NOT A SOLICITATION OF AN OFFER TO BUY THESE SECURITIES IN ANY JURISDICTION WHERE THE OFFER OR SALE IS NOT PERMITTED.
71
| EASTON TOWN CENTER |

THE INFORMATION IN THIS STRUCTURAL AND COLLATERAL TERM SHEET IS NOT COMPLETE AND MAY BE AMENDED PRIOR TO THE TIME OF SALE. THIS TERM SHEET IS NOT AN OFFER TO SELL THESE SECURITIES AND IT IS NOT A SOLICITATION OF AN OFFER TO BUY THESE SECURITIES IN ANY JURISDICTION WHERE THE OFFER OR SALE IS NOT PERMITTED.
72
| EASTON TOWN CENTER |
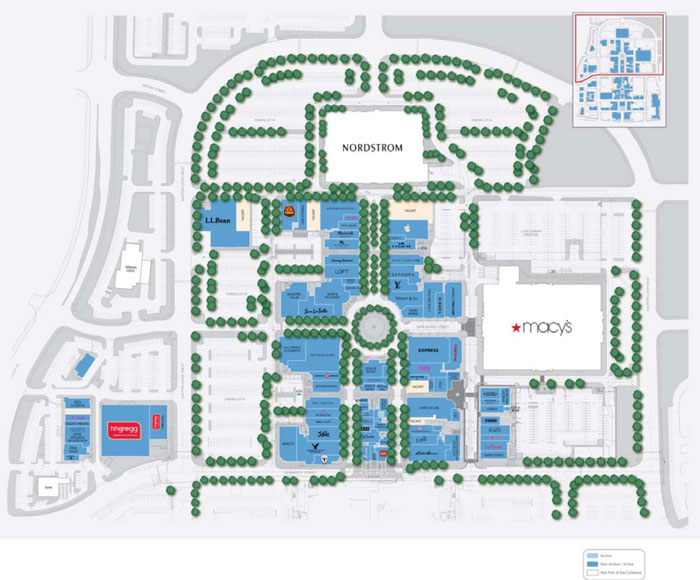
THE INFORMATION IN THIS STRUCTURAL AND COLLATERAL TERM SHEET IS NOT COMPLETE AND MAY BE AMENDED PRIOR TO THE TIME OF SALE. THIS TERM SHEET IS NOT AN OFFER TO SELL THESE SECURITIES AND IT IS NOT A SOLICITATION OF AN OFFER TO BUY THESE SECURITIES IN ANY JURISDICTION WHERE THE OFFER OR SALE IS NOT PERMITTED.
73
| EASTON TOWN CENTER |
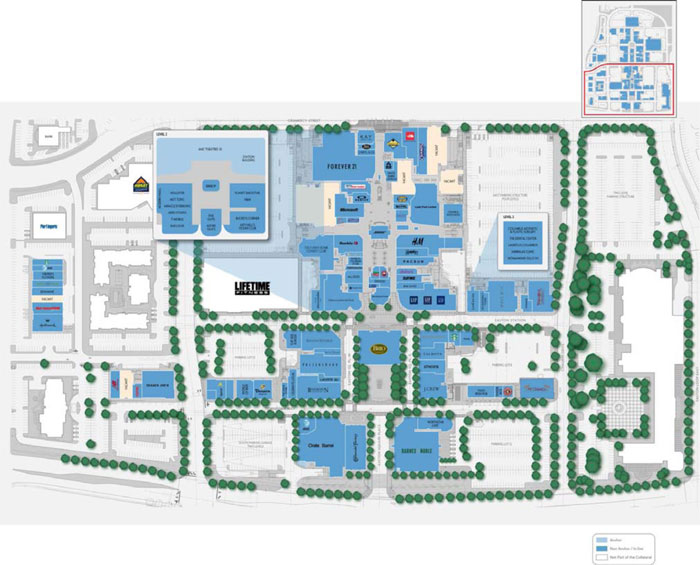
THE INFORMATION IN THIS STRUCTURAL AND COLLATERAL TERM SHEET IS NOT COMPLETE AND MAY BE AMENDED PRIOR TO THE TIME OF SALE. THIS TERM SHEET IS NOT AN OFFER TO SELL THESE SECURITIES AND IT IS NOT A SOLICITATION OF AN OFFER TO BUY THESE SECURITIES IN ANY JURISDICTION WHERE THE OFFER OR SALE IS NOT PERMITTED.
74
| EASTON TOWN CENTER |
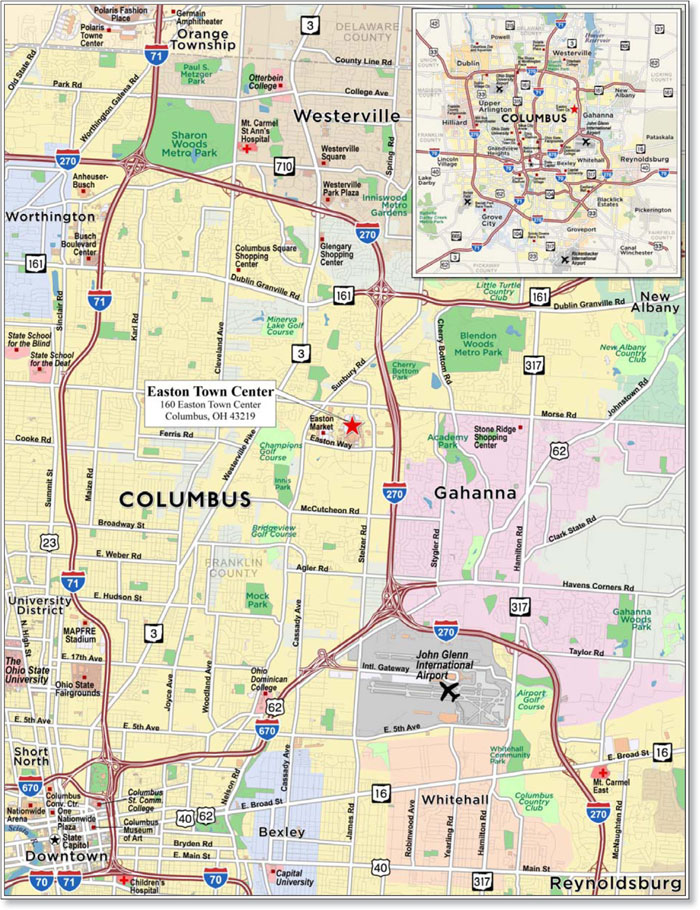
THE INFORMATION IN THIS STRUCTURAL AND COLLATERAL TERM SHEET IS NOT COMPLETE AND MAY BE AMENDED PRIOR TO THE TIME OF SALE. THIS TERM SHEET IS NOT AN OFFER TO SELL THESE SECURITIES AND IT IS NOT A SOLICITATION OF AN OFFER TO BUY THESE SECURITIES IN ANY JURISDICTION WHERE THE OFFER OR SALE IS NOT PERMITTED.
75
| No. 5 – Easton Town Center | |||||||
| Loan Information | Property Information | ||||||
| Mortgage Loan Seller: | Barclays Bank PLC | Single Asset/Portfolio: | Single Asset | ||||
Credit Assessment (Fitch/Moody’s/Morningstar): | A+sf/A2/AAA | Property Type: | Retail | ||||
| Original Principal Balance(1): | $45,000,000 | Specific Property Type: | Urban | ||||
| Cut-off Date Balance(1): | $45,000,000 | Location: | Columbus, OH | ||||
| % of Initial Pool Balance: | 5.2% | Size(5): | 1,303,073 SF | ||||
| Loan Purpose: | Refinance | Cut-off Date Balance Per SF(1)(5): | $259.00 | ||||
| Borrower Names(2): | Various | Year Built/Renovated: | 1999/2015 | ||||
| Sponsors: | L Brands, Inc.; Georgetown Sponsor | Title Vesting: | Fee | ||||
| Mortgage Rate: | 3.6159% | Property Manager: | Steiner Real Estate Services, LLC | ||||
| Note Date: | July 28, 2016 | 4th Most Recent Occupancy (As of)(6): | 96.2% (12/31/2012) | ||||
| Anticipated Repayment Date: | NAP | 3rd Most Recent Occupancy (As of)(6): | 98.5% (12/31/2013) | ||||
| Maturity Date: | August 5, 2026 | 2nd Most Recent Occupancy (As of)(6): | 98.3% (12/31/2014) | ||||
| IO Period: | 120 months | Most Recent Occupancy (As of)(6): | 98.0% (12/31/2015) | ||||
| Loan Term (Original): | 120 months | Current Occupancy (As of)(6): | 96.6% (6/24/2016) | ||||
| Seasoning: | 3 months | ||||||
| Amortization Term (Original): | NAP | Underwriting and Financial Information: | |||||
| Loan Amortization Type: | Interest-only, Balloon | ||||||
| Interest Accrual Method: | Actual/360 | 4th Most Recent NOI (As of): | $43,168,705 (12/31/2013) | ||||
| Call Protection: | GRTR 1%or YM(27), GRTR 1% or YM or D(86), O(7) | 3rd Most Recent NOI (As of): | $47,344,217 (12/31/2014) | ||||
| Lockbox Type: | Hard/Springing Cash Management | 2nd Most Recent NOI (As of): | $48,134,175 (12/31/2015) | ||||
| Additional Debt(1)(3): | Yes | Most Recent NOI (As of): | $49,067,709 (TTM 4/30/2016) | ||||
| Additional Debt Type(1)(3): | Pari Passu, Subordinate Debt and Future Mezzanine | ||||||
| U/W Revenues: | $78,773,625 | ||||||
| U/W Expenses: | $26,733,883 | ||||||
| U/W NOI: | $52,039,742 | ||||||
| U/W NCF: | $49,759,364 | ||||||
| U/W NOI DSCR(1): | 4.21x | ||||||
| Escrows and Reserves(4): | U/W NCF DSCR(1): | 4.02x | |||||
| Type: | Initial | Monthly | Cap (If Any) | U/W NOI Debt Yield(1): | 15.4% | ||
| Taxes | $0 | Springing | NAP | U/W NCF Debt Yield(1): | 14.7% | ||
| Insurance | $0 | Springing | NAP | As-Is Appraised Value: | $1,186,000,000 | ||
| Replacement Reserves | $0 | Springing | $512,472 | As-Is Appraisal Valuation Date: | July 12, 2016 | ||
| TI/LC Reserve | $0 | Springing | $3,843,537 | Cut-off Date LTV Ratio(1): | 28.5% | ||
| Existing Leasing Obligation Reserve | $7,161,275 | $0 | NAP | LTV Ratio at Maturity or ARD(1): | 28.5% | ||
| (1) | See “The Mortgage Loan” section. All statistical information related to balance per square foot, loan-to-value ratios, debt service coverage ratios and debt yields are based on the companionpari passu notes. The Cut-off Date LTV Ratio, U/W NCF DSCR and U/W NOI Debt Yield based on the Easton Town Center Whole Loan are 59.0%, 1.94x and 7.4%, respectively. |
| (2) | See “The Borrowers” section. |
| (3) | See “Subordinate and Mezzanine Indebtedness” section. |
| (4) | See “Escrows” section. |
| (5) | Size represents the square footage of collateral for Easton Town Center Whole Loan. Total square footage of the Easton Town Center Property (as defined below) including non-collateral retail space is 1,797,744 square feet. See “The Property” and “Major Tenants” sections. |
| (6) | See “Historical Occupancy” section. |
The Mortgage Loan.The mortgage loan (“Easton Town Center Mortgage Loan”) is part of a whole loan (“Easton Town Center Whole Loan”) evidenced by sixpari passu and two subordinate promissory notes (Note A-1-A, Note A-2-A, Note A-1-B-1, Note A-1-B-2, Note A-1-B-3, Note A-2-B, Note B-1 and Note B-2) that are secured by a first lien deed of trust on the borrower’s fee simple interest in an urban streetscape retail center located in Columbus, Ohio (“Easton Town Center Mortgaged Property”). The Easton Town Center Whole Loan was co-originated on July 28, 2016 by Barclays Bank PLC and Morgan Stanley Bank, N.A. The Easton Town Center Whole Loan had an original principal balance of $700,000,000, has an outstanding principal balance as of the Cut-off Date of $700,000,000 and accrues interest at an interest rate of 3.6159%per annum. The Easton Town Center Whole Loan had an initial term of 120 months, has a remaining term of 117 months as of the Cut-off Date and requires interest-only payments through the term of the Easton Town Center Whole Loan. The Easton Town Center Whole Loan matures on August 5, 2026.
THE INFORMATION IN THIS STRUCTURAL AND COLLATERAL TERM SHEET IS NOT COMPLETE AND MAY BE AMENDED PRIOR TO THE TIME OF SALE. THIS TERM SHEET IS NOT AN OFFER TO SELL THESE SECURITIES AND IT IS NOT A SOLICITATION OF AN OFFER TO BUY THESE SECURITIES IN ANY JURISDICTION WHERE THE OFFER OR SALE IS NOT PERMITTED.
76
| EASTON TOWN CENTER |
The Easton Town Center Mortgage Loan, evidenced by the non-controlling Note A-1-B-2, had an original principal balance of $45,000,000 and has an outstanding principal balance as of the Cut-off Date of $45,000,000. Twopari passu notes (Note A-1-A and Note A-2-A) and two subordinate notes (Note B-1 and Note B-2), with an aggregate original principal balance of $512,500,000 were contributed to the BBCMS 2016-ETC Trust. Note A-1-A represents the controlling interest in the Easton Town Center Whole Loan. Each of the mortgage loans evidenced by Note B-1 and Note B-2 are collectively referred to as the “Easton Town Center Subordinate Companion Loans”. The non-controlling Note A-1-B-1, which had an original principal balance of $45,000,000, is expected to be contributed to the CGCMT 2016-P5 Trust. The non-controlling Note A-2-B, which had an original principal balance of $75,000,000, is held by Morgan Stanley, and is expected to be contributed to the MSBAM 2016-C30 Trust. The non-controlling Note A-1-B-3, which had an original principal balance of $22,500,000, is held by Barclays Bank PLC, and is expected to be contributed to one or more future securitization trusts. The lender provides no assurances that any non-securitized notes will not be split further. Each of the mortgage loans evidenced by Note A-1-A, Note A-2-A, Note A-1-B-1, Note A-1-B-3 and Note A-2-B are collectively referred to as the “Easton Town CenterPari Passu Companion Loans”. See “Description of the Mortgage Pool—The Whole Loans—The Non-Serviced Whole Loans—The Easton Town Center Whole Loan” and “Pooling and Servicing Agreement” in the Preliminary Prospectus.
| Easton Town Center Whole Loan ($700,000,000) | ||||
| Easton Town CenterPari Passu Companion Notes ($337,500,000) | ||||
| Companion A Notes | Companion A Note | Companion A Note | Companion A Note | Companion A Note |
| BBCMS 2016-ETC | CGCMT 2016-P5 | WFCM 2016-C36 | MSBAM 2016-C30 | Future Conduit Securitizations |
| $150,000,000 | $45,000,000 | $45,000,000 | $75,000,000 | $22,500,000 |
| Notes A-1-A, A-2-A | Note A-1-B-1 | Note A-1-B-2 | Note A-2-B | Note A-1-B-3 |
| Easton Town Center Subordinate Companion Loans ($362,500,000) | ||||
| Subordinate Companion B Notes | ||||
| BBCMS 2016-ETC | ||||
| $362,500,000 | ||||
| Notes B-1, B-2 | ||||
Following the lockout period, on any date before February 5, 2026, the borrower has the right to defease the Easton Town Center Whole Loan in whole, but not in part. The lockout period will expire on the earlier to occur of (i) two years after the closing date of the securitization that includes the last note to be securitized and (ii) July 28, 2019. In addition, at any time prior to February 5, 2026, the borrower has the right to prepay the Easton Town Center Whole Loan in whole or in part in increments of not less than $5,000,000, as long as such prepayment is accompanied with the payment of the greater of a yield maintenance premium or 1.0% of the amount being prepaid. The Easton Town Center Whole Loan may be prepaid with the payment of the greater of a yield maintenance premium or 1.0% of the amount being prepaid in order to maintain a debt service coverage ratio of at least 1.20x or in order to achieve a debt service coverage ratio of at least 1.25x if a Reserve Trigger Event (as defined below) is occurring. The Easton Town Center Whole Loan is prepayable without penalty on or after February 5, 2026.
Sources and Uses
| Sources | Uses | |||||||
| Original whole loan amount | $700,000,000 | 100.0% | Loan payoff(1) | $425,364,813 | 60.8% | |||
| Upfront reserves | 7,161,275 | 1.0 | ||||||
| Closing costs | 4,564,309 | 0.7 | ||||||
| Return of equity | 262,909,603 | 37.6 | ||||||
| Total Sources | $700,000,000 | 100.0% | Total Uses | $700,000,000 | 100.0% |
| (1) | The Easton Town Center Mortgaged Property was previously securitized in the MSC 2007-IQ16 and BSCMS 2007-T28 transactions. |
The Property.The Easton Town Center Mortgaged Property is an urban streetscape retail center located in Columbus, Ohio approximately 9.1 miles northwest of downtown Columbus and five miles north of the John Glenn Columbus International Airport. Built in 1999 by the sponsors, the Easton Town Center which consists of the Easton Town Center Mortgaged Property and space occupied by Macy’s, Nordstrom and Lifetime Fitness that is not collateral for the Easton Town Center Whole Loan (collectively, the “Easton Town Center Property”) contains approximately 1,797,744 square feet of retail, office and storage space, of which 1,303,073 square feet serves as collateral for the Easton Town Center Whole Loan. The Easton Town Center Mortgaged Property is located on approximately 83.2 acres of land as part of a larger master-planned development. The Easton Town Center Mortgaged Property features 7,926 parking spaces, resulting in a parking ratio of approximately 6.1 spaces per 1,000 feet of rentable area.
According to the sponsors, the Easton Town Center Property draws more than 22.5 million visitors annually and according to a third party report, the Easton Town Center Property is listed as the #1 attraction of “Top 10 Attractions in Columbus.” A third party research report honored the Easton Town Center Property with the “Award for Innovative Design” shortly after opening.
THE INFORMATION IN THIS STRUCTURAL AND COLLATERAL TERM SHEET IS NOT COMPLETE AND MAY BE AMENDED PRIOR TO THE TIME OF SALE. THIS TERM SHEET IS NOT AN OFFER TO SELL THESE SECURITIES AND IT IS NOT A SOLICITATION OF AN OFFER TO BUY THESE SECURITIES IN ANY JURISDICTION WHERE THE OFFER OR SALE IS NOT PERMITTED.
77
| EASTON TOWN CENTER |
The Easton Town Center Property is anchored by Macy’s, Nordstrom, Lifetime Fitness and AMC 30; however, only AMC 30 is a collateral anchor for the Easton Town Center Mortgaged Property. Based on 2015 year-end sponsor-estimated sales, Macy’s generated sales of $58.2 million and has generated approximately $50.0 million to $60.0 million in sales in each of the past few years. In June 2016, Macy’s introduced their new store-within-a-store prototype at the Easton Town Center Property. As of the trailing 12-month period ending April 2016 (“TTM April 2016”), Nordstrom generated approximately $48.7 million in sales. Lifetime Fitness does not report sales, but according to sponsors’ estimates, there are approximately 7,000 members at the Easton Town Center Property location. AMC 30 achieved sales of approximately $15.0 million as of TTM April 2016, or approximately $501,200 per screen. The AMC 30 includes 30 screens at the Easton Town Center Mortgaged Property, of which 13 have been upgraded to a dine-in style. The remaining 17 screens are in process of being upgraded, with the tenant reportedly spending approximately $4.0 million, per the sponsors, with an additional $5.5 million of landlord funded tenant improvements. The remaining upgrades to AMC 30 are expected to be completed by March 2017.
The Easton Town Center Property, features approximately 215 tenants, including retailers such as American Girl ($939 sales per square foot), Apple ($4,686 sales per square foot), Footlocker ($756 sales per square foot), Lego ($1,885 sales per square foot), Louis Vuitton ($2,374 sales per square foot), Lululemon ($1,877 sales per square foot), Lush Cosmetics ($3,441 sales per square foot), Michael Kors ($1,058 sales per square foot), Pandora ($2,568 sales per square foot), PINK ($1,255 sales per square foot), Sephora ($1,363 sales per square foot), Sunglass Hut ($835 sales per square foot), Teavana ($1,057 sales per square foot) and Tesla ($7,731 sales per square foot). Sales per square foot information is as of TTM April 2016.
As of TTM April 2016, total reported Easton Town Center Property sales were approximately $640.3 million, which includes 2015 year-end sponsors-estimated sales for Macy’s. Comparable inline sales per square foot were $742, with an occupancy cost of 11.1%. Excluding Apple and Tesla, the Easton Town Center Mortgaged Property generated comparable inline sales per square foot of $629, with occupancy costs of 13.0%. From 2013 to TTM April 2016, total inline sales excluding Apple and Tesla have increased from $246.9 million to $305.0 million, representing an increase of 23.5%. As of TTM April 2016, Apple and Tesla reported total sales of approximately $40.0 million and $23.1 million, respectively.
As of June 24, 2016, the Easton Town Center Property was approximately 97.6% leased including tenants with executed leases that are not yet open and operating. Excluding tenants that are not yet open and operating, the Easton Town Center Property was 96.9% occupied. The Easton Town Center Mortgaged Property was approximately 96.6% leased including all owned collateral anchors and tenants with executed leases that are not yet open and operating. Excluding tenants that are not yet open and operating, the Easton Town Center Mortgaged Property was 95.7% occupied. Since 2008, the Easton Town Center Mortgaged Property has maintained an average occupancy of approximately 97.3%, with no year-end occupancy rate reported below 96.2%. Since January 2016, the Easton Town Center Mortgaged Property has added 10 new tenants totaling 23,372 square feet.
From 2010 to 2015, the sponsors have indicated that they have spent approximately $80.0 million renovating, expanding, maintaining, upgrading and improving the Easton Town Center Mortgaged Property. In 2011, the sponsors constructed the building that houses Jimmy John’s, Ideal Image, Sears Home Appliance, Exquisite Threading, T-Mobile and Cucinova, totaling approximately 18,105 square feet. Between 2012 and 2013, the sponsors purchased the building that houses Hallmark, Mattress Firm, Edamame Sushi, Pearle Vision, Oberer’s Flowers, AT&T Wireless and Starbucks, totaling approximately 24,948 square feet. In 2013, the sponsors built the building that houses Build-A-Bear, Avalon Nails, Moochie & Co., Evereve, Gymboree, The Children’s Place, Stride Rite, Free People, Stitch Wow and Paper Source, totaling approximately 21,439 square feet. From 2008 to 2013, the Easton Town Center Mortgaged Property was expanded by approximately 160,899 square feet.
The Easton Town Center Property is part of a larger master-planned development comprised of an office component, a residential component, a hospitality component and a complementary retail component. There is more than 4.2 million of class A office space, which is approximately 97.7% occupied. The three hotels offer over 590 rooms and 40,000 square feet of conference facilities. There are 750 residential units that range from garden-style apartments to townhomes, which are approximately 95.0% leased.
Condominium.One of the buildings at the Easton Town Center Mortgaged Property, representing approximately 1.6% of the net rentable area and approximately 1.9% of the underwritten base rent, consists of a retail unit of a two-unit condominium. The two-unit condominium is comprised of a retail unit, which is part of the Easton Town Center Mortgaged Property, and a parking garage unit, which is not collateral for the Easton Town Center Whole Loan. The condominium is controlled by the owner of the parking garage unit. The tenants located within the condominium are Build-A-Bear, Avalon Nails, Moochie & Co., Evereve, Gymboree, The Children’s Place, Stride Rite, Free People, Stitch Wow and Paper Source.
THE INFORMATION IN THIS STRUCTURAL AND COLLATERAL TERM SHEET IS NOT COMPLETE AND MAY BE AMENDED PRIOR TO THE TIME OF SALE. THIS TERM SHEET IS NOT AN OFFER TO SELL THESE SECURITIES AND IT IS NOT A SOLICITATION OF AN OFFER TO BUY THESE SECURITIES IN ANY JURISDICTION WHERE THE OFFER OR SALE IS NOT PERMITTED.
78
| EASTON TOWN CENTER |
The following table presents certain information relating to the tenancy at the Easton Town Center Property:
Major Tenants
| Tenant Name | Credit Rating (Fitch/ Moody’s/ S&P)(1) | Tenant NRSF | % of NRSF(2) | Annual U/W Base Rent PSF(3) | Annual U/W Base Rent(3) | % of Total Annual U/W Base Rent | Sales PSF(4) | Occupancy Cost(4) | Lease Expiration Date |
| Anchor Tenants — Non-Collateral | |||||||||
| Macy’s | BBB/Baa2/BBB | 240,000 | ANCHOR OWNED – NON-COLLATERAL | $243 | NAP | NAP | |||
| Nordstrom | BBB+/Baa1/BBB+ | 167,000 | $291 | NAP | NAP | ||||
| Lifetime Fitness | NR/NR/NR | 87,671 | NAP(5) | NAP | NAP | ||||
Total Anchor Tenants – Non — Collateral | 494,671 | ||||||||
| Anchor Tenant — Collateral | |||||||||
| AMC 30 | NR/NR/NR | 134,000 | 10.3% | $30.99 | $4,152,660 | 8.1% | $501,200(6) | 35.3%(6) | 12/31/2029(7) |
| Total Anchor Tenants — Collateral | 134,000 | 10.3% | $30.99 | $4,152,660 | 8.1% | ||||
| Major Tenants — Collateral | |||||||||
| Forever 21 | NR/NR/NR | 28,111 | 2.2% | $46.67 | $1,311,916 | 2.6% | $300 | 15.6% | 1/31/2021 |
| Express | NR/NR/NR | 12,635 | 1.0% | $77.19 | $975,302 | 1.9% | $545 | 19.2% | 1/31/2023 |
| H&M | NR/NR/NR | 20,177 | 1.5% | $46.84 | $945,150 | 1.9% | $395 | 11.9% | 1/31/2021 |
| Victoria’s Secret(8) | NR/NR/NR | 16,191 | 1.2% | $51.96 | $841,360 | 1.7% | $523 | 14.5% | 1/31/2023 |
| Total Major Tenants – Collateral | 77,114 | 5.9% | $52.83 | $4,073,728 | 8.0% | ||||
| Non-Major Tenants – Collateral | 1,026,217 | 78.8% | $41.65 | $42,744,041 | 83.9% | ||||
| Occupied Collateral Total | 1,237,331 | 95.0% | $41.19 | $50,970,430 | 100.0% | ||||
| Storage Space | 21,894 | 1.7% | |||||||
| Vacant Space(9) | 43,848 | 3.4% | |||||||
| Collateral Total | 1,303,073 | 100.0% | |||||||
| (1) | Certain ratings are those of the parent company whether or not the parent guarantees the lease. |
| (2) | % of NRSF is based on the Easton Town Center Mortgaged Property collateral square footage of 1,303,073, which excludes all non-collateral anchor tenants. |
| (3) | Annual U/W Base Rent includes base rent and contractual rent steps through June 2017 equal to $1,413,048. |
| (4) | All Sales PSF and Occupancy Cost information presented herein are based upon TTM April 2016 information provided by the Borrower unless otherwise noted. Sales PSF figures include 2015 year-end sponsors’ estimates for Macy’s. The rest of the tenancy Sales PSF figures are as of TTM April 2016. |
| (5) | Lifetime Fitness does not report sales; however, per sponsors’ estimates, Lifetime Fitness has 7,000 members at the Easton Town Center Property. |
| (6) | AMC 30 Sales PSF on a per screen basis, based on 30 screens. AMC 30’s TTM April 2016 Occupancy Cost is based on the underlying rent on a PSF basis. |
| (7) | AMC 30 has three, five-year extension options remaining. |
| (8) | Victoria’s Secret also occupies 7,666 square feet of office space at the Easton Town Center Mortgaged Property. |
| (9) | Vacant Space also includes 6,917 square feet attributable to Aeropostale and PacSun, who have filed for bankruptcy. Both tenants were underwritten as vacant, although, they are in occupancy, paying rent and as of October 3, 2016 are not included on any closure lists. |
THE INFORMATION IN THIS STRUCTURAL AND COLLATERAL TERM SHEET IS NOT COMPLETE AND MAY BE AMENDED PRIOR TO THE TIME OF SALE. THIS TERM SHEET IS NOT AN OFFER TO SELL THESE SECURITIES AND IT IS NOT A SOLICITATION OF AN OFFER TO BUY THESE SECURITIES IN ANY JURISDICTION WHERE THE OFFER OR SALE IS NOT PERMITTED.
79
| EASTON TOWN CENTER |
The following table presents certain information relating to the historical sales and occupancy costs at the Easton Town Center Property:
Historical Sales (PSF) and Occupancy Costs(1)(2)
| Tenant | 2013 | 2014 | 2015 | TTM April 2016 | TTM April 2016 Occupancy Cost |
| Non-Collateral Anchors | |||||
| Macy’s(3) | NAP | NAP | $243 | NAP | NAP |
| Nordstrom | $323 | $302 | $296 | $291 | NAP |
| Lifetime Fitness(4) | NAP | NAP | NAP | NAP | NAP |
| Collateral Anchor | |||||
| AMC 30(5) | $595,767 | $496,300 | $508,167 | $501,200 | 35.3% |
| Major Retail Tenants | |||||
| HH Gregg | $482 | $504 | $491 | $501 | 3.9% |
| Barnes & Noble | $219 | $216 | $220 | $218 | 14.8% |
| KDB(6) | $70 | $65 | $49 | $66 | 34.6% |
| Comparable Inline Sales PSF | $660 | $686 | $742 | $742 | |
| Occupancy Costs | 10.8% | 11.1% | 10.7% | 11.1% | |
| Comparable Inline Sales (excluding Apple and Tesla) PSF | $583 | $600 | $626 | $629 | |
| Occupancy Costs (excluding Apple and Tesla) | 12.1% | 12.7% | 12.6% | 13.0% | |
| Comparable Inline Sales (excluding restaurant tenants) PSF | $703 | $737 | $818 | $810 | |
| Occupancy Costs (excluding restaurant tenants) | 10.8% | 11.2% | 10.6% | 11.0% |
| (1) | All Historical Sales PSF and Occupancy Costs presented herein are based upon information provided by the borrower. |
| (2) | Historical Sales (PSF) are based on leased square footage during each given period as some tenants listed may have expanded or contracted their leased square footage during such given time period. |
| (3) | Macy’s does not report sales. According to the sponsors’ estimates, Macy’s has generated approximately $55.0 million to $60.0 million of sales in each of the past few years. As of year-end 2015, Macy’s had sponsors-estimated sales of approximately $58.2 million. |
| (4) | Lifetime Fitness does not report sales; however, according to the sponsors, they have approximately 7,000 members at the Easton Town Center Property. |
| (5) | Sales PSF for AMC 30 is calculated on a per screen basis, based on 30 screens. |
| (6) | KDB is a restaurant with an arcade component featuring more than 25,000 square feet of arcade space. KDB was renovated in 2015 and was closed during their renovation period. |
The following table presents certain information relating to the lease rollover schedule at the Easton Town Center Mortgaged Property:
Lease Expiration Schedule(1)(2)(3)
| Year Ending December 31, | No. of Leases Expiring | Expiring NRSF | % of Total NRSF | Cumulative Expiring NRSF | Cumulative % of Total NRSF | Annual U/W Base Rent | Annual U/W Base Rent PSF(5) |
| MTM | 4 | 24,617 | 1.9% | 24,617 | 1.9% | $342,000 | $13.89 |
| 2016 | 2 | 7,430 | 0.6% | 32,047 | 2.5% | $198,170 | $26.67 |
| 2017 | 15 | 79,488 | 6.2% | 111,535 | 8.7% | $3,173,010 | $39.92 |
| 2018 | 18 | 112,979 | 8.8% | 224,514 | 17.5% | $3,485,551 | $30.85 |
| 2019 | 25 | 113,655 | 8.9% | 338,169 | 26.4% | $4,519,293 | $39.76 |
| 2020 | 25 | 130,657 | 10.2% | 468,826 | 36.6% | $4,662,797 | $35.69 |
| 2021 | 28 | 219,130 | 17.1% | 687,956 | 53.7% | $8,719,061 | $39.79 |
| 2022 | 13 | 57,801 | 4.5% | 745,757 | 58.2% | $3,168,037 | $54.81 |
| 2023 | 24 | 116,767 | 9.1% | 862,524 | 67.3% | $6,995,401 | $59.91 |
| 2024 | 31 | 118,194 | 9.2% | 980,718 | 76.5% | $5,132,920 | $43.43 |
| 2025 | 13 | 71,644 | 5.6% | 1,052,362 | 82.1% | $3,280,005 | $45.78 |
| 2026 | 10 | 45,680 | 3.6% | 1,098,042 | 85.7% | $2,722,180 | $59.59 |
| Thereafter | 4 | 139,289 | 10.9% | 1,237,331 | 96.6% | $4,572,003 | $32.82 |
| Vacant(4) | 0 | 43,848 | 3.4% | 1,281,179 | 100.0% | $0 | $0.00 |
| Total/Weighted Average | 212 | 1,281,179(6) | 100.0% | $50,970,430 | $41.19 |
| (1) | Information obtained from the underwritten rent roll. |
| (2) | Certain tenants may have lease termination options that are exercisable prior to the originally stated expiration date of the subject lease and that are not considered in the Lease Expiration Schedule. |
| (3) | Includes two executed leases that have not yet commenced as of June 24, 2016, totaling 11,854 square feet and $734,550 of Annual U/W Base Rent. |
| (4) | Vacant and Expiring NRSF includes 6,917 square feet attributable to Aeropostale and PacSun, who have filed for bankruptcy. Both tenants have been underwritten as vacant although they are in occupancy, paying rent and as of October 3, 2016 are not included on any closure lists. |
| (5) | Total/Weighted Average Annual U/W Base Rent PSF excludes vacant space. |
| (6) | Total Expiring NRSF excludes 21,894 square feet of storage space for which no lease expiration date is attributed. |
THE INFORMATION IN THIS STRUCTURAL AND COLLATERAL TERM SHEET IS NOT COMPLETE AND MAY BE AMENDED PRIOR TO THE TIME OF SALE. THIS TERM SHEET IS NOT AN OFFER TO SELL THESE SECURITIES AND IT IS NOT A SOLICITATION OF AN OFFER TO BUY THESE SECURITIES IN ANY JURISDICTION WHERE THE OFFER OR SALE IS NOT PERMITTED.
80
| EASTON TOWN CENTER |
The following table presents historical occupancy percentages at the Easton Town Center Mortgaged Property:
Historical Occupancy(1)
12/31/2012(2) | 12/31/2013(2) | 12/31/2014(2) | 12/31/2015(2) | 6/24/2016(3)(4) |
| 96.2% | 98.5% | 98.3% | 98.0% | 96.6% |
| (1) | Including the non-collateral anchor tenants, Easton Town Center Property had a historical occupancy of 97.1%, 98.9%, 98.7% and 98.5% in 2012, 2013, 2014 and 2015, respectively. The current occupancy of Easton Town Center Property as of June 24, 2016, inclusive of tenants with executed leases that are not yet open and operating, is 97.6%. |
| (2) | Information obtained from the borrower. |
| (3) | Information obtained from the underwritten rent roll. Occupancy as of June 24, 2016 excludes two tenants who have filed for bankruptcy, Aeropostale and PacSun, occupying 6,917 square feet. Including these two tenants, the Easton Town Center Property occupancy would be 97.9% and the Easton Town Center Mortgaged Property occupancy would be 97.2%. See “Cash Flow Analysis” section. |
| (4) | Occupancy as of June 24, 2016 includes tenants with executed leases that are not yet open and operating. Excluding tenants that are not yet open and operating, the Easton Town Center Mortgaged Property was 95.7% occupied. |
Operating History and Underwritten Net Cash Flow.The following table presents certain information relating to the historical operating performance and underwritten net cash flow at the Easton Town Center Mortgaged Property:
Cash Flow Analysis
| 2013 | 2014 | 2015 | TTM 4/30/2016 | U/W | % of U/W Effective Gross Income | U/W $ per SF | |||||||||
| Base Rent(1) | $43,961,285 | $47,139,823 | $48,613,606 | $49,309,396 | $50,970,430(4) | 64.7% | $39.12 | ||||||||
| Grossed up Vacant Space | 0 | 0 | 0 | 0 | 3,987,780 | 5.1 | 3.06 | ||||||||
| Percentage Rent(2) | 1,284,571 | 2,214,903 | 2,121,003 | 2,200,630 | 2,010,379 | 2.6 | 1.54 | ||||||||
| Storage Rent | 270,476 | 353,398 | 438,050 | 407,348 | 387,534 | 0.5 | 0.30 | ||||||||
| Total Reimbursables | 22,229,501 | 22,561,634 | 22,513,614 | 22,444,784 | 22,702,356 | 28.8 | 17.42 | ||||||||
| Other Income(3) | 2,859,082 | 2,667,860 | 2,635,480 | 2,679,940 | 2,702,926 | 3.4 | 2.07 | ||||||||
| Less Vacancy & Credit Loss | 0 | 0 | 0 | 0 | (3,987,780) | (5.1) | (3.06) | ||||||||
| Effective Gross Income | $70,604,915 | $74,937,618 | $76,321,753 | $77,042,098 | $78,773,625 | 100.0% | $60.45 | ||||||||
| Total Operating Expenses | $27,436,210 | $27,593,401 | $28,187,578 | $27,974,389 | $26,733,883 | 33.9% | $20.52 | ||||||||
| Net Operating Income | $43,168,705 | $47,344,217 | $48,134,175 | $49,067,709 | $52,039,742 | 66.1% | $39.94 | ||||||||
| TI/LC | 0 | 0 | 0 | 0 | 1,954,610 | 2.5 | 1.50 | ||||||||
| Capital Expenditures | 0 | 0 | 0 | 0 | 325,768 | 0.4 | 0.25 | ||||||||
| Net Cash Flow | $43,168,705 | $47,344,217 | $48,134,175 | $49,067,709 | $49,759,364 | 63.2% | $38.19 | ||||||||
| NOI DSCR(5) | 3.49x | 3.83x | 3.89x | 3.97x | 4.21x | ||||||||||
| NCF DSCR(5) | 3.49x | 3.83x | 3.89x | 3.97x | 4.02x | ||||||||||
| NOI DY(5) | 12.8% | 14.0% | 14.3% | 14.5% | 15.4% | ||||||||||
| NCF DY(5) | 12.8% | 14.0% | 14.3% | 14.5% | 14.7% |
| (1) | Historical Base Rent is inclusive of any rent abatements that were provided to tenants. |
| (2) | Percentage Rent was underwritten to in-place breakpoints as of June 30, 2017 and percentage rents based on TTM April 2016 sales. |
| (3) | Historical and TTM 4/30/2016 Other Income includes income from temporary tenants, marketing, parking and other non-rental activities. |
| (4) | U/W Base Rent includes rent steps through June 2017 totaling $1,413,048. |
| (5) | The debt service coverage ratios and debt yields are calculated based on the totalpari passucompanion notes. |
Appraisal. As of the appraisal valuation date of July 12, 2016, the Easton Town Center Mortgaged Property had an “as-is” appraised value of $1,186,000,000.
Environmental Matters.According to the Phase I environmental site assessment dated July 14, 2016, there was no evidence of any recognized environmental conditions at the Easton Town Center Mortgaged Property.
Market Overview and Competition.The Easton Town Center Property is located in Franklin County, within the northeast portion of the Columbus core-based statistical area. With a current population of more than 2.0 million, the Columbus core-based statistical area grew at a compound annual rate of 1.2% from 2000 through 2015, compared to the compound annual rate of 0.9% for the United States. The Easton Town Center Property has a primary trade area consisting of a 15-mile radius that contains a population of 1,412,912 people with an average household income of $77,992 as of 2015. The Easton Town Center Property is located in close proximity to suburbs located primarily to the north of Columbus, such as New Albany, Dublin, Westerville and Upper Arlington. The closest suburb, New Albany has an average reported income of $138,636. According to the appraisal, some of the largest employers in the area are the State of Ohio, The Ohio State University, JPMorgan Chase & Co., Nationwide and OhioHealth. Columbus is headquarters to multiple Fortune 1000 companies such as L Brands, Inc., Cardinal Health, Huntington Bank, Nationwide, Alliance Data and Big Lots. The Easton Town Center Property is approximately 9.0 miles northeast of downtown Columbus; 117.0 miles northeast of Cincinnati; 140.0 miles southwest of Cleveland; and 180.0 miles from Pittsburgh, Pennsylvania. According to the sponsors, there are also consumers who visit the Easton Town Center Property from Canada.
The Easton Town Center Property is located along the western portion of Interstate 270, off of Exit 33, linking directly to Easton Way, the main thoroughfare for the master-planned development. The Easton Town Center Property can also be accessed via Morse Road, off of Exit 32, an arterial road running east/west through northern Columbus, providing access to New Albany in the east and Dublin in the west. Interstate 270 is a beltway encircling the Columbus metro area. Interstate 270 intersects Interstate 71
THE INFORMATION IN THIS STRUCTURAL AND COLLATERAL TERM SHEET IS NOT COMPLETE AND MAY BE AMENDED PRIOR TO THE TIME OF SALE. THIS TERM SHEET IS NOT AN OFFER TO SELL THESE SECURITIES AND IT IS NOT A SOLICITATION OF AN OFFER TO BUY THESE SECURITIES IN ANY JURISDICTION WHERE THE OFFER OR SALE IS NOT PERMITTED.
81
| EASTON TOWN CENTER |
approximately five miles northwest of the Easton Town Center Property and intersects Interstate 70 approximately six miles southwest of the Easton Town Center Property. According to a state governmental agency, Interstate 270’s Exit 33 has an annual traffic count that averages approximately 57.3 million vehicles per year (approximately 157,070 vehicles per day). Morse Road, located to the north of the Easton Town Center Property has an annual traffic count that averages approximately 56.2 million vehicles per year (approximately 154,010 vehicles per day). The city of Columbus is also serviced by two airports and three regional railroad companies.
According to the appraisal, the Easton Town Center Property’s primary competitors include Polaris Fashion Place, Mall at Tuttle Crossing and Eastland Mall. Polaris Fashion Place is anchored by Field & Stream, JCPenney, Macy’s, Saks Fifth Avenue, Sears and Von Maur. Polaris Fashion Place originally had seven anchor tenants, but in 2008, Kauffman vacated its box. In lieu of replacing the box with another tenant, a 155,000 square foot open-air lifestyle component was built. Polaris Fashion Place is located north of the Interstate 270. The Mall at Tuttle Crossing is located 11.0 miles west of the Easton Town Center Property. The Mall at Tuttle Crossing is an approximately 1.1 million square foot enclosed mall anchored by two Macy’s, JCPenney and Sears. The Mall at Tuttle Crossing exhibits in-line sales of approximately $450 per square foot as of year-end 2015, approximately $292 less than the Easton Town Center Property. Eastland Mall was developed in 1968 as one of the four directional malls to serve the Columbus core-based statistical area. The mall, which is located in the southeast portion of the Columbus core-based statistical area is anchored by Macy’s and Sears. Eastland Mall was acquired by Glimcher Realty Trust in 2003 and in 2012, Glimcher Realty Trust defaulted on the mall’s mortgage and turned the property over via a deed-in-lieu foreclosure to LNR Partners, the special servicer on the LBUBS 2007-C1 Trust.
The remaining secondary competition, Easton Gateway, Easton Market and Easton Square are various neighborhood and community centers located near the Easton Town Center Property, which are considered complementary retail centers.
According to the appraisal, in June 2016, Tanger Outlets and Simon Property Group broke ground on a new 56-acre outlet center. The outlet center is located to the north on Interstate 71 in Berkshire Township, Ohio, approximately 20 miles north of the Easton Town Center Property. The outlet center is anticipated to include approximately 350,000 square foot center and 80 outlet retailers. Given Polaris Fashion Place’s mid-point between the Tanger Outlets and Easton Town Center Property, it is expected that Polaris Fashion Place will likely be most impacted by the new project. Additionally, the Easton Town Center Property has seen consistent in-line sales growth despite its proximity to Polaris Fashion Place. According to the appraisal, there is another mixed-use development, Hamilton Quarter being developed approximately five miles northeast of Easton Town Center Property. A group of developers, Casto Communities, Daimler Group Inc. and New Albany Co. have plans to develop 330 acres of land and is expected to commence construction in 2017. The proposed project is expected to include multifamily, retail, office, and senior housing components and an entertainment space. The project has not identified any retail tenants.
The following table presents certain information relating to comparable retail properties for the Easton Town Center Property:
Competitive Set(1)
Easton Town (Subject) | Polaris Fashion Place | Mall at Tuttle Crossing | Eastland Mall | |
| Location | Columbus, OH | Columbus, OH | Columbus, OH | Columbus, OH |
| Distance from Subject | -- | 7.0 miles | 11.0 miles | 9.0 miles |
| Property Type | Urban Streetscape Retail Center | Regional Mall | Regional Mall | Regional Mall |
| Year Built/Renovated | 1999/2015 | 2001/NA | 1997/NA | 1968/2005 |
| Anchors | Macy’s, Nordstrom, AMC 30, Lifetime Fitness | Field & Stream, JCPenney, Macy’s, Sak’s Fifth Avenue, Sears, Von Maur | JCPenney, Sears, Macy’s(5) | Macy’s, Sears(6) |
| Total GLA | 1,797,744 SF(2) | 1,571,256 SF | 1,121,351 SF | 999,189 SF |
| Inline Sales PSF | $742(3) | $570 | $450 | $240 |
| Total Occupancy | 97.6%(4) | 98.0% | 96.0% | 47.0% |
| (1) | Information obtained from the appraisal and underwritten rent roll. |
| (2) | Total GLA includes non-collateral anchor tenants comprising 494,671 square feet. |
| (3) | Inline Sales PSF includes Apple and Tesla sales. Excluding Apple and Tesla, In-line Sales PSF for TTM April 2016 at the Easton Town Center Mortgaged Property was $629. |
| (4) | The Easton Town Center Property Total Occupancy of 97.6% is as of June 24, 2016. |
| (5) | The Mall at Tuttle Crossing has two Macy’s stores. |
| (6) | Eastland Mall’s other two anchor boxes are currently vacant. |
The Borrowers.The borrowing entities are Easton Town Center II, LLC, ETCBW, LLC, ETC Dime, LLC and ETC Fenlon, LLC, each with two independent directors. Legal counsel to the borrowers delivered a non-consolidation opinion in connection with the origination. There is no non-recourse carve-out guarantor on the Easton Town Center Whole Loan. Easton Town Center II, LLC owns the equity interest in Easton Town Center III, LLC (the“Lifetime Fitness Fee Owner”), which in turn owns the fee interest in the Lifetime Fitness parcel that is ground leased to LTF Real Estate Company, Inc. The equity interest in the Lifetime Fitness Fee Owner is pledged as collateral for the Easton Town Center Whole Loan. See “Description of the Mortgage Pool—Mortgage Pool Characteristics—Property Types—Retail Properties” in the Preliminary Prospectus. The ground leasehold interest held by Lifetime Fitness is subject to a leasehold mortgage in favor of another lender. Additionally, the ground lease prohibits the Lifetime Fitness Fee Owner from mortgaging its fee interest and requires the Lifetime Fitness Fee Owner to subject its fee interest to the leasehold mortgage in certain circumstances.
THE INFORMATION IN THIS STRUCTURAL AND COLLATERAL TERM SHEET IS NOT COMPLETE AND MAY BE AMENDED PRIOR TO THE TIME OF SALE. THIS TERM SHEET IS NOT AN OFFER TO SELL THESE SECURITIES AND IT IS NOT A SOLICITATION OF AN OFFER TO BUY THESE SECURITIES IN ANY JURISDICTION WHERE THE OFFER OR SALE IS NOT PERMITTED.
82
| EASTON TOWN CENTER |
The Sponsors.The sponsors of the Easton Town Center Mortgage Loan are L Brands, Inc. (“LBI”) and certain principals of the Georgetown Sponsor (“The Georgetown Company”).
L Brands, Inc. (“LBI”; NYSE: LB) was founded in 1963 by Leslie H. Wexner, in Columbus, Ohio where it remains headquartered. Leslie H. Wexner, the chairman and chief executive officer, founded LBI as one store and has subsequently expanded the company to operate more than 3,000 company-owned retail stores globally as of January 30, 2016. As of January 30, 2016, LBI’s products are sold in 738 franchised locations in over 80 countries. LBI owns Victoria’s Secret, PINK, Bath & Body Works, La Senza and Henri Bendel. All of the brands are focused on women’s intimate apparel, general apparel and personal care and beauty categories. For the fiscal year ended January 30, 2016, LBI reported net sales of approximately $12.2 billion, operating income of approximately $2.2 billion and net operating income of approximately $1.3 billion, an increase of approximately 6.1%, 12.2% and 20.2%, respectively, from the fiscal year ended January 31, 2015.
Founded in 1978, The Georgetown Company is a privately-held real estate company that owns, develops and manages commercial real estate, in addition to actively developing, acquiring and disposing of commercial real estate. The Georgetown Company and its principals have overseen, developed and managed over 20 million square feet of office, residential, retail and recreational properties. The Georgetown Company has over $3.0 billion in assets under management.
Escrows.The loan documents provide for upfront reserves in the amount of $7,161,275 for existing leasing obligations. Pursuant to the Easton Town Center Whole Loan documents, monthly escrows for real estate taxes, insurance premiums (unless insurance is being maintained under a blanket policy), replacement reserves, and tenant improvements and leasing commissions are only required during an event of default or during a Reserve Trigger Event (as defined below).
Following the occurrence and during the continuance of a Reserve Trigger Event or an event of default under the Easton Town Center Whole Loan documents, the borrower is required to escrow on each payment date: (i) real estate taxes; (ii) insurance premiums (unless insurance is maintained under a blanket policy); (iii) $21,353 (approximately $0.20 per square foot annually) for replacement reserves and such reserve is capped at 24 monthly payments ($512,472); and (iv) $160,147 (approximately $1.50 per square foot annually) for tenant improvements and leasing commissions and such reserve is capped at 24 monthly payments ($3,843,537).
A “Reserve Trigger Event” will commence upon (i) an event of default or (ii) the debt service coverage ratio being less than 1.20x for two consecutive quarters. A Reserve Trigger Event will end upon the cure of an event of default or when (i) the debt service coverage ratio is at least 1.25x for two consecutive quarters or (ii) cash is deposited in a reserve in an amount that would be necessary to prepay the Easton Town Center Whole Loan in order to achieve a debt service coverage ratio equal to 1.25x.
Lockbox and Cash Management.The Easton Town Center Whole Loan requires a lender-controlled lockbox account, which is already in place, and that the borrower direct tenants to pay all rents directly into such lockbox account. The loan documents also require that all rents received by the borrower or the property manager be deposited into the lockbox account within three business days of receipt. So long as no Lockbox Event (as defined below) has occurred and is continuing, the funds in the lockbox account will be swept on a periodic basis to the borrower’s operating account. Upon the occurrence and during the continuance of a Lockbox Event, all cash flow is swept into a lender-controlled cash management account.
A “Lockbox Event” will commence upon, (i) an event of default under the Easton Town Center Whole Loan documents or (ii) the debt service coverage ratio is less than 1.20x for two consecutive quarters. A Lockbox Event will end upon the occurrence of the applicable Lockbox Termination Event (as defined below).
A “Lockbox Termination Event” will mean, with respect to clause (i) above, the lender accepting the cure of such event of default or with respect to clause (ii) above, the debt service coverage ratio is greater than or equal to 1.25x for two consecutive quarters or cash is deposited in a reserve in an amount that would be necessary to prepay the Easton Town Center Whole Loan in order to achieve a debt service coverage ratio equal to 1.25x.
Property Management. The Easton Town Center Property is managed by, Steiner Real Estate Services, LLC, who own an interest in the borrowing entity.
Assumption.The borrower has the right to transfer the Easton Town Center Mortgaged Property or more than 25.1% of the aggregate interests in the borrower, provided that no event of default exists under the Easton Town Center Whole Loan documents and certain other conditions are satisfied, including, but not limited to: either (a) that the transfer is not a prohibited transfer under the loan documents or (b) the proposed transferee is a qualified transferee as provided in the loan documents, which may be conditioned upon rating agency confirmation from Fitch, Moody’s and Morningstar that such assumption will not result in a downgrade, withdrawal or qualification of the respective ratings assigned to the Series 2016-C36 Certificates or similar ratings confirmations from each rating agency rating any securities backed by any the Easton Town Center Companion Loans with respect to the ratings of such securities.
Partial Release.Provided no event of default has occurred and is continuing under the Easton Town Center Whole Loan, the borrower has the right to (i) obtain the release of up to 25,000 square feet of income-producing parcels at the Easton Town Center Mortgaged Property and (ii) transfer such income-producing parcels to third parties for the purpose of the transferee erecting and operating additional structures consistent with a retail or mixed use project; provided that (A) the borrower provides at least 30 days’ notice specifying and describing the proposed usage of the release parcel(s) and said parcel(s) will not materially affect utility and operation of the Easton Town Center Property; (B) the borrower provides a rating agency confirmation from Fitch, Morningstar and Moody’s that the transfer will not result in a downgrade, withdrawal or qualification of the respective ratings assigned to the Series 2016-C36 Certificates or similar ratings confirmations from each rating agency rating any securities backed by any of the Easton Town Center Companion Loans with respect to the ratings of such securities; (C) the borrower provides a REMIC opinion; (D) the borrower prepays the Easton Town Center Whole Loan in an amount that will result in a debt yield of at least 7.47%; however, if
THE INFORMATION IN THIS STRUCTURAL AND COLLATERAL TERM SHEET IS NOT COMPLETE AND MAY BE AMENDED PRIOR TO THE TIME OF SALE. THIS TERM SHEET IS NOT AN OFFER TO SELL THESE SECURITIES AND IT IS NOT A SOLICITATION OF AN OFFER TO BUY THESE SECURITIES IN ANY JURISDICTION WHERE THE OFFER OR SALE IS NOT PERMITTED.
83
| EASTON TOWN CENTER |
the debt yield immediately prior to such release is greater than or equal to 7.47%, the borrower will not be required to make a prepayment in connection with such release; (E) the loan-to-value ratio immediately after the release will be less than or equal to 125%, provided that the borrower prepays the loan with the greater of yield maintenance premium or 1% of an amount as defined in the REMIC code; (F) the borrower provides evidence that the remaining property continues to conform and comply with any requirements as set forth in the Easton Town Center Whole Loan documents; (G) not less than 25.1% of the direct or indirect interest in the borrower is owned by the sponsors; and (H) the satisfaction of any other conditions set forth in the loan documents.
In addition, provided no event of default has occurred and is continuing under the Easton Town Center Whole Loan documents, the borrower has the right to (1) obtain the release of non-income producing parcel(s) as defined in the Easton Town Center Whole Loan documents and (2) transfer such non-income producing parcels to third parties for the purpose of the transferee erecting and operating additional structures consistent with a retail or mixed use project, provided that (a) the borrower provides at least 30 days’ notice specifying and describing the proposed usage of the release parcel(s) and said parcel(s) will not materially affect utility and operation of the Easton Town Center Property, (b) the loan-to-value ratio immediately after the release will be less than or equal to 125%, provided that the borrower prepays the loan with the greater of a yield maintenance premium or 1% of an amount as defined in the REMIC code and (c) evidence is provided that the remaining property continues to conform and comply with any requirements as set forth in the Easton Town Center Loan documents.
Real Estate Substitution.Not permitted.
Subordinate and Mezzanine Indebtedness.The Easton Town Center Whole Loan includes sixpari passuand two subordinate promissory notes (Note A-1-A, Note A-2-A, Note A-1-B-1, Note A-1-B-2, Note A-1-B-3, Note A-2-B, Note B-1 and Note B-2) with an aggregate original principal balance of $700,000,000, and an outstanding aggregate principal balance as of the Cut-off Date of $700,000,000. The two subordinate notes (Note B-1 and Note B-2) have an aggregate original principal balance of $362,500,000 and an aggregate outstanding principal balance as of the Cut-off Date of $362,500,000.
In addition, provided no event of default has occurred and is continuing and upon written notice provided to the lender, the borrower is permitted to incur future mezzanine indebtedness, provided that (a) mezzanine lender enters into an intercreditor agreement acceptable to the rating agencies and reasonably acceptable to the lender; (b) the mezzanine loan will have a term that is at least co-terminus with the Easton Town Center Whole Loan; (c) the combined loan-to-value ratio will not be greater than 56.5%; (d) the debt service coverage ratio of the Easton Town Center Whole Loan and mezzanine indebtedness will not be less than 2.14x; (d) a rating agency confirmation from Fitch, Moody’s and Morningstar that the future mezzanine indebtedness will not result in a downgrade, withdrawal or qualification of the respective ratings assigned to the Series 2016-C36 Certificates or similar ratings confirmations from each rating agency rating any securities backed by any of the Easton Town Center Companion Loans with respect to the ratings of such securities; and (e) any other requirements as stated under the loan documents are met.
Ground Lease.None.
Terrorism Insurance.The borrower is required to maintain an “all-risk” insurance policy that provides coverage for terrorism in an amount equal to the full replacement cost of the Easton Town Center Property. If the Terrorism Risk Insurance Program Reauthorization Act is not in effect, the borrower is not required to pay annual premiums in excess of 200.0% of the then-current annual insurance premiums payable by the borrower for the policies insuring only the Easton Town Center Mortgaged Property on a stand-alone basis in order to obtain the terrorism coverage and, if the cost of terrorism insurance exceeds such cap, the borrower is required to purchase the maximum amount of terrorism insurance available with funds equal to such cap. The loan documents also require business interruption insurance for a period of 18-months, plus an additional 12-months extended period of indemnity.
THE INFORMATION IN THIS STRUCTURAL AND COLLATERAL TERM SHEET IS NOT COMPLETE AND MAY BE AMENDED PRIOR TO THE TIME OF SALE. THIS TERM SHEET IS NOT AN OFFER TO SELL THESE SECURITIES AND IT IS NOT A SOLICITATION OF AN OFFER TO BUY THESE SECURITIES IN ANY JURISDICTION WHERE THE OFFER OR SALE IS NOT PERMITTED.
84
(THIS PAGE INTENTIONALLY LEFT BLANK)
THE INFORMATION IN THIS STRUCTURAL AND COLLATERAL TERM SHEET IS NOT COMPLETE AND MAY BE AMENDED PRIOR TO THE TIME OF SALE. THIS TERM SHEET IS NOT AN OFFER TO SELL THESE SECURITIES AND IT IS NOT A SOLICITATION OF AN OFFER TO BUY THESE SECURITIES IN ANY JURISDICTION WHERE THE OFFER OR SALE IS NOT PERMITTED.
85
| CONRAD INDIANAPOLIS |

THE INFORMATION IN THIS STRUCTURAL AND COLLATERAL TERM SHEET IS NOT COMPLETE AND MAY BE AMENDED PRIOR TO THE TIME OF SALE. THIS TERM SHEET IS NOT AN OFFER TO SELL THESE SECURITIES AND IT IS NOT A SOLICITATION OF AN OFFER TO BUY THESE SECURITIES IN ANY JURISDICTION WHERE THE OFFER OR SALE IS NOT PERMITTED.
86
| CONRAD INDIANAPOLIS |

THE INFORMATION IN THIS STRUCTURAL AND COLLATERAL TERM SHEET IS NOT COMPLETE AND MAY BE AMENDED PRIOR TO THE TIME OF SALE. THIS TERM SHEET IS NOT AN OFFER TO SELL THESE SECURITIES AND IT IS NOT A SOLICITATION OF AN OFFER TO BUY THESE SECURITIES IN ANY JURISDICTION WHERE THE OFFER OR SALE IS NOT PERMITTED.
87
| No. 6 – Conrad Indianapolis | |||||||
| Loan Information | Property Information | ||||||
| Mortgage Loan Seller: | Wells Fargo Bank, National Association | Single Asset/Portfolio: | Single Asset | ||||
| Credit Assessment (Fitch/Moody’s/Morningstar): | NR/NR/NR | Property Type: | Hospitality | ||||
| Original Principal Balance(1): | $32,000,000 | Specific Property Type: | Full Service | ||||
| Cut-off Date Balance(1): | $31,962,031 | Location: | Indianapolis, IN | ||||
| % of Initial Pool Balance: | 3.7% | Size: | 247 Rooms | ||||
| Loan Purpose: | Refinance | Cut-off Date Balance Per Room(1): | $225,239 | ||||
| Borrower Names(2): | Circle Block Hotel, LLC; Circle Block Operators, LLC | Year Built/Renovated: | 2006/2015 | ||||
| Sponsors: | Alvin E. Kite; John Kite; Thomas McGowan | Title Vesting: | Fee | ||||
| Mortgage Rate: | 4.520% | Property Manager: | HLT Conrad Domestic LLC | ||||
| Note Date: | September 13, 2016 | 4thMost Recent Occupancy(As of)(4): | 70.9% (12/31/2012) | ||||
| Anticipated Repayment Date: | NAP | 3rdMost Recent Occupancy (As of)(4): | 72.9% (12/31/2013) | ||||
| Maturity Date: | October 11, 2026 | 2ndMost Recent Occupancy (As of)(4): | 75.0% (12/31/2014) | ||||
| IO Period: | None | Most Recent Occupancy (As of)(4): | 71.5% (12/31/2015) | ||||
| Loan Term (Original): | 120 months | Current Occupancy (As of): | 73.0% (8/31/2016) | ||||
| Seasoning: | 1 month | ||||||
| Amortization Term (Original): | 360 months | Underwriting and Financial Information: | |||||
| Loan Amortization Type: | Amortizing Balloon | ||||||
| Interest Accrual Method: | Actual/360 | 4thMost Recent NOI (As of)(4): | $6,184,748 (12/31/2013) | ||||
| Call Protection: | L(25),D(90),O(5) | 3rdMost Recent NOI (As of)(4): | $6,521,006 (12/31/2014) | ||||
| Lockbox Type: | Springing | 2ndMost Recent NOI (As of)(4)(5): | $6,202,235 (12/31/2015) | ||||
| Additional Debt(1): | Yes | Most Recent NOI (As of)(5): | $6,847,604 (TTM 8/31/2016) | ||||
| Additional Debt Type(1): | Pari Passu | ||||||
| U/W Revenues: | $23,499,703 | ||||||
| U/W Expenses: | $16,504,584 | ||||||
| U/W NOI: | $6,995,119 | ||||||
| U/W NCF: | $5,820,134 | ||||||
| U/W NOI DSCR(1): | 2.06x | ||||||
| U/W NCF DSCR(1): | 1.71x | ||||||
| Escrows and Reserves(3): | U/W NOI Debt Yield(1): | 12.6% | |||||
| U/W NCF Debt Yield(1): | 10.5% | ||||||
| Type: | Initial | Monthly | Cap (If Any) | As-Is Appraised Value: | $85,900,000 | ||
| Taxes | $0 | $97,100 | NAP | As-Is Appraisal Valuation Date: | August 9, 2016 | ||
| Insurance | $0 | Springing | NAP | Cut-off Date LTV Ratio(1): | 64.8% | ||
| FF&E Reserve | $0 | Springing | NAP | LTV Ratio at Maturity or ARD(1): | 52.5% | ||
| (1) | See “The Mortgage Loan” section. All statistical financial information related to balance per room, loan-to-value ratios, debt service coverage ratios and debt yields are based on the funded outstanding principal balance of the Conrad Indianapolis Whole Loan (as defined below) as of the Cut-off Date. |
| (2) | See “Operating Lease” section. |
| (3) | See “Escrows” section. |
| (4) | 2012, 2013, 2014 and part of 2015 historical operations are based on 243 rooms, prior to the addition of the four “The Collection” suites. See “The Property” section. |
| (5) | See “Cash Flow Analysis” section. |
The Mortgage Loan. The mortgage loan (the “Conrad Indianapolis Mortgage Loan”) is part of a whole loan (the “Conrad Indianapolis Whole Loan”) that is evidenced by twopari passu promissory notes (Notes A-1 and A-2) secured by a first mortgage encumbering the fee interest in a full service hotel located in Indianapolis, Indiana (the “Conrad Indianapolis Property”). The Conrad Indianapolis Whole Loan was originated on September 13, 2016 by Wells Fargo Bank, National Association. The Conrad Indianapolis Whole Loan had an original principal balance of $55,700,000, has an outstanding principal balance as of the Cut-off Date of $55,633,911 and accrues interest at an interest rate of 4.520%per annum. The Conrad Indianapolis Whole Loan had an initial term of 120 months, has a remaining term of 119 months as of the Cut-off Date and requires payments of principal and interest based on a 30-year amortization schedule through the term of the Conrad Indianapolis Whole Loan. The Conrad Indianapolis Whole Loan matures on October 11, 2026.
Note A-1, which will be contributed to the WFCM 2016-C36 Trust, had an original principal balance of $32,000,000, has an outstanding principal balance as of the Cut-off Date of $31,962,031 and represents the controlling interest in the Conrad Indianapolis Whole Loan. The non-controlling Note A-2, which had an original principal balance of $23,700,000, referred to herein as the “Conrad Indianapolis Companion Loan”, is expected to be contributed to a future securitization trust. The lender provides no assurances that any non-securitizedpari passunote will not be split further. See “Description of the Mortgage Pool—The Whole Loans—The Serviced Whole Loans—The Conrad Indianapolis Whole Loan” in the Preliminary Prospectus.
THE INFORMATION IN THIS STRUCTURAL AND COLLATERAL TERM SHEET IS NOT COMPLETE AND MAY BE AMENDED PRIOR TO THE TIME OF SALE. THIS TERM SHEET IS NOT AN OFFER TO SELL THESE SECURITIES AND IT IS NOT A SOLICITATION OF AN OFFER TO BUY THESE SECURITIES IN ANY JURISDICTION WHERE THE OFFER OR SALE IS NOT PERMITTED.
88
| CONRAD INDIANAPOLIS |
Note Summary
| Notes | Original Balance | Note Holder | Controlling Interest | |
| A-1 | $32,000,000 | WFCM 2016-C36 | Yes | |
| A-2 | $23,700,000 | Wells Fargo Bank, National Association | No | |
| Total | $55,700,000 |
Following the lockout period, the borrower has the right to defease the Conrad Indianapolis Whole Loan in whole, but not in part, on any date before June 11, 2026. In addition, the Conrad Indianapolis Whole Loan is prepayable without penalty on or after June 11, 2026. The lockout period will expire on the earlier to occur of (i) two years after the closing date of the securitization that includes the last note to be securitized and (ii) November 11, 2019.
Sources and Uses
| Sources | Uses | |||||||
| Original whole loan amount | $55,700,000 | 100.0% | Loan payoff(1) | $51,856,757 | 93.1% | |||
| Closing costs | 1,302,527 | 2.3 | ||||||
| Return of equity | 2,540,716 | 4.6 | ||||||
| Total Sources | $55,700,000 | 100.0% | Total Uses | $55,700,000 | 100.0% |
| (1) | The Conrad Indianapolis Property was previously securitized in the CSMC 2007-C1 transaction. |
The Property.The Conrad Indianapolis Property consists of two condominium units, each of which is part of separate mixed-use condominiums consisting of (i) floors one through 18 of a 23-story, full-service hotel comprising 247 guestrooms (“Unit One”) and (ii) restaurant and conference room space in the adjacent building (“Unit Two”), located in the central business district (“CBD”) of Indianapolis, Indiana. Situated on a 1.1-acre parcel, the Conrad Indianapolis Property was originally constructed in 2006 and renovated in 2015 with the addition of four “The Collection” luxury suites, each of which is approximately 800 square feet, with a focus on famous names in modern and contemporary art and which attain a significant premium compared to typical room rates. A total of approximately $6.4 million ($25,911 per room) was spent on capital projects since the Conrad Indianapolis Property opened, including $1.8 million for the creation of “The Collection” suites in 2015. Part of Hilton’s luxury grouping of hotels, The Conrad Hotels & Resorts brand consists of 26 properties across five continents, including five in the United States (including the Conrad Chicago, which is now accepting reservations for arrival on November 17, 2016).
The Conrad Indianapolis Property contains 160 king guestrooms, 41 double double guestrooms, 20 corner suites, 17 handicap accessible guestrooms, four “other” suites, four “The Collection” suites and one presidential suite. The king bedded guestrooms feature two nightstands, a bench, a desk with a chair, a sofa, a coffee table, a chair and a dresser. The double double bedded guestrooms feature a nightstand, a desk with a chair and a dresser. All of the guestrooms are equipped with a two-line with voicemail, a data port, high-speed wireless internet access, an LCD television and a coffeemaker. Amenities at the Conrad Indianapolis Property include 15,068 square feet of meeting space, an indoor swimming pool, a fitness center, a business center, a concierge lounge, an art gallery, a spa/salon and two high-end restaurants (Capital Grille and Tastings – A Wine Experience).
The Conrad Indianapolis Property contains a total of 110 dedicated parking spaces in the parking garage situated on the third and fourth floors, accounting for a parking ratio of 0.4 spaces per room. According to the appraisal, the demand segmentation for the Conrad Indianapolis Property is 43.0% corporate, 40.0% group and 17.0% leisure. The management agreement with HLT Conrad Domestic LLC expires in April 2031.
Condominium.The Conrad Indianapolis Property is comprised of two separate condominium units (as outlined in “The Property” section) in two separate condominium regimes. The Conrad Indianapolis Whole Loan borrower has a combined 75.3% voting interest in the Unit One master association and the power to appoint two of the three directors. The Conrad Indianapolis Whole Loan borrower has a combined 16.9% voting interest in the Unit Two master association and has the power to appoint one of the three directors. Further, certain material actions require consent of a supramajority (90.0%) of the board, including any increase in allocated costs or liabilities, the imposition of rules or limitations that would impose restrictions on the Conrad Indianapolis Whole Loan borrower and unanimous consent of the board is required for any amendment to the condominium documents. The loan documents provide for personal liability to the borrower and guarantors for losses related to amendment or termination of the condominium regime without the lender’s consent.
THE INFORMATION IN THIS STRUCTURAL AND COLLATERAL TERM SHEET IS NOT COMPLETE AND MAY BE AMENDED PRIOR TO THE TIME OF SALE. THIS TERM SHEET IS NOT AN OFFER TO SELL THESE SECURITIES AND IT IS NOT A SOLICITATION OF AN OFFER TO BUY THESE SECURITIES IN ANY JURISDICTION WHERE THE OFFER OR SALE IS NOT PERMITTED.
89
| CONRAD INDIANAPOLIS |
Operating History and Underwritten Net Cash Flow. The following table presents certain information relating to the historical operating performance and the underwritten net cash flow at the Conrad Indianapolis Property:
Cash Flow Analysis
| 2013(1) | 2014(1) | 2015(1) | TTM 8/31/2016 | U/W | % of U/W Total Revenue | U/W $ per Room | |
| Occupancy | 72.9% | 75.0% | 71.5% | 73.0% | 73.0% | ||
| ADR | $203.22 | $207.64 | $222.92 | $227.39 | $227.39 | ||
| RevPAR | $148.12 | $155.64 | $159.40 | $165.93 | $165.93 | ||
| Room Revenue | $13,137,251 | $13,804,235 | $14,370,449 | $14,959,786 | $14,959,786 | 63.7% | $60,566 |
| F&B Revenue | 5,112,368 | 5,167,468 | 6,078,837 | 6,327,595 | 6,327,595 | 26.9 | 25,618 |
| Other Revenue(2) | 2,171,405 | 2,166,205 | 2,259,293 | 2,212,322 | 2,212,322 | 9.4 | 8,957 |
| Total Revenue | $20,421,024 | $21,137,908 | $22,708,579 | $23,499,703 | $23,499,703 | 100.0% | $95,140 |
| Total Department Expenses | 7,380,275 | 7,246,403 | 8,121,312 | 7,825,423 | 7,825,423 | 33.3 | 31,682 |
| Gross Operating Profit | $13,040,749 | $13,891,505 | $14,587,267 | $15,674,280 | $15,674,280 | 66.7% | $63,459 |
| Total Undistributed Expenses | 5,939,813 | 6,396,528 | 7,108,840 | 7,390,656 | 7,192,356 | 30.6 | 29,119 |
| Profit Before Fixed Charges | $7,100,936 | $7,494,977 | $7,478,427 | $8,283,624 | $8,481,924 | 36.1% | $34,340 |
| Total Fixed Charges | 916,188 | 973,971 | 1,276,192 | 1,436,020 | 1,486,805 | 6.3 | 6,019 |
| Net Operating Income | $6,184,748 | $6,521,006 | $6,202,235(3) | $6,847,604(3) | $6,995,119 | 29.8% | $28,320 |
| FF&E | 0 | 0 | 0 | 0 | 1,174,985 | 5.0 | 4,757 |
| Net Cash Flow | $6,184,748 | $6,521,006 | $6,202,235 | $6,847,604 | $5,820,134 | 24.8% | $23,563 |
| NOI DSCR(4) | 1.82x | 1.92x | 1.83x | 2.02x | 2.06x | ||
| NCF DSCR(4) | 1.82x | 1.92x | 1.83x | 2.02x | 1.71x | ||
| NOI DY(4) | 11.1% | 11.7% | 11.1% | 12.3% | 12.6% | ||
| NCF DY(4) | 11.1% | 11.7% | 11.1% | 12.3% | 10.5% | ||
| (1) | 2013, 2014 and part of 2015 historical operating statements reflect performance for 243 rooms as the four “The Collection” suites did not come online until May 2015. |
| (2) | Other Revenue is comprised of leased space income (approximately $800,000), parking income, telephone charges, spa memberships and laundry (approximately $1.3 million in aggregate) and other miscellaneous revenue. |
| (3) | The increase in net operating income from 2015 to TTM 8/31/2016 was due to twelve full months of stabilized performance of the four “The Collection” suites, which contributed approximately $493,000 of revenue. |
| (4) | The debt service coverage ratios and debt yields are based on the Conrad Indianapolis Whole Loan. |
The Appraisal.As of the appraisal valuation date of August 9, 2016, the Conrad Indianapolis Property had an “as-is” appraised value of $85,900,000. The appraiser also concluded to an “as-stabilized” value of $96,700,000, which equates to an “as-stabilized” loan-to-value-ratio of 57.6% as of August 9, 2019, and assumes a stabilized RevPAR of $190.92.
Environmental Matters. According to a Phase I environmental assessment dated August 10, 2016, there was no evidence of any recognized environmental conditions at the Conrad Indianapolis Property.
Market Overview and Competition.The Conrad Indianapolis Property is located in the Indianapolis CBD, Indiana, in the heart of “Circle City”, the drive encircling the Soldiers’ and Sailors’ Monument at the center of Indianapolis. According to a third party research firm, approximately 27.4 million visitors to Indianapolis in 2015 generated $4.5 billion in total economic impact. The Conrad Indianapolis Property is located along the sky bridge, which provides direct interior access to the Indiana Convention Center, Circle Centre Mall and other local attractions. The Indiana Convention Center (four blocks west of the Conrad Indianapolis Property) underwent a major expansion in 2011 and now possesses over 1.2 million square feet of space for convention/meeting uses. The Simon Property Group-managed Circle Centre Mall (directly across the street), with three levels and 825,000 square feet of retail space, attracts more than one million visitors per month. Circle Centre Mall features over 100 retailers and according to a local newspaper, recorded its most profitable year ever in 2015. Other nearby attractions include Bankers Life Fieldhouse (0.4 miles southeast), home of the NBA’s Indianapolis Pacers, Lucas Oil Stadium (0.7 miles south), home of the NFL’s Indianapolis Colts, Indiana State Museum (0.6 miles west) and Indiana University – Purdue University Indianapolis (“IUPUI”) (1.0 mile northwest), a public research university with an enrollment of more than 30,000 students and the third largest university in Indiana. Indianapolis is also home to the Indianapolis Motor Speedway, which annually hosts the Indianapolis 500. Other recent major attractions have been the 2015 NCAA Men’s Final Four, the 2015 Big Ten Football Championship Game and the 2012 Super Bowl, among many others. Other nearby demand generators include Eli Lilly’s global headquarters (1.0 mile south), Simon Property Group’s global headquarters (directly adjacent) and the planned $30.0 million global distribution headquarters for Cummins Inc. in the Indianapolis CBD. Cummins Inc. is a Fortune 500 company that designs, manufactures, and distributes engines, filtration, and power generation products. The Indiana Pacers are collaborating with St. Vincent’s Health to develop a state-of-the-art training facility called the St. Vincent Center. The development is expected to cost $50.0 million and is anticipated to be completed in February 2017. The new 5-story, 130,000 square foot training facility is expected to be located adjacent to Bankers Life Fieldhouse.
According to a local business journal, since the Indiana Convention Center expansion opened in 2011, the number of hotel rooms in Indianapolis has declined 4.5% (approximately 1,060 rooms), mostly due to redevelopment opportunities. According to the appraisal, the estimated 2016 population within a three- and five-mile radius of the Conrad Indianapolis Property was 96,539 and 240,141, respectively; the estimated 2016 average household income within the same radii was $42,779 and $43,416, respectively.
THE INFORMATION IN THIS STRUCTURAL AND COLLATERAL TERM SHEET IS NOT COMPLETE AND MAY BE AMENDED PRIOR TO THE TIME OF SALE. THIS TERM SHEET IS NOT AN OFFER TO SELL THESE SECURITIES AND IT IS NOT A SOLICITATION OF AN OFFER TO BUY THESE SECURITIES IN ANY JURISDICTION WHERE THE OFFER OR SALE IS NOT PERMITTED.
90
| CONRAD INDIANAPOLIS |
The following table presents certain information relating to the Conrad Indianapolis Property’s competitive set:
Subject and Market Historical Occupancy, ADR and RevPAR(1)
Competitive Set | Conrad Indianapolis | Penetration Factor | |||||||
Year | Occupancy | ADR | RevPAR | Occupancy | ADR | RevPAR | Occupancy | ADR | RevPAR |
| 8/31/2016 TTM | 74.1% | $167.32 | $124.01 | 72.4% | $228.54 | $165.48 | 97.7% | 136.6% | 133.4% |
| 8/31/2015 TTM | 72.0% | $163.09 | $117.42 | 72.0% | $219.15 | $157.85 | 100.0% | 134.4% | 134.4% |
| 8/31/2014 TTM | 72.7% | $155.21 | $112.79 | 75.4% | $206.46 | $155.70 | 103.8% | 133.0% | 138.0% |
| (1) | Information obtained from a third party hospitality research report dated September 19, 2016. The competitive set includes: Hyatt Regency Indianapolis, Le Meridien Indianapolis, Westin Indianapolis, Omni Severin Hotel, JW Marriott Indianapolis and Dolce The Alexander. |
The Borrowers.The borrowers are Circle Block Hotel, LLC (the fee owner) and Circle Block Operators, LLC (the leasehold owner), both Delaware limited liability companies and single purpose entities each with two independent directors. See “Operating Lessee” section. Legal counsel to the borrower delivered a non-consolidation opinion in connection with the origination of the Conrad Indianapolis Whole Loan. Alvin E. Kite, John Kite and Thomas McGowan are the guarantors of certain nonrecourse carveouts under the Conrad Indianapolis Whole Loan.
Operating Lessee. The fee owner (Circle Block Hotel, LLC) leases the Conrad Indianapolis Property to Circle Block Operators, LLC pursuant to an operating lease (the “Conrad Indianapolis Operating Lease”). The Conrad Indianapolis Operating Lease will be collapsed and terminated shortly after origination of the Conrad Indianapolis Whole Loan.
The Sponsors.The sponsors are Alvin E. Kite, John Kite and Thomas McGowan, all executives of Kite Realty Group Trust (“Kite”). Alvin E. Kite is the founder and chairman of Kite’s predecessor company and other affiliated companies, and previously served as chairman of the board of trustees from Kite’s initial public offering in August 2004 to December 2008. John Kite is the chairman and chief executive officer and Thomas McGowan is the president and chief operating officer of Kite. Kite is a full-service real estate investment trust engaged in the ownership, operation, management, leasing, acquisition, construction, redevelopment and development of neighborhood and community shopping centers in the United States. As of June 30, 2016, Kite owned interests in a portfolio of 121 operating, development and redevelopment properties totaling approximately 24.0 million square feet across 20 states. While none of the individual guarantors were involved in prior defaults, Kite defaulted on a loan in 2013 due to a decrease in occupancy. See “Description of the Mortgage Pool – Loan Purpose; Default History, Bankruptcy Issues and Other Proceedings” in the Preliminary Prospectus.
Escrows.The loan documents provide for ongoing monthly reserves in the amount of $97,100 for real estate taxes. The loan documents do not require ongoing monthly escrows for insurance premiums as long as (i) no event of default has occurred and is continuing; (ii) the Conrad Indianapolis Property is insured via an acceptable blanket insurance policy; and (iii) the borrower provides the lender with evidence of renewal of the policies and timely proof of payment of insurance premiums. The loan documents do not require ongoing monthly escrows for FF&E as long as monthly reserves of 4.0% of total revenues (5.0% beginning January 2022) are being held with the property manager (an affiliate of Hilton) in accordance with the management agreement.
Lockbox and Cash Management. Upon the occurrence and during the continuance of a Cash Trap Event Period (as defined below), the Conrad Indianapolis Whole Loan requires that the borrowers establish a lockbox account and the borrowers or property manager shall deposit all rents into such lockbox account and such funds will be swept to the cash management account. During a Cash Trap Event Period, all excess cash flow after payment of all sums due and payable under the loan documents and all operating expenses will be retained by the lender as additional collateral.
A “Cash Trap Event Period” will commence upon any of the following: (i) the occurrence and continuance of an event of default or (ii) the trailing-twelve month net cash flow debt yield falling below 7.5% (tested quarterly). A Cash Trap Event Period will be cured, with regard to clause (i), upon the cure of such event of default; and with regard to clause (ii), upon the net cash flow debt yield being equal to or greater than 8.0% for two consecutive calendar quarters.
Property Management.The Conrad Indianapolis Property is managed by HLT Conrad Domestic LLC.
Assumption.The borrower has a two-time right to transfer the Conrad Indianapolis Property provided that certain conditions are satisfied, including (i) no event of default has occurred and is continuing; (ii) the lender reasonably determines that the proposed transferee and guarantor satisfy the lender’s credit review and underwriting standards, taking into consideration the transferee’s experience, financial strength and general business standing; and (iii) if required by the lender, the lender has received confirmation from Fitch, Moody’s and Morningstar that such assumption will not result in a downgrade, withdrawal or qualification of the respective ratings assigned to the Series 2016-C36 Certificates and similar confirmations from each rating agency rating any securities backed by the Conrad Indianapolis Companion Loan with respect to the ratings of such securities.
Right of First Offer.The property manager, HLT Conrad Domestic LLC, has right of first offer (“ROFO”) if the borrower decides to market the Conrad Indianapolis Property for sale. The ROFO is not extinguished by foreclosure; however, the ROFO does not apply to foreclosure or deed in lieu thereof.
Partial Release.Not permitted.
Real Estate Substitution.Not permitted.
THE INFORMATION IN THIS STRUCTURAL AND COLLATERAL TERM SHEET IS NOT COMPLETE AND MAY BE AMENDED PRIOR TO THE TIME OF SALE. THIS TERM SHEET IS NOT AN OFFER TO SELL THESE SECURITIES AND IT IS NOT A SOLICITATION OF AN OFFER TO BUY THESE SECURITIES IN ANY JURISDICTION WHERE THE OFFER OR SALE IS NOT PERMITTED.
91
| CONRAD INDIANAPOLIS |
Subordinate and Mezzanine Indebtedness. Not permitted.
Ground Lease.None.
Terrorism Insurance.The loan documents require that the “all risk” insurance policy required to be maintained by the borrower provide coverage for terrorism in an amount equal to the full replacement cost of the Conrad Indianapolis Property. The loan documents also require business interruption insurance covering no less than the 18-month period following the occurrence of a casualty event, together with a six-month extended period of indemnity.
THE INFORMATION IN THIS STRUCTURAL AND COLLATERAL TERM SHEET IS NOT COMPLETE AND MAY BE AMENDED PRIOR TO THE TIME OF SALE. THIS TERM SHEET IS NOT AN OFFER TO SELL THESE SECURITIES AND IT IS NOT A SOLICITATION OF AN OFFER TO BUY THESE SECURITIES IN ANY JURISDICTION WHERE THE OFFER OR SALE IS NOT PERMITTED.
92
(THIS PAGE INTENTIONALLY LEFT BLANK)
THE INFORMATION IN THIS STRUCTURAL AND COLLATERAL TERM SHEET IS NOT COMPLETE AND MAY BE AMENDED PRIOR TO THE TIME OF SALE. THIS TERM SHEET IS NOT AN OFFER TO SELL THESE SECURITIES AND IT IS NOT A SOLICITATION OF AN OFFER TO BUY THESE SECURITIES IN ANY JURISDICTION WHERE THE OFFER OR SALE IS NOT PERMITTED.
93
(THIS PAGE INTENTIONALLY LEFT BLANK)
THE INFORMATION IN THIS STRUCTURAL AND COLLATERAL TERM SHEET IS NOT COMPLETE AND MAY BE AMENDED PRIOR TO THE TIME OF SALE. THIS TERM SHEET IS NOT AN OFFER TO SELL THESE SECURITIES AND IT IS NOT A SOLICITATION OF AN OFFER TO BUY THESE SECURITIES IN ANY JURISDICTION WHERE THE OFFER OR SALE IS NOT PERMITTED.
94
MALL AT TURTLE CREEK
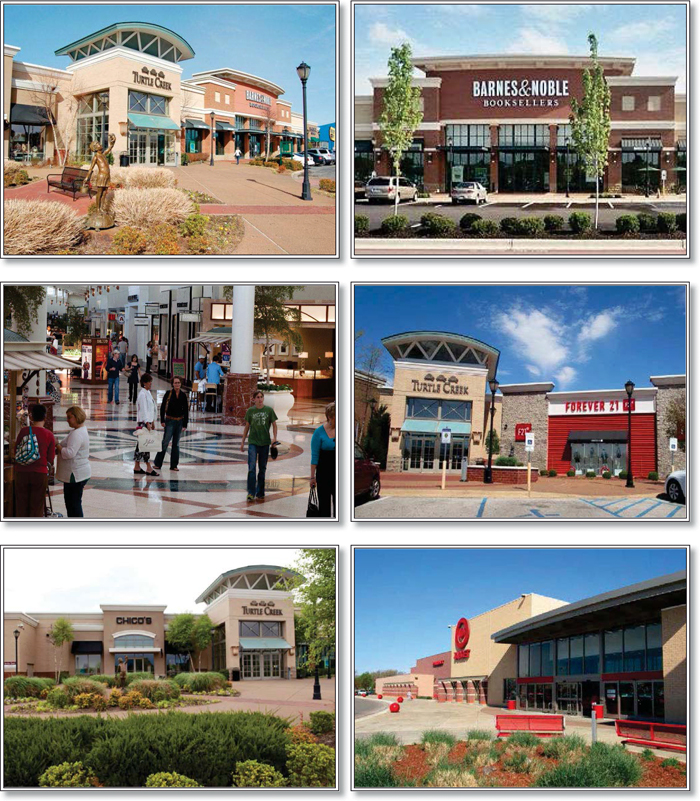
THE INFORMATION IN THIS STRUCTURAL AND COLLATERAL TERM SHEET IS NOT COMPLETE AND MAY BE AMENDED PRIOR TO THE TIME OF SALE. THIS TERM SHEET IS NOT AN OFFER TO SELL THESE SECURITIES AND IT IS NOT A SOLICITATION OF AN OFFER TO BUY THESE SECURITIES IN ANY JURISDICTION WHERE THE OFFER OR SALE IS NOT PERMITTED.
95
MALL AT TURTLE CREEK
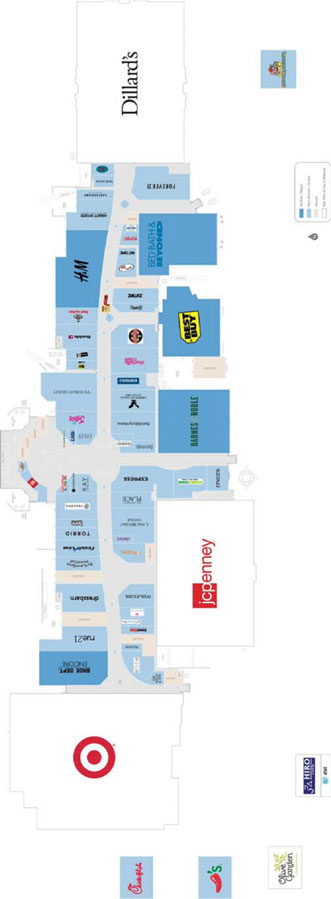
THE INFORMATION IN THIS STRUCTURAL AND COLLATERAL TERM SHEET IS NOT COMPLETE AND MAY BE AMENDED PRIOR TO THE TIME OF SALE. THIS TERM SHEET IS NOT AN OFFER TO SELL THESE SECURITIES AND IT IS NOT A SOLICITATION OF AN OFFER TO BUY THESE SECURITIES IN ANY JURISDICTION WHERE THE OFFER OR SALE IS NOT PERMITTED.
96
MALL AT TURTLE CREEK
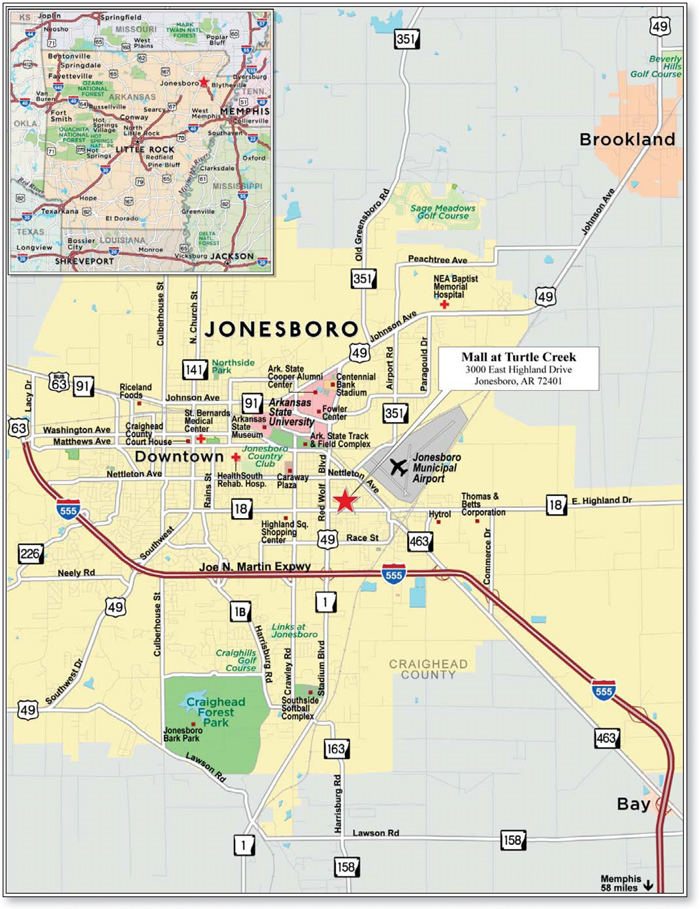
THE INFORMATION IN THIS STRUCTURAL AND COLLATERAL TERM SHEET IS NOT COMPLETE AND MAY BE AMENDED PRIOR TO THE TIME OF SALE. THIS TERM SHEET IS NOT AN OFFER TO SELL THESE SECURITIES AND IT IS NOT A SOLICITATION OF AN OFFER TO BUY THESE SECURITIES IN ANY JURISDICTION WHERE THE OFFER OR SALE IS NOT PERMITTED.
97
| No. 7 – Mall at Turtle Creek | |||||||
| Loan Information | Property Information | ||||||
| Mortgage Loan Seller: | Barclays Bank PLC | Single Asset/Portfolio: | Single Asset | ||||
Credit Assessment (Fitch/Moody’s/Morningstar): | NR/NR/NR | Property Type: | Retail | ||||
| Original Principal Balance(1): | $29,860,000 | Specific Property Type: | Regional Mall | ||||
| Cut-off Date Balance(1): | $29,683,636 | Location: | Jonesboro, AR | ||||
| % of Initial Pool Balance: | 3.5% | Size: | 329,398 SF | ||||
| Loan Purpose: | Refinance | Cut-off Date Balance Per SF(1): | $216.87 | ||||
| Borrower Name: | RPI Turtle Creek Mall, LLC | Year Built/Renovated: | 2006/NAP | ||||
| Sponsor: | Rouse Properties, LP | Title Vesting: | Fee | ||||
| Mortgage Rate: | 4.780% | Property Manager: | Self-managed | ||||
| Note Date: | June 2, 2016 | 4thMost Recent Occupancy (As of)(3): | 91.6% (12/31/2012) | ||||
| Anticipated Repayment Date: | NAP | 3rdMost Recent Occupancy (As of)(3): | 91.9% (12/31/2013) | ||||
| Maturity Date: | June 6, 2026 | 2ndMost Recent Occupancy (As of)(3): | 89.3% (12/31/2014) | ||||
| IO Period: | None | Most Recent Occupancy (As of)(3): | 91.2% (12/31/2015) | ||||
| Loan Term (Original): | 120 months | Current Occupancy (As of)(3): | 90.8% (4/1/2016) | ||||
| Seasoning: | 5 months | ||||||
| Amortization Term (Original): | 360 months | Underwriting and Financial Information: | |||||
| Loan Amortization Type: | Amortizing Balloon | ||||||
| Interest Accrual Method: | Actual/360 | 4thMost Recent NOI (As of): | $7,101,050 (12/31/2013) | ||||
| Call Protection: | L(29),D(87),O(4) | 3rdMost Recent NOI (As of): | $7,045,122 (12/31/2014) | ||||
| Lockbox Type: | Hard/Springing Cash Management | 2ndMost Recent NOI (As of): | $7,147,241 (12/31/2015) | ||||
| Additional Debt(1): | Yes | Most Recent NOI (As of)(4): | $7,260,314 (TTM 3/31/2016) | ||||
| Additional Debt Type(1): | Pari Passu | ||||||
| U/W Revenues(4): | $9,992,279 | ||||||
| U/W Expenses: | $2,364,573 | ||||||
| Escrows and Reserves(2): | U/W NOI(4): | $7,627,706 | |||||
| U/W NCF: | $7,084,199 | ||||||
| Type: | Initial | Monthly | Cap (If Any) | U/W NOI DSCR(1): | 1.69x | ||
| Taxes | $443,810 | $49,312 | NAP | U/W NCF DSCR(1): | 1.57x | ||
| Insurance | $0 | Springing | NAP | U/W NOI Debt Yield(1): | 10.7% | ||
| Replacement Reserves | $0 | $6,862 | $82,350 | U/W NCF Debt Yield(1): | 9.9% | ||
| TI/LC Reserve | $0 | $41,175 | $988,194 | As-Is Appraised Value: | $130,000,000 | ||
| Outstanding TI/LC Reserve | $2,907,450 | $0 | NAP | As-Is Appraisal Valuation Date: | April 5, 2016 | ||
| Free Rent Reserve | $151,667 | $0 | NAP | Cut-off Date LTV Ratio(1): | 55.0% | ||
| Bed, Bath & Beyond Reserve | $2,900,000 | $0 | NAP | LTV Ratio at Maturity or ARD(1): | 45.1% | ||
| (1) | See “The Mortgage Loan” section. All statistical financial information related to balances per square foot, loan-to-value ratios, debt service coverage ratios and debt yields are based on the Mall at Turtle Creek Whole Loan. |
| (2) | See “Escrows” section. |
| (3) | See “Historical Occupancy” section. |
| (4) | See “Cash Flow Analysis” section. |
The Mortgage Loan.The mortgage loan (the “Mall at Turtle Creek Mortgage Loan”) is part of a whole loan (the “Mall at Turtle Creek Whole Loan”) that is evidenced by two promissory notes (Notes A-1 and A-2) secured by a first mortgage encumbering a regional mall located in Jonesboro, Arkansas (the “Mall at Turtle Creek Property”). The Mall at Turtle Creek Whole Loan was originated on June 2, 2016 by Barclays Bank PLC. The Mall at Turtle Creek Whole Loan had an original principal balance of $71,860,000, has an outstanding principal balance as of the Cut-off Date of $71,435,569 and accrues interest at an interest rate of 4.780%per annum. The Mall at Turtle Creek Whole Loan had an initial term of 120 months, has a remaining term of 115 months as of the Cut-off Date and requires payments of principal and interest based on a 30-year amortization schedule through the term of the Mall at Turtle Creek Whole Loan. The Mall at Turtle Creek Whole Loan matures on June 6, 2026.
The Mall at Turtle Creek Mortgage Loan, evidenced by the non-controlling Note A-2, will be contributed to the WFCM 2016-C36 Trust, had an original principal balance of $29,860,000 and has an outstanding principal balance as of the Cut-off Date of $29,683,636. The controlling Note A-1 had an original principal balance of $42,000,000 and was contributed to the WFCM 2016-C35 Trust. See “Description of the Mortgage Pool—The Whole Loans—The Serviced Whole Loans—The Mall at Turtle Creek Whole Loan” in the Prospectus.
THE INFORMATION IN THIS STRUCTURAL AND COLLATERAL TERM SHEET IS NOT COMPLETE AND MAY BE AMENDED PRIOR TO THE TIME OF SALE. THIS TERM SHEET IS NOT AN OFFER TO SELL THESE SECURITIES AND IT IS NOT A SOLICITATION OF AN OFFER TO BUY THESE SECURITIES IN ANY JURISDICTION WHERE THE OFFER OR SALE IS NOT PERMITTED.
98
MALL AT TURTLE CREEK
Note Summary
| Notes | Original Balance | Note Holder | Controlling Interest | |
| A-1 | $42,000,000 | WFCM 2016-C35 Trust | Yes | |
| A-2 | $29,860,000 | WFCM 2016-C36 Trust | No | |
| Total | $71,860,000 |
Following the lockout period, the borrower has the right to defease the Mall at Turtle Creek Whole Loan in whole, but not in part, on any date before March 6, 2026. In addition, the Mall at Turtle Creek Whole Loan is prepayable without penalty on or after March 6, 2026.
Sources and Uses
| Sources | Uses | |||||||
| Original whole loan amount | $71,860,000 | 89.1% | Loan payoff(1) | $73,699,346 | 91.4% | |||
| Sponsor’s new cash contribution(2) | 8,784,412 | 10.9 | Reserves(2) | 6,402,927 | 7.9 | |||
| Closing costs | 542,139 | 0.7 | ||||||
| Total Sources | $80,644,412 | 100.0% | Total Uses | $80,644,412 | 100.0% |
| (1) | The Mall at Turtle Creek Mortgaged Property was previously securitized in the GCCFC 2006-GG7 transaction. |
| (2) | Subsequent to the Mall at Turtle Creek Whole Loan funding, $2.9 million initially held in escrow was released to the borrower after Bed, Bath & Beyond exercised its renewal option. |
The Property.The Mall at Turtle Creek Property is a single-story regional mall totaling 693,597 square feet, of which 329,398 square feet serves as collateral (the “Mall at Turtle Creek Mortgaged Property”) for the Mall at Turtle Creek Whole Loan, located in Jonesboro, Arkansas. Constructed in 2006, the Mall at Turtle Creek Property is anchored by Dillard’s, JCPenney and Target, all of which are not collateral for the Mall at Turtle Creek Whole Loan. Major tenants at the property include Bed, Bath & Beyond, Best Buy, Barnes & Noble, Shoe Department Encore and H&M which executed a new lease September 2015. Some other notable inline tenants at the Mall at Turtle Creek Property include Forever 21, Express, Victoria’s Secret and Charlotte Russe. There are also three tenants, Chuck E. Cheese’s, Chili’s Grill & Bar and Chick-Fil-A, that are located on outparcels which pay ground rent.
In 2012, an affiliate of the sponsor purchased the Mall at Turtle Creek Mortgaged Property and an adjacent strip center for a total purchase price of approximately $96.3 million. The estimated allocated purchase price to the Mall at Turtle Creek Mortgaged Property is approximately $89.9 million. Since acquisition, the sponsor has invested approximately $2.3 million in tenant improvements at the Mall at Turtle Creek Mortgaged Property. The sponsor will invest an additional $2.9 million at the Mall at Turtle Creek Mortgaged Property for outstanding tenant improvements and leasing commissions, which have been reserved. In addition to the approximately $8.8 million of fresh equity contributed by the sponsor to refinance the prior loan, the sponsor had an estimated all-in equity contribution of approximately $26.8 million at the time of funding the Mall at Turtle Creek Whole Loan. Subsequent to the Mall at Turtle Creek Whole Loan funding, $2.9 million initially held in escrow was released to the borrower after the tenant, Bed, Bath & Beyond, exercised its renewal option. According to the appraisal, the Mall at Turtle Creek Property is the only enclosed mall within a 75.0 mile radius. The closest mall to the north is located in Cape Girardeau, Missouri, approximately 150.0 miles away. The next closest Dillard’s and Target are located approximately 75.0 miles from the property and the next closest JCPenney is located 44.0 miles from the property. Additionally, the Mall at Turtle Creek Property is located near local and regional arteries as a result of being located on East Highland Drive, a main thorough-fare in Jonesboro and Route 49. According to the appraisal, within the immediate vicinity of the Mall at Turtle Creek Property, there is an average annual daily traffic count of approximately 43,000 cars.
Including non-collateral anchors, total occupancy at the Mall at Turtle Creek Mortgaged Property has averaged 95.7% since 2012 and has not fallen below 94.9% during that same time period. Since 2015, approximately 89,000 square feet of new leases, relocations and expansions have been signed, in addition to approximately 69,000 square feet of renewals. New tenants include H&M, Forever 21, Torrid and Foot Locker. The Mall at Turtle Creek Property is home to the first and only H&M in the state of Arkansas. Of the 27 tenants who have lease expirations in 2016, 20 have signed renewals and management is in renewal negotiations with six remaining tenants.
As of the trailing 12-month period ending March 2016 (“TTM March 2016”), the Mall at Turtle Creek Property reported total sales of approximately $160.8 million, which encompasses the tenants who report sales and sponsor estimated sales figures for non-collateral anchor tenants and junior anchors. TTM March 2016 comparable inline sales per square foot at the Mall at Turtle Creek Property were $349, up from $328 per square foot in 2013. According to the appraisal, the Mall at Turtle Creek Property comparable inline sales per square foot figure is in line with the southeast mall average of $347 per square foot. Simultaneously, the occupancy cost has decreased from 15.2% in 2013 to 11.7% as of TTM March 2016. Sponsor estimated 2015 anchor tenant sales were $22.0 million ($268 per square foot), $27.0 million ($173 per square foot) and $35.0 million ($277 per square foot) for JCPenney, Dillard’s and Target, respectively. According to the appraisal, JCPenney and Dillard’s are outperforming chain-wide sales PSF averages by approximately 223.4% and 132.4%, respectively. According to the appraisal, Target is considered to be in line with its chain-wide sales per square foot average of $303. As of April 1, 2016, the Mall at Turtle Creek Property was 95.6% leased by 64 tenants. Excluding temporary tenants, the occupancy is 95.3%.
THE INFORMATION IN THIS STRUCTURAL AND COLLATERAL TERM SHEET IS NOT COMPLETE AND MAY BE AMENDED PRIOR TO THE TIME OF SALE. THIS TERM SHEET IS NOT AN OFFER TO SELL THESE SECURITIES AND IT IS NOT A SOLICITATION OF AN OFFER TO BUY THESE SECURITIES IN ANY JURISDICTION WHERE THE OFFER OR SALE IS NOT PERMITTED.
99
MALL AT TURTLE CREEK
The following table presents certain information relating to the tenancy at the Mall at Turtle Creek Property:
Major Tenants
| Tenant Name | Credit Rating (Fitch/ Moody’s/ S&P)(1) | Tenant NRSF | % of NRSF | Annual U/W Base Rent PSF(2) | Annual U/W Base Rent(2) | % of Total Annual U/W Base Rent | Sales PSF(3) | Occupancy Cost(3) | Lease Expiration Date |
| Anchor Tenants – Not Part of Collateral | |||||||||
| Dillard’s | BBB-/Baa3/BBB- | 155,648 | |||||||
| Target | A-/A2/A | 126,483 | ANCHOR OWNED – NOT PART OF THE COLLATERAL | ||||||
| JCPenney | B+/B1/B | 82,068 | |||||||
| Major Tenants – Collateral | |||||||||
| Barnes & Noble | NR/NR/NR | 26,080 | 7.9% | $13.42 | $350,000 | 5.5% | $211 | 6.4% | 1/31/2021(4) |
| Bed, Bath & Beyond | NR/Baa1/BBB+ | 25,000 | 7.6% | $12.00 | $300,000 | 4.7% | $200 | 6.0% | 1/31/2022(5) |
| H&M | NR/NR/NR | 20,000 | 6.1% | $13.00 | $260,000 | 4.1% | NAV(6) | NAV(6) | 10/31/2026(7) |
| Shoe Department Encore | NR/NR/NR | 13,319 | 4.0% | $14.45 | $192,459 | 3.0% | $141 | 13.3% | 10/31/2023(8) |
| Best Buy | BBB-/Baa1/BBB- | 21,500 | 6.5% | $4.75 | $102,125 | 1.6% | $837 | 1.0% | 1/31/2020(9) |
| Total Major Tenants – Collateral | 105,899 | 32.1% | $11.37 | $1,204,584 | 18.9% | ||||
| Non-Major Tenants – Collateral | 193,188 | 58.6% | $26.69 | $5,155,414 | 81.1% | ||||
| Occupied Collateral Total | 299,087 | 90.8% | $21.26 | $6,359,998 | 100.0% | ||||
| Vacant Space | 30,311 | 9.2% | |||||||
| Collateral Total | 329,398 | 100.0% | |||||||
| (1) | Certain ratings are those of the parent company whether or not the parent guarantees the lease. |
| (2) | Annual U/W Base Rent PSF and Annual U/W Base Rent include contractual rent steps through May 2017, totaling $123,839. |
| (3) | Sales PSF and Occupancy Cost are for the trailing 12-month period ending March 31, 2016 except for Barnes & Noble, Bed, Bath & Beyond and Best Buy which are based on year end 2015 sponsor sales estimates. |
| (4) | Barnes & Noble has two, 5-year lease renewal options remaining after exercising its first 5-year lease renewal option for a renewal term that commenced May 2016. |
| (5) | Bed, Bath & Beyond has five, 5-year lease renewal options remaining after exercising its first 5-year lease renewal option for a renewal term that commences February 2017. The renewal rental rate of $12.50 per square foot is greater than the current underwritten rent of $12.00 per square foot. |
| (6) | H&M Sales PSF and Occupancy Cost are not available as H&M’s lease is expected to commence October 2016. |
| (7) | H&M has executed its lease, but is not currently in occupancy as it builds out its space. According to the mall website, H&M is expected to open for business October 20, 2016. $151,667 has been reserved at origination for the projected gap rent period. H&M has three, 5-year lease renewal options. In addition, H&M may terminate the lease if its gross sales do not equal or exceed $3,000,000 in the fourth full year of the lease term (2020) by providing 180 days’ written notice and payment of 50% of the unamortized amount of the construction allowance actually paid to the tenant as of the termination date, amortized on a straight line basis without interest over 10 years from the lease commencement date. |
| (8) | Shoe Department Encore may terminate its lease if sales are less than $1,650,000 in the fifth lease year (2018) upon 60 days’ written notice and payment of 65% of the construction allowance which remains unamortized as of the effective date of such termination. |
| (9) | Best Buy has five, 5-year lease renewal options. |
The following table presents certain information relating to the historical sales and occupancy costs at the Mall at Turtle Creek Mortgaged Property:
Historical Sales (PSF) and Occupancy Costs
| Tenant Name | 2013 | 2014 | 2015 | TTM March 2016 | Current Occupancy Cost(1) |
| Barnes & Noble(2) | $211 | $211 | $211 | $211 | 6.4% |
| Bed, Bath & Beyond(2) | $200 | $200 | $200 | $200 | 6.0% |
| Shoe Department Encore | $29(3) | $139 | $143 | $141 | 13.3% |
| Best Buy(2) | $837 | $837 | $837 | $837 | 1.0% |
| Comparable Inline Sales PSF | $328 | $320 | $351 | $349 | 11.7% |
| (1) | Current Occupancy Cost is based on TTM March 2016 sales. |
| (2) | Historical Sales (PSF) and Occupancy Costs are based on sponsor sales estimates. |
| (3) | Shoe Department Encore’s lease commenced November 2013. |
THE INFORMATION IN THIS STRUCTURAL AND COLLATERAL TERM SHEET IS NOT COMPLETE AND MAY BE AMENDED PRIOR TO THE TIME OF SALE. THIS TERM SHEET IS NOT AN OFFER TO SELL THESE SECURITIES AND IT IS NOT A SOLICITATION OF AN OFFER TO BUY THESE SECURITIES IN ANY JURISDICTION WHERE THE OFFER OR SALE IS NOT PERMITTED.
100
MALL AT TURTLE CREEK
The following table presents certain information relating to the lease rollover schedule at the Mall at Turtle Creek Mortgaged Property:
Lease Expiration Schedule(1)(2)
| Year Ending December 31, | No. of Leases Expiring | Expiring NRSF | % of Total NRSF | Cumulative Expiring NRSF | Cumulative % of Total NRSF | Annual U/W Base Rent | % of Total Annual U/W Base Rent | Annual U/W Base Rent PSF(3) |
| MTM | 6 | 13,553 | 4.1% | 13,553 | 4.1% | $431,636 | 6.8% | $31.85 |
| 2016 | 0 | 0 | 0.0% | 13,553 | 4.1% | $0 | 0.0% | $0.00 |
| 2017 | 9 | 33,593 | 10.2% | 47,146 | 14.3% | $857,449 | 13.5% | $25.52 |
| 2018 | 3 | 13,721 | 4.2% | 60,867 | 18.5% | $296,611 | 4.7% | $21.62 |
| 2019 | 5 | 7,702 | 2.3% | 68,569 | 20.8% | $298,718 | 4.7% | $38.78 |
| 2020 | 2 | 23,604 | 7.2% | 92,173 | 28.0% | $141,008 | 2.2% | $5.97 |
| 2021 | 9 | 51,461 | 15.6% | 143,634 | 43.6% | $943,790 | 14.8% | $18.34 |
| 2022(4) | 5 | 41,911 | 12.7% | 185,545 | 56.3% | $798,460 | 12.6% | $19.05 |
| 2023 | 2 | 19,583 | 5.9% | 205,128 | 62.3% | $295,940 | 4.7% | $15.11 |
| 2024 | 1 | 500 | 0.2% | 205,628 | 62.4% | $63,654 | 1.0% | $127.31 |
| 2025 | 5 | 33,073 | 10.0% | 238,701 | 72.5% | $678,821 | 10.7% | $20.52 |
| 2026 | 14 | 60,386 | 18.3% | 299,087 | 90.8% | $1,553,910 | 24.4% | $25.73 |
| Thereafter | 0 | 0 | 0.0% | 299,087 | 90.8% | $0 | 0.0% | $0.00 |
| Vacant | 0 | 30,311 | 9.2% | 329,398 | 100.0% | $0 | 0.0% | $0.00 |
| Total/Weighted Average | 61 | 329,398 | 100.0% | $6,359,998 | 100.0% | $21.26 |
| (1) | Information obtained from the underwritten rent roll. |
| (2) | Certain tenants may have lease termination options that are exercisable prior to the originally stated expiration date of the subject lease and that are not considered in the Lease Expiration Schedule. |
| (3) | Weighted Average Annual U/W Base Rent PSF excludes vacant space. |
| (4) | Subsequent to the Mall at Turtle Creek Whole Loan funding, Bed, Bath & Beyond exercised its first 5-year lease renewal option for a renewal term that commences February 2017 and expires January 2022. The underwriting is based on the original lease that was scheduled to expire January 2017, however the Lease Expiration Schedule reflects a January 2022 lease expiration. |
The following table presents historical occupancy percentages at the Mall at Turtle Creek Mortgaged Property:
Historical Occupancy(1)
12/31/2012(2) | 12/31/2013(2) | 12/31/2014(2) | 12/31/2015(2) | 4/1/2016(3) |
| 91.6% | 91.9% | 89.3% | 91.2% | 90.8% |
| (1) | Historical Occupancy figures represent collateral square footage only and include temporary tenants. Excluding temporary tenants, Historical Occupancy is 91.6%, 90.1%, 87.8%, 89.0% and 90.0% for the trailing 12-month periods ending 12/31/2012, 12/31/2013, 12/31/2014, 12/31/2015 and 4/1/2016, respectively. |
| (2) | Information obtained from the borrower. |
| (3) | Information obtained from the underwritten rent roll. Current occupancy includes H&M (20,000 square feet) and Charley’s Grilled Subs (576 square feet) each of which has an executed lease but is not currently in occupancy as the tenants are building out their respective spaces. H&M is expected to open for business October 20, 2016. $151,667 had been reserved at origination which reflects 7 months of gap rent for H&M. Excluding H&M and Charley’s Grilled Subs, current occupancy is 84.6%. |
THE INFORMATION IN THIS STRUCTURAL AND COLLATERAL TERM SHEET IS NOT COMPLETE AND MAY BE AMENDED PRIOR TO THE TIME OF SALE. THIS TERM SHEET IS NOT AN OFFER TO SELL THESE SECURITIES AND IT IS NOT A SOLICITATION OF AN OFFER TO BUY THESE SECURITIES IN ANY JURISDICTION WHERE THE OFFER OR SALE IS NOT PERMITTED.
101
MALL AT TURTLE CREEK
Operating History and Underwritten Net Cash Flow.The following table presents certain information relating to the historical operating performance and underwritten net cash flow at the Mall at Turtle Creek Mortgaged Property:
Cash Flow Analysis
| 2013 | 2014 | 2015 | TTM 3/31/2016 | U/W | % of U/W Effective Gross Income | U/W $ per SF | |
| Base Rent | $5,414,435 | $5,403,670 | $5,289,753 | $5,367,043(1) | $6,297,765(1)(2) | 63.0% | $19.12 |
| Grossed Up Vacant Space | 0 | 0 | 0 | 0 | 1,286,999 | 12.9 | 3.91 |
| Percentage Rent | 100,027 | 213,161 | 226,567 | 264,566 | 91,514 | 0.9 | 0.28 |
| Total Reimbursables | 2,301,778 | 2,411,823 | 2,406,467 | 2,417,574 | 2,448,120 | 24.5 | 7.43 |
| % in Lieu | 591,541 | 341,378 | 238,864 | 186,422 | 62,233 | 0.6 | 0.19 |
| Specialty Leasing | 494,795 | 589,504 | 670,928 | 692,439 | 692,439 | 6.9 | 2.10 |
| Other Income | 322,590 | 413,418 | 367,370 | 400,208 | 400,208 | 4.0 | 1.21 |
| Less Vacancy & Credit Loss | (66,964) | (95,861) | 3,698 | (23,746) | (1,286,999)(3) | (12.9) | (3.91) |
| Effective Gross Income | $9,158,203 | $9,277,093 | $9,203,647 | $9,304,506 | $9,992,279 | 100.0% | $30.33 |
| Total Operating Expenses | $2,057,152 | $2,231,971 | $2,056,405 | $2,044,191 | $2,364,573 | 23.7% | $7.18 |
|
|
|
|
|
|
| |
| Net Operating Income | $7,101,050 | $7,045,122 | $7,147,241 | $7,260,314 | $7,627,706 | 76.3% | $23.16 |
| TI/LC | 0 | 0 | 0 | 0 | 494,097 | 4.9 | 1.50 |
| Capital Expenditures | 0 | 0 | 0 | 0 | 49,410 | 0.5 | 0.15 |
| Net Cash Flow | $7,101,050 | $7,045,122 | $7,147,241 | $7,260,314 | $7,084,199 | 70.9% | $21.51 |
| NOI DSCR | 1.57x | 1.56x | 1.58x | 1.61x | 1.69x | ||
| NCF DSCR | 1.57x | 1.56x | 1.58x | 1.61x | 1.57x | ||
| NOI DY | 9.9% | 9.9% | 10.0% | 10.2% | 10.7% | ||
| NCF DY | 9.9% | 9.9% | 10.0% | 10.2% | 9.9% |
| (1) | The majority of the increase in Base Rent from TTM 3/31/2016 to U/W is due to recently executed leases with new tenants. Since July 2015 the sponsor executed seven leases with new tenants totaling 46,557 square feet and $938,935 of UW Base Rent. |
| (2) | U/W Base Rent includes contractual rent increases through May 2017, totaling $123,839. |
| (3) | The underwritten economic vacancy is 11.4%. The Mall at Turtle Creek Mortgaged Property was 90.8% physically occupied as of April 1, 2016. |
Appraisal.As of the appraisal valuation date of April 5, 2016, the Mall at Turtle Creek Mortgaged Property had an “as-is” appraised value of $130,000,000.
Environmental Matters.According to the Phase I environmental assessment dated April 12, 2016, there was no evidence of any recognized environmental conditions at the Mall at Turtle Creek Mortgaged Property.
Market Overview and Competition.The Mall at Turtle Creek Property is located at the corner of East Highland Drive and Route 49. Both thoroughfares provide local access, but Route 49 provides north/south access, running from northern Arkansas all the way down to Gulfport, Mississippi. Route 49 provides access to Interstate 555 and Interstate 55. The Mall at Turtle Creek Property is located approximately 125.0 miles northeast of the Little Rock central business district and approximately 70.0 miles northwest of the Memphis central business district. The Mall at Turtle Creek Property is located proximate to the intersection of Route 49 and Route 18, and according to the appraisal, has an approximate average annual daily traffic count of 43,000 cars. Further, the Mall at Turtle Creek Property is located approximately two miles away from the Jonesboro Municipal Airport. The area around the Mall at Turtle Creek Property is also served by the Jonesboro Economic Transit System.
Jonesboro is the fifth largest city in Arkansas, and according to the appraisal, is one of the fastest growing cities within the state. The three largest economic drivers in Jonesboro are agriculture, manufacturing and medical facilities. Arkansas State University (“ASU”) is located approximately two miles from the Mall at Turtle Creek Property and has an enrollment of over 13,000 undergraduates and approximately 160 fields of study. There are two medical systems, NEA Baptist Memorial Hospital (“NEA”) and St. Bernard’s Regional Medical Center, located proximate to the Mall at Turtle Creek Property. NEA recently moved to a new 770,000 square foot facility approximately four miles away from the Mall at Turtle Creek Property. St. Bernard’s is the largest employer in Jonesboro. Other top employers in the area are ASU, Wal-Mart Stores Inc., Nestle USA, Frito-Lay Inc., Unilever and Riceland Foods. Additionally, five hotels are either in the planning stage or are being developed within four miles of the Mall at Turtle Creek Property. According to the appraisal, youth sports create a large draw to Jonesboro and hotels are almost always fully occupied during tournaments.
According to the appraisal, the 2015 population within a forty- (the Mall at Turtle Creek Property’s primary trade area) and fifty-mile radius of the Mall at Turtle Creek Property was 254,575 and 356,025, respectively. According to the appraisal, the average household income within the same forty- and fifty-mile radii was $51,324 and $50,977, respectively. According to the appraisal, population has increased at a compound annual rate of approximately 0.5% between 2000 and 2015 for the forty-mile radius.
According to the appraisal, primary competitors include Oak Court Mall and Wolfchase Galleria, the closest of which is approximately 75.0 miles from the Mall at Turtle Creek Property. Highland Square Shopping Center (Kmart anchored), Caraway Mall (Sears Auto Center anchored), Benard Court (Hobby Lobby and Ashley Furniture anchored) and Caraway Shopping Plaza (Hastings, Old Navy, Save-A-Lot and Petco anchored) are considered to be local competitors with typical community center tenancy. There is no anchor overlap among the Mall at Turtle Creek Property and the local competition. According to the appraisal, there are no significant retail development projects underway in Jonesboro. The Mall at Turtle Creek Property is the only enclosed mall within a 75.0 mile radius.
THE INFORMATION IN THIS STRUCTURAL AND COLLATERAL TERM SHEET IS NOT COMPLETE AND MAY BE AMENDED PRIOR TO THE TIME OF SALE. THIS TERM SHEET IS NOT AN OFFER TO SELL THESE SECURITIES AND IT IS NOT A SOLICITATION OF AN OFFER TO BUY THESE SECURITIES IN ANY JURISDICTION WHERE THE OFFER OR SALE IS NOT PERMITTED.
102
MALL AT TURTLE CREEK
The following table presents certain information relating to some comparable retail properties for the Mall at Turtle Creek Property:
Competitive Set(1)
Mall at Turtle Creek (Subject) | Oak Court Mall | Wolfchase Galleria | Highland Square Shopping Center | Caraway Mall(2) | Bernard Court | Caraway Shopping Plaza | |
| Location | Jonesboro, AR | Memphis, TN | Memphis, TN | Jonesboro, AR | Jonesboro, AR | Jonesboro, AR | Jonesboro, AR |
| Distance from Subject | -- | 75.0 miles | 86.0 miles | 1.0 miles | 1.0 miles | 1.3 miles | 1.3 miles |
| Property Type | Regional Mall | Regional Mall | Super Regional Mall | Community Center | Community Center | Community Center | Community Center |
| Year Built/Renovated | 2006/NAP | 1988/1995 | 1996/NAP | 1980/NAP | 1967/1989 | 1993/NAP | 1969/2002 |
| Anchors | Dillard’s, Target, JCPenney | Dillard’s, Macy’s | Dillard’s, Macy’s, JCPenney, Sears | Kmart | Sears Appliance Center | Hobby Lobby, Ashley Furniture | Hastings, Old Navy, Save-A-Lot, Petco |
| Total GLA | 693,597 SF(3) | 723,010 SF | 1,152,196 SF | 219,344 SF | 371,325 SF | 128,134 SF | 161,486 SF |
| Inline Sales PSF | $349(4) | $300 | $400 | NAV | NAV | NAV | NAV |
| Total Occupancy | 95.6%(5) | 99.0% | 95.0% | 96.0% | 100.0% | 61.0% | 86.0% |
| (1) | Information obtained from the appraisal and underwritten rent roll. |
| (2) | Caraway Mall is an anchored retail center whose tenancy includes a small Sears Appliance Center, Buckle, Dollar Tree and Hallmark Gold Crown. |
| (3) | Total GLA includes non-collateral anchor tenants. |
| (4) | Represents comparable inline sales per square foot as of trailing 12-month period ending March 2016. |
| (5) | Total occupancy includes the three non-collateral anchor tenants. Excluding the three non-collateral anchor tenants, occupancy at the Mall at Turtle Creek Property is 90.8% as of April 1, 2016. |
The Borrower.The borrower is RPI Turtle Creek Mall, LLC, a Delaware limited liability company, a single purpose entity with two independent directors. Legal counsel to the borrower delivered a non-consolidation opinion in connection with the origination of the Mall at Turtle Creek Whole Loan. Rouse Properties, LP is the guarantor of certain nonrecourse carveouts under the Mall at Turtle Creek Whole Loan.
The Sponsor.The sponsor is Rouse Properties, LP (“Rouse”). Rouse is a publicly traded real estate investment trust headquartered in New York, New York. Rouse has a portfolio of properties, which includes 35 malls in 21 states encompassing approximately 24 million square feet of retail space. As of December 31, 2015, Rouse had total assets of approximately $2.5 billion and total equity of $534.5 million. Rouse was acquired by an affiliate of Brookfield Asset Management Inc. (“Brookfield”) on July 6, 2016. The indirect owner of the borrower and the sponsor (which is the carve-out guarantor) is a publically traded REIT into which certain properties (not including the mortgaged property) were spun off in connection with the April 2009 bankruptcy filing of General Growth Properties, Inc., which emerged from bankruptcy in November 2010. See also“Description of the Mortgage Pool—Loan Purpose; Default History, Bankruptcy Issues and Other Proceedings” in the Prospectus.
Escrows.The loan documents provide for upfront reserves of (i) $443,810 for taxes, (ii) $2,907,450 for outstanding tenant improvement and leasing commission obligations, including those related to H&M ($1,790,000), Victoria’s Secret ($407,450), Bath & Body Works ($225,000), Gearhead Outfitters ($200,000), Torrid ($145,000) and Spencer’s Gifts ($140,000) and (iii) $151,667 for gap rent related to H&M.
Additionally, a $2,900,000 Bed, Bath & Beyond reserve fund has been escrowed, which will be disbursed to the borrower, provided no event of default under the loan documents has occurred and is continuing and upon a Bed, Bath & Beyond Renewal Event (defined herein). Among other conditions, a “Bed, Bath & Beyond Renewal Event” will have occurred when the following requirements have been satisfied: (i) Bed, Bath & Beyond has renewed or extended its lease upon terms that are provided under its lease (including a five-year renewal at an annual base rent equal to $312,500); or (ii) the borrower re-leased all or a portion of the Bed, Bath & Beyond lease space (i.e., the space demised pursuant to the Bed, Bath and Beyond lease) with an acceptable replacement lease pursuant to the terms and provisions of the loan documents. Subsequent to the Mall at Turtle Creek Whole Loan funding, the $2,900,000 initially held in escrow was released to the borrower after Bed, Bath & Beyond exercised its renewal option at terms consistent with the loan documents.
Ongoing monthly reserves are required in an amount equal to (i) $49,312 for taxes, (ii) $6,862 (subject to a cap of $82,350) for replacement reserves and (iii) $41,175 (subject to a cap of $988,194) for tenant improvements and leasing commissions. The loan documents do not require monthly escrows for insurance provided that (x) no event of default under the loan documents has occurred and is continuing, (y) the Mall at Turtle Creek Mortgaged Property is insured via an acceptable blanket or umbrella insurance policy that meets the requirements set forth in the loan documents and (z) the borrower provides the lender with evidence of renewal of the policies and timely proof of payment of the insurance premiums when due.
Lockbox and Cash Management.The Mall at Turtle Creek Whole Loan requires a lender-controlled hard lockbox account, which is already in place, and into which the borrower and property manager direct all tenants to directly pay rents. The loan documents also require that the borrower or property manager, if any, to, deposit into the lockbox account no later than three business days after receipt (i) prior to a Trigger Event (as defined below), all rents from permanent leases and all forfeited security deposits received by the borrower and property manager, if any, and (ii) following a Trigger Event, all gross income from operations, all forfeited security deposits and all other revenue of any kind from the Mall at Turtle Creek Mortgaged Property received by the borrower or the property manager, if any. Prior to the occurrence of a Trigger Event, all funds on deposit in the lockbox account are to be disbursed to the
THE INFORMATION IN THIS STRUCTURAL AND COLLATERAL TERM SHEET IS NOT COMPLETE AND MAY BE AMENDED PRIOR TO THE TIME OF SALE. THIS TERM SHEET IS NOT AN OFFER TO SELL THESE SECURITIES AND IT IS NOT A SOLICITATION OF AN OFFER TO BUY THESE SECURITIES IN ANY JURISDICTION WHERE THE OFFER OR SALE IS NOT PERMITTED.
103
MALL AT TURTLE CREEK
borrower. During a Trigger Event, all cash flow is to be swept to a lender-controlled cash management account. During a Low DSCR Period (as defined below), all excess funds in the cash management account are to be swept to a lender controlled sub-account.
However, upon the occurrence and continuance of a Trigger Event caused solely by the debt service coverage ratio being less than 1.30x at the end of any trailing 12-month period, the borrower may (but will not be obligated to), in borrower’s sole discretion, cure such Trigger Event by posting (x) cash and/or (y) an evergreen letter of credit in form and substance reasonably acceptable to the lender, in an aggregate amount equal to the amount by which the Mall at Turtle Creek Whole Loan would have to be partially prepaid in order for the debt service coverage ratio to equal 1.30x, and such deposit of cash or provision of a letter of credit will cure such Trigger Event caused by the existence and continuance of the debt service coverage ratio being less than 1.30x, provided that when the debt service coverage ratio continues to be tested as of the end of each calendar quarter and with respect to such calculations, the borrower will be given credit against the outstanding balance of the Mall at Turtle Creek Whole Loan for any such cash deposited or the face amount of any such letter of credit.
A “Trigger Event” will commence upon the earlier of (i) the occurrence of an event of default; or (ii) the debt service coverage ratio being less than 1.30x at the end of any trailing 12-month period. A Trigger Event will expire, with regard to clause (i), upon the cure of such event of default; and with regard to clause (ii), the debt service coverage ratio being equal to or greater than 1.30x for two consecutive calendar quarters.
A “Low DSCR Period” will commence on the last day of the second consecutive calendar quarter for which the debt service coverage ratio is less than 1.20x and ends on the last day of any two consecutive calendar quarters thereafter for each of which the debt service coverage ratio is greater than or equal to 1.20x.
Property Management. The Mall at Turtle Creek Mortgaged Property is managed by an affiliate of the borrower.
Assumption.The borrower has the right to transfer the Mall at Turtle Creek Mortgaged Property, provided that certain conditions are satisfied, including (i) no event of default has occurred and is continuing; (ii) the identity, experience (demonstrated expertise in owning and operating properties in size, class and operation to the Mall at Turtle Creek Mortgaged Property), financial condition and credit worthiness of transferee and guarantor, as evidenced by financial statements and other information is satisfactory to lender, and (iii) rating agency confirmation from Fitch, Moody’s and Morningstar that the transfer will not result in a downgrade, withdrawal or qualification of the respective ratings assigned to the Series 2016-C36 Certificates or similar ratings confirmations from each rating agency rating any securities backed by any Mall at Turtle Creek companion loan with respect to the ratings of such securities.
Partial Release.Not permitted.
Real Estate Substitution.Not permitted.
Subordinate and Mezzanine Indebtedness.See “Other Indebtedness” below.
Other Indebtedness.The loan documents permit certain sponsor affiliates to pledge direct or indirect ownership interests to a qualified pledgee (an institution having in excess of $250.0 million in total assets and $60.0 million in capital/statutory surplus, and regularly engaged in business of owning or making commercial real estate loans or commercial loans secured by a pledge of interests in a mortgage borrower or owning and operating commercial properties, or otherwise is party for whom rating agency confirmation has been obtained) subject to certain conditions, including: (i) a pledge is given in connection with an operating debt facility, a corporate facility, a line of credit or other similar financing transaction credit facility secured by multiple properties for which repayment is not primarily dependent upon property cash flow; and (ii) the exercise of any remedies available under the pledge will not result in a change of manager unless the replacement manager is a qualified manager as defined in the loan documents.
Ground Lease.None.
Terrorism Insurance.The loan documents require that the “all risk” or “special form” insurance policy required to be maintained by the borrower provide coverage for terrorism in an amount equal to the full replacement cost of the Mall at Turtle Creek Mortgaged Property, as well as business interruption insurance for a period covering no less than the 18-month period following the occurrence of a casualty event, together with a 12-month extended period of indemnity. If TRIPRA is no longer in effect, the borrower will be obligated to maintain coverage for such insurance against foreign and domestic acts of terrorism or similar acts of sabotage; however the cost of such coverage may not exceed an amount equal to two times the annual premium for a separate “special form” or “all risks” policy basis.
THE INFORMATION IN THIS STRUCTURAL AND COLLATERAL TERM SHEET IS NOT COMPLETE AND MAY BE AMENDED PRIOR TO THE TIME OF SALE. THIS TERM SHEET IS NOT AN OFFER TO SELL THESE SECURITIES AND IT IS NOT A SOLICITATION OF AN OFFER TO BUY THESE SECURITIES IN ANY JURISDICTION WHERE THE OFFER OR SALE IS NOT PERMITTED.
104
(THIS PAGE INTENTIONALLY LEFT BLANK)
THE INFORMATION IN THIS STRUCTURAL AND COLLATERAL TERM SHEET IS NOT COMPLETE AND MAY BE AMENDED PRIOR TO THE TIME OF SALE. THIS TERM SHEET IS NOT AN OFFER TO SELL THESE SECURITIES AND IT IS NOT A SOLICITATION OF AN OFFER TO BUY THESE SECURITIES IN ANY JURISDICTION WHERE THE OFFER OR SALE IS NOT PERMITTED.
105
HOME2 SUITES – LONG ISLAND CITY
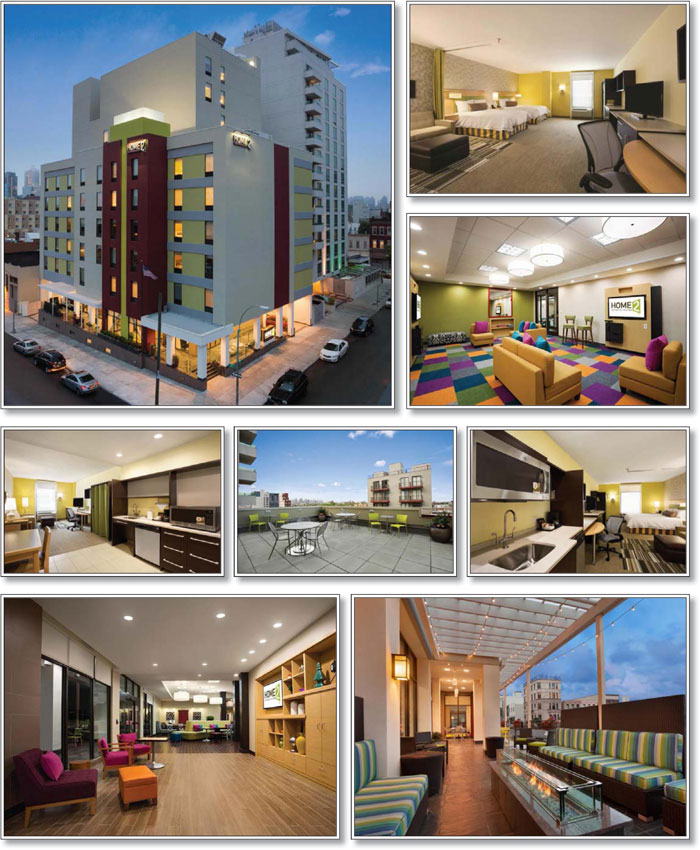
THE INFORMATION IN THIS STRUCTURAL AND COLLATERAL TERM SHEET IS NOT COMPLETE AND MAY BE AMENDED PRIOR TO THE TIME OF SALE. THIS TERM SHEET IS NOT AN OFFER TO SELL THESE SECURITIES AND IT IS NOT A SOLICITATION OF AN OFFER TO BUY THESE SECURITIES IN ANY JURISDICTION WHERE THE OFFER OR SALE IS NOT PERMITTED.
106
HOME2 SUITES – LONG ISLAND CITY
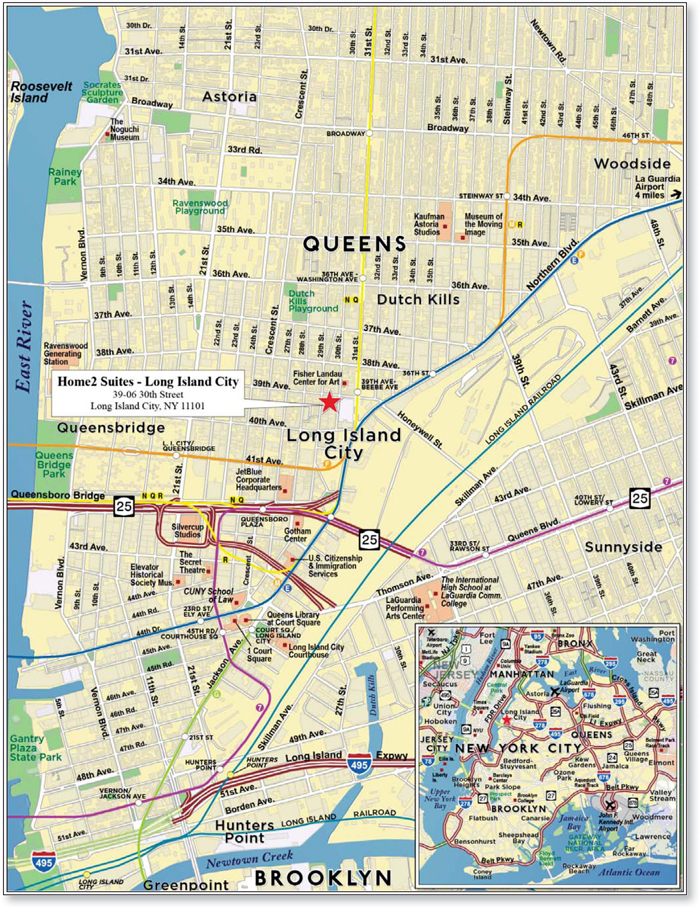
THE INFORMATION IN THIS STRUCTURAL AND COLLATERAL TERM SHEET IS NOT COMPLETE AND MAY BE AMENDED PRIOR TO THE TIME OF SALE. THIS TERM SHEET IS NOT AN OFFER TO SELL THESE SECURITIES AND IT IS NOT A SOLICITATION OF AN OFFER TO BUY THESE SECURITIES IN ANY JURISDICTION WHERE THE OFFER OR SALE IS NOT PERMITTED.
107
| No. 8 - Home2 Suites - Long Island City | ||||||||
| Loan Information | Property Information | |||||||
| Mortgage Loan Seller: | Basis Real Estate Capital II, LLC | Single Asset/Portfolio: | Single Asset | |||||
| Credit Assessment (Fitch/Moody’s/Morningstar): | NR/NR/NR | Property Type: | Hospitality | |||||
| Original Principal Balance: | $25,000,000 | Specific Property Type: | Extended Stay | |||||
| Cut-off Date Balance: | $24,973,745 | Location: | Long Island City, NY | |||||
| % of Initial Pool Balance: | 2.9% | Size: | 115 Rooms | |||||
| Loan Purpose: | Refinance | Cut-off Date Balance Per Room: | $217,163 | |||||
| Borrower Name: | LIC Hotel Property LLC | Year Built/Renovated: | 2014/NAP | |||||
| Sponsors: | Jacob Rad; Samuel Klein | Title Vesting: | Fee | |||||
| Mortgage Rate: | 5.050% | Property Manager: | Real Hospitality Group, LLC | |||||
| Note Date: | September 29, 2016 | 4thMost Recent Occupancy(3): | NAV | |||||
| Anticipated Repayment Date: | NAP | 3rdMost Recent Occupancy(3): | NAV | |||||
| Maturity Date: | October 1, 2026 | 2ndMost Recent Occupancy: | 88.1% (12/31/2014) | |||||
| IO Period: | None | Most Recent Occupancy (As of): | 86.4% (12/31/2015) | |||||
| Loan Term (Original): | 120 months | Current Occupancy (As of): | 85.9% (7/31/2016) | |||||
| Seasoning: | 1 month | |||||||
| Amortization Term (Original): | 360 months | Underwriting and Financial Information: | ||||||
| Loan Amortization Type: | Amortizing Balloon | 4thMost Recent NOI(3): | NAV | |||||
| Interest Accrual Method: | Actual/360 | 3rdMost Recent NOI(3): | NAV | |||||
| Call Protection: | L(25),D(91),O(4) | 2ndMost Recent NOI (As of): | $3,163,656 (12/31/2015) | |||||
| Lockbox Type: | Springing | Most Recent NOI (As of): | $3,195,079 (TTM 7/31/2016) | |||||
| Additional Debt(1): | Yes | |||||||
| Additional Debt Type(1): | Unsecured Debt | |||||||
| U/W Revenues: | $6,576,973 | |||||||
| U/W Expenses: | $3,828,493 | |||||||
| U/W NOI: | $2,748,480 | |||||||
| U/W NCF: | $2,485,401 | |||||||
| Escrows and Reserves(2): | U/W NOI DSCR: | 1.70x | ||||||
| U/W NCF DSCR: | 1.53x | |||||||
| Type: | Initial | Monthly | Cap (If Any) | U/W NOI Debt Yield: | 11.0% | |||
| Taxes | $69,269 | $13,854 | NAP | U/W NCF Debt Yield: | 10.0% | |||
| Insurance | $54,649 | $6,072 | NAP | As-Is Appraised Value: | $40,800,000 | |||
| FF&E Reserve | $0 | $21,923 | $789,237 | As-Is Appraisal Valuation Date: | August 23, 2016 | |||
| Deferred Maintenance | $34,375 | $0 | NAP | Cut-off Date LTV Ratio: | 61.2% | |||
| Seasonality Reserve | $175,000 | $0 | $175,000 | LTV Ratio at Maturity or ARD: | 50.5% | |||
| (1) | See “Subordinate and Mezzanine Indebtedness” section. |
| (2) | See “Escrows” section. |
| (3) | The Home2 Suites Property (as defined below) opened in May 2014; therefore, historical operating information prior to 2015 is not available. |
The Mortgage Loan. The mortgage loan (the “Home2 Suites Mortgage Loan”) is evidenced by a single promissory note that is secured by a first mortgage encumbering the fee interest in an extended stay hotel located in Long Island City, NY (the “Home2 Suites Property”). The Home2 Suites Mortgage Loan was originated on September 29, 2016 by Basis Real Estate Capital II, LLC. The Home2 Suites Mortgage Loan had an original principal balance of $25,000,000, has an outstanding principal balance as of the Cut-off Date of $24,973,745 and accrues interest at an interest rate of 5.050% per annum. The Home2 Suites Mortgage Loan had an initial term of 120 months, has a remaining term of 119 months as of the Cut-off Date and requires payments of principal and interest based on a 30-year amortization schedule through the term of the Home2 Suites Mortgage Loan. The Home2 Suites Mortgage Loan matures on October 1, 2026.
Following the lockout period, the borrower has the right to defease the Home2 Suites Mortgage Loan in whole, but not in part, on any date before July 1, 2026. In addition, the Home2 Suites Mortgage Loan is prepayable without penalty on or after July 1, 2026.
THE INFORMATION IN THIS STRUCTURAL AND COLLATERAL TERM SHEET IS NOT COMPLETE AND MAY BE AMENDED PRIOR TO THE TIME OF SALE. THIS TERM SHEET IS NOT AN OFFER TO SELL THESE SECURITIES AND IT IS NOT A SOLICITATION OF AN OFFER TO BUY THESE SECURITIES IN ANY JURISDICTION WHERE THE OFFER OR SALE IS NOT PERMITTED.
108
| HOME2 SUITES – LONG ISLAND CITY |
Sources and Uses
| Sources | Uses | |||||||
| Original loan amount | $25,000,000 | 100.0% | Loan payoff | $13,401,643 | 53.6% | |||
| Reserves | 333,293 | 1.3 | ||||||
| Closing costs | 468,630 | 1.9 | ||||||
| Return of equity(1) | 10,796,435 | 43.2 | ||||||
| Total Sources | $25,000,000 | 100.0% | Total Uses | $25,000,000 | 100.0% |
| (1) | All of the $10,796,435 returned to the borrower was used to pay down partnership debt. |
The Property.The Home2 Suites Property is a 115-room, 10-story, extended stay hotel located on 0.3 acres in Long Island City, New York, directly across the East River from Manhattan. The borrower acquired the land in 2007 and 2008 and constructed the Home2 Suites Property, which opened in May of 2014.
Amenities at the Home2 Suites Property include a market pantry, fitness center, lobby workstation, game room, guest laundry room, and 880 square feet of meeting space. Guestrooms are located on floors two through 10 and the guestroom mix includes 82 single queen-bed studio suites, 17 double queen-bed studio suites, 7 handicapped-accessible studio suites, 5 king one-bedroom suites, and 4 king studio suites. All of the guestrooms contain living, cooking and sleeping areas and the one-bedroom suites have a wall that separates the bedroom from the kitchen and living areas. Guestroom features include an industry-unique “working wall” that incorporates the kitchen and a flexible media/working zone. The kitchens include a refrigerator, microwave, dishwasher, and other typical kitchen amenities. The media/working zone includes a queen-size sofa sleeper, 42-inch flat-screen television, roll-around ottoman, ambient task lighting, an alarm clock with iPod port and MP3 jack, and various pieces of furniture that can be moved around to create customized living spaces and adjustable storage options.
Since opening in May 2014, the Home2 Suites Property has been awarded the TripAdvisor Certificate of Excellence and is currently ranked number one out of 29 Long Island City hotels, with 91.9% positive guest feedback. The franchise agreement with Hilton Franchise Holding LLC expires on August 31, 2034.
Operating History and Underwritten Net Cash Flow.The following table presents certain information relating to the historical operating performance and underwritten net cash flow at the Home2 Suites Property:
Cash Flow Analysis
| 2015(1) | TTM 7/31/2016 | U/W | % of U/W Total Revenue | U/W $ per Room | |||||
| Occupancy | 86.4% | 85.9% | 82.0% | ||||||
| ADR | $182.12 | $184.58 | $184.58 | ||||||
| RevPar | $157.26 | $158.50 | $151.36 | ||||||
| Total Revenue | $6,790,495 | $6,894,959 | $6,576,973 | 100.0% | $57,191 | ||||
| Total Department Expenses | 1,765,486 | 1,854,609 | 1,770,136 | 26.9 | 15,392 | ||||
| Gross Operating Profit | $5,025,009 | $5,040,350 | $4,806,838 | 73.1% | $41,799 | ||||
| Total Undistributed Expenses | 1,592,895 | 1,691,338 | 1,863,659 | 28.3 | 16,206 | ||||
| Profit Before Fixed Charges | $3,432,114 | $3,349,012 | $2,943,179 | 44.7% | $25,593 | ||||
| Total Fixed Charges(2) | 268,458 | 153,933 | 194,699 | 3.0 | 1,693 | ||||
| Net Operating Income | $3,163,656 | $3,195,079 | $2,748,480 | 41.8% | $23,900 | ||||
| FF&E | 0 | 275,798 | 263,079 | 4.0 | 2,288 | ||||
| Net Cash Flow | $3,163,656 | $2,919,281 | $2,485,401 | 37.8% | $21,612 | ||||
| NOI DSCR | 1.95x | 1.97x | 1.70x | ||||||
| NCF DSCR | 1.95x | 1.80x | 1.53x | ||||||
| NOI DY | 12.7% | 12.8% | 11.0% | ||||||
| NCF DY | 12.7% | 11.7% | 10.0% |
| (1) | The Home2 Suites Property opened for business in May 2014. Full year financial statements are therefore not available prior to 2015. |
| (2) | The Home2 Suites Property is located in a “Special Area” of New York City and benefits from a property tax abatement under the Industrial and Commercial Abatement Program (ICAP). This program provides partial abatement of property taxes for varying periods for eligible industrial and commercial buildings that are built, modernized, rehabilitated, expanded, or otherwise physically improved within the ICAP geographical boundaries. Accordingly, the Home2 Suites Property is exempt from any increases in assessed value resulting from construction of the hotel for a period of twenty-five years starting July 1, 2015. The Home2 Suites Property is expected to benefit from the full exemption for 16 years; thereafter, the improvement assessment abatement will be phased-out by 10% per annum from years 17 through 25. The property tax burden will encompass the full tax assessment in Year 26 of operation. Because the Home2 Suites Property is expected to receive the full abatement throughout the 10-year loan term, the abated tax amount, which reflects the projected 2016/2017 Real Estate Taxes, has been underwritten. Underwritten Total Fixed Charges are lower than 2015 Total Fixed Charges due to decrease in real estate tax rate and a small correction to the ICAP assessment that is being considered by the City of New York. |
Appraisal.As of the appraisal valuation date of August 23, 2016, the Home2 Suites Property had an “as-is” appraised value of $40,800,000.
Environmental Matters.According to a Phase I environmental assessment dated October 30, 2015, there was no evidence of any recognized environmental conditions at the Home2 Suites Property.
THE INFORMATION IN THIS STRUCTURAL AND COLLATERAL TERM SHEET IS NOT COMPLETE AND MAY BE AMENDED PRIOR TO THE TIME OF SALE. THIS TERM SHEET IS NOT AN OFFER TO SELL THESE SECURITIES AND IT IS NOT A SOLICITATION OF AN OFFER TO BUY THESE SECURITIES IN ANY JURISDICTION WHERE THE OFFER OR SALE IS NOT PERMITTED.
109
| HOME2 SUITES – LONG ISLAND CITY |
Market Overview and Competition.The Home2 Suites Property is located at 39-06 30th Street in Long Island City, New York. Long Island City is the westernmost neighborhood of the New York borough of Queens, one of New York City’s five boroughs. Long Island City sits across the East River between Midtown Manhattan and the Upper East Side. Primary access to the Home2 Suites Property neighborhood is provided by the Queens Midtown Tunnel, Queensboro Bridge, the Long Island Expressway (Interstate-495), the Brooklyn Queens Expressway (Interstate-278), Queens Blvd (Route 25), and Northern Boulevard (Route 25A). LaGuardia Airport is located 4.0 miles northeast and John F. Kennedy International Airport is located approximately 10.0 miles southeast of the Home2 Suites Property. In addition, the East River Ferry provides service to Midtown Manhattan (34th Street), Wall Street, Governors Island, Brooklyn Bridge Park, South & North Williamsburg, Long Island City and Greenpoint. The Home2 Suites Property is 2.4 miles northwest of the Brooklyn Queens Expressway, which provides access to the neighborhood area.
Per the appraiser, Long Island City has the largest commercial district in Queens and is also characterized by its waterfront parks and arts community. Long Island City’s proximity to Midtown and the Upper East Side of Manhattan, as well as its ample transportation options, has made it an increasingly attractive location for all types of businesses, particularly back-office companies attempting to reduce occupancy costs. Long Island City benefits from its accessibility attributes, as it is located approximately ten minutes from Midtown Manhattan via subway. Two primary districts – Queens Plaza and Court Square – make up the 37-block Long Island City Core, with Jackson Avenue serving as the main thoroughfare connecting the two. Major companies that now have offices in Long Island City include: Citigroup, Fresh Direct, JetBlue AirwayS, Kaufman Astoria Studios, MetLife, NYC Department of Health and Mental Hygiene, RCN Corporation, Silvercup Studios, Steve Madden, Uber and United Nations Federal Credit Union. Overall, Long Island City houses over 6,300 businesses with over 93,000 employees, as well as 48,000 students at two higher education institutions. Planned and ongoing public improvements at Queens Plaza and along Jackson Avenue are expected to complement private sector development. According to a third-party market research report, the 2015 estimated New York County, NY-NJ-PA metropolitan statistical area and NY-NJ-CT-PA combined statistical area populations are approximately 1,613,000, 20,116,000, and 23,715,000, respectively.
According to the appraisal, demand segmentation at the Home2 Suites Property is 55.0% commercial, 40.0% leisure/tourism and 5.0% meeting and group. A third party hospitality research report identified seven competitive hospitality properties, containing 860 rooms, which exhibited average occupancy, ADR, and RevPAR of 81.8%, $147.56, and $120.72, respectively, for the trailing 12-month period ending August 31, 2016.
The following table presents certain information relating to some comparable multifamily properties for the Home2 Suites Property:
| Subject and Market Historical Occupancy, ADR and RevPAR(1) | ||||||||||||||||||
| Competitive Set | Home2 Suites - Long Island City | Penetration Factor | ||||||||||||||||
| Year | Occupancy | ADR | RevPAR | Occupancy | ADR | RevPAR | Occupancy | ADR | RevPAR | |||||||||
| 8/31/2016 TTM | 81.8% | $147.56 | $120.72 | 85.7% | $184.99 | $158.52 | 104.7% | 125.4% | 131.3% | |||||||||
| 8/31/2015 TTM | 79.5% | $148.98 | $118.44 | 87.3% | $173.41 | $151.36 | 109.8% | 116.4% | 127.8% | |||||||||
| 8/31/2014 TTM(2) | 81.5% | $151.18 | $123.20 | 91.1% | $151.09 | $137.66 | 111.8% | 99.9% | 111.7% | |||||||||
| (1) | Information obtained from a third party hospitality research report dated September 19, 2016. The current competitive set includes: Holiday Inn Long Island City Manhattan, Best Western Plaza Hotel, Ramada Long Island City, Fairfield Inn & Suites New York Queens Queensboro Bridge, Z Hotel, Four Points by Sheraton Long Island City Queens Queensboro Bridge, and Hilton Garden Inn New York Long Island City Manhattan View. |
| (2) | The Home2 Suites Property opened in May 2014, therefore, the occupancy, ADR, RevPAR and Penetration Factors are based on less than a full year of results. |
The Borrower.The borrower is LIC Hotel Property LLC, a New York limited liability company and a single purpose entity with one independent director. Jacob Rad and Samuel Klein are the guarantors of certain nonrecourse carveouts under the Home2 Suites Mortgage Loan on a joint and several basis.
The Sponsors. The sponsors, Jacob Rad and Samuel Klein, are New York City based real estate developers. Mr. Rad co-founded Radson Development in 2012. Jacob Rad’s real estate development experience spans nearly four decades. In 2012, he co-founded Radson Development and prior to that he held several positions in real estate development, engineering and construction management. He spent 11 years as a developer in New York City, where he oversaw the design and construction of thousands of units of affordable and market-rate rental units. His background also includes the design and supervision of mixed-use, office and hotel development in Chicago and Los Angeles. Mr. Klein has developed numerous projects in New York City, including brand-name hotels, multifamily residences, commercial buildings, recreational facilities, renovations, and high-end custom homes. With respect to the Home2 Suites Mortgage Loan secured by the Home2 Suites Property, the related borrower and sponsors were named as defendants in a lawsuit for a breach of contract. The lawsuit was settled and as part of the settlement, an affiliate of the plaintiff holds a right of first refusal (“ROFR” - see “Right of First Refusal” section), which expires on October 7, 2018, to purchase the Home2 Suites Property or membership interests in the related borrower. The Home2 Suites ROFR does not apply to a foreclosure or deed in lieu thereof. For additional information regarding the sponsor, see “Description of the Mortgage Pool-Litigation and Other Considerations” and “Description of the Mortgage Pool-Loan Purpose; Default History, Bankruptcy Issues and Other Proceedings” in the Preliminary Prospectus.
Escrows. The loan documents provided for upfront escrows in the amount of $69,269 for real estate taxes, $54,649 for insurance premiums, $34,375 for deferred maintenance and $175,000 for a seasonality reserve, which is capped at $175,000 (the “Seasonality Reserve Cap”). The loan documents also provide for monthly escrows in the amount of $13,854 for real estate taxes, $6,072 for insurance premiums, and $21,923 for FF&E reserves. The borrower’s obligation to make monthly deposits into the FF&E reserve is capped at an amount equal to three years of the annual FF&E amount (the “FF&E Reserve Cap”), not to be less than three times the initial annual amount of $263,079, adjusted every payment date in January in an amount equal to the greater of 4.0% of the gross income from operations and the amount required to be collected by the franchisor. The seasonality reserve can be utilized to cover
THE INFORMATION IN THIS STRUCTURAL AND COLLATERAL TERM SHEET IS NOT COMPLETE AND MAY BE AMENDED PRIOR TO THE TIME OF SALE. THIS TERM SHEET IS NOT AN OFFER TO SELL THESE SECURITIES AND IT IS NOT A SOLICITATION OF AN OFFER TO BUY THESE SECURITIES IN ANY JURISDICTION WHERE THE OFFER OR SALE IS NOT PERMITTED.
110
| HOME2 SUITES – LONG ISLAND CITY |
debt service shortfalls each January and February and will be replenished from excess cash flow if the balance in the seasonality reserve drops below the Seasonality Reserve Cap.
If, at any time during the term of the Home2 Suites Mortgage Loan, a Property Improvement Plan (a “PIP”) is required by the franchisor, the borrower is required to deposit an amount equal to 125% of the cost of the work outlined in the PIP, which amount will be held in a separate PIP Reserve.
Lockbox and Cash Management.Upon the occurrence and continuance of a Cash Management Trigger Event (as defined below) the borrower is required to establish a lender-controlled lockbox account. The loan documents also require that all revenues received by the borrower or the property manager be deposited into the lockbox account within one business day of receipt. Prior to a Cash Sweep Event (as defined below) all excess funds on deposit are distributed to the borrower. During a Cash Sweep Event period all excess funds will be applied to the lender-controlled excess cash flow reserve account.
A “Cash Management Trigger Event” will occur if the debt service coverage ratio is less than 1.25x for one calendar quarter. A “Cash Sweep Event” period will commence if, among other things (i) an event of default occurs; (ii) the debt service coverage ratio falls below 1.20x for two consecutive calendar quarters based on the trailing twelve month period; or (iii) the borrower has received written notice of franchisor’s intent to terminate the franchise agreement, or the franchise agreement has been terminated for any reason (the “Franchise Agreement Trigger Event”). A Cash Sweep Event period will end with respect to clause (i), the event of default ceases to exist; with respect to clause (ii), once the debt service coverage ratio is greater than 1.30x for two consecutive calendar quarters; and with respect to clause (iii), the franchise agreement is reaffirmed by the borrower and franchisor in writing or borrower enters into a new franchise agreement with a franchisor similar or better than Home2 Suites by Hilton no less than 3 years past the Home2 Suites Mortgage Loan maturity date, and delivered a “comfort letter” from the franchisor.
Property Management.The Home2 Suites Property is managed by Real Hospitality Group, LLC.
Assumption.The borrower has the right to transfer the Home2 Suites Property at any time commencing one year following the origination date, provided that no event of default has occurred and is continuing and certain other conditions are satisfied, including (i) the lender’s reasonable determination that the proposed transferee and guarantor satisfy the lender’s credit review and underwriting standards, taking into consideration transferee experience, financial strength and general business standing; (ii) the execution of a recourse guaranty and an environmental indemnity by an affiliate of the transferee; and (iii) if requested by the lender, a rating agency confirmation from Fitch, Moody’s and Morningstar that the transfer will not result in a downgrade, withdrawal or qualification of the respective ratings assigned to the Series 2016-C36 Certificates.
Right of First Refusal.A third party holds a right of first refusal (“ROFR”) to purchase the Home2 Suites Property if the borrower decides to sell or transfer the Home2 Suites Property or all or any portion of the ownership interests in the borrower. Upon the exercise of the ROFR during the defeasance lockout period, the full amount of the Home2 Suites Mortgage Loan will be immediately due and payable and the borrower will be required to prepay the Home2 Suites Mortgage Loan in full, together with any yield maintenance premium. The ROFR expires on October 7, 2018.
Partial Release.Not permitted.
Real Estate Substitution.Not permitted.
Subordinate and Mezzanine Indebtedness. Existing unsecured debt in the amount of $4,500,000 in the form of shareholder loans (the “Shareholder Loans”) made to the borrower by Samuel Klein, one of the loan’s guarantors and one of two shareholders in the borrower. The Shareholder Loans were made to the borrower to provide working capital. The guarantors have fully subordinated the Shareholder Loans to the Home2 Suites Mortgage Loan and executed a standstill agreement.
Ground Lease.None.
Terrorism Insurance.The loan documents require that the “all risk” insurance policy required to be maintained by the borrower provides coverage for terrorism in an amount equal to the full replacement cost of the Home2 Suites Property. The loan documents also require business interruption insurance covering no less than the 18-month period following the occurrence of a casualty event, together with a 12-month extended period of indemnity.
THE INFORMATION IN THIS STRUCTURAL AND COLLATERAL TERM SHEET IS NOT COMPLETE AND MAY BE AMENDED PRIOR TO THE TIME OF SALE. THIS TERM SHEET IS NOT AN OFFER TO SELL THESE SECURITIES AND IT IS NOT A SOLICITATION OF AN OFFER TO BUY THESE SECURITIES IN ANY JURISDICTION WHERE THE OFFER OR SALE IS NOT PERMITTED.
111
EXCHANGERIGHT NET LEASED PORTFOLIO 13
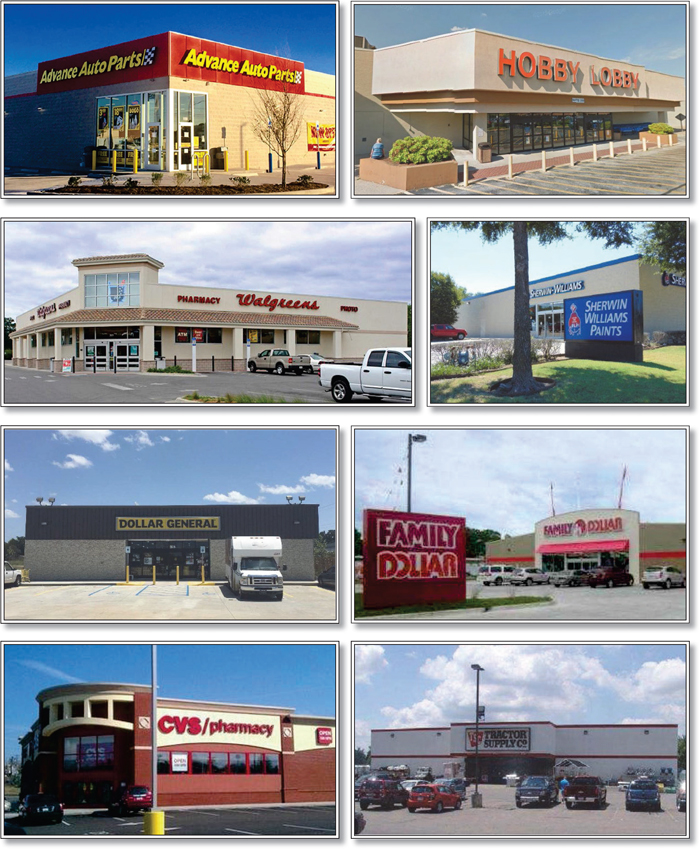
THE INFORMATION IN THIS STRUCTURAL AND COLLATERAL TERM SHEET IS NOT COMPLETE AND MAY BE AMENDED PRIOR TO THE TIME OF SALE. THIS TERM SHEET IS NOT AN OFFER TO SELL THESE SECURITIES AND IT IS NOT A SOLICITATION OF AN OFFER TO BUY THESE SECURITIES IN ANY JURISDICTION WHERE THE OFFER OR SALE IS NOT PERMITTED.
112
EXCHANGERIGHT NET LEASED PORTFOLIO 13
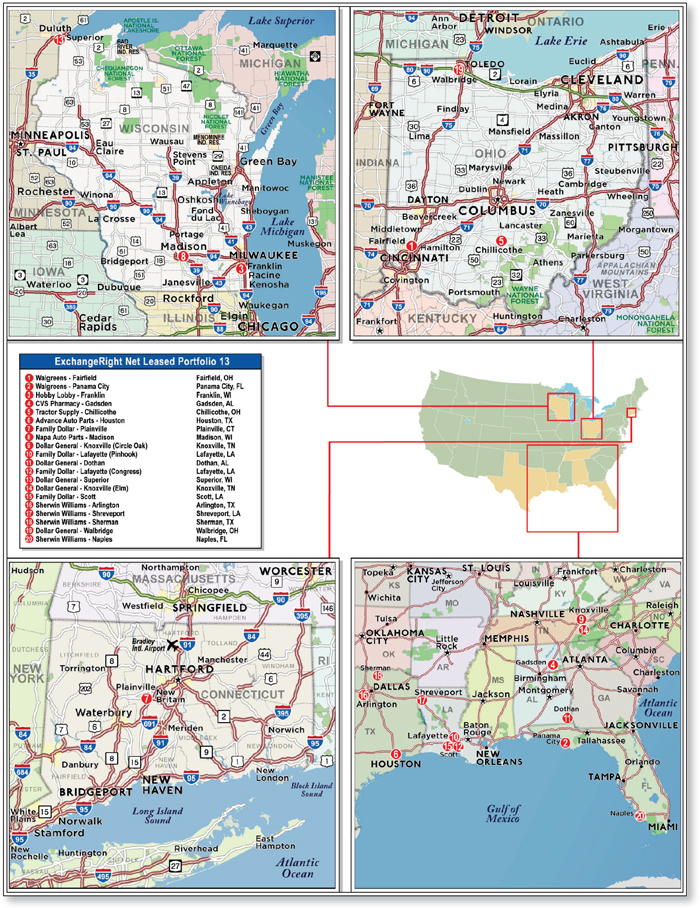
THE INFORMATION IN THIS STRUCTURAL AND COLLATERAL TERM SHEET IS NOT COMPLETE AND MAY BE AMENDED PRIOR TO THE TIME OF SALE. THIS TERM SHEET IS NOT AN OFFER TO SELL THESE SECURITIES AND IT IS NOT A SOLICITATION OF AN OFFER TO BUY THESE SECURITIES IN ANY JURISDICTION WHERE THE OFFER OR SALE IS NOT PERMITTED.
113
| No. 9 – ExchangeRight Net Leased Portfolio 13 | |||||||
| Loan Information | Property Information | ||||||
| Mortgage Loan Seller: | Barclays Bank PLC | Single Asset/Portfolio: | Portfolio | ||||
Credit Assessment (Fitch/Moody’s/Morningstar): | NR/NR/NR | Property Type: | Retail | ||||
| Original Principal Balance: | $24,485,000 | Specific Property Type: | Single Tenant | ||||
| Cut-off Date Balance: | $24,485,000 | Location(3): | Various | ||||
| % of Initial Pool Balance: | 2.9% | Size: | 233,055 SF | ||||
| Loan Purpose: | Acquisition | Cut-off Date Balance Per SF: | $105.06 | ||||
| Borrower Name(1): | ExchangeRight Net Leased Portfolio 13 DST | Year Built/Renovated(3): | Various | ||||
| Sponsors: | David Fisher; Joshua Ungerecht; Warren Thomas | Title Vesting: | Fee | ||||
| Mortgage Rate: | 3.821% | Property Manager: | Self-managed | ||||
| Note Date: | August 31, 2016 | 4th Most Recent Occupancy(4): | NAV | ||||
| Anticipated Repayment Date: | NAP | 3rd Most Recent Occupancy(4): | NAV | ||||
| Maturity Date: | September 6, 2026 | 2nd Most Recent Occupancy(4): | NAV | ||||
| IO Period: | 120 months | Most Recent Occupancy(4): | NAV | ||||
| Loan Term (Original): | 120 months | Current Occupancy (As of): | 100.0% (11/1/2016) | ||||
| Seasoning: | 2 months | ||||||
| Amortization Term (Original): | NAP | Underwriting and Financial Information: | |||||
| Loan Amortization Type: | Interest-only, Balloon | ||||||
| Interest Accrual Method: | Actual/360 | 4th Most Recent NOI(5): | NAV | ||||
| Call Protection: | L(26),D(90),O(4) | 3rd Most Recent NOI(5): | NAV | ||||
| Lockbox Type: | Hard/Springing Cash Management | 2nd Most Recent NOI(5): | NAV | ||||
| Additional Debt: | None | Most Recent NOI(5): | NAV | ||||
| Additional Debt Type: | NAP | ||||||
| U/W Revenues: | $3,035,101 | ||||||
| U/W Expenses: | $324,274 | ||||||
| U/W NOI: | $2,710,827 | ||||||
| Escrows and Reserves(2): | U/W NCF: | $2,600,747 | |||||
| U/W NOI DSCR: | 2.86x | ||||||
| Type: | Initial | Monthly | Cap (If Any) | U/W NCF DSCR: | 2.74x | ||
| Taxes | $78,724 | $21,553 | NAP | U/W NOI Debt Yield: | 11.1% | ||
| Insurance | $0 | Springing | NAP | U/W NCF Debt Yield: | 10.6% | ||
| Replacement Reserves | $0 | $1,440 | NAP | As-Is Appraised Value(6): | $45,293,000 | ||
| TI/LC Reserve | $0 | Springing | NAP | As-Is Appraisal Valuation Date(6): | Various | ||
| Deferred Maintenance | $95,243 | $0 | NAP | Cut-off Date LTV Ratio: | 54.1% | ||
| Condominium Assessments Reserve | $25,857 | Springing | NAP | LTV Ratio at Maturity or ARD: | 54.1% | ||
| (1) | See “The Borrower” section. |
| (2) | See “Escrows” section. |
| (3) | See “The Properties” section. |
| (4) | See “Historical Occupancy” section. |
| (5) | See “Cash Flow Analysis” section. Historical cash flows are unavailable as the ExchangeRight Properties were acquired by the sponsors between May 2015 and August 2016. The sellers of the ExchangeRight Properties did not provide historical operating statements to the borrower (the buyer). |
| (6) | See “Appraisal” section. Each of the ExchangeRight Properties was valued individually. The appraisals are dated from April 10, 2016 to August 19, 2016. |
The Mortgage Loan. The mortgage loan (the “ExchangeRight Mortgage Loan”) is evidenced by a single promissory note that is secured by a first mortgage encumbering 20 cross-collateralized, triple-net leased, single tenant properties located in Alabama, Connecticut, Florida, Louisiana, Ohio, Tennessee, Texas, and Wisconsin (the “ExchangeRight Properties”). The ExchangeRight Mortgage Loan was originated on August 31, 2016 by Barclays Bank PLC. The ExchangeRight Mortgage Loan had an original principal balance of $24,485,000, has an outstanding principal balance as of the Cut-off Date of $24,485,000 and accrues interest at an interest rate of 3.821%per annum. The ExchangeRight Mortgage Loan had an initial term of 120 months, has a remaining term of 118 months as of the Cut-off Date and requires interest-only payments through the term of the ExchangeRight Mortgage Loan. The ExchangeRight Mortgage Loan matures on September 6, 2026.
Following the lockout period, the borrower has the right to defease the ExchangeRight Mortgage Loan in whole, but not in part, on any date before June 6, 2026. In addition, the ExchangeRight Mortgage Loan is prepayable without penalty on or after June 6, 2026.
THE INFORMATION IN THIS STRUCTURAL AND COLLATERAL TERM SHEET IS NOT COMPLETE AND MAY BE AMENDED PRIOR TO THE TIME OF SALE. THIS TERM SHEET IS NOT AN OFFER TO SELL THESE SECURITIES AND IT IS NOT A SOLICITATION OF AN OFFER TO BUY THESE SECURITIES IN ANY JURISDICTION WHERE THE OFFER OR SALE IS NOT PERMITTED.
114
EXCHANGERIGHT NET LEASED PORTFOLIO 13
Sources and Uses
| Sources | Uses | |||||||
| Original loan amount | $24,485,000 | 53.7% | Purchase price(1) | $44,718,238 | 98.1% | |||
| Sponsor’s new cash contribution | 21,102,544 | 46.3 | Reserves | 199,824 | 0.4 | |||
| Closing costs | 669,482 | 1.5 | ||||||
| Total Sources | $45,587,544 | 100.0% | Total Uses | $45,587,544 | 100.0% |
| (1) | A portion of the ExchangeRight Mortgage Loan proceeds were used to unencumber 11 of the 20 properties that served as collateral under the sponsors’ line of credit facilities that were purchased between May 2015 and August 2016. |
The Properties. The ExchangeRight Properties comprise 20 single-tenant retail properties totaling 233,055 square feet located in Alabama (two properties), Connecticut (one property), Florida (two properties), Louisiana (four properties), Ohio (three properties), Tennessee (two properties), Texas (three properties) and Wisconsin (three properties). Built between 1986 and 2016, the ExchangeRight Properties range in size from 5,800 square feet to 53,000 square feet. The sponsor acquired the ExchangeRight Properties between May 2015 and August 2016 for a combined purchase price of approximately $44.7 million. As of November 1, 2016, the ExchangeRight Properties were 100.0% occupied.
The ExchangeRight Properties include nationally recognized credit-tenants, such as Walgreens (rated BBB/Baa2/BBB by Fitch/Moody’s/S&P), CVS Pharmacy (rated Baa1/BBB+ by Moody’s/S&P), Sherwin Williams (rated A-/A3/A by Fitch/Moody’s/S&P), Dollar General (rated Baa2/BBB by Moody’s/S&P), Family Dollar (rated Ba2/BB+ by Moody’s/S&P) and Advance Auto Parts (rated Baa2/BBB- by Moody’s/S&P). Credit rated tenants occupy 17 of the 20 properties representing 77.3% of underwritten base rent (leases are directly with rated entities or are guaranteed by such entities). Investment grade-rated tenants occupy 13 of the 20 properties representing 63.6% of underwritten base rent. The ExchangeRight Properties have a weighted average remaining initial lease term of approximately 12.9 years and if utilizing the fully extended lease maturity dates, the weighted average remaining lease term is approximately 40.5 years. Leases representing approximately 65.3% of the net rentable area and 79.0% of the underwritten base rent expire after the ExchangeRight Mortgage Loan maturity date. No individual property within the ExchangeRight Properties accounts for more than 13.6% of the underwritten base rent. The largest property, Hobby Lobby – Franklin comprises approximately 53,000 square feet (22.7% of the total net rentable area) and $344,500 of the underwritten base rent (12.1% of underwritten base rent). Excluding Hobby Lobby – Franklin, no individual property accounts for more than 8.1% of the net rentable area.
Condominium Structure.The Hobby Lobby – Franklin property comprises unit 1 of a two-unit commercial condominium. Unit 1 is a retail unit, and unit 2 is an industrial warehouse. Unit 2 is not part of the collateral for the ExchangeRight Mortgage Loan. Each unit has a 50% interest in the general common elements and equal voting rights. The borrower has 50% of the voting control, which gives the borrower the ability to block actions by the condominium board and association.
The following table presents certain information relating to the ExchangeRight Properties:
| Tenant Name | City, State | Specific Property Type | Allocated Cut-off Date Balance | % of Portfolio Cut-off Date Balance | Occupancy | Year Built/ Renovated | Net Rentable Area (SF) | Appraised Value(1) | |
| Walgreens | Fairfield, Ohio | Single Tenant | $3,395,000 | 13.9% | 100.0% | 2002/NAP | 14,490 | $6,200,000 | |
| Walgreens | Panama City, Florida | Single Tenant | $3,165,000 | 12.9% | 100.0% | 2006/NAP | 14,820 | $5,763,000 | |
| Hobby Lobby | Franklin, Wisconsin | Single Tenant | $2,825,000 | 11.5% | 100.0% | 2003/NAP | 53,000 | $5,300,000 | |
| CVS Pharmacy | Gadsden, Alabama | Single Tenant | $2,420,000 | 9.9% | 100.0% | 2008/NAP | 11,945 | $4,500,000 | |
| Tractor Supply | Chillicothe, Ohio | Single Tenant | $1,645,000 | 6.7% | 100.0% | 1996/NAP | 18,946 | $3,000,000 | |
| Advance Auto Parts | Houston, Texas | Single Tenant | $1,075,000 | 4.4% | 100.0% | 2015/NAP | 6,889 | $2,050,000 | |
| Family Dollar | Plainville, Connecticut | Single Tenant | $1,040,000 | 4.2% | 100.0% | 2015/NAP | 9,219 | $1,980,000 | |
| Napa Auto Parts | Madison, Wisconsin | Single Tenant | $960,000 | 3.9% | 100.0% | 1990/NAP | 7,800 | $1,800,000 | |
| Dollar General | Knoxville, Tennessee | Single Tenant | $825,000 | 3.4% | 100.0% | 2016/NAP | 9,100 | $1,475,000 | |
| Dollar General | Dothan, Alabama | Single Tenant | $745,000 | 3.0% | 100.0% | 2016/NAP | 9,026 | $1,400,000 | |
| Family Dollar | Lafayette, Louisiana | Single Tenant | $755,000 | 3.1% | 100.0% | 2016/NAP | 8,481 | $1,400,000 | |
| Dollar General | Superior, Wisconsin | Single Tenant | $735,000 | 3.0% | 100.0% | 2013/NAP | 9,493 | $1,380,000 | |
| Family Dollar | Lafayette, Louisiana | Single Tenant | $745,000 | 3.0% | 100.0% | 2016/NAP | 8,320 | $1,370,000 | |
| Dollar General | Knoxville, Tennessee | Single Tenant | $695,000 | 2.8% | 100.0% | 2016/NAP | 9,100 | $1,275,000 | |
| Family Dollar | Scott, Louisiana | Single Tenant | $670,000 | 2.7% | 100.0% | 2016/NAP | 8,532 | $1,230,000 | |
| Sherwin Williams | Arlington, Texas | Single Tenant | $655,000 | 2.7% | 100.0% | 1999/NAP | 6,000 | $1,210,000 | |
| Sherwin Williams | Shreveport, Louisiana | Single Tenant | $595,000 | 2.4% | 100.0% | 2003/NAP | 6,000 | $1,110,000 | |
| Sherwin Williams | Sherman, Texas | Single Tenant | $585,000 | 2.4% | 100.0% | 2001/NAP | 7,080 | $1,100,000 | |
| Dollar General | Walbridge, Ohio | Single Tenant | $485,000 | 2.0% | 100.0% | 2008/NAP | 9,014 | $890,000 | |
| Sherwin Williams | Naples, Florida | Single Tenant | $470,000 | 1.9% | 100.0% | 1986/NAP | 5,800 | $860,000 | |
| Total/Weighted Average | $24,485,000 | 100.0% | 100.0% | 233,055 | $45,293,000 | ||||
| (1) | In addition, each appraisal provides a “go dark” value for the related property. The ExchangeRight Properties have an aggregate “go dark” value of $23,830,000. |
THE INFORMATION IN THIS STRUCTURAL AND COLLATERAL TERM SHEET IS NOT COMPLETE AND MAY BE AMENDED PRIOR TO THE TIME OF SALE. THIS TERM SHEET IS NOT AN OFFER TO SELL THESE SECURITIES AND IT IS NOT A SOLICITATION OF AN OFFER TO BUY THESE SECURITIES IN ANY JURISDICTION WHERE THE OFFER OR SALE IS NOT PERMITTED.
115
EXCHANGERIGHT NET LEASED PORTFOLIO 13
The following table presents certain information relating to the tenancies at the ExchangeRight Properties:
Major Tenants(1)
| Tenant Name | Credit Rating (Fitch/Moody’s/S&P)(2) | Tenant NRSF | % of NRSF | Annual U/W Base Rent PSF | Annual U/W Base Rent | % of Total Annual U/W Base Rent | Lease Expiration Date |
| Major Tenants | |||||||
| Walgreens | BBB/Baa2/BBB | 29,310 | 12.6% | $24.77 | $726,000 | 25.5% | Various(3) |
| Dollar General | NR/Baa2/BBB | 45,733 | 19.6% | $9.49 | $433,882 | 15.3% | Various(4) |
| Family Dollar | NR/Ba2/BB+ | 34,552 | 14.8% | $11.25 | $388,608 | 13.7% | Various(5) |
| Hobby Lobby | NR/NR/NR | 53,000 | 22.7% | $6.50 | $344,500 | 12.1% | 3/31/2026(6) |
| CVS Pharmacy | NR/Baa1/BBB+ | 11,945 | 5.1% | $22.50 | $268,763 | 9.5% | 1/31/2034(7) |
| Sherwin Williams | A-/A3/A | 24,880 | 10.7% | $10.35 | $257,470 | 9.1% | Various(8) |
| Total Major Tenants | 199,420 | 85.6% | $12.13 | $2,419,222 | 85.1% | ||
| Non-Major Tenants | 33,635 | 14.4% | $12.58 | $423,163 | 14.9% | ||
| Occupied Collateral Total | 233,055 | 100.0% | $12.20 | $2,842,385 | 100.0% | ||
| Vacant Space | 0 | 0.0% | |||||
| Collateral Total | 233,055 | 100.0% | |||||
| (1) | Tenants are not required to report sales information. |
| (2) | Certain ratings are those of the parent company whether or not the parent guarantees the lease. |
| (3) | Walgreens is a tenant at two properties and leases 14,820 square feet at the Walgreens - Panama City property under a lease that expires on May 31, 2031 and has 10 five-year renewal options and 14,490 square feet at the Walgreens - Fairfield property under a lease that expires on December 31, 2027 and has 10 five-year renewal options. |
| (4) | Dollar General is a tenant at five properties and leases 9,493 square feet at the Dollar General - Superior property under a lease that expires on October 31, 2028 and has five five-year renewal options; 9,100 square feet at the Dollar General - Knoxville (Elm) property under a lease that expires on July 31, 2031 and has five five-year renewal options; 9,100 square feet at the Dollar General - Knoxville (Circle Oak) property under a lease that expires on April 30, 2031 and has five five-year renewal options; 9,014 square feet at the Dollar General - Walbridge property under a lease that expires on July 31, 2025 and has four five-year renewal options; and 9,026 square feet at the Dollar General - Dothan property under a lease that expires on July 31, 2031 and has five five-year renewal options. |
| (5) | Family Dollar is a tenant at four properties and leases 9,219 square feet at the Family Dollar – Plainville property under a lease that expires on June 30, 2030; 8,532 square feet at the Family Dollar – Scott property under a lease that expires on June 30, 2031; 8,481 square feet at the Family Dollar - Lafayette (Pinhook) property under a lease that expires on March 31, 2031; and 8,320 square feet at the Family Dollar - Lafayette (Congress) property under a lease that expires on June 30, 2031. Each Family Dollar tenant has six five-year renewal options. |
| (6) | Hobby Lobby has three five-year renewal options. |
| (7) | CVS Pharmacy has four five-year renewal options. |
| (8) | Sherwin Williams is a tenant at four properties and leases 7,080 square feet at the Sherwin Williams – Sherman property under a lease that expires on May 31, 2026 and has three five-year renewal options; 6,000 square feet at the Sherwin Williams - Arlington property under a lease that expires on October 31, 2026 and has four five-year renewal options; 6,000 square feet at the Sherwin Williams – Shreveport property under a lease that expires on July 31, 2026 and has three five-year renewal options; and 5,800 square feet at the Sherwin Williams - Naples property under a lease that expires on March 31, 2026 and has one five-year renewal option. |
THE INFORMATION IN THIS STRUCTURAL AND COLLATERAL TERM SHEET IS NOT COMPLETE AND MAY BE AMENDED PRIOR TO THE TIME OF SALE. THIS TERM SHEET IS NOT AN OFFER TO SELL THESE SECURITIES AND IT IS NOT A SOLICITATION OF AN OFFER TO BUY THESE SECURITIES IN ANY JURISDICTION WHERE THE OFFER OR SALE IS NOT PERMITTED.
116
EXCHANGERIGHT NET LEASED PORTFOLIO 13
The following table presents certain information relating to the lease rollover schedule at the ExchangeRight Properties:
Lease Expiration Schedule(1)
| Year Ending December 31, | No. of Leases Expiring | Expiring NRSF | % of Total NRSF | Cumulative Expiring NRSF | Cumulative % of Total NRSF | Annual U/W Base Rent | % of Total Annual U/W Base Rent | Annual U/W Base Rent PSF |
| MTM | 0 | 0 | 0.0% | 0 | 0.0% | $0 | 0.0% | $0.00 |
| 2016 | 0 | 0 | 0.0% | 0 | 0.0% | $0 | 0.0% | $0.00 |
| 2017 | 0 | 0 | 0.0% | 0 | 0.0% | $0 | 0.0% | $0.00 |
| 2018 | 0 | 0 | 0.0% | 0 | 0.0% | $0 | 0.0% | $0.00 |
| 2019 | 0 | 0 | 0.0% | 0 | 0.0% | $0 | 0.0% | $0.00 |
| 2020 | 0 | 0 | 0.0% | 0 | 0.0% | $0 | 0.0% | $0.00 |
| 2021 | 0 | 0 | 0.0% | 0 | 0.0% | $0 | 0.0% | $0.00 |
| 2022 | 0 | 0 | 0.0% | 0 | 0.0% | $0 | 0.0% | $0.00 |
| 2023 | 0 | 0 | 0.0% | 0 | 0.0% | $0 | 0.0% | $0.00 |
| 2024 | 0 | 0 | 0.0% | 0 | 0.0% | $0 | 0.0% | $0.00 |
| 2025 | 1 | 9,014 | 3.9% | 9,014 | 3.9% | $67,524 | 2.4% | $7.49 |
| 2026 | 6 | 96,826 | 41.5% | 105,840 | 45.4% | $789,002 | 27.8% | $8.15 |
| Thereafter | 13 | 127,215 | 54.6% | 233,055 | 100.0% | $1,985,859 | 69.9% | $15.61 |
| Vacant | 0 | 0 | 0.0% | 233,055 | 100.0% | $0 | 0.0% | $0.00 |
| Total/Weighted Average | 20 | 233,055 | 100.0% | $2,842,385 | 100.0% | $12.20 |
| (1) | Information obtained from the underwritten rent roll. |
The following table presents historical occupancy percentages at the ExchangeRight Properties:
Historical Occupancy
12/31/2012(1) | 12/31/2013(1) | 12/31/2014(1) | 12/31/2015(1) | 11/1/2016(2) |
| NAV | NAV | NAV | NAV | 100.0% |
| (1) | The ExchangeRight Properties were acquired by the sponsors between May 2015 and August 2016. The sellers of the ExchangeRight Properties did not provide historical occupancy information to the borrower (the buyer). |
| (2) | Information obtained from the underwritten rent roll. |
THE INFORMATION IN THIS STRUCTURAL AND COLLATERAL TERM SHEET IS NOT COMPLETE AND MAY BE AMENDED PRIOR TO THE TIME OF SALE. THIS TERM SHEET IS NOT AN OFFER TO SELL THESE SECURITIES AND IT IS NOT A SOLICITATION OF AN OFFER TO BUY THESE SECURITIES IN ANY JURISDICTION WHERE THE OFFER OR SALE IS NOT PERMITTED.
117
EXCHANGERIGHT NET LEASED PORTFOLIO 13
Operating History and Underwritten Net Cash Flow. The following table presents certain information relating to the underwritten net cash flow at the ExchangeRight Properties:
Cash Flow Analysis(1)
| U/W | % of U/W Effective Gross Income | U/W $/SF | ||||
| Base Rent | $2,842,385(2) | 93.7% | $12.20 | |||
| Grossed Up Vacant Space | 0 | 0.0 | 0.00 | |||
| Total Reimbursables | 263,572(3) | 8.7 | 1.13 | |||
| Other Income | 5,859 | 0.2 | 0.03 | |||
| Less Vacancy & Free Rent | (76,715)(4) | (2.5) | (0.33) | |||
| Effective Gross Income | $3,035,101 | 100.0% | $13.02 | |||
| Total Operating Expenses | $324,274 | 10.7% | $1.39 | |||
| Net Operating Income | $ 2,710,827 | 89.3% | $11.63 | |||
| TI/LC | 87,851 | 2.9 | 0.38 | |||
| Replacement Reserves | 22,229 | 0.7 | 0.10 | |||
| Net Cash Flow | $ 2,600,747 | 85.7% | $11.16 | |||
| NOI DSCR | 2.86x | |||||
| NCF DSCR | 2.74x | |||||
| NOI DY | 11.1% | |||||
| NCF DY | 10.6% | |||||
| (1) | Historical cash flows are unavailable as the ExchangeRight Properties were acquired by the sponsors between May 2015 and August 2016. The sellers of the ExchangeRight Properties did not provide historical operating statements to the borrower (the buyer). |
| (2) | U/W Base Rent is based on in-place rent per leases. |
| (3) | Total Reimbursables are underwritten based on tenant leases and discussions with the borrower. There are no reimbursements at eight of the properties as the tenants pay for the respective property expenses directly. The remaining twelve tenants reimburse either property taxes, insurance or operating expenses or some combination of the three. |
| (4) | The underwritten economic vacancy is 5.0% at the property level except for eight properties (Advance Auto Parts – Houston, CVS Pharmacy - Gadsden, Dollar General - Dothan, Dollar General - Knoxville (Elm), Dollar General - Knoxville (Circle Oak), Dollar General - Superior, Walgreens - Fairfield, and Walgreens - Panama City), which are underwritten to a 0.0% economic vacancy. The eight properties are 100.0% occupied by investment grade tenants with at least 11 years remaining on the initial lease term. The overall blended economic vacancy is 2.5%. The ExchangeRight Properties are 100.0% physically occupied as of November 1, 2016. |
Appraisal.The ExchangeRight Properties were valued individually, with the individual values reflecting a cumulative “as-is” appraised value of $45,293,000. The appraisals are dated from April 10, 2016 to August 19, 2016. Additionally, each appraisal provided a corresponding “go dark” value which equates to a cumulative “go dark” appraised value of $23,830,000 for the ExchangeRight Properties.
Environmental Matters. According to the Phase I environmental site assessment dated August 12, 2016, the Advance Auto Parts – Houston property has been impacted by the migration of contaminated groundwater from the adjacent, upgradient industrial property. The Advance Auto Parts - Houston property owner has enrolled in the Innocent Owner/Operator Program (“IOP”). The IOP provides a certificate to an innocent owner or operator if the property is contaminated as a result of a release or migration of contaminants from a source or sources not located on the owners/operator’s property and the owner/operator did not cause or contribute to the source or sources of contamination. The Advance Auto Parts – Houston property owner was awarded an IOP certificate on December 21, 2015. According to the IOP certificate, the owner of the Advance Auto Parts – Houston property is not liable under the Texas Health and Safety Code or Texas Water Code for investigation, monitoring, remediation or corrective measures. No further action is recommended. See“Description of the Mortgage Pool—Mortgage Pool Characteristics—Environmental Considerations” in the Preliminary Prospectus.
The Borrower. The borrower is ExchangeRight Net Leased Portfolio 13 DST, a Delaware Statutory Trust. At loan origination, the ExchangeRight Properties were conveyed and assumed from ExchangeRight Net Leased Portfolio 13, LLC to and by ExchangeRight Net Leased Portfolio 13 DST. ExchangeRight Net Leased Portfolio 13 DST has master leased the ExchangeRight Properties to a master lessee affiliated with the sponsors. The master lessee is structured as a special purpose entity. The master lessee’s interest in the master lease and all rents are assigned to the lender. The sponsors have a 100% ownership interest in the master lessee. The master lease is subordinate to the ExchangeRight Mortgage Loan. There is one independent director for the borrowing entity and one independent director for the master lessee. Legal counsel to the borrower delivered a non-consolidation opinion in connection with the origination of the ExchangeRight Mortgage Loan. David Fisher, Joshua Ungerecht and Warren Thomas are the guarantors of certain nonrecourse carveouts under the ExchangeRight Mortgage Loan. See“Description of the Mortgage Pool—Delaware Statutory Trusts” in the Preliminary Prospectus.
The Sponsors.The sponsors are David Fisher, Joshua Ungerecht and Warren Thomas, all of whom are managing members of ExchangeRight Real Estate, LLC (“ExchangeRight”). ExchangeRight has more than $550.0 million of assets and more than 3.2 million square feet under management. ExchangeRight has more than 195 investment-grade retail and class B/B+ multifamily properties
THE INFORMATION IN THIS STRUCTURAL AND COLLATERAL TERM SHEET IS NOT COMPLETE AND MAY BE AMENDED PRIOR TO THE TIME OF SALE. THIS TERM SHEET IS NOT AN OFFER TO SELL THESE SECURITIES AND IT IS NOT A SOLICITATION OF AN OFFER TO BUY THESE SECURITIES IN ANY JURISDICTION WHERE THE OFFER OR SALE IS NOT PERMITTED.
118
EXCHANGERIGHT NET LEASED PORTFOLIO 13
located across 27 states. Mr. Thomas was involved in a foreclosure in 2013.See “Description of the Mortgage Pool—Loan Purpose; Default History, Bankruptcy Issues and Other Proceedings” in the Preliminary Prospectus.
Escrows.The loan documents provide for upfront reserves in the amount of $78,724 for real estate taxes, $95,243 for deferred maintenance, and $25,857 for a condominium assessments reserve. The loan documents require monthly deposits of (i) $21,553 for real estate taxes; (ii) $1,440 for replacement reserves; and (iii) on each payment date an amount such that the balance in the condominium assessments reserve account will at all times equal at least the aggregate amount of the condominium assessments due from the borrower to the condominium association with respect to unit 1 at the Hobby Lobby – Franklin property for the next ensuing three month period. The loan documents do not require monthly escrows for insurance provided that the insurance required is maintained under an acceptable blanket insurance policy. If an event of default has occurred and is continuing, the borrower is required to deposit $13,594 on a monthly basis into the TI/LC reserve and any sum or termination fee payable to the borrower.
Lockbox and Cash Management.The ExchangeRight Mortgage Loan requires a lender-controlled lockbox account, which is already in place. The borrower and property manager are required to direct all tenants to pay rents directly into such lockbox account. The loan documents also require that all rents received by the borrower or property manager be deposited into the lockbox account within one business day of receipt. During a Cash Sweep Period (as defined below), funds deposited into the lockbox account are required to be swept on a daily basis into a cash management account controlled by the lender.
A “Cash Sweep Period” will commence upon the occurrence of a Cash Sweep Event (as defined below) and will continue until the earlier of (i) the next occurring payment date following the related Cash Sweep Event Cure (as defined below) or (ii) payment in full of all principal and interest on the ExchangeRight Mortgage Loan and all other amounts due and payable under the loan documents or defeasance of the ExchangeRight Mortgage Loan.
A “Cash Sweep Event” will commence upon the occurrence of: (i) an event of default; (ii) a debt service coverage ratio less than 1.45x as of the date of determination; or (iii) a Qualified Transfer Trigger Event (as defined below).
A “Cash Sweep Event Cure” will occur: with respect to clause (i) of the definition of “Cash Sweep Event” above, upon the acceptance by the lender of a cure of such event of default; with respect to clause (ii) of the definition of “Cash Sweep Event” above, upon the achievement of a debt service coverage ratio greater than or equal to 1.45x for two consecutive calendar quarters; and with respect to clause (iii) of the definition of “Cash Sweep Event” above, upon the occurrence of a Qualified Transfer Trigger Event Cure (as defined below); provided, however, that any such cure is subject to the absence of a continuing event of default.
A “Qualified Transfer Trigger Event” will commence upon the date that is 36 months prior to the maturity date.
A “Qualified Transfer Trigger Event Cure” will occur upon a Qualified Transfer (as defined below), provided that the Approved Transferee (as defined below): (i) maintains a minimum net worth of at least $200.0 million and total assets of at least $400.0 million; (ii) executes and delivers to lender a full recourse guaranty guaranteeing payment of the entire amount of the ExchangeRight Mortgage Loan; (iii) owns no less than 100.0% of the legal and beneficial ownership interests in the borrower and master lessee; (iv) is not a Delaware Statutory Trust; and (v) causes the borrower to convert to a limited liability company.
A “Qualified Transfer” will mean, at any time following the date six months from the origination date, the transfer of all outstanding ownership interests in the borrower in one or a series of transactions to an Approved Transferee and the replacement of the guarantor as the person who controls the borrower, provided the terms and conditions set forth in the loan documents are satisfied.
An “Approved Transferee” will mean (i) an eligible financial institution or (ii) any person who meets the requirements as set in the loan documents, is regularly engaged in the business of owning or operating commercial properties, owns interests in or operates at least five properties with a minimum of 750,000 square feet and has total assets of at least $100.0 million.
Property Management. The ExchangeRight Properties are managed by an affiliate of the borrower.
Assumption. The borrower is permitted to transfer the ExchangeRight Properties in whole, but not in part, provided that certain conditions are satisfied, including: (i) no event of default has occurred and is continuing; (ii) the lender has reasonably determined that the proposed transferee and guarantor satisfy the lender’s credit review and underwriting standards, taking into consideration transferee experience, financial strength and general business standing; (iii) the delivery of a REMIC opinion, an insolvency opinion and other opinions required by the lender; and (iv) the lender has received confirmation from Fitch, Moody’s and Morningstar that such assumption will not result in a downgrade, withdrawal or qualification of the respective ratings assigned to the Series 2016-C36 Certificates. If such transfer is a permitted transfer as set forth in the loan documents, the borrower is not required to receive lender consent and fulfill the aforementioned provisions.
Right of First Refusal.The sole tenants at the Walgreens – Panama City and the Walgreens – Fairfield properties each have a right of first refusal (“ROFR”) with respect to offers to purchase their respective properties. Walgreens, the tenant at both properties, agreed in a subordination, nondisturbance and attornment agreement that such ROFR is waived in the event of foreclosure or deed in lieu. The sole tenants at the Family Dollar – Plainville, Family Dollar - Lafayette (Pinhook), Family Dollar - Lafayette (Congress) and the Family Dollar - Scott properties, each have a ROFR with respect to offers to purchase their respective properties. However, the ROFR does not apply to a foreclosure sale, deed in lieu of foreclosure or similar conveyance resulting from the lender exercising its remedies under the ExchangeRight Mortgage Loan.
Partial Release.Not permitted.
Real Estate Substitution.Not permitted.
THE INFORMATION IN THIS STRUCTURAL AND COLLATERAL TERM SHEET IS NOT COMPLETE AND MAY BE AMENDED PRIOR TO THE TIME OF SALE. THIS TERM SHEET IS NOT AN OFFER TO SELL THESE SECURITIES AND IT IS NOT A SOLICITATION OF AN OFFER TO BUY THESE SECURITIES IN ANY JURISDICTION WHERE THE OFFER OR SALE IS NOT PERMITTED.
119
EXCHANGERIGHT NET LEASED PORTFOLIO 13
Subordinate and Mezzanine Indebtedness.Not permitted.
Ground Lease.None.
Terrorism Insurance.The loan documents require that the “all risk” insurance policy required to be maintained by the borrower provide coverage for terrorism in an amount equal to 100% of the full replacement cost of the ExchangeRight Properties. The loan documents also require business interruption insurance covering no less than the 12-month period following the occurrence of a casualty event, together with a three-month extended period of indemnity.
Windstorm Insurance.The loan documents require windstorm insurance covering the full replacement cost of the ExchangeRight Properties during the loan term. At the time of closing, the ExchangeRight Properties have windstorm insurance coverage.
THE INFORMATION IN THIS STRUCTURAL AND COLLATERAL TERM SHEET IS NOT COMPLETE AND MAY BE AMENDED PRIOR TO THE TIME OF SALE. THIS TERM SHEET IS NOT AN OFFER TO SELL THESE SECURITIES AND IT IS NOT A SOLICITATION OF AN OFFER TO BUY THESE SECURITIES IN ANY JURISDICTION WHERE THE OFFER OR SALE IS NOT PERMITTED.
120
(THIS PAGE INTENTIONALLY LEFT BLANK)
THE INFORMATION IN THIS STRUCTURAL AND COLLATERAL TERM SHEET IS NOT COMPLETE AND MAY BE AMENDED PRIOR TO THE TIME OF SALE. THIS TERM SHEET IS NOT AN OFFER TO SELL THESE SECURITIES AND IT IS NOT A SOLICITATION OF AN OFFER TO BUY THESE SECURITIES IN ANY JURISDICTION WHERE THE OFFER OR SALE IS NOT PERMITTED.
121
SHERATON TOWSON BALTIMORE NORTH |

THE INFORMATION IN THIS STRUCTURAL AND COLLATERAL TERM SHEET IS NOT COMPLETE AND MAY BE AMENDED PRIOR TO THE TIME OF SALE. THIS TERM SHEET IS NOT AN OFFER TO SELL THESE SECURITIES AND IT IS NOT A SOLICITATION OF AN OFFER TO BUY THESE SECURITIES IN ANY JURISDICTION WHERE THE OFFER OR SALE IS NOT PERMITTED.
122
SHERATON TOWSON BALTIMORE NORTH |
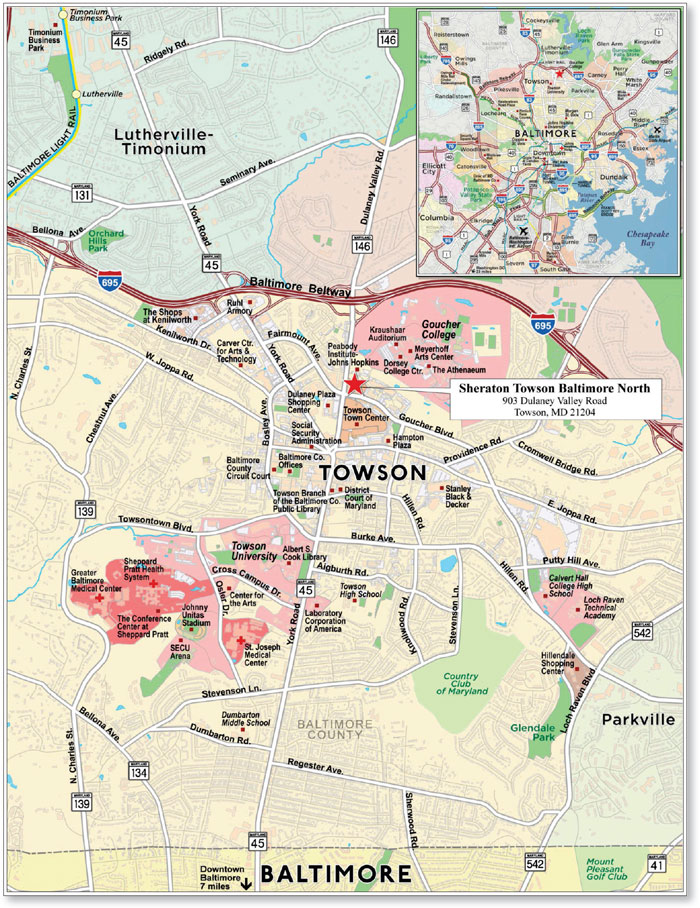
THE INFORMATION IN THIS STRUCTURAL AND COLLATERAL TERM SHEET IS NOT COMPLETE AND MAY BE AMENDED PRIOR TO THE TIME OF SALE. THIS TERM SHEET IS NOT AN OFFER TO SELL THESE SECURITIES AND IT IS NOT A SOLICITATION OF AN OFFER TO BUY THESE SECURITIES IN ANY JURISDICTION WHERE THE OFFER OR SALE IS NOT PERMITTED.
123
| No. 10 – Sheraton Towson Baltimore North | |||||||
| Loan Information | Property Information | ||||||
| Mortgage Loan Seller: | Barclays Bank PLC | Single Asset/Portfolio: | Single Asset | ||||
| Credit Assessment (Fitch/Moody’s/Morningstar): | NR/NR/NR | Property Type: | Hospitality | ||||
| Original Principal Balance: | $22,000,000 | Specific Property Type: | Full Service | ||||
| Cut-off Date Principal Balance: | $21,949,866 | Location: | Towson, MD | ||||
| % of Initial Pool Balance: | 2.6% | Size: | 283 Rooms | ||||
| Loan Purpose: | Refinance | Cut-off Date Balance Per Room: | $77,561 | ||||
| Borrower Name: | SBN Partners, L.P. | Year Built/Renovated: | 1987/2015 | ||||
| Sponsors: | Kenneth Kochenour; Ira Lubert | Title Vesting: | Fee | ||||
| Mortgage Rate: | 4.980% | Property Manager: | Self-managed | ||||
| Note Date: | August 10, 2016 | 4thMost Recent Occupancy (As of)(2): | 70.4% (12/31/2012) | ||||
| Anticipated Repayment Date: | NAP | 3rdMost Recent Occupancy (As of)(2): | 65.7% (12/31/2013) | ||||
| Maturity Date: | September 6, 2026 | 2ndMost Recent Occupancy (As of)(2): | 69.2% (12/31/2014) | ||||
| IO Period: | None | Most Recent Occupancy (As of)(2): | 65.7% (12/31/2015) | ||||
| Loan Term (Original): | 120 months | Current Occupancy (As of): | 67.1% (7/31/2016) | ||||
| Seasoning: | 2 months | ||||||
| Amortization Term (Original): | 360 months | Underwriting and Financial Information: | |||||
| Loan Amortization Type: | Amortizing Balloon | ||||||
| Interest Accrual Method: | Actual/360 | 4thMost Recent NOI (As of): | $1,893,837 (12/31/2013) | ||||
| Call Protection: | L(26),D(90),O(4) | 3rdMost Recent NOI (As of): | $1,825,379 (12/31/2014) | ||||
| Lockbox Type: | Hard/Springing Cash Management | 2ndMost Recent NOI (As of)(3): | $1,955,056 (12/31/2015) | ||||
| Additional Debt: | None | Most Recent NOI (As of)(3): | $2,538,852 (TTM 7/31/2016) | ||||
| Additional Debt Type: | NAP | ||||||
| U/W Revenues: | $12,727,882 | ||||||
| U/W Expenses: | $10,002,061 | ||||||
| U/W NOI: | $2,725,820 | ||||||
| U/W NCF: | $2,216,705 | ||||||
| U/W NOI DSCR: | 1.93x | ||||||
| Escrows and Reserves(1): | U/W NCF DSCR: | 1.57x | |||||
| U/W NOI Debt Yield: | 12.4% | ||||||
| Type: | Initial | Monthly | Cap (If Any) | U/W NCF Debt Yield: | 10.1% | ||
| Taxes | $0 | $29,117 | NAP | Appraised Value: | $35,000,000 | ||
| Insurance | $0 | Springing | NAP | Appraisal Valuation Date: | July 5, 2016 | ||
| FF&E Reserve | $0 | $42,426 | NAP | Cut-Off Date LTV Ratio: | 62.7% | ||
| Deferred Maintenance | $25,375 | $0 | NAP | LTV Ratio at Maturity or ARD: | 51.6% | ||
| (1) | See “Escrows” section. |
| (2) | The occupancy decrease from 2012 to 2013 is attributable to three competitive hotels that came back online after being de-flagged by their respective brands; however, the Sheraton Towson Baltimore North Property was able to recapture some market share in 2014. The occupancy decrease from 2014 to 2015 is attributable to guest room renovations, which took some guest rooms offline. |
| (3) | See “Cash Flows” section. |
The Mortgage Loan. The mortgage loan (the “Sheraton Towson Baltimore North Mortgage Loan”) is evidenced by a single promissory note that is secured by a first mortgage encumbering the borrower’s fee interest in a full service hotel property located in Towson, Maryland (the “Sheraton Towson Baltimore North Property”). The Sheraton Towson Baltimore North Mortgage Loan was originated on August 10, 2016 by Barclays Bank, PLC. The Sheraton Towson Baltimore North Mortgage Loan had an original principal balance of $22,000,000, has an outstanding principal balance as of the Cut-off Date of $21,949,866 and accrues interest at an interest rate of 4.980%per annum. The Sheraton Towson Baltimore North Mortgage Loan had an initial term of 120 months, has a remaining term of 118 months as of the Cut-off Date and requires payments of principal and interest based on a 30-year amortization schedule. The Sheraton Towson Baltimore North Mortgage Loan matures on September 6, 2026.
Following the lockout period, the borrower has the right to defease the Sheraton Towson Baltimore North Mortgage Loan in whole, but not in part, on any date before June 6, 2026. In addition, the Sheraton Towson Baltimore North Mortgage Loan is prepayable without penalty on or after June 6, 2026.
THE INFORMATION IN THIS STRUCTURAL AND COLLATERAL TERM SHEET IS NOT COMPLETE AND MAY BE AMENDED PRIOR TO THE TIME OF SALE. THIS TERM SHEET IS NOT AN OFFER TO SELL THESE SECURITIES AND IT IS NOT A SOLICITATION OF AN OFFER TO BUY THESE SECURITIES IN ANY JURISDICTION WHERE THE OFFER OR SALE IS NOT PERMITTED.
124
SHERATON TOWSON BALTIMORE NORTH |
Sources and Uses
| Sources | Uses | |||||||
| Original loan amount | $22,000,000 | 100.0% | Loan payoff(1) | $17,794,599 | 80.9% | |||
| Reserves | 25,375 | 0.1 | ||||||
| Closing costs | 299,197 | 1.4 | ||||||
| Return of equity | 3,880,829 | 17.6 | ||||||
| Total Sources | $22,000,000 | 100.0% | Total Uses | $22,000,000 | 100.0% |
| (1) | The Sheraton Towson Baltimore North Property was previously securitized in the WBCMT 2006-C27 transaction. |
The Property.The Sheraton Towson Baltimore North Property is a 283-room, 12-story, full service hotel located in Towson, Maryland, north of downtown Towson and approximately 14 miles north of downtown Baltimore. Additionally, the hotel is located near Goucher College and one mile away from Towson University. The Sheraton Towson Baltimore North Property is directly connected to the Towson Town Center, via a skywalk. The Sheraton Towson Baltimore North Property is situated on a 2.04-acre site and was originally built in 1987, with the most recent renovations completed in 2015.
Amenities at the Sheraton Towson Baltimore North Property include a restaurant (Rain 903), indoor heated pool, fitness center, Club Lounge for preferred Starwood guests, complimentary shuttle service and 18,574 square feet of meeting and event space. The meeting space at the Sheraton Towson Baltimore North Property is accessible through a separate entrance bypassing the hotel lobby. The Sheraton Towson Baltimore North Property is located within the Delaney Center, a mixed-use development comprised of the Sheraton Towson Baltimore North Property, two office buildings and a five-story parking garage. The Sheraton Towson Baltimore North Property has access to 400 parking spaces in the five-story parking garage through a declaration of easements, covenants and restrictions agreement. The parking garage is not owned by the sponsors; however, the Sheraton Towson Baltimore North Property is required to reimburse the parking garage owner for 25.0% of the operating expenses incurred by the parking operator. The Sheraton Towson Baltimore North Property is entitled to the parking income associated with the 400 parking spaces (both income and expenses associated with parking garage were underwritten).
The guestroom mix at the Sheraton Towson Baltimore North Property includes 158 king rooms, 124 double queen rooms and one presidential suite. Guestrooms at the hotel are located on the 3rd floor through the 12th floor. Each guestroom features a flat screen television, workspace with ergonomic desk chair, mini-refrigerator, coffee maker and a Sheraton Signature Sleep Experience bed. According to the appraisal, the demand segmentation for the Sheraton Towson Baltimore North Property is 50.0% corporate, 30.0% group and 20.0% leisure.
The sponsors have owned the Sheraton Towson Baltimore North Property since 1992 and have informed the lender that they have invested approximately $7.5 million ($26,349 per room) since 2011 in various renovations to common areas, guest rooms and guest amenities. In conjunction with renewing the franchise agreement, the sponsors completed a Property Improvement Plan (“PIP”) from 2013 to 2015, spending approximately $5.7 million ($20,067 per room), of which the sponsors estimated $4.7 million was related to the Starwood PIP requirements. The recent PIP involved renovations to the lobby, pre-function areas, meeting and banquet space, the restaurant/bar area and a complete soft-good and case-good upgrade of the guestrooms and corridors. The franchise agreement with Starwood Hotels & Resorts expires in November 2032.
THE INFORMATION IN THIS STRUCTURAL AND COLLATERAL TERM SHEET IS NOT COMPLETE AND MAY BE AMENDED PRIOR TO THE TIME OF SALE. THIS TERM SHEET IS NOT AN OFFER TO SELL THESE SECURITIES AND IT IS NOT A SOLICITATION OF AN OFFER TO BUY THESE SECURITIES IN ANY JURISDICTION WHERE THE OFFER OR SALE IS NOT PERMITTED.
125
SHERATON TOWSON BALTIMORE NORTH |
Operating History and Underwritten Net Cash Flow. The following table presents certain information relating to the historical operating performance and the underwritten net cash flow at the Sheraton Towson Baltimore North Property:
Cash Flow Analysis
| 2013 | 2014 | 2015 | TTM 7/31/2016 | U/W | % of U/W Total Revenue | U/W $ per Room | |||||||||
| Occupancy | 65.7% | 69.2%(1) | 65.7%(1) | 67.1% | 67.1% | ||||||||||
| ADR | $119.49 | $121.07 | $126.94 | $125.45 | $125.45 | ||||||||||
| RevPAR | $80.53 | $83.77 | $83.38 | $84.20 | $84.20 | ||||||||||
| Room Revenue | $8,118,559 | $8,660,074 | $8,589,548 | $8,673,129 | $8,673,129 | 68.1% | $30,647 | ||||||||
| F&B Revenue | 3,360,991 | 3,586,993 | 3,335,681 | 3,656,571 | 3,656,571 | 28.7 | 12,921 | ||||||||
| Other Revenue | 334,735 | 326,134 | 377,921 | 410,687 | 398,182 | 3.1 | 1,407 | ||||||||
| Total Revenue | $11,814,285 | $12,573,201 | $12,303,150 | $12,740,387 | $12,727,882 | 100.0% | $44,975 | ||||||||
| Total Department Expenses | 4,327,674 | 4,758,708 | 4,591,537 | 4,684,753 | 4,684,514 | 36.8 | 16,553 | ||||||||
| Gross Operating Profit | $7,486,611 | $7,814,493 | $7,711,613 | $8,055,634 | $8,043,368 | 63.2% | $28,422 | ||||||||
| Total Undistributed Expenses | 4,840,058 | 5,201,097 | 4,979,157 | 4,764,716 | 4,531,109 | 35.6 | 16,011 | ||||||||
| Profit Before Fixed Charges | $2,646,553 | $2,613,396 | $2,732,456 | $3,290,918 | $3,512,259 | 27.6% | $12,411 | ||||||||
| Total Fixed Charges | 752,716 | 788,017 | 777,400 | 752,066 | 786,438 | 6.2 | 2,779 | ||||||||
| Net Operating Income | $1,893,837 | $1,825,379 | $1,955,056(2) | $2,538,852(2)(3) | $2,725,820(3) | 21.4% | $9,632 | ||||||||
| FF&E | 0 | 0 | 0 | 0 | 509,115 | 4.0 | 1,799 | ||||||||
| Net Cash Flow | $1,893,837 | $1,825,379 | $1,955,056 | $2,538,852 | $2,216,705 | 17.4% | $7,833 | ||||||||
| NOI DSCR | 1.34x | 1.29x | 1.38x | 1.80x | 1.93x | ||||||||||
| NCF DSCR | 1.34x | 1.29x | 1.38x | 1.80x | 1.57x | ||||||||||
| NOI DY | 8.6% | 8.3% | 8.9% | 11.6% | 12.4% | ||||||||||
| NCF DY | 8.6% | 8.3% | 8.9% | 11.6% | 10.1% |
| (1) | The occupancy decrease from 2014 to 2015 is attributable to guest room renovations, which took some guest rooms offline. |
| (2) | The increase in TTM 7/31/2016 Net Operating Income from 2015 Net Operating Income is due to the completion of the hotel renovations. |
| (3) | The increase in U/W Net Operating Income from TTM 7/31/2016 Net Operating Income is primarily due to a negotiated decrease in the management fee from 5.0% to 3.0%. |
Appraisal.As of the appraisal valuation date of July 5, 2016, the Sheraton Towson Baltimore North Property had an “as-is” appraised value of $35,000,000.
Environmental Matters.According to the Phase I environmental assessment dated July 13, 2016, there was no evidence of any recognized environmental conditions at the Sheraton Towson Baltimore North Property.
Market Overview and Competition.The Sheraton Towson Baltimore North Property is located in Towson, Maryland, approximately 14 miles north of downtown Baltimore, which is Maryland’s largest metropolitan area. Towson, along with Parkville, Overlea and Riverwood make up the “Baltimore Beltway” communities along Interstate 695, a major beltway looping around the greater Baltimore area. Interstate 695 provides access to Interstate 95, which connects the Sheraton Towson Baltimore North Property to Baltimore and Washington, D.C. in the south and Philadelphia to the north. The Sheraton Towson Baltimore North Property is also serviced by the Baltimore/Washington International Thurgood Marshall Airport.
The Sheraton Towson Baltimore North Property is located within a market with employers in the government, healthcare and education sectors. Major employers in the market include the Social Security Administration, T. Rowe Price, the Greater Baltimore Medical Center, Towson University and Franklin Square Hospital. The Towson/Timonium office submarket within which the Sheraton Towson Baltimore North Property is located has 10.4 million square feet of office space generating commercial demand. The Sheraton Towson Baltimore North Property is connected to the Towson Town Center, a GGP-operated mall anchored by Macy’s, Nordstrom and Crate & Barrel, via a skywalk. The Sheraton Towson Baltimore North Property is located proximate to Goucher College, with an enrollment of 2,680 undergraduate and graduate students and one mile north of Towson University, with an enrollment of 22,284 undergraduate and graduate students.
THE INFORMATION IN THIS STRUCTURAL AND COLLATERAL TERM SHEET IS NOT COMPLETE AND MAY BE AMENDED PRIOR TO THE TIME OF SALE. THIS TERM SHEET IS NOT AN OFFER TO SELL THESE SECURITIES AND IT IS NOT A SOLICITATION OF AN OFFER TO BUY THESE SECURITIES IN ANY JURISDICTION WHERE THE OFFER OR SALE IS NOT PERMITTED.
126
SHERATON TOWSON BALTIMORE NORTH |
The following table presents certain information relating to the Sheraton Towson Baltimore North Property’s competitive set.
Subject and Market Historical Occupancy, ADR and RevPAR(1)
Competitive Set | Sheraton Towson BaltimoreNorth | Penetration Factor | |||||||||||||||||
Year | Occupancy | ADR | RevPAR | Occupancy | ADR | RevPAR | Occupancy | ADR | RevPAR | ||||||||||
| TTM 7/31/2016 | 59.2% | $121.36 | $71.88 | 67.1% | $125.44 | $84.18 | 113.3% | 103.4% | 117.1% | ||||||||||
| TTM 7/31/2015 | 57.3% | $118.71 | $68.06 | 66.6% | $125.91 | $83.81 | 116.1% | 106.1% | 123.1% | ||||||||||
| TTM 7/31/2014 | 54.6% | $115.24 | $62.89 | 67.3% | $118.69 | $79.91 | 123.4% | 103.0% | 127.1% | ||||||||||
| (1) | Information obtained from third party hospitality report dated August 18, 2016. The competitive set includes the following hotels: Wyndham Baltimore Hunt Valley Inn, Embassy Suites Baltimore North Hunt Valley, DoubleTree Baltimore North Pikesville, Radisson Hotel @ Cross Keys Baltimore and Marriott Conference Center Towson University Hotel. |
The Borrower.The borrower is SBN Partners, L.P., a Pennsylvania limited partnership and a single purpose entity with one independent director. Legal counsel to the borrower delivered a non-consolidation opinion in connection with the origination of the Sheraton Towson Baltimore North Mortgage Loan. Kenneth K. Kochenour is the guarantor of certain nonrecourse carveouts under the Sheraton Towson Baltimore North Mortgage Loan.
The Sponsor.The sponsors are Kenneth K. Kochenour, founder and CEO of GF Management, a hospitality ownership and management company based in Philadelphia, Pennsylvania and Ira Lubert, co-founder of Independence Capital Partners. GF Management specializes in owning and managing hotels, resorts, golf resorts and other related hospitality assets. Since GF Management was founded in 1988, the company has have managed more than 500 hotels across 45 states. Independence Capital Partners is comprised of seven fund families across various asset classes.
Escrows.The loan documents provided for upfront escrows in the amount of $25,375 for immediate repairs in order to bring the Sheraton Towson Baltimore North Property into ADA compliance.
The loan documents also provide for monthly escrows in an amount equal to (i) $29,117 for real estate taxes and (ii) $42,426 for FF&E reserves. The Sheraton Towson Baltimore North Mortgage Loan documents do not require monthly escrows for insurance provided (a) a Trigger Period (as defined below) has not occurred and is continuing; (b) the Sheraton Towson Baltimore North Property is insured via an acceptable blanket insurance policy that meets the requirements as set forth in the loan documents; and (c) the borrower provides the lender with evidence of renewal of the policies and timely proof of payment of the insurance premiums when due.
Lockbox and Cash Management. The Sheraton Towson Baltimore North Mortgage Loan requires the borrower to establish a lender-controlled lockbox account, which is already in place, and to direct all tenants to pay their rents and all credit card companies under merchant agreements to pay receipts directly into such lockbox account. Prior to a Trigger Period (as defined below), all funds on deposit in the lockbox account are disbursed to the borrower. During the occurrence and continuance of a Trigger Period, funds in the lockbox account are transferred daily into the cash management account, where they are applied in accordance with the loan documents.
A “Trigger Period” will commence upon the earlier of (i) the occurrence of an event of default; or (ii) the debt service coverage ratio being less than 1.30x on the last day of the calendar quarter. A Trigger Period will expire, with regard to clause (i), upon the cure of such event of default; and with regard to clause (ii), the debt service coverage ratio being equal to or greater than 1.35x for a calendar quarter.
Property Management.The Sheraton Towson Baltimore North Property is managed by an affiliate of the borrower.
Assumption.The borrower has the right to transfer the Sheraton Towson Baltimore North Property, provided that certain conditions are satisfied, including (i) no event of default has occurred and is continuing; (ii) the identity, experience, financial condition and credit worthiness of transferee and guarantor, as evidenced by financial statement(s) and other information, is satisfactory to the lender; and (iii) rating agency confirmation from Fitch, Moody’s and Morningstar that the transfer will not result in a downgrade, withdrawal or qualification of the respective ratings assigned to the Series 2016-C36 Certificates.
Partial Release. Not permitted.
Real Estate Substitution. Not permitted.
Subordinate and Mezzanine Indebtedness.Not permitted.
Ground Lease.None.
Terrorism Insurance.The Sheraton Towson Baltimore North Mortgage Loan documents require that an “all risk” insurance policy be maintained by the borrower to provide coverage for terrorism equal to the full replacement cost of the Sheraton Towson Baltimore North Property, as well as business interruption insurance covering no less than the 12-month period following the occurrence of a casualty event, together with a six-month extended period of indemnity.
THE INFORMATION IN THIS STRUCTURAL AND COLLATERAL TERM SHEET IS NOT COMPLETE AND MAY BE AMENDED PRIOR TO THE TIME OF SALE. THIS TERM SHEET IS NOT AN OFFER TO SELL THESE SECURITIES AND IT IS NOT A SOLICITATION OF AN OFFER TO BUY THESE SECURITIES IN ANY JURISDICTION WHERE THE OFFER OR SALE IS NOT PERMITTED.
127
| No. 11 – Houston Industrial Portfolio | |||||||
| Loan Information | Property Information | ||||||
| Mortgage Loan Seller: | Barclays Bank PLC | Single Asset/Portfolio: | Portfolio | ||||
| Credit Assessment (Fitch/Moody’s/Morningstar): | NR/NR/NR | Property Type: | Industrial | ||||
| Original Principal Balance: | $20,000,000 | Specific Property Type: | Flex | ||||
| Cut-off Date Balance: | $19,967,885 | Location: | Houston, TX | ||||
| % of Initial Pool Balance: | 2.3% | Size: | 459,485 SF | ||||
| Loan Purpose: | Refinance | Cut-off Date Balance Per SF: | $43.46 | ||||
| Borrower Name: | JHV-1, LLC | Year Built/Renovated: | Various–See Table | ||||
| Sponsors: | Nathan Herzog; Robert Herzog | Title Vesting: | Fee | ||||
| Mortgage Rate: | 4.768% | Property Manager: | Interra Management Company | ||||
| Note Date: | September 30, 2016 | 4thMost Recent Occupancy(As of)(3): | 82.7% (12/31/2012) | ||||
| Anticipated Repayment Date: | NAP | 3rdMost Recent Occupancy (As of)(3): | 85.4% (12/31/2013) | ||||
| Maturity Date: | October 6, 2026 | 2ndMost Recent Occupancy (As of)(3): | 94.4% (12/31/2014) | ||||
| IO Period: | None | Most Recent Occupancy (As of)(3): | 94.6% (12/31/2015) | ||||
| Loan Term (Original): | 120 months | Current Occupancy (As of)(3): | 87.1% (9/23/2016) | ||||
| Seasoning: | 1 month | ||||||
| Amortization Term (Original): | 300 months | Underwriting and Financial Information: | |||||
| Loan Amortization Type: | Amortizing Balloon | ||||||
| Interest Accrual Method: | Actual/360 | 4thMost Recent NOI (As of): | $1,905,279 (12/31/2013) | ||||
| Call Protection: | L(25),D(91),O(4) | 3rdMost Recent NOI (As of): | $1,985,494 (12/31/2014) | ||||
| Lockbox Type: | Hard/Springing Cash Management | 2ndMost Recent NOI (As of): | $2,276,521 (12/31/2015) | ||||
| Additional Debt: | None | Most Recent NOI (As of): | $2,155,206 (TTM 8/31/2016) | ||||
| Additional Debt Type: | NAP | ||||||
| U/W Revenues: | $3,410,082 | ||||||
| U/W Expenses: | $1,172,854 | ||||||
| U/W NOI: | $2,237,228 | ||||||
| Escrows and Reserves: | U/W NCF: | $1,993,276 | |||||
| U/W NOI DSCR: | 1.63x | ||||||
| Type: | Initial | Monthly | Cap (If Any) | U/W NCF DSCR: | 1.45x | ||
| Taxes | $392,591 | $48,621 | NAP | U/W NOI Debt Yield: | 11.2% | ||
| Insurance(1) | $0 | Springing | NAP | U/W NCF Debt Yield: | 10.0% | ||
| Replacement Reserves | $0 | $4,293 | NAP | As-Is Appraised Value: | $28,200,000 | ||
| TI/LC Reserve | $800,000 | $13,402 | $1,200,000 | As-Is Appraisal Valuation Date: | August 19, 2016 | ||
| Deferred Maintenance(2) | $47,813 | $0 | NAP | Cut-off Date LTV Ratio: | 70.8% | ||
| Free Rent Reserve | $20,821 | $0 | NAP | LTV Ratio at Maturity or ARD: | 52.6% | ||
| (1) | Ongoing monthly reserves for insurance premiums are not required as long as the Houston Industrial Portfolio Properties (as defined below) are insured via an acceptable blanket insurance policy. |
| (2) | Deferred Maintenance is comprised of $36,875 of parking lot and sidewalk repairs and $10,938 of other deferred maintenance. |
| (3) | See “Historical Occupancy” section. |
The Houston Industrial Portfolio mortgage loan is evidenced by a single promissory note that is secured by a first mortgage encumbering six industrial properties consisting of 19 buildings totaling 459,485 square feet located in Houston, Texas (the “Houston Industrial Portfolio Properties”). The sponsors acquired the Houston Industrial Portfolio Properties as well as two other industrial buildings in 2008 for approximately $29.4 million. Based on an allocated cost basis of approximately $27.7 million, the sponsor has approximately $9.7 million of equity remaining in the Houston Industrial Portfolio Properties. Built between 1983 and 1998, the Houston Industrial Portfolio Properties range in size from 19,630 square feet to 167,040 square feet and feature clear heights ranging from 12 feet to 28 feet, with an average of 20 feet. Each property is in close proximity to the Sam Houston Tollway, a beltway around the city of Houston, Texas which connects to major junctions such as I-45, I-69 and I-10. No individual property releases are permitted for the Houston Industrial Portfolio mortgage loan.
The Aldine Westfield property (7.2% of net rentable area) is 100.0% occupied by Amega West Services, LLC, while the five remaining properties (92.8% of net rentable area) are multi-tenanted and feature seven to 32 tenant spaces. The Houston Industrial Portfolio Properties are located across three Houston submarkets with submarket vacancy rates of 5.0%, 4.8% and 7.9%. The properties have seen strong leasing momentum with 78,700 square feet of space (17.1% of net rentable area) leased or renewed in 2016 by 21 tenants. The Houston Industrial Portfolio Properties are 87.1% leased as of September 23, 2016 by 91 tenants with an average occupancy of 90.6% since August 2013.
THE INFORMATION IN THIS STRUCTURAL AND COLLATERAL TERM SHEET IS NOT COMPLETE AND MAY BE AMENDED PRIOR TO THE TIME OF SALE. THIS TERM SHEET IS NOT AN OFFER TO SELL THESE SECURITIES AND IT IS NOT A SOLICITATION OF AN OFFER TO BUY THESE SECURITIES IN ANY JURISDICTION WHERE THE OFFER OR SALE IS NOT PERMITTED.
128
HOUSTON INDUSTRIAL PORTFOLIO
Sources and Uses
| Sources | Uses | |||||||||
| Original loan amount | $20,000,000 | 81.2 | % | Loan payoff(1) | $22,720,230 | 92.3 | % | |||
| Sponsor’s new cash contribution | 4,624,398 | 18.8 | Reserves | 1,261,224 | 5.1 | |||||
| Closing costs | 642,944 | 2.6 | ||||||||
| Total Sources | $24,624,398 | 100.0 | % | Total Uses | $24,624,398 | 100.0 | % | |||
| (1) | Loan payoff represents a previous loan collateralized by the Houston Industrial Portfolio Properties as well as two non-collateral industrial buildings. |
The following table presents certain information relating to the Houston Industrial Portfolio Properties:
| Property Name | Allocated Cut-off Date Balance | % of Portfolio Cut-off Date Balance | Number of Tenants(1) | Occupancy | Year Built/ Renovated | Net Rentable Area (SF) | Appraised Value | |||||||
| Emmott Business Center | $7,188,439 | 36.0% | 28 | 85.8% | 1993-1996/NAP | 167,040 | $9,450,000 | |||||||
| Eldridge Business Center | $4,542,694 | 22.8% | 30 | 97.2% | 1998/NAP | 99,500 | $6,500,000 | |||||||
| West Belt Business Center | $3,793,898 | 19.0% | 19 | 68.9% | 1997/NAP | 97,030 | $6,000,000 | |||||||
| Winkler Berrybrook | $1,996,788 | 10.0% | 7 | 100.0% | 1984/NAP | 43,100 | $2,750,000 | |||||||
| Aldine Westfield | $1,497,591 | 7.5% | 1 | 100.0% | 1991/NAP | 33,185 | $2,200,000 | |||||||
| Keough Business Center | $948,475 | 4.7% | 6 | 85.8% | 1983/NAP | 19,630 | $1,300,000 | |||||||
| Total/Weighted Average | $19,967,885 | 100.0% | 91 | 87.1% | 459,485 | $28,200,000 |
| (1) | Number of Tenants includes West Texas Cooling Tower Fabrication and Supplies, Inc. at Winkler Berrybrook which is currently occupying on a MTM basis after lease expiration on June 30, 2016 and does not include PT USA at West Belt Business Center, which has informed the sponsors that it will be vacating the property after lease expiration on December 31, 2017. |
THE INFORMATION IN THIS STRUCTURAL AND COLLATERAL TERM SHEET IS NOT COMPLETE AND MAY BE AMENDED PRIOR TO THE TIME OF SALE. THIS TERM SHEET IS NOT AN OFFER TO SELL THESE SECURITIES AND IT IS NOT A SOLICITATION OF AN OFFER TO BUY THESE SECURITIES IN ANY JURISDICTION WHERE THE OFFER OR SALE IS NOT PERMITTED.
129
HOUSTON INDUSTRIAL PORTFOLIO
The following table presents certain information relating to the tenancy at the Houston Industrial Portfolio Properties:
Major Tenants
| Tenant Name | Property Name | Credit Rating (Fitch/ Moody’s/ S&P)(1) | Tenant NRSF | % of NRSF | Annual U/W Base Rent PSF(2) | Annual U/W Base Rent(2) | % of Total Annual U/W Base Rent | Lease Expiration Date | ||||||||
| Major Tenants | ||||||||||||||||
| Amega West Services, LLC | Aldine Westfield | NR/Ba2/BBB | 33,185 | 7.2% | $6.02 | $199,774 | 8.3% | 12/31/2018(3) | ||||||||
| Lincare Inc. | Emmott Business Center | NR/A2/A+ | 8,220 | 1.8% | $11.37 | $93,480 | 3.9% | 02/28/2018(4) | ||||||||
| Lion Apparel Inc. | Winkler Berrybrook | NR/NR/NR | 12,000 | 2.6% | $6.54 | $78,448 | 3.2% | 06/30/2017(5) | ||||||||
| West Texas Cooling Inc. | Winkler Berrybrook | NR/NR/NR | 13,300 | 2.9% | $4.85 | $64,500 | 2.7% | MTM(6) | ||||||||
| Metal Oxide Technologies, Inc. | Emmott Business Center | NR/NR/NR | 11,400 | 2.5% | $5.57 | $63,525 | 2.6% | 06/30/2017 | ||||||||
| Pyramid Graphics | Emmott Business Center | NR/NR/NR | 12,000 | 2.6% | $4.60 | $55,200 | 2.3% | 03/31/2017(7) | ||||||||
| Texas Stud Weld Inc. | Eldridge Business Center | NR/NR/NR | 8,750 | 1.9% | $5.14 | $44,975 | 1.9% | 06/30/2019 | ||||||||
| Ranco Aire, Inc. | Emmott Business Center | NR/NR/NR | 9,000 | 2.0% | $4.72 | $42,480 | 1.8% | 02/28/2018(8) | ||||||||
| Punum Roofing of Houston, Inc. | Emmott Business Center | NR/NR/NR | 7,200 | 1.6% | $5.88 | $42,336 | 1.8% | 01/31/2019(9) | ||||||||
| Frontier Services Group, LLC | West Belt Business Center | NR/NR/NR | 6,780 | 1.5% | $6.03 | $40,883 | 1.7% | 10/31/2018 | ||||||||
| Total Major Tenants | 121,835 | 26.5% | $5.96 | $725,601 | 30.1% | |||||||||||
| Non-Major Tenants | 278,185 | 60.5% | $6.07 | $1,688,903 | 69.9% | |||||||||||
| Occupied Collateral Total | 400,020 | 87.1% | $6.04 | $2,414,504 | 100.0% | |||||||||||
| Vacant Space | 59,465 | 12.9% | ||||||||||||||
| Collateral Total | 459,485 | 100.0% | ||||||||||||||
| (1) | Certain ratings are those of the parent company whether or not the parent guarantees the lease. |
| (2) | Annual U/W Base Rent PSF and Annual U/W Base Rent include contractual rent steps through October 2017. |
| (3) | Amega West Services, LLC has one, five-year lease renewal option. |
| (4) | Lincare Inc. has two, one-year lease renewal options. |
| (5) | Lion Apparel Inc. has one, five-year lease renewal option. |
| (6) | West Texas Cooling Tower Fabrication and Supplies, Inc. (“West Texas Cooling Inc.”) lease expired on June 30, 2016 and is currently occupying the property on a MTM basis. |
| (7) | Pyramid Graphics has one two-year lease renewal option. |
| (8) | Ranco Aire, Inc. has one, one-year lease renewal option. |
| (9) | Punum Roofing of Houston, Inc. may terminate its lease on February 1, 2017 provided it has delivered notice on or before November 1, 2016. Upon such termination, the tenant is required to pay to the landlord a termination fee equal to three-months rent. |
The following table presents certain information relating to the lease rollover schedule at the Houston Industrial Portfolio Properties:
Lease Expiration Schedule(1)(2)
| Year Ending December 31, | No. of Leases Expiring | Expiring NRSF | % of Total NRSF | Cumulative Expiring NRSF | Cumulative % of Total NRSF | Annual U/W Base Rent | % of Total Annual U/W Base Rent | Annual U/W Base Rent PSF(3) | ||||||||
| MTM | 1 | 13,300 | 2.9% | 13,300 | 2.9% | 64,500 | 2.7% | $4.85 | ||||||||
| 2016 | 2 | 6,000 | 1.3% | 19,300 | 4.2% | 32,250 | 1.3% | $5.38 | ||||||||
| 2017 | 30 | 135,845 | 29.6% | 155,145 | 33.8% | 804,757 | 33.3% | $5.92 | ||||||||
| 2018 | 22 | 115,485 | 25.1% | 270,630 | 58.9% | 756,011 | 31.3% | $6.55 | ||||||||
| 2019 | 27 | 96,665 | 21.0% | 367,295 | 79.9% | 569,475 | 23.6% | $5.89 | ||||||||
| 2020 | 4 | 13,725 | 3.0% | 381,020 | 82.9% | 84,417 | 3.5% | $6.15 | ||||||||
| 2021 | 5 | 19,000 | 4.1% | 400,020 | 87.1% | 103,094 | 4.3% | $5.43 | ||||||||
| 2022 | 0 | 0 | 0.0% | 400,020 | 87.1% | 0 | 0.0% | $0.00 | ||||||||
| 2023 | 0 | 0 | 0.0% | 400,020 | 87.1% | 0 | 0.0% | $0.00 | ||||||||
| 2024 | 0 | 0 | 0.0% | 400,020 | 87.1% | 0 | 0.0% | $0.00 | ||||||||
| 2025 | 0 | 0 | 0.0% | 400,020 | 87.1% | 0 | 0.0% | $0.00 | ||||||||
| 2026 | 0 | 0 | 0.0% | 400,020 | 87.1% | 0 | 0.0% | $0.00 | ||||||||
| Thereafter | 0 | 0 | 0.0% | 400,020 | 87.1% | 0 | 0.0% | $0.00 | ||||||||
| Vacant | 0 | 59,465 | 12.9% | 459,485 | 100.0% | 0 | 0.0% | $0.00 | ||||||||
| Total/Weighted Average | 91 | 459,485 | 100.0% | $2,414,504 | 100.0% | $6.04 |
| (1) | Information obtained from the underwritten rent roll. |
| (2) | Certain tenants may have lease termination options that are exercisable prior to the originally stated expiration date of the subject lease and that are not considered in the Lease Expiration Schedule. |
| (3) | Weighted Average Annual U/W Base Rent PSF excludes vacant space. |
THE INFORMATION IN THIS STRUCTURAL AND COLLATERAL TERM SHEET IS NOT COMPLETE AND MAY BE AMENDED PRIOR TO THE TIME OF SALE. THIS TERM SHEET IS NOT AN OFFER TO SELL THESE SECURITIES AND IT IS NOT A SOLICITATION OF AN OFFER TO BUY THESE SECURITIES IN ANY JURISDICTION WHERE THE OFFER OR SALE IS NOT PERMITTED.
130
HOUSTON INDUSTRIAL PORTFOLIO
The following table presents historical occupancy percentages at the Houston Industrial Portfolio Properties:
Historical Occupancy
12/31/2012(1) | 12/31/2013(1) | 12/31/2014(1) | 12/31/2015(1) | 9/23/2016(2)(3) | ||||
| 82.7% | 85.4% | 94.4% | 94.6% | 87.1% |
| (1) | Information obtained from the borrower. |
| (2) | Information obtained from the underwritten rent roll. |
| (3) | The Houston Industrial Portfolio Properties were 90.5% occupied as of September 23, 2016 including PT USA (3.4% of the net rentable area), which gave notice of its intent to vacate once its lease expires on December 31, 2017 and was therefore considered vacant for underwriting purposes. |
Operating History and Underwritten Net Cash Flow. The following table presents certain information relating to the historical operating performance and the underwritten net cash flow at the Houston Industrial Portfolio Properties:
Cash Flow Analysis
| 2013 | 2014 | 2015 | TTM | U/W | % of U/W Effective Gross Income | U/W $ per SF | |||||||||
| Base Rent | $2,119,353 | $2,182,447 | $2,348,914 | $2,310,790 | $2,414,504(1) | 70.8% | $5.25 | ||||||||
| Grossed Up Vacant Space | 0 | 0 | 0 | 0 | 352,890 | 10.3 | 0.77 | ||||||||
| Total Reimbursables | 704,908 | 753,195 | 979,513 | 1,009,312 | 1,145,501 | 33.6 | 2.49 | ||||||||
| Other Income | 22,312 | 23,481 | 34,386 | 39,911 | 39,911 | 1.2 | 0.09 | ||||||||
| Less Vacancy & Free Rent | (13,935) | 0 | 0 | (62,690) | (542,725)(2) | (15.9) | (1.18) | ||||||||
| Effective Gross Income | $2,832,639 | $2,959,123 | $3,362,813 | $3,297,324 | $3,410,082 | 100.0% | $7.42 | ||||||||
| Total Operating Expenses | $927,360 | $973,628 | $1,086,292 | $1,142,117 | $1,172,854 | 34.4% | $2.55 | ||||||||
| Net Operating Income | $1,905,279 | $1,985,494 | $2,276,521 | $2,155,206 | $2,237,228 | 65.6% | $4.87 | ||||||||
| TI/LC | 0 | 0 | 0 | 0 | 192,400 | 5.6 | 0.42 | ||||||||
| Capital Expenditures | 0 | 0 | 0 | 0 | 51,552 | 1.5 | 0.11 | ||||||||
| Net Cash Flow | $1,905,279 | $1,985,494 | $2,276,521 | $2,155,206 | $1,993,276 | 58.5% | $4.34 | ||||||||
| NOI DSCR | 1.39x | 1.45x | 1.66x | 1.57x | 1.63x | ||||||||||
| NCF DSCR | 1.39x | 1.45x | 1.66x | 1.57x | 1.45x | ||||||||||
| NOI DY | 9.5% | 9.9% | 11.4% | 10.8% | 11.2% | ||||||||||
| NCF DY | 9.5% | 9.9% | 11.4% | 10.8% | 10.0% |
| (1) | U/W Base Rent includes contractual rent steps through October 2017 totaling $63,679. |
| (2) | The underwritten economic vacancy is 13.7%. The Houston Industrial Portfolio Properties were 87.1% leased as of September 23, 2016. |
THE INFORMATION IN THIS STRUCTURAL AND COLLATERAL TERM SHEET IS NOT COMPLETE AND MAY BE AMENDED PRIOR TO THE TIME OF SALE. THIS TERM SHEET IS NOT AN OFFER TO SELL THESE SECURITIES AND IT IS NOT A SOLICITATION OF AN OFFER TO BUY THESE SECURITIES IN ANY JURISDICTION WHERE THE OFFER OR SALE IS NOT PERMITTED.
131
| No. 12 - Central Park Retail | ||||||
| Loan Information | Property Information | |||||
| Mortgage Loan Seller: | Wells Fargo Bank, National Association | Single Asset/Portfolio: | Single Asset | |||
| Credit Assessment (Fitch/Moody’s/Morningstar): | NR/NR/NR | Property Type: | Retail | |||
| Original Principal Balance(1): | $20,000,000 | Specific Property Type: | Anchored | |||
| Cut-off Date Balance(1): | $19,948,500 | Location: | Fredericksburg, VA | |||
| % of Initial Pool Balance: | 2.3% | Size: | 441,907 SF | |||
| Loan Purpose: | Refinance | Cut-off Date Balance Per SF(1): | $203.14 | |||
| Borrower Name: | Central Park Retail, LLC | Year Built/Renovated: | 1966/2014 | |||
| Sponsor: | Gary D. Rappaport | Title Vesting: | Fee | |||
| Mortgage Rate: | 4.380% | Property Manager: | Self-managed | |||
| Note Date: | August 5, 2016 | 4thMost Recent Occupancy (As of): | 95.2% (12/31/2012) | |||
| Anticipated Repayment Date: | NAP | 3rdMost Recent Occupancy (As of): | 94.0% (12/31/2013) | |||
| Maturity Date: | September 1, 2026 | 2ndMost Recent Occupancy (As of): | 92.8% (12/31/2014) | |||
| IO Period: | 0 months | Most Recent Occupancy (As of): | 90.4% (12/31/2015) | |||
| Loan Term (Original): | 120 months | Current Occupancy (As of)(5): | 95.7% (7/22/2016) | |||
| Seasoning: | 2 months | |||||
| Amortization Term (Original): | 360 months | Underwriting and Financial Information: | ||||
| Loan Amortization Type: | Amortizing Balloon | |||||
| Interest Accrual Method: | Actual/360 | 4thMost Recent NOI (As of): | $7,397,218 (12/31/2013) | |||
| Call Protection: | L(26),D(90),O(4) | 3rdMost Recent NOI (As of): | $7,395,577 (12/31/2014) | |||
| Lockbox Type: | Hard/Upfront Cash Management | 2ndMost Recent NOI (As of): | $7,303,906 (12/31/2015) | |||
| Additional Debt(1): | Yes | Most Recent NOI (As of): | $7,307,782 (TTM 8/1/2016) | |||
| Additional Debt Type(1): | Pari Passu | |||||
| U/W Revenues: | $9,474,343 | |||||
| U/W Expenses: | $1,715,283 | |||||
| U/W NOI: | $7,759,060 | |||||
| Escrows and Reserves: | U/W NCF: | $7,116,672 | ||||
| U/W NOI DSCR(1): | 1.44x | |||||
| Type: | Initial | Monthly | Cap (If Any) | U/W NCF DSCR(1): | 1.32x | |
| Taxes | $278,383 | $55,677 | NAP | U/W NOI Debt Yield(1): | 8.6% | |
| Insurance(2) | $0 | Springing | NAP | U/W NCF Debt Yield(1): | 7.9% | |
| Replacement Reserves | $0 | $11,807 | NAP | As-Is Appraised Value: | $121,000,000 | |
| TI/LC Reserve | $0 | $36,898 | $1,328,340 | As-Is Appraisal Valuation Date: | June 1, 2016 | |
| Rent Concession Reserve(3) | $138,076 | $0 | NAP | Cut-off Date LTV Ratio(1): | 74.2% | |
| Outstanding TI/LC Reserve(4) | $526,940 | $0 | NAP | LTV Ratio at Maturity or ARD(1): | 59.9% | |
| (1) | The Central Park Retail Whole Loan with an original principal balance of $90,000,000 and an outstanding principal balance as of the Cut-off Date of $89,768,249, is comprised of twopari passu notes (Notes A-1 and A-2). The non-controlling Note A-2 had an original principal balance of $20,000,000, has an outstanding principal balance of $19,948,500 as of the Cut-Off Date and will be contributed to the WFCM 2016-C36 Trust. The controlling Note A-1 was contributed to the WFCM 2016-LC24 Trust with an original principal balance of $70,000,000. All statistical financial information related to the Cut-off Date balances per square foot, loan-to-value ratios, debt service coverage ratios and debt yields are based on the Central Park Retail Whole Loan. |
| (2) | The loan documents do not require monthly escrows for insurance provided (i) no event of default has occurred and is continuing; (ii) the insurance required to be maintained by the borrower is maintained pursuant to one or more blanket insurance policies approved by the lender; (iii) the borrower provides the lender with timely proof of payment of insurance premiums; and (iv) the borrower provides evidence of renewal of insurance policies. |
| (3) | Upfront reserves in the amount of $138,076 are required for outstanding rent concessions for Skyzone ($62,720), Occasions by M&K ($29,878), Veterinary Emergency Center ($15,254), Comcast ($12,856), Potbelly ($6,602), iCare Optometry ($6,512) and Ancient Kabob House ($4,255). |
| (4) | Upfront reserves in the amount of $526,940 for outstanding TI/LC costs are required for Skyzone ($284,962), Comcast ($178,980), The Cellular Connection ($38,998) and Ancient Kabob House ($24,000). |
| (5) | As of July 22, 2016, the Central Park Retail Property was 91.0% occupied and 95.7% leased by 62 tenants. |
The Central Park Retail mortgage loan is part of a whole loan evidenced by twopari passu promissory notes secured by a first mortgage encumbering the fee interest in an anchored retail center located in Fredericksburg, Virginia (the “Central Park Retail Property”). The Central Park Shopping Center is a regional power center located in Fredericksburg, Virginia, approximately 53.7 miles southwest of Washington, D.C. that contains 2.5 million square feet of retail and office space (the “Central Park Shopping Center”), of which the 441,907 square feet of retail space serves as collateral for the Central Park Retail Whole Loan. The Central Park Retail Property is situated on a 48.4-acre parcel of land and anchored by Office Depot and Hobby Lobby Stores. According to a third party geographic information provider, the Central Park Shopping Center is one of the largest power centers on the East Coast. The shadow anchors include Wal-Mart, Lowe’s, Target, Kohl’s, Regal Cinemas and Best Buy (all of which are not part of the collateral for the Central Park Retail Whole Loan). The Central Park Retail Property consists of a 29 single-story buildings and contains 2,837 parking spaces, resulting in a parking ratio of 6.4 spaces per 1,000 square feet of rentable area. The majority of the Central Park Retail Property is located along Carl D Silver Parkway, which serves as the backbone for the Central Park Shopping Center. This portion of the collateral is located in the heart of the Central Park Shopping Center and benefits from visibility and accessibility, being completely surrounded by roadways and shadow anchor tenancies on all four sides. Five buildings, representing 45,300 square feet
THE INFORMATION IN THIS STRUCTURAL AND COLLATERAL TERM SHEET IS NOT COMPLETE AND MAY BE AMENDED PRIOR TO THE TIME OF SALE. THIS TERM SHEET IS NOT AN OFFER TO SELL THESE SECURITIES AND IT IS NOT A SOLICITATION OF AN OFFER TO BUY THESE SECURITIES IN ANY JURISDICTION WHERE THE OFFER OR SALE IS NOT PERMITTED.
132
| CENTRAL PARK RETAIL |
(10.3% of net rentable area) are located in a retail area known as Waverly Village, which is located 0.3 miles southwest, across Plank Road (Route 3), from the Central Park Shopping Center and adjacent to the Spotsylvania Towne Center, an approximate 1.6 million square foot super-regional mall anchored by Macy’s, JCPenney, Sears, Dick’s Sporting Goods, Costco and Belk.
The Central Park Retail Property has benefited from positive leasing momentum, with a total of 117,247 square feet (26.5% of net rentable area) having either signed or renewed occupancy in 2015 and 2016. Tenants representing 51.1% of the underwritten base rent have been in occupancy at the Central Park Retail Property for over 10 years. Over the past eight years, the Central Park Retail Property has averaged 92.1% occupancy, with an average annual occupancy of at least 86.4%. As of July 22, 2016, the Central Park Retail Property was 91.0% occupied and 95.7% leased by 62 tenants subject to 63 leases. Skyzone has a fully executed lease for 20,930 square feet (4.7% of net rentable area) at the Central Park Retail Property but is still undergoing build-out of their space and is expected to take occupancy in November 2016.
As of April 2016, 15 tenants, representing approximately 77,728 square feet (17.6% of net rentable area) reported at least two full prior years of comparable sales (along with a trailing 12-month period ending in 2016). These tenants, along with the two anchor tenants, exhibited average trailing 12-month sales of $229 PSF with an average occupancy cost of 14.2%. Comparable year-over-year sales increased 1.8% from 2014 to 2015, and 1.4% from 2015 to the trailing 12-month period ending in 2016.
Note Summary
| Notes | Original Balance | Note Holder | Controlling Interest | |
| A-1 | $70,000,000 | WFCM 2016-LC24 | Yes | |
| A-2 | $20,000,000 | WFCM 2016-C36 | No | |
| Total | $90,000,000 |
Sources and Uses
| Sources | Uses | |||||||
| Original whole loan amount | $90,000,000 | 97.5% | Loan payoff(1) | $90,451,700 | 98.0% | |||
| Sponsor’s new cash contribution | 2,340,661 | 2.5 | Reserves | 943,399 | 1.0 | |||
| Closing costs | 945,562 | 1.0 | ||||||
| Total Sources | $92,340,661 | 100.0% | Total Uses | $92,340,661 | 100.0% |
| (1) | The Central Park Retail Property was previously securitized in the MLCFC 2006-4 transaction. The Central Park Retail Whole Loan was used to pay off a portion of the previous $125,000,000 mortgage loan, which also included debt secured by a 229,611 square foot office complex, which was refinanced separately. Approximately $90,451,770 of the previous $125,000,000 loan is allocated to the Central Park Retail Property. |
THE INFORMATION IN THIS STRUCTURAL AND COLLATERAL TERM SHEET IS NOT COMPLETE AND MAY BE AMENDED PRIOR TO THE TIME OF SALE. THIS TERM SHEET IS NOT AN OFFER TO SELL THESE SECURITIES AND IT IS NOT A SOLICITATION OF AN OFFER TO BUY THESE SECURITIES IN ANY JURISDICTION WHERE THE OFFER OR SALE IS NOT PERMITTED.
133
| CENTRAL PARK RETAIL |
The following table presents certain information relating to the tenancy at the Central Park Retail Property:
Major Tenants
| Tenant Name | Credit Rating (Fitch/Moody’s/ S&P)(1) | Tenant NRSF | % of NRSF | Annual U/W Base Rent PSF(2) | Annual U/W Base Rent(2) | % of Total Annual U/W Base Rent | Sales PSF | Occupancy Cost | Lease Expiration Date |
| Anchor Tenant – Not Part of Collateral | |||||||||
| Wal-Mart | AA/Aa2/AA | 230,000 | SHADOW ANCHOR – NOT PART OF THE COLLATERAL | ||||||
| Lowe’s | NR/A3/A- | 185,000 | SHADOW ANCHOR – NOT PART OF THE COLLATERAL | ||||||
| Target | A-/A2/A | 117,000 | SHADOW ANCHOR – NOT PART OF THE COLLATERAL | ||||||
| Kohl’s | BBB/Baa2/BBB | 86,000 | SHADOW ANCHOR – NOT PART OF THE COLLATERAL | ||||||
| Regal Cinemas | B+/B1/B+ | 51,000 | SHADOW ANCHOR – NOT PART OF THE COLLATERAL | ||||||
| Best Buy | BBB-/Baa1/BBB- | 46,000 | SHADOW ANCHOR – NOT PART OF THE COLLATERAL | ||||||
| Anchor Tenants | |||||||||
| Office Depot | NR/B1/B- | 29,887 | 6.8% | $16.40 | $490,200 | 5.9% | $143(3) | 12.4%(3) | 12/31/2017(4) |
| Hobby Lobby Stores | NR/NR/NR | 53,459 | 12.1% | $8.50 | $454,402 | 5.5% | $115(5) | 8.5%(5) | 10/31/2021(6) |
| Total Anchor Tenants | 83,346 | 18.9% | $11.33 | $944,602 | 11.4% | ||||
| Major Tenants | |||||||||
| Sports & Health | NR/NR/NR | 29,000 | 6.6% | $13.50 | $391,500 | 4.7% | NAV | NAV | 12/31/2020(7) |
| Mattress Discounters | NR/NR/NR | 15,700(8) | 3.6% | $23.00(8) | $361,040(8) | 4.4% | NAV | NAV | Various(8) |
| Party City | NR/NR/NR | 12,000 | 2.7% | $22.48 | $269,746 | 3.3% | NAV | NAV | 7/31/2019 |
| Old Navy | BB+/Baa2/BB+ | 15,002 | 3.4% | $17.60 | $264,035 | 3.2% | $322(9) | 6.3%(9) | 9/30/2018(10) |
| Pier 1 Imports | NR/NR/B+ | 9,013 | 2.0% | $29.01 | $261,464 | 3.2% | NAV | NAV | 2/28/2019 |
| Verizon Wireless | A-/Baa1/BBB+ | 11,000 | 2.5% | $22.00 | $242,004 | 2.9% | NAV | NAV | 3/31/2020(11) |
| Patient First | NR/NR/NR | 7,502 | 1.7% | $32.26 | $242,000 | 2.9% | NAV | NAV | 3/31/2020(12) |
| Total Major Tenants | 99,217 | 22.5% | $20.48 | $2,031,789 | 24.5% | ||||
| Non-Major Tenants | 240,489 | 54.4% | $22.06 | $5,305,118 | 64.1% | ||||
| Occupied Collateral Total | 423,052 | 95.7%(13) | $19.58 | $8,281,509 | 100.0% | ||||
| Vacant Space | 18,855 | 4.3% | |||||||
| Collateral Total | 441,907 | 100.0% | |||||||
| (1) | Certain ratings are those of the parent company whether or not the parent guarantees the lease. |
| (2) | Annual U/W Base Rent PSF and Annual U/W Base Rent include contractual rent steps through December 2017 totaling $37,261. |
| (3) | Office Depot sales PSF and occupancy costs are based on the trailing 12-month period ending December 31, 2015. |
| (4) | Office Depot has three, five-year lease extension options. |
| (5) | Hobby Lobby Stores sales PSF and occupancy costs are based on the trailing 12-month period ending October 31, 2015. |
| (6) | Hobby Lobby Stores has two, five-year lease extension options. |
| (7) | Sports & Health has the right to terminate its lease at any time after January 1, 2019 with a minimum of 6 months’ notice. |
| (8) | Mattress Discounters leases multiple suites under multiple leases with 11,700 square feet (2.6% of the net rentable area) within the Central Park Shopping Center expiring January 31, 2018 and 4,000 square feet (0.9% of the net rentable area) within Waverly Village expiring on February 28, 2021. |
| (9) | Old Navy sales PSF and occupancy costs are based on the trailing 12-month period ending April 30, 2016. |
| (10) | Old Navy has two, five-year lease extension options. |
| (11) | Verizon Wireless has two, five-year lease extension options. |
| (12) | Patient First has six, five-year lease extension options. |
| (13) | As of July 22, 2016, the Central Park Retail Property was 91.0% occupied and 95.7% leased. Skyzone has a fully executed lease for 20,930 square feet (4.7% of net rentable area) at the Central Park Retail Property but is still undergoing build-out of its space and is expected to take occupancy in November 2016. |
THE INFORMATION IN THIS STRUCTURAL AND COLLATERAL TERM SHEET IS NOT COMPLETE AND MAY BE AMENDED PRIOR TO THE TIME OF SALE. THIS TERM SHEET IS NOT AN OFFER TO SELL THESE SECURITIES AND IT IS NOT A SOLICITATION OF AN OFFER TO BUY THESE SECURITIES IN ANY JURISDICTION WHERE THE OFFER OR SALE IS NOT PERMITTED.
134
| CENTRAL PARK RETAIL |
The following table presents certain information relating to the historical sales and occupancy costs at the Central Park Retail Property:
Historical Sales (PSF) and Occupancy Costs(1)
| Tenant Name | 2014 | 2015 | TTM 4/30/2016 | Current Occupancy Cost |
| Office Depot | $139 | $143(2) | $143(2) | 12.4%(2) |
| Hobby Lobby Stores | $108 | $115(3) | $115(3) | 8.5%(3) |
| Old Navy | $335 | $328 | $322 | 6.3% |
| Ann Taylor Loft | $306 | $308 | $304 | 11.9% |
| Dress Barn Inc. | $160 | $156 | $159 | 15.5% |
| Noodles & Company | $427 | $452 | $467 | 11.4% |
| The Melting Pot | $216 | $228 | $228 | 10.0% |
| Lane Byrant | $252 | $257 | $258 | 10.9% |
| Kirkland’s | $237 | $249 | $250 | 9.7% |
| Shane’s Rib Shack | $389 | $362 | $347(4) | 8.0%(4) |
| Sleepys | $104 | $139 | $150 | 22.6% |
| Catherines Inc. | $146 | $146 | $150 | 16.0% |
| Total Comparable Sales(5) | $222 | $226 | $229 | |
| Occupancy Costs(5)(6) | 14.9% | 14.6% | 14.2% |
| (1) | Historical Sales (PSF) and Occupancy Costs were provided by the borrower. Current Occupancy Cost is based on the most recent available Historical Sales. |
| (2) | Office Depot sales and occupancy costs are based on the trailing 12-month period ending December 31, 2015. |
| (3) | Hobby Lobby Stores sales and occupancy costs are based on the trailing 12-month period ending October 31, 2015. |
| (4) | Shane’s Rib Shack sales and occupancy costs are based on the trailing 12-month period ending February 28, 2016. |
| (5) | Represents the 15 tenants, comprising approximately 77,728 square feet (17.6% of net rentable area), that reported at least two full prior years of comparable sales and a trailing 12-month period ending in 2016, along with the two anchor tenants at the Central Park Retail Property. |
| (6) | Occupancy Costs are based on the Annual U/W Base Rent and reimbursements and historical sales. |
The following table presents certain information relating to the lease rollover schedule at the Central Park Retail Property:
Lease Expiration Schedule(1)(2)
| Year Ending December 31, | No. of Leases Expiring | Expiring NRSF | % of Total NRSF | Cumulative Expiring NRSF | Cumulative % of Total NRSF | Annual U/W Base Rent | % of Total Annual U/W Base Rent | Annual U/W Base Rent PSF(3) |
| MTM | 1 | 2,000 | 0.5% | 2,000 | 0.5% | $14,000 | 0.2% | $7.00 |
| 2016 | 0 | 0 | 0.0% | 2,000 | 0.5% | $0 | 0.0% | $0.00 |
| 2017 | 6 | 47,250 | 10.7% | 49,250 | 11.1% | $1,026,585 | 12.4% | $21.73 |
| 2018 | 7 | 53,488 | 12.1% | 102,738 | 23.2% | $1,105,948 | 13.4% | $20.68 |
| 2019 | 14 | 59,577 | 13.5% | 162,315 | 36.7% | $1,559,914 | 18.8% | $26.18 |
| 2020 | 9 | 71,486 | 16.2% | 233,801 | 52.9% | $1,476,613 | 17.8% | $20.66 |
| 2021 | 7 | 78,159 | 17.7% | 311,960 | 70.6% | $1,048,094 | 12.7% | $13.41 |
| 2022 | 4 | 18,483 | 4.2% | 330,443 | 74.8% | $469,011 | 5.7% | $25.38 |
| 2023 | 7 | 29,979 | 6.8% | 360,422 | 81.6% | $686,354 | 8.3% | $22.89 |
| 2024 | 3 | 10,800 | 2.4% | 371,222 | 84.0% | $254,110 | 3.1% | $23.53 |
| 2025 | 2 | 9,200 | 2.1% | 380,422 | 86.1% | $177,300 | 2.1% | $19.27 |
| 2026 | 3 | 42,630 | 9.6% | 423,052 | 95.7% | $463,579 | 5.6% | $10.87 |
| Thereafter | 0 | 0 | 0.0% | 423,052 | 95.7% | $0 | 0.0% | $0.00 |
| Vacant | 0 | 18,855 | 4.3% | 441,907 | 100.0% | $0 | 0.0% | $0.00 |
| Total/Weighted Average | 63(4) | 441,907 | 100.0% | $8,281,509 | 100.0% | $19.58 |
| (1) | Information obtained from the underwritten rent roll. |
| (2) | Certain tenants may have lease termination options that are exercisable prior to the originally stated expiration date of the subject lease and that are not considered in the Lease Expiration Schedule. |
| (3) | Weighted Average Annual U/W Base Rent PSF excludes vacant space. |
| (4) | There are 62 tenants subject to 63 leases at the Central Park Retail Property. |
THE INFORMATION IN THIS STRUCTURAL AND COLLATERAL TERM SHEET IS NOT COMPLETE AND MAY BE AMENDED PRIOR TO THE TIME OF SALE. THIS TERM SHEET IS NOT AN OFFER TO SELL THESE SECURITIES AND IT IS NOT A SOLICITATION OF AN OFFER TO BUY THESE SECURITIES IN ANY JURISDICTION WHERE THE OFFER OR SALE IS NOT PERMITTED.
135
| CENTRAL PARK RETAIL |
The following table presents historical occupancy percentages at the Central Park Retail Property:
Historical Occupancy
12/31/2010(1) | 12/31/2011(1) | 12/31/2012(1) | 12/31/2013(1) | 12/31/2014(1) | 12/31/2015(1) | 7/22/2016(2)(3) |
| 93.4% | 91.2% | 95.2% | 94.0% | 92.8% | 90.4% | 95.7% |
| (1) | Information obtained from the borrower. |
| (2) | Information obtained from the underwritten rent roll. |
| (3) | As of July 22, 2016, the Central Park Retail Property was 91.0% occupied and 95.7% leased by 62 tenants. |
Operating History and Underwritten Net Cash Flow. The following table presents certain information relating to the historical operating performance and the underwritten net cash flow at the Central Park Retail Property:
Cash Flow Analysis
| 2013 | 2014 | 2015 | TTM 8/1/2016 | U/W | % of U/W Effective Gross Income | U/W $ per SF | |||||||||
| Base Rent | $7,807,330 | $7,955,152 | $7,753,235 | $7,759,387 | $8,281,509(1) | 87.4% | $18.74 | ||||||||
| Grossed Up Vacant Space | 0 | 0 | 0 | 0 | 454,684 | 4.8 | 1.03 | ||||||||
| Percentage Rent | 70,970 | 13,821 | 0 | 0 | 0 | 0.0 | 0.00 | ||||||||
| Total Reimbursables | 932,000 | 930,523 | 1,101,723 | 1,119,845 | 1,164,834 | 12.3 | 2.64 | ||||||||
| Other Income | 24,240 | 22,877 | 38,443 | 21,969 | 28,000 | 0.3 | 0.06 | ||||||||
| Less Vacancy & Credit Loss | 0 | 0 | 0 | 0 | (454,684)(2) | (4.8) | (1.03) | ||||||||
| Effective Gross Income | $8,834,540 | $8,922,373 | $8,893,401 | $8,901,201 | $9,474,343 | 100.0% | $21.44 | ||||||||
| Total Operating Expenses | $1,437,322 | $1,526,796 | $1,589,495 | $1,593,420 | $1,715,283 | 18.1% | $3.88 | ||||||||
| Net Operating Income | $7,397,218 | $7,395,577 | $7,303,906 | $7,307,782 | $7,759,060 | 81.9% | $17.56 | ||||||||
| TI/LC | 0 | 0 | 0 | 0 | 501,167 | 5.3 | 1.13 | ||||||||
| Capital Expenditures | 0 | 0 | 0 | 0 | 141,221 | 1.5 | 0.32 | ||||||||
| Net Cash Flow | $7,397,218 | $7,395,577 | $7,303,906 | $7,307,782 | $7,116,672 | 75.1% | $16.10 | ||||||||
| NOI DSCR(3) | 1.37x | 1.37x | 1.35x | 1.35x | 1.44x | ||||||||||
| NCF DSCR(3) | 1.37x | 1.37x | 1.35x | 1.35x | 1.32x | ||||||||||
| NOI DY(3) | 8.2% | 8.2% | 8.1% | 8.1% | 8.6% | ||||||||||
| NCF DY(3) | 8.2% | 8.2% | 8.1% | 8.1% | 7.9% |
| (1) | Annual U/W Base Rent PSF and Annual U/W Base Rent include contractual rent steps through December 2017 totaling $37,261. |
| (2) | The underwritten economic vacancy is 5.2%. The Central Park Retail Property was 95.7% leased and 91.0% physically occupied as of July 22, 2016. |
| (3) | The debt service coverage ratios and debt yields are based on the Central Park Retail Whole Loan. |
THE INFORMATION IN THIS STRUCTURAL AND COLLATERAL TERM SHEET IS NOT COMPLETE AND MAY BE AMENDED PRIOR TO THE TIME OF SALE. THIS TERM SHEET IS NOT AN OFFER TO SELL THESE SECURITIES AND IT IS NOT A SOLICITATION OF AN OFFER TO BUY THESE SECURITIES IN ANY JURISDICTION WHERE THE OFFER OR SALE IS NOT PERMITTED.
136
| CENTRAL PARK RETAIL |
The following table presents certain information relating to comparable retail leases to the Central Park Retail Property:
Comparable Leases(1)
| Property Name/ Location | Year Built/ Renovated | Anchor Tenants | Total GLA (SF) | Total Occupancy | Distance from Subject | Tenant Name | Lease Date / Term | Lease Area (SF) | Annual Base Rent PSF | Lease Type |
Dulles Landing Chantilly, VA | 2015/NAP | TJ Maxx, Home Goods, Ross Dress for Less, Dick’s Sporting Goods, Michaels | 429,415 | 85% | 58.3 miles | Michaels | March 2016 / 10 Yrs | 21,080 | $16.00 | NNN |
Dulles Landing Chantilly, VA | 2015/ NAP | TJ Maxx, Home Goods, Ross Dress for Less, Dick’s Sporting Goods, Michaels | 429,415 | 85% | 58.3 miles | TJ Maxx | March 2016 / 10 Yrs | 25,000 | $13.25 | NNN |
Dulles Landing Chantilly, VA | 2015/ NAP | TJ Maxx, Home Goods, Ross Dress for Less, Dick’s Sporting Goods, Michaels | 429,415 | 85% | 58.3 miles | Dicks Sporting Goods | March 2016 / 10 Yrs | 45,000 | $11.50 | NNN |
The Shops at Waldorf Waldorf, MD | 1987/NAP | hhgregg, Michaels, LA Fitness | 496,071 | 90% | 56.3 miles | LA Fitness | June 2015 / 12 Yrs | 30,253 | $19.00 | NNN |
Plaza America Reston, VA | 1995/NAP | Whole, Michael’s CVS | 165,000 | 92% | 55.8 miles | Whole Foods | March 2014 / 15 Yrs | 25,000 | $29.00 | NNN |
| (1) | Information obtained from the appraisal, a third party market report and underwritten rent roll. |
THE INFORMATION IN THIS STRUCTURAL AND COLLATERAL TERM SHEET IS NOT COMPLETE AND MAY BE AMENDED PRIOR TO THE TIME OF SALE. THIS TERM SHEET IS NOT AN OFFER TO SELL THESE SECURITIES AND IT IS NOT A SOLICITATION OF AN OFFER TO BUY THESE SECURITIES IN ANY JURISDICTION WHERE THE OFFER OR SALE IS NOT PERMITTED.
137
| No. 13 – Archdale Marketplace | |||||||
| Loan Information | Property Information | ||||||
| Mortgage Loan Seller: | Barclays Bank PLC | Single Asset/Portfolio: | Single Asset | ||||
Credit Assessment (Fitch/Moody’s/Morningstar): | NR/NR/NR | Property Type: | Retail | ||||
| Original Principal Balance: | $19,275,000 | Specific Property Type: | Anchored | ||||
| Cut-off Date Balance: | $19,275,000 | Location: | Charlotte, NC | ||||
| % of Initial Pool Balance: | 2.2% | Size: | 179,811 SF | ||||
| Loan Purpose: | Refinance | Cut-off Date Balance Per SF: | $107.20 | ||||
| Borrower Name: | Charlotte (Archdale) UY, LLC | Year Built/Renovated: | 1961/2005 | ||||
| Sponsors: | Stanley Werb; Jonathan Gaines | Title Vesting: | Fee | ||||
| Mortgage Rate: | 4.120% | Property Manager: | Self-managed | ||||
| Note Date: | October 3, 2016 | 4thMost Recent Occupancy (As of): | 97.8% (12/31/2012) | ||||
| Anticipated Repayment Date: | NAP | 3rdMost Recent Occupancy (As of): | 97.8% (12/31/2013) | ||||
| Maturity Date: | October 6, 2026 | 2ndMost Recent Occupancy (As of): | 92.2% (12/31/2014) | ||||
| IO Period: | 24 months | Most Recent Occupancy (As of): | 97.8% (12/31/2015) | ||||
| Loan Term (Original): | 120 months | Current Occupancy (As of): | 94.7% (9/30/2016) | ||||
| Seasoning: | 1 month | ||||||
| Amortization Term (Original): | 360 months | Underwriting and Financial Information: | |||||
| Loan Amortization Type: | Interest-only, Amortizing Balloon | ||||||
| Interest Accrual Method: | Actual/360 | 4thMost Recent NOI (As of): | $1,596,853 (12/31/2013) | ||||
| Call Protection: | L(25),D(90),O(5) | 3rdMost Recent NOI (As of): | $1,338,684 (12/31/2014) | ||||
| Lockbox Type: | Springing | 2ndMost Recent NOI (As of): | $1,619,871 (12/31/2015) | ||||
| Additional Debt: | None | Most Recent NOI (As of): | $1,673,536 (TTM 6/30/2016) | ||||
| Additional Debt Type: | NAP | ||||||
| U/W Revenues: | $2,218,870 | ||||||
| U/W Expenses: | $518,834 | ||||||
| U/W NOI: | $1,700,036 | ||||||
| U/W NCF: | $1,605,463 | ||||||
| U/W NOI DSCR: | 1.52x | ||||||
| Escrows and Reserves: | U/W NCF DSCR: | 1.43x | |||||
| U/W NOI Debt Yield: | 8.8% | ||||||
| Type: | Initial | Monthly | Cap (If Any) | U/W NCF Debt Yield: | 8.3% | ||
| Taxes | $0 | $16,099 | NAP | As-Is Appraised Value: | $25,700,000 | ||
| Insurance(1) | $0 | Springing | NAP | As-Is Appraisal Valuation Date: | August 19, 2016 | ||
| Replacement Reserves | $340,000 | $2,248 | NAP | Cut-off Date LTV Ratio: | 75.0% | ||
| TI/LC Reserve(2) | $500,000 | $7,492 | $359,622 | LTV Ratio at Maturity or ARD: | 63.4% | ||
| (1) | Ongoing reserves for insurance premiums are not required as long as (i) no event of default has occurred and is continuing; (ii) the amortizing debt service coverage ratio is greater than 1.15x; (iii) the Archdale Marketplace Property (as defined below) is insured via an acceptable blanket insurance policy; (iv) the borrower provides the lender with evidence of renewal of insurance premiums; and (v) the commencement of the period that is six months prior to Food Lion’s lease expiration. |
| (2) | Upon the commencement of the period that is six months prior to Food Lion’s lease expiration (and provided no other trigger period has then occurred and is continuing), the borrower is required to deposit on each payment date the excess cash flow generated by the Archdale Marketplace Property into the TI/LC reserve, in addition to the monthly payment amount of $7,492. The deposit amount is capped at $359,622. |
The Archdale Marketplace mortgage loan is evidenced by a single promissory note that is secured by a first mortgage encumbering a 179,811 square foot anchored retail center (the “Archdale Marketplace Property”) located in Charlotte, North Carolina, approximately 4.8 miles south of Charlotte’s central business district. The Archdale Marketplace Property was built in 1961 and 1963 and renovated in 2005. The sponsors stated that they have invested approximately $2.1 million in capital expenditures at the Archdale Marketplace Property, since 2013. The Archdale Marketplace Property is anchored by Food Lion and is comprised of two one-story buildings located on a 13.9-acre site. Major tenants at the Archdale Marketplace Property include Fallas, Badcock Home Furniture & More, Planet Fitness and Citi Trends. The Archdale Marketplace Property includes 702 surface parking spaces resulting in a parking ratio of 3.9 spaces per 1,000 square feet of rentable area. As of September 30, 2016, the Archdale Marketplace Property was 94.7% occupied by 21 tenants.
The Archdale Marketplace Property is situated on South Boulevard between Emerywood Drive and Archdale Drive, in addition to being located near the LYNX Blue Line corridor, which connects the Archdale Marketplace Property with Interstate 485. The estimated 2015 population within a three- and five-mile radius of the Archdale Marketplace Property was 86,728 and 191,297, respectively, while the estimated 2015 average household income within the same radii was $82,236 and $97,519, respectively. According to a third party market research report, the Archdale Marketplace Property is located within the Inner Southeast submarket of the Charlotte retail market. As of the second quarter of 2016, the Inner Southeast submarket reported total inventory of 885 properties totaling approximately 11.1 million square feet. During the same period, the Inner Southeast submarket exhibited a 4.3% vacancy rate and average asking rate $16.64 per square foot on a triple net basis.
THE INFORMATION IN THIS STRUCTURAL AND COLLATERAL TERM SHEET IS NOT COMPLETE AND MAY BE AMENDED PRIOR TO THE TIME OF SALE. THIS TERM SHEET IS NOT AN OFFER TO SELL THESE SECURITIES AND IT IS NOT A SOLICITATION OF AN OFFER TO BUY THESE SECURITIES IN ANY JURISDICTION WHERE THE OFFER OR SALE IS NOT PERMITTED.
138
| ARCHDALE MARKETPLACE |
Sources and Uses
| Sources | Uses | |||||||
| Original loan amount | $19,275,000 | 100.0% | Loan payoff | $13,229,868 | 68.6% | |||
| Reserves | 840,000 | 4.4 | ||||||
| Closing costs | 115,143 | 0.6 | ||||||
| Return of equity | 5,089,989 | 26.4 | ||||||
| Total Sources | $19,275,000 | 100.0% | Total Uses | $19,275,000 | 100.0% |
The following table presents certain information relating to the tenancies at the Archdale Marketplace Property:
Major Tenants
| Tenant Name | Credit Rating (Fitch/Moody’s/ S&P)(1) | Tenant NRSF | % of NRSF | Annual U/W Base Rent PSF | Annual U/W Base Rent | % of Total Annual U/W Base Rent | Sales PSF(2) | Occupancy Cost(2) | Lease Expiration Date |
| Anchor Tenant | |||||||||
| Food Lion | BBB/Baa2/BBB | 35,600 | 19.8% | $12.50 | $445,000 | 24.6% | $363 | 4.0% | 12/7/2018(3) |
| Total Anchor Tenant | 35,600 | 19.8% | $12.50 | $445,000 | 24.6% | ||||
| Major Tenants | |||||||||
| Citi Trends | NR/NR/NR | 16,425 | 9.1% | $9.50 | $156,038 | 8.6% | $98 | 9.7% | 4/30/2020 |
| Fallas | NR/NR/NR | 24,945 | 13.9% | $5.73 | $142,853 | 7.9% | NAV | NAV | 4/30/2020 |
| Octapharma Plasma | NR/NR/NR | 10,151 | 5.6% | $13.00 | $131,963 | 7.3% | NAV | NAV | 8/31/2026(4) |
| Planet Fitness | NR/NR/NR | 18,811 | 10.5% | $6.75 | $126,974 | 7.0% | NAV | NAV | 11/30/2024(5) |
| Bank of America | A-/Baa1/BBB+ | 2,715 | 1.5% | $43.19 | $117,260 | 6.5% | NAV | NAV | 11/30/2020(6)(7) |
| Total Major Tenants | 73,047 | 40.6% | $9.24 | $675,088 | 37.4% | ||||
| Non-Major Tenants | 61,589 | 34.3% | $11.15 | $686,790 | 38.0% | ||||
| Occupied Collateral Total | 170,236 | 94.7% | $10.61 | $1,806,878 | 100.0% | ||||
| Vacant Space | 9,575 | 5.3% | |||||||
| Collateral Total | 179,811 | 100.0% | |||||||
| (1) | Certain ratings are those of the parent company, whether or not the parent guarantees the lease. |
| (2) | Sales PSF and Occupancy Cost are for the year ending December 31, 2015. |
| (3) | Food Lion has two, 5-year lease renewal options. |
| (4) | Octapharma Plasma has two, 5-year lease renewal options. |
| (5) | Planet Fitness has two, 5-year lease renewal options. |
| (6) | Bank of America has three, 5-year lease renewal options. |
| (7) | Bank of America, which occupies an outparcel at the Archdale Marketplace Property, holds a right of first refusal under its lease to purchase its leased premises in the event the borrower elects to sell the leased premises at any time during the term of the lease. |
THE INFORMATION IN THIS STRUCTURAL AND COLLATERAL TERM SHEET IS NOT COMPLETE AND MAY BE AMENDED PRIOR TO THE TIME OF SALE. THIS TERM SHEET IS NOT AN OFFER TO SELL THESE SECURITIES AND IT IS NOT A SOLICITATION OF AN OFFER TO BUY THESE SECURITIES IN ANY JURISDICTION WHERE THE OFFER OR SALE IS NOT PERMITTED.
139
| ARCHDALE MARKETPLACE |
The following table presents certain information relating to the lease rollover schedule at the Archdale Marketplace Property:
Lease Expiration Schedule(1)(2)
| Year Ending December 31, | No. of Leases Expiring | Expiring NRSF | % of Total NRSF | Cumulative Expiring NRSF | Cumulative % of Total NRSF | Annual U/W Base Rent | % of Total Annual U/W Base Rent | Annual U/W Base Rent PSF(3) |
| MTM | 0 | 0 | 0.0% | 0 | 0.0% | $0 | 0.0% | $0.00 |
| 2016 | 2 | 2,142 | 1.2% | 2,142 | 1.2% | $42,268 | 2.3% | $19.73 |
| 2017 | 2 | 4,982 | 2.8% | 7,124 | 4.0% | $67,385 | 3.7% | $13.53 |
| 2018 | 4 | 41,997 | 23.4% | 49,121 | 27.3% | $571,829 | 31.6% | $13.62 |
| 2019 | 3 | 16,753 | 9.3% | 65,874 | 36.6% | $185,889 | 10.3% | $11.10 |
| 2020 | 4 | 45,265 | 25.2% | 111,139 | 61.8% | $441,639 | 24.4% | $9.76 |
| 2021 | 1 | 4,000 | 2.2% | 115,139 | 64.0% | $78,000 | 4.3% | $19.50 |
| 2022 | 1 | 3,043 | 1.7% | 118,182 | 65.7% | $45,645 | 2.5% | $15.00 |
| 2023 | 0 | 0 | 0.0% | 118,182 | 65.7% | $0 | 0.0% | $0.00 |
| 2024 | 2 | 21,787 | 12.1% | 139,969 | 77.8% | $176,078 | 9.7% | $8.08 |
| 2025 | 1 | 20,116 | 11.2% | 160,085 | 89.0% | $66,182 | 3.7% | $3.29 |
| 2026 | 1 | 10,151 | 5.6% | 170,236 | 94.7% | $131,963 | 7.3% | $13.00 |
| Thereafter | 0 | 0 | 0.0% | 170,236 | 94.7% | $0 | 0.0% | $0.00 |
| Vacant | 0 | 9,575 | 5.3% | 179,811 | 100.0% | $0 | 0.0% | $0.00 |
| Total/Weighted Average | 21 | 179,811 | 100.0% | $1,806,878 | 100.0% | $10.61 |
| (1) | Information obtained from the underwritten rent roll. |
| (2) | Certain tenants may have lease termination options that are exercisable prior to the stated expiration date of the subject lease and that are not considered in the Lease Expiration Schedule. |
| (3) | Weighted Average Annual U/W Base Rent PSF excludes vacant space. |
The following table presents historical occupancy percentages at the Archdale Marketplace Property:
Historical Occupancy
12/31/2012(1) | 12/31/2013(1) | 12/31/2014(1) | 12/31/2015(1) | 9/30/2016(2) |
| 97.8% | 97.8% | 92.2% | 97.8% | 94.7% |
| (1) | Information obtained from the borrower. |
| (2) | Information obtained from the underwritten rent roll. |
Operating History and Underwritten Net Cash Flow. The followingtable presents certain information relating to the historical operating performance and underwritten net cash flow at the Archdale Marketplace Property:
Cash Flow Analysis
| 2013 | 2014 | 2015 | TTM | U/W | % of U/W Effective Gross | U/W $ per SF | |
| Base Rent | $1,783,113 | $1,547,256 | $1,758,862 | $1,788,040 | $1,806,878(1) | 81.4% | $10.05 |
| Grossed Up Vacant Space | 0 | 0 | 0 | 0 | 148,877 | 6.7 | 0.83 |
| Percentage Rent | 19,316 | 15,195 | 10,011 | 10,011 | 10,011 | 0.5 | 0.06 |
| Total Reimbursables | 310,289 | 223,695 | 392,509 | 420,290 | 399,882 | 18.0 | 2.22 |
| Other Income | 5,634 | 5,501 | (2,112) | 2,099 | 2,099 | 0.1 | 0.01 |
| Less Vacancy and Credit Loss | 0 | 0 | 0 | 0 | (148,877)(2) | (6.7) | (0.83) |
| Effective Gross Income | $2,118,352 | $1,791,647 | $2,159,270 | $2,220,440 | $2,218,870 | 100.0% | $12.34 |
| Total Operating Expenses | $521,499 | $452,963 | $539,399 | $546,904 | $518,834 | 23.4% | $2.89 |
|
|
|
|
|
|
| |
| Net Operating Income | $1,596,853 | $1,338,684 | $1,619,871 | $1,673,536 | $1,700,036 | 76.6% | $9.45 |
| TI/LC | 0 | 0 | 0 | 0 | 67,601 | 3.0 | 0.38 |
| Capital Expenditures | 0 | 0 | 0 | 0 | 26,972 | 1.2 | 0.15 |
| Net Cash Flow | $1,596,853 | $1,338,684 | $1,619,871 | $1,673,536 | $1,605,463 | 72.4% | $8.93 |
| NOI DSCR | 1.43x | 1.19x | 1.45x | 1.49x | 1.52x | ||
| NCF DSCR | 1.43x | 1.19x | 1.45x | 1.49x | 1.43x | ||
| NOI DY | 8.3% | 6.9% | 8.4% | 8.7% | 8.8% | ||
| NCF DY | 8.3% | 6.9% | 8.4% | 8.7% | 8.3% |
| (1) | U/W Base Rent includes contractual rent steps through June 2017 totaling $3,750. |
| (2) | The underwritten economic occupancy is 93.3%. As of September, 30, 2016, the Archdale Marketplace Property was 94.7% physically occupied. |
THE INFORMATION IN THIS STRUCTURAL AND COLLATERAL TERM SHEET IS NOT COMPLETE AND MAY BE AMENDED PRIOR TO THE TIME OF SALE. THIS TERM SHEET IS NOT AN OFFER TO SELL THESE SECURITIES AND IT IS NOT A SOLICITATION OF AN OFFER TO BUY THESE SECURITIES IN ANY JURISDICTION WHERE THE OFFER OR SALE IS NOT PERMITTED.
140
| ARCHDALE MARKETPLACE |
The following table presents certain information relating to some comparable anchor retail leases for the Archdale Marketplace Property:
Comparable Leases(1)
| Property Name/ Location | Year Built/ Renovated | Total GLA (SF) | Total Occupancy | Distance from Subject | Tenant Name | Lease Date / Term | Lease Area (SF) | Annual Base Rent PSF | Lease Type |
Martin Farms – Publix Shopping Center Simpsonville, SC | 2017/NAP | 67,274 | NAV | NAV | Publix | March 2017 / 20 Yrs | 54,674 | $12.75 | NNN |
4130 Dawson Forest Road Dawsonville, GA | 2016/NAP | 98,139 | 58% | 223.0 miles | Publix | August 2016 / 20 Yrs | 45,600 | $13.25 | NNN |
9719 Sam Furr Road Huntersville, NC | 1987/2014 | 60,000 | 100% | 22.4 miles | Whole Foods | September 2014 / 20 Yrs | 40,000 | $13.00 | NNN |
760 US Highway 378 Lexington, SC | 1999/NAP | 39,218 | NAV | 102.0 miles | BI-LO | November 2013 / 6 Yrs | 33,216 | $8.00 | NNN |
885 Walnut Street Cary, NC | 1975/2014 | 222,030 | 100% | 146.0 miles | Harris Teeter | August 2013 / 20 Yrs | 53,000 | $7.75 | NNN |
1 North Forest Beach Drive Hilton Head Island, SC | 1962/2004 | 123,908 | 100% | 250.0 miles | Piggly Wiggly | January 2013 / 5 Yrs | 20,000 | $7.50 | NNN |
Mooresville Town Square Mooresville, NC | 2007/NAP | 89,641 | 100% | 32.8 miles | Lowe’s Food | January 2010 / 20 Yrs | 50,127 | $13.87 | NNN |
2226 Park Road Charlotte, NC | 1982/2010 | NAV | 100% | 4.2 miles | Food Lion | July 2011 / 1 8 Yrs | 44,549 | $14.00 | NNN |
| (1) | Information obtained from third party reports. |
THE INFORMATION IN THIS STRUCTURAL AND COLLATERAL TERM SHEET IS NOT COMPLETE AND MAY BE AMENDED PRIOR TO THE TIME OF SALE. THIS TERM SHEET IS NOT AN OFFER TO SELL THESE SECURITIES AND IT IS NOT A SOLICITATION OF AN OFFER TO BUY THESE SECURITIES IN ANY JURISDICTION WHERE THE OFFER OR SALE IS NOT PERMITTED.
141
| No. 14 – DoubleTree Dallas Near The Galleria | |||||||
| Loan Information | Property Information | ||||||
| Mortgage Loan Seller: | C-III Commercial Mortgage LLC | Single Asset/Portfolio: | Single Asset | ||||
Credit Assessment (Fitch/Moody’s/Morningstar): | NR/NR/NR | Property Type: | Hospitality | ||||
| Original Principal Balance: | $19,000,000 | Specific Property Type: | Full Service | ||||
| Cut-off Date Balance: | $18,977,355 | Location: | Dallas, TX | ||||
| % of Initial Pool Balance: | 2.2% | Size: | 290 Rooms | ||||
| Loan Purpose: | Refinance | Cut-off Date Balance Per Room: | $65,439 | ||||
| Borrower Name: | CHA Galleria LP | Year Built/Renovated: | 1980/2016 | ||||
| Sponsor: | Ki Yong Choi | Title Vesting: | Fee | ||||
| Mortgage Rate: | 4.500% | Property Manager: | Self-managed | ||||
| Note Date: | September 30, 2016 | 4thMost Recent Occupancy (As of): | 66.3% (12/31/2012) | ||||
| Anticipated Repayment Date: | NAP | 3rdMost Recent Occupancy (As of): | 71.2% (12/31/2013) | ||||
| Maturity Date: | October 11, 2026 | 2ndMost Recent Occupancy (As of): | 73.6% (12/31/2014) | ||||
| IO Period: | None | Most Recent Occupancy (As of): | 78.7% (12/31/2015) | ||||
| Loan Term (Original): | 120 months | Current Occupancy (As of): | 77.9% (7/31/2016) | ||||
| Seasoning: | 1 month | ||||||
| Amortization Term (Original): | 360 months | Underwriting and Financial Information: | |||||
| Loan Amortization Type: | Amortizing Balloon | ||||||
| Interest Accrual Method: | Actual/360 | 4thMost Recent NOI (As of): | $1,559,292 (12/31/2013) | ||||
| Call Protection: | L(25),D(92),O(3) | 3rdMost Recent NOI (As of)(3): | $1,995,917 (12/31/2014) | ||||
| Lockbox Type: | Springing | 2ndMost Recent NOI (As of)(3): | $2,492,005 (12/31/2015) | ||||
| Additional Debt: | None | Most Recent NOI (As of): | $2,594,488 (TTM 7/31/2016) | ||||
| Additional Debt Type: | NAP | ||||||
| U/W Revenues: | $10,438,632 | ||||||
| U/W Expenses: | $8,120,550 | ||||||
| U/W NOI: | $2,318,081 | ||||||
| U/W NCF: | $1,900,536 | ||||||
| Escrows and Reserves: | U/W NOI DSCR: | 2.01x | |||||
| U/W NCF DSCR: | 1.65x | ||||||
| Type: | Initial | Monthly | Cap (If Any) | U/W NOI Debt Yield: | 12.2% | ||
| Taxes | $324,611 | $32,461 | NAP | U/W NCF Debt Yield: | 10.0% | ||
| Insurance | $70,521 | $11,753 | NAP | As-Complete Appraised Value(4): | $30,800,000 | ||
| FF&E Reserve | $0 | $0(1) | $1,450,000 | As-Complete Appraisal Valuation Date: | August 5, 2016 | ||
| PIP Reserve | $8,118,137 | $0 | NAP | Cut-off Date LTV Ratio(4): | 61.6% | ||
| Seasonality Reserve | $170,000 | $35,000(2) | $170,000 | LTV Ratio at Maturity(4): | 49.9% | ||
| (1) | The Monthly FF&E Reserve is 1/12 of a specified percentage of the annual gross income for the prior year: (i) 0.0% prior to 10/11/2017, (ii) 2.0% from 10/11/2017 to 10/10/2018, (iii) 3.0% from 10/11/2018 to 10/10/2019, and (iv) 4.0% thereafter. |
| (2) | The Seasonality Reserve commences in February of each year, until the cap is reached, and can be altered at lender discretion. |
| (3) | See “Cash Flow Analysis” section. |
| (4) | Reflects an “as-complete” appraised value that assumes completion of a currently on-going PIP (as defined below). The “as-is” appraised value is $21,000,000. The Cut-off Date LTV Ratio and the LTV Ratio at Maturity (based on the “as-is” appraised value) are 90.4% and 73.1%, respectively. |
The DoubleTree Dallas Near The Galleria mortgage loan is evidenced by a single promissory note that is secured by a first mortgage encumbering a single hotel located in Dallas, Texas (the “DoubleTree Dallas Near The Galleria Property”).
The DoubleTree Dallas Near The Galleria Property is an eleven-story, 290-room full-service hotel located in northern Dallas, Texas, approximately two miles west of the Galleria Dallas shopping complex, in the northwestern quadrant of the intersection formed by Interstate 635 and Midway Road. The DoubleTree Dallas Near The Galleria Property features standard and suite-style guestroom configurations. The hotel contains 290 guestrooms, which consist of 120 king rooms, 6 king accessible rooms, 102 queen/queen rooms, 41 king executive level rooms, 1 king executive level accessible room, 13 queen/queen executive level rooms, 2 king junior suites, 4 king superior suites and 1 presidential suite. Amenities at the DoubleTree Dallas Near The Galleria Property include a restaurant (“The Chef’s Table”), a lounge (“Terrace Bar & Grill”), 29,632 square feet of meeting and banquet space across fourteen rooms, an outdoor swimming pool, a fitness room, lobby workstations, a coffee/gift shop and vending areas. The DoubleTree Dallas Near The Galleria Property operates as a DoubleTree by Hilton under a license agreement with Hilton Worldwide, that was signed in April 2016 and runs through January 31, 2031. A property improvement plan (“PIP”) with respect to the DoubleTree Dallas Near The Galleria Property was recently required by Hilton Worldwide with a total estimated cost of $9,643,966 ($33,255 per room). The DoubleTree Dallas Near The Galleria Property’s renovation plan includes updating guest rooms/suites and bathrooms, guest room corridors, public spaces, back of house and property exterior and implementing current brand standards. There are 430 surface
THE INFORMATION IN THIS STRUCTURAL AND COLLATERAL TERM SHEET IS NOT COMPLETE AND MAY BE AMENDED PRIOR TO THE TIME OF SALE. THIS TERM SHEET IS NOT AN OFFER TO SELL THESE SECURITIES AND IT IS NOT A SOLICITATION OF AN OFFER TO BUY THESE SECURITIES IN ANY JURISDICTION WHERE THE OFFER OR SALE IS NOT PERMITTED.
142
DOUBLETREE DALLAS NEAR THE GALLERIA
parking spaces at the DoubleTree Near The Galleria Property resulting in a parking ratio of 1.48 per room. Galleria Dallas welcomes more than 19 million visitors annually and features nearly 200 specialty retailers.
Sources and Uses
| Sources | Uses | |||||||
| Original loan amount | $19,000,000 | 100.0% | Loan payoff | $7,712,545 | 40.6% | |||
| Reserves | 8,683,268 | 45.7 | ||||||
| Closing costs | 276,547 | 1.5 | ||||||
| Return of equity | 2,327,640 | 12.3 | ||||||
| Total Sources | $19,000,000 | 100.0% | Total Uses | $19,000,000 | 100.0% |
Subject and Market Historical Occupancy, ADR and RevPAR(1)
| DoubleTree Dallas Near The Galleria | Penetration Factor | |||||||||||||||
Year | Occupancy | ADR | RevPAR | Occupancy | ADR | RevPAR | Occupancy | ADR | RevPAR | ||||||||
| 8/31/2016 TTM | 74.3% | $89.85 | $66.77 | 77.4% | $92.41 | $71.56 | 104.2% | 102.9% | 107.2% | ||||||||
| 8/31/2015 TTM | 69.2% | $86.21 | $59.62 | 76.7% | $87.06 | $66.76 | 110.9% | 101.0% | 112.0% | ||||||||
| 8/31/2014 TTM | 62.5% | $82.04 | $51.31 | 72.4% | $82.57 | $59.81 | 115.8% | 100.6% | 116.6% | ||||||||
| (1) | Information obtained from a third party hospitality report dated September 19, 2016. The competitive set includes the following hotels: Sheraton Hotel Dallas By The Galleria, Crowne Plaza Dallas Near Galleria Addison, Wyndham Garden Hotel Dallas North, Wyndham Dallas Park Central, and Courtyard Dallas Addison Quorum Drive. |
Operating History and Underwritten Net Cash Flow.The following table presents certain information relating to the historical operating performance and the underwritten net cash flow at the DoubleTree Dallas Near The Galleria Property:
Cash Flow Analysis
| 2013 | 2014 | 2015 | TTM 7/31/2016 | U/W | % of U/W Total Revenue | U/W $ per Room | ||||||||
| Occupancy | 71.2% | 73.6% | 78.7% | 77.9% | 75.0% | |||||||||
| ADR | $77.80 | $82.91 | $87.72 | $91.81 | $92.00 | |||||||||
| RevPAR | $55.37 | $61.01 | $69.05 | $71.57 | $69.00 | |||||||||
| Room Revenue | $5,860,614 | $6,457,473 | $7,308,764 | $7,596,248 | $7,323,660 | 70.2% | $25,254 | |||||||
| F&B Revenue | 3,653,614 | 3,343,708 | 3,284,401 | 2,967,542 | 2,967,542 | 28.4 | 10,233 | |||||||
| Other Revenue | 139,547 | 151,087 | 162,882 | 147,430 | 147,430 | 1.4 | 508 | |||||||
| Total Revenue | $9,653,775 | $9,952,268 | $10,756,047 | $10,711,220 | $10,438,632 | 100.0% | $35,995 | |||||||
| Total Department Expenses | 4,082,760 | 3,894,752 | 3,912,527 | 3,811,675 | 3,745,556 | 35.9 | 12,916 | |||||||
| Gross Operating Profit | $5,571,015 | $6,057,516 | $6,843,520 | $6,899,544 | $6,693,076 | 64.1% | $23,080 | |||||||
| Total Undistributed Expenses | 3,582,958 | 3,621,661 | 3,801,186 | 3,796,254 | 3,801,564 | 36.4 | 13,109 | |||||||
| Profit Before Fixed Charges | $1,988,057 | $2,435,855 | $3,042,334 | $3,103,290 | $2,891,512 | 27.7% | $9,971 | |||||||
| Total Fixed Charges | 428,765 | 439,938 | 550,329 | 508,802 | 573,431 | 5.5 | 1,977 | |||||||
| Net Operating Income | $1,559,292 | $1,995,917(1) | $2,492,005(1) | $2,594,488 | $2,318,081 | 22.2% | $7,993 | |||||||
| FF&E | 0 | 0 | 0 | 0 | 417,545 | 4.0 | 1,440 | |||||||
| Net Cash Flow | $1,559,292 | $1,995,917 | $2,492,005 | $2,594,488 | $1,900,536 | 18.2% | $6,554 | |||||||
| NOI DSCR | 1.35x | 1.73x | 2.16x | 2.25x | 2.01x | |||||||||
| NCF DSCR | 1.35x | 1.73x | 2.16x | 2.25x | 1.65x | |||||||||
| NOI DY | 8.2% | 10.5% | 13.1% | 13.7% | 12.2% | |||||||||
| NCF DY | 8.2% | 10.5% | 13.1% | 13.7% | 10.0% | |||||||||
| (1) | The increase in Net Operating Income from 2014 to 2015 was largely market driven as the entire competitive set saw occupancy rates increase from 64.8% to 70.5%, ADR increase from $83.12 to $88.03 and RevPAR increase from $53.87 to $62.06. |
THE INFORMATION IN THIS STRUCTURAL AND COLLATERAL TERM SHEET IS NOT COMPLETE AND MAY BE AMENDED PRIOR TO THE TIME OF SALE. THIS TERM SHEET IS NOT AN OFFER TO SELL THESE SECURITIES AND IT IS NOT A SOLICITATION OF AN OFFER TO BUY THESE SECURITIES IN ANY JURISDICTION WHERE THE OFFER OR SALE IS NOT PERMITTED.
143
| No. 15 – Tully Business Center | |||||||
| Loan Information | Property Information | ||||||
| Mortgage Loan Seller: | Wells Fargo Bank, National Association | Single Asset/Portfolio: | Single Asset | ||||
| Credit Assessment (Fitch/Moody’s/Morningstar): | NR/NR/NR | Property Type: | Industrial | ||||
| Original Principal Balance: | $17,500,000 | Specific Property Type: | Flex | ||||
| Cut-off Date Balance: | $17,500,000 | Location: | San Jose, CA | ||||
| % of Initial Pool Balance: | 2.0% | Size: | 143,913 SF | ||||
| Loan Purpose: | Refinance | Cut-off Date Balance Per SF: | $121.60 | ||||
| Borrower Names: | Tully Business Park, LLC | Year Built/Renovated: | 1987/NAP | ||||
| Sponsor: | David B. Dollinger | Title Vesting: | Fee | ||||
| Mortgage Rate(2): | 3.990% | Property Manager: | Self-managed | ||||
| Note Date: | August 25, 2016 | 4thMost Recent Occupancy (As of): | 90.2% (12/31/2012) | ||||
| Anticipated Repayment Date: | NAP | 3rdMost Recent Occupancy (As of): | 93.1% (12/31/2013) | ||||
| Maturity Date: | September 11, 2026 | 2ndMost Recent Occupancy (As of): | 94.6% (12/31/2014) | ||||
| IO Period: | 36 months | Most Recent Occupancy (As of): | 91.7% (12/31/2015) | ||||
| Loan Term (Original): | 120 months | Current Occupancy (As of)(3):: | 97.3% (8/22/2016) | ||||
| Seasoning: | 2 months | ||||||
| Amortization Term (Original): | 360 months | Underwriting and Financial Information: | |||||
| Loan Amortization Type: | Interest-only, Amortizing Balloon | ||||||
| Interest Accrual Method: | Actual/360 | 4thMost Recent NOI (As of): | $1,128,391 (12/31/2013) | ||||
| Call Protection: | L(26),GRTR 1% or YM or D(87),O(7) | 3rdMost Recent NOI (As of): | $1,212,495 (12/31/2014) | ||||
| Lockbox Type: | Springing | 2ndMost Recent NOI (As of): | $1,324,071 (12/31/2015) | ||||
| Additional Debt: | Yes | Most Recent NOI (As of)(4): | $1,680,239 (Annualized 5 7/31/2016) | ||||
| Additional Debt Type(1): | Future Mezzanine; Future Unsecured | ||||||
| U/W Revenues: | $2,409,189 | ||||||
| U/W Expenses: | $772,757 | ||||||
| U/W NOI: | $1,636,431 | ||||||
| U/W NCF: | $1,481,876 | ||||||
| U/W NOI DSCR: | 1.63x | ||||||
| Escrows and Reserves: | U/W NCF DSCR: | 1.48x | |||||
| U/W NOI Debt Yield: | 9.4% | ||||||
| Type: | Initial | Monthly | Cap (If Any) | U/W NCF Debt Yield: | 8.5% | ||
| Taxes | $161,340 | $26,204 | NAP | As-Is Appraised Value: | $25,800,000 | ||
| Insurance | $0 | Springing(2) | NAP | As-Is Appraisal Valuation Date: | August 11, 2016 | ||
| Replacement Reserves | $0 | $1,799 | $43,176 | Cut-off Date LTV Ratio: | 67.8% | ||
| TI/LC Reserve | $0 | $11,153 | $260,000 | LTV Ratio at Maturity or ARD: | 58.7% | ||
| (1) | The borrower may incur mezzanine debt provided certain provisions are satisfied, including, but not limited to: (i) the combined amortizing net cash flow debt service coverage ratio is not less than 1.15x, (ii) the combined net cash flow debt yield is not less than 8.0%; (iii) the combined loan-to-value ratio is not greater than 70.0%; (iv) the execution of an intercreditor agreement and (v) if requested by the lender, rating agency confirmation from Fitch, Moody’s and Morningstar. Future unsecured subordinate debt is permitted in an amount up to $175,000 so long as (i) no event of default has occurred and is continuing and (ii) evidenced by a promissory note stating that lender is third party beneficiary. |
| (2) | Ongoing monthly reserves for insurance are not required so long as (i) no event of default has occurred and is continuing; (ii) Tully Business Center Property is insured via an acceptable blanket insurance policy; and (iii) the borrower provides the lender with evidence of renewal of the insurance policies and timely proof of payment of insurance premiums. |
| (3) | As of August 22, 2016, the Tully Business Center Property (as defined below) was 97.3% leased and 94.1% occupied. One tenant (Phu Nguyen; 3.2% net rentable area) is completing its buildout, but began paying rent on May 1, 2015. They are scheduled to open for business in March 2017. |
| (4) | See “Cash Flow Analysis” section. |
The Tully Business Center mortgage loan is evidenced by a single promissory note that is secured by a first mortgage encumbering a 143,913 square foot industrial flex center located in San Jose, California (the “Tully Business Center Property”). Built in 1987, the Tully Business Center Property consists of six buildings located on an 11.0-acre site. The Tully Business Center Property includes 487 surface parking spaces, resulting in a parking ratio of 3.38 spaces per 1,000 square feet of rentable area. As of August 22, 2016, the Tully Business Center Property was 97.3% occupied by 62 tenants subject to 68 leases, and has averaged 91.8% occupancy since 2011.
The Tully Business Center Property is located at the intersection of Tully Road and Highway 101 approximately 5.1 miles southeast of the San Jose central business district. The tenant spaces are generally improved for light industrial or flex use, but several tenants have commercial related uses and improvements. Units at the Tully Business Center Property generally include an office area at the unit front, accounting for approximately 10% to 50% of the unit’s net rentable area, but some include 100% office buildout. The rear of the units is designed for warehouse use with most units including at least one grade level truck door. According to the appraisal, the 2015 population within a one-, three- and five-mile radius of the Tully Business Center Property was 43,021, 292,735 and 625,899, respectively, while the median household income within the same radii was $61,510, $65,743 and $78,045, respectively.
THE INFORMATION IN THIS STRUCTURAL AND COLLATERAL TERM SHEET IS NOT COMPLETE AND MAY BE AMENDED PRIOR TO THE TIME OF SALE. THIS TERM SHEET IS NOT AN OFFER TO SELL THESE SECURITIES AND IT IS NOT A SOLICITATION OF AN OFFER TO BUY THESE SECURITIES IN ANY JURISDICTION WHERE THE OFFER OR SALE IS NOT PERMITTED.
144
TULLY BUSINESS CENTER |
According to a third party research report, the Tully Business Center Property is located within the San Jose East light industrial submarket. As of the second quarter of 2016, the San Jose East light industrial submarket reported a total inventory of approximately 4.7 million square feet and a vacancy of 1.2%. For the same period, San Jose East light industrial submarket was the largest San Jose submarket and reported a positive net absorption of 193,000 for the trailing twelve month period.
Sources and Uses
| Sources | Uses | |||||||
| Original loan amount | $17,500,000 | 76.6% | Loan payoff | $22,151,864 | 96.9% | |||
| Sponsor’s new cash contribution | 5,359,120 | 23.4 | Closing costs | $545,916 | 2.4 | |||
| Reserves | 161,340 | 0.7 | ||||||
| Total Sources | $22,859,120 | 100.0% | Total Uses | $22,859,120 | 100.0% |
The following table presents certain information relating to the tenancy at the Tully Business Center Property:
Major Tenants
| Tenant Name | Credit Rating (Fitch/Moody’s/ S&P)(1) | Tenant NRSF | % of NRSF | Annual U/W Base Rent PSF | Annual Rent | % of Total Annual U/W Base Rent | Lease Expiration Date |
| Major Tenants | |||||||
| Asian American Recovery Services, Inc | NR/NR/NR | 7,872 | 5.5% | $13.01 | $102,410 | 5.7% | 9/30/2019 |
| Zinwave | NR/NR/NR | 5,184 | 3.6% | $13.20 | $68,429 | 3.8% | 9/30/2018 |
| Phu Nguyen(2) | NR/NR/NR | 4,578 | 3.2% | $14.28 | $65,365 | 3.6% | 10/31/2022(3) |
| Thermo Cool | NR/NR/NR | 4,320 | 3.0% | $12.96 | $55,987 | 3.1% | 5/31/2019 |
| Bravo Meat Company | NR/NR/NR | 3,840 | 2.7% | $14.40 | $55,296 | 3.1% | 4/30/2019 |
| Total Major Tenants | 25,794 | 17.9% | $13.47 | $347,487 | 19.2% | ||
| Non-Major Tenants | 114,279 | 79.4% | $12.78 | $1,460,095 | 80.8% | ||
| Occupied Collateral Total | 140,073 | 97.3% | $12.90 | $1,807,582 | 100.0% | ||
| Vacant Space | 3,840 | 2.7% | |||||
| Collateral Total | 143,913 | 100.0% | |||||
| (1) | Certain ratings are those of the parent company whether or not the parent guarantees the lease. |
| (2) | Phu Nguyen is completing its buildout and is not yet in occupancy, but began paying rent on May 1, 2015. They are scheduled to open for business in March 2017. |
| (3) | Phu Nguyen has one, seven-year renewal option. |
The following table presents certain information relating to the lease rollover schedule at the Tully Business Center Property:
Lease Expiration Schedule(1)(2)
| Year Ending December 31, | No. of Leases Expiring | Expiring NRSF | % of Total NRSF | Cumulative Expiring NRSF | Cumulative % of Total NRSF | Annual U/W Base Rent | % of Total Annual U/W Base Rent | Annual U/W Base Rent PSF(3) |
| MTM | 2 | 5,448 | 3.8% | 5,448 | 3.8% | $67,562 | 3.7% | $12.40 |
| 2016 | 2 | 2,808 | 2.0% | 8,256 | 5.7% | $32,659 | 1.8% | $11.63 |
| 2017 | 15 | 28,551 | 19.8% | 36,807 | 25.6% | $370,826 | 20.5% | $12.99 |
| 2018 | 20 | 39,524 | 27.5% | 76,331 | 53.0% | $501,660 | 27.8% | $12.69 |
| 2019 | 18 | 38,328 | 26.6% | 114,659 | 79.7% | $507,407 | 28.1% | $13.24 |
| 2020 | 0 | 0 | 0.0% | 114,659 | 79.7% | $0 | 0.0% | $0.00 |
| 2021 | 9 | 20,836 | 14.5% | 135,495 | 94.2% | $262,102 | 14.5% | $12.58 |
| 2022 | 2 | 4,578 | 3.2% | 140,073 | 97.3% | $65,365 | 3.6% | $14.28 |
| 2023 | 0 | 0 | 0.0% | 140,073 | 97.3% | $0 | 0.0% | $0.00 |
| 2024 | 0 | 0 | 0.0% | 140,073 | 97.3% | $0 | 0.0% | $0.00 |
| 2025 | 0 | 0 | 0.0% | 140,073 | 97.3% | $0 | 0.0% | $0.00 |
| 2026 | 0 | 0 | 0.0% | 140,073 | 97.3% | $0 | 0.0% | $0.00 |
| Thereafter | 0 | 0 | 0.0% | 140,073 | 97.3% | $0 | 0.0% | $0.00 |
| Vacant | 0 | 3,840 | 2.7% | 143,913 | 100.0% | $0 | 0.0% | $0.00 |
| Total/Weighted Average | 68(4) | 143,913 | 100.0% | $1,807,582 | 100.0% | $12.90 |
| (1) | Information obtained from the underwritten rent roll. |
| (2) | Certain tenants may have lease termination options that are exercisable prior to the originally stated expiration date of the subject lease and that are not considered in the Lease Expiration Schedule. |
| (3) | Weighted Average Annual U/W Base Rent PSF excludes vacant space. |
| (4) | There are 62 tenants subject to 68 leases at theTully Business CenterProperty. |
THE INFORMATION IN THIS STRUCTURAL AND COLLATERAL TERM SHEET IS NOT COMPLETE AND MAY BE AMENDED PRIOR TO THE TIME OF SALE. THIS TERM SHEET IS NOT AN OFFER TO SELL THESE SECURITIES AND IT IS NOT A SOLICITATION OF AN OFFER TO BUY THESE SECURITIES IN ANY JURISDICTION WHERE THE OFFER OR SALE IS NOT PERMITTED.
145
TULLY BUSINESS CENTER |
The following table presents historical occupancy percentages at the Tully Business Center Property:
Historical Occupancy
12/31/2012(1) | 12/31/2013(1) | 12/31/2014(1) | 12/31/2015(1) | 8/22/2016(2) |
| 90.2% | 93.1% | 94.6% | 91.7% | 97.3% |
| (1) | Information obtained from the borrower. |
| (2) | Information obtained from the underwritten rent roll. See “Cash Flow Analysis” section. |
Operating History and Underwritten Net Cash Flow. The following table presents certain information relating to the historical operating performance and underwritten net cash flow at the Tully Business Center Property:
Cash Flow Analysis
| 2013 | 2014 | 2015(1) | Annualized 5 7/31/2016(1) | U/W | % of U/W Effective Gross Income | U/W $ per SF | ||||||||
| Base Rent | $1,427,962 | $1,460,845 | $1,536,864 | $1,744,253 | $1,704,286 | 70.7% | $11.84 | |||||||
| Grossed Up Vacant Space | 0 | 0 | 0 | 0 | 156,288 | 6.5 | 1.09 | |||||||
| Total Reimbursables | 642,973 | 639,861 | 637,974 | 557,355 | 692,476 | 28.7 | 4.81 | |||||||
| Other Income | 9,457 | 24,887 | 12,427 | 1,776 | 12,427 | 0.5 | 0.09 | |||||||
| Less Vacancy & Credit Loss | 0 | 0 | 0 | 0 | (156,288)(2) | (6.5) | (1.09) | |||||||
| Effective Gross Income | $2,080,392 | $2,125,593 | $2,187,264 | $2,303,383 | $2,409,189 | 100.0% | $16.74 | |||||||
| Total Operating Expenses | $952,002 | $913,098 | $863,193 | $623,145 | $772,757 | 32.1% | $5.37 | |||||||
| Net Operating Income | $1,128,391 | $1,212,495 | $1,324,071 | $1,680,239 | $1,636,431 | 67.9% | $11.37 | |||||||
| TI/LC | 0 | 0 | 0 | 0 | 132,968 | 5.5 | 0.92 | |||||||
| Capital Expenditures | 0 | 0 | 0 | 0 | 21,587 | 0.9 | 0.15 | |||||||
| Net Cash Flow | $1,128,391 | $1,212,495 | $1,324,071 | $1,680,239 | $1,481,876 | 61.5% | $10.30 | |||||||
| NOI DSCR(2) | 1.13x | 1.21x | 1.32x | 1.68x | 1.63x | |||||||||
| NCF DSCR(2) | 1.13x | 1.21x | 1.32x | 1.68x | 1.48x | |||||||||
| NOI DY | 6.4% | 6.9% | 7.6% | 9.6% | 9.4% | |||||||||
| NCF DY | 6.4% | 6.9% | 7.6% | 9.6% | 8.5% |
| (1) | The increase in base rent and net operating income from 2015 to Annualized March – July 2016 was a result of an increase in occupancy at the Tully Business Center Property. Annualized March – July statements were only available as the borrower acquired the Tully Business Center Property in March 2016. |
| (2) | The underwritten economic vacancy is 8.4%. As of August 22, 2016, the Tully Business Center Property was 97.3% leased and 94.1% physically occupied. Phu Nguyen is still completing its buildout and is not yet in occupancy, but began paying rent on May 1, 2015. They are scheduled to open for business in March 2017. |
The following table presents certain information relating to some comparable industrial leases for the Tully Business Center Property:
Comparable Leases(1)
| Property Name/Location | Year Built/ Renovated | Stories | Total GLA (SF) | Total Occupancy | Distance from Subject | Tenant Name | Lease Date/Term | Lease Area (SF) | Annual Base Rent PSF | Lease Type |
780 Montague San Jose, CA | 1986/NAV | NAV | 95,317 | NAV | 9.0 miles | America’s Security | Dec 2015 / 61 Months | 1,680 | $16.20 | NNN |
1425 Koll Circle San Jose, CA | 1975/NAV | NAV | 178,317 | NAV | 7.1 miles | GLR Fasteners | Nov 2015 / 60 months | 4,000 | $14.40 | Industrial Gross |
6280 San Ignacio Avenue San Jose, CA | 1989/NAV | NAV | 83,588 | NAV | 8.8 miles | Andrew Cook Lynn | Nov 2015 / 36 Months | 1,185 | $15.00 | Industrial Gross |
1721-1729 Little Orchard San Jose, CA | 1970/NAP | NAV | 20,000 | NAV | 4.1 miles | New Heart Industries | Oct 2015 / 36 Months | 1,995 | $12.00 | Industrial Gross |
138 Martinvale Lane San Jose, CA | 1979/NAV | NAV | 19,488 | NAV | 8.6 miles | Zamar Media | May 2016 / 24 Months | 2,400 | $12.96 | Industrial Gross |
| (1) | Information obtained from the appraisal. |
THE INFORMATION IN THIS STRUCTURAL AND COLLATERAL TERM SHEET IS NOT COMPLETE AND MAY BE AMENDED PRIOR TO THE TIME OF SALE. THIS TERM SHEET IS NOT AN OFFER TO SELL THESE SECURITIES AND IT IS NOT A SOLICITATION OF AN OFFER TO BUY THESE SECURITIES IN ANY JURISDICTION WHERE THE OFFER OR SALE IS NOT PERMITTED.
146
| Wells Fargo Commercial Mortgage Trust 2016-C36 | Transaction Contact Information |
VI. Transaction Contact Information
Questions regarding this Structural and Collateral Term Sheet may be directed to any of the following individuals:
| Wells Fargo Securities, LLC | |
| Brigid Mattingly | Tel. (312) 269-3062 |
| A.J. Sfarra | Tel. (212) 214-5613 |
| Alex Wong | Tel. (212) 214-5615 |
| Barclays Capital Inc. | |
| Daniel Vinson | Tel. (212) 528-8224 |
| Brian Wiele | Tel. (212) 412-5780 |
| Brian La Belle | Tel. (212) 526-1809 |
THE INFORMATION IN THIS STRUCTURAL AND COLLATERAL TERM SHEET IS NOT COMPLETE AND MAY BE AMENDED PRIOR TO THE TIME OF SALE. THIS TERM SHEET IS NOT AN OFFER TO SELL THESE SECURITIES AND IT IS NOT A SOLICITATION OF AN OFFER TO BUY THESE SECURITIES IN ANY JURISDICTION WHERE THE OFFER OR SALE IS NOT PERMITTED.
147