UNITED STATES
SECURITIES AND EXCHANGE COMMISSION
Washington, D.C. 20549
FORM 10-K
ANNUAL REPORT PURSUANT TO SECTION 13 OR 15(D) OF
THE SECURITIES EXCHANGE ACT OF 1934
For the year ended December 31, 2009
Commission File Number 1-6702
NEXEN INC.
Incorporated under the Laws of Canada

98-6000202
(I.R.S. Employer Identification No.)
801 – 7th Avenue S.W.
Calgary, Alberta, Canada T2P 3P7
Telephone: (403) 699-4000
Web site: www.nexeninc.com
SECURITIES REGISTERED PURSUANT TO SECTION 12(B) OF THE ACT:
TITLE |
| EXCHANGE REGISTERED ON |
Common shares, no par value |
| The New York Stock Exchange |
|
|
|
Subordinated Securities, due 2043 |
| The New York Stock Exchange |
SECURITIES REGISTERED PURSUANT TO SECTION 12(G) OF THE ACT: NONE.
Indicate by check mark if the registrant is a well-known seasoned issuer, as defined in Rule 405 of the Securities Act. Yes x No o
Indicate by check mark if the registrant is not required to file reports pursuant to Section 13 or Section 15(d) of the Exchange Act. Yes o No x
Indicate by check mark whether the registrant (1) has filed all reports required to be filed by Section 13 or 15(d) of the Securities Exchange Act of 1934 during the preceding 12 months (or for such shorter period that the registrant was required to file such reports), and (2) has been subject to such filing requirements for the past 90 days. Yes x No o
Indicate by check mark if disclosure of delinquent filers pursuant to Item 405 of Regulation S-K is not contained herein, and will not be contained, to the best of registrant’s knowledge, in definitive proxy or information statements incorporated by reference in Part III of this Form 10-K or any amendment to this Form 10-K. x
Indicate by check mark whether the registrant is a large accelerated filer, an accelerated filer, a non-accelerated filer, or a smaller reporting company. See the definitions of “large accelerated filer”, “accelerated filer” and “smaller reporting company” in Rule 12b-2 of the Exchange Act.
Large accelerated filer x |
| Accelerated filer o |
Non-accelerated filer o |
| Smaller reporting company o |
Indicate by check mark whether the registrant is a shell company (as defined in Rule 12b-2 of the Exchange Act). Yes o No x
On June 30, 2009, the aggregate market value of the voting shares held by non-affiliates of the registrant was approximately Cdn$13 billion based on the Toronto Stock Exchange closing price on that date. On January 31, 2010, there were 523,285,022 common shares issued and outstanding.
Canadian investors to refer to the “Special Note to Canadian Investors” set out on page 97 of this Form 10-K.
Unless we indicate otherwise, all dollar amounts ($) are in Canadian dollars, and oil and gas volumes, reserves and related performance measures are presented on a working interest before-royalties basis. Where appropriate, information on an after-royalties basis is provided in tabular format.
Below is a list of terms specific to the oil and gas industry. They are used throughout the Form 10-K.
/d | = | per day |
bbl | = | barrel |
mbbls | = | thousand barrels |
mmbbls | = | million barrels |
mmbtu | = | million British thermal units |
km | = | kilometre |
MW | = | megawatt |
PSCTM | = | Premium Synthetic CrudeTM |
mboe | = | thousand barrels of oil equivalent |
mmboe | = | million barrels of oil equivalent |
mcf | = | thousand cubic feet |
mmcf | = | million cubic feet |
bcf | = | billion cubic feet |
WTI | = | West Texas Intermediate |
NGL | = | natural gas liquid |
NYMEX | = | New York Mercantile Exchange |
In this 10-K, we refer to oil and gas in common units called barrel of oil equivalent (boe). A boe is derived by converting six thousand cubic feet of gas to one barrel of oil (6 mcf/1 bbl). This conversion may be misleading, particularly if used in isolation, as the 6mcf/1bbl ratio is based on an energy equivalency at the burner tip and does not represent the value equivalency at the wellhead.
The noon-day Canadian to US dollar exchange rates for Cdn$1.00, as reported by the Bank of Canada, were:
(US$) |
| December 31 |
| Average |
| High |
| Low |
|
2005 |
| 0.8577 |
| 0.8253 |
| 0.8690 |
| 0.7872 |
|
2006 |
| 0.8581 |
| 0.8818 |
| 0.9099 |
| 0.8528 |
|
2007 |
| 1.0120 |
| 0.9304 |
| 1.0905 |
| 0.8437 |
|
2008 |
| 0.8166 |
| 0.9381 |
| 1.0289 |
| 0.7711 |
|
2009 |
| 0.9555 |
| 0.8757 |
| 0.9716 |
| 0.7692 |
|
On January 29, 2010, the noon-day exchange rate was US$0.9390 for Cdn$1.00.
Electronic copies of our filings with the Securities Exchange Commission (SEC) and the Ontario Securities Commission (OSC) (from November 8, 2002 onward) are available, free of charge, on our website (www.nexeninc.com). Filings prior to November 8, 2002 are available free of charge, on request, by contacting our investor relations department at 403.699.5931. As soon as reasonably practicable, our filings are made available on our website once they are electronically filed with the SEC and/or the OSC. Alternatively, the SEC and the OSC each maintain a website (www.sec.gov and www.sedar.com) that contains our reports, proxy and information statements and other published information that have been filed or furnished with the SEC and the OSC. The information on our website, is not, and shall not be deemed to be, a part of this Annual Report on Form 10-K.
Part I
| |
1 | |
2 | |
3 | |
4 | |
6 | |
7 | |
12 | |
22 | |
23 | |
34 | |
35 | |
36 | |
40 | |
|
|
40 | |
|
|
48 | |
|
|
48 | |
|
|
48 | |
|
|
| |
|
|
48 | |
|
|
50 |
PART I
Business and Properties
Certain statements in these items 1 and 2 constitute “forward-looking statements” and the reader should refer to the “Special Note Regarding Forward-Looking Statements” set out on page 96 of this Form 10-K.
Nexen Inc. (Nexen, we or our) is an independent, Canadian-based, global energy company. We were formed in Canada in 1971 as Canadian Occidental Petroleum Ltd. when Occidental Petroleum Corporation combined their Canadian crude oil, natural gas, sulphur and chemical operations into one company.
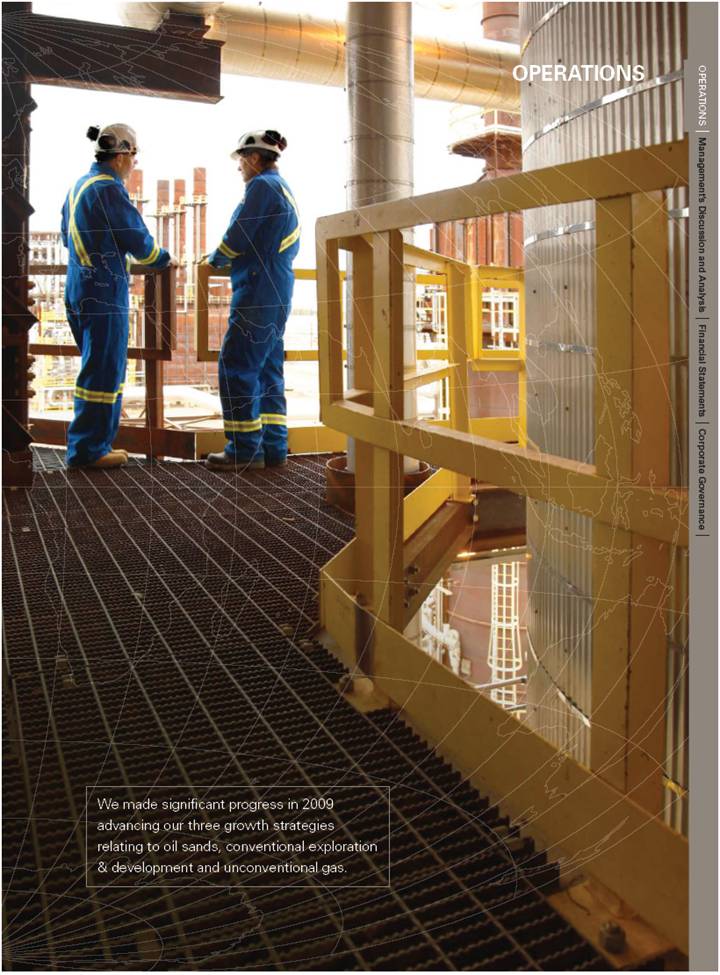
In the 1970s, we broadened our western Canadian asset base and entered the US Gulf of Mexico. In the 1980s, we grew our western Canadian and Gulf of Mexico assets through acquisitions and captured an interest in Syncrude. In the 1990s, we had two defining events—first, we discovered the first of 17 fields at Masila in Yemen in 1990 and commenced production in 1993. Second, we tripled our Canadian production in 1997 by purchasing Wascana Energy Inc. We leveraged our success in Yemen and western Canada to fund our growth elsewhere and today we are focused on three strategic growth areas: i) oil sands, including our 65% operated interest in the Long Lake project and our interest in Syncrude; ii) conventional exploration and development properties in our core areas including the North Sea, US Gulf of Mexico, Canada, Yemen and offshore West Africa; and iii) unconventional gas focused on our shale gas play in northeastern British Columbia.
We’ve grown from producing 10,700 boe/d before royalties with revenues of $26 million in 1971, to producing over 240,000 boe/d before royalties and revenues of $5.8 billion in 2009. We achieved this growth through exploration success and strategic acquisitions. Operating for almost 40 years, we have been profitable every year, except one, and have been paying quarterly dividends consecutively since 1975.

Choice—it’s what companies and investors value. Whether it’s how we allocate capital, fund our growth, or invest in projects that make the most sense over the long term, choice is key. Our strategy is to build a sustainable energy company focused on exploiting our existing three key growth areas: i) oil sands, ii) select conventional exploration and development, and iii) unconventional gas.
OIL SANDS
Our oil sands investments include interests in the Long Lake project, the Syncrude joint venture and our 735,000 undeveloped acres (gross) in the Athabasca oil sands in northern Alberta. Our oil sands strategy is designed to provide steady and predictable cash flow for decades.
We first entered the oil sands by acquiring an interest in the Syncrude joint venture. Syncrude develops and produces synthetic crude oil from mining bitumen.
In 2001, we formed a 50/50 joint venture with OPTI Canada Inc. (OPTI) to develop, produce and upgrade bitumen on our joint lands in the Athabasca oil sands. Production utilizes our patented OrCrude™ technology, which we expect will ultimately result in at least a $10/bbl margin advantage over conventional oil sands extraction and upgrading. Construction of the Long Lake project was completed in 2008 and we began producing premium synthetic crude oil (PSC™) in 2009. In early 2009, we acquired an additional 15% interest in the Long Lake project and joint venture lands from OPTI, increasing our ownership level to 65%. Following this acquisition, we are now responsible for operating both the steam-assisted-gravity-drainage (SAGD) bitumen extraction process and the upgrader for Phase 1 as well as for future phases.
CONVENTIONAL EXPLORATION AND DEVELOPMENT
Our conventional exploration and development is comprised of large acreage positions in select basins including the North Sea, deep-water Gulf of Mexico and offshore West Africa. Strategically, we focus on these basins due to: i) past successes; ii) existing infrastructure in place; iii) significant potential in remaining resource; and iv) attractive fiscal terms. Our global exploration team prioritizes investments in prospects that we expect will generate the highest returns in our selected basins of choice.
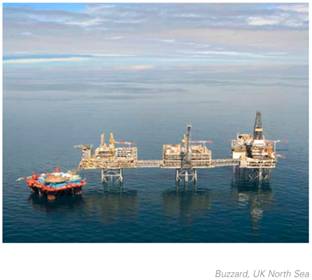
In the North Sea, we are a significant regional player with concentrated assets, infrastructure and exploration potential for future growth. We operate the Buzzard field and platform, which is the largest discovery in the UK North Sea in over a decade. We have since made several discoveries including Pink, Hobby and Golden Eagle in the Golden Eagle area; Blackbird; and Rochelle. We continue to actively explore the basin including relatively under-explored areas such as west of the Shetland Islands and in Norway.
In the deep-water Gulf of Mexico, we made several significant discoveries including Gunnison, Aspen, Knotty Head, Wrigley and Longhorn. We accumulated a large inventory of deep-water acreage and are a significant leaseholder in the Gulf. The deep-water Gulf is near infrastructure and continental US markets, so discoveries can be brought on stream in a reasonable time.
We have several significant discoveries offshore West Africa, including Usan, Usan West and Ukot, as well as our most recent success at Owowo South, offshore Nigeria. We are progressing the Usan field development with a floating production and storage offloading (FPSO) vessel and subsea facilities for scheduled first production in 2012.
UNCONVENTIONAL GAS
Our unconventional gas strategy is currently focused primarily on the Horn River Basin in northeast British Columbia. The Horn River Basin is emerging as a significant shale gas play with high resource density and excellent well productivity. We have a substantial land position in the Horn River Basin, with approximately 90,000 acres in the Dilly Creek area and 38,000 acres in the Cordova area, with a 100% working interest in each.
Shale gas complements our corporate portfolio which consists predominantly of large scale, and capital intensive, long cycle-time projects. It provides natural gas exposure and short cycle-time projects where we control the scale and pace of development.
POSITIONED FOR SUCCESS—FOCUSED ON VALUE
Our goal is to grow long-term value for our shareholders responsibly. Key drivers to grow value are increasing reserves, production, cash flow and net income on a cost-effective basis over the long term. Success in our three strategic growth areas and existing producing properties delivers growth in long-term value. Today, we are building sustainable businesses in the North Sea, western Canada, Gulf of Mexico, and offshore West Africa, capitalizing on the following corporate strengths:
RESOURCE INVENTORY
· diversification—our assets are geographically diverse and we produce oil and gas, onshore and offshore. We have large conventional and unconventional legacy assets in our portfolio which allows us to pursue value opportunities in varying economic environments;
· significant captured resource—we have key resource plays with a low cost of entry. Our Long Lake project is developing only 10% of our oil sands leases in the Athabasca oil sands, we hold 199 net sections in the emerging Horn River Basin shale gas play in northeast British Columbia, and we hold significant unexplored acreage in the Gulf of Mexico, the North Sea, and offshore West Africa; and
· production weighted to crude oil—current production is approximately 85% and proved reserves are approximately 92% weighted to crude oil, respectively.
STRUCTURAL GROWTH
· focus on growth—significant production growth is expected to come from identified projects currently under development. We are successful explorers with undeveloped discoveries at Knotty Head and Vicksburg in the Gulf of Mexico, the Golden Eagle area in the UK North Sea, and Usan and Owowo South, offshore Nigeria. We are ramping up production at Long Lake and continue to advance our shale gas play in the Horn River Basin. Our production has grown at a compounded annual growth rate of over 10% for the last three years.
FINANCIAL STRENGTH
· strong financial position—we have access to over $3 billion of liquidity through cash and undrawn committed credit facilities that will allow us to proceed with investments at our pace and to take advantage of organic and other opportunities as they arise; and
· industry-leading cash netbacks—position us well to withstand lower commodity prices.
SUPERIOR TALENT
· international expertise—we are an international operator with a proven track record of successful business ventures in Yemen, the United Kingdom, Nigeria, Colombia and Australia;
· employer of choice—proven ability to retain and attract talent (Hewitt Top 50 Employer in Canada); and
· skilled workforce—we significantly enhanced our technical skills over the last few years by hiring experienced employees for our Long Lake, shale gas, and Gulf of Mexico businesses.
HOW WE DO BUSINESS
· sustainable business practices—leveraging our strength in business practices such as health, safety, environment and social responsibility (HSE&SR) to access opportunities and responsibly create and demonstrate both long-term benefits and value growth for our investors, for the communities in which we operate and for other stakeholders. This makes us a desired business partner and/or joint venture operator; and
· leadership—industry leader in governance, community relations and environmental stewardship.
For financial reporting purposes, we report on three main segments:
· oil and gas;
· energy marketing; and
· chemicals.
Our oil and gas operations are broken down geographically into the UK North Sea, Canada, Syncrude, US Gulf of Mexico, Yemen and Other International (currently Colombia, offshore West Africa and Norway). Results from our Long Lake project are included in Canada. Energy Marketing includes our crude oil, natural gas, natural gas liquids and power marketing businesses in North America, Europe and Asia. Chemicals includes operations in North America and Brazil that manufacture, market and distribute sodium chlorate, caustic soda, muriatic acid and chlorine through the Canexus Income Fund.
Production, revenues, net income, capital expenditures and identifiable assets for these segments appear in Note 20 to the Consolidated Financial Statements and in Management’s Discussion and Analysis of Financial Condition and Results of Operations (MD&A) in this report. Reserves for our oil and gas operations appear on page 23.
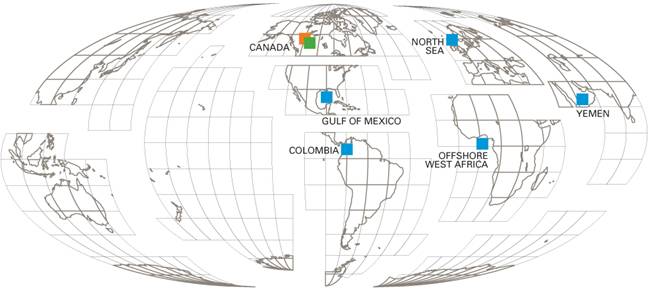
We have oil and gas operations in the UK North Sea, US Gulf of Mexico, western Canada, Yemen, offshore West Africa, Colombia, and Norway. We also have operations in Canada’s Athabasca oil sands which produce synthetic crude oil. We operate most of our production and continue to develop new growth opportunities in each area by actively exploring and applying technology.
In this Form 10-K, we provide estimates of remaining quantities of proved and probable oil, synthetic oil and natural gas reserves (oil and gas reserves) for our various properties. Our reserves estimates and related disclosures have been prepared in accordance with the definitions and disclosure requirements prescribed by the United States Securities and Exchange Commission (SEC). Our reserve estimates and disclosures may differ from other Canadian issuers who follow Canadian disclosure standards as set-out in National Instrument 51-101—Standards of Disclosure for Oil and Gas Activities (NI 51-101). Significant differences between SEC and Canadian reserves estimates and disclosures are described on page 97 (see Special Note to Canadian Investors).
On December 31, 2008, the SEC issued final revised rules relating to reserve definitions and related disclosure requirements. These new rules are effective for estimates and disclosures made on or after January 1, 2010, including those in this report. The primary impacts of changes on our reserves estimates resulting from the adoption of the new rules are as follows:
· our Syncrude oil sands activities are now considered an oil and gas activity rather than a mining activity. This impacts the classification of the reserves but does not result in a change in the estimate of reserves;
· reserves quantities are now based on the final product sold after field upgrading rather than the product initially produced. This results in presenting our Long Lake oil sands reserves as synthetic oil barrels rather than bitumen barrels. This results in a reduction in quantity reflecting the removal of the asphaltenes from the bitumen barrel, which we gasify for use as our internal fuel source in the steam generation, upgrading and cogeneration power processes;
· prices underlying our economic assumptions used for reserves estimation are now based on the average first-day-of-the-month prices during the year, rather than the prices on December 31 each year; and
· we are voluntarily disclosing probable reserves in addition to proved reserves in this Form 10-K.
The impact of the new rules on our reserves estimates also require us to modify our reserves disclosures this year to transition our reserves estimates from the old rules to the new rules. We have chosen to report our transition to the new rules in a manner that we believe best illustrates the impact of the changes on our reserves estimates and allows us to clearly present how our reserves estimates changed during 2009 as a result of our operational activities separate from the adoption of the new rules. Accordingly, throughout this report, we have reported the impact of the new rules on our December 31, 2009 reserves estimates as follows:
· the impact of the new rules on our proved reserves estimates have been shown separately in each table in a line entitled “SEC Rule Transition”, except for the impact of the change in the pricing rule. The new pricing rule was used in the preparation of the 2009 reserves estimates so there is no separate adjustment for this change. The prices underlying the year-end reserves estimates under the old and new rules change each year, and are a key determinant of whether the reserves are economic. Given its pervasive impact on the reserves estimates for each property, we felt it was most efficient to use the new pricing rule;
· we have segregated changes in reserves estimates in transitioning from the old rules to the new rules between those which pertains to the prior year’s estimates and those pertaining to changes in reserves during the year. We feel this additional information is helpful in understanding the impact of the changes on the current year’s activities;
· since we reported certain information with respect to Syncrude’s proved reserves in our prior Form 10-Ks, we included such information in our prior years’ reserves balances as if it was always an oil and gas activity. We have also presented a portion of the previously reported mining reserves as proved undeveloped reserves at December 31, 2008, by applying the oil and gas definitions. We feel this improves the consistency of reserves reporting, eliminates confusion that may arise by including the prior years’ information in a different place in this report and allows for better presentation of the activities during 2009; and
· since we reported probable reserves estimates in other disclosure documents in prior years, we have presented a continuity schedule as if they had been reported in our Form 10-K last year. This allows the probable reserves information to be presented consistently in our various reporting documents and provides for disclosure of changes in our probable reserves during 2009. Probable reserves estimates in prior years were prepared in accordance with NI 51-101 and the Canadian Oil and Gas Evaluation Handbook standards. Similar to the manner in which we have presented the impact of the new SEC rules on our proved reserves estimates, the impact of converting our 2008 probable reserves estimates to the new SEC rules is shown separately in each probable reserves table on the lines entitled “SEC Rule Conversion”, except for the impact of the new pricing rule which was used in preparation of the 2009 reserves estimates. See page 27 for a description of probable reserves.
Our proved and probable reserve estimates are internally prepared. We had 98% of our proved reserves before royalties (98% after royalties) assessed (either evaluated or audited as described on page 29) by independent reserves consultants. Their assessment of the proved reserves are performed at varying levels of property aggregation, and we work with them to reconcile the difference on the portfolio of properties to within 10% in the aggregate. Estimates pertaining to individual properties within the portfolio may differ by more than 10%, either positively or negatively; however, we believe such differences are not material relative to our total proved reserves.
We also had 98% of our proved plus probable oil and gas reserves before royalties (98% after royalties) assessed by independent reserves consultants. By definition, probable reserves must be determined together with proved reserves (see definition on page 27). As such, the independent reserves consultants’ assessments are prepared on a combined proved plus probable basis. Like proved reserves, their assessment of the proved plus probable reserves are performed at varying levels of property aggregation, and we work with them to reconcile the difference on the portfolio of properties to within an acceptable tolerance for the aggregate. Estimates pertaining to individual properties within the portfolio may differ by more than the acceptable tolerance, either positively or negatively; however, we believe such differences are not material relative to our total proved plus probable reserves.
Refer to the section on Basis of Reserves Estimates on page 29 for a description of our internal reserves process and the nature and scope of the independent assessments performed on our proved and probable reserves estimates and the results thereof.
UNDERSTANDING THE OIL AND GAS BUSINESS
The oil and gas industry is highly competitive. With strong global demand for energy, there is intense competition to find and develop new sources of supply. Yet, barrels from different reservoirs around the world do not have equal value. Their value depends on the costs to find, develop and produce the oil or gas, the fiscal terms of the host regime and the price that products command in the market based on quality and marketing efforts. We have captured an inventory of significant opportunities in our core growth areas and our goal is to extract the maximum value from each barrel of oil equivalent so that every dollar of capital we invest generates an attractive return.
Numerous factors can affect this. Changes in crude oil and natural gas prices can significantly affect our net income and cash flow generated from operating activities. Consequently, these prices may also affect the carrying value of our oil and gas properties and how much we invest in oil and gas exploration and development. We attempt to reduce these impacts by investing in projects we believe will generate positive returns at relatively low commodity prices. We maintain liquidity that provides us with the ability to invest in high-quality projects that we believe will generate value over the long term.
The prices we receive for our oil and gas products are determined by global crude oil and natural gas markets and regional dynamics, all of which can be volatile. With many alternative customers, the loss of any one customer is not expected to have a significantly adverse effect on the price of our products or revenues. Oil and gas producing operations are generally not seasonal. However, demand for some of our products can fluctuate season to season, which impacts price. In particular, natural gas is generally in higher demand in the winter for heating. We manage our operations on a country-by-country basis, reflecting differences in the regulatory regime, and competitive environments and risk factors associated with each country.
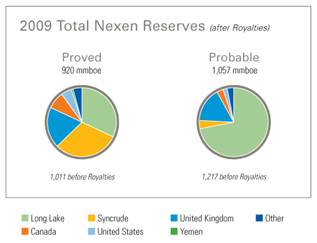
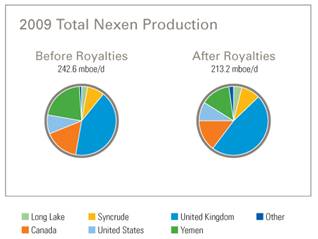
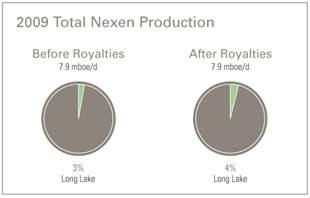
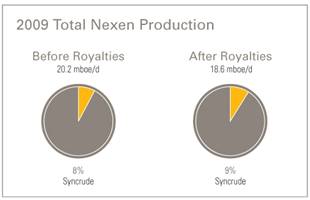
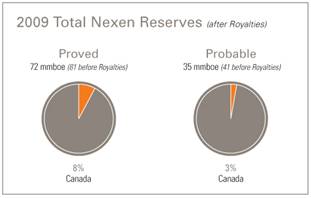
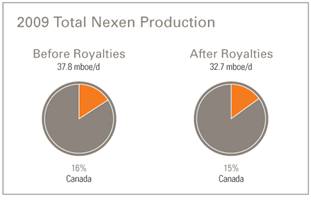
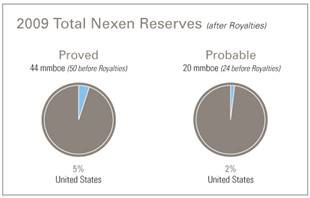
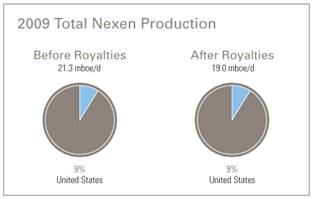
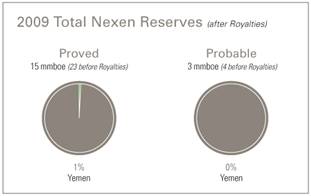
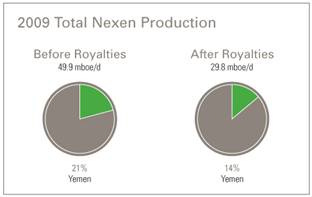
Nexen Consolidated Reserves and Production
In the charts below, our consolidated proved and probable reserves as at December 31, 2009 are presented, along with our oil and gas production for the year ended December 31, 2009.
· We made significant progress in the year proving that we can gasify the bottom of the bitumen barrel for internal fuel and upgrade the residual to a premium synthetic crude oil
· We have significant undeveloped acreage in the Athabasca oil sands, totalling over 700,000 acres (gross)
· Syncrude, which mines the oil sands and produces synthetic crude oil, has been operating for almost 35 years
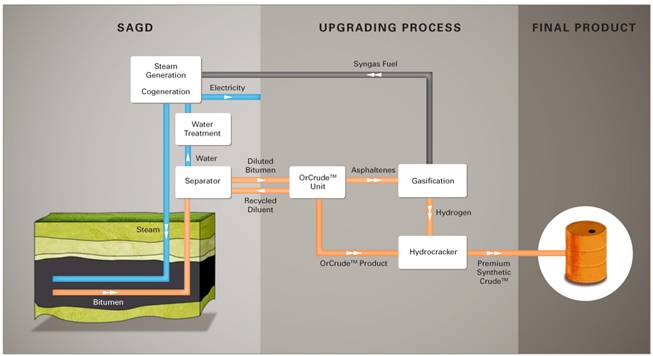
The Athabasca oil sands deposit in northeast Alberta is a key growth area for us. Our strategy is to economically develop our bitumen resource in phases to provide low-risk, stable, future growth over the long term. Our Long Lake project involves integrating SAGD bitumen production with field upgrading technology to produce premium synthetic crude for sale, and synthetic gas which significantly reduces our need to purchase natural gas for operations. We also have a 7.23% investment in the Syncrude oil sands operation.
Synthetic (Insitu Long Lake)

In 2001, we formed a 50/50 joint venture with OPTI to develop the Long Lake lease using SAGD for bitumen production and proprietary OrCrude™ technology for the first stage of upgrading. OPTI has the exclusive Canadian license for the OrCrude™ technology. We acquired the exclusive right to use this technology with OPTI within approximately 100 miles of Long Lake, and the right to use the technology elsewhere in Canada and the rest of the world (excluding Israel) subject to certain rights of OPTI to participate.
SAGD bitumen operations started mid 2008 and we began producing PSCTM from the upgrader in January 2009. Early in 2009, we acquired an additional 15% interest in the Long Lake project and the joint venture lands from OPTI, increasing our ownership level to 65%. Following this acquisition, we are now responsible for operating both the SAGD bitumen extraction process and the upgrader for Phase 1 as well as for future phases.
SAGD AND UPGRADER INTEGRATION
The SAGD process involves drilling two parallel horizontal wells, generally between 2,300 and 3,300 feet long, with about 16 feet of vertical separation. Steam is injected into the shallower well where it heats the bitumen that then flows by gravity to the deeper producing well. The OrCrude™ technology, using conventional distillation, solvent de-asphalting and thermal cracking, separates the produced bitumen into partially upgraded sour crude oil and liquid asphaltenes. By coupling the OrCrude™ process with commercially available hydrocracking and gasification technologies, sour crude oil is upgraded to light (39° API) premium synthetic sweet crude oil, and the asphaltenes are converted to a low-energy, synthetic fuel gas. This gas is available as a low-cost fuel for generating steam and as a source of hydrogen for the hydrocracking process. The gas is also burned in a cogeneration plant to produce electricity for on-site use and sale to the provincial electricity grid. The energy conversion efficiency for our Long Lake upgrader is about 90%, compared to 75% for a typical bitumen-fed coker, which we expect will provide us with an approximate $10/bbl margin advantage in the long term.
OUR STRATEGIC ADVANTAGE
Our integrated SAGD and upgrading process addresses three main economic hurdles of SAGD bitumen production: i) the potential high cost of natural gas; ii) the cost and availability of diluent; and iii) the typically lower realized price of bitumen. With synthetic gas from the asphaltenes as fuel, we expect to purchase considerably less natural gas. With the upgrading facilities on site, diluent is not required to transport the bitumen to market. By upgrading the bitumen into a highly desirable refinery feedstock or diluent supply, the end product commands light, sweet crude oil premium pricing.
PHASE 1
The Long Lake project received regulatory approval in 2003 and was sanctioned in 2004. Field construction of the SAGD and upgrader facilities began in 2004. In 2006, we substantially completed module and site construction of the SAGD facilities and in late 2007, we began injecting steam into the well pads. We continued to steam the SAGD well pairs and began turning wells over to SAGD production in 2008. Our steam generation was initially restricted by our ability to treat water during ramp-up as most of the water we inject into the reservoir is recycled and treated. In response to this, we implemented a number of low cost changes to the water treating system, which include adding supplementary heat to the hot lime softeners and improvements to our filtration system. This work was completed in 2009 at which time we also completed work to remove deposits which typically build up in water treatment facilities. Later in 2009, we replaced valves, cleaned out the hot lime softeners and isolated the water treatment trains. We also took the opportunity to perform a number of other maintenance activities to improve reliability and operability including installing electric submersible pumps (ESPs) in a number of our SAGD wells. This allows us to improve pressure control in the wells and should ultimately reduce our overall steam-to-oil ratio (SOR). The first several months of steam injection in a well pair largely involves heating the reservoir, followed by a ramp up of bitumen production to peak rates over 12 to 24 months. Our ramp-up has been slower than initially anticipated but still within industry experience. At the start of production, steam-to-oil ratios are high but will decline as bitumen production ramps up to our target rates. We expect the steam-to-oil ratio to reach approximately 3.0 over the long term.
We completed construction of the upgrader in 2008 and began commissioning for commercial operations. Initial production of premium synthetic crude oil from the upgrader began in January 2009. As the upgrader ramps up to capacity, we expect that there will be periods of downtime as we work through the various stages of commissioning and ramp-up. This periodic downtime is normal following initial facility start-up and consistent with industry experience. During the bitumen ramp-up period, we are purchasing third-party bitumen to assist with upgrader start-up. Production capacity for the first phase of Long Lake is approximately 60,000 bbls/d (39,000 net at a 65% working interest) of PSCTM. We expect to maintain production over the project’s life, estimated at 40 years, by periodically drilling additional SAGD well pairs.
Bitumen production for 2009 averaged 7,900 bbls/d (12,200 gross). We are currently producing approximately 18,000 bbls/d of bitumen (11,700 bbls/d, net to us) following maintenance and debottlenecking work completed late in 2009. Late in the year, we were processing about 90% of our produced bitumen along with 9,000 bbls/d of purchased third-party bitumen in the upgrader, yielding about 16,000 bbls/day of PSCTM.
We expect to achieve positive economic returns which benefit from a significant operating cost advantage. Combined SAGD, cogeneration and upgrading operating costs are expected to average about $25/bbl, substantially lower than coking or other upgrading processes as a result of the reduced need to purchase natural gas. We expect ongoing capital to average between $5/bbl and $10/bbl depending on well spacing, well length and recovery factor. The full-cycle capital costs of producing and upgrading bitumen using this technology are comparable to those for surface mining and coking upgrading on a barrel-of-daily production basis. Our technology will however add at least a $10/bbl margin advantage as we extract energy (for steam generation and power) and hydrogen (for upgrading) from a portion of the barrel others (cokers) discard.
FUTURE PHASES
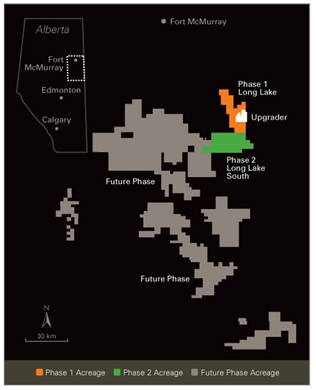
We have approximately 309,000 net acres of bitumen-prone lands in the Athabasca region. We plan to continue developing our bitumen lands in phases using our integrated SAGD and upgrading strategy. In 2009, we invested $100 million on land acquisition, additional drilling, seismic and engineering to develop our leases and advance regulatory applications for future phases.
Federal government climate change legislation has not yet been finalized. Due to this regulatory uncertainty and the ongoing ramp up of Phase 1, we are delaying certain planned expenditures on Phase 2. Phase 2 is expected to be followed by additional phases every three or four years. Each phase will leverage the knowledge and experience gained from successfully developing Long Lake and subsequent projects are expected to be similar in size and design. By keeping the core team in place and repeating and improving on existing designs and implementation plans, we expect to gain efficiencies in engineering, modular fabrication and on-site construction. We also anticipate enhanced operating efficiencies as we can train and move people easily between the various plants.
Syncrude
We hold a 7.23% participating interest in the Syncrude joint venture. This joint venture was established in 1975 to mine shallow oil sand deposits using open-pit mining methods, extract the bitumen and upgrade it to a high-quality, light (32° API), sweet, synthetic crude oil. Syncrude’s operating strategy is to develop this resource, focusing on safe, reliable and profitable operations.

Syncrude exploits a portion of the Athabasca oil sands that contains bitumen in the unconsolidated sands of the McMurray formation. Ore bodies are buried beneath 50 to 150 feet of over-burden, have bitumen grades ranging from 4 to 14% by weight and ore bearing sand thickness of 100 to 160 feet. Syncrude’s operations are on eight leases (10, 12, 17, 22, 29, 30, 31, and 34) covering 248,300 hectares, 40 km north of Fort McMurray in northeast Alberta. Syncrude currently mines oil sands at two mines: Mildred Lake North and Aurora North. These locations are readily accessible by public road. Trucks and shovels are used to collect the oil sands in the open pit mines. The oil sands are transferred for processing using a hydro-transport system.
The extraction facilities, which separate bitumen from oil sands, are capable of processing more than 310 million tons of oil sands per year and between 140 to 160 million barrels of bitumen per year depending on the average bitumen ore grade. To extract bitumen, the oil sands are mixed with water to form a slurry. Air and chemicals are added to separate bitumen from the sand grains. The process at the Mildred Lake North Mine uses hot water, steam and caustic soda to create a slurry, while at the Aurora North Mine, the oil sands are mixed with warm water. Close to 90% of the water used in operations is recycled from the upgrader and mine sites. Incremental water is drawn from the Athabasca River in accordance with existing licenses.

The extracted bitumen is fed into a vacuum distillation tower and three cokers for primary upgrading. The resulting products are then separated into naphtha, light gas-oil, and heavy gas-oil streams. These streams are hydrotreated to remove sulphur and nitrogen impurities to form light, sweet, synthetic crude oil. Sulphur and coke, which are by-products of the process, are stockpiled for possible future sale.
The high quality of Syncrude’s synthetic crude oil allows it to be sold at prices approximating WTI. In 2009, about 50% of the synthetic crude oil was sold to Edmonton area refineries, and the remaining 50% was sold to refineries in eastern Canada and the mid-western United States. Electricity is provided to Syncrude from two generating plants on site: a 270 MW plant and an 80 MW plant.
Since operations started in 1978, Syncrude has shipped more than two billion barrels of synthetic crude oil to Edmonton by Alberta Oil Sands Pipeline Ltd. The pipeline was expanded in 2004 and again in 2009, to accommodate increased Syncrude production.
At December 31, 2009, our total net book value of property, plant and equipment, including surface mining facilities, transportation equipment, and upgrading facilities, was approximately $1.2 billion. Based on development plans, our share of future expansion and equipment replacement costs over the next 35 years is expected to be about $5.7 billion.
In 1999, the Alberta Energy and Utilities Board (AEUB) extended Syncrude’s operating license for the eight oil sands leases through to 2035. The license permits Syncrude to mine oil sands and produce synthetic crude oil from approved development areas on the oil sands leases. The leases are automatically renewable as long as oil sands operations are ongoing or the leases are part of an approved development plan. All eight leases are included in a development plan approved by the AEUB. There were no known commercial operations on these leases prior to the start-up of operations in 1978.
In 1999, the AEUB approved an increase in Syncrude’s production capacity to 465,700 bbls/d. At the end of 2001, Syncrude increased its synthetic crude oil capacity to 246,500 bbls/d with the development of the Aurora North Mine, which involved extending mining operations to a new location about 25 miles north of the main Syncrude site. The next expansion of Syncrude came on stream in 2006,
increasing capacity to 360,000 bbls/d with the completion of the Stage 3 project.
Syncrude pays a royalty to the Alberta government. As of January 2002, this royalty was equal to the greater of 1% of gross revenue or 25% of net synthetic-based profit after deducting new capital expenditures. In connection with the provincial government’s review of Alberta royalty rates in 2007, the Syncrude owners negotiated revised royalty terms at the request of the government. Effective January 1, 2009, and consistent with other oil sands producers, Syncrude began paying royalties based on bitumen, rather than paying royalties calculated on fully upgraded synthetic crude oil. As a part of this conversion, the Alberta government will recapture upgrader capital expenses of about $5 billion (gross) that were deducted against prior royalties from future production. The $5 billion royalty deductions previously received by the Syncrude owners will be recaptured by the Alberta government over a 25 year period. In addition, the Province of Alberta and Syncrude reached an agreement to establish new transitional royalty terms. Under the terms of the agreement, until December 31, 2015, Syncrude will continue to pay base royalty rates (being the greater of 25% of net bitumen-based revenues, or 1% of gross bitumen-based revenues) plus an incremental royalty of up to $975 million (our share $70.5 million). The incremental royalty is subject to certain minimum bitumen production thresholds and is to be paid in six annual payments.
This agreement is in lieu of the Syncrude owners converting to the Province of Alberta’s new royalty framework announced in October 2007, that become effective January 1, 2009. After January 1, 2016, the rates under the new royalty framework will apply to the Syncrude project. See Canada fiscal terms on page 16.
CONVENTIONAL EXPLORATION AND DEVELOPMENT
United Kingdom (UK)
· We are the second largest oil producer in the UK North Sea
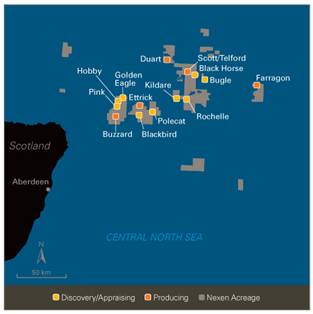
· We have recent exploration success in the Golden Eagle area, with potential development sanctioning in late 2010/early 2011
· We continue to actively explore the North Sea, with eight exploration and appraisal wells planned for 2010

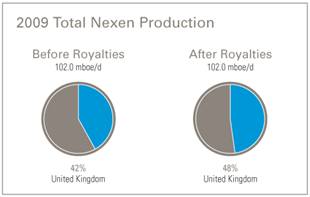
The UK North Sea is a key producing area for Nexen. Our primary assets here include a 43.2% operated interest in the Buzzard field and facilities, a 41.9% operated interest in the Scott field and production platform, a 71.8% operated interest in the Telford field, and a 79.7% operated interest in the Ettrick field, along with interests in several undeveloped discoveries and more than 750,000 net undeveloped exploration acres. We are a significant regional player with concentrated assets, infrastructure and exploration potential for future growth. Our North Sea operations have high-margin reserves and production, diversify our global portfolio with strong assets in a stable jurisdiction, and complement our other longer cycle-time projects.

Our UK strategy is to grow and sustain our existing North Sea production and identify new production sources with exploration and exploitation opportunities near existing infrastructure. We have a number of exploitation opportunities in our existing fields and undeveloped discoveries near infrastructure. Most of our unexplored acreage is near Scott/Telford, Buzzard or Ettrick and can be tied-in in a short time period.
BUZZARD
Buzzard is the largest discovery in the UK North Sea in over a decade. It was discovered in 2001 and came on stream in early 2007.
The Buzzard field is located about 60 miles northeast of Aberdeen in the Outer Moray Firth, central North Sea, in 317 feet of water. The Buzzard development initially is comprised of three platforms capable of processing at least 200,000 bbls/d of oil and 60 mmcf/d of gas. Oil from Buzzard is exported via the Forties pipeline to the Kinneil Terminal in Scotland. Gas is exported via the Frigg system to the St. Fergus Gas Terminal in northeast Scotland.
Initial development drilling resulted in more well-to-well variability in the concentration of hydrogen sulphide than was originally expected. To address this, we are constructing a fourth platform with production sweetening facilities to handle higher levels of hydrogen sulphide. The fourth platform jacket was installed during 2009. In 2010, we plan to install the deck of the fourth platform and tie it in to the existing platforms. At the current levels of hydrogen sulphide being produced we expect to require the oil sweetening equipment in 2011.
We expect to produce the Buzzard field through 30 production wells and maintain reservoir pressure with an active water-flood program. We have drilled 21 of these wells, of which 16 are available for production. Our share of production in 2009 was 81,400 boe/d. We expect to drill six additional development wells in 2010.
SCOTT/TELFORD
Scott and Telford are producing fields with additional exploitation opportunities and both tie back to the Scott platform. Scott was discovered in 1987 and began producing in September 1993, while Telford was discovered in 1991 and came on stream in 1996. Oil and gas from the fields is produced through subsea wells tied back to the Scott platform. Oil is delivered to the third-party Kinneil Terminal in Scotland via the Forties pipeline, while gas is exported via the SAGE pipeline to the St. Fergus Gas Terminal in northeast Scotland. In recent years, the Scott platform has
undergone several significant maintenance turnarounds and facilities upgrades to improve reliability and extend facility life. In 2009, we drilled the TAB well at Telford and three development wells at Scott. The TAB well exceeded our expectations and extended the field’s proved reserves. Scott/Telford produced 13,500 boe/d in 2009. We are currently reviewing technical subsurface work to support drilling another development well at Telford and potentially install an additional Telford flowline back to the Scott platform.
ETTRICK
The Ettrick subsea facilities and the majority of the leased floating production, storage and offloading vessel’s (FPSO) systems were successfully commissioned in 2009 and the Ettrick development produced first oil in August 2009. We have successfully tested the FPSO up to its design rates. Commissioning of the water injection and gas systems was largely completed in 2009. Our 2009 share of production was 4,300 boe/d and we expect this to increase to between 11,000 and 15,000 boe/d in 2010 as we continue to ramp up the facility. The FPSO is designed to handle 30,000 bbls/d of oil, 35 mmcf/d of gas and to re-inject 55,000 bbls/d of water.
OTHER
We have interests in two smaller non-operated fields in the UK North Sea. The Farragon field was brought on stream in late 2005. In 2007, the Duart field began producing oil from a single well tied back to a third-party platform.
EXPLORATION AND UNDEVELOPED ASSETS
We continue to actively explore in the UK North Sea and hold several undeveloped discoveries on operated blocks near Scott, Buzzard and Ettrick as follows:
Field |
| Interest (%) |
| Operator Status |
| Comments |
Blackbird |
| 80 |
| operated |
| discovery near Ettrick; appraisal well planned for 2010 |
Black Horse |
| 50 |
| operated |
| discovery near Scott; evaluating development alternatives |
Bugle |
| 41 |
| operated |
| discovery near Scott; appraisal well planned for 2010 |
Ferret (Polecat) |
| 40 |
| operated |
| discovery near Buzzard; appraisal well planned for 2010 |
Golden Eagle |
| 34 |
| operated |
| discovery near Buzzard; evaluating development alternatives |
Hobby |
| 34 |
| operated |
| discovery near Golden Eagle; evaluating development alternatives |
Kildare |
| 50 |
| operated |
| discovery near Scott; evaluating development alternatives |
Pink |
| 46 |
| operated |
| discovery near Golden Eagle; evaluating development alternatives |
Rochelle |
| 44 |
| non-operated |
| discovery near Scott; evaluating development alternatives |
In 2007, we discovered hydrocarbons at Golden Eagle, followed by Pink in 2008, and early in 2009 we made a discovery at Hobby. During 2009, we successfully pursued a comprehensive appraisal program of the discoveries which included drilling nine appraisal wells, two drill-stem tests and one injection test. With this success, we expect the Golden Eagle area will become a significant development over the next few years. In 2010, we will continue to complete the appraisal of the field and evaluate our development options. We also expect to complete the technical work necessary for project sanction in early 2011.
In 2010, we plan to drill an appraisal well at Blackbird, which we could tie back to the Ettrick FPSO if successful. Elsewhere in the UK North Sea, we plan to drill three exploration and two appraisal wells in 2010.
FISCAL TERMS
In the UK, new discoveries pay no royalties and result in cash netbacks that are higher than our company average. The Scott field is subject to Petroleum Revenue Tax (PRT), although no PRT is payable until available oil allowances have been fully utilized, which is not expected before 2011. Once payable, PRT is levied at 50% of cash flow after capital expenditures, operating costs and an oil allowance for the field. PRT is applicable to fields receiving development consent prior to March 1993. Our other fields in the UK North Sea are not subject to PRT. PRT is deductible for corporate income tax purposes. The UK corporate income tax rate on oil and gas activities is 30% of taxable income and oil and gas activity is also subject to a 20% supplemental charge.
Canada
· Our shale gas land position in the Horn River Basin provides opportunities to significantly expand our gas reserves and production
· Legacy assets provide steady and predictable cash flow to fund new growth initiatives
In addition to our developments in the Athabasca oil sands, our strategy in Canada is three fold: i) establish the Horn River Basin as a key growth area and continue to create value by exploring and developing the play; ii) generate new material resource play opportunities; and iii) optimize value from our producing assets.
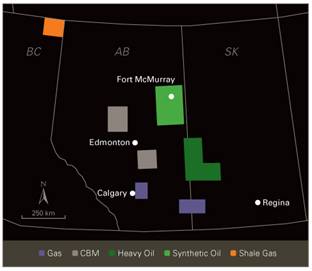
Our Canadian conventional producing assets include heavy oil production in east-central Alberta and west-central Saskatchewan, and natural gas near Calgary and in southern Alberta and Saskatchewan. Our coalbed methane (CBM) assets in the upper Mannville and Horseshoe Canyon coals are located in Alberta with commercial production at our Fort Assiniboine development over 50 mmcf/d in 2009. We operate most of our producing properties and hold almost one million net acres of undeveloped land across western Canada (excluding Athabasca oil sands). These assets provide predictable production volumes and cash flow.
In 2009, we invested $295 million in Canada including $203 million on our shale gas growth initiative. Our 2010 capital programs are focused on progressing our shale gas opportunities and evaluating material resource plays.
HEAVY OIL
Approximately 45% of our Canadian production (excluding Athabasca oil sands) is from our heavy oil properties. Heavy oil is characterized by high specific gravity or weight and high viscosity or resistance to flow. Therefore, heavy oil is more difficult and expensive to extract, transport and refine than other types of oil. Heavy oil typically receives a lower price than light oil, as more expensive and complex refineries are required to refine heavy crude into higher-value petroleum products. To maximize heavy oil returns, it is important to manage capital and operating costs. Our large production base and existing infrastructure are advantageous in managing these costs. As part of an ongoing strategic review of our assets, we announced in late 2009 that we identified a number of non-core assets for possible disposal, including some or all of our heavy oil assets in Western Canada.
NATURAL GAS
Approximately 32% of our Canadian conventional production is natural gas extracted primarily from shallow sweet reservoirs in southern Alberta and Saskatchewan and from sour gas reservoirs near Calgary. Generally, shallow gas targets are cheaper to drill and produce, but have relatively smaller reserves and lower productivity per well. Sour gas is natural gas that contains hydrogen sulphide which requires additional processing. Our Balzac field, northeast of Calgary, has been producing sour natural gas since 1961. This sour gas is processed through our operated Balzac plant, which went through a maintenance upgrade in 2008.
In southern Alberta and Saskatchewan, Colorado shale gas re-completions have the potential to add production on our existing acreage. As incremental production comes from existing wells and facilities, the economics are attractive.
COALBED METHANE (CBM)
Approximately 23% of our Canadian conventional production is from our CBM developments at Corbett, Doris and Thunder in the Fort Assiniboine area of central Alberta. We began commercial operations in the Upper Mannville coals in 2005, progressively developing opportunities on our land base. We are applying horizontal well technology to increase gas production rates and reduce de-watering time from water-saturated coal. Upper Mannville coals are generally deeper than the Horseshoe Canyon “dry coal” play, which is also being commercially developed in Alberta. We have limited activity planned here currently as a result of lower natural gas prices.
FISCAL TERMS
In Canada, we pay two types of royalties to federal and provincial governments on production from lands where they own the petroleum and natural gas rights. The first type of royalty, Net Profits Interest (NPI), applies to our oil sands projects and our Horn River shale gas project. The second type is a Gross Royalty system whereby we pay royalties ranging from 5% to 40% depending upon drilling date, production rate and product sales price.
During 2008, the Alberta government legislated a new royalty framework for NPI and Gross Royalty structures effective January 1, 2009. The new NPI royalty rates for oil sands projects range from 1% to 9% of gross revenue for projects that are pre-payout of costs, and 25% to 40% of net profit for projects that are post-payout. These royalty rates vary depending on the Canadian dollar equivalent of WTI (Cdn$55/bbl to Cdn$120/ bbl). The amended Gross Royalty system increases the upper royalty rate limit to 50% and reduces the lower limit for conventional oil to nil, depending on production rates and sales price. Most of our conventional Alberta production qualifies for lower rates and we expect royalties on our production to range between 5% and 25%.
In 2009, the Alberta Government commissioned a “Competitiveness Review” which included a review of the provincial royalty system. Results of this review are not known at this time.
In addition to royalties, some provinces impose taxes on production from lands where they do not own the mineral rights. The Saskatchewan government assesses a resource surcharge on gross Saskatchewan resource sales that are subject to crown royalties, ranging from 1.7% to 3.0%. In Alberta, we are subject to a freehold mineral tax of approximately 4%.
Profits earned in Canada from resource properties are subject to federal and provincial income taxes. These rates ultimately fall to 15% by 2012. In 2009, federal taxable income is taxed at 19% and will be taxed at 18% in 2010. Provincial income tax rates vary from approximately 10% to 16%.
United States (US)—Gulf of Mexico
· We are a significant leaseholder in the deep-water Gulf of Mexico which provides for future growth through exploration
· We are appraising discoveries at Knotty Head and Vicksburg
· Production from past discoveries provides liquidity for future exploration
The Gulf of Mexico is an integral part of our longer-term growth strategy. Existing production infrastructure, the potential for large discoveries and attractive fiscal terms make the deep-water Gulf of Mexico one of the world’s most prospective sources for oil and gas. While costs of deep-water exploration are typically higher, deep-water prospects generally have multiple sands and higher production rates—factors which enhance economics. The technology to find, drill, and develop deep-water discoveries is rapidly progressing and becoming more cost effective. The deep-water Gulf is near infrastructure and continental US markets, so discoveries can be brought on stream in reasonable time frames.
We focus our exploration program on three strategic play types:
· deep-water prospects near existing infrastructure;
· deep-water, Miocene and Lower Tertiary sub-salt plays with the potential to become new core areas; and
· deep-water, Norphlet targets in the eastern Gulf of Mexico.
The shorter cycle-times for deep-water prospects near infrastructure complement the longer cycle-times for deep-water sub-salt and Norphlet plays. Over the past few years, we have built our resources and capabilities to explore in the deep water by accumulating a large inventory of deep-water acreage to high-grade prospects, hired new employees with significant Gulf of Mexico oil and gas experience, and gained access to two new-build deep-water drilling rigs over the next few years.
Our Gulf production and reserves are primarily concentrated in five deep-water and five shallow-water (shelf) areas. Most of the production impacted by the 2008 hurricane season was restored early in 2009, with the exception of Wrigley which was delayed for a couple of months. The only production that remains shut in is at Green Canyon 6/50/137 where the third-party production facilities were destroyed by the hurricane.
DEEP WATER
Most of our deep-water production comes from our 30% non-operated Gunnison field, our 100% operated Aspen field, our 50% non-operated Wrigley field, our 25% non-operated Longhorn field and our 30% non-operated Mississippi Canyon 72 field.
Gunnison is in 3,100 feet of water and includes Garden Banks Blocks 667, 668 and 669. Gunnison began production in late 2003 through a truss SPAR platform that can handle 40,000 bbls/d of oil and 200 mmcf/d of gas. Our Gunnison
SPAR facility has excess capacity, leaving room for growth from regional exploration and processing of third-party volumes. We achieved payout on Gunnison in December 2005, just two years after first production. We plan to drill two sidetrack wells in 2010 as we look to utilize some of the Gunnison SPAR excess capacity and increase production.
Aspen is on Green Canyon Block 243 in 3,150 feet of water. The project was developed using subsea wells tied back to the Shell-operated Bullwinkle platform 16 miles away and began producing in late 2002. Our share of 2009 production before royalties was approximately 4,300 boe/d (3,900 after royalties).
Wrigley is on Mississippi Canyon Block 506 in 3,300 feet of water. The project consists of a single subsea well tied back to the Shell-operated Cognac platform 17 miles away and began gas production in 2007.

Mississippi Canyon 72 is located in 1,700 feet of water and is a single subsea well tied back to the BP-operated Pompano platform, five miles north of the field. First production was in September 2009.
Our Longhorn property is on Mississippi Canyon Block 502 and 546 in 2,400 feet of water. The project is a non-operated four-well subsea tie-back to the Corral platform located 19 miles north of the field. Longhorn came on stream in late 2009 and is approaching peak production of approximately 200 mmcf/d gross (50 mmcf/d, net to us), with higher than expected oil rates. Current production is 37,000 boe/d gross (9,300 boe/d, net to us).
In 2007, we acquired three deep-water producing fields: i) Garden Banks Block 205; ii) Green Canyon 137; and iii) Green Canyon 6/50. These fields are in water depths between 700 and 1,100 feet. Production from Green Canyon 6/50/137 has been temporarily suspended as the third-party platform that processed our oil and gas was destroyed by Hurricane Ike in September 2008. We are assessing our options to restore field production, which may include building our own processing platform or potentially divesting the asset.
SHELF
Our shelf producing assets are offshore Louisiana, primarily in five 100%-owned field areas: Eugene Island 255/257/258/259, Eugene Island 295, Vermilion 320/321/339/340, Vermilion 76 (consisting of Blocks 65, 66 and 67) and West Delta. We continue to look for opportunities to optimize these assets. In 2010, our shelf development program is expected to include up to 12 workovers across four fields to access non-producing proved reserves.
EXPLORATION AND UNDEVELOPED ASSETS
We hold approximately 205 blocks in the Gulf of Mexico and expect this acreage and future exploration opportunities to position us well for continued growth. Our undeveloped deep-water discoveries include:
Well |
| Interest (%) |
| Operator Status |
| Comments |
Knotty Head |
| 25 |
| operated |
| discovery; further appraisal required; currently drilling second well |
Vicksburg |
| 25 |
| non-operated |
| discovery; further appraisal required |
During the year, we drilled an unsuccessful exploratory well in deep water at Antietam, about three miles west of our Shiloh discovery. Later in 2009, we began drilling an exploration well at Appomattox which is approximately six miles west of our Vicksburg discovery. Operations at Appomattox are ongoing and we are currently drilling a side track well to further evaluate the prospect. We have a 20% interest in this well. Elsewhere in 2009, we accepted the first Ensco rig and commenced drilling a second appraisal well at Knotty Head. We expect to complete the well and appraise the results in 2010.
In 2010, we expect first production from our Tobago field. We are currently completing the subsea gathering system and the regional host facility, as well as drilling a sidetrack well. Elsewhere in 2010, we plan to drill up to four exploration wells in the deep-water Gulf of Mexico. We are targeting working interests of 25% in these wells and expect to operate three of them. We also expect to take receipt of the second Ensco deep-water drilling rig by mid 2010 to drill several of our exploration prospects.
FISCAL TERMS
In 2009, royalty rates on our US production averaged 16.3% for shelf volumes and 6.7% for deep-water volumes. The US government increased royalty rates from 12.5% to 16.7% for new deep-water leases awarded after July 2007. Our deep-water Aspen and Gunnison fields are not subject to royalties on the first 87.5 mmboe of production. US taxable income is subject to federal income tax of 35% and state taxes ranging from 0% to 12%.
Other International
· The Usan development is currently under construction. We have several discoveries and additional exploration prospects beyond Usan, offshore Nigeria
· Our entry into Yemen started our international expansion in the early 1990s, which provided us with other significant international opportunities
· We are leveraging international exploration and operating success with unconventional resource experience to enter new regions
Offshore West Africa
Offshore West Africa is a core area where we have several discoveries. It offers prolific reservoirs and multiple opportunities to invest in this oil-rich region. Our strategy here is to complete development of the Usan discovery and continue to explore our portfolio to provide medium to long-term growth.

NIGERIA
In 1998, we acquired a 20% non-operated interest in Block OPL-222, which covers 448,000 acres approximately 50 miles offshore in water depths ranging from 600 to 3,500 feet. In 1998, we discovered the Ukot field and encountered three oil-bearing intervals. This was followed up by a successful appraisal well in 2003. In 2002, the Usan field was discovered and seven more successful wells confirmed that significant hydrocarbons exist on the block.
The Nigerian government approved converting OPL-222 into two Oil Mining Leases (OMLs) that will allow the joint venture partners to develop the Usan and Ukot discoveries. OML-138 consists of 50% of the original acreage and includes the Usan discovery. OML-139 consists of the remaining OPL-222 acreage and includes the Ukot discovery.
Development of the Usan field is underway. The field development plan includes a FPSO vessel with a storage capacity of two million barrels of oil. During the year, we progressed the detailed engineering and procurement, commenced development drilling of the field, and continued construction of the FPSO hull and subsea facilities. The Usan project is approximately 50% complete. The Usan field is expected to come on stream in 2012, ramping up to peak
production rates of 180,000 bbls/d (36,000 bbls/d net to us). We expect that our investment in the Usan development will be approximately $2 billion (net to Nexen).
In 2008, we acquired an 18% non-operated interest in Block OPL-223, covering 230,000 acres, which provides us with future exploration potential on the adjacent block. In 2009, we completed drilling an exploration well in the southern portion of Block OPL-223. The Owowo South B-1 well was drilled in a water depth of 670 metres and is located 20 kilometers northeast of the Usan field. We are analyzing the drilling results with recently processed new 3-D seismic data to confirm a number of follow on prospects. Under the Production Sharing Contract governing OPL-223, the Nigerian National Petroleum Corporation is the concessionaire of the licence, which is operated by Total Exploration & Production Nigeria Ltd.
As is typical in many jurisdictions, the Nigerian Government is reviewing its existing petroleum fiscal terms, the impact of which is not yet known.
Middle East—Yemen
Yemen has been a significant international region for us since we first began production at Masila in 1993. We operate the country’s largest oil project and have developed strong relationships with the government and local communities. Our strategy in Yemen is to maximize the value from our two existing producing blocks: Masila (Block 14) and East Al Hajr (Block 51).
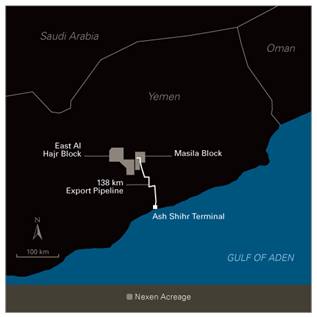
MASILA BLOCK (BLOCK 14)
We operate the Masila project with a 52% working interest. The Masila fields are mature and the PSA expires at the end of 2011, but significant value still remains.
The first successful Masila exploratory well was drilled at Sunah in 1990, with additional discoveries quickly following at Heijah and Camaal. Initial production began in July 1993. Masila crude oil averages 32° API at very low gas-oil ratios. Most of the oil is produced from the Upper Qishn formation, but we also produce from deeper formations including the Lower Qishn, Upper Saar, Saar, Madbi, Basal Sand and Basement formations. Production is collected at our Central Processing Facility (CPF) where water is separated for reinjection and oil is pumped to the Ash Shihr export terminal on the Indian Ocean and shipped to customers, primarily in Asia.
Under the Masila PSA between the Government of Yemen and the Masila joint venture partners (Masila Partners), we have the right to produce oil from Masila to December 2011. We are negotiating a five-year extension but there is no assurance that we will obtain an extension to operate the Masila field and CPF beyond 2011.
Production is divided into cost recovery oil and profit oil. Cost recovery oil provides for the recovery of all exploration, development, and operating costs that are funded by the Masila Partners. Costs are recovered from a maximum of 40% of production each year, as follows:
Costs |
| Recovery |
Operating |
| 100% in year incurred |
Exploration |
| 25% per year for four years |
Development |
| 16.7% per year for six years |
The remaining production is profit oil that is shared between the Masila Partners and the Government and is calculated on a sliding scale based on production. The Masila Partners’ share of profit oil ranges from 20% to 33%. The structure of the agreement moderates the impact on the Masila Partners’ cash flows during periods of low prices, as we recover our costs first and then share any remaining profit oil with the Government. The Government’s share of profit oil includes a component for Yemen income taxes payable by the Masila Partners at a rate of 35%. In 2009, the Masila Partners’ share of production, including recovery of costs, was approximately 45%.
EAST AL HAJR BLOCK (BLOCK 51)
The first successful exploratory well was drilled in 2003 and development of the block began in 2004 which included a CPF, gathering system and a 22 km tie-back to our Masila export pipeline. Production commenced in November 2004.
We operate Block 51, which is governed by a PSA between the Government of Yemen and the East Al Hajr partners (EAH Partners): The Yemen Company (TYCO) (12.5% carried working interest) and Nexen (87.5% working interest). Under the PSA, TYCO has no obligation to fund capital or operating expenditures and therefore, our effective interest is 100% and for purposes of accounting and reserves recognition, we treat TYCO’s 12.5% participating interest as a royalty interest. We recognize both the Government’s share and TYCO’s share of profit oil under the PSA as royalties and taxes consistent with our treatment of our Masila operations. Under the PSA, the EAH Partners pay a royalty ranging from 3% to 10% to the Government depending on production volumes. The remaining production is divided into cost recovery oil and profit oil. Cost recovery oil provides for the recovery of all of the project’s exploration, development and operating costs, funded solely by Nexen. Costs are recovered from a maximum of 50% of production each year after royalties, as follows:
Costs |
| Recovery |
Operating |
| 100% in year incurred |
Exploration |
| 75% in year one, 25% in year two |
Development |
| 75% in year one, 25% in year two |
The remaining production is profit oil that is shared between the EAH Partners and the Government on a sliding scale based on production rates. The EAH Partners’ share of profit oil ranges from 20% to 30%. The Government’s share of profit oil includes a component for Yemen income taxes payable by the EAH Partners at a rate of 35%. In 2009, the EAH Partners’ share of Block 51 production, including recovery of past costs, was approximately 53%.
COLOMBIA
In 2000, we made a discovery at Guando on our 20% non-operated Boqueron Block and production from Guando began in 2001. Boqueron is in the Upper Magdalena Basin of central Colombia, approximately 45 km southwest of Bogota. Under terms of our license, our working interest in Guando decreased from 20% to 10% during the second quarter of 2009, as cumulative production from the field reached 60 million barrels of oil. Our share of 2009 production averaged 3,500 bbls/d before royalties (3,200 after royalties), about 1% of our total production.
In 2009, we acquired two additional exploration blocks in Colombia and now hold five exploration blocks in the Upper Magdalena Basin that we are assessing for future growth opportunities. Production from Guando is subject to a royalty between 5% and 25% depending on daily production. In 2009, the royalty payable to the Colombian government averaged 8%. Colombian taxable income is subject to federal income tax of 33%.
NORWAY
Norway is an extension of our conventional offshore growth strategy in the North Sea. The Norwegian continental shelf is characterized by well developed infrastructure and potentially significant hydrocarbon resources. The Norwegian government created incentives for the oil and gas industry to explore this area by providing a 78% cash tax refund on qualifying exploration expenditures to companies that do not yet have a taxable income base.
At December 31, 2009, we hold working interests in nine exploration licenses in the Norwegian North Sea. In 2009, we acquired almost 1,500 km(2) of 3D seismic and 250 km(2) of 2D seismic. We are optimizing and adding to our portfolio through participation in annual bid rounds and through farm-ins. In 2010, we expect to participate in the Norwegian Government licensing rounds, and further mature our existing prospects.
Norwegian oil and gas activities are subject to a general corporate income tax rate of 28% plus an additional 50% special petroleum tax.
As part of our growth strategy in unconventional Canadian resource plays, we have 199 net sections of undeveloped land in an emerging Devonian shale gas play in the Horn River Basin in northeast British Columbia. Shale gas is natural gas produced from reservoirs composed of organic shale. The gas is stored in pore spaces, fractures or absorbed into organic matter. Currently, the United States is the largest producer of shale gas. In this Form 10-K, our shale gas operations in northeast British Columbia are reported with our conventional operations in Canada.
Shale gas complements our corporate oil and gas portfolio which consists predominately of large scale, capital intensive, long cycle-time projects. It provides natural gas exposure and relatively short cycle-time projects, where we control the scale and pace of development of the resource. In addition, the time required to evaluate drilling and testing results is relatively short. Once our commercial well design is established we can match the pace of drilling to prevailing economic conditions.
The Horn River Basin is a significant shale gas play in North America with high resource density and excellent well productivity. We have approximately 90,000 acres in the Dilly Creek area and 38,000 acres in the Cordova area in northeast British Columbia with a 100% working interest in each. To date, we have invested approximately $480 million in land, infrastructure and wells in the Horn River Basin to progress our shale gas strategy toward development and reserve recognition. We have recognized minimal reserves as we are investing primarily to gain understanding of the optimal commercial development and the resource characteristics.
We have drilled eight horizontal wells with six wells completed to date. Initial production test results are meeting expectations in terms of resource, initial production and decline profile. With five shale gas wells on-stream at various times, we reached production of over 15 mmcf/d during the year before declining as expected. Our land position here could support between 500 to 700 wells. Substantial cost savings and productivity improvements were realized in our 2009 drilling and completion program. We took advantage of learnings from prior activities to improve equipment utilization, drill longer wells and initiate more fracs per well. All 26 fracs put into the last three wells were successful.
Primary tenure in the Horn River Basin is four years and drilling activity and extensions increases this up to 18 years. Our drilling activity to date has allowed us to secure tenure for 10 more years on the majority of our Dilly Creek lands. Only two more wells are required to secure the remainder. With tenure secured, we have the ability to slow the pace of drilling during periods of low gas prices.
In 2010, we plan to continue our drilling, completions and fracing program, expand infield facilities and start investing in long-term infrastructure. We will continue to build on our success, which we expect will lead to further cost savings and productivity improvements. In late 2009, we began work on an eight well test program which is expected to start providing results and production in late 2010. The Horn River Basin is an early-stage potential shale gas play that has not been developed on a commercial scale. Many of our peers are also working to develop the future potential of the area.
Limited gas pipeline infrastructure and processing capacity in the Horn River Basin could potentially constrain early development of the play. To ensure sufficient gathering, processing and transportation capacity for our early development programs, we have contracted gas pipeline capacity of 96 mmcf/d and associated treating capacity at the Spectra operated Fort Nelson plant. We entered into additional agreements that will allow us to participate in projects that are expanding infrastructure in the region.
FISCAL TERMS
In British Columbia, within a designated area, a 2% royalty on gross revenue is payable to the provincial government until capital costs from our Horn River shale gas project are recovered or ten years pass, whichever is sooner. After that point, royalties are calculated on net revenue as defined by the province using progressive rates of 15%, 20% and 35%, with a minimum royalty payable of 5% on gross revenue.
RESERVES, PRODUCTION AND RELATED INFORMATION
In addition to the information below, we refer you to the Supplementary Data in Item 8 of this Form 10-K for information on our oil and gas producing activities. Nexen has not filed with nor included in reports to any other United States federal authority or agency, any estimates of its total proved oil or gas reserves since the beginning of the last fiscal year.
Oil and Gas Reserves
The process of estimating reserves requires complex judgments and decision-making. Reserves are categorized by the confidence that they will be economically recoverable. Probable reserves are less certain to be recovered than proved reserves. Refer to the Basis of Reserves Estimates on page 29 for a description of probable reserves and our process for estimating proved and probable reserves.
On December 31, 2008, the SEC issued final revised rules relating to reserve definitions and related disclosure requirements. These new rules are effective for estimates and disclosures made on or after January 1, 2010. The primary impacts of the changes on our reserves estimates resulting from the adoption of the new rules are discussed on page 5 of this Form 10-K.
At December 31, 2009 under the new SEC rules, we had 1,011 mmboe of proved reserves (920 after royalties) and 1,217 mmboe of probable reserves (1,057 after royalties). Under the old rules and including Syncrude, we would have had 1,082 mmboe of proved reserves (1,003 after royalties) and 1,397 mmboe of probable reserves (1,215 after royalties) at December 31, 2009.
The following is a summary of our proved and probable reserves as at December 31, 2009 under the new SEC rules:
|
| Reserves |
| ||||||||||
|
| Before Royalties |
| After Royalties |
| ||||||||
|
| Synthetic |
| Oil |
| Gas |
| Synthetic |
| Oil |
| Gas |
|
|
| (mmbbl) |
| (mmbbl) |
| (bcf) |
| (mmbbl) |
| (mmbbl) |
| (bcf) |
|
Developed |
| 265 |
| 219 |
| 418 |
| 240 |
| 203 |
| 379 |
|
Undeveloped |
| 377 |
| 75 |
| 35 |
| 339 |
| 69 |
| 32 |
|
Total Proved |
| 642 |
| 294 |
| 453 |
| 579 |
| 272 |
| 411 |
|
Developed |
| 39 |
| 115 |
| 176 |
| 36 |
| 110 |
| 158 |
|
Undeveloped |
| 895 |
| 127 |
| 71 |
| 759 |
| 114 |
| 68 |
|
Total Probable |
| 934 |
| 242 |
| 247 |
| 795 |
| 224 |
| 226 |
|
PROVED RESERVES
In 2009, before adjusting for the new SEC rules, we added 184 mmboe of proved reserves (155 after royalties) and produced 90 mmboe (78 after royalties). Under the new SEC rules, we added 166 mmboe of proved reserves (123 after royalties) during the year and reduced our bitumen reserves by 53 mmboe (51 after royalties) to reflect the impact of converting from bitumen to synthetic oil barrels on our December 31, 2008 Long Lake reserves estimates. The significant difference in the respective royalty rates reflects the impact of higher oil prices on oil sands royalties in 2009.
The following table provides a summary of the changes in our proved oil and gas reserves before royalties during 2009, including the impact of the adoption of the new SEC rules. Refer to pages 152 and 153 for proved reserves information on an after-royalties basis.
|
| Canada |
|
|
|
|
|
|
|
|
|
|
| ||||
(mmboe) |
| Syncrude |
| Long Lake |
| Other |
| United |
| United |
| Yemen |
| Other |
| Total |
|
December 31, 2008 |
| 324 |
| 285 |
| 90 |
| 175 |
| 49 |
| 31 |
| 34 |
| 988 |
|
Extension and discoveries |
| 7 |
| 25 |
| 4 |
| 20 |
| 3 |
| — |
| 8 |
| 67 |
|
Revisions—technical |
| — |
| (4 | ) | 1 |
| 5 |
| 2 |
| 11 |
| — |
| 15 |
|
Revisions—economic |
| — |
| — |
| — |
| 9 |
| 4 |
| 1 |
| 2 |
| 16 |
|
Acquisitions |
| — |
| 86 |
| — |
| — |
| — |
| — |
| — |
| 86 |
|
Divestments |
| — |
| — |
| — |
| — |
| — |
| — |
| — |
| — |
|
Production |
| (7 | ) | (3 | ) | (14 | ) | (37 | ) | (8 | ) | (20 | ) | (1 | ) | (90 | ) |
|
| 324 |
| 389 |
| 81 |
| 172 |
| 50 |
| 23 |
| 43 |
| 1,082 |
|
SEC Rule Transition |
|
|
|
|
|
|
|
|
|
|
|
|
|
|
|
|
|
Synthetic—current year |
| — |
| (18 | ) | — |
| — |
| — |
| — |
| — |
| (18 | ) |
Synthetic—prior years |
| — |
| (53 | ) | — |
| — |
| — |
| — |
| — |
| (53 | ) |
December 31, 2009 |
| 324 |
| 318 |
| 81 |
| 172 |
| 50 |
| 23 |
| 43 |
| 1,011 |
|
Extensions and discoveries of 67 mmboe (63 after royalties) relate primarily to ongoing Long Lake reservoir delineation and development drilling at Buzzard, Usan and Telford.
Technical revisions of 15 mmboe (9 after royalties) relate primarily to positive production performance and production optimization activities in Yemen, and continued analysis of the proved area at Long Lake, partially offset by a reduction of reserves at Long Lake to reflect lease set-back agreements.
Positive economic revisions of 16 mmboe (negative 2 after royalties) reflect the differences between the oil and gas prices on December 31, 2008 and the average prices in 2009, and differences in costs. Higher oil prices, particularly for heavy oil, resulted in positive economic revisions of 31 mmboe (11 after royalties). Approximately half of these positive economic revisions occurred in our Canadian heavy oil properties, with the rest in other areas such as Buzzard and the Gulf of Mexico. During 2009, gas prices continued to decline and reached an eight year low. Our gas properties had negative economic revisions of 15 mmboe (13 after royalties), with 75% occurring in our Canadian conventional gas properties and the remainder in our Canadian CBM properties. The positive economic revision before royalties became negative after royalties due to increased oil sands royalties related to higher oil prices.
The acquisition occurred at Long Lake where we acquired an additional 15% working interest from our partner early in the year.
The SEC Rule Transition represents changes in reserves quantities resulting from implementing the new SEC rules on the December 31, 2009 quantities. The revision relates to our oil sands reserves at Long Lake where we produce bitumen and upgrade it to a premium synthetic crude in the field. As part of the process, we remove the asphaltenes from the bitumen and use it as our internal fuel source in the steam generation, upgrading and cogeneration power processes. This results in a reduction in the quantity of reserves available for sale; however, these synthetic barrels are expected to have a higher value over the long term.
The following provides a summary of the changes in our proved oil and gas reserves before royalties during the past three years. Refer to pages 152 and 153 for proved reserves information on an after-royalty basis for each of the past three years.
|
| Canada |
|
|
|
|
|
|
|
|
|
|
| ||||
(mmboe) |
| Syncrude |
| Long Lake |
| Other |
| United |
| United |
| Yemen |
| Other |
| Total |
|
December 31, 2006 |
| 324 |
| 246 |
| 118 |
| 182 |
| 73 |
| 66 |
| 40 |
| 1,049 |
|
Extension and discoveries |
| 23 |
| 44 |
| 20 |
| 35 |
| 8 |
| 3 |
| 8 |
| 141 |
|
Revisions—technical |
| — |
| 18 |
| 7 |
| 63 |
| (8 | ) | 23 |
| — |
| 103 |
|
Revisions—economic |
| — |
| — |
| (23 | ) | (4 | ) | (4 | ) | 1 |
| — |
| (30 | ) |
Acquisitions |
| — |
| 86 |
| — |
| 1 |
| 11 |
| — |
| — |
| 98 |
|
Divestments |
| — |
| — |
| — |
| — |
| (2 | ) | — |
| — |
| (2 | ) |
Production |
| (23 | ) | (5 | ) | (41 | ) | (105 | ) | (28 | ) | (70 | ) | (5 | ) | (277 | ) |
|
| 324 |
| 389 |
| 81 |
| 172 |
| 50 |
| 23 |
| 43 |
| 1,082 |
|
SEC Rule Transition |
|
|
|
|
|
|
|
|
|
|
|
|
|
|
|
|
|
Synthetic—current year |
| — |
| (18 | ) | — |
| — |
| — |
| — |
| — |
| (18 | ) |
Synthetic—prior years |
| — |
| (53 | ) | — |
| — |
| — |
| — |
| — |
| (53 | ) |
December 31, 2009 |
| 324 |
| 318 |
| 81 |
| 172 |
| 50 |
| 23 |
| 43 |
| 1,011 |
|
Since 2006, we added 312 mmboe (326 after royalties), sold 2 mmboe (2 after royalties) and produced 277 mmboe (233 after royalties). Extensions and discoveries of 141 mmboe (132 after royalties) occurred primarily at Long Lake, Syncrude, Buzzard, Canadian CBM, and the deep-water Gulf of Mexico. The technical revisions of 103 mmboe (89 after royalties) include 63 mmboe (63 after royalties) of positive revisions in the UK related to better production performance at Buzzard, 23 mmboe (11 after royalties) from better than expected production performance at Yemen, and ongoing analysis of the reservoir at Long Lake. Negative technical revisions occurred primarily from lower than expected production performance from various deep water and shelf properties in the US Gulf of Mexico. Negative economic revisions of 30 mmboe (positive 10 after royalties) are primarily related to changes in prices and costs, primarily in our gas areas in Canada and the US, and to a lesser extent at our Canadian heavy oil properties. The positive economic revision after royalties reflects the change in royalty regulations for oil sands projects which make them oil price sensitive and causes them to be lower at the prices used in the reserves estimates.
PROVED DEVELOPED AND UNDEVELOPED RESERVES
The following table provides proved undeveloped reserves (PUDs) before royalties at December 31, 2009 and the changes during 2009. We have included Syncrude in the table and presented a portion of the previously reported mining reserves as PUDs at December 31, 2008 as if it was always an oil and gas activity. We believe this allows for better presentation of the changes during 2009.
|
| Canada |
|
|
|
|
|
|
|
|
|
|
| ||||
(mmboe) |
| Syncrude |
| Long Lake |
| Other |
| United |
| United |
| Yemen |
| Other |
| Total |
|
December 31, 2008 |
| 105 |
| 232 |
| 4 |
| 40 |
| 11 |
| 3 |
| 28 |
| 423 |
|
Extension and discoveries |
| 11 |
| 25 |
| 1 |
| — |
| — |
| — |
| 8 |
| 45 |
|
Revisions |
| — |
| (4 | ) | (2 | ) | — |
| 1 |
| (1 | ) | 2 |
| (4 | ) |
Conversions |
| — |
| (4 | ) | — |
| (12 | ) | (1 | ) | (1 | ) | — |
| (18 | ) |
Acquisitions |
| — |
| 70 |
| — |
| — |
| — |
| — |
| — |
| 70 |
|
|
| 116 |
| 319 |
| 3 |
| 28 |
| 11 |
| 1 |
| 38 |
| 516 |
|
SEC Rule Transition |
|
|
|
|
|
|
|
|
|
|
|
|
|
|
|
|
|
Synthetic—current year |
| — |
| (16 | ) | — |
| — |
| — |
| — |
| — |
| (16 | ) |
Synthetic—prior years |
| — |
| (42 | ) | — |
| — |
| — |
| — |
| — |
| (42 | ) |
December 31, 2009 |
| 116 |
| 261 |
| 3 |
| 28 |
| 11 |
| 1 |
| 38 |
| 458 |
|
PUD %1 |
| 36 | % | 82 | % | 3 | % | 16 | % | 23 | % | 4 | % | 88 | % | 45 | % |
1 Determined as a percentage of total proved reserves for that area.
In 2009, our PUDs increased by 35 mmboe (7 after royalties). Extensions and discoveries of 45 mmboe (41 after royalties) relate to the ongoing Long Lake reservoir delineation and the addition of another year of production at Syncrude which will come from an undeveloped mine. We had negative revisions of 4 mmboe (15 after royalties) primarily at Long Lake due to lease set-back agreements, and in our Canadian and US gas areas where low gas prices have made developments at average 2009 prices uneconomic. After-royalty changes reflect the impact of higher price-sensitive royalties from our oil sands properties at Long Lake and Syncrude. We converted 18 mmboe (18 after royalties) with the start-up of our Ettrick field in the North Sea, the drilling of an additional SAGD well pad at Long Lake, and ongoing development of various other properties.
At Syncrude, PUDs of 116 mmboe (103 after royalties) relate to a new mine that will be required to provide bitumen feedstock to the upgrading facility. The mine is part of the Syncrude development plan and was contemplated in conjunction with the Stage 3 expansion completed in 2005. We do not consider this mine to be developed as the extraction equipment to access the reserves has not yet been installed. We are proceeding with planning for the development of the mine and expect to initiate field construction in 2012.
At Long Lake, PUDs of 261 mmboe (236 after royalties) relate to ongoing drilling to offset declines from the initial SAGD wells. They are expected to be converted to developed over the next 27 years as we drill additional wells to provide bitumen feedstock to run the upgrader at capacity. These wells were part of the field development plan and were included in the project investment decision.
In the United Kingdom, about 90% of the 28 mmboe (28 after royalties) relate to Buzzard while the remainder relate to Ettrick. The Buzzard PUDs are expected to be converted to proved over the next few years with the expected completion of the addition of the H2S handling facilities in 2010 and as we drill additional development wells. We expect to convert the majority of Ettrick PUDs to producing within a year.
In our other international countries, PUDs of 38 mmboe (33 after royalties) relate primarily to offshore West Africa.
Excluding Long Lake, we expect to convert over 90% of our PUDs to producing in the next four years. Long Lake PUDs will be converted over the next 27 years as new wells are drilled to offset declines from the initial SAGD wells. We expect our ongoing exploration and development activities to continue to add new PUDs.
During the year, we spent $625 million on our PUDs. The amount relates to PUDs converted to proved developed reserves in the year and to those which will be converted in future years.
We have reviewed our PUDs and determined there are no material amounts in individual fields which have remained undeveloped for five years or more after they were initially recognized as proved reserves.
Following is a summary of our developed and undeveloped proved oil and gas reserves by country and product at December 31, 2009:
|
| Before Royalties |
| After Royalties |
| ||||||||
|
| Synthetic |
| Oil |
| Gas |
| Synthetic |
| Oil |
| Gas |
|
|
| (mmbbl) |
| (mmbbl) |
| (bcf) |
| (mmbbl) |
| (mmbbl) |
| (bcf) |
|
|
|
|
|
|
|
|
|
|
|
|
|
|
|
Canada |
| 265 |
| 35 |
| 260 |
| 240 |
| 29 |
| 241 |
|
United Kingdom |
| — |
| 142 |
| 13 |
| — |
| 142 |
| 13 |
|
United States |
| — |
| 15 |
| 145 |
| — |
| 13 |
| 125 |
|
Yemen |
| — |
| 22 |
| — |
| — |
| 14 |
| — |
|
Other Countries |
| — |
| 5 |
| — |
| — |
| 5 |
| — |
|
Developed |
| 265 |
| 219 |
| 418 |
| 240 |
| 203 |
| 379 |
|
Canada |
| 377 |
| 2 |
| 4 |
| 339 |
| 2 |
| 3 |
|
United Kingdom |
| — |
| 27 |
| 4 |
| — |
| 27 |
| 4 |
|
United States |
| — |
| 7 |
| 27 |
| — |
| 6 |
| 25 |
|
Yemen |
| — |
| 1 |
| — |
| — |
| 1 |
| — |
|
Other Countries |
| — |
| 38 |
| — |
| — |
| 33 |
| — |
|
Undeveloped |
| 377 |
| 75 |
| 35 |
| 339 |
| 69 |
| 32 |
|
Total Proved |
| 642 |
| 294 |
| 453 |
| 579 |
| 272 |
| 411 |
|
PROBABLE RESERVES
Probable reserves are those additional reserves that are less certain to be recovered than proved reserves but which, together with proved reserves, are as likely as not to be recovered. Therefore, probable reserves have a higher degree of uncertainty than proved reserves. In prior years, information on probable reserves was reported outside of our Form 10-K and was prepared in accordance with Canadian NI 51-101 and the Canadian Oil and Gas Evaluation Handbook standards. We have presented a continuity schedule as if they had been reported in our Form 10-K last year.
At December 31, 2009, we had 1,217 mmboe (1,057 after royalties) of probable oil and gas reserves. During the year, we added 349 mmboe (250 after royalties), representing a 33% (26% after royalties) increase to our estimate the prior year. The conversion of bitumen to PSCTM in accordance with SEC requirements reduced our quantities by 180 mmboe (158 after royalties), of which 41 mmboe (50 after royalties) reflect the current year and the remainder to prior years. The after-royalties reserves estimates did not increase as significantly due to the impact of higher prices. Including the effects of reconciliation to the new SEC rules our probable reserves have increased by 169 mmboe (92 after royalties).
The following provides a summary of the changes in our probable oil and gas reserves before royalties during 2009, including the impact of converting to the new SEC rules.
|
| Canada |
|
|
|
|
|
|
|
|
|
|
| ||||
(mmboe) |
| Syncrude |
| Long Lake |
| Other |
| United |
| United |
| Yemen |
| Other |
| Total |
|
December 31, 20081 |
| 46 |
| 732 |
| 36 |
| 136 |
| 24 |
| 13 |
| 61 |
| 1,048 |
|
Extension and discoveries |
| 7 |
| 152 |
| 8 |
| 48 |
| 3 |
| — |
| 6 |
| 224 |
|
Revisions—technical |
| — |
| (10 | ) | 3 |
| 5 |
| (2 | ) | (3 | ) | (10 | ) | (17 | ) |
Revisions—economic |
| — |
| (26 | ) | (5 | ) | (2 | ) | 1 |
| 1 |
| (2 | ) | (33 | ) |
Conversions |
| (7 | ) | — |
| (1 | ) | (18 | ) | (2 | ) | (7 | ) | (10 | ) | (45 | ) |
Acquisitions |
| — |
| 220 |
| — |
| — |
| — |
| — |
| — |
| 220 |
|
|
| 46 |
| 1,068 |
| 41 |
| 169 |
| 24 |
| 4 |
| 45 |
| 1,397 |
|
SEC Rule Conversion |
|
|
|
|
|
|
|
|
|
|
|
|
|
|
|
|
|
Synthetic—current year |
| — |
| (41 | ) | — |
| — |
| — |
| — |
| — |
| (41 | ) |
Synthetic–prior years |
| — |
| (139 | ) | — |
| — |
| — |
| — |
| — |
| (139 | ) |
December 31, 2009 |
| 46 |
| 888 |
| 41 |
| 169 |
| 24 |
| 4 |
| 45 |
| 1,217 |
|
1 Information on probable reserves was previously reported outside of our Form 10-K and was prepared in accordance with Canadian NI 51-101 and the Canadian Oil and Gas Evaluation Handbook standards. The estimates at December 31, 2008 and changes during 2009 were prepared under those standards. The conversion to the new SEC rules is shown separately.
2 The insitu oil sands reflect our share of the probable reserves for phases 1 and 2 at Long Lake.
The following provides a summary of the changes in our probable oil and gas reserves after royalties during 2009, including the impact of converting to the new rules.
|
| Canada |
|
|
|
|
|
|
|
|
|
|
| ||||
(mmboe) |
| Syncrude |
| Long Lake |
| Other |
| United |
| United |
| Yemen |
| Other |
| Total |
|
December 31, 20081 |
| 43 |
| 677 |
| 31 |
| 136 |
| 20 |
| 8 |
| 50 |
| 965 |
|
Extension and discoveries |
| 7 |
| 121 |
| 7 |
| 48 |
| 2 |
| — |
| 5 |
| 190 |
|
Revisions—technical |
| — |
| (9 | ) | 3 |
| 5 |
| (1 | ) | (1 | ) | (8 | ) | (11 | ) |
Revisions—economic |
| (2 | ) | (80 | ) | (6 | ) | (2 | ) | 1 |
| (1 | ) | (3 | ) | (93 | ) |
Conversions |
| (7 | ) | — |
| — |
| (18 | ) | (2 | ) | (3 | ) | (9 | ) | (39 | ) |
Acquisitions |
| — |
| 203 |
| — |
| — |
| — |
| — |
| — |
| 203 |
|
|
| 41 |
| 912 |
| 35 |
| 169 |
| 20 |
| 3 |
| 35 |
| 1,215 |
|
SEC Rule Conversion |
|
|
|
|
|
|
|
|
|
|
|
|
|
|
|
|
|
Synthetic—current year |
| — |
| (50 | ) | — |
| — |
| — |
| — |
| — |
| (50 | ) |
Synthetic—prior years |
| — |
| (108 | ) | — |
| — |
| — |
| — |
| — |
| (108 | ) |
December 31, 2009 |
| 41 |
| 754 |
| 35 |
| 169 |
| 20 |
| 3 |
| 35 |
| 1,057 |
|
1 Information on probable reserves was previously reported outside of our Form 10-K and was prepared in accordance with Canadian NI 51-101 and the Canadian Oil and Gas Evaluation Handbook. The estimates at December 31, 2008 and changes during 2009 were prepared under those standards. The conversion to the new SEC rules is shown separately.
2 The insitu oil sands reflect our share of the probable reserves for phase 1 and 2 at Long Lake.
Extensions and discoveries of 224 mmboe (190 after royalties) relate primarily to ongoing Long Lake reservoir delineation, successful development drilling at Telford, and exploration successes in the Golden Eagle area and Rochelle in the UK and at Owowo, offshore West Africa. Negative technical revisions of 17 mmboe (11 after royalties) relate primarily to a reduction at Long Lake to reflect lease set-back agreements. Negative economic revisions of 33 mmboe (93 after royalties) primarily reflect higher oil prices, changes in the economic assumptions at Long Lake Phase 2 and lower gas prices. The larger negative revisions after royalties reflects increased oil sands royalties related to higher oil prices. Conversions reflect probable reserves converted to proved as a result of increased confidence in producing the reserves based on production performance and drilling results. The acquisition reflects the additional working interest acquired in Long Lake Phases 1 and 2.
PROBABLE DEVELOPED AND UNDEVELOPED RESERVES
Following is a summary of our developed and undeveloped probable oil and gas reserves by country and product at December 31, 2009:
|
| Before Royalties |
| After Royalties |
| ||||||||
|
| Synthetic |
| Oil |
| Gas |
| Synthetic |
| Oil |
| Gas |
|
|
| (mmbbl) |
| (mmbbl) |
| (bcf) |
| (mmbbl) |
| (mmbbl) |
| (bcf) |
|
|
|
|
|
|
|
|
|
|
|
|
|
|
|
Canada |
| 39 |
| 18 |
| 75 |
| 36 |
| 14 |
| 69 |
|
United Kingdom |
| — |
| 88 |
| 18 |
| — |
| 88 |
| 18 |
|
United States |
| — |
| 5 |
| 83 |
| — |
| 4 |
| 71 |
|
Yemen |
| — |
| 3 |
| — |
| — |
| 3 |
| — |
|
Other Countries |
| — |
| 1 |
| — |
| — |
| 1 |
| — |
|
Developed |
| 39 |
| 115 |
| 176 |
| 36 |
| 110 |
| 158 |
|
Canada |
| 895 |
| 10 |
| 9 |
| 759 |
| 8 |
| 8 |
|
United Kingdom |
| — |
| 70 |
| 46 |
| — |
| 70 |
| 46 |
|
United States |
| — |
| 2 |
| 16 |
| — |
| 2 |
| 14 |
|
Yemen |
| — |
| 1 |
| — |
| — |
| — |
| — |
|
Other Countries |
| — |
| 44 |
| — |
| — |
| 34 |
| — |
|
Undeveloped |
| 895 |
| 127 |
| 71 |
| 759 |
| 114 |
| 68 |
|
Total Probable |
| 934 |
| 242 |
| 247 |
| 795 |
| 224 |
| 226 |
|
Developed probable reserves reflect increased recovery factors and recompletions of other zones on producing wells. Undeveloped probable reserves reflect reserves that have not yet been drilled or the production facilities completed.
Approximately 85% of our probable reserves before royalties (84% after royalties) are undeveloped. This reflects the incremental reserves related to the ongoing drilling required to keep the upgrader full for Phase 1 at Long Lake and the reserves related to the expected development of Phase 2 at Long Lake. The remaining undeveloped reserves principally relate to: completion of the H2S facilities at Buzzard; undeveloped discoveries at the Golden Eagle area and Rochelle in the UK and Usan and Owowo, offshore West Africa; and the extension of the plant life and expected higher future yields at Syncrude.
BASIS OF RESERVES ESTIMATES
The process of estimating reserves requires complex judgments and decision-making based on available geological, geophysical, engineering and economic data. To estimate the economically recoverable oil and gas reserves and related future net cash flows, we consider many factors and make various assumptions including:
· expected reservoir characteristics based on geological, geophysical and engineering assessments;
· future production rates based on historical performance and expected future operating and investment activities;
· future oil and gas prices and quality differentials;
· assumed effects of regulation by governmental agencies; and
· future development and operating costs.
We believe these factors and assumptions are reasonable based on the information available to us at the time we prepared our estimates. However, these estimates may change substantially as additional data from ongoing development activities and production performance becomes available and as economic conditions impacting oil and gas prices and costs change.
Reserve estimates are categorized by the confidence they will be economically recoverable. Proved reserves are those quantities of oil and gas, which, by analysis of geoscience and engineering data, can be estimated with reasonable certainty to be economically producible from a given date forward, from known reservoirs, and under existing economic conditions, operating conditions, and government regulations. Probable reserves are those additional reserves that are less certain to be recovered than proved reserves
but which, together with proved reserves, are as likely as not to be recovered. Therefore, probable reserves have a higher degree of uncertainty than proved reserves.
Management is responsible for the estimates of oil and gas reserves and for preparing related disclosures. Estimates and related disclosures are prepared in accordance with SEC requirements, generally accepted industry practices in the US and the standards of the Canadian Oil and Gas Evaluation Handbook modified to reflect SEC requirements. Our reserve estimates and disclosures may differ from other Canadian issuers who follow Canadian NI 51-101. Significant differences between SEC and Canadian reserve estimates and disclosures are described on page 97 (see Special Note to Canadian Investors).
Reserve estimates for each property are internally prepared at least annually by the property’s reservoir engineer and geoscientists. They are reviewed by engineers familiar with the property and by divisional management. An Executive Reserves Committee, including our CEO, CFO and internal qualified reserves evaluator, meet with divisional reserves personnel to review the estimates and any changes from previous estimates.
The internal qualified reserves evaluator (IQRE) is responsible for estimating reserves data and related disclosures. This position, required under Canadian NI 51-101, was appointed by the Board in December 2003. The IQRE is a professional engineer and meets all professional and statutory requirements in regards to experience, education and professional membership associated with the role. With over 27 years of experience, he has an in-depth knowledge of reserves estimation techniques and professional guidelines, and SEC and Canadian reserves regulations and related reporting requirements. His primary duty includes assessing whether the reserves estimates and related disclosures have been prepared in accordance with applicable regulatory requirements. He provides a report on Canadian NI 51-101 Form F-2 stating that the reserves information has, in all material respects, been prepared and reported in accordance with our reserves standards. This report is included as an exhibit to this Form 10-K.
Our reserves estimates are based on internal analysis. We have at least 80% of our oil and gas reserves either evaluated or audited annually by independent qualified reserves consultants to increase our confidence in our estimates. Given that reserve estimates are based on numerous assumptions, interpretations and judgments, differences frequently arise between the estimates prepared by different qualified estimators. When the initial estimate of proved reserves on the portfolio of properties differs by greater than 10%, we work with the independent reserves consultant to reconcile the difference to within 10%. Estimates pertaining to individual properties within the portfolio may differ by more than 10%, either positively or negatively. We do not attempt to resolve each property to within 10% as it would be time and cost prohibitive given the number of wells in which we have an interest. We follow a similar process in connection with our probable reserves estimates to reconcile any differences on a proved plus probable basis to be within an acceptable tolerance, and as such, probable reserves for individual properties within the portfolio may differ significantly. The nature and extent of the independent evaluations and audits, and the results thereof, are provided below.
The board of directors has a Reserves Review Committee (Reserves Committee) to assist the board and the Audit Committee to oversee the annual review of our oil and gas reserves and related disclosures. The Reserves Committee is comprised of three or more directors, the majority of whom are independent and familiar with estimating oil and gas reserves and disclosure requirements. The Reserves Committee meets with management periodically to review the reserves process, the portfolio of properties selected by management for independent assessment, results and related disclosures. The Reserves Committee appoints and meets with the IQRE and independent reserves consultants, independent of management, to review the scope of their work, whether they have had access to sufficient information, the nature and satisfactory resolution of any material differences of opinion, and in the case of the independent reserves consultants, their independence. In the event of a proposed change to the areas of responsibility of either an independent reserves consultant or the IQRE, the Reserves Committee inquires whether there have been disputes between the respective party and management.
The Reserves Committee has reviewed our procedures for preparing the reserves estimates and related disclosures and the properties selected by management for independent assessment. It reviewed the information with management, and met with the IQRE and the independent qualified reserves consultants. As a result, the Reserves Committee is satisfied that the internally-estimated reserves are reliable and free of material misstatement. Based on the recommendation of the Reserves Committee, the board has approved the reserves estimates and related disclosures in this Form 10-K.
The following provides an overview of the nature and scope of the independent evaluations and audits that we have performed. An independent evaluation is a process whereby we request a third-party engineering firm to prepare an estimate of our proved and probable reserves by assessing and interpreting all available data on a reservoir. An independent audit is a process whereby we request a third party engineering firm to prepare an estimate of our reserves by reviewing our estimates, supporting working papers and other data as they feel is necessary. The primary difference is that an auditor reviews our work and estimate in preparing their estimate whereas an evaluator uses the reservoir data to prepare their own estimate.
In each case, we request their estimates to be prepared using standard geological and engineering methods generally accepted by the petroleum industry. Generally accepted methods for estimating reserves include volumetric calculations, material balance techniques, production and pressure decline curve analysis, analogy with similar reservoirs, and reservoir simulation. The method or combination of methods used is based on their professional judgement and experience. In preparing their estimates, they obtain information from us with respect to property interests, production from such properties, current costs of operations, expected future development and abandonment costs, current prices for production, agreements relating to current and future operations and sale of production, and various other information and data. They may rely on the information without independent verification. However, if in the course of their evaluation they question the validity or sufficiency of any information, we request that they not rely on such information until they satisfactorily resolve their questions or independently verify such information. We do not place any limitations on the work to be performed. Upon completion of their work, the independent evaluator or auditor issues an opinion as to whether our estimates of the proved and probable reserves for that portfolio of properties is, in aggregate, reasonable relative to the criteria set forth in the SEC and Financial Accounting Standards Board rules.
We engaged DeGolyer and MacNaughton (D&M) to evaluate 100% of our proved and 100% of our proved plus probable reserves for the United Kingdom and Yemen Masila. They also reviewed 100% of our proved and 88% of our proved plus probable reserves for Nigeria. A separate opinion was provided on each of these areas. D&M provided opinions that the proved and proved plus probable reserves for the reviewed properties are reasonable within an acceptable tolerance based upon a detailed evaluation and comparison of their aggregate estimates to ours.
We engaged McDaniel & Associates Consultants Ltd. (McDaniel) to evaluate 98% of our proved and 99% of our proved plus probable reserves for our Canadian conventional, CBM and insitu oil sands properties. They also audited 100% of our proved and proved plus probable reserves for our Syncrude interest. Separate opinions were provided for the evaluation and for the audit. McDaniel provided opinions that the proved and proved plus probable reserves for the reviewed properties are reasonable within an acceptable tolerance based upon a detailed evaluation and comparison of their aggregate estimates to ours.
We engaged Ryder Scott Company (Ryder Scott) to evaluate 93% of our proved and 95% of our proved plus probable US Gulf of Mexico deep water and shelf properties. Ryder Scott provided an opinion that the proved and proved plus probable reserves for the reviewed properties are reasonable within an acceptable tolerance based upon a detailed evaluation and comparison of their aggregate estimates to ours.
For each opinion, a Report of Third Party has been prepared which summarizes the work undertaken, the assumptions, data, methods and procedures they used, and concludes with their opinion. The reports are included as exhibits to this Form 10-K.
Net Sales by Product from Oil and Gas Operations
(Cdn$ millions) |
| 2009 |
| 2008 |
| 2007 |
|
Conventional Crude Oil and Natural Gas Liquids (NGLs) |
| 3,605 |
| 5,534 |
| 4,077 |
|
Synthetic Crude Oil |
| 480 |
| 691 |
| 545 |
|
Natural Gas |
| 316 |
| 652 |
| 499 |
|
Total |
| 4,401 |
| 6,877 |
| 5,121 |
|
Crude oil (including synthetic crude oil) and NGLs represent approximately 93% of our oil and gas net sales, while natural gas represents the remaining 7%.
Sales Prices and Production Costs
|
| Average Sales Price1 |
| Average Production Cost1 |
| ||||||||
|
| 2009 |
| 2008 |
| 2007 |
| 2009 |
| 2008 |
| 2007 |
|
Crude Oil and NGLs (Cdn$/bbl) |
|
|
|
|
|
|
|
|
|
|
|
|
|
United Kingdom |
| 67.70 |
| 96.23 |
| 76.30 |
| 6.87 |
| 6.75 |
| 6.94 |
|
Canada |
| 53.04 |
| 74.51 |
| 44.07 |
| 20.82 |
| 22.16 |
| 18.67 |
|
Syncrude |
| 70.96 |
| 105.47 |
| 79.76 |
| 39.09 |
| 42.04 |
| 30.32 |
|
United States |
| 65.01 |
| 104.94 |
| 69.83 |
| 14.10 |
| 13.48 |
| 9.69 |
|
Yemen |
| 68.49 |
| 99.87 |
| 76.29 |
| 18.34 |
| 15.88 |
| 12.00 |
|
Other Countries |
| 59.05 |
| 98.98 |
| 71.29 |
| 6.53 |
| 4.91 |
| 3.76 |
|
Natural Gas (Cdn$/mcf) |
|
|
|
|
|
|
|
|
|
|
|
|
|
United Kingdom |
| 3.95 |
| 6.78 |
| 4.71 |
| 1.15 |
| 1.12 |
| 1.16 |
|
Canada |
| 3.78 |
| 7.73 |
| 6.32 |
| 1.92 |
| 2.09 |
| 2.28 |
|
United States |
| 4.67 |
| 10.07 |
| 7.80 |
| 2.35 |
| 2.25 |
| 1.61 |
|
Corporate Average (Cdn$/boe) |
| 60.02 |
| 89.78 |
| 68.46 |
| 13.33 |
| 13.18 |
| 11.63 |
|
1 Sales prices and unit production costs are calculated using our working interest production after royalties.
Oil and Gas Acreage
|
| Developed |
| Undeveloped1 |
| Total |
| ||||||
(thousands of acres) |
| Gross |
| Net |
| Gross |
| Net |
| Gross |
| Net |
|
United Kingdom |
| 220 |
| 104 |
| 1,303 |
| 917 |
| 1,523 |
| 1,021 |
|
Canada |
| 810 |
| 625 |
| 1,081 |
| 683 |
| 1,891 |
| 1,308 |
|
Synthetic |
| 10 |
| 6 |
| 735 |
| 303 |
| 745 |
| 309 |
|
Syncrude |
| 84 |
| 6 |
| 264 |
| 19 |
| 348 |
| 25 |
|
United States |
| 220 |
| 125 |
| 1,200 |
| 592 |
| 1,420 |
| 717 |
|
Yemen2 |
| 50 |
| 29 |
| 756 |
| 629 |
| 806 |
| 658 |
|
Colombia4 |
| 1 |
| — |
| 788 |
| 611 |
| 789 |
| 611 |
|
Nigeria2, 3 |
| — |
| — |
| 678 |
| 131 |
| 678 |
| 131 |
|
Norway |
| — |
| — |
| 753 |
| 426 |
| 753 |
| 426 |
|
Total5 |
| 1,395 |
| 895 |
| 7,558 |
| 4,311 |
| 8,953 |
| 5,206 |
|
1 Undeveloped acreage is considered to be those acres on which wells have not been drilled or completed to a point that would permit production of commercial quantities of crude oil and natural gas regardless of whether or not such acreage contains proved reserves.
2 The acreage is covered by production sharing contracts.
3 The acreage is covered by a joint venture agreements.
4 The acreage is covered by an association contract.
5 Approximately 25% of our net oil and gas acreage is scheduled to expire within three years if production is not established or we take no other action to extend the terms. We plan to continue the terms of many of these licences.
Producing Oil and Gas Wells
|
| Oil |
| Gas |
| Total |
| ||||||
(number of wells) |
| Gross1 |
| Net2 |
| Gross1 |
| Net2 |
| Gross1 |
| Net2 |
|
United Kingdom |
| 61 |
| 29 |
| — |
| — |
| 61 |
| 29 |
|
Canada |
| 2,033 |
| 1,448 |
| 3,087 |
| 2,713 |
| 5,120 |
| 4,161 |
|
Synthetic |
| 91 |
| 59 |
| 21 |
| 14 |
| 112 |
| 73 |
|
United States |
| 180 |
| 91 |
| 208 |
| 144 |
| 388 |
| 235 |
|
Yemen |
| 555 |
| 336 |
| — |
| — |
| 555 |
| 336 |
|
Colombia |
| 112 |
| 11 |
| — |
| — |
| 112 |
| 11 |
|
Total |
| 3,032 |
| 1,974 |
| 3,316 |
| 2,871 |
| 6,348 |
| 4,845 |
|
1 Gross wells are the total number of wells in which we own an interest.
2 Net wells are the sum of fractional interests owned in gross wells.
Drilling Activity
|
| 2009 |
| ||||||||||||
|
| Net Exploratory |
| Net Development |
|
|
| ||||||||
(number of net wells) |
| Productive |
| Dry Holes |
| Total |
| Productive |
| Dry Holes |
| Total |
| Total |
|
United Kingdom |
| 3.1 |
| 1.3 |
| 4.4 |
| 5.7 |
| 0.8 |
| 6.5 |
| 10.9 |
|
Canada |
| 8.1 |
| — |
| 8.1 |
| 50.3 |
| — |
| 50.3 |
| 58.4 |
|
Synthetic1 |
| — |
| — |
| — |
| 6.5 |
| — |
| 6.5 |
| 6.5 |
|
United States |
| 0.7 |
| 0.2 |
| 0.9 |
| 1.0 |
| — |
| 1.0 |
| 1.9 |
|
Yemen |
| — |
| — |
| — |
| 12.4 |
| — |
| 12.4 |
| 12.4 |
|
Nigeria |
| 0.2 |
| — |
| 0.2 |
| 1.6 |
| — |
| 1.6 |
| 1.8 |
|
Total |
| 12.1 |
| 1.5 |
| 13.6 |
| 77.5 |
| 0.8 |
| 78.3 |
| 91.9 |
|
|
| 2008 |
| ||||||||||||
|
| Net Exploratory |
| Net Development |
|
|
| ||||||||
(number of net wells) |
| Productive |
| Dry Holes |
| Total |
| Productive |
| Dry Holes |
| Total |
| Total |
|
United Kingdom |
| 2.5 |
| 2.0 |
| 4.5 |
| 3.3 |
| — |
| 3.3 |
| 7.8 |
|
Canada |
| 9.2 |
| — |
| 9.2 |
| 216.4 |
| — |
| 216.4 |
| 225.6 |
|
Synthetic1 |
| — |
| — |
| — |
| — |
| — |
| — |
| — |
|
United States |
| 0.5 |
| 1.0 |
| 1.5 |
| 1.3 |
| — |
| 1.3 |
| 2.8 |
|
Yemen |
| — |
| 1.0 |
| 1.0 |
| 17.4 |
| — |
| 17.4 |
| 18.4 |
|
Colombia |
| — |
| — |
| — |
| 1.6 |
| — |
| 1.6 |
| 1.6 |
|
Total |
| 12.2 |
| 4.0 |
| 16.2 |
| 240.0 |
| — |
| 240.0 |
| 256.2 |
|
|
| 2007 |
| ||||||||||||
|
| Net Exploratory |
| Net Development |
|
|
| ||||||||
(number of net wells) |
| Productive |
| Dry Holes |
| Total |
| Productive |
| Dry Holes |
| Total |
| Total |
|
United Kingdom |
| 2.0 |
| 3.2 |
| 5.2 |
| 4.2 |
| — |
| 4.2 |
| 9.4 |
|
Canada |
| 23.2 |
| 0.6 |
| 23.8 |
| 295.6 |
| 3.2 |
| 298.8 |
| 322.6 |
|
Synthetic1 |
| — |
| — |
| — |
| — |
| — |
| — |
| — |
|
United States |
| 0.8 |
| 2.9 |
| 3.7 |
| 8.6 |
| 1.0 |
| 9.6 |
| 13.3 |
|
Yemen |
| 1.0 |
| 1.0 |
| 2.0 |
| 28.0 |
| — |
| 28.0 |
| 30.0 |
|
Colombia |
| — |
| 0.9 |
| 0.9 |
| 7.0 |
| — |
| 7.0 |
| 7.9 |
|
Total |
| 27.0 |
| 8.6 |
| 35.6 |
| 343.4 |
| 4.2 |
| 347.6 |
| 383.2 |
|
1 Synthetic productive development wells are SAGD producer and injector wells pairs. In addition to these wells we have drilled a further 34.8 net wells during 2009 (2008—88.5 net wells; 2007—105.0 net wells).
Wells in Progress
At December 31, 2009, we were drilling two wells in the United Kingdom (1.1 net), one well in Canada (one net), two wells in the United States (0.5 net), one well in Yemen (0.5 net), two wells in Nigeria (0.4 net) and one well in Norway (0.5 net). There were no wells drilling in Colombia at December 31, 2009.
Our energy marketing group currently sells proprietary and third-party natural gas, crude oil, natural gas liquids, and power in certain regional global markets. We use financial and derivative contracts, including futures, forwards, swaps and options for hedging purposes.
Our marketing strategy is to:
· obtain competitive pricing on the sale of our oil and gas production;
· provide market intelligence in support of our oil and gas operations;
· provide superior customer service to producers and consumers;
· capitalize on crude oil market opportunities through physical trading; and
· optimize physical assets or contracts to which we have access.
This strategy aligns with our corporate focus on realizing the full value from our assets and provides us with the market intelligence needed to deliver oil and gas production to market at competitive pricing.
In 2009, we announced that we were reviewing strategic alternatives for our natural gas and power marketing businesses, which may include the sale of all or part of these businesses. At this time, the review is underway and is expected to conclude in 2010.
North American Crude Oil Marketing
Our crude oil business in North America markets physical crude oil to end-use refiners, as well as buying and selling natural gas liquids (NGLs). The crude oil group markets Nexen’s proprietary production and third-party production. Our team leverages regional knowledge, retains capacity on key North American infrastructure and maintains solid customer relationships. In addition to physical marketing, we take advantage of quality, time and location spreads to generate returns.
Our North American operations focus on key regions supported by our offices in Calgary, Houston and Denver. In western Canada, our producer services group concentrates on purchasing from a diversified supply base, while our commercial team seeks to optimize sales to refiners. At the end of 2009, we had access to 3.0 mmbbls of crude oil storage and over the course of the year, marketed approximately 852 mbbls per day.
North American Gas Marketing
The North American natural gas team focuses on key regional markets where we have a strategic presence, equity production, solid customer relationships, in-depth understanding of the market or established physical assets. We capture regional opportunities by managing supply, transportation and storage assets for producers and end users. In addition to the fee-for-service income we realize from managing these assets, we generate further revenue by:
· capitalizing on differences in prices between locations using our transportation assets;
· offering customized service to our customers that bundle our assets with the commodity;
· utilizing our storage assets where we optimize forward and seasonal pricing differences; and
· leveraging regional knowledge we gain through optimizing our assets.
At the end of 2009, we held 1.5 bcf/d of pipeline capacity, primarily between western Canada and the eastern US. We also use storage capacity to store normally cheaper summer gas in the ground until the winter heating season arrives. We had access to 32 bcf of natural gas storage facilities at the end of 2009.
North American Power Marketing
The power team is responsible for optimizing our 50% interest in a 120 MW gas-fired, combined-cycle power generation facility at Balzac, Alberta, as well as our 50% interest in the 70 MW Soderglen wind power operation in southern Alberta. The Balzac facility began operations in 2001 and Soderglen began operations in 2006. We also market the surplus power from the 170 MW cogeneration facility at Long Lake, in which Nexen has a 65% interest, which commenced operations in 2008. We market power to larger commercial, industrial and municipal clients.
Europe
Our European operations include a UK-based European gas and power marketing business. At the end of 2009, we had access to 0.1 bcf/d transportation capacity and 4.2 bcf of storage capacity. Our European marketing operations also market most of our international crude oil proprietary production.
Asia
Our international team in Asia continues to focus on the physical marketing of Masila crude oil. In order to meet customer needs, we occasionally market other regional crude qualities. In addition to our own crude, we sell production for our partners and third parties in the Yemen region.
In 2005, we monetized part of our chemicals business through an initial public offering of the Canexus Income Fund. We currently hold a 65.7% interest in our chemicals business, and continue to fully consolidate chemicals in our Consolidated Financial Statements.
Our chemicals business manufactures sodium chlorate and chlor-alkali products (chlorine, caustic soda and muriatic acid) in Canada and Brazil. This production is sold in North and South America, with some sodium chlorate distributed in Asia. Our manufacturing system is reliable, low-cost and strategically located to capitalize on competitive electricity costs and transportation infrastructure to minimize production and delivery costs.
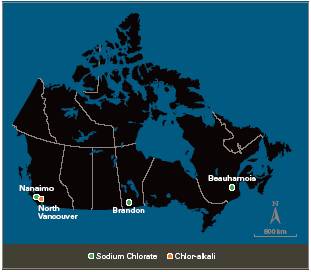
Electricity is the most significant operating cost in producing sodium chlorate and chlor-alkali products. At the end of December 2009, electricity costs were approximately 40% of total cash costs. Therefore, our facilities are strategically located to take advantage of economic power sources. Our second highest cost is transportation. The proximity of our manufacturing plants to major customers and competitive freight rates minimize our transportation costs. Labour is also a significant manufacturing cost. Approximately 55% of our workforce is unionized with collective agreements in place at all of our unionized plants.
To grow value in our chemicals business, we focus on reducing our costs while maintaining market share, building a sustainable North American customer base and capturing new offshore opportunities.
North America
The North American pulp and paper industry consumes approximately 92% of the continent’s sodium chlorate production. We market our sodium chlorate production to numerous pulp and paper mills under multi-year contracts that contain price and volume adjustment provisions. Approximately 29% of this production is sold in Canada, 66% in the US, and the rest is marketed offshore.
We are the third-largest manufacturer of sodium chlorate in North America with three Canadian facilities: Nanaimo, British Columbia; Brandon, Manitoba; and Beauharnois, Quebec.
In 2008, we completed an expansion of our Brandon plant, increasing capacity to over 290,000 tonnes per year. Brandon is the world’s largest sodium chlorate facility and has one of the lowest cost structures in the industry, significantly enhancing our competitive position in North America.
Our chlor-alkali facility at North Vancouver, British Columbia, manufactures caustic soda, chlorine and muriatic acid. Approximately 70% of our caustic soda is consumed by local pulp and paper mills with the balance consumed in water treatment, oil and gas industry applications and general chemical industry applications in the region. Approximately 25% of the chlorine that we produced was sold in the region as hydrochloric acid, primarily to oil and gas, mining/metal fabrication and general industry accounts. The balance of our chlorine is sold to various customers in the polyvinyl, chloride, water purification and petrochemicals industries, primarily in the United States. A technology
conversion project is currently underway at the North Vancouver plant that will replace existing diaphragm technology and assets with newer, proven membrane technology that is expected to be more cost effective and will expand productive capacity by 35%. This project is progressing with committed financing in place through to August 2011. The project is expected to start up in the second quarter of 2010 and should lower our cost structure and solidify our low-cost position in this regional market.
Average Annual Production Capacity
(short tons) |
| 2009 |
| 2008 |
| 2007 |
|
Sodium Chlorate |
|
|
|
|
|
|
|
North America |
| 431,900 |
| 484,800 |
| 450,055 |
|
Brazil |
| 68,563 |
| 68,563 |
| 68,563 |
|
Total |
| 500,463 |
| 553,363 |
| 518,618 |
|
Chlor-alkali |
|
|
|
|
|
|
|
North America |
| 364,500 |
| 364,500 |
| 364,500 |
|
Brazil |
| 109,430 |
| 109,430 |
| 109,430 |
|
Total |
| 473,930 |
| 473,930 |
| 473,930 |
|
Brazil
We entered Brazil in 1999 by acquiring a sodium chlorate plant and a chlor-alkali plant from Aracruz Celulose S.A. (Aracruz), the leading manufacturer of pulp in Brazil. The majority of the sodium chlorate production is sold to Aracruz under a long-term sales agreement that expires in 2024. Most of the chlorine and about 8% of the sodium chlorate production is sold in the merchant market under short-term contracts. In 2002, we completed an expansion at both facilities to meet Aracruz’s growing needs. A 2,000 tonne incremental sodium chlorate expansion project at our Brazil plant was completed in early 2009, with a further 4,400 tonne expansion planned to begin in early 2010. The majority of our electricity needs in Brazil are supplied by a long-term supply contract, which expires in February 2013.
GOVERNMENT AND ENVIRONMENTAL REGULATIONS
Our operations are subject to various levels of government controls and regulations in the countries where we operate. These laws and regulations include matters relating to exploration, production practices, occupational health and safety, environmental protection, midstream and marketing activities. These laws and regulations may increase the cost of doing business and, accordingly, affect profitability. We participate in many industry and professional associations through which our interests in new regulation and legislation are represented, and we monitor the progress of proposed legislation and regulatory amendments.
Laws and regulations change frequently and sometimes unpredictably and we are unable to predict the future costs or impact of compliance. However, we do not expect that any of these laws and regulations will affect our operations materially different than they would any other oil and gas company of similar size and financial strength. We believe our operations comply, in all material respects, with applicable laws and regulations in the various jurisdictions where we operate.
The types of laws and regulation that affect our business most significantly fall into two categories: i) Operational, and ii) Health, Safety and Environment.
OPERATIONAL REGULATIONS
Our oil and gas exploration and production activities are subject to various federal, state, provincial, territorial, local and international laws and regulations. Those laws and regulations affect a number of operational activities including:
· land access;
· acquisition of seismic data;
· location of wells;
· drilling, completion and well servicing;
· transportation, storage and disposal of waste products arising from oil and gas operations;
· land restoration and well abandonment;
· pricing policies;
· royalties;
· various taxes and levies including income tax; and
· foreign trade and investment.
The implications of these laws and regulations to our business include direct costs in the form of: tariffs; fees; taxes; rent; and royalties; and other direct charges measured by the type, region or intensity of activity. Indirect costs also arise from restricted access to certain areas of operation; restrictions on the type, frequency or conduct of permitted oilfield operations; limitations on production rates from certain oil and gas wells; forced pooling of oil and gas interests with third parties; changes in drill spacing units or well densities; infrastructure development; satisfaction of local content obligations for international projects; carried government participation in certain projects; and community consultation.
HEALTH, SAFETY AND ENVIRONMENTAL REGULATIONS
Our oil, gas and chemical operations are subject to various federal, state, provincial, territorial, local and international laws and regulations designed to regulate the impact of human activity on the natural environment and the safety of our worksites. These laws and regulations relate to:
· the types and quantities of substances and waste materials that can be discharged into the environment;
· use or removal of natural resources (such as water and timber) in exploration and production activities;
· abandonment, reclamation and remediation of worksites (including sites of former operations);
· development of emergency and community response plans; and
· implementation of safe work practices for employees and contractors.
We are committed to operating within these laws and regulations and to conducting our business in a safe and environmentally responsible manner.
Environmental regulation is becoming more complex and increasingly stringent. To reduce our risk of non-compliance with these laws, we apply industry standards, codes and best practices that meet or exceed our legal obligations. We conduct activities in countries where environmental regulatory frameworks are in various stages of development. Where regulations do not exist, or where we consider them to be insufficiently developed, we observe Canadian standards where applicable, as well as internationally accepted industry environmental management practices.
Our health, safety, environment and social responsibility group (HSE&SR) helps ensure our worldwide operations are conducted in a safe, ethical and socially responsible manner. Our HSE&SR practices are reported to our board of directors throughout the year. Nexen’s overall HSE&SR program is guided by our corporate HSE&SR management system that incorporates the Responsible Care continual improvement model of Plan, Do, Check, Act and our own 12 guiding elements for divisional performance. For more information on Nexen’s HSE&SR management system refer to our sustainability report available at www.nexeninc.com. For more information on Responsible Care please refer to our sustainability report and www.ccpa.ca.
Our performance against this system is reviewed by an external auditor every three years and we have been recognized by the Goldman Sachs Sustain Report and Dow Jones Sustainability Index (North America) as a sustainability leader. Our progress is publicly reported in our sustainability report.
Environmental Responsibilities and Climate Change
A growing awareness of possible causes and effects of climate change has increased concern over ways the world produces and consumes energy. Government and investor expectations continue to converge on sustainable resource development and responsible operating practices, including the preservation of air, water and land. Some jurisdictions in which we operate have already formalized these expectations into regulation while others move closer to doing so. Regardless of how the jurisdictions in which we operate ultimately define their emissions regulation, we expect that our regulatory obligations and the associated cost of compliance will increase. Due to the uncertainty surrounding the future implementation of emissions regulations, we are unable to estimate our costs of compliance in the future.
As a result of our commitment to sustainable development and responsible operating practices, we believe we are well positioned to meet the challenges of environmental regulation and climate change. We have built a corporate culture of integrity and respect for the communities and environments in which we operate, and have developed policies and practices for continuing compliance with all environmental laws and regulations.
Air
Canada has signed the Copenhagen Accord (Accord) which should allow Canada to set a new base year and further achieve alignment with the United States. The Accord aims to cut emissions so as to maintain projected world temperature increases at less than 2°C. Specific greenhouse gas (GHG) targets are not stipulated, however, developed nations were required to submit targets for 2020 by January 31, 2010. A commitment was made to raise US$30 billion over three years beginning in 2010 and US$100 billion annually starting in 2020 to fund climate change mitigation and adaptation measures in the developing world. The Accord does not include compliance mechanisms and it remains to be seen whether this agreement will become legally binding on participating nations.
Notwithstanding the Accord, obligations under the Kyoto Protocol remain in place. The Kyoto Protocol came into force in 2005 and was ratified by Canada in December 2002. Kyoto provides for a cap-and-trade system which requires participating nations to reduce GHG emissions. Canada committed to an emission reduction of 6% below 1990 levels during the First Commitment period from 2008 to 2012. True-up to Kyoto commitments will not take place until sometime later in 2014.
The Canadian federal government has yet to pass climate change legislation. In 2007, the Canadian federal government introduced a paper titled Regulatory Framework for Air Emissions which proposed that the federal government regulate GHGs and air pollutants beginning as early as 2010, with progressively more stringent reductions applied through 2050. Draft regulations have yet to be released. The federal government’s recent announcements respecting a Clean Energy Dialogue with the United States and their expressed interest in pursuing a bi-lateral cap and trade system with the United States have created further uncertainty about the implementation of the Regulatory Framework for Air Emissions.
In June 2009, the Canadian federal government introduced the Offset System for Greenhouse Gases. Under this program, the Government of Canada will issue offset credits for GHG emission reductions. Companies that are subject to GHG regulations will be able to purchase these credits in order to comply with regulated targets. Final versions of the offset system guidelines have yet to be published.
The Canadian federal government also indicated their intent to regulate air pollutants concurrent with GHGs, but their schedule and long-term objectives remain unclear. In recent months, work has progressed on a federal Comprehensive Air Management System. One of the key features of this system is implementing minimum emission standards for new and existing equipment. We could face technical challenges in meeting these minimum emission standards for certain pollutants. Any required reductions in the GHGs emitted from our operations (without an allowed offset compliance mechanism) could result in increases to our capital or operating expense, or reduced operating rates, especially at the Long Lake project, which could have an adverse effect on our results of operations and financial condition. As a “new facility”, Long Lake will have three years to establish an emissions baseline before having a reduction obligation assigned. In 2009, our Canadian operations, including Syncrude, accounted for 27% of our production before royalties.
Alberta became the first jurisdiction in Canada to enact and implement binding emission reductions (a one-time from base, 12% reduction in carbon intensity) on facilities emitting more than 100 kilo-tonnes of CO2 equivalent. Facilities unable to achieve internal reductions have unlimited ability to pay into a technology fund at the rate of $15 per tonne of CO2 equivalent. This amount must be paid annually until such time as internal reduction is achieved unless other approved offsets are acquired from projects in Alberta.
British Columbia enacted legislation in November 2007 entitled the Greenhouse Gas Reduction Targets Act which targets a 33% reduction in current provincial GHG emissions by 2020. British Columbia is actively engaged in the Western Climate Initiative and recently enacted a GHG reporting regulation. For oil and gas operations, the facility emission reporting threshold is zero (i.e., all facilities must report regardless of size). The province also applied a carbon tax to all hydrocarbon fuels sold in the province. The tax started at $10/tonne CO2 in 2008 and will increase $5 per year until it reaches $30 per tonne.
It remains to be seen if the federal and provincial governments will harmonize their compliance regimes in Canada.
In 2008, the European Union (EU) introduced Phase II of the Emissions Trading Scheme (ETS), which will run until 2012. Under the ETS, member states are required to establish a national allocation plan approved by the EU. The system only covers CO2 from some combustion and flaring activities and member states are allowed to manage allocation across their industrial base as they see fit. Installations have the option of purchasing allowances from other participants in order to meet the cap.
Several regulatory initiatives have recently been introduced in the United States. The proposed bills contemplate an economy-wide cap-and-trade regime to reduce GHG creation. Based on comments by the Canadian government we anticipate that any Canadian climate change regulations will be closely modeled on the United States scheme in both timing and substance. The US Environmental Protection Agency (EPA) has announced its findings that GHGs pose a threat to public health. This finding may lead to further regulations by the EPA under the Clean Air Act. It is unclear if and when these legislative proposals will be passed. To meet our current greenhouse gas (GHG) emissions obligations, we adhere to a four point emissions management strategy:
· reduce direct GHG emissions at our facilities;
· self-generate carbon credits from wind power;
· acquire carbon credits through qualified projects and authorized agencies; and
· participate in eligible international and domestic offset projects.
Water
We have developed a water strategy designed to minimize water use in our exploration and production operations. This strategy is embodied by the following four principles:
· optimize water use efficiency;
· minimize our impacts on ecosystem functions and ensure public health and safety are not affected by our activities;
· engage with stakeholders to promote responsible watershed management and evaluate opportunities to provide water management benefits to stakeholders; and
· measure and communicate our water management performance.
This strategy was implemented in 2009 with an emphasis on compliance and early adoption of best practices, incorporating water assessment tools in our investment decision-making process, developing water management systems to enhance water tracking and reporting, and seeking water re-use opportunities.
Land and Biodiversity
Our land use practices are based upon principles of minimal disturbance and a commitment to return land to its natural state after responsibly producing oil and gas resources. We also recognize our ability to effectively access land directly linked to the way in which we manage potential environmental effects and in how we cooperate with local communities, stakeholders, regulators, and other industries to reduce the cumulative impact of our projects throughout their lifecycle.
For many stakeholders, a company’s ability to meet environmental expectations is a significant criteria upon which their decision to invest or conduct business is based. A failure to meet those expectations can limit access to exploration, development and partnership opportunities. Therefore, we believe that superior environmental and social responsibility performance is directly linked to economic performance.
We have outlined and more fully discussed our environmental practices and policies in our sustainability report, available on our website at www.nexeninc.com.
Environmental Provisions and Expenditures
Meeting the challenges of climate change and environmental regulation and our commitment to sustainable resource development affects all stages of our operations and generally increases their cost. Environmental commitments and regulation can increase the operational or capital cost of operations, delay requisite permits or approvals from issuing authorities, and result in unprofitable or unfavourable operating conditions. During 2009 we incurred both capital and operational expenses, including expenses related to environmental control facilities. Those costs were not material and did not impair our ability to execute our business or operating strategy. We will continue to incur these costs in the future and expect they will be manageable. At December 31, 2009, $1,053 million ($2,341 million, undiscounted, adjusted for inflation) has been provided in our Consolidated Financial Statements for asset retirement obligations.
We had 4,594 employees on December 31, 2009, of which 323 were employed under collective bargaining schemes. Information on our executive officers is presented in Item 10 of this report.
Our operations are exposed to various risks, some of which are common to others in the oil and gas industry and some of which are unique to our operations. Certain risks set out below constitute “forward-looking statements” and the reader should refer to the “Special Note Regarding Forward-Looking Statements” set out on page 96 of this 10-K.
Our profitability and liquidity are highly dependent on the price of crude oil and natural gas.
Our financial performance depends significantly on the price of crude oil and natural gas. Crude oil and natural gas are commodities which are sensitive to numerous worldwide factors, many of which are beyond our control and are generally sold at contract or posted prices. Historically, these prices have been very volatile, and are likely to remain volatile in the future. A shortage of crude oil in 2007 and early 2008 drove oil prices to record highs. Recent worldwide economic conditions depressed demand for commodities and caused commodity prices to weaken significantly in late 2008 and early 2009. These swings in prices significantly affected our results of operations and revenue generated from our oil and gas producing assets. Periods of lower commodity prices may reduce our level of spending for oil and gas exploration and development, and materially and adversely affect our results of operations.
Crude oil prices we receive are based on various reference prices, which generally track the movement of Brent and WTI. Adjustments are made to the reference price to reflect quality differentials and transportation costs. Brent, WTI and other international reference prices are affected by numerous and complex worldwide factors such as supply and demand fundamentals, economic outlooks, production quotas set by the Organization of Petroleum Exporting Countries and geopolitical events.
Weak global economic activity and fragile credit markets may negatively impact our liquidity.
While we generally rely upon cash flow from operations to fund our activities, a sustained reduction in the prices of crude oil and natural gas may require us to rely upon existing credit facilities or issue new debt or equity to satisfy our funding needs. The most recent economic crisis resulted in a tightening of the credit markets, a lower level of liquidity in many financial markets, and volatility in world-wide fixed income, credit, currency and equity markets. There could be follow-on effects as a result of the credit crisis on our business which could negatively impact our liquidity and operations, and which may materially affect our business, including: a reduced ability to access credit markets or issue new public or private debt; higher borrowing costs; lower returns on invested cash; and, a negative change to our ratings outlook or a reduction of our credit ratings by one or more credit-rating agencies. A credit rating downgrade could limit our access to private and public credit markets and increase the costs of borrowing under existing facilities. In addition, if our credit ratings were downgraded, we could be required to provide additional liquidity to support our energy marketing division as further collateral may be required by our counterparties, or we may also be required to reduce some of our energy marketing activities.
The inability of counterparties and joint operating partners to fulfill their obligations to us could adversely impact our results of operations.
Credit risk arises from the sale of production and products our energy marketing group buys for resale, from financial contracts we acquire for hedging and trading purposes and from our joint venture partners for their share of capital and operating costs where we operate. There is the risk of loss and additional burden for amounts in excess of available remedies if counterparties or joint venture partners do not or cannot fulfill their contractual obligations. The recent credit crisis in 2008 and 2009 that impacted world financial
markets and depressed oil and gas prices caused some of our counterparties to restructure, declare bankruptcy or sell assets to fund liquidity requirements. We incurred some losses in 2008 from counterparties facing such difficulties, as described in our financial statements. In the future, we may experience similar losses. Most of our receivables and partners are with counterparties in the energy industry and are subject to normal industry credit risk. The inability of any one or more of these parties to fulfill their obligations to us may adversely impact our results of operations.
Increased environmental regulation could increase our operating costs and affect profitability.
Our oil, gas and chemical operations are subject to various federal, state, provincial, territorial, local and international laws and regulations designed to regulate the impact of human activity on the natural environment. Those laws and regulations govern, amongst other things:
· the types and quantities of substances and waste materials that may be discharged into the environment;
· the use or removal of natural resources (such as water and timber) in exploration and production activities;
· the release of greenhouse gases, such as carbon dioxide and methane, into the atmosphere;
· the protection of endangered species;
· the abandonment, reclamation and remediation of worksites (including sites of former operations); and
· the issuance of permits and other regulatory approvals in connection with exploration, drilling and production activities.
These laws and regulations may impose significant liabilities on a failure to comply with their requirements. Significant changes in the environmental laws and regulations governing our current operations, including many of the proposed initiatives to regulate greenhouse gas emissions, may have an adverse effect on the oil and gas industry. The cost of meeting new environmental and climate change regulations may have an adverse effect on the viability of future projects, our results of operations, cash flows, and financial condition.
Competitive forces may limit our access to natural resources, and create labour and equipment shortages.
The oil and gas industry is highly competitive, particularly in the following areas:
· gaining access to areas or countries known to have available resources;
· searching for and developing new sources of crude oil and natural gas reserves;
· constructing and operating crude oil and natural gas pipelines and facilities; and
· transporting and marketing crude oil, natural gas and other petroleum products.
Our competitors include national oil companies, major integrated oil and gas companies and various other independent oil and gas companies. The petroleum industry also competes with other industries in supplying energy, fuel and related products to customers. The pulp and paper chemicals market is also highly competitive. Key success factors in each of these markets are price, product quality, logistics and reliability of supply.
Competitive forces may result in shortages of; i) prospects to drill; ii) labour; iii) drilling rigs and other equipment to carry out exploration, development or operating activities; and iv) shortages of infrastructure to produce and transport production. It may also result in an oversupply of crude oil and natural gas. Each of these factors could negatively impact our costs and prices and, therefore, our financial results.
We operate in harsh and unpredictable climates and locations where our access is regulated which could adversely impact our operations.
Some of our facilities are located in harsh and unpredictable climates and locations which can experience extreme weather conditions and natural disasters such as: sustained ambient temperatures above 40°C or below -35°C, flooding, droughts, wind and dust storms, difficult terrain, high seas, monsoons and hurricanes. These conditions are difficult to anticipate and cannot be controlled. In these conditions, operations can become difficult or unsafe and are often suspended. Some of our facilities and those which our facilities rely upon (such as pipelines, power, communications and oil field equipment) are vulnerable to these types of
extreme weather conditions and may suffer extensive damage as a result. If any such extreme weather were to occur, our ability to operate certain facilities and proceed with exploration or development programs could be seriously or completely impaired or destroyed, and could have a material adverse effect on our business, financial condition and results of operations. The insurance we maintain may not be adequate to cover our losses resulting from disasters or other business interruptions.
In some areas of the world, access and operations can only be conducted during limited times of the year due to weather or government regulation. These adverse conditions can limit our ability to operate in those areas and can intensify competition during periods of good weather for oil field equipment, services and qualified personnel, which may lead to periodic shortages. These constraints and the resulting shortages or high costs could delay our operations and materially increase our operating and capital costs, and could have a material adverse effect on our business, financial condition and results of operations. Changing weather patterns may increase the frequency, intensity or duration of these weather conditions, and accordingly exacerbate their impacts on our operations.
Exploration, development and production activities may not be successful and carry a risk of loss.
Acquiring, developing and exploring for oil and natural gas involves many risks. There is a risk that we will not encounter commercially productive oil or gas reservoirs, and that the wells we drill may not be productive, or not sufficiently productive to recover a portion or all of our investment. Seismic data and other exploration technologies we use do not provide conclusive proof prior to drilling a well that crude oil or natural gas is present or may be produced economically. The costs of drilling, completing and operating wells are often uncertain, and drilling operations may be extended, curtailed, delayed or canceled as a result of a variety of factors, including:
· encountering unexpected formations or pressures;
· blow-outs, well bore collapse, equipment failures and other accidents;
· craterings and sour gas releases;
· accidents and equipment failures;
· uncontrollable flows of oil, natural gas or well fluids; and
· environmental risks.
We may not achieve production targets should our reservoir production decline sooner than expected. Also, we operate two facilities that are located in close proximity to populated areas, and each processes materials of potential harm to the local populations. We may not be fully insured against all of these risks. Losses resulting from the occurrence of these risks may materially impact our operational activities and financial results.
Unconventional gas resource plays carry additional risks and uncertainties.
Part of Nexen’s growth strategy is to invest in unconventional Canadian gas resource plays, such as CBM and shale gas. Exploitation techniques and practices for these resources in Canada generally remain in the early stages of development and it is difficult to determine whether or not these resource plays will prove commercially viable, to what degree or when.
CBM is commonly referred to as an unconventional form of natural gas because it is primarily stored through adsorption by the coal itself rather than in the pore space of the rock like most conventional gas. The gas is released in response to a drop in pressure in the coal seam. Some of the uncertainties associated with development of CBM resources are as follows:
· if the coalbed is water saturated, such as the Mannville coals in the Fort Assiniboine region of Alberta, water generally needs to be extracted to reduce the pressure and allow gas production to occur. A significant period of time may be required to dewater these wet coals and determine if commercial production is feasible. We may also have to invest significant capital in these assets before they achieve commercial rates of production, if ever;
· some coalbeds may not have sufficient natural permeability in the coalbed to recover the gas in place and can therefore require more extensive, and expensive, completion technologies which can increase the cost of drilling and production or which may not be successful;
· the public may react negatively to certain water disposal practices related to water-saturated CBM projects, even though these water disposal practices are regulated to
ensure public safety and water conservation. Negative public perception around water-saturated CBM production could impede our access to the resource;
· CBM wells typically have lower producing rates and reserves per well than conventional gas wells, although this varies by area; and
· regulatory approval is required to drill more than one well per section. As a result, the timing of drilling programs and land development can be uncertain.
Shale gas is an unconventional gas produced from reservoirs composed of organic rich shales. The gas is stored in pore spaces, fractures or adsorbed into organic matter. Some of the uncertainties associated with development of shale gas resources are as follows:
· shale gas wells typically have higher initial production decline rates and lower producing rates, and reserves per well than conventional gas wells, although this varies by area;
· regulatory approval is required to drill more than one well per section. As a result, the timing of drilling programs and land development can be uncertain;
· shales are typically less permeable than conventional gas reservoirs, and can therefore require more extensive, and expensive, completion technologies which can increase costs or which may not be successful;
· seasonal access to certain areas may limit activities or increase competition for equipment and/or qualified personnel;
· lack of access to regional infrastructure for the sale of production; and
· significant capital expenditures are required before establishing commerciality of a particular play.
Our heavy oil production is more expensive and yields lower prices than light oil.
Heavy oil is characterized by high specific gravity or weight and high viscosity or resistance to flow. Because of these features, heavy oil is more difficult and expensive to extract, transport and refine than other types of oil. Heavy oil typically yields a lower price relative to light oil and gas, as a smaller percentage of high-value petroleum products can be refined from heavy oil. As a result, our heavy oil operations are exposed to the following risks:
· additional costs may be incurred to purchase diluent to transport heavy oil;
· there could be a shortfall in the supply of diluent which may cause its price to increase; and
· the market for heavy oil is more limited than for light oil making it more susceptible to supply and demand fundamentals which may cause the price to decline.
Any one or a combination of these factors could cause some of our heavy oil properties to become uneconomic to produce and/or result in negative reserve revisions.
Without reserve additions, our reserves and production will decline over time and we require capital to produce remaining reserves.
Our future crude oil and natural gas reserves and production, and therefore our future operating cash flows and results of operations, are highly dependent upon our success in exploiting our current reserves and acquiring or discovering additional reserves in the future. Without reserve additions through exploration, development or acquisitions, our reserves and production will decline over time as reserves are produced. The business of exploring for, developing or acquiring reserves is capital intensive. To the extent cash flows from operations are insufficient and external sources of capital become limited or unavailable, our ability to make the necessary capital investments to maintain and expand our oil and natural gas reserves and production may be impaired.
Discovered oil and natural gas accumulations are generally only produced when they are economically recoverable. As such, oil and gas prices, and capital and operating costs have an impact on whether accumulations will ultimately be produced. As required by SEC rules, our reserves represent the quantities that we expect to economically recover using existing prices and costs held constant. Reserves can increase or decrease under different price and cost scenarios.
Our reserves include undeveloped properties that require additional capital to bring them on stream.
Under SEC rules, proved and probable oil and gas reserves include undeveloped reserves that are expected to be recovered from new wells on undrilled acreage or from existing wells where a relatively major expenditure is still required before such wells begin production. Reserves may be recognized when plans are in place to make the required investments to convert these undeveloped reserves to producing. Circumstances such as a sustained decline in commodity prices or poorer than expected results from initial activities could cause a change in the investment or development plans which could result in a material change in our reserves estimates. At December 31, 2009, 45% of our proved reserves before royalties (45% after royalties) were undeveloped largely reflecting oil sands reserves which will be developed as required to keep the related upgrader full.
Our oil sands projects face additional risks compared to conventional oil and gas production.
Phase 1 of our Long Lake oil sands development is a fully integrated production, upgrading and cogeneration facility. We are using SAGD technology to recover bitumen from oil sands. The bitumen is partially upgraded using our proprietary OrCrude™ process, followed by conventional hydrocracking to produce a sweet, light, premium synthetic crude oil. The OrCrude™ process also yields liquid asphaltenes that are gasified into synthetic gas. This gas is used as fuel for the SAGD process, a source of hydrogen in the upgrading process, and to generate electricity through a cogeneration facility.
We have a 65% working interest in this project. Given the initial investment and operating costs to produce and upgrade bitumen, the payout period for the project is longer and the economic return is lower than a conventional light oil project with an equal volume of reserves.
In addition to the risks associated with heavy oil production stated above, risks associated with our Long Lake project include the following:
APPLICATION OF RELATIVELY NEW SAGD BITUMEN RECOVERY PROCESS
SAGD has been used in western Canada to increase recoveries from conventional heavy oil reservoirs for over a decade; however, application of SAGD to the insitu recovery of bitumen from oil sands is relatively new. Some of the SAGD oil sands applications to date have been pilot projects, although several commercial SAGD projects have been in operation for over seven years.
Our estimates for performance and recoverable volumes for the Long Lake project are based primarily on our three well-pair SAGD pilot, the initial performance of our first commercial well phase, and industry performance from SAGD operations in similar reservoirs in the McMurray formation in the Athabasca oil sands. Using this data, our development assumptions included average well-pair productivity of 900 bbls/d of bitumen and a long-term steam-to-oil ratio within a plant capacity of 3.3. While some of our wells have achieved these levels to date, there can be no certainty that these wells will maintain these levels or that our overall SAGD operation will produce bitumen at the expected levels or steam-to-oil ratio. If the assumed production rates or steam-to-oil ratio are not achieved, we might have to drill additional wells to maintain optimal production levels, construct additional steam generating capacity, purchase natural gas for additional steam generation, and/or make short-term bitumen purchases. These could have an adverse impact on the future activities and economic return of the Long Lake project.
APPLICATION OF NEW BITUMEN UPGRADING PROCESS
The proprietary OrCrude™ process we are using to upgrade raw bitumen to synthetic crude is the first commercial application of the process although we have operated it in a 500 bbls/d demonstration plant. Initial upgrader operations began in January 2009. There is no certainty that the commercial upgrader at Long Lake will sustain or achieve the results which are now being seen or forecast. If we are unable to continue to upgrade the bitumen for any reason, we may decide to sell the bitumen directly to third parties without upgrading, which would expose us to the following risks:
· the market for bitumen may be limited;
· additional costs would be incurred to purchase diluent for blending and transporting bitumen;
· there could be a shortfall in the supply of diluent which may cause its price to increase;
· the market price for bitumen is relatively low reflecting its quality differential;
· the market price for bitumen fluctuates; and
· additional costs would be incurred to purchase natural gas for use in generating steam for the SAGD process since we would not be producing syngas from the upgrading process.
These factors could have a significant adverse impact on the future activities and economic returns of the Long Lake project.
If any of these factors arise, our operating costs would increase and our revenues would decrease from those we have assumed. This would materially decrease expected earnings from the project and the project may not be profitable under these conditions.
DEPENDENCE UPON PROPRIETARY TECHNOLOGY
The success of the Long Lake project and our investment depends highly on the proprietary technology of OPTI and proprietary technology of third parties that has been, or is required to be, licensed for the project. OPTI and Nexen rely on intellectual property rights and other contractual or proprietary rights, including (without limitation) copyright, trademark laws, trade secrets, confidentiality procedures, contractual provisions, licenses and patents, to secure the rights to utilize OPTI’s proprietary technology and the proprietary technology of third parties. OPTI and Nexen may have to engage in litigation to protect the validity of its patents or other intellectual property rights, or to determine the validity or scope of patents or proprietary rights of third parties. Litigation can be time-consuming and expensive, whether successful or not. The process of seeking patent protection can itself be long and expensive, with no assurance that any pending or future patent applications of OPTI or such third parties will actually result in issued patents, or that, if patents are issued, they will be of sufficient scope or strength to provide meaningful protection or any commercial advantage to OPTI. Others may develop technologies that are similar or superior to: i) the technology of OPTI or third parties; or ii) the design around the patents owned by OPTI and/or third parties.
OPERATIONAL HAZARDS
The operation of the project is subject to the customary hazards of recovering, transporting and processing hydrocarbons, such as fires, explosions, gaseous leaks, migration of harmful substances, blowouts and oil spills. A casualty occurrence might result in the loss of equipment or life, as well as injury or property damage. We may not carry insurance with respect to all potential casualty occurrences and disruptions, and our insurance may not sufficiently cover casualty occurrences or disruptions that occur. The Long Lake project could be interrupted by natural disasters or other events beyond our control. Losses and liabilities arising from uninsured or under-insured events could have a material adverse effect on the Long Lake project and on our business, financial condition and results of operations.
Recovering bitumen from oil sands and upgrading the recovered bitumen into synthetic crude oil and other products involve particular risks and uncertainties. The Long Lake project is susceptible to loss of production, slowdowns or restrictions on its ability to produce higher-value products due to the interdependence of its component systems. Severe climatic conditions can cause reduced production and in some situations result in higher costs. SAGD bitumen recovery facilities and development and expansion of production can entail significant capital outlays. The costs associated with synthetic crude oil production are largely fixed and, as a result, operating costs per unit depend largely on production levels.
The Long Lake project is designed to process large volumes of hydrocarbons at high-pressure and temperatures and also handles large volumes of high-pressure steam. Equipment failures could result in damage to the project’s facilities and liability to third parties against which we may not be able to fully insure or may elect not to insure because of high premium costs or for other reasons.
Certain components of the Long Lake project produce sour gas, which is gas containing hydrogen sulphide and carbon monoxide. Sour gas is a colourless, corrosive gas that is toxic at relatively low levels to plants and animals, including humans. Carbon monoxide is a colourless, odorless and tasteless gas which is toxic at relatively low levels to humans and animals. The project includes integrated facilities for handling and treating the sour gas and for consuming the carbon monoxide as a fuel, including the use of gas sweetening units, sulphur recovery systems and emergency flaring systems. Failures or leaks from these systems or other exposure to sour gas produced as part of the project could result in damage to other equipment, liability to third parties, adverse effect to humans, animals and the environment, or the shutdown of operations.
The Long Lake project produces carbon dioxide emissions. Risk factors relating to environmental regulation are provided separately in this document.
ABORIGINAL CLAIMS
Aboriginal peoples have claimed aboriginal title and rights to a substantial portion of western Canada. Certain aboriginal peoples have filed a claim against the Government of Canada, the Province of Alberta, certain governmental entities and the regional municipality of Wood Buffalo (which includes the city of Fort McMurray, Alberta) claiming, among other things, aboriginal title to large areas of lands surrounding Fort McMurray, including the lands on which the Long Lake project and most of the other oil sands operations in Alberta are located. Such claims, if successful, could have a significant adverse effect on the Long Lake project and on us.
PUBLIC PERCEPTION OF OIL SANDS DEVELOPMENT
Development of the Athabasca oil sands has figured prominently in recent political, media and activist commentary on the subject of climate change and greenhouse gas emissions. Public perceptions of greenhouse gas emissions, and water and land use practices in oil sands developments may directly or indirectly impair the profitability of our current oil sands projects and the viability of future oil sands projects in a number of ways, including:
· creating significant regulatory uncertainty that challenges economic modeling of future projects and delays sanctioning;
· motivating extraordinary environmental and emissions regulation of those projects by governmental authorities that could result in changes to facility design and operating requirements, thereby potentially increasing the cost of construction, operation and abandonment; and
· compelling legislation or policy that limits the purchase of crude oil produced from the Athabasca oil sands by governments or other institutional consumers that, in turn, limits the world market for this crude oil and reduces its price.
These perceptions may also impair our corporate reputation and limit our ability to access land and joint venture opportunities in other jurisdictions throughout the world.
Some of our production is concentrated in a few producing assets.
A significant portion of our current and future production is generated from highly productive individual wells or central production facilities. Examples include:
· Buzzard and Scott production platforms in the North Sea;
· central processing facilities, oil pipelines, and export terminal at our Yemen operations;
· our Long Lake synthetic crude oil operation in the Athabasca oil sands; and
· upgrading facilities at Syncrude in the Athabasca oil sands.
As significant production is generated from each asset, any single event that interrupts one of these operations could result in the loss of production.
Our energy marketing operations expose us to the risk of trading losses and liquidity constraints.
Our marketing operations expose us to the risk of financial losses from various sources which may have a material adverse effect on our financial performance. The commodity markets in which we trade have experienced unanticipated volatility relative to historical variances in the last 18 months, resulting in unusual and significant pricing changes, and
deviations from anticipated seasonal pricing trends and pricing levels. Our energy marketing team maintains a portfolio comprised of long and short physical and financial positions, which may be significant in size or number at any time. This portfolio of positions is managed based on a trading thesis for expected future pricing levels and trends in forward or regional markets. Unanticipated volatility in commodity price levels and trends upon which those positions are based may cause a position to decrease in value. The transportation and storage assets and contracts undertaken by our energy marketing business may decrease in value due to changes in temporal and regional commodity pricing.
Significant changes in the commodities and financial markets could require us to provide additional liquidity if additional collateral is required to be placed with counterparties, or we may also be required to reduce some of our energy marketing activities. Adverse credit-related events such as a downgrade of our credit rating to non-investment grade could require additional collateral to be placed with counterparties. Adverse broad-based industry credit-related events could also negatively affect trading counterparties who fail to fulfill their contractual obligations.
Use of marine transportation may expose us to the risk of financial loss and damaged reputation.
From time to time, we may choose to charter marine vessels for the transportation of crude oil. This may expose us to the risk of financial loss and damaged reputation in the event of oil spills.
We operate in countries with political, economic and security risks.
We operate in numerous countries, some of which may be considered politically and economically unstable. A portion of our revenue is derived from operations in these countries. As a result, our financial condition and operating results could be significantly affected by risks associated with international activities, including:
· civil unrest and general strikes;
· political instability, the risk of war and acts of terrorism;
· taxation policies, including royalty and tax increases and retroactive tax claims, and investment restrictions;
· expropriation or forced renegotiation or modification of existing contracts;
· exchange controls, currency fluctuations, devaluation or other activities that limit or disrupt markets and restrict payments or the movement of funds;
· the possibility of being subject to exclusive jurisdiction of foreign courts in connection with legal disputes relating to licenses to operate and concession rights in countries where we currently operate; and
· difficulties in enforcing our rights against a governmental agency because of the doctrine of sovereign immunity and foreign sovereignty over international operations.
The impact that future potential terrorist attacks or regional hostilities may have on the oil and gas industry, and on our operations in particular, is not known at this time. Uncertainty surrounding military strikes or a sustained military campaign may affect operations in unpredictable ways, including disruptions of fuel supplies and markets, particularly crude oil, and the possibility that infrastructure facilities, including pipelines, production facilities, processing plants and refineries, could be direct targets of, or indirect casualties of, an act of terror or war. We may be required to incur significant costs in the future to safeguard our assets against terrorist activities or to remediate potential damage to our facilities. There can be no assurance that we will be successful in protecting ourselves against these risks and the related financial consequences.
We may be affected by changes in government rules and regulations.
Our operations are subject to various levels of government controls and regulations in the countries where we operate. These laws and regulations include matters relating to land tenure, drilling, production practices, environmental protection (as discussed above), marketing and pricing policies, royalties, various taxes and levies including income tax, and foreign trade and investment, that are subject to change from time to time. Current legislation is generally a matter of public record, and we cannot predict what additional legislation or amendments may be proposed that will affect our operations or when any such proposals, if enacted, might become effective. Changes in government laws and regulations could adversely affect our results of operations and financial condition.
Unresolved Staff Comments
There are no unresolved staff comments with the SEC.
There are lawsuits and claims pending against Nexen, the ultimate results of which cannot be ascertained at this time. Management is of the opinion that any amounts assessed against us would not have a material adverse effect on our consolidated financial position or results of operations. We believe we have made adequate provisions for such lawsuits and claims.
Certain of our US oil and gas operations have received, over the years, notices and demands from the US Environmental Protection Agency (EPA), state environmental agencies, and certain third parties for certain sites seeking to require investigation and remediation under federal or state environmental statutes. In addition, notices, demands, and lawsuits have been received for certain sites related to historical operations and activities in the US for which, although no assurances can be made, we believe that certain assumption and indemnification agreements protect our US operations from any present or future material liabilities that may arise from these particular sites.
Submission of Matters to a Vote of Security Holders
No matters were submitted to a vote of Nexen’s security holders during the fourth quarter of 2009.
Market for the Registrant’s Common Equity, Related Stockholder Matters and Issuer Purchases of Equity Securities
Nexen’s common shares are traded on the Toronto Stock Exchange (TSX) and the New York Stock Exchange (NYSE) under the symbol NXY.
On December 31, 2009, there were 1,725 registered holders of common shares and 522,915,843 common shares outstanding. The number of registered holders of common shares is calculated excluding individual participants in securities positions listings. During the year, we made no purchases of our own equity securities.
Trading Range of Nexen’s Common Shares
|
| TSX (Cdn$) |
| NYSE (US$) |
| ||||
($/share) |
| High |
| Low |
| High |
| Low |
|
2009 |
|
|
|
|
|
|
|
|
|
First Quarter |
| 24.24 |
| 14.86 |
| 20.61 |
| 11.89 |
|
Second Quarter |
| 28.54 |
| 20.65 |
| 26.25 |
| 16.33 |
|
Third Quarter |
| 25.94 |
| 20.70 |
| 24.43 |
| 18.68 |
|
Fourth Quarter |
| 27.31 |
| 22.26 |
| 26.05 |
| 20.66 |
|
2008 |
|
|
|
|
|
|
|
|
|
First Quarter |
| 34.20 |
| 26.00 |
| 34.57 |
| 25.11 |
|
Second Quarter |
| 43.45 |
| 29.69 |
| 42.71 |
| 28.87 |
|
Third Quarter |
| 41.47 |
| 21.12 |
| 40.99 |
| 20.56 |
|
Fourth Quarter |
| 29.10 |
| 13.33 |
| 23.99 |
| 10.81 |
|
Quarterly Dividends Declared on Common Shares
(Cdn$/share) |
| First |
| Second |
| Third |
| Fourth |
|
2009 |
| 0.050 |
| 0.050 |
| 0.050 |
| 0.050 |
|
2008 |
| 0.025 |
| 0.050 |
| 0.050 |
| 0.050 |
|
Payment date for dividends was the first day of the next quarter. All dividends paid to holders of common shares in 2009 have been designated as “eligible dividends” for Canadian tax purposes. This designation will apply to all such dividends paid in the future unless otherwise notified by us.
The Income Tax Act of Canada requires us to deduct a withholding tax from all dividends remitted to non-residents. According to the Canada-US Tax Treaty, we have deducted a withholding tax of 15% on dividends paid to residents of the United States, except in the case of a company that owns at least 10% of the voting stock, where the withholding tax is 5%.
The Investment Canada Act requires that a “non-Canadian”, as defined, file notice with Investment Canada and obtain government approval prior to acquiring control of a Canadian business, as defined. Otherwise, there are no limitations, either under the laws of Canada or in Nexen’s charter on the right of a non-Canadian to hold or vote Nexen’s securities.
The following is a table of securities authorized for issuance under equity compensation plans as of December 31, 2009.
Plan Category |
| Number of Securities to |
| Weighted-Average |
| Number of |
|
Equity compensation plans approved by shareholders |
| 23,130,414 |
| $25/option |
| 26,283,536 |
|
Equity compensation plans not approved by shareholders |
| — |
| — |
| — |
|
Total |
| 23,130,414 |
| $25/option |
| 26,283,536 |
|
See page 178 for a graph showing the change in a $100 investment in Nexen common shares over the past five years, compared to the S&P/TSX Composite Index, the S&P/TSX Energy Sector Index and the S&P/TSX Oil & Gas Exploration & Production Index as at December 31, 2009.
On February 3, 2000, at a Special Meeting of Shareholders, a Shareholder Rights Plan was approved. On May 2, 2002, at the Annual General and Special Meeting of Shareholders, an Amended and Restated Shareholder Rights Plan (Plan) was approved. According to the Plan, a right is attached to each present and future outstanding common share, entitling the holder to acquire additional common shares during the term of the right. Prior to the separation date, the rights are not separable from the common shares, and no separate certificates are issued. The separation date would typically occur at the time of an unsolicited takeover bid, but our board can defer the separation date.
Rights created under the Plan, which can only be exercised when a person acquires 20% or more of our common shares (a Flip-In Event), entitle each shareholder, other than the 20% buyer, to acquire additional common shares at one-half of the market price at the time of exercise. The Plan must be reapproved by shareholders on or before our annual general meeting in 2011 to remain effective past that date. A copy of the Plan is available on our website at www.nexeninc.com.
Selected Financial Data
Five-Year Summary of Selected Financial Data in Accordance with US GAAP
(Cdn$ millions, except otherwise indicated) |
| 2009 |
| 2008 |
| 2007 |
| 2006 |
| 2005 |
|
|
|
|
|
|
|
|
|
|
|
|
|
Oil & Gas Production |
|
|
|
|
|
|
|
|
|
|
|
Production before Royalties (mboe/d)1 |
| 243 |
| 250 |
| 254 |
| 212 |
| 242 |
|
Production after Royalties (mboe/d)1 |
| 213 |
| 210 |
| 207 |
| 156 |
| 173 |
|
|
|
|
|
|
|
|
|
|
|
|
|
Results of Operations |
|
|
|
|
|
|
|
|
|
|
|
Revenue |
|
|
|
|
|
|
|
|
|
|
|
Oil & Gas2 |
| 4,447 |
| 6,907 |
| 5,174 |
| 3,656 |
| 3,535 |
|
Marketing |
| 967 |
| 522 |
| 926 |
| 1,373 |
| 864 |
|
Chemicals |
| 508 |
| 427 |
| 447 |
| 413 |
| 413 |
|
Other |
| (130 | ) | 364 |
| (26 | ) | (47 | ) | (193 | ) |
Total Revenue |
| 5,792 |
| 8,220 |
| 6,521 |
| 5,395 |
| 4,619 |
|
|
|
|
|
|
|
|
|
|
|
|
|
Net Income from Continuing Operations |
| 507 |
| 1,704 |
| 1,012 |
| 579 |
| 658 |
|
Basic Earnings per Common Share from Continuing Operations ($/share) |
| 0.97 |
| 3.24 |
| 1.92 |
| 1.10 |
| 1.26 |
|
Diluted Earnings per Common Share from Continuing Operations ($/share) |
| 0.97 |
| 3.20 |
| 1.88 |
| 1.08 |
| 1.23 |
|
Net Income |
| 507 |
| 1,704 |
| 1,012 |
| 579 |
| 1,110 |
|
Basic Earnings per Common Share ($/share) |
| 0.97 |
| 3.24 |
| 1.92 |
| 1.10 |
| 2.13 |
|
Diluted Earnings per Common Share ($/share) |
| 0.97 |
| 3.20 |
| 1.88 |
| 1.08 |
| 2.08 |
|
|
|
|
|
|
|
|
|
|
|
|
|
Financial Position |
|
|
|
|
|
|
|
|
|
|
|
Total Assets |
| 22,781 |
| 22,048 |
| 17,982 |
| 17,079 |
| 14,493 |
|
Long-Term Debt3 |
| 7,251 |
| 6,578 |
| 4,610 |
| 4,618 |
| 3,630 |
|
Equity |
| 7,420 |
| 6,998 |
| 5,449 |
| 4,614 |
| 3,961 |
|
Capital Investment, including Acquisitions |
| 3,497 |
| 3,066 |
| 3,401 |
| 3,408 |
| 2,638 |
|
Dividends per Common Share ($/share)4 |
| 0.20 |
| 0.175 |
| 0.10 |
| 0.10 |
| 0.10 |
|
Common Shares Outstanding (thousands)5 |
| 522,916 |
| 519,449 |
| 528,305 |
| 525,026 |
| 522,281 |
|
1 In 2005, we sold producing properties in Canada. In early 2007, the Buzzard field came on stream and offset declines from Masila in Yemen.
2 In the third quarter of 2005, we sold Canadian conventional oil and gas properties in Saskatchewan, British Columbia and Alberta producing 18,300 bbls/d. The results of these operations were shown as discontinued operations.
3 Our North Sea asset acquisition credit facility was repaid in 2005 with proceeds from the issuance of US$1.04 billion in senior notes in the first quarter and from asset dispositions in the third quarter. Our long-term debt increased in 2006 as a result of our capital investments, primarily at Buzzard and Long Lake. In May 2007, we issued US$1.5 billion of senior notes with US$250 million maturing in 10 years and US$1,250 million maturing in 30 years. In June 2009, we filed a universal base shelf prospectus in the US and Canada allowing us to potentially raise US$3.5 billion of debt, equity or other hybrid securities, should the need arise. In July 2009, we issued US$1 billion of senior notes with US$300 million maturing in 10 years and US$700 million maturing in 30 years.
4 Quarterly dividends were increased to 5¢ per share in the second quarter of 2008.
5 During the third quarter of 2008, we received approval from the TSX for a Normal Course Issuer Bid that allowed us to repurchase up to a maximum of 52,914,046 common shares for the period of August 6, 2008 to August 5, 2009. In 2008, we repurchased and cancelled 12,136,900 common shares for $338 million.

| |||
|
| ||
Item 7: Management’s Discussion and Analysis of Financial Condition and Results of Operations |
| ||
|
|
| |
| The following should be read in conjunction with the Consolidated Financial Statements included in this report. The Consolidated Financial Statements have been prepared in accordance with generally accepted accounting principles (GAAP) in Canada. The impact of significant differences between Canadian and United States (US) accounting principles on the financial statements is disclosed in Note 21 to the Consolidated Financial Statements. The date of this discussion is February 17, 2010. Unless otherwise noted, tabular amounts are in millions of Canadian dollars. Oil and gas volumes, reserves and related performance measures are presented on a working interest before-royalties basis. We measure our performance in this manner consistent with other Canadian oil and gas companies. Where appropriate, we have provided information on an after-royalty basis in tabular format. | ||
|
| ||
| 1 | Investors should read the Special Note Regarding Forward-Looking Statements on page 96. | |
| 2 | Canadian investors should read the Special Note to Canadian Investors on page 97 which highlights differences between our reserve estimates and related disclosures that are otherwise required by Canadian regulatory authorities. | |
|
|
|
|
| 51 | ||
| 53 | ||
|
| ||
| 58 | ||
|
| ||
| 59 | ||
| 62 | ||
| 65 | ||
| 67 | ||
| 69 | ||
| 70 | ||
| 72 | ||
| 75 | ||
| 76 | ||
| 79 | ||
| 80 | ||
| 87 | ||
| 89 | ||
|
|
| |
Item 7A: Quantitative and Qualitative Disclosures about Market Risk |
| ||
| 92 | ||
| 94 | ||
| 95 | ||
| 96 | ||
| 97 | ||
ITEM 7.
Management’s Discussion and Analysis of Financial Condition and Results of Operations
The following should be read in conjunction with the Consolidated Financial Statements included in this report. The Consolidated Financial Statements have been prepared in accordance with generally accepted accounting principles (GAAP) in Canada. The impact of significant differences between Canadian and United States (US) accounting principles on the financial statements is disclosed in Note 21 to the Consolidated Financial Statements. The date of this discussion is February 17, 2010. Unless otherwise noted, tabular amounts are in millions of Canadian dollars. Oil and gas volumes, reserves and related performance measures are presented on a working interest before royalties basis. We measure our performance in this manner consistent with other Canadian oil and gas companies. Where appropriate, we have provided information on an after royalty basis in tabular format.
Investors should read the Special Note Regarding Forward-Looking Statements on page 96. Canadian investors should read the Special Note to Canadian Investors on page 97 which highlights differences between our reserve estimates and related disclosures that are otherwise required by Canadian regulatory authorities.
2009 Results
(Cdn$ millions, except as stated) |
| 2009 |
| 2008 |
| 2007 |
|
Production before Royalties (mboe/d)1 |
| 243 |
| 250 |
| 254 |
|
Production after Royalties (mboe/d) |
| 213 |
| 210 |
| 207 |
|
Cash Flow from Operating Activities |
| 1,886 |
| 4,354 |
| 2,830 |
|
Net Income |
| 536 |
| 1,715 |
| 1,086 |
|
Earnings per Common Share, Basic ($/share) |
| 1.03 |
| 3.26 |
| 2.06 |
|
Net Debt2 |
| 5,551 |
| 4,575 |
| 4,404 |
|
1 Production before royalties reflects our working interest before royalties. We have presented our working interest before royalties as we measure our performance on this basis consistent with other Canadian oil and gas companies.
2 Long-term debt and short-term borrowings less cash and cash equivalents.
In 2009, we generated cash flow from operating activities of $1.9 billion and net income of $536 million. The decline from the prior year was primarily due to lower commodity prices as WTI averaged US$61.80/bbl for the year, down 38% from 2008. WTI started the year at approximately US$46/bbl before recovering to almost US$80/bbl by the end of 2009. Dated Brent decreased 37% to average US$61.51/bbl over the same period. The impact of lower commodity prices was partially offset by changes in the US/Canadian foreign exchange rate, which averaged 88 cents in 2009 as compared to 94 cents last year.
Production before royalties averaged 243,000 boe/d in 2009, 3% below last year’s volumes. At Buzzard, planned downtime reduced our production, while in Yemen our fields continued to mature. These decreases were partially offset by the start-up of the Ettrick field in the UK North Sea, the Longhorn field in the US Gulf of Mexico and higher bitumen production at Long Lake. Our production after royalties increased slightly over last year as a result of lower royalty rates on our Canadian gas production and higher Long Lake bitumen volumes. Production after royalties increased slightly to average 213,000 boe/d, as higher margin barrels displaced higher royalty barrels. Our production in the fourth quarter averaged 265,000 boe/d, 24% higher than the third quarter as Buzzard returned to full rates during the quarter and we brought Longhorn and Ettrick on stream. In 2010, we expect production to range between 230,000 and 280,000 boe/d before royalties. Over the last three years, our production after royalties has grown at an average compounded rate of 11%.
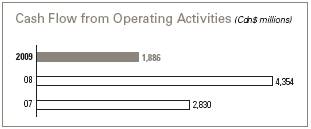
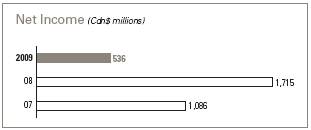
Despite lower commodity prices, our cash netbacks remain strong. Much of our production has low operating costs and royalties, resulting in annual cash netbacks of $38.55/boe (before royalties).
Our net debt increased by $976 million as capital investments, including costs to acquire an additional 15% working interest in Long Lake early in the year, exceeded our cash flow from operating activities by $1.6 billion. This increase was partially offset by the weaker US dollar, which reduced our US-dollar denominated debt and cash by approximately $900 million.
Our financial position is strong. For the past several years, we invested significant capital in a number of major development projects such as Buzzard and Long Lake. With the investment in these projects behind us and production ramping up at Ettrick, Longhorn and Long Lake, we expect to fund our next generation of new growth projects from operating cash flows. These projects include Golden Eagle in the UK North Sea, Usan offshore West Africa, future phases of Long Lake and shale gas in the Horn River Basin in northeast British Columbia, as well as several exploration prospects.
Our available liquidity is currently $3.3 billion, comprised of cash and undrawn committed credit facilities, most of which are available until 2012. In response to improving credit markets, we issued US$1 billion of senior notes during the year, which were used to repay a portion of our outstanding term credit facilities as well as for general corporate purposes. Issuing this debt increased the average term-to-maturity of our debt to 17 years.
Strategy Progress
(Cdn$ millions) |
| 2009 |
| 2008 |
| 2007 |
|
Capital Investment, including Acquisitions |
| 3,497 |
| 3,066 |
| 3,401 |
|
Proved Oil and Gas Reserves before Royalties (mmboe)1 |
| 1,011 |
| 988 |
| 1,058 |
|
Proved Oil and Gas Reserves after Royalties (mmboe)1 |
| 920 |
| 926 |
| 917 |
|
1 Includes developed and undeveloped proved reserves as at December 31.
Our strategy is to build a sustainable energy company focused in three growth areas: oil sands, conventional exploration and exploitation, and unconventional gas. Our investment in these areas generated the following results in 2009:
· oil sands—we acquired an additional 15% interest in the Long Lake project and joint venture lands from OPTI, increasing our ownership level to 65%. Following this acquisition, we are now responsible for operating both the SAGD bitumen extraction process and the upgrader for Phase 1, as well as future phases. During the year, we confirmed that our Long Lake design gasifies the bottom of the bitumen barrel and that we can upgrade bitumen to premium synthetic oil. Bitumen production ramped up as we increased our steam availability;
· conventional exploration and development—our conventional exploration program was focused in the UK and Norwegian North Sea, deep-water Gulf of Mexico and offshore West Africa. We were successful by bringing Ettrick and Longhorn on stream during the year, and from advancing the developments of Usan and the Buzzard H2S processing facilities. We had exploration success during the year at Golden Eagle and Owowo; and
· unconventional gas—we have a significant land position in the Horn River Basin in northeast British Columbia. Our 2009 drilling and completion program realized substantial cost savings, productivity improvements and demonstrated that we could successfully frac the shale to allow the gas to flow. We now have five shale gas wells on-stream and achieved peak rates of over 15 mmcf/d during the year.
During 2009, our proved oil and gas reserves additions replaced 205% of our oil and gas production (198% after royalties) before the year-end transition to new SEC reserves rules. Excluding economic revisions, we replaced 187% of our oil and gas production (202% after royalties). The difference in economic revisions between before and after royalties reflects an increase in oil sands royalties related to higher oil prices.
|
| Oil and Gas |
| ||
(mmboe) |
| Before |
| After |
|
Production |
| 90 |
| 78 |
|
|
|
|
|
|
|
Proved Reserve Changes excluding Production |
|
|
|
|
|
Net Additions |
| 168 |
| 157 |
|
Economic Revisions |
| 16 |
| (2 | ) |
|
| 184 |
| 155 |
|
The majority of our additions before economic revisions relate to our Long Lake acquisition, successful exploitation of our North Sea fields at Buzzard and Telford, and elsewhere at Long Lake, offshore West Africa, Syncrude and Masila. Economic revisions are largely related to positive revisions from oil price increases, somewhat offset by negative revisions from decreases in gas prices.
Outlook
In 2010, we expect our annual production to grow approximately 4% to 6%, assuming the midpoint of our guidance, and range from 230,000 to 280,000 boe/d (200,000 to 250,000 boe/d after royalties). This growth reflects a full year of production from Ettrick and Longhorn, and increasing volumes from Long Lake. At the high end of our guidance, our production growth would be as high as 15%. The low end includes the possibility of advancing the start-up of the fourth platform at Buzzard which is currently scheduled for 2011. Advancement to 2010 would only be required if we see higher than expected levels of hydrogen sulphide. The downtime associated with advancing the start-up could reduce annual volumes by 10,000 to 15,000 boe/d.
Our capital investment plans for 2010 total $2.5 billion. We plan to finance this investment through cash flow from operating activities and existing cash and cash equivalents. Our capital program will advance our future growth areas as we move forward with developing several major identified projects including Buzzard, Usan, Golden Eagle and Horn River shale gas. We also plan to spend approximately $575 million drilling 14 wells to advance our new growth exploration and appraisal opportunities, primarily in the North Sea and the Gulf of Mexico. We continue to monitor economic conditions and commodity prices and are prepared to adjust our capital investment program accordingly.
At December 31, 2009, we had $1.7 billion of cash on hand, and $1.6 billion of undrawn committed credit facilities. The primary debt maturity in the next few years is our $3.2 billion term credit facility which matures in 2012, of which $1.6 billion was drawn at December 31, 2009 and $407 million was utilized to support outstanding letters of credit. We also have $492 million in undrawn uncommitted credit facilities at December 31, 2009, of which $86 million was utilized to support outstanding letters of credit. The average term-to-maturity of our debt is approximately 17 years.
(Cdn$ millions) |
| Estimated 2010 |
| 2009 |
| 2008 |
|
Major Development |
| 700 |
| 726 |
| 1,437 |
|
Early Stage Development |
| 300 |
| 100 |
| 167 |
|
New Growth Exploration |
| 575 |
| 582 |
| 582 |
|
Core Asset Development |
| 825 |
| 1,814 |
| 731 |
|
Total Oil & Gas1 |
| 2,400 |
| 3,222 |
| 2,917 |
|
Energy Marketing, Corporate, Chemicals and Other |
| 100 |
| 275 |
| 149 |
|
Total Capital |
| 2,500 |
| 3,497 |
| 3,066 |
|
1 Includes capital related to capitalized interest and the Long Lake upgrader, but excludes cash flows related to geological and geophysical expenditures.
Our strategy and capital programs are focused on growing long-term value for our shareholders responsibly. To maximize value, we invest in:
· core assets for short-term production and free cash flow to fund capital programs and repay debt;
· development projects that convert our discoveries into new production and cash flow in the medium term; and
· exploration and new growth projects for longer-term growth.
As conventional basins in North America mature, we have been transitioning toward less mature basins and unconventional resource plays. Key focus areas include Athabasca oil sands, Canadian unconventional gas plays, the North Sea, deep-water Gulf of Mexico, and offshore West Africa—areas we believe have attractive fiscal terms, significant remaining opportunity, and where we have a competitive advantage.
2009 Capital1
(Cdn$ millions) |
| Major |
| Early Stage |
| New Growth |
| Core Asset |
| Total |
|
Oil and Gas |
|
|
|
|
|
|
|
|
|
|
|
United Kingdom |
| 128 |
| — |
| 143 |
| 355 |
| 626 |
|
Canada |
| — |
| — |
| 214 | 2 | 81 |
| 295 |
|
Synthetic |
| — |
| 100 |
| 1 |
| 1,202 | 3 | 1,303 |
|
Syncrude |
| — |
| — |
| — |
| 87 |
| 87 |
|
United States |
| 112 |
| — |
| 157 |
| 16 |
| 285 |
|
Yemen |
| — |
| — |
| — |
| 69 |
| 69 |
|
Nigeria |
| 486 |
| — |
| 20 |
| — |
| 506 |
|
Other Countries |
| — |
| — |
| 47 |
| 4 |
| 51 |
|
|
| 726 |
| 100 |
| 582 |
| 1,814 |
| 3,222 |
|
Chemicals |
| 144 |
| — |
| — |
| 70 |
| 214 |
|
Energy Marketing, Corporate and Other |
| — |
| — |
| — |
| 61 |
| 61 |
|
Total Capital |
| 870 |
| 100 |
| 582 |
| 1,945 |
| 3,497 |
|
|
|
|
|
|
|
|
|
|
|
|
|
As a % of Total Capital |
| 25 | % | 3 | % | 16 | % | 56 | % | 100 | % |
1 Excludes geological and geophysical expenditures of $81 million.
2 Includes shale gas in northeast British Columbia.
3 Includes $755 million to acquire an additional 15% working interest at Long Lake.
We invested $2.8 billion on oil and gas activities and added 184 mmboe of proved reserves and 349 mmboe of probable reserves (before royalties), before the year-end transition to new SEC reserve rules. We are not carrying any proved or probable reserves for our discoveries in the Eastern Gulf of Mexico, at Knotty Head or for our shale gas lands. A summary of our 2009 capital investment program and reserve additions are shown in the table below. In this section, production and reserves are before royalties. Additional information on our oil and gas reserves can be found in Items 1 and 2 Business and Properties (pages 23 to 31) and in Item 8 Consolidated Financial Statements and Supplementary Data (pages 150 to 158).
|
| Capital |
| Production2 |
| Proved |
| Probable |
|
Conventional Exploration and Production |
| 1,649 |
| 80 |
| 70 |
| 13 |
|
Unconventional—Oil Sands |
| 942 |
| 10 |
| 114 |
| 336 |
|
Unconventional—Shale Gas |
| 216 |
| — |
| — |
| — |
|
Total Oil and Gas |
| 2,807 |
| 90 |
| 184 |
| 349 |
|
1 Oil and gas capital investment excludes amounts related to capitalized interest, Long Lake upgrader, marketing, corporate, chemicals and other.
2 Before royalties and the adoption of the new SEC rules.
2010 Estimated Capital
(Cdn$ millions) |
| Major |
| Early Stage |
| New Growth |
| Core Asset |
| Total |
|
Oil and Gas |
|
|
|
|
|
|
|
|
|
|
|
United Kingdom |
| 75 |
| — |
| 250 |
| 425 |
| 750 |
|
Canada |
| — |
| 200 |
| — |
| 20 |
| 220 |
|
Synthetic |
| — |
| 100 |
| — |
| 200 |
| 300 |
|
Syncrude |
| — |
| — |
| — |
| 100 |
| 100 |
|
United States |
| 50 |
| — |
| 125 |
| 50 |
| 225 |
|
Yemen |
| — |
| — |
| — |
| 30 |
| 30 |
|
Nigeria |
| 575 |
| — |
| 50 |
| — |
| 625 |
|
Other Countries |
| — |
| — |
| 150 |
| — |
| 150 |
|
|
| 700 |
| 300 |
| 575 |
| 825 |
| 2,400 |
|
Chemicals |
| 55 |
| — |
| — |
| 10 |
| 65 |
|
Energy Marketing, Corporate and Other |
| — |
| — |
| — |
| 35 |
| 35 |
|
Total Capital |
| 755 |
| 300 |
| 575 |
| 870 |
| 2,500 |
|
|
|
|
|
|
|
|
|
|
|
|
|
As a % of Total Capital |
| 30 | % | 12 | % | 23 | % | 35 | % | 100 | % |
SYNTHETIC
In 2009, we invested $755 million on the acquisition of an additional 15% interest in the Long Lake project and joint venture lands. This added 86 mmboe of proved and 220 mmboe of probable bitumen reserves (before royalties). In addition, core-hole delineation activities on the first phase of Long Lake added 21 mmboe of proved bitumen reserves (before royalties), while lease delineation work on Phase 2 added 116 mmboe of probable bitumen reserves (before royalties).
With the completion of the turnaround at Long Lake, steam reliability has improved significantly and steam rates are at an all-time high of over 105,000 bbls/d and increasing. As a result, we are injecting more steam into more wells than ever before with 57 well pairs now on production and steam circulating in an additional 19 pairs. These circulating wells will be converted to production over the next few months.
The reservoir is responding to consistent steaming and bitumen production levels are increasing. Prior to the turnaround which was completed late last year, we were only providing meaningful steam to about one third of our 91 wells. These wells are providing the majority of our bitumen production which averaged 13,600 bbls/d (gross) in the fourth quarter. The remaining wells have been cold for about a year and need to go through the circulation and ramp-up cycle.
We are currently producing approximately 18,000 bbls/d (gross) at an all-in steam-to-oil ratio (SOR) of approximately 6.0. This SOR includes steam to the wells that are in the steam circulation stage and not yet producing bitumen, and wells early in their ramp-up cycle. As our circulating wells start producing, we expect to see an increase in bitumen production rates with a corresponding decrease in SOR. The SOR of our producing wells is approximately 5.0, and includes well pairs recently converted to production that are in the early stages of ramp-up. We continue to expect a long-term SOR of 3.0 over the life of the project.

1 Mainly Long Lake.
2 Energy Marketing, Corporate and Other.
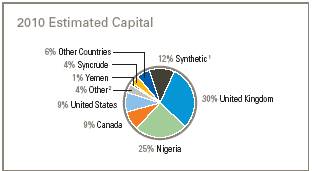
1 Mainly Long Lake.
2 Energy Marketing, Corporate and Other.
We have achieved a number of major milestones at Long Lake over the past year. The facility is running as designed. The gasification process is working, creating a low cost fuel source which reduces our need to purchase natural gas for operations. Post turnaround, the upgrader has processed approximately 90% of bitumen feedstock into the highest quality synthetic crude oil in North America. We continue to expect that we will ramp up to full rates and generate a significant margin advantage over our peers, even at current gas prices.
UNITED KINGDOM
We invested $626 million in the UK North Sea last year including $143 million on exploration activities. Our exploration program in the Golden Eagle area has generated discoveries at Golden Eagle, Pink and Hobby. To date, we have booked 50 mmboe of probable reserves (before royalties) for this area. We expect to book proved reserves as we advance the field development plan, which is progressing. We expect development will support standalone facilities and be economic with oil prices significantly lower than they are currently. We have a 34% interest in both Golden Eagle and Hobby, and a 46% interest in Pink, and operate all three.
At Buzzard, we invested $232 million of which $104 million related to the construction of the fourth platform, with the rest relating to ongoing development drilling. During the year, we added 22 mmboe of proved reserves here (before royalties). 14 mmboe are attributable to successful drilling and production performance which resulted in increases in both reservoir size and recovery factor. The remaining eight mmboe relate to positive economic revisions associated with improved oil prices. In 2010, Buzzard will continue to be a significant contributor to our cash flow and production volumes.
At Ettrick, production was brought on stream last year and is expected to ramp up to approximately 20,000 boe/d (gross) in 2010. We also have a discovery at Blackbird which could be a future tie-back to Ettrick, and plan to drill an appraisal well here later this year. We have no proved reserves booked for Blackbird. We operate both Ettrick and Blackbird, with a 79.73% working interest in each.
At Scott/Telford, we added 12 mmboe of proved reserves (before royalties) largely as a result of successful development drilling at Telford which allowed us to almost double our production from the Scott platform. We see further upside in the area with opportunities for quick tiebacks and additional drilling is planned for 2010.
NIGERIA
Development of the Usan field, offshore West Africa, is progressing well with first production expected in 2012. The development includes a FPSO with the ability to process 180,000 bbls/d (36,000 bbls/d net to us) and store up to two million barrels of oil. In 2009, our capital investment here focused on fabrication of the FPSO hull and topside facilities, subsea equipment, development drilling and completion of detailed engineering and procurement. In 2010, we expect to complete fabrication of the FPSO hull and most of the topsides. In addition, we will continue fabrication of subsea components, development drilling and well completion activities. We have a 20% interest in exploration and development on this block and Total Exploration & Production Nigeria Limited is the operator.
We continue to explore offshore West Africa and during the fourth quarter announced a successful exploration well at Owowo in the southern portion of Oil Prospecting License (OPL) 223. The Owowo South B-1 well was drilled in a water depth of 670 metres and is located 20 kilometres northeast of the Usan field. The well reached a total depth of 2,227 metres and discovered several oil bearing reservoirs containing light oil according to logs and other analysis. Under the production sharing contract governing OPL 223, the Nigerian National Petroleum Corporation (NNPC) is concessionaire of the license, which is operated by Total Exploration & Production Nigeria Ltd. We have an 18% interest in the discovery.
CANADA SHALE GAS
As conventional basins in Canada mature, we are focusing our investment on unconventional resource plays such as shale gas. In northeast British Columbia, we have a material shale gas position in the Horn River Basin with a 100% working interest. This play has the potential to be one of the most significant shale gas plays in North America. In 2009, we invested approximately $214 million to drill, frac, complete and test wells, and build infrastructure. Substantial cost savings and productivity improvements were realized with this drilling and completion program. We took advantage of improved equipment utilization, drilled longer wells, initiated more fracs per well and maintained an industry-leading frac pace this summer of 26 fracs in 15 days while achieving a 100% success rate on our frac program.
In 2010, we plan to build on this success by drilling an eight-well pad which will have longer horizontal wells with more fracs (18 fracs per well) than our earlier programs. The wells will be drilled this winter and then fraced and completed with production commencing in the second half of the year. We expect to achieve shale gas volumes from this program of approximately 50 mmcf/d in 2011. This program sets up a potential capital investment plan consisting of an 18-well pad which could commence drilling later in 2010. Further appraisal activity is required before we can establish commerciality and book reserves.
SYNCRUDE
At Syncrude, we invested $87 million in 2009 and converted seven mmboe of probable reserves to proved reserves. In 2010, a coker turnaround is scheduled in the third quarter and we expect annual production of between 19,000 and 24,000 bbls/d before royalties.
UNITED STATES
In the Gulf of Mexico, our capital program is focused on the deep water and in 2009, we invested approximately $64 million on our base shelf and deep-water producing assets.
We invested $91 million to complete the development of Longhorn which includes four subsea wells tied in to the ENI-operated Corral platform. Production is approaching peak rates in excess of 200 mmcf/d gross (50 mmcf/d net to us). In 2009, we added two mmboe of proved reserves (before royalties). We have a 25% non-operated working interest in Longhorn and ENI is the operator.
In the Eastern Gulf, we invested $62 million on our exploration activities which includes the Antietam and Appomattox wells. The Antietam well encountered thick, good quality sand, but was non-commercial. Operations at Appomattox are ongoing and we are currently drilling a sidetrack well to further evaluate the prospect. Appomattox is located six miles west of our Vicksburg discovery. We have a 25% interest in Vicksburg and a 20% interest in Appomattox and Shiloh, an earlier discovery. To date, we have not booked any proved or probable reserves for these two discoveries. Shell Offshore Inc. operates all these Eastern Gulf wells.
Elsewhere in the deep water, we are drilling an appraisal well at Knotty Head with our contracted Ensco 8501 rig. The well spud in December and we expect results in the second quarter. To date, we have not booked any proved or probable reserves here. A second deep-water drilling rig is expected to arrive in mid–2010 which will allow us to start drilling more of our identified prospects.
YEMEN
Yemen is an important asset for us and continues to generate cash flow in excess of capital requirements. In 2009, we invested $69 million and added 12 mmboe of proved reserves (before royalties). We will continue to maximize the value of these assets over the remaining life of the contract and expect our 2010 annual production to average between 32,000 and 37,000 boe/d, before royalties. We are currently working with the Yemen government on a possible contract extension.
CHEMICALS
We continued with the development of our technology conversion project (TCP) at our north Vancouver chlor-alkali plant. The TCP is providing technology and assets that are more cost efficient and environmentally friendly than our current infrastructure. Project benefits are expected to include incremental annual operating cash flow of approximately $40 million as a result of decreased production costs and increased plant capacity. The project is expected to start up in the second quarter of 2010 and should lower our cost structure and solidify our low-cost position in this regional market.
Year-to-Year Change in Net Income
(Cdn$ millions) |
| 2009 vs 2008 |
| 2008 vs 2007 |
|
Net Income for 2008 and 2007 |
| 1,715 |
| 1,086 |
|
Favourable (unfavourable) variances:1 |
|
|
|
|
|
Production Volumes, After Royalties |
|
|
|
|
|
Crude Oil |
| (137 | ) | 40 |
|
Natural Gas |
| 36 |
| (22 | ) |
Change in Crude Oil Inventory |
| (80 | ) | 13 |
|
Total Volume Variance |
| (181 | ) | 31 |
|
Realized Commodity Prices |
|
|
|
|
|
Crude Oil |
| (1,871 | ) | 1,495 |
|
Natural Gas |
| (313 | ) | 119 |
|
Total Price Variance |
| (2,184 | ) | 1,614 |
|
Oil & Gas Operating Expense |
| 9 |
| (121 | ) |
Depreciation, Depletion, Amortization and Impairment |
|
|
|
|
|
Oil & Gas |
| 241 |
| (228 | ) |
Other |
| (8 | ) | (19 | ) |
Total DD&A |
| 233 |
| (247 | ) |
Exploration Expense |
| 100 |
| (76 | ) |
Energy Marketing Revenue, Net |
| 610 |
| (424 | ) |
Chemicals Contribution |
| 73 |
| (76 | ) |
General and Administrative Expense |
| (240 | ) | 117 |
|
Interest Expense |
| (218 | ) | 74 |
|
Current Income Taxes |
| 83 |
| (425 | ) |
Future Income Taxes |
| 1,114 |
| (240 | ) |
Other |
|
|
|
|
|
Increase (Decrease) in Fair Value of Crude Oil Put Options |
| (454 | ) | 246 |
|
Other |
| (124 | ) | 156 |
|
|
|
|
|
|
|
Net Income for 2009 and 2008 |
| 536 |
| 1,715 |
|
1 All amounts are presented before provision for income taxes.
Significant variances in net income are explained in the sections that follow.
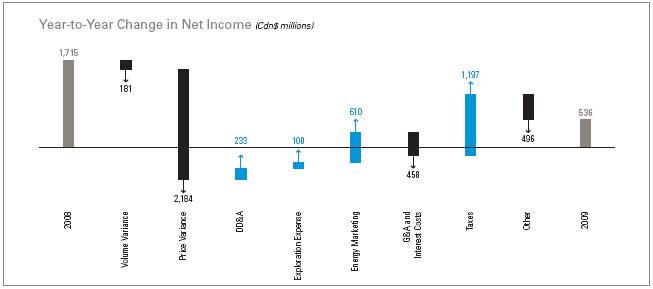
|
| 2009 |
| 2008 |
| 2007 |
| ||||||
|
| Before |
| After |
| Before |
| After |
| Before |
| After |
|
Oil and Liquids (mbbls/d) |
|
|
|
|
|
|
|
|
|
|
|
|
|
United Kingdom |
| 98.0 |
| 98.0 |
| 99.7 |
| 99.7 |
| 81.2 |
| 81.2 |
|
Canada |
| 14.6 |
| 11.4 |
| 16.2 |
| 12.3 |
| 17.1 |
| 13.4 |
|
Long Lake Bitumen2 |
| 7.9 |
| 7.9 |
| 3.9 |
| 3.9 |
| — |
| — |
|
Syncrude |
| 20.2 |
| 18.6 |
| 20.9 |
| 18.2 |
| 22.1 |
| 18.8 |
|
United States |
| 10.5 |
| 9.5 |
| 9.3 |
| 8.1 |
| 16.4 |
| 14.5 |
|
Yemen |
| 49.9 |
| 29.8 |
| 56.6 |
| 30.6 |
| 71.6 |
| 39.8 |
|
Other Countries |
| 3.5 |
| 3.2 |
| 5.8 |
| 5.3 |
| 6.2 |
| 5.7 |
|
|
| 204.6 |
| 178.4 |
| 212.4 |
| 178.1 |
| 214.6 |
| 173.4 |
|
|
|
|
|
|
|
|
|
|
|
|
|
|
|
Natural Gas (mmcf/d) |
|
|
|
|
|
|
|
|
|
|
|
|
|
United Kingdom |
| 24 |
| 24 |
| 18 |
| 18 |
| 16 |
| 16 |
|
Canada |
| 139 |
| 128 |
| 131 |
| 109 |
| 118 |
| 98 |
|
United States |
| 65 |
| 57 |
| 78 |
| 66 |
| 101 |
| 86 |
|
|
| 228 |
| 209 |
| 227 |
| 193 |
| 235 |
| 200 |
|
|
|
|
|
|
|
|
|
|
|
|
|
|
|
Total (mboe/d) |
| 243 |
| 213 |
| 250 |
| 210 |
| 254 |
| 207 |
|
1 We have presented production volumes before royalties as we measure our performance on this basis consistent with other Canadian oil and gas companies.
2 We report bitumen as production until we are consistently operating the upgrader and producing premium synthetic crude.
2009 VS 2008—LOWER VOLUMES DECREASED INCOME BY $181 MILLION
Production before royalties was down 3% from 2008. Buzzard production was lower due to planned downtime for pipeline maintenance and to install the jacket of the fourth platform, as well as downtime to reinstall the Galaxy III drilling rig on location. This was partially offset by the start-up of the Ettrick field in the UK North Sea and Longhorn in the Gulf of Mexico. Bitumen production at Long Lake continues to ramp up as we increase steam to the field and bring on more wells. Our mature Yemen fields declined as expected but our after-royalty production volumes were consistent with the prior year as lower prices increased our share of net production under the cost recovery arrangement.
Production after royalties increased slightly to average 213,000 boe/d, as higher margin barrels displaced higher royalty barrels.
The following table summarizes our production changes year over year:
(mboe/d) |
| Before |
| After |
|
2008 Production |
| 250 |
| 210 |
|
Production Changes |
|
|
|
|
|
United Kingdom |
| (1 | ) | (1 | ) |
Canada |
| — |
| 2 |
|
Long Lake Bitumen |
| 4 |
| 4 |
|
Syncrude |
| (1 | ) | 1 |
|
United States |
| (1 | ) | — |
|
Yemen |
| (6 | ) | (1 | ) |
Other Countries |
| (2 | ) | (2 | ) |
2009 Production |
| 243 |
| 213 |
|
Fourth quarter production averaged 265,000 boe/d (235,000 after royalties), 51,000 boe/d higher than the third quarter and 35,000 boe/d higher than the fourth quarter of 2008. The increase reflects resuming full production at Buzzard after successfully completing planned maintenance during the summer, ramping up of our new facilities at Ettrick and Longhorn, a successful step-out well at Telford, and the ramp-up of Long Lake.
Production volumes discussed in this section represent our working interest before royalties.
United Kingdom
UK production for the year decreased slightly from 2008 to average 102,000 boe/d. Our share of Buzzard production averaged 81,400 boe/d (188,000 boe/d gross), down 8% from the prior year due to planned maintenance downtime midway through the year. In the second quarter, Buzzard production was shut-in for a week while the Galaxy III drilling rig was reinstalled on the platform. There were also four weeks of planned downtime in the third quarter, coinciding with a six week slowdown of the Forties pipeline for routine maintenance. During this period, we successfully installed the jacket for the fourth platform and prepared the tie-ins. This platform will allow us to handle higher levels of hydrogen sulphide and maintain peak production until at least 2013. In the second quarter of 2010, we expect to install the topside facilities relating to the fourth platform onto the jacket. Based on our production experience to date, we anticipate that start up of the platform will not be required until 2011. If advanced to 2010, downtime associated with the start-up could reduce annual volumes in 2010 by 10,000 to 15,000 boe/d.
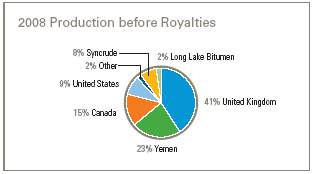
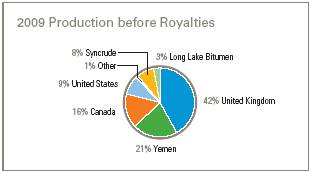
At Scott/Telford, we averaged 13,500 boe/d, 29% higher than 2008 as a result of a successful step-out development well at Telford. This well was completed in the third quarter and is tied back to our Scott platform. Production from our non-operated fields at Duart and Farragon averaged 2,700 boe/d in 2009.
Production from the Ettrick field commenced in the third quarter, contributing 4,300 boe/d to our annual average volumes. We successfully produced at rates that allowed us to test the design capacity of the floating production, storage and offloading vessel (FPSO). Ettrick continues to ramp up as we complete safe commissioning of all systems. Our share of production averaged 11,400 boe/d in the fourth quarter. We have a nearby discovery at Blackbird which could be a future tie-back to Ettrick, further enhancing the economics of this development.
In 2010, we expect to drill an additional development well at Telford which should add production volumes in the field. Additional development drilling is also planned at Ettrick, along with appraisal drilling at Blackbird. We expect production from the North Sea to average between 100,000 and 130,000 boe/d in 2010, taking into account expected downtime. Increases are expected to come from higher rates at Buzzard, ramp-up of Ettrick and additional successful development drilling at Telford.
On February 16th, we identified an item requiring repair to the separator unit on the Buzzard platform, which temporarily reduced production volumes to 30,000 to 50,000 boe/d (gross). Subsequently, production was restored to full rates of between 200,000 and 220,000 boe/d (86,000 and 95,000 boe/d, net to us).
Canada
Production in Canada (excluding oil sands) remained consistent with the prior year. Slightly lower conventional production from our heavy oil properties was offset somewhat by higher coalbed methane (CBM) production rates. CBM production increased 20% from 2008 and averaged 51 mmcf/d. Natural declines on our heavy oil properties resulted in production decreasing 11% in 2009. Our natural gas production in the Medicine Hat region and Balzac was comparable with the previous year. In 2010, we expect our share of production from Canada to average between 28,000 and 34,000 boe/d. We recently identified a number of non-core assets for possible disposal, including our heavy oil assets in Western Canada. Production from our heavy oil properties averaged 16,800 boe/d in 2009.
Long Lake
Bitumen production at Long Lake doubled from the prior year and averaged 7,900 boe/d (net to us) during 2009. The higher production represents the continued ramp-up of production in response to increased steam volumes and more well pairs on production. During the year, the facility sold approximately 2,400 boe/d (net to us) of bitumen and 3,200 boe/d (net to us) of PSC™.
Our capital investment program in 2010 includes converting more existing wells from gas lift to electrical submersible pumping and drilling two sustaining well pads in accordance with our full field resource development plan. These pads are expected to be available to come on stream starting in late 2011. In 2010, annual bitumen production at Long Lake is expected to average between 20,000 and 30,000 boe/d (net to us).
Syncrude
Syncrude production decreased 3% to average 20,200 boe/d during the year. Production in 2009 has been impacted by several factors including: i) a scheduled turnaround on Coker 8-3; ii) maintenance work on Coker 8-1; iii) fewer shipments of synthetic crude as a result of outages on the Pembina pipeline; and iv) unscheduled maintenance on both the vacuum distillation unit and the diluent recovery unit. In 2010, we expect to have one coker turnaround for routine maintenance and our share of production is expected to average between 19,000 and 24,000 boe/d.
United States
Gulf of Mexico production volumes were 21,300 boe/d, 4% lower than 2008 due to declines in our mature shelf production. In the deep-water, production remained consistent with the prior year. Production was higher at Aspen this year as production was shut-in during the fourth quarter of 2008 due to Hurricane Ike. When Aspen was brought back on stream, production rates were higher as a result of installing additional water-handling facilities on the third-party platform. Our non-operated Longhorn development commenced production late in 2009 and is approaching peak production of approximately 200 mmcf/d gross (50 mmcf/d, net to us). Current production is 37,000 boe/d gross (9,300 boe/d, net to us). Higher production volumes at Aspen and Longhorn were offset by Green Canyon 6, 50 and 137, which remain shut-in following Hurricane Ike. The third-party processing platform was destroyed during the hurricane last year and we are currently reviewing options to maximize the value of these fields.
Our shelf production decreased 1,200 boe/d, 12% below 2008 rates as a result of natural declines. During the year, we completed several successful recompletions and workovers to enhance performance, however, we are minimizing the capital invested in our mature shelf assets.
In 2010, we expect our share of production from the Gulf of Mexico to average between 20,000 and 28,000 boe/d.
Yemen
In 2009, production from our Masila field declined 14% compared to last year and averaged 39,400 boe/d. This decline is consistent with our expectations as the field matures. We continue to target select infill development drilling opportunities due to the maturity of the field. During the year, we drilled 20 development wells as we concentrated our drilling program on maximizing reserve recoveries and economic returns, prior to the 2011 expiry of our contract. In 2010, we plan to drill up to 10 development wells. We are working with the Yemen government and our partners to potentially extend our production sharing agreement for an additional five years beyond 2011. There is no assurance that this extension will be received.
Production at our East Al Hajr field on Block 51 decreased slightly from the prior year and averaged 10,500 boe/d for 2009. Successful well optimization and pressure maintenance somewhat offset natural declines.
Our oil and gas operations have operated as usual during the recent unrest in Yemen. Our production facilities are remote and located a significant distance from major population centres. We remain committed to operating in Yemen, focusing on the safety of our employees, contractors and facilities.
We expect our share of Yemen production to average between 32,000 and 37,000 boe/d in 2010.
Other Countries
Production from Guando in Colombia decreased 40% to average 3,500 boe/d in 2009. The lower volumes reflect the reduced working interest in the Guando field effective in the second quarter of 2009. Under the terms of our license, our working interest in the Guando field decreased from 20% to 10% in May 2009 after cumulative production from the field reached 60 million barrels. We expect our share of production to average 2,000 boe/d in 2010.
2008 VS 2007—HIGHER NET PRODUCTION INCREASED INCOME BY $31 MILLION
Production after royalties in 2008 was slightly higher than 2007. A full year of Buzzard production and increasing bitumen production at Long Lake offset declines at our maturing Yemen fields and hurricane interruptions in the US Gulf of Mexico. UK production was 22% higher than 2007 due primarily to a full year of production from Buzzard, which averaged 88,200 boe/d. This was offset somewhat by lower production at Scott/Telford resulting from higher than expected natural declines and increased downtime for maintenance.
Production in Canada (excluding oil sands) increased slightly in 2008, primarily as a result of increasing CBM volumes, offset somewhat by a decline in heavy oil production. Bitumen production at Long Lake averaged 3,900 boe/d (net to us) during 2008.
Our US production fell 33%, or about 11,000 boe/d from 2007, as hurricanes in the Gulf of Mexico temporarily shut-in production in the region. Prior to Hurricanes Gustav and Ike, we were producing approximately 30,000 boe/d. Production was reduced to 6,000 boe/d immediately after the hurricanes. Our properties at Gunnison, West Cameron and Eugene Island came back on stream during the fourth quarter, while production at Aspen, Wrigley and Green Canyon 6, 50 and 137 deep-water fields remained shut-in for the remainder of 2008. We exited 2008 producing approximately 12,000 boe/d.
At Syncrude, production decreased 5% from 2007 due to several factors including: (i) two planned coker turnarounds and other maintenance; (ii) shut down of the sulphur plant for maintenance; (iii) reduction in shipments of synthetic crude from outages in the Pembina pipeline; and (iv) shortage of bitumen supply as a result of production challenges in the mines.
|
| 2009 |
| 2008 |
| 2007 |
|
Crude Oil |
|
|
|
|
|
|
|
West Texas Intermediate (WTI) (US$/bbl) |
| 61.80 |
| 99.65 |
| 72.31 |
|
Dated Brent (Brent) (US$/bbl) |
| 61.51 |
| 96.99 |
| 72.52 |
|
Benchmark Differentials1 (US$/bbl) |
|
|
|
|
|
|
|
Heavy Oil |
| 9.91 |
| 20.27 |
| 23.44 |
|
Mars |
| 1.48 |
| 6.21 |
| 5.67 |
|
Masila |
| 0.39 |
| 4.31 |
| 0.50 |
|
Realized Prices from Producing Assets (Cdn$/bbl) |
|
|
|
|
|
|
|
United Kingdom |
| 67.70 |
| 96.23 |
| 76.30 |
|
Canada |
| 53.04 |
| 74.51 |
| 44.07 |
|
Syncrude |
| 70.96 |
| 105.47 |
| 79.76 |
|
United States |
| 65.01 |
| 104.94 |
| 69.83 |
|
Yemen |
| 68.49 |
| 99.87 |
| 76.29 |
|
Other Countries |
| 59.05 |
| 98.98 |
| 71.29 |
|
|
|
|
|
|
|
|
|
Corporate Average (Cdn$/bbl) |
| 66.85 |
| 96.92 |
| 73.43 |
|
Natural Gas |
|
|
|
|
|
|
|
New York Mercantile Exchange (US$/mmbtu) |
| 4.16 |
| 8.90 |
| 7.12 |
|
AECO (Cdn$/mcf) |
| 3.92 |
| 7.71 |
| 6.26 |
|
Realized Prices from Producing Assets (Cdn$/mcf) |
|
|
|
|
|
|
|
United Kingdom |
| 3.95 |
| 6.78 |
| 4.71 |
|
Canada |
| 3.78 |
| 7.73 |
| 6.32 |
|
United States |
| 4.67 |
| 10.07 |
| 7.80 |
|
|
|
|
|
|
|
|
|
Corporate Average (Cdn$/mcf) |
| 4.06 |
| 8.44 |
| 6.81 |
|
|
|
|
|
|
|
|
|
Nexen’s Average Realized Oil and Gas Price (Cdn$/boe) |
| 60.02 |
| 89.78 |
| 68.46 |
|
|
|
|
|
|
|
|
|
Average Foreign Exchange Rate—Canadian to US Dollar |
| 0.8757 |
| 0.9381 |
| 0.9304 |
|
1 These differentials are a discount/(premium) to WTI.
2009 VS 2008—LOWER REALIZED PRICES DECREASED NET INCOME $2,184 MILLION
Crude oil prices steadily increased during 2009, after falling dramatically in the fourth quarter of 2008 due to the economic crisis. WTI averaged US$61.80/bbl for the year, down 38% from 2008, while Dated Brent decreased 37% to average US$61.51/bbl over the same period. Gas prices fluctuated during the year with NYMEX averaging US$4.16/mmbtu and AECO averaging $3.92/mcf, decreases of 53% and 49% from 2008, respectively. The impact of lower average commodity prices was partially offset by foreign exchange savings. Our corporate average crude oil price fell 31% to $66.85/bbl, while our corporate average natural gas price was 52% lower, averaging $4.06/mcf.
In 2009, the average annual US dollar was stronger than the Canadian dollar as compared to 2008. This reduced the impact of lower benchmark commodity prices, increasing net sales by approximately $295 million. This impact on sales increased our realized crude oil and natural gas prices by approximately $4.45/bbl and $0.27/mcf, respectively.
Crude Oil Reference Prices
During 2009, WTI prices were volatile and ranged from a low of US$32.70/bbl to a high of US$82.00/bbl, while averaging US$61.80/bbl. WTI reached its low in February, recovering to US$60/bbl by May and traded between US$60/bbl and US$80/bbl for the remainder of the year. Prices at the beginning of the year were driven by a weak global economy but increased later in the year as world economies responded to monetary and fiscal stimuli. The main drivers supporting crude oil prices were macro-related, including a continuing rally in US equity markets, positive investment flows into commodity markets in response to the weakening US dollar and more optimistic outlooks for global economic recovery.
Near-term demand/supply fundamentals have been slow to recover, with inventory levels and spare capacity remaining high. However, increases in oil demand from China and emerging markets has taken crude oil out of the Atlantic basin and is helping to balance the market and reduce inventory levels. Future demand growth is expected to come from these markets. A colder than normal winter also reduced inventory levels at the end of the year, which supported higher oil prices.
Economic indicators continue to be mixed and uncertainty remains about the sustainability of the recovery over the next few years. Coordinated monetary and fiscal policies have ended the recession in most countries although much of the improvement in employment and GDP is being driven by unsustainable levels of public spending. A lasting global economic recovery is dependent on growth in Asia and the developing world and increased consumer spending in developed countries, which will be challenging due to high levels of unemployment, lower property values and a need to reduce consumer debt. The pace of the global recovery may be helped by China, which has significant cash reserves, low consumer debt and a high personal savings rate that could be reduced. China’s growth may be slowed by government efforts to avoid creating a credit bubble.
Geopolitical events during the year such as concerns over Iran’s nuclear enrichment program, military action in Nigeria, the ongoing wars in Iraq and Afghanistan, and requests for greater regulation of energy markets and futures trading seemed to have little impact on price due to spare capacity and high inventory levels. However, a much tighter supply/demand environment is expected to emerge in 2010. With minimal growth forecast in non-OPEC supply, oil demand growth is expected to reduce inventory levels and OPEC spare capacity. This will increase price sensitivity to geopolitical events.
Crude Oil Differentials
In Canada, heavy crude oil differentials averaged US$9.91/bbl (16% of WTI) for the year, compared to US$20.27/bbl (20% of WTI) in 2008. The heavy oil differential continued to be narrower than historic levels due to cuts in low/medium quality crude oil production quotas by OPEC, strong fuel oil prices and lower heavy oil supply from Mexico and Venezuela. Excess refinery capacity increased the demand for heavy oil and also contributed to the narrower differential.
The Brent/WTI differential strengthened during 2009, with Brent trading at a discount of only US$0.29/bbl compared to US$2.66/bbl in 2008. The Brent/WTI differential was volatile during the year. Initially, Brent was at a premium to WTI due to depressed WTI pricing caused by high inventory levels at Cushing and reduced supply in the North Sea due to maintenance downtime. However, as US inventories decreased through the year, the differential reverted to a discount.
The US Gulf Coast Mars differential narrowed during the year averaging US$1.48/bbl in 2009 compared with US$6.21/bbl in 2008. This was due to high inventory levels at Cushing as a portion of production from the Gulf of Mexico was sent overseas, rather than into an oversupplied onshore market. The differential also narrowed due to OPEC cuts in medium crude.
The Yemen Masila differential narrowed during the year averaging US$0.39/bbl in 2009 compared with US$4.31/bbl in 2008. The Masila price strengthened relative to both WTI and Brent, reflecting strong demand from China and other Asian countries that are the primary buyers of Masila Crude. High Cushing inventory levels also contributed to the narrower Yemen Masila differential to WTI.
Natural Gas Reference Prices
Low NYMEX natural gas prices were driven by declines in industrial and power demand and high inventory levels as natural gas producers have been slow to respond to lower prices by reducing supply. Market fears of reaching maximum gas storage well before the withdrawal season resulted in low prices for most of the year. Supply in North America has been impacted by the growth in unconventional gas and increased productivity through technological advances in horizontal drilling and fracturing techniques. Cold weather in late 2009 increased prices and reduced a portion of the inventory surplus. However, continuing weak gas prices are forecasted as strong supply additions are expected from shale gas, tight gas and new LNG volumes imported from Russia and the Middle East.

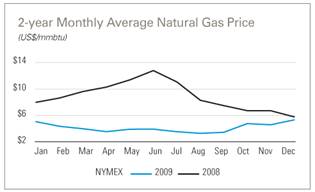
2008 VS 2007—HIGHER REALIZED PRICES INCREASED NET INCOME $1,614 MILLION
In 2008, commodity prices reached record highs but declined significantly in the fourth quarter. WTI averaged US$99.65/bbl for the year, 38% higher than 2007, while Dated Brent increased 34% over the same period. Our average realized crude oil price increased 32% from $73.43/bbl to $96.92/bbl. During the year, NYMEX gas price increased 25% and AECO increased 23%, averaging US$8.90/mmbtu and $7.71/mcf, respectively. During the same period, our corporate average realized gas price increased 24% to $8.44/mcf, as our gas sales are primarily based off of NYMEX and AECO prices. Compared to 2007, the US dollar weakened relative to the Canadian dollar. As a result, our realized crude oil and natural gas price decreased by approximately $0.80/bbl and $0.07/mcf, respectively and our net sales were lower by approximately $56 million.
|
| 2009 |
| 2008 |
| 2007 |
| ||||||
(Cdn$/boe) |
| Before |
| After |
| Before |
| After |
| Before |
| After |
|
Conventional Oil and Gas |
|
|
|
|
|
|
|
|
|
|
|
|
|
United Kingdom |
| 6.87 |
| 6.87 |
| 6.75 |
| 6.75 |
| 6.94 |
| 6.94 |
|
Canada |
| 12.76 |
| 14.80 |
| 13.12 |
| 16.38 |
| 12.91 |
| 15.93 |
|
United States |
| 12.58 |
| 14.10 |
| 11.57 |
| 13.48 |
| 8.43 |
| 9.69 |
|
Yemen |
| 10.69 |
| 18.34 |
| 8.51 |
| 15.88 |
| 6.56 |
| 12.00 |
|
Other Countries |
| 6.03 |
| 6.53 |
| 4.52 |
| 4.91 |
| 3.45 |
| 3.76 |
|
Average Conventional |
| 9.34 |
| 10.76 |
| 8.68 |
| 10.40 |
| 7.89 |
| 9.75 |
|
Synthetic Crude Oil |
|
|
|
|
|
|
|
|
|
|
|
|
|
Syncrude |
| 35.92 |
| 39.09 |
| 36.53 |
| 42.04 |
| 25.80 |
| 30.32 |
|
Average Oil and Gas |
| 11.66 |
| 13.33 |
| 11.04 |
| 13.18 |
| 9.45 |
| 11.63 |
|
1 Operating expenses per boe are our total oil and gas operating costs divided by our working interest production before royalties. We use production before royalties to monitor our performance consistent with other Canadian oil and gas companies.

2009 VS 2008—LOWER OPERATING EXPENSES INCREASED NET INCOME BY $9 MILLION
Our average oil and gas operating cost increased $0.62/boe from 2008 as lower costs in Canada and Syncrude were only partially offset by the impact of a stronger US dollar in other areas. US-dollar denominated operating costs were higher when translated to Canadian dollars, increasing our corporate average by $0.63/boe for 2009.
Changes in our production profile during the year increased our corporate average by $0.47/boe. Buzzard, a lower cost area, contributed a smaller percentage of our total production compared to higher cost areas such as Scott/Telford and Ettrick.
In the UK North Sea, lower production rates at Buzzard were more than offset by reduced operating costs due to higher planned downtime and lower production tariffs and logistics costs. This reduced our corporate average by $0.21/boe. The impact of other areas in the UK North Sea reduced our corporate average by $0.38/boe. At Scott/Telford, total costs decreased while production was higher due to additional Telford production. This was somewhat offset by the start-up of the Ettrick field and FPSO where operating costs per barrel are higher than our corporate average.
In Yemen, we continue to incur costs to maintain existing well productivity to maximize reserve recoveries and slow the natural decline of the field. These costs, combined with production declines, increased our corporate average operating cost by $0.20/boe. In the US Gulf of Mexico, slightly higher operating costs combined with lower shelf production, increased our corporate average by $0.02/boe.
Canada reduced our corporate average by $0.06/boe as lower heavy oil and CBM costs were substantially offset by increased operating costs at Balzac. Our heavy oil properties experienced improved run times and less downtime, which reduced downhole workover costs. This, combined with lower utility costs, reduced operating costs by 14%. CBM costs increased as we brought more wells on stream, however, the incremental production volumes reduced our average cost per barrel. This was partially offset by increased per unit cost at Balzac where the impact of declining production has only partially been offset by lower operating costs.
At Syncrude, operating costs decreased as lower natural gas costs were partially offset by higher maintenance costs. The lower operating costs reduced our corporate average by $0.05/boe. Costs at Long Lake are capitalized as development costs until we reach commercial operations which is expected to occur in the first quarter of 2010.
2008 VS 2007—HIGHER OPERATING EXPENSES DECREASED NET INCOME BY $121 MILLION
Overall, operating costs increased 14% from 2007, primarily due to the low-cost Buzzard field being on-stream for the full year and higher expenditures at Syncrude. Our production mix also changed from the previous year as additional Buzzard volumes were offset by lower volumes in Yemen and the US Gulf of Mexico. Changes in our production profile reduced our corporate average by $0.35/boe, as Buzzard has lower operating costs per barrel.
In the UK North Sea, operating costs increased 19%. The increase was attributable to a full year’s production at Buzzard, compared to 2007 when we were ramping up production. In addition, transportation costs increased from higher volumes and increased tariff charges. Elsewhere in the UK North Sea, operating costs increased while production declined, increasing our corporate average by $0.45/boe. The majority of the cost increase was due to platform maintenance at Scott/Telford, including: i) additional diesel costs for turbine repairs; ii) maintenance on our water injection and power generation facilities; and iii) subsea maintenance.
In Yemen, Masila and Block 51 increased our corporate average by $0.32/boe and $0.21/boe, respectively, as a result of lower production rates. Our operating costs were focused on service rig activity and maintenance programs for existing wells. In the US Gulf of Mexico, operating costs were 8% lower than 2007; however, lower production as a result of the hurricanes increased the average unit cost by $0.30/boe.
Operating costs in Canada were marginally higher than in 2007. Costs in our heavy oil operations increased as a result of higher salaries, utilities and trucking costs. While CBM costs were slightly higher as the number of producing wells increased, the incremental volumes reduced our average cost per barrel. At our natural gas properties, a combination of increased downhole activity and surface maintenance resulted in higher operating costs. These increases were offset by lower costs at our Balzac gas plant, which had a turnaround in the previous year.
Syncrude operating costs were $72 million or 35% higher than 2007 and increased our corporate average by $0.91/ boe. A number of factors contributed to the higher operating costs including: i) higher contracting costs to increase the mineable ore inventory for bitumen supply; ii) purchasing additional third-party bitumen to upgrade; iii) higher natural gas prices in the first half of 2008; and iv) unscheduled and extended maintenance.
US-dollar denominated operating costs were lower when translated to Canadian dollars as a result of the weaker US dollar for the majority of 2008. This decreased our corporate average by $0.23/boe.
Depreciation, Depletion, Amortization and Impairment (DD&A)
|
| 2009 |
| 2008 |
| 2007 |
| ||||||
(Cdn$/boe) |
| Before |
| After |
| Before |
| After |
| Before |
| After |
|
Conventional Oil and Gas2 |
|
|
|
|
|
|
|
|
|
|
|
|
|
United Kingdom |
| 22.42 |
| 22.42 |
| 17.72 |
| 17.72 |
| 19.59 |
| 19.59 |
|
Canada |
| 18.12 |
| 21.03 |
| 14.99 |
| 18.71 |
| 12.46 |
| 15.37 |
|
United States |
| 37.64 |
| 42.18 |
| 27.46 |
| 31.97 |
| 22.64 |
| 26.03 |
|
Yemen |
| 5.75 |
| 9.87 |
| 7.75 |
| 14.45 |
| 8.15 |
| 14.92 |
|
Other Countries |
| 11.16 |
| 12.08 |
| 7.90 |
| 8.58 |
| 3.68 |
| 4.06 |
|
Average Conventional |
| 19.16 |
| 22.09 |
| 15.48 |
| 18.54 |
| 14.94 |
| 18.47 |
|
Synthetic Crude Oil |
|
|
|
|
|
|
|
|
|
|
|
|
|
Syncrude |
| 8.46 |
| 9.20 |
| 6.39 |
| 7.35 |
| 6.59 |
| 7.74 |
|
Average Oil and Gas |
| 18.23 |
| 20.90 |
| 14.71 |
| 17.56 |
| 14.21 |
| 17.49 |
|
1 DD&A per boe is our DD&A for oil and gas operations divided by our working interest production before royalties. We use production before royalties to monitor our performance consistent with other Canadian oil and gas companies.
2 DD&A per boe excludes the impairment charges described in Note 4 of our Consolidated Financial Statements.
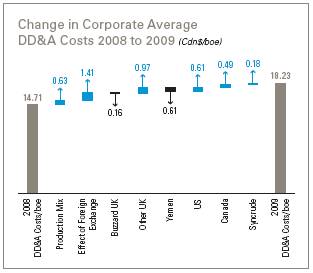
2009 VS 2008—LOWER OIL AND GAS DD&A INCREASED NET INCOME BY $241 MILLION
Our corporate average DD&A cost per barrel increased $3.52/boe from 2008. The stronger US dollar increased our corporate average by $1.41/boe as depletion of our international and US assets is denominated in US dollars, while changes in our production profile also increased our corporate average by $0.63/boe. The change in our production mix was primarily a result of: i) slightly lower Buzzard production, where our DD&A rate is low; and ii) higher production volumes at Scott/Telford and Ettrick where we have higher than average DD&A rates. We incurred non-cash impairment charges of $78 million in the fourth quarter at three natural gas properties in Canada and the US. Our year-end natural gas proved reserves at these properties were lower as a result of weak natural gas prices.
In the UK North Sea, our Buzzard depletion rate decreased from the same period last year as successful development drilling increased our proved reserve estimates at the end of 2008. This lower depletion rate reduced our total corporate average by $0.16/boe. Elsewhere in the UK, higher depletion rates at Ettrick and Scott/Telford increased our corporate average by $0.97/boe. The Ettrick depletion rate is higher than our average as a result of higher development costs. The Scott/Telford fields’ depletion rate increased compared to 2008 as a result of downward price-related reserve revisions at the end of 2008. Our DD&A expense also includes $49 million for our Perth prospect in the North Sea where we expensed allocated acquisition costs as we are unlikely to proceed with development of this prospect.
Lower depletion rates in Yemen, due to lower capital expenditures from drilling fewer development wells and higher reserve estimates, reduced our corporate average by $0.61/boe. In the Gulf of Mexico, higher estimates for future abandonment costs and downward price-related reserve revisions at the end of 2008 resulted in higher depletion rates, increasing our corporate average rate by $0.61/boe.
Canadian depletion increased our corporate average by $0.49/boe. Depletion rates at our heavy oil properties increased due to downward price-related revisions to our proved reserves at the end of 2008. This was partially offset by lower depletion rates at our CBM properties where additional proved reserves were recognized through improved recovery rates.
Syncrude incurred an additional depletion expense of $14 million in the fourth quarter related to the replacement of an asset that was previously damaged at the upgrading facilities. This increased Syncrude’s DD&A rate by $1.95/boe for the year and increased our corporate average by $0.18/boe. Excluding the impact of the additional depletion expense, Syncrude DD&A rate was consistent with prior year.
2008 VS 2007—HIGHER OIL AND GAS DD&A DECREASED NET INCOME BY $228 MILLION
During the fourth quarter of 2008, we recorded non-cash impairment charges of $568 million primarily related to properties in the UK North Sea and the Gulf of Mexico. In the North Sea, we recognized an impairment charge of $318 million relating to our Selkirk and Ettrick properties. At Selkirk, we expensed $62 million of allocated acquisition costs as we had no firm development plans. At Ettrick, the impairment charge largely reflected higher costs and lower reserve estimates. In the Gulf of Mexico, our impairment charge related to four shelf properties ($143 million) and our Green Canyon 6 deep-water property ($107 million). The shelf properties that were impaired were late-life, mature assets that were sensitive to near-term commodity prices. At Green Canyon 6, the impairment expense reflected higher costs after Hurricane Ike destroyed a third-party production platform in the third quarter of 2008. This resulted in unexpected costs to construct new production facilities.
In the UK, our DD&A expense increased 14% over 2007 as a result of additional production from Buzzard. The impact of higher production was offset by a lower DD&A rate at Buzzard with the addition of new reserves at the beginning of 2008. The lower depletion rate at Buzzard decreased our corporate average rate by $0.74/boe. Elsewhere in the UK, our depletion rate increased at our mature Scott/Telford and smaller Farragon fields, increasing our corporate average by $0.47/boe.
In the Gulf of Mexico, reserve revisions at the end of 2007 resulted in higher depletion rates in 2008 and increased our corporate average unit cost by $0.59/boe.
Depletion of our Canadian assets increased our corporate average rate by $0.38/boe and was primarily due to our CBM projects in central Alberta. During 2008, we invested capital in new wells and facilities. A difference exists between the timing of capital expenditures and the recognition of the reserves. This delay resulted in high initial depletion rates for our CBM projects.
In Colombia, our depletion rate doubled from 2007, a result of increased capital costs and lower reserve estimates. This increased our corporate average rate by $0.10/boe.
The stronger Canadian dollar relative to the US dollar decreased our corporate average DD&A rate by $0.45/boe as our US and international depletion is denominated in US dollars.
(Cdn$ millions) |
| 2009 |
| 2008 |
| 2007 |
|
Seismic |
| 81 |
| 137 |
| 123 |
|
Unsuccessful Drilling |
| 115 |
| 203 |
| 126 |
|
Other |
| 106 |
| 62 |
| 77 |
|
Total Exploration Expense |
| 302 |
| 402 |
| 326 |
|
|
|
|
|
|
|
|
|
New Growth Exploration |
| 582 |
| 582 |
| 573 |
|
Geological and Geophysical Costs |
| 81 |
| 137 |
| 123 |
|
Total Exploration Expenditures |
| 663 |
| 719 |
| 696 |
|
|
|
|
|
|
|
|
|
Exploration Expense as a % of Exploration Expenditures |
| 46 | % | 56 | % | 47 | % |
2009 VS 2008—LOWER EXPLORATION EXPENSE INCREASED NET INCOME BY $100 MILLION
Exploration expenditures decreased $56 million from last year as we focused our capital on the US Gulf of Mexico, the North Sea and shale gas in Canada. Exploration expense decreased 25% over the same period due to more successful exploration wells in 2009 and lower seismic data acquisition costs.
In the UK, we had significant exploration success in the Golden Eagle area, which includes our 34% operated interest in Golden Eagle and Hobby, and our 46% operated interest in Pink. In total, we have drilled three exploration and eleven appraisal wells here. We are evaluating development options for the Golden Eagle area as we continue project appraisal.
We drilled a successful exploration well in the southern portion of Oil Prospecting License (OPL) 223, offshore West Africa. The Owowo South B-1 well was drilled in a water depth of 670 metres and is located 20 kilometres east of the Usan field, currently under development. The well reached a total depth of 2,227 metres and discovered several oil bearing reservoirs.
In the Eastern Gulf of Mexico, operations at Appomattox are ongoing and we are currently drilling a sidetrack well to further evaluate the prospect. Appomattox is located six miles west of our Vicksburg discovery. We are also currently drilling an appraisal well at Knotty Head and results are expected in 2010. The well is being drilled by our first contracted deep-water rig, the Ensco 8501.
We continue to make significant progress on our shale gas project in the Dilly Creek area of the Horn River Basin in northeast British Columbia, where we have approximately 90,000 acres with a 100% working interest. During the year, we completed a drilling and completion program and realized substantial cost savings and productivity improvements. We now have five shale gas wells on-stream and achieved first month average rates of over 15 mmcf/d in 2009.
Unsuccessful drilling expense during the year includes expensing CBM drilling costs in Canada and unsuccessful wells in the Eastern Gulf of Mexico and UK North Sea.
In Canada, we expensed costs of $49 million related to our CBM exploration activities in central Alberta on properties where we currently have no future firm development plans. In the Eastern Gulf of Mexico, the Antietam well encountered thick, good quality sand, but was non-commercial and subsequently plugged and abandoned, resulting in expensing costs of $31 million. We also chose not to proceed with the development of a small discovery at Green Canyon 448 and accordingly expensed $14 million.
During 2009, seismic data acquisition costs were $56 million lower than 2008 when we purchased significant seismic data associated with newly acquired blocks in the Norwegian North Sea. Seismic data costs will fluctuate depending on the level of our evaluation activities stage.
2008 VS 2007—HIGHER EXPLORATION EXPENSE REDUCED NET INCOME BY $76 MILLION
Our total exploration expenditures increased $23 million from 2007. In 2008, we focused our investment on exploratory drilling in the US Gulf of Mexico, UK North Sea and CBM in Canada, and on acquiring seismic data in Norway. Exploration expense increased 23% over the same period due to higher seismic data acquisitions and unsuccessful exploration wells.
In the Gulf of Mexico, we drilled a successful deep-water exploration well early in 2008 at Mississippi Canyon 72. Elsewhere in the deep water, we drilled two unsuccessful wells. At Fredericksburg, we drilled to a depth of 24,560 feet but failed to encounter commercial hydrocarbons. This well was subsequently abandoned and $24 million in exploration costs were written off. Our unsuccessful exploration well at Sapphire resulted in a $28 million expense.
In the UK North Sea, we had successes at Blackbird, Pink, Bugle and Rochelle. Blackbird is located 6 km south of Ettrick and production could be tied in to the Ettrick FPSO, following additional appraisal drilling and development evaluation. At Pink, we drilled a successful exploration well and sidetrack. Early in 2009, we completed drilling a successful appraisal well at Rochelle where we have a 44% non-operated interest. Rochelle is located approximately 20 km south of the Scott/Telford fields. During 2008, we drilled a dry hole at Full Moon which cost $16 million and we expensed $32 million of drilling costs for our Selkirk prospect which we do not plan to develop.
In Canada, we expensed $67 million for unsuccessful CBM exploration in Alberta. The costs related to our CBM exploration activities in central Alberta where we have no future development plans.
During 2008, seismic data acquisition costs were 11% higher than 2007. Norway seismic acquisitions increased 47% during 2008 as we obtained data on newly acquired blocks in the Norwegian North Sea. In the US Gulf of Mexico, our seismic investment decreased from 2007 as we focused on analyzing seismic data acquired in previous years. Elsewhere, we acquired seismic data in the UK North Sea, Nigeria and Colombia.


Netbacks are the cash margins, before general and administrative expenses, we receive for every equivalent barrel sold. Our margins improved 26% over the last five years. Our cash netbacks are 64% of realized sales prices in 2009. This is caused by transitioning our production to lower royalty jurisdictions.
|
| 2009 |
| 2008 |
| 2007 |
| 2006 |
| 2005 |
|
Realized Sales Price |
| 60.02 |
| 89.78 |
| 68.46 |
| 62.92 |
| 57.97 |
|
Cash Netback |
| 38.55 |
| 60.64 |
| 43.22 |
| 32.75 |
| 30.57 |
|
Cash Netback as % of Realized Sales Price |
| 64 | % | 68 | % | 63 | % | 52 | % | 53 | % |
The following table lists the sales prices, per-unit costs and netbacks for our producing assets, calculated using our working interest production before and after royalties.
Before Royalties1
|
| 2009 |
| ||||||||||||
($/boe) |
| UK |
| Canada |
| Syncrude |
| US |
| Yemen |
| Other |
| Total |
|
Sales |
| 65.93 |
| 34.58 |
| 70.96 |
| 46.27 |
| 68.49 |
| 59.05 |
| 60.02 |
|
Royalties and Other |
| — |
| (5.75 | ) | (6.04 | ) | (4.89 | ) | (28.94 | ) | (4.52 | ) | (8.06 | ) |
Operating Expenses |
| (6.87 | ) | (12.76 | ) | (35.92 | ) | (12.58 | ) | (10.69 | ) | (6.03 | ) | (11.66 | ) |
In-country Taxes2 |
| — |
| — |
| — |
| — |
| (8.31 | ) | — |
| (1.75 | ) |
Cash Netback |
| 59.06 |
| 16.07 |
| 29.00 |
| 28.80 |
| 20.55 |
| 48.50 |
| 38.55 |
|
|
| 2008 |
| ||||||||||||
($/boe) |
| UK |
| Canada |
| Syncrude |
| US |
| Yemen |
| Other |
| Total |
|
Sales |
| 94.45 |
| 58.34 |
| 105.47 |
| 79.02 |
| 99.87 |
| 98.98 |
| 89.78 |
|
Royalties and Other |
| — |
| (12.25 | ) | (15.11 | ) | (11.03 | ) | (46.94 | ) | (7.88 | ) | (15.06 | ) |
Operating Expenses |
| (6.75 | ) | (13.12 | ) | (36.53 | ) | (11.57 | ) | (8.51 | ) | (4.52 | ) | (11.04 | ) |
In-country Taxes2 |
| — |
| — |
| — |
| — |
| (13.31 | ) | — |
| (3.04 | ) |
Cash Netback |
| 87.70 |
| 32.97 |
| 53.83 |
| 56.42 |
| 31.11 |
| 86.58 |
| 60.64 |
|
|
| 2007 |
| ||||||||||||
($/boe) |
| UK |
| Canada |
| Syncrude |
| US |
| Yemen |
| Other |
| Total |
|
Sales |
| 74.79 |
| 40.79 |
| 79.76 |
| 58.16 |
| 76.29 |
| 71.29 |
| 68.46 |
|
Royalties and Other |
| — |
| (7.81 | ) | (12.02 | ) | (7.45 | ) | (34.69 | ) | (5.90 | ) | (13.10 | ) |
Operating Expenses |
| (6.94 | ) | (12.91 | ) | (25.80 | ) | (8.43 | ) | (6.56 | ) | (3.45 | ) | (9.45 | ) |
In-country Taxes2 |
| — |
| — |
| — |
| — |
| (9.52 | ) | — |
| (2.69 | ) |
Cash Netback |
| 67.85 |
| 20.07 |
| 41.94 |
| 42.28 |
| 25.52 |
| 61.94 |
| 43.22 |
|
After Royalties1
|
| 2009 |
| ||||||||||||
($/boe) |
| UK |
| Canada |
| Syncrude |
| US |
| Yemen |
| Other |
| Total |
|
Sales |
| 65.93 |
| 34.58 |
| 70.96 |
| 46.27 |
| 68.49 |
| 59.05 |
| 60.02 |
|
Operating Expenses |
| (6.87 | ) | (14.80 | ) | (39.09 | ) | (14.10 | ) | (18.34 | ) | (6.53 | ) | (13.33 | ) |
In-country Taxes2 |
| — |
| — |
| — |
| — |
| (14.26 | ) | — |
| (2.00 | ) |
Cash Netback |
| 59.06 |
| 19.78 |
| 31.87 |
| 32.17 |
| 35.89 |
| 52.52 |
| 44.69 |
|
|
| 2008 |
| ||||||||||||
($/boe) |
| UK |
| Canada |
| Syncrude |
| US |
| Yemen |
| Other |
| Total |
|
Sales |
| 94.45 |
| 58.34 |
| 105.47 |
| 79.02 |
| 99.87 |
| 98.98 |
| 89.78 |
|
Operating Expenses |
| (6.75 | ) | (16.38 | ) | (42.04 | ) | (13.48 | ) | (15.88 | ) | (4.91 | ) | (13.18 | ) |
In-country Taxes2 |
| — |
| — |
| — |
| — |
| (24.83 | ) | — |
| (3.63 | ) |
Cash Netback |
| 87.70 |
| 41.96 |
| 63.43 |
| 65.54 |
| 59.16 |
| 94.07 |
| 72.97 |
|
|
| 2007 |
| ||||||||||||
($/boe) |
| UK |
| Canada |
| Syncrude |
| US |
| Yemen |
| Other |
| Total |
|
Sales |
| 74.79 |
| 40.79 |
| 79.76 |
| 58.16 |
| 76.29 |
| 71.29 |
| 68.46 |
|
Operating Expenses |
| (6.94 | ) | (15.93 | ) | (30.32 | ) | (9.69 | ) | (12.00 | ) | (3.76 | ) | (11.63 | ) |
In-country Taxes2 |
| — |
| — |
| — |
| — |
| (17.42 | ) | — |
| (3.31 | ) |
Cash Netback |
| 67.85 |
| 24.86 |
| 49.44 |
| 48.47 |
| 46.87 |
| 67.53 |
| 53.52 |
|
1 Before royalty cash netbacks are calculated by dividing sales, royalties and other, operating expenses and in-country taxes by production before royalties. After royalty cash netbacks are calculated by dividing sales, operating expenses and in-country taxes by production after royalties.
2 Comprises income taxes payable in Yemen that are included in the Government’s share of profit oil.
(Cdn$ millions) |
| 2009 |
| 2008 |
| 2007 |
|
Physical Sales1 |
| 41,093 |
| 54,772 |
| 34,358 |
|
Physical Purchases1 |
| (40,145 | ) | (54,047 | ) | (33,417 | ) |
Net Financial Transactions1, 2 |
| (171 | ) | (142 | ) | (61 | ) |
Change in Fair Market Value of Inventory1 |
| 166 |
| (116 | ) | 79 |
|
Marketing Revenue |
| 943 |
| 467 |
| 959 |
|
Transportation Expense |
| (600 | ) | (751 | ) | (806 | ) |
Other |
| 5 |
| 27 |
| 14 |
|
Net Marketing Revenue |
| 348 |
| (257 | ) | 167 |
|
|
|
|
|
|
|
|
|
Contribution to Net Marketing Revenue by Region: |
|
|
|
|
|
|
|
North America |
| 318 |
| (284 | ) | 151 |
|
Asia |
| 23 |
| 13 |
| 11 |
|
Europe |
| 7 |
| 14 |
| 5 |
|
Net Marketing Revenue |
| 348 |
| (257 | ) | 167 |
|
Depreciation, Depletion, Amortization and Impairment |
| (27) |
| (19 | ) | (13 | ) |
General and Administrative |
| (91) |
| (79 | ) | (87 | ) |
Allowance for Doubtful Receivables |
| 5 |
| (54 | ) | — |
|
|
|
|
|
|
|
|
|
Marketing Contribution to Income before Income Taxes |
| 235 |
| (409 | ) | 67 |
|
|
|
|
|
|
|
|
|
North America |
|
|
|
|
|
|
|
Natural Gas |
|
|
|
|
|
|
|
Physical Sales Volumes3 (bcf/d) |
| 4.9 |
| 6.7 |
| 5.8 |
|
Transportation Capacity (bcf/d) |
| 1.5 |
| 1.8 |
| 2.0 |
|
Storage Capacity4 (bcf) |
| 32 |
| 38 |
| 39 |
|
Financial Volumes5 (bcf/d) |
| 10.1 |
| 16.8 |
| 21.9 |
|
Crude Oil |
|
|
|
|
|
|
|
Physical Sales Volumes3 (mbbls/d) |
| 852 |
| 656 |
| 655 |
|
Storage Capacity4 (mbbls) |
| 3,030 |
| 2,578 |
| 2,734 |
|
Financial Volumes5 (mbbls/d) |
| 730 |
| 1,591 |
| 2,134 |
|
Power |
|
|
|
|
|
|
|
Physical Sales Volumes3 (GWhrs/d) |
| 10 |
| 5 |
| 5 |
|
Generation Capacity (MW/hr) |
| 87 |
| 87 |
| 87 |
|
|
|
|
|
|
|
|
|
Asia |
|
|
|
|
|
|
|
Physical Sales Volumes3 (mbbls/d) |
| 94 |
| 99 |
| 120 |
|
Financial Volumes5 (mbbls/d) |
| 384 |
| 349 |
| 256 |
|
|
|
|
|
|
|
|
|
Europe |
|
|
|
|
|
|
|
Financial Volumes5 (mbbls/d) |
| 378 |
| 787 |
| 529 |
|
|
|
|
|
|
|
|
|
Value-at-Risk |
|
|
|
|
|
|
|
Year End |
| 11 |
| 25 |
| 26 |
|
High |
| 24 |
| 40 |
| 38 |
|
Low |
| 9 |
| 19 |
| 24 |
|
Average |
| 15 |
| 30 |
| 30 |
|
1 Energy Marketing’s physical sales, physical purchases, net financial transactions and changes in fair market value of inventory are reported net on the Consolidated Statement of Income as marketing and other income.
2 Net financial transactions include all gains and losses on financial derivatives and the unrealized portion of gains and losses on physical purchase and sale contracts.
3 Excludes inter-segment transactions. Physical volumes represent amounts delivered during the year.
4 Energy Marketing’s storage capacity reflects volumes contracted but not necessarily used at all times.
5 Financial volumes represent amounts largely acquired to economically hedge physical transactions during the year.
2009 VS 2008—HIGHER CONTRIBUTIONS FROM ENERGY MARKETING INCREASED NET INCOME BY $610 MILLION
Energy marketing generated $348 million in net revenue in 2009, with all businesses contributing positive results. We renewed focus on the physical producer/marketer model which involves buying, selling, and holding physical commodities, and holding the rights to physical transportation and storage assets.
During the fourth quarter, energy marketing continued to optimize its trading around physical assets resulting in gains on physical positions and commodity inventory, together with gains from blending in our crude oil business. During the latter part of 2009, gas prices increased as a result of cold weather across North America resulting in unrealized gains on inventory which is carried at fair value. We also had gains on derivatives used to hedge our transportation assets.
The largest contribution in 2009 came from our global crude oil business, which generated gains by inventory management and physical business as a result of contango in the forward price curve. These gains were recognized largely in the first quarter of 2009. This contango, combined with narrowing crude oil differentials, enabled us to capture both realized and unrealized gains on our relatively low-risk physical trading strategies.
Similar to 2008, the natural gas business faced a challenging economic environment. Gas prices remained suppressed while location spreads between markets continued to narrow throughout the year. Early in the year, the gas business incurred losses as a result of exiting the last of its trading positions from 2008 and from selling natural gas inventory where the offsetting gains on the financial instruments hedging the inventory were recognized in prior periods. Weakness in gas markets reduced the value of holding transportation capacity. Any losses associated with the transportation and storage capacity contracts will be recognized when the contracts are used or sold.
During the year, we initiated a strategic review of our energy marketing natural gas and power businesses. This review continues to align our marketing activities with our upstream oil and gas businesses. In early 2010, we entered into an agreement to sell our European gas and power marketing business.
2008 VS 2007—REDUCED ENERGY MARKETING NET REVENUE DECREASED NET INCOME BY $424 MILLION
Our 2008 results were impacted by the significant volatility in commodity markets, the dramatic decrease in commodity prices, and markets which operated outside normal historical fundamentals. Losses in 2008 were largely from our North America gas team who were positioned to take advantage of differentials between locations and capture value between summer and winter prices. The rapidly deteriorating economic environment resulted in dramatic demand destruction. In mid 2008, we refocused on optimizing the physical business and the team began to exit positions thereby incurring losses due to the lack of liquidity in the market and falling commodity prices.
The credit crisis that impacted financial markets caused some of our counterparties to restructure or declare bankruptcy. In September 2008, Lehman Brothers filed for bankruptcy protection and our exposure to them in our trading operations was approximately $39 million. The entire amount was expensed in the third quarter of 2008 although we continue to pursue recovery of these amounts. We also provided an additional $15 million for credit risk with our counterparties. The majority of our counterparties are integrated oil companies, crude oil refiners and marketers, and large utilities.
Results from our marketing group vary between periods and historical results are not necessarily indicative of future results. Marketing results depend on a variety of factors such as market volatility, changes in time and location spreads, the manner in which we use our storage and transportation assets and the change in value of the financial instruments we use to economically hedge these assets.
COMPOSITION OF NET MARKETING REVENUE
(Cdn$ millions) |
| 2009 |
| 2008 |
| 2007 |
|
Trading Activities (Physical and Financial) |
| 339 |
| (287 | ) | 147 |
|
Other Activities |
| 9 |
| 30 |
| 20 |
|
Total Net Marketing Revenue |
| 348 |
| (257 | ) | 167 |
|
TRADING ACTIVITIES
In our energy marketing group, we enter into contracts to purchase and sell crude oil and natural gas. We also use financial and derivative contracts, including futures, forwards, swaps and options for hedging and trading purposes. We account for all derivative contracts using fair value accounting and record the net gain or loss from their revaluation in marketing and other income. The fair value of these instruments is included with accounts receivable or payable. They are classified as long-term or short-term based on their anticipated settlement date.
OTHER ACTIVITIES
We enter into fee for service contracts related to transportation and storage of third-party oil and gas. In addition, we earn income from our power generation facilities at Balzac and Soderglen.
Fair Value of Derivative Contracts
For purposes of estimating the fair value of our derivative contracts, wherever possible, we utilize quoted market prices and if not available, estimates from third-party brokers. These broker estimates are corroborated with multiple sources and/or other observable market data utilizing assumptions that market participants would use when pricing the asset or liability, including assumptions about risk and market liquidity. Inputs to fair valuations may be readily observable, market-corroborated, or generally unobservable. We utilize valuation techniques that seek to maximize the use of observable inputs and minimize the use of unobservable inputs. To value longer-term transactions and transactions in less active markets for which pricing information is not generally available, unobservable inputs may be used.
As a basis for establishing fair value, we utilize a mid-market pricing convention between bid and ask and then adjust our pricing to the ask price when we have a net short position and the bid price when we have a net long position. This adjustment reflects an estimated exit price and incorporates the impact of liquidity when the bid-ask spread widens in less liquid markets. We incorporate the credit risk associated with counterparty default, as well as Nexen’s own credit risk, into our estimates of fair value.
We classify the fair value of our derivatives according to the following hierarchy based on the amount of observable inputs used to value the instruments.
· Level 1—Quoted prices are available in active markets for identical assets or liabilities as of the reporting date. Active markets are those in which transactions occur in sufficient frequency and volume to provide pricing information on an ongoing basis. Level 1 consists of financial instruments such as exchange-traded derivatives and we use information from markets such as the New York Mercantile Exchange.
· Level 2—Pricing inputs are other than quoted prices in active markets included in Level 1. Prices in Level 2 are either directly or indirectly observable as of the reported date. Level 2 valuations are based on inputs, including quoted forward prices for commodities, time value, volatility factors, and broker quotations, which can be substantially observed or corroborated in the marketplace. Instruments in this category include non-exchange traded derivatives such as over-the-counter physical forwards and options, including those which have prices similar to quoted market prices. We obtain information from sources such as the Natural Gas Exchange, independent price publications and over-the-counter broker quotes.
· Level 3—Valuations in this level are those with inputs which are less observable, unavailable or where the observable data does not support the majority of the instrument’s fair value. Level 3 instruments may include items based on pricing services or broker quotes where we are unable to verify the observability of inputs into their prices. Level 3 instruments include longer-term transactions, transactions in less active markets or transactions at locations for which pricing information is not available. In these instances, internally developed methodologies are used to determine fair value which primarily includes extrapolation of observable future prices to similar locations, similar instruments or later time periods.
At December 31, 2009, the fair value of our derivative contracts in our energy marketing trading activities totaled $23 million. This includes contracts used to economically hedge our physical storage and transportation contracts which cannot be carried at fair value until they are used. Below is a breakdown of the derivative fair value by valuation method and contract maturity.
|
| Maturity |
| |||||||||||||
(Cdn$ millions) |
| < 1 year |
| 1-3 years |
| 4-5 years |
| > 5 years |
| Total |
| |||||
Level 1—Actively Quoted Markets |
| (68 | ) |
| (61 | ) |
| (14 | ) |
| — |
|
| (143 | ) |
|
Level 2—Based on Other Observable Pricing Inputs |
| 56 |
|
| 52 |
|
| 10 |
|
| 6 |
|
| 124 |
|
|
Level 3—Based on Unobservable Pricing Inputs |
| 22 |
|
| 20 |
|
| — |
|
| — |
|
| 42 |
|
|
Fair Value at December 31, 2009 |
| 10 |
|
| 11 |
|
| (4 | ) |
| 6 |
|
| 23 |
|
|
Changes in Fair Value of Derivative Contracts
(Cdn$ millions) |
| Total |
| |
Fair Value at December 31, 2008 |
| 63 |
|
|
Change in Fair Value of Contracts |
| 142 |
|
|
Net Losses (Gains) on Contracts Closed |
| (182 | ) |
|
Changes in Valuation Techniques and Assumptions1 |
| — |
|
|
Fair Value at December 31, 2009 |
| 23 |
|
|
1 Our valuation methodology has been applied consistently each period.
The fair values of our derivative contracts will be realized over time as the related contracts settle. Until then, the value of certain contracts will vary with forward commodity prices and price differentials. The average term of our derivative contracts is approximately 1.2 years.
(Cdn$ millions) |
| 2009 |
| 2008 |
| 2007 |
| |||
Net Sales |
| 458 |
|
| 477 |
|
| 414 |
|
|
Sales Volumes (thousand short tons) |
|
|
|
|
|
|
|
|
|
|
Sodium Chlorate |
| 441 |
|
| 495 |
|
| 478 |
|
|
Chlor-alkali |
| 447 |
|
| 469 |
|
| 465 |
|
|
Operating Profit1 |
| 143 |
|
| 125 |
|
| 118 |
|
|
Operating Margin2 |
| 31 | % |
| 26 | % |
| 29 | % |
|
Chemicals Contribution to Income Before Income Taxes3 |
| 79 |
|
| (14 | ) |
| 64 |
|
|
Capacity Utilization |
| 88 | % |
| 92 | % |
| 94 | % |
|
1 Net sales less operating costs, transportation and other.
2 Operating profit divided by net sales.
3 Includes foreign exchange gains and losses on long-term debt.
2009 VS 2008—HIGHER CHEMICALS CONTRIBUTION INCREASED NET INCOME BY $73 MILLION
North America chlorate revenue decreased 2% from 2008, as a 13% reduction in sales volumes attributable to the global economic downturn was partially offset by stronger pricing. North America chlor-alkali revenue increased 2% from 2008 as weaker caustic prices somewhat offset higher volumes. In Brazil, lower caustic prices and a decline in sales volumes decreased chlor-alkali revenues 32%. Chlor-alkali sales volumes decreased because we reduced sales of purchased product as this activity generates no gross margin. There was no impact on our returns in Brazil by eliminating this activity. Chlorate sales in Brazil increased 5% from the prior year as a result of higher prices.
The Canadian dollar strengthened compared to the prior year end and chemicals contribution includes unrealized foreign exchange gains of $50 million on the Canexus US-dollar denominated debt. This compared to our 2008 results which included unrealized foreign exchange losses of $54 million.
2008 VS 2007—LOWER CHEMICALS CONTRIBUTION DECREASED NET INCOME BY $76 MILLION
North America sodium chlorate revenues increased 14% in 2008 as a result of higher realized selling prices and higher sales volumes. Price increases implemented in North America in the first and third quarters more than offset the impact of the stronger Canadian dollar on US-dollar denominated sales. Strong demand from US customers contributed to the increase in sales volumes. North American chlor-alkali revenues were up 11% in 2008 as we realized higher selling prices for caustic soda. These increases were offset by higher operating and transportation costs, as the price of fuel and power increased during 2008. In Brazil, we have a pass-through contract with our primary customer Aracruz Cellulose that allows us to amend our sales prices when operating costs change. Higher costs in 2008 increased the sales revenues we receive from them.
Chemicals contribution to income included foreign exchange losses of $54 million in 2008, primarily from unrealized losses on the revaluation of US-dollar denominated long-term debt.
General and Administrative (G&A)
(Cdn$ millions) |
| 2009 |
| 2008 |
| 2007 |
|
General and Administrative Expense before Stock-Based Compensation |
| 428 |
| 417 |
| 336 |
|
Stock-Based Compensation1 |
| 69 |
| (160 | ) | 38 |
|
Total |
| 497 |
| 257 |
| 374 |
|
1 Includes cash and non-cash expenses related to our tandem option plan and stock appreciation rights plan.
2009 VS 2008—HIGHER COSTS DECREASED NET INCOME BY $240 MILLION
Higher stock-based compensation expense was the primary reason for the 93% increase in G&A costs in 2009. Changes in our share price create volatility in our net income as we account for stock-based compensation using the intrinsic-value method. This method uses our share price at the end of the reporting period to determine our stock-based compensation obligations and related expense. Our stock price fluctuated during the year before closing at $25.22/share, up 18% from $21.45/share at the end of 2008. Cash payments made in connection with our stock-based compensation programs in 2009 decreased 29% from 2008 to $79 million. Cash payments were higher in 2008 as our stock price reached a high of $43.45/share during the year.
2008 VS 2007—LOWER COSTS INCREASED NET INCOME BY $117 MILLION
During 2008, we recovered non-cash stock-based compensation costs of $272 million as our stock price closed the year at $21.45/share, compared to $32.10/share the previous year. This recovery was partially offset by cash payments for stock-based compensation programs of $112 million, 24% lower than 2007.
G&A expense before stock-based compensation increased $81 million, primarily as a result of higher employee costs and cost inflation. An integral part of our strategy to expand our oil and gas operations has been to actively recruit highly experienced employees, positioning us for success in our core areas. We have been actively recruiting skilled individuals to strengthen our teams in Norway and the US.
Interest
(Cdn$ millions) |
| 2009 |
| 2008 |
| 2007 |
|
Interest |
| 389 |
| 334 |
| 341 |
|
Less: Capitalized |
| (77 | ) | (240 | ) | (173 | ) |
Net Interest Expense |
| 312 |
| 94 |
| 168 |
|
|
|
|
|
|
|
|
|
Effective Interest Rate |
| 5.0 | % | 5.9 | % | 6.2 | % |
2009 VS 2008—HIGHER NET INTEREST EXPENSE REDUCED NET INCOME BY $218 MILLION
Financing costs increased $55 million from 2008. This 16% increase was a result of higher levels of debt, partially offset by lower interest rates. Our capital investment program, including the acquisition of an additional 15% interest in Long Lake, exceeded our cash flow, causing us to draw down a portion of our term credit facility. In addition, we issued US$1 billion of long-term notes in the third quarter, increasing interest costs by $32 million this year. The stronger US dollar increased our US-dollar denominated interest costs for the year by $32 million.
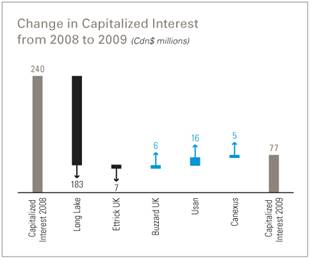
During the year, capitalized interest decreased $163 million from 2008, as a result of completing major development projects. Long Lake capitalized interest in 2009 was $23 million, down $183 million from 2008, while Ettrick capitalized interest decreased $7 million during the year. This was partially offset by an increase in Usan capitalized interest of $16 million. In addition to our Usan development, we also continue to capitalize interest on the construction of the fourth platform at Buzzard and our Chemicals technical conversion project in North Vancouver.
2008 VS 2007—LOWER NET INTEREST EXPENSE INCREASED NET INCOME BY $74 MILLION
Our financing costs are $7 million lower than the previous year as our strong cash flow reduced our debt needs. Lower interest rates on our variable rate debt also reduced interest costs. In the third quarter, we completed an internal reorganization and financing of our assets in the UK. This required us to draw down approximately US$1 billion under our term credit facilities. As a consequence, our financing costs increased in the fourth quarter of 2008.
Interest capitalized on our major development projects increased $67 million in 2008 compared to 2007. Our Long Lake capital costs include $207 million of capitalized interest, $49 million higher than last year. We also capitalized interest of $25 million on our Ettrick development. We continue to capitalize interest on our development project at Usan and the construction of the fourth platform at Buzzard.
Income Taxes
(Cdn$ millions) |
| 2009 |
| 2008 |
| 2007 |
|
Current |
| 776 |
| 859 |
| 434 |
|
Future |
| (516 | ) | 598 |
| 358 |
|
Total Provision for Income Taxes |
| 260 |
| 1,457 |
| 792 |
|
2009 VS 2008—LOWER TAXES INCREASED NET INCOME BY $1,197 MILLION
Our provision for income taxes decreased by $1,197 million as compared to the prior year. Lower commodity prices and production, a reduction in Canadian tax rates, and a fair value unrealized loss on our crude oil put options contributed to lower tax expense in 2009. During the year, future tax expense was reduced by the continued amortization of the deferred tax credit arising from the internal reorganization and financing of our North Sea assets completed in 2008. Our income tax provision includes current taxes in the UK, Yemen, Norway, Colombia and the US.
2008 VS 2007—HIGHER TAXES DECREASED NET INCOME BY $665 MILLION
Our provision for income taxes increased $665 million or 84% from the prior year. This increase was primarily due to record commodity prices and strong production at Buzzard in the UK, which has a corporate tax rate on oil and gas activities of 50%. Current income taxes include cash taxes in Yemen, the UK, Colombia, Norway and the US.
Other
(Cdn$ millions) |
| 2009 |
| 2008 |
| 2007 |
|
Increase (Decrease) in Fair Value of Crude Oil Put Options |
| (251 | ) | 203 |
| (43 | ) |
In the fourth quarter of 2009, we purchased put options on 90,000 bbls/d of our 2010 crude oil production. These options establish a WTI floor price of US$50/bbl on these volumes and provide a base level of price protection without limiting our upside to higher prices. Options on 60,000 bbls/d settle monthly, while the remaining options settle annually. These options are recorded at fair value throughout their term. As a result, changes in forward crude oil prices create gains or losses on these options at each period end. The put options were purchased for $39 million and are carried at fair value. At December 31, 2009, higher crude oil prices reduced the fair value of the options to $17 million, and we recorded a fair value loss in 2009 of $22 million.
In early 2008, we purchased put options on approximately 70,000 bbls/d of our 2009 crude oil production. These options were purchased for $14 million and established a Dated Brent floor price of US$60/bbl on these volumes. At December 31, 2008, the put options had an estimated fair value of $233 million due to lower crude oil prices. Strengthening crude oil prices in 2009 reduced the fair value of these options to nil and we recorded a fair value loss of $229 million in 2009.
In 2007, we purchased put options on approximately 100,000 bbls/d of our 2008 crude oil production for $24 million. These options established an annual average Dated Brent floor price of US$50/bbl on these volumes. These put options expired out-of-the-money.
Capital Investment
In 2010, we plan to invest $2.5 billion in capital activities on our oil and gas operations to solidify growth beyond 2010 as follows:
· 35% on our existing producing assets, including installation of the fourth platform at Buzzard;
· 30% in development projects at Usan, offshore West Africa and progressing the sanctioning of the Golden Eagle area;
· 23% on exploration and appraisal opportunities in our key regions of the North Sea, Gulf of Mexico and offshore West Africa; and
· 12% on early stage development projects expected to contribute future production and cash flow including advancement of our Horn River shale gas play and future phases of oil sands in the Athabasca region.
The amount of this capital investment could be reduced depending on the prevailing economic environment. Details of our 2010 capital program are included in the Capital Investment section of the MD&A.
Production
In 2010, we expect our annual production to grow approximately 4% to 6%, assuming the midpoint of our guidance, and range from 230,000 to 280,000 boe/d (200,000 to 250,000 boe/d after royalties). This growth reflects a full year of production from Ettrick and Longhorn, and increasing volumes from Long Lake. At the high end of our guidance, our production growth would be as high as 15%. The low end includes the possibility of advancing the start-up of the fourth platform at Buzzard which is currently scheduled for 2011. Advancement to 2010 would only be required if we see higher than expected levels of hydrogen sulphide. The downtime associated with advancing the start-up could reduce annual volumes by 10,000 to 15,000 boe/d.
|
| 2010 Estimated Production |
| 2009 Production |
| ||||
(mboe/d) |
| Before |
| After |
| Before |
| After |
|
United Kingdom |
| 100–130 |
| 100–130 |
| 102 |
| 102 |
|
Canada |
| 28–34 |
| 19–25 |
| 38 |
| 32 |
|
Long Lake Bitumen |
| 20–30 |
| 18–28 |
| 8 |
| 8 |
|
Syncrude |
| 19–24 |
| 18–23 |
| 20 |
| 19 |
|
United States |
| 20–28 |
| 17–25 |
| 21 |
| 19 |
|
Yemen |
| 32–37 |
| 19–23 |
| 50 |
| 30 |
|
Other Countries |
| 1–2 |
| 1–2 |
| 4 |
| 3 |
|
Total |
| 230–280 |
| 200–250 |
| 243 |
| 213 |
|
Cash Flow and Sensitivities
We expect cash flow from operating activities to fund our capital investments in 2010, assuming the following:
WTI (US$/bbl) |
| $ | 70 |
|
NYMEX Natural Gas (US$/mmbtu) |
| $ | 5.50 |
|
US to Canadian Dollar Exchange Rate |
| $ | 0.90 |
|
Changes in commodity prices and exchange rates impact our annual cash flow from operating activities, after cash taxes, as follows:
(Cdn$ millions) |
|
|
|
WTI—US$1/bbl change above US$50 |
| 47 |
|
WTI—US$1/bbl change below US$501 |
| 30 |
|
NYMEX Natural Gas—US$0.50/mcf change |
| 28 |
|
Exchange Rate—$0.01 US/Cdn change |
| 35 |
|
1 Put options mitigate the impact of a price decline below US$50 WTI (based on 90,000 puts).
LIQUIDITY AND CAPITAL RESOURCES
Capital Structure
(Cdn$ millions) |
| December 31 |
| December 31 |
|
Net Debt1 |
|
|
|
|
|
Bank Debt |
| 1,803 |
| 1,448 |
|
Public Senior Notes |
| 4,982 |
| 4,582 |
|
Total Senior Debt |
| 6,785 |
| 6,030 |
|
Subordinated Debt |
| 466 |
| 548 |
|
Total Debt |
| 7,251 |
| 6,578 |
|
Less: Cash and Cash Equivalents |
| (1,700 | ) | (2,003 | ) |
Total Net Debt |
| 5,551 |
| 4,575 |
|
|
|
|
|
|
|
Equity2 |
| 7,646 |
| 7,191 |
|
1 Includes all of our debt and is calculated as long-term debt and short-term borrowings less cash and cash equivalents.
2 Equity is the historical issue price of equity and accumulated retained earnings.
Net Debt
We use net debt as a key indicator of our leverage and to monitor the strength of our balance sheet. Net debt is directly related to our operating cash flows and capital investment. We ended the year with net debt of approximately $5.6 billion, $976 million higher than 2008. The year-over-year change in our net debt results from:
(Cdn$ millions) |
| 2009 |
| 2008 |
|
Capital Investment |
| 2,742 |
| 3,066 |
|
Acquisition of Additional Working Interest at Long Lake |
| 755 |
| — |
|
Cash Flow from Operating Activities |
| (1,886 | ) | (4,354 | ) |
Deficiency (Excess) |
| 1,611 |
| (1,288 | ) |
Dividends on Common Shares |
| 104 |
| 92 |
|
Issue of Common Shares |
| (57 | ) | (64 | ) |
Repurchase of Common Shares for Cancellation |
| — |
| 338 |
|
Foreign Exchange Translation of US-dollar Debt and Cash |
| (897 | ) | 1,012 |
|
Net Proceeds on Disposition of Assets |
| (17 | ) | (6 | ) |
Other |
| 232 |
| 87 |
|
Increase in Net Debt |
| 976 |
| 171 |
|
Our net debt increased from the prior year primarily due to capital investment exceeding cash flow generated from operating activities. During the year, our capital investment included the acquisition of an additional 15% working interest in Long Lake for $755 million and investments focused on our three key growth areas of: oil sands, conventional exploration and exploitation, and unconventional gas. Cash flow from operating activities decreased compared to the prior year mainly as a result of lower oil and gas commodity prices. This impact was partially offset as the Canadian dollar strengthened relative to the US dollar, which reduced our US-dollar denominated debt. We currently have liquidity of approximately $3.3 billion, which is comprised of cash and undrawn committed credit facilities, most of which are available until July 2012.
Operating cash flows in the oil and gas industry can be volatile as short-term commodity prices are driven by existing supply and demand fundamentals and market volatility. We manage our investments through the lows of the commodity market to create future growth and value for our shareholders over the long-term without putting our balance sheet under undue financial risk. Changes in our non-cash working capital can vary between periods as our energy marketing net working capital position fluctuates depending on timing of settlement of outstanding positions, the movement in commodity prices and inventory cycles.
The change in our net debt, combined with lower cash flow and earnings, increased our 2009 leverage as reflected in the following ratios:
(times) |
| 2009 |
| 2008 |
| 2007 |
|
Net Debt to Cash Flow from Operating Activities1 |
| 2.5 |
| 1.1 |
| 1.6 |
|
Interest Coverage2 |
| 8.5 |
| 15.6 |
| 12.1 |
|
1 For purposes of this calculation, cash flow from operating activities is before changes in non cash working capital and other.
2 Earnings before interest, taxes, DD&A, exploration and other non—cash expenses, divided by interest expense (before capitalized interest).
Our business strategy is focused on value-based growth through full-cycle exploration and development of conventional and unconventional resources, supplemented by strategic acquisitions when appropriate. Since most of our projects have long cycle-times requiring significant amounts of capital prior to cash flow generation, we have successfully leveraged our balance sheet many times in the past, including to:
· develop the Masila project in Yemen in 1993;
· acquire Wascana in 1997;
· repurchase 20 million common shares, representing 14% of our issued common shares, in 2000;
· acquire the remaining interest in Aspen in 2003;
· acquire the Buzzard project and other key assets in the North Sea in 2004;
· construct the first phase of Long Lake beginning in 2004; and
· acquire an additional 15% in the Long Lake project and joint venture lands in 2009.
For the twelve months ended December 31, 2009, our net debt to cash flow from operating activities (before changes in non-cash working capital and other) ratio was 2.5 times compared to 1.1 times at December 31, 2008. While we typically expect the target ratio to fluctuate between 1.0 and 2.0 times under normalized commodity prices, this can be higher or lower depending on commodity price volatility or when we identify strategic opportunities requiring additional investment. Whenever we exceed our target ratio, we assess whether we need to develop a strategy to reduce our leverage and lower this ratio back to target levels over time.
Change in Working Capital
(Cdn$ millions) |
| December 31 |
| December 31 |
| Increase |
|
Cash and Cash Equivalents |
| 1,700 |
| 2,003 |
| (303 | ) |
Restricted Cash |
| 198 |
| 103 |
| 95 |
|
Accounts Receivable |
| 2,788 |
| 3,163 |
| (375 | ) |
Inventories and Supplies |
| 680 |
| 484 |
| 196 |
|
Accounts Payable and Accrued Liabilities |
| (3,038 | ) | (3,326 | ) | 288 |
|
Other |
| 70 |
| 76 |
| (6 | ) |
Total |
| 2,398 |
| 2,503 |
| (105 | ) |
Our working capital balances remained strong in 2009 as we weathered the economic downturn that began in late 2008. Our capital expenditures exceeded our cash flow from operating activities, which caused us to draw upon our available liquidity and issue US$1 billion of long-term debt. We currently have approximately $1.7 billion of cash and cash equivalents on hand as well as significant undrawn committed credit facilities available.
Accounts receivable and payable in our energy marketing group decreased during the year as we reduced our trading activity to focus on supporting our core physical business as a producer/marketer. Commodity inventory increased since 2008 as our trading inventory is carried at fair value and was higher than last year as a result of stronger crude oil prices.
At December 31, 2009, our restricted cash consists of margin deposits of $198 million (2008—$103 million) related to exchange-traded derivative financial contracts used by our energy marketing group to economically hedge physical commodities, storage, transportation and customer sales contracts. We are required to maintain margin for net out-of-the-money derivative financial contracts. The increase in margin relates to derivative financial contracts protecting our
natural gas and crude oil positions. Our physical gas purchase contracts gained in value in a declining gas price environment, while our physical crude sales contracts gained in value in a rising price environment. The derivative financial contracts protecting these positions declined in value. Additional margin was required to cover the increase in the net out-of-the-money derivative financial contracts.
The weaker US dollar at the end of the year impacted our US-dollar denominated working capital by decreasing accounts receivable, inventories and accounts payable by approximately $215 million, $50 million and $210 million, respectively.
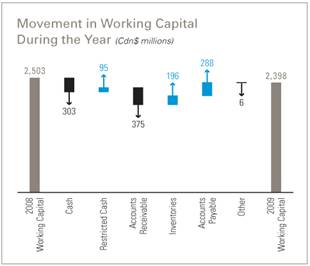
Liquidity
We generally rely on operating cash flows to fund capital requirements and provide liquidity. Given the long cycle-time of some of our development projects and volatile commodity prices, it is not unusual for capital expenditures to exceed our cash flow in any given year. We also require liquidity for our energy marketing business. We believe that maintaining strong liquidity is critical during periods of uncertain economic markets. We currently have liquidity of approximately $3.3 billion which is comprised of cash and undrawn committed credit facilities, most of which are available until 2012.
We maintain significant committed credit facilities. At December 31, 2009, we had unsecured term credit facilities of $3.2 billion that are available until July 2012. Of these facilities, $1.6 billion was drawn and $407 million was utilized to support letters of credit. We also had $492 million of uncommitted, unsecured credit facilities, of which $86 million was supporting letters of credit outstanding at December 31, 2009. Canexus had $451 million of committed, secured term credit facilities available until 2011 of which $233 million was drawn at December 31, 2009.
From time to time, we access capital markets to meet our financing needs. We also use financial instruments to minimize exposure to fluctuating commodity prices and foreign exchange. For example, we routinely purchase WTI and Dated Brent put options to establish a minimum value for our production. We manage our capital structure to maintain flexibility so we can fund our capital programs given the cyclical nature of the oil and gas business.
The following table shows how we financed our business activities. When our operating cash flows exceed our investment requirements, we generally pay down debt or return cash to shareholders. We borrow or issue equity to fund investment requirements that exceed our operating cash flow.
(Cdn$ millions) |
| 2009 |
| 2008 |
| 2007 |
| 2006 |
| 2005 |
|
Cash Flow from Operating Activities |
| 1,886 |
| 4,354 |
| 2,830 |
| 2,374 |
| 2,143 |
|
Cash Flow from Investing Activities |
| (3,743 | ) | (3,189 | ) | (3,281 | ) | (3,388 | ) | (1,864 | ) |
Surplus (Deficiency) |
| (1,857 | ) | 1,165 |
| (451 | ) | (1,014 | ) | 279 |
|
|
|
|
|
|
|
|
|
|
|
|
|
Cash Flow from Financing Activities |
| 1,821 |
| 322 |
| 677 |
| 1,081 |
| (274 | ) |
Net Cash Generated (Used) |
| (36 | ) | 1,487 |
| 226 |
| 67 |
| 5 |
|
In 2005, we used cash flow and proceeds from asset dispositions to fund our capital program and repay debt. In 2006, we borrowed approximately $1 billion under our committed term credit facilities and used cash flow from operating activities to fund our capital program. In 2007, we issued US$1.5 billion in senior debt to repay outstanding term credit facilities and $150 million in medium term notes, as well as to fund our 2007 capital program.
In 2008, our cash flow from operating activities exceeded capital expenditures by approximately $1.3 billion and we used this excess to: i) build our cash balances; ii) repurchase approximately 12 million common shares at a cost of $338 million; and iii) repay debt including maturing medium term notes of $125 million. We also borrowed approximately US$1 billion under our term credit facilities as a result of an internal reorganization and financing of our UK North Sea assets.
In 2009, our capital investment, including the acquisition of an additional working interest in Long Lake, exceeded our cash flow from operating activities. The purchase of Long Lake was funded primarily from accumulating excess cash in 2008. In response to improving credit markets, we also issued US$1 billion of senior notes during the year, with US$300 million maturing in 10 years and US$700 million maturing in 30 years. Proceeds from the debt issue were used to repay a portion of our outstanding term credit facilities as well as for general corporate purposes. The issuance of the new debt increased the average term-to-maturity of our debt to 17 years.
Our marketing business also requires liquidity to support its activities. We require liquidity for working capital, cash or credit lines to fund collateral requirements and to absorb unexpected market or credit losses. The commercial agreements our marketing business enters into often include financial assurance provisions that allow Nexen and our counterparties to effectively manage credit risk. These agreements typically require collateral to be posted if adverse credit-related events, such as reduced credit rating to non-investment grade, occur. We have developed mitigation strategies to significantly reduce our overall exposure if such a downgrade were to occur. We believe our current liquidity is sufficient enough to fund this exposure, if necessary. Additionally, our exchange-traded contracts require that we provide margin based on daily fluctuations in the value of our contracts. The largest single day margin call we received during 2009 was $37 million. In evaluating our liquidity requirements, we consider the current requirements of our marketing business as well as additional collateral or other payments that could be required if our credit ratings were reduced.
Future Liquidity
Our future liquidity depends upon cash flow generated from our operations, existing committed credit facilities and our ability to access debt and equity markets. Our 2010 capital investment budget is approximately $2.5 billion, which we expect to finance from cash flow and existing cash. We continue to monitor economic conditions and commodity prices and will adjust our capital investment program accordingly. We also continue to work with suppliers and contractors to negotiate supply rates that reflect existing market conditions.
In 2010, we expect cash flow from operating activities to fund our capital investment program assuming:
WTI (US$/bbl) |
| $ | 70 |
|
NYMEX Natural Gas (US$/mmbtu) |
| $ | 5.50 |
|
US to Canadian Dollar Exchange Rate |
| $ | 0.90 |
|
Changes in commodity prices and exchange rates will impact our cash flow and borrowing requirements. Refer to the Outlook for 2010 section on page 79 to see how changes in the above assumptions can impact our cash flow.
At December 31, 2009, we have $1.7 billion in cash, $1.6 billion of undrawn committed credit facilities and $492 million of undrawn uncommitted credit facilities. The average term of our public debt is approximately 17 years. The only debt maturity of significance in the next few years is our $3.2 billion term credit facility which matures in July 2012, although historically we have been able to negotiate an extension with our lenders. At December 31, 2009, we had drawn $1.6 billion on this facility. Given the long term-to-maturity of a significant portion of our debt, we believe we are well positioned to bring our near completion projects to production and pursue our next generation of growth while preserving our liquidity.
Our debt maturities over the next five years are:
(Cdn$ millions) |
| 2010 |
| 2011 |
| 2012 |
| 2013 |
| 2014 |
|
Term Credit Facilities1 |
| — |
| — |
| 1,570 |
| — |
| — |
|
Long-Term Notes |
| — |
| — |
| — |
| 523 |
| — |
|
Canexus LP Term Credit Facilities |
| — |
| 233 |
| — |
| — |
| — |
|
Canexus LP Notes |
| — |
| — |
| — |
| 52 |
| — |
|
Canexus Convertible Debt |
| — |
| — |
| — |
| — |
| 46 |
|
Total |
| — |
| 233 |
| 1,570 |
| 575 |
| 46 |
|
1 $3.2 billion available until July 2012.
For the past several years, we invested significant capital in a number of major development projects including Buzzard, Long Lake and Ettrick. The large capital investment required in these projects is behind us and we expect these assets will make significant contributions to our future cash flows. Cash flows generated from these projects allow us to repay debt and invest in our next generation of new growth projects such as: i) Usan, offshore West Africa; ii) shale gas in the Horn River Basin; and iii) the Golden Eagle area in the UK North Sea. In 2010, we expect to invest $575 million to progress our Usan development, $200 million at Horn River and $50 million at Golden Eagle. While these development projects lack exploration risk, they are subject to other risks including higher than anticipated capital costs or delayed start-up. We maintain significant undrawn committed credit facilities to manage these risks. We also have a US$3.5 billion shelf prospectus filed in the US and Canada for sales of debt securities and common shares, under which we issued US$1 billion of debt securities in July.
We are well positioned with our current debt structure. Our only debt covenant requires us to maintain a long—term debt to EBITDA ratio of less than 3.5. At December 31, 2009, this ratio was approximately 1.9 times. We do not expect to exceed 3.5 based on our current debt levels and planned operations.
With our expected cash flow streams, commodity price hedging strategies, current liquidity levels, access to debt and equity markets, and flexibility to reduce future capital expenditure programs, we expect to be able to fund all planned capital, dividend distributions and debt repayments, and meet other obligations that may arise from our oil and gas, chemicals and energy marketing operations.
In 2009 and 2008, the board declared common share dividends of $0.20 and $0.175, respectively. In each of the three years preceding 2008, the board declared common share dividends of $0.10 per share each year.
Contractual Obligations, Commitments and Guarantees
We assume various contractual obligations and commitments in the normal course of our operations and financing activities. We have considered these obligations and commitments in assessing our cash requirements, as noted in the above discussion of future liquidity. They include:
|
| Payments |
| ||||||||
(Cdn$ millions) |
| Total |
| < 1 year |
| 1-3 years |
| 4-5 years |
| > 5 years |
|
Long-Term Debt |
| 7,343 |
| — |
| 1,803 |
| 621 |
| 4,919 |
|
Interest on Long-Term Debt1 |
| 8,052 |
| 361 |
| 721 |
| 688 |
| 6,282 |
|
Operating Leases2 |
| 647 |
| 117 |
| 185 |
| 179 |
| 166 |
|
Capital Leases |
| 120 |
| 6 |
| 12 |
| 11 |
| 91 |
|
Energy Commodity Contract Liabilities |
| 694 |
| 482 |
| 180 |
| 32 |
| — |
|
Transportation and Storage Commitments2 |
| 977 |
| 303 |
| 345 |
| 209 |
| 120 |
|
Work Commitments and Purchase Obligations3 |
| 2,749 |
| 1,299 |
| 1,079 |
| 313 |
| 58 |
|
Asset Retirement Obligations |
| 2,341 |
| 35 |
| 79 |
| 162 |
| 2,065 |
|
Total |
| 22,923 |
| 2,603 |
| 4,404 |
| 2,215 |
| 13,701 |
|
1 Excludes interest on term credit facilities of $1.6 billion and Canexus term credit facilities of $233 million as the amounts drawn on the facilities fluctuate. Based on amounts drawn at December 31, 2009 and existing variable interest rates, we would be required to pay $19 million per year until the outstanding amounts on the term credit facilities are repaid.
2 Payments for operating leases and transportation and storage commitments are deducted from our cash flow from operating activities.
3 Some of these payments relate to work commitments that we can cancel without penalties or additional fees.
Contractual obligations can be financial or non-financial. Financial obligations are known future cash payments that we must make under existing contracts, such as debt and lease arrangements. Non-financial obligations are contractual obligations to perform specified activities such as work commitments. Commercial commitments are contingent obligations that become payable only if certain pre-defined events occur.
· Short-term and long-term debt amounts are included on our December 31, 2009 Consolidated Balance Sheet.
· Operating leases include the minimum lease payment obligations associated with leases for office space, rail cars, vehicles and processing agreements that allow our production to flow through third-party processing facilities.
· Capital leases include pipeline commitments primarily related to production at Long Lake.
· Energy commodity contract liabilities include the purchase and sale of physical quantities of oil and natural gas, and financial derivatives used to manage our exposure to commodity prices. For certain contracts, we may net settle. These contracts are included in our Consolidated Balance Sheet on a net basis at fair value.
· Work commitments include non-discretionary capital spending for drilling, seismic, facilities construction and other development commitments in our international operations, and include commitments for the Usan development project in Nigeria over the next five years ($585 million). Since the timing of certain payments is difficult to determine with certainty, the table was prepared using our best estimates. The majority of our 2010 capital investment is discretionary.
· We have included $998 million in work commitments for drilling rigs we have contracted in the UK, Norway and the Gulf of Mexico over the next five years.
· We have $2,341 million of undiscounted asset retirement obligations after inflation. As of December 31, 2009, the discounted value ($1,053 million) of these estimated obligations was provided for in our Consolidated Financial Statements (including $35 million of estimated current obligations). Since timing of any payments is difficult to determine with certainty, the table was prepared using our best estimates.
· We have a net pension liability of $55 million for our defined benefit pension plan. This includes a pension asset of $21 million from over contributing to the defined benefit plan, offset by a liability of $76 million for supplemental pension benefits. Supplemental pension benefits are funded from our operating cash flows and backed with an irrevocable letter of credit. Canexus has unfunded pension obligations of $12 million and our share of the unfunded pension obligation for Syncrude is $56 million.
· We have excluded obligations on our tandem option and stock appreciation rights programs as the amount and timing of cash payments are not determinable.
· We have excluded our normal purchase arrangements as they are discretionary and are reflected in our expected cash flow from operating activities and capital expenditures for 2010.
· We have excluded our future income tax liabilities as the amount and timing of any cash payment for income taxes is based on taxable income for each fiscal year in the various jurisdictions where we operate. We have also excluded future income tax liabilities as they relate to uncertain tax positions, as we cannot provide a reasonable estimate as to if, or when future payments would be required.
From time to time, we enter into contracts that require us to indemnify parties against certain possible claims, particularly when these contracts relate to the sale of assets. On occasion, we provide indemnifications to the purchaser. Generally, a maximum obligation is not stated; therefore, the overall maximum amount cannot be reasonably estimated. We have not made any significant payments related to these indemnifications. We believe existing indemnifications would not have a material adverse effect on our liquidity, financial condition or results of operations.
Credit Ratings
Currently, our senior debt is rated BBB by Dominion Bond Rating Service (DBRS), Baa3 by Moody’s Investor Service, Inc. (Moody’s), and BBB- by Standard & Poor’s (S&P). DBRS, Moody’s and S&P all currently rate our outlook as stable. We believe our financial results, ample liquidity and financial flexibility continue to support our credit ratings.
Financial Assurance Provisions in Commercial Contracts
The commercial agreements our energy marketing group enters into often include financial assurance provisions that allow Nexen and our counterparties to effectively manage credit risk. The agreements normally require collateral to be posted if an adverse credit-related event, such as a drop in credit ratings, occurs. Based on contracts in place and commodity prices at December 31, 2009, if we were downgraded to non-investment grade we could be required to post collateral of up to $962 million, which we expect we would be able to manage down. These obligations are reflected on our balance sheet and are expected to decrease over the next couple of years with the rationalization of our marketing business. The posting of collateral merely accelerates the payment of such amounts and lowers our available liquidity. Just as we may be required to post collateral if we were downgraded below investment grade, we have similar provisions in many of our contracts that allow us to demand certain counterparties post collateral for amounts they owe us if they are downgraded to non-investment grade.
Off-Balance Sheet Arrangements
We have no off-balance sheet arrangements that would have a material adverse effect on our liquidity, consolidated financial position or results of operations. We use operating leases in the normal course of business as disclosed in Contractual Obligations, Commitments and Guarantees in Note 15 to the Consolidated Financial Statements, which is incorporated herein by reference.
At December 31, 2009, we had outstanding letters of credit supported by $407 million (US$389 million) of unsecured term credit facilities and $86 million (US$82 million) of uncommitted unsecured credit facilities.
Contingencies
We have no contingencies that would have a material adverse effect on our liquidity, consolidated financial position or results of operations. See Note 15 to the Consolidated Financial Statements, which is incorporated herein by reference for a discussion of our contingencies.
We make estimates and assumptions that affect: i) the reported amounts of our assets and liabilities; ii) the disclosure of contingent assets and liabilities at the date of the Consolidated Financial Statements; and iii) our revenues and expenses during the reporting period. Our management review these estimates, including those related to accruals, litigation, environmental and asset retirement obligations, recoverability of assets, income taxes, fair values of derivative assets and liabilities, capital adequacy, and the estimation of reserves on an ongoing basis. Changes in facts and circumstances may result in revised estimates and actual results may differ from these estimates. Our critical accounting estimates are discussed below.
Oil and Gas Accounting—Reserves Determination
We follow the successful efforts method of accounting for our oil and gas activities, as described in Note 1 to our Consolidated Financial Statements. Successful efforts accounting depends on the estimated remaining reserves. The process of estimating reserves requires complex judgements and decision-making based on available geological, geophysical, engineering and economic data. To estimate the economically recoverable oil and gas reserves and related future net cash flows, we consider many factors and make various assumptions. Refer to the Basis of Reserves Estimates on page 29 for a description of our process for estimating reserves.
Reserves estimates are critical to many of our accounting estimates, including:
· determining whether or not an exploratory well has found economically producible reserves. If successful, we capitalize the costs of the well, and if not, we expense the costs immediately. In 2009, $115 million of our total $445 million spent on exploration drilling was expensed. If none of our exploration drilling had been successful, our net income would have decreased by $204 million, net of income tax;
· calculating our unit-of-production depletion rates. Both proved and proved developed reserves estimates are used to determine rates that are applied to each unit-of-production in calculating our depletion expense. Proved reserves are used where a property is acquired and proved developed reserves are used where a property is drilled and developed. In 2009, oil and gas depletion of $1,425 million (before impairments) was recorded in depletion, depreciation, amortization and impairment expense. If our proved reserves estimates changed by 10%, our depletion, depreciation, amortization and impairment expense would have changed by approximately $143 million, assuming no other changes to our reserves profiles; and
· assessing, when necessary, our oil and gas assets for impairment. Estimated future undiscounted cash flows are determined using proved reserves. The critical estimates used to assess impairment, including the impact of changes in reserves estimates, are discussed below.
Since we do not have any loan covenants directly linked to reserves, it would take a significant decrease in our proved reserves to limit our ability to borrow money under our term credit facilities, as previously described in the Liquidity section of the MD&A.
Impairments
PROPERTY, PLANT AND EQUIPMENT
We evaluate our long-lived assets for impairment if an adverse event or change occurs. Among other things, these might include falling oil and gas prices, a significant negative revision to our reserve estimates, changes in operating and capital costs, or significant or adverse political or regulatory changes. If one of these occurs, we assess estimated undiscounted future cash flows for affected assets to determine if they are impaired. If the undiscounted future cash flow for an asset is less than the carrying amount of that asset, we estimate its fair value using a discounted cash flow model.
Cash flow estimates for our impairment assessments require assumptions about the following primary elements—future prices and costs, reserves and discount rates. Our estimates of future prices are based on our assumptions of long-term prices and operating and development costs and require significant judgments about highly uncertain future events. Historically, oil and gas prices have exhibited significant volatility—over the last five years,
prices for WTI and NYMEX gas have ranged from US$32/bbl to US$147/bbl and US$2.41/mmbtu to US$15.38/mmbtu, respectively. Our forecasts for oil and gas revenues are based on prices derived from a consensus of future price forecasts amongst industry analysts, our own assessments and existing future strip prices. Our estimates of discount rates include consideration of the marketplace and risk of the asset. Given the significant assumptions required and the possibility that actual conditions will differ, we consider the assessment of impairment to be a critical accounting estimate. A change in these estimates would impact all our businesses with the exception of chemicals and energy marketing.
It is difficult to determine and assess how a decrease in proved reserves impacts our impairment tests. The relationship between our reserve estimate and the estimated undiscounted cash flows, and the nature of the property-by-property impairment test is complex. As a result, we are unable to provide a reasonable sensitivity analysis of the impact that a reserve estimate decrease would have on our assessment of impairment.
GOODWILL
We test goodwill for impairment whenever an event or circumstance occurs that may reduce the fair value of a reporting unit below its carrying amount and at least annually. Our goodwill impairment test compares the estimated fair value of a reporting unit with its carrying amount, including goodwill. If the carrying amount of the reporting unit exceeds the fair value, the goodwill is considered impaired. To measure the amount of impairment, we allocate the estimated fair value to the underlying assets and liabilities, resulting in an implied fair value of goodwill. If the carrying amount of the goodwill exceeds the implied fair value, an impairment loss equal to the excess is included in net income.
The process of assessing goodwill for impairment requires us to estimate the fair values of our assets using one or more valuation techniques including present value calculations of estimated future cash flows. This process involves making various assumptions and judgments about future commodity prices, future activity levels, operating costs and discount rates. Changes in any of these assumptions or judgments could result in an impairment of all or a portion of goodwill.
Asset Retirement Obligations
We are required to remove or remedy the effect of our activities on the environment at our present and former operating sites by dismantling and removing production facilities and remediating any damage caused. In estimating our future asset retirement obligations, we must make estimates and judgments on activities that will occur many years into the future. Additionally, contracts and regulations are often vague and unclear as to what constitutes removal and remediation. Furthermore, the ultimate financial impact is not always clearly known and cannot be reasonably estimated as asset removal and remediation techniques and costs are constantly changing, as are legal, regulatory, environmental, political, safety and other such considerations.
We record asset retirement obligations in our Consolidated Financial Statements by discounting the future value of the estimated retirement obligations associated with our oil and gas wells and facilities and chemical plants. In arriving at amounts recorded, numerous assumptions and judgments are made on ultimate settlement amounts, inflation factors, credit-adjusted discount rates, timing of settlement and expected changes in legal, regulatory, environmental, political and safety environments. The asset retirement obligations we record increase the carrying cost of our property, plant and equipment and accretes with the passage of time.
A change in any one of our assumptions could impact our asset retirement obligations, the carrying value of our property, plant and equipment and our DD&A expense.
Income Taxes
We follow the liability method of accounting for income taxes whereby future income tax assets and liabilities are recognized based on temporary differences in reported amounts for financial statement and income tax purposes. We carry on business in several countries and as a result, we are subject to income taxes in numerous jurisdictions. The determination of current income tax is inherently complex, interpretations will vary and we are required to make certain judgments. Our income tax filings are subject to audits and reassessments and we believe we have adequately provided for all income tax obligations. However, changes
in facts, circumstances and interpretations as a result of income tax audits, reassessments, jurisprudence and any new legislation may result in an increase or decrease in our provision for income taxes.
Derivatives and Fair Value Measurements
We enter into contracts to purchase and sell crude oil and natural gas and use derivative contracts, including futures, forwards, swaps and options, for hedging and trading purposes (collectively derivatives). We also use derivatives to manage commodity price risk and foreign currency risk for non-trading purposes.
The fair value of derivative contracts is estimated. Wherever possible, this estimate is based on quoted market prices, and if not available, on estimates from third-party brokers. We classify the fair value of our derivatives according to a three-level hierarchy based on the amount of observable inputs used to value the instruments. Inputs may be: i) readily observable; ii) market corroborated; or iii) generally unobservable. We utilize valuation techniques that maximize the use of observable inputs wherever possible and minimize the use of unobservable inputs. Another significant assumption that we use in determining the fair value of derivatives is market data or assumptions that market participants would use when pricing the asset or liability, including assumptions about risk. Additionally, we utilize a mid-market pricing convention between bid and ask and then adjust our pricing to the ask price when we have a net open sell position and the bid price when we have a net open buy position. We incorporate the credit risk associated with counterparty default into our estimates of fair value.
Our assessment of the significance of a particular input to the fair value measurement may affect the valuation of fair value within the hierarchy. Also for derivative contracts, the time between inception and settlement of the contract may affect fair value. The actual settlement of derivatives could differ materially from the fair value recorded and could impact future operating results. We performed a sensitivity analysis of inputs used to calculate the fair value of the instruments that are based on unobservable inputs. Using reasonably possible alternative assumptions, the fair value of these instruments would be change by $12 million (before tax).
International Financial Reporting Standards Adoption Plan
We are required to adopt International Financial Reporting Standards (IFRS) for our interim and annual financial reporting purposes beginning January 1, 2011. A project team, consisting of dedicated and experienced personnel who have IFRS knowledge, has been set up to manage this transition and to ensure successful implementation within the required timeframe.
A steering committee comprised of senior management has been established for project oversight. The steering committee has the responsibility to ensure the project is adequately planned in sufficient detail, appropriate resources are made available, necessary milestones are established and project progress is properly monitored. These senior leaders are also responsible for internal controls over financial reporting and our disclosure controls and procedures. The audit and conduct review committee of the board of directors regularly receives progress reporting on the status of the IFRS transition project and training of IFRS principles.
Our project consists of five phases: diagnostic, design and plan, develop solution, implementation, and closeout. We are currently in the Implementation phase where we are making the necessary changes to business processes, financial reporting and supporting information technology systems to allow us to capture and report on IFRS financial information throughout 2010 and onwards.
Project activities and key milestones are documented in the following chart:
Key Activity |
| Key Milestone |
| Status |
|
|
|
|
|
Financial Information |
|
|
|
|
|
|
|
|
|
· Identify differences between Canadian GAAP and IFRS · Revise accounting policies under IFRS · Identify potential adjustments to initial IFRS financial statements · Develop IFRS compliant financial statements, including transition period disclosures |
| · Comprehensive analysis of IFRS differences identified in the diagnostics phase · Senior management approval of IFRS accounting policies · Develop draft IFRS financial statements and disclosures |
| · Comprehensive analysis completed mid 2009 · Received senior management approval of IFRS accounting policies · Areas of potential adjustment to opening balance sheet have been identified · Draft IFRS financial statements and note disclosures are substantially complete |
|
|
|
|
|
Training and Communication |
|
|
|
|
|
|
|
|
|
· Develop and deliver targeted IFRS training to employees and management · Ensure internal and external stakeholders receive ongoing appropriate communications · Develop and deliver targeted IFRS training to senior management and board of directors |
| · Delivery of training in 2009 targeted to affected employees · Ongoing communication with major internal and external stakeholders |
| · Targeted training completed in 2009 · Strategy for follow-up training in 2010 developed · Regular communication with Project Steering Committee, senior management and Audit Committee throughout the year · Quarterly disclosure of project status in MD&A |
|
|
|
|
|
Information Technology |
|
|
|
|
|
|
|
|
|
· Ensure systems are able to adequately support conversion to IFRS and ongoing financial reporting |
| · Be IFRS data capture ready January 1, 2010 · Ensure dual GAAP reporting capability throughout 2010 |
| · System testing for IFRS data capture complete · Dual GAAP reporting capability testing complete |
|
|
|
|
|
Business Process |
|
|
|
|
|
|
|
|
|
· Ensure business processes and control environment properly support conversion to IFRS and ongoing financial reporting |
| · Implement necessary business process and key control changes to ensure adequate internal control over financial reporting |
| · Necessary changes to business process have been designed · Key controls designed to ensure adequate internal control over financial reporting on IFRS results throughout 2010 |
Summary of Accounting Differences between Canadian GAAP and IFRS
We determined that the majority of our existing Canadian GAAP oil and gas accounting policies are acceptable under IFRS. However, detailed analysis has identified differences, the most significant of which will impact certain aspects of our accounting for property, plant and equipment, asset retirement obligations, impairments of assets and share-based payments.
PROPERTY, PLANT AND EQUIPMENT
Significant components of property, plant and equipment with different useful lives must be accounted for and depreciated separately. Instances of major maintenance, turnarounds or inspections must also be capitalized and depreciated until the next scheduled major maintenance activity. Our current policy is to expense these items unless they result in improvements that increase capacity or extend the useful life. We anticipate that retrospective application of these concepts will have an affect on the accumulated depreciation balance on transition for certain of our assets with large production and processing facilities.
ASSET RETIREMENT OBLIGATIONS
There are differences in the calculation methodology for determining asset retirement obligations, which are expected to affect the obligations recorded in all of our operating areas. These obligations will be recalculated and asset retirement obligations and property, plant and equipment balances will be adjusted on the transition date.
IMPAIRMENT OF ASSETS
IFRS does not require a cost recoverability test when testing long-lived assets for impairment. Consequently, it is possible that we may have more impairments where carrying values of assets were previously supported under Canadian GAAP on an undiscounted cash flow basis, but could not be supported on a discounted cash flow basis under IFRS. However, the extent of future impairments under IFRS may be partially offset by potential reversals of previous impairment losses where circumstances that gave rise to the impairment reverses.
SHARE-BASED PAYMENTS
We currently use the intrinsic method to account for our cash-settled stock-based compensation. We expect that the IFRS requirement to value stock-based compensation at fair value each reporting period may result in less volatility in our reported earnings each period. We expect to use a fair value model such as Black-Scholes to value our stock-based compensation each period.
ONE TIME ADJUSTMENTS ON TRANSITION TO IFRS
IFRS allows certain adjustments to financial information on transition where retrospective restatement would either be onerous or would not provide more useful information. We expect to make one-time transitional adjustments on January 1, 2010 to our defined benefit pension obligations to reflect previously unrecognized actuarial losses and to other comprehensive income to reclassify accumulated foreign exchange gains and losses directly to retained earnings.
At this time, we cannot quantify the impact that the adoption of IFRS will have on our future results of operations or financial position. Additional disclosure of the key elements of our plan and progress on the project will be provided as we move toward the changeover date.
We continue to monitor the development of new standards and any changes will be incorporated as required.
In recent years, the CICA has issued standards with the intent to converge with IFRS to facilitate the transition in 2011. As a result, the majority of our current Canadian GAAP accounting policies are acceptable under IFRS.
As a foreign private issuer in the US, we are permitted to file financial statements prepared under IFRS without reconciliation to US GAAP with the SEC. Effective January 1, 2011, we will adopt IFRS as our basis for accounting. The impact of this change is that we will no longer prepare a reconciliation of our results to US GAAP. It is possible that certain of our accounting policies under IFRS could be different from US GAAP, but we expect that most accounting policies will remain consistent or converge with US GAAP as the International Accounting Standards Board (IASB) and the Financial Accounting Standards Board (FASB) undertake joint projects.
US Pronouncements
In June 2009, FASB issued Amendments to Consolidation of Variable Interest Entities. It retains the scope of the previous guidance with the addition of entities previously considered qualifying special-purpose entities and eliminates the previous quantitative approach for a qualitative analysis in determining whether the enterprise’s variable interest or interests give it a controlling financial interest in a variable interest entity. The statement is further amended to require ongoing reassessments of whether an enterprise is the primary beneficiary of a variable interest entity and requires enhanced disclosures about an enterprise’s involvement in a variable interest entity. The standard is effective at the
beginning of the first annual reporting period after November 15, 2009. We do not expect the adoption of this standard to have a material impact on our results of operations or financial position.
On January 6, 2010, FASB issued guidance for Oil and Gas Reserve Estimation and Disclosure, which is effective for the year ended December 31, 2009. The guidance expands the definition of oil and gas producing activities to include unconventional sources such as oil sands, changes the price used in reserve estimation from the year-end December 31 price to the simple average of the first day of the month price for the previous 12 months, and requires disclosures for geographic areas which represent 15% or more of proved reserves. The information required by this standard has been included in the unaudited supplementary data in item 8.
We follow the successful efforts method of accounting for our oil and gas activities, which depends on the estimated reserves we believe are recoverable from our oil and gas properties. Specifically, reserves estimates are used to calculate our unit-of-production depletion rates and to assess our oil and gas assets for impairment, when necessary. Adoption of these amendments at December 31, 2009 did not have an impact on our results of operations or financial position.
Quantitative and Qualitative Disclosures about Market Risk
We are exposed to normal market risks inherent in the oil and gas, energy marketing and chemicals businesses, including commodity price risk, foreign-currency rate risk, interest rate risk and credit risk. We recognize these risks and manage our operations to minimize our exposures to the extent practical.
Commodity Price Risk
Commodity price risk related to conventional and synthetic crude oil prices is our most significant market risk exposure. Crude oil and natural gas prices are sensitive to numerous worldwide factors, including the current global financial crisis, many of which are beyond our control, and are generally sold at contract or posted prices. Changes in world crude oil and natural gas prices may significantly affect our results of operations and cash generated from operating activities. Consequently, such prices also may affect the value of our oil and gas properties and our level of spending for exploration and development.
Our crude oil prices are based on various reference prices, primarily WTI and Brent and other prices which generally track the movement of WTI and Brent. Adjustments are made to the reference prices to reflect quality differentials and transportation. WTI, Brent and other international reference prices are affected by numerous and complex worldwide factors such as supply and demand fundamentals, economic outlooks, production quotas set by the Organization of Petroleum Exporting Countries and political events. Quality differentials are affected by local supply and demand factors.
We are also exposed to natural gas price movements. Natural gas prices are generally influenced by oil prices and supply and demand fundamentals, and to a lesser extent local market conditions.
In 2009, WTI averaged US$61.80/bbl, reaching a high of US$82/bbl and a low of US$32/bbl. Dated Brent, on which approximately 60% of our production is priced, averaged US$61.51/bbl, reaching a high of US$78/bbl and a low of US$39/bbl. NYMEX natural gas prices averaged US$4.16/mmbtu in 2009, reaching a high of US$6.24/mmbtu and a low of US$2.41/mmbtu. Our sensitivities to commodity prices and the expected impact on our 2010 cash flow from operating activities and net income are as follows:
(Cdn$ millions) |
| Cash |
| Net |
|
WTI—US$1/bbl change above US$50 |
| 47 |
| 45 |
|
WTI—US$1/bbl change below US$501 |
| 30 |
| 27 |
|
NYMEX Natural Gas—US$0.50/mcf change |
| 28 |
| 19 |
|
1 Put options mitigate the impact of a price decline below US$50 WTI (based on 90,000 puts).
These sensitivities are based on our estimated 2010 oil and gas production and assume a US/Canadian dollar exchange rate of $0.90. Our estimated oil and gas production range for 2010 is between 230,000 and 280,000 boe/d before royalties, of which approximately 15% is gas.
The majority of our oil and gas production is sold under short-term contracts, exposing us to short-term price movements. Other energy contracts we enter into also expose us to commodity price risk between the time we purchase and sell contracted volumes. From time to time, we actively manage these risks by using commodity futures, forwards, swaps and options.
In 2009, we purchased WTI put options to manage the commodity price risk exposure on a portion of our oil production in 2010. These put options have established an annual average WTI floor price of US$50/bbl on about 90,000 bbls/d of production.
Foreign Currency Risk
A substantial portion of our activities are transacted in or referenced to US dollars including:
· sales of crude oil, natural gas and certain chemicals products;
· capital spending and expenses for our oil and gas and chemicals operations; and
· short-term and long-term borrowings.
The US/Canadian dollar exchange rate averaged $0.88 in 2009, ranging from a low of $0.77 to a high of $0.97.
Our sensitivities to the US dollar and the expected impact of a one cent change on our 2010 cash flow from operating activities, net income, capital expenditures and long-term debt are as follows:
(Cdn$ millions) |
| Cash |
| Net |
| Capital |
| Long-term |
|
$0.01 Change in US to Cdn |
| 35 |
| 20 |
| 20 |
| 60 |
|
Our sensitivities to changes in the US/Canadian dollar exchange rate are calculated based on projected revenues, expenses, capital expenditures and US-dollar denominated long-term debt for 2010. These estimates are based on a WTI price of US$70/bbl, a NYMEX natural gas price of US$5.50/mmbtu and a US/Canadian dollar exchange rate of $0.90.
We manage our exposure to fluctuations between the US and Canadian dollar by matching our expected net cash flows and borrowings in the same currency. Net revenue from our foreign operations and our US-dollar borrowings are generally used to fund US-dollar capital expenditures and debt repayments. We maintain revolving Canadian and US-dollar borrowing facilities that can be used or repaid depending on expected net cash flows. We designate most of our US-dollar borrowings as a hedge against our US-dollar net investment in self-sustaining foreign operations.
Our chemicals operations are exposed to changes in the US-dollar exchange rate as part of their sales are denominated in US dollars. Canexus periodically purchases US-dollar call options to reduce this exposure and at December 31, 2009 had the following outstanding option contracts:
· the right to sell US$5 million monthly and purchase Canadian dollars at an exchange rate of US$0.9479 from January 1, 2010 to March 31, 2010; and
· the right to sell US$5 million monthly and purchase Canadian dollars at an exchange rate of US$0.9302 from January 1, 2010 to June 30, 2010.
We do not have any material exposure to highly inflationary foreign currencies.
Interest Rate Risk
We are exposed to fluctuations in interest rates on our floating-rate debt.
Our sensitivity to interest rates and the expected impact of a 1% change in interest rates on our 2010 cash flow from operating activities and net income is as follows:
(Cdn$ millions) |
| Cash |
| Net |
|
Interest Rates—1% change in rates |
| 16 |
| 12 |
|
Our sensitivity to changes in interest rates is based on 2010 estimated average floating-rate debt of $1.6 billion and a US/Canadian dollar exchange rate of $0.90.
Our floating-rate debt exposes us to changes in interest payments as interest rates fluctuate. To manage this exposure, we maintain a combination of fixed and floating-rate borrowings and facilities. At December 31, 2009, fixed-rate borrowings comprised 75% (2008—78%) of our long-term debt at an effective average rate of 6.4% (2008—6.4%). During the year, we periodically borrow under our committed, unsecured, term credit facilities and at December 31, 2009, floating-rate debt comprised 25% (2008—22%) of our long-term debt at an effective average rate of 1.02% (2008—2.7%) ranging from a low of 0.91% to a high of 1.22% during 2009.
Commodity Price Risk
Our marketing business is focused on providing services to our customers and suppliers to meet their energy commodity needs. We market and trade physical energy commodities in selected regions of the globe including crude oil, natural gas, electricity and other commodities. We do this by buying and selling physical commodities, by acquiring and holding rights to physical transportation and storage assets for these commodities, and by building strong relationships with our customers and suppliers.
In order to manage the commodity and foreign exchange price risks that come from this physical business, we use financial derivative contracts including energy-related futures, forwards, swaps and options, as well as currency swaps or forwards.
We also seek to profit from our views on the future direction of energy commodity pricing relationships, primarily between different locations, time periods or qualities. We do this by holding open positions, where the terms of physical or financial contracts are not completely matched to offsetting positions. We may also carry exposures to the absolute change in commodity prices based on our market views or as a consequence of managing our physical and financial positions on a day-to-day basis.
The physical and financial marketing and trading activities we undertake expose us to the risk of loss (and provide the opportunity to profit) from a range of factors including:
· changes in the prices of commodities at specific locations;
· changes in the relative level of nearer term prices to future prices;
· changes in the relative value of different qualities of a commodity;
· changes in the volatility of commodity prices;
· changes in the relationships between energy commodity prices and/or derivative instruments;
· changes in the operational costs of our physical transportation and storage contracts;
· physical or financial loss of physical product; and
· disputes over terms of deals and contracts.
In order to manage these risks we have risk management systems and processes including:
· reporting to the Board of Directors;
· reporting to the Executive Risk Management Committee;
· oversight of activities by experienced commercial management;
· a separate Risk Management Office; and
· comprehensive policies, procedures and controls.
Our risk management activities make use of tools such as Value-at-Risk (VaR) and stress testing. VaR is a statistical estimate of the expected profit or loss of a portfolio of positions assuming normal market conditions. We use a 95% confidence interval and an assumed two day holding period in our measure, although actual results can differ from this estimate in non-normal market conditions, or if positions are held longer than two days based on market views or a lack of market liquidity to exit them, which is typical for long-term assets. We estimate VaR primarily by using the Variance-Covariance method based on historical commodity price volatility and correlation inputs where available, and by historical simulation in other situations. Our estimate is based upon the following key assumptions:
· changes in commodity prices are either normally or “T” distributed;
· price volatility remains stable; and
· price correlation relationships remain stable.
We have defined VaR limits for different segments of our business. These limits are calculated on an economic basis and include physical and financial derivatives, as well as physical transportation and storage capacity contracts accounted for as executory contracts in our financial statements. We monitor and report our positions against these VaR limits daily. Our year end, annual high, annual low and average VaR amounts are as follows:
(Cdn$ millions) |
| 2009 |
| 2008 |
| 2007 |
|
Value-at-Risk |
|
|
|
|
|
|
|
Year End |
| 11 |
| 25 |
| 26 |
|
High |
| 24 |
| 40 |
| 38 |
|
Low |
| 9 |
| 19 |
| 24 |
|
Average |
| 15 |
| 30 |
| 30 |
|
If a market shock occurred as in 2008, the key assumptions underlying our VaR estimate could be exceeded and the potential loss could be greater than our estimate. We perform stress tests on a regular basis to complement VaR and assess the impact of non-normal changes in prices on our positions.
Throughout the second half of 2008 and into 2009, we realigned our marketing strategies and positions to focus on physical businesses which had been built around storage, blending and transportation. To this end, we reduced our trading levels in an orderly fashion recognizing the challenging economic environment. We exited trading positions that do not support our physical business.
Credit risk affects both our trading and non-trading activities and is the risk of loss if counterparties do not fulfill their contractual obligations. Most of our credit exposures are with counterparties in the energy industry, including integrated oil companies, refiners and utilities and are subject to normal industry credit risk. Approximately 72% of our exposure is with these large energy companies. This concentration of risk within the energy industry is reduced because of our broad base of domestic and international counterparties. We take the following measures to reduce this risk:
· assess the financial strength of our counterparties through a formal credit process;
· limit the total exposure extended to individual counterparties, and may require collateral from some counterparties;
· routinely monitor credit risk exposures, including sector, geographic and corporate concentrations of credit, and report these to our Executive Risk Management Committee and the Finance Committee of the board;
· set credit limits based on rating agency credit ratings and internal assessments based on company and industry analysis;
· review counterparty credit limits regularly; and
· use standard agreements that allow for the netting of exposures associated with a single counterparty.
We believe these measures minimize our overall credit risk. However, there can be no assurance that these processes will protect us against all losses from non-performance. During 2008 and 2009, we have taken the following specific actions for certain counterparties deemed to be at higher risk of non-performance:
· ceased trading activities;
· significantly reduced and, in some cases, revoked credit privileges;
· redirected business to: i) exchanges or clearing houses; and ii) entities with physical-based operations;
· increased “set off” arrangements with counterparties; and
· increased collateral and margining requirements where possible.
At December 31, 2009, only one counterparty individually made up more than 10% of our credit exposure. This counterparty is a major integrated oil company with a strong investment grade rating. One other counterparty made up more than 5% of our credit exposure. In addition, the following table illustrates the composition of credit exposure by credit rating.
Credit Rating |
| 2009 |
| 2008 |
|
A or Higher |
| 67 | % | 65 | % |
BBB |
| 26 | % | 29 | % |
Non-investment Grade |
| 7 | % | 6 | % |
Our maximum counterparty credit exposure at the balance sheet date consists primarily of the carrying amounts of non-derivative financial assets such as cash and cash equivalents, restricted cash, accounts receivable, as well as the fair value of derivative financial assets. We have provided an allowance of $54 million for credit risk with our counterparties. In addition, we incorporate the credit risk associated with counterparty default, as well as our own credit risk, into our estimates of fair value.
SPECIAL NOTE REGARDING FORWARD-LOOKING STATEMENTS
Certain statements in this report, including those appearing in Items 1 and 2—Business and Properties and Item 7—Management’s Discussion and Analysis of Financial Condition and Results of Operations, constitute “forward-looking statements” (within the meaning of the United States Private Securities Litigation Reform Act of 1995, as amended) or “forward-looking information” (within the meaning of applicable Canadian securities legislation). Such statements or information (together “forward-looking statements”) are generally identifiable by the forward-looking terminology used such as “anticipate”, “believe”, “intend”, “plan”, “expect”, “estimate”, “budget”, “outlook”, “forecast” or other similar words and include statements relating to or associated with individual wells, regions or projects. Any statements regarding the following are forward-looking statements:
· future crude oil, natural gas or chemical prices;
· future production levels;
· future capital expenditures and their allocation to exploration and development activities;
· future earnings;
· future asset acquisitions or dispositions;
· future sources of funding for our capital program;
· future debt levels;
· availability of committed credit facilities;
· possible commerciality;
· development plans or capacity expansions;
· future ability to execute dispositions of assets or businesses;
· future sources of liquidity, cash flows and their uses;
· future drilling of new wells;
· ultimate recoverability of current and long-term assets;
· ultimate recoverability of reserves or resources;
· expected finding and development costs;
· expected operating costs;
· future demand for chemical products;
· estimates on a per share basis;
· future foreign currency exchange rates;
· future expenditures and future allowances relating to environmental matters;
· dates by which certain areas will be developed or will come on stream or reach expected operating capacity; and
· changes in any of the foregoing.
Statements relating to “reserves” or “resources” are forward-looking statements, as they involve the implied assessment, based on estimates and assumptions that the reserves and resources described exist in the quantities predicted or estimated, and can be profitably produced in the future.
The forward-looking statements are subject to known and unknown risks and uncertainties and other factors which may cause actual results, levels of activity and achievements to differ materially from those expressed or implied by such statements. Such factors include, among others:
· market prices for oil and gas and chemical products;
· our ability to explore, develop, produce and transport crude oil and natural gas to markets;
· ultimate effectiveness of design or design modification to facilities;
· the results of exploration and development drilling and related activities;
· volatility in energy trading markets;
· foreign-currency exchange rates;
· economic conditions in the countries and regions in which we carry on business;
· governmental actions including changes to taxes or royalties, changes in environmental and other laws and regulations;
· renegotiations of contracts;
· results of litigation, arbitration or regulatory proceedings; and
· political uncertainty, including actions by terrorists, insurgent or other groups, or other armed conflict, including conflict between states.
These risks, uncertainties and other factors and their possible impact are discussed more fully in the section titled Risk Factors in Item 1A and Quantitative and Qualitative Disclosures about Market Risk in Item 7A. The impact of any one risk, uncertainty or factor on a particular forward-looking statement is not determinable with certainty as these factors are interdependent, and management’s future course of action would depend on our assessment of all information at that time.
Although we believe that the expectations conveyed by the forward-looking statements are reasonable based on information available to us on the date such forward-looking statements were made, no assurances can be given as to future results, levels of activity and achievements. Undue reliance should not be placed on the statements contained herein, which are made as of the date hereof and, except as required by law, we undertake no obligation to update publicly or revise any forward-looking statements, whether as a result of new information, future events or otherwise. The forward-looking statements contained herein are expressly qualified by this cautionary statement.
SPECIAL NOTE TO CANADIAN INVESTORS
Nexen is an SEC registrant and a voluntary Form 10-K (and related forms) filer. Therefore, our reserves estimates and securities regulatory disclosures follow SEC requirements. In Canada, NI 51-101—Standards of Disclosure for Oil and Gas Activities prescribes that Canadian companies follow certain standards for the preparation and disclosure of reserves and related information. Nexen reserves disclosures are made in reliance upon exemptions granted to Nexen by Canadian securities regulators from certain requirements of NI 51-101 which permits us to:
· prepare our reserves estimates and related disclosures in accordance with SEC disclosure requirements, generally accepted industry practices in the US and the Canadian Oil and Gas Evaluation Handbook (COGE Handbook) standards modified to reflect SEC requirements;
· substitute those SEC disclosures for much of the annual disclosure required by NI 51-101; and
· rely upon internally-generated reserves estimates and the Standardized Measure of Discounted Future Net Cash Flows and Changes Therein, included in the Supplementary Financial Information, without the requirement to have those estimates evaluated or audited by independent qualified reserves consultants.
As a result of these exemptions, Nexen’s disclosures may differ from other Canadian companies and Canadian investors should note the following fundamental differences in reserves estimates and related disclosures contained in the Form 10-K:
· SEC registrants apply SEC reserves definitions and prepare their reserves estimates in accordance with SEC requirements and generally accepted industry practices in the US whereas NI 51-101 requires adherence to the definitions and standards promulgated by the COGE Handbook;
· the SEC’s technical rules in estimating reserves differ from NI 51-101 in areas such as the use of reliable technology, aerial extent around a drilled location, quantities below the lowest known oil and quantities across an undrilled fault block;
· the SEC mandates disclosure of proved reserves and the Standardized Measure of Discounted Future Net Cash Flows and Changes Therein calculated using the year’s 12-month average prices and costs held constant whereas NI 51-101 requires disclosure of reserves and related future net revenues using forecast prices;
· the SEC mandates disclosure of reserves by geographic area whereas NI 51-101 requires disclosure of more reserve categories and product types;
· the SEC prescribes certain information about proved and probable undeveloped reserves and future development costs whereas NI 51-101 requirements are different;
· the SEC does not require disclosure of finding and development (F&D) costs per boe of proved reserves additions whereas NI 51-101 requires that various F&D costs per boe and additional information be disclosed;
· the SEC leaves the engagement of independent qualified reserves consultants to the discretion of a company’s board of directors whereas NI 51-101 requires issuers to engage such evaluators;
· the SEC does not allow proved and probable reserves to be aggregated whereas NI 51-101 requires issuers to disclose such; and
· the reserves disclosures in this document have not been reviewed by the independent qualified reserves consultants whereas NI 51-101 requires them to review it.
The foregoing is a general description of the principal differences only. The differences between SEC requirements and NI 51-101 may be material.
NI 51-101 requires that we make the following disclosures:
· we use oil equivalents (boe) to express quantities of natural gas and crude oil in a common unit. A conversion ratio of 6 mcf of natural gas to 1 barrel of oil is used. Boe may be misleading, particularly if used in isolation. The conversion ratio is based on an energy equivalency conversion method primarily applicable at the burner tip and does not represent a value equivalency at the wellhead; and
· because reserves data are based on judgments regarding future events actual results will vary and the variations may be material. Variations as a result of future events are expected to be consistent with the fact that reserves are categorized according to the probability of their recovery.
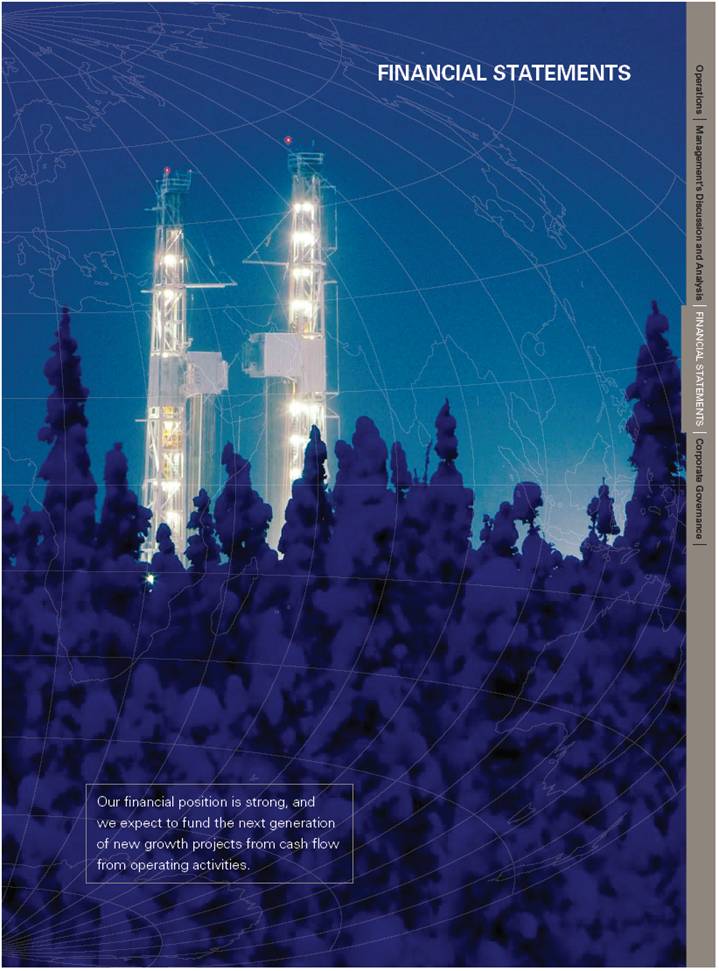
Part II (continued) |
|
|
|
| |
99 | |
100 | |
Consolidated Financial statements |
|
101 | |
102 | |
103 | |
104 | |
105 | |
106 | |
| |
Quarterly Financial Data in Accordance with Canadian and US GAAP | 150 |
151 | |
|
|
Item 9: Changes in and Disagreements with Accountants on Accounting and Financial Disclosure | 158 |
|
|
| |
158 | |
Management’s Report on Internal Control Over Financial Reporting | 159 |
159 | |
159 |
February 17, 2010
To the Shareholders of Nexen Inc.
We are responsible for the preparation and fair presentation of the Consolidated Financial Statements, as well as the financial reporting process that gives rise to such Consolidated Financial Statements. This responsibility requires us to make significant accounting judgments and estimates. For example, we are required to choose accounting principles and methods that are appropriate to the company’s circumstances, and we are required to make estimates and assumptions that affect amounts reported. Fulfilling this responsibility requires the preparation and presentation of our Consolidated Financial Statements in accordance with generally accepted accounting principles in Canada with a reconciliation to generally accepted accounting principles in the US.
We also have responsibility for the preparation and fair presentation of other financial information in this report and to ensure the consistency of this information with the financial statements.
We are responsible for developing and implementing internal controls over the financial reporting process. These controls are designed to provide reasonable assurance that relevant and reliable financial information is produced. To gather and control financial data, we have established accounting and reporting systems supported by internal controls over financial reporting and an internal audit program. We believe that our internal controls over financial reporting provide reasonable assurance that our assets are safeguarded against loss from unauthorized use or disposition, that receipts and expenditures of the company are made only in accordance with authorization of management and directors of the company, and that our records are reliable for preparing our Consolidated Financial Statements and other financial information in accordance with applicable generally accepted accounting principles and in accordance with applicable securities rules and regulations. All internal control systems, no matter how well designed, have inherent limitations. Therefore, even those systems determined to be effective can provide only reasonable assurance with respect to financial statement preparation and presentation.
We have established disclosure controls and procedures, internal controls over financial reporting and corporate-wide policies to ensure that Nexen’s consolidated financial position, results of operations and cash flows are presented fairly. Our disclosure controls and procedures are designed to ensure timely disclosure and communication of all material information required by regulators. We oversee, with assistance from our Disclosure Review Committee, these controls and procedures and all required regulatory disclosures.
To ensure the integrity of our financial statements, we carefully select and train qualified personnel. We also ensure our organizational structure provides appropriate delegation of authority and division of responsibilities. Our policies and procedures are communicated throughout the organization and include a written ethics and integrity policy that applies to all employees, including the Chief Executive Officer, Chief Financial Officer and Chief Accounting Officer or Controller.
Our Board of Directors is responsible for reviewing and approving the Consolidated Financial Statements and for overseeing management’s performance of its financial reporting responsibilities. Their financial statement related responsibilities are fulfilled mainly through the Audit and Conduct Review Committee (Audit Committee), with assistance from the Reserves Review Committee regarding the annual review of our crude oil and natural gas reserves, and the Finance Committee regarding the assessment and mitigation of financial risk. The Audit Committee is composed entirely of independent directors and includes three directors with financial expertise. The Audit Committee meets regularly with management, the internal auditors and the independent registered Chartered Accountants to review accounting policies, financial reporting and internal control issues and to ensure each party is properly discharging its responsibilities. The Audit Committee is responsible for the appointment and compensation of the independent registered Chartered Accountants and also considers their independence, reviews their fees and (subject to applicable securities laws), pre-approves their retention for any permitted non-audit services and their fee for such services. The internal auditors and independent registered Chartered Accountants have full and unlimited access to the Audit Committee, with and without the presence of management.
(signed) “Marvin F. Romanow” |
|
President and Chief Executive Officer |
|
|
|
(signed) “Kevin J. Reinhart” |
|
Senior Vice President and Chief Financial Officer |
|
REPORT OF INDEPENDENT REGISTERED CHARTERED ACCOUNTANTS
To the Board of Directors and Shareholders of Nexen Inc.
We have audited the accompanying Consolidated Balance Sheets of Nexen Inc. and subsidiaries (the “Company”) as of December 31, 2009 and 2008, and the related Consolidated Statements of Income, Cash Flows, Equity and Comprehensive Income for each of the years in the three year period ended December 31, 2009. These financial statements are the responsibility of the Company’s management. Our responsibility is to express an opinion on these financial statements based on our audits.
We conducted our audits in accordance with Canadian generally accepted auditing standards and the standards of the Public Company Accounting Oversight Board (United States). These standards require that we plan and perform the audit to obtain reasonable assurance about whether the financial statements are free of material misstatement. An audit includes examining, on a test basis, evidence supporting the amounts and disclosures in the financial statements. An audit also includes assessing the accounting principles used and significant estimates made by management, as well as evaluating the overall financial statement presentation. We believe that our audits provide a reasonable basis for our opinion.
In our opinion, these Consolidated Financial Statements present fairly, in all material respects, the financial position of Nexen Inc. and subsidiaries as of December 31, 2009 and 2008, and the results of their operations and their cash flows for each of the years in the three year period ended December 31, 2009 in accordance with Canadian generally accepted accounting principles.
We have also audited, in accordance with the standards of the Public Company Accounting Oversight Board (United States), the Company’s internal control over financial reporting as of December 31, 2009, based on the criteria established in Internal Control—Integrated Framework issued by the Committee of Sponsoring Organizations of the Treadway Commission and our report dated February 17, 2010 expressed an unqualified opinion on the Company’s internal control over financial reporting.
(signed) “Deloitte & Touche LLP”
Independent Registered Chartered Accountants
Calgary, Canada
February 17, 2010
COMMENTS BY INDEPENDENT REGISTERED CHARTERED ACCOUNTANTS ON CANADA-UNITED STATES OF AMERICA REPORTING DIFFERENCE
The standards of the Public Company Accounting Oversight Board (United States) require the addition of an explanatory paragraph when there are changes in accounting principles that have a material effect on the comparability of the Company’s financial statements, such as the changes described in Notes 1(U) and 21 to the Consolidated Financial Statements. Although our audits were conducted in accordance with Canadian generally accepted auditing standards and the standards of the Public Company Accounting Oversight Board (United States), our report to the Board of Directors and shareholders on the Consolidated Financial Statements of the Company dated February 17, 2010, is expressed in accordance with Canadian reporting standards which do not require a reference to such changes in accounting principles in the auditors’ report when the changes are properly accounted for and adequately disclosed in the financial statements.
(signed) “Deloitte & Touche LLP”
Independent Registered Chartered Accountants
Calgary, Canada
February 17, 2010
NEXEN INC.
CONSOLIDATED STATEMENT OF INCOME
FOR THE THREE YEARS ENDED DECEMBER 31, 2009
Cdn$ millions, except per share amounts |
| 2009 |
| 2008 |
| 2007 |
|
|
|
|
|
|
|
|
|
Revenues and Other Income |
|
|
|
|
|
|
|
Net Sales |
| 4,895 |
| 7,424 |
| 5,583 |
|
Marketing and Other (Note 16) |
| 909 |
| 813 |
| 1,021 |
|
|
| 5,804 |
| 8,237 |
| 6,604 |
|
|
|
|
|
|
|
|
|
Expenses |
|
|
|
|
|
|
|
Operating |
| 1,280 |
| 1,335 |
| 1,165 |
|
Depreciation, Depletion, Amortization and Impairment (Note 4) |
| 1,802 |
| 2,014 |
| 1,767 |
|
Transportation and Other |
| 795 |
| 967 |
| 908 |
|
General and Administrative |
| 497 |
| 257 |
| 374 |
|
Exploration |
| 302 |
| 402 |
| 326 |
|
Interest (Note 9) |
| 312 |
| 94 |
| 168 |
|
|
| 4,988 |
| 5,069 |
| 4,708 |
|
|
|
|
|
|
|
|
|
Income before Provision for Income Taxes |
| 816 |
| 3,168 |
| 1,896 |
|
|
|
|
|
|
|
|
|
Provision for (Recovery of) Income Taxes (Note 17) |
|
|
|
|
|
|
|
Current |
| 776 |
| 859 |
| 434 |
|
Future |
| (516 | ) | 598 |
| 358 |
|
|
| 260 |
| 1,457 |
| 792 |
|
|
|
|
|
|
|
|
|
Net Income |
| 556 |
| 1,711 |
| 1,104 |
|
Less: Net Income (Loss) Attributable to Canexus Non-Controlling Interests |
| 20 |
| (4 | ) | 18 |
|
|
|
|
|
|
|
|
|
Net Income Attributable to Nexen Inc. |
| 536 |
| 1,715 |
| 1,086 |
|
|
|
|
|
|
|
|
|
Earnings Per Common Share ($/share) (Note 18) |
|
|
|
|
|
|
|
Basic |
| 1.03 |
| 3.26 |
| 2.06 |
|
Diluted |
| 1.01 |
| 3.22 |
| 2.02 |
|
See accompanying notes to Consolidated Financial Statements.
NEXEN INC.
DECEMBER 31, 2009 AND 2008
Cdn$ millions, except share amounts |
| 2009 |
| 2008 |
| |
|
|
|
|
|
| |
ASSETS |
|
|
|
|
| |
Current Assets |
|
|
|
|
| |
Cash and Cash Equivalents |
| 1,700 |
| 2,003 |
| |
Restricted Cash |
| 198 |
| 103 |
| |
Accounts Receivable (Note 2) |
| 2,788 |
| 3,163 |
| |
Inventories and Supplies (Note 3) |
| 680 |
| 484 |
| |
Other |
| 185 |
| 169 |
| |
Total Current Assets |
| 5,551 |
| 5,922 |
| |
|
|
|
|
|
| |
Property, Plant and Equipment (Note 4) |
| 15,492 |
| 14,922 |
| |
Goodwill |
| 339 |
| 390 |
| |
Future Income Tax Assets (Note 17) |
| 1,148 |
| 351 |
| |
Deferred Charges and Other Assets (Note 5) |
| 370 |
| 570 |
| |
|
|
|
|
|
| |
TOTAL ASSETS |
| 22,900 |
| 22,155 |
| |
|
|
|
|
|
| |
LIABILITIES |
|
|
|
|
| |
Current Liabilities |
|
|
|
|
| |
Accounts Payable and Accrued Liabilities (Note 8) |
| 3,038 |
| 3,326 |
| |
Accrued Interest Payable |
| 89 |
| 67 |
| |
Dividends Payable |
| 26 |
| 26 |
| |
Total Current Liabilities |
| 3,153 |
| 3,419 |
| |
|
|
|
|
|
| |
Long-Term Debt (Note 9) |
| 7,251 |
| 6,578 |
| |
Future Income Tax Liabilities (Note 17) |
| 2,811 |
| 2,619 |
| |
Asset Retirement Obligations (Note 11) |
| 1,018 |
| 1,024 |
| |
Deferred Credits and Other Liabilities (Note 12) |
| 1,021 |
| 1,324 |
| |
EQUITY (Note 14) |
|
|
|
|
| |
Nexen Inc. Shareholders’ Equity |
|
|
|
|
| |
Common Shares, no par value |
|
|
|
|
| |
Authorized: | Unlimited |
|
|
|
|
|
Outstanding: | 2009—522,915,843 shares |
|
|
|
|
|
| 2008—519,448,590 shares |
| 1,049 |
| 981 |
|
Contributed Surplus |
| 1 |
| 2 |
| |
Retained Earnings |
| 6,722 |
| 6,290 |
| |
Accumulated Other Comprehensive Loss |
| (190 | ) | (134 | ) | |
Total Nexen Inc. Shareholders’ Equity |
| 7,582 |
| 7,139 |
| |
Canexus Non-Controlling Interests |
| 64 |
| 52 |
| |
Total Equity |
| 7,646 |
| 7,191 |
| |
Commitments, Contingencies and Guarantees (Notes 15 and 17) |
|
|
|
|
| |
TOTAL LIABILITIES AND EQUITY |
| 22,900 |
| 22,155 |
| |
See accompanying notes to Consolidated Financial Statements.
Approved on behalf of the Board:
(signed) “Marvin F. Romanow” |
| (signed) “Thomas C. O’Neill” |
|
Director |
| Director |
|
NEXEN INC.
CONSOLIDATED STATEMENT OF CASH FLOWS
FOR THE THREE YEARS ENDED DECEMBER 31, 2009
Cdn$ millions |
| 2009 |
| 2008 |
| 2007 |
|
|
|
|
|
|
|
|
|
Operating Activities |
|
|
|
|
|
|
|
Net Income |
| 556 |
| 1,711 |
| 1,104 |
|
Charges and Credits to Income not Involving Cash (Note 19) |
| 1,371 |
| 2,140 |
| 2,055 |
|
Exploration Expense |
| 302 |
| 402 |
| 326 |
|
Changes in Non-Cash Working Capital (Note 19) |
| (25 | ) | 119 |
| (348 | ) |
Other |
| (318 | ) | (18 | ) | (307 | ) |
|
| 1,886 |
| 4,354 |
| 2,830 |
|
|
|
|
|
|
|
|
|
Financing Activities |
|
|
|
|
|
|
|
Proceeds from Long-Term Notes |
| 1,081 |
| — |
| 1,660 |
|
Repayment of Medium-Term Notes and Debentures |
| — |
| (125 | ) | (150 | ) |
Proceeds from (Repayment of) Term Credit Facilities, Net |
| 728 |
| 803 |
| (697 | ) |
Proceeds from (Repayment of) Short-Term Borrowings, Net |
| (1 | ) | (4 | ) | (150 | ) |
Proceeds from Canexus Debentures |
| 46 |
| — |
| — |
|
Proceeds from Canexus Notes |
| — |
| 51 |
| — |
|
Proceeds from (Repayment of) Canexus Term Credit Facilities of Canexus, Net |
| 48 |
| (20 | ) | 60 |
|
Dividends on Common Shares |
| (104 | ) | (92 | ) | (53 | ) |
Distributions Paid to Canexus Non-Controlling Interests |
| (14 | ) | (17 | ) | (28 | ) |
Issue of Common Shares and Exercise of Tandem Options for Shares (Note 14) |
| 57 |
| 64 |
| 56 |
|
Repurchase of Common Shares for Cancellation (Note 14) |
| — |
| (338 | ) | — |
|
Other |
| (20 | ) | — |
| (21 | ) |
|
| 1,821 |
| 322 |
| 677 |
|
|
|
|
|
|
|
|
|
Investing Activities |
|
|
|
|
|
|
|
Capital Expenditures |
|
|
|
|
|
|
|
Exploration and Development |
| (2,467 | ) | (2,895 | ) | (3,132 | ) |
Proved Property Acquisitions |
| (755 | ) | (22 | ) | (151 | ) |
Energy Marketing, Chemicals, Corporate and Other |
| (275 | ) | (149 | ) | (118 | ) |
Proceeds on Disposition of Assets |
| 17 |
| 6 |
| 4 |
|
Changes in Non-Cash Working Capital (Note 19) |
| (110 | ) | (124 | ) | 130 |
|
Changes in Restricted Cash |
| (140 | ) | 106 |
| (16 | ) |
Other |
| (13 | ) | (111 | ) | 2 |
|
|
| (3,743 | ) | (3,189 | ) | (3,281 | ) |
|
|
|
|
|
|
|
|
Effect of Exchange Rate Changes on Cash and Cash Equivalents |
| (267 | ) | 310 |
| (121 | ) |
|
|
|
|
|
|
|
|
Increase (Decrease) in Cash and Cash Equivalents |
| (303 | ) | 1,797 |
| 105 |
|
|
|
|
|
|
|
|
|
Cash and Cash Equivalents, Beginning of Year |
| 2,003 |
| 206 |
| 101 |
|
|
|
|
|
|
|
|
|
Cash and Cash Equivalents, End of Year |
| 1,700 |
| 2,003 |
| 206 |
|
Cash and cash equivalents at December 31, 2009 consists of cash of $210 million (2008—$355 million; 2007—$62 million) and short-term investments of $1,490 million (2008—$1,648 million; 2007—$144 million).
See accompanying notes to Consolidated Financial Statements.
NEXEN INC.
CONSOLIDATED STATEMENT OF EQUITY
FOR THE THREE YEARS ENDED DECEMBER 31, 2009
Cdn$ millions |
| 2009 |
| 2008 |
| 2007 |
|
|
|
|
|
|
|
|
|
Common Shares, Beginning of Year |
| 981 |
| 917 |
| 821 |
|
Issue of Common Shares |
| 45 |
| 41 |
| 32 |
|
Exercise of Tandem Options for Shares |
| 12 |
| 23 |
| 24 |
|
Accrued Liability Relating to Tandem Options Exercised for Common Shares |
| 11 |
| 22 |
| 40 |
|
Repurchased Under Normal Course Issuer Bid (Note 14) |
| — |
| (22 | ) | — |
|
End of Year |
| 1,049 |
| 981 |
| 917 |
|
|
|
|
|
|
|
|
|
Contributed Surplus, Beginning of Year |
| 2 |
| 3 |
| 4 |
|
Stock-Based Compensation Expense |
| — |
| — |
| 1 |
|
Exercise of Tandem Options |
| (1 | ) | (1 | ) | (2 | ) |
End of Year |
| 1 |
| 2 |
| 3 |
|
|
|
|
|
|
|
|
|
Retained Earnings, Beginning of Year |
| 6,290 |
| 4,983 |
| 3,972 |
|
Net Income Attributable to Nexen Inc. |
| 536 |
| 1,715 |
| 1,086 |
|
Dividends on Common Shares |
| (104 | ) | (92 | ) | (53 | ) |
Transition Adjustment on Adoption of New Inventory Standard |
| — |
| — |
| (22 | ) |
Repurchase of Common Shares for Cancellation (Note 14) |
| — |
| (316 | ) | — |
|
End of Year |
| 6,722 |
| 6,290 |
| 4,983 |
|
|
|
|
|
|
|
|
|
Accumulated Other Comprehensive Loss, Beginning of Year |
| (134 | ) | (293 | ) | (161 | ) |
Opening Derivatives Designated as Cash Flow Hedges |
| — |
| — |
| 61 |
|
Other Comprehensive Income (Loss) Attributable to Nexen Inc. |
| (56 | ) | 159 |
| (193 | ) |
End of Year1 |
| (190 | ) | (134 | ) | (293 | ) |
|
|
|
|
|
|
|
|
Canexus Non-Controlling Interests, Beginning of Year |
| 52 |
| 67 |
| 75 |
|
Net Income Attributable to Non-Controlling Interests |
| 27 |
| (5 | ) | 26 |
|
Distributions Declared to Non-Controlling Interests |
| (18 | ) | (20 | ) | (28 | ) |
Issue of Partnership Units to Non-Controlling Interests under Distribution Reinvestment Plan |
| 4 |
| 3 |
| — |
|
Estimated Fair Value of Conversion Feature of Convertible Debenture Issue Attributable to Non-Controlling Interests |
| 4 |
| — |
| — |
|
Other Comprehensive Income (Loss) Attributable to Canexus Non-Controlling Interests |
| (5 | ) | 7 |
| (6 | ) |
End of Year |
| 64 |
| 52 |
| 67 |
|
1 Comprised of unrealized foreign currency translation adjustment.
See accompanying notes to Consolidated Financial Statements.
NEXEN INC.
CONSOLIDATED STATEMENT OF COMPREHENSIVE INCOME
FOR THE THREE YEARS ENDED DECEMBER 31, 2009
Cdn$ millions |
| 2009 |
| 2008 |
| 2007 |
|
|
|
|
|
|
|
|
|
Net Income Attributable to Nexen Inc. |
| 536 |
| 1,715 |
| 1,086 |
|
Other Comprehensive Income (Loss), Net of Income Taxes: |
|
|
|
|
|
|
|
Foreign Currency Translation Adjustment: |
|
|
|
|
|
|
|
Net Gains (Losses) on Investment in Self-Sustaining Foreign Operations |
| (810 | ) | 1,228 |
| (867 | ) |
Net Gains (Losses) on Foreign-Denominated Debt Hedges of Self-Sustaining Foreign Operations1 |
| 757 |
| (1,062 | ) | 738 |
|
|
|
|
|
|
|
|
|
Realized Translation Adjustments Recognized in Net Income |
| (3 | ) | (7 | ) | (3 | ) |
Cash Flow Hedges: |
|
|
|
|
|
|
|
Realized Mark-to-Market Gains Recognized in Net Income |
| — |
| — |
| (61 | ) |
Other Comprehensive Income (Loss) Attributable to Nexen Inc. |
| (56 | ) | 159 |
| (193 | ) |
|
|
|
|
|
|
|
|
Comprehensive Income Attributable to Nexen Inc. |
| 480 |
| 1,874 |
| 893 |
|
1 Net of income tax expense for the year ended December 31, 2009 of $109 million (2008—$145 million recovery; 2007—$97 million expense).
See accompanying notes to Consolidated Financial Statements.
NEXEN INC.
NOTES TO CONSOLIDATED FINANCIAL STATEMENTS
Cdn$ millions, except as noted
1. ACCOUNTING POLICIES
Our Consolidated Financial Statements are prepared in accordance with Canadian Generally Accepted Accounting Principles (GAAP). The impact of significant differences between Canadian and United States (US) GAAP on the Consolidated Financial Statements is disclosed in Note 21. As at February 17, 2010, there are no material subsequent events requiring additional disclosure in or amendment to these financial statements.
(A) CONSOLIDATION
The Consolidated Financial Statements include the accounts of Nexen and our subsidiary companies (Nexen, we or our). All subsidiary companies, with the exception of Canexus Limited Partnership and its subsidiaries (Canexus), are wholly owned. All intercompany accounts and transactions are eliminated upon consolidation.
We have a 65.7% interest in Canexus represented by 64.8 million Exchangeable LP Units. We have the right to nominate a majority of the members of the Board of Directors, who have the power to determine the strategic operating, investing and financing policies of Canexus. Through our majority ownership interest and the ability to elect the majority of the members of the board, Nexen holds effective control over Canexus. All assets, liabilities and results of operations of Canexus are consolidated and have been included in our Consolidated Financial Statements. Non-Nexen ownership interests in Canexus are shown as non-controlling interests.
We proportionately consolidate our undivided interests in our oil and gas exploration, development and production activities conducted under joint venture arrangements. We also proportionately consolidate our 7.23% undivided interest in the Syncrude joint venture. While the joint ventures under which these activities are carried out do not comprise distinct legal entities, they are operating entities. The significant operating policies of which are, by contractual arrangement, jointly controlled by all working interest parties.
(B) USE OF ESTIMATES
We make estimates and assumptions that affect the reported amounts of assets and liabilities and disclosure of contingent assets and liabilities at the date of the Consolidated Financial Statements, and revenues and expenses during the reporting period. Our management reviews these estimates on an ongoing basis, including those related to accruals, litigation, environmental and asset retirement obligations, recoverability of assets, income taxes, fair values of derivative assets and liabilities, capital adequacy, and the determination of proved reserves. Changes in facts and circumstances may result in revised estimates, and actual results may differ from these estimates.
(C) CASH AND CASH EQUIVALENTS
Cash and cash equivalents includes short-term, highly liquid investments that mature within three months of their purchase. These investments are recorded at cost, which approximates fair value.
(D) RESTRICTED CASH
Restricted cash includes margin deposits relating to our exchange-traded derivative contracts used in our energy marketing business.
(E) ACCOUNTS RECEIVABLE
Accounts receivable are recorded based on our revenue recognition policy (see Note 1(O)). Our allowance for doubtful accounts provides for specific doubtful receivables, as well as general counterparty credit risk evaluated using observable market information and internal assessments.
(F) INVENTORIES AND SUPPLIES
Inventories and supplies, other than inventory held for trading purposes, are stated at the lower of cost and net realizable value. Cost is determined using the first-in, first-out method. Inventory costs include expenditures and other costs, including depletion and depreciation, directly or indirectly incurred in bringing the inventory to its existing condition.
Commodity inventories in our energy marketing operations that are held for trading purposes are carried at fair value, as measured by the one-month forward price, less any costs to sell. Any changes in fair value are included as gains or losses in marketing and other income during the period of change.
(G) PROPERTY, PLANT AND EQUIPMENT (PP&E)
PP&E is recorded at cost and includes only recoverable costs that directly result in an identifiable future benefit. Unrecoverable costs, maintenance and turnaround costs are expensed as incurred. Improvements that increase capacity or extend the useful lives of the related assets are capitalized to PP&E. Major spare parts and standby equipment whose useful life is expected to last longer than one year are included with PP&E.
We follow successful efforts accounting for our oil and gas operations. Costs are initially capitalized to PP&E as unproved property costs. Once proved reserves are discovered, the costs are reclassified to proved property costs. Exploration drilling costs are capitalized as suspended exploration well costs pending evaluation as to whether sufficient quantities of reserves have been found to justify commercial production. If commercial quantities of reserves are not found, exploration drilling costs are expensed. All exploratory wells are evaluated for commercial viability on a regular basis following completion of drilling. Exploration drilling costs remain capitalized if a determination is made that a sufficient quantity of reserves have been found and sufficient progress is being made to assess the reserves and the economic and operating viability of a potential development. All other exploration costs, including geological and geophysical and annual lease rentals, are expensed to earnings as incurred. All development costs are capitalized as proved property costs. General and administrative costs that directly relate to acquisition, exploration and development activities are capitalized to PP&E.
We engage in research and development activities to develop or improve processes and techniques to extract oil and gas. Research involves investigating new knowledge. Development involves translating that knowledge into a new technology or process. Research costs are expensed as incurred. Development costs are deferred once technical feasibility is established, and we intend to proceed with development. We defer these costs in PP&E until the asset is substantially complete and ready for productive use. Otherwise, development costs are expensed as incurred.
(H) DEPRECIATION, DEPLETION, AMORTIZATION AND IMPAIRMENT (DD&A)
Under successful efforts accounting, we deplete oil and gas capitalized costs using the unit-of-production method. Development and exploration drilling and equipping costs are depleted over remaining proved developed reserves and proved property acquisition costs are depleted over remaining proved reserves. DD&A is considered a cost of inventory when the oil and gas is produced. When the inventory is sold, the depletion is charged to DD&A expense.
Our Syncrude PP&E is depleted using the unit-of-production method. Capitalized costs are depleted over proved reserves within developed areas of interest.
We depreciate other plant and equipment costs using the straight-line method based on the estimated useful lives of the assets, which range from 3 to 30 years. Unproved property costs and major projects that are under construction or development are not depreciated, depleted or amortized.
We evaluate the carrying value of our PP&E whenever events or conditions occur that indicate that the carrying value of properties on our balance sheet may not be recoverable from future cash flows. These events or conditions occur periodically. If carrying value exceeds the sum of estimated undiscounted future cash flows, the property’s value is impaired. The property is then assigned a fair value equal to its estimated future discounted net cash flows, and we expense the excess carrying value to DD&A. Our cash flow estimates require assumptions about future commodity prices, ultimate recoverability of oil and gas reserves, operating costs and other factors. Actual results can differ from these estimates.
In assessing the carrying values of our unproved properties, we take into account our future plans for these properties, the remaining terms of the leases and any other factors that may be indicators of potential impairment.
(I) CAPITALIZED INTEREST
We capitalize interest on major development projects until construction is complete using the weighted-average interest rate on all of our borrowings. Capitalized interest cannot exceed the actual interest incurred.
(J) CARRIED INTEREST
We conduct certain international operations jointly with foreign governments in accordance with production sharing agreements pursuant to which proved reserves are recognized using the economic interest method. Under these agreements, we pay both our share and the government’s share of operating and capital costs. We recover the government’s share of these costs from future revenues or production over several years. The government’s share of operating costs are recorded in operating expense when incurred and capital costs are recorded in PP&E and expensed to DD&A in the year recovered. All recoveries are recorded as revenue in the year of recovery.
(K) GOODWILL
Our goodwill is attributable to our energy marketing and UK operating segments. It has been recorded at cost and is not amortized. We test goodwill for impairment at least annually or whenever events or circumstances indicate that goodwill may be impaired. We base our test on the estimated fair value of the reporting unit. If goodwill is impaired, we reduce the carrying value to estimated fair value and an impairment loss is recorded in net income.
(L) FINANCIAL INSTRUMENTS AND HEDGING ACTIVITIES
All financial assets and liabilities are recognized on the balance sheet when we become a party to the contractual provisions of the instrument and are initially recognized at fair value. Subsequent measurement of the financial instruments is based on their classification. We have classified each financial instrument into one of the following categories: financial assets and financial liabilities held for trading; loans or receivables; financial assets held to maturity; financial assets available for sale; and other financial liabilities. The classification depends on the characteristics and the purpose for which the financial instruments were acquired. Except in limited circumstances, the classification of financial instruments is not subsequently changed.
Financial instruments carried at fair value on our balance sheet include cash and cash equivalents, restricted cash and derivatives used for trading and non-trading purposes. Realized and unrealized gains and losses from financial assets and liabilities carried at fair value are recognized in net income in the periods such gains and losses arise. Transaction costs related to these financial assets and liabilities are included in net income when incurred.
Financial instruments we carry at cost or amortized cost include our accounts receivable, accounts payable and accrued liabilities, accrued interest payable, dividends payable, short-term borrowings and long-term debt. Transaction costs are included in net income when incurred for these types of financial instruments except for short-term borrowings and long-term debt. These transaction costs are included with the initial fair value and the instrument is carried at amortized cost using the effective interest rate method. Gains and losses on financial assets and liabilities carried at cost or amortized cost are recognized in net income when these assets or liabilities settle.
Derivatives related to non-trading activities
We may use derivative instruments such as physical purchase and sales contracts, forwards, futures, swaps and options for non-trading purposes to manage fluctuations in commodity prices, foreign currency exchange rates and interest rates (see Notes 6 and 7). We record these instruments at fair value at the balance sheet date and record changes in fair value as net gains or losses in marketing and other income during the period of change unless the requirements for hedge accounting are met.
Derivatives related to trading activities
Our energy marketing operation uses derivative instruments for marketing and trading natural gas, crude oil, natural gas liquids and power including: commodity contracts settled with physical delivery; exchange-traded futures and options; and non-exchange traded forwards, swaps and options.
We record these instruments at fair value at the balance sheet date and record changes in fair value as net gains or losses in marketing and other income during the period of change. The fair value of these instruments is included with
accounts receivable or payable if we anticipate settling the instruments within a year of the balance sheet date. If we anticipate settling the instruments beyond twelve months, we include them with deferred charges and other assets or deferred credits and other liabilities.
Hedge accounting
Hedge accounting may be used when there is a high degree of correlation between price movements in the derivative instruments and the items designated as being hedged. Nexen formally documents all hedges and the risk management objectives at the inception of the hedge. Derivative instruments that have been designated and qualify for hedge accounting are classified as either cash flow or fair value hedges.
For cash flow hedges, changes in the fair value of a financial instrument designated as a cash flow hedge are recognized in net income in the same period as the hedged item. Any fair value change in the financial instrument before that period is recognized on the balance sheet. The effective portion of this fair value change is recognized in other comprehensive income with any ineffectiveness recognized in marketing and other income during the period of change.
For fair value hedges, both the financial instrument designated as a fair value hedge and the underlying commitment are recognized on the balance sheet at fair value. Changes in the fair value of both are reflected in net income.
Nexen had no cash flow or fair value hedges in place at December 31, 2009 or 2008.
For hedges of net investments, gains and losses resulting from foreign exchange translation of our net investments in self-sustaining foreign operations and the effective portion of the hedging items are recorded in other comprehensive income. Amounts included in accumulated other comprehensive income are reclassified to income when realized.
(M) ASSET RETIREMENT OBLIGATIONS
We provide for future asset retirement obligations on our resource properties, facilities, production platforms, pipelines and chemicals facilities based on estimates established by current legislation and industry practices. The asset retirement obligation is initially measured at fair value and capitalized to PP&E as an asset retirement cost. The obligation is accreted through DD&A expense until it is expected to settle and the cost is amortized through DD&A expense over the life of the respective asset. The fair value of the obligation is estimated by discounting expected future cash outflows to settle the asset retirement obligation using a weighted-average, credit-adjusted risk-free interest rate. Nexen recognizes period-to-period changes due to the passage of time and revisions to either the timing or the amount of the original estimate of undiscounted cash outflows. Actual retirement costs are recorded against the obligation when incurred. Any difference between the recorded asset retirement obligation and the actual retirement costs incurred is recorded as a gain or loss in the settlement period.
We own interests in assets for which the fair value of the asset retirement obligations cannot be reasonably determined because the assets currently have an indeterminate life and we cannot determine when remediation activities would take place. These assets include our interest in Syncrude’s upgrader and sulphur pile, and our interest in the Long Lake upgrader. The estimated future recoverable reserves at Syncrude and Long Lake are significant and given the long life of these assets, we are unable to determine when asset retirement activities would take place. Furthermore, the Syncrude plant and the Long Lake upgrader can both continue to run indefinitely with ongoing maintenance activities. The retirement obligations for these assets will be recorded in the first year in which the obligation to remediate becomes determinable.
(N) PENSION AND OTHER POST-RETIREMENT BENEFITS
Our employee post-retirement benefit programs consist of contributory and non-contributory defined benefit and defined contribution pension plans, as well as other post-retirement benefit programs.
For our defined benefit plans, we provide benefits to retirees based on their length of service and final average earnings. The cost of pension benefits earned by employees in our defined benefit pension plans is actuarially determined using the projected-benefit method prorated on service and our best estimate of the plans’ investment performance, salary escalations and retirement ages of employees. To calculate the plans’ expected returns, assets are measured at fair value. Past service costs arising from plan amendments, and net actuarial gains and losses that exceed 10% of the
greater of the accrued benefit obligation and the fair value of plan assets, are expensed in equal amounts over the expected average remaining service life of the employee group. Benefits paid out of Nexen’s defined benefit plan are indexed to 75% of the annual rate of inflation less 1% to a maximum increase of 5%.
In 2008, we changed our measurement date for defined benefit plans from October 31 to December 31. This change was applied prospectively and did not have a material impact on our financial statements.
Our defined contribution pension plan benefits are based on plan contributions. Company contributions to the defined contribution plan are expensed as incurred.
Other post-retirement benefits include group life and supplemental health insurance for eligible employees and their dependants. Costs are accrued as compensation in the period employees work; however, these future obligations are not funded.
(O) REVENUE RECOGNITION
Oil and gas
Revenue from the production of crude oil and natural gas is recognized when title passes to the customer. In Canada and the US, our customers primarily take title when the crude oil or natural gas reaches the end of the pipeline. For our other international operations, our customers generally take title when the crude oil is loaded onto tankers. When we produce or sell more or less oil or natural gas than our share, production overlifts and underlifts occur. We record overlifts as liabilities and underlifts as assets. We settle these over time as liftings are equalized or in cash when production ends.
Revenue represents Nexen’s share and is recorded net of royalty obligations to governments and other mineral interest owners. For our international operations, all government interests, except for income taxes, are considered royalty obligations. Our revenue also includes the recovery of costs paid on behalf of foreign governments in international locations. See Note 1(J).
Chemicals
Revenue from our chemicals operations is only recognized when our products are delivered to our customers. Delivery takes place when we have a sales contract specifying delivery volumes and sales prices. We assess customer credit worthiness before entering into sales contracts to minimize collection risk.
Energy marketing
Substantially all of the physical purchase and sales contracts entered into by our energy marketing operation are considered to be derivative instruments. Accordingly, financial and physical commodity contracts (collectively derivative instruments) held by our energy marketing operation are stated at fair value on the balance sheet. We record any change in fair value as a gain or loss in marketing and other income unless requirements for hedge accounting are met.
Any margin earned by our energy marketing operation on the sale of our proprietary oil and gas production is included in marketing and other income. Sales of our proprietary production are recorded at monthly average market-based prices and reported in our oil and gas segments. Intercompany profits and losses between segments are eliminated.
We assess customer credit worthiness before entering into contracts and provide for netting terms to minimize collection risk. Amounts are recorded on a net basis where we have a legally enforceable right and intention to offset.
(P) FOREIGN CURRENCY TRANSLATION
Our foreign operations, which are considered financially and operationally independent, are translated from their functional currency into Canadian dollars at the balance sheet date exchange rate for assets and liabilities and at the monthly average exchange rate for revenues and expenses. Gains and losses resulting from this translation are included in other comprehensive income.
We have designated our US-dollar debt (excluding debt related to Canexus) as a hedge against our net investment in US-dollar self-sustaining foreign operations. Gains and losses resulting from the translation of the designated US-dollar debt are included in other comprehensive income.
If our US-dollar debt, net of income taxes, exceeds our US-dollar investment in foreign operations, then the gains or losses attributable to such excess are included in marketing and other income in the Consolidated Statement of Income.
Monetary balances denominated in a currency other than a functional currency are translated into the functional currency using exchange rates at the balance sheet dates. Gains and losses arising from this translation are included in marketing and other income in the Consolidated Statement of Income.
(Q) TRANSPORTATION
We pay to transport the crude oil, natural gas and chemical products that we have sold, and often bill our customers for the transportation. This transportation is presented in our Consolidated Financial Statements as transportation and other expense. Amounts billed to our customers are presented within marketing and other income. Our energy marketing operation has received cash payments in exchange for assuming certain transportation obligations from third parties. These cash payments have been recorded as deferred liabilities and are recognized in net income as the transportation is used.
(R) LEASES
We classify leases entered into as either capital or operating leases. Leases that transfer substantially all of the benefits and risks of ownership to us are accounted for as capital leases and the related assets are included with PP&E and are amortized on a straight-line basis over the period of expected use, consistent with other PP&E. Rental payments under operating leases are expensed as incurred.
(S) STOCK-BASED COMPENSATION
Our stock-based compensation consists of tandem option (TOPs) and stock appreciation right (STARs) plans.
Tandem options to purchase common shares are granted to officers and employees at the discretion of the Board of Directors. Each tandem option gives the holder a right to either purchase one Nexen common share at the exercise price or to receive a cash payment equal to the excess of the market value of the common share over the exercise price. Options granted prior to February 2001 vest over four years and are exercisable on a cumulative basis over 10 years. Options granted after February 2001 vest over three years and are exercisable on a cumulative basis over five years. At the time of the grant, the exercise price equals the market value.
We record obligations for the tandem options using the intrinsic-value method of accounting and recognize compensation expense in the Consolidated Statement of Income. Obligations are accrued on a graded vesting basis and represent the difference between the market value of our common shares and the exercise price of the options. The obligations are revalued each reporting period based on the change in the market value of our common shares and the number of graded vested options outstanding. We reduce the liability when the options are surrendered for cash. When the options are exercised for stock, the accrued liability is transferred to share capital.
For employees eligible to retire during the vesting period, the compensation expense is recognized over the period from the grant date to the retirement eligibility date on a graded vesting basis. In instances where an employee is eligible to retire on the grant date of the stock-based award, compensation expense is recognized in full at that date.
Under our STARs plan, employees are entitled to cash payments equal to the excess of market price of the common share over the exercise price of the right. The vesting period and other terms of the plan are similar to the tandem option plan. At the time of grant, the exercise price equals market value. We account for stock appreciation rights to employees on the same basis as our tandem options. Obligations are accrued as compensation expense over the graded vesting period of the stock appreciation rights.
(T) INCOME TAXES
We follow the liability method of accounting for income taxes. This method recognizes income tax assets and liabilities at current rates, based on temporary differences in reported amounts for financial statement and tax purposes. The effect of a change in income tax rates on future income tax assets and future income tax liabilities is recognized in income when substantively enacted.
We do not provide for foreign withholding taxes on the undistributed earnings of our foreign subsidiaries, as we intend to invest such earnings indefinitely in foreign operations.
(U) CHANGES IN ACCOUNTING PRINCIPLES
Goodwill and Intangible Assets
On January 1, 2009, we retrospectively adopted the Canadian Institute of Chartered Accountants (CICA) section 3064, Goodwill and Intangible Assets issued by the Accounting Standards Board (AcSB). This section clarifies the criteria for the recognition of assets, intangible assets and internally developed intangible assets. Adoption of this standard did not have a material impact on our results of operations or financial position.
Business Combinations
On January 1, 2009, we prospectively adopted CICA Section 1582, Business Combinations issued by the AcSB. This section establishes principles and requirements of the acquisition method for business combinations and related disclosures. Adoption of this statement did not have a material impact on our results of operations or financial position.
Consolidated Financial Statements and Non-Controlling Interests
On January 1, 2009, we prospectively adopted CICA Sections 1601, Consolidated Financial Statements, and 1602, Non-Controlling Interests issued by the AcSB. Section 1601 establishes standards for the preparation of Consolidated Financial Statements. Section 1602 provides guidance on accounting for non-controlling interests in Consolidated Financial Statements subsequent to a business combination. Adoption of these sections did not have a material impact on our results of operations or financial position. The presentation changes have been included in the Consolidated Financial Statements as applicable.
Financial Instruments
In June 2009, the AcSB amended CICA Section 3862, Financial Instruments—Disclosures, to improve fair value and liquidity risk disclosures. Section 3862 now requires disclosure of the relative reliability of inputs into fair value estimates of financial instruments and disclosure of a three-level hierarchy based on the observability of inputs. The amendments are effective for fiscal years ending after September 30, 2009. Adoption of these amendments did not have an impact on our results of operations or financial position.
Oil and Gas Reserve Estimates
On January 6, 2010, the Financial Accounting Standards Board issued guidance for Oil and Gas Reserve Estimation and Disclosure, which is effective for years ended December 31, 2009. The guidance expands the definition of oil and gas producing activities to: i) include unconventional sources such as oil sands, ii) change the price used in reserve estimation from the year-end price to the simple average of the first-day-of-the-month price for the previous 12 months, and iii) requires disclosures for geographic areas which represent 15% or more of proved reserves. The information required by this standard has been included in the Supplementary Data (Unaudited).
We follow the successful efforts method of accounting for our oil and gas activities, which depends on the estimated reserves we believe are recoverable from our oil and gas properties. Specifically, reserves estimates are used to calculate our unit-of-production depletion rates and to assess, when necessary, our oil and gas assets for impairment. Adoption of these amendments at December 31, 2009 did not have an impact on our results of operations or financial position.
New accounting pronouncements
All Canadian publicly accountable enterprises will be required to adopt International Financial Reporting Standards (IFRS) for interim and annual reporting purposes for fiscal years beginning on or after January 1, 2011. A project team, consisting of dedicated personnel who have the experience and IFRS knowledge, has been set up to manage this transition and to ensure successful implementation within the required timeframe.
2. ACCOUNTS RECEIVABLE
|
| 2009 |
| 2008 |
|
Trade |
|
|
|
|
|
Energy Marketing |
| 1,410 |
| 1,501 |
|
Energy Marketing Derivative Contracts (Note 6) |
| 466 |
| 755 |
|
Oil and Gas |
| 823 |
| 639 |
|
Chemicals and Other |
| 44 |
| 68 |
|
|
| 2,743 |
| 2,963 |
|
Non-Trade |
| 99 |
| 270 |
|
|
| 2,842 |
| 3,233 |
|
Allowance for Doubtful Receivables |
| (54 | ) | (70 | ) |
|
|
|
|
|
|
Total |
| 2,788 |
| 3,163 |
|
3. INVENTORIES AND SUPPLIES
|
| 2009 |
| 2008 |
|
Finished Products |
|
|
|
|
|
Energy Marketing |
| 548 |
| 384 |
|
Oil and Gas |
| 25 |
| 17 |
|
Chemicals and Other |
| 12 |
| 16 |
|
|
| 585 |
| 417 |
|
Work in Process |
| 7 |
| 6 |
|
Field Supplies |
| 88 |
| 61 |
|
|
|
|
|
|
|
Total |
| 680 |
| 484 |
|
4. PROPERTY, PLANT AND EQUIPMENT
|
| 2009 |
| 2008 |
| ||||||||
|
| Cost |
| Accumulated |
| Net Book |
| Cost |
| Accumulated |
| Net Book |
|
Oil and Gas |
|
|
|
|
|
|
|
|
|
|
|
|
|
UK |
| 6,115 |
| 2,664 |
| 3,451 |
| 6,532 |
| 2,159 |
| 4,373 |
|
Canada1 |
| 9,664 |
| 2,038 |
| 7,626 |
| 8,134 |
| 1,786 |
| 6,348 |
|
Syncrude |
| 1,463 |
| 270 |
| 1,193 |
| 1,372 |
| 236 |
| 1,136 |
|
US |
| 3,900 |
| 2,529 |
| 1,371 |
| 4,398 |
| 2,702 |
| 1,696 |
|
Yemen |
| 800 |
| 728 |
| 72 |
| 899 |
| 781 |
| 118 |
|
Yemen—Carried Interest |
| 1,662 |
| 1,594 |
| 68 |
| 1,909 |
| 1,829 |
| 80 |
|
Other Countries2 |
| 930 |
| 99 |
| 831 |
| 554 |
| 113 |
| 441 |
|
|
| 24,534 |
| 9,922 |
| 14,612 |
| 23,798 |
| 9,606 |
| 14,192 |
|
Energy Marketing |
| 259 |
| 83 |
| 176 |
| 246 |
| 76 |
| 170 |
|
Chemicals |
| 1,135 |
| 562 |
| 573 |
| 940 |
| 507 |
| 433 |
|
Corporate and Other |
| 371 |
| 240 |
| 131 |
| 331 |
| 204 |
| 127 |
|
|
|
|
|
|
|
|
|
|
|
|
|
|
|
Total |
| 26,299 |
| 10,807 |
| 15,492 |
| 25,315 |
| 10,393 |
| 14,922 |
|
1 Includes capitalized costs related to our insitu oil sands (Long Lake and future phases) of $6,045 million (2008—$4,742 million).
2 Includes capitalized costs related to Usan development, offshore west Africa of $779 million (2008—$364 million).
Capitalized costs includes $8,740 million (2008—$7,386 million) relating to unproved properties and projects under construction or development and includes start-up costs, net of incidental revenues. These costs are currently not being depreciated, depleted or amortized, however, we will begin amortizing the capitalized costs of Long Lake Phase 1 in 2010.
DEPRECIATION, DEPLETION, AMORTIZATION AND IMPAIRMENT
Our DD&A expense in 2009 includes non-cash impairment charges of $78 million at three small natural gas properties in Canada and the US Gulf of Mexico. Year-end natural gas proved reserves at these properties were lower as a result of weak natural gas prices throughout 2009. These properties were written down to their estimated fair value based on their estimated future discounted net cash flows. The estimated future cash flows incorporate a risk-adjusted discount rate and management’s estimates of future prices, capital expenditures and production. Based on these significant unobservable inputs, the measurements are considered Level 3 within the fair value hierarchy. DD&A expense also includes $49 million for our Perth discovery in the North Sea where we expensed allocated acquisition costs as we are unlikely to proceed with development of this prospect.
Our DD&A expense in 2008 included $568 million of impairment expense relating to oil and gas properties in the US Gulf of Mexico and UK North Sea. These properties were written down to their estimated fair value based on their estimated total future discounted net cash flows.
In the US Gulf of Mexico, we reduced the carrying value of four shelf properties by $143 million in 2008, primarily as a result of low oil and gas prices and higher estimated asset remediation costs. These late-life, mature properties have a shorter production horizon, and therefore are sensitive to near-term commodity prices and higher abandonment costs. Inflationary pressures in the oil and gas industry increased the estimated future costs to remediate the assets. At Green Canyon 6, we reduced the carrying value of our assets by $107 million to reflect the impact of Hurricane Ike which destroyed a third-party production platform in the third quarter of 2008. This resulted in unexpected and uninsured costs to rebuild facilities as the original third-party production platform was not replaced by the operator.
In the UK North Sea, we reduced the carrying value of our Ettrick project by $256 million in 2008, primarily due to higher costs and lower reserve estimates following drilling and testing activities. We also expensed costs of $62 million in 2008 related to our Selkirk discovery as we are unlikely to proceed with development.
SUSPENDED EXPLORATION WELL COSTS
The following table shows the changes in capitalized exploratory well costs during the years ended December 31, 2009 and 2008, and does not include amounts that were initially capitalized and subsequently expensed in the same period. Suspended exploration well costs are included in property, plant and equipment.
|
| 2009 |
| 2008 |
| 2007 |
|
Beginning of Year |
| 518 |
| 326 |
| 226 |
|
Exploratory Well Costs Capitalized Pending the Determination of Proved Reserves |
| 396 |
| 254 |
| 215 |
|
Capitalized Exploratory Well Costs Charged to Expense |
| (56 | ) | (81 | ) | (10 | ) |
Transfers to Wells, Facilities and Equipment Based on Determination of Proved Reserves |
| (21 | ) | (29 | ) | (74 | ) |
Effects of Foreign Exchange Rate Changes |
| (43 | ) | 48 |
| (31 | ) |
End of Year |
| 794 |
| 518 |
| 326 |
|
The following table provides an aging of capitalized exploratory well costs based on the date drilling was completed and shows the number of projects for which exploratory well costs have been capitalized for a period greater than one year after the completion of drilling.
|
| 2009 |
| 2008 |
|
Capitalized for a Period of One Year or Less |
| 383 |
| 239 |
|
Capitalized for a Period of Greater than One Year |
| 411 |
| 279 |
|
Total |
| 794 |
| 518 |
|
|
|
|
|
|
|
Number of Projects that have Exploratory Well Costs Capitalized for a Period Greater than One Year |
| 12 |
| 7 |
|
As at December 31, 2009, we have exploratory costs that have been capitalized for more than one year relating to our interests in six exploratory blocks in the UK North Sea ($138 million), certain coalbed methane and shale gas exploratory activities in Canada ($138 million), two exploratory blocks in the Gulf of Mexico ($116 million) and our interest in two exploratory blocks offshore Nigeria ($19 million). These costs relate to projects with successful exploration wells for which we have not been able to recognize proved reserves. We are assessing all of these wells and projects, and are working with our partners to prepare development plans, drill additional appraisal wells or otherwise assess commercial viability.
Aging of Suspended Exploration Wells Greater Than 1 |
| United |
| Canada |
| United |
| Nigeria |
| Total |
|
1–3 years |
| 138 |
| 138 |
| 43 |
| — |
| 319 |
|
4–5 years |
| — |
| — |
| 73 |
| — |
| 73 |
|
Greater than 5 years |
| — |
| — |
| — |
| 19 |
| 19 |
|
Total |
| 138 |
| 138 |
| 116 |
| 19 |
| 411 |
|
5. DEFERRED CHARGES AND OTHER ASSETS
|
| 2009 |
| 2008 |
|
Long-Term Energy Marketing Derivative Contracts (Note 6) |
| 225 |
| 217 |
|
Crude Oil Put Options and Natural Gas Swaps (Note 6) |
| 4 |
| 234 |
|
Defined Benefit Pension Asset (Note 13) |
| 60 |
| 2 |
|
Long-Term Capital Prepayments |
| 27 |
| 61 |
|
Other |
| 54 |
| 56 |
|
Total |
| 370 |
| 570 |
|
6. FINANCIAL INSTRUMENTS
Financial instruments carried at fair value on our balance sheet include cash and cash equivalents, restricted cash and derivatives used for trading and non-trading purposes. Our other financial instruments including accounts receivable, accounts payable, accrued interest payable, dividends payable, short-term borrowings and long-term debt are carried at cost or amortized cost. The carrying value of our short-term receivables and payables approximates their fair value because the instruments are near maturity.
In our energy marketing group, we enter into contracts to purchase and sell crude oil, natural gas and other energy commodities, and use derivative contracts, including futures, forwards, swaps and options, for hedging and trading purposes (collectively derivatives). We also use derivatives to manage commodity price risk and foreign currency risk for non-trading purposes. We categorize our derivative instruments as trading or non-trading activities and carry the instruments at fair value on our balance sheet. The fair values are included with amounts receivable or payable and are classified as long-term or short-term based on anticipated settlement date. Any change in fair value is included in marketing and other income.
We carry our long-term debt at amortized cost using the effective interest rate method. At December 31, 2009, the estimated fair value of our long-term debt was $7,594 million (December 31, 2008—$5,686 million) as compared to the carrying value of $7,251 million (December 31, 2008—$6,578 million). The fair value of long-term debt is estimated based on prices provided by quoted markets and third-party brokers. The economic crisis in 2008 impacted market prices for corporate bonds and as a result, the estimated fair value of our long-term debt was lower in the fourth quarter of 2008.
Derivatives
(A) DERIVATIVE CONTRACTS RELATED TO TRADING ACTIVITIES
Our energy marketing group engages in various activities including the purchase and sale of physical commodities and the use of financial instruments such as commodity and foreign exchange futures, forwards and swaps to economically hedge exposures and generate revenue. These contracts are accounted for as derivatives and, where applicable, are presented net on the balance sheet in accordance with netting arrangements. The fair value and carrying amounts related to derivative instruments held by our energy marketing operations are as follows:
|
| 2009 |
| 2008 |
|
Commodity Contracts |
| 463 |
| 742 |
|
Foreign Exchange Contracts |
| 3 |
| 13 |
|
Accounts Receivable (Note 2) |
| 466 |
| 755 |
|
|
|
|
|
|
|
Commodity Contracts |
| 225 |
| 213 |
|
Foreign Exchange Contracts |
| — |
| 4 |
|
Deferred Charges and Other Assets (Note 5)1 |
| 225 |
| 217 |
|
|
|
|
|
|
|
Total Trading Derivative Assets |
| 691 |
| 972 |
|
|
|
|
|
|
|
Commodity Contracts |
| 410 |
| 585 |
|
Foreign Exchange Contracts |
| 46 |
| 30 |
|
Accounts Payable and Accrued Liabilities (Note 8) |
| 456 |
| 615 |
|
|
|
|
|
|
|
Commodity Contracts |
| 212 |
| 248 |
|
Foreign Exchange Contracts |
| — |
| 46 |
|
Deferred Credits and Other Liabilities (Note 12)1 |
| 212 |
| 294 |
|
|
|
|
|
|
|
Total Trading Derivative Liabilities |
| 668 |
| 909 |
|
|
|
|
|
|
|
Total Net Trading Derivative Contracts |
| 23 |
| 63 |
|
1 These derivative contracts settle beyond 12 months and are considered non-current; once settlement is within 12 months, they are included in accounts receivable or accounts payable.
Excluding the impact of netting arrangements, the fair value of derivative instruments is as follows:
|
| 2009 |
| 2008 |
|
Current Trading Assets |
| 2,625 |
| 3,945 |
|
Non-Current Trading Assets |
| 716 |
| 694 |
|
Total Trading Derivative Assets |
| 3,341 |
| 4,639 |
|
|
|
|
|
|
|
Current Trading Liabilities |
| 2,615 |
| 3,805 |
|
Non-Current Trading Liabilities |
| 703 |
| 771 |
|
Total Trading Derivative Liabilities |
| 3,318 |
| 4,576 |
|
|
|
|
|
|
|
Total Net Trading Derivative Contracts |
| 23 |
| 63 |
|
Trading revenues generated by our energy marketing group include gains and losses on derivative instruments and non-derivative instruments such as physical inventory. During 2009, the following trading revenues were recognized in marketing and other income:
|
| 2009 |
|
Commodity |
| 1,011 |
|
Foreign Exchange |
| (68 | ) |
Marketing Revenue, Net (Note 16) |
| 943 |
|
As an energy marketer, we may undertake several transactions during a period to execute a single sale of physical product. Each transaction may be represented by one or more derivative instruments including a physical buy, physical sell, and in many cases, numerous financial instruments for economically hedging and trading purposes. The absolute notional volumes associated with our derivative instrument transactions are as follows:
|
| 2009 |
|
Natural Gas (bcf/d) |
| 21.1 |
|
Crude Oil (mmbbls/d) |
| 3.5 |
|
Power (GWh/d) |
| 217.3 |
|
Foreign Exchange (USD millions) |
| 2,981 |
|
Foreign Exchange (Euro millions) |
| 376 |
|
(B) DERIVATIVE CONTRACTS RELATED TO NON-TRADING ACTIVITIES
The fair value and carrying amounts of derivative instruments related to non-trading activities are as follows:
|
| 2009 |
| 2008 |
|
Accounts Receivable |
| 13 |
| 6 |
|
Deferred Charges and Other Assets (Note 5)1 |
| 4 |
| 234 |
|
Total Non-Trading Derivative Assets |
| 17 |
| 240 |
|
|
|
|
|
|
|
Accounts Payable and Accrued Liabilities |
| 26 |
| 21 |
|
Deferred Credits and Other Liabilities (Note 12)1 |
| — |
| 26 |
|
Total Non-Trading Derivative Liabilities |
| 26 |
| 47 |
|
|
|
|
|
|
|
Total Net Non-Trading Derivative Contracts2 |
| (9 | ) | 193 |
|
1 These derivative contracts settle beyond 12 months and are considered non-current.
2 The net fair value of these derivatives is equal to the gross fair value before consideration of netting arrangements and collateral posted or received with counterparties.
Crude oil put options
In the fourth quarter of 2009, we purchased put options on 90,000 bbls/d of our 2010 crude oil production. These options establish a WTI floor price of US$50/bbl on these volumes and provide a base level of price protection without limiting our upside to higher prices. Options on 60,000 bbls/d settle monthly, while the remaining options settle annually. These options are recorded at fair value throughout their term. As a result, changes in forward crude oil prices create gains or losses on these options at each period end. The put options were purchased for $39 million and are carried at fair value. At December 31, 2009, higher crude oil prices reduced the fair value of the options to $17 million, and we recorded a fair value loss in 2009 of $22 million.
In early 2008, we purchased put options on approximately 70,000 bbls/d of our 2009 crude oil production. These options were purchased for $14 million and established a Dated Brent floor price of US$60/bbl on these volumes. At December 31, 2008, the put options had an estimated fair value of $233 million due to lower crude oil prices. Strengthening crude oil prices in 2009 reduced the fair value of these options to nil and we recorded a fair value loss of $229 million in 2009.
The crude oil put options are carried at fair value and are classified as long-term or short-term based on their anticipated settlement date. Fair value of the put options is supported by multiple quotes obtained from third-party brokers, which were validated with observable market data to the extent possible. Any change in fair value is included in marketing and other income.
|
| December 31, 2009 |
| ||||||||
|
| Notional |
| Term |
| Average |
| Fair Value |
| Change in Fair |
|
WTI Crude Oil Put Options (monthly) |
| 60,000 |
| 2010 |
| 50 |
| 13 |
| (12 | ) |
WTI Crude Oil Put Options (annual) |
| 30,000 |
| 2010 |
| 50 |
| 4 |
| (10 | ) |
|
|
|
|
|
|
|
| 17 |
| (22 | ) |
|
| December 31, 2008 |
| ||||||||
|
| Notional |
| Term |
| Average |
| Fair Value |
| Change in Fair Value |
|
Dated Brent Crude Oil Put Options (annual) |
| 70,000 |
| 2009 |
| 60 |
| 233 |
| 233 |
|
Fixed-price natural gas contracts and natural gas swaps
We have fixed-price natural gas sales contracts and offsetting natural gas swaps that are not part of our trading activities. These sales contracts and swaps are carried at fair value and are classified as short-term based on their anticipated settlement date. Any change in fair value is included in marketing and other income.
|
| December 31, 2009 |
| ||||||||
|
| Notional |
| Term |
| Average |
| Fair Value |
| Change in Fair Value |
|
Fixed-Price Natural Gas Contracts (monthly) |
| 15,514 |
| 2010 |
| 2.28 |
| (14 | ) | 12 |
|
Natural Gas Swaps (monthly) |
| 15,514 |
| 2010 |
| 7.60 |
| (12 | ) | (13 | ) |
|
|
|
|
|
|
|
| (26 | ) | (1 | ) |
|
| December 31, 2008 |
| ||||||||
|
| Notional |
| Term |
| Average |
| Fair Value |
| Change in Fair Value |
|
Fixed-Price Natural Gas Contracts (monthly) |
| 15,514 |
| 2009 |
| 2.28 |
| (21 | ) | 3 |
|
|
| 15,514 |
| 2010 |
| 2.28 |
| (26 | ) | (2 | ) |
Natural Gas Swaps (monthly) |
| 15,514 |
| 2009 |
| 7.60 |
| 6 |
| 8 |
|
|
| 15,514 |
| 2010 |
| 7.60 |
| 1 |
| 2 |
|
|
|
|
|
|
|
|
| (40 | ) | 11 |
|
(C) FAIR VALUE OF DERIVATIVES
For purposes of estimating the fair value of our derivative contracts, wherever possible, we utilize quoted market prices, and if not available, estimates from third-party brokers. These broker estimates are corroborated with multiple sources and/or other observable market data utilizing assumptions that market participants would use when pricing the asset or liability, including assumptions about risk and market liquidity. Inputs to fair valuations may be readily observable, market-corroborated, or generally unobservable. We utilize valuation techniques that seek to maximize the use of observable inputs and minimize the use of unobservable inputs. To value longer-term transactions and transactions in less active markets for which pricing information is not generally available, unobservable inputs may be used.
As a basis for establishing fair value, we utilize a mid-market pricing convention between bid and ask and then adjust our pricing to the ask price when we have a net short position and the bid price when we have a net long position. This adjustment reflects an estimated exit price and incorporates the impact of liquidity when the bid-ask spread widens in less liquid markets. We incorporate the credit risk associated with counterparty default, as well as our own credit risk, into our estimates of fair value.
We classify the fair value of our derivatives according to the following hierarchy based on the amount of observable inputs used to value the instruments.
· Level 1—Quoted prices are available in active markets for identical assets or liabilities as of the reporting date. Active markets are those in which transactions occur in sufficient frequency and volume to provide pricing information on an ongoing basis. Level 1 consists of financial instruments such as exchange-traded derivatives and we use information from markets such as the New York Mercantile Exchange.
· Level 2—Pricing inputs are other than quoted prices in active markets included in Level 1. Prices in Level 2 are either directly or indirectly observable as of the reported date. Level 2 valuations are based on inputs, including quoted forward prices for commodities, time value, volatility factors and broker quotations, which can be substantially observed or corroborated in the marketplace. Instruments in this category include non-exchange traded derivatives such as over-the-counter physical forwards and options, including those which have prices similar to quoted market prices. We obtain information from sources such as the Natural Gas Exchange, independent price publications and over-the-counter broker quotes.
· Level 3—Valuations in this level are those with inputs which are less observable, unavailable or where the observable data does not support the majority of the instrument’s fair value. Level 3 instruments may include items based on pricing services or broker quotes where we are unable to verify the observability of inputs into their prices. Level 3 instruments include longer-term transactions, transactions in less active markets or transactions at locations for which pricing information is not available. In these instances, internally developed methodologies are used to determine fair value which primarily includes extrapolation of observable future prices to similar locations, similar instruments or later time periods.
The following table includes our derivatives that are carried at fair value for our trading and non-trading activities as at December 31, 2009 and 2008. Financial assets and liabilities are classified in the fair value hierarchy in their entirety based on the least observable input that is significant to the fair value measurement. Assessment of the significance of a particular input to the fair value measurement requires judgment and may affect placement within the fair value hierarchy levels.
Net Derivatives at December 31, 2009 |
| Level 1 |
| Level 2 |
| Level 3 |
| Total |
|
Commodity Contracts |
| (143 | ) | 167 |
| 42 |
| 66 |
|
Foreign Exchange Contracts |
| — |
| (43 | ) | — |
| (43 | ) |
Trading Derivatives |
| (143 | ) | 124 |
| 42 |
| 23 |
|
Non-Trading Derivatives |
| — |
| (9 | ) | — |
| (9 | ) |
Total |
| (143 | ) | 115 |
| 42 |
| 14 |
|
Net Derivatives at December 31, 2008 |
| Level 1 |
| Level 2 |
| Level 3 |
| Total |
|
Trading Derivatives |
| 13 |
| 132 |
| (82 | ) | 63 |
|
Non-Trading Derivatives |
| — |
| 193 |
| — |
| 193 |
|
Total |
| 13 |
| 325 |
| (82 | ) | 256 |
|
A reconciliation of changes in the fair value of our derivatives classified as Level 3 for the year ended December 31, 2009 is provided below:
Level 3 Net Derivatives at January 1, 2009 |
| (82 | ) |
Realized and unrealized gains (losses) |
| 74 |
|
Purchases |
| 4 |
|
Settlements |
| 54 |
|
Transfers into Level 3 |
| — |
|
Transfers out of Level 3 |
| (8 | ) |
Level 3 Net Derivatives at December 31, 2009 |
| 42 |
|
|
|
|
|
Unsettled gains (losses) relating to instruments still held as of December 31, 2009 |
| 66 |
|
A reconciliation of changes in the fair value of our derivatives classified as Level 3 for the year ended December 31, 2008 is provided below:
Level 3 Net Derivatives at January 1, 2008 |
| (7 | ) |
Realized and unrealized gains (losses) |
| (64 | ) |
Purchases, issuances and settlements |
| (9 | ) |
Transfers in and/or out of Level 3 |
| (2 | ) |
Level 3 Net Derivatives at December 31, 2008 |
| (82 | ) |
|
|
|
|
Unsettled gains (losses) relating to instruments still held as of December 31, 2008 |
| 16 |
|
Items classified in Level 3 are generally economically hedged such that gains or losses on positions classified in Level 3 are often offset by gains or losses on positions classified in Level 1 or 2. Transfers into or out of Level 3 represent existing assets and liabilities that were either previously categorized as a higher level for which the inputs became unobservable or assets and liabilities that were previously classified as Level 3 for which the lowest significant input became observable during the period. Fair values of instruments in Level 3 are determined using broker quotes, pricing services, and internally-developed inputs. We performed a sensitivity analysis of inputs used to calculate the fair value of Level 3 instruments. Using reasonably possible alternative assumptions, the fair value of Level 3 instruments would change by $12 million.
7. RISK MANAGEMENT
(A) MARKET RISK
We invest in significant capital projects, purchase and sell commodities, issue short-term borrowings and long-term debt and invest in foreign operations. These activities expose us to market risks from changes in commodity prices, foreign currency rates and interest rates, which could affect our earnings and the value of the financial instruments we hold. We use derivatives for trading and non-trading purposes as part of our overall risk management policy to manage these market risk exposures.
The following market risk discussion relates primarily to commodity price risk and foreign currency risk related to our financial instruments as our exposure to interest rate risk is immaterial given that the majority of our debt is fixed rate.
Commodity price risk
We are exposed to commodity price movements as part of our normal oil and gas operations, particularly in relation to the prices received for our crude oil and natural gas. Commodity price risk related to conventional and synthetic crude oil prices is our most significant market risk exposure. Crude oil and natural gas are sensitive to numerous worldwide factors, many of which are beyond our control, and are generally sold at contract or posted prices. Changes in global supply and demand fundamentals in the crude oil market and geopolitical events can significantly affect crude oil prices. Changes in crude oil and natural gas prices may significantly affect our results of operations and cash generated from operating activities. Consequently, these changes also may affect the value of our oil and gas properties, our level of spending for exploration and development, and our ability to meet our obligations as they come due.
The majority of our oil and gas production is sold under short-term contracts, exposing us to the risk of near-term price movements. Other energy contracts we enter into also expose us to commodity price risk between the time we purchase and sell contracted volumes. We actively manage these risks by using derivative contracts such as commodity put options.
Our energy marketing business is focused on providing services to our customers and suppliers to meet their energy commodity needs. We market and trade physical energy commodities in selected regions of the world including crude oil, natural gas, electricity and other commodities. We do this by buying and selling physical commodities, by acquiring and holding rights to physical transportation and storage assets for these commodities, and by building strong relationships with our customers and suppliers.
In order to manage the commodity and foreign exchange price risks that come from this physical business, we use financial derivative contracts including energy-related futures, forwards, swaps and options, as well as currency swaps or forwards.
We also seek to profit from our views on the future movement of energy commodity pricing relationships, primarily between different locations, time periods or qualities. We do this by holding open positions, where the terms of physical or financial contracts are not completely matched to offsetting positions.
Our risk management activities make use of tools such as Value-at-Risk (VaR) and stress testing. VaR is a statistical estimate of the expected profit or loss of a portfolio of positions assuming normal market conditions. We use a 95% confidence interval and an assumed two day holding period in our measure, although actual results can differ from this estimate in abnormal market conditions, or if positions are held longer than two days based on market views or a lack of market liquidity to exit them, which is typical for long-term assets and may also apply to nearer term positions. We estimate VaR primarily by using the Variance-Covariance method based on historical commodity
price volatility and correlation inputs where available, and by historical simulation in other situations. Our estimate is based upon the following key assumptions:
· changes in commodity prices are either normally or “T” distributed;
· price volatility remains stable; and
· price correlation relationships remain stable.
We have defined VaR limits for different segments of our energy marketing business. These limits are calculated on an economic basis and include physical and financial derivatives, as well as physical transportation and storage capacity contracts accounted for as executory contracts in our financial statements. We monitor our positions against these VaR limits daily. Our year-end, annual high, annual low and average VaR amounts are as follows:
Value-at-Risk (Cdn$ millions) |
| 2009 |
| 2008 |
|
Year End |
| 11 |
| 25 |
|
High |
| 24 |
| 40 |
|
Low |
| 9 |
| 19 |
|
Average |
| 15 |
| 30 |
|
If a market shock occurred as in 2008, the key assumptions underlying our VaR estimate could be exceeded and the potential loss could be greater than our estimate. We perform stress tests on a regular basis to complement VaR and assess the impact of abnormal changes in prices on our positions.
Foreign currency risk
Foreign currency risk is created by fluctuations in the fair values or cash flows of financial instruments due to changes in foreign exchange rates. A substantial portion of our activities are transacted in or referenced to US dollars including:
· sales of crude oil, natural gas and certain chemicals products;
· capital spending and expenses for our oil and gas, and chemicals operations;
· commodity derivative contracts used primarily by our energy marketing group; and
· short-term borrowings and long-term debt.
The foreign exchange gains or losses related to the effective portion of our designated US-dollar debt are included in accumulated other comprehensive income in equity. Our net investment in self-sustaining foreign operations and our designated US-dollar debt at December 31, 2009 and 2008 are as follows:
(US$ millions) |
| December 31, 2009 |
| December 31, 2008 |
|
Net Investment in Self-Sustaining Foreign Operations |
| 4,492 |
| 4,662 |
|
Designated US-Dollar Debt |
| 4,492 |
| 4,545 |
|
In our oil and gas operations, we manage our exposure to fluctuations between the US and Canadian dollar by maintaining our expected net cash flows and borrowings in the same currency. Cash inflows generated by our foreign operations and borrowings on our US-dollar debt facilities are generally used to fund US-dollar capital expenditures and debt repayments. We maintain revolving Canadian and US-dollar borrowing facilities that can be used or repaid depending on expected net cash flows. We designate most of our US-dollar borrowings as a hedge against our US-dollar net investment in self-sustaining foreign operations. For the year ended December 31, 2009, the undesignated portion of our US-dollar debt resulted in a net foreign exchange gain of $151 million ($132 million, net of income tax expense) and is included in marketing and other income (2008—nil).
A one cent change in the US dollar to Canadian dollar exchange rate would increase or decrease our accumulated other comprehensive income by approximately $45 million, net of income tax, and would increase or decrease our net income by approximately $10 million, net of income tax.
We also have exposures to currencies other than the US dollar including a portion of our UK operating expenses, capital spending and future asset retirement obligations which are denominated in British pounds and Euros. We do not have any material exposure to highly inflationary foreign currencies. In our energy marketing group, we enter into transactions in various currencies including Canadian and US dollars, British pounds and Euros. We actively manage significant currency exposures using forward contracts and swaps.
(B) CREDIT RISK
Credit risk affects both our trading and non-trading activities and is the risk of loss if counterparties do not fulfill their contractual obligations. Most of our credit exposures are with counterparties in the energy industry, including integrated oil companies, refiners and utilities, and are subject to normal industry credit risk. Approximately 72% of our exposure is with these large energy companies. This concentration of risk within the energy industry is reduced because of our broad base of domestic and international counterparties. We take the following measures to reduce this risk:
· assess the financial strength of our counterparties through a rigorous credit analysis process;
· limit the total exposure extended to individual counterparties, and may require collateral from some counterparties;
· routinely monitor credit risk exposures, including sector, geographic and corporate concentrations of credit, and report these to our Executive Risk Management Committee and the Finance Committee of the board;
· set credit limits based on rating agency credit ratings and internal assessments based on company and industry analysis;
· review counterparty credit limits regularly; and
· use standard agreements that allow for the netting of exposures associated with a single counterparty.
We believe these measures minimize our overall credit risk; however, there can be no assurance that these processes will protect us against all losses from non-performance. Since 2008, we have taken the following specific actions for certain counterparties deemed to be at higher risk of non-performance:
· ceased trading activities;
· significantly reduced and, in some cases, revoked credit privileges;
· redirected business to: i) exchanges or clearing houses; and ii) entities with physical-based operations;
· increased “set off” arrangements with counterparties; and
· increased collateral and margining requirements where possible.
At December 31, 2009, only one counterparty individually made up more than 10% of our credit exposure. This counterparty is a major integrated oil company with a strong investment grade rating. One other counterparty made up more than 5% of our credit exposure. The following table illustrates the composition of credit exposure by credit rating.
Credit Rating |
| 2009 |
| 2008 |
|
A or higher |
| 67 | % | 65 | % |
BBB |
| 26 | % | 29 | % |
Non-Investment Grade |
| 7 | % | 6 | % |
Total |
| 100 | % | 100 | % |
Our maximum counterparty credit exposure at the balance sheet date consists primarily of the carrying amounts of non-derivative financial assets such as cash and cash equivalents, restricted cash, accounts receivable, as well as the fair value of derivative financial assets. We have provided an allowance of $54 million for credit risk with our counterparties. In addition, we incorporate the credit risk associated with counterparty default, as well as Nexen’s own credit risk, into our estimates of fair value.
Collateral received from customers at December 31, 2009 includes $45 million of cash and $444 million of letters of credit. The cash received is included in accounts payable and accrued liabilities.
(C) LIQUIDITY RISK
Liquidity risk is the risk that we will not be able to meet our financial obligations as they fall due. We require liquidity specifically to fund capital requirements, satisfy financial obligations as they become due, and to operate our energy marketing business. We generally rely on operating cash flows to provide liquidity and we also maintain significant undrawn committed credit facilities. At December 31, 2009, we had about $3.3 billion of cash and available undrawn committed lines of credit (US$3.2 billion). This includes $1.7 billion (US$1.6 billion) of cash and cash equivalents on hand and undrawn term credit facilities of $1.6 billion (US$1.6 billion), of which $407 million (US$389 million) was supporting letters of credit at December 31, 2009. Our committed term credit facilities are available until 2012 unless extended. We also have $492 million (US$470 million) of undrawn, uncommitted credit facilities, of which $86 million (US$82 million) was supporting letters of credit at year end.
The following table details the contractual maturities for our non-derivative financial liabilities, including both the principal and interest cash flows at December 31, 2009:
|
| December 31, 2009 |
| ||||||||
|
| Total |
| < 1 Year |
| 1–3 Years |
| 4–5 Years |
| > 5 Years |
|
Long-Term Debt (Note 9) |
| 7,343 |
| — |
| 1,803 |
| 621 |
| 4,919 |
|
Interest on Long-Term Debt1 |
| 8,052 |
| 361 |
| 721 |
| 688 |
| 6,282 |
|
Total |
| 15,395 |
| 361 |
| 2,524 |
| 1,309 |
| 11,201 |
|
1 Excludes interest on drawn term credit facilities of $1.6 billion (US$1.5 billion) and Canexus term credit facilities of $233 million (US$223 million) as the amounts drawn on the facilities fluctuate. Based on amounts drawn at December 31, 2009 and existing variable interest rates, we would be required to pay $19 million per year until the outstanding amounts on the term credit facilities are repaid.
The following table details contractual maturities for our derivative financial liabilities. The balance sheet amounts for derivative financial liabilities included below are not materially different from the contractual amounts due on maturity.
|
| December 31, 2009 |
| ||||||||
|
| Total |
| < 1 Year |
| 1–3 Years |
| 4–5 Years |
| > 5 Years |
|
Trading Derivatives (Note 6) |
| 668 |
| 456 |
| 180 |
| 32 |
| — |
|
Non-Trading Derivatives (Note 6) |
| 26 |
| 26 |
| — |
| — |
| — |
|
Total |
| 694 |
| 482 |
| 180 |
| 32 |
| — |
|
The commercial agreements our energy marketing group enters into often include financial assurance provisions that allow us and our counterparties to effectively manage credit risk. The agreements normally require collateral to be posted if an adverse credit-related event occurs, such as a drop in credit ratings to non-investment grade. Based on contracts in place and commodity prices at December 31, 2009, we could be required to post collateral of up to $962 million if we were downgraded to non-investment grade. These obligations are reflected on our balance sheet. The posting of collateral secures the payment of such amounts. In the event of a ratings downgrade, we have trading inventories and receivables that can be quickly monetized as well as significant undrawn credit facilities.
At December 31, 2009, collateral we have posted with counterparties includes $17 million of cash and $279 million of letters of credit related to our trading activities. Cash posted is included with our accounts receivable. Cash collateral is not normally applied to contract settlement. Once a contract has been settled, the collateral amounts are refunded. If there is a default, the cash is retained.
Our exchange-traded derivative contracts are also subject to margin requirements. We have margin deposits of $198 million (2008—$103 million), which have been included in restricted cash.
8. ACCOUNTS PAYABLE AND ACCRUED LIABILITIES
|
| 2009 |
| 2008 |
|
Energy Marketing Payables |
| 1,366 |
| 1,302 |
|
Energy Marketing Derivative Contracts (Note 6) |
| 456 |
| 615 |
|
Accrued Payables |
| 619 |
| 878 |
|
Trade Payables |
| 210 |
| 252 |
|
Income Taxes Payable |
| 179 |
| 69 |
|
Stock-Based Compensation |
| 72 |
| 97 |
|
Other |
| 136 |
| 113 |
|
Total |
| 3,038 |
| 3,326 |
|
9. SHORT-TERM BORROWINGS AND LONG-TERM DEBT
|
| 2009 |
| 2008 |
|
Canexus Term Credit Facilities, due 2011 (US$223 million drawn) (A) |
| 233 |
| 223 |
|
Term Credit Facilities, due 2012 (US$1.5 billion drawn) (B) |
| 1,570 |
| 1,225 |
|
Canexus Notes, due 2013 (US$50 million) (C) |
| 52 |
| 61 |
|
Notes, due 2013 (US$500 million) (D) |
| 523 |
| 612 |
|
Canexus Convertible Debentures, due 2014 (E) |
| 46 |
| — |
|
Notes, due 2015 (US$250 million) (F) |
| 262 |
| 306 |
|
Notes, due 2017 (US$250 million) (G) |
| 262 |
| 306 |
|
Notes, due 2019 (US$300 million) (H) |
| 314 |
| — |
|
Notes, due 2028 (US$200 million) (I) |
| 209 |
| 245 |
|
Notes, due 2032 (US$500 million) (J) |
| 523 |
| 612 |
|
Notes, due 2035 (US$790 million) (K) |
| 827 |
| 968 |
|
Notes, due 2037 (US$1,250 million) (L) |
| 1,308 |
| 1,531 |
|
Notes, due 2039 (US$700 million) (M) |
| 733 |
| — |
|
Subordinated Debentures, due 2043 (US$460 million) (N) |
| 481 |
| 563 |
|
|
| 7,343 |
| 6,652 |
|
Unamortized Discount and Debt Issue Costs |
| (92 | ) | (74 | ) |
Total |
| 7,251 |
| 6,578 |
|
(A) CANEXUS TERM CREDIT FACILITIES
Canexus has $451 million (US$431 million) of committed, secured term credit facilities, available until 2011. At December 31, 2009, $233 million (US$223 million) was drawn on these facilities (2008—$223 million (US$182 million)). Borrowings are available as Canadian bankers’ acceptances, LIBOR-based loans, Canadian prime rate loans or US-dollar base rate loans. Interest is payable monthly at floating rates. The term credit facilities are secured by a floating charge debenture over all of Canexus’ assets. The credit facility also contains covenants with respect to certain financial ratios for Canexus. During 2009, the weighted-average interest rate on the Canexus term credit facilities was 2.2% (2008—4.4%).
(B) TERM CREDIT FACILITIES
We have unsecured term credit facilities of $3.2 billion (US$3.1 billion) available until July 2012. At December 31, 2009, $1.6 billion (US$1.5 billion) was drawn on these facilities (2008—$1.2 billion (US$1 billion)). Borrowings are available as Canadian bankers’ acceptances, LIBOR-based loans, Canadian prime rate loans, US-dollar base rate loans or British pound call-rate loans. Interest is payable at floating rates. During 2009, the weighted-average interest rate was 1.0% (2008—2.8%). At December 31, 2009, $407 million (US$389 million) of these facilities were utilized to support outstanding letters of credit (December 31, 2008—$381 million (US$311 million)).
(C) CANEXUS NOTES, DUE 2013
During May 2008, Canexus issued US$50 million of notes. Interest is payable quarterly at a rate of 6.57% and the principal is to be repaid in May 2013. Canexus may redeem part or all of the notes at any time. The redemption price will be the greater of par and an amount that provides the same yield as a US Treasury security having a term-to-maturity equal to the remaining term of the notes plus 0.2%.
(D) NOTES, DUE 2013
During November 2003, we issued US$500 million of notes. Interest is payable semi-annually at a rate of 5.05%, and the principal is to be repaid in November 2013. We may redeem part or all of the notes at any time. The redemption price will be the greater of par and an amount that provides the same yield as a US Treasury security having a term-to-maturity equal to the remaining term of the notes plus 0.2%.
(E) CANEXUS CONVERTIBLE DEBENTURES
In August 2009, Canexus issued $46 million of unsecured subordinated convertible debentures to non-controlling interests. Interest is payable semi-annually at a rate of 8.00%. These debentures mature on December 31, 2014 and are convertible at the holder’s option at any time prior to the close of business on the earlier of i) the maturity date and ii) the business day immediately preceding the date specified by Canexus for redemption of the debentures into trust units. The conversion price is $5.10 per trust unit.
Canexus has the option to redeem the debentures in whole or in part from time to time subject to the satisfaction of certain conditions, after December 31, 2012 but before maturity, at a redemption price equal to the principal amount and unpaid interest. Canexus may elect to satisfy its obligation to pay interest or repay the principal by issuing trust units at market value.
The estimated fair value of the conversion feature of the convertible debentures amounted to $4 million and was included in non-controlling interests in equity. The amount of the convertible debentures allocated to long-term debt is accreted over the term of the debt using the effective interest rate method.
Concurrent with the issuance of the $46 million of unsecured subordinated convertible debentures to non-controlling interests, we acquired $40 million of debentures from Canexus with substantially the same terms which allow us to protect against dilution of our ownership interest at our option. These debentures are eliminated on consolidation.
(F) NOTES, DUE 2015
During March 2005, we issued US$250 million of notes. Interest is payable semi-annually at a rate of 5.2%, and the principal is to be repaid in March 2015. We may redeem part or all of the notes at any time. The redemption price will be the greater of par and an amount that provides the same yield as a US Treasury security having a term-to-maturity equal to the remaining term of the notes plus 0.15%.
(G) NOTES, DUE 2017
During May 2007, we issued US$250 million of notes. Interest is payable semi-annually at a rate of 5.65%, and the principal is to be repaid in May 2017. We may redeem part or all of the notes at any time. The redemption price will be the greater of par and an amount that provides the same yield as a US Treasury security having a term-to-maturity equal to the remaining term of the notes plus 0.2%.
(H) NOTES, DUE 2019
In July 2009, we issued US$300 million of notes. Interest is payable semi-annually at a rate of 6.2%, and the principal is to be repaid in July 2019. We may redeem part or all of the notes at any time. The redemption price will be the greater of par and an amount that provides the same yield as a US Treasury security having a term-to-maturity equal to the remaining term of the notes plus 0.40%.
(I) NOTES, DUE 2028
During April 1998, we issued US$200 million of notes. Interest is payable semi-annually at a rate of 7.4%, and the principal is to be repaid in May 2028. We may redeem part or all of the notes at any time. The redemption price will be the greater of par and an amount that provides the same yield as a US Treasury security having a term-to-maturity equal to the remaining term of the notes plus 0.25%.
(J) NOTES, DUE 2032
During March 2002, we issued US$500 million of notes. Interest is payable semi-annually at a rate of 7.875%, and the principal is to be repaid in March 2032. We may redeem part or all of the notes at any time. The redemption price will be the greater of par and an amount that provides the same yield as a US Treasury security having a term-to-maturity equal to the remaining term of the notes plus 0.375%.
(K) NOTES, DUE 2035
During March 2005, we issued US$790 million of notes. Interest is payable semi-annually at a rate of 5.875%, and the principal is to be repaid in March 2035. We may redeem part or all of the notes at any time. The redemption price will be the greater of par and an amount that provides the same yield as a US Treasury security having a term-to-maturity equal to the remaining term of the notes plus 0.2%.
(L) NOTES, DUE 2037
During May 2007, we issued US$1,250 million of notes. Interest is payable semi-annually at a rate of 6.4%, and the principal is to be repaid in May 2037. We may redeem part or all of the notes at any time. The redemption price will be the greater of par and an amount that provides the same yield as a US Treasury security having a term-to-maturity equal to the remaining term of the notes plus 0.35%.
(M) NOTES, DUE 2039
In July 2009, we issued US$700 million of notes. Interest is payable semi-annually at a rate of 7.5%, and the principal is to be repaid in July 2039. We may redeem part or all of the notes at any time. The redemption price will be the greater of par and an amount that provides the same yield as a US Treasury security having a term-to-maturity equal to the remaining term of the notes plus 0.45%.
(N) SUBORDINATED DEBENTURES, DUE 2043
During November 2003, we issued US$460 million of unsecured subordinated debentures. Interest is payable quarterly at a rate of 7.35%, and the principal is to be repaid in November 2043. We may redeem part or all of the debentures at any time on or after November 8, 2008. The redemption price is equal to the par value of the principal amount plus any accrued and unpaid interest to the redemption date. We may choose to redeem the principal amount with either cash or common shares.
(O) LONG-TERM DEBT REPAYMENTS
2010 |
| — |
|
2011 |
| 233 | 1 |
2012 |
| 1,570 |
|
2013 |
| 575 |
|
2014 |
| 46 |
|
Thereafter |
| 4,919 |
|
Total |
| 7,343 |
|
1 Canexus term credit facility.
(P) DEBT COVENANTS
Some of our debt instruments contain covenants with respect to certain financial ratios and our ability to grant security. At December 31, 2009 and 2008, we were in compliance with all covenants.
(Q) SHORT-TERM BORROWINGS
Nexen has uncommitted, unsecured credit facilities of approximately $492 million (US$470 million), none of which were drawn at December 31, 2009 (2008—nil). We utilized $86 million (US$82 million) of these facilities to support outstanding letters of credit at December 31, 2009 (2008—$29 million (US$24 million)). Interest is payable at floating rates. During 2009, the weighted-average interest rate on our short-term borrowings was 2.1% (2008—3.2%).
(R) INTEREST EXPENSE
|
| 2009 |
| 2008 |
| 2007 |
|
Long-Term Debt |
| 372 |
| 315 |
| 323 |
|
Other |
| 17 |
| 19 |
| 18 |
|
Total |
| 389 |
| 334 |
| 341 |
|
Less: Capitalized |
| (77 | ) | (240 | ) | (173 | ) |
Total |
| 312 |
| 94 |
| 168 |
|
Capitalized interest relates to and is included as part of the cost of oil and gas properties. The capitalization rates are based on our weighted-average cost of borrowings. In 2009, we ceased capitalizing interest on Phase 1 of Long Lake.
10. CAPITAL DISCLOSURE
Our objective for managing our capital structure is to ensure that we have the financial capacity, liquidity and flexibility to fund our investment in full-cycle exploration and development of conventional and unconventional resources and for energy marketing activities. We generally rely on operating cash flows to fund capital investments. However, given the long cycle-time of some of our development projects which require significant capital investment prior to cash flow generation and volatile commodity prices, it is not unusual for capital expenditures to exceed our cash flow from operating activities in any given period. As such, our financing needs depend on the timing of expected net cash flows in a particular development or commodity cycle. This requires us to maintain financial flexibility and liquidity. Our capital management policies are aimed at:
· maintaining an appropriate balance between short-term borrowings, long-term debt and equity;
· maintaining sufficient undrawn committed credit capacity to provide liquidity;
· ensuring ample covenant room permitting us to draw on credit lines as required; and
· ensuring we maintain a credit rating that is appropriate for our circumstances.
We have the ability to make adjustments to our capital structure by issuing additional equity or debt, returning cash to shareholders and making adjustments to our capital investment programs. Our capital consists of equity, short-term borrowings, long-term debt, and cash and cash equivalents as follows:
Net Debt1 |
| 2009 |
| 2008 |
|
Long-Term Debt |
| 7,251 |
| 6,578 |
|
Less: Cash and Cash Equivalents |
| (1,700 | ) | (2,003 | ) |
Total |
| 5,551 |
| 4,575 |
|
|
|
|
|
|
|
Equity2 |
| 7,646 |
| 7,191 |
|
1 Includes all of our borrowings and is calculated as long-term debt and short-term borrowings less cash and cash equivalents.
2 Equity is the historical issue of equity and accumulated retained earnings.
We monitor the leverage in our capital structure by reviewing the ratio of net debt to cash flow from operating activities and interest coverage ratios at various commodity prices.
We use the ratio of net debt to cash flow from operating activities as a key indicator of our leverage and to monitor the strength of our balance sheet. Net debt is a non-GAAP measure that does not have any standard meaning prescribed by GAAP and is therefore unlikely to be comparable to similar measures presented by others. We calculate net debt using the GAAP measures of long-term debt and short-term borrowings less cash and cash equivalents (excluding restricted cash).
For the twelve months ended December 31, 2009, the net debt to cash flow from operating activities ratio (before changes in non cash working capital and other) was 2.5 times compared to 1.1 times at December 31, 2008. While we typically expect the target ratio to fluctuate between 1.0 and 2.0 times under normalized commodity prices, this can be higher or lower depending on commodity price volatility or when we identify strategic opportunities requiring additional investment. Whenever we exceed our target ratio, we assess whether we need to develop a strategy to reduce our leverage and lower this ratio back to target levels over time.
Our interest coverage ratio monitors our ability to fund the interest requirements associated with our debt. Our interest coverage decreased from 15.6 times at the end of 2008 to 8.5 times at December 31, 2009. Interest coverage is calculated by dividing our twelve-month trailing earnings before interest, taxes, DD&A (adjusted EBITDA) by interest expense before capitalized interest. Adjusted EBITDA is a non-GAAP measure which is calculated using net income excluding interest expense, provision for income taxes, exploration expenses, DD&A, impairment and other non-cash expenses. The calculation of adjusted EBITDA is set out in the following table and is unlikely to be comparable to similar measures presented by others.
|
| 2009 |
| 2008 |
|
Net Income Attributable to Nexen Inc. |
| 536 |
| 1,715 |
|
Add: |
|
|
|
|
|
Interest Expense |
| 312 |
| 94 |
|
Provision for Income Taxes |
| 260 |
| 1,457 |
|
Depreciation, Depletion, Amortization and Impairment |
| 1,802 |
| 2,014 |
|
Exploration Expense |
| 302 |
| 402 |
|
Recovery of Non-Cash Stock-Based Compensation |
| (10 | ) | (272 | ) |
Change in Fair Value of Crude Oil Put Options |
| 251 |
| (203 | ) |
Other Non-Cash Expenses |
| (136 | ) | (1 | ) |
Adjusted EBITDA |
| 3,317 |
| 5,206 |
|
11. ASSET RETIREMENT OBLIGATIONS
Changes in carrying amounts of the asset retirement obligations associated with our PP&E are as follows:
|
| 2009 |
| 2008 |
|
Asset Retirement Obligations, Beginning of Year |
| 1,059 |
| 832 |
|
Obligations Incurred with Development Activities |
| 27 |
| 32 |
|
Obligations Settled |
| (42 | ) | (45 | ) |
Accretion Expense |
| 70 |
| 58 |
|
Revisions to Estimates |
| 13 |
| 159 |
|
Effects of Changes in Foreign Exchange Rate |
| (74 | ) | 23 |
|
End of Year1, 2 |
| 1,053 |
| 1,059 |
|
1 Obligations due within twelve months of $35 million (2008—$35 million) have been included in accounts payable and accrued liabilities.
2 Obligations relating to our oil and gas activities amount to $1,002 million (2008—$1,009 million) and obligations relating to our chemicals business amount to $51 million (2008—$50 million).
Our total estimated undiscounted inflated asset retirement obligations amount to $2,341 million (2008—$2,393 million). We discounted the total estimated asset retirement obligations using a weighted-average, credit-adjusted risk-free rate of 5.9% (2008—5.9%). Approximately $276 million included in our asset retirement obligations will be settled over the next five years. The remaining obligations settle beyond five years and will be funded by future cash flows from our operations.
12. DEFERRED CREDITS AND OTHER LIABILITIES
|
| 2009 |
| 2008 |
|
Deferred Tax Credit |
| 503 |
| 709 |
|
Long-Term Marketing Derivative Contracts (Note 6) |
| 212 |
| 294 |
|
Defined Benefit Pension Obligations (Note 13) |
| 76 |
| 67 |
|
Capital Lease Obligations |
| 61 |
| 53 |
|
Deferred Transportation Revenue |
| 55 |
| 69 |
|
Fixed-Price Natural Gas Contracts and Swaps (Note 6) |
| — |
| 26 |
|
Other |
| 114 |
| 106 |
|
Total |
| 1,021 |
| 1,324 |
|
During 2008, we completed an internal reorganization and financing of our assets in the North Sea which provided us with an additional one-time tax deduction in the UK. As these transactions were completed within our consolidated group, we are unable to recognize the benefit of the tax deductions until the assets are recognized in income by way of a sale to a third party or depletion through use. At December 31, 2009, we deferred recognizing $503 million (2008 — $709 million) of tax credits in our Consolidated Statement of Income.
13. PENSION AND OTHER POST-RETIREMENT BENEFITS
Nexen and Canexus have contributory and non-contributory defined benefit and defined contribution pension plans, as well as other post-retirement benefit programs, which cover substantially all employees. Syncrude has a defined benefit plan for its employees, and we disclose only our proportionate share of this plan.
(A) DEFINED BENEFIT PENSION PLANS
The cost of pension benefits earned by employees is determined using the projected-benefit method prorated on employment services and is expensed as services are rendered. We fund these plans according to federal and provincial government regulations by contributing to trust funds administered by an independent trustee. These funds are invested primarily in equities and bonds. As at December 31, 2009, Nexen’s registered defined benefit pension plan was overfunded by $21 million. Nexen’s supplemental benefit plan is funded from our operating cash flows and the year end obligation of $76 million is backed by an irrevocable letter of credit.
|
| 2009 |
| 2008 |
| ||||||||
|
| Nexen |
| Canexus |
| Syncrude |
| Nexen |
| Canexus |
| Syncrude |
|
Change in Projected Benefit Obligation (PBO) |
|
|
|
|
|
|
|
|
|
|
|
|
|
Beginning of Year |
| 265 |
| 59 |
| 107 |
| 272 |
| 62 |
| 125 |
|
Service Cost |
| 18 |
| 3 |
| 5 |
| 23 |
| 4 |
| 4 |
|
Interest Cost |
| 18 |
| 4 |
| 7 |
| 17 |
| 4 |
| 7 |
|
Plan Participants’ Contributions |
| 6 |
| 1 |
| 1 |
| 5 |
| 1 |
| 1 |
|
Actuarial Loss/(Gain) |
| 24 |
| 5 |
| 10 |
| (39 | ) | (11 | ) | (25 | ) |
Benefits Paid |
| (12 | ) | (4 | ) | (5 | ) | (13 | ) | (1 | ) | (5 | ) |
End of Year1, 2 |
| 319 |
| 68 |
| 125 |
| 265 |
| 59 |
| 107 |
|
Change in Fair Value of Plan Assets |
|
|
|
|
|
|
|
|
|
|
|
|
|
Beginning of Year |
| 153 |
| 50 |
| 57 |
| 200 |
| 55 |
| 74 |
|
Actual Return on Plan Assets |
| 40 |
| 6 |
| 9 |
| (54 | ) | (9 | ) | (19 | ) |
Employer’s Contribution |
| 77 |
| 3 |
| 7 |
| 15 |
| 4 |
| 6 |
|
Plan Participants’ Contributions |
| 6 |
| 1 |
| 1 |
| 5 |
| 1 |
| 1 |
|
Benefits Paid |
| (12 | ) | (4 | ) | (5 | ) | (13 | ) | (1 | ) | (5 | ) |
End of Year |
| 264 |
| 56 |
| 69 |
| 153 |
| 50 |
| 57 |
|
Reconciliation of Funded Status |
|
|
|
|
|
|
|
|
|
|
|
|
|
Funded Status1 |
| (55 | ) | (12 | ) | (56 | ) | (112 | ) | (9 | ) | (50 | ) |
Unamortized Prior Service Costs |
| 1 |
| — |
| — |
| 1 |
| — |
| — |
|
Unamortized Net Actuarial Loss |
| 55 |
| 10 |
| 39 |
| 60 |
| 8 |
| 35 |
|
Net Recognized Pension Asset (Liability) |
| 1 |
| (2 | ) | (17 | ) | (51 | ) | (1 | ) | (15 | ) |
Pension Liability |
|
|
|
|
|
|
|
|
|
|
|
|
|
Deferred Charges and Other Assets (Note 5) |
| 60 |
| — |
| — |
| 2 |
| — |
| — |
|
Accounts Payable and Accrued Liabilities |
| (2 | ) | — |
| — |
| (2 | ) | — |
| — |
|
Deferred Credits and Other Liabilities (Note 12) |
| (57 | ) | (2 | ) | (17 | ) | (51 | ) | (1 | ) | (15 | ) |
Net Recognized Pension Asset (Liability) |
| 1 |
| (2 | ) | (17 | ) | (51 | ) | (1 | ) | (15 | ) |
Assumptions (%) |
|
|
|
|
|
|
|
|
|
|
|
|
|
Accrued Benefit Obligation at December 31 Discount Rate |
| 6.00 |
| 6.00 |
| 6.00 |
| 6.50 |
| 6.50 |
| 6.50 |
|
Long-Term Rate of Employee Compensation Increase |
| 4.00 |
| 4.00 |
| 5.00 |
| 4.00 |
| 4.00 |
| 5.00 |
|
Benefit Cost for Year Ended December 31 Discount Rate |
| 6.50 |
| 6.50 |
| 6.00 |
| 5.25 |
| 5.25 |
| 6.50 |
|
Long-Term Rate of Employee Compensation Increase |
| 4.00 |
| 4.00 |
| 5.00 |
| 4.00 |
| 4.00 |
| 5.00 |
|
Long-Term Annual Rate of Return on Plan Assets |
| 7.00 |
| 6.50 |
| 8.50 |
| 7.00 |
| 6.50 |
| 8.50 |
|
1 Includes self-funded obligations for supplemental benefits to the extent that the benefit is limited by statutory guidelines. At December 31, 2009, the PBO for Nexen’s supplemental benefits plan was $76 million (2008—$62 million) and $1 million for Canexus (2008—$1 million). The self-funded obligations for supplemental benefits are backed by an irrevocable letter of credit.
2 The accumulated benefit obligations (the projected benefit obligation excluding future salary increases) of the Nexen and Canexus plans were $211 million and $52 million at December 31, 2009, respectively (2008—$179 million and $46 million, respectively). Nexen’s supplemental pension plan’s accumulated benefit obligation was $65 million at December 31, 2009 (2008—$49 million). Nexen’s share of Syncrude’s employee pension plan’s accumulated benefit obligation was $96 million at December 31, 2009 (2008—$82 million).
Net Pension Expense Recognized Under Our Defined Benefit Pension Plans
|
| 2009 |
| 2008 |
| 2007 |
|
Nexen |
|
|
|
|
|
|
|
Cost of Benefits Earned by Employees |
| 18 |
| 23 |
| 18 |
|
Interest Cost on Benefits Earned |
| 18 |
| 17 |
| 13 |
|
Actual (Return) Loss on Plan Assets |
| (40 | ) | 54 |
| (18 | ) |
Actuarial (Gains)/Losses |
| 24 |
| (39 | ) | (2 | ) |
Pension Expense Before Adjustments for the Long-Term Nature of Employee Future Benefit Costs |
| 20 |
| 55 |
| 11 |
|
Difference Between Actual and Expected Return on Plan Assets |
| 26 |
| (71 | ) | 5 |
|
Difference Between Actual and Recognized Actuarial Losses |
| (21 | ) | 41 |
| 3 |
|
Difference Between Actual and Recognized Past Service Costs |
| — |
| 1 |
| 1 |
|
Net Pension Expense |
| 25 |
| 26 |
| 20 |
|
|
|
|
|
|
|
|
|
Canexus |
|
|
|
|
|
|
|
Cost of Benefits Earned by Employees |
| 3 |
| 4 |
| 3 |
|
Interest Cost on Benefits Earned |
| 4 |
| 4 |
| 3 |
|
Actual (Return) Loss on Plan Assets |
| (6 | ) | 9 |
| (2 | ) |
Actuarial (Gains)/Losses |
| 5 |
| (11 | ) | (3 | ) |
Pension Expense Before Adjustments for the Long-Term Nature of Employee Future Benefit Costs |
| 6 |
| 6 |
| 1 |
|
Difference Between Actual and Expected Return on Plan Assets |
| 3 |
| (13 | ) | (1 | ) |
Difference Between Actual and Recognized Actuarial Gains |
| (5 | ) | 11 |
| 3 |
|
Net Pension Expense |
| 4 |
| 4 |
| 3 |
|
|
|
|
|
|
|
|
|
Syncrude1 |
|
|
|
|
|
|
|
Cost of Benefits Earned by Employees |
| 5 |
| 4 |
| 5 |
|
Interest Cost on Benefits Earned |
| 7 |
| 7 |
| 6 |
|
Actual (Return) Loss on Plan Assets |
| (9 | ) | 19 |
| (2 | ) |
Actuarial (Gains)/Losses |
| 10 |
| (25 | ) | 1 |
|
Pension Expense Before Adjustments for the Long-Term Nature of Employee Future Benefit Costs |
| 13 |
| 5 |
| 10 |
|
Difference Between Actual and Expected Return on Plan Assets |
| 4 |
| (26 | ) | (4 | ) |
Difference Between Actual and Recognized Actuarial Losses |
| (8 | ) | 27 |
| 1 |
|
Net Pension Expense |
| 9 |
| 6 |
| 7 |
|
|
|
|
|
|
|
|
|
Total Net Pension Expense |
| 38 |
| 36 |
| 30 |
|
1 Nexen’s share of Syncrude’s plan.
(B) PLAN ASSET ALLOCATION AT DECEMBER 31
Our investment goal for the assets in our defined benefit pension plans is to preserve capital and earn a long-term rate of return on assets, net of all management expenses, in excess of the inflation rate. Investment funds are managed by external fund managers based on policies approved by the Board of Directors and Pension Committees of Nexen and Canexus. Nexen’s and Canexus’ investment strategy is to diversify plan assets between debt and equity securities of Canadian and non-Canadian corporations that are traded on recognized stock exchanges. Allowable and prohibited investment types are also prescribed in Nexen’s and Canexus’ investment policies.
Nexen’s investment strategy is to ensure appropriate diversification between and within asset classes in order to optimize the return/risk trade-off. Nexen’s policy allows investment in equities, fixed income, cash and real estate assets. Derivative instruments can be utilized as deemed appropriate by the Pension Committee. Nexen’s expected long-term annual rate of return on plan assets assumption is based on a mix of historical market returns for debt and equity securities. The returns that are used as the basis for future expectations are derived from the major asset categories that Nexen is currently invested in.
The target allocations for plan assets are identified in the table below. Equity securities primarily include investments in large-cap companies, both Canadian and foreign, and debt securities primarily include corporate bonds of companies from diversified industries and Canadian Treasury issuances. The Canadian fixed income pooled funds invest in low-cost fixed income index funds that track the DEX Universe Bond Index. The Canadian equity pooled funds invest in low-cost equity index funds that track the S&P/TSX Composite Index. The foreign equity pooled funds are invested one-third in a low-cost equity index fund that tracks the S&P 500 and the balance primarily in large-cap US and international companies.
Nexen also has an unregistered self-funded supplemental benefits pension plan that covers obligations that are limited by statutory guidelines. These benefits are backed by an irrevocable letter of credit and payments are made from Nexen’s general operating revenues.
Because Canexus is a separate and publicly traded company, its pension plan is governed and administered separately from Nexen. Its assets are subject to similar investment goals, policies and strategies.
Syncrude’s pension plans are governed and administered separately from Nexen’s and Canexus’. Syncrude’s investment assets are subject to similar investment goals, policies and strategies.
Plan Asset Allocation (%) |
| Expected 2010 |
| 2009 |
| 2008 |
|
Nexen |
|
|
|
|
|
|
|
Equity Securities |
| 65 |
| 62 |
| 55 |
|
Debt Securities |
| 35 |
| 38 |
| 45 |
|
Total |
| 100 |
| 100 |
| 100 |
|
|
|
|
|
|
|
|
|
Canexus |
|
|
|
|
|
|
|
Equity Securities |
| 50 |
| 50 |
| 50 |
|
Debt Securities |
| 50 |
| 50 |
| 50 |
|
Total |
| 100 |
| 100 |
| 100 |
|
|
|
|
|
|
|
|
|
Syncrude |
|
|
|
|
|
|
|
Equity Securities |
| 70 |
| 71 |
| 68 |
|
Debt Securities |
| 30 |
| 29 |
| 32 |
|
Total |
| 100 |
| 100 |
| 100 |
|
The fair values of Nexen’s defined benefit pension plan assets at December 31, 2009 by asset category are as follows:
|
| Fair Value Measurements at December 31, 2009 |
| ||||||
|
| Total |
| Quoted Prices in |
| Significant |
| Significant |
|
Asset Category |
|
|
|
|
|
|
|
|
|
Cash |
| 9 |
| 9 |
| — |
| — |
|
Equity Securities |
|
|
|
|
|
|
|
|
|
Canadian Equity |
| 36 |
| 36 |
| — |
| — |
|
Pooled Funds |
|
|
|
|
|
|
|
|
|
Canadian Fixed Income |
| 90 |
| — |
| 90 |
| — |
|
Canadian Equity |
| 30 |
| — |
| 30 |
| — |
|
Foreign Equity |
| 99 |
| — |
| 99 |
| — |
|
Total |
| 264 |
| 45 |
| 219 |
| — |
|
The fair values of Canexus’s defined benefit pension plan assets at December 31, 2009 by asset category are as follows:
|
| Fair Value Measurements at December 31, 2009 |
| ||||||
|
| Total |
| Quoted Prices in |
| Significant |
| Significant |
|
Asset Category |
|
|
|
|
|
|
|
|
|
Pooled Funds |
|
|
|
|
|
|
|
|
|
Canadian Fixed Income |
| 29 |
| — |
| 29 |
| — |
|
Canadian Equity |
| 16 |
| — |
| 16 |
| — |
|
Foreign Equity |
| 11 |
| — |
| 11 |
| — |
|
Total |
| 56 |
| — |
| 56 |
| — |
|
The fair values of Syncrude’s defined benefit pension plan assets at December 31, 2009 by asset category are as follows:
|
| Fair Value Measurements at December 31, 2009 |
| ||||||
|
| Total |
| Quoted Prices in |
| Significant |
| Significant |
|
Asset Category |
|
|
|
|
|
|
|
|
|
Cash |
| 1 |
| 1 |
| — |
| — |
|
Pooled Funds |
|
|
|
|
|
|
|
|
|
Canadian Fixed Income |
| 17 |
| — |
| 17 |
| — |
|
Canadian Equity |
| 19 |
| — |
| 19 |
| — |
|
Foreign Equity |
| 30 |
| — |
| 30 |
| — |
|
Other Types of Investment |
|
|
|
|
|
|
|
|
|
Other |
| 2 |
| — |
| — |
| 2 |
|
Total |
| 69 |
| 1 |
| 66 |
| 2 |
|
(C) DEFINED CONTRIBUTION PENSION PLANS
Under these plans, pension benefits are based on plan contributions. During 2009, Canadian pension expense for these plans was $9 million (2008—$7 million; 2007—$6 million). During 2009, US pension expense for these plans was $7 million (2008—$4 million; 2007—$4 million) and UK pension expense for these plans was $6 million (2008—$6 million; 2007—$5 million).
(D) POST-RETIREMENT BENEFITS
Nexen provides certain post-retirement benefits, including group life and supplemental health insurance, to eligible employees and their dependants. The present value of Nexen employees’ future post-retirement benefits at December 31, 2009 was $14 million (2008—$15 million) and $2 million for Canexus (2008—$2 million).
(E) EMPLOYER FUNDING CONTRIBUTIONS AND BENEFIT PAYMENTS
Canadian regulators have prescribed funding requirements for Nexen and Canexus’ defined benefit plans. Funding contributions over the last three years have met these requirements and also included additional discretionary contributions permitted by law to ensure the plans are adequately funded. For our defined contribution plans, we make contributions on behalf of our employees and no further obligation exists. Funding contributions for the defined benefit plans are:
|
| Expected 2010 |
| 2009 |
| 2008 |
|
Nexen |
| 8 |
| 77 |
| 15 |
|
Canexus |
| 3 |
| 3 |
| 4 |
|
Syncrude |
| 7 |
| 7 |
| 6 |
|
Total Defined Benefit Contributions |
| 18 |
| 87 |
| 25 |
|
Our most recent funding valuation was prepared as of June 30, 2008. Our next funding valuation is required by June 30, 2011. Canexus’ most recent funding valuation was prepared as of December 31, 2007 and their next funding valuation is required by December 31, 2010. Syncrude’s most recent funding valuation was prepared as of December 31, 2006. Their next funding valuation is required as at December 31, 2009 and is expected to be completed in 2010.
Our total benefit payments in 2009 were $12 million for Nexen (2008—$13 million) and $4 million for Canexus (2008 —$1 million). Our share of Syncrude’s total benefit payments in 2009 was $5 million (2008—$5 million). Our estimated future payments are as follows:
|
| Defined Benefit |
| Other |
| ||||||||
|
| Nexen |
| Canexus |
| Syncrude |
| Nexen |
| Canexus |
| Syncrude |
|
2010 |
| 11 |
| 1 |
| 4 |
| 3 |
| — |
| — |
|
2011 |
| 12 |
| 2 |
| 5 |
| 3 |
| — |
| — |
|
2012 |
| 13 |
| 2 |
| 5 |
| 4 |
| — |
| — |
|
2013 |
| 14 |
| 3 |
| 6 |
| 4 |
| — |
| — |
|
2014 |
| 16 |
| 3 |
| 6 |
| 4 |
| — |
| — |
|
2015–2019 |
| 103 |
| 23 |
| 39 |
| 30 |
| — |
| 2 |
|
14. EQUITY
(A) AUTHORIZED CAPITAL
Authorized share capital consists of an unlimited number of common shares of no par value, and an unlimited number of Class A preferred shares of no par value, issuable in series.
(B) ISSUED COMMON SHARES AND DIVIDENDS
(thousands of shares) |
| 2009 |
| 2008 |
| 2007 |
|
Issued Common Shares, Beginning of Year |
| 519,449 |
| 528,305 |
| 525,026 |
|
Issue of Common Shares for Cash Exercise of Tandem Options |
| 1,146 |
| 1,911 |
| 2,257 |
|
Dividend Reinvestment Plan |
| 1,328 |
| 871 |
| 523 |
|
Employee Flow-through Shares |
| 993 |
| 499 |
| 499 |
|
Repurchased under Normal Course Issuer Bid |
| — |
| (12,137 | ) | — |
|
End of Year |
| 522,916 |
| 519,449 |
| 528,305 |
|
|
|
|
|
|
|
|
|
Dividends Declared per Common Share ($/share) |
| 0.20 |
| 0.18 |
| 0.10 |
|
|
|
|
|
|
|
|
|
Cash Consideration (Cdn$ millions) |
|
|
|
|
|
|
|
Exercise of Tandem Options |
| 12 |
| 23 |
| 24 |
|
Dividend Reinvestment Plan |
| 29 |
| 25 |
| 16 |
|
Employee Flow-through Shares |
| 16 |
| 16 |
| 16 |
|
Total |
| 57 |
| 64 |
| 56 |
|
During the year, 1,328,497 common shares were issued under the Dividend Reinvestment Plan leaving a balance of 2,275,344 common shares (2008—3,603,841; 2007—4,475,095) reserved for issuance at December 31, 2009. Dividends paid to holders of common shares have been designated as “eligible dividends” for Canadian tax purposes.
During 2008, we received approval from the Toronto Stock Exchange (TSX) for a Normal Course Issuer Bid to repurchase up to a maximum of 52,914,046 common shares between August 6, 2008 and August 5, 2009. Under this authorization, we repurchased and cancelled 12,136,900 common shares acquired on the open market through the TSX in 2008 at an average price of $27.85 per common share, totalling $338 million. Of the amount paid, $22 million reduced the book value of our common shares and the excess of $316 million reduced retained earnings. We did not repurchase any common shares in 2009.
(C) TANDEM OPTIONS
We grant tandem options to purchase common shares to officers and employees. Each option permits the right to either purchase one Nexen common share at the exercise price or receive a cash payment equal to the excess of market price over the exercise price. The following tandem options have been granted:
|
| 2009 |
| 2008 |
| 2007 |
| ||||||
(thousands of shares) |
| Options |
| Weighted |
| Options |
| Weighted |
| Options |
| Weighted |
|
Outstanding Tandem Options, Beginning of Year |
| 24,622 |
| 22 |
| 27,403 |
| 20 |
| 30,485 |
| 17 |
|
Granted |
| 4,350 |
| 24 |
| 3,534 |
| 19 |
| 4,007 |
| 28 |
|
Exercised for Stock |
| (1,146 | ) | 10 |
| (1,911 | ) | 13 |
| (2,257 | ) | 10 |
|
Surrendered for Cash |
| (4,116 | ) | 12 |
| (3,839 | ) | 13 |
| (4,414 | ) | 11 |
|
Cancelled |
| (560 | ) | 28 |
| (552 | ) | 30 |
| (418 | ) | 22 |
|
Expired |
| (20 | ) | 12 |
| (13 | ) | 11 |
| — |
| — |
|
End of Year |
| 23,130 |
| 25 |
| 24,622 |
| 22 |
| 27,403 |
| 20 |
|
|
|
|
|
|
|
|
|
|
|
|
|
|
|
Tandem Options Exercisable at End of Year |
| 15,282 |
| 25 |
| 17,087 |
| 21 |
| 18,216 |
| 16 |
|
Common Shares Reserved for Issuance Under the Tandem Option Plan |
| 26,283 |
|
|
| 27,429 |
|
|
| 29,430 |
|
|
|
The range of exercise prices of tandem options outstanding and exercisable at December 31, 2009 is as follows:
|
| Outstanding Tandem Options |
| Exercisable Tandem Options |
| ||||||
|
| Number of |
| Weighted |
| Weighted |
| Number of |
| Weighted |
|
$5.00 to $9.99 |
| 2,288 |
| 9 |
| 1 |
| 2,288 |
| 9 |
|
$10.00 to $14.99 |
| 50 |
| 14 |
| 1 |
| 50 |
| 14 |
|
$15.00 to $19.99 |
| 3,606 |
| 19 |
| 4 |
| 1,247 |
| 19 |
|
$20.00 to $24.99 |
| 4,818 |
| 25 |
| 4 |
| 604 |
| 25 |
|
$25.00 to $29.99 |
| 8,528 |
| 28 |
| 2 |
| 7,290 |
| 28 |
|
$30.00 to $34.99 |
| 3,815 |
| 32 |
| 2 |
| 3,788 |
| 32 |
|
$35.00 to $39.99 |
| 20 |
| 36 |
| 2 |
| 13 |
| 36 |
|
$40.00 to $44.99 |
| 5 |
| 40 |
| 3 |
| 2 |
| 40 |
|
Total |
| 23,130 |
|
|
|
|
| 15,282 |
|
|
|
(D) STOCK APPRECIATION RIGHTS
Our STARs plan entitles employees to cash payments equal to the excess of the market price of the common shares over the exercise price of the right. The following stock appreciation rights have been granted:
|
| 2009 |
| 2008 |
| 2007 |
| ||||||
(thousands of shares) |
| STARs |
| Weighted |
| STARs |
| Weighted |
| STARs |
| Weighted |
|
Outstanding STARs, Beginning of Year |
| 16,986 |
| 25 |
| 15,435 |
| 24 |
| 13,890 |
| 21 |
|
Granted |
| 5,273 |
| 25 |
| 4,917 |
| 19 |
| 4,195 |
| 29 |
|
Exercised for Cash |
| (2,079 | ) | 13 |
| (2,837 | ) | 15 |
| (2,349 | ) | 12 |
|
Cancelled |
| (700 | ) | 28 |
| (529 | ) | 31 |
| (301 | ) | 26 |
|
End of Year |
| 19,480 |
| 25 |
| 16,986 |
| 25 |
| 15,435 |
| 24 |
|
|
|
|
|
|
|
|
|
|
|
|
|
|
|
STARs Exercisable at End of Year |
| 9,812 |
| 28 |
| 8,119 |
| 25 |
| 7,525 |
| 19 |
|
The range of exercise prices of STARs outstanding and exercisable at December 31, 2009 is as follows:
|
| Outstanding STARs |
| Exercisable STARs |
| ||||||
|
| Number of |
| Weighted |
| Weighted |
| Number of |
| Weighted |
|
$5.00 to $9.99 |
| 103 |
| 8 |
| 1 |
| 103 |
| 8 |
|
$10.00 to $14.99 |
| 9 |
| 13 |
| 4 |
| 1 |
| 13 |
|
$15.00 to $19.99 |
| 4,718 |
| 19 |
| 4 |
| 1,585 |
| 19 |
|
$20.00 to $24.99 |
| 5,292 |
| 25 |
| 5 |
| 62 |
| 23 |
|
$25.00 to $29.99 |
| 5,970 |
| 28 |
| 2 |
| 4,762 |
| 28 |
|
$30.00 to $34.99 |
| 3,305 |
| 32 |
| 2 |
| 3,256 |
| 32 |
|
$35.00 to $39.99 |
| 72 |
| 37 |
| 3 |
| 39 |
| 37 |
|
$40.00 to $44.99 |
| 11 |
| 40 |
| 3 |
| 4 |
| 40 |
|
Total |
| 19,480 |
|
|
|
|
| 9,812 |
|
|
|
15. COMMITMENTS, CONTINGENCIES AND GUARANTEES
We assume various contractual obligations and commitments in the normal course of our operations. Our operating leases and transportation, storage and drilling rig commitments as at December 31, 2009 are comprised of the following:
|
| 2010 |
| 2011 |
| 2012 |
| 2013 |
| 2014 |
| Thereafter |
|
Operating Leases |
| 117 |
| 96 |
| 89 |
| 87 |
| 92 |
| 166 |
|
Transportation and Storage Commitments |
| 303 |
| 189 |
| 156 |
| 123 |
| 86 |
| 120 |
|
Drilling Rig Commitments |
| 403 |
| 362 |
| 289 |
| 170 |
| 55 |
| 1 |
|
We have a number of lawsuits and claims pending including income tax reassessments (see Note 17), for which we currently cannot determine the ultimate result. We record costs as they are incurred or become determinable. We believe the resolution of these matters would not have a material adverse effect on our liquidity, consolidated financial position or results of operations.
During 2009, total rental expense under operating leases was $62 million (2008—$59 million; 2007—$53 million).
From time to time, we enter into contracts that require us to indemnify parties against certain types of possible third-party claims, particularly when these contracts relate to divestiture transactions. On occasion, we may provide routine indemnifications. The terms of such obligations vary, and generally, a maximum is not explicitly stated. Because the obligations in these agreements are often not explicitly stated, the overall maximum amount of the obligations cannot be reasonably estimated. Historically, we have not been obligated to make significant payments for these obligations. We believe that payments, if any, related to existing indemnities, would not have a material adverse effect on our liquidity, financial condition or results of operations.
16. MARKETING AND OTHER INCOME
|
| 2009 |
| 2008 |
| 2007 |
|
Marketing Revenue, Net (Note 6) |
| 943 |
| 467 |
| 959 |
|
Change in Fair Value of Crude Oil Put Options (Note 6) |
| (251 | ) | 203 |
| (43 | ) |
Interest |
| 7 |
| 28 |
| 39 |
|
Foreign Exchange Gains (Losses) |
| 128 |
| 128 |
| (22 | ) |
Gains on Disposition of Assets |
| — |
| 3 |
| 2 |
|
Other |
| 82 |
| (16 | ) | 86 |
|
Total |
| 909 |
| 813 |
| 1,021 |
|
17. INCOME TAXES
(A) TEMPORARY DIFFERENCES
|
| 2009 |
| 2008 |
| ||||
|
| Future |
| Future |
| Future |
| Future |
|
Property, Plant and Equipment, Net |
| 36 |
| 2,762 |
| 27 |
| 2,543 |
|
Tax Losses Carried Forward |
| 1,092 |
| — |
| 300 |
| — |
|
Deferred Income |
| — |
| 49 |
| — |
| 76 |
|
Recoverable Taxes |
| 20 |
| — |
| 24 |
| — |
|
Total |
| 1,148 |
| 2,811 |
| 351 |
| 2,619 |
|
(B) CANADIAN AND FOREIGN INCOME TAXES
|
| 2009 |
| 2008 |
| 2007 |
|
Income (Loss) before Income Taxes |
|
|
|
|
|
|
|
Canadian |
| (484 | ) | (100 | ) | (33 | ) |
Foreign |
| 1,300 |
| 3,268 |
| 1,929 |
|
|
| 816 |
| 3,168 |
| 1,896 |
|
|
|
|
|
|
|
|
|
Provision for Income Taxes |
|
|
|
|
|
|
|
Current |
|
|
|
|
|
|
|
Canadian |
| 1 |
| 1 |
| 1 |
|
Foreign |
| 775 |
| 858 |
| 433 |
|
|
| 776 |
| 859 |
| 434 |
|
|
|
|
|
|
|
|
|
Future |
|
|
|
|
|
|
|
Canadian |
| (160 | ) | 22 |
| 12 |
|
Foreign |
| (356 | ) | 576 |
| 346 |
|
|
| (516 | ) | 598 |
| 358 |
|
|
|
|
|
|
|
|
|
Total |
| 260 |
| 1,457 |
| 792 |
|
The Canadian and foreign components of the provision for income taxes are based on the jurisdiction in which income is taxed. Foreign taxes relate mainly to Yemen, Colombia, UK, US and Norway.
(C) RECONCILIATION OF EFFECTIVE TAX RATE TO THE CANADIAN STATUTORY TAX RATE
|
| 2009 |
| 2008 |
| 2007 |
|
Income before Provision for Income Taxes |
| 816 |
| 3,168 |
| 1,896 |
|
|
|
|
|
|
|
|
|
Provision for Income Taxes Computed at the Canadian Statutory Rate |
| 205 |
| 893 |
| 537 |
|
Add (Deduct) the Tax Effect of: |
|
|
|
|
|
|
|
Foreign Tax Rate Differential |
| 96 |
| 525 |
| 233 |
|
Higher (Lower) Tax Rates on Capital Gains |
| (42 | ) | 9 |
| (5 | ) |
Federal and Provincial Capital Tax |
| 1 |
| 2 |
| 1 |
|
Effect of Changes in Tax Rates |
| (22 | ) | — |
| (15 | ) |
Non-Deductible Expenses and Other |
| 22 |
| 28 |
| 41 |
|
Provision for Income Taxes |
| 260 |
| 1,457 |
| 792 |
|
Effective Tax Rate |
| 32% |
| 46% |
| 42% |
|
In 2007, the federal government and some provincial governments in Canada reduced statutory corporate income tax rates. This reduced our liability and provision for future income taxes by $15 million in 2007 and $22 million in 2009.
(D) AVAILABLE UNUSED TAX LOSSES AND TAX CONTINGENCIES
At December 31, 2009, we had unused tax losses totalling $4,219 million (2008—$954 million; 2007—$820 million). The majority of these losses are in Canada and the US and will expire between 2015 and 2028.
Nexen’s income tax filings are subject to audit by taxation authorities. There are audits in progress and items under review, some of which may increase our tax liability. In addition, we have filed notices of objection with respect to certain issues. While the results of these items cannot be ascertained at this time, we believe we have an appropriate provision for income taxes based on available information.
18. EARNINGS PER COMMON SHARE
We calculate basic earnings per common share using net income divided by the weighted-average number of common shares outstanding. We calculate diluted earnings per common share in the same manner as basic, except we use the weighted-average number of diluted common shares outstanding in the denominator.
(millions of shares) |
| 2009 |
| 2008 |
| 2007 |
|
Weighted-Average Number of Common Shares, Basic |
| 521.4 |
| 526.1 |
| 527.1 |
|
Shares Issuable Pursuant to Tandem Options |
| 10.1 |
| 18.8 |
| 26.6 |
|
Shares to be Notionally Purchased from Proceeds of Tandem Options |
| (7.0 | ) | (12.7 | ) | (15.7 | ) |
Weighted-Average Number of Common Shares, Diluted |
| 524.5 |
| 532.2 |
| 538.0 |
|
In calculating the weighted-average number of diluted common shares outstanding for the year ended December 31, 2009, we excluded 13,485,465 tandem options (2008—5,694,055; 2007—49,333), because their exercise price was greater than the annual average common share market price in those periods. During the last three years, outstanding tandem options were the only potential dilutive instruments.
19. CASH FLOWS
(A) CHARGES AND CREDITS TO INCOME NOT INVOLVING CASH
|
| 2009 |
| 2008 |
| 2007 |
|
Depreciation, Depletion, Amortization and Impairment |
| 1,802 |
| 2,014 |
| 1,767 |
|
Stock-Based Compensation |
| (10 | ) | (272 | ) | (109 | ) |
Gains on Disposition of Assets |
| — |
| (3 | ) | (2 | ) |
Provision for (Recovery of) Future Income Taxes |
| (516 | ) | 598 |
| 358 |
|
Change in Fair Value of Crude Oil Put Options (Note 16) |
| 251 |
| (203 | ) | 43 |
|
Foreign Exchange |
| (177 | ) | (4 | ) | 18 |
|
Other |
| 21 |
| 10 |
| (20 | ) |
Total |
| 1,371 |
| 2,140 |
| 2,055 |
|
(B) CHANGES IN NON-CASH WORKING CAPITAL
|
| 2009 |
| 2008 |
| 2007 |
|
Accounts Receivable |
| 92 |
| 950 |
| (797 | ) |
Inventories and Supplies |
| (236 | ) | 246 |
| (97 | ) |
Other Current Assets |
| 9 |
| 5 |
| (15 | ) |
Accounts Payable and Accrued Liabilities |
| (23 | ) | (1,232 | ) | 691 |
|
Other Current Liabilities |
| 23 |
| 26 |
| — |
|
Total |
| (135 | ) | (5 | ) | (218 | ) |
Relating to: |
|
|
|
|
|
|
|
Operating Activities |
| (25 | ) | 119 |
| (348 | ) |
Investing Activities |
| (110 | ) | (124 | ) | 130 |
|
Total |
| (135 | ) | (5 | ) | (218 | ) |
(C) OTHER CASH FLOW INFORMATION
|
| 2009 |
| 2008 |
| 2007 |
|
Interest Paid |
| 335 |
| 319 |
| 328 |
|
Income Taxes Paid |
| 483 |
| 1,055 |
| 408 |
|
Cash flow from other operating activities includes cash outflows related to geological and geophysical expenditures of $81 million (2008—$137 million; 2007—$123 million).
20. OPERATING SEGMENTS AND RELATED INFORMATION
Nexen has the following operating segments in various industries and geographic locations:
Oil and Gas: We explore for, develop and produce crude oil, natural gas and related products around the world. We manage our operations to reflect differences in the regulatory environments and risk factors for each country. Our core operations are onshore in Yemen and Canada, and offshore in the US Gulf of Mexico and the UK North Sea. Our other operations are primarily in Colombia, offshore West Africa and Norway. We also own 7.23% of the Syncrude joint venture, which develops and produces synthetic crude oil from mining bitumen in the Athabasca oil sands in northern Alberta.
Energy Marketing: Our energy marketing group sells our crude oil and natural gas, markets third-party crude oil, natural gas, NGLs and power (including electricity generation). We use financial and derivative contracts, including futures, forwards, swaps and options for economic hedging and trading purposes. Our energy marketing group also uses physical commodity transportation and storage capacity contracts to capture regional opportunities as well as to take advantage of seasonal pricing differences. Weakness in gas markets has reduced the value of holding transportation contracts. Any losses associated with the transportation and storage capacity contracts will be recognized when the contracts are used or sold. In 2009, we initiated a strategic review of our energy marketing natural gas and power businesses. This review continues to align our marketing activities with our upstream oil and gas businesses.
In early 2010, we entered into an agreement to sell our European gas and power marketing business. These operations are not material to our results of operations. While net assets (total assets less total liabilities) of the business are not material, current assets and current liabilities in these operations comprise approximately 7% and 12% of our consolidated amounts, respectively.
Chemicals: Through our investment in Canexus, we manufacture, market and distribute industrial chemicals, principally sodium chlorate, chlorine, muriatic acid and caustic soda. We produce sodium chlorate at three facilities in Canada and one in Brazil. We produce chlorine, caustic soda and muriatic acid at chlor-alkali facilities in Canada and Brazil.
The accounting policies of our operating segments are the same as those described in Note 1. Net income of our operating segments excludes interest income, interest expense, unallocated corporate expenses and foreign exchange gains and losses with the exception of Chemicals. Identifiable assets are those used in the operations of the segments.
2009 Operating and Geographic Segments
|
| Oil and Gas |
|
|
|
|
|
|
|
|
| ||||||||||
(Cdn$ millions) |
| United |
| Canada |
| Syncrude |
| United |
| Yemen |
| Other |
| Energy |
| Chemicals |
| Corporate |
| Total |
|
Net Sales2 |
| 2,430 |
| 395 |
| 480 |
| 321 |
| 705 |
| 70 |
| 36 |
| 458 | 3 | — |
| 4,895 |
|
Marketing and Other |
| 18 |
| 1 |
| 7 |
| — |
| 14 |
| 6 |
| 943 |
| 50 |
| (130 | )4 | 909 |
|
|
| 2,448 |
| 396 |
| 487 |
| 321 |
| 719 |
| 76 |
| 979 |
| 508 |
| (130 | ) | 5,804 |
|
Less: Expenses |
|
|
|
|
|
|
|
|
|
|
|
|
|
|
|
|
|
|
|
|
|
Operating |
| 253 |
| 171 |
| 265 |
| 98 |
| 191 |
| 8 |
| 27 |
| 267 |
| — |
| 1,280 |
|
Depreciation, Depletion, Amortization and Impairment5 |
| 875 |
| 301 |
| 63 |
| 312 |
| 102 |
| 14 |
| 27 |
| 65 |
| 43 |
| 1,802 |
|
Transportation and Other |
| 17 |
| 27 |
| 28 |
| 22 |
| 30 |
| — |
| 599 |
| 48 |
| 24 |
| 795 |
|
General and Administrative6 |
| 18 |
| 67 |
| 1 |
| 60 |
| 6 |
| 35 |
| 91 |
| 42 |
| 177 |
| 497 |
|
Exploration |
| 50 |
| 84 |
| — |
| 104 |
| — |
| 64 | 7 | — |
| — |
| — |
| 302 |
|
Interest |
| — |
| — |
| — |
| — |
| — |
| — |
| — |
| 7 |
| 305 |
| 312 |
|
Income (Loss) before Income Taxes |
| 1,235 |
| (254 | ) | 130 |
| (275 | ) | 390 |
| (45 | ) | 235 |
| 79 |
| (679 | ) | 816 |
|
Less: Provision for (Recovery of) Income Taxes8 |
| 487 |
| (64 | ) | 33 |
| (95 | ) | 141 |
| (23 | ) | 96 |
| 18 |
| (333 | ) | 260 |
|
Less: Non-Controlling Interests |
| — |
| — |
| — |
| — |
| — |
| — |
| — |
| 20 |
| — |
| 20 |
|
Net Income (Loss) |
| 748 |
| (190 | ) | 97 |
| (180 | ) | 249 |
| (22 | ) | 139 |
| 41 |
| (346 | ) | 536 |
|
|
|
|
|
|
|
|
|
|
|
|
|
|
|
|
|
|
|
|
|
|
|
Identifiable Assets |
| 4,866 |
| 7,809 | 9 | 1,287 |
| 1,715 |
| 229 |
| 1,090 |
| 3,050 | 10 | 693 |
| 2,161 |
| 22,900 |
|
|
|
|
|
|
|
|
|
|
|
|
|
|
|
|
|
|
|
|
|
|
|
Capital Expenditures |
|
|
|
|
|
|
|
|
|
|
|
|
|
|
|
|
|
|
|
|
|
Development and Other |
| 483 |
| 628 |
| 87 |
| 128 |
| 69 |
| 490 |
| 28 |
| 214 |
| 33 |
| 2,160 |
|
Exploration |
| 143 |
| 215 |
| — |
| 157 |
| — |
| 67 |
| — |
| — |
| — |
| 582 |
|
Proved Property Acquisitions |
| — |
| 755 |
| — |
| — |
| — |
| — |
| — |
| — |
| — |
| 755 |
|
Total |
| 626 |
| 1,598 |
| 87 |
| 285 |
| 69 |
| 557 |
| 28 |
| 214 |
| 33 |
| 3,497 |
|
|
|
|
|
|
|
|
|
|
|
|
|
|
|
|
|
|
|
|
|
|
|
PP&E |
|
|
|
|
|
|
|
|
|
|
|
|
|
|
|
|
|
|
|
|
|
Cost |
| 6,115 |
| 9,664 |
| 1,463 |
| 3,900 |
| 2,462 |
| 930 |
| 259 |
| 1,135 |
| 371 |
| 26,299 |
|
Less: Accumulated DD&A |
| 2,664 |
| 2,038 |
| 270 |
| 2,529 |
| 2,322 |
| 99 |
| 83 |
| 562 |
| 240 |
| 10,807 |
|
Net Book Value2 |
| 3,451 |
| 7,626 | 9 | 1,193 |
| 1,371 |
| 140 |
| 831 |
| 176 |
| 573 |
| 131 |
| 15,492 |
|
|
|
|
|
|
|
|
|
|
|
|
|
|
|
|
|
|
|
|
|
|
|
Goodwill11 |
| 292 |
| — |
| — |
| — |
| — |
| — |
| 47 |
| — |
| — |
| 339 |
|
1 Includes results of operations from producing activities in Colombia.
2 Net sales made from all segments originating in Canada: $1,063 million PP&E located in Canada: $9,610 million
3 Net sales for our chemicals operations include:
($ millions) |
|
|
|
Canada |
| 152 |
|
US |
| 204 |
|
Brazil |
| 102 |
|
Total |
| 458 |
|
4 Includes interest income of $7 million, foreign exchange gains of $128 million, decrease in the fair value of crude oil put options of $251 million and other losses of $14 million.
5 Includes an impairment charge related to gas properties in Canada and the US Gulf of Mexico of $58 million and $20 million, respectively.
6 Includes stock-based compensation expense of $69 million.
7 Includes exploration activities primarily in Norway, Nigeria and Colombia.
8 The provision for (recovery of) income taxes for foreign locations is based on in-country taxes on foreign income. For oil and gas locations with no operating activities, the provision is based on the tax jurisdiction of the entity performing the activity.
9 Includes costs of $6,045 million related to our insitu oil sands (Long Lake and future phases).
10 78% of Marketing’s identifiable assets are accounts receivable and inventories.
11 Goodwill decreased in the UK and Energy Marketing by $49 million and $2 million, respectively, as a result of changes in foreign exchange rates.
2008 Operating and Geographic Segments
|
| Oil and Gas |
|
|
|
|
|
|
|
|
| ||||||||||
(Cdn$ millions) |
| United |
| Canada |
| Syncrude |
| United |
| Yemen |
| Other |
| Energy |
| Chemicals |
| Corporate |
| Total |
|
Net Sales2 |
| 3,580 |
| 656 |
| 691 |
| 665 |
| 1,093 |
| 192 |
| 70 |
| 477 | 3 | — |
| 7,424 |
|
Marketing and Other |
| 5 |
| 3 |
| 6 |
| 4 |
| 12 |
| — |
| 467 |
| (50 | ) | 366 | 4 | 813 |
|
|
| 3,585 |
| 659 |
| 697 |
| 669 |
| 1,105 |
| 192 |
| 537 |
| 427 |
| 366 |
| 8,237 |
|
Less: Expenses |
|
|
|
|
|
|
|
|
|
|
|
|
|
|
|
|
|
|
|
|
|
Operating |
| 253 |
| 182 |
| 280 |
| 94 |
| 176 |
| 10 |
| 43 |
| 297 |
| — |
| 1,335 |
|
Depreciation, Depletion, Amortization and Impairment5 |
| 999 |
| 208 |
| 49 |
| 475 |
| 160 |
| 17 |
| 19 |
| 44 |
| 43 |
| 2,014 |
|
Transportation and Other |
| 19 |
| 12 |
| 16 |
| 3 |
| 9 |
| — |
| 805 |
| 55 |
| 48 |
| 967 |
|
General and Administrative6 |
| (8 | ) | 20 |
| 1 |
| 38 |
| (7 | ) | 13 |
| 79 |
| 33 |
| 88 |
| 257 |
|
Exploration |
| 86 |
| 79 |
| — |
| 109 |
| 5 |
| 123 | 7 | — |
| — |
| — |
| 402 |
|
Interest |
| — |
| — |
| — |
| — |
| — |
| — |
| — |
| 12 |
| 82 |
| 94 |
|
Income (Loss) before Income Taxes |
| 2,236 |
| 158 |
| 351 |
| (50 | ) | 762 |
| 29 |
| (409 | ) | (14 | ) | 105 |
| 3,168 |
|
Less: Provision for (Recovery of) Income Taxes8 |
| 1,126 |
| 45 |
| 99 |
| (19 | ) | 264 |
| (4 | ) | (102 | ) | 2 |
| 46 |
| 1,457 |
|
Less: Non-Controlling Interests |
| — |
| — |
| — |
| — |
| — |
| — |
| — |
| (4 | ) | — |
| (4 | ) |
Net Income (Loss) |
| 1,110 |
| 113 |
| 252 |
| (31 | ) | 498 |
| 33 |
| (307 | ) | (12 | ) | 59 |
| 1,715 |
|
|
|
|
|
|
|
|
|
|
|
|
|
|
|
|
|
|
|
|
|
|
|
Identifiable Assets |
| 6,632 |
| 6,643 | 9 | 1,198 |
| 2,044 |
| 342 |
| 701 |
| 3,280 | 10 | 573 |
| 742 |
| 22,155 |
|
|
|
|
|
|
|
|
|
|
|
|
|
|
|
|
|
|
|
|
|
|
|
Capital Expenditures |
|
|
|
|
|
|
|
|
|
|
|
|
|
|
|
|
|
|
|
|
|
Development and Other |
| 545 |
| 1,180 |
| 55 |
| 251 |
| 92 |
| 190 |
| 8 |
| 88 |
| 53 |
| 2,462 |
|
Exploration |
| 146 |
| 225 |
| — |
| 154 |
| 9 |
| 48 |
| — |
| — |
| — |
| 582 |
|
Proved Property Acquisitions |
| — |
| 22 |
| — |
| — |
| — |
| — |
| — |
| — |
| — |
| 22 |
|
Total |
| 691 |
| 1,427 |
| 55 |
| 405 |
| 101 |
| 238 |
| 8 |
| 88 |
| 53 |
| 3,066 |
|
|
|
|
|
|
|
|
|
|
|
|
|
|
|
|
|
|
|
|
|
|
|
PP&E |
|
|
|
|
|
|
|
|
|
|
|
|
|
|
|
|
|
|
|
|
|
Cost |
| 6,532 |
| 8,134 |
| 1,372 |
| 4,398 |
| 2,808 |
| 554 |
| 246 |
| 940 |
| 331 |
| 25,315 |
|
Less: Accumulated DD&A |
| 2,159 |
| 1,786 |
| 236 |
| 2,702 |
| 2,610 |
| 113 |
| 76 |
| 507 |
| 204 |
| 10,393 |
|
Net Book Value2 |
| 4,373 |
| 6,348 | 9 | 1,136 |
| 1,696 |
| 198 |
| 441 |
| 170 |
| 433 |
| 127 |
| 14,922 |
|
|
|
|
|
|
|
|
|
|
|
|
|
|
|
|
|
|
|
|
|
|
|
Goodwill |
| 341 |
| — |
| — |
| — |
| — |
| — |
| 49 |
| — |
| — |
| 390 |
|
1 Includes results of operations from producing activities in Colombia.
2 Net sales made from all segments originating in Canada: $1,570 million PP&E located in Canada: $8,121 million
3 Net sales for our chemicals operations include:
($ millions) |
|
|
|
Canada |
| 153 |
|
US |
| 214 |
|
Brazil |
| 110 |
|
Total |
| 477 |
|
4 Includes interest income of $28 million, foreign exchange gains of $128 million, increase in the fair value of crude oil put options of $203 million and other income of $7 million.
5 Includes an impairment charge related to oil and gas properties in the UK North Sea and the US Gulf of Mexico of $318 million and $250 million, respectively.
6 Includes recovery of stock-based compensation expense of $160 million.
7 Includes exploration activities primarily in Norway, Nigeria and Colombia.
8 The provision for (recovery of) income taxes for foreign locations is based on in-country taxes on foreign income. For oil and gas locations with no operating activities, the provision is based on the tax jurisdiction of the entity performing the activity.
9 Includes costs of $4,742 million related to our insitu oil sands (Long Lake and future phases).
10 79% of Marketing’s identifiable assets are accounts receivable and inventories.
2007 Operating and Geographic Segments
|
| Oil and Gas |
|
|
|
|
|
|
|
|
| ||||||||||
(Cdn$ millions) |
| United |
| Canada |
| Syncrude |
| United |
| Yemen |
| Other |
| Energy |
| Chemicals |
| Corporate |
| Total |
|
Net Sales2 |
| 2,285 |
| 441 |
| 545 |
| 616 |
| 1,086 |
| 148 |
| 48 |
| 414 | 3 | — |
| 5,583 |
|
Marketing and Other |
| 39 |
| 6 |
| — |
| — |
| 10 |
| — |
| 959 |
| 33 |
| (26 | )4 | 1,021 |
|
|
| 2,324 |
| 447 |
| 545 |
| 616 |
| 1,096 |
| 148 |
| 1,007 |
| 447 |
| (26 | ) | 6,604 |
|
Less: Expenses |
|
|
|
|
|
|
|
|
|
|
|
|
|
|
|
|
|
|
|
|
|
Operating |
| 212 |
| 173 |
| 208 |
| 102 |
| 171 |
| 8 |
| 34 |
| 257 |
| — |
| 1,165 |
|
Depreciation, Depletion, Amortization and Impairment |
| 599 |
| 166 |
| 53 |
| 641 | 5 | 213 |
| 8 |
| 13 |
| 45 |
| 29 |
| 1,767 |
|
Transportation and Other |
| — |
| 22 |
| 17 |
| — |
| 8 |
| — |
| 806 |
| 39 |
| 16 |
| 908 |
|
General and Administrative6 |
| 3 |
| 50 |
| 1 |
| 38 |
| (6 | ) | 40 |
| 87 |
| 31 |
| 130 |
| 374 |
|
Exploration |
| 69 |
| 27 |
| — |
| 134 |
| 5 |
| 91 | 7 | — |
| — |
| — |
| 326 |
|
Interest |
| — |
| — |
| — |
| — |
| — |
| — |
| — |
| 11 |
| 157 |
| 168 |
|
Income (Loss) before Income Taxes |
| 1,441 |
| 9 |
| 266 |
| (299 | ) | 705 |
| 1 |
| 67 |
| 64 |
| (358 | ) | 1,896 |
|
Less: Provision for (Recovery of) Income Taxes8 |
| 712 |
| 3 |
| 75 |
| (103 | ) | 248 |
| — |
| 21 |
| 18 |
| (182 | ) | 792 |
|
Less: Non-Controlling Interests |
| — |
| — |
| — |
| — |
| — |
| — |
| — |
| 18 |
| — |
| 18 |
|
Net Income (Loss) |
| 729 |
| 6 |
| 191 |
| (196 | ) | 457 |
| 1 |
| 46 |
| 28 |
| (176 | ) | 1,086 |
|
|
|
|
|
|
|
|
|
|
|
|
|
|
|
|
|
|
|
|
|
|
|
Identifiable Assets |
| 4,642 |
| 5,379 | 9 | 1,212 |
| 1,640 |
| 359 |
| 317 |
| 3,663 | 10 | 487 |
| 376 |
| 18,075 |
|
|
|
|
|
|
|
|
|
|
|
|
|
|
|
|
|
|
|
|
|
|
|
Capital Expenditures |
|
|
|
|
|
|
|
|
|
|
|
|
|
|
|
|
|
|
|
|
|
Development and Other |
| 551 |
| 1,381 |
| 36 |
| 414 |
| 124 |
| 53 |
| 4 |
| 62 |
| 52 |
| 2,677 |
|
Exploration |
| 119 |
| 123 |
| — |
| 275 |
| 12 |
| 44 |
| — |
| — |
| — |
| 573 |
|
Proved Property Acquisitions |
| 46 | 12 | 1 |
| — |
| 104 | 11 | — |
| — |
| — |
| — |
| — |
| 151 |
|
Total |
| 716 |
| 1,505 |
| 36 |
| 793 |
| 136 |
| 97 |
| 4 |
| 62 |
| 52 |
| 3,401 |
|
|
|
|
|
|
|
|
|
|
|
|
|
|
|
|
|
|
|
|
|
|
|
PP&E |
|
|
|
|
|
|
|
|
|
|
|
|
|
|
|
|
|
|
|
|
|
Cost |
| 4,723 |
| 6,736 |
| 1,332 |
| 3,069 |
| 2,178 |
| 263 |
| 246 |
| 831 |
| 315 |
| 19,693 |
|
Less: Accumulated DD&A |
| 908 |
| 1,597 |
| 205 |
| 1,765 |
| 1,950 |
| 77 |
| 62 |
| 463 |
| 168 |
| 7,195 |
|
Net Book Value2 |
| 3,815 |
| 5,139 | 9 | 1,127 |
| 1,304 |
| 228 |
| 186 |
| 184 |
| 368 |
| 147 |
| 12,498 |
|
|
|
|
|
|
|
|
|
|
|
|
|
|
|
|
|
|
|
|
|
|
|
Goodwill |
| 276 |
| — |
| — |
| — |
| — |
| — |
| 50 |
| — |
| — |
| 326 |
|
1 Includes results of operations from producing activities in Colombia.
2 Net sales made from all segments originating in Canada: $1,188 million PP&E located in Canada: $6,893 million
3 Net sales for our chemicals operations include:
($ millions) |
|
|
|
Canada |
| 154 |
|
US |
| 169 |
|
Brazil |
| 91 |
|
Total |
| 414 |
|
4 Includes interest income of $39 million, foreign exchange losses of $22 million and decrease in the fair value of crude oil put options of $43 million.
5 Includes an impairment charge of $366 million related to oil and gas properties in the Gulf of Mexico.
6 Includes stock-based compensation expense of $38 million.
7 Includes exploration activities primarily in Nigeria, Norway and Colombia.
8 The provision for (recovery of) income taxes for foreign locations is based on in-country taxes on foreign income. For oil and gas locations with no operating activities, the provision is based on the tax jurisdiction of the entity performing the activity.
9 Includes costs of $3,695 million related to our insitu oil sands (Long Lake and future phases).
10 84% of Marketing’s identifiable assets are accounts receivable and inventories.
11 Includes acquisition of producing properties in the Gulf of Mexico.
12 Includes acquisition of additional interests in the Scott and Telford fields.
21. DIFFERENCES BETWEEN CANADIAN AND US GENERALLY ACCEPTED ACCOUNTING PRINCIPLES
The Consolidated Financial Statements have been prepared in accordance with Canadian GAAP. US GAAP Consolidated Financial Statements and summaries of differences from Canadian GAAP are as follows:
Consolidated Statement of Income—US GAAP for the Three Years ended December 31, 2009
(Cdn$ millions, except per share amounts) |
| 2009 |
| 2008 |
| 2007 |
|
Revenues and Other Income |
|
|
|
|
|
|
|
Net Sales |
| 4,895 |
| 7,424 |
| 5,583 |
|
Marketing and Other (i); (vi); (vii) |
| 897 |
| 796 |
| 938 |
|
|
| 5,792 |
| 8,220 |
| 6,521 |
|
Expenses |
|
|
|
|
|
|
|
Operating (ii) |
| 1,280 |
| 1,335 |
| 1,167 |
|
Depreciation, Depletion, Amortization and Impairment |
| 1,802 |
| 2,014 |
| 1,767 |
|
Transportation and Other (vi) |
| 795 |
| 964 |
| 906 |
|
General and Administrative (v) |
| 532 |
| 263 |
| 401 |
|
Exploration |
| 302 |
| 402 |
| 326 |
|
Interest |
| 312 |
| 94 |
| 168 |
|
|
| 5,023 |
| 5,072 |
| 4,735 |
|
|
|
|
|
|
|
|
|
Income before Provision for Income Taxes |
| 769 |
| 3,148 |
| 1,786 |
|
|
|
|
|
|
|
|
|
Provision for Income Taxes |
|
|
|
|
|
|
|
Current |
| 776 |
| 859 |
| 434 |
|
Deferred (i); (ii); (v); (vii); (viii) |
| (534 | ) | 589 |
| 322 |
|
|
| 242 |
| 1,448 |
| 756 |
|
|
|
|
|
|
|
|
|
Net Income |
| 527 |
| 1,700 |
| 1,030 |
|
Less: Net Income (Loss) Attributable to Non-Controlling Interests |
| 20 |
| (4 | ) | 18 |
|
|
|
|
|
|
|
|
|
Net Income Attributable to Nexen Inc.—US GAAP1 |
| 507 |
| 1,704 |
| 1,012 |
|
|
|
|
|
|
|
|
|
Earnings Per Common Share ($/share) (Note 18) |
|
|
|
|
|
|
|
Basic |
| 0.97 |
| 3.24 |
| 1.92 |
|
Diluted |
| 0.97 |
| 3.20 |
| 1.88 |
|
1 Reconciliation of Canadian and US GAAP Net Income
(Cdn$ millions) |
| 2009 |
| 2008 |
| 2007 |
|
Net Income Attributable to Nexen Inc.— Canadian GAAP |
| 536 |
| 1,715 |
| 1,086 |
|
Impact of US Principles, Net of Income Taxes: |
|
|
|
|
|
|
|
Ineffective Portion of Cash Flow Hedges (i) |
| — |
| — |
| (2 | ) |
Development Costs (ii) |
| — |
| — |
| (1 | ) |
Stock-based Compensation (v) |
| (26 | ) | (4 | ) | (19 | ) |
Inventory Valuation (vii) |
| (10 | ) | (7 | ) | (52 | ) |
Deferred Taxes (viii) |
| 7 |
| — |
| — |
|
Net Income Attributable to Nexen Inc.— US GAAP |
| 507 |
| 1,704 |
| 1,012 |
|
Consolidated Balance Sheet—US GAAP December 31, 2009 and 2008
(Cdn$ millions, except share amounts) |
| 2009 |
| 2008 |
| |
|
|
|
|
|
| |
ASSETS |
|
|
|
|
| |
Current Assets |
|
|
|
|
| |
Cash and Cash Equivalents |
| 1,700 |
| 2,003 |
| |
Restricted Cash |
| 198 |
| 103 |
| |
Accounts Receivable |
| 2,788 |
| 3,163 |
| |
Inventories and Supplies (vii) |
| 610 |
| 426 |
| |
Other |
| 185 |
| 169 |
| |
Total Current Assets |
| 5,481 |
| 5,864 |
| |
|
|
|
|
|
| |
Property, Plant and Equipment |
|
|
|
|
| |
Net of Accumulated Depreciation, Depletion, Amortization and Impairment of $11,200 (December 31, 2008—$10,786) (ii); (iv) |
| 15,443 |
| 14,873 |
| |
Goodwill |
| 339 |
| 390 |
| |
Deferred Income Tax Assets |
| 1,148 |
| 351 |
| |
Deferred Charges and Other Assets |
| 370 |
| 570 |
| |
|
|
|
|
|
| |
TOTAL ASSETS |
| 22,781 |
| 22,048 |
| |
|
|
|
|
|
| |
LIABILITIES |
|
|
|
|
| |
Current Liabilities |
|
|
|
|
| |
Accounts Payable and Accrued Liabilities (v) |
| 3,131 |
| 3,384 |
| |
Accrued Interest Payable |
| 89 |
| 67 |
| |
Dividends Payable |
| 26 |
| 26 |
| |
Total Current Liabilities |
| 3,246 |
| 3,477 |
| |
|
|
|
|
|
| |
Long-Term Debt |
| 7,251 |
| 6,578 |
| |
Deferred Income Tax Liabilities (ii); (iii); (v); (vii); (viii) |
| 2,720 |
| 2,543 |
| |
Asset Retirement Obligations |
| 1,018 |
| 1,024 |
| |
Deferred Credits and Other Liabilities (iii) |
| 1,126 |
| 1,428 |
| |
|
|
|
|
|
| |
Equity |
|
|
|
|
| |
Nexen Inc. Shareholders’ Equity |
|
|
|
|
| |
Common Shares, no par value |
|
|
|
|
| |
Authorized: | Unlimited |
|
|
|
|
|
Outstanding: | 2009—522,915,843 shares |
|
|
|
|
|
| 2008—519,448,590 shares |
| 1,049 |
| 981 |
|
Contributed Surplus |
| 1 |
| 2 |
| |
Retained Earnings (i); (ii); (iv); (v); (vii); (viii) |
| 6,575 |
| 6,172 |
| |
Accumulated Other Comprehensive Loss (i); (iii) |
| (269 | ) | (209 | ) | |
Total Nexen Inc. Shareholders’ Equity |
| 7,356 |
| 6,946 |
| |
Canexus Non-Controlling Interest |
| 64 |
| 52 |
| |
Total Equity |
| 7,420 |
| 6,998 |
| |
Commitments, Contingencies and Guarantees |
|
|
|
|
| |
TOTAL LIABILITIES AND EQUITY |
| 22,781 |
| 22,048 |
| |
Consolidated Statement of Comprehensive Income—US GAAP for the Three Years ended December 31, 2009
(Cdn$ millions) |
| 2009 |
| 2008 |
| 2007 |
|
Net Income Attributable to Nexen Inc.—US GAAP |
| 507 |
| 1,704 |
| 1,012 |
|
Other Comprehensive Income (Loss), Net of Income Taxes: |
|
|
|
|
|
|
|
Foreign Currency Translation Adjustment |
| (56 | ) | 159 |
| (132 | ) |
Change in Mark to Market on Cash Flow Hedges |
| — |
| — |
| (61 | ) |
Unamortized Defined Benefit Pension Plan Costs (iii) |
| (4 | ) | (21 | ) | 2 |
|
Comprehensive Income Attributable to Nexen Inc.— US GAAP |
| 447 |
| 1,842 |
| 821 |
|
Consolidated Statement of Accumulated Other Comprehensive Loss—US GAAP December 31, 2009 and 2008
(Cdn$ millions) |
| 2009 |
| 2008 |
|
Foreign Currency Translation Adjustment |
| (190 | ) | (134 | ) |
Unamortized Defined Benefit Pension Plan Costs (iii) |
| (79 | ) | (75 | ) |
Accumulated Other Comprehensive Loss (AOCL) |
| (269 | ) | (209 | ) |
Notes to the Consolidated US GAAP Financial Statements:
i. Under US GAAP, all derivative instruments are recognized on the balance sheet as either an asset or a liability measured at fair value. Changes in the fair value of derivatives are recognized in earnings unless specific hedge criteria are met. On January 1, 2007, we adopted the equivalent Canadian standard for derivative instruments and hedging.
In 2006, our US GAAP net income included gains of $2 million ($2 million, net of income taxes) for the ineffective portion of certain cash flow hedges. Under Canadian GAAP, these gains were recognized in 2007.
ii. Under Canadian GAAP, we defer certain development costs to PP&E. Under US GAAP, these costs have been included in operating expenses. As a result:
· in 2007, US GAAP operating expenses included development costs of $2 million ($1 million, net of income taxes)); and
· PP&E is lower under US GAAP by $30 million (December 31, 2008—lower by $30 million) and deferred income tax liabilities is $11 million lower (December 31, 2008—lower by $11 million).
iii. US GAAP requires the recognition of the over-funded and under-funded status of defined benefit pension plans on the balance sheet as an asset or liability. At year end, the unfunded amount of our defined benefit pension plans that was not included in the pension liability under Canadian GAAP was $105 million (2008—$104 million). This amount has been included in deferred credits and other liabilities and $79 million, net of income taxes (2008—$75 million, net of income taxes) has been included in AOCI.
iv. On January 1, 2003, we adopted Accounting for Asset Retirement Obligations for US GAAP reporting purposes. We adopted the equivalent Canadian standard for asset retirement obligations on January 1, 2004. These standards are consistent, except for the adoption date, which resulted in our PP&E under US GAAP being lower by $19 million.
v. Under Canadian principles, we record obligations for liability-based stock compensation plans using the intrinsic-value method of accounting. Under US principles, obligations for liability-based stock compensation plans are recorded using the fair-value method of accounting. As a result:
· general and administrative expense is higher by $35 million ($26 million, net of income taxes) for the year ended December 31, 2009 (2008—higher by $6 million ($4 million, net of income taxes); 2007—higher by $27 million ($19 million, net of income taxes)); and
· accounts payable and accrued liabilities are higher by $93 million at December 31, 2009 (2008—higher by $58 million) and deferred income tax liabilities are $26 million lower (2008—lower by $17 million).
vi. Under US GAAP, asset disposition gains and losses are included with transportation and other expense. In 2009, we had net asset disposition gains and losses of nil and have not reclassified from marketing and other income to transportation and other expense (2008—$3 million; 2007—$2 million).
vii. Under Canadian GAAP, we carry our commodity inventory held for trading purposes at fair value, less any costs to sell. Under US GAAP, we are required to carry this inventory at the lower of cost or net realizable value. As a result:
· marketing and other income is lower by $12 million ($10 million, net of income taxes) for the year ended December 31, 2009 (2008 lower by $14 million, ($7 million, net of income taxes); 2007 lower by $79 million, ($52 million, net of income taxes)); and
· inventories are lower by $70 million at December 31, 2009 (2008—lower by $58 million) and deferred income tax liabilities are $23 million lower (2008—lower by $21 million).
viii. Under US GAAP, we are required to apply FIN48 Accounting for Uncertainty in Income Taxes regarding accounting and disclosure for uncertain tax positions.
As at December 31, 2009, the total amount of our unrecognized tax benefits was approximately $277 million, all of which, if recognized, would affect our effective tax rate. To the extent interest and penalties may be assessed by taxing authorities on any underpayment of income tax, such amounts have been accrued and are classified as a component of income taxes in the Consolidated Statement of Income. As at December 31, 2009, the total amount of interest and penalties related to uncertain tax positions recognized in deferred income tax liabilities in the US GAAP—Consolidated Balance Sheet was approximately $8 million. We had no interest or penalties included in the US GAAP—Consolidated Statement of Income for the year ended December 31, 2009.
Our income tax filings are subject to audit by taxation authorities and as at December 31, 2009, the following tax years remained subject to examination, (i) Canada—1985 to date, (ii) United Kingdom—2008 to date and (iii) United States—2005 to date. We do not anticipate any material changes to the unrecognized tax benefits previously disclosed within the next twelve months.
Reconciliation of Unrecognized Tax Benefits
(Cdn$ millions) |
|
|
|
Balance at January 1, 2009 |
| 249 |
|
Additions for tax positions related to the current year |
| 22 |
|
Additions for tax positions related to prior years |
| 52 |
|
Reductions for tax positions related to prior years |
| (46 | ) |
Balance at December 31, 2009 |
| 277 |
|
US GAAP STOCK-BASED COMPENSATION
Under US GAAP, our stock-based compensation expense is accounted for by applying FASB Statement 123 (revised) Share-Based Payments. Under this guidance, our tandem options and stock appreciation rights (STARs) are considered liability-based stock compensation plans. Obligations for liability-based stock compensation plans are measured at the estimated fair value and remeasured in each subsequent reporting period.
Assumptions
We use the Generalized Black-Scholes option pricing model to estimate the fair value of our stock-based compensation, with the following assumptions:
Expected Annual Dividends per Common Share ($/share) |
| 0.20 |
|
Expected Volatility |
| 56% |
|
Risk-Free Interest Rate |
| 0.7%–3.1% |
|
Weighted-Average Expected Life of Compensation Instruments (years) |
| 3.1–3.3 |
|
These assumptions are based on multiple factors, including historical exercise patterns of employees in relatively homogenous groups with respect to exercise and post-vesting employment termination behaviors, expected future exercising patterns for those same homogenous groups, the implied volatility of our stock price, our expected future dividend levels and the interest rate for Government of Canada bonds.
Tandem Options
|
| Number |
| Weighted |
| Weighted |
| Aggregate |
| Weighted |
|
Outstanding at December 31, 2009 |
| 23,130 |
| 25 |
| 2.6 |
| 62 |
| 7 |
|
Outstanding at December 31, 2009 and Expected to Vest |
| 22,877 |
| 25 |
| 2.6 |
| 61 |
| 7 |
|
Exercisable at December 31, 2009 |
| 15,282 |
| 25 |
| 1.8 |
| 45 |
| 6 |
|
The total intrinsic value of stock options exercised during the year ended December 31, 2009 was $66 million (2008—$88 million; 2007—$149 million). As at December 31, 2009, we had $55 million of unrecognized compensation expense related to stock options which we expect to recognize over a weighted-average period of 1.6 years.
Stock Appreciation Rights
|
| Number |
| Weighted |
| Weighted |
| Aggregate |
| Weighted |
|
Outstanding at December 31, 2009 |
| 19,480 |
| 25 |
| 3.3 |
| 35 |
| 6 |
|
Outstanding at December 31, 2009 and Expected to Vest |
| 18,857 |
| 25 |
| 3.3 |
| 33 |
| 6 |
|
Exercisable at December 31, 2009 |
| 9,812 |
| 28 |
| 2.3 |
| 12 |
| 4 |
|
The total intrinsic value of stock appreciation rights exercised during the year ended December 31, 2009 was $26 million (2008—$52 million; 2007—$50 million). As at December 31, 2009, we had $64 million of unrecognized compensation expense related to stock appreciation rights which we expect to recognize over a weighted-average period of 1.6 years.
Stock-Based Compensation Expense and Payments
For the year ended December 31, 2009, stock-based compensation recovery of $104 million (2008—$154 million recovery; 2007—$65 million expense) was included in general and administrative expense in the Consolidated Statement of Income—US GAAP.
For the year ended December 31, 2009, cash proceeds of $12 million were received related to the exercise of stock options (2008—$23 million; 2007—$24 million). For the year ended December 31, 2009, $81 million was paid related to the exercise of stock options and stock appreciation rights (2008—$121 million; 2007—$149 million). The income tax benefit recorded from the exercise of stock options and stock appreciation rights was $20 million (2008—$34 million; 2007—$42 million) for the period.
Stock-Based Compensation Expense for Retired and Retirement Eligible Employees
We recognize stock-based compensation expense for our retired and retirement-eligible employees over an accelerated graded vesting period in accordance with the provisions of Share—Based Payments for stock-based awards granted to employees on or after January 1, 2006. For stock-based awards granted prior to the adoption of this guidance, stock-based compensation expense for our retired and retirement-eligible employees is recognized over a graded vesting period. If we applied the accelerated graded vesting provisions of the new guidance to stock-based awards granted to our retired and retirement-eligible employees prior to the its adoption, our stock-based compensation expense would remain unchanged for the year ended December 31, 2009 (2008—$2 million; 2007—$9 million).
Changes in Accounting Policies—US GAAP
BUSINESS COMBINATIONS
On January 1, 2009, we prospectively adopted Business Combinations, which establishes principles and requirements of the acquisition method for business combinations and related disclosures. The adoption of this standard did not impact our results of operations or financial position.
NON-CONTROLLING INTERESTS
On January 1, 2009, we prospectively adopted Non-controlling Interests in Consolidated Financial Statements. This standard clarifies that a non-controlling interest in a subsidiary is an ownership interest in the consolidated entity that should be reported as equity in the Consolidated Financial Statements. The adoption of this standard did not have a material impact on our results of operation or financial position. The presentation changes have been included in the Consolidated Financial Statements, as applicable.
DERIVATIVE AND HEDGING ACCOUNTING AND DISCLOSURES
On January 1, 2009, we prospectively adopted Disclosures about Derivative Instruments and Hedging Activities. The standard requires qualitative disclosures about the objectives and strategies for using derivatives, quantitative data about the fair value of gains and losses on derivative contracts and details of credit-risk-related contingent features in those derivative contracts. The standard also requires the disclosure of the location and amounts of derivative instruments in the financial statements. The disclosures required by this standard are provided in Notes 6 and 7.
On April 1, 2009, we prospectively adopted three changes to FASB guidance intended to improve guidance and disclosures on fair value measurement and impairments. The positions clarify fair value accounting specifically regarding: inactive markets and distressed transactions, other-than-temporary impairments, and expanded fair value disclosures for financial instruments in interim periods. The adoption of these positions did not have a material impact on our results of operations or financial position.
SUBSEQUENT EVENTS
On April 1, 2009, we prospectively adopted Subsequent Events. The new standard reflects the existing principles of current subsequent events accounting guidance and retains the notion and definition of “available to be issued” financial statements. The new standard requires disclosure of the date through which subsequent events have been evaluated and clarifies that original issuance of financial statements means both “issued” or “available to be issued”. The adoption of this standard did not have a material impact on our results of operations or financial position.
POST-RETIREMENT BENEFIT PLAN ASSETS DISCLOSURES
In December 2008, FASB issued Employers Disclosures about Postretirement Benefit Plan Assets. This standard provides guidance on disclosures about plan assets of a defined benefit pension or other post-retirement plans and has been adopted for our annual disclosures provided in Note 13. The adoption of this statement did not have a material impact on our results of operations or financial position.
New Accounting Pronouncement—US GAAP
In June 2009, FASB issued Amendments to Consolidation of Variable Interest Entities. It retains the scope of the previous guidance with the addition of entities previously considered qualifying special-purpose entities and replaces the previous quantitative approach with a qualitative analysis in determining whether the enterprise’s variable interest or interests give it a controlling financial interest in a variable interest entity. The Statement is further amended to require ongoing reassessments of whether an enterprise is the primary beneficiary of a variable interest entity and requires enhanced disclosures about an enterprise’s involvement in a variable interest entity. The standard is effective at the beginning of the first annual reporting period after November 15, 2009. We do not expect the adoption of this standard to have a material impact on our results of operations or financial position.
SUPPLEMENTARY DATA (UNAUDITED)
Quarterly Financial Data in Accordance with Canadian and US GAAP
|
| Quarter Ended |
| ||||||||||||||
|
| March 31 |
| June 30 |
| September 30 |
| December 31 |
| ||||||||
(Cdn$ millions) |
| 2009 |
| 2008 |
| 2009 |
| 2008 |
| 2009 |
| 2008 |
| 2009 |
| 2008 |
|
Net Sales |
| 1,048 |
| 1,870 |
| 1,200 |
| 2,071 |
| 1,097 |
| 2,213 |
| 1,550 |
| 1,270 |
|
|
|
|
|
|
|
|
|
|
|
|
|
|
|
|
|
|
|
Income (Loss) before Income Taxes is Comprised of: |
|
|
|
|
|
|
|
|
|
|
|
|
|
|
|
|
|
Oil and Gas1 |
| 196 |
| 1,128 |
| 282 |
| 1,073 |
| 250 |
| 1,503 |
| 453 |
| (218 | ) |
Energy Marketing |
| 83 |
| 14 |
| 25 |
| (183 | ) | 18 |
| (79 | ) | 109 |
| (161 | ) |
Chemicals |
| 10 |
| (4 | ) | 15 |
| 11 |
| 41 |
| 5 |
| 13 |
| (26 | ) |
Corporate and Other |
| (120 | ) | (38 | ) | (323 | ) | (208 | ) | (66 | ) | 77 |
| (170 | ) | 274 |
|
|
| 169 |
| 1,100 |
| (1 | ) | 693 |
| 243 |
| 1,506 |
| 405 |
| (131 | ) |
|
|
|
|
|
|
|
|
|
|
|
|
|
|
|
|
|
|
Net Income (Loss)—Canadian GAAP |
| 135 |
| 630 |
| 20 |
| 380 |
| 122 |
| 886 |
| 259 |
| (181 | ) |
US GAAP Adjustments |
| 21 |
| (13 | ) | (32 | ) | (62 | ) | 53 |
| 120 |
| (71 | ) | (56 | ) |
Net Income (Loss)—US GAAP |
| 156 |
| 617 |
| (12 | ) | 318 |
| 175 |
| 1,006 |
| 188 |
| (237 | ) |
|
|
|
|
|
|
|
|
|
|
|
|
|
|
|
|
|
|
Earnings (Loss) per Common Share ($/share) |
|
|
|
|
|
|
|
|
|
|
|
|
|
|
|
|
|
Canadian GAAP—Basic |
| 0.26 |
| 1.19 |
| 0.04 |
| 0.72 |
| 0.23 |
| 1.68 |
| 0.50 |
| (0.35 | ) |
Canadian GAAP—Diluted |
| 0.26 |
| 1.17 |
| 0.04 |
| 0.70 |
| 0.23 |
| 1.66 |
| 0.49 |
| (0.35 | ) |
US GAAP—Basic |
| 0.30 |
| 1.17 |
| (0.02 | ) | 0.60 |
| 0.34 |
| 1.91 |
| 0.36 |
| (0.46 | ) |
US GAAP—Diluted |
| 0.30 |
| 1.15 |
| (0.02 | ) | 0.59 |
| 0.33 |
| 1.89 |
| 0.36 |
| (0.46 | ) |
|
|
|
|
|
|
|
|
|
|
|
|
|
|
|
|
|
|
Dividends Declared2 |
| 0.050 |
| 0.025 |
| 0.050 |
| 0.050 |
| 0.050 |
| 0.050 |
| 0.050 |
| 0.050 |
|
|
|
|
|
|
|
|
|
|
|
|
|
|
|
|
|
|
|
Common Share Prices3 ($/share) |
|
|
|
|
|
|
|
|
|
|
|
|
|
|
|
|
|
Toronto Stock Exchange—High |
| 24.24 |
| 34.20 |
| 28.54 |
| 43.45 |
| 25.94 |
| 41.47 |
| 27.31 |
| 29.10 |
|
Toronto Stock Exchange—Low |
| 14.86 |
| 26.00 |
| 20.65 |
| 29.69 |
| 20.70 |
| 21.12 |
| 22.26 |
| 13.33 |
|
New York Stock Exchange—High (US$) |
| 20.61 |
| 34.57 |
| 26.25 |
| 42.71 |
| 24.43 |
| 40.99 |
| 26.05 |
| 23.99 |
|
New York Stock Exchange—Low (US$) |
| 11.89 |
| 25.11 |
| 16.33 |
| 28.87 |
| 18.68 |
| 20.56 |
| 20.66 |
| 10.81 |
|
1 The fourth quarter of 2009 includes an impairment charge of $78 million relating to oil and gas properties in Canada and the US Gulf of Mexico. The fourth quarter of 2008 includes an impairment charge of $568 million relating to oil and gas properties in the US Gulf of Mexico and the UK North Sea.
2 In February 2010, the Board of Directors declared a quarterly dividend of $0.05 per common share, payable April 1, 2010, to shareholders of record on March 10, 2010.
3 At December 31, 2009, there were 1,725 registered holders of common shares and 522,915,843 common shares outstanding.
Oil and Gas Producing Activities (Unaudited)
The following oil and gas information is provided in accordance with the Financial Accounting Standards Board (FASB) Topic 932 Extractive Activities—Oil and Gas.
On December 31, 2008, the SEC issued new rules relating to reserve definitions and related disclosure requirements. The new rules are effective for estimates and disclosures made on or after January 1, 2010. FASB amended their oil and gas disclosure rules in January 2010 to align with the new SEC rules. The primary impacts of changes on our reserves estimates and disclosures resulting from the adoption of the new SEC and FASB rules are as follows:
· our Syncrude oil sands activities are now considered an oil and gas activity rather than a mining activity. This impacts the classification of the reserves but does not result in a change in the estimate of reserves, except that under oil and gas reserves definitions we consider a portion of the previously reported mining reserves to be proved undeveloped reserves;
· reserves quantities are now based on the final product sold after field upgrading rather than the product initially produced. This results in presenting our Long Lake oil sands reserves as synthetic oil barrels rather than bitumen barrels. The reduction in quantity reflects the removal of the asphaltenes from the bitumen barrel, which we gasify for use as our internal fuel source in the steam generation, upgrading and cogeneration power processes. The adjustment from bitumen to synthetic reserves estimates upon adoption of the new rules is shown separately on pages 152 to 153; and
· prices underlying our economic assumptions used for reserves estimation are now based on the average first-day-of-the-month prices during the year, rather than the prices on December 31 each year. The average prices were used in preparing the 2009 reserves estimates and changes therein so there is no separate adjustment for this change in methodology. Based on a high level sensitivity analysis, had we presented our proved reserves estimates based on December 31, 2009 prices, our proved reserves would have been 14 mmboe higher which would then have been reversed upon adoption of the new rules.
Please refer to pages 4 to 6 of this report for more information on the impact of the new SEC rules on our reserves estimates and disclosures.
A. RESERVE QUANTITY INFORMATION
Our net proved reserves and changes in those reserves for our oil and gas operations are disclosed on pages 152 to 153.
The net proved reserves represent management’s best estimate of remaining proved oil and gas reserves after royalties. Reserve estimates for each property are prepared internally each year, and at least 80% of the proved reserves have been assessed by independent qualified reserves consultants.
Estimates of proved oil and gas reserves are determined through analysis of geological and engineering data, and demonstrate reasonable certainty that they are recoverable from known reservoirs under existing economic and operating conditions based on the 12-month average prices for 2009 and year-end prices for prior years. See Basis of Reserves Estimates on page 29 for a description of our oil and gas reserves estimation process.
|
| Total—by Product |
| Canada |
| ||||||||||||||||
|
| Total |
| Synthetic Oil |
| Bitumen |
| Oil |
| Gas |
| Syncrude |
| Long Lake |
| Long Lake |
| Oil |
| Gas |
|
Proved Reserves after Royalties6 |
|
|
|
|
|
|
|
|
|
|
|
|
|
|
|
|
|
|
|
|
|
December 31, 2006 |
| 912 |
| 274 |
| 219 |
| 330 |
| 532 |
| 274 |
| — |
| 219 |
| 48 |
| 314 |
|
Extensions & Discoveries |
| 29 |
| 7 |
| — |
| 13 |
| 51 |
| 7 |
| — |
| — |
| 1 |
| 31 |
|
Revisions—Technical |
| 53 |
| — |
| 19 |
| 34 |
| — |
| — |
| — |
| 19 |
| (1 | ) | 11 |
|
Revisions—Economic |
| (9 | ) | (7 | ) | (4 | ) | 4 |
| (11 | ) | (7 | ) | — |
| (4 | ) | 4 |
| (4 | ) |
Acquisitions |
| 10 |
| — |
| — |
| 3 |
| 42 |
| — |
| — |
| — |
| — |
| 1 |
|
Divestments |
| (2 | ) | — |
| — |
| — |
| (10 | ) | — |
| — |
| — |
| — |
| — |
|
Production |
| (76 | ) | (7 | ) | — |
| (57 | ) | (72 | ) | (7 | ) | — |
| — |
| (5 | ) | (35 | ) |
December 31, 2007 |
| 917 |
| 267 |
| 234 |
| 327 |
| 532 |
| 267 |
| — |
| 234 |
| 47 |
| 318 |
|
Extensions & Discoveries |
| 40 |
| 7 |
| 19 |
| 7 |
| 39 |
| 7 |
| — |
| 19 |
| 1 |
| 34 |
|
Revisions—Technical |
| 27 |
| — |
| — |
| 20 |
| 40 |
| — |
| — |
| — |
| (3 | ) | 54 |
|
Revisions—Economic |
| 21 |
| 28 |
| 31 |
| (34 | ) | (21 | ) | 28 |
| — |
| 31 |
| (19 | ) | (16 | ) |
Acquisitions |
| — |
| — |
| — |
| — |
| — |
| — |
| — |
| — |
| — |
| — |
|
Divestments |
| — |
| — |
| — |
| — |
| — |
| — |
| — |
| — |
| — |
| — |
|
Production |
| (79 | ) | (7 | ) | (2 | ) | (58 | ) | (71 | ) | (7 | ) | — |
| (2 | ) | (4 | ) | (40 | ) |
December 31, 2008 |
| 926 |
| 295 |
| 282 |
| 262 |
| 519 |
| 295 |
| — |
| 282 |
| 22 |
| 350 |
|
Extensions & Discoveries |
| 63 |
| 7 |
| 23 |
| 28 |
| 33 |
| 7 |
| — |
| 23 |
| 1 |
| 16 |
|
Revisions—Technical |
| 9 |
| — |
| (4 | ) | 10 |
| 16 |
| — |
| — |
| (4 | ) | (1 | ) | 12 |
|
Revisions—Economic3 |
| (2 | ) | (7 | ) | (9 | ) | 27 |
| (81 | ) | (7 | ) | — |
| (9 | ) | 13 |
| (87 | ) |
Acquisitions |
| 85 |
| — |
| 85 |
| — |
| — |
| — |
| — |
| 85 |
| — |
| — |
|
Divestments |
| — |
| — |
| — |
| — |
| — |
| — |
| — |
| — |
| — |
| — |
|
Production |
| (78 | ) | (7 | ) | (3 | ) | (55 | ) | (76 | ) | (7 | ) | — |
| (3 | ) | (4 | ) | (47 | ) |
|
| 1,003 |
| 288 |
| 374 |
| 272 |
| 411 |
| 288 |
| — |
| 374 |
| 31 |
| 244 |
|
SEC Rule Transition2 |
|
|
|
|
|
|
|
|
|
|
|
|
|
|
|
|
|
|
|
|
|
Synthetic—Current Year |
| (32 | ) | 60 |
| (92 | ) | — |
| — |
| — |
| 60 |
| (92 | ) | — |
| — |
|
Synthetic—Prior Years |
| (51 | ) | 231 |
| (282 | ) | — |
| — |
| — |
| 231 |
| (282 | ) | — |
| — |
|
December 31, 2009 |
| 920 |
| 579 |
| — |
| 272 |
| 411 |
| 288 |
| 291 |
| — |
| 31 |
| 244 |
|
|
|
|
|
|
|
|
|
|
|
|
|
|
|
|
|
|
|
|
|
|
|
Proved Undeveloped |
|
|
|
|
|
|
|
|
|
|
|
|
|
|
|
|
|
|
|
|
|
December 31, 2008 |
| 406 |
| 96 |
| 230 |
| 70 |
| 55 |
| 96 |
| — |
| 230 |
| — |
| 21 |
|
December 31, 2009 |
| 413 |
| 339 |
| — |
| 69 |
| 32 |
| 103 |
| 236 |
| — |
| 2 |
| 3 |
|
|
|
|
|
|
|
|
|
|
|
|
|
|
|
|
|
|
|
|
|
|
|
Proved Developed7 |
|
|
|
|
|
|
|
|
|
|
|
|
|
|
|
|
|
|
|
|
|
December 31, 2008 |
| 520 |
| 199 |
| 52 |
| 192 |
| 464 |
| 199 |
| — |
| 52 |
| 22 |
| 329 |
|
December 31, 2009 |
| 507 |
| 240 |
| — |
| 203 |
| 379 |
| 185 |
| 55 |
| — |
| 29 |
| 241 |
|
Continued on following page.
1 | As described on page 5, our Syncrude oil sands activities are now considered an oil and gas activity rather than a mining activity. This impacts the classification of the reserves but does not result in a change in the estimate of reserves. For simplicity of understanding, we have included the Syncrude reserves in our prior years’ reserves balances and changes therein as the information was previously presented in our 2008 Form 10-K. |
2 | As described on page 5, our Long Lake oil sands reserves are now presented as synthetic oil barrels rather than bitumen barrels. |
3 | As described on page 5, prices underlying our economic assumptions used for reserve estimation in 2009 are based on the average first-day-of-the-month prices during the year, rather than the year-end prices. The average prices were used in preparing the 2009 reserves estimates and changes therein so there is no separate adjustment for this change in methodology. Our reserve estimates in 2008 and 2007 were prepared using the December 31 prices. |
|
| United Kingdom |
| United States |
| Yemen4 |
| Other Countries5 |
| ||||
|
| Oil |
| Gas |
| Oil |
| Gas |
| Oil |
| Oil |
|
Proved Reserves after Royalties6 |
|
|
|
|
|
|
|
|
|
|
|
|
|
December 31, 2006 |
| 179 |
| 23 |
| 30 |
| 195 |
| 38 |
| 35 |
|
Extensions & Discoveries |
| 10 |
| 2 |
| 1 |
| 18 |
| 1 |
| — |
|
Revisions—Technical |
| 39 |
| 8 |
| (4 | ) | (19 | ) | — |
| — |
|
Revisions—Economic |
| 4 |
| (2 | ) | (2 | ) | (5 | ) | (2 | ) | — |
|
Acquisitions |
| 1 |
| — |
| 2 |
| 41 |
| — |
| — |
|
Divestments |
| — |
| — |
| — |
| (10 | ) | — |
| — |
|
Production |
| (30 | ) | (6 | ) | (6 | ) | (31 | ) | (14 | ) | (2 | ) |
December 31, 2007 |
| 203 |
| 25 |
| 21 |
| 189 |
| 23 |
| 33 |
|
Extensions & Discoveries |
| 5 |
| — |
| — |
| 5 |
| 1 |
| — |
|
Revisions—Technical |
| 17 |
| — |
| 2 |
| (14 | ) | 6 |
| (2 | ) |
Revisions—Economic |
| (16 | ) | — |
| (3 | ) | (5 | ) | 2 |
| 2 |
|
Acquisitions |
| — |
| — |
| — |
| — |
| — |
| — |
|
Divestments |
| — |
| — |
| — |
| — |
| — |
| — |
|
Production |
| (37 | ) | (7 | ) | (3 | ) | (24 | ) | (12 | ) | (2 | ) |
December 31, 2008 |
| 172 |
| 18 |
| 17 |
| 151 |
| 20 |
| 31 |
|
Extensions & Discoveries |
| 19 |
| 6 |
| 1 |
| 11 |
| — |
| 7 |
|
Revisions—Technical |
| 5 |
| 2 |
| 1 |
| 2 |
| 5 |
| — |
|
Revisions—Economic3 |
| 9 |
| — |
| 3 |
| 6 |
| 1 |
| 1 |
|
Acquisitions |
| — |
| — |
| — |
| — |
| — |
| — |
|
Divestments |
| — |
| — |
| — |
| — |
| — |
| — |
|
Production |
| (36 | ) | (9 | ) | (3 | ) | (20 | ) | (11 | ) | (1 | ) |
|
| 169 |
| 17 |
| 19 |
| 150 |
| 15 |
| 38 |
|
SEC Rule Transition2 |
|
|
|
|
|
|
|
|
|
|
|
|
|
Synthetic—Current Year |
| — |
| — |
| — |
| — |
| — |
| — |
|
Synthetic—Prior Years |
| — |
| — |
| — |
| — |
| — |
| — |
|
December 31, 2009 |
| 169 |
| 17 |
| 19 |
| 150 |
| 15 |
| 38 |
|
|
|
|
|
|
|
|
|
|
|
|
|
|
|
Proved Undeveloped |
|
|
|
|
|
|
|
|
|
|
|
|
|
December 31, 2008 |
| 39 |
| 7 |
| 5 |
| 27 |
| 1 |
| 25 |
|
December 31, 2009 |
| 27 |
| 4 |
| 6 |
| 25 |
| 1 |
| 33 |
|
|
|
|
|
|
|
|
|
|
|
|
|
|
|
Proved Developed7 |
|
|
|
|
|
|
|
|
|
|
|
|
|
December 31, 2008 |
| 133 |
| 11 |
| 12 |
| 124 |
| 19 |
| 6 |
|
December 31, 2009 |
| 142 |
| 13 |
| 13 |
| 125 |
| 14 |
| 5 |
|
4 | Under the terms of the Masila and the Block 51 production sharing contracts, production is divided into cost recovery oil and profit oil. The Government’s share of profit oil represents its royalty interest and an amount for income taxes payable in Yemen. Yemen’s net proved reserves have been determined using the economic interest method and include our share of future cost recovery and profit oil after the Government’s royalty interest, but before reserves relating to income taxes payable. Under this method, reported reserves will increase as oil prices decrease (and vice versa) as the barrels necessary to achieve cost recovery change with prevailing oil prices. Production includes volumes used for fuel. |
5 | Represents reserves in Nigeria and Colombia. |
6 | Proved reserves are those quantities of oil and gas, which, by analysis of geoscience and engineering data, can be estimated with reasonable certainty to be economically producible from a given date forward, from known reservoirs, and under existing economic conditions, operating conditions, and government regulations. |
7 | Proved developed oil and gas reserves are expected to be recovered through existing wells with existing equipment and operating methods. |
B. CAPITALIZED COSTS
In 2009, as a result of changes to oil and gas disclosure rules issued by FASB, Syncrude activities and field upgrading operations at Long Lake are considered oil and gas activities effective December 31, 2009. Information for Syncrude and Long Lake upgrading for 2009 has been provided. As the change in the rules is to be applied prospectively, information for prior years has not been restated. The impact of the changes result in including capitalized costs for our share of Syncrude and the Long Lake upgrader at December 31, 2009 of $1,193 million and $2,463 million, respectively.
(Cdn$ millions) |
| Proved |
| Unproved |
| Accumulated |
| Capitalized |
|
December 31, 2009 |
|
|
|
|
|
|
|
|
|
United Kingdom |
| 4,995 |
| 1,120 |
| (2,664 | ) | 3,451 |
|
Canada |
| 3,383 |
| 573 |
| (2,424 | ) | 1,532 |
|
Long Lake1 |
| 5,223 |
| 829 |
| (7 | ) | 6,045 |
|
Syncrude |
| 1,463 |
| — |
| (270 | ) | 1,193 |
|
United States |
| 3,665 |
| 235 |
| (2,529 | ) | 1,371 |
|
Yemen |
| 2,462 |
| — |
| (2,322 | ) | 140 |
|
Other Countries |
| 878 |
| 52 |
| (99 | ) | 831 |
|
Total Capitalized Costs |
| 22,069 |
| 2,809 |
| (10,315 | ) | 14,563 |
|
December 31, 2008 |
|
|
|
|
|
|
|
|
|
United Kingdom |
| 5,954 |
| 578 |
| (2,159 | ) | 4,373 |
|
Canada |
| 3,166 |
| 566 |
| (2,175 | ) | 1,557 |
|
Long Lake1 |
| 1,921 |
| 501 |
| (4 | ) | 2,418 |
|
United States |
| 4,152 |
| 246 |
| (2,702 | ) | 1,696 |
|
Yemen |
| 2,808 |
| — |
| (2,610 | ) | 198 |
|
Other Countries |
| 509 |
| 45 |
| (113 | ) | 441 |
|
Total Capitalized Costs |
| 18,510 |
| 1,936 |
| (9,763 | ) | 10,683 |
|
December 31, 2008 |
|
|
|
|
|
|
|
|
|
United Kingdom |
| 4,318 |
| 405 |
| (908 | ) | 3,815 |
|
Canada |
| 3,057 |
| 326 |
| (1,988 | ) | 1,395 |
|
Long Lake1 |
| 1,307 |
| 408 |
| (2 | ) | 1,713 |
|
United States |
| 2,931 |
| 138 |
| (1,765 | ) | 1,304 |
|
Yemen |
| 2,178 |
| — |
| (1,950 | ) | 228 |
|
Other Countries |
| 105 |
| 158 |
| (77 | ) | 186 |
|
Total Capitalized Costs |
| 13,896 |
| 1,435 |
| (6,690 | ) | 8,641 |
|
1 Capitalized costs in 2008 and 2007 reflect bitumen production activities only; 2009 amounts reflect upgrading activities to produce synthetic barrels.
C. COSTS INCURRED
In 2009, as a result of changes to oil and gas disclosure rules issued by FASB, Syncrude activities and field upgrading operations at Long Lake are considered oil and gas activities effective December 31, 2009. Information for 2009 for Syncrude and Long Lake upgrading has been provided. As the change in the rules is to be applied prospectively, information for prior years has not been restated. The impact of the changes result in including costs incurred at Syncrude and the Long Lake upgrader during 2009 of $114 million and $424 million, respectively.
|
|
|
| Oil and Gas |
| ||||||||||||
(Cdn$ millions) |
| Total |
| United |
| Canada Other |
| Long Lake1 |
| Syncrude |
| United |
| Yemen |
| Other |
|
Year Ended December 31, 2009 |
|
|
|
|
|
|
|
|
|
|
|
|
|
|
|
|
|
Property Acquisition Costs |
|
|
|
|
|
|
|
|
|
|
|
|
|
|
|
|
|
Proved |
| 755 |
| — |
| — |
| 755 |
| — |
| — |
| — |
| — |
|
Unproved |
| 13 |
| — |
| 3 |
| — |
| — |
| 10 |
| — |
| — |
|
Exploration Costs |
| 650 |
| 155 |
| 224 |
| 1 |
| — |
| 183 |
| — |
| 87 |
|
Development Costs |
| 1,923 |
| 457 |
| 115 |
| 549 |
| 114 |
| 120 |
| 69 |
| 499 |
|
Total Costs Incurred2 |
| 3,341 |
| 612 |
| 342 |
| 1,305 |
| 114 |
| 313 |
| 69 |
| 586 |
|
Year Ended December 31, 2008 |
|
|
|
|
|
|
|
|
|
|
|
|
|
|
|
|
|
Property Acquisition Costs |
|
|
|
|
|
|
|
|
|
|
|
|
|
|
|
|
|
Proved |
| 22 |
| — |
| 2 |
| 20 |
| — |
| — |
| — |
| — |
|
Unproved |
| 69 |
| — |
| 6 |
| — |
| — |
| 63 |
| — |
| — |
|
Exploration Costs |
| 650 |
| 157 |
| 220 |
| 2 |
| — |
| 132 |
| 9 |
| 130 |
|
Development Costs |
| 1,983 |
| 555 |
| 205 |
| 537 |
| — |
| 404 |
| 92 |
| 190 |
|
Total Costs Incurred |
| 2,724 |
| 712 |
| 433 |
| 559 |
| — |
| 599 |
| 101 |
| 320 |
|
Year Ended December 31, 2007 |
|
|
|
|
|
|
|
|
|
|
|
|
|
|
|
|
|
Property Acquisition Costs |
|
|
|
|
|
|
|
|
|
|
|
|
|
|
|
|
|
Proved |
| 151 |
| 46 |
| 1 |
| — |
| — |
| 104 |
| — |
| — |
|
Unproved |
| 59 |
| 1 |
| 29 |
| 5 |
| — |
| 24 |
| — |
| — |
|
Exploration Costs |
| 637 |
| 128 |
| 92 |
| 1 |
| — |
| 311 |
| 15 |
| 90 |
|
Development Costs |
| 1,986 |
| 636 |
| 296 |
| 427 |
| — |
| 444 |
| 130 |
| 53 |
|
Total Costs Incurred |
| 2,833 |
| 811 |
| 418 |
| 433 |
| — |
| 883 |
| 145 |
| 143 |
|
1 | Costs incurred in 2008 and 2007 reflect bitumen production activities only; 2009 amounts reflect upgrading activities to produce synthetic barrels. |
2 | Total costs incurred include asset retirement costs of $38 million, geological and geophysical costs of $81 million and excludes costs related to chemicals, energy marketing, corporate and other of $275 million. |
D. RESULTS OF OPERATIONS FOR PRODUCING ACTIVITIES
In 2009, as a result of changes to oil and gas disclosure rules issued by FASB, Syncrude activities and field upgrading operations at Long Lake are considered oil and gas activities effective December 31, 2009. Information for 2009 for Syncrude and Long Lake upgrading has been provided. As the change in the rules is to be applied prospectively, information for prior years has not been restated.
|
|
|
| Oil and Gas |
| ||||||||||
(Cdn$ millions) |
| Total |
| United |
| Canada |
| Syncrude |
| United |
| Yemen |
| Other |
|
Year Ended December 31, 2009 |
|
|
|
|
|
|
|
|
|
|
|
|
|
|
|
Net Sales |
| 4,401 |
| 2,430 |
| 395 |
| 480 |
| 321 |
| 705 |
| 70 |
|
Production Costs |
| 986 |
| 253 |
| 171 |
| 265 |
| 98 |
| 191 |
| 8 |
|
Exploration Expense |
| 302 |
| 50 |
| 84 |
| — |
| 104 |
| — |
| 64 |
|
Depreciation, Depletion, Amortization and Impairment |
| 1,667 |
| 875 |
| 301 |
| 63 |
| 312 |
| 102 |
| 14 |
|
Other Expenses (Income) |
| 265 |
| 17 |
| 93 |
| 22 |
| 82 |
| 22 |
| 29 |
|
|
| 1,181 |
| 1,235 |
| (254 | ) | 130 |
| (275 | ) | 390 |
| (45 | ) |
Income Tax Provision (Recovery) |
| 479 |
| 487 |
| (64 | ) | 33 |
| (95 | ) | 141 |
| (23 | ) |
Results of Operations |
| 702 |
| 748 |
| (190 | ) | 97 |
| (180 | ) | 249 |
| (22 | ) |
Year Ended December 31, 2008 |
|
|
|
|
|
|
|
|
|
|
|
|
|
|
|
Net Sales |
| 6,186 |
| 3,580 |
| 656 |
| — |
| 665 |
| 1,093 |
| 192 |
|
Production Costs |
| 715 |
| 253 |
| 182 |
| — |
| 94 |
| 176 |
| 10 |
|
Exploration Expense |
| 402 |
| 86 |
| 79 |
| — |
| 109 |
| 5 |
| 123 |
|
Depreciation, Depletion, Amortization and Impairment |
| 1,859 |
| 999 |
| 208 |
| — |
| 475 |
| 160 |
| 17 |
|
Other Expenses (Income) |
| 75 |
| 6 |
| 29 |
| — |
| 37 |
| (10 | ) | 13 |
|
|
| 3,135 |
| 2,236 |
| 158 |
| — |
| (50 | ) | 762 |
| 29 |
|
Income Tax Provision (Recovery) |
| 1,412 |
| 1,126 |
| 45 |
| — |
| (19 | ) | 264 |
| (4 | ) |
Results of Operations |
| 1,723 |
| 1,110 |
| 113 |
| — |
| (31 | ) | 498 |
| 33 |
|
Year Ended December 31, 2007 |
|
|
|
|
|
|
|
|
|
|
|
|
|
|
|
Net Sales |
| 4,576 |
| 2,285 |
| 441 |
| — |
| 616 |
| 1,086 |
| 148 |
|
Production Costs |
| 668 |
| 212 |
| 175 |
| — |
| 102 |
| 171 |
| 8 |
|
Exploration Expense |
| 326 |
| 69 |
| 27 |
| — |
| 134 |
| 5 |
| 91 |
|
Depreciation, Depletion, Amortization and Impairment |
| 1,627 |
| 599 |
| 166 |
| — |
| 641 |
| 213 |
| 8 |
|
Other Expenses (Income) |
| 100 |
| (36 | ) | 66 |
| — |
| 38 |
| (8 | ) | 40 |
|
|
| 1,855 |
| 1,441 |
| 7 |
| — |
| (299 | ) | 705 |
| 1 |
|
Income Tax Provision (Recovery) |
| 859 |
| 712 |
| 2 |
| — |
| (103 | ) | 248 |
| — |
|
Results of Operations |
| 996 |
| 729 |
| 5 |
| — |
| (196 | ) | 457 |
| 1 |
|
E. STANDARDIZED MEASURE OF DISCOUNTED FUTURE NET CASH FLOWS AND CHANGES THEREIN
The following disclosure is based on estimates of net proved reserves and the period during which they are expected to be produced. Future cash inflows are computed by applying average annual prices to our after-royalty share of estimated annual future production from proved oil and gas reserves. As a result of amended FASB oil and gas disclosure rules, future cash inflows at December 31, 2009 were computed using the average first-day-of-the-month prices for the year held constant. Future cash inflows at December 31, 2008 and 2007 were computed using the year-end prices held constant. Future development, production and abandonment costs to be incurred in producing and further developing the proved reserves are based on existing cost indicators. Future income taxes are computed by applying year-end statutory tax rates. These rates reflect allowable deductions and tax credits, and are applied to the estimated pre-tax future net cash flows.
Discounted future net cash flows are calculated using 10% mid-period discount factors. The calculations assume the continuation of existing economic, operating and contractual conditions. However, such arbitrary assumptions have not proved to be the case in the past. Other assumptions could give rise to substantially different results.
We believe this information does not in any way reflect the current economic value of our oil and gas producing properties or the present value of their estimated future cash flows as:
· no economic value is attributed to probable and possible reserves;
· use of a 10% discount rate is arbitrary; and
· prices change constantly from the prices used.
In 2009, as a result of changes to oil and gas disclosure rules issued by FASB, Syncrude and field upgrading operations are considered oil and gas activities. Information for Syncrude and Long Lake upgrading for 2009 has been provided. As the change in the rules is to be applied prospectively, information for prior years has not been restated.
|
|
|
| Canada |
| United |
| United |
|
|
| Other |
| ||||
(Cdn$ millions) |
| Total |
| Syncrude |
| Long Lake1 |
| Other |
| Kingdom |
| States |
| Yemen |
| Countries |
|
December 31, 2009 |
|
|
|
|
|
|
|
|
|
|
|
|
|
|
|
|
|
Future Cash Inflows |
| 59,427 |
| 21,290 |
| 20,294 |
| 2,597 |
| 10,366 |
| 1,708 |
| 829 |
| 2,343 |
|
Future Production Costs |
| 33,180 |
| 14,480 |
| 12,306 |
| 1,702 |
| 3,160 |
| 688 |
| 280 |
| 564 |
|
Future Development Costs |
| 5,384 |
| 1,170 |
| 2,563 |
| 41 |
| 433 |
| 107 |
| 14 |
| 1,056 |
|
Future Dismantlement and Site Restoration Costs, Net |
| 1,660 |
| 166 |
| 189 |
| 246 |
| 541 |
| 391 |
| 20 |
| 107 |
|
Future Income Tax |
| 3,727 |
| 249 |
| 238 |
| 28 |
| 3,017 |
| — |
| 158 |
| 37 |
|
Future Net Cash Flows |
| 15,476 |
| 5,225 |
| 4,998 |
| 580 |
| 3,215 |
| 522 |
| 357 |
| 579 |
|
10% Discount Factor |
| 9,183 |
| 4,217 |
| 3,633 |
| 24 |
| 725 |
| 95 |
| 27 |
| 462 |
|
Standardized Measure |
| 6,293 |
| 1,008 |
| 1,365 |
| 556 |
| 2,490 |
| 427 |
| 330 |
| 117 |
|
|
|
|
|
|
|
|
|
|
|
|
|
|
|
|
|
|
|
December 31, 2008 |
|
|
|
|
|
|
|
|
|
|
|
|
|
|
|
|
|
Future Cash Inflows |
| 25,305 |
| — |
| 9,276 |
| 2,984 |
| 8,753 |
| 1,809 |
| 904 |
| 1,579 |
|
Future Production Costs |
| 10,847 |
| — |
| 5,013 |
| 1,606 |
| 2,616 |
| 765 |
| 424 |
| 423 |
|
Future Development Costs |
| 3,008 |
| — |
| 1,350 |
| 138 |
| 564 |
| 33 |
| 51 |
| 872 |
|
Future Dismantlement and Site Restoration Costs, Net |
| 1,421 |
| — |
| 89 |
| 243 |
| 558 |
| 446 |
| 20 |
| 65 |
|
Future Income Tax |
| 2,653 |
| — |
| — |
| — |
| 2,467 |
| — |
| 141 |
| 45 |
|
Future Net Cash Flows |
| 7,376 |
| — |
| 2,824 |
| 997 |
| 2,548 |
| 565 |
| 268 |
| 174 |
|
10% Discount Factor |
| 2,953 |
| — |
| 1,802 |
| 186 |
| 505 |
| 84 |
| 24 |
| 352 |
|
Standardized Measure |
| 4,423 |
| — |
| 1,022 |
| 811 |
| 2,043 |
| 481 |
| 244 |
| (178 | ) |
|
|
|
|
|
|
|
|
|
|
|
|
|
|
|
|
|
|
December 31, 2007 |
|
|
|
|
|
|
|
|
|
|
|
|
|
|
|
|
|
Future Cash Inflows |
| 43,888 |
| — |
| 12,496 |
| 4,869 |
| 17,977 |
| 3,207 |
| 1,952 |
| 3,387 |
|
Future Production Costs |
| 11,988 |
| — |
| 4,845 |
| 2,384 |
| 3,347 |
| 539 |
| 468 |
| 405 |
|
Future Development Costs |
| 3,229 |
| — |
| 864 |
| 93 |
| 778 |
| 328 |
| 22 |
| 1,144 |
|
Future Dismantlement and Site Restoration Costs, Net |
| 1,143 |
| — |
| 72 |
| 201 |
| 595 |
| 197 |
| 16 |
| 62 |
|
Future Income Tax |
| 8,793 |
| — |
| 856 |
| 279 |
| 6,589 |
| 437 |
| 452 |
| 180 |
|
Future Net Cash Flows |
| 18,735 |
| — |
| 5,859 |
| 1,912 |
| 6,668 |
| 1,706 |
| 994 |
| 1,596 |
|
10% Discount Factor |
| 7,606 |
| — |
| 3,661 |
| 575 |
| 1,561 |
| 441 |
| 111 |
| 1,257 |
|
Standardized Measure |
| 11,129 |
| — |
| 2,198 |
| 1,337 |
| 5,107 |
| 1,265 |
| 883 |
| 339 |
|
1 Standardized measure amounts in 2008 and 2007 reflect bitumen production activities only; 2009 amounts reflect upgrading activities to produce synthetic barrels.
Changes in the Standardized Measure of Discounted Future Net Cash Flows
The following are the principal sources of change in the standardized measure of discounted future net cash flows:
(Cdn$ millions) |
| 2009 |
| 2008 |
| 2007 |
|
Beginning of Year |
| 4,423 |
| 11,129 |
| 8,373 |
|
Sales and Transfers of Oil and Gas Produced, Net of Production Costs |
| (2,306 | ) | (4,387 | ) | (3,010 | ) |
Net Changes in Prices and Production Costs Related to Future Production |
| (306 | ) | (9,756 | ) | 3,385 |
|
Extensions, Discoveries and Improved Recovery, Less Related Costs |
| 1,091 |
| 376 |
| 758 |
|
Changes in Estimated Future Development and Dismantlement Costs |
| 561 |
| (676 | ) | (443 | ) |
Previous Estimated Future Development and Dismantlement Costs Incurred During the Period |
| 884 |
| 1,343 |
| 1,102 |
|
Revisions of Previous Quantity Estimates |
| 607 |
| 615 |
| 2,189 |
|
Accretion of Discount |
| 655 |
| 1,730 |
| 1,191 |
|
Purchases of Reserves in Place |
| 330 |
| — |
| 272 |
|
Sales of Reserves in Place |
| (2 | ) | — |
| (49 | ) |
Net Change in Income Taxes |
| (596 | ) | 4,049 |
| (2,639 | ) |
|
| 5,341 |
| 4,423 |
| 11,129 |
|
Inclusion of Syncrude as Oil and Gas Activity |
| 1,008 |
| — |
| — |
|
Conversion of Long Lake Bitumen to Synthetic Reserves |
| (56 | ) | — |
| — |
|
End of Year |
| 6,293 |
| 4,423 |
| 11,129 |
|
Changes in and Disagreements with Accountants on Accounting and Financial Disclosure
There were no disagreements with accountants on accounting and financial disclosure.
Controls and Procedures
EVALUATION OF DISCLOSURE CONTROLS AND PROCEDURES
The Company’s Chief Executive Officer and Chief Financial Officer have designed disclosure controls and procedures (as defined in Rules 13(a)-15(e) and 15(d)-15(e) under the Securities Exchange Act of 1934), or caused such disclosure controls and procedures to be designed under their supervision, to ensure that material information relating to the Company is made known to them, particularly during the period in which this report is prepared. They have evaluated the effectiveness of such disclosure controls and procedures as of the end of the period covered by this report (Evaluation Date). Based upon that evaluation, the Chief Executive Officer and Chief Financial Officer concluded that, as of the Evaluation Date, the Company’s disclosure controls and procedures are effective (i) to ensure that information required to be disclosed by us in reports that the Company files or submits under the Exchange Act is recorded, processed, summarized and reported within the time periods specified in the Securities and Exchange Commission rules and forms; and (ii) to ensure that information required to be disclosed in the reports that the Company files or submits under the Exchange Act is accumulated and communicated to our management, including the Company’s Chief Executive Officer and Chief Financial Officer, to allow timely decisions regarding required disclosure.
The Company’s management, including its Chief Executive Officer and Chief Financial Officer, does not expect that the Company’s disclosure controls and procedures or internal controls will prevent all possible error and fraud. The Company’s disclosure controls and procedures are, however, designed to provide reasonable assurance of achieving their objectives, and the Company’s Chief Executive Officer and Chief Financial Officer have concluded that the Company’s financial controls and procedures are effective at that reasonable assurance level.
MANAGEMENT’S REPORT ON INTERNAL CONTROL OVER FINANCIAL REPORTING
Our management is responsible for establishing and maintaining adequate internal control over financial reporting (as defined in Exchange Act Rules 13(a)-15(f)). Under the supervision and with the participation of our management, including our principal executive officer (CEO) and principal financial officer (CFO), we conducted an evaluation of the effectiveness of our internal control over financial reporting based on the Internal Control-Integrated Framework issued by the Committee of Sponsoring Organizations of the Treadway Commission. Based on our evaluation, we concluded that our internal control over financial reporting is effective as of December 31, 2009. We have documented this assessment and made this assessment available to our independent registered Chartered Accountants. We recognize that all internal control systems, no matter how well designed, have inherent limitations. Therefore, even those systems determined to be effective can provide only reasonable assurance with respect to financial statement preparation and presentation.
Deloitte & Touche LLP audited our Consolidated Financial Statements as stated in their report which is on page 159 of this Form 10-K and has issued an attestation report on our internal control over financial reporting.
We have continually had in place systems of internal controls over financial reporting. There have not been any changes in the Company’s internal control over financial reporting during the last quarter that have materially affected, or are reasonably likely to materially affect, our internal control over financial reporting. As well, no material weaknesses requiring corrective action were identified in the conduct of our evaluation of internal control over financial reporting. As a result, no such corrective actions were taken.
REPORT OF INDEPENDENT REGISTERED CHARTERED ACCOUNTANTS
To the Board of Directors and Shareholders of Nexen Inc.
We have audited the internal control over financial reporting of Nexen Inc. and subsidiaries (the “Company”) as of December 31, 2009, based on criteria established in Internal Control—Integrated Framework issued by the Committee of Sponsoring Organizations of the Treadway Commission. The Company’s management is responsible for maintaining effective internal control over financial reporting and for its assessment of the effectiveness of internal control over financial reporting, included in the accompanying Management’s Report on Internal Control over Financial Reporting. Our responsibility is to express an opinion on the Company’s internal control over financial reporting based on our audit.
We conducted our audit in accordance with the standards of the Public Company Accounting Oversight Board (United States). Those standards require that we plan and perform the audit to obtain reasonable assurance about whether effective internal control over financial reporting was maintained in all material respects. Our audit included obtaining an understanding of internal control over financial reporting, assessing the risk that a material weakness exists, testing and evaluating the design and operating effectiveness of internal control based on the assessed risk, and performing such other procedures as we considered necessary in the circumstances. We believe that our audit provides a reasonable basis for our opinion.
A company’s internal control over financial reporting is a process designed by, or under the supervision of, the company’s principal executive and principal financial officers, or persons performing similar functions, and effected by the Company’s Board of Directors, management, and other personnel to provide reasonable assurance regarding the reliability of financial reporting and the preparation of financial statements for external purposes in accordance
with generally accepted accounting principles. A company’s internal control over financial reporting includes those policies and procedures that (1) pertain to the maintenance of records that, in reasonable detail, accurately and fairly reflect the transactions and dispositions of the assets of the company; (2) provide reasonable assurance that transactions are recorded as necessary to permit preparation of financial statements in accordance with generally accepted accounting principles, and that receipts and expenditures of the company are being made only in accordance with authorizations of management and directors of the company; and (3) provide reasonable assurance regarding prevention or timely detection of unauthorized acquisition, use, or disposition of the company’s assets that could have a material effect on the financial statements.
Because of the inherent limitations of internal control over financial reporting, including the possibility of collusion or improper management override of controls, material misstatements due to error or fraud may not be prevented or detected on a timely basis. Also, projections of any evaluation of the effectiveness of the internal control over financial reporting to future periods are subject to the risk that the controls may become inadequate because of changes in conditions, or that the degree of compliance with the policies or procedures may deteriorate.
In our opinion, the Company maintained, in all material respects, effective internal control over financial reporting as of December 31, 2009, based on the criteria established in Internal Control—Integrated Framework issued by the Committee of Sponsoring Organizations of the Treadway Commission.
We have also audited, in accordance with Canadian generally accepted auditing standards and the standards of the Public Company Accounting Oversight Board (United States), the Consolidated Financial Statements of the Company as of and for the year ended December 31, 2009, and our report dated February 17, 2010, expressed an unqualified opinion on those financial statements and includes a separate report titled Comments by Independent Registered Chartered Accountants on Canada—United States of America Reporting Difference referring to changes in accounting principles that have a material effect on the comparability of the Company’s Consolidated Financial Statements.
(signed) “Deloitte & Touche LLP”
Independent Registered Chartered Accountants
Calgary, Canada
February 17, 2010

| |
|
|
Items 10 and 11: Directors, Executive Officers and Corporate Governance, and Executive Compensation |
|
161 | |
165 | |
166 | |
167 | |
170 | |
172 | |
172 | |
172 | |
174 | |
175 | |
175 | |
175 | |
177 | |
178 | |
179 | |
181 | |
184 | |
186 | |
187 | |
188 | |
190 | |
190 | |
192 | |
193 | |
195 | |
196 | |
199 | |
|
|
200 | |
|
|
Item 13: Certain Relationships and Related Transactions, and Director Independence | 201 |
|
|
201 | |
|
|
| |
|
|
204 |
Directors, Executive Officers and Corporate Governance, and Executive Compensation
According to our Articles, Nexen must have between three and 15 directors. On February 11, 2009, the board set the size at 12 directors effective April 28, 2009.
Our By-Laws provide that directors will be elected at the annual general meeting (AGM) each year and will hold office until their successors are elected.
Name (Age) |
| Principal Occupation |
| Other Directorships |
| Nexen Director |
|
William B. Berry1, 3 (57) |
| Retired oil executive. |
| Willbros Group, Inc. |
| 2008 |
|
Robert G. Bertram1 (65) |
| Retired pension investment executive. |
| Mulvihill Capital Management Funds 2 |
| 2009 |
|
Dennis G. Flanagan (70) |
| Retired oil executive. |
| Canexus Income Fund (Chair) |
| 2000 |
|
S. Barry Jackson1 (57) |
| Retired oil executive. |
| TransCanada Corporation (Chair) TransCanada PipeLines Limited (Chair) WestJet Airlines Ltd. |
| 2001 |
|
Kevin J. Jenkins1, 3 (53) |
| President and Chief Executive Officer of World Vision International. |
| — |
| 1996 |
|
A. Anne McLellan, P.C.1 (59) |
| Counsel with Bennett Jones LLP, Barristers and Solicitors, and Distinguished Scholar in Residence at the University of Alberta in the Institute for United States Policy Studies. |
| Agrium Inc. |
| 2006 |
|
Eric P. Newell, O.C.1 (65) |
| Retired oil executive. |
| — |
| 2004 |
|
Thomas C. O’Neill1, 3 (64) |
| Retired chartered accountant. |
| Adecco S.A. |
| 2002 |
|
Marvin F. Romanow (54) |
| President and CEO of Nexen. Formerly: Executive Vice President and CFO of Nexen. |
| Canexus Income Fund |
| 2009 |
|
Francis M. Saville, Q.C.1 (71) |
| Chair of Nexen. |
| — |
| 1994 |
|
John M. Willson1 (70) |
| Retired mining executive. |
| Finning International Inc. |
| 1996 |
|
Victor J. Zaleschuk4 (66) |
| Retired oil executive. |
| Agrium Inc. |
| 1997 |
|
1 All members of the Audit and Conduct Review (Audit), Corporate Governance and Nominating (Governance), and Compensation and Human Resources (Compensation) Committees are independent. All members of the Audit Committee are independent under additional regulations for audit committee members.
2 An investment management fund organization managing a series of closed end funds listed on the Toronto Stock Exchange. Mr. Bertram is an audit committee member for each of these funds.
3 Financial Experts on Nexen’s Audit Committee.
4 Mr. Zaleschuk was President and CEO of Nexen from 1997 to 2001.
PREVIOUS DIRECTORSHIPS
The information in the following table represents previous directorships held by our directors over the last five years at public and registered investment companies.
Name |
| Company |
Flanagan |
| NAL Oil and Gas Trust |
Jackson |
| Cordero Energy Inc., Resolute Energy Inc., Deer Creek Energy Limited |
Newell |
| Canfor Corporation |
O’Neill |
| Dofasco Inc., Ontario Teachers’ Pension Plan Board |
Saville |
| Mullen Transport Inc. |
Willson |
| Pan American Silver Corp., Harry Winston Diamond Corp. |
EXPERIENCE AND QUALIFICATIONS
The experience and qualifications of our board members contribute to our success. The wealth of knowledge and depth of understanding of their role and our industry has a profound impact on the way we conduct business. The following chart illustrates the expertise that our directors have indicated they possess in each area.
|
| Managing/ |
| International |
| CEO/Senior |
| Exploration |
| Compensation |
| Oil and Gas |
| Governance/ |
| Financial |
| Health, Safety, |
| Diversity |
| Marketing |
|
Berry |
| √ |
| √ |
| √ |
| √ |
| √ |
| √ |
| √ |
| √ |
| √ |
| √ |
|
|
|
Bertram |
| √ |
|
|
|
|
|
|
| √ |
|
|
| √ |
| √ |
|
|
| √ |
|
|
|
Flanagan |
| √ |
| √ |
| √ |
| √ |
| √ |
| √ |
| √ |
| √ |
| √ |
| √ |
|
|
|
Jackson |
| √ |
|
|
| √ |
| √ |
| √ |
| √ |
| √ |
| √ |
| √ |
| √ |
| √ |
|
Jenkins |
| √ |
| √ |
| √ |
|
|
| √ |
|
|
| √ |
| √ |
| √ |
|
|
|
|
|
McLellan |
| √ |
| √ |
| √ |
|
|
|
|
|
|
| √ |
|
|
| √ |
| √ |
|
|
|
Newell |
| √ |
| √ |
| √ |
|
|
| √ |
| √ |
| √ |
| √ |
| √ |
| √ |
|
|
|
O’Neill |
| √ |
| √ |
| √ |
|
|
| √ |
| √ |
| √ |
| √ |
| √ |
| √ |
| √ |
|
Romanow |
| √ |
| √ |
| √ |
| √ |
| √ |
| √ |
| √ |
| √ |
| √ |
| √ |
| √ |
|
Saville |
| √ |
| √ |
| √ |
|
|
| √ |
| √ |
| √ |
|
|
| √ |
| √ |
|
|
|
Willson |
| √ |
| √ |
| √ |
| √ |
| √ |
|
|
| √ |
|
|
| √ |
| √ |
|
|
|
Zaleschuk |
| √ |
| √ |
| √ |
| √ |
| √ |
| √ |
| √ |
| √ |
| √ |
| √ |
| √ |
|
Total |
| 12 |
| 10 |
| 11 |
| 6 |
| 11 |
| 8 |
| 12 |
| 9 |
| 11 |
| 11 |
| 4 |
|
Mr. Berry brings over 35 years of oil and gas exploration experience to his role, including expertise in international affairs from his work overseas and in his capacity as an executive of a global energy company. Mr. Berry has Bachelor and Masters of Science degrees in Petroleum Engineering. Mr. Berry was responsible for understanding the financial reporting of exploration and production and finance managers reported directly to him on a functional basis. This executive level experience and his standing committee membership on the Compensation Committee at Willbros Group, Inc. give him an extensive background in compensation matters.
Mr. Bertram has a proven track record for managing and leading growth as an executive for a large pension fund. He has a Masters of Business Administration, a chartered financial analyst designation and is considered a financial expert with almost 40 years experience in financial roles. As Chair of the Strategic Committee of a leading independent governance analysis and proxy voting firm and a recipient of the ICD.D designation, Mr. Bertram brings considerable knowledge to his role in the areas of governance and board. Mr. Bertram has been involved at the board level of non-public companies and not-for-profit organizations for several years. His standing committee service on these boards and as a
member of our Compensation and Human Resources Committee, provide him with substantial experience on compensation matters.
Mr. Flanagan has been a member of the board for the past 10 years. He brings over 40 years of oil and gas and exploration experience, including several years in senior executive roles, including Chief Financial Officer, Chief Executive Officer and Executive Chair. During his career he was involved in all phases of several overseas projects. Mr. Flanagan’s education and experience in the areas of accounting and finance qualify him as a financial expert. He has served on several standing committees giving him extensive experience in the areas of compensation, governance, board and health, safety, environment and social responsibility issues. Mr. Flanagan brings a diverse background through his international work and varied skills and experience at the board level for both for-profit and not-for-profit sectors.
Mr. Jackson has been a member of the board for the past nine years. He brings over 35 years of oil and gas experience to his role and held several senior executive and board positions, including President and Chair of the Board. In this capacity, he was exposed to a broad range of business issues and developed expertise in marketing, governance and board matters. He has a Bachelor of Science degree in Engineering. Mr. Jackson’s board and standing committee memberships at Nexen and other public companies give him expertise in the areas of compensation, governance and board. Mr. Jackson has been a member of our Compensation Committee and Audit Committee since 2001.
Mr. Jenkins has served as a board member since 1996. He brings a wealth of knowledge and practical experience to his role on the board and standing committees. He received his Bachelor of Laws from the University of Alberta and is a graduate of the Harvard Graduate School of Business Administration. Mr. Jenkins held several senior executive positions in large corporations over the past 25 years and is currently President and Chief Executive Officer of World Vision International. He served as a member of the Finance and Audit Committees for the past 10 years and 11 years, respectively, and has chaired both committees during his tenure. Mr. Jenkins’ education and experience qualify him as a financial expert. He has been an active member of the board and standing committees providing him with extensive experience in the areas of compensation, governance, board and health, safety, environment and social responsibility.
Ms. McLellan brings diverse, senior executive experience to her role through her tenures as a law school professor and associate dean, Deputy Prime Minister of Canada, Attorney General of Canada, Member of Parliament, counsel for a leading Canadian law firm and as a board member of public companies. Ms. McLellan has Bachelor of Arts and Bachelor and Masters of Laws degrees. Her board and standing committee memberships at Nexen and other public companies give her a solid background in the areas of governance, board and safety, health and environment.
Dr. Newell is a proven corporate and community leader. He holds a Masters of Science in Management Studies, is an Officer of the Order of Canada, a member of the Alberta Order of Excellence and has Honorary Doctorates degrees from three Canadian universities and one from the Northern Alberta Institute of Technology. He has also been honoured by many other organizations whose interests lie in business leadership, education, youth development and public policy. Dr. Newell brings several years of oil and gas experience to his role including 14 years as Chief Executive Officer of the world’s largest producer of crude oil from oil sands. Under his leadership, the company became an increasingly significant source of energy supply for the entire nation, and a model of a reliably operated, environmentally efficient, socially responsible corporation. As President of the Alberta Chamber of Resources in the mid 1990s, Dr. Newell was instrumental in developing a comprehensive new energy vision for Canada, which led to the large-scale expansion now underway in the oil sands industry. Dr. Newell’s storied career has given him extensive experience in the areas of compensation and financial acumen.
Mr. O’Neill has a proven track record for managing and leading growth as a senior executive and Chair for a large global accounting firm. Mr. O’Neill has a Bachelor of Commerce degree, is a chartered accountant, a Fellow of the Institute of Chartered Accountants of Ontario and is considered a financial expert with over 40 years experience in financial roles. He worked in Brussels to broaden his international experience and serviced numerous
multinational companies. As a member of the board and standing committee memberships at Nexen and other public companies, he brings a wealth of knowledge to his role in the areas of governance, board, compensation, oil and gas, and marketing.
Mr. Romanow brings a wealth of knowledge and practical experience to his role on the board. He has a Bachelor of Engineering degree, with great distinction, and a Masters of Business Administration. He held several senior executive positions and leadership roles in corporate finance, planning, business development, marketing, exploration and development, and reservoir engineering, and is currently the President and Chief Executive Officer of Nexen. Mr. Romanow has a proven track record for managing and leading growth and was the recipient of Canada’s “CFO of the Year” for 2007 and “Energy Executive of the Year” for 2006. Mr. Romanow’s service on two public boards and one private board and his varied career has given him a solid background in the areas of governance, board, compensation, and health, safety, environment, social responsibility and enabled him to bring a broad, diverse perspective.
Mr. Saville has served as a board member since 1994. His tenure as senior partner and counsel for a large national law firm, leadership roles at the law firm, and over 40 years of energy and environmental regulatory law experience, gives him considerable knowledge and leadership for his role on the board and its standing committees. He has Bachelor of Arts and Bachelor of Laws degrees and is a recipient of the ICD.D designation. Mr. Saville is a recognized leader in corporate governance, and a frequent speaker and author on corporate governance, international and Canadian resources law and on integrity in law, business and government. His past board and standing committee membership on the Governance and Compensation Committee of a public company coupled with his participation on Nexen’s Corporate Governance and Nominating Committee and Compensation and Human Resources Committee for the past 11 years and 7 years, respectively, give him a solid background in the areas of governance, board and compensation. Mr. Saville was Chair of the Governance Committee for four years during this time and has also been a member of the Health, Safety, Environment and Social Responsibility Committee for the past 15 years.
Mr. Willson has served as a board member for the past 13 years and brings a wealth of knowledge and practical experience to his role on the board and standing committees. He was educated in Portugal and England receiving a Masters degree in Mining Engineering. Mr. Willson held several senior executive positions in the mining business over the past 40 years and his work has taken him to Ghana, the United States, Canada and Greenland. He served as a member of the Finance Committee for eight years and has served on the Audit Committee for the past four years, giving him a sound understanding of accounting and financial matters. His board and committee service over the years at Nexen and other public companies, including 10 years on our Compensation Committee—seven years as the Chair, give him a solid background in the areas of governance, board and compensation. Mr. Willson’s career as a mining executive and his participation as a member of the Health, Safety, Environment and Social Responsibility Committee for 10 years has provided him with extensive experience in these areas. He is also the Chair of the Reserves Committee of which he has been a member for the past 10 years.
Mr. Zaleschuk brings over 30 years of oil and gas and financial experience to his role. He has a Bachelor of Commerce degree, is a chartered accountant and held several senior executive positions at global energy companies, including his position as President and Chief Executive Officer of Nexen from 1997 to 2001. These leadership roles provide him with significant knowledge in the areas of finance, exploration and marketing. Mr. Zaleschuk is Chair of the Audit Committee for a public company, Chair of Nexen’s Finance Committee and is considered a financial expert. His board and standing committee memberships at Nexen and other public companies give him a solid background in the areas of governance, board, compensation and health, safety, environment, and social responsibility.
INDEPENDENCE AND BOARD COMMITTEES
The board affirmed director independence under our categorical standards for director independence (categorical standards), which were adopted in 2003 and most recently amended on February 17, 2010. Our categorical standards meet or exceed the requirements in SEC rules and regulations, the Sarbanes-Oxley Act of 2002 (Sarbanes-Oxley), the NYSE rules, National Policy 58-201—Corporate Governance Guidelines, Multilateral Instrument 52-110—Audit Committees, and applicable provisions of National Instrument 51-101—Standards of Disclosure for Oil and Gas Activities.
Mr. Romanow is not independent as he is Nexen’s President and CEO.
Ms. McLellan has been counsel with Bennett Jones LLP (BJ), Barristers and Solicitors, Edmonton, Alberta since June 27, 2006. BJ provided legal services to us in each of the last five years. Legal fees paid to BJ represent less than 6% of all legal fees paid by Nexen in 2009. Ms. McLellan does not solicit or participate in those services, does not receive any fees we pay to BJ, nor is she a partner or an employee of the firm. She is independent under our categorical standards.
Mr. Saville was counsel with Fraser Milner Casgrain LLP (FMC), Barristers and Solicitors, Calgary, Alberta from February 1, 2004 to January 31, 2010. Prior to that time, he was a senior partner of the firm. FMC provided legal services to us in each of the last five years. Mr. Saville does not solicit or participate in those services, does not receive any fees we pay to FMC, nor is he a partner or an employee of the firm. He is independent under our categorical standards.
We have not had an executive committee of the board since July 11, 2000.
|
| Committees (Number of Members) |
| ||||||||||
|
| Audit1, 2 |
| Compensation1 |
| Governance1 |
| Finance1 |
| HSE & SR1 |
| Reserves1 |
|
Management Director—Not Independent |
|
|
|
|
|
|
|
|
|
|
|
|
|
Marvin F. Romanow |
|
|
|
|
|
|
|
|
|
|
|
|
|
Independent Outside Directors |
|
|
|
|
|
|
|
|
|
|
|
|
|
William Berry3 |
| √ |
|
|
|
|
|
|
| √ |
| √ |
|
Robert G. Bertram |
|
|
| √ |
| √ |
| √ |
|
|
|
|
|
Dennis G. Flanagan4 |
|
|
|
|
|
|
| √ |
| √ |
| √ |
|
S. Barry Jackson |
| √ |
| √ |
| Chair |
|
|
|
|
| √ |
|
Kevin J. Jenkins3 |
| √ |
| Chair |
| √ |
| √ |
|
|
|
|
|
A. Anne McLellan, P.C. |
|
|
| √ |
| √ |
| √ |
| √ |
|
|
|
Eric P. Newell, O.C. |
| √ |
|
|
| √ |
|
|
| Chair |
| √ |
|
Thomas C. O’Neill3, 5 |
| Chair |
| √ |
| √ |
|
|
|
|
| √ |
|
Francis M. Saville, Q.C. |
|
|
| √ |
| √ |
| √ |
| √ |
|
|
|
John M. Willson |
| √ |
| √ |
| √ |
|
|
|
|
| Chair |
|
Victor J. Zaleschuk |
|
|
|
|
|
|
| Chair |
| √ |
| √ |
|
1 All members are independent. All Audit Committee members are independent under additional regulatory requirements applicable to them.
2 Experience of the members of the Audit Committee that indicates an understanding of the accounting principles we use to prepare our financial statements is shown on page 166.
3 Audit committee financial expert under US regulatory requirements.
4 Last year, Mr. Flanagan was not regarded as independent because of a family member who was an officer of a company with which Nexen did business beyond the prescribed independence limits. Effective December 15, 2009, this company was acquired and the family member ceased to be an officer. Accordingly, Mr. Flanagan has been independent since that date.
5 The board determined that Mr. O’Neill’s service on the audit committees of four other public companies and one not-for-profit organization does not impair his ability to serve as Chair of Nexen’s Audit Committee. The board considered that Mr. O’Neill has over 30 years of experience as a chartered accountant and, since retiring as Chair of PwC Consulting in 2002, his only business commitments are to the boards and committees on which he serves.
Directors are expected to attend the AGM. All directors were at the 2009 AGM.
Directors strive for attendance at all board and committee meetings and are expected to attend at least 75% of meetings held in the year. In 2009, the board and committee attendance rate averaged 98.5%. The following table shows the number of committee meetings held by each committee during 2009 and the number of sessions held without management.
|
| Sessions Without Management in 2009/Meetings Held |
| ||||
Board/Committee |
| Regular |
| Special |
| Overall |
|
Board |
| 5/5 |
| — |
| 5/5 |
|
Audit Committee |
| 5/5 |
| — |
| 5/5 |
|
Compensation Committee |
| 5/5 |
| — |
| 5/5 |
|
Governance Committee |
| 5/5 |
| — |
| 5/5 |
|
Finance Committee |
| 5/5 |
| — |
| 5/5 |
|
HSE & SR Committee |
| 5/5 |
| — |
| 5/5 |
|
Reserves Committee |
| 3/3 |
| 1/1 |
| 4/4 |
|
Total |
| 33/33 |
| 1/1 |
| 34/34 |
|
AUDIT COMMITTEE FINANCIAL EXPERT EXPERIENCE
Name |
| Berry |
| Jenkins |
| O’Neill |
Experience |
| William Berry, 57, is a retired oil and gas executive. He was formerly Executive Vice President of ConocoPhillips from 2003 to 2008. He also held other senior executive positions with Phillips Petroleum Co., including as Senior Vice President, Exploration and Production. His career in the oil and gas industry began in 1976 and includes experience working in Africa, the North Sea, Asia, Russia, the Caspian Sea and North America.
Mr. Berry has Bachelor and Masters of Science degrees in Petroleum Engineering from Mississippi State University. He was responsible for understanding the financial reporting of exploration and production at ConocoPhillips and had finance managers report directly to him on a functional basis. He held various management roles, including as Manager, Corporate Planning and Budgeting.
He is a director of Willbros Group, Inc. Mr. Berry serves on the Dean’s Advisory Council at Mississippi State University. He also serves on the Advisory Board |
| Kevin Jenkins, 53, is President and Chief Executive Officer of World Vision International. He was formerly a Managing Director of TriWest Capital Partners, an independent private equity firm, from 2003 to 2009. He was President, CEO and a director of The Westaim Corporation from 1996 to 2003. From 1985 to 1996, he held senior executive positions with Canadian Airlines International Ltd. (Canadian). He was elected to serve on Canadian’s Board of Directors in 1987, appointed President in 1991 and appointed President and CEO in 1994.
Mr. Jenkins has a Bachelor’s Degree in Law from the University of Alberta and a Master of Business Administration from Harvard Business School. He has worked in management positions with increasing level of responsibility including Assistant Treasurer, Vice President Finance, Executive Vice President and Chief Financial Officer, and President and CEO. |
| Tom O’Neill, 64, is the retired Chair of PwC Consulting. He was formerly CEO of PwC Consulting, COO of PricewaterhouseCoopers LLP, Global, CEO of PricewaterhouseCoopers LLP, Canada and Chair and CEO of Price Waterhouse Canada. He worked in Brussels in 1975 to broaden his international experience and from 1975 to 1985 was lead partner for numerous multinational companies, specializing in dual Canadian and US listed companies.
Mr. O’Neill has a Bachelor of Commerce Degree from Queen’s University. He received his Chartered Accountant designation in 1970 and was made a Fellow (FCA) of the Institute of Chartered Accountants of Ontario in 1988. He also has an Honorary Doctorate of Law from Queen’s University.
Tom is Chair of BCE Inc., the Vice Chair of Adecco S.A. and a director of Loblaw Companies Limited and The Bank of Nova Scotia. He is a member of the External Audit Committee of the International Monetary Fund. He is also Vice Chair of the Board of Governors of Queen’s University. |
DIRECTOR AND OFFICER LIABILITY INSURANCE
Nexen indemnifies directors and officers to the full extent permitted by law. We maintain a director and officer liability insurance policy. The policy covers costs to defend and settle claims against Nexen’s directors and officers and certain named officers to an annual limit of US$150 million. It includes a US$12.5 million deductible for an indemnifiable occurrence and no deductible for a non-indemnifiable occurrence. The cost of coverage for 2009 was approximately US$951,000. Directors and officers do not pay premiums and no indemnity claims were made or paid in 2009.
DIRECTOR AND OFFICER FIDUCIARY INSURANCE
Nexen maintains a fiduciary liability insurance policy. It covers costs to defend and settle claims against Nexen, our directors, officers and employees for breach of fiduciary duty related to company-sponsored plans, such as pension and savings plans. The policy has an annual limit of US$25 million with a US$2.5 million deductible for an indemnifiable occurrence and no deductible for a non-indemnifiable occurrence. The cost of coverage for 2009 was approximately US$27,600. Directors, officers and employees do not pay premiums and no claims were made or paid in 2009.
LOANS TO DIRECTORS
As set out in the corporate governance policy, we do not make loans to our directors. There are no loans outstanding from Nexen to our directors.
Nexen provides all non-executive directors with a comprehensive compensation package of annual cash retainers, meeting fees and equity-based awards in the form of deferred share units (DSUs). This package provides competitive remuneration for the increasing responsibilities, time commitments and accountability of board members. The CEO is the only management director and he receives no director compensation. Management, the Compensation Committee and the board regularly review the compensation for competitiveness against a peer group of major Canadian-based oil and gas and integrated pipeline companies. This director peer group is a subset of our executive peer group, which focuses on the independent Canadian companies. See pages 173 to 174 for details. Our directors compensation philosophy is consistent with our philosophy for employees, and targets compensation between the 50th and 75th percentile to attract, engage and retain qualified talent to our board.
Non-executive directors may choose certain benefits coverage at Nexen’s expense, including basic life insurance, extended health care, dental, business travel accident insurance and reimbursement of provincial health care premiums (in certain jurisdictions). Mr. Zaleschuk, a former CEO of Nexen, is a retiree in Nexen’s pension plan. His pension benefit is for previous employee service.
Eligible directors may elect to receive all or part of their fees in DSUs. See page 169 for more information on DSUs.
DIRECTOR COMPENSATION TABLE
Name |
| Total |
| DSU |
| All Other |
| Total |
|
Berry |
| 85,900 |
| 124,750 |
| 882 |
| 211,532 |
|
Bertram |
| 85,900 |
| 124,750 |
| 859 |
| 211,509 |
|
Flanagan4 |
| 102,800 |
| 124,750 |
| 145,409 |
| 372,959 |
|
Hentschel5 |
| 38,167 |
| — |
| 2,874 |
| 41,041 |
|
Jackson |
| 119,300 |
| 124,750 |
| 9,906 |
| 253,956 |
|
Jenkins |
| 127,700 |
| 124,750 |
| 9,827 |
| 262,277 |
|
McLellan |
| 119,400 |
| 124,750 |
| 5,559 |
| 249,709 |
|
Newell |
| 122,933 |
| 124,750 |
| 11,845 |
| 259,528 |
|
O’Neill |
| 143,600 |
| 124,750 |
| 9,191 |
| 277,541 |
|
Romanow |
| — |
| — |
| — |
| — |
|
Saville |
| 256,000 |
| 199,600 |
| 9,291 |
| 464,891 |
|
Thomson5 |
| 46,567 |
| — |
| 7,266 |
| 53,833 |
|
Willson |
| 129,200 |
| 124,750 |
| 9,946 |
| 263,896 |
|
Zaleschuk |
| 104,800 |
| 124,750 |
| 7,547 |
| 237,097 |
|
Total |
| 1,482,267 |
| 1,447,100 |
| 230,402 |
| 3,159,769 |
|
1 Includes all retainers, travel allowance and meeting fees, including those paid in DSUs.
2 The grant date fair value of DSUs granted on December 7, 2009, based on the closing market price of Nexen common shares on the TSX on December 4, 2009, of $24.95 per share.
3 The total value of perquisites provided to each non-executive director is less than both $50,000 or 10% of total fees, and is not included in this column. Amounts reflect life insurance premiums paid by Nexen, reinvested dividends earned in 2009 valued at the closing market price of Nexen common shares on the TSX on the payment dates and Canexus fees as set out in note 4.
4 Mr. Flanagan is the Board Chair of Canexus and was paid fees of $84,000, received deferred trust units of Canexus valued at $36,330 and distributions on his trust units of $17,923 in 2009. The total is included in this column.
5 Mr. Hentschel and Mr. Thomson retired from the board on April 28, 2009.
RETAINERS AND FEES
Annual board and committee retainers are paid in quarterly installments and pro-rated for partial service. The same fees are paid for attending meetings in person or by conference call. A travel allowance of $1,500 is paid when a non-executive director travels outside his or her home province or state, or travels more than three hours, round trip, to attend a Nexen meeting or site visit. Nexen also reimburses them for out-of-pocket travel expenses. There were no increases to director retainers or fees approved for 2010.
|
| 2009 |
| 2010 |
|
Board Chair Retainer |
| 250,000 | 1 | 250,000 | 1 |
Board Member Retainer |
| 35,000 |
| 35,000 |
|
Audit Committee Chair Retainer |
| 19,700 |
| 19,700 |
|
Other Committee Chair Retainer |
| 5,300 |
| 5,300 |
|
Committee Member Retainer |
| 9,100 |
| 9,100 |
|
Board and Committee Meeting Fees (per meeting attended) |
| 1,800 |
| 1,800 |
|
1 The Board Chair is paid only this retainer and the travel allowance, where applicable. He does not receive any other retainers or meetings fees.
2009 Retainers and Fees
|
|
|
|
|
| Annual |
|
|
|
|
|
|
|
|
|
|
|
|
| Total Fees |
|
|
| Annual |
| Annual |
| Committee |
| Board |
| Committee |
|
|
|
|
| Total Fees |
| Earned |
| ||
|
| Board |
| Committee |
| Chair |
| Meeting |
| Meeting |
| Travel |
| Total Fees |
| Credited in DSUs1 |
| in Cash |
| ||
Name |
| Retainer |
| Retainers |
| Retainer |
| Fees |
| Fees |
| Allowance |
| Earned |
| $ |
| % |
| ($) |
|
Berry |
| 35,000 |
| 18,200 |
| — |
| 9,000 |
| 16,200 |
| 7,500 |
| 85,900 |
| — |
| — |
| 85,900 |
|
Bertram |
| 35,000 |
| 18,200 |
| — |
| 9,000 |
| 16,200 |
| 7,500 |
| 85,900 |
| 78,400 |
| 91 | % | 7,500 |
|
Flanagan |
| 35,000 |
| 27,300 |
| — |
| 9,000 |
| 27,000 |
| 4,500 |
| 102,800 |
| — |
| — |
| 102,800 |
|
Hentschel2 |
| 11,667 |
| 9,100 |
| — |
| 3,600 |
| 10,800 |
| 3,000 |
| 38,167 |
| — |
| — |
| 38,167 |
|
Jackson |
| 35,000 |
| 36,400 |
| 5,300 |
| 9,000 |
| 30,600 |
| 3,000 |
| 119,300 |
| 116,300 |
| 97 | % | 3,000 |
|
Jenkins |
| 35,000 |
| 36,400 |
| 5,300 |
| 9,000 |
| 36,000 |
| 6,000 |
| 127,700 |
| — |
| — |
| 127,700 |
|
McLellan |
| 35,000 |
| 36,400 |
| — |
| 9,000 |
| 36,000 |
| 3,000 |
| 119,400 |
| 81,400 |
| 68 | % | 38,000 |
|
Newell |
| 35,000 |
| 36,400 |
| 3,533 |
| 9,000 |
| 36,000 |
| 3,000 |
| 122,933 |
| 119,933 |
| 98 | % | 3,000 |
|
O’Neill |
| 35,000 |
| 36,400 |
| 19,700 | 3 | 9,000 |
| 36,000 |
| 7,500 |
| 143,600 |
| — |
| — |
| 143,600 |
|
Romanow |
| — |
| — |
| — |
| — |
| — |
| — |
| — |
| — |
| — |
| — |
|
Saville |
| 250,000 |
| — |
| — |
| — |
| — |
| 6,000 |
| 256,000 |
| — |
| — |
| 256,000 |
|
Thomson2 |
| 11,667 |
| 12,133 |
| 1,767 |
| 3,600 |
| 14,400 |
| 3,000 |
| 46,567 |
| 43,567 |
| 94 | % | 3,000 |
|
Willson |
| 35,000 |
| 36,400 |
| 5,300 |
| 9,000 |
| 36,000 |
| 7,500 |
| 129,200 |
| 121,700 |
| 94 | % | 7,500 |
|
Zaleschuk |
| 35,000 |
| 27,300 |
| 5,300 |
| 9,000 |
| 25,200 |
| 3,000 |
| 104,800 |
| — |
| — |
| 104,800 |
|
Total |
| 623,334 |
| 330,633 |
| 46,200 |
| 97,200 |
| 320,400 |
| 64,500 |
| 1,482,267 |
| 561,300 |
|
|
| 920,967 |
|
1 Details of DSU holdings are set out in the table on page 169.
2 Mr. Hentschel and Mr. Thomson retired from the board on April 28, 2009.
3 Mr. O’Neill is the Audit Committee Chair.
SHARE OWNERSHIP GUIDELINE
One way our directors demonstrate their commitment to Nexen’s success is through share ownership. On February 17, 2010, the board amended the level of the guideline to reflect the change in share value since mid-2008. This results in an ownership requirement of 18,000 shares. Share ownership includes DSUs accumulated from the annual DSU grant and received in lieu of fees. Directors must accumulate these shares or DSUs within three years of their appointment. The amount they are required to own or control is intended to represent at least three times both the base annual board retainer of $35,000 and the value of the base annual DSU grant. The guideline will be reviewed every three years by the Corporate Governance and Nominating Committee to determine if an increase is needed, and compliance with the guidelines will be reviewed annually. New directors will be advised if they are on track to meet the guideline.
New directors, if eligible, are required to take their annual retainer in DSUs until the guideline is met. Eligibility is based on country of residence and Mr. Berry, as a US resident, is not eligible to take his annual retainer in DSUs. If there is an increase in the guideline which results in a director falling out of compliance with the requirement, he or she will have 18 months to meet the threshold again.
All directors appointed prior to January 1, 2007 surpass this guideline and directors appointed in the last three years are on track to meet the guideline.
DEFERRED SHARE UNITS
Nexen has two DSU plans. Under the first plan, eligible directors may elect annually to receive all or part of their fees in DSUs, rather than cash. The second plan was implemented in 2003 and replaced stock options as the equity-based vehicle to align director and shareholder interests.
DSUs provide directors with a stake in Nexen while they serve on the board. DSUs do not have voting rights as there are no shares underlying the plans. A DSU is a bookkeeping entry that tracks the value of one Nexen common share. When cash dividends are paid on our common shares, eligible directors are credited DSUs equal to the dividend. All DSUs vest at the time of grant; however, they accumulate over a director’s term of service and are only paid when the director leaves the board. Then, at Nexen’s option, payments may be made in cash or in Nexen common shares purchased on the open market.
Name |
| DSUs Held as of December 31, 20091 |
|
Berry |
| 10,044 |
|
Bertram |
| 13,335 |
|
Flanagan |
| 40,972 |
|
Jackson |
| 58,644 |
|
Jenkins |
| 54,215 |
|
McLellan |
| 35,766 |
|
Newell |
| 68,546 |
|
O’Neill |
| 51,016 |
|
Romanow |
| — |
|
Saville |
| 54,520 |
|
Willson |
| 58,920 |
|
Zaleschuk |
| 42,756 |
|
1 Number of DSUs has been adjusted to account for Nexen’s share splits that occurred in May 2005 and May 2007.
TOPS EXERCISED OR EXCHANGED AND AWARDS VESTED DURING 2009
In 2009, 111,004 tandem options (TOPs) were exercised or exchanged by non-executive directors and all exercises or exchanges of TOPs occurred within six months of expiry. We ceased awarding TOPs to non-executive directors in 2003. In 2010, all remaining outstanding TOPs held by non-executive directors will reach their expiry periods. Non-executive directors are granted share-based awards under the DSU plan. The DSUs vest at the time of grant. We do not award directors non-equity incentive plan compensation under other long-term incentive plans, as these terms are used in applicable disclosure requirements.
|
| TOPs Awards |
| DSU Awards |
| Non-Equity Annual Incentive |
| ||||
Name |
| Exercised or |
| Value |
| Vested |
| Value Vested |
| Value Earned |
|
Berry |
| — |
| — |
| 5,000 |
| 124,750 |
| — |
|
Bertram |
| — |
| — |
| 5,000 |
| 124,750 |
| — |
|
Flanagan |
| — |
| — |
| 5,000 |
| 124,750 |
| — |
|
Hentschel |
| 40,000 |
| 669,500 |
| — |
| — |
| — |
|
Jackson |
| — |
| — |
| 5,000 |
| 124,750 |
| — |
|
Jenkins |
| — |
| — |
| 5,000 |
| 124,750 |
| — |
|
McLellan |
| — |
| — |
| 5,000 |
| 124,750 |
| — |
|
Newell |
| — |
| — |
| 5,000 |
| 124,750 |
| — |
|
O’Neill |
| — |
| — |
| 5,000 |
| 124,750 |
| — |
|
Saville |
| 11,004 |
| 175,376 |
| 8,000 |
| 199,600 |
| — |
|
Thomson |
| 60,000 |
| 1,050,501 |
| — |
| — |
| — |
|
Willson |
| — |
| — |
| 5,000 |
| 124,750 |
| — |
|
Zaleschuck |
| — |
| — |
| 5,000 |
| 124,750 |
| — |
|
Total |
| 111,004 |
| 1,895,377 |
| 58,000 |
| 1,447,100 |
| — |
|
1 Reflects the closing market price at the time of the exercise or exchange, minus the exercise price, times the number of TOPs exercised or exchanged.
2 Reflects the grant date fair value of DSUs granted on December 7, 2009. Mr. Hentschel and Mr. Thomson were not on the board at the time of grant.
The Compensation Committee assists the board in overseeing key compensation and human resource policies, CEO and executive compensation, and executive management succession and development. The Committee reports to the board, as set out in its mandate, and the board or independent directors give final approval on compensation matters.
All Committee members are independent and knowledgeable in our compensation programs and their long-term implications. Six members are skilled or expert in compensation—expertise most relevant to the Committee’s mandate.
CHANGES TO COMMITTEE MEMBERSHIP IN 2009
Mr. Thomson left the Committee upon his retirement from the board and Mr. Bertram joined in April 2009.
COMMITTEE WORK PLAN / KEY ACTIVITIES IN 2009
The Committee held five meetings and sessions without management present in 2009. Additional meetings are held, when required, to accomplish business objectives and the Committee’s mandate. We have an existing mandate with a 12-month rolling work plan in place for the Committee. The activities of the Committee are managed in the context of a five-year business strategic plan that is reviewed and approved annually by the board. To some extent, the work plan of the committee is structured around compensation activities that occur in the market (e.g. compensation
survey releases) and business activities. The 12-month work plan allows us to effectively deliver the Committee’s responsibilities with the flexibility to respond to market events that may arise from time to time. In reviewing Nexen’s compensation philosophy, the Committee expressly included the assessment of risk in determining compensation policies and practices.
While each meeting agenda is subject to change as business needs arise, the timing of the Committee’s main activities, reviews and recommendations for 2009 are provided in this table.
Agenda Items |
|
|
Approved compensation disclosure and Committee report in the proxy circular Recommended the prior year’s incentive bonus plan pay-out factor Recommended the current year’s bonus performance targets, compensation program and budget Reviewed CEO’s prior year accountabilities, short-term and long-term results, and provided a bonus recommendation to the independent directors of the board Reviewed CEO’s current year objectives and provided a salary recommendation to the independent directors of the board Reviewed executives’ compensation and provided bonus and salary increase recommendations Recommended appointing the new Treasurer and ratification of the appointment of the new Vice President, Corporate Planning and Business Development Reviewed impact of current compensation on change of control agreements |
| February 2009
|
Recommended appointments for the Executive Vice President, Canada and Assistant Secretary positions and reviewed a new executive position of Vice President, Global Exploration Reviewed competitive analysis and design of the annual bonus program |
| April 2009
|
Reviewed competitive analysis and design of the long-term incentive program Recommended appointing the new Senior Vice President, Synthetic Crude Reviewed retention programs for key business initiatives |
| July 2009
|
Reviewed market activity updates and forecasts Reviewed workforce plan Reviewed competitiveness of individual compensation programs and total compensation offering Discussed future introduction of performance features into the long-term incentive plan Reviewed mandate and performance of outside consultant Reviewed say-on-pay policy |
| October 2009
|
Recommended long-term incentive grants Reviewed and recommended Directors’ compensation, including DSU grants Approved revised evaluation framework for annual bonus program Discussed future introduction of performance features into long-term incentive program Reviewed competitive analysis and recommended enhancement of executive share ownership guidelines Reviewed draft CGGG say-on-pay initiative |
| December 2009
|
In camera meetings |
| At each meeting |
SUCCESSION PLAN AND EXECUTIVE DEVELOPMENT
Our succession planning involves a detailed, documented process for identifying and developing successors from our most talented individuals for the CEO, senior management and other positions deemed critical for the success of the company. Each year, the CEO reviews with the Committee the internal talent pool considered for these positions. The Committee assists with candidate selection, development and performance evaluation as well as planning for illness, disability and other unscheduled absences.
OUTSIDE CONSULTANT
The Committee engaged Mercer (Canada) Limited (Mercer) to confidentially report and analyze market data on the compensation of the CEO and a select group of executives, in light of our operations and compensation programs. Mercer also provided other consulting services, as required. The reports included competitive information from a list of peer companies recommended by Mercer. The Committee’s decisions are its responsibility and may reflect factors other than the information and recommendations provided by Mercer and management.
Mercer did not provide compensation consulting services to management in 2009. We participated in compensation surveys in Canada and internationally, and purchased select published results. Management must obtain Committee approval before retaining Mercer for consulting services.
FEES BILLED BY OUTSIDE CONSULTANT (MERCER)
Type of Fee |
| Billed in 2008 |
| Billed in 2009 |
| Percentage of Total |
|
Committee Work—assessment of CEO and executive compensation |
| 58,900 |
| 83,636 |
| 100 | % |
Management Work—consulting services |
| — |
| — |
| — |
|
Total Annual Fees |
| 58,900 |
| 83,636 |
| 100 | % |
EXTERNAL RECOGNITION AND VERIFICATION
We received recognition for our human resources practices during 2009.
· One of the 50 Best Employers in Canada by Hewitt Associates.
· One of the Best Employers for New Canadians and one of Canada’s Best Diversity Employers by Mediacorp Canada Inc.
COMMITTEE APPROVAL
The Committee reviewed and discussed with management the compensation disclosure in this document, including the information in the Directors section (pages 161 to 170), the Compensation Discussion and Analysis section (pages 172 to 183) and the Executive Compensation section (pages 184 to 195). It has recommended to the board that the disclosure be included in the proxy circular and, as appropriate, the Form 10-K.
Submitted on behalf of the Compensation Committee:
Kevin Jenkins, Chair, Robert Bertram, Barry Jackson, Anne McLellan, Tom O’Neill, Francis Saville, John Willson
COMPENSATION COMMITTEE INTERLOCKS AND INSIDER PARTICIPATION
The members of the Compensation Committee are set out on page 165. Mr. Saville and Ms. McLellan had a relationship requiring disclosure, the details of which are set out under “Certain Relationships and Related Transactions, and Director Independence” on page 201. There are no Compensation Committee interlocks during 2009.
COMPENSATION DISCUSSION AND ANALYSIS
Our compensation disclosure complies with the requirements of the Canadian Securities Administrators. As a foreign private issuer listed in the US, we are not required to disclose compensation according to the SEC rules, but we attempt to comply with the spirit of those rules where possible, without compromising required Canadian disclosure.
Our policies and practices for executive compensation are linked to strategic business objectives, which focus on increasing shareholder returns in the long term. Our philosophy is to compensate executives:
· based on performance;
· at a level competitive with our peers; and
· in a manner designed to attract, engage and retain talented leadership focused on managing Nexen’s operations, finances and assets for long-term value creation.
All of our compensation programs are designed to meet pay-for-performance and competitiveness objectives. Actual rewards are directly linked to the results of Nexen. The objective and subjective performance measures are aligned with shareholder interests, and financial and non-financial goals. Measures set each year represent improvements and growth to our operations relative to prior years.
Our programs are responsive to market changes. We aim for simplicity in our compensation programs to help employees understand the value of the various components and how they can contribute to business results. Executive programs are generally consistent with employee programs in the same location. Where certain programs, such as perquisites, are only provided to executives or senior management, they reflect competitive practice and particular business needs and objectives.
ASSESSMENT OF RISK IN COMPENSATION POLICIES AND PRACTICES
Nexen’s compensation policies and practices encourage behaviours which align with the long-term interests of the company and its shareholders. While our programs and practices are not structured to reward excessive risk-taking, we recognize that some level of risk-taking is necessary in order to achieve outcomes in shareholders’ best interests. However, we have a number of mitigating strategies to limit risks within our policies and practices that are described below.
· Total direct compensation for named executive officers (named executives) reflects an appropriate balance between base salary and variable or “at risk” compensation. Typically, 75% of our named executives’ total direct compensation is variable based on company and individual performance with the remaining 25% comprised of base pay; the variable pay portion is greater for the CEO. Approximately 20% of this variable compensation is provided as an annual cash incentive and 80% in long-term incentives. This weighting toward long-term incentives mitigates the risk of encouraging achievement of short-term goals at the expense of long-term sustainability and shareholder value. Refer to page 174 for more detail on the named executives’ pay mix.
· The design of our annual cash incentive program, applicable to all employees, also inherently limits risk. The cash pool available for bonus payments is determined based on a balanced scorecard of measures, including net income, operating cash flow and a combination of other qualitative and quantitative measures. This approach diversifies the risk associated with any one single performance indicator. In addition, the nature of the primary financial measures used in cash pool determination (net income and operating cash flow) effectively ensures the company will have the ability to pay bonuses required under the program. The Compensation Committee exercises a considerable amount of discretion in assessing overall performance and can ensure that bonus payouts are not unduly influenced by an unusual result in any one given area. Finally, the total cash pool available is limited to a maximum of 200% of target.
· Our long-term incentives, applicable to eligible employees, vest over a three year period and have a five year term, thereby enhancing executive (and employee) focus on long-term company success and shareholder interests.
· Compensation levels are benchmarked and scenario tested to ensure a strong pay-for-performance relationship.
· Named executives and other senior leaders are subject to share ownership guidelines, which are described on page 178. In December 2009, ownership requirements were increased and expanded to include a greater number of employees.
BENCHMARK REVIEW
We use third-party compensation surveys to compare our pay levels and practices, including base pay, annual cash incentives and long-term incentives, to our peers. These surveys are used by management to formulate compensation recommendations to the Compensation Committee. We look at Canadian-based oil and gas and integrated pipeline companies with whom we compete for talent. Given similar positions across the industry, the surveys effectively represent competitive pay levels. It should be noted, however, we do not know if our peers benchmark each position. The peer groups are modified over time to reflect: i) geographical location; ii) a particular business line; iii) a more comparable position; or, iv) industry mergers and acquisitions.
Our peer groups are reviewed annually by third-party consultants and the Compensation Committee for continued relevance. In 2009, our executive peer group for named executives based in Canada consisted of the following 16 major oil and gas and integrated pipeline companies:
BP Canada Energy Company | Husky Energy Inc. |
Canadian Natural Resources Limited | Imperial Oil Limited |
Chevron Canada Resources | Petro-Canada |
ConocoPhillips Canada | Shell Canada Limited |
Devon Canada Corporation | Suncor Energy Inc. |
Enbridge Inc. | Syncrude Canada Limited |
EnCana Corporation | Talisman Energy Inc. |
ExxonMobil Canada | TransCanada Corporation |
For the CEO, the peer group is a subset of the 16 peer companies. This peer group focuses on the major Canadian-based and independent oil and gas companies that have more comparable CEO positions. For the Senior VP, US Oil and Gas, market data are based on comparable positions from mid and large cap US oil and gas companies.
COMMITTEE OVERSIGHT
The Compensation Committee reviews all programs to ensure we continue to attract, engage and retain the high-performing employees needed to achieve our business objectives, while demonstrating long-term fiscal responsibility to shareholders.
Our compensation programs include three elements: base salary, annual cash incentive and long-term incentive. At least once a year, we assess the competitiveness of these individual components and the overall compensation levels. Our goal is to provide total compensation for fully-qualified employees between the 50th and 75th percentile of our peers. Top-performing employees will approach the 75th percentile if they continue to accumulate knowledge and experience, which is accompanied by sustained high performance.
KEY ELEMENTS OF COMPENSATION
Element |
| Component |
| Form |
| Performance Period |
Base salary |
| Fixed |
| Cash |
| 1 year |
Annual cash incentive |
| Variable |
| Cash |
| 1 year |
Long-term incentive |
| Variable |
| TOPs and STARs |
| Greater than 1 year |
PAY MIX
The information in the following table represents the percentage of total compensation, excluding benefits, pension and perquisites, averaged over a three year period. Actual pay mix will vary from year to year as our compensation programs are designed to meet both performance and competitiveness objectives. In general, the programs are designed to provide most executive compensation in the form of at-risk pay to ensure alignment with shareholders interests. Base salary provides a competitive foundation considering both internal comparability and external market data. Annual cash incentives reward the delivery of results against objective and subjective measures within a one-year period. Long-term incentives reward Nexen’s sustained performance as seen in share price appreciation. The actual mix between the compensation elements varies, depending on the named executives’ ability to influence short and long-term business results and competitive local market practices.
|
|
|
| At-Risk Compensation |
| ||
Position |
| Base Salary |
| Annual Cash Incentive |
| Long-Term Incentive |
|
CEO |
| 20 | % | 15 | % | 65 | % |
CFO |
| 25 | % | 15 | % | 60 | % |
Executive VPs |
| 25 | % | 15 | % | 60 | % |
Senior VPs |
| 25 | % | 15 | % | 60 | % |

In determining our executives’ base salary, annual cash and long-term incentives, the Compensation Committee considers a comprehensive analysis, including a tally sheet prepared by management with input from an executive compensation consultant. The analysis includes market data for similar positions within the peer group, CEO recommendations for his direct reports, including all of the other named executives, and information on prior year annual cash and long-term incentives. Before approving management’s compensation recommendations, the Committee discusses a variety of potential performance scenarios, including analysis of various annual cash incentive payout factors and the impact of share price variation on our long-term incentive program (i.e. scenario tested). For pension, management provides the Committee with a sensitivity analysis that considers the pension cost implications for each 1% of incremental pensionable earnings.
The Committee reviews the three compensation elements both individually, and in total, to ensure they align with the program objectives. In addition, the Committee retains the services of its own executive compensation consultant, Mercer, to provide external market data and commentary on the relative positioning of executives, particularly the CEO. The Committee then makes recommendations on all executive payments and long-term incentive grants to the board or, in the case of the CEO, the independent directors for approval. Typically, this process begins in the fall and concludes with total compensation being approved the following February.
To determine base salaries, a framework of job levels based on internal comparability and external market data is used. We also consider the individual’s current and sustained performance, skills and potential.
The program provides an opportunity for competitive bonus compensation that reflects Nexen’s overall performance and that of the individual. Consistent with our pay-for-performance philosophy, variable compensation links Nexen’s business results and the named executives’ performance. The decrease in the named executives’ annual cash incentives in 2009 reflects the board’s assessment of our company performance as described below.
2009 ANNUAL INCENTIVE MEASURES
After assessing Nexen’s objective and subjective performance measures, the board, at the recommendation of the Compensation Committee, approves the payout factor. The payout factor determines the cash pool available for annual cash incentives and may range from 0 to 200% of the target incentive opportunity. The factors used were 88% in 2007, 120% in 2008 and 65% in 2009.
2009 Objective Performance Assessment (50%)
These key financial measures are consistent with our annual operating plan. Operating cash flow measures our ability to generate cash from our ongoing operations. It includes taxes and financing costs, but excludes one-time items such as gains on dispositions.
Measure |
| Target |
| Results |
| Results |
| ||
Operating cash flow (25%) |
| $ | 2,706 million |
| $ | 2,215 million |
| 82 | % |
Net income (25%) |
| $ | 852 million |
| $ | 536 million |
| 63 | % |
2009 Subjective Performance Assessment (50%)
The Compensation Committee subjectively considers a combination of quantitative and qualitative measures. The individual measures are not assigned a fixed weighting. This allows the Committee to exercise its discretion and increase or decrease the payout factor when assessing overall performance. Its discretion ensures that the award is not unduly positively or negatively impacted by an unusual result in any one area. The business measures that the Committee considers are commonly used in our industry. They include, among other measures, annual share performance against peers, production volumes, safety and environmental incidents, and reserve-related metrics. The Committee also assesses how costs are managed, including finding and development, operating and administrative. The business measures are assessed against objectives in light of our external environment and current business circumstances, including key projects and initiatives critical to Nexen’s success. The Committee also considers management’s assessment of Nexen’s performance and progress on the strategic plan.
Overall Performance Assessment
If Nexen does not achieve the minimum pre-determined performance level of any component of the objective measures, no allocation will be made for that component in the overall assessment of the payout factor. The Committee’s assessment of the subjective measures could also result in a decrease of the payout factor. Alternatively, exceptional performance in our objective and subjective measures may be rewarded with a 200% payout factor, which is the maximum allowed under the annual incentive plan. Exceptional performance means that we exceeded our objective measure targets by at least 25%. For 2009, the Committee used its discretion and considered that while many of Nexen’s core assets performed well, delays related to the ramp-up of Long Lake and delays at Ettrick in the North Sea had significant impacts on our ability to achieve certain financials and production targets, resulting in a payout factor of 65% for the annual cash incentive program.
Annual Cash Incentive Payout
The cash pool available for annual incentives is allocated to employees and executives based on individual incentive target levels and performance. The targets for individual awards increase as job responsibilities grow so that the ratio of at-risk compensation is greater for higher levels in the organization. Individual performance is assessed by the supervisor and a recommendation is made that reflects performance against pre-determined objectives. Award recommendations for all senior employees are then reviewed by the executive management team. The Compensation Committee assesses the CEO’s performance in the context of predetermined objectives which are described in more detail on pages 186 to 187. The CEO’s final incentive award is approved by the independent directors.
The CEO assesses the performance of the other named executives and discusses the recommendations with the Compensation Committee prior to approval by the board. The actual incentive award received by the individual may be more or less than target level. Typically, annual incentive awards range from 0 to 200% of the target for that position.
2009 ANNUAL INCENTIVE TARGETS1
Position |
| Minimum |
| Target |
| Maximum |
|
CEO |
| 0 | % | 75 | % | 150 | % |
CFO2 |
| 0 | % | 55 | % | 110 | % |
Executive VPs |
| 0 | % | 60 | % | 120 | % |
Senior VPs |
| 0 | % | 45 | % | 90 | % |
1 Reflects percentage of base salary on December 31, 2009.
2 To ensure competitive compensation, the board increased the bonus target from 50% to 55% effective January 1, 2009.
Revised Subjective Performance Assessment
Beginning in 2010, the Committee has adopted a slightly modified framework to evaluate subjective performance for the annual bonus program. Under this framework, the Committee is given the opportunity to assign greater or less emphasis to certain measurement areas depending on the strategic focus for the coming year. The subjective performance assessment will be organized into six key areas of focus outlined below.
Key Performance Area |
| Objective |
Strategic performance and other key initiatives |
| Demonstration of our core growth strategies in action and assessment of various other key initiatives |
Capital efficiency (investment value creation) |
| Creating full cycle value from our capital investments |
Operating efficiency |
| Meeting our shorter-term operational targets |
Competitive assessment |
| Assessing our performance and strategies relative to our industry peers |
How we do business |
| Building and maintaining our social license to operate |
People and talent |
| Ensuring we have the talent and engagement to support our initiatives |
At the end of the annual performance assessment cycle, the Committee will assess company performance with special consideration for the key performance areas previously determined.
REIMBURSEMENT
If, as a result of misconduct, Nexen’s performance results were restated in a way that would have resulted in lower incentive awards, the CEO and CFO would reimburse Nexen proportionately as required by law.
While Nexen is aligned and committed to the US requirements for clawbacks, we are consulting with industry leaders and shareholder advisory groups to better understand the development of clawback policy models in Canada. Identified barriers to implementation include employment law, enforcement and tax issues. Nexen is working to implement a more formal solution that effectively addresses alignment of shareholder and executive interests by ensuring that compensation is not increased as a result of willful misconduct.
There is no inherent connection between base salary levels and Nexen share performance as salary determination is based on market competitiveness and internal relativity, as well as individual performance and potential. There is some correlation between our annual cash incentive program payouts and share performance, as relative share price performance is a measure included in determining the payout factor. In addition, the annual incentive program payout reflects an assessment of overall company performance which is also directly or indirectly assessed by current or potential investors who ultimately determine our share price.
The sharp increase to our share price from 2004 to 2005 partially reflects the company’s strong performance year in 2005 which resulted in a payout factor of 200% for the annual incentive program. Our share price leveled in subsequent years and at the same time our payout factors were reduced to 120% in 2006 and 88% in 2007. At the end of 2008, turbulence in the global financial markets and slumping commodity prices had a significant impact on Nexen’s share price, not unlike that of other public companies. Despite this decline, we achieved record financial results and strong relative share price performance in 2008 leading to a program which exceeded target resulting in a payout factor of 120%. During 2009, we experienced some recovery in our share price. While many of Nexen’s core assets performed well, delays related to the ramp-up of Long Lake and delays at Ettrick in the North Sea had significant impacts on our ability to achieve certain financials and production targets resulting in a payout factor of 65% for the annual cash incentive program.
With respect to our long-term incentive program, a direct correlation exists between our share price performance and the actual gains realized by participating employees. The significant drop in our share price in 2008 resulted in a number of our earlier long-term incentive grants moving into an out-of-the money position offering zero value to
participating employees. Some of the value of these long-term incentive grants has been re-gained with the rise in our share price in 2009, but many outstanding long-term incentive grants remain out of the money. Our long-term incentive plan does not allow for repricing of grants.
The following graph shows the change in a $100 investment in Nexen common shares over the past five years, compared to the S&P/TSX Composite Index, the S&P/TSX Energy Sector Index and the S&P/TSX Oil & Gas Exploration & Production Index as at December 31, 2009. Our common shares are included in each of these indices.
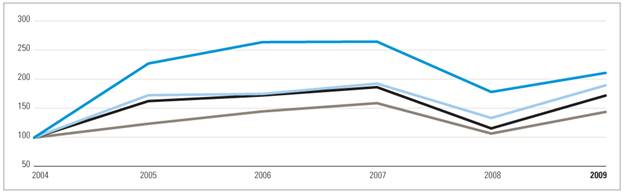
Total Return Index Values1
|
|
| 2004/12 |
| 2005/12 |
| 2006/12 |
| 2007/12 |
| 2008/12 |
| 2009/12 |
|
| Nexen Inc. |
| 100.00 |
| 228.69 |
| 265.80 |
| 266.65 |
| 179.29 |
| 212.36 |
|
| S&P/TSX Oil & Gas Exploration & Production Index |
| 100.00 |
| 173.65 |
| 175.95 |
| 193.77 |
| 134.13 |
| 190.75 |
|
| S&P/TSX Energy Sector Index |
| 100.00 |
| 163.43 |
| 173.34 |
| 187.61 |
| 116.00 |
| 173.00 |
|
| S&P/TSX Composite Index |
| 100.00 |
| 124.13 |
| 145.55 |
| 159.86 |
| 107.10 |
| 144.65 |
|
1 Assuming an investment of $100 and the reinvestment of dividends.
The Compensation Committee reviews a detailed analysis of the total compensation earned by the CEO during his tenure in this role as it relates to shareholder value creation. This analysis includes a comparison of total CEO compensation earned related to the increase in Nexen’s market capitalization, as well as a comparison to the value created in excess of a relevant peer group.
All executives are expected to demonstrate their commitment to Nexen by holding more shares than required under our board-approved guidelines. The guidelines, and compliance with them, are reviewed annually by the Compensation Committee and the board. See page 190 for the current share ownership of each named executive.
In December 2009, the Committee amended the level and scope of the share ownership guidelines to enhance the alignment between all executives and shareholders. The enhanced guidelines include: i) increased levels of share ownership; ii) greater number of employees covered by the guidelines; and iii) removal of the net value of exercisable options or TOPs from the share ownership calculation. Share ownership is limited to shares purchased and held within the Nexen employee savings plan and any other personal holdings. Under these guidelines, there is a specified timeframe for compliance, which is three years from the date of the amendment (December 2009) or five years from the date of their appointment, whichever is later.
Position |
| Required Share Ownership |
CEO |
| 4 times annual salary |
CFO and executive vice presidents |
| 2.5 times annual salary |
Senior vice presidents |
| 2 times annual salary |
Vice presidents and other senior leaders |
| 1 times annual salary |
Nexen’s long-term incentive programs, the TOPs and STARs plans, provide employees with a long-term incentive to sustain high performance, demonstrate commitment to Nexen and, most importantly, align their interests with those of our shareholders. As Nexen’s share price rises, grants increase in value. TOPs or STARs are granted to employees, based on internal organization levels, whose actions can most directly impact our business results. Named executives are granted TOPs, with the exception of the Senior VP, US Oil and Gas who was granted STARs in 2009.
In determining the number of TOPs and STARs to grant each year, Nexen considers the program’s dilutive impact on shareholders and market information on the value of stock options and other forms of long-term incentives. Market information also determines the extent to which employees at different levels participate in the program. The Compensation Committee reviews and recommends TOPs plan amendments for the board to approve. In determining the type of long-term incentives to award, management and the Compensation Committee also consider alternative long-term incentive programs used by our peers. As a result of a regular review of the competitiveness and design of our long-term incentive plans, in 2009 the Compensation Committee approved introducing a performance-based long-term incentive vehicle for implementation in 2010. This incentive vehicle will be introduced only for those employees who are critical to the strategic success of the company (senior management level and above) with 25% of the TOPs or STARs granted to these employees to include a performance vesting feature. The number of performance-based TOPs or STARs that vest for payout will be subject to the attainment of market, operational and/or financial performance measures. The specific performance range(s) will be ultimately determined by the Committee at the time of each annual grant.
TOPS PLAN
Our TOPs plan has been in place since 2004. It allows employees to either:
· exchange their vested TOPs for a cash payment equal to the difference between the exercise price and the closing market price of our common shares on the date the TOPs are exchanged; or
· exercise their TOPs for shares upon payment of the exercise price. Nexen common shares are issued for TOPs on a one-for-one basis.
When employees exchange their TOPs for cash: i) no shares are issued, which prevents further shareholder dilution over time; and, ii) Nexen receives a Canadian income tax deduction.
2009 TOPs Plan Exercises and Exchanges
Total Exercised |
| Exercised |
| Exchanged |
|
5,262,226 |
| 1,145,756 (22% | ) | 4,116,470 (78%) |
|
TOPs do not provide employees with the right to vote the underlying shares. The TOPs plan is Nexen’s only equity-based compensation arrangement.
The board, on the recommendation of the Compensation Committee, may grant TOPs to Nexen officers and employees. TOPs granted before February 2001 have a term of ten years; 20% of the grant vested after six months and 20% vested each year for four years on the grant’s anniversary. TOPs granted after February 2001 have a term of five years and vest one-third each year for three years. The board has the discretion to set vesting periods within the five-year term.
Generally, if a change of control event occurs (as defined in the TOPs plan), all issued but unvested options will vest.
STARs PLAN
The STARs plan, introduced in 2001, provides a cash payment to participants equal to the appreciation in Nexen’s share price between the date the STARs are granted and the date they are exercised. STARs are typically granted to participating employees below mid-level department manager in Canada and to all levels of participating employees in the US and UK. They have a five-year term and vest one-third each year for three years.
GRANT DATE AND EXERCISE PRICE
TOPs and STARs are granted during the annual grant process and at the time of hiring key positions. Since 1998, the annual grants have been approved at the December board meeting. According to our plans, the CEO can approve grants to key new hires, and typically, they occur shortly after the hire date. Under the plans, the exercise price is the closing market price of Nexen’s common shares on the relevant stock exchange (TSX for Canadian-based employees or NYSE for US-based employees) on the day before the grant is approved. Accordingly, backdating is not allowed. Nexen’s grants are intentionally timed so that they do not occur immediately prior to the release of material information (i.e. spring-loaded). The exercise price of existing TOPs or STARs may not be reduced except for automatic adjustments, such as a share split, or according to TSX rules. Accordingly, repricing is not allowed.
OPTIONS OUTSTANDING AND SHARES RESERVED FOR ISSUE
We limit the combined annual grants of TOPs and STARs (even though STARs are not dilutive) to less than 2% of total outstanding shares (on a non-diluted basis). The total TOPs granted, plus shares reserved for future issue under equity-based compensation programs, will not exceed 10% of our total outstanding shares (on a non-diluted basis). Since the inception of the TOPs plan in 2004 through December 31, 2009, 11,126,192 TOPs have been exercised for common shares. This represents a dilution of 2.13%.
GRANTS IN THE LAST THREE YEARS
Our 2009 long-term incentives recognized employees for future potential within Nexen, sustained high performance and retention risk. The TOPs granted in 2009 represent 0.83% of total outstanding shares.
Year |
| Granted to |
| Granted |
| Percentage of Employees |
| Total Number |
|
TOPs |
|
|
|
|
|
|
|
|
|
2009 |
| 1,772,000 |
| 2,577,700 |
| 5 | % | 4,349,700 |
|
2008 |
| 1,526,000 |
| 2,008,100 |
| 6 | % | 3,534,100 |
|
2007 |
| 1,735,000 |
| 2,272,100 |
| 7 | % | 4,007,100 |
|
STARs |
|
|
|
|
|
|
|
|
|
2009 |
| 100,000 |
| 5,172,500 |
| 46 | % | 5,272,500 |
|
2008 |
| — |
| 4,917,200 |
| 53 | % | 4,917,200 |
|
2007 |
| — |
| 4,194,600 |
| 54 | % | 4,194,600 |
|
Our benefit and pension plans support the health and well-being of our employees and encourage retirement savings. The plans are reviewed periodically to ensure they remain competitive and continue to meet our objectives. Market survey data is reviewed to ensure the plans provide benefits between the 50th and 75th percentile of plans within our peer group. Named executives participate in the same plans provided to all employees in the same location.
Disclosure in this document is specific to the Canadian and US plans in which the named executives participate. Nexen provides a variety of other benefit and pension plans outside of North America that reflect local market practices.
HEALTH AND WELFARE BENEFITS
Our benefit plans are designed to help protect employees’ health and that of their dependants, and help cover them in the event of disability or death. Under the flexible benefit plans, employees choose the level of coverage that best fits their needs. Those who select enhanced coverage levels are required to contribute to the cost of that coverage.
EMPLOYEE SAVINGS PLAN
To help employees save for their future and encourage ownership in the company, Nexen provides the incentive and opportunity to accumulate savings through an employee savings plan. In the plan, all eligible Canadian employees may contribute, through payroll deduction, any percentage of their base salary to purchase Nexen common shares, mutual fund units or a combination of both. Nexen matches employee contributions up to 6% of base salary, depending on the investment option and how long the employee has participated in the plan. Nexen contributions are invested in our common shares purchased on the open market and vest immediately. All contributions may be allocated to registered or non-registered accounts. Employees may vote the Nexen common shares they hold in the employee savings plan.
For US-based employees, savings plan benefits are a component of the US defined contribution pension plan described on page 182.
FLOW-THROUGH SHARES
Named executives are able to participate in our internal offerings of Nexen flow-through shares, which are periodically made available to all employees resident in Canada. Flow-through shares are a tax effective vehicle which provide an additional opportunity to invest in the future of Nexen.
DEFINED BENEFIT PENSION PLAN
Canadian employees of Nexen elect, upon hire, to participate in either the defined contribution pension plan or the defined benefit pension plan, both of which are registered. All Canadian-based named executives participated in the defined benefit pension plan in 2009. Features of the defined benefit pension plan are:
· participant contributions at 3% of their regular gross earnings (up to an annual plan maximum);
· retirement benefits at 1.8% (1.7% for years prior to 2005) of their average earnings for the 36 highest-paid consecutive months during the 10 years before retirement, multiplied by the years of credited service;
· plan participants may annually elect to increase their defined benefit accrual formula from 1.8% to 2%. Employees electing this option must contribute an additional 2% of pensionable earnings up to an allowable maximum under the Canadian Income Tax Act. The maximum employee contribution allowed in 2009 was $11,700;
· integration with Canada Pension Plan (CPP) to provide a maximum offset of one-half of the current CPP benefit, pro-rated by years of credited service to a maximum of 35 years;
· members who retire after 10 years of service are eligible for an early retirement benefit at age 55 with a 4% reduction per year of early retirement for each year that benefits commence prior to age 60; and
· ability for participants to periodically switch prospectively between the defined benefit pension plan and defined contribution pension plan at different stages in their career.
Benefits on retirement are generally paid monthly for the life of the retiree, subject to standard payment elections. The normal form of benefit paid is a joint life and survivor benefit with a five-year guarantee. If elected, it is payable for the participant’s lifetime and provides the spouse with a survivor benefit of 662⁄3% of the monthly payment. If the participant dies before receiving 60 monthly payments, the five-year guarantee allows the surviving spouse to receive the balance of the 60 monthly payments first and then the reduced survivor pension of 662⁄3%.
Pension benefits earned prior to January 1, 1993 may be indexed at the discretion of management’s pension committee, considering increases in the consumer price index. Pension benefits earned after December 31, 1992 are indexed annually between 0 and 5% based on the greater of:
· 75% of the increase in the consumer price index, less 1%; and
· 25% of the increase in the consumer price index.
Pension Benefit Obligation
At December 31, 2009, as indicated in the notes to our Consolidated Financial Statements, the:
· registered defined benefit pension plan’s accumulated benefit obligation (the projected benefit obligation, excluding future salary increases) was $211 million, which includes all active and inactive plan participants; and
· projected defined benefit obligation was $243 million.
The projected benefit obligation is an accounting-based value of the contractual entitlements that will change over time. The method used to determine this estimate will not be identical to those used by others and, as a result, the estimate may not be directly comparable across companies. The key assumptions used for the projected benefit obligation were:
· a discount rate of 6.5% per year as at December 31, 2008;
· a discount rate of 6.0% per year as at December 31, 2009;
· a long-term compensation rate increase of 4% per year; and
· an assumed rate of inflation of 2.5% per year.
To enhance the funded status of the registered defined benefit pension plan, we contributed $52 million in special payments to the plan in 2009. As of December 31, 2009, the plan had a $21 million surplus.
DEFINED CONTRIBUTION PENSION PLAN (US)
Under this qualified retirement plan, Nexen provides participants with a profit sharing contribution equal to 6% of eligible compensation up to the Social Security taxable wage base and 11.5% of eligible compensation that exceeds the Social Security taxable wage base. For 2009, the maximum profit sharing contribution under the plan was $22,301. In addition, a matching contribution equal to 100% of employee contributions, to a maximum of 6% of eligible compensation, is also available under the plan. Mr. Reinsborough defers compensation and receives an employer matching contribution to the full extent available under the plan.
The profit sharing contributions are subject to a two year vesting schedule while the matching contributions vest immediately. Investment decisions are made by the plan participant from a variety of investment options. The plan is intended to be an Employee Retirement Income Security Act (ERISA) 404(c) plan. One named executive (Mr. Reinsborough) participated in the plan during 2009.
NON-QUALIFIED RESTORATION PLAN (US)
This plan is intended to be an unfunded and non-qualified deferred compensation arrangement that provides deferred compensation benefits to a select group of management or highly compensated employees. The plan is established and maintained for the purpose of providing benefits in excess of applicable legislative limits. The plan complies with Section 409A of the Internal Revenue Code.
Under the plan provisions, a maximum of 50% of base salary and 100% of annual cash incentives may be deferred. Elections for the future distribution of benefits are required to be entered into upon the date of plan participation. Any changes to distribution or deferral elections must be compliant with Section 409A of the Internal Revenue Code. Investment decisions are made by the plan participant from a variety of investment options. During 2009, there were no distributions of assets to Mr. Reinsborough.
EXECUTIVE BENEFIT PLAN
The executive benefit plan is available to all Canadian employees. It provides supplemental retirement benefits for either defined benefit or defined contribution participants who have earned a retirement benefit in excess of the statutory limits, which varies by employees’ pension elections. This allows employees to fully accrue a pension that is aligned with their earnings level and is competitive within our market. For defined benefit plan participants, any supplemental benefits will accrue and be paid monthly in a similar manner to the underlying defined benefit pension plan set out above on pages 181 to 182. For executives, the average of the annual cash incentive payments during the last three years of plan participation are included for benefit accrual purposes, based on the lesser of target bonus or actual bonus paid.
Pension Benefit Obligation
At December 31, 2009, as indicated in the notes to our Consolidated Financial Statements, the:
· projected benefit obligation for the executive benefit plan was $76 million (which, consistent with accounting standards, includes an assumption for future salary increases) for all active and inactive plan participants; and
· accumulated benefit obligation (the projected benefit obligation, excluding future salary increases) for the defined benefit plan was $65 million.
The key assumptions used for determining the projected benefit obligation under the executive benefit plan are the same as those used for the registered pension plan.
As of January 1, 2005, the executive benefit plan was amended to provide a supplemental pension allocation for defined contribution pension plan participants who are impacted by annual statutory contribution limits. In 2009, the sum of all supplemental allocations for eligible participants was $42,276 and is estimated to be $45,000 in 2010.
Pension Benefit Security
The pension expense for the executive benefit plan is accounted for annually. Benefits are paid from Nexen’s cash flows and reduce the related pension liability. As liabilities under this plan are unfunded, a level of protection is provided to participants through an irrevocable letter of credit. The letter of credit allows the plan to turn to the issuing bank for funding the pension obligation if the company fails to meet its obligations. The cost of obtaining the letter of credit in 2009 for all plan participants was $1,368,230.
RETIREMENT BENEFITS
All Nexen retirees are provided with retirement benefits that consist of a $5,000 life insurance policy and reimbursement for provincial health care premiums, if applicable.
LOANS TO OFFICERS
As set out in the corporate governance policy, we do not make loans to officers. There are no loans outstanding from Nexen to any of its officers.
The board determines the term of office for each executive officer. Below are Nexen’s executive officers and significant employees, including prior offices and non-executive positions for each of them during the past five years. Start dates with Nexen are indicated for officer and other significant employee positions.
Officer (Age) |
| Current and Past Position(s) |
| Effective Date of |
| Executive |
|
Marvin F. Romanow (54) |
| President and CEO and a director. Formerly: Executive VP and CFO since June 1, 2001. |
| January 1, 2009 |
| 1997 |
|
Kevin J. Reinhart (51) |
| Senior VP and CFO. Formerly: Senior VP, Corporate Planning and Business Development since November 1, 2007. Formerly: VP, Corporate Planning and Business Development since July 11, 2002. |
| January 1, 2009 |
| 1994 |
|
Gary H. Nieuwenburg (51) |
| Executive VP, Canada. Formerly: Senior VP, Synthetic Crude since November 1, 2007; VP, Synthetic Crude since July 11, 2002. |
| May 1, 2009 |
| 2001 |
|
James T. Arnold (50) |
| Senior VP, Synthetic Crude. Formerly: Division VP Operations and Projects, Synthetic Oil since February 1, 2009; Chief Operating Officer at OPTI Canada Inc. since October 13, 2005; VP, Development at OPTI Canada Inc. since January 1, 2000. |
| July 16, 2009 |
| 2009 |
|
Brian C. Reinsborough (48) |
| Senior VP, United States Oil and Gas. Formerly: Division VP, Exploration, Operations and Production since May 12, 2006; Division VP, Exploration since July 8, 2002. |
| November 1, 2007 |
| 2007 |
|
Catherine J. Hughes (47) |
| VP, Operational Services, Technology and Human Resources. Formerly: Division VP, Operational Services, Technology and Human Resources since December 1, 2009; Division VP, Operational Services and Technology since September 1, 2009; VP Oil Sands at Husky Oil Operations Ltd. since October 1, 2007; VP Exploration and Production Services at Husky Oil Operations Ltd. since September 1, 2005; President at Schlumberger Canada Ltd. since February 1, 2001. |
| February 17, 2010 |
| 2010 |
|
Kim D. McKenzie (61) |
| VP and Chief Information Officer. Formerly: Division VP, Information Technology since January 1, 1992. |
| November 1, 2007 |
| 2007 |
|
Kevin J. McLachlan (46) |
| VP, Global Exploration. Formerly: Division VP, Global Exploration since July 1, 2009; Division VP, International Exploration since August 1, 2008; Manager, Exploration, since January 1, 2006; East Coast Exploration Manager at Imperial Oil Resources since April 1, 2005; Planning Manager at ExxonMobil Canada West, Production, since June 1, 2004. |
| February 17, 2010 |
| 2010 |
|
Eric B. Miller (47) |
| VP, General Counsel and Secretary. Formerly: Division VP and Chief Legal Counsel since July 1, 2006; Division VP, Legal Canadian Oil and Gas since March 1, 2002. |
| July 11, 2007 |
| 2007 |
|
Una M. Power (45) |
| VP, Corporate Planning and Business Development. Formerly: Treasurer since July 11, 2002. |
| January 16, 2009 |
| 1998 |
|
Brendon T. Muller (41) |
| Controller. Formerly: Manager, Corporate External Reporting since November 1, 2003. |
| April 9, 2007 |
| 2007 |
|
J. Michael Backus (39) |
| Treasurer. Formerly: Manager, Planning, Synthetic Crude since January 1, 2009; Project Planner—Phase 2 Long Lake, Synthetic Crude since April 1, 2005; Analyst, Investor Relations and Corporate Communications since April 1, 2003. |
| February 16, 2009 |
| 2009 |
|
Richard G. Jensen (56) |
| Chief Operating Officer, International Operations. Formerly: Division VP, International Production and Development since December 1, 2005; Division VP, International Production and Operations since October 1, 2004. |
| July 1, 2008 |
| 20081 |
|
1 While he is not an executive officer, he is an employee who is expected to make significant contributions to the business of Nexen and, therefore, is considered a significant employee.
COMPENSATION EXCHANGE RATE
The exchange rate used to convert US dollars to Canadian dollars is the 2009 average rate of 1.1568. Unless otherwise noted, all figures are in Canadian dollars.
SHARE SPLITS
All grant prices and numbers granted have been adjusted to account for the May 2005 and May 2007 share splits.
SUMMARY COMPENSATION TABLE
To determine the next three highest paid officers after the CEO and CFO, we total their salary, estimated option-based award value, non-equity incentive plan compensation and all other compensation as shown below. Grants of TOPs and STARs are considered option-based awards under applicable disclosure requirements. We do not award share-based awards or non-equity incentive plan compensation under long-term incentive plans, as these terms are used in applicable disclosure requirements.
|
|
|
|
|
| Option-Based |
|
|
|
|
|
|
|
|
| ||
|
|
|
|
|
| TOPs/ |
| Estimated |
| Non-Equity |
|
|
|
|
|
|
|
|
|
|
|
|
| STARs |
| TOPs/ |
| Annual Incentive |
|
|
|
|
|
|
|
Name and |
|
|
|
|
| Awards1 |
| STARs |
| Plan |
| Pension |
| All Other |
| Total |
|
Principal Position |
| Year |
| Salary |
| (#) |
| Value2 |
| Compensation3, 4 |
| Value5 |
| Compensation6 |
| Compensation |
|
|
|
|
|
|
|
|
|
|
|
|
|
|
|
|
|
|
|
Marvin F. Romanow,7 |
| 2009 |
| 1,100,000 |
| 550,000 |
| 5,351,775 |
| 429,000 |
| 3,949,300 |
| 179,978 |
| 11,010,053 |
|
President and CEO |
| 2008 |
| 601,250 |
| 475,000 |
| 2,747,514 | 8 | 700,000 |
| 317,800 |
| 119,016 |
| 4,485,580 |
|
|
| 2007 |
| 566,250 |
| 180,000 |
| 1,533,060 |
| 330,000 |
| 323,300 |
| 118,150 |
| 2,870,760 |
|
|
|
|
|
|
|
|
|
|
|
|
|
|
|
|
|
|
|
Kevin J. Reinhart,9 |
| 2009 |
| 440,000 |
| 150,000 |
| 1,459,575 |
| 175,000 |
| 381,300 |
| 124,438 |
| 2,580,313 |
|
Senior VP and CFO |
| 2008 |
| 365,000 |
| 130,000 |
| 733,964 | 10 | 300,000 |
| 128,800 |
| 104,582 |
| 1,632,346 |
|
|
| 2007 |
| 332,833 |
| 80,000 |
| 681,360 |
| 132,000 |
| 190,300 |
| 103,922 |
| 1,440,415 |
|
|
|
|
|
|
|
|
|
|
|
|
|
|
|
|
|
|
|
Gary H. Nieuwenburg, |
| 2009 |
| 474,000 |
| 220,000 |
| 2,097,225 | 11 | 156,000 |
| 624,300 |
| 56,552 |
| 3,408,077 |
|
Executive VP, |
| 2008 |
| 416,500 |
| 100,000 |
| 542,080 |
| 365,000 |
| 141,800 |
| 52,670 |
| 1,518,050 |
|
Canada |
| 2007 |
| 360,667 |
| 100,000 |
| 851,700 |
| 191,000 |
| 267,300 |
| 48,775 |
| 1,719,442 |
|
|
|
|
|
|
|
|
|
|
|
|
|
|
|
|
|
|
|
James T. Arnold, |
| 2009 |
| 375,833 |
| 170,000 |
| 1,402,206 | 12 | 99,000 |
| 87,300 |
| 238,747 | 13 | 2,203,086 |
|
Senior VP, |
| 2008 |
| — |
| — |
| — |
| — |
| — |
| — |
| — |
|
Synthetic Crude |
| 2007 |
| — |
| — |
| — |
| — |
| — |
| — |
| — |
|
|
|
|
|
|
|
|
|
|
|
|
|
|
|
|
|
|
|
Brian C. Reinsborough,14 |
| 2009 |
| 416,453 |
| 100,000 |
| 1,069,242 |
| 113,368 |
| 87,636 |
| 35,466 |
| 1,722,165 |
|
Senior VP, |
| 2008 |
| 392,774 |
| 70,000 |
| 317,578 |
| 218,527 |
| 77,589 |
| 29,342 |
| 1,035,810 |
|
US Oil and Gas |
| 2007 |
| 324,465 |
| 70,000 |
| 641,015 |
| 130,052 |
| 63,793 |
| 27,979 |
| 1,187,304 |
|
1 All named executives were granted TOPs in 2009 with the exception of Mr. Reinsborough who received STARs.
2 Reflects the estimated fair value under the Black-Scholes pricing model of TOPs granted in the year. The key assumptions of this valuation include current market price of Nexen’s stock, exercise price of the option, option term, risk-free interest rate, turnover, dividend yield of stock and volatility of stock return. The actual value realized will depend on the Nexen share price at the time of exercise. The accounting fair value is calculated using the intrinsic value method, which is the difference between the current market price of the stock and the exercise price of the option. The difference between these valuation methods is the TOPs value included in this column as the intrinsic value was nil at year end. Management’s consultant provides the annual Black-Scholes value. There were no amendments to the exercise price of TOPs in 2009.
3 Reflects the value of awards earned in each year under Nexen’s annual cash incentive program. The awards are paid in the following calendar year based on their salary on December 31 of the previous year.
4 For Mr. Romanow, Mr. Reinhart and Mr. Nieuwenburg, includes discretionary recognition in 2008 for the acquisition of an additional interest in Long Lake from OPTI.
5 Represents the current service cost, plus changes in compensation in excess of actuarial assumptions, less required member contributions to plan. Mr. Reinsborough’s value represents the sum of company-provided contributions to the US qualified and non-qualified retirement plans.
6 The total value of the perquisites portion of All Other Compensation provided to each named executive is less than $50,000 and less than 10% of their annual salary. See the All Other Compensation table on page 192 for details of these amounts.
7 Mr. Romanow is a director of Canexus and was paid fees of $34,000, received notional deferred trust units of Canexus valued at $25,950 and distributions on his trust units of $11,290 in 2009. In 2008, he was paid fees of $34,000, received notional deferred trust units of Canexus valued at $15,600 and distributions on his trust units of $6,399. In 2007, he was paid fees of $32,500, received notional deferred trust units of Canexus valued at $19,560 and distributions on his trust units of $5,280. These amounts are included in the All Other Compensation table on page 192.
8 Reflects Mr. Romanow’s annual grant of 180,000 TOPs on December 8, 2008 with a grant date fair value of $975,744, and a grant of $295,000 TOPs he received upon appointment as President and CEO in January 2009 with a grant date fair value of $1,771,770.
9 Mr. Reinhart is a director of Canexus and was paid fees of $34,000, received notional deferred trust units of Canexus values at $25,950 and distributions on his trust units of $11,290 in 2009. In 2008, he was paid fees of $34,000, received notional deferred trust units valued at $15,600 and distributions on his trust units of $6,399. In 2007, he was paid fees of $32,500, received notional deferred trust units valued at $19,560 and distributions on his trust units of $5,280. These amounts are included in the All Other Compensation table on page 192.
10 Reflects Mr. Reinhart’s annual grant of 80,000 TOPs on December 8, 2008 with a grant date fair value of $433,664, and a grant of 50,000 TOPs he received upon appointment as Senior VP and CFO in January 2009 with a grant date fair value of $300,300.
11 Reflects Mr. Nieuwenburg’s annual grant of 170,000 TOPs on December 7, 2009 with a grant date fair value of $1,654,185, and a grant of 50,000 TOPs he received upon appointment as Executive VP, Canada in May 2009 with a grant date fair value of $443,040.
12 Reflects Mr. Arnold’s annual grant of 100,000 TOPs on December 7, 2009 with a grant date fair value of $973,050, and a grant of 70,000 TOPs he received upon hire in February 2009 with a grant date fair value of $429,156.
13 Mr. Arnold received a $200,000 special bonus upon hire.
14 Mr. Reinsborough’s compensation has been converted from US to Canadian dollars using the average exchange rate for the applicable year; 1.1568 in 2009, 1.0660 in 2008 and 1.0748 in 2007.
CHANGES IN COMPENSATION ARRANGEMENTS IN 2009
We did not introduce any new compensation or benefit program in 2009 for Nexen’s named executives.
The compensation paid to named executives in 2009 is consistent with our philosophy and objectives of targeting total compensation between the 50th and 75th percentile as detailed on pages 172 to 174.
CHANGES IN PENSION OBLIGATIONS
The Summary Compensation Table pension value reflects the current service cost, less required member contributions to the plan, plus any changes in obligations resulting from compensation increases in excess of actuarial assumptions. Actual compensation changes may vary from the assumed rate of compensation increase and will vary among each executive from year to year. These values differ from the termination values reported under the change of control agreements on pages 194 to 195, which disclose additional lump sum pension benefits provided if a change of control occurs.
CEO COMPENSATION AND 2009 OBJECTIVES AND ACHIEVEMENTS
The CEO’s responsibility is to provide leadership in setting and achieving goals that create value for our shareholders in the short and long term. Mr. Romanow’s 2009 annual cash incentive award was based on the corporate results described on pages 175 to 176, which determined the total cash available for the awards. Cash incentive awards are determined from the available pool and distributed to individuals based on specific annual goals. Based on the board’s assessment of Mr. Romanow’s achievement of objectives, and their assessment of his contribution to continued shareholder value growth and strategic plan execution, he was awarded an annual cash incentive of $429,000, which is his target bonus times 52%. Mr. Romanow’s objectives for 2009 are outlined below, along with a summary of achievements in each area.
Executing our strategies
In 2009, Mr. Romanow met this objective by refocusing on our key growth strategies, taking steps to streamline our portfolio and ensuring that our core assets continued to perform well.
Our key growth strategies progressed well during 2009.
· At Long Lake, we demonstrated that our technology works. The gasifier and upgrader are now producing the highest quality synthetic crude in North America. We acquired an additional 15% of the project at 60% of sunk costs and assumed operatorship of the upgrader.
· We achieved exploration success in the North Sea and offshore West Africa which positions us well for future years. We also were successful in bringing new production on stream in the North Sea and the Gulf of Mexico and in advancing development of Usan, offshore West Africa.
· Significant progress was made in our shale gas business by realizing significant cost savings and productivity improvements through industry-leading completions.
Enhancing financial capacity and maintaining ample liquidity
Our long standing belief in maintaining ample liquidity and financing long-term assets with long-term debt meant that we were well positioned when the economic recession started. As a result, we did not overreact to the situation but continued to focus on advancing our core strategies with a prudent capital program and ongoing cost management practices. Our crude oil put protection program provided us with protection against falling oil prices without limiting our upside when prices rebounded.
In July 2009, in the midst of ongoing market volatility, we successfully executed a US$1 billion bond issue to enhance our liquidity. We generated strong operating cash flows during the year which, together with financing from our long-term credit facilities, were used to fund the purchase of the Long Lake acquisition and our 2009 capital investment program.
Managing physical assets to achieve a balance of short-term returns and long-term sustainability.
Under Mr. Romanow’s direction, we achieved strong performance in our core assets including the UK, US, Yemen, Canada and Colombia. While major milestones were achieved at Long Lake, challenges were encountered that delayed the ramp up of the project. Difficulty in achieving consistent steam production necessitated a turnaround in September, which has since improved plant reliability and production.
Attracting and retaining people to enhance our execution capabilities.
We maintained a strong corporate culture under Mr. Romanow’s leadership and has seen an increase in employee engagement during the past year as measured by external benchmarking. Mr. Romanow also focused on attracting world-class talent to our organization by hiring experienced senior professionals with expertise in oil sands, shale gas and deep water exploration.
Achieving operational excellence and strong returns from capital investment.
Mr. Romanow led initiatives which resulted in excellence in safety performance, and operating and capital cost savings throughout the business. In this context, our core producing assets continued to deliver strong performance. Our capital investment program delivered strong results with proved reserve additions that were double our annual production (before royalties and the adoption of the new SEC reserves rules).
Ensuring Nexen’s continuing leadership position in “how we do business”.
We remain fully committed to the highest standards of governance, integrity and social responsibility. Mr. Romanow’s personal involvement with our various initiatives ensures these programs have broad visibility and are embedded into our corporate culture.
In 2009, the Compensation Committee reviewed look-back information and analyzed Mr. Romanow’s total pay and shareholder value created from the date he became CEO. In the analysis, dollar values were assigned and tallied for each compensation component including salary, annual cash incentives, TOPs awards, benefits, pension and potential payments on change of control. The Committee reviewed his total compensation relative to Nexen’s market capitalization and that of industry peers for the CEO position.
|
| 2009 |
|
Cash |
|
|
|
Base Salary |
| 1,100,000 |
|
Annual Cash Incentive |
| 429,000 |
|
Equity |
|
|
|
Value of TOPs1 |
| 5,351,775 |
|
Total Direct Compensation |
| 6,880,775 |
|
All Other Compensation2 |
| 179,978 |
|
Pension Value3 |
| 3,949,300 |
|
Total Compensation |
| 11,010,053 |
|
Total Market Capitalization Growth ($millions) |
| 2,046 |
|
Total Cost as a % of Market Capitalization Growth |
| 0.54 | % |
1 Reflects the estimated fair value of TOPs using the Black-Scholes pricing model valued on the grant date. See note 2 on page 185 for details of this calculation.
2 See page 192 for details of All Other Compensation.
3 Represents the current service cost, less required member contributions to the plan, plus changes in compensation in excess of actuarial assumptions.
To value incentive plan awards (TOPs/STARs), Nexen uses the Black-Scholes pricing model, which is a generally accepted method for measuring this type of long-term incentive. The actual value realized on exercises may be higher or lower depending on the Nexen share price at the time of exercise.
INCENTIVE PLAN AWARDS GRANTED IN 2009
The term for TOPs/STARs granted in 2009 is five years and vests one-third each year for three years starting one year after the grant date. All named executives were granted TOPs in 2009 with the exception of Mr. Reinsborough who was granted STARs.
|
|
|
| TOPs/ |
| % of |
| Exercise |
|
|
| Grant |
| Potential Realizable Value |
| ||
Name |
| Grant Date |
| Granted1 |
| Granted to |
| Price |
| Expiry Date |
| Value3 |
| 5% |
| 10% |
|
Romanow |
| Dec. 7, 2009 |
| 550,000 |
| 12.6 | % | 24.95 | 2 | Dec. 6, 2014 |
| 5,351,775 |
| 3,791,274 |
| 8,377,723 |
|
Reinhart |
| Dec. 7, 2009 |
| 150,000 |
| 3.4 | % | 24.95 | 2 | Dec. 6, 2014 |
| 1,459,575 |
| 1,033,984 |
| 2,284,834 |
|
Nieuwenburg |
| May 1, 2009 | 4 | 50,000 |
| 1.1 | % | 22.72 |
| April 30, 2014 |
| 443,040 |
| 313,856 |
| 693,539 |
|
|
| Dec. 7, 2009 |
| 170,000 |
| 3.9 | % | 24.95 | 2 | Dec. 6, 2014 |
| 1,654,185 |
| 1,171,848 |
| 2,589,478 |
|
Arnold |
| Feb. 23, 2009 | 5 | 70,000 |
| 1.6 | % | 15.72 |
| Feb. 22, 2014 |
| 429,156 |
| 304,020 |
| 671,805 |
|
|
| Dec. 7, 2009 |
| 100,000 |
| 2.3 | % | 24.95 | 2 | Dec. 6, 2014 |
| 973,050 |
| 689,322 |
| 1,523,222 |
|
Reinsborough |
| Dec. 7, 2009 |
| 100,000 |
| — |
| US23.70 | 2 | Dec. 6, 2014 |
| 1,069,242 |
| 757,466 |
| 1,673,803 |
|
1 All named executives were granted TOPs in 2009, with the exception of Mr. Reinsborough who was granted STARs.
2 Reflects the December 4, 2009 closing market price of Nexen common shares on the TSX for TOPs grants and on the NYSE for the STARs grant.
3 Reflects the estimated fair value of the TOPs/STARs at the time of grant using the Black-Scholes pricing model. See note 2 on page 185 for details.
4 Mr. Nieuwenburg received this grant upon his appointment as Executive VP, Canada. The exercise price is the closing market price of Nexen common shares on the TSX on April 30, 2009.
5 Mr. Arnold received this grant upon hire. The exercise price is the closing market price of Nexen common shares on the TSX on February 20, 2009.
INCENTIVE PLAN AWARDS—TOPS EXERCISED OR EXCHANGED AND VALUE VESTED OR EARNED IN 2009
The TOPs value realized in 2009 occurred within seven months of grant expiry, demonstrating that executives are holding TOPs for the long term, in alignment with our long-term strategy. The TOPs value vested in 2009 represents what could have been earned if named executives exercised TOPs immediately upon vesting. As shown in the table, the TOPs awards vesting in 2009 had some in-the-money value upon vesting. The actual value realized will depend on the share price at the time of exercise. Grants of TOPs are considered option-based awards under applicable disclosure requirements. We do not award named executives share-based awards or non-equity incentive plan compensation under long-term incentive plans, as these terms are used in applicable disclosure requirements.
|
| TOPs Awards |
| TOPs Awards |
| Non-Equity Annual Incentive |
| ||||
Name |
| Exercised or |
| Value |
| Vested |
| Value Vested |
| Value Earned |
|
Romanow |
| 228,000 |
| 3,167,490 |
| 173,400 |
| 294,984 |
| 429,000 |
|
Reinhart |
| 100,000 |
| 1,275,750 |
| 80,000 |
| 131,104 |
| 175,000 |
|
Nieuwenburg |
| 120,000 |
| 1,377,900 |
| 100,000 |
| 163,880 |
| 156,000 |
|
Arnold |
| — |
| — |
| — |
| — |
| 99,000 |
|
Reinsborough |
| 92,000 |
| 1,057,145 |
| 64,060 |
| 208,416 |
| 113,368 |
|
Total |
| 540,000 |
| 6,878,285 |
| 417,460 |
| 798,384 |
| 972,368 |
|
1 Reflects the closing market price at the time of the exercise or exchange, minus the exercise price, times the number of TOPs exercised or exchanged.
2 Reflects the closing market price at the time of vesting, minus the exercise price, as defined in the TOPs plan. Most TOPs awards vesting in 2009 had an exercise price greater than the market price. See table on page 189 for further details of the exercise prices of TOPs vested.
3 Represents compensation earned in respect of 2009 and paid in 2010.
OUTSTANDING INCENTIVE PLAN AWARDS
|
|
|
|
|
|
|
|
|
| Vested and Unvested TOPs/ |
| Vested TOPs/STARs |
| ||||
Name |
| Date Granted |
| Expiry Date |
| Exercise |
| Granted3 |
| Number of |
| Value of |
| Number |
| Value4 |
|
Romanow |
| Dec. 12, 2000 |
| Dec. 11, 2010 |
| 9.025 |
| 200,000 |
| 200,000 |
| 3,239,000 |
| 200,000 |
| 3,239,000 |
|
|
| Dec. 6, 2005 |
| Dec. 5, 2010 |
| 27.285 |
| 124,000 |
| 124,000 |
| — |
| 124,000 |
| — |
|
|
| Dec. 4, 2006 |
| Dec. 3, 2011 |
| 31.600 |
| 160,000 |
| 160,000 |
| — |
| 160,000 |
| — |
|
|
| Dec. 3, 2007 |
| Dec. 2, 2012 |
| 28.390 |
| 180,000 |
| 180,000 |
| — |
| 120,600 |
| — |
|
|
| Dec. 8, 2008 |
| Dec. 7, 2013 |
| 19.360 |
| 180,000 |
| 180,000 |
| 1,054,800 |
| 61,200 |
| 358,632 |
|
|
| Jan. 2, 2009 |
| Jan. 1, 2014 |
| 21.450 |
| 295,000 |
| 295,000 |
| 1,112,150 |
| — |
| — |
|
|
| Dec. 7, 2009 |
| Dec. 6, 2014 |
| 24.950 |
| 550,000 |
| 550,000 |
| 148,500 |
| — |
| — |
|
Total |
|
|
|
|
|
|
| 1,689,000 |
| 1,689,000 |
| 5,554,450 |
| 665,800 |
| 3,597,632 |
|
Reinhart |
| Dec. 12, 2000 |
| Dec. 11, 2010 |
| 9.025 |
| 80,000 |
| 80,000 |
| 1,295,600 |
| 80,000 |
| 1,295,600 |
|
|
| Dec. 6, 2005 |
| Dec. 5, 2010 |
| 27.285 |
| 70,000 |
| 70,000 |
| — |
| 70,000 |
| — |
|
|
| Dec. 4, 2006 |
| Dec. 3, 2011 |
| 31.600 |
| 80,000 |
| 80,000 |
| — |
| 80,000 |
| — |
|
|
| Dec. 3, 2007 |
| Dec. 2, 2012 |
| 28.390 |
| 80,000 |
| 80,000 |
| — |
| 53,600 |
| — |
|
|
| Dec. 8, 2008 |
| Dec. 7, 2013 |
| 19.360 |
| 80,000 |
| 80,000 |
| 468,800 |
| 27,200 |
| 159,392 |
|
|
| Jan. 2, 2009 |
| Jan. 1, 2014 |
| 21.450 |
| 50,000 |
| 50,000 |
| 188,500 |
| — |
| — |
|
|
| Dec. 7, 2009 |
| Dec. 6, 2014 |
| 24.950 |
| 150,000 |
| 150,000 |
| 40,500 |
| — |
| — |
|
Total |
|
|
|
|
|
|
| 590,000 |
| 590,000 |
| 1,993,400 |
| 310,800 |
| 1,454,992 |
|
Nieuwenburg |
| Dec. 6, 2005 |
| Dec. 5, 2010 |
| 27.285 |
| 80,000 |
| 80,000 |
| — |
| 80,000 |
| — |
|
|
| Dec. 4, 2006 |
| Dec. 3, 2011 |
| 31.600 |
| 100,000 |
| 100,000 |
| — |
| 100,000 |
| — |
|
|
| Dec. 3, 2007 |
| Dec. 2, 2012 |
| 28.390 |
| 100,000 |
| 100,000 |
| — |
| 67,000 |
| — |
|
|
| Dec. 8, 2008 |
| Dec. 7, 2013 |
| 19.360 |
| 100,000 |
| 100,000 |
| 586,000 |
| 34,000 |
| 199,240 |
|
|
| May 1, 2009 |
| April 30, 2014 |
| 22.720 |
| 50,000 |
| 50,000 |
| 125,000 |
| — |
| — |
|
|
| Dec. 7, 2009 |
| Dec. 6, 2014 |
| 24.950 |
| 170,000 |
| 170,000 |
| 45,900 |
| — |
| — |
|
Total |
|
|
|
|
|
|
| 600,000 |
| 600,000 |
| 756,900 |
| 281,000 |
| 199,240 |
|
Arnold |
| Feb. 23, 2009 |
| Feb. 22, 2014 |
| 15.720 |
| 70,000 |
| 70,000 |
| 665,000 |
| — |
| — |
|
|
| Dec. 7, 2009 |
| Dec. 6, 2014 |
| 24.950 |
| 100,000 |
| 100,000 |
| 27,000 |
| — |
| — |
|
Total |
|
|
|
|
|
|
| 170,000 |
| 170,000 |
| 692,000 |
| — |
| — |
|
Reinsborough5 |
| Dec. 6, 2005 |
| Dec. 5, 2010 |
| US 23.605 |
| 50,000 |
| 50,000 |
| 18,799 |
| 50,000 |
| 18,798 |
|
|
| Dec. 4, 2006 |
| Dec. 3, 2011 |
| US 27.500 |
| 52,000 |
| 52,000 |
| — |
| 52,000 |
| — |
|
|
| Dec. 3, 2007 |
| Dec. 2, 2012 |
| US 28.400 |
| 70,000 |
| 70,000 |
| — |
| 46,900 |
| — |
|
|
| Dec. 8, 2008 |
| Dec. 7, 2013 |
| US 15.200 |
| 70,000 |
| 70,000 |
| 706,920 |
| 23,800 |
| 240,356 |
|
|
| Dec. 7, 2009 |
| Dec. 6, 2014 |
| US 23.700 |
| 100,000 |
| 100,000 |
| 26,606 |
| — |
| — |
|
Total |
|
|
|
|
|
|
| 342,000 |
| 342,000 |
| 752,325 |
| 172,700 |
| 259,154 |
|
1 Excludes grants that have been fully exercised.
2 The number and value of unvested TOPs/STARs can be determined by subtracting the vested TOPs/STARs from the vested and unvested TOPs/STARs. The value of unvested TOPs/STARs can be confirmed on page 195 in the Change of Control Table.
3 Nexen common shares are issued on exercise of TOPs on a one-for-one basis.
4 The difference between the closing market price of Nexen common shares on the TSX on December 31, 2009 of $25.22 per share (US$23.93 on the NYSE) and the exercise price of TOPs/STARs, times the number of TOPs/STARs. Where the exercise price exceeds the market value per share, the value shown is zero.
5 Mr. Reinsborough was granted STARs in 2009 and TOPs prior to 2009.
EQUITY OWNERSHIP AND CHANGES IN 2009
The Compensation Committee approved revised share ownership guidelines in December 2009. Share ownership under the new guidelines no longer includes the net value of exercisable TOPs. Mr. Romanow’s requirement to hold three times his annual salary has been increased to four times his annual salary under the new guidelines. Mr. Reinhart and Mr. Nieuwenburg were required to hold two and a half times their annual salary, and the remaining named executives are required to hold two times their annual salary. Remaining vice presidents and other senior leaders are now required to hold one times their annual salary.
|
| December 31, 2008 |
| December 31, 2009 |
| Net Change |
| Equity at Risk |
| ||
Name |
| Shares |
| Shares |
| Shares |
| Value1 |
| Multiple |
|
Romanow |
| 186,635 |
| 205,899 |
| 19,264 |
| 5,192,773 |
| 5 |
|
Reinhart3 |
| 46,040 |
| 65,855 |
| 19,815 |
| 1,660,863 |
| 4 |
|
Nieuwenburg |
| 77,016 |
| 99,750 |
| 22,734 |
| 2,515,695 |
| 5 |
|
Arnold |
| — |
| 5,319 |
| — |
| 134,145 |
| — | 4 |
Reinsborough |
| 7,573 |
| 17,793 |
| 10,220 |
| 492,549 |
| 1 | 5 |
Total |
| 317,264 |
| 394,616 |
| 72,033 |
| 9,996,025 |
|
|
|
1 Equity at risk is the market value of common shares using the closing market price of Nexen shares on the TSX on December 31, 2009 of $25.22 per share (US$23.93 on the NYSE).
2 Reflects the equity at risk, divided by the named executive’s 2009 salary amount shown on page 185.
3 Includes 1,581 shares held by spouse.
4 Mr. Arnold became an officer on July 16, 2009 and has five years to meet the guideline.
5. Mr. Reinsborough met the previous guideline and has three years to meet the revised guideline.
All named executives, except Brian Reinsborough, are members of Nexen’s registered defined benefit pension plan and executive benefit plan and accrue a pension benefit at a 2% accrual rate. With this option, they must contribute 5% of pensionable earnings up to the maximum allowed under the Canadian Income Tax Act. See pages 181 to 183 for details.
PENSION VALUE EARNED AND BENEFIT OBLIGATION CHANGES IN 2009
Our reported values use actuarial assumptions and methods that are the same as those used to calculate pension obligations and the related annual expense disclosed in our Consolidated Financial Statements. As the assumptions reflect our best estimate of future events, our reported values may not be directly comparable to similar pension liability values disclosed by other companies.
The board must approve additional past service credits or accelerated service credits. No accelerated service credits were authorized in 2009. The notes to the table below show additional past service credits authorized by the board for the named executives who participate in the Canadian defined benefit pension plan and the executive benefit plan.
No benefit payments were made to named executives in the last fiscal year.
DEFINED BENEFIT PLAN TABLE
|
| Years of |
| Annual Benefits Payable |
| Accrued |
| Compensatory |
| Non-Compensatory |
| Accrued |
| ||
Name |
| Credited Service |
| At Year End1 |
| At Age 652 |
| Jan. 1, 2009 |
| Change3 |
| Change4 |
| Dec. 31, 2009 |
|
Romanow |
| 22.50 | 5, 6 | 473,994 |
| 706,110 |
| 4,347,000 |
| 3,949,300 |
| 1,422,700 |
| 9,719,000 |
|
Reinhart |
| 15.33 |
| 139,435 |
| 277,931 |
| 1,266,000 |
| 381,300 |
| 316,700 |
| 1,964,000 |
|
Nieuwenburg |
| 5.00 | 7 | 127,936 |
| 292,138 |
| 1,142,000 |
| 624,300 |
| 293,700 |
| 2,060,000 |
|
Arnold |
| 0.92 | 8 | 7,374 |
| 126,696 |
| — |
| 87,300 |
| 26,700 |
| 114,000 |
|
Total |
|
|
| 748,739 |
| 1,402,875 |
| 6,755,000 |
| 5,042,200 |
| 2,059,800 |
| 13,857,000 |
|
1 All information as of December 31, 2009. Represents the sum of the benefits accrued under the registered and executive benefit pension plans.
2 Represents a value based on projected years of credited service at a 2% accrual rate to age 65 and actual pensionable earnings used to calculate the benefit amount in the previous column.
3 Includes the 2009 current service cost, less required member contributions to the plan, plus changes in compensation in excess of actuarial assumptions. Disclosure of the valuation method and significant assumptions used may be found in the pension and other post-retirement benefits note 13 in our 2009 Consolidated Financial Statements.
4 Reflects the impact of interest on prior year’s obligations, changes in discount rates used to measure the obligations and the impact of assumption and employee demographic changes.
5 Ten years of additional past service credits were granted to Mr. Romanow by the board in 2001. This was a competitive practice to recognize that he was at a certain level in his career in 2001 when he was appointed to a new position.
6 Mr. Romanow joined the defined benefit pension plan after 7.25 years in the defined contribution pension plan. A pension benefit, which is reflective of base salary, will be based on his 22.50 years of defined benefit pension plan service. A pension benefit, which is reflective of pensionable bonus, will also be based on 29.75 years of service, which includes 7.25 years of defined contribution service.
7 Mr. Nieuwenburg joined the defined benefit pension plan after 23.58 years in the defined contribution pension plan. A pension benefit, which is reflective of base salary, will be based on his 5 years of defined benefit pension plan service. A pension benefit, which is reflective of pensionable bonus, will also be based on 28.58 years of service, which includes the 23.58 years of defined contribution service.
8 Mr. Arnold joined the defined benefit pension plan on February 1, 2009.
The information in the following table is a supplement to the previous table. The final average earnings reported for each named executive are used in the respective calculations and are based on the:
· average base salary for the 36 highest-paid consecutive months during the ten years up to December 31, 2009; plus
· annual cash incentive payments at the lesser of the target bonus or actual bonus paid, averaged over the final three years of participation up to December 31, 2009.
|
| Years of Credited Service |
|
|
| Accrued Annual Pension Benefit1 |
| Estimated Annual |
| ||||||||
Name |
| Up to |
| From |
| Total |
| Final |
| Under the |
| Under the |
| Under the |
| Under the |
|
Romanow |
| 17.50 |
| 5.00 |
| 22.50 |
| 1,095,833 |
| 30,556 |
| 443,438 |
| 45,316 |
| 551,990 |
|
Reinhart |
| 10.33 |
| 5.00 |
| 15.33 |
| 514,478 |
| 37,481 |
| 101,954 |
| 59,867 |
| 167,395 |
|
Nieuwenburg |
| — |
| 5.00 |
| 5.00 |
| 590,756 |
| 12,222 |
| 115,714 |
| 35,130 |
| 198,711 |
|
Arnold |
| — |
| 0.92 |
| 0.92 |
| 410,000 |
| 2,241 |
| 5,133 |
| 26,815 |
| 59,660 |
|
1 All information is as of December 31, 2009.
2 Represents a value based on projected years of credited service at a 2% accrual rate at age 60 and actual pensionable earnings used to calculate the accrued annual pension benefit values in the previous column. Age 60 is the earliest age an individual can receive unreduced retirement benefits.
DEFINED CONTRIBUTION PLAN TABLE
The following table represents the value of accumulated pension assets within the registered defined contribution pension plan. Under the terms of this plan, all benefits have been funded. The individuals were entitled to benefits under this registered plan prior to being appointed to executive positions at Nexen. The individuals have no entitlements under any supplemental defined contribution pension plan arrangement and there are no above-market or preferential earnings provisions.
The two individuals are active participants of the defined benefit pension plan and have not contributed to or received any company-provided benefits under the terms of this plan for more than five years as indicated in the notes below.
Name |
| Accumulated Value |
| Compensatory 2 |
| Non-Compensatory |
| Accumulated Value |
|
Romanow1 |
| 331,641 |
| — |
| 85,365 |
| 417,006 |
|
Nieuwenburg2 |
| 410,801 |
| — |
| 105,741 |
| 516,542 |
|
1 Mr. Romanow joined the defined benefit pension plan in 1997 after 7.25 years in the defined contribution pension plan.
2 Mr. Nieuwenburg joined the defined benefit pension plan in 2005 after 23.58 years in the defined contribution pension plan.
DEFINED CONTRIBUTION PLAN TABLE (US)
The following table represents the value of the accumulated pension assets, along with employer contributions, within the respective qualified and non-qualified plans. Under these plans, there are no market or preferential earnings provisions.
Name |
| Accumulated Value |
| Compensatory2 |
| Non-Compensatory2 |
| Accumulated Value |
|
Reinsborough |
| 876,863 |
| 87,636 |
| 206,138 |
| 1,170,637 |
|
1 The exchange rate used to convert US to Canadian dollars at the beginning of the year is the December 31, 2008 rate of 1.2246.
2 The exchange rate used to convert US to Canadian dollars during the year is the 2009 average rate for the year of 1.1568.
3 The exchange rate used to convert US to Canadian dollars at the end of the year is the December 31, 2009 rate of 1.0466.
The total value of perquisites provided to any executive was less than $50,000 and less than 10% of the named executive’s annual salary in 2009. Certain perquisites shown below are at the maximum reimbursable amount available to executives. This maximum is often higher than what the named executive actually claimed in the year. These perquisites are not available to the broader employee population.
|
| Perquisites |
| Other Compensation |
|
|
| ||||||||||
Name |
| Car |
| Other |
| Total |
| Life |
| Savings |
| Other Compensation |
| Total |
| Total All Other Compensation |
|
Romanow |
| 31,200 |
| 10,500 |
| 41,700 |
| 1,038 |
| 66,000 |
| 71,240 | 3 | 138,278 |
| 179,978 |
|
Reinhart |
| 19,200 |
| 7,100 |
| 26,300 |
| 498 |
| 26,400 |
| 71,240 | 3 | 98,138 |
| 124,438 |
|
Nieuwenburg |
| 19,200 |
| 7,100 |
| 26,300 |
| 1,812 |
| 28,440 |
| — |
| 30,252 |
| 56,552 |
|
Arnold |
| 17,600 |
| 7,100 |
| 24,700 |
| 1,062 |
| 12,985 |
| 200,000 | 4 | 214,047 |
| 238,747 |
|
Reinsborough |
| 22,211 |
| 10,729 |
| 32,940 |
| 2,526 |
| — | 5 | — |
| 2,526 |
| 35,466 |
|
1 Represents a maximum reimbursement amount for financial counseling, luncheon club membership, medical exam and security monitoring. For Mr. Reinsborough, represents actual reimbursement for similar perquisites. For the CEO position only, this also includes a maximum reimbursement amount for a golf club membership.
2 The life insurance premiums provided to the named executives is made available to all employees.
3 Includes fees of $34,000, deferred trust units of Canexus valued at $25,950 and distributions on trust units of $11,290.
4 Mr. Arnold received a $200,000 special bonus upon hire in February 2009.
5 Benefits previously classified as savings plan are now classified as pension.
TERMINATION AND CHANGE OF CONTROL BENEFITS
Nexen does not enter into employment service contracts. Depending on the conditions of termination, we treat executives and employees as follows:
Event |
| Action |
Resignation |
| · All salary and benefit programs cease · Annual incentive bonus is not paid · TOPs/STARs must be exercised within 90 days · Pension paid as a commuted value or deferred benefit |
Retirement
|
| · Salary and benefit coverages cease except for a $5,000 life insurance policy · Monthly benefit to cover the cost of provincial health care premium continues in certain jurisdictions · Annual incentive bonus paid on a pro-rata basis · TOPs/STARs must be exercised within 18 months · Pension paid as a monthly benefit |
Death
|
| · All salary and benefit programs cease except for a one-year benefit coverage for surviving dependants and payout of any applicable insurance benefits · Annual incentive bonus paid on a pro-rata basis · TOPs/STARs must be exercised within 18 months · Pension benefits distributed to surviving spouse or to a designated beneficiary in the event of no spouse |
Termination without cause
|
| · All salary and benefit programs cease · TOPs/STARs must be exercised within 90 days · Pension paid as a commuted value or deferred benefit · Severance provided on an individual basis reflecting service, age and salary level |
Termination for cause
|
| · All salary and benefit programs cease · Annual incentive bonus is not paid · TOPs/STARs must be exercised on termination · Pension paid as a commuted value or deferred benefit |
PAYMENTS ON RESIGNATION
There are no additional payments for named executives upon resignation. The following table discloses values that would have been provided in the normal course had they resigned effective December 31, 2009: i) the lump sum value of pension benefits accrued under the defined benefit pension plan and executive benefit plan; and ii) the value of vested TOPs. If they are over the age of 55 and have at least 10 years of Nexen service, they are deemed to have retired and a lump sum pension benefit option is not available.
Name |
| Termination Scenario |
| Pension |
| Value of Vested TOPs1, 2 |
| Total |
|
Romanow |
| Resignation |
| 6,268,000 |
| 3,597,632 |
| 9,865,632 |
|
Reinhart |
| Resignation |
| 1,610,000 |
| 1,454,992 |
| 3,064,992 |
|
Nieuwenburg |
| Resignation |
| 1,410,000 |
| 199,240 |
| 1,609,240 |
|
Arnold |
| Resignation |
| 80,000 |
| — |
| 80,000 |
|
Reinsborough3 |
| Resignation |
| — |
| 259,154 |
| 259,154 |
|
1 Does not include unvested TOPs/STARs which will vest according to the TOPs/STARs plan over 90 days for resignation.
2 The difference between the closing market price of a Nexen common share on the TSX at year end of $25.22 (US$23.93 on the NYSE) and the exercise price of TOPs, times the number of vested TOPs.
3 Mr. Reinsborough does not participate in the defined benefit pension plan as he is employed in the US.
The nature of our time-vested TOPs/STARs ensures that retiring executives maintain a significant equity interest for at least 12 month (last vesting period) after departure.
CHANGE OF CONTROL AGREEMENTS
Nexen has entered into change of control agreements with each of the named executives and other key executives. We recognize that these executives are critical to Nexen’s ongoing business. Therefore, it is vital we work to retain the executives, protect them from employment interruption caused by a change of control and treat them in a fair and equitable manner. Consistent with industry standards for executives in similar circumstances, there are no restrictions on future employment or non-compete clauses in the agreements. Each year, the Compensation Committee reviews the estimated payments upon a change of control, including the termination value of pension benefits due under the defined benefit pension plan and executive benefit plan.
Mr. Romanow’s change of control agreement was amended in January 2009 when he was appointed President and CEO. In the event of a change of control and subsequent termination of employment, Mr. Romanow would be deemed to retire and his pension would commence upon the later of the completion of the severance period outlined below and the attainment of age 55, without any applicable early retirement reduction.
Under these agreements, a change of control includes any acquisition of common shares or other securities that carries the right to cast more than 35% of the common share votes. Generally, it is any event that results in a person or group exercising effective control of Nexen.
If the named executives terminate following a change of control, they are entitled to salary, target bonus and other compensatory benefits for the severance period specified below.
|
| Severance Period in Months on Change of Control |
| ||
Name |
| If Terminated |
| Upon Resignation1 |
|
Romanow |
| 36 |
| 30 |
|
Reinhart |
| 24 |
| — |
|
Nieuwenburg |
| 24 |
| — |
|
Arnold |
| 24 |
| — |
|
Reinsborough |
| 24 |
| — |
|
1 Within 12 months after change of control and only if the CEO has remained an employee.
The next table outlines the estimated incremental payments named executives would be entitled to had a change of control and a subsequent termination of employment occurred on December 31, 2009. Under the agreement, bonuses would be paid at target for the full severance period. A benefits uplift, equal to 13% of base salary, would be provided in lieu of medical, dental and life insurance coverage. In addition, the agreement provides a payment for other employee benefits and perquisites, including car allowance and savings plan contributions during the severance period, and an allowance for financial counselling, security monitoring and career transition services.
Named executives would also be entitled to an incremental pension benefit relating to their salary, service and annual incentive targets over the severance period. The pension value reported below discloses the resulting lump sum payout determined according to the named executive’s change of control agreement. These additional pension benefits do not include any termination benefits that would be payable under the registered defined benefit pension plan and executive benefit plan if a termination or retirement occurred that was not triggered by a change of control.
Estimated Incremental Payment on Change of Control1
Name |
| Severance Period |
| Base Salary |
| Bonus |
| Benefits |
| Other |
| Additional |
| Accelerated |
| Total |
|
Romanow |
| 36 |
| 3,300,000 |
| 2,475,000 |
| 429,000 |
| 329,500 |
| 16,188,000 |
| 1,956,818 |
| 24,678,318 |
|
Reinhart |
| 24 |
| 880,000 |
| 440,000 |
| 114,400 |
| 129,100 |
| 2,037,000 |
| 538,408 |
| 4,138,908 |
|
Nieuwenburg |
| 24 |
| 1,000,000 |
| 600,000 |
| 130,000 |
| 136,300 |
| 2,721,000 |
| 557,660 |
| 5,144,960 |
|
Arnold |
| 24 |
| 840,000 |
| 378,000 |
| 109,200 |
| 126,700 |
| 535,000 |
| 692,000 |
| 2,680,900 |
|
Reinsborough |
| 24 |
| 832,905 |
| 374,807 |
| 108,278 |
| 77,159 |
| 175,271 |
| 493,179 |
| 2,061,599 |
|
Total |
|
|
| 6,852,905 |
| 4,267,807 |
| 890,878 |
| 798,759 |
| 21,656,271 |
| 4,238,065 |
| 38,704,685 |
|
1 Assumes a triggering event occurred at December 31, 2009.
2 Does not include regular termination pension values which are reported in Payments on Resignation on page 193. Benefits payable under the registered defined benefit pension plan are funded from the pension trust and payable in the form of a monthly pension benefit if the named executive is 55 or older. For Mr. Reinsborough, the value does not include benefits presently residing in the qualified and non-qualified retirement plans.
3 Value of TOPs/STARs that automatically vest on a change of control, based on the number of TOPs/STARs with accelerated vesting, times the closing market price of Nexen common shares on the TSX on December 31, 2009 of $25.22 (US$23.93 on the NYSE), less the exercise price. The incremental value is not in addition to the value identified in the vesting provision section of the termination chart on page 193.
Nexen’s board takes its duties and responsibilities for good corporate governance seriously. Nexen supports and conducts business according to the rules of the Toronto Stock Exchange (TSX), NYSE, National Policy 58-201—Corporate Governance Guidelines and Multilateral Instrument 52-110—Audit Committees. Except as noted below, Nexen’s corporate governance practices comply with those followed by domestic companies under NYSE listing standards.
Nexen has a DSU plan for non-executive directors as described on page 169. For this plan, Nexen follows the TSX rules which, unlike the NYSE rules, exempt plans from shareholder approval where the common shares issued under the plan are purchased on the open market rather than issuing new shares.
Annually, the CEO certifies to the NYSE that he is not aware of any violation by Nexen of the NYSE’s corporate governance listing standards. Our CEO has not had to provide any notification of non-compliance to the NYSE, since no executive officer is aware of any non-compliance with any applicable provisions of section 303A of the NYSE listing standards. Nexen also provides the required Annual Written Affirmation to the NYSE. As well, our CEO and CFO have certified the quality of Nexen’s public disclosure to the SEC.
All Committee mandates, including those for the Audit, Compensation and Governance Committees, our code of ethics, and our corporate governance policy and categorical standards are available at www.nexeninc.com, and we intend to provide disclosure in this manner. Shareholders wishing to receive a copy of these documents may contact the Governance Office by telephone at 403.699.4926, or by email at governance@nexeninc.com.
The Governance Committee assists the board in overseeing implementation of our corporate governance programs. It recommends nominees for director appointments and manages the evaluation process of the board, its committees and individual directors and chairs. This oversight ensures we implement best-in-class governance practices relevant to an organization of Nexen’s size and complexity.
All Committee members are independent and knowledgeable on our corporate governance programs. Seven members are skilled or expert in governance and board experience or diversity—expertise most relevant to the Committee’s mandate.
CHANGES TO COMMITTEE MEMBERSHIP IN 2009
Mr. Thomson, as Chair of the Committee, left upon his retirement from the board and Mr. Bertram and Mr. Jackson joined in April 2009.
KEY ACTIVITIES IN 2009
· Reviewed board committee composition, including consideration for committees that promote a knowledgeable and informed board.
· Recommended committee memberships in a manner that promotes issue exposure and knowledge development on key matters for the company.
· Reviewed the board chair succession plan.
· Recommended a revised Integrity Guide.
· Recommended updates to governance documents, including mandates for the board, individual directors and all board committees (including amendments to more specifically delineate responsibilities for assessing and addressing risk), the external communications policy and the corporate governance policy.
· Received regular reports on management’s dialogue with governance-related stakeholders.
· Continued advancement of the online performance evaluation process by recommending new questions to further explore the areas of: how the board acts when company performance targets are not being met, risk management oversight, sustainability risk management, board and CEO relations and financial understanding.
· Consulted with Dr. Richard Leblanc, Assistant Professor of Corporate Governance, York University, on the board’s performance evaluations.
THE BOARD AND COMMITTEES
The Committee has determined that the board leadership structure is appropriate, given the specific characteristics and circumstances of the company. The CEO and board chair positions are separate and the Board Chair is independent.
The Committee reviews board and committee memberships annually, considering director independence, qualifications, skills and preferences. The board is large enough to permit a diversity of views and provide expertise in running the committees, without being so large as to detract from effectiveness. Each year, a skills matrix is compiled and reviewed by the Committee. This matrix sets out areas of expertise determined to be essential to ensure appropriate strategic direction and oversight by the board. It also assists with board recruitment. The Committee’s review of board experience indicates that the current mix of skills is appropriate.
RISK MANAGEMENT OVERSIGHT
The board regularly receives an assessment from management on key risks facing Nexen, assessed by probability of occurrence and expected market reaction. These risks and associated mitigation strategies are allocated and reported upon to the appropriate committees and/or the full board according to their mandates. The Committee oversees the allocation of risks identified to the appropriate committee or the full board. These risks include Long Lake project execution, the global recession (including the impact of commodity prices and credit risk), concentration of cash flow from the Buzzard project, rig commitments, marketing division performance, timing delay on capital projects, political and security risk in jurisdictions where we operate, environment regulation, proximity of operations to urban centres, fiscal term certainty, development/project risk, operational risk, commodity price risk, reporting/disclosure risk and human resource risk.
NOMINATING A NEW DIRECTOR FOR ELECTION
The Committee identifies and assesses candidates for board appointment or nomination. Our forward-looking skills matrix identifies skills with the greatest opportunity to strengthen the board.
Before recommending a new board candidate, the Committee considers his or her performance, independence, competencies, financial acumen, skills and diversity. Character and behavioural qualities, including credibility, integrity and communication skills, are considered. The Committee Chair and/or Board Chair meets with the candidate to discuss his or her interest and ability to devote sufficient time and resources to the position. While the board does consider gender, ethnic background, geographic origin, and other personal characteristics when looking at diversity, it is the skills, experience, character and behaviour qualities that are most important in determining the value which an individual could bring to the board. Prior to nomination, potential directors must disclose possible conflicts of interest with Nexen, and background checks, as appropriate, are completed. See www.nexeninc.com for the individual director mandate.
The Committee requires the corporate secretary to maintain an evergreen list of potential directors whose skills complement the board and whom the Committee would evaluate if the individual is available when an opening arises.
The Committee will also consider a board nominee recommended by a shareholder. See page 199 for information on communicating with the board.
BOARD CHAIR TERM
We have a well-established governance practice and guideline for a five-year rotation of the board and committee chairs. Ever since Nexen became a fully independent oil and gas company in 2000, we have rotated these chair positions every five years. In 2009, the Committee discussed the end of Mr. Saville’s five-year term as board chair in 2010. The Committee considered his strong leadership and Nexen’s current circumstances and decided to extend the term for two more years. Francis Saville will remain the board chair until 2012. When making this decision, the Committee considered the management and board changes we have experienced in the past year and determined continuity of the board chair is critical to our success and to maintaining good corporate governance leadership.
Mr. Saville is committed to the success of Nexen and to top-tier corporate governance. He does an excellent job of enhancing board effectiveness and has diligently worked with the CEO to facilitate a smooth transition since the CEO’s appointment at the start of 2009. There is great value to continuity of leadership from Mr. Saville at this time, both to complete the CEO transition and to continue to lay a solid foundation of trust between the board and management. We continue to plan for board chair succession in 2012 and beyond.
SAY ON PAY POLICY
After careful consideration, we have decided not to adopt a say on pay policy (advisory vote on executive compensation) at this time. We believe we have governance and compensation practices in place that achieve substantially the same results. The Canadian Coalition for Good Governance (CCGG) released a Model Shareholder Engagement and Say on Pay policy, which Nexen management commented on and discussed with them. As well, our Board Chair and the head of our compensation committee met with representatives of the CCGG in this regard. The CCGG ultimately released a final form of policy which we have considered, but declined to adopt at this time. We believe we have shareholder engagement and compensation disclosure practices that are top tier. Say on pay developments will be reviewed in the coming year as the form and substance of say on pay initiatives becomes clearer. For more details on our compensation practices, see the Compensation Discussion and Analysis on page 172 to 183.
PERFORMANCE EVALUATIONS
The board and management work together to foster continuous, open and honest communication, where concerns are brought forward and dealt with as they occur. In this spirit, the annual board evaluation is seen as an opportunity to review the past year and consider contributions, successes and opportunities for development. Visit www.nexeninc.com for a special report on our director evaluation process. This report describes the assessment process and the purpose of each of the six performance components, the four evaluations tools and the reporting and follow through process.
Our six-part performance evaluation review, together with the skills matrix, are our primary tools for determining who should be on the board. In light of this review, the board does not have a tenure policy and has flexible term limits. Nexen’s average board tenure of director nominees is 9.5 years. Our retirement age is 75.
The Committee strengthened the online evaluation process in 2009 by recommending new questions to further explore the areas of: how the board acts when company performance targets are not being met, risk management oversight, sustainability risk management, board and CEO relations and financial understanding. Additionally, questions were either expanded or added to reflect best practices. The changes included: i) adding the assessment of compensation policies, procedures and practices; and ii) assessing performance metrics and risk management relating to annual cash and long-term incentives.
The board rates its overall effectiveness on a 10-point scale, where 10 is the best. The average rating of 8.9 in 2009 is consistent with the 2008 average rating. A portion of this high score is attributed to the board receiving concise materials and presentations, which provides sufficient time for board discussion and inquiry. Even though this score shows a high degree of effectiveness, we continually look for opportunities to improve board value and processes in all areas of their oversight responsibilities.
EXTERNAL RECOGNITION
We received recognition for our governance practices during 2009.
· The Award of Excellence in Corporate Governance Disclosure in the 2009 Corporate Reporting Awards from the Canadian Institute of Chartered Accountants.
· Recognition from the Canadian Coalition for Good Governance for new best practices in shareholder communication and compensation disclosure.
· Current global rating of 10 out of 10 from GovernanceMetrics International for governance practices and disclosure.
· Ranked 8th, with a score of 86 out of 100, in the Report on Business 2009 corporate governance rankings.
COMMITTEE APPROVAL
The Committee has reviewed and discussed the governance disclosure in this document, including the information in the Directors section (pages 161 to 170). It has recommended to the board that the disclosure be included in the circular and, as appropriate, the Form 10-K.
Submitted on behalf of the Governance Committee:
Barry Jackson, Chair, Bob Bertram, Kevin Jenkins, Anne McLellan, Eric Newell, Tom O’Neill, Francis Saville, John Willson
ETHICS POLICY
On January 1, 2010 we replaced our ethics policy with “How We Work: Our Integrity Guide” (our guide). Our guide provides improved communication regarding expected behaviours and uses simplified language, real-life examples and Questions and Answers. It also includes an overview of Nexen’s 22 integrity-related policies, provides guidance for making ethical decisions and lists options for reporting concerns about business conduct.
Under our guide, all directors, officers and employees must demonstrate ethical business practices in all business relationships, within and outside of Nexen. Employees are not permitted to commit an unethical, dishonest or illegal act or to instruct other employees to do so. Our guide has been adopted as a code of ethics for our principal executive officer, principal financial officer and principal accounting officer or controller.
Any waivers from the provisions of our guide for a director or executive officer must be approved by the audit committee and board and disclosed to the public in accordance with regulatory requirements. Any waivers of the provisions of our guide for any employee may be made by Nexen’s chief legal officer.
Our guide is available at www.nexeninc.com and if we amend or waive any provision of it, it will be disclosed online. We also file our guide and any amendments to it on SEDAR at www.sedar.com. To request a copy of the guide, contact the Integrity Resource Centre by emailing integrity@nexeninc.com or calling 403.699.6789.
Reporting Concerns
There are several ways that a stakeholder can report concerns about Nexen’s business practices. These include contacting a member of Nexen’s management team, the Integrity Resource Centre, our integrity helpline or the Chair of our Audit and Conduct Review Committee.
· Employees, customers, suppliers, partners, shareholders and other external stakeholders who have a concern are encouraged to raise the matter with Nexen management or our Integrity Resource Centre by:
- | Mail: | Nexen Inc. |
|
|
|
| 801 – 7th Avenue SW |
|
|
|
| Calgary, Alberta, Canada T2P 3P7 |
|
|
|
| Attention: Integrity Resource Centre |
|
|
* | Email: | integrity@nexeninc.com |
|
|
( | Phone: | 403.699.6789 |
|
|
· Concerns may also be reported through the use of our integrity helpline, which is a secure reporting system operated by EthicsPoint, an independent third-party service provider. The helpline offers the option for anonymous reporting should the reporter wish to protect their identity. To learn more about our integrity helpline and for global, toll-free call numbers, visit www.nexeninc.com and click on the “Integrity Helpline” link at the top of the page. Alternatively you may access the helpline directly by:
: | Online: | www.ethicspoint.com |
|
|
( | Phone: | 1.866.384.4277 |
|
|
· Specifically, if you wish to raise concerns about Nexen’s financial statements, accounting practices or internal controls, and do not feel comfortable raising the matter using the reporting methods described above, you can make a report directly to the Chair of the Audit and Conduct Review Committee of Nexen’s board. The matter should be documented and mailed to Nexen Inc. at the address provided above in an envelope labeled: “To be opened by the Chair of the Audit and Conduct Review Committee only”.
COMMUNICATING WITH THE BOARD
Shareholders may write to the board or any board member(s) at the following address:
- | By mail: | Nexen Inc. |
|
|
|
| 801 – 7th Avenue SW |
|
|
|
| Calgary, Alberta, Canada T2P 3P7 |
|
|
|
| Attention: Governance Office |
|
|
* | By email: | board@nexeninc.com |
|
|
We receive inquiries on many subjects. The board and management have developed a process to manage inquiries so that the appropriate personnel respond to them.
Nexen reviews letters and emails addressed to the board, its members or the independent directors to determine if a board response is appropriate. While the board oversees management, it does not participate in day-to-day operations and is not normally in the best position to respond to inquiries on those matters. Those inquiries will be directed to appropriate personnel for response. The board has instructed the Governance Office to review all correspondence and, in its discretion, not forward items that are:
· not relevant to Nexen’s operations, policies or philosophies;
· commercial in nature; or
· not appropriate for the board to consider.
All inquiries will receive a response from the board or management. The Governance Office maintains a log of all correspondence sent to board members. Directors may review the log at any time and request copies of correspondence received.
See page 201 for a full report on the Audit Committee.
Security Ownership of Certain Beneficial Owners and Management and Related Stockholder Matters
SECURITY OWNERSHIP OF CERTAIN BENEFICIAL OWNERS
Nexen’s common shares are the only class of voting securities. Based on information known to Nexen, the following table shows each person or group who beneficially owns (pursuant to SEC Regulations) more than 5% of Nexen’s voting securities as at the date noted below.
Name and Address of Beneficial Owner |
| # of Shares Beneficially Owned |
| % of Shares Outstanding |
| Effective Date |
|
Jarislowsky, Fraser Limited1 |
| 43,857,995 |
| 8.39 | % | January 31, 2010 |
|
1 The beneficial owner has sole voting power over 38,196,468 shares, shared voting power over 5,661,527 shares and sole power to dispose of all shares.
SECURITY OWNERSHIP OF MANAGEMENT
At February 18, 2010, the following directors, certain executive officers, and all directors and executive officers as a group beneficially owned the following Nexen common shares:
Name of Beneficial Owner |
| Number of Shares1 |
| Exercisable TOPs2 |
|
William B. Berry |
| — |
| — |
|
Robert G. Bertram |
| 16,000 |
| — |
|
Dennis G. Flanagan |
| 31,264 |
| 20,000 |
|
S. Barry Jackson |
| 72,000 |
| — |
|
Kevin J. Jenkins |
| 12,540 |
| 60,000 |
|
A. Anne McLellan, P.C. |
| 300 |
| — |
|
Eric P. Newell, O.C. |
| 12,000 |
| — |
|
Thomas C. O’Neill |
| 16,000 |
| — |
|
Marvin F. Romanow |
| 206,875 |
| 766,100 |
|
Francis M. Saville, Q.C. |
| 59,864 |
| 60,000 |
|
John M. Willson |
| 15,055 |
| — |
|
Victor J. Zaleschuk |
| 63,371 |
| 140,000 |
|
Kevin J. Reinhart |
| 66,235 |
| 327,800 |
|
Gary H. Nieuwenburg |
| 100,116 |
| 281,000 |
|
James T. Arnold |
| 5,542 |
| 23,800 |
|
Brian C. Reinsborough |
| 17,895 |
| 172,700 |
|
All Directors and Executive Officers as a Group (23 persons) |
| 783,683 |
| 2,436,290 |
|
1 The number of shares held and TOPs exercisable by each beneficial owner represents less than 1% of the shares outstanding.
2 Includes all TOPs exercisable within 60 days of February 18, 2010. All TOPs held by non-executive directors are vested.
Under the terms of our TOPs plan, the board may grant options to officers and employees and, when previously allowed for, to directors. Nexen does not receive any consideration when options are granted.
Certain Relationships and Related Transactions, and Director Independence
As a Canadian foreign private issuer, Nexen provides the disclosure required under Item 7.B. of Form 20-F dealing with “related party transactions”. Nexen did not have any related party transactions in 2009 as defined under that standard. Certain other transactions described below which are not related party transactions, involving Nexen and certain of our directors, were entered into in 2009.
Mr. Saville was a senior partner of Fraser Milner Casgrain LLP (FMC), Barristers and Solicitors, Calgary, Alberta, until the end of January 2004. He has been counsel with the firm from February 1, 2004 to January 31, 2010. FMC provided legal services to us in each of the last five years. Mr. Saville does not solicit or participate in these services and did not receive any portion of the fees we pay to FMC, nor was he a partner or an employee of the firm. He is independent under our categorical standards.
Ms. McLellan has been counsel with Bennett Jones (BJ), Barristers and Solicitors, Edmonton, Alberta since June 27, 2006. BJ provided legal services to us in each of the last five years. Legal fees paid to BJ represent less than 6% of all legal fees paid by Nexen in 2009. Ms. McLellan does not solicit or participate in those services and does not receive any portion of the fees we pay to BJ, nor is she a partner or an employee of the firm. She is independent under our categorical standards.
Legal fees paid to BJ represent less than 6% of all legal fees paid by Nexen in 2009.
Mr. Romanow is not independent as he is Nexen’s President and CEO.
Principal Accounting Fees and Services
The Audit Committee assists our board in overseeing:
· the integrity of annual and quarterly financial statements;
· our compliance with accounting and finance-based legal and regulatory requirements;
· the independent auditor’s qualifications and independence;
· the internal accounting system and financial reporting controls established by management;
· performance of the internal and external audit process and independent auditor; and,
· implementation and effectiveness of How We Work: Our Integrity Guide, which constitutes our code of ethics, and related compliance programs.
The Committee is responsible for appointing (subject to shareholder approval), compensating and overseeing the independent registered chartered accountant (IRCA). The IRCA is accountable to and reports directly to the Committee, and understand that they must maintain an open and transparent relationship with the Committee, which represents our shareholders.
All Committee members are independent and knowledgeable on our financial reporting controls, and internal and external audit processes. All members are skilled or expert in financial acumen, particularly financial accounting, reporting requirements and internal controls—expertise most relevant to the Committee’s mandate.
Management is responsible for our internal controls and financial reporting process. The IRCA is responsible for independently auditing our: i) Consolidated Financial Statements according to Canadian and US generally accepted auditing standards and the standards of the Public Company Accounting Oversight Board (United States); and, ii) internal control over financial reporting according to the standards of the Public Company Accounting Oversight Board. The Committee monitors and oversees these processes.
CHANGES TO COMMITTEE MEMBERSHIP IN 2009
Mr. Thomson left the Committee upon his retirement from the board and Mr. Berry joined in April 2009.
KEY ACTIVITIES FOR 2009
· Reviewed and approved the quarterly Consolidated Financial Statements and reports on Form 10-Q.
· Met with management and the IRCA to review the December 31, 2009 Consolidated Financial Statements.
· Discussed the scope and result of the external audit with the IRCA.
· Discussed matters required by Canadian and US regulators with the IRCA.
· Received written disclosures from the IRCA required by US regulators.
· Discussed with the IRCA their independence.
· Oversaw the compliance activities by management to report on the effectiveness of internal control over financial reporting as at December 31, 2009.
· Approved the annual corporate audit plan and reviewed quarterly progress updates.
· Reviewed management’s annual and quarterly SOX control assessments.
· Recommended to the board that the audited Consolidated Financial Statements be included in Nexen’s annual report on Form 10-K for the year ended December 31, 2009, based on the reviews and discussions referred to above.
· Recommended approval of the Form 10-K to the board.
· Reviewed updates on new accounting and regulatory standards that affect Nexen, including progress on our transition to International Financial Reporting Standards.
· Approved a revised Integrity Guide.
· Reviewed and approved the decision to file an Annual Information Form in lieu of Form 10-K for 2011.
SECTIONS 302 AND 404 OF SARBANES-OXLEY
Nexen is a voluntary filer of the Form 10-K in the US and has complied with the requirements of Sections 302 and 404 of Sarbanes-Oxley since December 31, 2004. Accordingly, Nexen is in compliance with National Instrument 52-109—Certification of Disclosure in Issuers’ Annual and Interim Filings. In 2009, management assessed our disclosure controls and procedures and our internal control over financial reporting and concluded that they were effective as of December 31, 2009. The integrated audit report for 2009 is included in our Form 10-K.
IRCA ENGAGEMENT AND FEES BILLED
Before Nexen or any subsidiary engages the IRCA for additional audit or non-audit services, the Committee must approve the engagement. Since May 6, 2003, the Committee has approved all audit, audit-related, tax and other services provided by the IRCA. The Committee concludes that the services provided by the IRCA as described in “All Other Fees” below maintain that firm’s independence.
Type of Fee |
| Billed in 2008 |
| Billed in 2009 |
| Percentage of Total |
|
Audit Fees |
|
|
|
|
|
|
|
For the integrated audit of Nexen’s consolidated financial statements included in our annual report on Form 10-K |
| 2,812,000 | 1 | 3,061,149 | 2 |
|
|
For the integrated audit of the consolidated financial statements of Canexus 3 |
| 215,600 | 3 | 238,172 | 4 |
|
|
For the first, second and third quarter reviews of Nexen’s Consolidated Financial Statements included in Form 10-Qs |
| 110,000 |
| 117,000 |
|
|
|
For the first, second and third quarter reviews of the Consolidated Financial Statements of Canexus 3 |
| 45,000 |
| 45,000 |
|
|
|
For comfort letters and submissions to commissions |
| 3,000 |
| 130,000 |
|
|
|
|
|
|
|
|
|
|
|
Total Audit Fees |
| 3,185,600 |
| 3,591,321 |
| 62 | % |
Audit-Related Fees—Nexen and Canexus 3 |
|
|
|
|
|
|
|
For the annual audits and quarterly reviews of subsidiary financial statements and employee benefit plans |
| 1,144,700 |
| 1,786,308 |
|
|
|
|
|
|
|
|
|
|
|
Total Audit-Related Fees |
| 1,144,700 |
| 1,786,308 |
| 30 | % |
Tax Fees—Nexen and Canexus 3 |
|
|
|
|
|
|
|
For tax return preparation assistance and tax-related consultation |
| 139,800 |
| 151,269 |
|
|
|
Total Tax Fees |
| 139,800 |
| 151,269 |
| 3 | % |
|
|
|
|
|
|
|
|
All Other Fees |
| 216,300 | 5 | 262,848 |
| 5 | % |
Total Annual Fees |
| 4,686,400 |
| 5,791,746 |
| 100 | % |
1 Consulting of $936,000 to complete the 2007 audit and $1,876,000 to commence the 2008 audit.
2 Consulting of $1,276,498 to complete the 2008 audit and $1,784,651 to commence the 2009 audit.
3 Includes fees for Canexus Income Fund, Canexus Limited Partnership and its subsidiaries.
4 Consisting of $152,000 to complete the 2008 audit and $86,172 to commence the 2009 audit.
5 Petroview NW Europe subscription.
EXTERNAL RECOGNITION AND VERIFICATION
Nexen was recognized in 2008 and in 2009 with the Award of Excellence for Corporate Reporting in the Oil and Gas category of the Corporate Reporting Awards from the Canadian Institute of Chartered Accountants.
COMMITTEE APPROVAL
Based on the Committee’s discussions with management and the IRCA, and its review of both their representations, the Committee recommended to the board that the audited Consolidated Financial Statements be included in Nexen’s annual report on Form 10-K for the year ended December 31, 2009 and that the Form 10-K be approved.
Submitted on behalf of the Audit Committee:
Tom O’Neill, Chair, Bill Berry, Barry Jackson, Kevin Jenkins, Eric Newell, John Willson
Exhibits, Financial Statement Schedules
FINANCIAL STATEMENTS AND SCHEDULES
Schedules and separate financial statements of subsidiaries are omitted because they are not required or applicable, or the required information is shown in the Consolidated Financial Statements or notes.
EXHIBITS
Exhibits filed as part of this report are listed below. Certain exhibits have been previously filed with the Commission and are incorporated in this Form 10-K by reference. Instruments defining the rights of holders of debt securities that do not exceed 10% of Nexen’s consolidated assets have not been included. A copy of such instruments will be furnished to the Commission upon request.
2.2 | Agreement for the Sale and Purchase of EnCana (U.K.) Limited, between EnCana (U.K.) Holdings Limited and Nexen Energy Holdings International Limited dated October 28, 2004 (filed as Exhibit 2.1 to Form 8-K dated October 29, 2004). |
|
|
3.14 | Restated Certificate and Articles of Incorporation of the Registrant dated May 20, 2005 (filed as Exhibit 3.12 to Form 10-Q for the quarterly period ended June 30, 2005). |
|
|
3.15 | By-Law No. 3 of the Registrant enacted December 4, 2006, being a by-law relating generally to the transaction of the business and affairs of the Registrant (filed as Exhibit 3.15 to Form 8-K dated December 5, 2006). |
|
|
3.16 | Certificate and Articles of Amendment of the Registrant dated April 26, 2007 (filed as Exhibit 3.16 to Form 8-K dated April 27, 2007). |
|
|
4.42 | Trust Indenture dated April 28, 1998 between the Registrant and CIBC Mellon Trust Company providing for the issue of debt securities from time to time (filed as Exhibit 4.42 to Form 10-K for the year ended December 31, 2003). |
|
|
4.43 | First Supplemental Indenture dated April 28, 1998 to the Trust Indenture dated April 28, 1998 between the Registrant and CIBC Mellon Trust Company pertaining to the issuance of US$200 million, 7.40% notes due 2028 (filed as Exhibit 4.43 to Form 10-K for the year ended December 31, 2003). |
|
|
4.46 | Third Supplemental Indenture dated March 11, 2002 to the Trust Indenture dated April 28, 1998 between the Registrant and CIBC Mellon Trust Company pertaining to the issuance of $500 million, 7.85% notes due 2032 (filed as Exhibit 4.46 to Form 10-K for the year ended December 31, 2003). |
|
|
4.47 | Subordinated Debt Indenture dated November 4, 2003 between the Registrant and Deutsche Bank Trust Company Americas, pertaining to the issue of subordinated notes from time to time (filed as Exhibit 4.47 to Form 10-K for the year ended December 31, 2003). |
|
|
4.48 | Officer’s Certificate dated November 4, 2003 pursuant to the Subordinated Debt Indenture dated November 4, 2003 between the Registrant and Deutsche Bank Trust Company Americas, pertaining to the issuance of US$460 million, 7.35% subordinated notes due 2043 (filed as Exhibit 4.48 to Form 10-K for the year ended December 31, 2003). |
|
|
4.51 | Fourth Supplemental Indenture dated November 20, 2003 to the Trust Indenture dated April 28, 1998, between the Registrant and CIBC Mellon Trust Company pertaining to the issuance of US$500 million, 5.05% notes due 2013 (filed as Exhibit 4.51 to Form 10-K for the year ended December 31, 2003). |
4.53 | Fifth Supplemental Indenture dated March 10, 2005 to the Trust Indenture dated April 28, 1998, between the Registrant and CIBC Mellon Trust Company pertaining to the issuance of US$250 million, 5.20% notes due 2015 and the issuance of US$790 million, 5.875% notes due 2035 (filed as Exhibit 10.1 to Form 8-K dated March 11, 2005). |
|
|
4.55 | Senior Debt Indenture dated May 4, 2007 between the Registrant and Deutsche Bank Trust Company Americas, pertaining to the issue of senior notes from time to time (filed as Exhibit 4.1 to Form 8-K dated May 7, 2007). |
|
|
4.56 | First Supplemental Indenture dated May 4, 2007 to the Trust Indenture dated May 4, 2007 between the Registrant and Deutsche Bank Trust Company Americas pertaining to the issuance of US$250 million, 5.65% notes due 2017 and the issuance of US$1.25 billion, 6.40% notes due 2037 (filed as Exhibit 4.2 to Form 8-K dated May 7, 2007). |
|
|
4.57 | Amended and Restated Shareholder Rights Plan Agreement, dated April 29, 2008 between the Registrant and CIBC Mellon Trust Company, as Rights Agent (filed as Exhibit 4.57 to Form 8-K dated April 30, 2008). |
|
|
4.58 | Second Supplemental Indenture dated July 30, 2009 to the Trust Indenture dated May 4, 2007 between the Registrant and Deutsche Bank Trust Company Americas pertaining to the issuance of US$300 million, 6.20% notes due 2019 and the issuance of US$700 million, 7.50% notes due 2039 (filed as Exhibit 4.1 to Form 8-K dated July 30, 2009). |
|
|
10.41 | Indemnification Agreements made between the Registrant and its directors and officers during 2002 (filed as Exhibit 10.41 to Form 10-K for the year ended December 31, 2002). |
|
|
10.42 | Indemnification Agreement made between the Registrant and one of its directors, Eric P. Newell, as of January 5, 2004 (filed as Exhibit 10.42 to Form 10-K for the year ended December 31, 2003). |
|
|
10.43 | Credit Agreement dated as of July 22, 2005 between the Registrant and the Toronto Dominion Bank, as Agent, and the Lenders (filed as Exhibit 10.1 to Form 8-K dated July 28, 2005). |
|
|
10.44 | Guarantee dated as of July 22, 2005 as Schedule K to the Credit Agreement (filed as Exhibit 10.2 to Form 8-K dated July 28, 2005). |
|
|
10.46 | Indemnification Agreement made between the Registrant and one of its directors, A. Anne McLellan P.C., as of July 5, 2006 (filed as Exhibit 10.2 to Form 8-K dated July 20, 2006). |
|
|
10.47 | Second Amending Agreement dated July 14, 2006 to the Credit Agreement, dated as of July 22, 2005, between the Registrant and the Toronto-Dominion Bank, as Agent, and the Lenders (filed as Exhibit 10.1 to Form 8-K dated July 20, 2006). |
|
|
10.48 | Indemnification Agreement made between the Registrant and Brendon Muller dated April 9, 2007 (filed as Exhibit 10.48 to Form 8-K dated April 12, 2007). |
|
|
10.50 | Pricing Agreement dated May 1, 2007 among the Registrant and Banc of America Securities LLC, Citigroup Global Markets Inc. and Deutsche Bank Securities Inc., as Underwriters (filed as Exhibit 10.1 to Form 8-K dated May 7, 2007). |
|
|
10.52 | Amended and Restated Agreement Respecting Change of Control and Executive Benefit Plan Entitlements with Executive Officers dated during August and September, 2008 (filed as Exhibit 10.52 to Form 10-Q for the quarterly period ended September 30, 2008). |
|
|
10.53 | Amended and Restated Agreement Respecting Change of Control and Executive Benefit Plan Entitlements with Kevin J. Reinhart dated as of September 16, 2008 (filed as Exhibit 10.53 to Form 8-K dated November 21, 2008). |
|
|
10.54 | Form of Indemnification Agreement between the Registrant and William B. Berry and Robert G. Bertram (filed as Exhibit 10.54 to Form 8-K dated December 10, 2008). |
|
|
10.55 | Amending Agreement dated as of December 9, 2008 to the Amended and Restated Agreement Respecting Change of Control and Executive Benefit Plan Entitlements with Marvin F. Romanow dated as of September 17, 2008 (filed as Exhibit 10.55 to Form 8-K dated December 10, 2008). |
10.56 | Tandem Option Plan amended June 30, 2007. (filed as Exhibit 10.56 to Form 10-K for the year ended December 31, 2008). |
|
|
10.57 | Termination of Employment and Retirement Agreement between the Registrant and Roger D. Thomas dated May 12, 2009 (filed as Exhibit 10.57 to Form 10-Q for the quarterly period ended June 30, 2009). |
|
|
10.58 | Pricing Agreement dated July 27, 2009 among the Registrant and Banc of America Securities LLC, BNP Paribas Securities Corp., Deutsche Bank Securities Inc., and HSBC Securities (USA) Inc. as representatives of the Underwriters (filed as Exhibit 10.1 to Form 8-K dated July 30, 2009). |
|
|
10.59* | Agreement Respecting Change of Control with Brian C. Reinsborough dated February 29, 2008. |
|
|
10.60* | Agreement Respecting Change of Control and Executive Benefit Plan Entitlements with James T. Arnold dated November 12, 2009. |
|
|
10.61* | Form of Indemnification Agreement between the Registrant and Brian C. Reinsborough and James T. Arnold. |
|
|
11.1* | Statement regarding the Computation of Per Share Earnings for the three years ended December 31, 2009. |
|
|
21.1* | Subsidiaries of the Registrant. |
|
|
23.1* | Consent of Independent Registered Chartered Accountants. |
|
|
23.2* | Report of Third Party, DeGolyer and MacNaughton (selected United Kingdom properties). |
|
|
23.3* | Report of Third Party, DeGolyer and MacNaughton (selected Yemen properties). |
|
|
23.4* | Report of Third Party, DeGolyer and MacNaughton (selected Nigeria properties). |
|
|
23.5* | Consent of DeGolyer and MacNaughton. |
|
|
23.6* | Report of Third Party, McDaniel & Associates Consultants Ltd. (selected Canadian properties). |
|
|
23.7* | Report of Third Party, McDaniel & Associates Consultants Ltd. (Syncrude). |
|
|
23.8* | Consent of McDaniel & Associates Consultants Ltd. |
|
|
23.9* | Report of Third Party, Ryder Scott Company L.P. (selected Gulf of Mexico properties). |
|
|
23.10* | Consent of Ryder Scott Company L.P. |
|
|
31.1* | Certification of Chief Executive Officer pursuant to Section 302 of the Sarbanes-Oxley Act of 2002. |
|
|
31.2* | Certification of Chief Financial Officer pursuant to Section 302 of the Sarbanes-Oxley Act of 2002. |
|
|
32.1* | Certification of periodic report by Chief Executive Officer pursuant to 18 U.S.C., Section 1350, as adopted pursuant to Section 906 of the Sarbanes-Oxley Act of 2002. |
|
|
32.2* | Certification of periodic report by Chief Financial Officer pursuant to 18 U.S.C., Section 1350, as adopted pursuant to Section 906 of the Sarbanes-Oxley Act of 2002. |
|
|
99.1* | Report of Internal Qualified Reserves Evaluator on National Instrument 51-101 Form F2 as required by certain Canadian securities regulatory authorities. |
*Filed with this Form 10-K.
SIGNATURES
Pursuant to the requirements of Section 13 or 15(d) of the Securities Exchange Act of 1934, the Company has duly caused this report to be signed on its behalf by the undersigned, thereunto duly authorized, on February 25, 2010.
NEXEN INC. | ||
| ||
By: | /s/ Marvin F. Romanow |
|
Marvin F. Romanow | ||
President, Chief Executive Officer | ||
and Director (Principal Executive Officer) | ||
Pursuant to the requirements of the Securities Exchange Act of 1934, this report has been signed below by the following persons on behalf of the registrant and in the capacities indicated on February 25, 2010.
/s/ Dennis G. Flanagan |
| /s/ Victor J. Zaleschuk |
Dennis G. Flanagan, Director |
| Victor J. Zaleschuk, Director |
|
|
|
/s/ S. Barry Jackson |
| /s/ William B. Berry |
S. Barry Jackson, Director |
| William B. Berry, Director |
|
|
|
/s/ Kevin J. Jenkins |
| /s/ Robert G. Bertram |
Kevin J. Jenkins, Director |
| Robert G. Bertram, Director |
|
|
|
/s/ A Anne McLellan, Director |
| /s/ Marvin F. Romanow |
A. Anne McLellan, Director |
| Marvin F. Romanow |
|
| President, Chief Executive Officer |
/s/ Eric P. Newell |
| and Director (Principal Executive Officer) |
Eric P. Newell, Director |
|
|
|
| /s/ Kevin J. Reinhart |
/s/ Thomas C. O’Neill |
| Kevin J. Reinhart |
Thomas C. O’Neill, Director |
| Senior Vice President and Chief Financial Officer |
|
| (Principal Financial Officer) |
/s/ Francis M. Saville |
|
|
Francis M. Saville, Director |
| /s/ Brendon T. Muller |
|
| Brendon T. Muller |
/s/ John M. Willson |
| Controller |
John M. Willson, Director |
| (Principal Accounting Officer) |
|
|
|
|
| /s/ Eric B. Miller |
|
| Eric B. Miller |
|
| Vice President, General Counsel |
|
| and Secretary |