FILED PURSUANT TO RULE 424(B)(3)
REGISTRATION NO. 333-217924
PHILLIPS EDISON GROCERY CENTER REIT III, INC.
SUPPLEMENT NO. 2 DATED MAY 9, 2019
TO THE PROSPECTUS DATED MAY 1, 2019
This prospectus supplement, or this Supplement No. 2, is part of the prospectus of Phillips Edison Grocery Center REIT III, Inc., or the Company, dated May 1, 2019, or the Prospectus, as supplemented by Supplement No. 1 to the Prospectus dated May 1, 2019. Unless the context suggests otherwise, the terms “we,” “us,” and “our” used herein refer to the Company, together with its consolidated subsidiaries. The purposes of this Supplement No. 2 are to provide:
| |
| • | “Management’s Discussion and Analysis of Financial Condition and Results of Operations” similar to that filed in our quarterly Report on Form 10-Q for the period ended March 31, 2019, filed May 9, 2019; and |
| |
| • | our unaudited consolidated financial statements and the notes thereto as of March 31, 2019 and December 31, 2018 and for the three months ended March 31, 2019 and 2018. |
MANAGEMENT’S DISCUSSION AND ANALYSIS OF FINANCIAL CONDITION AND RESULTS OF OPERATIONS
All references to “Notes” throughout the document refer to the footnotes to the consolidated financial statements.
Overview
Organization—We completed a private placement offering of shares of Class A common stock to accredited investors. We ceased the private offering during the first quarter of 2018. Pursuant to our Registration Statement on Form S-11, as amended, declared effective on May 8, 2018, we are offering to the public (i) $1.5 billion in shares of common stock in the Primary Offering, consisting of two classes of shares, Class T and Class I, at purchase prices of $10.42 per share and $10.00 per share, respectively, with discounts available to some categories of investors with respect to Class T shares, and (ii) $0.2 billion in Class A, Class T, and Class I shares of our common stock pursuant to the DRIP at a price of $9.80 per share. The Dealer Manager is responsible for marketing our shares in the Public Offering.
We intend to invest primarily in well-occupied, grocery-anchored neighborhood and community shopping centers leased to a mix of national, regional, and local creditworthy tenants selling necessity-based goods and services in strong demographic markets throughout the United States. In addition, we may invest in other retail properties including power and lifestyle shopping centers, multi-tenant shopping centers, free-standing single-tenant retail properties, and other real estate and real estate-related loans and securities depending on real estate market conditions and investment opportunities that we determine are in the best interests of our stockholders. As of March 31, 2019, we wholly owned three shopping centers acquired from third parties unaffiliated with us or our Advisor.
Joint Venture with Northwestern Mutual—In November 2018, we entered into the Joint Venture with Northwestern Mutual. We contributed our ownership interests in three grocery-anchored shopping centers to the Joint Venture in exchange for $41.3 million in cash and a 10% ownership interest in the Joint Venture, and Northwestern Mutual made an initial capital contribution to the Joint Venture equal to $42.6 million in cash in exchange for a 90% ownership interest in the Joint Venture (see Note 5).
Equity Raise Activity—During the private placement offering, we raised $57.7 million in gross offering proceeds from the issuance of 5.9 million Class A shares, inclusive of the DRIP. As of March 31, 2019, through the Public Offering we had raised approximately $0.7 million and $1.8 million in gross offering proceeds from the issuance of Class I and Class T shares, respectively, inclusive of the DRIP, as well as $1.3 million in gross offering proceeds from the issuance of Class A shares pursuant to the DRIP. Subsequent to March 31, 2019, we raised approximately $0.2 million, $0.2 million, and $1.0 million from the issuance of Class A, Class I, and Class T shares, respectively.
Portfolio—Below are statistical highlights of our portfolio as of March 31, 2019:
|
| | | | | |
| | Wholly-Owned Portfolio | | Joint Venture Properties |
| Number of properties | 3 |
| | 3 |
|
| Number of states | 3 |
| | 3 |
|
| Total square feet (in thousands) | 251 |
| | 312 |
|
| Leased % of rentable square feet | 95.1 | % | | 94.6 | % |
Average remaining lease term (in years)(1) | 4.7 |
| | 5.1 |
|
| |
(1) | The average remaining lease term in years excludes future options to extend the term of the lease. |
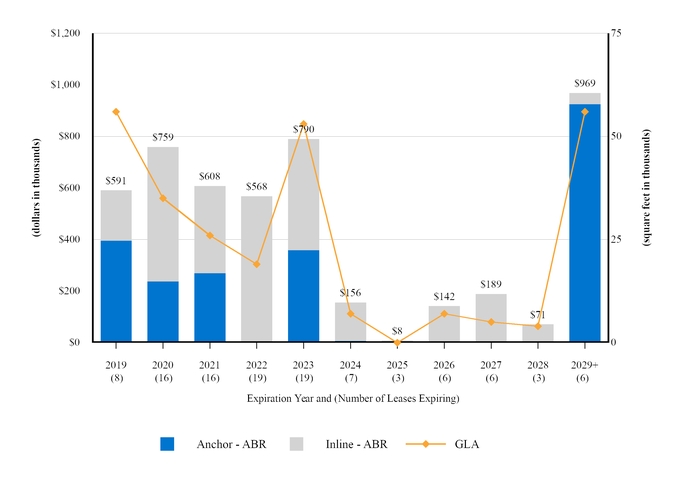
Lease Expirations—The following chart shows, on an aggregate basis, all of the scheduled lease expirations after March 31, 2019, for each of the next ten years and thereafter for our three properties, as well as the pro rata share of the three properties owned by GRP II. The following chart also shows the leased square feet and annual base rent (“ABR”) represented by the applicable lease expiration year:
Subsequent to March 31, 2019, we renewed approximately 1,046 total square feet and $26,076 of total ABR of the expiring leases. We have one anchor tenant lease wherein the current term is due to expire at the end of 2019. There are multiple extension options in the existing lease agreement.
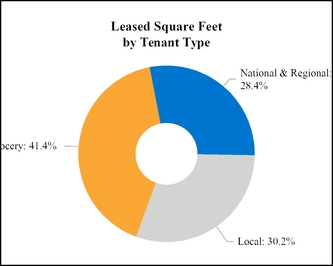
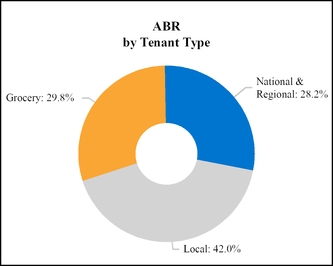
Portfolio Tenancy—Prior to the acquisition of a property, we assess the suitability of the anchor tenant and other tenants in light of our principal investment objectives, namely, preserving capital, providing stable cash flows for distributions, realizing growth in value of our assets upon sale of such assets, and providing our investors with the potential for future liquidity. Generally, we assess the strength of the tenant by consideration of company factors, such as its financial strength and market share in the geographic area of the property, as well as location-specific factors, such as the store’s sales, local competition, and demographics. When assessing the tenancy of the non-anchor space at the property, we consider the tenant mix at each property in light of our portfolio, the proportion of national and national franchise tenants, the creditworthiness of specific tenants, and the timing of lease expirations. When evaluating non-national tenancy, we attempt to obtain credit enhancements to leases, which typically come in the form of deposits and/or guarantees from one or more individuals.
We define national tenants as those tenants that operate in at least three states. Regional tenants are defined as those
tenants that have at least three locations. The following charts present the composition of our portfolio, including the pro rata share of the three properties held by GRP II, by tenant type as of March 31, 2019:
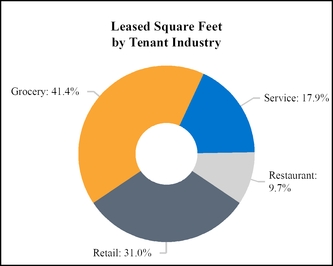
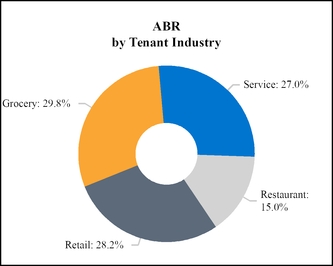
The following charts present the composition of our portfolio, including the pro rata share of the three properties held by GRP II, by tenant industry, as of March 31, 2019:
Results of Operations
We wholly owned three properties as of March 31, 2019. We owned four properties as of March 31, 2018, and in November 2018, we contributed three properties to the Joint Venture. Unless otherwise discussed below, the year-over-year comparative differences for the three months ended March 31, 2019 and 2018, are almost entirely attributable to the number of properties owned and the length of ownership of these properties. Due to the acquisition activity during 2018 and 2019, and contribution of properties to the Joint Venture in November 2018, our 2018 results are not expected to be indicative of our 2019 results.
Summary of Operating Activities for the Three Months Ended March 31, 2019 and 2018
(in thousands, except per share amounts) |
| | | | | | | | | | | |
| | 2019 | | 2018 | | Favorable (Unfavorable) Changes |
| Operating Data: | | | | | |
| Total revenues | $ | 1,516 |
| | $ | 1,373 |
| | $ | 143 |
|
| Property operating | (228 | ) | | (228 | ) | | — |
|
| Real estate taxes | (200 | ) | | (323 | ) | | 123 |
|
| General and administrative | (503 | ) | | (323 | ) | | (180 | ) |
| Depreciation and amortization | (676 | ) | | (606 | ) | | (70 | ) |
| Interest expense, net | (334 | ) | | (344 | ) | | 10 |
|
| Other income (expense), net | 125 |
| | (6 | ) | | 131 |
|
| Net loss | $ | (300 | ) | | $ | (457 | ) | | $ | 157 |
|
| | | | | | |
| Net loss per share—basic and diluted | $ | (0.05 | ) | | $ | (0.08 | ) | | $ | 0.03 |
|
Total revenues—The increase in total revenues was primarily related to tenant-related settlement income in the first quarter of 2019. During the three months ended March 31, 2019, we executed two new leases with approximately $44,000 in annual rent for an average term of three years. We also renewed one lease with a term of three years with approximately $49,000 in annual rent.
General and administrative expenses—The $0.2 million increase in general and administrative expenses was primarily attributable to an increase in accounting and legal fees related to the administration of the fund since entering the Public Offering.
Other income (expense), net—The $0.1 million increase in other income (expense), net is attributable to a one-time legal settlement.
Non-GAAP Measures
Net Operating Income—We present net operating income (“NOI”) as a supplemental measure of our performance. We define NOI as total operating revenues less property operating expenses, real estate taxes, and non-cash revenue items. We believe that NOI provides useful information to our investors about our financial and operating performance because it provides a performance measure of the revenues and expenses directly involved in owning and operating real estate assets and provides a perspective not immediately apparent from net income.
NOI should not be viewed as an alternative measure of our financial performance since it only highlights the operating income and costs on properties. NOI does not reflect the impact of general and administrative expenses, acquisition expenses, interest expense, depreciation and amortization, other income, or the level of capital expenditures and leasing costs necessary to maintain the operating performance of our properties that could materially impact our results from operations.
The table below is a comparison of NOI (in thousands): |
| | | | | | | | | | | |
| | Three Months Ended March 31, | | Favorable (Unfavorable) Changes |
| | 2019 | | 2018 | |
| Revenues: | | | | | |
Rental income(1) | $ | 1,045 |
| | $ | 898 |
| | $ | 147 |
|
| Tenant recovery income | 287 |
| | 410 |
| | (123 | ) |
| Other property income | 10 |
| | 7 |
| | 3 |
|
| Total revenues | 1,342 |
| | 1,315 |
| | 27 |
|
| Operating Expenses: | | | | | |
| Property operating expenses | 228 |
| | 228 |
| | — |
|
| Real estate taxes | 200 |
| | 323 |
| | 123 |
|
| Total operating expenses | 428 |
| | 551 |
| | 123 |
|
| Total NOI | $ | 914 |
| | $ | 764 |
| | $ | 150 |
|
| |
(1) | Excludes lease buy-out income and non-cash rental income adjustments related to straight-line rental income and amortization of above- and below-market leases. |
Below is a reconciliation of net loss to NOI (in thousands): |
| | | | | | | |
| | Three Months Ended March 31, |
| | 2019 | | 2018 |
| Net loss | $ | (300 | ) | | $ | (457 | ) |
| Adjusted to exclude: | | | |
| Non-cash rental income adjustments | (53 | ) | | (58 | ) |
| Lease buyout income | (121 | ) | | — |
|
| General and administrative expenses | 503 |
| | 323 |
|
| Depreciation and amortization | 676 |
| | 606 |
|
| Interest expense, net | 334 |
| | 344 |
|
| Other (income) expense, net | (125 | ) | | 6 |
|
| NOI | $ | 914 |
| | $ | 764 |
|
Funds from Operations and Modified Funds from Operations—Funds from Operations (“FFO”) is a non-GAAP performance financial measure that is widely recognized as a measure of REIT operating performance. We use FFO as defined by the National Association of Real Estate Investment Trusts (“NAREIT”) to be net income (loss) attributable to common stockholders computed in accordance with GAAP, excluding gains (or losses) from sales of property and gains (or losses) from change in control, plus depreciation and amortization, and after adjustments for unconsolidated partnerships and joint ventures. Adjustments for unconsolidated partnerships and joint ventures are calculated to reflect funds from operations on the same basis.
Modified Funds from Operations (“MFFO”) is an additional non-GAAP performance financial measure used by us as FFO includes certain non-comparable items that affect our performance over time. We believe that MFFO is helpful in assisting management and investors with the assessment of the sustainability of operating performance in future periods. Neither FFO nor MFFO should be considered as an alternative to net income (loss) or income (loss) from continuing operations under GAAP, nor as an indication of our liquidity, nor is either of these measures indicative of funds available to fund our cash needs, including our ability to fund distributions. MFFO may not be a useful measure of the impact of long-term operating performance on value if we do not continue to operate our business plan in the manner currently contemplated.
Accordingly, FFO and MFFO should be reviewed in connection with other GAAP measurements. FFO and MFFO should not be viewed as more prominent measures of performance than our net income or cash flows from operations prepared in accordance with GAAP. Our FFO and MFFO as presented may not be comparable to amounts calculated by other REITs.
The following section presents our calculation of FFO and MFFO and provides additional information related to our operations. As a result of the timing of the commencement of our initial public offering and our active real estate acquisitions, FFO and MFFO are not relevant to a discussion comparing operations for the periods presented. We expect revenues and expenses to increase in future periods as we acquire additional investments.
The following table presents our calculation of FFO and MFFO and provides additional information related to our operations (in thousands, except per share amounts): |
| | | | | | | |
| | Three Months Ended March 31, |
| | 2019 | | 2018 |
| Calculation of FFO | | | |
| Net loss | $ | (300 | ) | | $ | (457 | ) |
| Adjustments: | |
| | |
|
| Depreciation and amortization of real estate assets | 676 |
| | 606 |
|
| Depreciation and amortization related to unconsolidated Joint Venture | 68 |
| | — |
|
| FFO | $ | 444 |
| | $ | 149 |
|
| Calculation of MFFO | | | |
| FFO | $ | 444 |
| | $ | 149 |
|
| Adjustments: | | | |
| Acquisition expenses | 12 |
| | 6 |
|
| Non-cash rental income adjustments | (53 | ) | | (58 | ) |
| Adjustments related to unconsolidated Joint Venture | (3 | ) | | — |
|
| MFFO | $ | 400 |
| | $ | 97 |
|
| | | | |
| Earnings per common share | | | |
| Weighted-average common shares outstanding - basic and diluted | 6,576 |
| | 5,552 |
|
| Net loss per share - basic and diluted | $ | (0.05 | ) | | $ | (0.08 | ) |
| FFO per share - basic and diluted | $ | 0.07 |
| | $ | 0.03 |
|
| MFFO per share - basic and diluted | $ | 0.06 |
| | $ | 0.02 |
|
Liquidity and Capital Resources
General—Aside from standard operating expenses, we expect our principal cash demands to be for:
| |
| • | investments in real estate; |
| |
| • | capital expenditures and leasing costs; |
| |
| • | cash distributions to stockholders; and |
| |
| • | interest payments on our outstanding indebtedness. |
We expect our primary sources of liquidity to be:
| |
| • | proceeds from our Public Offering; |
| |
| • | distributions received from GRP II; |
| |
| • | proceeds from our unsecured revolving credit facility; |
| |
| • | reinvested distributions; |
| |
| • | available, unrestricted cash and cash equivalents; and |
As of March 31, 2019, we had cash and cash equivalents of $0.7 million, a net decrease of $10.8 million for the three month period, as discussed below.
Below is a summary of our cash flow activity for the three months ended March 31, 2019 and 2018 (in thousands): |
| | | | | | | | | | | |
| | 2019 | | 2018 | | Favorable (Unfavorable) Change |
| Net cash provided by operating activities | $ | 1,527 |
| | $ | 458 |
| | $ | 1,069 |
|
| Net cash used in investing activities | (31,605 | ) | | (12,344 | ) | | (19,261 | ) |
| Net cash provided by financing activities | 19,269 |
| | 10,676 |
| | 8,593 |
|
Operating Activities—Our net cash provided by operating activities was primarily impacted by the following:
| |
| • | Operations—Our operating cash primarily comes from rental income, and is offset by property operating expenses, real estate taxes, and general and administrative costs. |
| |
| • | Working capital—Our working capital changes over the same period in 2018 are largely a result of the timing of annual tax receipts at one of our properties. |
Investing Activities—Our net cash used in investing activities was primarily impacted by the following:
| |
| • | Real estate acquisitions—During the three months ended March 31, 2019, we acquired one grocery-anchored shopping center for a total cash outlay of $31.7 million. During the same period in 2018, we had one acquisition with a cash outlay of $12.3 million. |
| |
| • | Capital expenditures—We invest capital into leasing our properties and maintaining or improving the condition of our properties. |
Financing Activities—Net cash provided by financing activities was primarily impacted by the following:
| |
| • | Issuance of common stock and payment of offering costs—We ceased offering Class A shares in the private offering during the first quarter of 2018. On May 8, 2018, we began offering Class T and Class I shares to the public in the Primary Offering. During the three months ended March 31, 2019, our proceeds from issuing common stock decreased by $14.3 million over the same period in 2018, offset by a $1.4 million decrease in our payments for offering costs related to selling commissions and dealer manager fees. |
| |
| • | Debt borrowings/payments—During the three months ended March 31, 2019, we borrowed $20.5 million on our revolving credit facility for the acquisition of one property. The borrowing capacity on our revolving credit facility was $14.5 million as of March 31, 2019. |
| |
| • | Repurchases of common stock—We repurchased $1.8 million of our securities during the three months ended March 31, 2019. We had no stock repurchases during the same period in 2018. |
Activity related to distributions to our stockholders for the three months ended March 31, 2019 and 2018, is as follows (in thousands): |
| | | | | | | |
| | 2019 | | 2018 |
| Gross distributions paid | $ | 975 |
| | $ | 719 |
|
| Distributions reinvested through DRIP | 364 |
| | 303 |
|
| Net cash distributions | $ | 611 |
| | $ | 416 |
|
| Net loss | $ | (300 | ) | | $ | (457 | ) |
| Net cash provided by operating activities | $ | 1,527 |
| | $ | 458 |
|
FFO(1) | $ | 444 |
| | $ | 149 |
|
(1) See Non-GAAP Measures above for the definition of FFO, information regarding why we present FFO, and for a reconciliation of this non-GAAP financial measure to net loss on the consolidated statements of operations.
We expect to pay distributions monthly unless our results of operations, our general financial condition, general economic conditions, or other factors, as determined by the board, make it imprudent to do so. The timing and amount of distributions is determined by our Board and is influenced in part by our intention to continue to comply with REIT requirements of the Internal Revenue Code.
In order to continue to qualify as a REIT, we must make aggregate annual distributions to our stockholders of at least 90% of our REIT taxable income (which is computed without regard to the dividends paid deduction or net capital gain and which does not necessarily equal net income as calculated in accordance
with GAAP). If we meet the REIT qualification requirements, we generally will not be subject to U.S. federal income tax on the income that we distribute to our stockholders each year. However, we may be subject to certain state and local taxes on our income, property, or net worth, respectively, and to federal income and excise taxes on our undistributed income.
We have not established a minimum distribution level, and our charter does not require that our Board of Directors declares
distributions to our stockholders.
Critical Accounting Policies
Our 2018 Annual Report on Form 10-K contains a description of our critical accounting policies, including those relating to real estate assets, revenue recognition, and the valuation of real estate, investments, and related intangible assets. For the three months ended March 31, 2019, there were no significant changes to these policies except for the policies related to the accounting for leases as a result of the adoption of ASC 842 as of January 1, 2019, as described in Note 2 and Note 3 in the accompanying condensed consolidated financial statements.
Impact of Recently Issued Accounting Pronouncements
Refer to Note 2 for discussion of the impact of recently issued accounting pronouncements.
INDEX TO CONSOLIDATED FINANCIAL STATEMENTS
PHILLIPS EDISON GROCERY CENTER REIT III, INC.
CONSOLIDATED BALANCE SHEETS
AS OF MARCH 31, 2019 AND DECEMBER 31, 2018
(Unaudited)
(In thousands, except per share amounts) |
| | | | | | | |
| | March 31, 2019 | | December 31, 2018 |
| ASSETS | | | |
| Investment in real estate: | | | |
| Land and improvements | $ | 22,147 |
| | $ | 8,804 |
|
| Building and improvements | 34,183 |
| | 18,953 |
|
| In-place lease assets | 4,973 |
| | 2,246 |
|
| Above-market lease assets | 1,047 |
| | 229 |
|
| Total investment in real estate assets | 62,350 |
| | 30,232 |
|
| Accumulated depreciation and amortization | (1,526 | ) | | (820 | ) |
| Net investment in real estate assets | 60,824 |
| | 29,412 |
|
| Investment in unconsolidated joint venture | 4,590 |
| | 4,725 |
|
| Total investment in real estate assets, net | 65,414 |
| | 34,137 |
|
| Cash and cash equivalents | 672 |
| | 11,481 |
|
| Deferred financing expenses, net | 585 |
| | 661 |
|
| Other assets, net | 1,691 |
| | 2,498 |
|
| Total assets | $ | 68,362 |
| | $ | 48,777 |
|
| LIABILITIES AND EQUITY | |
| | |
| Liabilities: | |
| | |
| Debt obligation | $ | 20,500 |
| | $ | — |
|
| Below-market lease liabilities, net | 994 |
| | 679 |
|
| Accounts payable – affiliates | 5,099 |
| | 4,864 |
|
| Deferred income | 172 |
| | 232 |
|
| Accounts payable and other liabilities | 1,163 |
| | 770 |
|
| Total liabilities | 27,928 |
| | 6,545 |
|
| Commitments and contingencies (Note 8) | — |
| | — |
|
| Equity: | |
| | |
| Preferred stock, $0.01 par value per share, 10,000 shares authorized, and zero issued and outstanding | | | |
| at March 31, 2019 and December 31, 2018 | — |
| | — |
|
| Common stock - Class A, $0.01 par value per share, 75,000 shares authorized, 6,276 and 6,425 | | | |
| shares issued and outstanding, at March 31, 2019 and December 31, 2018, respectively | 63 |
| | 64 |
|
| Common stock - Class T, $0.01 par value per share, 750,000 shares authorized, 175 and 98 | | | |
shares issued and outstanding, at March 31, 2019 and December 31, 2018, respectively
| 2 |
| | 1 |
|
| Common stock - Class I, $0.01 par value per share, 75,000 shares authorized, 73 and 29 | | | |
| shares issued and outstanding, at March 31, 2019 and December 31, 2018, respectively | 1 |
| | — |
|
| Additional paid-in capital | 54,588 |
| | 55,114 |
|
| Accumulated deficit | (14,220 | ) | | (12,947 | ) |
| Total equity | 40,434 |
| | 42,232 |
|
| Total liabilities and equity | $ | 68,362 |
| | $ | 48,777 |
|
See notes to consolidated financial statements.
PHILLIPS EDISON GROCERY CENTER REIT III, INC.
CONSOLIDATED STATEMENTS OF OPERATIONS
FOR THE THREE MONTHS ENDED MARCH 31, 2019 AND 2018
(Unaudited)
(In thousands, except per share amounts)
|
| | | | | | | |
| | Three Months Ended March 31, |
| | 2019 | | 2018 |
| Revenues: | | | |
| Rental income | $ | 1,506 |
| | $ | 1,366 |
|
| Other property income | 10 |
| | 7 |
|
| Total revenues | 1,516 |
| | 1,373 |
|
| Expenses: | |
| | |
| Property operating | 228 |
| | 228 |
|
| Real estate taxes | 200 |
| | 323 |
|
| General and administrative | 503 |
| | 323 |
|
| Depreciation and amortization | 676 |
| | 606 |
|
| Total expenses | 1,607 |
| | 1,480 |
|
| Other: | | | |
| Interest expense, net | (334 | ) | | (344 | ) |
| Other income (expense), net | 125 |
| | (6 | ) |
| Net loss | $ | (300 | ) | | $ | (457 | ) |
| Earnings per common share: | |
| | |
| Loss per share - basic and diluted | $ | (0.05 | ) | | $ | (0.08 | ) |
| Weighted-average common shares outstanding: | | | |
| Basic and diluted | 6,576 |
| | 5,552 |
|
See notes to consolidated financial statements.
PHILLIPS EDISON GROCERY CENTER REIT III, INC.
CONSOLIDATED STATEMENTS OF EQUITY
FOR THE THREE MONTHS ENDED MARCH 31, 2019 AND 2018
(Unaudited)
(In thousands, except per share amounts)
|
| | | | | | | | | | | | | | | | | | | | | | | | | | | |
| | Common Stock Par Value | | Additional Paid-in Capital | | Stock Dividend to be Distributed | | Accumulated Deficit | | Total Equity |
| | Class A | | Class T | | Class I | | | | |
| Balance at January 1, 2018 | $ | 45 |
| | $ | — |
| | $ | — |
| | $ | 38,836 |
| | $ | 644 |
| | $ | (6,477 | ) | | $ | 33,048 |
|
| Issuance of common stock | 16 |
| | — |
| | — |
| | 16,199 |
| | (644 | ) | | — |
| | 15,571 |
|
| Distribution Reinvestment Plan (“DRIP”) | — |
| | — |
| | — |
| | 303 |
| | — |
| | — |
| | 303 |
|
| Common distributions declared, $0.15 per share | — |
| | — |
| | — |
| | — |
| | — |
| | (823 | ) | | (823 | ) |
| Stock dividends declared, 0.0289 shares per share | 2 |
| | — |
| | — |
| | 1,499 |
| | — |
| | (1,501 | ) | | — |
|
| Offering costs | — |
| | — |
| | — |
| | (1,478 | ) | | — |
| | — |
| | (1,478 | ) |
| Net loss | — |
| | — |
| | — |
| | — |
| | — |
| | (457 | ) | | (457 | ) |
| Balance at March 31, 2018 | $ | 63 |
| | $ | — |
| | $ | — |
| | $ | 55,359 |
| | $ | — |
| | $ | (9,258 | ) | | $ | 46,164 |
|
| | | | | | | | | | | | | | |
| Balance at January 1, 2019 | $ | 64 |
| | $ | 1 |
| | $ | — |
| | $ | 55,114 |
| | $ | — |
| | $ | (12,947 | ) | | $ | 42,232 |
|
| Issuance of common stock | — |
| | 1 |
| | 1 |
| | 1,226 |
| | — |
| | — |
| | 1,228 |
|
| Share repurchases | (2 | ) | | — |
| | — |
| | (1,814 | ) | | — |
| | — |
| | (1,816 | ) |
| DRIP | 1 |
| | — |
| | — |
| | 363 |
| | — |
| | — |
| | 364 |
|
| Common distributions declared, $0.15 per share | — |
| | — |
| | — |
| | — |
| | — |
| | (973 | ) | | (973 | ) |
| Offering costs | — |
| | — |
| | — |
| | (301 | ) | | — |
| | — |
| | (301 | ) |
| Net loss | — |
| | — |
| | — |
| | — |
| | — |
| | (300 | ) | | (300 | ) |
| Balance at March 31, 2019 | $ | 63 |
| | $ | 2 |
| | $ | 1 |
| | $ | 54,588 |
| | $ | — |
| | $ | (14,220 | ) | | $ | 40,434 |
|
See notes to consolidated financial statements.
PHILLIPS EDISON GROCERY CENTER REIT III, INC.
CONSOLIDATED STATEMENTS OF CASH FLOWS
FOR THE THREE MONTHS ENDED MARCH 31, 2019 AND 2018
(Unaudited)
(In thousands)
|
| | | | | | | |
| | Three Months Ended March 31, |
| | 2019 | | 2018 |
| CASH FLOWS FROM OPERATING ACTIVITIES: | | | |
| Net loss | $ | (300 | ) | | $ | (457 | ) |
| Adjustments to reconcile net loss to net cash provided by operating activities: | |
| | |
| Depreciation and amortization | 676 |
| | 607 |
|
| Amortization of deferred financing expense | 76 |
| | 134 |
|
| Non-cash rental income adjustments | (53 | ) | | (58 | ) |
| Earnings from unconsolidated joint venture | (5 | ) | | — |
|
| Changes in operating assets and liabilities: | | | |
| Other assets, net | 859 |
| | 290 |
|
| Accounts payable - affiliates | (34 | ) | | (9 | ) |
| Accounts payable and other liabilities | 308 |
| | (49 | ) |
| Net cash provided by operating activities | 1,527 |
| | 458 |
|
| CASH FLOWS FROM INVESTING ACTIVITIES: | | | |
| Real estate acquisitions | (31,730 | ) | | (12,340 | ) |
| Capital expenditures | (15 | ) | | (4 | ) |
| Distribution from unconsolidated joint venture | 140 |
| | — |
|
| Net cash used in investing activities | (31,605 | ) | | (12,344 | ) |
| CASH FLOWS FROM FINANCING ACTIVITIES: | |
| | |
| Net change in credit facility | 20,500 |
| | (3,000 | ) |
| Proceeds from issuance of common stock | 1,228 |
| | 15,570 |
|
| Distributions paid, net of DRIP | (611 | ) | | (416 | ) |
| Payment of offering costs | (32 | ) | | (1,478 | ) |
| Repurchases of common stock | (1,816 | ) | | — |
|
| Net cash provided by financing activities | 19,269 |
| | 10,676 |
|
| NET DECREASE IN CASH AND CASH EQUIVALENTS | (10,809 | ) | | (1,210 | ) |
| CASH AND CASH EQUIVALENTS | |
| | |
| Beginning of period | 11,481 |
| | 2,659 |
|
| End of period | $ | 672 |
| | $ | 1,449 |
|
| | | | |
| SUPPLEMENTAL CASH FLOW DISCLOSURE, INCLUDING NON-CASH INVESTING AND FINANCING ACTIVITIES: |
| Cash paid for interest | $ | 224 |
| | $ | 202 |
|
| Accrued capital expenditures and acquisition costs | 32 |
| | 1,104 |
|
| Change in offering costs payable | 269 |
| | — |
|
| Change in distributions payable | (2 | ) | | 104 |
|
| Distributions reinvested | 364 |
| | 303 |
|
See notes to consolidated financial statements.
Phillips Edison Grocery Center REIT III, Inc.
Notes to Consolidated Financial Statements
(Dollars and shares in thousands)
Phillips Edison Grocery Center REIT III, Inc. (“we,” the “Company,” “our,” or “us”) was formed as a Maryland corporation in April 2016. Substantially all of our business is conducted through Phillips Edison Grocery Center Operating Partnership III, L.P. (“Operating Partnership”), a Delaware limited partnership formed in July 2016. We are a limited partner of the Operating Partnership, and our wholly owned subsidiary, Phillips Edison Grocery Center OP GP III LLC, is the sole general partner of the Operating Partnership.
We completed a private placement offering of shares of Class A common stock to accredited investors and ceased offering Class A shares in the private offering during the first quarter of 2018. During the private placement offering, we raised $57.7 million in gross offering proceeds from the issuance of 5.9 million Class A shares, inclusive of the DRIP.
Pursuant to our Registration Statement on Form S-11 (SEC Registration No. 333-217924), as amended (“Registration Statement”), declared effective on May 8, 2018, we are offering to the public (“Public Offering”) (i) $1.5 billion in shares of common stock in the primary offering, consisting of two classes of shares, Class T and Class I, at purchase prices of $10.42 per share and $10.00 per share, respectively, with discounts available to some categories of investors with respect to Class T shares (“Primary Offering”), and (ii) $0.2 billion in Class A, Class T, and Class I shares of our common stock pursuant to the DRIP at a price of $9.80 per share. For more detail on the DRIP, see Note 9. We reserve the right to reallocate shares between the Primary Offering and the DRIP. As of March 31, 2019, we had raised $0.7 million and $1.8 million in gross offering proceeds from the issuance of Class I shares and Class T shares, respectively, inclusive of the DRIP, as well as $1.3 million in gross offering proceeds from the issuance of Class A shares pursuant to the DRIP as a part of the Public Offering.
We have retained Griffin Capital Securities, LLC (“Dealer Manager”) to serve as the dealer manager of the Public Offering. The Dealer Manager is responsible for marketing our shares in the Public Offering. Our advisor is PECO-Griffin REIT Advisor LLC (“Advisor”), a Delaware limited liability company that is jointly owned indirectly by Phillips Edison & Company, Inc. (“Phillips Edison sponsor” or “PECO”) and Griffin Capital Company, LLC (“Griffin sponsor”). Under the terms of the advisory agreement between the Advisor and us, the Advisor is responsible for the management of our day-to-day activities and the implementation of our investment strategy on our behalf, subject to the supervision of our Board of Directors.
We intend to invest primarily in well-occupied, grocery-anchored neighborhood and community shopping centers leased to a mix of national, regional, and local creditworthy retailers selling necessity-based goods and services in strong demographic markets throughout the United States. In addition, we may invest in other retail properties including power and lifestyle shopping centers, multi-tenant shopping centers, free-standing single-tenant retail properties, and other real estate and real estate-related loans and securities depending on real estate market conditions and investment opportunities that we determine are in the best interests of our stockholders. Our real property is managed and leased by subsidiaries of our Phillips Edison sponsor (together, the “Manager”).
In November 2018, we entered into a joint venture (“Joint Venture”) with The Northwestern Mutual Life Insurance Company (“Northwestern Mutual”) to create Grocery Retail Partners II LLC (“GRP II”). See Note 5 for additional details regarding this unconsolidated joint venture.
As of March 31, 2019, we owned fee simple interests in three properties acquired from third parties unaffiliated with us or our Advisor. In addition, we owned a 10% equity interest in GRP II, which owned three properties as of March 31, 2019.
|
|
| 2. SUMMARY OF SIGNIFICANT ACCOUNTING POLICIES |
Certain of our accounting estimates are particularly important for an understanding of our financial position and results of operations and require the application of significant judgment by management. For example, significant estimates and assumptions have been made with respect to the useful lives of assets, recoverable amounts of receivables, and other fair value measurement assessments required for the preparation of the consolidated financial statements. As a result, these estimates are subject to a degree of uncertainty.
Other than those noted below, there have been no changes to our significant accounting policies during the three months ended March 31, 2019. For a full summary of our accounting policies, refer to our 2018 Annual Report on Form 10-K filed with the SEC on March 15, 2019.
Basis of Presentation and Principles of Consolidation—The accompanying consolidated financial statements have been prepared in accordance with accounting principles generally accepted in the United States of America (“GAAP”) for interim financial information and with instructions to Form 10-Q and Article 10 of Regulation S-X. Accordingly, they do not include all of the information and footnotes required by GAAP for complete financial statements. Readers of this Quarterly Report on Form 10-Q should refer to our audited consolidated financial statements for the year ended December 31, 2018, which are included in our 2018 Annual Report on Form 10-K. In the opinion of management, all normal and recurring adjustments necessary for the fair presentation of the unaudited consolidated financial statements for the periods presented have been included in this Quarterly Report. Our results of operations for the three months ended March 31, 2019, are not necessarily indicative of the operating results expected for the full year.
The accompanying consolidated financial statements include our accounts and those of our majority-owned subsidiaries. All intercompany balances and transactions are eliminated upon consolidation.
Leases—The majority of our revenue is lease revenue derived from our real estate assets, which is accounted for under Accounting Standards Codification (“ASC”) Topic 842, Leases (“ASC 842”). We adopted the accounting guidance contained within ASC 842 on January 1, 2019, the effective date of the standard for public companies. We record lease and lease-related revenue as Rental Income on the consolidated statements of operations in accordance with ASC 842.
We enter into leases primarily as a lessor as part of our real estate operations, and leases represent the majority of our revenue. We lease space in our properties generally in the form of operating leases. Our leases typically provide for reimbursements from tenants for common area maintenance, insurance, and real estate tax expenses. Common area maintenance reimbursements can be fixed, with revenue earned on a straight-line basis over the term of the lease, or variable, with revenue recognized as services are performed for which we will be reimbursed.
The terms and expirations of our operating leases with our tenants are generally similar. The majority of leases for inline (non-anchor) tenants have terms that range from 2 to 6 years, and our leases with anchor tenants currently range from 2 to 13 years. In both cases, the full term of the lease prior to our acquisition or assumption of the lease will generally be longer, however, we are measuring the commencement date for these purposes as being the date that we acquired or assumed the lease, excluding option periods.
The lease agreements frequently contain fixed-price renewal options to extend the terms of leases and other terms and conditions as negotiated. In calculating the term of our leases, we consider whether these options are reasonably certain to be exercised. Our determination involves a combination of contract-, asset-, entity-, and market-based factors and involves considerable judgment. We retain substantially all of the risks and benefits of ownership of the real estate assets leased to tenants.
Beginning January 1, 2019, we evaluate whether a lease is an operating, sales-type, or direct financing lease using the criteria established in ASC 842. Leases will be considered either sales-type or direct financing leases if any of the following criteria are met:
| |
| • | if the lease transfers ownership of the underlying asset to the lessee by the end of the term; |
| |
| • | if the lease grants the lessee an option to purchase the underlying asset that is reasonably certain to be exercised; |
| |
| • | if the lease term is for the major part of the remaining economic life of the underlying asset; or |
| |
| • | if the present value of the sum of the lease payments and any residual value guaranteed by the lessee equals or exceeds substantially all of the fair value of the underlying asset. |
We utilize substantial judgment in determining the fair value of the leased asset, the economic life of the leased asset, and the relevant borrowing rate in performing our lease classification analysis. If none of the criteria listed above are met, the lease is classified as an operating lease. Currently all of our leases are classified as operating leases, and we expect that the majority, if not all, of our leases will continue to be classified as operating leases based upon our typical lease terms.
We commence revenue recognition on our leases based on a number of factors. In most cases, revenue recognition under a lease begins when the lessee takes possession of or controls the physical use of the leased asset. The determination of when revenue recognition under a lease begins, as well as the nature of the leased asset, is dependent upon our assessment of who is the owner, for accounting purposes, of any related tenant improvements. If we are the owner, for accounting purposes, of the tenant improvements, then the leased asset is the finished space, and revenue recognition begins when the lessee takes possession of the finished space, typically when the improvements are substantially complete.
If we conclude that we are not the owner, for accounting purposes, of the tenant improvements (i.e. the lessee is the owner), then the leased asset is the unimproved space and any tenant allowances funded under the lease are treated as lease incentives, which reduce revenue recognized over the term of the lease. In these circumstances, we begin revenue recognition when the lessee takes possession of the unimproved space to construct their own improvements. We consider a number of different factors in evaluating whether the lessee or we are the owner of the tenant improvements for accounting purposes. These factors include:
| |
| • | whether the lease stipulates how and on what a tenant improvement allowance may be spent; |
| |
| • | whether the tenant or landlord retains legal title to the improvements; |
| |
| • | the uniqueness of the improvements; |
| |
| • | the expected economic life of the tenant improvements relative to the length of the lease; and |
| |
| • | who constructs or directs the construction of the improvements. |
The majority of our leases provide for fixed rental escalations, and we recognize rental income on a straight-line basis over the term of each lease in such instances. The difference between rental income earned on a straight-line basis and the cash rent due under the provisions of the lease agreements is recorded as deferred rent receivable and is included as a component of Other Assets, Net. Due to the impact of the straight-line adjustments, rental income generally will be greater than the cash collected in the early years and will be less than the cash collected in the later years of a lease.
Reimbursements from tenants for recoverable real estate taxes and operating expenses that are fixed per the terms of the applicable lease agreements are recorded on a straight-line basis, as described above. The majority of our lease agreements with tenants, however, provide for tenant reimbursements that are variable depending upon the applicable expenses incurred. These reimbursements are accrued as revenue in the period in which the applicable expenses are incurred. We make certain assumptions and judgments in estimating the reimbursements at the end of each reporting period. We do not expect the actual results to materially differ from the estimated reimbursements. Both fixed and variable tenant reimbursements are recorded as Rental Income in the consolidated statements of operations. In certain cases, the lease agreement may stipulate that a tenant make a direct payment for real estate taxes to the relevant taxing authorities. In these cases, beginning on January 1, 2019, we no longer record any revenue or expense related to these tenant expenditures. Although we expect such cases to be rare, in the event that a direct-paying tenant failed to make their required payment to the taxing authorities, we would potentially be liable for such amounts, although they are not recorded as a liability in our consolidated balance sheets per the requirements of ASC 842. We have made a policy election to exclude amounts collected from customers for all sales tax and other similar taxes from the transaction price in our recognition of lease revenue.
Additionally, we record an immaterial amount of variable revenue in the form of percentage rental income. Our policy for percentage rental income is to defer recognition of contingent rental income until the specified target (i.e. breakpoint) that triggers the contingent rental income is achieved.
In some instances, as part of our negotiations, we may offer lease incentives to our tenants. These incentives usually take the form of payments made to or on behalf of the tenant, and such incentives will be deducted from the lease payment and recorded on a straight-line basis over the term of the new lease.
We record lease termination income if there is a signed termination agreement, all of the conditions of the agreement have been met, collectability is reasonably assured and the tenant is no longer occupying the property. Upon early lease termination, we provide for losses related to unrecovered tenant-specific intangibles and other assets. We record lease termination income as rental income in the consolidated statements of operations.
Historically, we periodically reviewed the collectability of outstanding receivables. Following the adoption of ASC 842, as of January 1, 2019, lease receivables are reviewed continually to determine whether or not it is likely that we will realize all amounts receivable for each of our tenants (i.e. whether a tenant is deemed to be a credit risk). If we determine that the tenant is not a credit risk, no reserve or reduction of revenue is recorded, except in the case of disputed charges. If we determine that the tenant is a credit risk, revenue for that tenant is recorded on a cash basis, including any amounts relating to straight-line rent receivables and/or receivables for recoverable expenses. Under ASC 842, the aforementioned adjustments as well as any reserve for disputed charges are recorded as a reduction of Rental Income rather than in Property Operating, where our reserves were previously recorded, on the consolidated statements of operations.
Revenue Recognition—Effective January 1, 2018, we adopted the guidance of ASC Topic 610-20, Other Income - Gains and Losses from the Derecognition of Nonfinancial Assets (“ASC 610-20”), which applies to sales or transfers to non-customers of non-financial assets, or in substance non-financial assets, that do not meet the definition of a business. Generally, our sales of real estate would be considered a sale of a non-financial asset as defined by ASC 610-20.
ASC 610-20 refers to the revenue recognition principles under ASC Topic 606, Revenue from Contracts with Customers. Under ASC 610-20, if we determine we do not have a controlling financial interest in the entity that holds the asset and the arrangement meets the criteria to be accounted for as a contract, we would de-recognize the asset and recognize a gain or loss on the sale of the real estate when control of the underlying asset transfers to the buyer. Further, we may defer a tax gain through an Internal Revenue Code (the “Code”) Section 1031 like-kind exchange by purchasing another property within a specified time period.
Recently Issued and Newly Adopted Accounting Pronouncements—The following table provides a brief description of recent accounting pronouncements that could have a material effect on our consolidated financial statements: |
| | | | | | |
| Standard | | Description | | Date of Adoption | | Effect on the Consolidated Financial Statements or Other Significant Matters |
ASU 2016-13, Financial Instruments - Credit Losses
(Topic 326):
Measurement of Credit Losses on Financial Instruments
ASU 2018-19, Financial Instruments - Credit Losses (Topic 326): Codification Improvements
| | The amendments in this update replace the incurred loss impairment methodology in current GAAP with a methodology that reflects expected credit losses and requires consideration of a broader range of reasonable and supportable information to inform credit loss estimates. It clarifies that receivables arising from operating leases are not within the scope of Topic 326. Instead, impairment of receivables arising from operating leases should be accounted for in accordance with Topic 842. This update is effective for public entities in fiscal years beginning after December 15, 2019, and interim periods within those fiscal years. Early adoption is permitted after December 15, 2018. | | January 1, 2020 | | We are currently evaluating the impact the adoption of this standard will have on our consolidated financial statements. |
| ASU 2018-13, Fair Value Measurement (Topic 820) | | This ASU eliminates, adds and modifies certain disclosure requirements for fair value measurements as part of the Financial Accounting Standards Board’s disclosure framework project. It is effective for annual and interim reporting beginning after December 15, 2019, but early adoption is accepted. | | January 1, 2020 | | We are currently evaluating the impact the adoption of this standard will have on our consolidated financial statements. |
| ASU 2018-17, Consolidation (Topic 810): Targeted Improvements to Related Party Guidance for Variable Interest Entities | | This Update amends two aspects of the related-party guidance in ASC 810: (1) adds an elective private-company scope exception to the variable interest entity guidance for entities under common control and (2) indirect interests held through related parties in common control arrangements should be considered on a proportional basis for determining whether fees paid to decision makers and service providers are variable interests. For entities other than private companies, the amendments in this update are effective for fiscal years beginning after December 15, 2019, and interim periods within those fiscal years. All entities are required to apply the amendments in this update retrospectively with a cumulative effect adjustment to retained earnings at the beginning of the earliest period presented. Early adoption is permitted. | | January 1, 2020 | | We are currently evaluating the impact the adoption of this standard will have on our consolidated financial statements. |
The following table provides a brief description of newly adopted accounting pronouncements and their effect on our consolidated financial statements: |
| | | | | | |
| Standard | | Description | | Date of Adoption | | Effect on the Financial Statements or Other Significant Matters |
Accounting Standards Update (“ASU”) 2016-02, Leases (Topic 842)
ASU 2018-01, Leases (Topic 842): Land Easement Practical Expedient for Transition to Topic 842
ASU 2018-10, Codification Improvements to Topic 842, Leases
ASU 2018-11, Leases (Topic 842): Targeted Improvements
ASU 2018-20, Leases (Topic 842): Narrow-Scope Improvements for Lessors
ASU 2019-01, Lease (Topic 842): Codification Improvements | | These updates amended existing guidance by recognizing lease assets and lease liabilities on the balance sheet and disclosing key information about leasing arrangements.
| | January 1, 2019 | | We adopted this standard on January 1, 2019 and a modified retrospective transition approach was required. We determined that the adoption had a material impact on our consolidated financial statements; please refer to Note 3 for additional details.
We elected to utilize the following optional practical expedients upon adoption: - Package of practical expedients which permits us not to reassess our prior conclusions about lease identification, lease classification, and initial direct costs. - Practical expedient permitting us not to assess whether existing, expired, or current land easements either are or contain a lease. - Practical expedient which permits us as a lessor not to separate non-lease components, such as common area maintenance reimbursements, from the associated lease component, provided that the timing and pattern of transfer of the services are substantially the same. Because of our decision to elect this practical expedient, we will no longer present our Rental Income and Tenant Recovery Income amounts separately on our statements of income, and have reclassified Tenant Recovery Income amounts to Rental Income for all periods presented on the consolidated statements of operations and comprehensive income (loss). - Practical expedient which permits us not to record a right of use (“ROU”) asset or lease liability related to leases of twelve months or fewer, but instead allows us to record expense related to any such leases as it is incurred.
|
Reclassifications—The following line item on our consolidated balance sheets for the year ended December 31, 2018, was reclassified to conform to current year presentation:
| |
| • | Deferred Income was separated out from Accounts Payable and Other Liabilities. |
The following line item on our consolidated statements of operations for the three months ended March 31, 2018, was reclassified to conform to current year presentation:
| |
| • | Tenant Recovery was combined with Rental Income. |
The following line items on our consolidated statements of cash flows for the three months ended March 31, 2018, were reclassified to conform to current year presentation:
| |
| • | Accounts Receivable, Net was combined with Other Assets, Net; and |
| |
| • | Straight-line Rental Income and Net Amortization of Above- and Below-market Leases were combined with Non-cash Rental Income Adjustments. |
Standard Adoption—Effective January 1, 2019, we adopted ASU 2016-02, Leases. This standard was adopted in conjunction with the related updates, ASU 2018-01, Leases (Topic 842): Land Easement Practical Expedient for Transition to Topic 842; ASU 2018-10, Codification Improvements to Topic 842, Leases; ASU 2018-11, Leases (Topic 842): Targeted Improvements; and ASU 2018-20, Leases (Topic 842): Narrow-Scope Improvements for Lessors, collectively “ASC 842,” using a modified-retrospective approach, as required. Consequently, financial information will not be updated and the disclosures required under the new standard will not be provided for dates and periods before January 1, 2019.
The adoption of ASC 842 did not result in any adjustments to the current year’s opening balances on the consolidated balance sheets.
Beginning January 1, 2019, operating lease receivables are accounted for under ASC 842, which requires us to recognize changes in the collectability assessment for an operating lease as an adjustment to lease income. For the year ended December 31, 2018, approximately $49,000 of bad debt expense was recorded as Property Operating on our consolidated statements of operations, which would have been recorded as a reduction to Rental Income under the new standard. For the three months ended March 31, 2019, this amount was not material.
Lessor—The majority of our leases are largely similar in that the leased asset is retail space within our properties, and the lease agreements generally contain similar provisions and features, without substantial variations. All of our leases are currently classified as operating leases.
Approximate future fixed contractual lease payments to be received under non-cancelable operating leases in effect as of March 31, 2019, assuming no new or renegotiated leases or option extensions on lease agreements, are as follows (in thousands): |
| | | |
| Year | Operating |
| Remaining 2019 | $ | 3,313 |
|
| 2020 | 3,605 |
|
| 2021 | 2,953 |
|
| 2022 | 2,505 |
|
| 2023 | 1,729 |
|
| 2024 and thereafter | 9,997 |
|
| Total | $ | 24,102 |
|
Ahold Delhaize comprised 19.4% of our aggregate annualized base rent (“ABR”) as of March 31, 2019. As a result, our portfolio is particularly susceptible to adverse economic developments for Ahold Delhaize. This concentration is to be expected in the early stages of building a real estate portfolio.
Lessee—As of March 31, 2019, we are not party to any leases in which we are the lessee.
|
|
| 4. REAL ESTATE ACQUISITIONS |
Acquisitions—One real estate asset was acquired during the three months ended March 31, 2019 (dollars in thousands): |
| | | | | | | | | | | | |
| Property Name | | Location | | Anchor Tenant | | Acquisition Date | | Purchase Price | | Square Footage |
| Ashburn Farm Market Center | | Ashburn, VA | | Ahold Delhaize | | 1/11/2019 | | $ | 31,730 |
| | 91,905 |
One real estate asset was acquired during the three months ended March 31, 2018 (dollars in thousands): |
| | | | | | | | | | | | |
| Property Name | | Location | | Anchor Tenant | | Acquisition Date | | Purchase Price | | Square Footage |
Albertville Crossing(1) | | Albertville, MN | | Coborn’s | | 2/21/2018 | | $ | 13,155 |
| | 99,013 |
| |
(1) | This property was contributed to the Joint Venture in November 2018. |
All of the 2018 and 2019 acquisitions were classified as asset acquisitions. As such, most acquisition costs were capitalized and are included in the total purchase prices shown above.
The fair value and weighted-average useful lives for in-place, above-market, and below-market lease intangibles acquired during the three months ended March 31, 2019, and 2018, are as follows (useful life in years): |
| | | | | | | | | | | | |
| | | March 31, 2019 | | March 31, 2018 |
| | | Fair Value | | Weighted-Average Useful Life | | Fair Value | | Weighted-Average Useful Life |
| In-place leases | | $ | 2,727 |
| | 9 | | $ | 1,632 |
| | 9 |
| Above-market leases | | 818 |
| | 11 | | 82 |
| | 7 |
| Below-market leases | | (346 | ) | | 5 | | (93 | ) | | 8 |
|
|
| 5. INVESTMENT IN UNCONSOLIDATED JOINT VENTURE |
In November 2018, we entered into an agreement (the “Joint Venture Agreement”) with Northwestern Mutual to create the Joint Venture. Under the terms of the Joint Venture Agreement, we contributed all of our ownership interests in three grocery-anchored shopping centers for a 10% ownership interest in the Joint Venture.
Affiliates of our Advisor will manage and conduct the day-to-day operations and affairs of the Joint Venture. We have customary approval rights with respect to major decisions, but do not have the right to cause or prohibit various material transactions. We account for our investment in the Joint Venture using the equity method and increase or reduce the value of our investment based upon our pro rata allocation of the Joint Venture's income, losses, and distributions. Distributions of net cash are anticipated to be made on a quarterly basis, as appropriate. Additional capital contributions in proportion to the members’ respective capital interests in the Joint Venture may be required.
The following table summarizes the operating information of the Joint Venture. We did not have any investments in unconsolidated joint ventures during the three months ended March 31, 2018 (dollars in thousands): |
| | | |
| | Three Months Ended |
| | March 31, 2019 |
| Income from unconsolidated joint venture | $ | 5 |
|
| Distributions after formation | 140 |
|
|
|
| 6. INTANGIBLE ASSETS AND LIABILITIES |
Intangible Assets and Liabilities—Intangible assets and liabilities consisted of the following amounts as of March 31, 2019 and December 31, 2018 (in thousands): |
| | | | | | | | | | | | | | | |
| | March 31, 2019 | | December 31, 2018 |
| | Gross Amount | | Accumulated Amortization | | Gross Amount | | Accumulated Amortization |
| In-place lease assets | $ | 4,973 |
| | $ | (399 | ) | | $ | 2,246 |
| | $ | (195 | ) |
| Above-market lease assets | 1,047 |
| | (51 | ) | | 229 |
| | (18 | ) |
| Below-market lease liabilities | (1,058 | ) | | 64 |
| | (713 | ) | | 34 |
|
Summarized below is the amortization recorded on the intangible assets and liabilities (in thousands): |
| | | | | | | |
| | Three Months Ended |
| | March 31, |
| | 2019 | | 2018 |
| In-place lease assets | $ | 204 |
| | $ | 147 |
|
| Above-market lease assets | 33 |
| | 34 |
|
| Below-market lease liabilities | (30 | ) | | (32 | ) |
Estimated future amortization of the respective acquired intangible lease assets and liabilities as of March 31, 2019, for each of the next five years is as follows (in thousands): |
| | | | | | | | | | | |
| Year | In-Place Leases | | Above-Market Leases | | Below- Market Leases |
| Remaining 2019 | $ | 528 |
| | $ | 88 |
| | $ | (87 | ) |
| 2020 | 704 |
| | 117 |
| | (116 | ) |
| 2021 | 704 |
| | 117 |
| | (116 | ) |
| 2022 | 601 |
| | 117 |
| | (116 | ) |
| 2023 | 361 |
| | 117 |
| | (93 | ) |
As of March 31, 2019 we had a $125 million unsecured revolving credit facility, with an interest rate spread of 1.8% plus LIBOR based on our leverage ratio. The revolving credit facility requires interest-only payments until it matures in March 2021 and has two six-month extension options.
The interest rate on our revolving credit facility approximated the market interest rate, and as such, the fair value and recorded value of our debt was $20.5 million as of March 31, 2019.
The following is a summary of the outstanding principal balance of our debt obligation, borrowing availability, and corresponding interest rate as of March 31, 2019 and December 31, 2018 (dollars in thousands): |
| | | | | | | |
| | March 31, 2019 | | December 31, 2018 |
| Outstanding principal balance | $ | 20,500 |
| | $ | — |
|
Borrowing availability(1) | 14,499 |
| | 15,764 |
|
| Interest rate | 4.3 | % | | 4.6 | % |
| |
(1) | Although the maximum capacity is $125 million, this is subject to further covenant-based restrictions. This represents the amount available for borrowing as of the relevant period end dates. |
Gross borrowings under our revolving credit facility were $21 million and $25 million, and gross payments on our revolving credit facility were $0.5 million and $28 million during the three months ended March 31, 2019 and 2018, respectively.
|
|
| 8. COMMITMENTS AND CONTINGENCIES |
Litigation—We may become involved in various claims and litigation matters arising in the ordinary course of business, some of which may involve claims for damages. Many of these matters are covered by insurance, although they may nevertheless be subject to deductibles or retentions. There are no material legal proceedings pending or known to be contemplated against us.
Environmental Matters—In connection with the ownership and operation of real estate, we may potentially be liable for costs and damages related to environmental matters. In addition, we may own or acquire certain properties that are subject to environmental remediation. Generally, the seller of the property, the tenant of the property, and/or another third party is responsible for environmental remediation costs related to a property. Additionally, in connection with the purchase of certain properties, the respective sellers and/or tenants may agree to indemnify us against future remediation costs. We also carry environmental liability insurance on our properties that provides limited coverage for any remediation liability and/or pollution liability for third-party bodily injury and/or property damage claims for which we may be liable. We are not aware of any environmental matters which we believe are reasonably likely to have a material effect on our consolidated financial statements.
General—The holders of all classes of common stock are entitled to one vote per share on all matters voted on by stockholders, including election of the Board of Directors. Our charter does not provide for cumulative voting in the election of directors. Our charter permits our Board of Directors to create classes of common stock and to establish the rights of each class of common stock. The differences among the classes of common stock relate to upfront selling commissions, dealer manager fees, and ongoing stockholder servicing fees (see Note 10 for more detail).
Common Stock Activity—The following table summarizes the changes in our outstanding shares of common stock (in thousands): |
| | | | | | | | | | | |
| | Common Stock | | |
| | Class A | | Class T | | Class I | | Total |
| Balance at January 1, 2018 | 4,502 |
| | — |
| | — |
| | 4,502 |
|
| Common stock issued | 1,566 |
| | — |
| | — |
| | 1,566 |
|
| DRIP | 32 |
| | — |
| | — |
| | 32 |
|
| Stock dividends | 215 |
| | — |
| | — |
| | 215 |
|
| Balance at March 31, 2018 | 6,315 |
| | — |
| | — |
| | 6,315 |
|
| | | | | | | | |
| Balance at January 1, 2019 | 6,425 |
| | 98 |
| | 29 |
| | 6,552 |
|
| Common stock issued | — |
| | 76 |
| | 44 |
| | 120 |
|
| DRIP | 37 |
| | 1 |
| | — |
| | 38 |
|
| Shares repurchased | (186 | ) | | — |
| | — |
| | (186 | ) |
| Balance at March 31, 2019 | 6,276 |
| | 175 |
| | 73 |
| | 6,524 |
|
Distributions and Stock Dividends—We have adopted a DRIP that allows stockholders to reinvest cash distributions in additional shares of our common stock at a price equal to $9.80 per share. Prior to the commencement of the Public Offering in May 2018, the DRIP price was $9.50 per share. Cash distributions are paid to stockholders of record based on the number of daily shares owned by each stockholder during the period covered by the declaration. Such distributions are issued on the first business day after the end of each month.
Share Repurchase Program—Our share repurchase plan may provide a limited opportunity for stockholders to have shares of common stock repurchased, subject to certain restrictions and limitations, at a price equal to or at a discount from the purchase price paid for the shares being repurchased. The cash available for repurchases on any particular date will generally be limited to the proceeds from the DRIP during the preceding four fiscal quarters, less amounts already used for repurchases since the beginning of that period. The Board of Directors reserves the right, in its sole discretion, at any time and from time to time, to reject any request for repurchase and we may amend, suspend, or terminate the program upon 30 days’ notice. Due to the program’s funding limits, we do not expect funds to be available for standard repurchases for the remainder of 2019.
|
|
| 10. RELATED PARTY TRANSACTIONS |
Economic Dependency—We are dependent on the Advisor, the Manager, and their respective affiliates for certain services that are essential to us, including asset acquisition and disposition decisions, asset management, operating and leasing of our properties, and other general and administrative responsibilities. PECO owns a partial interest in the Advisor and controls our Manager. In the event that the Advisor, the Manager, and/or their respective affiliates are unable to provide such services, we would be required to find alternative service providers, which could result in higher costs and expenses.
Advisor—The Advisor is responsible for the management of our day-to-day activities and the implementation of our investment strategy.
Acquisition Fee—We pay the Advisor an acquisition fee related to services provided in connection with the selection and purchase or origination of real estate and real estate-related investments. The acquisition fee is equal to 2% of the contract purchase price of each property we acquire or originate, including any debt attributable to such investments.
Organization and Offering Costs, Contingent Advisor Payment, and Holdback—Under the terms of the Advisory Agreement, we are required to reimburse the Advisor for cumulative organization and offering costs and future organization and offering costs it may incur on our behalf. All organization and offering costs incurred in connection with the private placement and public offering had been billed to us by the Advisor as of March 31, 2019. In connection with the Public Offering, the Advisor will pay organization and offering costs up to 1% of gross offering proceeds from the Primary Offering, which the Advisor intends to recoup through the receipt of a contingent advisor payment. We will reimburse the Advisor for any amounts in excess of 1% up to a maximum of 3.5% of gross offering proceeds from the Primary Offering.
We will reimburse the Advisor through an additional contingent advisor payment of 2.15% of the contract purchase price of each property or other real estate investments we acquire during the Public Offering. The reimbursement of organization and offering costs, dealer manager fees, and the contingent advisor payment are subject to the contingent advisor payment holdback. As a result of the holdback, the initial $4.5 million reimbursable to the Advisor for these amounts related to the Public Offering shall be retained by us until the termination of the Public Offering, at which time such amount shall be paid to the Advisor or its affiliates. As of March 31, 2019, the contingent advisor payment holdback had not been reached; therefore, no reimbursement had been made to the Advisor.
Amounts related to organization and offering costs and the contingent advisor payment as of March 31, 2019 and December 31, 2018, were as follows (dollars in thousands): |
| | | | | | |
| | March 31, 2019 | December 31, 2018 |
| Organization and offering costs liability for private placement | $ | 2,303 |
| $ | 2,303 |
|
| Amounts subject to contingent advisor holdback: | | |
Organization and offering costs liability for Public Offering(1) | 2,430 |
| 2,211 |
|
| Dealer manager fee payable | 41 |
| 21 |
|
| |
(1) | This amount represents all organization and offering costs incurred. This includes amounts currently earned through the contingent advisor payment, which were immaterial as of March 31, 2019 and December 31, 2018. |
Asset Management Fee—We pay the Advisor a monthly asset management fee in connection with the ongoing management and monitoring of the performance of our investments. The asset management fee is paid monthly in an amount of one-twelfth of 1% of the cost of our assets, as defined under the Advisory Agreement. The Advisor may elect to receive the asset management fee in cash, units of the Operating Partnership (“OP units”), common stock, or any combination thereof. All asset management fees paid during the three months ended March 31, 2019 and 2018, were paid in cash.
Disposition Fee—We will pay the Advisor or its affiliates for substantial assistance in connection with the sale of properties or other investments a disposition fee in an amount equal to 2% of the contract sales price of each property or other investment sold. For the three months ended March 31, 2019 and 2018, we incurred no disposition fees as we did not sell any properties.
Acquisition Expenses—We reimburse the Advisor for direct expenses incurred, including certain personnel costs, related to sourcing, selecting, evaluating, and acquiring assets on our behalf.
General and Administrative Expenses—As of March 31, 2019 and December 31, 2018, we owed the Advisor $42,000 and $9,000, respectively, for general and administrative expenses paid on our behalf.
Summarized below are the fees earned by and the expenses reimbursable to the Advisor, except for unpaid general and administrative expenses, which we disclosed above, and any related amounts unpaid as of March 31, 2019 and December 31, 2018 (dollars in thousands): |
| | | | | | | | | | | | | | | |
| | Three Months Ended | | Unpaid Amount as of |
| | March 31, | | March 31, | | December 31, |
| | 2019 | | 2018 | | 2019 | | 2018 |
Acquisition fees(1) | $ | 617 |
| | $ | 256 |
| | $ | — |
| | $ | — |
|
Acquisition expenses(1) | 62 |
| | 28 |
| | — |
| | — |
|
Asset management fees(2) | 142 |
| | 122 |
| | 50 |
| | 24 |
|
| Organization and offering costs | 219 |
| | — |
| | 4,719 |
| | 4,501 |
|
| Total | $ | 1,040 |
| | $ | 406 |
| | $ | 4,769 |
| | $ | 4,525 |
|
| |
(1) | The majority of acquisition fees and expenses are capitalized and allocated to the related investment in real estate assets on the consolidated balance sheets based on the acquisition-date fair values of the respective assets and liabilities acquired. |
| |
(2) | Asset management fees are presented as General and Administrative on the consolidated statements of operations. |
Manager—Our real property is managed and leased by the Manager. The Manager hires, directs and establishes policies for employees who have direct responsibility for the operations of each real property it manages, which may include, but is not limited to, on-site managers and building and maintenance personnel. Certain employees of the Manager may be employed on a part-time basis and may also be employed by us or certain of our affiliates. The Manager also directs the purchase of equipment and supplies, supervises all maintenance activity, and manages real property acquisitions by PECO affiliates and other
third parties.
Property Management Fee—We pay to the Manager a monthly property management fee equal to 4% of the gross receipts of each property managed by the Manager.
Leasing Commissions—In addition to the property management fee, if the Manager provides leasing services with respect to a property, we will pay the Manager leasing fees in an amount equal to the leasing fees charged by unaffiliated persons rendering comparable services in the same geographic location of the applicable property.
Construction Management and Development Fees—If we engage the Manager to provide construction management or development services with respect to a particular property, we will pay a construction management fee or a development fee in an amount that is usual and customary for comparable services rendered to similar projects in the geographic market of the property.
Expenses and Reimbursements—We reimburse the costs and expenses incurred by the Manager on our behalf, including employee compensation, legal, travel and other out-of-pocket expenses that are directly related to the management of specific properties, as well as fees and expenses of third-party accountants.
Summarized below are the fees earned by and the expenses reimbursable to the Manager, and any related amounts unpaid as of March 31, 2019 and December 31, 2018 (dollars in thousands): |
| | | | | | | | | | | | | | | |
| | Three Months Ended | | Unpaid Amount as of |
| | March 31, | | March 31, | | December 31, |
| | 2019 | | 2018 | | 2019 | | 2018 |
Property management fees(1) | $ | 41 |
| | $ | 46 |
| | $ | 13 |
| | $ | 9 |
|
Leasing commissions(2) | 17 |
| | 25 |
| | 4 |
| | 21 |
|
Construction management fees(2) | 1 |
| | — |
| | — |
| | 28 |
|
Other fees and reimbursements(3) | 125 |
| | 73 |
| | 159 |
| | 77 |
|
| Total | $ | 184 |
| | $ | 144 |
| | $ | 176 |
| | $ | 135 |
|
| |
(1) | The property management fees are included in Property Operating on the consolidated statements of operations. |
| |
(2) | Leasing commissions paid for leases with terms less than one year are expensed and included in Depreciation and Amortization on the consolidated statements of operations. Leasing commissions paid for leases with terms greater than one year and construction management fees are capitalized and amortized over the life of the related leases or assets. |
| |
(3) | Other fees and reimbursements are included in Property Operating and General and Administrative on the consolidated statements of operations based on the nature of the expense. |
Dealer Manager—The Dealer Manager is a Delaware limited liability company and has been a member firm of the Financial Industry Regulatory Authority, Inc. since 1995. The Dealer Manager is under common ownership with our Griffin sponsor and will provide certain sales, promotional, and marketing services in connection with the distribution of the shares of common stock offered under our offering. The following table summarizes the reimbursement rates of dealer manager fees, selling commissions, and stockholder servicing fees for Class T and Class I shares of common stock for the Primary Offering, as well as the Class A shares sold during the private offering: |
| | | | | |
| | T Shares | | I Shares | | A Shares |
| Dealer manager fees | The fee will be up to 3% of gross offering proceeds from the Primary Offering, of which 1% of gross offering proceeds will be funded by us, with the remaining amounts funded by the Advisor. | | The fee will be up to 1.5% of gross offering proceeds from the Primary Offering, all of which will be funded by the Advisor. | | 3% of gross offering proceeds |
| Selling commissions | Up to 3% of gross offering proceeds | | N/A | | 7% of gross offering proceeds |
| Stockholder servicing fees | The fee will accrue daily at an annual rate of 1% of the most recent purchase price per share of Class T sold in the Primary Offering, up to a maximum of 4% in the aggregate. | | N/A | | N/A |
The following table summarizes the dealer manager fees, selling commissions, and stockholder servicing fees for shares of common stock, and any related amounts unpaid as of March 31, 2019 and 2018 (dollars in thousands): |
| | | | | | | | | | | | | | | |
| | Three Months Ended | | Unpaid Amount as of |
| | March 31, | | March 31, | | December 31, |
| | 2019 | | 2018 | | 2019 | | 2018 |
| Dealer manager fees | $ | 27 |
| | $ | 1,240 |
| | $ | 41 |
| | $ | 21 |
|
| Selling commissions | 24 |
| | 228 |
| | — |
| | — |
|
Stockholder servicing fees(1) | 31 |
| | — |
| | 71 |
| | 40 |
|
| Total | $ | 82 |
| | $ | 1,468 |
| | $ | 112 |
| | $ | 61 |
|
| |
(1) | Stockholder servicing fees are included in Offering Costs on the consolidated statements of equity and included in Accounts Payable-Affiliates on the consolidated balance sheets. We will accrue the full cost of the stockholder servicing fee as an offering cost at the time each Class T share is sold during the Public Offering. |
Share Purchases by Advisor—Our Advisor has made an initial investment in us through the purchase of 22,222 shares of our Class A common stock. The Advisor may not sell any of these shares while serving as the Advisor. As of March 31, 2019, the Advisor owned 27,728 shares of our Class A common stock.
Joint Venture Payable—As of December 31, 2018, we had a payable to the Joint Venture of approximately $0.1 million. The balance was paid in the first quarter of 2019.
Distributions—Cash distributions equal to a daily amount of $0.00164384 per share of common stock outstanding were paid subsequent to March 31, 2019, to the stockholders of record from March 1, 2019 through April 30, 2019, as follows: |
| | | | | | | | | | | | | |
| Distribution Period | Date Distribution Paid | | Gross Amount of Distribution Paid | | Distribution Reinvested through the DRIP | | Net Cash Distribution |
| March 1, 2019 through March 31, 2019 | 4/1/2019 | | $ | 331 |
| | $ | 124 |
| | $ | 207 |
|
| April 1, 2019 through April 30, 2019 | 5/1/2019 | | 325 |
| | 122 |
| | 203 |
|
On May 9, 2019, our Board authorized cash distributions to all classes of common stockholders of record from June 1, 2019 through August 31, 2019 in a daily amount of $0.00164384 per share. The distributions for May 2019 were previously authorized by our Board and are expected to be paid on June 3, 2019.