Exhibit 99.2 2nd Quarter FY 2020 Earnings Presentation November 11, 2019Exhibit 99.2 2nd Quarter FY 2020 Earnings Presentation November 11, 2019
Non-GAAP financial measures We present non-GAAP financial measures of performance which are derived from the unaudited condensed consolidated statements of operations of DXC. These non-GAAP financial measures include earnings before interest and taxes (“EBIT”), adjusted EBIT, non-GAAP income before income taxes, non-GAAP net income and non-GAAP EPS, constant currency revenues, net debt and net debt-to-total capitalization. We present these non-GAAP financial measures to provide investors with meaningful supplemental financial information, in addition to the financial information presented on a GAAP basis. DXC management believes these non-GAAP measures allow investors to better understand the financial performance of DXC exclusive of the impacts of corporate-wide strategic decisions. DXC management believes that adjusting for these items provides investors with additional measures to evaluate the financial performance of our business operations on a comparable basis from period to period. DXC management believes the non-GAAP measures provided are also considered important measures by financial analysts covering DXC as equity research analysts continue to publish estimates and research notes based on our non-GAAP commentary, including our guidance around non-GAAP EPS. Non-GAAP financial measures exclude certain items from GAAP results which DXC management believes are not indicative of operating performance such as the amortization of acquired intangible assets and transaction, separation, and integration-related costs. Incremental amortization of intangible assets acquired through business combinations may result in a significant difference in period over period amortization expense on a GAAP basis. We specifically exclude amortization of certain acquired intangible assets as these non-cash amounts are inconsistent in amount and frequency and are significantly impacted by the timing and/or size of acquisitions. Although DXC management excludes amortization of acquired intangible assets from its non-GAAP expenses, we believe that it is important for investors to understand that such intangible assets were recorded as part of purchase accounting and contribute to revenue generation. Any future transactions may result in a change to the acquired intangible asset balances and associated amortization expense. There are limitations to the use of the non-GAAP financial measures presented in this presentation. One of the limitations is that they do not reflect complete financial results. We compensate for this limitation by providing a reconciliation between our non-GAAP financial measures and the respective most directly comparable financial measure calculated and presented in accordance with GAAP. Additionally, other companies, including companies in our industry, may calculate non-GAAP financial measures differently than we do, limiting the usefulness of those measures for comparative purposes between companies. Selected references are made on a “constant currency basis” (“cc”) so that certain financial results can be viewed without the impact of fluctuations in foreign currency rates, thereby providing comparisons of operating performance from period to period. Financial results on a “constant currency basis” are non-GAAP measures calculated by translating current period activity into U.S. dollars using the comparable prior period’s currency conversion rates. This approach is used for all results where the functional currency is not the U.S. dollar. 2nd Quarter FY 2020 Earnings Presentation November 11, 2019 2Non-GAAP financial measures We present non-GAAP financial measures of performance which are derived from the unaudited condensed consolidated statements of operations of DXC. These non-GAAP financial measures include earnings before interest and taxes (“EBIT”), adjusted EBIT, non-GAAP income before income taxes, non-GAAP net income and non-GAAP EPS, constant currency revenues, net debt and net debt-to-total capitalization. We present these non-GAAP financial measures to provide investors with meaningful supplemental financial information, in addition to the financial information presented on a GAAP basis. DXC management believes these non-GAAP measures allow investors to better understand the financial performance of DXC exclusive of the impacts of corporate-wide strategic decisions. DXC management believes that adjusting for these items provides investors with additional measures to evaluate the financial performance of our business operations on a comparable basis from period to period. DXC management believes the non-GAAP measures provided are also considered important measures by financial analysts covering DXC as equity research analysts continue to publish estimates and research notes based on our non-GAAP commentary, including our guidance around non-GAAP EPS. Non-GAAP financial measures exclude certain items from GAAP results which DXC management believes are not indicative of operating performance such as the amortization of acquired intangible assets and transaction, separation, and integration-related costs. Incremental amortization of intangible assets acquired through business combinations may result in a significant difference in period over period amortization expense on a GAAP basis. We specifically exclude amortization of certain acquired intangible assets as these non-cash amounts are inconsistent in amount and frequency and are significantly impacted by the timing and/or size of acquisitions. Although DXC management excludes amortization of acquired intangible assets from its non-GAAP expenses, we believe that it is important for investors to understand that such intangible assets were recorded as part of purchase accounting and contribute to revenue generation. Any future transactions may result in a change to the acquired intangible asset balances and associated amortization expense. There are limitations to the use of the non-GAAP financial measures presented in this presentation. One of the limitations is that they do not reflect complete financial results. We compensate for this limitation by providing a reconciliation between our non-GAAP financial measures and the respective most directly comparable financial measure calculated and presented in accordance with GAAP. Additionally, other companies, including companies in our industry, may calculate non-GAAP financial measures differently than we do, limiting the usefulness of those measures for comparative purposes between companies. Selected references are made on a “constant currency basis” (“cc”) so that certain financial results can be viewed without the impact of fluctuations in foreign currency rates, thereby providing comparisons of operating performance from period to period. Financial results on a “constant currency basis” are non-GAAP measures calculated by translating current period activity into U.S. dollars using the comparable prior period’s currency conversion rates. This approach is used for all results where the functional currency is not the U.S. dollar. 2nd Quarter FY 2020 Earnings Presentation November 11, 2019 2
Forward-looking statements All statements in this presentation that do not directly and exclusively relate to historical facts constitute “forward-looking statements.” These statements represent current expectations and beliefs, and no assurance can be given that the results described in such statements will be achieved. Such statements are subject to numerous assumptions, risks, uncertainties and other factors that could cause actual results to differ materially from those described in such statements, many of which are outside of our control. For a written description of these factors, see the section titled “Risk Factors” in DXC’s Annual Report on Form 10-K for the fiscal year ended March 31, 2019, and any updating information in subsequent SEC filings, including DXC’s upcoming Form 10-Q for the quarter ended September 30, 2019. No assurance can be given that any goal or plan set forth in any forward-looking statement can or will be achieved, and readers are cautioned not to place undue reliance on such statements which speak only as of the date they are made. We do not undertake any obligation to update or release any revisions to any forward-looking statement or to report any events or circumstances after the date of this presentation or to reflect the occurrence of unanticipated events except as required by law. 2nd Quarter FY 2020 Earnings Presentation November 11, 2019 3Forward-looking statements All statements in this presentation that do not directly and exclusively relate to historical facts constitute “forward-looking statements.” These statements represent current expectations and beliefs, and no assurance can be given that the results described in such statements will be achieved. Such statements are subject to numerous assumptions, risks, uncertainties and other factors that could cause actual results to differ materially from those described in such statements, many of which are outside of our control. For a written description of these factors, see the section titled “Risk Factors” in DXC’s Annual Report on Form 10-K for the fiscal year ended March 31, 2019, and any updating information in subsequent SEC filings, including DXC’s upcoming Form 10-Q for the quarter ended September 30, 2019. No assurance can be given that any goal or plan set forth in any forward-looking statement can or will be achieved, and readers are cautioned not to place undue reliance on such statements which speak only as of the date they are made. We do not undertake any obligation to update or release any revisions to any forward-looking statement or to report any events or circumstances after the date of this presentation or to reflect the occurrence of unanticipated events except as required by law. 2nd Quarter FY 2020 Earnings Presentation November 11, 2019 3
Agenda for today 1. Share observations on the business 2. Review preliminary second quarter results and full-year outlook 3. Introduce the enterprise technology stack and strategy moving forward 4. Present results of strategic review of assets 5. Outline longer term outlook for DXC Technology 2nd Quarter FY 2020 Earnings Presentation November 11, 2019 4Agenda for today 1. Share observations on the business 2. Review preliminary second quarter results and full-year outlook 3. Introduce the enterprise technology stack and strategy moving forward 4. Present results of strategic review of assets 5. Outline longer term outlook for DXC Technology 2nd Quarter FY 2020 Earnings Presentation November 11, 2019 4
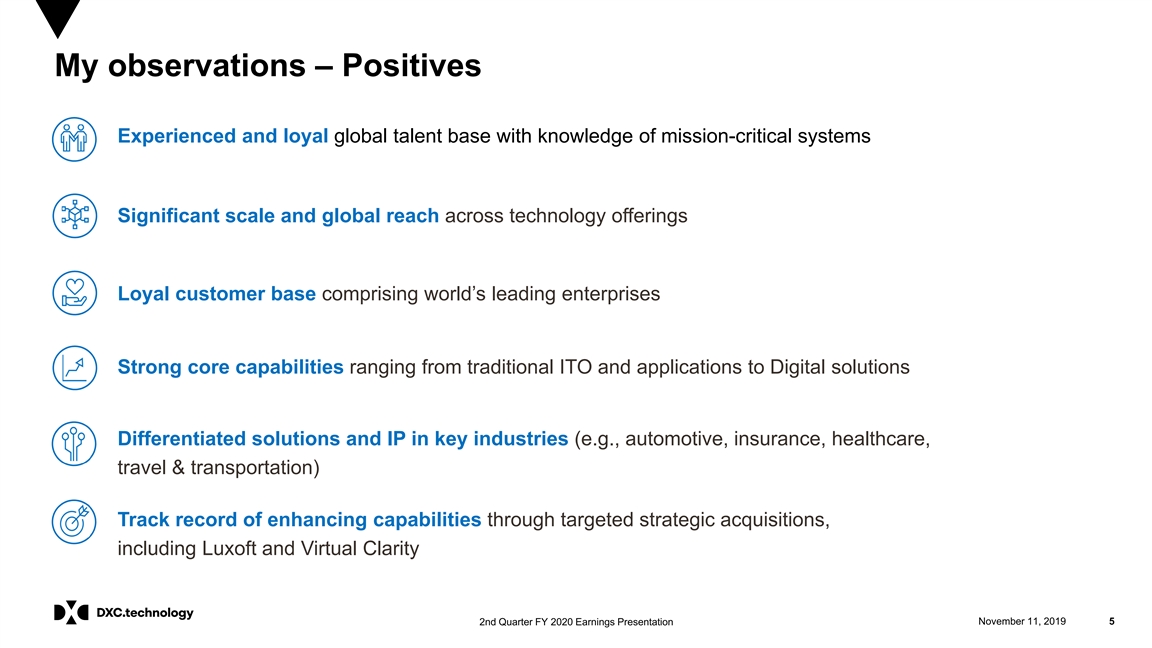
My observations – Positives Experienced and loyal global talent base with knowledge of mission-critical systems Significant scale and global reach across technology offerings Loyal customer base comprising world’s leading enterprises Strong core capabilities ranging from traditional ITO and applications to Digital solutions Differentiated solutions and IP in key industries (e.g., automotive, insurance, healthcare, travel & transportation) Track record of enhancing capabilities through targeted strategic acquisitions, including Luxoft and Virtual Clarity 2nd Quarter FY 2020 Earnings Presentation November 11, 2019 5My observations – Positives Experienced and loyal global talent base with knowledge of mission-critical systems Significant scale and global reach across technology offerings Loyal customer base comprising world’s leading enterprises Strong core capabilities ranging from traditional ITO and applications to Digital solutions Differentiated solutions and IP in key industries (e.g., automotive, insurance, healthcare, travel & transportation) Track record of enhancing capabilities through targeted strategic acquisitions, including Luxoft and Virtual Clarity 2nd Quarter FY 2020 Earnings Presentation November 11, 2019 5

My observations – Challenges § Insufficient execution on delivery of extended cost improvements at previously targeted pace § Evolving employee value proposition needing greater focus § Recent delivery issues on some large, complex accounts – recovery plans underway § Under-emphasized ITO business § Diffused organizational accountability and slow decision making § Shortcomings against opportunity to sell integrated, multi-offering solutions 2nd Quarter FY 2020 Earnings Presentation November 11, 2019 6My observations – Challenges § Insufficient execution on delivery of extended cost improvements at previously targeted pace § Evolving employee value proposition needing greater focus § Recent delivery issues on some large, complex accounts – recovery plans underway § Under-emphasized ITO business § Diffused organizational accountability and slow decision making § Shortcomings against opportunity to sell integrated, multi-offering solutions 2nd Quarter FY 2020 Earnings Presentation November 11, 2019 6
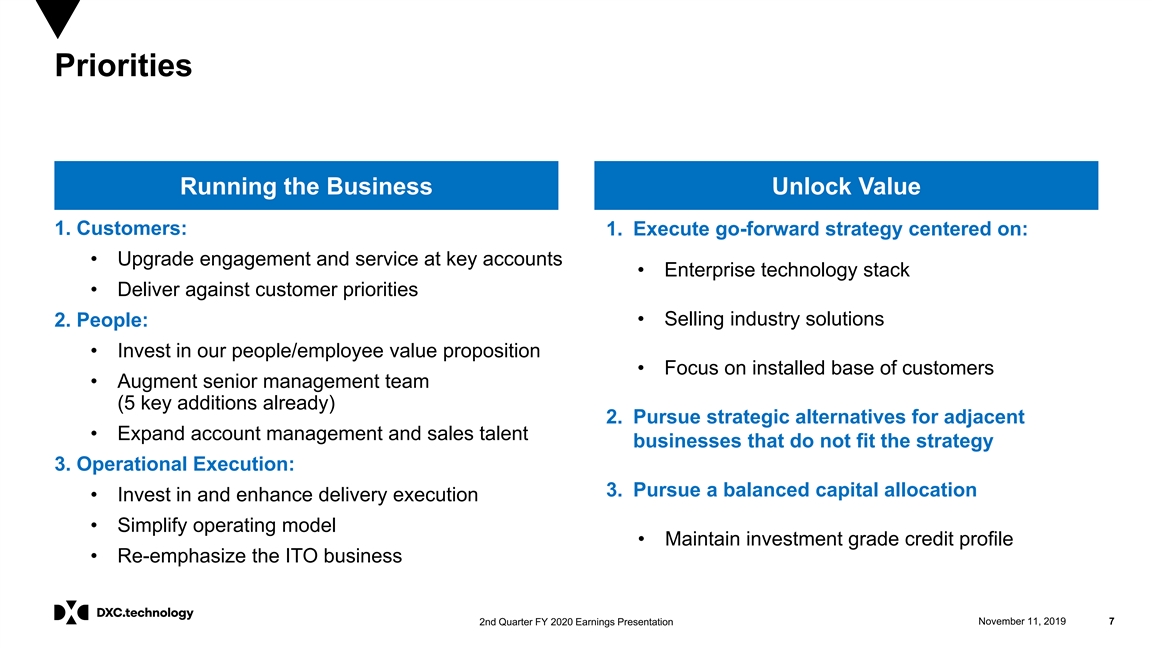
Priorities Running the Business Unlock Value 1. Customers: 1. Execute go-forward strategy centered on: • Upgrade engagement and service at key accounts • Enterprise technology stack • Deliver against customer priorities • Selling industry solutions 2. People: • Invest in our people/employee value proposition • Focus on installed base of customers • Augment senior management team (5 key additions already) 2. Pursue strategic alternatives for adjacent • Expand account management and sales talent businesses that do not fit the strategy 3. Operational Execution: 3. Pursue a balanced capital allocation • Invest in and enhance delivery execution • Simplify operating model • Maintain investment grade credit profile • Re-emphasize the ITO business 2nd Quarter FY 2020 Earnings Presentation November 11, 2019 7Priorities Running the Business Unlock Value 1. Customers: 1. Execute go-forward strategy centered on: • Upgrade engagement and service at key accounts • Enterprise technology stack • Deliver against customer priorities • Selling industry solutions 2. People: • Invest in our people/employee value proposition • Focus on installed base of customers • Augment senior management team (5 key additions already) 2. Pursue strategic alternatives for adjacent • Expand account management and sales talent businesses that do not fit the strategy 3. Operational Execution: 3. Pursue a balanced capital allocation • Invest in and enhance delivery execution • Simplify operating model • Maintain investment grade credit profile • Re-emphasize the ITO business 2nd Quarter FY 2020 Earnings Presentation November 11, 2019 7

Reconciliation of non-GAAP results Q2 FY20 Transaction, Amortization of Restructuring Separation and Goodwill Gain on Arbitration Non-GAAP (in millions except EPS) GAAP Acquired Intangible Tax Adjustment Costs Integration-Related Impairment Losses Award Results Assets Costs (Loss) income from continuing operations before income taxes (1,999) 32 53 151 2,887 (632) - 492 Income tax expense 116 4 5 34 - - (29) 130 (Loss) income from continuing operations (2,115) 28 48 117 2,887 (632) 29 362 (1) ($8.19) 0.11 0.18 0.45 11.10 (2.43) 0.11 $1.38 Diluted EPS from continuing operations YTD FY20 Transaction, Amortization of Restructuring Separation and Goodwill Gain on Arbitration Non-GAAP (in millions except EPS) GAAP Acquired Intangible Tax Adjustment Costs Integration-Related Impairment Losses Award Results Assets Costs (Loss) income from continuing operations before income taxes (1,793) 174 158 289 2,887 (632) - 1,083 Income tax expense 154 32 27 65 - - (29) 249 (Loss) income from continuing operations (1,947) 142 131 224 2,887 (632) 29 834 (1) ($7.44) 0.54 0.50 0.85 10.91 (2.39) 0.11 $3.12 Diluted EPS from continuing operations 1 EPS and per-share values of certain items do not sum to non-GAAP EPS 2nd Quarter FY 2020 Earnings Presentation November 11, 2019 8Reconciliation of non-GAAP results Q2 FY20 Transaction, Amortization of Restructuring Separation and Goodwill Gain on Arbitration Non-GAAP (in millions except EPS) GAAP Acquired Intangible Tax Adjustment Costs Integration-Related Impairment Losses Award Results Assets Costs (Loss) income from continuing operations before income taxes (1,999) 32 53 151 2,887 (632) - 492 Income tax expense 116 4 5 34 - - (29) 130 (Loss) income from continuing operations (2,115) 28 48 117 2,887 (632) 29 362 (1) ($8.19) 0.11 0.18 0.45 11.10 (2.43) 0.11 $1.38 Diluted EPS from continuing operations YTD FY20 Transaction, Amortization of Restructuring Separation and Goodwill Gain on Arbitration Non-GAAP (in millions except EPS) GAAP Acquired Intangible Tax Adjustment Costs Integration-Related Impairment Losses Award Results Assets Costs (Loss) income from continuing operations before income taxes (1,793) 174 158 289 2,887 (632) - 1,083 Income tax expense 154 32 27 65 - - (29) 249 (Loss) income from continuing operations (1,947) 142 131 224 2,887 (632) 29 834 (1) ($7.44) 0.54 0.50 0.85 10.91 (2.39) 0.11 $3.12 Diluted EPS from continuing operations 1 EPS and per-share values of certain items do not sum to non-GAAP EPS 2nd Quarter FY 2020 Earnings Presentation November 11, 2019 8
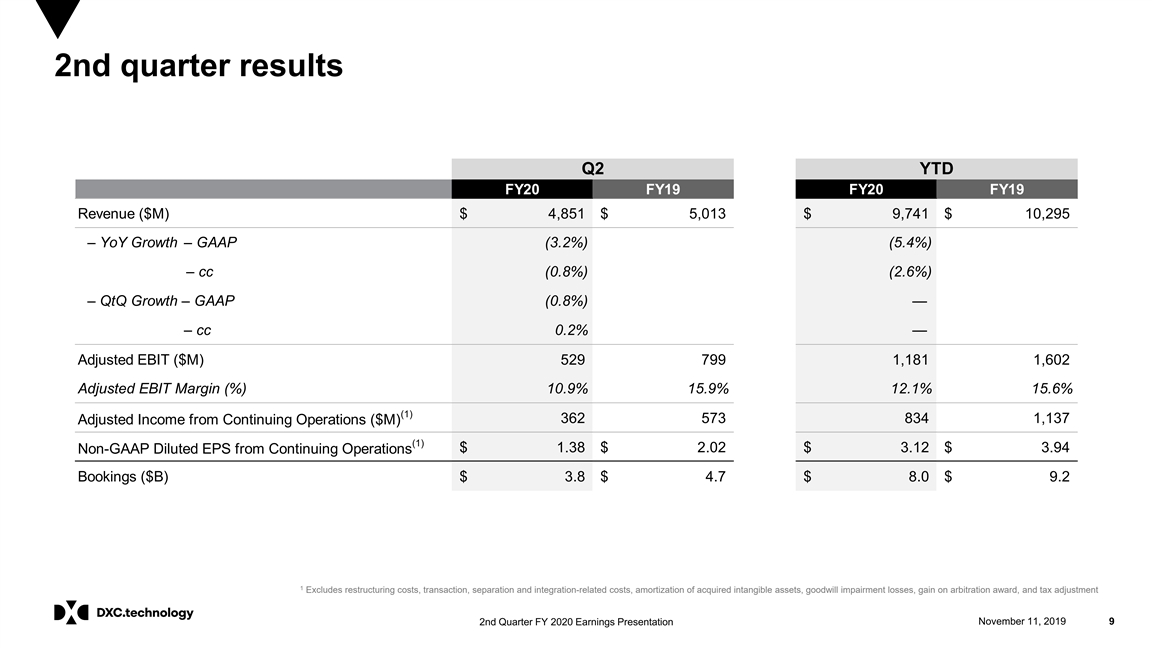
2nd quarter results Q2 YTD FY20FY19FY20FY19 Revenue ($M) $ 4,851 $ 5,013 $ 9,741 $ 10,295 – YoY Growth – GAAP (3.2%) (5.4%) – YoY Growth – cc (0.8%) (2.6%) – QtQ Growth – GAAP (0.8%) — – QtQ Growth – cc 0.2% — Adjusted EBIT ($M) 529 799 1,181 1,602 Adjusted EBIT Margin (%) 10.9% 15.9% 12.1% 15.6% (1) 362 573 834 1,137 Adjusted Income from Continuing Operations ($M) (1) $ 1.38 $ 2.02 $ 3.12 $ 3.94 Non-GAAP Diluted EPS from Continuing Operations Bookings ($B) $ 3.8 $ 4.7 $ 8.0 $ 9.2 1 Excludes restructuring costs, transaction, separation and integration-related costs, amortization of acquired intangible assets, goodwill impairment losses, gain on arbitration award, and tax adjustment 2nd Quarter FY 2020 Earnings Presentation November 11, 2019 92nd quarter results Q2 YTD FY20FY19FY20FY19 Revenue ($M) $ 4,851 $ 5,013 $ 9,741 $ 10,295 – YoY Growth – GAAP (3.2%) (5.4%) – YoY Growth – cc (0.8%) (2.6%) – QtQ Growth – GAAP (0.8%) — – QtQ Growth – cc 0.2% — Adjusted EBIT ($M) 529 799 1,181 1,602 Adjusted EBIT Margin (%) 10.9% 15.9% 12.1% 15.6% (1) 362 573 834 1,137 Adjusted Income from Continuing Operations ($M) (1) $ 1.38 $ 2.02 $ 3.12 $ 3.94 Non-GAAP Diluted EPS from Continuing Operations Bookings ($B) $ 3.8 $ 4.7 $ 8.0 $ 9.2 1 Excludes restructuring costs, transaction, separation and integration-related costs, amortization of acquired intangible assets, goodwill impairment losses, gain on arbitration award, and tax adjustment 2nd Quarter FY 2020 Earnings Presentation November 11, 2019 9
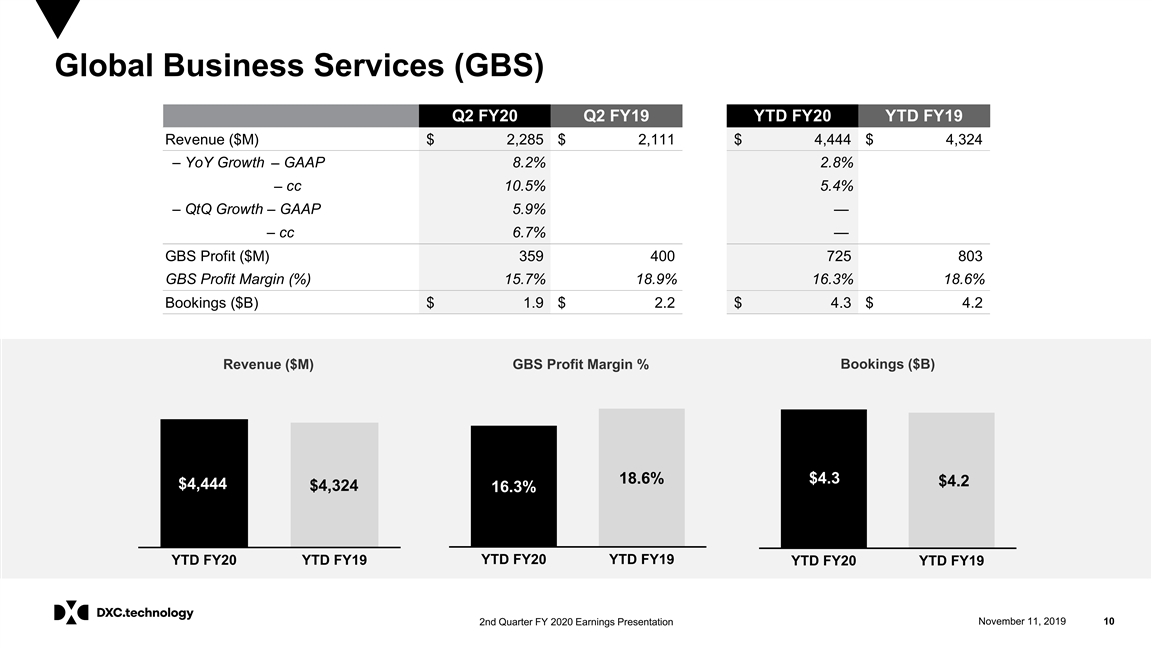
Global Business Services (GBS) Q2 FY20 Q2 FY19 YTD FY20 YTD FY19 Revenue ($M) $ 2,285 $ 2,111 $ 4,444 $ 4,324 – YoY Growth GAAP 8.2% 2.8% – – YoY Growth – cc 10.5% 5.4% – QtQ Growth – GAAP 5.9% — – QtQ growth – cc 6.7% — GBS Profit ($M) 359 400 725 803 GBS Profit Margin (%) 15.7% 18.9% 16.3% 18.6% Bookings ($B) $ 1.9 $ 2.2 $ 4.3 $ 4.2 Revenue ($M) GBS Profit Margin % Bookings ($B) 18.6% $4.3 $4.2 $4,444 $4,324 16.3% YTD FY20 YTD FY19 YTD FY20 YTD FY19 YTD FY20 YTD FY19 2nd Quarter FY 2020 Earnings Presentation November 11, 2019 10Global Business Services (GBS) Q2 FY20 Q2 FY19 YTD FY20 YTD FY19 Revenue ($M) $ 2,285 $ 2,111 $ 4,444 $ 4,324 – YoY Growth GAAP 8.2% 2.8% – – YoY Growth – cc 10.5% 5.4% – QtQ Growth – GAAP 5.9% — – QtQ growth – cc 6.7% — GBS Profit ($M) 359 400 725 803 GBS Profit Margin (%) 15.7% 18.9% 16.3% 18.6% Bookings ($B) $ 1.9 $ 2.2 $ 4.3 $ 4.2 Revenue ($M) GBS Profit Margin % Bookings ($B) 18.6% $4.3 $4.2 $4,444 $4,324 16.3% YTD FY20 YTD FY19 YTD FY20 YTD FY19 YTD FY20 YTD FY19 2nd Quarter FY 2020 Earnings Presentation November 11, 2019 10
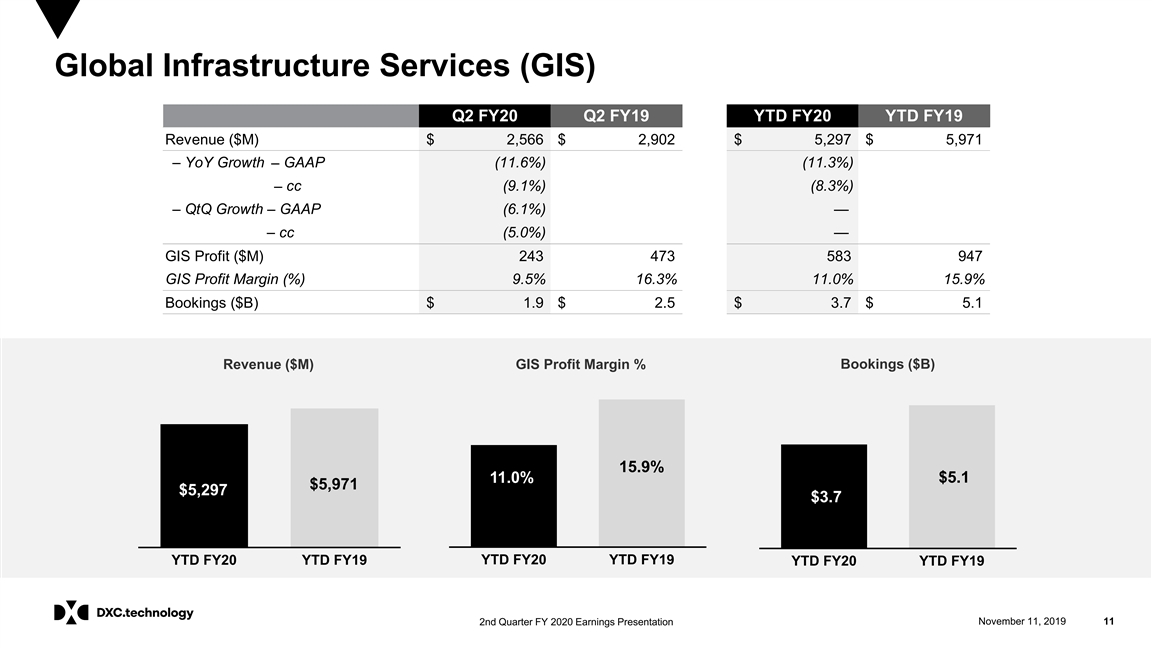
Global Infrastructure Services (GIS) Q2 FY20 Q2 FY19 YTD FY20 YTD FY19 Revenue ($M) $ 2,566 $ 2,902 $ 5,297 $ 5,971 – YoY Growth GAAP (11.6%) (11.3%) – – YoY Growth – cc (9.1%) (8.3%) – QtQ Growth – GAAP (6.1%) — – QtQ growth – cc (5.0%) — GIS Profit ($M) 243 473 583 947 GIS Profit Margin (%) 9.5% 16.3% 11.0% 15.9% Bookings ($B) $ 1.9 $ 2.5 $ 3.7 $ 5.1 Revenue ($M) GIS Profit Margin % Bookings ($B) 15.9% 11.0% $5.1 $5,971 $5,297 $3.7 YTD FY20 YTD FY19 YTD FY20 YTD FY19 YTD FY20 YTD FY19 2nd Quarter FY 2020 Earnings Presentation November 11, 2019 11Global Infrastructure Services (GIS) Q2 FY20 Q2 FY19 YTD FY20 YTD FY19 Revenue ($M) $ 2,566 $ 2,902 $ 5,297 $ 5,971 – YoY Growth GAAP (11.6%) (11.3%) – – YoY Growth – cc (9.1%) (8.3%) – QtQ Growth – GAAP (6.1%) — – QtQ growth – cc (5.0%) — GIS Profit ($M) 243 473 583 947 GIS Profit Margin (%) 9.5% 16.3% 11.0% 15.9% Bookings ($B) $ 1.9 $ 2.5 $ 3.7 $ 5.1 Revenue ($M) GIS Profit Margin % Bookings ($B) 15.9% 11.0% $5.1 $5,971 $5,297 $3.7 YTD FY20 YTD FY19 YTD FY20 YTD FY19 YTD FY20 YTD FY19 2nd Quarter FY 2020 Earnings Presentation November 11, 2019 11

Financial highlights Q2 FY20 YTD FY20 $739M $813M ► Adjusted Free Cash Flow Cash Flow $342M $699M Performance► Cap Ex — Including Payments on Capital Leases 7.1% 7.2% ► Cap Ex as a % of Revenue Q2 FY20 YTD FY20 Capital to $56M $107M ► Cash Dividends Capital to Shareholders Shareholders $250M $650M Share Repurchases ► 6.2M shares 13.6M shares Q2 FY20 Capital ► Cash and Cash Equivalents $2.9B Structure 34.9% ► Net Debt-to-Total Capitalization 2nd Quarter FY 2020 Earnings Presentation November 11, 2019 12Financial highlights Q2 FY20 YTD FY20 $739M $813M ► Adjusted Free Cash Flow Cash Flow $342M $699M Performance► Cap Ex — Including Payments on Capital Leases 7.1% 7.2% ► Cap Ex as a % of Revenue Q2 FY20 YTD FY20 Capital to $56M $107M ► Cash Dividends Capital to Shareholders Shareholders $250M $650M Share Repurchases ► 6.2M shares 13.6M shares Q2 FY20 Capital ► Cash and Cash Equivalents $2.9B Structure 34.9% ► Net Debt-to-Total Capitalization 2nd Quarter FY 2020 Earnings Presentation November 11, 2019 12
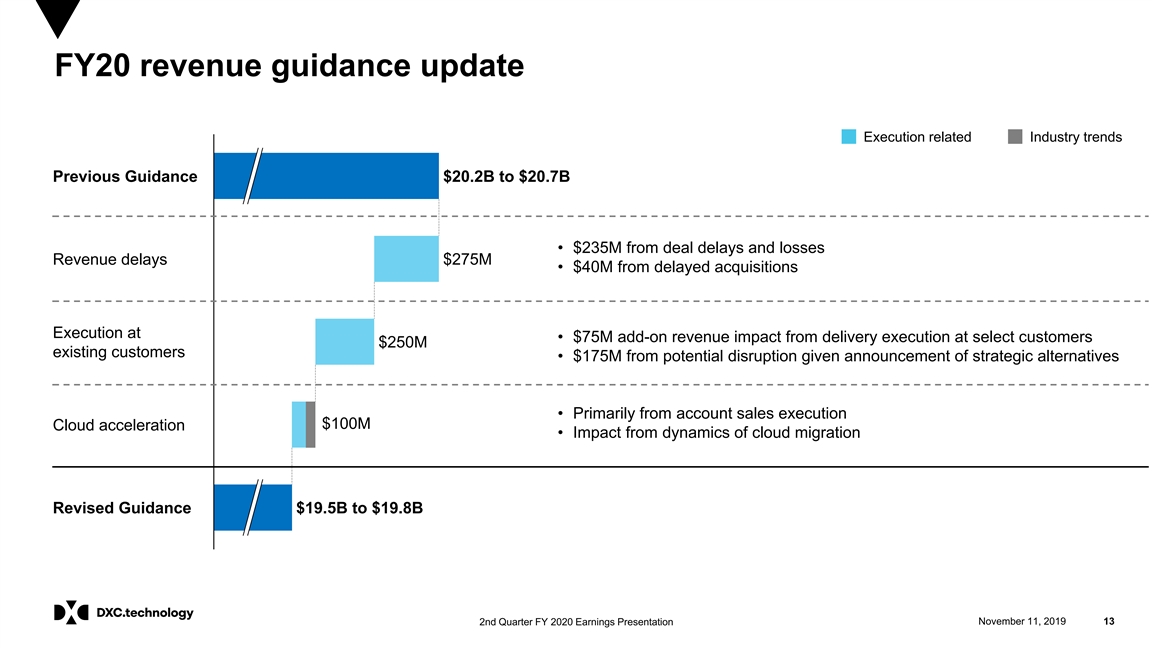
FY20 revenue guidance update Execution related Industry trends Previous Guidance $20.2B to $20.7B • $235M from deal delays and losses Revenue delays $275M • $40M from delayed acquisitions Execution at • $75M add-on revenue impact from delivery execution at select customers $250M existing customers • $175M from potential disruption given announcement of strategic alternatives • Primarily from account sales execution $100M Cloud acceleration • Impact from dynamics of cloud migration Revised Guidance $19.5B to $19.8B 2nd Quarter FY 2020 Earnings Presentation November 11, 2019 13FY20 revenue guidance update Execution related Industry trends Previous Guidance $20.2B to $20.7B • $235M from deal delays and losses Revenue delays $275M • $40M from delayed acquisitions Execution at • $75M add-on revenue impact from delivery execution at select customers $250M existing customers • $175M from potential disruption given announcement of strategic alternatives • Primarily from account sales execution $100M Cloud acceleration • Impact from dynamics of cloud migration Revised Guidance $19.5B to $19.8B 2nd Quarter FY 2020 Earnings Presentation November 11, 2019 13
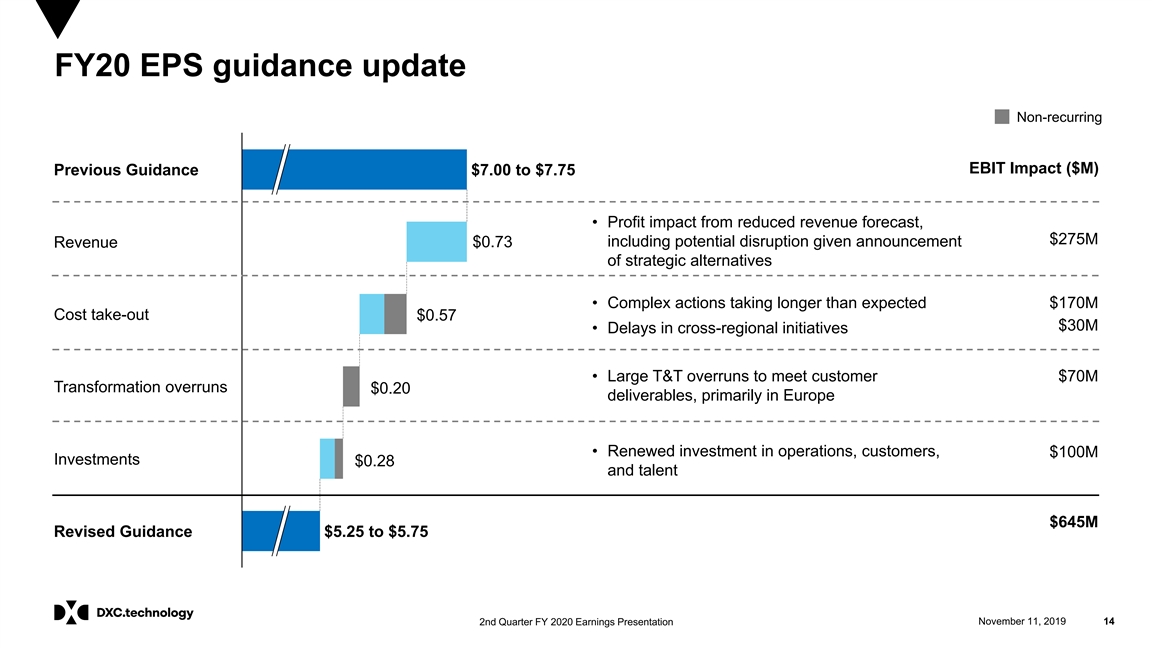
FY20 EPS guidance update Non-recurring EBIT Impact ($M) Previous Guidance $7.00 to $7.75 • Profit impact from reduced revenue forecast, $275M $0.73 including potential disruption given announcement Revenue of strategic alternatives • Complex actions taking longer than expected $170M Cost take-out $0.57 $30M • Delays in cross-regional initiatives • Large T&T overruns to meet customer $70M Transformation overruns $0.20 deliverables, primarily in Europe • Renewed investment in operations, customers, $100M Investments $0.28 and talent $645M Revised Guidance $5.25 to $5.75 2nd Quarter FY 2020 Earnings Presentation November 11, 2019 14FY20 EPS guidance update Non-recurring EBIT Impact ($M) Previous Guidance $7.00 to $7.75 • Profit impact from reduced revenue forecast, $275M $0.73 including potential disruption given announcement Revenue of strategic alternatives • Complex actions taking longer than expected $170M Cost take-out $0.57 $30M • Delays in cross-regional initiatives • Large T&T overruns to meet customer $70M Transformation overruns $0.20 deliverables, primarily in Europe • Renewed investment in operations, customers, $100M Investments $0.28 and talent $645M Revised Guidance $5.25 to $5.75 2nd Quarter FY 2020 Earnings Presentation November 11, 2019 14
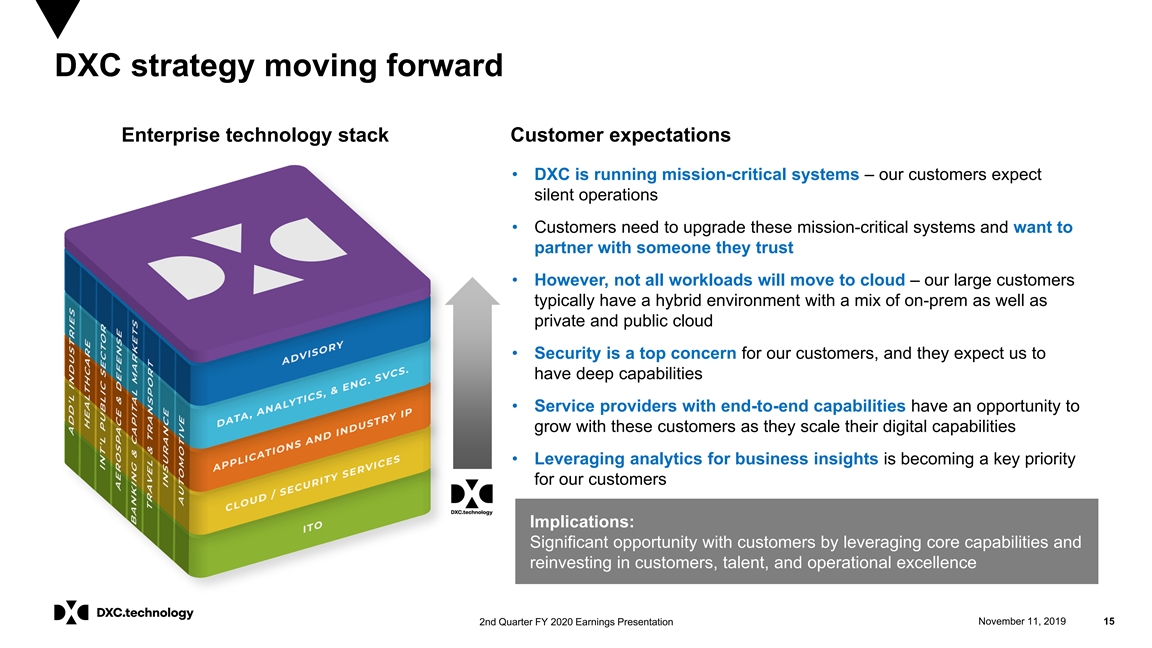
DXC strategy moving forward Enterprise technology stack Customer expectations • DXC is running mission-critical systems – our customers expect silent operations • Customers need to upgrade these mission-critical systems and want to partner with someone they trust • However, not all workloads will move to cloud – our large customers typically have a hybrid environment with a mix of on-prem as well as private and public cloud • Security is a top concern for our customers, and they expect us to have deep capabilities • Service providers with end-to-end capabilities have an opportunity to grow with these customers as they scale their digital capabilities • Leveraging analytics for business insights is becoming a key priority for our customers Implications: Significant opportunity with customers by leveraging core capabilities and reinvesting in customers, talent, and operational excellence 2nd Quarter FY 2020 Earnings Presentation November 11, 2019 15DXC strategy moving forward Enterprise technology stack Customer expectations • DXC is running mission-critical systems – our customers expect silent operations • Customers need to upgrade these mission-critical systems and want to partner with someone they trust • However, not all workloads will move to cloud – our large customers typically have a hybrid environment with a mix of on-prem as well as private and public cloud • Security is a top concern for our customers, and they expect us to have deep capabilities • Service providers with end-to-end capabilities have an opportunity to grow with these customers as they scale their digital capabilities • Leveraging analytics for business insights is becoming a key priority for our customers Implications: Significant opportunity with customers by leveraging core capabilities and reinvesting in customers, talent, and operational excellence 2nd Quarter FY 2020 Earnings Presentation November 11, 2019 15
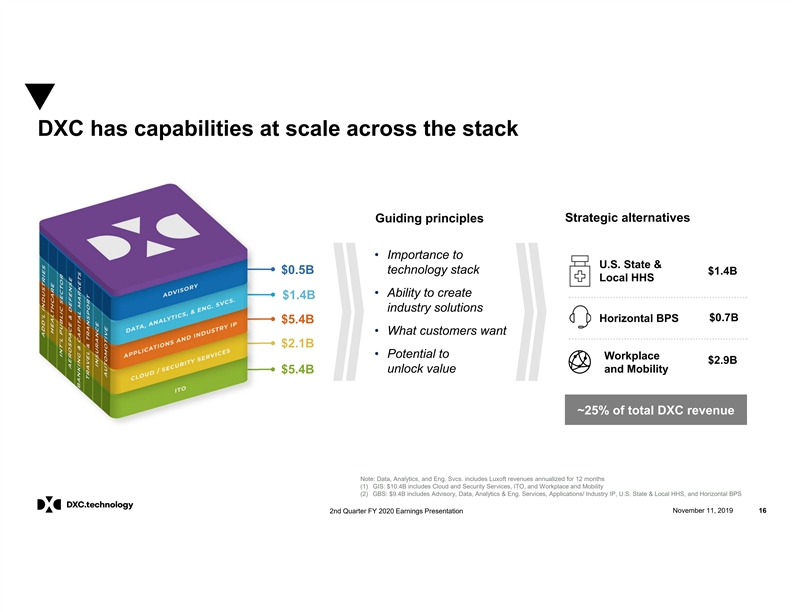
DXC has capabilities at scale across the stack Guiding principles Strategic alternatives • Importance to U.S. State & $0.5B technology stack $1.4B Local HHS • Ability to create $1.4B industry solutions $0.7B Horizontal BPS $5.4B • What customers want $2.1B • Potential to Workplace $2.9B unlock value and Mobility $5.4B ~25% of total DXC revenue Note: Data, Analytics, and Eng. Svcs. includes Luxoft revenues annualized for 12 months (1) GIS: $10.4B includes Cloud and Security Services, ITO, and Workplace and Mobility (2) GBS: $9.4B includes Advisory, Data, Analytics & Eng. Services, Applications/ Industry IP, U.S. State & Local HHS, and Horizontal BPS 2nd Quarter FY 2020 Earnings Presentation November 11, 2019 16DXC has capabilities at scale across the stack Guiding principles Strategic alternatives • Importance to U.S. State & $0.5B technology stack $1.4B Local HHS • Ability to create $1.4B industry solutions $0.7B Horizontal BPS $5.4B • What customers want $2.1B • Potential to Workplace $2.9B unlock value and Mobility $5.4B ~25% of total DXC revenue Note: Data, Analytics, and Eng. Svcs. includes Luxoft revenues annualized for 12 months (1) GIS: $10.4B includes Cloud and Security Services, ITO, and Workplace and Mobility (2) GBS: $9.4B includes Advisory, Data, Analytics & Eng. Services, Applications/ Industry IP, U.S. State & Local HHS, and Horizontal BPS 2nd Quarter FY 2020 Earnings Presentation November 11, 2019 16
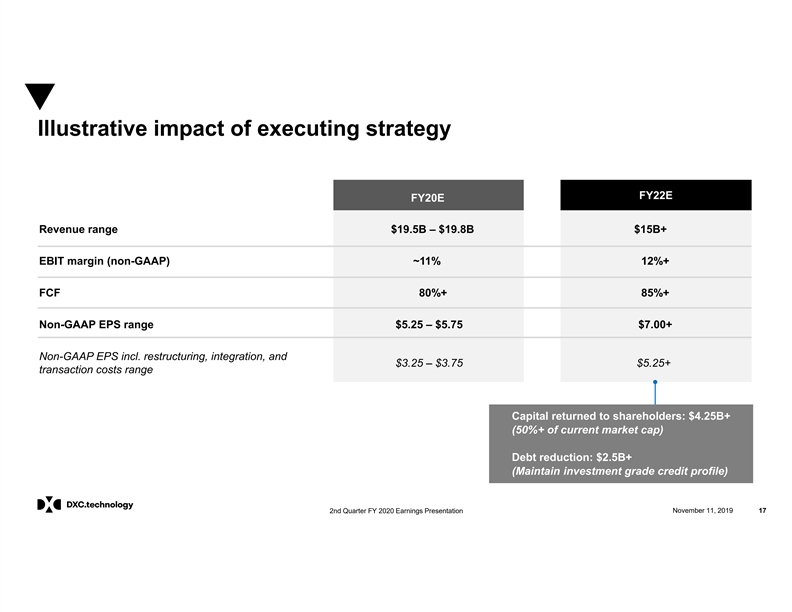
Illustrative impact of executing strategy FY22E FY20E Revenue range $19.5B – $19.8B $15B+ EBIT margin (non-GAAP) ~11% 12%+ FCF 80%+ 85%+ Non-GAAP EPS range $5.25 – $5.75 $7.00+ Non-GAAP EPS incl. restructuring, integration, and $3.25 – $3.75 $5.25+ transaction costs range Capital returned to shareholders: $4.25B+ (50%+ of current market cap) Debt reduction: $2.5B+ (Maintain investment grade credit profile) 2nd Quarter FY 2020 Earnings Presentation November 11, 2019 17Illustrative impact of executing strategy FY22E FY20E Revenue range $19.5B – $19.8B $15B+ EBIT margin (non-GAAP) ~11% 12%+ FCF 80%+ 85%+ Non-GAAP EPS range $5.25 – $5.75 $7.00+ Non-GAAP EPS incl. restructuring, integration, and $3.25 – $3.75 $5.25+ transaction costs range Capital returned to shareholders: $4.25B+ (50%+ of current market cap) Debt reduction: $2.5B+ (Maintain investment grade credit profile) 2nd Quarter FY 2020 Earnings Presentation November 11, 2019 17
DXC is well positioned to grow DXC has significant scale and scope, along with mission-critical positions at large customers DXC has reduced its cost structure in an industry where being a low-cost player boosts competitiveness Customers are facing transformation challenges across the entire enterprise technology stack. They need DXC to help them modernize their IT, optimize data architectures, and securely orchestrate all of it across public, private, and hybrid clouds 2nd Quarter FY 2020 Earnings Presentation November 11, 2019 18DXC is well positioned to grow DXC has significant scale and scope, along with mission-critical positions at large customers DXC has reduced its cost structure in an industry where being a low-cost player boosts competitiveness Customers are facing transformation challenges across the entire enterprise technology stack. They need DXC to help them modernize their IT, optimize data architectures, and securely orchestrate all of it across public, private, and hybrid clouds 2nd Quarter FY 2020 Earnings Presentation November 11, 2019 18