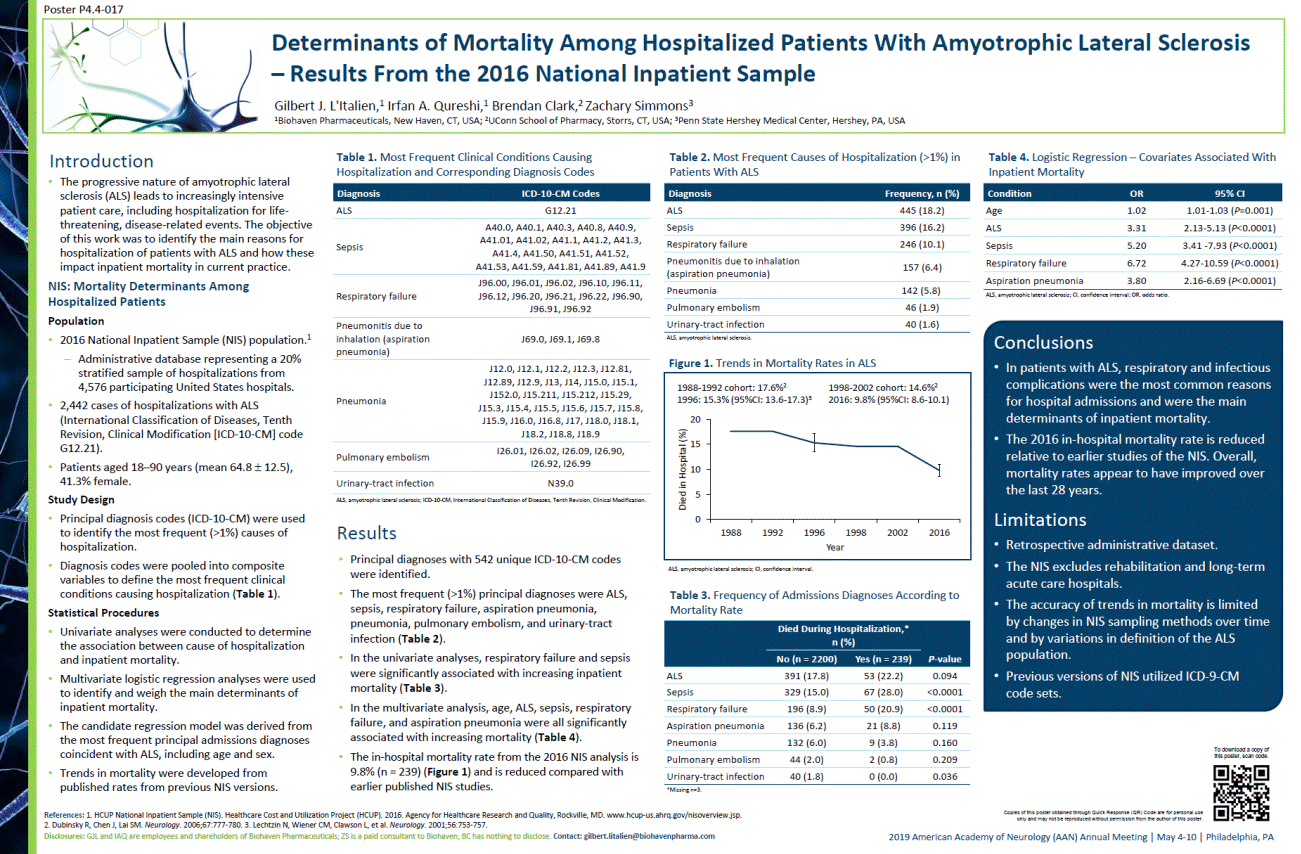
2019 AmericanAcademy of Neurology(AAN) Annual Meeting |May 4-10 | Philadelphia, PA References: 1.HCUP National Inpatient Sample (NIS). Healthcare Cost and Utilization Project (HCUP). 2016. Agency for Healthcare Research and Quality, Rockville, MD. www.hcup-us.ahrq.gov/nisoverview.jsp.2. Dubinsky R, Chen J, Lai SM. Neurology. 2006;67:777-780. 3. LechtzinN, Wiener CM, Clawson L, et al. Neurology. 2001;56:753-757. Disclosures: GJLand IAQ are employees and shareholders of BiohavenPharmaceuticals; ZS is a paid consultant to Biohaven; BC has nothing to disclose. Contact: gilbert.litalien@biohavenpharma.com •The progressive nature of amyotrophic lateral sclerosis (ALS) leads to increasingly intensive patient care, including hospitalization for life-threatening, disease-related events. The objective of this work was to identify the main reasons for hospitalization of patients with ALS and how these impact inpatient mortality in current practice. NIS: Mortality Determinants Among Hospitalized Patients Population •2016 National Inpatient Sample (NIS) population.1 –Administrative database representing a 20% stratified sample of hospitalizations from 4,576 participating United States hospitals. •2,442 cases of hospitalizationswith ALS (International Classification of Diseases, Tenth Revision, Clinical Modification[ICD-10-CM] code G12.21). •Patients aged 18–90 years (mean 64.8 12.5), 41.3% female. Study Design •Principal diagnosis codes (ICD-10-CM) were used to identify the most frequent (>1%) causes of hospitalization. •Diagnosis codes were pooled into composite variables to define the most frequent clinical conditions causing hospitalization (Table 1). Statistical Procedures •Univariate analyses were conducted to determine the association between cause of hospitalization and inpatient mortality. •Multivariate logistic regression analyses were used to identify and weigh the main determinants of inpatient mortality. •The candidate regression model was derived from the most frequent principal admissions diagnoses coincident with ALS, including age and sex. •Trends in mortality were developed from published rates from previous NIS versions. Introduction Copies of this poster obtained through Quick Response (QR) Code are for personal use only and may not be reproduced without permission from the author of this poster. To download a copy of this poster, scan code. Results •Principal diagnoses with 542 unique ICD-10-CM codes were identified. •The most frequent (>1%) principal diagnoses were ALS, sepsis, respiratory failure, aspiration pneumonia, pneumonia, pulmonary embolism, and urinary-tract infection (Table 2). •In the univariate analyses, respiratory failureand sepsis were significantly associated with increasing inpatient mortality(Table 3). •In the multivariate analysis, age, ALS, sepsis, respiratory failure, and aspiration pneumonia were all significantly associated with increasing mortality (Table 4). •The in-hospital mortality rate from the 2016 NIS analysis is 9.8% (n = 239) (Figure 1) and is reduced compared with earlier published NIS studies. Table 1. Most Frequent Clinical Conditions Causing Hospitalization and Corresponding Diagnosis Codes Figure 1. Trends in Mortality Rates in ALS Conclusions •In patients with ALS, respiratory and infectious complications were the most common reasons for hospital admissions and were the maindeterminants of inpatient mortality. •The 2016 in-hospital mortality rate is reduced relative to earlier studies of the NIS. Overall, mortality rates appear to have improved over the last 28years. Limitations •Retrospective administrative dataset. •The NIS excludes rehabilitation and long-term acute care hospitals. •The accuracy of trends in mortality is limited by changes in NIS sampling methods over time and by variations in definition of the ALS population. •Previous versions of NIS utilized ICD-9-CM code sets. Table 3. Frequency of Admissions Diagnoses According to Mortality Rate Diagnosis ICD-10-CM Codes ALS G12.21 Sepsis A40.0, A40.1, A40.3, A40.8, A40.9, A41.01, A41.02, A41.1, A41.2, A41.3, A41.4, A41.50, A41.51, A41.52, A41.53, A41.59, A41.81, A41.89, A41.9 Respiratory failure J96.00, J96.01, J96.02, J96.10, J96.11, J96.12, J96.20, J96.21, J96.22, J96.90, J96.91, J96.92 Pneumonitis due to inhalation (aspiration pneumonia) J69.0, J69.1, J69.8 Pneumonia J12.0, J12.1, J12.2, J12.3, J12.81, J12.89, J12.9, J13, J14, J15.0, J15.1, J152.0, J15.211, J15.212, J15.29, J15.3, J15.4, J15.5, J15.6, J15.7, J15.8, J15.9, J16.0, J16.8, J17, J18.0, J18.1, J18.2, J18.8, J18.9 Pulmonary embolism I26.01, I26.02, I26.09, I26.90, I26.92, I26.99 Urinary-tract infection N39.0 ALS, amyotrophic lateral sclerosis; ICD-10-CM, InternationalClassification of Diseases,Tenth Revision, Clinical Modification. Determinants of Mortality Among Hospitalized Patients With Amyotrophic Lateral Sclerosis –Results From the 2016 National Inpatient Sample Gilbert J. L'Italien,1Irfan A. Qureshi,1Brendan Clark,2 Zachary Simmons3 1BiohavenPharmaceuticals, New Haven, CT, USA; 2UConn School of Pharmacy, Storrs, CT, USA; 3Penn State Hershey Medical Center, Hershey, PA, USA Poster P4.4-017 0 5 10 15 20 1988 1992 1996 1998 2002 2016 Died in Hospital (%) Year 1988-1992 cohort: 17.6%2 1996: 15.3% (95%CI: 13.6-17.3)3 Table 2. Most Frequent Causes of Hospitalization (>1%) in Patients WithALS Diagnosis Frequency, n (%) ALS 445 (18.2) Sepsis 396 (16.2) Respiratory failure 246 (10.1) Pneumonitis due to inhalation (aspiration pneumonia) 157 (6.4) Pneumonia 142 (5.8) Pulmonary embolism 46 (1.9) Urinary-tract infection 40 (1.6) ALS, amyotrophic lateral sclerosis. Died During Hospitalization,* n(%) P-value No (n = 2200) Yes (n = 239) ALS 391 (17.8) 53 (22.2) 0.094 Sepsis 329 (15.0) 67 (28.0) <0.0001 Respiratory failure 196 (8.9) 50 (20.9) <0.0001 Aspiration pneumonia 136 (6.2) 21 (8.8) 0.119 Pneumonia 132 (6.0) 9 (3.8) 0.160 Pulmonary embolism 44 (2.0) 2 (0.8) 0.209 Urinary-tract infection 40 (1.8) 0 (0.0) 0.036 *Missingn=3. Table 4. Logistic Regression –Covariates Associated With Inpatient Mortality Condition OR 95% CI Age 1.02 1.01-1.03 (P=0.001) ALS 3.31 2.13-5.13 (P<0.0001) Sepsis 5.20 3.41 -7.93 (P<0.0001) Respiratory failure 6.72 4.27-10.59 (P<0.0001) Aspiration pneumonia 3.80 2.16-6.69 (P<0.0001) ALS, amyotrophic lateral sclerosis; CI,confidence interval; OR, odds ratio. 1998-2002 cohort: 14.6%2 2016: 9.8% (95%CI: 8.6-10.1) ALS, amyotrophic lateral sclerosis; CI, confidence interval.

