UNITED STATES
SECURITIES AND EXCHANGE COMMISSION
Washington, D.C. 20549
FORM N-CSR
CERTIFIED SHAREHOLDER REPORT OF REGISTERED MANAGEMENT INVESTMENT COMPANIES
Investment Company Act file number811-23214
GraniteShares ETF Trust
(Exact name of registrant as specified in charter)
205 Hudson Street, 7th floor
New York, New York 10013
(Address of principal executive offices) (Zip code)
William Rhind
GraniteShares ETF Trust
205 Hudson Street, 7th floor
New York, New York 10013
(Name and address of agent for service)
Copy to:
W. Thomas Conner, Esq.
Vedder Price
1633 Broadway, 31st Floor
New York, NY 10019
Registrant’s telephone number, including area code:1-800-422-3554
Date of fiscal year end:June 30
Date of reporting period:June 30, 2019
Form N-CSR is to be used by management investment companies to file reports with the Commission not later than 10 days after the transmission to stockholders of any report that is required to be transmitted to stockholders under Rule 30e-1 under the Investment Company Act of 1940 (17 CFR 270.30e-1). The Commission may use the information provided on Form N-CSR in its regulatory, disclosure review, inspection, and policymaking roles.
A registrant is required to disclose the information specified by Form N-CSR, and the Commission will make this information public. A registrant is not required to respond to the collection of information contained in Form N-CSR unless the Form displays a currently valid Office of Management and Budget (“OMB”) control number. Please direct comments concerning the accuracy of the information collection burden estimate and any suggestions for reducing the burden to Secretary, Securities and Exchange Commission, 450 Fifth Street, NW, Washington, DC 20549-0609. The OMB has reviewed this collection of information under the clearance requirements of 44 U.S.C. § 3507.
Item 1. Reports to Stockholders.
The Report to Shareholders is attached herewith.

GraniteShares ETF Trust
Annual Report
June 30, 2019
GraniteShares Bloomberg Commodity Broad Strategy No K-1 ETF
GraniteShares S&P GSCI Commodity Broad Strategy No K-1 ETF
GraniteShares HIPS US High Income ETF
Beginning on January 1, 2021, as permitted by regulations adopted by the U.S. Securities and Exchange Commission, paper copies of the Fund’s shareholder reports will no longer be sent by mail, unless you specifically request paper copies of the reports from your financial intermediary, such as a broker-dealer or bank. Instead, the reports will be made available on a website, and you will be notified by mail each time a report is posted and provided with a website link to access the report. If you already elected to receive shareholder reports electronically, you will not be affected by this change and you need not take any action. Please contact your financial intermediary to elect to receive shareholder reports and other communications electronically. You may elect to receive all future reports in paper free of charge. Please contact your financial intermediary to continue receiving paper copies of your shareholder reports and for information about whether your election to receive reports in paper will apply to all funds held with your financial intermediary.
GraniteShares ETF Trust
Table of Contents
GraniteShares ETF Trust
Management Discussion of Fund Performance (Unaudited)
THE MARKET ENVIRONMENT
Commodity Market
For the period July 1, 2018 to June 30, 2019 commodity returns, as measured by the performance of broad-based indexes were negative. For example, The Bloomberg Commodity Total Return Index decreased 6.75% over this period and the S&P Goldman Sachs Commodity Total Return Index decreased 11.49%. Poor performance in the energy and base metal sectors were primarily responsible for the negative returns.
The energy sector was the worst performing sector over the period. Natural gas prices dropped 22% while WTI and Brent crude oil prices fell 20% and 16%, respectively. Gasoline prices decreased 14% and heating oil and gasoil prices fell 12%. Energy prices moved sharply lower through the end of the calendar year over concerns of weaker global economic growth, record U.S. oil production and the U.S. Federal Reserve Bank’s continued rate increases despite the implementation of U.S. sanctions on Iran and OPEC+ production cutbacks. Though oil prices moved off their calendar year-end lows, continued concerns of weaker global growth combined with record U.S. oil production left prices significantly lower at the end of the period.
The base metals sector was the next worst performing sector. Aluminum prices fell 18%, nickel prices fell 17%, copper prices fell 10% and zinc prices fell 3%. Like energy prices, base metal prices moved lower through the end of the calendar year, falling on concerns of weaker global and Chinese growth, U.S.- China trade frictions and over concerns of restrictive U.S Federal Reserve Bank policy. Though base metal prices moved significantly off their calendar year-end lows as concerns of lower global economic growth receded, prices moved lower again, ending the period significantly lower, on renewed concerns of slower economic growth as well as continued concerns over U.S. Federal Reserve Bank monetary policy.
Grain prices, except for corn prices, were all lower for the period. Kansas wheat prices decreased 18%, Chicago wheat prices fell 3% and soybean prices declined 4%. Corn prices increased 4%. Stable throughout most of the period, grain prices fell on forecasts of global oversupply in the first quarter of 2019. Prices then increased, moving off their lows, due to unfavorable weather in the U.S. affecting harvests and plantings though ending the period lower. Corn prices ended the period higher, supported by forecasts of lower plantings and harvest than wheat and soybeans.
Precious metal prices were mixed over the period with gold prices increasing just 10% and silver prices decreasing 8%. Gold prices which were initially lower on a strong U.S. dollar and restrictive U.S. Federal Reserve Bank monetary policy, moved higher on greatly increased expectations of U.S. Federal Reserve Bank rate decreases and on the back of increased geopolitical tensions in the Middle East.
Fixed Income
Over the period July 1, 2018 to June 30, 2019, the U.S Federal Reserve Bank increased the federal funds target range 2 times, once in the September FOMC meeting and once in the December FOMC meeting. As a result, the interest rate paid on required and excess reserves increased from 1.95% to 2.20% and the target range for the federal funds rate increased from 1.75% - 2.00% to 2.00% - 2.50%. Following the December FOMC meeting, U.S. stock markets experienced increased volatility while significantly declining, precipitating the U.S. Federal Reserve Bank to implement less restrictive monetary policy. In the March meeting, the FOMC slowed its balance sheet reduction and adopted a “patient and flexible” monetary policy while maintaining the Fed Funds target rate. In the June meeting, the FOMC stated it would take appropriate actions to sustain the expansion while maintaining the current Fed Funds target range.
Over the period, 3-month Treasury Bill rates fell 18 bps from 2.09% to 1.91%. Over this same period, the 10-year U.S Treasury rate fell 85bps from approximately 2.86% to 2.01%.
Pass-Through Securities
For the period July 1, 2018 to June 30, 2019 pass-through security returns, as measured by the performance of TFMS HIPS 300 Total Return Index (a broad-based index), were positive. The TFMS HIPS 300 Total Return Index increased 5.82% over this period. The Index return was affected by positive performance in all sectors with the closed-end fund and BDC and REIT sectors contributing the most. For example, FT Taxable CEF Total Return Index increased 7.93%, the S&P BDC Total Return Index increased 8.63% and the Dow Jones Equity REIT Total Return Index increased 13.08%.
Pass-through securities prices generally moved lower in the first half of the period, pressured by the U.S. Federal Reserve Banks rate increase in December 2018 and continued restrictive monetary policy. Following the adoption by the U.S. Federal Reserve Banks of a more accommodative monetary policy, pass through securities prices generally moved higher.
GraniteShares ETF Trust
Management Discussion of Fund Performance (Unaudited) (continued)
MANAGER’S ANALYSIS
GraniteShares Bloomberg Commodity Broad Strategy No K-1 ETF (COMB)
The GraniteShares Bloomberg Commodity Broad Strategy No K-1 ETF (the “Fund”) is an actively managed exchange-traded fund (“ETF”) that seeks to provide long-term capital appreciation, primarily through exposure to commodity futures markets. The Fund’s investment strategy is based in part on the Bloomberg Commodity Index (the “BCOM Benchmark”), which is designed to be a highly liquid and broad benchmark for commodities futures investments. The BCOM Benchmark provides broad-based exposure to commodities as an asset class, since no single commodity or commodity sector dominates the BCOM Benchmark. The weightings of the components of the BCOM Benchmark are based on (1) liquidity data, which is the relative amount of trading activity of a particular commodity; (2) production data, which measures the importance of a commodity to the world economy; and (3) diversification rules that attempt to reduce disproportionate weightings of any single commodity. Rather than being driven by micro-economic events affecting one commodity market or sector, the BCOM Benchmark is comprised of futures contracts on a broad basket of underlying commodities, which potentially reduces volatility in comparison with narrower commodity baskets.
Currently, the BCOM Benchmark consists of 23 commodities futures contracts with respect to 21 commodities: aluminum, coffee, copper, corn, cotton, crude oil (WTI and Brent), gold, ULS Diesel, lean hogs, live cattle, low sulfur gasoil, natural gas, nickel, silver, soybean meal, soybean oil, soybeans, sugar, unleaded gas, wheat (Chicago and KC HRW), and zinc. The BCOM Benchmark reflects the return from these commodity futures contracts.
While the Fund generally seeks exposure to the commodity futures markets included in the BCOM Benchmark, the Fund is not an index tracking ETF and will seek to improve its performance, in part through a cash management strategy consisting of investments in investment grade fixed income securities issued by various U.S. public-sector or corporate entities (“Fixed Income Securities”). The Adviser will use such instruments to generate a total return for investors and exercise its discretion in the use of such instruments to seek to optimize the investment performance of the Fund. In addition, the Fund at times may actively select investments with differing maturities from the underlying components of the BCOM Benchmark, may not invest in all of the BCOM Benchmark’s components or in the same proportion as the BCOM Benchmark, may invest in commodity-linked derivative instruments and other commodity-linked instruments outside the BCOM Benchmark, and may emphasize some commodity sectors more than others.
The Fund is called “No K1” because it is designed to operate differently than commodity-based exchange traded funds that distribute a “Schedule K-1” to shareholders. Schedule K-1 is a tax document that contains information regarding a fund’s income and expenses. Schedule K-1 is a complex form and shareholders may find that preparing tax returns requires additional time or the assistance of a professional tax adviser, at additional expense to the shareholder. In contrast, the Fund is designed to be taxed like a conventional mutual fund and therefore will deliver a “Form 1099” to investors, from which income, gains, and losses can be entered onto the investor’s tax return. To deliver 1099s consistent with applicable tax law, the Fund currently expects to invest in an underlying subsidiary, as discussed below.
The Fund gains exposure to the commodity futures markets by investing in commodity futures contracts (“Commodity Futures”). Because the Fund may not invest directly in commodity futures, the Fund gains exposure to these investments by investing a portion of its assets in the GraniteShares BCOM Cayman Limited, a wholly-owned subsidiary of the Fund organized under the laws of the Cayman Islands (the “Subsidiary”). The Subsidiary is advised by the Adviser, and the Adviser complies with the provisions of the Investment Company Act of 1940 relating to advisory contracts. Unlike the Fund, the Subsidiary is not an investment company registered under the Investment Company Act of 1940 (the “1940 Act”). The Fund’s investment in the Subsidiary is intended to provide the Fund with exposure to commodity futures markets in accordance with applicable rules and regulations. The Subsidiary has the same investment objective and will follow the same general investment policies and restrictions as the Fund. The Fund will invest up to 25% of its total assets in the Subsidiary. The Fund complies with the provisions of the 1940 Act governing capital structure and leverage (Section 18) on an aggregate basis with the Subsidiary. Except as otherwise noted, references to the Fund’s investment strategies and risks include the investment strategies and risks of the Subsidiary.
For the period July 1, 2018 through June 30, 2019 (the fiscal year end of the Fund), on a market price basis, the Fund returned -7.40%. On a net asset value (“NAV”) basis, the Fund returned -7.16%. During the same time period, the BCOM Benchmark returned –8.87%. Additionally, the BCOM Total Return Index returned -6.75%. The BCOM Total Return Index is similar to the BCOM Benchmark except that the BCOM Total Return Index performance includes the return that would be generated in a fully collateralized investment in the BCOM Benchmark. This combines the returns of the BCOM Benchmark with the returns on cash collateral invested in Treasury Bills. The majority of the Fund’s outperformance on a NAV basis relative to the BCOM Benchmark is due to slight position differences between the BCOM Benchmark and the Fund as well as returns on collateral invested in Treasury Bills. The majority of the Fund’s underperformance on a NAV basis relative to the BCOM Total Return Index is a result of fees and operating expenses incurred by the fund.
GraniteShares ETF Trust
Management Discussion of Fund Performance (Unaudited) (continued)
Positions that contributed most significantly to the Fund’s return were Gold (CME) and Corn (CME) futures contracts (portfolio weight of 19.1%). Positions that detracted most significantly from the Fund’s return included Natural Gas (CME), WTI Crude Oil (CME), Brent Crude Oil (ICE), Gasoil (ICE) and Heating Oil (CME) futures contracts (combined portfolio weight of 31.3%), the Aluminum (ICE), Copper (CME) and Nickel (ICE) futures contracts (combined portfolio weight 14.2%) and the Cotton (CME) and Coffee (CME) futures contracts (combined portfolio weight of 3.8%)
| Percentage Weight* (% of Fund’s Net Assets as of June 30, 2019) |
| Asset Class | | Fund Percentage Weight By Sector** | | | |
| Commodities | | | | | | |
| | | Agriculture | | | 35.0 | % |
| | | Energy | | | 31.2 | % |
| | | Base Metals | | | 17.3 | % |
| | | Precious Metals | | | 16.5 | % |
*Based on notional value of futures contracts.
**Allocations are subject to change.
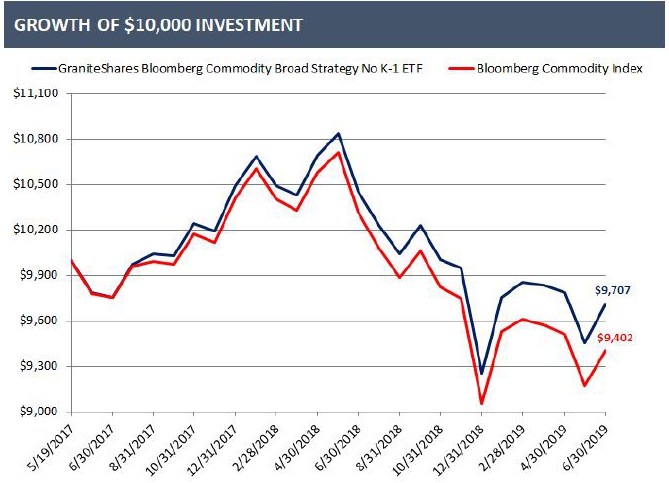
GROWTH OF $10,000 INVESTMENT
For the period May 19, 2017* to June 30, 2019
HISTORICAL PERFORMANCE
Total Return as of June 30, 2019
| | | 1 Year | | | Since
Inception
5/19/2017* | |
| GraniteShares Bloomberg Commodity Broad Strategy No K-1 ETF NAV | | | (7.16 | )% | | | (1.40 | )% |
| GraniteShares Bloomberg Commodity Broad Strategy No K-1 ETF Market Price** | | | (7.40 | )% | | | (1.51 | )% |
| Bloomberg Commodity Index | | | (8.87 | )% | | | (2.88 | )% |
GraniteShares ETF Trust
Management Discussion of Fund Performance (Unaudited) (continued)
Total Annual Fund Operating Expenses were 0.25%.Performance data quoted represents past performance and is no guarantee of future results. Current performance may be lower or higher than the performance data quoted. Investment return and principal value will fluctuate so that an investor’s shares, when redeemed, may be worth more or less than original cost. Fund NAV returns are calculated using the Fund’s daily 4:00 p.m. NAV. Returns shown include the reinvestment of all dividends and other distributions. Index returns do not include expenses. The performance table and graph do not reflect the deduction of taxes that a shareholder would pay on Fund distributions or the redemption of Fund shares. For the fund’s most recent month end performance, please call 1(844) 476-8747 or visit www.graniteshares.com.
| | * | Commencement of operations. |
| | ** | The price used to calculate market return (‘‘Market Price’’) is determined by using the closing price listed on the NYSE Arca and does not represent returns an investor would receive if shares were traded at other times. Total returns are calculated using the daily 4:00 pm midpoint between the bid and offer. Shares are bought and sold at market price, not NAV and are not individually redeemed from the Fund. |
| | | |
| | - | Bloomberg Commodity Index - is a broad-based index providing exposure to commodities as an asset class, with no single commodity or commodity sector dominating the index. Currently, the BCOM Benchmark consists of 22 commodities futures contracts with respect to 20 commodities: aluminum, coffee, copper, corn, cotton, crude oil (WTI and Brent), gold, ULS Diesel, lean hogs, live cattle, natural gas, nickel, silver, soybean meal, soybean oil, soybeans, sugar, unleaded gas, wheat (Chicago and KC HRW), and zinc. The BCOM Benchmark reflects the return from these commodity futures contracts. |
| | - | An investor cannot invest directly in an unmanaged index. Indexes do not reflect fees and/or expenses. |
| | - | Investing involves market risk, including the potential loss of principal. Investing in commodities is speculative, can be extremely volatile and may not be suitable for all investors. There are no assurances that the investment objective and strategies of the funds will be achieved. You could lose money by investing in the exchange-traded funds. Past performance does not guarantee future performance results. |
GraniteShares ETF Trust
Management Discussion of Fund Performance (Unaudited) (continued)
GraniteShares S&P GSCI Commodity Broad Strategy No K-1 ETF (COMG)
The GraniteShares S&P GSCI Commodity Broad Strategy No K-1 ETF (the “Fund”) is an actively managed exchange traded fund (“ETF”) that seeks to provide long-term capital appreciation, primarily through exposure to commodity futures markets. The Fund’s investment strategy is based in part on the S&P GSCI Index (the “GSCI Benchmark”), which is designed to be a measure of commodity market performance over time.
The commodity futures contracts represented in the GSCI Benchmark are weighted based on global production values to reflect the relative significance of the physical commodities underlying such commodity futures contracts to the world economy.
Currently, the GSCI Benchmark consists of 24 commodities futures contracts with respect to 22 commodities: crude oil (WTI and Brent), corn, live cattle, wheat (Chicago and Kansas), heating oil, gasoil, gold, copper, RBOB gasoline, soybeans, natural gas, aluminum, lean hogs, sugar, cotton, feeder cattle, coffee, zinc, lead, nickel, cocoa and silver. The GSCI Benchmark reflects the return from these commodity futures contracts.
While the Fund generally seeks exposure to the commodity futures markets included in the GSCI Benchmark, the Fund is not an index tracking ETF and seeks to improve its performance, in part through a cash management strategy consisting of investments in investment grade fixed income securities issued by various U.S. public-sector or corporate entities (“Fixed Income Securities”). The Adviser will use such instruments to generate a total return for investors and exercise its discretion in the use of such instruments to seek to optimize the investment performance of the Fund. In addition, the Fund at times may actively select investments with differing maturities from the underlying components of the GSCI Benchmark, may not invest in all of the GSCI Benchmark’s components or in the same proportion as the GSCI Benchmark, may invest in commodity-linked derivative instruments and other commodity-linked instruments outside the GSCI Benchmark, and may emphasize some commodity sectors more than others.
The Fund is called “No K1” because it is designed to operate differently than commodity-based exchange traded funds that distribute a “Schedule K-1” to shareholders. Schedule K-1 is a tax document that contains information regarding a fund’s income and expenses. Schedule K-1 is a complex form and shareholders may find that preparing tax returns requires additional time or the assistance of a professional tax adviser, at additional expense to the shareholder. In contrast, the Fund is designed to be taxed like a conventional mutual fund and therefore will deliver a “Form 1099” to investors, from which income, gains, and losses can be entered onto the investor’s tax return. To deliver 1099s consistent with applicable tax law, the Fund currently expects to invest in an underlying subsidiary, as discussed below.
The Fund gains exposure to the commodity futures markets by investing initially in commodity futures contracts (“Commodity Futures”). The Fund does will not invest directly in Commodity Futures. The Fund expects to gain exposure to these investments by investing a portion of its assets in the GraniteShares GSCI Cayman Limited, a wholly-owned subsidiary of the Fund organized under the laws of the Cayman Islands (the “Subsidiary”). The Subsidiary is advised by the Adviser, and the Adviser complies with the provisions of the Investment Company Act of 1940 relating to advisory contracts. Unlike the Fund, the Subsidiary is not an investment company registered under the Investment Company Act of 1940 (the “1940 Act”). The Fund’s investment in the Subsidiary is intended to provide the Fund with exposure to commodity futures markets in accordance with applicable rules and regulations. The Subsidiary has the same investment objective and will follow the same general investment policies and restrictions as the Fund. The Fund will invest up to 25% of its total assets in the Subsidiary. The Fund complies with the provisions of the 1940 Act governing capital structure and leverage (Section 18) on an aggregate basis with the Subsidiary. Except as otherwise noted, references to the Fund’s investment strategies and risks include the investment strategies and risks of the Subsidiary.
For the period July 1, 2018 through June 30, 2019 (the fiscal year end of the Fund), on a market price basis, the Fund returned -12.65%. On a net asset value (“NAV”) basis, the Fund returned -12.51%. During the same period, the GSCI Benchmark returned -12.74%. Additionally, the S&P GSCI Total Return Index returned -11.49%. The S&P GSCI Total Return Index is similar to the GSCI Benchmark except that the S&P GSCI Total Return Index performance includes the return that would be generated in a fully collateralized investment in the GSCI Benchmark as well as reflecting the positive or negative returns that would be generated over time by rolling each underlying futures contract forward as it approaches expiration to the next expiring contract month. The majority of the Fund’s outperformance on a NAV basis relative to the GSCI Benchmark is due to tracking error incurred from the Fund’s investing in GSCI Index Futures and not the individual commodity futures comprising the GSCI Benchmark as well as returns on collateral invested in Treasury Bills. The majority of the Fund’s underperformance on a NAV basis relative to the GSCI Total Return Index is a result of fees and operating expenses incurred by the fund and to tracking error incurred from the Fund’s investing in GSCI Index Futures and not the individual commodity futures comprising the GSCI Benchmark.
For the period July 1, 2018 through June 30, 2019, the fund invested in the GSCI Index futures instead of the individual futures contracts comprising the GSCI Benchmark. The GSCI Index futures track the underlying futures contracts comprising the S&P GSCI Spot Index. The weightings of the futures contracts in the S&P GSCI Spot Index are the same as those in the GSCI Benchmark.
GraniteShares ETF Trust
Management Discussion of Fund Performance (Unaudited) (continued)
Positions that contributed most significantly to the Fund’s return were Gold (CME) and Corn (CME) futures contracts (portfolio weight of 9.6%). Positions that detracted most significantly from the Fund’s return included Natural Gas (CME), WTI Crude Oil (CME), Brent Crude Oil (ICE), Gasoil (ICE) and Heating Oil (CME) futures contracts (combined portfolio weight of 61.5%) and the Aluminum (ICE) and Copper (ICE) futures contracts (combined portfolio weight 7.6%)
| Percentage Weight* (% of Fund’s Net Assets as of June 30, 2019) | |
| Asset Class | | Fund Percentage Weight By Sector** | | | |
| Commodities | | | | | |
| | Energy | | | 61.5 | % |
| | Agriculture | | | 23.6 | % |
| | | Base Metals | | | 10.2 | % |
| | | Precious Metals | | | 4.7 | % |
*Based on notional value of futures contracts.
**Allocations are subject to change.
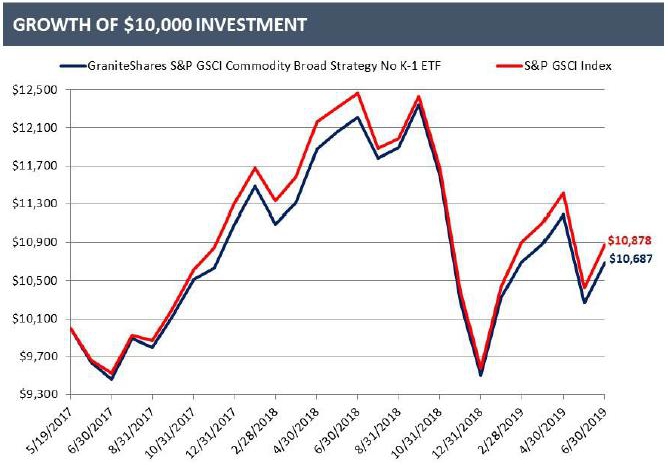
GROWTH OF $10,000 INVESTMENT
For the period May 19, 2017* to June 30, 2019
HISTORICAL PERFORMANCE
Total Return as of June 30, 2019
| | | 1 Year | | | Since
Inception
5/19/2017* | |
| GraniteShares S&P GSCI Commodity Broad Strategy No K-1 ETF NAV | | | (12.51 | )% | | | 3.19 | % |
| GraniteShares S&P GSCI Commodity Broad Strategy No K-1 ETF Market Price** | | | (12.65 | )% | | | 3.15 | % |
| S&P GSCI Index | | | (12.74 | )% | | | 4.07 | % |
GraniteShares ETF Trust
Management Discussion of Fund Performance (Unaudited) (continued)
Total Annual Fund Operating Expenses were 0.35%. Performance data quoted represents past performance and is no guarantee of future results. Current performance may be lower or higher than the performance data quoted. Investment return and principal value will fluctuate so that an investor’s shares, when redeemed, may be worth more or less than original cost. Fund NAV returns are calculated using the Fund’s daily 4:00 p.m. NAV. Returns shown include the reinvestment of all dividends and other distributions. Index returns do not include expenses. The performance table and graph do not reflect the deduction of taxes that a shareholder would pay on Fund distributions or the redemption of Fund shares. For the fund’s most recent month end performance, please call 1(844) 476-8747 or visit www.graniteshares.com.
| | * | Commencement of operations. |
| | ** | The price used to calculate market return (‘‘Market Price’’) is determined by using the closing price listed on the NYSE Arca and does not represent returns an investor would receive if shares were traded at other times. Total returns are calculated using the daily 4:00 pm midpoint between the bid and offer. Shares are bought and sold at market price, not NAV and are not individually redeemed from the Fund. |
| | | |
| | - | S&P Goldman Sachs Commodity Index - is a broad-based index designed to be a measure of commodity market performance over time. The commodity futures contracts represented in the GSCI Benchmark are weighted based on global production values to reflect the relative significance of the physical commodities underlying such commodity futures contracts to the world economy. Currently, the GSCI Benchmark consists of 24 commodities futures contracts with respect to 22 commodities: crude oil, corn, live cattle, wheat, heating oil, gasoil, gold, copper, RBOB gasoline, soybeans, natural gas, aluminum, lean hogs, sugar, cotton, feeder cattle, coffee, zinc, lead, nickel, cocoa and silver. |
| | - | An investor cannot invest directly in an unmanaged index. Indexes do not reflect fees and/or expenses. |
| | - | Investing involves market risk, including the potential loss of principal. Investing in commodities is speculative, can be extremely volatile and may not be suitable for all investors. There are no assurances that the investment objective and strategies of the funds will be achieved. You could lose money by investing in the exchange-traded funds. Past performance does not guarantee future performance results. |
GraniteShares ETF Trust
Management Discussion of Fund Performance (Unaudited) (continued)
GraniteShares HIPS US High Income ETF (HIPS)
The GraniteShares HIPS US High Income ETF (the “Fund”) seeks to track the performance, before fees and expenses, of the TFMS HIPS Index (the “Index”).
The Fund employs a “passive management”—or indexing—investment approach designed to track the performance of the Index. The rules-based Index measures the performance of up to 60 high income U.S.-listed securities that typically have “pass-through” structures that require them to distribute substantially all of their earnings to shareholders as cash distributions. This “high income, pass-through” strategy is known as HIPS.
The Index
The Index is constructed to capture up to 60 high income securities, typically with pass-through structures, across the following sectors: (i) closed-end funds (“CEFs”), (ii) real estate investment trusts (“REITS”), (iii) asset management and business development companies (“BDCs”), and (iv) energy production and energy transportation and processing companies. Energy-related companies included in the Index are expected to primarily be structured as master limited partnerships (“MLPs”). CEFs included in the Index are option income funds and taxable, debt-based funds and may include CEFs that invest primarily in bank loans, high-yield securities (also known as “junk bonds”), foreign securities (including those in emerging markets), and mortgage- or asset-backed securities.
The Index applies a quantitative screen to the securities in such sectors for minimum sector-specific yields relative to the yield of the S&P 500® Index, minimum market capitalizations and minimum liquidity thresholds. The Index may include small-, mid-, and large-capitalization companies meeting the screening criteria.
The Index applies a quantitative screen to the securities in such sectors for minimum market capitalizations and minimum liquidity thresholds. The Index then selects up to 15 securities with the highest yield and lowest volatility over a prescribed time period for each sector with all securities equally weighted. Finally, the Index adjusts the weights of each sector to minimize the Index volatility and maximize the Index return, as measured over a prescribed time period, subject to a minimum sector weight of 15% and a maximum MLP sector weight of 25%.The Index may include small-, mid-, and large-capitalization companies meeting the screening criteria.
The Index is reconstituted annually and rebalanced only if the MLP sector weight exceeds 25% at the end of a quarter.
The Fund’s Investment Strategy attempts to invest all, or substantially all, of its assets in the securities that make up the Index. The Fund will generally use a “replication” strategy to achieve its investment objective, meaning it generally will invest in all of the component securities of the Index, but may, when the adviser believes it is in the best interests of the Fund, use a “representative sampling” strategy, meaning it may invest in a sample of the securities in the Index whose risk, return and other characteristics are expected to closely resemble the risk, return and other characteristics of the Index as a whole.
Under normal circumstances, at least 80% of the Fund’s total assets (exclusive of collateral held from securities lending) will be invested in the component securities of the Index and investments that have economic characteristics that are substantially identical to the economic characteristics of such component securities. GraniteShares Advisors LLC (“GraniteShares” or the “Adviser”), the Fund’s investment adviser, expects that, over time, the correlation between the Fund’s performance and that of the Index, before fees and expenses, will be 95% or better
For the period July 1, 2018 through June 30, 2019 (the fiscal year end of the Fund), on a market price basis, the Fund returned 6.24%, on a total return basis. On a net asset value (“NAV”) basis, the Fund returned 4.95%, on a total return basis. During the same time period, the TFMS HIPS Total Return Index returned 5.82%. The TFMS HIPS Total Return Index is similar to the TFMS HIPS Index except that the TFMS HIPS Total Return Index performance includes the return that would be generated if all distributions from securities comprising the TFMS HIPS Index were reinvested in the TFMS HIPS Index. The majority of the Fund’s underperformance on a NAV basis relative to the TFMS HIPS Index Total Return Index is a result of fees and operating expenses incurred by the fund and the Fund’s cash position.
GraniteShares ETF Trust
Management Discussion of Fund Performance (Unaudited) (continued)
Positions that contributed most significantly to the Fund’s return included REITs (portfolio weight of 32%), CEFs (portfolio weight of 25%) and Asset Managers and BDCs (portfolio weight 25%).
| Percentage Weight (% of Fund’s Net Assets as of June 30, 2019) | |
| Sector | | Fund Percentage Weight By Sector* | |
| Asset Mgmt Cos and BDCs | | | 24.8 | % |
| Closed End Funds | | | 25.0 | % |
| REITs | | | 32.0 | % |
| MLPS | | | 17.6 | % |
| Cash | | | 0.6 | % |
*Allocations are subject to change.
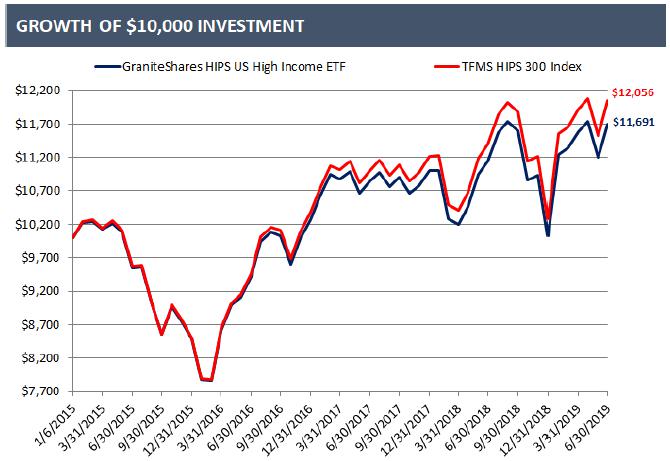
GROWTH OF $10,000 INVESTMENT
For the period January 6, 2015* to June 30, 2019
HISTORICAL PERFORMANCE
Total Return as of June 30, 2019
| | | 1 Year | | | 3 Year | | | Since
Inception
1/6/2015* | |
| GraniteShares HIPS US High Income ETF NAV | | | 4.95 | % | | | 7.48 | % | | | 3.55 | % |
| GraniteShares HIPS US High Income ETF Market Price** | | | 6.24 | % | | | 7.88 | % | | | 3.64 | % |
| TFMS HIPS 300 Index | | | 5.82 | % | | | 8.40 | % | | | 4.26 | % |
GraniteShares ETF Trust
Management Discussion of Fund Performance (Unaudited) (continued)
Total Annual Fund Operating Expenses were 1.42%.Performance data quoted represents past performance and is no guarantee of future results. Current performance may be lower or higher than the performance data quoted. Investment return and principal value will fluctuate so that an investor’s shares, when redeemed, may be worth more or less than original cost. Fund NAV returns are calculated using the Fund’s daily 4:00 p.m. NAV. Returns shown include the reinvestment of all dividends and other distributions. Index returns do not include expenses. The performance table and graph do not reflect the deduction of taxes that a shareholder would pay on Fund distributions or the redemption of Fund shares. For the fund’s most recent month end performance, please call 1(844) 476-8747 or visit www.graniteshares.com.
| | * | Commencement of operations. |
| | ** | The price used to calculate market return (‘‘Market Price’’) is determined by using the closing price listed on the NYSE Arca and does not represent returns an investor would receive if shares were traded at other times. Total returns are calculated using the daily 4:00 pm midpoint between the bid and offer. Shares are bought and sold at market price, not NAV and are not individually redeemed from the Fund. |
| | | |
| | - | Dow Jones REIT Total Return Index - is an index comprised of REITs that directly own all or part of the properties in their portfolios. |
| | - | S&P BDC Total Return Index - is an index designed to track leading business development companies that trade on major U.S. exchanges. |
| | - | Alerian MLP Total Return Index - is a cap-weighted index, whose constituents represent approximately 85% the total market capitalization of energy MLPs. |
| | - | FT TaxCEFT Index - the First Trust Taxable Fixed Income Closed Fund Total Return Index is a cap weighted index designed to provide a broad representation of the taxable fixed income closed-end fund universe. |
| | - | An investor cannot invest directly in an unmanaged index. Indexes do not reflect fees and/or expenses. |
| | - | Investing involves market risk, including the potential loss of principal. There are no assurances that the investment objective and strategies of the fund will be achieved. You could lose money by investing in the exchange-traded fund. Diversification does not assure a profit or protect against loss in a declining market. Past performance does not guarantee future performance results. |
Shareholder Expense Example (Unaudited)
June 30, 2019
As a shareholder of the Fund you incur two types of costs: (1) transaction costs, including brokerage commissions paid on purchases and sales of Fund shares; and (2) ongoing costs, including management fees and other fund expenses. The following examples are intended to help you understand your ongoing costs (in dollars and cents) of investing in the Fund and to compare these costs with the ongoing costs of investing in other funds.
The expense examples are based on an investment of $1,000 invested at January 1, 2019 and held for the entire period ended June 30, 2019.
ACTUAL EXPENSES
The first line under the Fund in the table below provides information about actual account values and actual expenses. You may use the information in this line, together with the amount you invested, to estimate the expenses that you paid over the period. Simply divide your account value by $1,000 (for example, an $8,600 account value divided by $1,000 = 8.6), then multiply the result by the number in the first line for the Fund under the heading entitled “Expenses Paid During the Period” to estimate the expenses you paid on your account during this period.
HYPOTHETICAL EXAMPLE FOR COMPARISON PURPOSES
The second line under the Fund in the table provides information about hypothetical account values and hypothetical expenses based on the Fund’s actual expense ratio and an assumed rate of return of 5% per year before expenses, which is not the Fund’s actual return. The hypothetical account values and expenses may not be used to estimate the actual ending account balance or expenses you paid for the period. You may use this information to compare the ongoing costs of investing in the Fund and other funds. To do so, compare this 5% hypothetical example with the 5% hypothetical examples that appear in the shareholder reports of the other funds. Please note that the expenses shown in the table are meant to highlight your ongoing costs only and do not reflect any transactional costs, such as brokerage commissions paid on purchases and sales of Fund shares. Therefore, the second line under the Fund in the table is useful in comparing ongoing Fund costs only and will not help you determine the relative total costs of owning different funds. In addition, if these transactional costs were included, your costs would have been higher.
| | | Beginning
Account Value
1/1/2019 | | | Ending
Account Value 6/30/2019 | | | Annualized
Net Expense Ratio for the Period | | | Expenses Paid During the Period(1) | |
GraniteShares Bloomberg Commodity Broad StrategyNo K-1 ETF | | | | | | | | | | | | | | | | |
| Actual | | $ | 1,000.00 | | | $ | 1,048.80 | | | | 0.25 | % | | $ | 1.27 | |
| Hypothetical (5% return before expenses) | | $ | 1,000.00 | | | $ | 1,023.55 | | | | 0.25 | % | | $ | 1.25 | |
| | | | | | | | | | | | | | | | | |
GraniteShares S&P GSCI Commodity Broad StrategyNo K-1 ETF | | | | | | | | | | | | | | | | |
| Actual | | $ | 1,000.00 | | | $ | 1,124.30 | | | | 0.35 | % | | $ | 1.84 | |
| Hypothetical (5% return before expenses) | | $ | 1,000.00 | | | $ | 1,023.06 | | | | 0.35 | % | | $ | 1.76 | |
| | | | | | | | | | | | | | | | | |
| GraniteShares HIPS US High Income ETF | | | | | | | | | | | | | | | | |
| Actual | | $ | 1,000.00 | | | $ | 1,166.20 | | | | 0.70 | % | | $ | 3.76 | |
| Hypothetical (5% return before expenses) | | $ | 1,000.00 | | | $ | 1,021.32 | | | | 0.70 | % | | $ | 3.51 | |
(1)Expenses are calculated using the Fund’s annualized net expense ratio, multiplied by the average account value for the period, multiplied by 181/365 (to reflect the six month period).
See accompanying notes to consolidated financial statements.
GraniteShares ETF Trust
| Consolidated Schedule of Investments |
GraniteShares Bloomberg Commodity Broad Strategy No K-1 ETF
June 30, 2019
| Investments | | Principal | | | Value | |
| U.S. TREASURY OBLIGATIONS – 99.3%(a) | | | | | | | | |
| U.S. Treasury Bill, 2.43%, 07/05/19(b) | | $ | 4,200,000 | | | $ | 4,199,092 | |
| U.S. Treasury Bill, 2.41%, 07/11/19(b) | | | 4,595,000 | | | | 4,592,546 | |
| U.S. Treasury Bill, 2.39%, 07/18/19(b) | | | 4,235,000 | | | | 4,230,908 | |
| U.S. Treasury Bill, 2.40%, 07/25/19(b) | | | 4,420,000 | | | | 4,414,269 | |
| U.S. Treasury Bill, 2.41%, 08/01/19(b) | | | 4,460,000 | | | | 4,452,300 | |
| U.S. Treasury Bill, 2.41%, 08/08/19(b) | | | 4,280,000 | | | | 4,270,710 | |
| U.S. Treasury Bill, 2.40%, 08/15/19(b) | | | 4,250,000 | | | | 4,238,910 | |
| U.S. Treasury Bill, 2.39%, 08/22/19(b) | | | 4,605,000 | | | | 4,591,071 | |
| U.S. Treasury Bill, 2.33%, 08/29/19(b) | | | 3,895,000 | | | | 3,881,627 | |
| U.S. Treasury Bill, 2.34%, 09/05/19 | | | 4,765,000 | | | | 4,746,764 | |
| U.S. Treasury Bill, 2.19%, 09/12/19(b) | | | 4,145,000 | | | | 4,127,706 | |
| U.S. Treasury Bill, 2.14%, 09/19/19(b) | | | 4,530,000 | | | | 4,509,135 | |
| U.S. Treasury Bill, 2.13%, 09/26/19(b) | | | 1,000,000 | | | | 994,998 | |
| U.S. Treasury Bill, 2.21%, 10/03/19 | | | 5,000,000 | | | | 4,972,747 | |
| U.S. Treasury Bill, 2.08%, 10/10/19(b) | | | 3,705,000 | | | | 3,683,275 | |
| U.S. Treasury Bill, 2.17%, 10/24/19(b) | | | 4,890,000 | | | | 4,859,012 | |
Total United States Treasury Obligations (Cost $66,749,428) | | | | | | | 66,765,070 | |
| Total Investments – 99.3% | | | | | | | | |
| (Cost $66,749,428) | | | | | | | 66,765,070 | |
| Other Assets in Excess of Liabilities – 0.7% | | | | | | | 451,044 | |
| Net Assets – 100.0% | | | | | | $ | 67,216,114 | |
| (a) | Represents zero coupon bonds. Rates shown reflects the effective yield. |
| (b) | A portion or all of the security is owned by GraniteShares BCOM Cayman Limited, a wholly-owned subsidiary of the Fund. See Note 2. |
At June 30, 2019, open futures contracts were as follows:
| Description | | Number of Contracts | | | Expiration
Date | | Contract Type | | Notional Amount | | | Value/Unrealized Appreciation | | | Value/Unrealized Depreciation | |
| Brent Crude(a) | | | 83 | | | 7/31/2019 | | Long | | $ | 5,373,420 | | | $ | – | | | $ | (227,390 | ) |
| Coffee ‘C’(a) | | | 42 | | | 9/18/2019 | | Long | | | 1,723,837 | | | | 131,588 | | | | – | |
| Copper(a) | | | 72 | | | 9/26/2019 | | Long | | | 4,884,300 | | | | 104,363 | | | | – | |
| Corn(a) | | | 199 | | | 9/13/2019 | | Long | | | 4,226,263 | | | | – | | | | (102,587 | ) |
| Cotton No. 2(a) | | | 25 | | | 12/06/2019 | | Long | | | 826,000 | | | | 4,045 | | | | – | |
| Crude Oil(a) | | | 101 | | | 8/20/2019 | | Long | | | 5,910,520 | | | | 562,700 | | | | – | |
| Gasoline RBOB(a) | | | 26 | | | 8/30/2019 | | Long | | | 2,024,677 | | | | 207,262 | | | | – | |
| Gold 100 OZ(a) | | | 61 | | | 8/28/2019 | | Long | | | 8,623,570 | | | | 694,130 | | | | – | |
| KC Hard Red Winter Wheat(a) | | | 33 | | | 9/13/2019 | | Long | | | 761,475 | | | | – | | | | (17,575 | ) |
| Lean Hogs(a) | | | 48 | | | 8/14/2019 | | Long | | | 1,459,200 | | | | – | | | | (142,960 | ) |
| Live Cattle(a) | | | 54 | | | 8/30/2019 | | Long | | | 2,253,960 | | | | – | | | | (69,400 | ) |
| LME Nickel(a) | | | 23 | | | 7/15/2019 | | Long | | | 1,744,320 | | | | – | | | | (67,464 | ) |
See accompanying notes to consolidated financial statements.
GraniteShares ETF Trust
| Consolidated Schedule of Investments |
GraniteShares Bloomberg Commodity Broad Strategy No K-1 ETF (continued)
June 30, 2019
| Description | | Number of Contracts | | | Expiration Date | | | Contract
Type | | Notional
Amount | | | Value/Unrealized
Appreciation | | | Value/Unrealized Depreciation | |
| LME Nickel(a) | | | (23) | | | | 7/15/2019 | | | Short | | $ | (1,744,320 | ) | | $ | – | | | $ | (127,920 | ) |
| LME Nickel(a) | | | 26 | | | | 9/16/2019 | | | Long | | | 1,981,980 | | | | 144,216 | | | | – | |
| LME Primary Aluminum(a) | | | 54 | | | | 7/15/2019 | | | Long | | | 2,406,038 | | | | – | | | | (124,557 | ) |
| LME Primary Aluminum(a) | | | (54) | | | | 7/15/2019 | | | Short | | | (2,406,038 | ) | | | – | | | | (27,181 | ) |
| LME Primary Aluminum(a) | | | 62 | | | | 9/16/2019 | | | Long | | | 2,790,388 | | | | 27,687 | | | | – | |
| LME Primary Aluminum(a) | | | (2) | | | | 9/16/2019 | | | Short | | | (90,013 | ) | | | 738 | | | | – | |
| LME Zinc(a) | | | (30) | | | | 7/15/2019 | | | Short | | | (1,908,750 | ) | | | – | | | | (6,325 | ) |
| LME Zinc(a) | | | 30 | | | | 7/15/2019 | | | Long | | | 1,908,750 | | | | – | | | | (248,850 | ) |
| LME Zinc(a) | | | (1) | | | | 9/16/2019 | | | Short | | | (62,525 | ) | | | 1,356 | | | | – | |
| LME Zinc(a) | | | 34 | | | | 9/16/2019 | | | Long | | | 2,125,850 | | | | 12,800 | | | | – | |
| Low Sulphur Gasoil(a) | | | 31 | | | | 9/12/2019 | | | Long | | | 1,861,550 | | | | 117,985 | | | | – | |
| Natural Gas(a) | | | 187 | | | | 8/28/2019 | | | Long | | | 4,267,340 | | | | – | | | | (115,090 | ) |
| NY Harbour ULSD(a) | | | 19 | | | | 8/30/2019 | | | Long | | | 1,553,866 | | | | 100,913 | | | | – | |
| Silver(a) | | | 32 | | | | 9/26/2019 | | | Long | | | 2,454,560 | | | | 73,655 | | | | – | |
| Soybean(a) | | | 84 | | | | 11/14/2019 | | | Long | | | 3,876,600 | | | | 107,600 | | | | – | |
| Soybean Meal(a) | | | 69 | | | | 12/13/2019 | | | Long | | | 2,228,010 | | | | – | | | | (15,940 | ) |
| Soybean Oil(a) | | | 117 | | | | 12/13/2019 | | | Long | | | 2,023,866 | | | | 44,988 | | | | – | |
| Sugar #11(a) | | | 143 | | | | 9/30/2019 | | | Long | | | 2,021,219 | | | | – | | | | (32,738 | ) |
| Wheat (CBT)(a) | | | 79 | | | | 9/13/2019 | | | Long | | | 2,082,638 | | | | 12,575 | | | | – | |
| Total Futures Contracts | | | | | | | | | | | | $ | 67,182,551 | | | $ | 2,348,601 | | | $ | (1,325,977 | ) |
| Net Unrealized Appreciation (Depreciation) | | | | | | | | | | | | | | | | $ | 1,022,624 | | | | | |
| (a) | A portion or all of the security is owned by GraniteShares BCOM Cayman Limited, a wholly-owned subsidiary of the Fund. See Note 2. |
The following table summarizes valuation of the Fund’s investments under the fair value hierarchy levels as of June 30, 2019:
| | | | | | | | | | | | | |
| | | Level 1 | | | Level 2 | | | Level 3 | | | Total | |
| Asset Valuation Inputs | | | | | | | | | | | | | | | | |
| Investments in Securities | | | | | | | | | | | | | | | | |
| U.S. Treasury Obligations | | $ | 66,765,070 | | | $ | – | | | $ | – | | | $ | 66,765,070 | |
| Other Investments | | | | | | | | | | | | | | | | |
| Futures | | | 2,348,601 | | | | – | | | | – | | | | 2,348,601 | |
| Total | | $ | 69,113,671 | | | $ | – | | | $ | – | | | $ | 69,113,671 | |
| Liability Valuation Inputs | | | | | | | | | | | | | | | | |
| Other Investments | | | | | | | | | | | | | | | | |
| Futures | | $ | 1,325,977 | | | $ | – | | | $ | – | | | $ | 1,325,977 | |
| Total | | $ | 1,325,977 | | | $ | – | | | $ | – | | | $ | 1,325,977 | |
As of June 30, 2019, there were no Level 3 investments held in the Fund.
See accompanying notes to consolidated financial statements.
GraniteShares ETF Trust
| Consolidated Schedule of Investments |
GraniteShares S&P GSCI Commodity Broad Strategy No K-1 ETF
June 30, 2019
| Investments | | Principal | | | Value | |
| U.S. TREASURY OBLIGATIONS – 99.3%(a) | | | | | | | | |
| U.S. Treasury Bill, 2.45%, 07/05/19(b) | | $ | 500,000 | | | $ | 499,892 | |
| U.S. Treasury Bill, 2.41%, 07/11/19(b) | | | 470,000 | | | | 469,749 | |
| U.S. Treasury Bill, 2.39%, 07/18/19(b) | | | 595,000 | | | | 594,425 | |
| U.S. Treasury Bill, 2.38%, 07/25/19 | | | 500,000 | | | | 499,352 | |
| U.S. Treasury Bill, 2.40%, 08/01/19(b) | | | 440,000 | | | | 439,240 | |
| U.S. Treasury Bill, 2.41%, 08/08/19 | | | 500,000 | | | | 498,915 | |
| U.S. Treasury Bill, 2.39%, 08/15/19(b) | | | 370,000 | | | | 369,034 | |
| U.S. Treasury Bill, 2.38%, 08/22/19(b) | | | 520,000 | | | | 518,427 | |
| U.S. Treasury Bill, 2.33%, 08/29/19 | | | 210,000 | | | | 209,279 | |
| U.S. Treasury Bill, 2.35%, 09/05/19 | | | 445,000 | | | | 443,297 | |
| U.S. Treasury Bill, 2.22%, 09/12/19(b) | | | 705,000 | | | | 702,059 | |
| U.S. Treasury Bill, 2.14%, 09/19/19 | | | 480,000 | | | | 477,789 | |
| U.S. Treasury Bill, 2.14%, 09/26/19(b) | | | 100,000 | | | | 99,500 | |
| U.S. Treasury Bill, 2.08%, 10/10/19 | | | 600,000 | | | | 596,482 | |
| U.S. Treasury Bill, 2.17%, 10/24/19(b) | | | 125,000 | | | | 124,208 | |
Total United States Treasury Obligations (Cost $6,540,300) | | | | | | | 6,541,648 | |
| Total Investments – 99.3% | | | | | | | | |
| (Cost $6,540,300) | | | | | | | 6,541,648 | |
| Other Assets in Excess of Liabilities – 0.7% | | | | | | | 49,041 | |
| Net Assets – 100.0% | | | | | | $ | 6,590,689 | |
| (a) | Represents zero coupon bonds. Rates shown reflects the effective yield. |
| (b) | A portion or all of the security is owned by GraniteShares GSCI Cayman Limited, a wholly-owned subsidiary of the Fund. See Note 2. |
At June 30, 2019, open futures contracts were as follows:
| Description | | Number of Contracts | | | Expiration Date | | Contract
Type | | Notional Amount | | | Value/Unrealized
Appreciation | | | Value/Unrealized Depreciation | |
| S&P-Goldman Sachs Commodity Index(a) | | | 62 | | | 7/16/2019 | | Long | | $ | 6,569,675 | | | $ | 306,937 | | | $ | – | |
| (a) | A portion or all of the security is owned by GraniteShares GSCI Cayman Limited, a wholly-owned subsidiary of the Fund. See Note 2. |
The following table summarizes valuation of the Fund's investments under the fair value hierarchy levels as of June 30, 2019:
| | | Level 1 | | | Level 2 | | | Level 3 | | | Total | |
| Asset Valuation Inputs | | | | | | | | | | | | | | | | |
| Investments in Securities | | | | | | | | | | | | | | | | |
| U.S. Treasury Obligations | | $ | 6,541,648 | | | $ | – | | | $ | – | | | $ | 6,541,648 | |
| Other Investments | | | | | | | | | | | | | | | | |
| Futures | | | 306,937 | | | | – | | | | – | | | | 306,937 | |
| Total | | $ | 6,848,585 | | | $ | – | | | $ | – | | | $ | 6,848,585 | |
As of June 30, 2019, there were no Level 3 investments held in the Fund.
See accompanying notes to consolidated financial statements.
GraniteShares ETF Trust
| Consolidated Statements of Assets and Liabilities |
June 30, 2019
| | | GraniteShares Bloomberg Commodity Broad Strategy No
K-1 ETF | | | GraniteShares
S&P GSCI
Commodity Broad
Strategy No
K-1 ETF | |
| Assets: | | | | | | | | |
| Investments at cost | | $ | 66,749,428 | | | $ | 6,540,300 | |
| Investments at value | | $ | 66,765,070 | | | $ | 6,541,648 | |
| Cash | | | 6,833 | | | | 10,796 | |
| Unrealized appreciation on open futures contracts | | | 2,348,601 | | | | 306,937 | |
| Total Assets | | | 69,120,504 | | | | 6,859,381 | |
| Liabilities: | | | | | | | | |
| Advisory fees payable | | | 13,013 | | | | 1,846 | |
| Due to broker | | | 565,400 | | | | 266,846 | |
| Unrealized depreciation on open future contracts | | | 1,325,977 | | | | — | |
| Total Liabilities | | | 1,904,390 | | | | 268,692 | |
| Net Assets | | $ | 67,216,114 | | | $ | 6,590,689 | |
| | | | | | | | | |
| Net Assets Consist of: | | | | | | | | |
| Paid-in capital | | $ | 65,678,251 | | | $ | 6,236,087 | |
| Distributable earnings/accumulated (loss) | | | 1,537,863 | | | | 354,602 | |
| Net Assets | | $ | 67,216,114 | | | $ | 6,590,689 | |
| | | | | | | | | |
| Shares Outstanding | | | 2,802,000 | | | | 302,000 | |
| Net Asset Value per share: | | $ | 23.99 | | | $ | 21.82 | |
See accompanying notes to consolidated financial statements.
GraniteShares ETF Trust
| Consolidated Statementsof Operations |
June 30, 2019
| | | GraniteShares Bloomberg Commodity Broad Strategy No
K-1 ETF | | | GraniteShares
S&P GSCI
Commodity Broad
Strategy No
K-1 ETF | |
| | | Year Ended
June 30, 2019 | | | Year Ended
June 30, 2019 | |
| Investment Income: | | | | | | | | |
| Interest | | $ | 1,163,393 | | | $ | 147,713 | |
| Total Investment Income | | | 1,163,393 | | | | 147,713 | |
| Expenses: | | | | | | | | |
| Advisory fees | | | 130,106 | | | | 23,944 | |
| Tax fees | | | 57 | | | | 57 | |
| Trustees' fees(a) | | | 1,502 | | | | 1,502 | |
| CCO fees(a) | | | 4,468 | | | | 1,571 | |
| Total Expenses | | | 136,133 | | | | 27,074 | |
| Expense Reimbursement | | | (5,970 | ) | | | (3,073 | ) |
| Net Expenses | | | 130,163 | | | | 24,001 | |
| Net Investment Income | | | 1,033,230 | | | | 123,712 | |
| Net Realized and Unrealized Gain (Loss) on: | | | | | | | | |
| Net realized gain (loss) on: | | | | | | | | |
| Investments | | | (43 | ) | | | (51 | ) |
| Futures contracts | | | (5,845,310 | ) | | | (1,688,291 | ) |
| Net realized loss | | | (5,845,353 | ) | | | (1,688,342 | ) |
| Net change in unrealized appreciation (depreciation) on: | | | | | | | | |
| Investments | | | 15,079 | | | | 1,335 | |
| Futures contracts | | | 1,742,435 | | | | 135,787 | |
| Net change in unrealized appreciation (depreciation) | | | 1,757,514 | | | | 137,122 | |
| Net Realized and Unrealized Loss | | | (4,087,839 | ) | | | (1,551,220 | ) |
| Net Decrease in Net Assets Resulting from Operations | | $ | (3,054,609 | ) | | $ | (1,427,508 | ) |
| (a) | From the period July 1, 2018 through August 17, 2018, the Funds paid Trustees’ fees and CCO fees, but was reimbursed through a fee waiver agreement by the Adviser. Starting August 18, 2018, the Board of Directors of the GraniteShares ETF Trust adopted a unitary fee model for the Funds. |
See accompanying notes to consolidated financial statements.
GraniteShares ETF Trust
| Consolidated Statements of Changes in Net Assets |
June 30, 2019
| | | GraniteShares Bloomberg Commodity Broad Strategy No
K-1 ETF | | | GraniteShares S&P GSCI Commodity Broad Strategy No
K-1 ETF | |
| | | Year Ended
June 30, 2019 | | | Year Ended
June 30, 2018 | | | Year Ended
June 30, 2019 | | | Year Ended
June 30, 2018 | |
| Operations: | | | | | | | | | | | | | | | | |
| Net investment income | | $ | 1,033,230 | | | $ | 184,940 | | | $ | 123,712 | | | $ | 47,678 | |
| Net realized gain (loss) | | | (5,845,353 | ) | | | 643,990 | | | | (1,688,342 | ) | | | 838,635 | |
| Net change in unrealized gain (loss) | | | 1,757,514 | | | | (714,209 | ) | | | 137,122 | | | | 153,369 | |
| Net Increase (Decrease) in Net Assets Resulting from Operations | | | (3,054,609 | ) | | | 114,721 | | | | (1,427,508 | ) | | | 1,039,682 | |
| | | | | | | | | | | | | | | | | |
| Distributions to shareholders | | | (499,719 | ) | | | (20,807 | )(a) | | | (1,088,275 | ) | | | (6,519 | )(a) |
| | | | | | | | | | | | | | | | | |
| From share transactions: | | | | | | | | | | | | | | | | |
| Proceeds from sales of shares | | | 43,080,362 | | | | 28,816,954 | | | | 2,727,705 | | | | 8,175,050 | |
| Cost of shares redeemed | | | (2,361,563 | ) | | | (1,346,661 | ) | | | (1,304,358 | ) | | | (3,938,162 | ) |
| Net increase in net assets resulting from share transactions | | | 40,718,799 | | | | 27,470,293 | | | | 1,423,347 | | | | 4,236,888 | |
| Total Increase (Decrease) in net assets | | | 37,164,471 | | | | 27,564,207 | | | | (1,092,436 | ) | | | 5,270,051 | |
| | | | | | | | | | | | | | | | | |
| Net Assets: | | | | | | | | | | | | | | | | |
| Beginning of year | | | 30,051,643 | | | | 2,487,436 | | | | 7,683,125 | | | | 2,413,074 | |
| End of year | | $ | 67,216,114 | | | $ | 30,051,643 | (b) | | $ | 6,590,689 | | | $ | 7,683,125 | (b) |
| | | | | | | | | | | | | | | | | |
| Changes in Shares Outstanding: | | | | | | | | | | | | | | | | |
| Shares outstanding, beginning of year | | | 1,152,000 | | | | 102,000 | | | | 252,000 | | | | 102,000 | |
| Shares sold | | | 1,750,000 | | | | 1,100,000 | | | | 100,000 | | | | 300,000 | |
| Shares redeemed | | | (100,000 | ) | | | (50,000 | ) | | | (50,000 | ) | | | (150,000 | ) |
| Shares outstanding, end of year | | | 2,802,000 | | | | 1,152,000 | | | | 302,000 | | | | 252,000 | |
| (a) | Includes distributions from net investment income of $(20,807) and $(6,519), respectively. |
| (b) | Includes undistributed net investment income of $145,591 and $1,034,492, respectively. |
See accompanying notes to consolidated financial statements.
GraniteShares ETF Trust
| Consolidated Financial Highlights |
| | | Year Ended
June 30, | | | For the Period May 19, 2017(a) to | |
| GraniteShares Bloomberg Commodity Broad Strategy No K-1 ETF | | 2019 | | | 2018 | | | June 30, 2017 | |
| Operating Performance: | | | | | | | | | | | | |
| Net asset value, beginning of year/period | | $ | 26.09 | | | $ | 24.39 | | | $ | 25.00 | |
| Net investment income(b) | | | 0.48 | ) | | | 0.32 | | | | 0.01 | |
| Net realized and unrealized gain (loss)(c) | | | (2.36 | ) | | | 1.43 | | | | (0.62 | ) |
| Total gain (loss) from investment operations | | | (1.88 | ) | | | 1.75 | | | | (0.61 | ) |
| Less distributions from: | | | | | | | | | | | | |
| Net investment income | | | (0.22 | ) | | | (0.05 | ) | | | — | |
| Net asset value, end of year/period | | $ | 23.99 | | | $ | 26.09 | | | $ | 24.39 | |
| Total Return(d) | | | (7.16 | )% | | | 7.19 | % | | | (2.46 | )%(e) |
| Ratios to Average Net Assets and Supplemental Data: | | | | | | | | | | | | |
| Net assets, end of year/period (in 000's) | | $ | 67,216 | | | $ | 30,052 | | | $ | 2,487 | |
| Ratio of net investment income to average net assets | | | 1.99 | % | | | 1.21 | % | | | 0.49 | %(f) |
| Ratio of operating expenses before waivers/reimbursements | | | 0.26 | % | | | 0.52 | % | | | 1.85 | %(f) |
| Ratio of net operating expenses net of waivers/reimbursements | | | 0.25 | % | | | 0.27 | % | | | 0.30 | %(f) |
| Portfolio turnover rate | | | — | % | | | — | % | | | — | % |
| (a) | Commencement of operations. |
| (b) | Per share data is calculated using the average daily shares outstanding method. |
| (c) | Calculation of the net gain (loss) per share (both realized and unrealized) may not correlate to the aggregate realized and unrealized gains (losses) presented in the Consolidated Statements of Operations due to the timing of sales and repurchases of Fund shares in relation to fluctuating market values of the investments of the Fund. |
| (d) | Total return would have been lower if certain fund expenses had not been reimbursed by the Advisor. |
| (e) | Not annualized. |
| (f) | Annualized. |
See accompanying notes to consolidated financial statements.
GraniteShares ETF Trust
| Consolidated Financial Highlights |
| | | Year Ended June 30, | | | For the Period May 19, 2017(a) to
| |
| GraniteShares S&P GSCI Commodity Broad Strategy No K-1 ETF | | 2019 | | | 2018 | | | June 30, 2017 | |
| Operating Performance: | | | | | | | | | | | | |
| Net asset value, beginning of year/period | | $ | 30.49 | | | $ | 23.66 | | | $ | 25.00 | |
| Net investment income(b) | | | 0.45 | | | | 0.28 | | | | 0.01 | |
| Net realized and unrealized gain (loss)(c) | | | (4.80 | ) | | | 6.59 | | | | (1.35 | ) |
| Total gain (loss) from investment operations | | | (4.35 | ) | | | 6.87 | | | | (1.34 | ) |
| Less distributions from: | | | | | | | | | | | | |
| Net investment income | | | (4.32 | ) | | | (0.04 | ) | | | — | |
| Net asset value, end of year/period | | $ | 21.82 | | | $ | 30.49 | | | $ | 23.66 | |
| Total Return(d) | | | (12.51 | )% | | | 29.08 | % | | | (5.37 | )%(e) |
| Ratios to Average Net Assets and Supplemental Data: | | | | | | | | | | | | |
| Net assets, end of year/period (in 000's) | | $ | 6,591 | | | $ | 7,683 | | | $ | 2,413 | |
| Ratio of net investment income to average net assets | | | 1.81 | % | | | 1.03 | % | | | 0.45 | %(f) |
| Ratio of operating expenses before waivers/reimbursements | | | 0.40 | % | | | 0.88 | % | | | 2.12 | %(f) |
| Ratio of net operating expenses net of waivers/reimbursements | | | 0.35 | % | | | 0.37 | % | | | 0.40 | %(f) |
| Portfolio turnover rate | | | — | % | | | — | % | | | — | % |
| (a) | Commencement of operations. |
| (b) | Per share data is calculated using the average daily shares outstanding method. |
| (c) | Calculation of the net gain (loss) per share (both realized and unrealized) may not correlate to the aggregate realized and unrealized gains (losses) presented in the Consolidated Statements of Operations due to the timing of sales and repurchases of Fund shares in relation to fluctuating market values of the investments of the Fund. |
| (d) | Total return would have been lower if certain fund expenses had not been reimbursed by the Advisor. |
| (e) | Not annualized. |
| (f) | Annualized. |
See accompanying notes to consolidated financial statements.
Notes to Consolidated Financial Statements
June 30, 2019
1. ORGANIZATION
The GraniteShares ETF Trust (the “Trust”) was organized as a Delaware statutory trust on November 7, 2016. The Trust is registered with the Securities and Exchange Commission (the “SEC”) under the Investment Company Act of 1940, as amended (the “1940 Act”), and the offering of each Fund’s shares (“Shares”) is registered under the Securities Act of 1933, as amended (the “Securities Act”). GraniteShares Advisors LLC (the “Adviser”) serves as investment adviser to the Funds. Each Fund is a non-diversified series of a management investment company under the 1940 Act. The Trust is an open-end management investment company currently consisting of three investment series, of which two are presented below (each, a “Fund,” and collectively, the “Funds”) and presented herein. The remaining Fund in the Trust is presented separately.
| Fund | | Commencement of Operations |
| GraniteShares Bloomberg Commodity Broad Strategy No K-1 ETF | | May 19, 2017 |
| GraniteShares S&P GSCI Commodity Broad Strategy No K-1 ETF | | May 19, 2017 |
2. CONSOLIDATED SUBSIDIARY
GraniteShares Bloomberg Commodity Broad Strategy No K-1 ETF and GraniteShares S&P GSCI Commodity Broad Strategy No K-1 ETF invest in certain commodity-related investments through GraniteShares BCOM Cayman Limited and GraniteShares GSCI Cayman Limited respectively, wholly-owned subsidiaries (each, a “Subsidiary”, collectively, the “Subsidiaries”).
The following table reflects the net assets of each Subsidiary as a percentage of each Fund’s net assets at June 30, 2019:
| Fund | | Wholly Owned Subsidiary | | Value | | | Percentage of
Fund’s Net Assets | |
| GraniteShares Bloomberg Commodity Broad Strategy No K-1 ETF | | GraniteShares BCOM
Cayman Limited | | $ | 12,574,594 | | | | 18.7 | % |
| GraniteShares S&P GSCI Commodity Broad Strategy No K-1 ETF | | GraniteShares GSCI
Cayman Limited | | $ | 1,024,560 | | | | 15.5 | % |
3. SIGNIFICANT ACCOUNTING POLICIES
The financial statements have been prepared in conformity with accounting principles generally accepted in the United States of America (U.S. GAAP), which require management to make certain estimates and assumptions at the date of the financial statements. Actual results could differ from those estimates. The Fund follows the accounting and reporting guidance in the Accounting Standards Codifications 946, “Financial Services—Investment Companies” issued by the U.S. Financial Accounting Standards Board.
The following is a summary of significant accounting policies followed by the Funds in the preparation of its financial statements.
Investment Transactions and Investment Income:Investment transactions are recorded on the trade date. Gains and losses on securities sold are determined on the basis of identified cost. Dividend income, if any, is recorded on the ex-dividend date or, in the case of foreign securities, as soon as each Fund is informed of the ex-dividend dates. Interest income, including accretion of discounts and amortization of premiums, is recorded on the accrual basis.
Dividend Distributions: Distributions to shareholders are recorded on the ex-dividend date and are determined in accordance with federal income tax regulations, which may differ from U.S. GAAP. The Funds distribute all or substantially all of their net investment income to shareholders in the form of dividends.
Futures contracts: The GraniteShares Bloomberg Commodity Broad Strategy No K-1 ETF and The GraniteShares S&P GSCI Commodity Broad Strategy No K-1 ETF, through their Subsidiaries, invest in a combination of exchange-listed commodity futures contracts in the normal course of pursuing their investment objectives. A futures contract is a financial instrument in which a party agrees to pay a fixed price for securities or commodities at a specified future date. Futures contracts are traded at market prices on exchanges pursuant to terms common to all market participants. Upon entering into such contracts, the Funds are required to deposit with the broker, either in cash or in securities, an initial margin in an amount equal to a certain percentage of the contract amount. Subsequent fluctuations in the value of the contract are recorded for financial statement purposes as unrealized appreciation or depreciation on open futures contracts. Payments received or paid by the Funds adjust the variation margin accounts. When a contract is closed, the Funds record a realized gain or loss.
Notes to Consolidated Financial Statements (continued)
June 30, 2019
Futures contracts may be highly volatile. Price movements may be sudden and extreme, and are influenced by a variety of factors including, among other things, changing supply and demand relationships; climate; government agricultural, trade, fiscal, monetary and exchange control programs and policies; national and international political and economic events; crop diseases; the purchasing and marketing programs of different nations; and changes in interest rates.
Open futures contracts at June 30, 2019 are listed in the Consolidated Schedules of Investments. As of June 30, 2019, the balance of margin deposited with the broker by the GraniteShares Bloomberg Commodity Broad Strategy No K-1 ETF, and the GraniteShares S&P GSCI Commodity Broad Strategy No K-1 ETF, was $565,400, and $266,846, respectively, as presented on the Consolidated Statements of Assets and Liabilities as due to broker. At June 30, 2019 the GraniteShares Bloomberg Commodity Broad Strategy No K-1 ETF had variation margin receivable from broker of $457,224, and the GraniteShares S&P GSCI Commodity Broad Strategy No K-1 ETF had variation margin receivable from broker in the amount of $40,091. The variation margin payable/receivable is represented by the difference between the balance of margin on deposit with the broker and the unrealized appreciation/depreciation on open futures contracts as of June 30, 2019.
4. SECURITIES VALUATION
Investment Valuation: Each Fund calculates its net asset value (“NAV”) each day the New York Stock Exchange (the “NYSE”) is open for trading as of the close of regular trading on the NYSE, normally 4:00 p.m. Eastern time (the “NAV Calculation Time”).
If a market quotation is not readily available or is deemed not to reflect market value, GraniteShares Advisors LLC, (the “Adviser”) determines the price of the security held by each Fund based on a determination of the security’s fair value pursuant to policies and procedures approved by the Board of Trustees (the “Board”). In addition, each Fund may use fair valuation to price securities that trade on a foreign exchange when a significant event has occurred after the foreign exchange closes but before the time at which the Fund’s NAV is calculated. Such valuations would typically be categorized as Level 2 or Level 3 in the fair value hierarchy described below.
Exchange-traded futures contracts are valued at the closing price in the market where such contracts are principally traded. If no closing price is available, exchange-traded futures contracts are fair valued at the mean of the last bid and asked prices, if available, and otherwise at the closing bid price. Such valuations are typically categorized as Level 1 in the fair value hierarchy described below.
Certain securities may not be able to be priced by pre-established pricing methods. Such securities may be valued by the Board or its delegate at fair value. These securities generally include but are not limited to, restricted securities (securities which may not be publicly sold without registration under the 1933 Act) for which a pricing service is unable to provide a market price; securities whose trading has been formally suspended; a security whose market price is not available from a pre- established pricing source; a security with respect to which an event has occurred that is likely to materially affect the value of the security after the market has closed but before the calculation of each Fund net asset value (as may be the case in foreign markets on which the security is primarily traded) or make it difficult or impossible to obtain a reliable market quotation; and a security whose price, as provided by the pricing service, does not reflect the security’s “fair value.” A variety of factors may be considered in determining the fair value of such securities.
Valuing the Funds’ investments using fair value pricing will result in using prices for those investments that may differ from current market valuations.
5. FAIR VALUE MEASUREMENT
The Financial Accounting Standards Board (FASB) established a framework for measuring fair value in accordance with U.S. GAAP. Under Fair Value Measurements and Disclosures, various inputs are used in determining the value of the exchange traded fund’s investments. The inputs or methodology used for valuing securities are not necessarily an indication of the risk associated with investing in those securities. The three Levels of inputs of the fair value hierarchy are defined as follows:
Level 1 — Unadjusted quoted prices in active markets for identical assets or liabilities.
Level 2 — Observable inputs other than quoted prices included in Level 1 that are observable for the asset or liability, either directly or indirectly. These inputs may include quoted prices for the identical instrument on an inactive market, prices for similar securities, interest rates, prepayment speeds, credit risk, yield curves, default rates and similar data.
Level 3 — Unobservable inputs for the asset or liability, to the extent relevant observable inputs are not available; representing the Funds’ own assumptions about the assumptions a market participant would use in valuing the asset or liability, and would be based on the best information available.
A financial instrument’s level within the fair value hierarchy is based on the lowest level of any input that is significant to the fair value measurement.
The availability of observable inputs can vary from security to security and is affected by a wide variety of factors, including, for example, the type of security, whether the security is new and not yet established in the marketplace, the liquidity of markets, and other characteristics particular to the security. To the extent that valuation is based on models or inputs that are less observable or unobservable in the market, the determination of fair value requires more judgment. Accordingly, the degree of judgment exercised in determining fair value is greatest for instruments categorized in Level 3.
The hierarchy classification of inputs used to value each Fund’s investments at June 30, 2019, is disclosed at the end of each Fund’s Consolidated Schedule of Investments.
Notes to Consolidated Financial Statements (continued)
June 30, 2019
6. ADVISORY, OTHER AGREEMENTS, AND TRANSACTIONS WITH RELATED PARTIES
GraniteShares Advisors LLC, the investment adviser to the Fund, is a Delaware limited Liability Company located at 205 Hudson Street, 7th Floor, New York, NY 10013. The Adviser provides investment advisory services to exchange-traded funds. The Adviser serves as investment adviser to the Fund with overall responsibility for the portfolio management of the Fund, subject to the supervision of the Board of Trustees (the “Board”) of the Trust.
For its services, the Adviser receives a fee that is equal to 0.25% per annum of the average daily net assets of the COMB Fund and 0.35% per annum of the average daily net assets of the COMG Fund, in each case calculated daily and paid monthly. Pursuant to the Advisory Agreement, the Adviser is responsible for substantially all expenses of each Fund (excluding interest, taxes, brokerage commissions, expenses related to short sales, other expenditures which are capitalized in accordance with generally accepted accounting principles, other extraordinary expenses not incurred in the ordinary course of each Fund’s business, and amounts, if any, payable pursuant to a plan adopted in accordance with Rule 12b-1 under the 1940 Act).
Pursuant to the Advisory Agreement, the Adviser has agreed to pay all expenses of the Funds, except for: (i) brokerage expenses and other fees, charges, taxes, levies or expenses (such as stamp taxes) incurred in connection with the execution of portfolio transactions or in connection with creation and redemption transactions; (ii) legal fees or expenses in connection with any arbitration, litigation or pending or threatened arbitration or litigation, including any settlements in connection therewith; (iii) compensation and expenses of the Independent Trustees; (iv) compensation and expenses of counsel to the Independent Trustees; (v) compensation and expenses of the Trust’s Chief Compliance Officer; (vi) extraordinary expenses; (vii) distribution fees and expenses paid by the Trust under any distribution plan adopted pursuant to Rule 12b-1 under the 1940 Act; (viii) interest and taxes of any kind or nature; (ix) any fees and expenses related to the provision of securities lending services; and (x) the advisory fee payable to the Adviser under the Advisory Agreement.
This contractual arrangement may only be changed or eliminated by or with the consent of the Funds’ Board of Trustees.
During the year ended June 30, 2019, the COMB Fund and the COMG Fund received cash payments of $15,287 and $7,048, respectively, from the Adviser in connection with the expense reimbursement arrangement to the advisory agreement.
GraniteShares Advisors LLC is the only related party involved with the operations of the Funds.
Administrator, Custodian, Accounting Agent and Transfer Agent Services: The Bank of New York Mellon (in each capacity, the “Administrator”, “Custodian,” “Accounting Agent” or “Transfer Agent”) serves as the Funds’ Administrator, Custodian, Accounting Agent and Transfer Agent pursuant to the Funds Administration and Accounting Agreement. The Bank of New York Mellon is a subsidiary of The Bank of New York Mellon Corporation, a financial holding company.
Distribution and Service Fees: Foreside Fund Services, LLC. (“Distributor”) serves as the Funds’ distributor. The Trust has adopted a distribution and service plan (“Rule 12b-1 Plan”) pursuant to Rule 12b-1 under the 1940 Act. Under the Rule 12b-1 Plan, the Funds are authorized to pay an amount up to a maximum annual rate of 0.25% of its average net assets in connection with the sale and distribution of its shares and pay service fees in connection with the provision of ongoing services to shareholders. No distribution fees are currently charged to the Funds; there are no plans to impose these fees.
Notes to Consolidated Financial Statements (continued)
June 30, 2019
Share Transactions
The Funds issue and redeem shares at NAV only with certain authorized participants in large increments known as Creation Units. A Creation Unit consists of 50,000 shares. Creation Units are issued and redeemed principally in exchange for the deposit or delivery of cash. A fund's shares are available in smaller increments to investors in the secondary market at market prices and may be subject to commissions. Authorized participants pay a transaction fee to the shareholder servicing agent when purchasing and redeeming Creation Units of a fund. The transaction fee is used to defray the costs associated with the issuance and redemption of Creation Units.
7. INVESTMENT TRANSACTIONS
There were no cost of purchases and proceeds from sales of investment securities (excluding short-term investments) for the year ended June 30, 2019.
8. VALUATION OF DERIVATIVE INSTRUMENTS
The Funds have adopted authoritative standards of accounting for derivative instruments which establish disclosure requirements for derivative instruments. These standards improve financial reporting for derivative instruments by requiring enhanced disclosures that enables investors to understand how and why a fund uses derivatives instruments, how derivatives instruments are accounted for and how derivative instruments affect a fund’s financial position and results of operations. The Funds use derivative instruments as part of their principal investment strategy to achieve their investment objective.
The following is the location and each Fund’s fair values of derivative investments disclosed, if any, in the Consolidated Statements of Assets and Liabilities, categorized by primary market risk exposure as of June 30, 2019:
| Fund | | Asset Derivatives: | | Commodity Risk | |
| GraniteShares Bloomberg Commodity Broad Strategy No K-1 ETF | | Unrealized appreciation on futures contracts | | $ | 2,348,601 | |
| GraniteShares S&P GSCI Commodity Broad Strategy No K-1 ETF | | Unrealized appreciation on futures contracts | | | 306,937 | |
| Fund | | Liability Derivatives: | | Commodity Risk | |
| GraniteShares Bloomberg Commodity Broad Strategy No K-1 ETF | | Unrealized depreciation on futures contracts | | $ | 1,325,977 | |
The following is the location and the effect of derivative investments, if any, on each of the fund’s Consolidated Statements of Operations, categorized by primary market risk exposure during the year ended June 30, 2019:
| Fund | | Realized Gain (Loss) | | Commodity Risk | |
| GraniteShares Bloomberg Commodity Broad Strategy No K-1 ETF | | Futures contracts | | $ | (5,845,309 | ) |
| GraniteShares S&P GSCI Commodity Broad Strategy No K-1 ETF | | Futures contracts | | | (1,688,291 | ) |
| Fund | | Change in Unrealized Gain (Loss): | | Commodity Risk | |
| GraniteShares Bloomberg Commodity Broad Strategy No K-1 ETF | | Futures contracts | | $ | 1,742,435 | |
| GraniteShares S&P GSCI Commodity Broad Strategy No K-1 ETF | | Futures contracts | | | 135,787 | |
The following is a summary of the average volume derivative activity for the year ended June 30, 2019:
| | GraniteShares Bloomberg Commodity Broad
Strategy No K-1 ETF | | | GraniteShares S&P GSCI Commodity Broad
Strategy No K-1 ETF | |
| Futures contracts: | | | | | | | | |
| Average notional value of contracts | | $ | 56,737,021 | | | $ | 6,507,670 | |
Notes to Consolidated Financial Statements (continued)
June 30, 2019
For the purpose of this calculation, the absolute value of quarterly outstanding notional amounts were used.
9. FEDERAL INCOME TAX MATTERS
The Funds intend to qualify as a ‘‘regulated investment company’’ under Subchapter M of the Internal Revenue Code of 1986, as amended. If so qualified, the Funds will not be subject to Federal income tax to the extent they distribute substantially all of their net investment income and net capital gains to its shareholders. Accounting for Uncertainty in Income Taxes provides guidance for how uncertain tax positions should be recognized, measured, presented and disclosed in the consolidated financial statements, and requires the evaluation of tax positions taken or expected to be taken in the course of preparing each Fund’s tax returns to determine whether the tax positions are ‘‘more-likely-than-not’’ of being sustained by the applicable tax authority. Tax positions not deemed to meet the more than- likely-than-not threshold would be recorded as a tax benefit or expense in the current year. Interest and penalty related to income taxes would be recorded as income tax expense. Management of the Funds is required to analyze all open tax years, as defined by IRS statute of limitations, for all major jurisdictions, including federal tax authorities and certain state tax authorities. As of June 30, 2019, the Funds did not have a liability for any unrecognized tax benefits. The Funds have no examination in progress and are not aware of any tax positions for which it is reasonably possible that the amounts of unrecognized tax benefits will significantly change in the next twelve months.
At June 30, 2019, the cost of investments and net unrealized appreciation (depreciation) for federal income tax purposes were as follows:
| Fund | | Federal Tax Cost of Investments | | | Gross Unrealized Appreciation | | | Gross Unrealized Depreciation | | | Net Unrealized Appreciation (Depreciation) | |
GraniteShares Bloomberg Commodity Broad
Strategy No K-1 ETF | | $ | 66,749,428 | | | $ | 16,214 | | | $ | (572 | ) | | $ | 15,642 | |
GraniteShares S&P GSCI Commodity Broad
Strategy No K-1 ETF | | | 6,540,300 | | | | 1,441 | | | | (93 | ) | | | 1,348 | |
The differences between book and tax basis cost of investments and net unrealized appreciation (depreciation) are primarily attributable to investments in pass through entities.
At June 30, 2019, the components of undistributed or accumulated earnings (loss) on a tax-basis were as follows:
| Fund | | Undistributed Net Investment Income (Loss) | | | Accumulated Capital and Other Gains (Losses) | | | Net Unrealized Appreciation (Depreciation) | | | Total Accumulated Earnings (Losses) | |
GraniteShares Bloomberg Commodity Broad
Strategy No K-1 ETF | | $ | 499,600 | | | $ | (3 | ) | | $ | 1,038,266 | | | $ | 1,537,863 | |
GraniteShares S&P GSCI Commodity Broad
Strategy No K-1 ETF | | | 46,561 | | | | (244 | ) | | | 308,285 | | | | 354,602 | |
At June 30, 2019, the effect of permanent book/tax reclassifications resulted in increase (decrease) to the components of net assets were as follows:
| Fund | | Undistributed Net Investment Income (Loss) | | | Undistributed Capital Gains (Accumulated Losses) | | | Paid-In Capital | |
GraniteShares Bloomberg Commodity
Broad Strategy No K-1 ETF | | $ | (179,502 | ) | | $ | 5,845,365 | | | $ | (5,665,863 | ) |
GraniteShares S&P GSCI Commodity
Broad Strategy No K-1 ETF | | | (23,368 | ) | | | 1,688,331 | | | | (1,664,963 | ) |
10. INDEMNIFICATION
In the normal course of business, the Funds enter into contracts that contain a variety of representations and warranties which provide general indemnities. The Fund’s maximum exposure under these arrangements is unknown, as this would involve future claims that may be made against the Funds that have not yet occurred. Management expects this risk of loss due to be remote.
Notes to Consolidated Financial Statements (continued)
June 30, 2019
11. PRINCIPAL RISKS
The Funds are “non-diversified,” meaning that a relatively high percentage of their assets may be invested in a limited number of issuers of securities.
In the normal course of business, each Fund makes investments in financial instruments where the risk of potential loss exists due to changes in the market. The following is a description of select risks of investing in the Funds.
Fixed Income Securities: The Fund will invest in Fixed Income Securities. The Fixed Income Securities in which the Fund may invest include U.S. government securities, U.S. government agency securities, corporate bonds, debentures and notes, mortgage-backed and other asset-backed securities, event-linked bonds, bank certificates of deposit, fixed time deposits, bankers’ acceptances, commercial paper and other short-term fixed income securities with maturities of up to two years. The Fund’s Fixed Income Securities earn interest income for the Fund and can be used as collateral (also referred to as “margin”) for the Fund’s investments in Commodity Futures. The Fund does not target a specific duration or maturity for the debt securities in which it invests. The average duration of the portfolio of Fixed Income Securities will vary based on interest rates.
Commodity-linked derivative instruments:Commodities are assets that have tangible properties, such as oil, metals, and agricultural products. A commodity-linked instrument is a financial instrument whose value is linked to the movement of a commodity, commodity index, or commodity futures contract. The value of commodity-linked instruments may be affected by overall market movements and other factors affecting the value of a particular industry or commodity, such as weather, disease, embargoes, or political and regulatory developments.
| ● | Commodity Futures:The Funds expect to gain exposure to the commodity futures markets initially by investing in Commodity Futures through the Subsidiary. A Commodity Futures contract is a standardized contract traded on, or subject to the rules of, an exchange that calls for the future delivery of a specified quantity and type of underlying commodity at a specified time and place or, alternatively, may call for cash settlement. |
The Funds’ prospectus contains additional information regarding risks associated with investments in the Funds.
12. SUBSEQUENT EVENTS
Management has evaluated the events and transactions that have occurred through the date the financial statements were available to be issued and noted no items requiring adjustment of the financial statements or additional disclosures.
GraniteShares ETF Trust
Report of Independent Registered Public Accounting Firm
Report of Independent Registered Public Accounting Firm
To the Shareholders and Board of Directors
GraniteShares ETF Trust:
Opinion on the Financial Statements
We have audited the accompanying consolidated statements of assets and liabilities of GraniteShares Bloomberg Commodity Broad Strategy No K-1 ETF and GraniteShares S&P GSCI Commodity Broad Strategy No K-1 ETF (the “Funds”), each a series of GraniteShares ETF Trust, including the consolidated schedules of investments as of June 30, 2019, the related consolidated statements of operations for the year then ended, the consolidated statements of changes in net assets for each of the years in the two-year period then ended and the related notes (collectively, the consolidated financial statements) and the consolidated financial highlights for each of the years in the two-year period ended June 30, 2019 and for the period from May 19, 2017 to June 30, 2017. In our opinion, the consolidated financial statements and financial highlights present fairly, in all material respects, the financial position of the Funds as of June 30, 2019, the results of their operations for the year then ended, the changes in their net assets for each of the years in the two-year period then ended, and the financial highlights for each of the years in the two-year period then ended and for the period from May 19, 2017 to June 30, 2017, in conformity with U.S. generally accepted accounting principles.
Basis for Opinion
These consolidated financial statements and financial highlights are the responsibility of the Funds’ management. Our responsibility is to express an opinion on these consolidated financial statements and financial highlights based on our audits. We are a public accounting firm registered with the Public Company Accounting Oversight Board (United States) (PCAOB) and are required to be independent with respect to the Company in accordance with the U.S. federal securities laws and the applicable rules and regulations of the Securities and Exchange Commission and the PCAOB.
We conducted our audits in accordance with the standards of the PCAOB. Those standards require that we plan and perform the audit to obtain reasonable assurance about whether the consolidated financial statements and financial highlights are free of material misstatement, whether due to error or fraud. Our audits included performing procedures to assess the risks of material misstatement of the consolidated financial statements and financial highlights, whether due to error or fraud, and performing procedures that respond to those risks. Such procedures included examining, on a test basis, evidence regarding the amounts and disclosures in the consolidated financial statements and financial highlights. Such procedures also included confirmation of securities owned as of June 30, 2019, by correspondence with custodians and brokers. Our audits also included evaluating the accounting principles used and significant estimates made by management, as well as evaluating the overall presentation of the consolidated financial statements and financial highlights. We believe that our audits provide a reasonable basis for our opinion.
We have served as the auditor of one or more GraniteShares LLC investment companies since 2017.
New York, NY
August 26, 2019
GraniteShares ETF Trust
GraniteShares HIPS US High Income ETF
June 30, 2019
| Investments | | Shares | | | Value | |
| COMMON STOCKS – 74.3% | | | | | | | | |
| Capital Markets – 24.7% | | | | | | | | |
| Ares Capital Corp. | | | 6,978 | | | $ | 125,185 | |
| BlackRock TCP Capital Corp. | | | 8,701 | | | | 123,989 | |
| Franklin Resources, Inc. | | | 3,657 | | | | 127,263 | |
| FS KKR Capital Corp. | | | 20,900 | | | | 124,564 | |
| Goldman Sachs BDC, Inc. | | | 6,185 | | | | 121,659 | |
| Golub Capital BDC, Inc. | | | 7,081 | | | | 126,042 | |
| Hercules Capital, Inc. | | | 9,806 | | | | 125,713 | |
| Main Street Capital Corp. | | | 3,048 | | | | 125,334 | |
| New Mountain Finance Corp. | | | 8,911 | | | | 124,487 | |
| Oaktree Capital Group LLC(a) | | | 2,524 | | | | 125,039 | |
| Oaktree Specialty Lending Corp. | | | 23,023 | | | | 124,785 | |
| Prospect Capital Corp. | | | 18,977 | | | | 123,920 | |
| Solar Capital Ltd. | | | 6,127 | | | | 125,787 | |
| TCG BDC, Inc. | | | 8,223 | | | | 125,318 | |
| TPG Specialty Lending, Inc. | | | 6,245 | | | | 122,402 | |
| Total Capital Markets | | | | | | | 1,871,487 | |
| Energy Equipment & Services – 1.2% | | | | | | | | |
| USA Compression Partners LP(a) | | | 5,036 | | | | 89,490 | |
| Equity Real Estate Investment Trust (REIT) – 6.3% | | | | | | | | |
| Apple Hospitality REIT, Inc. | | | 10,283 | | | | 163,089 | |
| Equity Commonwealth | | | 4,908 | | | | 159,608 | |
| Gaming and Leisure Properties, Inc. | | | 4,039 | | | | 157,440 | |
| Total Equity Real Estate Investment Trust (REIT) | | | | | | | 480,137 | |
| Mortgage Real Estate Investment Trust (REIT) – 25.7%(b) | | | | | | | | |
| AGNC Investment Corp. | | | 9,679 | | | | 162,801 | |
| Annaly Capital Management, Inc. | | | 17,792 | | | | 162,441 | |
| Apollo Commercial Real Estate Finance, Inc. | | | 8,701 | | | | 160,011 | |
| Blackstone Mortgage Trust, Inc., Class A | | | 4,512 | | | | 160,537 | |
| Chimera Investment Corp. | | | 8,505 | | | | 160,489 | |
| KKR Real Estate Finance Trust, Inc. | | | 8,050 | | | | 160,356 | |
| MFA Financial, Inc. | | | 22,546 | | | | 161,880 | |
| PennyMac Mortgage Investment Trust | | | 7,571 | | | | 165,275 | |
| Redwood Trust, Inc. | | | 10,110 | | | | 167,118 | |
| Starwood Property Trust, Inc. | | | 7,058 | | | | 160,358 | |
| TPG RE Finance Trust, Inc. | | | 8,345 | | | | 160,975 | |
| Two Harbors Investment Corp. | | | 12,798 | | | | 162,151 | |
| Total Mortgage Real Estate Investment Trust (REIT) | | | | | | | 1,944,392 | |
| Oil, Gas & Consumable Fuels – 16.4% | | | | | | | | |
| Alliance Resource Partners LP(a) | | | 5,163 | | | | 87,668 | |
| Black Stone Minerals LP(a) | | | 5,594 | | | | 86,707 | |
| CNX Midstream Partners LP(a) | | | 6,187 | | | | 86,927 | |
| Crestwood Equity Partners LP(a) | | | 2,530 | | | | 90,498 | |
| Enable Midstream Partners LP(a) | | | 6,533 | | | | 89,567 | |
| EQM Midstream Partners LP(a) | | | 1,970 | | | | 88,020 | |
| Genesis Energy LP(a) | | | 3,995 | | | | 87,491 | |
| Holly Energy Partners LP(a) | | | 3,234 | | | | 88,935 | |
| MPLX LP(a) | | | 2,697 | | | | 86,816 | |
| PBF Logistics LP(a) | | | 4,172 | | | | 88,196 | |
| COMMON STOCKS (continued) | | | | | | | | |
| Oil, Gas & Consumable Fuels (continued) | | | | | | | | |
| Shell Midstream Partners LP(a) | | | 4,355 | | | | 90,236 | |
| Ship Finance International Ltd. (Norway) | | | 7,119 | | | | 89,059 | |
| Sunoco LP(a) | | | 2,819 | | | | 88,178 | |
| Western Midstream Partners LP(a) | | | 3,048 | | | | 93,787 | |
| Total Oil, Gas & Consumable Fuels | | | | | | | 1,242,085 | |
| Total Common Stocks | | | | | | | | |
| (Cost $5,570,715) | | | | | | | 5,627,591 | |
| INVESTMENT COMPANIES – 25.0% | | | | | | | | |
| Aberdeen Global Premier Properties Fund | | | 20,110 | | | | 125,889 | |
| Aberdeen Total Dynamic Dividend Fund | | | 15,233 | | | | 127,043 | |
| AllianceBernstein Global High Income Fund, Inc. | | | 10,614 | | | | 125,033 | |
| BlackRock Enhanced Global Dividend Trust | | | 11,858 | | | | 127,236 | |
| BlackRock Resources & Commodities Strategy Trust | | | 15,578 | | | | 127,428 | |
| Central Securities Corp. | | | 4,144 | | | | 126,475 | |
| Duff & Phelps Global Utility Income Fund, Inc. | | | 8,016 | | | | 122,725 | |
| First Trust Energy Infrastructure Fund | | | 7,821 | | | | 124,667 | |
| First Trust High Income Long/Short Fund | | | 8,469 | | | | 127,204 | |
| First Trust Senior Floating Rate Income Fund II | | | 10,458 | | | | 126,019 | |
| Nuveen Global High Income Fund, Class I | | | 8,175 | | | | 126,467 | |
| Nuveen Real Asset Income and Growth Fund | | | 7,529 | | | | 127,466 | |
| Templeton Global Income Fund | | | 19,908 | | | | 126,615 | |
| Wells Fargo Global Dividend Opportunity Fund | | | 22,937 | | | | 125,695 | |
| Western Asset Emerging Markets Debt Fund, Inc. | | | 8,891 | | | | 127,319 | |
| Total Investment Companies (Cost $1,892,671) | | | | | | | 1,893,281 | |
| MONEY MARKET FUND – 0.2% | | | | | | | | |
BlackRock Treasury Trust,
Institutional Class, 2.26%(c)
(Cost $12,447) | | | 12,447 | | | | 12,447 | |
| Total Investments – 99.5% | | | | | | | | |
| (Cost $7,475,833) | | | | | | | 7,533,319 | |
Other Assets in Excess of
Liabilities – 0.5% | | | | | | | 35,882 | |
| Net Assets – 100.0% | | | | | | $ | 7,569,201 | |
| (a) | Master Limited Partnership (“MLP”) |
| (b) | To the extent the Fund invests more heavily in particular sectors of the economy its performance will be especially sensitive to developments that significantly affect those sectors. |
| (c) | Rate shown reflects the 7-day yield as of June 30, 2019. |
The following table summarizes valuation of the Fund's investments under the fair value hierarchy levels as of June 30, 2019:
| | | Level 1 | | | Level 2 | | | Level 3 | | | Total | |
| Asset Valuation Inputs | | | | | | | | | | | | | | | | |
| Investments in Securities | | | | | | | | | | | | | | | | |
| Common Stocks | | $ | 5,627,591 | | | $ | – | | | $ | – | | | $ | 5,627,591 | |
| Investment Companies | | | 1,893,281 | | | | – | | | | – | | | | 1,893,281 | |
| Money Market Fund | | | 12,447 | | | | – | | | | – | | | | 12,447 | |
| Total | | $ | 7,533,319 | | | $ | – | | | $ | – | | | $ | 7,533,319 | |
As of June 30, 2019, there were no Level 3 investments held in the Fund.
See accompanying notes to financial statements.
GraniteShares ETF Trust
| Statement of Assets and Liabilities |
June 30, 2019
| | | GraniteShares HIPS US High Income ETF | |
| Assets: | | | | |
| Investments at cost | | $ | 7,475,833 | |
| Investments at value | | $ | 7,533,319 | |
| Cash | | | 215 | |
| Capital shares receivable | | | 835,789 | |
| Securities sold receivable | | | 6,934,149 | |
| Dividends receivable | | | 39,164 | |
| Total Assets | | | 15,342,636 | |
| Liabilities: | | | | |
| Securities purchased payable | | | 6,928,090 | |
| Advisory fees payable | | | 4,323 | |
| Capital shares payable | | | 841,022 | |
| Total Liabilities | | | 7,773,435 | |
| Net Assets | | $ | 7,569,201 | |
| | | | | |
| Net Assets Consist of: | | | | |
| Paid-in capital | | $ | 8,103,216 | |
| Distributable earnings/accumulated (loss) | | | (534,015 | ) |
| Net Assets | | $ | 7,569,201 | |
| | | | | |
| Shares Outstanding | | | 450,000 | |
| Net Asset Value per share: | | $ | 16.82 | |
See accompanying notes to financial statements.
GraniteShares ETF Trust
| | | GraniteShares HIPS US High Income ETF | |
| | | Year Ended June 30, 2019 | |
| Investment Income: | | | | |
| Dividends | | $ | 300,039 | |
| Total Investment Income | | | 300,039 | |
| Expenses: | | | | |
| Advisory fees | | | 52,070 | |
| Tax fees | | | 43 | |
| Trustees’ fees(a) | | | 858 | |
| CCO fees(a) | | | 1,333 | |
| Total Expenses | | | 54,304 | |
| Expense Reimbursement | | | (2,191 | ) |
| Net Expenses | | | 52,113 | |
| Net Investment Income | | | 247,926 | |
| Net Realized and Unrealized Gain (Loss) on: | | | | |
| Net realized gain (loss) on: | | | | |
| Investments | | | (367,978 | ) |
| Distributions by other investment companies | | | 167 | |
| In-Kind redemptions | | | 435,560 | |
| Net realized gain | | | 67,749 | |
| Net change in unrealized appreciation on: | | | | |
| Investments | | | 8,093 | |
| Net change in unrealized appreciation | | | 8,093 | |
| Net Realized and Unrealized Gain | | | 75,842 | |
| Net Increase in Net Assets Resulting from Operations | | $ | 323,768 | |
| (a) | From the period July 1, 2018 through August 17, 2018, the Fund paid Trustees’ fees and CCO fees, but was reimbursed through a fee waiver agreement by the Adviser. Starting August 18, 2018, the Board of Directors of the GraniteShares ETF Trust adopted a unitary fee model for the Fund. |
See accompanying notes to financial statements.
GraniteShares ETF Trust
| Statement of Changes in Net Assets |
| | | GraniteShares HIPS US High Income ETF | |
| | | Year Ended
June 30, 2019 | | | Year Ended
June 30, 2018(a) | | | Year Ended
November 30, 2017
| |
| Operations: | | | | | | | | | | | | |
| Net investment income | | $ | 247,926 | | | $ | 151,063 | | | $ | 299,789 | |
| Net realized gain | | | 67,749 | | | | 135,532 | | | | 181,484 | |
| Net change in unrealized gain (loss) | | | 8,093 | | | | (25,385 | ) | | | 168,598 | |
| Net Increase in Net Assets Resulting from Operations | | | 323,768 | | | | 261,210 | | | | 649,871 | |
| | | | | | | | | | | | | |
| Distributions to shareholders | | | (141,263 | ) | | | (299,833 | ) | | | (250,280 | ) |
| Tax return of capital to shareholders | | | (423,112 | ) | | | (87,167 | ) | | | (426,970 | ) |
| Total distributions to shareholders | | | (564,375 | ) | | | (387,000 | )(b) | | | (677,250 | ) |
| | | | | | | | | | | | | |
| From share transactions: | | | | | | | | | | | | |
| Proceeds from sales of shares | | | 2,534,818 | | | | — | | | | 4,489,725 | |
| Cost of shares redeemed | | | (2,511,002 | ) | | | (2,581,936 | ) | | | (934,185 | ) |
| Net increase (decrease) in net assets resulting from share transactions | | | 23,816 | | | | (2,581,936 | ) | | | 3,555,540 | |
| Total Decrease in net assets | | | (216,791 | ) | | | (2,707,726 | ) | | | 3,528,161 | |
| | | | | | | | | | | | | |
| Net Assets: | | | | | | | | | | | | |
| Beginning of year/period | | | 7,785,992 | | | | 10,493,718 | | | | 6,965,557 | |
| End of year/period | | $ | 7,569,201 | | | $ | 7,785,992 | (c) | | $ | 10,493,718 | (d) |
| | | | | | | | | | | | | |
| Changes in Shares Outstanding: | | | | | | | | | | | | |
| Shares outstanding, beginning of year/period | | | 450,000 | | | | 600,000 | | | | 400,000 | |
| Shares sold | | | 150,000 | | | | — | | | | 250,000 | |
| Shares redeemed | | | (150,000 | ) | | | (150,000 | ) | | | (50,000 | ) |
| Shares outstanding, end of year/period | | | 450,000 | | | | 450,000 | | | | 600,000 | |
| (a) | For the period December 1, 2017 to June 30, 2018. |
| (b) | Includes distributions from net investment income of $(299,833). Prior year information has been conformed to current year presentation. |
| (c) | Includes distributions in excess of net investment income of $(267,756). |
| (d) | Includes distributions in excess of net investment income of $(74,917). |
See accompanying notes to financial statements.
GraniteShares ETF Trust
| | Year Ended June 30, | | | Year Ended November 30, | | | For the Period from January 6, 2015* to November | |
| GraniteShares HIPS US High Income ETF | | 2019 | | | 2018(a) | | | 2017 | | | 2016 | | | 30, 2015 | |
| Operating Performance: | | | | | | | | | | | | | | | | | | | | |
| Net asset value, beginning of year/period | | $ | 17 .30 | | | $ | 7 .49 | | | $ | 17 .41 | | | $ | 16 .54 | | | $ | 20 .00 | |
| Net investment income(b) | | | 0 .56 | | | | 0 .29 | | | | 0 .57 | | | | 0 .74 | | | | 0 .63 | |
| Distributions of net realized gains from investments in other investment companies | | | – | (c) | | | – | (c) | | | – | | | | – | | | | – | |
| Net realized and unrealized gain (loss)(d) | | | 0 .25 | | | | 0 .27 | | | | 0 .80 | | | | 1 .42 | | | | (3 .01 | ) |
| Total gain (loss) from investment operations | | | 0 .81 | | | | 0 .56 | | | | 1 .37 | | | | 2 .16 | | | | (2 .38 | ) |
| Less distributions from: | | | | | | | | | | | | | | | | | | | | |
| Net investment income | | | (0 .32 | ) | | | (0 .58 | ) | | | (0 .48 | ) | | | (0 .85 | ) | | | (0 .59 | ) |
| Tax return of capital to shareholders | | | (0 .97 | ) | | | (0 .17 | ) | | | (0 .81 | ) | | | (0 .44 | ) | | | (0 .49 | ) |
| Total distributions | | | (1 .29 | ) | | | (0 .75 | ) | | | (1 .29 | ) | | | (1 .29 | ) | | | (1 .08 | ) |
| Net asset value, end of year/period | | $ | 16 .82 | | | $ | 17 .30 | | | $ | 7 .49 | | | $ | 17 .41 | | | $ | 16 .54 | |
| Total Return(e) | | | 4 .95 | % | | | 3 .38 | %(f) | | | 7 .87 | % | | | 14 .02 | % | | | (12 .39 | )%(f) |
| Ratios to Average Net Assets and Supplemental Data: | | | | | | | | | | | | | | | | | | | | |
| Net assets, end of year/period (in 000’s) | | $ | 7,569 | | | $ | 7,786 | | | $ | 10,494 | | | $ | 6,966 | | | $ | 4,962 | |
| Ratio of net investment income to average net assets | | | 3 .33 | % | | | 2 .92 | %(g) | | | 3 .18 | % | | | 4 .49 | % | | | 3 .72 | %(g) |
| Ratio of investment income (loss) excluding tax expense to average net assets | | | 3 .33 | % | | | 2 .92 | %(g) | | | 3 .18 | % | | | 4 .50 | % | | | 3 .72 | %(g) |
| Ratio of operating expenses before waivers/reimbursements | | | 0 .73 | % | | | 0 .98 | %(g) | | | 0 .75 | % | | | 0 .76 | % | | | 0 .75 | %(g) |
| Ratio of net operating expenses net of waivers/reimbursements | | | 0 .70 | % | | | 0 .70 | %(g) | | | 0 .75 | % | | | 0 .75 | % | | | 0 .75 | %(g) |
| Portfolio turnover rate | | | 112 | % | | | 33 | %(f) | | | 88 | % | | | 54 | % | | | 23 | %(f) |
| * | Commencement of operations. |
| (a) | For the period December 1, 2017 to June 30, 2018. |
| (b) | Per share data is calculated using the average daily shares outstanding method. |
| (c) | Amount represents less than $0.005 per share. |
| (d) | Calculation of the net gain (loss) per share (both realized and unrealized) may not correlate to the aggregate realized and unrealized losses presented in the Statement of Operations due to the timing of sales and repurchases of Fund shares in relation to fluctuating market values of the investments of the Fund. |
| (e) | Total return would have been lower if certain fund expenses had not been reimbursed by the Advisor. |
| (f) | Not annualized. |
| (g) | Annualized. |
See accompanying notes to financial statements.
GraniteShares ETF Trust
Notes to Financial Statements
June 30, 2019
1. ORGANIZATION
GraniteShares HIPS US High Income ETF (the “Fund”) is a diversified series of GraniteShares ETF Trust (the “Trust”), an open-end management investment company consisting of three investment series, organized as a Delaware statutory trust on November 7, 2016. The remaining Funds in the Trust is presented separately. The Trust is registered with the SEC under the Investment Company Act of 1940, as amended (the “1940 Act”), as an open-end management investment company and the offering of the Fund’s shares is registered under the Securities Act of 1933, as amended (the “Securities Act”). The investment objective of the Fund is to track the performance, before fees and expenses, of the TFMS HIPS 300 Index (the “Index”). The Fund commenced operations on January 6, 2015.
On December 13, 2017, the shareholders of the Master Income ETF (the “Reorganizing Fund”), a series of the ETF Series Solutions, approved an Agreement and Plan of Reorganization providing for the transfer of all assets and liabilities of the Reorganizing Fund to the GraniteShares ETF Trust. The GraniteShares HIPS US High Income ETF, a new series of the Trust, assumed the financial and performance history of the Master Income ETF. The tax-free merger took place on December 15, 2017.
The Fund’s fiscal year was changed to June 30. As a result, the Fund had a shortened fiscal year covering the transitional period between the Fund’s prior fiscal year end November 30, 2017 and June 30, 2018.
2. SIGNIFICANT ACCOUNTING POLICIES
The financial statements have been prepared in conformity with accounting principles generally accepted in the United States of America (U.S. GAAP), which require management to make certain estimates and assumptions at the date of the financial statements. Actual results could differ from those estimates. The Fund follows the accounting and reporting guidance in the Accounting Standards Codifications 946, “Financial Services—Investment Companies” issued by the U.S. Financial Accounting Standards Board.
The following is a summary of significant accounting policies followed by the Fund in the preparation of its financial statements.
Investment Transactions and Investment Income:Investment transactions are recorded on the trade date. Gains and losses on securities sold are determined on the basis of identified cost. Dividend income, if any, is recorded on the ex-dividend date or, in the case of foreign securities, as soon as the Fund is informed of the ex-dividend dates. Interest income, including accretion of discounts and amortization of premiums, is recorded on the accrual basis. Withholding taxes on foreign dividends have been provided for in accordance with the Fund’s understanding of the applicable tax rules and regulations.
Distributions received from the Fund’s investments in master limited partnerships (“MLPs”) generally are comprised of ordinary income and return of capital from the MLPs. The Fund allocates distributions between investment income and return of capital based on estimates. Such estimates are based on information provided by each MLP and other industry sources. These estimates may subsequently be revised based on actual allocations received from MLPs after their tax reporting periods are concluded, as the actual character of these distributions is not known until after the fiscal year end of the Fund.
Distributions received from the Fund’s investments in real estate investment trusts (“REITs”) and Business Development Corporations (“BDCs”) may be characterized as ordinary income, net capital gain, or a return of capital. The proper characterization of BDC and REIT distributions is generally not known until after the end of each calendar year. As such, the Fund must use estimates in reporting the character of its income and distributions for financial statement purposes. The actual character of distributions to the Fund’s shareholders will be reflected on the Form 1099 received by shareholders after the end of the calendar year. Due to the nature of REIT and BDC investments, a portion of the distributions received by the Fund’s shareholders may represent a return of capital.
Distributions received from the Fund’s investments in closed-end funds (“CEFs”) are recorded as ordinary income, net realized capital gain or return of capital based on information reported by the CEFs and management’s estimates of such amounts based on historical information. These estimates are adjusted with the tax returns after the actual source of distributions has been disclosed by the CEFs and may differ from the estimated amounts.
Dividend Distributions:Distributions to shareholders are recorded on the ex-dividend date and are determined in accordance with federal income tax regulations, which may differ from U.S. GAAP. The Fund distributes all or substantially all of its net investment income to shareholders in the form of dividends.
GraniteShares ETF Trust
Notes to Financial Statements (continued)
June 30, 2019
3. SECURITIES VALUATION
The NAV per share of the Fund is calculated by dividing the sum of the value of the securities held by the Fund, plus cash and other assets, minus all liabilities (including estimated accrued expenses) by the total number of shares outstanding of the Fund, rounded to the nearest cent. The Fund’s shares will not be priced on the days on which the New York Stock Exchange Arca, Inc. (“NYSE Arca”) is closed for trading. The offering and redemption price per share for the Fund is equal to the Fund’s NAV per share.
Equity securities listed on an exchange or on the NASDAQ National Market System are valued at the last quoted sale price or the official closing price of the day, respectively. Foreign equity securities are valued as of the close of trading on the foreign stock exchange on which the security is primarily traded or as of 4 p.m. Eastern time. The value is then converted into its U.S. dollar equivalent at the foreign exchange rate in effect at 4 p.m. Eastern time on the day that the value of the security is determined.
Investments in open-end mutual funds are valued at the closing NAV. Investments in closed-end funds are valued at closing quoted sale price or the official closing price of the day, respectively. Registered fund positions held by HIPS as at June 30, 2019 are represented by an open-ended mutual fund and closed-ended (single class) registered funds.
Certain securities may not be able to be priced by pre-established pricing methods. Such securities may be valued by the Board or its delegate at fair value. These securities generally include but are not limited to, restricted securities (securities which may not be publicly sold without registration under the 1933 Act) for which a pricing service is unable to provide a market price; securities whose trading has been formally suspended; a security whose market price is not available from a pre- established pricing source; a security with respect to which an event has occurred that is likely to materially affect the value of the security after the market has closed but before the calculation of each Fund net asset value (as may be the case in foreign markets on which the security is primarily traded) or make it difficult or impossible to obtain a reliable market quotation; and a security whose price, as provided by the pricing service, does not reflect the security’s “fair value.” A variety of factors may be considered in determining the fair value of such securities.
Valuing the Fund’s investments using fair value pricing will result in using prices for those investments that may differ from current market valuations.
4. FAIR VALUE MEASUREMENT
The Financial Accounting Standards Board (FASB) established a framework for measuring fair value in accordance with U.S. GAAP. Under Fair Value Measurements and Disclosures, various inputs are used in determining the value of the exchange traded fund’s investments. The inputs or methodology used for valuing securities are not necessarily an indication of the risk associated with investing in those securities. The three Levels of inputs of the fair value hierarchy are defined as follows:
| | Level 1 - | Unadjusted quoted prices in active markets for identical assets or liabilities. |
| | Level 2 - | Observable inputs other than quoted prices included in Level 1 that are observable for the asset or liability, either directly or indirectly. These inputs may include quoted prices for the identical instrument on an inactive market, prices for similar securities, interest rates, prepayment speeds, credit risk, yield curves, default rates and similar data. |
| | Level 3 - | Unobservable inputs for the asset or liability, to the extent relevant observable inputs are not available; representing the Fund’s own assumptions about the assumptions a market participant would use in valuing the asset or liability, and would be based on the best information available. |
A financial instrument’s level within the fair value hierarchy is based on the lowest level of any input that is significant to the fair value measurement.
The availability of observable inputs can vary from security to security and is affected by a wide variety of factors, including, for example, the type of security, whether the security is new and not yet established in the marketplace, the liquidity of markets, and other characteristics particular to the security. To the extent that valuation is based on models or inputs that are less observable or unobservable in the market, the determination of fair value requires more judgment. Accordingly, the degree of judgment exercised in determining fair value is greatest for instruments categorized in Level 3.
The hierarchy classification of inputs used to value the Fund’s investments at June 30, 2019, is disclosed at the end of the Fund’s Schedule of Investments.
GraniteShares ETF Trust
Notes to Financial Statements (continued)
June 30, 2019
5. ADVISORY, OTHER AGREEMENTS, AND TRANSACTIONS WITH RELATED PARTIES
GraniteShares Advisors LLC, the investment adviser to the Fund, is a Delaware limited Liability Company located at 205 Hudson Street, 7th Floor, New York, NY 10013. The Adviser provides investment advisory services to exchange-traded funds. The Adviser serves as investment adviser to the Fund with overall responsibility for the portfolio management of the Fund, subject to the supervision of the Board of Trustees (the “Board”) of the Trust.
For its services, the Adviser receives a fee that is equal to 0.70% per annum of the average daily net assets of the Fund, calculated daily and paid monthly. Pursuant to the Advisory Agreement, the Adviser is responsible for substantially all expenses of each Fund (excluding interest, taxes, brokerage commissions, expenses related to short sales, other expenditures which are capitalized in accordance with generally accepted accounting principles, other extraordinary expenses not incurred in the ordinary course of each Fund’s business, and amounts, if any, payable pursuant to a plan adopted in accordance with Rule 12b-1 under the 1940 Act).
Pursuant to the Advisory Agreement, the Adviser has agreed to pay all expenses of the Fund, except for: (i) brokerage expenses and other fees, charges, taxes, levies or expenses (such as stamp taxes) incurred in connection with the execution of portfolio transactions or in connection with creation and redemption transactions; (ii) legal fees or expenses in connection with any arbitration, litigation or pending or threatened arbitration or litigation, including any settlements in connection therewith; (iii) compensation and expenses of the Independent Trustees; (iv) compensation and expenses of counsel to the Independent Trustees; (v) compensation and expenses of the Trust’s Chief Compliance Officer; (vi) extraordinary expenses; (vii) distribution fees and expenses paid by the Trust under any distribution plan adopted pursuant to Rule 12b-1 under the 1940 Act; (viii) interest and taxes of any kind or nature; (ix) any fees and expenses related to the provision of securities lending services; and (x) the advisory fee payable to the Adviser under the Advisory Agreement.
During the year ended June 30, 2019, the Fund received cash payments of $14,960 from the Adviser in connection with the expense reimbursement arrangement pursuant to the advisory agreement.
GraniteShares Advisors LLC is the only related party involved with the operations of the Funds.
The Bank of New York Mellon (in each capacity, the “Administrator”, “Custodian,” “Accounting Agent” or “Transfer Agent”) serves as the Fund’s Administrator, Custodian, Accounting Agent and Transfer Agent pursuant to the Fund Administration and Accounting Agreement. The Bank of New York Mellon is a subsidiary of The Bank of New York Mellon Corporation, a financial holding company.
Foreside Fund Services, LLC. (“Distributor”) serves as the Fund’s distributor. The Trust has adopted a distribution and service plan (“Rule 12b-1 Plan”) pursuant to Rule 12b-1 under the 1940 Act. Under the Rule 12b-1 Plan, the Fund is authorized to pay an amount up to a maximum annual rate of 0.25% of its average net assets in connection with the sale and distribution of its shares and pay service fees in connection with the provision of ongoing services to shareholders. No distribution fees are currently charged to the Fund; there are no plans to impose these fees.
6. SHARE TRANSACTIONS
Shares of the Fund are listed and traded on NYSE Arca. Market prices for the shares may be different from their NAV. The Fund issues and redeems shares on a continuous basis at NAV only in blocks of 50,000 shares, called “Creation Units.” Creation Units are issued and redeemed principally in-kind for securities included in a specified universe. Once created, shares generally trade in the secondary market at market prices that change throughout the day. Except when aggregated in Creation Units, shares are not redeemable securities of the Fund. Creation Units may only be purchased or redeemed by certain financial institutions (“Authorized Participants”). An Authorized Participant is either (i) a broker-dealer or other participant in the clearing process through the Continuous Net Settlement System of the National Securities Clearing Corporation or (ii) a Depository Trust Company participant and, in each case, must have executed a Participant Agreement with the Distributor. Most retail investors do not qualify as Authorized Participants nor have the resources to buy and sell whole Creation Units. Therefore, they are unable to purchase or redeem shares directly from the Fund. Rather, most retail investors may purchase shares in the secondary market with the assistance of a broker and are subject to customary brokerage commissions or fees.
The Fund currently offers one class of shares, which has no front-end sales load, no deferred sales charge, and no redemption fee. A fixed transaction fee is imposed for the transfer and other transaction costs associated with the purchase or sale of a Creation Unit. The standard fixed transaction fee for the Fund is $750, payable to the Custodian. In addition, a variable fee may be charged on all cash transactions or substitutes for Creation Units of up to a maximum of 2% of the value of the Creation Units subject to the transaction. Variable fees are imposed to compensate the Fund for the transaction costs associated with the cash transactions. There were no variable fees received during the year. The Fund may issue an unlimited number of shares of beneficial interest, with no par value. All shares of the Fund have equal rights and privileges.
GraniteShares ETF Trust
Notes to Financial Statements (continued)
June 30, 2019
7. INVESTMENT TRANSACTIONS
During the year ended June 30, 2019, purchases and sales of securities by the Fund, excluding short-term securities and in-kind transactions, were $8,319,039 and $8,354,266, respectively.
During the year ended June 30, 2019, in-kind transactions associated with creations and redemptions were $2,482,455 and $2,493,399, respectively.
8. FEDERAL INCOME TAX MATTERS
The Fund intends to qualify as a ‘‘regulated investment company’’ under Subchapter M of the Internal Revenue Code of 1986, as amended. If so qualified, the Fund will not be subject to Federal income tax to the extent they distribute substantially all of their net investment income and net capital gains to its shareholders. Accounting for Uncertainty in Income Taxes provides guidance for how uncertain tax positions should be recognized, measured, presented and disclosed in the financial statements, and requires the evaluation of tax positions taken or expected to be taken in the course of preparing the Fund’s tax returns to determine whether the tax positions are ‘‘more-likely-than-not’’ of being sustained by the applicable tax authority. Tax positions not deemed to meet the more than- likely-than-not threshold would be recorded as a tax benefit or expense in the current year. Interest and penalty related to income taxes would be recorded as income tax expense. Management of the Fund is required to analyze all open tax years, as defined by IRS statute of limitations, for all major jurisdictions, including federal tax authorities and certain state tax authorities. As of June 30, 2019, the Fund did not have a liability for any unrecognized tax benefits. The Fund has no examination in progress and is not aware of any tax positions for which it is reasonably possible that the amounts of unrecognized tax benefits will significantly change in the next twelve months.
At June 30, 2019, the cost of investments and net unrealized appreciation (depreciation) for federal income tax purposes were as follows:
| Federal Tax Cost of Investments | | | Gross Unrealized Appreciation | | | Gross Unrealized Depreciation | | | Net Unrealized Appreciation (Depreciation) | |
| $ | 7,515,135 | | | $ | 86,688 | | | $ | (68,504 | ) | | $ | 18,184 | |
The differences between book and tax basis cost of investments and net unrealized appreciation (depreciation) are primarily attributable to wash sales and investments in pass through entities.
At June 30, 2019, the components of undistributed or accumulated earnings/loss on a tax-basis were as follows:
| Undistributed Net Investment Income (Loss) | | | Accumulated Capital and Other Gains (Losses) | | | Net Unrealized Appreciation (Depreciation) | | | Total Accumulated Earnings (Losses) | |
| $ | (166,265 | )** | | $ | (385,934 | )* | | $ | 18,184 | | | $ | (534,015 | ) |
* Amount represents capital loss carryforward for Federal income tax purposes which is available for offset against future taxable net capital gains. Accordingly, no capital gain distributions are expected to be paid to shareholders of the Fund until future net capital gains have been realized in excess of the available capital loss carryforward.
** Late year ordinary loss incurred and elected to be deferred until July 1, 2019.
At June 30, 2019, the effect of permanent book/tax reclassifications resulted in increase/(decrease) to the components of net assets were as follows:
| Undistributed Net Investment Income (Loss) | | | Undistributed Capital Gains (Accumulated Losses) | | | Paid-In Capital | |
| $ | 357,698 | | | $ | (378,651 | ) | | $ | 20,953 | |
GraniteShares ETF Trust
Notes to Financial Statements (continued)
June 30, 2019
The tax character of distributions paid by the Fund during the year ended June 30, 2019 and the year ended June 30, 2018 were as follows.
| | | Year Ended June 30, 2019 | | | Year Ended June 30, 2018* | |
| Ordinary Income | | $ | 141,263 | | | $ | 299,833 | |
| Return of Capital | | | 423,112 | | | | 87,167 | |
| Total Distributions Paid | | $ | 564,375 | | | $ | 387,000 | |
* For the period December 1, 2017 to June 30, 2018.
9. INDEMNIFICATION
In the normal course of business, the Fund enters into contracts that contain a variety of representations and warranties which provide general indemnities. The Fund’s maximum exposure under these arrangements is unknown, as this would involve future claims that may be made against the Fund that has not yet occurred. Management expects this risk of loss due to be remote
10. PRINCIPAL RISKS
In the normal course of business, the Fund makes investments in financial instruments where the risk of potential loss exists due to changes in the market. The following is a description of select risks of investing in the Fund.
REIT Investment Risk: Investments in REITs involve unique risks. REITs may have limited financial resources, may trade less frequently and in limited volume, and may be more volatile than other securities. The risks of investing in REITs include certain risks associated with the direct ownership of real estate and the real estate industry in general. REITs are also subject to heavy cash flow dependency, defaults by borrowers and self-liquidation.
MLP Risk: MLP investment returns are enhanced during periods of declining or low interest rates and tend to be negatively influenced when interest rates are rising. In addition, most MLPs are fairly leveraged and typically carry a portion of a “floating” rate debt. As such, a significant upward swing in interest rates would also drive interest expense higher. Furthermore, most MLPs grow by acquisitions partly financed by debt, and higher interest rates could make it more difficult to make acquisitions. MLP investments also entail many of the general tax risks of investing in a partnership. Limited partners in an MLP typically have limited control and limited rights to vote on matters affecting the partnership. Additionally, there is always the risk that an MLP will fail to qualify for favorable tax treatment.
Business Development Company (“BDC”) Risk: BDC’s may carry risks similar to those of a private equity or venture capital fund. BDC company securities are not redeemable at the option of the shareholder and they may trade in the market at a discount to their net asset value. BDCs usually trade at a discount to their NAV because they invest in unlisted securities and have limited access to capital markets. BDC’s are subject to management and other expenses, which will be indirectly paid by the Fund.
Investment Company Risk: The risks of investment in investment companies typically reflect the risks of the types of instruments in which the investment companies invest in. By investing in another investment company, the Fund becomes a shareholder of that investment company and bears its proportionate share of the fees and expenses of the other investment company. The Fund may be subject to statutory limits with respect to the amount it can invest in other investment companies, which may adversely affect the Fund’s ability to achieve its investment objective.
Sector Risk: To the extent the Fund invests more heavily in particular sectors of the economy, its performance will be especially sensitive to developments that significantly affect those sectors.
11. SUBSEQUENT EVENTS
Management has evaluated the events and transactions that have occurred through the date the financial statements were available to be issued and noted no items requiring adjustment of the financial statements or additional disclosures.
GraniteShares ETF Trust
Report of Independent Registered Public Accounting Firm
Report of Independent Registered Public Accounting Firm
To the Shareholders and Board of Directors GraniteShares ETF Trust :
Opinion on the Financial Statements
We have audited the accompanying statement of assets and liabilities of GraniteShares HIPS US High Income ETF (the “Fund”), a series of GraniteShares ETF Trust, including the schedule of investments as of June 30, 2019, the related statement of operations for the year ended June 30, 2019, the statement of changes in net assets for the year ended June 30, 2019 and for the period from December 1, 2017 to June 30, 2018, and the related notes (collectively, the financial statements) and the financial highlights for the year ended June 30, 2019 and for the period from December 1, 2017 to June 30, 2018. In our opinion, the financial statements and financial highlights present fairly, in all material respects, the financial position of the Fund as of June 30, 2019, the results of its operations for the year then ended, changes in its net assets and financial highlights for the year ended June 30, 2019 and for the period from December 1, 2017 to June 30, 2018, in conformity with U.S. generally accepted accounting principles. The statements of changes in net assets for the year ended November 30, 2017, and the financial highlights for each of the years in the two-year period ended November 30, 2017 and for the period from January 6, 2015 through November 30, 2015, were audited by other independent registered public accountants whose report, dated January 26, 2018, expressed an unqualified opinion on those financial statements and those financial highlights.
Basis for Opinion
These financial statements and financial highlights are the responsibility of the Fund’s management. Our responsibility is to express an opinion on these financial statements and financial highlights based on our audits. We are a public accounting firm registered with the Public Company Accounting Oversight Board (United States) (PCAOB) and are required to be independent with respect to the Company in accordance with the U.S. federal securities laws and the applicable rules and regulations of the Securities and Exchange Commission and the PCAOB.
We conducted our audits in accordance with the standards of the PCAOB. Those standards require that we plan and perform the audit to obtain reasonable assurance about whether the financial statements and financial highlights are free of material misstatement, whether due to error or fraud. Our audits included performing procedures to assess the risks of material misstatement of the financial statements and financial highlights, whether due to error or fraud, and performing procedures that respond to those risks. Such procedures included examining, on a test basis, evidence regarding the amounts and disclosures in the financial statements and financial highlights. Such procedures also included confirmation of securities owned as of June 30, 2019, by correspondence with custodians and brokers. Our audits also included evaluating the accounting principles used and significant estimates made by management, as well as evaluating the overall presentation of the financial statements and financial highlights. We believe that our audits provides a reasonable basis for our opinion.

We have served as the auditor of one or more GraniteShares LLC investment companies since 2017.
New York, NY
August 26, 2019
GraniteShares ETF Trust
Board Considerations Regarding Approval of Investment Advisory Agreement (continued)
Pursuant to Section 15(c) of the Investment Company Act of 1940 (the “1940 Act”), the Trust’s Board of Trustees (the “Board”) held an in-person meeting on May 14, 2019 as required to consider the renewal of the investment advisory agreement (the “Advisory Agreement”) between GraniteShares Advisors LLC (the “Adviser”) and GraniteShares ETF Trust (the “Trust”) for the following funds: (i) GraniteShares Bloomberg Commodity Broad Strategy No K-1 ETF, (ii) GraniteShares S&P GSCI Commodity Broad Strategy No K-1 ETF and GraniteShares HIPS High Income ETF (collectively, the “Funds”). After its initial two-year term, the Agreement was required to be approved: (i) by the vote of the Trustees or by a vote of the shareholders of the Fund; and (ii) by the vote of a majority of the Trustees who are not parties to the Agreement or “interested persons” of any party thereto, as defined in the 1940 Act (the “Independent Trustees”), cast in person at a meeting called for the purpose of voting on such approval.
The Board conducts an ongoing review of the performance of the Funds and the services provided by the Adviser and its service providers at regularly scheduled meetings held throughout the year. In addition, the Board reviewed and approved an Advisory Agreement for each Fund when it was launched. Accordingly, the review process undertaken by the Trustees spans the course of the Initial Term and culminates with the annual “15(c)” approval process for the Funds as required as required by Section 15(c) of the 1940 Act.
The Board discussed certain information provided in advance of the meeting in a presentation (the “Presentation”) prepared by Vedder Price, counsel to the Adviser and the Trust, which summarizes and updates the information provided to the Board at prior meetings in memoranda typically known as “Gartenberg Memos.” The Presentation discussed the fiduciary responsibilities of the Trustees, including the Independent Trustees. The Presentation provided an overview of the judicial decisions addressing Trustees’ review and approval of advisory agreements, including Gartenberg v. Merrill Lynch Asset Management Inc. (“Gartenberg”) and Jones v. Harris. The Presentation explained that the Gartenberg decision concluded, and the U.S. Supreme Court recently affirmed in the Jones v. Harris case, that the basic test for determining whether advisory fees bear a reasonable relationship to the services rendered, and are not disproportionately large, is essentially whether the fee represents a charge within the range of what would have been negotiated at arms-length in light of all the circumstances. The Presentation also explained that Gartenberg set forth a number of factors for a board to weigh in determining whether this arms-length test had been met: 1) the nature and quality of the Adviser’s services; 2) the Adviser’s costs of, and profits realized in, providing services, including any “fall-out” benefits; 3) whether economies of scale are being shared with investors, as well as fee structures of comparable investment companies; and 4) the role of the independent trustees in the approval of advisory agreements. The Board then discussed the important principles discussed in the Presentation.
Prior to the Meeting, counsel to the Funds provided a written request to the Adviser for a range of information for consideration by the Board. The Adviser provided such information in a memorandum to the Board included in the Meeting Materials. During the Meeting, the Board received an oral presentation of that information covering the following points:
| - | General information about the Adviser:(i) reminding the Board of the biographical experience of the principals and proposed portfolio managers, (ii) the Adviser’s existing financial situation and financial support provided by the parent company, GraniteShares Inc., (iii) confirmation that the Trust was the Adviser’s sole client, and (iv) the absence of pending litigation or regulatory proceedings; |
| | |
| - | Fund historical performances:Ability for each Fund to meet its investment objective by comparing, since inception, the Fund’s performances with its relevant benchmark and whether the performance differences could be explained by the stated expense ratio; |
| | |
| - | Competitive overview:level of management fee proposed against the level charged on funds, ETFs and mutual funds with comparable investment strategies; |
| | |
| - | Service providers used:presenting the services providers used to support the Funds’ daily operations and rational for keeping the service at the same level. |
GraniteShares ETF Trust
Board Considerations Regarding Approval of Investment Advisory Agreement (continued)
The Board, including a majority of the Independent Trustees, determined that approving the renewal of the Advisory Agreement was in the best interests of the Funds. In reaching this decision, the Board considered all factors it believed relevant, including (1) the nature and quality of the services that had been provided by the Adviser since the inception of the Funds; (2) the cost to the Adviser of providing the services and, accordingly, the profitability of the services to the Adviser; (3) the extent to which the Adviser will realize economies of scale as each Fund grows larger; (4) comparative fee structures of other advisers. The Board, including the Independent Trustees, did not identify any single factor or group of factors as all-important or controlling and considered all factors together.
With respect to the nature and quality of the services to be provided by the Adviser under the Advisory Agreement, the Board considered and reviewed all information concerning the services proposed to be provided under the Advisory Agreement, in particular whether the Adviser had been able to meet the Funds’ relevant investment objectives since their inception, information describing the Adviser’s current organization and the background and experience of the Adviser’s management persons in particular in relation to working with exchange-traded funds. Based upon their review, the Board concluded that the Adviser was qualified to continue managing the Funds and oversee the services to be provided by other service providers and that the services to be provided by the Adviser to each Fund were expected to remain satisfactory.
With respect to the costs of services to be provided and profits to be realized by the Adviser, the Board considered the resources involved in managing each Fund as well as the fee structure in place for each Fund. Based on historical performances and the financial backing behind the Adviser, the Board considered that it was highly likely that the Adviser would be expected to continue to absorb the operational fees incurred by each Fund through the next 12-month period.
With respect to the extent to which the Adviser will realize economies of scale as each Fund grows larger, the Board considered whether fee levels reflect a reasonable sharing of such economies of scale for the benefit the Fund’s investors. The Trustees noted the Adviser’s views on their expectations for growth and concluded that a unitary management fee was reasonable and appropriate.
With respect to the comparative fee structures of other advisers, the Board also reviewed information provided by the Adviser showing the proposed advisory fee for each Fund as compared to those of a peer group of ETFs and mutual funds. The Board also noted that each Fund had a unitary fee structure, and each generally will not be required to pay more in expenses than the fee charged by the Adviser; the Board noted in this regard that the unitary fee structure does not cover interest, taxes, brokerage commissions, expenses related to short sales, other expenditures which are capitalized in accordance with generally accepted accounting principles, other extraordinary expenses not incurred in the ordinary course of business, and amounts, if any, payable pursuant to a plan adopted in accordance with Rule 12b-1 under the 1940 Act. The Board considered that each Fund’s expense ratio was lower than those of such Fund’s peer group. The Board concluded that each Fund’s advisory fee was reasonable given the nature, extent, and anticipated quality of the services to be provided under the Advisory Agreement and the fee structure that would be in place.
Given all the information available to it and considering all material factors, the Board, including the Independent Trustees, concluded that the Advisory Agreement was fair and reasonable, that the Adviser’s fees are reasonable in light of the services that the Adviser will provide to the Funds, and the Advisory Agreement was unanimously re-approved another year.
GraniteShares ETF Trust
Trustees and Officers
MANAGEMENT OF THE TRUST
The following information supplements and should be read in conjunction with the section in the Prospectus entitled “Fund Management.”
Set forth below are the names, birth years, positions with the Trust, length of term of office, the number of portfolios in the Fund Complex (defined below) overseen, and the principal occupations and other directorships held during at least the last five years of each of the persons currently serving as a Trustee, as well as information about each officer of the Trust. The business address of each Trustee and officer of the Trust is 205 Hudson Street, 7th Floor, New York, NY 10013. The “Fund Complex” includes all open- and closed-end funds (including all of their portfolios) advised by the Adviser.
| | | | | | | Number of | | |
| | | | Portfolios in | |
| | | | Fund | |
| | Position(s) Held | | Complex | Other |
| | with the Trust, | | Overseen | Directorships Held |
| | Term of Office | | By Trustee | by Trustee |
| Name and | and Length of | Principal Occupation(s) | and/or | During Past 5 |
| Year of Birth | Time Served | During Past 5 Years | Officer | Years |
| | | | | Interested Trustees and Officers | | | | |
| William Rhind 1979 | | Trustee, Chairman of the Board, and President of the Trust (since 2016)(1) | | CEO, World Gold Trust Services LLC (sponsor of SPDR Gold Trust) (2013-2016) Managing Director, ETF Securities (investment advisory firm) (2007-2013) | | 3 | | Director, University of Bath Foundation (charitable organization) |
| | | | | | | | | |
| James R. Nash 1981 | | Chief Compliance Officer of the Trust (since 2017) | | Fund Chief Compliance Officer, Foreside Fund Officer Services, LLC (fund compliance services firm) (2016-present) Senior Associate and Regulatory Advisor, J.P. Morgan Chase Bank, N.A. (2014-2016) Back Officer Product Analyst, Linedata Services (financial services software firm) (2011-2014) | | 3 | | None |
(1) William Rhind is an interested trustee due to his ownership of shares of, and his position as CEO of, GraniteShares, Inc., the owner of the Adviser.
| | | | | Independent Trustees | | | | |
| Steven James Smyser 1973 | | Independent Trustee of the Trust (since 2017) | | CFO, Packet Host, Inc. (information technology firm) (2014-present) Founder, Silver Horse Capital Partners, LLC (hedge fund) (2013-present) Director, Citi (1999-2013) | | 3 | | None |
| Seddik Meziani 1952 | | Independent Trustee of the Trust (since 2017) | | Professor, Montclair State University, New Jersey (1999-present) | | 3 | | Member of the Research Advisory Board, ETF Global, LLC (market data and research provider) |
GraniteShares ETF Trust
Supplemental Information
Federal Tax Information
For the fiscal year ended June 30, 2019, certain dividends paid by GraniteShares HIPS US High Income ETF may be subject to the maximum tax rate of 20%, as provided for by the Jobs and Growth Tax Relief Reconciliation Act of 2003. The percentage of dividends declared from ordinary income designated as qualified dividend income was 48.62%.
For corporate shareholders of GraniteShares HIPS US High Income ETF, the percentage of ordinary income distributions qualifying for the corporate dividends received deduction for the fiscal year ended June 30, 2019 was 30.73%.
The percentage of taxable ordinary income distributions that are designated as short-term capital gain distributions under Internal Revenue Section 871(k)(2)(C) for GraniteShares HIPS US High Income ETF was 0%.
Quarterly Portfolio Holdings Information
The Funds will be required to file their complete schedule of portfolio holdings with the SEC for their first and third quarters on Form N-Q. Copies of the filings will be available without charge on the SEC’s website at www.sec.gov. You will also be able obtain copies of Form N-Q by visiting the SEC’s Public Reference Room in Washington, DC. Information on the operation of the Public Reference Room may be obtained by calling 1-800-SEC-0330.
Proxy Voting Information
A description of the Funds proxy voting policies and procedures, as well as a record of how the Funds voted proxies during the most recent 12-month period ended June 30, is available without charge upon request by calling 1-844-476-8747. This information will also be available on the SEC’s website at www.sec.gov.
Premium/Discount Information
Information about the differences between the daily market price on the secondary market for the shares of a Fund and the Fund’s net asset value may be found on the Fund’s website atwww.graniteshares.com.
Authorized for distribution only when accompanied or preceded by a prospectus. Investors should carefully consider the fund’s investment goals, risks, charges and expense before investing. A prospectus contains this and other important information. Please read carefully before investing.
Distributor, Foreside Fund Services, LLC
GraniteShares ETF Trust
205 Hudson Street, 7th Floor
New York, NY 10013
Item 2. Code of Ethics.
| | (a) | The registrant, as of the end of the period covered by this report, has adopted a code of ethics that applies to the registrant’s principal executive officer, principal financial officer, principal accounting officer or controller, or persons performing similar functions, regardless of whether these individuals are employed by the registrant or a third party. |
| | | |
| | (c) | There have been no amendments, during the period covered by this report, to a provision of the code of ethics that applies to the registrant’s principal executive officer, principal financial officer, principal accounting officer or controller, or persons performing similar functions, regardless of whether these individuals are employed by the registrant or a third party, and that relates to any element of the code of ethics description. |
| | | |
| | (d) | The registrant has not granted any waivers, including an implicit waiver, from a provision of the code of ethics that applies to the registrant’s principal executive officer, principal financial officer, principal accounting officer or controller, or persons performing similar functions, regardless of whether these individuals are employed by the registrant or a third party, that relates to one or more of the items set forth in paragraph (b) of this item’s instructions. |
Item 3. Audit Committee Financial Expert.
As of the end of the period covered by the report, the registrant’s board of trustees has determined that Seddik Meziani is qualified to serve as an audit committee financial expert serving on its audit committee and that he is “independent,” as defined by Item 3 of Form N-CSR.
Item 4. Principal Accountant Fees and Services.
Audit Fees
| | (a) | The aggregate fees billed for each of the last two fiscal years for professional services rendered by the principal accountant for the audit of the registrant’s annual financial statements or services that are normally provided by the accountant in connection with statutory and regulatory filings or engagements for those fiscal years are $ 46,500 for 2018 and $ 48,824 for 2019. |
Audit-Related Fees
| | (b) | The aggregate fees billed in each of the last two fiscal years for assurance and related services by the principal accountant that are reasonably related to the performance of the audit of the registrant’s financial statements and are not reported under paragraph (a) of this Item are $0 for 2018 and $2,000for 2019. |
Tax Fees
| | (c) | The aggregate fees billed in each of the last two fiscal years for professional services rendered by the principal accountant for tax compliance, tax advice, and tax planning are $12,400for 2018 and $30,020for 2019. |
All Other Fees
| | (d) | The aggregate fees billed in each of the last two fiscal years for products and services provided by the principal accountant, other than the services reported in paragraphs (a) through (c) of this Item are $0 for 2018 and $0 for 2019. |
| | (e)(1) | Disclose the audit committee’s pre-approval policies and procedures described in paragraph (c)(7) of Rule 2-01 of Regulation S-X. |
| | | |
| | | The Audit Committee of the Trust’s Board of Trustees is responsible for, among other things, the appointment, compensation and oversight of the work of the Trust’s auditor. As part of this responsibility, and to ensure that the Auditor’s independence is not impaired, the Audit Committee (1) pre-approves the audit and non-audit services provided to the Trust by the Auditor, and (2) all non-audit services provided to the Trust’s investment adviser and advisory affiliates (that directly relate to the Trust’s operations and financial reporting). except that (a) services provided to a sub-adviser whose role is primarily portfolio management and is sub-contracted or overseen by another investment adviser, and (b)de minimis non-audit services, shall not require pre-approval. |
| | (e)(2) | The percentage of services described in each of paragraphs (b) through (d) of this Item that were approved by the audit committee pursuant to paragraph (c)(7)(i)(C) of Rule 2-01 of Regulation S-X are as follows: |
(b) 100%
(c) 100%
(d) n/a. No expenses for the period considered
The percentage of hours expended on the principal accountant’s engagement to audit the registrant’s financial statements for the most recent fiscal year that were attributed to work performed by persons other than the principal accountant’s full-time, permanent employees was 0.
| | (g) | The aggregate non-audit fees billed by the registrant’s accountant for services rendered to the registrant, and rendered to the registrant’s investment adviser (not including any sub-adviser whose role is primarily portfolio management and is subcontracted with or overseen by another investment adviser), and any entity controlling, controlled by, or under common control with the adviser that provides ongoing services to the registrant for each of the last two fiscal years of the registrant was $0 for 2018 and $0 for 2019. |
(h) Not applicable.
Item 5. Audit Committee of Listed Registrants.
| | (a) | The registrant has a separately designated audit committee consisting of all the independent directors of the registrant. The members of the audit committee are: Steven J. Smyser and Seddik Meziani. |
| | | |
| | (b) | If applicable, provide the disclosure required by Rule 10A-3(d) under the Exchange Act (17 CFR 240.10A-3(d)) regarding an exemption from the listing standards for audit committees. |
Item 6. Investments.
| | (a) | Schedule of Investments in securities of unaffiliated issuers as of the close of the reporting period is included as part of the report to shareholders filed under Item 1 of this form. |
Item 7. Disclosure of Proxy Voting Policies and Procedures for Closed-End Management Investment Companies.
Not applicable.
Item 8. Portfolio Managers of Closed-End Management Investment Companies.
Not applicable.
Item 9. Purchases of Equity Securities by Closed-End Management Investment Company and Affiliated Purchasers.
Not applicable.
Item 10. Submission of Matters to a Vote of Security Holders.
There have been no material changes to the procedures by which the shareholders may recommend nominees to the registrant’s Board of Trustees, where those changes were implemented after the registrant last provided disclosure in response to the requirements of Item 407(c)(2)(iv) of Regulation S-K (17 CFR 229.407) (as required by Item 22(b)(15) of Schedule 14A (17 CFR 240.14a-101)), or this Item.
Item 11. Controls and Procedures.
| | (a) | The registrant’s principal executive and principal financial officers, or persons performing similar functions, have concluded that the registrant’s disclosure controls and procedures (as defined in Rule 30a-3(c) under the Investment Company Act of 1940, as amended (the “1940 Act”) (17 CFR 270.30a-3(c)) are effective, as of a date within 90 days of the filing date of the report that includes the disclosure required by this paragraph, based on their evaluation of these controls and procedures required by Rule 30a-3(b) under the 1940 Act (17 CFR 270.30a-3(b)) and Rules 13a-15(b) or 15d-15(b) under the Securities Exchange Act of 1934, as amended (17 CFR 240.13a-15(b) or 240.15d-15(b)). |
| | | |
| | (b) | There were no changes in the registrant’s internal control over financial reporting (as defined in Rule 30a-3(d) under the 1940 Act (17 CFR 270.30a-3(d)) that occurred during the registrant’s last fiscal quarter that has materially affected, or is reasonably likely to materially affect, the registrant’s internal control over financial reporting. |
Item 12. Disclosure of Securities Lending Activities for Closed-End Management Investment Companies.
Not applicable.
Item 13. Exhibits.
SIGNATURES
Pursuant to the requirements of the Securities Exchange Act of 1934 and the Investment Company Act of 1940, the registrant has duly caused this report to be signed on its behalf by the undersigned, thereunto duly authorized.
| (Registrant) | GraniteShares ETF Trust | |
| By (Signature and Title)* | /s/ William Rhind | |
| | William Rhind, Trustee, President and Chief Financial Officer | |
| | (principal executive officer and principal financial officer) | |
Pursuant to the requirements of the Securities Exchange Act of 1934 and the Investment Company Act of 1940, this report has been signed below by the following persons on behalf of the registrant and in the capacities and on the dates indicated.
| By (Signature and Title)* | /s/ William Rhind | |
| | William Rhind, Trustee, President and Chief Financial Officer | |
| | (principal executive officer and principal financial officer) | |
*Print the name and title of each signing officer under his or her signature.