Exhibit 99.1
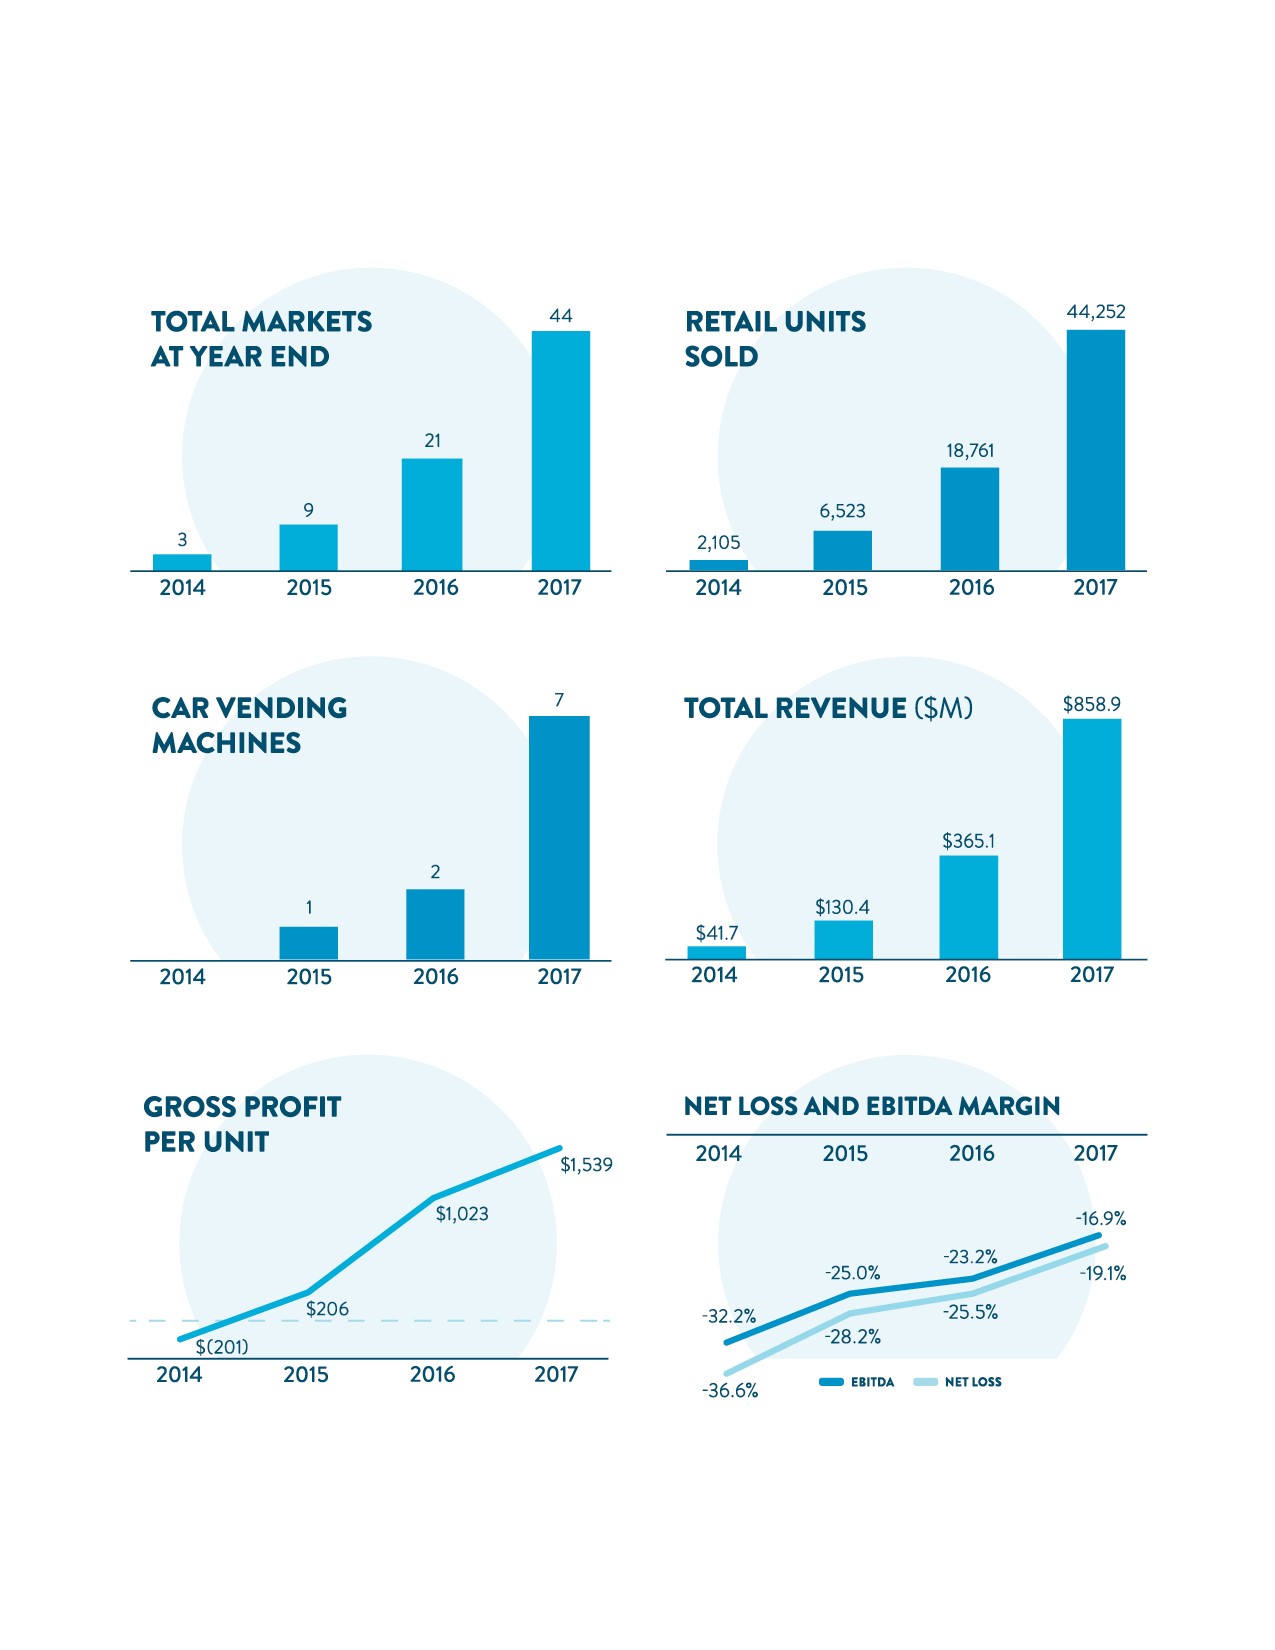
Annual Key Metrics
Dear Shareholders,
We’re pleased to announce our fourth quarter and full year 2017 results. This was a big year for Carvana. We grew retail unit sales 136% YOY, improved GPU 50% YOY as we march towards our mid-term target of $3,000, and we opened a record 23 markets. Those milestones are important, but exploring what we learned along the way and what we expect from here are equally important.
We are growing rapidly and have more conviction than ever about the business we are building. At the same time, extremely rapid growth paired with a relatively thin operating history has occasionally made the path difficult to predict. Our retail unit sales came in just below our guidance range for Q4 and the full year, largely attributable to weaker than expected results from our Cyber Monday promotion. That said, we are proud of our substantial growth and total GPU gains this year, and as you’ll see in our 2018 guidance, we expect our fifth straight year of triple digit top-line growth for Carvana. We look forward to discussing our Q4 results and outlook with you on our conference call today.
Summary of Q4 and 2017 Results
Q4 2017: All financial comparisons stated below are versus Q4 2016, unless otherwise noted. Complete financial tables appear at the end of this letter.
| |
| • | Retail units sold totaled 13,517, an increase of 141% |
| |
| • | Revenue totaled $265.1 million, an increase of 148% |
| |
| • | Total gross profit was $21.9 million, an increase of 798% |
| |
| • | Total gross profit per unit was $1,619, an increase of $1,184 |
| |
| • | Net loss was $47.2 million, an increase of 32% |
| |
| • | EBITDA margin was (15.5%), an improvement from (30.6%) |
| |
| • | GAAP basic and diluted net loss per Class A share was $0.45 based on 15.9 million shares of Class A common stock outstanding; absent $1.65 million in accrued charges associated with our convertible preferred stock issuance net loss per Class A share would have been $0.34. |
| |
| • | Adjusted net loss per Class A share, a non-GAAP measure, was $0.36, based on 136.9 million adjusted shares of Class A common stock outstanding assuming the exchange of all outstanding LLC Units for shares of Class A common stock; absent $1.65 million in accrued charges associated with our convertible preferred stock issuance adjusted net loss per Class A share would have been $0.34. |
| |
| • | We opened 5 new markets, bringing our end-of-quarter total to 44 |
| |
| • | We achieved the lowest quarterly average days to sale in our history of 72, compared to 97 in Q3 |
FY 2017: All financial comparisons stated below are versus 2016, unless otherwise noted.
| |
| • | Retail units sold totaled 44,252, an increase of 136% |
| |
| • | Revenue totaled $858.9 million, an increase of 135% |
| |
| • | Total gross profit was $68.1 million, an increase of 255% |
| |
| • | Total gross profit per unit was $1,539, an increase of $516 |
| |
| • | Net loss was $164.3 million, an increase of 76% |
| |
| • | EBITDA margin was (16.9%), an improvement from (23.2%) |
| |
| • | GAAP basic and diluted net loss per Class A share was $1.31 based on 15.2 million shares of Class A common stock outstanding |
| |
| • | Adjusted net loss per Class A share, a non-GAAP measure, was $1.21, based on 136.9 million adjusted shares of Class A common stock outstanding assuming the exchange of all outstanding LLC Units for shares of Class A common stock |
| |
| • | We opened 23 new markets, bringing our end-of-year total to 44 |
| |
| • | Our average days to sale for the full year 2017 was 91, an increase of 2 days |
Recent Events
We had a few other notable accomplishments in Q4 2017 and already in Q1 2018, including:
| |
| • | We raised $100 million through the sale of convertible preferred securities to Dundon Capital Partners in early December. The additional capital adds liquidity and cushion to our balance sheet and provides flexibility to accelerate market openings. |
| |
| • | We sold and leased back $24.3 million of vending machines in Q4, including $19.2 million sold and leased back under our $75 million Master Sale-Leaseback Agreement, and $5.1 million under a separate transaction. We still have over $55 million available under our MSL agreement, which we intend to utilize over the course of this year, while also securing additional asset financing from other third parties. |
| |
| • | We have opened 10 markets quarter-to-date, bringing our current total to 54. |
Q1 and 2018 Outlook
We anticipate continued triple digit growth in units and revenue for both Q1 and the full year 2018 as we increase penetration in our existing markets, open new markets, and broaden our brand awareness with national advertising and additional vending machines. We have historically estimated used vehicle demand to be seasonally strongest in the first half of the year, correlating closely with customer receipt of federal tax refunds; however, as tax refunds have begun arriving later over the last two years the true strength of that seasonality is shifting to favor Q2 over Q1. We expect to make progress on GPU and EBITDA margin in Q1, although less than we may have experienced throughout our history largely due to the shift in seasonality. We expect our EBITDA losses to peak in Q1 this year, followed by a significant reduction in Q2.
Our Q1 guidance is as follows. All financial comparisons stated below are versus Q1 2017, unless otherwise noted.
| |
| • | Retail unit sales of 17,000 – 18,500, an increase of 104% – 122% |
| |
| • | Total revenue of $325 million – $355 million, an increase of 104% – 123% |
| |
| • | Total gross profit per unit of $1,650 – $1,750, an increase from $1,169 |
| |
| • | EBITDA margin of (15.0%) – (13.0%), an improvement from (21.6%) |
Our FY 2018 guidance is as follows. All financial comparisons stated below are versus FY 2017, unless otherwise noted.
| |
| • | Retail unit sales of 89,000 – 93,000, an increase of 101% – 110% |
| |
| • | Revenue of $1.725 billion – $1.825 billion, an increase of 101% – 112% |
| |
| • | Total gross profit per unit of $1,950 – $2,150, an increase from $1,539 |
| |
| • | EBITDA margin of (9.0%) – (7.0%), an improvement from (16.9%), reflecting both our decision to accelerate market expansion along with increasing operating leverage on our growth |
| |
| • | 30 – 40 market openings, an increase from 23 markets in 2017, bringing our end-of-year total to 74 – 84 markets and our total U.S. population coverage to at least 55% |
For more information regarding the non-GAAP financial measures discussed in this letter, please see the reconciliations of our non-GAAP measurements to their most directly comparable GAAP-based financial measurements included at the end of this letter. Guidance for EBITDA margin excludes depreciation and amortization expense and interest expense. We have not reconciled EBITDA guidance to GAAP net loss as a result of the uncertainty regarding, and the potential variability of, interest expense. Accordingly, a reconciliation of the non-GAAP financial measure guidance to the corresponding GAAP measure is not available without unreasonable effort. Depreciation and amortization expense, which is a component of the reconciliation between EBITDA and GAAP net loss, is expected to be between 1.2% and 1.4% of total revenues for both Q1 2018 and FY 2018.
Markets and Cohorts
We delivered continued improvements in our markets during 2017, with penetration increasing in our existing markets and our newly launched markets off to the best start in our history. Atlanta, our oldest and largest market, continued to show impressive unit growth of 44% in both FY 2017 and Q4, reaching market penetration in Q4 of 1.54% vs. 1.07% in Q4 2016. As a result, we reduced our advertising cost per unit in Atlanta to $440 in Q4 vs. $551 in Q4 2016. Our other market cohorts continue to grow rapidly, leveraging advertising expenditures, and with our move towards national TV, new markets are launching with lower customer acquisition costs.
Market Penetration
The charts below show the market penetration and advertising expense per unit of our five annual market cohorts (2013 through 2017) by quarters since launch. The charts align performance of all markets in a cohort with their first quarter in operation and includes data in quarters where all markets in a cohort were active (e.g. there is one data point for the 2017 cohort, five for the 2016 cohort, etc.). Additional details on methodology are provided in our Annual Report on Form 10-K.
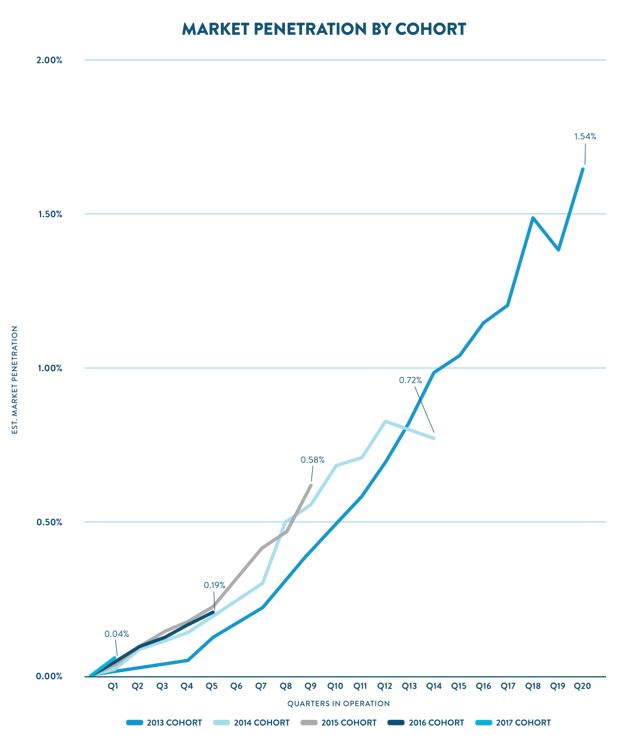
The 2014 market cohort comprised of Nashville and Charlotte, our smallest cohort by population, showed a slower rate of growth in 2017. We ran an extended marketing test in Nashville and Charlotte that ultimately proved less effective than campaigns in other markets. By continually testing marketing channels and creative content across markets, we can optimize our marketing strategies over time. We saw sequential improvement in both markets following the end of the test and expect positive trends to continue.
We believe the cohort penetration chart demonstrates the power of our customer offering and the long runway for growth in front of us.
Customer Acquisition Costs
Similar to cohort market penetration, cohort advertising expense per unit has shown steady improvement both within and across cohorts. For the full year, advertising expense per unit sold in all cohorts declined year-over-year, and our 2015 and 2016 cohorts declined steeply, to $1,154 from $2,363 and to $2,204 from $5,093, respectively. For the full year, the 2017 cohort advertising expense per unit was $2,730, which was $2,363 lower than the 2016 cohort expense during its first year. As displayed in the quarterly cohort graph below, our 2017 cohort had the lowest first quarter advertising expense per unit in our history, we believe due largely to the benefits of national advertising. We believe the overall trends in advertising expense per unit bodes well for the replicability of our market rollout model, as well as our ability to leverage advertising expense over time.
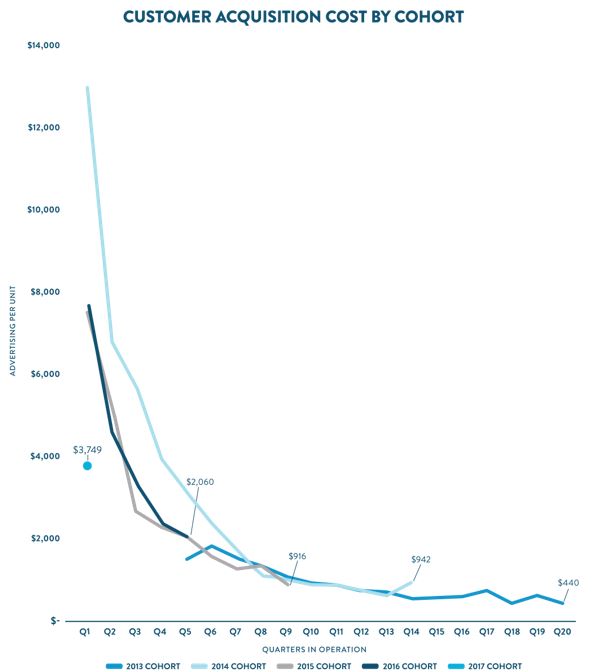
*Excludes out of market advertising costs, which primarily consist of production costs, pre-opening advertising costs, and a portion of national television advertising costs representative of the population not served by an open market
Expansion
We launched five new markets in the fourth quarter. This brought our total number of markets to 44 on December 31, 2017. This expansion increases the total percentage of the U.S. population our markets collectively serve to 41.2%, up from 19.7% at the end of 2016. Opening Newark last quarter begins our rollout into the New York metro area and the broader Northeast. Less than five years after establishing our first market in Atlanta, we’ve built a coast-to-coast production, logistics and fulfillment network using a nimble, capital-light expansion model that allows us to quickly and efficiently enter new markets. As our logistics network covers more of the country, we can more easily fill in markets within our footprint and better leverage our assets. As a result, we plan to open 30-40 markets in FY 2018 to reach a total coverage of at least 55% of the U.S. population, another record for market openings.
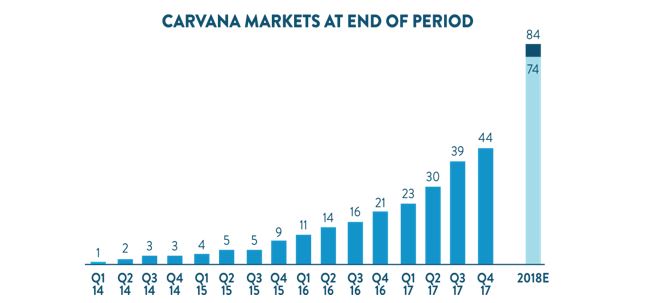
*2018E bar represents high and low end points of end-of-year total market guidance range.
*Represents facilities and markets as of December 31, 2017
Vending Machines
Vending machines are the most visible element of the Carvana brand. They generate awareness and interest from local communities and enable us to deliver fun and memorable experiences to our customers at even lower variable costs than home delivery. While the vending machines are differentiated relative to anything else in the market, they still require physical real estate and are therefore more difficult to scale.
Last year, we successfully opened five vending machines, but wish we could have opened more. Our real estate team is hard at work in site selection, city approvals, and construction to launch more as quickly as possible.
2017 provided additional information on how vending machine performance evolves over time, which has reinforced their value, while also improving our understanding of how a vending machine enhances a market's sales.
Based on our experiences to date, we have found that initially a vending machine generates significant excitement in the local market. That excitement leads to fairly rapid unit growth, increasing market penetration. Over the next few quarters, the slope of the market penetration curve tends to moderate before returning to the original growth rate, albeit from a higher level of penetration.
Management Objectives
Our management team continues to believe that customer experience quality is the most important focal point to drive the long-term success of the business, and that by offering customers lower prices, wider selection, and simpler experiences, we can improve that customer experience quality over the traditional standard in automotive retail, which will power our growth. To realize that long-term vision, we focus on three primary financial objectives: (1) Grow Retail Units and Revenue; (2) Increase Total Gross Profit Per Unit; and (3) Demonstrate Operating Leverage.
Objective #1: Grow Retail Units and Revenue
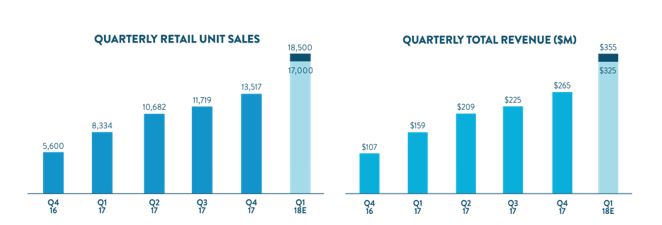
Q4 was another strong growth quarter, despite units coming in below our guidance, as retail units sold increased to 13,517, up 141% from 5,600 in the prior year period. Revenue in Q4 grew to $265.1 million, up 148% from $106.8 million in Q4 2016. In addition, we are encouraged by Atlanta unit growth of 44% in FY 2017 because it implies we have yet to reach a market saturation point in our oldest and largest market. Our Q1 guidance of 17,000-18,500 units equates to 104% – 122% year-over-year growth, and reflects the expected timing of consumers receiving income tax refunds in 2018.
*Q1 2018E bars represent high and low end points of quarterly retail unit sales and quarterly total revenue guidance ranges.
Our growth in retail units sold during 2017 was broad based by market cohort and demonstrates strong underlying trends.
Objective #2: Increase Total Gross Profit Per Unit
Total GPU in Q4 2017 grew to $1,619 per unit, up $1,184 vs. Q4 2016. As expected, total GPU for the quarter decreased sequentially, primarily driven by the impact of our Cyber Monday and Hurricane promotions. These impacts were partially offset by other efficiencies in our retail business and the rollout of GAP waiver coverage.
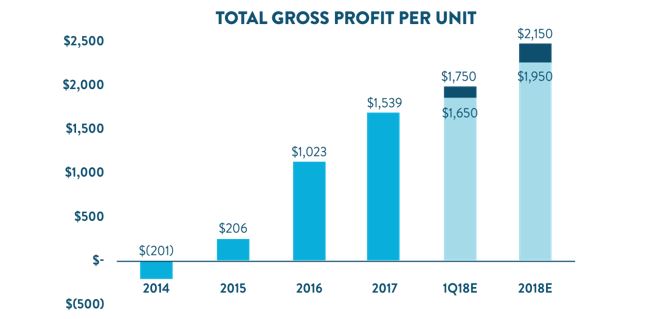
For the full year 2017 our GPU grew to $1,539 per unit, an increase of $516 over the previous year. Our GPU improvements were broad-based, including improvements on retail used vehicles, wholesale vehicles, and other products. Our gains in retail used vehicle GPU were driven by improvements in purchasing and pricing optimization ($229 benefit) partially offset by an increase in days to sale (approximately -$20 impact), and inventory management and reconditioning process efficiencies among other items (collectively $216 benefit). Our gains in other GPU were driven by higher upfront premiums on the sale of our finance receivables, which benefited from the launch of our new proprietary credit scoring model in early 2017. We also saw small gains in wholesale gross profit, driven by technology and process improvements in bidding for and subsequently selling wholesale cars. We expect further gains in all three gross profit components in 2018.
In addition to increasing GPU, we also successfully reduced the average days to sale for vehicles in our inventory over the course of 2017 by leveraging our centralized eCommerce inventory model, which allows us to rapidly grow markets and increase market share without significantly adding inventory. While we did not see GPU benefits from lower average days to sale in the full year 2017, we exited the year with our lowest quarterly average days to sale ever at 72 days in Q4, versus a recent high of 105 days in Q2 and 97 days in Q3. We expect this metric to fall further in 2018, particularly in the second and third quarters.
We expect to again significantly improve total GPU in 2018 as we march towards our $3,000 mid-term goal. The mid-point of our full year guidance implies a roughly $500 improvement in total GPU, similar to the improvement in 2017. We anticipate that approximately half of the improvement will come from higher retail used vehicle GPU primarily driven by a reduction in average days to sale, while the other half of the improvement will come from all other GPU sources.
*Q1 2018E and 2018E bars represent high and low end points of quarterly and annual GPU guidance ranges.
Objective #3: Demonstrate Operating Leverage
In Q4, we continued to invest in our infrastructure and staffing in preparation for the significant seasonal tailwinds in the first half of 2018. While the fourth quarter was another substantial investment quarter for us we did achieve positive operating leverage from our 141% unit sales growth. Total SG&A as a percent of revenue was 25.2% in Q4, compared to 34.4% in Q4 2016. For the full year, SG&A decreased to 26.0% of revenue despite large investments in public company costs, compared to 29.8% in 2016, and our net loss for the quarter was $47.2 million, as compared to $39.8 million in Q3. Full year net loss was $164.3 million, up from $93.1 million in FY 2016.
We consider EBITDA margin an important measure of the leverage in our business. EBITDA margin in the fourth quarter of 2017 was (15.5%), a slight improvement from (15.9%) in Q3. For the full year EBITDA margin was (16.9%) an improvement from (23.2%) in 2016. A reconciliation of EBITDA, a non-GAAP measure, to net loss, its most directly comparable GAAP measure, is provided in the appendix.
For the full year, we expect to again make significant gains in improving our EBITDA margin and EBITDA per unit. We anticipate that about half of our improvements in SG&A per unit will come from leveraging our fixed operations with the remainder of the improvement split between lower customer acquisition costs and lower fulfillment operations costs. As noted earlier, we expect our EBITDA losses to peak in Q1 this year, followed by a significant reduction in Q2.
Summary
Thank you for taking the time to read through our letter. Our goal in writing these letters is to keep shareholders informed of the trends in the business and our progress so that you can better interpret our results.
We also want to communicate our own thoughts on that progress through the lens of our experience over the last 5 years and our plans for the future.
We have never been more confident in the path we are on.
The customer experiences we are delivering are exceptional, differentiated, and very difficult to replicate. The response to those experiences is clearly apparent in our cohort penetration curves. We know that the path along a triple digit growth curve into this tremendous opportunity won’t always be a straight line, but the pieces are in place.
We are focused and determined. We will remain aggressive and will keep our customers at the center of every decision we make.
Sincerely,
Ernie Garcia, III, Chairman and CEO
Mark Jenkins, CFO
Appendix
Conference Call Details
Carvana will host a conference call today, March 6, 2018, at 5:30 p.m. EST (2:30 p.m. PST) to discuss financial results. To participate in the live call, analysts and investors should dial (877) 270-2148 or (412) 902-6510, and ask for “Carvana Earnings.” A live audio webcast of the conference call along with supplemental financial information will also be accessible on the company's website at investors.carvana.com. Following the webcast, an archived version will be available on the website for one year. A telephonic replay of the conference call will be available until March 13, 2018, by dialing (877) 344-7529 or (412) 317-0088 and entering passcode 10116688#.
Forward Looking Statements
This letter contains forward-looking statements within the meaning of the Private Securities Litigation Reform Act of 1995. These forward-looking statements reflect Carvana’s current expectations and projections with respect to, among other things, its financial condition, results of operations, plans, objectives, future performance, and business. These statements may be preceded by, followed by or include the words "aim," "anticipate," "believe," "estimate," "expect," "forecast," "intend," "likely," "outlook," "plan," "potential," "project," "projection," "seek," "can," "could," "may," "should," "would," "will," the negatives thereof and other words and terms of similar meaning.
Forward-looking statements include all statements that are not historical facts. Such forward-looking statements are subject to various risks and uncertainties. Accordingly, there are or will be important factors that could cause actual outcomes or results to differ materially from those indicated in these statements. Among these factors are risks related to the “Risk Factors” identified in our Annual Report on Form 10-K for 2017.
There is no assurance that any forward-looking statements will materialize. You are cautioned not to place undue reliance on forward-looking statements, which reflect expectations only as of this date. Carvana does not undertake any obligation to publicly update or review any forward-looking statement, whether as a result of new information, future developments, or otherwise.
Use of Non-GAAP Financial Measures
As appropriate, we supplement our results of operations determined in accordance with U.S. generally accepted accounting principles (“GAAP”) with certain non-GAAP financial measurements that are used by management, and which we believe are useful to investors, as supplemental operational measurements to evaluate our financial performance. These measurements should not be considered in isolation or as a substitute for reported GAAP results because they may include or exclude certain items as compared to similar GAAP-based measurements, and such measurements may not be comparable to similarly-titled measurements reported by other companies. Rather, these measurements should be considered as an additional way of viewing aspects of our operations that provide a more complete understanding of our business. We strongly encourage investors to review our consolidated financial statements included in publicly filed reports in their entirety and not rely solely on any one, single financial measurement or communication.
Reconciliations of our non-GAAP measurements to their most directly comparable GAAP-based financial measurements are included at the end of this letter.
Investor Relations Contact Information: Mike Levin, investors@carvana.com
CARVANA CO. AND SUBSIDIARIES
CONSOLIDATED BALANCE SHEETS
(In thousands, except per share amounts)
|
| | | | | | | |
| | December 31, |
| 2017 | | 2016 |
| ASSETS | | | |
| Current assets: | | | |
| Cash and cash equivalents | $ | 172,680 |
| | $ | 39,184 |
|
| Restricted cash | 14,443 |
| | 10,266 |
|
| Accounts receivable, net | 14,105 |
| | 5,692 |
|
| Finance receivables held for sale, net | 45,564 |
| | 24,771 |
|
| Vehicle inventory | 227,446 |
| | 185,506 |
|
| Other current assets | 15,480 |
| | 9,822 |
|
| Total current assets | 489,718 |
| | 275,241 |
|
| Property and equipment, net | 148,681 |
| | 60,592 |
|
| Other assets | 2,738 |
| | — |
|
| Total assets | $ | 641,137 |
| | $ | 335,833 |
|
| LIABILITIES, TEMPORARY EQUITY & STOCKHOLDERS' EQUITY / MEMBERS’ DEFICIT | | |
|
| Current liabilities: | | |
|
| Accounts payable and accrued liabilities | $ | 50,306 |
| | $ | 28,164 |
|
| Accounts payable due to related party | 1,802 |
| | 1,884 |
|
| Floor plan facility | 248,792 |
| | 165,313 |
|
| Current portion of long-term debt | 5,131 |
| | 1,057 |
|
| Total current liabilities | 306,031 |
| | 196,418 |
|
| Long-term debt, excluding current portion | 48,469 |
| | 4,404 |
|
| Other liabilities | 7,093 |
| | — |
|
| Total liabilities | 361,593 |
| | 200,822 |
|
| Commitments and contingencies |
|
| |
|
|
| Temporary equity - Class C redeemable preferred units - 0 and 43,089 units authorized and outstanding as of December 31, 2017 and December 31, 2016, respectively | — |
| | 250,972 |
|
| Stockholders' equity / members' deficit: | | | |
| Members' deficit | — |
| | (115,961 | ) |
| Class A Convertible Preferred Stock, $0.01 par value, $1,000 liquidation value per share - 100 shares authorized, issued and outstanding as of December 31, 2017 | 97,127 |
| | — |
|
| Preferred stock, $.01 par value - 50,000 shares authorized, none issued and outstanding as of December 31, 2017 | — |
| | — |
|
| Class A common stock, $0.001 par value - 500,000 shares authorized, 18,096 shares issued and outstanding as of December 31, 2017 | 18 |
| | — |
|
| Class B common stock, $0.001 par value - 125,000 shares authorized, 114,664 shares issued and outstanding as of December 31, 2017 | 115 |
| | — |
|
| Additional paid in capital | 41,375 |
| | — |
|
| Accumulated deficit | (12,899 | ) | | — |
|
| Total stockholders' equity / members' deficit attributable to Carvana Co. | 125,736 |
| | (115,961 | ) |
| Non-controlling interests | 153,808 |
| | — |
|
| Total stockholders' equity / members’ deficit | 279,544 |
| | (115,961 | ) |
| Total liabilities, temporary equity & stockholders' equity / members’ deficit | $ | 641,137 |
| | $ | 335,833 |
|
CARVANA CO. AND SUBSIDIARIES
CONSOLIDATED STATEMENTS OF OPERATIONS
(In thousands, except per share amounts)
|
| | | | | | | | | | | | | | | |
| | Three Months Ended December 31, | | Years Ended December 31, |
| | 2017 | | 2016 | | 2017 | | 2016 |
| | | | | | | | |
| | (Unaudited) | | | | |
| Sales and operating revenues: | | | | | | | |
| Used vehicle sales, net | $ | 246,473 |
| | $ | 100,891 |
| | $ | 796,915 |
| | $ | 341,989 |
|
Wholesale vehicle sales(3) | 7,511 |
| | 3,259 |
| | 28,514 |
| | 10,163 |
|
| Other sales and revenues, including $2,877, $460, $8,947 and $460, respectively, from related parties | 11,069 |
| | 2,677 |
| | 33,441 |
| | 12,996 |
|
| Net sales and operating revenues | 265,053 |
| | 106,827 |
| | 858,870 |
| | 365,148 |
|
| Cost of sales | 243,163 |
| | 104,390 |
| | 790,779 |
| | 345,951 |
|
| Gross profit | 21,890 |
| | 2,437 |
| | 68,091 |
| | 19,197 |
|
| Selling, general and administrative expenses | 66,805 |
| | 36,705 |
| | 223,400 |
| | 108,676 |
|
| Interest expense, including $0, $0, $1,382 and $0, respectively, to related parties | 2,255 |
| | 1,356 |
| | 7,659 |
| | 3,587 |
|
| Other expense, net | 68 |
| | 70 |
| | 1,348 |
| | 46 |
|
| Net loss before income taxes | (47,238 | ) | | (35,694 | ) | | (164,316 | ) | | (93,112 | ) |
| Income tax provision | — |
| | — |
| | — |
| | — |
|
| Net loss | (47,238 | ) | | (35,694 | ) | | (164,316 | ) | | (93,112 | ) |
| Less: net loss attributable to non-controlling interests | (41,758 | ) | | — |
| | (101,475 | ) | | — |
|
| Net loss attributable to Carvana Co. | $ | (5,480 | ) | | $ | (35,694 | ) | | $ | (62,841 | ) | | $ | (93,112 | ) |
| Less: dividends on Class A convertible preferred stock | 413 |
| | — |
| | 413 |
| | — |
|
| Less: accretion of beneficial conversion feature on Class A convertible preferred stock | 1,237 |
| | — |
| | 1,237 |
| | — |
|
| Net loss attributable to Class A common stockholders | $ | (7,130 | ) | | $ | (35,694 | ) | | $ | (64,491 | ) | | $ | (93,112 | ) |
Net loss per share of Class A common stock, basic and diluted(1) | $ | (0.45 | ) | | $ | (0.26 | ) | | $ | (1.31 | ) | | $ | (0.68 | ) |
Weighted-average shares of Class A common stock, basic and diluted(1)(2) | 15,891 |
| | 15,000 |
| | 15,241 |
| | 15,000 |
|
(1) Amounts for periods prior to the initial public offering have been retrospectively adjusted to give effect to 15.0 million shares of Class A common stock issued in the initial public offering and the Organizational Transactions.
(2) Weighted-average shares of Class A common stock outstanding have been adjusted for unvested restricted stock awards.
(3) Wholesale vehicle sales revenue relates to 1,844 and 731 wholesale units sold during the three months ended December 31, 2017 and 2016, respectively, and 6,509 and 2,651 wholesale units sold during the years ended December 31, 2017 and 2016, respectively.
CARVANA CO. AND SUBSIDIARIES
CONSOLIDATED STATEMENTS OF CASH FLOWS
(In thousands)
|
| | | | | | | | | | | |
| | For the Years Ended December 31, |
| | 2017 | | 2016 | | 2015 |
| Cash Flows from Operating Activities: | | | | | |
| Net loss | $ | (164,316 | ) | | $ | (93,112 | ) | | $ | (36,780 | ) |
| Adjustments to reconcile net loss to net cash used in operating activities: | | | | | |
| Depreciation and amortization expense | 11,568 |
| | 4,658 |
| | 2,800 |
|
| Loss on disposal of property and equipment | 958 |
| | — |
| | — |
|
| Provision for bad debt and valuation allowance | 1,375 |
| | 1,348 |
| | 299 |
|
| Gain on loan sales, including $0, $269 and $0 from related parties, respectively | (21,697 | ) | | (7,446 | ) | | — |
|
| Equity-based compensation expense | 5,611 |
| | 555 |
| | 490 |
|
| Amortization and write-off of debt issuance costs | 1,646 |
| | — |
| | — |
|
| Originations of finance receivables | (529,153 | ) | | (224,169 | ) | | (80,070 | ) |
| Proceeds from sale of finance receivables | 527,265 |
| | 269,262 |
| | — |
|
| Proceeds from sale of finance receivables to related party | — |
| | 13,015 |
| | 79,362 |
|
| Purchase of finance receivables from related party | — |
| | (74,589 | ) | | — |
|
| Changes in assets and liabilities: | | | | | |
| Accounts receivable | (8,715 | ) | | (3,492 | ) | | (2,711 | ) |
| Vehicle inventory | (40,839 | ) | | (117,468 | ) | | (41,667 | ) |
| Other current assets | (6,605 | ) | | (7,157 | ) | | (789 | ) |
| Other assets | (1,019 | ) | | — |
| | — |
|
| Accounts payable and accrued liabilities | 16,986 |
| | 17,922 |
| | 4,122 |
|
| Accounts payable to related party | (82 | ) | | (19,552 | ) | | 21,436 |
|
| Other liabilities | 7,093 |
| | — |
| | — |
|
| Net cash used in operating activities | (199,924 | ) | | (240,225 | ) | | (53,508 | ) |
| Cash Flows from Investing Activities: | | | | | |
| Purchases of property and equipment | (78,490 | ) | | (39,539 | ) | | (13,950 | ) |
| Change in restricted cash | (4,177 | ) | | (8,151 | ) | | (2,115 | ) |
| Net cash used in investing activities | (82,667 | ) | | (47,690 | ) | | (16,065 | ) |
| Cash Flows from Financing Activities: | | | | | |
| Proceeds from floor plan facility | 949,144 |
| | 410,562 |
| | 125,080 |
|
| Payments on floor plan facility | (865,665 | ) | | (287,551 | ) | | (88,397 | ) |
| Proceeds from Verde Credit Facility | 35,000 |
| | — |
| | — |
|
| Payments on Verde Credit Facility | (35,000 | ) | | — |
| | — |
|
| Proceeds from long-term debt | 32,698 |
| | — |
| | — |
|
| Payments on long-term debt | (2,259 | ) | | (284 | ) | | — |
|
| Payments of debt issuance costs, including $1,000, $0 and $0 to related parties, respectively | (2,055 | ) | | (728 | ) | | (150 | ) |
| Proceeds from note payable to related party | — |
| | — |
| | 50,000 |
|
| Payment of note payable to related party | — |
| | — |
| | (11,752 | ) |
| Net proceeds from initial public offering | 206,198 |
| | (398 | ) | | — |
|
| Net proceeds from issuance of Class A Convertible Preferred Stock | 98,682 |
| | — |
| | — |
|
| Proceeds from exercise of stock options | 48 |
| | — |
| | — |
|
| Tax withholdings related to restricted stock awards | (704 | ) | | — |
| | — |
|
| Proceeds from issuance of Class C redeemable preferred units | — |
| | 162,446 |
| | 65,000 |
|
| Class C redeemable preferred units issuance costs | — |
| | (82 | ) | | (470 | ) |
| Dividends paid | — |
| | — |
| | (33,533 | ) |
| Net cash provided by financing activities | 416,087 |
| | 283,965 |
| | 105,778 |
|
| Net increase (decrease) in cash and cash equivalents | 133,496 |
| | (3,950 | ) | | 36,205 |
|
| Cash and cash equivalents at beginning of period | 39,184 |
| | 43,134 |
| | 6,929 |
|
| Cash and cash equivalents at end of period | $ | 172,680 |
| | $ | 39,184 |
| | $ | 43,134 |
|
CARVANA CO. AND SUBSIDIARIES
RECONCILIATION OF GAAP TO NON-GAAP FINANCIAL MEASURES
(Unaudited)
(In thousands, except per share amounts)
Adjusted Net Loss and Adjusted Net Loss per Share
Adjusted net loss and adjusted net loss per share are supplemental measures of operating performance that do not represent and should not be considered alternatives to net loss and net loss per share, as determined under GAAP. We believe that by assuming the full exchange of all outstanding LLC Units, adjusted net loss and adjusted net loss per share supplement GAAP measures and enable us and our investors to more effectively evaluate our performance period-over-period and relative to our competitors that have different organizational and tax structures because the assumption eliminates the effect of any changes in net income attributable to Carvana Co. driven by increases in our ownership of Carvana Group, LLC, which are unrelated to our operating performance. A reconciliation of adjusted net loss to net loss attributable to Carvana Co., the most directly comparable GAAP measure, and the computation of adjusted net loss per share are as follows (in thousands, except per share amounts):
|
| | | | | | | | | | | | | | | | | | | | | | | | | | | | | | | | | |
| | | | Three Months Ended |
| | Mar 31, 2016 | | Jun 30, 2016 | | Sep 30, 2016 | | Dec 31, 2016 | | Mar 31, 2017 | | Jun 30, 2017 | | Sep 30, 2017 | | Dec 31, 2017 |
| Numerator: | | | | | | | | | | | | | | | |
| | Net loss attributable to Carvana Co. | $ | (17,325 | ) | | $ | (18,108 | ) | | $ | (21,985 | ) | | $ | (35,694 | ) | | $ | (38,439 | ) | | $ | (14,542 | ) | | $ | (4,380 | ) | | $ | (5,480 | ) |
| | Add: Net loss attributable to non-controlling interests | — |
| | — |
| | — |
| | — |
| | — |
| | (24,328 | ) | | (35,389 | ) | | (41,758 | ) |
| | Less: dividends on Class A convertible preferred stock | — |
| | — |
| | — |
| | — |
| | — |
| | — |
| | — |
| | 413 |
|
| | Less: accretion of beneficial conversion feature on Class A convertible preferred stock | — |
| | — |
| | — |
| | — |
| | — |
| | — |
| | — |
| | 1,237 |
|
| | Adjusted net loss attributable to Carvana Co. Class A common stock | $ | (17,325 | ) | | $ | (18,108 | ) | | $ | (21,985 | ) | | $ | (35,694 | ) | | $ | (38,439 | ) | | $ | (38,870 | ) | | $ | (39,769 | ) | | $ | (48,888 | ) |
| | | | | | | | | | | | | | | | | | |
| Denominator: | | | | | | | | | | | | | | | |
| | Weighted-average shares of Class A common stock outstanding(1)(3) | 15,000 |
| | 15,000 |
| | 15,000 |
| | 15,000 |
| | 15,000 |
| | 15,026 |
| | 15,045 |
| | 15,891 |
|
| | Adjustments: | | | | | | | | | | | | | | |
|
| | | Assumed exchange of LLC Units for shares of Class A common stock (2) | 121,760 |
| | 121,760 |
| | 121,760 |
| | 121,760 |
| | 121,760 |
| | 121,666 |
| | 121,989 |
| | 121,057 |
|
| | Adjusted shares of Class A common stock outstanding | 136,760 |
| | 136,760 |
| | 136,760 |
| | 136,760 |
| | 136,760 |
| | 136,692 |
| | 137,034 |
| | 136,948 |
|
| | Adjusted net loss per share | $ | (0.13 | ) | | $ | (0.13 | ) | | $ | (0.16 | ) | | $ | (0.26 | ) | | $ | (0.28 | ) | | $ | (0.28 | ) | | $ | (0.29 | ) | | $ | (0.36 | ) |
(1) Amounts for periods prior to the initial public offering have been retrospectively adjusted to give effect to 15.0 million shares of Class A common stock issued in the initial public offering.
(2) Amounts for periods prior to the initial public offering have been retrospectively adjusted to include all LLC units outstanding at the initial public offering, including conversion of the Class C Redeemable Preferred Units into Class A Units on a one-for-one basis. Also assumes exchange of all outstanding LLC Units for shares of Class A common stock during each period presented.
(3) Excludes portions of unvested restricted stock awards and vested and unvested stock options outstanding because they were determined to be anti-dilutive.
CARVANA CO. AND SUBSIDIARIES
RECONCILIATION OF GAAP TO NON-GAAP FINANCIAL MEASURES (continued)
(Unaudited)
(In thousands, except per share amounts)
EBITDA and EBITDA Margin
EBITDA and EBITDA Margin are non-GAAP supplemental measures of operating performance that do not represent and should not be considered an alternative to net loss or cash flow from operations, as determined by GAAP. EBITDA is defined as net loss before interest expense, income tax expense and depreciation and amortization expense. EBITDA Margin is EBITDA as a percentage of total revenues. We use EBITDA to measure the operating performance of our business and EBITDA Margin to measure our operating performance relative to our total revenues. We believe that EBITDA and EBITDA Margin are useful measures to us and to our investors because they exclude certain financial and capital structure items that we do not believe directly reflect our core operations and may not be indicative of our recurring operations, in part because they may vary widely across time and within our industry independent of the performance of our core operations. We believe that excluding these items enables us to more effectively evaluate our performance period-over-period and relative to our competitors. EBITDA and EBITDA Margin may not be comparable to similarly titled measures provided by other companies due to potential differences in methods of calculations. A reconciliation of EBITDA to net loss, the most directly comparable GAAP measure, and calculation of EBITDA Margin is as follows (in thousands):
|
| | | | | | | | | | | | | | | | | | | | | | | | | | | | | | | | |
| | | Three Months Ended |
| | | Mar 31, 2016 | | Jun 30, 2016 | | Sep 30, 2016 | | Dec 31, 2016 | | Mar 31, 2017 | | Jun 30, 2017 | | Sep 30, 2017 | | Dec 31, 2017 |
| Net loss | | $ | (17,325 | ) | | $ | (18,108 | ) | | $ | (21,985 | ) | | $ | (35,694 | ) | | $ | (38,439 | ) | | $ | (38,870 | ) | | $ | (39,769 | ) | | $ | (47,238 | ) |
| Depreciation and amortization expense | | 866 |
| | 958 |
| | 1,196 |
| | 1,638 |
| | 2,061 |
| | 2,584 |
| | 3,101 |
| | 3,822 |
|
| Interest expense | | 710 |
| | 796 |
| | 725 |
| | 1,356 |
| | 2,059 |
| | 2,507 |
| | 838 |
| | 2,255 |
|
| EBITDA | | $ | (15,749 | ) | | $ | (16,354 | ) | | $ | (20,064 | ) | | $ | (32,700 | ) | | $ | (34,319 | ) | | $ | (33,779 | ) | | $ | (35,830 | ) | | $ | (41,161 | ) |
| | | | | | | | | | | | | | | | | |
| Total revenues | | $ | 72,951 |
| | $ | 86,526 |
| | $ | 98,844 |
| | $ | 106,827 |
| | $ | 159,073 |
| | $ | 209,365 |
| | $ | 225,379 |
| | $ | 265,053 |
|
| Net Loss Margin | | (23.7 | )% | | (20.9 | )% | | (22.2 | )% | | (33.4 | )% | | (24.2 | )% | | (18.6 | )% | | (17.6 | )% | | (17.8 | )% |
| EBITDA Margin | | (21.6 | )% | | (18.9 | )% | | (20.3 | )% | | (30.6 | )% | | (21.6 | )% | | (16.1 | )% | | (15.9 | )% | | (15.5 | )% |
CARVANA CO. AND SUBSIDIARIES
RESULTS OF OPERATIONS
(Unaudited)
(dollars in thousands, except per unit amounts)
|
| | | | | | | | | | | | | | | | | | | | | | | | | | | | | | | |
| | Three Months Ended |
| | Mar 31, 2016 | | Jun 30, 2016 | | Sep 30, 2016 | | Dec 31, 2016 | | Mar 31, 2017 | | Jun 30, 2017 | | Sep 30, 2017 | | Dec 31, 2017 |
| | | | | | | | | | | | | | | | |
| Net sales and operating revenues: | | | | | | | | | | |
| Used vehicle sales, net | $ | 68,495 |
| | $ | 80,488 |
| | $ | 92,115 |
| | $ | 100,891 |
| | $ | 148,382 |
| | $ | 193,947 |
| | $ | 208,113 |
| | $ | 246,473 |
|
| Wholesale vehicle sales | 1,559 |
| | 2,475 |
| | 2,870 |
| | 3,259 |
| | 5,726 |
| | 7,818 |
| | 7,459 |
| | 7,511 |
|
Other sales and revenues (1) | 2,897 |
| | 3,563 |
| | 3,859 |
| | 2,677 |
| | 4,965 |
| | 7,600 |
| | 9,807 |
| | 11,069 |
|
| Total net sales and operating revenues | $ | 72,951 |
| | $ | 86,526 |
| | $ | 98,844 |
| | $ | 106,827 |
| | $ | 159,073 |
| | $ | 209,365 |
| | $ | 225,379 |
| | $ | 265,053 |
|
| Gross profit: | | | | | | | | | | | | | | | |
| Used vehicle gross profit (loss) | $ | 1,130 |
| | $ | 2,311 |
| | $ | 2,849 |
| | $ | (346 | ) | | $ | 4,626 |
| | $ | 8,172 |
| | $ | 9,859 |
| | $ | 10,149 |
|
| Wholesale vehicle gross profit (loss) | (70 | ) | | 163 |
| | 58 |
| | 106 |
| | 155 |
| | 267 |
| | 751 |
| | 672 |
|
Other gross profit (1) | 2,897 |
| | 3,563 |
| | 3,859 |
| | 2,677 |
| | 4,965 |
| | 7,600 |
| | 9,806 |
| | 11,069 |
|
| Total gross profit | $ | 3,957 |
| | $ | 6,037 |
| | $ | 6,766 |
| | $ | 2,437 |
| | $ | 9,746 |
| | $ | 16,039 |
| | $ | 20,416 |
| | $ | 21,890 |
|
| Market information: | | | | | | | | | | | | | | |
| Markets, beginning of period | 9 |
| | 11 |
| | 14 |
| | 16 |
| | 21 |
| | 23 |
| | 30 |
| | 39 |
|
| Market launches | 2 |
| | 3 |
| | 2 |
| | 5 |
| | 2 |
| | 7 |
| | 9 |
| | 5 |
|
| Markets, end of period | 11 |
| | 14 |
| | 16 |
| | 21 |
| | 23 |
| | 30 |
| | 39 |
| | 44 |
|
| Unit sales information: | | | | | | | | | | | | | | |
| Used vehicle unit sales | 3,783 |
| | 4,355 |
| | 5,023 |
| | 5,600 |
| | 8,334 |
| | 10,682 |
| | 11,719 |
| | 13,517 |
|
| Wholesale vehicle unit sales | 504 |
| | 629 |
| | 787 |
| | 731 |
| | 1,288 |
| | 1,580 |
| | 1,797 |
| | 1,844 |
|
| Per unit selling prices: | | | | | | | | | | | | | | |
| Used vehicles | $ | 18,106 |
| | $ | 18,482 |
| | $ | 18,339 |
| | $ | 18,016 |
| | $ | 17,804 |
| | $ | 18,156 |
| | $ | 17,759 |
| | $ | 18,234 |
|
| Wholesale vehicles | $ | 3,093 |
| | $ | 3,935 |
| | $ | 3,647 |
| | $ | 4,458 |
| | $ | 4,446 |
| | $ | 4,948 |
| | $ | 4,151 |
| | $ | 4,073 |
|
Per unit gross profit (loss)(2): | | | | | | | | | | | | |
| Used vehicle gross profit (loss) | $ | 299 |
| | $ | 531 |
| | $ | 567 |
| | $ | (62 | ) | | $ | 555 |
| | $ | 765 |
| | $ | 841 |
| | $ | 751 |
|
| Wholesale vehicle gross profit (loss) | $ | (139 | ) | | $ | 259 |
| | $ | 74 |
| | $ | 145 |
| | $ | 120 |
| | $ | 169 |
| | $ | 418 |
| | $ | 364 |
|
| Other gross profit | $ | 766 |
| | $ | 818 |
| | $ | 768 |
| | $ | 478 |
| | $ | 596 |
| | $ | 711 |
| | $ | 837 |
| | $ | 819 |
|
| Total gross profit | $ | 1,046 |
| | $ | 1,386 |
| | $ | 1,347 |
| | $ | 435 |
| | $ | 1,169 |
| | $ | 1,501 |
| | $ | 1,742 |
| | $ | 1,619 |
|
| | | | | | | | | | | | | | | | |
| (1) Includes a portion of other sales and revenues from related parties. |
| (2) All gross profit per unit amounts are per used vehicle sold, except wholesale vehicle gross profit, which is per wholesale vehicle sold. |
Components of SG&A
(Unaudited)
|
| | | | | | | | | | | | | | | | | | | | | | | | | | | | | | | |
| | Three Months Ended |
| | Mar 31, 2016 | | Jun 30, 2016 | | Sep 30, 2016 | | Dec 31, 2016 | | Mar 31, 2017 | | Jun 30, 2017 | | Sep 30, 2017 | | Dec 31, 2017 |
| | | | | | | | | | | | | | | | |
| | (in thousands) |
Compensation and benefits (1) | $ | 6,647 |
| | $ | 7,875 |
| | $ | 9,868 |
| | $ | 12,830 |
| | $ | 16,303 |
| | $ | 18,789 |
| | $ | 19,404 |
| | $ | 22,219 |
|
| Advertising expense | 5,660 |
| | 5,591 |
| | 6,677 |
| | 9,060 |
| | 11,439 |
| | 12,385 |
| | 15,475 |
| | 16,398 |
|
Market occupancy costs (2) | 453 |
| | 400 |
| | 346 |
| | 569 |
| | 983 |
| | 1,424 |
| | 1,734 |
| | 2,081 |
|
Logistics (3) | 1,431 |
| | 1,832 |
| | 2,252 |
| | 2,835 |
| | 2,808 |
| | 3,116 |
| | 3,905 |
| | 4,555 |
|
Other overhead costs (4) | 6,441 |
| | 7,646 |
| | 8,852 |
| | 11,411 |
| | 14,375 |
| | 16,297 |
| | 18,158 |
| | 21,552 |
|
| Total | $ | 20,632 |
| | $ | 23,344 |
| | $ | 27,995 |
| | $ | 36,705 |
| | $ | 45,908 |
| | $ | 52,011 |
| | $ | 58,676 |
| | $ | 66,805 |
|
| | | | | | | | | | | | | | | | |
| (1) Compensation and benefits includes all payroll and related costs, including benefits, payroll taxes and equity-based compensation, except those related to preparing vehicles for sale, which are included in cost of sales. |
| (2) Market occupancy costs includes rent, utilities, security, repairs and maintenance and depreciation of buildings and improvements, including vending machines and fulfillment centers, excluding the portion related to reconditioning vehicles which is included in cost of sales, and excluding the portion related to our corporate office which is included in other overhead costs. |
| (3) Logistics includes fuel, maintenance and depreciation related to owning and operating our own transportation fleet, and third party transportation fees, except the portion related to inbound transportation, which are included in cost of sales. |
| (4) Other overhead costs include all other overhead and depreciation expenses such as IT expenses, limited warranty, travel, insurance, bad debt, title and registration and other administrative expenses. |