
ASV Holdings, Inc. Q2-2017 Earnings Conference Call August 9, 2017 EX 99.2
This presentation contains forward-looking statements. In some cases, you can identify forward-looking statements by terminology such as “may,” “should,” “expects,” “plans,” “anticipates,” “believes,” “estimates,” “predicts,” “potential,” “intends” or “continue,” and other similar expressions that are predictions of or indicate future events and future trends, or the negative of these terms or other comparable terminology. Forward-looking statements in this presentation include, without limitation: (1) projections of revenue, earnings, capital structure and other financial items, (2) statements of our plans and objectives, (3) statements regarding the capabilities and capacities of our business operations, (4) statements of expected future economic conditions and the effect on us and on dealers or OEM customers, (5) expected benefits of our cost reduction measures, and (6) assumptions underlying statements regarding us or our business. Our actual results may differ from information contained in these forward looking-statements for many reasons, including those described in the section entitled “Risk Factors” in our Registration Statement on Form S-1 (SEC File No. 333-216912), which was filed in connection with our initial public offering and is available on our EDGAR page at www.sec.gov. These statements are only current predictions and are subject to known and unknown risks, uncertainties and other factors that may cause our or our industry’s actual results, levels of activity, performance or achievements to be materially different from those anticipated by the forward-looking statements. We discuss many of these risks in greater detail under the heading “Risk Factors” and elsewhere in the Registration Statement on Form S-1. You should not rely upon forward-looking statements as predictions of future events. Although we believe that the expectations reflected in the forward-looking statements are reasonable, we cannot guarantee future results, levels of activity, performance or achievements. Except as required by law, after the date of this presentation, we are under no duty to update or revise any of the forward-looking statements, whether as a result of new information, future events or otherwise. We obtained the industry, market and competitive position data in this presentation from our own internal estimates and research as well as from industry and general publications and research surveys and studies conducted by third parties. While we believe that each of these studies and publications is reliable, we have not independently verified market and industry data from third-party sources. While we believe our internal company research is reliable and the market definitions we use are appropriate, neither such research nor these definitions have been verified by any independent source. We from time to time refer to various non-GAAP financial measures in this presentation. We believe that this information is useful to understanding our operating results by excluding certain items that may not be indicative of our core operating results and business outlook. Reference to these non-GAAP financial measures should not be considered as a substitute for, or superior to, results that are presented in a manner consistent with GAAP. Rather, the non-GAAP financial information should be considered in addition to results that are presented in a manner consistent with GAAP. A reconciliation of non-GAAP financial measures referred to in this presentation is provided in the tables at the conclusion of this presentation. Forward-Looking Statements & Non – GAAP Financial Measures
Strong second quarter income and cash flow results : Year over year revenue growth of 25.3% Machine sales revenue growth of 27.0% Adjusted EBITDA of $3.4 million or 9.9% of sales Q2-2017 Net income of $1.8 million and EPS of $0.20 Cash flow from operations of $4.8 million in the quarter- $5.9 million year to date Balance sheet continues to improve via net proceeds of $10.4 million from IPO and nearly $5 million in cash generation in the quarter Key markets of North America and Australia are growing modestly Progress made with key strategic initiatives to relaunch the brand, sign up new dealers, grow distribution, and penetrate rental markets Summary
North America Market Factors Housing Market*: Housing starts in June SAAR of 1,215,000. This is 8.3 percent above May estimate of 1,122,000 and is 2.1 percent above June 2016. Single-family housing starts in June were at a rate of 849,000, 6.3% above May 2017. Construction Spending*: June 2017 SAAR of $1,205.8 billion, 1.3% below May 2017. The June figure is 1.6 percent above June 2016. June YTD construction spending 4.8 percent above the same period in 2016. Rental Market**: 2016 rental penetration index at 53.8%, flat with 2015. Forecast CAGR of 4.3% to 2020. Rental company consolidations (H&E/Neff; Blue Line/Capital Rentals). July market update forecasts 2017 rental revenue 4.3% growth YOY in USA and 2.7% in Canada, slight increases v January 2017 forecast** Australia: *** Economic growth is projected to gain strength this year and reach almost 3% in 2018. The recovery in mining investment, new LNG production, and continued rebalancing towards non-mining sectors will drive the gradual pick-up of overall activity. Industry & Market Overview Source: *US Census Bureau: ** American Rental Association (ARA) ***OECD Economic Forecast Summary June 2017 SAAR: “Seasonally adjusted annual rate”
New machine sales Machine revenues growth of 27% compared to Q2-2016 ASV branded machine sales at 95.3% of machine sales in Q2-17 compared to 58.7% in Q2-16 – Year over year growth of 111% Shifting distribution to independent ASV dealer network Machine sales through Terex distribution at 4.7% compared to 41.3% in Q2-2016 Adding distribution and new channels to market Targeting 80-110 additional dealer locations in 2017- Added 35 YTD at 6/30/17 Good pipeline of prospects to continue expansion Attending ICUEE trade show in Louisville, KY in October 2017 Expand rental market penetration Machines on test at two regional rental companies with good feedback on performance Attending ARA trade show in New Orleans, LA in February 2018 ASV Strategic Growth Drivers-Update
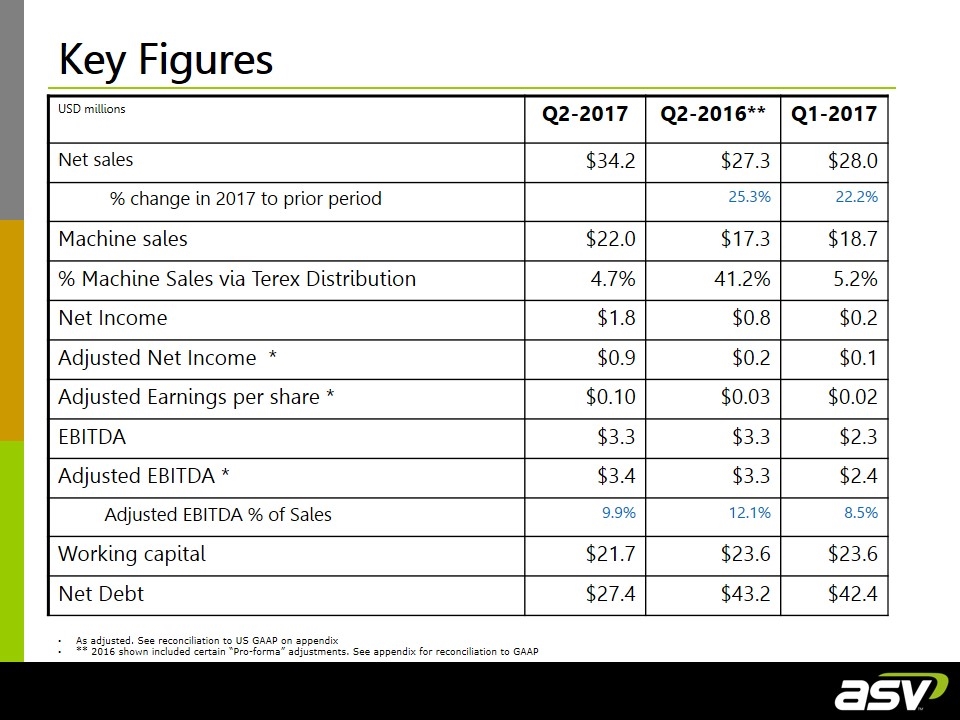
USD millions Q2-2017 Q2-2016** Q1-2017 Net sales $34.2 $27.3 $28.0 % change in 2017 to prior period 25.3% 22.2% Machine sales $22.0 $17.3 $18.7 % Machine Sales via Terex Distribution 4.7% 41.2% 5.2% Net Income $1.8 $0.8 $0.2 Adjusted Net Income * $0.9 $0.2 $0.1 Adjusted Earnings per share * $0.10 $0.03 $0.02 EBITDA $3.3 $3.3 $2.3 Adjusted EBITDA * $3.4 $3.3 $2.4 Adjusted EBITDA % of Sales 9.9% 12.1% 8.5% Working capital $21.7 $23.6 $23.6 Net Debt $27.4 $43.2 $42.4 As adjusted. See reconciliation to US GAAP on appendix ** 2016 shown included certain “Pro-forma” adjustments. See appendix for reconciliation to GAAP Key Figures
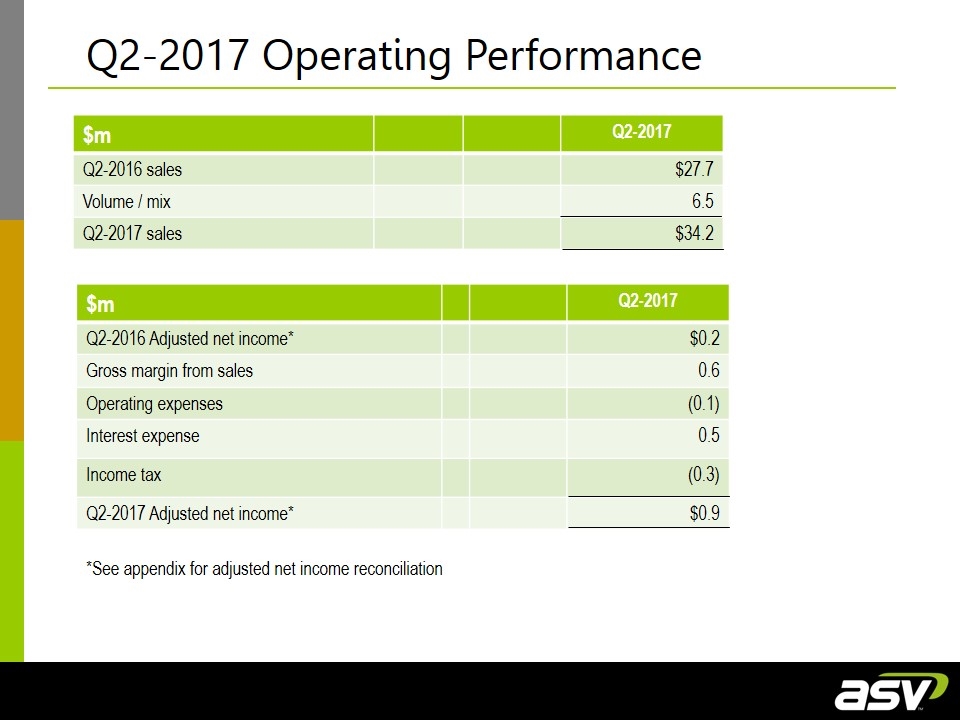
“Focused manufacturer of engineered lifting equipment” $m Q2-2017 Q2-2016 sales $27.7 Volume / mix 6.5 Q2-2017 sales $34.2 $m Q2-2017 Q2-2016 Adjusted net income* $0.2 Gross margin from sales 0.6 Operating expenses (0.1) Interest expense 0.5 Income tax (0.3) Q2-2017 Adjusted net income* $0.9 Q2-2017 Operating Performance *See appendix for adjusted net income reconciliation
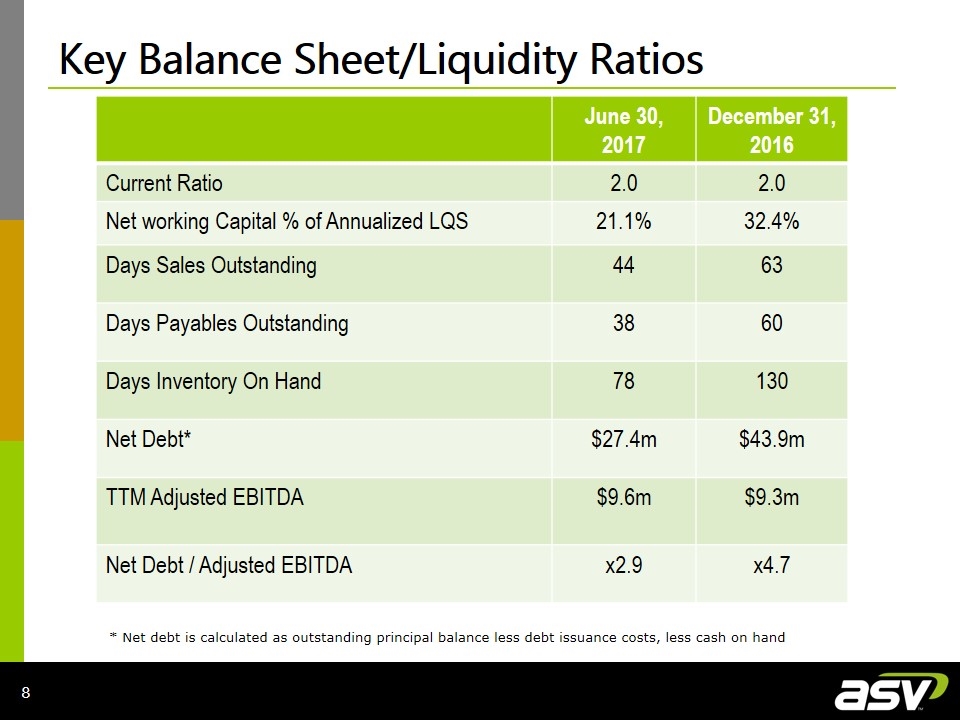
Key Balance Sheet/Liquidity Ratios June 30, 2017 December 31, 2016 Current Ratio 2.0 2.0 Net working Capital % of Annualized LQS 21.1% 32.4% Days Sales Outstanding 44 63 Days Payables Outstanding 38 60 Days Inventory On Hand 78 130 Net Debt* $27.4m $43.9m TTM Adjusted EBITDA $9.6m $9.3m Net Debt / Adjusted EBITDA x2.9 x4.7 * Net debt is calculated as outstanding principal balance less debt issuance costs, less cash on hand
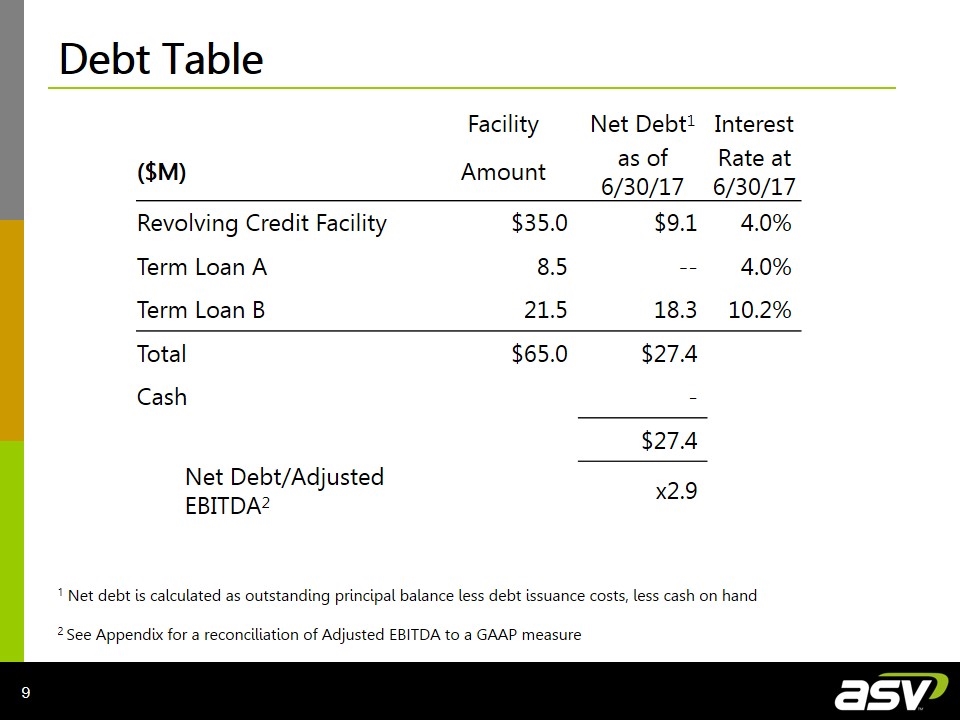
Debt Table Facility Net Debt1 Interest ($M) Amount as of 6/30/17 Rate at 6/30/17 Revolving Credit Facility $35.0 $9.1 4.0% Term Loan A 8.5 -- 4.0% Term Loan B 21.5 18.3 10.2% Total $65.0 $27.4 Cash - $27.4 Net Debt/Adjusted EBITDA2 x2.9 1 Net debt is calculated as outstanding principal balance less debt issuance costs, less cash on hand 2 See Appendix for a reconciliation of Adjusted EBITDA to a GAAP measure
Appendix
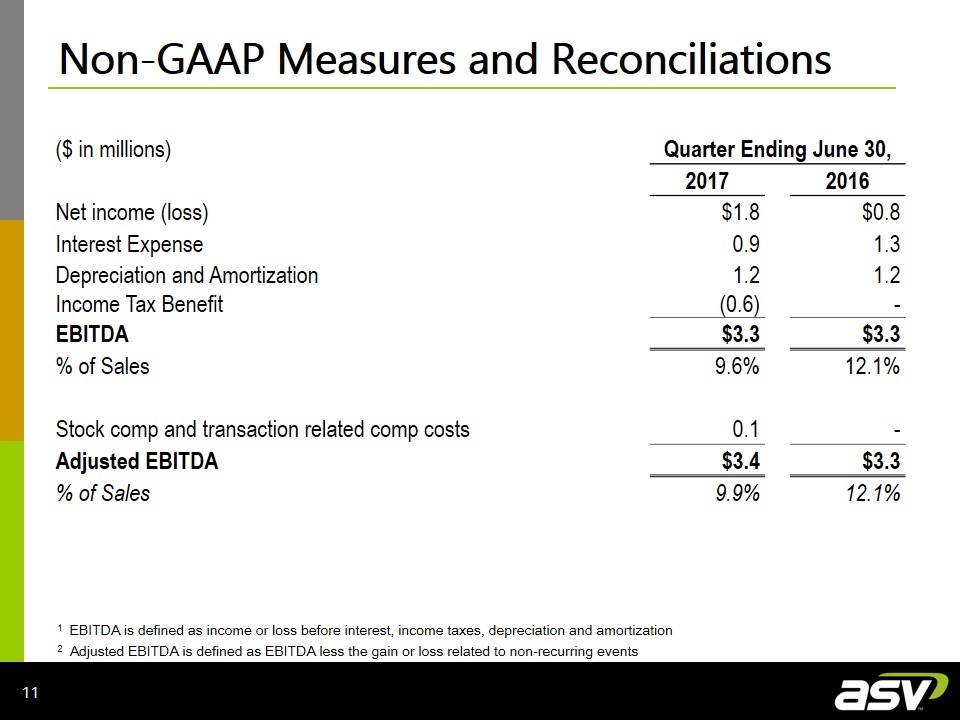
Non-GAAP Measures and Reconciliations 1 EBITDA is defined as income or loss before interest, income taxes, depreciation and amortization 2 Adjusted EBITDA is defined as EBITDA less the gain or loss related to non-recurring events ($ in millions) Quarter Ending June 30, 2017 2016 Net income (loss) $1.8 $0.8 Interest Expense 0.9 1.3 Depreciation and Amortization Income Tax Benefit 1.2 (0.6) 1.2 - EBITDA $3.3 $3.3 % of Sales 9.6% 12.1% Stock comp and transaction related comp costs 0.1 - Adjusted EBITDA $3.4 $3.3 % of Sales 9.9% 12.1%
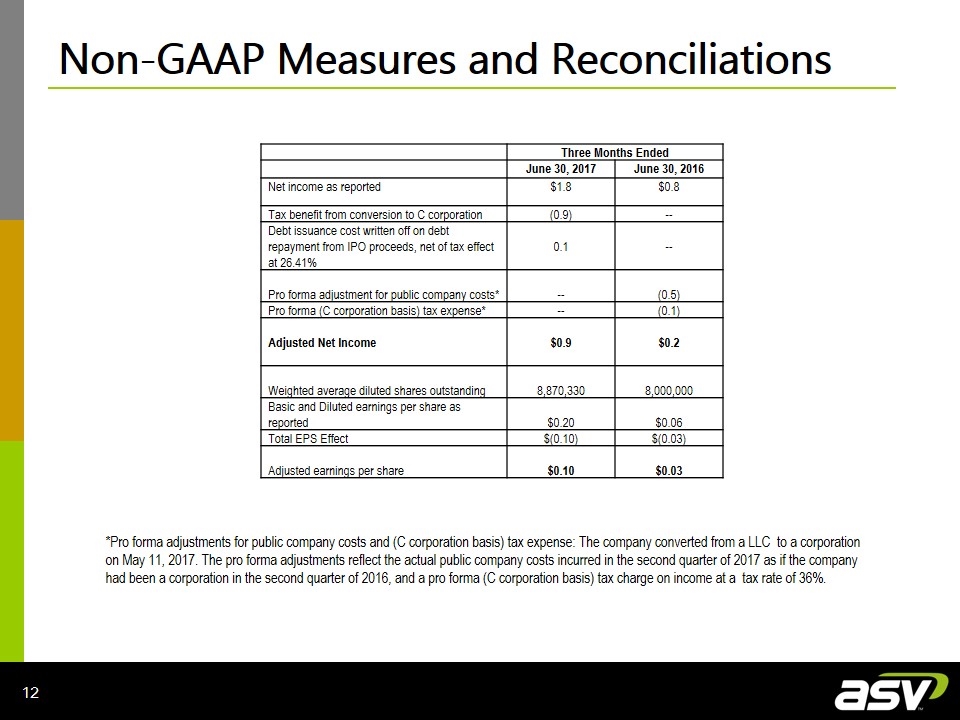
Non-GAAP Measures and Reconciliations Three Months Ended June 30, 2017 June 30, 2016 Net income as reported $1.8 $0.8 Tax benefit from conversion to C corporation (0.9) -- Debt issuance cost written off on debt repayment from IPO proceeds, net of tax effect at 26.41% 0.1 -- Pro forma adjustment for public company costs* -- (0.5) Pro forma (C corporation basis) tax expense* -- (0.1) Adjusted Net Income $0.9 $0.2 Weighted average diluted shares outstanding 8,870,330 8,000,000 Basic and Diluted earnings per share as reported $0.20 $0.06 Total EPS Effect $(0.10) $(0.03) Adjusted earnings per share $0.10 $0.03 *Pro forma adjustments for public company costs and (C corporation basis) tax expense: The company converted from a LLC to a corporation on May 11, 2017. The pro forma adjustments reflect the actual public company costs incurred in the second quarter of 2017 as if the company had been a corporation in the second quarter of 2016, and a pro forma (C corporation basis) tax charge on income at a tax rate of 36%.
ASV Holdings, Inc. Q2-2017 Earnings Conference Call August 9, 2017 At ASV Holdings, Inc. Andrew Rooke, Chairman & C.E.O. 1-218-327-5389 Contact: At Darrow Associates, Inc. Peter Seltzberg, IR for ASV 1-516-419-9915


