Table of Contents
UNITED STATES
SECURITIES AND EXCHANGE COMMISSION
Washington, D.C. 20549
FORM N-CSR
CERTIFIED SHAREHOLDER REPORT OF REGISTERED
MANAGEMENT INVESTMENT COMPANIES
Investment Company Act file number: 811-23216
FS Series Trust
(Exact name of registrant as specified in charter)
201 Rouse Boulevard
Philadelphia, Pennsylvania 19112
(Address of principal executive officers)
Michael C. Forman
FS Series Trust
201 Rouse Boulevard
Philadelphia, Pennsylvania 19112
(Name and address of agent for service)
Registrant’s telephone number, including area code: (215) 495-1185
Date of fiscal year end: December 31
Date of reporting period: December 31, 2021
Table of Contents
| Item 1. | Reports to Shareholders. |
| (a) | The following is a copy of the report transmitted to shareholders pursuant to Rule 30e-1 under the Investment Company Act of 1940, as amended (the “1940 Act”): |
Table of Contents
 | Annual report | |
| 2021 |
FS Series Trust
FS Multi-Strategy Alternatives Fund
FS Managed Futures Fund
FS Chiron Real Asset Fund |
Table of Contents
Annual Report for the Year Ended December 31, 2021
| Page | ||||
Management’s Discussion of Fund Performance (unaudited) | ||||
| 1 | ||||
| 3 | ||||
| 5 | ||||
| 7 | ||||
| 9 | ||||
Schedule of Investments | ||||
| 10 | ||||
| 44 | ||||
| 50 | ||||
| 54 | ||||
| 56 | ||||
| 57 | ||||
Financial Highlights | ||||
| 59 | ||||
| 63 | ||||
| 67 | ||||
| 71 | ||||
Table of Contents
FS MULTI-STRATEGY ALTERNATIVES FUND
Dear Shareholder:
For the fiscal year ended December 31, 2021, FS Multi-Strategy Alternatives Fund (the “Fund”) returned 13.96% (Class I shares) with a realized 3.8% annualized monthly volatility and a 0.49 correlation to equities. The BofA Merrill Lynch 3-Month U.S. Treasury Bill Index (which tracks the performance of the U.S. dollar-denominated U.S. Treasury Bills publicly issued in the U.S. domestic market with remaining term to final maturity of less than 3 months), the primary benchmark for the Fund, had a positive return of 0.05% over this time period.
The Fund follows a “hybrid” investment approach — allocating to both skilled hedge fund managers for alpha and rules-based alternative beta strategies for long/short sources of return that can be captured systematically. These strategies trade long and short across different asset groups: stocks of major developed markets, country indices, bond futures, interest rate futures, currencies, bonds and credit securities.
The fund allocates to three hedge fund managers:
| • | Chilton Investment Company, LLC (“Chilton”) pursues a long/short equity strategy focused on high-quality companies with strong business models and growth potential at reasonable valuations. |
| • | Crabel Capital Management, LLC (“Crabel”): specializes in the systematic, automated trading of worldwide futures and foreign exchange designed to capture market anomalies implemented through a technologically advanced, low latency infrastructure to deliver uncorrelated return. |
| • | MidOcean Credit Fund Management, L.P. (“MidOcean”) implements an event driven long/short credit strategy which seeks to capture current income and growth from three primary pockets of inefficiencies in the credit market: callable bonds, short-dated credit and crossover credit. |
The Fund invests across four main alternative beta strategy categories:
| • | Equity: Investing in stocks seeking to generate returns less sensitive to market direction based on specific factors (e.g. size, quality) |
| • | Macro: Investing in bonds, currencies and commodities seeking to generate risk-adjusted returns through specific factors (e.g., value, carry) |
| • | Technical trading: Investing across asset classes seeking to generate uncorrelated returns-based on price trends and trading patterns (e.g., momentum, mean reversion) |
| • | Volatility: Investing in volatility markets seeking to profit from price inefficiencies and relative value opportunities (e.g., realized volatility vs implied volatility) |
The Fund uses derivatives to execute investment objectives for a variety of purposes, such as to seek economic exposure to one or more alternative strategies, enhance returns, increase investment flexibility, speculate on a targeted investment opportunity, or for hedging purposes. In attempting to achieve its investment objectives, the Fund primarily use total return basket swaps that seek both long and short exposure on variety of strategies, in a notional amount, that the Funds could not otherwise have exposure to on a name by name basis. The total return basket swaps include exposure to equity, foreign currency, commodity and interest rate risk.
Performance this year was driven primarily by positive contributions from the rules-based alternative beta strategies. The Fund’s best performing alternative beta strategies were Equity risk premia strategies, particularly those strategies seeking to capture the value, size, and volatility factors. The Fund’s hedge fund managers, Chilton, MidOcean, and Crabel all positively contributed to fund performance in 2021. Though 2021 ended on a
1
Table of Contents
positive note for traditional assets, 2022 is likely to be more volatile and less constructive for markets. This type of environment creates a great opportunity set for the fund’s alpha managers and alternative beta strategies to deliver differentiated return. The fund’s low reliance on beta, broad return contribution and uncorrelated return streams allow the fund to navigate ever changing market dynamics. By focusing on balanced, macro aware return the fund is looking to generate quality of return with diversification benefits such as low correlation to equities and bonds as well as capital preservation.
Sincerely,
| • | Michael Kelly |
| • | Scott Burr |
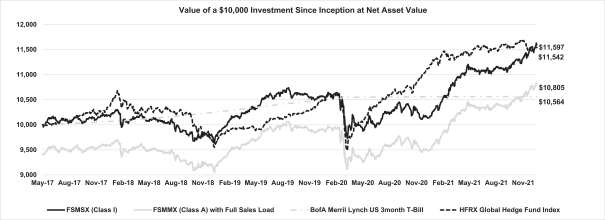
Cumulative Total Return
| Period from May 16, 2017 (Commencement of Operations) through December 31, 2021 | 2021 | |||||||
FSMSX (Class I) | 15.97 | % | 13.96 | % | ||||
FSMMX (Class A) with Full Sales Load | 8.06 | % | 7.04 | % | ||||
BofA Merril Lynch US 3month T-Bill | 5.64 | % | 0.05 | % | ||||
HFRX Global Hedge Fund Index | 15.42 | % | 3.04 | % | ||||
Performance quoted represents past performance, which may be higher or lower than current performance. Past performance is not indicative of future results. Investment returns and principal value of an investment will fluctuate so that an investor’s shares, when redeemed, may be worth more or less than their original costs. The returns shown do not reflect taxes that an investor would pay on Fund distributions or on the sale of Fund shares. To obtain the most recent month-end performance, visit www.fsinvestments.com.
2
Table of Contents
Dear Shareholder:
For the fiscal year ended December 31, 2021, FS Chiron Real Asset Fund (the “Fund”) returned 18.0% (Class I shares) with a realized 8.1% annualized monthly volatility and a 0.49 correlation to equities. The primary benchmarks for the Fund are a blended index consisting of 60% the BofA Merrill Lynch 3-Month U.S. Treasury Bill Index (which tracks the performance of the U.S. dollar-denominated U.S. Treasury Bills publicly issued in the U.S. domestic market with remaining term to final maturity of less than 3 months) and 40% the S&P 500 Index (which tracks the performance of large capitalization US equities), as well as a blended index consisting of 35% the MSCI ACWI Net Total Return USD Index (which is a free-float weighted equity index including both emerging and developed world markets), 32.5% the Bloomberg Commodity Total Return Index (which is composed of commodity futures contracts weighted 2/3 by trading volume and 1/3 by world production) and 32.5% the Bloomberg US Treasury Inflation-Linked Bond Index (which measures the performance of the US Treasury Inflation Protected Securities (TIPS) market). These benchmarks had positive returns of 10.9% and 17.3.0% over this period, respectively.
The Fund seeks to achieve its investment objective by actively allocating its assets across a broad spectrum of real asset investments, which may include i) instruments or companies that derive their value from physical properties (such as energy and natural resources, real estate, basic materials, equipment, utilities and infrastructure, and commodities), ii) companies that are directly involved in real asset activities (such as logistics, data centers, communication towers, life sciences office and lab space, cold storage and renewable power among, among others,, and iii) inflation-indexed securities that can generate returns in inflationary environments.
The Fund utilizes a “quantamental” approach, which combines quantitative and fundamental research. The quantitative process identifies opportunities for growth with the fundamental approach identifying changes not captured by the quantitative research, such as regulatory environment and industry dynamics. As markets are not static and go through various stages, the Fund seeks to identify the current stage in each market in which it invests and makes investment decisions accordingly, in order to capitalize on the underlying factors driving that particular market stage. The Fund aims to reduce volatility and risk through diversifying its investment choices across a range of industries.
The Fund uses derivatives to execute investment objectives for a variety of purposes, such as to seek economic exposure to one or more alternative strategies, enhance returns, increase investment flexibility, speculate on a targeted investment opportunity, or for hedging purposes.
Performance this year was driven primarily by long exposure to equities across the energy, real estate, materials, and industrials sectors. Commodity exposure also delivered positive returns for the fund.
Looking forward, as markets become increasingly focused on monetary policy and inflation, the opportunity set for the fund is quite robust. The fund will continue to dynamically invest in global markets across a broad range of traditional (real estate, commodities, infrastructure and energy) and next generation real assets to generate differentiated total returns through economic and inflationary cycles. This approach allows the fund to capitalize on cyclical and growth-oriented opportunities vs. traditional real asset funds which tend to be highly biased to value/cyclical assets. Finally, the fund’s focus on next generation real assets provides investors exposure to growth-oriented areas of the economy which may offer attractive returns regardless of the level or direction of inflation.
Sincerely,
| • | Peter Bianco |
| • | Scott Burr |
| • | Brian Cho |
3
Table of Contents
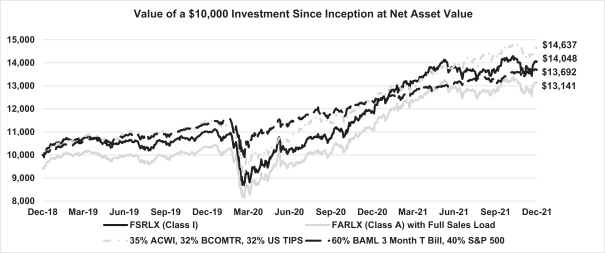
Cumulative Total Return
| Period from Dec 31, 2018 (Commencement of Operations) through December 31, 2021 | 2021 | |||||||
FSRLX (Class I) | 40.48 | % | 18.02 | % | ||||
FARLX (Class A) with Full Sales Load | 31.41 | % | 11.19 | % | ||||
60% BAML 3 Month T Bill, 40% S&P 500 | 36.92 | % | 10.88 | % | ||||
35% ACWI, 32% BCOMTR, 32% US TIPS | 46.37 | % | 17.88 | % | ||||
Performance quoted represents past performance, which may be higher or lower than current performance. Past performance is not indicative of future results. Investment returns and principal value of an investment will fluctuate so that an investor’s shares, when redeemed, may be worth more or less than their original costs. The returns shown do not reflect taxes that an investor would pay on Fund distributions or on the sale of Fund shares. To obtain the most recent month-end performance, visit www.fsinvestments.com.
4
Table of Contents
Dear Shareholder:
For the fiscal year ended December 31, 2021, FS Managed Futures Fund (the “Fund”) returned 3.5% (Class I shares) with a realized 8.7% annualized monthly volatility and a 0.64 correlation to equities. The BofA Merrill Lynch 3-Month U.S. Treasury Bill Index (which tracks the performance of the U.S. dollar-denominated U.S. Treasury Bills publicly issued in the U.S. domestic market with remaining term to final maturity of less than 3 months), the primary benchmark for the Fund, had a positive return of 0.05% over this time period.
The Fund seeks to achieve its investment objective by allocating its assets across a broad spectrum of alternative investment strategies. The Fund may provide exposure to alternative strategies across the five major asset classes (commodities, currencies, fixed income, equities and credit). The strategy will normally be implemented through rules-based strategies that typically use historical price data to determine whether to take a long, short, or cash position in a given instrument. A rules-based strategy is a methodology based on a systematic approach. Principal strategies include “momentum/trend” based strategies that buy and sell securities in the same direction as the historical price movement and “counter-trend/mean reversion” based strategies that buy and sell securities in the opposite direction as the historical price movement. Other alternative strategies that do not rely on historical prices may also be utilized to enhance return.
The Fund uses derivatives to execute investment objectives for a variety of purposes, such as to seek economic exposure to one or more alternative strategies, enhance returns, increase investment flexibility, speculate on a targeted investment opportunity, or for hedging purposes. In attempting to achieve its investment objectives, the Fund primarily use total return basket swaps that seek both long and short exposure on variety of strategies, in a notional amount, that the Funds could not otherwise have exposure to on a name by name basis. The total return basket swaps include exposure to equity, foreign currency, and interest rate risk.
In 2021, the top performing strategies for the Fund were equity risk premia strategies, particularly those looking to capture the low volatility and momentum factors, as well as commodity exposure. The bottom performing strategy for the Fund was a cross asset trend following strategy.
Rising market fragility, driven by the policy, illiquidity and positioning feedback loop creates a favorable backdrop for the Fund. With the market going from calm to stressed in record level frequency and intensity, the Fund’s strategies can monetize the market across time frames — intra-day, weekly and monthly. The fund has delivered its best returns during periods of market turbulence such as March 2020 and improves the overall risk adjusted return of traditional asset allocations.
Sincerely,
| • | Michael Kelly |
| • | Scott Burr |
5
Table of Contents
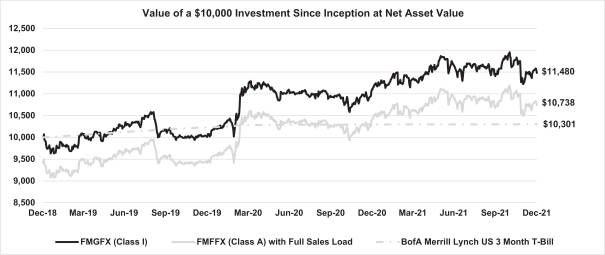
Cumulative Total Return
| Period from Dec 31, 2018 (Commencement of Operations) through December 31, 2021 | 2021 | |||||||
FMGFX (Class I) | 14.80 | % | 3.48 | % | ||||
FMFFX (Class A) with Full Sales Load | 7.38 | % | -2.71 | % | ||||
BofA Merrill Lynch US 3 Month T-Bill | 3.01 | % | 0.05 | % | ||||
Performance quoted represents past performance, which may be higher or lower than current performance. Past performance is not indicative of future results. Investment returns and principal value of an investment will fluctuate so that an investor’s shares, when redeemed, may be worth more or less than their original costs. The returns shown do not reflect taxes that an investor would pay on Fund distributions or on the sale of Fund shares. To obtain the most recent month-end performance, visit www.fsinvestments.com.
6
Table of Contents
Shareholder Fee Example (Unaudited)
Fund Expenses — for the period from July 01, 2021 through December 31, 2021 (Unaudited)
Example: As a Fund shareholder, you incur two types of costs: (1) transaction costs, including sales charges (loads) on purchase (if any); and (2) ongoing costs, including management fees; distribution and/or service fees (12b-1 fees); and other Fund expenses. This example is intended to help you understand your ongoing costs (in dollars) of investing in the Fund and to compare these costs with the ongoing costs of investing in other mutual funds. The actual and hypothetical expense examples are based on an investment of $1,000 invested at the beginning of a six month period and held through the six months ended December 31, 2021.
Actual Expenses: The first section of the table below provides information about actual account values and actual expenses. You may use the information in this section, together with the amount you invested, to estimate the expenses that you paid over the period. Simply divide your account value by $1,000 (for example, an $8,600 account value divided by $1,000 = 8.6), then multiply the result by the number in the first section under the heading entitled “Expenses Paid During Period” to estimate the expenses you paid on your account during this period.
Hypothetical Example for Comparison Purposes: The second section of the table below provides information about hypothetical account values and hypothetical expenses based on the Fund’s actual expense ratio and an assumed rate of return of 5% per year (before expenses), which is not the actual Fund return. The hypothetical account values and expenses may not be used to estimate the actual ending account balance or expenses you paid for the period. You may use this information to compare the ongoing costs of investing in the Fund and other funds. To do so, compare this 5% hypothetical example with the 5% hypothetical examples that appear in the shareholder reports of the other funds.
Please note that the expenses shown in the table are meant to highlight your ongoing costs only and do not reflect any transactional costs, such as sales charges (loads) or redemption/exchange fees. Therefore, the second section of the table is useful in comparing ongoing costs only, and will not help you determine the relative total costs of owning different funds. In addition, if these transactional costs were included, your costs would have been higher.
7
Table of Contents
FS Multi-Strategy Alternatives Fund
| Beginning Account Value (7/1/21) | Ending Account Value (12/31/21) | Expenses Paid During the Period(*) | Annualized Net Expense Ratio(**) | |||||||||||||
Actual |
| |||||||||||||||
Class A Shares | $ | 1,000.00 | $ | 1,044.20 | $ | 12.02 | 2.33 | % | ||||||||
Class I Shares | $ | 1,000.00 | $ | 1,046.70 | $ | 10.96 | 2.12 | % | ||||||||
| Beginning Account Value (7/1/21) | Ending Account Value (12/31/21) | Expenses Paid During the Period(*) | Annualized Expense Ratio(**) | |||||||||||||
Hypothetical (5% annual return before expenses) |
| |||||||||||||||
Class A Shares | $ | 1,000.00 | $ | 1,013.45 | $ | 11.84 | 2.33 | % | ||||||||
Class I Shares | $ | 1,000.00 | $ | 1,014.50 | $ | 10.78 | 2.12 | % | ||||||||
FS Managed Futures Fund
| Beginning Account Value (7/1/21) | Ending Account Value (12/31/21) | Expenses Paid During the Period(*) | Annualized Net Expense Ratio(**) | |||||||||||||
Actual |
| |||||||||||||||
Class A Shares | $ | 1,000.00 | $ | 985.50 | $ | 3.69 | 0.74 | % | ||||||||
Class I Shares | $ | 1,000.00 | $ | 986.10 | $ | 2.46 | 0.49 | % | ||||||||
| Beginning Account Value (7/1/21) | Ending Account Value (12/31/21) | Expenses Paid During the Period(*) | Annualized Expense Ratio(**) | |||||||||||||
Hypothetical (5% annual return before expenses) |
| |||||||||||||||
Class A Shares | $ | 1,000.00 | $ | 1,021.49 | $ | 3.76 | 0.74 | % | ||||||||
Class I Shares | $ | 1,000.00 | $ | 1,022.72 | $ | 2.51 | 0.49 | % | ||||||||
FS Chiron Real Asset Fund
| Beginning Account Value (7/1/21) | Ending Account Value (12/31/21) | Expenses Paid During the Period(*) | Annualized Net Expense Ratio(**) | |||||||||||||
Actual |
| |||||||||||||||
Class A Shares | $ | 1,000.00 | $ | 1,018.20 | $ | 5.07 | 1.00 | % | ||||||||
Class I Shares | $ | 1,000.00 | $ | 1,019.30 | $ | 5.53 | 1.09 | % | ||||||||
| Beginning Account Value (7/1/21) | Ending Account Value (12/31/21) | Expenses Paid During the Period(*) | Annualized Expense Ratio(**) | |||||||||||||
Hypothetical (5% annual return before expenses) |
| |||||||||||||||
Class A Shares | $ | 1,000.00 | $ | 1,020.18 | $ | 5.07 | 1.00 | % | ||||||||
Class I Shares | $ | 1,000.00 | $ | 1,019.72 | $ | 5.53 | 1.09 | % | ||||||||
| * | Hypothetical expenses are equal to the Fund’s annualized expense ratio for the indicated Class, multiplied by the average account value over the period, multiplied by 184/365 (to reflect the one-half year period). The Example assumes that the $1,000 was invested at the net asset value per share determined at the opening of business on July 1, 2021. |
| ** | Annualized ratio of expenses to average net assets for the period from July 1, 2021 through December 31, 2021. The expense ratio includes the effect of expenses waived or reimbursed by FS Fund Advisor, LLC, each Fund’s investment adviser. |
8
Table of Contents
Report of Independent Registered Public Accounting Firm
To the Shareholders and Board of Trustees of FS Series Trust
Opinion on the Financial Statements
We have audited the accompanying consolidated statements of assets and liabilities of FS Multi-Strategy Alternatives Fund, FS Managed Futures Fund and FS Chiron Real Asset Fund (collectively referred to as the “Funds”), three of the funds constituting FS Series Trust (the “Trust”)) , including the consolidated schedules of investments, as of December 31, 2021, and the related consolidated statements of operations and changes in net assets, and the consolidated financial highlights for each of the periods indicated in the table below and the related notes (collectively referred to as the “financial statements”). In our opinion, the financial statements present fairly, in all material respects, the consolidated financial position of each of the Funds (three of the funds constituting FS Series Trust) at December 31, 2021, the consolidated results of their operations, changes in net assets and financial highlights for each of the periods indicated in the table below, in conformity with U.S. generally accepted accounting principles.
Individual Funds | Consolidated Statements of Operations | Consolidated Statements of Changes in Net Assets | Consolidated Financial | |||
FS Multi-Strategy Alternatives Fund | For the year ended December 31, 2021 | For each of the two years in the period ended December 31, 2021 | For each of the four years in the period ended December 31, 2021 and the period from May 16, 2017 (Commencement of Operations) to December 31, 2017 | |||
FS Managed Futures Fund FS Chiron Real Asset Fund | For the year ended December 31, 2021 | For each of the two years in the period ended December 31, 2021 | For each of the three years in the period ended December 31, 2021 | |||
Basis for Opinion
These financial statements are the responsibility of the Trust’s management. Our responsibility is to express an opinion on each of the Funds’ financial statements based on our audits. We are a public accounting firm registered with the Public Company Accounting Oversight Board (United States) (“PCAOB”) and are required to be independent with respect to the Trust in accordance with the U.S. federal securities laws and the applicable rules and regulations of the Securities and Exchange Commission and the PCAOB.
We conducted our audits in accordance with the standards of the PCAOB. Those standards require that we plan and perform the audit to obtain reasonable assurance about whether the financial statements are free of material misstatement, whether due to error or fraud. The Trust is not required to have, nor were we engaged to perform, an audit of the Trust’s internal control over financial reporting. As part of our audits we are required to obtain an understanding of internal control over financial reporting but not for the purpose of expressing an opinion on the effectiveness of the Trust’s internal control over financial reporting. Accordingly, we express no such opinion.
Our audits included performing procedures to assess the risks of material misstatement of the financial statements, whether due to error or fraud, and performing procedures that respond to those risks. Such procedures included examining, on a test basis, evidence regarding the amounts and disclosures in the financial statements. Our procedures included confirmation of securities owned as of December 31, 2021, by correspondence with the custodian and others or by other appropriate auditing procedures where replies from others were not received. Our audits also included evaluating the accounting principles used and significant estimates made by management, as well as evaluating the overall presentation of the financial statements. We believe that our audits provide a reasonable basis for our opinion.

We have served as auditor of one or more FS Investments investment companies since 2013.
Philadelphia, Pennsylvania
March 2, 2022
9
Table of Contents
FS Multi-Strategy Alternatives Fund
Consolidated Schedule of Investments
As of December 31, 2021
(dollar values in thousands, except share and per share amounts)
| Portfolio Company(a) | Footnotes | Industry | Principal Amount(b) | Amortized Cost | Fair Value(c) | |||||||||||
|
|
|
|
|
| |||||||||||
Corporate Bonds—24.1% |
| |||||||||||||||
ACI Worldwide, Inc., 5.8%, 8/15/26 | (d) | Software | $ | 154 | $ | 161 | $ | 161 | ||||||||
Acrisure LLC / Acrisure Finance, Inc., 6.0%, 8/1/29 | (d) | Insurance | 399 | 399 | 395 | |||||||||||
Alliance Data Systems Corp., 4.8%, 12/15/24 | (d) | Diversified Financial Services | 948 | 913 | 968 | |||||||||||
Altice France Holding SA, 10.5%, 5/15/27 | (d) | Telecommunications | 500 | 446 | 538 | |||||||||||
American Greetings Corp., 8.8%, 4/15/25 | (d) | Housewares | 392 | 409 | 403 | |||||||||||
Apollo Commercial Real Estate Finance, Inc., 4.6%, 6/15/29 | (d) | Real Estate Investment Trusts | 376 | 376 | 364 | |||||||||||
APX Group, Inc., 5.8%, 7/15/29 | (d) | Commercial Services | 239 | 239 | 236 | |||||||||||
Aretec Escrow Issuer, Inc., 7.5%, 4/1/29 | (d) | Diversified Financial Services | 120 | 122 | 123 | |||||||||||
At Home Group, Inc., 4.9%, 7/15/28 | (d) | Retail | 138 | 138 | 136 | |||||||||||
B&G Foods, Inc., 5.3%, 4/1/25 | Food | 123 | 126 | 126 | ||||||||||||
Bausch Health Companies, Inc., 9.0%, 12/15/25 | (d) | Pharmaceuticals | 225 | 237 | 237 | |||||||||||
Bausch Health Companies, Inc., 6.1%, 4/15/25 | (d) | Pharmaceuticals | 806 | 822 | 822 | |||||||||||
Blackstone Mortgage Trust, Inc., 3.8%, 1/15/27 | (d) | Real Estate Investment Trusts | 144 | 144 | 144 | |||||||||||
Bombardier, Inc., 6.0%, 2/15/28 | (d) | Aerospace/Defense | 226 | 228 | 227 | |||||||||||
BroadStreet Partners, Inc., 5.9%, 4/15/29 | (d) | Insurance | 140 | 138 | 138 | |||||||||||
Callon Petroleum Co., 9.0%, 4/1/25 | (d) | Oil & Gas | 203 | 220 | 220 | |||||||||||
CITGO Petroleum Corp., 6.4%, 6/15/26 | (d) | Oil & Gas | 93 | 93 | 95 | |||||||||||
CITGO Petroleum Corp., 7.0%, 6/15/25 | (d) | Oil & Gas | 624 | 624 | 643 | |||||||||||
CommScope Finance LLC, 6.0%, 3/1/26 | (d) | Telecommunications | 264 | 274 | 272 | |||||||||||
CommScope, Inc., 4.8%, 9/1/29 | (d) | Telecommunications | 337 | 340 | 336 | |||||||||||
Connect Finco SARL / Connect US Finco LLC, 6.8%, 10/1/26 | (d) | Telecommunications | 135 | 143 | 142 | |||||||||||
CoreCivic, Inc., 4.8%, 10/15/27 | Commercial Services | 236 | 211 | 214 | ||||||||||||
CoreCivic, Inc., 8.3%, 4/15/26 | Commercial Services | 133 | 134 | 139 | ||||||||||||
CP Atlas Buyer, Inc., 7.0%, 12/1/28 | (d) | Building Materials | 268 | 277 | 267 | |||||||||||
CSC Holdings LLC, 4.5%, 11/15/31 | (d) | Media Entertainment | 433 | 426 | 428 | |||||||||||
Dave & Buster’s, Inc., 7.6%, 11/1/25 | (d) | Retail | 665 | 711 | 710 | |||||||||||
Dealer Tire LLC / DT Issuer LLC, 8.0%, 2/1/28 | (d) | Auto Parts & Equipment | 665 | 586 | 693 | |||||||||||
eG Global Finance Plc, 8.5%, 10/30/25 | (d) | Retail | 196 | 204 | 203 | |||||||||||
eG Global Finance Plc, 6.8%, 2/7/25 | (d) | Retail | 986 | 978 | 999 | |||||||||||
Empire Resorts, Inc., 7.8%, 11/1/26 | (d) | Entertainment | 207 | 208 | 208 | |||||||||||
Five Point Operating Co. LP / Five Point Capital Corp., 7.9%, 11/15/25 | (d) | Real Estate | 1,134 | 1,127 | 1,184 | |||||||||||
Flex Acquisition Co., Inc., 7.9%, 7/15/26 | (d) | Packaging & Containers | 458 | 479 | 476 | |||||||||||
Fortress Transportation and Infrastructure Investors LLC, 9.8%, 8/1/27 | (d) | Trucking & Leasing | 561 | 642 | 629 | |||||||||||
Gates Global LLC / Gates Corp., 6.3%, 1/15/26 | (d) | Miscellaneous Manufacturing | 317 | 327 | 328 | |||||||||||
Genesis Energy LP / Genesis Energy Finance Corp., 7.8%, 2/1/28 | Pipelines | 49 | 48 | 49 | ||||||||||||
GEO Group, Inc., 5.1%, 4/1/23 | Real Estate Investment Trusts | 210 | 201 | 200 | ||||||||||||
GEO Group, Inc., 6.0%, 4/15/26 | Real Estate Investment Trusts | 203 | 178 | 164 | ||||||||||||
Golden Nugget, Inc., 6.8%, 10/15/24 | (d) | Retail | 456 | 458 | 457 | |||||||||||
H-Food Holdings LLC / Hearthside Finance Co., Inc., 8.5%, 6/1/26 | (d) | Food | 246 | 252 | 246 | |||||||||||
See notes to consolidated financial statements.
10
Table of Contents
FS Multi-Strategy Alternatives Fund
Consolidated Schedule of Investments (continued)
As of December 31, 2021
(dollar values in thousands, except share and per share amounts)
Portfolio Company(a) | Footnotes | Industry | Principal Amount(b) | Amortized Cost | Fair Value(c) | |||||||||||
Hadrian Merger Sub, Inc., 8.5%, 5/1/26 | (d) | Healthcare-Services | $ | 283 | $ | 295 | $ | 292 | ||||||||
Herbalife Nutrition Ltd. / HLF Financing, Inc., 7.9%, 9/1/25 | (d) | Pharmaceuticals | 174 | 174 | 185 | |||||||||||
Ingevity Corp., 4.5%, 2/1/26 | (d) | Chemicals | 276 | 278 | 277 | |||||||||||
iStar, Inc., 5.5%, 2/15/26 | Real Estate Investment Trusts | 535 | 554 | 554 | ||||||||||||
Jacobs Entertainment, Inc., 7.9%, 2/1/24 | (d) | Entertainment | 93 | 96 | 95 | |||||||||||
JELD-WEN, Inc., 4.6%, 12/15/25 | (d) | Building Materials | 285 | 289 | 287 | |||||||||||
KAR Auction Services, Inc., 5.1%, 6/1/25 | (d) | Distribution/Wholesale | 942 | 956 | 957 | |||||||||||
Kronos Acquisition Holdings, Inc., 5.0%, 12/31/26 | (d) | Household Products/Wares | 110 | 112 | 109 | |||||||||||
Kronos Acquisition Holdings, Inc., 7.0%, 12/31/27 | (d) | Household Products/Wares | 261 | 266 | 246 | |||||||||||
Ladder Capital Finance Holdings LLLP / Ladder Capital Finance Corp., 4.3%, 2/1/27 | (d) | Real Estate Investment Trusts | 87 | 78 | 88 | |||||||||||
Ladder Capital Finance Holdings LLLP / Ladder Capital Finance Corp., 5.3%, 10/1/25 | (d) | Real Estate Investment Trusts | 444 | 450 | 450 | |||||||||||
Level 3 Financing, Inc., 5.4%, 5/1/25 | Telecommunications | 245 | 250 | 251 | ||||||||||||
LifePoint Health, Inc., 5.4%, 1/15/29 | (d) | Healthcare-Services | 141 | 140 | 141 | |||||||||||
Live Nation Entertainment, Inc., 4.9%, 11/1/24 | (d) | Entertainment | 276 | 279 | 279 | |||||||||||
Lumen Technologies, Inc., 4.0%, 2/15/27 | (d) | Telecommunications | 276 | 282 | 280 | |||||||||||
Maxim Crane Works Holdings Capital LLC, 10.1%, 8/1/24 | (d) | Machinery-Diversified | 688 | 692 | 705 | |||||||||||
Metis Merger Sub LLC, 6.5%, 5/15/29 | (d) | Commercial Services | 224 | 224 | 220 | |||||||||||
Midcap Financial Issuer Trust, 5.6%, 1/15/30 | (d) | Diversified Financial Services | 209 | 207 | 210 | |||||||||||
Mohegan Gaming & Entertainment, 8.0%, 2/1/26 | (d) | Entertainment | 820 | 820 | 862 | |||||||||||
New Home Co., Inc., 7.3%, 10/15/25 | (d) | Home Builders | 566 | 568 | 579 | |||||||||||
Nuance Communications, Inc., 5.6%, 12/15/26 | Software | 138 | 143 | 143 | ||||||||||||
Outfront Media Capital LLC / Outfront Media Capital Corp., 6.3%, 6/15/25 | (d) | Advertising | 164 | 173 | 171 | |||||||||||
Pactiv LLC , 8.0%, 12/15/25 | Packaging & Containers | 217 | 219 | 241 | ||||||||||||
Pactiv LLC, 8.4%, 4/15/27 | Packaging & Containers | 861 | 911 | 960 | ||||||||||||
Panther BF Aggregator 2 LP / Panther Finance Co., Inc., 8.5%, 5/15/27 | (d) | Auto Parts & Equipment | 263 | 283 | 279 | |||||||||||
Powdr Corp., 6.0%, 8/1/25 | (d) | Entertainment | 207 | 218 | 216 | |||||||||||
Prime Healthcare Services, Inc., 7.3%, 11/1/25 | (d) | Healthcare-Services | 264 | 272 | 280 | |||||||||||
Raptor Acquisition Corp. / Raptor Co-Issuer LLC, 4.9%, 11/1/26 | (d) | Entertainment | 382 | 387 | 386 | |||||||||||
RegionalCare Hospital Partners Holdings, Inc. / LifePoint Health, Inc., 9.8%, 12/1/26 | (d) | Healthcare-Services | 77 | 81 | 81 | |||||||||||
Rite Aid Corp., 7.5%, 7/1/25 | (d) | Retail | 36 | 36 | 37 | |||||||||||
Rite Aid Corp., 8.0%, 11/15/26 | (d) | Retail | 93 | 95 | 95 | |||||||||||
RLJ Lodging Trust LP, 3.8%, 7/1/26 | (d) | Real Estate Investment Trusts | 294 | 294 | 296 | |||||||||||
Rockies Express Pipeline LLC, 5.0%, 7/15/29 | (d) | Pipelines | 141 | 144 | 150 | |||||||||||
Royal Caribbean Cruises Ltd., 10.9%, 6/1/23 | (d) | Leisure Time | 451 | 499 | 493 | |||||||||||
RP Escrow Issuer LLC, 5.3%, 12/15/25 | (d) | Healthcare-Services | 239 | 247 | 241 | |||||||||||
Scientific Games International, Inc., 5.0%, 10/15/25 | (d) | Entertainment | 230 | 237 | 237 | |||||||||||
SeaWorld Parks & Entertainment, Inc., 8.8%, 5/1/25 | (d) | Entertainment | 402 | 432 | 427 | |||||||||||
SeaWorld Parks & Entertainment, Inc., 5.3%, 8/15/29 | (d) | Entertainment | 40 | 40 | 41 | |||||||||||
See notes to consolidated financial statements.
11
Table of Contents
FS Multi-Strategy Alternatives Fund
Consolidated Schedule of Investments (continued)
As of December 31, 2021
(dollar values in thousands, except share and per share amounts)
Portfolio Company(a) | Footnotes | Industry | Principal Amount(b) | Amortized Cost | Fair Value(c) | |||||||||||
Service Properties Trust, 7.5%, 9/15/25 | Real Estate Investment Trusts | $ | 814 | $ | 909 | $ | 883 | |||||||||
Sonic Automotive, Inc., 4.9%, 11/15/31 | (d) | Retail | 209 | 209 | 211 | |||||||||||
Sonic Automotive, Inc., 4.6%, 11/15/29 | (d) | Retail | 97 | 97 | 98 | |||||||||||
Spirit Loyalty Cayman Ltd. / Spirit IP Cayman Ltd., 8.0%, 9/20/25 | (d) | Airlines | 805 | 885 | 889 | |||||||||||
SRS Distribution, Inc., 6.0%, 12/1/29 | (d) | Retail | 287 | 288 | 289 | |||||||||||
Starwood Property Trust, Inc., 3.8%, 12/31/24 | (d) | Real Estate Investment Trusts | 460 | 460 | 466 | |||||||||||
Starwood Property Trust, Inc., 3.6%, 7/15/26 | (d) | Real Estate Investment Trusts | 492 | 493 | 490 | |||||||||||
Stericycle, Inc., 5.4%, 7/15/24 | (d) | Environmental Control | 325 | 331 | 332 | |||||||||||
Sunoco LP / Sunoco Finance Corp., 6.0%, 4/15/27 | Oil & Gas | 96 | 86 | 100 | ||||||||||||
Surgery Center Holdings, Inc., 6.8%, 7/1/25 | (d) | Healthcare-Services | 451 | 459 | 455 | |||||||||||
TKC Holdings, Inc., 6.9%, 5/15/28 | (d) | Food Service | 537 | 546 | 550 | |||||||||||
TransDigm UK Holdings Plc, 6.9%, 5/15/26 | Aerospace/Defense | 472 | 496 | 494 | ||||||||||||
TransDigm, Inc., 6.4%, 6/15/26 | Aerospace/Defense | 563 | 581 | 579 | ||||||||||||
TransDigm, Inc., 6.3%, 3/15/26 | (d) | Aerospace/Defense | 244 | 253 | 254 | |||||||||||
Triumph Group, Inc., 8.9%, 6/1/24 | (d) | Aerospace/Defense | 721 | 788 | 787 | |||||||||||
Trivium Packaging Finance B.V., 8.5%, 8/15/27 | (d) | Packaging & Containers | 221 | 237 | 234 | |||||||||||
Uber Technologies, Inc., 8.0%, 11/1/26 | (d) | Internet | 756 | 805 | 806 | |||||||||||
US Acute Care Solutions LLC, 6.4%, 3/1/26 | (d) | Healthcare-Services | 722 | 747 | 757 | |||||||||||
Vector Group Ltd., 5.8%, 2/1/29 | (d) | Agriculture | 728 | 728 | 710 | |||||||||||
Vector Group Ltd., 10.5%, 11/1/26 | (d) | Agriculture | 622 | 656 | 645 | |||||||||||
Verscend Escrow Corp., 9.8%, 8/15/26 | (d) | Commercial Services | 396 | 418 | 421 | |||||||||||
Viasat, Inc., 5.6%, 9/15/25 | (d) | Telecommunications | 521 | 529 | 524 | |||||||||||
WASH Multifamily Acquisition, Inc., 5.8%, 4/15/26 | (d) | Commercial Services | 778 | 799 | 819 | |||||||||||
Waste Pro USA, Inc., 5.5%, 2/15/26 | (d) | Environmental Control | 648 | 664 | 645 | |||||||||||
|
|
|
| |||||||||||||
Total Corporate Bonds |
| $ | 38,224 | $ | 38,599 | |||||||||||
|
|
|
| |||||||||||||
Convertible Bonds—0.6% |
| |||||||||||||||
Apollo Commercial Real Estate Finance, Inc., 5.4%, 10/15/23 | Real Estate Investment Trusts | 434 | 430 | 444 | ||||||||||||
RWT Holdings, Inc., 5.8%, 10/1/25 | Holding Companies-Diversified | 273 | 272 | 281 | ||||||||||||
|
|
|
| |||||||||||||
Total Convertible Bonds | $ | 702 | $ | 725 | ||||||||||||
|
|
|
| |||||||||||||
| Portfolio Company(a) | Footnotes | Industry | Number of Shares | Cost(b) | Fair Value(c) | |||||||||||
|
|
|
|
|
| |||||||||||
Common Stocks—11.8% |
| |||||||||||||||
Adobe, Inc. | (e) | Software | 712 | $ | 428 | $ | 404 | |||||||||
Ardagh Metal Packaging SA | (e) | Packaging & Containers | 16,373 | 164 | 148 | |||||||||||
Ball Corp. | (f) | Packaging & Containers | 14,676 | 1,157 | 1,413 | |||||||||||
Canadian Pacific Railway Ltd. | Transportation | 14,317 | 952 | 1,030 | ||||||||||||
Chipotle Mexican Grill, Inc. | (e) | Retail | 250 | 408 | 437 | |||||||||||
Cintas Corp. | (f) | Commercial Services | 1,494 | 475 | 662 | |||||||||||
Costco Wholesale Corp. | (f) | Retail | 1,753 | 668 | 995 | |||||||||||
CSX Corp. | Transportation | 4,618 | 145 | 174 | ||||||||||||
CVS Health Corp. | Pharmaceuticals | 5,349 | 443 | 552 | ||||||||||||
Danaher Corp. | Healthcare-Products | 2,121 | 556 | 698 | ||||||||||||
Davide Campari-Milano N.V. | Beverages | 35,734 | 401 | 523 | ||||||||||||
See notes to consolidated financial statements.
12
Table of Contents
FS Multi-Strategy Alternatives Fund
Consolidated Schedule of Investments (continued)
As of December 31, 2021
(dollar values in thousands, except share and per share amounts)
Portfolio Company(a) | Footnotes | Industry | Number of Shares | Cost(b) | Fair Value(c) | |||||||||||
Deere & Co. | Machinery-Diversified | 854 | $ | 292 | $ | 293 | ||||||||||
Domino’s Pizza, Inc. | Retail | 547 | 245 | 309 | ||||||||||||
Five Below, Inc. | (e) | Retail | 1,563 | 258 | 323 | |||||||||||
Floor & Decor Holdings, Inc. | (e) | Retail | 2,844 | 358 | 370 | |||||||||||
Home Depot, Inc. | (f) | Retail | 2,333 | 647 | 968 | |||||||||||
II-VI, Inc. | (e) | Electronics | 2,101 | 133 | 144 | |||||||||||
Intuit, Inc. | Software | 636 | 282 | 409 | ||||||||||||
Mastercard, Inc. | (f) | Diversified Financial Services | 1,425 | 435 | 512 | |||||||||||
Mettler-Toledo International, Inc. | (e) (f) | Electronics | 634 | 646 | 1,076 | |||||||||||
Microsoft Corp. | (f) | Software | 2,976 | 679 | 1,001 | |||||||||||
Mister Car Wash, Inc. | (e) | Commercial Services | 9,950 | 178 | 181 | |||||||||||
Moody’s Corp. | Commercial Services | 1,223 | 360 | 478 | ||||||||||||
Pool Corp. | Distribution/Wholesale | 966 | 339 | 547 | ||||||||||||
Republic Services, Inc. | (f) | Environmental Control | 5,165 | 539 | 720 | |||||||||||
Sherwin-Williams Co. | (f) | Chemicals | 3,755 | 889 | 1,322 | |||||||||||
Skyline Champion Corp. | (e) | Home Builders | 2,132 | 143 | 168 | |||||||||||
Target Corp. | Retail | 1,993 | 461 | 461 | ||||||||||||
Texas Instruments, Inc. | Semiconductors | 1,815 | 333 | 342 | ||||||||||||
Thermo Fisher Scientific, Inc. | Healthcare-Products | 567 | 257 | 378 | ||||||||||||
Tractor Supply Co. | Retail | 1,635 | 291 | 390 | ||||||||||||
Treatt Plc | Chemicals | 129 | 2 | 2 | ||||||||||||
Union Pacific Corp. | (f) | Transportation | 3,725 | 714 | 938 | |||||||||||
UnitedHealth Group, Inc. | Healthcare-Services | 659 | 274 | 331 | ||||||||||||
VPC Impact Acquisition Holdings III, Inc. | (e) | Holding Companies-Diversified | 10,029 | 99 | 103 | |||||||||||
Watches of Switzerland Group Plc | (d) (e) | Retail | 21,483 | 278 | 413 | |||||||||||
|
|
|
| |||||||||||||
Total Common Stocks |
| $ | 14,929 | $ | 19,215 | |||||||||||
|
|
|
| |||||||||||||
| Portfolio Company(a) | Footnotes | Yield | Number of Shares | Cost | Fair Value(c) | |||||||||||
|
|
|
|
|
| |||||||||||
Short-Term Investments—52.7% |
| |||||||||||||||
State Street Institutional Liquid Reserves Fund - Premier Class | (g) | 0.04% | 85,942,284 | $ | 85,960 | $ | 85,951 | |||||||||
|
|
|
| |||||||||||||
Total Short-Term Investments |
| 85,960 | 85,951 | |||||||||||||
TOTAL INVESTMENTS—88.6% |
| $ | 139,815 | 144,490 | ||||||||||||
|
|
|
| |||||||||||||
Other Assets in Excess of Liabilities—11.4% |
| 18,592 | ||||||||||||||
|
| |||||||||||||||
Net Assets—100.0% |
| $ | 163,082 | |||||||||||||
|
| |||||||||||||||
Investments Sold Short—(6.80)% |
| |||||||||||||||
| Portfolio Company(a) | Footnotes | Number of Shares | Proceeds | Fair Value(c) | ||||||||||||
|
|
|
|
| ||||||||||||
Mutual Funds Sold Short—(2.5)% |
| |||||||||||||||
iPath Series B Bloomberg Coffee Subindex Total Return ETN | (2,432 | ) | $ | (133 | ) | $ | (149 | ) | ||||||||
iShares Russell 1000 ETF | (14,039 | ) | (3,616 | ) | (3,712 | ) | ||||||||||
ProShares Short VIX Short-Term Futures ETF | (3,509 | ) | (212 | ) | (216 | ) | ||||||||||
|
|
|
| |||||||||||||
Total Mutual Funds Sold Short |
| $ | (3,961 | ) | $ | (4,077 | ) | |||||||||
|
|
|
| |||||||||||||
See notes to consolidated financial statements.
13
Table of Contents
FS Multi-Strategy Alternatives Fund
Consolidated Schedule of Investments (continued)
As of December 31, 2021
(dollar values in thousands, except share and per share amounts)
| Portfolio Company(a) | Footnotes | Industry | Par(b) | Proceeds | Fair Value(c) | |||||||||||
|
|
|
|
|
| |||||||||||
Corporate Bonds Sold Short—(1.1)% |
| |||||||||||||||
99 Escrow Issuer, Inc., 7.5%, 1/15/26 | Retail | (90 | ) | $ | (82 | ) | $ | (71 | ) | |||||||
At Home Group, Inc., 7.1%, 7/15/29 | Retail | (138 | ) | (135 | ) | (136 | ) | |||||||||
Beazer Homes USA, Inc., 7.3%, 10/15/29 | Home Builders | (276 | ) | (308 | ) | (308 | ) | |||||||||
Carrols Restaurant Group, Inc., 5.9%, 7/1/29 | Retail | (280 | ) | (261 | ) | (253 | ) | |||||||||
DIRECTV Holdings LLC / DIRECTV Financing Co., Inc., 5.9%, 8/15/27 | Media Entertainment | (286 | ) | (296 | ) | (293 | ) | |||||||||
Lumen Technologies, Inc., 5.4%, 6/15/29 | Telecommunications | (138 | ) | (140 | ) | (138 | ) | |||||||||
Polar US Borrower LLC / Schenectady International Group, Inc., 6.8%, 5/15/26 | Chemicals | (111 | ) | (111 | ) | (109 | ) | |||||||||
Tallgrass Energy Partners LP / Tallgrass Energy Finance Corp., 6.0%, 12/31/30 | Pipelines | (141 | ) | (147 | ) | (141 | ) | |||||||||
United Rentals North America, Inc., 3.9%, 2/15/31 | Commercial Services | (412 | ) | (422 | ) | (419 | ) | |||||||||
|
|
|
| |||||||||||||
Total Corporate Bonds Sold Short |
| $ | (1,902 | ) | $ | (1,868 | ) | |||||||||
|
|
|
| |||||||||||||
Portfolio Company(a) | Footnotes | Industry | Number of Shares | Proceeds | Fair Value(c) | |||||||||||
Common Stocks Sold Short—(3.2)% | ||||||||||||||||
3M Co. | Miscellaneous Manufacturing | (263 | ) | $ | (47 | ) | $ | (47 | ) | |||||||
Activision Blizzard, Inc. | Software | (132 | ) | (9 | ) | (9 | ) | |||||||||
Aflac, Inc. | Insurance | (2,889 | ) | (158 | ) | (169 | ) | |||||||||
Air Products and Chemicals, Inc. | Chemicals | (18 | ) | (5 | ) | (5 | ) | |||||||||
Albertsons Companies, Inc. | Food | (1,751 | ) | (57 | ) | (53 | ) | |||||||||
Amazon.com, Inc. | Internet | (9 | ) | (30 | ) | (30 | ) | |||||||||
AMC Entertainment Holdings, Inc. | Entertainment | (433 | ) | (24 | ) | (12 | ) | |||||||||
American Airlines Group, Inc. | Airlines | (2,596 | ) | (58 | ) | (47 | ) | |||||||||
Automatic Data Processing, Inc. | Commercial Services | (967 | ) | (222 | ) | (238 | ) | |||||||||
Beyond Meat, Inc. | Food | (524 | ) | (41 | ) | (34 | ) | |||||||||
Black Knight, Inc. | Software | (1,140 | ) | (92 | ) | (94 | ) | |||||||||
Boise Cascade Co. | Building Materials | (2,958 | ) | (171 | ) | (211 | ) | |||||||||
Callaway Golf Co. | Leisure Time | (1,747 | ) | (54 | ) | (48 | ) | |||||||||
Cargurus, Inc. | Internet | (3,067 | ) | (113 | ) | (103 | ) | |||||||||
Church & Dwight Co., Inc. | Household Products/Wares | (2,544 | ) | (227 | ) | (261 | ) | |||||||||
Citrix Systems, Inc. | Software | (44 | ) | (4 | ) | (4 | ) | |||||||||
Clean Harbors, Inc. | Environmental Control | (263 | ) | (26 | ) | (26 | ) | |||||||||
Clorox Co./The | Household Products/Wares | (966 | ) | (162 | ) | (168 | ) | |||||||||
CME Group, Inc. | Diversified Financial Services | (438 | ) | (99 | ) | (100 | ) | |||||||||
Conagra Brands, Inc. | Food | (2,019 | ) | (67 | ) | (69 | ) | |||||||||
Datadog, Inc. | Software | (149 | ) | (27 | ) | (27 | ) | |||||||||
Denny’s Corp. | Retail | (864 | ) | (14 | ) | (14 | ) | |||||||||
Diageo Plc | Beverages | (1,777 | ) | (93 | ) | (97 | ) | |||||||||
Dollar Tree, Inc. | Retail | (1,491 | ) | (205 | ) | (210 | ) | |||||||||
Ecolab, Inc. | Chemicals | (44 | ) | (10 | ) | (10 | ) | |||||||||
Fox Factory Holding Corp. | Auto Parts & Equipment | (438 | ) | (69 | ) | (75 | ) | |||||||||
General Electric Co. | Miscellaneous Manufacturing | (352 | ) | (34 | ) | (33 | ) | |||||||||
General Mills, Inc. | Food | (3,064 | ) | (186 | ) | (206 | ) | |||||||||
See notes to consolidated financial statements.
14
Table of Contents
FS Multi-Strategy Alternatives Fund
Consolidated Schedule of Investments (continued)
As of December 31, 2021
(dollar values in thousands, except share and per share amounts)
Portfolio Company(a) | Footnotes | Industry | Number of Shares | Proceeds | Fair Value(c) | |||||||||||
Genuine Parts Co. | Retail | (2,146 | ) | $ | (276 | ) | $ | (301 | ) | |||||||
HB Fuller Co. | Chemicals | (2,358 | ) | (167 | ) | (191 | ) | |||||||||
Hilton Worldwide Holdings, Inc. | Lodging | (132 | ) | (21 | ) | (21 | ) | |||||||||
Hormel Foods Corp. | Food | (1,492 | ) | (71 | ) | (73 | ) | |||||||||
Lockheed Martin Corp. | Aerospace/Defense | (26 | ) | (9 | ) | (9 | ) | |||||||||
Louisiana-Pacific Corp. | Building Materials | (3,132 | ) | (197 | ) | (245 | ) | |||||||||
Minerals Technologies, Inc. | Chemicals | (55 | ) | (4 | ) | (4 | ) | |||||||||
Nektar Therapeutics | Biotechnology | (351 | ) | (5 | ) | (5 | ) | |||||||||
Nestle SA | Food | (789 | ) | (104 | ) | (111 | ) | |||||||||
New York Times Co. | Media Entertainment | (88 | ) | (4 | ) | (4 | ) | |||||||||
Planet Fitness, Inc. | Leisure Time | (1,585 | ) | (129 | ) | (144 | ) | |||||||||
PotlatchDeltic Corp. | Real Estate Investment Trusts | (255 | ) | (14 | ) | (15 | ) | |||||||||
Principal Financial Group, Inc. | Insurance | (2,107 | ) | (146 | ) | (152 | ) | |||||||||
Prudential Financial, Inc. | Insurance | (350 | ) | (37 | ) | (38 | ) | |||||||||
Rivian Automotive, Inc. | Auto Manufacturers | (263 | ) | (26 | ) | (27 | ) | |||||||||
Shake Shack, Inc. | Retail | (175 | ) | (13 | ) | (13 | ) | |||||||||
Snap, Inc. | Internet | (175 | ) | (8 | ) | (8 | ) | |||||||||
Snowflake, Inc. | Software | (88 | ) | (31 | ) | (30 | ) | |||||||||
Sonoco Products Co. | Packaging & Containers | (694 | ) | (43 | ) | (40 | ) | |||||||||
Starbucks Corp. | Retail | (2,191 | ) | (253 | ) | (256 | ) | |||||||||
Tesla, Inc. | Auto Manufacturers | (18 | ) | (19 | ) | (19 | ) | |||||||||
Thor Industries, Inc. | Home Builders | (172 | ) | (20 | ) | (18 | ) | |||||||||
Trupanion, Inc. | Insurance | (886 | ) | (94 | ) | (117 | ) | |||||||||
Uber Technologies, Inc. | Internet | (2,185 | ) | (92 | ) | (92 | ) | |||||||||
Verisk Analytics, Inc. | Commercial Services | (24 | ) | (4 | ) | (5 | ) | |||||||||
Visa, Inc. | Diversified Financial Services | (44 | ) | (10 | ) | (10 | ) | |||||||||
Walgreens Boots Alliance, Inc. | Retail | (3,936 | ) | (190 | ) | (205 | ) | |||||||||
Walt Disney Co. | Media Entertainment | (88 | ) | (14 | ) | (14 | ) | |||||||||
Warby Parker, Inc. | Retail | (175 | ) | (8 | ) | (8 | ) | |||||||||
Wayfair, Inc. | Internet | (44 | ) | (9 | ) | (8 | ) | |||||||||
West Fraser Timber Co. Ltd. | Forest Products & Paper | (1,396 | ) | (115 | ) | (133 | ) | |||||||||
Weyerhaeuser Co. | Real Estate Investment Trusts | (3,710 | ) | (142 | ) | (153 | ) | |||||||||
Yum! Brands, Inc. | Retail | (2,002 | ) | (250 | ) | (278 | ) | |||||||||
|
|
|
| |||||||||||||
Total Common Stocks Sold Short | $ | (4,829 | ) | $ | (5,147 | ) | ||||||||||
|
|
|
| |||||||||||||
Total Investments Sold Short | $ | (10,693 | ) | $ | (11,092 | ) | ||||||||||
|
|
|
| |||||||||||||
Forward Foreign Currency Exchange Contracts—0.1%
Counterparty | Contract | Currency and Amount to be Received | Currency and Amount to be Delivered | Unrealized Appreciation | Unrealized Depreciation | |||||||||||||||||
Deutsche Bank AG | 1/12/22 | AUD | 200 | JPY | 16,294 | $ | 4 | $ | — | |||||||||||||
Deutsche Bank AG | 1/12/22 | AUD | 465 | GBP | 250 | — | — | |||||||||||||||
Deutsche Bank AG | 1/12/22 | AUD | 198 | EUR | 125 | 1 | — | |||||||||||||||
Deutsche Bank AG | 1/12/22 | AUD | 200 | JPY | 16,112 | 5 | — | |||||||||||||||
Deutsche Bank AG | 1/12/22 | AUD | 200 | CAD | 184 | — | — | |||||||||||||||
Deutsche Bank AG | 1/12/22 | AUD | 200 | JPY | 16,542 | 2 | — | |||||||||||||||
Deutsche Bank AG | 1/12/22 | AUD | 100 | USD | 72 | 1 | — | |||||||||||||||
See notes to consolidated financial statements.
15
Table of Contents
FS Multi-Strategy Alternatives Fund
Consolidated Schedule of Investments (continued)
As of December 31, 2021
(dollar values in thousands, except share and per share amounts)
Counterparty | Contract | Currency and Amount to be Received | Currency and Amount to be Delivered | Unrealized Appreciation | Unrealized Depreciation | |||||||||||||||||
Deutsche Bank AG | 1/12/22 | AUD | 100 | USD | 71 | $ | 2 | $ | — | |||||||||||||
Deutsche Bank AG | 1/12/22 | AUD | 500 | USD | 357 | 7 | — | |||||||||||||||
Deutsche Bank AG | 1/12/22 | AUD | 200 | USD | 145 | — | — | |||||||||||||||
Deutsche Bank AG | 1/12/22 | CAD | 200 | USD | 155 | 6 | — | |||||||||||||||
Deutsche Bank AG | 1/12/22 | CAD | 200 | USD | 156 | 2 | — | |||||||||||||||
Deutsche Bank AG | 1/12/22 | CAD | 100 | USD | 78 | 1 | — | |||||||||||||||
Deutsche Bank AG | 1/12/22 | CHF | 125 | USD | 135 | 2 | — | |||||||||||||||
Deutsche Bank AG | 1/12/22 | CHF | 125 | USD | 136 | 2 | — | |||||||||||||||
Deutsche Bank AG | 1/18/22 | CLP | 84,585 | USD | 100 | — | 1 | |||||||||||||||
Deutsche Bank AG | 1/24/22 | CLP | 87,140 | USD | 100 | 2 | — | |||||||||||||||
Deutsche Bank AG | 1/12/22 | CNH | 3,831 | USD | 600 | 2 | — | |||||||||||||||
Deutsche Bank AG | 1/12/22 | CNH | 2,554 | USD | 400 | 2 | — | |||||||||||||||
Deutsche Bank AG | 1/12/22 | CNH | 1,919 | USD | 300 | 2 | — | |||||||||||||||
Deutsche Bank AG | 1/12/22 | CNH | 639 | USD | 100 | 1 | — | |||||||||||||||
Deutsche Bank AG | 1/12/22 | CNH | 3,193 | USD | 500 | 2 | — | |||||||||||||||
Deutsche Bank AG | 1/12/22 | CNH | 637 | USD | 100 | — | — | |||||||||||||||
Deutsche Bank AG | 1/12/22 | EUR | 1,125 | USD | 1,276 | 5 | — | |||||||||||||||
Deutsche Bank AG | 1/12/22 | EUR | 750 | USD | 848 | 6 | — | |||||||||||||||
Deutsche Bank AG | 1/12/22 | EUR | 125 | USD | 142 | — | — | |||||||||||||||
Deutsche Bank AG | 1/12/22 | EUR | 1,125 | USD | 1,272 | 9 | — | |||||||||||||||
Deutsche Bank AG | 1/12/22 | GBP | 250 | USD | 330 | 8 | — | |||||||||||||||
Deutsche Bank AG | 1/12/22 | GBP | 188 | USD | 249 | 5 | — | |||||||||||||||
Deutsche Bank AG | 1/12/22 | GBP | 313 | USD | 421 | 2 | — | |||||||||||||||
Deutsche Bank AG | 1/12/22 | GBP | 63 | USD | 84 | — | — | |||||||||||||||
Deutsche Bank AG | 1/12/22 | ILS | 621 | USD | 200 | — | — | |||||||||||||||
Deutsche Bank AG | 1/6/22 | INR | 13,949 | USD | 185 | 2 | — | |||||||||||||||
Deutsche Bank AG | 1/6/22 | INR | 1,101 | USD | 15 | — | — | |||||||||||||||
Deutsche Bank AG | 1/3/22 | INR | 22,681 | USD | 300 | 5 | — | |||||||||||||||
Deutsche Bank AG | 1/3/22 | INR | 15,122 | USD | 200 | 3 | — | |||||||||||||||
Deutsche Bank AG | 1/10/22 | INR | 4,909 | USD | 65 | 1 | — | |||||||||||||||
Deutsche Bank AG | 1/10/22 | INR | 2,650 | USD | 35 | — | — | |||||||||||||||
Deutsche Bank AG | 1/18/22 | INR | 7,612 | USD | 100 | 2 | — | |||||||||||||||
Deutsche Bank AG | 1/10/22 | INR | 22,808 | USD | 300 | 6 | — | |||||||||||||||
Deutsche Bank AG | 1/18/22 | INR | 22,721 | USD | 300 | 5 | — | |||||||||||||||
Deutsche Bank AG | 1/21/22 | INR | 7,576 | USD | 100 | 2 | — | |||||||||||||||
Deutsche Bank AG | 1/24/22 | INR | 7,581 | USD | 100 | 2 | — | |||||||||||||||
Deutsche Bank AG | 1/24/22 | INR | 22,500 | USD | 300 | 1 | — | |||||||||||||||
Deutsche Bank AG | 1/31/22 | INR | 7,503 | USD | 100 | — | — | |||||||||||||||
Deutsche Bank AG | 1/12/22 | JPY | 12,500 | USD | 110 | — | 1 | |||||||||||||||
Deutsche Bank AG | 1/12/22 | JPY | 87,500 | USD | 766 | — | 5 | |||||||||||||||
Deutsche Bank AG | 1/12/22 | JPY | 50,000 | USD | 434 | 1 | — | |||||||||||||||
Deutsche Bank AG | 1/3/22 | KRW | 40,862 | USD | 35 | — | — | |||||||||||||||
Deutsche Bank AG | 1/3/22 | KRW | 86,197 | USD | 73 | — | — | |||||||||||||||
Deutsche Bank AG | 1/3/22 | KRW | 31,953 | USD | 27 | — | — | |||||||||||||||
Deutsche Bank AG | 1/3/22 | KRW | 40,840 | USD | 35 | — | — | |||||||||||||||
Deutsche Bank AG | 1/3/22 | KRW | 34,608 | USD | 29 | — | — | |||||||||||||||
Deutsche Bank AG | 1/3/22 | KRW | 45,112 | USD | 38 | — | — | |||||||||||||||
Deutsche Bank AG | 1/3/22 | KRW | 3,364 | USD | 3 | — | — | |||||||||||||||
Deutsche Bank AG | 1/3/22 | KRW | 36,207 | USD | 31 | — | — | |||||||||||||||
Deutsche Bank AG | 1/3/22 | KRW | 34,554 | USD | 29 | — | — | |||||||||||||||
Deutsche Bank AG | 1/7/22 | KRW | 118,027 | USD | 100 | — | 1 | |||||||||||||||
See notes to consolidated financial statements.
16
Table of Contents
FS Multi-Strategy Alternatives Fund
Consolidated Schedule of Investments (continued)
As of December 31, 2021
(dollar values in thousands, except share and per share amounts)
Counterparty | Contract | Currency and Amount to be Received | Currency and Amount to be Delivered | Unrealized Appreciation | Unrealized Depreciation | |||||||||||||||||
Deutsche Bank AG | 1/6/22 | KRW | 354,135 | USD | 300 | $ | — | $ | 2 | |||||||||||||
Deutsche Bank AG | 1/18/22 | KRW | 117,833 | USD | 100 | — | 1 | |||||||||||||||
Deutsche Bank AG | 1/10/22 | KRW | 354,960 | USD | 300 | — | 2 | |||||||||||||||
Deutsche Bank AG | 1/18/22 | KRW | 357,570 | USD | 300 | 1 | — | |||||||||||||||
Deutsche Bank AG | 1/24/22 | KRW | 107,345 | USD | 90 | — | — | |||||||||||||||
Deutsche Bank AG | 1/24/22 | KRW | 11,808 | USD | 10 | — | — | |||||||||||||||
Deutsche Bank AG | 1/27/22 | KRW | 118,661 | USD | 100 | — | — | |||||||||||||||
Deutsche Bank AG | 1/24/22 | KRW | 118,779 | USD | 100 | — | — | |||||||||||||||
Deutsche Bank AG | 1/24/22 | KRW | 237,558 | USD | 200 | — | — | |||||||||||||||
Deutsche Bank AG | 1/24/22 | KRW | 118,805 | USD | 100 | — | — | |||||||||||||||
Deutsche Bank AG | 1/3/22 | KRW | 2,326 | USD | 2 | — | — | |||||||||||||||
Deutsche Bank AG | 1/12/22 | MXN | 2,000 | USD | 96 | 1 | — | |||||||||||||||
Deutsche Bank AG | 1/12/22 | MXN | 500 | USD | 24 | 1 | — | |||||||||||||||
Deutsche Bank AG | 1/12/22 | MXN | 500 | USD | 25 | — | — | |||||||||||||||
Deutsche Bank AG | 1/12/22 | NOK | 882 | USD | 100 | — | — | |||||||||||||||
Deutsche Bank AG | 1/12/22 | NZD | 100 | USD | 68 | 1 | — | |||||||||||||||
Deutsche Bank AG | 1/12/22 | NZD | 300 | USD | 205 | — | — | |||||||||||||||
Deutsche Bank AG | 1/12/22 | PLN | 409 | USD | 100 | 1 | — | |||||||||||||||
Deutsche Bank AG | 1/12/22 | RUB | 7,479 | USD | 100 | — | — | |||||||||||||||
Deutsche Bank AG | 1/12/22 | SGD | 137 | USD | 100 | 1 | — | |||||||||||||||
Deutsche Bank AG | 2/10/22 | TRY | 1,380 | USD | 100 | 1 | — | |||||||||||||||
Deutsche Bank AG | 2/10/22 | TRY | 1,427 | USD | 100 | 9 | — | |||||||||||||||
Deutsche Bank AG | 2/10/22 | TRY | 1,298 | USD | 100 | — | 5 | |||||||||||||||
Deutsche Bank AG | 2/9/22 | TRY | 1,306 | USD | 100 | — | 5 | |||||||||||||||
Deutsche Bank AG | 2/9/22 | TRY | 1,331 | USD | 100 | — | 3 | |||||||||||||||
Deutsche Bank AG | 2/9/22 | TRY | 1,164 | USD | 100 | — | 30 | |||||||||||||||
Deutsche Bank AG | 2/9/22 | TRY | 1,151 | USD | 100 | — | 16 | |||||||||||||||
Deutsche Bank AG | 2/9/22 | TRY | 1,097 | USD | 100 | — | 20 | |||||||||||||||
Deutsche Bank AG | 2/9/22 | TRY | 998 | USD | 100 | — | 27 | |||||||||||||||
Deutsche Bank AG | 2/9/22 | TRY | 4,053 | USD | 400 | — | 103 | |||||||||||||||
Deutsche Bank AG | 2/9/22 | TRY | 956 | USD | 100 | — | 30 | |||||||||||||||
Deutsche Bank AG | 3/10/22 | TRY | 1,565 | USD | 100 | 12 | — | |||||||||||||||
Deutsche Bank AG | 3/10/22 | TRY | 1,745 | USD | 100 | 25 | — | |||||||||||||||
Deutsche Bank AG | 3/10/22 | TRY | 1,401 | USD | 100 | — | — | |||||||||||||||
Deutsche Bank AG | 1/5/22 | TRY | 1,357 | USD | 100 | 2 | — | |||||||||||||||
Deutsche Bank AG | 1/10/22 | TWD | 5,532 | USD | 200 | — | — | |||||||||||||||
Deutsche Bank AG | 1/10/22 | TWD | 5,557 | USD | 200 | 1 | — | |||||||||||||||
Deutsche Bank AG | 1/18/22 | TWD | 5,550 | USD | 200 | — | — | |||||||||||||||
Deutsche Bank AG | 1/3/22 | TWD | 5,535 | USD | 200 | — | — | |||||||||||||||
Deutsche Bank AG | 1/24/22 | TWD | 5,552 | USD | 200 | 1 | — | |||||||||||||||
Deutsche Bank AG | 1/18/22 | TWD | 5,555 | USD | 200 | 1 | — | |||||||||||||||
Deutsche Bank AG | 1/28/22 | TWD | 2,765 | USD | 100 | — | — | |||||||||||||||
Deutsche Bank AG | 1/24/22 | TWD | 5,513 | USD | 200 | — | 1 | |||||||||||||||
Deutsche Bank AG | 1/28/22 | TWD | 5,508 | USD | 200 | — | 1 | |||||||||||||||
Deutsche Bank AG | 1/3/22 | TWD | 7 | USD | — | — | — | |||||||||||||||
Deutsche Bank AG | 1/12/22 | USD | 71 | AUD | 100 | — | 3 | |||||||||||||||
Deutsche Bank AG | 1/12/22 | USD | 213 | AUD | 300 | — | 5 | |||||||||||||||
Deutsche Bank AG | 1/12/22 | USD | 72 | AUD | 100 | — | 1 | |||||||||||||||
Deutsche Bank AG | 1/12/22 | USD | 215 | AUD | 300 | — | 3 | |||||||||||||||
Deutsche Bank AG | 1/12/22 | USD | 72 | AUD | 100 | — | — | |||||||||||||||
Deutsche Bank AG | 1/12/22 | USD | 155 | CAD | 200 | — | 7 | |||||||||||||||
See notes to consolidated financial statements.
17
Table of Contents
FS Multi-Strategy Alternatives Fund
Consolidated Schedule of Investments (continued)
As of December 31, 2021
(dollar values in thousands, except share and per share amounts)
Counterparty | Contract | Currency and Amount to be Received | Currency and Amount to be Delivered | Unrealized Appreciation | Unrealized Depreciation | |||||||||||||||||
Deutsche Bank AG | 1/12/22 | USD | 79 | CAD | 100 | $ | — | $ | 1 | |||||||||||||
Deutsche Bank AG | 1/12/22 | USD | 156 | CAD | 200 | — | 2 | |||||||||||||||
Deutsche Bank AG | 1/12/22 | USD | 136 | CHF | 125 | — | 2 | |||||||||||||||
Deutsche Bank AG | 1/12/22 | USD | 135 | CHF | 125 | — | 2 | |||||||||||||||
Deutsche Bank AG | 1/24/22 | USD | 100 | CLP | 88,073 | — | 3 | |||||||||||||||
Deutsche Bank AG | 1/18/22 | USD | 100 | CLP | 87,116 | — | 2 | |||||||||||||||
Deutsche Bank AG | 1/12/22 | USD | 200 | CNH | 1,276 | — | 1 | |||||||||||||||
Deutsche Bank AG | 1/12/22 | USD | 700 | CNH | 4,465 | — | 2 | |||||||||||||||
Deutsche Bank AG | 1/12/22 | USD | 500 | CNH | 3,189 | — | 2 | |||||||||||||||
Deutsche Bank AG | 1/12/22 | USD | 283 | EUR | 250 | — | 1 | |||||||||||||||
Deutsche Bank AG | 1/12/22 | USD | 1,551 | EUR | 1,375 | — | 15 | |||||||||||||||
Deutsche Bank AG | 1/12/22 | USD | 1,133 | EUR | 1,000 | — | 6 | |||||||||||||||
Deutsche Bank AG | 1/12/22 | USD | 1,273 | EUR | 1,125 | — | 8 | |||||||||||||||
Deutsche Bank AG | 1/12/22 | USD | 845 | EUR | 750 | — | 9 | |||||||||||||||
Deutsche Bank AG | 1/12/22 | USD | 282 | EUR | 250 | — | 3 | |||||||||||||||
Deutsche Bank AG | 1/12/22 | USD | 141 | EUR | 125 | — | 1 | |||||||||||||||
Deutsche Bank AG | 1/12/22 | USD | 83 | GBP | 63 | — | 1 | |||||||||||||||
Deutsche Bank AG | 1/12/22 | USD | 417 | GBP | 313 | — | 6 | |||||||||||||||
Deutsche Bank AG | 1/12/22 | USD | 248 | GBP | 188 | — | 6 | |||||||||||||||
Deutsche Bank AG | 1/12/22 | USD | 84 | GBP | 63 | — | 1 | |||||||||||||||
Deutsche Bank AG | 1/12/22 | USD | 300 | HUF | 97,718 | — | 1 | |||||||||||||||
Deutsche Bank AG | 1/3/22 | USD | 500 | INR | 37,708 | — | 7 | |||||||||||||||
Deutsche Bank AG | 1/10/22 | USD | 300 | INR | 22,708 | — | 5 | |||||||||||||||
Deutsche Bank AG | 1/6/22 | USD | 200 | INR | 15,132 | — | 3 | |||||||||||||||
Deutsche Bank AG | 1/18/22 | USD | 300 | INR | 22,835 | — | 6 | |||||||||||||||
Deutsche Bank AG | 1/10/22 | USD | 100 | INR | 7,603 | — | 2 | |||||||||||||||
Deutsche Bank AG | 1/21/22 | USD | 100 | INR | 7,635 | — | 2 | |||||||||||||||
Deutsche Bank AG | 1/24/22 | USD | 300 | INR | 22,744 | — | 5 | |||||||||||||||
Deutsche Bank AG | 1/18/22 | USD | 100 | INR | 7,573 | — | 2 | |||||||||||||||
Deutsche Bank AG | 1/31/22 | USD | 300 | INR | 22,524 | — | 2 | |||||||||||||||
Deutsche Bank AG | 1/24/22 | USD | 100 | INR | 7,499 | — | — | |||||||||||||||
Deutsche Bank AG | 1/3/22 | USD | 1 | INR | 95 | — | — | |||||||||||||||
Deutsche Bank AG | 1/12/22 | USD | 110 | JPY | 12,500 | 2 | — | |||||||||||||||
Deutsche Bank AG | 1/12/22 | USD | 1,321 | JPY | 150,000 | 17 | — | |||||||||||||||
Deutsche Bank AG | 1/12/22 | USD | 219 | JPY | 25,000 | 1 | — | |||||||||||||||
Deutsche Bank AG | 1/12/22 | USD | 327 | JPY | 37,500 | 1 | — | |||||||||||||||
Deutsche Bank AG | 1/12/22 | USD | 110 | JPY | 12,500 | 2 | — | |||||||||||||||
Deutsche Bank AG | 1/4/22 | USD | 434 | JPY | 50,000 | — | 1 | |||||||||||||||
Deutsche Bank AG | 1/3/22 | USD | 200 | KRW | 237,874 | — | — | |||||||||||||||
Deutsche Bank AG | 1/6/22 | USD | 147 | KRW | 172,788 | 1 | — | |||||||||||||||
Deutsche Bank AG | 1/6/22 | USD | 57 | KRW | 67,150 | 1 | — | |||||||||||||||
Deutsche Bank AG | 1/6/22 | USD | 67 | KRW | 79,282 | 1 | — | |||||||||||||||
Deutsche Bank AG | 1/6/22 | USD | 29 | KRW | 34,095 | — | — | |||||||||||||||
Deutsche Bank AG | 1/7/22 | USD | 100 | KRW | 117,729 | 1 | — | |||||||||||||||
Deutsche Bank AG | 1/10/22 | USD | 300 | KRW | 354,225 | 2 | — | |||||||||||||||
Deutsche Bank AG | 1/3/22 | USD | 100 | KRW | 118,056 | 1 | — | |||||||||||||||
Deutsche Bank AG | 1/18/22 | USD | 300 | KRW | 355,110 | 1 | — | |||||||||||||||
Deutsche Bank AG | 1/18/22 | USD | 100 | KRW | 118,546 | — | — | |||||||||||||||
Deutsche Bank AG | 1/24/22 | USD | 100 | KRW | 119,025 | — | — | |||||||||||||||
Deutsche Bank AG | 1/24/22 | USD | 100 | KRW | 119,242 | — | — | |||||||||||||||
Deutsche Bank AG | 1/24/22 | USD | 300 | KRW | 357,630 | — | — | |||||||||||||||
See notes to consolidated financial statements.
18
Table of Contents
FS Multi-Strategy Alternatives Fund
Consolidated Schedule of Investments (continued)
As of December 31, 2021
(dollar values in thousands, except share and per share amounts)
Counterparty | Contract | Currency and Amount to be Received | Currency and Amount to be Delivered | Unrealized Appreciation | Unrealized Depreciation | |||||||||||||||||
Deutsche Bank AG | 1/28/22 | USD | 200 | KRW | 237,598 | $ | — | $ | — | |||||||||||||
Deutsche Bank AG | 1/27/22 | USD | 100 | KRW | 118,822 | — | — | |||||||||||||||
Deutsche Bank AG | 1/28/22 | USD | 100 | KRW | 118,799 | — | — | |||||||||||||||
Deutsche Bank AG | 1/3/22 | USD | — | KRW | 94 | — | — | |||||||||||||||
Deutsche Bank AG | 1/12/22 | USD | 120 | MXN | 2,500 | — | 2 | |||||||||||||||
Deutsche Bank AG | 1/12/22 | USD | 24 | MXN | 500 | — | 2 | |||||||||||||||
Deutsche Bank AG | 1/12/22 | USD | 200 | NOK | 1,797 | — | 4 | |||||||||||||||
Deutsche Bank AG | 1/12/22 | USD | 136 | NZD | 200 | — | 1 | |||||||||||||||
Deutsche Bank AG | 1/12/22 | USD | 68 | NZD | 100 | — | 2 | |||||||||||||||
Deutsche Bank AG | 1/12/22 | USD | 67 | NZD | 100 | — | 1 | |||||||||||||||
Deutsche Bank AG | 1/12/22 | USD | 201 | NZD | 300 | — | 4 | |||||||||||||||
Deutsche Bank AG | 1/12/22 | USD | 300 | PLN | 1,227 | — | 4 | |||||||||||||||
Deutsche Bank AG | 1/12/22 | USD | 200 | RUB | 14,894 | 2 | — | |||||||||||||||
Deutsche Bank AG | 1/12/22 | USD | 100 | RUB | 7,402 | 1 | — | |||||||||||||||
Deutsche Bank AG | 1/12/22 | USD | 100 | RUB | 7,439 | 1 | — | |||||||||||||||
Deutsche Bank AG | 1/12/22 | USD | 200 | SEK | 1,807 | — | — | |||||||||||||||
Deutsche Bank AG | 1/12/22 | USD | 600 | SGD | 819 | — | 8 | |||||||||||||||
Deutsche Bank AG | 1/12/22 | USD | 100 | SGD | 136 | — | 1 | |||||||||||||||
Deutsche Bank AG | 2/10/22 | USD | 100 | TRY | 1,246 | 9 | — | |||||||||||||||
Deutsche Bank AG | 2/10/22 | USD | 100 | TRY | 1,440 | — | 5 | |||||||||||||||
Deutsche Bank AG | 2/10/22 | USD | 100 | TRY | 1,423 | — | 4 | |||||||||||||||
Deutsche Bank AG | 3/10/22 | USD | 100 | TRY | 1,453 | — | 8 | |||||||||||||||
Deutsche Bank AG | 3/10/22 | USD | 100 | TRY | 1,465 | — | 5 | |||||||||||||||
Deutsche Bank AG | 2/10/22 | USD | 100 | TRY | 1,307 | 4 | — | |||||||||||||||
Deutsche Bank AG | 2/9/22 | USD | 100 | TRY | 1,043 | 24 | — | |||||||||||||||
Deutsche Bank AG | 2/9/22 | USD | 200 | TRY | 2,022 | 52 | — | |||||||||||||||
Deutsche Bank AG | 2/9/22 | USD | 100 | TRY | 1,000 | 27 | — | |||||||||||||||
Deutsche Bank AG | 2/9/22 | USD | 100 | TRY | 984 | 28 | — | |||||||||||||||
Deutsche Bank AG | 2/9/22 | USD | 100 | TRY | 993 | 27 | — | |||||||||||||||
Deutsche Bank AG | 2/9/22 | USD | 100 | TRY | 978 | 28 | — | |||||||||||||||
Deutsche Bank AG | 2/9/22 | USD | 100 | TRY | 962 | 30 | — | |||||||||||||||
Deutsche Bank AG | 2/9/22 | USD | 100 | TRY | 948 | 31 | — | |||||||||||||||
Deutsche Bank AG | 2/9/22 | USD | 300 | TRY | 2,845 | 92 | — | |||||||||||||||
Deutsche Bank AG | 3/10/22 | USD | 100 | TRY | 1,377 | 2 | — | |||||||||||||||
Deutsche Bank AG | 1/3/22 | USD | 200 | TWD | 5,542 | — | — | |||||||||||||||
Deutsche Bank AG | 1/10/22 | USD | 99 | TWD | 2,745 | — | — | |||||||||||||||
Deutsche Bank AG | 1/10/22 | USD | 101 | TWD | 2,784 | — | — | |||||||||||||||
Deutsche Bank AG | 1/18/22 | USD | 200 | TWD | 5,555 | — | 1 | |||||||||||||||
Deutsche Bank AG | 1/10/22 | USD | 200 | TWD | 5,556 | — | 1 | |||||||||||||||
Deutsche Bank AG | 1/24/22 | USD | 200 | TWD | 5,556 | — | 1 | |||||||||||||||
Deutsche Bank AG | 1/28/22 | USD | 200 | TWD | 5,513 | 1 | — | |||||||||||||||
Deutsche Bank AG | 1/24/22 | USD | 200 | TWD | 5,513 | 1 | — | |||||||||||||||
Deutsche Bank AG | 2/7/22 | USD | 100 | TWD | 2,765 | — | — | |||||||||||||||
Deutsche Bank AG | 1/12/22 | USD | 100 | ZAR | 1,595 | — | — | |||||||||||||||
Deutsche Bank AG | 1/12/22 | ZAR | 1,590 | USD | 100 | — | — | |||||||||||||||
Deutsche Bank AG | 1/12/22 | CAD | 733 | AUD | 800 | — | 2 | |||||||||||||||
Deutsche Bank AG | 1/12/22 | CAD | 181 | EUR | 125 | 1 | — | |||||||||||||||
Deutsche Bank AG | 1/12/22 | CAD | 200 | JPY | 17,776 | 4 | — | |||||||||||||||
Deutsche Bank AG | 1/12/22 | CAD | 200 | JPY | 17,547 | 6 | — | |||||||||||||||
Deutsche Bank AG | 1/12/22 | EUR | 100 | JPY | 12,873 | 1 | — | |||||||||||||||
Deutsche Bank AG | 1/12/22 | EUR | 200 | GBP | 170 | — | 3 | |||||||||||||||
See notes to consolidated financial statements.
19
Table of Contents
FS Multi-Strategy Alternatives Fund
Consolidated Schedule of Investments (continued)
As of December 31, 2021
(dollar values in thousands, except share and per share amounts)
Counterparty | Contract | Currency and Amount to be Received | Currency and Amount to be Delivered | Unrealized Appreciation | Unrealized Depreciation | |||||||||||||||||
Deutsche Bank AG | 1/12/22 | EUR | 100 | HUF | 36,932 | $ | — | $ | — | |||||||||||||
Deutsche Bank AG | 1/12/22 | EUR | 100 | GBP | 85 | — | 4 | |||||||||||||||
Deutsche Bank AG | 1/12/22 | EUR | 125 | SEK | 1,291 | — | — | |||||||||||||||
Deutsche Bank AG | 1/12/22 | EUR | 100 | JPY | 12,837 | 2 | — | |||||||||||||||
Deutsche Bank AG | 1/12/22 | EUR | 300 | JPY | 38,666 | 5 | — | |||||||||||||||
Deutsche Bank AG | 1/12/22 | EUR | 200 | GBP | 169 | — | 1 | |||||||||||||||
Deutsche Bank AG | 1/12/22 | EUR | 100 | JPY | 12,970 | 1 | — | |||||||||||||||
Deutsche Bank AG | 1/12/22 | EUR | 125 | SEK | 1,284 | — | — | |||||||||||||||
Deutsche Bank AG | 1/12/22 | EUR | 100 | JPY | 13,024 | 1 | — | |||||||||||||||
Deutsche Bank AG | 1/12/22 | EUR | 200 | JPY | 26,048 | 2 | — | |||||||||||||||
Deutsche Bank AG | 1/12/22 | EUR | 125 | NOK | 1,248 | 1 | — | |||||||||||||||
Deutsche Bank AG | 1/12/22 | EUR | 100 | GBP | 84 | 1 | — | |||||||||||||||
Deutsche Bank AG | 1/12/22 | HUF | 36,723 | EUR | 100 | — | 1 | |||||||||||||||
Deutsche Bank AG | 1/12/22 | JPY | 16,294 | AUD | 200 | — | 4 | |||||||||||||||
Deutsche Bank AG | 1/12/22 | JPY | 25,746 | EUR | 200 | — | 4 | |||||||||||||||
Deutsche Bank AG | 1/12/22 | JPY | 15,393 | NZD | 200 | — | 3 | |||||||||||||||
Deutsche Bank AG | 1/12/22 | JPY | 37,846 | GBP | 250 | — | 9 | |||||||||||||||
Deutsche Bank AG | 1/12/22 | JPY | 12,781 | EUR | 100 | — | 3 | |||||||||||||||
Deutsche Bank AG | 1/12/22 | JPY | 25,674 | EUR | 200 | — | 5 | |||||||||||||||
Deutsche Bank AG | 1/12/22 | JPY | 16,540 | AUD | 200 | — | 2 | |||||||||||||||
Deutsche Bank AG | 1/12/22 | JPY | 19,165 | GBP | 125 | — | 3 | |||||||||||||||
Deutsche Bank AG | 1/12/22 | JPY | 13,011 | EUR | 100 | — | 1 | |||||||||||||||
Deutsche Bank AG | 1/12/22 | JPY | 38,934 | EUR | 300 | — | 3 | |||||||||||||||
Deutsche Bank AG | 1/12/22 | JPY | 15,624 | NZD | 200 | — | 1 | |||||||||||||||
Deutsche Bank AG | 1/4/22 | JPY | 13,022 | EUR | 100 | — | 1 | |||||||||||||||
Deutsche Bank AG | 1/4/22 | JPY | 19,388 | GBP | 125 | — | 1 | |||||||||||||||
Deutsche Bank AG | 1/12/22 | JPY | 19,388 | GBP | 125 | — | 1 | |||||||||||||||
Deutsche Bank AG | 1/4/22 | JPY | 26,044 | EUR | 200 | — | 1 | |||||||||||||||
Deutsche Bank AG | 1/12/22 | NZD | 423 | AUD | 400 | — | 1 | |||||||||||||||
Deutsche Bank AG | 1/12/22 | NZD | 200 | JPY | 15,393 | 3 | — | |||||||||||||||
Deutsche Bank AG | 1/12/22 | NZD | 200 | JPY | 15,448 | 3 | — | |||||||||||||||
Deutsche Bank AG | 1/12/22 | NZD | 200 | JPY | 15,619 | 1 | — | |||||||||||||||
Deutsche Bank AG | 1/12/22 | NOK | 1,273 | EUR | 125 | 2 | — | |||||||||||||||
Deutsche Bank AG | 1/12/22 | NOK | 1,000 | SEK | 1,006 | 2 | — | |||||||||||||||
Deutsche Bank AG | 1/12/22 | NOK | 2,550 | EUR | 250 | 5 | — | |||||||||||||||
Deutsche Bank AG | 1/12/22 | GBP | 125 | AUD | 232 | — | — | |||||||||||||||
Deutsche Bank AG | 1/12/22 | GBP | 170 | EUR | 200 | 2 | — | |||||||||||||||
Deutsche Bank AG | 1/12/22 | GBP | 250 | JPY | 37,846 | 9 | — | |||||||||||||||
Deutsche Bank AG | 1/12/22 | GBP | 125 | JPY | 18,965 | 4 | — | |||||||||||||||
Deutsche Bank AG | 1/12/22 | GBP | 425 | EUR | 500 | 6 | — | |||||||||||||||
Deutsche Bank AG | 1/12/22 | GBP | 125 | JPY | 19,124 | 3 | — | |||||||||||||||
Deutsche Bank AG | 1/12/22 | GBP | 125 | JPY | 19,287 | 2 | — | |||||||||||||||
Deutsche Bank AG | 1/12/22 | GBP | 336 | EUR | 400 | — | — | |||||||||||||||
Deutsche Bank AG | 1/12/22 | GBP | 125 | JPY | 19,388 | 1 | — | |||||||||||||||
Deutsche Bank AG | 1/4/22 | GBP | 125 | JPY | 19,388 | 1 | — | |||||||||||||||
Deutsche Bank AG | 1/12/22 | SEK | 1,281 | EUR | 125 | — | 1 | |||||||||||||||
Deutsche Bank AG | 1/12/22 | SEK | 1,280 | EUR | 125 | — | 1 | |||||||||||||||
Deutsche Bank AG | 1/12/22 | CHF | 390 | EUR | 375 | 1 | — | |||||||||||||||
Morgan Stanley & Co. International PLC | 3/16/22 | USD | 541 | EUR | 477 | — | 3 | |||||||||||||||
See notes to consolidated financial statements.
20
Table of Contents
FS Multi-Strategy Alternatives Fund
Consolidated Schedule of Investments (continued)
As of December 31, 2021
(dollar values in thousands, except share and per share amounts)
Counterparty | Contract | Currency and Amount to be Received | Currency and Amount to be Delivered | Unrealized Appreciation | Unrealized Depreciation | |||||||||||||||||
Morgan Stanley & Co. International PLC | 3/16/22 | USD | 405 | GBP | 305 | $ | — | $ | 9 | |||||||||||||
State Street Bank and Trust Company | 1/4/22 | GBP | 2 | USD | 2 | — | — | |||||||||||||||
| ||||||||||||||||||||||
|
|
|
| |||||||||||||||||||
Total Forward Foreign Currency Exchange Contracts |
| $ | 630 | $ | 505 | |||||||||||||||||
|
|
|
| |||||||||||||||||||
| Description | Number of Contracts | Position | Expiration Date | Notional Amount | Unrealized Appreciation | Unrealized Depreciation | ||||||||||||
|
|
|
|
|
|
| ||||||||||||
Long Futures—0.3% |
| |||||||||||||||||
Commodity Futures Contracts—0.2% |
| |||||||||||||||||
Aluminum | 1 | Long | 1/4/22 | 72 | $ | — | $ | 2 | ||||||||||
Aluminum | 1 | Long | 1/6/22 | 77 | — | 7 | ||||||||||||
Aluminum | 3 | Long | 1/7/22 | 227 | — | 16 | ||||||||||||
Aluminum | 1 | Long | 2/11/22 | 66 | 4 | — | ||||||||||||
Aluminum | 1 | Long | 2/22/22 | 65 | 5 | — | ||||||||||||
Aluminum | 1 | Long | 2/25/22 | 68 | 2 | — | ||||||||||||
Aluminum | 1 | Long | 3/1/22 | 66 | 4 | — | ||||||||||||
Aluminum | 1 | Long | 3/2/22 | 67 | 3 | — | ||||||||||||
Aluminum | 1 | Long | 3/8/22 | 66 | 4 | — | ||||||||||||
Aluminum | 1 | Long | 3/15/22 | 67 | 4 | — | ||||||||||||
Aluminum | 1 | Long | 3/22/22 | 70 | — | — | ||||||||||||
Brent Crude | 1 | Long | 1/31/22 | 78 | — | 1 | ||||||||||||
Canola | 1 | Long | 3/14/22 | 16 | — | — | ||||||||||||
Coffee | 1 | Long | 3/21/22 | 88 | — | 3 | ||||||||||||
Copper | 1 | Long | 3/29/22 | 112 | — | 1 | ||||||||||||
Copper | 1 | Long | 1/5/22 | 229 | 14 | — | ||||||||||||
Copper | 2 | Long | 1/12/22 | 474 | 14 | — | ||||||||||||
Copper | 1 | Long | 1/28/22 | 242 | 2 | — | ||||||||||||
Copper | 1 | Long | 2/3/22 | 238 | 6 | — | ||||||||||||
Copper | 2 | Long | 2/4/22 | 478 | 9 | — | ||||||||||||
Copper | 1 | Long | 2/9/22 | 236 | 7 | — | ||||||||||||
Copper | 1 | Long | 2/10/22 | 236 | 7 | — | ||||||||||||
Copper | 1 | Long | 2/11/22 | 243 | — | — | ||||||||||||
Copper | 2 | Long | 2/18/22 | 482 | 4 | — | ||||||||||||
Copper | 1 | Long | 3/3/22 | 238 | 5 | — | ||||||||||||
Copper | 1 | Long | 3/7/22 | 237 | 7 | — | ||||||||||||
Copper | 1 | Long | 3/9/22 | 239 | 4 | — | ||||||||||||
Copper | 1 | Long | 3/14/22 | 238 | 5 | — | ||||||||||||
Copper | 2 | Long | 3/22/22 | 479 | 7 | — | ||||||||||||
Corn | 2 | Long | 12/14/22 | 56 | — | 1 | ||||||||||||
Corn | 2 | Long | 3/14/22 | 58 | 2 | — | ||||||||||||
Cotton | 1 | Long | 3/9/22 | 56 | — | — | ||||||||||||
Crude Palm Oil Future | 1 | Long | 3/15/22 | 28 | — | — | ||||||||||||
Gasoline | 1 | Long | 1/31/22 | 90 | 4 | — | ||||||||||||
Lead | 1 | Long | 1/6/22 | 54 | 5 | — | ||||||||||||
Lead | 1 | Long | 1/14/22 | 58 | — | — | ||||||||||||
Lead | 1 | Long | 1/28/22 | 60 | — | 2 | ||||||||||||
Lead | 1 | Long | 2/2/22 | 59 | — | — | ||||||||||||
Lead | 1 | Long | 2/3/22 | 59 | — | — | ||||||||||||
Lead | 1 | Long | 2/17/22 | 55 | 3 | — | ||||||||||||
Lead | 1 | Long | 2/18/22 | 56 | 2 | — | ||||||||||||
See notes to consolidated financial statements.
21
Table of Contents
FS Multi-Strategy Alternatives Fund
Consolidated Schedule of Investments (continued)
As of December 31, 2021
(dollar values in thousands, except share and per share amounts)
| Description | Number of Contracts | Position | Expiration Date | Notional Amount | Unrealized Appreciation | Unrealized Depreciation | ||||||||||||
|
|
|
|
|
|
| ||||||||||||
Lead | 2 | Long | 2/23/22 | 113 | $ | 3 | $ | — | ||||||||||
Lead | 2 | Long | 3/3/22 | 109 | 7 | — | ||||||||||||
Lead | 1 | Long | 3/7/22 | 55 | 3 | — | ||||||||||||
Live Cattle | 1 | Long | 4/29/22 | 57 | 1 | — | ||||||||||||
Low Sulphar Gasoil | 1 | Long | 2/10/22 | 65 | 2 | — | ||||||||||||
Natural Gas | 1 | Long | 9/28/22 | 40 | — | 3 | ||||||||||||
Nickel | 1 | Long | 1/6/22 | 115 | 11 | — | ||||||||||||
Nickel | 1 | Long | 1/11/22 | 116 | 10 | — | ||||||||||||
Nickel | 1 | Long | 1/13/22 | 118 | 8 | — | ||||||||||||
Nickel | 1 | Long | 1/14/22 | 118 | 8 | — | ||||||||||||
Nickel | 1 | Long | 1/19/22 | 124 | 2 | — | ||||||||||||
Nickel | 1 | Long | 2/9/22 | 118 | 7 | — | ||||||||||||
Nickel | 1 | Long | 2/11/22 | 119 | 7 | — | ||||||||||||
Nickel | 1 | Long | 2/15/22 | 118 | 7 | — | ||||||||||||
Nickel | 1 | Long | 2/18/22 | 115 | 9 | — | ||||||||||||
Nickel | 1 | Long | 2/22/22 | 122 | 3 | — | ||||||||||||
Nickel | 1 | Long | 2/24/22 | 121 | 3 | — | ||||||||||||
Nickel | 1 | Long | 2/25/22 | 121 | 3 | — | ||||||||||||
Nickel | 1 | Long | 3/1/22 | 121 | 3 | — | ||||||||||||
Nickel | 1 | Long | 3/3/22 | 121 | 3 | — | ||||||||||||
Nickel | 1 | Long | 3/7/22 | 119 | 6 | — | ||||||||||||
NY Harbor ULSD | 1 | Long | 2/28/22 | 98 | — | — | ||||||||||||
SGX Iron Ore 62 Index | 1 | Long | 2/28/22 | 12 | — | — | ||||||||||||
Soybean | 2 | Long | 3/14/22 | 68 | — | — | ||||||||||||
Sugar | 1 | Long | 2/11/22 | 26 | — | 1 | ||||||||||||
Tin | 1 | Long | 1/18/22 | 189 | 8 | — | ||||||||||||
Tin | 1 | Long | 1/28/22 | 189 | 8 | — | ||||||||||||
Wheat | 1 | Long | 3/14/22 | 52 | — | 3 | ||||||||||||
Wheat | 1 | Long | 12/14/22 | �� | 43 | — | 4 | |||||||||||
WTI Crude | 1 | Long | 1/20/22 | 76 | — | 1 | ||||||||||||
WTI Crude | 3 | Long | 2/22/22 | 226 | — | 2 | ||||||||||||
Zinc | 1 | Long | 1/4/22 | 76 | 13 | — | ||||||||||||
Zinc | 1 | Long | 1/7/22 | 79 | 11 | — | ||||||||||||
Zinc | 1 | Long | 1/12/22 | 84 | 5 | — | ||||||||||||
Zinc | 1 | Long | 1/13/22 | 84 | 5 | — | ||||||||||||
Zinc | 1 | Long | 1/18/22 | 83 | 6 | — | ||||||||||||
Zinc | 1 | Long | 2/22/22 | 84 | 5 | — | ||||||||||||
Zinc | 1 | Long | 2/23/22 | 83 | 5 | — | ||||||||||||
Zinc | 1 | Long | 3/2/22 | 83 | 6 | — | ||||||||||||
Zinc | 1 | Long | 3/21/22 | 85 | 3 | — | ||||||||||||
Zinc | 1 | Long | 3/23/22 | 88 | 1 | — | ||||||||||||
|
|
|
| |||||||||||||||
Total Commodity Futures Contracts | $ | 315 | $ | 47 | ||||||||||||||
|
|
|
| |||||||||||||||
Equity Futures Contracts—0.1% | ||||||||||||||||||
BIST 30 Index | 3 | Long | 2/28/22 | 5 | $ | — | $ | — | ||||||||||
CAC40 10 Euro Future | 6 | Long | 1/21/22 | 465 | 19 | — | ||||||||||||
DAX Index Future | 1 | Long | 3/18/22 | 435 | 13 | — | ||||||||||||
DAX Mini Index | 1 | Long | 3/18/22 | 90 | — | — | ||||||||||||
DJIA E-mini Industrial Average SM Index | 6 | Long | 3/18/22 | 1,064 | 23 | — | ||||||||||||
E-mini Russell 2000 Index | 3 | Long | 3/18/22 | 329 | 7 | — | ||||||||||||
Euro-STOXX 50 Index | 8 | Long | 3/18/22 | 375 | 13 | — | ||||||||||||
See notes to consolidated financial statements.
22
Table of Contents
FS Multi-Strategy Alternatives Fund
Consolidated Schedule of Investments (continued)
As of December 31, 2021
(dollar values in thousands, except share and per share amounts)
| Description | Number of Contracts | Position | Expiration Date | Notional Amount | Unrealized Appreciation | Unrealized Depreciation | ||||||||||||||
|
|
|
|
|
|
| ||||||||||||||
FTSE Taiwan Index | 1 | Long | 1/25/22 | 64 | $ | — | $ | — | ||||||||||||
FTSE/JSE Top 40 Index | 1 | Long | 3/17/22 | 41 | 1 | — | ||||||||||||||
FTSE/MIB Index | 4 | Long | 3/18/22 | 601 | 16 | — | ||||||||||||||
FTSES 100 Index | 5 | �� | Long | 3/18/22 | 490 | 1 | — | |||||||||||||
Hang Seng Index | 2 | Long | 1/28/22 | 296 | 5 | — | ||||||||||||||
IBEX 35 Index | 1 | Long | 1/21/22 | 98 | — | — | ||||||||||||||
MICRO E-Mini Russell 2000 Index | 1 | Long | 3/18/22 | 11 | — | — | ||||||||||||||
Mini H-Shares Index | 1 | Long | 1/28/22 | 10 | — | — | ||||||||||||||
MSCI EAFE | 1 | Long | 3/18/22 | 116 | — | — | ||||||||||||||
MSCI Singapore Index | 1 | Long | 1/28/22 | 25 | — | — | ||||||||||||||
NASDAQ 100 E-Mini | 1 | Long | 3/18/22 | 320 | 7 | — | ||||||||||||||
Nikkei 225 Mini Index | 1 | Long | 3/10/22 | 25 | — | — | ||||||||||||||
Nikkei 225 SGX Index | 3 | Long | 3/10/22 | 376 | 3 | — | ||||||||||||||
OMXS30 Index | 3 | Long | 1/21/22 | 79 | 1 | — | ||||||||||||||
S&P/TSX 60 Index | 3 | Long | 3/17/22 | 587 | 12 | — | ||||||||||||||
SGX Nifty 50 Index | 3 | Long | 1/27/22 | 104 | — | — | ||||||||||||||
SPI 200 Index futures | 3 | Long | 3/17/22 | 388 | 7 | — | ||||||||||||||
STOXX Europe 600 Insurance Index | 2 | Long | 3/18/22 | 36 | — | — | ||||||||||||||
STOXX Europe 600 Utilities Index | 1 | Long | 3/18/22 | 23 | — | — | ||||||||||||||
Yen Denom Nikkei Index | 1 | Long | 3/10/22 | 126 | — | 1 | ||||||||||||||
|
|
|
| |||||||||||||||||
Total Equity Futures Contracts | $ | 128 | $ | 1 | ||||||||||||||||
|
|
|
| |||||||||||||||||
Foreign Currency Futures Contracts—0.0% | ||||||||||||||||||||
INR/USD | 1 | Long | 1/27/22 | 27 | $ | — | $ | — | ||||||||||||
New Zealand Dollar | 1 | Long | 3/14/22 | 68 | — | — | ||||||||||||||
Swiss Franc | 1 | Long | 3/14/22 | 137 | 1 | — | ||||||||||||||
Dollar Index | 1 | Long | 3/14/22 | 96 | — | 1 | ||||||||||||||
|
|
|
| |||||||||||||||||
Total Foreign Currency Futures Contracts | $ | 1 | $ | 1 | ||||||||||||||||
|
|
|
| |||||||||||||||||
Interest Rate Futures Contracts—0.0% | ||||||||||||||||||||
Australia 10-Year Bond | 2 | Long | 3/15/22 | 204 | $ | — | $ | 2 | ||||||||||||
Canada 10-Year Bond | 8 | Long | 3/22/22 | 890 | 2 | — | ||||||||||||||
Euro BTP | 7 | Long | 3/8/22 | 1,180 | — | 17 | ||||||||||||||
Euro Bund | 2 | Long | 3/8/22 | 394 | — | 6 | ||||||||||||||
Euro Buxl | 3 | Long | 3/8/22 | 727 | — | 25 | ||||||||||||||
Euro-OAT | 1 | Long | 3/8/22 | 186 | — | 1 | ||||||||||||||
Euro-Schatz | 5 | Long | 3/8/22 | 631 | — | 1 | ||||||||||||||
Japanese 10-Year Bond | 1 | Long | 3/14/22 | 1,328 | — | 2 | ||||||||||||||
Short Euro-BTP | 2 | Long | 3/8/22 | 257 | — | 1 | ||||||||||||||
U.S. Treasury 10-Year Note | 26 | Long | 3/22/22 | 3,396 | — | 4 | ||||||||||||||
U.S. Treasury 10-Year Ultra Bond | 4 | Long | 3/22/22 | 589 | — | 4 | ||||||||||||||
U.S. Treasury Ultra Bond | 2 | Long | 3/22/22 | 393 | 1 | — | ||||||||||||||
|
|
|
| |||||||||||||||||
Total Interest Rate Futures Contracts | $ | 3 | $ | 63 | ||||||||||||||||
|
|
|
| |||||||||||||||||
Total Long Futures | $ | 447 | $ | 112 | ||||||||||||||||
|
|
|
| |||||||||||||||||
| Description | Number of Contracts | Position | Expiration Date | Notional Amount | Unrealized Appreciation | Unrealized Depreciation | ||||||||||||||
|
|
|
|
|
|
| ||||||||||||||
Short Futures—(0.2)% |
| |||||||||||||||||||
Commodity Futures Contracts—(0.2)% | ||||||||||||||||||||
Aluminum | (1) | Short | 1/4/22 | (77 | ) | $ | 7 | $ | — | |||||||||||
See notes to consolidated financial statements.
23
Table of Contents
FS Multi-Strategy Alternatives Fund
Consolidated Schedule of Investments (continued)
As of December 31, 2021
(dollar values in thousands, except share and per share amounts)
| Description | Number of Contracts | Position | Expiration Date | Notional Amount | Unrealized Appreciation | Unrealized Depreciation | ||||||||||||
|
|
|
|
|
|
| ||||||||||||
Aluminum | (1) | Short | 1/6/22 | (72 | ) | $ | 2 | $ | — | |||||||||
Aluminum | (3) | Short | 1/7/22 | (219 | ) | 9 | — | |||||||||||
Aluminum | (1) | Short | 2/11/22 | (65 | ) | — | 5 | |||||||||||
Aluminum | (1) | Short | 2/22/22 | (66 | ) | — | 4 | |||||||||||
Aluminum | (1) | Short | 2/25/22 | (68 | ) | — | 2 | |||||||||||
Aluminum | (1) | Short | 3/1/22 | (67 | ) | — | 4 | |||||||||||
Aluminum | (1) | Short | 3/2/22 | (66 | ) | — | 5 | |||||||||||
Aluminum | (1) | Short | 3/8/22 | (67 | ) | — | 4 | |||||||||||
Aluminum | (1) | Short | 3/15/22 | (65 | ) | — | 5 | |||||||||||
Aluminum | (1) | Short | 3/21/22 | (67 | ) | — | 3 | |||||||||||
Copper | (1) | Short | 1/5/22 | (237 | ) | — | 7 | |||||||||||
Copper | (2) | Short | 1/12/22 | (475 | ) | — | 13 | |||||||||||
Copper | (1) | Short | 1/28/22 | (239 | ) | — | 5 | |||||||||||
Copper | (1) | Short | 2/3/22 | (240 | ) | — | 3 | |||||||||||
Copper | (2) | Short | 2/4/22 | (475 | ) | — | 12 | |||||||||||
Copper | (1) | Short | 2/9/22 | (238 | ) | — | 6 | |||||||||||
Copper | (1) | Short | 2/10/22 | (238 | ) | — | 5 | |||||||||||
Copper | (1) | Short | 2/11/22 | (236 | ) | — | 7 | |||||||||||
Copper | (2) | Short | 2/18/22 | (474 | ) | — | 13 | |||||||||||
Copper | (1) | Short | 3/1/22 | (238 | ) | — | 5 | |||||||||||
Copper | (1) | Short | 3/3/22 | (236 | ) | — | 7 | |||||||||||
Copper | (1) | Short | 3/7/22 | (238 | ) | — | 5 | |||||||||||
Copper | (1) | Short | 3/9/22 | (238 | ) | — | 5 | |||||||||||
Copper | (1) | Short | 3/14/22 | (239 | ) | — | 5 | |||||||||||
Corn | (1) | Short | 3/14/22 | (30 | ) | — | — | |||||||||||
Gold | (6) | Short | 2/24/22 | (1,080 | ) | — | 17 | |||||||||||
Lead | (1) | Short | 1/6/22 | (59 | ) | — | — | |||||||||||
Lead | (1) | Short | 1/14/22 | (60 | ) | 2 | — | |||||||||||
Lead | (1) | Short | 1/28/22 | (58 | ) | — | — | |||||||||||
Lead | (1) | Short | 2/2/22 | (59 | ) | 1 | — | |||||||||||
Lead | (1) | Short | 2/3/22 | (60 | ) | 2 | — | |||||||||||
Lead | (1) | Short | 2/17/22 | (57 | ) | — | 1 | |||||||||||
Lead | (1) | Short | 2/18/22 | (56 | ) | — | 2 | |||||||||||
Lead | (2) | Short | 2/23/22 | (109 | ) | — | 7 | |||||||||||
Lead | (2) | Short | 3/3/22 | (111 | ) | — | 5 | |||||||||||
Lead | (1) | Short | 3/7/22 | (55 | ) | — | 3 | |||||||||||
Nickel | (1) | Short | 1/6/22 | (109 | ) | — | 17 | |||||||||||
Nickel | (1) | Short | 1/11/22 | (118 | ) | — | 8 | |||||||||||
Nickel | (1) | Short | 1/13/22 | (115 | ) | — | 11 | |||||||||||
Nickel | (1) | Short | 1/14/22 | (118 | ) | — | 7 | |||||||||||
Nickel | (1) | Short | 1/19/22 | (117 | ) | — | 8 | |||||||||||
Nickel | (1) | Short | 2/9/22 | (116 | ) | — | 9 | |||||||||||
Nickel | (1) | Short | 2/11/22 | (118 | ) | — | 7 | |||||||||||
Nickel | (1) | Short | 2/15/22 | (118 | ) | — | 7 | |||||||||||
Nickel | (1) | Short | 2/18/22 | (118 | ) | — | 7 | |||||||||||
Nickel | (1) | Short | 2/22/22 | (121 | ) | — | 3 | |||||||||||
Nickel | (1) | Short | 2/24/22 | (127 | ) | 2 | — | |||||||||||
Nickel | (1) | Short | 2/25/22 | (121 | ) | — | 4 | |||||||||||
Nickel | (1) | Short | 3/1/22 | (121 | ) | — | 3 | |||||||||||
Nickel | (1) | Short | 3/3/22 | (120 | ) | — | 5 | |||||||||||
Nickel | (1) | Short | 3/7/22 | (121 | ) | — | 3 | |||||||||||
Platinum | (1) | Short | 4/27/22 | (48 | ) | — | — | |||||||||||
See notes to consolidated financial statements.
24
Table of Contents
FS Multi-Strategy Alternatives Fund
Consolidated Schedule of Investments (continued)
As of December 31, 2021
(dollar values in thousands, except share and per share amounts)
| Description | Number of Contracts | Position | Expiration Date | Notional Amount | Unrealized Appreciation | Unrealized Depreciation | ||||||||||||||
|
|
|
|
|
|
| ||||||||||||||
Silver | (1) | Short | 3/29/22 | (116 | ) | $ | — | $ | — | |||||||||||
Tin | (1) | Short | 1/18/22 | (190 | ) | — | 7 | |||||||||||||
Tin | (1) | Short | 1/28/22 | (175 | ) | — | 21 | |||||||||||||
Wheat | (1) | Short | 3/10/22 | (16 | ) | — | — | |||||||||||||
Wheat | (1) | Short | 3/14/22 | (51 | ) | 2 | — | |||||||||||||
Wheat | (1) | Short | 3/14/22 | (39 | ) | — | — | |||||||||||||
Zinc | (1) | Short | 1/4/22 | (84 | ) | — | 5 | |||||||||||||
Zinc | (1) | Short | 1/7/22 | (84 | ) | — | 6 | |||||||||||||
Zinc | (1) | Short | 1/12/22 | (81 | ) | — | 9 | |||||||||||||
Zinc | (1) | Short | 1/13/22 | (83 | ) | — | 6 | |||||||||||||
Zinc | (1) | Short | 1/18/22 | (94 | ) | 4 | — | |||||||||||||
Zinc | (1) | Short | 2/22/22 | (81 | ) | — | 8 | |||||||||||||
Zinc | (1) | Short | 2/23/22 | (83 | ) | — | 6 | |||||||||||||
Zinc | (1) | Short | 3/2/22 | (80 | ) | — | 9 | |||||||||||||
Zinc | (1) | Short | 3/9/22 | (83 | ) | — | 5 | |||||||||||||
Zinc | (1) | Short | 3/30/22 | (88 | ) | — | — | |||||||||||||
|
|
|
| |||||||||||||||||
Total Commodity Futures Contracts | $ | 31 | $ | 346 | ||||||||||||||||
|
|
|
| |||||||||||||||||
Equity Futures Contracts—(0.0)% | ||||||||||||||||||||
CBOE Volatility Index | (6) | Short | 2/16/22 | (135 | ) | $ | 3 | $ | — | |||||||||||
CBOE Volatility Index | (3) | Short | 1/19/22 | (61 | ) | 2 | — | |||||||||||||
FTSE China A50 Index | (1) | Short | 1/27/22 | (16 | ) | — | — | |||||||||||||
FTSE KLCI Futures | (1) | Short | 1/31/22 | (18 | ) | — | — | |||||||||||||
MSCI Emerging Market Index | (3) | Short | 3/18/22 | (183 | ) | — | 1 | |||||||||||||
S&P 500 E-Mini | (4) | Short | 3/18/22 | (956 | ) | 4 | — | |||||||||||||
SET50 Index Futures | (3) | Short | 3/30/22 | (18 | ) | — | — | |||||||||||||
|
|
|
| |||||||||||||||||
Total Equity Futures Contracts | $ | 9 | $ | 1 | ||||||||||||||||
|
|
|
| |||||||||||||||||
Foreign Currency Futures Contracts—0.0% | ||||||||||||||||||||
Mexican Peso | (1) | Short | 3/14/22 | (24 | ) | $ | — | $ | — | |||||||||||
|
|
|
| |||||||||||||||||
Total Foreign Currency Futures Contracts | $ | — | $ | — | ||||||||||||||||
|
|
|
| |||||||||||||||||
Interest Rate Futures Contracts—(0.0)% | ||||||||||||||||||||
10 year Mini-JGB Futures | (1) | Short | 3/11/22 | (132 | ) | $ | — | $ | — | |||||||||||
3 Month Eurodollar | (1) | Short | 12/19/22 | (288 | ) | — | — | |||||||||||||
3 Month Eurodollar | (1) | Short | 12/18/23 | (281 | ) | — | — | |||||||||||||
3 Month Eurodollar | (1) | Short | 12/16/24 | (281 | ) | 1 | — | |||||||||||||
3 Month Eurodollar | (1) | Short | 3/13/23 | (284 | ) | — | — | |||||||||||||
3 Month SOFR | (1) | Short | 12/20/22 | (249 | ) | — | — | |||||||||||||
90 Day Eurodollar | (2) | Short | 12/19/22 | (496 | ) | 1 | — | |||||||||||||
90 Day Eurodollar | (1) | Short | 12/15/25 | (245 | ) | — | — | |||||||||||||
90 Day Eurodollar | (3) | Short | 3/18/24 | (738 | ) | — | — | |||||||||||||
90 Day Eurodollar | (1) | Short | 3/17/25 | (246 | ) | — | — | |||||||||||||
90 Day Eurodollar | (1) | Short | 3/16/26 | (246 | ) | — | — | |||||||||||||
Euro BOBL | (3) | Short | 3/8/22 | (453 | ) | — | — | |||||||||||||
U.S. Treasury 2-Year Note | (11) | Short | 3/31/22 | (2,400 | ) | 1 | — | |||||||||||||
U.S. Treasury 5-Year Note | (4) | Short | 3/31/22 | (484 | ) | — | — | |||||||||||||
U.S. Treasury Long Bond | (8) | Short | 3/22/22 | (1,278 | ) | — | 6 | |||||||||||||
|
|
|
| |||||||||||||||||
Total Interest Rate Futures Contracts | $ | 3 | $ | 6 | ||||||||||||||||
|
|
|
| |||||||||||||||||
Total Short Futures | $ | 43 | $ | 353 | ||||||||||||||||
|
|
|
| |||||||||||||||||
See notes to consolidated financial statements.
25
Table of Contents
FS Multi-Strategy Alternatives Fund
Consolidated Schedule of Investments (continued)
As of December 31, 2021
(dollar values in thousands, except share and per share amounts)
Counterparty | Fund Pays | Fund Receives | Notional Amount | Expiration | Periodic | Premium Paid (Received) | Fair Value(c) | Unrealized Appreciation | Unrealized Depreciation | |||||||||||||||||
Total Return Index Swaps(h)—0.7% | ||||||||||||||||||||||||||
Bank of America, N.A. | Fixed Rate of 0.00% | Total Return on BAML Excess Return Strategy Index(i) | USD 8,002 | 12/21/22 | Quarterly | $ | — | $ | — | $ | — | $ | — | |||||||||||||
Bank of America, N.A. | Fixed Rate of 0.00% | Total Return on BAML Commodity Basket Index(j) | USD 15,301 | 11/21/22 | Quarterly | — | 241 | 241 | — | |||||||||||||||||
Barclays Bank PLC | Fixed Rate of 0.00% | Total return on Barclays EB05 Desk Strategy Index(k) | USD 28,999 | 6/8/22 | Quarterly | — | — | — | — | |||||||||||||||||
Barclays Bank PLC | Fixed Rate of 0.00% | Total Return on Barclays MFI vs REMIX Index(l) | USD 71,400 | 12/16/22 | Monthly | — | 20 | 20 | — | |||||||||||||||||
BNP Paribas | 3 Month LIBOR + 0.30% | Total return on BNP Equity Value Factor Index(m) | USD 15,322 | 6/15/22 | Quarterly | — | 491 | 491 | — | |||||||||||||||||
BNP Paribas | Total return on BNP Equity Growth Factor Index(n) | 3 Month LIBOR + 0.10% | USD 15,125 | 6/15/22 | Quarterly | — | (145 | ) | — | 145 | ||||||||||||||||
Credit Suisse International | Fixed Rate of 0.50% | Total return on Credit Suisse Gamma Weighted Dispersion Index ER(o) | USD 7,385 | 5/20/22 | Monthly | — | (86) | — | 86 | |||||||||||||||||
Goldman Sachs International | Fixed Rate of 0.15% | Total return on Goldman Sachs Calls-vs-Calls US Series 2 Excess Return Strategy Index(p) | USD 7,713 | 11/8/22 | Quarterly | — | (64 | ) | — | 64 | ||||||||||||||||
Goldman Sachs International | Fixed Rate of 0.15% | Total return on Goldman Sachs Systematic Skew US Series 1D Excess Return Strategy Index(q) | USD 7,765 | 11/8/22 | Quarterly | — | 77 | 77 | — | |||||||||||||||||
See notes to consolidated financial statements.
26
Table of Contents
FS Multi-Strategy Alternatives Fund
Consolidated Schedule of Investments (continued)
As of December 31, 2021
(dollar values in thousands, except share and per share amounts)
Counterparty | Fund Pays | Fund Receives | Notional Amount | Expiration | Periodic | Premium Paid (Received) | Fair Value(c) | Unrealized Appreciation | Unrealized Depreciation | |||||||||||||||||
Goldman Sachs International | Fixed Rate of 0.15% | Total return on Goldman Sachs Macro Index VA01(r) | USD 23,266 | 5/17/22 | Quarterly | $ | — | $ | 128 | $ | 128 | $ | — | |||||||||||||
JP Morgan Chase Bank, N.A. | Fixed Rate of 0.25% | Total return on JP Morgan Correlation Spread Index(s) | USD 8,734 | 7/29/22 | Quarterly | — | 119 | 119 | — | |||||||||||||||||
JP Morgan Chase Bank, N.A. | Fixed Rate of 0.00% | Total return on JP Morgan Equity Risk Premium - Global Pure Low Vol L/S USD Index(t) | USD 9,560 | 6/28/22 | Quarterly | — | 10 | 10 | — | |||||||||||||||||
JP Morgan Chase Bank, N.A. | Fixed Rate of 0.20% | Total return on JPM US Conviction Mean Reversion Index(u) | USD 7,929 | 9/26/22 | Quarterly | — | (14 | ) | — | 14 | ||||||||||||||||
JP Morgan Chase Bank, N.A. | 3 Month SOFR | Total Return on iBoxx USD Liquid High Yield Index Index | USD 5,000 | 6/20/22 | Quarterly | — | (57 | ) | — | 57 | ||||||||||||||||
JP Morgan Chase Bank, N.A. | Federal Funds Rate + 0.64% | Total Return on JPM Long ERP Sector Index(v) | USD 13,050 | 2/18/22 | Quarterly | — | 8 | 8 | — | |||||||||||||||||
JP Morgan Chase Bank, N.A. | Total Return on JPM Short ERP Sector Index(w) | Federal Funds Rate - 0.21% | USD 9,904 | 2/18/22 | Quarterly | — | 37 | 37 | — | |||||||||||||||||
Macquarie Bank, Ltd. | Fixed Rate of 0.43% | Total Return on Macquarie Commodity Flex Basket Index(x) | USD 7,300 | 11/29/22 | Quarterly | — | 29 | 29 | — | |||||||||||||||||
Macquarie Bank, Ltd. | Fixed Rate of 0.25% | Total return on Macquarie US Equity Overnight Mean Reversion Index(y) | USD 7,344 | 3/9/22 | Quarterly | — | (18 | ) | — | 18 | ||||||||||||||||
See notes to consolidated financial statements.
27
Table of Contents
FS Multi-Strategy Alternatives Fund
Consolidated Schedule of Investments (continued)
As of December 31, 2021
(dollar values in thousands, except share and per share amounts)
Counterparty | Fund Pays | Fund Receives | Notional Amount | Expiration | Periodic | Premium Paid (Received) | Fair Value(c) | Unrealized Appreciation | Unrealized Depreciation | |||||||||||||||||
Morgan Stanley & Co. International PLC | Federal Funds Rate + 1.07% | Total return on Morgan Stanley US Sector-Neutral Quality Basket Index(z) | USD 5,541 | 3/31/22 | Quarterly | $ | — | $ | (6 | ) | $ | — | $ | 6 | ||||||||||||
Nomura Securities Co., Ltd. | Fixed Rate of 0.15% | Total return on Nomura G10 All Currencies Mean Reversion 25x w/ no Vol Adjustment Index(aa) | USD 12,300 | 7/29/22 | Quarterly | — | 76 | 76 | — | |||||||||||||||||
Societe Generale | Fixed Rate of 0.40% | Total return on Soc Gen STEP Index(ab) | USD 7,337 | 3/14/22 | Quarterly | — | 15 | 15 | — | |||||||||||||||||
Societe Generale | Federal Funds Rate | Total return on Soc Gen Vol Roll on Rates Index(ac) | USD 19,665 | 4/5/22 | N/A | — | 284 | 284 | — | |||||||||||||||||
Total Total Return Index Swaps | $ | — | $ | 1,145 | $ | 1,535 | $ | 390 | ||||||||||||||||||
| (a) | Security may be an obligation of one or more entities affiliated with the named company. |
| (b) | Denominated in U.S. dollars unless otherwise noted. |
| (c) | Fair value as of December 31, 2021 is determined by Adviser in accordance with the Fund’s valuation policy as approved by the board of trustees of FS Series Trust (the “Trust’’). See Note 2 for information on the Fund’s policy regarding valuation of investments, fair value hierarchy and other significant accounting policies. |
| (d) | Exempt from registration under Rule 144A of the Securities Act of 1933, as amended. Such securities may be deemed liquid by the investment adviser and may be resold, normally to qualified institutional buyers in transactions exempt from registration. Total market value of Rule 144A securities amounts to $33,915, which represents approximately 20.8% of net assets as of December 31, 2021. |
| (e) | Security is non-income producing. |
| (f) | Security or portion thereof is pledged as collateral supporting the amounts outstanding under the prime brokerage facility with Morgan Stanley & Co. (“MSC”). Securities may be rehypothecated from time to time as permitted under Rule 15c-1(a)(1) promulgated under the Securities Exchange Act of 1934, as amended, subject to terms and conditions governing the prime brokerage facility with MSC. As of December 31, 2021, there were no securities rehypothecated by MSC. |
| (g) | Rate represents the seven-day yield as of December 31, 2021. The State Street Institutional Liquid Reserves Fund’s financial statements are available on the SEC’s website at http://www.sec.gov. |
| (h) | The Fund pays or receives periodic payments in accordance with the total return swap contracts depending on the performance of the reference index. On reset dates and on the expiration date of the swap contracts, the Fund will either receive from or pay to the counterparty an amount equal to the net of (i) the accrued financing fees and (ii) the percentage change in price of the reference index times the notional amount, and (iii) if applicable any dividends received into the basket since the previous reset date. Valuations may be inclusive of interest and/or dividends receivable/payable and, as a result, the notional amounts presented may not recalculate directly with the fair value presented. |
See notes to consolidated financial statements.
28
Table of Contents
FS Multi-Strategy Alternatives Fund
Consolidated Schedule of Investments (continued)
As of December 31, 2021
(dollar values in thousands, except share and per share amounts)
| (i) | Short commodity volatility strategy to monetize the spread between implied and realized volatility. |
Top Underlying Components | Notional | Percentage of Notional | ||||||||||
Futures | ||||||||||||
NATURAL GAS FUTURE Feb22 | (415 | ) | -5.19 | % | ||||||||
NATURAL GAS FUTURE Mar22 | (283 | ) | -3.53 | % | ||||||||
WTI CRUDE FUTURE Feb22 | 181 | 2.26 | % | |||||||||
WTI CRUDE FUTURE Mar22 | (154 | ) | -1.92 | % | ||||||||
LME COPPER FUTURE Jan22 | 121 | 1.51 | % | |||||||||
BRENT CRUDE FUTURE May22 | 120 | 1.50 | % | |||||||||
WTI CRUDE FUTURE Apr22 | 98 | 1.22 | % | |||||||||
BRENT CRUDE FUTURE Apr22 | (97 | ) | -1.22 | % | ||||||||
LME COPPER FUTURE Apr22 | 79 | 0.98 | % | |||||||||
WTI CRUDE FUTURE May22 | 77 | 0.97 | % | |||||||||
LME COPPER FUTURE Mar22 | 52 | 0.64 | % | |||||||||
BRENT CRUDE FUTURE Jun22 | 34 | 0.42 | % | |||||||||
NATURAL GAS FUTURE Apr22 | (28 | ) | -0.35 | % | ||||||||
LME COPPER FUTURE Feb22 | 26 | 0.33 | % | |||||||||
BRENT CRUDE FUTURE Mar22 | (22 | ) | -0.27 | % | ||||||||
LME COPPER FUTURE May22 | 3 | 0.03 | % | |||||||||
Options | ||||||||||||
NATURAL GAS OPTION Feb22P | (319 | ) | -3.99 | % | ||||||||
NATURAL GAS OPTION Mar22P | (175 | ) | -2.19 | % | ||||||||
CRUDE OIL OPTION IPE May22C | (56 | ) | -0.70 | % | ||||||||
CRUDE OIL FUTURE OPTION Apr22C | (51 | ) | -0.64 | % | ||||||||
CRUDE OIL FUTURE OPTION Mar22P | (41 | ) | -0.52 | % | ||||||||
CRUDE OIL FUTURE OPTION May22C | (41 | ) | -0.51 | % | ||||||||
CRUDE OIL OPTION IPE Apr22P | (40 | ) | -0.50 | % | ||||||||
CRUDE OIL FUTURE OPTION Feb22C | (37 | ) | -0.46 | % | ||||||||
COPPER LME OPTION Apr22C | (36 | ) | -0.46 | % | ||||||||
CRUDE OIL OPTION IPE May22P | (33 | ) | -0.41 | % | ||||||||
CRUDE OIL FUTURE OPTION Apr22P | (32 | ) | -0.40 | % | ||||||||
NATURAL GAS OPTION Apr22P | (30 | ) | -0.38 | % | ||||||||
COPPER LME OPTION Apr22P | (29 | ) | -0.37 | % | ||||||||
CRUDE OIL FUTURE OPTION May22P | (27 | ) | -0.34 | % | ||||||||
COPPER LME OPTION Mar22C | (27 | ) | -0.33 | % | ||||||||
CRUDE OIL OPTION IPE Mar22C | (24 | ) | -0.31 | % | ||||||||
COPPER LME OPTION Mar22P | (24 | ) | -0.29 | % | ||||||||
CRUDE OIL OPTION IPE Mar22P | (24 | ) | -0.29 | % | ||||||||
CRUDE OIL OPTION IPE Jun22C | (22 | ) | -0.28 | % | ||||||||
CRUDE OIL OPTION IPE Apr22C | (22 | ) | -0.27 | % | ||||||||
COPPER LME OPTION Feb22C | (21 | ) | -0.26 | % | ||||||||
COPPER LME OPTION Feb22P | (20 | ) | -0.25 | % | ||||||||
NATURAL GAS OPTION Mar22C | (19 | ) | -0.24 | % | ||||||||
CRUDE OIL OPTION IPE Jun22P | (17 | ) | -0.22 | % | ||||||||
CRUDE OIL FUTURE OPTION Mar22C | (17 | ) | -0.21 | % | ||||||||
NATURAL GAS OPTION Apr22C | (14 | ) | -0.18 | % | ||||||||
CRUDE OIL FUTURE OPTION Feb22P | (10 | ) | -0.13 | % | ||||||||
COPPER LME OPTION Jan22C | (6 | ) | -0.08 | % | ||||||||
COPPER LME OPTION May22P | (4 | ) | -0.05 | % | ||||||||
See notes to consolidated financial statements.
29
Table of Contents
FS Multi-Strategy Alternatives Fund
Consolidated Schedule of Investments (continued)
As of December 31, 2021
(dollar values in thousands, except share and per share amounts)
Top Underlying Components | Notional | Percentage of Notional | ||||||||||
COPPER LME OPTION May22C | (3 | ) | -0.04 | % | ||||||||
NATURAL GAS OPTION Feb22C | (1 | ) | -0.02 | % | ||||||||
COPPER LME OPTION Jan22P | (1 | ) | -0.01 | % | ||||||||
| (j) | Basket of three commodity strategies: Cross-Maturity Seasonal Carry, Cross-Sectional Carry/Backwardation, and Spot Price Mean Reversion Value. |
Top Underlying Components | Notional | Percentage of Notional | ||||||||||
Futures | ||||||||||||
WTI CRUDE FUTURE Mar22 | 3,943 | 25.37 | % | |||||||||
BRENT CRUDE FUTURE Mar22 | 3,348 | 21.54 | % | |||||||||
WTI CRUDE FUTURE Apr22 | (3,165 | ) | -20.36 | % | ||||||||
NATURAL GAS FUTURE Jun22 | (3,010 | ) | -19.37 | % | ||||||||
NATURAL GAS FUTURE Mar22 | 2,834 | 18.23 | % | |||||||||
BRENT CRUDE FUTURE May22 | (2,559 | ) | -16.47 | % | ||||||||
LME COPPER FUTURE Mar22 | 2,395 | 15.41 | % | |||||||||
CORN FUTURE Jul22 | (1,756 | ) | -11.30 | % | ||||||||
LME COPPER FUTURE Apr22 | (1,684 | ) | -10.84 | % | ||||||||
SOYBEAN OIL FUTURE Mar22 | 1,536 | 9.88 | % | |||||||||
LME PRI ALUM FUTURE Apr22 | (1,523 | ) | -9.80 | % | ||||||||
LME NICKEL FUTURE Mar22 | 1,521 | 9.78 | % | |||||||||
SOYBEAN FUTURE Jul22 | (1,506 | ) | -9.69 | % | ||||||||
LIVE CATTLE FUTURE Jun22 | (1,482 | ) | -9.53 | % | ||||||||
COFFEE ‘C’ FUTURE Mar22 | 1,357 | 8.73 | % | |||||||||
LIVE CATTLE FUTURE Apr22 | 1,355 | 8.72 | % | |||||||||
WHEAT FUTURE(CBT) Mar22 | 1,346 | 8.66 | % | |||||||||
COFFEE ‘C’ FUTURE Jul22 | (1,341 | ) | -8.63 | % | ||||||||
LEAN HOGS FUTURE Apr22 | (1,341 | ) | -8.63 | % | ||||||||
CORN FUTURE Mar22 | 1,330 | 8.56 | % | |||||||||
SOYBEAN OIL FUTURE Jul22 | (1,302 | ) | -8.38 | % | ||||||||
LIVE CATTLE FUTURE Feb22 | 1,241 | 7.99 | % | |||||||||
GOLD 100 OZ FUTURE Apr22 | 1,185 | 7.63 | % | |||||||||
SOYBEAN FUTURE Mar22 | 1,058 | 6.81 | % | |||||||||
LME ZINC FUTURE Apr22 | (1,047 | ) | -6.73 | % | ||||||||
Low Su Gasoil G Apr22 | (1,038 | ) | -6.68 | % | ||||||||
WTI CRUDE FUTURE Dec22 | (1,006 | ) | -6.47 | % | ||||||||
SUGAR #11 (WORLD) May22 | 998 | 6.42 | % | |||||||||
SUGAR #11 (WORLD) Jul22 | (994 | ) | -6.39 | % | ||||||||
KC HRW WHEAT FUTURE Mar22 | 991 | 6.38 | % | |||||||||
GASOLINE RBOB FUTURE Apr22 | (901 | ) | -5.80 | % | ||||||||
GASOLINE RBOB FUTURE Mar22 | 868 | 5.58 | % | |||||||||
BRENT CRUDE FUTURE Dec22 | (842 | ) | -5.42 | % | ||||||||
LME PRI ALUM FUTURE Mar22 | 830 | 5.34 | % | |||||||||
LME NICKEL FUTURE Apr22 | (821 | ) | -5.28 | % | ||||||||
NY Harb ULSD FUTURE Apr22 | (819 | ) | -5.27 | % | ||||||||
NATURAL GAS FUTURE Dec22 | (698 | ) | -4.49 | % | ||||||||
KC HRW WHEAT FUTURE Jul22 | (670 | ) | -4.31 | % | ||||||||
CORN FUTURE Dec22 | (616 | ) | -3.97 | % | ||||||||
WHEAT FUTURE(CBT) Jul22 | (612 | ) | -3.94 | % | ||||||||
See notes to consolidated financial statements.
30
Table of Contents
FS Multi-Strategy Alternatives Fund
Consolidated Schedule of Investments (continued)
As of December 31, 2021
(dollar values in thousands, except share and per share amounts)
Top Underlying Components | Notional | Percentage of Notional | ||||||||||
SOYBEAN MEAL FUTURE Jul22 | (588 | ) | -3.78 | % | ||||||||
COTTON NO.2 FUTURE Mar22 | 567 | 3.65 | % | |||||||||
COTTON NO.2 FUTURE May22 | (559 | ) | -3.60 | % | ||||||||
LME COPPER FUTURE Dec22 | 543 | 3.49 | % | |||||||||
LEAN HOGS FUTURE Feb22 | 540 | 3.48 | % | |||||||||
LME PRI ALUM FUTURE Dec22 | 486 | 3.13 | % | |||||||||
COFFEE ‘C’ FUTURE May22 | 434 | 2.79 | % | |||||||||
LEAN HOGS FUTURE Jun22 | (429 | ) | -2.76 | % | ||||||||
SOYBEAN MEAL FUTURE Mar22 | 384 | 2.47 | % | |||||||||
LME ZINC FUTURE Dec22 | (358 | ) | -2.30 | % | ||||||||
| (k) | Seeks to capture intraday momentum in global equity markets. |
Top Underlying Components | Notional | Percentage of Notional | ||||||||||
Index | ||||||||||||
Barclays EB05 strategy | 28,999 | 100.00 | % | |||||||||
| (l) | A strategy that seeks to provide exposure to the spread between mortgages and treasury securities. |
Top Underlying Components | Notional | Percentage of Notional | ||||||||||
TBA Agency MBS | ||||||||||||
FNCL 2% 2/2022 | (11,213 | ) | -15.70 | % | ||||||||
FNCL 2.5% 2/2022 | (8,170 | ) | -11.44 | % | ||||||||
FNCL 3% 2/2022 | (8,020 | ) | -11.23 | % | ||||||||
G2SF 2% 2/2022 | (5,964 | ) | -8.35 | % | ||||||||
FNCI 2% 2/2022 | (5,949 | ) | -8.33 | % | ||||||||
G2SF 2.5% 2/2022 | (5,328 | ) | -7.46 | % | ||||||||
FNCL 3.5% 2/2022 | (4,685 | ) | -6.56 | % | ||||||||
FNCL 4.5% 2/2022 | (4,257 | ) | -5.96 | % | ||||||||
G2SF 3% 2/2022 | (3,785 | ) | -5.30 | % | ||||||||
FNCL 1.5% 2/2022 | (3,328 | ) | -4.66 | % | ||||||||
FNCL 4% 2/2022 | (2,857 | ) | -4.00 | % | ||||||||
FNCI 2.5% 2/2022 | (2,564 | ) | -3.59 | % | ||||||||
FNCI 1.5% 2/2022 | (2,357 | ) | -3.30 | % | ||||||||
G2SF 4% 2/2022 | (1,636 | ) | -2.29 | % | ||||||||
G2SF 3.5% 2/2022 | (1,321 | ) | -1.85 | % | ||||||||
Futures | ||||||||||||
US 5YR NOTE (CBT) Mar22 | 32,675 | 45.75 | % | |||||||||
US 10YR NOTE (CBT) Mar22 | 27,839 | 38.98 | % | |||||||||
US 2YR NOTE (CBT) Mar22 | 4,099 | 5.74 | % | |||||||||
Index | ||||||||||||
MFI US Bills | 68,201 | 95.49 | % | |||||||||
See notes to consolidated financial statements.
31
Table of Contents
FS Multi-Strategy Alternatives Fund
Consolidated Schedule of Investments (continued)
As of December 31, 2021
(dollar values in thousands, except share and per share amounts)
| (m) | Seeks to provide directional exposure that is long undervalued names in the Russell 3000 as determined by the Wilshire Value model. |
Top Underlying Components | Shares | Notional | Percentage of Notional | |||||||||
Common Stock | ||||||||||||
Photronics Inc | 4,088 | 77 | 0.49 | % | ||||||||
StarTek Inc | 13,874 | 72 | 0.46 | % | ||||||||
Citrix Systems Inc | 719 | 68 | 0.43 | % | ||||||||
SMART Global Holdings Inc | 935 | 66 | 0.42 | % | ||||||||
Jabil Inc | 933 | 66 | 0.42 | % | ||||||||
Alpha & Omega Semiconductor Ltd | 1,069 | 65 | 0.41 | % | ||||||||
Cohu Inc | 1,681 | 64 | 0.41 | % | ||||||||
Xerox Holdings Corp | 2,818 | 64 | 0.40 | % | ||||||||
Micron Technology Inc | 677 | 63 | 0.40 | % | ||||||||
Axcelis Technologies Inc | 846 | 63 | 0.40 | % | ||||||||
ACI Worldwide Inc | 1,805 | 63 | 0.40 | % | ||||||||
Dolby Laboratories Inc | 657 | 63 | 0.40 | % | ||||||||
MoneyGram International Inc | 7,931 | 63 | 0.40 | % | ||||||||
Paysafe Ltd | 15,971 | 62 | 0.40 | % | ||||||||
Arrow Electronics Inc | 464 | 62 | 0.39 | % | ||||||||
MKS Instruments Inc | 357 | 62 | 0.39 | % | ||||||||
A10 Networks Inc | 3,743 | 62 | 0.39 | % | ||||||||
Cirrus Logic Inc | 674 | 62 | 0.39 | % | ||||||||
Instructure Inc | 2,585 | 62 | 0.39 | % | ||||||||
NetScout Systems Inc | 1,865 | 62 | 0.39 | % | ||||||||
Avnet Inc | 1,496 | 62 | 0.39 | % | ||||||||
Sanmina Corp | 1,488 | 62 | 0.39 | % | ||||||||
Veeco Instruments Inc | 2,166 | 62 | 0.39 | % | ||||||||
Unisys Corp | 2,992 | 62 | 0.39 | % | ||||||||
Vishay Precision Group Inc | 1,654 | 61 | 0.39 | % | ||||||||
IBEX Ltd | 4,746 | 61 | 0.39 | % | ||||||||
ON24 Inc | 3,519 | 61 | 0.39 | % | ||||||||
Symantec Corp | 2,350 | 61 | 0.39 | % | ||||||||
Diebold Nixdorf Inc | 6,744 | 61 | 0.39 | % | ||||||||
SS&C Technologies Holdings Inc | 741 | 61 | 0.38 | % | ||||||||
Benchmark Electronics Inc | 2,241 | 61 | 0.38 | % | ||||||||
SYNNEX Corp | 530 | 61 | 0.38 | % | ||||||||
TTM Technologies Inc | 4,068 | 61 | 0.38 | % | ||||||||
AXT Inc | 6,847 | 60 | 0.38 | % | ||||||||
Plantronics Inc | 2,053 | 60 | 0.38 | % | ||||||||
Belden Inc | 912 | 60 | 0.38 | % | ||||||||
The Western Union Co | 3,355 | 60 | 0.38 | % | ||||||||
CDK Global Inc | 1,429 | 60 | 0.38 | % | ||||||||
Vishay Intertechnology Inc | 2,722 | 60 | 0.38 | % | ||||||||
DXC Technology Co | 1,848 | 60 | 0.38 | % | ||||||||
Daktronics Inc | 11,744 | 59 | 0.38 | % | ||||||||
Hewlett Packard Enterprise Co | 3,758 | 59 | 0.37 | % | ||||||||
Rimini Street Inc | 9,904 | 59 | 0.37 | % | ||||||||
Mitek Systems Inc | 3,326 | 59 | 0.37 | % | ||||||||
Amkor Technology Inc | 2,374 | 59 | 0.37 | % | ||||||||
ScanSource Inc | 1,677 | 59 | 0.37 | % | ||||||||
NETGEAR Inc | 2,013 | 59 | 0.37 | % | ||||||||
InterDigital Inc | 821 | 59 | 0.37 | % | ||||||||
McAfee Corp | 2,271 | 59 | 0.37 | % | ||||||||
Dropbox Inc | 2,361 | 58 | 0.37 | % | ||||||||
See notes to consolidated financial statements.
32
Table of Contents
FS Multi-Strategy Alternatives Fund
Consolidated Schedule of Investments (continued)
As of December 31, 2021
(dollar values in thousands, except share and per share amounts)
| (n) | Seeks to provide directional exposure that is short the most expensive names in the Russell 3000 as determined by the Wilshire Value model. |
Top Underlying Components | Shares | Notional | Percentage of Notional | |||||||||
Common Stock | ||||||||||||
Clearfield Inc | (928 | ) | (78 | ) | -0.51 | % | ||||||
Arlo Technologies Inc | (7,089 | ) | (74 | ) | -0.49 | % | ||||||
Identiv Inc | (2,599 | ) | (73 | ) | -0.48 | % | ||||||
Infinera Corp | (7,258 | ) | (70 | ) | -0.46 | % | ||||||
Arista Networks Inc | (483 | ) | (69 | ) | -0.45 | % | ||||||
EPAM Systems Inc | (102 | ) | (68 | ) | -0.45 | % | ||||||
Switch Inc | (2,322 | ) | (66 | ) | -0.44 | % | ||||||
Zscaler Inc | (205 | ) | (66 | ) | -0.43 | % | ||||||
Impinj Inc | (740 | ) | (66 | ) | -0.43 | % | ||||||
Ubiquiti Inc | (212 | ) | (65 | ) | -0.43 | % | ||||||
Motorola Solutions Inc | (239 | ) | (65 | ) | -0.43 | % | ||||||
MongoDB Inc | (122 | ) | (65 | ) | -0.42 | % | ||||||
Napco Security Technologies In | (1,281 | ) | (64 | ) | -0.42 | % | ||||||
Broadridge Financial Solutions | (350 | ) | (64 | ) | -0.42 | % | ||||||
Allegro MicroSystems Inc | (1,765 | ) | (64 | ) | -0.42 | % | ||||||
VeriSign Inc | (250 | ) | (63 | ) | -0.41 | % | ||||||
Apple Inc | (356 | ) | (63 | ) | -0.41 | % | ||||||
Novanta Inc | (359 | ) | (63 | ) | -0.41 | % | ||||||
Coherent Inc | (230 | ) | (61 | ) | -0.40 | % | ||||||
Asana Inc | (820 | ) | (61 | ) | -0.40 | % | ||||||
Rekor Systems Inc | (9,337 | ) | (61 | ) | -0.40 | % | ||||||
Cognex Corp | (786 | ) | (61 | ) | -0.40 | % | ||||||
Atlassian Corp PLC | (159 | ) | (61 | ) | -0.40 | % | ||||||
Tucows Inc | (724 | ) | (61 | ) | -0.40 | % | ||||||
Advanced Micro Devices Inc | (421 | ) | (61 | ) | -0.40 | % | ||||||
Twilio Inc | (230 | ) | (61 | ) | -0.40 | % | ||||||
Synaptics Inc | (208 | ) | (60 | ) | -0.39 | % | ||||||
Zebra Technologies Corp | (101 | ) | (60 | ) | -0.39 | % | ||||||
Splunk Inc | (517 | ) | (60 | ) | -0.39 | % | ||||||
Avid Technology Inc | (1,831 | ) | (60 | ) | -0.39 | % | ||||||
Pure Storage Inc | (1,830 | ) | (60 | ) | -0.39 | % | ||||||
Badger Meter Inc | (557 | ) | (59 | ) | -0.39 | % | ||||||
Okta Inc | (265 | ) | (59 | ) | -0.39 | % | ||||||
Akoustis Technologies Inc | (8,875 | ) | (59 | ) | -0.39 | % | ||||||
Lattice Semiconductor Corp | (768 | ) | (59 | ) | -0.39 | % | ||||||
Grid Dynamics Holdings Inc | (1,550 | ) | (59 | ) | -0.39 | % | ||||||
Sabre Corp | (6,843 | ) | (59 | ) | -0.38 | % | ||||||
Domo Inc | (1,177 | ) | (58 | ) | -0.38 | % | ||||||
Marvell Technology Group Ltd | (666 | ) | (58 | ) | -0.38 | % | ||||||
nLight Inc | (2,428 | ) | (58 | ) | -0.38 | % | ||||||
Quantum Corp | (10,494 | ) | (58 | ) | -0.38 | % | ||||||
Brooks Automation Inc | (561 | ) | (58 | ) | -0.38 | % | ||||||
Xilinx Inc | (272 | ) | (58 | ) | -0.38 | % | ||||||
National CineMedia Inc | (20,413 | ) | (57 | ) | -0.38 | % | ||||||
Nutanix Inc | (1,800 | ) | (57 | ) | -0.38 | % | ||||||
Clear Channel Outdoor Holdings Inc | (17,272 | ) | (57 | ) | -0.37 | % | ||||||
Atomera Inc | (2,838 | ) | (57 | ) | -0.37 | % | ||||||
Ambarella Inc | (281 | ) | (57 | ) | -0.37 | % | ||||||
Snowflake Inc | (168 | ) | (57 | ) | -0.37 | % | ||||||
Unity Software Inc | (397 | ) | (57 | ) | -0.37 | % | ||||||
See notes to consolidated financial statements.
33
Table of Contents
FS Multi-Strategy Alternatives Fund
Consolidated Schedule of Investments (continued)
As of December 31, 2021
(dollar values in thousands, except share and per share amounts)
| (o) | Defensive S&P 500 vs. Top 50 dispersion strategy, combining a short position in index volatility with a long position in single stock volatility. |
Top Underlying Components | Notional | Percentage of Notional | ||||||||||
Options | ||||||||||||
SPDR S&P 500 ETF Tust Put | (28,381 | ) | -388.75 | % | ||||||||
SPDR S&P 500 ETF Tust Call | (11,137 | ) | -152.55 | % | ||||||||
Microsoft Put | 3,050 | 41.77 | % | |||||||||
Apple Call | 2,934 | 40.19 | % | |||||||||
Apple Put | 2,831 | 38.78 | % | |||||||||
Microsoft Call | 2,366 | 32.41 | % | |||||||||
Amazon Put | 1,667 | 22.83 | % | |||||||||
Amazon Call | 1,623 | 22.24 | % | |||||||||
GoogleL Put | 1,047 | 14.34 | % | |||||||||
Google Put | 1,000 | 13.70 | % | |||||||||
Tesla Call | 968 | 13.26 | % | |||||||||
Facebook Call | 878 | 12.03 | % | |||||||||
NVIDIA Call | 878 | 12.02 | % | |||||||||
GoogleL Call | 843 | 11.55 | % | |||||||||
Facebook Put | 828 | 11.34 | % | |||||||||
Tesla Put | 822 | 11.25 | % | |||||||||
Google Call | 759 | 10.40 | % | |||||||||
NVIDIA Put | 740 | 10.13 | % | |||||||||
Berkshire Hathaway Put | 730 | 10.00 | % | |||||||||
JPMorgan Put | 608 | 8.32 | % | |||||||||
Johnson & Johnson Put | 590 | 8.08 | % | |||||||||
United Health Group Put | 564 | 7.73 | % | |||||||||
Home Depot Put | 520 | 7.12 | % | |||||||||
Berkshire Hathaway Call | 492 | 6.74 | % | |||||||||
Pfizer Call | 437 | 5.98 | % | |||||||||
Procter & Gamble Put | 421 | 5.76 | % | |||||||||
Visa Put | 415 | 5.68 | % | |||||||||
Home Depot Call | 410 | 5.61 | % | |||||||||
Bank of America Put | 397 | 5.44 | % | |||||||||
JPMorgan Call | 388 | 5.31 | % | |||||||||
Procter & Gamble Call | 375 | 5.13 | % | |||||||||
Johnson & Johnson Call | 364 | 4.98 | % | |||||||||
Visa Call | 340 | 4.66 | % | |||||||||
United Health Group Call | 340 | 4.65 | % | |||||||||
Disney Put | 313 | 4.28 | % | |||||||||
salesforce.com Put | 310 | 4.25 | % | |||||||||
Adobe Call | 310 | 4.25 | % | |||||||||
CMCSA Put | 308 | 4.22 | % | |||||||||
Accenture PLC Put | 308 | 4.22 | % | |||||||||
Exxon Mobil Put | 308 | 4.21 | % | |||||||||
Pepsi Put | 306 | 4.19 | % | |||||||||
Disney Call | 303 | 4.15 | % | |||||||||
Broadcom Put | 299 | 4.10 | % | |||||||||
Cisco Systems Put | 292 | 4.00 | % | |||||||||
Netflix Call | 290 | 3.98 | % | |||||||||
Netflix Put | 290 | 3.97 | % | |||||||||
Thermo Fisher Scientific Put | 289 | 3.96 | % | |||||||||
Common Stock | ||||||||||||
SPDR S&P 500 ETF Tust | 3,046 | 41.72 | % | |||||||||
Apple | (1,178 | ) | -16.13 | % | ||||||||
Microsoft | (310 | ) | -4.24 | % | ||||||||
See notes to consolidated financial statements.
34
Table of Contents
FS Multi-Strategy Alternatives Fund
Consolidated Schedule of Investments (continued)
As of December 31, 2021
(dollar values in thousands, except share and per share amounts)
| (p) | Attempts to generate income by selling dislocated single stock calls while offsetting the market risk with a long S&P call. |
Top Underlying Components | Notional | Percentage of Notional | ||||||||||
Options | ||||||||||||
SPX European Call Option | 18,438 | 240.81 | % | |||||||||
AAPL American Call Option | (1,045 | ) | -13.65 | % | ||||||||
PFE American Call Option | (964 | ) | -12.59 | % | ||||||||
ADBE American Call Option | (717 | ) | -9.37 | % | ||||||||
ACN American Call Option | (637 | ) | -8.32 | % | ||||||||
ISRG American Call Option | (598 | ) | -7.82 | % | ||||||||
AMZN American Call Option | (518 | ) | -6.77 | % | ||||||||
NVDA American Call Option | (518 | ) | -6.77 | % | ||||||||
BLK American Call Option | (437 | ) | -5.70 | % | ||||||||
VZ American Call Option | (430 | ) | -5.61 | % | ||||||||
TSLA American Call Option | (410 | ) | -5.35 | % | ||||||||
MRK American Call Option | (392 | ) | -5.12 | % | ||||||||
BAC American Call Option | (376 | ) | -4.91 | % | ||||||||
PYPL American Call Option | (366 | ) | -4.78 | % | ||||||||
CMCSA American Call Option | (353 | ) | -4.61 | %�� | ||||||||
NKE American Call Option | (334 | ) | -4.36 | % | ||||||||
C American Call Option | (331 | ) | -4.32 | % | ||||||||
MSFT American Call Option | (318 | ) | -4.15 | % | ||||||||
MS American Call Option | (306 | ) | -3.99 | % | ||||||||
AMD American Call Option | (301 | ) | -3.93 | % | ||||||||
COST American Call Option | (298 | ) | -3.89 | % | ||||||||
FB American Call Option | (290 | ) | -3.79 | % | ||||||||
NOW American Call Option | (287 | ) | -3.74 | % | ||||||||
NFLX American Call Option | (285 | ) | -3.72 | % | ||||||||
UPS American Call Option | (282 | ) | -3.68 | % | ||||||||
GOOG American Call Option | (262 | ) | -3.42 | % | ||||||||
ORCL American Call Option | (251 | ) | -3.28 | % | ||||||||
WFC American Call Option | (245 | ) | -3.20 | % | ||||||||
AMT American Call Option | (241 | ) | -3.14 | % | ||||||||
MA American Call Option | (225 | ) | -2.94 | % | ||||||||
BKNG American Call Option | (218 | ) | -2.85 | % | ||||||||
CVS American Call Option | (216 | ) | -2.82 | % | ||||||||
COP American Call Option | (205 | ) | -2.68 | % | ||||||||
AMAT American Call Option | (204 | ) | -2.67 | % | ||||||||
SPGI American Call Option | (203 | ) | -2.65 | % | ||||||||
CSCO American Call Option | (187 | ) | -2.45 | % | ||||||||
WMT American Call Option | (175 | ) | -2.28 | % | ||||||||
TJX American Call Option | (173 | ) | -2.26 | % | ||||||||
PM American Call Option | (157 | ) | -2.05 | % | ||||||||
PNC American Call Option | (156 | ) | -2.03 | % | ||||||||
MU American Call Option | (153 | ) | -2.00 | % | ||||||||
ABBV American Call Option | (149 | ) | -1.95 | % | ||||||||
AMGN American Call Option | (145 | ) | -1.90 | % | ||||||||
PLD American Call Option | (142 | ) | -1.86 | % | ||||||||
MMC American Call Option | (142 | ) | -1.85 | % | ||||||||
MDT American Call Option | (139 | ) | -1.82 | % | ||||||||
GM American Call Option | (138 | ) | -1.80 | % | ||||||||
GOOGL American Call Option | (136 | ) | -1.77 | % | ||||||||
LLY American Call Option | (126 | ) | -1.65 | % | ||||||||
Cash | ||||||||||||
US Dollar | 331 | 4.33 | % | |||||||||
See notes to consolidated financial statements.
35
Table of Contents
FS Multi-Strategy Alternatives Fund
Consolidated Schedule of Investments (continued)
As of December 31, 2021
(dollar values in thousands, except share and per share amounts)
| (q) | Seeks to capture the risk premium associated with selling equity puts while buying equity calls. Delta and gamma hedges daily to reduce market and volatility premium exposures. |
Top Underlying Components | Notional | Percentage of Notional | ||||||||||
Options | ||||||||||||
SPX European Call Option | 27,463 | 349.89 | % | |||||||||
SPX EQ Forward | (24,340 | ) | -310.09 | % | ||||||||
Cash | ||||||||||||
USD | (529 | ) | -6.74 | % | ||||||||
| (r) | Aims to take advantage of the convergence in the performance of bonds with higher vs. lower real yields across G8 government bonds. |
Top Underlying Components | Notional | Percentage of Notional | ||||||||||
Futures | ||||||||||||
LONG GILT FUTURE Mar22 | (17,193 | ) | -73.48 | % | ||||||||
Euro-BUND FUTURE Mar22 | (11,395 | ) | -48.70 | % | ||||||||
US 10YR NOTE (CBT)Mar22 | (9,021 | ) | -38.55 | % | ||||||||
AUST 10Y BOND FUTURE Mar22 | 5,327 | 22.77 | % | |||||||||
CAN 10YR BOND FUTURE Mar22 | 1,855 | 7.93 | % | |||||||||
Euro-BTP Future Mar22 | 1,217 | 5.20 | % | |||||||||
JPN 10Y BOND(OSE) Mar22 | (0 | ) | 0.00 | % | ||||||||
Euro-OAT Future Mar22 | (0 | ) | 0.00 | % | ||||||||
| (s) | Aims to capture the spread of realized correlation between US Equity and US Equity volatility. |
Top Underlying Components | Notional | Percentage of Notional | ||||||||||
Index | ||||||||||||
S&P 500 Index | (1,792 | ) | -20.23 | % | ||||||||
iPath Series B S&P 500 VIX Short-Term Futures ETN | (311 | ) | -3.51 | % | ||||||||
| (t) | Market neutral strategy that seeks to provide exposure to Low Volatility risk premium. |
Top Underlying Components | Shares | Notional | Percentage of Notional | |||||||||
Common Stock | ||||||||||||
Cerner Corp | 598 | 56 | 0.58 | % | ||||||||
Argenx SE | (154) | (55 | ) | -0.58 | % | |||||||
Western Digital Corp | (839) | (55 | ) | -0.57 | % | |||||||
Lyft Inc | (1,270) | (54 | ) | -0.57 | % | |||||||
Tesla Inc | (51) | (54 | ) | -0.57 | % | |||||||
Carvana Co | (233) | (54 | ) | -0.56 | % | |||||||
Micron Technology Inc | (575) | (54 | ) | -0.56 | % | |||||||
Sinch AB | (4,214) | (54 | ) | -0.56 | % | |||||||
Hilton Worldwide Holdings Inc | 342 | 53 | 0.56 | % | ||||||||
Fortinet Inc | 147 | 53 | 0.55 | % | ||||||||
Uber Technologies Inc | (1,262) | (53 | ) | -0.55 | % | |||||||
Asana Inc | (708) | (53 | ) | -0.55 | % | |||||||
Booking Holdings Inc | 22 | 53 | 0.55 | % | ||||||||
Aramark | 1,427 | 53 | 0.55 | % | ||||||||
Chewy Inc | (891) | (53 | ) | -0.55 | % | |||||||
MongoDB Inc | (99) | (52 | ) | -0.55 | % | |||||||
Marriott International Inc | 316 | 52 | 0.54 | % | ||||||||
See notes to consolidated financial statements.
36
Table of Contents
FS Multi-Strategy Alternatives Fund
Consolidated Schedule of Investments (continued)
As of December 31, 2021
(dollar values in thousands, except share and per share amounts)
Top Underlying Components | Shares | Notional | Percentage of Notional | |||||||||
Paychex Inc | 381 | 52 | 0.54 | % | ||||||||
10X Genomics Inc | (349) | (52 | ) | -0.54 | % | |||||||
Delta Air Lines Inc | (1,329) | (52 | ) | -0.54 | % | |||||||
GVC Holdings PLC | (2,277) | (52 | ) | -0.54 | % | |||||||
Freeport-McMoRan Inc | (1,243) | (52 | ) | -0.54 | % | |||||||
CDW Corp | 253 | 52 | 0.54 | % | ||||||||
Vistra Energy Corp | (2,273) | (52 | ) | -0.54 | % | |||||||
Lasertec Corp | (169) | (52 | ) | -0.54 | % | |||||||
Embracer Group AB | (4,841) | (52 | ) | -0.54 | % | |||||||
Mettler-Toledo International Inc | 30 | 52 | 0.54 | % | ||||||||
Edwards Lifesciences Corp | 398 | 52 | 0.54 | % | ||||||||
NRG Energy Inc | (1,194) | (51 | ) | -0.54 | % | |||||||
Seagate Technology PLC | (455) | (51 | ) | -0.54 | % | |||||||
Arrow Electronics Inc | 382 | 51 | 0.54 | % | ||||||||
The Mosaic Co | (1,306) | (51 | ) | -0.54 | % | |||||||
Liberty Media Corp-Liberty Formula One | 810 | 51 | 0.54 | % | ||||||||
Las Vegas Sands Corp | 1,355 | 51 | 0.53 | % | ||||||||
Lam Research Corp | (71) | (51 | ) | -0.53 | % | |||||||
Zillow Group Inc | (819) | (51 | ) | -0.53 | % | |||||||
Ulta Beauty Inc | 124 | 51 | 0.53 | % | ||||||||
Bill.com Holdings Inc | (204) | (51 | ) | -0.53 | % | |||||||
Unity Software Inc | (356) | (51 | ) | -0.53 | % | |||||||
TFI International Inc | (453) | (51 | ) | -0.53 | % | |||||||
Global Payments Inc | 375 | 51 | 0.53 | % | ||||||||
Waters Corp | 136 | 51 | 0.53 | % | ||||||||
Automatic Data Processing Inc | 205 | 51 | 0.53 | % | ||||||||
Stryker Corp | 189 | 51 | 0.53 | % | ||||||||
Signature Bank | (156) | (51 | ) | -0.53 | % | |||||||
Carrefour SA | (2,759) | (51 | ) | -0.53 | % | |||||||
Oak Street Health Inc | (1,524) | (51 | ) | -0.53 | % | |||||||
GN Store Nord A/S | (803) | (51 | ) | -0.53 | % | |||||||
Fair Isaac Corp | 116 | 51 | 0.53 | % | ||||||||
Sysco Corp | (643) | (50 | ) | -0.53 | % | |||||||
| (u) | Seeks to monetize the tendency for the equity market to mean revert over short periods of time. |
Top Underlying Components | Notional | Percentage of Notional | ||||||||||
Index | ||||||||||||
JPM US Conviction Mean Reversion Index | 7,916 | 100.00 | % | |||||||||
| (v) | Uses factor-based stock selection to provide long exposure to the equity of natural resource, real estate, equipment and industrial, and infrastructure companies. |
Top Underlying Components | Shares | Notional | Percentage of Notional | |||||||||
Common Stock | ||||||||||||
Newmont Mining Corp | 4,650 | 288 | 2.21 | % | ||||||||
Medical Properties Trust Inc | 12,148 | 287 | 2.20 | % | ||||||||
Omega Healthcare Investors Inc | 9,702 | 287 | 2.20 | % | ||||||||
Amcor PLC | 23,685 | 284 | 2.18 | % | ||||||||
See notes to consolidated financial statements.
37
Table of Contents
FS Multi-Strategy Alternatives Fund
Consolidated Schedule of Investments (continued)
As of December 31, 2021
(dollar values in thousands, except share and per share amounts)
Top Underlying Components | Shares | Notional | Percentage of Notional | ||||||||||||
CH Robinson Worldwide Inc | 2,643 | 284 | 2.18 | % | |||||||||||
FirstEnergy Corp | 6,840 | 284 | 2.18 | % | |||||||||||
Packaging Corp of America | 2,089 | 284 | 2.18 | % | |||||||||||
Pinnacle West Capital Corp | 4,030 | 284 | 2.18 | % | |||||||||||
Harris Corp | 1,328 | 283 | 2.17 | % | |||||||||||
PACCAR Inc | 3,208 | 283 | 2.17 | % | |||||||||||
PPL Corp | 9,420 | 283 | 2.17 | % | |||||||||||
3M Co | 1,587 | 282 | 2.16 | % | |||||||||||
Cummins Inc | 1,292 | 282 | 2.16 | % | |||||||||||
Dow Inc | 4,969 | 282 | 2.16 | % | |||||||||||
General Dynamics Corp | 1,352 | 282 | 2.16 | % | |||||||||||
International Paper Co | 5,999 | 282 | 2.16 | % | |||||||||||
Lockheed Martin Corp | 793 | 282 | 2.16 | % | |||||||||||
SL Green Realty Corp | 3,814 | 282 | 2.16 | % | |||||||||||
Caterpillar Inc | 1,357 | 281 | 2.15 | % | |||||||||||
Emerson Electric Co | 3,018 | 281 | 2.15 | % | |||||||||||
Iron Mountain Inc | 5,361 | 281 | 2.15 | % | |||||||||||
Kinder Morgan Inc | 17,689 | 281 | 2.15 | % | |||||||||||
LyondellBasell Industries NV | 3,042 | 281 | 2.15 | % | |||||||||||
United Technologies Corp | 3,260 | 281 | 2.15 | % | |||||||||||
WP Carey Inc | 3,419 | 281 | 2.15 | % | |||||||||||
The Williams Cos Inc | 10,723 | 279 | 2.14 | % | |||||||||||
AGCO Corp | 2,396 | 278 | 2.13 | % | |||||||||||
ONEOK Inc | 4,730 | 278 | 2.13 | % | |||||||||||
SM Energy Co | 9,295 | 274 | 2.10 | % | |||||||||||
Vornado Realty Trust | 6,515 | 273 | 2.09 | % | |||||||||||
Gaming and Leisure Properties | 5,524 | 269 | 2.06 | % | |||||||||||
Huntington Ingalls Industries | 1,432 | 267 | 2.05 | % | |||||||||||
Callon Petroleum Co | 5,440 | 257 | 1.97 | % | |||||||||||
Centennial Resource Developmen | 36,222 | 217 | 1.66 | % | |||||||||||
The Chemours Co | 6,260 | 210 | 1.61 | % | |||||||||||
Spirit Realty Capital Inc | 4,251 | 205 | 1.57 | % | |||||||||||
ManpowerGroup Inc | 2,065 | 201 | 1.54 | % | |||||||||||
OGE Energy Corp | 5,202 | 200 | 1.53 | % | |||||||||||
Hubbell Inc | 896 | 187 | 1.43 | % | |||||||||||
Herc Holdings Inc | 1,175 | 184 | 1.41 | % | |||||||||||
Antero Midstream GP LP | 18,737 | 181 | 1.39 | % | |||||||||||
Equitrans Midstream Corp | 16,910 | 175 | 1.34 | % | |||||||||||
MGM Growth Properties LLC | 4,025 | 164 | 1.26 | % | |||||||||||
Physicians Realty Trust | 8,593 | 162 | 1.24 | % | |||||||||||
Sabra Health Care REIT Inc | 11,661 | 158 | 1.21 | % | |||||||||||
MSC Industrial Direct Co Inc | 1,739 | 146 | 1.12 | % | |||||||||||
Tanger Factory Outlet Centers Inc | 7,445 | 144 | 1.10 | % | |||||||||||
Gevo Inc | 32,926 | 141 | 1.08 | % | |||||||||||
South Jersey Industries Inc | 5,245 | 137 | 1.05 | % | |||||||||||
Avis Budget Group Inc | 636 | 132 | 1.01 | % | |||||||||||
See notes to consolidated financial statements.
38
Table of Contents
FS Multi-Strategy Alternatives Fund
Consolidated Schedule of Investments (continued)
As of December 31, 2021
(dollar values in thousands, except share and per share amounts)
| (w) | Uses factor-based stock selection to provide short exposure to the equity of natural resource, real estate, equipment and industrial, and infrastructure companies. |
Top Underlying Components | Shares | Notional | Percentage of Notional | |||||||||
Common Stock | ||||||||||||
Sunrun Inc | (6,126) | (210 | ) | -2.13 | % | |||||||
Plug Power Inc | (7,409) | (209 | ) | -2.12 | % | |||||||
American Homes 4 Rent | (4,773) | (208 | ) | -2.11 | % | |||||||
Ball Corp | (2,162) | (208 | ) | -2.11 | % | |||||||
Generac Holdings Inc | (591) | (208 | ) | -2.11 | % | |||||||
Invitation Homes Inc | (4,591) | (208 | ) | -2.11 | % | |||||||
Prologis Inc | (1,236) | (208 | ) | -2.11 | % | |||||||
American Tower Corp | (708) | (207 | ) | -2.10 | % | |||||||
American Water Works Co Inc | (1,097) | (207 | ) | -2.10 | % | |||||||
Equinix Inc | (245) | (207 | ) | -2.10 | % | |||||||
NextEra Energy Inc | (2,219) | (207 | ) | -2.10 | % | |||||||
SBA Communications Corp | (533) | (207 | ) | -2.10 | % | |||||||
Southwest Airlines Co | (4,836) | (207 | ) | -2.10 | % | |||||||
TransDigm Group Inc | (326) | (207 | ) | -2.10 | % | |||||||
Berry Global Group Inc | (2,795) | (206 | ) | -2.09 | % | |||||||
Host Hotels & Resorts Inc | (11,857) | (206 | ) | -2.09 | % | |||||||
The Sherwin-Williams Co | (585) | (206 | ) | -2.09 | % | |||||||
Uber Technologies Inc | (4,917) | (206 | ) | -2.09 | % | |||||||
Ecolab Inc | (875) | (205 | ) | -2.08 | % | |||||||
Lyft Inc | (4,802) | (205 | ) | -2.08 | % | |||||||
PG&E Corp | (16,903) | (205 | ) | -2.08 | % | |||||||
XPO Logistics Inc | (2,650) | (205 | ) | -2.08 | % | |||||||
General Electric Co | (2,162) | (204 | ) | -2.07 | % | |||||||
United States Steel Corp | (8,577) | (204 | ) | -2.07 | % | |||||||
Halliburton Co | (8,886) | (203 | ) | -2.06 | % | |||||||
Park Hotels & Resorts Inc | (10,764) | (203 | ) | -2.06 | % | |||||||
United Rentals Inc | (612) | (203 | ) | -2.06 | % | |||||||
The Boeing Co | (1,005) | (202 | ) | -2.05 | % | |||||||
Delta Air Lines Inc | (5,175) | (202 | ) | -2.05 | % | |||||||
Occidental Petroleum Corp | (6,976) | (202 | ) | -2.05 | % | |||||||
Trex Co Inc | (1,498) | (202 | ) | -2.05 | % | |||||||
American Airlines Group Inc | (11,151) | (200 | ) | -2.03 | % | |||||||
Cheniere Energy Inc | (1,975) | (200 | ) | -2.03 | % | |||||||
Southwestern Energy Co | (42,976) | (200 | ) | -2.03 | % | |||||||
Apache Corp | (7,411) | (199 | ) | -2.02 | % | |||||||
JetBlue Airways Corp | (13,994) | (199 | ) | -2.02 | % | |||||||
EQT Corp | (9,092) | (198 | ) | -2.01 | % | |||||||
Colfax Corp | (4,099) | (188 | ) | -1.91 | % | |||||||
HEICO Corp | (1,307) | (188 | ) | -1.91 | % | |||||||
National Oilwell Varco Inc | (13,688) | (185 | ) | -1.88 | % | |||||||
Axalta Coating Systems Ltd | (5,064) | (168 | ) | -1.70 | % | |||||||
Transocean Ltd | (60,050) | (166 | ) | -1.68 | % | |||||||
Sensata Technologies Holding PLC | (2,591) | (160 | ) | -1.62 | % | |||||||
Pioneer Natural Resources Co | (819) | (149 | ) | -1.51 | % | |||||||
PBF Energy Inc | (10,421) | (135 | ) | -1.37 | % | |||||||
Sunstone Hotel Investors Inc | (10,092) | (118 | ) | -1.20 | % | |||||||
Freeport-McMoRan Inc | (2,790) | (116 | ) | -1.18 | % | |||||||
See notes to consolidated financial statements.
39
Table of Contents
FS Multi-Strategy Alternatives Fund
Consolidated Schedule of Investments (continued)
As of December 31, 2021
(dollar values in thousands, except share and per share amounts)
Top Underlying Components | Shares | Notional | Percentage of Notional | |||||||||
Pebblebrook Hotel Trust | (5,027) | (112 | ) | -1.14 | % | |||||||
Range Resources Corp | (5,367) | (96 | ) | -0.97 | % | |||||||
Rexford Industrial Realty Inc | (1,046) | (85 | ) | -0.86 | % | |||||||
| (x) | Attempts to deliver an enhanced commodity exposure relative to traditional commodity indices by introducing off benchmark commodities, deferred curve placement, dynamic commodity selection and dynamic beta. |
Top Underlying Components | Notional | Percentage of Notional | ||||||||||
Futures | ||||||||||||
GOLD 100 OZ FUTURE Feb22 | 758 | 10.34 | % | |||||||||
NATURAL GAS FUTURE Dec22 | 598 | 8.16 | % | |||||||||
WTI CRUDE FUTURE Dec22 | 557 | 7.60 | % | |||||||||
BRENT CRUDE FUTURE Dec22 | 454 | 6.20 | % | |||||||||
CORN FUTURE Sep22 | 315 | 4.30 | % | |||||||||
SOYBEAN FUTURE Nov22 | 262 | 3.57 | % | |||||||||
COFFEE ‘C’ FUTURE Sep22 | 245 | 3.34 | % | |||||||||
COPPER FUTURE Sep22 | 226 | 3.08 | % | |||||||||
LIVE CATTLE FUTURE Aug22 | 222 | 3.03 | % | |||||||||
LME PRI ALUM FUTURE Sep22 | 200 | 2.73 | % | |||||||||
SOYBEAN OIL FUTURE Dec22 | 194 | 2.64 | % | |||||||||
Low Su Gasoil G Dec22 | 185 | 2.53 | % | |||||||||
SUGAR #11 (WORLD) Oct22 | 175 | 2.38 | % | |||||||||
GASOLINE RBOB FUTURE Dec22 | 150 | 2.05 | % | |||||||||
NY Harb ULSD FUTURE Dec22 | 146 | 2.00 | % | |||||||||
LME ZINC FUTURE Sep22 | 137 | 1.86 | % | |||||||||
LME COPPER FUTURE Sep22 | 116 | 1.58 | % | |||||||||
LME NICKEL FUTURE Sep22 | 109 | 1.49 | % | |||||||||
KC HRW WHEAT FUTURE Sep22 | 101 | 1.38 | % | |||||||||
COTTON NO.2 FUTURE Dec22 | 100 | 1.36 | % | |||||||||
LEAN HOGS FUTURE Jul22 | 96 | 1.31 | % | |||||||||
PALLADIUM FUTURE Mar22 | 84 | 1.15 | % | |||||||||
COFF ROBUSTA 10tn Mar22 | 77 | 1.06 | % | |||||||||
MILL WHEAT Euro Mar22 | 70 | 0.95 | % | |||||||||
SGX Iron Ore 62% Feb22 | 66 | 0.90 | % | |||||||||
LME LEAD FUTURE Sep22 | 57 | 0.78 | % | |||||||||
RAPESEED Euro Feb22 | 52 | 0.71 | % | |||||||||
WHITE SUGAR (ICE) Mar22 | 49 | 0.67 | % | |||||||||
RAPESEED Euro May22 | 33 | 0.44 | % | |||||||||
WHITE SUGAR (ICE) May22 | 24 | 0.33 | % | |||||||||
| (y) | Seeks to monetize the tendency for the equity market to mean revert over short periods of time. |
Top Underlying Components | Notional | Percentage of Notional | ||||||||||
Futures | ||||||||||||
S&P500 EMINI FUTURE Mar22 | - | 0.00 | % | |||||||||
See notes to consolidated financial statements.
40
Table of Contents
FS Multi-Strategy Alternatives Fund
Consolidated Schedule of Investments (continued)
As of December 31, 2021
(dollar values in thousands, except share and per share amounts)
| (z) | Market neutral strategy that seeks to provide exposure to the quality risk premium. |
Top Underlying Components | Shares | Notional | Percentage of Notional | |||||||||
Common Stock | ||||||||||||
Western Digital Corp | (961) | (63 | ) | -1.13 | % | |||||||
Accenture PLC | 149 | 62 | 1.11 | % | ||||||||
Cisco Systems Inc | 970 | 61 | 1.11 | % | ||||||||
Shift4 Payments Inc | (1,061) | (61 | ) | -1.11 | % | |||||||
ON Semiconductor Corp | (905) | (61 | ) | -1.11 | % | |||||||
MongoDB Inc | (112) | (59 | ) | -1.07 | % | |||||||
Autodesk Inc | 209 | 59 | 1.06 | % | ||||||||
Pure Storage Inc | (1,794) | (58 | ) | -1.05 | % | |||||||
Microchip Technology Inc | (666) | (58 | ) | -1.05 | % | |||||||
Wix.com Ltd | (364) | (57 | ) | -1.04 | % | |||||||
Apple Inc | 322 | 57 | 1.03 | % | ||||||||
New Relic Inc | (501) | (55 | ) | -1.00 | % | |||||||
PayPal Holdings Inc | 288 | 54 | 0.98 | % | ||||||||
Microsoft Corp | 161 | 54 | 0.98 | % | ||||||||
QUALCOMM Inc | 295 | 54 | 0.97 | % | ||||||||
Splunk Inc | (459) | (53 | ) | -0.96 | % | |||||||
Workday Inc | 194 | 53 | 0.96 | % | ||||||||
Fortinet Inc | 146 | 53 | 0.95 | % | ||||||||
VMware Inc | 456 | 53 | 0.95 | % | ||||||||
Intuit Inc | 82 | 52 | 0.95 | % | ||||||||
Crowdstrike Holdings Inc | (256) | (52 | ) | -0.95 | % | |||||||
Atlassian Corp PLC | 134 | 51 | 0.92 | % | ||||||||
Oracle Corp | 586 | 51 | 0.92 | % | ||||||||
Cree Inc | (453) | (51 | ) | -0.91 | % | |||||||
Arista Networks Inc | 352 | 51 | 0.91 | % | ||||||||
Advanced Micro Devices Inc | 336 | 48 | 0.87 | % | ||||||||
RingCentral Inc | (257) | (48 | ) | -0.87 | % | |||||||
NVIDIA Corp | 163 | 48 | 0.86 | % | ||||||||
salesforce.com Inc | 187 | 47 | 0.86 | % | ||||||||
Zoom Video Communications Inc | 252 | 46 | 0.83 | % | ||||||||
Adobe Inc | 79 | 45 | 0.81 | % | ||||||||
Elastic NV | (357) | (44 | ) | -0.79 | % | |||||||
WEX Inc | (313) | (44 | ) | -0.79 | % | |||||||
Qorvo Inc | 269 | 42 | 0.76 | % | ||||||||
MicroStrategy Inc | (77) | (42 | ) | -0.76 | % | |||||||
Live Nation Entertainment Inc | (340) | (41 | ) | -0.73 | % | |||||||
Asana Inc | (535) | (40 | ) | -0.72 | % | |||||||
Activision Blizzard Inc | 592 | 39 | 0.71 | % | ||||||||
AT&T Inc | (1,587) | (39 | ) | -0.70 | % | |||||||
Cloudflare Inc | (295) | (39 | ) | -0.70 | % | |||||||
The Walt Disney Co | (250) | (39 | ) | -0.70 | % | |||||||
BigCommerce Holdings Inc | (1,075) | (38 | ) | -0.69 | % | |||||||
T-Mobile US Inc | 319 | 37 | 0.67 | % | ||||||||
Match Group Inc | (279) | (37 | ) | -0.67 | % | |||||||
Nutanix Inc | (1,156) | (37 | ) | -0.66 | % | |||||||
Sabre Corp | (4,198) | (36 | ) | -0.65 | % | |||||||
Cognizant Technology Solutions Corp | 406 | 36 | 0.65 | % | ||||||||
Facebook Inc | 107 | 36 | 0.65 | % | ||||||||
See notes to consolidated financial statements.
41
Table of Contents
FS Multi-Strategy Alternatives Fund
Consolidated Schedule of Investments (continued)
As of December 31, 2021
(dollar values in thousands, except share and per share amounts)
Top Underlying Components | Shares | Notional | Percentage of Notional | |||||||||
Verizon Communications Inc | 690 | 36 | 0.65 | % | ||||||||
Twitter Inc | (825) | (36 | ) | -0.64 | % | |||||||
| (aa) | Currency selection strategy using mean reversion signals. |
Top Underlying Components | Notional | Percentage of Notional | ||||||||||
Cash | ||||||||||||
JAPANESE YEN | 2,463 | 19.90 | % | |||||||||
NORWEGIAN KRONE | (1,482 | ) | -11.97 | % | ||||||||
BRITISH POUND | (1,250 | ) | -10.09 | % | ||||||||
AUSTRALIAN DOLLAR | (948 | ) | -7.66 | % | ||||||||
SWEDISH KRONA | 786 | 6.35 | % | |||||||||
SWISS FRANC | (745 | ) | -6.02 | % | ||||||||
NEW ZEALAND DOLLAR | 531 | 4.29 | % | |||||||||
CANADIAN DOLLAR | (479 | ) | -3.87 | % | ||||||||
EURO | 134 | 1.08 | % | |||||||||
| (ab) | Systematic strategy seeks to monetize the implied-to-realized volatility risk premium by selling short-dated OTM puts. |
Top Underlying Components | Notional | Percentage of Notional | ||||||||||
Options | ||||||||||||
SPXW US 01/03/22 P4640 Index | 1,274 | 17.33 | % | |||||||||
SPXW US 01/05/22 P4540 Index | 637 | 8.66 | % | |||||||||
SPXW US 01/03/22 P4560 Index | 636 | 8.65 | % | |||||||||
SPXW US 01/03/22 P4435 Index | 429 | 5.84 | % | |||||||||
SPXW US 01/07/22 P4470 Index | 425 | 5.78 | % | |||||||||
SPXW US 01/05/22 P4495 Index | 424 | 5.77 | % | |||||||||
| (ac) | Systematic strategy that takes advantage of the volatility curve to generate positive carry. |
Top Underlying Components | Notional | Percentage of Notional | ||||||||||
Derivatives | ||||||||||||
1y Forward 5y20y Straddle | 10,364 | 51.92 | % | |||||||||
1y Forward 3y7y Straddle | 4,606 | 23.08 | % | |||||||||
1y Forward 1y7y Straddle | 2,687 | 13.46 | % | |||||||||
1y Forward 10y20y Straddle | 2,303 | 11.54 | % | |||||||||
AUD | - Australian Dollar | |
BofA | - Bank of America | |
CAD | - Canadian Dollar | |
CHF | - Swiss Franc | |
CLP | - Chilean Peso | |
CNH | - Chinese Yuan | |
ETF | - Exchange Traded Fund | |
EUR | - Euro | |
GBP | - British Pound | |
GSCI | - Goldman Sachs Commodity Index | |
HUF | - Hungarian Forint | |
INR | - India Rupee | |
JPY | - Japanese Yen |
See notes to consolidated financial statements.
42
Table of Contents
FS Multi-Strategy Alternatives Fund
Consolidated Schedule of Investments (continued)
As of December 31, 2021
(dollar values in thousands, except share and per share amounts)
KRW | - South Korean Won | |
LIBOR | - London Interbank Offered Rate | |
L/S | - Long/Short | |
MSCI | - Morgan Stanley Capital International | |
MXN | - Mexican Peso | |
NOK | - Norwegian Krone | |
NZD | - New Zealand Dollar | |
PLN | - Polish Zloty | |
PIK | - Payment In Kind | |
RBOB | - Reformulated Blendstock for Oxygenate Blending | |
RUB | - Russian Ruble | |
SEK | - Swedish Krona | |
SGD | - Singapore Dollar | |
Soc Gen | - Societe Generale | |
SOFR | - Secured Overnight Financing Rate | |
TRY | - Turkish Lira | |
TWD | - Taiwan Dollar | |
ULSD | - Ultra-Low Sulfur Diesel | |
USD | - U.S. Dollar | |
Vol | - Volatility | |
ZAR | - South African Rand |
See notes to consolidated financial statements.
43
Table of Contents
FS Managed Futures Fund
Consolidated Schedule of Investments
As of December 31, 2021
(in thousands, except share and per share amounts)
Portfolio Company(a) | Footnotes | Yield | Number of Shares | Cost | Fair Value(b) | |||||||||||||||
Short-Term Investments—102.4% | ||||||||||||||||||||
State Street Institutional Liquid Reserves Fund - Premier Class | (c) | 0.04% | 2,119,850 | $ | 2,121 | $ | 2,120 | |||||||||||||
|
|
|
| |||||||||||||||||
Total Short-Term Investments | $ | 2,121 | $ | 2,120 | ||||||||||||||||
|
|
|
| |||||||||||||||||
TOTAL INVESTMENTS—102.4% | $ | 2,121 | $ | 2,120 | ||||||||||||||||
|
|
|
| |||||||||||||||||
Other Assets in Excess of Liabilities—(2.4)% | (50 | ) | ||||||||||||||||||
|
| |||||||||||||||||||
Net Assets—100.0% | $ | 2,070 | ||||||||||||||||||
|
| |||||||||||||||||||
Total Return Index Swaps(d)—4.0% | ||||||||||||||||||||
Counterparty | Fund Pays | Fund Receives | Notional Amount | Expiration | Periodic | Premium Paid (Received) | Fair Value(b) | Unrealized Appreciation | Unrealized Depreciation | |||||||||||||||||
Bank of America, N.A. | 3 Month LIBOR + 0.55% | Total return on iShares S&P GSCI Commodity-Indexed Trust | USD 319 | 3/18/22 | N/A | $ | — | $ | 68 | $ | 68 | $ | — | |||||||||||||
Barclays Bank PLC | 0.00% | Total return on Barclays EB05 Desk Strategy (Asia/SPX IDMO basket) Index(e) | USD 780 | 7/8/22 | N/A | — | (13 | ) | — | 13 | ||||||||||||||||
BNP Paribas | Fixed Rate of 0.10% | Total return on BNP Paribas Artificial Intelligence Trend ex-Como USD 2021 Index(f) | USD 530 | 5/6/22 | N/A | — | 20 | 20 | — | |||||||||||||||||
Deutsche Bank AG | 0.00% | Total return on Deutsche Bank Diversified Rates Strategy Index 008(g) | USD 444 | 7/7/22 | N/A | — | (1 | ) | — | 1 | ||||||||||||||||
Goldman Sachs International | Fixed Rate of 0.15% | Total return on Goldman Sachs Cross Asset Trend Basket Series 11 Excess Return Strategy Index(h) | USD 1,110 | 2/4/22 | N/A | — | (80 | ) | — | 80 | ||||||||||||||||
JP Morgan Chase Bank, N.A. | Fixed Rate of 0.20% | Total return JPM Bi-Weekly 1 Month Variance US Conviction Mean Reversion Index(i) | USD 448 | 2/4/22 | N/A | — | 36 | 36 | — | |||||||||||||||||
See notes to consolidated financial statements.
44
Table of Contents
FS Managed Futures Fund
Consolidated Schedule of Investments (continued)
As of December 31, 2021
(in thousands, except share and per share amounts)
Counterparty | Fund Pays | Fund Receives | Notional Amount | Expiration | Periodic | Premium Paid (Received) | Fair Value(b) | Unrealized Appreciation | Unrealized Depreciation | |||||||||||||||||
JP Morgan Chase Bank, N.A. | Fixed Rate of 0.25% | Total return on JP Morgan Correlation Spread Index(j) | USD 222 | 7/28/22 | N/A | $ | — | $ | — | $ | — | $ | — | |||||||||||||
JP Morgan Chase Bank, N.A. | 0.00% | Total return on JP Morgan Equity Risk Premium - Global Pure Low Vol L/S USD Index(k) | USD 286 | 7/28/22 | N/A | — | 47 | 47 | — | |||||||||||||||||
Macquarie Bank, Ltd. | Fixed Rate of 0.25% | Total return on Macquarie US Equity Overnight Mean Reversion Index(l) | USD 201 | 3/9/22 | Quarterly | — | — | — | — | |||||||||||||||||
Nomura Securities Co., Ltd. | Fixed Rate of 0.15% | Total return on Nomura G10 All Currencies Mean Reversion 25xw/ no Vol Adjustment Index(m) | USD 300 | 2/4/22 | N/A | — | 6 | 6 | — | |||||||||||||||||
Total Total Return Index Swaps | $ | — | $ | 83 | $ | 177 | $ | 94 | ||||||||||||||||||
| (a) | Security may be an obligation of one or more entities affiliated with the named company. |
| (b) | Fair value as of December 31, 2021 is determined by Adviser in accordance with the Fund’s valuation policy as approved by the board of trustees of FS Series Trust (the “Trust’’). See Note 2 for information on the Fund’s policy regarding valuation of investments, fair value hierarchy and other significant accounting policies. |
| (c) | Rate represents the seven-day yield as of December 31, 2021. The State Street Institutional Liquid Reserves Fund’s financial statements are available on the SEC’s website at http://www.sec.gov. |
| (d) | The Fund pays or receives periodic payments in accordance with the total return swap contracts depending on the performance of the reference index. On reset dates and on the expiration date of the swap contracts, the Fund will either receive from or pay to the counterparty an amount equal to the net of (i) the accrued financing fees and (ii) the percentage change in price of the reference index times the notional amount, and (iii) if applicable any dividends received into the basket since the previous reset date. Valuations may be inclusive of interest and/or dividends receivable/payable and, as a result, the notional amounts presented may not recalculate directly with the fair value presented. |
| (e) | Seeks to capture intraday momentum in global equity markets. |
Top Underlying Components | Notional | Percentage of Notional | ||||||||||
Index | ||||||||||||
Barclays EB05 strategy | 767 | 100.00 | % | |||||||||
See notes to consolidated financial statements.
45
Table of Contents
FS Managed Futures Fund
Consolidated Schedule of Investments (continued)
As of December 31, 2021
(in thousands, except share and per share amounts)
| (f) | Futures-based liquid strategy that is composed of BNP proprietary trend strategies across Equity and Fixed Income markets. |
Top Underlying Components | Notional | Percentage of Notional | ||||||||||
Index | ||||||||||||
BNP Paribas USD 10Y Futures Index | 406 | 73.69 | % | |||||||||
BNP Paribas EUR 10Y Futures Index | 387 | 70.37 | % | |||||||||
BNP Paribas JPY 10Y Futures Index | (63 | ) | -11.47 | % | ||||||||
BNP Paribas Eurozone Equity Futures Index | 61 | 11.03 | % | |||||||||
BNP Paribas Japan Equity Futures Index | 58 | 10.60 | % | |||||||||
BNP Paribas China Equity Futures Index | (37 | ) | -6.80 | % | ||||||||
BNP Paribas Emerging Equities Index | (21 | ) | -3.83 | % | ||||||||
BNP Paribas US Equity Futures Index | 0 | 0.06 | % | |||||||||
Cash | ||||||||||||
Euro | (449 | ) | -81.60 | % | ||||||||
US Dollar | 167 | 30.27 | % | |||||||||
Hong Kong Dollar | 37 | 6.80 | % | |||||||||
Japanese Yen | 5 | 0.87 | % | |||||||||
| (g) | Seeks to monetize short-term interest rate momentum by taking long or short positions in US and European rates markets. |
Top Underlying Components | Notional | Percentage of Notional | ||||||||||
Index | ||||||||||||
Deutsche Bank Duration Bias EUR | (89 | ) | -20.17 | % | ||||||||
Deutsche Bank Duration Bias USD | 23 | 5.21 | % | |||||||||
| (h) | Future and forward based liquid and fully transparent strategy that is composed of Goldman Sachs’ proprietary strategies across three asset classes - FX Trend, Rates & Bonds Trend, and Equity Trend. |
Top Underlying Components | Notional | Percentage of Notional | ||||||||||
Futures | ||||||||||||
US 2YR NOTE (CBT) Mar22 | (792 | ) | -76.72 | % | ||||||||
ICE 3MTH SONIA FUTURE Jun22 | (643 | ) | -62.27 | % | ||||||||
ICE 3MTH SONIA FUTURE Jun23 | (641 | ) | -62.08 | % | ||||||||
3MO EURO EURIBOR Jun22 | 637 | 61.72 | % | |||||||||
3MO EURO EURIBOR Mar23 | (636 | ) | -61.58 | % | ||||||||
3MO EURO EURIBOR Jun23 | (635 | ) | -61.54 | % | ||||||||
3 MONTH SOFR FUTURE Jun22 | (630 | ) | -61.00 | % | ||||||||
3 MONTH SOFR FUTURE Sep22 | (628 | ) | -60.87 | % | ||||||||
ICE 3MTH SONIA FUTURE Sep22 | (626 | ) | -60.68 | % | ||||||||
ICE 3MTH SONIA FUTURE Mar23 | (626 | ) | -60.60 | % | ||||||||
3 MONTH SOFR FUTURE Mar23 | (626 | ) | -60.58 | % | ||||||||
3 MONTH SOFR FUTURE Jun23 | (624 | ) | -60.47 | % | ||||||||
EURO-SCHATZ FUTURE Mar22 | 456 | 44.17 | % | |||||||||
3MO EURO EURIBOR Sep22 | (345 | ) | -33.44 | % | ||||||||
US 5YR NOTE (CBT) Mar22 | (254 | ) | -24.59 | % | ||||||||
JPN 10Y BOND(OSE) Mar22 | 244 | 23.63 | % | |||||||||
US 10YR NOTE (CBT)Mar22 | (149 | ) | -14.46 | % | ||||||||
EURO-BOBL FUTURE Mar22 | 120 | 11.59 | % | |||||||||
EURO-BUND FUTURE Mar22 | 105 | 10.14 | % | |||||||||
See notes to consolidated financial statements.
46
Table of Contents
FS Managed Futures Fund
Consolidated Schedule of Investments (continued)
As of December 31, 2021
(in thousands, except share and per share amounts)
Top Underlying Components | Notional | Percentage of Notional | ||||||||||
US LONG BOND(CBT) Mar22 | 75 | 7.26 | % | |||||||||
LONG GILT FUTURE Mar22 | 69 | 6.66 | % | |||||||||
SWISS MKT IX FUTR Mar22 | 35 | 3.41 | % | |||||||||
S&P/TSX 60 IX FUTURE Mar22 | 35 | 3.41 | % | |||||||||
SPI 200 FUTURE Jan22 | 35 | 3.40 | % | |||||||||
SET50 FUTURE Mar22 | 35 | 3.38 | % | |||||||||
FTSE 100 IDX FUTURE Mar22 | 33 | 3.24 | % | |||||||||
Foreign Exchange | ||||||||||||
China Offshore Spot | 186 | 17.97 | % | |||||||||
Indonesian Rupiah | 148 | 14.38 | % | |||||||||
Singapore Dollar | (144 | ) | -13.98 | % | ||||||||
Taiwan Dollar | (144 | ) | -13.97 | % | ||||||||
South Korean Won | (111 | ) | -10.78 | % | ||||||||
Euro | (93 | ) | -9.02 | % | ||||||||
Czech Koruna | (78 | ) | -7.51 | % | ||||||||
Israeli Shekel | 78 | 7.51 | % | |||||||||
Swiss Franc | (75 | ) | -7.22 | % | ||||||||
British Pound | (75 | ) | -7.22 | % | ||||||||
Canadian Dollar | (75 | ) | -7.22 | % | ||||||||
Japanese Yen | (75 | ) | -7.22 | % | ||||||||
Polish Zloty | (72 | ) | -7.01 | % | ||||||||
Australian Dollar | (65 | ) | -6.32 | % | ||||||||
Swedish Krona | (65 | ) | -6.32 | % | ||||||||
Hungarian Forint | (62 | ) | -6.01 | % | ||||||||
New Zealand Dollar | (56 | ) | -5.41 | % | ||||||||
Indian Rupee | 54 | 5.19 | % | |||||||||
Chilean Peso | (47 | ) | -4.52 | % | ||||||||
Russian Ruble | 47 | 4.52 | % | |||||||||
Norwegian Krone | (47 | ) | -4.51 | % | ||||||||
Brazil Real | (47 | ) | -4.51 | % | ||||||||
Philippines Peso | 45 | 4.39 | % | |||||||||
South African Rand | (36 | ) | -3.51 | % | ||||||||
| (i) | Seeks to monetize the tendency for the equity market to mean revert over short periods of time. |
Top Underlying Components | Notional | Percentage of Notional | ||||||||||
Index | ||||||||||||
JPM US Conviction Mean Reversion Index | 485 | 100.00 | % | |||||||||
| (j) | Aims to capture the spread of realized correlation between US Equity and US Equity volatility. |
Top Underlying Components | Notional | Percentage of Notional | ||||||||||
Index | ||||||||||||
S&P 500 Index | (45 | ) | -20.23 | % | ||||||||
iPath Series B S&P 500 VIX Short-Term Futures ETN | (8 | ) | -3.51 | % | ||||||||
See notes to consolidated financial statements.
47
Table of Contents
FS Managed Futures Fund
Consolidated Schedule of Investments (continued)
As of December 31, 2021
(in thousands, except share and per share amounts)
| (k) | Market neutral strategy that seeks to provide exposure to Low Volatility risk premium. |
Top Underlying Components | Shares | Notional | Percentage of Notional | |||||||||
Common Stock | ||||||||||||
Cerner Corp | 21 | 2 | 0.58 | % | ||||||||
Argenx SE | (5) | (2 | ) | -0.58 | % | |||||||
Western Digital Corp | (29) | (2 | ) | -0.57 | % | |||||||
Lyft Inc | (44) | (2 | ) | -0.57 | % | |||||||
Tesla Inc | (2 | ) | (2 | ) | -0.57 | % | ||||||
Carvana Co | (8 | ) | (2 | ) | -0.56 | % | ||||||
Micron Technology Inc | (20 | ) | (2 | ) | -0.56 | % | ||||||
Sinch AB | (146 | ) | (2 | ) | -0.56 | % | ||||||
Hilton Worldwide Holdings Inc | 12 | 2 | 0.56 | % | ||||||||
Fortinet Inc | 5 | 2 | 0.55 | % | ||||||||
Uber Technologies Inc | (44 | ) | (2 | ) | -0.55 | % | ||||||
Asana Inc | (25 | ) | (2 | ) | -0.55 | % | ||||||
Booking Holdings Inc | 1 | 2 | 0.55 | % | ||||||||
Aramark | 50 | 2 | 0.55 | % | ||||||||
Chewy Inc | (31 | ) | (2 | ) | -0.55 | % | ||||||
MongoDB Inc | (3 | ) | (2 | ) | -0.55 | % | ||||||
Marriott International Inc | 11 | 2 | 0.54 | % | ||||||||
Paychex Inc | 13 | 2 | 0.54 | % | ||||||||
10X Genomics Inc | (12 | ) | (2 | ) | -0.54 | % | ||||||
Delta Air Lines Inc | (46 | ) | (2 | ) | -0.54 | % | ||||||
GVC Holdings PLC | (79 | ) | (2 | ) | -0.54 | % | ||||||
Freeport-McMoRan Inc | (43 | ) | (2 | ) | -0.54 | % | ||||||
CDW Corp | 9 | 2 | 0.54 | % | ||||||||
Vistra Energy Corp | (79 | ) | (2 | ) | -0.54 | % | ||||||
Lasertec Corp | (6 | ) | (2 | ) | -0.54 | % | ||||||
Embracer Group AB | (168 | ) | (2 | ) | -0.54 | % | ||||||
Mettler-Toledo International Inc | 1 | 2 | 0.54 | % | ||||||||
Edwards Lifesciences Corp | 14 | 2 | 0.54 | % | ||||||||
NRG Energy Inc | (41 | ) | (2 | ) | -0.54 | % | ||||||
Seagate Technology PLC | (16 | ) | (2 | ) | -0.54 | % | ||||||
Arrow Electronics Inc | 13 | 2 | 0.54 | % | ||||||||
The Mosaic Co | (45 | ) | (2 | ) | -0.54 | % | ||||||
Liberty Media Corp-Liberty Formula One | 28 | 2 | 0.54 | % | ||||||||
Las Vegas Sands Corp | 47 | 2 | 0.53 | % | ||||||||
Lam Research Corp | (2 | ) | (2 | ) | -0.53 | % | ||||||
Zillow Group Inc | (28 | ) | (2 | ) | -0.53 | % | ||||||
Ulta Beauty Inc | 4 | 2 | 0.53 | % | ||||||||
Bill.com Holdings Inc | (7 | ) | (2 | ) | -0.53 | % | ||||||
Unity Software Inc | (12 | ) | (2 | ) | -0.53 | % | ||||||
TFI International Inc | (16 | ) | (2 | ) | -0.53 | % | ||||||
Global Payments Inc | 13 | 2 | 0.53 | % | ||||||||
Waters Corp | 5 | 2 | 0.53 | % | ||||||||
Automatic Data Processing Inc | 7 | 2 | 0.53 | % | ||||||||
Stryker Corp | 7 | 2 | 0.53 | % | ||||||||
Signature Bank | (5 | ) | (2 | ) | -0.53 | % | ||||||
Carrefour SA | (96 | ) | (2 | ) | -0.53 | % | ||||||
Oak Street Health Inc | (53 | ) | (2 | ) | -0.53 | % | ||||||
See notes to consolidated financial statements.
48
Table of Contents
FS Managed Futures Fund
Consolidated Schedule of Investments (continued)
As of December 31, 2021
(in thousands, except share and per share amounts)
Top Underlying Components | Shares | Notional | Percentage of Notional | |||||||||
GN Store Nord A/S | (28 | ) | (2 | ) | -0.53 | % | ||||||
Fair Isaac Corp | 4 | 2 | 0.53 | % | ||||||||
Sysco Corp | (22 | ) | (2 | ) | -0.53 | % | ||||||
| (l) | Seeks to monetize the tendency for the equity market to mean revert over short periods of time. |
Top Underlying Components | Notional | Percentage of Notional | ||||||||||
Index | ||||||||||||
S&P500 EMINI FUTURE Mar22 | - | 0.00 | % | |||||||||
| (m) | Currency selection strategy using mean reversion signals. |
Top Underlying Components | Notional | Percentage of Notional | ||||||||||
Cash | ||||||||||||
JAPANESE YEN | 61 | 19.90 | % | |||||||||
NORWEGIAN KRONE | (37 | ) | -11.97 | % | ||||||||
BRITISH POUND | (31 | ) | -10.09 | % | ||||||||
AUSTRALIAN DOLLAR | (23 | ) | -7.66 | % | ||||||||
SWEDISH KRONA | 19 | 6.35 | % | |||||||||
SWISS FRANC | (18 | ) | -6.02 | % | ||||||||
NEW ZEALAND DOLLAR | 13 | 4.29 | % | |||||||||
CANADIAN DOLLAR | (12 | ) | -3.87 | % | ||||||||
EURO | 3 | 1.08 | % | |||||||||
See notes to consolidated financial statements.
49
Table of Contents
FS Chiron Real Asset Fund
Consolidated Schedule of Investments
As of December 31, 2021
(dollar values in thousands, except share and per share amounts)
Portfolio Company(a) | Footnotes | Industry | Number of Shares | Cost | Fair Value(b) | |||||||||||||
Common Stocks—62.0% | ||||||||||||||||||
A. O. Smith Corp. | Miscellaneous Manufacturing | 4,715 | $ | 326 | $ | 405 | ||||||||||||
Airbus SE | (c) | Aerospace/Defense | 2,671 | 309 | 342 | |||||||||||||
Aker Carbon Capture ASA | (c) | Energy-Alternate Sources | 20,539 | 67 | 64 | |||||||||||||
Applied Materials, Inc. | Semiconductors | 1,758 | 267 | 277 | ||||||||||||||
Archer-Daniels-Midland Co. | Agriculture | 7,549 | 488 | 510 | ||||||||||||||
Avantor, Inc. | (c) | Healthcare-Products | 3,208 | 130 | 135 | |||||||||||||
Baker Hughes Co. | Oil & Gas Services | 21,355 | 506 | 514 | ||||||||||||||
Bunge Ltd. | Agriculture | 6,786 | 571 | 634 | ||||||||||||||
Caterpillar, Inc. | Machinery-Construction & Mining | 448 | 93 | 93 | ||||||||||||||
Cia de Saneamento Basico do Estado de Sao Paulo | Water | 7,386 | 52 | 54 | ||||||||||||||
CME Group, Inc. | Diversified Financial Services | 2,560 | 510 | 585 | ||||||||||||||
Digital Realty Trust, Inc. | Real Estate Investment Trusts | 765 | 129 | 135 | ||||||||||||||
EOG Resources, Inc. | Oil & Gas | 8,120 | 724 | 721 | ||||||||||||||
Equinor ASA | Oil & Gas | 24,725 | 638 | 662 | ||||||||||||||
Ferrari N.V. | Auto Manufacturers | 1,253 | 297 | 324 | ||||||||||||||
Gaming and Leisure Properties, Inc. | Real Estate Investment Trusts | 1,393 | 66 | 68 | ||||||||||||||
Generac Holdings, Inc. | (c) | Electrical Components & Equipment | 570 | 202 | 201 | |||||||||||||
Glencore Plc | (c) | Mining | 135,805 | 633 | 689 | |||||||||||||
Impala Platinum Holdings Ltd. | Mining | 14,152 | 193 | 200 | ||||||||||||||
Innoviz Technologies Ltd. | (c) | Auto Parts & Equipment | 3,947 | 27 | 25 | |||||||||||||
Intercontinental Exchange, Inc. | Diversified Financial Services | 4,081 | 546 | 558 | ||||||||||||||
Italgas SpA | Gas | 29,449 | 194 | 203 | ||||||||||||||
Jabil, Inc. | Electronics | 1,654 | 105 | 116 | ||||||||||||||
Johnson & Johnson | Pharmaceuticals | 2,439 | 391 | 417 | ||||||||||||||
LVMH Moet Hennessy Louis Vuitton SE | Apparel | 779 | 603 | 645 | ||||||||||||||
Mastercard, Inc. | Diversified Financial Services | 970 | 316 | 348 | ||||||||||||||
Micron Technology, Inc. | Semiconductors | 4,527 | 389 | 422 | ||||||||||||||
Microsoft Corp. | Software | 1,019 | 327 | 343 | ||||||||||||||
MTN Group Ltd. | (c) | Telecommunications | 15,182 | 159 | 163 | |||||||||||||
Norsk Hydro ASA | Mining | 30,348 | 218 | 240 | ||||||||||||||
Nutrien Ltd. | Chemicals | 2,704 | 193 | 203 | ||||||||||||||
Occidental Petroleum Corp. | Oil & Gas | 17,480 | 530 | 507 | ||||||||||||||
Porsche Automobil Holding SE | Auto Manufacturers | 3,264 | 315 | 310 | ||||||||||||||
POSCO | Iron/Steel | 3,654 | 224 | 213 | ||||||||||||||
Prologis, Inc. | Real Estate Investment Trusts | 2,740 | 403 | 461 | ||||||||||||||
Republic Services, Inc. | Environmental Control | 2,819 | 392 | 393 | ||||||||||||||
Simon Property Group, Inc. | Real Estate Investment Trusts | 1,176 | 183 | 188 | ||||||||||||||
Taiwan Semiconductor Manufacturing Co. Ltd. | Semiconductors | 5,417 | 612 | 652 | ||||||||||||||
Teck Resources Ltd. | Mining | 23,633 | 610 | 681 | ||||||||||||||
Telenor ASA | Telecommunications | 17,003 | 256 | 268 | ||||||||||||||
Toronto-Dominion Bank | Commercial Banks | 4,440 | 328 | 340 | ||||||||||||||
UniCredit SpA | Banks | 22,338 | 287 | 344 | ||||||||||||||
Vale SA | Iron/Steel | 9,739 | 135 | 136 | ||||||||||||||
VICI Properties, Inc. | Real Estate Investment Trusts | 10,945 | 315 | 330 | ||||||||||||||
West Fraser Timber Co. Ltd. | Forest Products & Paper | 3,552 | 315 | 339 | ||||||||||||||
Weyerhaeuser Co. | Real Estate Investment Trusts | 13,611 | 508 | 560 | ||||||||||||||
|
|
|
| |||||||||||||||
Total Common Stocks | $ | 15,082 | $ | 16,018 | ||||||||||||||
|
|
|
| |||||||||||||||
See notes to consolidated financial statements.
50
Table of Contents
FS Chiron Real Asset Fund
Consolidated Schedule of Investments (continued)
As of December 31, 2021
(dollar values in thousands, except share and per share amounts)
Portfolio Company(a) | Footnotes | Industry | Principal Amount | Cost | Fair Value(b) | |||||||||||||||||||||
U.S. Treasury & Government Agencies—15.7% | ||||||||||||||||||||||||||
Deutsche Bundesrepublik Inflation Linked Bond, 0.1%, 4/15/2026 | Sovereign | 438,388 | $ | 563 | $ | 553 | ||||||||||||||||||||
Deutsche Bundesrepublik Inflation Linked Bond, 0.5%, 4/15/2030 | Sovereign | 472,518 | 682 | 666 | ||||||||||||||||||||||
Italy Buoni Poliennali Del Tesoro, 3.1%, 9/15/2026 | (d) | Sovereign | 648,155 | 918 | 899 | |||||||||||||||||||||
United Kingdom Inflation-Linked Gilt, 0.125%, 3/22/2026 | Sovereign | 471,019 | 747 | 739 | ||||||||||||||||||||||
United Kingdom Inflation-Linked Gilt, 0.125%, 8/10/2031 | Sovereign | 371,802 | 691 | 677 | ||||||||||||||||||||||
United States Treasury Inflation Protected Security, 0.125%, 2/15/2051 | Sovereign | 451,388 | 542 | 535 | ||||||||||||||||||||||
|
|
|
| |||||||||||||||||||||||
Total U.S. Treasury & Government Agencies | $ | 4,143 | $ | 4,069 | ||||||||||||||||||||||
|
|
|
| |||||||||||||||||||||||
Portfolio Company(a) | Footnotes | Yield | Number of Shares | Cost | Fair Value(b) | |||||||||||||||||||||
Short-Term Investments—20.9% | ||||||||||||||||||||||||||
State Street Institutional Liquid Reserves Fund - Premier Class | (e) | 0.04% | 5,397,487 | $ | 5,399 | $ | 5,398 | |||||||||||||||||||
|
|
|
| |||||||||||||||||||||||
Total Short-Term Investments | $ | 5,399 | $ | 5,398 | ||||||||||||||||||||||
|
|
|
| |||||||||||||||||||||||
TOTAL INVESTMENTS—98.6% |
| $ | 24,624 | $ | 25,485 | |||||||||||||||||||||
|
|
|
| |||||||||||||||||||||||
Other Assets in Excess of Liabilities—1.4% |
| 349 | ||||||||||||||||||||||||
|
| |||||||||||||||||||||||||
Net Assets—100.0% | $ | 25,834 | ||||||||||||||||||||||||
|
| |||||||||||||||||||||||||
Description | Number of Contracts | Position | Expiration Date | Notional Amount | Unrealized Appreciation | Unrealized Depreciation | ||||||||||||||||||||||
Long Futures—0.1% | ||||||||||||||||||||||||||||
Commodity Futures Contracts—0.1% | ||||||||||||||||||||||||||||
Coffee | 1 | Long | 03/21/2022 | 88 | $ | — | $ | 3 | ||||||||||||||||||||
Gold | 2 | Long | 02/24/2022 | 361 | 5 | — | ||||||||||||||||||||||
Palladium | 1 | Long | 03/29/2022 | 186 | 6 | — | ||||||||||||||||||||||
Platinum | 5 | Long | 04/27/2022 | 239 | 2 | — | ||||||||||||||||||||||
Silver | 1 | Long | 03/29/2022 | 111 | 5 | — | ||||||||||||||||||||||
Soybean | 3 | Long | 03/14/2022 | 192 | 9 | — | ||||||||||||||||||||||
Wheat | 5 | Long | 03/14/2022 | 193 | — | — | ||||||||||||||||||||||
|
|
|
| |||||||||||||||||||||||||
Total Commodity Futures Contracts | $ | 27 | $ | 3 | ||||||||||||||||||||||||
|
|
|
| |||||||||||||||||||||||||
Total Long Futures | $ | 27 | $ | 3 | ||||||||||||||||||||||||
|
|
|
| |||||||||||||||||||||||||
See notes to consolidated financial statements.
51
Table of Contents
FS Chiron Real Asset Fund
Consolidated Schedule of Investments (continued)
As of December 31, 2021
(dollar values in thousands, except share and per share amounts)
Total Return Index Swaps(f)—(0.1)% |
| |||||||||||||||||||||||||||||
Counterparty | Fund Pays | Fund Receives | Notional Amount | Expiration Date | Periodic Payment Frequency | Premium Paid (Received) | Fair Value(b) | Unrealized Appreciation | Unrealized Depreciation | |||||||||||||||||||||
Macquarie Bank, Ltd. | Fixed Rate of 0.40% | Total return on Macquarie Commodity Flex Basket Index(g) | USD 3,933 | 9/30/22 | Quarterly | $ | — | $ | (13 | ) | $ | — | $ | 13 | ||||||||||||||||
Total Total Return Index Swaps |
| $ | — | $ | (13 | ) | $ | — | $ | 13 | ||||||||||||||||||||
| (a) | Security may be an obligation of one or more entities affiliated with the named company. |
| (b) | Fair value as of December 31, 2021 is determined by Adviser in accordance with the Fund’s valuation policy as approved by the board of trustees of FS Series Trust (the “Trust’’). See Note 2 for information on the Fund’s policy regarding valuation of investments, fair value hierarchy and other significant accounting policies. |
| (c) | Security is non-income producing. |
| (d) | Exempt from registration under Rule 144A of the Securities Act of 1933, as amended. Such securities may be deemed liquid by the investment adviser and may be resold, normally to qualified institutional buyers in transactions exempt from registration. Total market value of Rule 144A securities amounts to $899, which represents approximately 3.5% of net assets as of December 31, 2021. |
| (e) | Rate represents the seven-day yield as of December 31, 2021. The State Street Institutional Liquid Reserves Fund’s financial statements are available on the SEC’s website at http://www.sec.gov. |
| (f) | The Fund pays or receives periodic payments in accordance with the total return swap contracts depending on the performance of the reference index. On reset dates and on the expiration date of the swap contracts, the Fund will either receive from or pay to the counterparty an amount equal to the net of (i) the accrued financing fees and (ii) the percentage change in price of the reference index times the notional amount, and (iii) if applicable any dividends received into the basket since the previous reset date. Valuations may be inclusive of interest and/or dividends receivable/payable and, as a result, the notional amounts presented may not recalculate directly with the fair value presented. |
| (g) | Attempts to deliver an enhanced commodity exposure relative to traditional commodity indices by introducing off benchmark commodities, deferred curve placement, dynamic commodity selection and dynamic beta. |
Top Underlying Components | Notional | Percentage of Notional | ||||||||
Futures | ||||||||||
WTI CRUDE FUTURE Dec22 | 377 | 9.61 | % | |||||||
BRENT CRUDE FUTURE Dec22 | 304 | 7.76 | % | |||||||
NATURAL GAS FUTURE Dec22 | 278 | 7.10 | % | |||||||
CORN FUTURE Sep22 | 272 | 6.95 | % | |||||||
SOYBEAN FUTURE Nov22 | 243 | 6.20 | % | |||||||
COPPER FUTURE Sep22 | 179 | 4.56 | % | |||||||
LME COPPER FUTURE Sep22 | 158 | 4.04 | % | |||||||
PALLADIUM FUTURE Mar22 | 156 | 3.98 | % | |||||||
PLATINUM FUTURE Apr22 | 152 | 3.87 | % | |||||||
LIVE CATTLE FUTURE Aug22 | 151 | 3.85 | % | |||||||
LME PRI ALUM FUTURE Sep22 | 123 | 3.13 | % | |||||||
SUGAR #11 (WORLD) Oct22 | 121 | 3.09 | % | |||||||
GOLD 100 OZ FUTURE Feb22 | 119 | 3.04 | % | |||||||
SILVER FUTURE Mar22 | 118 | 3.00 | % | |||||||
SOYBEAN OIL FUTURE Dec22 | 118 | 3.00 | % | |||||||
GASOLINE RBOB FUTURE Dec22 | 111 | 2.83 | % | |||||||
NY Harb ULSD FUTURE Dec22 | 98 | 2.49 | % | |||||||
Low Su Gasoil G Dec22 | 91 | 2.33 | % | |||||||
LME ZINC FUTURE Sep22 | 85 | 2.17 | % | |||||||
LME NICKEL FUTURE Sep22 | 81 | 2.06 | % | |||||||
See notes to consolidated financial statements.
52
Table of Contents
FS Chiron Real Asset Fund
Consolidated Schedule of Investments (continued)
As of December 31, 2021
(dollar values in thousands, except share and per share amounts)
Top Underlying Components | Notional | Percentage of Notional | ||||||||
LEAN HOGS FUTURE Jul22 | 73 | 1.87 | % | |||||||
COTTON NO.2 FUTURE Dec22 | 66 | 1.68 | % | |||||||
COFF ROBUSTA 10tn Mar22 | 60 | 1.52 | % | |||||||
MILL WHEAT Euro Mar22 | 59 | 1.49 | % | |||||||
COCOA FUTURE Sep22 | 52 | 1.33 | % | |||||||
COCOA FUTURE - IC Mar22 | 49 | 1.25 | % | |||||||
SGX Iron Ore 62% Feb22 | 42 | 1.06 | % | |||||||
LME LEAD FUTURE Sep22 | 41 | 1.03 | % | |||||||
RAPESEED Euro Feb22 | 39 | 1.00 | % | |||||||
WHITE SUGAR (ICE) Mar22 | 34 | 0.87 | % | |||||||
RAPESEED Euro May22 | 25 | 0.63 | % | |||||||
WHITE SUGAR (ICE) May22 | 17 | 0.43 | % | |||||||
See notes to consolidated financial statements.
53
Table of Contents
FS Series Trust
Consolidated Statements of Assets and Liabilities
(dollar values in thousands, except share and per share data)
| December 31, 2021 | ||||||||||||
| FS Multi- Strategy Alternatives Fund | FS Managed Futures Fund | FS Chiron Real Asset Fund | ||||||||||
Assets |
| |||||||||||
Investments, at fair value | $ | 144,490 | $ | 2,120 | $ | 25,485 | ||||||
Cash | 94 | — | — | |||||||||
Foreign currency, at fair value | 127 | — | 26 | |||||||||
Collateral held at broker(1) | 27,359 | — | 106 | |||||||||
Receivable for investments sold | 223 | — | 55 | |||||||||
Receivable from Fund shares sold | 1,827 | — | — | |||||||||
Receivable due from investment manager | 295 | — | 379 | |||||||||
Dividends receivable | 9 | — | 22 | |||||||||
Interest receivable | 621 | — | 10 | |||||||||
Unrealized appreciation on forward foreign currency exchange contracts | 630 | — | — | |||||||||
Unrealized appreciation on swap contracts(2) | 1,535 | 177 | — | |||||||||
Receivable for variation margin on futures contracts | 490 | — | 27 | |||||||||
Payment due from broker | 78 | — | 108 | |||||||||
Prepaid expenses and other assets | 78 | 1 | 35 | |||||||||
|
|
|
|
|
| |||||||
Total assets | $ | 177,856 | $ | 2,298 | $ | 26,253 | ||||||
|
|
|
|
|
| |||||||
Liabilities |
| |||||||||||
Investments sold short, at fair value | 11,092 | — | — | |||||||||
Unrealized depreciation on forward foreign currency exchange contracts | 505 | — | — | |||||||||
Payable for variation margin on futures contracts | 465 | — | 3 | |||||||||
Unrealized depreciation on swap contracts(2) | 390 | 94 | 13 | |||||||||
Due to custodian | — | 5 | 50 | |||||||||
Payable for investments purchased | 279 | — | — | |||||||||
Payment due to broker | 367 | — | 2 | |||||||||
Payable for Fund shares repurchased | 3 | — | — | |||||||||
Dividends payable | 4 | — | — | |||||||||
Management fees payable | 460 | — | 63 | |||||||||
Administrative services expense payable | 239 | 15 | 180 | |||||||||
Accounting and administrative fees payable | 283 | 52 | 47 | |||||||||
Professional fees payable | 141 | 36 | 32 | |||||||||
Trustees’ fees payable | 1 | 1 | — | |||||||||
Interest payable for investments sold short | 39 | — | — | |||||||||
Service fee—Class A payable | 2 | — | — | |||||||||
Other accrued expenses and liabilities | 504 | 25 | 29 | |||||||||
|
|
|
|
|
| |||||||
Total liabilities | $ | 14,774 | $ | 228 | $ | 419 | ||||||
|
|
|
|
|
| |||||||
Net assets | $ | 163,082 | $ | 2,070 | $ | 25,834 | ||||||
|
|
|
|
|
| |||||||
Composition of net assets |
| |||||||||||
Common shares, $0.001 par value | $ | 15 | $ | — | $ | 2 | ||||||
Capital in excess of par value | 158,308 | 2,011 | 25,140 | |||||||||
Accumulated earnings (deficit) | 4,759 | 59 | 692 | |||||||||
|
|
|
|
|
| |||||||
Net assets | $ | 163,082 | $ | 2,070 | $ | 25,834 | ||||||
|
|
|
|
|
| |||||||
Investments, at amortized cost | $ | 139,815 | $ | 2,121 | $ | 24,624 | ||||||
|
|
|
|
|
| |||||||
Foreign currency, at cost | $ | 112 | $ | — | $ | 25 | ||||||
|
|
|
|
|
| |||||||
Investments sold short, at proceeds | $ | 10,693 | $ | — | $ | — | ||||||
|
|
|
|
|
| |||||||
Commitments and contingencies(3) | $ | 5,281 | $ | 649 | $ | 1,102 | ||||||
|
|
|
|
|
| |||||||
See notes to consolidated financial statements.
54
Table of Contents
| December 31, 2021 | ||||||||||||
| FS Multi- Strategy Alternatives Fund | FS Managed Futures Fund | FS Chiron Real Asset Fund | ||||||||||
Class A Shares |
| |||||||||||
Net Assets | $ | 7,891 | $ | 26 | $ | 30 | ||||||
Shares Outstanding | 731,016 | 2,500 | 2,500 | |||||||||
Net Asset Value (“NAV”) and Redemption Price Per Share (net assets ÷ shares outstanding) | $ | 10.78 | $ | 10.29 | $ | 12.18 | ||||||
Maximum Offering Price Per Share (NAV ÷ 94.25% of net asset value per share) | $ | 11.44 | $ | 10.92 | $ | 12.92 | ||||||
Class I Shares |
| |||||||||||
Net Assets | $ | 155,191 | $ | 2,044 | $ | 25,804 | ||||||
Shares Outstanding | 14,333,858 | 198,739 | 2,116,806 | |||||||||
Net Asset Value and Redemption Price Per Share (net assets ÷ shares outstanding) | $ | 10.82 | $ | 10.29 | $ | 12.18 | ||||||
| (1) | Represents cash on deposit at broker. |
| (2) | See Note 7 for a discussion of the Fund’s total return swap agreements. |
| (3) | See Note 11 for a discussion of the Fund’s commitments and contingencies. |
See notes to consolidated financial statements.
55
Table of Contents
FS Series Trust
Consolidated Statements of Operations
(dollar values in thousands)
| Year Ended December 31, 2021 | ||||||||||||
| FS Multi-Strategy Alternatives Fund | FS Managed Futures Fund | FS Chiron Real Asset Fund | ||||||||||
Investment income |
| |||||||||||
Interest income | $ | 1,857 | $ | — | $ | 34 | ||||||
Dividend income* | 122 | 1 | 123 | |||||||||
Other fee income | 8 | — | — | |||||||||
|
|
|
|
|
| |||||||
Total investment income | 1,987 | 1 | 157 | |||||||||
|
|
|
|
|
| |||||||
Operating expenses |
| |||||||||||
| Management fees | 1,644 | 25 | 90 | |||||||||
| Administrative services expenses | 870 | 78 | 424 | |||||||||
| Accounting and administrative fees | 303 | 56 | 51 | |||||||||
| Other professional fees | 573 | 16 | 20 | |||||||||
| Audit fees | 86 | 34 | 33 | |||||||||
| Legal fees | 186 | 9 | 50 | |||||||||
| Trustees’ fees | 22 | — | — | |||||||||
| Distribution and service fees—Class A | 19 | — | — | |||||||||
| Dividend and interest expense on securities sold short | 74 | — | — | |||||||||
| Transfer agent fees | 226 | 41 | 41 | |||||||||
| Other general and administrative expenses | 303 | 4 | 14 | |||||||||
|
|
|
|
|
| |||||||
Total operating expenses | 4,306 | 263 | 723 | |||||||||
| Less: Expense reimbursement from sponsor(1) | (1,735 | ) | (230 | ) | (607 | ) | ||||||
| Less: Waiver from adviser(1) | — | (25 | ) | (27 | ) | |||||||
|
|
|
|
|
| |||||||
Net operating expenses | 2,571 | 8 | 89 | |||||||||
|
|
|
|
|
| |||||||
Net investment income (loss) | (584 | ) | (7 | ) | 68 | |||||||
|
|
|
|
|
| |||||||
Realized and unrealized gain/loss |
| |||||||||||
| Net realized gain (loss) on investments | 2,341 | — | (56 | ) | ||||||||
| Net realized gain (loss) on forward foreign currency exchange contracts | (277 | ) | — | (5 | ) | |||||||
| Net realized gain (loss) on total return swaps(2) | 12,502 | 62 | 698 | |||||||||
| Net realized gain (loss) on futures contracts | 1,091 | — | (34 | ) | ||||||||
| Net realized gain (loss) on foreign currency | 96 | — | (59 | ) | ||||||||
| Net change in unrealized appreciation (depreciation) on investments | (114 | ) | (1 | ) | 861 | |||||||
| Net change in unrealized appreciation (depreciation) on forward foreign currency exchange contracts | 127 | — | — | |||||||||
| Net change in unrealized appreciation (depreciation) on total return swaps(2) | 1,323 | 18 | (95 | ) | ||||||||
| Net change in unrealized appreciation (depreciation) on investments sold short | 472 | — | — | |||||||||
| Net change in unrealized appreciation (depreciation) on futures contracts | 25 | — | 24 | |||||||||
| Net change in unrealized gain (loss) on foreign currency | 13 | — | — | |||||||||
|
|
|
|
|
| |||||||
Total net realized gain (loss) and unrealized appreciation (depreciation) | 17,599 | 79 | 1,334 | |||||||||
|
|
|
|
|
| |||||||
| Net increase (decrease) in net assets resulting from operations | $ | 17,015 | $ | 72 | $ | 1,402 | ||||||
|
|
|
|
|
| |||||||
* Net of tax withholding | $ | 5 | $ | — | $ | 6 | ||||||
| (1) | See Note 4 for a discussion of reimbursements payable to the Fund by its investment adviser and affiliates. |
| (2) | See Note 7 for a discussion of the Fund’s total return swap agreements. |
See notes to consolidated financial statements.
56
Table of Contents
FS Series Trust
Consolidated Statements of Changes in Net Assets
(dollar values in thousands)
| FS Multi-Strategy Alternatives Fund | FS Managed Futures Fund | |||||||||||||||
| Year Ended December 31, 2021 | Year Ended December 31, 2020 | Year Ended December 31, 2021 | Year Ended December 31, 2020 | |||||||||||||
Operations |
| |||||||||||||||
Net investment income (loss) | $ | (584 | ) | $ | 757 | $ | (7 | ) | $ | 5 | ||||||
Net realized gain (loss) | 15,753 | (6,129 | ) | 62 | 120 | |||||||||||
Net change in unrealized appreciation (depreciation) on investments | (114 | ) | (3,088 | ) | (1 | ) | — | |||||||||
Net change in unrealized appreciation (depreciation) on forward foreign currency exchange contracts | 127 | 7 | — | — | ||||||||||||
Net change in unrealized appreciation (depreciation) on total return swaps(1) | 1,323 | 735 | 18 | 87 | ||||||||||||
Net change in unrealized appreciation (depreciation) on investments sold short | 472 | (223 | ) | — | — | |||||||||||
Net change in unrealized appreciation (depreciation) on futures contracts | 25 | — | — | — | ||||||||||||
Net change in unrealized gain (loss) on foreign currency | 13 | 3 | — | — | ||||||||||||
|
|
|
|
|
|
|
| |||||||||
| Net increase (decrease) in net assets resulting from operations | 17,015 | (7,938 | ) | 72 | 212 | |||||||||||
|
|
|
|
|
|
|
| |||||||||
Shareholder distributions |
| |||||||||||||||
Distributions to shareholders |
| |||||||||||||||
Class A | (225 | ) | (32 | ) | (1 | ) | (2 | ) | ||||||||
Class I | (4,775 | ) | (969 | ) | (79 | ) | (135 | ) | ||||||||
|
|
|
|
|
|
|
| |||||||||
| Decrease in net assets resulting from shareholder distributions | (5,000 | ) | (1,001 | ) | (80 | ) | (137 | ) | ||||||||
|
|
|
|
|
|
|
| |||||||||
Capital share transactions(2) |
| |||||||||||||||
| Net increase (decrease) in net assets resulting from capital share transactions | 22,364 | (57,874 | ) | — | 1 | |||||||||||
|
|
|
|
|
|
|
| |||||||||
| Total increase (decrease) in net assets | 34,379 | (66,813 | ) | (8 | ) | 76 | ||||||||||
| Net assets at beginning of year | 128,703 | 195,516 | 2,078 | 2,002 | ||||||||||||
|
|
|
|
|
|
|
| |||||||||
Net assets at end of year | $ | 163,082 | $ | 128,703 | $ | 2,070 | $ | 2,078 | ||||||||
|
|
|
|
|
|
|
| |||||||||
| (1) | See Note 7 for a discussion of the Fund’s total return swap agreements. |
| (2) | See Note 3 for a discussion of the Fund’s common share transactions. |
See notes to consolidated financial statements.
57
Table of Contents
FS Series Trust
Consolidated Statements of Changes in Net Assets
(dollar values in thousands)
| FS Chiron Real Asset Fund | ||||||||
| Year Ended December 31, 2021 | Year Ended December 31, 2020 | |||||||
Operations |
| |||||||
Net investment income | $ | 68 | $ | 7 | ||||
Net realized gain (loss) | 544 | 144 | ||||||
Net change in unrealized appreciation (depreciation) on investments | 861 | (28 | ) | |||||
Net change in unrealized appreciation (depreciation) on total return swaps(1) | (95 | ) | 55 | |||||
Net change in unrealized appreciation (depreciation) on futures contracts | 24 | — | ||||||
|
|
|
| |||||
| Net increase (decrease) in net assets resulting from operations | 1,402 | 178 | ||||||
|
|
|
| |||||
Shareholder distributions |
| |||||||
Distributions to shareholders |
| |||||||
Class A | (1 | ) | (1 | ) | ||||
Class I | (756 | ) | (88 | ) | ||||
|
|
|
| |||||
Net decrease in net assets resulting from shareholder distributions | (757 | ) | (89 | ) | ||||
|
|
|
| |||||
Capital share transactions(2) |
| |||||||
Net increase (decrease) in net assets resulting from capital share transactions | 22,995 | (997 | ) | |||||
|
|
|
| |||||
Total increase (decrease) in net assets | 23,640 | (908 | ) | |||||
Net assets at beginning of year | 2,194 | 3,102 | ||||||
|
|
|
| |||||
Net assets at end of year | $ | 25,834 | $ | 2,194 | ||||
|
|
|
| |||||
| (1) | See Note 7 for a discussion of the Fund’s total return swap agreements. |
| (2) | See Note 3 for a discussion of the Fund’s common share transactions. |
See notes to consolidated financial statements.
58
Table of Contents
FS Multi-Strategy Alternatives Fund
Consolidated Financial Highlights—Class A Shares
(in thousands, except share and per share amounts)
| Year Ended December 31, 2021 | Year Ended December 31, 2020 | Year Ended December 31, 2019 | Year Ended December 31, 2018 | Period from May 16, 2017 (Commencement of Operations) through December 31, 2017 | ||||||||||||||||
Per Share Data:(1) | ||||||||||||||||||||
Net asset value, beginning of period | $ | 9.77 | $ | 10.22 | $ | 9.68 | $ | 10.18 | $ | 10.00 | ||||||||||
Results of operations | ||||||||||||||||||||
Net investment income(2) | (0.07 | ) | 0.02 | 0.15 | 0.15 | 0.05 | ||||||||||||||
Net realized gain (loss) and unrealized appreciation (depreciation) on investments | 1.40 | (0.43 | ) | 0.59 | (0.57 | ) | 0.13 | |||||||||||||
|
|
|
|
|
|
|
|
|
| |||||||||||
Net increase (decrease) in net assets resulting from operations | 1.33 | (0.41 | ) | 0.74 | (0.42 | ) | 0.18 | |||||||||||||
|
|
|
|
|
|
|
|
|
| |||||||||||
Shareholder Distributions:(3) | ||||||||||||||||||||
Distributions from net investment income | (0.32 | ) | (0.04 | ) | (0.20 | ) | — | — | ||||||||||||
Distributions from net realized gain on investments | — | — | — | (0.08 | ) | — | ||||||||||||||
|
|
|
|
|
|
|
|
|
| |||||||||||
Net increase (decrease) in net assets resulting from shareholder distributions | (0.32 | ) | (0.04 | ) | (0.20 | ) | (0.08 | ) | — | |||||||||||
|
|
|
|
|
|
|
|
|
| |||||||||||
Net asset value, end of period | $ | 10.78 | $ | 9.77 | $ | 10.22 | $ | 9.68 | $ | 10.18 | ||||||||||
|
|
|
|
|
|
|
|
|
| |||||||||||
Shares outstanding, end of period | 731,016 | 720,143 | 1,073,885 | 776,764 | 281,056 | |||||||||||||||
|
|
|
|
|
|
|
|
|
| |||||||||||
Total return(4) | 13.62 | % | (3.99 | )% | 7.68 | % | (4.12 | )% | 1.80 | %(5) | ||||||||||
|
|
|
|
|
|
|
|
|
| |||||||||||
Ratio/Supplemental Data: | ||||||||||||||||||||
Net assets, end of period | $ | 7,891 | $ | 7,036 | $ | 10,973 | $ | 7,521 | $ | 2,860 | ||||||||||
Ratio of net investment income to average net assets(6)(7) | (0.66 | )% | 0.22 | % | 1.46 | % | 1.55 | % | 0.81 | % | ||||||||||
Ratio of total operating expenses to average net assets(6) | 3.49 | % | 3.42 | % | 3.55 | % | 3.63 | % | 5.34 | % | ||||||||||
Ratio of expense reimbursement and waiver from sponsor to average net assets(6) | (1.32 | )% | (1.01 | )% | (1.74 | )% | (2.76 | )% | (4.57 | )% | ||||||||||
|
|
|
|
|
|
|
|
|
| |||||||||||
Ratio of net operating expenses to average net assets(6) | 2.17 | % | 2.41 | % | 1.81 | % | 0.87 | % | 0.77 | % | ||||||||||
|
|
|
|
|
|
|
|
|
| |||||||||||
Portfolio turnover rate(5) | 183% | 244% | 178% | 317% | 133% | |||||||||||||||
See notes to consolidated financial statements.
59
Table of Contents
FS Multi-Strategy Alternatives Fund
Consolidated Financial Highlights—Class A Shares (continued)
(in thousands, except share and per share amounts)
| (1) | Per share data may be rounded in order to compute the ending net asset value per share. |
| (2) | The per share data was derived by using the average number of common shares outstanding during the applicable period. |
| (3) | The per share data for net decrease in net assets resulting from shareholder distributions reflects the actual amount of distributions declared per Class A common share during the applicable period. |
| (4) | The total return for each period presented is historical and is calculated by determining the percentage change in net asset value, assuming the reinvestment of all distributions in additional common shares of the same class of the Fund at such class’s net asset value per share on the ex-dividend date. The total return does not consider the effect of any selling commissions or charges that may be incurred in connection with the sale of the Fund’s common shares. The historical calculation of total return in the table should not be considered a representation of the Fund’s future total return, which may be greater or less than the total return shown in the table due to a number of factors, including, among others, the Fund’s ability or inability to make investments that meet its investment criteria, the interest rates payable on the debt securities the Fund acquires, the level of the Fund’s expenses, the amount of the expense limitation, if any, variations in and the timing of the recognition of realized and unrealized gains or losses, the degree to which the Fund encounters competition in its markets and general economic conditions. As a result of these and other factors, results for any previous period should not be relied upon as being indicative of performance in future periods. The total return calculations set forth above represent the total return on the Fund during the applicable period on a per class basis and do not represent an actual return to shareholders. |
| (5) | Information presented is not annualized. |
| (6) | Average daily net assets for the applicable period is used for this calculation. Data for periods of less than one year is annualized. |
| (7) | Had the sponsor not reimbursed certain operating expenses, the ratio of net investment income (loss) to average net assets would have been (1.98)%, (0.79)%, (0.28)%, (1.21)% and (3.76)% for the years ended December 31, 2021, 2020, 2019 and 2018, and for the period from May 16, 2017 (Commencement of Operations) through December 31, 2017, respectively. |
See notes to consolidated financial statements.
60
Table of Contents
FS Multi-Strategy Alternatives Fund
Consolidated Financial Highlights—Class I Shares
(in thousands, except share and per share amounts)
| Year Ended December 31, 2021 | Year Ended December 31, 2020 | Year Ended December 31, 2019 | Year Ended December 31, 2018 | Period from May 16, 2017 (Commencement of Operations) through December 31, 2017 | ||||||||||||||||
Per Share Data:(1) | ||||||||||||||||||||
Net asset value, beginning of period | $ | 9.80 | $ | 10.25 | $ | 9.72 | $ | 10.19 | $ | 10.00 | ||||||||||
Results of operations | ||||||||||||||||||||
Net investment income(2) | (0.05 | ) | 0.04 | 0.17 | 0.18 | 0.06 | ||||||||||||||
Net realized gain (loss) and unrealized appreciation (depreciation) on investments | 1.42 | (0.41 | ) | 0.59 | (0.57 | ) | 0.13 | |||||||||||||
|
|
|
|
|
|
|
|
|
| |||||||||||
Net increase (decrease) in net assets resulting from operations | 1.37 | (0.37 | ) | 0.76 | (0.39 | ) | 0.19 | |||||||||||||
|
|
|
|
|
|
|
|
|
| |||||||||||
Shareholder Distributions:(3) | ||||||||||||||||||||
Distributions from net investment income | (0.35 | ) | (0.08 | ) | (0.23 | ) | — | — | ||||||||||||
Distributions from net realized gain on investments | — | — | — | (0.08 | ) | — | ||||||||||||||
|
|
|
|
|
|
|
|
|
| |||||||||||
Net increase (decrease) in net assets resulting from shareholder distributions | (0.35 | ) | (0.08 | ) | (0.23 | ) | (0.08 | ) | — | |||||||||||
|
|
|
|
|
|
|
|
|
| |||||||||||
Net asset value, end of period | $ | 10.82 | $ | 9.80 | $ | 10.25 | $ | 9.72 | $ | 10.19 | ||||||||||
|
|
|
|
|
|
|
|
|
| |||||||||||
Shares outstanding, end of period | 14,333,858 | 12,418,229 | 17,997,221 | 9,241,564 | 5,043,239 | |||||||||||||||
|
|
|
|
|
|
|
|
|
| |||||||||||
Total return(4) | 13.96 | % | (3.65 | )% | 7.77 | % | (3.82 | )% | 1.90 | %(5) | ||||||||||
|
|
|
|
|
|
|
|
|
| |||||||||||
Ratio/Supplemental Data: | ||||||||||||||||||||
Net assets, end of period | $ | 155,191 | $ | 121,667 | $ | 184,543 | $ | 89,799 | $ | 51,387 | ||||||||||
Ratio of net investment income to average net assets(6)(7) | (0.43 | )% | 0.46 | % | 1.65 | % | 1.80 | % | 0.88 | % | ||||||||||
Ratio of total operating expenses to average net assets(6) | 3.26 | % | 3.17 | % | 3.28 | % | 3.54 | % | 4.62 | % | ||||||||||
Ratio of expense reimbursement from sponsor to average net assets(6) | (1.32 | )% | (1.01 | )% | (1.69 | )% | (2.91 | )% | (4.10 | )% | ||||||||||
|
|
|
|
|
|
|
|
|
| |||||||||||
Ratio of net operating expenses to average net assets(6) | 1.94 | % | 2.16 | % | 1.59 | % | 0.63 | % | 0.52 | % | ||||||||||
|
|
|
|
|
|
|
|
|
| |||||||||||
Portfolio turnover rate(5) | 183% | 244% | 178% | 317% | 133% | |||||||||||||||
| (1) | Per share data may be rounded in order to compute the ending net asset value per share. |
See notes to consolidated financial statements.
61
Table of Contents
FS Multi-Strategy Alternatives Fund
Consolidated Financial Highlights—Class I Shares (continued)
(in thousands, except share and per share amounts)
| (2) | The per share data was derived by using the average number of common shares outstanding during the applicable period. |
| (3) | The per share data for net decrease in net assets resulting from shareholder distributions reflects the actual amount of distributions declared per Class I common share during the applicable period. |
| (4) | The total return for each period presented is historical and is calculated by determining the percentage change in net asset value, assuming the reinvestment of all distributions in additional common shares of the same class of the Fund at such class’s net asset value per share on the ex-dividend date. The total return does not consider the effect of any selling commissions or charges that may be incurred in connection with the sale of the Fund’s common shares. The historical calculation of total return in the table should not be considered a representation of the Fund’s future total return, which may be greater or less than the total return shown in the table due to a number of factors, including, among others, the Fund’s ability or inability to make investments that meet its investment criteria, the interest rates payable on the debt securities the Fund acquires, the level of the Fund’s expenses, the amount of the expense limitation, if any, variations in and the timing of the recognition of realized and unrealized gains or losses, the degree to which the Fund encounters competition in its markets and general economic conditions. As a result of these and other factors, results for any previous period should not be relied upon as being indicative of performance in future periods. The total return calculations set forth above represent the total return on the Fund during the applicable period on a per class basis and do not represent an actual return to shareholders. |
| (5) | Information presented is not annualized. |
| (6) | Average daily net assets for the applicable period is used for this calculation. Data for periods of less than one year is annualized. |
| (7) | Had the sponsor not reimbursed certain operating expenses, the ratio of net investment income (loss) to average net assets would have been (1.75)%, (0.55)%, (0.04)%, (1.10)% and (3.22)% for the years ended December 31, 2021, 2020, 2019 and 2018, and for the period from May 16, 2017 (Commencement of Operations) through December 31, 2017, respectively. |
See notes to consolidated financial statements.
62
Table of Contents
Consolidated Financial Highlights—Class A Shares
(in thousands, except share and per share amounts)
| Year Ended December 31, 2021 | Year Ended December 31, 2020 | Year Ended December 31, 2019 | ||||||||||
Per Share Data:(1) | ||||||||||||
Net asset value, beginning of year | $ | 10.33 | $ | 9.96 | $ | 10.00 | ||||||
Results of operations | ||||||||||||
Net investment income (loss)(2) | (0.06 | ) | (0.00 | ) | 0.18 | |||||||
Net realized gain (loss) and unrealized appreciation (depreciation) on investments | 0.39 | 1.02 | (0.19 | ) | ||||||||
|
|
|
|
|
| |||||||
Net increase (decrease) in net assets resulting from operations | 0.33 | 1.02 | (0.01 | ) | ||||||||
|
|
|
|
|
| |||||||
Shareholder Distributions:(3) | ||||||||||||
Distributions from net investment income | (0.37 | ) | (0.65 | ) | (0.03 | ) | ||||||
|
|
|
|
|
| |||||||
Net increase (decrease) in net assets resulting from shareholder distributions | (0.37 | ) | (0.65 | ) | (0.03 | ) | ||||||
|
|
|
|
|
| |||||||
Net asset value, end of year | $ | 10.29 | $ | 10.33 | $ | 9.96 | ||||||
|
|
|
|
|
| |||||||
Shares outstanding, end of year | 2,500 | 2,500 | 2,500 | |||||||||
|
|
|
|
|
| |||||||
Total return(4) | 3.22 | % | 10.55 | % | (0.15 | )% | ||||||
|
|
|
|
|
| |||||||
Ratio/Supplemental Data: | ||||||||||||
Net assets, end of year | $ | 26 | $ | 26 | $ | 25 | ||||||
Ratio of net investment income (loss) to average net assets(5)(6) | (0.57 | )% | (0.03 | )% | 1.77 | % | ||||||
Ratio of total operating expenses to average net assets(5) | 12.40 | % | 13.13 | % | 10.14 | % | ||||||
Ratio of expense reimbursement and waiver from sponsor to average net assets(5) | (11.78 | )% | (12.63 | )% | (9.64 | )% | ||||||
|
|
|
|
|
| |||||||
Ratio of net operating expenses to average net assets(5) | 0.62 | % | 0.50 | % | 0.50 | % | ||||||
|
|
|
|
|
| |||||||
Portfolio turnover rate(7) | —% | —% | —% | |||||||||
| (1) | Per share data may be rounded in order to compute the ending net asset value per share. |
| (2) | The per share data was derived by using the average number of common shares outstanding during the applicable period. |
| (3) | The per share data for net decrease in net assets resulting from shareholder distributions reflects the actual amount of distributions declared per Class A common share during the applicable period. |
| (4) | The total return for each period presented is historical and is calculated by determining the percentage change in net asset value, assuming the reinvestment of all distributions in additional common shares of the same class of the Fund at such class’s net asset value per share on the ex-dividend date. The total return does not consider the effect of any selling commissions or charges that may be incurred in connection with the sale of the Fund’s common shares. The historical calculation of total return in the table should not be considered a representation of the Fund’s future total return, which may be greater or less than the total return shown in the table due to a number of factors, including, among others, the Fund’s ability or inability to make investments that meet its investment criteria, the interest rates payable on the debt securities the Fund acquires, the level of the Fund’s expenses, the amount of the expense limitation, if any, variations in |
See notes to consolidated financial statements.
63
Table of Contents
FS Managed Futures Fund
Consolidated Financial Highlights—Class A Shares (continued)
(in thousands, except share and per share amounts)
| and the timing of the recognition of realized and unrealized gains or losses, the degree to which the Fund encounters competition in its markets and general economic conditions. As a result of these and other factors, results for any previous period should not be relied upon as being indicative of performance in future periods. The total return calculations set forth above represent the total return on the Fund during the applicable period on a per class basis and do not represent an actual return to shareholders. |
| (5) | Average daily net assets is used for this calculation. |
| (6) | Had the sponsor not reimbursed certain operating expenses, the ratio of net investment income (loss) to average net assets would have been (12.35)%, (12.66)% and (7.87)% for the years ended December 31, 2021, 2020 and 2019, respectively. |
| (7) | Information presented is not annualized. |
See notes to consolidated financial statements.
64
Table of Contents
FS Managed Futures Fund
Consolidated Financial Highlights—Class I Shares
(in thousands, except share and per share amounts)
| Year Ended December 31, 2021 | Year Ended December 31, 2020 | Year Ended December 31, 2019 | ||||||||||
Per Share Data:(1) | ||||||||||||
Net asset value, beginning of year | $ | 10.33 | $ | 9.96 | $ | 10.00 | ||||||
Results of operations | ||||||||||||
Net investment income(2) | (0.03 | ) | 0.02 | 0.20 | ||||||||
Net realized gain (loss) and unrealized appreciation (depreciation) on investments | 0.39 | 1.03 | (0.18 | ) | ||||||||
|
|
|
|
|
| |||||||
Net increase (decrease) in net assets resulting from operations | 0.36 | 1.05 | 0.02 | |||||||||
|
|
|
|
|
| |||||||
Shareholder Distributions:(3) | ||||||||||||
Distributions from net investment income | (0.40 | ) | (0.68 | ) | (0.06 | ) | ||||||
|
|
|
|
|
| |||||||
Net increase (decrease) in net assets resulting from shareholder distributions | (0.40 | ) | (0.68 | ) | (0.06 | ) | ||||||
|
|
|
|
|
| |||||||
Net asset value, end of year | $ | 10.29 | $ | 10.33 | $ | 9.96 | ||||||
|
|
|
|
|
| |||||||
Shares outstanding, end of year | 198,739 | 198,693 | 198,617 | |||||||||
|
|
|
|
|
| |||||||
Total return(4) | 3.48 | % | 10.83 | % | 0.10 | % | ||||||
|
|
|
|
|
| |||||||
Ratio/Supplemental Data: | ||||||||||||
Net assets, end of year | $ | 2,044 | $ | 2,052 | $ | 1,977 | ||||||
Ratio of net investment income to average net assets(5)(6) | (0.32 | )% | 0.23 | % | 2.02 | % | ||||||
Ratio of total operating expenses to average net assets(5) | 12.15 | % | 12.88 | % | 9.89 | % | ||||||
Ratio of expense reimbursement and waiver from sponsor to average net assets(5) | (11.78 | )% | (12.63 | )% | (9.64 | )% | ||||||
|
|
|
|
|
| |||||||
Ratio of net operating expenses to average net assets(5) | 0.37 | % | 0.25 | % | 0.25 | % | ||||||
|
|
|
|
|
| |||||||
Portfolio turnover rate(7) | —% | —% | —% | |||||||||
| (1) | Per share data may be rounded in order to compute the ending net asset value per share. |
| (2) | The per share data was derived by using the average number of common shares outstanding during the applicable period. |
| (3) | The per share data for net decrease in net assets resulting from shareholder distributions reflects the actual amount of distributions declared per Class I common share during the applicable period. |
| (4) | The total return for each period presented is historical and is calculated by determining the percentage change in net asset value, assuming the reinvestment of all distributions in additional common shares of the same class of the Fund at such class’s net asset value per share on the ex-dividend date. The total return does not consider the effect of any selling commissions or charges that may be incurred in connection with the sale of the Fund’s common shares. The historical calculation of total return in the table should not be considered a representation of the Fund’s future total return, which may be greater or less than the total return shown in the table due to a number of factors, including, among others, the Fund’s ability or inability to make investments that meet its investment criteria, the interest rates payable on the debt securities the |
See notes to consolidated financial statements.
65
Table of Contents
FS Managed Futures Fund
Consolidated Financial Highlights—Class I Shares (continued)
(in thousands, except share and per share amounts)
| Fund acquires, the level of the Fund’s expenses, the amount of the expense limitation, if any, variations in and the timing of the recognition of realized and unrealized gains or losses, the degree to which the Fund encounters competition in its markets and general economic conditions. As a result of these and other factors, results for any previous period should not be relied upon as being indicative of performance in future periods. The total return calculations set forth above represent the total return on the Fund during the applicable period on a per class basis and do not represent an actual return to shareholders. |
| (5) | Average daily net assets is used for this calculation. |
| (6) | Had the sponsor not reimbursed certain operating expenses, the ratio of net investment income (loss) to average net assets would have been (12.10)%, (12.40)% and (7.62)% for the years ended December 31, 2021, 2020 and 2019, respectively. |
| (7) | Information presented is not annualized. |
See notes to consolidated financial statements.
66
Table of Contents
Consolidated Financial Highlights—Class A Shares
(in thousands, except share and per share amounts)
| Year Ended December 31, 2021 | Year Ended December 31, 2020 | Year Ended December 31, 2019 | ||||||||||
Per Share Data:(1) | ||||||||||||
Net asset value, beginning of year | $ | 10.72 | $ | 10.26 | $ | 10.00 | ||||||
Results of operations | ||||||||||||
Net investment income (loss)(2) | (0.01 | ) | (0.01 | ) | 0.18 | |||||||
Net realized gain (loss) and unrealized appreciation (depreciation) on investments | 1.91 | 0.77 | 0.79 | |||||||||
|
|
|
|
|
| |||||||
Net increase (decrease) in net assets resulting from operations | 1.90 | 0.76 | 0.97 | |||||||||
|
|
|
|
|
| |||||||
Shareholder Distributions:(3) | ||||||||||||
Distributions from net investment income | (0.44 | ) | (0.30 | ) | (0.71 | ) | ||||||
|
|
|
|
|
| |||||||
Net increase (decrease) in net assets resulting from shareholder distributions | (0.44 | ) | (0.30 | ) | (0.71 | ) | ||||||
|
|
|
|
|
| |||||||
Net asset value, end of year | $ | 12.18 | $ | 10.72 | $ | 10.26 | ||||||
|
|
|
|
|
| |||||||
Shares outstanding, end of year | 2,500 | 2,500 | 2,500 | |||||||||
|
|
|
|
|
| |||||||
Total return(4) | 17.93 | % | 7.69 | % | 9.87 | % | ||||||
|
|
|
|
|
| |||||||
Ratio/Supplemental Data: | ||||||||||||
Net assets, end of year | $ | 30 | $ | 27 | $ | 26 | ||||||
Ratio of net investment income (loss) to average net assets(5)(6) | (0.11 | )% | (0.06 | )% | 1.72 | % | ||||||
Ratio of total operating expenses to average net assets(5) | 8.14 | % | 11.21 | % | 8.95 | % | ||||||
Ratio of expense reimbursement and waiver from sponsor to average net assets(5) | (7.38 | )% | (10.71 | )% | (8.45 | )% | ||||||
|
|
|
|
|
| |||||||
Ratio of net operating expenses to average net assets(5) | 0.76 | % | 0.50 | % | 0.50 | % | ||||||
|
|
|
|
|
| |||||||
Portfolio turnover rate(7) | 651% | —% | —% | |||||||||
| (1) | Per share data may be rounded in order to compute the ending net asset value per share. |
| (2) | The per share data was derived by using the average number of common shares outstanding during the applicable period. |
| (3) | The per share data for net decrease in net assets resulting from shareholder distributions reflects the actual amount of distributions declared per Class A common share during the applicable period. |
| (4) | The total return for each period presented is historical and is calculated by determining the percentage change in net asset value, assuming the reinvestment of all distributions in additional common shares of the same class of the Fund at such class’s net asset value per share on the ex-dividend date. The total return does not consider the effect of any selling commissions or charges that may be incurred in connection with the sale of the Fund’s common shares. The historical calculation of total return in the table should not be considered a representation of the Fund’s future total return, which may be greater or less than the total return shown in the table due to a number of factors, including, among others, the Fund’s ability or inability to make investments that meet its investment criteria, the interest rates payable on the debt securities the Fund acquires, the level of the Fund’s expenses, the amount of the expense limitation, if any, variations in |
See notes to consolidated financial statements.
67
Table of Contents
FS Chiron Real Asset Fund
Consolidated Financial Highlights—Class A Shares (continued)
(in thousands, except share and per share amounts)
| and the timing of the recognition of realized and unrealized gains or losses, the degree to which the Fund encounters competition in its markets and general economic conditions. As a result of these and other factors, results for any previous period should not be relied upon as being indicative of performance in future periods. The total return calculations set forth above represent the total return on the Fund during the applicable period on a per class basis and do not represent an actual return to shareholders. |
| (5) | Average daily net assets is used for this calculation. |
| (6) | Had the sponsor not reimbursed certain operating expenses, the ratio of net investment income (loss) to average net assets would have been (7.49)%, (10.77)% and (6.73)% for the years ended December 31, 2021, 2020 and 2019, respectively. |
| (7) | Information presented is not annualized. |
See notes to consolidated financial statements.
68
Table of Contents
FS Chiron Real Asset Fund
Consolidated Financial Highlights—Class I Shares
(in thousands, except share and per share amounts)
| Year Ended December 31, 2021 | Year Ended December 31, 2020 | Year Ended December 31, 2019 | ||||||||||
Per Share Data:(1) | ||||||||||||
Net asset value, beginning of year | $ | 10.72 | $ | 10.26 | $ | 10.00 | ||||||
Results of operations | ||||||||||||
Net investment income(2) | 0.09 | 0.02 | 0.21 | |||||||||
Net realized gain (loss) and unrealized appreciation (depreciation) on investments | 1.84 | 0.76 | 0.79 | |||||||||
|
|
|
|
|
| |||||||
Net increase (decrease) in net assets resulting from operations | 1.93 | 0.78 | 1.00 | |||||||||
|
|
|
|
|
| |||||||
Shareholder Distributions:(3) | ||||||||||||
Distributions from net investment income | (0.47 | ) | (0.32 | ) | (0.74 | ) | ||||||
|
|
|
|
|
| |||||||
Net increase (decrease) in net assets resulting from shareholder distributions | (0.47 | ) | (0.32 | ) | (0.74 | ) | ||||||
|
|
|
|
|
| |||||||
Net asset value, end of year | $ | 12.18 | $ | 10.72 | $ | 10.26 | ||||||
|
|
|
|
|
| |||||||
Shares outstanding, end of year | 2,116,806 | 202,227 | 299,740 | |||||||||
|
|
|
|
|
| |||||||
Total return(4) | 18.12 | % | 8.07 | % | 10.14 | % | ||||||
|
|
|
|
|
| |||||||
Ratio/Supplemental Data: | ||||||||||||
Net assets, end of year | $ | 25,804 | $ | 2,167 | $ | 3,076 | ||||||
Ratio of net investment income to average net assets(5)(6) | 0.75 | % | 0.22 | % | 1.97 | % | ||||||
Ratio of total operating expenses to average net assets(5) | 7.95 | % | 10.95 | % | 8.71 | % | ||||||
Ratio of expense reimbursement and waiver from sponsor to average net assets(5) | (6.98 | )% | (10.70 | )% | (8.46 | )% | ||||||
|
|
|
|
|
| |||||||
Ratio of net operating expenses to average net assets(5) | 0.97 | % | 0.25 | % | 0.25 | % | ||||||
|
|
|
|
|
| |||||||
Portfolio turnover rate(7) | 651% | —% | —% | |||||||||
| (1) | Per share data may be rounded in order to compute the ending net asset value per share. |
| (2) | The per share data was derived by using the average number of common shares outstanding during the applicable period. |
| (3) | The per share data for net decrease in net assets resulting from shareholder distributions reflects the actual amount of distributions declared per Class I common share during the applicable period. |
| (4) | The total return for each period presented is historical and is calculated by determining the percentage change in net asset value, assuming the reinvestment of all distributions in additional common shares of the same class of the Fund at such class’s net asset value per share on the ex-dividend date. The total return does not consider the effect of any selling commissions or charges that may be incurred in connection with the sale of the Fund’s common shares. The historical calculation of total return in the table should not be considered a representation of the Fund’s future total return, which may be greater or less than the total return shown in the table due to a number of factors, including, among others, the Fund’s ability or inability to make investments that meet its investment criteria, the interest rates payable on the debt securities the Fund acquires, the level of the Fund’s expenses, the amount of the expense limitation, if any, variations in and the timing of the recognition of realized and unrealized gains or losses, the degree to which the Fund |
See notes to consolidated financial statements.
69
Table of Contents
FS Chiron Real Asset Fund
Consolidated Financial Highlights—Class I Shares (continued)
(in thousands, except share and per share amounts)
| encounters competition in its markets and general economic conditions. As a result of these and other factors, results for any previous period should not be relied upon as being indicative of performance in future periods. The total return calculations set forth above represent the total return on the Fund during the applicable period on a per class basis and do not represent an actual return to shareholders. |
| (5) | Average daily net assets is used for this calculation. |
| (6) | Had the sponsor not reimbursed certain operating expenses, the ratio of net investment income (loss) to average net assets would have been (6.23)%, (10.48)% and (6.49)% for the years ended December 31, 2021, 2020 and 2019, respectively. |
| (7) | Information presented is not annualized. |
See notes to consolidated financial statements.
70
Table of Contents
FS Series Trust
Notes to Consolidated Financial Statements
(dollar values in thousands, except share and per share amounts)
Note 1. Principal Business and Organization
FS Series Trust (the “Trust”) was organized as a Delaware statutory trust under the Delaware Statutory Trust Act on November 28, 2016. The Trust is an open-end management investment company, registered under the Investment Company Act of 1940, as amended (the “1940 Act”). As of December 31, 2021, the Trust consists of three active series, which are presented in this book (collectively, the “Funds” and each individually a “Fund”): (i) FS Multi-Strategy Alternatives Fund (“FSMS”), (ii) FS Managed Futures Fund (“Managed Futures”) and (iii) FS Chiron Real Asset Fund (“Real Asset” and, collectively with Managed Futures, the “Alt Beta Funds” and each individually, an “Alt Beta Fund”).
FSMS commenced investment operations on May 16, 2017. Each of the Alt Beta Funds commenced investment operations on December 31, 2018 and had no activity other than investing their cash in a money market fund. As such, no financial highlights for 2018 have been presented.
Each Fund represents two classes of shares of beneficial interest of the Trust in a separate portfolio of securities and other assets with their own investment objective and policies.
| • | FS Multi-Strategy Alternatives Fund seeks to provide shareholders with positive absolute returns over a complete market cycle. |
| • | FS Managed Futures Fund seeks to provide positive absolute returns with low correlation to traditional investments. |
| • | FS Chiron Real Asset Fund seeks to provide total returns consisting of capital appreciation and income. |
The Funds use derivatives in executing their respective investment objectives for a variety of purposes, such as to seek economic exposure to one or more alternative strategies, enhance returns, increase investment flexibility, speculate on a targeted investment opportunity, or for hedging purposes. In attempting to achieve their investment objectives, the Funds primarily use total return basket swaps that seek both long and short exposure on variety of strategies, in a notional amount, that the Funds could not otherwise have exposure to on a name by name basis. The total return basket swaps include exposure to equity risk as well as foreign currency, commodity and interest rate risk.
Each Fund is classified as a non-diversified, open-end management investment company registered under the 1940 Act and has elected to be treated for U.S. federal income tax purposes, and intends to qualify annually thereafter, as a regulated investment company (“RIC”) as defined under Subchapter M of the Internal Revenue Code of 1986, as amended (the “Code”).
As of December 31, 2021, FSMS had one wholly owned subsidiary, FS Alternatives Fund (Cayman), Managed Futures had one wholly owned subsidiary, FS Managed Futures Fund (Cayman) and Real Asset had one wholly owned subsidiary FS Chiron Real Asset Fund (Cayman), (collectively, the “Subsidiaries”), through which they may gain exposure to commodities. The audited consolidated financial statements include both the Funds’ accounts and the accounts of the Subsidiaries. All intercompany balances have been eliminated in consolidation.
On December 3, 2021, the Trust’s Board of Trustees (the “Board”) approved the liquidation of FS Alternative Income Opportunities Fund and FS Long/Short Equity Fund, which were each fully liquidated on January 24, 2022. As such, the financial statements for these funds are not presented in this book.
Note 2. Summary of Significant Accounting Policies
Basis of Presentation: The accompanying consolidated financial statements of the Funds have been prepared in accordance with U.S. generally accepted accounting principles (“GAAP”). Each Fund is considered an
71
Table of Contents
investment company under GAAP and follows the accounting and reporting guidance applicable to investment companies under Accounting Standards Codification Topic 946, Financial Services—Investment Companies. Each Fund has evaluated the impact of subsequent events through the date the respective consolidated financial statements were issued and filed with the U.S. Securities and Exchange Commission (“SEC”).
Use of Estimates: The preparation of the Funds’ audited consolidated financial statements in conformity with GAAP requires management to make estimates and assumptions that affect the reported amounts of assets and liabilities, and disclosure of contingent assets and liabilities, at the date of the audited consolidated financial statements and the reported amounts of revenues and expenses during the reporting period. Actual results could differ from those estimates. Many of the amounts have been rounded and all amounts are in thousands, except share and per share amounts.
Cash and Cash Equivalents: The Funds consider all highly liquid investments with original maturities of three months or less to be cash equivalents. The Funds invest their excess cash in an institutional money market fund, which is stated at fair value. The Funds’ uninvested cash is maintained with a high credit quality financial institution.
Valuation of Portfolio Investments: The Funds determine the net asset value (“NAV”) of their common shares on each day that the New York Stock Exchange (“NYSE”) is open for business as of the close of the regular trading session (normally 4:00 pm Eastern Time). Each Class A share of beneficial interest (“Class A Share”) is offered at NAV plus the applicable sales load, while each Class I Share of beneficial interest (“Class I Share”) is offered at NAV. The Funds calculate NAV per share on a class-specific basis. The NAV of a class of shares depends on the number of shares of the applicable class outstanding at the time the NAV of the applicable share class is determined. As such, the NAV of each class of shares may vary if such Fund sells different amounts of shares per class. The Funds’ assets and liabilities are valued in accordance with the principles set forth below.
The Adviser values the Funds’ assets in good faith pursuant to the Funds’ valuation policy and consistently applied valuation process, which was developed by the audit committee of the Board and approved by the Board. Portfolio securities and other assets for which market quotes are readily available are valued at market value. In circumstances where market quotes are not readily available, the Board has adopted methods for determining the fair value of such securities and other assets, and has delegated the responsibility for applying the valuation methods to the Adviser. On a quarterly basis, the Board reviews the valuation determinations made with respect to the Funds’ investments during the preceding quarter and evaluates whether such determinations were made in a manner consistent with the Funds’ valuation process.
Accounting Standards Codification Topic 820, Fair Value Measurements and Disclosures (“ASC Topic 820”) issued by the Financial Accounting Standards Board (“FASB”) clarifies the definition of fair value and requires companies to expand their disclosure about the use of fair value to measure assets and liabilities in interim and annual periods subsequent to initial recognition. ASC Topic 820 defines fair value as the price that would be received from the sale of an asset or paid to transfer a liability in an orderly transaction between market participants at the measurement date. ASC Topic 820 also establishes a three-tier fair value hierarchy, which prioritizes the inputs used in measuring fair value. These tiers include: Level 1, defined as observable inputs such as quoted prices in active markets; Level 2, which includes inputs such as quoted prices for similar securities in active markets and quoted prices for identical securities where there is little or no activity in the market; and Level 3, defined as unobservable inputs for which little or no market data exists, therefore requiring an entity to develop its own assumptions.
When determining the fair value of an asset or liability, the Adviser seeks to determine the price that would be received from the sale of the asset or paid to transfer the liability in an orderly transaction between market participants at the measurement date, in accordance with ASC Topic 820. Fair value determinations are based upon all available inputs that the Adviser deems relevant, which may include indicative dealer quotes, values of like securities, recent portfolio company financial statements and forecasts, and valuations prepared by third-party valuation services. However, determination of fair value involves subjective judgments and estimates. Accordingly, the notes to the Funds’ audited consolidated financial statements refer to the uncertainty with
72
Table of Contents
respect to the possible effect of such valuations and any change in such valuations on the Funds’ audited consolidated financial statements.
The Funds expect that their portfolios will primarily consist of securities listed or traded on a recognized securities exchange or automated quotation system (“Exchange-Traded Security”) or securities traded on a privately negotiated over-the-counter (“OTC”) secondary market for institutional investors for which indicative dealer quotes are available (“OTC Security”).
For purposes of calculating NAV, the Adviser uses the following valuation methods:
| • | The market value of each Exchange-Traded Security is the last reported sale price at the relevant valuation date on the composite tape or on the principal exchange on which such security is traded. |
| • | If no sale is reported for an Exchange-Traded Security on the valuation date or if a security is an OTC Security, the Funds value such security using quotations obtained from an independent third-party pricing service, which provides prevailing bid and ask prices that are screened for validity by the service from dealers on the valuation date. For investments for which a third-party pricing service is unable to obtain quoted prices, the Funds obtain bid and ask prices directly from dealers who make a market in such securities. In all such cases, securities are valued at the midpoint of the average bid and ask prices obtained from such sources. |
| • | To the extent that the Funds hold investments for which no active secondary market exists and, therefore, no bid and ask prices can be readily obtained, the Funds will value such investments at fair value as determined in good faith by the Adviser in accordance with the Funds’ valuation policy and pursuant to authority delegated by the Board as described below. In making such determination, the Adviser may rely upon valuations obtained from an independent valuation firm. |
| • | Forward foreign currency exchange contracts are valued at the mean of the appropriate foreign exchange rates at the close of regular trading on the NYSE. Exchange rates and forward points used to convert prices are obtained from independent third-party pricing services. |
| • | Swaps are typically valued using valuations provided by a third-party pricing service. Such pricing service valuations are based on the present value of fixed and projected floating rate cash flows over the term of the swap contract. |
In making its determination of fair value, the Adviser may use independent third-party pricing or valuation services; provided that the Adviser shall not be required to determine fair value in accordance with the valuation provided by any single source, and the Adviser shall retain the discretion to use any relevant data, including information obtained from any independent third-party valuation or pricing service, that the Adviser deems to be reliable in determining fair value under the circumstances.
Below is a description of factors that may be considered when valuing securities for which no active secondary market exists. Valuation of fixed income investments, such as loans and debt securities, depends upon a number of factors, including prevailing interest rates for like securities, expected volatility in future interest rates, call features, put features and other relevant terms of the debt. For investments without readily available market prices, these factors may be incorporated into discounted cash flow models to arrive at fair value. Other factors that may be considered include the borrower’s ability to adequately service its debt, the fair market value of the portfolio company in relation to the face amount of its outstanding debt and the quality of the collateral securing its debt investments.
For convertible debt securities, fair value will generally approximate the fair value of the debt plus the fair value of an option to purchase the underlying security (the security into which the debt may convert) at the conversion price. To value such an option, a standard option pricing model may be used.
For equity interests, various factors may be considered in determining fair value, including multiples of earnings before interest, taxes, depreciation and amortization (“EBITDA”), cash flows, net income, revenues or, in limited instances, book value or liquidation value. All of these factors may be subject to adjustments based
73
Table of Contents
upon the particular circumstances of a portfolio company or a Fund’s actual investment position. For example, adjustments to EBITDA may take into account compensation to previous owners or an acquisition, recapitalization, restructuring or other related items.
Other factors that may be considered in valuing securities include private merger and acquisition statistics, public trading multiples discounted for illiquidity and other factors, valuations implied by third-party investments in the portfolio companies, the acquisition price of such investment or industry practices in determining fair value. The Adviser may also consider the size and scope of a portfolio company and its specific strengths and weaknesses, and may apply discounts or premiums, where and as appropriate, due to the higher (or lower) financial risk and/or the size of the portfolio company relative to comparable firms, as well as such other factors as the Adviser, in consultation with any third-party valuation or pricing service, if applicable, may consider relevant in assessing fair value.
If a Fund receives warrants or other equity securities at nominal or no additional cost in connection with an investment in a debt security, the cost basis in the investment will be allocated between the debt securities and any such warrants or other equity securities received at the time of origination. Such warrants or other equity securities will subsequently be valued at fair value. Portfolio securities that carry certain restrictions on sale will typically be valued at a discount from the public market value of the security, where applicable.
If events materially affecting the price of foreign portfolio securities occur between the time when their price was last determined on such foreign securities exchange or market and the time when a Fund’s NAV was last calculated (for example, movements in certain U.S. securities indices which demonstrate strong correlation to movements in certain foreign securities markets), such securities may be valued at their fair value as determined in good faith in accordance with procedures established by the Board. For purposes of calculating NAV, all assets and liabilities initially expressed in foreign currencies will be converted into U.S. dollars at prevailing exchange rates as may be determined in good faith by the Adviser, under the supervision of the Board.
While the Funds’ policy is intended to result in a calculation of each Fund’s NAV that fairly reflects security values as of the time of pricing, the Funds cannot ensure that fair values determined by the Adviser would accurately reflect the price that the Funds could obtain for a security if it were to dispose of that security as of the time of pricing (for instance, in a forced or distressed sale). The prices used by the Funds may differ from the value that would be realized if the securities were sold. The Funds will periodically benchmark the bid and ask prices received from the third-party pricing service and/or dealers, as applicable, and valuations received from the third-party valuation service against the actual prices at which it purchases and sells its investments. The Funds believe that these prices will be reliable indicators of fair value.
Revenue Recognition: Security transactions are accounted for on the trade date. The Funds record interest income and expense on an accrual basis. The Funds record dividend income and expense on the ex-dividend date. The Funds do not accrue as a receivable interest or dividends on loans and securities if they have reason to doubt their ability to collect such income. The Funds consider many factors relevant to an investment when placing it on or removing it from non-accrual status, including, but not limited to, the delinquency status of the investment, economic and business conditions, the overall financial condition of the underlying investment, the value of the underlying collateral, bankruptcy status, if any, and any other facts or circumstances relevant to the investment. If there is reasonable doubt that the Funds will receive any previously accrued interest, then the previously recognized interest income will be written-off. Payments received on non-accrual investments may be recognized as income or applied to principal depending upon the collectability of the remaining principal and interest. Non-accrual investments may be restored to accrual status when principal and interest become current and are likely to remain current based on the Funds’ judgment.
Loan origination fees, original issue discount, and market discount are capitalized and such amounts are amortized as interest income over the respective term of the loan or security. Structuring and other non-recurring upfront fees are recorded as fee income when earned. The Funds record prepayment premiums on loans and securities as fee income when they receive such amounts.
Net Realized Gains or Losses, Net Change in Unrealized Appreciation or Depreciation and Net Change in Unrealized Gains or Losses on Foreign Currency: Gains or losses on the sale of investments will be
74
Table of Contents
calculated by using the specific identification method. The Funds measure realized gains or losses by the difference between the net proceeds from the repayment or sale and the amortized cost basis of the investment, without regard to unrealized appreciation or depreciation previously recognized, but considering unamortized upfront fees. Net change in unrealized appreciation or depreciation reflects the change in portfolio investment values during the reporting period, including any reversal of previously recorded unrealized gains or losses, when gains or losses are realized. Net change in unrealized gains or losses on foreign currency reflects the change in the value of receivables or accruals during the reporting period due to the impact of foreign currency fluctuations.
Organization and Offering Costs: Organization costs include, among other things, the cost of formation as a Delaware statutory trust, including the cost of legal services and other fees pertaining to the Trust’s organization. Franklin Square Holdings, L.P. (“FS Investments”), the Funds’ sponsor and an affiliate of the Adviser has assumed the Trust’s organization costs and will not seek reimbursement of such costs. Offering costs primarily include, among other things, marketing expenses and printing, legal and due diligence fees and certain costs pertaining to each Fund’s continuous public offering of its common shares, including the salaries and direct expenses of the Adviser’s personnel, employees of its affiliates and others while engaged in such activities. FS Investments has assumed all of the Funds’ offering costs and will not seek reimbursement of such costs incurred as of December 31, 2021.
Income Taxes: Each Fund has elected to be treated for U.S. federal income tax purposes, and each Fund intends to qualify annually thereafter, as a RIC under Subchapter M of the Code. To qualify and maintain qualification as a RIC, the Funds must, among other things, meet certain source-of-income and asset diversification requirements and distribute to its shareholders, for each taxable year, at least 90% of its “investment company taxable income,” which is generally each Fund’s net ordinary income plus the excess, if any, of realized net short-term capital gains over realized net long-term capital losses. As a RIC, each Fund will not have to pay corporate-level U.S. federal income taxes on any income that it distributes to its shareholders. Each Fund intends to make distributions in an amount sufficient to maintain its RIC status each year and to avoid any U.S. federal income taxes on income so distributed. Each Fund will also be subject to nondeductible U.S. federal excise taxes if it does not distribute at least 98% of net ordinary income, 98.2% of capital gain net income, if any, and any recognized and undistributed income from prior years for which it paid no U.S. federal income taxes.
Uncertainty in Income Taxes: Each Fund evaluates its tax positions to determine if the tax positions taken meet the minimum recognition threshold in connection with accounting for uncertainties in income tax positions taken or expected to be taken for the purposes of measuring and recognizing tax benefits or liabilities in its consolidated financial statements. Recognition of a tax benefit or liability with respect to an uncertain tax position is required only when the position is “more likely than not” to be sustained assuming examination by taxing authorities. The Funds recognize interest and penalties, if any, related to unrecognized tax liabilities as income tax expense on its consolidated statement of operations. During the year ended December 31, 2021, the Funds did not incur any interest or penalties related to unrecognized tax liabilities.
Each Fund has analyzed the tax positions taken on U.S. federal and state income tax returns for all open tax years, and has concluded that no provision for income tax for uncertain tax positions is required in its consolidated financial statements. Each Fund’s U.S. federal and state income and U.S. federal excise tax returns for tax years for which the applicable statutes of limitations have not yet expired are subject to examination by the Internal Revenue Service and state departments of revenue.
Swaps: Swaps (other than centrally cleared) are normally valued using valuations provided by a third party pricing service. Such pricing service valuations are based on the present value of fixed and projected floating rate cash flows over the term of the swap contract. Future cash flows on swaps are discounted to their present value using swap rates provided by electronic data services or by broker/dealers. Centrally cleared swaps are valued at the daily settlement price provided by the central clearing counterparty.
Pursuant to swap agreements, the Funds either make floating-rate payments based on a benchmark index in exchange for fixed or floating rate payments or the Funds make fixed or floating rate payments in
75
Table of Contents
exchange for floating-rate payments based on the return of a benchmark index. Payments received or made are recorded as realized gains or losses. During the term of the outstanding swap agreement, changes in the underlying value of the swap are recorded as unrealized gains or losses. The value of the swap is determined by changes in the relationship between the rate of interest and the benchmark index. The Funds are exposed to credit loss in the event of nonperformance by the swap counterparty. Risk may also arise from the unanticipated movements in value of interest rates or the index. The Funds enter into swap contracts (other than centrally cleared swaps) that may contain provisions whereby the counterparty may terminate the contract under certain conditions, including but not limited to a decline in the Funds’ net assets below a certain level over a certain period of time, which would trigger a payment by a Fund for those derivatives in a liability position.
The OTC derivatives in which the Funds invest are subject to the risk that the counterparty to the contract fails to perform its obligations under the contract. To mitigate this risk, the Funds have entered into an International Swaps and Derivatives Association, Inc. Master Agreement (“ISDA Master Agreement”) or similar agreement with substantially all its derivative counterparties. An ISDA Master Agreement is a bilateral agreement between the Funds and a counterparty that governs certain OTC derivatives and typically contains, among other things, set-off provisions in the event of a default and/or termination event as defined under the relevant ISDA Master Agreement. Under an ISDA Master Agreement, the Funds may, under certain circumstances, offset with the counterparty certain derivative financial instruments’ payables and/or receivables with collateral held and/or posted and create one single net payment. The provisions of the ISDA Master Agreement typically permit a single net payment in the event of default including the bankruptcy or insolvency of the counterparty. However, bankruptcy or insolvency laws of a particular jurisdiction may impose restrictions on or prohibitions against the right of offset in bankruptcy or insolvency. Certain ISDA Master Agreements allow counterparties to OTC derivatives to terminate derivative contracts prior to maturity in the event a Fund’s net assets decline by a stated percentage or a Fund fails to meet the terms of its ISDA Master Agreements, which would cause the counterparty to accelerate payment by such Fund of any net liability owed to it. The collateral requirements for derivatives traded under an ISDA Master Agreement are governed by a Credit Support Annex to the ISDA Master Agreement. Collateral requirements are determined at the close of business each day and are typically based on changes in market values for each transaction under an ISDA Master Agreement and netted into one amount for such agreement. Generally, the amount of collateral due from or to a counterparty is subject to a minimum transfer threshold amount before a transfer is required, which may vary by counterparty. Collateral pledged for the benefit of a Fund and/or counterparty is held in segregated accounts by such Fund’s custodian and cannot be sold, re-pledged, assigned or otherwise used while pledged. The portion of such collateral representing cash at the Fund’s custodian, if any, is reflected as restricted cash and, in the case of cash pledged by a counterparty for the benefit of a Fund, a corresponding liability on the consolidated statement of assets and liabilities. Securities pledged by a Fund as collateral, if any, are identified as such in the consolidated schedule of investments. For financial reporting purposes, the Funds do not offset derivative assets and derivative liabilities that are subject to netting arrangements in the consolidated statements of assets and liabilities.
Forward Foreign Currency Exchange Contracts: Forward foreign currency exchange contracts are over-the-counter agreements between two parties to buy and sell a currency at a set price on a future date. The Funds may utilize forward foreign currency exchange contracts to hedge the currency exposure associated with some or all of the Funds’ investments. These instruments may be used for other purposes in future periods. The values of forward foreign currency exchange contracts fluctuate daily with changes in foreign currency exchange rates. Changes in the value of these contracts are recorded as unrealized appreciation or depreciation until the contract is exercised or has expired. The Funds will realize a gain or loss when the forward foreign currency exchange contract is closed or expires.
The use of forward foreign currency exchange contracts does not eliminate fluctuations in the prices of the Funds’ investments. The risks of forward foreign currency exchange contracts include movement in the values of the foreign currencies relative to the U.S. dollar and the possibility that counterparties will not complete their contractual obligations, which may be in excess of the amount reflected, if any, in the consolidated statements of assets and liabilities.
76
Table of Contents
Securities Sold Short: The Funds may enter into short sale transactions. Short selling involves selling securities that may or may not be owned and, at times, borrowing the same securities for delivery to the purchaser, with an obligation to replace such borrowed securities at a later date. The proceeds received from short sales are recorded as liabilities and the Funds record an unrealized gain or loss to the extent of the difference between the proceeds received and the value of an open short position on the day of determination. The Funds record a realized gain or loss when the short position is closed out. By entering into a short sale, the Funds bear the market risk of an unfavorable change in the price of the security sold short. Dividends on short sales are recorded as an expense by the Funds on the ex-dividend date and interest expense is recorded on the accrual basis.
Options: The Funds may purchase call and put options in an effort to manage risk and/or generate gains from options premiums. When a Fund buys a call option, it gives the Fund the right (but not the obligation) to buy, and obligates the counterparty to sell (when the option is exercised), the underlying instrument at the exercise or strike price at any time or at a specified time during the option period. When a Fund buys a put option, it gives the Fund the right to sell and obligates such Fund to buy the underlying instrument at the exercise or strike price at any time or at a specified time during the option period. When a Fund writes an option, an amount equal to the premium received by the counterparty is reflected as a liability. The amount of the liability is subsequently marked-to-market to reflect the current market value of the option written. When an instrument is purchased or sold through an exercise of an option, the related premium received is deducted from the basis of the instrument acquired or added to the proceeds of the instrument sold. When a written option expires, a Fund realizes a gain on the option to the extent of the premiums received. When a written option is exercised, a Fund realizes a loss to the extent the cost of closing the option exceeds the premiums received, or a gain to the extent the premiums received exceed the cost of closing the option.
Distributions: Distributions to the Funds’ shareholders will be recorded as of the record date. Subject to the discretion of the Board and applicable legal restrictions, each Fund currently intends to authorize, declare and pay ordinary cash distributions on an annual basis. At least annually, each Fund intends to authorize and declare special cash distributions of net long-term capital gains, if any.
Note 3. Share Transactions
Below is a summary of transactions with respect to the Funds’ common shares during the year ended December 31, 2021 and the year ended December 31, 2020:
FS Multi-Strategy Alternatives Fund
| For the Year Ended December 31, 2021 | For the Year Ended December 31, 2020 | |||||||||||||||
Class A Shares | Shares | Amount | Shares | Amount | ||||||||||||
Gross Proceeds from Issuance | 382,178 | $ | 4,064 | 440,291 | $ | 4,373 | ||||||||||
Reinvestment of Distributions | 18,736 | 202 | 2,877 | 28 | ||||||||||||
Redemptions | (390,041 | ) | (4,117 | ) | (796,910 | ) | (7,834 | ) | ||||||||
|
|
|
|
|
|
|
| |||||||||
Net Proceeds from Class A Share Transactions | 10,873 | $ | 149 | (353,742 | ) | $ | (3,433 | ) | ||||||||
|
|
|
|
|
|
|
| |||||||||
| For the Year Ended December 31, 2021 | For the Year Ended December 31, 2020 | |||||||||||||||
Class I Shares | Shares | Amount | Shares | Amount | ||||||||||||
Gross Proceeds from Issuance | 6,295,417 | $ | 67,372 | 8,102,207 | $ | 80,649 | ||||||||||
Reinvestment of Distributions | 386,964 | 4,187 | 86,842 | 848 | ||||||||||||
Redemptions | (4,766,752 | ) | (49,344 | ) | (13,768,041 | ) | (135,938 | ) | ||||||||
|
|
|
|
|
|
|
| |||||||||
Net Proceeds from Class I Share Transactions | 1,915,629 | $ | 22,215 | (5,578,992 | ) | $ | (54,441 | ) | ||||||||
|
|
|
|
|
|
|
| |||||||||
Net Proceeds from Fund Share Transactions | 1,926,502 | $ | 22,364 | (5,932,734 | ) | $ | (57,874 | ) | ||||||||
|
|
|
|
|
|
|
| |||||||||
77
Table of Contents
FS Managed Futures Fund |
| |||||||||||||||
| For the Year Ended December 31, 2021 | For the Year Ended December 31, 2020 | |||||||||||||||
Class A Shares | Shares | Amount | Shares | Amount | ||||||||||||
Gross Proceeds from Issuance | — | $ | — | — | $ | — | ||||||||||
Redemptions | — | — | — | — | ||||||||||||
|
|
|
|
|
|
|
| |||||||||
Net Proceeds from Class A Share Transactions | — | $ | — | — | $ | — | ||||||||||
|
|
|
|
|
|
|
| |||||||||
| For the Year Ended December 31, 2021 | For the Year Ended December 31, 2020 | |||||||||||||||
Class I Shares | Shares | Amount | Shares | Amount | ||||||||||||
Gross Proceeds from Issuance | — | $ | — | — | $ | — | ||||||||||
Reinvestment of Distributions | 46 | — | 76 | 1 | ||||||||||||
Redemptions | — | — | — | — | ||||||||||||
|
|
|
|
|
|
|
| |||||||||
Net Proceeds from Class I Share Transactions | 46 | $ | — | 76 | $ | 1 | ||||||||||
|
|
|
|
|
|
|
| |||||||||
Net Proceeds from Fund Share Transactions | 46 | $ | — | 76 | $ | 1 | ||||||||||
|
|
|
|
|
|
|
| |||||||||
FS Chiron Real Asset Fund |
| |||||||||||||||
| For the Year Ended December 31, 2021 | For the Year Ended December 31, 2020 | |||||||||||||||
Class A Shares | Shares | Amount | Shares | Amount | ||||||||||||
Gross Proceeds from Issuance | — | $ | — | — | $ | — | ||||||||||
Redemptions | — | — | — | — | ||||||||||||
|
|
|
|
|
|
|
| |||||||||
Net Proceeds from Class A Share Transactions | — | $ | — | — | $ | — | ||||||||||
|
|
|
|
|
|
|
| |||||||||
| For the Year Ended December 31, 2021 | For the Year Ended December 31, 2020 | |||||||||||||||
Class I Shares | Shares | Amount | Shares | Amount | ||||||||||||
Gross Proceeds from Issuance | 1,914,392 | $ | 22,993 | 254 | $ | 2 | ||||||||||
Reinvestment of Distributions | 187 | 2 | 81 | 1 | ||||||||||||
Redemptions | — | — | (97,848 | ) | (1,000 | ) | ||||||||||
|
|
|
|
|
|
|
| |||||||||
Net Proceeds from Class I Share Transactions | 1,914,579 | $ | 22,995 | (97,513 | ) | $ | (997 | ) | ||||||||
|
|
|
|
|
|
|
| |||||||||
Net Proceeds from Fund Share Transactions | 1,914,579 | $ | 22,995 | (97,513 | ) | $ | (997 | ) | ||||||||
|
|
|
|
|
|
|
| |||||||||
Note 4. Related Party Transactions
Compensation of the Investment Adviser and its Affiliates
Pursuant to the investment management agreement, dated as of April 25, 2017 by and between the Adviser and FSMS and each investment management agreement, dated as of November 29, 2018 by and between the Adviser and each Alt Beta Fund, respectively (collectively, the “Management Agreements”), the Adviser is entitled to a management fee in consideration of the advisory services provided by the Adviser to the Funds. The Adviser is registered as an investment adviser under the Investment Advisers Act of 1940, as amended, and is an
78
Table of Contents
affiliate of the Funds. The management fee is calculated and payable quarterly in arrears at the annual rates of each Fund’s average daily net assets during such period noted in the table below:
| Fund | Period | Fee | ||
FS Multi-Strategy Alternatives Fund | Quarterly | 1.25% | ||
FS Managed Futures Fund | Quarterly | 1.15% | ||
FS Chiron Real Asset Fund | Quarterly | 0.95% | ||
The Adviser had contractually agreed to waive its management fee for FSMS until May 15, 2019. Effective September 1, 2021, the Adviser changed its management fee rate to 0.95% from 1.15% for Real Asset and effective September 30, 2021, the Adviser terminated its management fee waiver agreement for Real Asset. The Adviser agreed to continue its management fee waiver agreement for Managed Futures until March 31, 2022.
Pursuant to the administration agreement, dated as of April 26, 2017, by and between FSMS and the Adviser, and each administration agreement, dated as of November 29, 2018 by and between the Adviser and each Alt Beta Fund, respectively (collectively, the “Administration Agreements”), the Funds reimburse the Adviser for its actual costs incurred in providing administrative services to the Funds, including the Adviser’s allocable portion of the compensation and related expenses of certain personnel of FS Investments providing administrative services to the Funds on behalf of the Adviser. The Adviser is required to allocate the cost of such services to the Funds based on factors such as assets, revenues, time allocations and/or other reasonable metrics. The Board reviews the methodology employed in determining how the expenses are allocated to the Funds and the proposed allocation of the administrative expenses among the Funds and certain affiliates of the Adviser. The Board then assesses the reasonableness of such reimbursements for expenses allocated to the Funds based on the breadth, depth and quality of such services as compared to the estimated cost to the Funds of obtaining similar services from third-party service providers known to be available. In addition, the Board considers whether any single third-party service provider would be capable of providing all such services at comparable cost and quality. Finally, the Board, among other things, compares the total amount paid to the Adviser for such services as a percentage of the Funds’ respective net assets to the same ratios reported by other comparable investment companies. The Funds will not reimburse the Adviser for any services for which it receives a separate fee or for any administrative expenses allocated to a controlling person of the Adviser. Reimbursements of administrative expenses to the Adviser are subject to the Expense Limitation (defined below).
The following table describes the fees and expenses accrued under the Management Agreement and the Administration Agreement for Funds during the year ended December 31, 2021:
FS Multi-Strategy Alternatives Fund
Related Party | Source Agreement | Description | Amount | |||||
| FS Fund Advisor, LLC | Management Agreement | Management Fee(1) | $1,644 | |||||
| FS Fund Advisor, LLC | Administration Agreement | Administrative Services Expenses(2) | $870 | |||||
| (1) | During the year ended December 31, 2021, $1,642 of management fees paid to the Adviser. |
| (2) | During the year ended December 31, 2021, $655 of administrative services expenses were paid to the Adviser. |
FS Managed Futures Fund
Related Party | Source Agreement | Description | Amount | |||||
| FS Fund Advisor, LLC | Investment Advisory Agreement | Management Fee(1) | $25 | |||||
| FS Fund Advisor, LLC | Administration Agreement | Administrative Services Expenses(2) | $78 | |||||
| (1) | As described below, the Adviser has contractually agreed to waive the $25 in management fees payable during the year ended December 31, 2021. |
79
Table of Contents
| (2) | During the year ended December 31, 2021, $105 of administrative services expenses were paid to the Adviser. |
FS Chiron Real Asset Fund
Related Party | Source Agreement | Description | Amount | |||||
| FS Fund Advisor, LLC | Investment Advisory Agreement | Management Fee(1) | $90 | |||||
| FS Fund Advisor, LLC | Administration Agreement | Administrative Services Expenses(2) | $424 | |||||
| (1) | As described above, the Adviser has contractually agreed to waive $27 in management fees payable during the year ended December 31, 2021. |
| (2) | During the year ended December 31, 2021, $288 of administrative services expenses were paid to the Adviser. |
Expense Limitation Agreement
Pursuant to the expense limitation agreement, dated as of April 26, 2017, by and between the Adviser and FSMS, and each expense limitation agreement, dated as of November 29, 2018, by and between the Adviser and each Alt Beta Fund, respectively (collectively, the “Expense Limitation Agreements”), the Adviser agreed to pay or absorb, on a quarterly basis, the “ordinary operating expenses” (as defined below) of each Fund to the extent that such expenses exceed 0.25% per annum of the respective Fund’s average daily net assets (the “Expense Limitation”). The respective Expense Limitation Agreement, which became effective April 27, 2017 for FSMS and December 17, 2018 for the Alt Beta Funds, will continue in effect for successive twelve-month periods provided that such continuance is specifically approved at least annually by a majority of the Board and by the Adviser. Each Expense Limitation Agreement is currently in effect until at least April 30, 2022 (or September 1, 2022 with respect to Real Asset).
Amounts waived under the Expense Limitation for each Fund may be recouped by or repaid to the Adviser, subject to the limitations that: (1) the reimbursement for expenses will be made only if payable not more than three years after the Adviser bears the expense; and (2) the reimbursement may not be made if it would cause the lower of the respective Fund’s then-current expense limitation, if any, or the expense limitation that was in effect at the time when the Adviser waived or reimbursed the ordinary operating expenses that are the subject of the repayment, to be exceeded.
The Expense Limitation Agreements may not be terminated by the Adviser, but may be terminated by the Board on written notice to the Adviser. For the purposes of the Expense Limitation Agreements, “ordinary operating expenses” for a class of Shares consist of all ordinary expenses of a Fund attributable to such class, including administration fees, transfer agent fees, offering expenses, fees paid to the respective Fund’s trustees, administrative services expenses, and related costs associated with legal, regulatory compliance and investor relations, but excluding the following: (a) management fees, (b) distribution or servicing fees, (c) interest, (d) taxes, (e) brokerage fees and commissions, (f) dividends and interest paid on short positions, (g) acquired fund fees and expenses and (h) extraordinary expenses. The specific amount of expenses waivable and/or payable by the Adviser pursuant to the Expense Limitation Agreements, if any, is determined at the end of each fiscal quarter. Similarly, the conditional obligation of the Funds to repay the Adviser pursuant to the terms of such Expense Limitation Agreement shall survive the termination of such agreement by either party.
The following table describes the amounts accrued pursuant to the Expense Limitation Agreement that FS Investments has agreed to pay for the year ended December 31, 2021. These amounts may be subject to conditional repayment by the Fund as described below:
Fund | Accrued Amount | Subject to | Related to | |||
FS Multi-Strategy Alternatives Fund | $1,735 | $5,281 | $5,281 | |||
FS Managed Futures Fund | $230 | $649 | $649 | |||
FS Chiron Real Asset Fund | $607 | $1,102 | $1,102 |
80
Table of Contents
The Funds’ distributor, ALPS Distributors, Inc., has entered into a “wholesaling” agreement with FS Investment Solutions, LLC (“FS Solutions”), a registered broker-dealer and an affiliate of the Adviser. Pursuant to the terms of the wholesaling agreement, FS Solutions seeks to market and otherwise promote the Funds through various “wholesale” distribution channels, including but not limited to, the independent broker-dealer channel, the registered investment adviser channel and the wirehouse channel. FS Solutions may receive compensation for certain sales, promotional and marketing services provided to the Funds in connection with the distribution of certain classes of the Funds’ shares. The following table describes the amounts FS Solutions received in initial sales charges in connection with the distribution of Class A shares of the Funds for the year ended December 31, 2021:
Fund | Initial Sales Charge | |
FS Multi-Strategy Alternatives Fund | $3 | |
FS Managed Futures Fund | $— | |
FS Chiron Real Asset Fund | $— |
Note 5. Distribution and Service Plan
Pursuant to the Amended and Restated Distribution and Service Plan, each Fund’s Class A Shares bear 12b-1 fees at an annual rate of 0.25% of the average daily net assets of such Fund attributable to Class A Shares. Payments of the 12b-1 fee may be made without regard to expenses actually incurred. The Funds’ Class I shares are not subject to 12b-1 fees.
Note 6. Income Taxes
Each Fund intends to declare and pay distributions from net investment income and from net realized short term and long-term capital gain, if any, at least annually. All distributions are reinvested in additional shares of such Fund, unless the shareholder elects to receive cash distributions. During the year ended December 31, 2021, the Funds declared and paid the following distributions per share and total distributions:
Fund | Distributions Per Share | Total | ||||
Class A | Class I | |||||
FS Multi-Strategy Alternatives Fund | $0.32 | $0.35 | $5,000 | |||
FS Managed Futures Fund | 0.37 | 0.40 | 80 | |||
FS Chiron Real Asset Fund | 0.44 | 0.47 | 757 | |||
The timing and amount of any future distributions to shareholders are subject to applicable legal restrictions and the sole discretion of the Board.
The following tables reflect the sources of cash distributions on a tax basis that each Fund paid on its common shares during the year ended December 31, 2021:
| FS Multi-Strategy Alternatives Fund | Year Ended December 31, 2021 | |||||||
Source of Distribution | Distribution Amount | Percentage | ||||||
Net investment income(1) | $ 5,000 | 100% | ||||||
Long-term capital gains | - | -% | ||||||
Return of capital | - | -% | ||||||
|
|
|
| |||||
Total | $ 5,000 | 100% | ||||||
|
|
|
| |||||
(1) FSMS’s net investment income and short term capital gains on a tax basis for the year ended December 31, 2021 was $7,623. The determination of the tax attributes of FSMS’s distributions is made annually as of the end of the calendar year and based upon FSMS’s taxable income for the full year and distributions paid for the full year.
81
Table of Contents
| FS Managed Futures Fund | Year Ended December 31, 2021 | |||||||
Source of Distribution | Distribution Amount | Percentage | ||||||
Net investment income(1) | $ 80 | 100% | ||||||
Long-term capital gains | - | -% | ||||||
Return of capital | - | -% | ||||||
|
|
|
| |||||
Total | $ 80 | 100% | ||||||
|
|
|
| |||||
(1) Managed Futures’ net investment income and short term capital gains on a tax basis for the year ended December 31, 2021 was $13. The determination of the tax attributes of Managed Futures’ distributions is made annually as of the end of the calendar year and based upon Managed Futures’ taxable income for the full year and distributions paid for the full year.
| FS Chiron Real Asset Fund | Year Ended December 31, 2021 | |||||||
Source of Distribution | Distribution Amount | Percentage | ||||||
Net investment income(1) | $ 757 | 100% | ||||||
Long-term capital gains | - | -% | ||||||
Return of capital | - | -% | ||||||
|
|
|
| |||||
Total | $ 757 | 100% | ||||||
|
|
|
| |||||
(1) Real Asset’s net investment income and short term capital gains on a tax basis for the year ended December 31, 2021 was $594. The determination of the tax attributes of Real Asset’s distributions is made annually as of the end of the calendar year and based upon Real Asset’s taxable income for the full year and distributions paid for the full year.
The Funds’ net investment income and short term capital gains on a tax basis and undistributed net investment income and short term capital gains on a tax basis for the year ended December 31, 2021 was as follows:
Fund | Net Investment Income (Loss) | Undistributed Net Investment Income | ||||||
FS Multi-Strategy Alternatives Fund | $7,623 | $2,622 | ||||||
FS Managed Futures Fund | $13 | $- | ||||||
FS Chiron Real Asset Fund | $594 | $15 | ||||||
82
Table of Contents
The Funds may make certain adjustments to the classification of net assets as a result of permanent book-to-tax differences. During the year ended December 31, 2021, the Funds increased/ (decreased) accumulated earnings (deficit) and increased/ (decreased) capital in excess of par value by the below amounts. These reclassifications, resulting from nondeductible expenses related to partnerships and net operating loss write-off, have no impact on the net assets of the Funds.
Fund | Accumulated Earnings (Deficit) | Capital in Excess of Par Value | ||||||
| FS Multi-Strategy Alternatives Fund | $(504) | $504 | ||||||
FS Managed Futures Fund | $ – | $ – | ||||||
FS Chiron Real Asset Fund | $(120) | $120 | ||||||
As of December 31, 2021, the components of accumulated earnings (loss) on a tax basis were as follows:
Fund | Distributable Ordinary Income and Short Term Capital Gains | Late Year and Post- October Losses | Distributable Capital Gains/Accumulated Capital (Losses) | Net Unrealized Appreciation (Depreciation) | Total | |||||||||||||||
| FS Multi-Strategy Alternatives Fund | $ | 2,622 | $ | – | $ (1,221) | $ | 3,358 | $ | 4,759 | |||||||||||
FS Managed Futures Fund | $ | – | $ | (30 | ) | $ – | $ | 89 | $ | 59 | ||||||||||
FS Chiron Real Asset Fund | $ | 15 | $ | – | $ 3 | $ | 674 | $ | 692 | |||||||||||
Certain capital losses realized after October 31 and ordinary losses realized after December 31 may be deferred (and certain ordinary losses after October and/or December 31 may be deferred) and treated as occurring on the first day of the following fiscal year. For the year ended December 31, 2021, the Funds elected to defer the following losses:
Fund | Late Year Ordinary Loss | Post-October Capital Losses | ||||||
FS Multi-Strategy Alternatives Fund | $- | $- | ||||||
FS Managed Futures Fund | $30 | $- | ||||||
FS Chiron Real Asset Fund | $- | $- | ||||||
As of December 31, 2021, the cost and the unrealized appreciation and (depreciation) on investments and derivatives, each calculated for U.S. federal income tax purposes, were as follows:
Fund | Tax cost | Gross unrealized appreciation | Gross unrealized depreciation | Net unrealized appreciation (depreciation) | ||||||||||||
FS Multi-Strategy Alternatives Fund | $ | 141,329 | $ | 5,635 | $ | 2,274 | $ | 3,361 | ||||||||
FS Managed Futures Fund | $ | 2,121 | $ | 182 | $ | 92 | $ | 90 | ||||||||
FS Chiron Real Asset Fund | $ | 24,821 | $ | 836 | $ | 161 | $ | 675 | ||||||||
The determination of the tax attributes of each Fund’s distributions is made annually as of the end of the calendar year based upon each Fund’s taxable income for the full year and distributions paid for the full year.
83
Table of Contents
Note 7. Financial Instruments
The Funds may trade in financial instruments with off-balance sheet risk in the normal course of its investing activities. These financial instruments may include forward contracts, futures contracts, swap contracts and written options and may involve, to a varying degree, elements of risk in excess of the amounts recognized for financial statement purposes. The Funds invest in such derivatives in order to meet their investment objectives. The notional or contractual amounts of these instruments represent the investment the Funds have in particular classes of financial instruments and do not necessarily represent the amounts potentially subject to risk. The measurement of the risks associated with these instruments is meaningful only when all related and offsetting transactions are considered.
The Funds are subject to credit risk in the normal course of pursuing its investment objectives. The Funds may enter into total return swap contracts to manage its credit risk, to gain exposure to a credit in which it may otherwise invest or to enhance its returns. The Funds may also purchase and write call and put options in an effort to manage risk and/or generate gains from options premiums.
The Funds may enter into swap contracts containing provisions allowing the counterparty to terminate the contract under certain conditions, including, but not limited to, a decline in the respective Fund’s NAV below a certain level over a certain period of time, which would trigger a payment by such Fund for those swaps in a liability position. A call option gives the purchaser (holder) of the option the right (but not the obligation) to buy, and obligates the writer to sell (if the option is exercised), the underlying instrument at the exercise or strike price at any time or at a specified time during the option period. A put option gives the holder the right to sell and obligates the writer to buy the underlying instrument at the exercise or strike price at any time or at a specified time during the option period. The fair value of open derivative instruments held by the Funds (which are not considered to be hedging instruments for accounting disclosure purposes) as of December 31, 2021 was as follows:
FS Multi-Strategy Alternatives Fund | ||||||||
| Fair Value | ||||||||
| Asset Derivative | Liability Derivative | |||||||
Commodity Risk | ||||||||
Future (long) | $ | 315 | (1) | $ | 47 | (2) | ||
Future (short) | $ | 31 | (1) | $ | 346 | (2) | ||
Total return swaps | $ | 270 | (3) | $ | — | (4) | ||
Credit Risk | ||||||||
Future (long) | $ | 3 | (1) | $ | 63 | (2) | ||
Future (short) | $ | 3 | (1) | $ | 6 | (2) | ||
Total return swaps | $ | 304 | (3) | $ | 57 | (4) | ||
Equity Risk | ||||||||
Future (long) | $ | 128 | (1) | $ | 1 | (2) | ||
Future (short) | $ | 9 | (1) | $ | 1 | (2) | ||
Total return swaps | $ | 757 | (3) | $ | 333 | (4) | ||
Foreign Currency Risk | ||||||||
Forward foreign currency exchange contracts | $ | 630 | (5) | $ | 505 | (6) | ||
Future (long) | $ | 1 | (1) | $ | 1 | (2) | ||
Future (short) | $ | — | (1) | $ | — | (2) | ||
Total return swaps | $ | 204 | (3) | $ | — | (4) | ||
FSMS’s derivative assets and liabilities at fair value by risk, presented in the table above, are reported on a gross basis on its consolidated statement of assets and liabilities and located as follows:
| (1) | Unrealized appreciation on futures contracts. |
84
Table of Contents
| (2) | Unrealized depreciation on futures contracts. |
| (3) | Unrealized appreciation on total return swaps. |
| (4) | Unrealized depreciation on total return swaps. |
| (5) | Unrealized appreciation on forward foreign currency exchange contracts. |
| (6) | Unrealized depreciation on forward foreign currency exchange contracts. |
FS Managed Futures Fund |
| |||||||
| Fair Value | ||||||||
| Asset Derivative | Liability Derivative | |||||||
Commodity Risk |
| |||||||
Total return swaps | $ | 68 | (1) | $ | — | (2) | ||
Equity Risk |
| |||||||
Total return swaps | $ | 103 | (1) | $ | 13 | (2) | ||
Foreign Currency Risk |
| |||||||
Total return swaps | $ | 6 | (1) | $ | 81 | (2) | ||
Managed Futures’ derivative assets and liabilities at fair value by risk, presented in the table above, are reported on a gross basis on its consolidated statement of assets and liabilities and located as follows:
| (1) | Unrealized appreciation on total return swaps. |
| (2) | Unrealized depreciation on total return swaps. |
FS Chiron Real Asset Fund | ||||||||
| Fair Value | ||||||||
| Asset Derivative | Liability Derivative | |||||||
Commodity Risk | ||||||||
Future (long) | $ | 27 | (1) | $ | 3 | (2) | ||
Total return swaps | $ | — | $ | 13 | (3) | |||
Real Asset’s derivative assets and liabilities at fair value by risk, presented in the table above, are reported on a gross basis on its consolidated statement of assets and liabilities and located as follows:
| (1) | Unrealized appreciation on futures contracts. |
| (2) | Unrealized depreciation on futures contracts. |
| (3) | Unrealized depreciation on total return swaps. |
The following tables present the Funds’ derivative assets and liabilities by counterparty, net of amounts available for offset under a master netting agreement and net of the related collateral received by the Funds for assets or pledged by the Funds for liabilities as of December 31, 2021:
FS Multi-Strategy Alternatives Fund
Counterparty | Derivative Assets Subject to Master Netting Agreement | Derivatives Available for Offset | Non-cash Collateral Received(1) | Cash Collateral Received(1) | Net Amount of Derivative Assets(2) | |||||||||||||||
Bank of America, N.A. | $ | 241 | $ | — | $ | — | $ | — | $ | 241 | ||||||||||
Barclays Bank PLC | $ | 20 | $ | — | $ | — | $ | — | $ | 20 | ||||||||||
BNP Paribas | $ | 491 | $ | 145 | $ | — | $ | — | $ | 346 | ||||||||||
85
Table of Contents
Counterparty | Derivative Assets Subject to Master Netting Agreement | Derivatives Available for Offset | Non-cash Collateral Received(1) | Cash Collateral Received(1) | Net Amount of Derivative Assets(2) | |||||||||||||||
| Credit Suisse International | $ | — | $ | — | $ | — | $ | — | $ | — | ||||||||||
| Deutsche Bank | $ | 630 | $ | 493 | $ | — | $ | — | $ | 137 | ||||||||||
| Goldman Sachs International | $ | 205 | $ | 64 | $ | — | $ | — | $ | 141 | ||||||||||
| JP Morgan Chase Bank, N.A. | $ | 174 | $ | 71 | $ | — | $ | — | $ | 103 | ||||||||||
Macquarie Bank, Ltd. | $ | 29 | $ | 18 | $ | — | $ | — | $ | 11 | ||||||||||
| Morgan Stanley & Co. International PLC | $ | — | $ | — | $ | — | $ | — | $ | — | ||||||||||
| Nomura Securities Co., Ltd | $ | 76 | $ | — | $ | — | $ | — | $ | 76 | ||||||||||
Societe Generale | $ | 299 | $ | — | $ | — | $ | — | $ | 299 | ||||||||||
Counterparty | Derivative Liabilities Subject to Master Netting Agreement | Derivatives Available for Offset | Non-cash Collateral Pledged(1) | Cash Collateral Pledged(1) | Net Amount of Derivative Liabilities(3) | |||||||||||||||
Bank of America, N.A. | $ | — | $ | — | $ | — | $ | — | $ | — | ||||||||||
Barclays Bank PLC | $ | — | $ | — | $ | — | $ | — | $ | — | ||||||||||
BNP Paribas | $ | 145 | $ | 145 | $ | — | $ | — | $ | — | ||||||||||
Credit Suisse International | $ | 86 | $ | — | $ | — | $ | 86 | $ | — | ||||||||||
| Deutsche Bank | $ | 493 | $ | 493 | $ | — | $ | — | $ | — | ||||||||||
| Goldman Sachs International | $ | 64 | $ | 64 | $ | — | $ | — | $ | — | ||||||||||
| JP Morgan Chase Bank, N.A. | $ | 71 | $ | 71 | $ | — | $ | — | $ | — | ||||||||||
Macquarie Bank, Ltd. | $ | 18 | $ | 18 | $ | — | $ | — | $ | — | ||||||||||
| Morgan Stanley & Co. International PLC | $ | 18 | $ | — | $ | — | $ | 18 | $ | — | ||||||||||
| Nomura Securities Co., Ltd | $ | — | $ | — | $ | — | $ | — | $ | — | ||||||||||
Societe Generale | $ | — | $ | — | $ | — | $ | — | $ | — | ||||||||||
FS Managed Futures Fund
Counterparty | Derivative Assets Subject to Master Netting Agreement | Derivatives Available for Offset | Non-cash Collateral Received(1) | Cash Collateral Received(1) | Net Amount of Derivative Assets(2) | |||||||||||||||
| Bank of America, N.A. | $ | 68 | $ | — | $ | — | $ | — | $ | 68 | ||||||||||
| Barclays Bank PLC | $ | — | $ | — | $ | — | $ | — | $ | — | ||||||||||
| BNP Paribas | $ | 20 | $ | — | $ | — | $ | — | $ | 20 | ||||||||||
| Deutsche Bank | $ | — | $ | — | $ | — | $ | — | $ | — | ||||||||||
| Goldman Sachs International | $ | — | $ | — | $ | — | $ | — | $ | — | ||||||||||
| JP Morgan Chase Bank, N.A. | $ | 83 | $ | — | $ | — | $ | — | $ | 83 | ||||||||||
86
Table of Contents
Counterparty | Derivative Assets Subject to Master Netting Agreement | Derivatives Available for Offset | Non-cash Collateral Received(1) | Cash Collateral Received(1) | Net Amount of Derivative Assets(2) | |||||||||||||||
| Macquarie Bank, Ltd. | $ | — | $ | — | $ | — | $ | — | $ | — | ||||||||||
| Nomura Securities Co., Ltd | $ | 6 | $ | — | $ | — | $ | — | $ | 6 | ||||||||||
Counterparty | Derivative Liabilities Subject to Master Netting Agreement | Derivatives Available for Offset | Non-cash Collateral Pledged(1) | Cash Collateral Pledged(1) | Net Amount of Derivative Liabilities(3) | |||||||||||||||
| Bank of America, N.A. | $ | — | $ | — | $ | — | $ | — | $ | — | ||||||||||
| Barclays Bank PLC | $ | 13 | $ | — | $ | — | $ | — | $ | 13 | ||||||||||
| BNP Paribas | $ | — | $ | — | $ | — | $ | — | $ | — | ||||||||||
| Deutsche Bank | $ | 1 | $ | — | $ | — | $ | — | $ | 1 | ||||||||||
| Goldman Sachs International | $ | 80 | $ | — | $ | — | $ | — | $ | 80 | ||||||||||
| JP Morgan Chase Bank, N.A. | $ | — | $ | — | $ | — | $ | — | $ | — | ||||||||||
| Macquarie Bank, Ltd. | $ | — | $ | — | $ | — | $ | — | $ | — | ||||||||||
| Nomura Securities Co., Ltd | $ | — | $ | — | $ | — | $ | — | $ | — | ||||||||||
FS Chiron Real Asset Fund
Counterparty | Derivative Assets Subject to Master Netting Agreement | Derivatives Available for Offset | Non-cash Collateral Received(1) | Cash Collateral Received(1) | Net Amount of Derivative Assets(2) | |||||||||||||||
Macquarie Bank, Ltd. | $ | — | $ | — | $ | — | $ | — | $ | — | ||||||||||
Counterparty | Derivative Liabilities Subject to Master Netting Agreement | Derivatives Available for Offset | Non-cash Collateral Pledged(1) | Cash Collateral Pledged(1) | Net Amount of Derivative Liabilities(3) | |||||||||||||||
Macquarie Bank, Ltd. | $ | 13 | $ | — | $ | — | $ | — | $ | 13 | ||||||||||
| (1) | In some instances, the actual amount of the collateral received and/or pledged may be more than the amount shown due to overcollateralization. |
| (2) | Net amount of derivative assets represents the net amount due from the counterparty to the Fund in the event of default. |
| (3) | Net amount of derivative liabilities represents the net amount due from the Fund to the counterparty in the event of default. |
87
Table of Contents
The effect of derivative instruments (which are not considered to be hedging instruments for accounting disclosure purposes) on the Funds’ consolidated statement of operations for the year ended December 31, 2021 was as follows:
FS Multi-Strategy Alternatives Fund
| Realized Gain (Loss) on Derivatives Recognized in Income | Net Change in Unrealized Appreciation (Depreciation) on Derivatives Recognized in Income | |||||||
Foreign Currency Risk |
| |||||||
Forward foreign currency exchange contracts | $ | (277) (1) | $ | 127(2) | ||||
Commodity, Credit, Equity and Foreign Currency Risk |
| |||||||
Futures | $ | 1,091(3) | $ | 25(4) | ||||
Total return swap contracts | $ | 12,502(5) | $ | 1,323(6) | ||||
FSMS’s derivative instruments at fair value by risk, presented in the table above, are reported on FSMS’s Statement of Operations and located as follows:
| (1) | Net realized gain (loss) on forward foreign currency exchange contracts. |
| (2) | Net change in unrealized appreciation (depreciation) on forward foreign currency exchange contracts. |
| (3) | Net realized gain (loss) on futures contracts. |
| (4) | Net change in unrealized appreciation (depreciation) on futures contracts. |
| (5) | Net realized gain (loss) on total return swaps. |
| (6) | Net change in unrealized appreciation (depreciation) on total return swaps. |
FS Managed Futures Fund |
| |||||||
| Realized Gain (Loss) on Derivatives Recognized in Income | Net Change in Unrealized Appreciation (Depreciation) on Derivatives Recognized in Income | |||||||
Credit, Equity and Foreign Currency Risk | ||||||||
Total return swap contracts | $ | 62(1) | $ | 18(2) | ||||
Managed Futures’ derivative instruments at fair value by risk, presented in the table above, are reported on Managed Futures’ Statement of Operations and located as follows:
| (1) | Net realized gain (loss) on total return swaps. |
| (2) | Net change in unrealized appreciation (depreciation) on total return swaps. |
88
Table of Contents
FS Chiron Real Asset Fund |
| |||||||
| Realized Gain (Loss) on Derivatives Recognized in Income | Net Change in Unrealized Appreciation (Depreciation) on Derivatives Recognized in Income | |||||||
Foreign Currency Risk | ||||||||
Forward foreign currency exchange contracts | $ | (5) | (1) | $ | — | |||
Commodity Risk | ||||||||
Futures | $ | (34) | (2) | $ | 24 | (3) | ||
Total return swap contracts | $ | 698 | (4) | $ | (95 | )(5) | ||
Real Asset’s derivative instruments at fair value by risk, presented in the table above, are reported on Real Asset’s Statement of Operations and located as follows:
| (1) | Net realized gain (loss) on forward foreign currency exchange contracts. |
| (2) | Net realized gain (loss) on futures contracts. |
| (3) | Net change in unrealized appreciation (depreciation) on futures contracts. |
| (4) | Net realized gain (loss) on total return swaps. |
| (5) | Net change in unrealized appreciation (depreciation) on total return swaps. |
The average notional amounts of derivatives outstanding during the year ended December 31, 2021, which are indicative of the volumes of these derivative types, was as follows:
Fund | Forward Foreign Exchange Contract | Future Contracts | Total Return Debt Swap Contracts | Total Return Index Swap Contracts | ||||||||||||
FS Multi-Strategy Alternatives Fund | $ | 65,981 | $ | 29,770 | $ | 41,742 | $ | 5,794 | ||||||||
FS Managed Futures Fund | $ | — | $ | — | $ | — | $ | 55 | ||||||||
FS Chiron Real Asset Fund | $ | — | $ | 865 | $ | 661 | $ | 257 | ||||||||
Note 8. Investment Portfolio
The following tables summarize the composition of each Fund’s investment portfolio at cost and fair value as of December 31, 2021:
FS Multi-Strategy Alternatives Fund
Amortized Cost(1) | Fair Value | Percentage of Portfolio | ||||||||
Corporate Bonds | $ 38,224 | $ | 38,599 | 26% | ||||||
Convertible Bonds | 702 | 725 | 1% | |||||||
Common Stocks | 14,929 | 19,215 | 13% | |||||||
Short-Term Investments | 85,960 | 85,951 | 60% | |||||||
|
|
|
|
| ||||||
Total | $ 139,815 | $ | 144,490 | 100% | ||||||
|
|
|
|
| ||||||
FS Managed Futures Fund
Amortized Cost(1) | Fair Value | Percentage of Portfolio | ||||||||
Short-Term Investments | $ 2,121 | $ | 2,120 | 100% | ||||||
|
|
|
|
| ||||||
Total | $ 2,121 | $ | 2,120 | 100% | ||||||
|
|
|
|
| ||||||
89
Table of Contents
FS Chiron Real Asset Fund
Amortized Cost(1) | Fair Value | Percentage of Portfolio | ||||||||
Common Stocks | $ 15,082 | $ | 16,018 | 63% | ||||||
U.S. Treasury & Government Agencies | 4,143 | 4,069 | 16% | |||||||
Short-Term Investments | 5,399 | 5,398 | 21% | |||||||
|
|
|
|
| ||||||
Total | $ 24,624 | $ | 25,485 | 100% | ||||||
|
|
|
|
| ||||||
| (1) | Amortized cost represents the original cost adjusted for the amortization of premiums and/or accretion of discounts, as applicable, on investments. |
In general, under the 1940 Act, a Fund would be presumed to “control” a portfolio company if such Fund owned more than 25% of its voting securities or had the power to exercise control over the management or policies of such portfolio company, and would be an “affiliated person” of a portfolio company if such Fund owned 5% or more of its voting securities.
The table below describes investments by industry classification and enumerates the percentage, by fair value, of the total portfolio assets of FSMS in such industries as of December 31, 2021:
Industry Classification | Fair Value | Percentage of Portfolio | ||||||
Short-Term Investments | $ | 85,951 | 59.5 | % | ||||
Retail | 7,901 | 5.5 | % | |||||
Real Estate Investment Trusts | 4,543 | 3.1 | % | |||||
Packaging & Containers | 3,472 | 2.4 | % | |||||
Commercial Services | 3,370 | 2.3 | % | |||||
Entertainment | 2,751 | 1.9 | % | |||||
Healthcare-Services | 2,578 | 1.8 | % | |||||
Telecommunications | 2,343 | 1.6 | % | |||||
Aerospace/Defense | 2,341 | 1.6 | % | |||||
Transportation | 2,142 | 1.5 | % | |||||
Software | 2,118 | 1.5 | % | |||||
Diversified Financial Services | 1,813 | 1.3 | % | |||||
Pharmaceuticals | 1,796 | 1.2 | % | |||||
Environmental Control | 1,697 | 1.2 | % | |||||
Chemicals | 1,601 | 1.1 | % | |||||
Distribution/Wholesale | 1,504 | 1.0 | % | |||||
Agriculture | 1,355 | 0.9 | % | |||||
Electronics | 1,220 | 0.8 | % | |||||
Real Estate | 1,184 | 0.8 | % | |||||
Healthcare-Products | 1,076 | 0.8 | % | |||||
Oil & Gas | 1,058 | 0.7 | % | |||||
Machinery-Diversified | 998 | 0.7 | % | |||||
Auto Parts & Equipment | 972 | 0.7 | % | |||||
Airlines | 889 | 0.6 | % | |||||
Internet | 806 | 0.6 | % | |||||
Home Builders | 747 | 0.5 | % | |||||
Trucking & Leasing | 629 | 0.4 | % | |||||
Building Materials | 554 | 0.4 | % | |||||
Food Service | 550 | 0.4 | % | |||||
Insurance | 533 | 0.4 | % | |||||
Beverages | 523 | 0.4 | % | |||||
Leisure Time | 493 | 0.3 | % | |||||
Media Entertainment | 428 | 0.3 | % | |||||
90
Table of Contents
Industry Classification | Fair Value | Percentage of Portfolio | ||||||
Housewares | $ | 403 | 0.3 | % | ||||
Holding Companies-Diversified | 384 | 0.3 | % | |||||
Food | 372 | 0.3 | % | |||||
Household Products/Wares | 355 | 0.3 | % | |||||
Semiconductors | 342 | 0.2 | % | |||||
Miscellaneous Manufacturing | 328 | 0.2 | % | |||||
Pipelines | 199 | 0.1 | % | |||||
Advertising | 171 | 0.1 | % | |||||
|
|
|
| |||||
Total | $ | 144,490 | 100.0 | % | ||||
|
|
|
| |||||
The table below describes investments by industry classification and enumerates the percentage, by fair value, of the total portfolio assets of Real Asset in such industries as of December 31, 2021:
Industry Classification | Fair Value | Percentage of Portfolio | ||||||
Short-Term Investments | $ | 5,398 | 21.2% | |||||
Sovereign | 4,069 | 16.0% | ||||||
Oil & Gas | 1,890 | 7.4% | ||||||
Mining | 1,810 | 7.1% | ||||||
Real Estate Investment Trusts | 1,742 | 6.8% | ||||||
Diversified Financial Services | 1,491 | 5.9% | ||||||
Semiconductors | 1,351 | 5.3% | ||||||
Agriculture | 1,144 | 4.5% | ||||||
Apparel | 645 | 2.5% | ||||||
Auto Manufacturers | 634 | 2.5% | ||||||
Oil & Gas Services | 514 | 2.0% | ||||||
Telecommunications | 431 | 1.7% | ||||||
Pharmaceuticals | 417 | 1.6% | ||||||
Miscellaneous Manufacturing | 405 | 1.6% | ||||||
Environmental Control | 393 | 1.5% | ||||||
Iron/Steel | 349 | 1.4% | ||||||
Banks | 344 | 1.4% | ||||||
Software | 343 | 1.3% | ||||||
Aerospace/Defense | 342 | 1.3% | ||||||
Commercial Banks | 340 | 1.3% | ||||||
Forest Products & Paper | 339 | 1.3% | ||||||
Chemicals | 203 | 0.8% | ||||||
Gas | 203 | 0.8% | ||||||
Electrical Components & Equipment | 201 | 0.8% | ||||||
Healthcare-Products | 135 | 0.5% | ||||||
Electronics | 116 | 0.5% | ||||||
Machinery-Construction & Mining | 93 | 0.4% | ||||||
Energy-Alternate Sources | 64 | 0.3% | ||||||
Water | 54 | 0.2% | ||||||
Auto Parts & Equipment | 25 | 0.1% | ||||||
|
|
|
| |||||
Total | $ | 25,485 | 100.0% | |||||
|
|
|
| |||||
Purchases and sales of securities during the year ended December 31, 2021, other than short-term securities and U.S. government obligations, were as follows:
Fund | Purchases | Sales | ||||||
FS Multi-Strategy Alternatives Fund | $ | 90,250 | $ | 90,668 | ||||
FS Managed Futures Fund | $ | — | $ | — | ||||
FS Chiron Real Asset Fund | $ | 58,364 | $ | 39,054 | ||||
91
Table of Contents
Note 9. Fair Value of Financial Instruments
Under existing accounting guidance, fair value is defined as the price that a Fund would receive upon selling an investment or pay to transfer a liability in an orderly transaction to a market participant in the principal or most advantageous market for the investment. This accounting guidance emphasizes that valuation techniques maximize the use of observable market inputs and minimize the use of unobservable inputs. Inputs refer broadly to the assumptions that market participants would use in pricing an asset or liability, including assumptions about risk. Inputs may be observable or unobservable. Observable inputs are inputs that reflect the assumptions market participants would use in pricing an asset or liability developed based on market data obtained from sources independent of the Fund. Unobservable inputs are inputs that reflect the assumptions market participants would use in pricing an asset or liability developed based on the best information available in the circumstances. The Funds classify the inputs used to measure these fair values into the following hierarchy as defined by current accounting guidance:
Level 1: Inputs that are quoted prices (unadjusted) in active markets for identical assets or liabilities.
Level 2: Inputs that are quoted prices for similar assets or liabilities in active markets.
Level 3: Inputs that are unobservable for an asset or liability.
A financial instrument’s categorization within the valuation hierarchy is based upon the lowest level of input that is significant to the fair value measurement.
As of December 31, 2021, the Funds’ investments and derivatives were categorized as follows in the fair value hierarchy:
FS Multi-Strategy Alternatives Fund
| Asset Description | Level 1 | Level 2 | Level 3 | Total | ||||||||||||
Corporate Bonds | $ | — | $ | 38,599 | $ | — | $ | 38,599 | ||||||||
Convertible Bonds | — | 725 | — | 725 | ||||||||||||
Common Stocks | 19,215 | — | — | 19,215 | ||||||||||||
Short-Term Investments | 85,951 | — | — | 85,951 | ||||||||||||
Forward Foreign Currency Exchange Contracts | — | 630 | — | 630 | ||||||||||||
Long Futures | 447 | — | — | 447 | ||||||||||||
Short Futures | 43 | — | — | 43 | ||||||||||||
Total Return Index Swaps | — | 1,535 | — | 1,535 | ||||||||||||
Total Assets | $ | 105,656 | $ | 41,489 | $ | — | $ | 147,145 | ||||||||
| Liability Description | Level 1 | Level 2 | Level 3 | Total | ||||||||||||
Mutual Funds Sold Short | $ | (4,077 | ) | $ | — | $ | — | $ | (4,077 | ) | ||||||
Corporate Bonds Sold Short | — | (1,868 | ) | — | (1,868 | ) | ||||||||||
Common Stocks Sold Short | (5,147 | ) | — | — | (5,147 | ) | ||||||||||
Forward Foreign Currency Exchange Contracts | — | (505 | ) | — | (505 | ) | ||||||||||
Long Futures | (112 | ) | — | — | (112 | ) | ||||||||||
Short Futures | (353 | ) | — | — | (353 | ) | ||||||||||
Total Return Index Swaps | — | (390 | ) | — | (390 | ) | ||||||||||
Total Liabilities | $ | (9,689 | ) | $ | (2,763 | ) | $ | — | $ | (12,452 | ) | |||||
| FS Managed Futures Fund | ||||||||||||||||
| Asset Description | Level 1 | Level 2 | Level 3 | Total | ||||||||||||
Short-Term Investments | 2,120 | — | — | 2,120 | ||||||||||||
Total Return Index Swaps | — | 177 | — | 177 | ||||||||||||
Total Assets | $ | 2,120 | $ | 177 | $ | — | $ | 2,297 | ||||||||
| Liability Description | ||||||||||||||||
Total Return Index Swaps | $ | — | $ | (94 | ) | $ | — | $ | (94 | ) | ||||||
92
Table of Contents
| FS Chiron Real Asset Fund | ||||||||||||||||
| Asset Description | Level 1 | Level 2 | Level 3 | Total | ||||||||||||
Common Stocks | $ | 16,018 | $ | — | $ | — | $ | 16,018 | ||||||||
U.S. Treasury & Government Agencies | — | 4,069 | — | 4,069 | ||||||||||||
Short-Term Investments | 5,398 | — | — | 5,398 | ||||||||||||
Commodity Futures Contracts | 27 | — | — | 27 | ||||||||||||
Total Assets | $ | 21,443 | $ | 4,069 | $ | — | $ | 25,512 | ||||||||
| Liability Description | ||||||||||||||||
Commodity Futures Contracts | $ | (3 | ) | $ | — | $ | — | $ | (3 | ) | ||||||
Total Return Index Swaps | — | (13 | ) | — | (13 | ) | ||||||||||
Total Liabilities | $ | (3 | ) | $ | (13 | ) | $ | — | $ | (16 | ) | |||||
The Funds’ investments as of December 31, 2021 primarily consisted of Exchange-Traded Securities or OTC Securities. All of the common equity investments, each of which was traded on an active public market, were valued at their closing price as of December 31, 2021. All of the fixed income investments were valued by using the midpoint of the prevailing bid and ask prices from dealers on the date of the relevant period end, which were provided by an independent third-party pricing service and screened for validity by such service.
The Funds periodically benchmark the bid and ask prices they receive from the third-party pricing service and/or dealers, as applicable, against the actual prices at which they purchase and sell their investments. Based on the results of the benchmark analysis and the experience of the Funds’ management, the Funds believe that these prices are reliable indicators of fair value. The Funds may also use other methods, including the use of an independent third-party valuation service approved by the Board, to determine fair value for securities for which they cannot obtain prevailing bid and ask prices through independent third-party pricing services or independent dealers, or where the Board otherwise determines that the use of such other methods is appropriate. The Funds will periodically benchmark the valuations provided by the independent third-party valuation service against the actual prices at which the Funds purchase and sell their investments. The Funds’ audit committee and Board reviewed the valuation determinations made with respect to these investments and determined that they were made in a manner consistent with the Funds’ valuation processes.
Note 10. Concentration of Risk
Investing in the Funds involve risks, including, but not limited to, those set forth below. The risks described below are not, and are not intended to be, a complete enumeration or explanation of the risks involved in an investment in the Funds. For a more complete discussion of the risks of investing in the Funds, please refer to the Funds’ prospectuses and the Funds’ other filings with the SEC.
Market Risk: Investments in securities, in general, are subject to market risks that may cause their prices to fluctuate over time. The Funds’ investments may decline in value due to factors affecting securities markets generally, or particular countries, segments, economic sectors, industries or companies within those markets. The value of a security held in a short position may increase due to general economic and market conditions which are not specifically related to a particular issuer, such as real or perceived positive economic conditions or changes in interest or currency rates. Because the market value of exchange-traded fund shares may differ from their net asset value, the shares may trade at a premium or discount. An investment in the Funds may lose money.
Credit/Default Risk: An issuer or guarantor of fixed income securities or instruments held by the Funds (which issuer or guarantor may have a low credit rating or no credit rating) may default on its obligation to pay interest and repay principal or default on any other obligation. A fixed income instrument may deteriorate in quality after it has been purchased by the Funds, and such a deterioration can occur rapidly. In certain instances, the downgrading or default of a single holding or guarantor of the Funds’ holding may impair the Funds’ liquidity and have the potential to cause a significant NAV decline.
93
Table of Contents
Counterparty Risk: The stability and liquidity of repurchase agreements, swap transactions, forwards and over-the-counter derivative transactions depend in large part on the creditworthiness of the parties to the transactions. It is expected that the Adviser or an applicable sub-adviser will monitor the creditworthiness of firms with which it will cause the Funds to enter into repurchase agreements, swap transactions, caps, floors, collars, over-the-counter derivatives or other similar arrangements. If there is a default by the counterparty to such a transaction, the Funds will under most normal circumstances have contractual remedies pursuant to the agreements related to the transaction. However, exercising such contractual rights may involve delays or costs which could result in the value of the Funds being less than if the transaction had not been entered into. Furthermore, there is a risk that any of such counterparties could become insolvent and/or the subject of insolvency proceedings. If one or more of the Funds’ counterparties were to become insolvent or the subject of insolvency proceedings in the United States (either under the Securities Investor Protection Act or the United States Bankruptcy Code), there exists the risk that the recovery of such vehicle’s securities and other assets from such prime broker or broker-dealer will be delayed or be of a value less than the value of the securities or assets originally entrusted to such prime broker or broker-dealer.
In addition, the Funds may use counterparties located in jurisdictions outside the United States. Such local counterparties are subject to the laws and regulations in non-U.S. jurisdictions that are designed to protect their customers in the event of their insolvency. However, the practical effect of these laws and their application to the Funds’ assets are subject to substantial limitations and uncertainties. Because of the large number of entities and jurisdictions involved and the range of possible factual scenarios involving the insolvency of a counterparty, it is impossible to generalize about the effect of their insolvency on the Funds and their assets. Shareholders should assume that the insolvency of any counterparty would result in a loss to the Funds, which could be material.
Libor Risk: In July of 2017, the head of the United Kingdom Financial Conduct Authority (“FCA”) announced a desire to phase out the use of LIBOR by the end of 2021. On March 5, 2021, ICE announced that all LIBOR settings will either cease to be provided by any administrator or no longer be representative: (a) immediately after December 31, 2021, in the case of the 1-week and 2-month U.S. dollar LIBOR settings; and (b) immediately after June 30, 2023, in the case of the remaining U.S. dollar LIBOR settings.
On July 29, 2021, the U.S. Federal Reserve, in connection with the Alternative Reference Rates Committee (“ARRC”), a steering committee comprised of large U.S. financial institutions, formally recommended the forward-looking Secured Overnight Financing Rate (“SOFR”) term rates proposed by CME Group, Inc. as the replacement for U.S. dollar LIBOR. In addition, the current nominated replacement for GBP-LIBOR is the Sterling Overnight Interbank Average Rate (“SONIA”). In July 2020, Bloomberg began publishing fall-backs that the International Swaps and Derivatives Association (“ISDA”) intends to implement in lieu of LIBOR with respect to swaps and derivatives. Given the inherent differences between LIBOR and SOFR, or any other alternative Benchmark Rate that may be established, including SONIA, there remains uncertainty regarding the future utilization of LIBOR and the nature of any replacement rate (or “Benchmark Rates”). In many cases, the nominated replacements, as well as other potential replacements, are not complete or ready to implement and require margin adjustments. There is currently no final consensus as to which Benchmark Rate(s) (along with any adjustment and/or permutation thereof) will replace all or any LIBOR tenors after the discontinuation thereof and there can be no assurance that any such replacement Benchmark Rate(s) will attain market acceptance.
Any transition away from LIBOR to one or more alternative Benchmark Rates is complex and could have a material adverse effect on the Funds’ business, financial condition and results of operations, including, without limitation, as a result of any changes in the pricing and/or availability of the Funds’ investments, negotiations and/or changes to the documentation for certain of the Funds’ investments, the pace of such changes, disputes and other actions regarding the interpretation of current and prospective loan documentation, basis risks between investments and hedges, basis risks within investments (e.g., securitizations), costs of modifications to processes and systems, and/or costs of administrative services and operations, including monitoring of recommended conventions and Benchmark Rates, or any component of or adjustment to the foregoing.
It is not possible to predict whether there will be any further changes in the methods pursuant to which the LIBOR rates are determined and any other reforms to LIBOR that will be enacted in the United States, the
94
Table of Contents
U.K. or elsewhere, or the effects thereof. Any such changes or further reforms to LIBOR may result in a sudden or prolonged increase or decrease in reported LIBOR rates, which could have a material adverse impact on the value of the Funds’ investments and any payments linked to LIBOR thereunder.
Derivatives Risk: The Funds may invest in Financial Instruments (used herein to refer to (i) futures contracts, including futures based on equity or fixed income securities and/or equity or fixed income indices, interest rate futures, currency futures and swap futures; (ii) swaps, including equity, currency, interest rate, total return, variance and credit default swaps, and swaps on futures contracts; (iii) options, including long and short positions in call options and put options on indices, individual securities or currencies, swaptions and options on futures contracts; (iv) forward contracts, including forwards based on equity or fixed income securities and/or equity or fixed income indices, currency forwards, interest rate forwards, swap forwards and non-deliverable forwards; and (v) other instruments, including structured securities and contracts for differences). Financial Instruments may involve risks different from, or greater than, those associated with more traditional investments. Due to leverage, small changes in the value of the Financial Instruments’ reference assets, rates, or indexes may produce disproportionate losses to the Funds. The value of Financial Instruments may not move as expected relative to the value of the reference assets, rates or indexes. Financial Instruments used for hedging purposes may not hedge risks as expected, and Financial Instruments used for non-hedging purposes may not provide the anticipated investment exposure. Financial Instruments may be highly illiquid, and the Funds may not be able to close out or sell a Financial Instrument position at a particular time or at an anticipated price. Various legislative and regulatory initiatives may impact the availability, liquidity and cost of derivatives. Financial Instruments also may be subject to interest rate risk, currency risk and counterparty risk.
In October 2020, the SEC adopted new regulations governing the use of derivatives by registered investment companies. The Funds will be required to implement and comply with new Rule 18f-4 by the third quarter of 2022. Once implemented, Rule 18f-4 will impose limits on the amount of derivatives a fund can enter into, eliminate the asset segregation framework currently used by funds to comply with Section 18 of the 1940 Act, treat derivatives as senior securities so that a failure to comply with the limits would result in a statutory violation and require funds whose use of derivatives is more than a limited specified exposure to establish and maintain a comprehensive derivatives risk management program and appoint a derivatives risk manager.
Equity Risk: The prices of equity securities in which the Funds hold long and short positions may rise and fall daily. These price movements may result from factors affecting individual companies, industries, securities markets or economies.
Foreign Investment and Emerging Markets Risk: Investments in the securities of non-U.S. issuers involve risks beyond those associated with investments in U.S. securities. These additional risks include greater market volatility, the availability of less reliable financial information, higher transactional and custody costs, taxation by foreign governments, decreased market liquidity, political instability and less developed legal and accounting practices. Foreign issuers are often subject to less stringent requirements regarding accounting, auditing, financial reporting and record keeping than are U.S. issuers, and therefore not all material information will be available. Securities exchanges or foreign governments may adopt rules or regulations that may negatively impact the Funds’ ability to invest in foreign securities or may prevent the Funds from repatriating its investments. In addition, the Funds may not receive shareholder communications or be permitted to vote the securities that it holds, as the issuers may be under no legal obligation to distribute them.
Investment in Other Investment Companies Risk: As with other investments, investments in other investment companies are subject to market and manager risk. In addition, if a Fund acquires shares of investment companies, shareholders bear both their proportionate share of expenses in the Fund (including management and advisory fees) and, indirectly, the expenses of the investment companies. The Funds may invest in money market mutual funds. An investment in a money market mutual fund is not insured or guaranteed by the Federal Deposit Insurance Corporation or any other government agency. Although money market mutual funds that invest in U.S. government securities seek to preserve the value of a Fund’s investment at $1.00 per share, it is possible to lose money by investing in a stable NAV money market mutual fund. Moreover, SEC rules require prime money market mutual funds to use floating NAVs that do not preserve the value of a Fund’s investment at $1.00 per share.
95
Table of Contents
Liquidity Risk: Although the Funds will invest primarily in liquid, publicly traded securities, the Funds may make investments that trade in lower volumes or that otherwise may be illiquid. Also, the Funds may make investments that may become less liquid in response to market developments or adverse investor perceptions. Less liquid or illiquid investments may be difficult to value. An inability to sell one or more portfolio positions can adversely affect the Funds’ value or prevent the Funds from being able to take advantage of other investment opportunities.
Non-Diversification Risk: The Funds are classified as “non-diversified” investment companies, which means that the percentage of their assets that may be invested in the securities of a single issuer is not limited by the 1940 Act. As a result, the Funds’ investment portfolio may be subject to greater risk and volatility than if investments had been made in the securities of a broad range of issuers.
Short Sales Risk: A short sale of a security involves the theoretical risk of unlimited loss because of increases in the market price of the security sold short. The Funds’ use of short sales, in certain circumstances, can result in significant losses. In order to qualify as a regulated investment company under the Code, each Fund must meet certain requirements regarding the source of its income, the diversification of its assets, and the distribution of its income. Each Fund’s ability to pursue its investment strategy may therefore be limited by its intention to qualify as a regulated investment company under the Code and may bear adversely on its ability to so qualify. If a Fund were to fail to qualify as a regulated investment company and became subject to federal income tax, shareholders of that Fund would be subject to the risk of diminished returns.
U.S. Government Securities Risk: The U.S. government may not provide financial support to U.S. government agencies, instrumentalities or sponsored enterprises that have issued debt securities that may be held by the Funds. Such issuers may not have the funds to meet their payment obligations in the future.
Pandemic Risk: The continuing spread of an infectious respiratory illness caused by a novel strain of coronavirus (known as COVID-19) has caused volatility, severe market dislocations and liquidity constraints in many markets, including securities the Funds hold, and may adversely affect the Funds’ investments and operations. The outbreak was first detected in December 2019 and subsequently spread globally. Since then, the number of cases and new “variants” have been confirmed around the world. The transmission of COVID-19 and efforts to contain its spread have resulted in travel restrictions and disruptions, closed international borders, enhanced health screenings at ports of entry and elsewhere, disruption of and delays in healthcare service preparation and delivery, quarantines, event and service cancellations or interruptions, disruptions to business operations (including staff reductions), supply chains and consumer activity, as well as general concern and uncertainty that has negatively affected the economic environment. These disruptions have led to instability in the market place, including stock market losses and overall volatility. The impact of COVID-19, and other infectious illness outbreaks, epidemics or pandemics that may arise in the future, could adversely affect the economies of many nations or the entire global economy, the financial performance of individual issuers, borrowers and sectors and the health of the markets generally in potentially significant and unforeseen ways. In addition, the impact of infectious illnesses, such as COVID-19, in emerging market countries may be greater due to generally less established healthcare systems. This crisis or other public health crises may exacerbate other pre-existing political, social and economic risks in certain countries or globally.
The foregoing could lead to a significant economic downturn or recession, increased market volatility, a greater number of market closures, higher default rates and adverse effects on the values and liquidity of securities or other assets. Such impacts, which may vary across asset classes, may adversely affect the performance of the Funds’ investments, the Funds and a shareholder’s investment in the Funds. In certain cases, an exchange or market may close or issue trading halts on either specific securities or even the entire market, which may result in the Funds being, among other things, unable to buy or sell certain securities or financial instruments or to accurately price their investments.
To satisfy any shareholder redemptions during periods of extreme volatility, such as those associated with COVID- 19, it is more likely the Funds may be required to dispose of portfolio investments at unfavorable prices compared to their intrinsic value.
96
Table of Contents
The Funds and the Adviser have in place business continuity plans reasonably designed to ensure that they maintain normal business operations, and that the Funds, their portfolios and assets are protected. However, in the event of a pandemic or an outbreak, such as COVID-19, there can be no assurance that the Funds, their advisers and service providers, or the Funds’ portfolio companies, will be able to maintain normal business operations for an extended period of time or will not lose the services of key personnel on a temporary or long-term basis due to illness or other reasons. A pandemic or disease could also impair the information technology and other operational systems upon which the Funds’ advisers rely and could otherwise disrupt the ability of the Funds’ service providers to perform essential tasks.
Governmental authorities and regulators throughout the world, such as the U.S. Federal Reserve, have in the past responded to major economic disruptions with changes to fiscal and monetary policy, including but not limited to, direct capital infusions, new monetary programs and dramatically lower interest rates. Certain of those policy changes were implemented in response to the COVID-19 pandemic. Such policy changes may adversely affect the value, volatility and liquidity of dividend and interest paying securities. The effect of recent efforts undertaken by the U.S. Federal Reserve to address the economic impact of the COVID-19 pandemic, such as the reduction of the federal funds target rate, and other monetary and fiscal actions that may be taken by the U.S. federal government to stimulate the U.S. economy, are not yet fully known. Although vaccines for COVID-19 are becoming more widely available, the duration of the COVID-19 outbreak and its full impacts are also unknown, and the pace of recovery may vary from market to market, resulting in a high degree of uncertainty for potentially extended periods of time, especially in certain sectors in which the Fund may make investments.
Note 11. Commitments and Contingencies
The Funds enter into contracts that contain a variety of indemnification provisions. The Funds’ maximum exposure under these arrangements is unknown; however, the Funds have not had prior claims or losses pursuant to these contracts. Management of the Adviser has reviewed the Funds’ existing contracts and expects the risk of loss to the Funds to be remote.
The Funds are not currently subject to any material legal proceedings and, to the Funds’ knowledge, no material legal proceedings are threatened against the Funds. From time to time, the Funds may be a party to certain legal proceedings in the ordinary course of business, including proceedings related to the enforcement of the Funds’ rights under contracts with its portfolio companies. While the outcome of any legal proceedings cannot be predicted with certainty, to the extent the Funds become parties to such proceedings, the Funds would assess whether any such proceedings will have a material adverse effect upon their financial condition or results of operations.
See Note 4 for a discussion of the Funds’ commitments to the Adviser and its affiliates, which consists of the conditional obligation of the Funds to reimburse FS Investments pursuant to the terms of their respective Expense Limitation Agreements.
Note 12. Subsequent Events
Management has evaluated subsequent events for the Funds through the date the financial statements were issued, and has concluded that there are no recognized or non-recognized subsequent events relevant for financial statement disclosure, other than as noted below.
At a meeting held on September 2, 2021, the Board approved an Agreement and Plan of Reorganization (the “Plan”) providing for the reorganization of FSMS and Real Asset into newly created series of The Advisors’ Inner Circle Fund III. The reorganization of each Fund is subject to approval by its shareholders. The proposed reorganization is expected to occur after the close of business on March 14, 2022 (although the reorganization may be further delayed).
97
Table of Contents
Supplemental Information (Unaudited)
Changes in Accountants and Disagreements with Accountants on Accounting and Financial Disclosure
The Funds have not had any changes in their independent registered public accounting firm or disagreements with their independent registered public accounting firm on accounting or financial disclosure matters since their inception.
Board of Trustees
Information regarding the members of the Board is set forth below. The trustees have been divided into two groups — interested trustees and independent trustees. The address for each trustee is c/o FS Series Trust, 201 Rouse Boulevard, Philadelphia, Pennsylvania 19112. As set forth in the Trust’s agreement and declaration of trust, each trustee’s term of office shall continue until his or her death, resignation or removal.
Name | Age | Trustee Since | Title | Principal Occupation(s) | Number of Registered Investment Companies in Fund Complex* Overseen by Trustee | Other Directorships | ||||||||||||||
| Interested Trustees | ||||||||||||||||||||
| Michael C. Forman(1) | 60 | November 2016 | Chairman | Chairman and Chief Executive Officer of FS Investments | 5 | FS Credit Real Estate Income Trust (since 2016); FS Energy and Power Fund (since 2010); and FS KKR Capital Corp. (formerly FS Investment Corporation) (since 2007) | ||||||||||||||
| David J. Adelman(2) | 49 | August 2017 | Vice-Chairman | Chief Executive Officer of Campus Technologies, Inc. (since 2001); and President and Chief Executive Officer of Campus Apartments, Inc. (since 1997) | 4 | FS Credit Real Estate Income Trust (since 2018); and Actua Corporation (since 2011) | ||||||||||||||
| Independent Trustees | ||||||||||||||||||||
| Philip E. Hughes, Jr. | 72 | March 2017 | Trustee | Vice-chairman of Keystone Industries. (since 2000) | 4 | FS Global Credit Opportunities Fund (since 2013) | ||||||||||||||
| Scott J. Tarte | 59 | March 2017 | Trustee | Chief executive officer of Sparks Marketing Group, Inc. (since 2000) | 3 | N/A | ||||||||||||||
| James W. Brown | 70 | August 2017 | Trustee | Chief of Staff to United States Senator Robert P. Casey, Jr (2007 — 2016) | 3 | FS Credit Real Estate Income Trust (since 2021); The Hershey Company (since 2017) | ||||||||||||||
* The “Fund Complex” consists of the Funds, FS Credit Income Fund and FS Global Credit Opportunities Fund.
98
Table of Contents
| (1) | Mr. Forman is deemed to be an “interested person” of the Trust, as defined in Section 2(a)(19) of the 1940 Act, due to his role as a controlling person of the Adviser. |
| (2) | Mr. Adelman is deemed to be an “interested person” of the Trust, as defined in Section 2(a)(19) of the 1940 Act, due to his role as a controlling person of the Adviser. |
Executive Officers
Information regarding the executive officers of the Trust is set forth below. The address for each executive officer is c/o FS Series Trust, 201 Rouse Boulevard, Philadelphia, Pennsylvania 19112.
Name | Age | Position HeId with | Length of | Principal Occupation(s) During the Past Five Years | ||||
Michael C. Forman | 60 | President | Since 2016 | Chairman and Chief Executive Officer, FS Investments | ||||
William Goebel | 47 | Chief Financial Officer | Since 2017 | Managing Director, Fund Finance, FS Investments | ||||
Stephen S. Sypherd | 44 | Vice President, Treasurer & Secretary | Since 2016 | General Counsel, FS Investments | ||||
James F. Volk | 59 | Chief Compliance Officer | Since 2017 | Managing Director, Fund Compliance, FS Investments | ||||
Statement of Additional Information
The Trust’s statement of additional information, dated as of April 30, 2021, as amended and supplemented to date, contains additional information regarding the Trust’s trustees and executive officers and is available upon request and without charge by calling the Trust at 1-877-628-8575 or by accessing the Fund’s Literature/Fund Resources page on FS Investments’ website at www.fsinvestments.com.
Availability of Quarterly Portfolio Schedules
Each Fund files its complete schedule of portfolio holdings with the SEC for the first and third quarters of each fiscal year as an exhibit to its reports on Form N-PORT. Each Fund’s Forms N-PORT reports are available on www.fsinvestments.com.
Proxy Voting Policies and Procedures
Each Fund has delegated its proxy voting responsibility to the Adviser. Solely with regard to FSMS, the Adviser has delegated proxy voting responsibility to FSMS’s investment sub-advisers. For FSMS, each of the investment sub-advisers review any pending proxy vote decisions seeking to ensure that all votes cast for FSMS are in the best interest of FSMS and its shareholders. Shareholders may obtain a copy of the Adviser’s and the investment sub-advisers’ proxy voting policies and procedures upon request and without charge by calling the Trust at 1-877-628-8575 or on the SEC’s website at http://www.sec.gov.
Proxy Voting Record
Information regarding how the investment sub-advisers voted proxies relating to FSMS’s portfolio securities during the twelve-month period ended June 30 and information regarding how the Adviser voted proxies relating to each Alt Beta Fund’s portfolio securities during the twelve-month period ended June 30 will be available upon request and without charge by making a written request to the Trust’s Chief Compliance Officer at FS Series Trust, 201 Rouse Boulevard, Philadelphia, Pennsylvania 19112, Attn: Chief Compliance Officer, by calling the Fund at 1-877-628-8575 or on the SEC’s website at http://www.sec.gov.
99
Table of Contents
www.fsinvestments.com © 2022 FS Investments | AR21-ST DFIN |
Table of Contents
Item 1. Reports to Shareholders.
| (b) | The following is a copy of the notice transmitted to shareholders in reliance on Rule 30e-3 under the 1940 Act that contains disclosures specified by paragraph (c)(3) of that rule: |
FS INVESTMENTS
201 ROUSE BLVD
PHILADELPHIA, PA 19112
Notice of Internet Availability of Shareholder Report(s)
BROADRIDGE FINANCIAL SOLUTIONS, INC. ATTENTION: |  | |
TEST PRINT 51 MERCEDES WAY EDGEWOOD, NY 11717 |
FS INVESTMENTS®
Important Fund Report(s) Now Available online and In Print by Request.
Annual and Semi-Annual Reports contain important information about the fund, including its holdings and financials. We encourage you to review the report(s) at the website below:
https://fsinvestments.com/series-trust-reports/
FS Series Trust Annual Report
| Request a printed/email report at no charge and/or elect to receive paper reports in the future, by calling or visiting (otherwise you will not receive a paper/email report): 1-877-628-8575
www.fsinvestments.com/edelivery | |
 | Go Paperless! Update your communication preferences at the website listed or scanning the QR Code below
www.fsinvestments.com/edelivery
| |


Table of Contents
Item 2. Code of Ethics.
| (a) | On May 20, 2020, the Trust’s board of trustees (the “Board”) adopted an amended Code of Business Conduct and Ethics (“Code of Ethics”) that applies to all officers, trustees, directors and employees of the Trust and FS Fund Advisor, LLC (the “Adviser”), the investment adviser to the Funds, including the Trust’s principal executive officer, principal financial officer, principal accounting officer or controller and persons performing similar functions. |
| (b) | Not applicable. |
| (c) | During the period covered by the Annual Report included in Item 1 of this Form N-CSR, the Trust did not amend any provision of the Code of Ethics that applies to the Trust’s principal executive officer, principal financial officer, principal accounting officer or controller or persons performing similar functions. |
| (d) | During the period covered by the Annual Report included in Item 1 of this Form N-CSR, the Trust did not grant any waiver, explicit or implicit, from a provision of the Code of Ethics to its principal executive officer, principal financial officer, principal accounting officer or controller or persons performing similar functions. |
| (e) | Not applicable. |
| (f) | A copy of the Code of Ethics is included herein as Exhibit (a)(1) and also is available on the Funds’ “Corporate Governance” page on FS Investments’ website at www.fsinvestments.com. |
Item 3. Audit Committee Financial Expert.
| (a)(1) | The Board has determined that the Trust has at least one “audit committee financial expert” serving on the audit committee of the Board (the “Audit Committee”), as such term is defined for purposes of Item 3 of Form N-CSR. |
| (a)(2) | The Board has determined that Philip E. Hughes, Jr. is an “audit committee financial expert” and is “independent,” as such terms are defined for purposes of Item 3 of Form N-CSR. |
| (a)(3) | Not applicable. |
Item 4. Principal Accountant Fees and Services.
| (a) | Audit Fees. The aggregate fees billed for the fiscal years ended December 31, 2021 and 2020 for professional services rendered by Ernst & Young LLP, the Trust’s independent registered public accounting firm (“Ernst & Young”), for the audit of the Funds’ annual financial statements and services that are normally provided by Ernst & Young in connection with statutory and regulatory filings or engagements for each year were $223,658 and $256,850, respectively. |
| (b) | Audit-Related Fees. The aggregate fees billed for the fiscal years ended December 31, 2021 and 2020 for assurance and related services by Ernst & Young that were reasonably related to the performance of the audit of the Funds’ financial statements and not reported in Item 4(a) above were $18,000 and $0, respectively. Audit-related fees for the fiscal years ended December 31, 2021 and 2020 represent fees billed for services provided in connection with consents issued by Ernst & Young. |
| (c) | Tax Fees. The aggregate fees billed for the fiscal years ended December 31, 2021 and 2020 for professional services rendered by Ernst & Young for tax compliance, tax advice and tax planning were $122,399 and $112,541, respectively. Tax fees for the fiscal years ended December 31, 2021 and 2020 represent fees billed for tax compliance services provided in connection with the review of the Funds’ tax returns. |
Table of Contents
| (d) | All Other Fees. No fees were billed for the fiscal years ended December 31, 2021 and 2020 for products and services provided by Ernst & Young, other than the services reported in Items 4(a) through (c) above. |
| (e) | Audit Committee Pre-Approval Policies and Procedures. |
| (1) | The Audit Committee has adopted, and the Board has approved, a Policy on Pre-Approval of Audit and Non-Audit Services (the “Policy”), which is intended to comply with Rule 2-01 of Regulation S-X and sets forth guidelines and procedures to be followed by the Funds when retaining an auditor to perform audit, audit-related, tax and other services for the Funds. The Policy permits such services to be pre-approved by the Audit Committee pursuant to either a general pre-approval or specific pre-approval. Unless a type of service provided by the auditor has received general pre-approval, it requires specific pre-approval by the Audit Committee. Any proposed services exceeding pre-approved cost levels require specific pre- approval by the Audit Committee. |
| (2) | All services described in paragraphs (b) and (c) of this Item 4 were pre-approved before the engagement by the Audit Committee pursuant to paragraph (c)(7)(i)(A) of Rule 2-01 of Regulation S-X. Consequently, none of such services were required to be approved by the Audit Committee pursuant to paragraph (c)(7)(i)(C) of Rule 2-01 of Regulation S-X. |
| (f) | Not applicable. |
| (g) | The aggregate non-audit fees billed by Ernst & Young for services rendered to the Funds, the Adviser and any entity controlling, controlled by or under common control with the Adviser that provides ongoing services to the Funds for the fiscal years ended December 31, 2021 and 2020 were $140,399 and $112,541, respectively. |
| (h) | Not applicable. |
| (i) | Not applicable. |
| (j) | Not applicable. |
Item 5. Audit Committee of Listed Registrants.
| (a) | Not applicable. The Funds are not listed issuers as defined in Rule 10A-3 under the Securities Exchange Act of 1934, as amended (the “Exchange Act”). |
| (b) | Not applicable. The Funds are not listed issuers as defined in Rule 10A-3 under the Exchange Act. |
Item 6. Investments.
| (a) | The Funds’ schedules of investments as of December 31, 2021 are included as part of the Annual Report included in Item 1 of this Form N-CSR. |
| (b) | Not applicable. |
Item 7. Disclosure of Proxy Voting Policies and Procedures for Closed-End Management Investment Companies.
Not applicable to the Trust.
Item 8. Portfolio Managers of Closed-End Management Investment Companies.
Not applicable to the Trust.
Item 9. Purchases of Equity Securities by Closed-End Management Investment Company and Affiliated Purchasers.
Not applicable to the Trust.
Item 10. Submission of Matters to a Vote of Security Holders.
There were no material changes to the procedures by which the Funds’ shareholders may recommend nominees to the Board during the period covered by the Annual Report included in Item 1 of this Form N-CSR.
Table of Contents
Item 11. Controls and Procedures
| (a) | The Trust’s principal executive officer and principal financial officer have evaluated the Trust’s disclosure controls and procedures (as defined in Rule 30a-3(c) under the 1940 Act) as of a date within 90 days of the filing date of this report on Form N-CSR and have concluded that the Trust’s disclosure controls and procedures were effective, as of that date, in ensuring that information required to be disclosed by the Trust in this report on Form N-CSR was recorded, processed, summarized and reported timely. |
| (b) | There was no change in the Trust’s internal control over financial reporting (as defined in Rule 30a-3(d) under the 1940 Act) that occurred during the period covered by this report on Form N-CSR that has materially affected, or is reasonably likely to materially affect, the Trust’s internal control over financial reporting. |
Item 12. Disclosure of Securities Lending Activities for Closed-End Management Investment Companies.
Not applicable to the Trust.
Item 13. Exhibits.
| (a)(3) | Not applicable. |
| (a)(4) | Not applicable. |
Table of Contents
SIGNATURES
Pursuant to the requirements of the Securities Exchange Act of 1934 and the Investment Company Act of 1940, the registrant has duly caused this report to be signed on its behalf by the undersigned, thereunto duly authorized.
| FS Series Trust | ||
| By: | /s/ MICHAEL C. FORMAN | |
| Name: Michael C. Forman Title: President (Principal Executive Officer) Date: March 8, 2022 | ||
Pursuant to the requirements of the Securities Exchange Act of 1934 and the Investment Company Act of 1940, this report has been signed below by the following persons on behalf of the registrant and in the capacities and on the dates indicated.
| By: | /s/ MICHAEL C. FORMAN | |
| Name: Michael C. Forman Title: President (Principal Executive Officer) Date: March 8, 2022 | ||
| By: | /s/ WILLIAM GOEBEL | |
| Name: William Goebel Title: Chief Financial Officer (Principal Financial Officer) Date: March 8, 2022 | ||