UNITED STATES
SECURITIES AND EXCHANGE COMMISSION
Washington, D.C. 20549
FORM N-CSR
CERTIFIED SHAREHOLDER REPORT OF REGISTERED MANAGEMENT INVESTMENT
COMPANIES
Investment Company Act file number: 811-23218
Name of Fund: BlackRock 2022 Global Income Opportunity Trust (BGIO)
Fund Address: 100 Bellevue Parkway, Wilmington, DE 19809
Name and address of agent for service: John M. Perlowski, Chief Executive Officer, BlackRock 2022 Global
Income Opportunity Trust, 55 East 52nd Street, New York, NY 10055
Registrant’s telephone number, including area code: (800) 882-0052, Option 4
Date of fiscal year end: 12/31/2018
Date of reporting period: 06/30/2018
Item 1 – Report to Stockholders
JUNE 30, 2018
| | |
SEMI-ANNUAL REPORT (UNAUDITED) | |  |
BlackRock 2022 Global Income Opportunity Trust (BGIO)
|
| Not FDIC Insured • May Lose Value • No Bank Guarantee |
The Markets in Review
Dear Shareholder,
In the 12 months ended June 30, 2018, the strongest corporate profits in seven years drove the equity market higher, while rising interest rates constrained bond returns. Though the market’s appetite for risk remained healthy, risk taking was tempered somewhat, as shorter-term, higher-quality securities led the bond market, and U.S. equities outperformed most international stock markets.
Strong equity performance worldwide was driven by synchronized economic growth across the most influential economies. However, volatility in emerging market stocks rose, as U.S.-China trade relations and debt concerns weighed heavily on the Chinese stock market.
Short-term U.S. Treasury interest rates rose the fastest, while longer-term rates slightly increased, leading to a substantial flattening of the yield curve. The annual return for the three-month U.S. Treasury bill surpassed 1.0%, but remained well below the annual headline inflation rate of 2.9%. In contrast, the ten-year U.S. Treasury — a bellwether of the bond market — posted a negative return, as rising inflation expectations drove yields higher. Although the fundamentals in credit markets remained relatively solid, investment-grade bonds declined slightly, and high-yield bonds posted modest returns.
In response to rising growth and inflation, the U.S. Federal Reserve (the “Fed”) increased short-term interest rates three times during the reporting period. The Fed also announced plans to reduce its $4.4 trillion balance sheet by $420 billion in 2018, which began the process of gradually reversing its unprecedented stimulus measures after the financial crisis. Meanwhile, the European Central Bank announced that its bond-purchasing program would conclude at the end of the year, while also expressing an open-ended commitment to low interest rates. In contrast, the Bank of Japan continued to expand its balance sheet through bond purchasing while lowering its expectations for inflation.
The U.S. economy continued to gain momentum despite the Fed’s modest reduction of economic stimulus; unemployment declined to 4.0%, wages increased, and the number of job openings reached a record high. Strong economic performance may justify a more rapid pace of rate hikes in 2018, as the headline inflation rate and investors’ expectations for inflation have already surpassed the Fed’s target of 2.0%.
While U.S. monetary policy is seeking to restrain economic growth and inflation, fiscal policy has produced new sources of growth that could nourish the economy for the next few years. Corporate tax cuts and repatriation of capital held abroad could encourage a virtuous cycle of business spending. Lower individual tax rates coupled with the robust job market may refresh consumer spending. Proposed infrastructure spending would deliver growth from the government sector, generate demand, and improve economic activity in other sectors.
We continue to believe the primary risks to economic expansion are trade protectionism, rapidly rising interest rates, and geopolitical tension. Given the deflationary forces of technology and globalization, a substantial increase in inflation is unlikely to materialize as long as the unemployment rate remains above 3.0%. However, we are closely monitoring trade protectionism and the rise of populism in Western nations. In particular, the outcome of trade negotiations between the United States and China is likely to influence the global growth trajectory and set the tone for free trade in many other nations.
In this environment, investors need to think globally, extend their scope across a broad array of asset classes, and be nimble as market conditions change. We encourage you to talk with your financial advisor and visit blackrock.com for further insight about investing in today’s markets.
Sincerely,

Rob Kapito
President, BlackRock Advisors, LLC

Rob Kapito
President, BlackRock Advisors, LLC
| | | | |
| Total Returns as of June 30, 2018 |
| | | 6-month | | 12-month |
U.S. large cap equities
(S&P 500® Index) | | 2.65% | | 14.37% |
U.S. small cap equities
(Russell 2000® Index) | | 7.66 | | 17.57 |
International equities
(MSCI Europe, Australasia,
Far East Index) | | (2.75) | | 6.84 |
Emerging market equities
(MSCI Emerging Markets Index) | | (6.66) | | 8.20 |
3-month Treasury bills
(ICE BofAML 3-Month U.S. Treasury Bill Index) | | 0.81 | | 1.36 |
U.S. Treasury securities
(ICE BofAML 10-Year U.S. Treasury Index) | | (2.68) | | (2.69) |
U.S. investment grade bonds
(Bloomberg Barclays U.S.
Aggregate Bond Index) | | (1.62) | | (0.40) |
Tax-exempt municipal bonds
(S&P Municipal Bond Index) | | (0.02) | | 1.61 |
U.S. high yield bonds
(Bloomberg Barclays U.S. Corporate High Yield 2% Issuer
Capped Index) | | 0.16 | | 2.62 |
| Past performance is no guarantee of future results. Index performance is shown for illustrative purposes only. You cannot invest directly in an index. |
| | |
| 2 | | THIS PAGEISNOT PARTOF YOUR FUND REPORT |
Table of Contents
| | |
| Trust Summary as of June 30, 2018 | | BlackRock 2022 Global Income Opportunity Trust |
Investment Objective
BlackRock 2022 Global Income Opportunity Trust’s (BGIO) (the “Trust”) investment objective is to seek to distribute a high level of current income and to earn a total return, based on the net asset value of the Trust’s common shares of beneficial interest, that exceeds the return on the Bloomberg Barclays 1-3 Month U.S. Treasury Bill Index by 500 basis points (or 5.00%) on an annualized basis over the life of the Trust, under normal market conditions. The Trust will terminate on or about February 28, 2022.
No assurance can be given that the Trust’s investment objective will be achieved. Risks relating to the Trust’s investment objective are described in further detail in the Notes to Financial Statements.
Trust Information
| | |
Symbol on New York Stock Exchange (“NYSE”) | | BGIO |
Initial Offering Date | | February 27, 2017 |
Termination Date (on or about) | | February 28, 2022 |
Current Distribution Rate on Closing Market Price as of June 30, 2018 ($8.95)(a) | | 6.70% |
Current Monthly Distribution per Common Share(b) | | $0.0500 |
Current Annualized Distribution per Common Share(b) | | $0.6000 |
Economic Leverage as of June 30, 2018(c) | | 20% |
| | (a) | Current Distribution Rate on closing market price is calculated by dividing the current annualized distribution per share by the closing market price. The current distribution rate consists of income, net realized gains and/or a return of capital. Past performance does not guarantee future results. | |
| | (b) | The distribution rate is not constant and is subject to change. | |
| | (c) | Represents reverse repurchase agreements as a percentage of total managed assets, which is the total assets of the Trust, including any assets attributable to reverse repurchase agreements, minus the sum of liabilities (other than borrowings representing financial leverage). For a discussion of leveraging techniques utilized by the Trust, please see The Benefits and Risks of Leveraging on page 7. | |
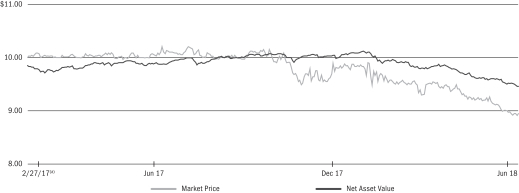
Market Price and Net Asset Value Per Share Summary
| | | | | | | | | | | | | | | | | | | | |
| | | 06/30/18 | | | 12/31/17 | | | Change | | | High | | | Low | |
Market Price | | | 8.95 | | | | 9.80 | | | | (8.67 | )% | | $ | 9.94 | | | $ | 8.88 | |
Net Asset Value | | | 9.46 | | | | 9.99 | | | | (5.31 | ) | | | 10.12 | | | | 9.46 | |
Market Price and Net Asset Value History Since Inception
| (a) | Commencement of operations. |
| | |
| 4 | | 2018 BLACKROCK SEMI-ANNUAL REPORTTO SHAREHOLDERS |
| | |
| Trust Summary as of June 30, 2018 (continued) | | BlackRock 2022 Global Income Opportunity Trust |
Performance and Portfolio Management Commentary
Returns for the six months ended June 30, 2018 were as follows:
| | | | | | | | | | | | | | | | |
| | | | | | | | | Average Annual Total Returns | |
| | | 6 Months | | | | | | 1 Year | | | Since Inception (a) | |
Trust at NAV(b)(c) | | | (2.74 | )% | | | | | | | 1.97 | % | | | 2.93 | % |
Trust at Market Price(b)(c) | | | (6.20 | ) | | | | | | | (4.97 | ) | | | (2.35 | ) |
Bloomberg Barclays 1-3 Month U.S. Treasury Bill Index(d) | | | 0.77 | | | | | | | | 1.29 | | | | 1.13 | |
| | (a) | The Trust commenced operations on February 27, 2017. | |
| | (b) | All returns reflect reinvestment of dividends and/or distributions at actual reinvestment prices. Performance results reflect the Trust’s use of leverage. | |
| | (c) | The Trust’s discount to NAV widened during the period, which accounts for the difference between performance based on market price and performance based on NAV. | |
| | (d) | An unmanaged index that tracks the market for treasury bills used by the U.S. government that have a maturity of more than 1 month and less than 3 months, are rated investment grade and have a minimum $300 million par amount outstanding. | |
Performance results may include adjustments made for financial reporting purposes in accordance with U.S. generally accepted accounting principles.
Past performance is not indicative of future results.
The Trust’s investment objective is, in part, to earn a total return that exceeds the return on the Bloomberg Barclays 1-3 Month U.S. Treasury Bill Index (the “Index”) by 500 basis points (or 5.00%) on an annualized basis over the life of the Trust, under normal market conditions. The Trust’s investment policies do not contemplate any meaningful amount of investment in securities that comprise the Index under normal market conditions; rather, the Trust uses the Index as a proxy for a risk-free rate of return that its investment objective seeks to exceed. Because the achievement of the Trust’s investment objective is measured on an annualized basis over the life of the Trust, the Trust’s performance may be more or less than the spread over the Index contained in the Trust’s investment objective during individual annual periods or for any period of time shorter than the life of the Trust. The Board considers certain factors to evaluate the Trust’s performance, such as the performance of the Trust relative to its investment objective and/or other information provided by BlackRock Advisors, LLC (the “Manager”).
More information about the Trust’s historical performance can be found in the “Closed End Funds” section of http://www.blackrock.com.
The following discussion relates to the Trust’s absolute performance based on NAV:
What factors influenced performance?
The Trust’s positions in asset-backed securities, non-agency residential mortgages (“RMBS”) and commercial mortgages (“CMBS”) were the main contributors to performance.
The Trust’s allocation to the emerging markets detracted from results, as did its weightings in investment-grade and high yield corporate bonds.
The Trust employed derivatives through the use of U.S. Treasury futures during the period as a means to manage duration (a measure of interest rate sensitivity) and yield curve exposure. The use of derivatives had a positive impact on the Trust’s performance.
Describe recent portfolio activity.
The Trust maintained a focus on the higher-yielding segments of the market, but it adjusted its positioning periodically in response to volatility. The Trust increased its allocation to short-term bonds as the period progressed, as rising yields in this area created an opportunity to earn higher income with a relatively low degree of interest-rate risk. The portfolio’s duration decreased as a result of this shift, which provides an element of defensiveness in case market volatility remains elevated.
Describe portfolio positioning at period end.
The Trust maintained diversified exposure across the non-government sectors, including the emerging markets, securitized assets, bank loans and high yield bonds. It had a small allocation to U.S. Treasuries for liquidity purposes. The investment adviser continued to favor the emerging markets (mostly U.S. dollar-denominated securities) based on their healthy fundamentals, the backdrop of positive global growth, and valuations that look more attractive following the category’s underperformance in the first half of the year. The Trust maintained a core position in securitized assets, including CMBS, non-agency RMBS, and collateralized loan obligations.
The views expressed reflect the opinions of BlackRock as of the date of this report and are subject to change based on changes in market, economic or other conditions. These views are not intended to be a forecast of future events and are no guarantee of future results.
| | |
| Trust Summary as of June 30, 2018 (continued) | | BlackRock 2022 Global Income Opportunity Trust |
Overview of the Trust’s Total Investments
PORTFOLIO COMPOSITION
| | | | | | | | |
| Asset Type | | 06/30/18 | | | 12/31/17 | |
Corporate Bonds | | | 42 | % | | | 47 | % |
Asset-Backed Securities | | | 20 | | | | 19 | |
Non-Agency Mortgage-Backed Securities | | | 12 | | | | 11 | |
Foreign Agency Obligations | | | 10 | | | | 14 | |
Floating Rate Loan Interests | | | 9 | | | | 2 | |
Short-Term Securities | | | 4 | | | | 2 | |
U.S. Government Sponsored Agency Securities | | | 2 | | | | 6 | |
Capital Trusts | | | 1 | | | | — | (a) |
Options Purchased | | | — | (a) | | | — | |
TBA Sale Commitments | | | — | | | | (1 | ) |
| | (a) | Representing less than 1% of the Trust’s total investments. | |
CREDIT QUALITY ALLOCATION (b)(c)
| | | | | | | | |
| Credit Rating | | 06/30/18 | | | 12/31/17 | |
AAA/Aaa(d) | | | 2 | % | | | 5 | % |
AA/Aa | | | — | | | | 1 | |
A | | | 1 | | | | 3 | |
BBB/Baa | | | 13 | | | | 21 | |
BB/Ba | | | 29 | | | | 23 | |
B | | | 27 | | | | 25 | |
CCC/Caa | | | 4 | | | | 4 | |
C | | | 5 | | | | 2 | |
D | | | — | | | | 1 | |
NR | | | 19 | | | | 15 | |
| | (b) | For financial reporting purposes, credit quality ratings shown above reflect the highest rating assigned by either Standard & Poor’s (“S&P”) or Moody’s Investors Service (“Moody’s”) if ratings differ. These rating agencies are independent, nationally recognized statistical rating organizations and are widely used. Investment grade ratings are credit ratings of BBB/Baa or higher. Below investment grade ratings are credit ratings of BB/Ba or lower. Investments designated N/R are not rated by either rating agency. Unrated investments do not necessarily indicate low credit quality. Credit quality ratings are subject to change. | |
| | (c) | Excludes Short-Term Securities and To-be-announced (“TBA”) Sale Commitments. | |
| | (d) | The investment adviser evaluates the credit quality of not-rated investments based upon certain factors including, but not limited to, credit ratings for similar investments and financial analysis of sectors, individual investments and/or issuer. Using this approach, the investment adviser has deemed U.S. Government Sponsored Agency Securities and U.S. Treasury Obligations as AAA/Aaa. | |
| | |
| 6 | | 2018 BLACKROCK SEMI-ANNUAL REPORTTO SHAREHOLDERS |
The Benefits and Risks of Leveraging
The Trust may utilize leverage to seek to enhance the distribution rate on, and net asset value (“NAV”) of, its common shares (“Common Shares”). However, there is no guarantee that these objectives can be achieved in all interest rate environments.
In general, the concept of leveraging is based on the premise that the financing cost of leverage, which is based on short-term interest rates, is normally lower than the income earned by the Trust on its longer-term portfolio investments purchased with the proceeds from leverage. To the extent that the total assets of the Trust (including the assets obtained from leverage) are invested in higher-yielding portfolio investments, the Trust’s shareholders benefit from the incremental net income. The interest earned on securities purchased with the proceeds from leverage is paid to shareholders in the form of dividends, and the value of these portfolio holdings is reflected in the per share NAV.
To illustrate these concepts, assume the Trust’s capitalization is $100 million and it utilizes leverage for an additional $30 million, creating a total value of $130 million available for investment in longer-term income securities. If prevailing short-term interest rates are 3% and longer-term interest rates are 6%, the yield curve has a strongly positive slope. In this case, the Trust’s financing costs on the $30 million of proceeds obtained from leverage are based on the lower short-term interest rates. At the same time, the securities purchased by the Trust with the proceeds from leverage earn income based on longer-term interest rates. In this case, the Trust’s financing cost of leverage is significantly lower than the income earned on the Trust’s longer-term investments acquired from such leverage proceeds, and therefore the holders of Common Shares (“Common Shareholders”) are the beneficiaries of the incremental net income.
However, in order to benefit shareholders, the return on assets purchased with leverage proceeds must exceed the ongoing costs associated with the leverage. If interest and other costs of leverage exceed the Trust’s return on assets purchased with leverage proceeds, income to shareholders is lower than if the Trust had not used leverage. Furthermore, the value of the Trust’s portfolio investments generally varies inversely with the direction of long-term interest rates, although other factors can influence the value of portfolio investments. In contrast, the value of the Trust’s obligations under its leverage arrangement generally does not fluctuate in relation to interest rates. As a result, changes in interest rates can influence the Trust’s NAVs positively or negatively. Changes in the future direction of interest rates are very difficult to predict accurately, and there is no assurance that the Trust’s intended leveraging strategy will be successful.
The use of leverage also generally causes greater changes in the Trust’s NAV, market price and dividend rates than comparable portfolios without leverage. In a declining market, leverage is likely to cause a greater decline in the NAV and market price of the Trust’s shares than if the Trust were not leveraged. In addition, the Trust may be required to sell portfolio securities at inopportune times or at distressed values in order to comply with regulatory requirements applicable to the use of leverage or as required by the terms of leverage instruments, which may cause the Trust to incur losses. The use of leverage may limit the Trust’s ability to invest in certain types of securities or use certain types of hedging strategies. The Trust incurs expenses in connection with the use of leverage, all of which are borne by shareholders and may reduce income to the shareholders. Moreover, to the extent the calculation of the Trust’s investment advisory fees includes assets purchased with the proceeds of leverage, the investment advisory fees payable to the Trust’s investment adviser will be higher than if the Trust did not use leverage.
The Trust may utilize leverage through reverse repurchase agreements as described in the Notes to Financial Statements.
Under the Investment Company Act of 1940, as amended (the “1940 Act”), the Trust is permitted to issue debt up to 33 1⁄3% of its total managed assets. The Trust may voluntarily elect to limit its leverage to less than the maximum amount permitted under the 1940 Act.
If the Trust segregates or designates on its books and records cash or liquid assets having a value not less than the value of the Trust’s obligations under the reverse repurchase agreement (including accrued interest), then such transaction is not considered a senior security and is not subject to the foregoing limitations and requirements imposed by the 1940 Act.
Derivative Financial Instruments
The Trust may invest in various derivative financial instruments. These instruments are used to obtain exposure to a security, commodity, index, market, and/or other assets without owning or taking physical custody of securities, commodities and/or other referenced assets or to manage market, equity, credit, interest rate, foreign currency exchange rate, commodity and/or other risks. Derivative financial instruments may give rise to a form of economic leverage and involve risks, including the imperfect correlation between the value of a derivative financial instrument and the underlying asset, possible default of the counterparty to the transaction or illiquidity of the instrument. The Trust’s successful use of a derivative financial instrument depends on the investment adviser’s ability to predict pertinent market movements accurately, which cannot be assured. The use of these instruments may result in losses greater than if they had not been used, may limit the amount of appreciation the Trust can realize on an investment and/or may result in lower distributions paid to shareholders. The Trust’s investments in these instruments, if any, are discussed in detail in the Notes to Financial Statements.
| | | | |
| THE BENEFITSAND RISKSOF LEVERAGING / DERIVATIVE FINANCIAL INSTRUMENTS | | | 7 | |
| | |
Schedule of Investments (unaudited) June 30, 2018 | | BlackRock 2022 Global Income Opportunity Trust (BGIO) (Percentages shown are based on Net Assets) |
| | | | | | | | |
| Security | | Par
(000) | | | Value | |
Asset-Backed Securities — 24.9% | |
Ajax Mortgage Loan Trust, Series 2017-D, Class A,
3.75%, 12/25/57(a)(b)(c) | | | USD 217 | | | $ | 216,651 | |
ALM VI Ltd., Series 2012-6A, Class DRR,
7.40%, 07/15/26(a)(b)(c) | | | 1,000 | | | | 999,000 | |
Anchorage Capital CLO Ltd.(b): | | | | | | | | |
Series 2013-1A, Class DR, 9.14%, 10/13/30(c) | | | 1,000 | | | | 1,017,163 | |
Series 2014-4RA, Class D, 4.96%, 01/28/31(c) | | | 1,000 | | | | 995,597 | |
Series 2016-9A, Class D, (3 mo. LIBOR US + 4.00%), 6.35%, 01/15/29(d) | | | 1,000 | | | | 1,007,168 | |
Apidos CLO XVIII, Series 2014-18A, Class D, (3 mo. LIBOR US + 5.20%), 7.56%, 07/22/26(b)(d) | | | 1,000 | | | | 1,004,254 | |
Apidos CLO XXI, Series 2015-21A(b): | | | | | | | | |
Class D, (3 mo. LIBOR US + 5.55%),
7.91%, 07/18/27(d) | | | 500 | | | | 501,166 | |
Class DR, 1.00%, 07/18/27(c)(e) | | | 500 | | | | 500,000 | |
Ares XXVIII CLO Ltd., Series 2013-3A, Class DR, (3 mo. LIBOR US + 3.25%), 5.60%, 10/17/24(b)(d) | | | 1,000 | | | | 1,000,971 | |
Ares XXXIV CLO Ltd., Series 2015-2A, Class E2, (3 mo. LIBOR US + 5.20%), 7.56%, 07/29/26 (b)(d) | | | 1,000 | | | | 1,000,444 | |
Atrium X, Series 10A, Class E, (3 mo. LIBOR US + 4.50%), 6.85%, 07/16/25(b)(d) | | | 500 | | | | 500,299 | |
Bayview Financial Revolving Asset Trust, Series 2005-E, Class A1, (1 mo. LIBOR + 1.00%), 3.10%, 12/28/40(b)(d) | | | 2,236 | | | | 2,117,030 | |
Benefit Street Partners CLO II Ltd., Series 2013-IIA, Class CR, (3 mo. LIBOR US + 3.70%),
6.05%, 07/15/29(b)(d) | | | 1,500 | | | | 1,510,600 | |
BlueMountain CLO Ltd.(b)(d): | | | | | | | | |
Series 2014-1A, Class E, (3 mo. LIBOR US + 4.75%), 7.11%, 04/30/26 | | | 1,000 | | | | 1,001,768 | |
Series 2014-3A, Class D, (3 mo. LIBOR US + 5.10%), 7.45%, 10/15/26 | | | 1,000 | | | | 1,000,682 | |
C-BASS Trust, Series 2007-CB1, Class AF4,
3.67%, 01/25/37(c)(f) | | | 2,342 | | | | 1,114,606 | |
Carlyle Global Market Strategies CLO Ltd., Series 2015-3A, Class D, (3 mo. LIBOR US + 5.70%),
8.06%, 07/28/28(b)(d) | | | 1,000 | | | | 999,921 | |
Conseco Finance Corp.: | | | | | | | | |
Series 1997-2, Class M1, 7.54%, 06/15/28(c) | | | 1,720 | | | | 1,707,939 | |
Series 2001-D, Class B1, (1 mo. LIBOR + 2.50%),
4.57%, 11/15/32(d) | | | 1,147 | | | | 1,143,702 | |
Conseco Finance Securitizations Corp., Series 2002-1, Class M2, 9.55%, 12/01/33(c) | | | 2,500 | | | | 2,662,129 | |
Credit-Based Asset Servicing & Securitization LLC, Series 2006-MH1, Class B1, 6.25%, 10/25/36(b)(c)(f) | | | 1,000 | | | | 1,010,088 | |
CSMC Trust, Series 2017-1TR, 4.50%, 03/25/21(b) | | | 1,045 | | | | 1,051,902 | |
CWABS Asset-Backed Certificates Trust, Series 2005-17, Class 1AF4, 4.42%, 05/25/36(c)(f) | | | 834 | | | | 773,262 | |
Deutsche Financial Capital Securitization LLC, Series 1991-I, Class M, 6.80%, 04/15/28 | | | 1,265 | | | | 1,320,589 | |
Dryden 64 CLO Ltd., Series 2018-64A, Class D,
4.87%, 04/18/31(b)(c) | | | 1,000 | | | | 989,952 | |
First Franklin Mortgage Loan Trust, Series 2006-FF16, Class 2A3, (1 mo. LIBOR US + 0.14%),
2.23%, 12/25/36(d) | | | 705 | | | | 433,614 | |
GoldenTree Loan Opportunities IX Ltd., Series 2014-9A, Class D, (3 mo. LIBOR US + 3.50%),
5.86%, 10/29/26(b)(d) | | | 750 | | | | 751,148 | |
Highbridge Loan Management Ltd.(d): | | | | | | | | |
Series 5A-2015, Class E, (3 mo. LIBOR US + 5.35%), 7.71%, 01/29/26(b) | | | 750 | | | | 750,964 | |
Series 5X-2015, Class E, (3 mo. LIBOR US + 5.35%), 7.71%, 01/29/26 | | | 1,000 | | | | 1,001,285 | |
| | | | | | | | |
| Security | | Par
(000) | | | Value | |
| Asset-Backed Securities (continued) | |
Lehman ABS Manufactured Housing Contract Trust, Series 2002-A, Class C, 0.00%, 06/15/33(c) | | | USD 2,511 | | | $ | 2,030,578 | |
Long Beach Mortgage Loan Trust (d): | | | | | | | | |
Series 2006-2, Class 2A4, (1 mo. LIBOR US + 0.29%), 2.38%, 03/25/46 | | | 685 | | | | 342,564 | |
Series 2006-4, Class 2A4, (1 mo. LIBOR US + 0.26%), 2.35%, 05/25/36 | | | 872 | | | | 407,533 | |
Series 2006-5, Class 2A3, (1 mo. LIBOR US + 0.15%), 2.24%, 06/25/36 | | | 1,139 | | | | 667,256 | |
Series 2006-7, Class 2A3, (1 mo. LIBOR US + 0.16%), 2.25%, 08/25/36 | | | 1,778 | | | | 952,499 | |
Series 2006-7, Class 2A4, (1 mo. LIBOR US + 0.24%), 2.33%, 08/25/36 | | | 1,778 | | | | 936,315 | |
Series 2006-9, Class 2A3, (1 mo. LIBOR US + 0.16%), 2.25%, 10/25/36 | | | 1,592 | | | | 698,252 | |
Madison Park Funding XIV Ltd., Series 2014-14A, Class E, (3 mo. LIBOR US + 4.75%), 7.11%, 07/20/26(b)(d) | | | 1,750 | | | | 1,755,479 | |
Merrill Lynch Mortgage Investors Trust, Series 2006-OPT1, Class M1, (1 mo. LIBOR US + 0.26%),
2.35%, 08/25/37(d) | | | 1,899 | | | | 399,369 | |
Neuberger Berman CLO XV, Series 2013-15A, Class DR, 5.40%, 10/15/29(b)(c) | | | 1,000 | | | | 1,001,859 | |
Oak Hill Credit Partners X Ltd., Series 2014-10A, Class DR, (3 mo. LIBOR US + 3.25%), 5.61%, 07/20/26(b)(d) | | | 1,500 | | | | 1,500,862 | |
OHA Credit Partners IX Ltd., Series 2013-9A, Class DR, (3 mo. LIBOR US + 3.30%), 5.66%, 10/20/25(b)(d) | | | 1,000 | | | | 1,000,846 | |
Option One Mortgage Loan Trust, Series 2007-FXD1, Class 2A1, 5.87%, 01/25/37(f) | | | 939 | | | | 883,323 | |
OZLM VII Ltd., Series 2014-7A, Class CR, (3 mo. LIBOR US + 3.50%), 5.85%, 07/17/26(b)(d) | | | 1,000 | | | | 999,987 | |
Palmer Square CLO Ltd., Series 2013-2A, Class CR, (3 mo. LIBOR US + 3.60%), 5.95%, 10/17/27(b)(d) | | | 1,000 | | | | 1,001,973 | |
Park Avenue Institutional Advisers CLO Ltd., Series 2016-1A, Class D, (3 mo. LIBOR US + 7.00%),
9.33%, 08/23/28(b)(d) | | | 500 | | | | 500,993 | |
Rockford Tower CLO Ltd., Series 2017-1A, Class D, (3 mo. LIBOR US + 3.25%), 5.60%, 04/15/29(b)(d) | | | 1,000 | | | | 1,001,287 | |
RSO REPO SPE Trust, 5.20%, 09/15/20(a)(b) | | | 1,422 | | | | 1,422,478 | |
Sound Point CLO V Ltd., Series 2014-1A, Class E, (3 mo. LIBOR US + 4.25%), 6.61%, 04/18/26(b)(d) | | | 1,000 | | | | 1,001,020 | |
THL Credit Wind River CLO Ltd., Series 2014-3A, Class DR, (3 mo. LIBOR US + 3.35%), 5.71%, 01/22/27(b)(d) | | | 1,000 | | | | 1,000,894 | |
TIAA CLO II Ltd., Series 2017-1A, Class E, (3 mo. LIBOR US + 5.85%), 8.21%, 04/20/29(b)(d) | | | 1,000 | | | | 1,006,720 | |
York CLO 1 Ltd., Series 2014-1A(b)(d): | | | | | | | | |
Class DR, (3 mo. LIBOR US + 3.40%), 5.76%, 01/22/27 | | | 500 | | | | 500,370 | |
Class E, (3 mo. LIBOR US + 5.45%), 7.81%, 01/22/27 | | | 1,000 | | | | 1,000,387 | |
| | | | | | | | |
Total Asset-Backed Securities — 24.9%
(Cost — $52,016,578) | | | | 52,096,738 | |
| | | | | | | | |
|
Corporate Bonds — 52.0% | |
|
| Argentina — 3.9% | |
Aeropuertos Argentina 2000 SA, 6.88%, 02/01/27(b) | | | 928 | | | | 890,416 | |
Arcor SAIC, 6.00%, 07/06/23(b) | | | 529 | | | | 528,735 | |
Cablevision SA, 6.50%, 06/15/21(b) | | | 529 | | | | 525,599 | |
Cia Latinoamericana de Infraestructura & Servicios SA, 9.50%, 07/20/23(b) | | | 951 | | | | 771,736 | |
Generacion Mediterranea SA/Generacion Frias SA/Central Termica Roca SA, 9.63%, 07/27/23(b)(g) | | | 1,078 | | | | 1,075,294 | |
Genneia SA, 8.75%, 01/20/22(b)(g) | | | 1,689 | | | | 1,629,311 | |
| | |
| 8 | | 2018 BLACKROCK SEMI-ANNUAL REPORTTO SHAREHOLDERS |
| | |
Schedule of Investments (unaudited) (continued) June 30, 2018 | | BlackRock 2022 Global Income Opportunity Trust (BGIO) (Percentages shown are based on Net Assets) |
| | | | | | | | | | | | |
| Security | | Par
(000) | | | Value | |
|
| Argentina (continued) | |
Tarjeta Naranja SA(Argentina Deposit Rates Badlar Pvt Banks + 3.50%), 26.19%, 04/11/22(b)(d)(g) | | | USD | | | | 740 | | | $ | 392,200 | |
YPF SA: | | | | | | | | | | | | |
(Argentina Deposit Rates Badlar Pvt Banks + 4.00%), 26.56%, 07/07/20(d) | | | | | | | 2,788 | | | | 1,392,239 | |
8.50%, 07/28/25 | | | | | | | 1,043 | | | | 993,145 | |
| | | | | | | | | | | | |
| | | | | | | | | | | 8,198,675 | |
| Bahrain — 0.1% | |
Oil and Gas Holding Co. BSCC, 7.50%, 10/25/27 | | | | | | | 200 | | | | 177,825 | |
| | | | | | | | | | | | |
| Bermuda — 0.4% | |
China Singyes Solar Technologies Holdings Ltd.,
7.95%, 02/15/19 | | | | | | | 300 | | | | 241,800 | |
Digicel Group Ltd., 8.25%, 09/30/20(b) | | | | | | | 558 | | | | 421,290 | |
Geopark Ltd., 6.50%, 09/21/24(b) | | | | | | | 200 | | | | 191,828 | |
| | | | | | | | | | | | |
| | | | | | | | | | | 854,918 | |
| British Virgin Islands — 0.9% | |
Baoxin Auto Finance I Ltd., 6.63%, 04/02/19 | | | | | | | 200 | | | | 198,003 | |
Central American Bottling Corp., 5.75%, 01/31/27(b) | | | | | | | 626 | | | | 622,870 | |
New Lion Bridge Co. Ltd., 9.75%, 10/10/20 | | | | | | | 200 | | | | 195,195 | |
Prime Bloom Holdings Ltd., 6.95%, 07/05/22 | | | | | | | 200 | | | | 152,800 | |
Rock International Investment Co., 6.63%, 03/27/20 | | | | | | | 550 | | | | 417,175 | |
Yingde Gases Investment Ltd. Co., 7.25%, 02/28/20 | | | | | | | 300 | | | | 299,992 | |
| | | | | | | | | | | | |
| | | | | | | | | | | 1,886,035 | |
| Canada — 3.8% | |
Canbriam Energy, Inc., 9.75%, 11/15/19(b)(g) | | | | | | | 1,540 | | | | 1,555,400 | |
Frontera Energy Corp., 9.70%, 06/25/23(b) | | | | | | | 1,000 | | | | 991,250 | |
Hammerhead Resources, Inc., Series AI, 9.00%, 07/10/22 | | | | | | | 1,500 | | | | 1,425,000 | |
Largo Resources Ltd., 9.25%, 06/01/21(b) | | | | | | | 234 | | | | 234,000 | |
NOVA Chemicals Corp., 5.25%, 06/01/27(b)(g) | | | | | | | 1,495 | | | | 1,393,153 | |
Stoneway Capital Corp., 10.00%, 03/01/27(b)(g) | | | | | | | 1,513 | | | | 1,512,228 | |
Valeant Pharmaceuticals International, Inc.,
9.00%, 12/15/25 (b) | | | | | | | 844 | | | | 874,553 | |
| | | | | | | | | | | | |
| | | | | | | | | | | 7,985,584 | |
| Cayman Islands — 4.4% | |
Alpha Star Holding V Ltd., 6.63%, 04/18/23 | | | | | | | 200 | | | | 188,461 | |
Ambac LSNI LLC, 7.34%, 02/12/23(b)(c) | | | | | | | 577 | | | | 585,421 | |
Central China Real Estate Ltd., 6.88%, 10/23/20 | | | | | | | 200 | | | | 194,296 | |
China Aoyuan Property Group Ltd., 7.50%, 05/10/21 | | | | | | | 200 | | | | 192,960 | |
China Huiyuan Juice Group Ltd., 6.50%, 08/16/20 | | | | | | | 200 | | | | 120,099 | |
China SCE Property Holdings Ltd., 7.45%, 04/17/21 | | | | | | | 300 | | | | 293,194 | |
CIFI Holdings Group Co. Ltd., 6.88%, 04/23/21 | | | | | | | 200 | | | | 197,461 | |
Energuate Trust, 5.88%, 05/03/27(b) | | | | | | | 503 | | | | 482,251 | |
Fantasia Holdings Group Co. Ltd.: | | | | | | | | | | | | |
7.25%, 02/13/19 | | | | | | | 200 | | | | 194,743 | |
8.38%, 03/08/21 | | | | | | | 200 | | | | 177,592 | |
FWD, Ltd., 5.50%(c)(h) | | | | | | | 200 | | | | 186,000 | |
Golden Wheel Tiandi Holdings Co. Ltd., 7.00%, 01/18/21 | | | | | | | 200 | | | | 187,977 | |
Gran Tierra Energy International Holdings Ltd.,
6.25%, 02/15/25(b) | | | | | | | 400 | | | | 375,500 | |
Jingrui Holdings Ltd., 9.45%, 04/23/21 | | | | | | | 200 | | | | 191,890 | |
Kaisa Group Holdings Ltd., 7.25%, 06/30/20 | | | | | | | 200 | | | | 179,100 | |
Latam Finance Ltd., 6.88%, 04/11/24(b)(g) | | | | | | | 645 | | | | 630,487 | |
Logan Property Holdings Co. Ltd., Series JUL,
6.88%, 04/24/21 | | | | | | | 250 | | | | 247,558 | |
Pearl Holding III Ltd., 9.50%, 12/11/22 | | | | | | | 200 | | | | 185,103 | |
Powerlong Real Estate Holdings Ltd., 6.95%, 04/17/21 | | | | | | | 300 | | | | 284,961 | |
Redco Group, 6.38%, 02/27/19 | | | | | | | 200 | | | | 191,150 | |
Ronshine China Holdings Ltd., 6.95%, 12/08/19 | | | | | | | 200 | | | | 193,900 | |
| | | | | | | | | | | | |
| Security | | Par
(000) | | | Value | |
| Cayman Islands (continued) | |
Times China Holdings Ltd.: | | | | | | | | | | | | |
6.25%, 01/17/21 | | | USD | | | | 500 | | | $ | 472,984 | |
7.85%, 06/04/21 | | | | | | | 300 | | | | 291,431 | |
Transocean Phoenix 2 Ltd., 7.75%, 10/15/24(b) | | | | | | | 1,404 | | | | 1,504,249 | |
Vale Overseas Ltd., 6.25%, 08/10/26(g) | | | | | | | 669 | | | | 724,527 | |
Yankuang Group Cayman Ltd., 4.75%, 11/30/20 | | | | | | | 200 | | | | 191,250 | |
Yuzhou Properties Co. Ltd., 7.90%, 05/11/21 | | | | | | | 500 | | | | 506,143 | |
| | | | | | | | | | | | |
| | | | | | | | | | | 9,170,688 | |
| Chile — 0.5% | |
Baoxin Auto Finance I Ltd., 5.63%(c)(h) | | | | | | | 200 | | | | 177,488 | |
Celeo Redes Operacion Chile SA, 5.20%, 06/22/47(b) | | | | | | | 750 | | | | 732,187 | |
Shandong Iron And Steel Xinheng International Co. Ltd., 6.50%, 06/14/21 | | | | | | | 200 | | | | 186,176 | |
| | | | | | | | | | | | |
| | | | | | | | | | | 1,095,851 | |
| China — 0.5% | |
Easy Tactic Ltd., 7.00%, 04/25/21 | | | | | | | 200 | | | | 193,984 | |
Excel Capital Global Ltd., 7.00%(a)(c)(h) | | | | | | | 200 | | | | 196,500 | |
Greenland Global Investment Ltd., 7.19%, 09/26/21(c) | | | | | | | 200 | | | | 199,992 | |
Guangxi Financial Investment Group Co. Ltd.,
5.75%, 01/23/21 | | | | | | | 200 | | | | 168,015 | |
Huachen Energy Co. Ltd., 6.63%, 05/18/20 | | | | | | | 300 | | | | 200,850 | |
| | | | | | | | | | | | |
| | | | | | | | | | | 959,341 | |
| Colombia — 0.2% | |
Credivalores-Crediservicios SAS, 9.75%, 07/27/22(b) | | | | | | | 400 | | | | 392,000 | |
| | | | | | | | | | | | |
| Dominican Republic — 0.5% | |
Aeropuertos Dominicanos Siglo XXI SA,
6.75%, 03/30/29(b) | | | | | | | 928 | | | | 965,120 | |
| | | | | | | | | | | | |
| Germany — 0.7% | |
Unitymedia GmbH, 6.13%, 01/15/25(b)(g) | | | | | | | 1,540 | | | | 1,586,200 | |
| | | | | | | | | | | | |
| Honduras — 0.2% | |
Inversiones Atlantida SA, 8.25%, 07/28/22(b) | | | | | | | 400 | | | | 410,964 | |
| | | | | | | | | | | | |
| Hong Kong — 0.1% | |
Studio City Finance Ltd., 8.50%, 12/01/20 | | | | | | | 300 | | | | 301,500 | |
| | | | | | | | | | | | |
| India — 0.2% | |
JSW Steel Ltd., 5.25%, 04/13/22 | | | | | | | 400 | | | | 388,854 | |
| | | | | | | | | | | | |
| Indonesia — 0.3% | |
Bukit Makmur Mandiri Uta, 7.75%, 02/13/22 | | | | | | | 300 | | | | 289,404 | |
Jasa Marga Persero Tbk PT, 7.50%, 12/11/20 | | | IDR | | | | 2,000,000 | | | | 138,047 | |
Wijaya Karya Persero Tbk PT, 7.70%, 01/31/21 | | | | | | | 2,000,000 | | | | 140,544 | |
| | | | | | | | | | | | |
| | | | | | | | | | | 567,995 | |
| Ireland — 0.7% | |
Ardagh Packaging Finance PLC/Ardagh Holdings USA, Inc., 6.00%, 02/15/25(b)(g) | | | USD | | | | 1,540 | | | | 1,499,575 | |
| | | | | | | | | | | | |
| Luxembourg — 1.4% | |
Gilex Holding Sarl, 8.50%, 05/02/23(b) | | | | | | | 364 | | | | 374,283 | |
Minerva Luxembourg SA, 6.50%, 09/20/26(b) | | | | | | | 557 | | | | 510,351 | |
Rumo Luxembourg Sarl, 7.38%, 02/09/24(b)(g) | | | | | | | 928 | | | | 937,289 | |
Telecom Italia Capital SA, 6.38%, 11/15/33 | | | | | | | 385 | | | | 379,225 | |
VM Holdings SA, 5.38%, 05/04/27(b)(g) | | | | | | | 750 | | | | 727,500 | |
| | | | | | | | | | | | |
| | | | | | | | | | | 2,928,648 | |
| Malaysia — 0.1% | |
Press Metal Labuan Ltd., 4.80%, 10/30/22 | | | | | | | 200 | | | | 184,882 | |
| | | | | | | | | | | | |
| Mexico — 1.9% | |
Cydsa SAB de C.V., 6.25%, 10/04/27(b) | | | | | | | 800 | | | | 721,200 | |
Docuformas SAPI de C.V., 9.25%, 10/11/22(b) | | | | | | | 400 | | | | 362,000 | |
Grupo Bimbo SAB de C.V., 5.95%(b)(c)(h) | | | | | | | 796 | | | | 786,050 | |
| | | | |
| SCHEDULE OF INVESTMENTS | | | 9 | |
| | |
Schedule of Investments (unaudited) (continued) June 30, 2018 | | BlackRock 2022 Global Income Opportunity Trust (BGIO) (Percentages shown are based on Net Assets) |
| | | | | | | | | | | | |
| Security | | Par
(000) | | | Value | |
| Mexico (continued) | |
Mexichem SAB de CV, 5.50%, 01/15/48(b) | | | USD | | | | 460 | | | $ | 401,378 | |
Petroleos Mexicanos: | | | | | | | | | | | | |
6.50%, 03/13/27 | | | | | | | 417 | | | | 427,600 | |
5.35%, 02/12/28(b) | | | | | | | 44 | | | | 41,659 | |
Trust F/1401, 6.95%, 01/30/44 | | | | | | | 1,192 | | | | 1,168,160 | |
| | | | | | | | | | | | |
| | | | | | | | | | | 3,908,047 | |
| Mongolia — 0.0% | |
Energy Resources LLC, 8.00%, 09/30/22(c) | | | | | | | 34 | | | | 32,671 | |
| | | | | | | | | | | | |
| Netherlands — 1.9% | |
Greenko Dutch BV, 5.25%, 07/24/24 | | | | | | | 200 | | | | 182,400 | |
Jababeka International BV, 6.50%, 10/05/23 | | | | | | | 500 | | | | 419,765 | |
Petrobras Global Finance BV(g): | | | | | | | | | | | | |
6.13%, 01/17/22 | | | | | | | 387 | | | | 393,579 | |
8.75%, 05/23/26 | | | | | | | 659 | | | | 713,367 | |
6.00%, 01/27/28(b) | | | | | | | 706 | | | | 638,930 | |
Royal Capital BV, 5.88%(h) | | | | | | | 200 | | | | 187,878 | |
Ziggo Secured Finance BV, 5.50%, 01/15/27(b)(g) | | | | | | | 1,540 | | | | 1,438,514 | |
| | | | | | | | | | | | |
| | | | | | | | | | | 3,974,433 | |
| Panama — 0.4% | |
Avianca Holdings SA/Avianca Leasing LLC/Grupo Taca Holdings Ltd., 8.38%, 05/10/20 | | | | | | | 757 | | | | 762,677 | |
| | | | | | | | | | | | |
| Singapore — 0.5% | |
APL Realty Holdings Pte Ltd., 5.95%, 06/02/24 | | | | | | | 200 | | | | 152,986 | |
Global Prime Capital Pte Ltd., 7.25%, 04/26/21 | | | | | | | 200 | | | | 198,960 | |
Medco Straits Services Pte Ltd., 8.50%, 08/17/22 | | | | | | | 200 | | | | 199,373 | |
Modernland Overseas Pte Ltd., 6.95%, 04/13/24 | | | | | | | 400 | | | | 344,169 | |
SSMS Plantation Holdings Pte Ltd., 7.75%, 01/23/23 | | | | | | | 285 | | | | 250,684 | |
| | | | | | | | | | | | |
| | | | | | | | | | | 1,146,172 | |
| Turkey — 0.2% | |
Petkim Petrokimya Holding, 5.88%, 01/26/23(b) | | | | | | | 440 | | | | 399,807 | |
| | | | | | | | | | | | |
| United Kingdom — 0.9% | |
MARB BondCo PLC: | | | | | | | | | | | | |
7.00%, 03/15/24 | | | | | | | 200 | | | | 192,250 | |
6.88%, 01/19/25(b) | | | | | | | 1,357 | | | | 1,289,150 | |
Vedanta Resources PLC, 7.13%, 05/31/23 | | | | | | | 500 | | | | 471,250 | |
| | | | | | | | | | | | |
| | | | | | | | | | | 1,952,650 | |
| United States — 27.3% | |
Ambac Assurance Corp., 5.10%, 06/07/20(b) | | | | | | | 23 | | | | 30,327 | |
Arconic, Inc., 6.75%, 01/15/28(g) | | | | | | | 1,540 | | | | 1,634,325 | |
BlueLine Rental Finance Corp., 9.25%, 03/15/24(b) | | | | | | | 1,500 | | | | 1,595,850 | |
Bristow Group, Inc., 8.75%, 03/01/23(b)(g) | | | | | | | 1,496 | | | | 1,456,730 | |
Calpine Corp., 5.75%, 01/15/25(g) | | | | | | | 1,540 | | | | 1,408,138 | |
Carlson Travel, Inc., 6.75%, 12/15/23(b) | | | | | | | 886 | | | | 868,280 | |
Carrizo Oil & Gas, Inc., 7.50%, 09/15/20(g) | | | | | | | 281 | | | | 282,756 | |
CCO Holdings LLC/CCO Holdings Capital Corp.,
5.13%, 05/01/27(b)(g) | | | | | | | 1,540 | | | | 1,440,863 | |
Centennial Resource Production LLC,
5.38%, 01/15/26(b) | | | | | | | 1,500 | | | | 1,458,750 | |
Cheniere Corpus Christi Holdings LLC,
5.13%, 06/30/27(g) | | | | | | | 1,489 | | | | 1,475,971 | |
Cheniere Energy, Inc. (4.88% PIK), 05/28/21 (b)(i)(j) | | | | | | | 615 | | | | 631,913 | |
Commercial Metals Co., 5.38%, 07/15/27 | | | | | | | 95 | | | | 90,250 | |
CSC Holdings LLC, 10.88%, 10/15/25(b)(g) | | | | | | | 1,268 | | | | 1,461,750 | |
DaVita, Inc., 5.00%, 05/01/25(g) | | | | | | | 1,540 | | | | 1,449,525 | |
Five Point Operating Co. LP/Five Point Capital Corp., 7.88%, 11/15/25(b)(g) | | | | | | | 1,050 | | | | 1,069,688 | |
Frontier Communications Corp.: | | | | | | | | | | | | |
7.13%, 03/15/19 | | | | | | | 1,540 | | | | 1,551,550 | |
8.50%, 04/01/26(b) | | | | | | | 1,679 | | | | 1,620,235 | |
Great Lakes Dredge & Dock Corp., 8.00%, 05/15/22 | | | | | | | 150 | | | | 153,375 | |
| | | | | | | | | | | | |
| Security | | Par
(000) | | | Value | |
| United States (continued) | |
HCA, Inc., 5.88%, 02/15/26(g) | | | USD | | | | 1,540 | | | $ | 1,553,475 | |
Herc Rentals, Inc., 7.50%, 06/01/22 (b) | | | | | | | 1,500 | | | | 1,586,250 | |
Iron Mountain US Holdings, Inc., 5.38%, 06/01/26(b)(g) | | | | | | | 1,540 | | | | 1,463,000 | |
Jagged Peak Energy LLC, 5.88%, 05/01/26(b) | | | | | | | 649 | | | | 636,020 | |
K Hovnanian Enterprises, Inc., 10.00%, 07/15/22(b)(g) | | | | | | | 1,500 | | | | 1,578,750 | |
Kaiser Aluminum Corp., 5.88%, 05/15/24(g) | | | | | | | 1,540 | | | | 1,570,800 | |
KFC Holding Co./Pizza Hut Holdings LLC/Taco Bell of America LLC, 5.00%, 06/01/24(b)(g) | | | | | | | 800 | | | | 789,760 | |
MGM Growth Properties Operating Partnership LP/MGP Finance Co-Issuer, Inc., 4.50%, 09/01/26(g) | | | | | | | 1,600 | | | | 1,486,000 | |
NGPL PipeCo LLC, 7.77%, 12/15/37(b)(g) | | | | | | | 1,000 | | | | 1,175,000 | |
Owens-Brockway Glass Container, Inc.,
6.38%, 08/15/25(b)(g) | | | | | | | 1,495 | | | | 1,532,375 | |
Post Holdings, Inc., 5.00%, 08/15/26(b)(g) | | | | | | | 1,540 | | | | 1,436,050 | |
Quicken Loans, Inc., 5.75%, 05/01/25(b) | | | | | | | 1,638 | | | | 1,603,242 | |
Resolute Energy Corp., 8.50%, 05/01/20(g) | | | | | | | 1,725 | | | | 1,720,687 | |
Sable Permian Resources Land LLC/AEPB Finance Corp., 13.00%, 11/30/20 (b)(g) | | | | | | | 1,400 | | | | 1,547,000 | |
Scientific Games International, Inc.,
10.00%, 12/01/22(g) | | | | | | | 1,500 | | | | 1,600,455 | |
SEACOR Holdings, Inc., 3.25%, 05/15/30 | | | | | | | 1,500 | | | | 1,528,335 | |
Sprint Corp., 7.88%, 09/15/23(g) | | | | | | | 1,540 | | | | 1,596,787 | |
Sunoco LP/Sunoco Finance Corp.,
5.88%, 03/15/28(b)(g) | | | | | | | 777 | | | | 732,579 | |
T-Mobile USA, Inc., 6.50%, 01/15/26(g) | | | | | | | 1,540 | | | | 1,588,125 | |
Talen Energy Supply LLC, 10.50%, 01/15/26(b)(g) | | | | | | | 1,500 | | | | 1,336,875 | |
Team Health Holdings, Inc., 6.38%, 02/01/25(b)(g) | | | | | | | 1,500 | | | | 1,290,000 | |
TransDigm, Inc., 6.50%, 05/15/25(g) | | | | | | | 1,540 | | | | 1,557,325 | |
United Rentals North America, Inc.,
4.88%, 01/15/28(g) | | | | | | | 1,500 | | | | 1,388,925 | |
Venator Finance Sarl/Venator Materials LLC,
5.75%, 07/15/25(b) | | | | | | | 200 | | | | 191,000 | |
VICI Properties 1 LLC/VICI FC, Inc., 8.00%, 10/15/23 | | | | | | | 292 | | | | 324,675 | |
Weekley Homes LLC/Weekley Finance Corp.(g): | | | | | | | | | | | | |
6.00%, 02/01/23 | | | | | | | 1,500 | | | | 1,460,625 | |
6.63%, 08/15/25(b) | | | | | | | 1,859 | | | | 1,761,402 | |
Zayo Group LLC/Zayo Capital, Inc.,
5.75%, 01/15/27(b)(g) | | | | | | | 1,540 | | | | 1,513,050 | |
| | | | | | | | | | | | |
| | | | | | | | | | | 57,228,843 | |
| | | | | | | | | | | | |
Total Corporate Bonds — 52.0%
(Cost — $115,550,341) | | | | 108,959,955 | |
| | | | | | | | | | | | |
|
Floating Rate Loan Interests (d) — 12.4% | |
|
| Netherlands — 0.6% | |
Stars Group Holdings B.V., 2018 USD Incremental Term Loan, 07/28/25(k) | | | | | | | 1,200 | | | | 1,200,756 | |
| | | | | | | | | | | | |
| United States — 11.8% | |
AL Midcoast Holdings LLC, 2018 Term Loan B,
06/28/25(a)(k) | | | | | | | 380 | | | | 378,100 | |
Beacon Roofing Supply, Inc., 2017 Term Loan B,
(1 mo. LIBOR + 2.25%), 4.28%, 01/02/25 | | | | | | | 654 | | | | 649,555 | |
Caesars Resort Collection LLC, 2017 1st Lien Term Loan B, (1 mo. LIBOR + 2.75%), 4.84%, 12/22/24 | | | | | | | 858 | | | | 854,585 | |
California Resources Corp., 2017 1st Lien Term Loan,
(1 mo. LIBOR + 4.75%), 6.84%, 12/31/22 | | | | | | | 893 | | | | 908,074 | |
Chesapeake Energy Corp., Term Loan,
(1 mo. LIBOR + 7.50%), 9.59%, 08/23/21 | | | | | | | 1,500 | | | | 1,567,815 | |
Chimera Special Holding LLC, Term Loan,
(1 mo. LIBOR + 2.00%), 4.00%, 10/04/19(a) | | | | | | | 2,221 | | | | 2,221,445 | |
First Data Corp., 2024 Term Loan,
(1 mo. LIBOR + 2.00%), 4.09%, 04/26/24 | | | | | | | 515 | | | | 511,596 | |
| | |
| 10 | | 2018 BLACKROCK SEMI-ANNUAL REPORTTO SHAREHOLDERS |
| | |
Schedule of Investments (unaudited) (continued) June 30, 2018 | | BlackRock 2022 Global Income Opportunity Trust (BGIO) (Percentages shown are based on Net Assets) |
| | | | | | | | | | | | |
| Security | | Par
(000) | | | Value | |
| United States (continued) | |
Gates Global LLC, 2017 Repriced Term Loan B,
(3 mo. LIBOR + 2.75%), 5.08%, 04/01/24 | | | USD | | | | 1,576 | | | $ | 1,573,482 | |
HD Supply, Inc., Term Loan B4, 10/17/23(k) | | | | | | | 860 | | | | 861,721 | |
Hilton Worldwide Finance LLC, Term Loan B2,
(1 mo. LIBOR + 1.75%), 3.84%, 10/25/23 | | | | | | | 570 | | | | 569,724 | |
Jeld-Wen, Inc., 2017 1st Lien Term Loan,
(3 mo. LIBOR + 2.00%), 4.33%, 12/14/24 | | | | | | | 891 | | | | 886,906 | |
Level 3 Financing, Inc., 2017 Term Loan B,
(1 mo. LIBOR + 2.25%), 4.33%, 02/22/24 | | | | | | | 863 | | | | 860,070 | |
LSF9 Cypress Holdings LLC, 2018 Term Loan B, 05/10/25(k) | | | | | | | 565 | | | | 563,237 | |
LSTAR Securities Financing Vehicle:LPN, 2018 Term Loan, (1 mo. LIBOR + 2.00%), 3.98%, 04/01/21(a) | | | | | | | 709 | | | | 706,491 | |
MGM Growth Properties Operating Partnership LP, 2016 Term Loan B, (1 mo. LIBOR + 2.00%),
4.09%, 04/25/23 | | | | | | | 860 | | | | 855,147 | |
Pioneer Energy Services Corp., Term Loan,
(1 mo. LIBOR + 7.75%), 9.80%, 11/08/22(a) | | | | | | | 1,504 | | | | 1,552,880 | |
Ply Gem Industries, Inc., 2018 Term Loan,
(3 mo. LIBOR + 3.75%), 6.09%, 04/12/25 | | | | | | | 2,200 | | | | 2,193,136 | |
Robertshaw US Holding Corp., 2018 1st Lien Term Loan, (1 mo. LIBOR + 3.50%), 5.63%, 02/28/25 | | | | | | | 858 | | | | 856,157 | |
Scientific Games International, Inc., 2018 Term Loan B5, (2 mo. LIBOR + 2.75%), 4.91%, 08/14/24 | | | | | | | 1,576 | | | | 1,564,219 | |
SRS Distribution, Inc., 2018 1st Lien Term Loan, (3 mo. LIBOR + 3.25%), 5.58%, 05/23/25 | | | | | | | 160 | | | | 157,467 | |
Summit Materials Companies I LLC, 2017 Term Loan B, (1 mo. LIBOR + 2.00%), 4.09%, 11/21/24 | | | | | | | 861 | | | | 856,394 | |
VICI Properties 1 LLC, Replacement Term Loan B,
(1 mo. LIBOR + 2.00%), 4.08%, 12/20/24 | | | | | | | 864 | | | | 857,163 | |
Vistra Operations Co. LLC, 2016 Term Loan B2,
12/14/23 (k) | | | | | | | 1,197 | | | | 1,190,235 | |
XPO Logistics, Inc., 2018 Term Loan B,
(1 mo. LIBOR + 2.00%), 4.09%, 02/24/25 | | | | | | | 1,580 | | | | 1,565,595 | |
| | | | | | | | | | | | |
| | | | | | | | | | | 24,054,703 | |
| | | | | | | | | | | | |
Total Floating Rate Loan Interests — 12.4%
(Cost — $26,035,394) | | | | 25,961,950 | |
| | | | | | | | | | | | |
|
Foreign Agency Obligations — 12.2% | |
|
| Argentina — 1.6% | |
Argentine Republic Government International Bond: | | | | | | | | | | | | |
6.88%, 04/22/21 | | | | | | | 1,115 | | | | 1,098,275 | |
5.63%, 01/26/22 | | | | | | | 918 | | | | 857,871 | |
6.88%, 01/26/27 | | | | | | | 1,513 | | | | 1,331,440 | |
| | | | | | | | | | | | |
| | | | | | | | | | | 3,287,586 | |
| Bahrain — 0.1% | |
Bahrain Government International Bond
6.75%, 09/20/29(b) | | | | | | | 314 | | | | 273,180 | |
| | | | | | | | | | | | |
| Colombia — 0.5% | |
Colombia Government International Bond: | | | | | | | | | | | | |
4.38%, 07/12/21 | | | | | | | 415 | | | | 423,508 | |
4.50%, 01/28/26 | | | | | | | 620 | | | | 629,300 | |
| | | | | | | | | | | | |
| | | | | | | | | | | 1,052,808 | |
| Egypt — 1.3% | |
Egypt Government International Bond: | | | | | | | | | | | | |
5.75%, 04/29/20 | | | | | | | 1,568 | | | | 1,587,271 | |
5.58%, 02/21/23(b) | | | | | | | 400 | | | | 379,000 | |
Egypt Government International Bond (continued): | | | | | | | | | | | | |
8.50%, 01/31/47(b) | | | | | | | 728 | | | | 704,427 | |
| | | | | | | | | | | | |
| | | | | | | | | | | 2,670,698 | |
| | | | | | | | | | | | |
| Security | | Par
(000) | | | Value | |
| Indonesia — 3.0% | |
Indonesia Government International Bond: | | | | | | | | | | | | |
3.75%, 04/25/22 | | | IDR | | | | 869 | | | $ | 860,050 | |
4.75%, 01/08/26 | | | | | | | 992 | | | | 1,005,376 | |
4.10%, 04/24/28 | | | | | | | 335 | | | | 323,709 | |
Indonesia Treasury Bond: | | | | | | | | | | | | |
7.88%, 04/15/19 | | | | | | | 29,766,000 | | | | 2,082,374 | |
11.00%, 11/15/20 | | | | | | | 12,986,000 | | | | 971,005 | |
8.38%, 09/15/26 | | | | | | | 14,968,000 | | | | 1,062,801 | |
| | | | | | | | | | | | |
| | | | | | | | | | | 6,305,315 | |
| Lebanon — 0.1% | |
Lebanon Government International Bond
6.85%, 03/23/27 | | | USD | | | | 223 | | | | 175,987 | |
| | | | | | | | | | | | |
| Maldives — 0.1% | |
Republic of Maldives Ministry of Finance and
Treasury Bond 7.00%, 06/07/22 | | | | | | | 200 | | | | 188,992 | |
| | | | | | | | | | | | |
| Mexico — 0.4% | |
Mexican Bonos: | | | | | | | | | | | | |
8.00%, 06/11/20 | | | MXN | | | | 7,100 | | | | 359,350 | |
7.50%, 06/03/27 | | | | | | | 9,200 | | | | 460,439 | |
| | | | | | | | | | | | |
| | | | | | | | | | | 819,789 | |
| Pakistan — 0.1% | |
Pakistan Government International Bond
6.87%, 12/05/27 | | | USD | | | | 200 | | | | 173,264 | |
| | | | | | | | | | | | |
| Qatar — 0.2% | |
Qatar Government International Bond
4.63%, 06/02/46 | | | | | | | 450 | | | | 430,227 | |
| | | | | | | | | | | | |
| Russia — 1.6% | |
Russian Federal Bond — OFZ: | | | | | | | | | | | | |
6.40%, 05/27/20 | | | RUB | | | | 56,360 | | | | 888,460 | |
7.05%, 01/19/28 | | | | | | | 102,328 | | | | 1,574,011 | |
Russian Foreign Bond — Eurobond: | | | | | | | | | | | | |
4.75%, 05/27/26 | | | USD | | | | 400 | | | | 400,402 | |
4.25%, 06/23/27 | | | | | | | 400 | | | | 385,468 | |
5.63%, 04/04/42 | | | | | | | 200 | | | | 208,900 | |
| | | | | | | | | | | | |
| | | | | | | | | | | 3,457,241 | |
| Saudi Arabia — 0.4% | |
Saudi Government International Bond(b): | | | | | | | | | |
3.25%, 10/26/26 | | | | 685 | | | | 641,738 | |
4.50%, 04/17/30 | | | | 200 | | | | 199,767 | |
| | | | | | | | | | | | |
| | | | | | | | 841,505 | |
| South Africa —1.9% | |
Republic of South Africa Government Bond,
6.25%, 03/31/36 | | | ZAR | | | | 16,178 | | | | 852,506 | |
Republic of South Africa Government International Bond: | | | | | | | | | | | | |
5.50%, 03/09/20(g) | | | USD | | | | 609 | | | | 624,389 | |
5.88%, 05/30/22(g) | | | | | | | 2,149 | | | | 2,248,404 | |
4.88%, 04/14/26 | | | | | | | 200 | | | | 192,399 | |
| | | | | | | | | | | | |
| | | | | | | | | | | 3,917,698 | |
| Sri Lanka — 0.2% | |
Sri Lanka Government International Bond: | | | | | | | | | | | | |
5.75%, 04/18/23 | | | | | | | 200 | | | | 191,482 | |
6.75%, 04/18/28 | | | | | | | 200 | | | | 188,730 | |
| | | | | | | | | | | | |
| | | | | | | | | | | 380,212 | |
| Turkey — 0.7% | |
Turkey Government International Bond,
6.25%, 09/26/22(g) | | | | | | | 1,605 | | | | 1,609,561 | |
| | | | | | | | | | | | |
Total Foreign Agency Obligations — 12.2%
(Cost — $27,119,539) | | | | 25,584,063 | |
| | | | | | | | | | | | |
| | | | |
| SCHEDULE OF INVESTMENTS | | | 11 | |
| | |
Schedule of Investments (unaudited) (continued) June 30, 2018 | | BlackRock 2022 Global Income Opportunity Trust (BGIO) (Percentages shown are based on Net Assets) |
| | | | | | | | | | | | |
| Security | | Par
(000) | | | Value | |
Non-Agency Mortgage-Backed Securities — 15.6% | |
|
| Collateralized Mortgage Obligations — 1.5% | |
Alternative Loan Trust, Series 2007-AL1, Class A1,
(1 mo. LIBOR US + 0.25%), 2.34%, 06/25/37 (d) | | | USD | | | | 928 | | | $ | 705,410 | |
ARI Investments LLC, 4.59%, 01/06/25(a)(c) | | | | | | | 955 | | | | 955,310 | |
RALI Trust, Series 2006-QO6, Class A1, (1 mo. LIBOR US + 0.18%), 2.27%, 06/25/46(d) | | | | | | | 3,192 | | | | 1,388,038 | |
| | | | | | | | | | | | |
| | | | | | | | | | | 3,048,758 | |
| Commercial Mortgage-Backed Securities — 14.1% | |
245 Park Avenue Trust, Series 2017-245P, Class E, 3.66%, 06/05/37(b)(c) | | | | | | | 380 | | | | 341,882 | |
Arbor Realty Commercial Real Estate Notes Ltd., Series 2017-FL1, Class B, (1 mo. LIBOR US + 2.50%), 4.57%, 04/15/27(b)(d) | | | | | | | 437 | | | | 442,927 | |
Atrium Hotel Portfolio Trust, Series 2017-ATRM, Class E, 5.12%, 12/15/36(b)(c) | | | | | | | 190 | | | | 189,761 | |
Bayview Commercial Asset Trust, Series 2007-6A, Class A4A, (1 mo. LIBOR + 1.50%),
3.59%, 12/25/37(b)(d) | | | | | | | 2,000 | | | | 1,492,323 | |
BBCMS Mortgage Trust, Series 2018-TALL, Class D, 3.52%, 03/15/37(b)(c) | | | | | | | 500 | | | | 499,215 | |
BBCMS Trust, Series 2015-STP, Class E,
4.43%, 09/10/28(b)(c) | | | | | | | 1,000 | | | | 959,882 | |
BHMS Mortgage Trust, Series 2014-ATLS, Class BFX, 4.24%, 07/05/33(b) | | | | | | | 1,000 | | | | 1,001,263 | |
Bsprt Issuer Ltd., Series 2017-FL1, Class A, (1 mo. LIBOR US + 1.35%), 3.42%, 06/15/27(b)(d) | | | | | | | 280 | | | | 280,235 | |
BXP Trust, Series 2017-CC(b)(c): | | | | | | | | | | | | |
Class D, 3.67%, 08/13/37 | | | | | | | 180 | | | | 168,106 | |
Class E, 3.67%, 08/13/37(a) | | | | | | | 350 | | | | 313,633 | |
CFCRE Commercial Mortgage Trust, Series 2011-C1, Class C, 6.28%, 04/15/44(b)(c) | | | | | | | 1,000 | | | | 1,044,561 | |
Citigroup Commercial Mortgage Trust(c): | | | | | | | | | | | | |
Series 2015-GC27, Class C, 4.58%, 02/10/48 | | | | | | | 1,000 | | | | 970,040 | |
Series 2016-P3, Class D, 2.80%, 04/15/49(b) | | | | | | | 540 | | | | 413,282 | |
CLNS Trust, Series 2017-IKPR, Class E, (1 mo. LIBOR + 3.50%), 5.55%, 06/11/32(b)(d) | | | | | | | 790 | | | | 792,225 | |
Commercial Mortgage Trust(c): | | | | | | | | | | | | |
Series 2015-CR23, Class C, 4.39%, 05/10/48 | | | | | | | 1,050 | | | | 1,014,261 | |
Series 2015-CR23, Class CMC, 3.81%, 05/10/48(b) | | | | | | | 1,000 | | | | 995,757 | |
Series 2015-CR23, Class CMD, 3.81%, 05/10/48(b) | | | | | | | 1,150 | | | | 1,138,938 | |
Series 2017-DLTA, Class F, 4.65%, 08/15/35(b) | | | | | | | 250 | | | | 247,140 | |
Core Industrial Trust, Series 2015-WEST, Class E, 4.37%, 02/10/37(b)(c) | | | | | | | 1,000 | | | | 971,718 | |
DBJPM Mortgage Trust, Series 2017-C6, Class XD, 1.00%, 06/10/50(b)(c) | | | | | | | 11,000 | | | | 720,830 | |
DBUBS Mortgage Trust(b)(c): | | | | | | | | | | | | |
Series 2011-LC1A, Class E, 5.88%, 11/10/46 | | | | | | | 1,000 | | | | 1,029,611 | |
Series 2017-BRBK, Class F, 3.65%, 10/10/34(a) | | | | | | | 390 | | | | 350,743 | |
GS Mortgage Securities Corp. Trust,
Series 2017-500K(b)(d): | | | | | | | | | | | | |
Class D, (1 mo. LIBOR + 1.30%), 3.37%, 07/15/32 | | | | | | | 120 | | | | 119,925 | |
Class E, (1 mo. LIBOR + 1.50%), 3.57%, 07/15/32 | | | | | | | 240 | | | | 239,924 | |
Class F, (1 mo. LIBOR + 1.80%), 3.87%, 07/15/32 | | | | | | | 10 | | | | 10,000 | |
Class G, (1 mo. LIBOR + 2.50%), 4.57%, 07/15/32 | | | | | | | 70 | | | | 70,022 | |
GS Mortgage Securities Trust(b): | | | | | | | | | | | | |
Series 2014-GC22, Class D, 4.80%, 06/10/47(c) | | | | | | | 613 | | | | 521,793 | |
Series 2017-GS7, Class D, 3.00%, 08/10/50 | | | | | | | 375 | | | | 308,147 | |
Series 2017-GS7, Class E, 3.00%, 08/10/50 | | | | | | | 300 | | | | 239,000 | |
JPMBB Commercial Mortgage Securities Trust, Series 2015-C33, Class D1, 4.27%, 12/15/48(b)(c) | | | | | | | 1,190 | | | | 1,113,721 | |
| | | | | | | | | | | | |
| Security | | Par
(000) | | | Value | |
| Commercial Mortgage-Backed Securities (continued) | |
JPMorgan Chase Commercial Mortgage
Securities Trust(b)(c): | | | | | | | | | | | | |
Series 2003-PM1A, Class G, 6.33%, 08/12/40 | | | USD | | | | 735 | | | $ | 747,264 | |
Series 2017-JP5, Class D, 4.80%, 03/15/50 | | | | | | | 1,240 | | | | 1,178,197 | |
LSTAR Commercial Mortgage Trust, Series 2017-5(b)(c): | | | | | | | | | | | | |
Class C, 4.87%, 03/10/50 | | | | | | | 1,000 | | | | 920,839 | |
Class X, 1.39%, 03/10/50 | | | | | | | 12,494 | | | | 598,842 | |
MAD Mortgage Trust, Series 2017-330M(b)(c): | | | | | | | | | | | | |
Class D, 4.11%, 08/15/34 | | | | | | | 130 | | | | 128,168 | |
Class E, 4.17%, 08/15/34 | | | | | | | 180 | | | | 171,351 | |
MASTR Reperforming Loan Trust, Series 2005-1, Class 1A5, 8.00%, 08/25/34(b) | | | | | | | 1,115 | | | | 1,169,522 | |
Morgan Stanley Bank of America Merrill Lynch Trust, Class D: | | | | | | | | | | | | |
Series 2015-C23, 4.27%, 07/15/50(b)(c) | | | | | | | 1,000 | | | | 877,285 | |
Series 2015-C25, 3.07%, 10/15/48 | | | | | | | 80 | | | | 65,996 | |
Morgan Stanley Capital I Trust, Series 2017-H1(b): | | | | | | | | | | | | |
Class D, 2.55%, 06/15/50 | | | | | | | 1,010 | | | | 782,043 | |
Class XD, 2.36%, 06/15/50(c) | | | | | | | 8,625 | | | | 1,376,205 | |
Morgan Stanley Capital I, Inc., Series 2017-JWDR, Class E, 5.12%, 11/15/34(b)(c) | | | | | | | 160 | | | | 160,756 | |
Natixis Commercial Mortgage Securities Trust, Series 2017-75B, Class E, 4.19%, 04/09/37 (b)(c) | | | | | | | 170 | | | | 156,647 | |
Olympic Tower Mortgage Trust,
Series 2017-OT(b)(c): | | | | | | | | | | | | |
Class D, 4.08%, 05/10/39 | | | | | | | 140 | | | | 135,097 | |
Class E, 4.08%, 05/10/39 | | | | | | | 290 | | | | 265,988 | |
RAIT Trust, Series 2017-FL7, Class C, (1 mo. LIBOR + 2.50%), 4.57%, 06/15/37(b)(d) | | | | | | | 260 | | | | 259,999 | |
Resource Capital Corp. Ltd., Series 2017-CRE5, Class B, (1 mo. LIBOR + 2.00%),
4.07%, 07/15/34(a)(b)(d) | | | | | | | 560 | | | | 559,508 | |
Wells Fargo Commercial Mortgage Trust (c): | | | | | | | | | | | | |
Series 2015-NXS4, Class D, 3.75%, 12/15/48 | | | | | | | 710 | | | | 625,270 | |
Series 2016-NXS5, Class D, 5.04%, 01/15/59 | | | | | | | 500 | | | | 480,002 | |
Series 2018-BXI, Class E, 4.23%, 12/15/36(b) | | | | | | | 100 | | | | 99,560 | |
Wells Fargo Mortgage Backed Securities Trust, Series 2008-AR1, Class A2, 3.77%, 03/25/38(c) | | | | | | | 1,005 | | | | 874,636 | |
| | | | | | | | | | | | |
| | | | | | | | | | | 29,634,040 | |
| | | | | | | | | | | | |
Total Non-Agency Mortgage-Backed Securities — 15.6%
(Cost — $32,741,900) | | | | 32,682,798 | |
| | | | | | | | | | | | |
|
Preferred Securities — 0.7% | |
|
| Capital Trusts — 0.7% | |
| Cayman Islands — 0.3% | |
Agile Group Holdings Ltd.(h):
6.88%(c) | | | | | | | 200 | | | | 182,221 | |
8.25%(l) | | | | | | | 300 | | | | 298,500 | |
King Talent Management Ltd., 5.60%(c)(h) | | | | | | | 200 | | | | 186,511 | |
| | | | | | | | | | | | |
| | | | | | | | | | | 667,232 | |
| China — 0.1% | |
Tewoo Group No. 5 Ltd., 5.80%(c)(h) | | | | | | | 200 | | | | 174,961 | |
| | | | | | | | | | | | |
| Hong Kong — 0.1% | |
Yancoal International Resources Development Co. Ltd., 5.75%(h)(l) | | | | | | | 235 | | | | 230,888 | |
| | | | | | | | | | | | |
| South Korea — 0.1% | |
KDB Life Insurance Co. Ltd., 7.50%, 05/21/78(c) | | | | | | | 200 | | | | 187,460 | |
| | | | | | | | | | | | |
| Thailand — 0.1% | |
PTTEP Treasury Center Co. Ltd., 4.60%(h)(l) | | | | | | | 200 | | | | 187,991 | |
| | | | | | | | | | | | |
Total Preferred Securities — 0.7%
(Cost — $1,516,625) | | | | 1,448,532 | |
| | | | | | | | | | | | |
| | |
| 12 | | 2018 BLACKROCK SEMI-ANNUAL REPORTTO SHAREHOLDERS |
| | |
Schedule of Investments (unaudited) (continued) June 30, 2018 | | BlackRock 2022 Global Income Opportunity Trust (BGIO) (Percentages shown are based on Net Assets) |
| | | | | | | | | | | | |
| Security | | Par
(000) | | | Value | |
U.S. Government Sponsored Agency Securities — 1.9% | |
|
| Collateralized Mortgage Obligations — 1.9% | |
Fannie Mae Connecticut Avenue Securities, Series 2017-C03 (d): | | | | | | | | | | | | |
Class 1M2, (1 mo. LIBOR US + 3.00%),
5.09%, 10/25/29 | | | USD | | | | 106 | | | $ | 112,949 | |
Class 1B1, (1 mo. LIBOR US + 4.85%),
6.94%, 10/25/29 | | | | | | | 1,000 | | | | 1,120,901 | |
Freddie Mac Structured Agency Credit Risk Debt Notes, Series 2017-DNA2(d): | | | | | | | | | | | | |
Class M2, (1 mo. LIBOR US + 3.45%),
5.54%, 10/25/29 | | | | | | | 1,465 | | | | 1,601,628 | |
Class B1, (1 mo. LIBOR US + 5.15%),
7.24%, 10/25/29 | | | | | | | 1,000 | | | | 1,142,977 | |
| | | | | | | | | | | | |
Total U.S. Government Sponsored Agency Securities — 1.9%
(Cost — $3,571,191) | | | | 3,978,455 | |
| | | | | | | | | | | | |
Total Long-Term Investments — 119.7%
(Cost — $258,551,568) | | | | 250,712,491 | |
| | | | | | | | | | | | |
| | | | | | | | | | | | |
| Security | | Par
(000) | | | Value | |
Short-Term Securities — 5.1% | |
|
| Foreign Agency Obligations — 1.2% | |
Egypt Treasury Bills(m): | | | | | | | | | | | | |
0.00%, 09/04/18 | | | EGP | | | | 13,000 | | | $ | 704,185 | |
0.00%, 10/16/18 | | | | | | | 1,725 | | | | 91,338 | |
0.00%, 11/13/18 | | | | | | | 28,650 | | | | 1,495,745 | |
0.00%, 12/11/18 | | | | | | | 2,700 | | | | 139,010 | |
| | | | | | | | | | | | |
Total Foreign Agency Obligations — 1.2%
(Cost — $2,479,268) | | | | 2,430,278 | |
| | | |
| | | | | | Shares | | | | |
| Money Market Funds — 3.9% | |
BlackRock Liquidity Funds, T-Fund,
Institutional Class, 1.80%(n)(o) | | | | | | | 8,102,195 | | | | 8,102,195 | |
| | | | | | | | | | | | |
Total Money Market Funds — 3.9%
(Cost — $8,102,195) | | | | 8,102,195 | |
| | | | | | | | | | | | |
| |
Total Short-Term Securities — 5.1%
(Cost — $10,581,463) | | | | 10,532,473 | |
| | | | | | | | | | | | |
Options Purchased — 0.0%
(Cost — $90,854) | | | | 17,203 | |
| | | | | | | | | | | | |
Total Investments — 124.8%
(Cost — $269,223,885) | | | | 261,262,167 | |
Liabilities in Excess of Other Assets — (24.8)% | | | | (51,845,338 | ) |
| | | | | | | | | | | | |
Net Assets — 100.0% | | | $ | 209,416,829 | |
| | | | | | | | | | | | |
| (a) | Security is valued using significant unobservable inputs and is classified as Level 3 in the fair value hierarchy. |
| (b) | Security exempt from registration pursuant to Rule 144A under the Securities Act of 1933, as amended. These securities may be resold in transactions exempt from registration to qualified institutional investors. |
| (c) | Variable or floating rate security, which interest rate adjusts periodically based on changes in current interest rates and prepayments on the underlying pool of assets. Rate shown is the rate in effect as of period end. |
| (d) | Variable rate security. Rate shown is the rate in effect as of period end. |
| (e) | When-issued security. |
| (f) | Step-up bond that pays an initial coupon rate for the first period and then a higher coupon rate for the following periods. Rate as of period end. |
| (g) | All or a portion of the security has been pledged as collateral in connection with outstanding reverse repurchase agreements. |
| (h) | Perpetual security with no stated maturity date. |
| (i) | Convertible security. |
| (j) | Payment-in-kind security which may pay interest/dividends in additional par/shares and/or in cash. Rates shown are the current rate and possible payment rates. |
| (k) | Represents an unsettled loan commitment at period end. Certain details associated with this purchase are not known prior to the settlement date, including coupon rate. |
| (l) | Variable rate security. Security may be issued at a fixed coupon rate, which converts to a variable rate at a specified date. Rate shown is the rate in effect as of period end. |
| (n) | Annualized 7-day yield as of period end. |
| (o) | During the six months ended June 30, 2018, investments in issuers considered to be an affiliate of the Trust for purposes of Section 2(a)(3) of the Investment Company Act of 1940, as amended, were as follows: |
| | | | | | | | | | | | | | | | | | | | | | | | | | | | |
| Affiliate | | Shares
Held at
12/31/17 | | | Net
Activity | | | Shares
Held at
06/30/18 | | | Value at
06/30/18 | | | Income | | | Net Realized Gain (Loss)(a) | | | Change in
Unrealized
Appreciation
(Depreciation) | |
BlackRock Liquidity Funds, T-Fund, Institutional Class | | | 3,180,865 | | | | 4,921,330 | | | | 8,102,195 | | | $ | 8,102,195 | | | $ | 59,050 | | | $ | — | | | $ | — | |
| | (a) | Includes net capital gain distributions, if applicable. | |
| | | | |
| SCHEDULE OF INVESTMENTS | | | 13 | |
| | |
Schedule of Investments (unaudited) (continued) June 30, 2018 | | BlackRock 2022 Global Income Opportunity Trust (BGIO) |
Reverse Repurchase Agreements
| | | | | | | | | | | | | | | | | | | | | | | | |
| Counterparty | | Interest
Rate | | | Trade
Date | | | Maturity
Date (a) | | | Face Value | | | Face Value
Including
Accrued Interest | | | Type of Non-Cash Underlying Collateral | | Remaining Contractual
Maturity of the Agreements (a) |
RBC Capital Markets LLC | | | 2.45 | % | | | 03/02/18 | | | | Open | | | $ | 226,460 | | | $ | 228,282 | | | Corporate Bonds | | Open/Demand |
BNP Paribas | | | 2.40 | | | | 03/08/18 | | | | Open | | | | 1,284,690 | | | | 1,294,352 | | | Corporate Bonds | | Open/Demand |
BNP Paribas | | | 2.40 | | | | 03/08/18 | | | | Open | | | | 692,016 | | | | 697,220 | | | Corporate Bonds | | Open/Demand |
BNP Paribas | | | 2.40 | | | | 03/08/18 | | | | Open | | | | 1,009,178 | | | | 1,016,767 | | | Corporate Bonds | | Open/Demand |
BNP Paribas | | | 2.40 | | | | 03/08/18 | | | | Open | | | | 634,869 | | | | 639,644 | | | Corporate Bonds | | Open/Demand |
BNP Paribas | | | 2.50 | | | | 03/08/18 | | | | Open | | | | 1,524,750 | | | | 1,536,704 | | | Foreign Agency Obligations | | Open/Demand |
Deutsche Bank Securities, Inc. | | | 2.50 | | | | 03/15/18 | | | | Open | | | | 1,266,000 | | | | 1,275,372 | | | Corporate Bonds | | Open/Demand |
Barclays Capital, Inc. | | | 2.25 | | | | 04/04/18 | | | | Open | | | | 1,132,500 | | | | 1,138,729 | | | Corporate Bonds | | Open/Demand |
Deutsche Bank Securities, Inc. | | | 2.50 | | | | 05/01/18 | | | | Open | | | | 1,175,000 | | | | 1,179,896 | | | Corporate Bonds | | Open/Demand |
Credit Suisse Securities (USA) LLC | | | 2.25 | | | | 05/02/18 | | | | Open | | | | 486,012 | | | | 487,835 | | | Corporate Bonds | | Open/Demand |
BNP Paribas | | | 2.30 | | | | 05/23/18 | | | | Open | | | | 937,125 | | | | 939,400 | | | Corporate Bonds | | Open/Demand |
BNP Paribas | | | 2.35 | | | | 05/23/18 | | | | Open | | | | 1,511,531 | | | | 1,515,281 | | | Corporate Bonds | | Open/Demand |
BNP Paribas | | | 2.35 | | | | 05/23/18 | | | | Open | | | | 1,509,375 | | | | 1,513,119 | | | Corporate Bonds | | Open/Demand |
Credit Suisse Securities (USA) LLC | | | 2.50 | | | | 05/23/18 | | | | Open | | | | 740,080 | | | | 742,033 | | | Corporate Bonds | | Open/Demand |
Credit Suisse Securities (USA) LLC | | | 2.50 | | | | 05/23/18 | | | | Open | | | | 1,091,350 | | | | 1,094,230 | | | Corporate Bonds | | Open/Demand |
Credit Suisse Securities (USA) LLC | | | 2.50 | | | | 05/23/18 | | | | Open | | | | 731,960 | | | | 733,892 | | | Corporate Bonds | | Open/Demand |
Credit Suisse Securities (USA) LLC | | | 2.50 | | | | 05/23/18 | | | | Open | | | | 756,320 | | | | 758,316 | | | Corporate Bonds | | Open/Demand |
Credit Suisse Securities (USA) LLC | | | 2.50 | | | | 05/23/18 | | | | Open | | | | 484,556 | | | | 485,835 | | | Corporate Bonds | | Open/Demand |
Deutsche Bank Securities, Inc. | | | 2.45 | | | | 05/23/18 | | | | Open | | | | 588,000 | | | | 589,521 | | | Corporate Bonds | | Open/Demand |
Credit Suisse Securities (USA) LLC | | | 2.25 | | | | 05/24/18 | | | | Open | | | | 564,263 | | | | 565,567 | | | Corporate Bonds | | Open/Demand |
Credit Suisse Securities (USA) LLC | | | 2.50 | | | | 05/24/18 | | | | Open | | | | 335,580 | | | | 336,442 | | | Corporate Bonds | | Open/Demand |
Credit Suisse Securities (USA) LLC | | | 2.50 | | | | 05/24/18 | | | | Open | | | | 647,000 | | | | 648,662 | | | Corporate Bonds | | Open/Demand |
Credit Suisse Securities (USA) LLC | | | 2.50 | | | | 05/24/18 | | | | Open | | | | 495,337 | | | | 496,610 | | | Corporate Bonds | | Open/Demand |
Credit Suisse Securities (USA) LLC | | | 2.50 | | | | 05/24/18 | | | | Open | | | | 736,600 | | | | 738,493 | | | Corporate Bonds | | Open/Demand |
RBC Capital Markets LLC | | | 2.45 | | | | 05/24/18 | | | | Open | | | | 1,259,538 | | | | 1,262,709 | | | Corporate Bonds | | Open/Demand |
RBC Capital Markets LLC | | | 2.45 | | | | 05/24/18 | | | | Open | | | | 1,305,150 | | | | 1,308,436 | | | Corporate Bonds | | Open/Demand |
RBC Capital Markets LLC | | | 2.45 | | | | 05/24/18 | | | | Open | | | | 1,312,850 | | | | 1,316,156 | | | Corporate Bonds | | Open/Demand |
RBC Capital Markets LLC | | | 2.45 | | | | 05/24/18 | | | | Open | | | | 1,216,600 | | | | 1,219,663 | | | Corporate Bonds | | Open/Demand |
RBC Capital Markets LLC | | | 2.45 | | | | 05/24/18 | | | | Open | | | | 1,197,350 | | | | 1,200,365 | | | Corporate Bonds | | Open/Demand |
RBC Capital Markets LLC | | | 2.45 | | | | 05/24/18 | | | | Open | | | | 1,251,250 | | | | 1,254,401 | | | Corporate Bonds | | Open/Demand |
Barclays Capital, Inc. | | | 2.25 | | | | 05/30/18 | | | | Open | | | | 1,698,945 | | | | 1,702,237 | | | Foreign Agency Obligations | | Open/Demand |
RBC Capital Markets LLC | | | 2.45 | | | | 05/30/18 | | | | Open | | | | 1,217,280 | | | | 1,219,848 | | | Corporate Bonds | | Open/Demand |
RBC Capital Markets LLC | | | 2.45 | | | | 05/30/18 | | | | Open | | | | 1,459,315 | | | | 1,462,394 | | | Corporate Bonds | | Open/Demand |
RBC Capital Markets LLC | | | 2.45 | | | | 05/30/18 | | | | Open | | | | 977,500 | | | | 979,562 | | | Corporate Bonds | | Open/Demand |
RBC Capital Markets LLC | | | 2.45 | | | | 06/01/18 | | | | Open | | | | 1,158,850 | | | | 1,160,979 | | | Corporate Bonds | | Open/Demand |
RBC Capital Markets LLC | | | 2.45 | | | | 06/01/18 | | | | Open | | | | 1,072,500 | | | | 1,074,471 | | | Corporate Bonds | | Open/Demand |
RBC Capital Markets LLC | | | 2.45 | | | | 06/01/18 | | | | Open | | | | 1,335,950 | | | | 1,338,405 | | | Corporate Bonds | | Open/Demand |
RBC Capital Markets LLC | | | 2.45 | | | | 06/01/18 | | | | Open | | | | 1,256,500 | | | | 1,258,809 | | | Corporate Bonds | | Open/Demand |
RBC Capital Markets LLC | | | 2.45 | | | | 06/01/18 | | | | Open | | | | 1,327,500 | | | | 1,329,939 | | | Corporate Bonds | | Open/Demand |
Barclays Capital, Inc. | | | 2.25 | | | | 06/06/18 | | | | Open | | | | 171,950 | | | | 172,219 | | | Corporate Bonds | | Open/Demand |
BNP Paribas | | | 2.55 | | | | 06/06/18 | | | | Open | | | | 527,231 | | | | 528,128 | | | Corporate Bonds | | Open/Demand |
Credit Suisse Securities (USA) LLC | | | 2.25 | | | | 06/06/18 | | | | Open | | | | 177,417 | | | | 177,695 | | | Corporate Bonds | | Open/Demand |
RBC Capital Markets LLC | | | 2.60 | | | | 06/18/18 | | | | Open | | | | 1,135,750 | | | | 1,136,734 | | | Corporate Bonds | | Open/Demand |
RBC Capital Markets LLC | | | 2.60 | | | | 06/18/18 | | | | Open | | | | 1,243,550 | | | | 1,244,628 | | | Corporate Bonds | | Open/Demand |
RBC Capital Markets LLC | | | 2.60 | | | | 06/18/18 | | | | Open | | | | 1,220,000 | | | | 1,221,057 | | | Corporate Bonds | | Open/Demand |
RBC Capital Markets LLC | | | 2.60 | | | | 06/18/18 | | | | Open | | | | 1,247,400 | | | | 1,248,481 | | | Corporate Bonds | | Open/Demand |
RBC Capital Markets LLC | | | 2.60 | | | | 06/18/18 | | | | Open | | | | 1,189,650 | | | | 1,190,681 | | | Corporate Bonds | | Open/Demand |
| | |
| 14 | | 2018 BLACKROCK SEMI-ANNUAL REPORTTO SHAREHOLDERS |
| | |
Schedule of Investments (unaudited) (continued) June 30, 2018 | | BlackRock 2022 Global Income Opportunity Trust (BGIO) |
Reverse Repurchase Agreements (continued)
| | | | | | | | | | | | | | | | | | | | | | | | |
| Counterparty | | Interest
Rate | | | Trade
Date | | | Maturity
Date (a) | | | Face Value | | | Face Value
Including
Accrued Interest | | | Type of Non-Cash Underlying Collateral | | Remaining Contractual
Maturity of the Agreements (a) |
RBC Capital Markets LLC | | | 2.60 | % | | | 06/20/18 | | | | Open | | | $ | 1,278,200 | | | $ | 1,279,123 | | | Corporate Bonds | | Open/Demand |
RBC Capital Markets LLC | | | 2.60 | | | | 06/20/18 | | | | Open | | | | 1,178,100 | | | | 1,178,951 | | | Corporate Bonds | | Open/Demand |
RBC Capital Markets LLC | | | 2.60 | | | | 06/20/18 | | | | Open | | | | 1,282,050 | | | | 1,282,976 | | | Corporate Bonds | | Open/Demand |
RBC Capital Markets LLC | | | 2.60 | | | | 06/20/18 | | | | Open | | | | 1,181,950 | | | | 1,182,330 | | | Corporate Bonds | | Open/Demand |
Barclays Capital, Inc. | | | 2.50 | | | | 06/26/18 | | | | Open | | | | 570,938 | | | | 571,096 | | | Foreign Agency Obligations | | Open/Demand |
| | | | | | | | | | | | | | | | | | | | | | | | |
| | | | | | | | | | | | | | $ | 52,011,816 | | | $ | 52,154,675 | | | | | |
| | | | | | | | | | | | | |
| | (a) | Certain agreements have no stated maturity and can be terminated by either party at any time. | |
Derivative Financial Instruments Outstanding as of Period End
Futures Contracts
| | | | | | | | | | | | | | | | |
| Description | | Number of
Contracts | | | Expiration
Date | | | Notional
Amount (000) | | | Value/
Unrealized
Appreciation
(Depreciation) | |
Long Contracts: | | | | | | | | | | | | | | | | |
Ultra Long U.S. Treasury Bond | | | 18 | | | | 09/19/18 | | | $ | 2,872 | | | $ | 72,446 | |
2-Year U.S. Treasury Note | | | 295 | | | | 09/28/18 | | | | 62,489 | | | | 80,327 | |
| | | | | | | | | | | | | | | | |
| | | | | | | | | | | | | | | 152,773 | |
| | | | | | | | | | | | | | | | |
Short Contracts: | | | | | | | | | | | | | | | | |
10-Year U.S. Treasury Note | | | 230 | | | | 09/19/18 | | | | 27,643 | | | | (145,904 | ) |
10-Year U.S. Ultra Long Treasury Note | | | 37 | | | | 09/19/18 | | | | 4,745 | | | | (34,538 | ) |
Long U.S. Treasury Bond | | | 28 | | | | 09/19/18 | | | | 4,060 | | | | (84,878 | ) |
5-Year U.S. Treasury Note | | | 25 | | | | 09/28/18 | | | | 2,840 | | | | (8,820 | ) |
| | | | | | | | | | | | | | | | |
| | | | | | | | | | | | | | | (274,140 | ) |
| | | | | | | | | | | | | | | | |
| | | | | | | | | | | | | | $ | (121,367 | ) |
| | | | | | | | | | | | | | | | |
Forward Foreign Currency Exchange Contracts
| | | | | | | | | | | | | | | | | | | | |
Currency Purchased | | | Currency Sold | | | Counterparty | | Settlement Date | | | Unrealized
Appreciation (Depreciation) | |
| USD | | | 425,000 | | | ARS | | | 11,173,250 | | | BNP Paribas S.A. | | | 07/30/18 | | | $ | 52,930 | |
| USD | | | 635,000 | | | ZAR | | | 8,515,444 | | | Standard Chartered Bank | | | 08/10/18 | | | | 17,482 | |
| ZAR | | | 8,863,895 | | | USD | | | 635,000 | | | Standard Chartered Bank | | | 08/10/18 | | | | 7,787 | |
| USD | | | 293,462 | | | IDR | | | 4,129,300,316 | | | Bank of America N.A. | | | 09/14/18 | | | | 7,900 | |
| | | | | | | | | | | | | | | | | | | | |
| | | $ | 86,099 | |
| | | | | |
OTC Barrier Options Purchased
| | | | | | | | | | | | | | | | | | | | | | | | | | | | | | | | | | | | |
| Description | | Type of Option | | Counterparty | | Number of
Contracts | | | Expiration
Date | | | Exercise
Price | | | Barrier Price/Range | | | Notional Amount (000) | | | Value | |
Call | | | | | | | | | | | | | | | | | | | | | | | | | | | | | | | | | | | | |
S&P 500 Index | | One-Touch | | Morgan Stanley & Co. International PLC | | | 1,075,200 | | | | 09/21/18 | | | | USD | | | | 2,567.49 | | | | 2,567.49 | | | | USD | | | | 2,760,568 | | | $ | 17,203 | |
| | | | | | | | | | | | | | | | | | | | | | | | | | | | | | | | | | | | |
| | | | |
| SCHEDULE OF INVESTMENTS | | | 15 | |
| | |
Schedule of Investments (unaudited) (continued) June 30, 2018 | | BlackRock 2022 Global Income Opportunity Trust (BGIO) |
Centrally Cleared Interest Rate Swaps
| | | | | | | | | | | | | | | | | | | | | | | | | | | | | | | | |
| Paid by the Trust | | Received by the Trust | | Effective
Date | | | Termination
Date | | | Notional Amount (000) | | | Value | | | Upfront
Premium
Paid
(Received) | | | Unrealized
Appreciation
(Depreciation) | |
| Rate | | Frequency | | Rate | | Frequency |
| 3-Month LIBOR, 2.34% | | Quarterly | | 2.14% | | Semi-annual | | | N/A | | | | 02/28/22 | | | USD | | | 6,900 | | | $ | (139,711 | ) | | $ | 80 | | | $ | (139,791 | ) |
| | | | | | | | | | | | | | | | | | | | | | | | | | | | | | | | |
OTC Credit Default Swaps — Buy Protection
| | | | | | | | | | | | | | | | | | | | | | | | | | | | | | | | |
| Reference Obligation/Index | | Financing Rate Paid
by the Trust | | | Payment
Frequency | | | Counterparty | | Termination
Date | | | Notional
Amount
(000) | | | Value | | | Upfront
Premium
Paid
(Received) | | | Unrealized
Appreciation
(Depreciation) | |
Republic of Colombia | | | 1.00 | % | | | Quarterly | | | HSBC Bank PLC | | | 06/20/23 | | | USD | | | 733 | | | $ | 8,119 | | | $ | 10,054 | | | $ | (1,935 | ) |
| | | | | | | | | | | | | | | | | | | | | | | | | | | | | | | | |
OTC Credit Default Swaps — Sell Protection
| | | | | | | | | | | | | | | | | | | | | | | | | | | | | | | | | | | | |
| Reference Obligation/Index | | Financing
Rate Received
by the Trust | | | Payment
Frequency | | | Counterparty | | Termination
Date | | | Credit
Rating (a) | | Notional
Amount
(000) (b) | | | Value | | | Upfront
Premium
Paid
(Received) | | | Unrealized
Appreciation
(Depreciation) | |
CMBX.NA.9.BBB- | | | 3.00 | % | | | Monthly | | | Morgan Stanley & Co. International PLC | | | 09/17/58 | | | BBB- | | | USD | | | | 5,000 | | | $ | (514,726 | ) | | $ | (541,348 | ) | | $ | 26,622 | |
CMBX.NA.9.BBB- | | | 3.00 | | | | Monthly | | | Morgan Stanley & Co. International PLC | | | 09/17/58 | | | BBB- | | | USD | | | | 3,000 | | | | (308,835 | ) | | | (321,006 | ) | | | 12,171 | |
CMBX.N. A.9.BBB- | | | 3.00 | | | | Monthly | | | Morgan Stanley & Co. International PLC | | | 09/17/58 | | | BBB- | | | USD | | | | 2,000 | | | | (205,890 | ) | | | (229,605 | ) | | | 23,715 | |
| | | | | | | | | | | | | | | | | | | | | | | | | | | | | | | | | | | | |
| | | | | | | | | | | | | | | | | | | | | | | | | | $ | (1,029,451 | ) | | $ | (1,091,959 | ) | | $ | 62,508 | |
| | | | | | | | | | | | | | | | | | | | | | | | | | | | | | | | | | | | |
| | (a) | Using Standard & Poor’s (“S&P”) rating of the issuer or the underlying securities of the index, as applicable. | |
| | (b) | The maximum potential amount the Trust may pay should a negative credit event take place as defined under the terms of the agreement. | |
Balances Reported in the Statement of Assets and Liabilities for Centrally Cleared Swaps and OTC Swaps
| | | | | | | | | | | | | | | | |
| | | Swap
Premiums
Paid | | | Swap
Premiums
Received | | | Unrealized
Appreciation | | | Unrealized
Depreciation | |
Centrally Cleared Swaps(a) | | $ | 80 | | | $ | — | | | $ | — | | | $ | (139,791 | ) |
OTC Swaps | | | 10,054 | | | | (1,091,959 | ) | | | 62,508 | | | | (1,935 | ) |
| | (a) | Includes cumulative appreciation (depreciation) on centrally cleared swaps, as reported in the Schedule of Investments. Only current day’s variation margin is reported within the Statement of Assets and Liabilities and is net of any previously paid (received) swap premium amounts. | |
Derivative Financial Instruments Categorized by Risk Exposure
As of period end, the fair values of derivative financial instruments located in the Statement of Assets and Liabilities were as follows:
| | | | | | | | | | | | | | | | | | | | | | | | | | | | |
| | | Commodity
Contracts | | | Credit
Contracts | | | Equity
Contracts | | | Foreign
Currency
Exchange
Contracts | | | Interest
Rate
Contracts | | | Other
Contracts | | | Total | |
Assets — Derivative Financial Instruments | | | | | | | | | | | | | | | | | | | | | | | | | | | | |
Futures contracts | | | | | | | | | | | | | | | | | | | | | | | | | | | | |
Net unrealized appreciation(a) | | $ | — | | | $ | — | | | $ | — | | | $ | — | | | $ | 152,773 | | | $ | — | | | $ | 152,773 | |
Forward foreign currency exchange contracts | | | | | | | | | | | | | | | | | | | | | | | | | | | | |
Unrealized appreciation on forward foreign currency exchange contracts | | | — | | | | — | | | | — | | | | 86,099 | | | | — | | | | — | | | | 86,099 | |
Options purchased | | | | | | | | | | | | | | | | | | | | | | | | | | | | |
Investments at value — unaffiliated | | | — | | | | — | | | | 17,203 | | | | — | | | | — | | | | — | | | | 17,203 | |
Swaps — OTC | | | | | | | | | | | | | | | | | | | | | | | | | | | | |
Unrealized appreciation on OTC swaps; Swap premiums paid | | | — | | | | 72,562 | | | | — | | | | — | | | | — | | | | — | | | | 72,562 | |
| | | | | | | | | | | | | | | | | | | | | | | | | | | | |
| | $ | — | | | $ | 72,562 | | | $ | 17,203 | | | $ | 86,099 | | | $ | 152,773 | | | $ | — | | | $ | 328,637 | |
| | | | | | | | | | | | | | | | | | | | | | | | | | | | |
| | |
| 16 | | 2018 BLACKROCK SEMI-ANNUAL REPORTTO SHAREHOLDERS |
| | |
Schedule of Investments (unaudited) (continued) June 30, 2018 | | BlackRock 2022 Global Income Opportunity Trust (BGIO) |
| | | | | | | | | | | | | | | | | | | | | | | | | | | | |
| | | Commodity
Contracts | | | Credit
Contracts | | | Equity
Contracts | | | Foreign
Currency
Exchange
Contracts | | | Interest
Rate
Contracts | | | Other
Contracts | | | Total | |
Liabilities — Derivative Financial Instruments | | | | | | | | | | | | | | | | | | | | | | | | | | | | |
Futures contracts | | | | | | | | | | | | | | | | | | | | | | | | | | | | |
Net unrealized depreciation(a) | | $ | — | | | $ | — | | | $ | — | | | $ | — | | | $ | 274,140 | | | $ | — | | | $ | 274,140 | |
Swaps — centrally cleared | | | | | | | | | | | | | | | | | | | | | | | | | | | | |
Net unrealized depreciation(a) | | | — | | | | — | | | | — | | | | — | | | | 139,791 | | | | — | | | | 139,791 | |
Swaps — OTC | | | | | | | | | | | | | | | | | | | | | | | | | | | | |
Unrealized depreciation on OTC swaps; Swap premiums received | | | — | | | $ | 1,093,894 | | | | — | | | | — | | | | — | | | | — | | | | 1,093,894 | |
| | | | | | | | | | | | | | | | | | | | | | | | | | | | |
| | $ | — | | | $ | 1,093,894 | | | $ | — | | | $ | — | | | $ | 413,931 | | | $ | — | | | $ | 1,507,825 | |
| | | | | | | | | | | | | | | | | | | | | | | | | | | | |
| | (a) | Includes cumulative appreciation (depreciation) on futures contracts and centrally cleared swaps, if any, as reported in the Schedule of Investments. Only current day’s variation margin is reported within the Statement of Assets and Liabilities. | |
For the period ended June 30, 2018, the effect of derivative financial instruments in the Statement of Operations was as follows:
| | | | | | | | | | | | | | | | | | | | | | | | | | | | |
| | | Commodity
Contracts | | | Credit
Contracts | | | Equity
Contracts | | | Foreign
Currency
Exchange
Contracts | | | Interest
Rate
Contracts | | | Other
Contracts | | | Total | |
Net Realized Gain (Loss) from: | | | | | | | | | | | | | | | | | | | | | | | | | | | | |
Futures contracts | | $ | — | | | $ | — | | | $ | — | | | $ | — | | | $ | 2,273,857 | | | $ | — | | | $ | 2,273,857 | |
Forward foreign currency exchange contracts | | | — | | | | — | | | | — | | | | (31,929 | ) | | | — | | | | — | | | | (31,929 | ) |
Swaps | | | — | | | | 159,242 | | | | — | | | | — | | | | (27,957 | ) | | | — | | | | 131,285 | |
| | | | | | | | | | | | | | | | | | | | | | | | | | | | |
| | $ | — | | | $ | 159,242 | | | $ | — | | | $ | (31,929 | ) | | $ | 2,245,900 | | | $ | — | | | $ | 2,373,213 | |
| | | | | | | | | | | | | | | | | | | | | | | | | | | | |
| Net Change in Unrealized Appreciation (Depreciation) on: | | | | | | | | | | | | | | | | | | | | | |
Futures contracts | | $ | — | | | $ | — | | | $ | — | | | $ | — | | | $ | (310,339 | ) | | $ | — | | | $ | (310,339 | ) |
Forward foreign currency exchange contracts | | | — | | | | — | | | | — | | | | 100,964 | | | | — | | | | — | | | | 100,964 | |
Options purchased | | | — | | | | — | | | | (73,651 | ) | | | — | | | | — | | | | — | | | | (73,651 | ) |
Swaps | | | — | | | | 63,941 | | | | — | | | | — | | | | (119,038 | ) | | | — | | | | (55,097 | ) |
| | | | | | | | | | | | | | | | | | | | | | | | | | | | |
| | $ | — | | | $ | 63,941 | | | $ | (73,651 | ) | | $ | 100,964 | | | $ | (429,377 | ) | | $ | — | | | $ | (338,123 | ) |
| | | | | | | | | | | | | | | | | | | | | | | | | | | | |
Average Quarterly Balances of Outstanding Derivative Financial Instruments
| | | | |
Futures contracts: | |
Average notional value of contracts — long | | $ | 47,563,368 | |
Average notional value of contracts — short | | $ | 55,593,668 | |
Forward foreign currency exchange contracts: | |
Average amounts purchased — in USD | | $ | 1,107,644 | |
Average amounts sold — in USD | | $ | 749,296 | |
Options: | |
Average value of option contracts purchased | | $ | 8,602 | |
Credit default swaps: | |
Average notional value-buy protection | | $ | 366,500 | |
Average notional value-sell protection | | $ | 10,000,000 | |
Interest rate swaps: | | | | |
Average notional value-receives fixed rate | | $ | 6,900,000 | |
For more information about the Trust’s investment risks regarding derivative financial instruments, refer to the Notes to Financial Statements.
Derivative Financial Instruments — Offsetting as of Period End
The Trust’s derivative assets and liabilities (by type) were as follows:
| | | | | | | | |
| | | Assets | | | Liabilities | |
Futures contracts | | $ | — | | | $ | 9,984 | |
Swaps — Centrally cleared | | | 2,171 | | | | — | |
Forward foreign currency exchange contracts | | | 86,099 | | | | — | |
Options | | | 17,203 | (b) | | | — | |
Swaps — OTC(a) | | | 72,562 | | | | 1,093,894 | |
| | | | | | | | |
Total derivative assets and liabilities in the Statement of Assets and Liabilities | | $ | 178,035 | | | $ | 1,103,878 | |
Derivatives not subject to a Master Netting Agreement or similar agreement (“MNA”) | | | (2,171 | ) | | | (9,984 | ) |
| | | | | | | | |
Total derivative assets and liabilities subject to an MNA | | $ | 175,864 | | | $ | 1,093,894 | |
| | | | | | | | |
| | (a) | Includes unrealized appreciation (depreciation) on OTC swaps and swap premiums (paid/received) in the Statement of Assets and Liabilities. | |
| | (b) | Includes options purchased at value which is included in Investments at value — unaffiliated in the Statement of Assets and Liabilities and reported in the Schedule of Investments. | |
| | | | |
| SCHEDULE OF INVESTMENTS | | | 17 | |
| | |
Schedule of Investments (unaudited) (continued) June 30, 2018 | | BlackRock 2022 Global Income Opportunity Trust (BGIO) |
The following table presents the Trust’s derivative assets (and liabilities) by counterparty net of amounts available for offset under a Master Netting Agreement (“MNA”) and net of the related collateral received (and pledged) by the Fund:
| | | | | | | | | | | | | | | | | | | | |
| Counterparty | | Derivative
Assets
Subject to
an MNA by
Counterparty | | | Derivatives
Available
for Offset (a) | | | Non-cash
Collateral
Received | | | Cash
Collateral
Received | | | Net Amount
of Derivative
Assets (b) | |
Bank of America N.A. | | $ | 7,900 | | | $ | — | | | $ | — | | | $ | — | | | $ | 7,900 | |
BNP Paribas S.A. | | | 52,930 | | | | — | | | | — | | | | — | | | | 52,930 | |
HSBC Bank PLC | | | 10,054 | | | | (1,935 | ) | | | — | | | | — | | | | 8,119 | |
Morgan Stanley & Co. International PLC | | | 79,711 | | | | (79,711 | ) | | | — | | | | — | | | | — | |
Standard Chartered Bank | | | 25,269 | | | | — | | | | — | | | | — | | | | 25,269 | |
| | | | | | | | | | | | | | | | | | | | |
| | $ | 175,864 | | | $ | (81,646 | ) | | $ | — | | | $ | — | | | $ | 94,218 | |
| | | | | | | | | | | | | | | | | | | | |
| | | | | |
| Counterparty | | Derivative
Liabilities
Subject to
an MNA by
Counterparty | | | Derivatives
Available
for Offset (a) | | | Non-cash
Collateral
Pledged | | | Cash
Collateral
Pledged (c) | | | Net Amount
of Derivative
Liabilities (d) | |
HSBC Bank PLC | | $ | 1,935 | | | $ | (1,935 | ) | | $ | — | | | $ | — | | | $ | — | |
Morgan Stanley & Co. International PLC | | | 1,091,959 | | | | (79,711 | ) | | | — | | | | (970,000 | ) | | | 42,248 | |
| | | | | | | | | | | | | | | | | | | | |
| | $ | 1,093,894 | | | $ | (81,646 | ) | | $ | — | | | $ | (970,000 | ) | | $ | 42,248 | |
| | | | | | | | | | | | | | | | | | | | |
| | (a) | The amount of derivatives available for offset is limited to the amount of derivative asset and/or liabilities that are subject to an MNA. | |
| | (b) | Net amount represents the net amount receivable from the counterparty in the event of default. | |
| | (c) | Excess of collateral received from the individual counterparty is not shown for financial reporting purposes. | |
| | (d) | Net amount represents the net amount payable due to counterparty in the event of default. | |
Fair Value Hierarchy as of Period End
Various inputs are used in determining the fair value of investments and derivative financial instruments. For information about the Trust’s policy regarding valuation of investments and derivative financial instruments, refer to the Notes to Financial Statements.
The following tables summarize the Trust’s investments and derivative financial instruments categorized in the disclosure hierarchy:
| | | | | | | | | | | | | | | | |
| | | Level 1 | | | Level 2 | | | Level 3 | | | Total | |
Assets: | | | | | | | | | | | | | | | | |
Investments: | | | | | | | | | | | | | | | | |
Long-Term Investments: | | | | | | | | | | | | | | | | |
Asset-Backed Securities | | $ | — | | | $ | 49,458,610 | | | $ | 2,638,129 | | | $ | 52,096,738 | |
Corporate Bonds | | | — | | | | 108,763,455 | | | | 196,500 | | | | 108,959,955 | |
Floating Rate Loan Interests | | | — | | | | 21,103,034 | | | | 4,858,916 | | | | 25,961,950 | |
Foreign Agency Obligations | | | — | | | | 25,584,063 | | | | — | | | | 25,584,063 | |
Non-Agency Mortgage-Backed Securities | | | — | | | | 30,503,603 | | | | 2,179,194 | | | | 32,682,798 | |
Preferred Securities | | | — | | | | 1,448,532 | | | | — | | | | 1,448,532 | |
U.S. Government Sponsored Agency Securities | | | — | | | | 3,978,455 | | | | — | | | | 3,978,455 | |
Short-Term Securities: | | | | | | | | | | | | | | | | |
Foreign Agency Obligations | | | — | | | | 2,430,278 | | | | — | | | | 2,430,278 | |
Money Market Funds | | | 8,102,195 | | | | — | | | | — | | | | 8,102,195 | |
Options Purchased: | | | | | | | | | | | | | | | | |
Equity Contracts | | | — | | | | 17,203 | | | | — | | | | 17,203 | |
| | | | | | | | | | | | | | | | |
| | $ | 8,102,195 | | | $ | 243,287,233 | | | $ | 9,872,739 | | | $ | 261,262,167 | |
| | | | | | | | | | | | | | | | |
Derivative Financial Instruments(a) | | | | | | | | | | | | | | | | |
Assets: | | | | | | | | | | | | | | | | |
Credit contracts | | $ | — | | | $ | 62,508 | | | $ | — | | | $ | 62,508 | |
Foreign Currency Exchange Contracts | | | — | | | | 86,099 | | | | — | | | | 86,099 | |
Interest rate contracts | | | 152,773 | | | | — | | | | — | | | | 152,773 | |
Liabilities: | | | | | | | | | | | | | | | | |
Credit contracts | | | — | | | | (1,935 | ) | | | — | | | | (1,935 | ) |
Interest rate contracts | | | (274,140 | ) | | | (139,791 | ) | | | — | | | | (413,931 | ) |
| | | | | | | | | | | | | | | | |
| | $ | (121,367 | ) | | $ | 6,881 | | | $ | — | | | $ | (114,486 | ) |
| | | | | | | | | | | | | | | | |
| | (a) | Derivative financial instruments are swaps, futures contracts and forward foreign currency exchange contracts. Swaps, futures contracts and forward foreign currency exchange contracts are valued at the unrealized appreciation (depreciation) on the instrument. | |
| | |
| 18 | | 2018 BLACKROCK SEMI-ANNUAL REPORTTO SHAREHOLDERS |
| | |
Schedule of Investments (unaudited) (continued) June 30, 2018 | | BlackRock 2022 Global Income Opportunity Trust (BGIO) |
The Trust may hold assets and/or liabilities in which the fair value approximates the carrying amount or face value, including accrued interest, for financial statement purposes. As of period end, reverse repurchase agreements of $52,154,675 are categorized as Level 2 within the disclosure hierarchy.
During the period ended June 30, 2018, there were no transfers between Level 1 and Level 2.
A reconciliation of Level 3 investments is presented when the Trust had a significant amount of Level 3 investments at the beginning and/or end of the period in relation to net assets. The following table is a reconciliation of Level 3 investments for which significant unobservable inputs were used in determining fair value:
| | | | | | | | | | | | | | | | | | | | |
| | | Asset-Backed Securities | | | Corporate Bonds | | | Floating
Rate Loan
Interests | | | Non-Agency
Mortgage-Backed
Securities | | | Total | |
Assets: | | | | | | | | | | | | | | | | | | | | |
Opening Balance, as of December 31, 2017 | | $ | 1,756,100 | | | $ | — | | | $ | 3,677,617 | | | $ | 3,897,617 | | | $ | 9,331,334 | |
Transfers into Level 3 | | | — | | | | — | | | | — | | | | 589,999 | | | | 589,999 | |
Transfers out of Level 3 | | | — | | | | — | | | | — | | | | (1,618,262 | ) | | | (1,618,262 | ) |
Accrued discounts/premiums | | | — | | | | — | | | | 2,911 | | | | 1,148 | | | | 4,059 | |
Net realized gain (loss) | | | 273 | | | | — | | | | 19,380 | | | | 6,063 | | | | 25,716 | |
Net change in unrealized appreciation (depreciation)(a)(b) | | | 297 | | | | (3,500 | ) | | | 22,193 | | | | (11,760 | ) | | | 7,230 | |
Purchases | | | 1,021,554 | | | | 200,000 | | | | 3,383,296 | | | | — | | | | 4,604,850 | |
Sales | | | (140,095 | ) | | | — | | | | (2,246,481 | ) | | | (685,611 | ) | | | (3,072,187 | ) |
| | | | | | | | | | | | | | | | | | | | |
Closing Balance, as of June 30, 2018 | | $ | 2,638,129 | | | $ | 196,500 | | | $ | 4,858,916 | | | $ | 2,178,194 | | | $ | 9,872,739 | |
| | | | | | | | | | | | | | | | | | | | |
Net change in unrealized appreciation (depreciation) on investments still held at June 30, 2018(b) | | $ | 297 | | | $ | (3,500 | ) | | $ | 21,549 | | | $ | (2,072 | ) | | $ | 16,274 | |
| | | | | | | | | | | | | | | | | | | | |
| | (a) | Included in the related net change in unrealized appreciation (depreciation) in the Statement of Operations. | |
| | (b) | Any difference between net change in unrealized appreciation (depreciation) and net change in unrealized appreciation (depreciation) on investments still held at June 30, 2018 is generally due to investments no longer held or categorized as Level 3 at period end. | |
The Trust’s investments that are categorized as Level 3 were valued utilizing third party pricing information without adjustment. Such valuations are based on unobservable inputs. A significant change in third party information could result in a significantly lower or higher value of such Level 3 investments.
See notes to financial statements.
| | | | |
| SCHEDULE OF INVESTMENTS | | | 19 | |
Statement of Assets and Liabilities (unaudited)
June 30, 2018
| | | | |
| | | BGIO | |
|
ASSETS | |
Investments at value — unaffiliated (cost — $261,121,690) | | $ | 253,159,972 | |
Investments at value — affiliated (cost — $8,102,195) | | | 8,102,195 | |
Cash | | | 1,031,849 | |
Cash pledged: | |
Collateral — OTC derivatives | | | 970,000 | |
Futures contracts | | | 312,000 | |
Centrally cleared swaps | | | 105,000 | |
Foreign currency at value (cost — $1,210,202) | | | 1,196,448 | |
Receivables: | |
Investments sold | | | 187,469 | |
Interest — unaffiliated | | | 3,523,040 | |
Dividends — affiliated | | | 15,499 | |
Variation margin on centrally cleared swaps | | | 2,171 | |
Swap premiums paid | | | 10,054 | |
Unrealized appreciation on: | |
Forward foreign currency exchange contracts | | | 86,099 | |
OTC derivatives | | | 62,508 | |
Prepaid expenses | | | 8,345 | |
| | | | |
Total assets | | | 268,772,649 | |
| | | | |
|
LIABILITIES | |
Reverse repurchase agreements at value | | | 52,154,675 | |
Payables: | |
Investments purchased | | | 5,754,379 | |
Income dividend distributions | | | 60,167 | |
Investment advisory fees | | | 134,129 | |
Trustees’ and Officer’s fees | | | 4,751 | |
Principle paydowns | | | 2,315 | |
Variation margin on futures contracts | | | 9,984 | |
Other accrued expenses | | | 131,640 | |
Swaps | | | 9,886 | |
Swap premiums received | | | 1,091,959 | |
Unrealized depreciation on OTC derivatives | | | 1,935 | |
| | | | |
Total liabilities | | | 59,355,820 | |
| | | | |
| |
NET ASSETS | | $ | 209,416,829 | |
| | | | |
|
NET ASSETS CONSIST OF | |
Paid-in capital | | $ | 217,531,215 | |
Undistributed net investment income | | | 1,694,557 | |
Accumulated net realized loss | | | (1,713,064 | ) |
Net unrealized appreciation (depreciation) | | | (8,095,879 | ) |
| | | | |
NET ASSETS | | $ | 209,416,829 | |
| | | | |
| |
NET ASSET VALUE | | | | |
Based on net assets of $209,416,829 and 22,128,879 shares outstanding, unlimited number of shares authorized, $0.001 par value | | $ | 9.46 | |
| | | | |
See notes to financial statements.
| | |
| 20 | | 2018 BLACKROCK SEMI-ANNUAL REPORTTO SHAREHOLDERS |
Statement of Operations (unaudited)
Six Months Ended June 30, 2018
| | | | |
| | | BGIO | |
|
INVESTMENT INCOME | |
Interest — unaffiliated | | $ | 9,160,566 | |
Dividends — affiliated | | | 59,050 | |
Foreign taxes withheld | | | (40,765 | ) |
| | | | |
Total investment income | | | 9,178,851 | |
| | | | |
|
EXPENSES | |
Investment advisory | | | 889,049 | |
Transfer agent | | | 11,896 | |
Accounting services | | | 22,726 | |
Custodian | | | 25,278 | |
Trustees and Officer | | | 9,917 | |
Printing | | | 13,000 | |
Registration | | | 4,693 | |
Professional | | | 45,272 | |
Miscellaneous | | | 6,213 | |
| | | | |
Total expenses excluding interest expense | | | 1,028,044 | |
Interest expense | | | 946,229 | |
| | | | |
Total expenses | | | 1,974,273 | |
Less fees waived and/or reimbursed by the Manager | | | (2,859 | ) |
| | | | |
Total expenses after fees waived and/or reimbursed | | | 1,971,414 | |
| | | | |
Net investment income | | | 7,207,437 | |
| | | | |
|
REALIZED AND UNREALIZED GAIN (LOSS) | |
Net realized gain (loss) from: | |
Investments — unaffiliated | | | (3,825,370 | ) |
Futures contracts | | | 2,273,857 | |
Forward foreign currency exchange contracts | | | (31,929 | ) |
Foreign currency transactions | | | (96,917 | ) |
Swaps | | | 131,285 | |
| | | | |
| | | (1,549,074 | ) |
| | | | |
Net change in unrealized appreciation (depreciation) on: | | | | |
Investments — unaffiliated | | | (11,422,417 | ) |
Futures contracts | | | (310,339 | ) |
Forward foreign currency exchange contracts | | | 100,964 | |
Foreign currency translations | | | (13,311 | ) |
Swaps | | | (55,097 | ) |
| | | | |
| | | (11,700,200 | ) |
| | | | |
Net realized and unrealized loss | | | (13,249,274 | ) |
| | | | |
NET DECREASE IN NET ASSETS RESULTING FROM OPERATIONS | | $ | (6,041,837 | ) |
| | | | |
See notes to financial statements.
Statements of Changes in Net Assets
| | | | | | | | |
| | | BGIO | |
| | | Six Months Ended
06/30/18
(unaudited) | | | Period from 02/27/17 (a) 12/31/17 | |
| | |
INCREASE (DECREASE) IN NET ASSETS | | | | | | | | |
|
OPERATIONS | |
Net investment income | | $ | 7,207,437 | | | $ | 10,989,289 | |
Net realized gain (loss) | | | (1,549,074 | ) | | | 342,258 | |
Net change in unrealized appreciation (depreciation) | | | (11,700,200 | ) | | | 3,604,321 | |
| | | | | | | | |
Net increase (decrease) in net assets resulting from operations | | | (6,041,837 | ) | | | 14,935,868 | |
| | | | | | | | |
|
DISTRIBUTIONS(b) | |
From net investment income | | | (5,532,220 | ) | | | (11,218,021 | ) |
From net realized gain | | | — | | | | (258,176 | ) |
| | | | | | | | |
Decrease in net assets resulting from distributions to shareholders | | | (5,532,220 | ) | | | (11,476,197 | ) |
| | | | | | | | |
|
CAPITAL SHARE TRANSACTIONS | |
Net proceeds from the issuance of shares(c) | | | — | | | | 206,850,000 | |
Net proceeds from the underwriter’s over allotment option exercised(d) | | | — | | | | 10,624,952 | |
Reinvestment of common distributions | | | — | | | | 321,692 | |
Capital charges with respect to the issuance of shares | | | — | | | | (365,431 | ) |
| | | | | | | | |
Net increase in net assets derived from capital share transactions | | | — | | | | 217,431,213 | |
| | | | | | | | |
|
NET ASSETS | |
Total increase (decrease) in net assets | | | (11,574,057 | ) | | | 220,890,884 | |
Beginning of period | | | 220,990,886 | | | | 100,002 | |
| | | | | | | | |
End of period | | $ | 209,416,829 | | | $ | 220,990,886 | |
| | | | | | | | |
Undistributed net investment income, end of period | | $ | 1,694,557 | | | $ | 19,340 | |
| | | | | | | | |
| (a) | Commencement of operations. |
| (b) | Distributions for annual periods determined in accordance with U.S. federal income tax regulations. |
| (c) | Net of sales load paid of $3,150,000. |
| (d) | Net of sales load paid of $161,796. |
See notes to financial statements.
| | |
| 22 | | 2018 BLACKROCK SEMI-ANNUAL REPORTTO SHAREHOLDERS |
Statement of Cash Flows (unaudited)
Six Months Ended June 30, 2018
| | | | |
| | | BGIO | |
| |
CASH PROVIDED BY (USED FOR) OPERATING ACTIVITIES | | | | |
Net decrease in net assets resulting from operations | | $ | (6,041,837 | ) |
Adjustments to reconcile net decrease in net assets resulting from operations to net cash provided by operating activities: | | | | |
Proceeds from sales of long-term investments and principal paydowns | | | 193,793,538 | |
Purchases of long-term investments | | | (143,372,294 | ) |
Net proceeds from purchases of short-term securities | | | (5,001,896 | ) |
Amortization of premium and accretion of discount on investments | | | 171,099 | |
Net realized loss on investments | | | 3,825,370 | |
Net unrealized depreciation on investments, swaps and foreign currency translations | | | 11,257,512 | |
| (Increase) Decrease in Assets: | | | |
Receivables: | | | | |
Interest — unaffiliated | | | 615,250 | |
Dividends — affiliated | | | (14,435 | ) |
Dividends — unaffiliated | | | (380 | ) |
Variation margin on centrally cleared swaps | | | (2,171 | ) |
Variation margin on futures contracts | | | 5,063 | |
Swap premiums paid | | | (10,054 | ) |
Prepaid expenses | | | (1,404 | ) |
| Increase (Decrease) in Liabilities: | | | |
Cash received for reverse repurchase agreements | | | (40,000 | ) |
Payables: | | | | |
Investment advisory fees | | | (29,456 | ) |
Interest expense and fees | | | (571,123 | ) |
Directors’ and Officer’s | | | (94 | ) |
Variation margin on futures contracts | | | (109,253 | ) |
Swaps | | | 9,886 | |
Other accrued expenses | | | (5,649 | ) |
Swap premiums received | | | (7,408 | ) |
| | | | |
Net cash provided by operating activities | | | 54,470,264 | |
| | | | |
| |
CASH PROVIDED BY (USED FOR) FINANCING ACTIVITIES | | | | |
Net borrowing of reverse repurchase agreements | | | (48,255,790 | ) |
Cash dividends paid to Common Shareholders | | | (6,996,357 | ) |
| | | | |
Net cash used for financing activities | | | (55,252,147 | ) |
| | | | |
| |
CASH IMPACT FROM FOREIGN EXCHANGE FLUCTUATIONS | | | | |
Cash impact from foreign exchange fluctuations | | | (8,938 | ) |
| | | | |
| |
CASH AND FOREIGN CURRENCY | | | | |
Net decrease in restricted and unrestricted cash and foreign currency at value | | | (790,821 | ) |
Restricted and unrestricted cash and foreign currency at beginning of period | | | 4,406,118 | |
| | | | |
Restricted and unrestricted cash and foreign currency at end of period | | $ | 3,615,297 | |
| | | | |
| |
SUPPLEMENTAL DISCLOSURE OF CASH FLOW INFORMATION | | | | |
Cash paid during the period for interest expense | | $ | 1,517,352 | |
| | | | |
| |
RECONCILIATION OF RESTRICTED AND UNRESTRICTED CASH TO THE STATEMENT OF ASSETS AND LIABILITIES | | | | |
| | | | | | | | |
| | | 06/30/18 | | | 12/31/17 | |
Cash | | $ | 1,031,849 | | | | 5,403 | |
Cash pledged: | | | | | | | | |
Collateral — OTC derivatives | | | 970,000 | | | | 1,370,000 | |
Futures contracts | | | 312,000 | | | | 726,000 | |
Centrally cleared swaps | | | 105,000 | | | | 120,000 | |
Foreign currency at value | | | 1,196,448 | | | | 2,184,715 | |
| | | | | | | | |
| | | 3,615,297 | | | | 4,406,118 | |
| | | | | | | | |
See notes to financial statements.
Financial Highlights
(For a share outstanding throughout each period)
| | | | | | | | |
| | | BlackRock 2022 Global Income Opportunity Trust | |
| | | Six Months Ended
06/30/18 (unaudited) | | | Period from 02/27/17(a) to 12/31/17 | |
Net asset value, beginning of period | | $ | 9.99 | | | $ | 9.85 | (b) |
| | | | | | | | |
Net investment income(c) | | | 0.33 | | | | 0.50 | |
Net realized and unrealized gain (loss) | | | (0.61 | ) | | | 0.18 | |
| | | | | | | | |
Net increase (decrease) from investment operations | | | (0.28 | ) | | | 0.68 | |
| | | | | | | | |
| Distributions(d) | | | | | | |
From net investment income | | | (0.25 | ) | | | (0.51 | ) |
From net realized gain | | | — | | | | (0.01 | ) |
| | | | | | | | |
Total distributions | | | (0.25 | ) | | | (0.52 | ) |
| | | | | | | | |
Capital charges with respect to the issuance of shares | | | — | | | | (0.02 | ) |
| | | | | | | | |
Net asset value, end of period | | $ | 9.46 | | | $ | 9.99 | |
| | | | | | | | |
Market price, end of period | | $ | 8.95 | | | $ | 9.80 | |
| | | | | | | | |
| | |
Total Return(e) | | | | | | | | |
Based on net asset value | | | (2.74 | )%(f) | | | 6.87 | %(f) |
| | | | | | | | |
Based on market price | | | (6.20 | )%(f) | | | 3.26 | %(f) |
| | | | | | | | |
| | |
Ratios to Average Net Assets | | | | | | | | |
Total expenses | | | 1.83 | %(g)(i) | | | 1.60 | %(g)(h)(i) |
| | | | | | | | |
Total expenses after fees waived | | | 1.83 | %(g)(i) | | | 1.59 | %(g)(h)(i) |
| | | | | | | | |
Total expenses after fees waived and excluding interest expense | | | 0.95 | %(g)(i) | | | 0.93 | %(g)(h)(i) |
| | | | | | | | |
Net investment income | | | 6.69 | %(g)(i) | | | 5.99 | %(g)(h)(i) |
| | | | | | | | |
| | |
Supplemental Data | | | | | | | | |
Net assets, end of period (000) | | $ | 209,417 | | | $ | 220,991 | |
| | | | | | | | |
Borrowings outstanding, end of period (000) | | $ | 52,155 | | | $ | 100,982 | |
| | | | | | | | |
Portfolio turnover rate(j) | | | 46 | % | | | 125 | % |
| | | | | | | | |
| (a) | Commencement of operations. |
| (b) | Net asset value, beginning of period, reflects a reduction of $0.15 per share sales charge from the initial offering price of $10.00 per share. |
| (c) | Based on average shares outstanding. |
| (d) | Distributions for annual periods determined in accordance with U.S. federal income tax regulations. |
| (e) | Total returns based on market price, which can be significantly greater or less than the net asset value, may result in substantially different returns. Where applicable, excludes the effects of any sales charges and assumes the reinvestment of distributions at actual reinvestment prices. |
| (f) | Aggregate total return. |
| (h) | Audit costs were not annualized in the calculation of the expense ratios and net investment income ratio. If these expenses were annualized, the total expenses would have been 1.61%,1.60%, 0.94% and 5.99%, respectively. |
| (i) | Excludes expenses incurred indirectly as a result of investments in underlying funds as follows: |
| | | | | | | | | | | | |
| | | Six Months Ended 06/30/18 (unaudited) | | | | | | Period from 02/27/17(a) to 12/31/17 | |
Investments in underlying funds | | | 0.01 | % | | | | | | | 0.03 | % |
| | | | | | | | | | | | |
| (j) | Includes mortgage dollar roll transactions (“MDRs”). Additional information regarding portfolio turnover rate is as follows: |
| | | | | | | | | | | | | | | | |
| | | Six Months Ended 06/30/18 (Unaudited) | | | | | | Period from 02/27/17(a) to 12/31/17 | | | | |
Portfolio turnover rate (excluding MDRs) | | | 41 | % | | | | | | | 93 | % | | | | |
| | | | | | | | | | | | | | | | |
See notes to financial statements.
| | |
| 24 | | 2018 BLACKROCK SEMI-ANNUAL REPORTTO SHAREHOLDERS |
Notes to Financial Statements (unaudited)
BlackRock 2022 Global Income Opportunity Trust (the “Trust”) is registered under the Investment Company Act of 1940, as amended (the “1940 Act”). The Trust is registered as a non-diversified, closed-end management investment company. The Trust is organized as a Delaware statutory trust. The Trust determines and makes available for publication the net asset value (“NAV”) of its Common Shares on a daily basis.
The Trust, together with certain other registered investment companies advised by BlackRock Advisors, LLC (the “Manager”) or its affiliates, is included in a complex of closed-end funds referred to as the Closed-End Complex.
| 2. | SIGNIFICANT ACCOUNTING POLICIES |
The financial statements are prepared in conformity with accounting principles generally accepted in the United States of America (“U.S. GAAP”), which may require management to make estimates and assumptions that affect the reported amounts of assets and liabilities in the financial statements, disclosure of contingent assets and liabilities at the date of the financial statements and the reported amounts of increases and decreases in net assets from operations during the reporting period. Actual results could differ from those estimates. The Trust is considered an investment company under U.S. GAAP and follows the accounting and reporting guidance applicable to investment companies. Below is a summary of significant accounting policies:
Investment Transactions and Income Recognition: For financial reporting purposes, investment transactions are recorded on the dates the transactions are entered into (the “trade dates”). Realized gains and losses on investment transactions are determined on the identified cost basis. Dividend income is recorded on the ex-dividend date. Interest income, including amortization and accretion of premiums and discounts on debt securities, is recognized on an accrual basis.
Foreign Currency Translation: The Trust’s books and records are maintained in U.S. dollars. Securities and other assets and liabilities denominated in foreign currencies are translated into U.S. dollars using exchange rates determined as of the close of trading on the New York Stock Exchange (“NYSE”). Purchases and sales of investments are recorded at the rates of exchange prevailing on the respective dates of such transactions. Generally, when the U.S. dollar rises in value against a foreign currency, the investments denominated in that currency will lose value; the opposite effect occurs if the U.S. dollar falls in relative value.
The Trust does not isolate the portion of the results of operations arising as a result of changes in the exchange rates from the changes in the market prices of investments held or sold for financial reporting purposes. Accordingly, the effects of changes in exchange rates on investments are not segregated in the Statement of Operations from the effects of changes in market prices of those investments, but are included as a component of net realized and unrealized gain (loss) from investments. The Trust reports realized currency gains (losses) on foreign currency related transactions as components of net realized gain (loss) for financial reporting purposes, whereas such components are generally treated as ordinary income for U.S. federal income tax purposes.
Segregation and Collateralization: In cases where the Trust enters into certain investments (e.g., dollar rolls, To-be-announced (“TBA”) sale commitments, futures contracts, forward foreign currency exchange contracts and swaps) or certain borrowings (e.g., reverse repurchase transactions) that would be treated as “senior securities” for 1940 Act purposes, the Trust may segregate or designate on its books and records cash or liquid assets having a market value at least equal to the amount of its future obligations under such investments or borrowings. Doing so allows the investment or borrowings to be excluded from treatment as a “senior security.” Furthermore, if required by an exchange or counterparty agreement, the Trust may be required to deliver/deposit cash and/or securities to/with an exchange, or broker-dealer or custodian as collateral for certain investments or obligations.
Distributions: Distributions from net investment income are declared monthly and paid monthly. Distributions of capital gains are recorded on the ex-dividend date and made at least annually. The character and timing of distributions are determined in accordance with U.S. federal income tax regulations, which may differ from U.S. GAAP.
Deferred Compensation Plan: Under the Deferred Compensation Plan (the “Plan”) approved by Trust’s Board, the independent Trustees (“Independent Trustees”) may defer a portion of their annual complex-wide compensation. Deferred amounts earn an approximate return as though equivalent dollar amounts had been invested in common shares of certain other BlackRock Closed-End Funds selected by the Independent Trustees. This has the same economic effect for the Independent Trustees as if the Independent Trustees had invested the deferred amounts directly in certain other BlackRock Closed-End Funds.
The Plan is not funded and obligations thereunder represent general unsecured claims against the general assets of the Trust, if applicable. Deferred compensation liabilities are included in the Trustees’ and Officer’s fees payable in the Statement of Assets and Liabilities and will remain as a liability of the Trust until such amounts are distributed in accordance with the Plan.
Recent Accounting Standards: In March 2017, the Financial Accounting Standards Board issued Accounting Standards Update “Premium Amortization of Purchased Callable Debt Securities” which amends the amortization period for certain purchased callable debt securities. Under the new guidance, the premium amortization of purchased callable debt securities that have explicit, non-contingent call features and are callable at fixed prices will be amortized to the earliest call date. The guidance will be applied on a modified retrospective basis and is effective for fiscal years, and their interim periods, beginning after December 15, 2018. Management is currently evaluating the impact of this guidance to the Trust.
Indemnifications: In the normal course of business, the Trust enters into contracts that contain a variety of representations that provide general indemnification. The Trust’s maximum exposure under these arrangements is unknown because it involves future potential claims against the Trust, which cannot be predicted with any certainty.
Other: Expenses directly related to the Trust are charged to the Trust. Other operating expenses shared by several funds, including other funds managed by the Manager, are prorated among those funds on the basis of relative net assets or other appropriate methods.
| | | | |
| NOTESTO FINANCIAL STATEMENTS | | | 25 | |
Notes to Financial Statements (unaudited) (continued)
| 3. | INVESTMENT VALUATION AND FAIR VALUE MEASUREMENTS |
Investment Valuation Policies: The Trust’s investments are valued at fair value (also referred to as “market value” within the financial statements) as of the close of trading on the NYSE (generally 4:00 p.m., Eastern time) (or if the reporting date falls on a day the NYSE is closed, investments are valued at fair value as of the period end). U.S. GAAP defines fair value as the price the Trust would receive to sell an asset or pay to transfer a liability in an orderly transaction between market participants at the measurement date. The Trust determines the fair values of their financial instruments using various independent dealers or pricing services under policies approved by the Board of Trustees of the Trust (the “Board”). The BlackRock Global Valuation Methodologies Committee (the “Global Valuation Committee”) is the committee formed by management to develop global pricing policies and procedures and to oversee the pricing function for all financial instruments.
Fair Value Inputs and Methodologies: The following methods and inputs are used to establish the fair value of the Trust’s assets and liabilities:
| | • | | Fixed-income securities for which market quotations are readily available are generally valued using the last available bid prices or current market quotations provided by independent dealers or third party pricing services. Floating rate loan interests are valued at the mean of the bid prices from one or more independent brokers or dealers as obtained from a third party pricing service. Pricing services generally value fixed-income securities assuming orderly transactions of an institutional round lot size, but a fund may hold or transact in such securities in smaller, odd lot sizes. Odd lots may trade at lower prices than institutional round lots. The pricing services may use matrix pricing or valuation models that utilize certain inputs and assumptions to derive values, including transaction data (e.g., recent representative bids and offers), credit quality information, perceived market movements, news, and other relevant information. Certain fixed-income securities, including asset-backed and mortgage related securities may be valued based on valuation models that consider the estimated cash flows of each tranche of the entity, establish a benchmark yield and develop an estimated tranche specific spread to the benchmark yield based on the unique attributes of the tranche. The amortized cost method of valuation may be used with respect to debt obligations with sixty days or less remaining to maturity unless the Manager determines such method does not represent fair value. |
Generally, trading in foreign instruments is substantially completed each day at various times prior to the close of trading on the NYSE. Occasionally, events affecting the values of such instruments may occur between the foreign market close and the close of trading on the NYSE that may not be reflected in the computation of the Trust’s net assets.
| | • | | Exchange-traded funds (“ETFs”) traded on a recognized securities exchange are valued at the official closing price each day, if available. For ETFs traded on more than one exchange, the official closing price on the exchange where the stock is primarily traded is used. ETFs traded on a recognized exchange for which there were no sales on that day may be valued at the last available bid (long positions) or ask (short positions) price. |
| | • | | Investments in open-end U.S. mutual funds are valued at NAV each business day. |
| | • | | Futures contracts traded on exchanges are valued at their last sale price. |
| | • | | Forward foreign currency exchange contracts are valued at the mean between the bid and ask prices and are determined as of the close of trading on the NYSE. Interpolated values are derived when the settlement date of the contract is an interim date for which quotations are not available. |
| | • | | Exchange-traded options are valued at the mean between the last bid and ask prices at the close of the options market in which the options trade. An exchange-traded option for which there is no mean price is valued at the last bid (long positions) or ask (short positions) price. If no bid or ask price is available, the prior day’s price will be used, unless it is determined that the prior day’s price no longer reflects the fair value of the option. Over-the-counter (“OTC”) options are valued by an independent pricing service using a mathematical model, which incorporates a number of market data factors, such as the trades and prices of the underlying instruments. |
| | • | | Swap agreements are valued utilizing quotes received daily by the Trust’s pricing service or through brokers, which are derived using daily swap curves and models that incorporate a number of market data factors, such as discounted cash flows, trades and values of the underlying reference instruments. |
| | • | | TBA commitments are valued on the basis of last available bid prices or current market quotations provided by pricing services. |
If events (e.g., a company announcement, market volatility or a natural disaster) occur that are expected to materially affect the value of such investments, or in the event that the application of these methods of valuation results in a price for an investment that is deemed not to be representative of the market value of such investment, or if a price is not available, the investment will be valued by the Global Valuation Committee, or its delegate, in accordance with a policy approved by the Board as reflecting fair value (“Fair Valued Investments”). The fair valuation approaches that may be used by the Global Valuation Committee will include market approach, income approach and cost approach. Valuation techniques such as discounted cash flow, use of market comparables and matrix pricing are types of valuation approaches and are typically used in determining fair value. When determining the price for Fair Valued Investments, the Global Valuation Committee, or its delegate, seeks to determine the price that the Trust might reasonably expect to receive or pay from the current sale or purchase of that asset or liability in an arm’s-length transaction. Fair value determinations shall be based upon all available factors that the Global Valuation Committee, or its delegate, deems relevant and consistent with the principles of fair value measurement.
The Global Valuation Committee, or its delegate, employs various methods for calibrating valuation approaches for investments where an active market does not exist, including regular due diligence of the Trust’s pricing vendors, regular reviews of key inputs and assumptions, transactional back-testing or disposition analysis to compare unrealized gains and losses to realized gains and losses, reviews of missing or stale prices and large movements in market values and reviews of any market related activity. The pricing of all Fair Valued Investments is subsequently reported to the Board or a committee thereof on a quarterly basis. As a result of the inherent uncertainty in valuation of these investments, the fair values may differ from the values that would have been used had an active market existed.
| | |
| 26 | | 2018 BLACKROCK SEMI-ANNUAL REPORTTO SHAREHOLDERS |
Notes to Financial Statements (unaudited) (continued)
For investments in equity or debt issued by privately held companies or funds (“Private Company” or collectively, the “Private Companies”) and other Fair Valued Investments, the fair valuation approaches that are used by third party pricing services utilize one or a combination of, but not limited to, the following inputs.
| | |
| | | Standard Inputs Generally Considered By Third Party Pricing Services |
Market approach | | (i) recent market transactions, including subsequent rounds of financing, in the underlying investment or comparable issuers; (ii) recapitalizations and other transactions across the capital structure; and (iii) market multiples of comparable issuers. |
Income approach | | (i) future cash flows discounted to present and adjusted as appropriate for liquidity, credit, and/or market risks; (ii) quoted prices for similar investments or assets in active markets; and (iii) other risk factors, such as interest rates, yield curves, volatilities, prepayment speeds, loss severities, credit risks, recovery rates, liquidation amounts and/or default rates. |
Cost approach | | (i) audited or unaudited financial statements, investor communications and financial or operational metrics issued by the Private Company; (ii) changes in the valuation of relevant indices or publicly traded companies comparable to the Private Company; (iii) relevant news and other public sources; and (iv) known secondary market transactions in the Private Company’s interests and merger or acquisition activity in companies comparable to the Private Company. |
Investments in series of preferred stock issued by Private Companies are typically valued utilizing market approach in determining the enterprise value of the company. Such investments often contain rights and preferences that differ from other series of preferred and common stock of the same issuer. Valuation techniques such as an option pricing model (“OPM”), a probability weighted expected return model (“PWERM”) or a hybrid of those techniques are used in allocating enterprise value of the company, as deemed appropriate under the circumstances. The use of OPM and PWERM techniques involve a determination of the exit scenarios of the investment in order to appropriately allocate the enterprise value of the company among the various parts of its capital structure.
The Private Companies are not subject to the public company disclosure, timing, and reporting standards as other investments held by the Trust. Typically, the most recently available information by a Private Company is as of a date that is earlier than the date the Trust is calculating its NAV. This factor may result in a difference between the value of the investment and the price the Trust could receive upon the sale of the investment.
Fair Value Hierarchy: Various inputs are used in determining the fair value of investments and derivative financial instruments. These inputs to valuation techniques are categorized into a fair value hierarchy consisting of three broad levels for financial statement purposes as follows:
| | • | | Level 1 — Unadjusted price quotations in active markets/exchanges for identical assets or liabilities that the Trust has the ability to access |
| | • | | Level 2 — Other observable inputs (including, but not limited to, quoted prices for similar assets or liabilities in markets that are active, quoted prices for identical or similar assets or liabilities in markets that are not active, inputs other than quoted prices that are observable for the assets or liabilities (such as interest rates, yield curves, volatilities, prepayment speeds, loss severities, credit risks and default rates) or other market–corroborated inputs) |
| | • | | Level 3 — Unobservable inputs based on the best information available in the circumstances, to the extent observable inputs are not available (including the Trust’s own assumptions used in determining the fair value of investments and derivative financial instruments) |
The hierarchy gives the highest priority to unadjusted quoted prices in active markets for identical assets or liabilities (Level 1 measurements) and the lowest priority to unobservable inputs (Level 3 measurements). Accordingly, the degree of judgment exercised in determining fair value is greatest for instruments categorized in Level 3. The inputs used to measure fair value may fall into different levels of the fair value hierarchy. In such cases, for disclosure purposes, the fair value hierarchy classification is determined based on the lowest level input that is significant to the fair value measurement in its entirety. Investments classified within Level 3 have significant unobservable inputs used by the Global Valuation Committee in determining the price for Fair Valued Investments. Level 3 investments include equity or debt issued by Private Companies. There may not be a secondary market, and/or there are a limited number of investors. Level 3 investments may also be adjusted to reflect illiquidity and/or non-transferability, with the amount of such discount estimated by the Global Valuation Committee in the absence of market information.
Changes in valuation techniques may result in transfers into or out of an assigned level within the hierarchy. In accordance with the Trust’s policy, transfers between different levels of the fair value hierarchy are deemed to have occurred as of the beginning of the reporting period. The categorization of a value determined for investments and derivative financial instruments is based on the pricing transparency of the investments and derivative financial instruments and is not necessarily an indication of the risks associated with investing in those securities.
| 4. | SECURITIES AND OTHER INVESTMENTS |
Asset-Backed and Mortgage-Backed Securities: Asset-backed securities are generally issued as pass-through certificates or as debt instruments. Asset-backed securities issued as pass-through certificates represent undivided fractional ownership interests in an underlying pool of assets. Asset-backed securities issued as debt instruments, which are also known as collateralized obligations, are typically issued as the debt of a special purpose entity organized solely for the purpose of owning such assets and issuing such debt. Asset-backed securities are often backed by a pool of assets representing the obligations of a number of different parties. The yield characteristics of certain asset-backed securities may differ from traditional debt securities. One such major difference is that all or a principal part of the obligations may be prepaid at any time because the underlying assets (i.e., loans) may be prepaid at any time. As a result, a decrease in interest rates in the market may result in increases in the level of prepayments as borrowers, particularly mortgagors, refinance and repay their loans. An increased prepayment rate with respect to an asset-backed security will have the effect of shortening the maturity of the security. In addition, a trust may subsequently have to reinvest the proceeds at lower interest rates. If a trust has purchased such an asset-backed security at a premium, a faster than anticipated prepayment rate could result in a loss of principal to the extent of the premium paid.
| | | | |
| NOTESTO FINANCIAL STATEMENTS | | | 27 | |
Notes to Financial Statements (unaudited) (continued)
For mortgage pass-through securities (the “Mortgage Assets”) there are a number of important differences among the agencies and instrumentalities of the U.S. Government that issue mortgage-related securities and among the securities that they issue. For example, mortgage-related securities guaranteed by Ginnie Mae are
guaranteed as to the timely payment of principal and interest by Ginnie Mae and such guarantee is backed by the full faith and credit of the United States. However, mortgage-related securities issued by Freddie Mac and Fannie Mae, including Freddie Mac and Fannie Mae guaranteed mortgage pass-through certificates, which are solely the obligations of Freddie Mac and Fannie Mae, are not backed by or entitled to the full faith and credit of the United States, but are supported by the right of the issuer to borrow from the U.S. Treasury.
Non-agency mortgage-backed securities are securities issued by non-governmental issuers and have no direct or indirect government guarantees of payment and are subject to various risks. Non-agency mortgage loans are obligations of the borrowers thereunder only and are not typically insured or guaranteed by any other person or entity. The ability of a borrower to repay a loan is dependent upon the income or assets of the borrower. A number of factors, including a general economic downturn, acts of God, terrorism, social unrest and civil disturbances, may impair a borrower’s ability to repay its loans.
Collateralized Debt Obligations: Collateralized debt obligations (“CDOs”), including collateralized bond obligations (“CBOs”) and collateralized loan obligations (“CLOs”), are types of asset-backed securities. A CDO is an entity that is backed by a diversified pool of debt securities (CBOs) or syndicated bank loans (CLOs). The cash flows of the CDO can be split into multiple segments, called “tranches,” which will vary in risk profile and yield. The riskiest segment is the subordinated or “equity” tranche. This tranche bears the greatest risk of defaults from the underlying assets in the CDO and serves to protect the other, more senior, tranches from default in all but the most severe circumstances. Since it is shielded from defaults by the more junior tranches, a “senior” tranche will typically have higher credit ratings and lower yields than their underlying securities, and often receive investment grade ratings from one or more of the nationally recognized rating agencies. Despite the protection from the more junior tranches, senior tranches can experience substantial losses due to actual defaults, increased sensitivity to future defaults and the disappearance of one or more protecting tranches as a result of changes in the credit profile of the underlying pool of assets.
Multiple Class Pass-Through Securities: Multiple class pass-through securities, including collateralized mortgage obligations (“CMOs”) and commercial mortgage-backed securities, may be issued by Ginnie Mae, U.S. Government agencies or instrumentalities or by trusts formed by private originators of, or investors in, mortgage loans. In general, CMOs are debt obligations of a legal entity that are collateralized by a pool of residential or commercial mortgage loans or Mortgage Assets. The payments on these are used to make payments on the CMOs or multiple pass-through securities. Multiple class pass-through securities represent direct ownership interests in the Mortgage Assets. Classes of CMOs include interest only (“IOs”), principal only (“POs”), planned amortization classes and targeted amortization classes. IOs and POs are stripped mortgage-backed securities representing interests in a pool of mortgages, the cash flow from which has been separated into interest and principal components. IOs receive the interest portion of the cash flow while POs receive the principal portion. IOs and POs can be extremely volatile in response to changes in interest rates. As interest rates rise and fall, the value of IOs tends to move in the same direction as interest rates. POs perform best when prepayments on the underlying mortgages rise since this increases the rate at which the principal is returned and the yield to maturity on the PO. When payments on mortgages underlying a PO are slower than anticipated, the life of the PO is lengthened and the yield to maturity is reduced. If the underlying Mortgage Assets experience greater than anticipated prepayments of principal, a trust’s initial investment in the IOs may not fully recoup.
Stripped Mortgage-Backed Securities: Stripped mortgage-backed securities are typically issued by the U.S. Government, its agencies and instrumentalities. Stripped mortgage-backed securities are usually structured with two classes that receive different proportions of the interest (IOs) and principal (POs) distributions on a pool of Mortgage Assets. Stripped mortgage-backed securities may be privately issued.
Zero-Coupon Bonds: Zero-coupon bonds are normally issued at a significant discount from face value and do not provide for periodic interest payments. These bonds may experience greater volatility in market value than other debt obligations of similar maturity which provide for regular interest payments.
Capital Securities and Trust Preferred Securities: Capital securities, including trust preferred securities, are typically issued by corporations, generally in the form of interest-bearing notes with preferred securities characteristics. In the case of trust preferred securities, an affiliated business trust of a corporation issues these securities, generally in the form of beneficial interests in subordinated debentures or similarly structured securities. The securities can be structured with either a fixed or adjustable coupon that can have either a perpetual or stated maturity date. For trust preferred securities, the issuing bank or corporation pays interest to the trust, which is then distributed to holders of these securities as a dividend. Dividends can be deferred without creating an event of default or acceleration, although maturity cannot take place unless all cumulative payment obligations have been met. The deferral of payments does not affect the purchase or sale of these securities in the open market. These securities generally are rated below that of the issuing company’s senior debt securities and are freely callable at the issuer’s option.
Floating Rate Loan Interests: Floating rate loan interests are typically issued to companies (the “borrower”) by banks, other financial institutions, or privately and publicly offered corporations (the “lender”). Floating rate loan interests are generally non-investment grade, often involve borrowers whose financial condition is troubled or uncertain and companies that are highly leveraged or in bankruptcy proceedings. In addition, transactions in floating rate loan interests may settle on a delayed basis, which may result in proceeds from the sale not being readily available for a trust to make additional investments or meet its redemption obligations. Floating rate loan interests may include fully funded term loans or revolving lines of credit. Floating rate loan interests are typically senior in the corporate capital structure of the borrower. Floating rate loan interests generally pay interest at rates that are periodically determined by reference to a base lending rate plus a premium. Since the rates reset only periodically, changes in prevailing interest rates (and particularly sudden and significant changes) can be expected to cause some fluctuations in the NAV of a trust to the extent that it invests in floating rate loan interests. The base lending rates are generally the lending rate offered by one or more European banks, such as the London Interbank Offered Rate (“LIBOR”), the prime rate offered by one or more U.S. banks or the certificate of deposit rate. Floating rate loan interests may involve foreign borrowers, and investments may be denominated in foreign currencies. These investments are treated as investments in debt securities for purposes of a trust’s investment policies.
When a trust purchases a floating rate loan interest, it may receive a facility fee and when it sells a floating rate loan interest, it may pay a facility fee. On an ongoing basis, a fund may receive a commitment fee based on the undrawn portion of the underlying line of credit amount of a floating rate loan interest. Facility and commitment fees are typically amortized to income over the term of the loan or term of the commitment, respectively. Consent and amendment fees are recorded to income as earned. Prepayment penalty fees, which may be received by a fund upon the prepayment of a floating rate loan interest by a borrower, are recorded as realized gains. A trust may invest in multiple series or tranches of a loan. A different series or tranche may have varying terms and carry different associated risks.
| | |
| 28 | | 2018 BLACKROCK SEMI-ANNUAL REPORTTO SHAREHOLDERS |
Notes to Financial Statements (unaudited) (continued)
Floating rate loan interests are usually freely callable at the borrower’s option. A trust may invest in such loans in the form of participations in loans (“Participations”) or assignments (“Assignments”) of all or a portion of loans from third parties. Participations typically will result in a fund having a contractual relationship only with the lender, not with the borrower. A trust has the right to receive payments of principal, interest and any fees to which it is entitled only from the lender selling the Participation and only upon receipt by the lender of the payments from the borrower. In connection with purchasing Participations, a trust generally will have no right to enforce compliance by the borrower with the terms of the loan agreement, nor any rights of offset against the borrower. A fund may not benefit directly from any collateral supporting the loan in which it has purchased the Participation. As a result, a fund assumes the credit risk of both the borrower and the lender that is selling the Participation. A trust’s investment in loan participation interests involves the risk of insolvency of the financial intermediaries who are parties to the transactions. In the event of the insolvency of the lender selling the Participation, a trust may be treated as a general creditor of the lender and may not benefit from any offset between the lender and the borrower. Assignments typically result in a fund having a direct contractual relationship with the borrower, and a trust may enforce compliance by the borrower with the terms of the loan agreement.
Forward Commitments and When-Issued Delayed Delivery Securities: The trust may purchase securities on a when-issued basis and may purchase or sell securities on a forward commitment basis. Settlement of such transactions normally occurs within a month or more after the purchase or sale commitment is made. The trust may purchase securities under such conditions with the intention of actually acquiring them, but may enter into a separate agreement to sell the securities before the settlement date. Since the value of securities purchased may fluctuate prior to settlement, the trust may be required to pay more at settlement than the security is worth. In addition, the trust is not entitled to any of the interest earned prior to settlement. When purchasing a security on a delayed delivery basis, the trust assumes the rights and risks of ownership of the security, including the risk of price and yield fluctuations. In the event of default by the counterparty, the trust’s maximum amount of loss is the unrealized appreciation of unsettled when-issued transactions.
TBA Commitments: TBA commitments are forward agreements for the purchase or sale of mortgage-backed securities for a fixed price, with payment and delivery on an agreed upon future settlement date. The specific securities to be delivered are not identified at the trade date. However, delivered securities must meet specified terms, including issuer, rate and mortgage terms. When entering into TBA commitments, a fund may take possession of or deliver the underlying mortgage-backed securities but can extend the settlement or roll the transaction. TBA commitments involve a risk of loss if the value of the security to be purchased or sold declines or increases, respectively, prior to settlement date.
In order to better define contractual rights and to secure rights that will help a fund mitigate their counterparty risk, TBA commitments may be entered into by a trust under Master Securities Forward Transaction Agreements (each, an “MSFTA”). An MSFTA typically contains, among other things, collateral posting terms and netting provisions in the event of default and/or termination event. The collateral requirements are typically calculated by netting the mark-to-market amount for each transaction under such agreement and comparing that amount to the value of the collateral currently pledged by a trust and the counterparty. Cash collateral that has been pledged to cover the obligations of a trust and cash collateral received from the counterparty, if any, is reported separately on the Statement of Assets and Liabilities as cash pledged as collateral for TBA commitments or cash received as collateral for TBA commitments, respectively. Non-cash collateral pledged by a fund, if any, is noted in the Schedule of Investments. Typically, a trust is permitted to sell, re-pledge or use the collateral it receives; however, the counterparty is not permitted to do so. To the extent amounts due to a trust is not fully collateralized, contractually or otherwise, a trust bears the risk of loss from counterparty non-performance.
Mortgage Dollar Roll Transactions: The trust may sell TBA mortgage-backed securities and simultaneously contract to repurchase substantially similar (i.e., same type, coupon and maturity) securities on a specific future date at an agreed upon price. During the period between the sale and repurchase, a trust is not entitled to receive interest and principal payments on the securities sold. Mortgage dollar roll transactions are treated as purchases and sales and realizes gains and losses on these transactions. Mortgage dollar rolls involve the risk that the market value of the securities that a fund is required to purchase may decline below the agreed upon repurchase price of those securities.
Reverse Repurchase Agreements: Reverse repurchase agreements are agreements with qualified third party broker dealers in which a fund sells securities to a bank or broker-dealer and agrees to repurchase the same securities at a mutually agreed upon date and price. A trust receives cash from the sale to use for other investment purposes. During the term of the reverse repurchase agreement, a trust continues to receive the principal and interest payments on the securities sold. Certain agreements have no stated maturity and can be terminated by either party at any time. Interest on the value of the reverse repurchase agreements issued and outstanding is based upon competitive market rates determined at the time of issuance. A trust may utilize reverse repurchase agreements when it is anticipated that the interest income to be earned from the investment of the proceeds of the transaction is greater than the interest expense of the transaction. Reverse repurchase agreements involve leverage risk. If a trust suffers a loss on its investment of the transaction proceeds from a reverse repurchase agreement, a trust would still be required to pay the full repurchase price. Further, a trust remains subject to the risk that the market value of the securities repurchased declines below the repurchase price. In such cases, a trust would be required to return a portion of the cash received from the transaction or provide additional securities to the counterparty.
Cash received in exchange for securities delivered plus accrued interest due to the counterparty is recorded as a liability in the Statement of Assets and Liabilities at face value including accrued interest. Due to the short-term nature of the reverse repurchase agreements, face value approximates fair value. Interest payments made by a trust to the counterparties are recorded as a component of interest expense in the Statement of Operations. In periods of increased demand for the security, a trust may receive a fee for the use of the security by the counterparty, which may result in interest income to a trust.
For the six months ended June 30, 2018, the average amount of reverse repurchase agreements outstanding and the daily weighted average interest rate for the Trust were $81,294,771 and 2.35%, respectively.
Reverse repurchase transactions are entered into by a trust under Master Repurchase Agreements (each, an “MRA”), which permit a trust, under certain circumstances, including an event of default (such as bankruptcy or insolvency), to offset payables and/or receivables under the MRA with collateral held and/or posted to the counterparty and create one single net payment due to or from a trust. With reverse repurchase transactions, typically a trust and counterparty under an MRA are permitted to sell, re-pledge, or use the collateral associated with the transaction. Bankruptcy or insolvency laws of a particular jurisdiction may impose restrictions on or prohibitions against such a right of offset in the event of the MRA counterparty’s bankruptcy or insolvency. Pursuant to the terms of the MRA, a trust receives or posts securities and cash as collateral with a market value in excess of the repurchase price to be paid or received by a trust upon the maturity of the transaction. Upon a bankruptcy or insolvency of
the MRA counterparty, a trust is considered an unsecured creditor with respect to excess collateral and, as such, the return of excess collateral may be delayed.
| | | | |
| NOTESTO FINANCIAL STATEMENTS | | | 29 | |
Notes to Financial Statements (unaudited) (continued)
As of period end, the following table is a summary of the Trust’s open reverse repurchase agreements by counterparty which are subject to offset under an MRA on a net basis:
| | | | | | | | | | | | | | | | |
| Counterparty | | Reverse Repurchase
Agreements | | | Fair Value of Non-cash Collateral
Pledged Including
Accrued Interest (a) | | | Cash Collateral
Pledged/Received | | | Net
Amount | |
Barclays Capital, Inc. | | $ | 3,584,281 | | | $ | (3,584,281 | ) | | | — | | | | — | |
BNP Paribas | | | 9,680,615 | | | | (9,680,615 | ) | | | — | | | | — | |
Credit Suisse Securities (USA) LLC | | | 7,265,610 | | | | (7,265,610 | ) | | | — | | | | — | |
Deutsche Bank Securities, Inc. | | | 3,044,789 | | | | (3,044,789 | ) | | | — | | | | — | |
RBC Capital Markets LLC | | | 28,579,380 | | | | (28,579,380 | ) | | | — | | | | — | |
| | | | | | | | | | | | | | | | |
| | $ | 52,154,675 | | | $ | (52,154,675 | ) | | | — | | | | — | |
| | | | | | | | | | | | | | | | |
| | (a) | Net collateral, including accrued interest, with a value of $64,370,741 has been pledged/received in connection with open reverse repurchase agreements. Excess of net collateral pledged to the individual counterparty is not shown for financial reporting purposes. | |
In the event the counterparty of securities under an MRA files for bankruptcy or becomes insolvent, a trust’s use of the proceeds from the agreement may be restricted while the counterparty, or its trustee or receiver, determines whether or not to enforce a trust’s obligation to repurchase the securities.
| 5. | DERIVATIVE FINANCIAL INSTRUMENTS |
The Trust engages in various portfolio investment strategies using derivative contracts both to increase the returns of the Trust and/or to manage its exposure to certain risks such as credit risk, equity risk, interest rate risk, foreign currency exchange rate risk, commodity price risk or other risks (e.g., inflation risk). Derivative financial instruments categorized by risk exposure are included in the Schedule of Investments. These contracts may be transacted on an exchange or OTC.
Futures Contracts: Futures contracts are purchased or sold to gain exposure to, or manage exposure to, changes in interest rates (interest rate risk), changes in the value of equity securities (equity risk) or foreign currencies (foreign currency exchange rate risk).
Futures contracts are agreements between the Trust and a counterparty to buy or sell a specific quantity of an underlying instrument at a specified price and on a specified date. Depending on the terms of a contract, it is settled either through physical delivery of the underlying instrument on the settlement date or by payment of a cash amount on the settlement date. Upon entering into a futures contract, the Trust is required to deposit initial margin with the broker in the form of cash or securities in an amount that varies depending on a contract’s size and risk profile. The initial margin deposit must then be maintained at an established level over the life of the contract. Amounts pledged, which are considered restricted, are included in Cash pledged: Futures contracts on the Statement of Assets and Liabilities.
Securities deposited as initial margin are designated in the Schedule of Investments and cash deposited, if any, is shown as cash pledged for futures contracts in the Statement of Assets and Liabilities. Pursuant to the contract, the Trust agrees to receive from or pay to the broker an amount of cash equal to the daily fluctuation in market value of the contract (“variation margin”). Variation margin is recorded as unrealized appreciation (depreciation) and, if any, shown as variation margin receivable (or payable) on futures contracts in the Statement of Assets and Liabilities. When the contract is closed, a realized gain or loss is recorded in the Statement of Operations equal to the difference between the notional amount of the contract at the time it was opened and the notional amount at the time it was closed. The use of futures contracts involves the risk of an imperfect correlation in the movements in the price of futures contracts and interest, foreign currency exchange rates or underlying assets.
Forward Foreign Currency Exchange Contracts: Forward foreign currency exchange contracts are entered into to gain or reduce exposure to foreign currencies (foreign currency exchange rate risk).
A forward foreign currency exchange contract is an agreement between two parties to buy and sell a currency at a set exchange rate on a specified date. These contracts help to manage the overall exposure to the currencies in which some of the investments held by the Trust are denominated and in some cases, may be used to obtain exposure to a particular market.
The contract is marked-to-market daily and the change in market value is recorded as unrealized appreciation (depreciation) in the Statement of Assets and Liabilities. When a contract is closed, a realized gain or loss is recorded in the Statement of Operations equal to the difference between the value at the time it was opened and the value at the time it was closed. Non-deliverable forward foreign currency exchange contracts are settled with the counterparty in cash without the delivery of foreign currency. The use of forward foreign currency exchange contracts involves the risk that the value of a forward foreign currency exchange contract changes unfavorably due to movements in the value of the referenced foreign currencies. Cash amounts pledged for forward foreign currency exchange contracts are considered restricted and are included in Cash pledged: Collateral — OTC derivatives on the Statement of Assets and Liabilities.
Options: The Trust purchases and writes call and put options to increase or decrease its exposure to the risks of underlying instruments, including equity risk, interest rate risk and/or commodity price risk and/or, in the case of options written, to generate gains from options premiums.
A call option gives the purchaser (holder) of the option the right (but not the obligation) to buy, and obligates the seller (writer) to sell (when the option is exercised) the underlying instrument at the exercise or strike price at any time or at a specified time during the option period. A put option gives the holder the right to sell and obligates the writer to buy the underlying instrument at the exercise or strike price at any time or at a specified time during the option period.
Premiums paid on options purchased and premiums received on options written, as well as the daily fluctuation in market value, are included in investments at value —unaffiliated and options written at value, respectively, in the Statement of Assets and Liabilities. When an instrument is purchased or sold through the exercise of an option, the premium is offset against the cost or proceeds of the underlying instrument. When an option expires, a realized gain or loss is recorded in the Statement of
| | |
| 30 | | 2018 BLACKROCK SEMI-ANNUAL REPORTTO SHAREHOLDERS |
Notes to Financial Statements (unaudited) (continued)
Operations to the extent of the premiums received or paid. When an option is closed or sold, a gain or loss is recorded in the Statement of Operations to the extent the cost of the closing transaction exceeds the premiums received or paid. When the Trust writes a call option, such option is typically “covered,” meaning that it holds the underlying instrument subject to being called by the option counterparty. When the Trust writes a put option, such option is covered by cash in an amount sufficient to cover the obligation. These amounts, which are considered restricted, are included in Cash pledged: Collateral — options written on the Statement of Assets and Liabilities.
In purchasing and writing options, the Trust bears the risk of an unfavorable change in the value of the underlying instrument or the risk that it may not be able to enter into a closing transaction due to an illiquid market. Exercise of a written option could result in the Trust purchasing or selling a security when it otherwise would not, or at a price different from the current market value.
| | • | | Barrier options — The Trust may purchase and write a variety of options with non-standard payout structures or other features (“barrier options”) that are generally traded OTC. |
The Trust may invest in various types of barrier options, including down-and-out options, down-and-in options, double no-touch options, one-touch options, up-and-out options and up-and-in options. Down-and-out options expire worthless to the purchaser if the price of the underlying instrument falls below a specific barrier price level prior to the expiration date. Down-and-in options expire worthless to the purchaser unless the price of the underlying instrument falls below a specific barrier price level prior to the expiration date. Double no-touch options provide the purchaser an agreed-upon payout if the price of the underlying instrument does not reach or surpass predetermined barrier price levels prior to the option’s expiration date. One-touch options provide the purchaser an agreed-upon payout if the price of the underlying instrument reaches or surpasses predetermined barrier price levels prior to the expiration date. Up-and-out options expire worthless to the purchaser if the price of the underlying instrument increases beyond a predetermined barrier price level prior to the expiration date. Up-and-in options can only be exercised when the price of the underlying instrument increases beyond a predetermined barrier price level.
Swaps: Swap contracts are entered into to manage exposure to issuers, markets and securities. Such contracts are agreements between the Trust and a counterparty to make periodic net payments on a specified notional amount or a net payment upon termination. Swap agreements are privately negotiated in the OTC market and may be entered into as a bilateral contract (“OTC swaps”) or centrally cleared (“centrally cleared swaps”).
For OTC swaps, any upfront premiums paid and any upfront fees received are shown as swap premiums paid and swap premiums received, respectively, in the Statement of Assets and Liabilities and amortized over the term of the contract. The daily fluctuation in market value is recorded as unrealized appreciation (depreciation) on OTC Swaps in the Statement of Assets and Liabilities. Payments received or paid are recorded in the Statement of Operations as realized gains or losses, respectively. When an OTC swap is terminated, a realized gain or loss is recorded in the Statement of Operations equal to the difference between the proceeds from (or cost of) the closing transaction and the Trust’s basis in the contract, if any. Generally, the basis of the contract is the premium received or paid.
In a centrally cleared swap, immediately following execution of the swap contract, the swap contract is novated to a central counterparty (the “CCP”) and the Trust’s counterparty on the swap agreement becomes the CCP. The Trust is required to interface with the CCP through the broker. Upon entering into a centrally cleared swap, the Trust is required to deposit initial margin with the broker in the form of cash or securities in an amount that varies depending on the size and risk profile of the particular swap. Securities deposited as initial margin are designated in the Schedule of Investments and cash deposited is shown as cash pledged for centrally cleared swaps in the Statement of Assets and Liabilities. Amounts pledged, which are considered restricted, are included in Cash pledged: centrally cleared swaps on the Statement of Assets and Liabilities. Pursuant to the contract, the Trust agrees to receive from or pay to the broker an amount of cash equal to the daily fluctuation in market value of the contract (“variation margin”). Variation margin is recorded as unrealized appreciation (depreciation) and shown as variation margin receivable (or payable) on centrally cleared swaps in the Statement of Assets and Liabilities. Payments received from (paid to) the counterparty, including at termination, are recorded as realized gains (losses) in the Statement of Operations.
| | • | | Credit default swaps – Credit default swaps are entered into to manage exposure to the market or certain sectors of the market, to reduce risk exposure to defaults of corporate and/or sovereign issuers or to create exposure to corporate and/or sovereign issuers to which a fund is not otherwise exposed (credit risk). |
The Trust may either buy or sell (write) credit default swaps on single-name issuers (corporate or sovereign), a combination or basket of single-name issuers or traded indexes. Credit default swaps are agreements in which the protection buyer pays fixed periodic payments to the seller in consideration for a promise from the protection seller to make a specific payment should a negative credit event take place with respect to the referenced entity (e.g., bankruptcy, failure to pay, obligation acceleration, repudiation, moratorium or restructuring). As a buyer, if an underlying credit event occurs, the Trust will either (i) receive from the seller an amount equal to the notional amount of the swap and deliver the referenced security or underlying securities comprising the index, or (ii) receive a net settlement of cash equal to the notional amount of the swap less the recovery value of the security or underlying securities comprising the index. As a seller (writer), if an underlying credit event occurs, the Trust will either pay the buyer an amount equal to the notional amount of the swap and take delivery of the referenced security or underlying securities comprising the index or pay a net settlement of cash equal to the notional amount of the swap less the recovery value of the security or underlying securities comprising the index.
| | • | | Interest rate swaps – Interest rate swaps are entered into to gain or reduce exposure to interest rates or to manage duration, the yield curve or interest rate (interest rate risk). |
Interest rate swaps are agreements in which one party pays a stream of interest payments, either fixed or floating, in exchange for another party’s stream of interest payments, either fixed or floating, on the same notional amount for a specified period of time. In more complex interest rate swaps, the notional principal amount may decline (or amortize) over time.
Swap transactions involve, to varying degrees, elements of interest rate, credit and market risk in excess of the amounts recognized in the Statement of Assets and Liabilities. Such risks involve the possibility that there will be no liquid market for these agreements, that the counterparty to the agreements may default on its obligation to perform or disagree as to the meaning of the contractual terms in the agreements, and that there may be unfavorable changes in interest rates and/or market values associated with these transactions.
| | | | |
| NOTESTO FINANCIAL STATEMENTS | | | 31 | |
Notes to Financial Statements (unaudited) (continued)
Master Netting Arrangements: In order to define their contractual rights and to secure rights that will help them mitigate their counterparty risk, the Trust may enter into an International Swaps and Derivatives Association, Inc. Master Agreement (“ISDA Master Agreement”) or similar agreement with their counterparties. An ISDA Master Agreement is a bilateral agreement between the Trust and a counterparty that governs certain OTC derivatives and typically contains, among other things, collateral posting terms and netting provisions in the event of a default and/or termination event. Under an ISDA Master Agreement, the Trust may, under certain circumstances, offset with the counterparty certain derivative financial instruments’ payables and/or receivables with collateral held and/or posted and create one single net payment. The provisions of the ISDA Master Agreement typically permit a single net payment in the event of default including the bankruptcy or insolvency of the counterparty. Bankruptcy or insolvency laws of a particular jurisdiction may restrict or prohibit the right of offset in bankruptcy, insolvency or other events.
Collateral Requirements: For derivatives traded under an ISDA Master Agreement, the collateral requirements are typically calculated by netting the mark-to-market amount for each transaction under such agreement and comparing that amount to the value of any collateral currently pledged by the Trust and the counterparty.
Cash collateral that has been pledged to cover obligations of the Trust and cash collateral received from the counterparty, if any, is reported separately on the Statement of Assets and Liabilities as cash pledged as collateral and cash received as collateral, respectively. Non-cash collateral pledged by the Trust, if any, is noted in the Schedule of Investments. Generally, the amount of collateral due from or to a counterparty is subject to a certain minimum transfer amount threshold before a transfer is required, which is determined at the close of business of the Trust. Any additional required collateral is delivered to/pledged by the Trust on the next business day. Typically, the counterparty is not permitted to sell, re-pledge or use cash and non-cash collateral it receives. The Trust generally agrees not to use non-cash collateral that it receives but may, absent default or certain other circumstances defined in the underlying ISDA Master Agreement, be permitted to use cash collateral received. In such cases, interest may be paid pursuant to the collateral arrangement with the counterparty. To the extent amounts due to the Trust from its counterparties are not fully collateralized, they bear the risk of loss from counterparty non-performance. Likewise, to the extent the Trust has delivered collateral to a counterparty and stands ready to perform under the terms of its agreement with such counterparty, it bears the risk of loss from a counterparty in the amount of the value of the collateral in the event the counterparty fails to return such collateral. Based on the terms of agreements, collateral may not be required for all derivative contracts.
For financial reporting purposes, the Trust does not offset derivative assets and derivative liabilities that are subject to netting arrangements, if any, in the Statement of Assets and Liabilities.
| 6. | INVESTMENT ADVISORY AGREEMENT AND OTHER TRANSACTIONS WITH AFFILIATES |
The PNC Financial Services Group, Inc. is the largest stockholder and an affiliate of BlackRock, Inc. (“BlackRock”) for 1940 Act purposes.
Investment Advisory: The Trust entered into an Investment Advisory Agreement with the Manager, the Trust’s investment adviser, an indirect, wholly-owned subsidiary of BlackRock, to provide investment advisory and administrative services. The Manager is responsible for the management of the Trust’s portfolio and provides the personnel, facilities, equipment and certain other services necessary to the operations of the Trust.
For such services, the Trust pays the Manager a monthly fee at an annual rate equal to 0.60% of the average daily value of the Trust’s managed assets. For purposes of calculating this fee, “managed assets” mean the total assets of the Trust (including any assets attributable to money borrowed for investment purposes) minus the sum of its accrued liabilities (other than money borrowed for investment purposes).
The Manager entered into a sub-advisory agreement with each of BlackRock International Limited (“BIL”) and BlackRock (Singapore) Limited (“BRS”), each an affiliate of the Manager. The Manager pays BIL and BRS, for services each provides, for that portion of the Trust for which it acts as sub-adviser, a monthly fee that is equal to a percentage of the investment advisory fees paid by the Trust to the Manager.
Expense Waivers: With respect to the Trust, the Manager voluntarily agreed to waive its investment advisory fees by the amount of investment advisory fees the Trust pays to the Manager indirectly through its investment in affiliated money market funds (the “affiliated money market fund waiver”). This amount is included in fees waived and/or reimbursed by the Manager in the Statement of Operations. For the six months ended June 30, 2018, the amount waived was $2,859.
The Manager contractually agreed to waive its investment advisory fee with respect to any portion of the Trust’s assets invested in affiliated equity and fixed-income mutual funds and affiliated exchange-traded funds that have a contractual management fee through June 30, 2019. The agreement can be renewed for annual periods thereafter, and may be terminated on 90 days’ notice by a majority of the Trusts’ Independent Trustees. This amount is included in fees waived and/or reimbursed by the Manager in the Statement of Operations. For the six months ended June 30, 2018, there were no fees waived by the Manager.
Trustees and Officers: Certain Trustees and/or officers of the Trust are trustees and/or officers of BlackRock or its affiliates. The Trust reimburses the Manager for a portion of the compensation paid to the Trust’s Chief Compliance Officer, which is included in Trustees and Officer in the Statement of Operations.
Other Transactions: The Trust may purchase securities from, or sell securities to, an affiliated fund provided the affiliation is due solely to having a common investment adviser, common officers, or common trustees. For the six months ended June 30, 2018, the purchase and sale transactions and any net realized gains (losses) with an affiliated fund in compliance with Rule 17a-7 under the 1940 Act were as follows:
| | | | | | | | | | | | |
| | | Purchases | | | Sales | | | Net Realized Gain | |
| | | $ | 322,545 | | | $ | — | | | $ | — | |
For the six months ended June 30, 2018, purchases and sales of investments, including paydowns and excluding short-term securities, were $127,565,247 and $192,644,617, respectively.
For the six months ended June 30, 2018, purchases and sales related to mortgage dollar rolls were $11,952,217 and $11,968,486, respectively.
| | |
| 32 | | 2018 BLACKROCK SEMI-ANNUAL REPORTTO SHAREHOLDERS |
Notes to Financial Statements (unaudited) (continued)
It is the Trust’s policy to comply with the requirements of the Internal Revenue Code of 1986, as amended, applicable to regulated investment companies, and to distribute substantially all of its taxable income to its shareholders. Therefore, no U.S. federal income tax provision is required.
The Trust files U.S. federal and various state and local tax returns. No income tax returns are currently under examination. The statute of limitations on the Trust’s U.S. federal tax returns generally remains open for the period ended December 31, 2017. The statutes of limitations on the Trust’s state and local tax returns may remain open for an additional year depending upon the jurisdiction.
Management has analyzed tax laws and regulations and their application to the Trust as of June 30, 2018, inclusive of the open tax return years, and does not believe that there are any uncertain tax positions that require recognition of a tax liability in the Trust’s financial statements.
As of June 30, 2018, gross unrealized appreciation and depreciation for investments and derivatives based on cost for U.S. federal income tax purposes were as follows:
| | | | |
Tax cost | | $ | 269,256,682 | |
| | | | |
Gross unrealized appreciation | | | 2,273,504 | |
Gross unrealized depreciation | | | (10,382,505 | ) |
| | | | |
Net unrealized depreciation | | $ | (8,109,001 | ) |
| | | | |
The Tax Cuts and Jobs Act (the “Act”) was enacted on December 22, 2017. Certain provisions of the Act were effective upon enactment with the remainder becoming effective for tax years beginning after December 31, 2017. Although the Act does not amend any provisions directly related to the qualification or taxation of regulated investment companies (“RICs”), the Act does change the taxation of entities in which some RICs invest, the tax treatment of income derived from those entities and the taxation of RIC shareholders. While management does not anticipate significant impact to the Trust or to its shareholders, there is uncertainty in the application of certain provisions in the Act. Specifically, provisions in the Act may increase the amount of or accelerate the recognition of taxable income and may limit the deductibility of certain expenses by RICs. Until full clarity around these provisions is obtained, the impact on the Trust’s financial statements, if any, cannot be fully determined.
In the normal course of business, the Trust invests in securities or other instruments and may enter into certain transactions, and such activities subject the Trust to various risks, including among others, fluctuations in the market (market risk) or failure of an issuer to meet all of its obligations. The value of securities or other instruments may also be affected by various factors, including, without limitation: (i) the general economy; (ii) the overall market as well as local, regional or global political and/or social instability; (iii) regulation, taxation or international tax treaties between various countries; or (iv) currency, interest rate and price fluctuations.
The Trust may be exposed to prepayment risk, which is the risk that borrowers may exercise their option to prepay principal earlier than scheduled during periods of declining interest rates, which would force the Trust to reinvest in lower yielding securities. The Trust may also be exposed to reinvestment risk, which is the risk that income from the Trust’s portfolio will decline if the Trust invests the proceeds from matured, traded or called fixed-income securities at market interest rates that are below the Trust portfolio’s current earnings rate.
The Trust will terminate at the close of business on February 28, 2022. The Trust is not a target term fund and thus does not seek to return its initial public offering price of $10.00 per common share upon termination. The final distribution of net assets upon termination may be more than, equal to or less than $10.00 per common share.
Investment Objective Risk: There is no assurance that the Trust will achieve its investment objective. A variety of circumstances may make it extremely difficult for the Trust to achieve its investment objective. Such circumstances include, but may not be limited to, the existence of an inverted yield curve, a rapid and significant increase in interest rates, a significant decrease in issuer credit quality generally and/or increased defaults, increased volatility in currency markets and/or in currency exchange rates and negative economic, market, political and/or social developments impacting emerging markets. Additionally, the limited term of the Trust may increase the risk that the Trust may not meet its investment objective. A limited term limits the period during which the Trust can generate returns and increases the potential impact that a disruptive market event or one or more of the conditions outlined above could have on the Trust’s annualized returns.
Valuation Risk: The price the Trust could receive upon the sale of any particular portfolio investment may differ from the Trust’s valuation of the investment, particularly for securities that trade in thin or volatile markets or that are valued using a fair valuation technique or a price provided by an independent pricing service. Changes to significant unobservable inputs and assumptions (i.e., publicly traded company multiples, growth rate, time to exit) due to the lack of observable inputs may significantly impact the resulting fair value and therefore the Trust’s results of operations. As a result, the price received upon the sale of an investment may be less than the value ascribed by the Trust, and the Trust could realize a greater than expected loss or lesser than expected gain upon the sale of the investment. The Trust’s ability to value its investments may also be impacted by technological issues and/or errors by pricing services or other third party service providers.
Counterparty Credit Risk: The Trust may be exposed to counterparty credit risk, or the risk that an entity may fail to or be unable to perform on its commitments related to unsettled or open transactions. The Trust manages counterparty credit risk by entering into transactions only with counterparties that the Manager believes have the financial resources to honor their obligations and by monitoring the financial stability of those counterparties. Financial assets, which potentially expose the Trust to market,
issuer and counterparty credit risks, consist principally of financial instruments and receivables due from counterparties. The extent of the Trust’s exposure to market, issuer and counterparty credit risks with respect to these financial assets is approximately their value recorded in the Statement of Assets and Liabilities, less any collateral held by the Trust.
A derivative contract may suffer a mark-to-market loss if the value of the contract decreases due to an unfavorable change in the market rates or values of the underlying instrument. Losses can also occur if the counterparty does not perform under the contract.
| | | | |
| NOTESTO FINANCIAL STATEMENTS | | | 33 | |
Notes to Financial Statements (unaudited) (continued)
The Trust’s risk of loss from counterparty credit risk on OTC derivatives is generally limited to the aggregate unrealized gain less the value of any collateral held by the Trust.
For OTC options purchased, the Trust bears the risk of loss in the amount of the premiums paid plus the positive change in market values net of any collateral held by the Trust should the counterparty fail to perform under the contracts. Options written by the Trust do not typically give rise to counterparty credit risk, as options written generally obligate the Trust, and not the counterparty, to perform. The Trust may be exposed to counterparty credit risk with respect to options written to the extent the Trust deposits collateral with its counterparty to a written option.
With exchange-traded options purchased, futures and centrally cleared swaps, there is less counterparty credit risk to the Trust since the exchange or clearinghouse, as counterparty to such instruments, guarantees against a possible default. The clearinghouse stands between the buyer and the seller of the contract; therefore, credit risk is limited to failure of the clearinghouse. While offset rights may exist under applicable law, the Trust does not have a contractual right of offset against a clearing broker or clearinghouse in the event of a default (including the bankruptcy or insolvency). Additionally, credit risk exists in exchange-traded futures and centrally cleared swaps with respect to initial and variation margin that is held in a clearing broker’s customer accounts. While clearing brokers are required to segregate customer margin from their own assets, in the event that a clearing broker becomes insolvent or goes into bankruptcy and at that time there is a shortfall in the aggregate amount of margin held by the clearing broker for all its clients, typically the shortfall would be allocated on a pro rata basis across all the clearing broker’s customers, potentially resulting in losses to the Trust.
Concentration Risk: The Trust may invest in securities that are rated below investment grade quality (sometimes called “junk bonds”), which are predominantly speculative, have greater credit risk and generally are less liquid and have more volatile prices than higher quality securities.
The Trust invests a significant portion of its assets in fixed-income securities and/or uses derivatives tied to the fixed-income markets. Changes in market interest rates or economic conditions may affect the value and/or liquidity of such investments. Interest rate risk is the risk that prices of bonds and other fixed-income securities will increase as interest rates fall and decrease as interest rates rise. The Trust may be subject to a greater risk of rising interest rates due to the current period of historically low rates.
The Trust invests a significant portion of its assets in securities backed by commercial or residential mortgage loans or in issuers that hold mortgage and other asset-backed securities. Investment percentages in these securities are presented in the Schedule of Investments. Changes in economic conditions, including delinquencies and/or defaults on assets underlying these securities, can affect the value, income and/or liquidity of such positions.
| 10. | CAPITAL SHARE TRANSACTIONS |
The Trust is authorized to issue an unlimited numbers of shares, all of which were initially classified as Common Shares. The Board is authorized, however, to reclassify any unissued Common Shares without the approval of Common Shareholders.
For the six months ended June 30, 2018, shares issued and outstanding remained constant.
Shares issued and outstanding for the period February 27, 2017 to December 31, 2017, increased by 32,321 as a result of dividend reinvestment and 21,000,000 from the initial public offering and 1,078,639 from the underwriters’ exercising the over-allotment option.
As of June 30, 2018, BlackRock HoldCo 2, Inc., an affiliate of the Trust, owned 17,919 shares of the Trust.
Management’s evaluation of the impact of all subsequent events on the Trust’s financial statements was completed through the date the financial statements were issued and the following items were noted:
The Trust paid a net investment income dividend in the amount of $0.0500 per share on July 31, 2018 to Common shareholders of record on July 16, 2018.
Additionally, the Trust declared a net investment income dividend of $0.0500 per share on August 1, 2018 payable to Common Shareholders of record on August 15, 2018.
| | |
| 34 | | 2018 BLACKROCK SEMI-ANNUAL REPORTTO SHAREHOLDERS |
Disclosure of Investment Advisory Agreement and Sub-Advisory Agreements
The Board of Trustees (the “Board,” the members of which are referred to as “Board Members”) of BlackRock 2022 Global Income Opportunity Trust (the “Trust”) met in person on April 24, 2018 (the “April Meeting”) and June 6-7, 2018 (the “June Meeting”) to consider the approval of the Trust’s investment advisory agreement (the “Advisory Agreement”) with BlackRock Advisors, LLC (the “Manager”), the Trust’s investment advisor. The Board also considered the approval of two sub-advisory agreements (the “Sub-Advisory Agreements”) among (1) the Manager, BlackRock International Limited (“BIL”) and the Trust and (2) the Manager, BlackRock (Singapore) Limited (“BSL”) and the Trust. The Manager, BIL and BSL are referred to herein as “BlackRock.” The Advisory Agreement and the Sub-Advisory Agreements are referred to herein as the “Agreements”.
Activities and Composition of the Board
On the date of the June Meeting, the Board consisted of ten individuals, eight of whom were not “interested persons” of the Trust as defined in the Investment Company Act of 1940, as amended (the “1940 Act”) (the “Independent Board Members”). The Board Members are responsible for the oversight of the operations of the Trust and perform the various duties imposed on the directors of investment companies by the 1940 Act. The Independent Board Members have retained independent legal counsel to assist them in connection with their duties. The Chair of the Board is an Independent Board Member. The Board has established five standing committees: an Audit Committee, a Governance and Nominating Committee, a Compliance Committee, a Performance Oversight Committee, and an Executive Committee, each of which is chaired by an Independent Board Member and composed of Independent Board Members (except for the Executive Committee, which also has one interested Board Member).
The Agreements
Pursuant to the 1940 Act, the Board is required to consider the continuation of the Agreements on an annual basis. The Board has four quarterly meetings per year, each typically extending for two days, and additional in-person and telephonic meetings throughout the year, as needed. The Board also has a fifth one-day meeting to consider specific information surrounding the consideration of renewing the Agreements. The Board’s consideration of the Agreements is a year-long deliberative process, during which the Board assessed, among other things, the nature, extent and quality of the services provided to the Trust by BlackRock, BlackRock’s personnel and affiliates, including, as applicable; investment management, accounting, administrative, and shareholder services; oversight of the Trust’s service providers; marketing; risk management and oversight; legal and compliance services; and ability to meet applicable legal and regulatory requirements.
The Board, acting directly and through its committees, considers at each of its meetings, and from time to time as appropriate, factors that are relevant to its annual consideration of the renewal of the Agreements, including the services and support provided by BlackRock to the Trust and its shareholders. BlackRock also furnished additional information to the Board in response to specific questions from the Board. This additional information is discussed further below in the section titled “Board Considerations in Approving the Agreements.” Among the matters the Board considered were: (a) investment performance for the since inception period against peer funds, applicable benchmarks, and performance metrics, as applicable, as well as senior management’s and portfolio managers’ analysis of the reasons for any over-performance or underperformance relative to its peers, benchmarks, and other performance metrics, as applicable; (b) leverage management, as applicable; (c) fees, including advisory, administration, if applicable, paid to BlackRock and its affiliates by the Trust for services; (d) Trust operating expenses and how BlackRock allocates expenses to the Trust; (e) the resources devoted to, risk oversight of, and compliance reports relating to, implementation of the Trust’s investment objective(s), policies and restrictions, and meeting regulatory requirements; (f) the Trust’s adherence to its compliance policies and procedures; (g) the nature, character and scope of non-investment management services provided by BlackRock and its affiliates and the estimated cost of such services; (h) BlackRock’s and other service providers’ internal controls and risk and compliance oversight mechanisms; (i) BlackRock’s implementation of the proxy voting policies approved by the Board; (j) execution quality of portfolio transactions; (k) BlackRock’s implementation of the Trust’s valuation and liquidity procedures; (l) an analysis of management fees for products with similar investment mandates across the open-end fund, closed-end fund, sub-advised mutual fund, collective investment trust, and institutional separate account product channels, as applicable, and the similarities and differences between these products and the services provided as compared to the Trust; (m) BlackRock’s compensation methodology for its investment professionals and the incentives and accountability it creates, along with investment professionals’ investments in the fund(s) they manage; and (n) periodic updates on BlackRock’s business.
Board Considerations in Approving the Agreements
The Approval Process: Prior to the April Meeting, the Board requested and received materials specifically relating to the Agreements. The Board is continuously engaged in a process with its independent legal counsel and BlackRock to review the nature and scope of the information provided to better assist its deliberations. The materials provided in connection with the April Meeting included, among other things: (a) information independently compiled and prepared by Broadridge Financial Solutions, Inc. (“Broadridge”), based on Lipper classifications, regarding the Trust’s fees and expenses as compared with a peer group of funds as determined by Broadridge (“Expense
Peers”) and the investment performance of the Trust as compared with a peer group of funds (“Performance Peers”) and other metrics, as applicable; (b) information on the composition of the Expense Peers and Performance Peers, and a description of the Broadridge’s methodology; (c) information on the estimated profits realized by BlackRock and its affiliates pursuant to the Agreements and a discussion of fall-out benefits to BlackRock and its affiliates; (d) a general analysis provided by BlackRock concerning investment management fees received in connection with other types of investment products, such as institutional accounts, sub-advised mutual funds, closed-end funds, and open-end funds, under similar investment mandates, as applicable; (e) review of non-management fees; (f) the existence and impact and sharing of potential economies of scale, if any, and the sharing of potential economies of scale with the Trust; (g) a summary of aggregate amounts paid by the Trust to BlackRock; and (h) various additional information requested by the Board as appropriate regarding BlackRock’s and the Trust’s operations.
At the April Meeting, the Board reviewed materials relating to its consideration of the Agreements. As a result of the discussions that occurred during the April Meeting, and as a culmination of the Board’s year-long deliberative process, the Board presented BlackRock with questions and requests for additional information. BlackRock responded to these requests with additional written information in advance of the June Meeting.
At the June Meeting, the Board considered, among other things: (a) the nature, extent and quality of the services provided by BlackRock; (b) the investment performance of the Trust as compared with Performance Peers and other metrics, as applicable; (c) the advisory fee and the estimated cost of the services and estimated profits
| | | | |
| DISCLOSUREOF INVESTMENT ADVISORY AGREEMENTAND SUB-ADVISORY AGREEMENTS | | | 35 | |
Disclosure of Investment Advisory Agreement and Sub-Advisory Agreements (continued)
realized by BlackRock and its affiliates from their relationship with the Trust; (d) the Trust’s fees and expenses compared to Expense Peers; (e) the sharing of potential economies of scale; (f) fall-out benefits to BlackRock and its affiliates as a result of BlackRock’s relationship with the Trust; and (g) other factors deemed relevant by the Board Members.
The Board also considered other matters it deemed important to the approval process, such as other payments made to BlackRock or its affiliates relating to securities lending and cash management, services related to the valuation and pricing of Trust portfolio holdings, and advice from independent legal counsel with respect to the review process and materials submitted for the Board’s review. The Board noted the willingness of BlackRock personnel to engage in open, candid discussions with the Board. The Board did not identify any particular information as determinative, and each Board Member may have attributed different weights to the various items considered.
A. Nature, Extent and Quality of the Services Provided by BlackRock: The Board, including the Independent Board Members, reviewed the nature, extent and quality of services provided by BlackRock, including the investment advisory services and the resulting performance of the Trust. Throughout the year, the Board compared Trust performance to the performance of a comparable group of closed-end funds, relevant benchmark, and performance metrics, as applicable. The Board met with BlackRock’s senior management personnel responsible for investment activities, including the senior investment officers. The Board also reviewed the materials provided by the Trust’s portfolio management team discussing the Trust’s performance and the Trust’s investment objective(s), strategies and outlook.
The Board considered, among other factors, with respect to BlackRock: the number, education and experience of investment personnel generally and the Trust’s portfolio management team; BlackRock’s research capabilities; investments by portfolio managers in the funds they manage; portfolio trading capabilities; use of technology; commitment to compliance; credit analysis capabilities; risk analysis and oversight capabilities; and the approach to training and retaining portfolio managers and other research, advisory and management personnel. The Board also considered BlackRock’s overall risk management program, including the continued efforts of BlackRock and its affiliates to address cybersecurity risks and the role of BlackRock’s Risk & Quantitative Analysis Group. The Board engaged in a review of BlackRock’s compensation structure with respect to the Trust’s portfolio management team and BlackRock’s ability to attract and retain high-quality talent and create performance incentives.
In addition to investment advisory services, the Board considered the quality of the administrative and other non-investment advisory services provided to the Trust. BlackRock and its affiliates provide the Trust with certain administrative, shareholder, and other services (in addition to any such services provided to the Trust by third parties) and officers and other personnel as are necessary for the operations of the Trust. In particular, BlackRock and its affiliates provide the Trust with administrative services including, among others: (i) responsibility for disclosure documents, such as the prospectus and the statement of additional information in connection with the initial public offering and periodic shareholder reports; (ii) preparing communications with analysts to support secondary market trading of the Trust; (iii) oversight of daily accounting and pricing; (iv) responsibility for periodic filings with regulators and stock exchanges; (v) overseeing and coordinating the activities of other service providers including, among others, the Trust’s custodian, fund accountant, transfer agent, and auditor; (vi) organizing Board meetings and preparing the materials for such Board meetings; (vii) providing legal and compliance support; (viii) furnishing analytical and other support to assist the Board in its consideration of strategic issues such as the merger, consolidation or repurposing of certain closed-end funds; and (ix) performing administrative functions necessary for the operation of the Trust, such as tax reporting, expense management, fulfilling regulatory filing requirements, and shareholder call center and other services. The Board reviewed the structure and duties of BlackRock’s fund administration, shareholder services, and legal & compliance departments and considered BlackRock’s policies and procedures for assuring compliance with applicable laws and regulations.
B. The Investment Performance of the Trust and BlackRock: The Board, including the Independent Board Members, also reviewed and considered the performance history of the Trust. In preparation for the April Meeting, the Board was provided with reports independently prepared by Broadridge, which included a comprehensive analysis of the Trust’s performance as of December 31, 2017. The performance information is based on net asset value (NAV), and utilizes Lipper data. Lipper’s methodology calculates a fund’s total return assuming distributions are reinvested on the ex-date at a fund’s ex-date NAV. Broadridge ranks funds in quartiles, ranging from first to fourth, where first is the most desirable quartile position and fourth is the least desirable. In connection with its review, the Board received and reviewed information regarding the investment performance of the Trust as compared to its Performance Peers and the performance of the Trust as compared with its custom benchmark. The Board and its Performance Oversight Committee regularly review, and meet with Trust management to discuss, the performance of the Trust throughout the year.
In evaluating performance, the Board recognized that the performance data reflects a snapshot of a period as of a particular date and that selecting a different performance period could produce significantly different results. Further, the Board recognized that it is possible that long-term performance can be impacted by even one period of significant outperformance or underperformance, so that a single investment theme has the ability to affect long-term performance disproportionately.
The Board noted that for the since-inception period reported, the Trust outperformed its customized benchmark. BlackRock believes that performance relative to the customized benchmark is an appropriate performance metric for the Trust.
C. Consideration of the Advisory/Management Fees and the Estimated Cost of the Services and Estimated Profits Realized by BlackRock and its Affiliates from their Relationship with the Trust: The Board, including the Independent Board Members, reviewed the Trust’s contractual management fee rate compared with those of its Expense Peers. The contractual management fee rate represents a combination of the advisory fee and any administrative fees, before taking into account any reimbursements or fee waivers. The Board also compared the Trust’s total expense ratio, as well as its actual management fee rate as a percentage of total assets, to those of its Expense Peers. The total expense ratio represents a fund’s total net operating expenses, excluding any investment related expenses. The total expense ratio gives effect to any expense reimbursements or fee waivers that benefit a fund, and the actual management fee rate gives effect to any management fee reimbursements or waivers that benefit a fund. The Board considered the services provided and the fees charged by BlackRock and its affiliates to other types of clients with similar investment mandates, as applicable, including institutional accounts and sub-advised mutual funds (including mutual funds sponsored by third parties).
The Board received and reviewed statements relating to BlackRock’s financial condition. The Board reviewed BlackRock’s profitability methodology and was also provided with an estimated profitability analysis that detailed the revenues earned and the expenses incurred by BlackRock for services provided to the Trust. The Board reviewed
| | |
| 36 | | 2018 BLACKROCK SEMI-ANNUAL REPORTTO SHAREHOLDERS |
Disclosure of Investment Advisory Agreement and Sub-Advisory Agreements (concluded)
BlackRock’s estimated profitability with respect to the Trust and other funds the Board currently oversees for the year ended December 31, 2017 compared to available aggregate estimated profitability data provided for the prior two years. The Board reviewed BlackRock’s estimated profitability with respect to certain other U.S. fund complexes managed by the Manager and/or its affiliates. The Board reviewed BlackRock’s assumptions and methodology of allocating expenses in the estimated profitability analysis, noting the inherent limitations in allocating costs among various advisory products. The Board recognized that profitability may be affected by numerous factors including, among other things, fee waivers and expense reimbursements by the Manager, the types of funds managed, precision of expense allocations and business mix. As a result, calculating and comparing profitability at individual fund levels is difficult.
The Board noted that, in general, individual fund or product line profitability of other advisors is not publicly available. The Board reviewed BlackRock’s overall operating margin, in general, compared to that of certain other publicly-traded asset management firms. The Board considered the differences between BlackRock and these other firms, including the contribution of technology at BlackRock, BlackRock’s expense management, and the relative product mix.
In addition, the Board considered the estimated cost of the services provided to the Trust by BlackRock, and BlackRock’s and its affiliates’ estimated profits relating to the management of the Trust and the other funds advised by BlackRock and its affiliates. As part of its analysis, the Board reviewed BlackRock’s methodology in allocating its costs of managing the Trust, to the Trust. The Board considered whether BlackRock has the financial resources necessary to attract and retain high quality investment management personnel to perform its obligations under the Agreements and to continue to provide the high quality of services that is expected by the Board. The Board further considered factors including but not limited to BlackRock’s commitment of time, assumption of risk, and liability profile in servicing the Trust in contrast to what is required of BlackRock with respect to other products with similar investment mandates across the open-end fund, closed-end fund, sub-advised mutual fund, collective investment trust, and institutional separate account product channels, as applicable.
The Board noted that the Trust’s contractual management fee rate ranked in the first quartile, and that the actual management fee rate and total expense ratio each ranked in the first quartile, relative to the Expense Peers.
D. Economies of Scale: The Board, including the Independent Board Members, considered the extent to which economies of scale might be realized as the assets of the Trust increase. The Board also considered the extent to which the Trust benefits from such economies in a variety of ways, and whether there should be changes in the advisory fee rate or breakpoint structure in order to enable the Trust to more fully participate in these economies of scale. The Board considered the Trust’s asset levels and whether the current fee was appropriate.
Based on the Board’s review and consideration of the issue, the Board concluded that most closed-end funds do not have fund level breakpoints because closed-end funds generally do not experience substantial growth after the initial public offering. They are typically priced at scale at a fund’s inception.
E. Other Factors Deemed Relevant by the Board Members: The Board, including the Independent Board Members, also took into account other ancillary or “fall-out” benefits that BlackRock or its affiliates may derive from BlackRock’s respective relationships with the Trust, both tangible and intangible, such as BlackRock’s ability to leverage its investment professionals who manage other portfolios and risk management personnel, an increase in BlackRock’s profile in the investment advisory community, and the engagement of BlackRock’s affiliates as service providers to the Trust, including for administrative, securities lending and cash management services. The Board also considered BlackRock’s overall operations and its efforts to expand the scale of, and improve the quality of, its operations. The Board also noted that, subject to applicable law, BlackRock may use and benefit from third party research obtained by soft dollars generated by certain registered fund transactions to assist in managing all or a number of its other client accounts.
In connection with its consideration of the Agreements, the Board also received information regarding BlackRock’s brokerage and soft dollar practices. The Board received reports from BlackRock which included information on brokerage commissions and trade execution practices throughout the year.
The Board noted the competitive nature of the closed-end fund marketplace, and that shareholders are able to sell their Trust shares in the secondary market if they believe that the Trust’s fees and expenses are too high or if they are dissatisfied with the performance of the Trust.
The Board also considered the various notable initiatives and projects BlackRock performed in connection with its closed-end fund product line. These initiatives included the completion of the redemption of auction rate preferred securities for all of the BlackRock closed-end funds; developing equity shelf programs; efforts to eliminate product overlap with fund mergers; ongoing services to manage leverage that has become increasingly complex; periodic evaluation of share repurchases and other support initiatives for certain BlackRock funds; and continued communications efforts with shareholders, fund analysts and financial advisers. With respect to the latter, the Independent Board Members noted BlackRock’s continued commitment to supporting the secondary market for the common shares of its closed-end funds through a comprehensive secondary market communication program designed to raise investor and analyst awareness and understanding of closed-end funds. BlackRock’s support services included, among other things: sponsoring and participating in conferences; communicating with closed-end fund analysts covering the BlackRock funds throughout the year; providing marketing and product updates for the closed-end funds; and maintaining and enhancing its closed-end fund website.
Conclusion
The Board, including the Independent Board Members, unanimously approved the continuation of the Advisory Agreement between the Manager and the Trust for a one-year term ending June 30, 2019, and the Sub-Advisory Agreements among (1) the Manager, BSL and the Trust and (2) the Manager, BIL and the Trust, for a one-year term ending June 30, 2019. Based upon its evaluation of all of the aforementioned factors in their totality, as well as other information, the Board, including the Independent Board Members, was satisfied that the terms of the Agreements were fair and reasonable and in the best interest of the Trust and its shareholders. In arriving at its decision to approve the Agreements, the Board did not identify any single factor or group of factors as, all-important or controlling, but considered all factors together, and different Board Members may have attributed different weights to the various factors considered. The Independent Board Members were also assisted by the advice of independent legal counsel in making this determination.
| | | | |
| DISCLOSUREOF INVESTMENT ADVISORY AGREEMENTAND SUB-ADVISORY AGREEMENTS | | | 37 | |
Trustee and Officer Information
Richard E. Cavanagh, Chair of the Board and Trustee
Karen P. Robards, Vice Chair of the Board and Trustee
Michael J. Castellano, Trustee
Cynthia L. Egan, Trustee
Frank J. Fabozzi, Trustee
R. Glenn Hubbard, Trustee
W. Carl Kester, Trustee
Catherine A. Lynch, Trustee
Robert Fairbairn, Trustee
John M. Perlowski, Trustee and President and Chief Executive Officer
Jonathan Diorio, Vice President
Neal J. Andrews, Chief Financial Officer
Jay M. Fife, Treasurer
Charles Park, Chief Compliance Officer
Janey Ahn, Secretary
Effective February 16, 2018, Barbara G. Novick resigned, and Robert Fairbairn was appointed, as an Interested Trustee of the Trust.
Effective March 16, 2018, the portfolio managers of BGIO are Rick Rieder, Amer Bisat, Trevor Slaven, Robert Wuertz and Jacob Caplain. Mr. Caplain joined BGIO’s portfolio management team effective March 16, 2018. Mr. Caplain has been a Vice President of BlackRock, Inc. since 2017; an Associate thereof from 2015 to 2016; and an Analyst from 2012 to 2014.
Investment Adviser
BlackRock Advisors, LLC
Wilmington, DE 19809
Sub-Advisers
BlackRock International Limited
Edinburgh, EH3 8BL
BlackRock (Singapore) Limited
079912 SIngapore
Accounting Agent and Custodian
State Street Bank and Trust Company
Boston, MA 02111
Transfer Agent
Computershare Trust Company, N.A.
Canton, MA 02021
Independent Registered Public Accounting Firm
Deloitte & Touche LLP
Boston, MA 02116
Legal Counsel
Skadden, Arps, Slate, Meagher & Flom LLP
Boston, MA 02116
Address of the Trust
100 Bellevue Parkway
Wilmington, DE 19809
| | |
| 38 | | 2018 BLACKROCK SEMI-ANNUAL REPORTTO SHAREHOLDERS |
Additional Information
Trust Certification
The Trust is listed for trading on the NYSE and has filed with the NYSE its annual chief executive officer certification regarding compliance with the NYSE’s listing standards. The Trust filed with the Securities and Exchange Commission (“SEC”) the certification of its chief executive officer and chief financial officer required by section 302 of the Sarbanes-Oxley Act.
Dividend Policy
The Trust’s dividend policy is to distribute all or a portion of its net investment income to its shareholders on a monthly basis. In order to provide shareholders with a more stable level of dividend distributions, the distributions paid by the Trust for any particular month may be more or less than the amount of net investment income earned by the Trust during such month. The portion of distributions that exceeds the Trust’s current and accumulated earnings and profits, which are measured on a tax basis, will constitute a nontaxable return of capital. Distributions in excess of the Trust’s taxable income and net capital gains, but not in excess of the Trust’s earnings and profits, will be taxable to shareholders as ordinary income and will not constitute a nontaxable return of capital. The Trust’s current accumulated but undistributed net investment income, if any, is disclosed in the Statement of Assets and Liabilities, which comprises part of the financial information included in this report.
General Information
The Trust does not make available copies of its Statement of Additional Information because the Trust’s shares are not continuously offered, which means that the Statement of Additional Information of the Trust has not been updated after completion of the respective Trust’s offerings and the information contained in the Trust’s Statement of Additional Information may have become outdated.
During the period, there were no material changes in the Trust’s investment objectives or policies or to the Trust’s charters or by-laws that would delay or prevent a change of control of the Trust that were not approved by the shareholders or in the principal risk factors associated with investment in the Trust. Except as disclosed on page 38, there have been no changes in the persons who are primarily responsible for the day-to-day management of the Trust’s portfolio.
In accordance with Section 23(c) of the Investment Company Act of 1940, as amended, the Trust from time to time may purchase its common shares in the open market or in private transactions.
Quarterly performance, semi-annual and annual reports, current net asset value and other information regarding the Trust may be found on BlackRock’s website, which can be accessed at http://www.blackrock.com. Any reference to BlackRock’s website in this report is intended to allow investors public access to information regarding the Trust and does not, and is not intended to, incorporate BlackRock’s website in this report.
Electronic Delivery
Shareholders can sign up for e-mail notifications of quarterly statements, annual and semi-annual shareholder reports by enrolling in the electronic delivery program. Electronic copies of shareholder reports are available on BlackRock’s website.
To enroll in electronic delivery:
Shareholders Who Hold Accounts with Investment Advisers, Banks or Brokerages:
Please contact your financial advisor. Please note that not all investment advisers, banks or brokerages may offer this service.
Householding
The Trust will mail only one copy of shareholder documents, annual and semi-annual reports and proxy statements, to shareholders with multiple accounts at the same address. This practice is commonly called “householding” and is intended to reduce expenses and eliminate duplicate mailings of shareholder documents. Mailings of your shareholder documents may be householded indefinitely unless you instruct us otherwise. If you do not want the mailing of these documents to be combined with those for other members of your household, please call the Trust at (800) 882-0052.
Availability of Quarterly Schedule of Investments
The Trust files its complete schedule of portfolio holdings with the SEC for the first and third quarters of each fiscal year on Form N-Q. The Trust’s Form N-Q is available on the SEC’s website at http://www.sec.gov and may also be reviewed and copied at the SEC’s Public Reference Room in Washington, D.C. Information on the operation of the Public Reference Room or how to access documents on the SEC’s website without charge may be obtained by calling (800) SEC-0330. The Trust’s Form N-Q may also be obtained upon request and without charge by calling (800) 882-0052.
Availability of Proxy Voting Policies and Procedures
A description of the policies and procedures that the Trust uses to determine how to vote proxies relating to portfolio securities is available upon request and without charge (1) by calling (800) 882-0052; (2) at http://www.blackrock.com; and (3) on the SEC’s website at http://www.sec.gov.
| | | | |
| ADDITIONAL INFORMATION | | | 39 | |
Additional Information (continued)
Availability of Proxy Voting Record
Information about how the Trust voted proxies relating to securities held in the Trust’s portfolio during the most recent 12-month period ended June 30 is available upon request and without charge (1) at http://www.blackrock.com; or by calling (800) 882-0052 and (2) on the SEC’s website at http://www.sec.gov.
Availability of Trust Updates
BlackRock will update performance and certain other data for the Trust on a monthly basis on its website in the “Closed-end Funds” section of http://www.blackrock.com as well as certain other material information as necessary from time to time. Investors and others are advised to check the website for updated performance information and the release of other material information about the Trust. This reference to BlackRock’s website is intended to allow investors public access to information regarding the Trust and does not, and is not intended to, incorporate BlackRock’s website in this report.
BlackRock Privacy Principles
BlackRock is committed to maintaining the privacy of its current and former fund investors and individual clients (collectively, “Clients”) and to safeguarding their non-public personal information. The following information is provided to help you understand what personal information BlackRock collects, how we protect that information and why in certain cases we share such information with select parties.
If you are located in a jurisdiction where specific laws, rules or regulations require BlackRock to provide you with additional or different privacy-related rights beyond what is set forth below, then BlackRock will comply with those specific laws, rules or regulations.
BlackRock obtains or verifies personal non-public information from and about you from different sources, including the following: (i) information we receive from you or, if applicable, your financial intermediary, on applications, forms or other documents; (ii) information about your transactions with us, our affiliates, or others; (iii) information we receive from a consumer reporting agency; and (iv) from visits to our websites.
BlackRock does not sell or disclose to non-affiliated third parties any non-public personal information about its Clients, except as permitted by law or as is necessary to respond to regulatory requests or to service Client accounts. These non-affiliated third parties are required to protect the confidentiality and security of this information and to use it only for its intended purpose.
We may share information with our affiliates to service your account or to provide you with information about other BlackRock products or services that may be of interest to you. In addition, BlackRock restricts access to non-public personal information about its Clients to those BlackRock employees with a legitimate business need for the information. BlackRock maintains physical, electronic and procedural safeguards that are designed to protect the non-public personal information of its Clients, including procedures relating to the proper storage and disposal of such information.
| | |
| 40 | | 2018 BLACKROCK SEMI-ANNUAL REPORTTO SHAREHOLDERS |
Glossary of Terms Used in this Report
| | |
| Currency |
| |
| ARS | | Argentine Peso |
| EUR | | Euro |
| IDR | | Indonesian Rupiah |
| USD | | U.S. Dollar |
| ZAR | | South African Rand |
| | |
| Portfolio Abbreviations |
| |
| ABS | | Asset-Backed Security |
| CLO | | Collateralized Loan Obligation |
| ETF | | Exchange-Traded Fund |
| LIBOR | | London Interbank Offered Rate |
| OTC | | Over-the-Counter |
| PIK | | Payment-In-Kind |
| | | | |
| GLOSSARYOF TERMS USEDINTHIS REPORT | | | 41 | |
This report is intended for current holders. It is not a prospectus. Past performance results shown in this report should not be considered a representation of future performance. The Trust has leveraged its Common Shares, which creates risks for Common Shareholders, including the likelihood of greater volatility of net asset value and market price of the Common Shares, and the risk that fluctuations in short-term interest rates may reduce the Common Shares’ yield. Statements and other information herein are as dated and are subject to change.

| | |
| BGIO-6/18-SAR | |  |
| | |
| |
Item 2 –
| | Code of Ethics – Not Applicable to this semi-annual report |
| |
| Item 3 – | | Audit Committee Financial Expert – Not Applicable to this semi-annual report |
| |
| Item 4 – | | Principal Accountant Fees and Services – Not Applicable to this semi-annual report |
| |
| Item 5 – | | Audit Committee of Listed Registrants – Not Applicable to this semi-annual report |
| |
| Item 6 – | | Investments (a) The registrant’s Schedule of Investments is included as part of the Report to Stockholders filed under Item 1 of this Form. (b) Not Applicable due to no such divestments during the semi-annual period covered since the previous Form N-CSR filing. |
| |
| Item 7 – | | Disclosure of Proxy Voting Policies and Procedures for Closed-End Management Investment Companies – Not Applicable to this semi-annual report |
| |
| Item 8 – | | Portfolio Managers of Closed-End Management Investment Companies (a) (1) As of the date of filing this Report: |
| |
| | The registrant is managed by a team of investment professionals comprised of Amer Bisat, Managing Director at BlackRock, Rick Rieder, Managing Director at BlackRock, Trevor Slaven, Director at BlackRock, Robert Wuertz, Director at BlackRock and Jacob Caplain, Vice President at BlackRock. Messrs. Bisat, Rieder, Slaven, Wuertz and Caplain are the Fund’s portfolio managers and are responsible for the day-to-day management of the Fund’s portfolio and the selection of its investments. Messrs. Bisat, and Rieder have been members of the Fund’s portfolio management team since 2017. Messrs. Slaven, Wuertz and Caplain have been members of the Fund’s portfolio management team since 2018.] |
| |
| | The information below is with respect to Mr. Caplain, who became a portfolio manager to the Fund on March 16, 2018. |
| | |
Portfolio Manager | | Biography |
| Jacob Caplain | | Vice President since 2017; Associate from 2015 through 2016;
Analyst from 2012 through 2014. |
(a) (2) As of June 30, 2018:
| | | | | | | | | | | | |
| | | (ii) Number of Other Accounts Managed and Assets by Account Type | | (iii) Number of Other Accounts and Assets for Which Advisory Fee is Performance-Based |
(i) Name of Portfolio Manager | | Other Registered Investment Companies | | Other Pooled Investment Vehicles | | Other Accounts | | Other Registered Investment Companies | | Other Pooled Investment Vehicles | | Other Accounts |
Jacob Caplain | | 1 | | 2 | | 0 | | 0 | | 0 | | 0 |
| | | $443.8 Million | | $2.37 Billion | | $0 | | $0 | | $0 | | $0 |
(iv) Potential Material Conflicts of Interest
BlackRock has built a professional working environment, firm-wide compliance culture and compliance procedures and systems designed to protect against potential incentives that may favor one account over
2
another. BlackRock has adopted policies and procedures that address the allocation of investment opportunities, execution of portfolio transactions, personal trading by employees and other potential conflicts of interest that are designed to ensure that all client accounts are treated equitably over time. Nevertheless, BlackRock furnishes investment management and advisory services to numerous clients in addition to the Fund, and BlackRock may, consistent with applicable law, make investment recommendations to other clients or accounts (including accounts which are hedge funds or have performance or higher fees paid to BlackRock, or in which portfolio managers have a personal interest in the receipt of such fees), which may be the same as or different from those made to the Fund. In addition, BlackRock, Inc., its affiliates and significant shareholders and any officer, director, shareholder or employee may or may not have an interest in the securities whose purchase and sale BlackRock recommends to the Fund. BlackRock, Inc. or any of its affiliates or significant shareholders, or any officer, director, shareholder, employee or any member of their families may take different actions than those recommended to the Fund by BlackRock with respect to the same securities. Moreover, BlackRock may refrain from rendering any advice or services concerning securities of companies of which any of BlackRock, Inc.’s (or its affiliates’ or significant shareholders’) officers, directors or employees are directors or officers, or companies as to which BlackRock, Inc. or any of its affiliates or significant shareholders or the officers, directors and employees of any of them has any substantial economic interest or possesses material non-public information. Certain portfolio managers also may manage accounts whose investment strategies may at times be opposed to the strategy utilized for a fund. It should also be noted that Mr. Caplain may be managing certain hedge fund and/or long only accounts, or may be part of a team managing certain hedge fund and/or long only accounts, subject to incentive fees. Mr. Caplain may therefore be entitled to receive a portion of any incentive fees earned on such accounts.
As a fiduciary, BlackRock owes a duty of loyalty to its clients and must treat each client fairly. When BlackRock purchases or sells securities for more than one account, the trades must be allocated in a manner consistent with its fiduciary duties. BlackRock attempts to allocate investments in a fair and equitable manner among client accounts, with no account receiving preferential treatment. To this end, BlackRock, Inc. has adopted policies that are intended to ensure reasonable efficiency in client transactions and provide BlackRock with sufficient flexibility to allocate investments in a manner that is consistent with the particular investment discipline and client base, as appropriate.
(a)(3) As of June 30, 2018:
Portfolio Manager Compensation Overview
The discussion below describes the portfolio managers’ compensation as of June 30, 2018.
BlackRock’s financial arrangements with its portfolio managers, its competitive compensation and its career path emphasis at all levels reflect the value senior management places on key resources. Compensation may include a variety of components and may vary from year to year based on a number of factors. The principal components of compensation include a base salary, a performance-based discretionary bonus, participation in various benefits programs and one or more of the incentive compensation programs established by BlackRock.
Base Compensation. Generally, portfolio managers receive base compensation based on their position with the firm.
Discretionary Incentive Compensation
3
Discretionary incentive compensation is a function of several components: the performance of BlackRock, Inc., the performance of the portfolio manager’s group within BlackRock, the investment performance, including risk-adjusted returns, of the firm’s assets under management or supervision by that portfolio manager relative to predetermined benchmarks, and the individual’s performance and contribution to the overall performance of these portfolios and BlackRock. In most cases, these benchmarks are the same as the benchmark or benchmarks against which the performance of the Fund or other accounts managed by the portfolio managers are measured. Among other things, BlackRock’s Chief Investment Officers make a subjective determination with respect to each portfolio manager’s compensation based on the performance of the Fund and other accounts managed by each portfolio manager relative to the various benchmarks. Performance of fixed income funds is measured on a pre-tax and/or after-tax basis over various time periods including 1-, 3- and 5- year periods, as applicable. With respect to the portfolio manager, such benchmarks for the Fund and other accounts are: A combination of market-based indices (e.g., Bloomberg Barclays U.S. Aggregate Bond Index), certain customized indices and certain fund industry peer groups.
Distribution of Discretionary Incentive Compensation. Discretionary incentive compensation is distributed to portfolio managers in a combination of cash, deferred BlackRock, Inc. stock awards, and/or deferred cash awards that notionally track the return of certain BlackRock investment products.
Portfolio managers receive their annual discretionary incentive compensation in the form of cash. Portfolio managers whose total compensation is above a specified threshold also receive deferred BlackRock, Inc. stock awards annually as part of their discretionary incentive compensation. Paying a portion of discretionary incentive compensation in the form of deferred BlackRock, Inc. stock puts compensation earned by a portfolio manager for a given year “at risk” based on BlackRock’s ability to sustain and improve its performance over future periods. In some cases, additional deferred BlackRock, Inc. stock may be granted to certain key employees as part of a long-term incentive award to aid in retention, align interests with long-term shareholders and motivate performance. Deferred BlackRock, Inc. stock awards are generally granted in the form of BlackRock, Inc. restricted stock units that vest pursuant to the terms of the applicable plan and, once vested, settle in BlackRock, Inc. common stock. The portfolio managers of this Fund have deferred BlackRock, Inc. stock awards.
For certain portfolio managers, a portion of the discretionary incentive compensation is also distributed in the form of deferred cash awards that notionally track the returns of select BlackRock investment products they manage, which provides direct alignment of portfolio manager discretionary incentive compensation with investment product results. Deferred cash awards vest ratably over a number of years and, once vested, settle in the form of cash. Only portfolio managers who manage specified products and whose total compensation is above a specified threshold are eligible to participate in the deferred cash award program.
Other Compensation Benefits. In addition to base salary and discretionary incentive compensation, portfolio managers may be eligible to receive or participate in one or more of the following:
Incentive Savings Plans — BlackRock, Inc. has created a variety of incentive savings plans in which BlackRock, Inc. employees are eligible to participate, including a 401(k) plan, the BlackRock Retirement Savings Plan (RSP), and the BlackRock Employee Stock Purchase Plan (ESPP). The employer contribution components of the RSP include a company match equal to 50% of the first 8% of eligible pay contributed to the plan capped at $5,000 per year, and a company retirement contribution equal to 3-5% of eligible compensation up to the Internal Revenue Service limit ($275,000 for 2018). The RSP offers a range of investment options, including registered investment companies and collective investment funds
4
managed by the firm. BlackRock, Inc. contributions follow the investment direction set by participants for their own contributions or, absent participant investment direction, are invested into a target date fund that corresponds to, or is closest to, the year in which the participant attains age 65. The ESPP allows for investment in BlackRock, Inc. common stock at a 5% discount on the fair market value of the stock on the purchase date. Annual participation in the ESPP is limited to the purchase of 1,000 shares of common stock or a dollar value of $25,000 based on its fair market value on the purchase date. All of the eligible portfolio managers are eligible to participate in these plans.
(a)(4) Beneficial Ownership of Securities – As of June 30, 2018:
| | |
| Portfolio Manager | | Dollar Range of Equity Securities
of the Fund Beneficially Owned |
Jacob Caplain | | $1 - $10,000 |
(b) Effective March 16, 2018, Jacob Caplain was added as a portfolio manager.
| | |
| Item 9 – | | Purchases of Equity Securities by Closed-End Management Investment Company and Affiliated Purchasers – Not Applicable due to no such purchases during the period covered by this report. |
| |
| Item 10 – | | Submission of Matters to a Vote of Security Holders – There have been no material changes to these procedures. |
| |
| Item 11 – | | Controls and Procedures |
| |
| | (a) – The registrant’s principal executive and principal financial officers, or persons performing similar functions, have concluded that the registrant’s disclosure controls and procedures (as defined in Rule 30a-3(c) under the Investment Company Act of 1940, as amended (the “1940 Act”)) are effective as of a date within 90 days of the filing of this report based on the evaluation of these controls and procedures required by Rule 30a-3(b) under the 1940 Act and Rule 13a-15(b) under the Securities Exchange Act of 1934, as amended. |
| |
| | (b) – There were no changes in the registrant’s internal control over financial reporting (as defined in Rule 30a-3(d) under the 1940 Act) that occurred during the second fiscal quarter of the period covered by this report that have materially affected, or are reasonably likely to materially affect, the registrant’s internal control over financial reporting. |
| |
| Item 12 – | | Disclosure of Securities Lending Activities for Closed-End Management Investment Companies — Not applicable to this semi-annual |
| |
| Item 13 – | | Exhibits attached hereto |
| |
| | (a)(1) – Code of Ethics – Not Applicable to this semi-annual report |
| |
| | (a)(2) – Certifications – Attached hereto |
| |
| | (a)(3) – Not Applicable |
| |
| | (a)(4) – Not Applicable |
5
| | | | |
| | |
| | | | (b) – Certifications – Attached hereto |
6
Pursuant to the requirements of the Securities Exchange Act of 1934 and the Investment Company Act of 1940, the registrant has duly caused this report to be signed on its behalf by the undersigned, thereunto duly authorized.
| | |
| BlackRock 2022 Global Income Opportunity Trust |
| |
| By: | | /s/ John M. Perlowski |
| | John M. Perlowski |
| | Chief Executive Officer (principal executive officer) of |
| | BlackRock 2022 Global Income Opportunity Trust |
Date: September 4, 2018
Pursuant to the requirements of the Securities Exchange Act of 1934 and the Investment Company Act of 1940, this report has been signed below by the following persons on behalf of the registrant and in the capacities and on the dates indicated.
| | |
| By: | | /s/ John M. Perlowski |
| | John M. Perlowski |
| | Chief Executive Officer (principal executive officer) of |
| | BlackRock 2022 Global Income Opportunity Trust |
Date: September 4, 2018
| | |
| By: | | /s/ Neal J. Andrews |
| | Neal J. Andrews |
| | Chief Financial Officer (principal financial officer) of |
| | BlackRock 2022 Global Income Opportunity Trust |
Date: September 4, 2018
7