UNITED STATES
SECURITIES AND EXCHANGE COMMISSION
Washington, D.C. 20549
FORMN-CSR
CERTIFIED SHAREHOLDER REPORT OF REGISTERED MANAGEMENT INVESTMENT COMPANIES
Investment Company Act file number:811-23218
Name of Fund: BlackRock 2022 Global Income Opportunity Trust (BGIO)
Fund Address: 100 Bellevue Parkway, Wilmington, DE 19809
Name and address of agent for service: John M. Perlowski, Chief Executive Officer, BlackRock 2022 Global Income Opportunity Trust, 55 East 52nd Street, New York, NY 10055
Registrant’s telephone number, including area code: (800)882-0052, Option 4
Date of fiscal year end: 12/31/2019
Date of reporting period: 06/30/2019
Item 1 – Report to Stockholders
JUNE 30, 2019
| | |
SEMI-ANNUAL REPORT (UNAUDITED) | |  |
BlackRock 2022 Global Income Opportunity Trust (BGIO)
BlackRock Income Trust, Inc. (BKT)
Beginning on January 1, 2021, as permitted by regulations adopted by the Securities and Exchange Commission, paper copies of each Trust’s shareholder reports will no longer be sent by mail, unless you specifically request paper copies of the reports from BlackRock or from your financial intermediary, such as a broker-dealer or bank. Instead, the reports will be made available on a website, and you will be notified by mail each time a report is posted and provided with a website link to access the report.
You may elect to receive all future reports in paper free of charge. If you hold accounts directly with BlackRock, you can call Computershare at (800)699-1236 to request that you continue receiving paper copies of your shareholder reports. If you hold accounts through a financial intermediary, you can follow the instructions included with this disclosure, if applicable, or contact your financial intermediary to request that you continue to receive paper copies of your shareholder reports. Please note that not all financial intermediaries may offer this service. Your election to receive reports in paper will apply to all funds advised by BlackRock Advisors, LLC or its affiliates, or all funds held with your financial intermediary, as applicable.
If you already elected to receive shareholder reports electronically, you will not be affected by this change and you need not take any action. You may elect to receive electronic delivery of shareholder reports and other communications by contacting your financial intermediary, if you hold accounts through a financial intermediary. Please note that not all financial intermediaries may offer this service.
|
| Not FDIC Insured • May Lose Value • No Bank Guarantee |
Section 19(a) Notices
BlackRock Income Trust, Inc.’s (BKT) and BlackRock 2022 Global Income Opportunity Trust (BGIO) (the “Trusts”), amounts and sources of distributions reported are estimates and are being provided to you pursuant to regulatory requirements and are not being provided for tax reporting purposes. The actual amounts and sources for tax reporting purposes will depend upon each Trust’s investment experience during the remainder of its fiscal year and may be subject to changes based on tax regulations. Each Trust will provide a Form 1099-DIV each calendar year that will tell you how to report these distributions for U.S. federal income tax purposes.
June 30, 2019
| | | | | | | | | | | | | | | | | | | | | | | | | | | | | | | | | | | | | | | | |
| | | Total Fiscal Year to Date
Cumulative Distributions by Character | | | % of Fiscal Year to Date Cumulative
Distributions by Character | |
| | | Net
Investment
Income | | | Net Realized
Capital Gains
Short Term | | | Net Realized
Capital Gains
Long Term | | | Return of
Capital (a) | | | Total Per
Common
Share | | | Net
Investment
Income | | | Net Realized
Capital Gains
Short Term | | | Net Realized
Capital Gains
Long Term | | | Return of
Capital (a) | | | Total Per
Common
Share | |
BGIO | | $ | 0.250000 | | | $ | — | | | $ | — | | | $ | — | | | $ | 0.250000 | | | | 100 | % | | | — | % | | | — | % | | | — | % | | | 100 | % |
BKT | | | 0.128416 | | | | — | | | | — | | | | 0.043584 | | | | 0.172000 | | | | 75 | | | | — | | | | — | | | | 25 | | | | 100 | |
| | (a) | BKT estimates that it has distributed more than the amount of earned income and net realized gains; therefore, a portion of the distribution may be a return of capital. A return of capital may occur, for example, when some or all of the shareholder's investment in BKT are returned to the shareholder. A return of capital does not necessarily reflect BKT’s investment performance and should not be confused with “yield” or “income”. When distributions exceed total return performance, the difference will reduce BKT’s net asset value per share. | |
Section 19(a) notices for the Trusts, as applicable, are available on the BlackRock websitehttp://www.blackrock.com.
Managed Distribution Plan
On July 24, 2018, BKT, with the approval of BKT’s Board of Directors (the “Board”), adopted a plan, consistent with its investment objective and policies, to support a level distribution of income, capital gains and/or return of capital (the “Plan”). In accordance with the Plan, BKT distributes the following fixed amounts per share on a monthly basis beginning August 2018:
| | | | |
| | | Amount Per
Common Share | |
BKT | | $ | 0.0344 | |
The fixed amount distributed per share is subject to change at the discretion of the Board. Under its Plan, BKT will distribute all available investment income to its shareholders, consistent with its investment objective and as required by the Internal Revenue Code of 1986, as amended (the “Code”). If sufficient investment income is not available on a monthly basis, BKT will distribute long-term capital gains and/or return of capital to shareholders in order to maintain a level distribution. BKT expects that distributions under the Plan will exceed current income and capital gains and therefore will likely include a return of capital. Each monthly distribution to shareholders is expected to be at the fixed amount established by the Board. However, BKT may make additional distributions from time to time, including additional capital gain distributions at the end of the taxable year, if required to meet requirements imposed by the Code and/or the Investment Company Act of 1940, as amended (the “1940 Act”).
Shareholders should not draw any conclusions about BKT’s investment performance from the amount of these distributions or from the terms of the Plan. BKT’s total return performance on net asset value is presented in its financial highlights table. The Board may amend, suspend or terminate the Plan at any time without prior notice to BKT’s shareholders if it deems such actions to be in the best interests of BKT or its shareholders. The suspension or termination of the Plan could have the effect of creating a trading discount (if BKT’s stock is trading at or above net asset value) or widening an existing trading discount. BKT is subject to risks that could have an adverse impact on its ability to maintain level distributions. Examples of potential risks include, but are not limited to, economic downturns impacting the markets, changes in interest rates, decreased market volatility, companies suspending or decreasing corporate dividend distributions and changes in the Code.
| | |
| 2 | | 2019 BLACKROCK SEMI-ANNUAL REPORTTO SHAREHOLDERS |
The Markets in Review
Dear Shareholder,
Investment performance in the 12 months ended June 30, 2019 was a tale of two markets. The first half of the reporting period was characterized by restrictive monetary policy, deteriorating economic growth, equity market volatility, and rising fear of an imminent recession. During the second half of the reporting period, stocks and bonds rebounded sharply, as restrained inflation and weak economic growth led the U.S. Federal Reserve (the “Fed”) to stop raising interest rates, which led to broad-based optimism that stimulative monetary policy could help forestall a recession.
After the dust settled, the U.S. equity and bond markets posted mixed returns while weathering significant volatility. Less volatile U.S. large cap equities and U.S. bonds advanced, while equities at the high end of the risk spectrum — emerging markets, international developed, and U.S. small cap — posted relatively flat returns.
Fixed-income securities delivered modest positive returns with relatively low volatility. Short-term U.S. Treasury yields rose, while longer-term yields declined. This led to positive returns for U.S. Treasuries and a substantial flattening of the yield curve. Investment grade and high yield corporate bonds also posted positive returns, as the credit fundamentals in corporate markets remained relatively solid.
In the U.S. equity market, volatility spiked in late 2018, as a wide range of risks were brought to bear on markets, ranging from rising interest rates and slowing global growth to heightened trade tensions and political turmoil. These risks manifested in a broad-basedsell-off in December, leading to the worst December performance on record since 1931.
Volatility also rose in emerging markets, as the rising U.S. dollar and higher interest rates in the U.S. disrupted economic growth abroad. U.S.-China trade relations and debt concerns adversely affected the Chinese stock market, particularly in mainland China, while Turkey and Argentina became embroiled in currency crises, largely due to hyperinflation in both countries. An economic slowdown in Europe led to modest performance for European equities.
As equity performance faltered and global economic growth slowed, the Fed shifted to a more patient perspective on the economy in January 2019. In its last four meetings, the Fed left interest rates unchanged and signaled a slower pace of rate hikes in response to the global economic slowdown. Similarly, the European Central Bank signaled a continuation of accommodative monetary policy, while China committed to looser credit conditions and an increase in fiscal spending.
The outpouring of global economic stimulus led to a sharp rally in risk assets throughout the world. Hopes continued to remain high thereafter, as the current economic expansion became the longest in U.S. history. Looking ahead, markets are pricing in three interest rate cuts by the Fed over the next year, as investors anticipate a steady shift toward more stimulative monetary policy.
We expect a slowing expansion with additional room to run, as opposed to an economic recession. However, escalating trade tensions and the resulting disruptions in global supply chains have become the greatest risk to the global expansion.
We believe U.S. and emerging market equities remain relatively attractive. Within U.S. equities, companies with high-quality earnings and strong balance sheets offer the most attractive risk/rewardtrade-off. For bonds, U.S. Treasuries are likely to help buffer against volatility in risk assets, while income from other types of bonds can continue to offer steady returns.
In this environment, investors need to think globally, extend their scope across a broad array of asset classes, and be nimble as market conditions change. We encourage you to talk with your financial advisor and visitblackrock.com for further insight about investing in today’s markets.
Sincerely,

Rob Kapito
President, BlackRock Advisors, LLC

Rob Kapito
President, BlackRock Advisors, LLC
| | | | |
| Total Returns as of June 30, 2019 |
| | | 6-month | | 12-month |
U.S. large cap equities
(S&P 500® Index) | | 18.54% | | 10.42% |
U.S. small cap equities
(Russell 2000® Index) | | 16.98 | | (3.31) |
International equities
(MSCI Europe, Australasia, Far East Index) | | 14.03 | | 1.08 |
Emerging market equities
(MSCI Emerging Markets Index) | | 10.58 | | 1.21 |
3-month Treasury bills
(ICE BofAML3-Month U.S. Treasury Bill Index) | | 1.24 | | 2.31 |
U.S. Treasury securities
(ICE BofAML10-Year U.S. Treasury Index) | | 7.45 | | 10.38 |
U.S. investment grade bonds
(Bloomberg Barclays U.S. Aggregate Bond Index) | | 6.11 | | 7.87 |
Tax-exempt municipal bonds
(S&P Municipal Bond Index) | | 4.94 | | 6.39 |
U.S. high yield bonds
(Bloomberg Barclays U.S. Corporate High Yield 2% Issuer Capped Index) | | 9.94 | | 7.48 |
| Past performance is no guarantee of future results. Index performance is shown for illustrative purposes only. You cannot invest directly in an index. |
| | | | |
| THIS PAGEISNOT PARTOF YOUR FUND REPORT | | | 3 | |
Table of Contents
| | |
| Trust Summary as of June 30, 2019 | | BlackRock 2022 Global Income Opportunity Trust |
Trust Overview
BlackRock 2022 Global Income Opportunity Trust’s (BGIO) (the “Trust”) investment objective is to seek to distribute a high level of current income and to earn a total return, based on the net asset value of the Trust’s common shares of beneficial interest, that exceeds the return on the Bloomberg Barclays 1-3 Month U.S. Treasury Bill Index by 500 basis points (or 5.00%) on an annualized basis over the life of the Trust, under normal market conditions. The Trust will terminate on or about February 28, 2022.
No assurance can be given that the Trust’s investment objective will be achieved. Risks relating to the Trust’s investment objective are described in further detail in the Notes to Financial Statements.
Trust Information
| | |
Symbol on New York Stock Exchange (“NYSE”) | | BGIO |
Initial Offering Date | | February 27, 2017 |
Termination Date (on or about) | | February 28, 2022 |
Current Distribution Rate on Closing Market Price as of June 30, 2019 ($9.45)(a) | | 6.35% |
Current Monthly Distribution per Common Share(b) | | $0.0500 |
Current Annualized Distribution per Common Share(b) | | $0.6000 |
Leverage as of June 30, 2019(c) | | 22% |
| | (a) | Current Distribution Rate on closing market price is calculated by dividing the current annualized distribution per share by the closing market price. The current distribution rate consists of income, net realized gains and/or a return of capital. Past performance does not guarantee future results. | |
| | (b) | The distribution rate is not constant and is subject to change. A portion of the distribution may be deemed a return of capital or net realized gain. | |
| | (c) | Represents reverse repurchase agreements as a percentage of total managed assets, which is the total assets of the Trust (including any assets attributable to any borrowings) minus the sum of its liabilities (other than borrowings representing financial leverage). Does not reflect derivatives or other instruments that may give rise to economic leverage. For a discussion of leveraging techniques utilized by the Trust, please see The Benefits and Risks of Leveraging and Derivative Financial Instruments on page 11. | |
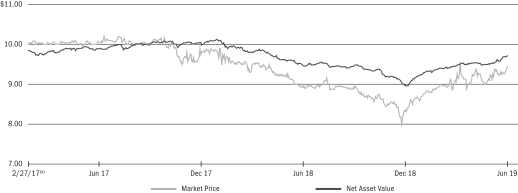
Market Price and Net Asset Value Per Share Summary
| | | | | | | | | | | | | | | | | | | | |
| | | 06/30/19 | | | 12/31/18 | | | Change | | | High | | | Low | |
Market Price | | $ | 9.45 | | | $ | 8.32 | | | | 13.58 | % | | $ | 10.00 | | | $ | 8.29 | |
Net Asset Value | | | 9.71 | | | | 8.96 | | | | 8.37 | | | | 9.71 | | | | 8.96 | |
Market Price and Net Asset Value History Since Inception
| (a) | Commencement of operations. |
| | |
| Trust Summary as of June 30, 2019 (continued) | | BlackRock 2022 Global Income Opportunity Trust |
Performance and Portfolio Management Commentary
Returns for the period ended June 30, 2019 were as follows:
| | | | | | | | | | | | |
| | | | | | Average Annual Total Returns | |
| | | 6-Months | | | 1 Year | | | Since Inception (a) | |
Trust at NAV(b)(c) | | | 11.32 | % | | | 9.75 | % | | | 5.80 | % |
Trust at Market Price(b)(c) | | | 16.68 | | | | 12.90 | | | | 3.90 | |
Bloomberg Barclays 1-3 Month U.S. Treasury Bill Index(d) | | | 1.22 | | | | 2.27 | | | | 1.61 | |
| | (a) | The Trust commenced operations on February 27, 2017. | |
| | (b) | All returns reflect reinvestment of dividends and/or distributions at actual reinvestment prices. Performance results reflect the Trust’s use of leverage. | |
| | (c) | The Trust’s discount to NAV narrowed during the period, which accounts for the difference between performance based on market price and performance based on NAV. | |
| | (d) | An unmanaged index that tracks the market for treasury bills used by the U.S. government that have a maturity of more than 1 month and less than 3 months, are rated investment grade and have a minimum $300 million par amount outstanding. | |
Performance results may include adjustments made for financial reporting purposes in accordance with U.S. generally accepted accounting principles.
Past performance is not indicative of future results.
The Trust’s investment objective is, in part, to earn a total return that exceeds the return on the Bloomberg Barclays 1-3 Month U.S. Treasury Bill Index (the “Index”) by 500 basis points (or 5.00%) on an annualized basis over the life of the Trust, under normal market conditions. The Trust’s investment policies do not contemplate any meaningful amount of investment in securities that comprise the Index under normal market conditions; rather, the Trust uses the Index as a proxy for a risk-free rate of return that its investment objective seeks to exceed. Because the achievement of the Trust’s investment objective is measured on an annualized basis over the life of the Trust, the Trust’s performance may be more or less than the spread over the Index contained in the Trust’s investment objective during individual annual periods or for any period of time shorter than the life of the Trust. The Board considers certain factors to evaluate the Trust’s performance, such as the performance of the Trust relative to its investment objective and/or other information provided by BlackRock Advisors, LLC (the “Manager”).
More information about the Trust’s historical performance can be found in the “Closed End Funds” section of http://www.blackrock.com.
The following discussion relates to the Trust’s absolute performance based on NAV:
What factors influenced performance?
The most significant positive contributions to the Trust’s performance during thesix-month period came from exposure to credit-sensitive sectors, most notably U.S. high yield corporate bonds and emerging market debt. The Trust’s allocations to securitized assets also contributed meaningfully, in particular non-agency mortgage-backed securities (“MBS”) and commercial mortgage-backed securities (“CMBS”).
The Trust’s tactical positioning in its interest rate overlay strategy slightly detracted from performance for the six months.
The Trust used U.S. Treasury futures during the period to manage duration (sensitivity to changing interest rate levels) and yield curve exposure.
Describe recent portfolio activity.
During the reporting period, the Trust increased exposure to U.S. high yield credit, favoring short term issues with anup-in-quality bias given their attractive income profile. Additionally, the Trust added to emerging market debt, with a focus on debt denominated in the U.S. dollar. The investment adviser saw attractive upside in the emerging market sector given the supportive monetary policy backdrop provided by the Fed’s dovish policy shift. At the same time, the investment adviser continued to be cautious around credit selection amid geopolitical risks, preferring specific country stories such as in Indonesia, Mexico and Brazil. Within securitized assets, the Trust added in CMBS while trimming marginally innon-agency MBS and collateralized loan obligations. The securitized sector continued to drive durable and attractive income in the portfolio. The investment adviser sought to maintain diversified exposure across securitized assets while tactically trading around near-term opportunities.
Describe portfolio positioning at period end.
As of June 30, 2019, the Trust’s portfolio carried leverage of 22% of managed net assets. The effective duration of the portfolio was 1.98 years. The Trust maintained diversified exposure acrossnon-government sectors, including emerging markets, high yield corporate bonds and securitized assets.
The views expressed reflect the opinions of BlackRock as of the date of this report and are subject to change based on changes in market, economic or other conditions. These views are not intended to be a forecast of future events and are no guarantee of future results.
| | |
| 6 | | 2019BLACKROCK SEMI-ANNUAL REPORTTO SHAREHOLDERS |
| | |
| Trust Summary as of June 30, 2019 (continued) | | BlackRock 2022 Global Income Opportunity Trust |
Overview of the Trust’s Total Investments
PORTFOLIO COMPOSITION
| | | | | | | | |
| Asset Type | | 06/30/19 | | | 12/31/18 | |
Corporate Bonds | | | 50 | % | | | 50 | % |
Asset-Backed Securities | | | 18 | | | | 19 | |
Non-Agency Mortgage-Backed Securities | | | 16 | | | | 15 | |
Floating Rate Loan Interests | | | 6 | | | | 7 | |
Foreign Agency Obligations | | | 5 | | | | 4 | |
Preferred Securities | | | 3 | | | | 3 | |
Short-Term Securities | | | 1 | | | | 1 | |
U.S. Government Sponsored Agency Securities | | | 1 | | | | 1 | |
Options Purchased | | | — | | | | — | (a) |
| | (a) | Representing less than 1% of the Trust’s total investments. | |
CREDIT QUALITY ALLOCATION (b)(c)
| | | | | | | | |
| Credit Rating | | 06/30/19 | | | 12/31/18 | |
AAA/Aaa(d) | | | 1 | % | | | 2 | % |
AA/Aa | | | 1 | | | | — | |
A | | | 4 | | | | 3 | |
BBB/Baa | | | 20 | | | | 18 | |
BB/Ba | | | 28 | | | | 26 | |
B | | | 21 | | | | 24 | |
CCC/Caa | | | 3 | | | | 4 | |
CC | | | 3 | | | | 5 | |
N/R | | | 19 | | | | 18 | |
| | (b) | For financial reporting purposes, credit quality ratings shown above reflect the highest rating assigned by either S&P Global Ratings (“S&P”) or Moody’s Investors Service (“Moody’s”) if ratings differ. These rating agencies are independent, nationally recognized statistical rating organizations and are widely used. Investment grade ratings are credit ratings of BBB/Baa or higher. Below investment grade ratings are credit ratings of BB/Ba or lower. Investments designated N/R are not rated by either rating agency. Unrated investments do not necessarily indicate low credit quality. Credit quality ratings are subject to change. | |
| | (c) | Excludes short-term securities. | |
| | (d) | The investment adviser evaluates the credit quality of not-rated investments based upon certain factors including, but not limited to, credit ratings for similar investments and financial analysis of sectors, individual investments and/or issuer. Using this approach, the investment adviser has deemed U.S. Government Sponsored Agency Securities and U.S. Treasury Obligations as AAA/Aaa. | |
| | |
| Trust Summary as of June 30, 2019 (continued) | | BlackRock Income Trust, Inc. |
Trust Overview
BlackRock Income Trust, Inc.’s (BKT) (the “Trust”) investment objective is to manage a portfolio of high-quality securities to achieve both preservation of capital and high monthly income. The Trust seeks to achieve its investment objective by investing at least 65% of its assets in mortgage-backed securities. The Trust invests at least 80% of its assets in securities that are (i) issued or guaranteed by the U.S. government or one of its agencies or instrumentalities or (ii) rated at the time of investment either AAA by S&P or Aaa by Moody’s. The Trust may invest directly in such securities or synthetically through the use of derivatives.
No assurance can be given that the Trust’s investment objective will be achieved.
Trust Information
| | |
Symbol on NYSE | | BKT |
Initial Offering Date | | July 22, 1988 |
Current Distribution Rate on Closing Market Price as of June 30, 2019 ($6.05)(a) | | 6.82% |
Current Monthly Distribution per Common Share(b) | | $0.0344 |
Current Annualized Distribution per Common Share(b) | | $0.4128 |
Leverage as of June 30, 2019(c) | | 31% |
| | (a) | Current distribution rate on closing market price is calculated by dividing the current annualized distribution per share by the closing market price. The current distribution rate may consist of income, net realized gains and/or a tax return of capital. Past performance does not guarantee future results. | |
| | (b) | The distribution rate is not constant and is subject to change. A portion of the distribution may be deemed a return of capital or net realized gain. | |
| | (c) | Represents reverse repurchase agreements as a percentage of total managed assets, which is the total assets of the Trust (including any assets attributable to any borrowings) minus the sum of its liabilities (other than borrowings representing financial leverage). Does not reflect derivatives or other instruments that may give rise to economic leverage. For a discussion of leveraging techniques utilized by the Trust, please see The Benefits and Risks of Leveraging and Derivative Financial Instruments on page 11. | |
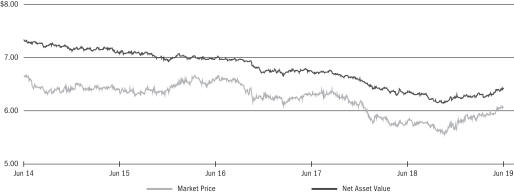
Market Price and Net Asset Value Per Share Summary
| | | | | | | | | | | | | | | | | | | | |
| | | 06/30/19 | | | 12/31/18 | | | Change | | | High | | | Low | |
Market Price | | $ | 6.05 | | | $ | 5.64 | | | | 7.27 | % | | $ | 6.09 | | | $ | 5.64 | |
Net Asset Value | | | 6.42 | | | | 6.25 | | | | 2.72 | | | | 6.42 | | | | 6.23 | |
Market Price and Net Asset Value History For the Past Five Years
| | |
| 8 | | 2019BLACKROCK SEMI-ANNUAL REPORTTO SHAREHOLDERS |
| | |
| Trust Summary as of June 30, 2019 (continued) | | BlackRock Income Trust, Inc. |
Performance and Portfolio Management Commentary
Returns for the period ended June 30, 2019 were as follows:
| | | | | | | | | | | | | | | | |
| | | | | | Average Annual Total Returns | |
| | | 6-Months | | | 1 Year | | | 3 Years | | | 5 Years | |
Trust at NAV(a)(b) | | | 5.71 | % | | | 8.33 | % | | | 2.87 | % | | | 3.16 | % |
Trust at Market Price(a)(b) | | | 10.39 | | | | 11.20 | | | | 2.69 | | | | 3.98 | |
FTSE Mortgage Index(c) | | | 4.30 | | | | 6.39 | | | | 2.09 | | | | 2.58 | |
| | (a) | All returns reflect reinvestment of dividends and/or distributions at actual reinvestment prices. Performance results reflect the Trust’s use of leverage. | |
| | (b) | The Trust’s discount to NAV narrowed during the period, which accounts for the difference between performance based on market price and performance based on NAV. | |
| | (c) | This unmanaged index (formerly known as Citigroup Mortgage Index) (the “Reference Benchmark”) includes all outstanding government sponsored fixed rate mortgage-backed securities, weighted in proportion to their current market capitalization. | |
Performance results may include adjustments made for financial reporting purposes in accordance with U.S. generally accepted accounting principles.
Past performance is not indicative of future results.
BKT is presenting the Reference Benchmark to accompany Trust performance. The Reference Benchmark is presented for informational purposes only, as the Trust is actively managed and does not seek to track or replicate the performance of the Reference Benchmark or any other index. The portfolio investments of the Trust may differ substantially from the securities that comprise the indices within the Reference Benchmark, which may cause the Trust’s performance to differ materially from that of the Reference Benchmark. The Trust employs leverage as part of its investment strategy, which may change over time at the discretion of the Manager as market and other conditions warrant. In contrast, the Reference Benchmark is not adjusted for leverage. Therefore, leverage generally may result in the Trust outperforming the Reference Benchmark in rising markets and underperforming in declining markets. The Board considers additional factors to evaluate the Trust’s performance, such as the performance of the Trust relative to a peer group of funds, a leverage-adjusted benchmark and/or other information provided by the Manager.
More information about the Trust’s historical performance can be found in the “Closed End Funds” section of http://www.blackrock.com.
The following discussion relates to the Trust’s absolute performance based on NAV:
What factors influenced performance?
The largest contribution to the Trust’s return during thesix-month period came from positioning with respect to securitized assets. In particular, allocations to agency collateralized mortgage obligations (“CMOs”) and interest-only and principal-only agency mortgage-backed security (“MBS”) derivatives added to relative return, as did security selection within30-year agency MBS. The Trust’s stance with respect to portfolio duration (and corresponding sensitivity to interest rate changes) and yield curve positioning also helped performance.
The largest detractors from returns were the Trust’s allocations to30- and15-year agency MBS, driven by the underperformance of specified pool holdings. The Trust’s swap- and swaption-based strategies also detracted from returns.
The Trust held derivatives during the period as a part of its investment strategy, and will have derivative exposure of more than 20% at certain times. Derivatives are utilized by the Trust in order to manage and/or take outright views on interest rates and/or credit risk positions in the portfolio. In particular, the portfolio employed U.S. Treasury futures to express duration bias and yield curve bias. The Trust also tactically allocated to mortgage derivatives in order to gain specific market exposure when relative value opportunities presented themselves. The Trust’s derivative positions detracted modestly from Trust performance.
Describe recent portfolio activity.
During the period, exposures across securitized assets including agency MBS, agency CMOs,non-agency MBS and commercial mortgage-backed securities (“CMBS”) were left essentially unchanged.
Describe portfolio positioning at period end.
The Trust was positioned with a reasonably constructive stance with respect to agency MBS, based on valuations that have adjusted and an improved collateral backdrop for newly issued pools. The Trust held positions in specified pools, preferring low loan balance stories where the maximum loan amount supporting each pool is capped, along with seasoning where available, particularly in higher coupon securities. In addition, the Trust continued to be overweight in well-structured agency CMOs backed by call protected and seasoned collateral that demonstrated more favorable prepayment characteristics. The Trust held only marginal positions in other securitized assets such as legacy(pre-financial crisis)non-agency residential MBS and CMBS, preferring to isolate prepayment and structural characteristics in higher quality agency-backed assets rather than seek credit exposure.
The views expressed reflect the opinions of BlackRock as of the date of this report and are subject to change based on changes in market, economic or other conditions. These views are not intended to be a forecast of future events and are no guarantee of future results.
| | |
| Trust Summary as of June 30, 2019 (continued) | | BlackRock Income Trust, Inc. |
Overview of the Trust’s Total Investments
PORTFOLIO COMPOSITION
| | | | | | | | |
| | | 06/30/19 | | | 12/31/18 | |
U.S. Government Sponsored Agency Securities | | | 104 | % | | | 111 | % |
Non-Agency Mortgage-Backed Securities | | | 4 | | | | 3 | |
Short-Term Securities | | | 1 | | | | 1 | |
Asset-Backed Securities(a) | | | — | | | | — | |
Borrowed Bonds(a) | | | — | | | | — | |
TBA Sale Commitments | | | (9 | ) | | | (15 | ) |
| | (a) | Representing less than 1% of the Trust’s total investments. | |
CREDIT QUALITY ALLOCATION (b)(c)
| | | | | | | | |
| | | 06/30/19 | | | 12/31/18 | |
AAA/Aaa(d) | | | 100 | % | | | 98 | % |
BBB | | | — | | | | 2 | |
| | (b) | For financial reporting purposes, credit quality ratings shown above reflect the highest rating assigned by either S&P or Moody’s if ratings differ. These rating agencies are independent, nationally recognized statistical rating organizations and are widely used. Investment grade ratings are credit ratings of BBB/Baa or higher. Below investment grade ratings are credit ratings of BB/Ba or lower. Investments designated N/R are not rated by either rating agency. Unrated investments do not necessarily indicate low credit quality. Credit quality ratings are subject to change. | |
| | (c) | Excludes short-term securities. | |
| | (d) | The investment adviser evaluates the credit quality of not-rated investments based upon certain factors including, but not limited to, credit ratings for similar investments and financial analysis of sectors and individual investments. Using this approach, the investment adviser has deemed U.S. Government Sponsored Agency Securities and U.S. Treasury Obligations as AAA/Aaa. | |
| | |
| 10 | | 2019BLACKROCK SEMI-ANNUAL REPORTTO SHAREHOLDERS |
The Benefits and Risks of Leveraging
The Trusts may utilize leverage to seek to enhance the distribution rate on, and net asset value (“NAV”) of, their common shares (“Common Shares”). However, there is no guarantee that these objectives can be achieved in all interest rate environments.
In general, the concept of leveraging is based on the premise that the financing cost of leverage, which is based on short-term interest rates, is normally lower than the income earned by a Trust on its longer-term portfolio investments purchased with the proceeds from leverage. To the extent that the total assets of the Trusts (including the assets obtained from leverage) are invested in higher-yielding portfolio investments, the Trusts’ shareholders benefit from the incremental net income. The interest earned on securities purchased with the proceeds from leverage (after paying leverage costs) is paid to shareholders in the form of dividends, and the value of these portfolio holdings (less the leverage liability) is reflected in the per share NAV.
To illustrate these concepts, assume a Trust’s capitalization is $100 million and it utilizes leverage for an additional $30 million, creating a total value of $130 million available for investment in longer-term income securities. If prevailing short-term interest rates are 3% and longer-term interest rates are 6%, the yield curve has a strongly positive slope. In this case, a Trust’s financing costs on the $30 million of proceeds obtained from leverage are based on the lower short-term interest rates. At the same time, the securities purchased by a Trust with the proceeds from leverage earn income based on longer-term interest rates. In this case, a Trust’s financing cost of leverage is significantly lower than the income earned on a Trust’s longer-term investments acquired from such leverage proceeds, and therefore the holders of Common Shares (“Common Shareholders”) are the beneficiaries of the incremental net income.
However, in order to benefit shareholders, the return on assets purchased with leverage proceeds must exceed the ongoing costs associated with the leverage. If interest and other costs of leverage exceed the Trusts’ return on assets purchased with leverage proceeds, income to shareholders is lower than if the Trusts had not used leverage. Furthermore, the value of the Trusts’ portfolio investments generally varies inversely with the direction of long-term interest rates, although other factors can influence the value of portfolio investments. In contrast, the amount of the Trusts’ obligations under their respective leverage arrangement generally does not fluctuate in relation to interest rates. As a result, changes in interest rates can influence the Trusts’ NAVs positively or negatively. Changes in the future direction of interest rates are very difficult to predict accurately, and there is no assurance that the Trusts’ intended leveraging strategy will be successful.
The use of leverage also generally causes greater changes in each Trust’s NAV, market price and dividend rates than comparable portfolios without leverage. In a declining market, leverage is likely to cause a greater decline in the NAV and market price of a Trust’s shares than if the Trust were not leveraged. In addition, each Trust may be required to sell portfolio securities at inopportune times or at distressed values in order to comply with regulatory requirements applicable to the use of leverage or as required by the terms of leverage instruments, which may cause the Trust to incur losses. The use of leverage may limit a Trust’s ability to invest in certain types of securities or use certain types of hedging strategies. Each Trust incurs expenses in connection with the use of leverage, all of which are borne by shareholders and may reduce income to the shareholders. Moreover, to the extent the calculation of the Trusts’ investment advisory fees includes assets purchased with the proceeds of leverage, the investment advisory fees payable to the Trusts’ investment adviser will be higher than if the Trusts did not use leverage.
Each Trust may utilize leverage through reverse repurchase agreements as described in the Notes to Financial Statements.
Under the 1940 Act, each Trust is permitted to issue debt up to 331⁄3% of its total managed assets. A Trust may voluntarily elect to limit its leverage to less than the maximum amount permitted under the 1940 Act.
If a Trust segregates or designates on its books and records cash or liquid assets having a value not less than the value of a Trust’s obligations under the reverse repurchase agreement (including accrued interest), then such transaction is not considered a senior security and is not subject to the foregoing limitations and requirements imposed by the 1940 Act.
Derivative Financial Instruments
The Trusts may invest in various derivative financial instruments. These instruments are used to obtain exposure to a security, commodity, index, market, and/or other assets without owning or taking physical custody of securities, commodities and/or other referenced assets or to manage market, equity, credit, interest rate, foreign currency exchange rate, commodity and/or other risks. Derivative financial instruments may give rise to a form of economic leverage and involve risks, including the imperfect correlation between the value of a derivative financial instrument and the underlying asset, possible default of the counterparty to the transaction or illiquidity of the instrument. The Trusts’ successful use of a derivative financial instrument depends on the investment adviser’s ability to predict pertinent market movements accurately, which cannot be assured. The use of these instruments may result in losses greater than if they had not been used, may limit the amount of appreciation a Trust can realize on an investment and/or may result in lower distributions paid to shareholders. The Trusts’ investments in these instruments, if any, are discussed in detail in the Notes to Financial Statements.
| | | | |
| THE BENEFITSAND RISKSOF LEVERAGING / DERIVATIVE FINANCIAL INSTRUMENTS | | | 11 | |
| | |
Schedule of Investments (unaudited) June 30, 2019 | | BlackRock 2022 Global Income Opportunity Trust (BGIO) (Percentages shown are based on Net Assets) |
| | | | | | | | | | | | |
| Security | | | Par
(000) | | | Value | |
|
| Asset-Backed Securities — 23.0% | |
Ajax Mortgage Loan Trust,Series 2017-D, Class A, 3.75%, 12/25/57(a) | | | USD | | | | 192 | | | $ | 197,725 | |
ALM VI Ltd.,Series 2012-6A, Class DR3, 7.65%, 07/15/26(a)(b) | | | | | | | 1,000 | | | | 961,096 | |
ALM VII Ltd., Series 2013-7R2A, Class CR2, 5.60%, 10/15/27(a)(b) | | | | | | | 500 | | | | 488,512 | |
Anchorage Capital CLO Ltd.(a): | | | | | | | | | | | | |
Series 2013-1A, Class DR, 9.40%, 10/13/30(b) | | | | | | | 1,000 | | | | 997,748 | |
Series 2014-4RA, Class D, 5.18%, 01/28/31(b) | | | | | | | 1,000 | | | | 960,708 | |
Series 2016-9A, Class D, (3 mo. LIBOR US + 4.00%), 6.60%, 01/15/29(c) | | | | | | | 1,000 | | | | 999,018 | |
Apidos CLO XVIII,Series 2018-18A, Class E, 8.29%, 10/22/30(a)(b) | | | | | | | 1,000 | | | | 945,291 | |
Apidos CLO XXI,Series 2015-21A, Class DR, 7.80%, 07/18/27(a)(b) | | | | | | | 500 | | | | 483,396 | |
Ares XXXIV CLO Ltd.,Series 2015-2A, Class E2, (3 mo. LIBOR US + 5.20%), 7.78%, 07/29/26(a)(c) | | | | | | | 1,000 | | | | 994,806 | |
Ares XXXVII CLO Ltd.,Series 2015-4A, Class DR, 8.75%, 10/15/30(a)(b) | | | | | | | 250 | | | | 244,584 | |
Bayview Financial Revolving Asset Trust,Series 2005-E, Class A1, (1 mo. LIBOR + 0.05%), 3.40%, 12/28/40(a)(c) | | | | | | | 1,753 | | | | 1,667,890 | |
Benefit Street Partners CLO II Ltd.,Series 2013-IIA, Class CR, (3 mo. LIBOR US + 3.70%), 6.30%, 07/15/29(a)(c) | | | | | | | 1,500 | | | | 1,500,665 | |
Burnham Park CLO Ltd.,Series 2016-1A, Class ER, 7.99%, 10/20/29(a)(b) | | | | | | | 500 | | | | 473,001 | |
C-BASS Trust,Series 2007-CB1, Class AF4, 5.91%, 01/25/37 | | | | | | | 2,224 | | | | 978,541 | |
Carlyle US CLO Ltd.,Series 2016-4A(a)(b): | | | | | | | | | | | | |
Class CR, 5.39%, 10/20/27 | | | | | | | 750 | | | | 723,287 | |
Class DR, 7.99%, 10/20/27 | | | | | | | 250 | | | | 239,332 | |
CarVal CLO II Ltd.,Series 2019-1A, Class E, 9.39%, 04/20/32(a)(b) | | | | | | | 250 | | | | 243,532 | |
Cedar Funding VI CLO Ltd.,Series 2016-6A(a)(b): | | | | | | | | | | | | |
Class DR, 5.59%, 10/20/28 | | | | | | | 1,000 | | | | 978,751 | |
Class ER, 8.49%, 10/20/28 | | | | | | | 250 | | | | 237,174 | |
Conseco Finance Corp.,Series 2001-D, Class B1, (1 mo. LIBOR + 2.50%), 4.89%, 11/15/32(c) | | | | | | | 1,147 | | | | 1,124,105 | |
Conseco Finance Securitizations Corp.,Series 2002-1, Class M2, 9.55%, 12/01/33(b) | | | | | | | 2,500 | | | | 2,654,056 | |
Credit-Based Asset Servicing & Securitization LLC,Series 2006-MH1, Class B1, 5.03%, 10/25/36(a) | | | | | | | 1,000 | | | | 1,028,123 | |
CWABS Asset-Backed Certificates Trust,Series 2005-17, Class 1AF4, 6.05%, 05/25/36 | | | | | | | 813 | | | | 823,360 | |
Deutsche Financial Capital Securitization LLC,Series 1991-I, Class M, 6.80%, 04/15/28 | | | | | | | 1,000 | | | | 1,048,718 | |
Dryden 64 CLO Ltd.,Series 2018-64A, Class D, 5.25%, 04/18/31(a)(b) | | | | | | | 1,000 | | | | 956,702 | |
Elevation CLO Ltd.,Series 2014-3A, Class DR,
(3 mo. LIBOR US + 3.65%), 6.25%, 10/15/26(a)(c) | | | | | | | 410 | | | | 410,660 | |
First Franklin Mortgage Loan Trust, Series 2006-FF16, Class 2A3, (1 mo. LIBOR US + 0.14%), 2.54%, 12/25/36(c) | | | | | | | 649 | | | | 376,295 | |
Flatiron CLO Ltd.,Series 2013-1A, Class C,
(3 mo. LIBOR US + 3.60%), 6.19%, 01/17/26(a)(c) | | | | | | | 500 | | | | 499,981 | |
Galaxy XXIX CLO Ltd.,Series 2018-29A, Class D, 4.92%, 11/15/26(a)(b) | | | | | | | 750 | | | | 738,805 | |
GoldenTree Loan Opportunities IX Ltd.,Series 2014-9A, Class ER2, 8.33%, 10/29/29(a)(b) | | | | | | | 500 | | | | 487,289 | |
Highbridge Loan Management Ltd.,Series 5A-2015, Class ERR, 8.60%, 10/15/30(a)(b) | | | | | | | 500 | | | | 475,131 | |
| | | | | | | | | | | | |
| Security | | | Par
(000) | | | Value | |
|
| Asset-Backed Securities (continued) | |
KKR CLO Ltd., Series 12, Class ER2, 8.75%, 10/15/30(a)(b) | | | USD | | | | 1,000 | | | $ | 957,967 | |
Lehman ABS Manufactured Housing Contract Trust,Series 2002-A, Class C, 0.00%, 06/15/33 | | | | | | | 2,187 | | | | 1,830,524 | |
Long Beach Mortgage Loan Trust(c): | | | | | | | | | | | | |
Series 2006-4, Class 2A4, (1 mo. LIBOR US + 0.26%), 2.92%, 05/25/36 | | | | | | | 833 | | | | 374,451 | |
Series 2006-5, Class 2A3, (1 mo. LIBOR US + 0.15%), 2.55%, 06/25/36 | | | | | | | 1,090 | | | | 603,461 | |
Series 2006-7, Class 2A3, (1 mo. LIBOR US + 0.16%), 2.56%, 08/25/36 | | | | | | | 1,716 | | | | 888,696 | |
Series 2006-7, Class 2A4, (1 mo. LIBOR US + 0.24%), 2.64%, 08/25/36 | | | | | | | 1,716 | | | | 902,621 | |
Series 2006-9, Class 2A3, (1 mo. LIBOR US + 0.16%), 2.56%, 10/25/36 | | | | | | | 1,532 | | | | 660,597 | |
Madison Park Funding X Ltd.,Series 2012-10A, Class DR2, (3 mo. LIBOR US + 3.25%), 5.69%, 01/20/29(a)(c) | | | | | | | 550 | | | | 545,288 | |
Madison Park Funding XVI Ltd.,Series 2015-16A, Class C, (3 mo. LIBOR US + 3.70%), 6.29%, 04/20/26(a)(c) | | | | | | | 1,000 | | | | 1,002,063 | |
Madison Park Funding XXV Ltd.,Series 2017-25A, Class D, 8.68%, 04/25/29(a)(b) | | | | | | | 500 | | | | 486,106 | |
Madison Park Funding XXX Ltd.(b): | | | | | | | | | | | | |
Series 2012-30X, Class C, 7.55%, 04/15/29 | | | | | | | 250 | | | | 244,036 | |
Series 2018-30A, Class D, 5.10%, 04/15/29(a) | | | | | | | 500 | | | | 484,189 | |
Mariner CLO LLC,Series 2018-1A, Class E, 9.43%, 04/30/32(a) | | | | | | | 250 | | | | 245,668 | |
Merrill Lynch Mortgage Investors Trust,
Series 2006-OPT1, Class M1, (1 mo. LIBOR US + 0.26%), 2.66%, 08/25/37(c) | | | | | | | 1,595 | | | | 754,006 | |
Nationstar HECM Loan Trust,Series 2019-1A, Class M4, 5.80%, 06/25/29(a)(b) | | | | | | | 750 | | | | 749,999 | |
Neuberger Berman CLO XV,Series 2013-15A, Class DR, 5.65%, 10/15/29(a)(b) | | | | | | | 1,000 | | | | 976,955 | |
OCP CLO Ltd.,Series 2016-12A, Class CR, 5.60%, 10/18/28(a)(b) | | | | | | | 250 | | | | 245,591 | |
OHA Credit Partners IX Ltd.,Series 2013-9A, Class DR, (3 mo. LIBOR US + 3.30%), 5.89%, 10/20/25(a)(c) | | | | | | | 1,000 | | | | 1,002,875 | |
Option One Mortgage Loan Trust, Series 2007-FXD1, Class 2A1, 5.87%, 01/25/37 | | | | | | | 816 | | | | 781,675 | |
OZLM Funding Ltd.,Series 2012-1A, Class CR2,
(3 mo. LIBOR US + 3.60%), 6.19%, 07/22/29(a)(c) | | | | | | | 250 | | | | 249,093 | |
OZLM XIV Ltd.,Series 2015-14A, Class CR, 5.60%, 01/15/29(a)(b) | | | | | | | 1,000 | | | | 977,435 | |
Palmer Square Loan Funding Ltd.,Series 2018-4A, Class C, 5.07%, 11/15/26(a)(b) | | | | | | | 1,800 | | | | 1,713,231 | |
Park Avenue Institutional Advisers CLO Ltd.,Series 2016-1A, Class DR, 8.38%, 08/23/31(a)(b) | | | | | | | 500 | | | | 471,917 | |
Regatta VI Funding Ltd.,Series 2016-1A, Class DR, 5.29%, 07/20/28(a)(b) | | | | | | | 500 | | | | 485,457 | |
Rockford Tower CLO Ltd.(a): | | | | | | | | | | | | |
Series 2017-1A, Class D, (3 mo. LIBOR US + 3.25%), 5.85%, 04/15/29(c) | | | | | | | 1,000 | | | | 998,344 | |
Series 2017-3A, Class D, 5.24%, 10/20/30(b) | | | | | | | 420 | | | | 406,816 | |
Series 2017-3A, Class SUB, 0.00%, 10/20/30(b) | | | | | | | 250 | | | | 235,035 | |
Series 2018-1A, Class SUB, 0.00%, 05/20/31(b) | | | | | | | 250 | | | | 222,416 | |
Series 2018-2A, Class SUB, 0.00%, 10/20/31(b) | | | | | | | 250 | | | | 222,511 | |
RSO REPO SPE Trust, 5.20%, 09/15/20(a)(d) | | | | | | | 1,262 | | | | 1,249,759 | |
TIAA CLO II Ltd.,Series 2017-1A, Class E,
(3 mo. LIBOR US + 5.85%), 8.44%, 04/20/29(a)(c) | | | | | | | 1,000 | | | | 955,591 | |
TICP CLO XII Ltd.,Series 2018-12A, Class E, 8.31%, 01/15/31(a)(b) | | | | | | | 1,000 | | | | 973,043 | |
| | |
| 12 | | 2019 BLACKROCK SEMI-ANNUAL REPORTTO SHAREHOLDERS |
| | |
Schedule of Investments (unaudited) (continued) June 30, 2019 | | BlackRock 2022 Global Income Opportunity Trust (BGIO) (Percentages shown are based on Net Assets) |
| | | | | | | | | | | | |
| Security | | | Par
(000) | | | Value | |
|
| Asset-Backed Securities (continued) | |
TRESTLES CLO II Ltd.,Series 2018-2A, Class D, 8.33%, 07/25/31(a)(b) | | | USD | | | | 250 | | | $ | 234,968 | |
West CLO Ltd.,Series 2013-1A, Class C, (3 mo. LIBOR US + 3.65%), 6.22%, 11/07/25(a)(c) | | | | | | | 1,000 | | | | 1,000,345 | |
Westcott Park CLO Ltd.,Series 2016-1A, Class DR, 5.72%, 07/20/28(a)(b) | | | | | | | 250 | | | | 248,081 | |
| | | | | | | | | | | | |
| |
Total Asset-Backed Securities — 23.0%
(Cost — $50,001,419) | | | | 49,319,092 | |
| | | | | | | | | | | | |
|
Corporate Bonds — 63.1% | |
|
Argentina — 1.0% | |
Generacion Mediterranea SA/Generacion Frias SA/Central Termica Roca SA, 9.63%, 07/27/23(a) | | | | | | | 1,078 | | | | 899,456 | |
Tarjeta Naranja SA(Argentina Deposit Rates Badlar Pvt Banks + 3.50%), 51.31%, 04/11/22(a)(c) | | | | | | | 740 | | | | 253,253 | |
YPF SA(Argentina Deposit Rates Badlar Pvt Banks + 4.00%), 48.75%, 07/07/20(c) | | | | | | | 2,788 | | | | 1,004,338 | |
| | | | | | | | | | | | |
| | | | | | | | | | | 2,157,047 | |
|
| Australia — 0.1% | |
Santos Finance Ltd., 5.25%, 03/13/29 | | | | | | | 200 | | | | 208,932 | |
| | | | | | | | | | | | |
|
| Austria — 0.4% | |
Suzano Austria GmbH, 6.00%, 01/15/29(a)(e) | | | | | | | 861 | | | | 940,642 | |
| | | | | | | | | | | | |
|
| Bermuda — 0.5% | |
Geopark Ltd., 6.50%, 09/21/24(a)(e) | | | | | | | 1,000 | | | | 1,020,000 | |
| | | | | | | | | | | | |
|
| Brazil — 0.3% | |
Oi SA, (8.00% Cash or 4.00% PIK), 10.00%, 07/27/25(f) | | | | | | | 615 | | | | 635,756 | |
| | | | | | | | | | | | |
|
| British Virgin Islands — 1.0% | |
Baoxin Auto Finance I Ltd., 7.90%, 02/09/20 | | | | | | | 200 | | | | 197,500 | |
Central American Bottling Corp., 5.75%, 01/31/27(a)(e) | | | | | | | 626 | | | | 646,345 | |
Coastal Emerald Ltd., 5.95%, 01/13/20 | | | | | | | 200 | | | | 200,500 | |
Easy Tactic Ltd.: | | | | | | | | | | | | |
9.13%, 07/28/22 | | | | | | | 200 | | | | 212,000 | |
8.63%, 02/27/24 | | | | | | | 200 | | | | 203,750 | |
New Lion Bridge Co. Ltd., 9.75%, 10/10/20 | | | | | | | 200 | | | | 187,850 | |
Prime Bloom Holdings Ltd., 6.95%, 07/05/22 | | | | | | | 200 | | | | 156,000 | |
Rock International Investment Co., 6.63%, 03/27/20 | | | | | | | 350 | | | | 277,375 | |
| | | | | | | | | | | | |
| | | | | | | | | | | 2,081,320 | |
|
| Canada — 3.8% | |
Bausch Health Cos., Inc.: | | | | | | | | | | | | |
4.50%, 05/15/23 | | | EUR | | | | 100 | | | | 115,177 | |
9.00%, 12/15/25(a)(e) | | | USD | | | | 844 | | | | 943,001 | |
Frontera Energy Corp., 9.70%, 06/25/23(a)(e) | | | | | | | 2,000 | | | | 2,126,875 | |
Hammerhead Resources, Inc., Series AI, 9.00%, 07/10/22 | | | | | | | 1,500 | | | | 1,368,750 | |
Largo Resources Ltd., 9.25%, 06/01/21(a) | | | | | | | 210 | | | | 219,954 | |
Masonite International Corp., 5.63%, 03/15/23(a) | | | | | | | 399 | | | | 410,970 | |
NOVA Chemicals Corp., 5.25%, 06/01/27(a)(e) | | | | | | | 1,495 | | | | 1,590,307 | |
Stoneway Capital Corp., 10.00%, 03/01/27(a)(e) | | | | | | | 1,400 | | | | 1,318,022 | |
TransCanada PipeLines Ltd., 4.88%, 01/15/26 | | | | | | | 75 | | | | 82,776 | |
| | | | | | | | | | | | |
| | | | | | | | | | | 8,175,832 | |
|
| Cayman Islands — 6.1% | |
21Vianet Group, Inc., 7.88%, 10/15/21 | | | | | | | 200 | | | | 205,500 | |
Ambac LSNI LLC, 7.59%, 02/12/23(a)(b) | | | | | | | 542 | | | | 550,921 | |
Anton Oilfield Services Group, 9.75%, 12/05/20 | | | | | | | 200 | | | | 204,345 | |
Central China Real Estate Ltd., 7.33%, 01/27/20 | | | | | | | 200 | | | | 201,500 | |
CFLD Cayman Investment Ltd., 8.63%, 02/28/21 | | | | | | | 200 | | | | 207,500 | |
| | | | | | | | | | | | |
| Security | | | Par
(000) | | | Value | |
|
| Cayman Islands (continued) | |
China Aoyuan Group Ltd.: | | | | | | | | | | | | |
7.50%, 05/10/21 | | | USD | | | | 200 | | | $ | 206,000 | |
8.50%, 01/23/22 | | | | | | | 200 | | | | 211,174 | |
7.95%, 02/19/23 | | | | | | | 200 | | | | 208,388 | |
China Evergrande Group: | | | | | | | | | | | | |
7.00%, 03/23/20 | | | | | | | 200 | | | | 201,063 | |
9.50%, 04/11/22 | | | | | | | 235 | | | | 232,650 | |
4.25%, 02/14/23 | | | HKD | | | | 4,000 | | | | 479,889 | |
10.00%, 04/11/23 | | | USD | | | | 300 | | | | 291,663 | |
China SCE Group Holdings Ltd., 8.75%, 01/15/21 | | | | | | | 200 | | | | 209,500 | |
China SCE Property Holdings Ltd., 7.45%, 04/17/21 | | | | | | | 300 | | | | 306,968 | |
CIFI Holdings Group Co. Ltd., 5.50%, 01/23/22 | | | | | | | 400 | | | | 396,169 | |
Country Garden Holdings Co. Ltd., 6.50%, 04/08/24 | | | | | | | 200 | | | | 206,188 | |
Energuate Trust, 5.88%, 05/03/27(a) | | | | | | | 503 | | | | 514,317 | |
Fantasia Holdings Group Co. Ltd.: | | | | | | | | | | | | |
8.38%, 03/08/21 | | | | | | | 200 | | | | 191,000 | |
11.75%, 04/17/22 | | | | | | | 200 | | | | 196,000 | |
Future Land Development Holdings Ltd., 7.50%, 01/22/21 | | | | | | | 200 | | | | 205,500 | |
Gol Finance, Inc., 7.00%, 01/31/25(a)(e) | | | | | | | 1,000 | | | | 975,000 | |
Golden Wheel Tiandi Holdings Co. Ltd., 7.00%, 01/18/21 | | | | | | | 200 | | | | 188,770 | |
Gran Tierra Energy International Holdings Ltd., 6.25%, 02/15/25(a) | | | | | | | 400 | | | | 372,500 | |
Jingrui Holdings Ltd., 9.45%, 04/23/21 | | | | | | | 200 | | | | 190,850 | |
KWG Group Holdings Ltd., 7.88%, 09/01/23 | | | | | | | 200 | | | | 202,000 | |
Latam Finance Ltd., 6.88%, 04/11/24(a)(e) | | | | | | | 645 | | | | 669,792 | |
Pearl Holding III Ltd., 9.50%, 12/11/22 | | | | | | | 200 | | | | 162,900 | |
Powerlong Real Estate Holdings Ltd.: | | | | | | | | | | | | |
5.95%, 07/19/20 | | | | | | | 200 | | | | 199,086 | |
6.95%, 04/17/21 | | | | | | | 300 | | | | 300,000 | |
Redco Properties Group Ltd., 13.50%, 01/21/20 | | | | | | | 200 | | | | 206,000 | |
Ronshine China Holdings Ltd., 8.75%, 10/25/22 | | | | | | | 200 | | | | 197,522 | |
Saudi Electricity Global Sukuk Co. 3, 5.50%, 04/08/44 | | | | | | | 600 | | | | 666,000 | |
Sunac China Holdings Ltd., 7.25%, 06/14/22 | | | | | | | 200 | | | | 200,250 | |
Times China Holdings Ltd., 7.63%, 02/21/22 | | | | | | | 200 | | | | 206,000 | |
Transocean Phoenix 2 Ltd., 7.75%, 10/15/24(a)(e) | | | | | | | 1,239 | | | | 1,322,632 | |
Yankuang Group Cayman Ltd., 4.75%, 11/30/20 | | | | | | | 200 | | | | 199,522 | |
Yuzhou Properties Co. Ltd.: | | | | | | | | | | | | |
7.90%, 05/11/21 | | | | | | | 700 | | | | 724,062 | |
8.63%, 01/23/22 | | | | | | | 200 | | | | 209,000 | |
Zhenro Properties Group Ltd.: | | | | | | | | | | | | |
10.50%, 06/28/20 | | | | | | | 200 | | | | 206,688 | |
12.50%, 01/02/21 | | | | | | | 200 | | | | 213,313 | |
| | | | | | | | | | | | |
| | | | | | | | | | | 13,038,122 | |
|
| Chile — 0.4% | |
Celeo Redes Operacion Chile SA, 5.20%, 06/22/47(a)(e) | | | | | | | 735 | | | | 763,275 | |
Shandong Iron And Steel Xinheng International Co. Ltd., 6.50%, 06/14/21 | | | | | | | 200 | | | | 199,640 | |
| | | | | | | | | | | | |
| | | | | | | | | | | 962,915 | |
|
| China — 0.7% | |
China Singyes Solar Technologies Holdings Ltd., 7.95%, 02/15/20(c)(g)(h) | | | | | | | 300 | | | | 234,000 | |
Excel Capital Global Ltd., 7.00%(b)(i) | | | | | | | 200 | | | | 202,406 | |
Greenland Global Investment Ltd., 7.18%, 09/26/21(b) | | | | | | | 200 | | | | 203,150 | |
Guangxi Financial Investment Group Co. Ltd., 5.75%, 01/23/21 | | | | | | | 200 | | | | 193,170 | |
Huachen Energy Co. Ltd., 6.63%, 05/18/20(g)(h) | | | | | | | 300 | | | | 193,359 | |
Scenery Journey Ltd., 11.00%, 11/06/20 | | | | | | | 200 | | | | 208,000 | |
Zhejiang Baron BVI Co. Ltd., 6.80%, 08/27/21 | | | | | | | 200 | | | | 199,000 | |
| | | | | | | | | | | | |
| | | | | | | | | | | 1,433,085 | |
| | | | |
| SCHEDULES OF INVESTMENTS | | | 13 | |
| | |
Schedule of Investments (unaudited) (continued) June 30, 2019 | | BlackRock 2022 Global Income Opportunity Trust (BGIO) (Percentages shown are based on Net Assets) |
| | | | | | | | | | | | |
| Security | | | Par
(000) | | | Value | |
|
| Colombia — 0.2% | |
Credivalores-Crediservicios SAS, 9.75%, 07/27/22(a) | | | USD | | | | 400 | | | $ | 394,250 | |
| | | | | | | | | | | | |
|
| Czech Republic — 0.1% | |
Residomo SRO, 3.38%, 10/15/24 | | | EUR | | | | 100 | | | | 118,040 | |
| | | | | | | | | | | | |
|
| Denmark — 0.2% | |
DKT Finance ApS, 7.00%, 06/17/23 | | | | | | | 280 | | | | 347,717 | |
| | | | | | | | | | | | |
|
| Dominican Republic — 0.5% | |
Aeropuertos Dominicanos Siglo XXI SA, 6.75%, 03/30/29(a)(e) | | | USD | | | | 928 | | | | 975,560 | |
| | | | | | | | | | | | |
|
| France — 1.1% | |
BNP Paribas SA, 4.38%, 03/01/33(b)(e) | | | | | | | 800 | | | | 824,133 | |
BPCE SA, 5.15%, 07/21/24(a)(e) | | | | | | | 600 | | | | 649,068 | |
Credit Agricole SA, 4.00%, 01/10/33(a)(b) | | | | | | | 750 | | | | 758,418 | |
Crown European Holdings SA, 2.25%, 02/01/23 | | | EUR | | | | 100 | | | | 119,822 | |
Parts Europe SA, 5.50%, 05/01/22(b) | | | | | | | 101 | | | | 115,422 | |
| | | | | | | | | | | | |
| | | | | | | | | | | 2,466,863 | |
|
| Germany — 1.2% | |
IHO Verwaltungs GmbH, (4.38% PIK), 3.63%, 05/15/25(f) | | | | | | | 100 | | | | 116,269 | |
IKB Deutsche Industriebank AG, 4.00%, 01/31/28(b) | | | | | | | 500 | | | | 559,065 | |
Merck KGaA(5 year EUR Swap + 2.94%), 2.88%, 06/25/79(j) | | | | | | | 400 | | | | 469,647 | |
Schaeffler AG: | | | | | | | | | | | | |
1.13%, 03/26/22 | | | | | | | 100 | | | | 116,382 | |
1.88%, 03/26/24 | | | | | | | 50 | | | | 59,349 | |
thyssenkrupp AG, 2.88%, 02/22/24 | | | | | | | 164 | | | | 194,395 | |
Unitymedia GmbH, 6.13%, 01/15/25(a)(e) | | | USD | | | | 988 | | | | 1,027,767 | |
| | | | | | | | | | | | |
| | | | | | | | | | | 2,542,874 | |
|
| India — 0.3% | |
Adani Ports & Special Economic Zone Ltd., 4.38%, 07/03/29(a) | | | | | | | 441 | | | | 447,296 | |
ReNew Power Synthetic, 6.67%, 03/12/24 | | | | | | | 200 | | | | 204,137 | |
| | | | | | | | | | | | |
| | | | | | | | | | | 651,433 | |
|
| Indonesia — 0.1% | |
Jasa Marga Persero Tbk PT, 7.50%, 12/11/20 | | | IDR | | | | 1,500,000 | | | | 103,892 | |
Wijaya Karya Persero Tbk PT, 7.70%, 01/31/21 | | | | | | | 2,000,000 | | | | 138,142 | |
| | | | | | | | | | | | |
| | | | | | | | | | | 242,034 | |
|
| Ireland — 1.5% | |
Ardagh Packaging Finance PLC/Ardagh Holdings USA, Inc.: | | | | | | | | | | | | |
4.13%, 05/15/23 | | | EUR | | | | 100 | | | | 117,406 | |
6.00%, 02/15/25(a)(e) | | | USD | | | | 1,000 | | | | 1,036,250 | |
4.75%, 07/15/27 | | | GBP | | | | 140 | | | | 173,348 | |
Bank of Ireland Group PLC, 4.13%, 09/19/27(b) | | | USD | | | | 500 | | | | 486,791 | |
C&W Senior Financing DAC, 6.88%, 09/15/27(a) | | | | | | | 841 | | | | 868,417 | |
Virgin Media Receivables Financing Notes II DAC, 5.75%, 04/15/23 | | | GBP | | | | 110 | | | | 144,402 | |
Zurich Finance Ireland Designated Activity Co., 1.63%, 06/17/39 | | | EUR | | | | 280 | | | | 327,589 | |
| | | | | | | | | | | | |
| | | | | | | | | | | 3,154,203 | |
|
| Italy — 1.0% | |
Assicurazioni Generali SpA(3 mo. EURIBOR + 5.35%), 5.00%, 06/08/48(j) | | | | | | | 500 | | | | 628,486 | |
Banca Carige SpA, 0.75%, 07/26/20 | | | | | | | 200 | | | | 227,969 | |
Buzzi Unicem SpA, 2.13%, 04/28/23 | | | | | | | 100 | | | | 117,974 | |
Nexi Capital SpA, 4.13%, 11/01/23 | | | | | | | 100 | | | | 117,742 | |
Sisal Group SpA, 7.00%, 07/31/23 | | | | | | | 100 | | | | 116,828 | |
Telecom Italia SpA, 1.13%, 03/26/22(k) | | | | | | | 100 | | | | 112,156 | |
| | | | | | | | | | | | |
| Security | | | Par
(000) | | | Value | |
|
| Italy (continued) | |
UniCredit SpA: | | | | | | | | | | | | |
6.57%, 01/14/22(a)(e) | | | USD | | | | 700 | | | $ | 744,140 | |
(5 year EUR Swap + 4.10%), 5.75%, 10/28/25(j) | | | EUR | | | | 100 | | | | 119,696 | |
| | | | | | | | | | | | |
| | | | | | | | | | | 2,184,991 | |
|
| Japan — 0.1% | |
SoftBank Group Corp., 4.00%, 04/20/23 | | | | | | | 200 | | | | 246,700 | |
| | | | | | | | | | | | |
|
| Jersey — 0.2% | |
AA Bond Co. Ltd., 2.88%, 07/31/43 | | | GBP | | | | 100 | | | | 120,821 | |
CPUK Finance Ltd., 4.25%, 02/28/47 | | | | | | | 100 | | | | 127,111 | |
LHC3 PLC, (4.13% Cash or 4.88% PIK), 4.13%, 08/15/24(f) | | | EUR | | | | 240 | | | | 279,287 | |
| | | | | | | | | | | | |
| | | | | | | | | | | 527,219 | |
|
| Luxembourg — 2.9% | |
Allergan Funding SCS, 3.80%, 03/15/25 | | | USD | | | | 45 | | | | 46,700 | |
B&M European Value Retail SA, 4.13%, 02/01/22 | | | GBP | | | | 100 | | | | 128,468 | |
Cabot Financial Luxembourg SA, 7.50%, 10/01/23 | | | | | | | 100 | | | | 131,122 | |
ContourGlobal Power Holdings SA, 3.38%, 08/01/23 | | | EUR | | | | 100 | | | | 117,974 | |
Garfunkelux Holdco 3 SA, 7.50%, 08/01/22 | | | | | | | 100 | | | | 104,404 | |
Gilex Holding Sarl, 8.50%, 05/02/23(a) | | | USD | | | | 214 | | | | 226,361 | |
INEOS Group Holdings SA, 5.38%, 08/01/24 | | | EUR | | | | 100 | | | | 116,837 | |
Intelsat Connect Finance SA, 9.50%, 02/15/23(a) | | | USD | | | | 167 | | | | 147,795 | |
Intelsat Jackson Holdings SA: | | | | | | | | | | | | |
5.50%, 08/01/23 | | | | | | | 404 | | | | 368,650 | |
8.50%, 10/15/24(a) | | | | | | | 44 | | | | 43,560 | |
Intelsat SA, 4.50%, 06/15/25(a) | | | | | | | 94 | | | | 130,041 | |
Lincoln Financing Sarl: | | | | | | | | | | | | |
3.63%, 04/01/24 | | | EUR | | | | 104 | | | | 122,350 | |
3.88%, 04/01/24(b) | | | | | | | 100 | | | | 114,279 | |
Minerva Luxembourg SA, 6.50%, 09/20/26(a) | | | USD | | | | 557 | | | | 578,232 | |
Nexa Resources SA, 5.38%, 05/04/27(a)(e) | | | | | | | 1,350 | | | | 1,416,319 | |
Puma International Financing SA, 5.13%, 10/06/24(a) | | | | | | | 1,000 | | | | 919,986 | |
Rumo Luxembourg Sarl, 7.38%, 02/09/24(a) | | | | | | | 928 | | | | 999,920 | |
Telecom Italia Capital SA, 6.38%, 11/15/33 | | | | | | | 385 | | | | 399,438 | |
Telenet Finance VI Luxembourg SCA, 4.88%, 07/15/27 | | | EUR | | | | 90 | | | | 111,046 | |
| | | | | | | | | | | | |
| | | | | | | | | | | 6,223,482 | |
|
| Mexico — 3.2% | |
Axtel SAB de CV, 6.38%, 11/14/24(a)(e) | | | USD | | | | 1,000 | | | | 1,019,687 | |
BBVA Bancomer SA, 6.75%, 09/30/22(a) | | | | | | | 500 | | | | 544,150 | |
Controladora Mabe SA de CV, 5.60%, 10/23/28(a) | | | | | | | 444 | | | | 464,951 | |
Cydsa SAB de CV, 6.25%, 10/04/27(a)(e) | | | | | | | 800 | | | | 800,250 | |
Grupo Bimbo SAB de CV, 5.95%(a)(b)(i) | | | | | | | 796 | | | | 835,720 | |
Grupo Posadas SAB de CV, 7.88%, 06/30/22(a)(e) | | | | | | | 1,000 | | | | 1,000,313 | |
Mexichem SAB de CV, 5.50%, 01/15/48(a) | | | | | | | 460 | | | | 458,390 | |
Petroleos Mexicanos: | | | | | | | | | | | | |
6.50%, 03/13/27 | | | | | | | 417 | | | | 412,705 | |
5.35%, 02/12/28 | | | | | | | 19 | | | | 17,292 | |
Trust F/1401, 6.95%, 01/30/44 | | | | | | | 1,192 | | | | 1,331,315 | |
| | | | | | | | | | | | |
| | | | | | | | | | | 6,884,773 | |
|
| Mongolia — 0.1% | |
Mongolian Mortgage Corp. Hfc LLC, 9.75%, 01/29/22 | | | | | | | 200 | | | | 202,437 | |
| | | | | | | | | | | | |
|
| Netherlands — 3.7% | |
ABN AMRO Bank NV(5 year USD Swap + 2.20%), 4.40%, 03/27/28(j) | | | | | | | 800 | | | | 824,566 | |
ASR Nederland NV, 3.38%, 05/02/49(b) | | | EUR | | | | 130 | | | | 153,760 | |
Axalta Coating Systems Dutch Holding B BV, 3.75%, 01/15/25 | | | | | | | 100 | | | | 118,247 | |
Hertz Holdings Netherlands BV, 5.50%, 03/30/23 | | | | | | | 110 | | | | 132,109 | |
Iberdrola International BV, 3.25%(b)(i) | | | | | | | 200 | | | | 245,559 | |
ING Groep NV, 4.70%, 03/22/28(j) | | | USD | | | | 800 | | | | 832,869 | |
| | |
| 14 | | 2019 BLACKROCK SEMI-ANNUAL REPORTTO SHAREHOLDERS |
| | |
Schedule of Investments (unaudited) (continued) June 30, 2019 | | BlackRock 2022 Global Income Opportunity Trust (BGIO) (Percentages shown are based on Net Assets) |
| | | | | | | | | | | | |
| Security | | | Par
(000) | | | Value | |
|
| Netherlands (continued) | |
InterXion Holding NV, 4.75%, 06/15/25 | | | EUR | | | | 100 | | | $ | 123,717 | |
NN Group NV(3 mo. EURIBOR + 4.95%), 4.63%, 01/13/48(j) | | | | | | | 500 | | | | 651,894 | |
NXP BV/NXP Funding LLC, 3.88%, 09/01/22(a) | | | USD | | | | 200 | | | | 205,648 | |
OCI NV, 5.00%, 04/15/23 | | | EUR | | | | 180 | | | | 216,427 | |
Petrobras Global Finance BV: | | | | | | | | | | | | |
5.30%, 01/27/25 | | | USD | | | | 430 | | | | 456,230 | |
8.75%, 05/23/26(e) | | | | | | | 659 | | | | 813,931 | |
6.00%, 01/27/28(e) | | | | | | | 706 | | | | 750,654 | |
7.25%, 03/17/44 | | | | | | | 460 | | | | 511,463 | |
United Group BV, 4.88%, 07/01/24 | | | EUR | | | | 240 | | | | 283,132 | |
Ziggo BV, 5.50%, 01/15/27(a)(e) | | | USD | | | | 1,540 | | | | 1,566,503 | |
| | | | | | | | | | | | |
| | | | | | | | | | | 7,886,709 | |
|
| Panama — 0.6% | |
Avianca Holdings SA/Avianca Leasing LLC/Grupo Taca Holdings Ltd.: | | | | | | | | | | | | |
8.38%, 05/10/20 | | | | | | | 757 | | | | 726,870 | |
8.38%, 05/10/20(a) | | | | | | | 400 | | | | 384,079 | |
Promerica Financial Corp., 9.70%, 05/14/24(a) | | | | | | | 200 | | | | 210,625 | |
| | | | | | | | | | | | |
| | | | | | | | | | | 1,321,574 | |
|
| Portugal — 0.3% | |
EDP — Energias de Portugal SA, 4.50%, 04/30/79(b) | | | EUR | | | | 500 | | | | 621,141 | |
| | | | | | | | | | | | |
|
| Saudi Arabia — 0.1% | |
Saudi Arabian Oil Co., 3.50%, 04/16/29(a) | | | USD | | | | 215 | | | | 217,419 | |
| | | | | | | | | | | | |
|
| Singapore — 0.5% | |
Alam Synergy Pte Ltd., 11.50%, 04/22/21 | | | | | | | 200 | | | | 215,188 | |
JGC Ventures Pte Ltd., 10.75%, 08/30/21 | | | | | | | 200 | | | | 215,100 | |
Jubilant Pharma Ltd., 6.00%, 03/05/24 | | | | | | | 200 | | | | 204,294 | |
Medco Straits Services Pte Ltd., 8.50%, 08/17/22 | | | | | | | 200 | | | | 215,437 | |
Mulhacen Pte Ltd., (6.50% Cash or 7.25% PIK), 6.50%, 08/01/23(f) | | | EUR | | | | 310 | | | | 334,435 | |
| | | | | | | | | | | | |
| | | | | | | | | | | 1,184,454 | |
|
| South Africa — 0.3% | |
Eskom Holdings SOC Ltd., 6.35%, 08/10/28(a) | | | USD | | | | 340 | | | | 366,584 | |
Gold Fields Orogen Holdings BVI Ltd., 5.13%, 05/15/24(a) | | | | | | | 254 | | | | 265,430 | |
| | | | | | | | | | | | |
| | | | | | | | | | | 632,014 | |
|
| Spain — 0.7% | |
Banco de Sabadell SA, 5.38%, 12/12/28(b) | | | EUR | | | | 400 | | | | 499,715 | |
Banco Santander SA, 2.13%, 02/08/28 | | | | | | | 500 | | | | 594,287 | |
Hipercor SA, 3.88%, 01/19/22 | | | | | | | 300 | | | | 365,053 | |
| | | | | | | | | | | | |
| | | | | | | | | | | 1,459,055 | |
|
| Sweden — 0.1% | |
Verisure Holding AB, 3.50%, 05/15/23 | | | | | | | 144 | | | | 170,292 | |
Verisure Midholding AB, 5.75%, 12/01/23 | | | | | | | 100 | | | | 117,550 | |
| | | | | | | | | | | | |
| | | | | | | | | | | 287,842 | |
|
| Switzerland — 0.1% | |
UBS Group Funding Switzerland AG, 3.49%, 05/23/23(a) | | | USD | | | | 200 | | | | 205,035 | |
| | | | | | | | | | | | |
|
| United Kingdom — 2.3% | |
Aon PLC, 3.88%, 12/15/25(e) | | | | | | | 185 | | | | 196,806 | |
Arrow Global Finance PLC, 5.13%, 09/15/24 | | | GBP | | | | 240 | | | | 299,073 | |
Barclays Bank PLC, 6.63%, 03/30/22 | | | EUR | | | | 300 | | | | 393,103 | |
Barclays PLC: | | | | | | | | | | | | |
(5 year EUR Swap + 2.45%), 2.63%, 11/11/25(j) | | | | | | | 100 | | | | 115,162 | |
4.84%, 05/09/28(e) | | | USD | | | | 500 | | | | 511,381 | |
eG Global Finance PLC: | | | | | | | | | | | | |
3.63%, 02/07/24 | | | EUR | | | | 175 | | | | 198,396 | |
4.38%, 02/07/25 | | | | | | | 100 | | | | 113,198 | |
| | | | | | | | | | | | |
| Security | | | Par
(000) | | | Value | |
|
| United Kingdom (continued) | |
GKN Holdings Ltd., 5.38%, 09/19/22 | | | GBP | | | | 100 | | | $ | 138,201 | |
International Game Technology PLC, 4.75%, 02/15/23 | | | EUR | | | | 100 | | | | 126,673 | |
Jerrold Finco PLC, 6.25%, 09/15/21 | | | GBP | | | | 100 | | | | 129,376 | |
Ladbrokes Group Finance PLC: | | | | | | | | | | | | |
5.13%, 09/16/22 | | | | | | | 7 | | | | 8,896 | |
5.13%, 09/08/23 | | | | | | | 200 | | | | 265,292 | |
MARB BondCo PLC: | | | | | | | | | | | | |
7.00%, 03/15/24 | | | USD | | | | 200 | | | | 207,517 | |
6.88%, 01/19/25(a)(e) | | | | | | | 1,357 | | | | 1,408,030 | |
Pinnacle Bidco PLC, 6.38%, 02/15/25 | | | GBP | | | | 100 | | | | 134,259 | |
Stonegate Pub Co. Financing PLC, 7.04%, 03/15/22(b) | | | | | | | 100 | | | | 127,586 | |
Tesco Corporate Treasury Services PLC, 1.38%, 10/24/23 | | | EUR | | | | 100 | | | | 117,542 | |
Vedanta Resources Ltd., 7.13%, 05/31/23 | | | USD | | | | 500 | | | | 493,906 | |
| | | | | | | | | | | | |
| | | | | | | | | | | 4,984,397 | |
|
| United States — 27.4% | |
AbbVie, Inc., 3.60%, 05/14/25 | | | | | | | 75 | | | | 77,488 | |
Altria Group, Inc., 4.40%, 02/14/26 | | | | | | | 75 | | | | 80,254 | |
Ambac Assurance Corp., 5.10%, 06/07/20(a) | | | | | | | 23 | | | | 32,025 | |
American Airlines Group, Inc.: | | | | | | | | | | | | |
5.00%, 06/01/22(a) | | | | | | | 1,214 | | | | 1,250,784 | |
4.87%, 04/22/25(d) | | | | | | | 234 | | | | 240,015 | |
4.00%, 12/15/25 | | | | | | | 179 | | | | 179,000 | |
American Tower Corp., 3.38%, 05/15/24 | | | | | | | 185 | | | | 190,309 | |
Andeavor Logistics LP/Tesoro Logistics Finance Corp., 5.25%, 01/15/25 | | | | | | | 393 | | | | 415,845 | |
Anheuser-Busch InBev Worldwide, Inc., 4.75%, 01/23/29(e) | | | | | | | 185 | | | | 210,013 | |
Arconic, Inc., 6.75%, 01/15/28(e) | | | | | | | 1,540 | | | | 1,678,600 | |
Ashton Woods USA LLC/Ashton Woods Finance Co., 9.88%, 04/01/27(a) | | | | | | | 278 | | | | 292,943 | |
AT&T, Inc., 3.40%, 05/15/25 | | | | | | | 75 | | | | 77,100 | |
Bank of America Corp., 3.37%, 01/23/26(b) | | | | | | | 75 | | | | 77,392 | |
BAT Capital Corp., 3.22%, 08/15/24 | | | | | | | 75 | | | | 75,493 | |
Bayer US Finance II LLC, 4.25%, 12/15/25(a) | | | | | | | 200 | | | | 211,616 | |
Bristow Group, Inc., 8.75%, 03/01/23(a)(e)(g) | | | | | | | 537 | | | | 520,890 | |
Bruin E&P Partners LLC, 8.88%, 08/01/23(a) | | | | | | | 57 | | | | 47,880 | |
Capital One Financial Corp., 3.90%, 01/29/24 | | | | | | | 39 | | | | 40,987 | |
Carlson Travel, Inc., 6.75%, 12/15/23(a)(e) | | | | | | | 886 | | | | 897,075 | |
Carrizo Oil & Gas, Inc., 6.25%, 04/15/23(e) | | | | | | | 210 | | | | 202,650 | |
Celgene Corp., 3.88%, 08/15/25 | | | | | | | 100 | | | | 107,147 | |
Centennial Resource Production LLC, 5.38%, 01/15/26(a)(e) | | | | | | | 1,000 | | | | 950,000 | |
Charter Communications Operating LLC/Charter Communications Operating Capital: | | | | | | | | | | | | |
4.91%, 07/23/25 | | | | | | | 185 | | | | 200,844 | |
5.05%, 03/30/29(e) | | | | | | | 800 | | | | 883,714 | |
Cheniere Corpus Christi Holdings LLC, 5.88%, 03/31/25 | | | | | | | 400 | | | | 445,500 | |
Cheniere Energy, Inc., (4.88% PIK), 4.88%, 05/28/21(a)(f)(k) | | | | | | | 645 | | | | 677,415 | |
Chesapeake Energy Corp., 7.00%, 10/01/24(e) | | | | | | | 1,329 | | | | 1,192,777 | |
Cimarex Energy Co., 4.38%, 03/15/29 | | | | | | | 181 | | | | 192,440 | |
Citigroup, Inc.: | | | | | | | | | | | | |
3.30%, 04/27/25 | | | | | | | 75 | | | | 77,595 | |
6.68%, 09/13/43(e) | | | | | | | 500 | | | | 693,809 | |
Commercial Metals Co., 5.38%, 07/15/27 | | | | | | | 95 | | | | 94,525 | |
Continental Resources, Inc., 5.00%, 09/15/22(e) | | | | | | | 533 | | | | 537,374 | |
CVS Health Corp., 3.88%, 07/20/25 | | | | | | | 75 | | | | 78,313 | |
DaVita, Inc., 5.00%, 05/01/25(e) | | | | | | | 875 | | | | 863,844 | |
Diamondback Energy, Inc., 4.75%, 11/01/24(a)(e) | | | | | | | 513 | | | | 527,749 | |
DTE Energy Co., Series B, 2.60%, 06/15/22 | | | | | | | 21 | | | | 21,095 | |
| | | | |
| SCHEDULES OF INVESTMENTS | | | 15 | |
| | |
Schedule of Investments (unaudited) (continued) June 30, 2019 | | BlackRock 2022 Global Income Opportunity Trust (BGIO) (Percentages shown are based on Net Assets) |
| | | | | | | | | | | | |
| Security | | | Par
(000) | | | Value | |
|
| United States (continued) | |
DuPont de Nemours, Inc., 4.49%, 11/15/25 | | | USD | | | | 75 | | | $ | 82,992 | |
Energen Corp., 4.63%, 09/01/21 | | | | | | | 72 | | | | 72,720 | |
Energy Transfer Operating LP, 4.25%, 03/15/23 | | | | | | | 75 | | | | 78,294 | |
Enterprise Products Operating LLC, 3.75%, 02/15/25 | | | | | | | 75 | | | | 79,343 | |
Equinix, Inc., 2.88%, 03/15/24 | | | EUR | | | | 100 | | | | 118,827 | |
Fidelity National Information Services, Inc., 3.00%, 08/15/26 | | | USD | | | | 185 | | | | 187,191 | |
First Data Corp., 5.00%, 01/15/24(a)(e) | | | | | | | 504 | | | | 516,348 | |
FirstEnergy Corp., Series B, 4.25%, 03/15/23 | | | | | | | 75 | | | | 78,792 | |
Fiserv, Inc.: | | | | | | | | | | | | |
3.85%, 06/01/25 | | | | | | | 75 | | | | 79,383 | |
3.20%, 07/01/26 | | | | | | | 44 | | | | 44,910 | |
Five Point Operating Co. LP/Five Point Capital Corp., 7.88%, 11/15/25(a)(e) | | | | | | | 1,050 | | | | 1,055,271 | |
Ford Motor Credit Co. LLC: | | | | | | | | | | | | |
1.51%, 02/17/23 | | | EUR | | | | 100 | | | | 114,431 | |
3.02%, 03/06/24 | | | | | | | 230 | | | | 276,995 | |
5.58%, 03/18/24 | | | USD | | | | 292 | | | | 313,426 | |
Forestar Group, Inc., 8.00%, 04/15/24(a) | | | | | | | 488 | | | | 511,790 | |
Frontier Communications Corp.(a): | | | | | | | | | | | | |
8.50%, 04/01/26(e) | | | | | | | 1,500 | | | | 1,455,000 | |
8.00%, 04/01/27 | | | | | | | 914 | | | | 950,560 | |
GLP Capital LP/GLP Financing II, Inc., 5.38%, 11/01/23(e) | | | | | | | 495 | | | | 530,729 | |
Golden Entertainment, Inc., 7.63%, 04/15/26(a) | | | | | | | 149 | | | | 152,353 | |
Goldman Sachs Group, Inc.: | | | | | | | | | | | | |
3.75%, 05/22/25 | | | | | | | 75 | | | | 78,448 | |
5.15%, 05/22/45(e) | | | | | | | 700 | | | | 801,190 | |
Great Lakes Dredge & Dock Corp., 8.00%, 05/15/22 | | | | | | | 150 | | | | 158,813 | |
HCA, Inc.: | | | | | | | | | | | | |
5.88%, 02/15/26(e) | | | | | | | 1,540 | | | | 1,701,700 | |
5.88%, 02/01/29 | | | | | | | 48 | | | | 52,620 | |
HSBC Holdings PLC, 5.25%, 03/14/44(e) | | | | | | | 700 | | | | 819,053 | |
International Business Machines Corp., 3.30%, 05/15/26(e) | | | | | | | 100 | | | | 103,661 | |
Interpublic Group of Cos., Inc., 3.75%, 02/15/23 | | | | | | | 75 | | | | 78,248 | |
IQVIA, Inc., 3.25%, 03/15/25 | | | EUR | | | | 100 | | | | 117,115 | |
Iron Mountain US Holdings, Inc., 5.38%, 06/01/26(a)(e) | | | USD | | | | 1,540 | | | | 1,545,775 | |
Iron Mountain, Inc., 3.00%, 01/15/25 | | | EUR | | | | 100 | | | | 117,369 | |
Jagged Peak Energy LLC, 5.88%, 05/01/26(e) | | | USD | | | | 649 | | | | 639,265 | |
JPMorgan Chase & Co. (3 mo. LIBOR US + 1.34%), 3.78%, 02/01/28(j) | | | | | | | 75 | | | | 79,508 | |
Kaiser Aluminum Corp., 5.88%, 05/15/24(e) | | | | | | | 1,540 | | | | 1,601,600 | |
KB Home, 7.63%, 05/15/23 | | | | | | | 189 | | | | 211,208 | |
KFC Holding Co./Pizza Hut Holdings LLC/Taco Bell of America LLC, 5.00%, 06/01/24(a) | | | | | | | 800 | | | | 827,000 | |
Kinder Morgan Energy Partners LP, 3.95%, 09/01/22 | | | | | | | 75 | | | | 78,079 | |
Level 3 Financing, Inc., 5.63%, 02/01/23 | | | | | | | 92 | | | | 93,146 | |
Marsh & McLennan Cos., Inc., 4.38%, 03/15/29 | | | | | | | 75 | | | | 82,747 | |
Mauser Packaging Solutions Holding Co.: | | | | | | | | | | | | |
4.75%, 04/15/24 | | | EUR | | | | 110 | | | | 128,621 | |
5.50%, 04/15/24(a) | | | USD | | | | 150 | | | | 150,075 | |
MGM Growth Properties Operating Partnership LP/MGP FinanceCo-Issuer, Inc., 4.50%, 09/01/26(e) | | | | | | | 1,600 | | | | 1,642,000 | |
Mid-America Apartments LP, 3.95%, 03/15/29 | | | | | | | 44 | | | | 46,561 | |
Morgan Stanley, 3.63%, 01/20/27 | | | | | | | 75 | | | | 78,715 | |
MPLX LP, 4.00%, 02/15/25 | | | | | | | 185 | | | | 193,186 | |
MPT Operating Partnership LP/MPT Finance Corp., 3.33%, 03/24/25 | | | EUR | | | | 100 | | | | 123,146 | |
Newfield Exploration Co., 5.63%, 07/01/24 | | | USD | | | | 185 | | | | 204,555 | |
| | | | | | | | | | | | |
| Security | | | Par
(000) | | | Value | |
|
| United States (continued) | |
Nexstar Escrow, Inc., 5.63%, 07/15/27(a)(l) | | | USD | | | | 421 | | | $ | 430,999 | |
NGPL PipeCo LLC, 7.77%, 12/15/37(a)(e) | | | | | | | 1,000 | | | | 1,270,000 | |
Outfront Media Capital LLC/Outfront Media Capital Corp., 5.63%, 02/15/24 | | | | | | | 3 | | | | 3,086 | |
Owens-Brockway Glass Container, Inc., 6.38%, 08/15/25(a)(e) | | | | | | | 1,495 | | | | 1,629,550 | |
Pacific Drilling SA, 8.38%, 10/01/23(a) | | | | | | | 148 | | | | 146,520 | |
Panther BF Aggregator 2 LP/Panther Finance Co., Inc., 6.25%, 05/15/26(a) | | | | | | | 42 | | | | 43,628 | |
Parsley Energy LLC/Parsley Finance Corp., 6.25%, 06/01/24(a)(e) | | | | | | | 403 | | | | 419,120 | |
Post Holdings, Inc., 5.00%, 08/15/26(a)(e) | | | | | | | 1,540 | | | | 1,561,175 | |
PPL Capital Funding, Inc., 3.95%, 03/15/24 | | | | | | | 75 | | | | 78,656 | |
PulteGroup, Inc., 5.50%, 03/01/26 | | | | | | | 302 | | | | 326,160 | |
QEP Resources, Inc., 6.88%, 03/01/21 | | | | | | | 190 | | | | 195,225 | |
Quicken Loans, Inc., 5.75%, 05/01/25(a)(e) | | | | | | | 1,638 | | | | 1,689,187 | |
Sabine Pass Liquefaction LLC, 5.63%, 03/01/25 | | | | | | | 185 | | | | 207,213 | |
Sable Permian Resources Land LLC/AEPB Finance Corp., 13.00%, 11/30/20(a)(e)(h) | | | | | | | 1,400 | | | | 1,330,000 | |
Sabre GLBL, Inc., 5.38%, 04/15/23(a) | | | | | | | 400 | | | | 409,000 | |
Schlumberger Holdings Corp., 3.75%, 05/01/24(a) | | | | | | | 55 | | | | 57,309 | |
Scientific Games International, Inc., 10.00%, 12/01/22(e) | | | | | | | 740 | | | | 776,075 | |
SEACOR Holdings, Inc., 3.25%, 05/15/30 | | | | | | | 1,500 | | | | 1,416,969 | |
Sirius XM Radio, Inc., 4.63%, 07/15/24(a)(l) | | | | | | | 535 | | | | 547,455 | |
Sprint Corp., 7.88%, 09/15/23(e) | | | | | | | 787 | | | | 854,879 | |
Steel Dynamics, Inc., 5.50%, 10/01/24(e) | | | | | | | 496 | | | | 513,980 | |
Sunoco LP/Sunoco Finance Corp., Series WI, 4.88%, 01/15/23(e) | | | | | | | 607 | | | | 619,899 | |
Synchrony Financial, 4.38%, 03/19/24 | | | | | | | 93 | | | | 97,384 | |
Talen Energy Supply LLC(a): | | | | | | | | | | | | |
7.25%, 05/15/27 | | | | | | | 730 | | | | 748,250 | |
6.63%, 01/15/28(l) | | | | | | | 386 | | | | 383,587 | |
Taylor Morrison Communities, Inc., 5.88%, 06/15/27(a) | | | | | | | 366 | | | | 372,405 | |
Total System Services, Inc., 3.75%, 06/01/23 | | | | | | | 75 | | | | 77,414 | |
TransDigm, Inc.(e): | | | | | | | | | | | | |
6.50%, 05/15/25 | | | | | | | 1,540 | | | | 1,557,710 | |
6.25%, 03/15/26(a) | | | | | | | 512 | | | | 538,880 | |
TRI Pointe Group, Inc., 4.88%, 07/01/21(e) | | | | | | | 676 | | | | 689,520 | |
Tyson Foods, Inc., 4.00%, 03/01/26 | | | | | | | 20 | | | | 21,272 | |
United Rentals North America, Inc., 4.88%, 01/15/28(e) | | | | | | | 1,500 | | | | 1,530,000 | |
United Technologies Corp., 3.95%, 08/16/25 | | | | | | | 75 | | | | 80,880 | |
Venator Finance Sarl/Venator Materials LLC, 5.75%, 07/15/25(a)(e) | | | | | | | 200 | | | | 183,500 | |
VeriSign, Inc., 4.75%, 07/15/27(e) | | | | | | | 414 | | | | 431,077 | |
Verizon Communications, Inc., 4.33%, 09/21/28 | | | | | | | 145 | | | | 160,688 | |
VICI Properties 1 LLC/VICI FC, Inc., 8.00%, 10/15/23 | | | | | | | 293 | | | | 323,213 | |
Vistra Energy Corp.: | | | | | | | | | | | | |
5.88%, 06/01/23 | | | | | | | 28 | | | | 28,630 | |
7.63%, 11/01/24 | | | | | | | 189 | | | | 199,864 | |
Vistra Operations Co. LLC, 5.00%, 07/31/27(a) | | | | | | | 450 | | | | 466,312 | |
Weekley Homes LLC/Weekley Finance Corp., 6.00%, 02/01/23(e) | | | | | | | 1,500 | | | | 1,481,250 | |
Wells Fargo & Co., 3.75%, 01/24/24 | | | | | | | 40 | | | | 42,054 | |
William Lyon Homes, Inc., 6.63%, 07/15/27(a)(l) | | | | | | | 853 | | | | 850,867 | |
Williams Cos., Inc., 4.00%, 09/15/25 | | | | | | | 145 | | | | 153,443 | |
WMG Acquisition Corp., 4.13%, 11/01/24 | | | EUR | | | | 162 | | | | 192,226 | |
Zayo Group LLC/Zayo Capital, Inc., 5.75%, 01/15/27(a)(e) | | | USD | | | | 832 | | | | 847,708 | |
| | |
| 16 | | 2019 BLACKROCK SEMI-ANNUAL REPORTTO SHAREHOLDERS |
| | |
Schedule of Investments (unaudited) (continued) June 30, 2019 | | BlackRock 2022 Global Income Opportunity Trust (BGIO) (Percentages shown are based on Net Assets) |
| | | | | | | | | | | | |
| Security | | | Par
(000) | | | Value | |
|
| United States (continued) | |
Zekelman Industries, Inc., 9.88%, 06/15/23(a) | | | USD | | | | 72 | | | $ | 76,005 | |
| | | | | | | | | | | | |
| | | | | | | | | | | 58,855,483 | |
| | | | | | | | | | | | |
| |
Total Corporate Bonds — 63.1%
(Cost — $135,292,022) | | | | 135,471,350 | |
| | | | | | | | | | | | |
|
Floating Rate Loan Interests(c) — 8.3% | |
|
Luxembourg — 0.2% | |
Intelsat Jackson Holdings SA, 2017 Term Loan B4, 01/02/24(m) | | | | | | | 430 | | | | 431,040 | |
| | | | | | | | | | | | |
|
| Netherlands — 0.5% | |
Stars Group Holdings BV, 2018 USD Incremental Term Loan, (3 mo. LIBOR + 3.50%), 5.83%, 07/10/25 | | | | | | | 1,071 | | | | 1,069,961 | |
| | | | | | | | | | | | |
|
| United States — 7.6% | |
AL Midcoast Holdings LLC, 2018 Term Loan B,
(3 mo. LIBOR + 5.50%), 7.83%, 07/31/25 | | | | | | | 377 | | | | 377,622 | |
Allegiant Travel Co., Term Loan B, (3 mo. LIBOR + 4.50%), 7.07%, 02/05/24 | | | | | | | 371 | | | | 370,840 | |
BCP Raptor II LLC, 1st Lien Term Loan, (1 mo.
LIBOR + 4.75%), 7.15%, 11/03/25 | | | | | | | 402 | | | | 381,566 | |
Bristow Group, Inc., Prepetition Term Loan,
(3 mo. LIBOR + 7.00%), 9.50%, 05/10/22(d) | | | | | | | 159 | | | | 152,777 | |
California Resources Corp., 2017 1st Lien Term Loan, (1 mo. LIBOR + 4.75%, 1.00% Floor), 7.15%, 12/31/22 | | | | | | | 893 | | | | 852,181 | |
Chimera Special Holding LLC, Term Loan,
(1 mo. LIBOR + 2.00%), 4.43%, 10/04/19(d) | | | | | | | 1,796 | | | | 1,795,645 | |
CLGF Holdco 1 LLC, Term Loan, (3 mo. LIBOR + 5.00%), 7.59%, 12/20/19(d) | | | | | | | 1,250 | | | | 1,243,750 | |
Foundation Building Materials LLC, 2018 Term Loan B, (1 mo. LIBOR + 3.00%), 5.40%, 08/13/25(d) | | | | | | | 562 | | | | 559,364 | |
Gates Global LLC, 2017 Repriced Term Loan B, (1 mo. LIBOR + 2.75%, 1.00% Floor), 5.15%, 04/01/24 | | | | | | | 1,560 | | | | 1,549,141 | |
Jeld-Wen, Inc., 2017 1st Lien Term Loan, (3 mo.
LIBOR + 2.00%), 4.33%, 12/14/24 | | | | | | | 882 | | | | 876,555 | |
PCI Gaming Authority, Term Loan, (1 mo. LIBOR + 3.00%), 5.40%, 05/29/26 | | | | | | | 459 | | | | 459,477 | |
Pioneer Energy Services Corp., Term Loan,
(1 mo. LIBOR + 7.75%, 1.00% Floor), 10.15%, 11/08/22(d) | | | | | | | 1,504 | | | | 1,413,760 | |
PLH Infrastructure Services, Inc., 2018 Term Loan,
(3 mo. LIBOR + 6.00%), 8.57%, 08/07/23(d) | | | | | | | 326 | | | | 319,961 | |
Ply Gem Midco, Inc., 2018 Term Loan, (3 mo. LIBOR + 3.75%), 6.35%, 04/12/25 | | | | | | | 1,459 | | | | 1,415,411 | |
Robertshaw US Holding Corp., 2018 1st Lien Term Loan, (1 mo. LIBOR + 3.50%, 1.00% Floor), 5.94%, 02/28/25(d) | | | | | | | 850 | | | | 781,723 | |
Roundpoint Mortgage Servicing Corp., 2018 Term Loan, (1 mo. LIBOR + 3.38%), 5.82%, 08/08/20(d) | | | | | | | 1,352 | | | | 1,352,211 | |
Scientific Games International, Inc., 2018 Term
Loan B5, (2 mo. LIBOR + 2.75%), 5.23%, 08/14/24 | | | | | | | 1,560 | | | | 1,535,322 | |
SRS Distribution, Inc., 2018 1st Lien Term Loan,
(1 mo. LIBOR + 3.25%), 5.65%, 05/23/25 | | | | | | | 159 | | | | 152,084 | |
Summit Materials Companies I LLC, 2017 Term
Loan B, (1 mo. LIBOR + 2.00%), 4.40%, 11/21/24 | | | | | | | 852 | | | | 846,722 | |
| | | | | | | | | | | | |
| | | | | | | | | | | 16,436,112 | |
| | | | | | | | | | | | |
| |
Total Floating Rate Loan Interests — 8.3%
(Cost — $18,213,046) | | | | 17,937,113 | |
| | | | | | | | | | | | |
| | | | | | | | | | | | |
| Security | | | Par
(000) | | | Value | |
|
Foreign Agency Obligations — 6.3% | |
|
Colombia — 1.2% | |
Colombia Government International Bond: | | | | | | | | | | | | |
4.38%, 07/12/21 | | | USD | | | | 215 | | | $ | 222,525 | |
8.13%, 05/21/24 | | | | | | | 590 | | | | 727,359 | |
4.50%, 01/28/26(e) | | | | | | | 671 | | | | 725,016 | |
3.88%, 04/25/27(e) | | | | | | | 870 | | | | 907,845 | |
| | | | | | | | | | | | |
| | | | | | | | | | | 2,582,745 | |
|
| Egypt — 1.3% | |
Egypt Government International Bond: | | | | | | | | | | | | |
5.75%, 04/29/20(e) | | | | | | | 1,051 | | | | 1,066,765 | |
7.60%, 03/01/29(a) | | | | | | | 256 | | | | 270,080 | |
6.38%, 04/11/31(a) | | | EUR | | | | 737 | | | | 852,709 | |
8.50%, 01/31/47(a) | | | USD | | | | 488 | | | | 516,670 | |
| | | | | | | | | | | | |
| | | | | | | | | | | 2,706,224 | |
|
| Indonesia — 0.8% | |
Indonesia Government International Bond: | | | | | | | | | | | | |
4.75%, 01/08/26 | | | | | | | 200 | | | | 217,812 | |
4.10%, 04/24/28 | | | | | | | 200 | | | | 211,250 | |
Indonesia Treasury Bond: | | | | | | | | | | | | |
8.38%, 09/15/26 | | | IDR | | | | 8,525,000 | | | | 641,148 | |
6.13%, 05/15/28 | | | | | | | 10,559,000 | | | | 688,736 | |
| | | | | | | | | | | | |
| | | | | | | | | | | 1,758,946 | |
|
| Maldives — 0.1% | |
Republic of Maldives Ministry of Finance and Treasury Bond, 7.00%, 06/07/22 | | | USD | | | | 200 | | | | 192,000 | |
| | | | | | | | | | | | |
|
| Mexico — 0.2% | |
Mexico Government International Bond, 4.15%, 03/28/27 | | | | | | | 320 | | | | 336,000 | |
| | | | | | | | | | | | |
|
| Nigeria — 0.2% | |
Nigeria Government International Bond, 7.63%, 11/21/25(e) | | | | | | | 460 | | | | 501,400 | |
| | | | | | | | | | | | |
|
| Paraguay — 0.1% | |
Paraguay Government International Bond, 5.40%, 03/30/50(a) | | | | | | | 250 | | | | 278,594 | |
| | | | | | | | | | | | |
|
| Qatar — 1.1% | |
Qatar Government International Bond: | | | | | | | | | | | | |
4.50%, 04/23/28 | | | | | | | 920 | | | | 1,028,100 | |
4.00%, 03/14/29(a)(e) | | | | | | | 1,145 | | | | 1,235,884 | |
| | | | | | | | | | | | |
| | | | | | | | | | | 2,263,984 | |
|
| Russia — 0.2% | |
Russian Foreign Bond — Eurobond: | | | | | | | | | | | | |
4.75%, 05/27/26 | | | | | | | 200 | | | | 213,062 | |
4.25%, 06/23/27 | | | | | | | 200 | | | | 206,700 | |
| | | | | | | | | | | | |
| | | | | | | | | | | 419,762 | |
|
| Saudi Arabia — 0.8% | |
Saudi Government International Bond: | | | | | | | | | | | | |
4.38%, 04/16/29(a) | | | | | | | 200 | | | | 216,500 | |
4.50%, 04/17/30(e) | | | | | | | 1,200 | | | | 1,309,200 | |
5.25%, 01/16/50(a) | | | | | | | 200 | | | | 227,375 | |
| | | | | | | | | | | | |
| | | | | | | | | | | 1,753,075 | |
|
| South Africa — 0.1% | |
Republic of South Africa Government International Bond, 5.88%, 05/30/22(e) | | | | | | | 224 | | | | 240,310 | |
| | | | | | | | | | | | |
|
| Sri Lanka — 0.2% | |
Sri Lanka Government International Bond, 7.85%, 03/14/29 | | | | | | | 400 | | | | 413,750 | |
| | | | | | | | | | | | |
| |
Total Foreign Agency Obligations — 6.3%
(Cost — $12,890,684) | | | | 13,446,790 | |
| | | | | | | | | | | | |
| | | | |
| SCHEDULES OF INVESTMENTS | | | 17 | |
| | |
Schedule of Investments (unaudited) (continued) June 30, 2019 | | BlackRock 2022 Global Income Opportunity Trust (BGIO) (Percentages shown are based on Net Assets) |
| | | | | | | | | | | | |
| Security | | | Par
(000) | | | Value | |
|
Non-Agency Mortgage-Backed Securities — 20.2% | |
|
Collateralized Mortgage Obligations — 2.1% | |
Alternative Loan Trust,Series 2007-AL1, Class A1, (1 mo. LIBOR US + 0.25%), 2.65%, 06/25/37(c) | | | USD | | | | 796 | | | $ | 648,769 | |
ARI Investments LLC, 5.32%, 01/06/25(b)(d) | | | | | | | 843 | | | | 843,102 | |
BCAP LLC Trust,Series 2012-RR3, Class 1A5, 6.62%, 12/26/37(a)(b) | | | | | | | 1,049 | | | | 968,957 | |
Citicorp Mortgage Securities Trust,Series 2007-9, Class 1A1, 6.25%, 12/25/37 | | | | | | | 982 | | | | 883,284 | |
RALI Trust,Series 2006-QO6, Class A1, (1 mo. LIBOR US + 0.18%), 2.58%, 06/25/46(c) | | | | | | | 3,007 | | | | 1,189,743 | |
| | | | | | | | | | | | |
| | | | | | | | | | | 4,533,855 | |
|
| Commercial Mortgage-Backed Securities — 18.1% | |
245 Park Avenue Trust, Series 2017-245P, Class E, 3.66%, 06/05/37(a)(b) | | | | | | | 380 | | | | 371,526 | |
Arbor Realty Commercial Real Estate Notes Ltd.,Series 2017-FL1, Class B, (1 mo. LIBOR US + 2.50%), 4.89%, 04/15/27(a)(c) | | | | | | | 437 | | | | 438,942 | |
Atrium Hotel Portfolio Trust, Series 2017-ATRM, Class E, (1 mo. LIBOR US + 3.05%), 5.44%, 12/15/36(a)(c) | | | | | | | 190 | | | | 191,423 | |
Bayview Commercial Asset Trust,Series 2007-6A, Class A4A, (1 mo. LIBOR + 1.50%), 3.90%, 12/25/37(a)(c) | | | | | | | 2,000 | | | | 1,712,738 | |
BBCMS Mortgage Trust(a)(c): | | | | | | | | | | | | |
Series 2017-DELC, Class F, (1 mo. LIBOR US + 3.50%), 5.89%, 08/15/36 | | | | | | | 550 | | | | 550,684 | |
Series 2018-TALL, Class D, (1 mo. LIBOR US + 1.45%), 3.84%, 03/15/37 | | | | | | | 500 | | | | 499,841 | |
BBCMS Trust(a): | | | | | | | | | | | | |
Series 2015-STP, Class E, 4.29%, 09/10/28(b) | | | | | | | 1,000 | | | | 986,674 | |
Series 2019-CLP, Class D, (1 mo. LIBOR US + 1.73%), 4.12%, 12/15/31(c) | | | | | | | 424 | | | | 421,328 | |
Benchmark Mortgage Trust,Series 2018-B7, Class C, 5.02%, 05/15/53(b) | | | | | | | 1,000 | | | | 1,103,486 | |
BX Commercial Mortgage Trust,Series 2018-IND, Class H, (1 mo. LIBOR US + 3.00%), 5.39%, 11/15/35(a)(c) | | | | | | | 812 | | | | 814,659 | |
BXP Trust,Series 2017-CC(a)(b): | | | | | | | | | | | | |
Class D, 3.67%, 08/13/37 | | | | | | | 180 | | | | 178,731 | |
Class E, 3.67%, 08/13/37 | | | | | | | 350 | | | | 331,138 | |
CAMB Commercial Mortgage Trust, Series 2019-LIFE, Class E, (1 mo. LIBOR US + 2.15%), 4.54%, 12/15/37(a)(c) | | | | | | | 633 | | | | 638,533 | |
CCRE Commercial Mortgage Trust,Series 2019-FAX, Class E, 4.64%, 01/15/39 | | | | | | | 1,000 | | | | 1,056,188 | |
CFCRE Commercial Mortgage Trust, Class C(b): | | | | | | | | | | | | |
Series 2011-C1, 6.27%, 04/15/44(a) | | | | | | | 1,000 | | | | 1,051,068 | |
Series 2016-C3, 4.76%, 01/10/48 | | | | | | | 1,000 | | | | 1,058,179 | |
Citigroup Commercial Mortgage Trust(b): | | | | | | | | | | | | |
Series 2015-GC27, Class C, 4.43%, 02/10/48 | | | | | | | 1,000 | | | | 1,029,781 | |
Series 2016-C1, Class C, 4.95%, 05/10/49 | | | | | | | 534 | | | | 583,872 | |
Series 2016-C1, Class D, 4.95%, 05/10/49(a) | | | | | | | 1,000 | | | | 1,013,567 | |
Series 2016-P3, Class D, 2.80%, 04/15/49(a) | | | | | | | 500 | | | | 432,262 | |
CLNS Trust, Series 2017-IKPR, Class E, (1 mo. LIBOR US + 3.50%), 5.87%, 06/11/32(a)(c) | | | | | | | 790 | | | | 793,946 | |
COMM Mortgage Trust, Series 2015-CR23, Class CME, 3.81%, 05/10/48(a)(b) | | | | | | | 600 | | | | 598,986 | |
Commercial Mortgage Trust, Series 2015-CR23(a)(b): | | | | | | | | | | | | |
Class CMC, 3.81%, 05/10/48 | | | | | | | 1,000 | | | | 1,002,416 | |
Class CMD, 3.81%, 05/10/48 | | | | | | | 1,150 | | | | 1,151,201 | |
Core Industrial Trust, Series 2015-WEST, Class E, 4.23%, 02/10/37(a)(b) | | | | | | | 1,000 | | | | 1,057,706 | |
| | | | | | | | | | | | |
| Security | | | Par
(000) | | | Value | |
|
| Commercial Mortgage-Backed Securities (continued) | |
DBGS Mortgage Trust, Series 2019-1735, Class F, 4.19%, 04/10/37(a)(b) | | | USD | | | | 499 | | | $ | 478,221 | |
DBJPM Mortgage Trust,Series 2017-C6, Class XD, 1.00%, 06/10/50(b) | | | | | | | 11,000 | | | | 679,140 | |
DBUBS Mortgage Trust(a)(b): | | | | | | | | | | | | |
Series 2011-LC1A, Class E, 5.70%, 11/10/46 | | | | | | | 1,000 | | | | 1,038,633 | |
Series 2017-BRBK, Class F, 3.53%, 10/10/34 | | | | | | | 390 | | | | 385,441 | |
GS Mortgage Securities Corp. Trust,Series 2017-500K(a)(c): | | | | | | | | | | | | |
Class D, (1 mo. LIBOR US + 1.30%), 3.69%, 07/15/32 | | | | | | | 120 | | | | 119,630 | |
Class E, (1 mo. LIBOR US + 1.50%), 3.89%, 07/15/32 | | | | | | | 240 | | | | 239,925 | |
Class F, (1 mo. LIBOR US + 1.80%), 4.19%, 07/15/32 | | | | | | | 10 | | | | 9,956 | |
Class G, (1 mo. LIBOR US + 2.50%), 4.89%, 07/15/32 | | | | | | | 70 | | | | 69,538 | |
GS Mortgage Securities Trust,Series 2017-GS7(a): | | | | | | | | | | | | |
Class D, 3.00%, 08/10/50 | | | | | | | 375 | | | | 336,158 | |
Class E, 3.00%, 08/10/50 | | | | | | | 300 | | | | 266,928 | |
JPMBB Commercial Mortgage Securities Trust,Series 2015-C33, Class D1, 4.27%, 12/15/48(a)(b) | | | | | | | 1,619 | | | | 1,610,033 | |
JPMCC Commercial Mortgage Securities Trust,Series 2017-JP5, Class D, 4.80%, 03/15/50(a)(b) | | | | | | | 1,240 | | | | 1,268,240 | |
JPMorgan Chase Commercial Mortgage Securities Trust,Series 2018-WPT, Class FFX, 5.54%, 07/05/33(a) | | | | | | | 250 | | | | 255,758 | |
LSTAR Commercial Mortgage Trust,Series 2017-5(a)(b): | | | | | | | | | | | | |
Class C, 4.87%, 03/10/50 | | | | | | | 1,000 | | | | 980,263 | |
Class X, 1.11%, 03/10/50 | | | | | | | 12,429 | | | | 538,043 | |
MAD Mortgage Trust, Series 2017-330M(a)(b): | | | | | | | | | | | | |
Class D, 4.11%, 08/15/34 | | | | | | | 130 | | | | 132,703 | |
Class E, 4.17%, 08/15/34 | | | | | | | 180 | | | | 177,954 | |
MASTR Reperforming Loan Trust,Series 2005-1, Class 1A5, 8.00%, 08/25/34(a) | | | | | | | 997 | | | | 1,063,449 | |
Morgan Stanley Bank of America Merrill Lynch Trust, Class D: | | | | | | | | | | | | |
Series 2015-C23, 4.27%, 07/15/50(a)(b) | | | | | | | 1,000 | | | | 976,810 | |
Series 2015-C25, 3.07%, 10/15/48 | | | | | | | 80 | | | | 75,766 | |
Morgan Stanley Capital I Trust: | | | | | | | | | | | | |
Series 2017-H1, Class D, 2.55%, 06/15/50(a) | | | | | | | 1,010 | | | | 849,400 | |
Series 2017-H1, Class XD, 2.36%, 06/15/50(a)(b) | | | | | | | 8,625 | | | | 1,279,174 | |
Series 2018-H4, Class C, 5.25%, 12/15/51(b) | | | | | | | 711 | | | | 790,625 | |
Series 2018-MP, Class E, 4.28%, 07/11/40(a)(b) | | | | | | | 250 | | | | 245,820 | |
Series 2018-SUN, Class F, (1 mo. LIBOR US + 2.55%), 4.94%, 07/15/35(a)(c) | | | | | | | 220 | | | | 222,318 | |
Series 2019-AGLN, Class F, (1 mo. LIBOR US + 2.60%), 4.99%, 03/15/34(a)(c) | | | | | | | 1,000 | | | | 1,001,256 | |
Morgan Stanley Capital I, Inc., Series 2017-JWDR, Class E, (1 mo. LIBOR US + 3.05%), 5.44%, 11/15/34(a)(c) | | | | | | | 160 | | | | 161,299 | |
Natixis Commercial Mortgage Securities Trust,Series 2017-75B, Class E, 4.06%, 04/09/37(a)(b) | | | | | | | 170 | | | | 160,616 | |
Olympic Tower Mortgage Trust,Series 2017-OT(a)(b): | | | | | | | | | | | | |
Class D, 3.95%, 05/10/39 | | | | | | | 140 | | | | 143,448 | |
Class E, 3.95%, 05/10/39 | | | | | | | 190 | | | | 185,843 | |
RAIT Trust,Series 2017-FL7, Class C, (1 mo. LIBOR + 2.50%), 4.89%, 06/15/37(a)(c) | | | | | | | 260 | | | | 256,294 | |
US 2018-USDC, Series 2018-USDC, Class E, 4.64%, 05/13/38(a)(b) | | | | | | | 769 | | | | 802,016 | |
Wells Fargo Commercial Mortgage Trust: | | | | | | | | | | | | |
Series 2015-NXS4, Class D, 3.75%, 12/15/48(b) | | | | | | | 305 | | | | 302,541 | |
Series 2016-C37, Class C, 4.64%, 12/15/49(b) | | | | | | | 1,000 | | | | 1,044,804 | |
Series 2016-NXS5, Class D, 5.04%, 01/15/59(b) | | | | | | | 500 | | | | 514,527 | |
| | |
| 18 | | 2019 BLACKROCK SEMI-ANNUAL REPORTTO SHAREHOLDERS |
| | |
Schedule of Investments (unaudited) (continued) June 30, 2019 | | BlackRock 2022 Global Income Opportunity Trust (BGIO) (Percentages shown are based on Net Assets) |
| | | | | | | | | | | | |
| Security | | | Par
(000) | | | Value | |
|
| Commercial Mortgage-Backed Securities (continued) | |
Series 2018-BXI, Class E, (1 mo. LIBOR US + 2.16%), 4.55%, 12/15/36(a)(c) | | | USD | | | | 99 | | | $ | 98,416 | |
Wells Fargo Mortgage Backed Securities Trust,Series 2008-AR1, Class A2, 4.77%, 03/25/38(b) | | | | | | | 746 | | | | 651,648 | |
WFRBS Commercial Mortgage Trust,Series 2012-C6, Class D, 5.77%, 04/15/45(a)(b) | | | | | | | 350 | | | | 366,487 | |
| | | | | | | | | | | | |
| | | | | | | | | | | 38,847,996 | |
| | | | | | | | | | | | |
| |
TotalNon-Agency Mortgage-Backed Securities — 20.2%
(Cost — $41,677,563) | | | | 43,381,851 | |
| | | | | | | | | | | | |
|
Preferred Securities — 4.1% | |
|
Capital Trusts — 4.1% | |
|
| Australia — 0.1% | |
Origin Energy Finance Ltd., 4.00%, 09/16/74(j) | | | | | | | 100 | | | | 114,457 | |
| | | | | | | | | | | | |
|
| Cayman Islands — 0.2% | |
Agile Group Holdings Ltd., 6.88%(b)(i) | | | | | | | 200 | | | | 196,187 | |
FWD Ltd., 5.50%(b)(i) | | | | | | | 200 | | | | 186,116 | |
King Talent Management Ltd., 5.60%(b)(i) | | | | | | | 200 | | | | 174,000 | |
| | | | | | | | | | | | |
| | | | | | | | | | | 556,303 | |
|
| Denmark — 0.4% | |
Orsted A/S, 2.25%, 11/24/17(b) | | | | | | | 800 | | | | 938,335 | |
| | | | | | | | | | | | |
|
| France — 1.6% | |
AXA SA, 3.25%, 05/28/49(b) | | | | | | | 700 | | | | 875,424 | |
Engie SA, 3.25%(b)(i) | | | | | | | 700 | | | | 868,087 | |
Societe Generale SA, 5.63%, 11/24/45 | | | | | | | 700 | | | | 800,010 | |
Solvay Finance SA, 5.43%(i)(j) | | | | | | | 140 | | | | 184,633 | |
TOTAL SA, 3.37%(i)(j) | | | | | | | 600 | | | | 760,550 | |
| | | | | | | | | | | | |
| | | | | | | | | | | 3,488,704 | |
|
| Hong Kong — 0.1% | |
Yancoal International Resources Development Co. Ltd., 5.75%(i)(j) | | | | | | | 235 | | | | 236,175 | |
| | | | | | | | | | | | |
|
| Luxembourg — 0.1% | |
Holcim Finance Luxembourg SA, 3.00%(b)(i) | | | | | | | 100 | | | | 117,425 | |
| | | | | | | | | | | | |
|
| Netherlands — 1.4% | |
Argentum Netherlands BV for Swiss Re Ltd., 5.75%, 08/15/50(j) | | | | | | | 500 | | | | 538,750 | |
ATF Netherlands BV, 3.75%(i)(j) | | | | | | | 300 | | | | 355,652 | |
Naturgy Finance BV, 4.13%(i)(j) | | | | | | | 100 | | | | 123,521 | |
Repsol International Finance BV, 3.88%(i)(j) | | | | | | | 100 | | | | 119,680 | |
Telefonica Europe BV(i): | | | | | | | | | | | | |
3.75%(j) | | | | | | | 300 | | | | 360,326 | |
3.88%(b) | | | | | | | 500 | | | | 588,358 | |
Volkswagen International Finance NV(i)(j): | | | | | | | | | | | | |
3.88% | | | | | | | 500 | | | | 578,500 | |
4.63% | | | | | | | 300 | | | | 373,943 | |
| | | | | | | | | | | | |
| | | | | | | | | | | 3,038,730 | |
|
| South Korea — 0.1% | |
KDB Life Insurance Co. Ltd., 7.50%(b)(i) | | | | | | | 200 | | | | 194,625 | |
| | | | | | | | | | | | |
|
| United States — 0.1% | |
Belden, Inc., 4.13%, 10/15/26 | | | | | | | 100 | | | | 120,967 | |
| | | | | | | | | | | | |
| |
Total Capital Trusts — 4.1%
(Cost — $8,359,400) | | | | 8,805,721 | |
| | | | | | | | | | | | |
| |
Total Preferred Securities — 4.1%
(Cost — $8,359,400) | | | | 8,805,721 | |
| | | | | | | | | | | | |
| | | | | | | | | | | | |
| Security | | | Par
(000) | | | Value | |
|
U.S. Government Sponsored Agency Securities — 0.8% | |
|
Collateralized Mortgage Obligations — 0.6% | |
Fannie Mae Connecticut Avenue Securities,Series 2017-C03, Class 1M2, (1 mo. LIBOR US + 3.00%), 5.40%, 10/25/29(c) | | | USD | | | | 106 | | | $ | 110,801 | |
Freddie Mac Structured Agency Credit Risk Debt Notes, Series 2017-DNA2, Class B1, (1 mo. LIBOR US + 5.15%), 7.55%, 10/25/29(c) | | | | | | | 1,000 | | | | 1,138,605 | |
| | | | | | | | | | | | |
| | | | | | | | | | | 1,249,406 | |
|
| Commercial Mortgage-Backed Securities — 0.2% | |
FREMF Mortgage Trust, Series 2017-KGX1, Class BFX, 3.71%, 10/25/27(a)(b) | | | | | | | 500 | | | | 483,635 | |
| | | | | | | | | | | | |
| |
Total U.S. Government Sponsored Agency Securities — 0.8%
(Cost — $1,578,007) | | | | 1,733,041 | |
| | | | | | | | | | | | |
| |
Total Long-Term Investments — 125.8%
(Cost — $268,012,141) | | | | 270,094,958 | |
| | | | | | | | | | | | |
|
Short-Term Securities — 1.5% | |
|
Foreign Agency Obligations — 0.6% | |
Egypt Treasury Bills, 16.50%, 08/20/19(n) | | | EGP | | | | 23,825 | | | | 1,396,834 | |
| | | | | | | | | | | | |
| |
Total Foreign Agency Obligations — 0.6%
(Cost — $1,328,419) | | | | 1,396,834 | |
| | | | | | | | | | | | |
| | |
| | | | Shares | | | | |
|
| Money Market Funds — 0.9% | |
BlackRock Liquidity Funds,T-Fund, Institutional Class, 2.26%(p)(q) | | | | | | | 1,875,883 | | | | 1,875,883 | |
| | | | | | | | | | | | |
| |
Total Money Market Funds — 0.9%
(Cost — $1,875,883) | | | | 1,875,883 | |
| | | | | | | | | | | | |
| |
Total Short-Term Securities — 1.5%
(Cost — $3,204,302) | | | | 3,272,717 | |
| | | | | | | | | | | | |
| |
Total Investments — 127.3%
(Cost — $271,216,443) | | | | 273,367,675 | |
| |
Liabilities in Excess of Other Assets — (27.3)% | | | | (58,590,898 | ) |
| | | | | | | | | | | | |
| |
Net Assets — 100.0% | | | $ | 214,776,777 | |
| | | | | | | | | | | | |
| (a) | Security exempt from registration pursuant to Rule 144A under the Securities Act of 1933, as amended. These securities may be resold in transactions exempt from registration to qualified institutional investors. |
| (b) | Variable or floating rate security, which interest rate adjusts periodically based on changes in current interest rates and prepayments on the underlying pool of assets. Rate shown is the rate in effect as of period end. |
| (c) | Variable rate security. Rate shown is the rate in effect as of period end. |
| (d) | Security is valued using significant unobservable inputs and is Classified as Level 3 in the fair value hierarchy. |
| (e) | All or a portion of the security has been pledged as collateral in connection with outstanding reverse repurchase agreements. |
| (f) | Payment-in-kind security which may pay interest/dividends in additional par/shares and/or in cash. Rates shown are the current rate and possible payment rates. |
| (g) | Non-income producing security. |
| (h) | Issuer filed for bankruptcy and/or is in default. |
| (i) | Perpetual security with no stated maturity date. |
| (j) | Variable rate security. Security may be issued at a fixed coupon rate, which converts to a variable rate at a specified date. Rate shown is the rate in effect as of period end. |
| (k) | Convertible security. |
| (l) | When-issued security. |
| | | | |
| SCHEDULES OF INVESTMENTS | | | 19 | |
| | |
Schedule of Investments (unaudited) (continued) June 30, 2019 | | BlackRock 2022 Global Income Opportunity Trust (BGIO) |
| (m) | Represents an unsettled loan commitment at period end. Certain details associated with this purchase are not known prior to the settlement date, including coupon rate. |
| (n) | Rates shown are discount rates or a range of discount rates as of period end. |
| (p) | Annualized7-day yield as of period end. |
| (q) | During the six months ended June 30, 2019, investments in issuers considered to be an affiliate/affiliates of the Trust for purposes of Section 2(a)(3) of the Investment Company Act of 1940, as amended, were as follows: |
| | | | | | | | | | | | | | | | | | | | | | | | | | | | |
| Affiliate | | Shares
Held at
12/31/18 | | | Net
Activity | | | Shares
Held at
06/30/19 | | | Value at
06/30/19 | | | Income | | | Net
Realized
Gain (Loss) (a) | | | Change in
Unrealized
Appreciation
(Depreciation) | |
BlackRock Liquidity Funds,T-Fund, Institutional Class | | | 2,363,454 | | | | (487,571 | ) | | | 1,875,883 | | | $ | 1,875,883 | | | $ | 42,295 | | | $ | — | | | $ | — | |
| | | | | | | | | | | | | | | | | | | | | | | | | | | | |
| | (a) | Includes net capital gain distributions, if applicable. | |
Reverse Repurchase Agreements
| | | | | | | | | | | | | | | | | | | | | | | | |
| Counterparty | | Interest
Rate | | | Trade
Date | | | Maturity
Date (a) | | | Face Value | | | Face Value
Including
Accrued Interest | | | Type of Non-Cash
Underlying Collateral | | Remaining Contractual
Maturity of the Agreements (a) |
Deutsche Bank Securities, Inc. | | | 3.15 | % | | | 08/20/18 | | | | Open | | | $ | 589,000 | | | $ | 603,865 | | | Corporate Bonds | | Open/Demand |
Deutsche Bank Securities, Inc. | | | 3.15 | | | | 11/15/18 | | | | Open | | | | 673,000 | | | | 685,519 | | | Corporate Bonds | | Open/Demand |
Credit Suisse Securities (USA) LLC | | | 2.65 | | | | 02/26/19 | | | | Open | | | | 590,480 | | | | 595,870 | | | Foreign Agency Obligations | | Open/Demand |
Goldman Sachs & Co LLC. | | | 2.50 | | | | 03/11/19 | | | | Open | | | | 653,689 | | | | 658,637 | | | Foreign Agency Obligations | | Open/Demand |
Citigroup Global Markets, Inc. | | | 1.75 | | | | 03/26/19 | | | | Open | | | | 761,000 | | | | 764,551 | | | Corporate Bonds | | Open/Demand |
RBC Capital Markets LLC | | | 3.05 | | | | 04/04/19 | | | | Open | | | | 811,250 | | | | 817,230 | | | Corporate Bonds | | Open/Demand |
RBC Capital Markets LLC | | | 3.05 | | | | 04/04/19 | | | | Open | | | | 691,250 | | | | 696,345 | | | Corporate Bonds | | Open/Demand |
RBC Capital Markets LLC | | | 3.05 | | | | 04/04/19 | | | | Open | | | | 832,390 | | | | 838,525 | | | Corporate Bonds | | Open/Demand |
RBC Capital Markets LLC | | | 3.05 | | | | 04/04/19 | | | | Open | | | | 670,800 | | | | 675,744 | | | Corporate Bonds | | Open/Demand |
RBC Capital Markets LLC | | | 3.05 | | | | 04/04/19 | | | | Open | | | | 1,274,488 | | | | 1,283,882 | | | Corporate Bonds | | Open/Demand |
Barclays Capital, Inc. | | | 1.00 | | | | 04/09/19 | | | | Open | | | | 158,812 | | | | 159,265 | | | Corporate Bonds | | Open/Demand |
Barclays Capital, Inc. | | | 2.50 | | | | 04/09/19 | | | | Open | | | | 960,351 | | | | 965,820 | | | Foreign Agency Obligations | | Open/Demand |
Barclays Capital, Inc. | | | 2.50 | | | | 04/09/19 | | | | Open | | | | 1,063,200 | | | | 1,069,254 | | | Corporate Bonds | | Open/Demand |
Barclays Capital, Inc. | | | 2.50 | | | | 04/09/19 | | | | Open | | | | 727,371 | | | | 731,762 | | | Foreign Agency Obligations | | Open/Demand |
Barclays Capital, Inc. | | | 2.65 | | | | 04/09/19 | | | | Open | | | | 1,173,000 | | | | 1,180,080 | | | Foreign Agency Obligations | | Open/Demand |
Barclays Capital, Inc. | | | 2.75 | | | | 04/09/19 | | | | Open | | | | 548,750 | | | | 552,187 | | | Corporate Bonds | | Open/Demand |
Barclays Capital, Inc. | | | 2.75 | | | | 04/09/19 | | | | Open | | | | 558,750 | | | | 562,250 | | | Corporate Bonds | | Open/Demand |
Barclays Capital, Inc. | | | 2.85 | | | | 04/09/19 | | | | Open | | | | 821,179 | | | | 826,510 | | | Corporate Bonds | | Open/Demand |
Barclays Capital, Inc. | | | 3.00 | | | | 04/09/19 | | | | Open | | | | 861,880 | | | | 867,770 | | | Corporate Bonds | | Open/Demand |
Barclays Capital, Inc. | | | 3.00 | | | | 04/09/19 | | | | Open | | | | 1,115,625 | | | | 1,123,248 | | | Corporate Bonds | | Open/Demand |
Barclays Capital, Inc. | | | 3.00 | | | | 04/09/19 | | | | Open | | | | 1,185,679 | | | | 1,193,781 | | | Corporate Bonds | | Open/Demand |
Barclays Capital, Inc. | | | 3.00 | | | | 04/09/19 | | | | Open | | | | 930,038 | | | | 936,393 | | | Corporate Bonds | | Open/Demand |
Barclays Capital, Inc. | | | 3.00 | | | | 04/09/19 | | | | Open | | | | 146,250 | | | | 147,249 | | | Corporate Bonds | | Open/Demand |
Barclays Capital, Inc. | | | 3.00 | | | | 04/09/19 | | | | Open | | | | 462,000 | | | | 465,157 | | | Corporate Bonds | | Open/Demand |
Barclays Capital, Inc. | | | 3.00 | | | | 04/09/19 | | | | Open | | | | 980,625 | | | | 987,326 | | | Corporate Bonds | | Open/Demand |
Barclays Capital, Inc. | | | 3.00 | | | | 04/09/19 | | | | Open | | | | 725,000 | | | | 729,954 | | | Corporate Bonds | | Open/Demand |
Barclays Capital, Inc. | | | 3.05 | | | | 04/09/19 | | | | Open | | | | 662,008 | | | | 666,607 | | | Corporate Bonds | | Open/Demand |
Barclays Capital, Inc. | | | 3.05 | | | | 04/09/19 | | | | Open | | | | 217,217 | | | | 218,726 | | | Foreign Agency Obligations | | Open/Demand |
RBC Capital Markets LLC | | | 2.79 | | | | 04/09/19 | | | | Open | | | | 711,375 | | | | 715,896 | | | Corporate Bonds | | Open/Demand |
RBC Capital Markets LLC | | | 2.79 | | | | 04/09/19 | | | | Open | | | | 721,000 | | | | 725,582 | | | Corporate Bonds | | Open/Demand |
RBC Capital Markets LLC | | | 2.79 | | | | 04/09/19 | | | | Open | | | | 749,000 | | | | 753,760 | | | Corporate Bonds | | Open/Demand |
RBC Capital Markets LLC | | | 3.05 | | | | 04/09/19 | | | | Open | | | | 1,239,700 | | | | 1,248,312 | | | Corporate Bonds | | Open/Demand |
RBC Capital Markets LLC | | | 3.05 | | | | 04/09/19 | | | | Open | | | | 341,039 | | | | 343,408 | | | Corporate Bonds | | Open/Demand |
RBC Capital Markets LLC | | | 3.05 | | | | 04/09/19 | | | | Open | | | | 778,750 | | | | 784,160 | | | Corporate Bonds | | Open/Demand |
RBC Capital Markets LLC | | | 3.05 | | | | 04/09/19 | | | | Open | | | | 1,270,000 | | | | 1,278,823 | | | Corporate Bonds | | Open/Demand |
RBC Capital Markets LLC | | | 3.05 | | | | 04/09/19 | | | | Open | | | | 1,220,450 | | | | 1,228,929 | | | Corporate Bonds | | Open/Demand |
RBC Capital Markets LLC | | | 3.05 | | | | 04/09/19 | | | | Open | | | | 423,844 | | | | 426,788 | | | Corporate Bonds | | Open/Demand |
RBC Capital Markets LLC | | | 3.05 | | | | 04/09/19 | | | | Open | | | | 410,440 | | | | 413,291 | | | Corporate Bonds | | Open/Demand |
RBC Capital Markets LLC | | | 3.05 | | | | 04/09/19 | | | | Open | | | | 335,857 | | | | 338,191 | | | Corporate Bonds | | Open/Demand |
RBC Capital Markets LLC | | | 3.05 | | | | 04/09/19 | | | | Open | | | | 1,318,625 | | | | 1,327,786 | | | Corporate Bonds | | Open/Demand |
RBC Capital Markets LLC | | | 3.05 | | | | 04/09/19 | | | | Open | | | | 1,149,750 | | | | 1,157,738 | | | Corporate Bonds | | Open/Demand |
RBC Capital Markets LLC | | | 3.05 | | | | 04/09/19 | | | | Open | | | | 1,295,525 | | | | 1,304,525 | | | Corporate Bonds | | Open/Demand |
RBC Capital Markets LLC | | | 3.05 | | | | 04/09/19 | | | | Open | | | | 983,750 | | | | 990,584 | | | Corporate Bonds | | Open/Demand |
RBC Capital Markets LLC | | | 3.05 | | | | 04/09/19 | | | | Open | | | | 1,243,550 | | | | 1,252,189 | | | Corporate Bonds | | Open/Demand |
RBC Capital Markets LLC | | | 3.05 | | | | 04/09/19 | | | | Open | | | | 1,278,200 | | | | 1,287,080 | | | Corporate Bonds | | Open/Demand |
| | |
| 20 | | 2019 BLACKROCK SEMI-ANNUAL REPORTTO SHAREHOLDERS |
| | |
Schedule of Investments (unaudited) (continued) June 30, 2019 | | BlackRock 2022 Global Income Opportunity Trust (BGIO) |
Reverse Repurchase Agreements (continued)
| | | | | | | | | | | | | | | | | | | | | | | | |
| Counterparty | | Interest
Rate | | | Trade
Date | | | Maturity
Date (a) | | | Face Value | | | Face Value
Including
Accrued Interest | | | Type of Non-Cash
Underlying Collateral | | Remaining Contractual
Maturity of the Agreements (a) |
RBC Capital Markets LLC | | | 3.05 | % | | | 04/09/19 | | | | Open | | | $ | 528,935 | | | $ | 532,610 | | | Corporate Bonds | | Open/Demand |
RBC Capital Markets LLC | | | 3.05 | | | | 04/09/19 | | | | Open | | | | 1,349,425 | | | | 1,358,800 | | | Corporate Bonds | | Open/Demand |
RBC Capital Markets LLC | | | 3.05 | | | | 04/09/19 | | | | Open | | | | 405,625 | | | | 408,443 | | | Corporate Bonds | | Open/Demand |
BNP Paribas S.A. | | | 2.72 | | | | 04/10/19 | | | | Open | | | | 696,500 | | | | 700,763 | | | Corporate Bonds | | Open/Demand |
BNP Paribas S.A. | | | 2.74 | | | | 04/10/19 | | | | Open | | | | 136,687 | | | | 137,530 | | | Corporate Bonds | | Open/Demand |
BNP Paribas S.A. | | | 2.78 | | | | 04/10/19 | | | | Open | | | | 675,938 | | | | 680,166 | | | Corporate Bonds | | Open/Demand |
BNP Paribas S.A. | | | 2.89 | | | | 04/10/19 | | | | Open | | | | 469,980 | | | | 473,036 | | | Corporate Bonds | | Open/Demand |
BNP Paribas S.A. | | | 2.89 | | | | 04/10/19 | | | | Open | | | | 480,937 | | | | 484,065 | | | Corporate Bonds | | Open/Demand |
BNP Paribas S.A. | | | 2.89 | | | | 04/10/19 | | | | Open | | | | 480,000 | | | | 483,121 | | | Corporate Bonds | | Open/Demand |
BNP Paribas S.A. | | | 2.89 | | | | 04/10/19 | | | | Open | | | | 485,696 | | | | 488,855 | | | Corporate Bonds | | Open/Demand |
BNP Paribas S.A. | | | 2.90 | | | | 04/10/19 | | | | Open | | | | 626,145 | | | | 630,231 | | | Corporate Bonds | | Open/Demand |
BNP Paribas S.A. | | | 2.90 | | | | 04/10/19 | | | | Open | | | | 815,120 | | | | 820,439 | | | Corporate Bonds | | Open/Demand |
BNP Paribas S.A. | | | 2.90 | | | | 04/10/19 | | | | Open | | | | 834,505 | | | | 839,950 | | | Corporate Bonds | | Open/Demand |
BNP Paribas S.A. | | | 2.90 | | | | 04/10/19 | | | | Open | | | | 635,400 | | | | 639,546 | | | Corporate Bonds | | Open/Demand |
BNP Paribas S.A. | | | 2.95 | | | | 04/10/19 | | | | Open | | | | 878,063 | | | | 883,891 | | | Corporate Bonds | | Open/Demand |
BNP Paribas S.A. | | | 2.98 | | | | 04/10/19 | | | | Open | | | | 1,847,500 | | | | 1,859,887 | | | Corporate Bonds | | Open/Demand |
BNP Paribas S.A. | | | 3.00 | | | | 04/10/19 | | | | Open | | | | 1,391,250 | | | | 1,400,641 | | | Corporate Bonds | | Open/Demand |
BNP Paribas S.A. | | | 3.00 | | | | 04/10/19 | | | | Open | | | | 1,300,950 | | | | 1,309,731 | | | Corporate Bonds | | Open/Demand |
BNP Paribas S.A. | | | 3.05 | | | | 04/10/19 | | | | Open | | | | 803,663 | | | | 809,178 | | | Foreign Agency Obligations | | Open/Demand |
BNP Paribas S.A. | | | 3.05 | | | | 04/10/19 | | | | Open | | | | 1,002,140 | | | | 1,009,017 | | | Corporate Bonds | | Open/Demand |
BNP Paribas S.A. | | | 3.20 | | | | 04/10/19 | | | | Open | | | | 1,106,381 | | | | 1,114,347 | | | Corporate Bonds | | Open/Demand |
BNP Paribas S.A. | | | 3.20 | | | | 04/10/19 | | | | Open | | | | 867,116 | | | | 873,359 | | | Corporate Bonds | | Open/Demand |
BNP Paribas S.A. | | | 3.20 | | | | 04/10/19 | | | | Open | | | | 847,500 | | | | 853,602 | | | Corporate Bonds | | Open/Demand |
BNP Paribas S.A. | | | 3.25 | | | | 04/10/19 | | | | Open | | | | 582,112 | | | | 586,369 | | | Corporate Bonds | | Open/Demand |
BNP Paribas S.A. | | | 3.25 | | | | 04/10/19 | | | | Open | | | | 1,270,750 | | | | 1,280,042 | | | Corporate Bonds | | Open/Demand |
BNP Paribas S.A. | | | 3.00 | | | | 04/18/19 | | | | Open | | | | 780,700 | | | | 785,514 | | | Corporate Bonds | | Open/Demand |
BNP Paribas S.A. | | | 3.05 | | | | 04/24/19 | | | | Open | | | | 360,461 | | | | 362,507 | | | Corporate Bonds | | Open/Demand |
Credit Suisse Securities (USA) LLC | | | 2.75 | | | | 05/07/19 | | | | Open | | | | 405,950 | | | | 407,472 | | | Foreign Agency Obligations | | Open/Demand |
RBC Capital Markets LLC | | | 2.79 | | | | 06/27/19 | | | | Open | | | | 265,625 | | | | 265,687 | | | Corporate Bonds | | Open/Demand |
RBC Capital Markets LLC | | | 2.79 | | | | 06/27/19 | | | | Open | | | | 250,625 | | | | 250,683 | | | Corporate Bonds | | Open/Demand |
RBC Capital Markets LLC | | | 2.79 | | | | 06/27/19 | | | | Open | | | | 196,000 | | | | 196,046 | | | Corporate Bonds | | Open/Demand |
RBC Capital Markets LLC | | | 2.79 | | | | 06/27/19 | | | | Open | | | | 194,500 | | | | 194,545 | | | Corporate Bonds | | Open/Demand |
RBC Capital Markets LLC | | | 2.79 | | | | 06/27/19 | | | | Open | | | | 143,625 | | | | 143,659 | | | Corporate Bonds | | Open/Demand |
| | | | | | | | | | | | | | | | | | | | | | | | |
| | | $ | 59,431,741 | | | $ | 59,844,281 | | | | | |
| | | | | | | | | | | | | |
| | (a) | Certain agreements have no stated maturity and can be terminated by either party at any time. | |
Derivative Financial Instruments Outstanding as of Period End
Futures Contracts
| | | | | | | | | | | | | | | | |
| Description | | Number of
Contracts | | | Expiration
Date | | | Notional
Amount (000) | | | Value/
Unrealized
Appreciation
(Depreciation) | |
Long Contracts | | | | | | | | | | | | | | | | |
10-Year U.S. Ultra Long Treasury Bond | | | 117 | | | | 09/19/19 | | | $ | 16,161 | | | $ | 184,985 | |
Long U.S. Treasury Bond | | | 9 | | | | 09/19/19 | | | | 1,400 | | | | 37,105 | |
5-Year U.S. Treasury Note | | | 28 | | | | 09/30/19 | | | | 3,308 | | | | 41,306 | |
| | | | | | | | | | | | | | | | |
| | | | | | | | | | | | | | | 263,396 | |
| | | | | | | | | | | | | | | | |
Short Contracts | | | | | | | | | | | | | | | | |
10-Year U.S. Treasury Note | | | 172 | | | | 09/19/19 | | | | 22,011 | | | | (437,854 | ) |
U.S. Ultra Bond | | | 15 | | | | 09/19/19 | | | | 2,663 | | | | (90,576 | ) |
2-Year U.S. Treasury Note | | | 135 | | | | 09/30/19 | | | | 29,049 | | | | (31,625 | ) |
| | | | | | | | | | | | | | | | |
| | | | | | | | | | | | | | | (560,055 | ) |
| | | | | | | | | | | | | | | | |
| | | | | | | | | | | | | | $ | (296,659 | ) |
| | | | | | | | | | | | | | | | |
| | | | |
| SCHEDULES OF INVESTMENTS | | | 21 | |
| | |
Schedule of Investments (unaudited) (continued) June 30, 2019 | | BlackRock 2022 Global Income Opportunity Trust (BGIO) |
Forward Foreign Currency Exchange Contracts
| | | | | | | | | | | | | | | | | | | | |
Currency
Purchased | | | Currency
Sold | | | Counterparty | | Settlement Date | | | Unrealized
Appreciation
(Depreciation) | |
| GBP | | | 1,415,000 | | | USD | | | 1,793,684 | | | State Street Bank and Trust Co. | | | 07/03/19 | | | $ | 3,387 | |
| USD | | | 431,120 | | | EUR | | | 378,000 | | | State Street Bank and Trust Co. | | | 07/03/19 | | | | 1,260 | |
| USD | | | 18,528,370 | | | EUR | | | 16,238,000 | | | UBS AG | | | 08/06/19 | | | | 11,173 | |
| IDR | | | 486,312,484 | | | USD | | | 34,032 | | | Bank of America N.A. | | | 09/20/19 | | | | 49 | |
| | | | | | | | | | | | | | | | | | | | |
| | | | | | | | | | | | | | | | | | | 15,869 | |
| | | | | | | | | | | | | | | | | | | | |
| EUR | | | 16,238,000 | | | USD | | | 18,477,220 | | | UBS AG | | | 07/03/19 | | | | (11,411 | ) |
| USD | | | 104,887 | | | EUR | | | 93,000 | | | BNP Paribas S.A. | | | 07/03/19 | | | | (873 | ) |
| USD | | | 17,233,437 | | | EUR | | | 15,422,000 | | | HSBC Bank USA N.A. | | | 07/03/19 | | | | (304,419 | ) |
| USD | | | 389,642 | | | EUR | | | 345,000 | | | JPMorgan Chase Bank N.A. | | | 07/03/19 | | | | (2,691 | ) |
| USD | | | 1,784,502 | | | GBP | | | 1,417,000 | | | JPMorgan Chase Bank N.A. | | | 07/03/19 | | | | (15,109 | ) |
| USD | | | 1,734,771 | | | ARS | | | 83,008,792 | | | Citibank N.A. | | | 07/17/19 | | | | (173,890 | ) |
| USD | | | 1,796,651 | | | GBP | | | 1,415,000 | | | State Street Bank and Trust Co. | | | 08/06/19 | | | | (3,424 | ) |
| USD | | | 837,985 | | | EUR | | | 737,000 | | | Bank of America N.A. | | | 09/09/19 | | | | (4,610 | ) |
| USD | | | 230,472 | | | HKD | | | 1,805,000 | | | Bank of America N.A. | | | 09/20/19 | | | | (673 | ) |
| USD | | | 230,792 | | | HKD | | | 1,807,751 | | | HSBC Bank USA N.A. | | | 09/20/19 | | | | (704 | ) |
| USD | | | 278,000 | | | IDR | | | 4,018,493,290 | | | Morgan Stanley & Co. International PLC | | | 09/20/19 | | | | (3,616 | ) |
| | | | | | | | | | | | | | | | | | | | |
| | | | | | | | | | | | | | | | | | | (521,420 | ) |
| | | | | | | | | | | | | | | | | | | | |
| | | | | | | | | | | | | | | $ | (505,551 | ) |
| | | | | | | | | | | | | | | | | | | | |
Centrally Cleared Interest Rate Swaps
| | | | | | | | | | | | | | | | | | | | | | | | | | | | | | | | |
| Paid by the Trust | | Received by the Trust | | Effective
Date | | | Termination
Date | | | Notional
Amount (000) | | | Value | | | Upfront
Premium
Paid
(Received) | | | Unrealized
Appreciation
(Depreciation) | |
| Rate | | Frequency | | Rate | | Frequency |
| 3-Month LIBOR, 2.32% | | Quarterly | | 2.14% | | Semi-Annual | | | N/A | | | | 02/28/22 | | | USD | | | 6,900 | | | $ | 101,958 | | | $ | 59 | | | $ | 101,899 | |
| | | | | | | | | | | | | | | | | | | | | | | | | | | | | | | | |
OTC Credit Default Swaps — Buy Protection
| | | | | | | | | | | | | | | | | | | | | | | | | | | | | | | | | | | | |
| Reference Obligation/Index | | Financing
Rate Paid
by the Trust | | | Payment
Frequency | | | Counterparty | | | Termination
Date | | | Notional
Amount (000) | | | Value | | | Upfront
Premium
Paid
(Received) | | | Unrealized
Appreciation
(Depreciation) | |
Republic of Colombia | | | 1.00 | % | | | Quarterly | | | | Citibank N.A. | | | | 12/20/23 | | | | USD | | | | 733 | | | $ | (6,389 | ) | | $ | 5,093 | | | $ | (11,482 | ) |
| | | | | | | | | | | | | | | | | | | | | | | | | | | | | | | | | | | | |
OTC Credit Default Swaps — Sell Protection
| | | | | | | | | | | | | | | | | | | | | | | | | | | | | | | | | | | | | | |
| Reference Obligation/Index | | | Financing
Rate Received
by the Trust | | | Payment
Frequency | | Counterparty | | | Termination
Date | | Credit
Rating (a) | | Notional
Amount
(000) (b) | | | Value | | | Upfront
Premium
Paid
(Received) | | | Unrealized
Appreciation
(Depreciation) | |
CMBX.NA.9 | | | | 3.00 | % | | Monthly | | | Morgan Stanley & Co. International PLC | | | 09/17/58 | | N/R | | | USD | | | | 5,000 | | | $ | (162,896 | ) | | $ | (533,955 | ) | | $ | 371,059 | |
CMBX.NA.9 | | | | 3.00 | | | Monthly | | | Morgan Stanley & Co. International PLC | | | 09/17/58 | | N/R | | | USD | | | | 3,000 | | | | (97,737 | ) | | | (316,551 | ) | | | 218,814 | |
| | | | | | | | | | | | | | | | | | | | | | | | | | | | | | | | | | | |
| | | | | | | | | | | | | | | | | | | | | | | | | | | | $ | (260,633 | ) | | $ | (850,506 | ) | | $ | 589,873 | |
| | | | | | | | | | | | | | | | | | | | | | | | | | | | | | | | | | | | | | |
| | (a) | Using S&P’s rating of the issuer or the underlying securities of the index, as applicable. | |
| | (b) | The maximum potential amount the Trust may pay should a negative credit event take place as defined under the terms of the agreement. | |
Balances Reported in the Statements of Assets and Liabilities for Centrally Cleared Swaps and OTC Swaps
| | | | | | | | | | | | | | | | |
| | | Swap
Premiums
Paid | | | Swap
Premiums
Received | | | Unrealized
Appreciation | | | Unrealized
Depreciation | |
Centrally Cleared Swaps(a) | | $ | 59 | | | $ | — | | | $ | 101,899 | | | $ | — | |
OTC Swaps | | | 5,093 | | | | (850,506 | ) | | | 589,873 | | | | (11,482 | ) |
| | (a) | Includes cumulative appreciation (depreciation) on centrally cleared swaps, as reported in the Schedule of Investments. Only current day’s variation margin is reported within the Statements of Assets and Liabilities and is net of any previously paid (received) swap premium amounts. | |
| | |
| 22 | | 2019 BLACKROCK SEMI-ANNUAL REPORTTO SHAREHOLDERS |
| | |
Schedule of Investments (unaudited) (continued) June 30, 2019 | | BlackRock 2022 Global Income Opportunity Trust (BGIO) |
Derivative Financial Instruments Categorized by Risk Exposure
As of period end, the fair values of derivative financial instruments located in the Statements of Assets and Liabilities were as follows:
| | | | | | | | | | | | | | | | | | | | | | | | | | | | |
| | | Commodity
Contracts | | | Credit
Contracts | | | Equity
Contracts | | | Foreign
Currency
Exchange
Contracts | | | Interest
Rate
Contracts | | | Other
Contracts | | | Total | |
Assets — Derivative Financial Instrument | |
Futures contracts | |
Unrealized appreciation on futures contracts(a) | | $ | — | | | $ | — | | | $ | — | | | $ | — | | | $ | 263,396 | | | $ | — | | | $ | 263,396 | |
Forward foreign currency exchange contracts | |
Unrealized appreciation on forward foreign currency exchange contracts | | | — | | | | — | | | | — | | | | 15,869 | | | | — | | | | — | | | | 15,869 | |
Swaps — centrally cleared | |
Unrealized appreciation on centrally cleared swaps(a) | | | — | | | | — | | | | — | | | | — | | | | 101,899 | | | | — | | | | 101,899 | |
Swaps — OTC | |
Unrealized appreciation on OTC swaps; Swap premiums paid | | | — | | | | 594,966 | | | | — | | | | — | | | | — | | | | — | | | | 594,966 | |
| | | | | | | | | | | | | | | | | | | | | | | | | | | | |
| | $ | — | | | $ | 594,966 | | | $ | — | | | $ | 15,869 | | | $ | 365,295 | | | $ | — | | | $ | 976,130 | |
| | | | | | | | | | | | | | | | | | | | | | | | | | | | |
|
| Liabilities — Derivative Financial Instrument | |
Futures contracts | |
Unrealized depreciation on futures contracts(a) | | $ | — | | | $ | — | | | $ | — | | | $ | — | | | $ | 560,055 | | | $ | — | | | $ | 560,055 | |
Forward foreign currency exchange contracts | |
Unrealized depreciation on forward foreign currency exchange contracts | | | — | | | | — | | | | — | | | | 521,420 | | | | — | | | | — | | | | 521,420 | |
Swaps — OTC | |
Unrealized depreciation on OTC swaps; Swap premiums received | | | — | | | | 861,988 | | | | — | | | | — | | | | — | | | | — | | | | 861,988 | |
| | | | | | | | | | | | | | | | | | | | | | | | | | | | |
| | $ | — | | | $ | 861,988 | | | $ | — | | | $ | 521,420 | | | $ | 560,055 | | | $ | — | | | $ | 1,943,463 | |
| | | | | | | | | | | | | | | | | | | | | | | | | | | | |
| | (a) | Net cumulative unrealized appreciation (depreciation) on futures contracts and centrally cleared swaps, if any, are reported in the Schedule of Investments. In the Statements of Assets and Liabilities, only current day’s variation margin is reported in receivables or payables and the net cumulative unrealized appreciation (depreciation) is included in accumulated earnings (loss). | |
For the six months ended June 30, 2019, the effect of derivative financial instruments in the Statements of Operations was as follows:
| | | | | | | | | | | | | | | | | | | | | | | | | | | | |
| | | Commodity
Contracts | | | Credit
Contracts | | | Equity
Contracts | | | Foreign
Currency
Exchange
Contracts | | | Interest
Rate
Contracts | | | Other
Contracts | | | Total | |
Net Realized Gain (Loss) from: | | | | | | | | | | | | | | | | | | | | | | | | | | | | |
Futures contracts | | $ | — | | | $ | — | | | $ | — | | | $ | — | | | $ | (435,954 | ) | | $ | — | | | $ | (435,954 | ) |
Forward foreign currency exchange contracts | | | — | | | | — | | | | — | | | | 436,702 | | | | — | | | | — | | | | 436,702 | |
Options purchased(a) | | | — | | | | — | | | | (65,029 | ) | | | — | | | | (42,793 | ) | | | — | | | | (107,822 | ) |
Swaps | | | — | | | | 252,090 | | | | — | | | | — | | | | (18,526 | ) | | | — | | | | 233,564 | |
| | | | | | | | | | | | | | | | | | | | | | | | | | | | |
| | $ | — | | | $ | 252,090 | | | $ | (65,029 | ) | | $ | 436,702 | | | $ | (497,273 | ) | | $ | — | | | $ | 126,490 | |
| | | | | | | | | | | | | | | | | | | | | | | | | | | | |
| | (a) | Options purchased are included in net realized gain (loss) from investments. | |
| | | | | | | | | | | | | | | | | | | | | | | | | | | | |
| | | Commodity
Contracts | | | Credit
Contracts | | | Equity
Contracts | | | Foreign
Currency
Exchange
Contracts | | | Interest
Rate
Contracts | | | Other
Contracts | | | Total | |
Net Change in Unrealized Appreciation (Depreciation) on: | | | | | | | | | | | | | | | | | | | | | | | | | | | | |
Futures contracts | | $ | — | | | $ | — | | | $ | — | | | $ | — | | | $ | (84,976 | ) | | $ | — | | | $ | (84,976 | ) |
Forward foreign currency exchange contracts | | | — | | | | — | | | | — | | | | (232,403 | ) | | | — | | | | — | | | | (232,403 | ) |
Options purchased(a) | | | — | | | | — | | | | (2,016 | ) | | | — | | | | (63,226 | ) | | | — | | | | (65,242 | ) |
Swaps | | | — | | | | 688,485 | | | | — | | | | — | | | | 161,849 | | | | — | | | | 850,334 | |
| | | | | | | | | | | | | | | | | | | | | | | | | | | | |
| | $ | — | | | $ | 688,485 | | | $ | (2,016 | ) | | $ | (232,403 | ) | | $ | 13,647 | | | $ | — | | | $ | 467,713 | |
| | | | | | | | | | | | | | | | | | | | | | | | | | | | |
| | (a) | Options purchased are included in net change in unrealized appreciation (depreciation) on investments. | |
| | | | |
| SCHEDULES OF INVESTMENTS | | | 23 | |
| | |
Schedule of Investments (unaudited) (continued) June 30, 2019 | | BlackRock 2022 Global Income Opportunity Trust (BGIO) |
Average Quarterly Balances of Outstanding Derivative Financial Instruments
| | | | |
Futures contracts: | |
Average notional value of contracts — long | | $ | 23,850,633 | |
Average notional value of contracts — short | | $ | 48,137,191 | |
Forward foreign currency exchange contracts: | |
Average amounts purchased — in USD | | $ | 42,291,633 | |
Average amounts sold — in USD | | $ | 19,874,302 | |
Options: | |
Average value of option contracts purchased | | $ | 13,050 | |
Average notional value of swaption contracts purchased | | $ | — | (a) |
Credit default swaps: | |
Average notional value — buy protection | | $ | 733,000 | |
Average notional value — sell protection | | $ | 8,000,000 | |
Interest rate swaps: | |
Average notional value — receives fixed rate | | $ | 6,900,000 | |
| | (a) | Derivative not held atquarter-end. The risk exposure table serves as an indicator of activity during the period. | |
For more information about the Trust’s Investment risks regarding derivative financial instruments, refer to the Notes to Financial Statements
Derivative Financial Instruments — Offsetting as of Period End
The Trust’s derivative assets and liabilities (by type) are as follows:
| | | | | | | | |
| | | Assets | | | Liabilities | |
Derivative Financial Instruments: | | | | | | | | |
Futures contracts | | $ | 12,185 | | | $ | 6,500 | |
Forward foreign currency exchange contracts | | | 15,869 | | | | 521,420 | |
Swaps — centrally cleared | | | — | | | | 1,881 | |
Swaps — OTC(a) | | | 594,966 | | | | 861,988 | |
| | | | | | | | |
Total derivative assets and liabilities in the Statements of Assets and Liabilities | | $ | 623,020 | | | $ | 1,391,789 | |
Derivatives not subject to a Master Netting Agreement or similar agreement (“MNA”) | | | (12,185 | ) | | | (8,381 | ) |
| | | | | | | | |
Total derivative assets and liabilities subject to an MNA | | $ | 610,835 | | | $ | 1,383,408 | |
| | | | | | | | |
| | (a) | Includes unrealized appreciation (depreciation) on OTC swaps and swap premiums (paid/received) in the Statements of Assets and Liabilities. | |
The following table presents the Trust’s derivative assets (and liabilities) by counterparty net of amounts available for offset under an MNA and net of the related collateral received (and pledged) by the Trust:
| | | | | | | | | | | | | | | | | | | | |
| Counterparty | | Derivative
Assets
Subject to
an MNA by
Counterparty | | | Derivatives
Available
for Offset (a) | | | Non-cash
Collateral
Received | | | Cash
Collateral
Received | | | Net Amount
of Derivative
Assets (b) | |
Bank of America N.A. . . . . | | $ | 49 | | | $ | (49 | ) | | $ | — | | | $ | — | | | $ | — | |
Citibank N.A. . . . . . . . . . . . | | | 5,093 | | | | (5,093 | ) | | | — | | | | — | | | | — | |
Morgan Stanley & Co. International PLC | | | 589,873 | | | | (589,873 | ) | | | — | | | | — | | | | — | |
State Street Bank and Trust Co. | | | 4,647 | | | | (3,424 | ) | | | — | | | | — | | | | 1,223 | |
UBS AG | | | 11,173 | | | | (11,173 | ) | | | — | | | | — | | | | — | |
| | | | | | | | | | | | | | | | | | | | |
| | $ | 610,835 | | | $ | (609,612 | ) | | $ | — | | | $ | — | | | $ | 1,223 | |
| | | | | | | | | | | | | | | | | | | | |
| | |
| 24 | | 2019 BLACKROCK SEMI-ANNUAL REPORTTO SHAREHOLDERS |
| | |
Schedule of Investments (unaudited) (continued) June 30, 2019 | | BlackRock 2022 Global Income Opportunity Trust (BGIO) |
| | | | | | | | | | | | | | | | | | | | |
| Counterparty | | Derivative
Liabilities
Subject to
an MNA by
Counterparty | | | Derivatives
Available
for Offset (a) | | | Non-cash
Collateral
Pledged | | | Cash
Collateral
Pledged | | | Net Amount
of Derivative
Liabilities (c) | |
Bank of America N.A. . . . . | | $ | 5,283 | | | $ | (49 | ) | | $ | — | | | $ | — | | | $ | 5,234 | |
BNP Paribas S.A. | | | 873 | | | | — | | | | — | | | | — | | | | 873 | |
Citibank N.A. . . . . . . . . . . . | | | 185,372 | | | | (5,093 | ) | | | — | | | | — | | | | 180,279 | |
HSBC Bank USA N.A. | | | 305,123 | | | | — | | | | — | | | | — | | | | 305,123 | |
JPMorgan Chase Bank N.A. | | | 17,800 | | | | — | | | | — | | | | — | | | | 17,800 | |
Morgan Stanley & Co. International PLC | | | 854,122 | | | | (589,873 | ) | | | — | | | | (220,000 | ) | | | 44,249 | |
State Street Bank and Trust Co. | | | 3,424 | | | | (3,424 | ) | | | — | | | | — | | | | — | |
UBS AG | | | 11,411 | | | | (11,173 | ) | | | — | | | | — | | | | 238 | |
| | | | | | | | | | | | | | | | | | | | |
| | $ | 1,383,408 | | | $ | (609,612 | ) | | $ | — | | | $ | (220,000 | ) | | $ | 553,796 | |
| | | | | | | | | | | | | | | | | | | | |
| | (a) | The amount of derivatives available for offset is limited to the amount of derivative asset and/or liabilities that are subject to an MNA. | |
| | (b) | Net amount represents the net amount receivable from the counterparty in the event of default. | |
| | (c) | Net amount represents the net amount payable due to counterparty in the event of default. | |
Fair Value Hierarchy as of Period End
Various inputs are used in determining the fair value of investments and derivative financial instruments. For information about the Trust’s policy regarding valuation of investments and derivative financial instruments, refer to the Notes to Financial Statements.
The following tables summarize the Trust’s investments and derivative financial instruments categorized in the disclosure hierarchy:
| | | | | | | | | | | | | | | | |
| | | Level 1 | | | Level 2 | | | Level 3 | | | Total | |
Assets: | |
Investments: | |
Long-Term Investments: | |
Asset-Backed Securities | | $ | — | | | $ | 48,069,333 | | | $ | 1,249,759 | | | $ | 49,319,092 | |
Corporate Bonds | | | 592,045 | | | | 134,639,290 | | | | 240,015 | | | | 135,471,350 | |
Floating Rate Loan Interests | | | — | | | | 10,317,922 | | | | 7,619,191 | | | | 17,937,113 | |
Foreign Agency Obligation | | | — | | | | 13,446,790 | | | | — | | | | 13,446,790 | |
Non-Agency Mortgage-Backed Securities | | | — | | | | 42,538,749 | | | | 843,102 | | | | 43,381,851 | |
Preferred Securities | | | — | | | | 8,805,721 | | | | — | | | | 8,805,721 | |
U.S. Government Sponsored Agency Securities | | | — | | | | 1,733,041 | | | | — | | | | 1,733,041 | |
Short-Term Securities: | |
Foreign Agency Obligations | | | — | | | | 1,396,834 | | | | — | | | | 1,396,834 | |
Money Market Funds | | | 1,875,883 | | | | — | | | | — | | | | 1,875,883 | |
| | | | | | | | | | | | | | | | |
| | $ | 2,467,928 | | | $ | 260,947,680 | | | $ | 9,952,067 | | | $ | 273,367,675 | |
| | | | | | | | | | | | | | | | |
Derivative Financial Instruments(a) | |
Assets: | |
Credit contracts | | $ | — | | | $ | 589,873 | | | $ | — | | | $ | 589,873 | |
Forward foreign currency contracts | | | — | | | | 15,869 | | | | — | | | | 15,869 | |
Interest rate contracts | | | 263,396 | | | | 101,899 | | | | — | | | | 365,295 | |
Liabilities: | |
Credit contracts | | | — | | | | (11,482 | ) | | | — | | | | (11,482 | ) |
Forward foreign currency contracts | | | — | | | | (521,420 | ) | | | — | | | | (521,420 | ) |
Interest rate contracts | | | (560,055 | ) | | | — | | | | — | | | | (560,055 | ) |
| | | | | | | | | | | | | | | | |
| | $ | (296,659 | ) | | $ | 174,739 | | | $ | — | | | $ | (121,920 | ) |
| | | | | | | | | | | | | | | | |
| | (a) | Derivative financial instruments are swaps, futures contracts and forward foreign currency exchange contracts. Swaps, futures contracts and forward foreign currency exchange contracts are valued at the unrealized appreciation (depreciation) on the instrument. | |
The Trust may hold assets and/or liabilities in which the fair value approximates the carrying amount or face value, including accrued interest, for financial statement purposes. As of period end, reverse repurchase agreements of $59,844,281 are categorized as Level 2 within the disclosure hierarchy.
| | | | |
| SCHEDULES OF INVESTMENTS | | | 25 | |
| | |
Schedule of Investments (unaudited) (continued) June 30, 2019 | | BlackRock 2022 Global Income Opportunity Trust (BGIO) |
A reconciliation of Level 3 investments is presented when the Trust had a significant amount of Level 3 investments at the beginning and/or end of the period in relation to net assets. The following table is a reconciliation of Level 3 investments for which significant unobservable inputs were used in determining fair value:
| | | | | | | | | | | | | | | | | | | | |
| | | Asset-Backed
Securities | | | Corporate Bonds | | | Floating
Rate Loan
Interests | | | Non-Agency
Mortgage-Backed
Securities | | | Total | |
Assets: | | | | | | | | | | | | | | | | | | | | |
Opening Balance, as of December 31, 2018 | | $ | 1,922,478 | | | $ | 257,000 | | | $ | 7,867,669 | | | $ | 1,228,227 | | | $ | 11,275,374 | |
Transfers into Level 3 | | | — | | | | — | | | | 775,006 | | | | — | | | | 775,006 | |
Transfers out of Level 3(a) | | | (500,000 | ) | | | — | | | | (1,333,024 | ) | | | (346,174 | ) | | | (2,179,198 | ) |
Accrued discounts/premiums | | | — | | | | — | | | | 11,994 | | | | — | | | | 11,994 | |
Net realized gain (loss) | | | 236 | | | | — | | | | 2,537 | | | | — | | | | 2,773 | |
Net change in unrealized appreciation (depreciation)(b)(c) | | | (12,860 | ) | | | 5,854 | | | | (12,251 | ) | | | — | | | | (19,257 | ) |
Purchases | | | — | | | | — | | | | 1,394,064 | | | | — | | | | 1,394,064 | |
Sales | | | (160,095 | ) | | | (22,839 | ) | | | (1,086,804 | ) | | | (38,951 | ) | | | (1,308,689 | ) |
| | | | | | | | | | | | | | | | | | | | |
Closing Balance, as of June 30, 2019 | | $ | 1,249,759 | | | $ | 240,015 | | | $ | 7,619,191 | | | $ | 843,102 | | | $ | 9,952,067 | |
| | | | | | | | | | | | | | | | | | | | |
Net change in unrealized appreciation (depreciation) on investments still held at June 30, 2019(c) | | $ | (12,860 | ) | | $ | 5,854 | | | $ | (12,251 | ) | | $ | — | | | $ | (19,257 | ) |
| | | | | | | | | | | | | | | | | | | | |
| | (a) | As of December 31, 2018, the Trust used significant unobservable inputs in determining the value of certain investments. As of June 30, 2019, the Trust used observable inputs in determining the value of the same investments. As a result, investments at beginning of period value were transferred from Level 3 to Level 2 in the disclosure hierarchy. | |
| | (b) | Included in the related net change in unrealized appreciation (depreciation) in the Statements of Operations. | |
| | (c) | Any difference between net change in unrealized appreciation (depreciation) and net change in unrealized appreciation (depreciation) on investments still held at June 30, 2019 is generally due to investments no longer held or categorized as Level 3 at period end. | |
The Trust’s investments that are categorized as Level 3 were valued utilizing third party pricing information without adjustment. Such valuations are based on unobservable inputs. A significant change in third party information could result in a significantly lower or higher value of such Level 3 investments.
See notes to financial statements.
| | |
| 26 | | 2019 BLACKROCK SEMI-ANNUAL REPORTTO SHAREHOLDERS |
| | |
Schedule of Investments (unaudited) June 30, 2019 | | BlackRock Income Trust, Inc. (BKT) (Percentages shown are based on Net Assets) |
| | | | | | | | |
| Security | | Par
(000) | | | Value | |
|
Asset-Backed Securities — 0.1% | |
|
| Interest Only Asset-Backed Securities — 0.1% | |
Small Business Administration Participation Certificates,Series 2000-1, 1.00%, 03/15/21(a)(b) | | $ | 102 | | | $ | 892 | |
Sterling Bank Trust,Series 2004-2, Class Note, 2.08%, 03/30/30(a)(c) | | | 1,001 | | | | 45,376 | |
Sterling Coofs Trust,Series 2004-1, Class A, 2.36%, 04/15/29(a)(b)(c) | | | 1,333 | | | | 54,129 | |
| | | | | | | | |
| |
Total Asset-Backed Securities — 0.1%
(Cost — $314,784) | | | | 100,397 | |
| | | | | |
|
Non-Agency Mortgage-Backed Securities — 4.6% | |
|
Collateralized Mortgage Obligations — 3.8% | |
Deutsche Securities, Inc. Mortgage Alternate Loan Trust,Series 2006-AR5, Class 22A, 5.50%, 10/25/21 | | | 41 | | | | 40,859 | |
Kidder Peabody Acceptance Corp.,Series 1993-1, Class A6, (1 mo. LIBOR + 16.62%), 12.11%, 08/25/23(d) | | | 23 | | | | 24,493 | |
Seasoned Credit Risk Transfer Trust, Class MA: | | | | | | | | |
Series 2018-2, 3.50%, 11/25/57 | | | 1,564 | | | | 1,620,107 | |
Series 2018-3, 3.50%, 08/25/57 | | | 2,161 | | | | 2,237,766 | |
Series 2018-4, 3.50%, 03/25/58 | | | 7,520 | | | | 7,793,350 | |
Series 2019-1, 3.50%, 07/25/58 | | | 2,408 | | | | 2,496,176 | |
Series 2019-2, 3.50%, 08/25/58 | | | 842 | | | | 867,358 | |
Structured Adjustable Rate Mortgage Loan Trust,Series 2004-11, Class A, 4.26%, 08/25/34(b) | | | 436 | | | | 433,367 | |
| | | | | | | | |
| | | | | | | 15,513,476 | |
|
| Commercial Mortgage-Backed Securities — 0.7% | |
CSAIL Commercial Mortgage Trust, Class XA(b): | | | | | | | | |
Series 2018-C14, 0.73%, 11/15/51 | | | 2,397 | | | | 103,248 | |
Series 2019-C16, 1.57%, 06/15/52 | | | 6,505 | | | | 807,811 | |
FRESB Mortgage Trust, Series 2019-SB60, Class A10F, 3.31%, 01/25/29(b) | | | 1,535 | | | | 1,594,121 | |
Natixis Commercial Mortgage Securities Trust,Series 2018-FL1, Class A, (1 mo. LIBOR + 0.95%), 3.34%, 06/15/35(c)(d) | | | 298 | | | | 296,669 | |
Wells Fargo Commercial Mortgage Trust,Series 2018-C44, Class XA, 0.92%, 05/15/51(b) | | | 5,089 | | | | 272,930 | |
| | | | | | | | |
| | | | | | | 3,074,779 | |
|
| Interest Only Collateralized Mortgage Obligations — 0.0% | |
CitiMortgage Alternative Loan Trust,Series 2007-A5, Class 1A7, 6.00%, 05/25/37 | | | 287 | | | | 65,849 | |
IndyMac INDX Mortgage Loan Trust, Series 2006-AR33, Class 4AX, 0.17%, 01/25/37 | | | 32,202 | | | | 322 | |
Vendee Mortgage Trust,Series 1999-2, Class 1, 1.00%, 05/15/29(b) | | | 15,601 | | | | 16 | |
| | | | | | | | |
| | | | | | | 66,187 | |
|
| Principal Only Collateralized Mortgage Obligations — 0.1% | |
Countrywide Home Loan Mortgage Pass-Through Trust,Series 2003-J8, 0.00%, 09/25/23(e) | | | 14 | | | | 12,987 | |
Residential Asset Securitization Trust,Series 2005-A15, Class 1A8, 0.00%, 02/25/36(e) | | | 212 | | | | 185,815 | |
Washington Mutual Alternative Mortgage Pass-Through Certificates,Series 2005-9, Class CP, 0.00%, 11/25/35(e) | | | 93 | | | | 70,700 | |
| | | | | | | | |
| | | | | | | 269,502 | |
| | | | | | | | |
| |
TotalNon-Agency Mortgage-Backed Securities — 4.6%
(Cost — $18,295,178) | | | | 18,923,944 | |
| | | | | |
| | | | | | | | |
| Security | | Par
(000) | | | Value | |
|
U.S. Government Sponsored Agency Securities — 142.6% | |
|
| Agency Obligations — 2.7% | |
Federal Housing Administration(a): | | | | | | | | |
USGI Projects, Series 99, 7.43%, 06/01/21 - 10/01/23 | | $ | 1,185 | | | $ | 1,174,896 | |
Merrill Lynch Projects, Series 54, 7.43%, 05/15/23 | | | 1 | | | | — | |
Residual Funding Corp., 0.00%, 04/15/30(e) | | | 13,000 | | | | 9,963,478 | |
| | | | | | | | |
| | | | | | | 11,138,374 | |
|
| Collateralized Mortgage Obligations — 69.9% | |
Fannie Mae Mortgage-Backed Securities: | | | | | | | | |
3.65%, 06/25/49 | | | 19,805 | | | | 3,792,773 | |
Series 2017-76, Class PB, 3.00%, 10/25/57 | | | 3,415 | | | | 3,351,031 | |
Series 4830, Class AV, 4.00%, 10/15/33 | | | 1,069 | | | | 1,191,148 | |
Series 2010-136, Class CY, 4.00%, 12/25/40 | | | 3,060 | | | | 3,357,160 | |
Series 2011-8, Class ZA, 4.00%, 02/25/41 | | | 5,911 | | | | 6,235,178 | |
Series 2011-117, Class CP, 4.00%, 11/25/41 | | | 14,350 | | | | 15,866,016 | |
Series 2012-104, Class QD, 4.00%, 09/25/42 | | | 1,639 | | | | 1,860,422 | |
Series 2013-81, Class YK, 4.00%, 08/25/43 | | | 7,000 | | | | 7,857,595 | |
Series 2018-50, Class EB, 4.00%, 07/25/48 | | | 2,001 | | | | 2,260,468 | |
Series 2018-32, Class PS, 4.43%, 05/25/48(b) | | | 8,446 | | | | 9,317,778 | |
Series 2010-134, Class DB, 4.50%, 12/25/40 | | | 7,000 | | | | 7,892,495 | |
Series 2011-99, Class CB, 4.50%, 10/25/41 | | | 43,000 | | | | 48,471,772 | |
Series 2010-47, Class JB, 5.00%, 05/25/30 | | | 6,407 | | | | 6,905,311 | |
Series 2003-135, Class PB, 6.00%, 01/25/34 | | | 3,278 | | | | 3,379,962 | |
Series 2004-31, Class ZG, 7.50%, 05/25/34 | | | 4,521 | | | | 5,486,733 | |
Series 2004-84, Class SD, (1 mo. LIBOR + 12.75%), 8.66%, 04/25/34(d) | | | 2,040 | | | | 2,310,439 | |
Series 1993-247, Class SN, (11th District Cost of Funds + 63.85%), 10.00%, 12/25/23(d) | | | 49 | | | | 56,125 | |
Series 2005-73, Class DS, (1 mo. LIBOR + 17.55%), 11.30%, 08/25/35(d) | | | 157 | | | | 185,158 | |
Series 1991-87, Class S, (1 mo. LIBOR + 26.68%), 20.31%, 08/25/21(d) | | | 2 | | | | 1,840 | |
Series G-49, Class S, (1 mo. LIBOR + 1034.80%), 784.74%, 12/25/21(d) | | | — | (f) | | | 2 | |
Series G-07, Class S, (1 mo. LIBOR + 1151.69%), 870.51%, 03/25/21(d) | | | — | (f) | | | 19 | |
Freddie Mac Mortgage-Backed Securities: | | | | | | | | |
Series 4384, Class LB, 3.50%, 08/15/43 | | | 5,100 | | | | 5,358,082 | |
Series 4748, Class BM, 3.50%, 11/15/47 | | | 3,351 | | | | 3,611,171 | |
Series 3745, Class ZA, 4.00%, 10/15/40 | | | 1,230 | | | | 1,360,680 | |
Series 3762, Class LN, 4.00%, 11/15/40 | | | 2,000 | | | | 2,216,609 | |
Series 3780, Class ZA, 4.00%, 12/15/40 | | | 2,321 | | | | 2,589,012 | |
Series 4269, Class PM, 4.00%, 08/15/41 | | | 8,884 | | | | 10,075,010 | |
Series 4016, Class BX, 4.00%, 09/15/41 | | | 15,408 | | | | 17,153,741 | |
Series 3960, Class PL, 4.00%, 11/15/41 | | | 2,859 | | | | 3,135,856 | |
Series 4299, Class JY, 4.00%, 01/15/44 | | | 1,000 | | | | 1,119,118 | |
Series 3688, Class PB, 4.50%, 08/15/32 | | | 3,693 | | | | 3,738,342 | |
Series 2731, Class ZA, 4.50%, 01/15/34 | | | 3,604 | | | | 3,865,911 | |
Series 4316, Class VB, 4.50%, 03/15/34 | | | 10,787 | | | | 11,560,668 | |
Series 4615, Class LB, 4.50%, 09/15/41 | | | 8,000 | | | | 9,246,482 | |
Series 3963, Class JB, 4.50%, 11/15/41 | | | 800 | | | | 913,346 | |
Series 4774, Class L, 4.50%, 03/15/48 | | | 10,000 | | | | 11,156,912 | |
Series 3856, Class PB, 5.00%, 05/15/41 | | | 10,000 | | | | 11,539,637 | |
Series 2927, Class BZ, 5.50%, 02/15/35 | | | 4,556 | | | | 5,090,124 | |
Series 2542, Class UC, 6.00%, 12/15/22 | | | 670 | | | | 688,216 | |
Series 0040, Class K, 6.50%, 08/17/24 | | | 48 | | | | 52,735 | |
Series 2218, Class Z, 8.50%, 03/15/30 | | | 1,123 | | | | 1,301,190 | |
Series 1160, Class F, (1 mo. LIBOR + 40.16%), 29.99%, 10/15/21(d) | | | 2 | | | | 1,969 | |
Ginnie Mae Mortgage-Backed Securities: | | | | | | | | |
Series 2010-099, Class JM, 3.75%, 12/20/38 | | | 4,381 | | | | 4,389,709 | |
Series 2010-112, Class TL, 4.00%, 01/20/39 | | | 5,098 | | | | 5,125,805 | |
Series 2011-80, Class PB, 4.00%, 10/20/39 | | | 5,660 | | | | 5,748,632 | |
| | | | |
| SCHEDULES OF INVESTMENTS | | | 27 | |
| | |
Schedule of Investments (unaudited) (continued) June 30, 2019 | | BlackRock Income Trust, Inc. (BKT) (Percentages shown are based on Net Assets) |
| | | | | | | | |
| Security | | Par
(000) | | | Value | |
|
| Collateralized Mortgage Obligations (continued) | |
Series 2012-16, Class HJ, 4.00%, 09/20/40 | | $ | 10,000 | | | $ | 10,751,697 | |
Series 2011-88, Class PY, 4.00%, 06/20/41 | | | 15,402 | | | | 16,236,637 | |
Series 2015-96, Class ZM, 4.00%, 07/20/45 | | | 7,340 | | | | 8,435,005 | |
Series 2004-89, Class PE, 6.00%, 10/20/34 | | | 5 | | | | 5,242 | |
| | | | | | | | |
| | | | | | | 286,246,963 | |
|
| Commercial Mortgage-Backed Securities(b) — 1.7% | |
Fannie Mae Mortgage-Backed Securities,Series 2015-M1, Class X2, 0.65%, 09/25/24 | | | 37,268 | | | | 873,420 | |
FRESB Mortgage Trust, Series 2019-SB61, Class A10F, 3.17%, 01/25/29 | | | 1,270 | | | | 1,312,907 | |
Ginnie Mae Mortgage-Backed Securities, Class IO: | | | | | | | | |
Series 2017-64, 0.72%, 11/16/57 | | | 3,379 | | | | 222,109 | |
Series 2013-63, 0.79%, 09/16/51 | | | 11,719 | | | | 623,737 | |
Series 2014-169, 0.82%, 10/16/56 | | | 31,470 | | | | 1,539,661 | |
Series 2016-119, 1.12%, 04/16/58 | | | 19,514 | | | | 1,518,337 | |
Series 2016-113, 1.18%, 02/16/58 | | | 10,000 | | | | 924,161 | |
| | | | | | | | |
| | | | | | | 7,014,332 | |
|
| Interest Only Collateralized Mortgage Obligations — 9.9% | |
Fannie Mae Mortgage-Backed Securities: | | | | | | | | |
Series 1997-50, Class SI, (1 mo. LIBOR + 9.20%), 1.20%, 04/25/23(d) | | | 38 | | | | 624 | |
Series G92-60, Class SB, (11th District Cost of Funds + 9.35%), 1.60%, 10/25/22(d) | | | 18 | | | | 337 | |
Series 2013-10, Class PI, 3.00%, 02/25/43 | | | 9,927 | | | | 830,747 | |
Series 2018-21, Class IO, 3.00%, 04/25/48 | | | 20,055 | | | | 3,087,564 | |
Series 2011-134, Class ST, (1 mo. LIBOR + 6.00%), 3.60%, 12/25/41(d) | | | 10,043 | | | | 1,868,410 | |
Series 2016-81, Class CS, (1 mo. LIBOR + 6.10%), 3.70%, 11/25/46(d) | | | 7,642 | | | | 1,226,526 | |
Series 2017-70, Class SA, 3.75%, 09/25/47(b) | | | 40,727 | | | | 8,184,080 | |
Series 2015-66, Class AS, (1 mo. LIBOR + 6.25%), 3.85%, 09/25/45(d) | | | 23,742 | | | | 3,946,020 | |
Series 2012-96, Class DI, 4.00%, 02/25/27 | | | 1,828 | | | | 100,607 | |
Series 2013-45, Class EI, 4.00%, 04/25/43 | | | 4,519 | | | | 627,505 | |
Series 2011-100, Class S, (1 mo. LIBOR + 6.45%), 4.05%, 10/25/41(d) | | | 2,325 | | | | 360,896 | |
Series 2006-36, Class PS, (1 mo. LIBOR + 6.60%), 4.20%, 05/25/36(d) | | | 4,635 | | | | 920,302 | |
Series 2011-124, Class GS, (1 mo. LIBOR + 6.70%), 4.30%, 03/25/37(d) | | | 1,703 | | | | 34,635 | |
Series 2010-74, Class DI, 5.00%, 12/25/39 | | | 944 | | | | 17,501 | |
Series 1997-90, Class M, 6.00%, 01/25/28 | | | 671 | | | | 60,457 | |
Series 1999-W4, Class IO, 6.50%, 12/25/28 | | | 74 | | | | 6,240 | |
Series G92-05, Class H, 9.00%, 01/25/22 | | | — | (f) | | | 6 | |
Series 094, Class 2, 9.50%, 08/25/21 | | | — | (f) | | | 11 | |
Freddie Mac Mortgage-Backed Securities: | | | | | | | | |
Series 2559, Class IO, 0.50%, 08/15/30(b) | | | 6 | | | | 7 | |
Series 3923, Class SD, (1 mo. LIBOR + 6.00%), 3.61%, 09/15/41(d) | | | 40,645 | | | | 6,922,989 | |
Series 3954, Class SL, (1 mo. LIBOR + 6.00%), 3.61%, 11/15/41(d) | | | 22,830 | | | | 4,115,933 | |
Series 4611, Class BS, (1 mo. LIBOR + 6.10%), 3.71%, 06/15/41(d) | | | 17,541 | | | | 2,912,181 | |
Series 3744, Class PI, 4.00%, 06/15/39 | | | 5,573 | | | | 493,310 | |
Series 3796, Class WS, (1 mo. LIBOR + 6.55%), 4.16%, 02/15/40(d) | | | 3,443 | | | | 322,427 | |
Series 4026, Class IO, 4.50%, 04/15/32 | | | 1,591 | | | | 186,618 | |
Series 1043, Class H, (1 mo. LIBOR + 45.00%), 34.02%, 02/15/21(d) | | | 1 | | | | 1 | |
Ginnie Mae Mortgage-Backed Securities: | | | | | | | | |
Series 2012-97, Class JS, (1 mo. LIBOR + 6.25%), 3.86%, 08/16/42(d) | | | 12,925 | | | | 1,763,250 | |
| | | | | | | | |
| Security | | Par
(000) | | | Value | |
|
| Interest Only Collateralized Mortgage Obligations (continued) | |
Series 2009-116, Class KS, (1 mo. LIBOR + 6.47%), 4.08%, 12/16/39(d) | | $ | 808 | | | $ | 118,432 | |
Series 2011-52, Class MJ, (1 mo. LIBOR + 6.65%), 4.27%, 04/20/41(d) | | | 6,409 | | | | 942,256 | |
Series 2011-52, Class NS, 4.28%, 04/16/41(b) | | | 7,614 | | | | 1,341,633 | |
| | | | | | | | |
| | | | | | | 40,391,505 | |
|
| Mortgage-Backed Securities — 58.3% | |
Fannie Mae Mortgage-Backed Securities: | | | | | | | | |
2.50%, 07/01/34(g) | | | 340 | | | | 342,328 | |
3.50%, 07/01/49(g) | | | 8,864 | | | | 9,062,401 | |
4.00%, 01/01/41 - 01/01/57(h) | | | 112,571 | | | | 118,453,652 | |
4.50%, 08/01/25 - 09/01/41(h) | | | 37,524 | | | | 40,307,135 | |
5.00%, 01/01/23 - 07/01/49(g)(h) | | | 39,414 | | | | 42,378,775 | |
5.50%, 01/01/21 - 10/01/39(h) | | | 8,156 | | | | 9,028,599 | |
6.50%, 12/01/37 - 10/01/39 | | | 2,868 | | | | 3,366,939 | |
7.50%, 02/01/22 | | | — | (f) | | | 1 | |
Freddie Mac Mortgage-Backed Securities: | | | | | | | | |
Series T-11, Class A9, 2.48%, 01/25/28(b) | | | 445 | | | | 457,516 | |
5.00%, 02/01/22 - 04/01/22 | | | 46 | | | | 47,030 | |
5.50%, 01/01/39(h) | | | 10,898 | | | | 12,113,602 | |
9.00%, 09/01/20 | | | — | (f) | | | 80 | |
Ginnie Mae Mortgage-Backed Securities: | | | | | | | | |
5.00%, 10/20/39(h) | | | 2,793 | | | | 3,066,209 | |
7.50%, 01/15/23 - 11/15/23 | | | 32 | | | | 33,873 | |
8.00%, 10/15/22 - 08/15/27 | | | 20 | | | | 20,393 | |
9.00%, 04/15/20 - 09/15/21 | | | — | (f) | | | 614 | |
| | | | | | | | |
| | | | | | | 238,679,147 | |
|
| Principal Only Collateralized Mortgage Obligations — 0.1% | |
Fannie Mae Mortgage-Backed Securities(e): | | | | | | | | |
Series 1991-7, Class J, 0.00%, 02/25/21 | | | — | (f) | | | 299 | |
Series G93-2, Class KB, 0.00%, 01/25/23 | | | 22 | | | | 21,124 | |
Series 1993-51, Class E, 0.00%, 02/25/23 | | | 7 | | | | 7,070 | |
Series 203, Class 1, 0.00%, 02/25/23 | | | 2 | | | | 2,157 | |
Series 1993-70, Class A, 0.00%, 05/25/23 | | | 1 | | | | 1,230 | |
Series 0228, Class 1, 0.00%, 06/25/23 | | | 2 | | | | 1,913 | |
Series 1999-W4, Class PO, 0.00%, 02/25/29 | | | 36 | | | | 33,896 | |
Series 2002-13, Class PR, 0.00%, 03/25/32 | | | 61 | | | | 55,655 | |
Freddie Mac Mortgage-Backed Securities(e): | | | | | | | | |
Series 1418, Class M, 0.00%, 11/15/22 | | | 7 | | | | 6,985 | |
Series 1571, Class G, 0.00%, 08/15/23 | | | 62 | | | | 59,266 | |
Series 1691, Class B, 0.00%, 03/15/24 | | | 135 | | | | 127,940 | |
Series T-8, Class A10, 0.00%, 11/15/28 | | | 2 | | | | 2,002 | |
| | | | | | | | |
| | | | | | | 319,537 | |
| | | | | | | | |
| |
Total U.S. Government Sponsored Agency Securities — 142.6%
(Cost — $580,045,718) | | | | 583,789,858 | |
| | | | | |
| |
Total Long-Term Investments — 147.3%
(Cost — $598,655,680) | | | | 602,814,199 | |
| | | | | |
|
| Short-Term Securities — 2.0% | |
|
| Borrowed Bond Agreement(j)(k) — 0.2% | |
Credit Suisse Securities (USA) LLC, 2.43%, Open (Purchased on 8/7/18 to be repurchased at $890,225. Collateralized by U.S. Treasury Bonds, 2.75%, 11/15/42, par and fair values of $917,000 and $961,274, respectively) | | | 871 | | | | 871,150 | |
| | | | | | | | |
| |
Total Borrowed Bond Agreement — 0.2%
(Cost — $871,150) | | | | 871,150 | |
| | | | | |
| | |
| 28 | | 2019 BLACKROCK SEMI-ANNUAL REPORTTO SHAREHOLDERS |
| | |
Schedule of Investments (unaudited) (continued) June 30, 2019 | | BlackRock Income Trust, Inc. (BKT) (Percentages shown are based on Net Assets) |
| | | | | | | | |
| | |
Shares | | | Value | |
|
| Money Market Funds — 1.8% | |
BlackRock Liquidity Funds,T-Fund, Institutional Class, 2.26%(i)(l) | | | 7,466,305 | | | $ | 7,466,305 | |
| | | | | | | | |
| |
Total Money Market Funds — 1.8%
(Cost — $7,466,305) | | | | 7,466,305 | |
| | | | | |
| |
Total Short-Term Securities — 2.0%
(Cost — $8,337,455) | | | | 8,337,455 | |
| | | | | |
| |
Total Investments Before Borrowed Bonds and TBA Sale Commitments — 149.3%
(Cost — $606,993,135) | | | | 611,151,654 | |
| | | | | |
| | |
| | | Par
(000) | | | | |
|
Borrowed Bonds | |
| | |
U.S. Government Obligations | | | | | | | | |
U.S. Treasury Bonds, 2.75%, 11/15/42 | | $ | (917 | ) | | | (961,274 | ) |
| | | | | | | | |
| |
Total Borrowed Bonds — (0.2%)
(Proceeds — $842,347) | | | | (961,274 | ) |
| | | | | |
|
TBA Sale Commitments(g) — (12.3%) | |
|
Mortgage-Backed Securities — (12.3%) | |
Fannie Mae Mortgage-Backed Securities : | | | | | | | | |
2.50%, 01/01/34 | | | 160 | | | | (161,122 | ) |
3.00%, 01/01/49 | | | 21,994 | | | | (22,181,722 | ) |
3.50%, 01/01/49 | | | 5,200 | | | | (5,316,391 | ) |
4.00%, 01/01/49 | | | 20,500 | | | | (21,187,470 | ) |
5.00%, 01/01/49 | | | 1,283 | | | | (1,356,687 | ) |
| | | | | | | | |
| |
Total TBA Sale Commitments — (12.3)%
(Proceeds — $49,969,115) | | | | (50,203,392 | ) |
| | | | | |
| |
Total Investments, Net of Borrowed Bonds and TBA Sale Commitments — 136.8%
(Cost — $556,181,673) | | | | 559,986,988 | |
| |
Liabilities in Excess of Other Assets — (36.8)% | | | | (150,644,761 | ) |
| | | | | |
| |
Net Assets — 100.0% | | | $ | 409,342,227 | |
| | | | | |
| (a) | Security is valued using significant unobservable inputs and is classified as Level 3 in the fair value hierarchy. |
| (b) | Variable or floating rate security, which interest rate adjusts periodically based on changes in current interest rates and prepayments on the underlying pool of assets. Rate shown is the rate in effect as of period end. |
| (c) | Security exempt from registration pursuant to Rule 144A under the Securities Act of 1933, as amended. These securities may be resold in transactions exempt from registration to qualified institutional investors. |
| (d) | Variable rate security. Rate shown is the rate in effect as of period end. |
| (f) | Amount is less than $500. |
| (g) | Represents or includes a TBA transaction. |
| (h) | All or a portion of the security has been pledged as collateral in connection with outstanding reverse repurchase agreements. |
| (i) | Annualized7-day yield as of period end. |
| (j) | Certain agreements have no stated maturity and can be terminated by either party at any time. |
| (k) | The amount to be repurchased assumes the maturity will be the day after period end. |
| (l) | During the six months ended June 30, 2019, investments in issuers considered to be an affiliate/affiliates of the Trust for purposes of Section 2(a)(3) of the Investment Company Act of 1940, as amended, were as follows: |
| | | | | | | | | | | | | | | | | | | | | | | | | | | | |
| Affiliate | | Shares
Held at
12/31/18 | | | Net
Activity | | | Shares
Held at
06/30/19 | | | Value at
06/30/19 | | | Income | | | Net
Realized
Gain (Loss) (a) | | | Change in
Unrealized
Appreciation
(Depreciation) | |
BlackRock Liquidity Funds, T-Fund, Institutional Class | | | 6,469,268 | | | | 997,037 | | | | 7,466,305 | | | $ | 7,466,305 | | | $ | 77,385 | | | $ | — | | | $ | — | |
| | | | | | | | | | | | | | | | | | | | | | | | | | | | |
| | (a) | Includes net capital gain distributions, if applicable. | |
Reverse Repurchase Agreements
| | | | | | | | | | | | | | | | | | | | | | | | |
| Counterparty | | Interest
Rate | | | Trade
Date | | | Maturity
Date | | | Face Value | | | Face Value
Including
Accrued Interest | | | Type of Non-Cash
Underlying Collateral | | Remaining Contractual
Maturity of the Agreements |
HSBC Securities (USA), Inc. | | | 2.63 | % | | | 06/12/19 | | | | 7/15/19 | | | $ | 4,404,519 | | | $ | 4,410,311 | | | U.S. Government Sponsored Agency Securities | | Up to 30 Days |
HSBC Securities (USA), Inc. | | | 2.63 | | | | 06/12/19 | | | | 7/15/19 | | | | 11,720,903 | | | | 11,736,316 | | | U.S. Government Sponsored Agency Securities | | Up to 30 Days |
HSBC Securities (USA), Inc. | | | 2.63 | | | | 06/12/19 | | | | 7/15/19 | | | | 3,441,901 | | | | 3,446,427 | | | U.S. Government Sponsored Agency Securities | | Up to 30 Days |
HSBC Securities (USA), Inc. | | | 2.63 | | | | 06/12/19 | | | | 7/15/19 | | | | 2,928,638 | | | | 2,932,489 | | | U.S. Government Sponsored Agency Securities | | Up to 30 Days |
HSBC Securities (USA), Inc. | | | 2.63 | | | | 06/12/19 | | | | 7/15/19 | | | | 5,665,971 | | | | 5,673,422 | | | U.S. Government Sponsored Agency Securities | | Up to 30 Days |
HSBC Securities (USA), Inc. | | | 2.63 | | | | 06/12/19 | | | | 7/15/19 | | | | 17,948,134 | | | | 17,971,736 | | | U.S. Government Sponsored Agency Securities | | Up to 30 Days |
| | | | |
| SCHEDULES OF INVESTMENTS | | | 29 | |
| | |
Schedule of Investments (unaudited) (continued) June 30, 2019 | | BlackRock Income Trust, Inc. (BKT) |
Reverse Repurchase Agreements (continued)
| | | | | | | | | | | | | | | | | | | | | | | | |
| Counterparty | | Interest
Rate | | | Trade
Date | | | Maturity
Date | | | Face Value | | | Face Value
Including
Accrued Interest | | | Type of Non-Cash
Underlying Collateral | | Remaining Contractual
Maturity of the Agreements |
HSBC Securities (USA), Inc. | | | 2.63 | % | | | 06/12/19 | | | | 7/15/19 | | | $ | 2,495,653 | | | $ | 2,498,935 | | | U.S. Government Sponsored Agency Securities | | Up to 30 Days |
HSBC Securities (USA), Inc. | | | 2.63 | | | | 06/12/19 | | | | 7/15/19 | | | | 2,205,012 | | | | 2,207,912 | | | U.S. Government Sponsored Agency Securities | | Up to 30 Days |
HSBC Securities (USA), Inc. | | | 2.63 | | | | 06/12/19 | | | | 7/15/19 | | | | 7,530,388 | | | | 7,540,291 | | | U.S. Government Sponsored Agency Securities | | Up to 30 Days |
HSBC Securities (USA), Inc. | | | 2.63 | | | | 06/12/19 | | | | 7/15/19 | | | | 17,805,432 | | | | 17,828,846 | | | U.S. Government Sponsored Agency Securities | | Up to 30 Days |
HSBC Securities (USA), Inc. | | | 2.63 | | | | 06/12/19 | | | | 7/15/19 | | | | 43,101,556 | | | | 43,158,235 | | | U.S. Government Sponsored Agency Securities | | Up to 30 Days |
HSBC Securities (USA), Inc. | | | 2.63 | | | | 06/12/19 | | | | 7/15/19 | | | | 6,025,855 | | | | 6,033,779 | | | U.S. Government Sponsored Agency Securities | | Up to 30 Days |
HSBC Securities (USA), Inc. | | | 2.63 | | | | 06/12/19 | | | | 7/15/19 | | | | 5,780,266 | | | | 5,787,866 | | | U.S. Government Sponsored Agency Securities | | Up to 30 Days |
HSBC Securities (USA), Inc. | | | 2.63 | | | | 06/12/19 | | | | 7/15/19 | | | | 11,458,129 | | | | 11,473,197 | | | U.S. Government Sponsored Agency Securities | | Up to 30 Days |
HSBC Securities (USA), Inc. | | | 2.63 | | | | 06/12/19 | | | | 7/15/19 | | | | 2,554,596 | | | | 2,557,955 | | | U.S. Government Sponsored Agency Securities | | Up to 30 Days |
HSBC Securities (USA), Inc. | | | 2.63 | | | | 06/12/19 | | | | 7/15/19 | | | | 9,258,617 | | | | 9,270,792 | | | U.S. Government Sponsored Agency Securities | | Up to 30 Days |
HSBC Securities (USA), Inc. | | | 2.63 | | | | 06/12/19 | | | | 7/15/19 | | | | 2,239,746 | | | | 2,242,691 | | | U.S. Government Sponsored Agency Securities | | Up to 30 Days |
HSBC Securities (USA), Inc. | | | 2.63 | | | | 06/12/19 | | | | 7/15/19 | | | | 1,022,324 | | | | 1,023,668 | | | U.S. Government Sponsored Agency Securities | | Up to 30 Days |
HSBC Securities (USA), Inc. | | | 2.63 | | | | 06/12/19 | | | | 7/15/19 | | | | 7,677,066 | | | | 7,687,162 | | | U.S. Government Sponsored Agency Securities | | Up to 30 Days |
HSBC Securities (USA), Inc. | | | 2.63 | | | | 06/12/19 | | | | 7/15/19 | | | | 990,957 | | | | 992,259 | | | U.S. Government Sponsored Agency Securities | | Up to 30 Days |
HSBC Securities (USA), Inc. | | | 2.63 | | | | 06/12/19 | | | | 7/15/19 | | | | 3,444,858 | | | | 3,449,388 | | | U.S. Government Sponsored Agency Securities | | Up to 30 Days |
HSBC Securities (USA), Inc. | | | 2.63 | | | | 06/12/19 | | | | 7/15/19 | | | | 2,614,644 | | | | 2,618,082 | | | U.S. Government Sponsored Agency Securities | | Up to 30 Days |
HSBC Securities (USA), Inc. | | | 2.63 | | | | 06/12/19 | | | | 7/15/19 | | | | 6,416,534 | | | | 6,424,972 | | | U.S. Government Sponsored Agency Securities | | Up to 30 Days |
HSBC Securities (USA), Inc. | | | 2.63 | | | | 06/12/19 | | | | 7/15/19 | | | | 4,363,062 | | | | 4,368,799 | | | U.S. Government Sponsored Agency Securities | | Up to 30 Days |
| | | | | | | | | | | | | | | | | | | | | | | | |
| | | $ | 183,094,761 | | | $ | 183,335,530 | | | | | |
| | | | | | | | | | | | | |
Derivative Financial Instruments Outstanding as of Period End
Futures Contracts
| | | | | | | | | | | | | | | | |
| Description | | Number of
Contracts | | | Expiration
Date | | | Notional
Amount (000) | | | Value /
Unrealized
Appreciation
(Depreciation) | |
Long Contracts | | | | | | | | | | | | | | | | |
10-Year U.S. Treasury Note | | | 223 | | | | 09/19/19 | | | $ | 28,537 | | | $ | 345,175 | |
| | | | | | | | | | | | | | | | |
Short Contracts | |
90-Day Euro-Dollar | | | 54 | | | | 09/16/19 | | | | 13,229 | | | | (108,170 | ) |
10-Year U.S. Ultra Long Treasury Note | | | 243 | | | | 09/19/19 | | | | 33,564 | | | | (612,382 | ) |
Long U.S. Treasury Bond | | | 318 | | | | 09/19/19 | | | | 49,479 | | | | (1,340,434 | ) |
5-Year U.S. Treasury Note | | | 720 | | | | 09/30/19 | | | | 85,073 | | | | (916,708 | ) |
90-Day Euro-Dollar | | | 48 | | | | 12/16/19 | | | | 11,771 | | | | (117,703 | ) |
90-Day Euro Dollar | | | 40 | | | | 03/16/20 | | | | 9,829 | | | | (117,164 | ) |
90-Day Euro-Dollar | | | 94 | | | | 06/15/20 | | | | 23,119 | | | | (314,433 | ) |
90-Day Euro Dollar | | | 94 | | | | 09/14/20 | | | | 23,135 | | | | (356,759 | ) |
| | | | | | | | | | | | | | | | |
| | | | | | | | | | | | | | | (3,883,753 | ) |
| | | | | | | | | | | | | | | | |
Net unrealized depreciation | | | | | | | | | | | | | | $ | (3,538,578 | ) |
| | | | | | | | | | | | | | | | |
Centrally Cleared Interest Rate Swaps
| | | | | | | | | | | | | | | | | | | | | | | | | | | | | | | | |
| Paid by the Trust | | Received by the Trust | | Effective
Date (a) | | | Termination
Date | | | Notional
Amount (000) | | | Value | | | Upfront
Premium
Paid
(Received) | | | Unrealized
Appreciation
(Depreciation) | |
| Rate | | Frequency | | Rate | | Frequency |
| 2.35% | | Semi-Annual | | 3-Month LIBOR, 2.32% | | Quarterly | | | 07/03/19 | | | | 08/31/23 | | | USD | | | 12,100 | | | $ | (299,258 | ) | | $ | 158 | | | $ | (299,416 | ) |
| 2.30% | | Semi-Annual | | 3-Month LIBOR, 2.32% | | Quarterly | | | 07/03/19 | | | | 08/31/23 | | | USD | | | 14,100 | | | | (322,940 | ) | | | 184 | | | | (323,124 | ) |
| | | | | | | | | | | | | | | | | | | | | | | | | | | | | | | | |
| | | | | | | | | | | | | | | | | | | | | | $ | (622,198 | ) | | $ | 342 | | | $ | (622,540 | ) |
| | | | | | | | | | | | | | | | | | | | | | | | | | | | | | | | |
| | |
| 30 | | 2019 BLACKROCK SEMI-ANNUAL REPORTTO SHAREHOLDERS |
| | |
Schedule of Investments (unaudited) (continued) June 30, 2019 | | BlackRock Income Trust, Inc. (BKT) |
OTC Interest Rate Swaps
| | | | | | | | | | | | | | | | | | | | | | | | | | | | | | | | | | | | |
Paid by the Trust | | Received by the Trust | | Counterparty | | Effective
Date | | | Termination
Date | | | Notional
Amount (000) | | | Value | | | Upfront
Premium
Paid
(Received) | | | Unrealized
Appreciation
(Depreciation) | |
| Rate | | Frequency | | Rate | | Frequency |
| 3-Month LIBOR, 2.32% | | Quarterly | | 3.43% | | Semi-Annual | | JPMorgan Chase Bank N.A. | | | N/A | | | | 03/28/21 | | | | USD | | | | 6,000 | | | $ | 217,014 | | | $ | (50,826 | ) | | $ | 267,840 | |
| 3-Month LIBOR, 2.32% | | Quarterly | | 5.41% | | Semi-Annual | | JPMorgan Chase Bank N.A. | | | N/A | | | | 08/15/22 | | | | USD | | | | 9,565 | | | | 1,232,628 | | | | — | | | | 1,232,628 | |
| | | | | | | | | | | | | | | | | | | | | | | | | | | | | | | | | | | | |
| | | | | | | | | | | | | | | | | | | | | | | | | | $ | 1,449,642 | | | $ | (50,826 | ) | | $ | 1,500,468 | |
| | | | | | | | | | | | | | | | | | | | | | | | | | | | | | | | | | | | |
Balances Reported in the Statements of Assets and Liabilities for Centrally Cleared Swaps and OTC Swaps
| | | | | | | | | | | | | | | | |
| | | Swap
Premiums
Paid | | | Swap
Premiums
Received | | | Unrealized
Appreciation | | | Unrealized
Depreciation | |
Centrally Cleared Swaps(a) | | $ | 342 | | | $ | — | | | $ | — | | | $ | (622,540 | ) |
OTC Swaps | | | — | | | | (50,826 | ) | | | 1,500,468 | | | | — | |
| | (a) | Includes cumulative appreciation (depreciation) on centrally cleared swaps, as reported in the Schedule of Investments. Only current day’s variation margin is reported within the Statements of Assets and Liabilities and is net of any previously paid (received) swap premium amounts. | |
Derivative Financial Instruments Categorized by Risk Exposure
As of period end, the fair values of derivative financial instruments located in the Statements of Assets and Liabilities were as follows:
| | | | | | | | | | | | | | | | | | | | | | | | | | | | |
| | | Commodity
Contracts | | | Credit
Contracts | | | Equity
Contracts | | | Foreign
Currency
Exchange
Contracts | | | Interest
Rate
Contracts | | | Other Contracts | | | Total | |
Assets — Derivative Financial Instruments | | | | | | | | | | | | | | | | | | | | | | | | | | | | |
Futures contracts | | | | | | | | | | | | | | | | | | | | | | | | | | | | |
Unrealized appreciation on futures contracts(a) | | $ | — | | | $ | — | | | $ | — | | | $ | — | | | $ | 345,175 | | | $ | — | | | $ | 345,175 | |
Swaps — OTC | | | | | | | | | | | | | | | | | | | | | | | | | | | | |
Unrealized appreciation on OTC swaps; Swap premiums paid | | | — | | | | — | | | | — | | | | — | | | | 1,500,468 | | | | — | | | | 1,500,468 | |
| | | | | | | | | | | | | | | | | | | | | | | | | | | | |
| | $ | — | | | $ | — | | | $ | — | | | $ | — | | | $ | 1,845,643 | | | $ | — | | | $ | 1,845,643 | |
| | | | | | | | | | | | | | | | | | | | | | | | | | | | |
| | | | | | | | | | | | | | | | | | | | | | | | | | | | |
| | | Commodity
Contracts | | | Credit
Contracts | | | Equity
Contracts | | | Foreign
Currency
Exchange
Contracts | | | Interest
Rate
Contracts | | | Other Contracts | | | Total | |
Liabilities — Derivative Financial Instruments | | | | | | | | | | | | | | | | | | | | | | | | | | | | |
Futures contracts | | | | | | | | | | | | | | | | | | | | | | | | | | | | |
Unrealized depreciation on futures contracts(a) | | $ | — | | | $ | — | | | $ | — | | | $ | — | | | $ | 3,883,753 | | | $ | — | | | $ | 3,883,753 | |
Swaps — centrally cleared | | | | | | | | | | | | | | | | | | | | | | | | | | | | |
Unrealized depreciation on centrally cleared swaps(a) | | | — | | | | — | | | | — | | | | — | | | | 622,540 | | | | — | | | | 622,540 | |
Swaps — OTC | | | | | | | | | | | | | | | | | | | | | | | | | | | | |
Unrealized depreciation on OTC swaps; Swap premiums received | | | — | | | | — | | | | — | | | | — | | | | 50,826 | | | | — | | | | 50,826 | |
| | | | | | | | | | | | | | | | | | | | | | | | | | | | |
| | $ | — | | | $ | — | | | $ | — | | | $ | — | | | $ | 4,557,119 | | | $ | — | | | $ | 4,557,119 | |
| | | | | | | | | | | | | | | | | | | | | | | | | | | | |
| | (a) | Net cumulative unrealized appreciation (depreciation) on futures contracts and centrally cleared swaps, if any, are reported in the Schedule of Investments. In the Statements of Assets and Liabilities, only current day’s variation margin is reported in receivables or payables and the net cumulative unrealized appreciation (depreciation) is included in accumulated earnings (loss). | |
| | | | |
| SCHEDULES OF INVESTMENTS | | | 31 | |
| | |
Schedule of Investments (unaudited) (continued) June 30, 2019 | | BlackRock Income Trust, Inc. (BKT) |
For the six months ended June 30, 2019, the effect of derivative financial instruments in the Statements of Operations was as follows:
| | | | | | | | | | | | | | | | | | | | | | | | | | | | |
| | | Commodity
Contracts | | | Credit
Contracts | | | Equity
Contracts | | | Foreign
Currency
Exchange
Contracts | | | Interest
Rate
Contracts | | | Other Contracts | | | Total | |
Net Realized Gain (Loss) from: | | | | | | | | | | | | | | | | | | | | | | | | | | | | |
Futures contracts | | $ | — | | | $ | — | | | $ | — | | | $ | — | | | $ | (8,633,847 | ) | | $ | — | | | $ | (8,633,847 | ) |
Swaps | | | — | | | | — | | | | — | | | | — | | | | 167,182 | | | | | | | | 167,182 | |
| | | | | | | | | | | | | | | | | | | | | | | | | | | | |
| | $ | — | | | $ | — | | | $ | — | | | $ | — | | | $ | (8,466,665 | ) | | $ | — | | | $ | (8,466,665 | ) |
| | | | | | | | | | | | | | | | | | | | | | | | | | | | |
| | | | | | | |
| Net Change in Unrealized Appreciation (Depreciation) on: | | | | | | | | | | | | | | | | | | | | | |
Futures contracts | | $ | — | | | $ | — | | | $ | — | | | $ | — | | | $ | 932,747 | | | $ | — | | | $ | 932,747 | |
Swaps | | | — | | | | — | | | | — | | | | — | | | | (443,662 | ) | | | — | | | | (443,662 | ) |
| | | | | | | | | | | | | | | | | | | | | | | | | | | | |
| | $ | — | | | $ | — | | | $ | — | | | $ | — | | | $ | 489,085 | | | $ | — | | | $ | 489,085 | |
| | | | | | | | | | | | | | | | | | | | | | | | | | | | |
Average Quarterly Balances of Outstanding Derivative Financial Instruments
| | | | |
Futures contracts: | |
Average notional value of contracts — long | | $ | 22,466,953 | |
Average notional value of contracts — short | | $ | 265,829,284 | |
Interest rate swaps: | |
Average notional value — pay fixed rate | | $ | 13,100,000 | |
Average notional value — receives fixed rate | | $ | 15,565,000 | |
For more information about the Trust investment risks regarding derivative financial instruments, refer to the Notes to Financial Statements.
Derivative Financial Instruments — Offsetting as of Period End
The Trust’s derivative assets and liabilities (by type) were as follows:
| | | | | | | | |
| | | Assets | | | Liabilities | |
Futures contracts | | $ | 63,194 | | | $ | 7,594 | |
Swaps — centrally cleared | | | 10,282 | | | | — | |
Swaps — OTC(a) | | | 1,500,468 | | | | 50,826 | |
| | | | | | | | |
Total derivative assets and liabilities in the Statements of Assets and Liabilities | | $ | 1,573,944 | | | $ | 58,420 | |
Derivatives not subject to a Master Netting Agreement or similar agreement (“MNA”) | | | (73,476 | ) | | | (7,594 | ) |
| | | | | | | | |
Total derivative assets and liabilities subject to an MNA | | $ | 1,500,468 | | | $ | 50,826 | |
| | | | | | | | |
| | (a) | Includes unrealized appreciation (depreciation) on OTC swaps and swap premiums (paid/received) in the Statements of Assets and Liabilities. | |
The following table presents the Trust’s derivative assets (and liabilities) by counterparty net of amounts available for offset under an MNA and net of the related collateral received (and pledged ) by the Trust:
| | | | | | | | | | | | | | | | | | | | |
| Counterparty | | Derivative Assets
Subject to an MNA by
Counterparty | | | Derivatives
Available
for Offset (a) | | | Non-cash
Collateral
Received | | | Cash
Collateral
Received | | | Net Amount
of Derivative
Assets (b) | |
JPMorgan Chase Bank N.A. | | $ | 1,500,468 | | | $ | (50,826 | ) | | $ | — | | | $ | (1,340,000 | ) | | $ | 109,642 | |
| | | | | | | | | | | | | | | | | | | | |
| | | | | | | | | | | | | | | | | | | | |
| Counterparty | | Derivative Liabilities
Subject to an MNA by
Counterparty | | | Derivatives
Available
for Offset (a) | | | Non-cash
Collateral
Pledged | | | Cash
Collateral
Pledged | | | Net Amount
of Derivative
Liabilities | |
JPMorgan Chase Bank N.A. | | $ | 50,826 | | | $ | (50,826 | ) | | $ | — | | | $ | — | | | $ | — | |
| | | | | | | | | | | | | | | | | | | | |
| | (a) | The amount of derivatives available for offset is limited to the amount of derivative asset and/or liabilities that are subject to an MNA. | |
| | (b) | Net amount represents the net amount receivable from the counterparty in the event of default. | |
| | |
| 32 | | 2019 BLACKROCK SEMI-ANNUAL REPORTTO SHAREHOLDERS |
| | |
Schedule of Investments (unaudited) (continued) June 30, 2019 | | BlackRock Income Trust, Inc. (BKT) |
Fair Value Hierarchy as of Period End
Various inputs are used in determining the fair value of investments and derivative financial instruments. For information about the Trust’s policy regarding valuation of investments and derivative financial instruments, refer to the Notes to Financial Statements.
The following tables summarize the Trust’s investments and derivative financial instruments categorized in the disclosure hierarchy:
| | | | | | | | | | | | | | | | |
| | | Level 1 | | | Level 2 | | | Level 3 | | | Total | |
Assets: | |
Investments: | |
Long-Term Investments: | |
Asset-Backed Securities | | $ | — | | | $ | — | | | $ | 100,397 | | | $ | 100,397 | |
Non-Agency Mortgage-Backed Securities | | | — | | | | 18,923,944 | | | | — | | | | 18,923,944 | |
U.S. Government Sponsored Agency Securities | | | — | | | | 582,614,962 | | | | 1,174,896 | | | | 583,789,858 | |
Short-Term Securities: | |
Money Market Funds | | | 7,466,305 | | | | — | | | | — | | | | 7,466,305 | |
Borrowed Bond Agreement | | | — | | | | 871,150 | | | | — | | | | 871,150 | |
| | | | | | | | | | | | | | | | |
| | $ | 7,466,305 | | | $ | 602,410,056 | | | $ | 1,275,293 | | | $ | 611,151,654 | |
| | | | | | | | | | | | | | | | |
Liabilities: | |
Investments: | |
Borrowed Bonds | | $ | — | | | $ | (961,274 | ) | | $ | — | | | $ | (961,274 | ) |
TBA Sale Commitments | | | — | | | | (50,203,392 | ) | | | — | | | | (50,203,392 | ) |
| | | | | | | | | | | | | | | | |
| | $ | 7,466,305 | | | $ | 551,245,390 | | | $ | 1,275,293 | | | $ | 559,986,988 | |
| | | | | | | | | | | | | | | | |
Derivative Financial Instruments(a) | |
Assets: | |
Interest rate contracts | | $ | 345,175 | | | $ | 1,500,468 | | | $ | — | | | $ | 1,845,643 | |
Liabilities: | |
Interest rate contracts | | | (3,883,753 | ) | | | (622,540 | ) | | | — | | | | (4,506,293 | ) |
| | | | | | | | | | | | | | | | |
| | $ | (3,538,578 | ) | | $ | 877,928 | | | $ | — | | | $ | (2,660,650 | ) |
| | | | | | | | | | | | | | | | |
| | (a) | Derivative financial instruments are swaps and futures contracts. Swaps and futures contracts are valued at the unrealized appreciation (depreciation) on the instrument. | |
The Trust may hold assets and/or liabilities in which the fair value approximates the carrying amount for financial statement purposes. As of period end, reverse repurchase agreements of $183,335,530 are categorized as Level 2 within the disclosure hierarchy.
See notes to financial statements.
| | | | |
| SCHEDULES OF INVESTMENTS | | | 33 | |
Statements of Assets and Liabilities (unaudited)
June 30, 2019
| | | | | | | | |
| | | BGIO | | | BKT | |
|
ASSETS | |
Investments at value — unaffiliated(a) | | $ | 271,491,792 | | | $ | 603,685,349 | |
Investments at value — affiliated(b) | | | 1,875,883 | | | | 7,466,305 | |
Cash | | | 89,745 | | | | — | |
Cash pledged: | |
Futures contracts | | | 128,000 | | | | 1,524,260 | |
Collateral — OTC derivatives | | | 220,000 | | | | — | |
Centrally cleared swaps | | | 85,000 | | | | 356,000 | |
Foreign currency at value(c) | | | 1,084,871 | | | | — | |
Receivables: | | | | |
Investments sold | | | 2,848,243 | | | | 67,484 | |
TBA sale commitments | | | — | | | | 49,969,115 | |
Dividends — affiliated | | | 7,374 | | | | 29,510 | |
Interest — unaffiliated | | | 3,703,631 | | | | 2,173,657 | |
Variation margin on futures contracts | | | 12,185 | | | | 63,194 | |
Variation margin on centrally cleared swaps | | | — | | | | 10,282 | |
Swap premiums paid | | | 5,093 | | | | — | |
Unrealized appreciation on: | |
Forward foreign currency exchange contracts | | | 15,869 | | | | — | |
OTC swaps | | | 589,873 | | | | 1,500,468 | |
Prepaid expenses | | | 43,304 | | | | 14,266 | |
| | | | | | | | |
Total assets | | | 282,200,863 | | | | 666,859,890 | |
| | | | | | | | |
|
LIABILITIES | |
Borrowed bonds at value(d) | | | — | | | | 961,274 | |
Bank overdraft | | | — | | | | 53,159 | |
Reverse repurchase agreements at value | | | 59,844,281 | | | | 183,335,530 | |
TBA sale commitments at value(e) | | | — | | | | 50,203,392 | |
Cash received: | |
Collateral — OTC derivatives | | | — | | | | 1,340,000 | |
Collateral — TBA sale commitments | | | — | | | | 11,000 | |
Payables: | |
Investments purchased | | | 5,793,530 | | | | 20,702,865 | |
Administration fees | | | — | | | | 50,278 | |
Income dividend distributions | | | 67,231 | | | | 55,514 | |
Interest expense | | | — | | | | 3,221 | |
Investment advisory fees | | | 133,391 | | | | 217,492 | |
Trustees’ and Officer’s fees | | | 351 | | | | 225,029 | |
Other accrued expenses | | | 193,513 | | | | 300,489 | |
Variation margin on futures contracts | | | 6,500 | | | | 7,594 | |
Variation margin on centrally cleared swaps | | | 1,881 | | | | — | |
Swap premiums received | | | 850,506 | | | | 50,826 | |
Unrealized depreciation on: | |
Forward foreign currency exchange contracts | | | 521,420 | | | | — | |
OTC swaps | | | 11,482 | | | | — | |
| | | | | | | | |
Total liabilities | | | 67,424,086 | | | | 257,517,663 | |
| | | | | | | | |
| | |
NET ASSETS | | $ | 214,776,777 | | | $ | 409,342,227 | |
| | | | | | | | |
|
NET ASSETS CONSIST OF | |
Paid-in capital(f)(g)(h) | | $ | 217,531,215 | | | $ | 473,431,433 | |
Accumulated loss | | | (2,754,438 | ) | | | (64,089,206 | ) |
| | | | | | | | |
NET ASSETS | | $ | 214,776,777 | | | $ | 409,342,227 | |
| | | | | | | | |
| | |
Net asset value | | $ | 9.71 | | | $ | 6.42 | |
| | | | | | | | |
| | |
(a) Investments at cost — unaffiliated | | $ | 269,340,560 | | | $ | 599,526,830 | |
(b) Investments at cost — affiliated | | $ | 1,875,883 | | | $ | 7,466,305 | |
(c) Foreign currency at cost | | $ | 1,086,756 | | | $ | — | |
(d) Proceeds received from borrowed bonds | | $ | — | | | $ | 842,347 | |
(e) Proceeds from TBA sale commitments | | $ | — | | | $ | 49,969,115 | |
(f) Shares outstanding | | | 22,128,879 | | | | 63,797,112 | |
(g) Shares authorized | | | Unlimited | | | | 200,000,000 | |
(g) Par value | | $ | 0.001 | | | $ | 0.010 | |
See notes to financial statements.
| | |
| 34 | | 2019 BLACKROCK SEMI-ANNUAL REPORTTO SHAREHOLDERS |
Statements of Operations (unaudited)
Six Months Ended June 30, 2019
| | | | | | | | |
| | | BGIO | | | BKT | |
|
INVESTMENT INCOME | |
Interest — unaffiliated | | $ | 8,021,123 | | | $ | 12,214,497 | |
Dividends — affiliated | | | 42,295 | | | | 77,385 | |
| | | | | | | | |
Total investment income | | | 8,063,418 | | | | 12,291,882 | |
| | | | | | | | |
|
EXPENSES | |
Investment advisory | | | 797,898 | | | | 1,295,171 | |
Administration | | | — | | | | 298,886 | |
Professional | | | 51,392 | | | | 95,503 | |
Accounting services | | | 28,751 | | | | 46,751 | |
Transfer agent | | | 13,607 | | | | 57,542 | |
Custodian | | | 10,626 | | | | 16,119 | |
Trustees and Officer | | | 8,553 | | | | 26,163 | |
Printing | | | 8,124 | | | | 7,976 | |
Registration | | | 4,547 | | | | 11,865 | |
Miscellaneous | | | 14,295 | | | | 23,468 | |
| | | | | | | | |
Total expenses excluding interest expense | | | 937,793 | | | | 1,879,444 | |
Interest expense | | | 896,720 | | | | 2,451,108 | |
| | | | | | | | |
Total expenses | | | 1,834,513 | | | | 4,330,552 | |
Less fees waived and/or reimbursed by the Manager | | | (1,339 | ) | | | (2,427 | ) |
| | | | | | | | |
Total expenses after fees waived and/or reimbursed | | | 1,833,174 | | | | 4,328,125 | |
| | | | | | | | |
Net investment income | | | 6,230,244 | | | | 7,963,757 | |
| | | | | | | | |
|
REALIZED AND UNREALIZED GAIN (LOSS) | |
Net realized gain (loss) from: | |
Investments — unaffiliated | | | (366,079 | ) | | | (9,739,439 | ) |
Futures contracts | | | (435,954 | ) | | | (8,633,847 | ) |
Forward foreign currency exchange contracts | | | 436,702 | | | | — | |
Foreign currency transactions | | | 2,308 | | | | — | |
Swaps | | | 233,564 | | | | 167,182 | |
| | | | | | | | |
| | | (129,459 | ) | | | (18,206,104 | ) |
| | | | | | | | |
Net change in unrealized appreciation (depreciation) on: | | | | | | | | |
Investments — unaffiliated | | | 15,392,417 | | | | 31,524,034 | |
Futures contracts | | | (84,976 | ) | | | 932,747 | |
Forward foreign currency exchange contracts | | | (232,403 | ) | | | — | |
Foreign currency translations | | | 10,411 | | | | — | |
Swaps | | | 850,334 | | | | (443,662 | ) |
Borrowed bonds | | | — | | | | (84,500 | ) |
| | | | | | | | |
| | | 15,935,783 | | | | 31,928,619 | |
| | | | | | | | |
Net realized and unrealized gain | | | 15,806,324 | | | | 13,722,515 | |
| | | | | | | | |
NET INCREASE IN NET ASSETS RESULTING FROM OPERATIONS | | $ | 22,036,568 | | | $ | 21,686,272 | |
| | | | | | | | |
See notes to financial statements.
Statements of Changes in Net Assets
| | | | | | | | | | | | | | | | | | | | | | | | |
| | | BGIO | | | | | | BKT | |
| | | Six Months Ended
06/30/19 (unaudited) | | | Year Ended 12/31/18 | | | | | | Six Months Ended
06/30/19 (unaudited) | | | Period from
09/01/18 to 12/31/18 | | | Year Ended 08/31/18 | |
| | | | | | |
INCREASE (DECREASE) IN NET ASSETS | | | | | | | | | | | | | | | | | | | | | | | | |
| | | | | | |
OPERATIONS | | | | | | | | | | | | | | | | | | | | | | | | |
Net investment income | | $ | 6,230,244 | | | $ | 13,829,737 | | | | | | | $ | 7,963,757 | | | $ | 5,356,949 | | | $ | 15,380,273 | |
Net realized gain (loss) | | | (129,459 | ) | | | (5,759,750 | ) | | | | | | | (18,206,104 | ) | | | 1,883,503 | | | | 3,580 | |
Net change in unrealized appreciation (depreciation) | | | 15,935,783 | | | | (17,511,117 | ) | | | | | | | 31,928,619 | | | | (401,364 | ) | | | (21,780,683 | ) |
| | | | | | | | | | | | | | | | | | | | | | | | |
Net increase (decrease) in net assets resulting from operations | | | 22,036,568 | | | | (9,441,130 | ) | | | | | | | 21,686,272 | | | | 6,839,088 | | | | (6,396,830 | ) |
| | | | | | | | | | | | | | | | | | | | | | | | |
| | | | | | |
DISTRIBUTIONS TO SHAREHOLDERS(a) | | | | | | | | | | | | | | | | | | | | | | | | |
From net investment income | | | (5,532,220 | )(b) | | | (13,277,327 | ) | | | | | | | (10,973,103 | )(b) | | | (8,502,470 | ) | | | (19,309,786 | ) |
From return of capital | | | — | | | | — | | | | | | | | — | | | | (2,470,634 | ) | | | (1,505,499 | ) |
| | | | | | | | | | | | | | | | | | | | | | | | |
Decrease in net assets resulting from distributions to shareholders | | | (5,532,220 | ) | | | (13,277,327 | ) | | | | | | | (10,973,103 | ) | | | (10,973,104 | ) | | | (20,815,285 | ) |
| | | | | | | | | | | | | | | | | | | | | | | | |
| | | | | | |
CAPITAL SHARE TRANSACTIONS | | | | | | | | | | | | | | | | | | | | | | | | |
Cost of shares repurchased | | | — | | | | — | | | | | | | | — | | | | — | | | | (854,488 | ) |
| | | | | | | | | | | | | | | | | | | | | | | | |
| | | | | | |
NET ASSETS | | | | | | | | | | | | | | | | | | | | | | | | |
Total increase (decrease) in net assets | | | 16,504,348 | | | | (22,718,457 | ) | | | | | | | 10,713,169 | | | | (4,134,016 | ) | | | (28,066,603 | ) |
Beginning of period | | | 198,272,429 | | | | 220,990,886 | | | | | | | | 398,629,058 | | | | 402,763,074 | | | | 430,829,677 | |
| | | | | | | | | | | | | | | | | | | | | | | | |
End of period | | $ | 214,776,777 | | | $ | 198,272,429 | | | | | | | $ | 409,342,227 | | | $ | 398,629,058 | | | $ | 402,763,074 | |
| | | | | | | | | | | | | | | | | | | | | | | | |
| (a) | Distributions for annual periods determined in accordance with U.S. federal income tax regulations. |
| (b) | A portion of the distributions from net investment income may be deemed a return of capital or net realized gain at fiscal year end. |
See notes to financial statements.
| | |
| 36 | | 2019 BLACKROCK SEMI-ANNUAL REPORTTO SHAREHOLDERS |
Statements of Cash Flows (unaudited)
Six Months Ended June 30, 2019
| | | | | | | | |
| | | BGIO | | | BKT | |
|
CASH PROVIDED BY (USED FOR) OPERATING ACTIVITIES | |
Net increase in net assets resulting from operations | | $ | 22,036,568 | | | | 21,686,272 | |
Adjustments to reconcile net increase in net assets resulting from operations to net cash provided by (used for) operating activities: | |
Proceeds from sales of long-term investments and principal paydowns | | | 53,661,570 | | | | 570,522,277 | |
Purchases of long-term investments | | | (63,321,726 | ) | | | (557,264,598 | ) |
Net purchases of short-term securities | | | (840,848 | ) | | | (997,037 | ) |
Amortization of premium and accretion of discount on investments and other fees | | | 361,358 | | | | 4,314,467 | |
Net realized loss on investments | | | 366,079 | | | | 9,739,439 | |
Net unrealized appreciation on investments, swaps and foreign currency translations | | | (15,848,499 | ) | | | (31,618,412 | ) |
|
(Increase) Decrease in Assets: | |
Receivables: | |
Dividends — affiliated | | | (3,455 | ) | | | (15,844 | ) |
Interest — unaffiliated | | | (138,970 | ) | | | 134,294 | |
Variation margin on futures contracts | | | (12,185 | ) | | | (34,678 | ) |
Variation margin on centrally cleared swaps | | | 8,225 | | | | (10,282 | ) |
Swap premiums paid | | | 525 | | | | — | |
Prepaid expenses | | | (41,916 | ) | | | (11,760 | ) |
|
Increase (Decrease) in Liabilities: | |
Cash received as collateral for OTC derivatives | | | (270,000 | ) | | | 330,000 | |
Payables: | |
Administration fees | | | — | | | | (369 | ) |
Investment advisory fees | | | 7,815 | | | | (1,771 | ) |
Interest expense | | | 311,734 | | | | (372,549 | ) |
Trustees’ and Officer’s fees | | | (4,275 | ) | | | 2,627 | |
Variation margin on futures contracts | | | (15,073 | ) | | | (468,160 | ) |
Variation margin on centrally cleared swaps | | | 1,881 | | | | — | |
Other accrued expenses | | | 88,596 | | | | 163,965 | |
Swap premiums received | | | (233,882 | ) | | | (13,905 | ) |
| | | | | | | | |
Net cash provided by (used for) operating activities | | | (3,886,478 | ) | | | 16,083,976 | |
| | | | | | | | |
|
CASH PROVIDED BY (USED FOR) FINANCING ACTIVITIES | |
Net borrowing of reverse repurchase agreements | | | 8,556,059 | | | | (3,090,739 | ) |
Cash dividends paid to Common Shareholders | | | (6,571,433 | ) | | | (13,112,210 | ) |
Increase in bank overdraft | | | — | | | | 1,973 | |
| | | | | | | | |
Net cash (provided by) used for financing activities | | | 1,984,626 | | | | (16,200,976 | ) |
| | | | | | | | |
|
CASH IMPACT FROM FOREIGN EXCHANGE FLUCTUATIONS | |
Cash impact from foreign exchange fluctuations | | $ | 9,467 | | | $ | — | |
| | | | | | | | |
| | |
CASH AND FOREIGN CURRENCY | | | | | | | | |
Net decrease in restricted and unrestricted cash and foreign currency | | | (1,892,385 | ) | | | (117,000 | ) |
Restricted and unrestricted cash and foreign currency at beginning of period | | | 3,500,001 | | | | 1,997,260 | |
Restricted and unrestricted cash and foreign currency at end of period | | $ | 1,607,616 | | | $ | 1,880,260 | |
| | | | | | | | |
|
SUPPLEMENTAL DISCLOSURE OF CASH FLOW INFORMATION | |
Cash paid during the period for interest expense | | $ | 584,986 | | | $ | 2,823,657 | |
| | | | | | | | |
| | |
RECONCILIATION OF RESTRICTED AND UNRESTRICTED CASH AND FOREIGN CURRENCY AT THE END OF PERIOD TO THE STATEMENTS OF ASSETS AND LIABILITIES | | | | | | | | |
Cash | | $ | 89,745 | | | $ | — | |
Cash pledged: | |
Collateral — OTC derivatives | | | 220,000 | | | | — | |
Futures contracts | | | 128,000 | | | | 1,524,260 | |
Centrally cleared swaps | | | 85,000 | | | | 356,000 | |
Foreign currency at value | | | 1,084,871 | | | | — | |
| | | | | | | | |
| | $ | 1,607,616 | | | $ | 1,880,260 | |
| | | | | | | | |
See notes to financial statements.
Statements of Cash Flows (unaudited) (continued)
Six Months Ended June 30, 2019
| | | | | | | | |
| | | BGIO | | | BKT | |
| | |
RECONCILIATION OF RESTRICTED AND UNRESTRICTED CASH AND FOREIGN CURRENCY AT THE BEGINNING OF PERIOD TO THE STATEMENTS OF ASSETS AND LIABILITIES | | | | | | | | |
Cash | | $ | 43,062 | | | $ | — | |
Cash pledged: | |
Collateral — reverse repurchase agreements | | | — | | | | 216,000 | |
Collateral — OTC derivatives | | | 1,030,000 | | | | — | |
Futures contracts | | | 73,000 | | | | 1,781,260 | |
Centrally cleared swaps | | | 86,000 | | | | — | |
Foreign currency at value | | | 2,267,939 | | | | — | |
| | | | | | | | |
| | $ | 3,500,001 | | | $ | 1,997,260 | |
| | | | | | | | |
See notes to financial statements.
| | |
| 38 | | 2019 BLACKROCK SEMI-ANNUAL REPORTTO SHAREHOLDERS |
Financial Highlights
(For a share outstanding throughout each period)
| | | | | | | | | | | | |
| | | BGIO | |
| | | Six Months Ended
06/30/19
(unaudited) | | | Year Ended
12/31/18 | | | Period from 02/27/17 (a) to 12/31/17 | |
| | | | |
Net asset value, beginning of period | | $ | 8.96 | | | $ | 9.99 | | | $ | 9.85 | (b) |
| | | | | | | | | | | | |
Net investment income(c) | | | 0.28 | | | | 0.62 | | | | 0.50 | |
Net realized and unrealized gain (loss) | | | 0.72 | | | | (1.05 | ) | | | 0.18 | |
| | | | | | | | | | | | |
Net increase (decrease) from investment operations | | | 1.00 | | | | (0.43 | ) | | | 0.68 | |
| | | | | | | | | | | | |
|
Distributions(d) | |
From net investment income | | | (0.25 | )(e) | | | (0.60 | ) | | | (0.51 | ) |
From net realized gain | | | — | | | | — | | | | (0.01 | ) |
| | | | | | | | | | | | |
Total distributions | | | (0.25 | ) | | | (0.60 | ) | | | (0.52 | ) |
| | | | | | | | | | | | |
| | | |
Capital changes with respect to issuance of Preferred Shares | | | — | | | | — | | | | (0.02 | ) |
| | | | | | | | | | | | |
| | | |
Net asset value, end of period | | $ | 9.71 | | | $ | 8.96 | | | $ | 9.99 | |
| | | | | | | | | | | | |
| | | |
Market price, end of period | | $ | 9.45 | | | $ | 8.32 | | | $ | 9.80 | |
| | | | | | | | | | | | |
|
Total Return(f) | |
Based on net asset value | | | 11.32 | %(g) | | | (4.11 | )%(h) | | | 6.87 | %(g) |
| | | | | | | | | | | | |
Based on market price | | | 16.68 | %(g) | | | (9.24 | )% | | | 3.26 | %(g) |
| | | | | | | | | | | | |
|
Ratios to Average Net Assets(i) | |
Total expenses | | | 1.78 | %(j) | | | 1.66 | % | | | 1.60 | %(j)(k) |
| | | | | | | | | | | | |
Total expenses after fees waived | | | 1.77 | %(j) | | | 1.65 | % | | | 1.59 | %(j)(k) |
| | | | | | | | | | | | |
Total expenses after fees waived and excluding interest expense | | | 0.91 | %(j) | | | 0.93 | % | | | 0.93 | %(j)(k) |
| | | | | | | | | | | | |
Net investment income | | | 6.10 | %(j) | | | 6.52 | % | | | 5.99 | %(j)(k) |
| | | | | | | | | | | | |
|
Supplemental Data | |
Net assets, end of period (000) | | $ | 214,777 | | | $ | 198,272 | | | $ | 220,991 | |
| | | | | | | | | | | | |
Borrowings outstanding, end of period (000) | | $ | 59,844 | | | $ | 50,976 | | | $ | 100,982 | |
| | | | | | | | | | | | |
Portfolio turnover rate(l) | | | 21 | % | | | 83 | % | | | 125 | % |
| | | | | | | | | | | | |
| (a) | Commencement of operations. |
| (b) | Net asset value, beginning of period, reflects a reduction of $0.15 per share sales charge from the initial offering price of $10.00 per share. |
| (c) | Based on average shares outstanding. |
| (d) | Distributions for annual periods determined in accordance with U.S. federal income tax regulations. |
| (e) | A portion of the distributions from net investment income may be deemed a return of capital or net realized gain at fiscal year-end. |
| (f) | Total returns based on market price, which can be significantly greater or less than the net asset value, may result in substantially different returns. Where applicable, excludes the effects of any sales charges and assumes the reinvestment of distributions at actual reinvestment prices. |
| (g) | Aggregate total return. |
| (h) | Includes payment received from an affiliate, which had no impact on the Trust’s total return. |
| (i) | Excludes expenses incurred indirectly as a result of investments in underlying funds as follows: |
| | | | | | | | | | | | | | | | | | | | | | | | |
| | | Six Months Ended
06/30/19
(unaudited) | | | | | | Year Ended
12/31/18 | | | | | | Period from
02/27/17 (a) to 12/31/17 | | | | |
Investments in underlying funds | | | — | % | | | | | | | — | % | | | | | | | 0.03 | % | | | | |
| | | | | | | | | | | | | | | | | | | | | | | | |
| (k) | Audit costs were not annualized in the calculation of the expense ratios and net investment income ratio. If these expenses were annualized, the total expenses would have been 1.61%,1.60%, 0.94% and 5.99%, respectively. |
| (l) | Includes mortgage dollar roll transactions (“MDRs”). Additional information regarding portfolio turnover rate is as follows: |
| | | | | | | | | | | | | | | | | | | | | | | | |
| | | Six Months Ended
06/30/19 (unaudited) | | | | | | Year Ended
12/31/18 | | | | | | Period from
02/27/17 (a) to 12/31/17 | | | | |
Portfolio turnover rate (excluding MDRs) | | | 21 | % | | | | | | | 78 | % | | | | | | | 93 | % | | | | |
| | | | | | | | | | | | | | | | | | | | | | | | |
See notes to financial statements.
Financial Highlights (continued)
(For a share outstanding throughout each period)
| | | | | | | | | | | | | | | | | | | | | | | | | | | | | | | | |
| | | BKT | |
| | | Six Months Ended
06/30/19
(unaudited) | | | Period from
09/01/18
to 12/31/18 | | | | | | Year Ended August 31, | |
| | | 2018 | | | 2017 | | | 2016 | | | 2015 | | | 2014 | |
| | | | | | | | | |
Net asset value, beginning of period | | $ | 6.25 | | | $ | 6.31 | | | | | | | $ | 6.74 | | | $ | 6.96 | | | $ | 7.08 | | | $ | 7.27 | | | $ | 7.32 | |
| | | | | | | | | | | | | | | | | | | | | | | | | | | | | | | | |
Net investment income(a) | | | 0.12 | | | | 0.08 | | | | | | | | 0.24 | | | | 0.25 | | | | 0.28 | | | | 0.32 | | | | 0.35 | |
Net realized and unrealized gain (loss) | | | 0.22 | | | | 0.03 | | | | | | | | (0.34 | ) | | | (0.15 | ) | | | (0.05 | ) | | | (0.11 | ) | | | 0.03 | |
| | | | | | | | | | | | | | | | | | | | | | | | | | | | | | | | |
Net increase (decrease) from investment operations | | | 0.34 | | | | 0.11 | | | | | | | | (0.10 | ) | | | 0.10 | | | | 0.23 | | | | 0.21 | | | | 0.38 | |
| | | | | | | | | | | | | | | | | | | | | | | | | | | | | | | | |
|
Distributions(b) | |
From net investment income | | | (0.17 | )(c) | | | (0.13 | ) | | | | | | | (0.30 | ) | | | (0.32 | ) | | | (0.35 | ) | | | (0.40 | ) | | | (0.43 | ) |
From return of capital | | | — | | | | (0.04 | ) | | | | | | | (0.03 | ) | | | — | | | | — | | | | — | | | | — | |
| | | | | | | | | | | | | | | | | | | | | | | | | | | | | | | | |
Total distributions | | | (0.17 | ) | | | (0.17 | ) | | | | | | | (0.33 | ) | | | (0.32 | ) | | | (0.35 | ) | | | (0.40 | ) | | | (0.43 | ) |
| | | | | | | | | | | | | | | | | | | | | | | | | | | | | | | | |
| | | | | | | | |
Net asset value, end of period | | $ | 6.42 | | | $ | 6.25 | | | | | | | $ | 6.31 | | | $ | 6.74 | | | $ | 6.96 | | | $ | 7.08 | | | $ | 7.27 | |
| | | | | | | | | | | | | | | | | | | | | | | | | | | | | | | | |
| | | | | | | | |
Market price, end of period | | $ | 6.05 | | | $ | 5.64 | | | | | | | $ | 5.77 | | | $ | 6.31 | | | $ | 6.60 | | | $ | 6.30 | | | $ | 6.42 | |
| | | | | | | | | | | | | | | | | | | | | | | | | | | | | | | | |
|
Total Return(d) | |
Based on net asset value | | | 5.71 | %(e) | | | 2.06 | %(e) | | | | | | | (1.14 | )% | | | 1.82 | % | | | 3.64 | % | | | 3.56 | % | | | 6.05 | % |
| | | | | | | | | | | | | | | | | | | | | | | | | | | | | | | | |
Based on market price | | | 10.39 | %(e) | | | 0.72 | %(e) | | | | | | | (3.44 | )% | | | 0.53 | % | | | 10.44 | % | | | 4.35 | % | | | 7.12 | % |
| | | | | | | | | | | | | | | | | | | | | | | | | | | | | | | | |
|
Ratios to Average Net Assets(f) | |
Total expenses | | | 2.17 | %(g) | | | 2.08 | %(g)(h) | | | | | | | 1.79 | % | | | 1.29 | % | | | 1.08 | % | | | 0.99 | %(i) | | | 1.02 | %(i) |
| | | | | | | | | | | | | | | | | | | | | | | | | | | | | | | | |
Total expenses after fees waived and/or reimbursed | | | 2.17 | %(g) | | | 2.08 | %(g) | | | | | | | 1.79 | % | | | 1.28 | % | | | 1.08 | % | | | 0.99 | %(i) | | | 1.02 | %(i) |
| | | | | | | | | | | | | | | | | | | | | | | | | | | | | | | | |
Total expenses after fees waived and/or reimbursed and excluding interest expense | | | 0.94 | %(g) | | | 0.99 | %(g) | | | | | | | 1.04 | % | | | 0.90 | % | | | 0.89 | % | | | 0.90 | %(i) | | | 0.96 | %(i) |
| | | | | | | | | | | | | | | | | | | | | | | | | | | | | | | | |
Net investment income | | | 4.00 | %(g) | | | 4.04 | %(g) | | | | | | | 3.72 | % | | | 3.63 | % | | | 4.01 | % | | | 4.48 | % | | | 4.74 | % |
| | | | | | | | | | | | | | | | | | | | | | | | | | | | | | | | |
|
Supplemental Data | |
Net assets, end of period (000) | | $ | 409,342 | | | $ | 398,629 | | | | | | | $ | 402,763 | | | $ | 430,830 | | | $ | 444,882 | | | $ | 452,616 | | | $ | 464,933 | |
| | | | | | | | | | | | | | | | | | | | | | | | | | | | | | | | |
Borrowings outstanding, end of period (000) | | $ | 183,336 | | | $ | 186,799 | | | | | | | $ | 186,441 | | | $ | 185,769 | | | $ | 152,859 | | | $ | 173,695 | | | $ | 205,415 | |
| | | | | | | | | | | | | | | | | | | | | | | | | | | | | | | | |
Portfolio turnover rate(j) | | | 102 | % | | | 95 | % | | | | | | | 373 | % | | | 346 | % | | | 141 | % | | | 191 | % | | | 256 | % |
| | | | | | | | | | | | | | | | | | | | | | | | | | | | | | | | |
| (a) | Based on average shares outstanding. |
| (b) | Distributions for annual periods determined in accordance with U.S. federal income tax regulations. |
| (c) | A portion of the distributions from net investment income may be deemed a return of capital or net realized gain at fiscal year-end. |
| (d) | Total returns based on market price, which can be significantly greater or less than the net asset value, may result in substantially different returns. Where applicable, excludes the effects of any sales charges and assumes the reinvestment of distributions at actual reinvestment prices. |
| (e) | Aggregate total return. |
| (f) | Excludes expenses incurred indirectly as a result of investments in underlying funds as follows: |
| | | | | | | | | | | | | | | | | | | | | | | | | | | | | | | | | | | | | | | | | | | | | | | | | | | | | | | | |
| | | Six Months Ended
06/30/19
(unaudited) | | | | | | Period from 09/01/18
to 12/31/18 | | | | | | Year Ended August 31, | |
| | 2018 | | | | | | 2017 | | | | | | 2016 | | | | | | 2015 | | | | | | 2014 | | | | |
Investments in underlying funds | | | — | % | | | | | | | — | % | | | | | | | 0.01 | % | | | | | | | 0.01 | % | | | | | | | — | % | | | | | | | — | % | | | | | | | — | % | | | | |
| | | | | | | | | | | | | | | | | | | | | | | | | | | | | | | | | | | | | | | | | | | | | | | | | | | | | | | | |
| (h) | Audit fees were not annualized in the calculation of the expenses ratios. If these expenses were annualized, the total expenses would have been 2.11%. |
| (i) | Includes reorganization costs. Without these costs, total expenses, total expenses after fees waived and total expenses after fees waived and excluding interest expense would have been 0.99%, 0.99% and 0.89% for the year ended August 31, 2015 and 0.97%, 0.97% and 0.90% for the year ended August 31, 2014, respectively. |
| (j) | Includes MDRs. Additional information regarding portfolio turnover rate is as follows: |
| | | | | | | | | | | | | | | | | | | | | | | | | | | | | | | | | | | | | | | | | | | | | | | | | | | | | | | | |
| | | Six Months Ended
06/30/19
(unaudited) | | | | | | Period from 09/01/18
to 12/31/18 | | | | | | Year Ended August 31, | |
| | 2018 | | | | | | 2017 | | | | | | 2016 | | | | | | 2015 | | | | | | 2014 | | | | |
Portfolio turnover rate (excluding MDRs) | | | 57 | % | | | | | | | 45 | % | | | | | | | 181 | % | | | | | | | 161 | % | | | | | | | 63 | % | | | | | | | 78 | % | | | | | | | 125 | % | | | | |
| | | | | | | | | | | | | | | | | | | | | | | | | | | | | | | | | | | | | | | | | | | | | | | | | | | | | | | | |
See notes to financial statements.
| | |
| 40 | | 2019 BLACKROCK SEMI-ANNUAL REPORTTO SHAREHOLDERS |
Notes to Financial Statements (unaudited)
The following are registered under the Investment Company Act of 1940, as amended (the “1940 Act”), asclosed-end management investment companies and are referred to herein collectively as the “Trusts”, or individually as a “Trust”:
| | | | | | |
| Trust Name | | Herein Referred To As | | Organized | | Diversification
Classification |
BlackRock 2022 Global Income Opportunity Trust | | BGIO | | Delaware | | Non-diversified |
BlackRock Income Trust, Inc. | | BKT | | Maryland | | Diversified |
The Board of Directors of BKT and Board of Trustees of BGIO are collectively referred to throughout this report as the “Board of Trustees” or the “Board,” and the directors/trustees thereof are collectively referred to throughout this report as “Trustees”. The Trusts determine and make available for publication the net asset values (“NAVs”) of their common shares (“Common Shares”) on a daily basis.
The Trusts, together with certain other registered investment companies advised by BlackRock Advisors, LLC (the “Manager”) or its affiliates, are included in a complexnon-index fixed-income mutual funds and all BlackRock-advisedclosed-end funds referred to as the BlackRock Fixed-Income Complex.
| 2. | SIGNIFICANT ACCOUNTING POLICIES |
The financial statements are prepared in conformity with accounting principles generally accepted in the United States of America (“U.S. GAAP”), which may require management to make estimates and assumptions that affect the reported amounts of assets and liabilities in the financial statements, disclosure of contingent assets and liabilities at the date of the financial statements and the reported amounts of increases and decreases in net assets from operations during the reporting period. Actual results could differ from those estimates. Each Trust is considered an investment company under U.S. GAAP and follows the accounting and reporting guidance applicable to investment companies. Below is a summary of significant accounting policies:
Investment Transactions and Income Recognition:For financial reporting purposes, investment transactions are recorded on the dates the transactions are executed (the “trade dates”). Realized gains and losses on investment transactions are determined on the identified cost basis. Dividend income is recorded on theex-dividend date. Dividends from foreign securities where theex-dividend date may have passed are subsequently recorded when the Trusts are informed of theex-dividend date. Under the applicable foreign tax laws, a withholding tax at various rates may be imposed on capital gains, dividends and interest. Interest income, including amortization and accretion of premiums and discounts on debt securities, is recognized on an accrual basis.
Foreign Currency Translation:Each Trust’s books and records are maintained in U.S. dollars. Securities and other assets and liabilities denominated in foreign currencies are translated into U.S. dollars using exchange rates determined as of the close of trading on the New York Stock Exchange (“NYSE”). Purchases and sales of investments are recorded at the rates of exchange prevailing on the respective dates of such transactions. Generally, when the U.S. dollar rises in value against a foreign currency, the investments denominated in that currency will lose value; the opposite effect occurs if the U.S. dollar falls in relative value.
Each Trust does not isolate the portion of the results of operations arising as a result of changes in the exchange rates from the changes in the market prices of investments held or sold for financial reporting purposes. Accordingly, the effects of changes in exchange rates on investments are not segregated in the Statements of Operations from the effects of changes in market prices of those investments, but are included as a component of net realized and unrealized gain (loss) from investments. Each Trust reports realized currency gains (losses) on foreign currency related transactions as components of net realized gain (loss) for financial reporting purposes, whereas such components are generally treated as ordinary income for U.S. federal income tax purposes.
Segregation and Collateralization:In cases where a Trust enters into certain investments (e.g., dollar rolls, TBA sale commitments, futures contracts, forward foreign currency exchange contracts, swaps and short sales) or certain borrowings (e.g., reverse repurchase transactions) that would be treated as “senior securities” for 1940 Act purposes, a Trust may segregate or designate on its books and records cash or liquid assets having a market value at least equal to the amount of its future obligations under such investments or borrowings. Doing so allows the investment or borrowings to be excluded from treatment as a “senior security.” Furthermore, if required by an exchange or counterparty agreement, the Trusts may be required to deliver/deposit cash and/or securities to/with an exchange, or broker-dealer or custodian as collateral for certain investments or obligations.
Distributions:For BGIO, distributions from net investment income are declared monthly and paid monthly. Distributions of capital gains are recorded on theex-dividend date and made at least annually. Distributions paid by BKT are recorded on theex-dividend date. Subject to the BKT’s level distribution plan, BKT intends to make monthly cash distributions to shareholders, which may consist of net investment income, net options premium and net realized and unrealized gains on investments and/or return of capital.
The character of distributions is determined in accordance with U.S. federal income tax regulations, which may differ from U.S. GAAP. The portion of distributions that exceeds BKT’s current and accumulated earnings and profits, which are measured on a tax basis, will constitute anon-taxable return of capital.
Deferred Compensation Plan:Under the Deferred Compensation Plan (the “Plan”) approved by each Trust’s Board, the trustees who are not “interested persons” of the Trust, as defined in the 1940 Act (“Independent Trustees”), may defer a portion of their annual complex-wide compensation. Deferred amounts earn an approximate return as though equivalent dollar amounts had been invested in common shares of certain funds in the BlackRock Fixed-Income Complex selected by the Independent Trustees. This has the same economic effect for the Independent Trustees as if the Independent Trustees had invested the deferred amounts directly in certain funds in the BlackRock Fixed-Income Complex.
The Plan is not funded and obligations thereunder represent general unsecured claims against the general assets of each Trust, as applicable. Deferred compensation liabilities are included in the Trustees’ and Officer’s fees payable in the Statements of Assets and Liabilities and will remain as a liability of the Trusts until such amounts are distributed in accordance with the Plan.
| | | | |
| NOTESTO FINANCIAL STATEMENTS | | | 41 | |
Notes to Financial Statements (unaudited) (continued)
Recent Accounting Standards:The Trusts have adopted Financial Accounting Standards Board Accounting Standards Update2017-08 to amend the amortization period for certain purchased callable debt securities held at a premium. Under the new standard, the Trusts have changed the amortization period for the premium on certain purchased callable debt securities withnon-contingent call features to the earliest call date. In accordance with the transition provisions of the standard, the Trusts applied the amendments on a modified retrospective basis beginning with the fiscal period ended June 30, 2019. The cost basis of securities at December 31, 2018 has been adjusted for BGIO to $256,472,875. This change in accounting policy has been made to comply with the newly issued accounting standard and had no impact on accumulated earnings (loss) or the net asset value of BGIO.
Indemnifications:In the normal course of business, a Trust enters into contracts that contain a variety of representations that provide general indemnification. A Trust’s maximum exposure under these arrangements is unknown because it involves future potential claims against a Trust, which cannot be predicted with any certainty.
Other: Expenses directly related to a Trust are charged to that Trust. Other operating expenses shared by several trusts, including other trusts managed by the Manager, are prorated among those trusts on the basis of relative net assets or other appropriate methods.
| 3. | INVESTMENT VALUATION AND FAIR VALUE MEASUREMENTS |
Investment Valuation Policies: The Trusts’ investments are valued at fair value (also referred to as “market value” within the financial statements) as of the close of trading on the NYSE (generally 4:00 p.m., Eastern time) (or if the reporting date falls on a day the NYSE is closed, investments are valued at fair value as of the period end). U.S. GAAP defines fair value as the price the Trusts would receive to sell an asset or pay to transfer a liability in an orderly transaction between market participants at the measurement date. The Trusts determine the fair values of their financial instruments using various independent dealers or pricing services under policies approved by the Board. The BlackRock Global Valuation Methodologies Committee (the “Global Valuation Committee”) is the committee formed by management to develop global pricing policies and procedures and to oversee the pricing function for all financial instruments.
Fair Value Inputs and Methodologies: The following methods and inputs are used to establish the fair value of each Trust’s assets and liabilities:
| | • | | Fixed-income securities for which market quotations are readily available are generally valued using the last available bid prices or current market quotations provided by independent dealers or third party pricing services. Floating rate loan interests are valued at the mean of the bid prices from one or more independent brokers or dealers as obtained from a third party pricing service. Pricing services generally value fixed-income securities assuming orderly transactions of an institutional round lot size, but a trust may hold or transact in such securities in smaller, odd lot sizes. Odd lots may trade at lower prices than institutional round lots. The pricing services may use matrix pricing or valuation models that utilize certain inputs and assumptions to derive values, including transaction data (e.g., recent representative bids and offers), credit quality information, perceived market movements, news, and other relevant information. Certain fixed-income securities, including asset-backed and mortgage related securities may be valued based on valuation models that consider the estimated cash flows of each tranche of the entity, establish a benchmark yield and develop an estimated tranche specific spread to the benchmark yield based on the unique attributes of the tranche. The amortized cost method of valuation may be used with respect to debt obligations with sixty days or less remaining to maturity unless the Manager determines such method does not represent fair value. |
Generally, trading in foreign instruments is substantially completed each day at various times prior to the close of trading on the NYSE. Occasionally, events affecting the values of such instruments may occur between the foreign market close and the close of trading on the NYSE that may not be reflected in the computation of the Trusts’ net assets.
| | • | | Investments inopen-end U.S. mutual funds are valued at NAV each business day. |
| | • | | Futures contracts traded on exchanges are valued at their last sale price. |
| | • | | Forward foreign currency exchange contracts are valued at the mean between the bid and ask prices and are determined as of the close of trading on the NYSE. Interpolated values are derived when the settlement date of the contract is an interim date for which quotations are not available. |
| | • | | Swap agreements are valued utilizing quotes received daily by the Trusts’ pricing service or through brokers, which are derived using daily swap curves and models that incorporate a number of market data factors, such as discounted cash flows, trades and values of the underlying reference instruments. |
| | • | | To-be-announced (“TBA”) commitments are valued on the basis of last available bid prices or current market quotations provided by pricing services. |
If events (e.g., a company announcement, market volatility or a natural disaster) occur that are expected to materially affect the value of such investments, or in the event that the application of these methods of valuation results in a price for an investment that is deemed not to be representative of the market value of such investment, or if a price is not available, the investment will be valued by the Global Valuation Committee, or its delegate, in accordance with a policy approved by the Board as reflecting fair value (“Fair Valued Investments”). The fair valuation approaches that may be used by the Global Valuation Committee will include market approach, income approach and cost approach. Valuation techniques such as discounted cash flow, use of market comparables and matrix pricing are types of valuation approaches and are typically used in determining fair value. When determining the price for Fair Valued Investments, the Global Valuation Committee, or its delegate, seeks to determine the price that each Trust might reasonably expect to receive or pay from the current sale or purchase of that asset or liability in anarm’s-length transaction. Fair value determinations shall be based upon all available factors that the Global Valuation Committee, or its delegate, deems relevant and consistent with the principles of fair value measurement. The pricing of all Fair Valued Investments is subsequently reported to the Board or a committee thereof on a quarterly basis.
| | |
| 42 | | 2019 BLACKROCK SEMI-ANNUAL REPORTTO SHAREHOLDERS |
Notes to Financial Statements (unaudited) (continued)
For investments in equity or debt issued by privately held companies or funds (“Private Company” or collectively, the “Private Companies”) and other Fair Valued Investments, the fair valuation approaches that are used by third party pricing services utilize one or a combination of, but not limited to, the following inputs.
| | |
| | | Standard Inputs Generally Considered By Third Party Pricing Services |
Market approach | | (i) recentmarket transactions, including subsequent rounds of financing, in the underlying investment or comparable issuers; (ii) recapitalizations and other transactions across the capital structure; and (iii) market multiples of comparable issuers. |
Income approach | | (i) future cash flows discounted to present and adjusted as appropriate for liquidity, credit, and/or market risks; (ii) quoted prices for similar investments or assets in active markets; and (iii) other risk factors, such as interest rates, yield curves, volatilities, prepayment speeds, loss severities, credit risks, recovery rates, liquidation amounts and/or default rates. |
Cost approach | | (i) audited or unaudited financial statements, investor communications and financial or operational metrics issued by the Private Company; (ii) changes in the valuation of relevant indices or publicly traded companies comparable to the Private Company; (iii) relevant news and other public sources; and (iv) known secondary market transactions in the Private Company’s interests and merger or acquisition activity in companies comparable to the Private Company. |
Investments in series of preferred stock issued by Private Companies are typically valued utilizing market approach in determining the enterprise value of the company. Such investments often contain rights and preferences that differ from other series of preferred and common stock of the same issuer. Valuation techniques such as an option pricing model (“OPM”), a probability weighted expected return model (“PWERM”) or a hybrid of those techniques are used in allocating enterprise value of the company, as deemed appropriate under the circumstances. The use of OPM and PWERM techniques involve a determination of the exit scenarios of the investment in order to appropriately allocate the enterprise value of the company among the various parts of its capital structure.
The Private Companies are not subject to the public company disclosure, timing, and reporting standards as other investments held by a Trust. Typically, the most recently available information by a Private Company is as of a date that is earlier than the date a Trust is calculating its NAV. This factor may result in a difference between the value of the investment and the price a Trust could receive upon the sale of the investment.
Fair Value Hierarchy: Various inputs are used in determining the fair value of investments and derivative financial instruments. These inputs to valuation techniques are categorized into a fair value hierarchy consisting of three broad levels for financial statement purposes as follows:
| | • | | Level 1 — Unadjusted price quotations in active markets/exchanges for identical assets or liabilities that each Trust has the ability to access |
| | • | | Level 2 — Other observable inputs (including, but not limited to, quoted prices for similar assets or liabilities in markets that are active, quoted prices for identical or similar assets or liabilities in markets that are not active, inputs other than quoted prices that are observable for the assets or liabilities (such as interest rates, yield curves, volatilities, prepayment speeds, loss severities, credit risks and default rates) or other market–corroborated inputs) |
| | • | | Level 3 — Unobservable inputs based on the best information available in the circumstances, to the extent observable inputs are not available (including each Trust’s own assumptions used in determining the fair value of investments and derivative financial instruments) |
The hierarchy gives the highest priority to unadjusted quoted prices in active markets for identical assets or liabilities (Level 1 measurements) and the lowest priority to unobservable inputs (Level 3 measurements). Accordingly, the degree of judgment exercised in determining fair value is greatest for instruments categorized in Level 3. The inputs used to measure fair value may fall into different levels of the fair value hierarchy. In such cases, for disclosure purposes, the fair value hierarchy classification is determined based on the lowest level input that is significant to the fair value measurement in its entirety. Investments classified within Level 3 have significant unobservable inputs used by the Global Valuation Committee in determining the price for Fair Valued Investments. Level 3 investments include equity or debt issued by Private Companies. There may not be a secondary market, and/or there are a limited number of investors. The categorization of a value determined for investments and derivative financial instruments is based on the pricing transparency of the investments and derivative financial instruments and is not necessarily an indication of the risks associated with investing in those securities.
| 4. | SECURITIES AND OTHER INVESTMENTS |
Asset-Backed and Mortgage-Backed Securities:Asset-backed securities are generally issued as pass-through certificates or as debt instruments. Asset-backed securities issued as pass-through certificates represent undivided fractional ownership interests in an underlying pool of assets. Asset-backed securities issued as debt instruments, which are also known as collateralized obligations, are typically issued as the debt of a special purpose entity organized solely for the purpose of owning such assets and issuing such debt. Asset-backed securities are often backed by a pool of assets representing the obligations of a number of different parties. The yield characteristics of certain asset-backed securities may differ from traditional debt securities. One such major difference is that all or a principal part of the obligations may be prepaid at any time because the underlying assets (i.e., loans) may be prepaid at any time. As a result, a decrease in interest rates in the market may result in increases in the level of prepayments as borrowers, particularly mortgagors, refinance and repay their loans. An increased prepayment rate with respect to an asset-backed security will have the effect of shortening the maturity of the security. In addition, a trust may subsequently have to reinvest the proceeds at lower interest rates. If a trust has purchased such an asset-backed security at a premium, a faster than anticipated prepayment rate could result in a loss of principal to the extent of the premium paid.
For mortgage pass-through securities (the “Mortgage Assets”) there are a number of important differences among the agencies and instrumentalities of the U.S. Government that issue mortgage-related securities and among the securities that they issue. For example, mortgage-related securities guaranteed by Ginnie Mae are guaranteed as to the timely payment of principal and interest by Ginnie Mae and such guarantee is backed by the full faith and credit of the United States. However,
| | | | |
| NOTESTO FINANCIAL STATEMENTS | | | 43 | |
Notes to Financial Statements (unaudited) (continued)
mortgage-related securities issued by Freddie Mac and Fannie Mae, including Freddie Mac and Fannie Mae guaranteed mortgage pass-through certificates, which are solely the obligations of Freddie Mac and Fannie Mae, are not backed by or entitled to the full faith and credit of the United States, but are supported by the right of the issuer to borrow from the U.S. Treasury.
Non-agency mortgage-backed securities are securities issued bynon-governmental issuers and have no direct or indirect government guarantees of payment and are subject to various risks.Non-agency mortgage loans are obligations of the borrowers thereunder only and are not typically insured or guaranteed by any other person or entity. The ability of a borrower to repay a loan is dependent upon the income or assets of the borrower. A number of factors, including a general economic downturn, acts of God, terrorism, social unrest and civil disturbances, may impair a borrower’s ability to repay its loans.
Collateralized Debt Obligations:Collateralized debt obligations (“CDOs”), including collateralized bond obligations (“CBOs”) and collateralized loan obligations (“CLOs”), are types of asset-backed securities. A CDO is an entity that is backed by a diversified pool of debt securities (CBOs) or syndicated bank loans (CLOs). The cash flows of the CDO can be split into multiple segments, called “tranches,” which will vary in risk profile and yield. The riskiest segment is the subordinated or “equity” tranche. This tranche bears the greatest risk of defaults from the underlying assets in the CDO and serves to protect the other, more senior, tranches from default in all but the most severe circumstances. Since it is shielded from defaults by the more junior tranches, a “senior” tranche will typically have higher credit ratings and lower yields than their underlying securities, and often receive investment grade ratings from one or more of the nationally recognized rating agencies. Despite the protection from the more junior tranches, senior tranches can experience substantial losses due to actual defaults, increased sensitivity to future defaults and the disappearance of one or more protecting tranches as a result of changes in the credit profile of the underlying pool of assets.
Multiple Class Pass-Through Securities: Multiple class pass-through securities, including collateralized mortgage obligations (“CMOs”) and commercial mortgage-backed securities, may be issued by Ginnie Mae, U.S. Government agencies or instrumentalities or by trusts formed by private originators of, or investors in, mortgage loans. In general, CMOs are debt obligations of a legal entity that are collateralized by a pool of residential or commercial mortgage loans or Mortgage Assets. The payments on these are used to make payments on the CMOs or multiple pass-through securities. Multiple class pass-through securities represent direct ownership interests in the Mortgage Assets. Classes of CMOs include interest only (“IOs”), principal only (“POs”), planned amortization classes and targeted amortization classes. IOs and POs are stripped mortgage-backed securities representing interests in a pool of mortgages, the cash flow from which has been separated into interest and principal components. IOs receive the interest portion of the cash flow while POs receive the principal portion. IOs and POs can be extremely volatile in response to changes in interest rates. As interest rates rise and fall, the value of IOs tends to move in the same direction as interest rates. POs perform best when prepayments on the underlying mortgages rise since this increases the rate at which the principal is returned and the yield to maturity on the PO. When payments on mortgages underlying a PO are slower than anticipated, the life of the PO is lengthened and the yield to maturity is reduced. If the underlying Mortgage Assets experience greater than anticipated prepayments of principal, a trust’s initial investment in the IOs may not fully recoup.
Stripped Mortgage-Backed Securities:Stripped mortgage-backed securities are typically issued by the U.S. Government, its agencies and instrumentalities. Stripped mortgage-backed securities are usually structured with two classes that receive different proportions of the interest (IOs) and principal (POs) distributions on a pool of Mortgage Assets. Stripped mortgage-backed securities may be privately issued.
Zero-Coupon Bonds: Zero-coupon bonds are normally issued at a significant discount from face value and do not provide for periodic interest payments. These bonds may experience greater volatility in market value than other debt obligations of similar maturity which provide for regular interest payments.
Capital Securities and Trust Preferred Securities: Capital securities, including trust preferred securities, are typically issued by corporations, generally in the form of interest-bearing notes with preferred securities characteristics. In the case of trust preferred securities, an affiliated business trust of a corporation issues these securities, generally in the form of beneficial interests in subordinated debentures or similarly structured securities. The securities can be structured with either a fixed or adjustable coupon that can have either a perpetual or stated maturity date. For trust preferred securities, the issuing bank or corporation pays interest to the trust, which is then distributed to holders of these securities as a dividend. Dividends can be deferred without creating an event of default or acceleration, although maturity cannot take place unless all cumulative payment obligations have been met. The deferral of payments does not affect the purchase or sale of these securities in the open market. These securities generally are rated below that of the issuing company’s senior debt securities and are freely callable at the issuer’s option.
Floating Rate Loan Interests: Floating rate loan interests are typically issued to companies (the “borrower”) by banks, other financial institutions, or privately and publicly offered corporations (the “lender”). Floating rate loan interests are generallynon-investment grade, often involve borrowers whose financial condition is troubled or uncertain and companies that are highly leveraged or in bankruptcy proceedings. In addition, transactions in floating rate loan interests may settle on a delayed basis, which may result in proceeds from the sale not being readily available for a trust to make additional investments or meet its redemption obligations. Floating rate loan interests may include fully funded term loans or revolving lines of credit. Floating rate loan interests are typically senior in the corporate capital structure of the borrower. Floating rate loan interests generally pay interest at rates that are periodically determined by reference to a base lending rate plus a premium. Since the rates reset only periodically, changes in prevailing interest rates (and particularly sudden and significant changes) can be expected to cause some fluctuations in the NAV of a Trust to the extent that it invests in floating rate loan interests. The base lending rates are generally the lending rate offered by one or more European banks, such as the London Interbank Offered Rate (“LIBOR”), the prime rate offered by one or more U.S. banks or the certificate of deposit rate. Floating rate loan interests may involve foreign borrowers, and investments may be denominated in foreign currencies. These investments are treated as investments in debt securities for purposes of a trust’s investment policies.
When a trust purchases a floating rate loan interest, it may receive a facility fee and when it sells a floating rate loan interest, it may pay a facility fee. On an ongoing basis, a trust may receive a commitment fee based on the undrawn portion of the underlying line of credit amount of a floating rate loan interest. Facility and commitment fees are typically amortized to income over the term of the loan or term of the commitment, respectively. Consent and amendment fees are recorded to income as earned. Prepayment penalty fees, which may be received by a trust upon the prepayment of a floating rate loan interest by a borrower, are recorded as realized gains. A trust may invest in multiple series or tranches of a loan. A different series or tranche may have varying terms and carry different associated risks.
Floating rate loan interests are usually freely callable at the borrower’s option. A trust may invest in such loans in the form of participations in loans (“Participations”) or assignments (“Assignments”) of all or a portion of loans from third parties. Participations typically will result in a trust having a contractual relationship only with the lender,
| | |
| 44 | | 2019 BLACKROCK SEMI-ANNUAL REPORTTO SHAREHOLDERS |
Notes to Financial Statements (unaudited) (continued)
not with the borrower. A trust has the right to receive payments of principal, interest and any fees to which it is entitled only from the lender selling the Participation and only upon receipt by the lender of the payments from the borrower. In connection with purchasing Participations, a trust generally will have no right to enforce compliance by the borrower with the terms of the loan agreement, nor any rights of offset against the borrower. A trust may not benefit directly from any collateral supporting the loan in which it has purchased the Participation. As a result, a trust assumes the credit risk of both the borrower and the lender that is selling the Participation. A trust’s investment in loan participation interests involves the risk of insolvency of the financial intermediaries who are parties to the transactions. In the event of the insolvency of the lender selling the Participation, a trust may be treated as a general creditor of the lender and may not benefit from any offset between the lender and the borrower. Assignments typically result in a trust having a direct contractual relationship with the borrower, and a trust may enforce compliance by the borrower with the terms of the loan agreement.
Forward Commitments, When-Issued and Delayed Delivery Securities: The Trust may purchase securities on a when-issued basis and may purchase or sell securities on a forward commitment basis. Settlement of such transactions normally occurs within a month or more after the purchase or sale commitment is made. A trust may purchase securities under such conditions with the intention of actually acquiring them, but may enter into a separate agreement to sell the securities before the settlement date. Since the value of securities purchased may fluctuate prior to settlement, a trust may be required to pay more at settlement than the security is worth. In addition, a trust is not entitled to any of the interest earned prior to settlement. When purchasing a security on a delayed delivery basis, a trust assumes the rights and risks of ownership of the security, including the risk of price and yield fluctuations. In the event of default by the counterparty, a trust’s maximum amount of loss is the unrealized appreciation of unsettled when-issued transactions.
TBA Commitments:TBA commitments are forward agreements for the purchase or sale of mortgage-backed securities for a fixed price, with payment and delivery on an agreed upon future settlement date. The specific securities to be delivered are not identified at the trade date. However, delivered securities must meet specified terms, including issuer, rate and mortgage terms. When entering into TBA commitments, a trust may take possession of or deliver the underlying mortgage-backed securities but can extend the settlement or roll the transaction. TBA commitments involve a risk of loss if the value of the security to be purchased or sold declines or increases, respectively, prior to settlement date.
In order to better define contractual rights and to secure rights that will help a trust mitigate their counterparty risk, TBA commitments may be entered into by a trust under Master Securities Forward Transaction Agreements (each, an “MSFTA”). An MSFTA typically contains, among other things, collateral posting terms and netting provisions in the event of default and/or termination event. The collateral requirements are typically calculated by netting themark-to-market amount for each transaction under such agreement and comparing that amount to the value of the collateral currently pledged by a trust and the counterparty. Cash collateral that has been pledged to cover the obligations of a trust and cash collateral received from the counterparty, if any, is reported separately in the Statements of Assets and Liabilities as cash pledged as collateral for TBA commitments or cash received as collateral for TBA commitments, respectively.Non-cash collateral pledged by a trust, if any, is noted in the Schedules of Investments. Typically, a trust is permitted to sell,re-pledge or use the collateral it receives; however, the counterparty is not permitted to do so. To the extent amounts due to a trust are not fully collateralized, contractually or otherwise, a trust bears the risk of loss from counterpartynon-performance.
Mortgage Dollar Roll Transactions: Certain trusts may sell TBA mortgage-backed securities and simultaneously contract to repurchase substantially similar (i.e., same type, coupon and maturity) securities on a specific future date at an agreed upon price. During the period between the sale and repurchase, a trust is not entitled to receive interest and principal payments on the securities sold. Mortgage dollar roll transactions are treated as purchases and sales and realize gains and losses on these transactions. Mortgage dollar rolls involve the risk that the market value of the securities that a trust is required to purchase may decline below the agreed upon repurchase price of those securities.
Borrowed Bond Agreements: Repurchase agreements may be referred to as borrowed bond agreements when entered into in connection with short sales of bonds. In a borrowed bond agreement, a trust borrows a bond from counterparty in exchange for cash collateral. The agreement contains a commitment that the security and the cash will be returned to the counterparty and a trust at a mutually agreed upon date. Certain agreements have no stated maturity and can be terminated by either party at any time. Earnings on cash collateral and compensation to the lender of the bond are based on agreed upon rates between a trust and the counterparty. The value of the underlying cash collateral approximates the market value and accrued interest of the borrowed bond. To the extent that a borrowed bond transaction exceeds one business day, the value of the cash collateral in the possession of the counterparty is monitored on a daily basis to ensure the adequacy of the collateral. As the market value of the borrowed bond changes, the cash collateral is periodically increased or decreased with a frequency and in amounts prescribed in the borrowed bond agreement. A trust may also experience delays in gaining access to the collateral.
Reverse Repurchase Agreements: Reverse repurchase agreements are agreements with qualified third party broker dealers in which a trust sells securities to a bank or broker-dealer and agrees to repurchase the same securities at a mutually agreed upon date and price. A trust receives cash from the sale to use for other investment purposes. During the term of the reverse repurchase agreement, a trust continues to receive the principal and interest payments on the securities sold. Certain agreements have no stated maturity and can be terminated by either party at any time. Interest on the value of the reverse repurchase agreements issued and outstanding is based upon competitive market rates determined at the time of issuance. A trust may utilize reverse repurchase agreements when it is anticipated that the interest income to be earned from the investment of the proceeds of the transaction is greater than the interest expense of the transaction. Reverse repurchase agreements involve leverage risk. If a trust suffers a loss on its investment of the transaction proceeds from a reverse repurchase agreement, a trust would still be required to pay the full repurchase price. Further, a trust remains subject to the risk that the market value of the securities repurchased declines below the repurchase price. In such cases, a trust would be required to return a portion of the cash received from the transaction or provide additional securities to the counterparty.
Cash received in exchange for securities delivered plus accrued interest due to the counterparty is recorded as a liability in the Statements of Assets and Liabilities at face value including accrued interest. Due to the short-term nature of the reverse repurchase agreements, face value approximates fair value. Interest payments made by a trust to the counterparties are recorded as a component of interest expense in the Statements of Operations. In periods of increased demand for the security, a trust may receive a fee for the use of the security by the counterparty, which may result in interest income to a trust.
| | | | |
| NOTESTO FINANCIAL STATEMENTS | | | 45 | |
Notes to Financial Statements (unaudited) (continued)
For the six months ended June 30, 2019, the average amount of reverse repurchase agreements outstanding and the daily weighted average interest rate for the Trusts were as follows:
| | | | | | | | |
| | | Average Amount
Outstanding | | | Daily Weighted Average
Interest Rate | |
BGIO | | $ | 59,940,789 | | | | 3.02 | % |
BKT | | | 187,535,333 | | | | 2.64 | % |
Borrowed bond agreements and reverse repurchase transactions are entered into by a trust under Master Repurchase Agreements (each, an “MRA”), which permit a trust, under certain circumstances, including an event of default (such as bankruptcy or insolvency), to offset payables and/or receivables under the MRA with collateral held and/or posted to the counterparty and create one single net payment due to or from a trust. With borrowed bond agreements and reverse repurchase transactions, typically a trust and counterparty under an MRA are permitted to sell,re-pledge, or use the collateral associated with the transaction. Bankruptcy or insolvency laws of a particular jurisdiction may impose restrictions on or prohibitions against such a right of offset in the event of the MRA counterparty’s bankruptcy or insolvency. Pursuant to the terms of the MRA, a trust receives or posts securities and cash as collateral with a market value in excess of the repurchase price to be paid or received by a trust upon the maturity of the transaction. Upon a bankruptcy or insolvency of the MRA counterparty, a trust is considered an unsecured creditor with respect to excess collateral and, as such, the return of excess collateral may be delayed.
As of period end, the following table is a summary of BGIO’s open reverse repurchase agreements by counterparty which are subject to offset under an MRA on a net basis:
| | | | | | | | | | | | | | | | |
| BGIO | | | | | | | | | | | | |
| Counterparty | | Reverse Repurchase Agreements | | | Fair Value of Non-cash Collateral Pledged Including Accrued Interest (a) | | | Cash Collateral Pledged/Received | | | Net Amount | |
Barclays Capital, Inc. | | $ | 13,383,339 | | | $ | (13,383,339 | ) | | $ | — | | | $ | — | |
BNP Paribas S.A. | | | 19,505,787 | | | | (19,505,787 | ) | | | — | | | | — | |
Citigroup Global Markets, Inc. | | | 764,551 | | | | (764,551 | ) | | | — | | | | — | |
Credit Suisse Securities (USA) LLC | | | 1,003,342 | | | | (1,003,342 | ) | | | — | | | | — | |
Deutsche Bank Securities, Inc. | | | 1,289,384 | | | | (1,289,384 | ) | | | — | | | | — | |
Goldman Sachs & Co LLC. | | | 658,637 | | | | (658,637 | ) | | | — | | | | — | |
RBC Capital Markets LLC | | | 23,239,241 | | | | (23,239,241 | ) | | | — | | | | — | |
| | | | | | | | | | | | | | | | |
| | $ | 59,844,281 | | | $ | (59,844,281 | ) | | $ | — | | | $ | — | |
| | | | | | | | | | | | | | | | |
| | (b) | Net collateral, including accrued interest, with a value of $71,725,130 has been pledged/received in connection with open reverse repurchase agreements. Excess of net collateral pledged to the individual counterparty is not shown for financial reporting purposes. | |
As of period end, the following table is a summary of BKT’s open borrowed bond agreements and reverse repurchase agreements by counterparty which are subject to offset under an MRA on a net basis:
| | | | | | | | | | | | | | | | | | | | | | | | | | | | | | | | | | | | | | | | |
| BKT | |
| Counterparty | | Borrowed
Bond
Agreements (a) | | | Reverse
Repurchase
Agreements | | | Borrowed
Bonds at
Value
including
Accrued
Interest (b) | | | Net
Amount
before
Collateral | | | Non-cash
Collateral
Received | | | Cash
Collateral
Received | | | Fair Value of
Non-cash
Collateral
Pledged
Including
Accrued
Interest (c) | | | Cash
Collateral
Pledged | | | Net
Collateral
(Received) /
Pledged | | | Net
Exposure
Due (to) /
from
Counterparty (d) | |
Credit Suisse Securities (USA) LLC | | $ | 871,150 | | | $ | — | | | $ | (964,495 | ) | | $ | (93,345 | ) | | $ | — | | | $ | — | | | $ | — | | | $ | — | | | $ | — | | | $ | (93,345 | ) |
HSBC Securities (USA), Inc. | | | — | | | | 183,335,530 | | | | — | | | | 183,335,530 | | | | 714,679 | | | | — | | | | (184,050,209 | ) | | | — | | | | (184,050,209 | ) | | | — | |
| | | | | | | | | | | | | | | | | | | | | | | | | | | | | | | | | | | | | | | | |
| | $ | 871,150 | | | $ | 183,335,530 | | | $ | (964,495 | ) | | $ | 183,242,185 | | | $ | 714,679 | | | $ | — | | | $ | (184,050,209 | ) | | $ | — | | | $ | (184,050,209 | ) | | $ | (93,345 | ) |
| | | | | | | | | | | | | | | | | | | | | | | | | | | | | | | | | | | | | | | | |
| | (a) | Included in Investments at value-unaffiliated in the Statements of Assets and Liabilities. | |
| | (b) | Includes accrued interest on borrowed bonds in the amount of $3,221 which is included in interest expense payable in the Statements of Assets and Liabilities. | |
| | (c) | Net collateral, including accrued interest, with a value of $191,331,187 has been pledged/received in connection with open reverse repurchase agreements. Excess of net collateral pledged to the individual counterparty is not shown for financial reporting purposes. | |
| | (d) | Net exposure represents the net receivable (payable) that would be due from/to the counterparty in the event of default. | |
In the event the counterparty of securities under an MRA files for bankruptcy or becomes insolvent, a trust’s use of the proceeds from the agreement may be restricted while the counterparty, or its trustee or receiver, determines whether or not to enforce a trust’s obligation to repurchase the securities.
Short Sale Transactions: In short sale transactions, a trust sells a security it does not hold in anticipation of a decline in the market price of that security. When a trust makes a short sale, it will borrow the security sold short (borrowed bond) and deliver the fixed-income security to the counterparty to which it sold the security short. An amount equal to the proceeds received by a trust is reflected as an asset and an equivalent liability. The amount of the liability is subsequentlymarked-to-market to reflect
| | |
| 46 | | 2019 BLACKROCK SEMI-ANNUAL REPORTTO SHAREHOLDERS |
Notes to Financial Statements (unaudited) (continued)
the market value of the short sale. A trust is required to repay the counterparty interest on the security sold short, which, if applicable, is included in interest expense in the Statements of Operations. A trust is exposed to market risk based on the amount, if any, that the market value of the security increases beyond the market value at which the position was sold. Thus, a short sale of a security involves the risk that instead of declining, the price of the security sold short will rise. The short sale of securities involves the possibility of an unlimited loss since there is an unlimited potential for the market price of the security sold short to increase. A gain is limited to the price at which a trust sold the security short. A realized gain or loss is recognized upon the termination of a short sale if the market price is either less than or greater than the proceeds originally received. There is no assurance that a trust will be able to close out a short position at a particular time or at an acceptable price.
| 5. | DERIVATIVE FINANCIAL INSTRUMENTS |
The Trusts engage in various portfolio investment strategies using derivative contracts both to increase the returns of the Trusts and/or to manage their exposure to certain risks such as credit risk, equity risk, interest rate risk, foreign currency exchange rate risk, commodity price risk or other risks (e.g., inflation risk). Derivative financial instruments categorized by risk exposure are included in the Schedules of Investments. These contracts may be transacted on an exchange or OTC.
Futures Contracts:Futures contracts are purchased or sold to gain exposure to, or manage exposure to, changes in interest rates (interest rate risk) and changes in the value of equity securities (equity risk) or foreign currencies (foreign currency exchange rate risk).
Futures contracts are agreements between the Trusts and a counterparty to buy or sell a specific quantity of an underlying instrument at a specified price and on a specified date. Depending on the terms of a contract, it is settled either through physical delivery of the underlying instrument on the settlement date or by payment of a cash amount on the settlement date. Upon entering into a futures contract, the Trusts are required to deposit initial margin with the broker in the form of cash or securities in an amount that varies depending on a contract’s size and risk profile. The initial margin deposit must then be maintained at an established level over the life of the contract. Amounts pledged, which are considered restricted, are included in cash pledged for futures contracts in the Statements of Assets and Liabilities.
Securities deposited as initial margin are designated in the Schedules of Investments and cash deposited, if any, is shown as cash pledged for futures contracts in the Statements of Assets and Liabilities. Pursuant to the contract, the Trusts agree to receive from or pay to the broker an amount of cash equal to the daily fluctuation in market value of the contract (“variation margin”). Variation margin is recorded as unrealized appreciation (depreciation) and, if any, shown as variation margin receivable (or payable) on futures contracts in the Statements of Assets and Liabilities. When the contract is closed, a realized gain or loss is recorded in the Statements of Operations equal to the difference between the notional amount of the contract at the time it was opened and the notional amount at the time it was closed. The use of futures contracts involves the risk of an imperfect correlation in the movements in the price of futures contracts and interest, foreign currency exchange rates or underlying assets.
Forward Foreign Currency Exchange Contracts:Forward foreign currency exchange contracts are entered into to gain or reduce exposure to foreign currencies (foreign currency exchange rate risk).
A forward foreign currency exchange contract is an agreement between two parties to buy and sell a currency at a set exchange rate on a specified date. These contracts help to manage the overall exposure to the currencies in which some of the investments held by the Trusts are denominated and in some cases, may be used to obtain exposure to a particular market.
The contract ismarked-to-market daily and the change in market value is recorded as unrealized appreciation (depreciation) in the Statements of Assets and Liabilities. When a contract is closed, a realized gain or loss is recorded in the Statements of Operations equal to the difference between the value at the time it was opened and the value at the time it was closed.Non-deliverable forward foreign currency exchange contracts are settled with the counterparty in cash without the delivery of foreign currency. The use of forward foreign currency exchange contracts involves the risk that the value of a forward foreign currency exchange contract changes unfavorably due to movements in the value of the referenced foreign currencies, and such value may exceed the amounts reflected in the Statements of Assets and Liabilities. Cash amounts pledged for forward foreign currency exchange contracts are considered restricted and are included in cash pledged as collateral for OTC derivatives in the Statements of Assets and Liabilities.
Options:Certain Trusts purchase and write call and put options to increase or decrease their exposure to the risks of underlying instruments, including equity risk, interest rate risk and/or commodity price risk and/or, in the case of options written, to generate gains from options premiums.
A call option gives the purchaser (holder) of the option the right (but not the obligation) to buy, and obligates the seller (writer) to sell (when the option is exercised) the underlying instrument at the exercise or strike price at any time or at a specified time during the option period. A put option gives the holder the right to sell and obligates the writer to buy the underlying instrument at the exercise or strike price at any time or at a specified time during the option period.
Premiums paid on options purchased and premiums received on options written, as well as the daily fluctuation in market value, are included in investments at value — unaffiliated and options written at value, respectively, in the Statements of Assets and Liabilities. When an instrument is purchased or sold through the exercise of an option, the premium is offset against the cost or proceeds of the underlying instrument. When an option expires, a realized gain or loss is recorded in the Statements of Operations to the extent of the premiums received or paid. When an option is closed or sold, a gain or loss is recorded in the Statements of Operations to the extent the cost of the closing transaction exceeds the premiums received or paid. When the Trusts write a call option, such option is typically “covered,” meaning that they hold the underlying instrument subject to being called by the option counterparty. When the Trusts write a put option, such option is covered by cash in an amount sufficient to cover the obligation. These amounts, which are considered restricted, are included in cash pledged as collateral for options written in the Statements of Assets and Liabilities.
| | • | | Swaptions — Certain Trusts purchase and write options on swaps (“swaptions”) primarily to preserve a return or spread on a particular investment or portion of the Trusts’ holdings, as a duration management technique or to protect against an increase in the price of securities it anticipates purchasing at a later date. The purchaser and writer of a swaption is buying or granting the right to enter into a previously agreed upon interest rate or credit default swap agreement (interest rate risk and/or credit risk) at any time before the expiration of the option. |
| | | | |
| NOTESTO FINANCIAL STATEMENTS | | | 47 | |
Notes to Financial Statements (unaudited) (continued)
In purchasing and writing options, the Trusts bear the risk of an unfavorable change in the value of the underlying instrument or the risk that they may not be able to enter into a closing transaction due to an illiquid market. Exercise of a written option could result in the Trusts purchasing or selling a security when they otherwise would not, or at a price different from the current market value.
Swaps:Swap contracts are entered into to manage exposure to issuers, markets and securities. Such contracts are agreements between the Trusts and a counterparty to make periodic net payments on a specified notional amount or a net payment upon termination. Swap agreements are privately negotiated in the OTC market and may be entered into as a bilateral contract (“OTC swaps”) or centrally cleared (“centrally cleared swaps”).
For OTC swaps, any upfront premiums paid and any upfront fees received are shown as swap premiums paid and swap premiums received, respectively, in the Statements of Assets and Liabilities and amortized over the term of the contract. The daily fluctuation in market value is recorded as unrealized appreciation (depreciation) on OTC Swaps in the Statements of Assets and Liabilities. Payments received or paid are recorded in the Statements of Operations as realized gains or losses, respectively. When an OTC swap is terminated, a realized gain or loss is recorded in the Statements of Operations equal to the difference between the proceeds from (or cost of) the closing transaction and the Trusts’ basis in the contract, if any. Generally, the basis of the contract is the premium received or paid.
In a centrally cleared swap, immediately following execution of the swap contract, the swap contract is novated to a central counterparty (the “CCP”) and the Trusts’ counterparty on the swap agreement becomes the CCP. The Trusts are required to interface with the CCP through the broker. Upon entering into a centrally cleared swap, the Trusts are required to deposit initial margin with the broker in the form of cash or securities in an amount that varies depending on the size and risk profile of the particular swap. Securities deposited as initial margin are designated in the Schedules of Investments and cash deposited is shown as cash pledged for centrally cleared swaps in the Statements of Assets and Liabilities. Amounts pledged, which are considered restricted cash, are included in cash pledged for centrally cleared swaps in the Statements of Assets and Liabilities. Pursuant to the contract, the Trusts agree to receive from or pay to the broker an amount of cash equal to the daily fluctuation in market value of the contract (“variation margin”). Variation margin is recorded as unrealized appreciation (depreciation) and shown as variation margin receivable (or payable) on centrally cleared swaps in the Statements of Assets and Liabilities. Payments received from (paid to) the counterparty, including at termination, are recorded as realized gains (losses) in the Statements of Operations.
| | • | | Credit default swaps — Credit default swaps are entered into to manage exposure to the market or certain sectors of the market, to reduce risk exposure to defaults of corporate and/or sovereign issuers or to create exposure to corporate and/or sovereign issuers to which a trust is not otherwise exposed (credit risk). |
The Trusts may either buy or sell (write) credit default swaps on single-name issuers (corporate or sovereign), a combination or basket of single-name issuers or traded indexes. Credit default swaps are agreements in which the protection buyer pays fixed periodic payments to the seller in consideration for a promise from the protection seller to make a specific payment should a negative credit event take place with respect to the referenced entity (e.g., bankruptcy, failure to pay, obligation acceleration, repudiation, moratorium or restructuring). As a buyer, if an underlying credit event occurs, the Trusts will either (i) receive from the seller an amount equal to the notional amount of the swap and deliver the referenced security or underlying securities comprising the index, or (ii) receive a net settlement of cash equal to the notional amount of the swap less the recovery value of the security or underlying securities comprising the index. As a seller (writer), if an underlying credit event occurs, the Trusts will either pay the buyer an amount equal to the notional amount of the swap and take delivery of the referenced security or underlying securities comprising the index or pay a net settlement of cash equal to the notional amount of the swap less the recovery value of the security or underlying securities comprising the index.
| | • | | Interest rate swaps — Interest rate swaps are entered into to gain or reduce exposure to interest rates or to manage duration, the yield curve or interest rate (interest rate risk). |
Interest rate swaps are agreements in which one party pays a stream of interest payments, either fixed or floating, in exchange for another party’s stream of interest payments, either fixed or floating, on the same notional amount for a specified period of time. In more complex interest rate swaps, the notional principal amount may decline (or amortize) over time.
Swap transactions involve, to varying degrees, elements of interest rate, credit and market risk in excess of the amounts recognized in the Statements of Assets and Liabilities. Such risks involve the possibility that there will be no liquid market for these agreements, that the counterparty to the agreements may default on its obligation to perform or disagree as to the meaning of the contractual terms in the agreements, and that there may be unfavorable changes in interest rates and/or market values associated with these transactions.
Master Netting Arrangements: In order to define their contractual rights and to secure rights that will help them mitigate their counterparty risk, the Trusts may enter into an International Swaps and Derivatives Association, Inc. Master Agreement (“ISDA Master Agreement”) or similar agreement with their counterparties. An ISDA Master Agreement is a bilateral agreement between each Trust and a counterparty that governs certain OTC derivatives and typically contains, among other things, collateral posting terms and netting provisions in the event of a default and/or termination event. Under an ISDA Master Agreement, each Trust may, under certain circumstances, offset with the counterparty certain derivative financial instruments’ payables and/or receivables with collateral held and/or posted and create one single net payment. The provisions of the ISDA Master Agreement typically permit a single net payment in the event of default including the bankruptcy or insolvency of the counterparty. Bankruptcy or insolvency laws of a particular jurisdiction may restrict or prohibit the right of offset in bankruptcy, insolvency or other events.
Collateral Requirements:For derivatives traded under an ISDA Master Agreement, the collateral requirements are typically calculated by netting themark-to-market amount for each transaction under such agreement and comparing that amount to the value of any collateral currently pledged by the Trusts and the counterparty.
Cash collateral that has been pledged to cover obligations of the Trusts and cash collateral received from the counterparty, if any, is reported separately in the Statements of Assets and Liabilities as cash pledged as collateral and cash received as collateral, respectively.Non-cash collateral pledged by the Trusts, if any, is noted in the Schedules of Investments. Generally, the amount of collateral due from or to a counterparty is subject to a certain minimum transfer amount threshold before a transfer is required, which is determined at the close of business of the Trusts. Any additional required collateral is delivered to/pledged by the Trusts on the next business day. Typically, the counterparty is not permitted to sell,re-pledge or use cash andnon-cash collateral it receives. A Trust generally agrees not to usenon-cash collateral that it receives but may, absent default or certain other circumstances defined in the underlying ISDA Master Agreement, be permitted to use cash collateral received. In such
| | |
| 48 | | 2019 BLACKROCK SEMI-ANNUAL REPORTTO SHAREHOLDERS |
Notes to Financial Statements (unaudited) (continued)
cases, interest may be paid pursuant to the collateral arrangement with the counterparty. To the extent amounts due to the Trusts from their counterparties are not fully collateralized, they bear the risk of loss from counterpartynon-performance. Likewise, to the extent the Trusts have delivered collateral to a counterparty and stand ready to perform under the terms of their agreement with such counterparty, they bear the risk of loss from a counterparty in the amount of the value of the collateral in the event the counterparty fails to return such collateral. Based on the terms of agreements, collateral may not be required for all derivative contracts.
For financial reporting purposes, the Trusts do not offset derivative assets and derivative liabilities that are subject to netting arrangements, if any, in the Statements of Assets and Liabilities.
| 6. | INVESTMENT ADVISORY AGREEMENT AND OTHER TRANSACTIONS WITH AFFILIATES |
Each Trust entered into an Investment Advisory Agreement with the Manager, each Trust’s investment adviser and an indirect, wholly-owned subsidiary of BlackRock, Inc. (“BlackRock”), to provide investment advisory and administrative services. The Manager is responsible for the management of each Trust’s portfolio and provides the personnel, facilities, equipment and certain other services necessary to the operations of each Trust.
For such services, BGIO pays the Manager a monthly fee at an annual rate equal to 0.60% of the average daily value of the Trust’s managed assets. For purposes of calculating this fee, “managed assets” means the total assets of the Trust (including any assets attributable to money borrowed for investment purposes) minus the sum of its accrued liabilities (other than money borrowed for investment purposes).
For such services, BKT pays the Manager a monthly fee at an annual rate equal to 0.65% of the average weekly value of the Trust’s net assets. For purposes of calculating this fee, “net assets” means the total assets of the Trust minus the sum of its accrued liabilities (including the aggregate indebtedness constituting financial leverage).
With respect to BGIO, the Manager entered intosub-advisory agreements with BlackRock International Limited (“BIL”) and BlackRock (Singapore) Limited (“BRS”), each an affiliate of the Manager. The Manager pays BIL and BRS, for services they provide for that portion of BGIO for which BIL or BRS, as applicable, act assub-adviser, a monthly fee that is equal to a percentage of the investment advisory fees paid by BGIO to the Manager.
Administration: BKT has an Administration Agreement with the Manager. The administration fee paid monthly to the Manager is computed at an annual rate of 0.15% of the Trust’s average weekly net assets. For BKT, the Manager may reduce or discontinue these arrangements at any time without notice.
Expense Waivers:With respect to each Trust,the Manager voluntarily agreed to waive its investment advisory fees by the amount of investment advisory fees each Trust pays to the Manager indirectly through its investment in affiliated money market funds (the “affiliated money market fund waiver”). These amounts are included in fees waived and/or reimbursed by the Manager in the Statements of Operations. For the six months ended June 30, 2019, the amounts waived were as follows:
| | | | | | | | |
| | | BGIO | | | BKT | |
Amounts waived | | $ | 1,339 | | | $ | 2,427 | |
The Manager contractually agreed to waive its investment advisory fee with respect to any portion of each Trust’s assets invested in affiliated equity and fixed-income mutual funds and affiliated exchange-traded funds that have a contractual management fee through June 30, 2020. The agreement can be renewed for annual periods thereafter, and may be terminated on 90 days’ notice, each subject to approval by a majority of the Trusts’ Independent Trustees.
Trustees and Officers: Certain Trustees and/or officers of the Trusts are directors and/or officers of BlackRock or its affiliates. The Trusts reimburse the Manager for a portion of the compensation paid to the Trusts’ Chief Compliance Officer, which is included in Trustees and Officer in the Statements of Operations.
For the six months ended June 30, 2019, purchases and sales of investments, including paydowns, mortgage dollar rolls and excluding short-term securities, were as follows:
| | | | | | | | |
| Purchases | | | | | | |
| | | BGIO | | | BKT | |
Non-U.S. Government Securities | | $ | 68,849,370 | | | $ | 560,864,955 | |
U.S. Government Securities | | | — | | | | — | |
Total Purchases | | $ | 68,849,370 | | | $ | 560,864,955 | |
| | | | | | | | |
| Sales | | | | | | |
| | | BGIO | | | BKT | |
Non-U.S. Government Securities | | $ | 54,302,330 | | | $ | 545,127,096 | |
U.S. Government Securities | | | — | | | | — | |
Total Sales | | $ | 54,302,330 | | | $ | 545,127,096 | |
For the six months ended June 30, 2019, purchases and sales related to mortgage dollar rolls were as follows:
| | | | | | | | |
| | | Purchases | | | Sales | |
BKT | | $ | 240,523,863 | | | $ | 240,353,195 | |
| | | | |
| NOTESTO FINANCIAL STATEMENTS | | | 49 | |
Notes to Financial Statements (unaudited) (continued)
It is each Trust’s policy to comply with the requirements of the Internal Revenue Code of 1986, as amended, applicable to regulated investment companies, and to distribute substantially all of its taxable income to its shareholders. Therefore, no U.S. federal income tax provision is required.
Each Trust files U.S. federal and various state and local tax returns. No income tax returns are currently under examination. The statute of limitations on BGIO’s and BKT’s U.S. federal tax returns generally remains open, for BGIO, for the year ended December 31, 2018 and period ended December 31, 2017 and for BKT, each of the three years ended August 31, 2018 and period ended December 31, 2018. The statutes of limitations on each Trust’s state and local tax returns may remain open for an additional year depending upon the jurisdiction.
Management has analyzed tax laws and regulations and their application to the Trusts as of June 30, 2019, inclusive of the open tax return years, and does not believe that there are any uncertain tax positions that require recognition of a tax liability in the Trusts’ financial statements.
As of December 31, 2018, the Trusts had capital loss carryforwards, with no expiration dates, available to offset future realized capital gains as follows:
| | | | | | | | |
| | | BGIO | | | BKT | |
No expiration date | | $ | 5,005,013 | | | $ | 45,881,918 | |
As of June 30, 2019, gross unrealized appreciation and depreciation for investments and derivatives based on cost for U.S. federal income tax purposes were as follows:
| | | | | | | | |
| | | BGIO | | | BKT | |
Tax cost | | $ | 271,375,650 | | | $ | 606,993,135 | |
| | | | | | | | |
Gross unrealized appreciation | | | 9,132,926 | | | | 26,632,303 | |
Gross unrealized depreciation | | | (7,262,821 | ) | | | (25,487,638 | ) |
| | | | | | | | |
Net unrealized appreciation | | $ | 1,870,105 | | | $ | 1,144,665 | |
| | | | | | | | |
In the normal course of business, certain Trusts invest in securities or other instruments and may enter into certain transactions, and such activities subject each Trust to various risks, including among others, fluctuations in the market (market risk) or failure of an issuer to meet all of its obligations. The value of securities or other instruments may also be affected by various factors, including, without limitation: (i) the general economy; (ii) the overall market as well as local, regional or global political and/or social instability; (iii) regulation, taxation or international tax treaties between various countries; or (iv) currency, interest rate and price fluctuations.
Each Trust may be exposed to prepayment risk, which is the risk that borrowers may exercise their option to prepay principal earlier than scheduled during periods of declining interest rates, which would force each Trust to reinvest in lower yielding securities. Each Trust may also be exposed to reinvestment risk, which is the risk that income from each Trust’s portfolio will decline if each Trust invests the proceeds from matured, traded or called fixed-income securities at market interest rates that are below each Trust portfolio’s current earnings rate.
BGIO will terminate on or about February 28, 2022. BGIO is not a target term fund and thus does not seek to return its initial public offering price of $10.00 per common share upon termination. The final distribution of net assets upon termination may be more than, equal to or less than $10.00 per common share.
Investment Objective Risk: There is no assurance that BGIO will achieve its investment objective. A variety of circumstances may make it extremely difficult for BGIO to achieve its investment objective. Such circumstances include, but may not be limited to, the existence of an inverted yield curve, a rapid and significant increase in interest rates, a significant decrease in issuer credit quality generally and/or increased defaults, increased volatility in currency markets and/or in currency exchange rates and negative economic, market, political and/or social developments impacting emerging markets. Additionally, the limited term of the Trust may increase the risk that BGIO may not meet its investment objective. A limited term limits the period during which BGIO can generate returns and increases the potential impact that a disruptive market event or one or more of the conditions outlined above could have on BGIO’s annualized returns.
Valuation Risk: The price a Trust could receive upon the sale of any particular portfolio investment may differ from a Trust’s valuation of the investment, particularly for securities that trade in thin or volatile markets or that are valued using a fair valuation technique or a price provided by an independent pricing service. Changes to significant unobservable inputs and assumptions (i.e., publicly traded company multiples, growth rate, time to exit) due to the lack of observable inputs may significantly impact the resulting fair value and therefore a Trust’s results of operations. As a result, the price received upon the sale of an investment may be less than the value ascribed by a Trust, and a Trust could realize a greater than expected loss or lesser than expected gain upon the sale of the investment. A Trust’s ability to value its investments may also be impacted by technological issues and/or errors by pricing services or other third party service providers.
Counterparty Credit Risk:The Trusts may be exposed to counterparty credit risk, or the risk that an entity may fail to or be unable to perform on its commitments related to unsettled or open transactions. The Trusts manage counterparty credit risk by entering into transactions only with counterparties that the Manager believes have the financial resources to honor their obligations and by monitoring the financial stability of those counterparties. Financial assets, which potentially expose the Trusts to market, issuer and counterparty credit risks, consist principally of financial instruments and receivables due from counterparties. The extent of the Trusts’ exposure to market, issuer and counterparty credit risks with respect to these financial assets is approximately their value recorded in the Statements of Assets and Liabilities, less any collateral held by the Trusts.
A derivative contract may suffer amark-to-market loss if the value of the contract decreases due to an unfavorable change in the market rates or values of the underlying instrument. Losses can also occur if the counterparty does not perform under the contract.
| | |
| 50 | | 2019 BLACKROCK SEMI-ANNUAL REPORTTO SHAREHOLDERS |
Notes to Financial Statements (unaudited) (continued)
A Trust’s risk of loss from counterparty credit risk on OTC derivatives is generally limited to the aggregate unrealized gain less the value of any collateral held by such Trust.
For OTC options purchased, each Trust bears the risk of loss in the amount of the premiums paid plus the positive change in market values net of any collateral held by the Trusts should the counterparty fail to perform under the contracts. Options written by the Trusts do not typically give rise to counterparty credit risk, as options written generally obligate the Trusts, and not the counterparty, to perform. The Trusts may be exposed to counterparty credit risk with respect to options written to the extent the Trusts deposits collateral with its counterparty to a written option.
With exchange-traded futures and centrally cleared swaps, there is less counterparty credit risk to the Trusts since the exchange or clearinghouse, as counterparty to such instruments, guarantees against a possible default. The clearinghouse stands between the buyer and the seller of the contract; therefore, credit risk is limited to failure of the clearinghouse. While offset rights may exist under applicable law, the Trusts does not have a contractual right of offset against a clearing broker or clearinghouse in the event of a default (including the bankruptcy or insolvency). Additionally, credit risk exists in exchange-traded futures and centrally cleared swaps with respect to initial and variation margin that is held in a clearing broker’s customer accounts. While clearing brokers are required to segregate customer margin from their own assets, in the event that a clearing broker becomes insolvent or goes into bankruptcy and at that time there is a shortfall in the aggregate amount of margin held by the clearing broker for all its clients, typically the shortfall would be allocated on a pro rata basis across all the clearing broker’s customers, potentially resulting in losses to the Trusts.
Concentration Risk:BGIO may invest in securities that are rated below investment grade quality (sometimes called “junk bonds”), which are predominantly speculative, have greater credit risk and generally are less liquid and have more volatile prices than higher quality securities.
The Trusts invest a significant portion of their assets in fixed-income securities and/or uses derivatives tied to the fixed-income markets. Changes in market interest rates or economic conditions may affect the value and/or liquidity of such investments. Interest rate risk is the risk that prices of bonds and other fixed-income securities will increase as interest rates fall and decrease as interest rates rise. The Trusts may be subject to a greater risk of rising interest rates due to the current period of historically low rates.
The Trusts invest a significant portion of their assets in securities backed by commercial or residential mortgage loans or in issuers that hold mortgage and other asset-backed securities. Investment percentages in these securities are presented in the Schedules of Investments. Changes in economic conditions, including delinquencies and/or defaults on assets underlying these securities, can affect the value, income and/or liquidity of such positions.
| 10. | CAPITAL SHARE TRANSACTIONS |
BGIO is authorized to issue an unlimited numbers of shares, par value $0.001, all of which were initially classified as Common Shares. BKT is authorized to issue 200 million shares, par value $0.01, all of which were initially classified as Common Shares. The Board is authorized, however, to reclassify any unissued Common Shares to Preferred Shares without the approval of Common Shareholders.
For the six months ended June 30, 2019 and year ended December 31, 2018, for BGIO and BKT, shares issued and outstanding remained constant.
BKT participates in an open market share repurchase program (the “Repurchase Program”). From December 1, 2017 through November 30, 2018, BKT was permitted to repurchase up to 5% of its outstanding common shares under the Repurchase Program, based on common shares outstanding as of the close of business on November 30, 2017, subject to certain conditions. From December 1, 2018 through November 30, 2019, BKT may repurchase up to 5% of its outstanding common shares under the Repurchase Program, based on common shares outstanding as of the close of business on November 30, 2018, subject to certain conditions. There is no assurance that BKT will purchase shares in any particular amounts. For the six months ended June 30, 2019, BKT did not repurchase any shares.
For the period shown, shares repurchased and cost, including transaction costs, were as follows:
| | | | | | | | |
| BKT | | Shares | | | Amount | |
Period Ended June 30, 2019 | | | — | | | $ | — | |
Period Ended December 31, 2018 | | | — | | | | — | |
Year Ended August 31, 2018 | | | 145,423 | | | | 854,488 | |
As of June 30, 2019, BlackRock HoldCo 2, Inc., an affiliate of the Trusts, owned 17,919 shares of BGIO.
Management’s evaluation of the impact of all subsequent events on the Trusts’ financial statements was completed through the date the financial statements were issued and the following items were noted:
| | | | | | | | |
| | | Common Dividend
Per Share | |
| | | Paid (a) | | | Declared (b) | |
BGIO | | | 0.0500 | | | | 0.0500 | |
BKT | | | 0.0344 | | | | 0.0344 | |
| | (a) | Net investment income dividend paid on July 31, 2019 to Common Shareholders of record on July 15, 2019. | |
| | (b) | Net investment income dividend declared on August 1, 2019, payable to shareholders of record on August 15, 2019. | |
| | | | |
| NOTESTO FINANCIAL STATEMENTS | | | 51 | |
Disclosure of Investment Advisory Agreements and Sub-Advisory Agreements
The Board of Trustees or Directors, as applicable (collectively, the “Board,” the members of which are referred to as “Board Members”), of BlackRock 2022 Global Income Opportunity Trust (“BGIO”) and BlackRock Income Trust, Inc. (“BKT” and together with BGIO, the “Funds” and each, a “Fund”) met in person on May 1, 2019 (the “May Meeting”) and June5-6, 2019 (the “June Meeting”) to consider the approval of each Fund’s investment advisory agreement (the “Advisory Agreements”) with BlackRock Advisors, LLC (the “Manager”), each Fund’s investment advisor. The Board also considered the approval ofsub-advisory agreements (the“Sub-Advisory Agreements”) between (1) the Manager, BGIO and BlackRock International Limited (“BIL”) and (2) the Manager, BGIO and BlackRock (Singapore) Limited (“BRS”). The Manager, BIL and BRS are referred to herein as “BlackRock.” The Advisory Agreements and theSub-Advisory Agreements are referred to herein as the “Agreements.”
Activities and Composition of the Board
On the date of the June Meeting, the Board consisted of eleven individuals, nine of whom were not “interested persons” of each Fund as defined in the Investment Company Act of 1940, as amended (the “1940 Act”) (the “Independent Board Members”). The Board Members are responsible for the oversight of the operations of each Fund and perform the various duties imposed on the directors of investment companies by the 1940 Act. The Independent Board Members have retained independent legal counsel to assist them in connection with their duties. TheCo-Chairs of the Board are Independent Board Members. The Board has established five standing committees: an Audit Committee, a Governance and Nominating Committee, a Compliance Committee, a Performance Oversight Committee and an Executive Committee, each of which is chaired by an Independent Board Member and composed of Independent Board Members (except for the Executive Committee, which also has one interested Board Member).
The Agreements
Consistent with the requirements of the 1940 Act, the Board considers the continuation of the Agreements on an annual basis. The Board has four quarterly meetings per year, each typically extending for two days, and additionalin-person and telephonic meetings throughout the year, as needed. While the Board also has a fifthone-day meeting to consider specific information surrounding the renewal of the Agreements, the Board’s consideration entails a year-long deliberative process whereby the Board and its committees assess BlackRock’s services to each Fund. In particular, the Board assessed, among other things, the nature, extent and quality of the services provided to each Fund by BlackRock, BlackRock’s personnel and affiliates, including (as applicable): investment management; accounting, administrative and shareholder services; oversight of each Fund’s service providers; risk management and oversight; legal and compliance services; and ability to meet applicable legal and regulatory requirements. Throughout the year, including during the contract renewal process, the Independent Board Members were advised by independent legal counsel, and met with independent legal counsel in various executive sessions outside of the presence of management.
During the year, the Board, acting directly and through its committees, considers information that is relevant to its annual consideration of the renewal of the Agreements, including the services and support provided by BlackRock to each Fund and its shareholders. BlackRock also furnished additional information to the Board in response to specific questions from the Board. This additional information is discussed further below in the section titled “Board Considerations in Approving the Agreements.” Among the matters the Board considered were: (a) investment performance forone-year, three-year, five-year,ten-year, and/or since inception periods, as applicable, against peer funds, applicable benchmarks, and performance metrics, as applicable, as well as senior management’s and portfolio managers’ analyses of the reasons for any over-performance or underperformance relative to its peers, benchmarks, and other performance metrics, as applicable; (b) leverage management, as applicable; (c) fees, including advisory, administration, if applicable, and other amounts paid to BlackRock and its affiliates by each Fund for services; (d) Fund operating expenses and how BlackRock allocates expenses to each Fund; (e) the resources devoted to, risk oversight of, and compliance reports relating to, implementation of each Fund’s investment objective, policies and restrictions, and meeting regulatory requirements; (f) BlackRock and each Fund’s adherence to applicable compliance policies and procedures; (g) the nature, character and scope ofnon-investment management services provided by BlackRock and its affiliates and the estimated cost of such services; (h) BlackRock’s and other service providers’ internal controls and risk and compliance oversight mechanisms; (i) BlackRock’s implementation of the proxy voting policies approved by the Board; (j) execution quality of portfolio transactions; (k) BlackRock’s implementation of each Fund’s valuation and liquidity procedures; (l) an analysis of management fees for products with similar investment mandates across theopen-end fund,closed-end fund,sub-advised mutual fund, collective investment trust, and institutional separate account product channels, as applicable, and the similarities and differences between these products and the services provided as compared to each Fund; (m) BlackRock’s compensation methodology for its investment professionals and the incentives and accountability it creates, along with investment professionals’ investments in the fund(s) they manage; (n) periodic updates on BlackRock’s business; and (o) each Fund’s market discount/premium compared to peer funds.
Board Considerations in Approving the Agreements
The Approval Process: Prior to the May Meeting, the Board requested and received materials specifically relating to the Agreements. The Independent Board Members are continuously engaged in a process with their independent legal counsel and BlackRock to review the nature and scope of the information provided to better assist its deliberations. The materials provided in connection with the May Meeting included, among other things: (a) information independently compiled and prepared by Broadridge Financial Solutions, Inc. (“Broadridge”), based on Lipper classifications, regarding each Fund’s fees and expenses as compared with a peer group of funds as determined by Broadridge (“Expense Peers”), the investment performance of each Fund as compared with a peer group of funds (“Performance Peers”) and other metrics, as applicable; (b) information on the composition of the Expense Peers and Performance Peers, and a description of Broadridge’s methodology; (c) information on the estimated profits realized by BlackRock and its affiliates pursuant to the Agreements and a discussion offall-out benefits to BlackRock and its affiliates; (d) a general analysis provided by BlackRock concerning investment management fees received in connection with other types of investment products, such as institutional accounts,sub-advised mutual funds,closed-end funds, andopen-end funds, under similar investment mandates, as applicable; (e) review ofnon-management fees; (f) the existence, impact and sharing of potential economies of scale, if any, with each Fund; (g) a summary of aggregate amounts paid by each Fund to BlackRock; and (h) various additional information requested by the Board as appropriate regarding BlackRock’s and each Fund’s operations.
At the May Meeting, the Board reviewed materials relating to its consideration of the Agreements. As a result of the discussions that occurred during the May Meeting, and as a culmination of the Board’s year-long deliberative process, the Board presented BlackRock with questions and requests for additional information. BlackRock responded to these requests with additional written information in advance of the June Meeting. Topics covered included: (a) the methodology for measuring estimated
| | |
| 52 | | 2019 BLACKROCK SEMI-ANNUAL REPORTTO SHAREHOLDERS |
Disclosure of Investment Advisory Agreements and Sub-Advisory Agreements (continued)
fund profitability; (b) fund expenses and potential fee waivers; (c) differences in services provided and management fees betweenclosed-end funds and other product channels; and (d) BlackRock’s option overwrite strategy.
At the June Meeting, the Board concluded its assessment of, among other things: (a) the nature, extent and quality of the services provided by BlackRock; (b) the investment performance of each Fund as compared with Performance Peers and other metrics, as applicable; (c) the advisory fee and the estimated cost of the services and estimated profits realized by BlackRock and its affiliates from their relationship with each Fund; (d) each Fund’s fees and expenses compared to Expense Peers; (e) the sharing of potential economies of scale;(f) fall-out benefits to BlackRock and its affiliates as a result of BlackRock’s relationship with each Fund; and (g) other factors deemed relevant by the Board Members.
The Board also considered other matters it deemed important to the approval process, such as other payments made to BlackRock or its affiliates relating to securities lending and cash management, and BlackRock’s services related to the valuation and pricing of Fund portfolio holdings. The Board noted the willingness of BlackRock personnel to engage in open, candid discussions with the Board. The Board did not identify any particular information as determinative, and each Board Member may have attributed different weights to the various items considered.
A. Nature, Extent and Quality of the Services Provided by BlackRock: The Board, including the Independent Board Members, reviewed the nature, extent and quality of services provided by BlackRock, including the investment advisory services and the resulting performance of each Fund. Throughout the year, the Board compared Fund performance to the performance of a comparable group ofclosed-end funds, relevant benchmarks, and performance metrics, as applicable. The Board met with BlackRock’s senior management personnel responsible for investment activities, including the senior investment officers. The Board also reviewed the materials provided by each Fund’s portfolio management team discussing each Fund’s performance and each Fund’s investment objective, strategies and outlook.
The Board considered, among other factors, with respect to BlackRock: the number, education and experience of investment personnel generally and each Fund’s portfolio management team; BlackRock’s research capabilities; investments by portfolio managers in the funds they manage; portfolio trading capabilities; use of technology; commitment to compliance; credit analysis capabilities; risk analysis and oversight capabilities; and the approach to training and retaining portfolio managers and other research, advisory and management personnel. The Board also considered BlackRock’s overall risk management program, including the continued efforts of BlackRock and its affiliates to address cybersecurity risks and the role of BlackRock’s Risk & Quantitative Analysis Group. The Board engaged in a review of BlackRock’s compensation structure with respect to each Fund’s portfolio management team and BlackRock’s ability to attract and retain high-quality talent and create performance incentives.
In addition to investment advisory services, the Board considered the nature and quality of the administrative and othernon-investment advisory services provided to each Fund. BlackRock and its affiliates provide each Fund with certain administrative, shareholder and other services (in addition to any such services provided to each Fund by third parties) and officers and other personnel as are necessary for the operations of each Fund. In particular, BlackRock and its affiliates provide each Fund with administrative services including, among others: (i) responsibility for disclosure documents, such as the prospectus and the statement of additional information in connection with the initial public offering and periodic shareholder reports; (ii) preparing communications with analysts to support secondary market trading of each Fund; (iii) oversight of daily accounting and pricing; (iv) responsibility for periodic filings with regulators and stock exchanges; (v) overseeing and coordinating the activities of other service providers including, among others, each Fund’s custodian, fund accountant, transfer agent, and auditor; (vi) organizing Board meetings and preparing the materials for such Board meetings; (vii) providing legal and compliance support; (viii) furnishing analytical and other support to assist the Board in its consideration of strategic issues such as the merger, consolidation or repurposing of certainclosed-end funds; and (ix) performing or managing administrative functions necessary for the operation of each Fund, such as tax reporting, expense management, fulfilling regulatory filing requirements, and shareholder call center and other services. The Board reviewed the structure and duties of BlackRock’s fund administration, shareholder services, and legal & compliance departments and considered BlackRock’s policies and procedures for assuring compliance with applicable laws and regulations.
B. The Investment Performance of each Fund and BlackRock: The Board, including the Independent Board Members, also reviewed and considered the performance history of each Fund. In preparation for the May Meeting, the Board was provided with reports independently prepared by Broadridge, which included a comprehensive analysis of each Fund’s performance as of December 31, 2018. The performance information is based on net asset value (NAV), and utilizes Lipper data. Lipper’s methodology calculates a fund���s total return assuming distributions are reinvested on theex-date at a fund’sex-date NAV. Broadridge ranks funds in quartiles, ranging from first to fourth, where first is the most desirable quartile position and fourth is the least desirable. In connection with its review, the Board received and reviewed information regarding the investment performance of each Fund as compared to its Performance Peers, the performance of each Fund as compared with its custom benchmark and, with respect to BKT, a custom peer group of funds as defined by BlackRock (“Customized Peer Group”). The Board and its Performance Oversight Committee regularly review, and meet with Fund management to discuss, the performance of each Fund throughout the year.
In evaluating performance, the Board focused particular attention on funds with less favorable performance records. The Board also noted that while it found the data provided by Broadridge generally useful, it recognized the limitations of such data, including in particular, that notable differences may exist between a fund and the Performance Peer funds (for example, the investment objective(s) and investment strategies). Further, the Board recognized that the performance data reflects a snapshot of a period as of a particular date and that selecting a different performance period could produce significantly different results. The Board also acknowledged that long-term performance could be impacted by even one period of significant outperformance or underperformance, and that a single investment theme could have the ability to affect long-term performance disproportionately.
The Board noted that for theone-year and since-inception periods reported, BGIO underperformed its customized benchmark. The Board noted that BlackRock believes that performance relative to the customized benchmark is an appropriate performance metric for BGIO, and that BlackRock has explained its rationale for this belief to the Board. The Board and BlackRock reviewed BGIO’s underperformance during the applicable periods.
The Board noted that for theone-, three- and five-year periods reported, BKT outperformed, underperformed, and underperformed, respectively, its customized benchmark. The Board noted that BlackRock believes that performance relative to the customized benchmark is an appropriate performance metric for BKT, and that BlackRock has explained its rationale for this belief to the Board. The Board and BlackRock reviewed BKT’s underperformance during the applicable periods.
| | | | |
| DISCLOSUREOF INVESTMENT ADVISORY AGREEMENTSAND SUB-ADVISORY AGREEMENTS | | | 53 | |
Disclosure of Investment Advisory Agreements and Sub-Advisory Agreements (continued)
The Board also considered alternative measures of performance when evaluating BKT’s performance, including its “high quality” Customized Peer Group. The Customized Peer Group consists ofclosed-end funds that invest an average of 75% or greater of their portfolios inAAA-rated bonds, securities issued or guaranteed by the U.S. government or one of its agencies or instrumentalities and cash or cash equivalents. Relative to the Customized Peer Group as of December 31, 2018, the Board noted that for theone-, three-, and five-year periods reported, BKT ranked in the first, third, and first quartiles, respectively.
C. Consideration of the Advisory/Management Fees and the Estimated Cost of the Services and Estimated Profits Realized by BlackRock and its Affiliates from their Relationship with each Fund: The Board, including the Independent Board Members, reviewed each Fund’s contractual management fee rate compared with those of its Expense Peers. The contractual management fee rate represents a combination of the advisory fee and any administrative fees, before taking into account any reimbursements or fee waivers. The Board also compared each Fund’s total expense ratio, as well as its actual management fee rate as a percentage of total assets, to those of its Expense Peers. The total expense ratio represents a fund’s total net operating expenses, excluding any investment related expenses. The total expense ratio gives effect to any expense reimbursements or fee waivers that benefit a fund, and the actual management fee rate gives effect to any management fee reimbursements or waivers that benefit a fund. The Board considered the services provided and the fees charged by BlackRock and its affiliates to other types of clients with similar investment mandates, as applicable, including institutional accounts andsub-advised mutual funds (including mutual funds sponsored by third parties).
The Board received and reviewed statements relating to BlackRock’s financial condition. The Board reviewed BlackRock’s profitability methodology and was also provided with an estimated profitability analysis that detailed the revenues earned and the expenses incurred by BlackRock for services provided to each Fund. The Board reviewed BlackRock’s estimated profitability with respect to each Fund and other funds the Board currently oversees for the year ended December 31, 2018 compared to available aggregate estimated profitability data provided for the prior two years. The Board reviewed BlackRock’s estimated profitability with respect to certain other U.S. fund complexes managed by the Manager and/or its affiliates. The Board reviewed BlackRock’s assumptions and methodology of allocating expenses in the estimated profitability analysis, noting the inherent limitations in allocating costs among various advisory products. The Board recognized that profitability may be affected by numerous factors including, among other things, fee waivers and expense reimbursements by the Manager, the types of funds managed, precision of expense allocations and business mix. The Board thus recognized that calculating and comparing profitability at individual fund levels is difficult.
The Board noted that, in general, individual fund or product line profitability of other advisors is not publicly available. The Board reviewed BlackRock’s overall operating margin, in general, compared to that of certain other publicly-traded asset management firms. The Board considered the differences between BlackRock and these other firms, including the contribution of technology at BlackRock, BlackRock’s expense management, and the relative product mix.
In addition, the Board considered the estimated cost of the services provided to each Fund by BlackRock, and BlackRock’s and its affiliates’ estimated profits relating to the management of each Fund and the other funds advised by BlackRock and its affiliates. As part of its analysis, the Board reviewed BlackRock’s methodology in allocating its costs of managing the Funds, to each Fund. The Board considered whether BlackRock has the financial resources necessary to attract and retain high quality investment management personnel to perform its obligations under the Agreements and to continue to provide the high quality of services that is expected by the Board. The Board further considered factors including but not limited to BlackRock’s commitment of time, assumption of risk, and liability profile in servicing each Fund, including in contrast to what is required of BlackRock with respect to other products with similar investment mandates across theopen-end fund,closed-end fund,sub-advised mutual fund, collective investment trust, and institutional separate account product channels, as applicable.
The Board noted that BGIO’s contractual management fee rate ranked in the first quartile, and that the actual management fee rate and total expense ratio each ranked in the first quartile, relative to the Expense Peers.
The Board noted that BKT’s contractual management fee rate ranked in the first quartile, and that the actual management fee rate and total expense ratio each ranked in the first quartile, relative to the Expense Peers.
D. Economies of Scale: The Board, including the Independent Board Members, considered the extent to which economies of scale might be realized as the assets of each Fund increase. The Board also considered the extent to which each Fund benefits from such economies in a variety of ways, and whether there should be changes in the advisory fee rate or breakpoint structure in order to enable each Fund to more fully participate in these economies of scale. The Board considered each Fund’s asset levels and whether the current fee was appropriate.
Based on the Board’s review and consideration of the issue, the Board concluded that mostclosed-end funds do not have fund level breakpoints becauseclosed-end funds generally do not experience substantial growth after the initial public offering. They are typically priced at scale at a fund’s inception.
E. Other Factors Deemed Relevant by the Board Members: The Board, including the Independent Board Members, also took into account other ancillary or“fall-out” benefits that BlackRock or its affiliates may derive from BlackRock’s respective relationships with each Fund, both tangible and intangible, such as BlackRock’s ability to leverage its investment professionals who manage other portfolios and risk management personnel, an increase in BlackRock’s profile in the investment advisory community, and the engagement of BlackRock’s affiliates as service providers to each Fund, including for administrative, securities lending and cash management services. The Board also considered BlackRock’s overall operations and its efforts to expand the scale of, and improve the quality of, its operations. The Board also noted that, subject to applicable law, BlackRock may use and benefit from third party research obtained by soft dollars generated by certain registered fund transactions to assist in managing all or a number of its other client accounts.
In connection with its consideration of the Agreements, the Board also received information regarding BlackRock’s brokerage and soft dollar practices. The Board received reports from BlackRock which included information on brokerage commissions and trade execution practices throughout the year.
The Board noted the competitive nature of theclosed-end fund marketplace, and that shareholders are able to sell their Fund shares in the secondary market if they believe that each Fund’s fees and expenses are too high or if they are dissatisfied with the performance of each Fund.
The Board also considered the various notable initiatives and projects BlackRock performed in connection with itsclosed-end fund product line. These initiatives included developing equity shelf programs; efforts to eliminate product overlap with fund mergers; ongoing services to manage leverage that has become increasingly complex;
| | |
| 54 | | 2019 BLACKROCK SEMI-ANNUAL REPORTTO SHAREHOLDERS |
Disclosure of Investment Advisory Agreements and Sub-Advisory Agreements (continued)
periodic evaluation of share repurchases and other support initiatives for certain BlackRock funds; and continued communications efforts with shareholders, fund analysts and financial advisers. With respect to the latter, the Independent Board Members noted BlackRock’s continued commitment to supporting the secondary market for the common shares of itsclosed-end funds through a comprehensive secondary market communication program designed to raise investor and analyst awareness and understanding ofclosed-end funds. BlackRock’s support services included, among other things: sponsoring and participating in conferences; communicating withclosed-end fund analysts covering the BlackRock funds throughout the year; providing marketing and product updates for theclosed-end funds; and maintaining and enhancing itsclosed-end fund website.
Conclusion
The Board, including the Independent Board Members, approved the continuation of the Advisory Agreement between the Manager and each Fund for aone-year term ending June 30, 2020, and theSub-Advisory Agreements between (1) the Manager, BGIO and BIL and (2) the Manager, BGIO and BRS, each for aone-year term ending June 30, 2020. Based upon its evaluation of all of the aforementioned factors in their totality, as well as other information, the Board, including the Independent Board Members, was satisfied that the terms of the Agreements were fair and reasonable and in the best interest of each Fund and its shareholders. In arriving at its decision to approve the Agreements, the Board did not identify any single factor or group of factors asall-important or controlling, but considered all factors together, and different Board Members may have attributed different weights to the various factors considered. The Independent Board Members were also assisted by the advice of independent legal counsel in making this determination.
| | | | |
| DISCLOSUREOF INVESTMENT ADVISORY AGREEMENTSAND SUB-ADVISORY AGREEMENTS | | | 55 | |
Trustee and Officer Information
Richard E. Cavanagh, Co-Chair of the Board and Trustee
Karen P. Robards, Co-Chair of the Board and Trustee
Michael J. Castellano, Trustee
Cynthia L. Egan, Trustee
Frank J. Fabozzi, Trustee
Henry Gabbay, Trustee
R. Glenn Hubbard, Trustee
W. Carl Kester, Trustee
Catherine A. Lynch, Trustee
Robert Fairbairn, Trustee
John M. Perlowski, Trustee, President and Chief Executive Officer
Jonathan Diorio, Vice President
Neal J. Andrews, Chief Financial Officer
Jay M. Fife, Treasurer
Charles Park, Chief Compliance Officer
Janey Ahn, Secretary
Investment Adviser
BlackRock Advisors, LLC
Wilmington, DE 19809
Sub-Advisers(a)
BlackRock International Limited
Edinburgh, EH3 8BL
BlackRock (Singapore) Limited
079912 SIngapore
Accounting Agent and Custodian
State Street Bank and Trust Company
Boston, MA 02111
Transfer Agent
Computershare Trust Company, N.A.
Canton, MA 02021
Independent Registered Public Accounting Firm
Deloitte & Touche LLP
Boston, MA 02116
Legal Counsel
Willkie Farr & Gallagher LLP
New York, NY 10019
Address of the Trusts
100 Bellevue Parkway
Wilmington, DE 19809
| | |
| 56 | | 2019 BLACKROCK SEMI-ANNUAL REPORTTO SHAREHOLDERS |
Additional Information
Trust Certification
The Trusts are listed for trading on the NYSE and have filed with the NYSE their annual chief executive officer certification regarding compliance with the NYSE’s listing standards. The Trusts filed with the Securities and Exchange Commission (“SEC”) the certification of their chief executive officer and chief financial officer required by section 302 of the Sarbanes-Oxley Act.
Dividend Policy
Each Trust’s dividend policy is to distribute all or a portion of its net investment income to its shareholders on a monthly basis. In order to provide shareholders with a more stable level of dividend distributions, the distributions paid by the Trusts for any particular month may be more or less than the amount of net investment income earned by the Trusts during such month. The portion of distributions that exceeds a Trust’s current and accumulated earnings and profits, which are measured on a tax basis, will constitute a nontaxable return of capital. Distributions in excess of a Trust’s taxable income and net capital gains, but not in excess of a Trust’s earnings and profits, will be taxable to shareholders as ordinary income and will not constitute a nontaxable return of capital. The Trusts’ current accumulated but undistributed net investment income, if any, is disclosed as accumulated earnings (loss) in the Statements of Assets and Liabilities, which comprises part of the financial information included in this report.
General Information
The Trusts do not make available copies of its Statement of Additional Information because the Trusts’ shares are not continuously offered, which means that the Statement of Additional Information of each Trust has not been updated after completion of the respective Trust’s offerings and the information contained in each Trust’s Statement of Additional Information may have become outdated.
On July 29, 2019, the Board approved the elimination of BKT’s non-fundamental policy limiting investments in illiquid securities to 20% of BKT’s net assets. As a result, BKT may invest without limit in illiquid securities.
Except as described above, during the period, there were no material changes in the Trusts’ investment objectives or policies or to the Trusts’ charters or by-laws that would delay or prevent a change of control of the Trusts that were not approved by the shareholders or in the principal risk factors associated with investment in the Trusts. There have been no changes in the persons who are primarily responsible for the day-to-day management of the Trusts’ portfolios.
In accordance with Section 23(c) of the Investment Company Act of 1940, each Trust may from time to time purchase shares of its common stock in the open market or in private transactions.
Quarterly performance, semi-annual and annual reports, current net asset value and other information regarding the Trusts may be found on BlackRock’s website, which can be accessed athttp://www.blackrock.com. Any reference to BlackRock’s website in this report is intended to allow investors public access to information regarding the Trusts and does not, and is not intended to, incorporate BlackRock’s website in this report.
Electronic Delivery
Shareholders can sign up for e-mail notifications of quarterly statements, annual and semi-annual shareholder reports by enrolling in the electronic delivery program. Electronic copies of shareholder reports are available on BlackRock’s website.
To enroll in electronic delivery:
Shareholders Who Hold Accounts with Investment Advisers, Banks or Brokerages:
Please contact your financial advisor. Please note that not all investment advisers, banks or brokerages may offer this service.
Householding
The Trusts will mail only one copy of shareholder documents, including prospectuses, annual and semi-annual reports and proxy statements, to shareholders with multiple accounts at the same address. This practice is commonly called “householding” and is intended to reduce expenses and eliminate duplicate mailings of shareholder documents. Mailings of your shareholder documents may be householded indefinitely unless you instruct us otherwise. If you do not want the mailing of these documents to be combined with those for other members of your household, please call the Trusts at (800) 882-0052.
Availability of Quarterly Schedule of Investments
The Trusts file their complete schedule of portfolio holdings with the SEC for the first and third quarters of each fiscal year as an exhibit to its reports on Form N-PORT, and for reporting periods ended prior to March 31, 2019, filed such information on Form N-Q. The Trusts’ Forms N-PORT and N-Q, as applicable, are available on the SEC’s website at http://www.sec.gov. The Trusts’ Forms N-PORT and N-Q may also be obtained upon request and without charge by calling (800) 882-0052.
Availability of Proxy Voting Policies and Procedures
A description of the policies and procedures that the Trusts use to determine how to vote proxies relating to portfolio securities is available upon request and without charge (1) by calling (800) 882-0052; (2) athttp://www.blackrock.com; and (3) on the SEC’s website at http://www.sec.gov.
| | | | |
| ADDITIONAL INFORMATION | | | 57 | |
Additional Information (continued)
Availability of Proxy Voting Record
Information about how the Trusts voted proxies relating to securities held in the Trusts’ portfolios during the most recent 12-month period ended June 30 is available upon request and without charge (1) athttp://www.blackrock.com; or by calling (800) 882-0052 and (2) on the SEC’s website at http://www.sec.gov.
Availability of Trust Updates
BlackRock will update performance and certain other data for the Trusts on a monthly basis on its website in the “Closed-end Funds” section ofhttp://www.blackrock.com as well as certain other material information as necessary from time to time. Investors and others are advised to check the website for updated performance information and the release of other material information about the Trusts. This reference to BlackRock’s website is intended to allow investors public access to information regarding the Trusts and does not, and is not intended to, incorporate BlackRock’s website in this report.
BlackRock Privacy Principles
BlackRock is committed to maintaining the privacy of its current and former fund investors and individual clients (collectively, “Clients”) and to safeguarding their non-public personal information. The following information is provided to help you understand what personal information BlackRock collects, how we protect that information and why in certain cases we share such information with select parties.
If you are located in a jurisdiction where specific laws, rules or regulations require BlackRock to provide you with additional or different privacy-related rights beyond what is set forth below, then BlackRock will comply with those specific laws, rules or regulations.
BlackRock obtains or verifies personal non-public information from and about you from different sources, including the following: (i) information we receive from you or, if applicable, your financial intermediary, on applications, forms or other documents; (ii) information about your transactions with us, our affiliates, or others; (iii) information we receive from a consumer reporting agency; and (iv) from visits to our websites.
BlackRock does not sell or disclose to non-affiliated third parties any non-public personal information about its Clients, except as permitted by law or as is necessary to respond to regulatory requests or to service Client accounts. These non-affiliated third parties are required to protect the confidentiality and security of this information and to use it only for its intended purpose.
We may share information with our affiliates to service your account or to provide you with information about other BlackRock products or services that may be of interest to you. In addition, BlackRock restricts access to non-public personal information about its Clients to those BlackRock employees with a legitimate business need for the information. BlackRock maintains physical, electronic and procedural safeguards that are designed to protect the non-public personal information of its Clients, including procedures relating to the proper storage and disposal of such information.
| | |
| 58 | | 2019 BLACKROCK SEMI-ANNUAL REPORTTO SHAREHOLDERS |
Glossary of Terms Used in this Report
| | |
| Currency |
| |
| ARS | | Argentine Peso |
| |
| EGP | | Egyptian Pound |
| |
| EUR | | Euro |
| |
| GBP | | British Pound |
| |
| HKD | | Hong Kong Dollar |
| |
| IDR | | Indonesian Rupiah |
| |
| USD | | U.S. Dollar |
| | |
| Portfolio Abbreviations |
| |
| ABS | | Asset-Backed Security |
| |
| CLO | | Collateralized Loan Obligation |
| |
| CME | | Chicago Mercantile Exchange |
| |
| CR | | Custodian Receipt |
| |
| IO | | Interest Only |
| |
| LIBOR | | London Interbank Offered Rate |
| |
| OTC | | Over-the-Counter |
| |
| PIK | | Payment-In-Kind |
| |
| PO | | Principal Only |
| |
| TBA | | To-Be-Announced |
| | | | |
| GLOSSARYOF TERMS USEDINTHIS REPORT | | | 59 | |
This report is intended for current holders. It is not a prospectus. Past performance results shown in this report should not be considered a representation of future performance. Statements and other information herein are as dated and are subject to change.

| | |
| BGIO-6/19-SAR | |  |
| Item 2 – | Code of Ethics – Not Applicable to this semi-annual report |
| Item 3 – | Audit Committee Financial Expert – Not Applicable to this semi-annual report |
| Item 4 – | Principal Accountant Fees and Services – Not Applicable to this semi-annual report |
| Item 5 – | Audit Committee of Listed Registrants – Not Applicable to this semi-annual report |
(a) The registrant’s Schedule of Investments is included as part of the Report to Stockholders filed under Item 1 of this Form.
(b) Not Applicable due to no such divestments during the semi-annual period covered since the previous FormN-CSR filing.
| Item 7 – | Disclosure of Proxy Voting Policies and Procedures forClosed-End Management Investment Companies – Not Applicable to this semi-annual report |
| Item 8 – | Portfolio Managers ofClosed-End Management Investment Companies |
(a) Not Applicable to this semi-annual report.
(b) As of the date of this filing, there have been no changes in any of the portfolio managers identified in the most recent annual report on FormN-CSR.
| Item 9 – | Purchases of Equity Securities byClosed-End Management Investment Company and Affiliated Purchasers -- Not Applicable due to no such purchases during the period covered by this report. |
| Item 10 – | Submission of Matters to a Vote of Security Holders – There have been no material changes to these procedures. |
| Item 11 – | Controls and Procedures |
(a) – The registrant’s principal executive and principal financial officers, or persons performing similar functions, have concluded that the registrant’s disclosure controls and procedures (as defined in Rule30a-3(c) under the Investment Company Act of 1940, as amended (the “1940 Act”)) are effective as of a date within 90 days of the filing of this report based on the evaluation of these controls and procedures required by Rule30a-3(b) under the 1940 Act and Rule 13a-15(b) under the Securities Exchange Act of 1934, as amended.
(b) – There were no changes in the registrant’s internal control over financial reporting (as defined in Rule30a-3(d) under the 1940 Act) that occurred during the period covered by this report that have materially affected, or are reasonably likely to materially affect, the registrant’s internal control over financial reporting.
| Item 12 – | Disclosure of Securities Lending Activities forClosed-End Management Investment Companies — Not applicable to this semi-annual report. |
| Item 13 – | Exhibits attached hereto |
(a)(1) – Code of Ethics – Not Applicable to this semi-annual report
(a)(2) – Certifications – Attached hereto
2
(a)(3) – Not Applicable
(a)(4) – Not Applicable
(b) – Certifications – Attached hereto
3
Pursuant to the requirements of the Securities Exchange Act of 1934 and the Investment Company Act of 1940, the registrant has duly caused this report to be signed on its behalf by the undersigned, thereunto duly authorized.
| | |
| BlackRock 2022 Global Income Opportunity Trust |
| |
| By: | | /s/ John M. Perlowski |
| | John M. Perlowski |
| | Chief Executive Officer (principal executive officer) of |
| | BlackRock 2022 Global Income Opportunity Trust |
Date: September 3, 2019
Pursuant to the requirements of the Securities Exchange Act of 1934 and the Investment Company Act of 1940, this report has been signed below by the following persons on behalf of the registrant and in the capacities and on the dates indicated.
| | |
| By: | | /s/ John M. Perlowski |
| | John M. Perlowski |
| | Chief Executive Officer (principal executive officer) of |
| | BlackRock 2022 Global Income Opportunity Trust |
Date: September 3, 2019
| | |
| By: | | /s/ Neal J. Andrews |
| | Neal J. Andrews |
| | Chief Financial Officer (principal financial officer) of |
| | BlackRock 2022 Global Income Opportunity Trust |
Date: September 3, 2019
4