As filed with the U.S. Securities and Exchange Commission on [date]
UNITED STATES
SECURITIES AND EXCHANGE COMMISSION
Washington, D.C. 20549
FORM N-CSR
CERTIFIED SHAREHOLDER REPORT OF REGISTERED
MANAGEMENT INVESTMENT COMPANIES
Investment Company Act file number 811-23219
USQ Core Real Estate Fund
(Exact name of registrant as specified in charter)
235 Whitehorse Lane, Suite 200
Kennett Square, PA 19348
(Address of principal executive offices) (Zip code)
Union Square Capital Partners, LLC
235 Whitehorse Lane, Suite 200
Kennett Square, PA 19348
(Name and address of agent for service)
(610) 925-3120
Registrant's telephone number, including area code
Date of fiscal year end: March 31
Date of reporting period: September 30, 2018
Item 1. Reports to Stockholders.

|
USQ Core Real Estate Fund
|
Semi-Annual Report
September 30, 2018
(Unaudited)
Must be preceded or accompanied by a prospectus.
The USQ Core Real Estate Fund is distributed by Quasar Distributors LLC.
USQ Core Real Estate Fund | TABLE OF CONTENTS |
| | |
Letter to Shareholders | 1 |
Schedule of Investments | 5 |
Statement of Assets & Liabilities | 7 |
Statement of Operations | 8 |
Statements of Changes in Net Assets | 9 |
Statement of Cash Flows | 11 |
Financial Highlights | 12 |
Notes to Financial Statements | 14 |
Additional Information | 21 |
Privacy Policy | 22 |
USQ Core Real Estate Fund | Letter to Shareholders |
| | September 30, 2018 (Unaudited) |
Dear Shareholder,
Union Square Capital Partners LLC is pleased to present the financial statements for the period ended September 30, 2018. The Fund performed in line with our expectations over the reporting period (six months ended 9/30/2018).
Over the reporting period, broad based equity markets delivered a strong 11.41% return (S&P 500) while fixed income returns were unimpressive delivering a negative -0.14% return (BBgBarc US Agg. Bond). The USQ Core Real Estate Fund (USQIX) delivered a strong total return of 3.77% during the reporting period and paid dividends of 2.0% (1.0% quarterly).
Although the market has certainly been more volatile in 2018 (as evidenced by 38 days in which the S&P moved +/- 1% through September vs. just 8 moves during all of 2017), we continue to believe the fundamentals that support commercial real estate remain favorable. Economic indicators such as gross domestic product (GDP), job growth and inflation rates support demand for commercial real estate. GDP in the second quarter of 2018 increased 4.2% and according to advance estimates by the Bureau of Economic Analysis, the growth in the third quarter will continue to increase 3.5%. In fact, this is now the sixth consecutive quarter that U.S. GDP increased by 2% or more. The unemployment picture is also very strong ending the reporting period at 3.7% - the lowest in nearly 50 years. Finally, inflation remains manageable around the Federal Reserve’s target of 2%, which should allow the Fed to maintain its path of interest rate increases, without any unexpected acceleration.
The Fed remained on its path to increase short term rates over the reporting period. The Fed’s decision to raise rates a quarter of a percentage point (current target range of 2.0% - 2.25%) after the September meeting was widely anticipated and marked the third increase for the year. To date, the Fed has not wavered and continued on its path to gradually increase interest rates in spite of increased stock market volatility and political pressure. We believe this is evidence of the Fed’s continued confidence in the U.S. economy and expect rates will continue to rise through 2019. On the longer end of the curve, the U.S. 10-year Treasury note yield rose approximately 30 basis points and, while rising rates across the curve are a concern for most investors, the equity markets were resilient given the strong economic backdrop.
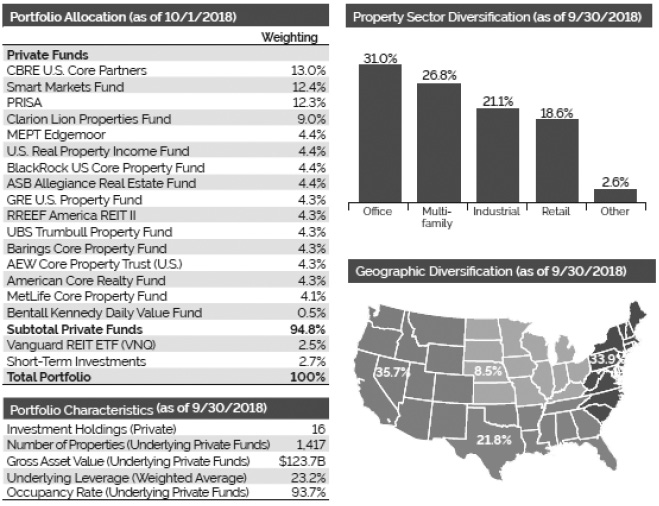
We believe the Fund’s private real estate holdings, which make up 95% of the portfolio, remain well positioned to continue to generate income and produce solid total returns. As a reminder, the Fund will only invest its private allocation in private real estate funds found within the NCREIF Fund Index – Open-end Diversified Core Equity (the “NFI-ODCE”). As a result, the Fund’s portfolio is diversified across property types and major markets in the U.S., has an occupancy ratio of 93.7%, and a conservative leverage ratio of 23.2%. The Fund also has a small allocation to a publicly traded REIT ETF (2.5%) and cash (2.5%) for liquidity. We believe the Fund is well positioned and that the underlying private real estate fund managers will be able to grow net operating income in the current environment given limited new supply and the supportive economic backdrop.
I would like to personally thank you for your support of the Fund and look forward to our continued partnership.

S. Timothy Grugeon
CEO, Union Square Capital Partners
This letter represents the opinions of the Fund’s management and are subject to change, are not guaranteed and should not be considered recommendations to buy or sell any security. The information provided is not intended to be, and is not, a forecast of future events, a guarantee of results, or investment advice.
Semi-Annual Report | September 30, 2018 | 1 |
USQ Core Real Estate Fund | Letter to Shareholders |
| | September 30, 2018 (Unaudited) |

The performance quoted represents past performance. Past performance does not guarantee future results. The current performance may be lower or higher than the performance data quoted. Short term performance, in particular, is not a good indication of the Fund’s future performance, and an investment should not be made solely based on returns. The investment return and principal value of the Fund will fluctuate; an investor’s shares, when redeemed, may be worth more or less than their original cost. Performance data current to the most recent month end may be obtained by calling 1-833-877-3863.
Fund returns reflect actual fee waivers and reimbursement of expenses for the time periods represented. Had fees and expenses not been waived and reimbursed, returns would have been lower. See the prospectus for more information on current fees and expenses. All investing involves risk, including the possible loss of principal. Performance for periods less than one year is not annualized. Since Inception performance of the NFI-ODCE NR is as of 10/2/2017, due to quarterly calculation of the index. Class I gross expenses are 3.73% and net expenses are 0.96%. Class IS gross expenses are 3.98% and net expenses are 1.21%. Net fees are based on a contractual fee waiver and reimbursement agreement. The Adviser has contractually agreed through July 31, 2019, to waive its advisory fees and/or assume expenses otherwise payable by the Fund to the extent necessary to ensure that Total Annual Fund Operating Expenses for Class I and Class IS.
Fund holdings and sector and geographic allocations are as of 10/1/18 and are subject to change and are not recommendations to buy or sell securities. Diversification does not ensure profit or prevent losses. Sector and geographic percentages, as well as Portfolio Characteristics, are with respect to the portion of the Fund invested in private funds.
Semi-Annual Report | September 30, 2018 | 2 |
USQ Core Real Estate Fund | Letter to Shareholders |
| | September 30, 2018 (Unaudited) |
By investing in the Fund, a shareholder will not be deemed to be an investor in any underlying Fund and will not have the ability to exercise any rights attributable to an investor in any such Underlying Fund related to their investment. In addition, shareholders in the Fund understand that they shall not be entitled to rely upon any written or oral information from any Underlying Fund, Underlying Fund manager or their respective affiliates.
Definitions
Net Operating Income (NOI) Net operating income equals all revenue from the property minus all reasonably necessary operating expenses. NOI is a before-tax figure which excludes principal and interest payments on loans, capital expenditures, depreciation and amortization.
Basis Point Refers to a common unit of measure for interest rates and other percentages in finance. One basis point is equal to 1/100th of 1%, or 0.01%, or 0.0001, and is used to denote the percentage change in a financial instrument.
Indexes
BBgBarc U.S. Agg Bond Index The Bloomberg Barclays U.S. Aggregate Bond Index is an unmanaged market value-weighted index for U.S. dollar denominated investment-grade fixed-rate debt issues, including government, corporate, asset-backed, and mortgage-backed securities with maturities of at least one year.
The MSCI US REIT Index is a free float-adjusted market capitalization index that is comprised of equity REITs. With 152 constituents, it represents about 99% of the US REIT universe and securities are classified in the Equity REITs Industry (under the Real Estate sector) according to the Global Industry Classification Standard (GICS®). It however excludes Mortgage REIT and selected Specialized REITs.
NFI-ODCE The NCREIF Fund Index — Open-end Diversified Core Equity (NFI-ODCE) consists of private real estate equity funds that meet certain criteria with respect to such things as leverage (less than 40%), operations (at least 80% leased or available to be leased), sector and geographic diversification, and investment in core real estate (at least 80% in office, industrial, apartment and retail properties).
S&P 500 Index S&P 500 Index is a market capitalization-weighted index of 500 common stocks chosen for market size, liquidity, and industry group representation to represent U.S. equity performance.
One cannot invest directly in an index.
Semi-Annual Report | September 30, 2018 | 3 |
USQ Core Real Estate Fund | Letter to Shareholders |
| | September 30, 2018 (Unaudited) |
Risk Disclosures
Investing in the Fund’s shares involves substantial risks, including the risks set forth in the “Risk Factors” section of this prospectus, which include, but are not limited to the following:
| | ● | Investing in real estate entails special risks, including (i) changes in general economic and market conditions; (ii) changes in the value of real estate properties; (iii) risks related to local economic conditions, overbuilding and increased competition; (iv) increases in property taxes and operating expenses; (v) changes in zoning laws; (vi) casualty and condemnation losses; (vii) variations in rental income, neighborhood values or the appeal of property to tenants; (viii) the availability of financing and (ix) changes in interest rates and leverage. There are also special risks associated with particular real estate sectors, or real estate operations generally. |
| | ● | The Fund is not intended to be a complete investment program, but instead as a way to help investors diversify into real estate. Diversification does not ensure a profit or guarantee against a loss. |
| | ● | There currently is no secondary market for the Fund’s shares and the Adviser does not expect that a secondary market will develop. Limited liquidity is provided to shareholders only through the Fund’s quarterly Repurchase Offers for no less than 5% of the Fund’s shares outstanding at net asset value. There is no guarantee that shareholders will be able to sell all of the shares they desire in a quarterly Repurchase Offer. |
Semi-Annual Report | September 30, 2018 | 4 |
USQ Core Real Estate Fund | Schedule of Investments |
| | September 30, 2018 (Unaudited) |
Description | | Shares | | | Fair Value | |
Real Estate Investments - 92.8% | | | | | | | | |
Private Equity Real Estate Funds - 90.3%* (1) | | | | | | | | |
AEW Core Property Trust (U.S.), Inc. | | | 1,168 | | | $ | 1,183,966 | |
American Core Realty Fund, LP | | | 9 | | | | 1,184,595 | |
ASB Allegiance Real Estate Fund, LP | | | 833 | | | | 1,210,818 | |
Barings Core Property Fund, LP | | | 9,198 | | | | 1,199,530 | |
Bentall Kennedy Daily Value Fund - Class F | | | 13,345 | | | | 142,445 | |
BlackRock US Core Property Fund, LP (2) | | | — | | | | 1,206,659 | |
CBRE US Core Partners, LP | | | 2,585,911 | | | | 3,641,065 | |
Clarion Lion Properties Fund, LP | | | 1,682 | | | | 2,500,944 | |
GRE US Property Fund, LP (3) | | | — | | | | 1,200,432 | |
MEPT Edgemoor, LP | | | 590 | | | | 1,243,368 | |
PRISA, LP | | | 2,128 | | | | 3,460,247 | |
RREEF America REIT II, Inc. | | | 9,760 | | | | 1,206,605 | |
Smart Markets Fund, LP | | | 2,267 | | | | 3,492,017 | |
UBS Trumbull Property Fund, LP | | | 107 | | | | 1,207,685 | |
U.S. Real Property Income Fund, LP | | | 1,200 | | | | 1,216,398 | |
Total Private Equity Real Estate Funds (Cost $24,154,621) | | | | | | | 25,296,774 | |
| | | | | | | | | |
Exchange Traded Funds - 2.5% | | | | | | | | |
Vanguard REIT ETF | | | 8,740 | | | | 705,143 | |
Total Exchange Traded Funds (Cost $667,509) | | | | | | | | |
Total Real Estate Investments (Cost $24,822,130) | | | | | | | 26,001,917 | |
| | | | | | | | | |
Short-Term Investments - 6.9% | | | | | | | | |
Money Market Fund - 6.9% | | | | | | | | |
Invesco Government & Agency - Institutional Shares, 1.52% (4) | | | 1,920,658 | | | | 1,920,658 | |
Total Short-Term Investments (Cost $1,920,658) | | | | | | | | |
| | | | | | | | | |
Total Investments - 99.7% (Cost $26,742,788) | | | | | | $ | 27,922,575 | |
Other Assets Less Liabilities - 0.3% | | | | | | | 78,574 | |
Net Assets - 100.0% | | | | | | $ | 28,001,149 | |
| Percentages are stated as a percent of net assets. |
| REIT - Real Estate Investment Trust |
| ETF - Exchange Traded Fund |
(1) | Securities considered illiquid. As of September 30, 2018, the value of these investments was $ 25,296,774 or 90.3% of total assets. |
(2) | Partnership is not designated in units. The Fund owns approximately 0.06% at September 30, 2018. |
(3) | Partnership is not designated in units. The Fund owns approximately 0.10% at September 30, 2018. |
(4) | Rate reflects seven-day effective yield on September 30, 2018. |
See Notes to Financial Statements.
Semi-Annual Report | September 30, 2018 | 5 |
USQ Core Real Estate Fund | Schedule of Investments |
| | September 30, 2018 (Unaudited) |
* Additional Information on Investments in Private Investment Funds:
| | Fair Value | | Security | | Redemption
Frequency | | | Redemption
Notice
(Days)** | | | Unfunded
Commitments
as of
September 30,
2018 | |
| | $ | 1,183,966 | | AEW Core Property Trust (U.S.), Inc. | | | Quarterly | | | | 45 | | | $ | 0 | |
| | | 1,184,595 | | American Core Realty Fund, LP | | | Quarterly | | | | 10 | | | | 0 | |
| | | 1,210,818 | | ASB Allegiance Real Estate Fund, LP | | | Quarterly | | | | 30 | | | | 0 | |
| | | 1,199,530 | | Barings Core Property Fund, LP | | | Quarterly | | | | 30 | | | | 0 | |
| | | 142,445 | | Bentall Kennedy Daily Value Fund - Class F | | | Daily | | | | N/A | *** | | | 0 | |
| | | 1,206,659 | | BlackRock US Core Property Fund, LP | | | Quarterly | | | | 60 | | | | 0 | |
| | | 3,641,065 | | CBRE US Core Partners, LP | | | Quarterly | | | | 60 | | | | 0 | |
| | | 2,500,944 | | Clarion Lion Properties Fund, LP | | | Quarterly | | | | 90 | | | | 0 | |
| | | 1,200,432 | | GRE US Property Fund, LP | | | Quarterly | | | | 90 | | | | 0 | |
| | | 1,243,368 | | MEPT Edgemoor, LP | | | Quarterly | | | | N/A | **** | | | 0 | |
| | | 0 | | MetLife Core Property Fund, LP | | | Quarterly | | | | 60 | | | | 1,160,000 | |
| | | 3,460,247 | | PRISA, LP | | | Quarterly | | | | 90 | | | | 0 | |
| | | 1,206,605 | | RREEF America REIT II, Inc. | | | Quarterly | | | | 45 | | | | 0 | |
| | | 3,492,017 | | Smart Markets Fund, LP | | | Quarterly | | | | 45 | | | | 0 | |
| | | 1,207,685 | | UBS Trumbull Property Fund, LP | | | Quarterly | | | | 60 | | | | 0 | |
| | | 1,216,398 | | U.S Real Property Income Fund, LP | | | Quarterly | | | | 90 | | | | 0 | |
** | Each of the following Private Investment Funds can suspend redemptions if its respective Board deems it in the best interest of its shareholders. None of these Private Investment Funds currently have suspended redemptions. |
*** | Daily redemptions are accepted up to an aggregate 10% of the Net Asset Value during the quarter. |
**** | Written notice required for redemption, no minimum timeline required. |
See Notes to Financial Statements.
Semi-Annual Report | September 30, 2018 | 6 |
USQ Core Real Estate Fund | Statement of Assets & Liabilities |
| | September 30, 2018 (Unaudited) |
Assets | | | | |
Investments, at value ($26,742,788) | | $ | 27,922,575 | |
Receivable from Adviser, net of waiver (Note 3) | | | 27,636 | |
Dividends receivable | | | 82,769 | |
Prepaid expenses | | | 53,569 | |
Interest receivable | | | 2,990 | |
Other assets | | | 1,052 | |
Total assets | | | 28,090,591 | |
| | | | | |
Liabilities | | | | |
Trustees' fees payable (Note 3) | | | 25,116 | |
Audit fees payable | | | 18,176 | |
Administration fees payable (Note 3) | | | 14,938 | |
Reports to shareholders payable | | | 9,912 | |
Transfer agency fees payable (Note 3) | | | 9,138 | |
Legal fees payable | | | 598 | |
Accrued expenses and other liabilities | | | 11,564 | |
Total liabilities | | | 89,442 | |
Net assets | | $ | 28,001,149 | |
| | | | | |
Net Assets Consist of | | | | |
Paid-in capital | | $ | 27,445,475 | |
Accumulated undistributed net investment loss | | | (722,374 | ) |
Accumulated undistributed realized gain | | | 98,025 | |
Net unrealized appreciation on investments | | | 1,179,787 | |
Total distributable earnings | | | 555,674 | |
Net assets | | $ | 28,001,149 | |
| | | | | |
Class I | | | | |
Net assets applicable to outstanding shares | | $ | 27,894,607 | |
Shares of beneficial interest outstanding (unlimited shares authorized, no par value) | | | 1,092,977 | |
Net asset value per share outstanding | | $ | 25.52 | |
| | | | | |
Class IS | | | | |
Net assets applicable to outstanding shares | | $ | 106,542 | |
Shares of beneficial interest outstanding (unlimited shares authorized, no par value) | | | 4,175 | |
Net asset value per share outstanding | | $ | 25.52 | |
See Notes to Financial Statements.
Semi-Annual Report | September 30, 2018 | 7 |
USQ Core Real Estate Fund | Statement of Operations |
| | April 1, 2018 - September 30, 2018 (Unaudited) |
Investment Income | | | | |
Dividends | | $ | 452,839 | |
Interest | | | 12,836 | |
Total investment income | | | 465,675 | |
| | | | | |
Expenses | | | | |
Management fees | | | 89,469 | |
Professional fees | | | 76,377 | |
Trustees' fees | | | 46,869 | |
Administrator fees | | | 45,309 | |
Compliance fees | | | 39,107 | |
Transfer agent fees | | | 30,263 | |
Registration fees | | | 27,614 | |
Insurance expense | | | 8,151 | |
Custodian fees and expenses | | | 2,901 | |
Reports to shareholders | | | 2,411 | |
Service fees - Class I | | | 6 | |
Other expenses | | | 121 | |
Total expenses | | | 368,598 | |
Less fees waived/expense reimbursement by Adviser (Note 3) | | | (251,594 | ) |
Net Fund Expenses | | | 117,004 | |
Net Investment Income | | | 348,671 | |
| | | | | |
Realized and Unrealized Gain on Investments | | | | |
Net realized gain on investments | | | 21,866 | |
Net change in unrealized appreciation of investments | | | 660,081 | |
Net Realized and Unrealized Gain on Investments | | | 681,947 | |
Increase in Net Assets Resulting from Operations | | $ | 1,030,618 | |
See Notes to Financial Statements.
Semi-Annual Report | September 30, 2018 | 8 |
USQ Core Real Estate Fund | Statements of Changes in Net Assets |
| | |
| | For the period
from April 1, 2018 -
September 30, 2018
(Unaudited) | | | For the period from
September 27, 2017(1)
through
March 31, 2018 | |
Operations | | | | | | | | |
Net investment income | | $ | 348,671 | | | $ | 72,102 | |
Net realized gain on investments | | | 21,866 | | | | 76,159 | |
Net change in unrealized appreciation on investments | | | 660,081 | | | | 519,706 | |
Net increase in net assets resulting from operations | | | 1,030,618 | | | | 667,967 | |
Distributions to Shareholders | | | | | | | | |
Class I | | | (550,635 | ) | | | (588,350 | ) |
Class IS | | | (2,105 | ) | | | (2,293 | ) |
Net decrease in net assets from distributions | | | (552,740 | ) | | | (590,643 | ) |
Capital Share Transactions | | | | | | | | |
Class I | | | | | | | | |
Proceeds from sales of shares | | | 186,296 | | | | 25,970,623 | |
Distributions reinvested | | | 548,596 | | | | 587,355 | |
Cost of shares redeemed | | | (51,322 | ) | | | — | |
Net increase from capital shares transactions | | | 683,570 | | | | 26,557,978 | |
Class IS | | | | | | | | |
Proceeds from sales of shares | | | — | | | | 100,000 | |
Distributions reinvested | | | 2,106 | | | | 2,293 | |
Net increase from capital shares transactions | | | 2,106 | | | | 102,293 | |
Net increase in net assets | | | 1,163,554 | | | | 26,737,595 | |
Net Assets | | | | | | | | |
Beginning of period | | | 26,837,595 | | | | 100,000 | |
End of period | | $ | 28,001,149 | | | $ | 26,837,595 | |
| | (1) | Commencement of Operations |
See Notes to Financial Statements.
Semi-Annual Report | September 30, 2018 | 9 |
USQ Core Real Estate Fund | Statements of Changes in Net Assets |
| | |
| | For the period from April 1, 2018 - September 30, 2018
(Unaudited) | | | For the period from
September 27, 2017(1)
through
March 31, 2018 | |
Other Information | | | | | | | | |
Beneficial Interest Transactions: | | | | | | | | |
Class I | | | | | | | | |
Beginning shares | | | 1,066,091 | | | | 4,000 | |
Shares sold | | | 7,338 | | | | 1,038,600 | |
Distributions reinvested | | | 21,577 | | | | 23,491 | |
Shares redeemed | | | (2,029 | ) | | | — | |
Net Increase in shares outstanding | | | 26,886 | | | | 1,062,091 | |
Ending shares | | | 1,092,977 | | | | 1,066,091 | |
Class IS | | | | | | | | |
Beginning shares | | | 4,092 | | | | — | |
Shares sold | | | — | | | | 4,000 | |
Distribtuions reinvested | | | 83 | | | | 92 | |
Net Increase in shares outstanding | | | 83 | | | | 4,092 | |
Ending shares | | | 4,175 | | | | 4,092 | |
| | (1) | Commencement of Operations |
See Notes to Financial Statements.
Semi-Annual Report | September 30, 2018 | 10 |
USQ Core Real Estate Fund | Statement of Cash Flows |
| | April 1, 2018 - September 30, 2018 (Unaudited) |
Cash Flow from Operating Activities: | | | | |
Net increase in net assets resulting from operations | | $ | 1,030,618 | |
Adjustments to reconcile net increase in net assets resulting from operations to net cash used in operating activities: | | | | |
Purchase of investments | | | (1,822,665 | ) |
Proceeds from sales | | | 1,738,054 | |
Net purchase of short term investments | | | (325,122 | ) |
Net realized gain on investments | | | (21,866 | ) |
Net change in unrealized appreciation on investments | | | (660,081 | ) |
(Increase) in assets: | | | | |
Receivable from adviser | | | 54,179 | |
Interest receivable | | | 28,964 | |
Dividends receivable | | | (53,569 | ) |
Prepaid expenses and other assets | | | (80,869 | ) |
Increase in liabilities: | | | | |
Trustees' fees payable | | | 3,464 | |
Audit fees payable | | | (16,824 | ) |
Administration fees payable | | | (341 | ) |
Reports to shareholders payable | | | (88 | ) |
Transfer agency fees payable | | | (2,412 | ) |
Legal fees payable | | | (14,305 | ) |
Accrued expenses and other liabilities | | | 9,927 | |
Net cash used in operating activities | | | (132,936 | ) |
| | | | | |
Cash Flows from Financing Activities: | | | | |
Proceeds from shares sold | | | 186,296 | |
Payment on shares redeemed | | | (51,322 | ) |
Cash distributions paid | | | (2,038 | ) |
Net cash provided by financing activities | | | 132,936 | |
| | | | | |
Net decrease in cash | | | — | |
Cash, beginning of period | | $ | — | |
Cash, ending of period | | $ | — | |
| | | | | |
Non-cash financing activities not included herein consist of reinvestment of distributions of: | | $ | 550,702 | |
See Notes to Financial Statements.
Semi-Annual Report | September 30, 2018 | 11 |
USQ Core Real Estate Fund - Class I | Financial Highlights |
| | For a Share Outstanding Throughout the Periods Presented |
| | For the period
from April 1, 2018 -
September 30, 2018
(Unaudited) | | | For the Period From
September 27, 2017(1)
through
March 31, 2018 | |
Net Asset Value, Beginning of Period | | $ | 25.08 | | | $ | 25.00 | |
| | | | | | | | | |
Income from Investment Operations | | | | | | | | |
Net investment income(2) | | | 0.25 | | | | 0.07 | |
Net realized and unrealized gain/(loss) on investments | | | 0.71 | | | | 0.58 | |
Total income/(loss) from investment operations | | | 0.95 | | | | 0.65 | |
| | | | | | | | | |
Distributions to Shareholders | | | | | | | | |
From net investment income | | | (0.51 | ) | | | (0.57 | ) |
Total distributions | | | (0.51 | ) | | | (0.57 | ) |
Increase/(Decrease) in Net Asset Value | | | 0.44 | | | | 0.08 | |
Net Asset Value, End of Period | | $ | 25.52 | | | $ | 25.08 | |
| | | | | | | | | |
Total Return(3) | | | 3.81 | %(4) | | | 2.62 | %(4) |
| | | | | | | | | |
Supplemental Data and Ratios | | | | | | | | |
Net assets, end of period (000s) | | $ | 27,895 | | | $ | 26,735 | |
| | | | | | | | | |
Ratio of expenses to average net assets, before waiver(5)(6) | | | 2.68 | % | | | 3.62 | % |
Ratio of expenses to average net assets, after waiver(5)(6) | | | 0.85 | % | | | 0.85 | % |
Ratio of net investment income to average net assets, before waiver(5)(6) | | | 0.10 | % | | | (2.22 | )% |
Ratio of net investment income to average net assets, after waiver(5)(6) | | | 1.93 | % | | | 0.55 | % |
| | | | | | | | | |
Portfolio turnover rate | | | 7 | %(4) | | | 24 | %(4) |
| | (1) | Commencement of Operations. |
| | (2) | Calculated using the average shares method. |
| | (3) | Total returns shown are historical in nature and assume changes in share price, reinvestment of dividends and capital gains distributions, if any. Had the Adviser not waived/reimbursed a portion of Fund expenses, total returns would have been lower. |
| | (5) | All income and expenses are annualized for periods less than one full year. |
| | (6) | Ratios do not include expenses of underlying investment companies in which the Fund invests. |
See Notes to Financial Statements.
Semi-Annual Report | September 30, 2018 | 12 |
USQ Core Real Estate Fund - Class IS | Financial Highlights |
| | For a Share Outstanding Throughout the Periods Presented |
| | For the period
from April 1, 2018 -
September 30, 2018
(Unaudited) | | | For the Period From
September 27, 2017(1)
through
March 31, 2018 | |
Net Asset Value, Beginning of Period | | $ | 25.08 | | | $ | 25.00 | |
| | | | | | | | | |
Income from Investment Operations | | | | | | | | |
Net investment income(2) | | | 0.25 | | | | 0.07 | |
Net realized and unrealized gain/(loss) on investments | | | 0.71 | | | | 0.58 | |
Total income/(loss) from investment operations | | | 0.95 | | | | 0.65 | |
| | | | | | | | | |
Distributions to Shareholders | | | | | | | | |
From net investment income | | | (0.51 | ) | | | (0.57 | ) |
Total distributions | | | (0.51 | ) | | | (0.57 | ) |
Increase/(Decrease) in Net Asset Value | | | 0.44 | | | | 0.08 | |
Net Asset Value, End of Period | | $ | 25.52 | | | $ | 25.08 | |
| | | | | | | | | |
Total Return(3) | | | 3.81 | %(4) | | | 2.62 | %(4) |
| | | | | | | | | |
Supplemental Data and Ratios | | | | | | | | |
Net assets, end of period (000s) | | $ | 106 | | | $ | 103 | |
| | | | | | | | | |
Ratio of expenses to average net assets, before waiver(5)(6) | | | 2.68 | % | | | 3.62 | % |
Ratio of expenses to average net assets, after waiver(5)(6) | | | 0.85 | % | | | 0.85 | % |
Ratio of net investment income to average net assets, before waiver(5)(6) | | | 0.10 | % | | | (2.22 | )% |
Ratio of net investment income to average net assets, after waiver(5)(6) | | | 1.93 | % | | | 0.55 | % |
| | | | | | | | | |
Portfolio turnover rate | | | 7 | %(4) | | | 24 | %(4) |
| | (1) | Commencement of Operations. |
| | (2) | Calculated using the average shares method. |
| | (3) | Total returns shown are historical in nature and assume changes in share price, reinvestment of dividends and capital gains distributions, if any. Had the Adviser not waived/reimbursed a portion of Fund expenses, total returns would have been lower. |
| | (5) | All income and expenses are annualized for periods less than one full year. |
| | (6) | Ratios do not include expenses of underlying investment companies in which the Fund invests. |
See Notes to Financial Statements.
Semi-Annual Report | September 30, 2018 | 13 |
USQ Core Real Estate Fund | Notes to Financial Statements |
| | September 30, 2018 (Unaudited) |
1. ORGANIZATION
The USQ Core Real Estate Fund (the “Fund”) is registered under the Investment Company Act of 1940, as amended (the “1940 Act”), as a non-diversified, closed-end management company. The Fund engages in a continuous offering of shares and operates as an interval fund that offers quarterly repurchases of shares at net asset value. The Fund’s investment adviser is Union Square Capital Partners, LLC (the “Adviser”). The investment objective of the Fund is to generate a return comprised of both current income and capital appreciation with moderate volatility and low correlation to the broader markets.
The Fund is organized as a statutory trust under the laws of the State of Delaware. The Fund commenced operations on September 27, 2017.
The Fund currently offers Class I and Class IS shares. All classes of shares have equal voting privileges except that each class has exclusive voting rights with respect to its service and/or distribution plans. The Fund’s income, expenses (other than class specific distribution fees and shareholder servicing expenses) and realized and unrealized gains and losses are allocated proportionately each day based upon the relative net assets of each class.
2. SIGNIFICANT ACCOUNTING POLICIES
The following is a summary of significant accounting policies followed by the Fund in preparation of its financial statements. The policies are in conformity with accounting principles generally accepted in the United States of America (“U.S. GAAP”). The Fund is an investment company and, accordingly, follows the investment company accounting and reporting guidance of the Financial Accounting Standards Board Accounting Standards Codification (ASC) Topic 946, Financial Services - Investment Companies.
Valuation of Private Investment Funds
The private institutional real estate investment funds in which the Fund invests (“Private Investment Funds”) are not publicly traded. The Private investment Funds measure their investment assets at fair value and report a NAV per share on a calendar quarter basis. In accordance with Accounting Standards Codification (“ASC”) 820, the Fund has elected to apply the practical expedient and to value its investments in Private investment Funds at their respective NAVs at each quarter. For non-calendar quarter-end days, the Adviser may consider certain information provided by a Private Investment Fund’s investment manager to determine the estimated value of the Fund’s holdings in such Private Investment Funds. The valuation provided by the investment manager as of a specific date may vary from the actual sale price that may be obtained if such investment were sold to a third party. To determine the estimated value of the Fund’s investment in Private Investment Funds, the Adviser considers, among other things, information provided by the Private Investment Funds, including quarterly unaudited financial statements.
Valuation of Public Investment Funds
Readily marketable portfolio securities listed on the New York Stock Exchange (“NYSE”) are valued at the last sale price reflected on the consolidated tape at the close of the NYSE on the business day as of which such value is being determined. If there has been no sale on such day, the securities are valued at the mean of the closing bid and asked prices on such day. If no bid or asked prices are quoted on such day or if market prices may be unreliable because of events occurring after the close of trading, then the security is valued by such method as the Adviser shall determine in good faith to reflect its fair market value. Readily marketable securities not listed on the NYSE but listed on other domestic or foreign securities exchanges are valued in a like manner. Portfolio securities traded on more than one securities exchange are valued at the last sale price on the business day as of which such value is being determined as reflected on the consolidated tape at the close of the exchange representing the principal market for such securities. Securities trading on the NASDAQ are valued at the NASDAQ official closing price.
Semi-Annual Report | September 30, 2018 | 14 |
USQ Core Real Estate Fund | Notes to Financial Statements |
| | September 30, 2018 (Unaudited) |
Fair Value Measurements
In applying the valuation procedures described in this Valuation Policy, the Adviser maximizes the use of “observable” versus “unobservable” inputs in markets which are active or markets where there has not been a significant decrease in the volume and frequency of transactions, as stressed by ASC Topic 820. Observable inputs are defined as inputs that reflect the assumptions market participants would use in pricing an asset or liability developed based on market data obtained from sources independent of the reporting entity. Unobservable inputs are defined as inputs that reflect the Adviser’s own assumptions about the assumptions market participants would use in pricing an asset or liability developed based on the best information available in the circumstances. To clarify observable versus unobservable inputs and increase consistency and comparability in Fair Value measurements, ASC Topic 820 establishes a Fair Value hierarchy (the “Fair Value Hierarchy”) that prioritizes valuation inputs into three levels, which is utilized by the Adviser. The Fair Value Hierarchy is described below in further detail.
Level 1 - Level 1 inputs (“Level 1 Inputs”) are quoted prices (unadjusted) in active markets for identical assets or liabilities that the Adviser has the ability to access at the valuation date. As defined in ASC Topic 820, an active market (“Active Market”) for an asset or liability is a market in which transactions for the asset or liability occur with sufficient frequency and volume to provide pricing information on an ongoing basis. The portfolio has investments in actively traded securities and therefore are valued through the use of Level 1 Inputs in accordance with the Fair Value Hierarchy. In accordance with ASC Topic 820, when applicable Level 1 Inputs are available for a particular security, the Fair Value of the security is equal to the quoted price multiplied by the quantity held. Adjustments are not applied to the quoted price due to the size of a position relative to trading volume (i.e., blockage).
Level 2 - Level 2 inputs (“Level 2 Inputs”) are inputs other than quoted prices included within Level 1 Inputs that are observable for the asset or liability, either directly or indirectly. Level 2 Inputs can include: quoted prices for identical or similar assets or liabilities in markets that are not active; inputs other than quoted prices that are observable for the asset or liability (i.e., interest rates, volatilities, prepayment speeds, loss severities, credit risks, default rates, etc.); and observable market-based inputs.
Level 3 - Level 3 inputs (“Level 3 Inputs”) are unobservable inputs for the asset or liability. Unobservable inputs are used in the absence of observable inputs. Level 3 Inputs reflect the Adviser’s own assumptions about the assumptions that market participants would use in pricing the asset or liability. A Level 3 input includes investments in private equity real estate funds where the Adviser estimates the value of the private equity real estate fund utilizing the most recent published net asset values provided by the underlying private real estate funds, adjusted for unobserved inputs.
The inputs or methodology used for valuing securities are not necessarily an indication of the risk associated with investing in those securities.
These inputs are summarized in the three broad levels that follow.
Investments in Securities at Value | | Level 1 | | | Level 2 | | | Level 3 | | | Total | |
Private Equity Real Estate Funds(a) | | $ | — | | | $ | — | | | $ | — | | | $ | 25,296,774 | |
Exchange Traded Funds | | | 705,143 | | | | — | | | | — | | | | — | |
Short-Term Investments | | | 1,920,658 | | | | — | | | | — | | | | — | |
Total | | $ | 2,625,801 | | | $ | — | | | $ | — | | | $ | 27,922,575 | |
(a) | In accordance with ASC 820-10, certain investments that are measured at fair value using the net asset value per share (or its equivalent) practical expedient have not been classified in the fair value hierarchy. The fair value amounts presented in this table are intended to permit reconciliation of the fair value hierarchy to the amounts presented in the Statement of Assets and Liabilities. |
Semi-Annual Report | September 30, 2018 | 15 |
USQ Core Real Estate Fund | Notes to Financial Statements |
| | September 30, 2018 (Unaudited) |
There were no transfers between Level 1, 2 and 3 during the period ended September 30, 2018. It is the Fund’s policy to recognize transfers between levels at the end of the reporting period.
The following is a reconciliation of assets in which Level 3 inputs were used in determining value:
Investments in
Securities | | Balance
as of
April 1,
2018 | | | Realized
Gain/
(Loss) | | | Change in
Unrealized
Appreciation/
(Depreciation) | | | Purchases | | | Sales
Proceeds | | | Transfer
into
Level 3 | | | Transfer
out of
Level 3(a) | | | Balance
as of
September 30,
2018 | |
| Real Estate Investments | | | | | | | | | | | | | | | | | | |
| Private Equity Real Estate Funds | | $ | 23,031,182 | | | $ | (7,862 | ) | | $ | 509,396 | | | $ | 1,822,665 | | | $ | (58,607 | ) | | $ | — | | | $ | 25,296,774 | | | $ | — | |
| Total | | $ | 23,031,182 | | | $ | (7,862 | ) | | $ | 509,396 | | | $ | 1,822,665 | | | $ | (58,607 | ) | | $ | — | | | $ | 25,296,774 | | | $ | — | |
(a) | Transfers out of level 3 are due to valuing securities using the net asset value per share rather than fair valuing. |
Third-Party Pricing Agents
The Adviser may contract with independent, third-party pricing agents to provide primary and secondary valuation coverage. Generally, there will be only one primary pricing agent identified for each type of security within the Fund’s portfolio.
Use of Independent Brokers to Value Securities
If a security price cannot be obtained from an independent, third-party pricing agent, the Adviser shall seek to obtain a bid price from at least one independent broker. The Adviser shall report to the Board on any use of an independent broker to value securities.
Fair Value Pricing Procedures
Securities for which market prices are not “readily available,” or which cannot be valued using the methodologies described in these procedures, will be valued in accordance with the Adviser’s Valuation Policy as approved by the Board. Notwithstanding the foregoing, a security shall not be required to be fair valued in accordance with the Adviser’s Valuation Policy if the aggregate impact to the Fund’s NAV would be less than $0.01 if all securities that would otherwise be required to be fair valued were assumed to be worthless in a hypothetical worst-case scenario. In such cases, the most recent available market value for such security may be used.
Use of Estimates
The preparation of the financial statements in accordance with U.S. GAAP requires management to make estimates and assumptions that affect the reported amounts of assets and liabilities and disclosures of contingencies at the date of the financial statements. The Fund believes that these estimates utilized in preparing the financial statements are reasonable and prudent; however, actual results could differ from these estimates.
Indemnifications
In the normal course of business, the Fund enters into contracts that contain a variety of representations which provide general indemnifications. The Fund’s maximum exposure under these arrangements is unknown as this would involve future claims that may be made against the Fund that have not yet occurred. However, the Fund expects the risk of loss to be remote.
Federal Income Taxes
The Fund intends to continue to qualify as a regulated investment company and comply with the provisions available to certain investment companies as defined in Subchapter M of the Internal Revenue Code of 1986, as amended, and to make distributions from net investment income and from net realized capital gains sufficient to relieve it from all, or substantially all, federal income taxes.
Semi-Annual Report | September 30, 2018 | 16 |
USQ Core Real Estate Fund | Notes to Financial Statements |
| | September 30, 2018 (Unaudited) |
The Fund evaluates tax positions taken (or expected to be taken) in the course of preparing the Fund’s tax provisions to determine whether these positions meet a “more-likely-than-not” standard that, based on the technical merits, have a more than fifty percent likelihood of being sustained by a taxing authority upon examination. A tax position that meets the “more-likely-than-not” recognition threshold is measured to determine the amount of benefit to recognize in the financial statements.
As of and during the tax period ended September 30, 2018, the Fund did not have a liability for any unrecognized tax benefits. The Fund recognizes interest and penalties, if any, related to unrecognized tax benefits as income tax expenses in the Statement of Operations. The Fund files U.S. federal, state and local tax returns as required. The Fund’s tax returns are subject to examination by the relevant tax authorities until expiration of the applicable statute of limitations which is generally three years after the filing of the tax return for federal purposes and four years for most state returns. Tax returns for open years have incorporated no uncertain tax positions that require a provision for income taxes.
Investment Transactions
Investment security transactions are accounted for on trade date. Gains and losses on securities sold are determined on a specific identification basis.
Exchange-Traded Funds (“ETFs”)
The Fund may invest in ETFs, which are funds whose shares are traded on a national exchange. ETFs may be based on underlying equity or fixed income securities, as well as commodities or currencies. ETFs do not sell individual shares directly to investors and only issue their shares in large blocks known as “creation units.” The investor purchasing a creation unit then sells the individual shares on a secondary market. Although similar diversification benefits may be achieved through an investment in another investment company, ETFs generally offer greater liquidity and lower expenses. Because an ETF incurs its own fees and expenses, shareholders of the Fund investing in an ETF will indirectly bear those costs. The Fund will also incur brokerage commissions and related charges when purchasing or selling shares of an ETF. Unlike typical investment company shares, which are valued once daily, shares in an ETF may be purchased or sold on a securities exchange throughout the trading day at market prices that are generally close to the NAV of the ETF.
Distributions to Shareholders
Distributions from investment income are declared and paid quarterly. Distributions from net realized capital gains, if any, are declared and paid annually and are recorded on the ex-dividend date. The character of income and gains to be distributed is determined in accordance with income tax regulations, which may differ from GAAP.
Investment Income
Interest income is accrued and recorded on a daily basis including amortization of premiums, accretion of discounts and income earned from money market funds. Dividend income is recorded on the ex-dividend date, except that certain dividends from private investments are recorded as soon as the information is available to the Fund. Capital gain distributions received are recorded as capital gains as soon as information is available to the Fund.
Industry Concentration
If a Fund has significant investments in the securities of issuers within a particular industry, any development affecting that industry will have a greater impact on the value of the net assets of the Fund than would be the case if the Fund did not have significant investments in that industry. In addition, this may increase the risk of loss in the Fund and increase the volatility of the Fund’s net asset value per share. Occasionally, market conditions, regulatory changes or other developments may negatively impact this industry, and therefore and value of the Fund’s portfolio will be adversely affected. As of September 30, 2018, the Fund had 92.8% of the value of its net assets invested within the real estate industry.
Semi-Annual Report | September 30, 2018 | 17 |
USQ Core Real Estate Fund | Notes to Financial Statements |
| | September 30, 2018 (Unaudited) |
Liquidity Risk
Liquidity risk exists when particular investments are difficult to sell. The Fund may not be able to sell these investments at the best prices or at the value the Fund places on them. In such a market, the value of such investments and the Fund’s share price may fall dramatically, even during periods of declining interest rates. Investments that are illiquid or that trade in lower volumes may be more difficult to value. The market for high yield securities in particular may be less liquid and therefore these securities may be harder to value or sell at an acceptable price, especially during times of market volatility or decline.
Recent Accounting Pronouncements
In August 2018, FASB issued ASU 2018-13, Fair Value Measurement (Topic 820): Disclosure Framework—Changes to the Disclosure Requirements for Fair Value Measurement (“ASU 2018-13”). The primary focus of ASU 2018-13 is to improve the effectiveness of the disclosure requirements for fair value measurements. The changes affect all companies that are required to include fair value measurement disclosures. In general, the amendments in ASU 2018-13 are effective for all entities for fiscal years and interim periods within those fiscal years, beginning after December 15, 2019. An entity is permitted to early adopt the removed or modified disclosures upon the issuance of ASU 2018-13 and may delay adoption of the additional disclosures, which are required for public companies only, until their effective date. Management is currently evaluating the impact these changes will have on the Fund’s financial statements and disclosures.
3. ADVISORY FEES AND OTHER RELATED PARTY TRANSACTIONS AND OTHER FEES
The Adviser serves as the investment adviser to the Fund. Under the terms of the Investment Advisory Agreement (the “Agreement”), the Adviser, subject to the supervision of the Board of Trustees (the “Board”), provides or arranges to be provided to the Fund such investment advice as it deems advisable and will furnish or arrange to be furnished a continuous investment program for the Fund consistent with the Fund’s investment objectives and policies. As compensation for its management services, the Fund agrees to pay to the Adviser a monthly fee in dollars at the annual rate of 0.65% (as a percentage of daily net assets) on assets up to $500 million, 0.50% on assets of $500 million and more but less than $1 billion, 0.40% on assets of $1 billion and more but less than $5 billion, and 0.30% on assets of $5 billion and more, payable at the end of each calendar month. During the period ended September 30, 2018, the Fund accrued $89,469 in advisory fees.
The Fund’s Board of Trustees approved the Agreement at its September 18, 2017 meeting. See the effect of expenses on Statement of Operations.
The Adviser has contractually agreed to waive its fees and/or pay Fund expenses so that the total annual operating expenses of the Fund for Class I and Class IS shares (excluding taxes, interest, trading costs, acquired fund fees and expenses, distribution fees, and shareholder servicing expenses), as a percentage of average daily net assets, do not exceed 0.85%. The expense limitation agreement may not be terminated prior to July 31, 2019 unless the Board of Trustees consents to an earlier termination or revision. Thereafter, the expense limitation agreement for the Fund will be reviewed each year, at which time the continuation of the expense limitation agreement will be discussed by the Adviser and the Fund’s Board of Trustees. The expense limitation agreement also provides that the Adviser is entitled to be reimbursed by the Fund for any fees it waived and/or expenses it paid for a period of three years following the end of the fiscal year in which the Adviser waived fees or paid expenses, to the extent such reimbursement will not cause the Fund to exceed any applicable expense limit that was in place when the Adviser waived the fees or reimbursed the expenses or the Fund’s current expense limit. During the period ended September 30, 2018, the Adviser waived fees of $251,594, all of which is available to be recouped by the Adviser until March 31, 2021.
Semi-Annual Report | September 30, 2018 | 18 |
USQ Core Real Estate Fund | Notes to Financial Statements |
| | September 30, 2018 (Unaudited) |
One Trustee and certain Officers of the Fund are also Officers of the Adviser. Trustees and officers, other than the Chief Compliance Officer, affiliated with the Adviser are not compensated by the Fund for their services. Each Trustee who is not an affiliated person of the Adviser receives from the Fund an annual retainer of $20,000, paid quarterly; a fee of $2,000 for attendance at each in-person meeting of the Board; and a fee of $500 for attendance at each telephonic regular meeting of the Board.
The Adviser also provides a Chief Compliance Officer to the Fund. For these services, the Fund pays the Adviser fees of $6,500 payable monthly. See the effect of expenses on Statement of Operations.
Quasar Distributors LLC, an affiliate of U.S. Bank National Association, serves as the Fund’s distributor. The Fund has adopted a plan of distribution under Rule 12b-1 of the 1940 Act applicable to Class IS shares. Under the plan, 12b-1 distribution fees at an annual rate of 0.25% of average daily net assets of Class IS shares are paid to the distributor or others for distribution services. The Fund has also adopted a shareholder servicing plan applicable to Class I and Class IS shares. Under the plan, shareholder servicing fees at an annual rate up to a maximum of 0.10% and 0.25% of average daily net assets of Class I and Class IS shares are paid for shareholder services, respectively. For the period ended September 30, 2018, the Fund had not incurred any 12b-1 fees and incurred $6 shareholder servicing fees.
The custodian to the Fund is U.S. Bank National Association. The administrator and transfer agent to the Fund is U.S. Bancorp Fund Services, LLC, an affiliate of U.S. Bank National Association. See the effect of expenses on Statements of Operations.
4. INVESTMENT TRANSACTIONS
The cost of purchases and proceeds from the sale of securities, other than short-term securities, for the period ended September 30, 2018 amounted to $1,822,665 and $1,738,054, respectively.
5. TAX BASIS INFORMATION
The amount and character of income and capital gain distribution to be paid, if any, are determined in accordance with federal income tax regulations, which may differ from U.S. GAAP. These differences are primarily due to differences in the timing of recognition of gains or losses on investments. Permanent book and tax basis differences, if any, may result in reclassifications to undistributed net investment income (loss), undistributed net realized gain (loss) and additional paid-in capital.
For the tax period ended September 30, 2017, there were no distributions or distributable earnings. The following reclassifications, which had no impact on results of operations or net assets, were recorded to reflect tax character.
Paid-in Capital | Accumulated
Undistributed Net
Investment Income | Accumulated
Undistributed Net
Realized Gain |
| $ (236) | $ 236 | $ — |
As of September 30, 2018, net unrealized appreciation/(depreciation) of investments based on the federal tax cost was as follows:
Gross
Appreciation
(excess of value
over tax cost) | Gross
Depreciation
(excess of tax cost
over value) | Net
Unrealized
Appreciation | Cost of
Investments
for Income
Tax Purposes |
| $ 1,179,787 | $ — | $ 1,179,787 | $ 26,742,788 |
Semi-Annual Report | September 30, 2018 | 19 |
USQ Core Real Estate Fund | Notes to Financial Statements |
| | September 30, 2018 (Unaudited) |
There was no difference between book and tax basis net unrealized appreciation.
6. REPURCHASE OFFERS
The Fund operates as an interval fund pursuant to Rule 23c-2 under the 1940 Act and, as such, has adopted a fundamental policy to make quarterly repurchase offers, at net asset value, of no less than 5% and no more than 25% of the Fund’s shares outstanding on the Repurchase Request Deadline (as defined below). There is no guarantee that shareholders will be able to sell all of the shares they desire to sell in a quarterly repurchase offer, although each shareholder will have the right to require the Fund to purchase at least 5% of such shareholder’s shares in each quarterly repurchase. Liquidity will be provided to shareholders only through the Fund’s quarterly repurchases. Shareholders will be notified in writing of each quarterly repurchase offer and the date the repurchase offer ends (the “Repurchase Request Deadline”). Shares will be repurchased at the NAV per share determined as of the close of regular trading on the NYSE no later than the 14th day after the Repurchase Request Deadline, or the next business day if the 14th day is not a business day (each a “Repurchase Pricing Date”).
During the period ended September 30, 2018, the Fund completed two repurchase offers. In this offer, the Fund offered to repurchase up to 5% of the number of its outstanding shares as of the Repurchase Pricing Dates. The result of the repurchase offer is as follows:
| Commencement Date | | | March 29, 2018 | | | | June 29, 2018 | |
| Repurchase Request Deadline | | | May 4, 2018 | | | | August 3, 2018 | |
| Repurchase Pricing Date | | | May 4, 2018 | | | | August 3, 2018 | |
| Amount Repurchased | | $ | 50,834 | | | $ | — | |
| Shares Repurchased | | | 2,009.262 | | | | — | |
7. UNFUNDED COMMITMENTS
As of September 30, 2018, the Fund had unfunded capital commitments for the Private Equity Real Estate Funds below:
| | Unfunded
Commitments as of
September 30, 2018 | |
MetLife Core Property Fund, LP | | $ | 1,160,000 | |
8. SUBSEQUENT EVENTS
Subsequent events after the date of the Statement of Assets and Liabilities have been evaluated through the date the financial statements were issued.
The Fund completed a quarterly repurchase offer on November 2, 2018 which resulted in 0 of Fund shares being repurchased for $0.
Management has determined that there were no other subsequent events to report through the issuance of these financial statements.
Semi-Annual Report | September 30, 2018 | 20 |
USQ Core Real Estate Fund | Additional Information |
| | September 30, 2018 (Unaudited) |
1. PROXY VOTING POLICIES AND VOTING RECORD
A description of the policies and procedures that the Fund uses to determine how to vote proxies relating to portfolio securities owned by the Fund and information regarding how the Fund voted proxies relating to the portfolio securities during the most recent 12-month period ended June 30 is available to shareholders without charge by visiting the Securities and Exchange Commission’s (“SEC”) web site at www.sec.gov.
2. QUARTERLY PORTFOLIO HOLDINGS
The Fund files a complete listing of portfolio holdings for the Fund with the SEC as of first and third quarters of each fiscal year on Form N-Q. The filings are available on the SEC’s website at http://www.sec.gov. The Fund’s Form N-Q may also be reviewed and copied at the SEC’s Public Reference Room in Washington, D.C., and information on the operation of the Public Reference Room may be obtained by calling 1-800-SEC-0330.
Semi-Annual Report | September 30, 2018 | 21 |
USQ Core Real Estate Fund | Privacy Policy |
| | September 30, 2018 (Unaudited) |
As the investment adviser for USQ Core Real Estate Fund (the “Fund”), Union Square Capital Partners, LLC (the “Adviser”) invests the assets of the Fund and manages their day-to-day business. We appreciate your business and the trust you have placed in us. Our privacy philosophy reflects the value of your trust. We are committed to protecting the personal data we obtain about you. On behalf of the Fund and the Adviser (collectively, “USQ”), we make the following assurance of your privacy.
Not Using Your Personal Data for our Financial Gain
USQ has never sold shareholder information to any other party, nor have we disclosed such data to any other organization, except as permitted by law. We have no plans to do so in the future. We will notify you prior to making any change in this policy.
How We Do Use Your Personal and Financial Data
We use your information primarily to complete your investment transactions. We may also use it to communicate with you about other financial products that we offer.
The Information We Collect About You
You typically provide personal information when you complete a USQ account application or when you request a transaction that involves USQ, either directly or through a brokerage firm. This information may include your:
| | ● | Name, address and phone numbers |
| | ● | Social security or taxpayer identification number |
| | ● | Birth date and beneficiary information (for IRA applications) |
| | ● | Basic trust document information (for trusts only) |
How We Protect Your Personal Information
As emphasized above, we do not sell information about current or former shareholders or their accounts to third parties. We occasionally share such information to the extent permitted by law to complete transactions at your request, or to make you aware of related financial products that we offer. Here are the details:
| | ● | To complete certain transactions or account changes that you direct, it may be necessary to provide identifying information to companies, individuals, or groups that are not affiliated with USQ. For example, if you ask to transfer assets from another financial institution to USQ, we will need to provide certain information about you to that company to complete the transaction. |
| | ● | In certain instances, we may contract with non-affiliated companies to perform services for us, such as processing orders for share purchases and repurchases and distribution of shareholder letters. Where necessary, we will disclose information about you to these third parties. In all such cases, we provide the third party with only the information necessary to carry out its assigned responsibilities (in the case of shareholder letters, only your name and address) and only for that purpose. We require these third parties to treat your private information with the same high degree of confidentiality that we do. |
| | ● | Finally, we will release information about you if you direct us to do so, if we are compelled by law to do so, or in other legally limited circumstances (for example, to protect your account from fraud). |
How We Safeguard Your Personal Information
We restrict access to your information to those USQ representatives who need to know the information to provide products or services to you. We maintain physical, electronic, and procedural safeguards to protect your personal information.
Semi-Annual Report | September 30, 2018 | 22 |
USQ Core Real Estate Fund | Privacy Policy |
| | September 30, 2018 (Unaudited) |
Purchasing Shares of the Fund through Brokerage Firms
USQ shareholders may purchase their shares through brokerage firms. Please contact those firms for their own policies with respect to privacy issues.
What You Can Do
For your protection, we recommend that you do not provide your account information, user name, or password to anyone except a USQ representative as appropriate for a transaction or to set up an account. If you become aware of any suspicious activity relating to your account, please contact us immediately.
We’ll Keep You Informed
If we change our privacy policy with regard to disclosing your confidential information, we are required by law to notify you and provide you with a revised notice. You can access our privacy policy from our website.
Semi-Annual Report | September 30, 2018 | 23 |
This page intentionally left blank.
This page intentionally left blank.
Investment Adviser
Union Square Capital Partners, LLC
235 Whitehorse Lane, Suite 200
Kennett Square, PA 19348
Distributor
Quasar Distributors LLC
615 E. Michigan Street
Milwaukee, WI 53202
Legal Counsel
Stradley Ronon Stevens & Young, LLP
1250 Connecticut Avenue, NW, Suite 500
Washington, D.C. 20036
Independent Registered Public Accounting Firm
Cohen & Company, Ltd.
1350 Euclid Avenue, Suite 800
Cleveland, Ohio 44115

| USQ Core Real Estate Fund
235 Whitehorse Lane Suite 200 Kennett Square, PA 19348
www.usqfunds.com 833.USQ.Fund
|
Item 2. Code of Ethics.
Not applicable for semi-annual reports.
Item 3. Audit Committee Financial Expert.
Not applicable for semi-annual reports.
Item 4. Principal Accountant Fees and Services.
Not applicable for semi-annual reports.
Item 5. Audit Committee of Listed Registrants.
Not applicable for semi-annual reports.
Item 6. Investments.
| (a) | Schedule of Investments is included as part of the report to shareholders filed under Item 1 of this Form. |
Item 7. Disclosure of Proxy Voting Policies and Procedures for Closed-End Management Investment Companies.
Not applicable for semi-annual reports.
Item 8. Portfolio Managers of Closed-End Management Investment Companies.
Not applicable for semi-annual reports.
Item 9. Purchases of Equity Securities by Closed-End Management Investment Company and Affiliated Purchasers.
| Period | (a)
Total Number of Shares (or Units) Purchased | (b)
Average Price Paid per Share (or Unit) | (c)
Total Number of Shares (or Units) Purchased as Part of Publicly Announced Plans or Programs | (d)
Maximum Number (or Approximate Dollar Value) of Shares (or Units) that May Yet Be Purchased Under the Plans or Programs |
| Month #1 4/1/18-4/30/18 | - | - | - | - |
| Month #2 5/1/18-5/31/18 (1) | 2,009.262 | $25.30 | 2,009.262 | 0 |
| Month #3 6/1/18-6/30/18 | - | - | - | - |
| Month #4 7/1/18-7/31/18 | - | - | - | - |
| Month #5 8/1/18-8/31/18 | - | - | - | - |
| Month #6 9/1/18-9/30/18 | - | - | - | - |
| Total | 2,009.262 | $25.30 | 2,009.262 | 0 |
| (1) | On March 29, 2018 the Registrant offered to repurchase up to 5% of the Registrant’s total outstanding shares as of May 4, 2018 (the "Repurchase Request Deadline"). On the Repurchase Request Deadline, 53,675 shares represented 5% of the Registrant's total outstanding shares. |
Item 10. Submission of Matters to a Vote of Security Holders.
There have been no material changes to the procedures by which shareholders may recommend nominees to the registrant’s board of trustees.
Item 11. Controls and Procedures.
| (a) | The Registrant’s Chief Executive Officer and Chief Operating Officer have reviewed the Registrant's disclosure controls and procedures (as defined in Rule 30a-3(c) under the Investment Company Act of 1940 (the “Act”)) as of a date within 90 days of the filing of this report, as required by Rule 30a-3(b) under the Act and Rules 13a-15(b) or 15d-15(b) under the Securities Exchange Act of 1934. Based on their review, such officers have concluded that the disclosure controls and procedures are effective in ensuring that information required to be disclosed in this report is appropriately recorded, processed, summarized and reported and made known to them by others within the Registrant and by the Registrant’s service provider. |
| (b) | There were no changes in the Registrant's internal control over financial reporting (as defined in Rule 30a-3(d) under the Act) that occurred during the second fiscal quarter of the period covered by this report that have materially affected, or are reasonably likely to materially affect, the Registrant's internal control over financial reporting. |
Item 12. Disclosure of Securities Lending Activities for Closed-End Management Investment Companies
The registrant did not engage in securities lending activities during the fiscal period reported on this Form N-CSR.
Item 13. Exhibits.
| (a) | (1) Any code of ethics or amendment thereto, that is the subject of the disclosure required by Item 2, to the extent that the registrant intends to satisfy Item 2 requirements through filing an exhibit. Filed herewith. |
(2) A separate certification for each principal executive officer and principal financial officer pursuant to Section 302 of the Sarbanes-Oxley Act of 2002. Filed herewith.
(3) Any written solicitation to purchase securities under Rule 23c-1 under the Act sent or given during the period covered by the report by or on behalf of the registrant to 10 or more persons. Not applicable.
| (b) | Certifications pursuant to Section 906 of the Sarbanes-Oxley Act of 2002. Furnished herewith. |
SIGNATURES
Pursuant to the requirements of the Securities Exchange Act of 1934 and the Investment Company Act of 1940, the registrant has duly caused this report to be signed on its behalf by the undersigned, thereunto duly authorized.
| (Registrant) | USQ Core Real Estate Fund | |
| | |
| By (Signature and Title) | /s/ S. Timothy Grugeon | |
| | S. Timothy Grugeon, Chief Executive Officer | |
| | |
| Date | 11/19/18 | |
Pursuant to the requirements of the Securities Exchange Act of 1934 and the Investment Company Act of 1940, this report has been signed below by the following persons on behalf of the registrant and in the capacities and on the dates indicated.
| By (Signature and Title) | /s/ S. Timothy Grugeon | |
| | S. Timothy Grugeon, Chief Executive Officer | |
| | |
| Date | 11/19/18 | |
| | |
| By (Signature and Title) | /s/ G. Keith Downing | |
| | G. Keith Downing, Chief Operating Officer | |
| | |
| Date | 11/19/18 | |