As filed with the U.S. Securities and Exchange Commission on December 1, 2021
UNITED STATES
SECURITIES AND EXCHANGE COMMISSION
Washington, D.C. 20549
FORM N-CSR
CERTIFIED SHAREHOLDER REPORT OF REGISTERED
MANAGEMENT INVESTMENT COMPANIES
Investment Company Act file number 811-23219
USQ Core Real Estate Fund
(Exact name of registrant as specified in charter)
235 Whitehorse Lane, Suite 200
Kennett Square, PA 19348
(Address of principal executive offices) (Zip code)
Union Square Capital Partners, LLC
235 Whitehorse Lane, Suite 200
Kennett Square, PA 19348
(Name and address of agent for service)
(484) 731-3101
Registrant's telephone number, including area code
Date of fiscal year end: March 31
Date of reporting period: September 30, 2021
Item 1. Reports to Stockholders.

|
USQ Core Real Estate Fund
|
Semi-Annual Report
September 30, 2021
(Unaudited)
Must be preceded or accompanied by a prospectus.
The USQ Core Real Estate Fund is distributed by Quasar Distributors LLC.
USQ Core Real Estate Fund | TABLE OF CONTENTS |
| | |
| | |
Letter to Shareholders | 1 |
Schedule of Investments | 5 |
Statement of Assets & Liabilities | 7 |
Statement of Operations | 8 |
Statements of Changes in Net Assets | 9 |
Statement of Cash Flows | 11 |
Financial Highlights | 12 |
Notes to Financial Statements | 14 |
Additional Information | 22 |
Management Agreement Renewal | 23 |
Privacy Policy | 26 |
USQ Core Real Estate Fund | Letter to Shareholders |
| | September 30, 2021 (Unaudited) |
Dear Shareholder,
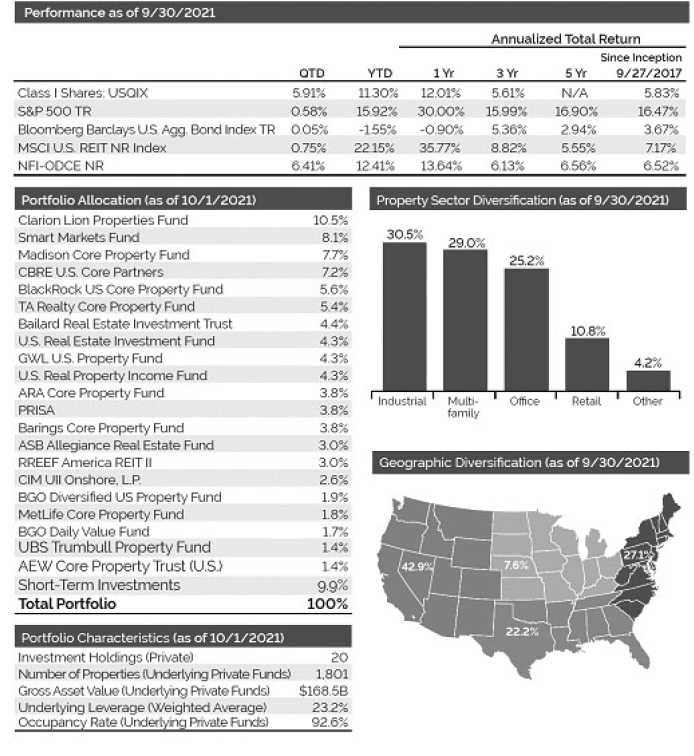
I am pleased to write this semi-annual letter to you, highlighting the USQ Core Real Estate Fund’s performance for the prior six months. In managing the Fund, Union Square Capital Partners seeks to provide shareholders with current income and capital appreciation with moderate volatility and low correlation to the broader markets. We believe the Fund continued to deliver in each of these four ways during the six-month period ended September 30, 2021, and performed in line with our expectations. As a reminder, the Fund’s private real estate allocation, which comprised approximately 95% of the Fund’s portfolio over the period, is invested exclusively in private real estate funds that are constituents of the NCREIF Fund Index – Open-end Diversified Core Equity (the “NFI-ODCE”).
Over the six months ended September 30, 2021, the Fund (USQIX) delivered a total return of 9.70% and paid distributions totaling $0.518 per share. During the same period, broad-based equity markets delivered a 9.18% return (S&P 500), while publicly traded REITs delivered a 10.34% return (MSCI U.S. REIT). Fixed income returns (BBgBarc U.S. Agg Bond Index) were not nearly as impressive posting just a 1.88% return for the period. As rates move higher, we believe fixed income returns will continue to face headwinds.
The six-month reporting period showed many positive signs across many sectors, but there were also quite a few issues that emerged which make the recovery from the pandemic fragile. First, and arguably the most important, controlling the pandemic is of paramount performance. While the U.S. did make progress on getting a plan in place to combat the pandemic, and vaccines are now available to all U.S. citizens, vaccine hesitantly continues to challenge the Biden administration. Second, the supply chain disruptions resulting from Covid-19 shutdowns throughout the world and record economic stimulus have pushed inflation to highest levels the country has seen in decades. While the Federal Reserve continues to believe much of this inflation is transitory, many experts are not convinced. If the Federal Reserve must raise rates before they are currently anticipating as a result of this inflationary pressure, we can expect quite a bit of market volatility. Finally, the political turmoil in Washington continues to worry markets. While the Biden Administration anticipated a return to bi-partisanship, those aspirations are not coming to fruition. The coming months will be the ultimate test for the Administration as they try to pass the very aggressive social spending packages. Many experts are less than optimistic that all of these programs will be passed, but most agree that the sorely needed infrastructure package will get through, bringing relief for the deteriorating infrastructure in the U.S. Only time will tell, but we continue to be cautiously optimistic that the pent-up demand from the U.S. consumer will drive economic growth in the coming 18 months, and that many of these current worries should abate.
In regard to commercial real estate specifically, high quality commercial real estate held up very well in the recent downturn and had record appreciation in the third quarter of 2021. Many of the negative assumptions that were put into valuation models in 2020 were reversed in 2021 as leasing activity increased and cap rates declined in certain markets. Industrial properties continued to be the primary driver of returns, which has been a consistent story for the past few years. Multi-family properties appreciated as well, and we believe the sector now has a strong tailwind behind it. As new home supply continues to be well below demand, and mortgage rates continue to increase, multi-family investors should be rewarded with stronger returns. Office properties showed signs of optimism as leasing activity continued to increase and many employers began implementing their return to office plans during the period. Finally, retail properties, especially grocery anchored and necessity based, saw slight increases in the third quarter. Moving forward, we believe the abundance of capital available in the market, low interest rates, demand for core product, and the income stability within the NFI-ODCE all position the Fund well for continued success. Furthermore, as worries of inflation continue to dominate the headlines, it is worth noting that commercial real estate has traditionally been a good hedge in these environments.

Thomas Miller
Chief Investment Officer, Union Square Capital Partners
This letter represents the opinions of the Fund’s management and are subject to change, are not guaranteed and should not be considered recommendations to buy or sell any security. The information provided is not intended to be, and is not, a forecast of future events, a guarantee of results, or investment advice.
Semi-Annual Report | September 30, 2021 | 1 |
USQ Core Real Estate Fund | Letter to Shareholders |
| | September 30, 2021 (Unaudited) |
The performance quoted represents past performance. Past performance does not guarantee future results. The current performance may be lower or higher than the performance data quoted. The investment return and principal value of the Fund will fluctuate; an investor’s shares, when redeemed, may be worth more or less than their original cost. Performance data current to the most recent month end may be obtained by calling 1-833-877-3863.
Fund returns reflect actual fee waivers and reimbursement of expenses for the time periods represented. Had fees and expenses not been waived and reimbursed, returns would have been lower. See the prospectus for more information on current fees and expenses. All investing involves risk, including the possible loss of principal. Performance for periods less than one year is not annualized. Since Inception performance of the NFI-ODCE NR is as of 10/2/2017, due to quarterly calculation of the index. Class I gross expenses are 1.86% and net expenses are 0.96%. Net fees are based on a contractual fee waiver and reimbursement agreement that will continue indefinitely until terminated by mutual agreement of the Adviser and the Fund, including consent of the Fund’s Board.
Semi-Annual Report | September 30, 2021 | 2 |
USQ Core Real Estate Fund | Letter to Shareholders |
| | September 30, 2021 (Unaudited) |
Fund holdings and sector and portfolio characteristics are as of 10/1/21 and are subject to change and are not recommendations to buy or sell securities. Diversification does not ensure profit or prevent losses. Sector and geographic percentages, as well as Portfolio Characteristics, are with respect to the portion of the Fund invested in private funds.
By investing in the Fund, a shareholder will not be deemed to be an investor in any underlying Fund and will not have the ability to exercise any rights attributable to an investor in any such Underlying Fund related to their investment. In addition, shareholders in the Fund understand that they shall not be entitled to rely upon any written or oral information from any Underlying Fund, Underlying Fund manager or their respective affiliates.
Definitions
Correlation is a statistic that measures the extent to which two asset classes (or securities) move in relation to each other. Two asset classes that have a high correlation move in the same direction as markets rise and fall. Two asset classes with negative or inverse correlation move in opposite directions as markets rise and fall. The closer the correlation statistic between two asset classes is to zero, the more independently the asset classes move with respect to each other.
Indexes
BBgBarc U.S. Agg Bond Index The Bloomberg Barclays U.S. Aggregate Bond Index is an unmanaged market value-weighted index for U.S. dollar denominated investment-grade fixed-rate debt issues, including government, corporate, asset-backed, and mortgage-backed securities with maturities of at least one year.
The MSCI US REIT Index is a free float-adjusted market capitalization index that is comprised of equity REITs. With 139 constituents, it represents about 99% of the US REIT universe and securities are classified in the Equity REITs Industry (under the Real Estate sector) according to the Global Industry Classification Standard (GICS(r)). It however excludes Mortgage REIT and selected Specialized REITs.
NFI-ODCE The NCREIF Fund Index — Open-end Diversified Core Equity (NFI-ODCE) consists of private real estate equity funds that meet certain criteria with respect to such things as leverage (less than 35%), operations (at least 75% invested in properties that are 75% or more leased), sector and geographic diversification, and investment in core real estate (at least 75% in office, industrial, apartment and retail properties).
S&P 500 Index S&P 500 Index is a market capitalization-weighted index of 500 common stocks chosen for market size, liquidity, and industry group representation to represent U.S. equity performance.
One cannot invest directly in an index.
Risk Disclosures
Investing in the Fund’s shares involves substantial risks, including the risks set forth in the “Risk Factors” section of the prospectus, which include, but are not limited to the following:
| | ● | Investing in real estate entails special risks, including (i) changes in general economic and market conditions; (ii) changes in the value of real estate properties; (iii) risks related to local economic conditions, overbuilding and increased competition; (iv) increases in property taxes and operating expenses; (v) changes in zoning laws; (vi) casualty and condemnation losses; (vii) variations in rental income, neighborhood values or the appeal of property to tenants; (viii) the availability of financing and (ix) changes in interest rates and leverage. There are also special risks associated with particular real estate sectors, or real estate operations generally. |
| | ● | The Fund is not intended to be a complete investment program, but instead as a way to help investors diversify into real estate. Diversification does not ensure a profit or guarantee against a loss. |
| | ● | There currently is no secondary market for the Fund’s shares and the Adviser does not expect that a secondary market will develop. Limited liquidity is provided to shareholders only through the Fund’s quarterly Repurchase Offers for no less than 5% of the Fund’s shares outstanding at net asset value. There is no guarantee that shareholders will be able to sell all of the shares they desire in a quarterly Repurchase Offer. |
Semi-Annual Report | September 30, 2021 | 3 |
USQ Core Real Estate Fund | Letter to Shareholders |
| | September 30, 2021 (Unaudited) |
The Fund’s distribution policy is to make quarterly distributions to shareholders. The level of quarterly distributions (including any return of capital) is not fixed. However, this distribution policy is subject to change. The Fund’s distribution amounts are calculated based on the ordinary income received from the underlying investments, including short-term capital gains realized from the disposition of such investments. Shareholders should not assume that the source of a distribution from the Fund is net profit. A portion of the distributions consist of a return of capital based on the character of the distributions received from the underlying holdings, primarily Real Estate Investment Trusts. The final determination of the source and tax characteristics of all distributions will be made after the end of the year. Shareholders should note that return of capital will reduce the tax basis of their shares and potentially increase the taxable gain, if any, upon disposition of their shares. There is no assurance that the Fund will continue to declare distributions or that the distributions will continue at these rates.
Semi-Annual Report | September 30, 2021 | 4 |
USQ Core Real Estate Fund | Schedule of Investments |
| | September 30, 2021 (Unaudited) |
Description | | Shares | | | Fair Value | |
Real Estate Investments — 89.7% | | | | | | | | |
Private Equity Real Estate Funds — 89.7%* (1) | | | | | | | | |
AEW Core Property Trust (U.S.), Inc. | | | 1,245 | | | $ | 1,365,893 | |
American Core Realty Fund, LP | | | 29 | | | | 3,909,072 | |
ASB Allegiance Real Estate Fund, LP | | | 1,876 | | | | 3,092,072 | |
Bailard Real Estate Investment Trust, Inc. | | | 148,828 | | | | 4,557,109 | |
Barings Core Property Fund, LP | | | 27,186 | | | | 3,866,768 | |
BGO Daily Value Fund - Class F | | | 135,821 | | | | 1,753,305 | |
BGO Diversified U.S. Property Fund | | | 752 | | | | 1,929,332 | |
BlackRock U.S. Core Property Fund, LP (2) | | | — | | | | 5,635,053 | |
CBRE U.S. Core Partners, LP | | | 4,327,998 | | | | 7,249,844 | |
CIM UII Onshore, LP | | | 2,026 | | | | 2,747,888 | |
Clarion Lion Properties Fund, LP | | | 6,256 | | | | 10,640,903 | |
GWL USPF, LP (3) | | | — | | | | 4,389,479 | |
Madison Core Property Fund, LP | | | 3,395 | | | | 7,771,684 | |
MetLife Core Property Fund, LP | | | 1,178 | | | | 1,878,370 | |
PRISA, LP | | | 1,965 | | | | 3,984,599 | |
RREEF America REIT II, Inc. | | | 19,301 | | | | 2,635,573 | |
Smart Markets Fund, LP | | | 4,622 | | | | 8,290,244 | |
TA Realty Core Property Fund, LP | | | 4,158 | | | | 5,593,819 | |
U.S. Real Estate Investment Fund, LLC | | | 3,247 | | | | 4,413,803 | |
U.S. Real Property Income Fund, LP (4) | | | — | | | | 4,592,638 | |
UBS Trumbull Property Fund, LP | | | 142 | | | | 1,497,920 | |
Total Real Estate Investments (Cost $78,371,741) | | | | | | | 91,795,368 | |
| | | | | | | | | |
Short-Term Investments — 10.1% | | | | | | | | |
U.S. Bank Money Market Deposit Account, 0.003% (5) | | | 10,353,964 | | | | 10,353,964 | |
Total Short-Term Investments (Cost $10,353,964) | | | | | | | | |
| | | | | | | | | |
Total Investments — 99.8% (Cost $88,725,705) | | | | | | $ | 102,149,332 | |
Other Assets Less Liabilities — 0.2% | | | | | | | 238,697 | |
Net Assets — 100.0% | | | | | | $ | 102,388,029 | |
| Percentages are stated as a percent of net assets. |
| REIT - Real Estate Investment Trust |
| LLC - Limited Liability Company |
* | See page 6 for additional information on the Fund’s Private Investment Funds. |
(1) | Securities considered illiquid. As of September 30, 2021, the value of these investments was $91,795,368 or 89.7% of the Fund’s net assets. |
(2) | Partnership is not designated in units. The Fund owns approximately 0.22% at September 30, 2021. |
(3) | Partnership is not designated in units. The Fund owns approximately 0.42% at September 30, 2021. |
(4) | Partnership is not designated in units. The Fund owns approximately 0.20% at September 30, 2021. |
(5) | The Money Market Deposit Account (the “MMDA”) is a short-term investment vehicle in which the Fund holds cash balances. The MMDA will bear interest at a variable rate that is determined based on conditions and may change daily and by any amount. The rate shows is as of September 30, 2021. |
See Notes to Financial Statements.
Semi-Annual Report | September 30, 2021 | 5 |
USQ Core Real Estate Fund | Schedule of Investments (Continued) |
| | September 30, 2021 (Unaudited) |
Additional Information on Investments in Private Investment Funds:
| | Fair Value | | Security | | Redemption
Frequency(1) | | | Redemption
Notice
(Days) | | | Commitments
as of
September 30,
2021 | |
| | $ | 1,365,893 | | AEW Core Property Trust (U.S.), Inc. | | | Quarterly | | | | 45 | | | $ | 0 | |
| | | 3,909,072 | | American Core Realty Fund, LP | | | Quarterly | | | | 10 | | | | 0 | |
| | | 3,092,072 | | ASB Allegiance Real Estate Fund, LP | | | Quarterly | | | | 30 | | | | 0 | |
| | | 4,557,109 | | Bailard Real Estate Investment Trust, Inc. | | | Quarterly | | | | 30 | | | | 0 | |
| | | 3,866,768 | | Barings Core Property Fund, LP | | | Quarterly | | | | 60 | | | | 0 | |
| | | 1,753,305 | | BGO Daily Value Fund - Class F | | | Daily | | | | N/A | (2) | | | 0 | |
| | | 1,929,332 | | BGO Diversified U.S. Property Fund | | | Quarterly | | | | 45 | | | | 0 | |
| | | 5,635,053 | | BlackRock U.S. Core Property Fund, LP | | | Quarterly | | | | 60 | | | | 0 | |
| | | 7,249,844 | | CBRE U.S. Core Partners, LP | | | Quarterly | | | | 60 | | | | 0 | |
| | | 2,747,888 | | CIM UII Onshore, LP | | | Quarterly | | | | 90 | (3) | | | 0 | |
| | | 10,640,903 | | Clarion Lion Properties Fund, LP | | | Quarterly | | | | 90 | | | | 0 | |
| | | 4,389,479 | | GWL USPF, LP | | | Quarterly | | | | 90 | | | | 0 | |
| | | 7,771,684 | | Madison Core Property Fund LP | | | Quarterly | | | | 90 | | | | 0 | |
| | | 1,878,370 | | MetLife Core Property Fund, LP | | | Quarterly | | | | 60 | | | | 0 | |
| | | 3,984,599 | | PRISA, LP | | | Quarterly | | | | 90 | | | | 0 | |
| | | 2,635,573 | | RREEF America REIT II, Inc. | | | Quarterly | | | | 45 | | | | 375,000 | |
| | | 8,290,244 | | Smart Markets Fund, LP | | | Quarterly | | | | 45 | | | | 0 | |
| | | 5,593,819 | | TA Realty Core Property Fund, LP | | | Quarterly | | | | 45 | (4) | | | 0 | |
| | | 4,413,803 | | U.S. Real Estate Investment Fund, LLC | | | Quarterly | | | | 90 | | | | 0 | |
| | | 4,592,638 | | U.S. Real Property Income Fund, LP | | | Quarterly | | | | 90 | | | | 0 | |
| | | 1,497,920 | | UBS Trumbull Property Fund, LP | | | Quarterly | | | | 60 | | | | 0 | |
(1) | While redemptions can be requested at the frequency listed above, there is no guarantee the Fund will be paid all or any of the redemption amount at the time requested. Each of the following Private Investment Funds can suspend redemptions if the general partner or its respective Board deems it in the best interest of its shareholders. As a result of the COVID-19 pandemic, most of the Private Investment Funds experienced an increase in redemption requests as investors sought to raise cash and rebalance their portfolios. Some funds temporarily suspended their redemption payout while others paid out a pro-rata portion of redemption requests and continue to have redemption queues. |
(2) | Daily redemptions are accepted up to an aggregate 10% of the Net Asset Value during the quarter. |
(3) | Redemptions are subject to a three-year holding period from date of the initial capital call. Partial redemptions are subject to the value of remaining units of at least $5 million. Redemption requirements may be waived as the sole discretion of the general partner. |
(4) | Redemption subject to a six-month holding period for the shares being redeemed. |
See Notes to Financial Statements.
Semi-Annual Report | September 30, 2021 | 6 |
USQ Core Real Estate Fund | Statement of Assets & Liabilities |
| | September 30, 2021 (Unaudited) |
Assets | | | | |
Investments, at value ($88,725,705) | | $ | 102,149,332 | |
Dividends receivable | | | 310,732 | |
Receivable for Fund shares sold | | | 24,850 | |
Interest receivable | | | 58 | |
Prepaid assets and other assets | | | 52,228 | |
Total assets | | | 102,537,200 | |
| | | | | |
Liabilities | | | | |
Legal fees payable | | | 34,982 | |
Trustees’ fees payable (Note 3) | | | 32,082 | |
Administration fees payable (Note 3) | | | 19,629 | |
Audit fees payable | | | 16,545 | |
Payable to Adviser, net of waiver (Note 3) | | | 15,032 | |
Transfer agency fees payable (Note 3) | | | 14,082 | |
Compliance fees payable | | | 6,607 | |
Reports to shareholders payable | | | 1,634 | |
Accrued expenses and other liabilities | | | 8,578 | |
Total liabilities | | | 149,171 | |
Net assets | | $ | 102,388,029 | |
Commitments and Contingencies (See Note 7).
Net Assets Consist of | | | | |
Paid-in capital | | $ | 90,255,062 | |
Total distributable earnings | | | 12,132,967 | |
Net assets | | $ | 102,388,029 | |
| | | | | |
Class I | | | | |
Net assets applicable to outstanding shares | | $ | 102,261,350 | |
Shares of beneficial interest outstanding (unlimited shares authorized, no par value) | | | 3,805,585 | |
Net asset value per share outstanding | | $ | 26.87 | |
| | | | | |
Class IS | | | | |
Net assets applicable to outstanding shares | | $ | 126,679 | |
Shares of beneficial interest outstanding (unlimited shares authorized, no par value) | | | 4,710 | |
Net asset value per share outstanding | | $ | 26.90 | |
See Notes to Financial Statements.
Semi-Annual Report | September 30, 2021 | 7 |
USQ Core Real Estate Fund | Statement of Operations |
| | April 1, 2021 - September 30, 2021 (Unaudited) |
Investment Income | | | | |
Dividends | | $ | 54,590 | |
Interest | | | 821 | |
Total investment income | | | 55,411 | |
| | | | | |
Expenses | | | | |
Management fees | | | 288,613 | |
Professional fees | | | 87,445 | |
Trustees’ fees | | | 62,081 | |
Administrator fees | | | 56,684 | |
Compliance fees | | | 39,107 | |
Transfer agent fees | | | 37,270 | |
Shareholder service fees - Class I | | | 26,692 | |
Registration fees | | | 21,933 | |
Insurance expense | | | 10,468 | |
Custodian fees and expenses | | | 3,625 | |
Reports to shareholders | | | 4,669 | |
Total expenses | | | 638,587 | |
Less fees waived/expense reimbursement by Adviser (Note 3) | | | (234,478 | ) |
Net Fund Expenses | | | 404,109 | |
Net Investment Loss | | | (348,698 | ) |
| | | | | |
Realized and Unrealized Gain on Investments | | | | |
Long term capital gain distributions | | | (212,203 | ) |
Net realized loss on investments | | | (17,446 | ) |
Net change in unrealized appreciation of investments | | | 9,844,178 | |
Net Realized and Unrealized Gain on Investments | | | 9,614,529 | |
Increase in Net Assets Resulting from Operations | | $ | 9,265,831 | |
See Notes to Financial Statements.
Semi-Annual Report | September 30, 2021 | 8 |
USQ Core Real Estate Fund | Statements of Changes in Net Assets |
| | |
| | For the period
from April 1, 2021 -
September 30, 2021
(Unaudited) | | | Year Ended
March 31, 2021 | |
Operations | | | | | | | | |
Net investment income/(loss) | | $ | (348,698 | ) | | $ | 8,261 | |
Net realized gain/(loss) on investments | | | (229,649 | ) | | | 405,148 | |
Net change in unrealized appreciation on investments | | | 9,844,178 | | | | 479,897 | |
Net increase in net assets resulting from operations | | | 9,265,831 | | | | 893,306 | |
Distributions to Shareholders | | | | | | | | |
Distributable earnings | | | | | | | | |
Class I | | | (183,327 | ) | | | (336,484 | ) |
Class IS | | | (240 | ) | | | (718 | ) |
From return of capital | | | | | | | | |
Class I | | | (1,649,943 | ) | | | (1,903,667 | ) |
Class IS | | | (2,164 | ) | | | (4,061 | ) |
Decrease in net assets from distributions | | | (1,835,674 | ) | | | (2,244,930 | ) |
Capital Share Transactions | | | | | | | | |
Class I | | | | | | | | |
Proceeds from sales of shares | | | 15,146,239 | | | | 39,915,603 | |
Distributions reinvested | | | 883,790 | | | | 1,535,196 | |
Cost of shares redeemed | | | (2,337,392 | ) | | | (8,600,389 | ) |
Net increase from capital shares transactions | | | 13,692,637 | | | | 32,850,410 | |
Class IS | | | | | | | | |
Distributions reinvested | | | 2,404 | | | | 4,489 | |
Net increase from capital shares transactions | | | 2,404 | | | | 4,489 | |
Net increase in net assets | | | 21,125,198 | | | | 31,503,275 | |
Net Assets | | | | | | | | |
Beginning of period | | | 81,262,831 | | | | 49,759,556 | |
End of period | | $ | 102,388,029 | | | $ | 81,262,831 | |
See Notes to Financial Statements.
Semi-Annual Report | September 30, 2021 | 9 |
USQ Core Real Estate Fund | Statements of Changes in Net Assets |
| | |
| | For the period from April 1, 2021 - September 30, 2021
(Unaudited) | | | Year Ended
March 31, 2021 | |
Other Information | | | | | | | | |
Beneficial Interest Transactions: | | | | | | | | |
Class I | | | | | | | | |
Beginning shares | | | 3,270,279 | | | | 1,942,707 | |
Shares sold | | | 593,411 | | | | 1,609,980 | |
Distributions reinvested | | | 34,546 | | | | 62,010 | |
Shares redeemed | | | (92,651 | ) | | | (344,418 | ) |
Net Increase in shares outstanding | | | 535,306 | | | | 1,327,572 | |
Ending shares | | | 3,805,585 | | | | 3,270,279 | |
Class IS | | | | | | | | |
Beginning shares | | | 4,616 | | | | 4,435 | |
Distributions reinvested | | | 94 | | | | 181 | |
Net Increase in shares outstanding | | | 94 | | | | 181 | |
Ending shares | | | 4,710 | | | | 4,616 | |
See Notes to Financial Statements.
Semi-Annual Report | September 30, 2021 | 10 |
USQ Core Real Estate Fund | Statement of Cash Flows |
| | As of September 30, 2021 (Unaudited) |
Cash Flow from Operating Activities: | | | | |
Net increase in net assets resulting from operations | | $ | 9,265,831 | |
Adjustments to reconcile net increase in net assets resulting from operations to net cash used in operating activities: | | | | |
Purchase of investments | | | (17,096,735 | ) |
Proceeds from sales | | | 57,288 | |
Net sales of short term investments | | | 4,578,572 | |
Long term capital gain distributions | | | 212,203 | |
Net realized gain on investments | | | 17,446 | |
Net change in unrealized depreciation on investments | | | (9,844,178 | ) |
Return of capital distributions received | | | 1,244,290 | |
Long term capital gain distributions received | | | (212,203 | ) |
(Increase)/decrease in assets: | | | | |
Dividends receivable | | | (13,049 | ) |
Interest receivable | | | 417 | |
Prepaid expenses and other assets | | | (29,682 | ) |
Increase/(decrease) in liabilities: | | | | |
Payable to Adviser | | | (23,384 | ) |
Audit fees payable | | | (16,455 | ) |
Trustees’ fees payable | | | 2,082 | |
Administration fees payable | | | (74 | ) |
Legal fees payable | | | 22,777 | |
Transfer agency fees payable | | | 218 | |
Compliance fees payable | | | 107 | |
Reports to shareholders payable | | | (1,443 | ) |
Accrued expenses and other liabilities | | | 1,455 | |
Net cash used in operating activities | | | (11,834,517 | ) |
| | | | | |
Cash Flows from Financing Activities: | | | | |
Proceeds from shares sold, net of change in receivable | | | 15,121,389 | |
Payment on shares redeemed | | | (2,337,392 | ) |
Cash distributions paid | | | (949,480 | ) |
Net cash provided by financing activities | | | 11,834,517 | |
| | | | | |
Net decrease in cash | | | — | |
Cash, beginning of period | | $ | — | |
Cash, end of period | | $ | — | |
| | | | | |
Non-cash financing activities not included herein consist of reinvestment of distributions of: | | $ | 886,194 | |
See Notes to Financial Statements.
Semi-Annual Report | September 30, 2021 | 11 |
USQ Core Real Estate Fund - Class I | Financial Highlights |
| | For a Share Outstanding Throughout the Periods Presented |
| | For the period
from
April 1, 2021 -
September 30,
2021
(Unaudited) | | | Year Ended
March 31, 2021 | | | Year Ended
March 31, 2020 | | | Year Ended
March 31, 2019 | | | For the period
from
September 27,
2017(1)
through
March 31, 2018 | |
Net Asset Value, Beginning of Period | | $ | 24.81 | | | $ | 25.56 | | | $ | 25.65 | | | $ | 25.08 | | | $ | 25.00 | |
| | | | | | | | | | | | | | | | | | | | | |
Income from Investment Operations | | | | | | | | | | | | | | | | | | | | |
Net investment income/(loss)(2) | | | (0.10 | ) | | | 0.01 | | | | 0.02 | | | | 0.60 | | | | 0.07 | |
Net realized and unrealized gain/(loss) on investments | | | 2.68 | | | | 0.24 | | | | 0.93 | | | | 1.00 | | | | 0.58 | |
Total income/(loss) from investment operations | | | 2.58 | | | | 0.25 | | | | 0.95 | | | | 1.60 | | | | 0.65 | |
| | | | | | | | | | | | | | | | | | | | | |
Distributions to Shareholders | | | | | | | | | | | | | | | | | | | | |
From net investment income | | | (0.05 | ) | | | (0.15 | ) | | | (0.36 | ) | | | (0.44 | ) | | | (0.57 | ) |
From return of capital | | | (0.47 | ) | | | (0.85 | ) | | | (0.68 | ) | | | (0.59 | ) | | | — | |
Total distributions | | | (0.52 | ) | | | (1.00 | ) | | | (1.04 | ) | | | (1.03 | ) | | | (0.57 | ) |
Increase/(Decrease) in Net Asset Value | | | 2.06 | | | | (0.75 | ) | | | (0.09 | ) | | | 0.57 | | | | 0.08 | |
Net Asset Value, End of Period | | $ | 26.87 | | | $ | 24.81 | | | $ | 25.56 | | | $ | 25.65 | | | $ | 25.08 | |
| | | | | | | | | | | | | | | | | | | | | |
Total Return (3)(4) | | | 10.69 | %(5) | | | 0.88 | % | | | 4.00 | % | | | 6.47 | % | | | 2.62 | %(5) |
| | | | | | | | | | | | | | | | | | | | | |
Supplemental Data and Ratios | | | | | | | | | | | | | | | | | | | | |
Net assets, end of period (000s) | | $ | 102,261 | | | $ | 81,148 | | | $ | 49,646 | | | $ | 30,391 | | | $ | 26,735 | |
| | | | | | | | | | | | | | | | | | | | | |
Ratio of expenses to average net assets, before waiver(6)(7) | | | 1.44 | % | | | 1.83 | % | | | 2.34 | % | | | 2.94 | % | | | 3.62 | % |
Ratio of expenses to average net assets, after waiver(6)(7) | | | 0.91 | % | | | 0.89 | % | | | 0.87 | % | | | 0.85 | % | | | 0.85 | % |
Ratio of net investment income to average net assets, before waiver(6)(7) | | | (1.31 | )% | | | (0.93 | )% | | | (1.38 | )% | | | 0.25 | % | | | (2.22 | )% |
Ratio of net investment income to average net assets, after waiver(6)(7) | | | (0.78 | )% | | | 0.02 | % | | | 0.09 | % | | | 2.34 | % | | | 0.55 | % |
| | | | | | | | | | | | | | | | | | | | | |
Portfolio turnover rate | | | 0.07 | %(5) | | | 5.35 | % | | | 1.54 | % | | | 10 | % | | | 24 | %(5) |
| | (1) | Commencement of Operations. |
| | (2) | Calculated using the average shares method. |
| | (3) | Total returns shown are historical in nature and assume changes in share price, reinvestment of dividends and capital gains distributions, if any. Had the Adviser not waived/reimbursed a portion of Fund expenses, total returns would have been lower. |
| | (4) | Includes adjustments in accordance with accounting principles generally accepted in the United States and, consequently, the net asset value for financial reporting purposes and returns based upon those net asset values may differ from the net asset values and returns for shareholder transactions. |
| | (6) | All income and expenses are annualized for periods less than one full year. |
| | (7) | Ratios do not include expenses of underlying private investment funds in which the Fund invests. |
See Notes to Financial Statements.
Semi-Annual Report | September 30, 2021 | 12 |
USQ Core Real Estate Fund - Class IS | Financial Highlights |
| | For a Share Outstanding Throughout the Periods Presented |
| | For the period
from
April 1, 2021 -
September 30,
2021
(Unaudited) | | | Year Ended
March 31, 2021 | | | Year Ended
March 31, 2020 | | | Year Ended
March 31, 2019 | | | For the period
from
September 27,
2017(1)
through
March 31, 2018 | |
Net Asset Value, Beginning of Period | | $ | 24.85 | | | $ | 25.55 | | | $ | 25.66 | | | $ | 25.08 | | | $ | 25.00 | |
| | | | | | | | | | | | | | | | | | | | | |
Income from Investment Operations | | | | | | | | | | | | | | | | | | | | |
Net investment income/(loss)(2) | | | (0.08 | ) | | | 0.02 | | | | 0.22 | | | | 0.60 | | | | 0.07 | |
Net realized and unrealized gain/(loss) on investments | | | 2.67 | | | | 0.28 | | | | 0.71 | | | | 1.01 | | | | 0.58 | |
Total income/(loss) from investment operations | | | 2.59 | | | | 0.30 | | | | 0.93 | | | | 1.61 | | | | 0.65 | |
| | | | | | | | | | | | | | | | | | | | | |
Distributions to Shareholders | | | | | | | | | | | | | | | | | | | | |
From net investment income | | | (0.05 | ) | | | (0.15 | ) | | | (0.36 | ) | | | (0.44 | ) | | | (0.57 | ) |
From return of capital | | | (0.47 | ) | | | (0.85 | ) | | | (0.68 | ) | | | (0.59 | ) | | | — | |
Total distributions | | | (0.52 | ) | | | (1.00 | ) | | | (1.04 | ) | | | (1.03 | ) | | | (0.57 | ) |
Increase/(Decrease) in Net Asset Value | | | 2.07 | | | | (0.70 | ) | | | (0.11 | ) | | | 0.58 | | | | 0.08 | |
Net Asset Value, End of Period | | $ | 26.92 | | | $ | 24.85 | | | $ | 25.55 | | | $ | 25.66 | | | $ | 25.08 | |
| | | | | | | | | | | | | | | | | | | | | |
Total Return (3)(4) | | | 10.76 | %(5) | | | 1.04 | % | | | 3.96 | % | | | 6.51 | % | | | 2.62 | %(5) |
| | | | | | | | | | | | | | | | | | | | | |
Supplemental Data and Ratios | | | | | | | | | | | | | | | | | | | | |
Net assets, end of period (000s) | | $ | 127 | | | $ | 115 | | | $ | 113 | | | $ | 109 | | | $ | 103 | |
| | | | | | | | | | | | | | | | | | | | | |
Ratio of expenses to average net assets, before waiver(6)(7) | | | 1.38 | % | | | 1.85 | % | | | 2.39 | % | | | 2.94 | % | | | 3.62 | % |
Ratio of expenses to average net assets, after waiver(6)(7) | | | 0.85 | % | | | 0.85 | % | | | 0.85 | % | | | 0.85 | % | | | 0.85 | % |
Ratio of net investment income to average net assets, before waiver(6)(7) | | | (1.19 | )% | | | (0.93 | )% | | | (0.68 | )% | | | 0.25 | % | | | (2.22 | )% |
Ratio of net investment income to average net assets, after waiver(6)(7) | | | (0.66 | )% | | | 0.08 | % | | | 0.86 | % | | | 2.34 | % | | | 0.55 | % |
| | | | | | | | | | | | | | | | | | | | | |
Portfolio turnover rate | | | 0.07 | %(5) | | | 5.35 | % | | | 1.54 | % | | | 10 | % | | | 24 | %(5) |
| | (1) | Commencement of Operations. |
| | (2) | Calculated using the average shares method. |
| | (3) | Total returns shown are historical in nature and assume changes in share price, reinvestment of dividends and capital gains distributions, if any. Had the Adviser not waived/reimbursed a portion of Fund expenses, total returns would have been lower. |
| | (4) | Includes adjustments in accordance with accounting principles generally accepted in the United States and, consequently, the net asset value for financial reporting purposes and returns based upon those net asset values may differ from the net asset values and returns for shareholder transactions. |
| | (6) | All income and expenses are annualized for periods less than one full year. |
| | (7) | Ratios do not include expenses of underlying private investment funds in which the Fund invests. |
See Notes to Financial Statements.
Semi-Annual Report | September 30, 2021 | 13 |
USQ Core Real Estate Fund | Notes to Financial Statements |
| | September 30, 2021 (Unaudited) |
1. ORGANIZATION
The USQ Core Real Estate Fund (the “Fund”) is registered under the Investment Company Act of 1940, as amended (the “1940 Act”), as a non-diversified, closed-end management company. The Fund engages in a continuous offering of shares and operates as an interval fund that offers quarterly repurchases of shares at net asset value (“NAV”). The Fund’s investment adviser is Union Square Capital Partners, LLC (the “Adviser”). The investment objective of the Fund is to generate a return comprised of both current income and capital appreciation with moderate volatility and low correlation to the broader markets.
The Fund is organized as a statutory trust under the laws of the State of Delaware. The Fund commenced operations on September 27, 2017.
The Fund currently offers Class I and Class IS shares. All classes of shares have equal voting privileges except that each class has exclusive voting rights with respect to its service and/or distribution plans. The Fund’s income, expenses (other than class specific distribution fees and shareholder servicing expenses) and realized and unrealized gains and losses are allocated proportionately each day based upon the relative net assets of each class.
2. SIGNIFICANT ACCOUNTING POLICIES
The following is a summary of significant accounting policies followed by the Fund in preparation of its financial statements. The policies are in conformity with accounting principles generally accepted in the United States of America (“U.S. GAAP”). The Fund is an investment company and, accordingly, follows the investment company accounting and reporting guidance of the Financial Accounting Standards Board (FASB) Accounting Standards Codification (ASC) Topic 946, Financial Services - Investment Companies.
Valuation of Private Investment Funds
The private institutional real estate investment funds in which the Fund invests (“Private Investment Funds”) are not publicly traded. The Private Investment Funds measure their investment assets at fair value and report a NAV per share on a calendar quarter basis. In accordance with Accounting Standards Codification (“ASC”) 820, the Fund applies the practical expedient to value its investments in Private Investment Funds at their respective NAVs at each quarter – as this method more accurately estimates the actual value of each Private Investment Fund at quarter-end. For non-calendar quarter-end days, the Adviser may consider certain information provided by a Private Investment Fund’s investment manager to determine the estimated value of the Fund’s holdings in such Private Investment Funds. The valuation provided by the investment manager as of a specific date may vary from the actual sale price that may be obtained if such investment were sold to a third party. To determine the estimated value of the Fund’s investment in Private Investment Funds, the Adviser considers, among other things, information provided by the Private Investment Funds, including quarterly unaudited financial statements.
Valuation of Public Investments
Readily marketable portfolio securities listed on the New York Stock Exchange (“NYSE”) are valued at the last sale price reflected on the consolidated tape at the close of the NYSE on the business day as of which such value is being determined. If there has been no sale on such day, the securities are valued at the mean of the closing bid and asked prices on such day. If no bid or asked prices are quoted on such day or if market prices may be unreliable because of events occurring after the close of trading, then the security is valued by such method as the Adviser shall determine in good faith to reflect its fair market value. Readily marketable securities not listed on the NYSE but listed on other domestic or foreign securities exchanges are valued in a like manner. Portfolio securities traded on more than one securities exchange are valued at the last sale price on the business day as of which such value is being determined as reflected on the consolidated tape at the close of the exchange representing the principal market for such securities. Securities trading on The NASDAQ Stock Market (“NASDAQ”) are valued at the NASDAQ official closing price.
Semi-Annual Report | September 30, 2021 | 14 |
USQ Core Real Estate Fund | Notes to Financial Statements |
| | September 30, 2021 (Unaudited) |
Third-Party Pricing Agents
The Adviser may contract with independent, third-party pricing agents to provide primary and secondary valuation coverage. Generally, there will be only one primary pricing agent identified for each type of security within the Fund’s portfolio.
Use of Independent Brokers to Value Securities
If a security price cannot be obtained from an independent, third-party pricing agent, the Adviser shall seek to obtain a bid price from at least one independent broker. The Adviser shall report to the Board on any use of an independent broker to value securities.
Fair Value Pricing Procedures
Securities for which market prices are not “readily available,” or which cannot be valued using the methodologies described in these procedures, will be valued in accordance with the Adviser’s Valuation Policy as approved by the Board. Notwithstanding the foregoing, a security shall not be required to be fair valued in accordance with the Adviser’s Valuation Policy if the aggregate impact to the Fund’s NAV would be less than $0.01 if all securities that would otherwise be required to be fair valued were assumed to be worthless in a hypothetical worst-case scenario. In such cases, the most recent available market value for such security may be used.
Fair Value Measurements
In applying the valuation procedures described in this Valuation Policy, the Adviser maximizes the use of “observable” versus “unobservable” inputs in markets which are active or markets where there has not been a significant decrease in the volume and frequency of transactions, as stressed by ASC Topic 820. Observable inputs are defined as inputs that reflect the assumptions market participants would use in pricing an asset or liability developed based on market data obtained from sources independent of the reporting entity. Unobservable inputs are defined as inputs that reflect the Adviser’s own assumptions about the assumptions market participants would use in pricing an asset or liability developed based on the best information available in the circumstances. To clarify observable versus unobservable inputs and increase consistency and comparability in Fair Value measurements, ASC Topic 820 establishes a Fair Value hierarchy (the “Fair Value Hierarchy”) that prioritizes valuation inputs into three levels, which is utilized by the Adviser. The Fair Value Hierarchy is described below in further detail.
Level 1 - Level 1 inputs (“Level 1 Inputs”) are quoted prices (unadjusted) in active markets for identical assets or liabilities that the Adviser has the ability to access at the valuation date. As defined in ASC Topic 820, an active market (“Active Market”) for an asset or liability is a market in which transactions for the asset or liability occur with sufficient frequency and volume to provide pricing information on an ongoing basis. The portfolio has investments in actively traded securities and therefore are valued through the use of Level 1 Inputs in accordance with the Fair Value Hierarchy. In accordance with ASC Topic 820, when applicable Level 1 Inputs are available for a particular security, the Fair Value of the security is equal to the quoted price multiplied by the quantity held. Adjustments are not applied to the quoted price due to the size of a position relative to trading volume (i.e., blockage).
Level 2 - Level 2 inputs (“Level 2 Inputs”) are inputs other than quoted prices included within Level 1 Inputs that are observable for the asset or liability, either directly or indirectly. Level 2 Inputs can include: quoted prices for identical or similar assets or liabilities in markets that are not active; inputs other than quoted prices that are observable for the asset or liability (i.e., interest rates, volatilities, prepayment speeds, loss severities, credit risks, default rates, etc.); and observable market-based inputs.
Level 3 - Level 3 inputs (“Level 3 Inputs”) are unobservable inputs for the asset or liability. Unobservable inputs are used in the absence of observable inputs. Level 3 Inputs reflect the Adviser’s own assumptions about the assumptions that market participants would use in pricing the asset or liability.
The inputs or methodology used for valuing securities are not necessarily an indication of the risk associated with investing in those securities.
Semi-Annual Report | September 30, 2021 | 15 |
USQ Core Real Estate Fund | Notes to Financial Statements |
| | September 30, 2021 (Unaudited) |
These inputs are summarized in the three broad levels that follow.
Investments in Securities at Value | | Level 1 | | | Level 2 | | | Level 3 | | | Total | |
Private Equity Real Estate Funds(a) | | $ | — | | | $ | — | | | $ | — | | | $ | 91,795,368 | |
Total | | $ | — | | | $ | — | | | $ | — | | | $ | 91,795,368 | |
(a) | In accordance with ASC 820-10, certain investments that are measured at fair value using the NAV per share (or its equivalent) practical expedient have not been classified in the fair value hierarchy. The fair value amounts presented in this table are intended to permit reconciliation of the fair value hierarchy to the amounts presented in the Statement of Assets & Liabilities. |
Use of Estimates
The preparation of the financial statements in accordance with U.S. GAAP requires management to make estimates and assumptions that affect the reported amounts of assets and liabilities and disclosures of contingencies at the date of the financial statements. The Fund believes that these estimates utilized in preparing the financial statements are reasonable and prudent; however, actual results could differ from these estimates.
Indemnifications
In the normal course of business, the Fund enters into contracts that contain a variety of representations which provide general indemnifications. The Fund’s maximum exposure under these arrangements is unknown as this would involve future claims that may be made against the Fund that have not yet occurred. However, the Fund expects the risk of loss to be remote.
Federal Income Taxes
The Fund intends to continue to qualify as a regulated investment company and comply with the provisions available to certain investment companies as defined in Subchapter M of the Internal Revenue Code of 1986, as amended, and to make distributions from net investment income and from net realized capital gains sufficient to relieve it from all, or substantially all, federal income taxes.
The Fund evaluates tax positions taken (or expected to be taken) in the course of preparing the Fund’s tax provisions to determine whether these positions meet a “more-likely-than-not” standard that, based on the technical merits, have a more than fifty percent likelihood of being sustained by a taxing authority upon examination. A tax position that meets the “more-likely-than-not” recognition threshold is measured to determine the amount of benefit to recognize in the financial statements.
As of September 30, 2020, the Fund’s most recent tax year end, the Fund did not have a liability for any unrecognized tax benefits. The Fund recognizes interest and penalties, if any, related to unrecognized tax benefits as income tax expenses in the Statement of Operations. The Fund files U.S. federal, state and local tax returns as required. The Fund’s tax returns are subject to examination by the relevant tax authorities until expiration of the applicable statute of limitations which is generally three years after the filing of the tax return for federal purposes and four years for most state returns. Tax returns for open years have incorporated no uncertain tax positions that require a provision for income taxes.
Investment Transactions
Investment security transactions are accounted for on trade date. Gains and losses on securities sold are determined on a specific identification basis.
Distributions to Shareholders
Distributions from investment income are declared and paid quarterly. Distributions from net realized capital gains, if any, are declared and paid annually and are recorded on the ex-dividend date. The character of income and gains to be distributed is determined in accordance with income tax regulations, which may differ from GAAP.
Semi-Annual Report | September 30, 2021 | 16 |
USQ Core Real Estate Fund | Notes to Financial Statements |
| | September 30, 2021 (Unaudited) |
Investment Income
Interest income is accrued and recorded on a daily basis including amortization of premiums, accretion of discounts, and income earned from money market funds. Dividend income is recorded on the ex-dividend date, except that certain dividends from private investment funds are recorded as soon as the information is available to the Fund. Distributions received from the Fund’s investments in private investment funds generally are comprised of investment income, capital gains, and return of capital. For financial statement purposes, the Fund uses investment income, capital gains, and return of capital estimates to allocate the distribution income received. Such estimates are based on historical information available from each private investment and other industry sources. These estimates may subsequently be revised based on information received from the private investment funds after their tax reporting periods are concluded, as the actual character of these distributions is not known until after the fiscal year end of the Fund. The Fund estimates the allocation of investment income, capital gains, and return of capital for the distributions received from private investment funds with the Statement of Operations. For the period ended September 30, 2021, the Fund has estimated approximately 17.4%, 4%, and 78.6% of the distributions from private investment funds to be investment income, capital gains, and return of capital, respectively. The Fund records the character of distributions received during the year based on estimates available. The characterization of distributions received by the Fund may be subsequently revised based on the information received from the private investment funds after their tax reporting periods conclude.
Industry Concentration
If a Fund has significant investments in the securities of issuers within a particular industry, any development affecting that industry will have a greater impact on the value of the net assets of the Fund than would be the case if the Fund did not have significant investments in that industry. In addition, this may increase the risk of loss in the Fund and increase the volatility of the Fund’s NAV per share. Occasionally, market conditions, regulatory changes, or other developments may negatively impact this industry, and therefore the value of the Fund’s portfolio will be adversely affected. As of September 30, 2021, the Fund had 89.7% of the value of its net assets invested within the real estate industry.
Liquidity Risk
Liquidity risk exists when particular investments are difficult to sell. The Fund may not be able to sell these investments at the best prices or at the value the Fund places on them. In such a market, the value of such investments and the Fund’s share price may fall dramatically, even during periods of declining interest rates. Investments that are illiquid or that trade in lower volumes may be more difficult to value. The market for high yield securities in particular may be less liquid and therefore these securities may be harder to value or sell at an acceptable price, especially during times of market volatility or decline.
3. ADVISORY FEES AND OTHER RELATED PARTY TRANSACTIONS AND OTHER FEES
The Adviser serves as the investment adviser to the Fund. Under the terms of the Investment Advisory Agreement (the “Agreement”), the Adviser, subject to the supervision of the Board of Trustees (the “Board”), provides or arranges to be provided to the Fund such investment advice as it deems advisable and will furnish or arrange to be furnished a continuous investment program for the Fund consistent with the Fund’s investment objectives and policies. As compensation for its management services, the Fund agrees to pay to the Adviser a monthly fee in dollars at the annual rate of 0.65% (as a percentage of daily net assets) on assets up to $500 million, 0.50% on assets of $500 million and more but less than $1 billion, 0.40% on assets of $1 billion and more but less than $5 billion, and 0.30% on assets of $5 billion and more, payable at the end of each calendar month. During the period ended September 30, 2021, the Fund accrued $288,613 in management fees.
The Fund’s Board of Trustees approved the Agreement at its September 9, 2021 meeting.
Semi-Annual Report | September 30, 2021 | 17 |
USQ Core Real Estate Fund | Notes to Financial Statements |
| | September 30, 2021 (Unaudited) |
The Adviser has contractually agreed to waive its fees and/or pay Fund expenses so that the total annual operating expenses of the Fund for Class I and Class IS shares (excluding taxes, interest, trading costs, acquired fund fees and expenses, distribution fees, and shareholder servicing expenses), as a percentage of average daily net assets, do not exceed 0.85%. The Expense Limitation Agreement will continue indefinitely until revised or terminated by mutual agreement by the Fund and the Adviser, with the consent of the Board. Under the Expense Limitation Agreement, the Adviser may request and receive reimbursement from the Fund for advisory fees waived or other expenses reimbursed by the Adviser pursuant to the Expense Limitation Agreement at a date not to exceed three years from the month in which the corresponding waiver or reimbursement to the Fund was made. However, no reimbursement may be made unless the total annual expense ratio of the class making such reimbursement is no higher than the amount of the expense limitation that was in place at the time the Adviser waived the fees or reimbursed the expenses and does not cause the expense ratio to exceed the current expense limitation.
Fees and reimbursed Fund expenses, including prior year expenses, are subject to potential recoupment by year of expiration. The Adviser’s waived fees and reimbursed expenses that are subject to potential recoupment are as follows:
Fiscal Period
Incurred | | Amount
Waived | | | Amount
Recouped(a) | | | Amount Subject
to Potential
Recoupment | | | Expiration
Date | |
March 31, 2019 | | $ | 582,873 | | | $ | — | | | $ | 582,873 | | | | March 31, 2022 | |
March 31, 2020 | | | 558,294 | | | | — | | | | 558,294 | | | | March 31, 2023 | |
March 31, 2021 | | | 499,126 | | | | — | | | | 499,126 | | | | March 31, 2024 | |
March 31, 2022 | | | 234,478 | | | | — | | | | 234,478 | | | | March 31, 2025 | |
Total | | $ | 1,874,771 | | | $ | — | | | $ | 1,874,771 | | | | | |
(a) | Amount recouped was in compliance with the Expense Limitation Agreement, and did not cause the total Fund’s expense ratio to exceed 0.85%. |
Certain Officers of the Fund are also Officers of the Adviser. Trustees and officers, other than the Chief Compliance Officer, affiliated with the Adviser are not compensated by the Fund for their services. Each Trustee who is not an affiliated person of the Adviser receives from the Fund an annual retainer of $30,000, paid quarterly; a fee of $2,500 for attendance at each in-person meeting of the Board; and a fee of $500 for attendance at each telephonic regular meeting of the Board.
The Adviser also provides a Chief Compliance Officer to the Fund. For these services, the Fund pays the Adviser a monthly fee of $6,500, which is included in Compliance fees in the Statement of Operations.
Quasar Distributors, LLC (“Quasar”), a wholly-owned broker-dealer subsidiary of Foreside Financial Group, LLC (“Foreside”), serves as the Fund’s distributor. On July 7, 2021, Foreside announced that it had entered into a definitive purchase and sale agreement with Genstar Capital (“Genstar”) such that Genstar would acquire a majority stake in Foreside. The transaction closed on September 30, 2021. The Fund’s Board of Trustees approved Quasar to remain the Fund’s distributor at its September 9, 2021 meeting. The Fund has adopted a plan of distribution under Rule 12b-1 of the 1940 Act applicable to Class IS shares. Under the plan, 12b-1 distribution fees at an annual rate of 0.25% of average daily net assets of Class IS shares are paid to the distributor or others for distribution services. For the period ended September 30, 2021, the Fund had not incurred any 12b-1 fees. The Fund has also adopted a shareholder servicing plan applicable to Class I and Class IS shares. Under the plan, shareholder servicing fees at an annual rate up to a maximum of 0.10% and 0.25% of average daily net assets of Class I and Class IS shares are paid for shareholder services, respectively. For the period ended September 30, 2021, the Fund incurred shareholder servicing fees of $26,692 for Class I and $0 for Class IS.
The custodian to the Fund is U.S. Bank National Association. The administrator and transfer agent to the Fund is U.S. Bancorp Fund Services, LLC, d/b/a U.S. Bank Global Fund Services (“Fund Services”). See the effect of expenses on Statement of Operations.
Semi-Annual Report | September 30, 2021 | 18 |
USQ Core Real Estate Fund | Notes to Financial Statements |
| | September 30, 2021 (Unaudited) |
4. INVESTMENT TRANSACTIONS
The cost of purchases and proceeds from the sale of securities, other than short-term securities, for the period ended September 30, 2021 amounted to $17,096,735 and $57,288, respectively.
5. TAX BASIS INFORMATION
The amount and character of income and capital gain distribution to be paid, if any, are determined in accordance with federal income tax regulations, which may differ from U.S. GAAP. These differences are primarily due to differences in the timing of recognition of gains or losses on investments. Permanent book and tax basis differences, if any, may result in reclassifications to total distributable earnings and additional paid-in capital.
The following reclassifications, which had no impact on results of operations or net assets, were recorded to reflect tax character.
Paid-in Capital | | Total
Distributable Earnings | |
$ — | | $ | — | |
Under current tax law, net capital losses realized after October 31st and net ordinary losses incurred after December 31st may be deferred and treated as occurring on the first day of the following fiscal year. As of September 30, 2020, the Fund deferred, on a tax basis, late-year investment losses of $291,676.
As of March 31, 2021, the unrealized appreciation and depreciation of investments, based on cost for federal income tax purposes, were as follows:
| | Investments | |
Cost of investments for tax purposes | | $ | 77,527,128 | |
Gross tax unrealized appreciation | | $ | 3,868,141 | |
Gross tax unrealized depreciation | | | (289,254 | ) |
Net tax unrealized appreciation (depreciation) | | $ | 3,578,887 | |
As of September 30, 2020, the Fund’s most recent tax year end, the tax basis of distributable earnings (accumulated deficit) were as follows:
| | Investments | |
Undistributed ordinary income | | $ | — | |
Undistributed long-term capital gains | | | — | |
Tax accumulated earnings | | $ | — | |
Accumulated capital and other losses | | | (291,676 | ) |
Unrealized appreciation on investments | | $ | 2,261,774 | |
Total accumulated earnings | | $ | 1,970,098 | |
Difference between book and tax basis net unrealized appreciation relates to outstanding partnership basis adjustments.
Semi-Annual Report | September 30, 2021 | 19 |
USQ Core Real Estate Fund | Notes to Financial Statements |
| | September 30, 2021 (Unaudited) |
During the tax years ended September 30, 2020 and September 30, 2019, the tax character of distributions paid by the Fund was as follows:
| | Tax Year Ended
September 30, 2020 | | | Tax Year Ended
September 30, 2019 | |
Ordinary income | | $ | 204,249 | | | $ | 213,487 | |
Long-term capital gain | | | 416,458 | | | | 346,841 | |
Return of capital | | | 1,248,040 | | | | 691,138 | |
| | | $ | 1,868,747 | | | $ | 1,251,466 | |
6. REPURCHASE OFFERS
The Fund operates as an interval fund pursuant to Rule 23c-2 under the 1940 Act and, as such, has adopted a fundamental policy to make quarterly repurchase offers, at NAV, of no less than 5% and no more than 25% of the Fund’s shares outstanding on the Repurchase Request Deadline (as defined below). There is no guarantee that shareholders will be able to sell all of the shares they desire to sell in a quarterly repurchase offer, although each shareholder will have the right to require the Fund to purchase at least 5% of such shareholder’s shares in each quarterly repurchase. Liquidity will be provided to shareholders only through the Fund’s quarterly repurchases. Shareholders will be notified in writing of each quarterly repurchase offer and the date the repurchase offer ends (the “Repurchase Request Deadline”). Shares will be repurchased at the NAV per share determined as of the close of regular trading on the NYSE no later than the 14th day after the Repurchase Request Deadline, or the next business day if the 14th day is not a business day (each a “Repurchase Pricing Date”).
During the period ended September 30, 2021, the Fund completed two repurchase offers. In this offer, the Fund offered to repurchase up to 5% of the number of its outstanding shares as of the Repurchase Pricing Dates. The result of the repurchase offers are as follows:
Commencement Date | April 9, 2021 | July 9, 2021 |
Repurchase Request Deadline | April 30, 2021 | July 30, 2021 |
Repurchase Pricing Date | April 30, 2021 | July 30, 2021 |
Amount Repurchased | $ 1,451,923 | $ 885,445 |
Shares Repurchased | 58,170 | 34,480 |
7. UNFUNDED COMMITMENTS
As of September 30, 2021, the Fund had unfunded capital commitments, net of investments paid in advance, for the Private Equity Real Estate Funds below:
| | | Unfunded
Commitments as of
September 30, 2021 | |
RREEF America REIT II, Inc. | | $ | 375,000 | |
Semi-Annual Report | September 30, 2021 | 20 |
USQ Core Real Estate Fund | Notes to Financial Statements |
| | September 30, 2021 (Unaudited) |
8. OTHER MATTERS
COVID-19 Risk – The global pandemic outbreak of an infectious respiratory illness caused by a novel coronavirus known as COVID-19 has resulted in substantial market volatility and global business disruption, impacting the global economy and the financial health of individual companies in significant and unforeseen ways. The duration and future impact of COVID-19 are currently unknown, which may exacerbate other types of risks that apply to the Fund and negatively impact Fund performance and the value of your investment in the Fund. Specifically, issuers of real estate securities with properties, operations, productions, offices, and/or personnel in (or other exposure to) areas affected with the virus may experience significant disruptions to their business and/or holdings. Potential impacts on the real estate market may include lower occupancy rates, decreased lease payments, defaults and foreclosures, among other consequences. The extent to which COVID-19 will affect the Fund, the Fund’s service providers and/or such issuer’s operations and results will depend on future developments, which are highly uncertain and cannot be predicted, including new information that may emerge concerning the severity of COVID-19 and the actions taken to contain COVID-19. The duration of the COVID-19 outbreak and its impact on the global economy cannot be determined with certainty.
9. ACCOUNTING PRONOUNCEMENTS
In April 2020, the SEC issued a final rule entitled “Securities Offering Reform for Closed-End Investment Companies” (the “Release”) containing amended rules and forms intended to streamline the registration, communications and offering practices for business development companies and registered closed-end investment companies (“registered CEFs”), including interval funds and tender offer funds. Among its provisions, the Release amends Form N-2 to extend a Management Discussion of Fund Performance disclosure requirement to the annual reports of all registered CEFs and also mandates the inclusion of a Fee and Expense Table, Share Price Data information and a Senior Securities Table, all of which are currently contained in a registered CEF’s prospectus, in its annual report. The Release’s rule and form amendments became effective August 1, 2020, with the new annual report requirements effective in August 2021. The Adviser is currently evaluating the impact, if any, of the Release on the Fund’s fiscal 2022 annual report.
In December 2020, the SEC adopted a final rule (Rule 2a-5) under the 1940 Act addressing fair valuation of fund investments. The new rule sets forth requirements for good faith determinations of fair value as well as for the performance of fair value determinations, including related oversight and reporting obligations. The new rule also defines “readily available market quotations” for purposes of the definition of “value” under the Act, and the SEC noted that this definition would apply in all contexts under the Act. The effective date for the rule is March 8, 2021. The SEC adopted an eighteen-month transition period beginning from the effective date for the new rule. The Adviser is currently evaluating the impact, if any, on the financial statements.
10. SUBSEQUENT EVENTS
Subsequent events after the date of the Statement of Assets and Liabilities have been evaluated through the date the financial statements were issued.
The Fund completed a quarterly repurchase offer on October 29, 2021, which resulted in 47,366 of Fund shares being repurchased for $1,283,157.
Management has determined that there were no other subsequent events to report through the issuance of these financial statements.
Semi-Annual Report | September 30, 2021 | 21 |
USQ Core Real Estate Fund | Additional Information |
| | September 30, 2021 (Unaudited) |
1. PROXY VOTING POLICIES AND VOTING RECORD
A description of the policies and procedures that the Fund uses to determine how to vote proxies relating to portfolio securities owned by the Fund and information regarding how the Fund voted proxies relating to the portfolio securities during the most recent 12-month period ended June 30 is available to shareholders without charge by visiting the Securities and Exchange Commission’s (“SEC”) web site at www.sec.gov.
2. QUARTERLY PORTFOLIO HOLDINGS
The Fund files a complete listing of portfolio holdings for the Fund with the SEC as of first and third quarters of each fiscal year on Form N-PORT, within 60 days after the end of the period. The filings are available on the SEC’s website at http://www.sec.gov.
Semi-Annual Report | September 30, 2021 | 22 |
USQ Core Real Estate Fund | Management Agreement Renewal |
| | September 30, 2021 (Unaudited) |
Board Consideration and Approval of Investment Advisory Agreement
At a meeting held on September 9, 2021, the Board of Trustees (the “Board”) of USQ Core Real Estate Fund (the “Fund”), including the trustees who are not “interested persons” of the Fund (the “Independent Trustees”) as defined in the Investment Company Act of 1940, as amended (the “1940 Act”), considered the continuance of the Investment Advisory Agreement (the “Advisory Agreement”) between the Fund and Union Square Capital Partners, LLC (the “Investment Advisor”). Following its review and consideration, the Board, including the Independent Trustees, determined that such continuance was in the best interests of the Fund and its shareholders and unanimously approved the Advisory Agreement for an additional one-year term.
Background
In advance of the meeting, the Board requested and received from the Investment Advisor information about the Fund and the Advisory Agreement, certain portions of which are discussed below. The materials, among other things, included information about the Investment Advisor’s organization and financial condition; information regarding the background and experience of relevant personnel providing services to the Fund; information about the Investment Advisor’s investment policies and procedures; information comparing the investment advisory fee and total expenses of the Fund to those of a group of comparable funds (the “Peer Group”); information comparing the performance of the Fund with returns of the NCREIF Fund Index – Open End Diversified Core Equity (“NFI-ODCE”), certain broad-based market indexes, and the Peer Group during various periods; and information regarding the profitability of the Investment Advisor’s overall relationship with the Fund. The Board also received a memorandum from the independent legal counsel to the Independent Trustees discussing the legal standards under the 1940 Act and other applicable law for their consideration of the proposed continuance of the Advisory Agreement. In addition, the Board considered information reviewed by the Board at other Board and Board committee meetings since the last review of the Advisory Agreement.
In their deliberations, the Independent Trustees met privately without representatives of the Investment Advisor present and were represented throughout the process by independent legal counsel. In approving the continuance of the Advisory Agreement, the Trustees evaluated and weighed a number of considerations that they believed to be relevant in light of the legal advice furnished to them by counsel, including independent legal counsel, and made a decision in the exercise of their own business judgment. They considered a variety of factors, including those discussed below. In their deliberations, the Board and the Independent Trustees did not identify any particular factor that was controlling, and each Trustee may have attributed different weights to the various factors.
Nature, Extent and Quality of Services
The Board considered the scope of services provided by the Investment Advisor under the Advisory Agreement with respect to the Fund. The Board also considered the qualifications, experience and responsibilities of the personnel of the Investment Advisor involved in the activities of the Fund. In addition, the Board considered the overall quality of the organization and operations, the financial resources and compliance structure, and management processes of the Investment Advisor.
The Board noted that the investment management and related services provided by the Investment Advisor include, among others: the design, development and ongoing review and evaluation of the Fund and its investment strategy, including security selection, portfolio trading responsibilities, and compliance with the Fund’s investment limitations and restrictions; risk management oversight and analysis; design, development, implementation and ongoing review and evaluation of a process for the valuation of Fund investments; monitoring and evaluating the services provided to the Fund by third-party service providers; participation in Board meetings and oversight of preparation of materials for the Board, including materials for Board meetings and regular communications with the Board; and oversight of preparation of the Fund’s prospectus, statement of additional information, shareholder reports and other disclosure materials and regulatory filings. The Board also noted the continued ability of Investment Advisor personnel to effectively handle remote work environments, as well as the Investment Advisor’s successful establishment of long-term remote operations to service the Fund, in connection with the COVID-19 pandemic.
Semi-Annual Report | September 30, 2021 | 23 |
USQ Core Real Estate Fund | Management Agreement Renewal |
| | September 30, 2021 (Unaudited) |
The Board concluded that based on the various factors they had reviewed, the nature, overall quality, and extent of the management and oversight services provided by the Investment Advisor to the Fund were satisfactory.
Performance
The Board considered information included in the meeting materials regarding the performance of the Fund. In particular, the Board compared the performance of the Fund to the performance of the NFI-ODCE, certain broad-based market indexes (the S&P 500 Index, MSCI U.S. REIT Index, and Bloomberg Barclays U.S. Aggregate Bond Index), and the Peer Group for various periods of time. The Board considered the process to determine the Peer Group, which was intended to represent funds with structures and investment classification/objectives, strategies and characteristics that were comparable to those of the Fund.
The Board noted that the Fund is designed to deliver the risk/return profile of the NFI-ODCE; however, due to investment limitations, cash drag, and Fund expenses, the Fund is unable to entirely replicate the NFI-ODCE. The Board noted that, as a result, the Fund had underperformed the NFI-ODCE during the periods presented, but that the Fund’s returns were generally not significantly different than the returns of the NFI-ODCE. With respect to the performance results of the Fund compared to the broad-based market indexes, the Board considered the Investment Advisor’s belief that the Fund was expected to deliver returns that fall between the returns of the equity and fixed income markets and, consistent with that belief, the Fund’s performance since its inception had lagged the results of the broad-based equity and public real estate market indexes, and generally outperformed the results of the broad-based fixed income market index. With respect to the performance results of the Fund compared to the Peer Group, and in particular during periods when the Fund underperformed other funds included in the Peer Group, the Board noted that the Fund had a unique strategy to deliver the risk/return profile of the NFI-ODCE, that the Fund’s investment universe was more limited than those of the other funds included in the Peer Group, and that the Fund did not utilize leverage to the same extent as most other funds in the Peer Group. The Board also considered the Investment Advisor’s belief that the Fund was performing in line with expectations and had delivered on its intended strategy.
Based on this information, the Board concluded that the investment results that the Investment Advisor had been able to achieve for the Fund were sufficient to support continuance of the Advisory Agreement.
Advisory Fee and Expense Ratio
The Board considered information included in the meeting materials regarding the investment advisory fee and total expenses of the Fund. In particular, the Board compared the investment advisory fee and total expenses of the Fund to those of the Peer Group.
The Board observed that the investment advisory fee (gross of fee waivers by the Investment Advisor) was among the lowest in the Peer Group and below the average advisory fees of the funds in the Peer Group (excluding the Fund) by 64 basis points. The Board also noted that the Fund’s total expenses (after fee waivers) were lower than the total expenses (after fee waivers) of all funds in the Peer Group. In considering the advisory fee, the Board also observed that, unlike other funds in the Peer Group, the advisory fee schedule for the Fund included reductions in the advisory fee rate (i.e., “breakpoints”) at various asset levels, such that as Fund assets grow in excess of those breakpoint asset levels, the Fund would pay a lower effective advisory fee rate. In considering the Fund’s expense ratio, the Board noted the Investment Advisor’s commitment to limit the Fund’s operating expenses by agreeing to indefinitely waive its advisory fee and/or assume Fund expenses as necessary to maintain the expense ratio of each share class at a certain level.
The Board concluded that the compensation payable to the Investment Advisor under the Advisory Agreement was fair and reasonable in light of the services provided by the Investment Advisor to the Fund.
Semi-Annual Report | September 30, 2021 | 24 |
USQ Core Real Estate Fund | Management Agreement Renewal |
| | September 30, 2021 (Unaudited) |
Profitability, Benefits to the Investment Advisor and Economies of Scale
The Board considered information provided by the Investment Advisor relating to the Investment Advisor’s costs and profits with respect to the Fund. The Board noted that the Investment Advisor had waived substantially all of its investment advisory fee since the Fund’s inception in connection with its commitment to limit the Fund’s expenses and had not realized a profit with respect to the Fund. The Board also considered its discussions during the past year with representatives of Chatham Financial Corp., the indirect parent company of the Investment Advisor, who had affirmed Chatham’s continued support of the Investment Advisor and the Fund, including with respect to the commitment of resources.
The Board also considered the benefits received by the Investment Advisor as a result of its relationship with the Fund (other than the receipt of investment advisory fees), including the intangible benefits of the Investment Advisor’s association with the Fund generally and any favorable publicity arising in connection with the Fund’s performance. The Board considered economies of scale with respect to the management of the Fund and whether the Fund would benefit from any such economies. In evaluating economies of scale, the Board considered the Advisory Agreement fee schedule, which the Board noted included fee breakpoints at various asset level and would permit the Fund to share in economies of scale as Fund assets grow. The Board also took into account the Investment Advisor’s undertaking to limit Fund expenses. The Board concluded that the Investment Advisor’s arrangements with respect to the Fund reflected an appropriate sharing of any efficiencies or economies of scale.
Conclusion
Based on these and other factors, the Board and the Independent Trustees concluded that approval of the continuance of the Advisory Agreement for an additional one year term was in the best interests of the Fund and its shareholders and, accordingly, approved the continuance of the Advisory Agreement.
Semi-Annual Report | September 30, 2021 | 25 |
USQ Core Real Estate Fund | Privacy Policy |
| | September 30, 2021 (Unaudited) |
As the investment adviser for USQ Core Real Estate Fund (the “Fund”), Union Square Capital Partners, LLC (the “Adviser”) invests the assets of the Fund and manages their day-to-day business. We appreciate your business and the trust you have placed in us. Our privacy philosophy reflects the value of your trust. We are committed to protecting the personal data we obtain about you. On behalf of the Fund and the Adviser (collectively, “USQ”), we make the following assurance of your privacy.
Not Using Your Personal Data for our Financial Gain
USQ has never sold shareholder information to any other party, nor have we disclosed such data to any other organization, except as permitted by law. We have no plans to do so in the future. We will notify you prior to making any change in this policy.
How We Do Use Your Personal and Financial Data
We use your information primarily to complete your investment transactions. We may also use it to communicate with you about other financial products that we offer.
The Information We Collect About You
You typically provide personal information when you complete a USQ account application or when you request a transaction that involves USQ, either directly or through a brokerage firm. This information may include your:
| | ● | Name, address, and phone numbers |
| | ● | Social security or taxpayer identification number |
| | ● | Birth date and beneficiary information (for IRA applications) |
| | ● | Basic trust document information (for trusts only) |
How We Protect Your Personal Information
As emphasized above, we do not sell information about current or former shareholders or their accounts to third parties. We occasionally share such information to the extent permitted by law to complete transactions at your request, or to make you aware of related financial products that we offer. Here are the details:
| | ● | To complete certain transactions or account changes that you direct, it may be necessary to provide identifying information to companies, individuals, or groups that are not affiliated with USQ. For example, if you ask to transfer assets from another financial institution to USQ, we will need to provide certain information about you to that company to complete the transaction. |
| | ● | In certain instances, we may contract with non-affiliated companies to perform services for us, such as processing orders for share purchases and repurchases and distribution of shareholder letters. Where necessary, we will disclose information about you to these third parties. In all such cases, we provide the third party with only the information necessary to carry out its assigned responsibilities (in the case of shareholder letters, only your name and address) and only for that purpose. We require these third parties to treat your private information with the same high degree of confidentiality that we do. |
| | ● | Finally, we will release information about you if you direct us to do so, if we are compelled by law to do so, or in other legally limited circumstances (for example, to protect your account from fraud). |
How We Safeguard Your Personal Information
We restrict access to your information to those USQ representatives who need to know the information to provide products or services to you. We maintain physical, electronic, and procedural safeguards to protect your personal information.
Semi-Annual Report | September 30, 2021 | 26 |
USQ Core Real Estate Fund | Privacy Policy |
| | September 30, 2021 (Unaudited) |
Purchasing Shares of the Fund through Brokerage Firms
USQ shareholders may purchase their shares through brokerage firms. Please contact those firms for their own policies with respect to privacy issues.
What You Can Do
For your protection, we recommend that you do not provide your account information, user name, or password to anyone except a USQ representative as appropriate for a transaction or to set up an account. If you become aware of any suspicious activity relating to your account, please contact us immediately.
We’ll Keep You Informed
If we change our privacy policy with regard to disclosing your confidential information, we are required by law to notify you and provide you with a revised notice. You can access our privacy policy from our website.
Semi-Annual Report | September 30, 2021 | 27 |
This page intentionally left blank.
Investment Adviser
Union Square Capital Partners, LLC
235 Whitehorse Lane, Suite 200
Kennett Square, PA 19348
Distributor
Quasar Distributors LLC
111 East Kilbourn Ave.
Suite 1250
Milwaukee, WI 53202
Legal Counsel
Stradley Ronon Stevens & Young, LLP
1250 Connecticut Avenue, NW, Suite 500
Washington, D.C. 20036
Independent Registered Public Accounting Firm
Cohen & Company, Ltd.
1350 Euclid Avenue, Suite 800
Cleveland, Ohio 44115

| USQ Core Real Estate Fund
235 Whitehorse Lane Suite 200 Kennett Square, PA 19348
www.usqfunds.com 833.USQ.Fund
|
Item 2. Code of Ethics.
Not applicable for semi-annual reports.
Item 3. Audit Committee Financial Expert.
Not applicable for semi-annual reports.
Item 4. Principal Accountant Fees and Services.
Not applicable for semi-annual reports.
Item 5. Audit Committee of Listed Registrants.
Not applicable for semi-annual reports.
Item 6. Investments.
| (a) | Schedule of Investments is included as part of the report to shareholders filed under Item 1 of this Form. |
Item 7. Disclosure of Proxy Voting Policies and Procedures for Closed-End Management Investment Companies.
Not applicable for semi-annual reports.
Item 8. Portfolio Managers of Closed-End Management Investment Companies.
Not applicable for semi-annual reports.
Item 9. Purchases of Equity Securities by Closed-End Management Investment Company and Affiliated Purchasers.
| Period | (a)
Total Number of Shares (or Units) Purchased | (b)
Average Price Paid per Share (or Unit) | (c)
Total Number of Shares (or Units) Purchased as Part of Publicly Announced Plans or Programs | (d)
Maximum Number (or Approximate Dollar Value) of Shares (or Units) that May Yet Be Purchased Under the Plans or Programs |
| Month #1 4/1/21-4/30/21 (1) | - | - | - | - |
| Month #2 5/1/21-5/31/21 | 58,170 | 24.96 | 58,170 | - |
| Month #3 6/1/21-6/30/21 | - | - | - | - |
| Month #4 7/1/21-7/31/21 (2) | - | - | - | - |
| Month #5 8/1/21-8/31/21 | 34,480 | 25.68 | 34,480 | - |
| Month #6 9/1/21-9/30/21 | - | - | - | - |
| Total | 92,650 | 25.32 | 92,650 | - |
| (1) | On April 9, 2021 the Registrant offered to repurchase up to 5% of the Registrant’s total outstanding shares as of April 30, 2021 (the "Repurchase Request Deadline"). On the Repurchase Request Deadline, 167,675 shares represented 5% of the Registrant's total outstanding shares. |
| (2) | On July 9, 2021 the Registrant offered to repurchase up to 5% of the Registrant’s total outstanding shares as of July 30, 2021 (the "Repurchase Request Deadline"). On the Repurchase Request Deadline, 179,519 shares represented 5% of the Registrant's total outstanding shares. |
Item 10. Submission of Matters to a Vote of Security Holders.
There have been no material changes to the procedures by which shareholders may recommend nominees to the registrant’s board of trustees.
Item 11. Controls and Procedures.
| (a) | The Registrant’s Chief Executive Officer and Chief Operating Officer have reviewed the Registrant's disclosure controls and procedures (as defined in Rule 30a-3(c) under the Investment Company Act of 1940 (the “Act”)) as of a date within 90 days of the filing of this report, as required by Rule 30a-3(b) under the Act and Rules 13a-15(b) or 15d-15(b) under the Securities Exchange Act of 1934. Based on their review, such officers have concluded that the disclosure controls and procedures are effective in ensuring that information required to be disclosed in this report is appropriately recorded, processed, summarized and reported and made known to them by others within the Registrant and by the Registrant’s service provider. |
| (b) | There were no changes in the Registrant's internal control over financial reporting (as defined in Rule 30a-3(d) under the Act) that occurred during the second fiscal quarter of the period covered by this report that have materially affected, or are reasonably likely to materially affect, the Registrant's internal control over financial reporting. |
Item 12. Disclosure of Securities Lending Activities for Closed-End Management Investment Companies
The registrant did not engage in securities lending activities during the fiscal period reported on this Form N-CSR.
Item 13. Exhibits.
| (a) | (1) Any code of ethics or amendment thereto, that is the subject of the disclosure required by Item 2, to the extent that the registrant intends to satisfy Item 2 requirements through filing an exhibit. Filed herewith. |
(2) A separate certification for each principal executive officer and principal financial officer pursuant to Section 302 of the Sarbanes-Oxley Act of 2002. Filed herewith.
(3) Any written solicitation to purchase securities under Rule 23c-1 under the Act sent or given during the period covered by the report by or on behalf of the registrant to 10 or more persons. Not applicable.
SIGNATURES
Pursuant to the requirements of the Securities Exchange Act of 1934 and the Investment Company Act of 1940, the registrant has duly caused this report to be signed on its behalf by the undersigned, thereunto duly authorized.
| | (Registrant) | USQ Core Real Estate Fund | |
| | | | |
| | By (Signature and Title) | /s/ Thomas E. Miller | |
| | | Thomas E. Miller, Chief Executive Officer | |
| | | | |
| | Date | 11/26/2021 | |
Pursuant to the requirements of the Securities Exchange Act of 1934 and the Investment Company Act of 1940, this report has been signed below by the following persons on behalf of the registrant and in the capacities and on the dates indicated.
| | By (Signature and Title) | /s/ Thomas E. Miller | |
| | | Thomas E. Miller, Chief Executive Officer | |
| | | | |
| | Date | 11/26/2021 | |
| | | | |
| | By (Signature and Title) | /s/ G. Keith Downing | |
| | | G. Keith Downing, Chief Operating Officer | |
| | | | |
| | Date | 11/26/2021 | |