Filed Pursuant to Rule 424(b)(3)
Registration No. 333-258754
COTTONWOOD COMMUNITIES, INC.
SUPPLEMENT NO. 2 DATED NOVEMBER 22, 2021
TO THE PROSPECTUS DATED NOVEMBER 4, 2021
This document supplements, and should be read in conjunction with, the prospectus of Cottonwood Communities, Inc. dated November 4, 2021 as supplemented by supplement no. 1 dated November 16, 2021. As used herein, the terms “we,” “our” and “us” refer to Cottonwood Communities, Inc. and, as required by context, Cottonwood Residential O.P., LP, which we refer to as our “Operating Partnership,” and to their subsidiaries. Capitalized terms used in this supplement have the same meanings as set forth in the prospectus. The purpose of this supplement is to disclose:
•updated information regarding our portfolio;
•updated information regarding distributions;
•updated information regarding fees and expenses payable to our advisor and its affiliates;
Real Estate Investments
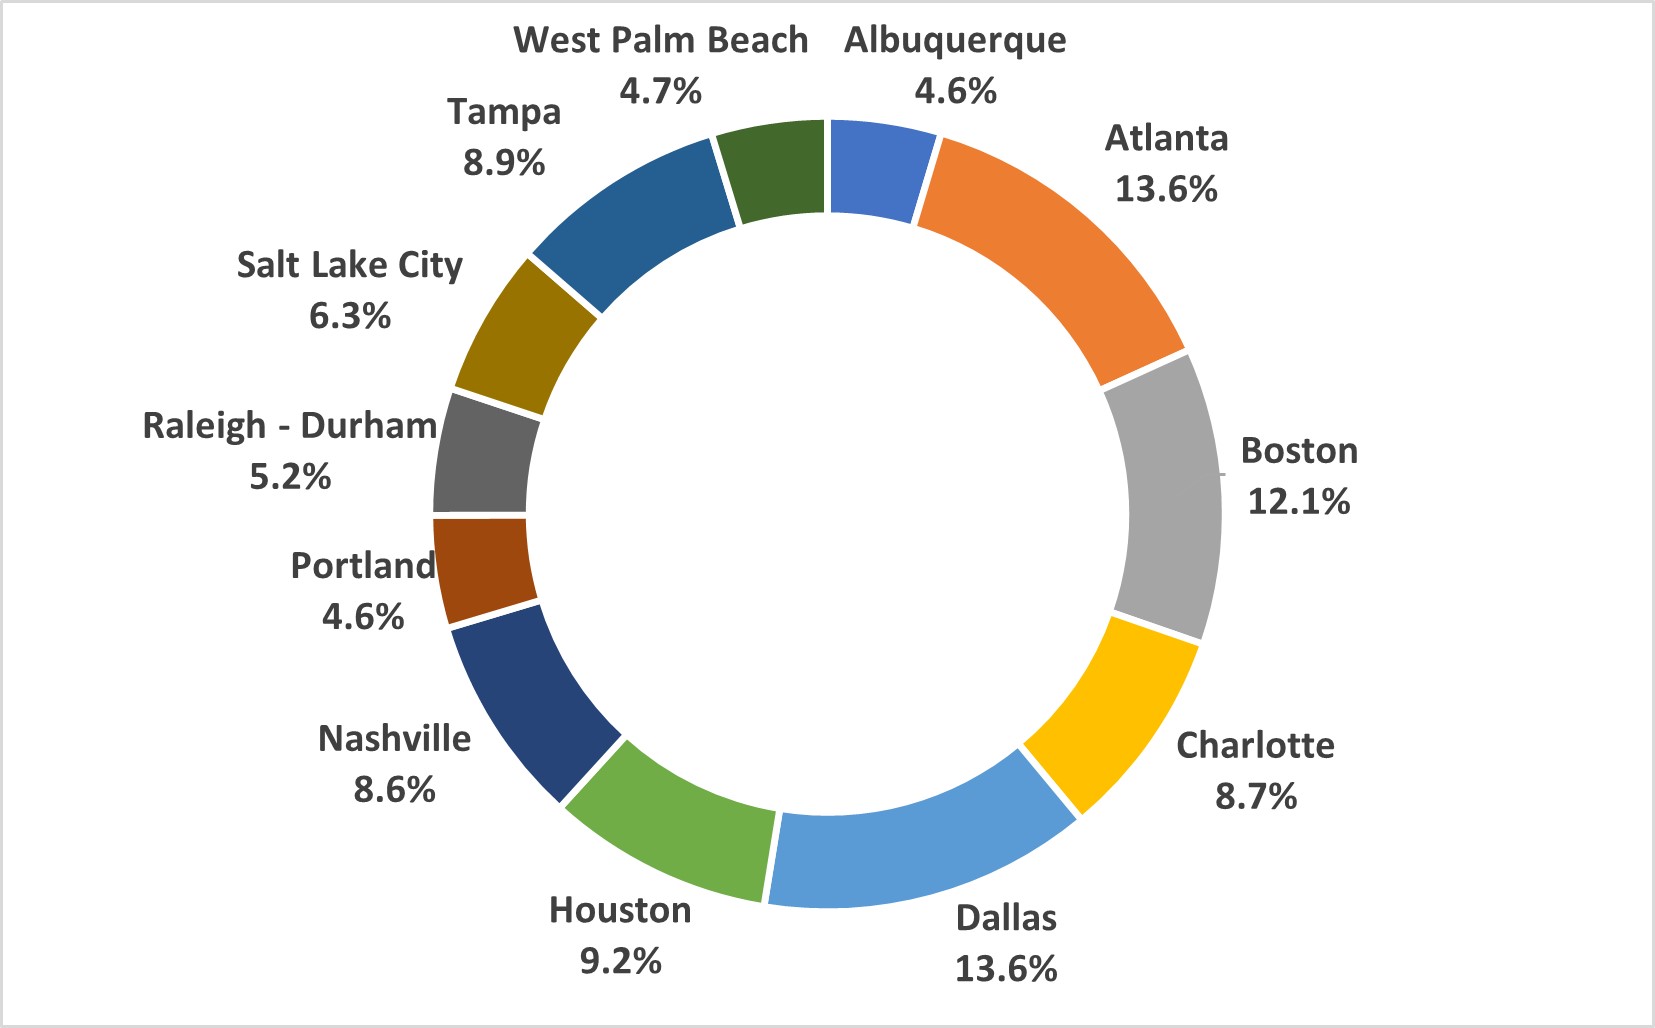
As of October 31, 2021, we have an ownership interest or structured investment interest in 33 multifamily apartment communities in 13 states with 9,746 units, including 1,373 units in four multifamily apartment communities in which we have a structured investment interest and another 1,079 units in four multifamily apartment communities under construction. In addition, we have an ownership interest in two properties planned for development. Generally, we own our investments in fee simple through single purpose limited liability companies that are direct wholly owned subsidiaries of our operating partnership. As of September 30, 2021, our multifamily properties were 95.83% occupied.
The following chart illustrates the geographic diversification of our operating real estate properties based on net operating income and weighted by our ownership interest in each asset using data as of September 30, 2021:
1
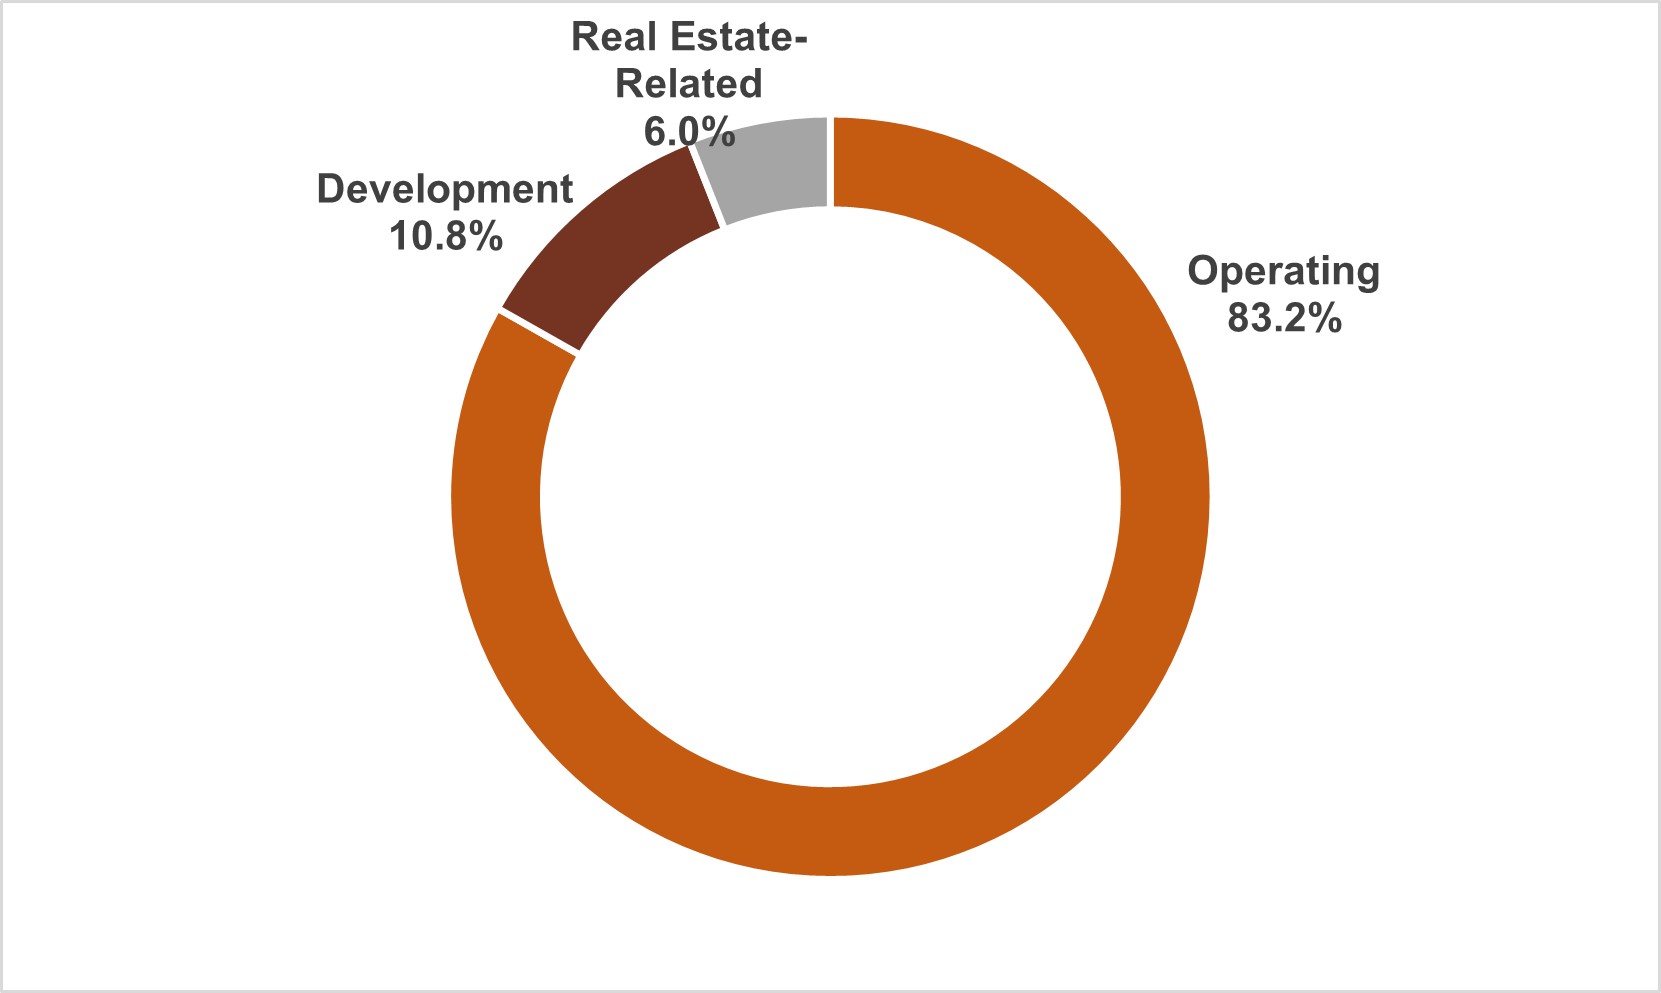
The following chart illustrates the diversification of the investments in our portfolio based on our NAV as of September 30, 2021 and equity investment:
The following tables provide summary information regarding these real estate investments as of September 30, 2021, including stabilized properties, development projects, real estate-related investments and structured investment properties:
Stabilized Properties ($ in thousands, except monthly net effective rent)
| Property Name | Location | Number of Units | Average Unit Size (Sq Ft) | Purchase Date | Purchase Date Property Value | Mortgage Debt Outstanding (1) | Physical Occupancy Rate | Percentage Owned by CROP | Monthly Net Effective Rent | ||||||||||||||||||||
| 3800 Main | Houston, TX | 319 | 831 | May 2021 | $ | 58,100 | $ | 36,019 | 94.67% | 50.00% | $ | 1,440 | |||||||||||||||||
| Alpha Mill | Charlotte, NC | 267 | 830 | May 2021 | 69,500 | 36,265 | 94.01% | 100.00% | 1,406 | ||||||||||||||||||||
| Cason Estates | Murfreesboro, TN | 262 | 1,078 | May 2021 | 51,400 | 33,594 | 96.56% | 100.00% | 1,273 | ||||||||||||||||||||
| Cottonwood | Salt Lake City, UT | 264 | 834 | May 2021 | 47,300 | 21,645 | 94.32% | 100.00% | 1,174 | ||||||||||||||||||||
| Cottonwood Bayview | St. Petersburg, FL | 309 | 805 | May 2021 | 95,900 | 47,449 | 96.76% | 71.00% | 2,078 | ||||||||||||||||||||
| Cottonwood One Upland | Boston, MA | 262 | 1,160 | March 2020 | 103,600 | 29,000 | 93.51% | 100.00% | 2,455 | ||||||||||||||||||||
| Cottonwood Reserve | Charlotte, NC | 352 | 1,021 | May 2021 | 77,500 | 38,435 | 94.64% | 91.14% | 1,272 | ||||||||||||||||||||
| Cottonwood Ridgeview | Plano, TX | 322 | 1,156 | May 2021 | 70,000 | 29,951 | 97.52% | 90.45% | 1,517 | ||||||||||||||||||||
| Cottonwood West Palm | West Palm Beach, FL | 245 | 1,122 | May 2019 | 66,900 | 35,995 | 98.37% | 100.00% | 1,933 | ||||||||||||||||||||
| Cottonwood Westside | Atlanta, GA | 197 | 860 | May 2021 | 47,900 | 25,655 | 96.45% | 100.00% | 1,538 | ||||||||||||||||||||
| Enclave on Golden Triangle | Keller, TX | 273 | 1,048 | May 2021 | 51,600 | 34,000 | 95.97% | 98.93% | 1,432 | ||||||||||||||||||||
| Fox Point | Salt Lake City, UT | 398 | 841 | May 2021 | 79,400 | 46,000 | 94.22% | 52.75% | 1,210 | ||||||||||||||||||||
| Heights at Meridian | Durham, NC | 339 | 997 | May 2021 | 79,900 | 33,750 | 96.17% | 100.00% | 1,350 | ||||||||||||||||||||
| Melrose | Nashville, TN | 220 | 951 | May 2021 | 67,400 | 47,100 | 96.80% | 100.00% | 1,646 | ||||||||||||||||||||
| Melrose Phase II | Nashville, TN | 139 | 675 | May 2021 | 40,350 | 21,500 | 94.20% | 24.88% | 1,454 | ||||||||||||||||||||
| Parc Westborough | Boston, MA | 249 | 1,008 | May 2021 | 74,000 | 38,010 | 95.98% | 100.00% | 2,039 | ||||||||||||||||||||
| Pavilions | Albuquerque, NM | 240 | 1,162 | May 2021 | 61,100 | 37,350 | 96.67% | 96.35% | 1,652 | ||||||||||||||||||||
| Raveneaux | Houston, TX | 382 | 1,065 | May 2021 | 57,500 | 26,675 | 96.60% | 96.97% | 1,259 | ||||||||||||||||||||
| Regatta | Houston, TX | 490 | 862 | May 2021 | 48,100 | 35,367 | 95.71% | 100.00% | 982 | ||||||||||||||||||||
| Retreat at Peachtree City | Peachtree City, GA | 312 | 980 | May 2021 | 72,500 | 48,719 | 96.79% | 100.00% | 1,494 | ||||||||||||||||||||
| Scott Mountain | Portland, OR | 262 | 927 | May 2021 | 70,700 | 48,373 | 94.66% | 95.80% | 1,512 | ||||||||||||||||||||
| Stonebriar of Frisco | Frisco, TX | 306 | 963 | May 2021 | 59,200 | 36,400 | 94.44% | 84.19% | 1,314 | ||||||||||||||||||||
| Summer Park | Buford, GA | 358 | 1,064 | May 2021 | 75,500 | 44,620 | 96.93% | 98.68% | 1,293 | ||||||||||||||||||||
The Marq Highland Park (2) | Tampa, FL | 239 | 999 | May 2021 | 65,700 | 32,260 | 95.40% | 100.00% | 1,646 | ||||||||||||||||||||
| Toscana at Valley Ridge | Lewisville, TX | 288 | 738 | May 2021 | 47,700 | 30,700 | 98.26% | 58.60% | 1,089 | ||||||||||||||||||||
| Total / Weighted-Average | 7,294 | 962 | $ | 1,638,750 | $ | 894,832 | 95.83% | ||||||||||||||||||||||
(1) Mortgage debt outstanding is shown as if CROP owned 100% of the property. | |||||||||||||||||||||||||||||
(2) Excludes the commercial data in units count and physical occupancy. | |||||||||||||||||||||||||||||
2
Development Properties ($ in thousands)
| Property Name | Location | Units to be Built | Average Unit Size (Sq Ft) | Purchase Date | Estimated Completion Date | Investment Amount | Percentage Owned by CROP | Expected Total Development Cost | ||||||||||||||||||
| Cottonwood on Broadway | Salt Lake City, UT | 254 | 817 | May 2021 | 2Q2022 | $ | 5,769 | 18.84% (1) | $ | 76,295 | ||||||||||||||||
| Park Avenue | Salt Lake City, UT | 234 | 714 | May 2021 | 1Q2022 | 5,901 | 22.57%(1) | 60,137 | ||||||||||||||||||
| Sugarmont | Salt Lake City, UT | 341 | 904 | May 2021 | 4Q2021 | 66,959 | 99.00%(3) | 156,573 | ||||||||||||||||||
Cottonwood on Highland (2) | Millcreek, UT | 250 | 757 | May 2021 | 1Q2023 | 8,546 | 35.57% | 63,015 | ||||||||||||||||||
| Total | 1,079 | $ | 87,175 | |||||||||||||||||||||||
(1) Cottonwood Multifamily Opportunity Fund, Inc., a fund sponsored by a subsidiary of CROP, indirectly owns a majority of the remaining interest. | ||||||||||||||||||||||||||
(2) Intended to qualify as a qualified opportunity zone investment. Excludes the commercial data in unit count. | ||||||||||||||||||||||||||
(3) The one percent interest not owned by us has limited rights, including the right to control on behalf of the joint venture the prosecution and resolution of all litigation, claims, or causes of action that the joint venture has or may have against certain third parties associated with the design and construction of Sugarmont, as well as the obligation to defend any crossclaims resulting from these actions. | ||||||||||||||||||||||||||
Structured Investments ($ in thousands)
| Property Name | Location | Investment Type | Date of Initial Investment | Preferred Return/Interest | Number of Units | Funding Commitment | Amount Funded to Date | ||||||||||||||||
| Lector85 | Ybor City, FL | Preferred Equity | August 2019 | 13% (1) | 254 | $ | 9,900 | $ | 9,900 | ||||||||||||||
| Vernon Boulevard | Queens, NY | Preferred Equity | July 2020 | 13% (2) | 534 | 15,000 | 15,000 | ||||||||||||||||
| Riverfront | West Sacramento, CA | Preferred Equity | November 2020 | 16% | 285 | 15,092 | 15,092 | ||||||||||||||||
| Integra Peaks at Damonte | Reno, NV | Mezzanine Loan | June 2021 | 12% | 300 | 13,000 | 9,698 | ||||||||||||||||
| Total | 1,373 | $ | 52,992 | $ | 49,690 | ||||||||||||||||||
(1) Will be reduced to 10% annually upon the later to occur of (i) stabilization of the development project or (ii) the one-year anniversary of the receipt of all temporary certificates of occupancy subject to certain financial conditions being satisfied. | |||||||||||||||||||||||
(2) Return also includes a profit participation upon a liquidity event, pari passu alongside the preferred equity contribution from our co-investor. | |||||||||||||||||||||||
Land Held for Development ($ in thousands)
| Property Name | Location | Purchase Date | Investment Amount | Percentage Owned by CROP | ||||||||||
Block C (1) | Salt Lake City, UT | May 2021 | $ | 1,946 | 37.02% | |||||||||
| Jasper | Salt Lake City, UT | June 2021 | 3,307 | 100.00% | ||||||||||
| Total | $ | 5,253 | ||||||||||||
(1) Cottonwood Multifamily Opportunity Fund, Inc., a fund sponsored by a subsidiary of CROP, indirectly owns a majority of the remaining interest. | ||||||||||||||
3
Distribution Information
The following table provides information on the sources used to fund distributions paid to holders of our common stock and common units in our Operating Partnership for the periods indicated below (in thousands):
| Nine Months Ended September 30, | Year Ended December 31, 2020 | ||||||||||
| Distributions paid in cash - common stockholders | $ | 6,382 | $ | 4,145 | |||||||
| Distributions paid in cash to noncontrolling interests - limited partners | 6,260 | — | |||||||||
| Distributions of DRP (reinvested) | — | 1,107 | |||||||||
Total distributions (1) | $ | 12,642 | $ | 5,252 | |||||||
Source of distributions (2) | |||||||||||
| Paid from cash flows provided by operations | $ | 10,842 | $ | 572 | |||||||
| Paid from revolving credit facility | 1,800 | — | |||||||||
| Paid from offering proceeds | — | 3,573 | |||||||||
| Offering proceeds from issuance of common stock pursuant to the DRP | — | 1,107 | |||||||||
| Total sources | $ | 12,642 | $ | 5,252 | |||||||
Net cash provided by (used in) operating activities (2) | $ | 10,842 | $ | (2,816) | |||||||
(1) Distributions are paid on a monthly basis. In general, distributions for all record dates of a given month are paid on or about the fifth business day of the following month. | |||||||||||
(2) The allocation of total sources are calculated on a quarterly basis. Generally, for purposes of determining the source of our distributions paid, we assume first that we use positive cash flow from operating activities from the relevant or prior quarter to fund distribution payments. As such, amounts reflected above as distributions paid from cash flows provided by operations may be from a prior quarter which had positive cash flow from operations. | |||||||||||
For the nine months ended September 30, 2021, distributions declared to common stockholders and limited partners were approximately $5.9 million and $6.3 million, respectively. For the nine months ended September 30, 2021, we paid aggregate distributions to common stockholders and limited partners of approximately $6.4 million and $6.3 million, all paid in cash due to our distribution reinvestment plan being suspended. For the nine months ended September 30, 2021, our net loss was approximately $81.4 million. Cash flows provided by operating activities for the nine months ended September 30, 2021 was approximately $10.8 million.
For the year ended December 31, 2020, we made aggregate distributions of approximately $5.3 million, including approximately $4.1 million of distributions paid in cash and $1.1 million of distributions reinvested through our distribution reinvestment plan. Our net loss for the year ended December 31, 2020 was approximately $8.6 million. Cash flows used in operating activities for the year ended December 31, 2020 was $2.8 million.
Generally, for purposes of determining the source of our distributions paid, we assume first that we use cash flow from operating activities from the relevant or prior periods to fund distribution payments. To the extent that we pay distributions from sources other than our cash flow from operating activities, we will have less funds available for the acquisition of real estate investments, the overall return to our stockholders may be reduced and subsequent investors will experience dilution. In addition, to the extent distributions exceed cash flow from operating activities, a stockholder's basis in our stock will be reduced and, to the extent distributions exceed a stockholder's basis, the stockholder may recognize capital gain.
4
Fees and Expenses Payable to Our Advisor and its Affiliates
The table below provides information regarding fees and expenses paid to our advisor and its affiliates in connection with their services provided to us pursuant to the terms of the agreements with them in effect at such times. The table includes amounts incurred for the year ended December 31, 2020 and the nine months ended September 30, 2021. We entered an amended and restated advisory agreement on May 7, 2021 at the effective time of the CRII Merger. The fees paid prior to May 7, 2021 were earned under our prior advisory agreement.
| Nine Months Ended September 30, 2021 | Year Ended December 31, 2020 | |||||||||||||
| Form of Compensation | ||||||||||||||
| Operational Stage | ||||||||||||||
Asset management fees(1) | $4,720,256 | $2,799,466 | ||||||||||||
Asset management fees waived by our advisor(2) | (27,128) | (197,397) | ||||||||||||
Property management fee(3) | 151,099 | 374,346 | ||||||||||||
Reimbursable operating expenses(4) | 330,768 | 1,029,920 | ||||||||||||
Performance participation allocation(5) | 35,978,744 | — | ||||||||||||
| $41,153,739 | $4,006,335 | |||||||||||||
(1)Under our advisory agreement in effect through May 6, 2021, we paid our advisor an annual asset management fee, paid monthly, in an amount equal to 1.25% per annum of our gross assets as of the last day of the prior month. Under the amended and restated advisory agreement entered May 7, 2021, our Operating Partnership pays our advisor a monthly management fee equal to 0.0625% of GAV (gross asset value of our Operating Partnership, calculated pursuant to our valuation guidelines and reflective of the ownership interest held by our Operating Partnership in such gross assets), subject to a cap of 0.125% of net asset value of our Operating Partnership.
(2)In connection with our initial public offering, our advisor agreed to waive its asset management fee each month in an amount equivalent to the 6.0% discount provided to those who purchased Class A shares through certain distribution channels. This was to ensure that we received proceeds equivalent to those received for sales of shares outside of these channels.
(3)Through May 7, 2021, we paid Cottonwood Communities Management, LLC (our subsidiary following the CRII Merger) a property management fee in an amount up to 3.5% of the annual gross revenues of our multifamily apartment communities that it manages. Cottonwood Communities Management, LLC may subcontract the performance of its property management duties to third parties and Cottonwood Communities Management, LLC will pay a portion of its property management fee to the third parties with whom it subcontracts for these services.
(4)Under our advisory agreement in effect through May 7, 2021, we reimbursed our advisor or its affiliates for all actual expenses paid or incurred by our advisor or its affiliates in connection with the services provided to us; provided, however, that we did not reimburse our advisor or its affiliates for salaries, wages and related benefits of personnel who performed investment advisory services for us or served as our executive officers. Under the amended and restated advisory agreement entered into on May 7, 2021, subject to the limitations on total operating expenses, our advisor is entitled to reimbursement of all costs and expenses incurred by it or its affiliates on our behalf, provided that our advisor is responsible for the expenses related to any and all of our advisor’s personnel who provide investment advisory services pursuant to the amended and restated advisory agreement (including, without limitation, each of our executive officers and any directors who are also directors, officers or employees of our advisor or any of its affiliates), including, without limitation, salaries, bonuses and other wages, payroll taxes and the cost of employee benefit plans of such personnel, and costs of insurance with respect to such personnel; provided that we will be responsible for the personnel costs of our employees even if they are also directors or officers of our advisor or any of its affiliates except as provided for in the Reimbursement and Cost Sharing Agreement.
(5)As of May 7, 2021, our advisor as the “Special Limited Partner” is entitled to receive a 12.5% promotional interest, subject to a 5% hurdle and certain limitations, under the terms of the amended and restated limited partnership agreement of CROP as amended to date. The performance participation allocation is an annual distribution to be made following the end of each year and accrues on a monthly basis.
5