| | OMB APPROVAL |
| | OMB Number: 3235-0570 Expires: July 31, 2022 Estimated average burden hours per response: 20.6 |
UNITED STATES
SECURITIES AND EXCHANGE COMMISSION
Washington, D.C. 20549
FORM N-CSR
CERTIFIED SHAREHOLDER REPORT OF REGISTERED
MANAGEMENT INVESTMENT COMPANIES
| Investment Company Act file number | 811-23244 | |
| The Chartwell Funds |
| (Exact name of registrant as specified in charter) |
| 1205 Westlakes Drive, Suite 100 Berwyn, Pennsylvania | 19312 |
| (Address of principal executive offices) | (Zip code) |
Timothy J. Riddle |
| The Chartwell Funds, 1205 Westlakes Drive, Suite 100 Berwyn, Pennsylvania 19312 |
| (Name and address of agent for service) |
With a copy to:
Alan R. Gedrich, Esq.
Stradley Ronon Stevens & Young, LLP
2005 Market Street, Suite 2600
Philadelphia, PA 19103-7018
| Registrant's telephone number, including area code: | (610) 296-1400 | |
| Date of fiscal year end: | October 31 | |
| | | |
| Date of reporting period: | October 31, 2020 | |
Form N-CSR is to be used by management investment companies to file reports with the Commission not later than 10 days after the transmission to stockholders of any report that is required to be transmitted to stockholders under Rule 30e-1 under the Investment Company Act of 1940 (17 CFR 270.30e-1). The Commission may use the information provided on Form N-CSR in its regulatory, disclosure review, inspection, and policymaking roles.
A registrant is required to disclose the information specified by Form N-CSR, and the Commission will make this information public. A registrant is not required to respond to the collection of information contained in Form N-CSR unless the Form displays a currently valid Office of Management and Budget ("OMB") control number. Please direct comments concerning the accuracy of the information collection burden estimate and any suggestions for reducing the burden to the Secretary, Securities and Exchange Commission, 450 Fifth Street, NW, Washington, DC 20549-0609. The OMB has reviewed this collection of information under the clearance requirements of 44 U.S.C. § 3507.
| Item 1. | Reports to Stockholders. |

Chartwell Income Fund (BERIX)
Chartwell Mid Cap Value Fund (BERCX)
Chartwell Small Cap Value Fund (CWSIX)
Chartwell Short Duration High Yield Fund (CWFIX)
Chartwell Small Cap Growth Fund (CWSGX)
ANNUAL REPORT
October 31, 2020
Beginning on January 1, 2021, as permitted by regulations adopted by the U.S. Securities and Exchange Commission, paper copies of the Funds’ shareholder reports like this one will no longer be sent by mail, unless you specifically request paper copies of the reports from the Funds or from your financial intermediary, such as a broker-dealer or bank. Instead, the reports will be made available on a website, and you will be notified by mail each time a report is posted and provided with a website link to access the report.
If you have already elected to receive shareholder reports electronically, you will not be affected by this change and you need not take any action. You may elect to receive shareholder reports and other communications from the Funds electronically by contacting the Funds at 1-888-995-5505 or, if you own these shares through a financial intermediary, by contacting your financial intermediary.
You may elect to receive all future reports in paper free of charge. You can inform the Funds that you wish to continue receiving paper copies of your shareholder reports by contacting the Funds at 1-888-995-5505. If you own shares through a financial intermediary, you may contact your financial intermediary or follow instructions included with this document to elect to continue to receive paper copies of your shareholder reports. Your election to receive reports in paper will apply to all Funds held with the Fund complex or at your financial intermediary.
THE CHARTWELL FUNDS
LETTER FROM THE PRESIDENT (Unaudited)
Dear Fellow Shareholder,
As we close out our mutual funds’ fiscal year, I want to thank you for trusting The Chartwell Funds with your assets. At Chartwell, we are committed to enhancing our shareholder’s value every day through the quality of our research and portfolio implementation. As I write this letter, the markets continue to reach new highs, despite the unprecedented medical and economic challenges we are facing. A year such as 2020 underscores our belief that in volatile and challenging market environments, active management and experience matter. At Chartwell, we feel that, over time, our experience across various market cycles and our disciplined approach, will provide opportunities for our shareholders. And for that, we thank you for the trust which you have placed in The Chartwell Funds.
With the election behind us and multiple vaccines on the horizon, the economy is clearly on an uptrend, as businesses reopen and employees return to work. However, the improvement appears to have moderated as we move through another wave of the pandemic. There are still significant segments of the economy which remained shuttered, and the positive impacts from the unprecedented fiscal stimulus fade. The uncertainty of future stimulus, along with additional state shutdowns, will cloud the outlook in the near term. That said, we do expect to see continued economic expansion in calendar year 2021.
I want to assure you that Chartwell’s investment teams continue to find solid investment opportunities, across our five mutual funds. At the start of our Funds’ annual year in October 31, 2019, we found ourselves in a bull market, which rapidly declined to a low on March 23, 2020, as the pandemic gripped the world. Throughout the Funds’ fiscal year, our investment teams have remained focused on their investment processes, to ensure we provide our shareholders with consistent, long-term competitive performance.
You are a valued partner of Chartwell Investments and we greatly appreciate our relationship. We hope that your families remain safe and healthy during this challenging time. Thank you for investing your trust and confidence in Chartwell Investment Partners. Stay safe and have a healthy 2021. Highlighted below are the performance summaries of each of our Funds for the fiscal year ended October 31, 2020. We welcome any questions you may have on the Fund(s) performance. Inquiries may be directed to Shareholder Services at 888.995.5505 or via our web-site at https://www.chartwellip.com/.
Thank you and we look forward to serving as your mutual funds’ manager in the coming year.
Best Regards,

Timothy Riddle
President of The Chartwell Funds
1
THE CHARTWELL FUNDS
LETTER FROM THE PRESIDENT (Unaudited) (Continued)
Chartwell Income Fund (BERIX)1:
The 1-year total return to shareholders of the Chartwell Income Fund (BERIX) for the fiscal year ended October 31, 2020 was -0.83 percent. Net asset value decreased from $13.26 on October 31, 2019, to $12.72 on October 31, 2020, and monthly dividends totaled $0.4214 per share for the twelve-month period. For the fiscal year, BERIX underperformed the benchmarks which includes the Bloomberg Barclays U.S. Aggregate Bond Index (+6.19%) and the ICE BofA High Yield Master II Index (+2.54%). Underperformance was driven by the Fund’s allocation to value-oriented equities. Over the last 12 months, the Russell 3000 Value Index returned -8.00%. We believe relative performance in value equities will start to improve as the economy reopens in the coming quarters. In addition, the valuation discount in value vs. growth equities is at historic extremes. If this valuation discount were to revert over the coming years, this would likely be a tailwind to relative performance.
Chartwell Mid-Cap Value Fund (BERCX):
The total return to shareholders of the Chartwell Mid-Cap Value Fund (BERCX) for the fiscal year ended October 31, 2020 was -13.81%. Net asset value decreased from $15.54 on October 31, 2019, to $13.12 on October 31, 2020. For the fiscal year, BERCX underperformed its reference index, the Russell Midcap Value Index with a return of -6.94%.
Within the Fund, the biggest detractor for the fiscal year was Technology, where an underweight hurt, and software and services provider Amdocs2 did not keep pace with companies benefiting more directly from the work from home (“WFH”) and home entertainment trends. In Financial Services, bank holdings such as Pinnacle Financial were pressured by net interest margin contraction and increasing credit risk. In Consumer Services, online travel agent Expedia trailed its sector as competition intensified and travel declined.
The best performing sector within the Fund was Capital Spending, where utility services provider Quanta rebounded on better growth and margins. The Real Estate Investment Trust (REIT) sector was additive with good selection in the Fund’s industrial, multi-family and healthcare holdings. In Energy, an underweight position was helpful and holdings such as Pioneer Natural Resources benefited from higher quality and financial strength.
In summary, the Fund underperformed the Russell Midcap Value benchmark as sector allocation was a modest headwind and selection was poor in seven of twelve sectors, where Technology, Financial Services, and Consumer Cyclical were the biggest detractors, and Capital Spending, Energy, and Utilities were the biggest contributors. The market rebound led by low-quality stocks proved difficult to match.
Although the potential effect of the COVID pandemic remains a critically important decision factor, portfolio positioning continues to be driven primarily by bottom-up selection decisions and with a longer time horizon in mind. We believe current sector positioning is well-balanced, with the largest overweights in Utilities, Consumer Services, and Business Services and the largest underweights in Technology, Basic Industry, and Financial Services.
1 | Effective 03.01.2020, the Berwyn Income Fund changed its name to Chartwell Income Fund. Neither the Fund’s objective nor principal investment strategies have changed. |
2 | Current and future portfolio holdings are subject to change and risk. |
2
THE CHARTWELL FUNDS
LETTER FROM THE PRESIDENT (Unaudited) (Continued)
Chartwell Small Cap Value Fund (CWSIX):
The total return to shareholders of the Chartwell Small Cap Value Fund (CWSIX) for the fiscal year ended October 31, 2020 was -18.16%. Net asset value decreased from $18.67 on October 31, 2019, to $14.75 on October 31, 2020. For the fiscal year, CWSIX underperformed its reference index, the Russell 2000 Value Index with a return of -13.92%. The Fund underperformed the Russell 2000 Value Index as sector allocation had little effect and underperformance was primarily driven by poor selection. Six of twelve sectors made negative contributions, in part because of lower exposure to low-quality companies which led the market rebound.
The biggest detractor was Consumer Services, where exposure to apparel companies such as G-III and restaurant operators such as Denny’s was particularly impactful. In Health Care, Phibro Animal Health struggled with COVID’s impact on the meat processing industry as well as lingering effects of swine fever in China. In Capital Spending, end market conditions deteriorated for commercial flooring manufacturer Interface.
The best performing sector was Basic Industry, where LTL trucking company Saia benefited from favorable competitive dynamics in an unsteady tonnage environment. In REITs, warehouse properties were among the most resilient, benefiting STAG Industrial and others. In Energy, holdings such as wellhead equipment manufacturer Cactus benefited from higher quality and stronger balance sheets. Overweights in all three sectors also contributed to relative returns.
Although the potential effect of the COVID pandemic remains a critically important decision factor, portfolio positioning continues to be driven primarily by bottom-up selection decisions and with a longer time horizon in mind. We believe current sector positioning is well-balanced, with the largest overweights in Technology, Basic Industry, and Utilities and the largest underweights in Consumer Services, REITs, and Health Care.
Chartwell Short Duration High Yield Fund (CWFIX):
The 1-year total return to shareholders of the Chartwell Short Duration High Yield Fund (CWFIX) for the fiscal year ended October 31, 2020 was +2.62%. Net asset value decreased slightly from $9.68 on October 31, 2019, to $9.59 on October 31, 2020, and monthly dividends totaled $0.3358 per share for the twelve-month period. For the fiscal year, CWFIX underperformed its reference indices, the Bloomberg Barclays Intermediate U.S. Government/Credit (+5.67%) and the ICE BofAML High Yield US Cash Pay High BB 1-3 Years Index (+3.43%). Compared to the Bloomberg Barclays Intermediate Government/Credit index, a significant decline in interest rates during the fiscal year was a headwind for the Fund’s relative performance. Compared to the ICE BofAML High Yield US Cash Pay High BB 1-3 Years Index, fund expenses and an underweight position in the Automotive sector hurt relative performance, which was partially offset by an overweight position in Financials and good credit selection in the Transportation sector. As previously disclosed, the Fund invests in a narrow slice of the high yield bond market, for which we believe there is no good, replicable index. The Fund seeks to generate attractive income with a focus on relatively low volatility over full market cycles.
As the U.S. economy continued to recover from virus related shutdowns, the broad high yield bond market closed out the fiscal year with a return of 2.59%, as measure by the ICE BofAML
3
THE CHARTWELL FUNDS
LETTER FROM THE PRESIDENT (Unaudited) (Continued)
High Yield U.S. Corporates Cash Pay Index. For the fiscal year, higher quality high yield bonds outperformed as BB’s returned approximately 5.20% compared to -5.33% for CCC’s within this same broad index.
Chartwell Small Cap Growth Fund (CWSGX):
The 1-year total return to shareholders of the Chartwell Small Cap Growth Fund (CWSGX) for the fiscal year ended October 31, 2020 was +29.25%. Net asset value increased from $11.78 on October 31, 2019, to $15.22 on October 31, 2020. For the fiscal year, CWSGX significantly outperformed its reference index, the Russell 2000 Growth Index (+13.37%). The strongest sector return within the Russell small cap universe for the fiscal year and into 2020 was the Healthcare sector. The weakest performing sectors were two cyclical sectors, specifically Industrials and Real Estate sectors. The Fund’s top overall contributor on a relative basis closing out October 2020 was Horizon Therapeutics, in the Health Care sector. The bottom overall detractor closing out the fiscal year was, Caesars Entertainment in the Consumer Discretionary sector.
Our investment in casino operator Eldorado Resorts has been the greatest underperformer, down approximately 80 percent. The company was significantly impacted by the pandemic, and unfortunately the company was in the midst of an acquisition of Caesars Resorts which led to high leverage at the exact wrong time. We sold the position earlier in 2020. Another underperformer was our investment in Amarin, which is down approximately 80.7 percent. On the last day of March 2020, we were surprised with a negative patent litigation decision. A federal judge in Nevada decided that there was sufficient prior art to negate Amarin���s IP that was protecting the company’s Vascepa drug from generic competitors. We held onto the position while the original ruling was appealed, but unfortunately the final decision went against Amarin. With that final litigation ruling, given the uncertainty as it relates to generic competition in the US, we have sold and exited our position.
We continue to find compelling investment opportunities, particularly in the alternative energy industries. We have generated significant alpha specifically in the solar energy industry, and the advances that are occurring in energy storage should further drive adoption of solar energy. We remain focused on generating alpha and producing the strongest investment results over the long run.
Investing in mutual funds involves risk, including possible loss of principal.
4
CHARTWELL INCOME FUND
PERFORMANCE INFORMATION
October 31, 2020 (Unaudited)
Comparison of the Change in Value of a $10,000 Investment
in Chartwell Income Fund versus the Bloomberg Barclays U.S. Aggregate Bond Index, the
ICE BofA High Yield Master II Index and the Lipper Income Fund Index.
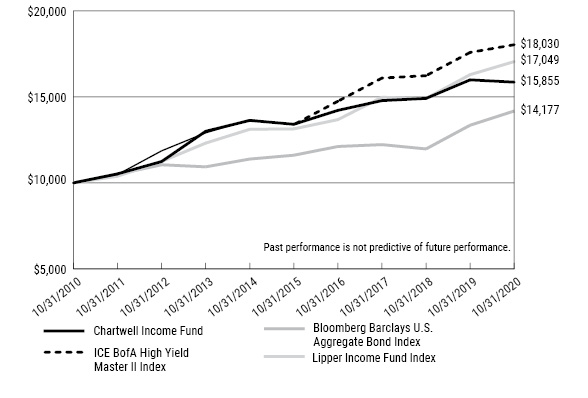
This graph compares a hypothetical $10,000 investment in the Fund with a similar investment in the Bloomberg Barclays U.S. Aggregate Bond Index, the ICE BofA High Yield Master II Index, and the Lipper Income Fund Index for the periods shown. Results include the reinvestment of all dividends and capital gains.
The Bloomberg Barclays U.S. Aggregate Bond Index is an unmanaged index composed of the Bloomberg Barclays U.S. Government/Credit Index and the Bloomberg Barclays U.S. Mortgage-Backed Securities Index and includes Treasury issues, agency issues, corporate bond issues and mortgage-backed securities and is intended to be generally representative of the bond market as a whole. The ICE BofA High Yield Master II Index is a broad-based index consisting of all US dollar denominated high-yield bonds with a minimum outstanding amount of $100 million and a maturity of over one year. The Lipper Income Fund Index consists of a small number of the largest mutual funds in a particular category as tracked by Lipper Inc. These indices do not reflect expenses, fees, or sales charge, which would lower performance. The indices are unmanaged, and they are not available for investment.
5
CHARTWELL INCOME FUND
PERFORMANCE INFORMATION (Continued)
October 31, 2020 (Unaudited)
Average Annual Total Returns
(for periods ended October 31, 2020) |
| | 1 Year | 5 Years | 10 Years |
Chartwell Income Fund | (0.83%) | 3.41% | 4.72% |
Bloomberg Barclays U.S. Aggregate Bond Index | 6.19% | 4.08% | 3.55% |
ICE BofA HY Master II Index | 2.54% | 6.14% | 6.07% |
Lipper Income Fund Index | 4.65% | 5.35% | 5.48% |
The Fund acquired the assets and liabilities of the Berwyn Income Fund (the “IMST Predecessor Fund”), a series of Investment Managers Series Trust, on July 17, 2017. The IMST Predecessor Fund acquired the assets and liabilities of the Berwyn Income Fund (the “Berwyn Funds Predecessor Fund,” and together with the IMST Predecessor Fund, the “Predecessor Funds”), a series of The Berwyn Funds, on April 29, 2016. As a result of the reorganizations, the Fund is the accounting successor of the Predecessor Funds. Performance results shown reflect the performance of the IMST Predecessor Fund for the period from April 29, 2016 through July 17, 2017, and the performance of the Berwyn Funds Predecessor Fund for the period prior to April 29, 2016.
The performance data quoted here represents past performance and past performance is not a guarantee of future results. Investment return and principal value will fluctuate so that an investor’s shares, when redeemed, may be worth more or less than their original cost. Current performance may be lower or higher than the performance information quoted. The most recent month end performance may be obtained by calling (888) 995-5505.
Gross and net expense ratios for the Fund were 0.66% and 0.64%, respectively, as stated in the current prospectus dated March 1, 2020. For the Fund’s current one year expense ratios, please refer to the Financial Highlights section of this report. The Fund’s advisor has contractually agreed to reduce its fees and/or reimburse other operating expenses of the Fund to ensure that annual operating expenses do not exceed 0.64% of the Fund’s average daily net assets. This agreement is in effect until March 1, 2021, and it may be terminated prior to such date only by the Trust’s Board of Trustees. In the absence of such fee reductions and expense reimbursements, the Fund’s returns would have been lower.
Returns reflect the reinvestment of distributions made by the Fund, if any. The graph and performance table above do not reflect the deduction of taxes that a shareholder would pay on Fund distributions or the redemption of Fund shares. Shares redeemed within 30 days of purchase will be charged a redemption fee of 1.00%.
6
CHARTWELL MID CAP VALUE FUND
PERFORMANCE INFORMATION
October 31, 2020 (Unaudited)
Comparison of the Change in Value of a $10,000 Investment
in Chartwell Mid Cap Value Fund versus the Russell Midcap Value Index,
the S&P Mid-Cap 400 Index and the S&P 500 Index.
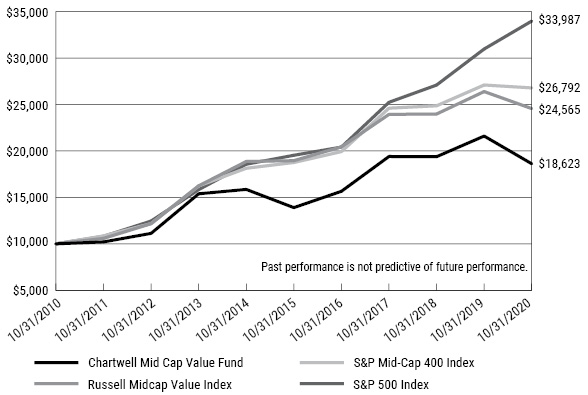
This graph compares a hypothetical $10,000 investment in the Fund with a similar investment in the Russell Midcap Value Index, the S&P Mid-Cap 400 Index and the S&P 500 Index for the periods shown. Results include the reinvestment of all dividends and capital gains.
The Russell Midcap Value Index measures the performance of those Russell Midcap companies with lower price/book ratios and lower forecasted growth values. The S&P 500 Index tracks the stocks of 500 large US companies. The S&P Mid-Cap 400 Index measures the performance of 400 selected companies with a mid-sized market capitalization. These indices do not reflect expenses, fees, or sales charge, which would lower performance. The indices are unmanaged, and they are not available for investment.
7
CHARTWELL MID CAP VALUE FUND
PERFORMANCE INFORMATION (Continued)
October 31, 2020 (Unaudited)
Average Annual Total Returns
(for periods ended October 31, 2020) |
| | 1 Year | 5 Years | 10 Years |
Chartwell Mid Cap Value Fund | (13.81%) | 6.03% | 6.42% |
Russell Midcap Value Index | (6.94%) | 5.32% | 9.40% |
S&P Mid-Cap 400 Index | (1.15%) | 7.39% | 10.36% |
S&P 500 Index | 9.71% | 11.71% | 13.01% |
The Fund acquired the assets and liabilities of the Berwyn Cornerstone Fund (the “IMST Predecessor Fund”), a series of Investment Managers Series Trust, on July 17, 2017. The IMST Predecessor Fund acquired the assets and liabilities of the Berwyn Cornerstone Fund (the “Berwyn Funds Predecessor Fund,” and together with the IMST Predecessor Fund, the “Predecessor Funds”), a series of The Berwyn Funds, on April 29, 2016. As a result of the reorganizations, the Fund is the accounting successor of the Predecessor Funds. Performance results shown reflect the performance of the IMST Predecessor Fund for the period from April 29, 2016 through July 17, 2017, and the performance of the Berwyn Funds Predecessor Fund for the period prior to April 29, 2016. The Fund’s principal investment strategies differ from those of the Predecessor Funds; therefore, the performance and average annual total returns shown for periods prior to the reorganization may have differed had the Fund’s current investment strategy been in effect during those periods.
The performance data quoted here represents past performance and past performance is not a guarantee of future results. Investment return and principal value will fluctuate so that an investor’s shares, when redeemed, may be worth more or less than their original cost. Current performance may be lower or higher than the performance information quoted. The most recent month end performance may be obtained by calling (888) 995-5505.
Gross and net expense ratios for the Fund were 1.44% and 0.90%, respectively, as stated in the current prospectus dated March 1, 2020. For the Fund’s current one year expense ratios, please refer to the Financial Highlights section of this report. The Fund’s advisor has contractually agreed to reduce its fees and/or reimburse other operating expenses of the Fund to ensure that annual operating expenses do not exceed 0.90% of the Fund’s average daily net assets. This agreement is in effect until March 1, 2021, and it may be terminated prior to such date only by the Trust’s Board of Trustees. In the absence of such fee reductions and expense reimbursements, the Fund’s returns would have been lower.
Returns reflect the reinvestment of distributions made by the Fund, if any. The graph and performance table above do not reflect the deduction of taxes that a shareholder would pay on Fund distributions or the redemption of Fund shares. Shares redeemed within 30 days of purchase will be charged a redemption fee of 1.00%.
8
CHARTWELL SMALL CAP VALUE FUND
PERFORMANCE INFORMATION
October 31, 2020 (Unaudited)
Comparison of the Change in Value of a $10,000 Investment
in Chartwell Small Cap Value Fund versus the Russell 2000 Value Index.

This graph compares a hypothetical $10,000 investment in the Fund’s shares, made at its inception, with a similar investment in the Russell 2000 Value Index. Results include the reinvestment of all dividends and capital gains. The performance figures include the performance for Class A shares for the periods prior to the start date of the current share class (March 16, 2012). Class A shares were liquidated on June 30, 2016.
The Russell 2000 Value Index measures the performance of the Russell 2000 companies with lower price-to-book ratios and lower forecasted growth values. This index does not reflect expenses, fees or sales charges, which would lower performance. The index is unmanaged, and it is not available for investment.
9
CHARTWELL SMALL CAP VALUE FUND
PERFORMANCE INFORMATION (Continued)
October 31, 2020 (Unaudited)
Average Annual Total Returns
(for periods ended October 31, 2020) |
| | 1 Year | 5 Years | Since
Inception(a) |
Chartwell Small Cap Value Fund | (18.16%) | 2.62% | 7.09% |
Russell 2000 Value Index | (13.92%) | 3.71% | 7.85% |
(a) | Inception date of the Fund was November 9, 2011. The performance figures include the performance for Class A for the periods prior to the start date of current share class (March 16, 2012). Class A shares were liquidated on June 30, 2016. |
On July 17, 2017, the Chartwell Small Cap Value Fund acquired all the assets and liabilities of the Chartwell Small Cap Value Fund, a series of the Investment Managers Series Trust (the “Predecessor Fund”). As a result of the acquisition, the Fund is the accounting successor of the Predecessor Fund. Performance results shown in the graph and the performance table above for the periods prior to July 17, 2017 reflect the performance of the Predecessor Fund.
The performance data quoted here represents past performance and past performance is not a guarantee of future results. Investment return and principal value will fluctuate so that an investor’s shares, when redeemed, may be worth more or less than their original cost. Current performance may be lower or higher than the performance information quoted. The most recent month end performance may be obtained by calling (888) 995-5505.
Gross and net expense ratios for the Fund were 1.07% and 1.05%, respectively, as stated in the current prospectus dated March 1, 2020. For the Fund’s current one year expense ratios, please refer to the Financial Highlights section of this report. The Fund’s advisor has contractually agreed to reduce its fees and/or reimburse other operating expenses of the Fund to ensure that annual operating expenses do not exceed 1.05% of the Fund’s average daily net assets. This agreement is in effect until March 1, 2021, and it may be terminated prior to such date only by the Trust’s Board of Trustees. In the absence of such fee reductions and expense reimbursements, the Fund’s returns would have been lower.
Returns reflect the reinvestment of distributions made by the Fund, if any. The graph and performance table above do not reflect the deduction of taxes that a shareholder would pay on Fund distributions or the redemption of Fund shares. Shares redeemed within 30 days of purchase will be charged a redemption fee of 1.00%.
10
CHARTWELL SHORT DURATION HIGH YIELD FUND
PERFORMANCE INFORMATION
October 31, 2020 (Unaudited)
Comparison of the Change in Value of a $10,000 Investment
in Chartwell Short Duration High Yield Fund versus
the ICE BofA 1-3 Year BB US Cash Payout High Yield Index and
the Bloomberg Barclays Intermediate US Government/Credit Index.

This graph compares a hypothetical $10,000 investment in the Fund’s shares, made at its inception, with a similar investment in the ICE BofA 1-3 Year BB US Cash Payout High Yield Index and the Bloomberg Barclays Intermediate US Government/Credit Index. Results include the reinvestment of all dividends and capital gains.
The ICE BofA 1-3 Year BB US Cash Payout High Yield Index is a subset of the ICE BofA US Cash Payout High Yield Index including all securities with a remaining term to final maturity less than 3 years and rated BB1 through BB3, inclusive. The Bloomberg Barclays Intermediate US Government/Credit Index is a broad-based flagship benchmark the measures the non-securitized component of the US Aggregate Index. It includes investment grade, US dollar-denominated, fixed-rate Treasuries, government-related and corporate securities. These indices do not reflect expenses, fees or sales charges, which would lower performance. These indices are unmanaged, and they are not available for investment.
11
CHARTWELL SHORT DURATION HIGH YIELD FUND
PERFORMANCE INFORMATION (Continued)
October 31, 2020 (Unaudited)
Average Annual Total Returns
(for periods ended October 31, 2020) |
| | 1 Year | 5 Years | Since
Inception(a) |
Chartwell Short Duration High Yield Fund | 2.62% | 3.54% | 2.70% |
Bloomberg Barclays Intermediate US Govt/Credit Index | 5.67% | 3.37% | 3.10% |
ICE BofA High Yield US Cash Pay BB 1-3 Yrs Index | 3.43% | 4.54% | 4.02% |
(a) | Commencement of operations was July 15, 2014. |
On July 17, 2017, the Chartwell Short Duration High Yield Fund acquired all the assets and liabilities of the Chartwell Short Duration High Yield Fund, a series of the Investment Managers Series Trust (the “Predecessor Fund”). As a result of the acquisition, the Fund is the accounting successor of the Predecessor Fund. Performance results shown in the graph and the performance table above for the periods prior to July 17, 2017 reflect the performance of the Predecessor Fund.
The performance data quoted here represents past performance and past performance is not a guarantee of future results. Investment return and principal value will fluctuate so that an investor’s shares, when redeemed, may be worth more or less than their original cost. Current performance may be lower or higher than the performance information quoted. The most recent month end performance may be obtained by calling (888) 995-5505.
Gross and net expense ratios for the Fund were 0.67% and 0.49%, respectively, as stated in the current prospectus dated March 1, 2020. For the Fund’s current one year expense ratios, please refer to the Financial Highlights section of this report. The Fund’s advisor has contractually agreed to reduce its fees and/or reimburse other operating expenses of the Fund to ensure that annual operating expenses do not exceed 0.49% of the Fund’s average daily net assets. This agreement is in effect until March 1, 2021, and it may be terminated prior to such date only by the Trust’s Board of Trustees. In the absence of such fee reductions and expense reimbursements, the Fund’s returns would have been lower.
Returns reflect the reinvestment of distributions made by the Fund, if any. The graph and performance table above do not reflect the deduction of taxes that a shareholder would pay on Fund distributions or the redemption of Fund shares. Shares redeemed within 30 days of purchase will be charged a redemption fee of 1.00%.
12
CHARTWELL SMALL CAP GROWTH FUND
PERFORMANCE INFORMATION
October 31, 2020 (Unaudited)
Comparison of the Change in Value of a $10,000 Investment
in Chartwell Small Cap Growth Fund versus the Russell 2000 Growth Index.
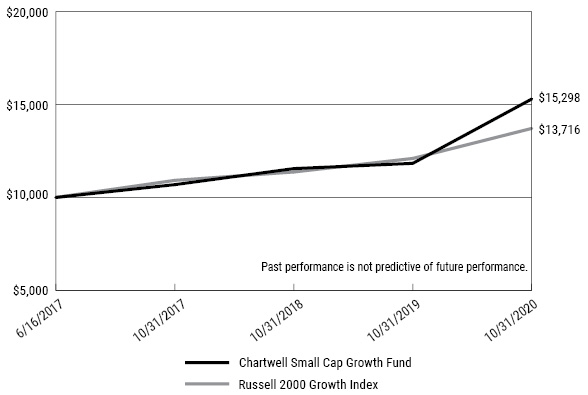
This graph compares a hypothetical $10,000 investment in the Fund, made at its inception, with a similar investment in the Russell 2000 Growth Index. Results include the reinvestment of all dividends and capital gains.
The Russell 2000 Growth Index measures the performance of the constituents that exhibit growth characteristics within the 2000 small-cap companies of the US stock market and is designed to represent the small-cap segment of the US equity universe. This index does not reflect expenses, fees or sales charge, which would lower performance. The index is unmanaged, and it is not available for investment.
13
CHARTWELL SMALL CAP GROWTH FUND
PERFORMANCE INFORMATION (Continued)
October 31, 2020 (Unaudited)
Average Annual Total Returns
(for periods ended October 31, 2020) |
| | 1 Year | Since
Inception(a) |
Chartwell Small Cap Growth Fund | 29.25% | 13.42% |
Russell 2000 Growth Index | 13.37% | 9.81% |
(a) | Commencement of operations was June 16, 2017. |
The performance data quoted here represents past performance and past performance is not a guarantee of future results. Investment return and principal value will fluctuate so that an investor’s shares, when redeemed, may be worth more or less than their original cost. Current performance may be lower or higher than the performance information quoted. The most recent month end performance may be obtained by calling (888) 995-5505.
Gross and net expense ratios for the Fund were 1.64% and 1.05%, respectively, as stated in the current prospectus dated March 1, 2020. For the Fund’s current one year expense ratios, please refer to the Financial Highlights section of this report. The Fund’s advisor has contractually agreed to reduce its fees and/or reimburse other operating expenses of the Fund to ensure that annual operating expenses do not exceed 1.05% of the Fund’s average daily net assets. This agreement is in effect until March 1, 2021, and it may be terminated prior to such date only by the Trust’s Board of Trustees. In the absence of such fee reductions and expense reimbursements, the Fund’s returns would have been lower.
Returns reflect the reinvestment of distributions made by the Fund, if any. The graph and performance table above do not reflect the deduction of taxes that a shareholder would pay on Fund distributions or the redemption of Fund shares. Shares redeemed within 30 days of purchase will be charged a redemption fee of 1.00%.
14
CHARTWELL INCOME FUND
SCHEDULE OF INVESTMENTS
October 31, 2020 |
COMMON STOCKS — 24.3% | | Shares | | | Value | |
Communications — 0.9% | | | | | | | | |
Internet Media & Services — 0.3% | | | | | | | | |
Expedia Group, Inc. | | | 19,809 | | | $ | 1,865,017 | |
| | | | | | | | | |
Telecommunications — 0.6% | | | | | | | | |
AT&T, Inc. | | | 52,690 | | | | 1,423,684 | |
Verizon Communications, Inc. | | | 34,080 | | | | 1,942,219 | |
| | | | | | | | 3,365,903 | |
Consumer Discretionary — 2.7% | | | | | | | | |
Apparel & Textile Products — 0.4% | | | | | | | | |
Columbia Sportswear Company | | | 27,594 | | | | 2,058,236 | |
| | | | | | | | | |
Automotive — 0.2% | | | | | | | | |
General Motors Company | | | 32,592 | | | | 1,125,402 | |
| | | | | | | | | |
Consumer Services — 0.3% | | | | | | | | |
Service Corporation International | | | 41,290 | | | | 1,912,140 | |
| | | | | | | | | |
Leisure Facilities & Services — 0.3% | | | | | | | | |
Las Vegas Sands Corporation | | | 16,076 | | | | 772,612 | |
Restaurant Brands International, Inc. | | | 15,312 | | | | 796,224 | |
| | | | | | | | 1,568,836 | |
Retail - Discretionary — 1.5% | | | | | | | | |
AutoZone, Inc. (a) | | | 2,166 | | | | 2,445,371 | |
Foot Locker, Inc. | | | 36,762 | | | | 1,355,783 | |
Genuine Parts Company | | | 36,188 | | | | 3,272,481 | |
Home Depot, Inc. (The) | | | 5,381 | | | | 1,435,166 | |
| | | | | | | | 8,508,801 | |
Consumer Staples — 1.8% | | | | | | | | |
Beverages — 0.2% | | | | | | | | |
Coca-Cola Company (The) | | | 24,775 | | | | 1,190,686 | |
| | | | | | | | | |
Food — 0.7% | | | | | | | | |
Conagra Brands, Inc. | | | 55,137 | | | | 1,934,757 | |
Lamb Weston Holdings, Inc. | | | 33,910 | | | | 2,151,590 | |
| | | | | | | | 4,086,347 | |
Household Products — 0.3% | | | | | | | | |
Procter & Gamble Company (The) | | | 11,248 | | | | 1,542,101 | |
| | | | | | | | | |
Retail - Consumer Staples — 0.4% | | | | | | | | |
Dollar Tree, Inc. (a) | | | 22,441 | | | | 2,026,871 | |
| | See accompanying notes to financial statements. | 15 |
CHARTWELL INCOME FUND
SCHEDULE OF INVESTMENTS (Continued) |
COMMON STOCKS — 24.3% (Continued) | | Shares | | | Value | |
Consumer Staples — 1.8% (Continued) | | | | | | | | |
Tobacco & Cannabis — 0.2% | | | | | | | | |
Philip Morris International, Inc. | | | 15,233 | | | $ | 1,081,848 | |
| | | | | | | | | |
Energy — 0.8% | | | | | | | | |
Oil & Gas Producers — 0.8% | | | | | | | | |
ConocoPhillips | | | 13,120 | | | | 375,494 | |
Diamondback Energy, Inc. | | | 26,409 | | | | 685,578 | |
Exxon Mobil Corporation | | | 32,472 | | | | 1,059,237 | |
Hess Corporation | | | 12,532 | | | | 466,441 | |
Pioneer Natural Resources Company | | | 24,492 | | | | 1,948,583 | |
| | | | | | | | 4,535,333 | |
Financials — 4.0% | | | | | | | | |
Asset Management — 0.1% | | | | | | | | |
Ares Capital Corporation | | | 47,964 | | | | 663,342 | |
| | | | | | | | | |
Banking — 1.5% | | | | | | | | |
Citigroup, Inc. | | | 15,210 | | | | 629,998 | |
JPMorgan Chase & Company | | | 20,258 | | | | 1,986,094 | |
KeyCorp | | | 117,168 | | | | 1,520,841 | |
M&T Bank Corporation | | | 8,857 | | | | 917,408 | |
Pinnacle Financial Partners, Inc. | | | 43,527 | | | | 1,993,102 | |
PNC Financial Services Group, Inc. (The) | | | 5,565 | | | | 622,612 | |
Truist Financial Corporation | | | 23,683 | | | | 997,528 | |
| | | | | | | | 8,667,583 | |
Institutional Financial Services — 0.4% | | | | | | | | |
CME Group, Inc. | | | 5,403 | | | | 814,340 | |
Morgan Stanley | | | 30,374 | | | | 1,462,508 | |
| | | | | | | | 2,276,848 | |
Insurance — 1.7% | | | | | | | | |
Allstate Corporation (The) | | | 35,429 | | | | 3,144,324 | |
Arthur J. Gallagher & Company | | | 14,582 | | | | 1,512,299 | |
Hanover Insurance Group, Inc. (The) | | | 21,257 | | | | 2,033,445 | |
Lincoln National Corporation | | | 46,816 | | | | 1,643,241 | |
Progressive Corporation (The) | | | 12,091 | | | | 1,111,163 | |
| | | | | | | | 9,444,472 | |
Specialty Finance — 0.3% | | | | | | | | |
Blackstone Mortgage Trust, Inc. - Class A | | | 14,098 | | | | 305,927 | |
Synchrony Financial | | | 48,841 | | | | 1,222,002 | |
| | | | | | | | 1,527,929 | |
16 | See accompanying notes to financial statements. | |
CHARTWELL INCOME FUND
SCHEDULE OF INVESTMENTS (Continued) |
COMMON STOCKS — 24.3% (Continued) | | Shares | | | Value | |
Health Care — 2.4% | | | | | | | | |
Biotech & Pharma — 0.9% | | | | | | | | |
Bristol-Myers Squibb Company | | | 19,813 | | | $ | 1,158,070 | |
Johnson & Johnson | | | 14,250 | | | | 1,953,817 | |
Merck & Company, Inc. | | | 24,603 | | | | 1,850,392 | |
| | | | | | | | 4,962,279 | |
Health Care Facilities & Services — 1.1% | | | | | | | | |
Quest Diagnostics, Inc. | | | 32,402 | | | | 3,957,580 | |
Universal Health Services, Inc. - Class B | | | 22,441 | | | | 2,458,412 | |
| | | | | | | | 6,415,992 | |
Medical Equipment & Devices — 0.4% | | | | | | | | |
Abbott Laboratories | | | 22,300 | | | | 2,343,953 | |
| | | | | | | | | |
Industrials — 3.1% | | | | | | | | |
Aerospace & Defense — 0.3% | | | | | | | | |
Boeing Company (The) | | | 2,886 | | | | 416,709 | |
Lockheed Martin Corporation | | | 3,405 | | | | 1,192,193 | |
| | | | | | | | 1,608,902 | |
Diversified Industrials — 0.2% | | | | | | | | |
Emerson Electric Company | | | 22,281 | | | | 1,443,586 | |
| | | | | | | | | |
Engineering & Construction — 0.9% | | | | | | | | |
Quanta Services, Inc. | | | 82,245 | | | | 5,134,555 | |
| | | | | | | | | |
Machinery — 0.8% | | | | | | | | |
Caterpillar, Inc. | | | 7,396 | | | | 1,161,542 | |
Snap-on, Inc. | | | 20,498 | | | | 3,229,050 | |
| | | | | | | | 4,390,592 | |
Transportation & Logistics — 0.3% | | | | | | | | |
Delta Air Lines, Inc. | | | 12,736 | | | | 390,231 | |
United Parcel Service, Inc. - Class B | | | 7,284 | | | | 1,144,389 | |
| | | | | | | | 1,534,620 | |
Transportation Equipment — 0.6% | | | | | | | | |
Allison Transmission Holdings, Inc. | | | 76,881 | | | | 2,779,248 | |
PACCAR, Inc. | | | 6,456 | | | | 551,214 | |
| | | | | | | | 3,330,462 | |
| | See accompanying notes to financial statements. | 17 |
CHARTWELL INCOME FUND
SCHEDULE OF INVESTMENTS (Continued) |
COMMON STOCKS — 24.3% (Continued) | | Shares | | | Value | |
Materials — 1.7% | | | | | | | | |
Chemicals — 1.1% | | | | | | | | |
Air Products & Chemicals, Inc. | | | 4,727 | | | $ | 1,305,786 | |
CF Industries Holdings, Inc. | | | 17,185 | | | | 474,478 | |
FMC Corporation | | | 41,290 | | | | 4,242,135 | |
| | | | | | | | 6,022,399 | |
Construction Materials — 0.6% | | | | | | | | |
Vulcan Materials Company | | | 25,559 | | | | 3,701,966 | |
| | | | | | | | | |
Real Estate — 2.3% | | | | | | | | |
REITs — 2.3% | | | | | | | | |
Crown Castle International Corporation | | | 8,395 | | | | 1,311,299 | |
Healthcare Trust of America, Inc. - Class A | | | 139,009 | | | | 3,377,919 | |
Healthpeak Properties, Inc. | | | 73,034 | | | | 1,969,727 | |
Lamar Advertising Company - Class A | | | 14,473 | | | | 896,747 | |
Life Storage, Inc. | | | 16,266 | | | | 1,856,764 | |
Mid-America Apartment Communities, Inc. | | | 25,255 | | | | 2,945,490 | |
Weyerhaeuser Company | | | 35,303 | | | | 963,419 | |
| | | | | | | | 13,321,365 | |
Technology — 2.1% | | | | | | | | |
Semiconductors — 0.4% | | | | | | | | |
Intel Corporation | | | 35,348 | | | | 1,565,210 | |
Lam Research Corporation | | | 1,592 | | | | 544,591 | |
| | | | | | | | 2,109,801 | |
Software — 0.3% | | | | | | | | |
Microsoft Corporation | | | 10,070 | | | | 2,038,873 | |
| | | | | | | | | |
Technology Hardware — 1.0% | | | | | | | | |
Apple, Inc. | | | 8,552 | | | | 930,971 | |
Cisco Systems, Inc. | | | 18,206 | | | | 653,595 | |
Dolby Laboratories, Inc. - Class A | | | 41,755 | | | | 3,134,965 | |
Seagate Technology plc | | | 18,833 | | | | 900,594 | |
| | | | | | | | 5,620,125 | |
Technology Services — 0.4% | | | | | | | | |
Amdocs Ltd. | | | 41,502 | | | | 2,339,883 | |
18 | See accompanying notes to financial statements. | |
CHARTWELL INCOME FUND
SCHEDULE OF INVESTMENTS (Continued) |
COMMON STOCKS — 24.3% (Continued) | | Shares | | | Value | |
Utilities — 2.5% | | | | | | | | |
Electric Utilities — 2.5% | | | | | | | | |
Ameren Corporation | | | 38,313 | | | $ | 3,107,950 | |
American Electric Power Company, Inc. | | | 12,443 | | | | 1,118,999 | |
CMS Energy Corporation | | | 41,958 | | | | 2,657,200 | |
Exelon Corporation | | | 25,963 | | | | 1,035,664 | |
FirstEnergy Corporation | | | 44,843 | | | | 1,332,734 | |
PPL Corporation | | | 37,052 | | | | 1,018,930 | |
Public Service Enterprise Group, Inc. | | | 67,264 | | | | 3,911,402 | |
| | | | | | | | 14,182,879 | |
| | | | | | | | | |
Total Common Stocks (Cost $141,261,983) | | | | | | $ | 137,949,927 | |
|
PREFERRED STOCKS — 4.7% | | Shares | | | Value | |
Consumer Discretionary — 0.4% | | | | | | | | |
Retail - Discretionary — 0.4% | | | | | | | | |
QVC, Inc., 6.25% | | | 98,504 | | | $ | 2,323,709 | |
| | | | | | | | | |
Energy — 0.0% (b) | | | | | | | | |
Oil & Gas Producers — 0.0% (b) | | | | | | | | |
Chesapeake Energy Corporation, 5.00% CV (c) | | | 304,398 | | | | 60,880 | |
| | | | | | | | | |
Financials — 2.2% | | | | | | | | |
Specialty Finance — 2.2% | | | | | | | | |
AGNC Investment Corporation, Series C, 7.00% | | | 179,054 | | | | 4,091,384 | |
AGNC Investment Corporation, Series F, 6.12% | | | 45,000 | | | | 974,250 | |
Annaly Capital Management, Inc., Series F, 6.95% | | | 321,143 | | | | 7,228,929 | |
| | | | | | | | 12,294,563 | |
Real Estate — 2.1% | | | | | | | | |
Real Estate Owners & Developers — 0.5% | | | | | | | | |
Brookfield Property Partners, L.P., Series A2, 6.375% | | | 141,815 | | | | 2,864,663 | |
| | | | | | | | | |
REITs — 1.6% | | | | | | | | |
Chimera Investment Corporation, Series B, 8.00% | | | 266,980 | | | | 5,526,486 | |
New Residential Investment Corporation, Series C, 6.375% | | | 200,000 | | | | 3,546,000 | |
| | | | | | | | 9,072,486 | |
| | | | | | | | | |
Total Preferred Stocks (Cost $43,341,672) | | | | | | $ | 26,616,301 | |
| | See accompanying notes to financial statements. | 19 |
CHARTWELL INCOME FUND
SCHEDULE OF INVESTMENTS (Continued) |
CORPORATE BONDS — 38.2% | | Par Value | | | Value | |
Communications — 2.7% | | | | | | | | |
Belo Corporation, 7.25%, due 9/15/2027 | | $ | 1,500,000 | | | $ | 1,650,000 | |
CenturyLink, Inc., 7.65%, due 3/15/2042 | | | 1,682,000 | | | | 1,879,635 | |
Cincinnati Bell, Inc., 8.00%, due 10/15/2025 (d) | | | 1,430,000 | | | | 1,515,800 | |
Consolidated Communications Holdings, Inc., 6.50%, due 10/1/2022 | | | 970,000 | | | | 970,000 | |
Consolidated Communications Holdings, Inc., 6.50%, due 10/1/2028 (d) | | | 1,040,000 | | | | 1,068,600 | |
Diamond Sports Group, LLC/Diamond Sports Finance Company, 5.38%, due 8/15/2026 (d) | | | 2,700,000 | | | | 1,577,813 | |
Liberty Interactive, LLC, 8.50%, due 7/15/2029 | | | 1,200,000 | | | | 1,296,000 | |
National CineMedia, LLC, 5.75%, due 8/15/2026 | | | 2,500,000 | | | | 1,387,500 | |
Walt Disney Company (The), 3.80%, due 3/22/2030 | | | 3,405,000 | | | | 3,993,270 | |
| | | | | | | | 15,338,618 | |
Consumer Discretionary — 9.7% | | | | | | | | |
AAG FH, L.P./AAG FH Finco, Inc., 9.75%, due 7/15/2024 (d) | | | 2,523,000 | | | | 2,371,620 | |
American Axle & Manufacturing, Inc., 6.25%, due 4/1/2025 | | | 1,730,000 | | | | 1,753,251 | |
AutoNation, Inc., 3.80%, due 11/15/2027 | | | 4,127,000 | | | | 4,507,218 | |
Bed Bath & Beyond, Inc., 3.75%, due 8/1/2024 | | | 2,320,000 | | | | 2,237,234 | |
Bed Bath & Beyond, Inc., 5.17%, due 8/1/2044 | | | 1,390,000 | | | | 1,132,850 | |
Carriage Services, Inc., 6.63%, due 6/1/2026 (d) | | | 1,172,000 | | | | 1,231,842 | |
Ford Motor Company, 9.00%, due 4/22/2025 | | | 1,290,000 | | | | 1,520,130 | |
Ford Motor Credit Company, LLC, 4.54%, due 8/1/2026 | | | 1,650,000 | | | | 1,678,875 | |
General Motors Financial Company, Inc., 5.65%, due 1/17/2029 | | | 3,579,000 | | | | 4,219,906 | |
Kohl’s Corporation, 9.50%, due 5/15/2025 | | | 6,615,000 | | | | 7,915,281 | |
Kohl’s Corporation, 5.55%, due 7/17/2045 | | | 3,199,000 | | | | 2,894,905 | |
L Brands, Inc., 5.25%, due 2/1/2028 | | | 1,430,000 | | | | 1,408,550 | |
LGI Homes, Inc., 6.88%, due 7/15/2026 (d) | | | 1,295,000 | | | | 1,353,275 | |
Nordstrom, Inc., 8.75%, due 5/15/2025 (d) | | | 1,560,000 | | | | 1,708,532 | |
Penn National Gaming, Inc., 5.63%, due 1/15/2027 (d) | | | 1,800,000 | | | | 1,840,860 | |
Sonic Automotive, Inc., 6.13%, due 3/15/2027 | | | 1,700,000 | | | | 1,754,179 | |
Tenneco, Inc., 5.38%, due 12/15/2024 | | | 1,050,000 | | | | 867,878 | |
Tiffany & Company, 4.90%, due 10/1/2044 | | | 7,559,000 | | | | 10,434,660 | |
TRI Pointe Group, Inc., 5.25%, due 6/1/2027 | | | 750,000 | | | | 806,250 | |
Truck Hero, Inc., 8.50%, due 4/21/2024 (d) | | | 1,600,000 | | | | 1,696,000 | |
WW International, Inc., 8.63%, due 12/1/2025 (d) | | | 1,475,000 | | | | 1,537,688 | |
| | | | | | | | 54,870,984 | |
Consumer Staples — 1.9% | | | | | | | | |
Anheuser-Busch InBev Worldwide, Inc., 4.50%, due 6/1/2050 | | | 5,095,000 | | | | 6,018,659 | |
Belrose Funding Trust, 2.33%, due 8/15/2030 (d) | | | 1,130,000 | | | | 1,125,908 | |
Clearwater Seafoods, Inc., 6.88%, due 5/1/2025 (d) | | | 1,750,000 | | | | 1,817,392 | |
KeHE Distributors, LLC, 8.63%, due 10/15/2026 (d) | | | 1,591,000 | | | | 1,710,325 | |
| | | | | | | | 10,672,284 | |
20 | See accompanying notes to financial statements. | |
CHARTWELL INCOME FUND
SCHEDULE OF INVESTMENTS (Continued) |
CORPORATE BONDS — 38.2% (Continued) | | Par Value | | | Value | |
Energy — 5.0% | | | | | | | | |
Antero Resources Corporation, 5.38%, due 11/1/2021 | | $ | 3,045,000 | | | $ | 3,051,090 | |
Blue Racer Midstream, LLC/Blue Racer Finance Corporation, 6.63%, due 7/15/2026 (d) | | | 1,863,000 | | | | 1,672,043 | |
Energy Transfer Operating, L.P., Series G, 7.13%, due 5/15/2165 | | | 9,548,000 | | | | 7,804,153 | |
Ensign Drilling, Inc., 9.25%, due 4/15/2024 (d) | | | 4,000,000 | | | | 1,380,000 | |
Enviva Partners, L.P., 6.50%, due 1/15/2026 (d) | | | 900,000 | | | | 949,500 | |
Genesis Energy, L.P./Genesis Energy Finance Corporation, 5.63%, due 6/15/2024 | | | 3,250,000 | | | | 2,795,683 | |
NLG Energy Partners, L.P., 6.13%, due 3/1/2025 | | | 2,740,000 | | | | 1,370,000 | |
Parkland Fuel Corporation, 5.88%, due 7/15/2027 (d) | | | 1,723,000 | | | | 1,778,282 | |
Plains All American Pipeline, L.P., 3.80%, due 9/15/2030 | | | 3,855,000 | | | | 3,726,472 | |
Precision Drilling Corporation, 7.75%, due 12/15/2023 | | | 1,200,000 | | | | 888,000 | |
Rattler Midstream, L.P., 5.63%, due 7/15/2025 (d) | | | 850,000 | | | | 873,375 | |
Targa Resources Partners, L.P./Targa Resources Partners Finance Corporation, 5.25%, due 5/1/2023 | | | 2,436,000 | | | | 2,434,782 | |
| | | | | | | | 28,723,380 | |
Financials — 8.4% | | | | | | | | |
Ares Capital Corporation, 4.20%, due 6/10/2024 | | | 4,495,000 | | | | 4,695,142 | |
Ares Capital Corporation, 3.25%, due 7/15/2025 | | | 5,240,000 | | | | 5,253,254 | |
Bank of America Corporation, 1.01% (3MO LIBOR + 76), due 9/15/2026 (e) | | | 7,577,000 | | | | 7,443,164 | |
Bank of Nova Scotia, 4.90% (H15T5Y + 455.1), due 9/4/2099 (c)(e) | | | 1,580,000 | | | | 1,649,204 | |
Citizens Financial Group, Inc., Series B, 6.00%, due 12/31/2099 (c) | | | 3,340,000 | | | | 3,219,414 | |
Compass Group Diversified Holdings, LLC, 8.00%, due 5/1/2026 (d) | | | 1,300,000 | | | | 1,366,859 | |
Goldman Sachs Group, Inc. (The), 1.30% (3MO LIBOR + 105), due 6/5/2023 (e) | | | 3,161,000 | | | | 3,186,702 | |
StoneX Group, Inc., 8.63%, due 6/15/2025 (d) | | | 1,259,000 | | | | 1,328,245 | |
Jefferies Group, LLC, 6.50%, due 1/20/2043 | | | 2,950,000 | | | | 3,801,202 | |
Lincoln National Corporation, 3.05%, due 1/15/2030 | | | 3,660,000 | | | | 3,925,653 | |
MetLife, Inc., Series C, 3.83% (3MO LIBOR + 357.5), due 12/31/2099 (c)(e) | | | 4,598,000 | | | | 4,552,020 | |
NMI Holdings, Inc., 7.38%, due 6/1/2025 (d) | | | 1,640,000 | | | | 1,787,600 | |
Oaktree Specialty Lending Corporation, 3.50%, due 2/25/2025 | | | 2,296,000 | | | | 2,298,657 | |
Provident Funding Associates, L.P./PFG Finance Corporation, 6.38%, due 6/15/2025 (d) | | | 1,649,000 | | | | 1,619,936 | |
Starwood Property Trust, Inc., 5.00%, due 12/15/2021 | | | 1,575,000 | | | | 1,567,125 | |
| | | | | | | | 47,694,177 | |
| | See accompanying notes to financial statements. | 21 |
CHARTWELL INCOME FUND
SCHEDULE OF INVESTMENTS (Continued) |
CORPORATE BONDS — 38.2% (Continued) | | Par Value | | | Value | |
Health Care — 2.2% | | | | | | | | |
Anthem, Inc., 3.65%, due 12/1/2027 | | $ | 4,416,000 | | | $ | 4,992,806 | |
CVS Health Corporation, 4.30%, due 3/25/2028 | | | 4,000,000 | | | | 4,631,975 | |
Horizon Pharma USA, Inc., 5.50%, due 8/1/2027 (d) | | | 1,685,000 | | | | 1,793,042 | |
Prime Healthcare Services, Inc., 7.25%, due 11/1/2025 (d) | | | 1,065,000 | | | | 1,073,307 | |
| | | | | | | | 12,491,130 | |
Industrials — 2.7% | | | | | | | | |
Boeing Company (The), 5.15%, due 5/1/2030 | | | 2,170,000 | | | | 2,398,135 | |
Delta Air Lines, Inc., 3.63%, due 3/15/2022 | | | 3,000,000 | | | | 2,939,952 | |
Delta Air Lines, Inc., 7.38%, due 1/15/2026 | | | 1,315,000 | | | | 1,361,025 | |
Grinding Media, Inc./MC Grinding Media, Inc., 7.38%, due 12/15/2023 (d) | | | 1,290,000 | | | | 1,302,900 | |
H&E Equipment Services, Inc., 5.63%, due 9/1/2025 | | | 1,285,000 | | | | 1,333,188 | |
Harsco Corporation, 5.75%, due 7/31/2027 (d) | | | 1,230,000 | | | | 1,257,675 | |
JPW Industries Holding Corporation, 9.00%, due 10/1/2024 (d) | | | 1,195,000 | | | | 1,099,400 | |
Quad Graphics, Inc., 7.00%, due 5/1/2022 | | | 2,000,000 | | | | 1,750,000 | |
SkyMiles IP Ltd. & Delta Airlines, Inc., 4.50%, due 10/20/2025 (d) | | | 680,000 | | | | 690,163 | |
WESCO Distribution, Inc., 7.13%, due 6/15/2025 (d) | | | 1,000,000 | | | | 1,077,500 | |
| | | | | | | | 15,209,938 | |
Materials — 2.2% | | | | | | | | |
Arconic Corporation, 6.13%, due 2/15/2028 (d) | | | 505,000 | | | | 532,086 | |
Cliffs Natural Resources, Inc., 6.25%, due 10/1/2040 | | | 1,780,000 | | | | 1,514,602 | |
Commercial Metals Company, 5.38%, due 7/15/2027 | | | 1,665,000 | | | | 1,735,762 | |
Compass Minerals International, Inc., 4.88%, due 7/15/2024 (d) | | | 1,850,000 | | | | 1,877,750 | |
JW Aluminum Continuous Cast Company, 10.25%, due 6/1/2026 (d) | | | 2,500,000 | | | | 2,625,000 | |
Mercer International, Inc., 5.50%, due 1/15/2026 | | | 2,000,000 | | | | 1,895,000 | |
Neon Holdings, Inc., 10.13%, due 4/1/2026 (d) | | | 1,190,000 | | | | 1,258,425 | |
Plastipak Holdings, Inc., 6.25%, due 10/15/2025 (d) | | | 1,200,000 | | | | 1,201,500 | |
| | | | | | | | 12,640,125 | |
Real Estate — 0.6% | | | | | | | | |
Greystar Real Estate Partners, LLC, 5.75%, due 12/1/2025 (d) | | | 1,800,000 | | | | 1,822,500 | |
iStar, Inc., 5.50%, due 2/15/2026 | | | 1,560,000 | | | | 1,476,961 | |
| | | | | | | | 3,299,461 | |
Technology — 2.2% | | | | | | | | |
Apple, Inc., 3.85%, due 5/4/2043 | | | 1,990,000 | | | | 2,441,631 | |
Brightstar Escrow Corporation, 9.75%, due 10/15/2025 (d) | | | 1,675,000 | | | | 1,670,327 | |
Dell International, LLC/EMC Corporation, 6.20%, due 7/15/2030 (d) | | | 2,805,000 | | | | 3,428,174 | |
Hewlett Packard Enterprise Company, 6.35%, due 10/15/2045 | | | 3,924,000 | | | | 5,021,289 | |
| | | | | | | | 12,561,421 | |
22 | See accompanying notes to financial statements. | |
CHARTWELL INCOME FUND
SCHEDULE OF INVESTMENTS (Continued) |
CORPORATE BONDS — 38.2% (Continued) | | Par Value | | | Value | |
Utilities — 0.6% | | | | | | | | |
Suburban Propane Partners, L.P., 5.88%, due 3/1/2027 | | $ | 1,500,000 | | | $ | 1,545,000 | |
Talen Energy Supply, LLC, 6.63%, due 1/15/2028 (d) | | | 1,825,000 | | | | 1,742,875 | |
| | | | | | | | 3,287,875 | |
| | | | | | | | | |
Total Corporate Bonds (Cost $210,713,539) | | | | | | $ | 216,789,393 | |
|
ASSET-BACKED SECURITIES — 3.3% | | Par Value | | | Value | |
Colony American Finance Ltd., Series 2019-1, 3.32%, due 1/15/2029 (d)(e) | | $ | 4,917,588 | | | $ | 5,227,342 | |
Colony American Finance Ltd., Series 2019-3, 2.71%, due 10/15/2052 (d)(e) | | | 2,608,480 | | | | 2,750,833 | |
Latitude Management Real Estate Investors, Inc., Series 2019-CRE3, 1.55% (1MO LIBOR + 140), due 12/22/2035 (d)(e) | | | 3,615,000 | | | | 3,524,625 | |
ORIX Credit Alliance Owner Trust, Series 2018-CRE1, 1.33% (1MO LIBOR + 118), due 6/15/2036 (d)(e) | | | 7,385,000 | | | | 7,255,763 | |
Total Asset-Backed Securities (Cost $18,542,710) | | | | | | $ | 18,758,563 | |
|
MORTGAGE-BACKED SECURITIES — 16.9% | | Par Value | | | Value | |
Agency Fixed Rate — 8.3% | | | | | | | | |
Federal Home Loan Mortgage Corporation, Pool #G6-1858, 3.50%, due 1/1/2048 | | $ | 6,278,223 | | | $ | 6,658,249 | |
Federal Home Loan Mortgage Corporation, Pool #ZA-5269, 3.00%, due 2/1/2048 | | | 2,700,906 | | | | 2,821,555 | |
Federal Home Loan Mortgage Corporation, Pool #ZN-6606, 3.00%, due 6/1/2049 | | | 3,588,955 | | | | 3,761,354 | |
Federal Home Loan Mortgage Corporation, Pool #SD-0144, 3.00%, due 11/1/2049 | | | 1,869,858 | | | | 1,953,761 | |
Federal Home Loan Mortgage Corporation, Pool #QA-7416, 3.00%, due 2/1/2050 | | | 6,249,007 | | | | 6,536,435 | |
Federal National Mortgage Association, Pool #BM6059, 3.00%, due 9/1/2029 | | | 1,651,835 | | | | 1,723,584 | |
Federal National Mortgage Association, Pool #BN0356, 3.00%, due 12/1/2033 | | | 3,172,078 | | | | 3,319,242 | |
Federal National Mortgage Association, Pool #CA4128, 3.00%, due 9/1/2049 | | | 3,839,390 | | | | 4,015,106 | |
Federal National Mortgage Association, Pool #FM1526, 3.00%, due 9/1/2049 | | | 5,475,932 | | | | 5,726,425 | |
| | See accompanying notes to financial statements. | 23 |
CHARTWELL INCOME FUND
SCHEDULE OF INVESTMENTS (Continued) |
MORTGAGE-BACKED SECURITIES — 16.9% (Continued) | | Par Value | | | Value | |
Agency Fixed Rate — 8.3% (Continued) | | | | | | | | |
Federal National Mortgage Association, Pool #B03192, 3.00%, due 10/1/2049 | | $ | 5,135,197 | | | $ | 5,362,194 | |
Federal National Mortgage Association, Pool #BO8653, 3.00%, due 2/1/2050 | | | 4,925,868 | | | | 5,153,923 | |
| | | | | | | | 47,031,828 | |
Commercial — 8.6% | | | | | | | | |
Agate Bay Mortgage Loan Trust, Series 2016-2, 3.50%, due 3/25/2046 (d) | | | 3,814,745 | | | | 3,931,017 | |
Bancorp Commercial Mortgage Trust (The), Series 2019-CRE5, 1.15% (1MO LIBOR + 100), due 1/15/2022 (d)(e) | | | 1,775,101 | | | | 1,728,644 | |
BDS Ltd., Series 2019-FL4, 1.25% (1MO LIBOR + 110), due 8/15/2036 (d)(e) | | | 3,640,000 | | | | 3,610,407 | |
Credit Suisse Mortgage Trust, Series 2018-J1, 3.50%, due 2/25/2048 (d) | | | 4,706,548 | | | | 4,812,247 | |
Ellington Financial Mortgage Trust, Series 2019-1, 2.93%, due 6/25/2059 (d) | | | 3,889,161 | | | | 3,984,665 | |
Exantas Capital Corporation, Series 2019-RS07, 1.15% (1MO LIBOR + 100), due 4/15/2022 (d)(e) | | | 1,811,560 | | | | 1,788,916 | |
Flagstar Mortgage Trust, Series 2020-2, 3.00%, due 6/25/2048 (d) | | | 3,028,535 | | | | 3,106,850 | |
GS Mortgage Securities Trust, Series 2020-PJ5, 3.00%, due 3/27/2051 | | | 3,340,000 | | | | 3,443,331 | |
JPMorgan Mortgage Trust, 3.00%, due 11/25/2050 (d) | | | 2,050,408 | | | | 2,102,148 | |
JPMorgan Wealth Management Trust, Series 2020-ATR1, 3.00%, due 2/25/2050 (d) | | | 1,640,746 | | | | 1,685,225 | |
Onslow Bay Financial, LLC, Series 2019-EXP3, 3.50%, due 10/25/2059 (d) | | | 3,506,369 | | | | 3,594,442 | |
Pear Street Mortgage Company, LLC, Series 2019-1, 4.00%, due 7/25/2049 (d) | | | 1,534,332 | | | | 1,558,050 | |
Provident Funding Mortgage Trust, Series 2019-1, 3.00%, due 12/25/2049 (d) | | | 4,527,124 | | | | 4,657,788 | |
RMF Buyout Issuance Trust, Series 2020-HB1, 1.72%, due 10/25/2050 (d) | | | 2,515,000 | | | | 2,514,997 | |
Sequoia Mortgage Trust, Series 2019-5, 3.50%, due 12/25/2049 (d) | | | 3,039,067 | | | | 3,109,509 | |
Starwood Mortgage Residential Trust, Series 2019-1, 2.94%, due 6/25/2049 (d) | | | 3,404,847 | | | | 3,452,835 | |
Wells Fargo Mortgage Back Securities, Series 2019-2, 4.00%, due 4/25/2049 (d) | | | 21,358 | | | | 21,322 | |
| | | | | | | | 49,102,393 | |
| | | | | | | | | |
Total Mortgage-Backed Securities (Cost $94,536,208) | | | | | | $ | 96,134,221 | |
24 | See accompanying notes to financial statements. | |
CHARTWELL INCOME FUND
SCHEDULE OF INVESTMENTS (Continued) |
U.S. GOVERNMENT & AGENCY OBLIGATIONS — 9.2% | | Par Value | | | Value | |
Federal Farm Credit Bank — 3.1% | | | | | | | | |
Federal Farm Credit Bank, 1.48%, due 3/10/2026 | | $ | 6,055,000 | | | $ | 6,079,120 | |
Federal Farm Credit Bank, 2.50%, due 2/4/2031 | | | 6,520,000 | | | | 6,546,120 | |
Federal Farm Credit Bank, 3.50%, due 2/1/2033 | | | 5,000,000 | | | | 5,039,043 | |
| | | | | | | | 17,664,283 | |
Small Business Administration — 0.8% | | | | | | | | |
Small Business Administration Participation Certificates, 3.20%, due 3/1/2039 | | | 4,120,682 | | | | 4,521,168 | |
| | | | | | | | | |
U.S. Treasury Bonds — 0.4% | | | | | | | | |
U.S. Treasury Bonds, 3.75%, due 8/15/2041 | | | 1,700,000 | | | | 2,429,340 | |
| | | | | | | | | |
U.S. Treasury Notes — 4.9% | | | | | | | | |
U.S. Treasury Notes, 2.00%, due 2/15/2023 | | | 2,075,000 | | | | 2,161,323 | |
U.S. Treasury Inflation-Protected Notes, 0.63%, due 4/15/2023 | | | 6,800,950 | | | | 7,071,925 | |
U.S. Treasury Notes, 0.63%, due 5/15/2030 | | | 5,750,000 | | | | 5,637,695 | |
U.S. Treasury Inflation-Protected Notes, 0.88%, due 2/15/2047 | | | 9,857,529 | | | | 12,819,537 | |
| | | | | | | | 27,690,480 | |
| | | | | | | | | |
Total U.S. Government & Agency Obligations (Cost $49,851,986) | | | | | | $ | 52,305,271 | |
| | See accompanying notes to financial statements. | 25 |
CHARTWELL INCOME FUND
SCHEDULE OF INVESTMENTS (Continued) |
MONEY MARKET FUNDS — 0.0% (b) | | Shares | | | Value | |
Fidelity Institutional Money Market Government Portfolio - Class I, 0.01% (f) (Cost $243,639) | | | 243,639 | | | $ | 243,639 | |
| | | | | | | | | |
Investments at Value — 96.6% (Cost $558,491,737) | | | | | | $ | 548,797,315 | |
| | | | | | | | | |
Other Assets in Excess of Liabilities — 3.4% | | | | | | | 19,227,474 | |
| | | | | | | | | |
Net Assets — 100.0% | | | | | | $ | 568,024,789 | |
(a) | Non-income producing security. |
(b) | Percentage rounds to less than 0.1%. |
(c) | Security has a perpetual maturity date. |
(d) | 144A - Security was purchased in a transaction exempt from registration in compliance with Rule 144A of the Securities Act of 1933. This security may be resold in transactions exempt from registration, normally to qualified institutional buyers. The total value of such securities is $122,181,744 as of October 31, 2020, representing 21.5% of net assets. |
(e) | Variable rate security. Interest rate resets periodically. The rate shown is the effective interest rate as of October 31, 2020. For securities based on a published reference rate and spread, the reference rate and spread (in basis points) are indicated parenthetically. Certain variable rate securities are not based on a published reference rate and spread but are determined by the issuer or agent and are based on current market conditions. These securities, therefore, do not indicate a reference rate and spread. |
(f) | The rate shown is the 7-day effective yield as of October 31, 2020. |
CV – Convertible Security |
H15T5Y – U.S. Treasury yield curve rate for U.S. Treasury note with a constant maturity of 1 year |
LIBOR – London Interbank Offered Rate |
26 | See accompanying notes to financial statements. | |
CHARTWELL INCOME FUND
SUMMARY OF INVESTMENTS
As of October 31, 2020 (Unaudited)
Security Type / Sector | Percent of
Net Assets |
Common Stocks | |
Financials | 4.0% |
Industrials | 3.1% |
Consumer Discretionary | 2.7% |
Utilities | 2.5% |
Health Care | 2.4% |
Real Estate | 2.3% |
Technology | 2.1% |
Consumer Staples | 1.8% |
Materials | 1.7% |
Communications | 0.9% |
Energy | 0.8% |
Total Common Stocks | 24.3% |
Preferred Stocks | |
Financials | 2.2% |
Real Estate | 2.1% |
Consumer Discretionary | 0.4% |
Energy | 0.0%(a) |
Total Preferred Stocks | 4.7% |
Corporate Bonds | |
Consumer Discretionary | 9.7% |
Financials | 8.4% |
Energy | 5.0% |
Communications | 2.7% |
Industrials | 2.7% |
Materials | 2.2% |
Technology | 2.2% |
Health Care | 2.2% |
Consumer Staples | 1.9% |
Real Estate | 0.6% |
Utilities | 0.6% |
Total Corporate Bonds | 38.2% |
Asset-Backed Securities | 3.3% |
Mortgage-Backed Securities | 16.9% |
U.S. Government & Agency Obligations | 9.2% |
Money Market Funds | 0.0%(a) |
Investments | 96.6% |
Other Assets in Excess of Liabilities | 3.4% |
Net Assets | 100.0% |
(a) | Percentage rounds up to less than 0.1%. |
27
CHARTWELL MID CAP VALUE FUND
SCHEDULE OF INVESTMENTS
October 31, 2020 |
COMMON STOCKS — 96.9% | | Shares | | | Value | |
Communications — 2.1% | | | | | | | | |
Internet Media & Services — 2.1% | | | | | | | | |
Expedia Group, Inc. | | | 5,657 | | | $ | 532,606 | |
| | | | | | | | | |
Consumer Discretionary — 11.2% | | | | | | | | |
Apparel & Textile Products — 2.4% | | | | | | | | |
Columbia Sportswear Company | | | 7,913 | | | | 590,231 | |
| | | | | | | | | |
Consumer Services — 2.2% | | | | | | | | |
Service Corporation International | | | 11,791 | | | | 546,041 | |
| | | | | | | | | |
Retail - Discretionary — 6.6% | | | | | | | | |
AutoZone, Inc. (a) | | | 618 | | | | 697,710 | |
Genuine Parts Company | | | 10,334 | | | | 934,503 | |
| | | | | | | | 1,632,213 | |
Consumer Staples — 7.1% | | | | | | | | |
Food — 4.7% | | | | | | | | |
Conagra Brands, Inc. | | | 15,770 | | | | 553,369 | |
Lamb Weston Holdings, Inc. | | | 9,684 | | | | 614,450 | |
| | | | | | | | 1,167,819 | |
Retail - Consumer Staples — 2.4% | | | | | | | | |
Dollar Tree, Inc. (a) | | | 6,408 | | | | 578,771 | |
| | | | | | | | | |
Energy — 2.4% | | | | | | | | |
Oil & Gas Producers — 2.4% | | | | | | | | |
Diamondback Energy, Inc. | | | 7,542 | | | | 195,790 | |
Pioneer Natural Resources Company | | | 4,885 | | | | 388,651 | |
| | | | | | | | 584,441 | |
Financials — 14.4% | | | | | | | | |
Banking — 5.1% | | | | | | | | |
KeyCorp | | | 33,460 | | | | 434,311 | |
M&T Bank Corporation | | | 2,529 | | | | 261,954 | |
Pinnacle Financial Partners, Inc. | | | 12,430 | | | | 569,169 | |
| | | | | | | | 1,265,434 | |
Insurance — 7.9% | | | | | | | | |
Allstate Corporation (The) | | | 10,117 | | | | 897,884 | |
Hanover Insurance Group, Inc. (The) | | | 6,070 | | | | 580,656 | |
Lincoln National Corporation | | | 13,369 | | | | 469,252 | |
| | | | | | | | 1,947,792 | |
Specialty Finance — 1.4% | | | | | | | | |
Synchrony Financial | | | 13,948 | | | | 348,979 | |
28 | See accompanying notes to financial statements. | |
CHARTWELL MID CAP VALUE FUND
SCHEDULE OF INVESTMENTS (Continued) |
COMMON STOCKS — 96.9% (Continued) | | Shares | | | Value | |
Health Care — 7.4% | | | | | | | | |
Health Care Facilities & Services — 7.4% | | | | | | | | |
Quest Diagnostics, Inc. | | | 9,253 | | | $ | 1,130,162 | |
Universal Health Services, Inc. - Class B | | | 6,408 | | | | 701,996 | |
| | | | | | | | 1,832,158 | |
Industrials — 12.8% | | | | | | | | |
Engineering & Construction — 5.9% | | | | | | | | |
Quanta Services, Inc. | | | 23,487 | | | | 1,466,294 | |
| | | | | | | | | |
Machinery — 3.7% | | | | | | | | |
Snap-on, Inc. | | | 5,853 | | | | 922,023 | |
| | | | | | | | | |
Transportation Equipment — 3.2% | | | | | | | | |
Allison Transmission Holdings, Inc. | | | 21,955 | | | | 793,673 | |
| | | | | | | | | |
Materials — 9.2% | | | | | | | | |
Chemicals — 4.9% | | | | | | | | |
FMC Corporation | | | 11,791 | | | | 1,211,407 | |
| | | | | | | | | |
Construction Materials — 4.3% | | | | | | | | |
Vulcan Materials Company | | | 7,299 | | | | 1,057,187 | |
| | | | | | | | | |
Real Estate — 11.3% | | | | | | | | |
REITs — 11.3% | | | | | | | | |
Healthcare Trust of America, Inc. - Class A | | | 35,076 | | | | 852,347 | |
Healthpeak Properties, Inc. | | | 20,857 | | | | 562,513 | |
Life Storage, Inc. | | | 4,652 | | | | 531,026 | |
Mid-America Apartment Communities, Inc. | | | 7,212 | | | | 841,135 | |
| | | | | | | | 2,787,021 | |
Technology — 6.3% | | | | | | | | |
Technology Hardware — 3.6% | | | | | | | | |
Dolby Laboratories, Inc. - Class A | | | 11,924 | | | | 895,254 | |
| | | | | | | | | |
Technology Services — 2.7% | | | | | | | | |
Amdocs Ltd. | | | 11,852 | | | | 668,216 | |
| | See accompanying notes to financial statements. | 29 |
CHARTWELL MID CAP VALUE FUND
SCHEDULE OF INVESTMENTS (Continued) |
COMMON STOCKS — 96.9% (Continued) | | Shares | | | Value | |
Utilities — 12.7% | | | | | | | | |
Electric Utilities — 12.7% | | | | | | | | |
Ameren Corporation | | | 10,941 | | | $ | 887,534 | |
CMS Energy Corporation | | | 11,982 | | | | 758,820 | |
FirstEnergy Corporation | | | 12,806 | | | | 380,594 | |
Public Service Enterprise Group, Inc. | | | 19,209 | | | | 1,117,004 | |
| | | | | | | | 3,143,952 | |
| | | | | | | | | |
Total Common Stocks (Cost $24,400,150) | | | | | | $ | 23,971,512 | |
|
MONEY MARKET FUNDS — 3.1% | | Shares | | | Value | |
Fidelity Institutional Money Market Government Portfolio - Class I, 0.01% (b) (Cost $778,720) | | | 778,720 | | | $ | 778,720 | |
| | | | | | | | | |
Investments at Value — 100.0% (Cost $25,178,870) | | | | | | $ | 24,750,232 | |
| | | | | | | | | |
Other Assets in Excess of Liabilities — 0.0% (c) | | | | | | | 1,358 | |
| | | | | | | | | |
Net Assets — 100.0% | | | | | | $ | 24,751,590 | |
(a) | Non-income producing security. |
(b) | The rate shown is the 7-day effective yield as of October 31, 2020. |
(c) | Percentage rounds to less than 0.1%. |
30 | See accompanying notes to financial statements. | |
CHARTWELL MID CAP VALUE FUND
SUMMARY OF INVESTMENTS
As of October 31, 2020 (Unaudited)
Security Type / Sector | Percent of
Net Assets |
Common Stocks | |
Financials | 14.4% |
Industrials | 12.8% |
Utilities | 12.7% |
Real Estate | 11.3% |
Consumer Discretionary | 11.2% |
Materials | 9.2% |
Health Care | 7.4% |
Consumer Staples | 7.1% |
Technology | 6.3% |
Energy | 2.4% |
Communications | 2.1% |
Total Common Stocks | 96.9% |
Money Market Funds | 3.1% |
Investments | 100.0% |
Other Assets in Excess of Liabilities | 0.0%(a) |
Net Assets | 100.0% |
(a) | Amount rounds to less than 0.1%. |
31
CHARTWELL SMALL CAP VALUE FUND
SCHEDULE OF INVESTMENTS
October 31, 2020 |
COMMON STOCKS — 98.4% | | Shares | | | Value | |
Consumer Discretionary — 12.1% | | | | | | | | |
Apparel & Textile Products — 1.6% | | | | | | | | |
Oxford Industries, Inc. | | | 17,562 | | | $ | 723,027 | |
Wolverine World Wide, Inc. | | | 63,531 | | | | 1,694,372 | |
| | | | | | | | 2,417,399 | |
Home & Office Products — 0.7% | | | | | | | | |
Knoll, Inc. | | | 90,756 | | | | 1,040,064 | |
| | | | | | | | | |
Home Construction — 2.0% | | | | | | | | |
JELD-WEN Holding, Inc. (a) | | | 43,049 | | | | 905,321 | |
TRI Pointe Group, Inc. (a) | | | 128,114 | | | | 2,104,913 | |
| | | | | | | | 3,010,234 | |
Leisure Facilities & Services — 4.6% | | | | | | | | |
Cheesecake Factory, Inc. (The) | | | 54,707 | | | | 1,625,892 | |
Denny’s Corporation (a) | | | 202,942 | | | | 1,818,360 | |
Jack in the Box, Inc. | | | 41,900 | | | | 3,354,514 | |
| | | | | | | | 6,798,766 | |
Retail - Discretionary — 2.4% | | | | | | | | |
Rush Enterprises, Inc. - Class A | | | 96,878 | | | | 3,472,108 | |
| | | | | | | | | |
Wholesale - Discretionary — 0.8% | | | | | | | | |
G-III Apparel Group Ltd. (a) | | | 87,755 | | | | 1,182,937 | |
| | | | | | | | | |
Consumer Staples — 3.5% | | | | | | | | |
Consumer Products — 0.7% | | | | | | | | |
Phibro Animal Health Corporation - Class A | | | 58,465 | | | | 961,165 | |
| | | | | | | | | |
Food — 2.8% | | | | | | | | |
Fresh Del Monte Produce, Inc. | | | 78,536 | | | | 1,690,880 | |
Sanderson Farms, Inc. | | | 19,650 | | | | 2,514,610 | |
| | | | | | | | 4,205,490 | |
Energy — 0.8% | | | | | | | | |
Oil & Gas Producers — 0.4% | | | | | | | | |
PDC Energy, Inc. (a) | | | 45,532 | | | | 542,742 | |
| | | | | | | | | |
Oil & Gas Services & Equipment — 0.4% | | | | | | | | |
ChampionX Corporation (a) | | | 65,910 | | | | 575,394 | |
32 | See accompanying notes to financial statements. | |
CHARTWELL SMALL CAP VALUE FUND
SCHEDULE OF INVESTMENTS (Continued) |
COMMON STOCKS — 98.4% (Continued) | | Shares | | | Value | |
Financials — 26.1% | | | | | | | | |
Banking — 19.5% | | | | | | | | |
Columbia Banking System, Inc. | | | 82,923 | | | $ | 2,355,842 | |
CVB Financial Corporation | | | 85,884 | | | | 1,502,970 | |
First Financial Bancorp | | | 93,022 | | | | 1,330,215 | |
First Midwest Bancorp, Inc. | | | 137,682 | | | | 1,727,909 | |
FNB Corporation | | | 211,841 | | | | 1,601,518 | |
Independent Bank Group, Inc. | | | 45,812 | | | | 2,362,983 | |
Pacific Premier Bancorp, Inc. | | | 86,719 | | | | 2,211,335 | |
Renasant Corporation | | | 67,111 | | | | 1,913,335 | |
Sandy Spring Bancorp, Inc. | | | 75,625 | | | | 1,917,094 | |
South State Corporation | | | 42,498 | | | | 2,609,377 | |
TowneBank | | | 96,674 | | | | 1,757,533 | |
UMB Financial Corporation | | | 35,937 | | | | 2,187,485 | |
Umpqua Holdings Corporation | | | 144,465 | | | | 1,814,480 | |
United Bankshares, Inc. | | | 43,865 | | | | 1,150,579 | |
United Community Banks, Inc. | | | 116,388 | | | | 2,437,165 | |
| | | | | | | | 28,879,820 | |
Insurance — 4.6% | | | | | | | | |
American Equity Investment Life Holding Company | | | 72,951 | | | | 1,810,644 | |
Kemper Corporation | | | 29,748 | | | | 1,834,261 | |
Selective Insurance Group, Inc. | | | 61,179 | | | | 3,184,979 | |
| | | | | | | | 6,829,884 | |
Specialty Finance — 2.0% | | | | | | | | |
PRA Group, Inc. (a) | | | 86,353 | | | | 2,947,228 | |
| | | | | | | | | |
Health Care — 3.2% | | | | | | | | |
Biotech & Pharma — 1.2% | | | | | | | | |
Eagle Pharmaceuticals, Inc. (a) | | | 36,889 | | | | 1,716,076 | |
| | | | | | | | | |
Health Care Facilities & Services — 2.0% | | | | | | | | |
Patterson Companies, Inc. | | | 120,814 | | | | 3,005,248 | |
| | | | | | | | | |
Industrials — 20.7% | | | | | | | | |
Aerospace & Defense — 1.4% | | | | | | | | |
Moog, Inc. - Class A | | | 32,649 | | | | 2,036,971 | |
| | See accompanying notes to financial statements. | 33 |
CHARTWELL SMALL CAP VALUE FUND
SCHEDULE OF INVESTMENTS (Continued) |
COMMON STOCKS — 98.4% (Continued) | | Shares | | | Value | |
Industrials — 20.7% (Continued) | | | | | | | | |
Commercial Support Services — 4.5% | | | | | | | | |
Harsco Corporation (a) | | | 122,287 | | | $ | 1,577,502 | |
Korn Ferry | | | 54,030 | | | | 1,631,166 | |
TrueBlue, Inc. (a) | | | 100,290 | | | | 1,556,501 | |
UniFirst Corporation | | | 11,531 | | | | 1,888,893 | |
| | | | | | | | 6,654,062 | |
Diversified Industrials — 2.6% | | | | | | | | |
ITT, Inc. | | | 65,166 | | | | 3,943,195 | |
| | | | | | | | | |
Engineering & Construction — 3.6% | | | | | | | | |
Dycom Industries, Inc. (a) | | | 45,434 | | | | 2,950,484 | |
Parsons Corporation (a) | | | 76,730 | | | | 2,418,529 | |
| | | | | | | | 5,369,013 | |
Industrial Intermediate Products — 1.7% | | | | | | | | |
EnPro Industries, Inc. | | | 41,995 | | | | 2,478,545 | |
| | | | | | | | | |
Machinery — 2.6% | | | | | | | | |
Cactus, Inc. - Class A | | | 75,039 | | | | 1,275,663 | |
Mueller Water Products, Inc. - Series A | | | 247,875 | | | | 2,567,985 | |
| | | | | | | | 3,843,648 | |
Transportation & Logistics — 4.3% | | | | | | | | |
Hub Group, Inc. - Class A (a) | | | 40,838 | | | | 2,047,209 | |
Saia, Inc. (a) | | | 29,182 | | | | 4,309,014 | |
| | | | | | | | 6,356,223 | |
Materials — 7.4% | | | | | | | | |
Chemicals — 2.9% | | | | | | | | |
Ferro Corporation (a) | | | 154,410 | | | | 1,985,713 | |
Minerals Technologies, Inc. | | | 43,632 | | | | 2,386,234 | |
| | | | | | | | 4,371,947 | |
Construction Materials — 1.3% | | | | | | | | |
Eagle Materials, Inc. | | | 23,179 | | | | 1,976,010 | |
| | | | | | | | | |
Containers & Packaging — 1.5% | | | | | | | | |
TriMas Corporation (a) | | | 90,149 | | | | 2,193,325 | |
| | | | | | | | | |
Paper & Forest Products — 1.7% | | | | | | | | |
Glatfelter Corporation | | | 171,522 | | | | 2,447,619 | |
34 | See accompanying notes to financial statements. | |
CHARTWELL SMALL CAP VALUE FUND
SCHEDULE OF INVESTMENTS (Continued) |
COMMON STOCKS — 98.4% (Continued) | | Shares | | | Value | |
Real Estate — 9.6% | | | | | | | | |
Real Estate Owners & Developers — 1.3% | | | | | | | | |
McGrath RentCorp | | | 34,162 | | | $ | 1,949,967 | |
| | | | | | | | | |
REITs — 8.3% | | | | | | | | |
First Industrial Realty Trust, Inc. | | | 39,559 | | | | 1,574,844 | |
Healthcare Realty Trust, Inc. | | | 83,777 | | | | 2,329,001 | |
Kite Realty Group Trust | | | 65,238 | | | | 675,866 | |
Pebblebrook Hotel Trust | | | 86,735 | | | | 1,039,085 | |
Piedmont Office Realty Trust, Inc. - Class A | | | 127,806 | | | | 1,459,544 | |
PS Business Parks, Inc. | | | 21,933 | | | | 2,501,020 | |
STAG Industrial, Inc. | | | 86,596 | | | | 2,694,867 | |
| | | | | | | | 12,274,227 | |
Technology — 8.1% | | | | | | | | |
Semiconductors — 2.6% | | | | | | | | |
Diodes, Inc. (a) | | | 67,723 | | | | 3,916,421 | |
| | | | | | | | | |
Software — 3.1% | | | | | | | | |
CommVault Systems, Inc. (a) | | | 65,023 | | | | 2,574,261 | |
Progress Software Corporation | | | 56,627 | | | | 2,059,524 | |
| | | | | | | | 4,633,785 | |
Technology Hardware — 1.9% | | | | | | | | |
Plexus Corporation (a) | | | 40,307 | | | | 2,802,949 | |
| | | | | | | | | |
Technology Services — 0.5% | | | | | | | | |
CACI International, Inc. - Class A (a) | | | 3,342 | | | | 696,907 | |
| | | | | | | | | |
Utilities — 6.9% | | | | | | | | |
Electric Utilities — 5.5% | | | | | | | | |
Avista Corporation | | | 40,961 | | | | 1,360,724 | |
Black Hills Corporation | | | 27,630 | | | | 1,565,516 | |
NorthWestern Corporation | | | 49,546 | | | | 2,582,833 | |
PNM Resources, Inc. | | | 52,797 | | | | 2,639,850 | |
| | | | | | | | 8,148,923 | |
Gas & Water Utilities — 1.4% | | | | | | | | |
Southwest Gas Holdings, Inc. | | | 31,661 | | | | 2,080,761 | |
| | | | | | | | | |
Total Common Stocks (Cost $152,954,125) | | | | | | $ | 145,759,053 | |
| | See accompanying notes to financial statements. | 35 |
CHARTWELL SMALL CAP VALUE FUND
SCHEDULE OF INVESTMENTS (Continued) |
MONEY MARKET FUNDS — 0.3% | | Shares | | | Value | |
Fidelity Institutional Money Market Government Portfolio - Class I, 0.01% (b) (Cost $458,983) | | | 458,983 | | | $ | 458,983 | |
| | | | | | | | | |
Investments at Value — 98.7% (Cost $153,413,108) | | | | | | $ | 146,218,036 | |
| | | | | | | | | |
Other Assets in Excess of Liabilities — 1.3% | | | | | | | 1,851,313 | |
| | | | | | | | | |
Net Assets — 100.0% | | | | | | $ | 148,069,349 | |
(a) | Non-income producing security. |
(b) | The rate shown is the 7-day effective yield as of October 31, 2020. |
36 | See accompanying notes to financial statements. | |
CHARTWELL SMALL CAP VALUE FUND
SUMMARY OF INVESTMENTS
As of October 31, 2020 (Unaudited)
Security Type / Sector | Percent of
Net Assets |
Common Stocks | |
Financials | 26.1% |
Industrials | 20.7% |
Consumer Discretionary | 12.1% |
Real Estate | 9.6% |
Technology | 8.1% |
Materials | 7.4% |
Utilities | 6.9% |
Consumer Staples | 3.5% |
Health Care | 3.2% |
Energy | 0.8% |
Total Common Stocks | 98.4% |
Money Market Funds | 0.3% |
Investments | 98.7% |
Other Assets in Excess of Liabilities | 1.3% |
Net Assets | 100.0% |
37
CHARTWELL SHORT DURATION HIGH YIELD FUND
SCHEDULE OF INVESTMENTS
October 31, 2020 |
CORPORATE BONDS — 94.7% | | Par Value | | | Value | |
Communications — 13.3% | | | | | | | | |
AMC Networks, Inc., 5.00%, due 4/1/2024 | | $ | 3,876,000 | | | $ | 3,894,179 | |
CCO Holdings, LLC/CCO Holdings Capital Corporation, 5.75%, due 2/15/2026 (a) | | | 3,655,000 | | | | 3,788,992 | |
Level 3 Financing, Inc., 5.38%, due 1/15/2024 | | | 3,095,000 | | | | 3,117,315 | |
Sirius XM Radio, Inc., 4.63%, due 7/15/2024 (a) | | | 3,875,000 | | | | 3,995,900 | |
TEGNA, Inc., 4.75%, due 3/15/2026 (a) | | | 2,600,000 | | | | 2,671,500 | |
T-Mobile USA, Inc., 4.00%, due 4/15/2022 | | | 3,875,000 | | | | 3,997,004 | |
| | | | | | | | 21,464,890 | |
Consumer Discretionary — 10.3% | | | | | | | | |
Ford Motor Credit Company, LLC, 5.60%, due 1/7/2022 | | | 1,165,000 | | | | 1,192,960 | |
Ford Motor Credit Company, LLC, 4.38%, due 8/6/2023 | | | 1,665,000 | | | | 1,692,223 | |
Ford Motor Credit Company, LLC, 4.06%, due 11/1/2024 | | | 1,790,000 | | | | 1,795,012 | |
Hilton Domestic Operating Company, Inc., 4.25%, due 9/1/2024 | | | 3,875,000 | | | | 3,853,688 | |
Lennar Corporation, 4.13%, due 1/15/2022 | | | 2,995,000 | | | | 3,066,131 | |
Lennar Corporation, 4.75%, due 11/15/2022 | | | 880,000 | | | | 925,052 | |
QVC, Inc., 4.85%, due 4/1/2024 | | | 3,875,000 | | | | 4,039,687 | |
| | | | | | | | 16,564,753 | |
Consumer Staples — 1.3% | | | | | | | | |
Albertsons Companies, Inc., 3.25%, due 3/15/2026 (a) | | | 1,500,000 | | | | 1,471,425 | |
Clearwater Paper Corporation, 5.38%, due 2/1/2025 (a) | | | 560,000 | | | | 588,700 | |
| | | | | | | | 2,060,125 | |
Energy — 14.9% | | | | | | | | |
Apache Corporation, 4.63%, due 11/15/2025 | | | 140,000 | | | | 133,000 | |
DCP Midstream Operating, L.P., 4.95%, due 4/1/2022 | | | 815,000 | | | | 827,225 | |
DCP Midstream Operating, L.P., 3.88%, due 3/15/2023 | | | 3,060,000 | | | | 3,044,700 | |
Ensign Drilling, Inc., 9.25%, due 4/15/2024 (a) | | | 2,035,000 | | | | 702,075 | |
EQT Midstream Partners, L.P., 4.75%, due 7/15/2023 | | | 3,875,000 | | | | 3,854,480 | |
Rattler Midstream, L.P., 5.63%, due 7/15/2025 (a) | | | 3,875,000 | | | | 3,981,562 | |
Sunoco, L.P./Sunoco Finance Corporation, Series WI, 4.88%, due 1/15/2023 | | | 3,875,000 | | | | 3,904,062 | |
Targa Resources Partners, L.P./Targa Resources Partners Finance Corporation, 5.25%, due 5/1/2023 | | | 3,849,000 | | | | 3,847,076 | |
Western Midstream Operations, L.P., 4.00%, due 7/1/2022 | | | 1,765,000 | | | | 1,765,000 | |
Western Midstream Operations, L.P., 4.10%, due 2/1/2025 | | | 2,110,000 | | | | 1,987,873 | |
| | | | | | | | 24,047,053 | |
38 | See accompanying notes to financial statements. | |
CHARTWELL SHORT DURATION HIGH YIELD FUND
SCHEDULE OF INVESTMENTS (Continued) |
CORPORATE BONDS — 94.7% (Continued) | | Par Value | | | Value | |
Financials — 17.7% | | | | | | | | |
CIT Group, Inc., 5.00%, due 8/15/2022 | | $ | 3,875,000 | | | $ | 4,092,969 | |
Hub International Ltd., 6.88%, due 5/1/2025 | | | 1,690,000 | | | | 1,880,125 | |
Icahn Enterprises, L.P., 6.25%, due 2/1/2022 | | | 3,875,000 | | | | 3,884,688 | |
StoneX Group, Inc., 8.63%, due 6/15/2025 (a) | | | 3,870,000 | | | | 4,082,850 | |
Navient Corporation, 5.88%, due 3/25/2021 | | | 1,665,000 | | | | 1,681,650 | |
Navient Corporation, 6.63%, due 7/26/2021 | | | 2,210,000 | | | | 2,254,200 | |
NMI Holdings, Inc., 7.38%, due 6/1/2025 (a) | | | 3,875,000 | | | | 4,223,750 | |
SLM Corporation, 5.13%, due 4/5/2022 | | | 1,745,000 | | | | 1,792,987 | |
SLM Corporation, 4.20%, due 10/29/2025 | | | 655,000 | | | | 663,187 | |
Springleaf Finance Corporation, 5.63%, due 3/15/2023 | | | 1,850,000 | | | | 1,926,313 | |
Springleaf Finance Corporation, 6.13%, due 3/15/2024 | | | 2,025,000 | | | | 2,128,686 | |
| | | | | | | | 28,611,405 | |
Health Care — 5.8% | | | | | | | | |
Centene Corporation, 4.75%, due 1/15/2025 | | | 1,170,000 | | | | 1,202,175 | |
HCA, Inc., 5.88%, due 5/1/2023 | | | 3,875,000 | | | | 4,219,701 | |
Tenet Healthcare Corporation, 4.63%, due 7/15/2024 | | | 3,935,000 | | | | 4,001,508 | |
| | | | | | | | 9,423,384 | |
Industrials — 6.1% | | | | | | | | |
CNH Industrial Capital, LLC, 4.38%, due 11/6/2020 | | | 1,900,000 | | | | 1,900,001 | |
Delta Air Lines, Inc., 3.63%, due 3/15/2022 | | | 3,875,000 | | | | 3,797,439 | |
WESCO Distribution, Inc., 7.13%, due 6/15/2025 (a) | | | 3,875,000 | | | | 4,175,312 | |
| | | | | | | | 9,872,752 | |
Materials — 11.1% | | | | | | | | |
Alcoa, Inc., 5.13%, due 10/1/2024 | | | 2,180,000 | | | | 2,294,014 | |
Ball Corporation, 5.00%, due 3/15/2022 | | | 2,850,000 | | | | 2,968,417 | |
Crown Americas Capital Corporation IV, 4.50%, due 1/15/2023 | | | 3,875,000 | | | | 4,030,000 | |
Freeport-McMoran Copper & Gold, Inc., 3.88%, due 3/15/2023 | | | 3,365,000 | | | | 3,476,045 | |
Mercer International, Inc., 6.50%, due 2/1/2024 | | | 973,000 | | | | 977,865 | |
Polyone Corporation, 5.25%, due 3/15/2023 | | | 3,875,000 | | | | 4,143,867 | |
| | | | | | | | 17,890,208 | |
Real Estate — 8.9% | | | | | | | | |
GLP Capital, L.P./GLP Financing II, Inc., 5.38%, due 11/1/2023 | | | 2,835,000 | | | | 3,033,875 | |
iStar, Inc., 4.75%, due 10/1/2024 | | | 3,875,000 | | | | 3,700,625 | |
Kennedy Wilson Holdings, Inc., 5.88%, due 4/1/2024 | | | 3,875,000 | | | | 3,739,375 | |
Starwood Property Trust, Inc., 5.00%, due 12/15/2021 | | | 3,875,000 | | | | 3,855,625 | |
| | | | | | | | 14,329,500 | |
| | See accompanying notes to financial statements. | 39 |
CHARTWELL SHORT DURATION HIGH YIELD FUND
SCHEDULE OF INVESTMENTS (Continued) |
CORPORATE BONDS — 94.7% (Continued) | | Par Value | | | Value | |
Technology — 5.3% | | | | | | | | |
Dell International, LLC/EMC Corporation, 5.88%, due 6/15/2021 (a) | | $ | 1,733,000 | | | $ | 1,737,177 | |
EMC Corporation, 3.38%, due 6/1/2023 | | | 2,144,000 | | | | 2,185,915 | |
Seagate HDD Cayman, 4.75%, due 6/1/2023 | | | 2,480,000 | | | | 2,677,998 | |
Western Ditigal Corporation, 4.75%, due 2/15/2026 | | | 1,800,000 | | | | 1,938,690 | |
| | | | | | | | 8,539,780 | |
| | | | | | | | | |
Total Corporate Bonds (Cost $153,261,720) | | | | | | $ | 152,803,850 | |
|
MONEY MARKET FUNDS — 0.4% | | Shares | | | Value | |
Fidelity Institutional Money Market Government Portfolio - Class I, 0.01% (b) (Cost $707,919) | | | 707,919 | | | $ | 707,919 | |
| | | | | | | | | |
Investments at Value — 95.1% (Cost $153,969,639) | | | | | | $ | 153,511,769 | |
| | | | | | | | | |
Other Assets in Excess of Liabilities — 4.9% | | | | | | | 7,962,690 | |
| | | | | | | | | |
Net Assets — 100.0% | | | | | | $ | 161,474,459 | |
(a) | 144A - Security was purchased in a transaction exempt from registration in compliance with Rule 144A of the Securities Act of 1933. This security may be resold in transactions exempt from registration, normally to qualified institutional buyers. The total value of such securities is $31,419,243 as of October 31, 2020, representing 19.5% of net assets. |
(b) | The rate shown is the 7-day effective yield as of October 31, 2020. |
40 | See accompanying notes to financial statements. | |
CHARTWELL SHORT DURATION HIGH YIELD FUND
SUMMARY OF INVESTMENTS
As of October 31, 2020 (Unaudited)
Security Type / Sector | Percent of
Net Assets |
Corporate Bonds | |
Financials | 17.7% |
Energy | 14.9% |
Communications | 13.3% |
Materials | 11.1% |
Consumer Discretionary | 10.3% |
Real Estate | 8.9% |
Industrials | 6.1% |
Health Care | 5.8% |
Technology | 5.3% |
Consumer Staples | 1.3% |
Total Corporate Bonds | 94.7% |
Money Market Funds | 0.4% |
Investments | 95.1% |
Other Assets in Excess of Liabilities | 4.9% |
Net Assets | 100.0% |
41
CHARTWELL SMALL CAP GROWTH FUND
SCHEDULE OF INVESTMENTS
October 31, 2020 |
COMMON STOCKS — 94.3% | | Shares | | | Value | |
Communications — 0.9% | | | | | | | | |
Entertainment Content — 0.9% | | | | | | | | |
Zynga, Inc. - Class A (a) | | | 21,854 | | | $ | 196,468 | |
| | | | | | | | | |
Consumer Discretionary — 14.7% | | | | | | | | |
Apparel & Textile Products — 2.1% | | | | | | | | |
Capri Holdings Ltd. (a) | | | 7,530 | | | | 159,787 | |
Deckers Outdoor Corporation (a) | | | 1,254 | | | | 317,726 | |
| | | | | | | | 477,513 | |
Home Construction — 0.6% | | | | | | | | |
Taylor Morrison Home Corporation (a) | | | 6,764 | | | | 146,103 | |
| | | | | | | | | |
Leisure Facilities & Services — 7.6% | | | | | | | | |
Bloomin’ Brands, Inc. | | | 12,752 | | | | 178,273 | |
Boyd Gaming Corporation | | | 14,861 | | | | 471,391 | |
Brinker International, Inc. | | | 7,407 | | | | 322,501 | |
Churchill Downs, Inc. | | | 1,277 | | | | 190,464 | |
Extended Stay America, Inc. | | | 25,269 | | | | 286,803 | |
Papa John’s International, Inc. | | | 2,944 | | | | 225,510 | |
Penn National Gaming, Inc. (a) | | | 1,220 | | | | 65,856 | |
| | | | | | | | 1,740,798 | |
Retail - Discretionary — 4.4% | | | | | | | | |
Asbury Automotive Group, Inc. (a) | | | 1,620 | | | | 166,828 | |
At Home Group, Inc. (a) | | | 19,390 | | | | 315,863 | |
Builders FirstSource, Inc. (a) | | | 7,291 | | | | 220,917 | |
Lithia Motors, Inc. - Class A | | | 1,253 | | | | 287,651 | |
| | | | | | | | 991,259 | |
Consumer Staples — 4.2% | | | | | | | | |
Beverages — 0.9% | | | | | | | | |
Boston Beer Company, Inc. (The) - Class A (a) | | | 189 | | | | 196,405 | |
| | | | | | | | | |
Household Products — 2.0% | | | | | | | | |
Helen of Troy Ltd. (a) | | | 2,455 | | | | 465,468 | |
| | | | | | | | | |
Retail - Consumer Staples — 1.3% | | | | | | | | |
Ollie’s Bargain Outlet Holdings, Inc. (a) | | | 3,332 | | | | 290,184 | |
42 | See accompanying notes to financial statements. | |
CHARTWELL SMALL CAP GROWTH FUND
SCHEDULE OF INVESTMENTS (Continued) |
COMMON STOCKS — 94.3% (Continued) | | Shares | | | Value | |
Energy — 2.5% | | | | | | | | |
Renewable Energy — 2.5% | | | | | | | | |
Canadian Solar, Inc. (a) | | | 4,344 | | | $ | 157,904 | |
Sunnova Energy International, Inc. (a) | | | 5,589 | | | | 134,471 | |
Sunrun, Inc. (a) | | | 5,286 | | | | 274,978 | |
| | | | | | | | 567,353 | |
Financials — 1.5% | | | | | | | | |
Asset Management — 0.8% | | | | | | | | |
Open Lending Corporation - Class A (a) | | | 6,931 | | | | 179,929 | |
| | | | | | | | | |
Insurance — 0.7% | | | | | | | | |
BRP Group, Inc. - Class A (a) | | | 6,195 | | | | 157,972 | |
| | | | | | | | | |
Health Care — 35.5% | | | | | | | | |
Biotech & Pharma — 15.1% | | | | | | | | |
Allogene Therapeutics, Inc. (a) | | | 2,154 | | | | 73,064 | |
Arena Pharmaceuticals, Inc. (a) | | | 3,865 | | | | 331,308 | |
Axsome Therapeutics, Inc. (a) | | | 1,131 | | | | 74,997 | |
ChemoCentryx, Inc. (a) | | | 2,339 | | | | 112,272 | |
Horizon Therapeutics plc (a) | | | 11,366 | | | | 851,654 | |
Krystal Biotech, Inc. (a) | | | 2,994 | | | | 128,712 | |
Kura Oncology, Inc. (a) | | | 6,646 | | | | 207,687 | |
Mirum Pharmaceuticals, Inc. (a) | | | 6,543 | | | | 103,052 | |
MyoKardia, Inc. (a) | | | 2,432 | | | | 543,625 | |
Novavax, Inc. (a) | | | 363 | | | | 29,298 | |
PTC Therapeutics, Inc. (a) | | | 1,082 | | | | 56,470 | |
Relmada Therapeutics, Inc. (a) | | | 1,101 | | | | 34,054 | |
Scholar Rock Holding Corporation (a) | | | 3,173 | | | | 123,430 | |
Trillium Therapeutics, Inc. (a) | | | 18,141 | | | | 225,855 | |
Turning Point Therapeutics, Inc. (a) | | | 928 | | | | 85,552 | |
United Therapeutics Corporation (a) | | | 3,360 | | | | 451,013 | |
| | | | | | | | 3,432,043 | |
Health Care Facilities & Services — 6.3% | | | | | | | | |
Addus HomeCare Corporation (a) | | | 2,593 | | | | 252,999 | |
Covetrus, Inc. (a) | | | 5,343 | | | | 131,919 | |
ICON plc (a) | | | 2,637 | | | | 475,451 | |
LHC Group, Inc. (a) | | | 1,185 | | | | 256,612 | |
Owens & Minor, Inc. | | | 13,004 | | | | 326,660 | |
| | | | | | | | 1,443,641 | |
| | See accompanying notes to financial statements. | 43 |
CHARTWELL SMALL CAP GROWTH FUND
SCHEDULE OF INVESTMENTS (Continued) |
COMMON STOCKS — 94.3% (Continued) | | Shares | | | Value | |
Health Care — 35.5% (Continued) | | | | | | | | |
Medical Equipment & Devices — 14.1% | | | | | | | | |
AtriCure, Inc. (a) | | | 2,662 | | | $ | 91,999 | |
Castle Biosciences, Inc. (a) | | | 2,380 | | | | 110,503 | |
ICU Medical, Inc. (a) | | | 1,537 | | | | 273,263 | |
Invitae Corporation (a) | | | 2,967 | | | | 116,336 | |
Merit Medical Systems, Inc. (a) | | | 8,786 | | | | 439,739 | |
Natera, Inc. (a) | | | 9,854 | | | | 662,780 | |
Novocure Ltd. (a) | | | 2,794 | | | | 341,147 | |
Quidel Corporation (a) | | | 1,656 | | | | 444,288 | |
Repligen Corporation (a) | | | 1,513 | | | | 252,021 | |
Silk Road Medical, Inc. (a) | | | 2,348 | | | | 142,289 | |
Tandem Diabetes Care, Inc. (a) | | | 3,230 | | | | 352,070 | |
| | | | | | | | 3,226,435 | |
Industrials — 9.4% | | | | | | | | |
Commercial Support Services — 0.8% | | | | | | | | |
UniFirst Corporation | | | 1,172 | | | | 191,985 | |
| | | | | | | | | |
Electrical Equipment — 2.4% | | | | | | | | |
Generac Holdings, Inc. (a) | | | 2,564 | | | | 538,825 | |
| | | | | | | | | |
Engineering & Construction — 2.6% | | | | | | | | |
TopBuild Corporation (a) | | | 1,162 | | | | 178,030 | |
WillScot Mobile Mini Holdings Corporation (a) | | | 22,429 | | | | 416,731 | |
| | | | | | | | 594,761 | |
Industrial Support Services — 2.0% | | | | | | | | |
Applied Industrial Technologies, Inc. | | | 1,265 | | | | 77,228 | |
H&E Equipment Services, Inc. | | | 7,083 | | | | 149,026 | |
SiteOne Landscape Supply, Inc. (a) | | | 1,858 | | | | 222,013 | |
| | | | | | | | 448,267 | |
Machinery — 1.1% | | | | | | | | |
Oshkosh Corporation | | | 3,798 | | | | 255,833 | |
| | | | | | | | | |
Transportation & Logistics — 0.5% | | | | | | | | |
Atlas Air Worldwide Holdings, Inc. (a) | | | 1,779 | | | | 105,246 | |
44 | See accompanying notes to financial statements. | |
CHARTWELL SMALL CAP GROWTH FUND
SCHEDULE OF INVESTMENTS (Continued) |
COMMON STOCKS — 94.3% (Continued) | | Shares | | | Value | |
Materials — 5.1% | | | | | | | | |
Chemicals — 1.5% | | | | | | | | |
Quaker Chemical Corporation | | | 1,860 | | | $ | 354,870 | |
| | | | | | | | | |
Construction Materials — 2.8% | | | | | | | | |
Advanced Drainage Systems, Inc. | | | 6,123 | | | | 388,382 | |
Forterra, Inc. (a) | | | 19,429 | | | | 253,548 | |
| | | | | | | | 641,930 | |
Forestry, Paper & Wood Products — 0.8% | | | | | | | | |
Trex Company, Inc. (a) | | | 2,482 | | | | 172,598 | |
| | | | | | | | | |
Real Estate — 6.4% | | | | | | | | |
Real Estate Services — 0.8% | | | | | | | | |
Realogy Holdings Corporation (a) | | | 7,817 | | | | 87,238 | |
Redfin Corporation (a) | | | 2,435 | | | | 101,710 | |
| | | | | | | | 188,948 | |
REITs — 5.6% | | | | | | | | |
Hannon Armstrong Sustainable Infrastructure Capital, Inc. | | | 6,689 | | | | 279,935 | |
MGM Growth Properties, LLC - Class A | | | 7,639 | | | | 202,051 | |
Physicians Realty Trust | | | 16,273 | | | | 274,363 | |
QTS Realty Trust, Inc. - Class A | | | 3,973 | | | | 244,379 | |
STAG Industrial, Inc. | | | 9,048 | | | | 281,574 | |
| | | | | | | | 1,282,302 | |
Technology — 14.1% | | | | | | | | |
Semiconductors — 1.2% | | | | | | | | |
MACOM Technology Solutions Holdings, Inc. (a) | | | 7,387 | | | | 269,625 | |
| | | | | | | | | |
Software — 11.4% | | | | | | | | |
Bandwidth, Inc. - Class A (a) | | | 2,279 | | | | 365,449 | |
Everbridge, Inc. (a) | | | 1,360 | | | | 142,378 | |
Five9, Inc. (a) | | | 1,806 | | | | 274,006 | |
LivePerson, Inc. (a) | | | 6,055 | | | | 323,700 | |
Manhattan Associates, Inc. (a) | | | 3,505 | | | | 299,678 | |
Nutanix, Inc. - Class A (a) | | | 13,850 | | | | 337,109 | |
Q2 Holdings, Inc. (a) | | | 2,411 | | | | 219,980 | |
Rapid7, Inc. (a) | | | 7,719 | | | | 478,038 | |
Varonis Systems, Inc. (a) | | | 1,319 | | | | 152,437 | |
| | | | | | | | 2,592,775 | |
Technology Hardware — 0.5% | | | | | | | | |
Akoustis Technologies, Inc. (a) | | | 15,021 | | | | 124,524 | |
| | See accompanying notes to financial statements. | 45 |
CHARTWELL SMALL CAP GROWTH FUND
SCHEDULE OF INVESTMENTS (Continued) |
COMMON STOCKS — 94.3% (Continued) | | Shares | | | Value | |
Technology — 14.1% (Continued) | | | | | | | | |
Technology Services — 1.0% | | | | | | | | |
Endava plc - ADR (a) | | | 2,041 | | | $ | 130,420 | |
ManTech International Corporation - Class A | | | 1,465 | | | | 95,049 | |
| | | | | | | | 225,469 | |
| | | | | | | | | |
Total Common Stocks (Cost $16,248,431) | | | | | | $ | 21,499,529 | |
|
MONEY MARKET FUNDS — 3.9% | | Shares | | | Value | |
Fidelity Institutional Money Market Government Portfolio - Class I, 0.01% (b) (Cost $887,628) | | | 887,628 | | | $ | 887,628 | |
| | | | | | | | | |
Investments at Value — 98.2% (Cost $17,136,059) | | | | | | $ | 22,387,157 | |
| | | | | | | | | |
Other Assets in Excess of Liabilities — 1.8% | | | | | | | 420,933 | |
| | | | | | | | | |
Net Assets — 100.0% | | | | | | $ | 22,808,090 | |
(a) | Non-income producing security. |
(b) | The rate shown is the 7-day effective yield as of October 31, 2020. |
ADR – American Depositary Receipt |
46 | See accompanying notes to financial statements. | |
CHARTWELL SMALL CAP GROWTH FUND
SUMMARY OF INVESTMENTS
As of October 31, 2020 (Unaudited)
Security Type / Sector | Percent of
Net Assets |
Common Stocks | |
Health Care | 35.5% |
Consumer Discretionary | 14.7% |
Technology | 14.1% |
Industrials | 9.4% |
Real Estate | 6.4% |
Materials | 5.1% |
Consumer Staples | 4.2% |
Energy | 2.5% |
Financials | 1.5% |
Communications | 0.9% |
Total Common Stocks | 94.3% |
Money Market Funds | 3.9% |
Investments | 98.2% |
Other Assets in Excess of Liabilities | 1.8% |
Net Assets | 100.0% |
47
CHARTWELL FUNDS
STATEMENTS OF ASSETS AND LIABILITIES
October 31, 2020 |
| | Chartwell
Income Fund | | | Chartwell
Mid Cap
Value Fund | | | Chartwell
Small Cap
Value Fund | |
ASSETS | | | | | | | | | | | | |
Investments at cost | | $ | 558,491,737 | | | $ | 25,178,870 | | | $ | 153,413,108 | |
Investments at value (Notes 2 and 7) | | $ | 548,797,315 | | | $ | 24,750,232 | | | $ | 146,218,036 | |
Cash | | | 24,000,000 | | | | 66 | | | | 2,000,000 | |
Receivable for capital shares sold | | | 119,887 | | | | 24,469 | | | | 42,717 | |
Receivable for investment securities sold | | | 2,015,633 | | | | — | | | | — | |
Dividends and interest receivable | | | 4,096,015 | | | | 12,759 | | | | 58,933 | |
Foreign tax reclaims receivable | | | 65,432 | | | | — | | | | — | |
Other assets | | | 52,327 | | | | 12,006 | | | | 18,931 | |
TOTAL ASSETS | | | 579,146,609 | | | | 24,799,532 | | | | 148,338,617 | |
| | | | | | | | | | | | | |
LIABILITIES | | | | | | | | | | | | |
Payable for capital shares redeemed | | | 2,531,431 | | | | 22,665 | | | | 126,055 | |
Payable for investment securities purchased | | | 8,236,488 | | | | — | | | | — | |
Payable to Advisor (Note 3) | | | 242,365 | | | | 1,668 | | | | 99,742 | |
Payable to administrator (Note 3) | | | 23,100 | | | | 3,900 | | | | 8,200 | |
Other accrued expenses | | | 88,436 | | | | 19,709 | | | | 35,271 | |
TOTAL LIABILITIES | | | 11,121,820 | | | | 47,942 | | | | 269,268 | |
| | | | | | | | | | | | | |
NET ASSETS | | $ | 568,024,789 | | | $ | 24,751,590 | | | $ | 148,069,349 | |
| | | | | | | | | | | | | |
NET ASSETS CONSIST OF: | | | | | | | | | | | | |
Paid-in capital | | $ | 603,219,217 | | | $ | 26,453,375 | | | $ | 159,089,446 | |
Accumulated deficit | | | (35,194,428 | ) | | | (1,701,785 | ) | | | (11,020,097 | ) |
NET ASSETS | | $ | 568,024,789 | | | $ | 24,751,590 | | | $ | 148,069,349 | |
Shares of beneficial interest outstanding (unlimited number of shares authorized, par value $0.01) | | | 44,655,714 | | | | 1,886,412 | | | | 10,039,289 | |
Net asset value, offering price and redemption price per share (Note 2) | | $ | 12.72 | | | $ | 13.12 | | | $ | 14.75 | |
48 | See accompanying notes to financial statements. | |
CHARTWELL FUNDS
STATEMENTS OF ASSETS AND LIABILITIES (Continued)
October 31, 2020 |
| | Chartwell
Short Duration
High Yield Fund | | | Chartwell
Small Cap
Growth Fund | |
ASSETS | | | | | | | | |
Investments at cost | | $ | 153,969,639 | | | $ | 17,136,059 | |
Investments at value (Notes 2 and 7) | | $ | 153,511,769 | | | $ | 22,387,157 | |
Cash | | | 6,000,000 | | | | 244 | |
Receivable for capital shares sold | | | 500 | | | | — | |
Receivable for investment securities sold | | | — | | | | 435,462 | |
Dividends and interest receivable | | | 2,010,999 | | | | 1,088 | |
Other assets | | | 18,837 | | | | 10,534 | |
TOTAL ASSETS | | | 161,542,105 | | | | 22,834,485 | |
| | | | | | | | | |
LIABILITIES | | | | | | | | |
Payable to Advisor (Note 3) | | | 35,544 | | | | 2,531 | |
Payable to administrator (Note 3) | | | 8,500 | | | | 3,800 | |
Other accrued expenses | | | 23,602 | | | | 20,064 | |
TOTAL LIABILITIES | | | 67,646 | | | | 26,395 | |
| | | | | | | | | |
NET ASSETS | | $ | 161,474,459 | | | $ | 22,808,090 | |
| | | | | | | | | |
NET ASSETS CONSIST OF: | | | | | | | | |
Paid-in capital | | $ | 162,255,039 | | | $ | 15,930,775 | |
Accumulated earnings (deficit) | | | (780,580 | ) | | | 6,877,315 | |
NET ASSETS | | $ | 161,474,459 | | | $ | 22,808,090 | |
Shares of beneficial interest outstanding (unlimited number of shares authorized, par value $0.01) | | | 16,835,882 | | | | 1,498,914 | |
Net asset value, offering price and redemption price per share (Note 2) | | $ | 9.59 | | | $ | 15.22 | |
| | See accompanying notes to financial statements. | 49 |
CHARTWELL FUNDS
STATEMENTS OF OPERATIONS
For the Year Ended October 31, 2020 |
| | Chartwell
Income Fund | | | Chartwell
Mid Cap
Value Fund | | | Chartwell
Small Cap
Value Fund | |
INVESTMENT INCOME | | | | | | | | | | | | |
Dividends | | $ | 6,173,309 | | | $ | 539,963 | | | $ | 2,906,005 | |
Foreign withholding taxes on dividends | | | (6,094 | ) | | | — | | | | — | |
Interest | | | 21,884,180 | | | | 5,716 | | | | 32,613 | |
Securities lending income (Note 8) | | | 10,308 | | | | 4 | | | | 854 | |
TOTAL INVESTMENT INCOME | | | 28,061,703 | | | | 545,683 | | | | 2,939,472 | |
| | | | | | | | | | | | | |
EXPENSES | | | | | | | | | | | | |
Investment advisory fees (Note 3) | | | 3,782,115 | | | | 177,935 | | | | 1,425,107 | |
Transfer agent fees (Note 3) | | | 504,685 | | | | 19,446 | | | | 159,801 | |
Fund administration fees (Note 3) | | | 341,147 | | | | 47,952 | | | | 101,887 | |
Legal fees | | | 101,994 | | | | 3,341 | | | | 21,994 | |
Registration and filing fees | | | 43,045 | | | | 31,998 | | | | 32,054 | |
Custodian and bank service fees | | | 76,558 | | | | 7,371 | | | | 21,075 | |
Trustees’ fees and expenses (Note 3) | | | 29,221 | | | | 27,697 | | | | 27,947 | |
Insurance fees | | | 49,504 | | | | 1,200 | | | | 9,470 | |
Audit and tax services fees | | | 18,450 | | | | 18,450 | | | | 18,450 | |
Printing of shareholder reports | | | 37,029 | | | | 2,231 | | | | 10,593 | |
Other expenses | | | 105,654 | | | | 9,928 | | | | 31,378 | |
TOTAL EXPENSES | | | 5,089,402 | | | | 347,549 | | | | 1,859,756 | |
Less fee reductions by the Advisor (Note 3) | | | (259,244 | ) | | | (134,150 | ) | | | (198,691 | ) |
NET EXPENSES | | | 4,830,158 | | | | 213,399 | | | | 1,661,065 | |
| | | | | | | | | | | | | |
NET INVESTMENT INCOME | | | 23,231,545 | | | | 332,284 | | | | 1,278,407 | |
| | | | | | | | | | | | | |
REALIZED AND UNREALIZED LOSSES ON INVESTMENTS | | | | | | | | | | | | |
Net realized losses on investment transactions | | | (15,945,872 | ) | | | (1,478,100 | ) | | | (364,523 | ) |
Net change in unrealized appreciation (depreciation) on investments | | | (30,558,528 | ) | | | (1,900,580 | ) | | | (34,328,452 | ) |
NET REALIZED AND UNREALIZED LOSSES ON INVESTMENTS | | | (46,504,400 | ) | | | (3,378,680 | ) | | | (34,692,975 | ) |
| | | | | | | | | | | | | |
NET DECREASE IN NET ASSETS RESULTING FROM OPERATIONS | | $ | (23,272,855 | ) | | $ | (3,046,396 | ) | | $ | (33,414,568 | ) |
50 | See accompanying notes to financial statements. | |
CHARTWELL FUNDS
STATEMENTS OF OPERATIONS (Continued)
For the Year Ended October 31, 2020 |
| | Chartwell
Short Duration
High Yield Fund | | | Chartwell
Small Cap
Growth Fund | |
INVESTMENT INCOME | | | | | | | | |
Dividends | | $ | 3,893 | | | $ | 98,508 | |
Interest | | | 4,608,662 | | | | 2,364 | |
Securities lending income (Note 8) | | | 1,653 | | | | 910 | |
TOTAL INVESTMENT INCOME | | | 4,614,208 | | | | 101,782 | |
| | | | | | | | | |
EXPENSES | | | | | | | | |
Investment advisory fees (Note 3) | | | 456,181 | | | | 176,765 | |
Fund administration fees (Note 3) | | | 84,201 | | | | 46,716 | |
Registration and filing fees | | | 36,140 | | | | 29,154 | |
Trustees’ fees and expenses (Note 3) | | | 27,807 | | | | 27,691 | |
Transfer agent fees (Note 3) | | | 16,413 | | | | 31,321 | |
Audit and tax services fees | | | 18,450 | | | | 18,450 | |
Legal fees | | | 16,866 | | | | 7,693 | |
Custodian and bank service fees | | | 15,336 | | | | 7,947 | |
Insurance fees | | | 4,734 | | | | 1,028 | |
Printing of shareholder reports | | | 2,082 | | | | 2,185 | |
Other expenses | | | 23,054 | | | | 11,488 | |
TOTAL EXPENSES | | | 701,264 | | | | 360,438 | |
Less fee reductions by the Advisor (Note 3) | | | (141,721 | ) | | | (142,122 | ) |
NET EXPENSES | | | 559,543 | | | | 218,316 | |
| | | | | | | | | |
NET INVESTMENT INCOME (LOSS) | | | 4,054,665 | | | | (116,534 | ) |
| | | | | | | | | |
REALIZED AND UNREALIZED GAINS (LOSSES) ON INVESTMENTS | | | | | | | | |
Net realized gains on investment transactions | | | 268,007 | | | | 1,924,380 | |
Net change in unrealized appreciation (depreciation) on investments | | | (1,050,130 | ) | | | 3,495,156 | |
NET REALIZED AND UNREALIZED GAINS (LOSSES) ON INVESTMENTS | | | (782,123 | ) | | | 5,419,536 | |
| | | | | | | | | |
NET INCREASE IN NET ASSETS RESULTING FROM OPERATIONS | | $ | 3,272,542 | | | $ | 5,303,002 | |
| | See accompanying notes to financial statements. | 51 |
CHARTWELL INCOME FUND
STATEMENTS OF CHANGES IN NET ASSETS |
| | Year
Ended
October 31,
2020 | | | Year
Ended
October 31,
2019 | |
FROM OPERATIONS | | | | | | | | |
Net investment income | | $ | 23,231,545 | | | $ | 37,293,015 | |
Net realized gains (losses) from investment transactions | | | (15,945,872 | ) | | | 679,622 | |
Net change in unrealized appreciation (depreciation) on investments | | | (30,558,528 | ) | | | 49,852,893 | |
Net increase (decrease) in net assets resulting from operations | | | (23,272,855 | ) | | | 87,825,530 | |
| | | | | | | | | |
DISTRIBUTIONS TO SHAREHOLDERS (Notes 2 and 4) | | | (24,453,130 | ) | | | (82,348,018 | ) |
| | | | | | | | | |
FROM CAPITAL SHARE TRANSACTIONS | | | | | | | | |
Proceeds from shares sold | | | 44,119,470 | | | | 165,835,797 | |
Reinvestment of distributions to shareholders | | | 23,616,932 | | | | 79,458,128 | |
Proceeds from redemption fees collected (Note 2) | | | 4,961 | | | | 14,167 | |
Payments for shares redeemed | | | (482,238,215 | ) | | | (710,832,878 | ) |
Net decrease in net assets from capital share transactions | | | (414,496,852 | ) | | | (465,524,786 | ) |
| | | | | | | | | |
TOTAL DECREASE IN NET ASSETS | | | (462,222,837 | ) | | | (460,047,274 | ) |
| | | | | | | | | |
NET ASSETS | | | | | | | | |
Beginning of year | | | 1,030,247,626 | | | | 1,490,294,900 | |
End of year | | $ | 568,024,789 | | | $ | 1,030,247,626 | |
| | | | | | | | | |
SUMMARY OF CAPITAL SHARE ACTIVITY | | | | | | | | |
Shares sold | | | 3,410,553 | | | | 12,783,350 | |
Shares issued in reinvestment of distributions to shareholders | | | 1,859,248 | | | | 6,236,576 | |
Shares redeemed | | | (38,300,799 | ) | | | (54,373,349 | ) |
Net decrease in shares outstanding | | | (33,030,998 | ) | | | (35,353,423 | ) |
Shares outstanding, beginning of year | | | 77,686,712 | | | | 113,040,135 | |
Shares outstanding, end of year | | | 44,655,714 | | | | 77,686,712 | |
52 | See accompanying notes to financial statements. | |
CHARTWELL MID CAP VALUE FUND
STATEMENTS OF CHANGES IN NET ASSETS |
| | Year
Ended
October 31,
2020 | | | Year
Ended
October 31,
2019 | |
FROM OPERATIONS | | | | | | | | |
Net investment income | | $ | 332,284 | | | $ | 268,409 | |
Net realized gains (losses) from investment transactions | | | (1,478,100 | ) | | | 167,581 | |
Net change in unrealized appreciation (depreciation) on investments | | | (1,900,580 | ) | | | 2,176,985 | |
Net increase (decrease) in net assets resulting from operations | | | (3,046,396 | ) | | | 2,612,975 | |
| | | | | | | | | |
DISTRIBUTIONS TO SHAREHOLDERS (Notes 2 and 4) | | | (502,601 | ) | | | (1,644,533 | ) |
| | | | | | | | | |
FROM CAPITAL SHARE TRANSACTIONS | | | | | | | | |
Proceeds from shares sold | | | 10,310,948 | | | | 5,932,732 | |
Reinvestment of distributions to shareholders | | | 501,860 | | | | 1,317,111 | |
Payments for shares redeemed | | | (8,215,753 | ) | | | (7,836,397 | ) |
Net increase (decrease) in net assets from capital share transactions | | | 2,597,055 | | | | (586,554 | ) |
| | | | | | | | | |
TOTAL INCREASE (DECREASE) IN NET ASSETS | | | (951,942 | ) | | | 381,888 | |
| | | | | | | | | |
NET ASSETS | | | | | | | | |
Beginning of year | | | 25,703,532 | | | | 25,321,644 | |
End of year | | $ | 24,751,590 | | | $ | 25,703,532 | |
| | | | | | | | | |
SUMMARY OF CAPITAL SHARE ACTIVITY | | | | | | | | |
Shares sold | | | 799,048 | | | | 397,719 | |
Shares issued in reinvestment of distributions to shareholders | | | 32,150 | | | | 102,260 | |
Shares redeemed | | | (599,199 | ) | | | (525,594 | ) |
Net increase (decrease) in shares outstanding | | | 231,999 | | | | (25,615 | ) |
Shares outstanding, beginning of year | | | 1,654,413 | | | | 1,680,028 | |
Shares outstanding, end of year | | | 1,886,412 | | | | 1,654,413 | |
| | See accompanying notes to financial statements. | 53 |
CHARTWELL SMALL CAP VALUE FUND
STATEMENTS OF CHANGES IN NET ASSETS |
| | Year
Ended
October 31,
2020 | | | Year
Ended
October 31,
2019 | |
FROM OPERATIONS | | | | | | | | |
Net investment income | | $ | 1,278,407 | | | $ | 1,356,756 | |
Net realized gains (losses) from investment transactions | | | (364,523 | ) | | | 730,657 | |
Net change in unrealized appreciation (depreciation) on investments | | | (34,328,452 | ) | | | 11,242,254 | |
Net increase (decrease) in net assets resulting from operations | | | (33,414,568 | ) | | | 13,329,667 | |
| | | | | | | | | |
DISTRIBUTIONS TO SHAREHOLDERS (Notes 2 and 4) | | | (6,288,627 | ) | | | (15,260,911 | ) |
| | | | | | | | | |
FROM CAPITAL SHARE TRANSACTIONS | | | | | | | | |
Proceeds from shares sold | | | 55,427,208 | | | | 33,091,902 | |
Reinvestment of distributions to shareholders | | | 4,682,565 | | | | 12,900,047 | |
Proceeds from redemption fees collected (Note 2) | | | 26 | | | | 1,176 | |
Payments for shares redeemed | | | (45,089,775 | ) | | | (100,088,621 | ) |
Net increase (decrease) in net assets from capital share transactions | | | 15,020,024 | | | | (54,095,496 | ) |
| | | | | | | | | |
TOTAL DECREASE IN NET ASSETS | | | (24,683,171 | ) | | | (56,026,740 | ) |
| | | | | | | | | |
NET ASSETS | | | | | | | | |
Beginning of year | | | 172,752,520 | | | | 228,779,260 | |
End of year | | $ | 148,069,349 | | | $ | 172,752,520 | |
| | | | | | | | | |
SUMMARY OF CAPITAL SHARE ACTIVITY | | | | | | | | |
Shares sold | | | 3,610,972 | | | | 1,875,120 | |
Shares issued in reinvestment of distributions to shareholders | | | 247,624 | | | | 818,012 | |
Shares redeemed | | | (3,073,144 | ) | | | (5,616,035 | ) |
Net increase (decrease) in shares outstanding | | | 785,452 | | | | (2,922,903 | ) |
Shares outstanding, beginning of year | | | 9,253,837 | | | | 12,176,740 | |
Shares outstanding, end of year | | | 10,039,289 | | | | 9,253,837 | |
54 | See accompanying notes to financial statements. | |
CHARTWELL SHORT DURATION HIGH YIELD FUND
STATEMENTS OF CHANGES IN NET ASSETS |
| | Year
Ended
October 31,
2020 | | | Year
Ended
October 31,
2019 | |
FROM OPERATIONS | | | | | | | | |
Net investment income | | $ | 4,054,665 | | | $ | 2,951,955 | |
Net realized gains from investment transactions | | | 268,007 | | | | 209,404 | |
Net change in unrealized appreciation (depreciation) on investments | | | (1,050,130 | ) | | | 1,442,190 | |
Net increase in net assets resulting from operations | | | 3,272,542 | | | | 4,603,549 | |
| | | | | | | | | |
DISTRIBUTIONS TO SHAREHOLDERS (Notes 2 and 4) | | | (4,083,761 | ) | | | (2,983,171 | ) |
| | | | | | | | | |
FROM CAPITAL SHARE TRANSACTIONS | | | | | | | | |
Proceeds from shares sold | | | 77,512,641 | | | | 28,495,123 | |
Reinvestment of distributions to shareholders | | | 4,009,862 | | | | 2,784,881 | |
Proceeds from redemption fees collected (Note 2) | | | 13 | | | | 2 | |
Payments for shares redeemed | | | (11,151,261 | ) | | | (16,521,718 | ) |
Net increase in net assets from capital share transactions | | | 70,371,255 | | | | 14,758,288 | |
| | | | | | | | | |
TOTAL INCREASE IN NET ASSETS | | | 69,560,036 | | | | 16,378,666 | |
| | | | | | | | | |
NET ASSETS | | | | | | | | |
Beginning of year | | | 91,914,423 | | | | 75,535,757 | |
End of year | | $ | 161,474,459 | | | $ | 91,914,423 | |
| | | | | | | | | |
SUMMARY OF CAPITAL SHARE ACTIVITY | | | | | | | | |
Shares sold | | | 8,088,395 | | | | 2,956,306 | |
Shares issued in reinvestment of distributions to shareholders | | | 420,426 | | | | 289,630 | |
Shares redeemed | | | (1,172,529 | ) | | | (1,716,129 | ) |
Net increase in shares outstanding | | | 7,336,292 | | | | 1,529,807 | |
Shares outstanding, beginning of year | | | 9,499,590 | | | | 7,969,783 | |
Shares outstanding, end of year | | | 16,835,882 | | | | 9,499,590 | |
| | See accompanying notes to financial statements. | 55 |
CHARTWELL SMALL CAP GROWTH FUND
STATEMENTS OF CHANGES IN NET ASSETS |
| | Year
Ended
October 31,
2020 | | | Year
Ended
October 31,
2019 | |
FROM OPERATIONS | | | | | | | | |
Net investment loss | | $ | (116,534 | ) | | $ | (80,098 | ) |
Net realized gains (losses) from investment transactions | | | 1,924,380 | | | | (47,099 | ) |
Net change in unrealized appreciation (depreciation) on investments | | | 3,495,156 | | | | 844,833 | |
Net increase in net assets resulting from operations | | | 5,303,002 | | | | 717,636 | |
| | | | | | | | | |
DISTRIBUTIONS TO SHAREHOLDERS (Notes 2 and 4) | | | (7,527 | ) | | | (70,964 | ) |
| | | | | | | | | |
FROM CAPITAL SHARE TRANSACTIONS | | | | | | | | |
Proceeds from shares sold | | | 647,299 | | | | 3,964,802 | |
Reinvestment of distributions to shareholders | | | 7,527 | | | | 70,764 | |
Proceeds from redemption fees collected (Note 2) | | | 16 | | | | 1 | |
Payments for shares redeemed | | | (3,778,852 | ) | | | (1,866,199 | ) |
Net increase (decrease) in net assets from capital share transactions | | | (3,124,010 | ) | | | 2,169,368 | |
| | | | | | | | | |
TOTAL INCREASE IN NET ASSETS | | | 2,171,465 | | | | 2,816,040 | |
| | | | | | | | | |
NET ASSETS | | | | | | | | |
Beginning of year | | | 20,636,625 | | | | 17,820,585 | |
End of year | | $ | 22,808,090 | | | $ | 20,636,625 | |
| | | | | | | | | |
SUMMARY OF CAPITAL SHARE ACTIVITY | | | | | | | | |
Shares sold | | | 52,256 | | | | 362,801 | |
Shares issued in reinvestment of distributions to shareholders | | | 584 | | | | 7,048 | |
Shares redeemed | | | (306,323 | ) | | | (160,368 | ) |
Net increase (decrease) in shares outstanding | | | (253,483 | ) | | | 209,481 | |
Shares outstanding, beginning of year | | | 1,752,397 | | | | 1,542,916 | |
Shares outstanding, end of year | | | 1,498,914 | | | | 1,752,397 | |
56 | See accompanying notes to financial statements. | |
CHARTWELL INCOME FUND
FINANCIAL HIGHLIGHTS |
Per Share Data for a Share Outstanding Throughout Each Year |
| | Year
Ended
October 31,
2020 | | | Year
Ended
October 31,
2019 | | | Year
Ended
October 31,
2018 | |
Net asset value at beginning of year | | $ | 13.26 | | | $ | 13.18 | | | $ | 13.80 | |
| | | | | | | | | | | | | |
Income (loss) from investment operations: | | | | | | | | | | | | |
Net investment income | | | 0.40 | | | | 0.41 | | | | 0.31 | |
Net realized and unrealized gains (losses) on investment transactions | | | (0.52 | ) | | | 0.50 | | | | (0.19 | ) |
Total from investment operations | | | (0.12 | ) | | | 0.91 | | | | 0.12 | |
| | | | | | | | | | | | | |
Less distributions from: | | | | | | | | | | | | |
Net investment income | | | (0.42 | ) | | | (0.44 | ) | | | (0.30 | ) |
Net realized gains on investments | | | — | | | | (0.39 | ) | | | (0.44 | ) |
Total distributions | | | (0.42 | ) | | | (0.83 | ) | | | (0.74 | ) |
| | | | | | | | | | | | | |
Proceeds from redemption fees collected (Note 2) | | | 0.00 | (a) | | | 0.00 | (a) | | | 0.00 | (a) |
| | | | | | | | | | | | | |
Net asset value at end of year | | $ | 12.72 | | | $ | 13.26 | | | $ | 13.18 | |
| | | | | | | | | | | | | |
Total return (b) | | | (0.83 | %) | | | 7.22 | % | | | 0.88 | % |
| | | | | | | | | | | | | |
Ratios/Supplementary data: | | | | | | | | | | | | |
Net assets at end of year (000,000’s) | | $ | 568 | | | $ | 1,030 | | | $ | 1,490 | |
| | | | | | | | | | | | | |
Ratio of total expenses to average net assets: | | | | | | | | | | | | |
Before fees reduced | | | 0.67 | % | | | 0.66 | % | | | 0.68 | % |
After fees reduced (c) | | | 0.64 | % | | | 0.64 | % | | | 0.64 | % |
Ratio of net investment income to average net assets: | | | | | | | | | | | | |
Before fees reduced | | | 3.04 | % | | | 2.93 | % | | | 2.26 | % |
After fees reduced (c) | | | 3.08 | % | | | 2.95 | % | | | 2.29 | % |
| | | | | | | | | | | | | |
Portfolio turnover rate | | | 63 | % | | | 137 | % | | | 75 | % |
(a) | Amount rounds to less than $0.01 per share. |
(b) | Total return is a measure of the change in value of an investment in the Fund over the periods covered, which assumes any dividends or capital gains distributions are reinvested in shares of the Fund. The returns shown do not reflect the deduction of taxes a shareholder would pay on Fund distributions or the redemption of Fund shares. The total returns would have been lower if the Advisor had not reduced advisory fees and reimbursed expenses. |
(c) | Effective May 1, 2016, the Advisor had contractually agreed to reduce its fees and/or pay for operating expenses of the Fund to ensure that total annual operating expenses do not exceed 0.64% of the average daily net assets of the Fund (Note 3). |
| | See accompanying notes to financial statements. | 57 |
CHARTWELL INCOME FUND
FINANCIAL HIGHLIGHTS (Continued) |
Per Share Data for a Share Outstanding Throughout Each Period |
| | Year
Ended
October 31,
2017 | | | For the Period
January 1,
2016
through
October 31,
2016* | | | Year
Ended
December 31,
2015 | |
Net asset value at beginning of period | | $ | 13.64 | | | $ | 12.85 | | | $ | 13.61 | |
| | | | | | | | | | | | | |
Income (loss) from investment operations: | | | | | | | | | | | | |
Net investment income | | | 0.24 | (a) | | | 0.19 | (a) | | | 0.31 | |
Net realized and unrealized gains (losses) on affiliated and unaffiliated investments | | | 0.29 | | | | 0.79 | | | | (0.76 | ) |
Total from investment operations | | | 0.53 | | | | 0.98 | | | | (0.45 | ) |
| | | | | | | | | | | | | |
Less distributions from: | | | | | | | | | | | | |
Net investment income | | | (0.22 | ) | | | (0.19 | ) | | | (0.31 | ) |
Net realized gains on investments | | | (0.15 | ) | | | — | | | | (0.00 | )(b) |
Total distributions | | | (0.37 | ) | | | (0.19 | ) | | | (0.31 | ) |
| | | | | | | | | | | | | |
Proceeds from redemption fees collected (Note 2) | | | 0.00 | (b) | | | 0.00 | (b) | | | 0.00 | (b) |
| | | | | | | | | | | | | |
Net asset value at end of period | | $ | 13.80 | | | $ | 13.64 | | | $ | 12.85 | |
| | | | | | | | | | | | | |
Total return (c) | | | 3.98 | % | | | 7.68 | %(d) | | | (3.30 | %)(e) |
| | | | | | | | | | | | | |
Ratios/Supplementary data: | | | | | | | | | | | | |
Net assets at end of period (000,000’s) | | $ | 1,672 | | | $ | 1,711 | | | $ | 1,742 | |
| | | | | | | | | | | | | |
Ratio of total expenses to average net assets: | | | | | | | | | | | | |
Before fees reduced | | | 0.67 | % | | | 0.67 | %(f) | | | 0.64 | % |
After fees reduced | | | 0.64 | % | | | 0.66 | %(f)(g) | | | 0.64 | % |
Ratio of net investment income to average net assets: | | | | | | | | | | | | |
Before fees reduced | | | 1.75 | % | | | 1.74 | %(f) | | | 2.18 | % |
After fees reduced | | | 1.78 | % | | | 1.75 | %(f)(g) | | | 2.18 | % |
| | | | | | | | | | | | | |
Portfolio turnover rate | | | 69 | % | | | 72 | %(d) | | | 45 | % |
* | Fiscal year changed to October 31, effective September 30, 2016. |
(a) | Based on average daily shares outstanding. |
(b) | Amount rounds to less than $0.01 per share. |
(c) | Total return is a measure of the change in value of an investment in the Fund over the periods covered, which assumes any dividends or capital gains distributions are reinvested in shares of the Fund. The returns shown do not reflect the deduction of taxes a shareholder would pay on Fund distributions or the redemption of Fund shares. The total returns would have been lower if the Advisor had not reduced advisory fees and reimbursed expenses. |
(d) | Not annualized. |
(e) | The Fund received payment from the Advisor of $1,601,595 for losses realized in the disposal of investments purchased in violation of investment restrictions, which otherwise would have reduced the total return by 0.07%. |
(f) | Annualized. |
(g) | Effective May 1, 2016, the Advisor had contractually agreed to reduce its fees and/or pay for operating expenses of the Fund to ensure that total annual operating expenses do not exceed 0.64% of the average daily net assets of the Fund (Note 3). |
58 | See accompanying notes to financial statements. | |
CHARTWELL MID CAP VALUE FUND
FINANCIAL HIGHLIGHTS |
Per Share Data for a Share Outstanding Throughout Each Year |
| | Year
Ended
October 31,
2020 | | | Year
Ended
October 31,
2019 | | | Year
Ended
October 31,
2018 | |
Net asset value at beginning of year | | $ | 15.54 | | | $ | 15.07 | | | $ | 18.55 | |
| | | | | | | | | | | | | |
Income (loss) from investment operations: | | | | | | | | | | | | |
Net investment income | | | 0.19 | | | | 0.17 | | | | 0.11 | |
Net realized and unrealized gains (losses) on investment transactions | | | (2.28 | ) | | | 1.34 | | | | 0.03 | |
Total from investment operations | | | (2.09 | ) | | | 1.51 | | | | 0.14 | |
| | | | | | | | | | | | | |
Less distributions from: | | | | | | | | | | | | |
Net investment income | | | (0.18 | ) | | | (0.11 | ) | | | (0.14 | ) |
Net realized gains on investments | | | (0.15 | ) | | | (0.93 | ) | | | (3.48 | ) |
Total distributions | | | (0.33 | ) | | | (1.04 | ) | | | (3.62 | ) |
| | | | | | | | | | | | | |
Net asset value at end of year | | $ | 13.12 | | | $ | 15.54 | | | $ | 15.07 | |
| | | | | | | | | | | | | |
Total return (a) | | | (13.81 | %) | | | 11.47 | % | | | (0.12 | %) |
| | | | | | | | | | | | | |
Ratios/Supplementary data: | | | | | | | | | | | | |
Net assets at end of year (000’s) | | $ | 24,752 | | | $ | 25,704 | | | $ | 25,322 | |
| | | | | | | | | | | | | |
Ratio of total expenses to average net assets: | | | | | | | | | | | | |
Before fees waived/reduced | | | 1.47 | % | | | 1.44 | % | | | 1.57 | % |
After fees waived/reduced | | | 0.90 | % | | | 1.02 | %(b) | | | 1.05 | %(c) |
Ratio of net investment income to average net assets: | | | | | | | | | | | | |
Before fees waived/reduced | | | 0.84 | % | | | 0.67 | % | | | 0.26 | % |
After fees waived/reduced | | | 1.40 | % | | | 1.09 | %(b) | | | 0.77 | %(c) |
| | | | | | | | | | | | | |
Portfolio turnover rate | | | 35 | % | | | 36 | % | | | 65 | % |
(a) | Total return is a measure of the change in value of an investment in the Fund over the period covered, which assumes any dividends or capital gains distributions are reinvested in shares of the Fund. The returns shown do not reflect the deduction of taxes a shareholder would pay on Fund distributions or the redemption of Fund shares. The total returns would have been lower had the Advisor not reduced its fees or reimbursed expenses. |
(b) | Effective September 1, 2019, the Advisor contractually agreed to reduce its fees and/or reimburse other operating expenses of the Fund to ensure that total annual operating expenses do not exceed 0.90% of the average daily net assets of the Fund. Prior to September 1, 2019, the annual operating expense limitation was 1.05% (Note 3). |
(c) | Effective November 6, 2017, the Advisor contractually agreed to reduce its fees and/or reimburse other operating expenses of the Fund to ensure that total annual operating expenses do not exceed 1.05% of the average daily net assets of the Fund. Prior to November 6, 2017, the annual operating expense limitation was 1.15% (Note 3). |
| | See accompanying notes to financial statements. | 59 |
CHARTWELL MID CAP VALUE FUND
FINANCIAL HIGHLIGHTS (Continued) |
Per Share Data for a Share Outstanding Throughout Each Period |
| | Year
Ended
October 31,
2017 | | | For the Period
January 1,
2016
through
October 31,
2016* | | | Year
Ended
December 31,
2015 | |
Net asset value at beginning of period | | $ | 15.46 | | | $ | 13.31 | | | $ | 15.83 | |
| | | | | | | | | | | | | |
Income (loss) from investment operations: | | | | | | | | | | | | |
Net investment income | | | 0.16 | (a) | | | 0.20 | (a) | | | 0.12 | |
Net realized and unrealized gains (losses) on investment transactions | | | 3.48 | | | | 1.95 | | | | (2.52 | ) |
Total from investment operations | | | 3.64 | | | | 2.15 | | | | (2.40 | ) |
| | | | | | | | | | | | | |
Less distributions from: | | | | | | | | | | | | |
Net investment income | | | (0.25 | ) | | | — | | | | (0.12 | ) |
Net realized gains on investments | | | (0.30 | ) | | | — | | | | — | |
Total distributions | | | (0.55 | ) | | | — | | | | (0.12 | ) |
| | | | | | | | | | | | | |
Proceeds from redemption fees collected (Note 2) | | | 0.00 | (b) | | | 0.00 | (b) | | | 0.00 | (b) |
| | | | | | | | | | | | | |
Net asset value at end of period | | $ | 18.55 | | | $ | 15.46 | | | $ | 13.31 | |
| | | | | | | | | | | | | |
Total return (c) | | | 23.95 | % | | | 16.15 | %(d) | | | (15.16 | %) |
| | | | | | | | | | | | | |
Ratios/Supplementary data: | | | | | | | | | | | | |
Net assets at end of period (000’s) | | $ | 23,274 | | | $ | 18,712 | | | $ | 16,817 | |
| | | | | | | | | | | | | |
Ratio of total expenses to average net assets: | | | | | | | | | | | | |
Before fees reduced and other expenses absorbed | | | 1.71 | % | | | 2.03 | %(e) | | | 1.81 | % |
After fees reduced and other expenses absorbed | | | 1.15 | % | | | 1.19 | %(e)(f) | | | 1.25 | %(g) |
Ratio of net investment income to average net assets: | | | | | | | | | | | | |
Before fees reduced and other expenses absorbed | | | 0.37 | % | | | 0.81 | %(e) | | | 0.24 | % |
After fees reduced and other expenses absorbed | | | 0.93 | % | | | 1.65 | %(e)(f) | | | 0.80 | %(g) |
| | | | | | | | | | | | | |
Portfolio turnover rate | | | 159 | % | | | 38 | %(d) | | | 30 | % |
* | Fiscal year changed to October 31, effective September 31, 2016. |
(a) | Based on average daily shares outstanding. |
(b) | Amount rounds to less than $0.01 per share. |
(c) | Total return is a measure of the change in value of an investment in the Fund over the period covered, which assumes any dividends or capital gains distributions are reinvested in shares of the Fund. The returns shown do not reflect the deduction of taxes a shareholder would pay on Fund distributions or the redemption of Fund shares. The total returns would have been lower had the Advisor not reduced its fees or reimbursed expenses. |
(d) | Not annualized. |
(e) | Annualized. |
(f) | The Advisor voluntarily agreed to waive a portion of its fees and/or reimburse the Fund for expenses above 1.15% through June 30, 2017. Prior to May 1, 2016, the annual operating expense limitation was 1.25%. |
(g) | The Advisor voluntarily agreed to waive a portion of its fees and/or reimburse the Fund for expenses above 1.25%. |
60 | See accompanying notes to financial statements. | |
CHARTWELL SMALL CAP VALUE FUND
FINANCIAL HIGHLIGHTS |
Per Share Data for a Share Outstanding Throughout Each Year |
| | Year
Ended
October 31,
2020 | | | Year
Ended
October 31,
2019 | | | Year
Ended
October 31,
2018 | |
Net asset value at beginning of year | | $ | 18.67 | | | $ | 18.79 | | | $ | 20.07 | |
| | | | | | | | | | | | | |
Income (loss) from investment operations: | | | | | | | | | | | | |
Net investment income | | | 0.13 | | | | 0.13 | | | | 0.06 | |
Net realized and unrealized gains (losses) on investment transactions | | | (3.37 | ) | | | 1.04 | | | | (0.45 | ) |
Total from investment operations | | | (3.24 | ) | | | 1.17 | | | | (0.39 | ) |
| | | | | | | | | | | | | |
Less distributions from: | | | | | | | | | | | | |
Net investment income | | | (0.14 | ) | | | (0.07 | ) | | | (0.05 | ) |
Net realized gains on investments | | | (0.54 | ) | | | (1.22 | ) | | | (0.84 | ) |
Total distributions | | | (0.68 | ) | | | (1.29 | ) | | | (0.89 | ) |
| | | | | | | | | | | | | |
Proceeds from redemption fees collected (Note 2) | | | 0.00 | (a) | | | 0.00 | (a) | | | 0.00 | (a) |
| | | | | | | | | | | | | |
Net asset value at end of year | | $ | 14.75 | | | $ | 18.67 | | | $ | 18.79 | |
| | | | | | | | | | | | | |
Total return (b) | | | (18.16 | %) | | | 7.54 | % | | | (2.18 | %) |
| | | | | | | | | | | | | |
Ratios/Supplementary data: | | | | | | | | | | | | |
Net assets at end of year (000’s) | | $ | 148,069 | | | $ | 172,753 | | | $ | 228,779 | |
| | | | | | | | | | | | | |
Ratio of total expenses to average net assets: | | | | | | | | | | | | |
Before fees reduced and other expenses absorbed | | | 1.18 | % | | | 1.07 | % | | | 1.08 | % |
After fees reduced and other expenses absorbed (c) | | | 1.05 | % | | | 1.05 | % | | | 1.05 | % |
Ratio of net investment income to average net assets: | | | | | | | | | | | | |
Before fees reduced and other expenses absorbed | | | 0.68 | % | | | 0.67 | % | | | 0.25 | % |
After fees reduced and other expenses absorbed (c) | | | 0.81 | % | | | 0.69 | % | | | 0.28 | % |
| | | | | | | | | | | | | |
Portfolio turnover rate | | | 30 | % | | | 30 | % | | | 19 | % |
(a) | Amount rounds to less than $0.01 per share. |
(b) | Total return is a measure of the change in value of an investment in the Fund over the period covered, which assumes any dividends or capital gains distributions are reinvested in shares of the Fund. The returns shown do not reflect the deduction of taxes a shareholder would pay on Fund distributions or the redemption of Fund shares. The returns would have been lower had the Advisor not reduced its fees or reimbursed expenses. |
(c) | The Advisor has contractually agreed to reduce its fees and/or reimburse other expenses of the Fund to ensure that the total annual operating expenses do not exceed 1.05% of average daily net assets (Note 3). |
| | See accompanying notes to financial statements. | 61 |
CHARTWELL SMALL CAP VALUE FUND
FINANCIAL HIGHLIGHTS (Continued) |
Per Share Data for a Share Outstanding Throughout Each Year |
| | Year
Ended
October 31,
2017 | | | Year
Ended
October 31,
2016 | |
Net asset value at beginning of year | | $ | 16.25 | | | $ | 15.38 | |
| | | | | | | | | |
Income (loss) from investment operations: | | | | | | | | |
Net investment income (a) | | | 0.05 | | | | 0.10 | |
Net realized and unrealized gains (losses) on investment transactions | | | 3.86 | | | | 0.89 | |
Total from investment operations | | | 3.91 | | | | 0.99 | |
| | | | | | | | | |
Less distributions from: | | | | | | | | |
Net investment income | | | (0.09 | ) | | | (0.11 | ) |
Net realized gains on investments | | | — | | | | (0.01 | ) |
Total distributions | | | (0.09 | ) | | | (0.12 | ) |
| | | | | | | | | |
Proceeds from redemption fees collected (Note 2) | | | 0.00 | (b) | | | 0.00 | (b) |
| | | | | | | | | |
Net asset value at end of year | | $ | 20.07 | | | $ | 16.25 | |
| | | | | | | | | |
Total return (c) | | | 24.09 | % | | | 6.51 | % |
| | | | | | | | | |
Ratios/Supplementary data: | | | | | | | | |
Net assets at end of year (000’s) | | $ | 165,538 | | | $ | 162,782 | |
| | | | | | | | | |
Ratio of total expenses to average net assets: | | | | | | | | |
Before fees reduced and other expenses absorbed | | | 1.14 | % | | | 1.30 | % |
After fees reduced and other expenses absorbed (d) | | | 1.05 | % | | | 1.05 | % |
Ratio of net investment income to average net assets: | | | | | | | | |
Before fees reduced and other expenses absorbed | | | 0.18 | % | | | 0.42 | % |
After fees reduced and other expenses absorbed (d) | | | 0.27 | % | | | 0.67 | % |
| | | | | | | | | |
Portfolio turnover rate | | | 39 | % | | | 22 | % |
(a) | Based on average shares outstanding. |
(b) | Amount rounds to less than $0.01 per share. |
(c) | Total return is a measure of the change in value of an investment in the Fund over the period covered, which assumes any dividends or capital gains distributions are reinvested in shares of the Fund. The returns shown do not reflect the deduction of taxes a shareholder would pay on Fund distributions or the redemption of Fund shares. The returns would have been lower had the Advisor not reduced its fees or reimbursed expenses. |
(d) | The Advisor has contractually agreed to reduce its fees and/or reimburse other expenses of the Fund to ensure that the total annual operating expenses do not exceed 1.05% of average daily net assets (Note 3). |
62 | See accompanying notes to financial statements. | |
CHARTWELL SHORT DURATION HIGH YIELD FUND
FINANCIAL HIGHLIGHTS |
Per Share Data for a Share Outstanding Throughout Each Year |
| | Year
Ended
October 31,
2020 | | | Year
Ended
October 31,
2019 | | | Year
Ended
October 31,
2018 | |
Net asset value at beginning of year | | $ | 9.68 | | | $ | 9.48 | | | $ | 9.72 | |
| | | | | | | | | | | | | |
Income (loss) from investment operations: | | | | | | | | | | | | |
Net investment income | | | 0.33 | | | | 0.35 | | | | 0.29 | |
Net realized and unrealized gains (losses) on investment transactions | | | (0.08 | ) | | | 0.20 | | | | (0.24 | ) |
Total from investment operations | | | 0.25 | | | | 0.55 | | | | 0.05 | |
| | | | | | | | | | | | | |
Less distributions from: | | | | | | | | | | | | |
Net investment income | | | (0.34 | ) | | | (0.35 | ) | | | (0.29 | ) |
Net realized gains on investments | | | — | | | | — | | | | — | |
Total distributions | | | (0.34 | ) | | | (0.35 | ) | | | (0.29 | ) |
| | | | | | | | | | | | | |
Proceeds from redemption fees collected (Note 2) | | | 0.00 | (a) | | | 0.00 | (a) | | | — | |
| | | | | | | | | | | | | |
Net asset value at end of year | | $ | 9.59 | | | $ | 9.68 | | | $ | 9.48 | |
| | | | | | | | | | | | | |
Total return (b) | | | 2.62 | % | | | 5.89 | % | | | 0.55 | % |
| | | | | | | | | | | | | |
Ratios/Supplementary data: | | | | | | | | | | | | |
Net assets at end of year (000’s) | | $ | 161,474 | | | $ | 91,914 | | | $ | 75,536 | |
| | | | | | | | | | | | | |
Ratio of total expenses to average net assets: | | | | | | | | | | | | |
Before fees reduced and other expenses absorbed | | | 0.61 | % | | | 0.67 | % | | | 0.80 | % |
After fees reduced and other expenses absorbed (c) | | | 0.49 | % | | | 0.49 | % | | | 0.49 | % |
Ratio of net investment income to average net assets: | | | | | | | | | | | | |
Before fees reduced and other expenses absorbed | | | 3.43 | % | | | 3.44 | % | | | 2.84 | % |
After fees reduced and other expenses absorbed (c) | | | 3.55 | % | | | 3.62 | % | | | 3.15 | % |
| | | | | | | | | | | | | |
Portfolio turnover rate | | | 63 | % | | | 41 | % | | | 26 | % |
(a) | Amount rounds to less than $0.01 per share. |
(b) | Total return is a measure of the change in value of an investment in the Fund over the period covered, which assumes any dividends or capital gains distributions are reinvested in shares of the Fund. The returns shown do not reflect the deduction of taxes a shareholder would pay on Fund distributions or the redemption of Fund shares. The returns would have been lower had the Advisor not reduced its fees or reimbursed expenses. |
(c) | Effective August 11, 2017, the Advisor contractually agreed to reduce its fees and/or absorb expenses of the Fund to ensure that the total annual operating expenses do not exceed 0.49% of average daily net assets. Prior to August 11, 2017, the annual operating expense limit was 0.65% (Note 3). |
| | See accompanying notes to financial statements. | 63 |
CHARTWELL SHORT DURATION HIGH YIELD FUND
FINANCIAL HIGHLIGHTS (Continued) |
Per Share Data for a Share Outstanding Throughout Each Year |
| | Year
Ended
October 31,
2017 | | | Year
Ended
October 31,
2016 | |
Net asset value at beginning of year | | $ | 9.62 | | | $ | 9.58 | |
| | | | | | | | | |
Income (loss) from investment operations: | | | | | | | | |
Net investment income (a) | | | 0.31 | | | | 0.33 | |
Net realized and unrealized gains (losses) on investment transactions | | | 0.11 | | | | 0.06 | |
Total from investment operations | | | 0.42 | | | | 0.39 | |
| | | | | | | | | |
Less distributions from: | | | | | | | | |
Net investment income | | | (0.32 | ) | | | (0.33 | ) |
Net realized gains on investments | | | — | | | | (0.02 | ) |
Total distributions | | | (0.32 | ) | | | (0.35 | ) |
| | | | | | | | | |
Net asset value at end of year | | $ | 9.72 | | | $ | 9.62 | |
| | | | | | | | | |
Total return (b) | | | 4.42 | % | | | 4.29 | % |
| | | | | | | | | |
Ratios/Supplementary data: | | | | | | | | |
Net assets at end of year (000’s) | | $ | 35,191 | | | $ | 21,349 | |
| | | | | | | | | |
Ratio of total expenses to average net assets: | | | | | | | | |
Before fees reduced and other expenses absorbed | | | 1.16 | % | | | 1.50 | % |
After fees reduced and other expenses absorbed (c) | | | 0.61 | % | | | 0.65 | % |
Ratio of net investment income to average net assets: | | | | | | | | |
Before fees reduced and other expenses absorbed | | | 2.70 | % | | | 2.66 | % |
After fees reduced and other expenses absorbed (c) | | | 3.25 | % | | | 3.51 | % |
| | | | | | | | | |
Portfolio turnover rate | | | 62 | % | | | 52 | % |
(a) | Based on average shares outstanding. |
(b) | Total return is a measure of the change in value of an investment in the Fund over the period covered, which assumes any dividends or capital gains distributions are reinvested in shares of the Fund. The returns shown do not reflect the deduction of taxes a shareholder would pay on Fund distributions or the redemption of Fund shares. The returns would have been lower had the Advisor not reduced its fees or reimbursed expenses. |
(c) | Effective August 11, 2017, the Advisor contractually agreed to reduce its fees and/or absorb expenses of the Fund to ensure that the total annual operating expenses do not exceed 0.49% of average daily net assets. Prior to August 11, 2017, the annual operating expense limit was 0.65% (Note 3). |
64 | See accompanying notes to financial statements. | |
CHARTWELL SMALL CAP GROWTH FUND
FINANCIAL HIGHLIGHTS |
Per Share Data for a Share Outstanding Throughout Each Period |
| | Year
Ended
October 31,
2020 | | |
Year
Ended
October 31,
2019
| | | Year
Ended
October 31,
2018 | | | For the Period
June 16,
2017*
through
October 31,
2017 | |
Net asset value at beginning of period | | $ | 11.78 | | | $ | 11.55 | | | $ | 10.69 | | | $ | 10.00 | |
| | | | | | | | | | | | | | | | | |
Income (loss) from investment operations: | | | | | | | | | | | | | | | | |
Net investment loss | | | (0.09 | ) | | | (0.04 | ) | | | (0.04 | ) | | | (0.03 | )(a) |
Net realized and unrealized gains on investment transactions | | | 3.53 | | | | 0.32 | | | | 0.90 | | | | 0.72 | |
Total from investment operations | | | 3.44 | | | | 0.28 | | | | 0.86 | | | | 0.69 | |
| | | | | | | | | | | | | | | | | |
Less distributions from: | | | | | | | | | | | | | | | | |
Net investment income | | | — | | | | — | | | | (0.00 | )(b) | | | — | |
Net realized gains on investments | | | (0.00 | )(b) | | | (0.05 | ) | | | — | | | | — | |
Total distributions | | | (0.00 | )(b) | | | (0.05 | ) | | | (0.00 | )(b) | | | — | |
| | | | | | | | | | | | | | | | | |
Proceeds from redemption fees collected (Note 2) | | | 0.00 | (b) | | | 0.00 | (b) | | | — | | | | — | |
| | | | | | | | | | | | | | | | | |
Net asset value at end of period | | $ | 15.22 | | | $ | 11.78 | | | $ | 11.55 | | | $ | 10.69 | |
| | | | | | | | | | | | | | | | | |
Total return (c) | | | 29.25 | % | | | 2.46 | % | | | 8.07 | % | | | 6.90 | %(d) |
| | | | | | | | | | | | | | | | | |
Ratios/Supplementary data: | | | | | | | | | | | | | | | | |
Net assets at end of period (000’s) | | $ | 22,808 | | | $ | 20,637 | | | $ | 17,821 | | | $ | 6,744 | |
| | | | | | | | | | | | | | | | | |
Ratio of total expenses to average net assets: | | | | | | | | | | | | | | | | |
Before fees waived/reduced and other expenses absorbed | | | 1.73 | % | | | 1.64 | % | | | 2.15 | % | | | 11.54 | %(e) |
After fees waived/reduced and other expenses absorbed (f) | | | 1.05 | % | | | 1.05 | % | | | 1.05 | % | | | 1.25 | %(e) |
Ratio of net investment loss to average net assets: | | | | | | | | | | | | | | | | |
Before fees waived/reduced and other expenses absorbed | | | (1.24 | %) | | | (0.98 | %) | | | (1.56 | %) | | | (11.12 | %)(e) |
After fees waived/reduced and other expenses absorbed (f) | | | (0.56 | %) | | | (0.39 | %) | | | (0.45 | %) | | | (0.83 | %)(e) |
| | | | | | | | | | | | | | | | | |
Portfolio turnover rate | | | 104 | % | | | 104 | % | | | 97 | % | | | 43 | %(d) |
* | Commencement of operations. |
(a) | Based on average shares outstanding. |
(b) | Amount rounds to less than $0.01 per share. |
(c) | Total return is a measure of the change in value of an investment in the Fund over the period covered, which assumes any dividends or capital gains distributions are reinvested in shares of the Fund. The returns shown do not reflect the deduction of taxes a shareholder would pay on Fund distributions or the redemption of Fund shares. The returns would have been lower had the Advisor not reduced its fees and reimbursed expenses. |
(d) | Not annualized. |
(e) | Annualized. |
(f) | Effective November 6, 2017, the Advisor contractually agreed to reduce its fees and/or pay for operating expenses of the Fund to ensure that total annual operating expenses do not exceed 1.05% of the average daily net assets of the Fund. Prior to November 6, 2017, the annual operating expense limitation was 1.25% (Note 3). |
| | See accompanying notes to financial statements. | 65 |
CHARTWELL FUNDS
NOTES TO FINANCIAL STATEMENTS
October 31, 2020
Note 1 – Organization
Chartwell Income Fund (formerly Berwyn Income Fund), Chartwell Mid Cap Value Fund, Chartwell Small Cap Value Fund, Chartwell Short Duration High Yield Fund and Chartwell Small Cap Growth Fund (each a “Fund” and collectively the “Funds”) are each a diversified series of The Chartwell Funds, a Delaware statutory trust (the “Trust”) which is registered as an open-end management investment company under the Investment Company Act of 1940, as amended (the “1940 Act”).
Chartwell Income Fund’s primary investment objective is to provide investors with current income; seeking to preserve capital is a secondary consideration. The Fund commenced investment operations on September 3, 1987.
Chartwell Mid Cap Value Fund’s primary investment objective is to achieve long-term capital appreciation. The Fund commenced investment operations on May 1, 2002.
Chartwell Small Cap Value Fund’s primary investment objective is to seek long-term capital appreciation. The Fund commenced investment operations on March 16, 2012.
Chartwell Short Duration High Yield Fund’s primary investment objective is to seek income and long-term capital appreciation. The Fund commenced investment operations on July 15, 2014.
Chartwell Small Cap Growth Fund’s primary investment objective is to seek long-term capital appreciation. The Fund commenced investment operations on June 16, 2017.
Note 2 – Significant Accounting Policies
Each Fund follows accounting and reporting guidance under Financial Accounting Standards Board Accounting Standards Codification (“ASC”) Topic 946, “Financial Services – Investment Companies.” The following is a summary of the Funds’ significant accounting policies. These policies are in conformity with accounting principles generally accepted in the United States of America (“GAAP”).
(a) | Valuation of Investments |
Each Fund values equity securities at the last reported sale price on the principal exchange or in the principal over the counter (“OTC”) market in which such securities are traded, as of the close of regular trading on the New York Stock Exchange on the day the securities are being valued or, if the last-quoted sales price is not readily available, the securities will be valued at the last bid or the mean between the last available bid and ask price. Securities traded on the NASDAQ are valued at the NASDAQ Official Closing Price. Investments in open-end investment companies are valued at the daily closing net asset value (“NAV”) of the respective investment company. Debt securities are typically valued by utilizing a price supplied by independent pricing service providers. The independent pricing service providers may use various valuation methodologies including matrix pricing and other analytical pricing models as well as market transactions and dealer quotations. These models generally consider such factors as yields or prices of bonds of comparable quality, type of issue, coupon, maturity, ratings and general
66
CHARTWELL FUNDS
NOTES TO FINANCIAL STATEMENTS (Continued)
market conditions. If a price is not readily available for a portfolio security, the security will be valued at fair value (the amount which a Fund might reasonably expect to receive for the security upon its current sale) as determined in good faith by Chartwell Investment Partners, LLC (the “Advisor”) as defined in Note 3, subject to review and approval by the Advisor’s Portfolio Pricing Committee (“APPC”), pursuant to procedures adopted by the Board of Trustees. The actions of the APPC are subsequently reviewed by the Board at its next regularly scheduled board meeting. The APPC meets as needed. The APPC is comprised of personnel of the Advisor (CFO, COO, CCO, the applicable portfolio manager or lead analyst).
(b) | Share Valuation and Redemption Fees |
The NAV per share of each Fund is calculated as of the close of regular trading on the NYSE (normally 4:00 p.m., Eastern time) on each day that the NYSE is open for business. The NAV per share of each Fund is calculated by dividing the total value of the Fund’s assets, less its liabilities, by the number of its shares outstanding. The offering price and redemption price per share of each Fund is equal to the NAV per share next computed after receipt of an order to purchase or to redeem shares. However, a redemption fee of 1%, payable to the applicable Fund, generally will apply to shares that are redeemed within 30 days of purchase. During the years ended October 31, 2020 and 2019, proceeds from redemption fees were as follows:
| | | October 31, 2020 | | | October 31, 2019 | |
Chartwell Income Fund | | $ | 4,961 | | | $ | 14,167 | |
Chartwell Mid Cap Value Fund | | | — | | | | — | |
Chartwell Small Cap Value Fund | | | 26 | | | | 1,176 | |
Chartwell Short Duration High Yield Fund | | | 13 | | | | 2 | |
Chartwell Small Cap Growth Fund | | | 16 | | | | 1 | |
(c) | Investment Transactions, Investment Income and Expenses |
Investment transactions are accounted for on the trade date. Realized gains and losses on investments are determined on the identified cost basis. Dividend income is recorded net of applicable withholding taxes on the ex-dividend date and interest income is recorded on an accrual basis. Non-cash dividends included in dividend income, if any, are recorded at the fair market value of the security received. Withholding taxes on foreign dividends, if applicable, are paid (a portion of which may be reclaimable) or provided for in accordance with the applicable country’s tax rules and rates and are disclosed on the Statements of Operations. Withholding tax reclaims are filed in certain countries to recover a portion of the amounts previously withheld. The Funds record a reclaim receivable based on a number of factors, including a jurisdiction’s legal obligation to pay reclaims, as well as payment history and market convention. Discounts or premiums on debt securities are accreted or amortized to interest income over the lives of the respective securities using the effective interest method. Expenses incurred by the Trust with respect to more than one Fund are allocated in proportion to the net assets of each Fund except where allocation of direct expenses to each Fund or an alternative allocation method can be more appropriately made.
67
CHARTWELL FUNDS
NOTES TO FINANCIAL STATEMENTS (Continued)
At times, the Funds may invest cash in a sweep vehicle program whereby a bank, acting as agent of its customer, endeavors to place such amounts in excess of the FDIC standard maximum deposit insurance amount (currently $250,000) with one or more other FDIC-insured member banks in either demand deposit accounts or money market deposit accounts. Such deposits are in amounts at any such bank not in excess of the FDIC standard maximum deposit insurance amount such that the customer’s funds are FDIC-insured across the various banks at which such funds are deposited. TriState Capital Bank provides this service to its clients, including the Advisor. Both TriState Capital Bank and the Advisor are subsidiaries of TriState Capital Holdings. These deposits are not custodied by TriState Capital Bank, and TriState Capital Bank does not receive any fees relating to these deposits. These amounts are included as Cash on the Statements of Assets and Liabilities to the extent they are held by a Fund as of October 31, 2020.
The Funds intend to comply with the requirements of Subchapter M of the Internal Revenue Code applicable to regulated investment companies and to distribute substantially all of their net investment income and any net realized capital gains to their shareholders. Therefore, no provision is made for federal income or excise taxes. Due to the timing of distributions and the differences in accounting for net investment income and realized capital gains and losses for financial statement and federal income tax purposes, the fiscal year in which amounts are distributed may differ from the year in which the net investment income and realized capital gains and losses are recorded by the Funds.
Accounting for Uncertainty in Income Taxes (the “Income Tax Statement”) requires an evaluation of tax positions taken (or expected to be taken) in the course of preparing a Fund’s tax returns to determine whether these positions meet a “more-likely-than-not” standard that, based on the technical merits, have a more than fifty percent likelihood of being sustained by a taxing authority upon examination. A tax position that meets the “more-likely-than-not” recognition threshold is measured to determine the amount of benefit or expense to recognize in the financial statements. The Funds recognize interest and penalties, if any, as income tax expense on the Statements of Operations.
The Income Tax Statement requires management of the Funds to analyze tax positions taken in the prior three open tax years, if any, and tax positions expected to be taken in the Funds’ current tax year, as defined by the IRS statute of limitations for all major jurisdictions, including federal tax authorities and certain state tax authorities. As of and during the open periods (generally, three years) the Funds did not have a liability for any unrecognized tax expenses. The Funds have no examination in progress and are not aware of any tax positions for which it is reasonably likely that the total amounts of unrecognized tax expenses will significantly change in the next twelve months.
(f) | Distributions to Shareholders |
Chartwell Mid Cap Value Fund, Chartwell Small Cap Value Fund and Chartwell Small Cap Growth Fund make distributions of net investment income and net realized capital gains, if any, at least annually. Chartwell Income Fund and Chartwell Short Duration High Yield Fund make distributions of net investment income monthly and net realized capital gains, if any, at
68
CHARTWELL FUNDS
NOTES TO FINANCIAL STATEMENTS (Continued)
least annually. Distributions to shareholders are recorded on the ex-dividend date. The amount and timing of distributions are determined in accordance with federal income tax regulations, which may differ from GAAP.
The preparation of financial statements in conformity with GAAP requires management to make estimates and assumptions that affect the reported amounts of assets and liabilities and the disclosure of contingent assets and liabilities as of the date of the financial statements and the reported amounts of increase (decrease) in net assets from operations during the reporting period. Actual results could differ from these estimates.
(h) | New Accounting Pronouncement |
In March 2020, the Financial Accounting Standards Board issued Accounting Standards Update No. 2020-04 (“ASU 2020-04”), “Reference Rate Reform (Topic 840): Facilitation of the Effects of Reference Rate Reform on Financial Reporting”. ASU 2020-04 provides entities with optional guidance to ease the potential accounting burden associated with transitioning away from reference rates (e.g., LIBOR) that are expected to be discontinued. ASU 2020-04 allows, among other things, certain contract modifications to be accounted as a continuation of the existing contract. This ASU was effective upon the issuance and its optional relief can be applied through December 31, 2022. The Funds will consider this optional guidance prospectively, if applicable.
Note 3 – Investment Advisory and Other Agreements
The Trust, on behalf of the Funds, has entered into an Investment Advisory Agreement (the “Agreement”) with the Advisor. Under the terms of the Agreement, the Funds pay a monthly investment advisory fee to the Advisor at the following annual rates based on the average daily net assets of the Funds:
Chartwell Income Fund | | | | |
First $1.75 billion | | | 0.50 | % |
Next $1.75 billion | | | 0.48 | % |
Thereafter | | | 0.46 | % |
Chartwell Mid Cap Value Fund | | | 0.75 | % |
Chartwell Small Cap Value Fund | | | 0.90 | % |
Chartwell Short Duration High Yield Fund | | | 0.40 | % |
Chartwell Small Cap Growth Fund | | | 0.85 | % |
The Advisor has contractually agreed to reduce its fees and/or reimburse other operating expenses (excluding taxes, leverage interest, brokerage commissions, dividend and interest expenses on short sales, acquired fund fees and expenses, expenses incurred in connection with any merger or reorganization, and extraordinary expenses such as litigation expenses) in order to limit total annual operating expenses of each Fund as stated below. This agreement is in effect until March 1, 2021 with respect to each Fund, and it may be terminated prior to
69
CHARTWELL FUNDS
NOTES TO FINANCIAL STATEMENTS (Continued)
this time only by the Trust’s Board of Trustees, or if the investment advisory agreement is terminated (i) by the Funds upon 60 days’ notice to the Advisor provided such termination was directed or approved by a vote of a majority of the Trustees of the Funds or by the vote of the holders of a majority of the voting securities of the Fund at the time outstanding or entitled to vote; (ii) by the Advisor upon 60 days’ notice to the Funds; or (iii) by an assignment of the investment advisory agreement. The table below reflects the expense cap for each Fund:
| | Expense Limit as a %
of average
daily net assets | |
Chartwell Income Fund | | | 0.64 | % |
Chartwell Mid Cap Value Fund | | | 0.90 | % |
Chartwell Small Cap Value Fund | | | 1.05 | % |
Chartwell Short Duration High Yield Fund | | | 0.49 | % |
Chartwell Small Cap Growth Fund | | | 1.05 | % |
During the year ended October 31, 2020, the Advisor reduced its fees as follows:
| | Advisory fees
waived | |
Chartwell Income Fund | | $ | 259,244 | |
Chartwell Mid Cap Value Fund | | | 134,150 | |
Chartwell Small Cap Value Fund | | | 198,691 | |
Chartwell Short Duration High Yield Fund | | | 141,721 | |
Chartwell Small Cap Growth Fund | | | 142,122 | |
The Advisor is permitted to seek reimbursement of fee reductions and expense reimbursements from each Fund for a period ending three years after the date of the reduction or reimbursement, provided that the reimbursement does not cause expenses to exceed the lesser of (a) the expense limitation amount in effect at the time such fees were reduced or reimbursements made, or (b) the expense limitation amount in effect at the time of the reimbursement. However, for Chartwell Income Fund and Chartwell Mid Cap Value Fund, the Advisor is not
70
CHARTWELL FUNDS
NOTES TO FINANCIAL STATEMENTS (Continued)
permitted to seek reimbursement of any advisory fee reductions or expense reimbursements prior to April 29, 2018. The Advisor may recapture all or a portion of fee reductions and expense reimbursements no later than the dates stated below:
| | Chartwell
Income Fund | | | Chartwell
Mid Cap Value
Fund | | | Chartwell
Small Cap
Value Fund | | | Chartwell
Short Duration
High Yield Fund | | | Chartwell
Small Cap
Growth Fund | |
October 31, 2021 | | $ | 227,945 | | | $ | 59,204 | | | $ | 50,320 | | | $ | 158,590 | | | $ | 170,579 | |
October 31, 2022 | | | 212,996 | | | | 102,814 | | | | 36,561 | | | | 149,868 | | | | 119,074 | |
October 31, 2023 | | | 259,244 | | | | 134,150 | | | | 198,691 | | | | 141,721 | | | | 142,122 | |
Total | | $ | 700,185 | | | $ | 296,168 | | | $ | 285,572 | | | $ | 450,179 | | | $ | 431,775 | |
The Advisor and the officers of the Advisor, together with their families, owned 31,319 shares, 37,785 shares, 40,167 shares, 103,544 shares and 34,581 shares of Chartwell Income Fund, Chartwell Mid Cap Value Fund, Chartwell Small Cap Value Fund, Chartwell Short Duration High Yield Fund and Chartwell Small Cap Growth Fund, respectively, as of October 31, 2020.
Ultimus Fund Solutions, LLC (“Ultimus”) provides administration, fund accounting and transfer agency services to the Funds. The Funds pay Ultimus fees in accordance with the agreements for such services. In addition, the Funds pay out-of-pocket expenses including, but not limited to, postage, supplies, and certain costs related to the pricing of the Funds’ portfolio securities.
The Funds compensate certain financial intermediaries for providing account maintenance and shareholder services to shareholder accounts held through such intermediaries. During the year ended October 31, 2020, Chartwell Income Fund, Chartwell Mid Cap Value Fund, Chartwell Small Cap Value Fund, Chartwell Short Duration High Yield Fund, and Chartwell Small Cap Growth Fund paid $449,241, $6,560, $140,664, $3,921 and $19,170, respectively, to financial intermediaries for such services. These amounts are included in transfer agent fees on the Statements of Operations.
Foreside Fund Services, LLC (“Foreside”) serves as the Funds’ distributor.
Certain Trustees and officers of the Trust are also officers or employees of the Advisor and/or Ultimus. The Funds do not compensate Trustees and officers affiliated with the Funds’ Advisor or Ultimus. For their services to the Trust, each Independent Trustee receives an annual retainer of $35,000, plus $1,500 for each Board meeting attended in-person, and $1,000 for each Board meeting attended telephonically, plus reimbursement of related expenses. In addition, each member of the Audit Committee, which is comprised solely of Independent Trustees, receives $1,500 for each Audit Committee meeting attended in-person, and $1,000 for each Audit Committee meeting attended telephonically.
The Trust’s Chief Compliance Officer (“CCO”) is an officer of the Advisor.
71
CHARTWELL FUNDS
NOTES TO FINANCIAL STATEMENTS (Continued)
PRINCIPAL HOLDERS OF FUND SHARES
As of October 31, 2020, the following shareholders owned of record 25% or more of the outstanding shares of the following Funds:
NAME OF RECORD OWNER | % Ownership |
Chartwell Mid Cap Value Fund | |
Morgan Stanley Smith Barney (for the benefit of its customers) | 33% |
| | |
Chartwell Short Duration Fund | |
CAPINCO | 30% |
| | |
Chartwell Small Cap Growth Fund | |
National Financial Services, LLC (for the benefit of its customers) | 75% |
A beneficial owner of 25% or more of a Fund’s outstanding shares may be considered a controlling person. That shareholder’s vote could have a more significant effect on matters presented at a shareholders’ meeting.
Note 4 – Federal Income Taxes
At October 31, 2020, gross unrealized appreciation and depreciation of investments, based on cost for federal income tax purposes, were as follows:
| | Chartwell
Income Fund | | | Chartwell
Mid Cap Value
Fund | |
Cost of investments | | $ | 563,347,132 | | | $ | 25,355,183 | |
Gross unrealized appreciation | | $ | 32,670,676 | | | $ | 2,605,854 | |
Gross unrealized depreciation | | | (47,220,493 | ) | | | (3,210,805 | ) |
Net unrealized depreciation on investments | | $ | (14,549,817 | ) | | $ | (604,951 | ) |
| | Chartwell
Small Cap
Value Fund | | | Chartwell
Short Duration
High Yield Fund | | | Chartwell
Small Cap
Growth Fund | |
Cost of investments | | $ | 157,089,972 | | | $ | 153,971,131 | | | $ | 17,234,100 | |
Gross unrealized appreciation | | $ | 19,122,113 | | | $ | 2,746,419 | | | $ | 5,809,829 | |
Gross unrealized depreciation | | | (29,994,049 | ) | | | (3,205,781 | ) | | | (656,772 | ) |
Net unrealized appreciation (depreciation) on investments | | $ | (10,871,936 | ) | | $ | (459,362 | ) | | $ | 5,153,057 | |
72
CHARTWELL FUNDS
NOTES TO FINANCIAL STATEMENTS (Continued)
The difference between the cost of investments for financial statement and federal income tax purposes is due to certain timing differences in recognizing capital gains and losses in security transactions under income tax regulations and GAAP. These “book/tax” differences are temporary in nature and are primarily due to the tax deferral of losses on wash sales and adjustments to basis on passive foreign investment companies.
As of October 31, 2020, the components of accumulated earnings (deficit) on a tax basis were as follows:
| | Chartwell
Income Fund | | | Chartwell
Mid Cap Value
Fund | |
Net unrealized depreciation on investments | | $ | (14,549,817 | ) | | $ | (604,951 | ) |
Undistributed ordinary income | | | 21,576 | | | | 261,254 | |
Accumulated capital and other losses | | | (20,666,187 | ) | | | (1,358,088 | ) |
Total accumulated deficit | | $ | (35,194,428 | ) | | $ | (1,701,785 | ) |
| | Chartwell
Small Cap
Value Fund | | | Chartwell
Short Duration
High Yield Fund | | | Chartwell
Small Cap
Growth Fund | |
Net unrealized appreciation (depreciation) on investments | | $ | (10,871,936 | ) | | $ | (459,362 | ) | | $ | 5,153,057 | |
Undistributed ordinary income | | | 929,039 | | | | — | | | | 240,867 | |
Undistributed long-term capital gains | | | — | | | | — | | | | 1,483,391 | |
Accumulated capital and other losses | | | (1,077,200 | ) | | | (321,218 | ) | | | — | |
Total accumulated earnings (deficit) | | $ | (11,020,097 | ) | | $ | (780,580 | ) | | $ | 6,877,315 | |
As of October 31, 2020, the Funds had the following capital loss carryforwards for federal income tax purposes:
| | Chartwell
Income Fund | | | Chartwell
Mid Cap Value
Fund | | | Chartwell
Small Cap Value
Fund | | | Chartwell
Short Duration
High Yield Fund | |
Short-term capital loss carryforwards | | $ | — | | | $ | 358,320 | | | $ | 1,077,200 | | | $ | 257,350 | |
Long-term capital loss carryforwards | | | 20,666,187 | | | | 999,768 | | | | — | | | | 63,868 | |
Total | | $ | 20,666,187 | | | $ | 1,358,088 | | | $ | 1,077,200 | | | $ | 321,218 | |
These capital loss carryforwards, which do not expire, are available to offset realized capital gains in future years, thereby reducing future taxable gain distributions.
73
CHARTWELL FUNDS
NOTES TO FINANCIAL STATEMENTS (Continued)
During the year ended October 31, 2020, Chartwell Short Duration High Yield Fund utilized $102,717 and $159,428 of short-term and long-term capital loss carryovers, respectively.
For the year ended October 31, 2020, the following reclassifications were made as a result of permanent differences between the financial statement and income tax reporting requirements:
| | Chartwell
Income Fund | | | Chartwell
Mid Cap Value
Fund | | | Chartwell
Small Cap
Value Fund | | | Chartwell
Short Duration
High Yield
Fund | | | Chartwell
Small Cap
Growth Fund | |
Paid-in capital | | $ | — | | | $ | — | | | $ | — | | | $ | (29,096 | ) | | $ | 75 | |
Accumulated earnings (deficit) | | | — | | | | — | | | | — | | | | 29,096 | | | | (75 | ) |
Such reclassifications have no effect on each Fund’s total net assets or its NAV per share.
The tax character of distributions paid during the years ended October 31, 2020 and 2019 was as follows:
| | | Chartwell Income Fund | | | Chartwell Mid Cap Value Fund | |
| | 2020 | | | 2019 | | | 2020 | | | 2019 | |
Distributions paid from: | | | | | | | | | | | | | | | | |
Ordinary Income | | $ | 24,453,130 | | | $ | 59,728,632 | | | $ | 279,000 | | | $ | 1,147,462 | |
Net long-term capital gains | | | — | | | | 22,619,386 | | | | 223,601 | | | | 497,071 | |
Total distributions paid | | $ | 24,453,130 | | | $ | 82,348,018 | | | $ | 502,601 | | | $ | 1,644,533 | |
| | | Chartwell Small
Cap Value Fund | | | Chartwell Short Duration
High Yield Fund | |
| | 2020 | | | 2019 | | | 2020 | | | 2019 | |
Distributions paid from: | | | | | | | | | | | | | | | | |
Ordinary Income | | $ | 1,335,998 | | | $ | 2,076,114 | | | $ | 4,083,761 | | | $ | 2,983,171 | |
Net long-term capital gains | | | 4,952,629 | | | | 13,184,797 | | | | — | | | | — | |
Total distributions paid | | $ | 6,288,627 | | | $ | 15,260,911 | | | $ | 4,083,761 | | | $ | 2,983,171 | |
| | | Chartwell Small Cap Growth Fund | |
| | 2020 | | | 2019 | |
Distributions paid from: | | | | | | | | |
Net long-term capital gains | | $ | 7,527 | | | $ | 70,964 | |
Total distributions paid | | $ | 7,527 | | | $ | 70,964 | |
74
CHARTWELL FUNDS
NOTES TO FINANCIAL STATEMENTS (Continued)
Note 5 – Investment Transactions
During the year ended October 31, 2020, purchases and sales of investments, excluding short-term investments and U.S. government securities, were as follows:
| | Purchases | | | Sales | |
Chartwell Income Fund | | $ | 458,580,744 | | | $ | 862,859,516 | |
Chartwell Mid Cap Value Fund | | | 11,268,929 | | | | 8,027,816 | |
Chartwell Small Cap Value Fund | | | 58,737,603 | | | | 45,687,768 | |
Chartwell Short Duration High Yield Fund | | | 134,257,599 | | | | 66,872,690 | |
Chartwell Small Cap Growth Fund | | | 20,893,729 | | | | 24,322,605 | |
Note 6 – Indemnifications
In the normal course of business, the Funds enter into contracts that contain a variety of representations which provide general indemnifications. The Funds’ maximum exposure under these arrangements is unknown, as this would involve future claims that may be made against the Funds that have not yet occurred. However, the Funds expect the risk of loss to be remote.
Note 7 – Fair Value Measurements and Disclosure
ASC 820 defines fair value, establishes a framework for measuring fair value in accordance with GAAP, and expands disclosure about fair value measurements. It also provides guidance on determining when there has been a significant decrease in the volume and level of activity for an asset or a liability, when a transaction is not orderly, and how that information must be incorporated into a fair value measurement.
Various inputs are used in determining the value of each Fund’s investments. These inputs are summarized into three broad Levels as described below:
| | ● | Level 1 – Unadjusted quoted prices in active markets for identical assets or liabilities that a Fund has the ability to access. |
| | ● | Level 2 – Observable inputs other than quoted prices included in Level 1 that are observable for the asset or liability, either directly or indirectly. These inputs may include quoted prices for the identical instrument on an inactive market, prices for similar instruments, interest rates, prepayment speeds, credit risk, yield curves, default rates and similar data. |
| | ● | Level 3 – Unobservable inputs for the asset or liability, to the extent relevant observable inputs are not available, representing a Fund’s own assumptions about the assumptions a market participant would use in valuing the asset or liability, and would be based on the best information available. |
The availability of observable inputs can vary from security to security and is affected by a wide variety of factors, including, for example, the type of security, whether the security is new
75
CHARTWELL FUNDS
NOTES TO FINANCIAL STATEMENTS (Continued)
and not yet established in the marketplace, the liquidity of markets, and other characteristics particular to the security. To the extent that valuation is based on models or inputs that are less observable or unobservable in the market, the determination of fair value requires more judgment. Accordingly, the degree of judgment exercised in determining fair value is greatest for instruments categorized in Level 3.
The inputs used to measure fair value may fall into different Levels of the fair value hierarchy. In such cases, for disclosure purposes, the level in the fair value hierarchy within which the fair value measurement falls in its entirety is determined based on the lowest level input that is significant to the fair value measurement in its entirety.
The inputs or methodology used for valuing securities are not an indication of the risks associated with investing in those securities.
The following is a summary of the Funds’ investments based on the inputs used to value the investments as of October 31, 2020:
Chartwell Income Fund | | Level 1 | | | Level 2 | | | Level 3 | | | Total | |
Common Stocks | | $ | 137,949,927 | | | $ | — | | | $ | — | | | $ | 137,949,927 | |
Preferred Stocks | | | 26,616,301 | | | | — | | | | — | | | | 26,616,301 | |
Corporate Bonds | | | — | | | | 216,789,393 | | | | — | | | | 216,789,393 | |
Asset-Backed Securities | | | — | | | | 18,758,563 | | | | — | | | | 18,758,563 | |
Mortgage-Backed Securities | | | — | | | | 96,134,221 | | | | — | | | | 96,134,221 | |
U.S. Government & Agency Obligations | | | — | | | | 52,305,271 | | | | — | | | | 52,305,271 | |
Money Market Funds | | | 243,639 | | | | — | | | | — | | | | 243,639 | |
Total Investments | | $ | 164,809,867 | | | $ | 383,987,448 | | | $ | — | | | $ | 548,797,315 | |
Chartwell Mid Cap Value Fund | | Level 1 | | | Level 2 | | | Level 3 | | | Total | |
Common Stocks | | $ | 23,971,512 | | | $ | — | | | $ | — | | | $ | 23,971,512 | |
Money Market Funds | | | 778,720 | | | | — | | | | — | | | | 778,720 | |
Total Investments | | $ | 24,750,232 | | | $ | — | | | $ | — | | | $ | 24,750,232 | |
Chartwell Small Cap Value | | Level 1 | | | Level 2 | | | Level 3 | | | Total | |
Common Stocks | | $ | 145,759,053 | | | $ | — | | | $ | — | | | $ | 145,759,053 | |
Money Market Funds | | | 458,983 | | | | — | | | | — | | | | 458,983 | |
Total Investments | | $ | 146,218,036 | | | $ | — | | | $ | — | | | $ | 146,218,036 | |
76
CHARTWELL FUNDS
NOTES TO FINANCIAL STATEMENTS (Continued)
Chartwell Short Duration High Yield | | Level 1 | | | Level 2 | | | Level 3 | | | Total | |
Corporate Bonds | | $ | — | | | $ | 152,803,850 | | | $ | — | | | $ | 152,803,850 | |
Money Market Funds | | | 707,919 | | | | — | | | | — | | | | 707,919 | |
Total Investments | | $ | 707,919 | | | $ | 152,803,850 | | | $ | — | | | $ | 153,511,769 | |
Chartwell Small Cap Growth Fund | | Level 1 | | | Level 2 | | | Level 3 | | | Total | |
Common Stocks | | $ | 21,499,529 | | | $ | — | | | $ | — | | | $ | 21,499,529 | |
Money Market Funds | | | 887,628 | | | | — | | | | — | | | | 887,628 | |
Total Investments | | $ | 22,387,157 | | | $ | — | | | $ | — | | | $ | 22,387,157 | |
Refer to each Fund’s Schedule of Investments for a listing of the common stocks and/or corporate bonds, if applicable, by sector and/or industry type. The Funds did not hold derivative instruments or any assets or liabilities that were measured at fair value on a recurring basis using significant unobservable inputs (Level 3) as of or during the year ended October 31, 2020.
Note 8 – Securities Lending
Prior to March 4, 2020, under the terms of a securities lending agreement with BMO Securities Lending (“BMO”), BMO was authorized to loan securities on behalf of the Funds to approved borrowers. The contractual maturity of securities lending transactions was on an overnight and continuous basis. In exchange, the Funds received cash collateral in the amount of at least 100% of the value of the securities loaned. Any collateral shortfalls due to changes in security market prices were adjusted the next business day. The cash collateral was invested in short-term instruments. Although risk was mitigated by the collateral, the Funds could have experienced a delay in recovering their securities and possible loss of income or value if the borrower failed to return them. The agreement indemnified the Funds from losses incurred in the event of a borrower’s material default of the terms and conditions of the borrower agreement. The agreement provided that after predetermined rebates to borrowers, the Funds each retained a portion of their respective net securities lending income and paid BMO the remaining portion. As of October 31, 2020, the Funds are not engaged in securities lending.
77
CHARTWELL FUNDS
NOTES TO FINANCIAL STATEMENTS (Continued)
Note 9 – Sector Risk
If a Fund has significant investments in the securities of issuers in industries within a particular business sector, any development generally affecting that sector will have a greater impact on the value of the net assets of the Fund than would be the case if the Fund did not have significant investments in that sector. This may increase the risk of loss of an investment in a Fund and increase the volatility of a Fund’s NAV per share. From time to time, circumstances may affect a particular sector and the companies within such sector. For instance, economic or market factors, regulation or deregulation, and technological or other developments, may negatively impact all companies in a particular sector and therefore the value of a Fund’s portfolio could be adversely affected if it has significant holdings of securities of issuers in that sector. As of October 31, 2020, Chartwell Small Cap Value Fund had 26.1% of the value of its net assets invested in stocks in the Financials sector and Chartwell Small Cap Growth Fund had 35.5% of the value of its net assets invested in stocks within the Health Care sector.
Note 10 – Events Subsequent to the Fiscal Year End
The Funds have adopted financial reporting rules regarding subsequent events which require an entity to recognize in the financial statements the effects of all subsequent events that provide additional evidence about conditions that existed at the date of the balance sheet. Management has evaluated the Funds’ related events and transactions that occurred through the date of issuance of the Funds’ financial statements. There were no events or transactions that occurred during the fiscal year that materially impacted the amounts or disclosures in the Funds’ financial statements.
78
CHARTWELL FUNDS
REPORT OF INDEPENDENT REGISTERED PUBLIC
ACCOUNTING FIRM
To the Board of Trustees of The Chartwell Funds
and the Shareholders of Chartwell Income Fund, Chartwell Mid Cap Value Fund,
Chartwell Small Cap Value Fund, Chartwell Short Duration High Yield Fund,
and Chartwell Small Cap Growth Fund
Opinion on the Financial Statements
We have audited the accompanying statements of assets and liabilities of Chartwell Income Fund (previously “Berwyn Income Fund”), Chartwell Mid Cap Value Fund, Chartwell Small Cap Value Fund, Chartwell Short Duration High Yield Fund, and Chartwell Small Cap Growth Fund, each a series of shares of beneficial interest in The Chartwell Funds (the “Funds”), including the schedules of investments, as of October 31, 2020, and the related statements of operations for the year then ended, the statements of changes in net assets for each of the years in the two-year period then ended and the financial highlights for each of the years and the period June 16, 2017 (commencement of operations for the Chartwell Small Cap Growth Fund) through October 31, 2017 in the four-year period then ended, and the related notes (collectively referred to as the “financial statements”). We have also audited the financial highlights of Chartwell Income Fund and Chartwell Mid Cap Value Fund for the year ended December 31, 2015. In our opinion, the financial statements present fairly, in all material respects, the financial position of the Funds as of October 31, 2020, and the results of their operations for the year then ended, the changes in their net assets for each of the years in the two-year period then ended and their financial highlights for each of the years or periods detailed above, in conformity with accounting principles generally accepted in the United States of America. With respect to each of the Funds, and with the exception of the Chartwell Small Cap Growth Fund, the financial highlights for each of the periods presented in the table below have been audited by other auditors, whose report dated December 30, 2016 expressed an unqualified opinion on such financial highlights.
Fund | Financial Highlights Presented |
Chartwell Income Fund | For the period January 1, 2016 through October 31, 2016 |
Chartwell Mid Cap Value Fund | For the period January 1, 2016 through October 31, 2016 |
Chartwell Small Cap Value Fund | For the year ended October 31, 2016 |
Chartwell Short Duration High Yield Fund | For the year ended October 31, 2016 |
Basis for Opinion
These financial statements are the responsibility of the Funds’ management. Our responsibility is to express an opinion on the Funds’ financial statements based on our audits. We are a public accounting firm registered with the Public Company Accounting Oversight Board (United States) (“PCAOB”) and are required to be independent with respect to the Funds in accordance with the U.S. federal securities law and the applicable rules and regulations of the Securities and Exchange Commission and the PCAOB.
79
CHARTWELL FUNDS
REPORT OF INDEPENDENT REGISTERED PUBLIC
ACCOUNTING FIRM (Continued)
We conducted our audits in accordance with the standards of the PCAOB. Those standards require that we plan and perform the audits to obtain reasonable assurance about whether the financial statements are free of material misstatement, whether due to error or fraud. The Funds are not required to have, nor were we engaged to perform, an audit of their internal control over financial reporting. As part of our audits we are required to obtain an understanding of internal control over financial reporting but not for the purpose of expressing an opinion on the effectiveness of the Funds’ internal control over financial reporting. Accordingly, we express no such opinion.
Our audits included performing procedures to assess the risk of material misstatement of the financial statements, whether due to error or fraud, and performing procedures that respond to those risks. Such procedures included examining, on a test basis, evidence regarding the amounts and disclosures in the financial statements. Our procedures included confirmation of securities owned as of October 31, 2020 by correspondence with the custodians and brokers. Our audits also included evaluating the accounting principles used and significant estimates made by management, as well as evaluating the overall presentation of the financial statements. We believe that our audits provide a reasonable basis for our opinion.

BBD, LLP
We have served as the auditor of one or more of the Funds in The Chartwell Funds since 2017. Previously, we had served as the auditor of one or more of the Funds in the Berwyn Funds since 2003.
Philadelphia, Pennsylvania
December 23, 2020
80
CHARTWELL FUNDS
ABOUT YOUR FUNDS’ EXPENSES (Unaudited)
Expense Examples
As a shareholder of the Funds, you incur two types of costs: (1) transaction costs, which may include redemption fees; and (2) ongoing costs, including management fees and other Fund expenses. The examples below are intended to help you understand your ongoing costs (in dollars) of investing in the Funds and to compare these costs with the ongoing costs of investing in other mutual funds. A mutual fund’s ongoing costs are expressed as a percentage of its average net assets. This figure is known as the expense ratio.
These examples are based on an investment of $1,000 invested at the beginning of the period and held for the entire period from May 1, 2020 to October 31, 2020
Actual Expenses
The information in the row titled “Based on Actual Fund Return” of the table below provides actual account values and actual expenses. You may use the information in these columns, together with the amount you invested, to estimate the expenses that you paid over the period. Simply divide your account value by $1,000 (for example, an $8,600 account value divided by $1,000 = 8.6), then multiply the result by the number in the appropriate row for your Fund, under the column titled “Expenses Paid During Period” to estimate the expenses you paid on your account during this period.
Hypothetical Example for Comparison Purposes
The information in the row titled “Based on Hypothetical 5% Return (before expenses)” of the table below provides hypothetical account values and hypothetical expenses based on each Fund’s actual expense ratios and an assumed rate of return of 5% per year before expenses, which is not each Fund’s actual return. The hypothetical account values and expenses may not be used to estimate the actual ending account balance or expenses you paid for the period. You may use this information to compare the ongoing costs of investing in the Funds with the ongoing costs of investing in other mutual funds. To do so, compare these 5% hypothetical examples with the 5% hypothetical examples that appear in the shareholder reports of the other mutual funds.
Please note that the expenses shown in the table are meant to highlight your ongoing costs only and do not reflect any transaction costs, such as sales charges (load) or redemption fees. Therefore, this information is useful in comparing ongoing costs only, and will not help you determine the relative total costs of owning different funds. In addition, if these transactional costs were included, your costs would have been higher.
81
CHARTWELL FUNDS
ABOUT YOUR FUNDS’ EXPENSES (Unaudited) (Continued)
| Beginning
Account Value
May 1,
2020 | Ending
Account Value
October 31,
2020 | Net
Expense
Ratio(a) | Expenses
Paid During
Period(b) |
Chartwell Income Fund | | |
Based on Actual Fund Return | $1,000.00 | $1,081.00 | 0.64% | $3.35 |
Based on Hypothetical 5% Return (before expenses) | $1,000.00 | $1,021.92 | 0.64% | $3.25 |
| | | | | |
Chartwell Mid Cap Value Fund | | |
Based on Actual Fund Return | $1,000.00 | $1,069.30 | 0.90% | $4.68 |
Based on Hypothetical 5% Return (before expenses) | $1,000.00 | $1,020.61 | 0.90% | $4.57 |
| | | | | |
Chartwell Small Cap Value Fund | | |
Based on Actual Fund Return | $1,000.00 | $1,065.00 | 1.05% | $5.45 |
Based on Hypothetical 5% Return (before expenses) | $1,000.00 | $1,019.86 | 1.05% | $5.33 |
| | | | | |
Chartwell Short Duration High Yield Fund | | |
Based on Actual Fund Return | $1,000.00 | $1,055.50 | 0.49% | $2.53 |
Based on Hypothetical 5% Return (before expenses) | $1,000.00 | $1,022.67 | 0.49% | $2.49 |
| | | | | |
Chartwell Small Cap Growth Fund | | |
Based on Actual Fund Return | $1,000.00 | $1,306.40 | 1.05% | $6.09 |
Based on Hypothetical 5% Return (before expenses) | $1,000.00 | $1,019.86 | 1.05% | $5.33 |
(a) | Annualized, based on each Fund’s most recent one-half year expenses. |
(b) | Expenses are equal to each Fund’s annualized net expense ratio multiplied by the average account value over the period, multiplied by 184/366 (to reflect the one-half year period). |
82
CHARTWELL FUNDS
OTHER INFORMATION (Unaudited)
Proxy Voting Policies and Procedures
A description of the Funds’ proxy voting policies and procedures related to portfolio securities is available without charge, upon request, by calling the Funds at 1-888-995-5505, or on the U.S. Securities and Exchange Commission (the “SEC”) website at www.sec.gov.
Proxy Voting Record
Information regarding how the Funds voted proxies for portfolio securities during the most recent 12-month period ended June 30, is also available, without charge and upon request, by calling the Funds at 1-888-995-5505, or by accessing the Funds’ Form N-PX on the SEC’s website at www.sec.gov.
Portfolio Disclosure
The Funds file a complete listing of portfolio holdings with the SEC as of the end of the first and third quarters of each fiscal year as an exhibit to its reports on Form N-PORT. These filings are available upon request by calling 1-888-995-5505. Furthermore, you may obtain a copy of the filings on the SEC’s website at www.sec.gov.
83
CHARTWELL FUNDS
FEDERAL TAX INFORMATION (Unaudited)
Dividends Received Deduction
For corporate shareholders, the following percentages of ordinary income dividends paid during the year ended December 31, 2019 qualify for the corporate dividends received deduction:
Chartwell Income Fund | 20.02% |
Chartwell Mid Cap Value Fund | 100.00% |
Chartwell Small Cap Value Fund | 100.00% |
Chartwell Short Duration High Yield Fund | 0.00% |
Qualified Dividend Income
The Funds have designated the maximum amount allowable of their net taxable income as qualified dividend income as provided in the Jobs and Growth Tax Relief Reconciliation Act of 2003. This amount was reflected on Form 1099-DIV for the calendar year 2019.
Capital Gain Distributions
For the year ended October 31, 2020, the following Funds designated long-term capital gain distributions:
Chartwell Mid Cap Value Fund | | $ | 223,601 | |
Chartwell Small Cap Value Fund | | $ | 4,952,629 | |
Chartwell Small Cap Growth Fund | | $ | 7,527 | |
84
CHARTWELL FUNDS
BOARD OF TRUSTEES AND EXECUTIVE OFFICERS
(Unaudited)
The Board of Trustees has overall responsibility for management of the Trust’s affairs. The Trustees serve during the lifetime of the Trust and until its termination, or until death, resignation, retirement, or removal. The Trustees, in turn, elect the officers of the Trust to actively supervise its day-to-day operations. The officers have been elected for an annual term. The following are the Trustees and executive officers of the Trust:
Name, Address, Year of Birth and Position(s)
held with Trust | Term of Office and Length of Time Served | Principal Occupation During the
Past Five Years and Other Affiliations | Number of Portfolios in the Fund Complex Overseen by Trustee | Other Directorships Held During the Past Five Years |
“Independent” Trustees: | | | |
Gerald Frey (born 1946) Trustee | Since 2017 | Principal/General Partner, GSF Investments (1996-Present) | 5 | None |
David M. O’Brien (born 1950) Trustee | Since 2017 | Retired (2012-Present) | 5 | None |
Paul L. Rudy, III (born 1967) Trustee | Since 2017 | President, Graham Capital Company (2011-Present) | 5 | None |
Interested Trustees: |
Timothy J. Riddle † (born 1955) Chairman, Trustee, President and Chief Executive Officer | Since 2017 | Managing Partner and Chief Executive Officer, Chartwell Investment Partners, LLC (1997-Present) | 5 | N/A |
85
CHARTWELL FUNDS
BOARD OF TRUSTEES AND EXECUTIVE OFFICERS
(Unaudited) (Continued)
Name, Address, Year of Birth and Position(s)
held with Trust | Term of Office and Length of Time Served | Principal Occupation During the
Past Five Years and Other Affiliations | Number of Portfolios in the Fund Complex Overseen by Trustee | Other Directorships Held During the Past Five Years |
Officers of the Trust: | | | |
Neil Walker (born 1980) Treasurer, Chief Financial Officer and Secretary | Since 2017 | Controller, Chartwell Investment Partners, LLC (2016-Present); Controller, The Killen Group (2011-2016) | N/A | N/A |
Michael Magee (born 1965) Executive Vice President | Since 2017 | Chief Operating Officer, Chartwell Investment Partners, LLC (2016-Present); Chief Operating Officer, The Killen Group (2013-2016) | N/A | N/A |
Gregory Hagar (born 1968) Vice President | Since 2017 | Managing Partner and Chief Financial Officer, Chartwell Investment Partners, LLC (1997-Present) | N/A | N/A |
LuAnn Molino (born 1963) Chief Compliance Officer | Since 2017 | Chief Compliance Officer, Marketing, Client Service, Chartwell Investment Partners, LLC (1997-Present) | N/A | N/A |
† | Timothy J. Riddle is an “interested person” of the Trust by virtue of his affiliation with the Adviser and its affiliates. |
Additional information about the Trustees and executive officers is included in the Funds’ Statement of Additional Information which is available, without charge, upon request by calling (888) 995-5505.
86
CHARTWELL FUNDS
BOARD CONSIDERATION AND APPROVAL OF INVESTMENT ADVISORY AGREEMENT
(Unaudited)
At a meeting held on June 4, 2020 (the “Meeting”), the Board of Trustees (the “Trustees” or the “Board”) of The Chartwell Funds (the “Trust”), including the Trustees who are not “interested persons” of the Trust (the “Independent Trustees”) as defined in the Investment Company Act of 1940, as amended (the “1940 Act”), reviewed and approved the continuance of the Investment Advisory Agreement (the “Advisory Agreement”) between the Trust and Chartwell Investment Partners (the “Advisor”) with respect to the Chartwell Income Fund (“Income Fund”), Chartwell Mid Cap Value Fund (“Mid Cap Value Fund”), Chartwell Short Duration High Yield Fund (“High Yield Fund”), Chartwell Small Cap Growth Fund (“Small Cap Growth Fund”) and Chartwell Small Cap Value Fund (“Small Cap Value Fund”), each a series of the Trust (each, a “Fund” and together, the “Funds”), for an additional one-year period.
In considering the continuation of the Investment Advisory Agreement, the Independent Trustees reviewed and considered information provided by the Advisor at the Meeting and throughout the year at meetings of the Board and its committees. The Independent Trustees also reviewed and considered the information and materials provided in response to a request for information submitted to the Advisor on behalf of the Board in connection with the proposed renewal of the Investment Advisory Agreement, including statistical materials from Morningstar, an independent organization, comparing the performance of each Fund and the fees and expenses of each Fund with those of a peer group of funds. In connection with their review of each Fund, each Independent Trustee reviewed and considered all of the factors that he deemed relevant in approving the continuance of the Investment Advisory Agreement, including, but not limited to: (i) the nature, extent and quality of the services provided by the Advisor; (ii) the investment performance of the Funds and the Advisor; (iii) the costs of the services provided and profits realized by the Advisor and its affiliates from their relationship with the Funds; (iv) the extent to which economies of scale are realized as the Funds grow; and (v) whether fee levels reflect these economies of scale for the benefit of Fund investors.
In their deliberations, the Independent Trustees considered all of the information provided, including the factors summarized below, in renewing the Investment Advisory Agreement with respect to each Fund, noting that the Trustees did not identify any single factor as being more or less important than any of the others, and individual Trustees may have weighed certain factors differently. The Independent Trustees received a memorandum discussing the legal standards for their consideration of the continuation of the Investment Agreement and met separately with, and were assisted and advised by, their independent counsel.
Nature, Extent and of Quality of Services
The Trustees considered information about the nature, extent and quality of the services provided by the Advisor, including investment management services and operational and compliance support. The Trustees reviewed background, qualifications and experience of the Advisor’s personnel who are responsible for the day-to-day portfolio management of the Funds, or who provide significant other services to the Funds. The Trustees considered the Advisor’s responsibilities in serving as the Funds’ investment advisor, including: supervising and managing the investment and reinvestment of each Fund’s assets; voting, exercising
87
CHARTWELL FUNDS
BOARD CONSIDERATION AND APPROVAL OF INVESTMENT ADVISORY AGREEMENT
(Unaudited) (Continued)
consents and exercising all other rights appertaining to such securities and other assets on behalf of the Fund; supervising the investment program of the Fund and the composition of its investment portfolio; arranging for the purchase and sale of securities and other assets held in the investment portfolio of the Fund; monitoring compliance with various policies and procedures of the Funds; and periodic reporting to the Board. The Trustees were provided with, and considered information regarding, the Advisor’s investment decision-making process and its trading and investment research functions. The Trustees considered the Funds’ compliance program, the compliance reports periodically furnished to the Board, and the operations of the Funds and the Advisor during the COVID-19 crisis. The Trustees also considered the marketing and distribution arrangements for the Funds and the current asset levels of the Funds. The Trustees concluded that they were satisfied with the nature, extent, and quality of services provided to each Fund by the Advisor under the Investment Advisory Agreement.
Fund Performance
The Trustees reviewed the performance information for each Fund compiled by the Advisor and from Morningstar data for periods ended March 31, 2020, as well as during the period between March 31, 2020 and the date of the Meeting. The Trustees reviewed each Fund’s performance in absolute terms and relative to the peer funds in its Morningstar investment category during both of the foregoing periods. The Trustees considered the size of each Fund in comparison to its peer funds in each Morningstar investment category. The Trustees also reviewed the performance analysis prepared by the Advisor comparing each Fund’s performance relative to its benchmark index, over multiple performance periods, along with the Advisor’s explanation of the performance. Among other things, Trustees considered the following Fund-specific factors:
Income Fund. The Fund underperformed the category median and the Fund’s primary benchmark index for the one-, three-, and five-year periods ended March 31, 2020, and outperformed the category median but underperformed the primary benchmark index for the ten-year period ended such date. The Trustees considered that in 2019 the Income Fund transitioned to a new and expanded portfolio management team, which was not fully reflected in the performance results, and the Advisor’s confidence in the new team. The Trustees’ considered the Advisor’s explanation that Fund’s equity allocation, high yield bonds and certain legacy investments from the prior investment team detracted from performance relative to peers in the one-, three- and five-year periods. The Advisor’s noted that the redemptions experienced in this Fund did not affect the viability of the Advisor.
Mid Cap Value Fund. The Fund outperformed the category median and the Fund’s benchmark index for the one-, three- and 5-year periods ended March 31, 2020 and underperformed the category median and the Fund’s benchmark index for the ten-year period ended such date. The Trustees considered that the Fund has performed well relative to peers since it was repositioned in 2017.
High Yield Fund. The Fund outperformed the category median for the one-,three- and 5-year periods ended March 31, 2020, and outperformed the Fund’s primary benchmark index for
88
CHARTWELL FUNDS
BOARD CONSIDERATION AND APPROVAL OF INVESTMENT ADVISORY AGREEMENT
(Unaudited) (Continued)
the one-year period but underperformed the primary benchmark index for the three- and five-year periods ended such date. The Trustees considered that the Fund maintains a higher average quality and shorter average maturity than the traditional high yield bond funds that are included in the Morningstar investment category. The Advisor noted that cash was a drag on performance for the three- and five-year periods.
Small Cap Growth Fund. The Fund outperformed the category median and the Fund’s benchmark index for the one-year period ended March 31, 2020. The Trustees considered the Fund’s limited operational history and the challenging market environment in the first quarter of 2020.
Small Cap Value Fund. The Fund underperformed the category median but outperformed the Fund’s benchmark index for each of the one-, three- and five-year periods ended March 31, 2020. The Trustees considered the various sectors that the detracted most from performance over the applicable periods, including financial services in the one- and three-year periods, and consumer cyclicals over the five-year period.
After considering the information provided and presented at the Meeting and at meetings throughout the year, including discussions with and explanations by the Advisor, the Trustees determined that the performance of each Fund was reasonable.
Advisory Fees and Expenses
The Board reviewed the fee and expense information for each Fund compiled from Morningstar data for periods as of the Funds’ and the peer funds’ respective fiscal year ends. The Board compared each Fund’s actual advisory fee and total net expense ratio (after waivers) with the peer funds in its Morningstar investment category. The Board also considered the size of each Fund in comparison to its peer funds. Additionally, the Board received and considered information about the fees charged to other accounts and strategies managed by the Advisor that use similar investment styles and noted that these accounts are not subject to the same regulatory requirements Board reporting, separate website support, and client service responsibilities as the Funds. Among other things, the Trustees considered the following Fund-specific factors:
Income Fund. (1) The Fund’s actual advisory fee was higher than the category median of actual advisory fees charged to the peer funds included in the Fund’s Morningstar investment category; (2) the Fund’s total net expense ratio was lower than the category median of total net expense ratios of the peer funds in the Fund’s Morningstar investment category; (3) the Advisor agreed to continue to limit the Fund’s expense ratio for an additional year.
Mid Cap Value Fund. (1) The Fund’s actual advisory fee was higher than the category median of actual advisory fees charged to the peer funds included in the Fund’s Morningstar investment category; (2) the Fund’s total net expense ratio was lower than the category median of total net expense ratios of the peer funds in the Fund’s Morningstar investment category; (3) the Advisor agreed to limit the Fund’s expense ratio for an additional year.
89
CHARTWELL FUNDS
BOARD CONSIDERATION AND APPROVAL OF INVESTMENT ADVISORY AGREEMENT
(Unaudited) (Continued)
High Yield Fund. (1) The Fund’s actual advisory fee was lower than the category median of actual advisory fees charged to the peer funds included in the Fund’s Morningstar investment category; (2) the Fund’s total net expense ratio was below the category median of total net expense ratios of the peer funds in the Fund’s Morningstar investment category; (3) the Advisor agreed to limit the Fund’s expense ratio for an additional year.
Small Cap Growth Fund. (1) The Fund’s actual advisory fee was higher than the category median of actual advisory fees charged to the peer funds included in the Fund’s Morningstar investment category; (2) the Fund’s total net expense ratio was lower than the category median of total net expense ratios of the peer funds in the Fund’s Morningstar investment category; (3) the Advisor agreed to limit the Fund’s expense ratio for an additional year.
Small Cap Value Fund. (1) The Fund’s actual advisory fee was higher than the category median of actual advisory fees charged to the peer funds in the Fund’s Morningstar investment category; (2) the Fund’s total net expense ratio was lower than the category median of total net expense ratios of the peer funds in the Fund’s Morningstar investment category; (3) the Advisor agreed to limit the Fund’s expense ratio for an additional year.
The Trustees concluded that the compensation paid to the Advisor under the Investment Advisory Agreement and the total net expenses of each Fund, after waivers, were fair and reasonable in light of the nature and quality of the services to be provided by the Advisor to each Fund.
Costs of Services and Profitability
The Trustees considered the financial information provided by the Advisor, including the costs and profits with respect to each Fund. The Trustees concluded that the profits of the Advisor from its relationship with the Funds were reasonable.
The Trustees also considered the extent to which the Advisor might derive ancillary benefits as a result of its relationships with the Funds (other than the receipt of its investment advisory fee), including any research received from broker-dealers providing execution services to the Funds and the intangible benefits of its association with the Funds generally. Based upon its consideration of all these factors, the Trustees concluded that the level of profits realized by the Advisor from providing services to the Funds was not excessive in view of the nature, extent and quality of services provided to the Funds.
Economies of Scale
The Trustees considered the size of each Fund and noted the Advisor had instituted breakpoints in the advisory fee for the largest Fund, the Income Fund. The Trustees also noted that although there were no advisory fee breakpoints on the Mid Cap Value Fund, High Yield Fund, Small Cap Growth Fund and Small Cap Value Fund, the assets levels of those Funds were not currently likely to lead to significant economies of scale and that any such economies would be considered in the future as those Funds’ assets grow.
90
CHARTWELL FUNDS
BOARD CONSIDERATION AND APPROVAL OF INVESTMENT ADVISORY AGREEMENT
(Unaudited) (Continued)
Conclusion
Based on its review, consideration and evaluation of all factors it believed relevant, including the above-described factors and conclusions, the Board, including the Independent Trustees, unanimously approved the continuation of the Investment Advisory Agreement for an additional one-year period.
91
This page intentionally left blank.
This page intentionally left blank.
Chartwell Funds
Each a series of The Chartwell Funds
Investment Advisor
Chartwell Investment Partners, LLC
1205 Westlakes Drive, Suite 100
Berwyn, Pennsylvania 19312
Independent Registered Public Accounting Firm
BBD, LLP
1835 Market Street, 3rd Floor
Philadelphia, Pennsylvania 19103
Custodian
UMB Bank, n.a.
928 Grand Boulevard, 5th Floor
Kansas City, Missouri 64106
Fund Administrator, Transfer Agent and Fund Accountant
Ultimus Fund Solutions, LLC
225 Pictoria Drive, Suite 450
Cincinnati, OH 45246
Distributor
Foreside Fund Services, LLC
Three Canal Plaza, Suite 100
Portland, Maine 04101
www.foreside.com
This report and the financial statements contained herein are provided for the general information of the shareholders of the Chartwell Funds. This report is not authorized for distribution to prospective investors in the Funds unless preceded or accompanied by an effective prospectus.
As of the end of the period covered by this report, the registrant has adopted a code of ethics that applies to the registrant’s principal executive officer, principal financial officer, principal accounting officer or controller, or persons performing similar functions, regardless of whether these individuals are employed by the registrant or a third party. Pursuant to Item 13(a)(1), a copy of registrant’s code of ethics is filed as an exhibit to this Form N-CSR. During the period covered by this report, the code of ethics has not been amended, and the registrant has not granted any waivers, including implicit waivers, from the provisions of the code of ethics.
| Item 3. | Audit Committee Financial Expert. |
The registrant’s board of trustees has determined that the registrant has at least one audit committee financial expert serving on its audit committee. The name of the audit committee financial expert is Paul L. Rudy, III. Mr. Rudy, III is “independent” for purposes of this Item.
| Item 4. | Principal Accountant Fees and Services. |
| (a) | Audit Fees. The aggregate fees billed for professional services rendered by the principal accountant for the audit of the registrant’s annual financial statements or for services that are normally provided by the accountant in connection with statutory and regulatory filings or engagements were $71,000 and $71,000 with respect to the registrant’s fiscal years ended October 31, 2020 and 2019, respectively. |
| (b) | Audit-Related Fees. No fees were billed in either of the last two fiscal years for assurance and related services by the principal accountant that are reasonably related to the performance of the audit of the registrant’s financial statements and are not reported under paragraph (a) of this Item. |
| (c) | Tax Fees. The aggregate fees billed for professional services rendered by the principal accountant for tax compliance, tax advice, and tax planning were $11,250 and $11,250 with respect to the registrant’s fiscal years ended October 31, 2020 and 2019, respectively. The services comprising these fees are the preparation of the registrant’s federal income and excise tax returns. |
| (d) | All Other Fees. No fees were billed in either of the last two fiscal years for products and services provided by the principal accountant, other than the services reported in paragraphs (a) through (c) of this Item. |
| (e)(1) | The audit committee has not adopted pre-approval policies and procedures described in paragraph (c)(7) of Rule 2-01 of Regulation S-X. |
| (e)(2) | None of the services described in paragraph (b) through (d) of this Item were approved by the audit committee pursuant to paragraph (c)(7)(i)(C) of Rule 2-01 of Regulation S-X. |
| (f) | Less than 50% of hours expended on the principal accountant’s engagement to audit the registrant’s financial statements for the most recent fiscal year were attributed to work performed by persons other than the principal accountant’s full-time, permanent employees. |
| (g) | During the fiscal years ended October 31, 2020 and 2019, aggregate non-audit fees of $11,250 and $11,250, respectively, were billed by the registrant’s accountant for services rendered to the registrant. No non-audit fees were billed in either of the last two fiscal years by the registrant’s accountant for services rendered to the registrant’s investment adviser (not including any sub-adviser whose role is primarily portfolio management and is subcontracted with or overseen by another investment adviser), and any entity controlling, controlled by, or under common control with the adviser that provides ongoing services to the registrant. |
| (h) | The principal accountant has not provided any non-audit services that were not previously approved to the registrant’s investment adviser (not including any sub-adviser whose role is primarily portfolio management and is subcontracted with or overseen by another investment adviser), and any entity controlling, controlled by, or under common control with the investment adviser that provides ongoing services to the registrant. |
| Item 5. | Audit Committee of Listed Registrants. |
Not applicable
| (a) | Not applicable [schedule filed with Item 1] |
| Item 7. | Disclosure of Proxy Voting Policies and Procedures for Closed-End Management Investment Companies. |
Not applicable
| Item 8. | Portfolio Managers of Closed-End Management Investment Companies. |
Not applicable
| Item 9. | Purchases of Equity Securities by Closed-End Management Investment Company and Affiliated Purchasers. |
Not applicable
| Item 10. | Submission of Matters to a Vote of Security Holders. |
There have been no material changes to the procedures by which shareholders may recommend nominees to the registrant’s board of trustees.
| Item 11. | Controls and Procedures. |
(a) Based on their evaluation of the registrant’s disclosure controls and procedures (as defined in Rule 30a-3(c) under the Investment Company Act of 1940, as amended (the “Act”)) as of a date within 90 days of the filing date of this report, the registrant’s principal executive officer and principal financial officer have concluded that such disclosure controls and procedures are reasonably designed and are operating effectively to ensure that material information relating to the registrant is made known to them by others within those entities, particularly during the period in which this report is being prepared, and that the information required in filings on Form N-CSR is recorded, processed, summarized, and reported on a timely basis.
(b) There were no changes in the registrant’s internal control over financial reporting (as defined in Rule 30a-3(d) under the Investment Company Act of 1940) that occurred during the period covered by this report that have materially affected, or are reasonably likely to materially affect, the registrant’s internal control over financial reporting.
| Item 12. | Disclosure of Securities Lending Activities for Closed-End Management Investment Companies. |
Not applicable
File the exhibits listed below as part of this Form. Letter or number the exhibits in the sequence indicated.
(a)(1) Any code of ethics, or amendment thereto, that is the subject of the disclosure required by Item 2, to the extent that the registrant intends to satisfy the Item 2 requirements through filing of an exhibit: Attached hereto
(a)(2) A separate certification for each principal executive officer and principal financial officer of the registrant as required by Rule 30a-2(a) under the Act (17 CFR 270.30a-2(a)): Attached hereto
(a)(3) Any written solicitation to purchase securities under Rule 23c-1 under the Act (17 CFR 270.23c-1) sent or given during the period covered by the report by or on behalf of the registrant to 10 or more persons: Not applicable
(a)(4) Change in the registrant’s independent public accountants: Not applicable
(b) Certifications required by Rule 30a-2(b) under the Act (17 CFR 270.30a-2(b)): Attached hereto
SIGNATURES
Pursuant to the requirements of the Securities Exchange Act of 1934 and the Investment Company Act of 1940, the registrant has duly caused this report to be signed on its behalf by the undersigned, thereunto duly authorized.
| (Registrant) | The Chartwell Funds | | |
| | | | |
| By (Signature and Title)* | /s/ Timothy J. Riddle | |
| | | Timothy J. Riddle, Chairman, President and Chief Executive Officer (Principal Executive Officer) | |
| | | | |
| Date | December 31, 2020 | | |
| | | | |
| Pursuant to the requirements of the Securities Exchange Act of 1934 and the Investment Company Act of 1940, this report has been signed below by the following persons on behalf of the registrant and in the capacities and on the dates indicated. |
| | | | |
| By (Signature and Title)* | /s/ Timothy J. Riddle | |
| | | Timothy J. Riddle, Chairman, President and Chief Executive Officer (Principal Executive Officer) | |
| | | | |
| Date | December 31, 2020 | | |
| | | | |
| By (Signature and Title)* | /s/ Neil Walker | |
| | | Neil Walker, Treasurer and Chief Financial Officer (Principal Financial Officer) | |
| | | | |
| Date | December 31, 2020 | | |
| * | Print the name and title of each signing officer under his or her signature. |