| | OMB APPROVAL |
| | OMB Number: 3235-0570 Expires: July 31, 2022 Estimated average burden hours per response: 20.6 |
UNITED STATES
SECURITIES AND EXCHANGE COMMISSION
Washington, D.C. 20549
FORM N-CSR
CERTIFIED SHAREHOLDER REPORT OF REGISTERED
MANAGEMENT INVESTMENT COMPANIES
| Investment Company Act file number | 811-23244 | |
The Chartwell Funds
(Exact name of registrant as specified in charter)
| 1205 Westlakes Drive, Suite 100 Berwyn, Pennsylvania | 19312 |
| (Address of principal executive offices) | (Zip code) |
Timothy J. Riddle |
| The Chartwell Funds, 1205 Westlakes Drive, Suite 100 Berwyn, Pennsylvania 19312 |
| (Name and address of agent for service) |
With a copy to:
Alan R. Gedrich, Esq.
Stradley Ronon Stevens & Young, LLP
2005 Market Street, Suite 2600
Philadelphia, PA 19103-7018
| Registrant's telephone number, including area code: | (610) 296-1400 | |
| Date of fiscal year end: | December 31 | |
| | | |
| Date of reporting period: | December 31, 2021 | |
Form N-CSR is to be used by management investment companies to file reports with the Commission not later than 10 days after the transmission to stockholders of any report that is required to be transmitted to stockholders under Rule 30e-1 under the Investment Company Act of 1940 (17 CFR 270.30e-1). The Commission may use the information provided on Form N-CSR in its regulatory, disclosure review, inspection, and policymaking roles.
A registrant is required to disclose the information specified by Form N-CSR, and the Commission will make this information public. A registrant is not required to respond to the collection of information contained in Form N-CSR unless the Form displays a currently valid Office of Management and Budget ("OMB") control number. Please direct comments concerning the accuracy of the information collection burden estimate and any suggestions for reducing the burden to the Secretary, Securities and Exchange Commission, 450 Fifth Street, NW, Washington, DC 20549-0609. The OMB has reviewed this collection of information under the clearance requirements of 44 U.S.C. § 3507.
| Item 1. | Reports to Stockholders. |
| |
| |
| |
| |
| |
| |
| |
| |
| |
| |
| |
| |
 |
| |
| |
| |
| Chartwell Income Fund (BERIX) |
| Chartwell Mid Cap Value Fund (BERCX) |
| Chartwell Small Cap Value Fund (CWSIX) |
| Chartwell Short Duration High Yield Fund (CWFIX) |
| Chartwell Small Cap Growth Fund (CWSGX) |
| Chartwell Short Duration Bond Fund (CWSDX) |
| |
| |
| |
| ANNUAL REPORT |
| December 31, 2021 |
| |
| |
| |
| |
| |
| |
| |
| |
| |
| |
| |
| |
| |
| |
| |
| |
| |
| |
| THE CHARTWELL FUNDS |
| LETTER FROM THE PRESIDENT (Unaudited) |
Dear Fellow Shareholder,
As we close out our mutual funds’ 2021 fiscal year, I want to thank you for trusting The Chartwell Funds with your assets. At Chartwell, we are committed to enhancing our shareholders’ value every day through the quality of our research and portfolio implementation. As I write this letter, in late January, the markets have taken a step back and volatility is the order of the day. A year such as 2021 and the volatile start to 2022 underscores our belief that, in challenging market environments, active management and experience matter. At Chartwell, we feel that over time, our experience across various market cycles combined with our disciplined approach will reward our shareholders. And for that, we thank you for the trust you have placed in The Chartwell Funds.
Organizational Update:
On October 20, 2021, it was announced that the parent company of Chartwell Investment Partners, LLC (“Chartwell”), TriState Capital Holdings, Inc. (NASDAQ: TSC), had agreed to be acquired by Raymond James Financial, Inc. (NYSE: RJF), a leading diversified financial services company, headquartered in St. Petersburg, FL. Chartwell has operated as the asset management subsidiary of Tristate since March 2014. Under the ownership of Raymond James, Chartwell will continue to operate independently, as an affiliate of Carillon Tower Advisers (“Carillon”), the $70 billion asset management subsidiary of Raymond James. The essence of Carillon’s affiliate model is investment and client service team independence, which will allow our talented professionals to continue to focus on achieving the objectives of our shareholders and clients. While this acquisition will allow Chartwell to operate independently, it will also provide our firm with access to Carillon’s best of class distribution and shared services infrastructure. This transaction is subject to bank regulatory reviews and approval and is expected to close in the second quarter of 2022.
On December 15, 2021, The Chartwell Funds’ Board held a special meeting and voted unanimously to approve the proposed transaction and reorganization of The Chartwell Funds into the Carillon Funds. Over the next several weeks, our mutual funds’ shareholders will receive disclosure materials to review and a proxy card(s) to vote on the pending transaction. Please note that following the close of the proposed acquisition and the reorganization of The Chartwell Funds, the Chartwell team will continue to manage the assets of the funds. We encourage our shareholders to carefully review these materials and vote in favor of The Chartwell Funds’ reorganization.
Market Summary:
As we headed into 2021, Chartwell was bullish on the global economy as well as equities and high-grade corporate bonds (“risk assets”) for a handful of reasons that we detailed in our yearly outlook. The results did not disappoint. While the Delta variant and supply chain constraints created some headwinds, the U.S. economy could likely post its strongest annual growth numbers since 1984 and U.S. equity indices have produced robust returns. As we turn to our forecast for 2022, many of the strengths we recognized in the economy in late 2020 remain. For example, it appears that consumer balance sheets are strong, and savings are elevated. Furthermore, wage increases should continue to buoy the consumers’ spending ability, and with the reopening of the “experiential economy” (concerts, travel destinations,
| THE CHARTWELL FUNDS |
| LETTER FROM THE PRESIDENT (Unaudited) (Continued) |
etc.), individuals will have more outlets to spend this money outside of supply-constrained goods. For these reasons, and others, we believe economic growth in the first half of 2022 has the potential to remain strong. However, the second half of the year could lead to some consternation as growth starts to slow, inflation subsides, and the Federal Reserve continues to tighten policy.
While we fully support tighter monetary conditions and believe the economy can withstand significantly higher rates, the timing may cause some bumps along the way for risk assets. We believe inflation is likely to peak early in 2022 and start to moderate as the year progresses. Despite the anticipated volatility throughout 2022, I want to assure you that Chartwell’s investment teams will continue to work hard to find attractive investment opportunities across our six mutual funds.
You are a valued partner of Chartwell and we greatly appreciate our relationship. We hope that your families remain safe and healthy during this challenging time. Thank you for investing your trust and confidence in The Chartwell Funds. Stay safe and have a healthy 2022. Highlighted below are the performance summaries of each of our funds for the fiscal year ended December 31, 2021. We welcome any questions you may have on the fund(s) performance. Inquiries may be directed to Shareholder Services at 888.995.5505 or via our website at https://www.chartwellip.com/.
Thank you and we look forward to serving as your mutual funds’ manager in the coming year.
Best Regards,

Timothy Riddle
President of The Chartwell Funds
| THE CHARTWELL FUNDS |
| LETTER FROM THE PRESIDENT (Unaudited) (Continued) |
Mutual Funds Performance Summaries
Chartwell Income Fund (BERIX):
The 1-year total return to shareholders of the Chartwell Income Fund (BERIX) for the fiscal year ended December 31, 2021, was +7.35 percent, while the Bloomberg U.S. Aggregate Index was down -1.54%. Net asset value increased from $13.53 on December 31, 2020, to $14.15 on December 31, 2021, and monthly dividends totaled $0.3650 per share for the twelve-month period. The negative returns produced by the Index were largely a product of higher interest rates in 2021, as the yield on the 10-year Treasury jumped nearly 60 basis points (bps)1. Due to the Fund’s shorter duration, corporate credit selection, and an allocation to equities, the portfolio was able to overcome the headwind of higher rates.
While we are biased towards the upside in risk assets, we do believe 2022 will be a year of volatility. We therefore remain neutral on equities for now, with our allocation around 20%. We still believe interest rates have another leg higher and remain short duration relative to the Index. Currently, the duration on the Fund resides at roughly 3.7 years against the Bloomberg U.S. Aggregate Bond Index’s duration of 6.8 years. We expect our duration to remain short of the Index throughout this cycle but will slowly move it higher as interest rates approach our targets. As previously stated, we are bullish on precious metals for a variety of reasons. We expressed our belief that precious metals are set for another leg higher by purchasing both the underlying commodity (currently a position in SLV) and equities that mine precious metals. We plan on capping the total purchases towards precious metals and their related equities around 5% and will keep investors apprised on the individual holdings as the positions are filled out.
Chartwell Mid-Cap Value Fund (BERCX):
The 1-year total return to shareholders of the Chartwell Mid-Cap Value Fund (BERCX) for the fiscal year ended December 31, 2021, was +27.30 percent. Net asset value increased from $14.92 on December 31, 2020, to $18.88 on December 31, 2021. For the fiscal year, BERCX slightly underperformed its reference index, the Russell Midcap Value Index, with a return of +28.34%. After a second-half relative performance recovery, our Fund closed out the year lagging the Russell Midcap Value benchmark by 104 bps. We outperformed in just 5 of 12 sectors, but we were overweight where selection was best and underweight where we underperformed the most. This compensated for a meaningful drag from cash held in the portfolios during a period of strong market returns. Our biggest contributor was Consumer Services, where auto parts retailer AutoZone (2.9%)2 enjoyed a strong recovery in professional installer sales. In real estate investment trusts (REITs), self-storage facility operator Life Storage (2.3%) enjoyed strong occupancy and pricing growth. In Energy, E&P holdings including Diamondback (2.0%) were boosted by surging oil prices.
Our biggest detractor was Consumer Staples, where valued-added potato processor Lamb Weston (2.1%) encountered cost inflation that marred an impressive recovery in demand from foodservice customers. In Financial Services, P&C insurer Allstate (3.8%) was pressured by higher claims frequency and severity in its auto segment. In Basic Industry, we were underexposed to commodities and ag chemicals manufacturer FMC (3.9%) was challenged by raw material inflation.
| 1 | A basis point or bp represents a unit equal to 1/100th of 1%. |
| 2 | The numbers in parentheses following each company mentioned reflect the percentage of net assets comprised of such sectors or securities as of 12.31.2021. Holdings percentage is subject to change. |
| THE CHARTWELL FUNDS |
| LETTER FROM THE PRESIDENT (Unaudited) (Continued) |
We believe prioritizing business quality and financial strength when selecting value stocks is the key to potential outperformance over a full market cycle. This approach challenged our Fund in 2020 and in the first half of 2021 when weak, highly leveraged companies disproportionately benefited from an economic recovery fueled by fiscal and monetary stimulus. In the second half of 2021, we were encouraged to see investors begin to favor profitable, financially stable companies, and we’re cautiously optimistic that this market rotation will persist as stimulus is withdrawn and economic conditions normalize. Bottom-up selection decisions has continued to drive portfolio positioning, with our top-down economic outlook and view of industry prospects having a small influence on sector allocation. The Fund’s largest overweights are Consumer Services, Business Services, and Health Care, and their largest underweights are Capital Spending, Technology, and Basic Industry.
Chartwell Small Cap Value Fund (CWSIX):
The 1-year total return to shareholders of the Chartwell Small Cap Value Fund (CWSIX) for the fiscal year ended December 31, 2021, was +24.42 percent. Net asset value increased from $17.75 on December 31, 2020, to $19.90 on December 31, 2021. Our Fund trailed the Russell 2000 Value Index benchmark by 385 bps in 2021, which returned +28.27%. Sector allocation was a headwind, but selection was the primary driver of underperformance. Half of the sectors made positive contributions, but underperforming sectors were more impactful.
Our biggest detractor was Consumer Services, where selection was severely impacted in the first half by unowned “meme” stocks like AMC and GameStop, and pandemic winner Jack-in-the-Box (2.1%) lagged peers with more recovery potential. In Financial Services, non-standard auto insurer Kemper (1.4%) was pressured by increased claims frequency and severity. In Energy, an underweight was a headwind and selection was negatively impacted by higher exposure to service and equipment providers like ChampionX (1.2%) which trailed E&Ps.
Our biggest contributor was Business Services, where HR services provider Korn Ferry (1.7%) benefited from growing labor demand. In Consumer Cyclical, furniture manufacturer Knoll (0.5%) agreed to be acquired by a competitor for a substantial premium. In Consumer Staples, poultry producer Sanderson Farms (1.1%) also agreed to be acquired by a competitor for a substantial premium.
Chartwell Short Duration High Yield Fund (CWFIX):
The 1-year total return to shareholders of the Chartwell Short Duration High Yield Fund (CWFIX) for the fiscal year ended December 31, 2021, was +2.40 percent. For the fiscal year, CWFIX slightly outperformed its reference index, the Bloomberg Intermediate US Government/Credit Index, with a return of -1.44%. Net asset value decreased slightly from $9.79 on December 31, 2020, to $9.75 on December 31, 2021, and monthly dividends totaled $0.2725 per share for the twelve-month period.
The Fund closed out 2021 with Insurance (2.8%), Automotive (3.1%), and Transportation (4.5%) being the portfolio’s the best performing sectors, while Leisure (3.3%), Health Care (2.4%), and Capital Goods (2.3%) lagged. Top contributors closing out the Fund’s fiscal year included National Mortgage Insurance (2.8%)1, Rattler Midstream (2.5%), and Albertsons (2.5%). Offsetting these, iStar (2.5%), Sirius XM (2.5%), and SLM Corp. (1.5%) lagged. Trading
| THE CHARTWELL FUNDS |
| LETTER FROM THE PRESIDENT (Unaudited) (Continued) |
activity was modest in 2021 with turnover of approximately 52%. Several bonds were tendered or called at premiums to par including Ball Corp. (0.0%), Cheniere Energy (0.0%), Crown Americas (0.0%), Dell Technology (0.0%), SLM Corp. (1.5%), and Sunoco (0.0%). Proceeds were re-deployed by extending maturities in some of these same issuers, adding to existing positions, and initiating a couple new positions including Vici Properties (2.6%) and XPO Logistics (2.6%). At the close of 2021, the portfolio’s largest sector weights were in Basic Industry (12.7%), Financials (10.6%), and Energy (8.8%).
We would not be surprised to see interest rates grind higher during 2022. The circumstances that drove up inflation expectations in the second half of 2021 feel stubborn to us. While some of the components driving recent inflation higher are expected to roll over in 2022, increased government outlays, accommodative monetary policy (still, even after tapering and the initial rate hikes), a smaller labor force, disjointed supply chains, and pent-up consumer demand could conspire to support inflation readings that remain higher than recent historical averages. Of the companies we research for investment ideas, many believe they have pricing power sufficient to transmit higher costs through to consumers. In this environment, we believe high yield has the potential to outperform other areas of traditional fixed income. High yield bonds have relatively short durations and tend to benefit from a strong economy and some inflation. That said, we recognize the high yield’s 4.8% yield-to-maturity3 (30- Day SEC yield for subsidized and unsubsidized were 2.13% and 2.06%, respectively) is near an all-time low. We believe portfolios ought to be positioned with a quality bias today and look to capitalize on higher volatility when it comes. While absolute yield levels are relatively low, high yield corporates generate more income than most liquid fixed income alternatives.
The portfolio’s quality (BB)4 and maturity ‘guardrails’ remain the foundation around which we invest. We believe these structural inputs produce a relatively consistent and attractive income stream given the associated credit and interest rate risk.
Chartwell Small Cap Growth Fund (CWSGX):
The 1-year total return to shareholders of the Chartwell Small Cap Growth Fund (CWSGX) for the fiscal year ended December 31, 2021, was +16.47 percent. Net asset value decreased from $17.29 on December 31, 2020, to $16.36 on December 31, 2021. The Fund significantly outperformed the Russell 2000 Growth Index for the year, which returned +2.83%. While the
| 3 | Yield to Maturity is the estimated rate of return based on the assumption that it will be held until its maturity date and not called. |
The 30-Day SEC Yield is computed under an SEC standardized formula based on net income earned over the past 30 days. It is a “subsidized” yield, which means it includes contractual expense reimbursements, and it would be lower without those reimbursements.
The Unsubsidized 30-Day SEC Yield is computed under an SEC standardized formula based on net income earned over the past 30 days. It excludes contractual expense reimbursements, resulting in a lower yield.
| 4 | Credit quality ratings are sourced from Standard & Poor’s (the “S&P”), Moody’s and Fitch’s. Ratings values are based on the higher of either S&P or Moody’s. If none of the rating agencies has assigned a rating, the Fund will assign a rating of NR (non-rated security). The ratings represent their (S&P, Moody’s) opinions as to the quality of the securities they rate. The ratings range from AAA (S&P) or Aaa (Moody’s) (extremely strong capacity to meet its financial commitment) to D (S&P, Fitch’s) or C (Moody’s) (in default). Credit ratings of BBB are good credit quality and the lowest category of investment grade. Ratings are relative and subjective and are not absolute standards of quality. The ratings provided relate to the underlying securities within the fund and not the fund itself. |
| THE CHARTWELL FUNDS |
| LETTER FROM THE PRESIDENT (Unaudited) (Continued) |
small cap growth style was broadly out of favor among investors this year when compared to other segments of the stock market, the strategy delivered strong performance through broad stock selection. While the Health Care sector had the best relative performance for the year, Consumer Discretionary, Industrials, and Technology sectors all had meaningful contributions to the outperformance as well.
For the year, the top overall contributor was At Home Group, (1.0%), which gained 134% for the year. At Home is a retailer focused on home furnishings whose sales and earnings benefited from the continued hybrid/Work From Home trends. Earlier this year, the company agreed to be acquired by a private equity firm at a 22% premium. The next largest contributor was Generac (1.2%), which returned 79% for the year. Generac is the largest automatic and stationary standby generator manufacturer in the U.S., serving both residential and commercial customers. The unstable electrical grid in numerous parts of the country have driven record high levels of orders for the company. Indeed, the company’s challenge now is trying to reduce the high level of backlog, as it navigates a challenging supply chain. Given its very strong returns over the past two years, the market capitalization moved out of the small cap range, leading to the sale of the position earlier this year.
The largest detractor in the Fund was Bandwidth (0.9%), which had a -53% return. Bandwidth is a cloud-based Communications Platform as a Service (CPaaS) company, reselling and utilizing their voice-based IP network for their enterprise customers. Bandwidth suffered through major disruptions in December as their network was interrupted by digital hackers. While the disruption was resolved within weeks, the traffic that was diverted has taken longer to return. Also, the company was seen as a Covid beneficiary, with many investors believing that the growth seen in 2020 was an aberration. While growth will slow going forward, we feel the stock over-corrected, and we are retaining our position in Bandwidth.
Another underperformer was our investment in Axsome Therapeutics (0.4%) which had a -70% return. Axsome Therapeutics suffered through several negative regulatory surprises; in early August, the FDA notified the company that there were deficiencies in the New Drug Application of AXS-05 for Major Depression Disorder. Later in the month, the FDA informed the company that the regulatory agency would not be able to review the NDA by the expected targeted date. At this point, it is still unclear if the company needs to submit additional data, or if the FDA just missed its internal deadlines due to other non-company issues. Given the significant uncertainties, we sold our position in Axsome.
Chartwell Short Duration Bond Fund (CWSDX):
The fiscal year-to-date (YTD) 2021 total return to shareholders of the Chartwell Short Duration Bond Fund (CWSDX) for the period since inception through December 31, 2021, was -0.37%. This is our newest fund that incepted on September 22, 2021. Net asset value commenced at $10.00 and slightly decreased to $9.95 on December 31, 2021.
For the year ended December 31, 2021, CWSDX outperformed the Bloomberg Intermediate US Government/Credit Index at -1.07% and the Bloomberg 1-3 Year US Government /Credit Index at -0.60%. The performance data quoted represents past performance and is no guarantee of future results. Investment returns and principal value of an investment will fluctuate, so that
| THE CHARTWELL FUNDS |
| LETTER FROM THE PRESIDENT (Unaudited) (Continued) |
an investor’s shares, when redeemed, may be worth more or less than the original cost. Current performance may be lower or higher than the performance data cited. Current month end data is available at www.chartwellip.com. Returns for periods of less than a year are not annualized.
Closing out the fiscal year, the portfolio’s significant underweight to Treasuries (8%) and allocation to High Yield Securities (13%) were the biggest contributors to outperformance. The overweight in Financials (37.7%), particularly Banks (24.8%), was the biggest detractor to performance, although the selection benefit helped offset some of the total contribution to return. The current overweight in Banking is reflective of sound fundamentals within the sector and attractive relative value versus other corporate sectors given their ratings, likely due to banks being regular issuers in the front-end of the curve.
The Fund seeks to maximize current income by investing in high quality short maturity fixed income securities while also preserving capital. The portfolio’s short duration is more resistant to interest rate fluctuation than longer-term bonds. However, short-term bond funds do not seek to maintain stable values and offer no guarantees (i.e., not a money-market account). The portfolio’s total return approach means that it is designed to potentially avoid sacrificing principal by simply reaching for the highest yields available in the respective universe. In addition to employing sophisticated risk controls, the portfolio seeks to potentially benefit from the team’s efforts to identify major market risks early and position portfolios accordingly. The dollar-weighted average effective maturity5 will be more than one but less than three years during normal market conditions. The most distinct feature of the Fund is the ability to invest up to 25% in High Yield rated debt instruments. As of December 31, 2021, 13% of the portfolio is invested in below investment grade corporate securities and it is exclusively comprised of names that carry BB ratings. The enhanced income from this backet provides the potential cushion necessary to preserve capital, mitigating the underlying rate risk, and is the key differentiator towards generating alpha6.
Given the current backdrop, the Fund is primarily focused on income and capital preservation seeking to offer an attractive form of cash flow to navigate a potentially volatile year ahead. What was once viewed as a valuable alternative has become a necessary compliment to a broader fixed income allocation, particularly longer-duration strategies. As valuations have become rich on the front-end, we believe a pensive approach with a focus on being opportunistic and liquid, while potentially preserving optionality is a prudent balance. We also believe that maintaining the yield advantage in the form of high-quality income is paramount, so excess carry and active cash management has put us in a position not to make outsized duration bets. It could be expected for duration to approach a more neutral position as the curve prices in further terminal rate discovery. The digestion of the monetary and fiscal normalization process is not going to be smooth as defined by bouts of volatility and overshooting in rates. To help offset the rise in rates we have been buying investment grade corporate floating rate notes
| 5 | The average time it takes for securities in a portfolio to mature, weighted in proportion to the dollar amount that is invested in the portfolio. Weighted average maturity measures the sensitivity of fixed-income portfolios to interest rate changes. |
| 6 | A measure of performance on a risk-adjusted basis. Alpha takes the volatility (price risk) of a fund and compares its risk-adjusted performance to a benchmark index. The excess return of the fund relative to the return of the benchmark is a fund’s alpha. |
| THE CHARTWELL FUNDS |
| LETTER FROM THE PRESIDENT (Unaudited) (Continued) |
(5.3%) and selectively recycling capital from the high yield basket with the proceeds from calls, tenders and maturities. The guardrails in place have helped mitigate volatility and are aimed for the portfolio to potentially outperform the market on an absolute and risk-adjusted basis over a full-cycle.
Investing in mutual funds involves risk, including possible loss of principal.
| CHARTWELL INCOME FUND |
| PERFORMANCE INFORMATION |
| December 31, 2021 (Unaudited) |
Comparison of the Change in Value of a $10,000 Investment
in Chartwell Income Fund versus the Bloomberg U.S. Aggregate Bond Index,
the ICE BofA U.S. Cash Pay High Yield Index*, the 25% Russell 3000 Value Index/55%
Bloomberg U.S. Aggregate Bond Index/20% ICE BofA High Yield Cash Pay Index**, the
ICE BofA High Yield Master II Index and the Lipper Income Fund Index.
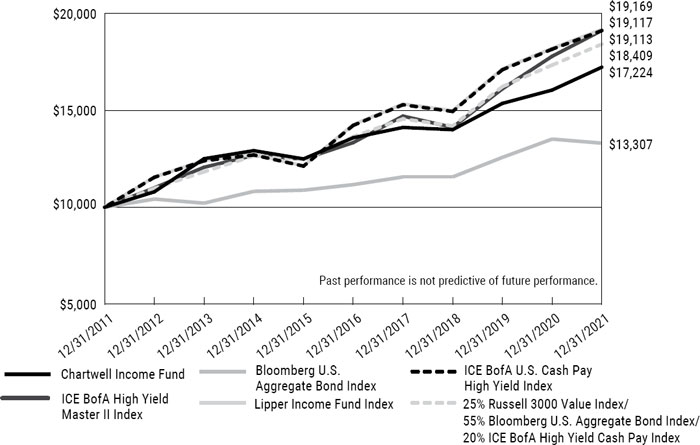
This graph compares a hypothetical $10,000 investment in the Fund with a similar investment in the Bloomberg U.S. Aggregate Bond Index, the ICE BofA U.S. Cash Pay High Yield Index*, the 25% Russell 3000 Value Index/55% Bloomberg U.S. Aggregate Bond Index/20% ICE BofA High Yield Cash Pay Index**, the ICE BofA High Yield Master II Index, and the Lipper Income Fund Index for the periods shown.
The Bloomberg U.S. Aggregate Bond Index is an unmanaged index composed of the Bloomberg U.S. Government/Credit Index and the Bloomberg U.S. Mortgage-Backed Securities Index and includes Treasury issues, agency issues, corporate bond issues and mortgage-backed securities and is intended to be generally representative of the bond market as a whole. The ICE BofA U.S. Cash Pay High Yield Index is an index of all sectors of the non-investment grade bond market. The Russell 3000 Value Index measures the performance of the broad value segment of the U.S. equity value universe. The ICE BofA High Yield Master II Index is a broad-based index consisting of all US dollar denominated high-yield bonds with a minimum outstanding amount of $100 million and a maturity of over one year. The Lipper Income Fund Index consists of a small number of the largest mutual funds in a particular category as tracked by Lipper Inc. These indices do not reflect expenses, fees, or sales charge, which would lower performance. The indices are unmanaged, and they are not available for investment.
| * | The ICE BofA High Yield Master II Index is replaced with the ICE BofA U.S. Cash Pay High Yield Index which most closely reflects the allocation of the Fund’s portfolio investments. |
| ** | The Lipper Income Fund Index is replaced with the 25% Russell 3000 Value Index/55% Bloomberg U.S. Aggregate Bond Find/55% ICE BofA U.S. Cash Pay High Yield Index which most closely reflects the allocation of the Fund’s portfolio investments. |
| CHARTWELL INCOME FUND |
| PERFORMANCE INFORMATION (Continued) |
| December 31, 2021 (Unaudited) |
Average Annual Total Returns
(for periods ended December 31, 2021)
| | 1 Year | | 5 Years | | 10 Years |
| Chartwell Income Fund | 7.35% | | 4.86% | | 5.59% |
| Bloomberg U.S. Aggregate Bond Index | -1.54% | | 3.57% | | 2.90% |
| ICE BofA U.S. Cash Pay High Yield Index | 5.29% | | 6.09% | | 6.69% |
| 25% Russell 3000 Value Index/ | | | | | |
55% Bloomberg U.S. Aggregate Bond Index/
20% ICE BofA U.X. Cash Pay High Yield Index | 6.20% | | 6.18% | | 6.29% |
| ICE BofA HY Master II Index | 5.36% | | 6.10% | | 6.72% |
| Lipper Income Fund Index | 7.48% | | 7.47% | | 6.69% |
The Fund acquired the assets and liabilities of the Berwyn Income Fund (the “IMST Predecessor Fund”), a series of Investment Managers Series Trust, on July 17, 2017. The IMST Predecessor Fund acquired the assets and liabilities of the Berwyn Income Fund (the “Berwyn Funds Predecessor Fund,” and together with the IMST Predecessor Fund, the “Predecessor Funds”), a series of The Berwyn Funds, on April 29, 2016. As a result of the reorganizations, the Fund is the accounting successor of the Predecessor Funds. Performance results shown reflect the performance of the IMST Predecessor Fund for the period from April 29, 2016 through July 17, 2017, and the performance of the Berwyn Funds Predecessor Fund for the period prior to April 29, 2016.
The performance data quoted here represents past performance and past performance is not a guarantee of future results. Investment return and principal value will fluctuate so that an investor’s shares, when redeemed, may be worth more or less than their original cost. Current performance may be lower or higher than the performance information quoted. The most recent month end performance may be obtained by calling (888) 995-5505.
Gross and net expense ratios for the Fund were 0.68% and 0.65%, respectively, as stated in the current prospectus dated May 1, 2021 and include Acquired Fund Fees and Expenses. For the Fund’s current expense ratios, please refer to the Financial Highlights section of this report. The Fund’s advisor has contractually agreed to reduce its fees and/or reimburse other operating expenses of the Fund to ensure that annual operating expenses do not exceed 0.64% of the Fund’s average daily net assets. This agreement is in effect until May 1, 2022, and it may be terminated prior to such date only by the Trust’s Board of Trustees. In the absence of such fee reductions and expense reimbursements, the Fund’s returns would have been lower.
Returns reflect the reinvestment of distributions made by the Fund, if any. The graph and performance table above do not reflect the deduction of taxes that a shareholder would pay on Fund distributions or the redemption of Fund shares.
| CHARTWELL MID CAP VALUE FUND |
| PERFORMANCE INFORMATION |
| December 31, 2021 (Unaudited) |
Comparison of the Change in Value of a $10,000 Investment
in Chartwell Mid Cap Value Fund versus the Russell Midcap Value Index,
the S&P Mid-Cap 400 Index and the S&P 500 Index.
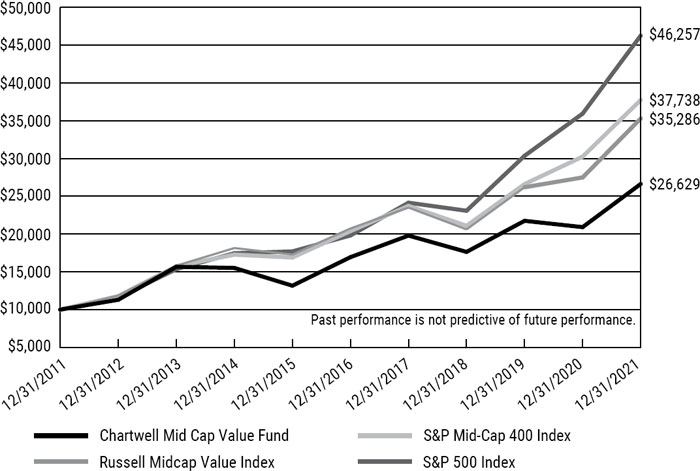
This graph compares a hypothetical $10,000 investment in the Fund with a similar investment in the Russell Midcap Value Index, the S&P Mid-Cap 400 Index and the S&P 500 Index for the periods shown.
The Russell Midcap Value Index measures the performance of those Russell Midcap companies with lower price/book ratios and lower forecasted growth values. The S&P 500 Index tracks the stocks of 500 large US companies. The S&P Mid-Cap 400 Index measures the performance of 400 selected companies with a mid-sized market capitalization. These indices do not reflect expenses, fees, or sales charge, which would lower performance. The indices are unmanaged, and they are not available for investment.
| CHARTWELL MID CAP VALUE FUND |
| PERFORMANCE INFORMATION (Continued) |
| December 31, 2021 (Unaudited) |
Average Annual Total Returns
(for periods ended December 31, 2021)
| | 1 Year | | 5 Years | | 10 Years |
| Chartwell Mid Cap Value Fund | 27.30% | | 9.47% | | 10.29% |
| Russell Midcap Value Index | 28.34% | | 11.22% | | 13.44% |
| S&P Mid-Cap 400 Index | 24.76% | | 13.09% | | 14.20% |
| S&P 500 Index | 28.71% | | 18.47% | | 16.55% |
The Fund acquired the assets and liabilities of the Berwyn Cornerstone Fund (the “IMST Predecessor Fund”), a series of Investment Managers Series Trust, on July 17, 2017. The IMST Predecessor Fund acquired the assets and liabilities of the Berwyn Cornerstone Fund (the “Berwyn Funds Predecessor Fund,” and together with the IMST Predecessor Fund, the “Predecessor Funds”), a series of The Berwyn Funds, on April 29, 2016. As a result of the reorganizations, the Fund is the accounting successor of the Predecessor Funds. Performance results shown reflect the performance of the IMST Predecessor Fund for the period from April 29, 2016 through July 17, 2017, and the performance of the Berwyn Funds Predecessor Fund for the period prior to April 29, 2016. The Fund’s principal investment strategies differ from those of the Predecessor Funds; therefore, the performance and average annual total returns shown for periods prior to the reorganization may have differed had the Fund’s current investment strategy been in effect during those periods.
The performance data quoted here represents past performance and past performance is not a guarantee of future results. Investment return and principal value will fluctuate so that an investor’s shares, when redeemed, may be worth more or less than their original cost. Current performance may be lower or higher than the performance information quoted. The most recent month end performance may be obtained by calling (888) 995-5505.
Gross and net expense ratios for the Fund were 1.47% and 0.90%, respectively, as stated in the current prospectus dated May 1, 2021. For the Fund’s current expense ratios, please refer to the Financial Highlights section of this report. The Fund’s advisor has contractually agreed to reduce its fees and/or reimburse other operating expenses of the Fund to ensure that annual operating expenses do not exceed 0.90% of the Fund’s average daily net assets. This agreement is in effect until May 1, 2022, and it may be terminated prior to such date only by the Trust’s Board of Trustees. In the absence of such fee reductions and expense reimbursements, the Fund’s returns would have been lower.
Returns reflect the reinvestment of distributions made by the Fund, if any. The graph and performance table above do not reflect the deduction of taxes that a shareholder would pay on Fund distributions or the redemption of Fund shares.
| CHARTWELL SMALL CAP VALUE FUND |
| PERFORMANCE INFORMATION |
| December 31, 2021 (Unaudited) |
Comparison of the Change in Value of a $10,000 Investment
in Chartwell Small Cap Value Fund versus the Russell 2000 Value Index.
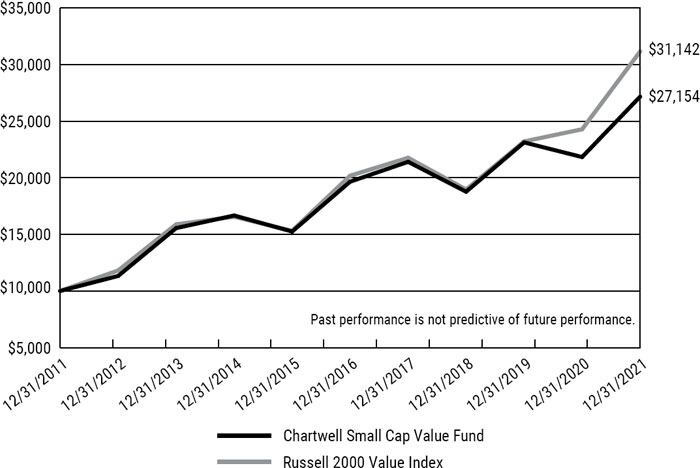
This graph compares a hypothetical $10,000 investment in the Fund’s shares, made at its inception, with a similar investment in the Russell 2000 Value Index. Results include the reinvestment of all dividends and capital gains. The performance figures include the performance for Class A shares for the periods prior to the start date of the current share class (March 16, 2012). Class A shares were liquidated on June 30, 2016.
The Russell 2000 Value Index measures the performance of the Russell 2000 companies with lower price-to-book ratios and lower forecasted growth values. This index does not reflect expenses, fees or sales charges, which would lower performance. The index is unmanaged, and it is not available for investment.
| CHARTWELL SMALL CAP VALUE FUND |
| PERFORMANCE INFORMATION (Continued) |
| December 31, 2021 (Unaudited) |
Average Annual Total Returns
(for periods ended December 31, 2021)
| | 1 Year | | 5 Years | | 10 Years |
| Chartwell Small Cap Value Fund(a) | 24.42% | | 6.68% | | 10.51% |
| Russell 2000 Value Index | 28.27% | | 9.07% | | 12.03% |
| (a) | The performance figures include the performance for Class A for the periods prior to the start date of the current share class (March 16, 2012). Class A shares were liquidated on June 30, 2016. |
On July 17, 2017, the Chartwell Small Cap Value Fund acquired all the assets and liabilities of the Chartwell Small Cap Value Fund, a series of the Investment Managers Series Trust (the “Predecessor Fund”). As a result of the acquisition, the Fund is the accounting successor of the Predecessor Fund. Performance results shown in the graph and the performance table above for the periods prior to July 17, 2017 reflect the performance of the Predecessor Fund.
The performance data quoted here represents past performance and past performance is not a guarantee of future results. Investment return and principal value will fluctuate so that an investor’s shares, when redeemed, may be worth more or less than their original cost. Current performance may be lower or higher than the performance information quoted. The most recent month end performance may be obtained by calling (888) 995-5505.
Gross and net expense ratios for the Fund were 1.18% and 1.05%, respectively, as stated in the current prospectus dated May 1, 2021. For the Fund’s current expense ratios, please refer to the Financial Highlights section of this report. The Fund’s advisor has contractually agreed to reduce its fees and/or reimburse other operating expenses of the Fund to ensure that annual operating expenses do not exceed 1.05% of the Fund’s average daily net assets. This agreement is in effect until May 1, 2022, and it may be terminated prior to such date only by the Trust’s Board of Trustees. In the absence of such fee reductions and expense reimbursements, the Fund’s returns would have been lower.
Returns reflect the reinvestment of distributions made by the Fund, if any. The graph and performance table above do not reflect the deduction of taxes that a shareholder would pay on Fund distributions or the redemption of Fund shares.
| CHARTWELL SHORT DURATION HIGH YIELD FUND |
| PERFORMANCE INFORMATION |
| December 31, 2021 (Unaudited) |
Comparison of the Change in Value of a $10,000 Investment
in Chartwell Short Duration High Yield Fund versus
the ICE BofA 1-3 Year BB US Cash Payout High Yield Index and
the Bloomberg Intermediate US Government/Credit Index.
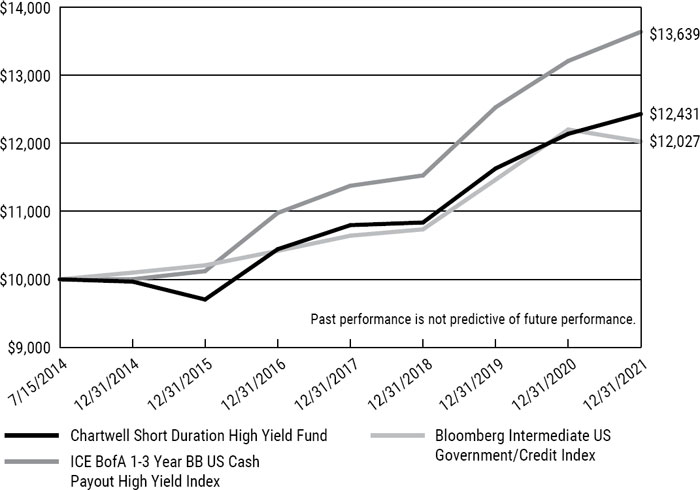
This graph compares a hypothetical $10,000 investment in the Fund’s shares, made at its inception, with a similar investment in the ICE BofA 1-3 Year BB US Cash Payout High Yield Index and the Bloomberg Intermediate US Government/Credit Index. Results include the reinvestment of all dividends and capital gains.
The ICE BofA 1-3 Year BB US Cash Payout High Yield Index is a subset of the ICE BofA US Cash Payout High Yield Index including all securities with a remaining term to final maturity less than 3 years and rated BB1 through BB3, inclusive. The Bloomberg Intermediate US Government/ Credit Index is a broad-based flagship benchmark that measures the non-securitized component of the US Aggregate Index. It includes investment grade, US dollar-denominated, fixed-rate Treasuries, government-related and corporate securities. These indices do not reflect expenses, fees or sales charges, which would lower performance. These indices are unmanaged, and they are not available for investment.
| CHARTWELL SHORT DURATION HIGH YIELD FUND |
| PERFORMANCE INFORMATION (Continued) |
| December 31, 2021 (Unaudited) |
Average Annual Total Returns
(for periods ended December 31, 2021)
| | 1 Year | | 5 Years | | Since
Inception(a) |
| Chartwell Short Duration High Yield Fund | 2.40% | | 3.55% | | 2.96% |
| Bloomberg Intermediate US Government/Credit Index | -1.44% | | 2.91% | | 2.50% |
| ICE BofA 1-3 Year BB US Cash Payout High Yield Index | 3.24% | | 4.44% | | 4.25% |
| (a) | Commencement of operations was July 15, 2014. |
On July 17, 2017, the Chartwell Short Duration High Yield Fund acquired all the assets and liabilities of the Chartwell Short Duration High Yield Fund, a series of the Investment Managers Series Trust (the “Predecessor Fund”). As a result of the acquisition, the Fund is the accounting successor of the Predecessor Fund. Performance results shown in the graph and the performance table above for the periods prior to July 17, 2017 reflect the performance of the Predecessor Fund.
The performance data quoted here represents past performance and past performance is not a guarantee of future results. Investment return and principal value will fluctuate so that an investor’s shares, when redeemed, may be worth more or less than their original cost. Current performance may be lower or higher than the performance information quoted. The most recent month end performance may be obtained by calling (888) 995-5505.
Gross and net expense ratios for the Fund were 0.61% and 0.49%, respectively, as stated in the current prospectus dated May 1, 2021. For the Fund’s current expense ratios, please refer to the Financial Highlights section of this report. The Fund’s advisor has contractually agreed to reduce its fees and/or reimburse other operating expenses of the Fund to ensure that annual operating expenses do not exceed 0.49% of the Fund’s average daily net assets. This agreement is in effect until May 1, 2022, and it may be terminated prior to such date only by the Trust’s Board of Trustees. In the absence of such fee reductions and expense reimbursements, the Fund’s returns would have been lower.
Returns reflect the reinvestment of distributions made by the Fund, if any. The graph and performance table above do not reflect the deduction of taxes that a shareholder would pay on Fund distributions or the redemption of Fund shares.
| CHARTWELL SMALL CAP GROWTH FUND |
| PERFORMANCE INFORMATION |
| December 31, 2021 (Unaudited) |
Comparison of the Change in Value of a $10,000 Investment
in Chartwell Small Cap Growth Fund versus the Russell 2000 Growth Index.
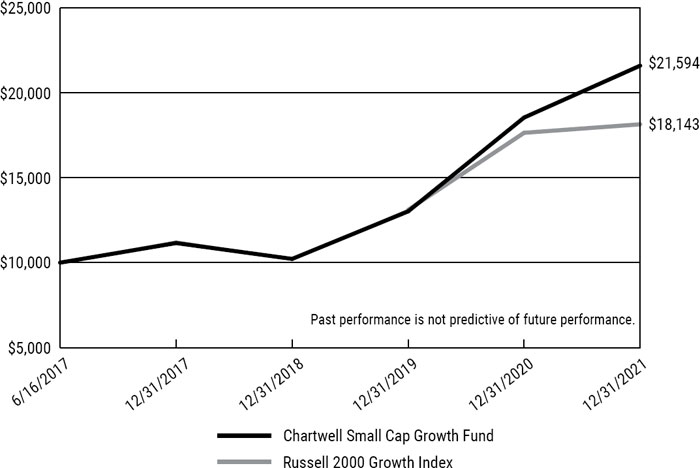
This graph compares a hypothetical $10,000 investment in the Fund, made at its inception, with a similar investment in the Russell 2000 Growth Index.
The Russell 2000 Growth Index measures the performance of the constituents that exhibit growth characteristics within the 2000 small-cap companies of the US stock market and is designed to represent the small-cap segment of the US equity universe. This index does not reflect expenses, fees or sales charge, which would lower performance. The index is unmanaged, and it is not available for investment.
| CHARTWELL SMALL CAP GROWTH FUND |
| PERFORMANCE INFORMATION (Continued |
| December 31, 2021 (Unaudited) |
Average Annual Total Returns
(for periods ended December 31, 2021)
| | 1 Year | | Since
Inception(a) |
| Chartwell Small Cap Growth Fund | 16.47% | | 18.47% |
| Russell 2000 Growth Index | 2.83% | | 14.01% |
| (a) | Commencement of operations was June 16, 2017. |
The performance data quoted here represents past performance and past performance is not a guarantee of future results. Investment return and principal value will fluctuate so that an investor’s shares, when redeemed, may be worth more or less than their original cost. Current performance may be lower or higher than the performance information quoted. The most recent month end performance may be obtained by calling (888) 995-5505.
Gross and net expense ratios for the Fund were 1.73% and 1.05%, respectively, as stated in the current prospectus dated May 1, 2021. For the Fund’s current expense ratios, please refer to the Financial Highlights section of this report. The Fund’s advisor has contractually agreed to reduce its fees and/or reimburse other operating expenses of the Fund to ensure that annual operating expenses do not exceed 1.05% of the Fund’s average daily net assets. This agreement is in effect until May 1, 2022, and it may be terminated prior to such date only by the Trust’s Board of Trustees. In the absence of such fee reductions and expense reimbursements, the Fund’s returns would have been lower.
Returns reflect the reinvestment of distributions made by the Fund, if any. The graph and performance table above do not reflect the deduction of taxes that a shareholder would pay on Fund distributions or the redemption of Fund shares.
| CHARTWELL SHORT DURATION BOND FUND |
| PERFORMANCE INFORMATION |
| December 31, 2021 (Unaudited) |
Comparison of the Change in Value of a $10,000 Investment
in Chartwell Short Duration Bond Fund versus
the Bloomberg 1-3 Year US Government/Credit Index and
the Bloomberg Intermediate US Government/Credit Index.
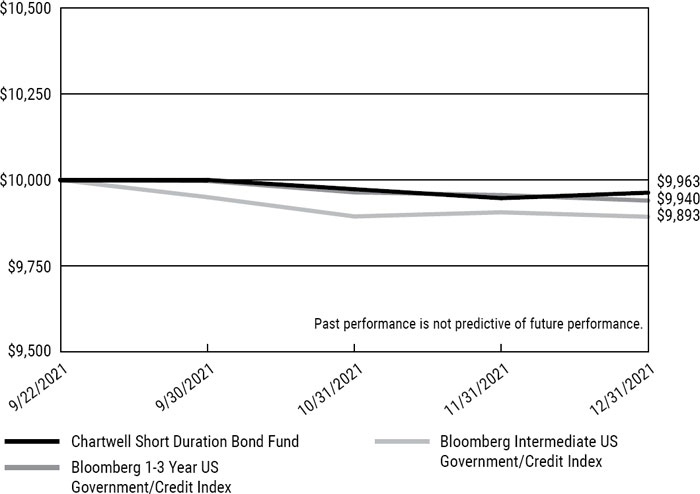
This graph compares a hypothetical $10,000 investment in the Fund’s shares, made at its inception, with a similar investment in the Bloomberg 1-3 Year US Government/Credit Index and the Bloomberg Intermediate US Government/Credit Index.
The Bloomberg 1-3 Year US Government/Credit Index is a broad-based flagship benchmark that measures the performance of US Treasury securities that have a maturity of 1-3 years. It includes investment grade, US dollar-denominated, fixed-rate Treasuries, government-related and corporate securities. The Bloomberg Intermediate US Government/Credit Index is a broad-based flagship benchmark that measures the non-securitized component of the US Aggregate Index. It includes investment grade, US dollar-denominated, fixed-rate Treasuries, government-related and corporate securities. These indices do not reflect expenses, fees or sales charges, which would lower performance. These indices are unmanaged, and they are not available for investment.
| CHARTWELL SHORT DURATION BOND FUND |
| PERFORMANCE INFORMATION (Continued) |
| December 31, 2021 (Unaudited) |
Total Returns
(for period ended December 31, 2021)
| | Since |
| | Inception(a) |
| Chartwell Short Duration Bond Fund | -0.37% |
| Bloomberg 1-3 Year US Government/Credit Index | -0.60% |
| Bloomberg Intermediate US Government/Credit Index | -1.07% |
| (a) | Commencement of operations was September 22, 2021. |
The performance data quoted here represents past performance and past performance is not a guarantee of future results. Investment return and principal value will fluctuate so that an investor’s shares, when redeemed, may be worth more or less than their original cost. Current performance may be lower or higher than the performance information quoted. The most recent month end performance may be obtained by calling (888) 995-5505.
Gross and net expense ratios for the Fund were 2.31% and 0.39%, respectively, as stated in the current prospectus dated September 22, 2021. For the Fund’s current expense ratios, please refer to the Financial Highlights section of this report. The Fund’s advisor has contractually agreed to reduce its fees and/or reimburse other operating expenses of the Fund to ensure that annual operating expenses do not exceed 0.39% of the Fund’s average daily net assets. This agreement is in effect until at least September 22, 2022, and it may be terminated prior to such date only by the Trust’s Board of Trustees. In the absence of such fee reductions and expense reimbursements, the Fund’s returns would have been lower.
Returns reflect the reinvestment of distributions made by the Fund, if any. The graph and performance table above do not reflect the deduction of taxes that a shareholder would pay on Fund distributions or the redemption of Fund shares.
| CHARTWELL INCOME FUND |
| SCHEDULE OF INVESTMENTS |
| December 31, 2021 |
| COMMON STOCKS — 20.9% | | Shares | | | Value | |
| Communications — 1.8% | | | | | | | | |
| Advertising & Marketing — 0.1% | | | | | | | | |
| Omnicom Group, Inc. | | | 8,361 | | | $ | 612,610 | |
| | | | | | | | | |
| Entertainment Content — 0.2% | | | | | | | | |
| Activision Blizzard, Inc. | | | 10,409 | | | | 692,511 | |
| | | | | | | | | |
| Internet Media & Services — 0.2% | | | | | | | | |
| Expedia Group, Inc. (a) | | | 6,287 | | | | 1,136,187 | |
| | | | | | | | | |
| Telecommunications — 1.3% | | | | | | | | |
| AT&T, Inc. | | | 74,355 | | | | 1,829,133 | |
| Verizon Communications, Inc. | | | 95,527 | | | | 4,963,583 | |
| | | | | | | | 6,792,716 | |
| Consumer Discretionary — 1.8% | | | | | | | | |
| Apparel & Textile Products — 0.2% | | | | | | | | |
| Columbia Sportswear Company | | | 8,758 | | | | 853,379 | |
| | | | | | | | | |
| Automotive — 0.1% | | | | | | | | |
| General Motors Company (a) | | | 12,464 | | | | 730,764 | |
| | | | | | | | | |
| Consumer Services — 0.2% | | | | | | | | |
| Service Corporation International | | | 13,105 | | | | 930,324 | |
| | | | | | | | | |
| Leisure Facilities & Services — 0.1% | | | | | | | | |
| Las Vegas Sands Corporation (a) | | | 13,468 | | | | 506,936 | |
| | | | | | | | | |
| Retail - Discretionary — 1.2% | | | | | | | | |
| AutoZone, Inc. (a) | | | 689 | | | | 1,444,413 | |
| Foot Locker, Inc. | | | 73,731 | | | | 3,216,883 | |
| Genuine Parts Company | | | 5,796 | | | | 812,599 | |
| Home Depot, Inc. (The) | | | 1,874 | | | | 777,729 | |
| | | | | | | | 6,251,624 | |
| Consumer Staples — 1.3% | | | | | | | | |
| Beverages — 0.2% | | | | | | | | |
| Coca-Cola Company (The) | | | 16,744 | | | | 991,412 | |
| | | | | | | | | |
| Food — 0.3% | | | | | | | | |
| Conagra Brands, Inc. | | | 17,499 | | | | 597,591 | |
| Lamb Weston Holdings, Inc. | | | 10,690 | | | | 677,532 | |
| | | | | | | | 1,275,123 | |
See accompanying notes to financial statements.
| CHARTWELL INCOME FUND |
| SCHEDULE OF INVESTMENTS (Continued) |
| COMMON STOCKS — 20.9% (Continued) | | Shares | | | Value | |
| Consumer Staples — 1.3% (Continued) | | | | | | | | |
| Household Products — 0.2% | | | | | | | | |
| Procter & Gamble Company (The) | | | 7,604 | | | $ | 1,243,862 | |
| | | | | | | | | |
| Retail - Consumer Staples — 0.3% | | | | | | | | |
| Dollar Tree, Inc. (a) | | | 10,413 | | | | 1,463,235 | |
| | | | | | | | | |
| Tobacco & Cannabis — 0.3% | | | | | | | | |
| Philip Morris International, Inc. | | | 17,365 | | | | 1,649,675 | |
| | | | | | | | | |
| Energy — 1.1% | | | | | | | | |
| Oil & Gas Producers — 1.1% | | | | | | | | |
| Diamondback Energy, Inc. | | | 8,409 | | | | 906,911 | |
| Exxon Mobil Corporation | | | 26,001 | | | | 1,591,001 | |
| Hess Corporation | | | 8,404 | | | | 622,148 | |
| Pioneer Natural Resources Company | | | 11,437 | | | | 2,080,162 | |
| TotalEnergies SE - ADR | | | 13,727 | | | | 678,937 | |
| | | | | | | | 5,879,159 | |
| Financials — 3.2% | | | | | | | | |
| Asset Management — 0.2% | | | | | | | | |
| Ares Capital Corporation | | | 39,967 | | | | 846,901 | |
| | | | | | | | | |
| Banking — 1.5% | | | | | | | | |
| Citigroup, Inc. | | | 16,007 | | | | 966,663 | |
| JPMorgan Chase & Company | | | 13,691 | | | | 2,167,970 | |
| KeyCorp | | | 37,215 | | | | 860,783 | |
| M&T Bank Corporation | | | 2,772 | | | | 425,724 | |
| Pinnacle Financial Partners, Inc. | | | 13,857 | | | | 1,323,343 | |
| PNC Financial Services Group, Inc. (The) | | | 5,222 | | | | 1,047,115 | |
| Truist Financial Corporation | | | 18,929 | | | | 1,108,293 | |
| | | | | | | | 7,899,891 | |
| Institutional Financial Services — 0.5% | | | | | | | | |
| CME Group, Inc. | | | 2,999 | | | | 685,151 | |
| Morgan Stanley | | | 17,581 | | | | 1,725,751 | |
| | | | | | | | 2,410,902 | |
| Insurance — 0.8% | | | | | | | | |
| Allstate Corporation (The) | | | 11,284 | | | | 1,327,563 | |
| Arthur J. Gallagher & Company | | | 3,367 | | | | 571,279 | |
| Hanover Insurance Group, Inc. (The) | | | 6,731 | | | | 882,165 | |
| Lincoln National Corporation | | | 24,009 | | | | 1,638,854 | |
| | | | | | | | 4,419,861 | |
See accompanying notes to financial statements.
| CHARTWELL INCOME FUND |
| SCHEDULE OF INVESTMENTS (Continued) |
| COMMON STOCKS — 20.9% (Continued) | | Shares | | | Value | |
| Financials — 3.2% (Continued) | | | | | | | | |
| Specialty Finance — 0.2% | | | | | | | | |
| Blackstone Mortgage Trust, Inc. - Class A | | | 15,557 | | | $ | 476,355 | |
| Synchrony Financial | | | 15,441 | | | | 716,308 | |
| | | | | | | | 1,192,663 | |
| Health Care — 2.6% | | | | | | | | |
| Biotech & Pharma — 1.3% | | | | | | | | |
| AbbVie, Inc. | | | 4,090 | | | | 553,786 | |
| Bristol-Myers Squibb Company | | | 46,981 | | | | 2,929,265 | |
| Johnson & Johnson | | | 12,006 | | | | 2,053,867 | |
| Merck & Company, Inc. | | | 19,068 | | | | 1,461,372 | |
| | | | | | | | 6,998,290 | |
| Health Care Facilities & Services — 1.0% | | | | | | | | |
| CVS Health Corporation | | | 5,714 | | | | 589,456 | |
| Quest Diagnostics, Inc. | | | 10,223 | | | | 1,768,681 | |
| Syneos Health, Inc. (a) | | | 10,595 | | | | 1,087,895 | |
| UnitedHealth Group, Inc. | | | 1,229 | | | | 617,130 | |
| Universal Health Services, Inc. - Class B | | | 7,135 | | | | 925,124 | |
| | | | | | | | 4,988,286 | |
| Medical Equipment & Devices — 0.3% | | | | | | | | |
| Abbott Laboratories | | | 12,242 | | | | 1,722,939 | |
| | | | | | | | | |
| Industrials — 1.9% | | | | | | | | |
| Diversified Industrials — 0.3% | | | | | | | | |
| Emerson Electric Company | | | 15,058 | | | | 1,399,943 | |
| | | | | | | | | |
| Electrical Equipment — 0.2% | | | | | | | | |
| nVent Electric plc | | | 22,976 | | | | 873,088 | |
| | | | | | | | | |
| Machinery — 0.9% | | | | | | | | |
| Caterpillar, Inc. | | | 14,961 | | | | 3,093,037 | |
| Gates Industrial Corporation plc (a) | | | 56,123 | | | | 892,917 | |
| Snap-on, Inc. | | | 3,310 | | | | 712,908 | |
| | | | | | | | 4,698,862 | |
| Transportation & Logistics — 0.2% | | | | | | | | |
| United Parcel Service, Inc. - Class B | | | 4,924 | | | | 1,055,410 | |
| | | | | | | | | |
| Transportation Equipment — 0.3% | | | | | | | | |
| Allison Transmission Holdings, Inc. | | | 24,388 | | | | 886,504 | |
| PACCAR, Inc. | | | 8,794 | | | | 776,158 | |
| | | | | | | | 1,662,662 | |
See accompanying notes to financial statements.
| CHARTWELL INCOME FUND |
| SCHEDULE OF INVESTMENTS (Continued) |
| COMMON STOCKS — 20.9% (Continued) | | Shares | | | Value | |
| Materials — 2.3% | | | | | | | | |
| Chemicals — 0.7% | | | | | | | | |
| Air Products & Chemicals, Inc. | | | 2,750 | | | $ | 836,715 | |
| FMC Corporation | | | 13,113 | | | | 1,440,988 | |
| Univar Solutions, Inc. (a) | | | 44,064 | | | | 1,249,214 | |
| | | | | | | | 3,526,917 | |
| Construction Materials — 0.3% | | | | | | | | |
| Vulcan Materials Company | | | 8,116 | | | | 1,684,719 | |
| | | | | | | | | |
| Metals & Mining — 1.3% | | | | | | | | |
| Alamos Gold, Inc. - Class A | | | 310,000 | | | | 2,383,900 | |
| Southern Copper Corporation | | | 14,624 | | | | 902,447 | |
| SSR Mining, Inc. | | | 190,000 | | | | 3,363,000 | |
| | | | | | | | 6,649,347 | |
| Real Estate — 1.9% | | | | | | | | |
| REITs — 1.9% | | | | | | | | |
| Crown Castle International Corporation | | | 5,241 | | | | 1,094,006 | |
| Healthcare Trust of America, Inc. - Class A | | | 49,933 | | | | 1,667,263 | |
| Healthpeak Properties, Inc. | | | 83,200 | | | | 3,002,688 | |
| Life Storage, Inc. | | | 7,744 | | | | 1,186,226 | |
| Mid-America Apartment Communities, Inc. | | | 7,998 | | | | 1,835,061 | |
| Weyerhaeuser Company | | | 26,642 | | | | 1,097,118 | |
| | | | | | | | 9,882,362 | |
| Technology — 1.9% | | | | | | | | |
| Semiconductors — 0.5% | | | | | | | | |
| Intel Corporation | | | 26,493 | | | | 1,364,390 | |
| Lam Research Corporation | | | 928 | | | | 667,371 | |
| QUALCOMM, Inc. | | | 3,977 | | | | 727,274 | |
| | | | | | | | 2,759,035 | |
| Software — 0.2% | | | | | | | | |
| Microsoft Corporation | | | 3,131 | | | | 1,053,018 | |
| | | | | | | | | |
| Technology Hardware — 1.0% | | | | | | | | |
| Apple, Inc. | | | 3,733 | | | | 662,869 | |
| Ciena Corporation (a) | | | 22,654 | | | | 1,743,678 | |
| Dolby Laboratories, Inc. - Class A | | | 13,263 | | | | 1,262,903 | |
| Seagate Technology Holdings plc | | | 11,523 | | | | 1,301,868 | |
| | | | | | | | 4,971,318 | |
| Technology Services — 0.2% | | | | | | | | |
| DXC Technology Company (a) | | | 19,249 | | | | 619,625 | |
| International Business Machines Corporation | | | 4,163 | | | | 556,427 | |
| | | | | | | | 1,176,052 | |
See accompanying notes to financial statements.
| CHARTWELL INCOME FUND |
| SCHEDULE OF INVESTMENTS (Continued) |
| COMMON STOCKS — 20.9% (Continued) | | Shares | | | Value | |
| Utilities — 1.1% | | | | | | | | |
| Electric Utilities — 1.1% | | | | | | | | |
| Ameren Corporation | | | 12,155 | | | $ | 1,081,917 | |
| American Electric Power Company, Inc. | | | 16,196 | | | | 1,440,958 | |
| CMS Energy Corporation | | | 13,303 | | | | 865,360 | |
| Public Service Enterprise Group, Inc. | | | 21,339 | | | | 1,423,951 | |
| Southern Company (The) | | | 16,722 | | | | 1,146,795 | |
| | | | | | | | 5,958,981 | |
| Total Common Stocks (Cost $86,925,430) | | | | | | $ | 108,840,964 | |
| | | | | | | | | |
| EXCHANGE-TRADED FUNDS — 2.9% | | Shares | | | Value | |
| iShares Silver Trust (a) | | | 515,000 | | | $ | 11,077,650 | |
| VanEck Gold Miners ETF | | | 130,000 | | | | 4,163,900 | |
| Total Exchange-Traded Funds (Cost $16,600,702) | | | | | | $ | 15,241,550 | |
| | | | | | | | | |
| PREFERRED STOCKS — 3.3% | | Shares | | | Value | |
| Communications — 0.1% | | | | | | | | |
| Entertainment Content — 0.1% | | | | | | | | |
| ViacomCBS, Inc., Series A, 5.75% | | | 12,400 | | | $ | 622,728 | |
| | | | | | | | | |
| Financials — 1.1% | | | | | | | | |
| Specialty Finance — 1.1% | | | | | | | | |
| AGNC Investment Corporation, Series F, 6.12% | | | 29,603 | | | | 747,772 | |
| Annaly Capital Management, Inc., Series F, 6.95% | | | 201,929 | | | | 5,165,344 | |
| | | | | | | | 5,913,116 | |
| Real Estate — 2.1% | | | | | | | | |
| REITs — 2.1% | | | | | | | | |
| Chimera Investment Corporation, Series B, 8.00% | | | 181,980 | | | | 4,649,589 | |
| New Residential Investment Corporation, Series C, 6.375% | | | 260,000 | | | | 6,021,600 | |
| | | | | | | | 10,671,189 | |
| Total Preferred Stocks (Cost $14,253,202) | | | | | | $ | 17,207,033 | |
See accompanying notes to financial statements.
| CHARTWELL INCOME FUND |
| SCHEDULE OF INVESTMENTS (Continued) |
| CORPORATE BONDS — 26.8% | | Par Value | | | Value | |
| Communications — 0.8% | | | | | | | | |
| Consolidated Communications Holdings, Inc., 6.50%, due 10/1/2028 (c) | | $ | 975,000 | | | $ | 1,023,750 | |
| Gannett Holdings, LLC, 6.00%, due 11/1/2026 (c) | | | 1,745,000 | | | | 1,782,081 | |
| Liberty Interactive, LLC, 8.50%, due 7/15/2029 | | | 1,000,000 | | | | 1,090,000 | |
| | | | | | | | 3,895,831 | |
| Consumer Discretionary — 4.6% | | | | | | | | |
| AAG FH L.P./AAG FH Finco, Inc., 9.75%, due 7/15/2024 (c) | | | 2,523,000 | | | | 2,491,538 | |
| Affinity Gaming, 6.88%, due 12/15/2027 (c) | | | 1,200,000 | | | | 1,248,000 | |
| AutoNation, Inc., 3.80%, due 11/15/2027 | | | 3,532,000 | | | | 3,763,204 | |
| Bed Bath & Beyond, Inc., 3.75%, due 8/1/2024 | | | 1,820,000 | | | | 1,835,925 | |
| Ford Motor Credit Company, LLC, 4.54%, due 8/1/2026 | | | 1,375,000 | | | | 1,493,594 | |
| General Motors Financial Company, Inc., | | | | | | | | |
| 5.65%, due 1/17/2029 | | | 1,954,000 | | | | 2,319,023 | |
| Kohl’s Corporation, 5.55%, due 7/17/2045 | | | 2,969,000 | | | | 3,471,549 | |
| L Brands, Inc., 5.25%, due 2/1/2028 | | | 1,180,000 | | | | 1,303,900 | |
| QVC, Inc., 5.95%, due 3/15/2043 | | | 1,645,000 | | | | 1,638,831 | |
| StoneMor, Inc., 8.50%, due 5/15/2029 (c) | | | 1,520,000 | | | | 1,569,400 | |
| Tiffany & Company, 4.90%, due 10/1/2044 | | | 2,049,000 | | | | 2,760,309 | |
| | | | | | | | 23,895,273 | |
| Consumer Staples — 1.2% | | | | | | | | |
| Anheuser-Busch InBev Worldwide, Inc., 4.50%, due 6/1/2050 | | | 4,245,000 | | | | 5,251,720 | |
| KeHE Distributors, LLC, 8.63%, due 10/15/2026 (c) | | | 1,030,000 | | | | 1,102,100 | |
| | | | | | | | 6,353,820 | |
| Energy — 4.2% | | | | | | | | |
| Blue Racer Midstream, LLC/Blue Racer Finance Corporation, 6.63%, due 7/15/2026 (c) | | | 1,463,000 | | | | 1,506,890 | |
| Colgate Energy Partners III, LLC, 7.75%, due 2/15/2026 (c) | | | 2,465,000 | | | | 2,662,200 | |
| Energy Transfer Operating, L.P., 7.13%, (H15T5Y + 530.6) due 5/15/2030 (b) (d) | | | 5,653,000 | | | | 5,737,795 | |
| EnLink Midstream Partners, L.P., 4.85%, due 7/15/2026 | | | 1,475,000 | | | | 1,552,437 | |
| Genesis Energy, L.P./Genesis Energy Finance Corporation, 5.63%, due 6/15/2024 | | | 1,750,000 | | | | 1,732,500 | |
| Parkland Fuel Corporation, 5.88%, due 7/15/2027 (c) | | | 1,373,000 | | | | 1,448,515 | |
| Plains All American Pipeline, L.P., 3.80%, due 9/15/2030 | | | 3,365,000 | | | | 3,517,373 | |
| Summit Midstream Holdings, LLC/Summit Midstream Finance Corporation, 8.50%, due 10/15/2026 (c) | | | 1,870,000 | | | | 1,948,409 | |
| Teekay Corporation, 9.25%, due 11/15/2022 (c) | | | 1,075,000 | | | | 1,101,875 | |
| Western Midstream Operations, L.P., 4.35%, due 2/1/2025 | | | 845,000 | | | | 883,042 | |
| | | | | | | | 22,091,036 | |
See accompanying notes to financial statements.
| CHARTWELL INCOME FUND |
| SCHEDULE OF INVESTMENTS (Continued) |
| CORPORATE BONDS — 26.8% (Continued) | | Par Value | | | Value | |
| Financials — 7.0% | | | | | | | | |
| Ares Capital Corporation, 4.20%, due 6/10/2024 | | $ | 3,995,000 | | | $ | 4,216,304 | |
| Ares Capital Corporation, 3.25%, due 7/15/2025 | | | 4,240,000 | | | | 4,380,854 | |
| Bank of America Corporation, 0.88% (3MO LIBOR + 76), due 9/15/2026 (b) | | | 4,812,000 | | | | 4,791,471 | |
| Citizens Financial Group, Inc., Series B, 6.00% (3MO LIBOR + 300.3), due 12/31/2099 (b) (d) | | | 2,750,000 | | | | 2,815,312 | |
| Lincoln National Corporation, 3.05%, due 1/15/2030 | | | 2,845,000 | | | | 2,961,254 | |
| NMI Holdings, Inc., 7.38%, due 6/1/2025 (c) | | | 1,640,000 | | | | 1,862,220 | |
| Owl Rock Capital Corporation, 3.40%, due 7/15/2026 | | | 3,885,000 | | | | 3,949,546 | |
| PennyMac Corporation, 5.50%, due 3/15/2026 (c) | | | 7,000,000 | | | | 6,825,000 | |
| PRA Group, Inc., 5.00%, due 10/1/2029 (c) | | | 1,850,000 | | | | 1,854,625 | |
| Provident Funding Associates, L.P./PFG Finance Corporation, 6.38%, due 6/15/2025 (c) | | | 1,649,000 | | | | 1,677,858 | |
| StoneX Group, Inc., 8.63%, due 6/15/2025 (c) | | | 884,000 | | | | 937,040 | |
| | | | | | | | 36,271,484 | |
| Health Care — 0.5% | | | | | | | | |
| Horizon Pharma USA, Inc., 5.50%, due 8/1/2027 (c) | | | 1,275,000 | | | | 1,339,706 | |
| Prime Healthcare Services, Inc., 7.25%, due 11/1/2025 (c) | | | 1,065,000 | | | | 1,128,900 | |
| | | | | | | | 2,468,606 | |
| Industrials — 2.0% | | | | | | | | |
| American Airlines, Inc./AAdvantage Loyalty IP Ltd., 5.50%, due 4/20/2026 (c) | | | 1,680,000 | | | | 1,746,990 | |
| Boeing Company (The), 5.15%, due 5/1/2030 | | | 1,920,000 | | | | 2,239,069 | |
| Brundage-Bone Concrete Pumping Holdings, Inc., 6.00%, due 2/1/2026 (c) | | | 1,500,000 | | | | 1,560,000 | |
| Delta Air Lines, Inc., 7.38%, due 1/15/2026 | | | 533,000 | | | | 627,427 | |
| Harsco Corporation, 5.75%, due 7/31/2027 (c) | | | 980,000 | | | | 998,375 | |
| JPW Industries Holding Corporation, 9.00%, due 10/1/2024 (c) . | | | 1,195,000 | | | | 1,244,294 | |
| Railworks Holdings, L.P./Railworks Rally, Inc., 8.25%, due 11/15/2028 (c) | | | 2,000,000 | | | | 2,060,000 | |
| | | | | | | | 10,476,155 | |
| Materials — 2.0% | | | | | | | | |
| Compass Minerals International, Inc., 4.88%, due 7/15/2024 (c) | | | 1,410,000 | | | | 1,441,725 | |
| Fortress Transportation & Infrastructure Investors, LLC, | | | | | | | | |
| 9.75%, due 8/1/2027 (c) | | | 1,320,000 | | | | 1,478,400 | |
| IAMGOLD Corporation, 5.75%, due 10/15/2028 (c) | | | 2,400,000 | | | | 2,358,000 | |
| JW Aluminum Continuous Cast Company, 10.25%, due 6/1/2026 (c) | | | 1,365,000 | | | | 1,438,369 | |
| Neon Holdings, Inc., 10.13%, due 4/1/2026 (c) | | | 1,903,000 | | | | 2,027,285 | |
| Tacora Resources, Inc., 8.25%, due 5/15/2026 (c) | | | 1,870,000 | | | | 1,860,650 | |
| | | | | | | | 10,604,429 | |
See accompanying notes to financial statements.
| CHARTWELL INCOME FUND |
| SCHEDULE OF INVESTMENTS (Continued) |
| CORPORATE BONDS — 26.8% (Continued) | | Par Value | | | Value | |
| Real Estate — 1.0% | | | | | | | | |
| Greystar Real Estate Partners, LLC, 5.75%, due 12/1/2025 (c) | | $ | 1,500,000 | | | $ | 1,526,580 | |
| iStar, Inc., 5.50%, due 2/15/2026 | | | 1,160,000 | | | | 1,200,600 | |
| Safehold Operating Partnership, L.P., 2.85%, due 1/15/2032 | | | 2,490,000 | | | | 2,443,756 | |
| | | | | | | | 5,170,936 | |
| Technology — 3.0% | | | | | | | | |
| Apple, Inc., 3.85%, due 5/4/2043 | | | 1,990,000 | | | | 2,350,404 | |
| Brightstar Escrow Corporation, 9.75%, due 10/15/2025 (c) | | | 1,430,000 | | | | 1,533,675 | |
| CPI Card Group, Inc., 8.63%, due 3/15/2026 (c) | | | 495,000 | | | | 523,497 | |
| Dell International, LLC /EMC Corporation, 6.20%, due 7/15/2030 | | | 2,265,000 | | | | 2,860,782 | |
| Hewlett Packard Enterprise Company, 6.35%, due 10/15/2045 . | | | 3,209,000 | | | | 4,310,101 | |
| Oracle Corporation, 3.95%, due 3/25/2051 | | | 3,810,000 | | | | 3,969,878 | |
| | | | | | | | 15,548,337 | |
| Utilities — 0.5% | | | | | | | | |
| NSG Holdings, LLC, 7.75%, due 12/15/2025 (c) | | | 1,151,419 | | | | 1,230,579 | |
| Suburban Propane Partners, L.P., 5.88%, due 3/1/2027 | | | 1,100,000 | | | | 1,135,750 | |
| | | | | | | | 2,366,329 | |
| Total Corporate Bonds (Cost $129,205,021) | | | | | | $ | 139,142,236 | |
| | | | | | | |
| ASSET-BACKED SECURITIES — 2.6% | | Par Value | | | Value | |
| Colony American Finance Ltd., Series 2019-1, 3.32%, due 1/15/2029 (c) | | $ | 3,949,417 | | | $ | 4,135,294 | |
| Colony American Finance Ltd., Series 2019-3, 2.71%, due 10/15/2052 (c) | | | 1,999,078 | | | | 2,042,641 | |
| Latitude Management Real Estate Investors, Inc., Series 2019-CRE3, 1.486% (1MO LIBOR + 140), due 12/22/2035 (b) (c) | | | 3,615,000 | | | | 3,610,662 | |
| NRZ Excess Spread Collateralized Notes, Series 2021-FHT1, 3.10%, due 7/25/2026 (c) | | | 564,135 | | | | 562,282 | |
| NRZ Excess Spread Collateralized Notes, Series 2021-GNT1, 3.47%, due 11/25/2026 (c) | | | 2,982,125 | | | | 2,979,695 | |
| Total Asset-Backed Securities (Cost $13,109,501) | | | | | | $ | 13,330,574 | |
See accompanying notes to financial statements.
| CHARTWELL INCOME FUND |
| SCHEDULE OF INVESTMENTS (Continued) |
| MORTGAGE-BACKED SECURITIES — 25.0% | | Par Value | | | Value | |
| Agency Fixed Rate — 8.0% | | | | | | | | |
| Federal Home Loan Mortgage Corporation Pool #G6-1858, 3.50%, due 1/1/2048 | | $ | 2,949,051 | | | $ | 3,113,859 | |
| Federal Home Loan Mortgage Corporation Pool #ZA-5269, 3.00%, due 2/1/2048 | | | 1,060,692 | | | | 1,104,347 | |
| Federal Home Loan Mortgage Corporation Pool #ZN-6606, 3.00%, due 6/1/2049 | | | 1,339,321 | | | | 1,394,316 | |
| Federal Home Loan Mortgage Corporation Pool #SD-0144, 3.00%, due 11/1/2049 | | | 655,365 | | | | 680,153 | |
| Federal Home Loan Mortgage Corporation Pool #QA-7416, 3.00%, due 2/1/2050 | | | 3,781,482 | | | | 3,933,284 | |
| Federal National Mortgage Association Pool #BM6059, 3.00%, due 9/1/2029 | | | 966,566 | | | | 1,008,912 | |
| Federal National Mortgage Association Pool #BN0356, 3.00%, due 12/1/2033 | | | 1,487,376 | | | | 1,560,268 | |
| Federal National Mortgage Association Pool #BP6450, 2.50%, due 7/1/2040 | | | 3,116,210 | | | | 3,211,004 | |
| Federal National Mortgage Association Pool #BP6638, 2.50%, due 8/1/2040 | | | 2,403,383 | | | | 2,475,447 | |
| Federal National Mortgage Association Pool #BP6565, 2.50%, due 8/1/2040 | | | 2,428,931 | | | | 2,502,871 | |
| Federal National Mortgage Association Pool #FM1526, 3.00%, due 9/1/2049 | | | 2,350,037 | | | | 2,436,430 | |
| Federal National Mortgage Association Pool #CA4128, 3.00%, due 9/1/2049 | | | 1,647,502 | | | | 1,712,062 | |
| Federal National Mortgage Association Pool #B03192, 3.00%, due 10/1/2049 | | | 2,350,038 | | | | 2,442,401 | |
| Federal National Mortgage Association Pool #BO8653, 3.00%, due 2/1/2050 | | | 2,470,304 | | | | 2,573,600 | |
| Federal National Mortgage Association Pool #MA4392, 2.50%, due 7/1/2051 | | | 3,784,294 | | | | 3,843,664 | |
| Federal National Mortgage Association Pool #BT1862, 2.50%, due 7/1/2051 | | | 5,460,473 | | | | 5,583,598 | |
| Federal National Mortgage Association Pool #FM8793, 2.50%, due 10/1/2051 | | | 1,977,135 | | | | 2,022,105 | |
| | | | | | | | 41,598,321 | |
| Commercial — 17.0% | | | | | | | | |
| Agate Bay Mortgage Loan Trust, Series 2016-2 (c), 3.50%, due 3/25/2046 | | | 1,307,895 | | | | 1,315,780 | |
| BDS Ltd., Series 2019-FL4 (b) (c), 1.189% (1MO LIBOR + 110), due 8/15/2036 | | | 1,602,909 | | | | 1,600,985 | |
| Credit Suisse Mortgage Trust, Series 2018-J1 (c), 3.50%, due 2/25/2048 | | | 2,091,512 | | | | 2,123,666 | |
See accompanying notes to financial statements.
| CHARTWELL INCOME FUND |
| SCHEDULE OF INVESTMENTS (Continued) |
| MORTGAGE-BACKED SECURITIES — 25.0% (Continued) | | Par Value | | | Value | |
| Commercial — 17.0% (Continued) | | | | | | | | |
| Flagstar Mortgage Trust, Series 2020-2 (c), 3.00%, due 6/25/2048 | | $ | 1,125,359 | | | $ | 1,133,254 | |
| Flagstar Mortgage Trust, Series 2021-1 (c), 2.50%, due 2/1/2051 | | | 1,954,704 | | | | 1,956,891 | |
| Flagstar Mortgage Trust, Series 2021-1 (c), 2.50%, due 2/1/2051 | | | 2,693,687 | | | | 2,674,748 | |
| FMC GMSR Issuer Trust, Series 2020-GT1 (c), 4.45%, due 1/25/2026 | | | 2,265,000 | | | | 2,269,277 | |
| GS Mortgage Securities Trust, Series 2020-PJ5, 3.00%, due 3/27/2051 | | | 1,504,444 | | | | 1,530,558 | |
| GS Mortgage Securities Trust, Series 2021-PJ1 (c), 2.50%, due 6/25/2051 | | | 3,453,320 | | | | 3,424,723 | |
| GS Mortgage Securities Trust, Series 2021-PJ2 (c), 2.50%, due 7/25/2051 | | | 2,946,687 | | | | 2,914,919 | |
| GS Mortgage Securities Trust, Series 2021-PJ3 (c), 2.50%, due 8/25/2051 | | | 4,576,526 | | | | 4,538,628 | |
| GS Mortgage Securities Trust, Series 2021-PJ4 (c), 2.50%, due 9/25/2051 | | | 6,199,850 | | | | 6,148,509 | |
| GS Mortgage Securities Trust, Series 2021-P17 (c), 0.08%, due 1/25/2052 | | | 530,475,738 | | | | 1,450,108 | |
| GS Mortgage Securities Trust, Series 2021-PJ8 (c), 0.10%, due 1/25/2052 | | | 352,446,081 | | | | 1,259,431 | |
| GS Mortgage Securities Trust (c), 0.50%, due 2/26/2052 | | | 95,820,986 | | | | 1,858,927 | |
| HLSS Holdings, LLC, Series 2020-PLS1 (c), 3.84%, due 12/25/2025 | | | 1,173,723 | | | | 1,178,772 | |
| JPMorgan Mortgage Trust, Series 2020-LTV2 (c), 3.00%, due 11/25/2050 | | | 492,933 | | | | 494,890 | |
| JPMorgan Mortgage Trust, Series 2021-4 (c), 2.50%, due 8/25/2051 | | | 4,176,045 | | | | 4,138,853 | |
| JPMorgan Mortgage Trust, Series 2021-6 (c), 2.50%, due 10/25/2051 | | | 4,309,216 | | | | 4,273,531 | |
| JPMorgan Mortgage Trust, Series 2021-10 (c), 0.14%, due 12/25/2051 | | | 288,414,593 | | | | 1,515,388 | |
| JPMorgan Mortgage Trust, Series 2021-12 (c), 0.51%, due 2/25/2052 | | | 180,444,728 | | | | 3,025,409 | |
| JPMorgan Wealth Management Trust, Series 2020-ATR1 (c), 3.00%, due 2/25/2050 | | | 657,337 | | | | 667,054 | |
| Mello Mortgage Capital Acceptance Trust, Series 2021-MTG3 (c), 0.13%, due 7/1/2051 | | | 168,094,399 | | | | 524,001 | |
| Mello Mortgage Capital Acceptance Trust, Series 2021-MTG3 (c), 2.50%, due 7/1/2051 | | | 4,315,985 | | | | 4,305,277 | |
See accompanying notes to financial statements.
| CHARTWELL INCOME FUND |
| SCHEDULE OF INVESTMENTS (Continued) |
| MORTGAGE-BACKED SECURITIES — 25.0% (Continued) | | Par Value | | | Value | |
| Commercial — 17.0% (Continued) | | | | | | | | |
| Morgan Stanley Residential Mortgage Loan Trust, Series 2020-1 (c), 2.50%, due 12/25/2050 | | $ | 1,851,500 | | | $ | 1,853,571 | |
| Onslow Bay Financial, LLC, Series 2021-J1 (c), 2.50%, due 5/25/2051 | | | 4,581,687 | | | | 4,538,019 | |
| Onslow Bay Financial, LLC, Series 2019-EXP3 (c), 3.50%, due 10/25/2059 | | | 1,717,082 | | | | 1,747,593 | |
| Provident Funding Mortgage Trust, Series 2019-1 (c), 3.00%, due 12/25/2049 | | | 1,496,689 | | | | 1,496,169 | |
| Rate Mortgage Trust, Series 2021-J1 (c), 2.50%, due 7/1/2051 | | | 4,433,416 | | | | 4,396,703 | |
| RMF Buyout Issuance Trust, Series 2020-HB1 (c), 1.72%, due 10/25/2050 | | | 2,514,449 | | | | 2,520,472 | |
| Rocket Mortgage Trust, Series 2021-1 (c), 2.50%, due 3/25/2051 | | | 2,393,606 | | | | 2,367,801 | |
| Rocket Mortgage Trust, Series 2021-2 (c), 2.50%, due 6/25/2051 | | | 5,127,274 | | | | 5,094,428 | |
| Rocket Mortgage Trust, Series 2021-3 (c), 0.14%, due 7/25/2051 | | | 309,793,017 | | | | 1,517,986 | |
| Rocket Mortgage Trust, Series 2021-4 (c), 2.50%, due 9/25/2051 | | | 2,886,593 | | | | 2,851,720 | |
| Sequoia Mortgage Trust, Series 2019-5 (c), 3.50%, due 12/25/2049 | | | 1,088,634 | | | | 1,106,131 | |
| Sequoia Mortgage Trust, Series 2021-6 (c), 0.50%, due 10/25/2051 | | | 92,303,889 | | | | 1,772,235 | |
| United Wholesale Mortgage, LLC, Series 2021-1 (c), 0.14%, due 6/25/2051 | | | 194,574,410 | | | | 811,326 | |
| | | | | | | | 88,397,733 | |
| Total Mortgage-Backed Securities (Cost $130,394,798) | | | | | | $ | 129,996,054 | |
See accompanying notes to financial statements.
| CHARTWELL INCOME FUND |
| SCHEDULE OF INVESTMENTS (Continued) |
| U.S. GOVERNMENT & AGENCY OBLIGATIONS — 13.3% | | Par Value | | | Value | |
| Federal Home Loan Bank — 1.7% | | | | | | | | |
| Federal Home Loan Bank, 1.15%, due 2/26/2031 | | $ | 2,660,000 | | | $ | 2,603,290 | |
| Federal Home Loan Bank, 1.25%, due 7/7/2031 | | | 6,100,000 | | | | 6,018,979 | |
| | | | | | | | 8,622,269 | |
| Small Business Administration — 0.7% | | | | | | | | |
| Small Business Administration Participation Certificates, 3.20%, due 3/1/2039 | | | 3,648,462 | | | | 3,933,430 | |
| | | | | | | | | |
| U.S. Treasury Bonds — 1.5% | | | | | | | | |
| U.S. Treasury Bonds, 3.75%, due 8/15/2041 | | | 6,105,000 | | | | 7,996,835 | |
| | | | | | | | | |
| U.S. Treasury Inflation-Protected Notes — 1.1% | | | | | | | | |
| U.S. Treasury Inflation-Protected Notes, 0.63%, due 4/15/2023 | | | 5,566,100 | | | | 5,818,531 | |
| | | | | | | | | |
| U.S. Treasury Notes — 8.3% | | | | | | | | |
| U.S. Treasury Notes, 2.00%, due 2/15/2023 | | | 9,160,000 | | | | 9,318,153 | |
| U.S. Treasury Notes, 1.63%, due 9/30/2026 | | | 8,330,000 | | | | 8,476,751 | |
| U.S. Treasury Notes, 1.13%, due 2/15/2031 | | | 16,355,000 | | | | 15,890,544 | |
| U.S. Treasury Notes, 1.88%, due 2/15/2051 | | | 3,600,000 | | | | 3,578,062 | |
| U.S. Treasury Notes, 1.38%, due 11/15/2031 | | | 5,795,000 | | | | 5,728,901 | |
| | | | | | | | 42,992,411 | |
| Total U.S. Government & Agency Obligations (Cost $68,996,796) | | | | | | $ | 69,363,476 | |
See accompanying notes to financial statements.
| CHARTWELL INCOME FUND |
| SCHEDULE OF INVESTMENTS (Continued) |
| MONEY MARKET FUNDS — 0.9% | | Shares | | | Value | |
| Fidelity Institutional Money Market Government Portfolio - Class I, 0.01% (e) (Cost $4,476,660) | | | 4,476,660 | | | $ | 4,476,660 | |
| | | | | | | | | |
| Investments at Value — 95.7% (Cost $463,962,110) | | | | | | $ | 497,598,547 | |
| | | | | | | | | |
| Other Assets in Excess of Liabilities — 4.3% | | | | | | | 22,578,137 | |
| | | | | | | | | |
| Net Assets — 100.0% | | | | | | $ | 520,176,684 | |
| (a) | Non-income producing security. |
| (b) | Variable rate security. Interest rate resets periodically. The rate shown is the effective interest rate as of December 31, 2021. For securities based on a published reference rate and spread, the reference rate and spread (in basis points) are indicated parenthetically. Certain variable rate securities are not based on a published reference rate and spread but are determined by the issuer or agent and are based on current market conditions. These securities, therefore, do not indicate a reference rate and spread. |
| (c) | 144A - Security was purchased in a transaction exempt from registration in compliance with Rule 144A of the Securities Act of 1933. This security may be resold in transactions exempt from registration, normally to qualified institutional buyers. The total value of such securities is $156,736,175 as of December 31, 2021, representing 30.1% of net assets. |
| (d) | Security has a perpetual maturity date. |
| (e) | The rate shown is the 7-day effective yield as of December 31, 2021. |
H15T5Y – U.S. Treasury yield curve rate for U.S. Treasury note with a constant maturity of 1 year
LIBOR – London Interbank Offered Rate
See accompanying notes to financial statements.
| CHARTWELL INCOME FUND |
| SUMMARY OF INVESTMENTS |
| As of December 31, 2021 (Unaudited) |
| | | Percent of | |
| Security Type / Sector | | Net Assets | |
| Common Stocks | | | | |
| Financials | | | 3.2 | % |
| Health Care | | | 2.6 | % |
| Materials | | | 2.3 | % |
| Technology | | | 1.9 | % |
| Real Estate | | | 1.9 | % |
| Industrials | | | 1.9 | % |
| Consumer Discretionary | | | 1.8 | % |
| Communications | | | 1.8 | % |
| Consumer Staples | | | 1.3 | % |
| Utilities | | | 1.1 | % |
| Energy | | | 1.1 | % |
| Total Common Stocks | | | 20.9 | % |
| Exchanged-Traded Funds | | | 2.9 | % |
| Preferred Stocks | | | | |
| Real Estate | | | 2.1 | % |
| Financials | | | 1.1 | % |
| Communications | | | 0.1 | % |
| Total Preferred Stocks | | | 3.3 | % |
| Corporate Bonds | | | | |
| Financials | | | 7.0 | % |
| Consumer Discretionary | | | 4.6 | % |
| Energy | | | 4.2 | % |
| Technology | | | 3.0 | % |
| Materials | | | 2.0 | % |
| Industrials | | | 2.0 | % |
| Consumer Staples | | | 1.2 | % |
| Real Estate | | | 1.0 | % |
| Communications | | | 0.8 | % |
| Health Care | | | 0.5 | % |
| Utilities | | | 0.5 | % |
| Total Corporate Bonds | | | 26.8 | % |
| Asset-Backed Securities | | | 2.6 | % |
| Mortgage-Backed Securities | | | 25.0 | % |
| U.S. Government & Agency Obligations | | | 13.3 | % |
| Money Market Funds | | | 0.9 | % |
| Investments | | | 95.7 | % |
| Other Assets in Excess of Liabilities | | | 4.3 | % |
| Net Assets | | | 100.0 | % |
| CHARTWELL MID CAP VALUE FUND |
| SCHEDULE OF INVESTMENTS |
| December 31, 2021 |
| COMMON STOCKS — 96.9% | | Shares | | | Value | |
| Communications — 2.8% | | | | | | | | |
| Internet Media & Services — 2.8% | | | | | | | | |
| Expedia Group, Inc. (a) | | | 5,976 | | | $ | 1,079,983 | |
| | | | | | | | | |
| Consumer Discretionary — 10.0% | | | | | | | | |
| Apparel & Textile Products — 2.1% | | | | | | | | |
| Columbia Sportswear Company | | | 8,358 | | | | 814,404 | |
| | | | | | | | | |
| Consumer Services — 2.3% | | | | | | | | |
| Service Corporation International | | | 12,455 | | | | 884,180 | |
| | | | | | | | | |
| Retail - Discretionary — 5.6% | | | | | | | | |
| AutoZone, Inc. (a) | | | 653 | | | | 1,368,943 | |
| Genuine Parts Company | | | 5,490 | | | | 769,698 | |
| | | | | | | | 2,138,641 | |
| Consumer Staples — 6.8% | | | | | | | | |
| Food — 3.2% | | | | | | | | |
| Conagra Brands, Inc. | | | 16,657 | | | | 568,837 | |
| Lamb Weston Holdings, Inc. | | | 10,229 | | | | 648,314 | |
| | | | | | | | 1,217,151 | |
| Retail - Consumer Staples — 3.6% | | | | | | | | |
| Dollar Tree, Inc. (a) | | | 9,964 | | | | 1,400,141 | |
| | | | | | | | | |
| Energy — 4.7% | | | | | | | | |
| Oil & Gas Producers — 4.7% | | | | | | | | |
| Diamondback Energy, Inc. | | | 7,966 | | | | 859,133 | |
| Pioneer Natural Resources Company | | | 5,160 | | | | 938,501 | |
| | | | | | | | 1,797,634 | |
| Financials — 16.2% | | | | | | | | |
| Banking — 6.4% | | | | | | | | |
| KeyCorp | | | 35,342 | | | | 817,460 | |
| M&T Bank Corporation | | | 2,672 | | | | 410,366 | |
| Pinnacle Financial Partners, Inc. | | | 13,130 | | | | 1,253,915 | |
| | | | | | | | 2,481,741 | |
| Insurance — 8.0% | | | | | | | | |
| Allstate Corporation (The) | | | 10,686 | | | | 1,257,208 | |
| Hanover Insurance Group, Inc. (The) | | | 6,412 | | | | 840,357 | |
| Lincoln National Corporation | | | 14,121 | | | | 963,899 | |
| | | | | | | | 3,061,464 | |
| Specialty Finance — 1.8% | | | | | | | | |
| Synchrony Financial | | | 14,733 | | | | 683,464 | |
See accompanying notes to financial statements.
| CHARTWELL MID CAP VALUE FUND |
| SCHEDULE OF INVESTMENTS (Continued) |
| COMMON STOCKS — 96.9% (Continued) | | Shares | | | Value | |
| Health Care — 9.3% | | | | | | | | |
| Health Care Facilities & Services — 9.3% | | | | | | | | |
| Quest Diagnostics, Inc. | | | 9,773 | | | $ | 1,690,827 | |
| Syneos Health, Inc. (a) | | | 10,043 | | | | 1,031,215 | |
| Universal Health Services, Inc. - Class B | | | 6,768 | | | | 877,539 | |
| | | | | | | | 3,599,581 | |
| Industrials — 6.2% | | | | | | | | |
| Machinery — 4.0% | | | | | | | | |
| Gates Industrial Corporation plc (a) | | | 54,003 | | | | 859,188 | |
| Snap-on, Inc. | | | 3,130 | | | | 674,139 | |
| | | | | | | | 1,533,327 | |
| Transportation Equipment — 2.2% | | | | | | | | |
| Allison Transmission Holdings, Inc. | | | 23,190 | | | | 842,956 | |
| | | | | | | | | |
| Materials — 10.8% | | | | | | | | |
| Chemicals — 6.6% | | | | | | | | |
| FMC Corporation | | | 12,455 | | | | 1,368,680 | |
| Univar Solutions, Inc. (a) | | | 41,698 | | | | 1,182,138 | |
| | | | | | | | 2,550,818 | |
| Construction Materials — 4.2% | | | | | | | | |
| Vulcan Materials Company | | | 7,709 | | | | 1,600,234 | |
| | | | | | | | | |
| Real Estate — 12.8% | | | | | | | | |
| REITs — 12.8% | | | | | | | | |
| Healthcare Trust of America, Inc. - Class A | | | 37,050 | | | | 1,237,099 | |
| Healthpeak Properties, Inc. | | | 22,030 | | | | 795,063 | |
| Life Storage, Inc. | | | 7,371 | | | | 1,129,090 | |
| Mid-America Apartment Communities, Inc. | | | 7,618 | | | | 1,747,874 | |
| | | | | | | | 4,909,126 | |
| Technology — 9.0% | | | | | | | | |
| Technology Hardware — 7.5% | | | | | | | | |
| Ciena Corporation (a) | | | 21,751 | | | | 1,674,174 | |
| Dolby Laboratories, Inc. - Class A | | | 12,594 | | | | 1,199,201 | |
| | | | | | | | 2,873,375 | |
| Technology Services — 1.5% | | | | | | | | |
| DXC Technology Company (a) | | | 18,448 | | | | 593,841 | |
See accompanying notes to financial statements.
| CHARTWELL MID CAP VALUE FUND |
| SCHEDULE OF INVESTMENTS (Continued) |
| COMMON STOCKS — 96.9% (Continued) | | Shares | | | Value | |
| Utilities — 8.3% | | | | | | | | |
| Electric Utilities — 8.3% | | | | | | | | |
| Ameren Corporation | | | 11,556 | | | $ | 1,028,599 | |
| CMS Energy Corporation | | | 12,655 | | | | 823,208 | |
| Public Service Enterprise Group, Inc. | | | 20,290 | | | | 1,353,952 | |
| | | | | | | | 3,205,759 | |
| | | | | | | | | |
| Total Common Stocks (Cost $27,601,310) | | | | | | $ | 37,267,820 | |
| | | | | | | | | |
| MONEY MARKET FUNDS — 0.3% | | Shares | | | Value | |
| Fidelity Institutional Money Market Government Portfolio - Class I, 0.01% (b) (Cost $127,357) | | | 127,357 | | | $ | 127,357 | |
| | | | | | | | | |
| Investments at Value — 97.2% (Cost $27,728,667) | | | | | | $ | 37,395,177 | |
| | | | | | | | | |
| Other Assets in Excess of Liabilities — 2.8% | | | | | | | 1,071,777 | |
| | | | | | | | | |
| Net Assets — 100.0% | | | | | | $ | 38,466,954 | |
| (a) | Non-income producing security. |
| (b) | The rate shown is the 7-day effective yield as of December 31, 2021. |
See accompanying notes to financial statements.
| CHARTWELL MID CAP VALUE FUND |
| SUMMARY OF INVESTMENTS |
| As of December 31, 2021 (Unaudited) |
| | | Percent of | |
| Security Type / Sector | | Net Assets | |
| Common Stocks | | | |
| Financials | | | 16.2 | % |
| Real Estate | | | 12.8 | % |
| Materials | | | 10.8 | % |
| Consumer Discretionary | | | 10.0 | % |
| Health Care | | | 9.3 | % |
| Technology | | | 9.0 | % |
| Utilities | | | 8.3 | % |
| Consumer Staples | | | 6.8 | % |
| Industrials | | | 6.2 | % |
| Energy | | | 4.7 | % |
| Communications | | | 2.8 | % |
| Total Common Stocks | | | 96.9 | % |
| Money Market Funds | | | 0.3 | % |
| Investments | | | 97.2 | % |
| Other Assets in Excess of Liabilities | | | 2.8 | % |
| Net Assets | | | 100.0 | % |
| CHARTWELL SMALL CAP VALUE FUND |
| SCHEDULE OF INVESTMENTS |
| December 31, 2021 |
| COMMON STOCKS — 99.0% | | Shares | | | Value | |
| Consumer Discretionary — 11.9% | | | | | | | | |
| Apparel & Textile Products — 1.7% | | | | | | | | |
| Oxford Industries, Inc. | | | 14,827 | | | $ | 1,505,237 | |
| Wolverine World Wide, Inc. | | | 53,227 | | | | 1,533,470 | |
| | | | | | | | 3,038,707 | |
| Automotive — 1.3% | | | | | | | | |
| Visteon Corporation (a) | | | 21,224 | | | | 2,358,835 | |
| | | | | | | | | |
| Home Construction — 2.2% | | | | | | | | |
| JELD-WEN Holding, Inc. (a) | | | 36,340 | | | | 957,922 | |
| Tri Pointe Homes, Inc. (a) | | | 108,148 | | | | 3,016,248 | |
| | | | | | | | 3,974,170 | |
| Leisure Facilities & Services — 4.2% | | | | | | | | |
| Cheesecake Factory, Inc. (The) (a) | | | 46,182 | | | | 1,808,025 | |
| Denny’s Corporation (a) | | | 171,312 | | | | 2,740,992 | |
| Jack in the Box, Inc. | | | 35,370 | | | | 3,094,168 | |
| | | | | | | | 7,643,185 | |
| Retail - Discretionary — 1.4% | | | | | | | | |
| Rush Enterprises, Inc. - Class A | | | 47,733 | | | | 2,655,864 | |
| | | | | | | | | |
| Wholesale - Discretionary — 1.1% | | | | | | | | |
| G-III Apparel Group Ltd. (a) | | | 74,079 | | | | 2,047,544 | |
| | | | | | | | | |
| Consumer Staples — 3.8% | | | | | | | | |
| Food — 3.8% | | | | | | | | |
| Fresh Del Monte Produce, Inc. | | | 65,245 | | | | 1,800,762 | |
| Hain Celestial Group, Inc. (The) (a) | | | 20,319 | | | | 865,793 | |
| Hostess Brands, Inc. (a) | | | 160,181 | | | | 3,270,896 | |
| Phibro Animal Health Corporation - Class A | | | 49,353 | | | | 1,007,788 | |
| | | | | | | | 6,945,239 | |
| Energy — 2.2% | | | | | | | | |
| Oil & Gas Producers — 1.0% | | | | | | | | |
| PDC Energy, Inc. | | | 38,436 | | | | 1,874,908 | |
| | | | | | | | | |
| Oil & Gas Services & Equipment — 1.2% | | | | | | | | |
| ChampionX Corporation (a) | | | 107,035 | | | | 2,163,177 | |
See accompanying notes to financial statements.
| CHARTWELL SMALL CAP VALUE FUND |
| SCHEDULE OF INVESTMENTS (Continued) |
| COMMON STOCKS — 99.0% (Continued) | | Shares | | | Value | |
| Financials — 26.5% | | | | | | | | |
| Banking — 19.6% | | | | | | | | |
| Columbia Banking System, Inc. | | | 70,001 | | | $ | 2,290,433 | |
| CVB Financial Corporation | | | 72,499 | | | | 1,552,204 | |
| First Financial Bancorp | | | 78,526 | | | | 1,914,464 | |
| First Midwest Bancorp, Inc. | | | 116,224 | | | | 2,380,267 | |
| FNB Corporation | | | 178,828 | | | | 2,169,184 | |
| Independent Bank Group, Inc. | | | 38,675 | | | | 2,790,401 | |
| Pacific Premier Bancorp, Inc. | | | 73,205 | | | | 2,930,396 | |
| Renasant Corporation | | | 56,654 | | | | 2,150,019 | |
| Sandy Spring Bancorp, Inc. | | | 63,838 | | | | 3,069,331 | |
| SouthState Corporation | | | 20,553 | | | | 1,646,501 | |
| TowneBank | | | 81,609 | | | | 2,578,028 | |
| UMB Financial Corporation | | | 30,337 | | | | 3,219,059 | |
| Umpqua Holdings Corporation | | | 121,951 | | | | 2,346,337 | |
| United Bankshares, Inc. | | | 37,028 | | | | 1,343,376 | |
| United Community Banks, Inc. | | | 98,247 | | | | 3,530,997 | |
| | | | | | | | 35,910,997 | |
| Insurance — 4.9% | | | | | | | | |
| American Equity Investment Life Holding Company | | | 61,581 | | | | 2,396,733 | |
| Kemper Corporation | | | 38,876 | | | | 2,285,520 | |
| Selective Insurance Group, Inc. | | | 51,645 | | | | 4,231,791 | |
| | | | | | | | 8,914,044 | |
| Specialty Finance — 2.0% | | | | | | | | |
| PRA Group, Inc. (a) | | | 72,895 | | | | 3,660,058 | |
| | | | | | | | | |
| Health Care — 4.2% | | | | | | | | |
| Biotech & Pharma — 0.9% | | | | | | | | |
| Eagle Pharmaceuticals, Inc. (a) | | | 31,140 | | | | 1,585,649 | |
| | | | | | | | | |
| Health Care Facilities & Services — 1.6% | | | | | | | | |
| Patterson Companies, Inc. | | | 101,985 | | | | 2,993,260 | |
| | | | | | | | | |
| Medical Equipment & Devices — 1.7% | | | | | | | | |
| Integer Holdings Corporation (a) | | | 36,571 | | | | 3,130,112 | |
| | | | | | | | | |
| Industrials — 22.9% | | | | | | | | |
| Aerospace & Defense — 2.7% | | | | | | | | |
| AAR Corporation (a) | | | 68,479 | | | | 2,672,735 | |
| Moog, Inc. - Class A | | | 27,561 | | | | 2,231,614 | |
| | | | | | | | 4,904,349 | |
See accompanying notes to financial statements.
| CHARTWELL SMALL CAP VALUE FUND |
| SCHEDULE OF INVESTMENTS (Continued) |
| COMMON STOCKS — 99.0% (Continued) | | Shares | | | Value | |
| Industrials — 22.9% (Continued) | | | | | | | | |
| Commercial Support Services — 5.6% | | | | | | | | |
| Harsco Corporation (a) | | | 103,230 | | | $ | 1,724,973 | |
| Korn Ferry | | | 45,610 | | | | 3,454,045 | |
| TrueBlue, Inc. (a) | | | 84,660 | | | | 2,342,542 | |
| UniFirst Corporation | | | 13,129 | | | | 2,762,342 | |
| | | | | | | | 10,283,902 | |
| Diversified Industrials — 1.3% | | | | | | | | |
| ITT, Inc. | | | 22,915 | | | | 2,341,684 | |
| | | | | | | | | |
| Electrical Equipment — 1.2% | | | | | | | | |
| nVent Electric plc | | | 57,054 | | | | 2,168,052 | |
| | | | | | | | | |
| Engineering & Construction — 3.4% | | | | | | | | |
| Dycom Industries, Inc. (a) | | | 38,353 | | | | 3,595,977 | |
| Parsons Corporation (a) | | | 75,667 | | | | 2,546,195 | |
| | | | | | | | 6,142,172 | |
| Industrial Intermediate Products — 2.1% | | | | | | | | |
| EnPro Industries, Inc. | | | 35,451 | | | | 3,902,092 | |
| | | | | | | | | |
| Machinery — 4.4% | | | | | | | | |
| Cactus, Inc. - Class A | | | 63,345 | | | | 2,415,345 | |
| Columbus McKinnon Corporation | | | 56,381 | | | | 2,608,185 | |
| Mueller Water Products, Inc. - Series A | | | 209,244 | | | | 3,013,113 | |
| | | | | | | | 8,036,643 | |
| Transportation & Logistics — 2.2% | | | | | | | | |
| Hub Group, Inc. - Class A (a) | | | 48,257 | | | | 4,065,170 | |
| | | | | | | | | |
| Materials — 6.1% | | | | | | | | |
| Chemicals — 1.5% | | | | | | | | |
| Minerals Technologies, Inc. | | | 36,832 | | | | 2,694,261 | |
| | | | | | | | | |
| Construction Materials — 1.8% | | | | | | | | |
| Eagle Materials, Inc. | | | 19,568 | | | | 3,257,289 | |
| | | | | | | | | |
| Containers & Packaging — 1.5% | | | | | | | | |
| TriMas Corporation | | | 76,100 | | | | 2,815,700 | |
| | | | | | | | | |
| Paper & Forest Products — 1.3% | | | | | | | | |
| Glatfelter Corporation | | | 144,791 | | | | 2,490,405 | |
See accompanying notes to financial statements.
| CHARTWELL SMALL CAP VALUE FUND |
| SCHEDULE OF INVESTMENTS (Continued) |
| COMMON STOCKS — 99.0% (Continued) | | Shares | | | Value | |
| Real Estate — 10.5% | | | | | | | | |
| Real Estate Owners & Developers — 1.3% | | | | | | | | |
| McGrath RentCorp | | | 28,838 | | | $ | 2,314,538 | |
| | | | | | | | | |
| REITs — 9.2% | | | | | | | | |
| First Industrial Realty Trust, Inc. | | | 33,397 | | | | 2,210,881 | |
| Healthcare Realty Trust, Inc. | | | 70,721 | | | | 2,237,613 | |
| Kite Realty Group Trust | | | 83,949 | | | | 1,828,409 | |
| Pebblebrook Hotel Trust | | | 73,220 | | | | 1,637,931 | |
| Piedmont Office Realty Trust, Inc. - Class A | | | 107,888 | | | | 1,982,982 | |
| PS Business Parks, Inc. | | | 18,516 | | | | 3,410,092 | |
| STAG Industrial, Inc. | | | 73,101 | | | | 3,505,924 | |
| | | | | | | | 16,813,832 | |
| Technology — 6.9% | | | | | | | | |
| Semiconductors — 1.1% | | | | | | | | |
| CTS Corporation | | | 54,329 | | | | 1,994,961 | |
| | | | | | | | | |
| Software — 2.7% | | | | | | | | |
| CommVault Systems, Inc. (a) | | | 38,189 | | | | 2,631,986 | |
| Progress Software Corporation | | | 47,802 | | | | 2,307,402 | |
| | | | | | | | 4,939,388 | |
| Technology Hardware — 3.1% | | | | | | | | |
| Fabrinet (a) | | | 19,912 | | | | 2,358,975 | |
| Plexus Corporation (a) | | | 34,025 | | | | 3,262,657 | |
| | | | | | | | 5,621,632 | |
| Utilities — 4.0% | | | | | | | | |
| Electric Utilities — 3.0% | | | | | | | | |
| Avista Corporation | | | 34,578 | | | | 1,469,219 | |
| Black Hills Corporation | | | 23,325 | | | | 1,646,046 | |
| NorthWestern Corporation | | | 41,825 | | | | 2,390,717 | |
| | | | | | | | 5,505,982 | |
| Gas & Water Utilities — 1.0% | | | | | | | | |
| Southwest Gas Holdings, Inc. | | | 26,727 | | | | 1,872,226 | |
| | | | | | | | | |
| Total Common Stocks (Cost $136,199,575) | | | | | | $ | 181,060,027 | |
See accompanying notes to financial statements.
| CHARTWELL SMALL CAP VALUE FUND |
| SCHEDULE OF INVESTMENTS (Continued) |
| MONEY MARKET FUNDS — 0.7% | | Shares | | | Value | |
| Fidelity Institutional Money Market Government Portfolio - Class I, 0.01% (b) (Cost $1,229,655) | | | 1,229,655 | | | $ | 1,229,655 | |
| | | | | | | | | |
| Investments at Value — 99.7% (Cost $137,429,230) | | | | | | $ | 182,289,682 | |
| | | | | | | | | |
| Other Assets in Excess of Liabilities — 0.3% | | | | | | | 578,567 | |
| | | | | | | | | |
| Net Assets — 100.0% | | | | | | $ | 182,868,249 | |
| (a) | Non-income producing security. |
| (b) | The rate shown is the 7-day effective yield as of December 31, 2021. |
See accompanying notes to financial statements.
| CHARTWELL SMALL CAP VALUE FUND |
| SUMMARY OF INVESTMENTS |
| As of December 31, 2021 (Unaudited) |
| | | Percent of | |
| Security Type / Sector | | Net Assets | |
| Common Stocks | | | | |
| Financials | | | 26.5 | % |
| Industrials | | | 22.9 | % |
| Consumer Discretionary | | | 11.9 | % |
| Real Estate | | | 10.5 | % |
| Technology | | | 6.9 | % |
| Materials | | | 6.1 | % |
| Health Care | | | 4.2 | % |
| Utilities | | | 4.0 | % |
| Consumer Staples | | | 3.8 | % |
| Energy | | | 2.2 | % |
| Total Common Stocks | | | 99.0 | % |
| Money Market Funds | | | 0.7 | % |
| Investments | | | 99.7 | % |
| Other Assets in Excess of Liabilities | | | 0.3 | % |
| Net Assets | | | 100.0 | % |
| CHARTWELL SHORT DURATION HIGH YIELD FUND |
| SCHEDULE OF INVESTMENTS |
| December 31, 2021 |
| CORPORATE BONDS — 93.9% | | Par Value | | | Value | |
| Communications — 11.3% | | | | | | | | |
| AMC Networks, Inc., 5.00%, due 4/1/2024 | | $ | 2,488,000 | | | $ | 2,506,660 | |
| Level 3 Financing, Inc., 5.38%, due 5/1/2025 | | | 1,120,000 | | | | 1,144,377 | |
| Quebecor Media, Inc., 5.75%, due 1/15/2023 | | | 5,068,000 | | | | 5,270,720 | |
| Sirius XM Radio, Inc., 3.13%, due 9/1/2026 (a) | | | 5,270,000 | | | | 5,271,529 | |
| Sprint Corporation, 7.13%, due 6/15/2024 | | | 2,060,000 | | | | 2,312,669 | |
| TEGNA, Inc., 4.75%, due 3/15/2026 (a) | | | 5,265,000 | | | | 5,475,600 | |
| T-Mobile USA, Inc., 4.00%, due 4/15/2022 | | | 2,545,000 | | | | 2,559,659 | |
| | | | | | | | 24,541,214 | |
| Consumer Discretionary — 7.9% | | | | | | | | |
| Ford Motor Credit Company, LLC, 4.38%, due 8/6/2023 | | | 1,710,000 | | | | 1,779,118 | |
| Ford Motor Credit Company, LLC, 4.06%, due 11/1/2024 | | | 4,610,000 | | | | 4,850,504 | |
| Lennar Corporation, 4.75%, due 11/15/2022 | | | 880,000 | | | | 899,800 | |
| QVC, Inc., 4.85%, due 4/1/2024 | | | 5,265,000 | | | | 5,619,097 | |
| Travel + Leisure Company, 3.90%, due 3/1/2023 | | | 3,825,000 | | | | 3,882,375 | |
| | | | | | | | 17,030,894 | |
| Consumer Staples — 3.7% | | | | | | | | |
| Albertsons Companies, Inc., 3.25%, due 3/15/2026 (a) | | | 5,265,000 | | | | 5,363,719 | |
| Clearwater Paper Corporation, 5.38%, due 2/1/2025 (a) | | | 2,500,000 | | | | 2,700,000 | |
| | | | | | | | 8,063,719 | |
| Energy — 8.6% | | | | | | | | |
| DCP Midstream Operating, L.P., 3.88%, due 3/15/2023 | | | 3,300,000 | | | | 3,382,500 | |
| DCP Midstream Operating, L.P., 5.38%, due 7/15/2025 | | | 1,700,000 | | | | 1,857,250 | |
| EQT Midstream Partners, L.P., 4.75%, due 7/15/2023 | | | 2,535,000 | | | | 2,636,400 | |
| Rattler Midstream, L.P., 5.63%, due 7/15/2025 (a) | | | 5,000,000 | | | | 5,200,000 | |
| Western Midstream Operations, L.P., 4.35%, due 2/1/2025 | | | 5,265,000 | | | | 5,502,030 | |
| | | | | | | | 18,578,180 | |
| Financials — 16.7% | | | | | | | | |
| CIT Group, Inc., 5.00%, due 8/15/2022 | | | 4,245,000 | | | | 4,339,579 | |
| Icahn Enterprises, L.P., 4.75%, due 9/15/2024 | | | 5,265,000 | | | | 5,462,437 | |
| Navient Corporation, 5.50%, due 1/25/2023 | | | 4,736,000 | | | | 4,932,544 | |
| NMI Holdings, Inc., 7.38%, due 6/1/2025 (a) | | | 5,265,000 | | | | 5,978,407 | |
| OneMain Finance Corporation, 5.63%, due 3/15/2023 | | | 1,850,000 | | | | 1,932,427 | |
| OneMain Finance Corporation, 6.13%, due 3/15/2024 | | | 2,620,000 | | | | 2,777,803 | |
| SLM Corporation, 4.20%, due 10/29/2025 | | | 2,975,000 | | | | 3,108,875 | |
| Starwood Property Trust, Inc., 3.63%, due 7/15/2026 (a) | | | 2,442,000 | | | | 2,429,790 | |
| StoneX Group, Inc., 8.63%, due 6/15/2025 (a) | | | 5,000,000 | | | | 5,300,000 | |
| | | | | | | | 36,261,862 | |
See accompanying notes to financial statements.
| CHARTWELL SHORT DURATION HIGH YIELD FUND |
| SCHEDULE OF INVESTMENTS (Continued) |
| CORPORATE BONDS — 93.9% (Continued) | | Par Value | | | Value | |
| Health Care — 2.4% | | | | | | | | |
| HCA, Inc., 5.88%, due 5/1/2023 | | $ | 3,865,000 | | | $ | 4,096,958 | |
| HCA, Inc., 5.38%, due 2/1/2025 | | | 915,000 | | | | 1,005,585 | |
| | | | | | | | 5,102,543 | |
| Industrials — 16.5% | | | | | | | | |
| ADT Corporation (The), 4.13%, due 6/15/2023 | | | 5,265,000 | | | | 5,468,466 | |
| Arconic Corporation, 6.00%, due 5/15/2025 (a) | | | 5,265,000 | | | | 5,501,925 | |
| Delta Air Lines, Inc., 3.63%, due 3/15/2022 | | | 4,115,000 | | | | 4,115,029 | |
| GFL Environmental, Inc., 4.25%, due 6/1/2025 (a) | | | 3,345,000 | | | | 3,441,821 | |
| GFL Environmental, Inc., 3.75%, due 8/1/2025 (a) | | | 1,590,000 | | | | 1,605,900 | |
| Howmet Aerospace, Inc., 6.88%, due 5/1/2025 | | | 2,411,000 | | | | 2,770,010 | |
| Sensata Technologies B.V, 5.00%, due 10/1/2025 (a) | | | 1,725,000 | | | | 1,871,625 | |
| WESCO Distribution, Inc., 7.13%, due 6/15/2025 (a) | | | 5,265,000 | | | | 5,580,900 | |
| XPO Logistics, Inc., 6.25%, due 5/1/2025 (a) | | | 5,266,000 | | | | 5,509,552 | |
| | | | | | | | 35,865,228 | |
| Materials — 7.1% | | | | | | | | |
| Alcoa, Inc., 5.13%, due 10/1/2024 | | | 1,980,000 | | | | 2,133,450 | |
| Freeport-McMoran Copper & Gold, Inc., 3.88%, due 3/15/2023 | | | 5,070,000 | | | | 5,247,450 | |
| Mercer International, Inc., 5.50%, due 1/15/2026 | | | 2,410,000 | | | | 2,440,125 | |
| PolyOne Corporation, 5.25%, due 3/15/2023 | | | 5,265,000 | | | | 5,515,087 | |
| | | | | | | | 15,336,112 | |
| Real Estate — 7.8% | | | | | | | | |
| Brookfield Property REIT, Inc., 4.50%, due 4/1/2027 (a) | | | 4,250,000 | | | | 4,169,548 | |
| GLP Capital, L.P./GLP Financing II, Inc., 5.38%, due 11/1/2023 | | | 2,835,000 | | | | 3,008,502 | |
| iStar, Inc., 4.75%, due 10/1/2024 | | | 5,000,000 | | | | 5,187,500 | |
| SBA Communications Corporation, 3.88%, due 2/15/2027 | | | 4,460,000 | | | | 4,593,800 | |
| | | | | | | | 16,959,350 | |
| Technology — 9.6% | | | | | | | | |
| CommScope Finance, LLC, 6.00%, due 3/1/2026 (a) | | | 4,893,000 | | | | 5,039,790 | |
| Seagate HDD Cayman, 4.75%, due 6/1/2023 | | | 2,480,000 | | | | 2,592,133 | |
| Sensata Technologies B.V., 5.63%, due 11/1/2024 (a) | | | 1,785,000 | | | | 1,962,250 | |
| VICI Properties, L.P., 4.25%, due 12/1/2026 (a) | | | 5,265,000 | | | | 5,483,340 | |
| Western Digital Corporation, 4.75%, due 2/15/2026 | | | 5,265,000 | | | | 5,752,013 | |
| | | | | | | | 20,829,526 | |
| Utilities — 2.3% | | | | | | | | |
| AmeriGas Partners, L.P./AmeriGas Financial Corporation, 5.63%, due 5/20/2024 | | | 3,575,000 | | | | 3,865,183 | |
| AmeriGas Partners, L.P./AmeriGas Financial Corporation, 5.88%, due 8/20/2026 | | | 1,050,000 | | | | 1,174,435 | |
| | | | | | | | 5,039,618 | |
| | | | | | | | | |
| Total Corporate Bonds (Cost $201,338,797) | | | | | | $ | 203,608,246 | |
See accompanying notes to financial statements.
| CHARTWELL SHORT DURATION HIGH YIELD FUND |
| SCHEDULE OF INVESTMENTS (Continued) |
| MONEY MARKET FUNDS — 1.4% | | Shares | | | Value | |
| Fidelity Institutional Money Market Government Portfolio - Class I, 0.01% (b) (Cost $3,163,297) | | | 3,163,297 | | | $ | 3,163,297 | |
| | | | | | | | | |
| Investments at Value — 95.3% (Cost $204,502,094) | | | | | | $ | 206,771,543 | |
| | | | | | | | | |
| Other Assets in Excess of Liabilities — 4.7% | | | | | | | 10,107,956 | |
| | | | | | | | | |
| Net Assets — 100.0% | | | | | | $ | 216,879,499 | |
| (a) | 144A - Security was purchased in a transaction exempt from registration in compliance with Rule 144A of the Securities Act of 1933. This security may be resold in transactions exempt from registration, normally to qualified institutional buyers. The total value of such securities is $77,885,696 as of December 31, 2021, representing 35.9% of net assets. |
| (b) | The rate shown is the 7-day effective yield as of December 31, 2021. |
See accompanying notes to financial statements.
| CHARTWELL SHORT DURATION HIGH YIELD FUND |
| SUMMARY OF INVESTMENTS |
| As of December 31, 2021 (Unaudited) |
| | | Percent of | |
| Security Type / Sector | | Net Assets | |
| Corporate Bonds | | | | |
| Financials | | | 16.7 | % |
| Industrials | | | 16.5 | % |
| Communications | | | 11.3 | % |
| Technology | | | 9.6 | % |
| Energy | | | 8.6 | % |
| Consumer Discretionary | | | 7.9 | % |
| Real Estate | | | 7.8 | % |
| Materials | | | 7.1 | % |
| Consumer Staples | | | 3.7 | % |
| Health Care | | | 2.4 | % |
| Utilities | | | 2.3 | % |
| Total Corporate Bonds | | | 93.9 | % |
| Money Market Funds | | | 1.4 | % |
| Investments | | | 95.3 | % |
| Other Assets in Excess of Liabilities | | | 4.7 | % |
| Net Assets | | | 100.0 | % |
| CHARTWELL SMALL CAP GROWTH FUND |
| SCHEDULE OF INVESTMENTS |
| December 31, 2021 |
| COMMON STOCKS — 99.5% | | Shares | | | Value | |
| Communications — 0.8% | | | | | | |
| Telecommunications — 0.8% | | | | | | |
| Cyxtera Technologies, Inc. (a) | | | 17,903 | | | $ | 225,757 | |
| | | | | | | | | |
| Consumer Discretionary — 17.4% | | | | | | | | |
| Apparel & Textile Products — 3.0% | | | | | | | | |
| Capri Holdings Ltd. (a) | | | 6,380 | | | | 414,126 | |
| Deckers Outdoor Corporation (a) | | | 1,198 | | | | 438,839 | |
| | | | | | | | 852,965 | |
| Home Construction — 2.2% | | | | | | | | |
| Skyline Champion Corporation (a) | | | 4,810 | | | | 379,894 | |
| Taylor Morrison Home Corporation (a) | | | 6,562 | | | | 229,407 | |
| | | | | | | | 609,301 | |
| Leisure Facilities & Services — 8.0% | | | | | | | | |
| Bloomin’ Brands, Inc. (a) | | | 12,762 | | | | 267,747 | |
| Boyd Gaming Corporation (a) | | | 14,345 | | | | 940,602 | |
| Brinker International, Inc. (a) | | | 6,305 | | | | 230,700 | |
| Century Casinos, Inc. (a) | | | 10,569 | | | | 128,730 | |
| Churchill Downs, Inc. | | | 1,373 | | | | 330,756 | |
| Everi Holdings, Inc. (a) | | | 9,447 | | | | 201,693 | |
| Full House Resorts, Inc. (a) | | | 14,510 | | | | 175,716 | |
| | | | | | | | 2,275,944 | |
| Retail - Discretionary — 4.2% | | | | | | | | |
| American Eagle Outfitters, Inc. | | | 11,117 | | | | 281,483 | |
| Asbury Automotive Group, Inc. (a) | | | 1,533 | | | | 264,795 | |
| Builders FirstSource, Inc. (a) | | | 5,548 | | | | 475,519 | |
| Foot Locker, Inc. | | | 4,013 | | | | 175,087 | |
| | | | | | | | 1,196,884 | |
| Energy — 0.4% | | | | | | | | |
| Oil Field Services — 0.4% | | | | | | | | |
| TETRA Technologies, Inc. (a) | | | 42,775 | | | | 121,481 | |
| | | | | | | | | |
| Financials — 6.2% | | | | | | | | |
| Asset Management — 4.0% | | | | | | | | |
| Hamilton Lane, Inc. - Class A | | | 2,704 | | | | 280,189 | |
| Open Lending Corporation - Class A (a) | | | 9,186 | | | | 206,501 | |
| Silvergate Capital Corporation - Class A (a) | | | 2,272 | | | | 336,710 | |
| StepStone Group, Inc. - Class A | | | 7,261 | | | | 301,840 | |
| | | | | | | | 1,125,240 | |
See accompanying notes to financial statements.
| CHARTWELL SMALL CAP GROWTH FUND |
| SCHEDULE OF INVESTMENTS (Continued) |
| COMMON STOCKS — 99.5% (Continued) | | Shares | | | Value | |
| Financials — 6.2% (Continued) | | | | | | | | |
| Banking — 0.9% | | | | | | | | |
| Pinnacle Financial Partners, Inc. | | | 2,605 | | | $ | 248,777 | |
| | | | | | | | | |
| Specialty Finance — 1.3% | | | | | | | | |
| Walker & Dunlop, Inc. | | | 2,526 | | | | 381,123 | |
| | | | | | | | | |
| Health Care — 25.5% | | | | | | | | |
| Biotech & Pharma — 7.7% | | | | | | | | |
| Affimed N.V. (a) | | | 11,991 | | | | 66,190 | |
| Allogene Therapeutics, Inc. (a) | | | 5,708 | | | | 85,163 | |
| Biohaven Pharmaceutical Holding Company Ltd. (a) | | | 1,803 | | | | 248,471 | |
| Fate Therapeutics, Inc. (a) | | | 2,103 | | | | 123,047 | |
| Kura Oncology, Inc. (a) | | | 6,105 | | | | 85,470 | |
| Mirum Pharmaceuticals, Inc. (a) | | | 16,431 | | | | 262,075 | |
| Phathom Pharmaceuticals, Inc. (a) | | | 3,986 | | | | 78,405 | |
| PTC Therapeutics, Inc. (a) | | | 957 | | | | 38,117 | |
| Scholar Rock Holding Corporation (a) | | | 3,005 | | | | 74,644 | |
| Turning Point Therapeutics, Inc. (a) | | | 821 | | | | 39,162 | |
| United Therapeutics Corporation (a) | | | 5,058 | | | | 1,092,933 | |
| | | | | | | | 2,193,677 | |
| Health Care Facilities & Services — 6.3% | | | | | | | | |
| Acadia Healthcare Company, Inc. (a) | | | 2,947 | | | | 178,883 | |
| ModivCare, Inc. (a) | | | 2,741 | | | | 406,463 | |
| Owens & Minor, Inc. | | | 9,468 | | | | 411,858 | |
| Syneos Health, Inc. (a) | | | 2,679 | | | | 275,080 | |
| Tenet Healthcare Corporation (a) | | | 6,102 | | | | 498,472 | |
| | | | | | | | 1,770,756 | |
| Medical Equipment & Devices — 11.5% | | | | | | | | |
| AtriCure, Inc. (a) | | | 2,374 | | | | 165,064 | |
| Axonics, Inc. (a) | | | 8,334 | | | | 466,704 | |
| Cardiff Oncology, Inc. (a) | | | 14,036 | | | | 84,356 | |
| Castle Biosciences, Inc. (a) | | | 2,497 | | | | 107,046 | |
| CONMED Corporation | | | 2,424 | | | | 343,626 | |
| ICU Medical, Inc. (a) | | | 1,415 | | | | 335,836 | |
| Inspire Medical Systems, Inc. (a) | | | 1,029 | | | | 236,732 | |
| Merit Medical Systems, Inc. (a) | | | 4,902 | | | | 305,395 | |
| Natera, Inc. (a) | | | 6,510 | | | | 607,969 | |
| Stevanato Group S.p.A. (a) | | | 7,413 | | | | 166,422 | |
| Tandem Diabetes Care, Inc. (a) | | | 2,934 | | | | 441,626 | |
| | | | | | | | 3,260,776 | |
See accompanying notes to financial statements.
| CHARTWELL SMALL CAP GROWTH FUND |
| SCHEDULE OF INVESTMENTS (Continued) |
| COMMON STOCKS — 99.5% (Continued) | | Shares | | | Value | |
| Industrials — 13.6% | | | | | | |
| Aerospace & Defense — 0.8% | | | | | | | | |
| Mercury Systems, Inc. (a) | | | 4,067 | | | $ | 223,929 | |
| | | | | | | | | |
| Engineering & Construction — 4.5% | | | | | | | | |
| TopBuild Corporation (a) | | | 1,997 | | | | 550,992 | |
| WillScot Mobile Mini Holdings Corporation (a) | | | 18,059 | | | | 737,530 | |
| | | | | | | | 1,288,522 | |
| Industrial Intermediate Products — 1.3% | | | | | | | | |
| Chart Industries, Inc. (a) | | | 2,260 | | | | 360,447 | |
| | | | | | | | | |
| Industrial Support Services — 2.6% | | | | | | | | |
| H&E Equipment Services, Inc. | | | 6,752 | | | | 298,911 | |
| SiteOne Landscape Supply, Inc. (a) | | | 1,803 | | | | 436,831 | |
| | | | | | | | 735,742 | |
| Machinery — 4.4% | | | | | | | | |
| Lincoln Electric Holdings, Inc. | | | 1,715 | | | | 239,191 | |
| Oshkosh Corporation | | | 4,320 | | | | 486,907 | |
| Terex Corporation | | | 5,588 | | | | 245,593 | |
| Valmont Industries, Inc. | | | 1,118 | | | | 280,059 | |
| | | | | | | | 1,251,750 | |
| Materials — 5.8% | | | | | | | | |
| Chemicals — 2.9% | | | | | | | | |
| Avient Corporation | | | 5,560 | | | | 311,082 | |
| Quaker Chemical Corporation | | | 2,158 | | | | 498,023 | |
| | | | | | | | 809,105 | |
| Construction Materials — 1.7% | | | | | | | | |
| Advanced Drainage Systems, Inc. | | | 3,654 | | | | 497,419 | |
| | | | | | | | | |
| Containers & Packaging — 1.2% | | | | | | | | |
| Sealed Air Corporation | | | 4,907 | | | | 331,076 | |
| | | | | | | | | |
| Real Estate — 3.6% | | | | | | | | |
| Real Estate Owners & Developers — 0.7% | | | | | | | | |
| Radius Global Infrastructure, Inc. - Class A (a) | | | 13,057 | | | | 210,218 | |
| | | | | | | | | |
| REITs — 2.9% | | | | | | | | |
| DigitalBridge Group, Inc. (a) | | | 19,897 | | | | 165,742 | |
| NexPoint Residential Trust, Inc. | | | 3,555 | | | | 298,016 | |
| Ryman Hospitality Properties, Inc. (a) | | | 3,741 | | | | 344,022 | |
| | | | | | | | 807,780 | |
See accompanying notes to financial statements.
| CHARTWELL SMALL CAP GROWTH FUND |
| SCHEDULE OF INVESTMENTS (Continued) |
| COMMON STOCKS — 99.5% (Continued) | | Shares | | | Value | |
| Technology — 26.2% | | | | | | |
| Biotech & Pharma — 0.6% | | | | | | | | |
| Intellia Therapeutics, Inc. (a) | | | 1,480 | | | $ | 174,995 | |
| | | | | | | | | |
| Semiconductors — 5.1% | | | | | | | | |
| MACOM Technology Solutions Holdings, Inc. (a) | | | 7,061 | | | | 552,876 | |
| Silicon Motion Technology Corporation - ADR | | | 3,961 | | | | 376,414 | |
| Synaptics, Inc. (a) | | | 1,725 | | | | 499,405 | |
| | | | | | | | 1,428,695 | |
| Software — 16.5% | | | | | | | | |
| Avaya Holdings Corporation (a) | | | 15,316 | | | | 303,257 | |
| Bandwidth, Inc. - Class A (a) | | | 2,172 | | | | 155,863 | |
| Calix, Inc. (a) | | | 5,969 | | | | 477,341 | |
| Digital Turbine, Inc. (a) | | | 3,310 | | | | 201,877 | |
| Domo, Inc. - Class B (a) | | | 2,521 | | | | 125,042 | |
| Jamf Holding Corporation (a) | | | 9,846 | | | | 374,246 | |
| Manhattan Associates, Inc. (a) | | | 3,220 | | | | 500,678 | |
| Nutanix, Inc. - Class A (a) | | | 19,794 | | | | 630,637 | |
| Rapid7, Inc. (a) | | | 6,126 | | | | 720,969 | |
| SailPoint Technology Holdings, Inc. (a) | | | 6,392 | | | | 308,989 | |
| Tenable Holdings, Inc. (a) | | | 6,221 | | | | 342,590 | |
| Thryv Holdings, Inc. (a) | | | 7,166 | | | | 294,738 | |
| Varonis Systems, Inc. (a) | | | 4,771 | | | | 232,729 | |
| | | | | | | | 4,668,956 | |
| Technology Services — 4.0% | | | | | | | | |
| DXC Technology Company (a) | | | 16,283 | | | | 524,149 | |
| Endava plc - ADR (a) | | | 3,639 | | | | 611,061 | |
| | | | | | | | 1,135,210 | |
| | | | | | | | | |
| Total Common Stocks (Cost $19,628,326) | | | | | | $ | 28,186,525 | |
See accompanying notes to financial statements.
| CHARTWELL SMALL CAP GROWTH FUND |
| SCHEDULE OF INVESTMENTS (Continued) |
| MONEY MARKET FUNDS — 0.6% | | Shares | | | Value | |
| Fidelity Institutional Money Market Government Portfolio -Class I, 0.01% (b) (Cost $166,167) | | | 166,167 | | | $ | 166,167 | |
| | | | | | | | | |
| Investments at Value — 100.1% (Cost $19,794,493) | | | | | | $ | 28,352,692 | |
| Liabilities in Excess of Other Assets — (0.1%) | | | | | | | (23,040 | ) |
| Net Assets — 100.0% | | | | | | $ | 28,329,652 | |
| (a) | Non-income producing security. |
| (b) | The rate shown is the 7-day effective yield as of December 31, 2021. |
See accompanying notes to financial statements.
| CHARTWELL SMALL CAP GROWTH FUND |
| SUMMARY OF INVESTMENTS |
| As of December 31, 2021 (Unaudited) |
| | | Percent of | |
| Security Type / Sector | | Net Assets | |
| Common Stocks | | | | |
| Technology | | | 26.2 | % |
| Health Care | | | 25.5 | % |
| Consumer Discretionary | | | 17.4 | % |
| Industrials | | | 13.6 | % |
| Financials | | | 6.2 | % |
| Materials | | | 5.8 | % |
| Real Estate | | | 3.6 | % |
| Communications | | | 0.8 | % |
| Energy | | | 0.4 | % |
| Total Common Stocks | | | 99.5 | % |
| Money Market Funds | | | 0.6 | % |
| Investments | | | 100.1 | % |
| Liabilities in Excess of Other Assets | | | -0.1 | % |
| Net Assets | | | 100.0 | % |
| CHARTWELL SHORT DURATION BOND FUND |
| SCHEDULE OF INVESTMENTS (Continued) |
| CORPORATE BONDS — 79.9% | | Par Value | | | Value | |
| Communications — 2.4% | | | | | | |
| AT&T, Inc., 0.90%, due 3/25/2024 | | $ | 45,000 | | | $ | 44,805 | |
| T-Mobile USA, Inc., 4.00%, due 4/15/2022 | | | 75,000 | | | | 75,432 | |
| Walt Disney Company (The), 1.75%, due 1/13/2026 | | | 25,000 | | | | 25,273 | |
| | | | | | | | 145,510 | |
| Consumer Discretionary — 3.2% | | | | | | | | |
| AutoNation, Inc., 3.50%, due 11/15/2024 | | | 50,000 | | | | 52,445 | |
| General Motors Financial Company, Inc., 1.70%, due 8/18/2023 | | | 110,000 | | | | 111,057 | |
| Toyota Motor Credit Corporation, 0.50%, due 8/14/2023 | | | 25,000 | | | | 24,910 | |
| | | | | | | | 188,412 | |
| Consumer Staples — 0.9% | | | | | | | | |
| CVS Health Corporation, 2.63%, due 8/15/2024 | | | 50,000 | | | | 51,781 | |
| | | | | | | | | |
| Energy — 4.2% | | | | | | | | |
| DCP Midstream Operating, L.P., 4.95%, due 4/1/2022 | | | 70,000 | | | | 70,000 | |
| Pioneer Natural Resources Company, 0.75%, due 1/15/2024 | | | 100,000 | | | | 98,660 | |
| Regency Energy Partners, L.P., 4.50%, due 11/1/2023 | | | 50,000 | | | | 52,381 | |
| Targa Resources Partners, L.P., 5.88%, due 4/15/2026 | | | 25,000 | | | | 26,086 | |
| | | | | | | | 247,127 | |
| Financials — 33.6% | | | | | | | | |
| Ares Capital Corporation, 4.25%, due 3/1/2025 | | | 100,000 | | | | 105,871 | |
| Bank of America Corporation, 0.98% (SOFR + 91), due 9/25/2025 (a) | | | 100,000 | | | | 98,807 | |
| Bank of America Corporation, 0.89% (3MO LIBOR + 77), due 2/5/2026 (a) | | | 85,000 | | | | 86,238 | |
| Bank of Montreal, 0.95%, due 1/22/2027 | | | 25,000 | | | | 24,200 | |
| Canadian Imperial Bank of Commerce, 3.50%, due 9/13/2023 | | | 75,000 | | | | 78,409 | |
| Citigroup, Inc., 2.88%, due 7/24/2023 (a) | | | 55,000 | | | | 55,662 | |
| Citigroup, Inc., 3.35% (3MO LIBOR + 89.66), due 4/24/2025 (a) | | | 115,000 | | | | 120,099 | |
| Goldman Sachs Group, Inc., 0.91% (3MO LIBOR + 75), due 2/23/2023 (a) | | | 50,000 | | | | 50,209 | |
| Goldman Sachs Group, Inc., 2.91%, due 6/5/2023 (a) | | | 55,000 | | | | 55,459 | |
| Goldman Sachs Group, Inc., 0.67% (SOFR + 57.2), due 3/8/2024 (a) | | | 100,000 | | | | 99,555 | |
| Goldman Sachs Group, Inc., 3.50%, due 11/16/2026 | | | 50,000 | | | | 53,310 | |
| Icahn Enterprises, L.P., 4.75%, due 9/15/2024 | | | 50,000 | | | | 51,875 | |
| JPMorgan Chase & Company, 3.21%, due 4/1/2023 (a) | | | 94,000 | | | | 94,561 | |
| JPMorgan Chase & Company, 1.35% (3MO LIBOR + 123), due 10/24/2023 (a) | | | 25,000 | | | | 25,150 | |
| JPMorgan Chase & Company, 1.04% (SOFR + 69.5), due 2/4/2027 (a) | | | 25,000 | | | | 24,209 | |
See accompanying notes to financial statements.
| CHARTWELL SHORT DURATION BOND FUND |
| SCHEDULE OF INVESTMENTS (Continued) |
| CORPORATE BONDS — 79.9% (Continued) | | Par Value | | | Value | |
| Financials — 33.6% (Continued) | | | | | | | | |
| Mitsubishi UFJ Financial Group, Inc., 0.96%, due 10/11/2025 | | $ | 70,000 | | | $ | 69,019 | |
| Morgan Stanley, 0.56%, due 11/10/2023 | | | 50,000 | | | | 49,933 | |
| Morgan Stanley, 0.73% (SOFR + 61.6), due 4/5/2024 (a) | | | 100,000 | | | | 99,698 | |
| Morgan Stanley, 2.19% (SOFR + 199), due 4/28/2026 (a) | | | 25,000 | | | | 25,501 | |
| Nasdaq, Inc., 0.45%, due 12/21/2022 | | | 75,000 | | | | 74,892 | |
| Navient Corporation, 7.25%, due 9/25/2023 | | | 30,000 | | | | 32,325 | |
| OneMain Finance Corporation, 6.13%, due 3/15/2024 | | | 65,000 | | | | 68,915 | |
| Owl Rock Capital Corporation, 4.00%, due 3/30/2025 | | | 80,000 | | | | 83,246 | |
| Royal Bank of Canada, 0.50%, due 10/26/2023 | | | 150,000 | | | | 149,113 | |
| StoneX Group, Inc., 8.63%, due 6/15/2025 (b) | | | 50,000 | | | | 53,000 | |
| Toronto-Dominion Bank (The), 1.90%, due 12/1/2022 | | | 50,000 | | | | 50,623 | |
| Truist Bank, 1.25%, due 3/9/2023 | | | 140,000 | | | | 140,854 | |
| Wells Fargo & Company, 1.65% (SOFR + 160), due 6/2/2024 (a) | | | 75,000 | | | | 75,641 | |
| | | | | | | | 1,996,374 | |
| Health Care — 5.8% | | | | | | | | |
| AmerisourceBergen Corporation, 0.74%, due 3/15/2023 | | | 50,000 | | | | 49,873 | |
| Anthem, Inc., 2.38%, due 1/15/2025 | | | 70,000 | | | | 72,202 | |
| Thermo Fischer Scientific, Inc., 1.22%, due 10/18/2024 | | | 175,000 | | | | 174,835 | |
| UnitedHealth Group, Inc., 0.55%, due 5/15/2024 | | | 50,000 | | | | 49,637 | |
| | | | | | | | 346,547 | |
| Industrials — 10.9% | | | | | | | | |
| Arconic Corporation, 6.00%, due 5/15/2025 (b) | | | 50,000 | | | | 52,250 | |
| Boeing Company (The), 1.43%, due 2/4/2024 | | | 75,000 | | | | 74,898 | |
| Canadian Pacific Railway Ltd., 1.35%, due 12/2/2024 | | | 50,000 | | | | 50,064 | |
| CNH Industrial Capital, LLC, 1.95%, due 7/2/2023 | | | 50,000 | | | | 50,655 | |
| Crown Americas, LLC, 4.75%, due 2/1/2026 | | | 25,000 | | | | 25,625 | |
| Delta Air Lines, Inc., 3.63%, due 3/15/2022 | | | 40,000 | | | | 40,000 | |
| Hillenbrand, Inc., 5.75%, due 6/15/2025 | | | 60,000 | | | | 62,700 | |
| John Deere Capital Corporation, 2.70%, due 1/6/2023 | | | 58,000 | | | | 59,155 | |
| Quanta Services, Inc., 0.95%, due 10/1/2024 | | | 125,000 | | | | 123,671 | |
| WESCO Distribution, Inc., 7.13%, due 6/15/2025 (b) | | | 50,000 | | | | 53,000 | |
| XPO Logistics, Inc., 6.25%, due 5/1/2025 (b) | | | 56,000 | | | | 58,590 | |
| | | | | | | | 650,608 | |
| Materials — 2.4% | | | | | | | | |
| Dow Chemical Company (The), 3.63%, due 5/15/2026 | | | 25,000 | | | | 26,946 | |
| DuPont de Nemours, Inc., 1.70%, due 7/15/2025 | | | 50,000 | | | | 50,380 | |
| Mercer International, Inc., 5.50%, due 1/15/2026 | | | 65,000 | | | | 65,813 | |
| | | | | | | | 143,139 | |
| Real Estate — 2.4% | | | | | | | | |
| Brookfield Property REIT, Inc., 4.50%, due 4/1/2027 (b) | | | 36,000 | | | | 35,318 | |
| Simon Property Group, L.P., 3.50%, due 9/1/2025 | | | 50,000 | | | | 53,309 | |
See accompanying notes to financial statements.
| CHARTWELL SHORT DURATION BOND FUND |
| SCHEDULE OF INVESTMENTS (Continued) |
| CORPORATE BONDS — 79.9% (Continued) | | Par Value | | | Value | |
| Real Estate — 2.4% (Continued) | | | | | | | | |
| Simon Property Group, L.P., 1.38%, due 1/15/2027 | | $ | 55,000 | | | $ | 53,749 | |
| | | | | | | | 142,376 | |
| Technology — 7.5% | | | | | | | | |
| CommScope Finance, LLC, 6.00%, due 3/1/2026 (b) | | | 50,000 | | | | 51,500 | |
| Hewlett Packard Enterprise Company, 1.75%, due 4/1/2026 | | | 115,000 | | | | 114,919 | |
| NVIDIA Corporation, 0.31%, due 6/15/2023 | | | 150,000 | | | | 148,931 | |
| salesforce.com, inc., 0.63%, due 7/15/2024 | | | 60,000 | | | | 59,454 | |
| VMware, Inc., 1.00%, due 8/15/2024 | | | 75,000 | | | | 74,291 | |
| | | | | | | | 449,095 | |
| Utilities — 6.6% | | | | | | | | |
| American Electric Power, 0.75%, due 11/1/2023 | | | 75,000 | | | | 74,491 | |
| CenterPoint Energy Resources Corporation, 0.67%, due 3/2/2023 | | | 60,000 | | | | 59,860 | |
| CenterPoint Energy Resources Corporation, 0.70%, due 3/2/2023 | | | 55,000 | | | | 54,751 | |
| NextEra Energy Capital Holdings, Inc., 0.43%, due 2/22/2023 | | | 90,000 | | | | 89,848 | |
| OGE Energy Corporation, 0.70%, due 5/26/2023 | | | 112,000 | | | | 111,493 | |
| | | | | | | | 390,443 | |
| | | | | | | | | |
| Total Corporate Bonds (Cost $4,778,435) | | | | | | $ | 4,751,412 | |
| U.S. GOVERNMENT & AGENCY OBLIGATIONS — 14.0% | | Par Value | | | Value | |
| Federal Home Loan Bank — 6.1% | | | | | | | | |
| Federal Home Loan Bank, 1.00%, due 6/14/2024 | | $ | 55,000 | | | $ | 54,991 | |
| Federal Home Loan Bank, 0.65%, due 10/25/2024 | | | 75,000 | | | | 74,397 | |
| Federal Home Loan Bank, 1.00%, due 11/22/2024 | | | 50,000 | | | | 49,906 | |
| Federal Home Loan Bank, 1.25%, due 12/20/2024 | | | 55,000 | | | | 55,032 | |
| Federal Home Loan Bank, 1.25%, due 10/26/2026 | | | 100,000 | | | | 99,516 | |
| Federal Home Loan Bank, 1.50%, due 11/23/2026 | | | 30,000 | | | | 29,958 | |
| | | | | | | | 363,800 | |
| U.S. Treasury Notes — 7.9% | | | | | | | | |
| U.S. Treasury Notes, 2.00%, due 2/15/2023 | | | 150,000 | | | | 152,590 | |
| U.S. Treasury Notes, 0.25%, due 9/30/2023 | | | 55,000 | | | | 54,618 | |
| U.S. Treasury Notes, 0.38%, due 9/15/2024 | | | 175,000 | | | | 172,566 | |
| U.S. Treasury Notes, 0.75%, due 11/15/2024 | | | 40,000 | | | | 39,784 | |
| U.S. Treasury Notes, 0.38%, due 11/30/2025 | | | 25,000 | | | | 24,256 | |
| U.S. Treasury Notes, 1.63%, due 9/30/2026 | | | 25,000 | | | | 25,440 | |
| | | | | | | | 469,254 | |
| | | | | | | | | |
| Total U.S. Government & Agency Obligations (Cost $837,107) | | | | | | $ | 833,054 | |
See accompanying notes to financial statements.
| CHARTWELL SHORT DURATION BOND FUND |
| SCHEDULE OF INVESTMENTS (Continued) |
| MONEY MARKET FUNDS — 5.3% | | Shares | | | Value | |
| Fidelity Institutional Money Market Government Portfolio -Class I, 0.01% (c) (Cost $316,326) | | | 316,326 | | | $ | 316,326 | |
| | | | | | | | | |
| Investments at Value — 99.2% (Cost $5,931,868) | | | | | | $ | 5,900,792 | |
| Other Assets in Excess of Liabilities — 0.8% | | | | | | | 47,234 | |
| Net Assets — 100.0% | | | | | | $ | 5,948,026 | |
| (a) | Variable rate security. Interest rate resets periodically. The rate shown is the effective interest rate as of December 31, 2021. For securities based on a published reference rate and spread, the reference rate and spread (in basis points) are indicated parenthetically. Certain variable rate securities are not based on a published reference rate and spread but are determined by the issuer or agent and are based on current market conditions. These securities, therefore, do not indicate a reference rate and spread. |
| (b) | 144A - Security was purchased in a transaction exempt from registration in compliance with Rule 144A of the Securities Act of 1933. This security may be resold in transactions exempt from registration, normally to qualified institutional buyers. The total value of such securities is $303,658 as of December 31, 2021, representing 5.1% of net assets. |
| (c) | The rate shown is the 7-day effective yield as of December 31, 2021. |
LIBOR – London Interbank Offered Rate
SOFR – Secured Overnight Financing Rate
See accompanying notes to financial statements.
| CHARTWELL SHORT DURATION BOND FUND |
| SUMMARY OF INVESTMENTS |
| As of December 31, 2021 (Unaudited) |
| | | Percent of | |
| Security Type / Sector | | Net Assets | |
| Corporate Bonds | | | | |
| Financials | | | 33.6 | % |
| Industrials | | | 10.9 | % |
| Technology | | | 7.5 | % |
| Utilities | | | 6.6 | % |
| Health Care | | | 5.8 | % |
| Energy | | | 4.2 | % |
| Consumer Discretionary | | | 3.2 | % |
| Communications | | | 2.4 | % |
| Materials | | | 2.4 | % |
| Real Estate | | | 2.4 | % |
| Consumer Staples | | | 0.9 | % |
| Total Corporate Bonds | | | 79.9 | % |
| U.S. Government & Agency Obligations | | | 14.0 | % |
| Money Market Funds | | | 5.3 | % |
| Investments | | | 99.2 | % |
| Other Assets in Excess of Liabilities | | | 0.8 | % |
| Net Assets | | | 100.0 | % |
| CHARTWELL FUNDS |
| STATEMENTS OF ASSETS AND LIABILITIES |
| December 31, 2021 |
| | | | | | Chartwell | | | Chartwell | |
| | | Chartwell | | | Mid Cap | | | Small Cap | |
| | | Income Fund | | | Value Fund | | | Value Fund | |
| ASSETS | | | | | | | | | |
| Investments at cost | | $ | 463,962,110 | | | $ | 27,728,667 | | | $ | 137,429,230 | |
| Investments at value (Notes 2 and 7) | | $ | 497,598,547 | | | $ | 37,395,177 | | | $ | 182,289,682 | |
| Cash (Note 2) | | | 20,000,000 | | | | 1,000,000 | | | | 1,000,000 | |
| Receivable for capital shares sold | | | 47,610 | | | | 80,957 | | | | 285,331 | |
| Dividends and interest receivable | | | 3,087,591 | | | | 23,120 | | | | 171,597 | |
| Foreign tax reclaims receivable | | | 63,661 | | | | — | | | | — | |
| Other assets | | | 29,383 | | | | 11,322 | | | | 12,302 | |
| TOTAL ASSETS | | | 520,826,792 | | | | 38,510,576 | | | | 183,758,912 | |
| | | | | | | | | | | | | |
| LIABILITIES | | | | | | | | | | | | |
| Payable for capital shares redeemed | | | 328,300 | | | | 254 | | | | 715,572 | |
| Payable to Advisor (Note 3) | | | 207,503 | | | | 12,348 | | | | 118,911 | |
| Payable to administrator (Note 3) | | | 20,600 | | | | 4,300 | | | | 9,100 | |
| Accrued Trustees’ fees (Note 3) | | | 6,150 | | | | 6,150 | | | | 6,150 | |
| Other accrued expenses | | | 87,555 | | | | 20,570 | | | | 40,930 | |
| TOTAL LIABILITIES | | | 650,108 | | | | 43,622 | | | | 890,663 | |
| | | | | | | | | | | | | |
| NET ASSETS | | $ | 520,176,684 | | | $ | 38,466,954 | | | $ | 182,868,249 | |
| | | | | | | | | | | | | |
| NET ASSETS CONSIST OF: | | | | | | | | | | | | |
| Paid-in capital | | $ | 495,781,602 | | | $ | 28,957,645 | | | $ | 139,155,021 | |
| Accumulated earnings | | | 24,395,082 | | | | 9,509,309 | | | | 43,713,228 | |
| NET ASSETS | | $ | 520,176,684 | | | $ | 38,466,954 | | | $ | 182,868,249 | |
| Shares of beneficial interest outstanding (unlimited number of shares authorized, par value $0.01) | | | 36,757,424 | | | | 2,037,167 | | | | 9,190,105 | |
| Net asset value, offering price and redemption price per share (Note 2) | | $ | 14.15 | | | $ | 18.88 | | | $ | 19.90 | |
See accompanying notes to financial statements.
| CHARTWELL FUNDS |
| STATEMENTS OF ASSETS AND LIABILITIES |
| December 31, 2021 (Continued) |
| | | Chartwell | | | Chartwell | | | Chartwell | |
| | | Short Duration | | | Small Cap | | | Short Duration | |
| | | High Yield Fund | | | Growth Fund | | | Bond Fund | |
| ASSETS | | | | | | | | | | | | |
| Investments at cost | | $ | 204,502,094 | | | $ | 19,794,493 | | | $ | 5,931,868 | |
| Investments at value (Notes 2 and 7) | | $ | 206,771,543 | | | $ | 28,352,692 | | | $ | 5,900,792 | |
| Cash (Note 2) | | | 5,000,000 | | | | — | | | | 30 | |
| Receivable for capital shares sold | | | 2,838,829 | | | | — | | | | — | |
| Dividends and interest receivable | | | 2,350,938 | | | | 5,115 | | | | 28,101 | |
| Receivable from Advisor (Note 3) | | | — | | | | — | | | | 42,011 | |
| Other assets | | | 18,725 | | | | 11,026 | | | | 1,342 | |
| TOTAL ASSETS | | | 216,980,035 | | | | 28,368,833 | | | | 5,972,276 | |
| | | | | | | | | | | | | |
| LIABILITIES | | | | | | | | | | | | |
| Payable for capital shares redeemed | | | 21 | | | | 1,481 | | | | — | |
| Payable to Advisor (Note 3) | | | 52,142 | | | | 4,715 | | | | — | |
| Payable to administrator (Note 3) | | | 10,200 | | | | 4,000 | | | | 3,200 | |
| Accrued Trustees’ fees (Note 3) | | | 6,150 | | | | 6,150 | | | | 6,150 | |
| Other accrued expenses | | | 32,023 | | | | 22,835 | | | | 14,900 | |
| TOTAL LIABILITIES | | | 100,536 | | | | 39,181 | | | | 24,250 | |
| | | | | | | | | | | | | |
| NET ASSETS | | $ | 216,879,499 | | | $ | 28,329,652 | | | $ | 5,948,026 | |
| | | | | | | | | | | | | |
| NET ASSETS CONSIST OF: | | | | | | | | | | | | |
| Paid-in capital | | $ | 215,058,071 | | | $ | 19,226,460 | | | $ | 5,977,726 | |
| Accumulated earnings (deficit) | | | 1,821,428 | | | | 9,103,192 | | | | (29,700 | ) |
| NET ASSETS | | $ | 216,879,499 | | | $ | 28,329,652 | | | $ | 5,948,026 | |
| Shares of beneficial interest outstanding (unlimited number of shares authorized, par value $0.01) | | | 22,238,653 | | | | 1,731,701 | | | | 597,990 | |
| Net asset value, offering price and redemption price per share (Note 2) | | $ | 9.75 | | | $ | 16.36 | | | $ | 9.95 | |
See accompanying notes to financial statements.
| CHARTWELL FUNDS |
| STATEMENTS OF OPERATIONS |
| For the Year Ended December 31, 2021 |
| | | | | | Chartwell | | | Chartwell | |
| | | Chartwell | | | Mid Cap | | | Small Cap | |
| | | Income Fund | | | Value Fund | | | Value Fund | |
| INVESTMENT INCOME | | | | | | | | | | | | |
| Dividends | | $ | 4,017,363 | | | $ | 531,181 | | | $ | 3,063,929 | |
| Foreign withholding taxes on dividends | | | (7,804 | ) | | | — | | | | — | |
| Interest | | | 12,296,133 | | | | — | | | | — | |
| TOTAL INVESTMENT INCOME | | | 16,305,692 | | | | 531,181 | | | | 3,063,929 | |
| | | | | | | | | | | | | |
| EXPENSES | | | | | | | | | | | | |
| Investment advisory fees (Note 3) | | | 2,671,604 | | | | 251,650 | | | | 1,834,350 | |
| Transfer agent fees (Note 3) | | | 335,061 | | | | 22,373 | | | �� | 175,857 | |
| Fund administration fees (Note 3) | | | 251,981 | | | | 51,824 | | | | 119,912 | |
| Registration and filing fees | | | 42,671 | | | | 30,749 | | | | 32,835 | |
| Postage and supplies | | | 55,866 | | | | 7,127 | | | | 37,014 | |
| Custodian and bank service fees | | | 59,793 | | | | 6,945 | | | | 27,499 | |
| Trustees’ fees and expenses (Note 3) | | | 29,790 | | | | 29,098 | | | | 29,333 | |
| Insurance fees | | | 59,302 | | | | 2,824 | | | | 24,805 | |
| Legal fees | | | 52,963 | | | | 3,318 | | | | 20,582 | |
| Audit and tax services fees | | | 20,560 | | | | 17,060 | | | | 17,060 | |
| Printing of shareholder reports | | | 20,152 | | | | 5,248 | | | | 8,455 | |
| Other expenses | | | 42,806 | | | | 5,894 | | | | 9,919 | |
| TOTAL EXPENSES | | | 3,642,549 | | | | 434,110 | | | | 2,337,621 | |
| Less fee reductions by the Advisor (Note 3) | | | (237,212 | ) | | | (132,407 | ) | | | (199,214 | ) |
| NET EXPENSES | | | 3,405,337 | | | | 301,703 | | | | 2,138,407 | |
| | | | | | | | | | | | | |
| NET INVESTMENT INCOME | | | 12,900,355 | | | | 229,478 | | | | 925,522 | |
| | | | | | | | | | | | | |
| REALIZED AND UNREALIZED GAINS ON INVESTMENTS | | | | | | | | | | | | |
| Net realized gains on investment transactions | | | 15,389,586 | | | | 1,326,556 | | | | 20,542,553 | |
| Net change in unrealized appreciation (depreciation) on investments | | | 9,800,076 | | | | 6,496,125 | | | | 21,138,138 | |
| NET REALIZED AND UNREALIZED GAINS ON INVESTMENTS | | | 25,189,662 | | | | 7,822,681 | | | | 41,680,691 | |
| | | | | | | | | | | | | |
| NET INCREASE IN NET ASSETS RESULTING FROM OPERATIONS | | $ | 38,090,017 | | | $ | 8,052,159 | | | $ | 42,606,213 | |
See accompanying notes to financial statements.
| CHARTWELL FUNDS |
| STATEMENTS OF OPERATIONS |
| For the Year Ended December 31, 2021(a) (Continued) |
| | | Chartwell | | | Chartwell | | | Chartwell | |
| | | Short Duration | | | Small Cap | | | Short Duration | |
| | | High Yield Fund | | | Growth Fund | | | Bond Fund | |
| INVESTMENT INCOME | | | | | | | | | | | | |
| Dividends | | $ | 92 | | | $ | 51,629 | | | $ | 27 | |
| Foreign withholding taxes on dividends | | | — | | | | (10 | ) | | | — | |
| Interest | | | 6,144,714 | | | | — | | | | 12,643 | |
| TOTAL INVESTMENT INCOME | | | 6,144,806 | | | | 51,619 | | | | 12,670 | |
| | | | | | | | | | | | | |
| EXPENSES | | | | | | | | | | | | |
| Investment advisory fees (Note 3) | | | 751,800 | | | | 256,267 | | | | 4,417 | |
| Fund administration fees (Note 3) | | | 113,698 | | | | 50,469 | | | | 13,219 | |
| Registration and filing fees | | | 48,046 | | | | 30,662 | | | | 4,870 | |
| Transfer agent fees (Note 3) | | | 30,322 | | | | 33,072 | | | | 4,013 | |
| Trustees’ fees and expenses (Note 3) | | | 29,321 | | | | 29,093 | | | | 6,155 | |
| Audit and tax services fees | | | 19,560 | | | | 17,060 | | | | 11,550 | |
| Custodian and bank service fees | | | 22,490 | | | | 8,482 | | | | 2,233 | |
| Legal fees | | | 18,528 | | | | 2,858 | | | | 158 | |
| Insurance fees | | | 14,739 | | | | 2,447 | | | | — | |
| Postage and supplies | | | 8,574 | | | | 6,970 | | | | 547 | |
| Printing of shareholder reports | | | 5,693 | | | | 5,293 | | | | 1,360 | |
| Other expenses | | | 15,310 | | | | 7,320 | | | | 3,711 | |
| TOTAL EXPENSES | | | 1,078,081 | | | | 449,993 | | | | 52,233 | |
| Less fee reductions by the Advisor (Note 3) | | | (162,566 | ) | | | (133,401 | ) | | | (46,428 | ) |
| NET EXPENSES | | | 915,515 | | | | 316,592 | | | | 5,805 | |
| | | | | | | | | | | | | |
| NET INVESTMENT INCOME (LOSS) | | | 5,229,291 | | | | (264,973 | ) | | | 6,865 | |
| | | | | | | | | | | | | |
| REALIZED AND UNREALIZED GAINS (LOSSES) ON INVESTMENTS | | | | | | | | | | | | |
| Net realized gains on investment transactions | | | 991,177 | | | | 4,455,760 | | | | 2,237 | |
| Net change in unrealized appreciation (depreciation) on investments | | | (1,816,378 | ) | | | 209,882 | | | | (31,076 | ) |
| NET REALIZED AND UNREALIZED GAINS (LOSSES) ON INVESTMENTS | | | (825,201 | ) | | | 4,665,642 | | | | (28,839 | ) |
| | | | | | | | | | | | | |
| NET INCREASE (DECREASE) IN NET ASSETS RESULTING FROM OPERATIONS | | $ | 4,404,090 | | | $ | 4,400,669 | | | $ | (21,974 | ) |
| (a) | Except for Chartwell Short Duration Bond Fund, which represents the period from the commencement of operations (September 22, 2021) through December 31, 2021. |
See accompanying notes to financial statements.
| CHARTWELL INCOME FUND |
| STATEMENTS OF CHANGES IN NET ASSETS |
| | | Year | | | Two Months | | | Year | |
| | | Ended | | | Ended | | | Ended | |
| | | December 31, | | | December 31, | | | October 31, | |
| | | 2021 | | | 2020 (a) | | | 2020 | |
| FROM OPERATIONS | | | | | | | | | | | | |
| Net investment income | | $ | 12,900,355 | | | $ | 2,801,681 | | | $ | 23,231,545 | |
| Net realized gains (losses) from investment transactions | | | 15,389,586 | | | | 2,001,473 | | | | (15,945,872 | ) |
| Net change in unrealized appreciation (depreciation) on investments | | | 9,800,076 | | | | 33,530,783 | | | | (30,558,528 | ) |
| Net increase (decrease) in net assets resulting from operations | | | 38,090,017 | | | | 38,333,937 | | | | (23,272,855 | ) |
| | | | | | | | | | | | | |
| DISTRIBUTIONS TO SHAREHOLDERS (Notes 2 and 4) | | | (13,869,991 | ) | | | (2,998,883 | ) | | | (24,453,130 | ) |
| | | | | | | | | | | | | |
| FROM CAPITAL SHARE TRANSACTIONS | | | | | | | | | | | | |
| Proceeds from shares sold | | | 48,745,042 | | | | 3,384,672 | | | | 44,119,470 | |
| Reinvestment of distributions to shareholders | | | 13,296,681 | | | | 2,881,713 | | | | 23,616,932 | |
| Proceeds from redemption fees collected (Note 2) | | | 8 | | | | 103 | | | | 4,961 | |
| Payments for shares redeemed | | | (122,935,011 | ) | | | (52,776,393 | ) | | | (482,238,215 | ) |
| Net decrease in net assets from capital share transactions | | | (60,893,280 | ) | | | (46,509,905 | ) | | | (414,496,852 | ) |
| | | | | | | | | | | | | |
| TOTAL DECREASE IN NET ASSETS | | | (36,673,254 | ) | | | (11,174,851 | ) | | | (462,222,837 | ) |
| | | | | | | | | | | | | |
| NET ASSETS | | | | | | | | | | | | |
| Beginning of period | | | 556,849,938 | | | | 568,024,789 | | | | 1,030,247,626 | |
| End of period | | $ | 520,176,684 | | | $ | 556,849,938 | | | $ | 568,024,789 | |
| | | | | | | | | | | | | |
| SUMMARY OF CAPITAL SHARE ACTIVITY | | | | | | | | | | | | |
| Shares sold | | | 3,484,616 | | | | 253,990 | | | | 3,410,553 | |
| Shares issued in reinvestment of distributions to shareholders | | | 951,621 | | | | 214,711 | | | | 1,859,248 | |
| Shares redeemed | | | (8,843,113 | ) | | | (3,960,115 | ) | | | (38,300,799 | ) |
| Net decrease in shares outstanding | | | (4,406,876 | ) | | | (3,491,414 | ) | | | (33,030,998 | ) |
| Shares outstanding, beginning of period | | | 41,164,300 | | | | 44,655,714 | | | | 77,686,712 | |
| Shares outstanding, end of period | | | 36,757,424 | | | | 41,164,300 | | | | 44,655,714 | |
| (a) | Fund changed fiscal year to December 31. |
See accompanying notes to financial statements.
| CHARTWELL MID CAP VALUE FUND |
| STATEMENTS OF CHANGES IN NET ASSETS |
| | | Year | | | Two Months | | | Year | |
| | | Ended | | | Ended | | | Ended | |
| | | December 31, | | | December 31, | | | October 31, | |
| | | 2021 | | | 2020 (a) | | | 2020 | |
| FROM OPERATIONS | | | | | | | | | | | | |
| Net investment income | | $ | 229,478 | | | $ | 57,071 | | | $ | 332,284 | |
| Net realized gains (losses) from investment transactions | | | 1,326,556 | | | | 50,260 | | | | (1,478,100 | ) |
| Net change in unrealized appreciation (depreciation) on investments | | | 6,496,125 | | | | 3,599,023 | | | | (1,900,580 | ) |
| Net increase (decrease) in net assets resulting from operations | | | 8,052,159 | | | | 3,706,354 | | | | (3,046,396 | ) |
| | | | | | | | | | | | | |
| DISTRIBUTIONS TO SHAREHOLDERS (Notes 2 and 4) | | | (230,069 | ) | | | (317,350 | ) | | | (502,601 | ) |
| | | | | | | | | | | | | |
| FROM CAPITAL SHARE TRANSACTIONS | | | | | | | | | | | | |
| Proceeds from shares sold | | | 8,127,832 | | | | 699,681 | | | | 10,310,948 | |
| Reinvestment of distributions to shareholders | | | 230,005 | | | | 316,970 | | | | 501,860 | |
| Payments for shares redeemed | | | (6,253,256 | ) | | | (616,962 | ) | | | (8,215,753 | ) |
| Net increase in net assets from capital share transactions | | | 2,104,581 | | | | 399,689 | | | | 2,597,055 | |
| | | | | | | | | | | | | |
| TOTAL INCREASE (DECREASE) IN NET ASSETS | | | 9,926,671 | | | | 3,788,693 | | | | (951,942 | ) |
| | | | | | | | | | | | | |
| NET ASSETS | | | | | | | | | | | | |
| Beginning of period | | | 28,540,283 | | | | 24,751,590 | | | | 25,703,532 | |
| End of period | | $ | 38,466,954 | | | $ | 28,540,283 | | | $ | 24,751,590 | |
| | | | | | | | | | | | | |
| SUMMARY OF CAPITAL SHARE ACTIVITY | | | | | | | | | | | | |
| Shares sold | | | 483,270 | | | | 48,041 | | | | 799,048 | |
| Shares issued in reinvestment of distributions to shareholders | | | 12,202 | | | | 21,417 | | | | 32,150 | |
| Shares redeemed | | | (371,696 | ) | | | (42,479 | ) | | | (599,199 | ) |
| Net increase in shares outstanding | | | 123,776 | | | | 26,979 | | | | 231,999 | |
| Shares outstanding, beginning of period | | | 1,913,391 | | | | 1,886,412 | | | | 1,654,413 | |
| Shares outstanding, end of period | | | 2,037,167 | | | | 1,913,391 | | | | 1,886,412 | |
| (a) | Fund changed fiscal year to December 31. |
See accompanying notes to financial statements.
| CHARTWELL SMALL CAP VALUE FUND |
| STATEMENTS OF CHANGES IN NET ASSETS |
| | | Year | | | Two Months | | | Year | |
| | | Ended | | | Ended | | | Ended | |
| | | December 31, | | | December 31, | | | October 31, | |
| | | 2021 | | | 2020 (a) | | | 2020 | |
| FROM OPERATIONS | | | | | | | | | | | | |
| Net investment income | | $ | 925,522 | | | $ | 375,393 | | | $ | 1,278,407 | |
| Net realized gains (losses) from investment transactions | | | 20,542,553 | | | | 20,290 | | | | (364,523 | ) |
| Net change in unrealized appreciation (depreciation) on investments | | | 21,138,138 | | | | 30,917,386 | | | | (34,328,452 | ) |
| Net increase (decrease) in net assets resulting from operations | | | 42,606,213 | | | | 31,313,069 | | | | (33,414,568 | ) |
| | | | | | | | | | | | | |
| DISTRIBUTIONS TO SHAREHOLDERS (Notes 2 and 4) | | | (17,883,886 | ) | | | (1,302,071 | ) | | | (6,288,627 | ) |
| | | | | | | | | | | | | |
| FROM CAPITAL SHARE TRANSACTIONS | | | | | | | | | | | | |
| Proceeds from shares sold | | | 58,182,681 | | | | 5,292,192 | | | | 55,427,208 | |
| Reinvestment of distributions to shareholders | | | 14,906,386 | | | | 990,888 | | | | 4,682,565 | |
| Proceeds from redemption fees collected (Note 2) | | | 1,382 | | | | — | | | | 26 | |
| Payments for shares redeemed | | | (92,278,453 | ) | | | (7,029,501 | ) | | | (45,089,775 | ) |
| Net increase (decrease) in net assets from capital share transactions | | | (19,188,004 | ) | | | (746,421 | ) | | | 15,020,024 | |
| | | | | | | | | | | | | |
| TOTAL INCREASE (DECREASE) IN NET ASSETS | | | 5,534,323 | | | | 29,264,577 | | | | (24,683,171 | ) |
| | | | | | | | | | | | | |
| NET ASSETS | | | | | | | | | | | | |
| Beginning of period | | | 177,333,926 | | | | 148,069,349 | | | | 172,752,520 | |
| End of period | | $ | 182,868,249 | | | $ | 177,333,926 | | | $ | 148,069,349 | |
| | | | | | | | | | | | | |
| SUMMARY OF CAPITAL SHARE ACTIVITY | | | | | | | | | | | | |
| Shares sold | | | 2,861,036 | | | | 306,000 | | | | 3,610,972 | |
| Shares issued in reinvestment of distributions to shareholders | | | 771,189 | | | | 56,109 | | | | 247,624 | |
| Shares redeemed | | | (4,431,550 | ) | | | (411,968 | ) | | | (3,073,144 | ) |
| Net increase (decrease) in shares outstanding | | | (799,325 | ) | | | (49,859 | ) | | | 785,452 | |
| Shares outstanding, beginning of period | | | 9,989,430 | | | | 10,039,289 | | | | 9,253,837 | |
| Shares outstanding, end of period | | | 9,190,105 | | | | 9,989,430 | | | | 10,039,289 | |
| (a) | Fund changed fiscal year to December 31. |
See accompanying notes to financial statements.
| CHARTWELL SHORT DURATION HIGH YIELD FUND |
| STATEMENTS OF CHANGES IN NET ASSETS |
| | | Year | | | Two Months | | | Year | |
| | | Ended | | | Ended | | | Ended | |
| | | December 31, | | | December 31, | | | October 31, | |
| | | 2021 | | | 2020 (a) | | | 2020 | |
| FROM OPERATIONS | | | | | | | | | | | | |
| Net investment income | | $ | 5,229,291 | | | $ | 848,309 | | | $ | 4,054,665 | |
| Net realized gains (losses) from investment transactions | | | 991,177 | | | | (1,116,488 | ) | | | 268,007 | |
| Net change in unrealized appreciation (depreciation) on investments | | | (1,816,378 | ) | | | 4,543,697 | | | | (1,050,130 | ) |
| Net increase in net assets resulting from operations | | | 4,404,090 | | | | 4,275,518 | | | | 3,272,542 | |
| | | | | | | | | | | | | |
| DISTRIBUTIONS TO SHAREHOLDERS (Notes 2 and 4) | | | (5,242,419 | ) | | | (863,004 | ) | | | (4,083,761 | ) |
| | | | | | | | | | | | | |
| FROM CAPITAL SHARE TRANSACTIONS | | | | | | | | | | | | |
| Proceeds from shares sold | | | 68,978,150 | | | | 2,625,951 | | | | 77,512,641 | |
| Reinvestment of distributions to shareholders | | | 5,174,743 | | | | 850,191 | | | | 4,009,862 | |
| Proceeds from redemption fees collected (Note 2) | | | — | | | | — | | | | 13 | |
| Payments for shares redeemed | | | (20,138,478 | ) | | | (4,659,702 | ) | | | (11,151,261 | ) |
| Net increase (decrease) in net assets from capital share transactions | | | 54,014,415 | | | | (1,183,560 | ) | | | 70,371,255 | |
| | | | | | | | | | | | | |
| TOTAL INCREASE IN NET ASSETS | | | 53,176,086 | | | | 2,228,954 | | | | 69,560,036 | |
| | | | | | | | | | | | | |
| NET ASSETS | | | | | | | | | | | | |
| Beginning of period | | | 163,703,413 | | | | 161,474,459 | | | | 91,914,423 | |
| End of period | | $ | 216,879,499 | | | $ | 163,703,413 | | | $ | 161,474,459 | |
| | | | | | | | | | | | | |
| SUMMARY OF CAPITAL SHARE ACTIVITY | | | | | | | | | | | | |
| Shares sold | | | 7,052,800 | | | | 269,518 | | | | 8,088,395 | |
| Shares issued in reinvestment of distributions to shareholders | | | 529,407 | | | | 87,084 | | | | 420,426 | |
| Shares redeemed | | | (2,056,927 | ) | | | (479,111 | ) | | | (1,172,529 | ) |
| Net increase (decrease) in shares outstanding | | | 5,525,280 | | | | (122,509 | ) | | | 7,336,292 | |
| Shares outstanding, beginning of period | | | 16,713,373 | | | | 16,835,882 | | | | 9,499,590 | |
| Shares outstanding, end of period | | | 22,238,653 | | | | 16,713,373 | | | | 16,835,882 | |
| (a) | Fund changed fiscal year to December 31. |
See accompanying notes to financial statements.
| CHARTWELL SMALL CAP GROWTH FUND |
| STATEMENTS OF CHANGES IN NET ASSETS |
| | | Year | | | Two Months | | | Year | |
| | | Ended | | | Ended | | | Ended | |
| | | December 31, | | | December 31, | | | October 31, | |
| | | 2021 | | | 2020 (a) | | | 2020 | |
| FROM OPERATIONS | | | | | | | | | | | | |
| Net investment loss | | $ | (264,973 | ) | | $ | (24,809 | ) | | $ | (116,534 | ) |
| Net realized gains from investment transactions | | | 4,455,760 | | | | 1,752,724 | | | | 1,924,380 | |
| Net change in unrealized appreciation (depreciation) on investments | | | 209,882 | | | | 3,097,219 | | | | 3,495,156 | |
| Net increase in net assets resulting from operations | | | 4,400,669 | | | | 4,825,134 | | | | 5,303,002 | |
| | | | | | | | | | | | | |
| DISTRIBUTIONS TO SHAREHOLDERS (Notes 2 and 4) | | | (5,275,367 | ) | | | (1,724,473 | ) | | | (7,527 | ) |
| | | | | | | | | | | | | |
| FROM CAPITAL SHARE TRANSACTIONS | | | | | | | | | | | | |
| Proceeds from shares sold | | | 3,358,720 | | | | 67,266 | | | | 647,299 | |
| Reinvestment of distributions to shareholders | | | 5,255,275 | | | | 1,724,473 | | | | 7,527 | |
| Proceeds from redemption fees collected (Note 2) | | | — | | | | — | | | | 16 | |
| Payments for shares redeemed | | | (6,845,290 | ) | | | (264,845 | ) | | | (3,778,852 | ) |
| Net increase (decrease) in net assets from capital share transactions | | | 1,768,705 | | | | 1,526,894 | | | | (3,124,010 | ) |
| | | | | | | | | | | | | |
| TOTAL INCREASE IN NET ASSETS | | | 894,007 | | | | 4,627,555 | | | | 2,171,465 | |
| | | | | | | | | | | | | |
| NET ASSETS | | | | | | | | | | | | |
| Beginning of period | | | 27,435,645 | | | | 22,808,090 | | | | 20,636,625 | |
| End of period | | $ | 28,329,652 | | | $ | 27,435,645 | | | $ | 22,808,090 | |
| | | | | | | | | | | | | |
| SUMMARY OF CAPITAL SHARE ACTIVITY | | | | | | | | | | | | |
| Shares sold | | | 170,918 | | | | 3,998 | | | | 52,256 | |
| Shares issued in reinvestment of distributions to shareholders | | | 340,968 | | | | 99,565 | | | | 584 | |
| Shares redeemed | | | (367,240 | ) | | | (15,422 | ) | | | (306,323 | ) |
| Net increase (decrease) in shares outstanding | | | 144,646 | | | | 88,141 | | | | (253,483 | ) |
| Shares outstanding, beginning of period | | | 1,587,055 | | | | 1,498,914 | | | | 1,752,397 | |
| Shares outstanding, end of period | | | 1,731,701 | | | | 1,587,055 | | | | 1,498,914 | |
| (a) | Fund changed fiscal year to December 31. |
See accompanying notes to financial statements.
| CHARTWELL SHORT DURATION BOND FUND |
| STATEMENT OF CHANGES IN NET ASSETS |
| | | Period | |
| | | Ended | |
| | | December 31, | |
| | | 2021 (a) | |
| FROM OPERATIONS | | | | |
| Net investment income | | $ | 6,865 | |
| Net realized gains from investment transactions | | | 2,237 | |
| Net change in unrealized appreciation (depreciation) on investments | | | (31,076 | ) |
| Net decrease in net assets resulting from operations | | | (21,974 | ) |
| | | | | |
| DISTRIBUTIONS TO SHAREHOLDERS (Notes 2 and 4) | | | (7,726 | ) |
| | | | | |
| FROM CAPITAL SHARE TRANSACTIONS | | | | |
| Proceeds from shares sold | | | 5,970,000 | |
| Reinvestment of distributions to shareholders | | | 7,726 | |
| Net increase in net assets from capital share transactions | | | 5,977,726 | |
| | | | | |
| TOTAL INCREASE IN NET ASSETS | | | 5,948,026 | |
| | | | | |
| NET ASSETS | | | | |
| Beginning of period | | | — | |
| End of period | | $ | 5,948,026 | |
| | | | | |
| SUMMARY OF CAPITAL SHARE ACTIVITY | | | | |
| Shares sold | | | 597,213 | |
| Shares issued in reinvestment of distributions to shareholders | | | 777 | |
| Net increase in shares outstanding | | | 597,990 | |
| Shares outstanding, beginning of period | | | — | |
| Shares outstanding, end of period | | | 597,990 | |
| (a) | Represents the period from the commencement of operations (September 22, 2021) through December 31, 2021. |
See accompanying notes to financial statements.
| CHARTWELL INCOME FUND |
| FINANCIAL HIGHLIGHTS |
Per Share Data for a Share Outstanding Throughout Each Period
| | | Year | | | Two Months | | | Year | |
| | | Ended | | | Ended | | | Ended | |
| | | December 31, | | | December 31, | | | October 31, | |
| | | 2021 | | | 2020(a) | | | 2020 | |
| Net asset value at beginning of period | | $ | 13.53 | | | $ | 12.72 | | | $ | 13.26 | |
| Income (loss) from investment operations: | | | | | | | | | | | | |
| Net investment income | | | 0.34 | | | | 0.07 | | | | 0.40 | |
| Net realized and unrealized gains (losses) on investment transactions | | | 0.65 | | | | 0.81 | | | | (0.52 | ) |
| Total from investment operations | | | 0.99 | | | | 0.88 | | | | (0.12 | ) |
| Less distributions from: | | | | | | | | | | | | |
| Net investment income | | | (0.37 | ) | | | (0.07 | ) | | | (0.42 | ) |
| Proceeds from redemption fees collected (Note 2) | | | 0.00 | (b) | | | 0.00 | (b) | | | 0.00 | (b) |
| Net asset value at end of period | | $ | 14.15 | | | $ | 13.53 | | | $ | 12.72 | |
| Total return (c) | | | 7.35 | % | | | 6.93 | % (d) | | | (0.83 | %) |
| Ratios/Supplementary data: | | | | | | | | | | | | |
| Net assets at end of period (000,000’s) | | $ | 520 | | | $ | 557 | | | $ | 568 | |
| Ratio of total expenses to average net assets: | | | | | | | | | | | | |
| Before fees reduced | | | 0.68 | % | | | 0.73 | % (e) | | | 0.67 | % |
| After fees reduced | | | 0.64 | % | | | 0.64 | % (e) | | | 0.64 | % |
| Ratio of net investment income to average net assets: | | | | | | | | | | | | |
| Before fees reduced | | | 2.37 | % | | | 2.84 | % (e) | | | 3.04 | % |
| After fees reduced | | | 2.41 | % | | | 2.93 | % (e) | | | 3.08 | % |
| Portfolio turnover rate | | | 56 | % | | | 7 | % (d) | | | 63 | % |
| (a) | Fund changed fiscal year to December 31. |
| (b) | Amount rounds to less than $0.01 per share. |
| (c) | Total return is a measure of the change in value of an investment in the Fund over the periods covered, which assumes any dividends or capital gains distributions are reinvested in shares of the Fund. The returns shown do not reflect the deduction of taxes a shareholder would pay on Fund distributions or the redemption of Fund shares. The total returns would have been lower if the Advisor had not reduced advisory fees and reimbursed expenses. |
See accompanying notes to financial statements.
| CHARTWELL INCOME FUND |
| FINANCIAL HIGHLIGHTS (Continued) |
Per Share Data for a Share Outstanding Throughout Each Year
| | | Year | | | Year | | | Year | |
| | | Ended | | | Ended | | | Ended | |
| | | October 31, | | | October 31, | | | October 31, | |
| | | 2019 | | | 2018 | | | 2017 | |
| Net asset value at beginning of year | | $ | 13.18 | | | $ | 13.80 | | | $ | 13.64 | |
| Income (loss) from investment operations: | | | | | | | | | | | | |
| Net investment income | | | 0.41 | | | | 0.31 | | | | 0.24 | (a) |
| Net realized and unrealized gains (losses) on affiliated and unaffiliated investments | | | 0.50 | | | | (0.19 | ) | | | 0.29 | |
| Total from investment operations | | | 0.91 | | | | 0.12 | | | | 0.53 | |
| Less distributions from: | | | | | | | | | | | | |
| Net investment income | | | (0.44 | ) | | | (0.30 | ) | | | (0.22 | ) |
| Net realized gains on investments | | | (0.39 | ) | | | (0.44 | ) | | | (0.15 | ) |
| Total distributions | | | (0.83 | ) | | | (0.74 | ) | | | (0.37 | ) |
| Proceeds from redemption fees collected (Note 2) | | | 0.00 | (b) | | | 0.00 | (b) | | | 0.00 | (b) |
| Net asset value at end of year | | $ | 13.26 | | | $ | 13.18 | | | $ | 13.80 | |
| Total return (c) | | | 7.22 | % | | | 0.88 | % | | | 3.98 | % |
| Ratios/Supplementary data: | | | | | | | | | | | | |
| Net assets at end of year (000,000’s) | | $ | 1,030 | | | $ | 1,490 | | | $ | 1,672 | |
| Ratio of total expenses to average net assets: | | | | | | | | | | | | |
| Before fees reduced | | | 0.66 | % | | | 0.68 | % | | | 0.67 | % |
| After fees reduced | | | 0.64 | % | | | 0.64 | % | | | 0.64 | % |
| Ratio of net investment income to average net assets: | | | | | | | | | | | | |
| Before fees reduced | | | 2.93 | % | | | 2.26 | % | | | 1.75 | % |
| After fees reduced | | | 2.95 | % | | | 2.29 | % | | | 1.78 | % |
| Portfolio turnover rate | | | 137 | % | | | 75 | % | | | 69 | % |
| (a) | Based on average daily shares outstanding. |
| (b) | Amount rounds to less than $0.01 per share. |
| (c) | Total return is a measure of the change in value of an investment in the Fund over the periods covered, which assumes any dividends or capital gains distributions are reinvested in shares of the Fund. The returns shown do not reflect the deduction of taxes a shareholder would pay on Fund distributions or the redemption of Fund shares. The total returns would have been lower if the Advisor had not reduced advisory fees and reimbursed expenses. |
See accompanying notes to financial statements.
| CHARTWELL MID CAP VALUE FUND |
| FINANCIAL HIGHLIGHTS |
Per Share Data for a Share Outstanding Throughout Each Period
| | | Year | | | Two Months | | | Year | |
| | | Ended | | | Ended | | | Ended | |
| | | December 31, | | | December 31, | | | October 31, | |
| | | 2021 | | | 2020(a) | | | 2020 | |
| Net asset value at beginning of period | | $ | 14.92 | | | $ | 13.12 | | | $ | 15.54 | |
| Income (loss) from investment operations: | | | | | | | | | | | | |
| Net investment income | | | 0.11 | | | | 0.03 | | | | 0.19 | |
| Net realized and unrealized gains (losses) on investment transactions | | | 3.96 | | | | 1.94 | | | | (2.28 | ) |
| Total from investment operations | | | 4.07 | | | | 1.97 | | | | (2.09 | ) |
| Less distributions from: | | | | | | | | | | | | |
| Net investment income | | | (0.11 | ) | | | (0.17 | ) | | | (0.18 | ) |
| Net realized gains on investments | | | — | | | | — | | | | (0.15 | ) |
| Total distributions | | | (0.11 | ) | | | (0.17 | ) | | | (0.33 | ) |
| Net asset value at end of period | | $ | 18.88 | | | $ | 14.92 | | | $ | 13.12 | |
| Total return (b) | | | 27.30 | % | | | 15.00 | % (c) | | | (13.81 | %) |
| Ratios/Supplementary data: | | | | | | | | | | | | |
| Net assets at end of period (000’s) | | $ | 38,467 | | | $ | 28,540 | | | $ | 24,752 | |
| Ratio of total expenses to average net assets: | | | | | | | | | | | | |
| Before fees reduced | | | 1.29 | % | | | 1.56 | % (d) | | | 1.47 | % |
| After fees reduced | | | 0.90 | % | | | 0.90 | % (d) | | | 0.90 | % |
| Ratio of net investment income to average net assets: | | | | | | | | | | | | |
| Before fees reduced | | | 0.29 | % | | | 0.59 | % (d) | | | 0.84 | % |
| After fees reduced | | | 0.68 | % | | | 1.25 | % (d) | | | 1.40 | % |
| Portfolio turnover rate | | | 15 | % | | | 3 | % (c) | | | 35 | % |
| (a) | Fund changed fiscal year to December 31. |
| (b) | Total return is a measure of the change in value of an investment in the Fund over the period covered, which assumes any dividends or capital gains distributions are reinvested in shares of the Fund. The returns shown do not reflect the deduction of taxes a shareholder would pay on Fund distributions or the redemption of Fund shares. The total returns would have been lower had the Advisor not reduced its fees or reimbursed expenses. |
See accompanying notes to financial statements.
| CHARTWELL MID CAP VALUE FUND |
| FINANCIAL HIGHLIGHTS (Continued) |
Per Share Data for a Share Outstanding Throughout Each Year
| | | Year | | | Year | | | Year | |
| | | Ended | | | Ended | | | Ended | |
| | | October 31, | | | October 31, | | | October 31, | |
| | | 2019 | | | 2018 | | | 2017 | |
| Net asset value at beginning of year | | $ | 15.07 | | | $ | 18.55 | | | $ | 15.46 | |
| Income from investment operations: | | | | | | | | | | | | |
| Net investment income | | | 0.17 | | | | 0.11 | | | | 0.16 | (a) |
| Net realized and unrealized gains on investment transactions | | | 1.34 | | | | 0.03 | | | | 3.48 | |
| Total from investment operations | | | 1.51 | | | | 0.14 | | | | 3.64 | |
| Less distributions from: | | | | | | | | | | | | |
| Net investment income | | | (0.11 | ) | | | (0.14 | ) | | | (0.25 | ) |
| Net realized gains on investments | | | (0.93 | ) | | | (3.48 | ) | | | (0.30 | ) |
| Total distributions | | | (1.04 | ) | | | (3.62 | ) | | | (0.55 | ) |
| Proceeds from redemption fees collected (Note 2) | | | — | | | | — | | | | 0.00 | (b) |
| Net asset value at end of year | | $ | 15.54 | | | $ | 15.07 | | | $ | 18.55 | |
| Total return (c) | | | 11.47 | % | | | (0.12 | %) | | | 23.95 | % |
| Ratios/Supplementary data: | | | | | | | | | | | | |
| Net assets at end of year (000’s) | | $ | 25,704 | | | $ | 25,322 | | | $ | 23,274 | |
| Ratio of total expenses to average net assets: | | | | | | | | | | | | |
| Before fees reduced and other expenses absorbed | | | 1.44 | % | | | 1.57 | % | | | 1.71 | % |
| After fees reduced and other expenses absorbed | | | 1.02 | % (d) | | | 1.05 | % (e) | | | 1.15 | % |
| Ratio of net investment income to average net assets: | | | | | | | | | | | | |
| Before fees reduced and other expenses absorbed | | | 0.67 | % | | | 0.26 | % | | | 0.37 | % |
| After fees reduced and other expenses absorbed | | | 1.09 | % (d) | | | 0.77 | % (e) | | | 0.93 | % |
| Portfolio turnover rate | | | 36 | % | | | 65 | % | | | 159 | % |
| (a) | Based on average daily shares outstanding. |
| (b) | Amount rounds to less than $0.01 per share. |
| (c) | Total return is a measure of the change in value of an investment in the Fund over the period covered, which assumes any dividends or capital gains distributions are reinvested in shares of the Fund. The returns shown do not reflect the deduction of taxes a shareholder would pay on Fund distributions or the redemption of Fund shares. The total returns would have been lower had the Advisor not reduced its fees or reimbursed expenses. |
| (d) | Effective September 1, 2019, the Advisor contractually agreed to reduce its fees and/or reimburse other operating expenses of the Fund to ensure that total annual operating expenses do not exceed 0.90% of the average daily net assets of the Fund. Prior to September 1, 2019, the annual operating expense limitation was 1.05% (Note 3). |
| (e) | Effective November 6, 2017, the Advisor contractually agreed to reduce its fees and/or reimburse other operating expenses of the Fund to ensure that total annual operating expenses do not exceed 1.05% of the average daily net assets of the Fund. Prior to November 6, 2017, the annual operating expense limitation was 1.15%. |
See accompanying notes to financial statements.
| CHARTWELL SMALL CAP VALUE FUND |
| FINANCIAL HIGHLIGHTS |
Per Share Data for a Share Outstanding Throughout Each Period
| | | Year | | | Two Months | | | Year | |
| | | Ended | | | Ended | | | Ended | |
| | | December 31, | | | December 31, | | | October 31, | |
| | | 2021 | | | 2020(a) | | | 2020 | |
| Net asset value at beginning of period | | $ | 17.75 | | | $ | 14.75 | | | $ | 18.67 | |
| Income (loss) from investment operations: | | | | | | | | | | | | |
| Net investment income | | | 0.10 | | | | 0.04 | | | | 0.13 | |
| Net realized and unrealized gains (losses) on investment transactions | | | 4.16 | | | | 3.09 | | | | (3.37 | ) |
| Total from investment operations | | | 4.26 | | | | 3.13 | | | | (3.24 | ) |
| Less distributions from: | | | | | | | | | | | | |
| Net investment income | | | (0.10 | ) | | | (0.13 | ) | | | (0.14 | ) |
| Net realized gains on investments | | | (2.01 | ) | | | — | | | | (0.54 | ) |
| Total distributions | | | (2.11 | ) | | | (0.13 | ) | | | (0.68 | ) |
| Proceeds from redemption fees collected (Note 2) | | | 0.00 | (b) | | | — | | | | 0.00 | (b) |
| Net asset value at end of period | | $ | 19.90 | | | $ | 17.75 | | | $ | 14.75 | |
| Total return (c) | | | 24.42 | % | | | 21.23 | % (d) | | | (18.16 | %) |
| Ratios/Supplementary data: | | | | | | | | | | | | |
| Net assets at end of period (000’s) | | $ | 182,868 | | | $ | 177,334 | | | $ | 148,069 | |
| Ratio of total expenses to average net assets: | | | | | | | | | | | | |
| Before fees reduced and other expenses absorbed | | | 1.15 | % | | | 1.21 | % (e) | | | 1.18 | % |
| After fees reduced and other expenses absorbed (f) | | | 1.05 | % | | | 1.05 | % (e) | | | 1.05 | % |
| Ratio of net investment income to average net assets: | | | | | | | | | | | | |
| Before fees reduced and other expenses absorbed | | | 0.36 | % | | | 1.16 | % (e) | | | 0.68 | % |
| After fees reduced and other expenses absorbed (f) | | | 0.45 | % | | | 1.32 | % (e) | | | 0.81 | % |
| Portfolio turnover rate | | | 20 | % | | | 2 | % (d) | | | 30 | % |
| (a) | Fund changed fiscal year to December 31. |
| (b) | Amount rounds to less than $0.01 per share. |
| (c) | Total return is a measure of the change in value of an investment in the Fund over the period covered, which assumes any dividends or capital gains distributions are reinvested in shares of the Fund. The returns shown do not reflect the deduction of taxes a shareholder would pay on Fund distributions or the redemption of Fund shares. The returns would have been lower had the Advisor not reduced its fees or reimbursed expenses. |
| (f) | The Advisor has contractually agreed to reduce its fees and/or reimburse other expenses of the Fund to ensure that the total annual operating expenses do not exceed 1.05% of average daily net assets (Note 3). |
See accompanying notes to financial statements.
| CHARTWELL SMALL CAP VALUE FUND |
| FINANCIAL HIGHLIGHTS (Continued) |
Per Share Data for a Share Outstanding Throughout Each Year
| | | Year | | | Year | | | Year | |
| | | Ended | | | Ended | | | Ended | |
| | | October 31, | | | October 31, | | | October 31, | |
| | | 2019 | | | 2018 | | | 2017 | |
| Net asset value at beginning of year | | $ | 18.79 | | | $ | 20.07 | | | $ | 16.25 | |
| Income (loss) from investment operations: | | | | | | | | | | | | |
| Net investment income | | | 0.13 | | | | 0.06 | | | | 0.05 | (a) |
| Net realized and unrealized gains (losses) on investment transactions | | | 1.04 | | | | (0.45 | ) | | | 3.86 | |
| Total from investment operations | | | 1.17 | | | | (0.39 | ) | | | 3.91 | |
| Less distributions from: | | | | | | | | | | | | |
| Net investment income | | | (0.07 | ) | | | (0.05 | ) | | | (0.09 | ) |
| Net realized gains on investments | | | (1.22 | ) | | | (0.84 | ) | | | — | |
| Total distributions | | | (1.29 | ) | | | (0.89 | ) | | | (0.09 | ) |
| Proceeds from redemption fees collected (Note 2) | | | 0.00 | (b) | | | 0.00 | (b) | | | 0.00 | (b) |
| Net asset value at end of year | | $ | 18.67 | | | $ | 18.79 | | | $ | 20.07 | |
| Total return (c) | | | 7.54 | % | | | (2.18 | %) | | | 24.09 | % |
| Ratios/Supplementary data: | | | | | | | | | | | | |
| Net assets at end of year (000’s) | | $ | 172,753 | | | $ | 228,779 | | | $ | 165,538 | |
| Ratio of total expenses to average net assets: | | | | | | | | | | | | |
| Before fees reduced and other expenses absorbed | | | 1.07 | % | | | 1.08 | % | | | 1.14 | % |
| After fees reduced and other expenses absorbed (d) | | | 1.05 | % | | | 1.05 | % | | | 1.05 | % |
| Ratio of net investment income to average net assets: | | | | | | | | | | | | |
| Before fees reduced and other expenses absorbed | | | 0.67 | % | | | 0.25 | % | | | 0.18 | % |
| After fees reduced and other expenses absorbed (d) | | | 0.69 | % | | | 0.28 | % | | | 0.27 | % |
| Portfolio turnover rate | | | 30 | % | | | 19 | % | | | 39 | % |
| (a) | Based on average shares outstanding. |
| (b) | Amount rounds to less than $0.01 per share. |
| (c) | Total return is a measure of the change in value of an investment in the Fund over the period covered, which assumes any dividends or capital gains distributions are reinvested in shares of the Fund. The returns shown do not reflect the deduction of taxes a shareholder would pay on Fund distributions or the redemption of Fund shares. The returns would have been lower had the Advisor not reduced its fees or reimbursed expenses. |
| (d) | The Advisor has contractually agreed to reduce its fees and/or reimburse other expenses of the Fund to ensure that the total annual operating expenses do not exceed 1.05% of average daily net assets (Note 3). |
See accompanying notes to financial statements.
| CHARTWELL SHORT DURATION HIGH YIELD FUND |
| FINANCIAL HIGHLIGHTS |
Per Share Data for a Share Outstanding Throughout Each Period
| | | Year | | | Two Months | | | Year | |
| | | Ended | | | Ended | | | Ended | |
| | | December 31, | | | December 31, | | | October 31, | |
| | | 2021 | | | 2020(a) | | | 2020 | |
| Net asset value at beginning of period | | $ | 9.79 | | | $ | 9.59 | | | $ | 9.68 | |
| Income (loss) from investment operations: | | | | | | | | | | | | |
| Net investment income | | | 0.27 | | | | 0.05 | | | | 0.33 | |
| Net realized and unrealized gains (losses) on investment transactions | | | (0.04 | ) | | | 0.20 | | | | (0.08 | ) |
| Total from investment operations | | | 0.23 | | | | 0.25 | | | | 0.25 | |
| Less distributions from: | | | | | | | | | | | | |
| Net investment income | | | (0.27 | ) | | | (0.05 | ) | | | (0.34 | ) |
| Proceeds from redemption fees collected (Note 2) | | | — | | | | — | | | | 0.00 | (b) |
| Net asset value at end of period | | $ | 9.75 | | | $ | 9.79 | | | $ | 9.59 | |
| Total return (c) | | | 2.40 | % | | | 2.63 | % (d) | | | 2.62 | % |
| Ratios/Supplementary data: | | | | | | | | | | | | |
| Net assets at end of period (000’s) | | $ | 216,879 | | | $ | 163,703 | | | $ | 161,474 | |
| Ratio of total expenses to average net assets: | | | | | | | | | | | | |
| Before fees reduced and other expenses absorbed | | | 0.58 | % | | | 0.66 | % (e) | | | 0.61 | % |
| After fees reduced and other expenses absorbed | | | 0.49 | % | | | 0.49 | % (e) | | | 0.49 | % |
| Ratio of net investment income to average net assets: | | | | | | | | | | | | |
| Before fees reduced and other expenses absorbed | | | 2.69 | % | | | 2.96 | % (e) | | | 3.43 | % |
| After fees reduced and other expenses absorbed | | | 2.78 | % | | | 3.13 | % (e) | | | 3.55 | % |
| Portfolio turnover rate | | | 54 | % | | | 9 | % (d) | | | 63 | % |
| (a) | Fund changed fiscal year to December 31. |
| (b) | Amount rounds to less than $0.01 per share. |
| (c) | Total return is a measure of the change in value of an investment in the Fund over the period covered, which assumes any dividends or capital gains distributions are reinvested in shares of the Fund. The returns shown do not reflect the deduction of taxes a shareholder would pay on Fund distributions or the redemption of Fund shares. The returns would have been lower had the Advisor not reduced its fees or reimbursed expenses. |
See accompanying notes to financial statements.
| CHARTWELL SHORT DURATION HIGH YIELD FUND |
| FINANCIAL HIGHLIGHTS (Continued) |
Per Share Data for a Share Outstanding Throughout Each Year
| | | Year | | | Year | | | Year | |
| | | Ended | | | Ended | | | Ended | |
| | | October 31, | | | October 31, | | | October 31, | |
| | | 2019 | | | 2018 | | | 2017 | |
| Net asset value at beginning of year | | $ | 9.48 | | | $ | 9.72 | | | $ | 9.62 | |
| Income (loss) from investment operations: | | | | | | | | | | | | |
| Net investment income | | | 0.35 | | | | 0.29 | | | | 0.31 | (a) |
| Net realized and unrealized gains (losses) on investment transactions | | | 0.20 | | | | (0.24 | ) | | | 0.11 | |
| Total from investment operations | | | 0.55 | | | | 0.05 | | | | 0.42 | |
| Less distributions from: | | | | | | | | | | | | |
| Net investment income | | | (0.35 | ) | | | (0.29 | ) | | | (0.32 | ) |
| Proceeds from redemption fees collected (Note 2) | | | 0.00 | (b) | | | — | | | | — | |
| Net asset value at end of year | | $ | 9.68 | | | $ | 9.48 | | | $ | 9.72 | |
| Total return (c) | | | 5.89 | % | | | 0.55 | % | | | 4.42 | % |
| Ratios/Supplementary data: | | | | | | | | | | | | |
| Net assets at end of year (000’s) | | $ | 91,914 | | | $ | 75,536 | | | $ | 35,191 | |
| Ratio of total expenses to average net assets: | | | | | | | | | | | | |
| Before fees reduced and other expenses absorbed | | | 0.67 | % | | | 0.80 | % | | | 1.16 | % |
| After fees reduced and other expenses absorbed | | | 0.49 | % | | | 0.49 | % | | | 0.61 | % (d) |
| Ratio of net investment income to average net assets: | | | | | | | | | | | | |
| Before fees reduced and other expenses absorbed | | | 3.44 | % | | | 2.84 | % | | | 2.70 | % |
| After fees reduced and other expenses absorbed | | | 3.62 | % | | | 3.15 | % | | | 3.25 | % (d) |
| Portfolio turnover rate | | | 41 | % | | | 26 | % | | | 62 | % |
| (a) | Based on average shares outstanding. |
| (b) | Amount rounds to less than $0.01 per share. |
| (c) | Total return is a measure of the change in value of an investment in the Fund over the period covered, which assumes any dividends or capital gains distributions are reinvested in shares of the Fund. The returns shown do not reflect the deduction of taxes a shareholder would pay on Fund distributions or the redemption of Fund shares. The returns would have been lower had the Advisor not reduced its fees or reimbursed expenses. |
| (d) | Effective August 11, 2017, the Advisor contractually agreed to reduce its fees and/or absorb expenses of the Fund to ensure that the total annual operating expenses do not exceed 0.49% of average daily net assets. Prior to August 11, 2017, the annual operating expense limit was 0.65% (Note 3). |
See accompanying notes to financial statements.
| CHARTWELL SMALL CAP GROWTH FUND |
| FINANCIAL HIGHLIGHTS |
Per Share Data for a Share Outstanding Throughout Each Period
| | | Year | | | Two Months | | | Year | |
| | | Ended | | | Ended | | | Ended | |
| | | December 31, | | | December 31, | | | October 31, | |
| | | 2021 | | �� | 2020(a) | | | 2020 | |
| Net asset value at beginning of period | | $ | 17.29 | | | $ | 15.22 | | | $ | 11.78 | |
| Income (loss) from investment operations: | | | | | | | | | | | | |
| Net investment loss | | | (0.15 | ) | | | (0.01 | ) | | | (0.09 | ) |
| Net realized and unrealized gains on investment transactions | | | 2.78 | | | | 3.24 | | | | 3.53 | |
| Total from investment operations | | | 2.63 | | | | 3.23 | | | | 3.44 | |
| Less distributions from: | | | | | | | | | | | | |
| Net investment income | | | (0.01 | ) | | | — | | | | — | |
| Net realized gains on investments | | | (3.55 | ) | | | (1.16 | ) | | | (0.00 | ) (b) |
| Total distributions | | | (3.56 | ) | | | (1.16 | ) | | | (0.00 | ) (b) |
| Proceeds from redemption fees collected (Note 2) | | | — | | | | — | | | | 0.00 | (b) |
| Net asset value at end of period | | $ | 16.36 | | | $ | 17.29 | | | $ | 15.22 | |
| Total return (c) | | | 16.47 | % | | | 21.20 | % (d) | | | 29.25 | % |
| Ratios/Supplementary data: | | | | | | | | | | | | |
| Net assets at end of period (000’s) | | $ | 28,330 | | | $ | 27,436 | | | $ | 22,808 | |
| Ratio of total expenses to average net assets: | | | | | | | | | | | | |
| Before fees waived/reduced and other expenses absorbed | | | 1.47 | % | | | 1.76 | % (e) | | | 1.73 | % |
| After fees waived/reduced and other expenses absorbed | | | 1.05 | % | | | 1.05 | % (e) | | | 1.05 | % |
| Ratio of net investment loss to average net assets: | | | | | | | | | | | | |
| Before fees waived/reduced and other expenses absorbed | | | (1.30 | %) | | | (1.29 | %) (e) | | | (1.24 | %) |
| After fees waived/reduced and other expenses absorbed | | | (0.88 | %) | | | (0.58 | %) (e) | | | (0.56 | %) |
| Portfolio turnover rate | | | 61 | % | | | 24 | % (d) | | | 104 | % |
| (a) | Fund changed fiscal year to December 31. |
| (b) | Amount rounds to less than $0.01 per share. |
| (c) | Total return is a measure of the change in value of an investment in the Fund over the period covered, which assumes any dividends or capital gains distributions are reinvested in shares of the Fund. The returns shown do not reflect the deduction of taxes a shareholder would pay on Fund distributions or the redemption of Fund shares. The returns would have been lower had the Advisor not reduced its fees and reimbursed expenses. |
See accompanying notes to financial statements.
| CHARTWELL SMALL CAP GROWTH FUND |
| FINANCIAL HIGHLIGHTS (Continued) |
Per Share Data for a Share Outstanding Throughout Each Period
| | | | | | | | | For the Period | |
| | | | | | | | | June 16, | |
| | | Year | | | Year | | | 2017* | |
| | | Ended | | | Ended | | | through | |
| | | October 31, | | | October 31, | | | October 31, | |
| | | 2019 | | | 2018 | | | 2017 | |
| Net asset value at beginning of period | | $ | 11.55 | | | $ | 10.69 | | | $ | 10.00 | |
| Income (loss) from investment operations: | | | | | | | | | | | | |
| Net investment loss | | | (0.04 | ) | | | (0.04 | ) | | | (0.03 | ) (a) |
| Net realized and unrealized gains on investment transactions | | | 0.32 | | | | 0.90 | | | | 0.72 | |
| Total from investment operations | | | 0.28 | | | | 0.86 | | | | 0.69 | |
| Less distributions from: | | | | | | | | | | | | |
| Net investment income | | | — | | | | (0.00 | ) (b) | | | — | |
| Net realized gains on investments | | | (0.05 | ) | | | — | | | | — | |
| Total distributions | | | (0.05 | ) | | | (0.00 | ) (b) | | | — | |
| Proceeds from redemption fees collected (Note 2) | | | 0.00 | (b) | | | — | | | | — | |
| Net asset value at end of period | | $ | 11.78 | | | $ | 11.55 | | | $ | 10.69 | |
| Total return (c) | | | 2.46 | % | | | 8.07 | % | | | 6.90 | % (d) |
| Ratios/Supplementary data: | | | | | | | | | | | | |
| Net assets at end of period (000’s) | | $ | 20,637 | | | $ | 17,821 | | | $ | 6,744 | |
| Ratio of total expenses to average net assets: | | | | | | | | | | | | |
| Before fees waived/reduced and other expenses absorbed | | | 1.64 | % | | | 2.15 | % | | | 11.54 | % (e) |
| After fees waived/reduced and other expenses absorbed | | | 1.05 | % | | | 1.05 | % (f) | | | 1.25 | % (e) |
| Ratio of net investment loss to average net assets: | | | | | | | | | | | | |
| Before fees waived/reduced and other expenses absorbed | | | (0.98 | %) | | | (1.56 | %) | | | (11.12 | %) (e) |
| After fees waived/reduced and other expenses absorbed | | | (0.39 | %) | | | (0.45 | %) (f) | | | (0.83 | %) (e) |
| Portfolio turnover rate | | | 104 | % | | | 97 | % | | | 43 | % (d) |
| * | Commencement of operations. |
| (a) | Based on average shares outstanding. |
| (b) | Amount rounds to less than $0.01 per share. |
| (c) | Total return is a measure of the change in value of an investment in the Fund over the periods covered, which assumes any dividends or capital gains distributions are reinvested in shares of the Fund. The returns shown do not reflect the deduction of taxes a shareholder would pay on Fund distributions or the redemption of Fund shares. The returns would have been lower had the Advisor not reduced its fees and reimbursed expenses. |
| (f) | Effective November 6, 2017, the Advisor contractually agreed to reduce its fees and/or pay for operating expenses of the Fund to ensure that total annual operating expenses do not exceed 1.05% of the average daily net assets of the Fund. Prior to November 6, 2017, the annual operating expense limitation was 1.25% (Note 3). |
See accompanying notes to financial statements.
| CHARTWELL SHORT DURATION BOND FUND |
| FINANCIAL HIGHLIGHTS |
Per Share Data for a Share Outstanding Throughout the Period
| | | For the Period | |
| | | September 22, | |
| | | 2021* | |
| | | through | |
| | | December 31, | |
| | | 2021 | |
| Net asset value at beginning of period | | $ | 10.00 | |
| Income (loss) from investment operations: | | | | |
| Net investment income | | | 0.01 | |
| Net realized and unrealized losses on investment transactions | | | (0.05 | ) |
| Total from investment operations | | | (0.04 | ) |
| Less distributions from: | | | | |
| Net investment income | | | (0.01 | ) |
| Net realized gains on investments | | | (0.00 | ) (a) |
| Total distributions | | | (0.01 | ) |
| Net asset value at end of period | | $ | 9.95 | |
| Total return (b) | | | (0.37 | %) (c) |
| Ratios/Supplementary data: | | | | |
| Net assets at end of period (000’s) | | $ | 5,948 | |
| Ratio of total expenses to average net assets: | | | | |
| Before fees waived/reduced and other expenses absorbed | | | 3.51 | % (d) |
| After fees waived/reduced and other expenses absorbed | | | 0.39 | % (d) |
| Ratio of net investment income (loss) to average net assets: | | | | |
| Before fees waived/reduced and other expenses absorbed | | | (2.66 | %) (d) |
| After fees waived/reduced and other expenses absorbed | | | 0.46 | % (d) |
| Portfolio turnover rate | | | 6 | % (c) |
| * | Commencement of operations. |
| (a) | Amount rounds to less than $0.01 per share. |
| (b) | Total return is a measure of the change in value of an investment in the Fund over the period covered, which assumes any dividends or capital gains distributions are reinvested in shares of the Fund. The return shown does not reflect the deduction of taxes a shareholder would pay on Fund distributions or the redemption of Fund shares. The return would have been lower had the Advisor not reduced its fees and reimbursed expenses. |
See accompanying notes to financial statements.
| CHARTWELL FUNDS |
| NOTES TO FINANCIAL STATEMENTS |
| December 31, 2021 |
Note 1 – Organization
Chartwell Income Fund, Chartwell Mid Cap Value Fund, Chartwell Small Cap Value Fund, Chartwell Short Duration High Yield Fund, Chartwell Small Cap Growth Fund and Chartwell Short Duration Bond Fund (each a “Fund” and collectively the “Funds”) are each a diversified series of The Chartwell Funds, a Delaware statutory trust (the “Trust”) which is registered as an open-end management investment company under the Investment Company Act of 1940, as amended (the “1940 Act”).
Chartwell Income Fund’s primary investment objective is to provide investors with current income; seeking to preserve capital is a secondary consideration. The Fund commenced investment operations on September 3, 1987.
Chartwell Mid Cap Value Fund’s primary investment objective is to achieve long-term capital appreciation. The Fund commenced investment operations on May 1, 2002.
Chartwell Small Cap Value Fund’s primary investment objective is to seek long-term capital appreciation. The Fund commenced investment operations on March 16, 2012.
Chartwell Short Duration High Yield Fund’s primary investment objective is to seek income and long-term capital appreciation. The Fund commenced investment operations on July 15, 2014.
Chartwell Small Cap Growth Fund’s primary investment objective is to seek long-term capital appreciation. The Fund commenced investment operations on June 16, 2017.
Chartwell Short Duration Bond Fund’s primary investment objective is to maximize current income by investing in high quality short maturity fixed income securities while also preserving capital. The Fund commenced investment operations on September 22, 2021.
Note 2 – Significant Accounting Policies
Each Fund follows accounting and reporting guidance under Financial Accounting Standards Board Accounting Standards Codification (“ASC”) Topic 946, “Financial Services – Investment Companies.” The following is a summary of the Funds’ significant accounting policies. These policies are in conformity with accounting principles generally accepted in the United States of America (“GAAP”).
| (a) | Valuation of Investments |
Each Fund values equity securities at the last reported sale price on the principal exchange or in the principal over the counter (“OTC”) market in which such securities are traded, as of the close of regular trading on the New York Stock Exchange on the day the securities are being valued or, if the last-quoted sales price is not readily available, the securities will be valued at the last bid or the mean between the last available bid and ask price. Securities traded on the NASDAQ are valued at the NASDAQ Official Closing Price. Investments in open-end investment companies are valued at the daily closing net asset value (“NAV”) of the respective investment company. Debt securities are typically valued by utilizing a price supplied by independent pricing service providers. The independent pricing service providers may use various valuation
| CHARTWELL FUNDS |
| NOTES TO FINANCIAL STATEMENTS (Continued) |
methodologies including matrix pricing and other analytical pricing models as well as market transactions and dealer quotations. These models generally consider such factors as yields or prices of bonds of comparable quality, type of issue, coupon, maturity, ratings and general market conditions. If a price is not readily available for a portfolio security, the security will be valued at fair value (the amount which a Fund might reasonably expect to receive for the security upon its current sale) as determined in good faith by Chartwell Investment Partners, LLC (the “Advisor”) as defined in Note 3, subject to review and approval by the Advisor’s Portfolio Pricing Committee (“APPC”), pursuant to procedures adopted by the Board of Trustees. The actions of the APPC are subsequently reviewed by the Board at its next regularly scheduled board meeting. The APPC meets as needed. The APPC is comprised of personnel of the Advisor (CFO, COO, CCO, the applicable portfolio manager or lead analyst).
| (b) | Share Valuation and Redemption Fees |
The NAV per share of each Fund is calculated as of the close of regular trading on the NYSE (normally 4:00 p.m., Eastern time) on each day that the NYSE is open for business. The NAV per share of each Fund is calculated by dividing the total value of the Fund’s assets, less its liabilities, by the number of its shares outstanding. The offering price and redemption price per share of each Fund is equal to the NAV per share next computed after receipt of an order to purchase or to redeem shares. However, prior to May 1, 2021, a redemption fee of 1%, payable to the applicable Fund, generally was applied to shares that were redeemed within 30 days of purchase. During the periods ended December 31, 2021, December 31, 2020 and October 31, 2020, proceeds from redemption fees were as follows:
| | | Year Ended | | | Two Months Ended | | | Year Ended | |
| | | December 31, 2021 | | | December 31, 2020 | | | October 31, 2020 | |
| Chartwell Income Fund | | $ | 8 | | | $ | 103 | | | $ | 4,961 | |
| Chartwell Mid Cap Value Fund | | | — | | | | — | | | | — | |
| Chartwell Small Cap Value Fund | | | 1,382 | | | | — | | | | 26 | |
| Chartwell Short Duration High Yield Fund | | | — | | | | — | | | | 13 | |
| Chartwell Small Cap Growth Fund | | | — | | | | — | | | | 16 | |
| Chartwell Short Duration Bond Fund | | | — | | | | N/A | | | | N/A | |
| (c) | Investment Transactions, Investment Income and Expenses |
Investment transactions are accounted for on the trade date. Realized gains and losses on investments are determined on the identified cost basis. Dividend income is recorded net of applicable withholding taxes on the ex-dividend date and interest income is recorded on an accrual basis. Non-cash dividends included in dividend income, if any, are recorded at the fair market value of the security received. Withholding taxes on foreign dividends, if applicable, are paid (a portion of which may be reclaimable) or provided for in accordance with the applicable country’s tax rules and rates and are disclosed on the Statements of Operations. Withholding tax reclaims are filed in certain countries to recover a portion of the amounts previously withheld. The Funds record a reclaim receivable based on a number of factors,
| CHARTWELL FUNDS |
| NOTES TO FINANCIAL STATEMENTS (Continued) |
including a jurisdiction’s legal obligation to pay reclaims, as well as payment history and market convention. Discounts or premiums on debt securities are accreted or amortized to interest income over the lives of the respective securities using the effective interest method.
Expenses incurred by the Trust with respect to more than one Fund are allocated in proportion to the net assets of each Fund except where allocation of direct expenses to each Fund or an alternative allocation method can be more appropriately made.
At times, the Funds may invest cash in a sweep vehicle program whereby a bank, acting as agent of its customer, endeavors to place such amounts in excess of the FDIC standard maximum deposit insurance amount (currently $250,000) with one or more other FDIC-insured member banks in either demand deposit accounts or money market deposit accounts. Such deposits are in amounts at any such bank not in excess of the FDIC standard maximum deposit insurance amount such that the customer’s funds are FDIC-insured across the various banks at which such funds are deposited. TriState Capital Bank provides this service to its clients, including the Advisor. Both TriState Capital Bank and the Advisor are subsidiaries of TriState Capital Holdings. These deposits are not custodied by TriState Capital Bank, and TriState Capital Bank does not receive any fees relating to these deposits. These amounts are included as Cash on the Statements of Assets and Liabilities to the extent they are held by a Fund as of December 31, 2021.
The Funds intend to comply with the requirements of Subchapter M of the Internal Revenue Code applicable to regulated investment companies and to distribute substantially all of their net investment income and any net realized capital gains to their shareholders. Therefore, no provision is made for federal income or excise taxes. Due to the timing of distributions and the differences in accounting for net investment income and realized capital gains and losses for financial statement and federal income tax purposes, the fiscal year in which amounts are distributed may differ from the year in which the net investment income and realized capital gains and losses are recorded by the Funds.
Accounting for Uncertainty in Income Taxes (the “Income Tax Statement”) requires an evaluation of tax positions taken (or expected to be taken) in the course of preparing a Fund’s tax returns to determine whether these positions meet a “more-likely-than-not” standard that, based on the technical merits, have a more than fifty percent likelihood of being sustained by a taxing authority upon examination. A tax position that meets the “more-likely-than-not” recognition threshold is measured to determine the amount of benefit or expense to recognize in the financial statements. The Funds recognize interest and penalties, if any, as income tax expense on the Statements of Operations.
The Income Tax Statement requires management of the Funds to analyze tax positions taken in the prior three open tax years, if any, and tax positions expected to be taken in the Funds’ current tax year, as defined by the IRS statute of limitations for all major jurisdictions, including federal tax authorities and certain state tax authorities. As of and during the open periods (generally, three years) the Funds did not have a liability for any unrecognized tax expenses.
| CHARTWELL FUNDS |
| NOTES TO FINANCIAL STATEMENTS (Continued) |
The Funds have no examination in progress and are not aware of any tax positions for which it is reasonably likely that the total amounts of unrecognized tax expenses will significantly change in the next twelve months.
| (f) | Distributions to Shareholders |
Chartwell Mid Cap Value Fund, Chartwell Small Cap Value Fund and Chartwell Small Cap Growth Fund make distributions of net investment income and net realized capital gains, if any, at least annually. Chartwell Income Fund, Chartwell Short Duration High Yield Fund and Chartwell Short Duration Bond Fund make distributions of net investment income monthly and net realized capital gains, if any, at least annually. Distributions to shareholders are recorded on the ex-dividend date. The amount and timing of distributions are determined in accordance with federal income tax regulations, which may differ from GAAP.
The preparation of financial statements in conformity with GAAP requires management to make estimates and assumptions that affect the reported amounts of assets and liabilities and the disclosure of contingent assets and liabilities as of the date of the financial statements and the reported amounts of increase (decrease) in net assets from operations during the reporting period. Actual results could differ from these estimates.
| (h) | New Accounting Pronouncement |
In March 2020, the Financial Accounting Standards Board issued Accounting Standards Update No. 2020-04 (“ASU 2020-04”), “Reference Rate Reform (Topic 840): Facilitation of the Effects of Reference Rate Reform on Financial Reporting”. ASU 2020-04 provides entities with optional guidance to ease the potential accounting burden associated with transitioning away from reference rates (e.g., LIBOR) that are expected to be discontinued. ASU 2020-04 allows, among other things, certain contract modifications to be accounted as a continuation of the existing contract. This ASU was effective upon the issuance and its optional relief can be applied through December 31, 2022. The Funds will consider this optional guidance prospectively, if applicable.
Note 3 – Investment Advisory and Other Agreements
On October 20, 2021, TriState Capital Holdings, Inc. (“TSC”) announced that it had entered into a definitive agreement with Raymond James Financial, Inc. (“RJF”) under which RJF will acquire TSC (the “Transaction”). As part of the Transaction, the Advisor, a wholly owned subsidiary of TSC, will become a wholly owned subsidiary of Carillon Tower Advisors, Inc. (“CTA”), which is a wholly owned subsidiary of RJF. In connection with the Transaction, the parties agreed to reorganize each Fund into a newly created shell series (each, an “Acquiring Fund” and together, the “Acquiring Funds”) of the Carillon Series Trust, which would be advised by CTA and sub-advised by the Advisor.
At a special meeting held on December 15, 2021, the Board of Trustees of the Trust approved an Agreement and Plan of Reorganization and Termination (the “Reorganization Plan”) pursuant to which each Fund would transfer all of it assets and liabilities to the corresponding Acquiring Fund in exchanged for shares of the Acquiring Fund that would be distributed to
| CHARTWELL FUNDS |
| NOTES TO FINANCIAL STATEMENTS (Continued) |
each Fund’s shareholders (each, a “Reorganization,” and together, the “Reorganizations”). The Reorganizations are not expected to change the objectives or strategies of the Funds or the manner in which the Funds are managed, and it is anticipated that the portfolio managers responsible for each Fund will be the portfolio managers for the corresponding Acquiring Fund.
Each Reorganization Plan requires approval by each Fund’s shareholders and will be submitted to each Fund’s shareholders for their consideration at a special shareholder meeting to be held in the second quarter of 2022. If the Reorganization Plan is approved by shareholders of each Fund and the conditions of the Reorganization Plan are satisfied or waived, the Reorganizations are expected to be consummated concurrent with the closing of the Transaction, which is currently expected to occur in the second or third quarter of 2022 but may be delayed subject to requisite shareholder and regulatory approvals.
The Trust, on behalf of the Funds, has entered into an Investment Advisory Agreement (the “Agreement”) with the Advisor. Under the terms of the Agreement, the Funds pay a monthly investment advisory fee to the Advisor at the following annual rates based on the average daily net assets of the Funds:
| Chartwell Income Fund | | |
| First $1.75 billion | | 0.50% |
| Next $1.75 billion | | 0.48% |
| Thereafter | | 0.46% |
| Chartwell Mid Cap Value Fund | | 0.75% |
| Chartwell Small Cap Value Fund | | 0.90% |
| Chartwell Short Duration High Yield Fund | | 0.40% |
| Chartwell Small Cap Growth Fund | | 0.85% |
| Chartwell Short Duration Bond Fund | | 0.30% |
The Advisor has contractually agreed to reduce its fees and/or reimburse other operating expenses (excluding taxes, leverage interest, brokerage commissions, dividend and interest expenses on short sales, acquired fund fees and expenses, expenses incurred in connection with any merger or reorganization, and extraordinary expenses such as litigation expenses) in order to limit total annual operating expenses of each Fund as stated below. This agreement is in effect until May 1, 2022 with respect to each Fund, and it may be terminated prior to this time only by the Trust’s Board of Trustees, or if the investment advisory agreement is terminated (i) by the Funds upon 60 days’ notice to the Advisor provided such termination was directed or approved by a vote of a majority of the Trustees of the Funds or by the vote of the holders of
| CHARTWELL FUNDS |
| NOTES TO FINANCIAL STATEMENTS (Continued) |
a majority of the voting securities of the Fund at the time outstanding or entitled to vote; (ii) by the Advisor upon 60 days’ notice to the Funds; or (iii) by an assignment of the investment advisory agreement. The table below reflects the expense cap for each Fund:
| | | Expense Limit as a % | |
| | | of average | |
| | | daily net assets | |
| Chartwell Income Fund | | | 0.64 | % |
| Chartwell Mid Cap Value Fund | | | 0.90 | % |
| Chartwell Small Cap Value Fund | | | 1.05 | % |
| Chartwell Short Duration High Yield Fund | | | 0.49 | % |
| Chartwell Small Cap Growth Fund | | | 1.05 | % |
| Chartwell Short Duration Bond Fund | | | 0.39 | % |
During the year ended December 31, 2021, the Advisor reduced its fees as follows:
| | | December 31, 2021 | |
| Chartwell Income Fund | | $ | 237,212 | |
| Chartwell Mid Cap Value Fund | | | 132,407 | |
| Chartwell Small Cap Value Fund | | | 199,214 | |
| Chartwell Short Duration High Yield Fund | | | 162,566 | |
| Chartwell Small Cap Growth Fund | | | 133,401 | |
| Chartwell Short Duration Bond Fund | | | 46,428 | |
The Advisor is permitted to seek reimbursement of fee reductions and expense reimbursements from each Fund for a period ending three years after the date of the reduction or reimbursement, provided that the reimbursement does not cause expenses to exceed the lesser of (a) the expense limitation amount in effect at the time such fees were reduced or reimbursements made, or (b) the expense limitation amount in effect at the time of the reimbursement. The Advisor may recapture all or a portion of fee reductions and expense reimbursements no later than the dates stated below:
| | | | | | Chartwell | | | Chartwell | | | Chartwell | | | Chartwell | | | Chartwell | |
| | | Chartwell | | | Mid Cap | | | Small Cap | | | Short | | | Small Cap | | | Short | |
| | | Income | | | Value | | | Value | | | Duration High | | | Growth | | | Duration | |
| | | Fund | | | Fund | | | Fund | | | Yield Fund | | | Fund | | | Bond Fund | |
| October 31, 2022 | | $ | 212,996 | | | $ | 87,872 | | | $ | 33,664 | | | $ | 122,988 | | | $ | 97,987 | | | $ | — | |
| October 31, 2023 | | | 259,244 | | | | 134,150 | | | | 198,691 | | | | 141,721 | | | | 142,122 | | | | — | |
| December 31, 2023 | | | 85,613 | | | | 29,930 | | | | 45,596 | | | | 45,006 | | | | 30,470 | | | | — | |
| December 31, 2024 | | | 237,212 | | | | 132,407 | | | | 199,214 | | | | 162,566 | | | | 133,401 | | | | 46,428 | |
| Total | | $ | 795,065 | | | $ | 384,359 | | | $ | 477,165 | | | $ | 472,281 | | | $ | 403,980 | | | $ | 46,428 | |
| CHARTWELL FUNDS |
| NOTES TO FINANCIAL STATEMENTS (Continued) |
The Advisor and the officers of the Advisor, together with their families, owned 30,928 shares, 6,958 shares, 46,922 shares, 15,449 shares, 29,907 shares and 501 shares of Chartwell Income Fund, Chartwell Mid Cap Value Fund, Chartwell Small Cap Value Fund, Chartwell Short Duration High Yield Fund, Chartwell Small Cap Growth Fund and Chartwell Short Duration Bond Fund, respectively, as of December 31, 2021.
Ultimus Fund Solutions, LLC (“Ultimus”) provides administration, fund accounting and transfer agency services to the Funds. The Funds pay Ultimus fees in accordance with the agreements for such services. In addition, the Funds pay out-of-pocket expenses including, but not limited to, postage, supplies, and certain costs related to the pricing of the Funds’ portfolio securities.
The Funds compensate certain financial intermediaries for providing account maintenance and shareholder services to shareholder accounts held through such intermediaries. During the year ended December 31, 2021, Chartwell Income Fund, Chartwell Mid Cap Value Fund, Chartwell Small Cap Value Fund, Chartwell Short Duration High Yield Fund, Chartwell Small Cap Growth Fund and Chartwell Short Duration Bond Fund paid $289,448, $9,416, $157,288, $17,595, $20,825 and $0, respectively, to financial intermediaries for such services. These amounts are included in transfer agent fees on the Statements of Operations.
Foreside Fund Services, LLC (“Foreside”) serves as the Funds’ distributor.
Certain Trustees and officers of the Trust are also officers or employees of the Advisor and/ or Ultimus. The Funds do not compensate Trustees and officers affiliated with the Funds’ Advisor or Ultimus. For their services to the Trust, each Independent Trustee receives an annual retainer of $35,000, plus $1,500 for each Board meeting attended in-person, and $1,000 for each Board meeting attended telephonically, plus reimbursement of related expenses. In addition, each member of the Audit Committee, which is comprised solely of Independent Trustees, receives $1,500 for each Audit Committee meeting attended in-person, and $1,000 for each Audit Committee meeting attended telephonically.
The Trust’s Chief Compliance Officer (“CCO”) is an officer of the Advisor.
| CHARTWELL FUNDS |
| NOTES TO FINANCIAL STATEMENTS (Continued) |
PRINCIPAL HOLDERS OF FUND SHARES
As of December 31, 2021, the following shareholders owned of record 25% or more of the outstanding shares of the following Funds:
| NAME OF RECORD OWNER | | % Ownership |
| Chartwell Mid Cap Value Fund | | |
| Morgan Stanley Smith Barney (for the benefit of its customers) | | 36% |
| | | |
| Chartwell Small Cap Value Fund | | |
| UBS (for the benefit of its customers) | | 28% |
| | | |
| Chartwell Short Duration Fund | | |
| CAPINCO | | 27% |
| | | |
| Chartwell Small Cap Growth Fund | | |
| National Financial Services, LLC (for the benefit of its customers) | | 75% |
| | | |
| Chartwell Short Duration Bond Fund | | |
| TriState Capital Holdings, Inc. | | 84% |
A beneficial owner of 25% or more of a Fund’s outstanding shares may be considered a controlling person. That shareholder’s vote could have a more significant effect on matters presented at a shareholders’ meeting.
Note 4 – Federal Income Taxes
At December 31 2021, gross unrealized appreciation and depreciation of investments, based on cost for federal income tax purposes, were as follows:
| | | | | | Chartwell | | | Chartwell | |
| | | Chartwell | | | Mid Cap Value | | | Small Cap Value | |
| | | Income Fund | | | Fund | | | Fund | |
| Cost of investments | | $ | 466,667,067 | | | $ | 27,907,929 | | | $ | 140,371,002 | |
| Gross unrealized appreciation | | $ | 38,770,697 | | | $ | 9,907,362 | | | $ | 47,538,007 | |
| Gross unrealized depreciation | | | (7,839,217 | ) | | | (420,114 | ) | | | (5,619,327 | ) |
| Net unrealized appreciation on investments | | $ | 30,931,480 | | | $ | 9,487,248 | | | $ | 41,918,680 | |
| CHARTWELL FUNDS |
| NOTES TO FINANCIAL STATEMENTS (Continued) |
| | | Chartwell | | | Chartwell | | | Chartwell | |
| | | Short Duration | | | Small Cap | | | Short Duration | |
| | | High Yield Fund | | | Growth Fund | | | Bond Fund | |
| Cost of investments | | $ | 204,505,965 | | | $ | 19,838,508 | | | $ | 5,931,868 | |
| Gross unrealized appreciation | | $ | 4,372,331 | | | $ | 9,388,806 | | | $ | 1,009 | |
| Gross unrealized depreciation | | | (2,106,753 | ) | | | (874,622 | ) | | | (32,085 | ) |
| Net unrealized appreciation (depreciation) on investments | | $ | 2,265,578 | | | $ | 8,514,184 | | | $ | (31,076 | ) |
The difference between the cost of investments for financial statement and federal income tax purposes for Chartwell Income Fund, Chartwell Mid Cap Value Fund, Chartwell Small Cap Value Fund, Chartwell Short Duration High Yield Fund and Chartwell Small Cap Growth Fund is due to certain timing differences in recognizing capital gains and losses in security transactions under income tax regulations and GAAP. These “book/tax” differences are temporary in nature and are primarily due to the tax deferral of losses on wash sales and adjustments to basis on passive foreign investment companies.
As of December 31, 2021, the components of accumulated earnings on a tax basis were as follows:
| | | | | | Chartwell | | | Chartwell | |
| | | Chartwell | | | Mid Cap Value | | | Small Cap Value | |
| | | Income Fund | | | Fund | | | Fund | |
| Net unrealized appreciation on investments | | $ | 30,931,480 | | | $ | 9,487,248 | | | $ | 41,918,680 | |
| Undistributed ordinary income | | | — | | | | 384 | | | | — | |
| Undistributed long-term capital gains | | | — | | | | 21,677 | | | | 1,794,548 | |
| Capital loss carryforwards | | | (6,536,398 | ) | | | — | | | | — | |
| Total accumulated earnings | | $ | 24,395,082 | | | $ | 9,509,309 | | | $ | 43,713,228 | |
| | | Chartwell | | | Chartwell | | | Chartwell | |
| | | Short Duration | | | Small Cap | | | Short Duration | |
| | | High Yield Fund | | | Growth Fund | | | Bond Fund | |
| Net unrealized appreciation (depreciation) on investments | | $ | 2,265,578 | | | $ | 8,514,184 | | | $ | (31,076 | ) |
| Undistributed ordinary income | | | — | | | | — | | | | 1,376 | |
| Undistributed long-term capital gains | | | — | | | | 792,440 | | | | — | |
| Capital loss carryforwards | | | (444,150 | ) | | | — | | | | — | |
| Post-October losses | | | — | | | | (203,432 | ) | | | — | |
| Total accumulated earnings (deficit) | | $ | 1,821,428 | | | $ | 9,103,192 | | | $ | (29,700 | ) |
| CHARTWELL FUNDS |
| NOTES TO FINANCIAL STATEMENTS (Continued) |
During the year ended December 31, 2021, Chartwell Income Fund, Chartwell Mid Cap Value Fund, Chartwell Small Cap Value Fund and Chartwell Short Duration High Yield Fund utilized $11,953,480, $1,307,999, $1,097,654 and $993,628 of capital loss carryforwards to offset current year capital gains.
As of December 31, 2021, the Funds had the following capital loss carryforwards for federal income tax purposes:
| | | | | | Chartwell | |
| | | Chartwell | | | Short Duration | |
| | | Income Fund | | | High Yield Fund | |
| Short-term capital loss carryforwards | | $ | — | | | $ | — | |
| Long-term capital loss carryforwards | | | 6,536,398 | | | | 444,150 | |
| Total | | $ | 6,536,398 | | | $ | 444,150 | |
These capital loss carryforwards, which do not expire, are available to offset realized capital gains in future years, thereby reducing future taxable gain distributions.
Qualified late year capital losses incurred after October 31, 2021 and within the current taxable year are deemed to arise on the first day of the Fund’s next taxable year. For the year ended December 31, 2021, Chartwell Small Cap Growth Fund deferred $203,432 of late year capital losses to January 1, 2022 for federal income tax purposes.
For the year ended December 31, 2021, the following reclassifications were made as a result of permanent differences between the financial statement and income tax reporting requirements:
| | | | | | | | | | | | Chartwell | | | | | | Chartwell | |
| | | | | | Chartwell | | | Chartwell | | | Short | | | Chartwell | | | Short | |
| | | Chartwell | | | Mid Cap | | | Small Cap | | | Duration High | | | Small Cap | | | Duration | |
| | | Income Fund | | | Value Fund | | | Value Fund | | | Yield Fund | | | Growth Fund | | | Bond Fund | |
| Paid-in capital | | $ | (15,774 | ) | | $ | — | | | $ | — | | | $ | (13,128 | ) | | $ | 75 | | | $ | — | |
| Accumulated earnings (deficit) | | | 15,774 | | | | — | | | | — | | | | 13,128 | | | | (75 | ) | | | — | |
Such reclassifications have no effect on each Fund’s total net assets or its NAV per share.
| CHARTWELL FUNDS |
| NOTES TO FINANCIAL STATEMENTS (Continued) |
The tax character of distributions paid during the periods ended December 31, 2021, December 31, 2020 and October 31, 2020 was as follows:
| | | Chartwell Income Fund | |
| | | December 31, | | | December 31, | | | October 31, | |
| | | 2021 | | | 2020 | | | 2020 | |
| Distributions paid from: | | | | | | | | | | | | |
| Ordinary Income | | $ | 13,869,991 | | | $ | 2,998,883 | | | $ | 24,453,130 | |
| Total distributions paid | | $ | 13,869,991 | | | $ | 2,998,883 | | | $ | 24,453,130 | |
| | | Chartwell Mid Cap Value Fund | |
| | | December 31, | | | December 31, | | | October 31, | |
| | | 2021 | | | 2020 | | | 2020 | |
| Distributions paid from: | | | | | | | | | | | | |
| Ordinary Income | | $ | 230,069 | | | $ | 317,350 | | | $ | 279,000 | |
| Net long-term capital gains | | | — | | | | — | | | | 223,601 | |
| Total distributions paid | | $ | 230,069 | | | $ | 317,350 | | | $ | 502,601 | |
| | | Chartwell Small Cap Value Fund | |
| | | December 31, | | | December 31, | | | October 31, | |
| | | 2021 | | | 2020 | | | 2020 | |
| Distributions paid from: | | | | | | | | | | | | |
| Ordinary Income | | $ | 927,884 | | | $ | 1,302,071 | | | $ | 1,335,998 | |
| Net long-term capital gains | | | 16,956,002 | | | | — | | | | 4,952,629 | |
| Total distributions paid | | $ | 17,883,886 | | | $ | 1,302,071 | | | $ | 6,288,627 | |
| | | Chartwell Short Duration High Yield Fund | |
| | | December 31, | | | December 31, | | | October 31, | |
| | | 2021 | | | 2020 | | | 2020 | |
| Distributions paid from: | | | | | | | | | | | | |
| Ordinary Income | | $ | 5,242,419 | | | $ | 863,004 | | | $ | 4,083,761 | |
| Total distributions paid | | $ | 5,242,419 | | | $ | 863,004 | | | $ | 4,083,761 | |
| CHARTWELL FUNDS |
| NOTES TO FINANCIAL STATEMENTS (Continued) |
| | | Chartwell Small Cap Growth Fund | |
| | | December 31, | | | December 31, | | | October 31, | |
| | | 2021 | | | 2020 | | | 2020 | |
| Distributions paid from: | | | | | | | | | | | | |
| Ordinary Income | | $ | 1,823,945 | | | $ | 241,015 | | | $ | — | |
| Net long-term capital gains | | | 3,451,422 | | | | 1,483,458 | | | | 7,527 | |
| Total distributions paid | | $ | 5,275,367 | | | $ | 1,724,473 | | | $ | 7,527 | |
| | | Chartwell Short | |
| | | Duration Bond | |
| | | Fund | |
| | | December 31, | |
| | | 2021 | |
| Distributions paid from: | | | | |
| Ordinary Income | | $ | 7,726 | |
| Total distributions paid | | $ | 7,726 | |
Note 5 – Investment Transactions
During the period ended December 31, 2021, purchases and sales of investments, excluding short-term investments and U.S. government securities, were as follows:
| | | Purchases | | | Sales | |
| Chartwell Income Fund | | $ | 283,982,868 | | | $ | 355,956,141 | |
| Chartwell Mid Cap Value Fund | | | 6,460,196 | | | | 4,747,571 | |
| Chartwell Small Cap Value Fund | | | 39,348,262 | | | | 76,835,270 | |
| Chartwell Short Duration High Yield Fund | | | 147,806,600 | | | | 95,724,736 | |
| Chartwell Small Cap Growth Fund | | | 17,515,382 | | | | 21,151,781 | |
| Chartwell Short Duration Bond Fund | | | 5,723,077 | | | | 282,377 | |
Note 6 – Indemnifications
In the normal course of business, the Funds enter into contracts that contain a variety of representations which provide general indemnifications. The Funds’ maximum exposure under these arrangements is unknown, as this would involve future claims that may be made against the Funds that have not yet occurred. However, the Funds expect the risk of loss to be remote.
| CHARTWELL FUNDS |
| NOTES TO FINANCIAL STATEMENTS (Continued) |
Note 7 – Fair Value Measurements and Disclosure
ASC 820 defines fair value, establishes a framework for measuring fair value in accordance with GAAP, and expands disclosure about fair value measurements. It also provides guidance on determining when there has been a significant decrease in the volume and level of activity for an asset or a liability, when a transaction is not orderly, and how that information must be incorporated into a fair value measurement.
Various inputs are used in determining the value of each Fund’s investments. These inputs are summarized into three broad Levels as described below:
| ● | Level 1 – Unadjusted quoted prices in active markets for identical assets or liabilities that a Fund has the ability to access. |
| ● | Level 2 – Observable inputs other than quoted prices included in Level 1 that are observable for the asset or liability, either directly or indirectly. These inputs may include quoted prices for the identical instrument on an inactive market, prices for similar instruments, interest rates, prepayment speeds, credit risk, yield curves, default rates and similar data. |
| ● | Level 3 – Unobservable inputs for the asset or liability, to the extent relevant observable inputs are not available, representing a Fund’s own assumptions about the assumptions a market participant would use in valuing the asset or liability, and would be based on the best information available. |
The availability of observable inputs can vary from security to security and is affected by a wide variety of factors, including, for example, the type of security, whether the security is new and not yet established in the marketplace, the liquidity of markets, and other characteristics particular to the security. To the extent that valuation is based on models or inputs that are less observable or unobservable in the market, the determination of fair value requires more judgment. Accordingly, the degree of judgment exercised in determining fair value is greatest for instruments categorized in Level 3.
The inputs used to measure fair value may fall into different Levels of the fair value hierarchy. In such cases, for disclosure purposes, the level in the fair value hierarchy within which the fair value measurement falls in its entirety is determined based on the lowest level input that is significant to the fair value measurement in its entirety.
The inputs or methodology used for valuing securities are not an indication of the risks associated with investing in those securities.
| CHARTWELL FUNDS |
| NOTES TO FINANCIAL STATEMENTS (Continued) |
The following is a summary of the Funds’ investments based on the inputs used to value the investments as of December 31, 2021:
| Chartwell Income Fund | | Level 1 | | | Level 2 | | | Level 3 | | | Total | |
| Common Stocks | | $ | 108,840,964 | | | $ | — | | | $ | — | | | $ | 108,840,964 | |
| Exchange-Traded Funds | | | 15,241,550 | | | | — | | | | — | | | | 15,241,550 | |
| Preferred Stocks | | | 17,207,033 | | | | — | | | | — | | | | 17,207,033 | |
| Corporate Bonds | | | — | | | | 139,142,236 | | | | — | | | | 139,142,236 | |
| Asset-Backed Securities | | | — | | | | 13,330,574 | | | | — | | | | 13,330,574 | |
| Mortgage-Backed Securities | | | — | | | | 129,996,054 | | | | — | | | | 129,996,054 | |
| U.S. Government & Agency Obligations | | | — | | | | 69,363,476 | | | | — | | | | 69,363,476 | |
| Money Market Funds | | | 4,476,660 | | | | — | | | | — | | | | 4,476,660 | |
| Total Investments | | $ | 145,766,207 | | | $ | 351,832,340 | | | $ | — | | | $ | 497,598,547 | |
| | | | | | | | | | | | | | | | | |
| | | | | | | | | | | | | | | | | |
| | | | | | | | | | | | | | | | | |
| Chartwell Mid Cap Value Fund | | Level 1 | | | Level 2 | | | Level 3 | | | Total | |
| Common Stocks | | $ | 37,267,820 | | | $ | — | | | $ | — | | | $ | 37,267,820 | |
| Money Market Funds | | | 127,357 | | | | — | | | | — | | | | 127,357 | |
| Total Investments | | $ | 37,395,177 | | | $ | — | | | $ | — | | | $ | 37,395,177 | |
| | | | | | | | | | | | | | | | | |
| | | | | | | | | | | | | | | | | |
| | | | | | | | | | | | | | | | | |
| Chartwell Small Cap Value | | Level 1 | | | Level 2 | | | Level 3 | | | Total | |
| Common Stocks | | $ | 181,060,027 | | | $ | — | | | $ | — | | | $ | 181,060,027 | |
| Money Market Funds | | | 1,229,655 | | | | — | | | | — | | | | 1,229,655 | |
| Total Investments | | $ | 182,289,682 | | | $ | — | | | $ | — | | | $ | 182,289,682 | |
| | | | | | | | | | | | | | | | | |
| | | | | | | | | | | | | | | | | |
| | | | | | | | | | | | | | | | | |
| Chartwell Short Duration High Yield Fund | | Level 1 | | | Level 2 | | | Level 3 | | | Total | |
| Corporate Bonds | | $ | — | | | $ | 203,608,246 | | | $ | — | | | $ | 203,608,246 | |
| Money Market Funds | | | 3,163,297 | | | | — | | | | — | | | | 3,163,297 | |
| Total Investments | | $ | 3,163,297 | | | $ | 203,608,246 | | | $ | — | | | $ | 206,771,543 | |
| | | | | | | | | | | | | | | | | |
| | | | | | | | | | | | | | | | | |
| | | | | | | | | | | | | | | | | |
| Chartwell Small Cap Growth Fund | | Level 1 | | | Level 2 | | | Level 3 | | | Total | |
| Common Stocks | | $ | 28,186,525 | | | $ | — | | | $ | — | | | $ | 28,186,525 | |
| Money Market Funds | | | 166,167 | | | | — | | | | — | | | | 166,167 | |
| Total Investments | | $ | 28,352,692 | | | $ | — | | | $ | — | | | $ | 28,352,692 | |
| CHARTWELL FUNDS |
| NOTES TO FINANCIAL STATEMENTS (Continued) |
| Chartwell Short Duration Bond Fund | | Level 1 | | | Level 2 | | | Level 3 | | | Total | |
| Corporate Bonds | | $ | — | | | $ | 4,751,412 | | | $ | — | | | $ | 4,751,412 | |
| U.S. Government & Agency Obligations | | | — | | | | 833,054 | | | | — | | | | 833,054 | |
| Money Market Funds | | | 316,326 | | | | — | | | | — | | | | 316,326 | |
| Total Investments | | $ | 316,326 | | | $ | 5,584,466 | | | $ | — | | | $ | 5,900,792 | |
Refer to each Fund’s Schedule of Investments for a listing of the common stocks and/or corporate bonds, if applicable, by sector and/or industry type. The Funds did not hold derivative instruments or any assets or liabilities that were measured at fair value on a recurring basis using significant unobservable inputs (Level 3) as of or during the year ended December 31, 2021.
Note 8 – Sector Risk
If a Fund has significant investments in the securities of issuers in industries within a particular business sector, any development generally affecting that sector will have a greater impact on the value of the net assets of the Fund than would be the case if the Fund did not have significant investments in that sector. This may increase the risk of loss of an investment in a Fund and increase the volatility of a Fund’s NAV per share. From time to time, circumstances may affect a particular sector and the companies within such sector. For instance, economic or market factors, regulation or deregulation, and technological or other developments, may negatively impact all companies in a particular sector and therefore the value of a Fund’s portfolio could be adversely affected if it has significant holdings of securities of issuers in that sector. As of December 31, 2021, Chartwell Small Cap Value Fund had 26.5% of the value of its net assets invested in stocks in the Financials sector, Chartwell Small Cap Growth Fund had 26.2% and 25.5% of the value of its net assets invested in stocks within the Technology and Health Care sectors, respectively, and Chartwell Short Duration Bond Fund had 33.6% of the value of its net assets invested in corporate bonds in the Financials sector.
Note 9 – Events Subsequent to the Fiscal Period End
The Funds have adopted financial reporting rules regarding subsequent events which require an entity to recognize in the financial statements the effects of all subsequent events that provide additional evidence about conditions that existed at the date of the balance sheet. Management has evaluated the Funds’ related events and transactions that occurred through the date of issuance of the Funds’ financial statements. There were no events or transactions that occurred during the fiscal period that materially impacted the amounts or disclosures in the Funds’ financial statements.
| CHARTWELL FUNDS |
| REPORT OF INDEPENDENT REGISTERED PUBLIC |
| ACCOUNTING FIRM |
To the Board of Trustees of The Chartwell Funds
and the Shareholders of Chartwell Income Fund, Chartwell Mid Cap Value Fund,
Chartwell Small Cap Value Fund, Chartwell Short Duration High Yield Fund,
Chartwell Small Cap Growth Fund, and Chartwell Short Duration Bond Fund
Opinion on the Financial Statements
We have audited the accompanying statements of assets and liabilities of Chartwell Income Fund, Chartwell Mid Cap Value Fund, Chartwell Small Cap Value Fund, Chartwell Short Duration High Yield Fund, Chartwell Small Cap Growth Fund, and Chartwell Short Duration Bond Fund, each a series of shares of beneficial interest in The Chartwell Funds (the “Funds”), including the schedules of investments, as of December 31, 2021, and the related statements of operations and changes in net assets and the financial highlights as noted in the table below, and the related notes (collectively referred to as the “financial statements”). In our opinion, the financial statements present fairly, in all material respects, the financial position of the Funds as of December 31, 2021, and the results of their operations, the changes in their net assets and their financial highlights as noted in the table below, in conformity with accounting principles generally accepted in the United States of America.
| Fund | Statements of Operations and Changes in Net Assets and
Financial Highlights Presented |
| Chartwell Income Fund, Chartwell Mid Cap Value Fund, Chartwell Small Cap Value Fund, and Chartwell Short Duration High Yield Fund | The statement of operations for the year ended December 31, 2021, the statements of changes in net assets for the year ended December 31, 2021, the period from November 1, 2020 through December 31, 2020, and for the year ended October 31, 2020 and the financial highlights for the year ended December 31, 2021, the period from November 1, 2020 through December 31, 2020 and for each of the years in the four-year period ended October 31, 2020 |
| Chartwell Small Cap Growth Fund | The statement of operations for the year ended December 31, 2021, the statements of changes in net assets for the year ended December 31, 2021, the period from November 1, 2020 through December 31, 2020 and for the year ended October 31, 2020 and the financial highlights for the year ended December 31, 2021, the period from November 1, 2020 through December 31, 2020, for each of the years in the three-year period then ended October 31, 2020, and for the period June 16, 2017 (commencement of operations) through October 31, 2017 |
| Chartwell Short Duration Bond Fund | The statements of operations and changes in net assets and the financial highlights for the period September 22, 2021 (commencement of operations) through December 31, 2021 |
Basis for Opinion
These financial statements are the responsibility of the Funds’ management. Our responsibility is to express an opinion on the Funds’ financial statements based on our audits. We are a public accounting firm registered with the Public Company Accounting Oversight Board (United
| CHARTWELL FUNDS |
| REPORT OF INDEPENDENT REGISTERED PUBLIC |
| ACCOUNTING FIRM (Continued) |
States) (“PCAOB”) and are required to be independent with respect to the Funds in accordance with the U.S. federal securities law and the applicable rules and regulations of the Securities and Exchange Commission and the PCAOB.
We conducted our audits in accordance with the standards of the PCAOB. Those standards require that we plan and perform the audits to obtain reasonable assurance about whether the financial statements are free of material misstatement, whether due to error or fraud. The Funds are not required to have, nor were we engaged to perform, an audit of their internal control over financial reporting. As part of our audits we are required to obtain an understanding of internal control over financial reporting but not for the purpose of expressing an opinion on the effectiveness of the Funds’ internal control over financial reporting. Accordingly, we express no such opinion.
Our audits included performing procedures to assess the risk of material misstatement of the financial statements, whether due to error or fraud, and performing procedures that respond to those risks. Such procedures included examining, on a test basis, evidence regarding the amounts and disclosures in the financial statements. Our procedures included confirmation of securities owned as of December 31, 2021 by correspondence with the custodian. Our audits also included evaluating the accounting principles used and significant estimates made by management, as well as evaluating the overall presentation of the financial statements. We believe that our audits provide a reasonable basis for our opinion.

BBD, LLP
We have served as the auditor of one or more of the Funds in The Chartwell Funds since 2017.
Philadelphia, Pennsylvania
February 21, 2022
| CHARTWELL FUNDS |
| ABOUT YOUR FUNDS’ EXPENSES (Unaudited) |
Expense Examples
As a shareholder of the Funds, you incur two types of costs: (1) transaction costs, which may include redemption fees; and (2) ongoing costs, including management fees and other Fund expenses. The examples below are intended to help you understand your ongoing costs (in dollars) of investing in the Funds and to compare these costs with the ongoing costs of investing in other mutual funds. A mutual fund’s ongoing costs are expressed as a percentage of its average net assets. This figure is known as the expense ratio.
These examples are based on an investment of $1,000 invested at the beginning of the period and held for the entire period from July 1, 2021 to December 31, 2021, except that for Chartwell Short Duration Bond Fund, the examples are based on an investment of $1,000 made at the commencement of operations (September 22, 2021) and held until the end of the period (December 31, 2021).
Actual Expenses
The information in the row titled “Based on Actual Fund Return” of the table below provides actual account values and actual expenses. You may use the information in these columns, together with the amount you invested, to estimate the expenses that you paid over the period. Simply divide your account value by $1,000 (for example, an $8,600 account value divided by $1,000 = 8.6), then multiply the result by the number in the appropriate row for your Fund, under the column titled “Expenses Paid During Period” to estimate the expenses you paid on your account during this period.
Hypothetical Example for Comparison Purposes
The information in the row titled “Based on Hypothetical 5% Return (before expenses)” of the table below provides hypothetical account values and hypothetical expenses based on each Fund’s actual expense ratios and an assumed rate of return of 5% per year before expenses, which is not each Fund’s actual return. The hypothetical account values and expenses may not be used to estimate the actual ending account balance or expenses you paid for the period. You may use this information to compare the ongoing costs of investing in the Funds with the ongoing costs of investing in other mutual funds. To do so, compare these 5% hypothetical examples with the 5% hypothetical examples that appear in the shareholder reports of the other mutual funds.
Please note that the expenses shown in the table are meant to highlight your ongoing costs only and do not reflect any transaction costs, such as sales charges (load) or redemption fees. Therefore, this information is useful in comparing ongoing costs only, and will not help you determine the relative total costs of owning different funds. In addition, if these transactional costs were included, your costs would have been higher.
| CHARTWELL FUNDS |
| ABOUT YOUR FUNDS’ EXPENSES (Unaudited) (Continued) |
| | | Beginning | | Ending | | | | |
| | | Account Value | | Account Value | | Net | | Expenses |
| | | July 1, | | December 31, | | Expense | | Paid During |
| | | 2021 | | 2021 | | Ratio(a) | | Period(b) |
| Chartwell Income Fund | | | | | | | | |
| Based on Actual Fund Return | | $1,000.00 | | $1,017.10 | | 0.64% | | $3.25 |
| Based on Hypothetical 5%Return (before expenses) | | $1,000.00 | | $1,021.98 | | 0.64% | | $3.26 |
| | | | | | | | | |
| Chartwell Mid Cap Value Fund | | | | | | | | |
| Based on Actual Fund Return | | $1,000.00 | | $1,116.60 | | 0.90% | | $4.80 |
| Based on Hypothetical 5%Return (before expenses) | | $1,000.00 | | $1,020.67 | | 0.90% | | $4.58 |
| | | | | | | | | |
| Chartwell Small Cap Value Fund | | | | | | | | |
| Based on Actual Fund Return | | $1,000.00 | | $1,038.80 | | 1.05% | | $5.40 |
| Based on Hypothetical 5%Return (before expenses) | | $1,000.00 | | $1,019.91 | | 1.05% | | $5.35 |
| | | | | | | | | |
| Chartwell Short Duration High Yield Fund | | | | | | | | |
| Based on Actual Fund Return | | $1,000.00 | | $1,006.20 | | 0.49% | | $2.48 |
| Based on Hypothetical 5%Return (before expenses) | | $1,000.00 | | $1,022.74 | | 0.49% | | $2.50 |
| | | | | | | | | |
| Chartwell Small Cap Growth Fund | | | | | | | | |
| Based on Actual Fund Return | | $1,000.00 | | $1,003.80 | | 1.05% | | $5.30 |
| Based on Hypothetical 5%Return (before expenses) | | $1,000.00 | | $1,019.91 | | 1.05% | | $5.35 |
| (a) | Annualized, based on each Fund’s most recent one-half year expenses. |
| (b) | Expenses are equal to each Fund’s annualized net expense ratio multiplied by the average account value over the period, multiplied by 184/365 (to reflect the one-half year period). |
| CHARTWELL FUNDS |
| ABOUT YOUR FUNDS’ EXPENSES (Unaudited) (Continued) |
| | | | | | | | | |
| | | Beginning | | Ending | | | | |
| | | Account Value | | Account Value | | Net | | Expenses |
| | | July 1, | | December 31, | | Expense | | Paid During |
| | | 2021(a) | | 2021 | | Ratio(b) | | Period(c) |
| Chartwell Short Duration Bond Fund | | | | | | | | |
| Based on Actual Fund Return | | $1,000.00 | | $996.30 | | 0.39% | | $1.07 |
| Based on Hypothetical 5%Return (before expenses) | | $1,000.00 | | $1,023.18 | | 0.39% | | $1.98 |
| (a) | Beginning Account Value is as of September 22, 2021 (date of commencement of operations) for the Actual Fund Return information. |
| (b) | Annualized, based on the Fund’s net expenses since the commencement of operations (September 22, 2021). |
| (c) | Expenses are equal to the Fund’s annualized net expense ratio multiplied by the average account value over the period, multiplied by 101/365 (to reflect the period since inception) and 184/365 (to reflect the one-half year period), for Actual Fund Return and Hypothetical 5% Return information, respectively. |
| CHARTWELL FUNDS |
| OTHER INFORMATION (Unaudited) |
Proxy Voting Policies and Procedures
A description of the Funds’ proxy voting policies and procedures related to portfolio securities is available without charge, upon request, by calling the Funds at 1-888-995-5505, or on the U.S. Securities and Exchange Commission (the “SEC”) website at www.sec.gov.
Proxy Voting Record
Information regarding how the Funds voted proxies for portfolio securities during the most recent 12-month period ended June 30, is also available, without charge and upon request, by calling the Funds at 1-888-995-5505, or by accessing the Funds’ Form N-PX on the SEC’s website at www.sec.gov.
Portfolio Disclosure
The Funds file a complete listing of portfolio holdings with the SEC as of the end of the first and third quarters of each fiscal year as an exhibit to its reports on Form N-PORT. These filings are available upon request by calling 1-888-995-5505. Furthermore, you may obtain a copy of the filings on the SEC’s website at www.sec.gov.
| CHARTWELL FUNDS |
| FEDERAL TAX INFORMATION (Unaudited) |
Dividends Received Deduction
For corporate shareholders, the following percentages of ordinary income dividends paid during the period ended December 31, 2021 qualify for the corporate dividends received deduction:
| Chartwell Income Fund | | 29.08% | |
| Chartwell Mid Cap Value Fund | | 100.00% | |
| Chartwell Small Cap Value Fund | | 100.00% | |
| Chartwell Short Duration High Yield Fund | | 0.00% | |
| Chartwell Small Cap Growth Fund | | 4.00% | |
| Chartwell Short Duration Bond Fund | | 0.00% | |
| | | | |
Qualified Dividend Income
The Funds have designated the maximum amount allowable of their net taxable income as qualified dividend income as provided in the Jobs and Growth Tax Relief Reconciliation Act of 2003. This amount was reflected on Form 1099-DIV for the calendar year 2021.
Capital Gain Distributions
For the period ended December 31, 2021, the following Funds designated long-term capital gain distributions:
| Chartwell Small Cap Value Fund | | $ | 16,956,002 | |
| Chartwell Small Cap Growth Fund | | $ | 3,451,422 | |
| | | | | |
| CHARTWELL FUNDS |
| BOARD OF TRUSTEES AND EXECUTIVE OFFICERS (Unaudited) |
The Board of Trustees has overall responsibility for management of the Trust’s affairs. The Trustees serve during the lifetime of the Trust and until its termination, or until death, resignation, retirement, or removal. The Trustees, in turn, elect the officers of the Trust to actively supervise its day-to-day operations. The officers have been elected for an annual term. The following are the Trustees and executive officers of the Trust:
Name, Address, Year of
Birth and Position(s)
held with Trust | Term of
Office and
Length of
Time Served | Principal Occupation During the
Past Five Years and Other Affiliations | Number of
Portfolios
in the Fund
Complex
Overseen by
Trustee | Other
Directorships
Held During
the Past Five
Years |
| “Independent” Trustees: |
Gerald Frey
(born 1946)
Trustee | Since 2017 | Principal/General Partner, GSF Investments (1996-Present) | 6 | None |
David M. O’Brien
(born 1950)
Trustee | Since 2017 | Retired (2012-Present) | 6 | None |
Paul L. Rudy, III
(born 1967)
Trustee | Since 2017 | President, Graham Capital Company (2011-Present) | 6 | None |
| Interested Trustees: |
Timothy J. Riddle †
(born 1955)
Chairman, Trustee,
President and Chief
Executive Officer | Since 2017 | Managing Partner and Chief Executive Officer, Chartwell Investment Partners, LLC (1997-Present) | 6 | N/A |
| CHARTWELL FUNDS |
| BOARD OF TRUSTEES AND EXECUTIVE OFFICERS (Unaudited) (Continued) |
Name, Address, Year of
Birth and Position(s)
held with Trust | Term of
Office and
Length of
Time Served | Principal Occupation During the
Past Five Years and Other Affiliations | Number of
Portfolios
in the Fund
Complex
Overseen by
Trustee | Other
Directorships
Held During
the Past Five
Years |
| Officers of the Trust: |
Neil Walker
(born 1980)
Treasurer, Chief Financial
Officer and Secretary | Since 2017 | Controller, Chartwell Investment Partners, LLC (2016-Present); Controller, The Killen Group (2011-2016) | N/A | N/A |
Michael Magee
(born 1965)
Executive Vice President | Since 2017 | Chief Operating Officer, Chartwell Investment Partners, LLC (2016-Present); Chief Operating Officer, The Killen Group (2013-2016) | N/A | N/A |
Gregory Hagar
(born 1968)
Vice President | Since 2017 | Managing Partner and Chief Financial Officer, Chartwell Investment Partners, LLC (1997-Present) | N/A | N/A |
LuAnn Molino
(born 1963)
Chief Compliance Officer | Since 2017 | Chief Compliance Officer, Marketing, Client Service, Chartwell Investment Partners, LLC (1997-Present) | N/A | N/A |
| † | Timothy J. Riddle is an “interested person” of the Trust by virtue of his affiliation with the Adviser and its affiliates. |
Additional information about the Trustees and executive officers is included in the Funds’ Statement of Additional Information which is available, without charge, upon request by calling (888) 995-5505.
| CHARTWELL FUNDS |
| BOARD CONSIDERATION AND APPROVAL OF INVESTMENT |
| ADVISORY AGREEMENT (Unaudited) |
At a meeting held on May 13, 2021 (the “Meeting”), the Board of Trustees (the “Trustees” or the “Board”) of The Chartwell Funds (the “Trust”), including the Trustees who are not “interested persons” of the Trust (the “Independent Trustees”) as defined in the Investment Company Act of 1940, as amended (the “1940 Act”), reviewed and approved the continuance of the Investment Advisory Agreement (the “Advisory Agreement”) between the Trust and Chartwell Investment Partners (the “Advisor”) with respect to the Chartwell Income Fund (“Income Fund”), Chartwell Mid Cap Value Fund (“Mid Cap Value Fund”), Chartwell Short Duration High Yield Fund (“High Yield Fund”), Chartwell Small Cap Growth Fund (“Small Cap Growth Fund”) and Chartwell Small Cap Value Fund (“Small Cap Value Fund”), each a series of the Trust (each, a “Fund” and together, the “Funds”), for an additional one-year period.
In considering the continuation of the Advisory Agreement, the Independent Trustees reviewed and considered information provided by the Advisor at the Meeting and throughout the year at meetings of the Board and its committees. The Independent Trustees also reviewed and considered the information and materials provided in response to a request for information submitted to the Advisor on behalf of the Board in connection with the proposed renewal of the Advisory Agreement, including statistical materials from Morningstar, an independent organization, comparing the performance of each Fund and the fees and expenses of each Fund with those of a peer group of funds. In connection with their review of each Fund, each Independent Trustee reviewed and considered all of the factors that he deemed relevant in approving the continuance of the Advisory Agreement, including, but not limited to: (i) the nature, extent and quality of the services provided by the Advisor; (ii) the investment performance of the Funds and the Advisor; (iii) the costs of the services provided and profits realized by the Advisor and its affiliates from their relationship with the Funds; (iv) the extent to which economies of scale are realized as the Funds grow; and (v) whether fee levels reflect these economies of scale for the benefit of Fund investors.
In their deliberations, the Independent Trustees considered all of the information provided, including the factors summarized below, in renewing the Advisory Agreement with respect to each Fund. The Independent Trustees did not identify any single factor as being more or less important than any of the others, and individual Trustees may have weighed certain factors differently. The Independent Trustees received a memorandum discussing the legal standards for their consideration of the continuation of the Advisory Agreement and met separately with, and were assisted and advised by, their independent counsel.
Nature, Extent and of Quality of Services
The Trustees considered information about the nature, extent and quality of the services provided by the Advisor, including investment management services and operational and compliance support. The Trustees reviewed background, qualifications and experience of the Advisor’s personnel who are responsible for the day-to-day portfolio management of the Funds, or who provide significant other services to the Funds. The Trustees considered the Advisor’s responsibilities in serving as the Funds’ investment advisor, including: supervising and managing the investment and reinvestment of each Fund’s assets; voting, exercising consents and exercising all other rights appertaining to such securities and other assets on behalf of the Fund through arrangements with a proxy advisory firm; supervising the investment program
| CHARTWELL FUNDS |
| BOARD CONSIDERATION AND APPROVAL OF INVESTMENT |
| ADVISORY AGREEMENT (Unaudited) (Continued) |
of the Fund and the composition of its investment portfolio; arranging for the purchase and sale of securities and other assets held in the investment portfolio of the Fund; monitoring and testing compliance with various policies and procedures of the Funds; assisting with the administration of the Trust’s liquidity risk management program; periodic reviews of intermediary services and related fees; and periodic reporting to the Board. The Trustees were provided with, and considered information regarding, the Advisor’s investment decision-making process and its trading and investment research functions. The Trustees considered the Funds’ compliance program, changes made to the compliance program throughout the year, the compliance reports periodically furnished to the Board, and the operations of the Funds and the Advisor during the COVID-19 pandemic. The Trustees also considered the marketing and distribution arrangements for the Funds and the current asset levels of the Funds. The Trustees concluded that they were satisfied with the nature, extent, and quality of services provided to each Fund by the Advisor under the Advisory Agreement.
Fund Performance
The Trustees reviewed the performance information for each Fund compiled by the Advisor and from Morningstar data for periods ended March 31, 2021, as well. The Trustees reviewed each Fund’s performance in absolute terms and relative to the peer funds in its Morningstar investment category during both of the foregoing periods. The Trustees considered the size of each Fund in comparison to its peer funds in each Morningstar investment category. The Trustees also reviewed the performance analysis prepared by the Advisor comparing each Fund’s performance relative to its benchmark index, over multiple performance periods, along with the Advisor’s explanation of the Funds’ performance. Among other things, Trustees considered the following Fund-specific factors:
Income Fund. The Fund underperformed the category median for the three- and five-year periods ended March 31, 2021, and outperformed the category median for the one-year period ended such date. The Fund outperformed its primary benchmark index for the one-, three- and five-year periods ended March 31, 2021. The Trustees considered that in 2019 the Income Fund transitioned to a new and expanded portfolio management team and noted that the Fund’s performance relative to peers had improved over the one-year period ended March 31, 2021. The Trustees’ considered the Advisor’s explanation that Fund’s equity allocation, particularly the allocations to mid-cap equities and higher quality value stocks within such allocation, detracted from performance relative to peers. The Advisor noted that while the Fund’s value tilt in equities lagged the performance of growth stocks in 2020, the Advisor believes those dynamics are on the precipice of changing going forward.
Mid Cap Value Fund. The Fund underperformed the category median and the Fund’s benchmark index for the one-, three- and five-year periods ended March 31, 2021 The Advisor noted that poor stock selection, sector and, to a greater degree, industry allocation detracted from the Fund’s performance relative to peers, as did the outperformance of lower quality stocks relative to higher quality positioning of the Fund.
High Yield Fund. The Fund underperformed the category median and the Fund’s primary benchmark index for the one-, three- and five-year periods ended March 31, 2021. The Trustees
| CHARTWELL FUNDS |
| BOARD CONSIDERATION AND APPROVAL OF INVESTMENT |
| ADVISORY AGREEMENT (Unaudited) (Continued) |
considered that the Fund maintains a higher average quality and shorter average maturity than the traditional high yield bond funds that are included in the Morningstar investment category. The Advisor noted that the Fund invests in a narrow slice of the high yield bond market, for which the Advisor believes there is no appropriate replicable index and/or peer group. The Advisor further noted that the Fund seeks to generate attractive income with relatively low volatility over full market cycles.
Small Cap Growth Fund. The Fund, which was launched in 2017, outperformed the category median and the Fund’s benchmark index for the one- and three-year periods ended March 31, 2021.
Small Cap Value Fund. The Fund underperformed the category median and the Fund’s benchmark index for each of the one-, three- and five-year periods ended March 31, 2021. The Advisor noted that poor stock selection, sector and, to a greater degree, industry allocation detracted from the Fund’s performance relative to peers, as did the outperformance of lower quality stocks relative to higher quality positioning of the Fund.
After considering the information provided and presented at the Meeting and at meetings throughout the year, including discussions with and explanations by the Advisor, the Trustees determined that the performance of each Fund was reasonable.
Advisory Fees and Expenses
The Board reviewed the fee and expense information for each Fund compiled from Morningstar data for periods as of the Funds’ and the peer funds’ respective fiscal year ends. The Board compared each Fund’s actual advisory fee and total net expense ratio (after waivers) with the peer funds in its Morningstar investment category. The Board also considered the size of each Fund in comparison to its peer funds. Additionally, the Board received and considered information about the fees charged to other accounts and strategies managed by the Advisor that use similar investment styles and noted that these accounts are not subject to the same regulatory requirements Board reporting, separate website support, and client service responsibilities as the Funds. Among other things, the Trustees considered the following Fund-specific factors:
Income Fund. (1) The Fund’s actual advisory fee was higher than the category median of actual advisory fees charged to the peer funds included in the Fund’s Morningstar investment category; (2) the Fund’s total net expense ratio was lower than the category median of total net expense ratios of the peer funds in the Fund’s Morningstar investment category; (3) the Advisor agreed to continue to limit the Fund’s expense ratio for an additional year.
Mid Cap Value Fund. (1) The Fund’s actual advisory fee was higher than the category median of actual advisory fees charged to the peer funds included in the Fund’s Morningstar investment category; (2) the Fund’s total net expense ratio was lower than the category median of total net expense ratios of the peer funds in the Fund’s Morningstar investment category; (3) the Advisor agreed to limit the Fund’s expense ratio for an additional year.
| CHARTWELL FUNDS |
| BOARD CONSIDERATION AND APPROVAL OF INVESTMENT |
| ADVISORY AGREEMENT (Unaudited) (Continued) |
High Yield Fund. (1) The Fund’s actual advisory fee was lower than the category median of actual advisory fees charged to the peer funds included in the Fund’s Morningstar investment category; (2) the Fund’s total net expense ratio was below the category median of total net expense ratios of the peer funds in the Fund’s Morningstar investment category; (3) the Advisor agreed to limit the Fund’s expense ratio for an additional year.
Small Cap Growth Fund. (1) The Fund’s actual advisory fee was higher than the category median of actual advisory fees charged to the peer funds included in the Fund’s Morningstar investment category; (2) the Fund’s total net expense ratio was lower than the category median of total net expense ratios of the peer funds in the Fund’s Morningstar investment category; (3) the Advisor agreed to limit the Fund’s expense ratio for an additional year.
Small Cap Value Fund. (1) The Fund’s actual advisory fee was higher than the category median of actual advisory fees charged to the peer funds in the Fund’s Morningstar investment category; (2) the Fund’s total net expense ratio at the category median of total net expense ratios of the peer funds in the Fund’s Morningstar investment category; (3) the Advisor agreed to limit the Fund’s expense ratio for an additional year.
The Trustees concluded that the compensation paid to the Advisor under the Advisory Agreement and the total net expenses of each Fund, after waivers, were fair and reasonable in light of the nature and quality of the services to be provided by the Advisor to each Fund.
Costs of Services and Profitability
The Trustees considered the financial information provided by the Advisor, including the costs and profits with respect to each Fund. The Trustees concluded that the profits of the Advisor from its relationship with the Funds were reasonable.
The Trustees also considered the extent to which the Advisor might derive ancillary benefits as a result of its relationships with the Funds (other than the receipt of its investment advisory fee), including any research received from broker-dealers providing execution services to the Funds and the intangible benefits of its association with the Funds generally. Based upon its consideration of all these factors, the Trustees concluded that the level of profits realized by the Advisor from providing services to the Funds was not excessive in view of the nature, extent and quality of services provided to the Funds.
Economies of Scale
The Trustees considered the size of each Fund and noted the Advisor had instituted breakpoints in the advisory fee for the largest Fund, the Income Fund. The Trustees also noted that although there were no advisory fee breakpoints on the Mid Cap Value Fund, High Yield Fund, Small Cap Growth Fund and Small Cap Value Fund, the assets levels of those Funds were not currently likely to lead to significant economies of scale and that any such economies would be considered in the future as those Funds’ assets grow.
| CHARTWELL FUNDS |
| BOARD CONSIDERATION AND APPROVAL OF INVESTMENT |
| ADVISORY AGREEMENT (Unaudited) (Continued) |
Conclusion
Based on its review, consideration and evaluation of all factors it believed relevant, including the above-described factors and conclusions, the Board, including the Independent Trustees, unanimously approved the continuation of the Advisory Agreement for an additional one-year period.
| CHARTWELL SHORT DURATION BOND FUND |
| BOARD CONSIDERATION AND APPROVAL OF INVESTMENT |
| ADVISORY AGREEMENT (Unaudited) |
At a meeting held on August 12, 2021 (the “Meeting”), the Board of Trustees (the “Trustees” or the “Board”) of The Chartwell Funds (the “Trust”), including the Trustees who are not “interested persons” of the Trust (the “Independent Trustees”) as defined in the Investment Company Act of 1940, as amended (the “1940 Act”), reviewed and approved the initial Investment Advisory Agreement (the “Advisory Agreement”) between the Trust and Chartwell Investment Partners (the “Advisor”) with respect to the Chartwell Short Duration Bond Fund (the “New Fund”) for an initial two-year period.
In considering the approval of the Advisory Agreement, the Independent Trustees reviewed and considered information provided by the Advisor at the Meeting and throughout the year at meetings of the Board, including meetings held in May and June of 2021. The Independent Trustees also reviewed and considered the information and materials provided in response to a request for information submitted to the Advisor on behalf of the Independent Trustees in connection with the proposed Advisory Agreement, including reports comparing the proposed advisory fee and the estimated total annual operating expenses of the New Fund to those of a group of comparable funds (the “peer group”) selected by Morningstar, Inc.
In their deliberations, the Independent Trustees considered all of the information provided, including the factors summarized below, in approving the Advisory Agreement. The Independent Trustees did not identify any single factor as being more or less important than any of the others, and individual Trustees may have weighed certain factors differently. The Independent Trustees received a memorandum discussing the legal standards for their consideration of the approval of the Advisory Agreement and met separately with, and were assisted and advised by, their independent counsel.
Nature, Extent and of Quality of Services
The Board discussed the fees payable under the proposed Advisory Agreement and the services to be provided by the Advisor to the New Fund. The Trustees reviewed and considered information about the nature, extent and quality of the investment advisory services to be provided by the Advisor to the New Fund, which included, among other things, the investment objective, strategies, risks and policies of the New Fund; the resources and key personnel who would perform services for the New Fund; and the Advisor’s capabilities and experience as the investment advisor of the other series of the Trust. The Trustees also considered the Advisor’s capabilities and experience as the investment advisor of the other series of the Trust. The Board concluded that the Advisor had the requisite, resources, capabilities, experience and personnel to provide quality services to the New Fund.
Fund Performance
The Board noted that the New Fund had not yet commenced investment operations and had no investment performance. The Board considered performance information for a similar investment strategy managed by the Advisor for other accounts and noted that the New Fund appears to be designed to achieve acceptable performance.
| CHARTWELL SHORT DURATION BOND FUND |
| BOARD CONSIDERATION AND APPROVAL OF INVESTMENT |
| ADVISORY AGREEMENT (Unaudited) (Continued) |
Advisory Fees and Expenses
The Board reviewed and considered information regarding the proposed investment advisory fee to be charged to the New Fund by the Advisor, the New Fund’s anticipated total expense ratio, and the fee waivers and expense limitation arrangements (“waivers”) that the Advisor contractually agreed to implement. The Board considered that the New Fund’s proposed investment advisory fee and anticipated total expense ratio, after waivers, were both below the median and average of the advisory fees and total expense ratios, after waivers, of the New Fund’s peer group. The Board and the Independent Trustees concluded that the compensation payable to the Advisor under the Advisory Agreement was fair and reasonable in light of the nature and quality of the services to be provided by the Advisor to the New Fund.
Costs of Services and Profitability
The Board noted that the Advisor could not report any financial results from its relationship with the New Fund because the New Fund had not yet commenced operations. The Board considered the estimated costs and profitability with respect to the New Fund at different asset levels and, based on these estimates, noted that it was not anticipated that the New Fund will generate significant, if any, profit for the Advisor in the near future.
Economies of Scale
The Board also considered the potential benefits by the Advisor as a result of its relationships with the New Fund (other than the receipt of its advisory fee), including any research received from broker-dealers providing execution services to the New Fund and the intangible benefits of its association with the New Fund generally and any favorable publicity arising in connection with the New Fund’s performance once launched. The Board considered that the New Fund was new and had no assets, and although there were no advisory fee breakpoints, the assets of the New Fund in the near future were not likely to lead to significant economies of scale and that any such economies would be considered in the future as the New Fund’s assets grow.
Conclusion
Based on these and other factors, the Board and the Independent Trustees separately concluded that the overall fee arrangement between the Trust, on behalf of the New Fund, and the Advisor was fair and reasonable, and approved the Advisory Agreement for an initial two-year period.
This page intentionally left blank.
This page intentionally left blank.
| |
| |
| |
| |
| |
| Chartwell Funds |
| Each a series of The Chartwell Funds |
| |
| Investment Advisor |
| Chartwell Investment Partners, LLC |
| 1205 Westlakes Drive, Suite 100 |
| Berwyn, Pennsylvania 19312 |
| |
| Independent Registered Public Accounting Firm |
| BBD, LLP |
| 1835 Market Street, 3rd Floor |
| Philadelphia, Pennsylvania 19103 |
| |
| Custodian |
| UMB Bank, n.a. |
| 928 Grand Boulevard, 5th Floor |
| Kansas City, Missouri 64106 |
| |
| Fund Administrator, Transfer Agent and Fund Accountant |
| Ultimus Fund Solutions, LLC |
| 225 Pictoria Drive, Suite 450 |
| Cincinnati, OH 45246 |
| |
| Distributor |
| Foreside Fund Services, LLC |
| Three Canal Plaza, Suite 100 |
| Portland, Maine 04101 |
| www.foreside.com |
This report and the financial statements contained herein are provided for the general information of the shareholders of the Chartwell Funds. This report is not authorized for distribution to prospective investors in the Funds unless preceded or accompanied by an effective prospectus.
Chartwell-AR-21
As of the end of the period covered by this report, the registrant has adopted a code of ethics that applies to the registrant’s principal executive officer, principal financial officer, principal accounting officer or controller, or persons performing similar functions, regardless of whether these individuals are employed by the registrant or a third party. Pursuant to Item 13(a)(1), a copy of registrant’s code of ethics is filed as an exhibit to this Form N-CSR. During the period covered by this report, the code of ethics has not been amended, and the registrant has not granted any waivers, including implicit waivers, from the provisions of the code of ethics.
| Item 3. | Audit Committee Financial Expert. |
The registrant’s board of trustees has determined that the registrant has at least one audit committee financial expert serving on its audit committee. The name of the audit committee financial expert is Paul L. Rudy, III. Mr. Rudy, III is “independent” for purposes of this Item.
| Item 4. | Principal Accountant Fees and Services. |
| (a) | Audit Fees. The aggregate fees billed for professional services rendered by the principal accountant for the audit of the registrant’s annual financial statements or for services that are normally provided by the accountant in connection with statutory and regulatory filings or engagements were $80,300 and $42,600 with respect to the registrant’s fiscal years ended December 31, 2021 and December 31, 2020, respectively. |
| (b) | Audit-Related Fees. No fees were billed in either of the last two fiscal years for assurance and related services by the principal accountant that are reasonably related to the performance of the audit of the registrant’s financial statements and are not reported under paragraph (a) of this Item. |
| (c) | Tax Fees. The aggregate fees billed for professional services rendered by the principal accountant for tax compliance, tax advice, and tax planning were $13,500 and $11,250 with respect to the registrant’s fiscal years ended December 31, 2021 and December 31, 2020, respectively. The services comprising these fees are the preparation of the registrant’s federal income and excise tax returns. |
| (d) | All Other Fees. No fees were billed in either of the last two fiscal years for products and services provided by the principal accountant, other than the services reported in paragraphs (a) through (c) of this Item. |
(e)(1) The audit committee has not adopted pre-approval policies and procedures described in paragraph (c)(7) of Rule 2-01 of Regulation S-X.
| (e)(2) | None of the services described in paragraph (b) through (d) of this Item were approved by the audit committee pursuant to paragraph (c)(7)(i)(C) of Rule 2-01 of Regulation S-X. |
| (f) | Less than 50% of hours expended on the principal accountant’s engagement to audit the registrant’s financial statements for the most recent fiscal year were attributed to work performed by persons other than the principal accountant’s full-time, permanent employees. |
(g) During the fiscal years ended December 31, 2021 and December 31, 2020, aggregate non-audit fees of $13,500 and $11,250, respectively, were billed by the registrant’s accountant for services rendered to the registrant. No non-audit fees were billed in either of the last two fiscal years by the registrant’s accountant for services rendered to the registrant’s investment adviser (not including any sub-adviser whose role is primarily portfolio management and is subcontracted with or overseen by another investment adviser), and any entity controlling, controlled by, or under common control with the adviser that provides ongoing services to the registrant.
| (h) | The principal accountant has not provided any non-audit services that were not previously approved to the registrant’s investment adviser (not including any sub-adviser whose role is primarily portfolio management and is subcontracted with or overseen by another investment adviser), and any entity controlling, controlled by, or under common control with the investment adviser that provides ongoing services to the registrant. |
| Item 5. | Audit Committee of Listed Registrants. |
Not applicable
| (a) | Not applicable [schedule filed with Item 1] |
| Item 7. | Disclosure of Proxy Voting Policies and Procedures for Closed-End Management Investment Companies. |
Not applicable
| Item 8. | Portfolio Managers of Closed-End Management Investment Companies. |
Not applicable
| Item 9. | Purchases of Equity Securities by Closed-End Management Investment Company and Affiliated Purchasers. |
Not applicable
| Item 10. | Submission of Matters to a Vote of Security Holders. |
There have been no material changes to the procedures by which shareholders may recommend nominees to the registrant’s board of trustees.
| Item 11. | Controls and Procedures. |
(a) Based on their evaluation of the registrant’s disclosure controls and procedures (as defined in Rule 30a-3(c) under the Investment Company Act of 1940, as amended (the “Act”)) as of a date within 90 days of the filing date of this report, the registrant’s principal executive officer and principal financial officer have concluded that such disclosure controls and procedures are reasonably designed and are operating effectively to ensure that material information relating to the registrant is made known to them by others within those entities, particularly during the period in which this report is being prepared, and that the information required in filings on Form N-CSR is recorded, processed, summarized, and reported on a timely basis.
(b) There were no changes in the registrant’s internal control over financial reporting (as defined in Rule 30a-3(d) under the Investment Company Act of 1940) that occurred during the period covered by this report that have materially affected, or are reasonably likely to materially affect, the registrant’s internal control over financial reporting.
Item 12. Disclosure of Securities Lending Activities for Closed-End Management Investment Companies.
Not applicable
File the exhibits listed below as part of this Form. Letter or number the exhibits in the sequence indicated.
(a)(1) Any code of ethics, or amendment thereto, that is the subject of the disclosure required by Item 2, to the extent that the registrant intends to satisfy the Item 2 requirements through filing of an exhibit: Attached hereto
(a)(2) A separate certification for each principal executive officer and principal financial officer of the registrant as required by Rule 30a-2(a) under the Act (17 CFR 270.30a-2(a)): Attached hereto
(a)(3) Any written solicitation to purchase securities under Rule 23c-1 under the Act (17 CFR 270.23c-1) sent or given during the period covered by the report by or on behalf of the registrant to 10 or more persons: Not applicable
(a)(4) Change in the registrant’s independent public accountants: Not applicable
(b) Certifications required by Rule 30a-2(b) under the Act (17 CFR 270.30a-2(b)): Attached hereto
.
SIGNATURES
Pursuant to the requirements of the Securities Exchange Act of 1934 and the Investment Company Act of 1940, the registrant has duly caused this report to be signed on its behalf by the undersigned, thereunto duly authorized.
| (Registrant) | The Chartwell Funds | | |
| | | | |
| By (Signature and Title)* | /s/ Timothy J. Riddle | |
| | | Timothy J. Riddle, Chairman, President and Chief Executive Officer (Principal Executive Officer) | |
| Date | February 28, 2022 | | |
| | | | |
| Pursuant to the requirements of the Securities Exchange Act of 1934 and the Investment Company Act of 1940, this report has been signed below by the following persons on behalf of the registrant and in the capacities and on the dates indicated. |
| | | | |
| By (Signature and Title)* | /s/ Timothy J. Riddle | |
| | | Timothy J. Riddle, Chairman, President and Chief Executive Officer (Principal Executive Officer) | |
| | | | |
| Date | February 28, 2022 | | |
| | | | |
| By (Signature and Title)* | /s/ Neil Walker | |
| | | Neil Walker, Treasurer and Chief Financial Officer (Principal Financial Officer) | |
| | | | |
| Date | February 28, 2022 | | |
* Print the name and title of each signing officer under his or her signature.