UNITED STATES
SECURITIES AND EXCHANGE COMMISSION
Washington, D.C. 20549
FORMN-CSR
CERTIFIED SHAREHOLDER REPORT OF REGISTERED MANAGEMENT
INVESTMENT COMPANIES
Investment Company Act file number 811-23235
Morningstar Funds Trust
(Exact name of registrant as specified in charter)
Morningstar Funds Trust
22 W. Washington Street
Chicago, IL 60602
(Address of principal executive offices) (Zip code)
D. Scott Schilling
Morningstar Funds Trust
22 W. Washington Street
Chicago, IL 60602
With a copy to:
Eric S. Purple
Stradley Ronon Stevens & Young, LLP
1250 Connecticut Avenue, N.W., Suite 500
Washington, District of Columbia, 20036
(Name and address of agent for service)
Registrant’s telephone number, including area code: (312)696-6000
Date of fiscal year end: April 30
Date of reporting period: April 30, 2019
Item 1. Reports to Stockholders.
2
April 30, 2019
A N N U A L R E P O R T
| | | | |
Morningstar Funds Trust | | Morningstar U.S. Equity Fund Morningstar International Equity Fund Morningstar Global Income Fund Morningstar Total Return Bond Fund Morningstar Municipal Bond Fund Morningstar Defensive Bond Fund Morningstar Multisector Bond Fund Morningstar Unconstrained Allocation Fund Morningstar Alternatives Fund | | |
| | |
| | Important Notice Beginning on January 1, 2021, as permitted by regulations adopted by the Securities and Exchange Commission, paper copies of the Funds’ shareholder reports will no longer be sent by mail, unless you specifically request paper copies of the reports from your financial intermediary (e.g., custodian, financial adviser through which you invest or sponsor of the investment advisory program). Instead, the reports will be made available on a website (http://connect.rightprospectus.com/Morningstar), and you will be notified by mail or by such other manner as you have agreed upon with your financial intermediary each time a report is posted and provided with a website link to access the report. If you already elected to receive shareholder reports electronically, you will not be affected by this change and you need not take any action. You may elect to receive shareholder reports and other communications from the Fund or your financial intermediary electronically by contacting your financial intermediary. You may elect to receive all future reports in paper free of charge. If you invest through a financial intermediary (including through an investment advisory program sponsored by Morningstar Investment Services LLC or another financial institution), you can contact your financial intermediary to inform it that you wish to continue receiving paper copies of your shareholder reports. Your election to receive reports in paper will apply to all Morningstar Funds held with your financial intermediary. | | |

| | | | |
Morningstar Funds Trust April 30, 2019
Introduction
Morningstar Investment Management, LLC launched anopen-end management investment company consisting of nine separate portfolios (each a fund) that span the investment opportunity set. Most of these Funds were designed to provide exposure to a broad asset class, such as U.S. equities, while our active management of each Fund’s asset allocation and active managers (known as “subadvisers”) will adjust exposures tosub-asset classes (such assmall-cap value) based on our valuation views and those of the subadvisers.
Concept and Structure
We created the Morningstar Funds Trust using an open architecture, multi-manager approach, hiring as active subadvisers both institutional managers and other managers whose mutual funds were previously used in Morningstar®Managed PortfoliosSM. Our analysts and portfolio managers continually use research, data, and analysis from Morningstar, Inc. and its affiliates to study the subadvisers and their investments closely and determine which fit best with our investment philosophy and the investment objectives of each Morningstar Fund1. We have selected managers we believed were independent, skilled investors in their respective asset classes.
Consistent with our investment approach, our asset allocation process for the Morningstar Funds is based on fundamentals and driven by valuations. We look for asset classes and sub-asset classes around the globe that, in our view, offer fundamental value relative to price. Allocations within each Fund are in line with what we believe to reflect the best risk-adjusted opportunities.
How to Read This Report
This report outlines the structure and performance of the assets comprised by the Morningstar Funds Trust from inception (November 2, 2018) through April 30, 2019 (our fiscal period end). Included are fund holdings, positioning, and performance summaries, including relevant commentary and examples that may aid understanding of returns for the period.
The commentary, views, and opinions in this report were current as of April 30, 2019. Our views reflect performance results net of fees and expenses as of the end of the reporting period.
Statements made within this report are not guarantees of future performance or investment results and should not be taken as investment advice. Investment decisions reflect a variety of factors, and we reserve the right to change views about individual holdings, sectors, and markets at any time. As a result, the views expressed should not be relied upon as a forecast of the Morningstar Funds’ future investment intent.
1Morningstar Funds Trust is an open-end management investment company registered under the Investment Company Act of 1940 (as amended). Use of the term “Morningstar Funds” hereafter refers to Morningstar Funds Trust, or its individual series, as applicable.
Morningstar Funds Trust April 30, 2019
Table of Contents
Morningstar Funds Trust April 30, 2019
Statement of Shareholder Rights
It is important to note that as a shareholder, you have certain rights and protections, chief among them an independent board of trustees, whose main role is to represent your interests.
The Trustees are responsible for the overall management of the Trust, including general supervision and review of the investment activities of each Fund. The Trustees, in turn, elect the officers of the Trust, who are responsible for administering theday-to-day operations of the Trust and its separate series, including the Funds.
The “Independent Trustees” are Trustees who are not “interested persons” of the Trust, as that term is defined in the Investment Company Act of 1940 (e.g. not a Morningstar employee).
More information about the Trustees is available athttps://www.morningstar.com/company/morningstar-funds-governance.
The Board of Trustees for the Morningstar Funds Trust is committed to representing your interests as well as implementing and maintaining sound fund governance principles. If you have comments or questions with respect to your investment in the Morningstar Funds, you may direct them to the Board of Trustees in the following ways:
By email:BoardofTrustees.MorningstarFundsTrust@morningstar.com
By mail: Chair of the Board of Trustees of Morningstar Funds Trust
c/o D. Scott Schilling, Chief Compliance Officer
22 West Washington Street
Chicago, IL 60602
1
Morningstar Funds Trust April 30, 2019
Letter to Shareholders
To Our Shareholders:
This won’t be your typical shareholder letter, with a standard operational overview, market synopsis, and performance highlights. When we launched the Morningstar Funds Trust, we set out to do things differently—the Morningstar way, which is independent, transparent, and long term. This letter continues that tradition, as we strive to raise transparency to a level that puts investors first.
Role of the Morningstar Funds
Morningstar®Managed PortfoliosSMprovides multi-asset portfolios to financial advisors in an effort to empower their clients and help achieve their financial goals. Our multi-asset mutual fund-based portfolios now use the Morningstar Funds in place of third-party funds. This has allowed us to simplify the product structure, improve our ability to implement the investment strategy, and, most importantly, to lower the aggregate fees and expenses for investors.
These funds serve two primary purposes: to achieve the investment objectives as outlined within the funds’ prospectus and to be the primary building blocks within some of our Managed Portfolios strategies. These are not funds that have been built with the sole focus of raising assets within a category or part of the market. They’ve been created to play a critical role in the portfolios of the clients of the numerous financial advisors that we serve across the United States.
That means we strive to manage these portfolios differently than your average mutual fund. For example, they won’t fit nicely into a Morningstar Category for at least two reasons. First, for the benefit of implementation efficiency and investment flexibility, we designed the funds to each be a large building block, like U.S. equity, rather than creating funds by style or market capitalization, as typically seen in the market. And second, we will also express investment views within the funds that deviate materially from indexes and categories, leading to wider short-term relative return variation—and this is an essential feature of our investment approach and our goal of long-term success. Again, these will differ from the characteristics of a typical mutual fund.
Through a detailed, comprehensive due diligence process, we selected what we believe werebest-in-class asset managers as subadvisers within the funds. Across the subadvisers, we’ve been able to select managers that we believe share many of the core investment principles that we adhere to when building and managing investment strategies. Our horizon is the long term, and our approach to selecting investment managers is to conduct significant amounts of work up front. Selecting subadvisers that we hope will outperform should be a very challenging, time-consuming, and expensive undertaking.
In our opinion, excessive subadviser turnover is one of the dangers and destroyers of value for investors. We are acutely aware of this risk, and to paraphrase legendary value investor Howard Marks,1well-researched is half-retained. If you don’t do the work up front, you can remove managers who appear to be underperforming and replace them with managers who appear to be outperforming. Unfortunately, the past isn’t predictive, and what matters to investors isn’t so much the performance of the past three years but that of the next 10—we always need to be looking forward. Finding long-term, well-resourced, like-minded fund managers and letting them manage assets for the long-term is critical to success.
1Howard Marks isco-chairman of Oaktree Capital Management.
2
Morningstar Funds Trust April 30, 2019
Letter to Shareholders(continued)
These funds are designed with a clear purpose in mind, and we expect them to form key parts of investors’ multi-asset strategies for decades to come. As long-term investors, we’ll continue to stay the course, take advantage of opportunities in markets, and share scale with investors as we grow, seeking to offer awin-win for end investors and their advisors.
Our Investment Views
The funds have existed for only a few months, so we will not devote any time discussing these short-term returns in this letter (although we discuss fund performance elsewhere in this report). We believe the long term is what matters for investment success, and we’ll avoid getting caught in a short-term relative performance derby in these annual letters. Instead, we’ll share some high-level views on the current conditions and how we’re responding.
To start, 2018 and 2019 are turning out to be much more volatile than the preceding few years. Despite the pickup in stock-market volatility in early 2018, markets reachedall-time highs in the third quarter in the U.S. before coming back to earth in the fourth quarter. Since then, we’ve seen a decent rally and then the resumption of volatility.
Stepping back from the short-term gyrations, asset prices are generally high relative to the underlying fundamentals they deliver, in our view. At the index level, price/earnings ratios are elevated, and bond yields and corporate spreads are low. While uncertainty remains high, markets appear to be reflecting lower levels of risk aversion from investors in what could be described as complacency. This is an environment where we believe more caution is warranted, balanced against generating long-term returns.
When looking below the surface, at the security and industry levels, the picture appears somewhat more encouraging. While credit markets are not appealing, thebottom-up picture for stocks is somewhat more appealing. Generally, high-growth, defensive, and “safe” stocks have been bid up to prices that limit the potential returns and add material downside risk. On the other hand, cyclicals, financials, and stocks facing disruption risks appear to be out of favor and discounted heavily, especially those businesses more exposed to a potential recession. The valuation spread betweenlow-returning and high-returning businesses is the widest since the early 2000s. We believe that this provides an interesting opportunity forbottom-up stock pickers and valuation-driven asset allocators.
Across our strategies, we seek to be positioned to take advantage of these opportunities at the industry and stock levels via our subadvisers and ETF allocations. At the same time, our risk levels are being managed at the multi-asset strategy level. This includes holding lower weightings in stocks than we would average over the cycle and owning less corporate debt in favor of U.S. government securities. Within each fund, positioning will vary based on its investment objectives, the relative valuations across asset classes, and the subadvisers’ positioning for the strategy-specific opportunity set.
As contrarian, valuation-driven investors, we see market volatility as an opportunity. Rather than focus on the noise in the market, we choose to tune into whether the current market behavior is creating opportunities that may pay off in the long term. After all, as Warren Buffett noted in his 2008 letter to shareholders, “price is what you pay, value is what you get,”2and we believe that a keen eye on the fundamentals will serve investors well.
2Chairman’s Letter—Berkshire-Hathaway 2008
3
Morningstar Funds Trust April 30, 2019
Letter to Shareholders(continued)
While market predictions aren’t worth the paper that they’re printed on, one thing we know for sure is that markets will fluctuate, and outcomes will differ from those priced into markets. Investing is as much a psychological endeavor as it is one of rational calculation. We believe our philosophy coupled with a studied understanding of behavioral finance helps keep us focused on what matters most—helping investors reach their financial goals.
Understanding Fees and Expenses in Morningstar Funds
To further help investors not only stay invested but also achieve better outcomes, we’re keenly focused on operational efficiency to create value by lowering investment costs. One of our seven investment principles is to Minimize Costs, and lower fees mean more money in investors’ pockets and less to the purveyors of investment services.
That’s one of the compelling reasons for creating the Morningstar Funds—lowering costs3on our mutual fund-based Managed Portfolios by using the multimanager Morningstar Funds to achieve fundamentally the same portfolio objectives, but at a savings.
Morningstar Investment ManagementInvestment Principles

Morningstar’s research has shown that fees have often been the best predictor of future relative performance, and lower-cost funds generally have greater odds of surviving and outperforming their more-expensive peers. We believe that we have set a competitive fee, based on our expectations that we will achieve scale and capitalize on efficiencies.
But mutual fund fees can be much more complex than a single figure. What investors really pay can be quite opaque. Regulators have required some transparency on fund costs, but we think fund managers can go further. And we are.
In fact, to aid understanding, we’re going to start by explaining the various fees that can be charged by mutual funds before answering the surprisingly complex question, “What is my mutual fund charging?”
It’s worth saying why we’re spending time on this explanation, which is simple: We’re keeping our word to investors in our funds. We aim to show that there’s a lot of complexity around how fees are charged in mutual funds and perhaps even more complexity in how they’re reported, but all in the effort to let our investors know that we’re honoring the level of fees we estimated in our original prospectuses for the funds. Our pledge came at a cost—we voluntarily waived about a third of the total fees incurred by the funds.
3For Morningstar®Managed PortfoliosSMthat contain Morningstar Funds, the total fee charged to investors does not include an investment management fee with respect to those Morningstar Funds where we act as a discretionary manager on our own platform. Where we act as a model provider on third-party platforms, we have eliminated the strategist fee for those Morningstar Managed Portfolios composed entirely of Morningstar Funds.
4
Morningstar Funds Trust April 30, 2019
Letter to Shareholders(continued)
Why did we have to waive the fees? That is, why were expenses higher than we expected? It was a matter of scale. When setting up the funds, we had a range of asset levels in mind and recognized there would be uncertainty around the assets under management (AUM) path. We set the pricing of the funds based on the levels that we reasonably expected to arrive at after completing the full transition of assets within our Managed Portfolios. Assets came in at the lower end of the range of our anticipated asset levels.
In our opinion, establishing the funds should not come at the expense of investors, nor should the impact of lower asset levels. On this front, we paid the startup costs outside of the funds and waived fees to stay in line with the estimated prospectus expenses, including expenses not required to be waived under the expense caps. More on this below.
One final note before we get into the details of these expenses and waivers: We want to be clear that this was part of the anticipated process of setting up the funds. At the time of writing, we had reached sufficient asset levels in the funds, such that the size of the waivers will likely be lower in future years.
How to Think About Fees
The Morningstar Funds, like any mutual fund family, incur expenses for a variety of reasons, including covering costs, like the custody of assets, and to pay investment managers—others and ourselves. Fees that are relevant are those that reduce net returns to deliver the outcomes for fund investors. Whether you’re paying fund managers via subadvisory services, mutual funds, or ETFs, we think it all counts. At the same time, things like dividends and interest rates on shorted securities are a part of the gross investment returns and are not the same as custody, management, or similar fund expenses, in our opinion. For most Morningstar Funds, the fees and expenses that represent our view come in four types as outlined by accounting rules:
1. Management fees (money paid to investment managers, including Morningstar Investment Management);
2.Sub-accounting fees (which covers shareholder recordkeeping services performed by brokerage platforms);
3. Other operating expenses like administration, legal, and audit costs; and
4. AFFE, or acquired fund fees and expenses, which are fees the Morningstar Funds pay indirectly to other fund providers by investing in mutual funds or ETFs they advise. These are effectively the management fees that every shareholder in those funds bear indirectly. They are embedded in the daily net asset value (NAV) of the underlying fund and are part of the returns of that particular holding.
We used more mutual funds than expected as we built scale to set up some of the subadviser mandates. Some Morningstar Funds needed to use mutual fund versions of the strategies for which we intended to hire subadvisers. Using other funds as investments incurs AFFE, which are separate from the other three fee types (that we refer to as gross fees) and are not direct expenses of the Morningstar Funds, although they do affect performance. Ultimately, when we use a fund, AFFE rises visibly in the Annual Fund Operating Expenses table within the fund’s prospectus, while the management fees, where subadvisory fees fall, stays constant.
Of course, we are able to bear AFFE through room made in the management fees area, as we don’t need to pay subadvisers on this portion of the funds’ assets. But we don’t treat this casually and intend to use third-party mutual funds sparingly in the future within the Morningstar Funds, primarily to take advantage of an investment opportunity or to build scale prior to establishing a subadviser. We do plan to regularly use ETFs in
5
Morningstar Funds Trust April 30, 2019
Letter to Shareholders(continued)
our funds to nimbly target exposure to certain country- or sector-specific equity investments. This use also incurs AFFE, but again, we plan to use ETFs only for targeted exposures.
AFFE falls outside of what’s known as the expense cap, or a fee level set in the prospectus of each fund as a cost ceiling for the investor. If a fund’s gross fees (management plussub-accounting plus other operating expenses) exceed the expense cap, we will waive all or a portion of our advisory fee and if necessary, assume certain other expenses (to the extent permitted by the Internal Revenue Code) such that the investor pays no more than the expense cap (plus any other fees outside the cap, like AFFE). Note that these rebates are, for fairness reasons, accrued on a daily basis and paid monthly.
AFFE is similar to “Dividend & Interest Expense on Shorts” in the prospectus in that if it is present, it needs to be presented as a separate line item in the Annual Fund Operating Expense table in the prospectus. While we’re required to report each type of cost for regulatory reasons, they are very different beasts. AFFE are the fees and expenses incurred indirectly by the Morningstar Fund as a result of investing in a mutual fund or ETF, and they can be avoided by engaging in direct investment in securities. Meanwhile, “Dividend & Interest Expense on Shorts” are normally part of one side of a short trade, and strategies that use this approach include equity long-short, merger arbitrage, and convertible arbitrage.
Without getting into the technical definitions of the strategies, shorting involves selling a stock that is borrowed, normally from a prime broker. As an example, a manager might like GM relative to Ford. They could buy some stock in GM, or “go long,” and then borrow an equivalent value of stocks in Ford. They take these borrowed stocks and sell them in the market, which is referred to as “selling short,” in the hope that the price will decline, providing them with a profit. For the Ford stock that they’ve sold, interest expense and any dividends that fall due on the borrowed stocks need to be paid to the stock lender. Given they’re also long GM, they will receive dividends on these stocks.
Ultimately the investment strategy will pay the difference between the returns of these two stocks (plus any other investments made in the period). And while the dividends on GM may be positive, offsetting some or all of the borrowing costs to be paid on Ford, the only part of the trade reported is the dividend and interest expense of the short side of the trade. This doesn’t seem right to us. Shorting costs are a critical part of the investment strategy and are not comparable to fund expenses. They should be excluded from the Total Annual Operating Expenses to make anapples-to-apples comparison between funds or within a fund across time.
Because we view these shorting costs as part of the investment strategy—which again is much different from AFFE—we exclude them from our estimates of the Total Annual Operating Expenses for a fund, such as the Morningstar Alternatives Fund, and do not plan to waive them when they are different than projected. Presumably a strategy that accrues considerable dividend & interest expense on shorts will aim to more than make up for these “costs” in its investment outcome.
Digging Into the Details
To help explain these various expenses, we’ve added a detailed table that illustrates their interplay in the context of one of the nine Morningstar Funds. Our goal is to use a concrete example to explain a frustratingly complicated attribute of mutual funds expenses.
6
Morningstar Funds Trust April 30, 2019
Letter to Shareholders(continued)
In order to better explain the fees, we discuss the expenses from three separate perspectives:
| ● | | The expenses disclosed in ourprospectus, which were forward looking and based on estimated expenses; |
| ● | | Theactual expensesand indirect costs to shareholders incurred during the period, which includes AFFE (which represent our estimate of the fees paid to third-party funds for the period); and |
| ● | | The expenses that we show in ourfinancial statements, and which do not include AFFE. (Because AFFE are not an actual expense of the Morningstar Funds, but are the indirect cost of investing in a third-party mutual fund or ETF, they are not reflected as an expense in the financial statements.) |
7
Morningstar Funds Trust April 30, 2019
Letter to Shareholders(continued)
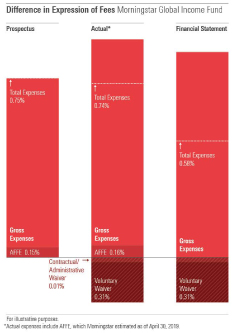
The table below illustrates fees for one fund, the Morningstar Global Income Fund.
| | | | | | | | |
| | | |
Expense Detail | | Prospectus* | | Actual** | | Financial
Statements** |
| | |
| Fund Expenses Covered by the Expense Cap | | | | |
| | | | |
| 1 | | Management Fees | | 0.35 | | 0.35 | | 0.35 |
| | | | |
| 2 | | Sub-Accounting Fees | | 0.10 | | 0.10 | | 0.10 |
| | | | |
| 3 | | Other Operating Expenses | | 0.15 | | 0.45 | | 0.45 |
Gross Expense Ratio | | 0.60 | | 0.90 | | 0.90 |
| | |
Fund Expenses Not Covered by the Expense Cap | | | | |
| | | | |
| 4 | | AFFE (Estimated)*** | | 0.15 | | 0.16 | | 0 |
| | | |
Dividend & Interest Expense on Shorts | | 0 | | 0 | | 0 |
Total Expenses Not Subject to Cap | | 0.15 | | 0.16 | | 0 |
| | | |
Total Expenses Excluding the Voluntary Waiver | | 0.75 | | 1.06 | | 0.90 |
|
| | | |
| Total Fund Expenses Reported | | Prospectus | | Actual** | | Financial
Statements** |
| | | | |
| | Gross Expense Ratio | | 0.60 | | 0.90 | | 0.90 |
| | | | |
| 4 | | AFFE (Estimated)*** | | 0.15 | | 0.16 | | 0 |
| | | |
Contractual Waiver | | 0 | | 0 | | 0 |
| | | |
Voluntary Waiver | | 0 | | -0.31 | | -0.31 |
| | | |
Administrator Waiver**** | | 0 | | -0.01 | | -0.01 |
| Total Expenses | | 0.75 | | 0.74 | | 0.58 |
|
| ** | Actual expenses include AFFE, which Morningstar estimated as of the fiscal period ended April 30, 2019. |
| *** | AFFE is an estimate based on information from our custodian. |
| **** | The expense cap for the fund was 0.89, and the gross expense ratio was 0.90. This represents aone-time waiver from our administrator and accounting agent that is set to expire October 31, 2019. |
8
Morningstar Funds Trust April 30, 2019
Letter to Shareholders(continued)
In the first column, we show figures from the initialProspectusprior to the launch of the funds (which was based on reasonable estimates), and the second column (Actual) is what we estimate shareholders actually experienced in the first period of operation. The third column shows the figures presented in theFinancial Statementsaccompanying this letter, which differ from the second column in large part because AFFE are not direct expenses of the fund and are not included in the financial statements.
To navigate this section, we’ll use the numbers of the fee components from the previous section:
1. Management fees
2.Sub-accounting fees
3. Other operating expenses
4. AFFE (acquired fund fees and expenses)
Looking at items 1 through 3, our estimated expenses in theProspectusmatched the fund’s experience in most areas except for operating expenses, item 3. In that area, this fund experienced 30 basis points of additional expenses—these expenses weren’t higher per se, but thisper-shareholder figure was higher due to the fact that we were operating at lower asset levels than projected. Altogether, that meant the fund exceeded its expense cap by 0.01%. Waiving that overage is standard mutual fund practice when an expense limitation is in place. In the case of this fund, our shareholders benefited from aone-time fee waiver from our administrator/accounting agent. Therefore, we did not need to contractually waive the amount over the expense cap.
The number that matters for us is the totalActualexpenses, including AFFE. If you look at the table, in the last row of the first column (Prospectus), we estimated 0.75% for the fund. When we add the expenses up to the fee cap of 0.89%, in column 2, with the AFFE at 0.16%, we end up with 1.06% ofActualexpenses, including AFFE.
In considering the estimated expenses (Prospectus) versus theActualexpenses, we thought it appropriate to match the projected expenses of 0.75%. To do so, we needed to voluntarily waive a minimum of 0.31% of additional fees. Voluntary waivers at that level are not expected or required, but we felt it was the right thing to do.
Note that this is one example of the nine Morningstar Funds, each of which is different and, at times, more complex, especially when it comes to the Morningstar Alternatives Fund. The basics, however, remain the same: We made the principled, investors-first decision to waive fees back to our original estimates, above and beyond the expense cap and costs falling outside of the normal fee waiver process.
We would like to provide additional clarity to another confusing fact: If we waived fees back to our original estimates, why are the expense ratios for some of our funds in ourFinancial Statementslower than those estimates? Let’s continue to use the Morningstar Global Income Fund as an example. The total expenses reported in theFinancial Statementsis well below that in theProspectusand what we’ve outlined as our estimated costs experienced as of April 30, 2019—0.58% in theFinancial Statementsversus 0.74% for theActualexpenses. That difference, caused by AFFE not being reported in the financial statement, is 0.16%—the same size as our estimate of AFFE for the period.
Because there are different requirements and expectations for what’s reported in each document, it can be difficult to decipher the bottom line when it comes to fees. In our case, with these being new funds, the
9
Morningstar Funds Trust April 30, 2019
Letter to Shareholders(continued)
expenses noted in theProspectuswere based on projections whereas in ourFinancial Statementsappearing in this annual report, they reflect expenses actually incurred during the reporting period which in our case is the period ending April 30, 2019.
The apparent differences in these fees is also illustrated in the graph below, but one key element should emerge: TheActualtotal expenses are slightly below what we estimated it to be in theProspectus(however, technically there it is referred to as the Total Annual Operating Expense).
So, depending where you look, in either the prospectus or this report, you could have seen our fees as either over or under our estimates. The truth is, because of how we’ve chosen to implement the voluntary waiver, investors will realize fees that are consistent with what we intended from the start, but you won’t find that reported clearly in the financial statement or the prospectus because of different reporting conventions required by regulatory or accounting rules related to each document.
| | |
 | | Most importantly, our decision to reimburse fees in this way is completely aligned with our principles. We have a fiduciary responsibility to our Managed Portfolios clients; this move primarily benefits the funds, which in turn helps us achieve the investment objectives of the strategies for shareholders. What to Expect Moving Forward Expense caps aren’t permanent—it’s up to our board to regularly reevaluate and approve them based on whether they benefit shareholders. We’re using voluntary waivers to ensure that expenses experienced are in line with the estimated expenses originally announced. Unfortunately, not every fund company follows this practice. Some use contractual waivers to entice investors with lower fees, only to raise them once they’ve reached scale. But for Morningstar Funds, when the Total Annual Operating Expenses, including AFFE but disregarding dividend & interest expense on shorts, are above the initial prospectus levels, we will waive the fees. |
It’s our commitment that over time we’ll work to share the operating efficiencies and benefits of scale with shareholders. In the meantime, we remain committed to waiving fees to the equivalent of Total Annual Operating Expenses listed in the initial prospectuses—but again, we don’t expect to include dividend & interest expense on shorts in the voluntary waiver.
10
Morningstar Funds Trust April 30, 2019
Letter to Shareholders(continued)
Summary
We’ve spent more time on the discussion of fees than we will devote in future annual letters. The goal was for this to be an owner’s manual, to help you navigate the complicated fee disclosures for mutual funds. Fees are very important, and we want to be transparentup-front. Rest assured, the investment and operational elements of the funds are also very important.
The nine funds are now the core of many of the multi-asset strategies that we manage on behalf of financial advisors. We have assembled what we believe to be some of the most talented investment firms to subadvise across the funds, and we will be managing the allocations within the funds to work toward achieving the Morningstar Funds’ investment objectives.
Our seven investment principles will guide us as we navigate the markets ahead. And we look forward to managing these funds for decades to come, empowering investors to help them reach their financial goals.
Best Regards,

Daniel Needham
President and CIO
Morningstar Investment Management
11
Morningstar Funds Trust April 30, 2019
Fund Information(unaudited)
|
|
Morningstar U.S. Equity Fund |
| | | | |
General Information | | | | |
Net Asset Value Per Share | | | $10.68 | |
Total Net Assets (millions) | | | $678 | |
Net Expense Ratio(a) | | | 0.82% | |
Gross Expense Ratio(a) | | | 1.08% | |
Portfolio Turnover Rate | | | 20% | |
Number of Issuers | | | 320 | |
Fund Inception | | | November 02, 2018 | |
No sales charges or distribution fees | |
Asset Allocation

| | | | |
Portfolio Characteristics | | | | |
Weighted Average Market Capitalization (billions) | | $ | 33,055.65 | |
Price-to-Earnings Ratio(b) | | | 19.72x | |
| | | | |
Ten Largest Equities (%)(c) | | | | |
JPMorgan Chase & Co. | | | 1.8 | |
Pfizer, Inc. | | | 1.8 | |
Amazon.com, Inc. | | | 1.4 | |
Comcast Corp., Class A | | | 1.2 | |
Johnson & Johnson | | | 1.1 | |
Facebook, Inc., Class A | | | 1.1 | |
Apple, Inc. | | | 1.1 | |
Honeywell International, Inc. | | | 1.0 | |
Citigroup, Inc. | | | 1.0 | |
Microsoft Corp. | | | 1.0 | |
| | | | |
Sector Diversification (%) | | | | |
Consumer,Non-cyclical | | | 20.9 | |
Financial | | | 19.8 | |
Technology | | | 10.6 | |
Industrial | | | 10.5 | |
Communications | | | 9.9 | |
Consumer, Cyclical | | | 9.1 | |
Energy | | | 3.9 | |
Basic Materials | | | 3.5 | |
Utilities | | | 2.1 | |
*Includes cash, short-term investments, receivables and payables.
(a)Net expense ratios reflects fee waivers and/or expense reimbursements, if any, pursuant to an agreement that is in effect to cap the expenses whereas the gross expense ratio does not. On September 26, 2018, the Fund and Morningstar Investment Management, LLC (“MIM”) entered into an amended, written fee waiver/expense reimbursement agreement pursuant to which (“MIM”) is contractually obligated to waive its advisory fees and/or reimburse expenses so that the Fund’s ordinary total operating expenses through August 31, 2020 (excluding taxes, interest, brokerage commissions, trading costs, acquired fund fees and expenses, short sale dividend and interest expenses, litigation expenses, and extraordinary expenses) would not exceed 0.85%. The fee waiver/expense reimbursement agreement may be terminated by the Fund’s board at any time and also will terminate automatically upon the expiration or termination of the Fund’s advisory contract with MIM.
(b)Price-to-earnings (P/E) ratio is calculated using12-month forward earnings estimates from third-party sources deemed reliable.
(c) The Fund’s portfolio holdings are subject to change without notice. The mention of specific securities is not a recommendation to buy, sell, or hold any particular security and is not indicative of current or future trading activity.
12
Morningstar Funds Trust April 30, 2019
Performance Summary (unaudited)
|
|
Morningstar U.S. Equity Fund |
Investment Objective
Morningstar U.S. Equity Fund seeks long-term capital appreciation.
Investment Strategies
In seeking long-term capital appreciation, the Fund will normally invest at least 80% of its assets in equity securities of U.S.-based companies, and may invest up to 100% of its assets in such securities. The Fund seeks to provide broad U.S. equity exposure across market capitalizations and investment styles and has the flexibility to invest inlarge-cap,mid-cap, andsmall-cap common stocks across the growth and value style spectrum. The Fund may also invest in real estate investment trusts (REITs) andnon-U.S. companies. The Fund may invest in derivatives, including futures and forward foreign currency contracts, for risk management purposes or as part of its investment strategies. The Fund employs a multi-manager, subadvised structure. The Fund may also invest a portion of the Fund’s assets in shares of exchange-traded funds (ETFs), which use a passive management strategy.
Investment Commentary
The Morningstar U.S. Equity Fund returned 6.98% from inception (November 2, 2018) through the Fund’s fiscal period end on April 30, 2019, trailing the Fund’s benchmark (the Morningstar U.S. Market Index), which returned 9.25% for the same period. All of the underperformance came during the first two weeks when the Fund held only seed capital and no public money, and was not yet fully allocated across the Fund’s six subadvisers. Subsequent to the seed period, the Fund modestly outpaced the benchmark gaining 9.50% from November 16, 2018 through April 30, 2019, compared to its benchmark return of 9.03%.
The U.S. equity market sold off sharply in December 2018 as investors fretted about the U.S./China tariff war, economic weakness abroad, and a ninth consecutive Federal Reserve rate hike. The Morningstar U.S. Market Index fell 9.24% in December 2018. The Fund recorded a slightly larger 9.64% decline, during the same period due in part to its diversification into smaller-cap stocks, which performed worse than large-cap stocks. The U.S. equity market rebounded strongly in January 2019, and continued to post gains through April 2019. The Fund moderately outperformed in that environment, returning 19.46% from January 1, 2019 through April 30, 2019, compared with the Index’s 18.67% return.
One positive return driver in early 2019 was the Fund’s position in energy infrastructure via the Global X MLP & Energy Infrastructure ETF, the only ETF position held in the Fund. The stocks of energy infrastructure assets (primarily comprising oil and gas pipelines and storage facilities) appeared unfairly depressed to us around the time of the Fund’s launch, so we included this position within the Fund’s ETF sleeve. After falling about as much as the overall market in December 2018, the ETF almost doubled the market’s returns in January’s 2019 rebound. The portfolio’s exposure tosmall-cap stocks also boosted returns from January 2019 through April 2019 as the market rose.
Our decision to weight the Fund more toward the value-style subadvisers (MFS Investment Management, Diamond Hill Capital Management, Inc. and Westwood Management Corp.) in late January 2019—owing to what we considered an overheated equity market—may have diluted the Fund’s participation in subsequent market gains as growth stocks continued to surge. It helped, however, that most of the six subadvisers
13
Morningstar Funds Trust April 30, 2019
Performance Summary (unaudited)(continued)
Morningstar U.S. Equity Fund
performed well relative to their style benchmarks. Although several beat their benchmarks meaningfully as the market climbed, ClearBridge deserves special mention, with its investment mandate having lost less than the market in December 2018 and then subsequently outperforming at the beginning of 2019.
Investment Subadvisers:
ClearBridge Investments, LLC
Diversifiedlarge-cap growth equity across stable, cyclical and select growth companies.
Diamond Hill Capital Management, Inc.
Targeted exposure to U.S.mid-cap value companies.
Levin Easterly Partners LLC
Provideslarge-cap blend U.S. equity exposure.
Massachusetts Financial Services Company, d/b/a MFS Investment Management
Provideslarge-cap value exposure, favoring higher-quality, value companies with stronger balance sheets and more consistent profitability.
Wasatch Advisors, Inc.
Small-/mid-cap growth companies with the potential to deliver more stable profits while avoiding earlier-stage companies that may lack a proven track record of revenues and earnings.
Westwood Management Corp.
Providessmall-cap equity with an emphasis on value.
14
Morningstar Funds Trust April 30, 2019
Performance Summary (unaudited)(continued)
Morningstar U.S. Equity Fund
Performance at a glance
| | | | | | | | |
| Average Total Returns as of 04/30/19 | | YTD2 | | | Since Inception3 | |
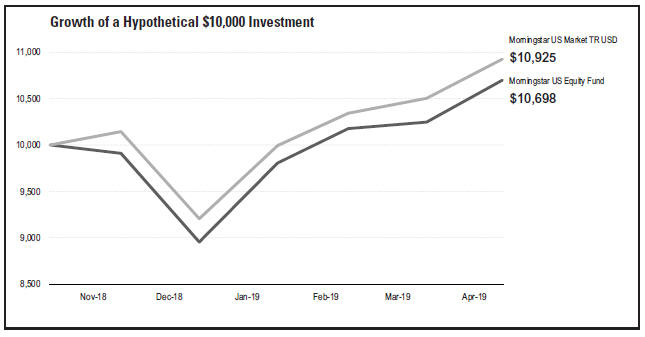
Morningstar U.S. Equity Fund | | | 19.46 | % | | | 6.98 | % |
Morningstar U.S. Market Index1 | | | 18.67 | % | | | 9.25 | % |
Illustration of an assumed investment of $10,000
The following graph depicts the performance of Morningstar U.S. Equity Fund shares versus the Morningstar U.S. Market Index from its inception (November 2, 2018) to April 30, 2019 (the Fund’s fiscal period end). Shares held through advisory programs may be subject to a program fee, which, if included, would have reduced performance. The performance provided does not reflect the deduction of taxes that a shareholder would pay on Fund distributions or the redemption of Fund shares. Past performance is no guarantee of future results. Share price and returns will vary with market conditions; investors may realize a gain or loss upon redemption. It is important to note that Morningstar U.S. Equity Fund is a professionally managed portfolio while the Index is not available for direct investment, is unmanaged and does not include fees, expenses or taxes. The comparison is shown for illustration purposes only.
Morningstar U.S. Equity Fund
This chart does not imply future performance.
1The Morningstar U.S. Market Index is a diversified, broad-market index that targets 97% market capitalization coverage of the U.S. stock market. Investors should note that indices do not reflect the deduction of fees, expenses or taxes.
2Represents performance from January 1, 2019 to April 30, 2019.
3Inception Date is November 2, 2018.
Past performance does not predict future performance, and the performance information provided, does not reflect the deduction of taxes that a shareholder would pay on Fund distributions or the redemption of Fund shares. Shares held through advisory programs are subject to a program fee, which, if included, would have reduced performance. The return and principal value of an investment will fluctuate, so that an investor’s shares, when redeemed, may be worth more or less than their original cost. Performance results assume reinvestment of all dividends and capital gain distributions at net asset value on theex-dividend dates. Current performance may be higher or lower than the performance data quoted.
15
Morningstar Funds Trust April 30, 2019
Fund Information(unaudited)
|
|
Morningstar International Equity Fund |
| | | | |
General Information | | | | |
Net Asset Value Per Share | | | $10.79 | |
Total Net Assets (millions) | | | $469 | |
Net Expense Ratio(a) | | | 0.94% | |
Gross Expense Ratio(a) | | | 1.29% | |
Portfolio Turnover Rate | | | 19% | |
Number of Companies | | | 239 | |
Fund Inception | | | November 02, 2018 | |
No sales charges or distribution fees | | | | |
| | | | |
Portfolio Characteristics | | | | |
Weighted Average Market Capitalization (billions) | | | $38,593.27 | |
Price-to-Earnings Ratio(b) | | | 14.10x | |
Countries Represented | | | 42 | |
Emerging Markets | | | 28.9% | |
| | | | |
Ten Largest Equities (%)(c) | | | | |
Allianz S.E. | | | 1.7 | |
Samsung Electronics Co. Ltd. | | | 1.5 | |
BNP Paribas S.A. | | | 1.4 | |
Bayerische Motoren Werke A.G. | | | 1.3 | |
Taiwan Semiconductor Manufacturing Co. Ltd. | | | 1.3 | |
AIA Group Ltd. | | | 1.2 | |
Continental A.G. | | | 1.2 | |
Daimler A.G. | | | 1.2 | |
Credit Suisse Group A.G. | | | 1.2 | |
Intesa Sanpaolo S.p.A. | | | 1.2 | |
Asset Allocation
| | | | |
Sector Diversification (%) | | | | |
Financial | | | 19.9 | |
Consumer,Non-cyclical | | | 12.6 | |
Consumer, Cyclical | | | 11.4 | |
Technology | | | 9.4 | |
Industrial | | | 9.4 | |
Communications | | | 9.2 | |
Basic Materials | | | 4.0 | |
Energy | | | 2.7 | |
Utilities | | | 0.2 | |
Diversified | | | 0.2 | |
| | | | |
Region Diversification (%) | | | | |
Europe (excluding United Kingdom) | | | 32.5 | |
Pacific (excluding Japan) | | | 22.1 | |
United Kingdom | | | 8.7 | |
Japan | | | 4.9 | |
Latin America | | | 4.2 | |
Africa | | | 2.9 | |
Middle East | | | 1.3 | |
Canada | | | 1.3 | |
United States | | | 1.1 | |
*Includes cash, short-term investments, derivatives, receivables and payables.
(a)Net expense ratio reflects fee waivers and/or expense reimbursements, if any, pursuant to an agreement that is in effect to cap the expenses whereas the gross expense ratio does not. On September 26, 2018, the Fund and Morningstar Investment Management, LLC (“MIM”) entered into an amended, written fee waiver/expense reimbursement agreement pursuant to which (“MIM”) is contractually obligated to waive its advisory fees and/or reimburse expenses so that the Fund’s ordinary total operating expenses through August 31, 2020 (excluding taxes, interest, brokerage commissions, trading costs, acquired fund fees and expenses, short sale dividend and interest expenses, litigation expenses, and extraordinary expenses) would not exceed 1.00%. The fee waiver/expense reimbursement agreement may be terminated by the Fund’s board at any time and also will terminate automatically upon the expiration or termination of the Fund’s advisory contract with MIM.
(b)Price-to-earnings (P/E) ratio is calculated using12-month forward earnings estimates from third-party sources deemed reliable.
(c) The Fund’s portfolio holdings are subject to change without notice. The mention of specific securities is not a recommendation to buy, sell, or hold any particular security and is not indicative of current or future trading activity.
16
Morningstar Funds Trust April 30, 2019
Performance Summary (unaudited)
|
|
Morningstar International Equity Fund |
Investment Objective
Morningstar International Equity Fund seeks long-term capital appreciation.
Investment Strategies
In seeking long-term capital appreciation, the Fund will normally invest at least 80% of its assets in equity securities. Under normal circumstances, the Fund will invest approximately80-100% of its assets in securities of issuers domiciled outside of the United States. The Fund may invest in developed and emerging markets and will typically invest in a minimum of 10 countries. The Fund seeks to provide broad international equity exposure across market capitalizations and investment styles and has the flexibility to invest inlarge-cap,mid-cap, andsmall-cap common stocks across the growth and value style spectrum. The Fund may also invest in derivatives, including futures and forward foreign currency contracts, for risk management purposes or as part of its investment strategies. The Fund employs a multi-manager, subadvised structure. The Fund may also invest a portion of the Fund’s assets in shares of exchange-traded funds (ETFs), which use a passive management strategy.
Investment Commentary
The Morningstar International Equity Fund returned 8.19% from inception (November 2, 2018) through the Fund’s fiscal period end on April 30, 2019, outperforming the Fund’s benchmark Morningstar Global Markets ex U.S. Index (net), which returned 6.71% for the same period.
Foreign stocks rebounded sharply in early 2019, but not before experiencing steep declines in late 2018 amid worries over slowing global growth and trade tensions. A move to a more dovish stance by the Federal Reserve and investor optimism for a U.S./China trade deal helped to bolster both developed and emerging-market stocks in the early months of 2019.
The Fund’s outperformance over the Index owed to an overweight in outperforming U.K. stocks and a simultaneous underweight in Japanese equities, which lagged broader developed markets during the period. The Fund’s overweight to the U.K. owes to the U.K.-focused ETF holding and, more indirectly, to our allocation to Harris Associates’ investment mandate.
Overall, our subadvisers contributed positively to the Fund’s results. T. Rowe Price and Harris Associates well outperformed their respective style benchmarks during the market rebound, making up for lost ground during the market decline. Lazard Asset Management, the Fund’s subadviser that focuses on value-oriented stocks within emerging-market equities, lagged its style benchmark for thesix-month period, however.
17
Morningstar Funds Trust April 30, 2019
Performance Summary (unaudited)(continued)
Morningstar International Equity Fund
Investment Subadvisers:
Harding Loevner L.P.
Provides growth-leaning exposure tonon-U.S. developed equity markets.
Harris Associates L.P.
Provides exposure to value-leaning,non-U.S. developed equity markets.
Lazard Asset Management LLC
Provides active equity exposure to emerging-markets value companies.
T. Rowe Price Associates, Inc.
Provides active exposure to emerging-markets growth companies.
18
Morningstar Funds Trust April 30, 2019
Performance Summary (unaudited)(continued)
Morningstar International Equity Fund
Performance at a glance
| | | | | | | | |
| Average Total Returns as of 04/30/19 | | YTD2 | | | Since Inception3 | |
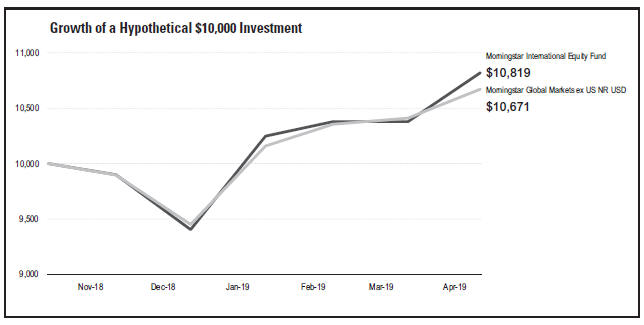
Morningstar International Equity Fund | | | 15.03 | % | | | 8.19 | % |
Morningstar Global Markets ex U.S. Index (net)1 | | | 12.91 | % | | | 6.71 | % |
Illustration of an assumed investment of $10,000
The following graph depicts the performance of Morningstar International Equity Fund shares versus the Morningstar Global Markets ex U.S. Index (net) from its inception (November 2, 2018) to April 30, 2019 (the Fund’s fiscal period end). Shares held through advisory programs may be subject to a program fee, which, if included, would have reduced performance. The performance provided does not reflect the deduction of taxes that a shareholder would pay on Fund distributions or the redemption of Fund shares. Past performance is no guarantee of future results. Share price and returns will vary with market conditions; investors may realize a gain or loss upon redemption. It is important to note that Morningstar International Equity Fund is a professionally managed portfolio while the Index is not available for direct investment, is unmanaged and does not include fees, expenses or certain taxes. The comparison is shown for illustration purposes only.
Morningstar International Equity Fund
This chart does not imply future performance.
1The Morningstar Global Markets ex U.S. Index (net) captures the performance of the stocks located in the developed and emerging countries across the world, excluding the United States. Stocks in the index are weighted by their float capital, which removes corporate cross-ownership, government holdings and otherlocked-in shares. Net total return indices reinvest dividends after the deduction of withholding taxes, using a tax rate applicable tonon-resident who do not benefit from double taxation. Investors should note that such indices do not reflect the deduction of fees, expenses or other taxes.
2Represents performance from January 1, 2019 to April 30, 2019.
3Inception Date is November 2, 2018.
Past performance does not predict future performance, and the performance information provided, does not reflect the deduction of taxes that a shareholder would pay on Fund distributions or the redemption of Fund shares. Shares held through advisory programs are subject to a program fee, which, if included, would have reduced performance. The return and principal value of an investment will fluctuate, so that an investor’s shares, when redeemed, may be worth more or less than their original cost. Performance results assume reinvestment of all dividends and capital gain distributions at net asset value on theex-dividend dates. Current performance may be higher or lower than the performance data quoted.
19
Morningstar Funds Trust April 30, 2019
Fund Information(unaudited)
|
|
Morningstar Global Income Fund |
| | | | |
| |
General Information | | | | |
Net Asset Value Per Share | | | $10.58 | |
Total Net Assets (millions) | | | $186 | |
Net Expense Ratio(a) | | | 0.58% | |
Gross Expense Ratio(a) | | | 0.90% | |
Portfolio Turnover Rate | | | 27% | |
Fund Inception | | | November 02, 2018 | |
No sales charges or distribution fees | |
| | | | |
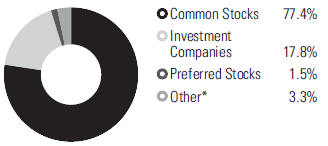
Number of Common Stocks | | | 32 | |
| | | | |
| | |
Five Largest Sectors (%) | | | | |
Financial | | | 10.4 | |
Consumer,Non-cyclical | | | 9.2 | |
Industrial | | | 4.2 | |
Communications | | | 4.1 | |
Energy | | | 3.7 | |
| | | | |
| | |
Ten Largest Equities (%)(b) | | | | |
JPMorgan Chase & Co. | | | 1.7 | |
Unilever N.V. | | | 1.7 | |
NextEra Energy, Inc. | | | 1.7 | |
United Overseas Bank Ltd. | | | 1.6 | |
Cisco Systems, Inc. | | | 1.5 | |
Allianz S.E. | | | 1.5 | |
Sonic Healthcare Ltd. | | | 1.5 | |
Welltower, Inc. | | | 1.5 | |
Zurich Insurance Group A.G. | | | 1.5 | |
Novartis A.G. ADR | | | 1.5 | |
Asset Allocation
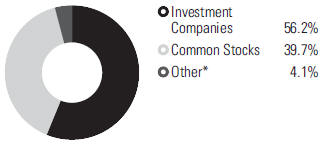
*Includes cash, short-term investments, receivables and payables.
(a)Net expense ratio reflects fee waivers and/or expense reimbursements, if any, pursuant to an agreement that is in effect to cap the expenses whereas the gross expense ratio does not. On September 26, 2018, the Fund and Morningstar Investment Management, LLC (“MIM”) entered into an amended, written fee waiver/expense reimbursement agreement pursuant to which (“MIM”) is contractually obligated to waive its advisory fees and/or reimburse expenses so that the Fund’s ordinary total operating expenses through August 31, 2020 (excluding taxes, interest, brokerage commissions, trading costs, acquired fund fees and expenses, short sale dividend and interest expenses, litigation expenses, and extraordinary expenses) would not exceed 0.89%. The fee waiver/expense reimbursement agreement may be terminated by the Fund’s board at any time and also will terminate automatically upon the expiration or termination of the Fund’s advisory contract with MIM.
(b)The Fund’s portfolio holdings are subject to change without notice. The mention of specific securities is not a recommendation to buy, sell, or hold any particular security and is not indicative of current or future trading activity.
20
Morningstar Funds Trust April 30, 2019
Performance Summary (unaudited)
|
|
Morningstar Global Income Fund |
Investment Objective
Morningstar Global Income Fund seeks current income and long-term capital appreciation.
Investment Strategies
In seeking current income and long-term capital appreciation, the Fund has significant flexibility and invests across asset classes and geographies, according to the portfolio management team’s assessment of their valuations, fundamental health, and income levels. Under normal circumstances, the Fund will invest at least 20% (or, if market conditions are unfavorable, at least 10%) of assets in securities of issuers domiciled outside of the United States and may invest up to 100% assets in such securities.
The Fund invests in income-generating equity securities, which may include common stocks, convertible securities, preferred stocks, real estate investment trusts (REITs), and master limited partnerships (MLPs). The Fund may invest in companies of any size from any country, including emerging markets.
The Fund also invests in fixed-income securities of varying maturity, duration, and quality. These may include U.S. andnon-U.S. corporate debt securities, U.S. andnon-U.S. government debt securities, emerging-market debt securities, mortgage-backed and asset-backed securities, and floating-rate notes. The Fund may invest without limit in fixed-income securities that are rated below investment grade (commonly known as junk bonds) or, if unrated, are determined by the Fund’s subadviser(s) to be of comparable quality.
To meet its objective, the Fund may invest in exchange traded funds (ETFs), which could represent a significant percentage of assets. The Fund may also invest in derivatives, including options, futures, swaps, and forward foreign currency contracts, for risk management purposes or as part of its investment strategies. The Fund employs a multi-manager, subadvised structure. The Fund may also invest a portion of the Fund’s assets in shares of exchange-traded funds (ETFs), which use a passive management strategy.
Investment Commentary
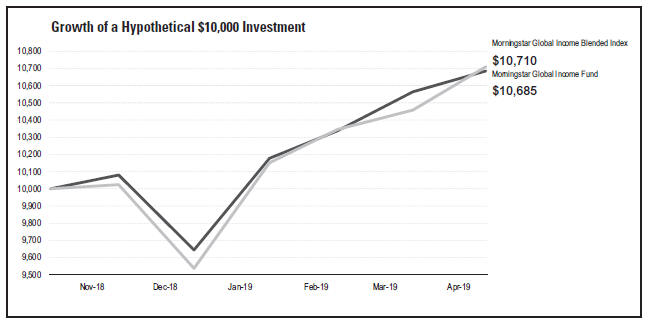
The Morningstar Global Income Fund returned 6.85% from inception (November 2, 2018) through the Fund’s fiscal period end on April 30, 2019, underperforming the Fund’s blended benchmark (75% Global Markets Index (net), 25% Bloomberg Barclays Multiverse Total Return Index), which returned 7.10% for the same period.
The Fund’s holdings generally gained ground during the period from November 2, 2018 to April 30, 2019, with the largest gains coming from income-producing asset classes such as REITs, MLPs, convertible bonds and long-term, investment grade debt. Other portions of the Fund, including telecommunications stocks, generated positive, albeit more modest, returns.
The Fund’s modest underweight to equities detracted from relative performance since inception through the end of April 2019, as equities outperformed global bonds. Particular Fund exposures, including exposure to U.K. equities, further dragged on returns. However, strong performance from convertibles and long-term debt helped close the gap.
The Fund’s sole subadviser Schaffer Cullen trailed the Index during the period in question.
21
Morningstar Funds Trust April 30, 2019
Performance Summary (unaudited)(continued)
Morningstar Global Income Fund
Investment Subadviser:
Schafer Cullen Capital Management, Inc.
Global income that seeks exposure to attractively priced, high-quality, dividend-paying companies in the U.S. and international markets, including emerging markets.
22
Morningstar Funds Trust April 30, 2019
Performance Summary (unaudited)(continued)
Morningstar Global Income Fund
Performance at a glance
| | | | | | | | |
| Average Total Returns as of 04/30/19 | | YTD2 | | | Since Inception3 | |
Morningstar Global Income Fund | | | 10.80 | % | | | 6.85 | % |
Morningstar Global Income Blended Index1 | | | 12.30 | % | | | 7.10 | % |
Illustration of an assumed investment of $10,000
The following graph depicts the performance of Morningstar Global Income Fund shares versus the Morningstar Global Income Blended Index from its inception (November 2, 2018) to April 30, 2019 (the Fund’s fiscal period end). Shares held through advisory programs may be subject to a program fee, which, if included, would have reduced performance. The performance provided does not reflect the deduction of taxes that a shareholder would pay on Fund distributions or the redemption of Fund shares. Past performance is no guarantee of future results. Share price and returns will vary with market conditions; investors may realize a gain or loss upon redemption. It is important to note that Morningstar Global Income Fund is a professionally managed portfolio while the Index is not available for direct investment, is unmanaged and does not include fees, expenses or certain taxes. The comparison is shown for illustration purposes only.
Morningstar Global Income Fund
This chart does not imply future performance.
1The Morningstar Global Income Blended Index is composed of 75% Morningstar Global Ex U.S. Index (net) and 25% Bloomberg Barclays Multiverse Total Return Index. The Morningstar Global Ex U.S. Index (net) captures the performance of the stocks located in the developed and emerging countries across the world, excluding the United States. The Bloomberg Barclays Multiverse Total Return Index provides a broad-based measure of the global fixed-income bond market. Net total return indices reinvest dividends after the deduction of withholding taxes, using a tax rate applicable tonon-resident individuals who do not benefit from double taxation treaties. Investors should note that such indices do not reflect the deduction of fees, expenses or other taxes.
2Represents performance from January 1, 2019 to April 30, 2019.
3Inception Date is November 2, 2018.
Past performance does not predict future performance, and the performance information provided, does not reflect the deduction of taxes that a shareholder would pay on Fund distributions or the redemption of Fund shares. Shares held through advisory programs are subject to a program fee, which, if included, would have reduced performance. The return and principal value of an investment will fluctuate, so that an investor’s shares, when redeemed, may be worth more or less than their original cost. Performance results assume reinvestment of all dividends and capital gain distributions at net asset value on theex-dividend dates. Current performance may be higher or lower than the performance data quoted.
23
Morningstar Funds Trust April 30, 2019
Fund Information(unaudited)
|
|
Morningstar Total Return Bond Fund |
| | | | |
| | |
General Information | | | | |
Net Asset Value Per Share | | | $10.48 | |
Total Net Assets (millions) | | | $415 | |
Net Expense Ratio(a) | | | 0.53% | |
Gross Expense Ratio(a) | | | 0.88% | |
Portfolio Turnover Rate | | | 318% | |
30-Day SEC Yield (using net
expenses)(b) | | | 2.56% | |
30-Day SEC Yield (using gross
expenses)(b) | | | 2.91% | |
Number of Issuers | | | 490 | |
Fund Inception | | | November 02, 2018 | |
No sales charges or distribution fees | |
| | | | |
| | |
Portfolio Characteristics | | | | |
Effective Duration (years)(c) | | | 15.5 | |
Non-USD Exposure(d) | | | 0.6% | |
| | | | |
| | |
Five Largest Issuers (%) | | | | |
U.S. Treasury | | | 21.3 | |
Federal National Mortgage Association | | | 14.3 | |
Government National Mortgage Association | | | 9.3 | |
Federal Home Loan Mortgage Association | | | 6.4 | |
Federal Home Loan Banks | | | 4.1 | |
| | | | |
Credit Quality (%)(e)(f) | | | | |
US Treasury | | | 22.0 | |
US Agency | | | 35.2 | |
AAA | | | 6.7 | |
AA | | | 3.4 | |
A | | | 12.4 | |
BBB | | | 21.2 | |
BB | | | 0.8 | |
B | | | 0.6 | |
CCC | | | 0.2 | |
CC | | | 0.1 | |
Not Rated | | | 3.0 | |
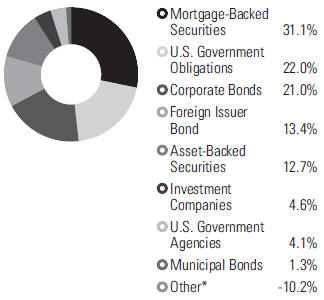
Asset Allocation
| | | | |
| | |
Sector Diversification (%) | | | | |
Mortgage Securities | | | 37.0 | |
Government | | | 31.3 | |
Financial | | | 10.9 | |
Asset Backed Securities | | | 6.8 | |
Energy | | | 4.5 | |
Consumer,Non-cyclical | | | 4.5 | |
Communications | | | 3.0 | |
Technology | | | 1.7 | |
Industrial | | | 1.7 | |
Consumer, Cyclical | | | 1.4 | |
Basic Materials | | | 1.4 | |
Utilities | | | 1.4 | |
| | |
Region Diversification (%) | | | | |
United States | | | 87.9 | |
Latin America | | | 7.7 | |
Europe (excluding United Kingdom) | | | 4.6 | |
United Kingdom | | | 2.0 | |
Pacific (excluding Japan) | | | 1.5 | |
Middle East | | | 0.8 | |
Africa | | | 0.4 | |
Japan | | | 0.4 | |
Canada | | | 0.3 | |
*Includes cash, short-term investments, derivatives, receivables and payables.
(a)Net expense ratio reflects fee waivers and/or expense reimbursements, if any, pursuant to an agreement that is in effect to cap the expenses whereas the gross expense ratio does not. On September 26, 2018, the Fund and Morningstar Investment Management, LLC (“MIM”) entered into an amended, written fee waiver/expense reimbursement agreement pursuant to which (“MIM”) is contractually obligated to waive its advisory fees and/or reimburse expenses so that the Fund’s ordinary total operating expenses through August 31, 2020 (excluding taxes, interest, brokerage commissions, trading costs, acquired fund fees and expenses, short sale dividend and interest expenses, litigation expenses, and extraordinary expenses) would not exceed 0.53%.
24
Morningstar Funds Trust April 30, 2019
Fund Information (unaudited)(continued)
Morningstar Total Return Bond Fund
The fee waiver/expense reimbursement agreement may be terminated by the Fund’s board at any time and also will terminate automatically upon the expiration or termination of the Fund’s advisory contract with MIM.
(b)SEC Yield is an annualization of the Fund’s net investment income for the trailing30-day period. Dividends paid by the Fund may be higher or lower than implied by the SEC Yield.
(c) Effective duration is measure of a Fund’s interest-rate sensitivity—the longer a Fund’s duration, the more sensitive the Fund is to shifts in interest rates. Duration is determined by a formula that includes coupon rates and bond maturities. Small coupons tend to increase duration, while shorter maturities and higher coupons shorten duration.
(d)Non-USD currency exposure for the Fund reflects the value of the portfolio’snon-U.S. dollar denominated investments, as well as the impact of currency derivatives.
(e)Credit quality ratings are based on the conservative average of Moody’s, S&P Global and Fitch ratings. If ratings from all three rating agencies disagree, the model assigns the middle rating to the security. If two of the three agree, the model assigns the rating from those two to the security. If none of these three rating agencies has assigned a rating, the Fund will assign a rating of not rated. The ratings, expressed in S&P Global’s nomenclature, range from AAA (extremely strong capacity to meet its financial commitment) to D (in default). Short-term ratings, expressed in S&P Global’s nomenclature, range from A1 to D (in default). The ratings represent the rating agencies’ opinions of the quality of the securities they rate. Ratings are relative and subjective and are not absolute standards of quality.
(f)Excludes the Fund’s derivative contracts.
25
Morningstar Funds Trust April 30, 2019
Performance Summary (unaudited)
|
|
Morningstar Total Return Bond Fund |
Investment Objective
Morningstar Total Return Bond Fund seeks to maximize total return while also generating income and preserving capital.
Investment Strategies
In seeking to maximize total return while also generating income and preserving capital, the Fund will normally invest at least 80% of its assets in debt securities (commonly referred to as “bonds”) of varying maturity, duration, and quality.
The Fund invests primarily in investment-grade fixed-income securities. These may include U.S. andnon-U.S. investment-grade corporate debt securities, U.S. government debt securities including Treasury Inflation Protected Bond Securities andzero-coupon securities,non-U.S. government debt securities, emerging-market debt securities, and mortgage-backed and asset-backed securities. The Fund may also invest up to 20% of its assets in fixed-income securities that are rated below investment grade (commonly known as junk bonds), or if unrated, are determined by the Fund’s subadviser(s) to be of comparable quality.
In addition, the Fund may invest up to 15% of its assets in collateralized debt obligations (CDOs), of which 10% (as a percentage of the Fund’s assets) may be in collateralized loan obligations (CLOs). CDOs are types of asset-backed securities. CLOs are ordinarily issued by a trust or other special purpose entity and are typically collateralized by a pool of loans, which may include, among others, domestic andnon-U.S. senior secured loans, senior unsecured loans, and subordinate corporate loans, including loans that may be rated below investment grade or equivalent unrated loans, held by such issuer.
The Fund may invest up to 20% of its assets in securities denominated in foreign currencies. The Fund may also invest in securities acquired in a private placement, such as Rule 144A securities, as well as derivatives, including options, futures, swaps, and forward foreign currency contracts, for risk management purposes or as part of its investment strategies. The Fund may also enter into reverse repurchase agreements and dollar rolls. The Fund employs a multi-manager, subadvised structure. The Fund may also invest a portion of the Fund’s assets in shares of exchange-traded funds (ETFs), which use a passive management strategy.
Investment Commentary
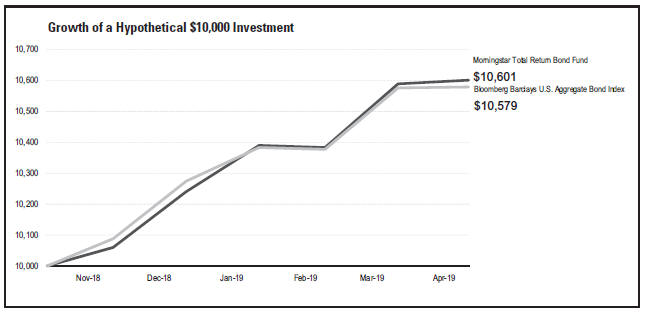
The Morningstar Total Return Bond Fund returned 6.01% from inception (November 2, 2018) through the Fund’s fiscal period end on April 30, 2019, outperforming the Bloomberg Barclays U.S. Aggregate Bond Index, which returned 5.79% for the same period.
Strong relative performance from the Fund’s subadvisers BlackRock Financial Management, Inc. and Western Asset Management Company was the primary driver of relative outperformance. The Fund’s overweight to duration relative to the benchmark, driven by the subadvisers’ positioning, aided relative results as yields declined meaningfully from the Fund’s inception through April 30, 2019. Western Asset’sout-of-benchmark allocation to hard-currency emerging-markets debt also contributed to the Fund’s relative outperformance.
26
Morningstar Funds Trust April 30, 2019
Performance Summary (unaudited)(continued)
Morningstar Total Return Bond Fund
Investment Subadvisers:
BlackRock Financial Management, Inc.
Core-plus total return objective; aims to primarily invest in investment-grade, domestic fixed-income securities with opportunistic,out-of-benchmark allocations and derivatives.
Western Asset Management Company
Provides core-bond exposure seeking exposure to investment-grade, domestic fixed-income securities.
27
Morningstar Funds Trust April 30, 2019
��
Performance Summary (unaudited)(continued)
Morningstar Total Return Bond Fund
Performance at a glance
| | | | | | | | |
| Average Total Returns as of 04/30/19 | | YTD2 | | | Since Inception3 | |
Morningstar Total Return Bond Fund | | | 3.53 | % | | | 6.01 | % |
Bloomberg Barclays U.S. Aggregate Bond Index1 | | | 2.97 | % | | | 5.79 | % |
Illustration of an assumed investment of $10,000
The following graph depicts the performance of Morningstar Total Return Bond Fund shares versus the Bloomberg Barclays U.S. Aggregate Bond Index from its inception (November 2, 2018) to April 30, 2019 (the Fund’s fiscal period end). Shares held through advisory programs may be subject to a program fee, which, if included, would have reduced performance. The performance provided does not reflect the deduction of taxes that a shareholder would pay on Fund distributions or the redemption of Fund shares. Past performance is no guarantee of future results. Share price and returns will vary with market conditions; investors may realize a gain or loss upon redemption. It is important to note that Morningstar Total Return Bond Fund is a professionally managed portfolio while the Index is not available for direct investment, is unmanaged and does not include fees, expenses or taxes. The comparison is shown for illustration purposes only.
Morningstar Total Return Bond Fund
This chart does not imply future performance.
1The Bloomberg Barclays U.S. Aggregate Bond Index is a broad-based, flagship benchmark that measures the investment grade, U.S.-dollar-denominated, fixed-rate, taxable bond market. Investors should note that indices do not reflect the deduction of fees, expenses or taxes.
2Represents performance from January 1, 2019 to April 30, 2019.
3Inception Date is November 2, 2018.
Past performance does not predict future performance, and the performance information provided, does not reflect the deduction of taxes that a shareholder would pay on Fund distributions or the redemption of Fund shares. Shares held through advisory programs are subject to a program fee, which, if included, would have reduced performance. The return and principal value of an investment will fluctuate, so that an investor’s shares, when redeemed, may be worth more or less than their original cost. Performance results assume reinvestment of all dividends and capital gain distributions at net asset value on theex-dividend dates. Current performance may be higher or lower than the performance data quoted.
28
Morningstar Funds Trust April 30, 2019
Fund Information (unaudited)
|
|
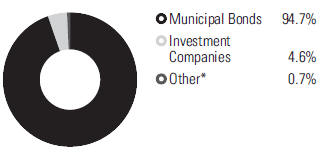
Morningstar Municipal Bond Fund |
| | | | |
| | |
General Information | | | | |
Net Asset Value Per Share | | | $10.38 | |
Total Net Assets (millions) | | | $105 | |
Net Expense Ratio(a) | | | 0.58% | |
Gross Expense Ratio(a) | | | 1.05% | |
Portfolio Turnover Rate | | | 115% | |
30-Day SEC Yield (using net
expenses)(b) | | | 1.98% | |
30-Day SEC Yield (using gross
expenses)(b) | | | 2.45% | |
Number of Issuers | | | 177 | |
Fund Inception | | | November 02, 2018 | |
No sales charges or distribution fees | |
| | | | |
| | |
Portfolio Characteristics | | | | |
Effective Duration (years)(c) | | | 15.5 | |
| | | | |
| | |
Five Largest Issuers (%) | | | | |
Pennsylvania Housing Finance Agency | | | 2.3 | |
Public Finance Authority | | | 2.2 | |
District of Columbia Water & Sewer Authority | | | 2.1 | |
Metropolitan Transportation Authority | | | 2.0 | |
New York State Dormitory Authority | | | 2.0 | |
| | | | |
| | |
Credit Quality (%)(d) | | | | |
AAA | | | 9.5 | |
AA | | | 31.9 | |
A | | | 29.6 | |
BBB | | | 14.6 | |
BB | | | 2.6 | |
B | | | 0.5 | |
A1+ (Short Term) | | | 1.0 | |
A1 (Short Term) | | | 1.9 | |
A2 (Short Term) | | | 0.5 | |
Not Rated | | | 2.6 | |
Asset Allocation
| | | | |
| | |
Sector Diversification (%) | | | | |
Medical | | | 14.2 | |
General | | | 14.1 | |
Transportation | | | 13.3 | |
School District | | | 7.6 | |
General Obligation | | | 7.5 | |
Airport | | | 6.2 | |
Development | | | 5.8 | |
Multifamily Housing | | | 5.7 | |
Water | | | 3.9 | |
Power | | | 3.3 | |
Higher Education | | | 2.9 | |
Utilities | | | 2.5 | |
Single Family Housing | | | 1.9 | |
Nursing Home | | | 1.6 | |
Education | | | 1.4 | |
Pollution | | | 0.9 | |
Housing | | | 0.8 | |
Student Loan | | | 0.5 | |
Facilities | | | 0.4 | |
Government | | | 0.2 | |
*Includes cash, short-term investments, receivables and payables.
(a)Net expense ratio reflects fee waivers and/or expense reimbursements, if any, pursuant to an agreement that is in effect to cap the expenses whereas the gross expense ratio does not. On September 26, 2018, the Fund and Morningstar Investment Management, LLC (“MIM”) entered into an amended, written fee waiver/expense reimbursement agreement pursuant to which (“MIM”) is contractually obligated to waive its advisory fees and/or reimburse expenses so that the Fund’s ordinary total operating expenses through August 31, 2020 (excluding taxes, interest, brokerage commissions, trading costs, acquired fund fees and expenses, short sale dividend and interest expenses, litigation expenses, and extraordinary expenses) would not exceed 0.59%.
29
Morningstar Funds Trust April 30, 2019
Fund Information (unaudited)(continued)
Morningstar Municipal Bond Fund
The fee waiver/expense reimbursement agreement may be terminated by the Fund’s board at any time and also will terminate automatically upon the expiration or termination of the Fund’s advisory contract with MIM.
(b)SEC Yield is an annualization of the Fund’s net investment income for the trailing30-day period. Dividends paid by the Fund may be higher or lower than implied by the SEC Yield.
(c)Effective duration is measure of a Fund’s interest-rate sensitivity—the longer a Fund’s duration, the more sensitive the Fund is to shifts in interest rates. Duration is determined by a formula that includes coupon rates and bond maturities. Small coupons tend to increase duration, while shorter maturities and higher coupons shorten duration.
(d)Credit quality ratings are based on the conservative average of Moody’s, S&P Global and Fitch ratings. If ratings from all three rating agencies disagree, the model assigns the middle rating to the security. If two of the three agree, the model assigns the rating from those two to the security. If none of these three rating agencies has assigned a rating, the Fund will assign a rating of not rated. The ratings, expressed in S&P Global’s nomenclature, range from AAA (extremely strong capacity to meet its financial commitment) to D (in default). Short-term ratings, expressed in S&P Global’s nomenclature, range from A1 to D (in default). The ratings represent the rating agencies’ opinions of the quality of the securities they rate. Ratings are relative and subjective and are not absolute standards of quality.
30
Morningstar Funds Trust April 30, 2019
Performance Summary (unaudited)
|
|
Morningstar Municipal Bond Fund |
Investment Objective
Morningstar Municipal Bond Fund seeks to generate income exempt from federal income taxes as well as capital preservation.
Investment Strategies
In seeking income exempt from federal income taxes as well as capital preservation, the Fund will normally invest at least 80% of its assets in debt securities (commonly referred to as “bonds”) from municipal issuers within the United States or its territories.
The Fund’s dividends are generally exempt from federal income tax, although a portion may be an item of tax preference for purposes of the federal alternative minimum tax (“Tax Preference Item”). A portion of the dividends may also be exempt from state and local income taxes, depending on where you live. Under normal market conditions, the Fund is not considered an optimal investment fortax-advantaged retirement accounts, such as 401(k) plan accounts or individual retirement accounts, or for investors in low tax brackets, because such investors may not take advantage of the tax benefits of the Fund.
The Fund intends to invest primarily in investment-grade municipal securities, but may invest up to 35% of assets in high-yield fixed-income securities that are rated below investment grade (commonly known as junk bonds) or, if unrated, are determined by the Fund’s subadviser(s) to be of comparable quality. The Fund may also invest in derivatives, including options, futures, swaps, and inverse floating-rate debt instruments (inverse floaters), for risk management purposes or as part of its investment strategies. The Fund employs a multi-manager, subadvised structure. The Fund may also invest a portion of the Fund’s assets in shares of exchange-traded funds (ETFs), which use a passive management strategy.
Investment Commentary
The Morningstar Municipal Bond Fund returned 4.79% from inception (November 2, 2018) through the Fund’s fiscal period end on April 30, 2019, outperforming the Fund’s blended benchmark (60% Bloomberg Barclays Municipal Bond Index, 40% Bloomberg Barclays Municipal1-3 Year Bond Index), which returned 4.34% for the same period.
Strong relative performance from the Fund’s subadvisers T. Rowe Price Associates, Inc. and Wells Capital Management Incorporated was the primary driver of relative outperformance. The Fund’s overweight to revenue bonds in lieu of general obligation bonds as well as modestout-of-benchmark exposure to high-yield municipal bonds, contributed to relative outperformance.
31
Morningstar Funds Trust April 30, 2019
Performance Summary (unaudited)(continued)
Morningstar Municipal Bond Fund
Investment Subadvisers:
T. Rowe Price Associates, Inc.
Core-plus exposure to intermediate and long-term municipal bonds and derivatives, including both investment-grade and below-investment-grade securities.
Wells Capital Management, Inc.
Exposure to intermediate and short-term municipal bonds and derivatives, including investment-grade and below-investment-grade securities.
32
Morningstar Funds Trust April 30, 2019
Performance Summary (unaudited)(continued)
Morningstar Municipal Bond Fund
Performance at a glance
| | | | | | | | |
| Average Total Returns as of 04/30/19 | | YTD2
| | | Since Inception3
| |
Morningstar Municipal Bond Fund | | | 2.68 | % | | | 4.79 | % |
Morningstar Municipal Bond Blended Index1 | | | 2.37 | % | | | 4.34 | % |
Illustration of an assumed investment of $10,000
The following graph depicts the performance of Morningstar Municipal Bond Fund shares versus the Morningstar Municipal Bond Blended Index from its inception (November 2, 2018) to April 30, 2019 (the Fund’s fiscal period end). Shares held through advisory programs may be subject to a program fee, which, if included, would have reduced performance. The performance provided does not reflect the deduction of taxes that a shareholder would pay on Fund distributions or the redemption of Fund shares. Past performance is no guarantee of future results. Share price and returns will vary with market conditions; investors may realize a gain or loss upon redemption. It is important to note that Morningstar Municipal Bond Fund is a professionally managed portfolio while the Index is not available for direct investment, is unmanaged and does not include fees, expenses or taxes. The comparison is shown for illustration purposes only.
Morningstar Municipal Bond Fund
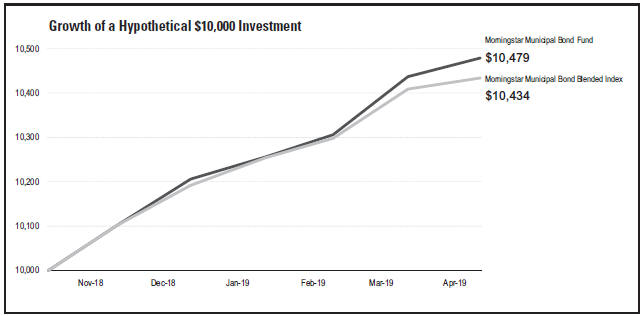
This chart does not imply future performance.
1The Morningstar Municipal Bond Blended Index is composed of 60% Bloomberg Barclays Municipal Bond Index and 40% Bloomberg Barclays Municipal1-3 Year Bond Index. The Bloomberg Barclays Municipal Bond Index is an unmanaged index that is considered representative of the broad market for investment grade,tax-exempt bonds with a maturity of at least one year. Bloomberg Barclays Municipal1-3 Year Bond Index consists of a broad selection of investment grade general obligation and revenue bonds of maturities ranging from one year to three years. Investors should note that indices do not reflect the deduction of fees, expenses or taxes.
2Represents performance from January 1, 2019 to April 30, 2019.
3Inception Date is November 2, 2018.
Past performance does not predict future performance, and the performance information provided, does not reflect the deduction of taxes that a shareholder would pay on Fund distributions or the redemption of Fund shares. Shares held through advisory programs are subject to a program fee, which, if included, would have reduced performance. The return and principal value of an investment will fluctuate, so that an investor’s shares, when redeemed, may be worth more or less than their original cost. Performance results assume reinvestment of all dividends and capital gain distributions at net asset value on theex-dividend dates. Current performance may be higher or lower than the performance data quoted.
33
Morningstar Funds Trust April 30, 2019
Fund Information (unaudited)
|
|
Morningstar Defensive Bond Fund |
| | | | |
General Information | | | | |
Net Asset Value Per Share | | | $10.10 | |
Total Net Assets (millions) | | | $156 | |
Net Expense Ratio(a) | | | 0.48% | |
Gross Expense Ratio(a) | | | 0.93% | |
Portfolio Turnover Rate | | | 4% | |
30-Day SEC Yield (using net
expenses)(b) | | | 1.47% | |
30-Day SEC Yield (using gross
expenses)(b) | | | 1.92% | |
Number of Issuers | | | 69 | |
Fund Inception | | | November 02, 2018 | |
No sales charges or distribution fees | |
| | | | |
Portfolio Characteristics | | | | |
Effective Duration (years)(c) | | | 6.8 | |
Non-USD Exposure(d) | | | 18.9% | |
| | | | |
Five Largest Issuers (%) | | | | |
Federal National Mortgage Association | | | 7.0 | |
Federal Home Loan Mortgage Association | | | 2.4 | |
Government National Mortgage Association | | | 1.6 | |
U.S. Treasury | | | 1.4 | |
PFS Financing Corp. | | | 1.0 | |
| | | | |
Credit Quality (%)(e) | | | | |
US Treasury | | | 1.4 | |
US Agency | | | 10.1 | |
AAA | | | 11.6 | |
AA | | | 3.0 | |
A | | | 0.4 | |
BBB | | | 0.2 | |
BB | | | 0.3 | |
B | | | 0.4 | |
CCC | | | 0.4 | |
Not Rated | | | 2.9 | |
Asset Allocation
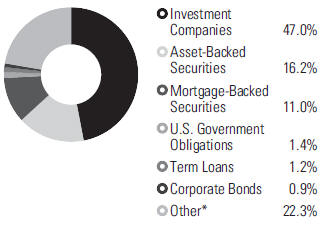
| | | | |
| | |
Sector Diversification (%) | | | | |
Asset Backed Securities | | | 13.9 | |
Mortgage Securities | | | 13.3 | |
Government | | | 1.4 | |
Energy | | | 0.6 | |
Communications | | | 0.5 | |
Industrial | | | 0.4 | |
Consumer, Cyclical | | | 0.3 | |
Basic Materials | | | 0.2 | |
Consumer, Non-cyclical | | | 0.1 | |
| | | | |
| | |
Region Diversification (%) | | | | |
United States | | | 27.4 | |
Latin America | | | 3.3 | |
* Includes cash, short-term investments, receivables and payables.
(a) Net expense ratio reflects fee waivers and/or expense reimbursements, if any, pursuant to an agreement that is in effect to cap the expenses whereas the gross expense ratio does not. On September 26, 2018, the Fund and Morningstar Investment Management, LLC (“MIM”) entered into an amended, written fee waiver/expense reimbursement agreement pursuant to which (“MIM”) is contractually obligated to waive its advisory fees and/or reimburse expenses so that the Fund’s ordinary total operating expenses through August 31, 2020 (excluding taxes, interest, brokerage commissions, trading costs, acquired fund fees and expenses, short sale dividend and interest expenses, litigation expenses, and extraordinary expenses) would not exceed 0.48%.
34
Morningstar Funds Trust April 30, 2019
Fund Information (unaudited)(continued)
Morningstar Defensive Bond Fund
The fee waiver/expense reimbursement agreement may be terminated by the Fund’s board at any time and also will terminate automatically upon the expiration or termination of the Fund’s advisory contract with MIM.
(b) SEC Yield is an annualization of the Fund’s net investment income for the trailing30-day period. Dividends paid by the Fund may be higher or lower than implied by the SEC Yield.
(c) Effective duration is measure of a Fund’s interest-rate sensitivity—the longer a Fund’s duration, the more sensitive the Fund is to shifts in interest rates. Duration is determined by a formula that includes coupon rates and bond maturities. Small coupons tend to increase duration, while shorter maturities and higher coupons shorten duration.
(d)Non-USD currency exposure for the Fund reflects the value of the portfolio’snon-U.S. dollar denominated investments, as well as the impact of currency derivatives.
(e) Credit quality ratings are based on the conservative average of Moody’s, S&P Global and Fitch ratings. If ratings from all three rating agencies disagree, the model assigns the middle rating to the security. If two of the three agree, the model assigns the rating from those two to the security. If none of these three rating agencies has assigned a rating, the Fund will assign a rating of not rated. The ratings, expressed in S&P Global’s nomenclature, range from AAA (extremely strong capacity to meet its financial commitment) to D (in default). Short-term ratings, expressed in S&P Global’s nomenclature, range from A1 to D (in default). The ratings represent the rating agencies’ opinions of the quality of the securities they rate. Ratings are relative and subjective and are not absolute standards of quality.
35
Morningstar Funds Trust April 30, 2019
Performance Summary (unaudited)
|
|
Morningstar Defensive Bond Fund |
Investment Objective
Morningstar Defensive Bond Fund seeks capital preservation.
Investment Strategies
In seeking capital preservation, the Fund will normally invest at least 80% of its assets in a diversified portfolio of debt securities (commonly referred to as “bonds”) of varying maturity, duration, and quality. Under normal conditions, the Fund intends to pursue a defensive strategy of limiting its interest-rate sensitivity by maintaining a portfolio duration of three years or less.
The Fund invests primarily in short and intermediate-term investment-grade fixed-income securities. These may include U.S. andnon-U.S. investment-grade corporate debt securities, U.S. andnon-U.S. government debt securities, and mortgage-backed and asset-backed securities. In most market environments, the Fund will not invest more than 20% of assets in fixed-income securities that are rated below investment grade (commonly known as junk bonds), or if unrated, are determined by the Fund’s subadviser(s) to be of comparable quality.
In addition, the Fund may invest a significant portion of its assets in collateralized debt obligations (CDOs), including collateralized loan obligations (CLOs). CDOs are types of asset-backed securities. CLOs are ordinarily issued by a trust or other special purpose entity and are typically collateralized by a pool of loans, which may include, among others, domestic andnon-U.S. senior secured loans, senior unsecured loans, and subordinate corporate loans, including loans that may be rated below investment grade or equivalent unrated loans, held by such issuer.
This Fund may also invest in exchange traded funds (ETFs), which could represent a significant percentage of assets. The Fund employs a multi-manager, subadvised structure. The Fund may also invest a portion of the Fund’s assets in shares of exchange-traded funds (ETFs), which use a passive management strategy.
Investment Commentary
The Morningstar Defensive Bond Fund returned 1.87% from inception (November 2, 2018) through the Fund’s fiscal period end on April 30, 2019, underperforming the Fund’s benchmark (Bloomberg Barclays U.S. Aggregate1-3 Year Index), which returned 2.59% for the same period.
Cash-like securities and short-term investment grade bonds generated positive, though modest, returns month-over-month since the Fund’s inception, with larger gains coming from both real and nominal bonds with maturities beyond one year.
Underperformance was largely driven by the Fund’s shorter duration relative to that of the benchmark, as longer-dated bonds generally outperformed during the period.
The Fund’s single subadviser, First Pacific Advisors, LLC, contributed positively to the Fund’s performance, although it slightly underperformed relative to the Index, adopting a patient stance and limiting the strategy’s allocation to credit against an unattractive valuation backdrop.
36
Morningstar Funds Trust April 30, 2019
Performance Summary (unaudited)(continued)
Morningstar Defensive Bond Fund
Investment Subadviser:
First Pacific Advisors, LLC
Diversified portfolio of short-duration, fixed-income securities designed to anchor a portfolio of defensive assets.
37
Morningstar Funds Trust April 30, 2019
Performance Summary (unaudited)(continued)
Morningstar Defensive Bond Fund
Performance at a glance
| | | | | | | | |
| Average Total Returns as of 04/30/19 | | YTD2 | | | Since Inception3 | |
Morningstar Defensive Bond Fund | | | 1.47 | % | | | 1.87 | % |
Bloomberg Barclays U.S. Aggregate1-3 Year Index1 | | | 1.44 | % | | | 2.59 | % |
Illustration of an assumed investment of $10,000
The following graph depicts the performance of Morningstar Defensive Bond Fund shares versus the Bloomberg Barclays U.S. Aggregate1-3 Year Index from its inception (November 2, 2018) to April 30, 2019 (the Fund’s fiscal period end). Shares held through advisory programs may be subject to a program fee, which, if included, would have reduced performance. The performance provided does not reflect the deduction of taxes that a shareholder would pay on Fund distributions or the redemption of Fund shares. Past performance is no guarantee of future results. Share price and returns will vary with market conditions; investors may realize a gain or loss upon redemption. It is important to note that Morningstar Defensive Bond Fund is a professionally managed portfolio while the Index is not available for direct investment, is unmanaged and does not include fees, expenses or taxes. The comparison is shown for illustration purposes only.
Morningstar Defensive Bond Fund
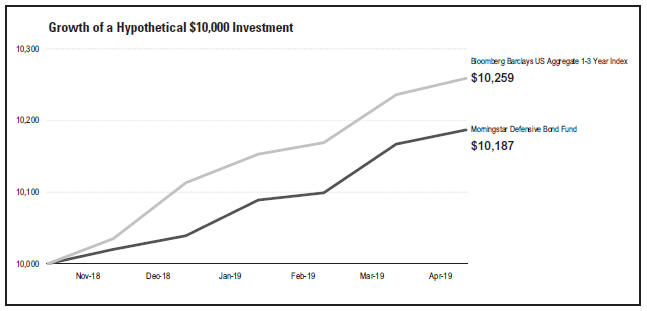
This chart does not imply future performance.
1The Bloomberg Barclays U.S. Aggregate1-3 Year Index consists of publicly issued, investment-grade corporate, U.S. Treasury and government agency securities with remaining maturities of one to three years. Investors should note that indices do not reflect the deduction of fees, expenses or taxes.
2Represents performance from January 1, 2019 to April 30, 2019.
3Inception Date is November 2, 2018.
Past performance does not predict future performance, and the performance information provided, does not reflect the deduction of taxes that a shareholder would pay on Fund distributions or the redemption of Fund shares. Shares held through advisory programs are subject to a program fee, which, if included, would have reduced performance. The return and principal value of an investment will fluctuate, so that an investor’s shares, when redeemed, may be worth more or less than their original cost. Performance results assume reinvestment of all dividends and capital gain distributions at net asset value on theex-dividend dates. Current performance may be higher or lower than the performance data quoted.
38
Morningstar Funds Trust April 30, 2019
Fund Information (unaudited)
|
|
Morningstar Multisector Bond Fund |
| | | | |
General Information | | | | |
Net Asset Value Per Share | | | $10.28 | |
Total Net Assets (millions) | | | $161 | |
Net Expense Ratio(a) | | | 0.80% | |
Gross Expense Ratio(a) | | | 1.18% | |
Portfolio Turnover Rate | | | 53% | |
30-Day SEC Yield (using net
expenses)(b) | | | 4.88% | |
30-Day SEC Yield (using gross
expenses)(b) | | | 5.26% | |
Number of Issuers | | | 266 | |
Fund Inception | | | November 02, 2018 | |
No sales charges or distribution fees | |
Asset Allocation
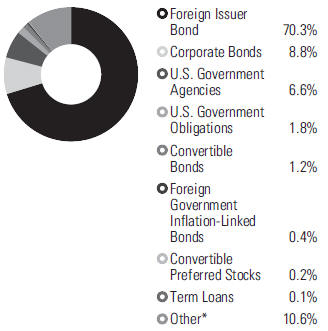
| | | | |
Portfolio Characteristics | | | | |
Effective Duration (years)(c) | | | 6.9 | |
Emerging Markets | | | 58.6% | |
Non-USD Exposure(d) | | | 41.9% | |
| | | | |
Five Largest Issuers (%) | | | | |
Mexican Bonos Desarollo | | | 7.6 | |
Federal Home Loan Banks | | | 6.6 | |
Nota Do Tesouro Nacional | | | 5.4 | |
Government of Indonesia | | | 3.7 | |
Republic of South Africa | | | 2.6 | |
| | | | |
Credit Quality (%)(e)(f) | | | | |
US Treasury | | | 1.8 | |
AA | | | 9.1 | |
A | | | 12.6 | |
BBB | | | 18.6 | |
BB | | | 22.2 | |
B | | | 16.4 | |
CCC | | | 1.1 | |
A2 (Short Term) | | | 1.5 | |
Not Rated | | | 5.9 | |
| | | | |
Sector Diversification (%) | | | | |
Government | | | 64.5 | |
Energy | | | 6.2 | |
Financial | | | 5.9 | |
Communications | | | 3.5 | |
Basic Materials | | | 2.5 | |
Consumer,Non-cyclical | | | 2.0 | |
Consumer, Cyclical | | | 1.5 | |
Utilities | | | 1.3 | |
Industrial | | | 1.1 | |
Technology | | | 0.7 | |
| | | | |
Region Diversification (%) | | | | |
Latin America | | | 29.4 | |
United States | | | 18.5 | |
Pacific (excluding Japan) | | | 16.1 | |
Africa | | | 9.7 | |
Middle East | | | 7.8 | |
Europe (excluding United Kingdom) | | | 7.0 | |
Canada | | | 0.4 | |
United Kingdom | | | 0.3 | |
| * | Includes cash, short-term investments, derivatives, receivables and payables. |
(a) Net expense ratio reflects fee waivers and/or expense reimbursements, if any, pursuant to an agreement that is in effect to cap the expenses whereas the gross expense ratio does not. On September 26, 2018, the Fund and Morningstar Investment Management, LLC (“MIM”) entered into an amended, written fee waiver/expense reimbursement agreement pursuant to which (“MIM”) is contractually obligated to waive its advisory fees and/or reimburse expenses so that the Fund’s ordinary total operating expenses through August 31, 2020 (excluding taxes, interest, brokerage commissions, trading costs, acquired fund fees and expenses, short sale dividend and interest expenses, litigation expenses, and extraordinary expenses) would not exceed 0.80%.
39
Morningstar Funds Trust April 30, 2019
Fund Information (unaudited)(continued)
Morningstar Multisector Bond Fund
The fee waiver/expense reimbursement agreement may be terminated by the Fund’s board at any time and also will terminate automatically upon the expiration or termination of the Fund’s advisory contract with MIM.
(b) SEC Yield is an annualization of the Fund’s net investment income for the trailing30-day period. Dividends paid by the Fund may be higher or lower than implied by the SEC Yield.
(c) Effective duration is measure of a Fund’s interest-rate sensitivity—the longer a Fund’s duration, the more sensitive the Fund is to shifts in interest rates. Duration is determined by a formula that includes coupon rates and bond maturities. Small coupons tend to increase duration, while shorter maturities and higher coupons shorten duration.
(d)Non-USD currency exposure for the Fund reflects the value of the portfolio’snon-U.S. dollar denominated investments, as well as the impact of currency derivatives.
(e) Credit quality ratings are based on the conservative average of Moody’s, S&P Global and Fitch ratings. If ratings from all three rating agencies disagree, the model assigns the middle rating to the security. If two of the three agree, the model assigns the rating from those two to the security. If none of these three rating agencies has assigned a rating, the Fund will assign a rating of not rated. The ratings, expressed in S&P Global’s nomenclature, range from AAA (extremely strong capacity to meet its financial commitment) to D (in default). Short-term ratings, expressed in S&P Global’s nomenclature, range from A1 to D (in default). The ratings represent the rating agencies’ opinions of the quality of the securities they rate. Ratings are relative and subjective and are not absolute standards of quality.
(f) Excludes the Fund’s derivative contracts.
40
Morningstar Funds Trust April 30, 2019
Performance Summary(unaudited)
|
Morningstar Multisector Bond Fund |
Investment Objective
Morningstar Multisector Bond Fund seeks total return through a combination of current income and capital appreciation.
Investment Strategies
In seeking total return through a combination of current income and capital appreciation, the Fund will normally invest at least 80% of its assets in debt securities (commonly referred to as “bonds”) of varying maturity, duration, and quality across various sectors of the fixed-income market. These may include U.S. andnon-U.S. corporate debt securities, U.S. andnon-U.S. government debt securities, emerging-market debt securities, mortgage-backed and asset-backed securities, municipal securities, and floating-rate notes.
The Fund may invest without limit in fixed-income securities that are rated below investment grade (commonly known as junk bonds), or if unrated, are determined by the Fund’s subadviser(s) to be of comparable quality. The Fund may invest without limit in securities denominated in foreign currencies and in U.S. dollar denominated securities of foreign issuers.
The Fund may invest in securities acquired in a private placement, such as Rule 144A securities, as well as derivatives, including options, futures, swaps, and forward foreign currency contracts, for risk management purposes or as part of its investment strategies. Due to the opportunistic nature of its strategy, the Fund may also invest up to 20% of its assets in equity securities, including common stocks and convertible securities. The Fund employs a multi-manager, subadvised structure. The Fund may also invest a portion of the Fund’s assets in shares of exchange-traded funds (ETFs), which use a passive management strategy.
Investment Commentary
The Morningstar Multisector Bond Fund returned 4.86% from inception (November 2, 2018) through the Fund’s fiscal period end on April 30, 2019, underperforming the Fund’s blended benchmark (50% Bloomberg Barclays U.S. Corporate High Yield Corporate Index, 25% J.P. Morgan EMBI Global TR Index, 25% JPMGBI-EM Global Diversified), which returned 5.92% for the same period.
Our decision to meaningfully underweight U.S high-yield bonds in favor of a global bond strategy managed by Franklin Advisers was the primary detractor from relative results; since the Fund’s inception, we’ve considered the valuations of the U.S. high-yield bond market to be quite rich, and don’t believe that investors are being rewarded for the inherent credit risks associated with investing in below investment-grade bonds. The strategy managed by Franklin Advisers, Inc. failed to keep pace with the Fund’s benchmark. Franklin’s significant exposure to local currency emerging markets bonds performed in line with the Fund’s benchmark, but its short position in U.S. Treasury bonds caused it to lag as U.S. bond yields fell in the period.
The Fund’s overweight to hard-currency emerging markets debt, which performed strongly since the Fund’s inception through April 30, 2019, contributed to returns and helped partially offset relative underperformance elsewhere in the Fund. Strong performance by TCW Investment Management Company, which invests in both U.S. dollar and local-currency emerging-markets debt, compounded these gains as it outperformed its strategy benchmark.
41
Morningstar Funds Trust April 30, 2019
Performance Summary (unaudited)(continued)
Morningstar Multisector Bond Fund
Investment Subadvisers:
Franklin Advisers, Inc.
Benchmark-agnostic investment strategy with opportunistic exposure to interest rates, credit and currencies across both developed and emerging bond markets.
Loomis, Sayles & Company, L.P.
High-yield bond exposure with opportunistic bond allocations to bank loans, convertible bonds, investment-grade credit, agency andnon-agency mortgage-backed securities.
TCW Investment Management Company LLC
Diversified, emerging-markets bond exposure across hard-currency, local-currency, and corporate emerging-markets debt.
42
Morningstar Funds Trust April 30, 2019
Performance Summary (unaudited)(continued)
Morningstar Multisector Bond Fund
Performance at a glance
| | | | | | | | |
| Average Total Returns as of 04/30/19 | | YTD2 | | | Since Inception3 | |
Morningstar Multisector Bond Fund | | | 5.00 | % | | | 4.86 | % |
Morningstar Multisector Bond Blended Index1 | | | 6.74 | % | | | 5.92 | % |
Illustration of an assumed investment of $10,000
The following graph depicts the performance of Morningstar Multisector Bond Fund shares versus the Morningstar Multisector Bond Blended Index from its inception (November 2, 2018) to April 30, 2019 (the Fund’s fiscal period end). Shares held through advisory programs may be subject to a program fee, which, if included, would have reduced performance. The performance provided does not reflect the deduction of taxes that a shareholder would pay on Fund distributions or the redemption of Fund shares. Past performance is no guarantee of future results. Share price and returns will vary with market conditions; investors may realize a gain or loss upon redemption. It is important to note that Morningstar Multisector Bond Fund is a professionally managed portfolio while the Index is not available for direct investment, is unmanaged and does not include fees, expenses or taxes. The comparison is shown for illustration purposes only.
Morningstar Multisector Bond Fund
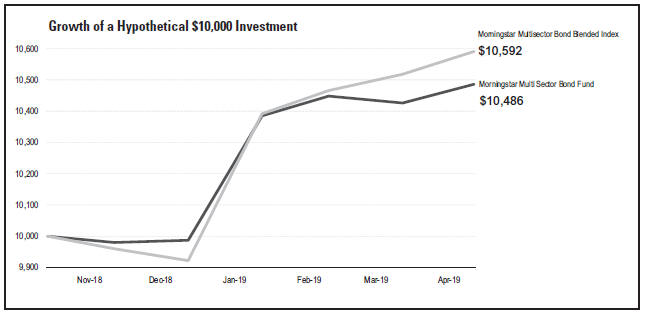
This chart does not imply future performance.
1The Morningstar Multisector Bond Blended Index is composed of 50% Bloomberg Barclays U.S. Corporate High Yield Index, 25% J.P. Morgan EMBI Global TR Index, and 25% J.P. Morgan Government Bond Index-Emerging Markets Global Diversified. The Bloomberg Barclays U.S. Corporate High Yield Index represents the universe of fixed rate, non-investment grade securities in which the Fund invests. Investors should note that indices do not reflect the deduction of fees, expenses or taxes.
2Represents performance from January 1, 2019 to April 30, 2019.
3Inception Date is November 2, 2018.
Past performance does not predict future performance, and the performance information provided, does not reflect the deduction of taxes that a shareholder would pay on Fund distributions or the redemption of Fund shares. Shares held through advisory programs are subject to a program fee, which, if included, would have reduced performance. The return and principal value of an investment will fluctuate, so that an investor’s shares, when redeemed, may be worth more or less than their original cost. Performance results assume reinvestment of all dividends and capital gain distributions at net asset value on theex-dividend dates. Current performance may be higher or lower than the performance data quoted.
43
Morningstar Funds Trust April 30, 2019
Fund Information (unaudited)
|
Morningstar Unconstrained Allocation Fund |
| | | | |
General Information | | | | |
Net Asset Value Per Share | | | $10.38 | |
Total Net Assets (millions) | | | $56 | |
Net Expense Ratio(a) | | | 0.64% | |
Gross Expense Ratio(a) | | | 1.48% | |
Portfolio Turnover Rate | | | 76% | |
Fund Inception | | | November 02, 2018 | |
No sales charges or distribution fees | | | | |
| |
Equity Portfolio (19.3%) | | | | |
Number of Common Stocks | | | 26 | |
Five Largest Sectors (%) | | | | |
Consumer,Non-cyclical | | | 9.1 | |
Technology | | | 3.0 | |
Consumer, Cyclical | | | 2.3 | |
Communications | | | 2.2 | |
Industrial | | | 1.5 | |
Ten Largest Equities (%)(b) | | | | |
International Game Technology PLC | | | 1.2 | |
SES S.A. | | | 1.2 | |
McKesson Corp. | | | 1.2 | |
Stericycle, Inc. | | | 1.2 | |
Nielsen Holdings PLC | | | 1.1 | |
H&R Block, Inc. | | | 1.0 | |
Oracle Corp. | | | 1.0 | |
CVS Health Corp. | | | 1.0 | |
MEDNAX, Inc. | | | 1.0 | |
Anheuser-Busch InBev S.A./N.V. | | | 1.0 | |
Asset Allocation
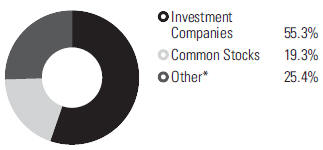
* Includes cash, short-term investments, receivables and payables.
(a) Net expense ratio reflects fee waivers and/or expense reimbursements, if any, pursuant to an agreement that is in effect to cap the expenses whereas the gross expense ratio does not. On September 26, 2018, the Fund and Morningstar Investment Management, LLC (“MIM”) entered into an amended, written fee waiver/expense reimbursement agreement pursuant to which (“MIM”) is contractually obligated to waive its advisory fees and/or reimburse expenses so that the Fund’s ordinary total operating expenses through August 31, 2020 (excluding taxes, interest, brokerage commissions, trading costs, acquired fund fees and expenses, short sale dividend and interest expenses, litigation expenses, and extraordinary expenses) would not exceed 1.00%. The fee waiver/expense reimbursement agreement may be terminated by the Fund’s board at any time and also will terminate automatically upon the expiration or termination of the Fund’s advisory contract with MIM.
(b) The Fund’s portfolio holdings are subject to change without notice. The mention of specific securities is not a recommendation to buy, sell, or hold any particular security and is not indicative of current or future trading activity.
44
Morningstar Funds Trust April 30, 2019
Performance Summary (unaudited)
|
Morningstar Unconstrained Allocation Fund |
Investment Objective
Morningstar Unconstrained Allocation Fund seeks long-term capital appreciation over a full market cycle.
Investment Strategies
In seeking long-term capital appreciation over a full market cycle, the Fund has significant flexibility and invests across asset classes and geographies according to the portfolio management team’s assessment of their valuations and fundamental health.
The Fund invests in equity securities, which may include common stocks and real estate investment trusts (REITs). The Fund may invest in companies of any size from any country, including emerging markets.
To meet its objective, the Fund may also invest in fixed-income securities of varying maturity, duration, and quality. These may include U.S. andnon-U.S. corporate debt securities, U.S. government debt securities including Treasury Inflation Protected Bond Securities andzero-coupon securities,non-U.S. government debt securities, emerging-market debt securities, and mortgage-backed and asset-backed securities. The Fund may invest without limit in fixed-income securities that are rated below investment grade (commonly known as junk bonds) or, if unrated, are determined by the Fund’s subadviser(s) to be of comparable quality.
The Fund may invest in exchange traded funds (ETFs), which could represent a significant percentage of assets. The Fund may also invest in derivatives, including options, futures, swaps, and forward foreign currency contracts, for risk management purposes or as part of its investment strategies. The Fund employs a multi-manager, subadvised structure. The Fund may also invest a portion of the Fund’s assets in shares of exchange-traded funds (ETFs), which use a passive management strategy.
Investment Commentary
The Morningstar Unconstrained Allocation Fund returned 4.97% from inception (November 2, 2018) through the Fund’s fiscal period end on April 30, 2019, underperforming the Fund’s blended benchmark (50% Bloomberg Barclays Multiverse Total Return Index, 50% Morningstar GlobalEx-U.S. Index), which returned 6.24% for the same period.
Strong returns by global equity markets, particularly from the start of 2019 through the end of April 2019, fueled the Fund’s returns. Securities of issuers domiciled in Italy were especially strong contributors. Fixed-income securities also generated positive returns, though to a lesser degree over the period.
While the Fund’s equity overweight was generally a positive, its limited exposure to U.S. markets was a detractor during the period. Select exposures, such as U.S. healthcare, Japan and European financials, were specific sources of underperformance.
Lazard Asset Management’s Global Equity mandate, with its highly selective quality criteria, underperformed the Morningstar Global Markets Index for the period in question.
45
Morningstar Funds Trust April 30, 2019
Performance Summary (unaudited)(continued)
Morningstar Unconstrained Allocation Fund
Investment Subadviser:
Lazard Asset Management, LLC
Anchor global equity exposure focused on quality, attractively valued stocks, which have appeal throughout a market cycle.
46
Morningstar Funds Trust April 30, 2019
Performance Summary (unaudited)(continued)
Morningstar Unconstrained Allocation Fund
Performance at a glance
| | | | | | | | |
| Average Total Returns as of 04/30/19 | | YTD2 | | | Since Inception3 | |
Morningstar Unconstrained Allocation Fund | | | 9.61 | % | | | 4.97 | % |
Morningstar Unconstrained Allocation Blended Index1 | | | 8.85 | % | | | 6.24 | % |
Illustration of an assumed investment of $10,000
The following graph depicts the performance of Morningstar Unconstrained Allocation Fund shares versus the Morningstar Unconstrained Allocation Blended Index from its inception (November 2, 2018) to April 30, 2019 (the Fund’s fiscal period end). Shares held through advisory programs may be subject to a program fee, which, if included, would have reduced performance. The performance provided does not reflect the deduction of taxes that a shareholder would pay on Fund distributions or the redemption of Fund shares. Past performance is no guarantee of future results. Share price and returns will vary with market conditions; investors may realize a gain or loss upon redemption. It is important to note that Morningstar Unconstrained Allocation Fund is a professionally managed portfolio while the Index is not available for direct investment, is unmanaged and does not include fees, expenses or certain taxes. The comparison is shown for illustration purposes only.
Morningstar Unconstrained Allocation Fund
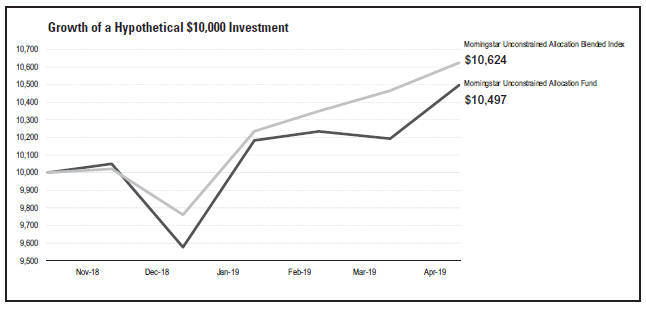
This chart does not imply future performance.
1The Morningstar Unconstrained Allocation Blended Index is composed of 50% Morningstar GlobalEx-U.S. Index (net) and 50% Bloomberg Barclays Multiverse Total Return Index. The Morningstar GlobalEx-U.S. Index (net) captures the performance of the stocks located in the developed and emerging countries across the world, excluding the United States. The Bloomberg Barclays Multiverse Total Return Index provides a broad-based measure of the global fixed-income bond market. Net total return indices reinvest dividends after the deduction of withholding taxes, using a tax rate applicable tonon-resident institutional. Investors should note that such indices do not reflect the deduction of fees, expenses or other taxes.
2Represents performance from January 1, 2019 to April 30, 2019.
3Inception Date is November 2, 2018.
Past performance does not predict future performance, and the performance information provided, does not reflect the deduction of taxes that a shareholder would pay on Fund distributions or the redemption of Fund shares. Shares held through advisory programs are subject to a program fee, which, if included, would have reduced performance. The return and principal value of an investment will fluctuate, so that an investor’s shares, when redeemed, may be worth more or less than their original cost. Performance results assume reinvestment of all dividends and capital gain distributions at net asset value on theex-dividend dates. Current performance may be higher or lower than the performance data quoted.
47
Morningstar Funds Trust April 30, 2019
Fund Information(unaudited)
|
Morningstar Alternatives Fund |
| | | | |
| |
General Information | | | | |
Net Asset Value Per Share | | | $10.10 | |
Total Net Assets (millions) | | | $112 | |
Net Expense Ratio(a) | | | 0.96% | |
Gross Expense Ratio(a) | | | 1.91% | |
Portfolio Turnover Rate | | | 103% | |
Fund Inception | | | November 02, 2018 | |
No sales charges or distribution fees | |
| | | | |
| |
Allocation Strategy Type (%) | | | | |
Global Macro | | | 37.7 | |
Convertible Arbitrage | | | 28.2 | |
Merger Arbitrage | | | 28.1 | |
Market Neutral | | | 3.6 | |
Short-term investments and ETFs | | | 2.4 | |
Asset Allocation
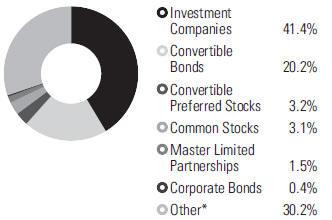
| | | | |
| |
Region Diversification (%) | | | | |
United States | | | 25.4 | |
United Kingdom | | | 1.2 | |
Europe (excluding United Kingdom) | | | 0.7 | |
Pacific (excluding Japan) | | | 0.5 | |
Middle East | | | 0.3 | |
Latin America | | | 0.3 | |
* Includes cash, short-term investments, derivatives, receivables and payables.
(a) Net expense ratio reflects fee waivers and/or expense reimbursements, if any, pursuant to an agreement that is in effect to cap the expenses whereas the gross expense ratio does not. On September 26, 2018, the Fund and Morningstar Investment Management, LLC (“MIM”) entered into an amended, written fee waiver/expense reimbursement agreement pursuant to which (“MIM”) is contractually obligated to waive its advisory fees and/or reimburse expenses so that the Fund’s ordinary total operating expenses through August 31, 2020 (excluding taxes, interest, brokerage commissions, trading costs, acquired fund fees and expenses, short sale dividend and interest expenses, litigation expenses, and extraordinary expenses) would not exceed 1.29%. The fee waiver/expense reimbursement agreement may be terminated by the Fund’s board at any time and also will terminate automatically upon the expiration or termination of the Fund’s advisory contract with MIM.
48
Morningstar Funds Trust April 30, 2019
Performance Summary(unaudited)
|
Morningstar Alternatives Fund |
Investment Objective
Morningstar Alternatives Fund seeks long-term capital appreciation and low sensitivity to traditional U.S. asset classes.
Investment Strategies
In seeking long-term capital appreciation and low sensitivity to traditional U.S. asset classes, the Fund allocates assets to strategies that provide alternative sources of return. In particular, the Fund has the latitude to invest in the following alternative strategies:
Long-Short Equity—Combines long equity positions with short equity positions (selling borrowed securities). Since the strategy is both long and short, total net exposure is typically less than 100%.
Convertible Arbitrage—Includes the purchase of convertible securities and the sale of the underlying common stock. These securities tend to be convertible bonds or convertible preferred stocks that may be converted into the stock of the same company.
Merger Arbitrage—Seeks to profit from the successful completion of corporate organizations. The process typically involves purchasing shares of an announced acquisition target company at a discount to their expected value upon completion of the acquisition. Hedging strategies may be used to reduce market exposure and volatility.
Credit Arbitrage—Seeks to exploit the mispricing of different classes of securities that are usually of the same company, and may include investments in investment-grade and/ornon-investment-grade corporate debt (otherwise known as junk bonds), credit derivatives, loans, equities, credit index securities, and private debt.
Global Macro—Establishes long (number of contracts bought exceeds number sold) with a short (number of contracts sold exceeds number bought) exposures around the globe to take advantage of what the subadviser believe to be attractive opportunities. This strategy may include investments in fixed-income and equity securities and a wide variety of derivative instruments. Such investments will likely have significant exposure to foreign investments and may be concentrated in a geographic region or country.
Hedged Equity—Seeks to limit investment loss by creating a transaction that offsets an existing position in a contract that provides the right to buy or sell shares of a security at a specific price for a certain time. Specifically, this strategy attempts to reduce the systematic risk created by factors such as exposures to sectors,market-cap ranges, investment styles, currencies, and/or countries; the strategy strives to achieve this by matching short positions within each area against long positions. This strategy may be managed as beta neutral, dollar-neutral, or sector-neutral in order to achieve low beta exposures to certain market indexes.
49
Morningstar Funds Trust April 30, 2019
Performance Summary (unaudited)(continued)
Morningstar Alternatives Fund
Market Neutral—Attempts to significantly reduce the systematic risk created by factors such as exposures to sectors,market-cap ranges, investment styles, currencies, and/or countries. This strategy seeks to achieve this by matching short positions within each area against long positions, and the strategy may be managed as beta-neutral, dollar-neutral, or sector-neutral. In attempting to significantly reduce systematic risk, issue selection may be emphasized, with profits dependent on the ability to sell short and buy long the chosen securities.
Nontraditional Bond—Pursues strategies that diverge in one or more ways from conventional practice in the broader bond-fund universe. In pursuing this strategy, the Fund may seek to avoid losses and produce returns uncorrelated with the overall bond market and may employ a variety of methods to achieve those aims, including investing tactically across a wide swath of individual sectors, including high-yield and foreign debt.
The Fund may invest in derivatives, including options, futures, swaps, and forward foreign currency contracts, for risk management purposes or as part of its investment strategies. The Fund employs a multi-manager, subadvised structure. The Fund may also invest a portion of the Fund’s assets in shares of exchange-traded funds (ETFs), which use a passive management strategy.
Investment Commentary
The Morningstar Alternatives Fund returned 1.26% from inception (November 2, 2018) through the Fund’s fiscal period end on April 30, 2019, outperforming the Fund’s benchmark (FTSE3-Month Treasury Bill Index), which returned 1.19% for the same period.
Positive returns were generated by the underlying subadvisers and one of the two third-party mutual funds held within the Fund. However, Vanguard Market Neutral Income lost ground for the period and dragged on overall results.
Both of the Fund’s subadvisers, Water Island Capital, LLC and SSI Investment Management, Inc. (now SSI Investment Management, LLC), outperformed the Fund’s stated benchmark.
Investment Subadvisers:
SSI Investment Management, Inc. (now SSI Investment Management, LLC)
Short-term cash exposure that pursues minimal correlation to broad markets and bond-like volatility through an unlevered convertible arbitrage strategy.
Water Island Capital, LLC
Seeks to provide cash-plus returns while remaining broadly uncorrelated to equity markets.
50
Morningstar Funds Trust April 30, 2019
Performance Summary (unaudited)(continued)
Morningstar Alternatives Fund
Performance at a glance
| | | | | | | | |
| Average Total Returns as of 04/30/19 | | YTD2 | | | Since Inception3 | |
Morningstar Alternatives Fund | | | 1.30 | % | | | 1.26 | % |
FTSE3-Month Treasury Bill Index1 | | | 0.80 | % | | | 1.19 | % |
Illustration of an assumed investment of $10,000
The following graph depicts the performance of Morningstar Alternatives Fund shares versus the FTSE3-Month Treasury Bill Index from its inception (November 2, 2018) to April 30, 2019 (the Fund’s fiscal period end). Shares held through advisory programs may be subject to a program fee, which, if included, would have reduced performance. The performance provided does not reflect the deduction of taxes that a shareholder would pay on Fund distributions or the redemption of Fund shares. Past performance is no guarantee of future results. Share price and returns will vary with market conditions; investors may realize a gain or loss upon redemption. It is important to note that Morningstar Alternatives Fund is a professionally managed portfolio while the Index is not available for direct investment, is unmanaged and does not include fees, expenses or taxes. The comparison is shown for illustration purposes only.
Morningstar Alternatives Fund
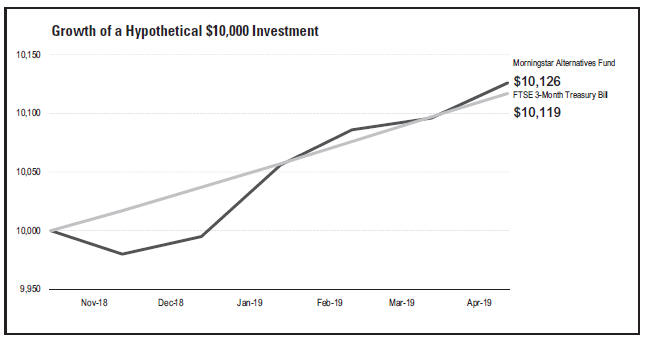
This chart does not imply future performance.
1The FTSE3-Month Treasury Bill Index is intended to track the daily performance of3-month U.S. Treasury bills. Investors should note that indices do not reflect the deduction of fees, expenses or taxes.
2Represents performance from January 1, 2019 to April 30, 2019.
3Inception Date is November 2, 2018.
Past performance does not predict future performance, and the performance information provided, does not reflect the deduction of taxes that a shareholder would pay on Fund distributions or the redemption of Fund shares. Shares held through advisory programs are subject to a program fee, which, if included, would have reduced performance. The return and principal value of an investment will fluctuate, so that an investor’s shares, when redeemed, may be worth more or less than their original cost. Performance results assume reinvestment of all dividends and capital gain distributions at net asset value on theex-dividend dates. Current performance may be higher or lower than the performance data quoted.
51
Morningstar Funds Trust April 30, 2019
Schedule of Investments
|
Morningstar U.S. Equity Fund |
| | | | | | | | |
| | | Number
of Shares | | | Value | |
| | |
Common Stocks – 90.3% | | | | | | | | |
Advertising – 0.3% | | | | | | | | |
Omnicom Group, Inc. | | | 25,571 | | | $ | 2,046,447 | |
| | | |
Aerospace/Defense – 1.4% | | | | | | | | |
Barnes Group, Inc. | | | 23,520 | | | | 1,308,182 | |
Kaman Corp. | | | 31,004 | | | | 1,919,458 | |
Lockheed Martin Corp. | | | 4,432 | | | | 1,477,319 | |
Northrop Grumman Corp. | | | 9,588 | | | | 2,779,657 | |
United Technologies Corp. | | | 14,427 | | | | 2,057,434 | |
| | | | | | | 9,542,050 | |
| | | |
Agriculture – 0.8% | | | | | | | | |
Altria Group, Inc. | | | 16,449 | | | | 893,674 | |
Archer-Daniels-Midland Co. | | | 47,370 | | | | 2,112,702 | |
Philip Morris International, Inc. | | | 31,214 | | | | 2,701,884 | |
| | | | | | | 5,708,260 | |
| | | |
Airlines – 0.5% | | | | | | | | |
Alaska Air Group, Inc. | | | 24,784 | | | | 1,534,129 | |
Allegiant Travel Co. | | | 3,520 | | | | 517,018 | |
United Continental Holdings, Inc.* | | | 17,909 | | | | 1,591,394 | |
| | | | | | | 3,642,541 | |
| | | |
Apparel – 0.5% | | | | | | | | |
Hanesbrands, Inc. | | | 74,015 | | | | 1,337,451 | |
Oxford Industries, Inc. | | | 9,522 | | | | 790,898 | |
VF Corp. | | | 12,193 | | | | 1,151,141 | |
| | | | | | | 3,279,490 | |
| | | |
Auto Manufacturers – 0.8% | | | | | | | | |
General Motors Co. | | | 142,147 | | | | 5,536,626 | |
| | | |
Auto Parts & Equipment – 1.4% | | | | | | | | |
Altra Industrial Motion Corp. | | | 27,755 | | | | 1,040,535 | |
Aptiv PLC | | | 16,710 | | | | 1,432,047 | |
BorgWarner, Inc. | | | 60,947 | | | | 2,545,756 | |
Douglas Dynamics, Inc. | | | 17,264 | | | | 651,889 | |
Gentherm, Inc.* | | | 9,235 | | | | 391,194 | |
Goodyear Tire & Rubber (The) Co. | | | 153,361 | | | | 2,946,065 | |
Lear Corp. | | | 2,311 | | | | 330,473 | |
| | | | | | | 9,337,959 | |
| | | |
Banks – 8.8% | | | | | | | | |
Bank of America Corp. | | | 163,887 | | | | 5,011,664 | |
Bank of New York Mellon (The) Corp. | | | 30,445 | | | | 1,511,899 | |
Bank OZK | | | 44,498 | | | | 1,452,860 | |
BankUnited, Inc. | | | 75,294 | | | | 2,754,254 | |
BB&T Corp. | | | 38,846 | | | | 1,988,915 | |
| | | | | | | | |
| | | Number
of Shares | | | Value | |
| | |
Banks (Continued) | | | | | | | | |
BOK Financial Corp. | | | 11,101 | | | $ | 967,341 | |
Central Pacific Financial Corp. | | | 21,596 | | | | 648,096 | |
Citigroup, Inc. | | | 96,186 | | | | 6,800,350 | |
City Union Bank Ltd. (India) | | | 228,078 | | | | 665,014 | |
Columbia Banking System, Inc. | | | 22,635 | | | | 849,718 | |
Eagle Bancorp, Inc.* | | | 24,267 | | | | 1,340,994 | |
First Republic Bank | | | 17,313 | | | | 1,828,599 | |
Glacier Bancorp, Inc. | | | 9,820 | | | | 418,234 | |
Goldman Sachs Group (The), Inc. | | | 12,949 | | | | 2,666,458 | |
Great Western Bancorp, Inc. | | | 23,990 | | | | 843,728 | |
Heritage Commerce Corp. | | | 28,000 | | | | 350,560 | |
Independent Bank Corp. | | | 3,221 | | | | 258,421 | |
JPMorgan Chase & Co. | | | 106,167 | | | | 12,320,680 | |
LegacyTexas Financial Group, Inc. | | | 20,434 | | | | 818,995 | |
Metro Bank PLC (United Kingdom)* | | | 34,989 | | | | 343,162 | |
PNC Financial Services Group (The), Inc. | | | 16,488 | | | | 2,257,702 | |
Renasant Corp. | | | 22,402 | | | | 812,297 | |
South State Corp. | | | 11,281 | | | | 853,520 | |
State Street Corp. | | | 18,851 | | | | 1,275,459 | |
SVB Financial Group* | | | 5,922 | | | | 1,490,686 | |
Texas Capital Bancshares, Inc.* | | | 8,997 | | | | 582,376 | |
U.S. Bancorp | | | 65,827 | | | | 3,509,896 | |
Webster Financial Corp. | | | 19,758 | | | | 1,049,743 | |
Wells Fargo & Co. | | | 76,011 | | | | 3,679,692 | |
| | | | | | | 59,351,313 | |
| | | |
Beverages – 2.4% | | | | | | | | |
Anheuser-Busch InBev S.A./N.V. ADR (Belgium) | | | 30,840 | | | | 2,742,910 | |
Coca-Cola (The) Co. | | | 35,997 | | | | 1,766,013 | |
Cott Corp. | | | 328,893 | | | | 5,101,130 | |
Diageo PLC (United Kingdom) | | | 52,989 | | | | 2,233,895 | |
Farmer Brothers Co.* | | | 69,710 | | | | 1,405,354 | |
Molson Coors Brewing Co., Class B | | | 31,360 | | | | 2,012,998 | |
PepsiCo, Inc. | | | 6,980 | | | | 893,789 | |
| | | | | | | 16,156,089 | |
| | | |
Biotechnology – 1.3% | | | | | | | | |
Abcam PLC (United Kingdom) | | | 45,603 | | | | 774,846 | |
Alexion Pharmaceuticals, Inc.* | | | 16,809 | | | | 2,288,209 | |
See accompanying Notes to Financial Statements
52
Morningstar Funds Trust April 30, 2019
Schedule of Investments(continued)
Morningstar U.S. Equity Fund
| | | | | | | | |
| | | Number
of Shares | | | Value | |
| | |
Biotechnology (Continued) | | | | | | | | |
BioMarin Pharmaceutical, Inc.* | | | 15,543 | | | $ | 1,329,393 | |
Bio-Rad Laboratories, Inc., Class A* | | | 12,940 | | | | 3,894,034 | |
Sangamo Therapeutics, Inc.* | | | 28,384 | | | | 331,809 | |
| | | | | | | 8,618,291 | |
| | | |
Building Materials – 0.9% | | | | | | | | |
Apogee Enterprises, Inc. | | | 10,744 | | | | 432,983 | |
Continental Building Products, Inc.* | | | 31,490 | | | | 807,719 | |
Johnson Controls International PLC | | | 61,241 | | | | 2,296,537 | |
Trex Co., Inc.* | | | 20,750 | | | | 1,437,352 | |
Universal Forest Products, Inc. | | | 22,905 | | | | 846,340 | |
| | | | | | | 5,820,931 | |
| | | |
Chemicals – 3.2% | | | | | | | | |
Ashland Global Holdings, Inc. | | | 7,084 | | | | 570,475 | |
Axalta Coating Systems Ltd.* | | | 80,380 | | | | 2,168,652 | |
Balchem Corp. | | | 15,921 | | | | 1,616,141 | |
Dow, Inc.* | | | 48,644 | | | | 2,759,574 | |
DowDuPont, Inc. | | | 151,452 | | | | 5,823,329 | |
Innospec, Inc. | | | 9,095 | | | | 771,438 | |
Linde PLC (Moscow Exchange) (United Kingdom) | | | 12,183 | | | | 2,196,108 | |
PPG Industries, Inc. | | | 26,217 | | | | 3,080,497 | |
RPM International, Inc. | | | 10,375 | | | | 629,244 | |
Sherwin-Williams (The) Co. | | | 3,395 | | | | 1,544,148 | |
Valvoline, Inc. | | | 34,106 | | | | 630,961 | |
| | | | | | | 21,790,567 | |
| | | |
Commercial Services – 3.2% | | | | | | | | |
Aaron’s, Inc. | | | 8,015 | | | | 446,355 | |
Avis Budget Group, Inc.* | | | 12,118 | | | | 430,795 | |
Cimpress N.V. (Netherlands)* | | | 7,846 | | | | 709,278 | |
Ecolab, Inc. | | | 14,206 | | | | 2,615,040 | |
Equifax, Inc. | | | 10,722 | | | | 1,350,436 | |
Euronet Worldwide, Inc.* | | | 12,099 | | | | 1,813,519 | |
Healthcare Services Group, Inc. | | | 23,536 | | | | 796,694 | |
HealthEquity, Inc.* | | | 11,252 | | | | 762,323 | |
IHS Markit Ltd.* | | | 38,792 | | | | 2,221,230 | |
Monro, Inc. | | | 22,732 | | | | 1,905,624 | |
Moody’s Corp. | | | 6,668 | | | | 1,311,062 | |
Paylocity Holding Corp.* | | | 12,340 | | | | 1,191,427 | |
PayPal Holdings, Inc.* | | | 28,510 | | | | 3,215,073 | |
| | | | | | | | |
| | | Number
of Shares | | | Value | |
| |
Commercial Services (Continued) | | | | | |
Verisk Analytics, Inc. | | | 4,964 | | | $ | 700,619 | |
Worldpay, Inc., Class A* | | | 18,952 | | | | 2,221,364 | |
| | | | | | | 21,690,839 | |
| | | |
Computers – 2.5% | | | | | | | | |
Accenture PLC, Class A | | | 27,546 | | | | 5,031,828 | |
Amdocs Ltd. | | | 5,782 | | | | 318,472 | |
Apple, Inc. | | | 36,224 | | | | 7,269,070 | |
Cognizant Technology Solutions Corp., Class A | | | 10,938 | | | | 798,036 | |
DXC Technology Co. | | | 9,758 | | | | 641,491 | |
EPAM Systems, Inc.* | | | 8,152 | | | | 1,462,143 | |
Nutanix, Inc., Class A* | | | 40,452 | | | | 1,747,122 | |
| | | | | | | 17,268,162 | |
| | |
Cosmetics/Personal Care – 0.2% | | | | | |
Colgate-Palmolive Co. | | | 4,781 | | | | 348,009 | |
Coty, Inc., Class A | | | 56,456 | | | | 610,854 | |
Procter & Gamble (The) Co. | | | 3,110 | | | | 331,153 | |
| | | | | | | 1,290,016 | |
| | | |
Distribution/Wholesale – 1.1% | | | | | | | | |
Copart, Inc.* | | | 24,819 | | | | 1,670,815 | |
Fastenal Co. | | | 6,581 | | | | 464,289 | |
HD Supply Holdings, Inc.* | | | 7,724 | | | | 352,910 | |
Pool Corp. | | | 9,916 | | | | 1,821,966 | |
SiteOne Landscape Supply, Inc.* | | | 9,140 | | | | 615,122 | |
W.W. Grainger, Inc. | | | 9,206 | | | | 2,596,092 | |
| | | | | | | 7,521,194 | |
| | |
Diversified Financial Services – 3.8% | | | | | |
American Express Co. | | | 30,879 | | | | 3,619,945 | |
BlackRock, Inc. | | | 8,211 | | | | 3,984,306 | |
Charles Schwab (The) Corp. | | | 61,843 | | | | 2,831,172 | |
Cohen & Steers, Inc. | | | 8,506 | | | | 426,576 | |
Credit Acceptance Corp.* | | | 2,660 | | | | 1,319,945 | |
Discover Financial Services | | | 27,737 | | | | 2,260,288 | |
Franklin Resources, Inc. | | | 27,818 | | | | 962,225 | |
Hamilton Lane, Inc., Class A | | | 20,692 | | | | 1,011,011 | |
Houlihan Lokey, Inc. | | | 9,227 | | | | 455,076 | |
Mr. Cooper Group, Inc.* | | | 66,894 | | | | 575,288 | |
Nasdaq, Inc. | | | 19,422 | | | | 1,790,708 | |
T. Rowe Price Group, Inc. | | | 7,200 | | | | 774,000 | |
Visa, Inc., Class A | | | 34,499 | | | | 5,672,671 | |
| | | | | | | 25,683,211 | |
| | | |
Electric – 1.6% | | | | | | | | |
CenterPoint Energy, Inc. | | | 77,414 | | | | 2,399,834 | |
Duke Energy Corp. | | | 34,240 | | | | 3,119,949 | |
FirstEnergy Corp. | | | 35,720 | | | | 1,501,312 | |
See accompanying Notes to Financial Statements
53
Morningstar Funds Trust April 30, 2019
Schedule of Investments(continued)
Morningstar U.S. Equity Fund
| | | | | | | | |
| | | Number
of Shares | | | Value | |
| | |
Electric (Continued) | | | | | | | | |
NorthWestern Corp. | | | 11,472 | | | $ | 801,319 | |
Southern (The) Co. | | | 48,654 | | | | 2,589,366 | |
Xcel Energy, Inc. | | | 13,478 | | | | 761,507 | |
| | | | | | | 11,173,287 | |
| |
Electrical Component & Equipment – 0.1% | |
Novanta, Inc.* | | | 8,855 | | | | 770,562 | |
| | | |
Electronics – 1.9% | | | | | | | | |
Avnet, Inc. | | | 25,989 | | | | 1,263,325 | |
Fluidigm Corp.* | | | 197,702 | | | | 2,716,425 | |
Honeywell International, Inc. | | | 39,747 | | | | 6,901,272 | |
OSI Systems, Inc.* | | | 4,615 | | | | 415,950 | |
Sensata Technologies Holding PLC* | | | 33,782 | | | | 1,687,073 | |
| | | | | | | 12,984,045 | |
| | |
Engineering & Construction – 0.1% | | | | | |
Comfort Systems USA, Inc. | | | 15,505 | | | | 838,821 | |
| | | |
Entertainment – 0.6% | | | | | | | | |
Red Rock Resorts, Inc., Class A | | | 102,381 | | | | 2,762,239 | |
Vail Resorts, Inc. | | | 5,177 | | | | 1,184,757 | |
| | | | | | | 3,946,996 | |
| | |
Environmental Control – 0.2% | | | | | |
Stericycle, Inc.* | | | 18,339 | | | | 1,070,814 | |
| | | |
Food – 3.6% | | | | | | | | |
B&G Foods, Inc. | | | 20,755 | | | | 539,630 | |
Danone S.A. (France) | | | 9,457 | | | | 764,551 | |
Flowers Foods, Inc. | | | 50,158 | | | | 1,090,435 | |
General Mills, Inc. | | | 21,393 | | | | 1,101,098 | |
Hostess Brands, Inc.* | | | 63,200 | | | | 846,880 | |
J&J Snack Foods Corp. | | | 5,141 | | | | 808,062 | |
JM Smucker (The) Co. | | | 5,635 | | | | 691,020 | |
Kraft Heinz (The) Co. | | | 114,735 | | | | 3,813,791 | |
McCormick & Co., Inc. (Non Voting) | | | 9,189 | | | | 1,414,830 | |
Nestle S.A. (Switzerland)(a) | | | 27,625 | | | | 2,659,670 | |
Nomad Foods Ltd. (United Kingdom)* | | | 20,455 | | | | 425,464 | |
Post Holdings, Inc.* | | | 48,854 | | | | 5,509,754 | |
TreeHouse Foods, Inc.* | | | 72,815 | | | | 4,877,149 | |
| | | | | | | 24,542,334 | |
| | |
Forest Products & Paper – 0.3% | | | | | |
International Paper Co. | | | 44,280 | | | | 2,072,747 | |
| | | | | | | | |
| | | Number
of Shares | | | Value | |
| | | |
Gas – 0.4% | | | | | | | | |
South Jersey Industries, Inc. | | | 25,589 | | | $ | 821,919 | |
UGI Corp. | | | 39,963 | | | | 2,178,383 | |
| | | | | | | 3,000,302 | |
| | | |
Hand/Machine Tools – 0.4% | | | | | | | | |
Colfax Corp.* | | | 35,112 | | | | 1,059,329 | |
Stanley Black & Decker, Inc. | | | 12,248 | | | | 1,795,557 | |
| | | | | | | 2,854,886 | |
| | | |
Healthcare - Products – 2.7% | | | | | | | | |
Abbott Laboratories | | | 26,490 | | | | 2,107,544 | |
Alcon, Inc. (Switzerland)* | | | 869 | | | | 50,045 | |
Boston Scientific Corp.* | | | 53,552 | | | | 1,987,850 | |
Cantel Medical Corp. | | | 13,938 | | | | 960,886 | |
CONMED Corp. | | | 9,922 | | | | 794,058 | |
Danaher Corp. | | | 21,057 | | | | 2,788,789 | |
Medtronic PLC | | | 45,503 | | | | 4,041,121 | |
Thermo Fisher Scientific, Inc. | | | 19,610 | | | | 5,440,795 | |
| | | | | | | 18,171,088 | |
| | | |
Healthcare - Services – 1.8% | | | | | | | | |
Ensign Group (The), Inc. | | | 24,726 | | | | 1,273,883 | |
ICON PLC (Ireland)* | | | 11,758 | | | | 1,605,908 | |
Medpace Holdings, Inc.* | | | 9,429 | | | | 529,627 | |
Quest Diagnostics, Inc. | | | 52,455 | | | | 5,055,613 | |
UnitedHealth Group, Inc. | | | 16,767 | | | | 3,907,885 | |
| | | | | | | 12,372,916 | |
| | | |
Home Builders – 0.5% | | | | | | | | |
Installed Building Products, Inc.* | | | 15,490 | | | | 743,985 | |
NVR, Inc.* | | | 765 | | | | 2,411,647 | |
| | | | | | | 3,155,632 | |
| | |
Household Products/Wares – 0.2% | | | | | |
Kimberly-Clark Corp. | | | 4,368 | | | | 560,764 | |
Reckitt Benckiser Group PLC (United Kingdom) | | | 9,304 | | | | 752,753 | |
| | | | | | | 1,313,517 | |
| | | |
Insurance – 4.7% | | | | | | | | |
American International Group, Inc. | | | 128,211 | | | | 6,098,997 | |
Aon PLC | | | 19,966 | | | | 3,596,675 | |
Argo Group International Holdings Ltd. | | | 10,710 | | | | 836,130 | |
Brighthouse Financial, Inc.* | | | 24,134 | | | | 1,008,560 | |
Chubb Ltd. | | | 22,102 | | | | 3,209,210 | |
Employers Holdings, Inc. | | | 9,600 | | | | 412,032 | |
Enstar Group Ltd.* | | | 3,325 | | | | 589,390 | |
See accompanying Notes to Financial Statements
54
Morningstar Funds Trust April 30, 2019
Schedule of Investments(continued)
Morningstar U.S. Equity Fund
| | | | | | | | |
| | | Number
of Shares | | | Value | |
| | |
Insurance (Continued) | | | | | | | | |
Hartford Financial Services Group (The), Inc. | | | 28,067 | | | $ | 1,468,185 | |
Loews Corp. | | | 82,105 | | | | 4,211,165 | |
Mercury General Corp. | | | 12,940 | | | | 695,913 | |
MetLife, Inc. | | | 27,340 | | | | 1,261,194 | |
Reinsurance Group of America, Inc. | | | 5,863 | | | | 888,303 | |
RenaissanceRe Holdings Ltd. | | | 8,764 | | | | 1,361,575 | |
Safety Insurance Group, Inc. | | | 4,000 | | | | 371,680 | |
Travelers (The) Cos., Inc. | | | 23,161 | | | | 3,329,394 | |
Willis Towers Watson PLC (United Kingdom) | | | 14,478 | | | | 2,668,875 | |
| | | | | | | 32,007,278 | |
| | | |
Internet – 4.6% | | | | | | | | |
Alibaba Group Holding Ltd. ADR (China)* | | | 11,520 | | | | 2,137,766 | |
Alphabet, Inc., Class A* | | | 1,433 | | | | 1,718,110 | |
Alphabet, Inc., Class C* | | | 3,593 | | | | 4,270,209 | |
Amazon.com, Inc.* | | | 4,819 | | | | 9,283,900 | |
Facebook, Inc., Class A* | | | 38,828 | | | | 7,509,335 | |
GrubHub, Inc.* | | | 21,298 | | | | 1,422,493 | |
Palo Alto Networks, Inc.* | | | 10,424 | | | | 2,593,804 | |
Proofpoint, Inc.* | | | 9,203 | | | | 1,154,240 | |
Q2 Holdings, Inc.* | | | 13,580 | | | | 1,024,204 | |
| | | | | | | 31,114,061 | |
| | | |
Leisure Time – 0.2% | | | | | | | | |
Camping World Holdings, Inc., Class A | | | 33,710 | | | | 502,953 | |
Harley-Davidson, Inc. | | | 4,999 | | | | 186,113 | |
Planet Fitness, Inc., Class A* | | | 13,340 | | | | 1,009,838 | |
| | | | | | | 1,698,904 | |
| | | |
Lodging – 0.1% | | | | | | | | |
Marcus (The) Corp. | | | 19,906 | | | | 748,864 | |
| |
Machinery - Construction & Mining – 0.3% | |
Caterpillar, Inc. | | | 12,972 | | | | 1,808,556 | |
| | | |
Machinery - Diversified – 0.8% | | | | | | | | |
Alamo Group, Inc. | | | 4,165 | | | | 431,660 | |
Albany International Corp., Class A | | | 11,064 | | | | 818,404 | |
Columbus McKinnon Corp. | | | 11,327 | | | | 445,831 | |
Deere & Co. | | | 4,492 | | | | 744,010 | |
Kadant, Inc. | | | 9,010 | | | | 883,791 | |
Wabtec Corp. | | | 27,730 | | | | 2,053,961 | |
| | | | | | | 5,377,657 | |
| | | |
| | | | | | | | |
| | | | | | | | |
| | | Number
of Shares | | | Value | |
| | | |
Media – 2.1% | | | | | | | | |
Comcast Corp., Class A | | | 189,414 | | | $ | 8,245,191 | |
Liberty Media Corp.-Liberty Formula One, Class C* | | | 51,606 | | | | 2,002,829 | |
Walt Disney (The) Co. | | | 27,540 | | | | 3,772,154 | |
| | | | | | | 14,020,174 | |
| | |
Metal Fabricate/Hardware – 0.4% | | | | | |
RBC Bearings, Inc.* | | | 11,167 | | | | 1,536,021 | |
Sun Hydraulics Corp. | | | 20,477 | | | | 1,071,766 | |
| | | | | | | 2,607,787 | |
| | |
Miscellaneous Manufacturing – 2.4% | | | | | |
3M Co. | | | 8,737 | | | | 1,655,749 | |
Eaton Corp. PLC | | | 64,331 | | | | 5,327,893 | |
Federal Signal Corp. | | | 14,135 | | | | 406,664 | |
Illinois Tool Works, Inc. | | | 15,636 | | | | 2,433,431 | |
Ingersoll-Rand PLC | | | 13,869 | | | | 1,700,478 | |
Lydall, Inc.* | | | 15,795 | | | | 388,715 | |
Parker-Hannifin Corp. | | | 6,622 | | | | 1,199,112 | |
Textron, Inc. | | | 59,133 | | | | 3,134,049 | |
| | | | | | | 16,246,091 | |
| | | |
Office Furnishings – 0.2% | | | | | | | | |
Interface, Inc. | | | 52,618 | | | | 843,993 | |
Knoll, Inc. | | | 37,847 | | | | 826,578 | |
| | | | | | | 1,670,571 | |
| | | |
Oil & Gas – 3.4% | | | | | | | | |
Callon Petroleum Co.* | | | 105,100 | | | | 789,301 | |
Chevron Corp. | | | 10,907 | | | | 1,309,494 | |
Cimarex Energy Co. | | | 38,616 | | | | 2,651,375 | |
EOG Resources, Inc. | | | 12,249 | | | | 1,176,516 | |
Exxon Mobil Corp. | | | 36,830 | | | | 2,956,712 | |
Hess Corp. | | | 45,674 | | | | 2,928,617 | |
Jagged Peak Energy, Inc.* | | | 35,575 | | | | 376,028 | |
Noble Energy, Inc. | | | 47,376 | | | | 1,281,995 | |
Occidental Petroleum Corp. | | | 112,379 | | | | 6,616,876 | |
Penn Virginia Corp.* | | | 11,290 | | | | 506,921 | |
Pioneer Natural Resources Co. | | | 9,982 | | | | 1,661,604 | |
SRC Energy, Inc.* | | | 100,922 | | | | 620,670 | |
| | | | | | | 22,876,109 | |
| | | |
Oil & Gas Services – 0.5% | | | | | | | | |
ProPetro Holding Corp.* | | | 27,110 | | | | 599,944 | |
Schlumberger Ltd. | | | 72,953 | | | | 3,113,634 | |
| | | | | | | 3,713,578 | |
| | | |
Pharmaceuticals – 4.8% | | | | | | | | |
Cigna Corp. | | | 29,425 | | | | 4,673,867 | |
Johnson & Johnson | | | 54,299 | | | | 7,667,019 | |
McKesson Corp. | | | 8,487 | | | | 1,012,075 | |
Merck & Co., Inc. | | | 22,259 | | | | 1,752,006 | |
See accompanying Notes to Financial Statements
55
Morningstar Funds Trust April 30, 2019
Schedule of Investments(continued)
Morningstar U.S. Equity Fund
| | | | | | | | |
| | | Number
of Shares | | | Value | |
| | |
Pharmaceuticals (Continued) | | | | | | | | |
Neogen Corp.* | | | 17,332 | | | $ | 1,051,359 | |
Novartis A.G. (Switzerland)(a) | | | 4,343 | | | | 355,866 | |
Pfizer, Inc. | | | 293,360 | | | | 11,913,349 | |
Roche Holding A.G. (Genusschein) (Switzerland) | | | 2,483 | | | | 655,173 | |
Zoetis, Inc. | | | 30,825 | | | | 3,139,218 | |
| | | | | | | 32,219,932 | |
| | | |
Real Estate – 0.1% | | | | | | | | |
Jones Lang LaSalle, Inc. | | | 4,905 | | | | 758,166 | |
| | |
Real Estate Investment Trusts – 2.1% | | | | | |
American Campus | | | | | | | | |
Communities, Inc. | | | 39,407 | | | | 1,860,010 | |
Columbia Property Trust, Inc. | | | 35,760 | | | | 812,110 | |
CubeSmart | | | 64,377 | | | | 2,054,270 | |
Easterly Government Properties, Inc. | | | 46,000 | | | | 828,000 | |
Equinix, Inc. | | | 5,430 | | | | 2,469,021 | |
Mid-America Apartment Communities, Inc. | | | 14,804 | | | | 1,619,706 | |
Monmouth Real Estate Investment Corp. | | | 85,673 | | | | 1,177,147 | |
National Storage Affiliates Trust | | | 4,727 | | | | 138,312 | |
PotlatchDeltic Corp. | | | 15,586 | | | | 602,555 | |
Public Storage | | | 2,803 | | | | 619,967 | |
RPT Realty | | | 48,985 | | | | 594,188 | |
STAG Industrial, Inc. | | | 25,805 | | | | 742,668 | |
Summit Hotel Properties, Inc. | | | 69,815 | | | | 810,552 | |
| | | | | | | 14,328,506 | |
| | | |
Retail – 3.0% | | | | | | | | |
Advance Auto Parts, Inc. | | | 6,259 | | | | 1,040,997 | |
BJ’s Wholesale Club Holdings, Inc.* | | | 14,304 | | | | 405,518 | |
Bloomin’ Brands, Inc. | | | 41,177 | | | | 823,128 | |
Children’s Place (The), Inc. | | | 7,403 | | | | 835,206 | |
Chipotle Mexican Grill, Inc.* | | | 2,793 | | | | 1,921,696 | |
Costco Wholesale Corp. | | | 9,753 | | | | 2,394,654 | |
Dollar General Corp. | | | 3,509 | | | | 442,450 | |
Five Below, Inc.* | | | 8,668 | | | | 1,268,909 | |
Floor & Decor Holdings, Inc., Class A* | | | 15,136 | | | | 726,831 | |
Home Depot (The), Inc. | | | 13,276 | | | | 2,704,321 | |
Lowe’s Cos., Inc. | | | 37,199 | | | | 4,208,695 | |
Ollie’s Bargain Outlet Holdings, Inc.* | | | 13,781 | | | | 1,318,015 | |
| | | | | | | | |
| | | Number
of Shares | | | Value | |
| | |
Retail (Continued) | | | | | | | | |
Walmart, Inc. | | | 13,498 | | | $ | 1,388,134 | |
Yum China Holdings, Inc. (China) | | | 15,403 | | | | 732,259 | |
| | | | | | | 20,210,813 | |
| | | |
Savings & Loans – 0.3% | | | | | | | | |
Berkshire Hills Bancorp, Inc. | | | 27,015 | | | | 810,180 | |
Sterling Bancorp | | | 53,559 | | | | 1,147,234 | |
| | | | | | | 1,957,414 | |
| | | |
Semiconductors – 3.0% | | | | | | | | |
Analog Devices, Inc. | | | 11,392 | | | | 1,324,206 | |
Brooks Automation, Inc. | | | 13,205 | | | | 495,320 | |
Intel Corp. | | | 119,948 | | | | 6,122,146 | |
Lattice Semiconductor Corp.* | | | 36,470 | | | | 472,286 | |
Monolithic Power Systems, Inc. | | | 8,532 | | | | 1,328,518 | |
NVIDIA Corp. | | | 9,558 | | | | 1,729,998 | |
QUALCOMM, Inc. | | | 34,080 | | | | 2,935,310 | |
Texas Instruments, Inc. | | | 48,472 | | | | 5,711,456 | |
| | | | | | | 20,119,240 | |
| | | |
Software – 5.1% | | | | | | | | |
Adobe, Inc.* | | | 14,197 | | | | 4,106,482 | |
Akamai Technologies, Inc.* | | | 35,019 | | | | 2,803,621 | |
Altair Engineering, Inc., Class A* | | | 13,741 | | | | 541,945 | |
DocuSign, Inc.* | | | 10,935 | | | | 619,687 | |
Envestnet, Inc.* | | | 17,738 | | | | 1,259,221 | |
Fidelity National Information Services, Inc. | | | 16,937 | | | | 1,963,506 | |
Fiserv, Inc.* | | | 23,133 | | | | 2,018,123 | |
Five9, Inc.* | | | 13,229 | | | | 702,063 | |
Guidewire Software, Inc.* | | | 14,146 | | | | 1,506,549 | |
InterXion Holding N.V. (Netherlands)* | | | 18,405 | | | | 1,273,442 | |
Microsoft Corp. | | | 51,207 | | | | 6,687,634 | |
Omnicell, Inc.* | | | 10,047 | | | | 807,377 | |
Oracle Corp. | | | 55,097 | | | | 3,048,517 | |
Red Hat, Inc.* | | | 5,692 | | | | 1,038,961 | |
Splunk, Inc.* | | | 18,806 | | | | 2,595,980 | |
Tyler Technologies, Inc.* | | | 6,365 | | | | 1,476,107 | |
VMware, Inc., Class A | | | 9,591 | | | | 1,957,811 | |
| | | | | | | 34,407,026 | |
| | | |
Telecommunications – 2.9% | | | | | | | | |
AT&T, Inc. | | | 183,875 | | | | 5,692,770 | |
CommScope Holding Co., Inc.* | | | 176,888 | | | | 4,383,285 | |
Corning, Inc. | | | 23,848 | | | | 759,559 | |
Juniper Networks, Inc. | | | 41,244 | | | | 1,145,346 | |
See accompanying Notes to Financial Statements
56
Morningstar Funds Trust April 30, 2019
Schedule of Investments(continued)
Morningstar U.S. Equity Fund
| | | | | | | | |
| | | Number
of Shares | | | Value | |
| |
Telecommunications (Continued) | | | | | |
Nokia OYJ ADR (Finland) | | | 1,164,036 | | | $ | 6,146,110 | |
Verizon Communications, Inc. | | | 13,666 | | | | 781,558 | |
Viavi Solutions, Inc.* | | | 62,455 | | | | 830,651 | |
| | | | | | | 19,739,279 | |
| | | |
Textiles – 0.1% | | | | | | | | |
UniFirst Corp. | | | 5,065 | | | | 800,928 | |
| | | |
Transportation – 1.7% | | | | | | | | |
Canadian National Railway Co. (Canada) | | | 10,843 | | | | 1,006,014 | |
Hub Group, Inc., Class A* | | | 21,997 | | | | 914,415 | |
Kirby Corp.* | | | 28,708 | | | | 2,346,018 | |
Knight-Swift Transportation Holdings, Inc. | | | 33,222 | | | | 1,107,954 | |
Old Dominion Freight Line, Inc. | | | 7,462 | | | | 1,113,927 | |
Union Pacific Corp. | | | 11,995 | | | | 2,123,595 | |
United Parcel Service, Inc., Class B | | | 25,866 | | | | 2,747,486 | |
| | | | | | | 11,359,409 | |
| | | |
Total Common Stocks
(Cost $571,836,475) | | | | | | | 612,342,276 | |
| | | | | | | | |
| | | Number
of Shares | | | Value | |
Investment Companies – 5.7% | |
Global X MLP & Energy Infrastructure ETF | | | 2,956,753 | | | $ | 38,585,627 | |
| | | |
Total Investment Companies(Cost $36,642,913) | | | | | | | 38,585,627 | |
| |
Short-Term Investments – 3.8% | |
Money Market Fund – 3.8% | | | | | | | | |
Northern Institutional Funds - Treasury Portfolio (Premier), 2.29%(b) | | | 25,582,240 | | | | 25,582,240 | |
| | |
Total Short-Term Investments
(Cost $25,582,240) | | | | | | | 25,582,240 | |
| | | |
Total Investments – 99.8%(Cost $634,061,628) | | | | | | | 676,510,143 | |
| | |
Other Assets less Liabilities – 0.2% | | | | 1,416,528 | |
| | | |
NET ASSETS – 100.0% | | | | | | $ | 677,926,671 | |
All securities are United States companies, unless noted otherwise in parentheses.
(a) Security sold outside United States without registration under the Securities Act of 1933.
(b) 7-day current yield as of April 30, 2019 is disclosed.
* Non-Income Producing Security
Percentages shown are based on Net Assets
Abbreviations:
| | |
| ADR | | American Depositary Receipt |
| |
| ETF | | Exchange-Traded Fund |
| |
| PLC | | Public Limited Company |
See accompanying Notes to Financial Statements
57
Morningstar Funds Trust April 30, 2019
Schedule of Investments(continued)
Morningstar U.S. Equity Fund
Valuation Hierarchy
The following is a summary of the inputs used, as of April 30, 2019, in valuing the Fund’s investments carried at fair value:
| | | | | | | | | | | | | | | | |
| Morningstar U.S. Equity Fund | | Level 1 | | | Level 2 | | | Level 3 | | | Totals | |
| | | | |
Investments | | | | | | | | | | | | | | | | |
Assets: | | | | | | | | | | | | | | | | |
Investments in Securities: | | | | | | | | | | | | | | | | |
Common Stocks | | $ | 603,137,346 | | | $ | 9,204,930 | | | | $— | | | $ | 612,342,276 | |
Investment Companies | | | 38,585,627 | | | | — | | | | — | | | | 38,585,627 | |
Short-Term Investments | | | 25,582,240 | | | | — | | | | — | | | | 25,582,240 | |
| | | | |
Total Investments | | $ | 667,305,213 | | | $ | 9,204,930 | | | | $— | | | $ | 676,510,143 | |
See accompanying Notes to Financial Statements
58
Morningstar Funds Trust April 30, 2019
Schedule of Investments
|
Morningstar International Equity Fund |
| | | | | | | | |
| | | Number
of Shares | | | Value | |
Common Stocks – 77.4% | | | | | |
Advertising – 1.5% | | | | | | | | |
Dentsu, Inc. (Japan) | | | 24,100 | | | $ | 986,177 | |
Publicis Groupe S.A. (France) | | | 56,445 | | | | 3,354,883 | |
WPP PLC (United Kingdom) | | | 202,200 | | | | 2,523,011 | |
| | | | | | | 6,864,071 | |
| | | |
Aerospace/Defense – 0.6% | | | | | | | | |
Meggitt PLC (United Kingdom) | | | 75,800 | | | | 539,379 | |
Rolls-Royce Holdings PLC (United Kingdom)* | | | 12,310,903 | | | | 16,054 | |
Rolls-Royce Holdings PLC (London Exchange) (United Kingdom)* | | | 176,500 | | | | 2,113,682 | |
| | | | | | | 2,669,115 | |
| | | |
Agriculture – 0.2% | | | | | | | | |
British American Tobacco Malaysia Bhd. (Malaysia) | | | 48,400 | | | | 408,355 | |
KT&G Corp. (South Korea) | | | 5,763 | | | | 504,103 | |
| | | | | | | 912,458 | |
| | | |
Airlines – 0.8% | | | | | | | | |
Ryanair Holdings PLC ADR (Ireland)* | | | 47,420 | | | | 3,681,689 | |
| | | |
Apparel – 0.4% | | | | | | | | |
adidas A.G. (Germany) | | | 7,734 | | | | 1,992,185 | |
| | | |
Auto Manufacturers – 3.7% | | | | | | | | |
Bayerische Motoren Werke A.G. (Germany) | | | 69,811 | | | | 5,955,466 | |
Daimler A.G. (Germany)(a) | | | 86,065 | | | | 5,648,960 | |
Maruti Suzuki India Ltd. (India) | | | 1,916 | | | | 183,590 | |
Toyota Motor Corp. (Japan) | | | 49,300 | | | | 3,052,185 | |
Volvo AB, Class B (Sweden) | | | 161,100 | | | | 2,581,859 | |
| | | | | | | 17,422,060 | |
| | | |
Auto Parts & Equipment – 2.0% | | | | | | | | |
Continental A.G. (Germany) | | | 34,380 | | | | 5,703,322 | |
Hyundai Mobis Co. Ltd. (South Korea) | | | 3,975 | | | | 792,914 | |
Valeo S.A. (France) | | | 53,407 | | | | 1,942,558 | |
Weichai Power Co. Ltd., Class H (China) | | | 652,000 | | | | 1,067,544 | |
| | | | | | | 9,506,338 | |
| | | |
Banks – 12.2% | | | | | | | | |
Absa Group Ltd. (South Africa) | | | 17,148 | | | | 197,539 | |
Al Rajhi Bank (Saudi Arabia) | | | 21,642 | | | | 432,805 | |
| | | | | | | | |
| | | Number
of Shares | | | Value | |
| | |
Banks (Continued) | | | | | | | | |
Axis Bank Ltd. (India)* | | | 183,517 | | | $ | 2,023,064 | |
Banco Bilbao Vizcaya Argentaria S.A. (Spain) | | | 538,575 | | | | 3,274,994 | |
Banco do Brasil S.A. (Brazil)* | | | 145,500 | | | | 1,839,391 | |
Banco Santander Chile ADR (Chile) | | | 17,385 | | | | 486,780 | |
Bank Central Asia Tbk PT (Indonesia) | | | 363,100 | | | | 733,489 | |
Bank Mandiri Persero Tbk PT (Indonesia) | | | 5,482,000 | | | | 2,986,616 | |
BNP Paribas S.A. (France) | | | 122,705 | | | | 6,531,966 | |
China Construction Bank Corp., Class H (China) | | | 2,731,000 | | | | 2,407,556 | |
China Merchants Bank Co. Ltd., Class H (China) | | | 17,000 | | | | 84,133 | |
Commercial International Bank Egypt S.A.E. GDR (Egypt)(a) | | | 141,513 | | | | 620,271 | |
Credicorp Ltd. (Peru) | | | 2,505 | | | | 593,434 | |
Credit Suisse Group A.G. (Switzerland)(a)* | | | 422,600 | | | | 5,620,114 | |
DBS Group Holdings Ltd. (Singapore) | | | 187,000 | | | | 3,888,747 | |
First Abu Dhabi Bank PJSC (United Arab Emirates) | | | 80,563 | | | | 350,883 | |
FirstRand Ltd. (South Africa) | | | 115,866 | | | | 551,411 | |
Habib Bank Ltd. (Pakistan) | | | 136,000 | | | | 122,544 | |
HDFC Bank Ltd. ADR (India) | | | 19,471 | | | | 2,232,350 | |
HSBC Holdings PLC (United Kingdom) | | | 169,287 | | | | 1,474,992 | |
ICICI Bank Ltd. ADR (India) | | | 156,770 | | | | 1,795,016 | |
Intesa Sanpaolo S.p.A. (Italy) | | | 2,142,300 | | | | 5,612,862 | |
Kasikornbank PCL (Thailand)(a) | | | 71,500 | | | | 428,263 | |
Komercni banka A.S. (Czech Republic) | | | 3,037 | | | | 115,212 | |
Lloyds Banking Group PLC (United Kingdom) | | | 5,269,300 | | | | 4,309,420 | |
National Bank of Kuwait S.A.K.P. (Kuwait) | | | 21,997 | | | | 67,194 | |
Nedbank Group Ltd. (South Africa) | | | 26,117 | | | | 487,179 | |
OTP Bank Nyrt. (Hungary) | | | 29,511 | | | | 1,312,383 | |
Royal Bank of Scotland Group PLC (United Kingdom) | | | 862,500 | | | | 2,700,777 | |
Sberbank of Russia PJSC (Russia) | | | 371,469 | | | | 1,295,245 | |
Sberbank of Russia PJSC (Frankfurt Exchange) (Russia) | | | 126,243 | | | | 442,274 | |
See accompanying Notes to Financial Statements
59
Morningstar Funds Trust April 30, 2019
Schedule of Investments(continued)
Morningstar International Equity Fund
| | | | | | | | |
| | | Number
of Shares | | | Value | |
| | |
Banks (Continued) | | | | | | | | |
Sberbank of Russia PJSC ADR (Russia) | | | 92,537 | | | $ | 1,326,418 | |
Standard Bank Group Ltd. (South Africa) | | | 39,073 | | | | 545,688 | |
Yes Bank Ltd. (India) | | | 93,668 | | | | 226,342 | |
| | | | | | | 57,117,352 | |
| | | |
Beverages – 1.7% | | | | | | | | |
Ambev S.A. ADR (Brazil) | | | 591,819 | | | | 2,787,468 | |
Anheuser-Busch InBev S.A./N.V. (Belgium) | | | 2,012 | | | | 178,881 | |
China Resources Beer Holdings Co. Ltd. (China) | | | 58,000 | | | | 265,376 | |
Diageo PLC (United Kingdom) | | | 70,722 | | | | 2,981,475 | |
Fomento Economico Mexicano S.A.B. de C.V. ADR (Mexico) | | | 13,433 | | | | 1,310,926 | |
Kweichow Moutai Co. Ltd., Class A (China) | | | 2,300 | | | | 332,619 | |
| | | | | | | 7,856,745 | |
| | | |
Biotechnology – 0.5% | | | | | | | | |
Lonza Group A.G. (Switzerland)(a)* | | | 6,945 | | | | 2,144,820 | |
| | | |
Building Materials – 1.0% | | | | | | | | |
Anhui Conch Cement Co. Ltd., Class H (China) | | | 215,000 | | | | 1,312,321 | |
LafargeHolcim Ltd. (Switzerland)(a)* | | | 51,460 | | | | 2,641,825 | |
Loma Negra Cia Industrial Argentina S.A. ADR (Argentina)* | | | 6,700 | | | | 67,000 | |
PPC Ltd. (South Africa)* | | | 228,470 | | | | 79,697 | |
Semen Indonesia Persero Tbk PT (Indonesia) | | | 444,700 | | | | 422,149 | |
| | | | | | | 4,522,992 | |
| | | |
Chemicals – 1.8% | | | | | | | | |
Air Liquide S.A. (France) | | | 8,998 | | | | 1,197,020 | |
Akzo Nobel N.V. (Netherlands) | | | 5,430 | | | | 461,363 | |
Linde PLC (United Kingdom) | | | 13,128 | | | | 2,368,374 | |
Novozymes A/S, Class B (Denmark) | | | 24,309 | | | | 1,134,631 | |
Sasol Ltd. (South Africa) | | | 33,921 | | | | 1,125,378 | |
Symrise A.G. (Germany) | | | 19,361 | | | | 1,861,001 | |
UPL Ltd. (India) | | | 12,569 | | | | 175,193 | |
| | | | | | | 8,322,960 | |
| | | |
| | | | | | | | |
| | | | | | | | |
| | | Number
of Shares | | | Value | |
| | | |
Coal – 0.2% | | | | | | | | |
China Shenhua Energy Co. Ltd., Class H (China) | | | 199,500 | | | $ | 441,586 | |
Coal India Ltd. (India) | | | 119,617 | | | | 433,681 | |
| | | | | | | 875,267 | |
| | | |
Commercial Services – 2.0% | | | | | | | | |
Ashtead Group PLC (United Kingdom) | | | 107,700 | | | | 2,990,532 | |
Brambles Ltd. (Australia) | | | 62,000 | | | | 526,857 | |
Bureau Veritas S.A. (France) | | | 61,600 | | | | 1,561,479 | |
CCR S.A. (Brazil) | | | 205,900 | | | | 620,677 | |
Cielo S.A. (Brazil) | | | 227,900 | | | | 448,698 | |
DP World PLC (United Arab Emirates) | | | 7,607 | | | | 152,140 | |
Experian PLC (United Kingdom) | | | 4,600 | | | | 133,901 | |
G4S PLC (United Kingdom) | | | 495,500 | | | | 1,400,438 | |
SGS S.A. (Switzerland)(a) | | | 516 | | | | 1,361,492 | |
StoneCo Ltd., Class A (Brazil)* | | | 5,200 | | | | 149,708 | |
TAL Education Group ADR (China)* | | | 3,384 | | | | 130,182 | |
| | | | | | | 9,476,104 | |
| | | |
Computers – 1.2% | | | | | | | | |
Check Point Software Technologies Ltd. (Israel)* | | | 30,810 | | | | 3,720,615 | |
Infosys Ltd. (India) | | | 18,575 | | | | 200,071 | |
Infosys Ltd. ADR (India) | | | 45,684 | | | | 491,563 | |
Tata Consultancy Services Ltd. (India) | | | 34,047 | | | | 1,106,680 | |
| | | | | | | 5,518,929 | |
| | |
Cosmetics/Personal Care – 1.8% | | | | | |
LG Household & Health Care Ltd. (South Korea) | | | 1,026 | | | | 1,250,208 | |
L’Oreal S.A. (France) | | | 13,989 | | | | 3,847,710 | |
Unicharm Corp. (Japan) | | | 39,300 | | | | 1,296,972 | |
Unilever PLC (United Kingdom) | | | 37,249 | | | | 2,257,852 | |
| | | | | | | 8,652,742 | |
| | | |
Distribution/Wholesale – 0.5% | | | | | | | | |
Ferguson PLC* | | | 30,285 | | | | 2,155,259 | |
| | |
Diversified Financial Services – 1.3% | | | | | |
B3 S.A. - Brasil Bolsa Balcao (Brazil)* | | | 24,300 | | | | 214,115 | |
Housing Development Finance Corp. Ltd. (India) | | | 24,379 | | | | 699,406 | |
KB Financial Group, Inc. (South Korea) | | | 12,451 | | | | 491,632 | |
See accompanying Notes to Financial Statements
60
Morningstar Funds Trust April 30, 2019
Schedule of Investments(continued)
Morningstar International Equity Fund
| | | | | | | | |
| | | Number
of Shares | | | Value | |
| |
Diversified Financial Services (Continued) | | | | | |
Network International Holdings PLC (United Arab Emirates)(b)* | | | 13,835 | | | $ | 93,993 | |
Schroders PLC (United Kingdom) | | | 83,300 | | | | 3,447,533 | |
Shinhan Financial Group Co. Ltd. (South Korea) | | | 25,081 | | | | 947,934 | |
| | | | | | | 5,894,613 | |
| | | |
Electric – 0.1% | | | | | | | | |
China Longyuan Power Group Corp. Ltd., Class H (China) | | | 138,000 | | | | 95,164 | |
Huaneng Renewables Corp. Ltd., Class H (China) | | | 384,000 | | | | 110,692 | |
NTPC Ltd. (India) | | | 49,991 | | | | 96,256 | |
Power Grid Corp. of India Ltd. (India) | | | 62,201 | | | | 166,816 | |
| | | | | | | 468,928 | |
| | | |
Electronics – 0.4% | | | | | | | | |
AAC Technologies Holdings, Inc. (China) | | | 97,310 | | | | 632,141 | |
Hangzhou Hikvision Digital Technology Co. Ltd., Class A (China) | | | 76,430 | | | | 371,722 | |
Hon Hai Precision Industry Co. Ltd. (Taiwan) | | | 218,000 | | | | 613,742 | |
Omron Corp. (Japan) | | | 8,900 | | | | 478,055 | |
| | | | | | | 2,095,660 | |
| | |
Engineering & Construction – 0.1% | | | | | |
Airports of Thailand PCL (Thailand)(a) | | | 109,500 | | | | 234,906 | |
Grupo Aeroportuario del Sureste S.A.B. de C.V. ADR (Mexico) | | | 1,015 | | | | 167,018 | |
| | | | | | | 401,924 | |
| | | |
Food – 2.0% | | | | | | | | |
Bid Corp. Ltd. (South Africa) | | | 7,315 | | | | 154,646 | |
BIM Birlesik Magazalar A.S. (Turkey) | | | 13,300 | | | | 185,115 | |
China Mengniu Dairy Co. Ltd. (China)* | | | 187,000 | | | | 690,853 | |
Danone S.A. (France) | | | 6,400 | | | | 517,408 | |
Magnit PJSC GDR (Russia)(a) | | | 29,343 | | | | 419,474 | |
Nestle S.A. (Switzerland)(a) | | | 3,800 | | | | 365,855 | |
Nestle S.A. ADR (Switzerland) | | | 47,580 | | | | 4,592,897 | |
Shoprite Holdings Ltd. (South Africa) | | | 100,678 | | | | 1,215,284 | |
| | | | | | | | |
| | | Number
of Shares | | | Value | |
| | |
Food (Continued) | | | | | | | | |
Uni-President Enterprises Corp. (Taiwan) | | | 111,000 | | | $ | 263,811 | |
Universal Robina Corp. (Philippines) | | | 108,420 | | | | 316,707 | |
Woolworths Holdings Ltd. (South Africa) | | | 98,384 | | | | 328,480 | |
X5 Retail Group N.V. GDR (Russia)(a) | | | 6,661 | | | | 202,161 | |
| | | | | | | 9,252,691 | |
| | |
Forest Products & Paper – 0.0%(c) | | | | | |
Suzano S.A. (Brazil) | | | 12,560 | | | | 131,010 | |
| | | |
Gas – 0.1% | | | | | | | | |
ENN Energy Holdings Ltd. (China) | | | 54,100 | | | | 511,298 | |
| | | |
Healthcare - Products – 1.3% | | | | | | | | |
EssilorLuxottica S.A. (France) | | | 4,590 | | | | 559,239 | |
Hengan International Group Co. Ltd. (China) | | | 126,000 | | | | 1,107,795 | |
Olympus Corp. (Japan) | | | 138,500 | | | | 1,554,470 | |
Sonova Holding A.G. (Switzerland)(a) | | | 8,261 | | | | 1,668,575 | |
Sysmex Corp. (Japan) | | | 24,700 | | | | 1,415,361 | |
| | | | | | | 6,305,440 | |
| | | |
Healthcare - Services – 0.1% | | | | | | | | |
Life Healthcare Group Holdings Ltd. (South Africa) | | | 211,159 | | | | 385,150 | |
| | |
Holding Companies - Diversified – 0.2% | | | | | |
KOC Holding A.S. (Turkey) | | | 173,684 | | | | 471,548 | |
Siam Cement (The) PCL (Thailand)(a) | | | 31,400 | | | | 454,167 | |
| | | | | | | 925,715 | |
| | | |
Home Furnishings – 0.2% | | | | | | | | |
Midea Group Co. Ltd., Class A (China) | | | 7,200 | | | | 56,058 | |
Woongjin Coway Co. Ltd. (South Korea) | | | 8,669 | | | | 651,576 | |
| | | | | | | 707,634 | |
| | |
Household Products/Wares – 0.4% | | | | | |
Kimberly-Clark de Mexico S.A.B. de C.V., Series A (Mexico)* | | | 260,800 | | | | 450,401 | |
Reckitt Benckiser Group PLC (United Kingdom) | | | 19,640 | | | | 1,589,003 | |
| | | | | | | 2,039,404 | |
| | | |
| | | | | | | | |
See accompanying Notes to Financial Statements
61
Morningstar Funds Trust April 30, 2019
Schedule of Investments(continued)
Morningstar International Equity Fund
| | | | | | | | |
| | | Number
of Shares | | | Value | |
| | | |
Insurance – 4.8% | | | | | | | | |
AIA Group Ltd. (Hong Kong) | | | 566,600 | | | $ | 5,801,664 | |
Allianz S.E. (Germany)(a) | | | 33,322 | | | | 8,054,400 | |
AMP Ltd. (Australia) | | | 870,200 | | | | 1,394,874 | |
BB Seguridade Participacoes S.A. (Brazil) | | | 114,100 | | | | 826,993 | |
Hanwha Life Insurance Co. Ltd. (South Korea) | | | 33,540 | | | | 114,666 | |
Ping An Insurance Group Co. of China Ltd., Class H (China) | | | 301,000 | | | | 3,643,504 | |
Sanlam Ltd. (South Africa) | | | 204,978 | | | | 1,097,572 | |
Willis Towers Watson PLC (United Kingdom) | | | 9,595 | | | | 1,768,743 | |
| | | | | | | 22,702,416 | |
| | | |
Internet – 5.4% | | | | | | | | |
58.com, Inc. ADR (China)* | | | 3,000 | | | | 215,370 | |
Alibaba Group Holding Ltd. ADR (China)* | | | 14,255 | | | | 2,645,300 | |
Baidu, Inc. ADR (China)* | | | 32,232 | | | | 5,357,925 | |
Ctrip.com International Ltd. ADR (China)* | | | 9,600 | | | | 422,880 | |
M3, Inc. (Japan) | | | 116,600 | | | | 2,081,507 | |
Mail.Ru Group Ltd. GDR (Russia)(a)* | | | 7,347 | | | | 169,716 | |
MercadoLibre, Inc. (Argentina)* | | | 1,154 | | | | 558,698 | |
Naspers Ltd., Class N (South Africa) | | | 20,034 | | | | 5,153,757 | |
NAVER Corp. (South Korea) | | | 26,375 | | | | 2,701,131 | |
Tencent Holdings Ltd. (China) | | | 89,300 | | | | 4,401,388 | |
Yandex N.V., Class A (Russia)* | | | 47,429 | | | | 1,775,267 | |
| | | | | | | 25,482,939 | |
| |
Investment Management Companies – 0.7% | |
EXOR N.V. (Netherlands) | | | 52,300 | | | | 3,487,504 | |
| | | |
Iron/Steel – 0.6% | | | | | | | | |
Ternium S.A. ADR (Netherlands) | | | 13,792 | | | | 339,973 | |
thyssenkrupp A.G. (Germany) | | | 162,800 | | | | 2,295,257 | |
| | | | | | | 2,635,230 | |
| | | |
Leisure Time – 0.2% | | | | | | | | |
Bajaj Auto Ltd. (India) | | | 11,820 | | | | 507,206 | |
Hero MotoCorp Ltd. (India) | | | 17,651 | | | | 637,639 | |
| | | | | | | 1,144,845 | |
| | | |
Lodging – 0.6% | | | | | | | | |
Accor S.A. (France) | | | 71,535 | | | | 3,013,576 | |
| | | | | | | | |
| | | Number
of Shares | | | Value | |
| |
Machinery - Construction & Mining – 1.2% | | | | | |
Epiroc AB, Class A (Sweden)* | | | 120,696 | | | $ | 1,247,707 | |
Komatsu Ltd. (Japan) | | | 173,800 | | | | 4,489,326 | |
| | | | | | | 5,737,033 | |
| | | |
Machinery - Diversified – 3.0% | | | | | | | | |
Atlas Copco AB, Class A (Sweden) | | | 103,421 | | | | 3,228,215 | |
CNH Industrial N.V. (United Kingdom) | | | 455,600 | | | | 4,953,230 | |
FANUC Corp. (Japan) | | | 7,000 | | | | 1,315,129 | |
Keyence Corp. (Japan) | | | 3,700 | | | | 2,311,737 | |
Kubota Corp. (Japan) | | | 134,600 | | | | 2,049,319 | |
| | | | | | | 13,857,630 | |
| | | |
Media – 0.9% | | | | | | | | |
Grupo Televisa S.A.B. ADR (Mexico) | | | 68,600 | | | | 695,604 | |
Liberty Global PLC, Class A (United Kingdom)* | | | 65,200 | | | | 1,761,052 | |
Liberty Global PLC, Class C (United Kingdom)* | | | 64,400 | | | | 1,684,060 | |
| | | | | | | 4,140,716 | |
| | |
Metal Fabricate/Hardware – 0.8% | | | | | |
Catcher Technology Co. Ltd. (Taiwan) | | | 97,000 | | | | 769,048 | |
SKF AB, Class B (Sweden) | | | 147,500 | | | | 2,737,892 | |
Tenaris S.A. ADR (Netherlands) | | | 5,950 | | | | 165,053 | |
| | | | | | | 3,671,993 | |
| | | |
Mining – 1.4% | | | | | | | | |
Alrosa PJSC (Russia) | | | 208,700 | | | | 304,530 | |
Alrosa PJSC (Frankfurt Exchange) (Russia) | | | 237,022 | | | | 345,786 | |
Glencore PLC (Switzerland)* | | | 1,029,900 | | | | 4,086,190 | |
Grupo Mexico S.A.B. de C.V., Series B (Mexico) | | | 151,400 | | | | 444,431 | |
Rio Tinto PLC (Australia) | | | 22,846 | | | | 1,332,815 | |
Southern Copper Corp. (Peru) | | | 5,400 | | | | 207,468 | |
| | | | | | | 6,721,220 | |
| | |
Miscellaneous Manufacturing – 1.5% | | | | | |
Alfa Laval AB (Sweden) | | | 78,150 | | | | 1,813,992 | |
Largan Precision Co. Ltd. (Taiwan) | | | 7,000 | | | | 1,050,858 | |
Orica Ltd. (Australia) | | | 164,800 | | | | 2,160,740 | |
Smiths Group PLC (United Kingdom) | | | 87,700 | | | | 1,746,068 | |
Sunny Optical Technology Group Co. Ltd. (China) | | | 16,400 | | | | 200,623 | |
| | | | | | | 6,972,281 | |
| | | |
| | | | | | | | |
See accompanying Notes to Financial Statements
62
Morningstar Funds Trust April 30, 2019
Schedule of Investments(continued)
Morningstar International Equity Fund
| | | | | | | | |
| | | Number
of Shares | | | Value | |
| | |
Oil & Gas – 2.2% | | | | | | | | |
Bharat Petroleum Corp. Ltd. (India) | | | 73,712 | | | $ | 403,679 | |
Cenovus Energy, Inc. (Canada) | | | 192,700 | | | | 1,910,171 | |
CNOOC Ltd. (China) | | | 347,000 | | | | 630,268 | |
Gazprom PJSC ADR (Russia) | | | 147,684 | | | | 738,322 | |
LUKOIL PJSC ADR (Russia) | | | 12,498 | | | | 1,061,164 | |
LUKOIL PJSC ADR (Russia) | | | 17,937 | | | | 1,533,613 | |
Oil & Natural Gas Corp. Ltd. (India) | | | 164,400 | | | | 400,021 | |
Pakistan Petroleum Ltd. (Pakistan) | | | 295,500 | | | | 354,331 | |
Royal Dutch Shell PLC, Class B (Netherlands) | | | 65,146 | | | | 2,102,481 | |
Tupras Turkiye Petrol Rafinerileri A.S. (Turkey) | | | 29,425 | | | | 608,594 | |
YPF S.A. ADR (Argentina) | | | 58,557 | | | | 792,276 | |
| | | | | | | 10,534,920 | |
| | | |
Oil & Gas Services – 0.3% | | | | | | | | |
Schlumberger Ltd. | | | 30,048 | | | | 1,282,449 | |
| | | |
Pharmaceuticals – 2.4% | | | | | | | | |
Bayer A.G. (Germany)(a) | | | 76,860 | | | | 5,115,475 | |
Chugai Pharmaceutical Co. Ltd. (Japan) | | | 28,300 | | | | 1,794,684 | |
CSPC Pharmaceutical Group Ltd. (China) | | | 90,000 | | | | 173,721 | |
Grifols S.A. (Spain) | | | 20,498 | | | | 569,666 | |
Roche Holding A.G. (Genusschein) (Switzerland) | | | 14,494 | | | | 3,824,436 | |
| | | | | | | 11,477,982 | |
| | | |
Real Estate – 0.0%(c) | | | | | | | | |
BR Malls Participacoes S.A. (Brazil)* | | | 30,000 | | | | 94,565 | |
Multiplan Empreendimentos Imobiliarios S.A. (Brazil)* | | | 14,100 | | | | 86,231 | |
| | | | | | | 180,796 | |
| | | |
Retail – 3.0% | | | | | | | | |
Alimentation Couche-Tard, Inc., Class B (Canada) | | | 26,600 | | | | 1,568,362 | |
Astra International Tbk PT (Indonesia) | | | 2,055,600 | | | | 1,100,401 | |
Bidvest Group (The) Ltd. (South Africa) | | | 35,471 | | | | 539,518 | |
Cie Financiere Richemont S.A. (Switzerland)(a) | | | 31,300 | | | | 2,288,103 | |
Clicks Group Ltd. (South Africa) | | | 14,033 | | | | 191,940 | |
| | | | | | | | |
| | | Number
of Shares | | | Value | |
| | |
Retail (Continued) | | | | | | | | |
CP ALL PCL (Thailand)(a) | | | 275,400 | | | $ | 669,280 | |
Hennes & Mauritz AB, Class B (Sweden) | | | 252,221 | | | | 4,400,991 | |
Lojas Renner S.A. (Brazil) | | | 65,038 | | | | 768,295 | |
Motus Holdings Ltd. (South Africa) | | | 39,467 | | | | 245,423 | |
Mr Price Group Ltd. (South Africa) | | | 2,526 | | | | 38,282 | |
President Chain Store Corp. (Taiwan) | | | 31,000 | | | | 289,235 | |
Raia Drogasil S.A. (Brazil)* | | | 38,100 | | | | 666,271 | |
S.A.C.I. Falabella (Chile) | | | 19,059 | | | | 140,696 | |
SM Investments Corp. (Philippines) | | | 28,930 | | | | 527,800 | |
Wal-Mart de Mexico S.A.B. de C.V. (Mexico) | | | 143,501 | | | | 421,622 | |
| | | | | | | 13,856,219 | |
| | | |
Semiconductors – 5.6% | | | | | | | | |
ASM Pacific Technology Ltd. (Hong Kong) | | | 55,700 | | | | 646,066 | |
ASML Holding N.V. (Netherlands) | | | 11,820 | | | | 2,468,142 | |
Infineon Technologies A.G. (Germany) | | | 111,972 | | | | 2,654,362 | |
Samsung Electronics Co. Ltd. (South Korea) | | | 168,340 | | | | 6,618,662 | |
Samsung Electronics Co. Ltd. GDR (South Korea)(b) | | | 1,797 | | | | 1,778,838 | |
SK Hynix, Inc. (South Korea) | | | 29,248 | | | | 1,979,235 | |
Taiwan Semiconductor Manufacturing Co. Ltd. (Taiwan) | | | 709,000 | | | | 5,952,787 | |
Taiwan Semiconductor Manufacturing Co. Ltd. ADR (Taiwan) | | | 98,994 | | | | 4,337,917 | |
| | | | | | | 26,436,009 | |
| | | |
Software – 2.2% | | | | | | | | |
Dassault Systemes S.E. (France) | | | 13,027 | | | | 2,062,994 | |
HCL Technologies Ltd. (India) | | | 32,254 | | | | 548,951 | |
NetEase, Inc. ADR (China) | | | 6,314 | | | | 1,796,522 | |
SAP S.E. ADR (Germany) | | | 31,468 | | | | 4,054,966 | |
Temenos A.G. (Switzerland)(a)* | | | 9,448 | | | | 1,571,654 | |
Tencent Music Entertainment Group ADR (China)* | | | 4,446 | | | | 76,471 | |
| | | | | | | 10,111,558 | |
| | | |
| | | | | | | | |
See accompanying Notes to Financial Statements
63
Morningstar Funds Trust April 30, 2019
Schedule of Investments(continued)
Morningstar International Equity Fund
| | | | | | | | |
| | | Number
of Shares | | | Value | |
| | |
Telecommunications – 1.4% | | | | | | | | |
America Movil S.A.B. de C.V., Series L ADR (Mexico) | | | 68,264 | | | $ | 1,008,259 | |
China Mobile Ltd. ADR (China) | | | 63,914 | | | | 3,046,780 | |
Mobile TeleSystems PJSC ADR (Russia) | | | 85,063 | | | | 670,297 | |
PLDT, Inc. ADR (Philippines) | | | 17,740 | | | | 419,551 | |
Telekomunikasi Indonesia Persero Tbk PT ADR (Indonesia) | | | 32,529 | | | | 870,151 | |
Vodacom Group Ltd. (South Africa) | | | 64,417 | | | | 519,843 | |
| | | | | | | 6,534,881 | |
| | | |
Transportation – 0.9% | | | | | | | | |
Canadian National Railway Co. (Canada) | | | 27,109 | | | | 2,515,173 | |
Imperial Logistics Ltd. (South Africa) | | | 14,590 | | | | 63,643 | |
Kuehne + Nagel International A.G. (Switzerland)(a) | | | 11,140 | | | | 1,619,252 | |
| | | | | | | 4,198,068 | |
| | |
Total Common Stocks
(Cost $340,610,196) | | | | 362,990,818 | |
| |
Preferred Stocks – 1.5% | | | | | |
Banks – 0.8% | | | | | | | | |
Banco Bradesco S.A., (Brazil)(d)* | | | 70,620 | | | | 641,165 | |
Grupo Aval Acciones y Valores S.A., 4.85% (Colombia)(d) | | | 16,700 | | | | 131,262 | |
Itau Unibanco Holding S.A., 0.53% (Brazil)(d) | | | 163,956 | | | | 1,419,160 | |
Itau Unibanco Holding S.A. ADR, 0.55% (Brazil)(d) | | | 168,717 | | | | 1,459,402 | |
| | | | | | | 3,650,989 | |
| | | |
Chemicals – 0.1% | | | | | | | | |
FUCHS PETROLUB S.E., 2.49% (Germany)(d) | | | 16,450 | | | | 717,266 | |
| | | | | | | | |
| | | Number
of Shares | | | Value | |
| | |
Pharmaceuticals – 0.1% | | | | | | | | |
Grifols S.A. ADR, 2.41% (Spain)(d) | | | 27,409 | | | $ | 524,608 | |
| | | |
Semiconductors – 0.5% | | | | | | | | |
Samsung Electronics Co. Ltd., 3.81% (South Korea)(d) | | | 11,869 | | | | 378,636 | |
Samsung Electronics Co. Ltd. GDR, 3.93% (South Korea)(a)(d) | | | 2,244 | | | | 1,779,658 | |
| | | | | | | | 2,158,294 | |
| | |
Total Preferred Stocks
(Cost $7,200,289) | | | | 7,051,157 | |
| |
Investment Companies – 17.8% | | | | | |
iShares MSCI United Kingdom ETF | | | 1,363,688 | | | | 46,038,107 | |
JPMorgan BetaBuilders Japan ETF | | | 1,614,625 | | | | 37,184,813 | |
Total Investment Companies
(Cost $80,173,757) | | | | | | | 83,222,920 | |
Short-Term Investments – 3.0% | |
Money Market Fund – 3.0% | | | | | | | | |
Northern Institutional Funds - Treasury Portfolio (Premier), 2.29%(e) | | | 14,087,950 | | | | 14,087,950 | |
| |
Total Short-Term Investments
(Cost $14,087,950) | | | | 14,087,950 | |
| |
Total Investments – 99.7%
(Cost $442,072,192) | | | | 467,352,845 | |
| | |
Other Assets less Liabilities – 0.3% | | | | | | | 1,275,688 | |
| | |
NET ASSETS – 100.0% | | | | | | $ | 468,628,533 | |
All securities are United States companies, unless noted otherwise in parentheses.
| (a) | Security sold outside United States without registration under the Securities Act of 1933. |
| (b) | Securities exempt from registration under Rule 144A of the Securities Act of 1933. These securities may be resold in transactions exempt from registration, normally to qualified institutional buyers. The value of these securities is determined by valuations supplied by a pricing service or brokers, or, if not available, in accordance with procedures established by the Board of Trustees of Morningstar Funds. |
| (c) | Amount rounds to less than 0.05%. |
| (d) | Current yield is disclosed. Dividends are calculated based on a percentage of the issuer’s net income. |
| (e) | 7-day current yield as of April 30, 2019 is disclosed. |
See accompanying Notes to Financial Statements
64
Morningstar Funds Trust April 30, 2019
Schedule of Investments(continued)
Morningstar International Equity Fund
| * | Non-Income Producing Security |
Percentages shown are based on Net Assets
Abbreviations:
| | |
ADR | | American Depositary Receipt |
ETF | | Exchange-Traded Fund |
GDR | | Global Depositary Receipt |
MSCI | | Morgan Stanley Capital International |
PLC | | Public Limited Company |
See accompanying Notes to Financial Statements
65
Morningstar Funds Trust April 30, 2019
Schedule of Investments(continued)
Morningstar International Equity Fund
| | | | |
Concentration by Currency (%) | | | | |
Euro | | | 29.3 | |
U.S. Dollar | | | 26.1 | |
British Pound | | | 8.5 | |
Hong Kong Dollar | | | 5.2 | |
All other currencies less than 5% | | | 30.9 | |
Total | | | 100.0 | |
Forward Foreign Currency Contracts outstanding at April 30, 2019:
| | | | | | | | | | | | | | | | | | |
Expiration
Date | | Currency
Purchased | | Amount
of Currency
Purchased | | | Currency
Sold | | Amount
of Currency
Sold | | | Counterparty | | Unrealized
Appreciation
(Depreciation) | |
| 06/19/19 | | U.S. Dollars | | | 1,270,416 | | | Swiss Franc | | | 1,237,000 | | | Northern Trust | | | $50,360 | |
| | | | | |
Net Unrealized Appreciation | | | | | | | | | | | | | | | $50,360 | |
See accompanying Notes to Financial Statements
66
Morningstar Funds Trust April 30, 2019
Schedule of Investments(continued)
Morningstar International Equity Fund
Valuation Hierarchy
The following is a summary of the inputs used, as of April 30, 2019, in valuing the Fund’s investments carried at fair value:
| | | | | | | | | | | | | | | | |
| Morningstar International Equity Fund | | Level 1 | | | Level 2 | | | Level 3 | | | Totals | |
Investments | | | | | | | | | | | | | | | | |
Assets: | | | | | | | | | | | | | | | | |
Investments in Securities: | | | | | | | | | | | | | | | | |
Common Stocks | | $ | 74,534,161 | | | $ | 288,456,657 | | | | $— | | | $ | 362,990,818 | |
Preferred Stocks | | | 4,175,597 | | | | 2,875,560 | | | | — | | | | 7,051,157 | |
Investment Companies | | | 83,222,920 | | | | — | | | | — | | | | 83,222,920 | |
Short-Term Investments | | | 14,087,950 | | | | — | | | | — | | | | 14,087,950 | |
| | | | | |
Total Investments | | $ | 176,020,628 | | | $ | 291,332,217 | | | | $— | | | $ | 467,352,845 | |
| | | | |
| | | | | | | | | | | | | | | | |
| Morningstar International Equity Fund | | Level 1 | | | Level 2 | | | Level 3 | | | Totals | |
Derivative Financial Instruments | | | | | | | | | | | | | | | | |
Assets: | | | | | | | | | | | | | | | | |
Forward foreign currency exchange contracts | | | $— | | | | $50,360 | | | | $— | | | | $50,360 | |
| | | | | |
Total Net Derivative Financial Instruments | | | $— | | | | $50,360 | | | | $— | | | | $50,360 | |
See accompanying Notes to Financial Statements
67
Morningstar Funds Trust April 30, 2019
Schedule of Investments
|
Morningstar Global Income Fund |
| | | | | | | | |
| | | Number
of Shares | | | Value | |
| | |
Common Stocks – 39.7% | | | | | | | | |
Aerospace/Defense – 1.0% | | | | | | | | |
BAE Systems PLC (United Kingdom) | | | 284,300 | | | $ | 1,827,276 | |
| | | |
Agriculture – 1.8% | | | | | | | | |
Imperial Brands PLC (United Kingdom) | | | 49,308 | | | | 1,568,890 | |
Philip Morris International, Inc. | | | 20,853 | | | | 1,805,036 | |
| | | | | | | 3,373,926 | |
| | | |
Auto Parts & Equipment – 1.2% | | | | | | | | |
Cie Generale des Etablissements Michelin S.C.A. (France) | | | 17,735 | | | | 2,293,322 | |
| | | |
Banks – 3.4% | | | | | | | | |
JPMorgan Chase & Co. | | | 27,699 | | | | 3,214,469 | |
United Overseas Bank Ltd. (Singapore) | | | 147,900 | | | | 3,028,767 | |
| | | | | | | 6,243,236 | |
| | | |
Building Materials – 2.4% | | | | | | | | |
Johnson Controls International PLC | | | 48,759 | | | | 1,828,463 | |
Xinyi Glass Holdings Ltd. (Hong Kong) | | | 2,240,000 | | | | 2,561,950 | |
| | | | | | | 4,390,413 | |
| | | |
Chemicals – 1.4% | | | | | | | | |
Dow, Inc.* | | | 19,900 | | | | 1,128,927 | |
DowDuPont, Inc. | | | 40,327 | | | | 1,550,573 | |
| | | | | | | 2,679,500 | |
| | |
Cosmetics/Personal Care – 1.7% | | | | | |
Unilever N.V. (United Kingdom)(a) | | | 52,643 | | | | 3,185,428 | |
| | | |
Electric – 1.7% | | | | | | | | |
NextEra Energy, Inc. | | | 16,380 | | | | 3,184,927 | |
| | | |
Entertainment – 1.3% | | | | | | | | |
OPAP S.A. (Greece) | | | 217,410 | | | | 2,340,932 | |
| | | |
Healthcare - Services – 1.5% | | | | | | | | |
Sonic Healthcare Ltd. (Australia) | | | 152,585 | | | | 2,759,327 | |
| | | |
Insurance – 4.3% | | | | | | | | |
Allianz S.E. (Germany)(a) | | | 11,427 | | | | 2,762,068 | |
NN Group N.V. (Netherlands) | | | 58,410 | | | | 2,548,990 | |
Zurich Insurance Group A.G. (Switzerland) | | | 8,520 | | | | 2,715,904 | |
| | | | | | | | 8,026,962 | |
| | | | | | | | |
| | | Number
of Shares | | | Value | |
| | |
Mining – 1.1% | | | | | | | | |
MMC Norilsk Nickel PJSC ADR (Russia) | | | 87,047 | | | $ | 1,950,288 | |
| |
Miscellaneous Manufacturing – 0.8% | |
Siemens A.G. (Germany)(a) | | | 12,786 | | | | 1,533,069 | |
| | |
Oil & Gas – 3.7% | | | | | |
Chevron Corp. | | | 18,503 | | | | 2,221,470 | |
LUKOIL PJSC ADR (Russia) | | | 21,433 | | | | 1,832,521 | |
Royal Dutch Shell PLC, Class B ADR (Netherlands) | | | 36,976 | | | | 2,399,373 | |
Tupras Turkiye Petrol Rafinerileri A.S. (Turkey) | | | 18,200 | | | | 376,429 | |
| | | | | | | 6,829,793 | |
| | |
Pharmaceuticals – 4.2% | | | | | |
GlaxoSmithKline PLC (United Kingdom) | | | 117,676 | | | | 2,417,445 | |
Novartis A.G. ADR (Switzerland) | | | 32,801 | | | | 2,697,226 | |
Pfizer, Inc. | | | 65,079 | | | | 2,642,858 | |
| | | | | | | 7,757,529 | |
| | |
Real Estate Investment Trusts – 2.7% | | | | | |
PLA Administradora Industrial S. de R.L. de C.V. (Mexico) | | | 1,397,500 | | | | 2,333,129 | |
Welltower, Inc. | | | 36,871 | | | | 2,747,996 | |
| | | | | | | 5,081,125 | |
| | |
Semiconductors – 1.4% | | | | | |
Taiwan Semiconductor Manufacturing Co. Ltd. (Taiwan) | | | 302,000 | | | | 2,535,602 | |
| | |
Telecommunications – 4.1% | | | | | |
AT&T, Inc. | | | 72,229 | | | | 2,236,210 | |
BCE, Inc. (Canada) | | | 59,569 | | | | 2,665,117 | |
Cisco Systems, Inc. | | | 49,940 | | | | 2,794,143 | |
| | | | | | | | 7,695,470 | |
| | |
Total Common Stocks
(Cost $69,343,500) | | | | | | | 73,688,125 | |
| |
Investment Companies – 56.2% | | | | | |
Global X MLP & Energy Infrastructure ETF | | | 1,000,700 | | | | 13,059,135 | |
iShares MSCI United Kingdom ETF | | | 446,437 | | | | 15,071,713 | |
iShares STOXX Europe 600 Telecommunications UCITS ETF DE (Germany) | | | 833,238 | | | | 20,616,389 | |
Schwab U.S. REIT ETF | | | 266,058 | | | | 11,797,012 | |
See accompanying Notes to Financial Statements
68
Morningstar Funds Trust April 30, 2019
Schedule of Investments(continued)
Morningstar Global Income Fund
| | | | | | | | |
| | | Number of Shares | | | Value | |
| | |
SPDR Bloomberg Barclays Convertible Securities ETF | | | 178,805 | | | $ | 9,566,068 | |
Vanguard Intermediate-Term Bond ETF | | | 187,225 | | | | 15,693,199 | |
Vanguard Long-Term Treasury ETF | | | 243,904 | | | | 18,558,655 | |
| | | |
Total Investment Companies
(Cost $101,120,616) | | | | | | | 104,362,171 | |
| |
Short-Term Investments – 4.0% | | | | | |
Money Market Fund – 4.0% | | | | | | | | |
Northern Institutional Funds - Treasury Portfolio (Premier), 2.29%(b) | | | 7,337,093 | | | | 7,337,093 | |
| | |
Total Short-Term Investments
(Cost $7,337,093) | | | | | | | 7,337,093 | |
| | |
| | |
Total Investments – 99.9%
(Cost $177,801,209) | | | | | | | 185,387,389 | |
| | |
| | |
Other Assets less Liabilities – 0.1% | | | | | | | 144,056 | |
| | |
NET ASSETS – 100.0% | | | | | | $ | 185,531,445 | |
All securities are United States companies, unless noted otherwise in parentheses.
| (a) | Security sold outside United States without registration under the Securities Act of 1933. |
| (b) | 7-day current yield as of April 30, 2019 is disclosed. |
| * | Non-Income Producing Security |
Percentages shown are based on Net Assets
Abbreviations:
| | |
ADR | | American Depositary Receipt |
ETF | | Exchange-Traded Fund |
MSCI | | Morgan Stanley Capital International |
PLC | | Public Limited Company |
REIT | | Real Estate Investment Trust |
SPDR | | Standard & Poor’s Depositary Receipt |
UCITS | | Undertakings for Collective Investment in Transferable Securities |
| | | | |
Concentration by Currency (%) | | | | |
Euro | | | 69.7 | |
U.S. Dollar | | | 18.3 | |
All other currencies less than 5% | | | 12.0 | |
Total | | | 100.0 | |
| | | | |
Country Diversification (%) | | | | |
United States | | | 62.8 | |
Germany | | | 13.4 | |
All other countries less than 5% | | | 23.8 | |
Total | | | 100.0 | |
See accompanying Notes to Financial Statements
69
Morningstar Funds Trust April 30, 2019
Schedule of Investments(continued)
Morningstar Global Income Fund
Valuation Hierarchy
The following is a summary of the inputs used, as of April 30, 2019, in valuing the Fund’s investments carried at fair value:
| | | | | | | | | | | | | | | | |
| Morningstar Global Income Fund | | Level 1 | | | Level 2 | | | Level 3 | | | Totals | |
Investments | | | | | | | | | | | | | | | | |
Assets: | | | | | | | | | | | | | | | | |
Investments in Securities: | | | | | | | | | | | | | | | | |
Common Stocks | | $ | 42,418,154 | | | $ | 31,269,971 | | | | $— | | | $ | 73,688,125 | |
Investment Companies | | | 104,362,171 | | | | — | | | | — | | | | 104,362,171 | |
Short-Term Investments | | | 7,337,093 | | | | — | | | | — | | | | 7,337,093 | |
| | | | | |
Total Investments | | $ | 154,117,418 | | | $ | 31,269,971 | | | | $— | | | $ | 185,387,389 | |
See accompanying Notes to Financial Statements
70
Morningstar Funds Trust April 30, 2019
Schedule of Investments
|
Morningstar Total Return Bond Fund |
| | | | | | | | |
| | | Par(a) | | | Value | |
Long Positions – 121.5% | | | | | |
Asset-Backed Securities – 12.7% | |
Automobile – 0.3% | | | | | | | | |
Avis Budget Rental Car Funding AESOP LLC, Series2019-2A, Class A, 3.35%, 9/22/25(b) | | $ | 740,000 | | | $ | 745,130 | |
Hertz Vehicle Financing II L.P., Series2018-1A, Class A, 3.29%, 2/25/24(b) | | | 500,000 | | | | 500,485 | |
| | | | | | | 1,245,615 | |
| |
Commercial Mortgage-Backed Securities – 4.4% | |
245 Park Avenue Trust, Series 2017-245P, Class E, 3.78%, 6/05/37(b)(c)(d) | | | 880,000 | | | | 832,513 | |
AOA Mortgage Trust, Series 2015-1177, Class C, 3.11%,
12/13/29(b)(c)(d) | | | 113,000 | | | | 111,848 | |
BANK, Series 2017-BNK7, Class A5, 3.44%, 9/15/60 | | | 100,000 | | | | 101,863 | |
BANK, Series 2018-BN13, Class A5, 4.22%, 8/15/61 | | | 480,000 | | | | 517,041 | |
Bayview Commercial Asset Trust, Series2006-1A, Class A1,(ICE LIBOR USD 1M + 0.27%), 2.75%, 4/25/36(b)(d) | | | 519,299 | | | | 500,289 | |
Bear Stearns Commercial Mortgage Securities Trust, Series2007-T26, Class AM, 5.51%, 1/12/45(c)(d) | | | 117,694 | | | | 117,694 | |
BENCHMARK Mortgage Trust, Series2018-B2, Class A5, 3.88%, 2/15/51 | | | 390,000 | | | | 409,977 | |
BENCHMARK Mortgage Trust, Series2019-B10, Class A4, 3.72%, 3/15/62 | | | 500,000 | | | | 518,302 | |
Benchmark Mortgage Trust, Series2019-B9, Class XA, 1.22%,
3/15/52(c)(d) | | | 2,898,660 | | | | 238,574 | |
BHMS, Series 2018-ATLS, Class A,(ICE LIBOR USD 1M + 1.25%, 1.25% Floor), 3.72%, 7/15/35(b)(d) | | | 1,300,000 | | | | 1,299,177 | |
BXP Trust, Series2017-GM, Class D, 3.54%, 6/13/39(b)(c)(d) | | | 370,000 | | | | 358,818 | |
| | | | | | | | |
| | | Par(a) | | | Value | |
Commercial Mortgage-Backed Securities (Continued) | |
CAMB Commercial Mortgage Trust, Series 2019-LIFE, Class A,(ICE LIBOR USD 1M + 1.07%, 1.07% Floor), 3.54%, 12/15/37(b)(d) | | $ | 590,000 | | | $ | 591,475 | |
CAMB Commercial Mortgage Trust, Series 2019-LIFE, Class D,(ICE LIBOR USD 1M + 1.75%, 1.75% Floor), 4.22%, 12/15/37(b)(d) | | | 100,000 | | | | 100,563 | |
CFK Trust, Series2019-FAX, Class D, 4.64%, 1/15/39(b) | | | 100,000 | | | | 105,008 | |
Citigroup Commercial Mortgage Trust, Series2016-C1, Class D, 5.12%, 5/10/49(b)(c)(d) | | | 250,000 | | | | 245,918 | |
Citigroup Commercial Mortgage Trust, Series2016-P3, Class A4, 3.33%, 4/15/49 | | | 260,000 | | | | 263,676 | |
Citigroup Commercial Mortgage Trust, Series2016-P3, Class D, 2.80%, 4/15/49(b) | | | 484,000 | | | | 409,012 | |
Citigroup Commercial Mortgage Trust, Series2017-C4, Class A4, 3.47%, 10/12/50 | | | 420,000 | | | | 428,728 | |
Citigroup Commercial Mortgage Trust, Series 2019-SMRT, Class D, 4.90%,
1/10/24(b)(c)(d) | | | 500,000 | | | | 520,065 | |
Citigroup Commercial Mortgage Trust, Series 2019-SMRT, Class E, 4.90%,
1/10/24(b)(c)(d) | | | 500,000 | | | | 509,413 | |
Citigroup Commercial Mortgage Trust, Series 2019-SST2, Class A,(ICE LIBOR USD 1M + 0.92%, 0.92% Floor), 3.39%, 12/15/36(b)(d) | | | 300,000 | | | | 300,404 | |
CSAIL Commercial Mortgage Trust, Series 2018-CX11, Class A5, 4.03%, 4/15/51 | | | 220,000 | | | | 232,424 | |
CSAIL Commercial Mortgage Trust, Series2019-C15, Class C, 5.15%, 3/15/52(c)(d) | | | 142,018 | | | | 149,705 | |
DBGS Mortgage Trust, Series 2019-1735, Class X, 0.29%, 4/10/29(b)(c)(d) | | | 13,945,000 | | | | 390,109 | |
See accompanying Notes to Financial Statements
71
Morningstar Funds Trust April 30, 2019
Schedule of Investments(continued)
Morningstar Total Return Bond Fund
| | | | | | | | |
| | | Par(a) | | | Value | |
|
Commercial Mortgage-Backed Securities (Continued) | |
Exantas Capital Corp. Ltd., Series 2019-RSO7, Class AS,(ICE LIBOR USD 1M + 1.50%, 1.50% Floor), 4.00%, 4/15/36(b)(d) | | $ | 500,000 | | | $ | 500,476 | |
Fannie Mae - ACES, Series2019-M4, Class A2, 3.61%, 2/25/31 | | | 100,000 | | | | 103,733 | |
Fannie Mae - ACES, Series2019-M5, Class A2, 3.27%, 1/25/29 | | | 110,000 | | | | 111,536 | |
Fannie Mae - ACES, Series2019-M6, Class A2, 3.45%, 1/01/29 | | | 210,000 | | | | 215,381 | |
Fannie Mae Connecticut Avenue Securities, Series2014-C04, Class 1M2,(ICE LIBOR USD 1M + 4.90%), 7.38%, 11/25/24(d) | | | 256,568 | | | | 288,797 | |
Fannie Mae Connecticut Avenue Securities, Series2016-C04, Class 1M2,(ICE LIBOR USD 1M + 4.25%), 6.73%, 1/25/29(d) | | | 270,000 | | | | 297,107 | |
Fannie Mae Connecticut Avenue Securities, Series2017-C03, Class 1M1,(ICE LIBOR USD 1M + 0.95%), 3.43%, 10/25/29(d) | | | 297,453 | | | | 297,900 | |
Freddie Mac Multifamily Structured Pass Through Certificates, Series K070, Class A2, 3.42%, 2/25/29 | | | 371,000 | | | | 383,542 | |
3.51%, 3/25/29 | | | 230,000 | | | | 238,989 | |
Government National Mortgage Association, Series2014-H20, Class FA,(ICE LIBOR USD 1M + 0.43%, 0.43% Floor, 12.33% Cap), 2.91%, 10/20/64(d) | | | 307,999 | | | | 307,325 | |
GRACE Mortgage Trust, Series 2014-GRCE, Class F, 3.71%,
6/10/28(b)(c)(d) | | | 100,000 | | | | 99,516 | |
GS Mortgage Securities Corp. Trust, Series 2017-500K, Class E,(ICE LIBOR USD 1M + 1.50%, 1.75% Floor), 3.97%, 7/15/32(b)(d) | | | 110,000 | | | | 109,965 | |
GS Mortgage Securities Trust, Series2017-GS7, Class A4, 3.43%, 8/10/50 | | | 220,000 | | | | 222,585 | |
| | | | | | | | |
| | | Par(a) | | | Value | |
|
Commercial Mortgage-Backed Securities (Continued) | |
GS Mortgage Securities Trust, Series2017-GS7, Class E, 3.00%, 8/10/50(b) | | $ | 70,000 | | | $ | 60,745 | |
GS Mortgage Securities Trust, Series2017-GS8, Class A4, 3.47%, 11/10/50 | | | 240,000 | | | | 243,758 | |
J.P. Morgan Chase Commercial Mortgage Securities Trust, Series2017-JP6, Class A5, 3.49%, 7/15/50 | | | 235,000 | | | | 239,660 | |
LSTAR Commercial Mortgage Trust, Series2015-3, Class AS, 3.27%, 4/20/48(b)(c)(d) | | | 500,000 | | | | 497,606 | |
Morgan Stanley Capital I Trust, Series2017-H1, Class A5, 3.53%, 6/15/50 | | | 66,900 | | | | 68,508 | |
Morgan Stanley Capital I Trust, Series2019-L2, Class A4, 4.07%, 3/15/52 | | | 1,000,000 | | | | 1,066,856 | |
Morgan Stanley Capital I Trust, Series2019-L2, Class XA, 1.20%,
3/15/52(c)(d) | | | 2,573,412 | | | | 210,490 | |
Morgan Stanley Capital I, Inc., Series2018-H4, Class A4,(ICE LIBOR USD 1M + 1.40%, 1.40% Floor), 5/15/36(b)(e) | | | 410,000 | | | | 412,649 | |
PFP Ltd., Series2019-5, Class A,(ICE LIBOR USD 1M + 0.97%), 3.47%, 4/14/36(b)(d) | | | 314,500 | | | | 314,648 | |
Rosslyn Portfolio Trust, Series 2017-ROSS, Class A,(ICE LIBOR USD 1M + 0.95%, 1.94% Floor), 3.42%, 6/15/33(b)(d) | | | 1,493,000 | | | | 1,492,531 | |
Wells Fargo Commercial Mortgage Trust, Series2015-C28, Class A4, 3.54%, 5/15/48 | | | 240,000 | | | | 246,483 | |
Wells Fargo Commercial Mortgage Trust, Series2015-P2, Class D, 3.24%, 12/15/48(b) | | | 250,000 | | | | 213,699 | |
See accompanying Notes to Financial Statements
72
Morningstar Funds Trust April 30, 2019
Schedule of Investments(continued)
Morningstar Total Return Bond Fund
| | | | | | | | |
| | | Par(a) | | | Value | |
|
Commercial Mortgage-Backed Securities (Continued) | |
Wells Fargo Commercial Mortgage Trust, Series2017-C38, Class A5, 3.45%, 7/15/50 | | $ | 315,000 | | | $ | 320,179 | |
Wells Fargo Commercial Mortgage Trust, Series2019-C49, Class A5, 4.02%, 3/15/52 | | | 232,051 | | | | 245,244 | |
| | | | | | | 18,062,504 | |
| |
Home Equity – 0.8% | |
Morgan Stanley ABS Capital I, Inc. Trust, Series2004-OP1, Class M1,(ICE LIBOR USD 1M + 0.87%, 0.58% Floor), 3.34%, 11/25/34(d) | | | 881,137 | | | | 882,407 | |
New Residential Mortgage Loan Trust, Series2018-3A, Class A1, 4.50%, 5/25/58(b)(c)(d) | | | 1,447,927 | | | | 1,498,544 | |
Option One Mortgage Loan Trust, Series2004-3, Class M1,(ICE LIBOR USD 1M + 0.78%, 0.52% Floor), 3.26%, 11/25/34(d) | | | 578,103 | | | | 577,395 | |
Renaissance Home Equity Loan Trust, Series2005-2, Class AV3,(ICE LIBOR USD 1M + 0.37%, 0.37% Floor, 14.00% Cap), 2.85%, 8/25/35(d) | | | 424,772 | | | | 410,567 | |
| | | | | | | 3,368,913 | |
| |
Other – 5.5% | |
AIMCO CLO, Series2014-AA, Class AR,(ICE LIBOR USD 3M + 1.10%), 3.69%, 7/20/26(b)(d) | | | 359,377 | | | | 359,337 | |
Ajax Mortgage Loan Trust, Series2018-F, Class A, 4.37%,
11/25/58(b)(c)(d) | | | 203,624 | | | | 203,595 | |
Ajax Mortgage Loan Trust, Series2018-G, Class A, 4.37%,
6/25/57(b)(c)(d) | | | 94,136 | | | | 93,703 | |
Ajax Mortgage Loan Trust, Series2019-A, Class A, 3.75%,
8/25/57(b)(c)(d) | | | 500,000 | | | | 498,960 | |
Ajax Mortgage Loan Trust, Series2019-B, Class A, 3.75%,
1/25/59(b)(c)(d) | | | 600,000 | | | | 598,615 | |
Allegro CLO I Ltd., Series2013-1A, Class A1R,(ICE LIBOR USD 3M + 1.22%), 3.80%, 1/30/26(b)(d) | | | 357,215 | | | | 357,678 | |
| | | | | | | | |
| | | Par(a) | | | Value | |
|
Other (Continued) | |
Ameriquest Mortgage Securities, Inc. Asset-Backed Pass-Through Certificates, Series2005-R7, Class M2,(ICE LIBOR USD 1M + 0.50%, 0.50% Floor), 2.98%,
9/25/35(d) | | $ | 520,000 | | | $ | 520,222 | |
AMMC LTD., Series2017-21A, Class A,(ICE LIBOR USD 3M + 1.25%), 3.83%, 11/02/30(b)(d) | | | 250,000 | | | | 249,868 | |
Anchorage Capital CLO Ltd., Series2013-1A, Class A1R,(ICE LIBOR USD 3M + 1.25%), 3.85%, 10/13/30(b)(d) | | | 500,000 | | | | 497,954 | |
Ares XXIX CLO Ltd., Series2014-1A, Class A1R,(ICE LIBOR USD 3M + 1.19%), 3.78%, 4/17/26(b)(d) | | | 409,533 | | | | 410,030 | |
Atrium IX,(ICE LIBOR USD 3M + 1.24%), 3.87%, 5/28/30(b)(d) | | | 500,000 | | | | 499,970 | |
Babson Ltd., Series2015-IA, Class AR,(ICE LIBOR USD 3M + 0.99%, 0.99% Floor), 3.58%, 1/20/31(b)(d) | | | 250,000 | | | | 246,133 | |
Ballyrock Ltd., Series2018-1A, Class A1,(ICE LIBOR USD 3M + 1.00%), 3.59%, 4/20/31(b)(d) | | | 250,000 | | | | 245,522 | |
Bayview Commercial Asset Trust, Series2007-4A, Class A1,(ICE LIBOR USD 1M + 0.45%, 0.45% Floor), 2.93%, 9/25/37(b)(d) | | | 601,511 | | | | 569,674 | |
Benefit Street Partners CLO II Ltd., Series2013-IIA, Class A2R,(ICE LIBOR USD 3M + 1.75%), 4.35%, 7/15/29(b)(d) | | | 500,000 | | | | 497,707 | |
Benefit Street Partners CLO IV Ltd., Series2014-IVA, Class A1RR,(ICE LIBOR USD 3M + 1.25%, 1.25% Floor), 3.84%, 1/20/29(b)(d) | | | 500,000 | | | | 499,998 | |
BlueMountain CLO Ltd., Series2012-2A, Class AR2, (ICE LIBOR USD 3M + 1.05%, 1.05% Floor), 3.69%,
11/20/28(b)(d) | | | 250,000 | | | | 249,507 | |
See accompanying Notes to Financial Statements
73
Morningstar Funds Trust April 30, 2019
Schedule of Investments(continued)
Morningstar Total Return Bond Fund
| | | | | | | | |
| | | Par(a) | | | Value | |
|
Other (Continued) | |
BlueMountain CLO Ltd., Series2013-1A, Class A1R,(ICE LIBOR USD 3M + 1.40%), 3.99%,
1/20/29(b)(d) | | $ | 500,000 | | | $ | 500,743 | |
BlueMountain CLO Ltd., Series2013-1A, Class A1R2,(1.23% - ICE LIBOR USD 3M, 1.23% Floor), 1/20/29(b)(e) | | | 500,000 | | | | 500,000 | |
BlueMountain CLO Ltd., Series2015-3A, Class A1R,(ICE LIBOR USD 3M + 1.00%), 3.59%,
4/20/31(b)(d) | | | 250,000 | | | | 246,826 | |
Burnham Park Clo Ltd., Series2016-1A, Class A,(ICE LIBOR USD 3M + 1.43%), 4.02%, 10/20/29(b)(d) | | | 300,000 | | | | 300,031 | |
Carlyle Global Market Strategies CLO Ltd., Series2014-2RA, Class A1,(ICE LIBOR USD 3M + 1.05%), 3.73%, 5/15/31(b)(d) | | | 740,000 | | | | 731,350 | |
Citigroup Mortgage Loan Trust, Inc., Series 2007-WFH4, Class M3A,(ICE LIBOR USD 1M + 2.50%, 2.50% Floor), 4.98%, 7/25/37(d) | | | 500,000 | | | | 521,534 | |
Cutwater Ltd., Series2014-1A, Class A1AR,(ICE LIBOR USD 3M + 1.25%), 3.85%, 7/15/26(b)(d) | | | 271,178 | | | | 271,650 | |
Dryden 71 CLO Ltd., Series2018-71A, Class A,(ICE LIBOR USD 3M + 1.15%, 1.15% Floor), 3.84%,
1/15/29(b)(d) | | | 250,000 | | | | 250,285 | |
Dryden XXV Senior Loan Fund, Series2012-25A, Class ARR,(ICE LIBOR USD 3M + 0.90%), 3.50%,
10/15/27(b)(d) | | | 500,000 | | | | 498,938 | |
First Franklin Mortgage Loan Trust, Series2003-FF4, Class M1,(ICE LIBOR USD 1M + 1.80%, 1.20% Floor), 4.30%, 10/25/33(d) | | | 478,346 | | | | 479,339 | |
Flatiron Clo 17 Ltd., Series2017-1A, Class A,(ICE LIBOR USD 3M + 1.25%), 3.93%, 5/15/30(b)(d) | | | 300,000 | | | | 300,123 | |
JFIN CLO Ltd., Series2014-1A, Class AR,(ICE LIBOR USD 3M + 0.95%), 3.54%, 4/21/25(b)(d) | | | 339,458 | | | | 338,848 | |
| | | | | | | | |
| | | Par(a) | | | Value | |
|
Other (Continued) | |
KKR CLO Ltd., Series 21, Class A,(ICE LIBOR USD 3M + 1.00%), 3.60%, 4/15/31(b)(d) | | $ | 250,000 | | | $ | 247,002 | |
LCM Loan Income Fund I Income Note Issuer Ltd., Series 27A, Class A1,(ICE LIBOR USD 3M + 1.08%), 3.68%, 7/16/31(b)(d) | | | 250,000 | | | | 247,958 | |
LCM XXIV Ltd., Series 24A, Class A,(ICE LIBOR USD 3M + 1.31%, 1.31% Floor), 3.90%, 3/20/30(b)(d) | | | 750,000 | | | | 747,991 | |
Legacy Mortgage Asset Trust, Series2019-SL1, Class A, 4.00%,
12/28/54(b) | | | 730,203 | | | | 729,503 | |
Long Beach Mortgage Loan Trust, Series2006-6, Class 2A3,(ICE LIBOR USD 1M + 0.15%, 0.15% Floor), 2.63%, 7/25/36(d) | | | 914,182 | | | | 471,359 | |
Madison Park Funding XI Ltd., Series2013-11A, Class AR,(ICE LIBOR USD 3M + 1.16%), 3.75%, 7/23/29(b)(d) | | | 500,000 | | | | 500,316 | |
Madison Park Funding XIII Ltd., Series2014-13A, Class AR2,(ICE LIBOR USD 3M + 0.95%), 3.54%, 4/19/30(b)(d) | | | 500,000 | | | | 497,710 | |
Madison Park Funding XVI Ltd., Series2015-16A, Class A1R,(ICE LIBOR USD 3M + 1.33%), 3.92%, 4/20/26(b)(d) | | | 500,000 | | | | 499,978 | |
Madison Park Funding XXI Ltd., Series2016-21A, Class A1,(ICE LIBOR USD 3M + 1.53%), 4.11%, 7/25/29(b)(d) | | | 500,000 | | | | 501,163 | |
Mariner CLO, Series2017-4A, Class A,(ICE LIBOR USD 3M + 1.21%), 3.80%, 10/26/29(b)(d) | | | 250,000 | | | | 249,066 | |
Midocean Credit CLO VII, Series2017-7A, Class B,(ICE LIBOR USD 3M + 1.90%), 4.50%, 7/15/29(b)(d) | | | 250,000 | | | | 249,179 | |
Myers Park CLO Ltd., Series2018-1A, Class B1,(ICE LIBOR USD 3M + 1.60%, 1.60% Floor), 4.19%,
10/20/30(b)(d) | | | 250,000 | | | | 246,602 | |
See accompanying Notes to Financial Statements
74
Morningstar Funds Trust April 30, 2019
Schedule of Investments(continued)
Morningstar Total Return Bond Fund
| | | | | | | | |
| | | Par(a) | | | Value | |
|
Other (Continued) | |
Oaktree CLO Ltd., Series2015-1A, Class A1R,(ICE LIBOR USD 3M + 0.87%), 3.46%, 10/20/27(b)(d) | | $ | 500,000 | | | $ | 499,512 | |
OFSI Fund VI Ltd., Series2014-6A, Class BR,(ICE LIBOR USD 3M + 1.50%), 4.10%, 3/20/25(b)(d) | | | 500,000 | | | | 490,757 | |
Palmer Square CLO Ltd., Series2018-2A, Class A1A,(ICE LIBOR USD 3M + 1.10%), 3.70%,
7/16/31(b)(d) | | | 500,000 | | | | 494,970 | |
RR 3 Ltd.,(ICE LIBOR USD 3M + 1.09%, 1.09% Floor), 3.69%,
1/15/30(b)(d) | | | 250,000 | | | | 247,604 | |
SBA Small Business Investment Cos., Series2019-10A, Class 1, 3.11%, 3/10/29 | | | 100,000 | | | | 101,108 | |
Sound Point CLO XXIII, Series2019-2A, Class A1,(1.40% - ICE LIBOR USD 3M), 0.00%, 4/15/32(b)(d) | | | 250,000 | | | | 250,000 | |
Symphony CLO XIV Ltd., Series2014-14A, Class A1R,(ICE LIBOR USD 3M + 1.28%), 3.88%,
7/14/26(b)(d) | | | 487,343 | | | | 487,278 | |
TCW CLO Ltd., Series2019-1A, Class A,(ICE LIBOR USD 3M + 1.44%, 1.44% Floor), 4.12%,
2/15/29(b)(d) | | | 270,000 | | | | 270,102 | |
Thacher Park CLO Ltd., Series2014-1A, Class AR,(ICE LIBOR USD 3M + 1.16%), 3.75%, 10/20/26(b)(d) | | | 478,408 | | | | 478,605 | |
Towd Point Mortgage Trust, Series2019-SJ2, Class M1, 4.50%,
11/25/58(b) | | | 500,000 | | | | 504,872 | |
Tryon Park Ltd., Series2013-1A, Class A1SR,(ICE LIBOR USD 3M + 0.89%), 3.49%, 4/15/29(b)(d) | | | 250,000 | | | | 249,181 | |
United States Small Business Administration, Series2019-20D, Class 1, 2.98%, 4/01/39 | | | 50,000 | | | | 49,948 | |
Venture 31 CLO Ltd., Series2018-31A, Class A1,(ICE LIBOR USD 3M + 1.03%, 1.03% Floor), 3.62%,
4/20/31(b)(d) | | | 410,000 | | | | 404,729 | |
| | | | | | | | |
| | | Par(a) | | | Value | |
|
Other (Continued) | |
Vericrest Opportunity Loan Trust, Series 2019-NPL2, Class A1,(Step to 6.97% on 3/25/22), 3.97%, 2/25/49(b)(f) | | $ | 146,396 | | | $ | 146,753 | |
Vericrest Opportunity Loan Trust, Series 2019-NPL3, Class A1, 3.97%, 3/25/49(b) | | | 498,081 | | | | 498,657 | |
Westcott Park CLO Ltd., Series2016-1A, Class A,(ICE LIBOR USD 3M + 1.53%), 4.12%, 7/20/28(b)(d) | | | 500,000 | | | | 499,940 | |
YorkClo-3 Ltd., Series2016-1A, Class BR,(ICE LIBOR USD 3M + 1.75%), 4.34%, 10/20/29(b)(d) | | | 500,000 | | | | 494,915 | |
| | | | | | | 22,894,898 | |
| |
Residential Mortgage-Backed Securities – 0.1% | |
Mill City Mortgage Loan Trust, Series2018-2, Class B4, 0.00%, 10/25/28 | | | 979,255 | | | | 278,352 | |
Mill City Mortgage Loan Trust, Series2018-4, Class R, 4.00%, 10/25/28 | | | 238,074 | | | | 234,979 | |
| | | | | | | 513,331 | |
| |
Student Loan – 0.2% | |
Navient Student Loan Trust, Series2015-1, Class A2,(ICE LIBOR USD 1M + 0.60%, 0.60% Floor), 3.08%, 4/25/40(d) | | | 133,960 | | | | 133,623 | |
Navient Student Loan Trust, Series2017-1A, Class A3,(ICE LIBOR USD 1M + 1.15%), 3.62%,
7/26/66(b)(d) | | | 260,000 | | | | 262,854 | |
Navient Student Loan Trust, Series2017-2A, Class A,(ICE LIBOR USD 1M + 1.05%), 3.53%, 12/27/66(b)(d) | | | 137,603 | | | | 138,058 | |
SLM Student Loan Trust, Series2006-10, Class A6,(ICE LIBOR USD 3M + 0.15%), 2.73%, 3/25/44(d) | | | 300,000 | | | | 288,643 | |
| | | | | | | 823,178 | |
| |
| |
See accompanying Notes to Financial Statements
75
Morningstar Funds Trust April 30, 2019
Schedule of Investments(continued)
Morningstar Total Return Bond Fund
| | | | | | | | |
| | | Par(a) | | | Value | |
|
Whole Loan – 1.4% | |
Adjustable Rate Mortgage Trust, Series2005-9, Class 5A1,(ICE LIBOR USD 1M + 0.54%, 0.27% Floor, 11.00% Cap), 3.02%, 11/25/35(d) | | $ | 418,217 | | | $ | 416,440 | |
GSR Mortgage Loan Trust, Series2007-1F, Class 2A4, 5.50%, 1/25/37 | | | 698,133 | | | | 757,013 | |
Impac CMB Trust, Series2007-A, Class A,(ICE LIBOR USD 1M + 0.50%, 0.25% Floor, 11.50% Cap), 2.98%, 5/25/37(b)(d) | | | 408,850 | | | | 408,006 | |
LSTAR Securities Investment Trust, Series2019-2, Class A1,(ICE LIBOR USD 1M + 1.50%), 3.98%,
4/01/24(b)(d) | | | 750,000 | | | | 755,546 | |
MASTR Asset Securitization Trust, Series2007-1, Class 1A4, 6.50%, 11/25/37 | | | 826,918 | | | | 494,812 | |
MASTR Asset Securitization Trust, Series2007-2, Class A2, 6.25%, 1/25/38 | | | 609,571 | | | | 503,603 | |
Merrill Lynch Mortgage Investors Trust, Series2004-A1, Class 2A2, 4.62%, 2/25/34(c)(d) | | | 630,851 | | | | 635,088 | |
Morgan Stanley Resecuritization Trust, Series2015-R2, Class 2A1,(Federal Reserve U.S. 12 1Y CMT + 1.09%, 1.09% Floor), 4.43%, 12/26/46(b)(d) | | | 377,601 | | | | 379,165 | |
New Residential Mortgage Loan Trust, Series 2019-RPL1, Class A1,(Step to 7.34% on 3/25/22), 4.33%,
2/26/24(b)(f) | | | 247,071 | | | | 249,068 | |
| | | | | | | | |
| | | Par(a) | | | Value | |
|
Whole Loan (Continued) | |
Thornburg Mortgage Securities Trust, Series2004-2, Class A4,(ICE LIBOR USD 1M + 0.68%, 0.34% Floor, 11.50% Cap), 3.16%, 6/25/44(d) | | $ | 724,762 | | | $ | 726,001 | |
WaMu Mortgage Pass-Through Certificates Series, Series 2006-AR13, Class 1A,(Federal Reserve U.S. 12 1Y CMT + 0.88%, 0.88% Floor), 3.32%, 10/25/46(d) | | | 529,908 | | | | 499,008 | |
| | | | | | | | 5,823,750 | |
| | |
Total Asset-Backed Securities
(Cost $52,528,531) | | | | | | | 52,732,189 | |
| |
Corporate Bonds – 21.0% | |
Aerospace/Defense – 0.7% | |
Boeing (The) Co.,
4.87%, 2/15/20 | | | 30,000 | | | | 30,468 | |
3.20%, 3/01/29 | | | 110,000 | | | | 109,443 | |
3.83%, 3/01/59 | | | 18,000 | | | | 17,058 | |
General Dynamics Corp.,
3.75%, 5/15/28 | | | 26,000 | | | | 27,314 | |
Harris Corp.,
4.40%, 6/15/28 | | | 242,000 | | | | 255,195 | |
5.05%, 4/27/45 | | | 73,000 | | | | 80,845 | |
L3 Technologies, Inc.,
3.85%, 6/15/23 | | | 62,000 | | | | 64,066 | |
3.95%, 5/28/24 | | | 125,000 | | | | 128,025 | |
3.85%, 12/15/26 | | | 115,000 | | | | 116,872 | |
4.40%, 6/15/28 | | | 26,000 | | | | 27,414 | |
Lockheed Martin Corp.,
3.55%, 1/15/26 | | | 146,000 | | | | 149,929 | |
3.60%, 3/01/35 | | | 203,000 | | | | 200,934 | |
4.07%, 12/15/42 | | | 264,000 | | | | 268,016 | |
Northrop Grumman Corp.,
3.25%, 8/01/23 | | | 62,000 | | | | 62,742 | |
2.93%, 1/15/25 | | | 304,000 | | | | 300,796 | |
3.25%, 1/15/28 | | | 468,000 | | | | 460,239 | |
5.05%, 11/15/40 | | | 44,000 | | | | 48,921 | |
4.75%, 6/01/43 | | | 44,000 | | | | 47,716 | |
4.03%, 10/15/47 | | | 35,000 | | | | 34,330 | |
Raytheon Co.,
7.20%, 8/15/27 | | | 26,000 | | | | 33,679 | |
4.70%, 12/15/41 | | | 15,000 | | | | 17,094 | |
United Technologies Corp.,
1.95%, 11/01/21 | | | 97,000 | | | | 94,926 | |
3.10%, 6/01/22 | | | 79,000 | | | | 79,547 | |
3.13%, 5/04/27 | | | 123,000 | | | | 121,020 | |
4.13%, 11/16/28 | | | 71,000 | | | | 74,066 | |
See accompanying Notes to Financial Statements
76
Morningstar Funds Trust April 30, 2019
Schedule of Investments(continued)
Morningstar Total Return Bond Fund
| | | | | | | | |
| | | Par(a) | | | Value | |
|
Aerospace/Defense (Continued) | |
5.40%, 5/01/35 | | $ | 44,000 | | | $ | 49,546 | |
4.50%, 6/01/42 | | | 147,000 | | | | 152,516 | |
4.62%, 11/16/48 | | | 40,000 | | | | 42,408 | |
| | | | | | | 3,095,125 | |
| |
Agriculture – 0.4% | |
Altria Group, Inc.,
3.49%, 2/14/22 | | | 100,000 | | | | 101,307 | |
2.85%, 8/09/22 | | | 70,000 | | | | 69,614 | |
2.95%, 5/02/23 | | | 35,000 | | | | 34,752 | |
4.00%, 1/31/24 | | | 62,000 | | | | 63,718 | |
3.80%, 2/14/24 | | | 85,000 | | | | 86,585 | |
4.40%, 2/14/26 | | | 438,000 | | | | 452,407 | |
4.80%, 2/14/29 | | | 313,000 | | | | 325,242 | |
5.80%, 2/14/39 | | | 158,000 | | | | 168,990 | |
4.25%, 8/09/42 | | | 26,000 | | | | 23,012 | |
5.37%, 1/31/44 | | | 86,000 | | | | 87,526 | |
5.95%, 2/14/49 | | | 106,000 | | | | 114,586 | |
6.20%, 2/14/59 | | | 78,000 | | | | 84,762 | |
Philip Morris International, Inc.,
2.50%, 8/22/22 | | | 150,000 | | | | 148,579 | |
4.50%, 3/20/42 | | | 60,000 | | | | 60,897 | |
3.88%, 8/21/42 | | | 20,000 | | | | 18,645 | |
| | | | | | | 1,840,622 | |
| |
Airlines – 0.1% | |
American Airlines Pass Through Trust, Series2014-1, Class B, 4.38%, 10/01/22 | | | 659 | | | | 664 | |
American Airlines Pass Through Trust, Series2015-2, Class AA, 3.60%, 9/22/27 | | | 10,295 | | | | 10,334 | |
American Airlines Pass Through Trust, Series2015-2, Class B, 4.40%, 9/22/23 | | | 21,549 | | | | 21,776 | |
American Airlines Pass Through Trust, Series2016-1, Class B, 5.25%, 1/15/24 | | | 105,527 | | | | 109,317 | |
American Airlines Pass Through Trust, Series2016-2, Class AA, 3.20%, 6/15/28 | | | 13,493 | | | | 13,180 | |
American Airlines Pass Through Trust, Series2016-3, Class AA, 3.00%, 10/15/28 | | | 34,982 | | | | 33,920 | |
American Airlines Pass Through Trust, Series2016-3, Class B, 3.75%, 10/15/25 | | | 1,735 | | | | 1,702 | |
| | | | | | | | |
| | | Par(a) | | | Value | |
| | |
Airlines (Continued) | | | | | | | | |
American Airlines Pass Through Trust, Series2017-1, Class AA, 3.65%, 2/15/29 | | $ | 9,900 | | | $ | 9,990 | |
American Airlines Pass Through Trust, Series2017-1, Class B, 4.95%, 2/15/25 | | | 9,987 | | | | 10,243 | |
American Airlines Pass Through Trust, Series2017-2, Class AA, 3.35%, 10/15/29 | | | 23,647 | | | | 23,080 | |
American Airlines Pass Through Trust, Series2017-2, Class B, 3.70%, 10/15/25 | | | 33,231 | | | | 32,491 | |
Delta Air Lines Pass Through Trust, Series2019-1, Class AA, 3.20%, 4/25/24 | | | 44,000 | | | | 44,613 | |
United Airlines Pass Through Trust, Series2014-2, Class B, 4.62%, 9/03/22 | | | 6,053 | | | | 6,156 | |
United Airlines Pass Through Trust, Series2016-1, Class AA, 3.10%, 7/07/28 | | | 2,763 | | | | 2,715 | |
United Airlines Pass Through Trust, Series2016-1, Class B, 3.65%, 1/07/26 | | | 1,829 | | | | 1,810 | |
United Airlines Pass Through Trust, Series2016-2, Class AA, 2.88%, 10/07/28 | | | 11,969 | | | | 11,492 | |
United Airlines Pass Through Trust, Series2016-2, Class B, 3.65%, 10/07/25 | | | 3,486 | | | | 3,425 | |
United Airlines Pass Through Trust, Series2018-1, Class AA, 3.50%, 3/01/30 | | | 17,687 | | | | 17,555 | |
United Airlines Pass Through Trust, Series2019-1, Class AA, 4.15%, 8/25/31 | | | 35,000 | | | | 36,009 | |
| | | | | | | 390,472 | |
| |
Auto Manufacturers – 0.7% | |
Ford Motor Credit Co. LLC,
3.34%, 3/18/21 | | | 969,000 | | | | 965,622 | |
5.87%, 8/02/21 | | | 200,000 | | | | 209,285 | |
4.14%, 2/15/23 | | | 200,000 | | | | 200,288 | |
General Motors Co.,
4.88%, 10/02/23 | | | 210,000 | | | | 221,229 | |
5.00%, 4/01/35 | | | 62,000 | | | | 59,105 | |
See accompanying Notes to Financial Statements
77
Morningstar Funds Trust April 30, 2019
Schedule of Investments(continued)
Morningstar Total Return Bond Fund
| | | | | | | | |
| | | Par(a) | | | Value | |
|
Auto Manufacturers (Continued) | |
6.25%, 10/02/43 | | $ | 15,000 | | | $ | 15,808 | |
5.40%, 4/01/48 | | | 18,000 | | | | 17,442 | |
5.95%, 4/01/49 | | | 70,000 | | | | 72,414 | |
General Motors Financial Co., Inc.,
3.55%, 4/09/21 | | | 361,000 | | | | 364,303 | |
3.45%, 1/14/22 | | | 238,000 | | | | 239,670 | |
3.55%, 7/08/22 | | | 175,000 | | | | 175,843 | |
3.70%, 5/09/23 | | | 18,000 | | | | 18,083 | |
4.15%, 6/19/23 | | | 71,000 | | | | 72,372 | |
3.50%, 11/07/24 | | | 53,000 | | | | 52,257 | |
4.00%, 10/06/26 | | | 71,000 | | | | 69,812 | |
Hyundai Capital America,
3.95%, 2/01/22(b) | | | 247,000 | | | | 250,404 | |
Toyota Motor Credit Corp.,
3.20%, 1/11/27 | | | 35,000 | | | | 35,578 | |
3.05%, 1/11/28 | | | 35,000 | | | | 34,995 | |
| | | | | | | 3,074,510 | |
| |
Banks – 5.4% | |
Bank of America Corp.,
2.63%, 4/19/21 | | | 555,000 | | | | 553,805 | |
(ICE LIBOR USD 3M + 0.66%), 2.37%, 7/21/21(g) | | | 353,000 | | | | 350,687 | |
3.30%, 1/11/23 | | | 270,000 | | | | 273,415 | |
(ICE LIBOR USD 3M + 1.16%), 3.12%, 1/20/23(g) | | | 132,000 | | | | 132,388 | |
4.00%, 4/01/24 | | | 18,000 | | | | 18,790 | |
4.20%, 8/26/24 | | | 60,000 | | | | 62,254 | |
(ICE LIBOR USD 3M + 0.97%), 3.46%, 3/15/25(g) | | | 141,000 | | | | 142,411 | |
4.45%, 3/03/26 | | | 244,000 | | | | 256,165 | |
3.50%, 4/19/26 | | | 95,000 | | | | 95,861 | |
4.25%, 10/22/26 | | | 360,000 | | | | 371,717 | |
4.18%, 11/25/27 | | | 31,000 | | | | 31,697 | |
(ICE LIBOR USD 3M + 1.58%), 3.82%, 1/20/28(g) | | | 494,000 | | | | 502,533 | |
(ICE LIBOR USD 3M + 2.93%), 5.87%, 3/15/28(g)(h) | | | 221,000 | | | | 228,183 | |
(ICE LIBOR USD 3M + 1.51%), 3.71%, 4/24/28(g) | | | 132,000 | | | | 132,863 | |
(ICE LIBOR USD 3M + 1.37%), 3.59%, 7/21/28(g) | | | 186,000 | | | | 185,437 | |
(ICE LIBOR USD 3M + 1.04%), 3.42%, 12/20/28(g) | | | 759,000 | | | | 745,348 | |
| | | | | | | | |
| | | Par(a) | | | Value | |
| | |
Banks (Continued) | | | | | | | | |
(ICE LIBOR USD 3M + 1.21%), 3.97%, 2/07/30(g) | | $ | 840,000 | | | $ | 858,128 | |
5.00%, 1/21/44 | | | 190,000 | | | | 215,554 | |
(ICE LIBOR USD 3M + 1.52%), 4.33%, 3/15/50(g) | | | 240,000 | | | | 248,205 | |
Bank of New York Mellon (The) Corp., | | | | | | | | |
(ICE LIBOR USD 3M + 3.42%), 4.95%, 6/20/20(g)(h) | | | 35,000 | | | | 35,481 | |
3.65%, 2/04/24 | | | 176,000 | | | | 181,814 | |
(ICE LIBOR USD 3M + 3.13%), 4.62%, 9/20/26(g)(h) | | | 106,000 | | | | 104,046 | |
3.30%, 8/23/29 | | | 170,000 | | | | 167,586 | |
Citibank N.A., 3.65%, 1/23/24 | | | 500,000 | | | | 514,648 | |
Citigroup, Inc.,
2.75%, 4/25/22 | | | 42,000 | | | | 41,793 | |
(ICE LIBOR USD 3M + 0.95%), 2.88%, 7/24/23(g) | | | 11,000 | | | | 10,933 | |
4.40%, 6/10/25 | | | 132,000 | | | | 137,668 | |
5.50%, 9/13/25 | | | 220,000 | | | | 242,844 | |
3.20%, 10/21/26 | | | 251,000 | | | | 245,797 | |
(ICE LIBOR USD 3M + 1.56%), 3.89%, 1/10/28(g) | | | 62,000 | | | | 63,193 | |
(ICE LIBOR USD 3M + 1.39%), 3.67%, 7/24/28(g) | | | 229,000 | | | | 229,628 | |
(ICE LIBOR USD 3M + 1.15%), 3.52%, 10/27/28(g) | | | 210,000 | | | | 207,284 | |
(ICE LIBOR USD 3M + 1.19%), 4.08%, 4/23/29(g) | | | 400,000 | | | | 410,560 | |
(ICE LIBOR USD 3M + 1.34%), 3.98%, 3/20/30(g) | | | 454,000 | | | | 462,310 | |
8.12%, 7/15/39 | | | 390,000 | | | | 590,525 | |
4.65%, 7/23/48 | | | 180,000 | | | | 194,209 | |
Citizens Financial Group, Inc.,
2.38%, 7/28/21 | | | 326,000 | | | | 322,010 | |
Fifth Third Bancorp, 3.65%, 1/25/24 | | | 113,000 | | | | 116,181 | |
Goldman Sachs Group (The), Inc., 2.55%, 10/23/19 | | | 247,000 | | | | 246,875 | |
5.75%, 1/24/22 | | | 97,000 | | | | 104,037 | |
(ICE LIBOR USD 3M + 0.82%), 2.88%, 10/31/22(g) | | | 230,000 | | | | 228,674 | |
See accompanying Notes to Financial Statements
78
Morningstar Funds Trust April 30, 2019
Schedule of Investments(continued)
Morningstar Total Return Bond Fund
| | | | | | | | |
| | | Par(a) | | | Value | |
| | |
Banks (Continued) | | | | | | | | |
3.20%, 2/23/23 | | $ | 40,000 | | | $ | 40,025 | |
3.63%, 2/20/24 | | | 146,000 | | | | 148,583 | |
3.85%, 7/08/24 | | | 430,000 | | | | 440,690 | |
3.75%, 5/22/25 | | | 97,000 | | | | 98,359 | |
3.50%, 11/16/26 | | | 102,000 | | | | 100,563 | |
3.85%, 1/26/27 | | | 397,000 | | | | 399,960 | |
(ICE LIBOR USD 3M + 1.51%), 3.69%, 6/05/28(g) | | | 167,000 | | | | 165,431 | |
(ICE LIBOR USD 3M + 1.30%), 4.22%, 5/01/29(g) | | | 1,260,000 | | | | 1,287,203 | |
(ICE LIBOR USD 3M + 1.43%), 4.41%, 4/23/39(g) | | | 26,000 | | | | 26,309 | |
5.15%, 5/22/45 | | | 40,000 | | | | 42,788 | |
4.75%, 10/21/45 | | | 390,000 | | | | 415,898 | |
JPMorgan Chase & Co.,
2.55%, 3/01/21 | | | 44,000 | | | | 43,894 | |
2.40%, 6/07/21 | | | 212,000 | | | | 210,612 | |
(ICE LIBOR USD 3M + 0.94%), 2.78%, 4/25/23(g) | | | 123,000 | | | | 122,305 | |
(ICE LIBOR USD 3M + 0.89%), 3.80%, 7/23/24(g) | | | 467,000 | | | | 479,448 | |
3.88%, 9/10/24 | | | 90,000 | | | | 92,616 | |
(ICE LIBOR USD 3M + 1.00%), 4.02%, 12/05/24(g) | | | 538,000 | | | | 557,876 | |
3.30%, 4/01/26 | | | 220,000 | | | | 219,958 | |
(ICE LIBOR USD 3M + 1.34%), 3.78%, 2/01/28(g) | | | 458,000 | | | | 465,718 | |
(ICE LIBOR USD 3M + 1.38%), 3.54%, 5/01/28(g) | | | 291,000 | | | | 290,600 | |
(ICE LIBOR USD 3M + 1.26%), 4.20%, 7/23/29(g) | | | 150,000 | | | | 156,477 | |
(ICE LIBOR USD 3M + 1.33%), 4.45%, 12/05/29(g) | | | 511,000 | | | | 543,668 | |
(ICE LIBOR USD 3M + 1.36%), 3.88%, 7/24/38(g) | | | 46,000 | | | | 45,418 | |
4.95%, 6/01/45 | | | 260,000 | | | | 289,193 | |
Morgan Stanley,
5.50%, 7/28/21 | | | 300,000 | | | | 316,677 | |
3.63%, 1/20/27 | | | 590,000 | | | | 595,658 | |
(ICE LIBOR USD 3M + 1.34%), 3.59%, 7/22/28(g) | | | 264,000 | | | | 263,685 | |
(ICE LIBOR USD 3M + 1.14%), 3.77%, 1/24/29(g) | | | 274,000 | | | | 276,488 | |
| | | | | | | | |
| | | Par(a) | | | Value | |
| | |
Banks (Continued) | | | | | | | | |
(ICE LIBOR USD 3M + 1.63%), 4.43%, 1/23/30(g) | | $ | 339,000 | | | $ | 358,830 | |
State Street Corp.,
(ICE LIBOR USD 3M + 2.54%), 5.62%, 12/15/23(g)(h) | | | 212,000 | | | | 215,180 | |
3.55%, 8/18/25 | | | 18,000 | | | | 18,635 | |
US Bancorp, 2.95%, 7/15/22 | | | 26,000 | | | | 26,135 | |
Wells Fargo & Co.,
2.55%, 12/07/20 | | | 247,000 | | | | 246,283 | |
2.50%, 3/04/21 | | | 79,000 | | | | 78,612 | |
2.10%, 7/26/21 | | | 238,000 | | | | 234,398 | |
3.50%, 3/08/22 | | | 35,000 | | | | 35,579 | |
2.63%, 7/22/22 | | | 79,000 | | | | 78,323 | |
3.75%, 1/24/24 | | | 451,000 | | | | 464,099 | |
3.00%, 4/22/26 | | | 27,000 | | | | 26,380 | |
3.00%, 10/23/26 | | | 80,000 | | | | 77,832 | |
4.30%, 7/22/27 | | | 700,000 | | | | 727,869 | |
(ICE LIBOR USD 3M + 1.31%), 3.58%, 5/22/28(g) | | | 576,000 | | | | 578,295 | |
4.15%, 1/24/29 | | | 640,000 | | | | 665,539 | |
4.40%, 6/14/46 | | | 40,000 | | | | 40,168 | |
4.75%, 12/07/46 | | | 250,000 | | | | 262,895 | |
| | | | | | | 22,534,689 | |
| |
Beverages – 0.0%(i) | |
Constellation Brands, Inc.,
4.75%, 11/15/24 | | | 70,000 | | | | 74,979 | |
PepsiCo, Inc.,
4.45%, 4/14/46 | | | 53,000 | | | | 58,742 | |
| | | | | | | 133,721 | |
| |
Biotechnology – 0.3% | |
Amgen, Inc.,
4.40%, 5/01/45 | | | 38,000 | | | | 37,315 | |
4.66%, 6/15/51 | | | 44,000 | | | | 44,447 | |
Celgene Corp.,
3.25%, 8/15/22 | | | 159,000 | | | | 160,295 | |
2.75%, 2/15/23 | | | 194,000 | | | | 192,180 | |
3.88%, 8/15/25 | | | 140,000 | | | | 144,374 | |
5.00%, 8/15/45 | | | 90,000 | | | | 96,792 | |
Gilead Sciences, Inc.,
3.50%, 2/01/25 | | | 115,000 | | | | 117,193 | |
4.60%, 9/01/35 | | | 18,000 | | | | 19,108 | |
4.00%, 9/01/36 | | | 26,000 | | | | 25,388 | |
4.80%, 4/01/44 | | | 53,000 | | | | 55,313 | |
4.75%, 3/01/46 | | | 170,000 | | | | 177,665 | |
| | | | | | | 1,070,070 | |
| |
| |
See accompanying Notes to Financial Statements
79
Morningstar Funds Trust April 30, 2019
Schedule of Investments(continued)
Morningstar Total Return Bond Fund
| | | | | | | | |
| | | Par(a) | | | Value | |
| | |
Building Materials – 0.0%(i) | | | | | | | | |
Johnson Controls International PLC, 4.63%, 7/02/44 | | $ | 15,000 | | | $ | 14,550 | |
| |
Chemicals – 0.2% | |
Dow Chemical (The) Co.,
4.55%, 11/30/25(b) | | | 44,000 | | | | 46,737 | |
4.38%, 11/15/42 | | | 44,000 | | | | 42,590 | |
DowDuPont, Inc.,
4.49%, 11/15/25 | | | 238,000 | | | | 255,403 | |
5.42%, 11/15/48 | | | 220,000 | | | | 253,999 | |
RPM International, Inc.,
4.55%, 3/01/29 | | | 5,000 | | | | 5,111 | |
Sherwin-Williams (The) Co.,
4.00%, 12/15/42 | | | 18,000 | | | | 16,286 | |
4.50%, 6/01/47 | | | 18,000 | | | | 17,854 | |
| | | | | | | 637,980 | |
| |
Commercial Services – 0.1% | |
President & Fellows of Harvard College, 4.88%, 10/15/40 | | | 147,000 | | | | 175,755 | |
Total System Services, Inc.,
4.00%, 6/01/23 | | | 44,000 | | | | 45,257 | |
4.80%, 4/01/26 | | | 132,000 | | | | 138,645 | |
| | | | | | | 359,657 | |
| |
Computers – 0.4% | |
Apple, Inc.,
2.85%, 2/23/23 | | | 71,000 | | | | 71,457 | |
2.40%, 5/03/23 | | | 159,000 | | | | 157,307 | |
3.45%, 5/06/24 | | | 167,000 | | | | 172,214 | |
2.45%, 8/04/26 | | | 100,000 | | | | 96,336 | |
2.90%, 9/12/27 | | | 350,000 | | | | 344,234 | |
4.50%, 2/23/36 | | | 44,000 | | | | 48,832 | |
3.85%, 5/04/43 | | | 282,000 | | | | 280,577 | |
Dell International LLC/EMC Corp., 4.42%, 6/15/21(b) | | | 224,000 | | | | 229,409 | |
6.02%, 6/15/26(b) | | | 55,000 | | | | 59,591 | |
4.90%, 10/01/26(b) | | | 26,000 | | | | 26,631 | |
8.35%, 7/15/46(b) | | | 44,000 | | | | 54,154 | |
| | | | | | | 1,540,742 | |
| |
Diversified Financial Services – 0.5% | |
Air Lease Corp., 3.00%, 9/15/23 | | | 35,000 | | | | 34,384 | |
American Express Co.,
2.50%, 8/01/22 | | | 88,000 | | | | 87,010 | |
3.40%, 2/27/23 | | | 26,000 | | | | 26,451 | |
4.20%, 11/06/25 | | | 311,000 | | | | 330,415 | |
| | | | | | | | |
| | | Par(a) | | | Value | |
|
Diversified Financial Services (Continued) | |
Capital One Financial Corp.,
3.45%, 4/30/21 | | $ | 5,000 | | | $ | 5,055 | |
3.90%, 1/29/24 | | | 159,000 | | | | 163,302 | |
3.75%, 3/09/27 | | | 18,000 | | | | 17,848 | |
Charles Schwab (The) Corp.,
3.20%, 3/02/27 | | | 44,000 | | | | 44,287 | |
CME Group, Inc., 3.75%, 6/15/28 | | | 188,000 | | | | 197,637 | |
Intercontinental Exchange, Inc.,
4.00%, 10/15/23 | | | 15,000 | | | | 15,682 | |
3.75%, 9/21/28 | | | 79,000 | | | | 81,580 | |
International Lease Finance Corp., 5.87%, 8/15/22 | | | 230,000 | | | | 247,784 | |
Nuveen LLC, 4.00%, 11/01/28(b) | | | 260,000 | | | | 276,609 | |
Synchrony Financial, 4.38%, 3/19/24 | | | 35,000 | | | | 35,768 | |
Visa, Inc.,
3.15%, 12/14/25 | | | 201,000 | | | | 203,954 | |
4.15%, 12/14/35 | | | 26,000 | | | | 27,846 | |
4.30%, 12/14/45 | | | 103,000 | | | | 112,359 | |
| | | | | | | 1,907,971 | |
| | | |
Electric – 1.2% | | | | | | | | |
AEP Texas, Inc.,
3.95%, 6/01/28 | | | 88,000 | | | | 91,419 | |
4.15%, 5/01/49 | | | 25,000 | | | | 25,079 | |
AEP Transmission Co. LLC,
3.75%, 12/01/47 | | | 79,000 | | | | 77,184 | |
Alabama Power Co., 3.75%, 3/01/45 | | | 106,000 | | | | 102,586 | |
Ameren Illinois Co., 3.80%, 5/15/28 | | | 26,000 | | | | 27,129 | |
Baltimore Gas & Electric Co.,
3.50%, 8/15/46 | | | 49,000 | | | | 45,716 | |
3.75%, 8/15/47 | | | 62,000 | | | | 59,774 | |
4.25%, 9/15/48 | | | 26,000 | | | | 27,101 | |
Berkshire Hathaway Energy Co.,
6.12%, 4/01/36 | | | 3,000 | | | | 3,804 | |
3.80%, 7/15/48 | | | 26,000 | | | | 24,882 | |
CenterPoint Energy
Houston Electric LLC,
3.55%, 8/01/42 | | | 18,000 | | | | 17,197 | |
4.25%, 2/01/49 | | | 9,000 | | | | 9,626 | |
Consumers Energy Co.,
3.95%, 5/15/43 | | | 10,000 | | | | 10,156 | |
3.25%, 8/15/46 | | | 18,000 | | | | 16,321 | |
See accompanying Notes to Financial Statements
80
Morningstar Funds Trust April 30, 2019
Schedule of Investments(continued)
Morningstar Total Return Bond Fund
| | | | | | | | |
| | | Par(a) | | | Value | |
|
Electric (Continued) | |
DTE Electric Co.,
3.70%, 3/15/45 | | $ | 62,000 | | | $ | 60,464 | |
3.70%, 6/01/46 | | | 26,000 | | | | 25,211 | |
4.05%, 5/15/48 | | | 10,000 | | | | 10,355 | |
DTE Energy Co., 3.70%, 8/01/23 | | | 26,000 | | | | 26,737 | |
Duke Energy Carolinas LLC,
3.95%, 11/15/28 | | | 132,000 | | | | 140,169 | |
4.00%, 9/30/42 | | | 62,000 | | | | 62,813 | |
Duke Energy Corp.,
2.40%, 8/15/22 | | | 30,000 | | | | 29,622 | |
3.15%, 8/15/27 | | | 190,000 | | | | 186,633 | |
Duke Energy Florida LLC,
3.80%, 7/15/28 | | | 106,000 | | | | 110,692 | |
3.85%, 11/15/42 | | | 53,000 | | | | 52,417 | |
Duke Energy Progress LLC,
3.25%, 8/15/25 | | | 35,000 | | | | 35,650 | |
3.70%, 9/01/28 | | | 159,000 | | | | 165,773 | |
3.45%, 3/15/29 | | | 9,000 | | | | 9,202 | |
4.10%, 5/15/42 | | | 10,000 | | | | 10,261 | |
3.60%, 9/15/47 | | | 15,000 | | | | 14,250 | |
Entergy Louisiana LLC,
5.40%, 11/01/24 | | | 18,000 | | | | 20,295 | |
4.20%, 9/01/48 | | | 79,000 | | | | 81,649 | |
Eversource Energy, 2.90%, 10/01/24 | | | 44,000 | | | | 43,649 | |
Exelon Corp.,
5.63%, 6/15/35 | | | 9,000 | | | | 10,349 | |
5.10%, 6/15/45 | | | 79,000 | | | | 89,367 | |
FirstEnergy Corp.,
4.25%, 3/15/23 | | | 110,000 | | | | 114,507 | |
3.90%, 7/15/27 | | | 340,000 | | | | 344,670 | |
7.37%, 11/15/31 | | | 270,000 | | | | 356,985 | |
4.85%, 7/15/47 | | | 70,000 | | | | 74,556 | |
FirstEnergy Transmission LLC,
4.35%, 1/15/25(b) | | | 32,000 | | | | 33,414 | |
5.45%, 7/15/44(b) | | | 10,000 | | | | 11,300 | |
4.55%, 4/01/49(b) | | | 90,000 | | | | 91,997 | |
Florida Power & Light Co.,
3.70%, 12/01/47 | | | 106,000 | | | | 104,017 | |
3.95%, 3/01/48 | | | 35,000 | | | | 35,803 | |
Indiana Michigan Power Co.,
3.85%, 5/15/28 | | | 44,000 | | | | 45,811 | |
Kansas City Power & Light Co.,
4.20%, 6/15/47 | | | 71,000 | | | | 73,373 | |
MidAmerican Energy Co.,
3.50%, 10/15/24 | | | 120,000 | | | | 124,138 | |
3.65%, 4/15/29 | | | 140,000 | | | | 145,369 | |
4.40%, 10/15/44 | | | 55,000 | | | | 59,265 | |
| | | | | | | | |
| | | Par(a) | | | Value | |
|
Electric (Continued) | |
Northern States Power Co.,
3.40%, 8/15/42 | | $ | 88,000 | | | $ | 82,316 | |
3.60%, 9/15/47 | | | 18,000 | | | | 17,284 | |
Ohio Power Co., 4.15%, 4/01/48 | | | 79,000 | | | | 82,133 | |
Oncor Electric Delivery Co. LLC,
5.75%, 3/15/29 | | | 44,000 | | | | 52,596 | |
5.30%, 6/01/42 | | | 18,000 | | | | 21,512 | |
PacifiCorp,
6.00%, 1/15/39 | | | 56,000 | | | | 70,672 | |
4.10%, 2/01/42 | | | 53,000 | | | | 54,090 | |
4.13%, 1/15/49 | | | 53,000 | | | | 54,962 | |
Progress Energy, Inc.,
7.75%, 3/01/31 | | | 180,000 | | | | 246,256 | |
Public Service Electric & Gas Co., 3.00%, 5/15/27 | | | 97,000 | | | | 96,259 | |
Tampa Electric Co.,
4.45%, 6/15/49 | | | 62,000 | | | | 64,070 | |
Trans-Allegheny Interstate Line Co., 3.85%, 6/01/25(b) | | | 159,000 | | | | 163,276 | |
Union Electric Co., 3.50%, 3/15/29 | | | 53,000 | | | | 54,007 | |
Virginia Electric & Power Co.,
3.45%, 9/01/22 | | | 62,000 | | | | 63,192 | |
2.75%, 3/15/23 | | | 97,000 | | | | 96,828 | |
3.50%, 3/15/27 | | | 106,000 | | | | 108,327 | |
4.45%, 2/15/44 | | | 115,000 | | | | 122,685 | |
4.60%, 12/01/48 | | | 62,000 | | | | 67,997 | |
| | | | | | | 4,857,199 | |
| |
Electronics – 0.0%(i) | |
Amphenol Corp., 4.35%, 6/01/29 | | | 18,000 | | | | 19,178 | |
| |
Environmental Control – 0.1% | |
Republic Services, Inc.,
4.75%, 5/15/23 | | | 71,000 | | | | 75,670 | |
2.90%, 7/01/26 | | | 51,000 | | | | 49,881 | |
3.37%, 11/15/27 | | | 79,000 | | | | 79,207 | |
Waste Management, Inc.,
3.50%, 5/15/24 | | | 70,000 | | | | 71,821 | |
3.13%, 3/01/25 | | | 18,000 | | | | 18,168 | |
3.90%, 3/01/35 | | | 18,000 | | | | 17,824 | |
| | | | | | | 312,571 | |
| |
Food – 0.1% | |
Conagra Brands, Inc.,
3.80%, 10/22/21 | | | 53,000 | | | | 54,037 | |
Kraft Heinz Foods Co.,
3.00%, 6/01/26 | | | 110,000 | | | | 103,751 | |
See accompanying Notes to Financial Statements
81
Morningstar Funds Trust April 30, 2019
Schedule of Investments(continued)
Morningstar Total Return Bond Fund
| | | | | | | | |
| | | Par(a) | | | Value | |
|
Food (Continued) | |
Kroger (The) Co.,
2.65%, 10/15/26 | | $ | 71,000 | | | $ | 65,983 | |
5.15%, 8/01/43 | | | 20,000 | | | | 20,015 | |
Mars, Inc.,
2.70%, 4/01/25(b) | | | 90,000 | | | | 89,213 | |
3.20%, 4/01/30(b) | | | 180,000 | | | | 178,279 | |
Tyson Foods, Inc.,
3.55%, 6/02/27 | | | 79,000 | | | | 78,358 | |
5.15%, 8/15/44 | | | 18,000 | | | | 18,698 | |
| | | | | | | 608,334 | |
| |
Forest Products & Paper – 0.1% | |
Georgia-Pacific LLC,
5.40%, 11/01/20(b) | | | 26,000 | | | | 26,981 | |
3.73%, 7/15/23(b) | | | 18,000 | | | | 18,551 | |
3.60%, 3/01/25(b) | | | 155,000 | | | | 158,620 | |
7.75%, 11/15/29 | | | 18,000 | | | | 24,467 | |
International Paper Co.,
6.00%, 11/15/41 | | | 53,000 | | | | 59,373 | |
| | | | | | | 287,992 | |
| |
Gas – 0.0%(i) | |
Atmos Energy Corp.,
4.13%, 3/15/49 | | | 23,000 | | | | 23,626 | |
NiSource Finance Corp.,
3.49%, 5/15/27 | | | 79,000 | | | | 79,098 | |
| | | | | | | 102,724 | |
| |
Healthcare - Products – 0.5% | |
Abbott Laboratories,
2.95%, 3/15/25 | | | 203,000 | | | | 202,644 | |
3.75%, 11/30/26 | | | 513,000 | | | | 534,586 | |
4.90%, 11/30/46 | | | 10,000 | | | | 11,400 | |
Becton Dickinson and Co.,
2.68%, 12/15/19 | | | 35,000 | | | | 34,922 | |
3.25%, 11/12/20 | | | 44,000 | | | | 44,199 | |
3.36%, 6/06/24 | | | 190,000 | | | | 190,429 | |
4.68%, 12/15/44 | | | 29,000 | | | | 29,693 | |
Covidien International Finance S.A., 2.95%, 6/15/23 | | | 35,000 | | | | 35,222 | |
Medtronic Global Holdings S.C.A., 3.35%, 4/01/27 | | | 260,000 | | | | 264,427 | |
Medtronic, Inc., 3.50%, 3/15/25 | | | 88,000 | | | | 90,677 | |
4.38%, 3/15/35 | | | 224,000 | | | | 241,193 | |
Thermo Fisher Scientific, Inc., 2.95%, 9/19/26 | | | 243,000 | | | | 235,877 | |
| | | | | | | 1,915,269 | |
| |
Healthcare - Services – 0.5% | |
Aetna, Inc.,
2.80%, 6/15/23 | | | 90,000 | | | | 88,396 | |
| | | | | | | | |
| | | Par(a) | | | Value | |
|
Healthcare - Services (Continued) | |
4.50%, 5/15/42 | | $ | 121,000 | | | $ | 114,024 | |
Anthem, Inc.,
2.95%, 12/01/22 | | | 30,000 | | | | 29,969 | |
3.50%, 8/15/24 | | | 26,000 | | | | 26,319 | |
3.65%, 12/01/27 | | | 188,000 | | | | 186,361 | |
Baylor Scott & White Holdings, 3.97%, 11/15/46 | | | 126,000 | | | | 125,883 | |
CHRISTUS Health, 4.34%, 7/01/28 | | | 121,000 | | | | 129,408 | |
Cigna Corp.,
4.50%, 3/15/21 | | | 167,000 | | | | 171,185 | |
3.25%, 4/15/25 | | | 123,000 | | | | 121,820 | |
HCA, Inc.,
5.87%, 3/15/22 | | | 106,000 | | | | 113,378 | |
4.75%, 5/01/23 | | | 41,000 | | | | 42,840 | |
5.00%, 3/15/24 | | | 71,000 | | | | 75,165 | |
5.25%, 4/15/25 | | | 150,000 | | | | 160,642 | |
Humana, Inc., 3.95%, 3/15/27 | | | 140,000 | | | | 140,460 | |
UnitedHealth Group, Inc.,
3.75%, 7/15/25 | | | 317,000 | | | | 329,959 | |
3.70%, 12/15/25 | | | 26,000 | | | | 26,937 | |
3.10%, 3/15/26 | | | 18,000 | | | | 18,030 | |
3.85%, 6/15/28 | | | 130,000 | | | | 135,587 | |
3.88%, 12/15/28 | | | 110,000 | | | | 114,899 | |
4.62%, 11/15/41 | | | 26,000 | | | | 27,999 | |
4.75%, 7/15/45 | | | 62,000 | | | | 68,209 | |
4.45%, 12/15/48 | | | 18,000 | | | | 19,097 | |
| | | | | | | 2,266,567 | |
| |
Housewares – 0.0%(i) | |
Newell Brands, Inc.,
3.85%, 4/01/23 | | | 30,000 | | | | 29,822 | |
4.20%, 4/01/26 | | | 20,000 | | | | 19,033 | |
| | | | | | | 48,855 | |
| |
Insurance – 0.3% | |
American International Group, Inc., 4.20%, 4/01/28 | | | 40,000 | | | | 40,920 | |
3.88%, 1/15/35 | | | 18,000 | | | | 16,676 | |
Aon Corp.,
4.50%, 12/15/28 | | | 212,000 | | | | 224,556 | |
3.75%, 5/02/29 | | | 65,000 | | | | 64,978 | |
Berkshire Hathaway Finance Corp., 4.25%, 1/15/49 | | | 169,000 | | | | 176,836 | |
Marsh & McLennan Cos., Inc.,
3.50%, 12/29/20 | | | 53,000 | | | | 53,658 | |
3.30%, 3/14/23 | | | 185,000 | | | | 187,556 | |
4.05%, 10/15/23 | | | 18,000 | | | | 18,720 | |
See accompanying Notes to Financial Statements
82
Morningstar Funds Trust April 30, 2019
Schedule of Investments(continued)
Morningstar Total Return Bond Fund
| | | | | | | | |
| | | Par(a) | | | Value | |
|
Insurance (Continued) | |
3.88%, 3/15/24 | | $ | 53,000 | | | $ | 55,085 | |
4.37%, 3/15/29 | | | 58,000 | | | | 61,937 | |
4.35%, 1/30/47 | | | 44,000 | | | | 44,690 | |
4.20%, 3/01/48 | | | 26,000 | | | | 25,908 | |
4.90%, 3/15/49 | | | 3,000 | | | | 3,311 | |
MetLife, Inc.,
6.40%, 12/15/36 | | | 100,000 | | | | 110,662 | |
4.12%, 8/13/42 | | | 35,000 | | | | 35,543 | |
Prudential Financial, Inc.,
3.88%, 3/27/28 | | | 97,000 | | | | 101,597 | |
Travelers (The) Cos., Inc.,
4.60%, 8/01/43 | | | 18,000 | | | | 19,896 | |
4.00%, 5/30/47 | | | 26,000 | | | | 26,487 | |
Trinity Acquisition PLC,
4.40%, 3/15/26 | | | 18,000 | | | | 18,619 | |
Willis North America, Inc.,
3.60%, 5/15/24 | | | 132,000 | | | | 133,426 | |
| | | | | | | 1,421,061 | |
| |
Internet – 0.1% | |
Amazon.com, Inc.,
3.15%, 8/22/27 | | | 140,000 | | | | 140,945 | |
4.05%, 8/22/47 | | | 290,000 | | | | 302,108 | |
| | | | | | | 443,053 | |
| |
Iron/Steel – 0.0%(i) | |
Nucor Corp., 5.20%, 8/01/43 | | | 18,000 | | | | 20,398 | |
| | | |
Media – 1.5% | | | | | | | | |
Charter Communications
Operating LLC/Charter Communications
Operating Capital,
4.46%, 7/23/22 | | | 126,000 | | | | 130,714 | |
4.50%, 2/01/24 | | | 106,000 | | | | 110,481 | |
4.91%, 7/23/25 | | | 291,000 | | | | 308,374 | |
4.20%, 3/15/28 | | | 330,000 | | | | 330,253 | |
5.05%, 3/30/29 | | | 570,000 | | | | 603,583 | |
6.38%, 10/23/35 | | | 132,000 | | | | 149,139 | |
5.38%, 4/01/38 | | | 202,000 | | | | 207,377 | |
6.48%, 10/23/45 | | | 106,000 | | | | 120,070 | |
5.75%, 4/01/48 | | | 20,000 | | | | 21,091 | |
Comcast Corp.,
3.38%, 2/15/25 | | | 9,000 | | | | 9,154 | |
3.95%, 10/15/25 | | | 140,000 | | | | 146,662 | |
3.15%, 3/01/26 | | | 97,000 | | | | 97,312 | |
2.35%, 1/15/27 | | | 215,000 | | | | 201,231 | |
3.30%, 2/01/27 | | | 88,000 | | | | 87,999 | |
4.15%, 10/15/28 | | | 610,000 | | | | 645,661 | |
4.25%, 10/15/30 | | | 190,000 | | | | 202,115 | |
3.20%, 7/15/36 | | | 185,000 | | | | 168,664 | |
6.55%, 7/01/39 | | | 106,000 | | | | 136,722 | |
| | | | | | | | |
| | | Par(a) | | | Value | |
Media (Continued) | |
4.70%, 10/15/48 | | $ | 10,000 | | | $ | 10,864 | |
4.00%, 11/01/49 | | | 210,000 | | | | 204,369 | |
4.95%, 10/15/58 | | | 26,000 | | | | 29,078 | |
Cox Communications, Inc.,
3.15%, 8/15/24(b) | | | 32,000 | | | | 31,681 | |
3.35%, 9/15/26(b) | | | 109,000 | | | | 106,447 | |
Discovery Communications LLC,
3.30%, 5/15/22 | | | 44,000 | | | | 44,391 | |
3.80%, 3/13/24 | | | 44,000 | | | | 44,888 | |
4.90%, 3/11/26 | | | 18,000 | | | | 19,145 | |
4.88%, 4/01/43 | | | 26,000 | | | | 24,684 | |
Fox Corp.,
4.03%, 1/25/24(b) | | | 218,000 | | | | 226,626 | |
4.71%, 1/25/29(b) | | | 110,000 | | | | 118,347 | |
5.48%, 1/25/39(b) | | | 210,000 | | | | 233,841 | |
5.58%, 1/25/49(b) | | | 20,000 | | | | 22,693 | |
NBCUniversal Media LLC,
5.15%, 4/30/20 | | | 150,000 | | | | 153,530 | |
5.95%, 4/01/41 | | | 132,000 | | | | 162,895 | |
4.45%, 1/15/43 | | | 44,000 | | | | 45,692 | |
Time Warner Cable LLC,
4.13%, 2/15/21 | | | 113,000 | | | | 114,785 | |
5.87%, 11/15/40 | | | 140,000 | | | | 145,788 | |
5.50%, 9/01/41 | | | 44,000 | | | | 43,879 | |
Time Warner Entertainment Co. L.P., 8.37%, 7/15/33 | | | 170,000 | | | | 223,495 | |
Viacom, Inc., 6.87%, 4/30/36 | | | 35,000 | | | | 41,327 | |
Walt Disney (The) Co.,
6.40%, 12/15/35(b) | | | 25,000 | | | | 32,905 | |
7.75%, 12/01/45(b) | | | 9,000 | | | | 14,335 | |
Warner Media LLC,
3.60%, 7/15/25 | | | 35,000 | | | | 35,103 | |
3.80%, 2/15/27 | | | 188,000 | | | | 189,095 | |
7.62%, 4/15/31 | | | 28,000 | | | | 36,752 | |
6.25%, 3/29/41 | | | 18,000 | | | | 21,102 | |
5.37%, 10/15/41 | | | 79,000 | | | | 84,612 | |
| | | | | | | 6,138,951 | |
| |
Miscellaneous Manufacturing – 0.3% | |
Eaton Corp.,
2.75%, 11/02/22 | | | 40,000 | | | | 39,953 | |
4.15%, 11/02/42 | | | 30,000 | | | | 29,961 | |
General Electric Co.,
3.10%, 1/09/23 | | | 240,000 | | | | 239,553 | |
6.75%, 3/15/32 | | | 20,000 | | | | 23,391 | |
6.87%, 1/10/39 | | | 740,000 | | | | 875,493 | |
See accompanying Notes to Financial Statements
83
Morningstar Funds Trust April 30, 2019
Schedule of Investments(continued)
Morningstar Total Return Bond Fund
| | | | | | | | |
| | | Par(a) | | | Value | |
|
Miscellaneous Manufacturing (Continued) | |
4.50%, 3/11/44 | | $ | 71,000 | | | $ | 65,860 | |
Textron, Inc., 3.90%, 9/17/29 | | | 50,000 | | | | 49,994 | |
| | | | | | | 1,324,205 | |
| |
Oil & Gas – 1.3% | |
Anadarko Petroleum Corp.,
5.55%, 3/15/26 | | | 60,000 | | | | 67,499 | |
6.45%, 9/15/36 | | | 71,000 | | | | 88,622 | |
4.50%, 7/15/44 | | | 80,000 | | | | 81,503 | |
6.60%, 3/15/46 | | | 150,000 | | | | 202,311 | |
Apache Corp.,
2.63%, 1/15/23 | | | 26,000 | | | | 25,408 | |
4.38%, 10/15/28 | | | 540,000 | | | | 549,189 | |
4.75%, 4/15/43 | | | 144,000 | | | | 137,974 | |
4.25%, 1/15/44 | | | 380,000 | | | | 341,700 | |
BP Capital Markets America, Inc., 3.22%, 11/28/23 | | | 70,000 | | | | 70,758 | |
3.22%, 4/14/24 | | | 106,000 | | | | 106,973 | |
3.41%, 2/11/26 | | | 20,000 | | | | 20,369 | |
3.12%, 5/04/26 | | | 273,000 | | | | 271,733 | |
3.94%, 9/21/28 | | | 200,000 | | | | 209,234 | |
Cimarex Energy Co.,
4.38%, 6/01/24 | | | 88,000 | | | | 91,473 | |
3.90%, 5/15/27 | | | 249,000 | | | | 249,392 | |
Concho Resources, Inc.,
3.75%, 10/01/27 | | | 15,000 | | | | 15,038 | |
4.30%, 8/15/28 | | | 288,000 | | | | 300,116 | |
Continental Resources, Inc.,
4.50%, 4/15/23 | | | 229,000 | | | | 236,657 | |
3.80%, 6/01/24 | | | 143,000 | | | | 144,308 | |
4.37%, 1/15/28 | | | 80,000 | | | | 82,099 | |
Devon Energy Corp.,
5.85%, 12/15/25 | | �� | 395,000 | | | | 448,738 | |
5.60%, 7/15/41 | | | 30,000 | | | | 33,203 | |
5.00%, 6/15/45 | | | 140,000 | | | | 145,160 | |
EOG Resources, Inc.,
3.90%, 4/01/35 | | | 18,000 | | | | 18,267 | |
Exxon Mobil Corp.,
3.04%, 3/01/26 | | | 70,000 | | | | 70,352 | |
4.11%, 3/01/46 | | | 20,000 | | | | 21,290 | |
Hess Corp., 5.80%, 4/01/47 | | | 35,000 | | | | 37,876 | |
Kerr-McGee Corp.,
6.95%, 7/01/24 | | | 200,000 | | | | 235,985 | |
7.87%, 9/15/31 | | | 210,000 | | | | 280,781 | |
Marathon Petroleum Corp.,
6.50%, 3/01/41 | | | 18,000 | | | | 21,883 | |
4.50%, 4/01/48(b) | | | 88,000 | | | | 84,665 | |
| | | | | | | | |
| | | Par(a) | | | Value | |
|
Oil & Gas (Continued) | |
Noble Energy, Inc.,
3.85%, 1/15/28 | | $ | 40,000 | | | $ | 39,859 | |
4.95%, 8/15/47 | | | 40,000 | | | | 41,033 | |
Occidental Petroleum Corp.,
3.00%, 2/15/27 | | | 220,000 | | | | 213,343 | |
4.10%, 2/15/47 | | | 50,000 | | | | 47,988 | |
4.20%, 3/15/48 | | | 230,000 | | | | 224,290 | |
Valero Energy Corp.,
3.40%, 9/15/26 | | | 71,000 | | | | 69,890 | |
| | | | | | | 5,326,959 | |
| |
Oil & Gas Services – 0.1% | |
Halliburton Co.,
3.80%, 11/15/25 | | | 354,000 | | | | 362,132 | |
4.85%, 11/15/35 | | | 70,000 | | | | 73,357 | |
4.50%, 11/15/41 | | | 18,000 | | | | 17,919 | |
Schlumberger Holdings Corp.,
4.00%, 12/21/25(b) | | | 30,000 | | | | 30,876 | |
| | | | | | | 484,284 | |
| |
Pharmaceuticals – 1.3% | |
AbbVie, Inc.,
2.90%, 11/06/22 | | | 35,000 | | | | 34,899 | |
3.60%, 5/14/25 | | | 215,000 | | | | 216,266 | |
4.50%, 5/14/35 | | | 142,000 | | | | 138,903 | |
4.40%, 11/06/42 | | | 18,000 | | | | 16,676 | |
4.45%, 5/14/46 | | | 88,000 | | | | 81,612 | |
Allergan Funding SCS,
3.45%, 3/15/22 | | | 100,000 | | | | 100,507 | |
3.80%, 3/15/25 | | | 486,000 | | | | 491,307 | |
4.55%, 3/15/35 | | | 108,000 | | | | 106,293 | |
4.75%, 3/15/45 | | | 50,000 | | | | 48,853 | |
Cigna Corp.,
3.20%, 9/17/20(b) | | | 335,000 | | | | 336,111 | |
3.40%, 9/17/21(b) | | | 20,000 | | | | 20,207 | |
3.75%, 7/15/23(b) | | | 190,000 | | | | 193,391 | |
4.12%, 11/15/25(b) | | | 20,000 | | | | 20,672 | |
4.37%, 10/15/28(b) | | | 340,000 | | | | 350,710 | |
CVS Health Corp.,
3.35%, 3/09/21 | | | 140,000 | | | | 140,999 | |
3.70%, 3/09/23 | | | 326,000 | | | | 330,575 | |
4.10%, 3/25/25 | | | 440,000 | | | | 448,106 | |
3.88%, 7/20/25 | | | 18,000 | | | | 18,110 | |
4.30%, 3/25/28 | | | 750,000 | | | | 758,307 | |
4.87%, 7/20/35 | | | 44,000 | | | | 43,952 | |
5.12%, 7/20/45 | | | 327,000 | | | | 325,070 | |
5.05%, 3/25/48 | | | 260,000 | | | | 256,544 | |
Eli Lilly & Co., 4.15%, 3/15/59 | | | 51,000 | | | | 52,321 | |
Johnson & Johnson,
2.45%, 3/01/26 | | | 44,000 | | | | 42,824 | |
See accompanying Notes to Financial Statements
84
Morningstar Funds Trust April 30, 2019
Schedule of Investments(continued)
Morningstar Total Return Bond Fund
| | | | | | | | |
| | | Par(a) | | | Value | |
|
Pharmaceuticals (Continued) | |
3.63%, 3/03/37 | | $ | 140,000 | | | $ | 141,007 | |
Merck & Co., Inc., 4.00%, 3/07/49 | | | 30,000 | | | | 30,696 | |
Pfizer, Inc., 4.00%, 12/15/36 | | | 35,000 | | | | 36,111 | |
Shire Acquisitions Investments Ireland DAC,
1.90%, 9/23/19 | | | 185,000 | | | | 184,288 | |
2.88%, 9/23/23 | | | 79,000 | | | | 77,947 | |
3.20%, 9/23/26 | | | 115,000 | | | | 111,921 | |
Wyeth LLC,
6.45%, 2/01/24 | | | 9,000 | | | | 10,419 | |
6.50%, 2/01/34 | | | 44,000 | | | | 57,863 | |
5.95%, 4/01/37 | | | 44,000 | | | | 55,470 | |
| | | | | | | 5,278,937 | |
| |
Pipelines – 1.6% | |
Andeavor Logistics L.P./Tesoro Logistics Finance Corp.,
4.25%, 12/01/27 | | | 289,000 | | | | 293,971 | |
5.20%, 12/01/47 | | | 62,000 | | | | 63,386 | |
Boardwalk Pipelines L.P.,
4.80%, 5/03/29 | | | 25,000 | | | | 25,129 | |
Energy Transfer L.P./Regency Energy Finance Corp., 5.87%, 3/01/22 | | | 30,000 | | | | 32,006 | |
Energy Transfer Operating L.P.,
3.60%, 2/01/23 | | | 176,000 | | | | 177,079 | |
4.50%, 4/15/24 | | | 100,000 | | | | 104,431 | |
4.95%, 6/15/28 | | | 10,000 | | | | 10,508 | |
5.25%, 4/15/29 | | | 30,000 | | | | 32,297 | |
6.05%, 6/01/41 | | | 141,000 | | | | 150,760 | |
6.12%, 12/15/45 | | | 36,000 | | | | 39,361 | |
Enterprise Products Operating LLC,
4.15%, 10/16/28 | | | 210,000 | | | | 221,096 | |
4.45%, 2/15/43 | | | 53,000 | | | | 53,135 | |
5.10%, 2/15/45 | | | 88,000 | | | | 96,186 | |
Kinder Morgan Energy Partners L.P.,
4.25%, 9/01/24 | | | 162,000 | | | | 168,933 | |
4.70%, 11/01/42 | | | 26,000 | | | | 25,202 | |
5.50%, 3/01/44 | | | 50,000 | | | | 53,402 | |
Kinder Morgan, Inc.,
3.05%, 12/01/19 | | | 53,000 | | | | 53,033 | |
3.15%, 1/15/23 | | | 53,000 | | | | 53,094 | |
5.63%, 11/15/23(b) | | | 62,000 | | | | 67,730 | |
4.30%, 3/01/28 | | | 251,000 | | | | 259,737 | |
7.75%, 1/15/32 | | | 35,000 | | | | 46,140 | |
5.55%, 6/01/45 | | | 71,000 | | | | 77,332 | |
| | | | | | | | |
| | | Par(a) | | | Value | |
|
Pipelines (Continued) | |
5.05%, 2/15/46 | | $ | 115,000 | | | $ | 118,296 | |
MPLX L.P.,
4.88%, 6/01/25 | | | 176,000 | | | | 187,401 | |
4.13%, 3/01/27 | | | 256,000 | | | | 258,784 | |
4.00%, 3/15/28 | | | 260,000 | | | | 260,304 | |
4.80%, 2/15/29 | | | 280,000 | | | | 297,679 | |
4.50%, 4/15/38 | | | 90,000 | | | | 86,317 | |
5.20%, 3/01/47 | | | 10,000 | | | | 10,298 | |
4.70%, 4/15/48 | | | 108,000 | | | | 104,139 | |
5.50%, 2/15/49 | | | 90,000 | | | | 97,154 | |
Northwest Pipeline LLC,
4.00%, 4/01/27 | | | 141,000 | | | | 142,368 | |
Sabine Pass Liquefaction LLC,
5.62%, 4/15/23 | | | 100,000 | | | | 107,874 | |
5.75%, 5/15/24 | | | 200,000 | | | | 219,482 | |
5.62%, 3/01/25 | | | 238,000 | | | | 261,510 | |
5.87%, 6/30/26 | | | 97,000 | | | | 108,045 | |
5.00%, 3/15/27 | | | 76,000 | | | | 80,939 | |
Southern Natural Gas Co. LLC,
8.00%, 3/01/32 | | | 80,000 | | | | 107,472 | |
Spectra Energy Partners L.P.,
5.95%, 9/25/43 | | | 71,000 | | | | 83,863 | |
Sunoco Logistics Partners
Operations L.P.,
4.25%, 4/01/24 | | | 35,000 | | | | 36,193 | |
6.10%, 2/15/42 | | | 35,000 | | | | 37,601 | |
5.35%, 5/15/45 | | | 25,000 | | | | 24,767 | |
5.40%, 10/01/47 | | | 22,000 | | | | 22,086 | |
Texas Eastern Transmission L.P.,
3.50%, 1/15/28(b) | | | 62,000 | | | | 60,286 | |
4.15%, 1/15/48(b) | | | 26,000 | | | | 24,940 | |
Transcontinental Gas Pipe
Line Co. LLC,
7.85%, 2/01/26 | | | 531,000 | | | | 664,192 | |
4.00%, 3/15/28 | | | 88,000 | | | | 89,846 | |
4.45%, 8/01/42 | | | 18,000 | | | | 17,561 | |
Western Midstream Operating L.P.,
5.38%, 6/01/21 | | | 300,000 | | | | 311,659 | |
4.65%, 7/01/26 | | | 90,000 | | | | 93,907 | |
Williams (The) Cos., Inc.,
3.60%, 3/15/22 | | | 220,000 | | | | 223,317 | |
4.55%, 6/24/24 | | | 18,000 | | | | 18,971 | |
3.90%, 1/15/25 | | | 88,000 | | | | 89,746 | |
7.50%, 1/15/31 | | | 18,000 | | | | 22,691 | |
5.75%, 6/24/44 | | | 53,000 | | | | 57,705 | |
| | | | | | | 6,431,341 | |
| |
Real Estate Investment Trusts – 0.1% | |
American Tower Corp.,
3.50%, 1/31/23 | | | 44,000 | | | | 44,677 | |
See accompanying Notes to Financial Statements
85
Morningstar Funds Trust April 30, 2019
Schedule of Investments(continued)
Morningstar Total Return Bond Fund
| | | | | | | | |
| | | Par(a) | | | Value | |
|
Real Estate Investment Trusts (Continued) | |
5.00%, 2/15/24 | | $ | 176,000 | | | $ | 189,961 | |
3.95%, 3/15/29 | | | 44,000 | | | | 44,242 | |
Crown Castle International Corp.,
4.87%, 4/15/22 | | | 19,000 | | | | 20,030 | |
3.20%, 9/01/24 | | | 62,000 | | | | 61,749 | |
4.45%, 2/15/26 | | | 115,000 | | | | 120,528 | |
3.65%, 9/01/27 | | | 88,000 | | | | 87,192 | |
Realty Income Corp.,
4.13%, 10/15/26 | | | 35,000 | | | | 36,824 | |
| | | | | | | 605,203 | |
| |
Retail – 0.4% | |
Dollar General Corp.,
4.13%, 5/01/28 | | | 18,000 | | | | 18,504 | |
Home Depot (The), Inc.,
3.90%, 12/06/28 | | | 26,000 | | | | 27,558 | |
5.87%, 12/16/36 | | | 26,000 | | | | 32,841 | |
5.95%, 4/01/41 | | | 10,000 | | | | 12,794 | |
3.50%, 9/15/56 | | | 18,000 | | | | 16,414 | |
Lowe’s Cos., Inc., 3.70%, 4/15/46 | | | 71,000 | | | | 63,356 | |
McDonald’s Corp.,
3.38%, 5/26/25 | | | 35,000 | | | | 35,626 | |
3.70%, 1/30/26 | | | 85,000 | | | | 87,429 | |
3.80%, 4/01/28 | | | 250,000 | | | | 257,863 | |
6.30%, 10/15/37 | | | 26,000 | | | | 32,138 | |
4.87%, 7/15/40 | | | 26,000 | | | | 27,720 | |
3.63%, 5/01/43 | | | 45,000 | | | | 40,760 | |
4.87%, 12/09/45 | | | 26,000 | | | | 28,056 | |
4.45%, 3/01/47 | | | 51,000 | | | | 51,849 | |
Walgreens Boots Alliance, Inc.,
3.80%, 11/18/24 | | | 45,000 | | | | 45,528 | |
3.45%, 6/01/26 | | | 229,000 | | | | 221,518 | |
Walmart, Inc.,
3.55%, 6/26/25 | | | 35,000 | | | | 36,337 | |
3.70%, 6/26/28 | | | 340,000 | | | | 356,159 | |
3.25%, 7/08/29 | | | 40,000 | | | | 40,395 | |
4.00%, 4/11/43 | | | 18,000 | | | | 18,770 | |
| | | | | | | 1,451,615 | |
| |
Semiconductors – 0.5% | |
Analog Devices, Inc.,
3.90%, 12/15/25 | | | 18,000 | | | | 18,478 | |
3.50%, 12/05/26 | | | 26,000 | | | | 26,103 | |
5.30%, 12/15/45 | | | 26,000 | | | | 29,302 | |
Applied Materials, Inc.,
3.90%, 10/01/25 | | | 11,000 | | | | 11,577 | |
3.30%, 4/01/27 | | | 77,000 | | | | 77,723 | |
5.10%, 10/01/35 | | | 35,000 | | | | 40,116 | |
5.85%, 6/15/41 | | | 33,000 | | | | 40,619 | |
4.35%, 4/01/47 | | | 106,000 | | | | 110,690 | |
| | | | | | | | |
| | | Par(a) | | | Value | |
|
Semiconductors (Continued) | |
Broadcom Corp./Broadcom
Cayman Finance Ltd.,
3.00%, 1/15/22 | | $ | 177,000 | | | $ | 175,944 | |
3.63%, 1/15/24 | | | 115,000 | | | | 114,174 | |
3.87%, 1/15/27 | | | 116,000 | | | | 110,693 | |
Broadcom, Inc., 3.13%, 10/15/22(b) | | | 80,000 | | | | 79,579 | |
Intel Corp.,
3.70%, 7/29/25 | | | 20,000 | | | | 20,889 | |
4.80%, 10/01/41 | | | 40,000 | | | | 45,409 | |
KLA-Tencor Corp.,
4.10%, 3/15/29 | | | 150,000 | | | | 154,308 | |
5.00%, 3/15/49 | | | 54,000 | | | | 58,000 | |
Lam Research Corp.,
3.75%, 3/15/26 | | | 71,000 | | | | 72,893 | |
4.87%, 3/15/49 | | | 98,000 | | | | 105,750 | |
NVIDIA Corp., 3.20%, 9/16/26 | | | 104,000 | | | | 103,780 | |
QUALCOMM, Inc.,
2.90%, 5/20/24 | | | 34,000 | | | | 33,889 | |
3.45%, 5/20/25 | | | 8,000 | | | | 8,146 | |
4.65%, 5/20/35 | | | 183,000 | | | | 198,104 | |
4.80%, 5/20/45 | | | 67,000 | | | | 71,774 | |
Texas Instruments, Inc.,
2.25%, 5/01/23 | | | 18,000 | | | | 17,793 | |
2.90%, 11/03/27 | | | 200,000 | | | | 197,977 | |
4.15%, 5/15/48 | | | 18,000 | | | | 19,020 | |
| | | | | | | 1,942,730 | |
| |
Software – 0.7% | |
Autodesk, Inc., 3.50%, 6/15/27 | | | 141,000 | | | | 137,038 | |
Fidelity National
Information
Services, Inc.,
5.00%, 10/15/25 | | | 18,000 | | | | 19,591 | |
3.00%, 8/15/26 | | | 167,000 | | | | 161,788 | |
4.50%, 8/15/46 | | | 53,000 | | | | 52,487 | |
4.75%, 5/15/48 | | | 18,000 | | | | 18,479 | |
Fiserv, Inc.,
3.85%, 6/01/25 | | | 18,000 | | | | 18,534 | |
4.20%, 10/01/28 | | | 130,000 | | | | 134,353 | |
Microsoft Corp.,
2.40%, 8/08/26 | | | 60,000 | | | | 58,091 | |
3.30%, 2/06/27 | | | 500,000 | | | | 512,567 | |
3.50%, 2/12/35 | | | 150,000 | | | | 150,893 | |
4.20%, 11/03/35 | | | 9,000 | | | | 9,793 | |
3.45%, 8/08/36 | | | 132,000 | | | | 131,210 | |
3.50%, 11/15/42 | | | 44,000 | | | | 42,882 | |
3.75%, 2/12/45 | | | 110,000 | | | | 111,039 | |
3.70%, 8/08/46 | | | 386,000 | | | | 386,994 | |
See accompanying Notes to Financial Statements
86
Morningstar Funds Trust April 30, 2019
Schedule of Investments(continued)
Morningstar Total Return Bond Fund
| | | | | | | | |
| | | Par(a) | | | Value | |
|
Software (Continued) | |
Oracle Corp.,
2.50%, 10/15/22 | | $ | 129,000 | | | $ | 128,077 | |
3.63%, 7/15/23 | | | 55,000 | | | | 56,843 | |
2.65%, 7/15/26 | | | 141,000 | | | | 136,760 | |
3.25%, 11/15/27 | | | 44,000 | | | | 44,250 | |
3.80%, 11/15/37 | | | 35,000 | | | | 34,715 | |
6.50%, 4/15/38 | | | 26,000 | | | | 34,469 | |
4.12%, 5/15/45 | | | 62,000 | | | | 62,674 | |
4.00%, 7/15/46 | | | 53,000 | | | | 52,635 | |
salesforce.com, Inc., 3.70%, 4/11/28 | | | 430,000 | | | | 450,340 | |
| | | | | | | 2,946,502 | |
| |
Telecommunications – 1.1% | |
AT&T, Inc.,
3.00%, 2/15/22 | | | 20,000 | | | | 20,123 | |
3.60%, 2/17/23 | | | 215,000 | | | | 219,482 | |
3.40%, 5/15/25 | | | 18,000 | | | | 18,081 | |
4.12%, 2/17/26 | | | 9,000 | | | | 9,296 | |
4.30%, 2/15/30(b) | | | 375,000 | | | | 384,086 | |
6.35%, 3/15/40 | | | 150,000 | | | | 174,711 | |
6.00%, 8/15/40 | | | 79,000 | | | | 90,795 | |
4.80%, 6/15/44 | | | 150,000 | | | | 150,515 | |
4.35%, 6/15/45 | | | 9,000 | | | | 8,495 | |
5.15%, 11/15/46 | | | 50,000 | | | | 52,421 | |
4.50%, 3/09/48 | | | 140,000 | | | | 134,359 | |
5.15%, 2/15/50 | | | 132,000 | | | | 138,515 | |
Cisco Systems, Inc., 2.95%, 2/28/26 | | | 18,000 | | | | 17,946 | |
Corning, Inc.,
3.70%, 11/15/23 | | | 9,000 | | | | 9,148 | |
4.37%, 11/15/57 | | | 79,000 | | | | 72,729 | |
Sprint Spectrum Co. LLC/Sprint Spectrum Co. II LLC/Sprint Spectrum Co. III LLC, 3.36%, 9/20/21(b) | | | 125,000 | | | | 124,688 | |
4.74%, 3/20/25(b) | | | 200,000 | | | | 203,750 | |
Verizon Communications, Inc.,
3.38%, 2/15/25 | | | 120,000 | | | | 121,800 | |
2.63%, 8/15/26 | | | 10,000 | | | | 9,597 | |
4.12%, 3/16/27 | | | 871,000 | | | | 918,591 | |
4.33%, 9/21/28 | | | 550,000 | | | | 588,247 | |
3.88%, 2/08/29 | | | 30,000 | | | | 31,043 | |
4.50%, 8/10/33 | | | 130,000 | | | | 139,399 | |
4.27%, 1/15/36 | | | 353,000 | | | | 361,163 | |
4.81%, 3/15/39 | | | 18,000 | | | | 19,548 | |
3.85%, 11/01/42 | | | 50,000 | | | | 47,766 | |
6.55%, 9/15/43 | | | 115,000 | | | | 151,411 | |
4.52%, 9/15/48 | | | 180,000 | | | | 187,720 | |
| | | | | | | 4,405,425 | |
| |
| |
| | | | | | | | | | | | |
| | | | | | Par(a) | | | Value | |
| | | | |
Textiles – 0.0%(i) | | | | | | | | | | | | |
Cintas Corp. No. 2,
2.90%, 4/01/22 | | | | | | $ | 20,000 | | | $ | 20,008 | |
3.70%, 4/01/27 | | | | | | | 20,000 | | | | 20,488 | |
| | | | | | | | | | | 40,496 | |
| |
Transportation – 0.4% | |
Burlington Northern Santa
Fe LLC,
6.15%, 5/01/37 | | | | | | | 18,000 | | | | 23,066 | |
5.75%, 5/01/40 | | | | | | | 60,000 | | | | 74,062 | |
4.15%, 4/01/45 | | | | | | | 30,000 | | | | 31,165 | |
4.05%, 6/15/48 | | | | | | | 106,000 | | | | 109,183 | |
CSX Corp.,
3.25%, 6/01/27 | | | | | | | 97,000 | | | | 96,529 | |
4.75%, 5/30/42 | | | | | | | 44,000 | | | | 47,637 | |
4.25%, 11/01/66 | | | | | | | 53,000 | | | | 49,307 | |
FedEx Corp.,
3.40%, 1/14/22 | | | | | | | 35,000 | | | | 35,480 | |
3.90%, 2/01/35 | | | | | | | 132,000 | | | | 125,100 | |
3.87%, 8/01/42 | | | | | | | 62,000 | | | | 54,994 | |
4.10%, 4/15/43 | | | | | | | 44,000 | | | | 40,199 | |
5.10%, 1/15/44 | | | | | | | 62,000 | | | | 65,159 | |
4.10%, 2/01/45 | | | | | | | 20,000 | | | | 18,408 | |
Norfolk Southern Corp.,
3.65%, 8/01/25 | | | | | | | 18,000 | | | | 18,575 | |
2.90%, 6/15/26 | | | | | | | 132,000 | | | | 129,726 | |
4.84%, 10/01/41 | | | | | | | 18,000 | | | | 19,700 | |
5/15/49(e) | | | | | | | 5,000 | | | | 4,963 | |
4.05%, 8/15/52 | | | | | | | 35,000 | | | | 34,116 | |
Union Pacific Corp.,
2.75%, 3/01/26 | | | | | | | 53,000 | | | | 51,858 | |
3.95%, 9/10/28 | | | | | | | 220,000 | | | | 231,248 | |
3.38%, 2/01/35 | | | | | | | 88,000 | | | | 83,165 | |
3.60%, 9/15/37 | | | | | | | 62,000 | | | | 59,341 | |
4.75%, 9/15/41 | | | | | | | 5,000 | | | | 5,307 | |
4.50%, 9/10/48 | | | | | | | 270,000 | | | | 286,178 | |
3.80%, 10/01/51 | | | | | | | 44,000 | | | | 41,295 | |
3.87%, 2/01/55 | | | | | | | 71,000 | | | | 66,163 | |
| | | | | | | | | | | 1,801,924 | |
| |
Trucking & Leasing – 0.0%(i) | |
Penske Truck Leasing Co. L.P./PTL Finance Corp., 3.40%, 11/15/26(b) | | | | | | | 141,000 | | | | 134,156 | |
| | | |
Total Corporate Bonds
(Cost $84,925,750) | | | | | | | | | | | 87,216,038 | |
| |
Foreign Issuer Bonds – 13.4% | |
Argentina – 0.0%(i) | |
Argentina Bonar Bonds, 48.20%, 3/01/20(d) | | | ARS | | | | 200,000 | | | | 4,159 | |
| |
| |
See accompanying Notes to Financial Statements
87
Morningstar Funds Trust April 30, 2019
Schedule of Investments(continued)
Morningstar Total Return Bond Fund
| | | | | | | | |
| | | Par(a) | | | Value | |
|
Australia – 0.2% | |
Australia & New Zealand Banking Group Ltd., 4.87%, 1/12/21(b) | | $ | 100,000 | | | $ | 103,496 | |
BHP Billiton Finance USA Ltd.,
4.13%, 2/24/42 | | | 35,000 | | | | 36,638 | |
5.00%, 9/30/43 | | | 20,000 | | | | 23,208 | |
(USD Swap 5Y + 5.09%), 6.75%, 10/19/75(b)(g) | | | 400,000 | | | | 450,000 | |
Commonwealth Bank of Australia, 3.90%, 7/12/47(b) | | | 30,000 | | | | 29,944 | |
| | | | | | | 643,286 | |
| |
Belgium – 0.6% | |
Anheuser-Busch Cos.
LLC/Anheuser-Busch InBev Worldwide, Inc.,
3.65%, 2/01/26(b) | | | 80,000 | | | | 80,262 | |
4.70%, 2/01/36(b) | | | 247,000 | | | | 250,963 | |
4.90%, 2/01/46(b) | | | 26,000 | | | | 26,383 | |
Anheuser-Busch InBev Finance, Inc., 4.70%, 2/01/36 | | | 185,000 | | | | 187,968 | |
Anheuser-Busch InBev Worldwide, Inc., 3.50%, 1/12/24 | | | 100,000 | | | | 101,945 | |
4.15%, 1/23/25 | | | 400,000 | | | | 417,739 | |
4.00%, 4/13/28 | | | 160,000 | | | | 163,189 | |
4.75%, 1/23/29 | | | 775,000 | | | | 829,799 | |
3.75%, 7/15/42 | | | 71,000 | | | | 61,873 | |
5.55%, 1/23/49 | | | 140,000 | | | | 155,495 | |
| | | | | | | 2,275,616 | |
| |
Brazil – 0.5% | |
Brazilian Government International Bond, 4.50%, 5/30/29 | | | 242,000 | | | | 235,708 | |
Gol Finance, Inc., 7.00%, 1/31/25(b) | | | 200,000 | | | | 190,000 | |
Petrobras Global Finance
B.V.,
7.37%, 1/17/27 | | | 200,000 | | | | 223,160 | |
7.25%, 3/17/44 | | | 49,000 | | | | 51,818 | |
Suzano Austria GmbH, 6.00%, 1/15/29(b) | | | 520,000 | | | | 556,400 | |
Vale Overseas Ltd., 6.25%, 8/10/26 | | | 650,000 | | | | 709,800 | |
| | | | | | | 1,966,886 | |
| |
Canada – 0.3% | |
Air Canada Pass Through Trust, Series2015-2, Class B, 5.00%,
12/15/23(b) | | | 13,800 | | | | 14,200 | |
| | | | | | | | | | | | |
| | | | | | Par(a) | | | Value | |
|
Canada (Continued) | |
Air Canada Pass Through
Trust, Series2017-1,
Class AA, 3.30%, 1/15/30(b) | | | $ | 17,539 | | | $ | 17,087 | |
Bank of Montreal, 3.80%, 12/15/32(g) | | | | | | | 40,000 | | | | 38,916 | |
Barrick Gold Corp., 5.25%, 4/01/42 | | | | | | | 35,000 | | | | 37,918 | |
Barrick North America Finance LLC, 5.75%, 5/01/43 | | | | | | | 190,000 | | | | 218,595 | |
Enbridge, Inc., 2.90%, 7/15/22 | | | | | | | 91,000 | | | | 90,784 | |
4.25%, 12/01/26 | | | | | | | 62,000 | | | | 64,591 | |
3.70%, 7/15/27 | | | | | | | 79,000 | | | | 79,488 | |
(ICE LIBOR USD 3M + 3.42%), 5.50%, 7/15/77(g) | | | | | | | 150,000 | | | | 144,375 | |
Royal Bank of Canada, 3.20%, 4/30/21 | | | | | | | 220,000 | | | | 222,454 | |
Toronto-Dominion Bank (The), 3.25%, 6/11/21 | | | | | | | 220,000 | | | | 222,647 | |
TransCanada PipeLines Ltd.,
4.88%, 1/15/26 | | | | | | | 123,000 | | | | 132,447 | |
4.25%, 5/15/28 | | | | | | | 62,000 | | | | 64,610 | |
5.85%, 3/15/36 | | | | | | | 71,000 | | | | 80,327 | |
7.25%, 8/15/38 | | | | | | | 9,000 | | | | 11,757 | |
| | | | | | | | | | | 1,440,196 | |
| |
Chile – 0.1% | |
Corp. Nacional del Cobre de Chile, 3.63%, 8/01/27(b) | | | | | | | 330,000 | | | | 331,208 | |
| | | | |
China – 0.2% | | | | | | | | | | | | |
CNOOC Finance 2015 | | | | | | | | | | | | |
USA LLC, 3.50%, 5/05/25 | | | | | | | 410,000 | | | | 412,207 | |
Sinopec Group Overseas | | | | | | | | | | | | |
Development 2014 Ltd., 4.37%, 4/10/24(b) | | | | | | | 290,000 | | | | 303,673 | |
Tencent Holdings Ltd.,
3.60%, 1/19/28(b) | | | | | | | 220,000 | | | | 216,714 | |
| | | | | | | | | | | 932,594 | |
| |
Colombia – 0.7% | |
Colombia Government
International Bond,
3.88%, 4/25/27 | | | | | | | 415,000 | | | | 420,752 | |
5.00%, 6/15/45 | | | | | | | 410,000 | | | | 429,069 | |
5.20%, 5/15/49 | | | | | | | 720,000 | | | | 770,400 | |
Colombian TES, 7.00%, 6/30/32 | | | COP | | | | 1,106,700,000 | | | | 343,280 | |
See accompanying Notes to Financial Statements
88
Morningstar Funds Trust April 30, 2019
Schedule of Investments(continued)
Morningstar Total Return Bond Fund
| | | | | | | | | | | | |
| | | | | | Par(a) | | | Value | |
| | | |
Colombia (Continued) | | | | | | | | | | | | |
Ecopetrol S.A., 5.87%, 5/28/45 | | | | | | $ | 700,000 | | | $ | 721,910 | |
Transportadora de Gas Internacional S.A. ESP, 5.55%, 11/01/28(b) | | | | | | | 200,000 | | | | 218,250 | |
| | | | | | | | | | | 2,903,661 | |
| |
Denmark – 0.2% | |
Danske Bank A/S,
5.00%, 1/12/22(b) | | | | | | | 400,000 | | | | 411,329 | |
5.38%, 1/12/24(b) | | | | | | | 400,000 | | | | 418,901 | |
| | | | | | | | | | | 830,230 | |
| |
Egypt – 0.1% | |
Egypt Government International Bond, 8.70%, 3/01/49(b) | | | | | | | 262,000 | | | | 269,958 | |
| |
Finland – 0.2% | |
Nordea Bank Abp,
4.88%, 1/14/21(b) | | | | | | | 200,000 | | | | 206,901 | |
3.75%, 8/30/23(b) | | | | | | | 455,000 | | | | 460,461 | |
(U.S. Treasury Yield Curve Rate CMT 5Y + 4.11%), 6.62%, 3/26/26(b)(g)(h) | | | | | | | 200,000 | | | | 204,500 | |
| | | | | | | | | | | 871,862 | |
| |
France – 0.8% | |
BNP Paribas S.A., | | | | | | | | | | | | |
(USD Swap 5Y + 6.31%), 7.62%, 3/30/21(b)(g)(h) | | | | | | | 200,000 | | | | 210,750 | |
2.95%, 5/23/22(b) | | | | | | | 200,000 | | | | 199,092 | |
3.50%, 3/01/23(b) | | | | | | | 200,000 | | | | 201,800 | |
(ICE LIBOR USD 3M + 2.24%), 4.71%, 1/10/25(b)(g) | | | | | | | 200,000 | | | | 209,526 | |
(USD Swap 5Y + 5.15%), 7.37%, 8/19/25(b)(g)(h) | | | | | | | 200,000 | | | | 216,250 | |
4.40%, 8/14/28(b) | | | | | | | 200,000 | | | | 207,433 | |
(ICE LIBOR USD 3M + 2.57%), 5.20%, 1/10/30(b)(g) | | | | | | | 600,000 | | | | 653,755 | |
Credit Agricole S.A., | | | | | | | | | | | | |
(ICE LIBOR USD 3M + 6.98%), 8.37%, 10/13/19(b)(g)(h) | | | | | | | 340,000 | | | | 347,650 | |
(USD Swap 5Y + 6.19%), 8.12%, 12/23/25(b)(g)(h) | | | | | | | 200,000 | | | | 228,216 | |
Danone S.A., 2.95%, 11/02/26(b) | | | | | | | 400,000 | | | | 385,887 | |
WEA Finance LLC, 4.13%, 9/20/28(b) | | | | | | | 340,000 | | | | 352,807 | |
| | | | | | | | | | | | 3,213,166 | |
| | | | | | | | | | | | |
| | | | | | Par(a) | | | Value | |
| | | |
Germany – 0.3% | | | | | | | | | | | | |
Bayer US Finance II LLC, 3.37%, 7/15/24(b) | | | | | | $ | 44,000 | | | $ | 43,057 | |
4.40%, 7/15/44(b) | | | | | | | 44,000 | | | | 39,204 | |
Daimler Finance North America LLC,
2.20%, 5/05/20(b) | | | | | | | 150,000 | | | | 148,895 | |
2.85%, 1/06/22(b) | | | | | | | 300,000 | | | | 299,319 | |
Deutsche Bank A.G.,
4.25%, 2/04/21 | | | | | | | 529,000 | | | | 530,572 | |
| | | | | | | | | | | 1,061,047 | |
| |
Hungary – 0.0%(i) | |
Hungary Government International Bond, 5.38%, 3/25/24 | | | | | | | 122,000 | | | | 134,136 | |
| | | | |
India – 0.0%(i) | | | | | | | | | | | | |
Export-Import Bank of India, 3.38%, 8/05/26(b) | | | | | | | 200,000 | | | | 192,772 | |
| | | | |
Indonesia – 0.7% | | | | | | | | | | | | |
Indonesia Government International Bond,
4.35%, 1/11/48 | | | | | | | 1,130,000 | | | | 1,112,250 | |
Indonesia Treasury Bond, 8.25%, 5/15/29 | | | IDR | | | | 9,169,000,000 | | | | 664,350 | |
8.37%, 3/15/34 | | | | | | | 1,593,000,000 | | | | 113,327 | |
8.38%, 4/15/39 | | | | | | | 2,679,000,000 | | | | 189,143 | |
Pertamina Persero PT,
6.00%, 5/03/42(b) | | | | | | | 280,000 | | | | 304,797 | |
Perusahaan Listrik Negara PT, 5.45%, 5/21/28(b) | | | | | | | 480,000 | | | | 512,565 | |
| | | | | | | | | | | 2,896,432 | |
| |
Italy – 0.2% | |
Intesa Sanpaolo S.p.A.,
3.13%, 7/14/22(b) | | | | | | | 200,000 | | | | 195,916 | |
UniCredit S.p.A., 6.57%, 1/14/22(b) | | | | | | | 700,000 | | | | 737,666 | |
| | | | | | | | | | | 933,582 | |
| |
Japan – 0.4% | |
Mitsubishi UFJ Financial Group, Inc.,
2.95%, 3/01/21 | | | | | | | 200,000 | | | | 200,601 | |
2.53%, 9/13/23 | | | | | | | 400,000 | | | | 390,920 | |
Mizuho Financial Group, Inc., 2.95%, 2/28/22 | | | | | | | 705,000 | | | | 705,511 | |
Sumitomo Mitsui Financial Group, Inc., 2.06%, 7/14/21 | | | | | | | 70,000 | | | | 68,867 | |
Takeda Pharmaceutical Co. Ltd., 4.40%, 11/26/23(b) | | | | | | | 400,000 | | | | 420,479 | |
| | | | | | | | | | | | 1,786,378 | |
See accompanying Notes to Financial Statements
89
Morningstar Funds Trust April 30, 2019
Schedule of Investments(continued)
Morningstar Total Return Bond Fund
| | | | | | | | | | | | |
| | | | | | Par(a) | | | Value | |
| | | |
Kazakhstan – 0.2% | | | | | | | | | | | | |
Kazakhstan Government International Bond, 4.88%, 10/14/44(b) | | | | | | $ | 350,000 | | | $ | 375,488 | |
KazMunayGas National Co. JSC, 6.37%, 10/24/48(b) | | | | | | | 420,000 | | | | 464,999 | |
| | | | | | | | | | | 840,487 | |
| |
Kuwait – 0.2% | |
Equate Petrochemical B.V., 4.25%, 11/03/26(b) | | | | | | | 410,000 | | | | 417,774 | |
Kuwait International Government Bond, 3.50%, 3/20/27(b) | | | | | | | 210,000 | | | | 214,185 | |
| | | | | | | | | | | 631,959 | |
| |
Luxembourg – 0.1% | |
ArcelorMittal, 4.55%, 3/11/26 | | | | | | | 206,000 | | | | 213,429 | |
| | | | |
Macau – 0.1% | | | | | | | | | | | | |
Sands China Ltd., 5.13%, 8/08/25 | | | | | | | 300,000 | | | | 316,490 | |
| | | | |
Mexico – 1.2% | | | | | | | | | | | | |
America Movil S.A.B. de C.V., 3.13%, 7/16/22 | | | | | | | 200,000 | | | | 201,024 | |
Comision Federal de Electricidad, 4.75%, 2/23/27(b) | | | | | | | 200,000 | | | | 203,500 | |
Grupo KUO S.A.B. de C.V., 5.75%, 7/07/27(b) | | | | | | | 200,000 | | | | 192,250 | |
Mexican Bonos,
7.50%, 6/03/27 | | | MXN | | | | 1,000,000 | | | | 50,918 | |
8.50%, 5/31/29 | | | | | | | 3,496,000 | | | | 188,939 | |
7.75%, 11/23/34 | | | | | | | 1,000,000 | | | | 49,954 | |
10.00%, 11/20/36 | | | | | | | 1,200,000 | | | | 72,562 | |
Mexico Government International Bond,
4.15%, 3/28/27 | | | | | | | 679,000 | | | | 688,370 | |
4.75%, 3/08/44 | | | | | | | 1,800,000 | | | | 1,770,750 | |
5.75%, 10/12/10(j) | | | | | | | 26,000 | | | | 26,683 | |
Petroleos Mexicanos,
6.87%, 8/04/26 | | | | | | | 46,000 | | | | 47,881 | |
6.50%, 3/13/27 | | | | | | | 532,000 | | | | 538,863 | |
5.35%, 2/12/28 | | | | | | | 441,000 | | | | 414,099 | |
5.62%, 1/23/46 | | | | | | | 758,000 | | | | 632,172 | |
| | | | | | | | | | | 5,077,965 | |
| |
Morocco – 0.0%(i) | |
OCP S.A., 4.50%, 10/22/25(b) | | | | | | | 200,000 | | | | 198,519 | |
| | | | | | | | | | | | |
| | | | | | Par(a) | | | Value | |
| | | |
Netherlands – 0.7% | | | | | | | | | | | | |
Cooperatieve Rabobank U.A.,
(ICE LIBOR USD 3M + 10.87%), 11.00%, 6/30/19(b)(g)(h) | | | | | | $ | 230,000 | | | $ | 232,783 | |
4.37%, 8/04/25 | | | | | | | 940,000 | | | | 976,515 | |
ING Groep N.V., 4.10%, 10/02/23 | | | | | | | 400,000 | | | | 413,039 | |
NXP B.V./NXP Funding LLC,
4.12%, 6/01/21(b) | | | | | | | 200,000 | | | | 203,934 | |
3.88%, 9/01/22(b) | | | | | | | 200,000 | | | | 203,548 | |
4.87%, 3/01/24(b) | | | | | | | 26,000 | | | | 27,510 | |
Shell International Finance B.V.,
3.50%, 11/13/23 | | | | | | | 170,000 | | | | 175,223 | |
3.25%, 5/11/25 | | | | | | | 79,000 | | | | 80,491 | |
3.88%, 11/13/28 | | | | | | | 310,000 | | | | 327,472 | |
4.12%, 5/11/35 | | | | | | | 18,000 | | | | 19,131 | |
3.63%, 8/21/42 | | | | | | | 26,000 | | | | 25,222 | |
4.55%, 8/12/43 | | | | | | | 40,000 | | | | 44,118 | |
4.00%, 5/10/46 | | | | | | | 170,000 | | | | 174,937 | |
| | | | | | | | | | | 2,903,923 | |
| |
Panama – 0.2% | |
Panama Government | | | | | | | | | | | | |
International Bond,
3.88%, 3/17/28 | | | | | | | 200,000 | | | | 207,102 | |
6.70%, 1/26/36 | | | | | | | 510,000 | | | | 663,000 | |
| | | | | | | | | | | 870,102 | |
| |
Peru – 0.5% | |
Inkia Energy Ltd., 5.87%, 11/09/27(b) | | | | | | | 200,000 | | | | 200,452 | |
Peruvian Government International Bond, 4.13%, 8/25/27 | | | | | | | 152,000 | | | | 163,780 | |
6.55%, 3/14/37 | | | | | | | 110,000 | | | | 147,235 | |
5.62%, 11/18/50 | | | | | | | 320,000 | | | | 408,800 | |
Petroleos del Peru S.A.,
4.75%, 6/19/32(b) | | | | | | | 600,000 | | | | 610,500 | |
Southern Copper Corp., 5.25%, 11/08/42 | | | | | | | 510,000 | | | | 534,180 | |
| | | | | | | | | | | 2,064,947 | |
| |
Philippines – 0.0%(i) | |
Philippine Government International Bond, 3.00%, 2/01/28 | | | | | | | 200,000 | | | | 197,164 | |
| | | | |
Poland – 0.2% | | | | | | | | | | | | |
Republic of Poland Government International Bond, 4.00%, 1/22/24 | | | | | | | 650,000 | | | | 682,500 | |
See accompanying Notes to Financial Statements
90
Morningstar Funds Trust April 30, 2019
Schedule of Investments(continued)
Morningstar Total Return Bond Fund
| | | | | | | | | | | | |
| | | | | | Par(a) | | | Value | |
| | | |
Qatar – 0.3% | | | | | | | | | | | | |
Qatar Government International Bond,
3.87%, 4/23/23(b) | | | | | | $ | 200,000 | | | $ | 206,470 | |
4.82%, 3/14/49(b) | | | | | | | 1,056,000 | | | | 1,133,880 | |
| | | | | | | | | | | 1,340,350 | |
| |
Russia – 0.3% | |
Russian Federal Bond - OFZ, 6.90%, 5/23/29 | | | RUB | | | | 37,294,000 | | | | 534,447 | |
Russian Foreign Bond - Eurobond, 5.62%, 4/04/42(b) | | | | | | | 800,000 | | | | 886,833 | |
| | | | | | | | | | | 1,421,280 | |
| |
Saudi Arabia – 0.1% | |
Saudi Government International Bond, 5.00%, 4/17/49 | | | | | | | 200,000 | | | | 212,144 | |
| |
South Africa – 0.3% | |
Anglo American Capital PLC, 3.62%, 9/11/24(b) | | | | | | | 200,000 | | | | 199,572 | |
4.00%, 9/11/27(b) | | | | | | | 400,000 | | | | 393,101 | |
Republic of South Africa Government Bond,
6.25%, 3/31/36 | | | ZAR | | | | 9,534,000 | | | | 484,652 | |
9.00%, 1/31/40 | | | | | | | 1,823,000 | | | | 118,846 | |
8.75%, 1/31/44 | | | | | | | 1,799,000 | | | | 113,651 | |
8.75%, 2/28/48 | | | | | | | 1,254,000 | | | | 79,431 | |
| | | | | | | | | | | 1,389,253 | |
| |
Spain – 0.1% | |
Banco Santander S.A.,
4.38%, 4/12/28 | | | | | | | 200,000 | | | | 204,843 | |
Telefonica Emisiones S.A., 4.10%, 3/08/27 | | | | | | | 300,000 | | | | 307,516 | |
| | | | | | | | | | | 512,359 | |
| |
Sweden – 0.1% | |
Svenska Handelsbanken AB, 1.95%, 9/08/20 | | | | | | | 500,000 | | | | 495,172 | |
| |
Switzerland – 0.8% | |
Credit Suisse Group A.G., | | | | | | | | | | | | |
(USD Swap 5Y + 4.60%),
7.50%, 7/17/23(b)(g)(h) | | | | | | | 200,000 | | | | 210,744 | |
(ICE LIBOR USD 3M + 1.20%), 3.00%,
12/14/23(b)(g) | | | | | | | 500,000 | | | | 494,028 | |
(USD Swap 5Y + 4.33%), 7.25%, 9/12/25(b)(g)(h) | | | | | | | 200,000 | | | | 207,900 | |
(ICE LIBOR USD 3M + 1.41%), 3.87%,
1/12/29(b)(g) | | | | | | | 500,000 | | | | 495,722 | |
| | | | | | | | | | | | |
| | | | | | Par(a) | | | Value | |
| | | |
Switzerland (Continued) | | | | | | | | | | | | |
Glencore Funding LLC,
4.12%, 3/12/24(b) | | | | | | $ | 240,000 | | | $ | 243,367 | |
4.00%, 3/27/27(b) | | | | | | | 400,000 | | | | 392,378 | |
3.87%, 10/27/27(b) | | | | | | | 80,000 | | | | 77,276 | |
Tyco Electronics Group S.A.,
3.13%, 8/15/27 | | | | | | | 18,000 | | | | 17,458 | |
UBS Group Funding Switzerland A.G., | | | | | | | | | | | | |
(ICE LIBOR USD 3M + 0.95%),
2.86%, 8/15/23(b)(g) | | | | | | | 200,000 | | | | 197,632 | |
(USD Swap 5Y + 4.34%),
7.00%, 1/31/24(b)(g)(h) | | | | | | | 200,000 | | | | 208,494 | |
4.25%, 3/23/28(b) | | | | | | | 770,000 | | | | 801,813 | |
| | | | | | | | | | | 3,346,812 | |
| |
Ukraine – 0.1% | |
Ukraine Government International Bond, 9.75%, 11/01/28 | | | | | | | 200,000 | | | | 204,877 | |
| |
United Arab Emirates – 0.2% | |
Abu Dhabi Government International Bond, 2.50%, 10/11/22(b) | | | | | | | 410,000 | | | | 405,900 | |
DP World PLC, 5.63%, 9/25/48(b) | | | | | | | 500,000 | | | | 527,500 | |
| | | | | | | | | | | 933,400 | |
| |
United Kingdom – 2.0% | |
BAE Systems Holdings, Inc.,
3.80%, 10/07/24(b) | | | | | | | 123,000 | | | | 125,326 | |
Barclays PLC, | | | | | | | | | | | | |
(ICE LIBOR USD 3M + 1.61%),
3.93%, 5/07/25(g) | | | | | | | 400,000 | | | | 400,272 | |
(ICE LIBOR USD 3M + 1.90%),
4.97%, 5/16/29(g) | | | | | | | 400,000 | | | | 419,652 | |
BAT Capital Corp.,
2.76%, 8/15/22 | | | | | | | 176,000 | | | | 173,504 | |
3.22%, 8/15/24 | | | | | | | 62,000 | | | | 60,674 | |
3.56%, 8/15/27 | | | | | | | 300,000 | | | | 285,618 | |
4.54%, 8/15/47 | | | | | | | 210,000 | | | | 187,491 | |
BAT International Finance PLC,
3.95%, 6/15/25(b) | | | | | | | 123,000 | | | | 123,899 | |
British Telecommunications PLC,
9.62%, 12/15/30 | | | | | | | 20,000 | | | | 28,900 | |
GlaxoSmithKline Capital PLC,
3.00%, 6/01/24 | | | | | | | 123,000 | | | | 123,612 | |
3.38%, 6/01/29 | | | | | | | 30,000 | | | | 30,095 | |
See accompanying Notes to Financial Statements
91
Morningstar Funds Trust April 30, 2019
Schedule of Investments(continued)
Morningstar Total Return Bond Fund
| | | | | | | | |
| | | Par(a) | | | Value | |
| | |
United Kingdom (Continued) | | | | | | | | |
GlaxoSmithKline Capital, Inc.,
3.88%, 5/15/28 | | $ | 26,000 | | | $ | 27,223 | |
HSBC Holdings PLC, | | | | | | | | |
(ICE LIBOR USD 3M + 1.21%),
3.80%, 3/11/25(g) | | | 400,000 | | | | 407,478 | |
(ICE LIBOR USD 3M + 1.55%),
4.04%, 3/13/28(g) | | | 400,000 | | | | 407,409 | |
(USD ICE Swap Rate 5Y + 3.61%),
6.50%, 3/23/28(g)(h) | | | 200,000 | | | | 203,500 | |
(ICE LIBOR USD 3M + 1.53%),
4.58%, 6/19/29(g) | | | 900,000 | | | | 952,844 | |
Lloyds Banking Group PLC,
3.75%, 1/11/27 | | | 200,000 | | | | 198,365 | |
4.38%, 3/22/28 | | | 690,000 | | | | 714,044 | |
RELX Capital, Inc.,
3.50%, 3/16/23 | | | 97,000 | | | | 98,903 | |
4.00%, 3/18/29 | | | 86,000 | | | | 87,823 | |
Reynolds American, Inc., 4.45%, 6/12/25 | | | 220,000 | | | | 226,944 | |
Royal Bank of Scotland Group PLC, | | | | | | | | |
(ICE LIBOR USD 3M + 1.48%),
3.50%, 5/15/23(g) | | | 400,000 | | | | 399,737 | |
(ICE LIBOR USD 3M + 1.76%),
4.27%, 3/22/25(g) | | | 200,000 | | | | 203,899 | |
(ICE LIBOR USD 3M + 1.75%),
4.89%, 5/18/29(g) | | | 200,000 | | | | 209,033 | |
(ICE LIBOR USD 3M + 1.91%),
5.08%, 1/27/30(g) | | | 200,000 | | | | 213,824 | |
Santander UK PLC, 5.00%, 11/07/23(b) | | | 800,000 | | | | 831,883 | |
Standard Chartered PLC, 4.25%,
1/20/23(b)(g) | | | 200,000 | | | | 203,632 | |
Vodafone Group PLC,
2.95%, 2/19/23 | | | 229,000 | | | | 227,607 | |
4.38%, 5/30/28 | | | 300,000 | | | | 308,930 | |
6.15%, 2/27/37 | | | 62,000 | | | | 70,440 | |
4.37%, 2/19/43 | | | 53,000 | | | | 49,327 | |
5.25%, 5/30/48 | | | 35,000 | | | | 35,803 | |
(USD Swap 5Y + 4.87%),
7.00%, 4/04/79(g) | | | 75,000 | | | | 78,760 | |
| | | | | | | 8,116,451 | |
| |
Uruguay – 0.2% | |
Uruguay Government International Bond, 4.37%, 10/27/27 | | | 210,000 | | | | 218,925 | |
| | | | | | | | |
| | | Par(a) | | | Value | |
| | |
Uruguay (Continued) | | | | | | | | |
4.38%, 1/23/31 | | $ | 210,000 | | | $ | 218,612 | |
5.10%, 6/18/50 | | | 560,000 | | | | 588,000 | |
| | | | | | | | 1,025,537 | |
Total Foreign Issuer Bonds
(Cost $54,260,843) | | | | | | | 55,682,289 | |
| | |
| | | | | | | | |
|
U.S. Government Agencies(k)– 4.1% | |
| |
Federal Home Loan Banks – 4.1% | | | | | |
FHLB Discount Notes,
0.00%, 5/03/19(l) | | | 570,000 | | | | 569,924 | |
0.00%, 5/20/19(l) | | | 370,000 | | | | 369,530 | |
0.00%, 5/22/19(l) | | | 700,000 | | | | 699,016 | |
0.00%, 5/31/19(l) | | | 1,130,000 | | | | 1,127,731 | |
0.00%, 6/12/19(l) | | | 580,000 | | | | 578,369 | |
0.00%, 6/21/19(l) | | | 2,970,000 | | | | 2,959,860 | |
0.00%, 7/05/19(l) | | | 2,630,000 | | | | 2,618,557 | |
0.00%, 7/08/19(l) | | | 1,360,000 | | | | 1,353,809 | |
0.00%, 7/10/19(l) | | | 270,000 | | | | 268,735 | |
0.00%, 7/19/19(l) | | | 4,650,000 | | | | 4,625,406 | |
0.00%, 8/01/19(l) | | | 1,490,000 | | | | 1,480,823 | |
0.00%, 9/27/19(l) | | | 340,000 | | | | 336,623 | |
| | | | | | | | 16,988,383 | |
Total U.S. Government Agencies
(Cost $16,988,626) | | | | | | | 16,988,383 | |
U.S. Government Obligations – 22.1% | |
| | |
U.S. Treasury Bonds – 7.6% | | | | | | | | |
4.50%, 2/15/36(m) | | | 8,692,000 | | | | 10,839,872 | |
3.00%, 8/15/48 | | | 5,280,000 | | | | 5,339,194 | |
3.37%, 11/15/48 | | | 10,095,000 | | | | 10,974,759 | |
3.00%, 2/15/49(m) | | | 4,534,000 | | | | 4,590,321 | |
| | | | | | | 31,744,146 | |
| |
U.S. Treasury Inflation-Indexed Bonds – 0.8% | |
1.38%, 2/15/44 | | | 830,000 | | | | 986,930 | |
0.75%, 2/15/45 | | | 310,000 | | | | 317,179 | |
1.00%, 2/15/49 | | | 1,840,000 | | | | 1,875,858 | |
| | | | | | | 3,179,967 | |
| |
U.S. Treasury Notes – 13.7% | |
2.50%, 1/31/21 | | | 2,760,000 | | | | 2,767,979 | |
2.25%, 3/31/21 | | | 23,713,000 | | | | 23,699,104 | |
2.50%, 2/15/22 | | | 1,879,000 | | | | 1,891,991 | |
2.38%, 3/15/22(m) | | | 9,051,000 | | | | 9,088,127 | |
2.25%, 4/15/22 | | | 923,000 | | | | 923,144 | |
2.62%, 12/31/23 | | | 155,000 | | | | 157,337 | |
2.13%, 3/31/24(m) | | | 7,866,000 | | | | 7,807,619 | |
2.25%, 4/30/24 | | | 316,000 | | | | 315,519 | |
2.25%, 3/31/26 | | | 4,130,000 | | | | 4,092,409 | |
See accompanying Notes to Financial Statements
92
Morningstar Funds Trust April 30, 2019
Schedule of Investments(continued)
Morningstar Total Return Bond Fund
| | | | | | | | |
| | | Par | | | Value | |
| |
U.S. Treasury Notes (Continued) | | | | | |
3.12%, 11/15/28 | | $ | 3,140,000 | | | $ | 3,304,605 | |
2.62%, 2/15/29(m) | | | 2,591,000 | | | | 2,617,415 | |
| | | | | | | | 56,665,249 | |
Total U.S. Government Obligations
(Cost $90,721,740) | | | | | | | 91,589,362 | |
| | |
| | | Par(a) | | | | |
Mortgage-Backed Securities – 33.3% | |
|
Federal Home Loan Mortgage Corporation – 6.4% | |
Pool #G08747, 3.00%, 2/01/47 | | | 712,031 | | | | 703,986 | |
Pool #G08750, 3.00%, 3/01/47 | | | 464,351 | | | | 459,105 | |
Pool #G08779, 3.50%, 9/01/47 | | | 1,063,750 | | | | 1,076,578 | |
Pool #G08791, 3.00%, 12/01/47 | | | 792,962 | | | | 784,119 | |
Pool #G08799, 3.00%, 2/01/48 | | | 164,134 | | | | 162,280 | |
Pool #G08800, 3.50%, 2/01/48 | | | 274,805 | | | | 278,074 | |
Pool #G08803, 3.00%, 3/01/48 | | | 994,334 | | | | 983,100 | |
Pool #G08835, 3.50%, 9/01/48 | | | 298,113 | | | | 301,292 | |
Pool #G08841, 3.50%, 10/01/48 | | | 2,699,998 | | | | 2,732,128 | |
Pool #G08846, 3.50%, 11/01/48 | | | 1,499,999 | | | | 1,517,849 | |
Pool #G08861, 3.50%, 2/01/49 | | | 606,391 | | | | 613,219 | |
Pool #G08865, 3.50%, 3/01/49 | | | 995,071 | | | | 1,005,969 | |
Pool #G08871, 3.50%, 4/01/49 | | | 91,111 | | | | 92,095 | |
Pool #G08877, 5/01/49(e) | | | 1,292,376 | | | | 1,328,440 | |
Pool #G08887, 3.00%, 6/01/49 | | | 4,200,000 | | | | 4,209,729 | |
Pool #G60972, 5/01/47(e) | | | 62,257 | | | | 66,136 | |
Pool #G61047, 7/01/47(e) | | | 257,398 | | | | 273,434 | |
Pool #G61079, 7/01/47(e) | | | 80,140 | | | | 84,490 | |
Pool #G61677, 4/01/47(e) | | | 166,533 | | | | 175,414 | |
Pool #G61727, 4.00%, 11/01/48 | | | 291,267 | | | | 299,813 | |
Pool #G61813, 3.00%, 7/01/46 | | | 514,499 | | | | 511,155 | |
Pool #G61989, 4/01/49(e) | | | 5,806,612 | | | | 5,917,692 | |
Pool #G67715, 8/01/48(e) | | | 367,967 | | | | 391,215 | |
Pool #G67721, 4/01/49(e) | | | 145,842 | | | | 154,235 | |
Pool #Q41209, 3.50%, 6/01/46 | | | 74,826 | | | | 76,098 | |
Pool #Q48752, 3.50%, 6/01/47 | | | 84,897 | | | | 86,175 | |
| | | | | | | | |
| | | Par(a) | | | Value | |
|
Federal Home Loan Mortgage Corporation (Continued) | |
Pool #Q53534, 3.00%, 1/01/48 | | $ | 37,750 | | | $ | 37,323 | |
Pool #Q57853, 8/01/48(e) | | | 198,819 | | | | 211,393 | |
Pool #Q59918, 7/01/48(e) | | | 495,195 | | | | 525,984 | |
Pool #V84260, 3.50%, 6/01/48 | | | 379,281 | | | | 385,201 | |
Pool #V85283, 3/01/49(e) | | | 298,549 | | | | 302,279 | |
Pool TBA, 5/19/34(e) | | | 882,000 | | | | 879,601 | |
| | | | | | | 26,625,601 | |
| |
Federal National Mortgage Association – 17.7% | |
Pool #890696, 3.00%, 9/01/30 | | | 220,201 | | | | 221,721 | |
Pool #890843, 3.00%, 9/01/47 | | | 93,953 | | | | 93,056 | |
Pool #AK6740, 4.00%, 3/01/42 | | | 1,846,067 | | | | 1,922,106 | |
Pool #AL3311, 3.50%, 3/01/43 | | | 2,841,902 | | | | 2,900,354 | |
Pool #AL5597, 6/01/44(e) | | | 321,067 | | | | 339,586 | |
Pool #AL9475, 11/01/45(e) | | | 125,463 | | | | 132,691 | |
Pool #AS0496, 3.00%, 9/01/28 | | | 35,790 | | | | 36,037 | |
Pool #AS2947, 4.00%, 7/01/44 | | | 1,010,508 | | | | 1,049,210 | |
Pool #AS5480, 7/01/45(e) | | | 91,055 | | | | 96,731 | |
Pool #AS7313, 3.50%, 6/01/46 | | | 787,427 | | | | 799,979 | |
Pool #AS7488, 3.00%, 7/01/46 | | | 1,209,318 | | | | 1,202,216 | |
Pool #AS7726, 3.00%, 8/01/46 | | | 872,039 | | | | 864,466 | |
Pool #AS8269, 3.00%, 11/01/46 | | | 1,746,147 | | | | 1,727,594 | |
Pool #AU6873, 11/01/43(e) | | | 159,499 | | | | 169,884 | |
Pool #AW1281, 3.00%, 7/01/29 | | | 14,989 | | | | 15,097 | |
Pool #AW4229, 3.00%, 7/01/29 | | | 64,933 | | | | 65,439 | |
Pool #AX6435, 3.00%, 1/01/30 | | | 40,057 | | | | 40,344 | |
Pool #BE2735, 10/01/47(e) | | | 19,529 | | | | 20,722 | |
Pool #BH5764, 11/01/47(e) | | | 85,309 | | | | 90,075 | |
Pool #BH9243, 1/01/33(e) | | | 461,113 | | | | 463,530 | |
Pool #BJ9172, 5/01/48(e) | | | 411,382 | | | | 436,755 | |
Pool #BK5047, 3.50%, 7/01/48 | | | 151,258 | | | | 152,780 | |
Pool #BM1922, 7/01/46(e) | | | 225,961 | | | | 240,628 | |
Pool #BM3208, 11/01/47(e) | | | 171,027 | | | | 180,515 | |
Pool #BM4351, 8/01/48(e) | | | 159,286 | | | | 169,110 | |
Pool #BM4614, 3.00%, 3/01/33 | | | 77,262 | | | | 77,871 | |
Pool #BM4696, 3/01/47(e) | | | 1,408,881 | | | | 1,399,576 | |
Pool #BM4751, 3/01/43(e) | | | 187,859 | | | | 191,041 | |
See accompanying Notes to Financial Statements
93
Morningstar Funds Trust April 30, 2019
Schedule of Investments(continued)
Morningstar Total Return Bond Fund
| | | | | | | | |
| | | Par(a) | | | Value | |
|
Federal National Mortgage Association (Continued) | |
Pool #BM4897, 12/01/46(e) | | $ | 189,602 | | | $ | 192,814 | |
Pool #BM5024, 3.00%, 11/01/48 | | | 1,269,250 | | | | 1,255,439 | |
Pool #BM5073, 4/01/48(e) | | | 1,242,429 | | | | 1,231,907 | |
Pool #BM5304, 3.00%, 9/01/32 | | | 65,181 | | | | 65,691 | |
Pool #BM5520, 3.50%, 2/01/47 | | | 1,179,869 | | | | 1,195,089 | |
Pool #BM5526, 3.50%, 2/01/48 | | | 295,734 | | | | 298,866 | |
Pool #BM5862, 2/01/49(e) | | | 480,256 | | | | 508,063 | |
Pool #BM5896, 5/01/48(e) | | | 215,269 | | | | 227,699 | |
Pool #BN0691, 4.50%, 8/01/48 | | | 91,127 | | | | 96,412 | |
Pool #BN1623, 11/01/48(e) | | | 139,319 | | | | 147,142 | |
Pool #BN4351, 3.50%, 2/01/49 | | | 2,000,000 | | | | 2,018,689 | |
Pool #BN5424, 4/01/49(e) | | | 1,293,748 | | | | 1,306,057 | |
Pool #BN6290, 3.00%, 5/01/49 | | | 699,999 | | | | 692,382 | |
Pool #CA1021, 1/01/48(e) | | | 220,632 | | | | 232,958 | |
Pool #CA3022, 3.50%, 1/01/34 | | | 219,284 | | | | 224,814 | |
Pool #CA3094, 2/01/49(e) | | | 788,276 | | | | 844,080 | |
Pool #CA3471, 3.50%, 5/01/49 | | | 398,798 | | | | 403,453 | |
Pool #CA3478, 3.50%, 5/01/49 | | | 299,523 | | | | 302,349 | |
Pool #CA3516, 5/01/49(e) | | | 629,819 | | | | 674,406 | |
Pool #MA3210, 3.50%, 12/01/47 | | | 1,447,154 | | | | 1,461,861 | |
Pool #MA3444, 8/01/48(e) | | | 2,177,799 | | | | 2,274,600 | |
Pool #MA3494, 3.50%, 10/01/48 | | | 448,741 | | | | 453,292 | |
Pool #MA3536, 4.00%, 12/01/48 | | | 2,726,908 | | | | 2,802,451 | |
Pool #MA3537, 4.50%, 12/01/48 | | | 2,498,987 | | | | 2,608,520 | |
Pool #MA3563, 4.00%, 1/01/49 | | | 299,999 | | | | 308,210 | |
Pool #MA3664, 5/01/49(e) | | | 7,725,637 | | | | 7,933,124 | |
Pool #MA3665, 5/01/49(e) | | | 496,914 | | | | 517,913 | |
Pool TBA,
5/19/34(e) | | | 10,134,600 | | | | 10,175,609 | |
6/19/34(e) | | | 700,000 | | | | 714,358 | |
5/19/49(e) | | | 11,320,000 | | | | 11,461,825 | |
6/19/49(e) | | | 5,564,000 | | | | 5,814,940 | |
| | | | | | | 73,544,127 | |
| |
Government National Mortgage Association – 5.3% | |
Pool TBA,
5/19/49(e) | | | 17,269,000 | | | | 17,543,148 | |
6/19/49(e) | | | 4,344,000 | | | | 4,460,092 | |
| | | | | | | | 22,003,240 | |
| | | | | | | | |
| | | Par(a) | | | Value | |
|
Government National Mortgage Association I – 0.1% | |
Pool #784571, 3.50%, 6/15/48 | | $ | 184,532 | | | $ | 188,387 | |
Pool #AB2892, 3.00%, 9/15/42 | | | 300,511 | | | | 300,735 | |
| | | | | | | 489,122 | |
| |
Government National Mortgage Association II – 3.8% | |
Pool #784577, 7/20/47(e) | | | 1,380,153 | | | | 1,429,364 | |
Pool #784674, 3.50%, 4/20/48 | | | 197,200 | | | | 200,563 | |
Pool #MA2678, 3.50%, 3/20/45 | | | 40,604 | | | | 41,358 | |
Pool #MA3596, 3.00%, 4/20/46 | | | 957,783 | | | | 957,436 | |
Pool #MA3663, 3.50%, 5/20/46 | | | 1,173,517 | | | | 1,195,328 | |
Pool #MA3736, 3.50%, 6/20/46 | | | 1,550,533 | | | | 1,579,355 | |
Pool #MA4195, 3.00%, 1/20/47 | | | 870,020 | | | | 869,704 | |
Pool #MA4320, 3.00%, 3/20/47 | | | 544,550 | | | | 544,604 | |
Pool #MA4384, 4.50%, 4/20/47 | | | 611,007 | | | | 638,267 | |
Pool #MA4899, 3.00%, 12/20/47 | | | 1,742,702 | | | | 1,739,079 | |
Pool #MA4901, 4.00%, 12/20/47 | | | 170,851 | | | | 176,003 | |
Pool #MA5078, 4.00%, 3/20/48 | | | 716,095 | | | | 737,691 | |
Pool #MA5192, 4.00%, 5/20/48 | | | 672,874 | | | | 693,166 | |
Pool #MA5596, 4.50%, 11/20/48 | | | 2,452,233 | | | | 2,550,752 | |
Pool #MA5652, 4.50%, 12/20/48 | | | 1,680,399 | | | | 1,753,901 | |
Pool #MA5711, 4.50%, 1/20/49 | | | 450,724 | | | | 468,820 | |
| | | | | | | | 15,575,391 | |
Total Mortgage-Backed Securities
(Cost $137,595,569) | | | | | | | 138,237,481 | |
| | |
| | | | | | | | | |
Municipal Bonds – 1.3% | |
| | |
California – 0.4% | | | | | | | | |
Bay Area Toll Bridge Authority Subordinate Revenue Bonds, Series S1, Build America Bonds, 7.04%, 4/01/50 | | | 70,000 | | | | 106,091 | |
See accompanying Notes to Financial Statements
94
Morningstar Funds Trust April 30, 2019
Schedule of Investments(continued)
Morningstar Total Return Bond Fund
| | | | | | | | |
| | | Par | | | Value | |
| | |
California (Continued) | | | | | | | | |
Bay Area Toll Bridge Authority Taxable Revenue Bonds, Series S3, Build America Bonds, 6.91%, 10/01/50 | | $ | 50,000 | | | $ | 75,728 | |
California Educational Facilities Authority Revenue Bonds, Stanford University, SeriesV-1, 5.00%, 5/01/49 | | | 100,000 | | | | 140,015 | |
California State Health Facilities Financing Authority Revenue Bonds, SubseriesA-2, Kaiser Permanente, 5.00%, 11/01/47 | | | 20,000 | | | | 27,655 | |
California State Taxable G.O. Unlimited Refunding Bonds, 4.60%, 4/01/38 | | | 215,000 | | | | 228,760 | |
California State Various Purpose Bid Group G.O. Unlimited Bonds, 5.00%, 10/01/48 | | | 70,000 | | | | 83,325 | |
California State Various Purpose Taxable G.O. Unlimited Bonds, Build America Bonds,
7.50% 4/01/34 | | | 35,000 | | | | 50,305 | |
7.55% 4/01/39 | | | 80,000 | | | | 122,256 | |
Los Angeles Community College District G.O. Unlimited Bonds, Build America Bonds, 6.60%, 8/01/42 | | | 25,000 | | | | 35,439 | |
Los Angeles Department Water & Power Revenue Bonds, Build America Bonds, 6.60%, 7/01/50 | | | 85,000 | | | | 125,964 | |
Los Angeles Unified School District G.O. Unlimited Bonds, Series RY, Build America Bonds, 6.76%, 7/01/34 | | | 100,000 | | | | 133,999 | |
Sacramento County Sanitation Districts Financing Authority Variable Revenue Refunding Bonds, Series B, Sacramento County Regional (NATL Insured), 2.29%, 12/01/35(d) | | | 140,000 | | | | 137,554 | |
University of California Revenue Bonds, Build America Bonds, 5.77%, 5/15/43 | | | 80,000 | | | | 100,643 | |
| | | | | | | | |
| | | Par | | | Value | |
| | |
California (Continued) | | | | | | | | |
University of California Taxable General Revenue Bonds, Series AD, 4.86%, 5/15/12(n) | | $ | 15,000 | | | $ | 16,402 | |
University of California Taxable General Revenue Bonds, Series AJ,
4.60%, 5/15/31 | | | 55,000 | | | | 60,624 | |
| | | | | | | 1,444,760 | |
| |
Colorado – 0.0%(i) | |
Colorado State Building Excellent Schools Today COPS, Series N, 5.00%, 3/15/38 | | | 120,000 | | | | 141,988 | |
| |
Florida – 0.0%(i) | |
Putnam County Development Authority Revenue Refunding Bonds, Series A, Seminole Project, 5.00%, 3/15/42 | | | 20,000 | | | | 22,954 | |
| |
Georgia – 0.1% | |
Atlanta Water & Wastewater Revenue Refunding Bonds,
5.00% 11/01/40 | | | 90,000 | | | | 102,686 | |
5.00% 11/01/41 | | | 80,000 | | | | 94,500 | |
Metropolitan Atlanta Rapid Transit Authority Sales Tax Revenue Refunding Bonds, Series A, 4.00%, 7/01/25 | | | 100,000 | | | | 113,378 | |
Municipal Electric Authority of Georgia Taxable Revenue Bonds, Build America Bonds, 6.64%, 4/01/57 | | | 21,000 | | | | 23,166 | |
| | | | | | | 333,730 | |
| |
Illinois – 0.1% | |
Illinois State G.O. Unlimited Bonds, Series D,
5.00% 11/01/25 | | | 90,000 | | | | 98,576 | |
5.00% 11/01/26 | | | 170,000 | | | | 187,105 | |
Illinois State Taxable Pension G.O. Unlimited Bonds, 5.10%, 6/01/33 | | | 175,000 | | | | 172,013 | |
| | | | | | | | 457,694 | |
See accompanying Notes to Financial Statements
95
Morningstar Funds Trust April 30, 2019
Schedule of Investments(continued)
Morningstar Total Return Bond Fund
| | | | | | | | |
| | | Par | | | Value | |
| | |
Indiana – 0.1% | | | | | | | | |
Indiana Finance Authority Wastewater Utility Revenue Bonds, Series A, First Lien,
5.00%, 10/01/45 | | $ | 150,000 | | | $ | 168,733 | |
Indiana Finance Authority Wastewater Utility Revenue Bonds, Series A, First Lien, CWA Authority Project Green Bonds,
5.00%, 10/01/46 | | | 50,000 | | | | 57,072 | |
| | | | | | | 225,805 | |
| |
Mississippi – 0.0%(i) | |
Mississippi State Hospital Equipment and Facilities Authority Revenue Bonds, Baptist Memorial Health Corp., 5.00%, 9/01/46 | | | 90,000 | | | | 99,104 | |
| |
Missouri – 0.0%(i) | |
Missouri State Health & Educational Facilities Authority Taxable Revenue Refunding Bonds, Series A, Washington University, 3.65%, 1/15/46 | | | 50,000 | | | | 49,385 | |
| |
New Jersey – 0.1% | |
New Jersey State Transportation Trust Fund Authority Revenue Bonds, Federal Highway Reimbursement Notes, 5.00%, 6/15/27 | | | 90,000 | | | | 104,188 | |
New Jersey State Turnpike Authority Taxable Revenue Bonds, Build America Bonds, 7.41%, 1/01/40 | | | 100,000 | | | | 150,046 | |
| | | | | | | 254,234 | |
| |
New York – 0.2% | |
Metropolitan Transportation Authority Dedicated Tax Fund Taxable Revenue Bonds, Build America Bonds, 7.33%, 11/15/39 | | | 50,000 | | | | 73,687 | |
Metropolitan Transportation Authority Revenue Bonds, Build America Bonds,
5.87%, 11/15/39 | | | 25,000 | | | | 30,664 | |
| | | | | | | | |
| | | Par | | | Value | |
| | |
New York (Continued) | | | | | | | | |
New York City Municipal Water Finance Authority Water & Sewer System Revenue Bonds, Build America Bonds, 5.44%, 6/15/43 | | $ | 100,000 | | | $ | 127,170 | |
New York City Municipal Water Finance Authority Water & Sewer System Second General Resolution Taxable Revenue Bonds, 5.88%, 6/15/44 | | | 5,000 | | | | 6,690 | |
New York City Municipal Water Finance Authority Water & Sewer System Taxable Revenue Bonds, Build America Bonds, 6.01%, 6/15/42 | | | 15,000 | | | | 20,040 | |
New York City Transitional Finance Authority Future Tax Secured Subordinate Revenue Bonds,
3.60% 2/01/25 | | | 60,000 | | | | 61,260 | |
3.90% 8/01/31 | | | 25,000 | | | | 25,977 | |
New York G.O. Unlimited Bonds, SubseriesF-1, 5.00%, 4/01/43 | | | 40,000 | | | | 47,084 | |
New York State Dormitory Authority Personal Income TRB, Build America Bonds, 5.39%, 3/15/40 | | | 5,000 | | | | 5,931 | |
New York State Transportation Development Corp. Special Facility Revenue Bonds (AMT), LaGuardia Airport Terminal B Redevelopment,
5.00% 7/01/46 | | | 90,000 | | | | 97,630 | |
5.25% 1/01/50 | | | 90,000 | | | | 98,279 | |
New York Taxable G.O. Unlimited Bonds, SubseriesD-2, Fiscal 2019,
3.53% 12/01/25 | | | 45,000 | | | | 46,914 | |
3.76% 12/01/27 | | | 15,000 | | | | 15,727 | |
Port Authority of New York & New Jersey Consolidated 165th Taxable Revenue Bonds, 5.65%, 11/01/40 | | | 70,000 | | | | 88,716 | |
See accompanying Notes to Financial Statements
96
Morningstar Funds Trust April 30, 2019
Schedule of Investments(continued)
Morningstar Total Return Bond Fund
| | | | | | | | |
| | | Par | | | Value | |
| | |
New York (Continued) | | | | | | | | |
Port Authority of New York & New Jersey Consolidated 168th Revenue Bonds,
4.93%, 10/01/51 | | $ | 135,000 | | | $ | 161,544 | |
Port Authority of New York & New Jersey Consolidated Taxable Revenue Bonds, Series 181, 4.96%, 8/01/46 | | | 30,000 | | | | 35,975 | |
| | | | | | | 943,288 | |
| |
North Carolina – 0.0%(i) | |
Wake County G.O. Unlimited Refunding Bonds, Series B,
5.00% 3/01/20 | | | 10,000 | | | | 10,282 | |
5.00% 3/01/21 | | | 10,000 | | | | 10,612 | |
5.00% 3/01/22 | | | 10,000 | | | | 10,940 | |
5.00% 3/01/23 | | | 10,000 | | | | 11,254 | |
| | | | | | | 43,088 | |
| |
Ohio – 0.1% | |
American Municipal Power-Ohio, Inc. Revenue Bonds, Build America Bonds, 6.45%, 2/15/44 | | | 80,000 | | | | 107,078 | |
American Municipal Power-Ohio, Inc. Taxable Revenue Bonds, Series B, Build America Bonds, Combined Hydroelectric Projects, 7.83%, 2/15/41 | | | 65,000 | | | | 98,232 | |
JobsOhio Beverage System Statewide Liquor Profits Taxable Revenue Bonds, Series B, 3.99%, 1/01/29 | | | 55,000 | | | | 58,070 | |
| | | | | | | 263,380 | |
| |
Oregon – 0.0%(i) | |
University of Oregon General Revenue Bonds, Series A, 5.00%, 4/01/46 | | | 90,000 | | | | 102,782 | |
| |
Pennsylvania – 0.1% | |
Berks County IDA Health System Revenue Refunding Bonds, Tower Health Project, 5.00% 11/01/47 | | | 90,000 | | | | 101,514 | |
5.00% 11/01/50 | | | 90,000 | | | | 101,165 | |
| | | | | | | | |
| | | Par | | | Value | |
| | |
Pennsylvania (Continued) | | | | | | | | |
Pennsylvania State Turnpike Commission Oil Franchise TRB, Series A, 5.00%, 12/01/48 | | $ | 90,000 | | | $ | 104,656 | |
Pennsylvania State Turnpike Commission Turnpike Revenue Bonds, SeriesA-1, 5.00%, 12/01/46 | | | 100,000 | | | | 113,348 | |
| | | | | | | 420,683 | |
| |
Texas – 0.1% | |
Grand Parkway Transportation Corp. Subordinate Tier Tax Revenue Bonds Series A, 5.00%, 10/01/43 | | | 70,000 | | | | 82,492 | |
San Antonio Electric & Gas Revenue Bonds, Junior Lien, Build America Bonds, 5.81%, 2/01/41 | | | 40,000 | | | | 51,905 | |
Texas State Water Development Board Revenue Bonds, State Water Implementation Fund, 5.00%, 4/15/23 | | | 20,000 | | | | 22,536 | |
| | | | | | | 156,933 | |
| |
Utah – 0.0%(i) | |
Salt Lake City Airport Revenue Bonds, Series A (AMT), 5.00%, 7/01/47 | | | 90,000 | | | | 102,671 | |
| |
Virginia – 0.0%(i) | |
Virginia Small Business Financing Authority Private Activity Revenue Bonds (AMT), Transform 66 P3 Project, 5.00%, 12/31/52 | | | 90,000 | | | | 98,372 | |
| |
Wisconsin – 0.0%(i) | |
Public Finance Authority Revenue Bonds (AMT), Denver International Airport, 5.00%, 9/30/49 | | | 90,000 | | | | 100,161 | |
Total Municipal Bonds
(Cost $5,091,248) | | | | | | | 5,261,012 | |
| | |
| | | Number
of Shares | | | | |
|
Investment Companies – 4.7% | |
BlackRock Allocation Target Shares - BATS, Series A | | | 692,749 | | | | 6,934,420 | |
See accompanying Notes to Financial Statements
97
Morningstar Funds Trust April 30, 2019
Schedule of Investments(continued)
Morningstar Total Return Bond Fund
| | | | | | |
| | | Number
of Shares | | Value | |
| | |
Schwab U.S. TIPS ETF | | 223,602 | | $ | 12,331,650 | |
Total Investment Companies
(Cost $18,962,823) | | | | | 19,266,070 | |
| | |
| | | Par | | | |
Short Term Investments – 8.9% | |
|
Certificates of Deposit – 0.5% | |
Sumitomo Mitsui Banking Corp.,
2.54%, 7/29/19 | | 2,250,000 | | | 2,249,987 | |
| |
Commercial Paper – 2.2% | |
Banco Santander S.A., 2.69%, 5/01/19(o) | | 970,000 | | | 969,935 | |
BNG Bank N.V., 2.50%, 7/16/19(o) | | 1,310,000 | | | 1,303,020 | |
Mitsubishi UFJ Trust & Banking Corp., 2.61%, 5/30/19(o) | | 470,000 | | | 469,029 | |
Mizuho Bank Ltd. , 2.57%, 6/13/19(o) | | 1,230,000 | | | 1,226,258 | |
MUFG Bank Ltd., 2.51%, 5/07/19(o) | | 1,010,000 | | | 1,009,533 | |
Standard Chartered Bank, 2.58%,
7/24/19(o) | | 1,220,000 | | | 1,212,646 | |
Sumitomo Mitsui Trust Bank Ltd.,
2.56%, 7/17/19(o) | | 1,130,000 | | | 1,123,808 | |
Toronto Dominion Bank, 2.53%, 7/25/19(o) | | 2,020,000 | | | 2,007,844 | |
| | | | | 9,322,073 | |
| |
Money Market Fund – 3.7% | |
Northern Institutional Funds - Treasury Portfolio (Premier), 2.29%(p) | | 15,188,901 | | | 15,188,901 | |
| | | | | | | | | | | | |
| | | | | | Par | | | Value | |
| | |
Repurchase Agreements – 0.1% | | | | | |
Merrill Lynch Pierce Fenner & Smith, 2.52% (dated 5/1/19, due 5/2/19, repurchase price $174,322), collateralized by U.S. Treasury Notes2.50%-2.88%, due01/31/24-08/15/28, total market value $174,139) | | | | | | | 174,065 | | | $ | 174,065 | |
Merrill Lynch Pierce Fenner & Smith, 2.57% (dated 5/1/19, due 5/2/19, repurchase price $112,988, collateralized by U.S. Treasury Notes 2.38%, due 02/29/24, total market value $112,848) | | | | | | | 112,840 | | | | 112,840 | |
| | | | | | | | | | | 286,905 | |
| | |
U.S. Treasury Bills – 2.4% | | | | | |
U.S. Treasury Bill, 2.14%,
6/27/19(o) | | | | 10,000,000 | | | | 9,962,400 | |
| |
Total Short Term Investments
(Cost $37,011,781) | | | | 37,010,266 | |
| | | |
| | | Number of
Contracts | | | Notional
Amount | | | | |
| |
Purchased Options – 0.0%(i) | | | | | |
Call Options – 0.0%(i) | | | | | | | | | |
5-Year U.S. Treasury Note, Strike Price $115.25, Expires 5/24/19 | | | 2 | | | | 231,320 | | | | 1,031 | |
5-Year U.S. Treasury Note, Strike Price $116.00, Expires 6/21/19 | | | 2 | | | | 231,500 | | | | 641 | |
Long U.S. Treasury Bond, Strike Price $147.00, Expires 5/24/19 | | | 3 | | | | 442,770 | | | | 3,328 | |
Long U.S. Treasury Bond, Strike Price $146.00, Expires 5/24/19 | | | 1 | | | | 147,590 | | | | 1,797 | |
South Korean Won vs. U.S. Dollar, Strike Price $140.00, Expires 5/20/19 | | | 1 | | | | 41,000 | | | | 848 | |
Turkish Lira vs. U.S. Dollar, Strike Price $6.50, Expires 5/17/19 | | | 1 | | | | 3,000 | | | | 375 | |
Turkish Lira vs. U.S. Dollar, Strike Price $6.65, Expires 7/12/19 | | | 1 | | | | 49,000 | | | | 1,106 | |
U.S. Dollar vs. Australian Dollar, Strike Price $0.72, Expires 5/16/19 | | | 1 | | | | 58,000 | | | | 81 | |
See accompanying Notes to Financial Statements
98
Morningstar Funds Trust April 30, 2019
Schedule of Investments(continued)
Morningstar Total Return Bond Fund
| | | | | | | | | | | | |
| | | Number of
Contracts | | | Notional
Amount | | | Value | |
| | |
Call Options (Continued) | | | | | | | | | |
U.S. Dollar vs. Euro, Strike Price $1.15, Expires 5/17/19 | | | 1 | | | $ | 32,000 | | | $ | 7 | |
U.S. Dollar vs. Great Britain Pound, Strike Price $1.35, Expires 5/17/19 | | | 1 | | | | 39,000 | | | | 19 | |
| | | | | | | | | | | 9,233 | |
| |
Put Options – 0.0%(i) | |
Brazilian Real vs. U.S. Dollar, Strike Price $3.91, Expires 5/30/19 | | | 1 | | | | 98,000 | | | | 1,158 | |
Chilean Peso vs. U.S. Dollar, Strike Price $665.00, Expires 5/02/19 | | | 1 | | | | 27,000 | | | | 10 | |
Colombian Peso vs. U.S. Dollar, Strike Price $130.00, Expires 5/02/19 | | | 1 | | | | 27,000 | | | | 1 | |
Long U.S. Treasury Bond, Strike Price $147.00, Expires 5/24/19 | | | 4 | | | | 590,360 | | | | 2,562 | |
Mexican Peso vs. U.S. Dollar, Strike Price $18.80, Expires 6/06/19 | | | 1 | | | | 68,400 | | | | 390 | |
Mexican Peso vs. U.S. Dollar, Strike Price $18.50, Expires 6/06/19 | | | 1 | | | | 1,800 | | | | 558 | |
South African Rand vs. U.S. Dollar, Strike Price $13.40, Expires 5/03/19 | | | 1 | | | | 78,500 | | | | 5 | |
South African Rand vs. U.S. Dollar, Strike Price $13.75, Expires 5/09/19 | | | 1 | | | | 125,000 | | | | 75 | |
South African Rand vs. U.S. Dollar, Strike Price $13.75, Expires 5/15/19 | | | 1 | | | | 58,000 | | | | 52 | |
South Korean Won vs. U.S. Dollar, Strike Price $125.00, Expires 6/07/19 | | | 1 | | | | 43,000 | | | | 16 | |
Turkish Lira vs. U.S. Dollar, | | | | | | | | | | | | |
Strike Price $5.50, Expires 5/17/19 | | | 1 | | | | 6,000 | | | | 187 | |
U.S. Dollar vs. Great Britain Pound, Strike Price $1.25, Expires 7/15/19 | | | 1 | | | | 795,000 | | | | 1,933 | |
| | | | | | | | | | | | 6,947 | |
| |
Total Purchased Options
(Cost $35,103) | | | | 16,180 | |
| | | | | | | | |
| |
Total Long Positions–121.5%
(Cost $498,122,014) | | | | 503,999,270 | |
| | |
| | | Par | | | Value | |
| |
Short Positions – (2.3)% | | | | | |
U.S. Government Obligations – (0.1)% | |
U.S. Treasury Notes – (0.1)% | | | | | | | | |
2.50%, 1/31/24(m) | | $ | (146,000 | ) | | $ | (147,363 | ) |
2.38%, 2/29/24(m) | | | (112,000 | ) | | | (112,512 | ) |
2.87%, 8/15/28(m) | | | (25,000 | ) | | | (25,782 | ) |
| | | | | | | | (285,657 | ) |
| |
Total U.S. Government Obligations
(Cost $(283,519)) | | | | (285,657 | ) |
|
Mortgage-Backed Securities – (2.2)% | |
Pool TBA(e) | | | (8,745,000 | ) | | | (8,986,231 | ) |
Pool TBA | | | (412,000 | ) | | | (406,713 | ) |
| |
Total Mortgage-Backed Securities
(Proceeds $(9,391,020)) | | | | (9,392,944 | ) |
Foreign Issuer Bonds – (0.0)%(i) | |
YPF S.A.(b) | | | (23,000 | ) | | | (22,464 | ) |
| |
Total Foreign Issuer Bonds
(Proceeds $(22,388)) | | | | (22,464 | ) |
| |
Total Short Positions – (2.3)%
(Cost $(9,696,927)) | | | | (9,701,065 | ) |
| |
Total Written Options–(0.0)%
(Premiums Received $(70,870)) | | | | (52,624 | ) |
| |
Liabilities less Other Assets – (19.2)%(q) | | | | (79,614,486 | ) |
| | |
NET ASSETS – 100.0% | | | | | | $ | 414,631,095 | |
| (a) | Par value is in USD unless otherwise indicated. |
| (b) | Securities exempt from registration under Rule 144A of the Securities Act of 1933. These securities may be resold in transactions exempt from registration, normally to qualified institutional buyers. The value of these securities is determined by valuations supplied by a pricing service or brokers, or, if not available, in accordance with procedures established by the Board of Trustees of Morningstar Funds. |
| (c) | Variable or floating rate security, the interest rate of which adjusts periodically based on changes in current interest rates and prepayments on the underlying pool of assets. |
| (d) | Variable rate security. Rate as of April 30, 2019 is disclosed. |
See accompanying Notes to Financial Statements
99
Morningstar Funds Trust April 30, 2019
Schedule of Investments(continued)
Morningstar Total Return Bond Fund
| (e) | When-Issued Security. Coupon rate was not in effect at April 30, 2019. |
| (f) | Step coupon bond. Rate as of April 30, 2019 is disclosed. |
| (g) | Variable rate security. Security issued at a fixed coupon rate, which converts to a variable rate at a future date. Rate shown is the rate in effect as of period end. |
| (h) | Perpetual bond. Maturity date represents next call date. |
| (i) | Amount rounds to less than 0.05%. |
| (j) | Century bond maturing in 2110. |
| (k) | The obligations of certain U.S. government-sponsored entities are neither issued nor guaranteed by the United States Treasury. |
| (m) | All or a portion of the security was held as collateral for open futures, options, securities sold short and/or swap agreements. |
| (n) | Century bond maturing in 2112. |
| (o) | Discount rate at the time of purchase. |
| (p) | 7-day current yield as of April 30, 2019 is disclosed. |
| (q) | Includes appreciation/ (depreciation) on forward foreign currency exchange, futures, swap and written options contracts. |
Percentages shown are based on Net Assets
Abbreviations:
| | |
| |
| 1M | | 1 Month |
| |
| 1Y | | 1 Year |
| |
| 3M | | 3 Month |
| |
| 5Y | | 5 Year |
| |
| ABS | | Asset-Backed Security |
| |
| ACES | | Alternative Credit Enhancement Securities |
| |
| AMT | | Alternative Minimum Tax |
| |
| ARS | | Argentine Peso |
| |
| CLO | | Collateralized Loan Obligation |
| |
| CMT | | Constant Maturity |
| |
| COP | | Colombian Peso |
| |
| COPS | | Certificates of Participation |
| |
| CWA | | Clean Water Act |
| |
| ETF | | Exchange-Traded Fund |
| |
| Fannie Mae | | Federal National Mortgage Association |
| |
| FHLB | | Federal Home Loan Bank |
| |
| Freddie Mac | | Federal Home Loan Mortgage Corporation |
| |
| G.O. | | General Obligation |
| |
| ICE | | Intercontinental Exchange |
| |
| IDA | | Industrial Development Authority |
| |
| IDR | | Indonesian Rupiah |
| |
| LIBOR | | London Interbank Offered Rate |
| |
| MXN | | Mexican Peso |
| |
| NATL | | National Public Finance Guarantee Corporation |
| |
| PLC | | Public Limited Company |
| |
| RUB | | Russian Ruble |
| |
| TBA | | To be announced |
| |
| TIPS | | Treasury Inflation Protected Securities |
| |
| TRB | | Tax Revenue Bonds |
| |
| USD | | United States Dollar |
| |
| ZAR | | South African Rand |
See accompanying Notes to Financial Statements
100
Morningstar Funds Trust April 30, 2019
Schedule of Investments(continued)
Morningstar Total Return Bond Fund
Futures Contracts outstanding at April 30, 2019:
Exchange Traded
| | | | | | | | | | | | | | | | | | | | |
| Description | | Number of
Contracts | | | Expiration
Date | | | Trading
Currency | | | Notional
Amount | | | Unrealized
Appreciation
(Depreciation) | |
| | | | | |
Long Contracts | | | | | | | | | | | | | | | | | | | | |
Ultra U.S. Treasury Bond | | | 108 | | | | 6/19/2019 | | | | USD | | | | 17,742,375 | | | | $ 38,351 | |
2-Year U.S. Treasury Note | | | 131 | | | | 6/28/2019 | | | | USD | | | | 27,904,023 | | | | 40,207 | |
5-Year U.S. Treasury Note | | | 34 | | | | 6/28/2019 | | | | USD | | | | 3,931,781 | | | | 10,231 | |
2-Year Eurodollar | | | 345 | | | | 12/16/2019 | | | | USD | | | | 84,145,500 | | | | 190,050 | |
90-Day Eurodollar | | | 3 | | | | 3/16/2020 | | | | USD | | | | 732,525 | | | | 450 | |
90-Day Eurodollar | | | 32 | | | | 6/15/2020 | | | | USD | | | | 7,820,800 | | | | 16,863 | |
| | | | | | |
Total Long Contracts | | | | | | | | | | | | | | | | | | | $ 296,152 | |
| | | | | |
Short Contracts | | | | | | | | | | | | | | | | | | | | |
10-Year U.S. Treasury Note | | | (202 | ) | | | 6/19/2019 | | | | USD | | | | 24,981,719 | | | | $ (35,461 | ) |
U.S. Treasury Long Bond | | | (36 | ) | | | 6/19/2019 | | | | USD | | | | 5,308,876 | | | | (13,978 | ) |
Ultra10-Year U.S. Treasury Note | | | (229 | ) | | | 6/19/2019 | | | | USD | | | | 30,177,906 | | | | (233,920 | ) |
30-Day Federal Fund | | | (67 | ) | | | 7/31/2019 | | | | USD | | | | 27,257,222 | | | | 1,396 | |
| | | | | | |
Total Short Contracts | | | | | | | | | | | | | | | | | | | $(281,963 | ) |
| | | | | | | | | | | | | | | | | | | | $ 14,189 | |
Forward Foreign Currency Contracts outstanding at April 30, 2019:
| | | | | | | | | | | | |
Expiration Date | | Currency Purchased | | Amount
of Currency
Purchased | | Currency
Sold | | Amount
of Currency
Sold | | Counterparty | | Unrealized
Appreciation
(Depreciation) |
05/30/19 | | U.S. Dollars | | 119,255 | | South African Rand | | 1,660,000 | | Deutsche Bank | | $3,636 |
06/19/19 | | Euro | | 473,000 | | British Pounds | | 404,787 | | Morgan Stanley | | 3,588 |
05/30/19 | | U.S. Dollars | | 261,194 | | South African Rand | | 3,707,000 | | Bank of America | | 3,002 |
05/29/19 | | U.S. Dollars | | 264,077 | | Indonesian Rupiahs | | 3,732,915,378 | | BNP | | 2,649 |
05/30/19 | | U.S. Dollars | | 61,541 | | Colombian Pesos | | 192,460,000 | | Citibank | | 2,116 |
05/30/19 | | Mexican Pesos | | 1,030,865 | | U.S. Dollars | | 52,800 | | Barclays | | 1,305 |
05/15/19 | | U.S. Dollars | | 49,000 | | South African Rand | | 686,897 | | BNP | | 1,070 |
06/19/19 | | British Pounds | | 331,525 | | Euro | | 384,000 | | State Street | | 883 |
05/15/19 | | U.S. Dollars | | 80,000 | | South Korean Won | | 92,264,000 | | JPMorgan Chase | | 851 |
05/03/19 | | U.S. Dollars | | 35,700 | | Brazilian Reals | | 137,795 | | Citibank | | 566 |
05/06/19 | | U.S. Dollars | | 72,063 | | Mexican Pesos | | 1,357,000 | | HSBC | | 554 |
05/15/19 | | U.S. Dollars | | 39,000 | | South African Rand | | 552,899 | | Deutsche Bank | | 420 |
05/15/19 | | U.S. Dollars | | 58,000 | | Mexican Pesos | | 1,094,402 | | BNP | | 416 |
05/15/19 | | U.S. Dollars | | 76,491 | | Indonesian Rupiahs | | 1,086,297,645 | | Toronto-Dominion Bank | | 340 |
06/17/19 | | U.S. Dollars | | 15,000 | | Turkish Lira | | 90,300 | | JPMorgan Chase | | 319 |
06/04/19 | | Brazilian Reals | | 861,757 | | U.S. Dollars | | 218,903 | | BNP | | 259 |
05/30/19 | | U.S. Dollars | | 125,790 | | Mexican Pesos | | 2,392,000 | | State Street | | 245 |
05/15/19 | | U.S. Dollars | | 8,000 | | Argentine Pesos | | 353,600 | | BNP | | 194 |
05/28/19 | | U.S. Dollars | | 11,863 | | Turkish Lira | | 71,057 | | BNP | | 170 |
See accompanying Notes to Financial Statements
101
Morningstar Funds Trust April 30, 2019
Schedule of Investments(continued)
Morningstar Total Return Bond Fund
| | | | | | | | | | | | | | |
Expiration Date | | Currency Purchased | | Amount of Currency Purchased | | Currency Sold | | Amount
of Currency
Sold | | Counterparty | | Unrealized
Appreciation
(Depreciation) | |
05/15/19 | | U.S. Dollars | | 5,500 | | South African Rand | | 76,914 | | Goldman Sachs | | | $ 133 | |
05/15/19 | | Argentine Pesos | | 164,150 | | U.S. Dollars | | 3,500 | | BNP | | | 124 | |
05/15/19 | | U.S. Dollars | | 14,000 | | Mexican Pesos | | 264,162 | | UBS | | | 101 | |
05/15/19 | | South African Rand | | 460,035 | | U.S. Dollars | | 32,000 | | Citibank | | | 100 | |
06/17/19 | | U.S. Dollars | | 5,000 | | Turkish Lira | | 30,175 | | Citibank | | | 94 | |
05/15/19 | | Argentine Pesos | | 23,650 | | U.S. Dollars | | 500 | | Citibank | | | 22 | |
06/19/19 | | U.S. Dollars | | 9,888 | | Australian Dollars | | 14,000 | | Goldman Sachs | | | 6 | |
05/30/19 | | South African Rand | | 717,423 | | U.S. Dollars | | 49,965 | | Bank of America | | | 3 | |
| | | | | | |
Total Unrealized Appreciation | | | | | | | | | | | $23,166 | |
| | | | | | |
06/19/19 | | Euro | | 429,000 | | British Pounds | | 369,633 | | Goldman Sachs | | | $ (15 | ) |
06/19/19 | | Australian Dollars | | 14,000 | | U.S. Dollars | | 9,916 | | HSBC | | | (35 | ) |
05/15/19 | | U.S. Dollars | | 49,000 | | South African Rand | | 702,768 | | BNP | | | (38 | ) |
06/19/19 | | U.S. Dollars | | 498,124 | | British Pounds | | 381,000 | | Goldman Sachs | | | (56 | ) |
05/03/19 | | Brazilian Reals | | 24,644 | | U.S. Dollars | | 6,353 | | Morgan Stanley | | | (70 | ) |
05/15/19 | | Indonesian Rupiahs | | 726,444,000 | | U.S. Dollars | | 51,000 | | JPMorgan Chase | | | (76 | ) |
06/19/19 | | U.S. Dollars | | 21,000 | | Argentine Pesos | | 1,009,575 | | BNP | | | (105 | ) |
06/18/19 | | U.S. Dollars | | 3,500 | | Argentine Pesos | | 173,425 | | BNP | | | (131 | ) |
05/29/19 | | U.S. Dollars | | 201,622 | | Indonesian Rupiahs | | 2,881,378,043 | | BNP | | | (170 | ) |
07/16/19 | | Indonesian Rupiahs | | 457,600,000 | | U.S. Dollars | | 32,000 | | BNP | | | (176 | ) |
05/03/19 | | Brazilian Reals | | 80,111 | | U.S. Dollars | | 20,647 | | Citibank | | | (221 | ) |
06/17/19 | | Turkish Lira | | 21,042 | | U.S. Dollars | | 3,645 | | Citibank | | | (224 | ) |
05/03/19 | | U.S. Dollars | | 218,903 | | Brazilian Reals | | 859,510 | | BNP | | | (247 | ) |
06/04/19 | | U.S. Dollars | | 49,000 | | Brazilian Reals | | 193,746 | | Citibank | | | (273 | ) |
06/17/19 | | Turkish Lira | | 31,114 | | U.S. Dollars | | 5,351 | | Goldman Sachs | | | (292 | ) |
06/18/19 | | Argentine Pesos | | 319,550 | | U.S. Dollars | | 7,000 | | Citibank | | | (309 | ) |
05/28/19 | | Turkish Lira | | 70,072 | | U.S. Dollars | | 11,863 | | BNP | | | (332 | ) |
05/03/19 | | U.S. Dollars | | 20,397 | | Brazilian Reals | | 81,425 | | Goldman Sachs | | | (364 | ) |
05/15/19 | | U.S. Dollars | | 98,000 | | Indonesian Rupiahs | | 1,403,360,000 | | UBS | | | (377 | ) |
05/30/19 | | U.S. Dollars | | 35,000 | | Argentine Pesos | | 1,643,593 | | Citibank | | | (503 | ) |
05/07/19 | | U.S. Dollars | | 195,742 | | Japanese Yen | | 21,852,022 | | Goldman Sachs | | | (545 | ) |
06/17/19 | | Turkish Lira | | 63,232 | | U.S. Dollars | | 11,004 | | JPMorgan Chase | | | (723 | ) |
05/15/19 | | Mexican Pesos | | 2,105,530 | | U.S. Dollars | | 111,588 | | UBS | | | (801 | ) |
05/30/19 | | Argentine Pesos | | 418,800 | | U.S. Dollars | | 10,000 | | Deutsche Bank | | | (954 | ) |
05/15/19 | | South Korean Won | | 46,467,760 | | U.S. Dollars | | 41,000 | | Standard Chartered Bank | | | (1,137 | ) |
05/30/19 | | Colombian Pesos | | 192,460,000 | | U.S. Dollars | | 60,966 | | Citibank | | | (1,541 | ) |
06/19/19 | | Argentine Pesos | | 925,300 | | U.S. Dollars | | 21,000 | | BNP | | | (1,657 | ) |
05/03/19 | | Brazilian Reals | | 412,875 | | U.S. Dollars | | 107,000 | | Goldman Sachs | | | (1,729 | ) |
06/19/19 | | British Pounds | | 334,000 | | U.S. Dollars | | 438,479 | | State Street | | | (1,753 | ) |
05/03/19 | | Brazilian Reals | | 546,084 | | U.S. Dollars | | 141,000 | | BNP | | | (1,765 | ) |
05/30/19 | | U.S. Dollars | | 94,469 | | Mexican Pesos | | 1,840,559 | | Barclays | | | (2,134 | ) |
05/15/19 | | South Korean Won | | 90,576,000 | | U.S. Dollars | | 80,000 | | BNP | | | (2,299 | ) |
05/30/19 | | Argentine Pesos | | 1,040,995 | | U.S. Dollars | | 25,000 | | BNP | | | (2,514 | ) |
06/19/19 | | Brazilian Reals | | 853,376 | | U.S. Dollars | | 220,000 | | BNP | | | (3,246 | ) |
See accompanying Notes to Financial Statements
102
Morningstar Funds Trust April 30, 2019
Schedule of Investments(continued)
Morningstar Total Return Bond Fund
| | | | | | | | | | | | | | | | | | |
Expiration Date | | Currency Purchased | | Amount
of Currency
Purchased | | | Currency
Sold | | Amount
of Currency
Sold | | | Counterparty | | Unrealized
Appreciation
(Depreciation) | |
05/15/19 | | South African Rand | | | 2,489,471 | | | U.S. Dollars | | | 178,000 | | | Citibank | | | $ (4,290) | |
| 06/19/19 | | British Pounds | | | 407,000 | | | U.S. Dollars | | | 537,984 | | | Morgan Stanley | | | (5,807) | |
| 06/19/19 | | Brazilian Reals | | | 1,126,204 | | | U.S. Dollars | | | 293,000 | | | JPMorgan Chase | | | (6,948) | |
| 06/19/19 | | British Pounds | | | 804,739 | | | Euro | | | 941,000 | | | Morgan Stanley | | | (7,865) | |
| | | | | |
Total Unrealized Depreciation | | | | | | | | | | | | $(51,722) | |
| | | | |
Net Unrealized Appreciation/Depreciation | | | | | | | | | | | | $(28,556) | |
Written Call Option Contracts outstanding at April 30, 2019:
Exchange Traded
| | | | | | | | | | | | | | | | | | | | | | | | | | | | |
| Description | | Counterparty | | Number of
Contracts | | | | | | Notional
Amount | | | | | | Exercise
Price | | | Expiration
Date | | | Value |
10-Year U.S. Treasury Note | | UBS | | | 2 | | | | USD | | | | (247,340 | ) | | | USD | | | | 123.50 | | | | 5/24/2019 | | | $ (1,063) |
10-Year U.S. Treasury Note | | UBS | | | 8 | | | | USD | | | | (989,360 | ) | | | USD | | | | 123.00 | | | | 5/24/2019 | | | (6,875) |
10-Year U.S. Treasury Note | | UBS | | | 12 | | | | USD | | | | (1,484,040 | ) | | | USD | | | | 124.00 | | | | 5/24/2019 | | | (3,563) |
10-Year U.S. Treasury Note | | UBS | | | 38 | | | | USD | | | | (4,699,460 | ) | | | USD | | | | 125.00 | | | | 5/24/2019 | | | (3,562) |
10-Year U.S. Treasury Note | | UBS | | | 8 | | | | USD | | | | (991,120 | ) | | | USD | | | | 124.00 | | | | 6/21/2019 | | | (4,875) |
10-Year U.S. Treasury Note | | UBS | | | 8 | | | | USD | | | | (991,120 | ) | | | USD | | | | 124.50 | | | | 6/21/2019 | | | (3,250) |
5-Year U.S. Treasury Note | | UBS | | | 8 | | | | USD | | | | (925,280 | ) | | | USD | | | | 115.50 | | | | 5/24/2019 | | | (2,875) |
5-Year U.S. Treasury Note | | UBS | | | 10 | | | | USD | | | | (1,156,600 | ) | | | USD | | | | 116.00 | | | | 5/24/2019 | | | (1,562) |
Long U.S. Treasury Bond | | UBS | | | 2 | | | | USD | | | | (295,180 | ) | | | USD | | | | 145.00 | | | | 5/24/2019 | | | (344) |
Long U.S. Treasury Bond | | UBS | | | 4 | | | | USD | | | | (590,360 | ) | | | USD | | | | 149.00 | | | | 5/24/2019 | | | (1,313) |
Long U.S. Treasury Bond | | UBS | | | 6 | | | | USD | | | | (885,540 | ) | | | USD | | | | 148.00 | | | | 5/24/2019 | | | (3,656) |
| | | | | | |
Total Written Call Options Contracts (Premiums Received $35,169) | | | | | | | | | | | | | | | | | | | $(32,938) |
Written Put Option Contracts outstanding at April 30, 2019: Exchange Traded
| | | | | | | | | | | | | | | | | | | | | | | | | | | | |
| Description | | Counterparty | | Number of
Contracts | | | | | | Notional
Amount | | | | | | Exercise
Price | | | Expiration
Date | | | Value |
10-Year U.S. Treasury Note | | UBS | | | 14 | | | | USD | | | | (1,731,380 | ) | | | USD | | | | 123.50 | | | | 5/24/2019 | | | $ (5,031) |
10-Year U.S. Treasury Note | | UBS | | | 19 | | | | USD | | | | (2,349,730 | ) | | | USD | | | | 124.50 | | | | 5/24/2019 | | | (2,969) |
10-Year U.S. Treasury Note | | UBS | | | 19 | | | | USD | | | | (2,349,730 | ) | | | USD | | | | 123.00 | | | | 5/24/2019 | | | (3,562) |
5-Year U.S. Treasury Note | | UBS | | | 5 | | | | USD | | | | (578,300 | ) | | | USD | | | | 115.00 | | | | 5/24/2019 | | | (352) |
5-Year U.S. Treasury Note | | UBS | | | 8 | | | | USD | | | | (925,280 | ) | | | USD | | | | 115.20 | | | | 5/24/2019 | | | (1,000) |
Long U.S. Treasury Bond | | UBS | | | 2 | | | | USD | | | | (295,180 | ) | | | USD | | | | 150.00 | | | | 5/24/2019 | | | (344) |
Long U.S. Treasury Bond | | UBS | | | 4 | | | | USD | | | | (590,360 | ) | | | USD | | | | 146.00 | | | | 5/24/2019 | | | (1,313) |
Long U.S. Treasury Bond | | UBS | | | 9 | | | | USD | | | | (1,328,310 | ) | | | USD | | | | 144.00 | | | | 5/24/2019 | | | (703) |
| | | | | | |
Total Written Put Options Contracts (Premiums Received $26,057) | | | | | | | | | | | | | | | | | | | $(15,274) |
See accompanying Notes to Financial Statements
103
Morningstar Funds Trust April 30, 2019
Schedule of Investments(continued)
Morningstar Total Return Bond Fund
Written Call Option Contracts outstanding at April 30, 2019:
Over the Counter
| | | | | | | | | | | | | | | | | | | | | | | | | | | | |
| Description | | Counterparty | | Number of
Contracts | | | | | | Notional
Amount | | | | | | Exercise
Price | | | Expiration
Date | | | Value |
Chilean Peso vs. U.S. Dollar | | Morgan Stanley | | | 1 | | | | USD | | | | (27,000 | ) | | | USD | | | | 680.00 | | | | 5/2/2019 | | | $ (45) |
Colombian Peso vs. U.S. Dollar | | JPMorgan Chase | | | 1 | | | | USD | | | | (27,000 | ) | | | USD | | | | 165.00 | | | | 5/2/2019 | | | (579) |
South African Rand vs. U.S. Dollar | | Citibank | | | 1 | | | | USD | | | | (25,000 | ) | | | USD | | | | 14.70 | | | | 5/16/2019 | | | (114) |
Turkish Lira vs. U.S. Dollar | | Deutsche Bank | | | 1 | | | | USD | | | | (49,000 | ) | | | USD | | | | 7.20 | | | | 7/12/2019 | | | (601) |
| | | | | | |
Total Written OTC Call Options Contracts (Premiums Received $1,733) | | | | | | | | | | | | | | | | | | | $(1,339) |
Written Put Option Contracts outstanding at April 30, 2019:
Over the Counter
| | | | | | | | | | | | | | | | | | | | | | | | | | | | |
| Description | | Counterparty | | Number of
Contracts | | | | | | Notional
Amount | | | Exercise
Price | | | | | | Expiration
Date | | | Value |
Brazilian Real vs. U.S. Dollar | | HSBC | | | 1 | | | | USD | | | | (147,000 | ) | | | USD | | | | 3.84 | | | | 5/30/2019 | | | $ (776) |
Mexican Peso vs. U.S. Dollar | | Morgan Stanley | | | 1 | | | | USD | | | | (136,800 | ) | | | USD | | | | 18.50 | | | | 6/6/2019 | | | (310) |
South African Rand vs. U.S. Dollar | | Deutsche Bank | | | 1 | | | | USD | | | | (125,000 | ) | | | USD | | | | 13.30 | | | | 5/9/2019 | | | (7) |
South African Rand vs. U.S. Dollar | | BNP | | | 1 | | | | USD | | | | (117,000 | ) | | | USD | | | | 13.35 | | | | 5/15/2019 | | | (47) |
U.S. Dollar vs. Great Britain Pound | | Citibank | | | 1 | | | | GBP | | | | (795,000 | ) | | | GBP | | | | 1.25 | | | | 7/15/2019 | | | (1,933) |
| | | | | | |
Total Written OTC Put Options Contracts (Premiums Received $7,911) | | | | | | | | | | | | | | | | | | | $(3,073) |
Interest Rate Swap Contracts outstanding at April 30, 2019:
Exchange Traded
| | | | | | | | | | | | | | | | | | | | | | | | | | |
Pay Rate Index/ Pay Rate | | Receive Rate/ Receive Rate Index | | | Maturity Date | | | | | | Notional
Amount | | | Market Value | | | Upfront
Premiums
Paid
(Received) | | | Unrealized
Appreciation
(Depreciation) |
28-Day MXN-TIIE-BANXICO (Monthly) | | | 8.37% (Monthly) | | | | 4/23/2020 | | | | MXN | | | | 26,463,000 | | | | $ (89 | ) | | | $ — | | | $ (89) |
1-Day U.S. Federal Funds Rate (At Maturity) | | | 2.35% (Anually) | | | | 12/31/2020 | | | | USD | | | | 77,070,000 | | | | 224,404 | | | | 36,500 | | | 187,904 |
3-Month LIBOR (Quarterly) | | | 2.25% (Semi-Annually) | | | | 4/26/2022 | | | | USD | | | | 23,463,000 | | | | 11,537 | | | | 5,426 | | | 6,111 |
2.85% (Semi-Annually) | | | 3-Month LIBOR (Quarterly) | | | | 8/31/2022 | | | | USD | | | | 3,181,000 | | | | (55,713 | ) | | | (45,148 | ) | | (10,565) |
1.28% (Semi-Annually) | |
| 6-Month LIBOR
(Semi-Annually) |
| | | 4/5/2023 | | | | GBP | | | | 2,095,000 | | | | 509 | | | | — | | | 509 |
1.30% (Semi-Annually) | |
| 6-Month LIBOR
(Semi-Annually) |
| | | 4/5/2023 | | | | GBP | | | | 1,720,000 | | | | 38 | | | | — | | | 38 |
6-Month EURIBOR(Semi-Annually) | | | 0.92% (Annually) | | | | 4/11/2023 | | | | EUR | | | | 2,345,000 | | | | 713 | | | | — | | | 713 |
6-Month EURIBOR(Semi-Annually) | | | 0.16% (Annually) | | | | 4/11/2023 | | | | EUR | | | | 1,926,000 | | | | (253 | ) | | | — | | | (253) |
2.30% (Semi-Annually) | | | 3-Month LIBOR (Quarterly) | | | | 4/26/2023 | | | | USD | | | | 23,903,000 | | | | (2,453 | ) | | | 1,613 | | | (4,066) |
See accompanying Notes to Financial Statements
104
Morningstar Funds Trust April 30, 2019
Schedule of Investments(continued)
Morningstar Total Return Bond Fund
| | | | | | | | | | | | | | | | | | | | | | | | | | |
Pay Rate Index/ Pay Rate | | Receive Rate/
Receive Rate Index | | | Maturity
Date | | | | | | Notional
Amount | | | Market Value | | | Upfront Premiums Paid (Received) | | | Unrealized Appreciation (Depreciation) |
28-Day MXN-TIIE-BANXICO (Monthly) | | | 8.43% (Monthly) | | | | 12/29/2023 | | | | MXN | | | | 1,000,000 | | | | $ 1,159 | | | | $ — | | | $ 1,159 |
28-Day MXN-TIIE-BANXICO (Monthly) | | | 8.12% (Monthly) | | | | 2/2/2024 | | | | MXN | | | | 1,055,042 | | | | 552 | | | | — | | | 552 |
28-Day MXN-TIIE-BANXICO (Monthly) | | | 8.14% (Monthly) | | | | 2/5/2024 | | | | MXN | | | | 758,218 | | | | 416 | | | | — | | | 416 |
3-Month LIBOR (Quarterly) | |
| 1-Day U.S. Federal Fund
Rate (Quarterly) |
| | | 6/19/2024 | | | | USD | | | | 6,194,000 | | | | 4,250 | | | | 6,352 | | | (2,102) |
2.25% (Annually) | |
| 1-Day U.S. Federal Fund
Rate (At Maturity) |
| | | 12/31/2025 | | | | USD | | | | 4,335,000 | | | | (35,821 | ) | | | (25,809 | ) | | (10,012) |
2.25% (Semi-Annually) | | | 3-Month LIBOR (Quarterly) | | | | 12/31/2025 | | | | USD | | | | 1,612,000 | | | | 12,713 | | | | 2,213 | | | 10,500 |
2.50% (Semi-Annually) | | | 3-Month LIBOR (Quarterly) | | | | 1/31/2026 | | | | USD | | | | 15,164,000 | | | | (108,705 | ) | | | (79,937 | ) | | (28,768) |
3-Month LIBOR (Quarterly) | | | 3.00% (Semi-Annually) | | | | 2/15/2036 | | | | USD | | | | 3,368,000 | | | | 156,318 | | | | 92,641 | | | 63,677 |
2.88% (Semi-Annually) | | | 3-Month LIBOR (Quarterly) | | | | 5/15/2044 | | | | USD | | | | 1,924,000 | | | | (53,675 | ) | | | 13,648 | | | (67,323) |
3.00% (Semi-Annually) | | | 3-Month LIBOR (Quarterly) | | | | 5/15/2044 | | | | USD | | | | 2,498,000 | | | | (128,575 | ) | | | (81,526 | ) | | (47,049) |
2.75% (Semi-Annually) | | | 3-Month LIBOR (Quarterly) | | | | 8/15/2044 | | | | USD | | | | 5,864,000 | | | | (23,068 | ) | | | (61,171 | ) | | 38,103 |
| | | | | | | | |
Total | | | | | | | | | | | | | | | 205,938,260 | | | | $ 4,257 | | | | $(135,198) | | | $ 139,455 |
Interest Rate Swap Contracts outstanding at April 30, 2019:
Over the Counter
| | | | | | | | | | | | | | | | | | | | | | | | | | | | | | |
Pay Rate Index/ Pay Rate | | Receive Rate/ Receive Rate Index | | | Counterparty | | | Maturity Date | | | | | | Notional Amount | | | Market Value | | | Upfront Premiums Paid (Received) | | | Unrealized Appreciation (Depreciation) |
1-Day Brazil Cetip DI Interbank Deposit Rate (At Maturity) | | | 8.27% (At Maturity) | | | | JPMorgan Chase | | | | 1/2/2023 | | | | BRL | | | | 482,453 | | | | $ 885 | | | | $— | | | $ 885 |
1-Day Brazil Cetip DI Interbank Deposit Rate (At Maturity) | | | 8.35% (At Maturity) | | | | Goldman Sachs | | | | 1/2/2023 | | | | BRL | | | | 459,743 | | | | 1,167 | | | | — | | | 1,167 |
1-Day Brazil Cetip DI Interbank Deposit Rate (At Maturity) | | | 8.53% (At Maturity) | | | | Citibank | | | | 1/2/2023 | | | | BRL | | | | 400,000 | | | | 2,309 | | | | — | | | 2,309 |
1-Day Brazil Cetip DI Interbank Deposit Rate (At Maturity) | | | 8.26% (At Maturity) | | | | Citibank | | | | 1/2/2023 | | | | BRL | | | | 161,170 | | | | 404 | | | | — | | | 404 |
1-Day Brazil Cetip DI Interbank Deposit Rate (At Maturity) | | | 8.54% (At Maturity) | | | | Citibank | | | | 1/2/2025 | | | | BRL | | | | 876,000 | | | | (23 | ) | | | — | | | (23) |
1-Day Brazil Cetip DI Interbank Deposit Rate (At Maturity) | | | 8.49% (At Maturity) | | | | Citibank | | | | 1/2/2025 | | | | BRL | | | | 709,047 | | | | 192 | | | | — | | | 192 |
1-Day Brazil Cetip DI Interbank Deposit Rate (At Maturity) | | | 8.55% (At Maturity) | | | | BNP | | | | 1/2/2025 | | | | BRL | | | | 363,000 | | | | 319 | | | | — | | | 319 |
| | | | | | | | | |
Total | | | | | | | | | | | | | | | | | | | 3,451,413 | | | | $5,253 | | | | $— | | | $5,253 |
See accompanying Notes to Financial Statements
105
Morningstar Funds Trust April 30, 2019
Schedule of Investments(continued)
Morningstar Total Return Bond Fund
Credit Default Swap Contracts outstanding - Sell Protection as of April 30, 2019:
Exchange Traded
| | | | | | | | | | | | | | | | | | | | | | | | | | | | | | | | |
Reference
Obligation | | Implied Credit Spread | | | Fixed Deal (Pay) Rate | | | Maturity Date | | | Counterparty | | | Notional
Amount | | | Market Value | | | Upfront
Premiums
Paid/
(Received) | | | Unrealized
Appreciation
(Depreciation) | |
Markit CDX North America Investment Grade Index Series 32 (Quarterly) | | | 0.58 | % | | | 1.00 | % | | | 6/20/2024 | | | | UBS | | | | USD 52,660,000 | | | | $1,124,683 | | | | $948,813 | | | | $175,870 | |
Total | | | | | | | | | | | | | | | | | | | 52,660,000 | | | | $1,124,683 | | | | $948,813 | | | | $175,870 | |
Credit Default Swap Contracts outstanding - Buy Protection at April 30, 2019:
Over the Counter
| | | | | | | | | | | | | | | | | | | | | | | | | | | | | | | | |
| Reference Obligation | | Fixed
Deal
(Pay) Rate | | | Maturity
Date | | | Counterparty | | | | | | Notional
Amount | | | Market Value | | | Upfront
Premiums
Paid/
(Received) | | | Unrealized
Appreciation
(Depreciation) | |
Federal Republic Of Brazil, 4.25%, 1/7/2025 (Quarterly) | | | 1.00 | % | | | 12/20/2023 | | | | Barclays | | | | USD | | | | 4,000 | | | $ | 95 | | | $ | 175 | | | | $ (80 | ) |
Federal Republic Of Brazil, 4.25%, 1/7/2025 (Quarterly) | | | 1.00 | % | | | 6/20/2024 | | | | BNP | | | | USD | | | | 410,000 | | | | 13,387 | | | | 13,939 | | | | (552 | ) |
Federal Republic Of Brazil, 4.25%, 1/7/2025 (Quarterly) | | | 1.00 | % | | | 6/20/2024 | | | | Morgan Stanley | | | | USD | | | | 190,000 | | | | 6,204 | | | | 6,185 | | | | 19 | |
Federal Republic Of Brazil, 4.25%, 1/7/2025 (Quarterly) | | | 1.00 | % | | | 6/20/2024 | | | | Citibank | | | | USD | | | | 81,000 | | | | 2,645 | | | | 2,642 | | | | 3 | |
Republic of Argentina, 7.50%, 4/22/2026 (Quarterly) | | | 1.00 | % | | | 6/20/2024 | | | | HSBC | | | | USD | | | | 19,000 | | | | 6,621 | | | | 2,420 | | | | 4,201 | |
Republic of Colombia, 10.36%, 1/28/2033 (Quarterly) | | | 1.00 | % | | | 6/20/2024 | | | | Morgan Stanley | | | | USD | | | | 194,000 | | | | (441 | ) | | | (278 | ) | | | (163 | ) |
Republic of Colombia, 10.38%, 1/28/2033 (Quarterly) | | | 1.00 | % | | | 6/20/2024 | | | | Citibank | | | | USD | | | | 140,000 | | | | (318 | ) | | | 1,389 | | | | (1,707 | ) |
Republic of Philippines, 10.63%, 3/16/2025 (Quarterly) | | | 1.00 | % | | | 6/20/2024 | | | | Citibank | | | | USD | | | | 307,000 | | | | (7,653 | ) | | | (5,951 | ) | | | (1,702 | ) |
Republic of South Africa, 5.50%, 3/9/2020 (Quarterly) | | | 1.00 | % | | | 6/20/2024 | | | | Citibank | | | | USD | | | | 232,000 | | | | 9,110 | | | | 8,707 | | | | 403 | |
Republic of South Africa, 5.50%, 3/9/2020 (Quarterly) | | | 1.00 | % | | | 6/20/2024 | | | | Goldman Sachs | | | | USD | | | | 231,000 | | | | 9,071 | | | | 10,316 | | | | (1,245 | ) |
Republic of Turkey, 11.88%, 1/15/2030 (Quarterly) | | | 1.00 | % | | | 6/20/2024 | | | | BNP | | | | USD | | | | 30,000 | | | | 4,426 | | | | 3,018 | | | | 1,408 | |
Republic of Turkey, 11.88%, 1/15/2030 (Quarterly) | | | 1.00 | % | | | 6/20/2024 | | | | Morgan Stanley | | | | USD | | | | 25,000 | | | | 3,688 | | | | 2,533 | | | | 1,155 | |
United Mexican States, 4.15%, 3/28/2027 (Quarterly) | | | 1.00 | % | | | 6/20/2024 | | | | HSBC | | | | USD | | | | 314,342 | | | | 1,521 | | | | 5,730 | | | | (4,209 | ) |
United Mexican States, 4.15%, 3/28/2027 (Quarterly) | | | 1.00 | % | | | 6/20/2024 | | | | Citibank | | | | USD | | | | 195,658 | | | | 947 | | | | 2,978 | | | | (2,031 | ) |
United Mexican States, 4.15%, 3/28/2027 (Quarterly) | | | 1.00 | % | | | 6/20/2024 | | | | Morgan Stanley | | | | USD | | | | 137,000 | | | | 663 | | | | 909 | | | | (246 | ) |
Total | | | | | | | | | | | | | | | | | | | 2,510,000 | | | $ | 49,966 | | | $ | 54,712 | | | | $(4,746 | ) |
See accompanying Notes to Financial Statements
106
Morningstar Funds Trust April 30, 2019
Schedule of Investments(continued)
Morningstar Total Return Bond Fund
Inflation Swap Contracts outstanding at April 30, 2019:
Exchange Traded
| | | | | | | | | | | | | | | | | | | | | | | | | | |
Pay Rate Index/ Pay Rate | | Receive Rate/ Receive Rate Index | | | Maturity Date | | | Currency | | | Notional Amount | | | Market Value | | | Upfront Premiums Paid/ (Received) | | | Unrealized Appreciation (Depreciation) |
1-Day UK Retail Price Index (At Maturity) | | | 3.44% (At Maturity) | | | | 3/15/2024 | | | | GBP | | | | 345,000 | | | | $(1,196 | ) | | | $— | | | $(1,196) |
3.41% (At Maturity) | |
| 1-Day UK Retail Price Index
(At Maturity) |
| | | 3/15/2024 | | | | GBP | | | | 1,150,000 | | | | 6,647 | | | | — | | | 6,647 |
1-Day U.S. Consumer Price Index (At Maturity) | | | 1.97% (At Maturity) | | | | 4/9/2024 | | | | USD | | | | 1,088,000 | | | | (3,320 | ) | | | — | | | (3,320) |
1-Day U.S. Consumer Price Index (At Maturity) | | | 1.99% (At Maturity) | | | | 4/15/2024 | | | | USD | | | | 2,853,000 | | | | (4,482 | ) | | | — | | | (4,482) |
1-Day UK Retail Price Index (At Maturity) | | | 3.55% (At Maturity) | | | | 4/15/2024 | | | | GBP | | | | 355,000 | | | | 1,457 | | | | — | | | 1,457 |
3.52% (At Maturity) | |
| 1-Day UK Retail Price Index
(At Maturity) |
| | | 4/15/2024 | | | | GBP | | | | 364,000 | | | | (779 | ) | | | — | | | (779) |
1-Day UK Retail Price Index (At Maturity) | | | 3.49% (At Maturity) | | | | 3/15/2029 | | | | GBP | | | | 1,150,000 | | | | (11,557 | ) | | | — | | | (11,557) |
2.12% (At Maturity) | |
| 1-Day U.S. Consumer Price
Index (At Maturity) |
| | | 4/9/2029 | | | | USD | | | | 1,088,000 | | | | 3,935 | | | | — | | | 3,935 |
1-Day UK Retail Price Index (At Maturity) | | | 3.56% (At Maturity) | | | | 4/15/2029 | | | | GBP | | | | 944,000 | | | | 1,658 | | | | — | | | 1,658 |
2.14% (At Maturity) | |
| 1-Day U.S. Consumer Price
Index (At Maturity) |
| | | 4/15/2029 | | | | USD | | | | 893,000 | | | | 1,999 | | | | — | | | 1,999 |
2.15% (At Maturity) | |
| 1-Day U.S. Consumer Price
Index (At Maturity) |
| | | 4/15/2029 | | | | USD | | | | 1,960,000 | | | | 2,872 | | | | — | | | 2,872 |
| | | | | | | | |
Total | | | | | | | | | | | | | | | 12,190,000 | | | | $(2,766 | ) | | | $— | | | $(2,766) |
See accompanying Notes to Financial Statements
107
Morningstar Funds Trust April 30, 2019
Schedule of Investments(continued)
Morningstar Total Return Bond Fund
Valuation Hierarchy
The following is a summary of the inputs used, as of April 30, 2019, in valuing the Fund’s investments carried at fair value:
| | | | | | | | | | | | | | | | |
| Morningstar Total Return Bond Fund | | Level 1 | | | Level 2 | | | Level 3 | | | Totals | |
| | | | |
Investments | | | | | | | | | | | | | | | | |
| | | | |
Assets: | | | | | | | | | | | | | | | | |
| | | | |
Investments in Securities: | | | | | | | | | | | | | | | | |
Asset-Backed Securities | | $ | — | | | $ | 52,732,189 | | | | $— | | | $ | 52,732,189 | |
Corporate Bonds | | | — | | | | 87,216,038 | | | | — | | | | 87,216,038 | |
Foreign Issuer Bonds | | | — | | | | 55,682,289 | | | | — | | | | 55,682,289 | |
U.S. Government Agencies | | | — | | | | 16,988,383 | | | | — | | | | 16,988,383 | |
U.S. Government Obligations | | | — | | | | 91,589,362 | | | | — | | | | 91,589,362 | |
Mortgage-Backed Securities | | | — | | | | 138,237,481 | | | | — | | | | 138,237,481 | |
Municipal Bonds | | | — | | | | 5,261,012 | | | | — | | | | 5,261,012 | |
Investment Companies | | | 19,266,070 | | | | — | | | | — | | | | 19,266,070 | |
Short-Term Investments | | | 15,188,901 | | | | 21,534,460 | | | | — | | | | 36,723,361 | |
Repurchase Agreements | | | — | | | | 286,905 | | | | — | | | | 286,905 | |
Purchased Options | | | 9,359 | | | | 6,821 | | | | — | | | | 16,180 | |
| | | | | |
Total Assets – Investments at value | | $ | 34,464,330 | | | $ | 469,534,940 | | | | $— | | | $ | 503,999,270 | |
| | | | |
Liabilities: | | | | | | | | | | | | | | | | |
| | | | |
Foreign Issuer Bonds | | $ | — | | | $ | (22,464 | ) | | | $— | | | $ | (22,464 | ) |
Mortgage-Backed Securities | | | — | | | | (9,392,944 | ) | | | — | | | | (9,392,944 | ) |
U.S. Government Obligations | | | — | | | | (285,657 | ) | | | — | | | | (285,657 | ) |
| | | | | |
Total Liabilities – Investments at value | | $ | — | | | $ | (9,701,065 | ) | | | $— | | | $ | (9,701,065 | ) |
| | | | | |
Total Investments | | $ | 34,464,330 | | | $ | 459,833,875 | | | | $— | | | $ | 494,298,205 | |
| | | | | | | | | | | | | | | | |
| Morningstar Total Return Bond Fund | | Level 1 | | | Level 2 | | | Level 3 | | | Totals | |
| | | | |
Derivative Financial Instruments | | | | | | | | | | | | | | | | |
| | | | |
Assets: | | | | | | | | | | | | | | | | |
| | | | |
Futures contracts | | $ | 296,152 | | | $ | — | | | | $— | | | $ | 296,152 | |
Forward foreign currency exchange contracts | | | — | | | | 23,166 | | | | — | | | | 23,166 | |
Swap agreements at value | | | — | | | | 1,619,514 | | | | — | | | | 1,619,514 | |
| | | | | |
Total Assets - Derivative Financial Instruments | | $ | 296,152 | | | $ | 1,642,680 | | | | $— | | | $ | 1,938,832 | |
| | | | |
Liabilities: | | | | | | | | | | | | | | | | |
| | | | |
Futures contracts | | $ | (281,963 | ) | | $ | — | | | | $— | | | $ | (281,963 | ) |
Forward foreign currency exchange contracts | | | — | | | | (51,722 | ) | | | — | | | | (51,722 | ) |
Written Options | | | (48,212 | ) | | | (4,412 | ) | | | — | | | | (52,624 | ) |
Swap agreements at value | | | — | | | | (438,121 | ) | | | — | | | | (438,121 | ) |
| | | | | |
Total Liabilities - Derivative Financial Instruments | | $ | (330,175 | ) | | $ | (494,255 | ) | | | $— | | | $ | (824,430 | ) |
| | | | |
Total Net Derivative Financial Instruments | | $ | (34,023 | ) | | $ | 1,148,425 | | | | $— | | | $ | 1,114,402 | |
See accompanying Notes to Financial Statements
108
Morningstar Funds Trust April 30, 2019
Schedule of Investments
|
Morningstar Municipal Bond Fund |
| | | | | | | | | | | | |
| | | Par | | | | | | Value | |
| |
Municipal Bonds – 94.7% | | | | | |
Alabama – 0.8% | | | | | | | | | | | | |
Alabama Federal Aid Highway Finance Authority Special Obligation Revenue Bonds, Series A, Garvee, 5.00%, 6/01/37 | | $ | 545,000 | | | | | | | $ | 646,550 | |
Tuscaloosa County IDA Gulf Opportunity Zone Revenue Refunding Bonds,
Series A, Hunt Refining Project, 5/01/44(a)(b) | | | 185,000 | | | | | | | | 198,183 | |
| | | | | | | | | | | | 844,733 | |
| | | |
Arizona – 1.4% | | | | | | | | | | | | |
Arizona Board of Regents Refunding COPS, Series C, University of Arizona, 5.00%, 6/01/28 | | | 400,000 | | | | | | | | 435,764 | |
Phoenix Industrial Development Authority Solid Waste Variable Revenue Refunding Bonds (AMT), Republic Services, 1.90%,
8/01/19(c)(d)(e) | | | 500,000 | | | | | | | | 500,000 | |
Pima County IDA Education Revenue Facility Revenue Bonds, Paideia Academies Project,
6.13%, 7/01/45(a) | | | 240,000 | | | | | | | | 243,972 | |
Salt River Project Agricultural Improvement & Power District Electric Revenue Refunding Bonds, Series A, 5.00%, 12/01/28 | | | 300,000 | | | | | | | | 323,871 | |
| | | | | | | | | | | | 1,503,607 | |
| | | |
California – 3.7% | | | | | | | | | | | | |
Bay Area Toll Authority Toll Bridge Variable Revenue Bonds, San Francisco Bay Area, (SIFMA Municipal Swap Index Yield + 0.90%), 3.02%,
5/01/23(c)(e) | | | 700,000 | | | | | | | | 710,031 | |
California State Infrastructure & Economic Development Bank Variable Revenue Refunding Bonds, Series S, J. Paul Getty Trust, (ICE LIBOR USD 1M + 0.33%), 2.07%, 4/01/22(c)(e) | | | 1,000,000 | | | | | | | | 997,540 | |
| | | | | | | | | | | | |
| | | Par | | | | | | Value | |
| | | |
California (Continued) | | | | | | | | | | | | |
California State Various Purpose Bid Group G.O. Unlimited Refunding Bonds, 5.00%, 8/01/30 | | $ | 600,000 | | | | | | | $ | 747,900 | |
California Statewide Communities Development Authority Revenue Bonds, Series A, Loma Linda University Medical Center,
5.25%, 12/01/56(a) | | | 250,000 | | | | | | | | 274,615 | |
Los Angeles Department of Airports Airport Subordinate Revenue Bonds (AMT), Los Angeles International,
5.00%, 5/15/34 | | | 500,000 | | | | | | | | 579,025 | |
Rocklin Special Tax Community Facilities District No. 10 Revenue Bonds,
9/01/34(b) | | | 150,000 | | | | | | | | 167,956 | |
Sacramento County Sanitation Districts Financing Authority Variable Revenue Refunding Bonds, Series B, Sacramento County Regional (NATL Insured), (ICE LIBOR USD 3M + 0.53%), 2.29%, 12/01/35(e) | | | 100,000 | | | | | | | | 98,253 | |
San Francisco City & County Airports Commission International Airport Revenue Bonds, Series A (AMT),
5.00%, 5/01/44 | | | 250,000 | | | | | | | | 295,620 | |
| | | | | | | | | | | | 3,870,940 | |
| | | |
Colorado – 2.8% | | | | | | | | | | | | |
Colorado High Performance Transportation Enterprise Revenue Bonds,C-470 Express Lane,
5.00%, 12/31/56 | | | 500,000 | | | | | | | | 539,540 | |
Colorado State Health Facilities Authority Revenue Bonds, Series A, Catholic Health, 5.00%, 2/01/41 | | | 380,000 | | | | | | | | 393,266 | |
Colorado State HFA MFH Variable Revenue Bonds, S Range Crossings Project, 2.15%, 1/01/20(c)(d)(e) | | | 400,000 | | | | | | | | 400,500 | |
See accompanying Notes to Financial Statements
109
Morningstar Funds Trust April 30, 2019
Schedule of Investments(continued)
Morningstar Municipal Bond Fund
| | | | | | | | | | | | |
| | | Par | | | | | | Value | |
| | | |
Colorado (Continued) | | | | | | | | | | | | |
Denver City & County Airport Subordinate System Revenue Refunding Bonds, Series A (AMT), 5.25%, 12/01/43 | | $ | 500,000 | | | | | | | $ | 596,180 | |
E-470 Co. Public Highway Authority Variable Refunding Senior Libor Index Bonds, (ICE LIBOR USD 1M + 0.42%), 2.08%, 9/01/21(c)(e) | | | 500,000 | | | | | | | | 500,080 | |
Park Creek Metropolitan District Revenue Refunding Bonds, Series A (NATL, IBC Insured), 5.00%, 12/01/45 | | | 500,000 | | | | | | | | 555,560 | |
| | | | | | | | | | | | 2,985,126 | |
| | | |
Connecticut – 0.2% | | | | | | | | | | | | |
Connecticut State Health & Educational Facilities Authority Revenue Refunding Bonds, Series F, Masonicare Issue, 5.00%, 7/01/27 | | | 220,000 | | | | | | | | 241,100 | |
| | | |
Delaware – 0.9% | | | | | | | | | | | | |
Delaware State Health Facilities Authority Revenue Bonds, Beebe Medical Center, 5.00%, 6/01/48 | | | 500,000 | | | | | | | | 559,635 | |
Kent County Student Housing & Dining Facilities Revenue Bonds,CHF-DoverLLC-Delaware State University Project, 5.00%, 7/01/32 | | | 250,000 | | | | | | | | 281,170 | |
5.00%, 7/01/48 | | | 100,000 | | | | | | | | 109,067 | |
| | | | | | | | | | | | 949,872 | |
| | | |
District of Columbia – 2.9% | | | | | | | | | | | | |
District of Columbia Water & Sewer Authority Public Utility Revenue Bonds, Series B, 5.00%, 10/01/49 | | | 500,000 | | | | | | | | 588,725 | |
District of Columbia Water & Sewer Authority Public Utility Revenue Subordinate Lien Bonds, Series A, 5.00%, 10/01/48 | | | 650,000 | | | | | | | | 715,663 | |
District of Columbia Water & Sewer Authority Public Utility Revenue Subordinate Lien Bonds, Series B, 5.00%, 10/01/37 | | | 750,000 | | | | | | | | 861,450 | |
| | | | | | | | | | | | |
| | | Par | | | | | | Value | |
| | |
District of Columbia (Continued) | | | | | | | | | |
Metropolitan Washington Airports Authority Dulles Toll Road Revenue Refunding Bonds, Dulles Metrorail and Capital Improvement Projects, 5.00%, 10/01/53 | | $ | 500,000 | | | | | | | $ | 530,155 | |
Washington Metropolitan Area Transit Authority Gross Revenue Bonds, 5.00%, 7/01/43 | | | 300,000 | | | | | | | | 350,277 | |
| | | | | | | | | | | | 3,046,270 | |
| | | |
Florida – 3.3% | | | | | | | | | | | | |
Alachua County Health Facilities Authority Revenue Bonds, Shands Teaching Hospital & Clinics, 5.00%, 12/01/44 | | | 500,000 | | | | | | | | 544,925 | |
Central Florida Expressway Authority Revenue Refunding Bonds, Senior Lien, 5.00%, 7/01/42 | | | 350,000 | | | | | | | | 407,515 | |
Davie Educational Facilities Revenue Bonds, Series B, Nova Southeastern University Project, 5.00%, 4/01/24 | | | 250,000 | | | | | | | | 276,990 | |
Hillsborough County Aviation Authority Tampa International Subordinate Revenue Bonds, Series B, 5.00%, 10/01/40 | | | 470,000 | | | | | | | | 529,836 | |
JEA Bulk Power Supply System Revenue Bonds, Scherer 4 Project, Series A, 3.00%, 10/01/22 | | | 225,000 | | | | | | | | 225,151 | |
Lee Memorial Health System Hospital Revenue Refunding Bonds, SeriesA-1, 5.00%, 4/01/44 | | | 600,000 | | | | | | | | 696,930 | |
Orange County Health Facilities Authority Revenue Bonds, Orlando Health Obligated Group, 5.00%, 10/01/47 | | | 500,000 | | | | | | | | 577,645 | |
Orlando Community Redevelopment Agency Tax Increment Revenue Refunding Bonds, Republic Drive/Universal, 5.00%, 4/01/22 | | | 200,000 | | | | | | | | 215,828 | |
| | | | | | | | | | | | 3,474,820 | |
| | | |
Georgia – 4.4% | | | | | | | | | | | | |
Atlanta Development Authority Revenue Bonds, SeriesA-1, Senior Lien, 5.00%, 7/01/30 | | | 200,000 | | | | | | | | 232,718 | |
See accompanying Notes to Financial Statements
110
Morningstar Funds Trust April 30, 2019
Schedule of Investments(continued)
Morningstar Municipal Bond Fund
| | | | | | | | | | | | |
| | | Par | | | | | | Value | |
| | | |
Georgia (Continued) | | | | | �� | | | | | | | |
Atlanta Urban Residential Finance Authority MFH Revenue Bonds, Creekside at Adamsville Place,
1.95%, 5/01/21(c)(d)(e) | | $ | 500,000 | | | | | | | $ | 499,870 | |
Bartow County Development Authority Revenue Refunding Bonds, Series B, Georgia Power Company Plant Bowen Project, 2.05%, 11/19/21(c)(d)(e) | | | 275,000 | | | | | | | | 272,580 | |
Fulton County Development Authority Transportation Corp. Toll Revenue Refunding Bonds, Robert W. Woodruff Arts Center, Inc. Project, 5.00%,
3/15/32 | | | 200,000 | | | | | | | | 239,282 | |
Gainesville & Hall County Hospital Authority Revenue Refunding Bonds, Series S, Northeast Georgia Health System, Inc. Project (County Gtd.), 5.50%, 8/15/54 | | | 500,000 | | | | | | | | 576,740 | |
Glynn-Brunswick Memorial Hospital Authority Revenue Refunding Anticipation Certificates Bonds, Southeast Georgia Health System, 5.00%, 8/01/34 | | | 500,000 | | | | | | | | 552,750 | |
Main Street Natural Gas Inc. Gas Supply Revenue Bonds, Series A, 5.00%,
5/15/21 | | | 750,000 | | | | | | | | 789,682 | |
Main Street Natural Gas Inc. Gas Supply Revenue Bonds, Subseries C, 4.00%,
12/01/23(c)(d)(e) | | | 500,000 | | | | | | | | 540,975 | |
Metropolitan Atlanta Rapid Transit Authority Sales Tax Revenue Refunding Bonds, Series A, Third Indenture Series, 4.00%, 7/01/44 | | | 300,000 | | | | | | | | 313,722 | |
Municipal Electric Authority of Georgia Power Revenue Refunding Bonds, Series HH, 5.00%, 1/01/29 | | | 500,000 | | | | | | | | 591,015 | |
| | | | | | | | | | | | 4,609,334 | |
| | | | | | | | | | | | |
| | | Par | | | | | | Value | |
| | | |
Illinois – 12.3% | | | | | | | | | | | | |
Barrington Alternative Revenue Source G.O. Unlimited Bonds, 4.50%, 12/15/34 | | $ | 235,000 | | | | | | | $ | 264,138 | |
Bensenville G.O. Unlimited Bonds, Series B (AGM Insured), 5.00%, 12/30/24 | | | 245,000 | | | | | | | | 263,228 | |
Chicago Board of Education G.O. Unlimited Refunding Bonds, Series C,
5.00%, 12/01/19 | | | 200,000 | | | | | | | | 202,674 | |
5.00%, 12/01/20 | | | 200,000 | | | | | | | | 207,236 | |
Chicago City Colleges Capital Appreciation G.O. Unlimited Bonds (NATL Insured), 0.00%, 1/01/30(f) | | | 750,000 | | | | | | | | 509,655 | |
Chicago G.O. Unlimited Bonds, Series A, 5.00%, 12/01/21 | | | 500,000 | | | | | | | | 516,175 | |
5.50%, 1/01/49 | | | 100,000 | | | | | | | | 110,317 | |
Chicago O’Hare International Airport Revenue Refunding Bonds (AMT),
Series A, Senior Lien, 5.00%, 1/01/31 | | | 250,000 | | | | | | | | 299,450 | |
Chicago Park District G.O. Limited Tax Refunding Bonds, Series B, 5.00%,
1/01/26 | | | 395,000 | | | | | | | | 434,002 | |
Chicago Wastewater Transmission Revenue Bonds, Second Lien, 5.00%,
1/01/39 | | | 500,000 | | | | | | | | 535,245 | |
Cook County Community College District No. 527 Morton Revenue Bonds,
5.00%, 12/15/29 | | | 500,000 | | | | | | | | 500,845 | |
Cook County Sales TRB, 5.00%, 11/15/37 | | | 500,000 | | | | | | | | 533,585 | |
Hillside Incremental Tax Allocation Revenue Refunding Bonds, 5.00%, 1/01/24 | | | 100,000 | | | | | | | | 103,121 | |
Illinois State Finance Authority Revenue Refunding Bonds, Southern Illinois Healthcare,
5.00%, 3/01/22 | | | 300,000 | | | | | | | | 323,172 | |
Illinois State G.O. Unlimited Bonds,
5.00%, 7/01/20 | | | 440,000 | | | | | | | | 453,090 | |
See accompanying Notes to Financial Statements
111
Morningstar Funds Trust April 30, 2019
Schedule of Investments(continued)
Morningstar Municipal Bond Fund
| | | | | | | | | | | | |
| | | Par | | | | | | Value | |
| | | |
Illinois (Continued) | | | | | | | | | | | | |
Illinois State G.O. Unlimited Refunding Bonds, 5.00%, 8/01/24 | | $ | 400,000 | | | | | | | $ | 423,184 | |
Illinois State Housing Development Authority MFH Variable Revenue Bonds, Marshall Field Garden (FNMA LOC), (SIFMA Municipal Swap Index Yield + 1.00%), 3.12%, 5/15/25(c)(e) | | | 500,000 | | | | | | | | 502,405 | |
Illinois State Junior Obligation Build Illinois Sales Tax Revenue Bonds, 5.00%, 6/15/20 | | | 500,000 | | | | | | | | 515,440 | |
Illinois State Sales Tax Junior Obligations Revenue Bonds, Series A (BAM Insured), 4.00%, 6/15/34 | | | 620,000 | | | | | | | | 638,141 | |
Illinois State Sports Facilities Authority State Tax Supported Revenue CABS (AMBAC Insured),
0.00%, 6/15/21(f) | | | 410,000 | | | | | | | | 382,407 | |
0.00%, 6/15/25(f) | | | 95,000 | | | | | | | | 76,261 | |
Illinois State Sports Facilities Authority State Tax Supported Revenue Refunding Bonds (AGM Insured), 5.00%, 6/15/27 | | | 400,000 | | | | | | | | 444,448 | |
Illinois State Toll Highway Authority Senior Revenue Refunding Bonds, Series A, 5.00%, 1/01/31 | | | 500,000 | | | | | | | | 606,975 | |
Kane, Cook and Dupage Counties, Illinois School District, G.O. Unlimited Refunding Bonds, Series D,
5.00%, 1/01/28 | | | 200,000 | | | | | | | | 223,820 | |
Kane, McHenry, Cook and DeKalb Counties, Illinois School District, G.O. Unlimited Refunding Bonds,
4.25%, 1/01/23 | | | 500,000 | | | | | | | | 516,490 | |
Macon County School District No. 61 G.O. Unlimited Bonds, Series A (AGM Insured), 5.25%, 1/01/25 | | | 745,000 | | | | | | | | 784,843 | |
Moline G.O. Unlimited Refunding Bonds, Series F, 5.00%, 11/01/24 | | | 750,000 | | | | | | | | 783,802 | |
Regional Transportation Authority Revenue Bonds, Series B (NATL Insured), 5.50%, 6/01/27 | | | 350,000 | | | | | | | | 417,690 | |
| | | | | | | | | | | | |
| | | Par | | | | | | Value | |
| | | |
Illinois (Continued) | | | | | | | | | | | | |
Waukegan G.O. Unlimited Bonds, Series A (AGM Insured), 5.00%, 12/30/32 | | $ | 250,000 | | | | | | | $ | 281,078 | |
Will County Community School District No. 161 Summit Hill Refunding G.O. Unlimited Bonds, 4.00%, 1/01/24 | | | 470,000 | | | | | | | | 506,397 | |
Winnebago Boone Etc. Counties Community College District No. 511 G.O. Unlimited Refunding Bonds, Series A, Rock Valley College (AGM Insured), 5.00%, 1/01/21 | | | 500,000 | | | | | | | | 523,070 | |
| | | | | | | | | | | | 12,882,384 | |
| | | |
Indiana – 0.6% | | | | | | | | | | | | |
Clarksville Sewage Works Revenue BANS, 2.75%, 12/11/23 | | | 400,000 | | | | | | | | 400,124 | |
Indiana Finance Authority Midwestern Disaster Relief Revenue Bonds, Series A, Ohio Valley Electric Corp. Project, 5.00%, 6/01/39 | | | 100,000 | | | | | | | | 100,480 | |
Indiana State Finance Authority Private Activity Bonds (AMT), Ohio River Bridges East End Crossing Project, 5.25%, 1/01/51 | | | 100,000 | | | | | | | | 108,554 | |
| | | | | | | | | | | | 609,158 | |
| | | |
Iowa – 0.1% | | | | | | | | | | | | |
Iowa State Finance Authority Midwestern Disaster Area Revenue Refunding Bonds, Iowa Fertilizer Company Project, 3.13%, 12/01/22 | | | 100,000 | | | | | | | | 100,637 | |
| | | |
Kansas – 1.1% | | | | | | | | | | | | |
Kansas State Department of Transportation Highway Revenue Bonds, Series C, 4.00%, 9/01/30 | | | 500,000 | | | | | | | | 533,460 | |
University of Kansas Hospital Authority Health Facilities Revenue Bonds, Series A, University of Kansas Health System, 5.00%, 9/01/48 | | | 500,000 | | | | | | | | 582,930 | |
| | | | | | | | | | | | 1,116,390 | |
See accompanying Notes to Financial Statements
112
Morningstar Funds Trust April 30, 2019
Schedule of Investments(continued)
Morningstar Municipal Bond Fund
| | | | | | | | | | | | |
| | | Par | | | | | | Value | |
| | | |
Kentucky – 3.5% | | | | | | | | | | | | |
Kenton County Airport Board Revenue Refunding Bonds, 5.00%, 1/01/32 | | $ | 400,000 | | | | | | | $ | 463,768 | |
Kentucky Economic Development Finance Authority Health System Revenue Refunding Bonds, Norton Healthcare Inc., Series B (NATL Insured),
0.00%, 10/01/22(f) | | | 500,000 | | | | | | | | 458,935 | |
0.00%, 10/01/24(f) | | | 280,000 | | | | | | | | 242,253 | |
Kentucky Public Energy Authority Gas Supply Revenue Bonds, Series A, 4.00%, 4/01/24(c)(d)(e) | | | 100,000 | | | | | | | | 107,862 | |
Kentucky State Economic Development Finance Authority Revenue Refunding Bonds, Masonic Home Independent Living, 5.00%, 5/15/36 | | | 200,000 | | | | | | | | 209,160 | |
Kentucky State Economic Development Finance Authority Revenue Refunding Bonds, Series B, Owensboro Health, 5.00%, 6/01/40 | | | 300,000 | | | | | | | | 327,039 | |
Kentucky State Housing Corp. Variable Housing Revenue Bonds, Beecher Phase I Project, 2.00%,
9/01/21(c)(d)(e) | | | 480,000 | | | | | | | | 480,255 | |
Kentucky State Public Energy Authority Gas Supply Revenue Bonds,
SeriesA-1, 4.00%, 6/01/25(c)(d)(e) | | | 250,000 | | | | | | | | 272,750 | |
Louisville & Jefferson County Metro Government Environmental Facilities Revenue Refunding Bonds, Louisville Gas & Electric Project, 1.25%,
6/03/19(c)(d)(e) | | | 500,000 | | | | | | | | 499,770 | |
Louisville Regional Airport Authority Airport System Revenue Refunding Bonds (AMT), Series A, 5.00%,
7/01/23 | | | 500,000 | | | | | | | | 556,520 | |
| | | | | | | | | | | | 3,618,312 | |
| | | | | | | | | | | | |
| | | Par | | | | | | Value | |
| | | |
Maryland – 3.5% | | | | | | | | | | | | |
Baltimore Convention Center Hotel Revenue Refunding Bonds, Convention Center Hotel, 5.00%, 9/01/39 | | $ | 250,000 | | | | | | | $ | 279,758 | |
Maryland State & Local Facilities G.O. Unlimited Bonds, Loan of2013-1, 4.00%, 3/01/26 | | | 600,000 | | | | | | | | 624,318 | |
Maryland State Community Development Administration Department Housing & Community Development MFH Revenue Bonds, Series A, Bay Country Apartments, 2.52%, 2/01/21(a) | | | 1,000,000 | | | | | | | | 1,000,530 | |
Maryland State Department of Transportation Consolidated Transportation Revenue Bonds, 5.00%, 2/01/22 | | | 260,000 | | | | | | | | 283,735 | |
Maryland State Economic Development Corp. Private Activity Revenue Bonds (AMT), Purple Line Light Rail Projects,
5.00%, 3/31/24 | | | 150,000 | | | | | | | | 160,706 | |
5.00%, 3/31/36 | | | 100,000 | | | | | | | | 110,603 | |
5.00%, 3/31/51 | | | 100,000 | | | | | | | | 108,756 | |
Maryland State Health & Higher Educational Facilities Authority Revenue Bonds, Adventist Healthcare Obligated, 5.50%, 1/01/31 | | | 300,000 | | | | | | | | 356,775 | |
Maryland State Health & Higher Educational Facilities Authority Revenue Bonds, Medstar Health Issue, Series A, 5.00%, 5/15/45 | | | 405,000 | | | | | | | | 457,998 | |
Maryland State Health & Higher Educational Facilities Authority Revenue Refunding Bonds, Arundel Health Systems, 5.00%, 7/01/29 | | | 250,000 | | | | | | | | 297,735 | |
| | | | | | | | | | | | 3,680,914 | |
| | | |
Massachusetts – 2.1% | | | | | | | | | | | | |
Massachusetts State Consolidated Loan G.O. Limited Bonds, Series E, 5.25%, 9/01/48 | | | 500,000 | | | | | | | | 606,575 | |
See accompanying Notes to Financial Statements
113
Morningstar Funds Trust April 30, 2019
Schedule of Investments(continued)
Morningstar Municipal Bond Fund
| | | | | | | | | | | | |
| | | Par | | | | | | Value | |
| | | |
Massachusetts (Continued) | | | | | | | | | | | | |
Massachusetts State Department of Transportation Metropolitan Highway System Variable Revenue Refunding Bonds, Series A, 5.00%,
1/01/23(c)(d)(e) | | $ | 500,000 | | | | | | | $ | 556,125 | |
Massachusetts State Development Finance Agency Variable Revenue Refunding Bonds, Partners Healthcare, (SIFMA Municipal Swap Index Yield + 0.50%), 2.62%, 1/26/23(c)(e) | | | 500,000 | | | | | | | | 499,105 | |
Massachusetts State Educational Financing Authority Revenue Bonds, Series J (AMT), 5.00%, 7/01/21 | | | 500,000 | | | | | | | | 531,765 | |
| | | | | | | | | | | | 2,193,570 | |
| | | |
Michigan – 2.3% | | | | | | | | | | | | |
Detroit Downtown Development Authority Tax Increment Revenue Refunding Bonds, Series A, Catalyst Development Project (AGM Insured), 5.00%, 7/01/22 | | | 500,000 | | | | | | | | 542,010 | |
5.00%, 7/01/43 | | | 100,000 | | | | | | | | 108,657 | |
5.00%, 7/01/48 | | | 200,000 | | | | | | | | 216,278 | |
Detroit G.O. Unlimited Bonds, 5.00%, 4/01/20 | | | 500,000 | | | | | | | | 509,615 | |
5.00%, 4/01/27 | | | 50,000 | | | | | | | | 55,176 | |
Great Lakes Water Authority Sewage Disposal System Revenue Refunding Bonds Second Lien, Series C, 5.00%, 7/01/36 | | | 300,000 | | | | | | | | 343,761 | |
Michigan State Finance Authority Local Government Loan Program Revenue Refunding Bonds, 4.50%, 10/01/29 | | | 250,000 | | | | | | | | 266,895 | |
University of Michigan Variable General Revenue Bonds, Series B, 2.03%, 5/09/19(c)(e)(g) | | | 400,000 | | | | | | | | 400,000 | |
| | | | | | | | | | | | 2,442,392 | |
| | | | | | | | | | | | |
| | | Par | | | | | | Value | |
| | | |
Minnesota – 0.7% | | | | | | | | | | | | |
Minneapolis Health Care System Variable Revenue Refunding Bonds, Fairview Health Services (Wells Fargo Bank N.A.), 1.95%, 5/02/19(c)(e)(g) | | $ | 100,000 | | | | | | | $ | 100,000 | |
Minneapolis-Saint Paul Housing and Redevelopment Authority Health Care Facilities Variable Revenue Bonds, Series A, Children’s Hospitals and Clinics (AGM Insured), 1.95%,
5/02/19(c)(e)(g) | | | 600,000 | | | | | | | | 600,000 | |
| | | | | | | | | | | | 700,000 | |
| | | |
Missouri – 0.6% | | | | | | | | | | | | |
Missouri State Health & Educational Facilities Authority Health Facilities Revenue Refunding Bonds, Series A, St. Luke’s health System, Inc., 5.00%, 11/15/30 | | | 250,000 | | | | | | | | 291,080 | |
Saint Louis County IDA Senior Living Facilities Revenue Refunding Bonds, Friendship Village St. Louis, 5.00%, 9/01/48 | | | 300,000 | | | | | | | | 316,707 | |
| | | | | | | | | | | | 607,787 | |
| | | |
Nebraska – 0.8% | | | | | | | | | | | | |
Central Plains Energy Gas Project Revenue Bonds, Project No. 3, 5.00%, 9/01/22 | | | 500,000 | | | | | | | | 540,435 | |
Central Plains Energy Project Gas Supply Revenue Refunding Bonds, 5.00%,
12/01/19(c)(d)(e) | | | 250,000 | | | | | | | | 254,128 | |
| | | | | | | | | | | | 794,563 | |
| | | |
Nevada – 0.5% | | | | | | | | | | | | |
Washoe County Water Facilities Variable Revenue Refunding Bonds (AMT), Sierra Pacific, 2.05%, 4/15/22(c)(d)(e) | | | 500,000 | | | | | | | | 499,835 | |
| | | |
New Jersey – 2.6% | | | | | | | | | | | | |
Garden State Preservation Trust Open Space & Farmland Preservation Revenue Bonds, Series A (AGM Insured), 5.75%, 11/01/28 | | | 400,000 | | | | | | | | 492,672 | |
See accompanying Notes to Financial Statements
114
Morningstar Funds Trust April 30, 2019
Schedule of Investments(continued)
Morningstar Municipal Bond Fund
| | | | | | | | | | | | |
| | | Par | | | | | | Value | |
| | | |
New Jersey (Continued) | | | | | | | | | | | | |
New Jersey State Economic Development Authority Energy Facility Revenue Bonds (AMT), Series A, UMM Energy Partners Project, 5.12%, 6/15/43 | | $ | 250,000 | | | | | | | $ | 264,627 | |
New Jersey State EDA Motor Vehicle Surcharge Revenue Refunding Bonds, Subseries A, 3.38%, 7/01/30 | | | 250,000 | | | | | | | | 249,383 | |
New Jersey State EDA Private Activity Revenue Bonds (AMT), The Goethals Project,
5.00%, 1/01/24 | | | 150,000 | | | | | | | | 168,752 | |
5.25%, 1/01/25 | | | 100,000 | | | | | | | | 113,594 | |
New Jersey State EDA Special Facility Revenue Refunding Bonds (AMT), Port Newark Container, 5.00%, 10/01/47 | | | 100,000 | | | | | | | | 108,775 | |
New Jersey State Housing & Mortgage Finance Agency Multifamily Conduit Revenue Bonds, Series F, Camden Townhouses Project, 1.90%,
8/01/19(c)(d)(e) | | | 100,000 | | | | | | | | 100,010 | |
New Jersey State Transportation Trust Fund Authority Revenue Bonds, Transportation Program Bonds, 5.25%, 6/15/43 | | | 625,000 | | | | | | | | 702,887 | |
Newark Housing Authority Port Newark Marine Terminal Rental Revenue Refunding Bonds, Additional Newark Redevelopment Project (NATL Insured), 5.25%, 1/01/24 | | | 500,000 | | | | | | | | 561,060 | |
| | | | | | | | | | | | 2,761,760 | |
| | | |
New York – 7.8% | | | | | | | | | | | | |
Hudson Yards Infrastructure Corp., Senior Revenue Bonds Fiscal 2012, Unrefunded Balance, 5.75%, 2/15/47 | | | 300,000 | | | | | | | | 320,295 | |
Liberty Development Corp. Revenue Bonds, 5.50%, 10/01/37 | | | 110,000 | | | | | | | | 145,734 | |
Long Island Power Authority Electric System Revenue Bonds, 5.00%, 9/01/35 | | | 300,000 | | | | | | | | 361,917 | |
| | | | | | | | | | | | |
| | | Par | | | | | | Value | |
| | | |
New York (Continued) | | | | | | | | | | | | |
Met Transportation Authority Transportation Revenue BANS, Series A, 4.00%, 2/03/20 | | $ | 1,500,000 | | | | | | | $ | 1,525,305 | |
Metropolitan Transportation Authority Revenue Bonds, Green Bonds, Transportation Climate Bonds, 5.00%, 11/15/45 | | | 500,000 | | | | | | | | 582,015 | |
New York City Transitional Finance Authority Future Tax Secured Subordinate Revenue Bonds, 4.00%, 11/01/40 | | | 500,000 | | | | | | | | 548,450 | |
New York G.O. Unlimited Bonds, Series D, Subseries D1,
5.00%, 12/01/32 | | | 250,000 | | | | | | | | 308,497 | |
5.00%, 12/01/42 | | | 250,000 | | | | | | | | 298,408 | |
New York State Dorm Authority Revenues Non State Supported Debt Revenue Refunding Bonds, Memorial Sloan Kettering Cancer Center, 5.00%, 7/01/42 | | | 200,000 | | | | | | | | 232,706 | |
New York State Dormitory Authority Non State Supported Debt Revenue Refunding Bonds, Catholic Health System Obligated, 5.00%, 7/01/36 | | | 400,000 | | | | | | | | 475,304 | |
New York State Dormitory Authority Personal Income Taxable Revenue Refunding Bonds,
Series E, 5.00%, 2/15/44 | | | 400,000 | | | | | | | | 452,996 | |
New York State Dormitory Authority State Supported Debt Consolidated Fifth General Resolution Variable Revenue Bonds, Series C, City University (Bank of America N.A. LOC), 2.04%, 5/09/19(c)(e)(g) | | | 900,000 | | | | | | | | 900,000 | |
New York State Housing Finance Agency Variable Revenue Refunding Bonds, Affordable Housing (SonyMA Insured), 1.80%, 5/01/20(c)(d)(e) | | | 500,000 | | | | | | | | 499,805 | |
See accompanying Notes to Financial Statements
115
Morningstar Funds Trust April 30, 2019
Schedule of Investments(continued)
Morningstar Municipal Bond Fund
| | | | | | | | |
| | | Par | | | Value | |
| | |
New York (Continued) | | | | | | | | |
New York State Liberty Development Corp. Revenue Refunding Bonds, Class 2, 3 World Trade Center Project, 5.37%, 11/15/40(a) | | $ | 150,000 | | | $ | 164,736 | |
New York State Mortgage Agency Homeowner Mortgage Revenue Refunding Bonds, Series 214 (AMT), 2.85%, 4/01/22 | | | 360,000 | | | | 364,820 | |
2.90%, 10/01/22 | | | 140,000 | | | | 142,297 | |
New York Variable G.O. Unlimited Bonds, Fiscal 2018 Subseries B, 2.00%, 5/02/19(c)(e)(g) | | | 600,000 | | | | 600,000 | |
Niagara Frontier Transportation Authority Revenue Refunding Bonds (AMT), Buffalo Niagara International Airport, 5.00%, 4/01/26 | | | 250,000 | | | | 292,050 | |
| | | | | | | | 8,215,335 | |
| | |
North Carolina – 1.4% | | | | | | | | |
Durham Housing Authority MFH Revenue Bonds, Morreene Road Apartments, 1.85%, 1/01/20(c)(d)(e) | | | 100,000 | | | | 100,015 | |
North Carolina State Medical Care Commission Health Care Facilities Revenue Refunding Bonds, Vidant Health, 5.00%, 6/01/45 | | | 500,000 | | | | 555,740 | |
North Carolina State Medical Care Commission Retirement Facilities Revenue Refunding Bonds, First Mortgage, United Church Services, 5.00%, 9/01/37 | | | 155,000 | | | | 163,356 | |
North Carolina State Turnpike Authority Revenue Refunding Bonds, Senior Lien, 5.00%, 1/01/40 | | | 550,000 | | | | 630,729 | |
| | | | | | | | 1,449,840 | |
| | |
North Dakota – 0.5% | | | | | | | | |
University of North Dakota COPS, Infrastructure Energy Improvement, 5.00%, 4/01/48 | | | 500,000 | | | | 571,400 | |
| | | | | | | | |
| | | Par | | | Value | |
| | |
Ohio – 2.3% | | | | | | | | |
American Municipal Power-Ohio Inc., Variable Revenue Refunding Bonds, Series A, 2.30%, 2/15/22(c)(d)(e) | | $ | 1,250,000 | | | $ | 1,262,512 | |
Cleveland Cuyahoga County Port Authority Cultural Facilities Refunding Revenue Bonds, Playhouse Square Foundation Project, 5.50%, 12/01/43 | | | 175,000 | | | | 197,649 | |
Cleveland-Cuyahoga County Port Authority Euclid Avenue Development Corp. Revenue Refunding Bonds, 5.00%,
8/01/23 | | | 370,000 | | | | 413,223 | |
Franklin County MFH Variable Revenue Bonds, Sawyer & Trevitt Project, 1.30%, 6/01/19(c)(d)(e) | | | 300,000 | | | | 299,844 | |
Franklin County Variable Revenue Bonds, CHE Trinity Health Credit Group, 1.75%, 8/01/19(c)(d)(e) | | | 250,000 | | | | 250,000 | |
| | | | | | | | 2,423,228 | |
| | |
Oklahoma – 0.0%(h) | | | | | | | | |
Oklahoma County Finance Authority Revenue Refunding Bonds, Series A, Epworth Villa Project, 5.88%, 4/01/30 | | | 50,000 | | | | 50,008 | |
| | |
Pennsylvania – 7.3% | | | | | | | | |
Delaware River Port Authority Revenue Bonds, Series A, 5.00%, 1/01/34 | | | 250,000 | | | | 303,913 | |
Geisinger Authority Health System Variable Revenue Bonds, Geisinger Health System, 1.95%, 5/02/19(c)(e)(g) | | | 500,000 | | | | 500,000 | |
Lehigh County General Purpose Authority Revenue Refunding Bonds, Muhlenberg College Project, (SIFMA Municipal Swap Index Yield + 0.58%), 2.70%,
11/01/24(c)(e) | | | 500,000 | | | | 500,100 | |
Lehigh County Industrial Development Authority Revenue Refunding Bonds, PPL Electric Utilities Corp. Project, 1.80%, 8/15/22(c)(d)(e) | | | 330,000 | | | | 326,509 | |
See accompanying Notes to Financial Statements
116
Morningstar Funds Trust April 30, 2019
Schedule of Investments(continued)
Morningstar Municipal Bond Fund
| | | | | | | | |
| | | Par | | | Value | |
| | |
Pennsylvania (Continued) | | | | | | | | |
Pennsylvania State Economic Development Financing Authority Solid Waste Disposal Variable Revenue Bonds (AMT), Waste Management Inc. Project, 1.95%, 8/01/19(c)(d)(e) | | $ | 325,000 | | | $ | 325,000 | |
Pennsylvania State Economic Development Financing Authority Solid Waste Disposal Variable Revenue Refunding Bonds (AMT), Republic Services,
1.95%, 7/15/19(c)(d)(e) | | | 400,000 | | | | 400,032 | |
Pennsylvania State Higher Educational Facilities Authority Revenue Refunding Bonds, Thomas Jefferson University, 5.00%, 9/01/39 | | | 500,000 | | | | 558,665 | |
Pennsylvania State Housing Finance Agency MFH Revenue Bonds, Blumberg Senior Apartments,
1.65%, 11/01/19(c)(d)(e) | | | 1,000,000 | | | | 998,420 | |
Pennsylvania State Housing Finance Agency SFM Revenue Refunding Bonds (AMT), Series 125A, 2.37%, 10/01/25 | | | 1,450,000 | | | | 1,454,480 | |
Pennsylvania State Turnpike Commission Turnpike Variable Revenue Refunding Bonds, Series B, (SIFMA Municipal Swap Index Yield + 0.70%), 2.82%, 12/01/23(e) | | | 500,000 | | | | 499,080 | |
Philadelphia Airport Revenue Refunding Bonds, Series B (AMT),
5.00%, 7/01/30 | | | 495,000 | | | | 584,199 | |
5.00%, 7/01/33 | | | 400,000 | | | | 466,220 | |
Philadelphia Authority for Industrial Development Temple University Revenue Refunding Bonds,
Series1-2015, 5.00%, 4/01/33 | | | 400,000 | | | | 455,212 | |
Wilkes-Barre Area School District G.O. Limited Bonds (BAM State Aid Withholding), 5.00%, 4/15/23 | | | 200,000 | | | | 221,942 | |
| | | | | | | | 7,593,772 | |
| | | | | | | | |
| | | Par | | | Value | |
| | |
Puerto Rico – 0.3% | | | | | | | | |
Puerto Rico Electric Power Authority Power Revenue Refunding Bonds, Series ZZ, 5.25%, 7/01/23 | | $ | 75,000 | | | $ | 60,750 | |
Puerto Rico Electric Power Authority Revenue Bonds, Series TT, 5.00%, 7/01/37 | | | 50,000 | | | | 40,375 | |
Puerto Rico Sales Tax Financing Corp. Sales Tax Revenue CABS, SeriesA-1, 0.00%, 7/01/27(f) | | | 225,000 | | | | 168,683 | |
| | | | | | | | 269,808 | |
| | |
Rhode Island – 0.6% | | | | | | | | |
Rhode Island Commerce Corp. First Lien Special Facility Revenue Refunding Bonds, Rhode Isaland Airport Corp. International, 5.00%, 7/01/31 | | | 500,000 | | | | 587,400 | |
South Carolina – 0.4% | | | | | | | | |
South Carolina State Jobs EDA Hospital Revenue Refunding Bonds, Prisma Health Obligated Group, 5.00%, 5/01/38 | | | 400,000 | | | | 460,940 | |
Tennessee – 1.0% | | | | | | | | |
Metropolitan Government of Nashville and Davidson County Health and Education Facilities Board Revenue Bonds, Vanderbilt Medical Center, 5.00%, 7/01/40 | | | 400,000 | | | | 448,724 | |
Tennessee State Energy Acquisition Corp. Gas Revenue Bonds, Series A, 4.00%, 5/01/23(c)(d)(e) | | | 550,000 | | | | 582,901 | |
| | | | | | | | 1,031,625 | |
| | |
Texas – 11.6% | | | | | | | | |
Austin Airport System Revenue Bonds, Series A, 5.00%, 11/15/46 | | | 380,000 | | | | 436,996 | |
Austin Convention Enterprises, Inc. Convention Center Revenue Refunding Bonds, First Tier, 5.00%, 1/01/32 | | | 400,000 | | | | 461,496 | |
See accompanying Notes to Financial Statements
117
Morningstar Funds Trust April 30, 2019
Schedule of Investments(continued)
Morningstar Municipal Bond Fund
| | | | | | | | |
| | | Par | | | Value | |
| | |
Texas (Continued) | | | | | | | | |
Board of Managers Joint Guadalupe County City of Seguin Hospital Mortgage Refunding Revenue Bonds, 5.00%, 12/01/40 | | $ | 200,000 | | | $ | 209,466 | |
Central Regional Mobility Authority Revenue Refunding Bonds, Series A, Senior Lien, 5.00%, 1/01/22 | | | 300,000 | | | | 322,587 | |
Cypress Fairbanks Independent School District Variable G.O. Unlimited Bonds, SeriesA-1, School Building (PSF, Gtd.), 2.13%, 8/16/21(c)(d)(e) | | | 500,000 | | | | 501,540 | |
Dallas Independent School District G.O. Unlimited Bonds, SeriesB-5, Multi-Modal School Building (PSF, Gtd.), 5.00%, 2/15/21(c)(d)(e) | | | 500,000 | | | | 527,805 | |
Dallas-Fort Worth International Airport Improvement Revenue Bonds, Series B, 5.00%, 11/01/44 | | | 350,000 | | | | 377,458 | |
Dallas-Fort Worth International Airport Revenue Bonds, Series H (AMT), 5.00%, 11/01/42 | | | 400,000 | | | | 423,188 | |
Harris County Cultural Educational Facilities Finance Corp. Revenue Refunding Bonds, Hospital Memorial Hermann Health, 5.00%, 12/01/25 | | | 300,000 | | | | 331,407 | |
Houston Hotel Occupancy Tax & Special Revenue Refunding Bonds, Convention & Entertainment, 5.00%, 9/01/36 | | | 510,000 | | | | 604,727 | |
Houston Texas Independent School District Schoolhouse G.O. Limited Bonds,
SeriesA-2 (PSF, Gtd.), 3.00%,
6/01/19(c)(d)(e) | | | 600,000 | | | | 600,606 | |
Houston Utility System Adjustable Revenue Refunding Bonds, Series 2012A, First Lien, (SIFMA Municipal Swap Index Yield + 0.01%), 3.02%, 5/01/20(c)(e) | | | 500,000 | | | | 501,210 | |
| | | | | | | | |
| | | Par | | | Value | |
| | |
Texas (Continued) | | | | | | | | |
Lamar Consolidated Independent Schoolhouse District Variable G.O. Unlimited Bonds, Series A (PSF, Gtd.), 1.95%, 8/17/20(c)(d)(e) | | $ | 1,250,000 | | | $ | 1,251,737 | |
Leander Independent School District G.O. Unlimited CABS, Series C, School Building (PSF, Gtd.), Prerefunded, 0.00%, 8/15/24(i) | | | 1,000,000 | | | | 308,290 | |
New Hope Cultural Educational Facilities Finance Corp. Retirement Facilities Revenue Refunding Bonds, Presbyterian Village North Project, 5.25%, 10/01/49 | | | 100,000 | | | | 106,331 | |
North East Independent School District Variable G.O. Unlimited Bonds (PSF, Gtd.), 2.20%, 8/01/24(c)(d)(e) | | | 1,000,000 | | | | 1,011,990 | |
North Texas Tollway Authority Revenue Refunding Bonds, Series A, 5.00%,
1/01/26 | | | 70,000 | | | | 79,802 | |
Northside Independent School District School Building G.O. Unlimited Bonds (PSF, Gtd.), 2.12%, 8/01/20(c)(d)(e) | | | 1,105,000 | | | | 1,105,884 | |
San Antonio Water Variable Revenue Bonds, Series A, Junior Lien, 2.62%, 5/01/24(c)(d)(e) | | | 500,000 | | | | 515,480 | |
Tarrant County Cultural Educational Facilities Finance Corp. Revenue Refunding Bonds, Texas Health Resources System Obligation, 5.00%, 2/15/34 | | | 400,000 | | | | 464,412 | |
5.00%, 2/15/47 | | | 500,000 | | | | 567,660 | |
Texas State Private Activity Bond Surface Transportation Corp. Revenue Bonds (AMT), Senior Lien, Blueridge Transportation Group, LLC SH 288 Toll Lanes Project, 5.00%, 12/31/55 | | | 200,000 | | | | 217,178 | |
Texas State TRANS, 4.00%, 8/29/19 | | | 600,000 | | | | 604,338 | |
See accompanying Notes to Financial Statements
118
Morningstar Funds Trust April 30, 2019
Schedule of Investments(continued)
Morningstar Municipal Bond Fund
| | | | | | | | |
| | | Par | | | Value | |
| | |
Texas (Continued) | | | | | | | | |
Texas State Transportation Commission Central Turnpike System Subordinate Revenue Refunding Bonds, Series C, 5.00%, 8/15/42 | | $ | 100,000 | | | $ | 109,959 | |
Texas State Transportation Commission First Tier Toll CABS, 0.00%, 8/01/29(f) | | | 480,000 | | | | 351,034 | |
Texas State Transportation Commission First Tier Toll Revenue Bonds, State Highway, 5.00%, 8/01/57 | | | 100,000 | | | | 113,074 | |
| | | | | | | | 12,105,655 | |
| | |
Virginia – 4.2% | | | | | | | | |
Chesapeake Bay Bridge & Tunnel District Revenue First Tier General Resolution Revenue Bonds, 5.00%, 7/01/51 | | | 500,000 | | | | 556,665 | |
Chesapeake Transportation System Senior Toll Road Revenue Bonds, Series A, 5.00%, 7/15/47 | | | 500,000 | | | | 529,675 | |
Fairfax County EDA Residential Care Facilities Revenue Bonds, Series A, Vinson Hall LLC, 5.00%, 12/01/42 | | | 80,000 | | | | 85,666 | |
Fairfax County EDA Residential Care Facilities Revenue Refunding Bonds, Series A, Goodwin House, Inc., 5.00%, 10/01/36 | | | 150,000 | | | | 165,094 | |
Fairfax County IDA Health Care Revenue Bonds, Inova Health System, 4.00%, 5/15/42 | | | 250,000 | | | | 258,315 | |
Fairfax County Redevelopment & Housing Authority MFH Variable Revenue Bonds, Parkwood Apartments Project, 2.21%,
8/01/20(c)(d)(e) | | | 500,000 | | | | 501,550 | |
Fairfax County Water Authority Revenue Refunding Bonds, 5.00%, 4/01/45 | | | 500,000 | | | | 589,500 | |
Hampton Roads Transportation Accountability Commission Revenue Bonds, Series A, Senior Lien, 5.50%, 7/01/57 | | | 700,000 | | | | 846,888 | |
| | | | | | | | |
| | | Par | | | Value | |
| | |
Virginia (Continued) | | | | | | | | |
James City County EDA Residential Care Facilities Variable Revenue Bonds, United Methodist Home, 6.00%, 6/01/43 | | $ | 65,261 | | | $ | 64,283 | |
Virginia Small Business Financing Authority Private Activity Revenue Bonds (AMT), Transform 66 P3 Project, 5.00%, 12/31/56 | | | 50,000 | | | | 54,504 | |
Virginia State Small Business Financing Authority Revenue Bonds (AMT), Senior Lien, 95 Express Lane, 5.00%, 7/01/34 | | | 300,000 | | | | 317,895 | |
Virginia State Small Business Financing Authority Revenue Bonds (AMT), Senior Lien, Elizabeth River Crossings OpCo, LLC Project, 4.50%, 1/01/23 | | | 135,000 | | | | 144,350 | |
5.00%, 1/01/27 | | | 250,000 | | | | 267,472 | |
| | | | | | | | 4,381,857 | |
| | |
Washington – 1.9% | | | | | | | | |
Seattle Municipal Light & Power Variable Revenue Refunding Bonds, (SIFMA Municipal Swap Index Yield + 0.00%), 2.47%, 11/01/22(e) | | | 900,000 | | | | 897,633 | |
Snohomish County Housing Authority Revenue Bonds, 5.00%, 4/01/21 | | | 545,000 | | | | 576,158 | |
Washington State Health Care Facilities Authority Revenue Bonds, Series A, Providence Health & Services, 4.00%, 10/01/34 | | | 500,000 | | | | 518,110 | |
| | | | | | | | 1,991,901 | |
| | |
Wisconsin – 4.3% | | | | | | | | |
Barneveld School District BANS, 4.00%, 3/01/24 | | | 500,000 | | | | 515,080 | |
Public Finance Authority Educational Revenue Bonds, Piedmont Community Charter School, 5.00%, 6/15/39 | | | 490,000 | | | | 546,850 | |
5.00%, 6/15/49 | | | 150,000 | | | | 165,064 | |
See accompanying Notes to Financial Statements
119
Morningstar Funds Trust April 30, 2019
Schedule of Investments(continued)
Morningstar Municipal Bond Fund
| | | | | | | | |
| | | Par | | | Value | |
| | |
Wisconsin (Continued) | | | | | | | | |
Public Finance Authority Exempt Facilities Revenue Refunding Bonds (AMT), National Gypsum Co., 4.00%, 8/01/35 | | $ | 100,000 | | | $ | 101,315 | |
Public Finance Authority Hospital Revenue Refunding Bonds, Series A, WakeMed Hospital, 4.00%, 10/01/49 | | | 500,000 | | | | 519,830 | |
Public Finance Authority Solid Waste Disposal Revenue Refunding Bonds (AMT), Waste Management, Inc. Project, 1.95%, 8/01/19(c)(d)(e) | | | 500,000 | | | | 500,000 | |
Public Finance Authority Solid Waste Disposal Variable Revenue Refunding Bonds (AMT), Waste Management, Inc. Project, 1.95%, 8/01/19(c)(d)(e) | | | 500,000 | | | | 500,000 | |
Washington State Health & Educational Facilities Authority Revenue Refunding Bonds, Ascension Health Credit Group, 5.00%, 11/15/39 | | | 350,000 | | | | 400,484 | |
Wisconsin State COPS, 5.00%, 3/01/23 | | | 500,000 | | | | 529,140 | |
Wisconsin State Health & Educational Facilities Authority Revenue Refunding Bonds, Benevolent Corporation Cedar Community, 5.00%, 6/01/41 | | | 250,000 | | | | 260,930 | |
Wisconsin State Transportation Revenue Refunding Bonds, Series 1, 4.50%, 7/01/33 | | | 400,000 | | | | 427,652 | |
| | | | | | | | 4,466,345 | |
| | |
Total Municipal Bonds
(Cost $97,414,361) | | | | | | | 99,132,618 | |
| | | | | | | | |
| | | Number
of Shares | | | Value | |
| |
Investment Companies – 4.6% | | | | | |
iShares National Muni
Bond ETF | | | 43,279 | | | $ | 4,827,339 | |
| | |
Total Investment Companies
(Cost $4,722,020) | | | | | | | 4,827,339 | |
| |
Short-Term Investments – 2.6% | | | | | |
Money Market Fund – 2.6% | | | | | | | | |
Northern Institutional Funds - Treasury Portfolio (Premier), 2.29%(j) | | | 2,650,936 | | | | 2,650,936 | |
| | |
Total Short-Term Investments
(Cost $2,650,936) | | | | | | | 2,650,936 | |
| | |
Total Investments – 101.9%
(Cost $104,787,317) | | | | | | | 106,610,893 | |
| | |
Liabilities less Other Assets – (1.9)% | | | | | | | (1,937,907 | ) |
| | |
NET ASSETS – 100.0% | | | | | | $ | 104,672,986 | |
| (a) | Securities exempt from registration under Rule 144A of the Securities Act of 1933. These securities may be resold in transactions exempt from registration, normally to qualified institutional buyers. The value of these securities is determined by valuations supplied by a pricing service or brokers, or, if not available, in accordance with procedures established by the Board of Trustees of Morningstar Funds. |
| (b) | When-Issued Security. Coupon rate was not in effect at April 30, 2019. |
| (c) | Maturity date represents the puttable date. |
| (d) | These securities are remarketed by an agent, and the interest rate is determined by general market conditions and supply and demand. |
| (e) | Variable rate security. Rate as of April 30, 2019 is disclosed. |
See accompanying Notes to Financial Statements
120
Morningstar Funds Trust April 30, 2019
Schedule of Investments(continued)
Morningstar Municipal Bond Fund
| (g) | Rate is determined by a Remarketing Agent which, in its judgment, on the basis of prevailing financial markets, will be the lowest interest rate necessary to enable the remarketing agent to sell the bonds at a price equal to 100% of the principal amount. |
| (h) | Amount rounds to less than 0.05%. |
| (i) | Zero coupon bond. Maturity date represents the prerefunded date. |
| (j) | 7-day current yield as of April 30, 2019 is disclosed. |
Percentages shown are based on Net Assets
| | |
| Abbreviations: | | |
| 1M | | 1 Month |
| 3M | | 3 Month |
| AGM | | Assured Guarantee Municipal Corporation |
| AMBAC | | American Municipal Bond Assurance Corporation |
| AMT | | Alternative Minimum Tax |
| BAM | | Build America Mutual |
| BANS | | Bond Anticipation Notes |
| CABS | | Capital Appreciation Bonds |
| COPS | | Certificates of Participation |
| EDA | | Economic Development Authority |
| ETF | | Exchange-Traded Fund |
| FNMA | | Federal National Mortgage Association |
| G.O. | | General Obligation |
| Gtd. | | Guaranteed |
| HFA | | Housing Finance Authority |
| IBC | | Insured Bond Certificates |
| ICE | | Intercontinental Exchange |
| IDA | | Industrial Development Authority |
| LIBOR | | London Interbank Offered Rate |
| LOC | | Letter of Credit |
| MFH | | Multifamily Housing |
| NATL | | National Public Finance Guarantee Corporation |
| PSF | | Permanent School Fund |
| SFM | | Single Family Mortgage |
| SIFMA | | Securities Industry and Financial Markets Association |
| SonyMA | | State of New York Mortgage Agency |
| TRANS | | Tax Revenue Anticipation Bonds |
| TRB | | Tax Revenue Bonds |
| USD | | United States Dollar |
See accompanying Notes to Financial Statements
121
Morningstar Funds Trust April 30, 2019
Schedule of Investments(continued)
Morningstar Municipal Bond Fund
Valuation Hierarchy
The following is a summary of the inputs used, as of April 30, 2019, in valuing the Fund’s investments carried at fair value:
| | | | | | | | | | | | | | | | |
| Morningstar Municipal Bond Fund | | Level 1 | | | Level 2 | | | Level 3 | | | Totals | |
| | | | |
Investments | | | | | | | | | | | | | | | | |
| | | | |
Assets: | | | | | | | | | | | | | | | | |
| | | | |
Investments in Securities: | | | | | | | | | | | | | | | | |
Municipal Bonds | | $ | — | | | $ | 99,132,618 | | | | $— | | | $ | 99,132,618 | |
Investment Companies | | | 4,827,339 | | | | — | | | | — | | | | 4,827,339 | |
Short-Term Investments | | | 2,650,936 | | | | — | | | | — | | | | 2,650,936 | |
| | | | | |
Total Investments | | $ | 7,478,275 | | | $ | 99,132,618 | | | | $— | | | $ | 106,610,893 | |
See accompanying Notes to Financial Statements
122
Morningstar Funds Trust April 30, 2019
Schedule of Investments
|
Morningstar Defensive Bond Fund |
| | | | | | | | |
| | | Par | | | Value | |
|
Asset-Backed Securities – 16.2% | |
Automobile – 3.4% | | | | | | | | |
Ally Auto Receivables Trust, Series2019-1, Class A4, 3.02%, 4/15/24 | | $ | 308,000 | | | $ | 311,455 | |
ARI Fleet Lease Trust, Series2018-B, Class A3, 3.43%, 8/16/27(a) | | | 302,000 | | | | 306,932 | |
Avis Budget Rental Car Funding AESOP LLC, Series2017-1A, Class A, 3.07%, 9/20/23(a) | | | 307,000 | | | | 307,890 | |
Avis Budget Rental Car Funding AESOP LLC, Series2017-2A, Class A, 2.97%, 3/20/24(a) | | | 322,000 | | | | 321,354 | |
Avis Budget Rental Car Funding AESOP LLC, Series2019-1A, Class A, 3.45%, 3/20/23(a) | | | 302,000 | | | | 305,674 | |
Carmax Auto Owner Trust, Series2019-1, Class A4, 3.26%, 8/15/24 | | | 240,000 | | | | 244,530 | |
Carmax Auto Owner Trust, Series2019-1, Class B, 3.45%, 11/15/24 | | | 129,000 | | | | 130,829 | |
Chesapeake Funding II LLC, Series2019-1A, Class B, 3.11%, 4/15/31(a) | | | 324,000 | | | | 325,140 | |
Ford Credit Auto Owner Trust, Series2019-A, Class A4, 2.85%, 8/15/24 | | | 324,000 | | | | 326,215 | |
GM Financial Automobile Leasing Trust,Series 2019-1, Class B, 3.37%, 12/20/22 | | | 302,000 | | | | 304,262 | |
GM Financial Automobile Leasing Trust,Series 2019-2, Class B, 3/20/23(b) | | | 594,000 | | | | 593,993 | |
Honda Auto Receivables, Series2019-1, Class A4, 2.90%, 6/18/24 | | | 302,000 | | | | 304,563 | |
Hyundai Auto Lease Securitization Trust,Series 2019-A, Class B,
3.25%, 10/16/23(a) | | | 302,000 | | | | 304,117 | |
Nissan Auto Receivables, Series2019-A, Class A4, 3.00%, 9/15/25 | | | 308,000 | | | | 313,097 | |
Toyota Auto Receivables, Series2019-A, Class A4, 3.00%, 5/15/24 | | | 308,000 | | | | 311,829 | |
| | | | | | | | |
| | | Par | | | Value | |
|
Automobile (Continued) | |
World Omni Auto Receivables Trust,
Series2019-A, Class B, 3.34%, 6/16/25 | | $ | 304,000 | | | $ | 308,507 | |
World Omni Automobile Lease Securitization Trust, Series2019-A, Class B, 3.24%, 7/15/24 | | | 296,000 | | | | 298,397 | |
| | | | | | | | 5,318,784 | |
|
Automobile Floor Plan – 0.4% | |
NextGear Floorplan Master Owner Trust, Series2018-1A, Class A2, 3.22%,
2/15/23(a) | | | 300,000 | | | | 301,498 | |
NextGear Floorplan Master Owner Trust, Series2019-1A, Class A2, 3.21%,
2/15/24(a) | | | 302,000 | | | | 304,420 | |
| | | | | | | | 605,918 | |
|
Commercial Mortgage-Backed Securities – 1.3% | |
A10 Term Asset Financing LLC,
Series2017-1A, Class A1FX, 2.34%, 3/15/36(a) | | | 136,381 | | | | 136,327 | |
Citigroup Commercial Mortgage Trust,
Series2016-C3, Class A2, 2.51%, 11/15/49 | | | 95,000 | | | | 93,729 | |
Commercial Mortgage Trust,
Series2013-LC6, Class A4, 2.94%, 1/10/46 | | | 400,000 | | | | 400,937 | |
Commercial Mortgage Trust,
Series 2015-CR22, Class A3, 3.21%, 3/10/48 | | | 81,000 | | | | 82,103 | |
JP Morgan Chase Commercial Mortgage Securities Trust, Series2012-C8, Class A3, 3.42%, 10/15/45(a) | | | 313,000 | | | | 316,818 | |
JP Morgan Chase Commercial Mortgage Securities Trust, Series 2016-WIKI, Class A, 2.80%, 10/05/31(a) | | | 304,000 | | | | 303,216 | |
RETL, Series2019-RVP, Class B, (ICE LIBOR USD 1M + 1.55%, 1.55% Floor), 4.02%, 3/15/36(a)(c) | | | 265,000 | | | | 265,662 | |
Wells Fargo Commercial Mortgage Trust, Series2015-SG1, Class A3, 3.71%, 9/15/48 | | | 450,000 | | | | 459,229 | |
| | | | | | | | 2,058,021 | |
See accompanying Notes to Financial Statements
123
Morningstar Funds Trust April 30, 2019
Schedule of Investments(continued)
Morningstar Defensive Bond Fund
| | | | | | | | |
| | | Par | | | Value | |
|
Credit Card – 0.4% | |
American Express Credit Account Master Trust, Series2019-1, Class A, 2.87%, 10/15/24 | | $ | 308,000 | | | $ | 310,903 | |
Synchrony Card Funding LLC,
Series2019-A1, Class A, 2.95%, 3/17/25 | | | 296,000 | | | | 298,630 | |
| | | | | | | | 609,533 | |
|
Other – 9.7% | |
Ascentium Equipment Receivables,
Series2019-1A, Class A3, 2.83%, 5/12/25(a) | | | 603,000 | | | | 603,600 | |
Black Diamond CLO Ltd., Series2014-1A, Class A1R, (ICE LIBOR USD 3M + 1.15%), 3.74%, 10/17/26(a)(c) | | | 263,684 | | | | 263,846 | |
BlueMountain CLO Ltd., Series2012-2A, Class AR2, (ICE LIBOR USD 3M + 1.05%, 1.05% Floor), 3.69%, 11/20/28(a)(c) | | | 300,000 | | | | 299,409 | |
Canyon Capital CLO Ltd., Series2014-2A, Class AS, (ICE LIBOR USD 3M + 1.25%), 3.85%, 4/15/29(a)(c) | | | 373,000 | | | | 372,595 | |
Cerberus Loan Funding XXIII L.P.,
Series2018-2A, Class A, (ICE LIBOR USD 3M + 1.00%, 1.00% Floor), 3.60%,
4/15/28(a)(c) | | | 600,000 | | | | 594,893 | |
CIFC Funding Ltd., Series2015-4A, Class A1R, (ICE LIBOR USD 3M + 1.15%, 1.15% Floor), 3.74%, 10/20/27(a)(c) | | | 300,000 | | | | 300,145 | |
Coinstar Funding LLC, Series2017-1A, Class A2, 5.22%, 4/25/47(a) | | | 294,000 | | | | 299,627 | |
Daimler Trucks Retail Trust, Series2019-1, Class A4, 2.79%, 5/15/25(a) | | | 603,000 | | | | 603,717 | |
Dell Equipment Finance Trust, Series2019-1, Class B, 2.94%, 3/22/24(a) | | | 603,000 | | | | 603,713 | |
Fortress Credit Opportunities IX CLO Ltd., Series2016-7A, Class BR, (ICE LIBOR USD 3M + 2.45%, 2.45% Floor), 5.04%, 12/15/28(a)(c) | | | 395,000 | | | | 395,726 | |
| | | | | | | | |
| | | Par | | | Value | |
|
Other (Continued) | |
Fortress Credit Opportunities IX CLO Ltd., Series2017-9A, Series A1T, (ICE LIBOR USD 3M + 1.55%), 4.23%, 11/15/29(a)(c) | | $ | 300,000 | | | $ | 298,100 | |
Fortress Credit Opportunities VII CLO Ltd., Series2016-7I, Class E, (ICE LIBOR USD 3M + 7.49%), 10.10%, 12/15/28 | | | 302,000 | | | | 291,010 | |
Great American Auto Leasing, Inc.,
Series2019-1, Class A4, 3.21%, 2/18/25(a) | | | 302,000 | | | | 305,292 | |
Great American Auto Leasing, Inc.,
Series2019-1, Class B, 3.37%, 2/18/25(a) | | | 308,000 | | | | 311,524 | |
GreatAmerica Leasing Receivables Funding LLC, Series2018-1, Class B, 2.99%,
6/17/24(a) | | | 306,000 | | | | 305,958 | |
Hercules Capital Funding Trust,
Series2019-1A, Class A, 4.70%, 2/20/28(a) | | | 450,000 | | | | 453,996 | |
Ivy Hill Middle Market Credit Fund X Ltd.,
Series 10A, Class A1AR, (ICE LIBOR USD 3M + 1.25%), 3.85%, 7/18/30(a)(c) | | | 273,000 | | | | 269,069 | |
John Deere Owner Trust, Series2019-A, Class A4, 3.00%, 1/15/26 | | | 299,000 | | | | 302,049 | |
MelTel Land Funding LLC, Series2019-1A, Class C, 6.07%, 4/15/49(a) | | | 188,000 | | | | 188,133 | |
Mill City Mortgage Loan Trust, Series2018-3, Class A1, 3.50%, 8/25/58(a)(d) | | | 290,218 | | | | 291,464 | |
MMAF Equipment Finance LLC, Series2017-B, Class A4, 2.41%, 11/15/24(a) | | | 595,000 | | | | 590,360 | |
MMAF Equipment Finance LLC, Series2018-A, Class A4, 3.39%, 1/10/25(a) | | | 500,000 | | | | 509,516 | |
MMAF Equipment Finance LLC, Series2019-A, Class A3, 2.84%, 11/13/23(a) | | | 400,000 | | | | 402,026 | |
NRZ Advance Receivables Trust,
Series2016-T5, Class AT5, 3.33%,
12/15/51(a) | | | 457,000 | | | | 460,233 | |
See accompanying Notes to Financial Statements
124
Morningstar Funds Trust April 30, 2019
Schedule of Investments(continued)
Morningstar Defensive Bond Fund
| | | | | | | | |
| | | Par | | | Value | |
|
Other (Continued) | |
PFS Financing Corp, Series2019-A,
Class B, 3.13%, 4/15/24(a) | | $ | 603,000 | | | $ | 602,872 | |
PFS Financing Corp., Series2018-F,
Class A, 3.52%, 10/15/23(a) | | | 405,000 | | | | 411,638 | |
PFS Financing Corp., Series2019-A, Class A2, 2.86%, 4/15/24(a) | | | 603,000 | | | | 602,985 | |
Sound Point Clo XII Ltd.,
Series2016-2A, Class AR, (ICE LIBOR USD 3M + 1.29%, 1.29% Floor), 3.88%, 10/20/28(a)(c) | | | 301,000 | | | | 301,120 | |
Symphony CLO XII Ltd.,
Series2013-12A, Class AR, (ICE LIBOR USD 3M + 1.03%), 3.63%,
10/15/25(a)(c) | | | 697,498 | | | | 697,749 | |
Towd Point Mortgage Trust,
Series2018-2, Class A1, 3.25%, 3/25/58(a) | | | 594,806 | | | | 596,253 | |
Trinitas CLO V Ltd., Series2016-5A, Class AR, (ICE LIBOR USD 3M + 1.39%, 1.39% Floor), 3.97%, 10/25/28(a)(c) | | | 372,000 | | | | 372,000 | |
VCO CLO LLC, Series2018-1A, Class A, (ICE LIBOR USD 3M + 1.50%, 1.50% Floor), 4.09%,
7/20/30(a)(c) | | | 302,000 | | | | 300,833 | |
Venture XVII CLO Ltd.,
Series2014-17A, Class ARR, (ICE LIBOR USD 3M + 0.88%), 3.48%, 4/15/27(a)(c) | | | 197,000 | | | | 195,665 | |
Verizon Owner Trust,
Series2019-A, Class A1A, 2.93%, 9/20/23 | | | 299,000 | | | | 301,654 | |
Verizon Owner Trust,Series 2019-A,
Class B, 3.02%, 9/20/23 | | | 585,000 | | | | 590,145 | |
Volvo Financial Equipment LLC Series,
Series2019-1A, Class A4,
3.13%, 11/15/23(a) | | | 302,000 | | | | 304,986 | |
Wellfleet CLO Ltd., Series2016-1A, Class AR, (ICE LIBOR USD 3M + 0.91%), 3.50%, 4/20/28(a)(c) | | | 300,000 | | | | 297,702 | |
West CLO Ltd., Series2014-2A,
Series A1BR, 2.73%, 1/16/27(a) | | | 275,202 | | | | 272,424 | |
| | |
| | | | | | | | 15,164,027 | |
| | | | | | | | |
| | | Par | | | Value | |
|
Whole Loan – 1.0% | |
BRAVO Residential Funding Trust, Series2019-1, Class A1C, 3.50%, 3/25/58(a) | | $ | 581,459 | | | $ | 583,060 | |
CIM Trust, Series2017-7, Class A, 3.00%, 4/25/57(a) | | | 312,023 | | | | 309,565 | |
CIM Trust, Series2018-R3, Class A1, 5.00%, 12/25/57(a) | | | 569,141 | | | | 587,832 | |
| | | | | | | | 1,480,457 | |
| | |
Total Asset-Backed Securities
(Cost $25,068,358) | | | | | | | 25,236,740 | |
| |
Corporate Bonds – 0.9% | | | | | |
|
Chemicals – 0.2% | |
Neon Holdings, Inc., 10.12%, 4/01/26(a) | | | 300,000 | | | | 309,000 | |
|
Coal – 0.2% | |
Natural Resource Partners L.P./NRP Finance Corp., 9.12%, 6/30/25(a) | | | 240,000 | | | | 248,400 | |
|
Commercial Services – 0.1% | |
StoneMor Partners L.P./Cornerstone Family Services of West Virginia Subsidiary, 7.88%, 6/01/21 | | | 258,000 | | | | 234,780 | |
|
Oil & Gas Services – 0.4% | |
Bristow Group, Inc., 8.75%, 3/01/23(a) | | | 170,000 | | | | 142,800 | |
PHI, Inc., 5.25%, 3/15/19(e) | | | 688,000 | | | | 491,920 | |
| | | | | | | | 634,720 | |
| | |
Total Corporate Bonds
(Cost $1,609,745) | | | | | | | 1,426,900 | |
| |
Term Loans(c)– 1.2% | | | | | |
| |
Advertising – 0.2% | | | | | |
ABG Intermediate Holdings 2 LLC, Initial Term Loan, (ICE LIBOR USD 1M + 7.75%, 1.00% Floor), 10.23%, 9/29/25 | | | 311,000 | | | | 306,335 | |
|
Miscellaneous Manufacturing – 0.4% | |
Hexion, Inc., Initial Term Loan, (ICE LIBOR USD 3M + 2.75%), 5.35%, 10/01/20 | | | 594,000 | | | | 592,515 | |
See accompanying Notes to Financial Statements
125
Morningstar Funds Trust April 30, 2019
Schedule of Investments(continued)
Morningstar Defensive Bond Fund
| | | | | | | | |
| | | Par | | | Value | |
|
Retail – 0.3% | |
General Nutrition Centers, Inc., FILO Term Loan, (ICE LIBOR USD 1M + 7.00%), 9.49%, 12/31/22 | | $ | 196,000 | | | $ | 197,176 | |
JC Penney Corp., Inc., Loan,(ICE LIBOR USD 3M + 4.25%, 1.00% Floor), 6.88%, 6/23/23 | | | 280,265 | | | | 249,186 | |
Transform SR Holdings LLC, FILO Term Loan, 2/12/24(f) | | | 74,000 | | | | 74,370 | |
(ICE LIBOR USD 1M + 7.25%), 9.74%, 2/12/24 | | | 10,000 | | | | 10,050 | |
| | | | | | | | 530,782 | |
|
Telecommunications – 0.3% | |
LOGIX Holding Co. LLC, Initial Term Loan, (ICE LIBOR USD 1M + 5.75%, 1.00% Floor), 8.23%, 12/22/24 | | | 149,212 | | | | 149,959 | |
Windstream Holdings, Inc.,
Term Facility, 2/26/21(f) | | | 298,500 | | | | 298,500 | |
| | | | | | | | 448,459 | |
| | |
Total Term Loans
(Cost $1,871,711) | | | | | | | 1,878,091 | |
|
U.S. Government Obligations – 1.4% | |
|
U.S. Treasury Notes – 1.4% | |
2.00%, 7/31/22 | | | 675,000 | | | | 669,727 | |
1.87%, 8/31/22 | | | 670,000 | | | | 661,939 | |
1.88%, 9/30/22 | | | 518,000 | | | | 511,748 | |
2.00%, 10/31/22 | | | 416,000 | | | | 412,441 | |
| | | | | | | | 2,255,855 | |
| | |
Total U.S. Government Obligations
(Cost $2,233,151) | | | | | | | 2,255,855 | |
| | |
Par | | | | |
|
Mortgage-Backed Securities – 11.0% | |
|
Federal Home Loan Mortgage Corporation – 0.5% | |
Freddie Mac REMICS, Series 4336, Class WV, 3.00%, 10/15/25 | | | 340,480 | | | | 343,253 | |
Freddie Mac REMICS, Series 4387, Class VA, 3.00%, 2/15/26 | | | 442,920 | | | | 447,138 | |
| | | | | | | | 790,391 | |
| | | | | | | | |
| | | Par | | | Value | |
|
Federal Home Loan Mortgage Corporation Gold – 1.9% | |
Pool #E04232, 2/01/28(b) | | $ | 581,804 | | | $ | 578,958 | |
Pool #E04360, 4/01/28(b) | | | 578,287 | | | | 575,458 | |
Pool #G15601, 2.50%, 1/01/29 | | | 198,504 | | | | 197,534 | |
Pool #G16476, 3.00%, 4/01/28 | | | 434,169 | | | | 438,037 | |
Pool #G18431, 2.50%, 4/01/27 | | | 195,719 | | | | 194,768 | |
Pool #J20465, 2.50%, 9/01/27 | | | 284,531 | | | | 283,140 | |
Pool #J20770, 2.50%, 10/01/27 | | | 255,243 | | | | 253,996 | |
Pool #J21434, 2.50%, 12/01/27 | | | 446,310 | | | | 444,126 | |
| | | | | | | | 2,966,017 | |
|
Federal National Mortgage Association – 7.0% | |
Fannie Mae Interest STRIP, Series 284, Class 1, 0.00%, 7/25/27(g) | | | 223,723 | | | | 195,609 | |
Fannie Mae REMICS, Series2012-144, Class PD, 3.50%, 4/25/42 | | | 288,457 | | | | 294,348 | |
Fannie Mae REMICS, Series2014-3, Class AM, 2.50%, 1/25/32 | | | 571,515 | | | | 567,733 | |
Pool #AB6192, 2.50%, 9/01/27 | | | 445,990 | | | | 443,804 | |
Pool #AB7241, 2.00%, 12/01/27 | | | 184,230 | | | | 180,490 | |
Pool #AB7905, 2.50%, 2/01/28 | | | 793,818 | | | | 789,931 | |
Pool #AB8862, 2.50%, 4/01/28 | | | 184,841 | | | | 183,935 | |
Pool #AK3263, 3.00%, 2/01/27 | | | 586,441 | | | | 591,742 | |
Pool #AL1562, 2.50%, 4/01/27 | | | 224,981 | | | | 223,881 | |
Pool #AL5254, 11/01/27(b) | | | 574,312 | | | | 579,499 | |
Pool #AL5638, 6/01/28(b) | | | 570,457 | | | | 575,615 | |
Pool #AP9574, 10/01/27(b) | | | 673,333 | | | | 670,030 | |
Pool #AQ0437, 10/01/27(b) | | | 1,100,401 | | | | 1,095,006 | |
Pool #AQ7281, 2.00%, 12/01/27 | | | 445,510 | | | | 436,464 | |
Pool #AQ8185, 2.50%, 1/01/28 | | | 202,082 | | | | 201,093 | |
Pool #AQ8719, 2.50%, 12/01/27 | | | 460,362 | | | | 458,105 | |
Pool #AR3878, 2/01/28(b) | | | 709,890 | | | | 706,410 | |
Pool #BM1595, 2.50%, 3/01/31 | | | 444,467 | | | | 442,014 | |
Pool #BM3954, 2.50%, 12/01/28 | | | 521,579 | | | | 519,021 | |
Pool #BM4406, 2.50%, 9/01/28 | | | 444,525 | | | | 440,613 | |
See accompanying Notes to Financial Statements
126
Morningstar Funds Trust April 30, 2019
Schedule of Investments(continued)
Morningstar Defensive Bond Fund
| | | | | | | | |
| | |
Par | | | Value | |
|
Federal National Mortgage Association (Continued) | |
Pool #BM4743, 2.00%, 8/01/30 | | $ | 453,028 | | | $ | 443,800 | |
Pool #BM5514, 2.50%, 2/01/29 | | | 442,435 | | | | 438,582 | |
Pool #MA1101, 2.50%, 7/01/27 | | | 289,947 | | | | 288,526 | |
Pool #MA3079, 2.50%, 7/01/27 | | | 72,188 | | | | 71,568 | |
Pool #MA3158, 2.50%, 10/01/27 | | | 106,353 | | | | 105,439 | |
| | | | | | | | 10,943,258 | |
|
Government National Mortgage Association – 1.6% | |
Government National Mortgage Association, Series2010-161, Class B, 3.00%, 7/16/40 | | | 146,066 | | | | 145,764 | |
Government National Mortgage Association, Series2011-9, Class C, 3.51%, 9/16/41(d) | | | 291,351 | | | | 292,703 | |
Government National Mortgage Association, Series2012-150, Class IO, 0.72%, 11/16/52(d) | | | 2,801,461 | | | | 113,706 | |
Government National Mortgage Association, Series2014-138, Class A, 2.70%, 1/16/44 | | | 310,402 | | | | 309,020 | |
Government National Mortgage Association, Series2015-108, Class IO, 0.95%, 10/16/56(d) | | | 940,991 | | | | 55,684 | |
Government National Mortgage Association, Series2015-41, Class AF, 3.06%, 9/16/56(d) | | | 584,311 | | | | 599,527 | |
Government National Mortgage Association, Series2015-47, Class IO, 0.85%, 10/16/56(d) | | | 4,426,034 | | | | 245,486 | |
Government National Mortgage Association, Series2015-7, Class IO, 0.80%, 1/16/57(d) | | | 5,165,686 | | | | 293,984 | |
Government National Mortgage Association, Series2019-39, Class A, 3.10%, 5/16/59 | | | 396,799 | | | | 399,484 | |
| | | | | | | | 2,455,358 | |
| | |
Total Mortgage-Backed Securities
(Cost $17,042,700) | | | | | | | 17,155,024 | |
| | | | | | | | |
| | | Number
of Shares | | | Value | |
Investment Companies – 47.0% | |
Schwab Short-Term | | | | | | | | |
U.S. Treasury ETF | | | 240,367 | | | $ | 12,059,212 | |
SPDR Bloomberg Barclays1-3 MonthT-Bill ETF | | | 335,595 | | | | 30,740,502 | |
Vanguard Short-Term Bond ETF | | | 148,909 | | | | 11,847,200 | |
Vanguard Short-Term Inflation-Protected Securities ETF | | | 383,855 | | | | 18,774,348 | |
| | |
Total Investment Companies
(Cost $72,885,542) | | | | | | | 73,421,262 | |
|
Short-Term Investments – 26.1% | |
|
Money Market Fund – 15.1% | |
Northern Institutional Funds - Treasury Portfolio (Premier), 2.29%(h) | | | 23,590,884 | | | | 23,590,884 | |
|
U.S. Treasury Bills – 11.0% | |
U.S. Treasury Bill, 1.66%, 5/02/19(i) | | | 17,127,000 | | | | 17,125,870 | |
| | |
Total Short-Term Investments
(Cost $40,716,844) | | | | | | | 40,716,754 | |
| | |
Total Investments – 103.8%
(Cost $161,428,051) | | | | | | | 162,090,626 | |
| | |
Liabilities less Other Assets – (3.8)% | | | | | | | (6,001,965 | ) |
| | |
NET ASSETS – 100.0% | | | | | | $ | 156,088,661 | |
See accompanying Notes to Financial Statements
127
Morningstar Funds Trust April 30, 2019
Schedule of Investments(continued)
Morningstar Defensive Bond Fund
| (a) | Securities exempt from registration under Rule 144A of the Securities Act of 1933. These securities may be resold in transactions exempt from registration, normally to qualified institutional buyers. The value of these securities is determined by valuations supplied by a pricing service or brokers, or, if not available, in accordance with procedures established by the Board of Trustees of Morningstar Funds. |
| (b) | When-Issued Security. Coupon rate was not in effect at April 30, 2019. |
| (c) | Variable rate security. Rate as of April 30, 2019 is disclosed. |
| (d) | Variable or floating rate security, the interest rate of which adjusts periodically based on changes in current interest rates and prepayments on the underlying pool of assets. |
| (e) | Issuer has defaulted on terms of debt obligation. Income is not being accrued. |
| (f) | Position is unsettled. Contract rate was not determined at April 30, 2019 and does not take effect until settlement date. |
| (h) | 7-day current yield as of April 30, 2019 is disclosed. |
| (i) | Discount rate at the time of purchase. |
Percentages shown are based on Net Assets
| | |
| Abbreviations: | | |
1M | | 1 Month |
3M | | 3 Month |
CLO | | Collateralized Loan Obligation |
ETF | | Exchange-Traded Fund |
Fannie Mae | | Federal National Mortgage Association |
Freddie Mac | | Federal Home Loan Mortgage Corporation |
ICE | | Intercontinental Exchange |
IO | | Interest Only |
LIBOR | | London Interbank Offered Rate |
SPDR | | Standard & Poor’s Depositary Receipt |
STRIP | | Separate Trading of Registered Interest and Principal |
USD | | United States Dollar |
Valuation Hierarchy
The following is a summary of the inputs used, as of April 30, 2019, in valuing the Fund’s investments carried at fair value:
| | | | | | | | | | | | | | | | |
| Morningstar Defensive Bond Fund | | Level 1 | | | Level 2 | | | Level 3 | | | Totals | |
| | | | |
Investments | | | | | | | | | | | | | | | | |
| | | | |
Assets: | | | | | | | | | | | | | �� | | | |
| | | | |
Investments in Securities: | | | | | | | | | | | | | | | | |
Asset-Backed Securities | | $ | — | | | $ | 25,236,740 | | | | $— | | | $ | 25,236,740 | |
Corporate Bonds | | | — | | | | 1,426,900 | | | | — | | | | 1,426,900 | |
Term Loans | | | — | | | | 1,878,091 | | | | — | | | | 1,878,091 | |
U.S. Government Obligations | | | — | | | | 2,255,855 | | | | — | | | | 2,255,855 | |
Mortgage-Backed Securities | | | — | | | | 17,155,024 | | | | — | | | | 17,155,024 | |
Investment Companies | | | 73,421,262 | | | | — | | | | — | | | | 73,421,262 | |
Short-Term Investments | | | 23,590,884 | | | | 17,125,870 | | | | — | | | | 40,716,754 | |
| | | | | |
Total Investments | | $ | 97,012,146 | | | $ | 65,078,480 | | | | $— | | | $ | 162,090,626 | |
See accompanying Notes to Financial Statements
128
Morningstar Funds Trust April 30, 2019
Schedule of Investments
|
Morningstar Multisector Bond Fund |
| | | | | | | | |
| | | Number
of Shares | | | Value | |
Common Stocks – 0.0%(a) | |
Oil & Gas – 0.0%(a) | | | | | |
Whiting Petroleum Corp.* | | | 1,781 | | | $ | 48,782 | |
| | | |
Pharmaceuticals – 0.0%(a) | | | | | | | | |
Bristol-Myers Squibb Co. | | | 582 | | | | 27,022 | |
Total Common Stocks
(Cost $76,122) | | | | | | | 75,804 | |
Convertible Preferred Stocks – 0.2% | |
Agriculture – 0.2% | | | | | | | | |
Bunge Ltd., 4.88% | | | 2,499 | | | | 245,427 | |
Total Convertible Preferred Stocks (Cost $247,513) | | | | | | | 245,427 | |
| | | Par(b) | | | | |
Convertible Bonds – 1.2% | |
Auto Parts & Equipment – 0.0%(a) | | | | | |
Meritor, Inc., 3.25%, 10/15/37 | | $ | 55,000 | | | | 56,695 | |
| | | |
Biotechnology – 0.2% | | | | | | | | |
BioMarin Pharmaceutical, Inc., 0.60%, 8/01/24 | | | 250,000 | | | | 257,006 | |
Intercept Pharmaceuticals, Inc., 3.25%, 7/01/23 | | | 60,000 | | | | 55,843 | |
| | | | | | | 312,849 | |
| | | |
Computers – 0.0%(a) | | | | | | | | |
Western Digital Corp., 1.50%, 2/01/24(c) | | | 35,000 | | | | 31,224 | |
| | |
Engineering & Construction – 0.0%(a) | | | | | |
Tutor Perini Corp., 2.88%, 6/15/21 | | | 30,000 | | | | 29,555 | |
| | | |
Healthcare - Products – 0.0%(a) | | | | | | | | |
Insulet Corp., 1.38%, 11/15/24(c) | | | 5,000 | | | | 5,697 | |
| | | |
Internet – 0.1% | | | | | | | | |
Booking Holdings, Inc., 0.35%, 6/15/20 | | | 40,000 | | | | 57,156 | |
Palo Alto Networks, Inc., 0.75%, 7/01/23(c) | | | 30,000 | | | | 34,004 | |
| | | | | | | 91,160 | |
| | | |
Media – 0.2% | | | | | | | | |
DISH Network Corp., | | | | | | | | |
2.38%, 3/15/24 | | | 210,000 | | | | 182,534 | |
3.37%, 8/15/26 | | | 115,000 | | | | 105,491 | |
| | | | | | | 288,025 | |
| | | |
| | | | | | | | |
| | | | | | | | |
| | | Par(b) | | | Value | |
Oil & Gas – 0.3% | | | | | | | | |
Chesapeake Energy Corp., 5.50%, 9/15/26 | | $ | 220,000 | | | $ | 199,504 | |
Nabors Industries, Inc., 0.75%, 1/15/24 | | | 115,000 | | | | 82,843 | |
PDC Energy, Inc., 1.12%, 9/15/21 | | | 105,000 | | | | 99,696 | |
SM Energy Co., 1.50%, 7/01/21 | | | 15,000 | | | | 13,863 | |
Whiting Petroleum Corp., 1.25%, 4/01/20 | | | 50,000 | | | | 48,532 | |
| | | | | | | 444,438 | |
| | | |
Oil & Gas Services – 0.0%(a) | | | | | | | | |
Oil States International, Inc.,
1.50%, 2/15/23 | | | 65,000 | | | | 58,216 | |
Pharmaceuticals – 0.1% | | | | | |
Dermira, Inc., 3.00%, 5/15/22 | | | 70,000 | | | | 61,213 | |
Flexion Therapeutics, Inc., 3.37%, 5/01/24 | | | 70,000 | | | | 58,500 | |
| | | | | | | 119,713 | |
| | |
Real Estate Investment Trusts – 0.0%(a) | | | | | |
iStar, Inc., 3.12%, 9/15/22 | | | 65,000 | | | | 60,287 | |
| | | |
Software – 0.2% | | | | | | | | |
Avaya Holdings Corp., 2.25%, 6/15/23(c) | | | 85,000 | | | | 82,995 | |
Evolent Health, Inc., 2.00%, 12/01/21 | | | 85,000 | | | | 83,198 | |
Nuance Communications, Inc.,
1.25%, 4/01/25 | | | 20,000 | | | | 19,793 | |
1.00%, 12/15/35 | | | 105,000 | | | | 97,627 | |
Verint Systems, Inc., 1.50%, 6/01/21 | | | 35,000 | | | | 39,187 | |
| | | | | | | 322,800 | |
| | | |
Telecommunications – 0.0%(a) | | | | | | | | |
CalAmp Corp., 2.00%, 8/01/25(c) | | | 5,000 | | | | 4,187 | |
| | | |
Trucking & Leasing – 0.1% | | | | | | | | |
Greenbrier (The) Cos., Inc., 2.88%, 2/01/24 | | | 120,000 | | | | 120,239 | |
Total Convertible Bonds
(Cost $1,909,655) | | | | | | | 1,945,085 | |
Corporate Bonds – 8.8% | |
Aerospace/Defense – 0.1% | | | | | |
TransDigm, Inc., 6.25%, 3/15/26(c) | | | 140,000 | | | | 145,775 | |
See accompanying Notes to Financial Statements
129
Morningstar Funds Trust April 30, 2019
Schedule of Investments(continued)
Morningstar Multisector Bond Fund
| | | | | | | | |
| | | Par(b) | | | Value | |
| | |
Apparel – 0.0%(a) | | | | | | | | |
William Carter (The) Co., 5.63%, 3/15/27(c) | | $ | 15,000 | | | $ | 15,506 | |
| | | |
Auto Manufacturers – 0.1% | | | | | | | | |
Allison Transmission, Inc.,
5.00%, 10/01/24(c) | | | 53,000 | | | | 53,605 | |
5.88%, 6/01/29(c) | | | 70,000 | | | | 72,100 | |
| | | | | | | 125,705 | |
| | | |
Auto Parts & Equipment – 0.1% | | | | | | | | |
Dana Financing Luxembourg S.a.r.l., 5.75%, 4/15/25(c) | | | 23,000 | | | | 23,460 | |
Delphi Technologies PLC, 5.00%, 10/01/25(c) | | | 106,000 | | | | 97,255 | |
Goodyear Tire & Rubber (The) Co., 5.00%, 5/31/26 | | | 75,000 | | | | 72,909 | |
| | | | | | | 193,624 | |
| | | |
Banks – 0.1% | | | | | | | | |
CIT Group, Inc.,
4.13%, 3/09/21 | | | 75,000 | | | | 76,031 | |
5.00%, 8/01/23 | | | 75,000 | | | | 78,263 | |
Provident Funding Associates L.P./PFG Finance Corp., 6.37%, 6/15/25(c) | | | 30,000 | | | | 28,050 | |
| | | | | | | 182,344 | |
| | | |
Building Materials – 0.2% | | | | | | | | |
JELD-WEN, Inc., 4.63%, 12/15/25(c) | | | 43,000 | | | | 40,957 | |
Summit Materials LLC/Summit Materials Finance Corp., 6.13%, 7/15/23 | | | 60,000 | | | | 61,050 | |
US Concrete, Inc., 6.37%, 6/01/24 | | | 154,000 | | | | 158,235 | |
| | | | | | | 260,242 | |
| | | |
Chemicals – 0.0%(a) | | | | | | | | |
Hexion, Inc.,
6.63%, 4/15/20(d) | | | 21,000 | | | | 16,642 | |
10.37%, 2/01/22(c)(d) | | | 11,000 | | | | 8,608 | |
| | | | | | | 25,250 | |
| | | |
Commercial Services – 0.1% | | | | | | | | |
Midas Intermediate Holdco II LLC/Midas Intermediate Holdco II Finance, Inc., 7.87%, 10/01/22(c) | | | 43,000 | | | | 39,560 | |
| | | | | | | | |
| | | Par(b) | | | Value | |
Commercial Services (Continued) | |
Star Merger Sub, Inc., 6.87%, 8/15/26(c) | | $ | 75,000 | | | $ | 77,955 | |
United Rentals North America, Inc.,
4.63%, 10/15/25 | | | 96,000 | | | | 95,280 | |
| | | | | | | 212,795 | |
| | | |
Computers – 0.2% | | | | | | | | |
Dell International LLC/EMC Corp., 6.02%, 6/15/26(c) | | | 111,000 | | | | 120,265 | |
4.90%, 10/01/26(c) | | | 65,000 | | | | 66,578 | |
Western Digital Corp., 4.75%, 2/15/26 | | | 73,000 | | | | 70,445 | |
| | | | | | | 257,288 | |
| | |
Cosmetics/Personal Care – 0.0%(a) | | | | | |
Coty, Inc., 6.50%, 4/15/26(c) | | | 66,000 | | | | 65,092 | |
| | |
Diversified Financial Services – 0.9% | | | | | |
Aircastle Ltd., 5.50%, 2/15/22 | | | 148,000 | | | | 156,027 | |
Ally Financial, Inc.,
4.13%, 3/30/20 | | | 149,000 | | | | 149,745 | |
4.13%, 2/13/22 | | | 77,000 | | | | 77,866 | |
4.63%, 3/30/25 | | | 140,000 | | | | 144,200 | |
5.75%, 11/20/25 | | | 220,000 | | | | 238,425 | |
Ladder Capital Finance Holdings LLLP/Ladder Capital Finance Corp., 5.87%, 8/01/21(c) | | | 36,000 | | | | 36,675 | |
5.25%, 10/01/25(c) | | | 60,000 | | | | 59,775 | |
Nationstar Mortgage Holdings, Inc., 8.12%, 7/15/23(c) | | | 115,000 | | | | 115,863 | |
Navient Corp., 7.25%, 1/25/22 | | | 117,000 | | | | 125,336 | |
6.50%, 6/15/22 | | | 20,000 | | | | 21,075 | |
Quicken Loans, Inc., 5.75%, 5/01/25(c) | | | 205,000 | | | | 208,075 | |
5.25%, 1/15/28(c) | | | 20,000 | | | | 19,400 | |
Springleaf Finance Corp., 6.87%, 3/15/25 | | | 10,000 | | | | 10,725 | |
7.12%, 3/15/26 | | | 135,000 | | | | 144,956 | |
| | | | | | | 1,508,143 | |
| | | |
Electric – 0.2% | | | | | | | | |
AES Corp., 4.00%, 3/15/21 | | | 152,000 | | | | 153,520 | |
5.50%, 4/15/25 | | | 36,000 | | | | 37,368 | |
6.00%, 5/15/26 | | | 37,000 | | | | 39,127 | |
Vistra Operations Co. LLC,
5.50%, 9/01/26(c) | | | 115,000 | | | | 118,450 | |
| | | | | | | | 348,465 | |
| | | | | | | | |
See accompanying Notes to Financial Statements
130
Morningstar Funds Trust April 30, 2019
Schedule of Investments(continued)
Morningstar Multisector Bond Fund
| | | | | | | | |
| | | Par(b) | | | Value | |
| | |
Entertainment – 0.1% | | | | | | | | |
Lions Gate Capital | | | | | | | | |
Holdings LLC, 6.38%, 2/01/24(c) | | $ | 170,000 | | | $ | 177,862 | |
| | |
Food – 0.2% | | | | | | | | |
Albertsons Cos. LLC/Safeway, Inc./New Albertsons L.P./Albertson’s LLC, 5.75%, 3/15/25 | | | 131,000 | | | | 130,017 | |
B&G Foods, Inc., 5.25%, 4/01/25 | | | 38,000 | | | | 37,286 | |
JBS USA LUX S.A./JBS USA Food Co./JBS USA Finance, Inc., 6.50%, 4/15/29(c) | | | 10,000 | | | | 10,600 | |
JBS USA LUX SA/JBS USA Finance, Inc., 5.75%, 6/15/25(c) | | | 32,000 | | | | 32,720 | |
Pilgrim’s Pride Corp.,
5.75%, 3/15/25(c) | | | 54,000 | | | | 54,810 | |
5.87%, 9/30/27(c) | | | 40,000 | | | | 41,300 | |
Post Holdings, Inc., 5.75%, 3/01/27(c) | | | 71,000 | | | | 72,775 | |
| | | | | | | 379,508 | |
| | | |
Gas – 0.1% | | | | | | | | |
NGL Energy Partners L.P./NGL Energy Finance Corp.,
7.50%, 11/01/23 | | | 77,000 | | | | 80,065 | |
7.50%, 4/15/26(c) | | | 30,000 | | | | 31,011 | |
| | | | | | | 111,076 | |
| | | |
Healthcare - Products – 0.0%(a) | | | | | | | | |
Hologic, Inc., 4.38%, 10/15/25(c) | | | 40,000 | | | | 39,625 | |
| | |
Healthcare - Services – 0.7% | | | | | | | | |
Catalent Pharma Solutions, Inc.,
4.88%, 1/15/26(c) | | | 55,000 | | | | 55,137 | |
Centene Corp., 4.75%, 1/15/25 | | | 150,000 | | | | 152,175 | |
CHS/Community Health Systems, Inc., 6.25%, 3/31/23 | | | 65,000 | | | | 63,294 | |
DaVita, Inc., 5.75%, 8/15/22 | | | 30,000 | | | | 30,488 | |
5.12%, 7/15/24 | | | 45,000 | | | | 45,000 | |
HCA, Inc., 5.87%, 3/15/22 | | | 64,000 | | | | 68,454 | |
5.37%, 2/01/25 | | | 305,000 | | | | 321,012 | |
5.25%, 4/15/25 | | | 147,000 | | | | 157,429 | |
Polaris Intermediate Corp.,
8.50%, 12/01/22(c)(e) | | | 142,000 | | | | 141,290 | |
| | | | | | | | |
| | | Par(b) | | | Value | |
| |
Healthcare - Services (Continued) | | | | | |
Tenet Healthcare Corp.,
4.38%, 10/01/21 | | $ | 54,000 | | | $ | 54,608 | |
5.13%, 5/01/25 | | | 50,000 | | | | 50,438 | |
| | | | | | | 1,139,325 | |
| | | |
Home Builders – 0.2% | | | | | | | | |
Lennar Corp.,
4.75%, 11/15/22 | | | 74,000 | | | | 75,743 | |
4.75%, 5/30/25 | | | 155,000 | | | | 158,487 | |
PulteGroup, Inc., 6.37%, 5/15/33 | | | 96,000 | | | | 99,840 | |
TRI Pointe Group, Inc./TRI Pointe Homes, Inc.,
4.38%, 6/15/19 | | | 60,000 | | | | 59,897 | |
| | | | | | | 393,967 | |
| | | |
Insurance – 0.1% | | | | | | | | |
CNO Financial Group, Inc., 5.25%, 5/30/25 | | | 111,000 | | | | 116,411 | |
| | |
Internet – 0.2% | | | | | | | | |
Netflix, Inc., 4.88%, 4/15/28 | | | 182,000 | | | | 180,407 | |
5.37%, 11/15/29(c) | | | 65,000 | | | | 65,813 | |
Uber Technologies, Inc.,
7.50%, 11/01/23(c) | | | 90,000 | | | | 94,500 | |
| | | | | | | 340,720 | |
| | | |
Iron/Steel – 0.1% | | | | | | | | |
Commercial Metals Co., 4.88%, 5/15/23 | | | 119,000 | | | | 120,190 | |
| | |
Leisure Time – 0.0%(a) | | | | | | | | |
Sabre GLBL, Inc., 5.25%, 11/15/23(c) | | | 53,000 | | | | 54,060 | |
| | |
Lodging – 0.3% | | | | | | | | |
Boyd Gaming Corp., 6.37%, 4/01/26 | | | 15,000 | | | | 15,788 | |
Hilton Domestic Operating Co., Inc., 4.25%, 9/01/24 | | | 63,000 | | | | 63,085 | |
Hilton Worldwide Finance LLC/Hilton Worldwide Finance Corp.,
4.63%, 4/01/25 | | | 62,000 | | | | 62,775 | |
Marriott Ownership Resorts, Inc./ILG LLC, 6.50%, 9/15/26(c) | | | 36,000 | | | | 37,800 | |
6.50%, 9/15/26 | | | 55,000 | | | | 57,887 | |
MGM Resorts International,
7.75%, 3/15/22 | | | 139,000 | | | | 153,769 | |
Wyndham Destinations, Inc.,
5.62%, 3/01/21 | | | 150,000 | | | | 155,625 | |
| | | | | | | | 546,729 | |
See accompanying Notes to Financial Statements
131
Morningstar Funds Trust April 30, 2019
Schedule of Investments(continued)
Morningstar Multisector Bond Fund
| | | | | | | | |
| | | Par(b) | | | Value | |
| | |
Media – 0.6% | | | | | | | | |
AMC Networks, Inc.,
4.75%, 12/15/22 | | $ | 39,000 | | | $ | 39,378 | |
5.00%, 4/01/24 | | | 55,000 | | | | 55,688 | |
4.75%, 8/01/25 | | | 41,000 | | | | 40,778 | |
CCO Holdings LLC/CCO Holdings Capital Corp.,
5.25%, 9/30/22 | | | 39,000 | | | | 39,634 | |
5.13%, 2/15/23 | | | 70,000 | | | | 71,137 | |
5.75%, 1/15/24 | | | 112,000 | | | | 114,800 | |
5.37%, 5/01/25(c) | | | 105,000 | | | | 108,675 | |
Clear Channel Worldwide Holdings, Inc., 6.50%, 11/15/22 | | | 75,000 | | | | 76,594 | |
CSC Holdings LLC, 6.75%, 11/15/21 | | | 121,000 | | | | 129,470 | |
DISH DBS Corp., 7.75%, 7/01/26 | | | 45,000 | | | | 40,275 | |
Meredith Corp., 6.87%, 2/01/26 | | | 171,000 | | | | 177,840 | |
| | | | | | | 894,269 | |
| | | |
Mining – 0.1% | | | | | | | | |
Freeport-McMoRan, Inc., 5.40%, 11/14/34 | | | 115,000 | | | | 107,956 | |
| | |
Oil & Gas – 1.4% | | | | | | | | |
Bruin E&P Partners LLC, 8.87%, 8/01/23(c) | | | 109,000 | | | | 103,005 | |
California Resources Corp.,
8.00%, 12/15/22(c) | | | 179,000 | | | | 136,040 | |
Callon Petroleum Co., 6.13%, 10/01/24 | | | 23,000 | | | | 23,626 | |
Centennial Resource Production LLC,
5.38%, 1/15/26(c) | | | 60,000 | | | | 58,950 | |
6.87%, 4/01/27(c) | | | 105,000 | | | | 108,806 | |
Chesapeake Energy Corp., 8.00%, 1/15/25 | | | 52,000 | | | | 52,650 | |
CNX Resources Corp., 5.88%, 4/15/22 | | | 30,000 | | | | 29,850 | |
Continental Resources, Inc., 5.00%, 9/15/22 | | | 113,000 | | | | 113,923 | |
Denbury Resources, Inc.,
9.25%, 3/31/22(c) | | | 22,000 | | | | 22,275 | |
7.50%, 2/15/24(c) | | | 83,000 | | | | 76,360 | |
Gulfport Energy Corp.,
6.00%, 10/15/24 | | | 185,000 | | | | 162,223 | |
6.37%, 5/15/25 | | | 55,000 | | | | 48,400 | |
6.37%, 1/15/26 | | | 29,000 | | | | 25,013 | |
Halcon Resources Corp., 6.75%, 2/15/25 | | | 60,000 | | | | 38,550 | |
Matador Resources Co., 5.88%, 9/15/26 | | | 54,000 | | | | 54,405 | |
| | | | | | | | |
| | | Par(b) | | | Value | |
| | |
Oil & Gas (Continued) | | | | | | | | |
Montage Resources Corp., 8.87%, 7/15/23 | | $ | 121,000 | | | $ | 115,857 | |
Newfield Exploration Co., 5.63%, 7/01/24 | | | 37,000 | | | | 40,400 | |
Noble Holding International Ltd., 7.75%, 1/15/24 | | | 5,000 | | | | 4,538 | |
7.87%, 2/01/26(c) | | | 78,000 | | | | 75,465 | |
Oasis Petroleum, Inc., 6.87%, 3/15/22 | | | 116,000 | | | | 116,435 | |
PDC Energy, Inc., 6.13%, 9/15/24 | | | 47,000 | | | | 47,705 | |
Sanchez Energy Corp., 7.25%, 2/15/23(c) | | | 82,000 | | | | 69,085 | |
SM Energy Co.,
6.12%, 11/15/22 | | | 45,000 | | | | 45,450 | |
5.00%, 1/15/24 | | | 150,000 | | | | 140,531 | |
5.63%, 6/01/25 | | | 47,000 | | | | 44,004 | |
Southwestern Energy Co., 6.20%, 1/23/25 | | | 62,000 | | | | 60,954 | |
Transocean Guardian Ltd.,
5.88%, 1/15/24(c) | | | 35,910 | | | | 36,808 | |
Vine Oil & Gas L.P./Vine Oil & Gas Finance Corp., 9.75%, 4/15/23(c) | | | 50,000 | | | | 39,250 | |
Whiting Petroleum Corp.,
6.25%, 4/01/23 | | | 160,000 | | | | 163,600 | |
6.62%, 1/15/26 | | | 165,000 | | | | 164,744 | |
| | | | | | | 2,218,902 | |
| | | |
Oil & Gas Services – 0.1% | | | | | | | | |
McDermott Technology Americas, Inc./McDermott Technology U.S., Inc., 10.63%, 5/01/24(c) | | | 108,000 | | | | 97,540 | |
Transocean Proteus Ltd.,
6.25%, 12/01/24(c) | | | 30,400 | | | | 31,236 | |
| | | | | | | 128,776 | |
| | | |
Packaging & Containers – 0.1% | | | | | | | | |
Berry Global, Inc., 4.50%, 2/15/26(c) | | | 55,000 | | | | 53,350 | |
Crown Americas LLC/Crown Americas Capital Corp. VI, 4.75%, 2/01/26 | | | 39,000 | | | | 39,634 | |
Silgan Holdings, Inc., 4.75%, 3/15/25 | | | 95,000 | | | | 94,050 | |
| | | | | | | 187,034 | |
| | | |
Pharmaceuticals – 0.1% | | | | | | | | |
Bausch Health Cos., Inc.,
5.50%, 3/01/23(c) | | | 12,000 | | | | 12,045 | |
5.88%, 5/15/23(c) | | | 53,000 | | | | 53,408 | |
See accompanying Notes to Financial Statements
132
Morningstar Funds Trust April 30, 2019
Schedule of Investments(continued)
Morningstar Multisector Bond Fund
| | | | | | | | |
| | | Par(b) | | | Value | |
| | |
Pharmaceuticals (Continued) | | | | | | | | |
6.12%, 4/15/25(c) | | $ | 80,000 | | | $ | 80,900 | |
9.00%, 12/15/25(c) | | | 35,000 | | | | 38,763 | |
| | | | | | | 185,116 | |
| | | |
Pipelines – 0.5% | | | | | | | | |
Energy Transfer Operating L.P., (ICE LIBOR USD 3M + 4.03%), 6.25%, 2/15/23(f)(g) | | | 102,000 | | | | 97,060 | |
EnLink Midstream Partners L.P., 5.60%, 4/01/44 | | | 10,000 | | | | 9,013 | |
5.05%, 4/01/45 | | | 5,000 | | | | 4,300 | |
5.45%, 6/01/47 | | | 70,000 | | | | 61,775 | |
Hess Infrastructure Partners L.P./Hess Infrastructure Partners Finance Corp., 5.62%, 2/15/26(c) | | | 114,000 | | | | 116,565 | |
NGPL PipeCo LLC, 4.38%, 8/15/22(c) | | | 113,000 | | | | 115,825 | |
4.88%, 8/15/27(c) | | | 38,000 | | | | 39,235 | |
NuStar Logistics L.P., 5.62%, 4/28/27 | | | 120,000 | | | | 119,964 | |
SemGroup Corp./Rose Rock Finance Corp., 5.62%, 7/15/22 | | | 48,000 | | | | 47,580 | |
Targa Resources Partners L.P./Targa Resources Partners Finance Corp.,
5.25%, 5/01/23 | | | 113,000 | | | | 114,412 | |
| | | | | | | 725,729 | |
| | | |
Private Equity – 0.1% | | | | | | | | |
Icahn Enterprises L.P./Icahn Enterprises Finance Corp.,
5.88%, 2/01/22 | | | 115,000 | | | | 116,150 | |
| | | |
Real Estate – 0.1% | | | | | | | | |
Realogy Group LLC/RealogyCo-Issuer Corp.,
4.88%, 6/01/23(c) | | | 75,000 | | | | 71,509 | |
9.37%, 4/01/27(c) | | | 25,000 | | | | 25,968 | |
| | | | | | | 97,477 | |
| | |
Real Estate Investment Trusts – 0.4% | | | | | |
Brookfield Property REIT, Inc./BPR Cumulus LLC/BPR Nimbus LLC/GGSI Sellco LL, 5.75%, 5/15/26(c) | | | 110,000 | | | | 111,512 | |
Equinix, Inc., 5.37%, 1/01/22 | | | 76,000 | | | | 77,900 | |
iStar, Inc., 4.62%, 9/15/20 | | | 38,000 | | | | 38,380 | |
| | | | | | | | |
| | | Par(b) | | | Value | |
| |
Real Estate Investment Trusts (Continued) | | | | | |
6.50%, 7/01/21 | | $ | 52,000 | | | $ | 53,040 | |
5.25%, 9/15/22 | | | 38,000 | | | | 38,285 | |
MGM Growth Properties Operating Partnership L.P./MGP FinanceCo-Issuer, Inc.,
5.75%, 2/01/27(c) | | | 35,000 | | | | 36,838 | |
4.50%, 1/15/28 | | | 246,000 | | | | 236,160 | |
Starwood Property Trust, Inc., 3.63%, 2/01/21 | | | 29,000 | | | | 28,855 | |
4.75%, 3/15/25 | | | 62,000 | | | | 62,155 | |
| | | | | | | 683,125 | |
| | | |
Retail – 0.4% | | | | | | | | |
Asbury Automotive Group, Inc., 6.00%, 12/15/24 | | | 93,000 | | | | 96,255 | |
Beacon Roofing Supply, Inc.,
4.88%, 11/01/25(c) | | | 51,000 | | | | 49,072 | |
Group 1 Automotive, Inc., 5.00%, 6/01/22 | | | 92,000 | | | | 93,265 | |
JC Penney Corp., Inc., 5.87%, 7/01/23(c) | | | 167,000 | | | | 142,785 | |
KFC Holding Co./Pizza Hut Holdings LLC/Taco Bell of America LLC, 5.25%, 6/01/26(c) | | | 115,000 | | | | 118,594 | |
L Brands, Inc., 6.75%, 7/01/36 | | | 69,000 | | | | 60,030 | |
Party City Holdings, Inc., 6.62%, 8/01/26(c) | | | 25,000 | | | | 24,782 | |
| | | | | | | 584,783 | |
| | | |
Software – 0.2% | | | | | | | | |
Camelot Finance S.A., 7.87%, 10/15/24(c) | | | 15,000 | | | | 15,788 | |
First Data Corp.,
5.38%, 8/15/23(c) | | | 75,000 | | | | 76,680 | |
5.00%, 1/15/24(c) | | | 75,000 | | | | 76,883 | |
MSCI, Inc., 5.25%, 11/15/24(c) | | | 118,000 | | | | 121,540 | |
SS&C Technologies, Inc., 5.50%, 9/30/27(c) | | | 80,000 | | | | 82,050 | |
| | | | | | | 372,941 | |
| | | |
Telecommunications – 0.7% | | | | | | | | |
CenturyLink, Inc., 5.80%, 3/15/22 | | | 38,000 | | | | 39,048 | |
CommScope, Inc.,
5.50%, 3/01/24(c) | | | 140,000 | | | | 146,038 | |
6.00%, 3/01/26(c) | | | 50,000 | | | | 52,938 | |
8.25%, 3/01/27(c) | | | 115,000 | | | | 124,200 | |
See accompanying Notes to Financial Statements
133
Morningstar Funds Trust April 30, 2019
Schedule of Investments(continued)
Morningstar Multisector Bond Fund
| | | | | | | | | | | | |
| | | | | | Par(b) | | | Value | |
|
Telecommunications (Continued) | |
Frontier Communications Corp.,
8.50%, 4/01/26(c) | | | | | | $ | 122,000 | | | $ | 114,985 | |
8.00%, 4/01/27(c) | | | | | | | 135,000 | | | | 139,556 | |
Sprint Corp.,
7.25%, 9/15/21 | | | | | | | 183,000 | | | | 191,692 | |
7.87%, 9/15/23 | | | | | | | 20,000 | | | | 20,834 | |
7.13%, 6/15/24 | | | | | | | 110,000 | | | | 110,241 | |
T-Mobile USA, Inc.,
4.00%, 4/15/22 | | | | | | | 150,000 | | | | 151,500 | |
4.50%, 2/01/26 | | | | | | | 55,000 | | | | 55,229 | |
Windstream Services LLC/Windstream Finance Corp.,
10.50%, 6/30/24(c)(d) | | | | | | | 46,000 | | | | 31,970 | |
| | | | | | | | | | | | 1,178,231 | |
Total Corporate Bonds
(Cost $13,930,740) | | | | 14,240,191 | |
Foreign Government Inflation-Linked
Bonds – 0.4% | |
Sovereign – 0.4% | | | | | | | | | | | | |
Argentina Treasury Bond BONCER,
2.25%, 4/28/20 | | | ARS | | | | 4,430,000 | | | | 171,100 | |
Bonos de la Tesoreria de la Republica,
2.00%, 3/01/35 | | | CLP | | | | 9,500 | | | | 419,937 | |
Uruguay Government International Bond,
4.38%, 12/15/28 | | | UYU | | | | 1,050,000 | | | | 58,190 | |
3.70%, 6/26/37 | | | | | | | 920,000 | | | | 67,421 | |
| | | | | | | | | | | | 716,648 | |
Total Foreign Government Inflation-Linked Bonds
(Cost $768,246) | | | | 716,648 | |
Foreign Issuer Bonds – 70.3% | |
Angola – 0.6% | | | | | |
Angolan Government International Bond, 8.25%, 5/09/28(c) | | | | | | | 660,000 | | | | 690,052 | |
9.37%, 5/08/48(c) | | | | | | | 200,000 | | | | 214,614 | |
| | | | | | | | | | | 904,666 | |
| | | | |
Argentina – 1.9% | | | | | | | | | | | | |
Argentina Treasury Bill, | | | | | | | | | | | | |
0.00%, 6/28/19(h) | | | ARS | | | | 11,496,000 | | | | 294,654 | |
0.00%, 7/19/19(h) | | | | | | | 122,700 | | | | 2,708 | |
0.00%, 7/31/19(h) | | | | | | | 47,276,300 | | | | 1,074,105 | |
0.00%, 9/30/19(h) | | | | | | | 16,900,000 | | | | 464,673 | |
0.00%, 7/31/20(h) | | | | | | | 8,048,000 | | | | 158,574 | |
| | | | | | | | | | | | |
| | | | | | Par(b) | | | Value | |
|
Argentina (Continued) | |
Argentine Bonos del Tesoro, 18.20%, 10/03/21 | | | ARS | | | $ | 9,000,000 | | | $ | 150,406 | |
15.50%, 10/17/26 | | | | | | | 3,952,000 | | | | 67,871 | |
Argentine Republic Government International Bond, | | | | | | | | | | | | |
4.62%, 1/11/23 | | | | | | | 575,000 | | | | 424,062 | |
(Step to 5.25% on 3/31/29),
3.75%, 12/31/38(i) | | | | | | | 715,000 | | | | 375,561 | |
YPF S.A., (Argentina Deposit Rates Badlar Private Banks30-35 Days + 4.00%), | | | | | | | | | | | | |
48.75%, 7/07/20(c)(j) | | | | | | | 24,000 | | | | 7,052 | |
6.95%, 7/21/27(c) | | | | | | | 60,000 | | | | 51,012 | |
| | | | | | | | | | | 3,070,678 | |
| | | | |
Australia – 0.1% | | | | | | | | | | | | |
FMG Resources (August 2006) Pty. Ltd.,
5.13% 5/15/24(c) | | | | | | | 40,000 | | | | 40,500 | |
Mineral Resources Ltd.,
8.12% 5/01/27(c) | | | | | | | 70,000 | | | | 71,799 | |
| | | | | | | | | | | 112,299 | |
| | | | |
Azerbaijan – 0.3% | | | | | | | | | | | | |
Republic of Azerbaijan International Bond,
3.50% 9/01/32 | | | | | | | 200,000 | | | | 179,474 | |
Southern Gas Corridor CJSC,
6.88% 3/24/26 | | | | | | | 240,000 | | | | 271,674 | |
| | | | | | | | | | | 451,148 | |
| | | | |
Bahrain – 0.8% | | | | | | | | | | | | |
Bahrain Government International Bond,
7.00%, 10/12/28(c) | | | | | | | 450,000 | | | | 486,000 | |
6.75%, 9/20/29 | | | | | | | 400,000 | | | | 425,400 | |
7.50%, 9/20/47 | | | | | | | 200,000 | | | | 214,194 | |
Oil and Gas Holding (The) Co. BSCC,
8.37% 11/07/28(c) | | | | | | | 200,000 | | | | 225,560 | |
| | | | | | | | | | | 1,351,154 | |
| | | | |
Belarus – 0.1% | | | | | | | | | | | | |
Development Bank of the Republic of Belarus JSC, 5/02/24(c)(k) | | | | | | | 200,000 | | | | 201,016 | |
| | | | |
Belgium – 0.1% | | | | | | | | | | | | |
Telenet Finance Luxembourg Notes S.a.r.l.,
5.50% 3/01/28(c) | | | | | | | 200,000 | | | | 199,652 | |
See accompanying Notes to Financial Statements
134
Morningstar Funds Trust April 30, 2019
Schedule of Investments(continued)
Morningstar Multisector Bond Fund
| | | | | | | | | | | | |
| | | | | | Par(b) | | | Value | |
| | | |
Brazil – 7.9% | | | | | | | | | | | | |
Banco BTG Pactual S.A., (U.S. Treasury Yield Curve Rate CMT 5Y + 5.26%), 7.75% 2/15/29(c)(g) | | | | | | $ | 200,000 | | | $ | 203,770 | |
Banco do Brasil S.A., (U.S. Treasury Yield Curve Rate CMT 10Y + 4.40%),
6.25%, 4/15/24(f)(g) | | | | | | | 200,000 | | | | 180,700 | |
(U.S. Treasury Yield Curve Rate CMT 10Y + 6.36%), 9.00%, 6/18/24(f)(g) | | | | | | | 200,000 | | | | 213,000 | |
Brazil Letras do Tesouro Nacional, 0.00% 7/01/21(h) | | | BRL | | | | 4,600,000 | | | | 1,003,095 | |
Brazil Notas do Tesouro Nacional, Serie F,
10.00%, 1/01/21 | | | | | | | 1,900,000 | | | | 504,913 | |
10.00%, 1/01/23 | | | | | | | 5,575,000 | | | | 1,500,963 | |
10.00%, 1/01/25 | | | | | | | 14,070,000 | | | | 3,804,088 | |
10.00%, 1/01/27 | | | | | | | 10,700,000 | | | | 2,893,523 | |
CSN Islands XII Corp.,
7.00% 6/23/19(f) | | | | | | | 100,000 | | | | 87,000 | |
CSN Resources S.A.,
6.50%, 7/21/20 | | | | | | | 130,000 | | | | 131,950 | |
7.62%, 4/17/26(c) | | | | | | | 200,000 | | | | 200,105 | |
GTL Trade Finance, Inc.,
7.25% 4/16/44 | | | | | | | 200,000 | | | | 227,000 | |
Klabin Austria GmbH,
7.00% 4/03/49(c) | | | | | | | 200,000 | | | | 200,500 | |
Light Servicos de Eletricidade S.A./Light Energia S.A.,
7.25% 5/03/23(c) | | | | | | | 200,000 | | | | 203,000 | |
MARB BondCo PLC,
6.87% 1/19/25(c) | | | | | | | 200,000 | | | | 198,600 | |
Petrobras Global Finance B.V.,
5.75%, 2/01/29 | | | | | | | 338,000 | | | | 338,845 | |
5.63%, 5/20/43 | | | | | | | 15,000 | | | | 13,612 | |
6.90%, 3/19/49 | | | | | | | 285,000 | | | | 284,644 | |
6.85%, 6/05/15(l) | | | | | | | 286,000 | | | | 279,742 | |
Suzano Austria GmbH,
7.00% 3/16/47(c) | | | | | | | 200,000 | | | | 222,102 | |
| | | | | | | | | | | 12,691,152 | |
| | | | |
Canada – 0.4% | | | | | | | | | | | | |
1011778 B.C. ULC/New Red Finance, Inc.,
5.00% 10/15/25(c) | | | | | | | 104,000 | | | | 103,220 | |
Baytex Energy Corp.,
5.63% 6/01/24(c) | | | | | | | 123,000 | | | | 116,543 | |
MEG Energy Corp.,
7.00%, 3/31/24(c) | | | | | | | 119,000 | | | | 112,864 | |
6.50%, 1/15/25(c) | | | | | | | 54,000 | | | | 54,270 | |
| | | | | | | | | | | | |
| | | | | | Par(b) | | | Value | |
| |
Canada (Continued) | | | | | |
Open Text Corp.,
5.62%, 1/15/23(c) | | | | | | $ | 45,000 | | | $ | 46,125 | |
5.87%, 6/01/26(c) | | | | | | | 24,000 | | | | 25,140 | |
Parkland Fuel Corp.,
6.00% 4/01/26(c) | | | | | | | 94,000 | | | | 95,645 | |
Seven Generations Energy Ltd.,
6.87%, 6/30/23(c) | | | | | | | 37,000 | | | | 37,925 | |
5.38%, 9/30/25(c) | | | | | | | 41,000 | | | | 39,770 | |
| | | | | | | | | | | 631,502 | |
| | | | |
Chile – 0.5% | | | | | | | | | | | | |
Bonos de la Tesoreria de la Republica en pesos,
4.50% 3/01/26 | | | CLP | | | | 335,000,000 | | | | 511,844 | |
Latam Finance Ltd.,
7.00% 3/01/26(c) | | | | | | | 200,000 | | | | 204,750 | |
| | | | | | | | | | | 716,594 | |
| | | | |
China – 0.4% | | | | | | | | | | | | |
China SCE Group Holdings Ltd.,
7.45% 4/17/21 | | | | | | | 200,000 | | | | 204,300 | |
New Metro Global Ltd.,
6.50% 4/23/21 | | | | | | | 200,000 | | | | 201,595 | |
Sunac China Holdings Ltd.,
7.87% 2/15/22 | | | | | | | 200,000 | | | | 204,822 | |
| | | | | | | | | | | 610,717 | |
| | | | |
Colombia – 3.1% | | | | | | | | | | | | |
Colombia Government International Bond,
4.50%, 3/15/29 | | | | | | | 450,000 | | | | 474,304 | |
5.00%, 6/15/45 | | | | | | | 440,000 | | | | 460,464 | |
Colombian TES,
7.00%, 5/04/22 | | | COP | | | | 1,872,900,000 | | | | 606,982 | |
10.00%, 7/24/24 | | | | | | | 2,290,000,000 | | | | 836,830 | |
7.50%, 8/26/26 | | | | | | | 2,433,000,000 | | | | 804,018 | |
6.00%, 4/28/28 | | | | | | | 1,697,000,000 | | | | 505,351 | |
7.75%, 9/18/30 | | | | | | | 2,387,100,000 | | | | 792,414 | |
Ecopetrol S.A.,
5.87% 5/28/45 | | | | | | | 315,000 | | | | 324,860 | |
Millicom International Cellular S.A.,
6.25% 3/25/29(c) | | | | | | | 200,000 | | | | 207,000 | |
| | | | | | | | | | | 5,012,223 | |
| | | | |
Costa Rica – 0.6% | | | | | | | | | | | | |
Autopistas del Sol S.A.,
7.37% 12/30/30(c) | | | | | | | 189,910 | | | | 189,295 | |
Costa Rica Government International Bond,
4.38%, 4/30/25 | | | | | | | 400,000 | | | | 372,500 | |
7.16%, 3/12/45 | | | | | | | 400,000 | | | | 390,500 | |
| | | | | | | | | | | | 952,295 | |
See accompanying Notes to Financial Statements
135
Morningstar Funds Trust April 30, 2019
Schedule of Investments(continued)
Morningstar Multisector Bond Fund
| | | | | | | | | | |
| | | | | Par(b) | | | Value | |
| | | |
Denmark – 0.1% | | | | | | | | | | |
Danske Bank A/S,
5.00% 1/12/22(c) | | | | $ | 200,000 | | | $ | 205,665 | |
| |
Dominican Republic – 0.7% | | | | | |
Dominican Republic International Bond,
5.95%, 1/25/27(c) | | | | | 615,000 | | | | 648,056 | |
6.00%, 7/19/28(c) | | | | | 300,000 | | | | 316,125 | |
6.85%, 1/27/45 | | | | | 205,000 | | | | 220,375 | |
| | | | | | | | | 1,184,556 | |
| | | | |
Ecuador – 0.6% | | | | | | | | | | |
Ecuador Government International Bond, 7.95%, 6/20/24 | | | | | 420,000 | | | | 427,350 | |
7.88%, 1/23/28(c) | | | | | 540,000 | | | | 522,450 | |
| | | | | | | | | 949,800 | |
| | | | |
Egypt – 2.2% | | | | | | | | | | |
Egypt Government International Bond, 6.59%, 2/21/28(c) | | | | | 870,000 | | | | 839,794 | |
7.60%, 3/01/29(c) | | | | | 600,000 | | | | 604,620 | |
Egypt Treasury Bill, 0.00%, 5/07/19(h) | | EGP | | | 11,650,000 | | | | 678,342 | |
0.00%, 5/14/19(h) | | | | | 8,500,000 | | | | 494,519 | |
0.00%, 6/04/19(h) | | | | | 500,000 | | | | 28,853 | |
0.00%, 6/25/19(h) | | | | | 450,000 | | | | 25,781 | |
0.00%, 7/16/19(h) | | | | | 15,600,000 | | | | 884,865 | |
| | | | | | | | | 3,556,774 | |
| | | | |
El Salvador – 0.4% | | | | | | | | | | |
El Salvador Government International Bond, 5.88%, 1/30/25 | | | | | 410,000 | | | | 399,237 | |
6.37%, 1/18/27 | | | | | 225,000 | | | | 220,219 | |
7.65%, 6/15/35 | | | | | 50,000 | | | | 51,750 | |
| | | | | | | | | 671,206 | |
| | | | |
Finland – 0.1% | | | | | | | | | | |
Nokia OYJ,
4.38% 6/12/27 | | | | | 79,000 | | | | 79,198 | |
| | | |
Ghana – 1.0% | | | | | | | | | | |
Ghana Government International Bond,
7.63%, 5/16/29 | | | | | 200,000 | | | | 197,120 | |
8.12%, 3/26/32(c) | | | | | 400,000 | | | | 396,400 | |
8.95%, 3/26/51(c) | | | | | 400,000 | | | | 395,600 | |
Ghana Treasury Note,
19.75% 3/08/21 | | GHS | | | 220,000 | | | | 43,716 | |
Republic of Ghana | | | | | | | | | | |
Government Bonds, | | | | | | | | | | |
17.50%, 8/17/20 | | | | | 220,000 | | | | 42,678 | |
24.50%, 6/21/21 | | | | | 580,000 | | | | 124,178 | |
| | | | | | | | | | | | |
| | | | | | Par(b) | | | Value | |
| |
Ghana (Continued) | | | | | |
24.75%, 7/19/21 | | | GHS | | | $ | 678,000 | | | $ | 144,495 | |
18.25%, 7/25/22 | | | | | | | 1,530,000 | | | | 294,579 | |
| | | | | | | | | | | 1,638,766 | |
| | | | |
Hungary – 0.1% | | | | | | | | | | | | |
Hungary Government Bond, 2.50% 10/24/24 | | | HUF | | | | 36,000,000 | | | | 126,486 | |
| | | | |
India – 1.7% | | | | | | | | | | | | |
Azure Power Energy Ltd., 5.50% 11/03/22(c) | | | | | | | 200,000 | | | | 198,014 | |
India Government Bond, 8.15%, 6/11/22 | | | INR | | | | 97,000,000 | | | | 1,438,002 | |
8.24%, 2/15/27 | | | | | | | 53,000,000 | | | | 791,742 | |
Vedanta Resources Finance II PLC,
9.25% 4/23/26(c) | | | | | | | 200,000 | | | | 200,978 | |
Vedanta Resources Ltd., 6.12% 8/09/24 | | | | | | | 200,000 | | | | 180,724 | |
| | | | | | | | | | | 2,809,460 | |
| | | | |
Indonesia – 5.4% | | | | | | | | | | | | |
Indika Energy Capital III | | | | | | | | | | | | |
Pte Ltd., 5.88% 11/09/24 | | | | | | | 200,000 | | | | 189,153 | |
Indonesia Asahan | | | | | | | | | | | | |
Aluminium Persero PT, 6.53%, 11/15/28(c) | | | | | | | 430,000 | | | | 488,292 | |
6.76%, 11/15/48(c) | | | | | | | 650,000 | | | | 744,361 | |
Indonesia Treasury Bond, 7.00%, 5/15/22 | | | IDR | | | | 5,400,000,000 | | | | 379,137 | |
8.37%, 3/15/24 | | | | | | | 25,590,000,000 | | | | 1,876,665 | |
8.37%, 9/15/26 | | | | | | | 11,000,000,000 | | | | 810,398 | |
7.00%, 5/15/27 | | | | | | | 17,400,000,000 | | | | 1,166,850 | |
9.00%, 3/15/29 | | | | | | | 2,707,000,000 | | | | 204,719 | |
8.25%, 5/15/29 | | | | | | | 12,500,000,000 | | | | 905,702 | |
7.50%, 8/15/32 | | | | | | | 8,350,000,000 | | | | 551,652 | |
Minejesa Capital B.V., 5.63% 8/10/37(c) | | | | | | | 400,000 | | | | 395,799 | |
Perusahaan Penerbit SBSN Indonesia III, 4.15% 3/29/27 | | | | | | | 930,000 | | | | 945,112 | |
| | | | | | | | | | | 8,657,840 | |
| | | | |
Iraq – 0.3% | | | | | | | | | | | | |
Iraq International Bond, 5.80% 1/15/28 | | | | | | | 500,000 | | | | 486,691 | |
| | | |
Ireland – 0.6% | | | | | | | | | | | | |
C&W Senior Financing
DAC, 7.50%, 10/15/26(c) | | | | | | | 500,000 | | | | 518,750 | |
See accompanying Notes to Financial Statements
136
Morningstar Funds Trust April 30, 2019
Schedule of Investments(continued)
Morningstar Multisector Bond Fund
| | | | | | | | | | | | |
| | | | | | Par(b) | | | Value | |
| |
Ireland (Continued) | | | | | |
6.87%, 9/15/27(c) | | | | | | $ | 200,000 | | | $ | 200,198 | |
James Hardie International Finance DAC,
4.75% 1/15/25(c) | | | | | | | 240,000 | | | | 238,200 | |
| | | | | | | | | | | 957,148 | |
| | | | |
Israel – 0.1% | | | | | | | | | | | | |
Teva Pharmaceutical Finance Netherlands III B.V.,
2.80%, 7/21/23 | | | | | | | 175,000 | | | | 159,188 | |
4.10%, 10/01/46 | | | | | | | 32,000 | | | | 22,712 | |
| | | | | | | | | | | 181,900 | |
| | | | |
Italy – 0.0%(a) | | | | | | | | | | | | |
Telecom Italia Capital S.A., 7.20% 7/18/36 | | | | | | | 39,000 | | | | 39,956 | |
| | | | |
Ivory Coast – 0.3% | | | | | | | | | | | | |
Ivory Coast Government International Bond,
6.13% 6/15/33(c) | | | | | | | 600,000 | | | | 549,508 | |
| | | | |
Kazakhstan – 0.9% | | | | | | | | | | | | |
Kazakhstan Temir Zholy National Co. JSC,
4.85% 11/17/27(c) | | | | | | | 200,000 | | | | 207,423 | |
KazMunayGas National Co. JSC, 5.37%, 4/24/30(c) | | | | | | | 770,000 | | | | 819,169 | |
5.75%, 4/19/47(c) | | | | | | | 425,000 | | | | 444,694 | |
| | | | | | | | | | | 1,471,286 | |
| | | | |
Lebanon – 0.7% | | | | | | | | | | | | |
Lebanon Government International Bond,
6.10%, 10/04/22 | | | | | | | 480,000 | | | | 424,200 | |
6.00%, 1/27/23 | | | | | | | 328,000 | | | | 284,879 | |
6.65%, 4/22/24 | | | | | | | 514,000 | | | | 442,040 | |
| | | | | | | | | | | 1,151,119 | |
| | | | |
Malaysia – 1.3% | | | | | | | | | | | | |
Malaysia Government Bond, 3.48%, 3/15/23 | | | MYR | | | | 1,655,000 | | | | 398,173 | |
3.80%, 8/17/23 | | | | | | | 1,240,000 | | | | 301,570 | |
4.18%, 7/15/24 | | | | | | | 1,900,000 | | | | 469,306 | |
3.91%, 7/15/26 | | | | | | | 2,085,000 | | | | 508,493 | |
3.90%, 11/16/27 | | | | | | | 935,000 | | | | 226,825 | |
4.89%, 6/08/38 | | | | | | | 742,000 | | | | 191,817 | |
| | | | | | | | | | | | 2,096,184 | |
| | | | | | | | | | | | |
| | | | | | Par(b) | | | Value | |
| | | | |
Mexico – 10.7% | | | | | | | | | | | | |
Banco Mercantil del Norte S.A., (U.S. Treasury Yield Curve Rate CMT 5Y + 5.04%),
6.87% 7/06/22(c)(f)(g) | | | | | | $ | 200,000 | | | $ | 205,800 | |
Cometa Energia S.A. de C.V., 6.38% 4/24/35(c) | | | | | | | 195,000 | | | | 195,000 | |
Mexican Bonos,
6.50%, 6/10/21 | | | MXN | | | | 6,000,000 | | | | 307,657 | |
7.25%, 12/09/21 | | | | | | | 59,560,000 | | | | 3,088,785 | |
6.50%, 6/09/22 | | | | | | | 53,730,000 | | | | 2,722,501 | |
8.00%, 12/07/23 | | | | | | | 36,958,000 | | | | 1,954,211 | |
10.00%, 12/05/24 | | | | | | | 34,820,000 | | | | 2,008,357 | |
5.75%, 3/05/26 | | | | | | | 8,430,000 | | | | 391,486 | |
7.50%, 6/03/27 | | | | | | | 14,390,000 | | | | 732,702 | |
8.50%, 5/31/29 | | | | | | | 4,600,000 | | | | 248,604 | |
7.75%, 5/29/31 | | | | | | | 7,860,000 | | | | 399,075 | |
7.75%, 11/13/42 | | | | | | | 8,170,000 | | | | 399,115 | |
Mexico Cetes,
0.00%, 7/18/19(h) | | | | | | | 135,280,000 | | | | 701,213 | |
0.00%, 9/12/19(h) | | | | | | | 129,530,000 | | | | 663,107 | |
0.00%, 11/07/19(h) | | | | | | | 131,610,000 | | | | 665,515 | |
0.00%, 2/27/20(h) | | | | | | | 87,294,000 | | | | 430,904 | |
Mexico Government International Bond, 4.00%, 10/02/23 | | | | | | | 150,000 | | | | 154,125 | |
4.15%, 3/28/27 | | | | | | | 500,000 | | | | 507,650 | |
Petroleos Mexicanos, 5.35%, 2/12/28 | | | | | | | 660,000 | | | | 619,740 | |
6.50%, 1/23/29 | | | | | | | 625,000 | | | | 623,906 | |
6.62%, 6/15/35 | | | | | | | 215,000 | | | | 206,851 | |
| | | | | | | | | | | 17,226,304 | |
| | | | |
Mongolia – 0.3% | | | | | | | | | | | | |
Development Bank of | | | | | | | | | | | | |
Mongolia LLC,
7.25% 10/23/23(c) | | | | | | | 200,000 | | | | 203,651 | |
Mongolia Government | | | | | | | | | | | | |
International Bond,
5.13% 12/05/22 | | | | | | | 200,000 | | | | 196,269 | |
| | | | | | | | | | | 399,920 | |
| | | | |
Netherlands – 0.3% | | | | | | | | | | | | |
Ziggo B.V.,
5.50% 1/15/27(c) | | | | | | | 525,000 | | | | 523,687 | |
| | | | |
Nigeria – 1.3% | | | | | | | | | | | | |
Nigeria Government International Bond, 7.14%, 2/23/30(c) | | | | | | | 410,000 | | | | 408,016 | |
7.70%, 2/23/38(c) | | | | | | | 600,000 | | | | 591,660 | |
9.25%, 1/21/49(c) | | | | | | | 200,000 | | | | 217,736 | |
Nigeria OMO Bill,
0.00% 2/20/20(h) | | | NGN | | | | 68,900,000 | | | | 171,602 | |
See accompanying Notes to Financial Statements
137
Morningstar Funds Trust April 30, 2019
Schedule of Investments(continued)
Morningstar Multisector Bond Fund
| | | | | | | | | | | | |
| | | | | | Par(b) | | | Value | |
| | | |
Nigeria (Continued) | | | | | | | | | | | | |
Nigeria Treasury Bill,
0.00%, 1/16/20(h) | | | NGN | | | $ | 14,700,000 | | | $ | 37,259 | |
0.00%, 1/30/20(h) | | | | | | | 90,000,000 | | | | 227,021 | |
0.00%, 2/27/20(h) | | | | | | | 134,500,000 | | | | 333,519 | |
0.00%, 4/16/20(h) | | | | | | | 60,000,000 | | | | 146,204 | |
| | | | | | | | | | | 2,133,017 | |
| | | | |
Oman – 0.7% | | | | | | | | | | | | |
Oman Government International Bond,
5.63% 1/17/28(c) | | | | | | | 870,000 | | | | 831,245 | |
Oman Sovereign Sukuk SAOC, 5.93% 10/31/25(c) | | | | | | | 300,000 | | | | 304,500 | |
| | | | | | | | | | | 1,135,745 | |
| | | | |
Pakistan – 0.1% | | | | | | | | | | | | |
Pakistan Government | | | | | | | | | | | | |
International Bond,
6.88% 12/05/27 | | | | | | | 200,000 | | | | 199,202 | |
| | | | |
Panama – 0.4% | | | | | | | | | | | | |
Aeropuerto Internacional de Tocumen S.A.,
6.00% 11/18/48(c) | | | | | | | 200,000 | | | | 225,000 | |
Global Bank Corp.,
4.50%, 10/20/21 | | | | | | | 200,000 | | | | 203,000 | |
(ICE LIBOR USD 3M + 3.30%),
5.25%, 4/16/29(c)(g) | | | | | | | 250,000 | | | | 254,062 | |
| | | | | | | | | | | 682,062 | |
| | | | |
Paraguay – 0.1% | | | | | | | | | | | | |
Paraguay Government | | | | | | | | | | | | |
International Bond,
5.40% 3/30/50(c) | | | | | | | 200,000 | | | | 208,600 | |
| | | | |
Peru – 1.8% | | | | | | | | | | | | |
Inkia Energy Ltd.,
5.87% 11/09/27(c) | | | | | | | 200,000 | | | | 200,452 | |
Peru Government Bond,
6.15% 8/12/32(c) | | | PEN | | | | 1,500,000 | | | | 478,500 | |
Peru LNG Srl,
5.38% 3/22/30(c) | | | | | | | 200,000 | | | | 211,600 | |
Peruvian Government International Bond,
6.35%, 8/12/28(c) | | | PEN | | | | 1,100,000 | | | | 361,771 | |
6.95%, 8/12/31 | | | | | | | 1,525,000 | | | | 521,358 | |
Petroleos del Peru S.A.,
4.75%, 6/19/32 | | | | | | | 200,000 | | | | 203,500 | |
5.63%, 6/19/47(c) | | | | | | | 200,000 | | | | 211,200 | |
Telefonica del Peru S.A.A.,
7.37% 4/10/27(c) | | | PEN | | | | 2,200,000 | | | | 665,303 | |
| | | | | | | | | | | | 2,853,684 | |
| | | | | | | | | | | | |
| | | | | | Par(b) | | | Value | |
| | | | |
Philippines – 0.1% | | | | | | | | | | | | |
Philippine Government Bond,
3.88%, 11/22/19 | | | PHP | | | $ | 3,200,000 | | | $ | 60,663 | |
5.50%, 3/08/23 | | | | | | | 4,120,000 | | | | 78,061 | |
| | | | | | | | | | | 138,724 | |
| | | | |
Poland – 0.9% | | | | | | | | | | | | |
Republic of Poland Government Bond,
2.25%, 4/25/22 | | | PLN | | | | 2,250,000 | | | | 595,206 | |
2.50%, 7/25/27 | | | | | | | 3,474,000 | | | | 886,722 | |
| | | | | | | | | | | 1,481,928 | |
| | | | |
Qatar – 1.5% | | | | | | | | | | | | |
Qatar Government International Bond,
4.00%, 3/14/29(c) | | | | | | | 1,591,000 | | | | 1,656,383 | |
5.10%, 4/23/48(c) | | | | | | | 695,000 | | | | 775,794 | |
| | | | | | | | | | | 2,432,177 | |
| | | | |
Romania – 0.5% | | | | | | | | | | | | |
Romania Government Bond,
4.25% 6/28/23 | | | RON | | | | 3,390,000 | | | | 801,229 | |
| | | | |
Russia – 3.5% | | | | | | | | | | | | |
Russian Federal Bond - OFZ,
7.50%, 8/18/21 | | | RUB | | | | 26,600,000 | | | | 411,320 | |
7.00%, 8/16/23 | | | | | | | 26,100,000 | | | | 393,931 | |
6.50%, 2/28/24 | | | | | | | 36,000,000 | | | | 530,115 | |
7.10%, 10/16/24 | | | | | | | 34,500,000 | | | | 518,229 | |
7.75%, 9/16/26 | | | | | | | 25,600,000 | | | | 393,576 | |
7.05%, 1/19/28 | | | | | | | 32,000,000 | | | | 468,461 | |
6.90%, 5/23/29 | | | | | | | 50,100,000 | | | | 717,965 | |
8.50%, 9/17/31 | | | | | | | 22,500,000 | | | | 358,975 | |
Russian Foreign Bond - Eurobond, 4.25%, 6/23/27 | | | | | | | 400,000 | | | | 403,282 | |
4.37%, 3/21/29(c) | | | | | | | 800,000 | | | | 808,546 | |
5.10%, 3/28/35(c) | | | | | | | 600,000 | | | | 624,352 | |
| | | | | | | | | | | 5,628,752 | |
| | | | |
Saudi Arabia – 1.3% | | | | | | | | | | | | |
Saudi Arabian Oil Co.,
3.50%, 4/16/29(c) | | | | | | | 200,000 | | | | 196,582 | |
4.38%, 4/16/49(c) | | | | | | | 200,000 | | | | 194,312 | |
Saudi Government International Bond,
4.50% 10/26/46 | | | | | | | 1,785,000 | | | | 1,767,248 | |
| | | | | | | | | | | | 2,158,142 | |
See accompanying Notes to Financial Statements
138
Morningstar Funds Trust April 30, 2019
Schedule of Investments(continued)
Morningstar Multisector Bond Fund
| | | | | | | | | | | | |
| | | | | | Par(b) | | | Value | |
| |
Senegal – 0.5% | | | | | |
Senegal Government International Bond,
6.25%, 5/23/33 | | | | | | $ | 650,000 | | | $ | 627,885 | |
6.75%, 3/13/48 | | | | | | | 200,000 | | | | 184,904 | |
| | | | | | | | | | | 812,789 | |
| | | | |
South Africa – 3.3% | | | | | | | | | | | | |
Eskom Holdings SOC Ltd.,
6.75%, 8/06/23 | | | | | | | 400,000 | | | | 402,378 | |
7.12%, 2/11/25 | | | | | | | 200,000 | | | | 202,863 | |
Petra Diamonds US Treasury PLC,
7.25% 5/01/22 | | | | | | | 200,000 | | | | 194,500 | |
Republic of South Africa Government Bond, 8.00%, 1/31/30 | | | ZAR | | | | 13,594,261 | | | | 878,834 | |
8.25%, 3/31/32 | | | | | | | 3,900,000 | | | | 250,781 | |
8.50%, 1/31/37 | | | | | | | 14,830,000 | | | | 935,149 | |
8.75%, 1/31/44 | | | | | | | 15,953,898 | | | | 1,007,884 | |
8.75%, 2/28/48 | | | | | | | 7,500,000 | | | | 475,063 | |
Republic of South Africa Government International Bond, 4.67%, 1/17/24 | | | | | | | 200,000 | | | | 202,002 | |
4.30%, 10/12/28 | | | | | | | 400,000 | | | | 372,996 | |
SASOL Financing USA LLC, 6.50% 9/27/28 | | | | | | | 420,000 | | | | 460,567 | |
| | | | | | | | | | | 5,383,017 | |
| | | | |
South Korea – 2.7% | | | | | | | | | | | | |
Korea Monetary Stabilization Bond, 1.85%, 10/02/19 | | | KRW | | | | 496,000,000 | | | | 424,800 | |
2.05%, 10/05/20 | | | | | | | 1,825,000,000 | | | | 1,569,109 | |
Korea Treasury Bond, 1.25%, 12/10/19 | | | | | | | 987,000,000 | | | | 842,411 | |
2.00%, 3/10/20 | | | | | | | 1,827,000,000 | | | | 1,567,476 | |
| | | | | | | | | | | 4,403,796 | |
| | | | |
Sri Lanka – 0.8% | | | | | | | | | | | | |
Sri Lanka Government International Bond, 6.25%, 7/27/21 | | | | | | | 200,000 | | | | 201,168 | |
5.75%, 4/18/23(c) | | | | | | | 425,000 | | | | 416,821 | |
6.75%, 4/18/28 | | | | | | | 200,000 | | | | 193,534 | |
7.85%, 3/14/29(c) | | | | | | | 400,000 | | | | 411,320 | |
| | | | | | | | | | | 1,222,843 | |
| | | | |
Thailand – 2.1% | | | | | | | | | | | | |
Bank of Thailand Bond, 1.77%, 3/27/20 | | | THB | | | | 55,556,000 | | | | 1,739,600 | |
1.95%, 11/26/20 | | | | | | | 14,600,000 | | | | 457,941 | |
| | | | | | | | | | | | |
| | | | | | Par(b) | | | Value | |
| |
Thailand (Continued) | | | | | |
Thailand Government Bond, 3.87%, 6/13/19 | | | THB | | | $ | 1,374,000 | | | $ | 43,142 | |
2.13%, 12/17/26 | | | | | | | 39,200,000 | | | | 1,209,197 | |
| | | | | | | | | | | 3,449,880 | |
| | | | |
Turkey – 2.0% | | | | | | | | | | | | |
Turkcell Iletisim Hizmetleri A.S., 5.80% 4/11/28(c) | | | | | | | 200,000 | | | | 174,024 | |
Turkey Government Bond, 8.50%, 7/10/19 | | | TRY | | | | 2,330,000 | | | | 380,335 | |
9.20%, 9/22/21 | | | | | | | 472,694 | | | | 60,840 | |
11.00%, 2/24/27 | | | | | | | 8,715,000 | | | | 977,113 | |
10.50%, 8/11/27 | | | | | | | 300,000 | | | | 32,680 | |
Turkey Government International Bond,
5.75%, 3/22/24 | | | | | | | 470,000 | | | | 439,732 | |
6.00%, 3/25/27 | | | | | | | 815,000 | | | | 733,582 | |
7.62%, 4/26/29 | | | | | | | 250,000 | | | | 243,250 | |
Turkiye Vakiflar Bankasi TAO, (USD Swap 5Y + 5.44%), 6.88% 2/03/25(g) | | | | | | | 200,000 | | | | 178,252 | |
| | | | | | | | | | | 3,219,808 | |
| | | | |
Ukraine – 0.7% | | | | | | | | | | | | |
Ukraine Government International Bond,
7.75%, 9/01/22 | | | | | | | 610,000 | | | | 601,706 | |
7.75%, 9/01/23 | | | | | | | 555,000 | | | | 537,018 | |
| | | | | | | | | | | 1,138,724 | |
| | | |
United Arab Emirates – 0.3% | | | | | | | | | |
DP World PLC, 5.63% 9/25/48(c) | | | | | | | 210,000 | | | | 221,550 | |
Shelf Drilling Holdings Ltd.,
8.25% 2/15/25(c) | | | | | | | 184,000 | | | | 180,320 | |
| | | | | | | | | | | 401,870 | |
| | | |
United Kingdom – 0.3% | | | | | | | | | |
Ardonagh Midco 3 PLC,
8.63% 7/15/23(c) | | | | | | | 226,000 | | | | 190,405 | |
Virgin Media Secured Finance PLC, 5.50% 1/15/25(c) | | | | | | | 230,000 | | | | 234,313 | |
| | | | | | | | | | | 424,718 | |
| | | | |
Uruguay – 0.3% | | | | | | | | | | | | |
Uruguay Government | | | | | | | | | | | | |
International Bond, | | | | | | | | | | | | |
4.38%, 1/23/31 | | | | | | | 75,000 | | | | 78,076 | |
4.97%, 4/20/55 | | | | | | | 435,000 | | | | 448,050 | |
| | | | | | | | | | | | 526,126 | |
See accompanying Notes to Financial Statements
139
Morningstar Funds Trust April 30, 2019
Schedule of Investments(continued)
Morningstar Multisector Bond Fund
| | | | | | | | | | |
| | | | | Par(b) | | | Value | |
| | | |
Zambia – 0.5% | | | | | | | | | | |
First Quantum Minerals Ltd.,
7.00%, 2/15/21(c) | | | | $ | 48,000 | | | $ | 48,870 | |
7.25%, 4/01/23(c) | | | | | 430,000 | | | | 425,915 | |
Zambia Government International Bond, 8.50% 4/14/24 | | | | | 400,000 | | | | 280,106 | |
| | | | | | | | | | 754,891 | |
| | | |
Total Foreign Issuer Bonds
(Cost $112,580,588) | | | | | | | | | 113,460,274 | |
Term Loans(j)– 0.1% | |
Food – 0.0%(a) | | | | | | | | | | |
Albertson’s LLC,2017-1 TermB-5 Loan,(ICE LIBOR USD 3M + 3.00%, 0.75% Floor),
5.61%, 12/21/22 | | | | | 37,808 | | | | 37,838 | |
| | | | |
Internet – 0.1% | | | | | | | | | | |
Uber Technologies, Inc., Term Loan,(ICE LIBOR USD 1M + 4.00%, 1.00% Floor),
6.48%, 4/04/25 | | | | | 73,793 | | | | 74,054 | |
| | | | |
Retail – 0.0%(a) | | | | | | | | | | |
JC Penney Corp., Inc., Loan,(ICE LIBOR USD 3M + 4.25%, 1.00% Floor),
6.88%, 6/23/23 | | | | | 8,881 | | | | 7,896 | |
Total Term Loans
(Cost $117,924) | | | | | | | | | 119,788 | |
| | | | | | | | | | | |
U.S. Government Agencies – 6.6% | |
Federal Home Loan Banks – 6.6% | | | | | |
FHLB Discount Notes, 0.00%, 5/01/19(h) | | USD | | | 10,655,000 | | | | 10,655,000 | |
Total U.S. Government Agencies
(Cost $10,655,000) | | | | 10,655,000 | |
U.S. Government Obligations – 1.8% | |
U.S. Treasury Notes – 1.8% | | | | | |
2.00%, 1/31/20 | | | | | 1,200,000 | | | | 1,196,157 | |
2.75%, 11/30/20 | | | | | 1,180,000 | | | | 1,187,882 | |
2.25%, 4/15/22 | | | | | 500,000 | | | | 500,078 | |
| | | | | | | | | | 2,884,117 | |
Total U.S. Government Obligations
(Cost $2,880,292) | | | | 2,884,117 | |
| (a) | Amount rounds to less than 0.05%. |
| | | | | | | | | | | | |
| | | | | | Number
of Shares | | | Value | |
Short-Term Investments – 8.9% | | | | | |
Money Market Fund – 4.0% | | | | | | | | | |
Northern Institutional Funds - Treasury Portfolio (Premier),
2.29%(m) | | | | | | | 6,507,279 | | | $ | 6,507,279 | |
| | | |
U.S. Treasury Bills – 4.9% | | | | | | | | | |
U.S. Treasury Bill, 2.39%, 9/12/19(n) | | | | | | | 2,900,000 | | | | 2,874,335 | |
U.S. Treasury Bill, 2.41%, 5/30/19(n) | | | | | | | 1,790,000 | | | | 1,786,547 | |
U.S. Treasury Bill, 2.38%, 11/07/19(n) | | | | | | | 1,500,000 | | | | 1,481,277 | |
U.S. Treasury Bill, 2.40%, 10/24/19(n) | | | | | | | 1,700,000 | | | | 1,680,386 | |
| | | | | | | | | | | | 7,822,545 | |
Total Short-Term Investments
(Cost $14,329,716) | | | | | | | | | | | 14,329,824 | |
| | |
Number of Contracts | | | Notional
Amount | | | | |
| |
Purchased Options – 0.0%(a) | | | | | |
Put Options – 0.0%(a) | | | | | | | | | | | | |
South African Rand vs. U.S. Dollar, Strike Price $14.01, Expires 5/20/19 | | | 1 | | | | 605,000 | | | | 2,434 | |
Total Purchased Options
(Cost $9,093) | | | | | | | | | | | 2,434 | |
Total Investments – 98.3%
(Cost $157,504,889) | | | | | | | | | | | 158,674,592 | |
Other Assets less Liabilities – 1.7% | | | | | | | | | | | 2,694,579 | |
NET ASSETS – 100.0% | | | $ | 161,369,171 | |
See accompanying Notes to Financial Statements
140
Morningstar Funds Trust April 30, 2019
Schedule of Investments(continued)
Morningstar Multisector Bond Fund
| (b) | Par value is in USD unless otherwise indicated. |
| (c) | Securities exempt from registration under Rule 144A of the Securities Act of 1933. These securities may be resold in transactions exempt from registration, normally to qualified institutional buyers. The value of these securities is determined by valuations supplied by a pricing service or brokers, or, if not available, in accordance with procedures established by the Board of Trustees of Morningstar Funds. |
| (d) | Issuer has defaulted on terms of debt obligation. Income is not being accrued. |
| (e) | Security is a paymentin-kind bond (PIK), distributions receivedin-kind unless otherwise noted in the description. |
| (f) | Perpetual bond. Maturity date represents next call date. |
| (g) | Variable rate security. Security issued at a fixed coupon rate, which converts to a variable rate at a future date. Rate shown is the rate in effect as of period end. |
| (i) | Step coupon bond. Rate as of April 30, 2019 is disclosed. |
| (j) | Variable rate security. Rate as of April 30, 2019 is disclosed. |
| (k) | When-Issued Security. Coupon rate was not in effect at April 30, 2019. |
| (l) | Century bond maturing in 2115. |
| (m) | 7-day current yield as of April 30, 2019 is disclosed. |
| (n) | Discount rate at the time of purchase. |
| * | Non-Income Producing Security |
Percentages shown are based on Net Assets
| | |
| Abbreviations: | | |
1M | | 1 Month |
3M | | 3 Month |
5Y | | 5 Year |
10Y | | 10 Year |
CMT | | Constant Maturity |
FHLB | | Federal Home Loan Bank |
ICE | | Intercontinental Exchange |
LIBOR | | London Interbank Offered Rate |
MSCI | | Morgan Stanley Capital International |
PLC | | Public Limited Company |
REIT | | Real Estate Investment Trust |
USD | | United States Dollar |
| | | | |
Concentration by Currency (%) | |
U.S. Dollar | | | 57.1 | |
Mexican Peso | | | 9.1 | |
Brazilian Real | | | 6.0 | |
All other currencies less than 5% | | | 27.8 | |
Total | | | 100.0 | |
| | | | |
Composition by Type (%) | |
Sovereign | | | 69.4 | |
Non-Government | | | 28.9 | |
Others | | | 1.7 | |
Total | | | 100.0 | |
Forward Foreign Currency Contracts outstanding at April 30, 2019:
| | | | | | | | | | | | | | | | | | | | | | | | |
Expiration
Date | | Currency
Purchased | | | Amount
of Currency
Purchased | | | Currency Sold | | | Amount
of Currency
Sold | | | Counterparty | | | Unrealized
Appreciation
(Depreciation) | |
07/31/19 | | | U.S. Dollars | | | | 1,420,986 | | | | South Korean Won | | | | 1,579,000,000 | | | | HSBC | | | | $ 60,373 | |
07/16/19 | | | U.S. Dollars | | | | 1,823,299 | | | | South Korean Won | | | | 2,073,000,000 | | | | HSBC | | | | 38,121 | |
05/28/19 | | | U.S. Dollars | | | | 2,277,397 | | | | Euro | | | | 1,992,000 | | | | Citibank | | | | 37,573 | |
05/16/19 | | | U.S. Dollars | | | | 2,757,568 | | | | Euro | | | | 2,433,284 | | | | Deutsche Bank | | | | 24,490 | |
07/16/19 | | | U.S. Dollars | | | | 2,771,777 | | | | Euro | | | | 2,433,283 | | | | Deutsche Bank | | | | 23,816 | |
10/16/19 | | | U.S. Dollars | | | | 2,793,119 | | | | Euro | | | | 2,433,433 | | | | Deutsche Bank | | | | 23,745 | |
See accompanying Notes to Financial Statements
141
Morningstar Funds Trust April 30, 2019
Schedule of Investments(continued)
Morningstar Multisector Bond Fund
| | | | | | | | | | | | | | | | | | | | | | | | |
Expiration Date | | Currency
Purchased | | | Amount of Currency
Purchased | | | Currency
Sold | | | Amount of Currency
Sold | | | Counterparty | | | Unrealized
Appreciation
(Depreciation) | |
05/28/19 | | | U.S. Dollars | | | | 2,176,611 | | | | Japanese Yen | | | | 239,233,000 | | | | Citibank | | | | $ 23,741 | |
06/03/19 | | | U.S. Dollars | | | | 418,929 | | | | South Korean Won | | | | 466,000,000 | | | | HSBC | | | | 18,273 | |
05/02/19 | | | U.S. Dollars | | | | 291,336 | | | | Turkish Lira | | | | 1,635,085 | | | | BNP | | | | 17,310 | |
05/28/19 | | | U.S. Dollars | | | | 470,630 | | | | South Korean Won | | | | 528,000,000 | | | | HSBC | | | | 16,856 | |
09/23/19 | | | U.S. Dollars | | | | 1,095,860 | | | | Euro | | | | 950,000 | | | | Citibank | | | | 16,752 | |
08/22/19 | | | U.S. Dollars | | | | 436,767 | | | | South Korean Won | | | | 488,000,000 | | | | HSBC | | | | 15,888 | |
05/31/19 | | | Mexican Pesos | | | | 2,800,000 | | | | U.S. Dollars | | | | 132,940 | | | | Citibank | | | | 13,995 | |
05/17/19 | | | Japanese Yen | | | | 354,350,000 | | | | U.S. Dollars | | | | 3,171,868 | | | | JPMorgan Chase | | | | 13,885 | |
09/27/19 | | | U.S. Dollars | | | | 1,202,095 | | | | Euro | | | | 1,046,000 | | | | Citibank | | | | 13,549 | |
05/21/19 | | | U.S. Dollars | | | | 813,639 | | | | Euro | | | | 712,500 | | | | Bank of America | | | | 12,998 | |
09/23/19 | | | U.S. Dollars | | | | 821,669 | | | | Euro | | | | 712,500 | | | | Bank of America | | | | 12,338 | |
05/16/19 | | | U.S. Dollars | | | | 646,344 | | | | Australian Dollars | | | | 900,000 | | | | Deutsche Bank | | | | 11,625 | |
07/16/19 | | | U.S. Dollars | | | | 647,109 | | | | Australian Dollars | | | | 900,000 | | | | Deutsche Bank | | | | 11,450 | |
10/16/19 | | | U.S. Dollars | | | | 648,288 | | | | Australian Dollars | | | | 900,000 | | | | Deutsche Bank | | | | 11,084 | |
06/26/19 | | | Mexican Pesos | | | | 3,200,000 | | | | U.S. Dollars | | | | 156,235 | | | | Citibank | | | | 10,982 | |
07/23/19 | | | U.S. Dollars | | | | 420,000 | | | | Colombian Pesos | | | | 1,335,810,000 | | | | Bank of America | | | | 8,603 | |
06/11/19 | | | U.S. Dollars | | | | 300,000 | | | | Colombian Pesos | | | | 945,033,000 | | | | Barclays | | | | 8,358 | |
05/21/19 | | | U.S. Dollars | | | | 459,460 | | | | Australian Dollars | | | | 642,000 | | | | Bank of America | | | | 6,635 | |
05/13/19 | | | U.S. Dollars | | | | 413,273 | | | | Malaysian Ringgit | | | | 1,686,780 | | | | Goldman Sachs | | | | 5,574 | |
05/28/19 | | | Japanese Yen | | | | 120,000,000 | | | | U.S. Dollars | | | | 1,074,980 | | | | Citibank | | | | 4,906 | |
05/28/19 | | | U.S. Dollars | | | | 243,852 | | | | Australian Dollars | | | | 340,000 | | | | Citibank | | | | 3,994 | |
09/27/19 | | | U.S. Dollars | | | | 420,593 | | | | Australian Dollars | | | | 590,000 | | | | Citibank | | | | 3,080 | |
05/06/19 | | | Philippine Pesos | | | | 20,461,350 | | | | U.S. Dollars | | | | 390,000 | | | | Bank of America | | | | 2,982 | |
06/11/19 | | | U.S. Dollars | | | | 151,142 | | | | Hungarian Forints | | | | 43,000,000 | | | | Bank of America | | | | 1,790 | |
09/23/19 | | | U.S. Dollars | | | | 242,226 | | | | Australian Dollars | | | | 340,000 | | | | Citibank | | | | 1,651 | |
05/15/19 | | | Russian Rubles | | | | 4,570,319 | | | | U.S. Dollars | | | | 69,168 | | | | BNP | | | | 1,421 | |
07/22/19 | | | U.S. Dollars | | | | 1,447,835 | | | | Indian Rupees | | | | 102,000,000 | | | | HSBC | | | | 1,137 | |
05/06/19 | | | Philippine Pesos | | | | 7,331,800 | | | | U.S. Dollars | | | | 140,000 | | | | Barclays | | | | 815 | |
05/13/19 | | | Polish Zloty | | | | 4,299,778 | | | | U.S. Dollars | | | | 1,125,000 | | | | BNP | | | | 620 | |
05/06/19 | | | U.S. Dollars | | | | 145,397 | | | | South African Rand | | | | 2,077,000 | | | | Bank of America | | | | 310 | |
| | | Czech Republic | | | | | | | | | | | | | | | | | | | | | |
06/18/19 | | | Koruna | | | | 6,853,500 | | | | U.S. Dollars | | | | 300,000 | | | | BNP | | | | 296 | |
08/05/19 | | | U.S. Dollars | | | | 125,000 | | | | South African Rand | | | | 1,806,563 | | | | BNP | | | | 223 | |
06/20/19 | | | U.S. Dollars | | | | 17,005 | | | | Indian Rupees | | | | 1,185,000 | | | | JPMorgan Chase | | | | 112 | |
05/06/19 | | | Polish Zloty | | | | 794,768 | | | | U.S. Dollars | | | | 208,000 | | | | BNP | | | | 14 | |
| |
Total Unrealized Appreciation | | | | | | | | | | | | | | | | $481,365 | |
| |
| | | | | | |
07/11/19 | | | U.S. Dollars | | | | 43,885 | | | | Indian Rupees | | | | 3,092,378 | | | | HSBC | | | | $ (53) | |
07/15/19 | | | U.S. Dollars | | | | 29,182 | | | | Indian Rupees | | | | 2,061,000 | | | | Citibank | | | | (82) | |
06/19/19 | | | U.S. Dollars | | | | 19,578 | | | | Indian Rupees | | | | 1,379,000 | | | | JPMorgan Chase | | | | (83) | |
06/14/19 | | | U.S. Dollars | | | | 13,784 | | | | Indian Rupees | | | | 977,223 | | | | HSBC | | | | (160) | |
06/17/19 | | | U.S. Dollars | | | | 27,557 | | | | Indian Rupees | | | | 1,949,000 | | | | HSBC | | | | (239) | |
06/18/19 | | | U.S. Dollars | | | | 22,191 | | | | Indian Rupees | | | | 1,573,000 | | | | Citibank | | | | (240) | |
10/31/19 | | | U.S. Dollars | | | | 658,403 | | | | Australian Dollars | | | | 930,000 | | | | Citibank | | | | (299) | |
See accompanying Notes to Financial Statements
142
Morningstar Funds Trust April 30, 2019
Schedule of Investments(continued)
Morningstar Multisector Bond Fund
| | | | | | | | | | | | | | | | | | | | | | | | |
Expiration
Date | | Currency Purchased | | | Amount of Currency Purchased | | | Currency Sold | | | Amount of Currency Sold | | | Counterparty | | | Unrealized Appreciation (Depreciation) | |
06/28/19 | | | Thai Baht | | | | 35,058,100 | | | | U.S. Dollars | | | | 1,100,000 | | | | Bank of America | | | $ | (370 | ) |
05/20/19 | | | U.S. Dollars | | | | 18,043 | | | | Indian Rupees | | | | 1,297,000 | | | | HSBC | | | | (539 | ) |
07/22/19 | | | U.S. Dollars | | | | 17,032 | | | | Indian Rupees | | | | 1,241,000 | | | | HSBC | | | | (569 | ) |
05/22/19 | | | U.S. Dollars | | | | 19,066 | | | | Indian Rupees | | | | 1,375,000 | | | | JPMorgan Chase | | | | (626 | ) |
06/11/19 | | | U.S. Dollars | | | | 27,167 | | | | Indian Rupees | | | | 1,947,523 | | | | HSBC | | | | (634 | ) |
07/03/19 | | | U.S. Dollars | | | | 376,000 | | | | Chilean Pesos | | | | 255,210,000 | | | | Goldman Sachs | | | | (666 | ) |
07/23/19 | | | U.S. Dollars | | | | 160,000 | | | | Colombian Pesos | | | | 522,080,000 | | | | Barclays | | | | (788 | ) |
06/28/19 | | | Thai Baht | | | | 10,802,718 | | | | U.S. Dollars | | | | 340,000 | | | | Citibank | | | | (1,163 | ) |
07/25/19 | | | U.S. Dollars | | | | 435,828 | | | | Japanese Yen | | | | 48,350,000 | | | | Citibank | | | | (1,292 | ) |
05/28/19 | | | U.S. Dollars | | | | 76,261 | | | | Indian Rupees | | | | 5,479,000 | | | | Standard Chartered Bank | | | | (2,122 | ) |
06/18/19 | | | Czech Republic Koruna | | | | 5,767,633 | | | | U.S. Dollars | | | | 255,000 | | | | Citibank | | | | (2,283 | ) |
06/11/19 | | | Colombian Pesos | | | | 267,986,300 | | | | U.S. Dollars | | | | 85,000 | | | | Citibank | | | | (2,298 | ) |
10/31/19 | | | U.S. Dollars | | | | 1,003,329 | | | | Australian Dollars | | | | 1,420,000 | | | | Bank of America | | | | (2,431 | ) |
06/03/19 | | | U.S. Dollars | | | | 91,530 | | | | Indian Rupees | | | | 6,581,000 | | | | Standard Chartered Bank | | | | (2,528 | ) |
05/31/19 | | | U.S. Dollars | | | | 143,795 | | | | Mexican Pesos | | | | 2,800,000 | | | | Citibank | | | | (3,140 | ) |
06/26/19 | | | U.S. Dollars | | | | 163,347 | | | | Mexican Pesos | | | | 3,200,000 | | | | Citibank | | | | (3,870 | ) |
06/06/19 | | | U.S. Dollars | | | | 160,161 | | | | Indian Rupees | | | | 11,511,400 | | | | JPMorgan Chase | | | | (4,289 | ) |
06/06/19 | | | U.S. Dollars | | | | 190,672 | | | | Indian Rupees | | | | 13,689,900 | | | | Standard Chartered Bank | | | | (4,900 | ) |
06/11/19 | | | Colombian Pesos | | | | 677,046,700 | | | | U.S. Dollars | | | | 214,494 | | | | Bank of America | | | | (5,554 | ) |
05/13/19 | | | Polish Zloty | | | | 2,976,630 | | | | U.S. Dollars | | | | 785,000 | | | | Bank of America | | | | (5,761 | ) |
05/02/19 | | | Turkish Lira | | | | 384,824 | | | | U.S. Dollars | | | | 70,500 | | | | Bank of America | | | | (6,007 | ) |
06/18/19 | | | Czech Republic Koruna | | | | 18,734,445 | | | | U.S. Dollars | | | | 827,000 | | | | Bank of America | | | | (6,124 | ) |
07/03/19 | | | Chilean Pesos | | | | 374,901,000 | | | | U.S. Dollars | | | | 560,000 | | | | Barclays | | | | (6,681 | ) |
05/13/19 | | | Malaysian Ringgit | | | | 1,686,781 | | | | U.S. Dollars | | | | 415,000 | | | | Barclays | | | | (7,301 | ) |
07/31/19 | | | U.S. Dollars | | | | 1,903,685 | | | | Japanese Yen | | | | 211,290,000 | | | | Bank of America | | | | (7,448 | ) |
05/06/19 | | | South African Rand | | | | 2,077,000 | | | | U.S. Dollars | | | | 155,000 | | | | BNP | | | | (9,912 | ) |
05/06/19 | | | U.S. Dollars | | | | 523,864 | | | | Philippine Pesos | | | | 27,793,150 | | | | Bank of America | | | | (9,934 | ) |
07/31/19 | | | U.S. Dollars | | | | 3,274,374 | | | | Japanese Yen | | | | 363,467,000 | | | | Citibank | | | | (13,210 | ) |
05/17/19 | | | U.S. Dollars | | | | 3,171,508 | | | | Japanese Yen | | | | 354,350,000 | | | | JPMorgan Chase | | | | (14,245 | ) |
10/29/19 | | | U.S. Dollars | | | | 2,260,804 | | | | Euro | | | | 1,997,000 | | | | Citibank | | | | (14,323 | ) |
06/17/19 | | | U.S. Dollars | | | | 3,179,125 | | | | Japanese Yen | | | | 354,350,000 | | | | JPMorgan Chase | | | | (14,794 | ) |
06/11/19 | | | Hungarian Forints | | | | 119,478,940 | | | | U.S. Dollars | | | | 430,000 | | | | Goldman Sachs | | | | (15,012 | ) |
05/02/19 | | | Turkish Lira | | | | 1,250,260 | | | | U.S. Dollars | | | | 225,000 | | | | BNP | | | | (15,467 | ) |
10/31/19 | | | U.S. Dollars | | | | 2,200,401 | | | | Euro | | | | 1,946,000 | | | | Bank of America | | | | (16,998 | ) |
06/11/19 | | | Hungarian Forints | | | | 311,257,861 | | | | U.S. Dollars | | | | 1,100,000 | | | | BNP | | | | (18,904 | ) |
05/15/19 | | | U.S. Dollars | | | | 406,000 | | | | Russian Rubles | | | | 27,524,717 | | | | Bank of America | | | | (19,122 | ) |
| |
| | | | |
Total Unrealized Depreciation | | | | | | | | | | | | | | | $ | (242,461 | ) |
| |
| | | | |
Net Unrealized Appreciation | | | | | | | | | | | | | | | $ | 238,904 | |
See accompanying Notes to Financial Statements
143
Morningstar Funds Trust April 30, 2019
Schedule of Investments(continued)
Morningstar Multisector Bond Fund
Interest Rate Swap Contracts outstanding at April 30, 2019:
Exchange Traded
| | | | | | | | | | | | | | | | | | | | | | | | | | | | |
Pay Rate Index/ Pay Rate | | Receive Rate/
Receive Rate Index | | | Maturity Date | | | | | | Notional Amount | | | Market Value | | | Upfront Premiums Paid (Received) | | | Unrealized Appreciation (Depreciation) | |
3.01% (Semi-Annually) | | | 3-Month LIBOR (Quarterly) | | | | 12/6/2028 | | | | USD | | | | 1,350,000 | | | | $(72,946 | ) | | | $— | | | $ | (72,946 | ) |
2.72% (Semi-Annually) | | | 3-Month LIBOR (Quarterly) | | | | 1/16/2029 | | | | USD | | | | 1,740,000 | | | | (47,805 | ) | | | — | | | | (47,805 | ) |
2.73% (Semi-Annually) | | | 3-Month LIBOR (Quarterly) | | | | 2/7/2029 | | | | USD | | | | 490,000 | | | | (10,396 | ) | | | — | | | | (10,396 | ) |
2.68% (Semi-Annually) | | | 3-Month LIBOR (Quarterly) | | | | 2/27/2029 | | | | USD | | | | 630,000 | | | | (10,885 | ) | | | — | | | | (10,885 | ) |
2.50% (Semi-Annually) | | | 3-Month LIBOR (Quarterly) | | | | 4/26/2029 | | | | USD | | | | 3,310,000 | | | | (3,993 | ) | | | — | | | | (3,993 | ) |
3.08% (Semi-Annually) | | | 3-Month LIBOR (Quarterly) | | | | 12/6/2048 | | | | USD | | | | 600,000 | | | | (53,440 | ) | | | — | | | | (53,440 | ) |
2.85% (Semi-Annually) | | | 3-Month LIBOR (Quarterly) | | | | 1/16/2049 | | | | USD | | | | 750,000 | | | | (28,914 | ) | | | — | | | | (28,914 | ) |
2.85% (Semi-Annually) | | | 3-Month LIBOR (Quarterly) | | | | 2/7/2049 | | | | USD | | | | 210,000 | | | | (6,634 | ) | | | — | | | | (6,634 | ) |
2.84% (Semi-Annually) | | | 3-Month LIBOR (Quarterly) | | | | 2/27/2049 | | | | USD | | | | 270,000 | | | | (7,766 | ) | | | — | | | | (7,766 | ) |
2.71% (Semi-Annually) | | | 3-Month LIBOR (Quarterly) | | | | 4/26/2049 | | | | USD | | | | 1,410,000 | | | | (1,808 | ) | | | — | | | | (1,808 | ) |
| |
Total | | | | | | | | | | | | | | | 10,760,000 | | | | $(244,587 | ) | | | $— | | | $ | (244,587 | ) |
| |
Credit Default Swap Contracts outstanding - Sell Protection as of April 30, 2019:
Exchange Traded
| | | | | | | | | | | | | | | | | | | | | | | | | | | | | | | | | | | | |
Reference Obligation | | Implied
Credit
Spread | | | Fixed
Deal
(Pay) Rate | | | Maturity
Date | | | Counterparty | | | | | | Notional
Amount | | | Market Value | | | Upfront Premiums Paid/
(Received) | | | Unrealized
Appreciation
(Depreciation) | |
Markit CDX North America High Yield Index Series 32 (Pay Quarterly) | | | 3.26 | % | | | 5.00% | | | | 6/20/2024 | | | | Morgan Stanley | | | | USD | | | | 2,475,000 | | | | $202,552 | | | | $187,778 | | | | $14,774 | |
Total | | | | | | | | | | | | | | | | | | | | | | | 2,475,000 | | | | $202,552 | | | | $187,778 | | | | $14,774 | |
See accompanying Notes to Financial Statements
144
Morningstar Funds Trust April 30, 2019
Schedule of Investments(continued)
Morningstar Multisector Bond Fund
Valuation Hierarchy
The following is a summary of the inputs used, as of April 30, 2019, in valuing the Fund’s investments carried at fair value:
| | | | | | | | | | | | | | | | |
| Morningstar Multisector Bond Fund | | Level 1 | | | Level 2 | | | Level 3 | | | Totals | |
| | | | |
Investments | | | | | | | | | | | | | | | | |
| | | | |
Assets: | | | | | | | | | | | | | | | | |
| | | | |
Investments in Securities: | | | | | | | | | | | | | | | | |
Common Stocks | | $ | 75,804 | | | $ | — | | | | $— | | | $ | 75,804 | |
Convertible Preferred Stocks | | | — | | | | 245,427 | | | | — | | | | 245,427 | |
Convertible Bonds | | | — | | | | 1,945,085 | | | | — | | | | 1,945,085 | |
Corporate Bonds | | | — | | | | 14,240,191 | | | | — | | | | 14,240,191 | |
Foreign Government Inflation-Linked Bonds | | | — | | | | 716,648 | | | | — | | | | 716,648 | |
Foreign Issuer Bonds | | | — | | | | 113,460,274 | | | | — | | | | 113,460,274 | |
Term Loans | | | — | | | | 119,788 | | | | — | | | | 119,788 | |
U.S. Government Agencies | | | — | | | | 10,655,000 | | | | — | | | | 10,655,000 | |
U.S. Government Obligations | | | — | | | | 2,884,117 | | | | — | | | | 2,884,117 | |
Short-Term Investments | | | 6,507,279 | | | | 7,822,545 | | | | — | | | | 14,329,824 | |
Purchased Options | | | — | | | | 2,434 | | | | — | | | | 2,434 | |
Total Investments | | $ | 6,583,083 | | | $ | 152,091,509 | | | | $— | | | $ | 158,674,592 | |
| | | | | | | | | | | | | | | | | | | | |
| Morningstar Multisector Bond Fund | | Level 1 | | Level 2 | | Level 3 | | Totals |
| | | | |
Derivative Financial Instruments | | | | | | | | | | | | | | | | | | | | |
| | | | |
Assets: | | | | | | | | | | | | | | | | | | | | |
Forward foreign currency exchange contracts | | | $ | — | | | | $ | 481,365 | | | | | $— | | | | $ | 481,365 | |
Swap agreements at value | | | | — | | | | | 202,552 | | | | | — | | | | | 202,552 | |
Total Assets - Derivative Financial Instruments | | | $ | — | | | | $ | 683,917 | | | | | $— | | | | $ | 683,917 | |
| | | | |
Liabilities: | | | | | | | | | | | | | | | | | | | | |
Forward foreign currency exchange contracts | | | $ | — | | | | $ | (242,461 | ) | | | | $— | | | | $ | (242,461 | ) |
Swap agreements at value | | | | — | | | | | (244,587 | ) | | | | — | | | | | (244,587 | ) |
Total Liabilities - Derivative Financial Instruments | | | $ | — | | | | $ | (487,048 | ) | | | | $— | | | | $ | (487,048 | ) |
Total Net Derivative Financial Instruments | | | $ | — | | | | $ | 196,869 | | | | | $— | | | | $ | 196,869 | |
See accompanying Notes to Financial Statements
145
Morningstar Funds Trust April 30, 2019
Schedule of Investments
|
Morningstar Unconstrained Allocation Fund |
| | | | | | | | |
| | | Number
of Shares | | | Value | |
Common Stocks – 19.3% | | | | | |
Advertising – 0.8% | | | | | | | | |
Omnicom Group, Inc. | | | 5,697 | | | $ | 455,931 | |
| | | |
Apparel – 0.7% | | | | | | | | |
Tapestry, Inc. | | | 13,326 | | | | 430,030 | |
| | | |
Beverages – 1.0% | | | | | | | | |
Anheuser-Busch InBev
S.A./N.V. (Belgium) | | | 6,120 | | | | 544,112 | |
| | | |
Commercial Services – 3.2% | | | | | | | | |
Atlantia S.p.A. (Italy) | | | 12,381 | | | | 338,010 | |
Bureau Veritas S.A. (France) | | | 8,762 | | | | 222,105 | |
H&R Block, Inc. | | | 21,355 | | | | 581,070 | |
Nielsen Holdings PLC | | | 25,297 | | | | 645,832 | |
| | | | | | | 1,787,017 | |
| | | |
Computers – 0.4% | | | | | | | | |
Cognizant Technology Solutions Corp., Class A | | | 2,905 | | | | 211,949 | |
| | | |
Entertainment – 1.2% | | | | | | | | |
International Game Technology PLC | | | 46,548 | | | | 680,997 | |
| | | |
Environmental Control – 1.2% | | | | | | | | |
Stericycle, Inc.* | | | 11,345 | | | | 662,435 | |
| | | |
Gas – 0.6% | | | | | | | | |
National Grid PLC (United Kingdom) | | | 29,927 | | | | 327,878 | |
| | | |
Healthcare - Products – 1.2% | | | | | | | | |
EssilorLuxottica S.A. (France) | | | 2,904 | | | | 353,819 | |
Medtronic PLC | | | 3,830 | | | | 340,142 | |
| | | | | | | 693,961 | |
| | | |
Healthcare - Services – 1.5% | | | | | | | | |
Fresenius Medical Care A.G. & Co. KGaA (Germany) | | | 3,847 | | | | 324,239 | |
MEDNAX, Inc.* | | | 19,765 | | | | 552,827 | |
| | | | | | | 877,066 | |
| | | |
Internet – 0.2% | | | | | | | | |
Alphabet, Inc., Class C* | | | 86 | | | | 102,209 | |
| | | |
Pharmaceuticals – 2.2% | | | | | | | | |
CVS Health Corp. | | | 10,226 | | | | 556,090 | |
McKesson Corp. | | | 5,662 | | | | 675,193 | |
| | | | | | | | 1,231,283 | |
| | | | | | | | |
| | | Number
of Shares | | | Value | |
| |
Retail – 0.4% | | | | | |
Industria de Diseno Textil S.A. (Spain) | | | 7,190 | | | $ | 217,703 | |
| | | |
Semiconductors – 1.4% | | | | | | | | |
IPG Photonics Corp.* | | | 2,592 | | | | 452,900 | |
QUALCOMM, Inc. | | | 3,839 | | | | 330,653 | |
| | | | | | | 783,553 | |
| | | |
Software – 1.2% | | | | | | | | |
Microsoft Corp. | | | 904 | | | | 118,062 | |
Oracle Corp. | | | 10,135 | | | | 560,770 | |
| | | | | | | 678,832 | |
| | | |
Telecommunications – 1.2% | | | | | | | | |
SES S.A. (France) | | | 39,737 | | | | 676,112 | |
| | | |
Transportation – 0.3% | | | | | | | | |
Norfolk Southern Corp. | | | 831 | | | | 169,541 | |
| | | |
Water – 0.6% | | | | | | | | |
United Utilities Group PLC
(United Kingdom) | | | 29,989 | | | | 325,322 | |
Total Common Stocks
(Cost $10,379,286) | | | | | | | 10,855,931 | |
Investment Companies – 55.3% | | | | | |
iShares Core DAX UCITS ETF DE (Germany)* | | | 9,485 | | | | 1,128,732 | |
iShares MSCI Europe Financials ETF | | | 178,885 | | | | 3,500,779 | |
iShares MSCI South Korea ETF | | | 28,457 | | | | 1,749,536 | |
iShares MSCI United Kingdom ETF | | | 65,972 | | | | 2,227,215 | |
iShares STOXX Europe 600 Health Care UCITS ETF DE (Germany) | | | 20,331 | | | | 1,772,041 | |
iShares STOXX Europe 600 Telecommunications UCITS ETF DE (Germany) | | | 92,446 | | | | 2,287,345 | |
JPMorgan BetaBuilders Japan ETF | | | 192,952 | | | | 4,443,684 | |
Schwab Fundamental Emerging Markets Large Company Index ETF | | | 140,378 | | | | 3,990,946 | |
Schwab U.S. TIPS ETF | | | 49,619 | | | | 2,736,488 | |
VanEck Vectors Russia ETF | | | 131,966 | | | | 2,842,548 | |
Vanguard Consumer Staples ETF | | | 15,311 | | | | 2,279,655 | |
Vanguard Health Care ETF | | | 6,429 | | | | 1,078,979 | |
Vanguard Long-Term Treasury ETF | | | 14,800 | | | | 1,126,132 | |
Total Investment Companies
(Cost $30,620,035) | | | | | | | 31,164,080 | |
See accompanying Notes to Financial Statements
146
Morningstar Funds Trust April 30, 2019
Schedule of Investments(continued)
Morningstar Unconstrained Allocation Fund
| | | | | | | | |
| | | Number
of Shares | | | Value | |
Short-Term Investments – 3.3% | |
Money Market Fund – 3.3% | | | | | | | | |
Northern Institutional Funds - Treasury Portfolio (Premier), 2.29%(a) | | | 1,857,733 | | | $ | 1,857,733 | |
Total Short-Term Investments
(Cost $1,857,733) | | | | | | | 1,857,733 | |
Total Investments – 77.9%
(Cost $42,857,054) | | | | | | | 43,877,744 | |
Other Assets less Liabilities – 22.1% | | | | | | | 12,416,977 | |
NET ASSETS – 100.0% | | | | | | $ | 56,294,721 | |
All securities are United States companies, unless noted otherwise in parentheses.
| (a) | 7-day current yield as of April 30, 2019 is disclosed. |
| * | Non-Income Producing Security |
Percentages shown are based on Net Assets
| | |
| Abbreviations: | | |
| |
ETF | | Exchange-Traded Fund |
| |
MSCI | | Morgan Stanley Capital International |
| |
PLC | | Public Limited Company |
| |
TIPS | | Treasury Inflation Protected Securities |
| |
UCITS | | Undertakings for Collective Investment in Transferable Securities |
Valuation Hierarchy
The following is a summary of the inputs used, as of April 30, 2019, in valuing the Fund’s investments carried at fair value:
| | | | | | | | | | | | | | | | |
| Morningstar Unconstrained Allocation Fund | | Level 1 | | | Level 2 | | | Level 3 | | | Totals | |
Investments | | | | | | | | | | | | | | | | |
Assets: | | | | | | | | | | | | | | | | |
Investments in Securities: | | | | | | | | | | | | | | | | |
Common Stocks | | $ | 7,526,631 | | | | $3,329,300 | | | | $— | | | $ | 10,855,931 | |
Investment Companies | | | 31,164,080 | | | | — | | | | — | | | | 31,164,080 | |
Short-Term Investments | | | 1,857,733 | | | | — | | | | — | | | | 1,857,733 | |
Total Investments | | $ | 40,548,444 | | | | $3,329,300 | | | | $— | | | $ | 43,877,744 | |
See accompanying Notes to Financial Statements
147
Morningstar Funds Trust April 30, 2019
Schedule of Investments
| | | | | | | | |
Morningstar Alternatives Fund | | | | | | | | |
| | | | | | | | |
| | | Number
of Shares | | | Value | |
Long Positions – 101.7% | | | | | | | | |
Common Stocks – 19.1% | | | | | | | | |
Aerospace/Defense – 1.5% | | | | | | | | |
L3 Technologies, Inc.(a) | | | 7,821 | | | $ | 1,709,514 | |
| | | |
Auto Parts & Equipment – 0.6% | | | | | | | | |
WABCO Holdings, Inc.(a)* | | | 4,940 | | | | 654,254 | |
| | | |
Banks – 0.8% | | | | | | | | |
SunTrust Banks, Inc.(a) | | | 9,416 | | | | 616,560 | |
TCF Financial Corp.(a) | | | 11,924 | | | | 263,878 | |
| | | | | | | 880,438 | |
| | | |
Biotechnology – 1.0% | | | | | | | | |
Aratana Therapeutics, Inc.* | | | 23,691 | | | | 111,348 | |
Celgene Corp.* | | | 5,843 | | | | 553,098 | |
Nightstar Therapeutics PLC ADR(a)* | | | 7,961 | | | | 203,483 | |
Pacific Biosciences of California, Inc.(a)* | | | 36,273 | | | | 268,058 | |
| | | | | | | 1,135,987 | |
| | | |
Chemicals – 1.1% | | | | | | | | |
Versum Materials, Inc.(a)(b) | | | 24,213 | | | | 1,263,434 | |
| | | |
Commercial Services – 0.8% | | | | | | | | |
Rent-A-Center, Inc.(a)* | | | 11,861 | | | | 295,695 | |
Worldpay, Inc., Class A* | | | 4,716 | | | | 552,762 | |
| | | | | | | 848,457 | |
| | | |
Computers – 0.3% | | | | | | | | |
Electronics For | | | | | | | | |
Imaging, Inc.* | | | 2,572 | | | | 95,653 | |
KeyW Holding (The) Corp.* | | | 21,110 | | | | 239,387 | |
| | | | | | | 335,040 | |
| | |
Diversified Financial Services – 0.4% | | | | | |
Gluskin Sheff + Associates, Inc. | | | 4,198 | | | | 45,154 | |
Solium Capital, Inc.* | | | 25,512 | | | | 364,294 | |
| | | | | | | 409,448 | |
| | | |
Entertainment – 0.1% | | | | | | | | |
Parques Reunidos Servicios Centrales S.A.U.(c) | | | 5,157 | | | | 80,399 | |
| | | |
Environmental Control – 0.7% | | | | | | | | |
Advanced Disposal Services, Inc.* | | | 25,832 | | | | 835,407 | |
| | | |
Food – 0.1% | | | | | | | | |
Smart & Final Stores, Inc.* | | | 17,400 | | | | 113,622 | |
Wessanen | | | 4,367 | | | | 56,621 | |
| | | | | | | | 170,243 | |
| | | | | | | | |
| | | Number
of Shares | | | Value | |
| | | |
Insurance – 1.1% | | | | | | | | |
Navigators Group (The), Inc. | | | 16,594 | | | $ | 1,160,584 | |
TOWER Ltd.* | | | 153,932 | | | | 80,193 | |
| | | | | | | 1,240,777 | |
| | | |
Internet – 0.5% | | | | | | | | |
Attunity Ltd.* | | | 15,977 | | | | 374,661 | |
Liberty Expedia Holdings, Inc., Class A* | | | 3,493 | | | | 162,145 | |
| | | | | | | 536,806 | |
| | | |
Media – 1.9% | | | | | | | | |
Fox Corp., Class A* | | | 5,272 | | | | 205,568 | |
Tribune Media Co., Class A(a) | | | 41,622 | | | | 1,922,936 | |
| | | | | | | 2,128,504 | |
| | |
Metal Fabricate/Hardware – 0.4% | | | | | |
Global Brass & Copper Holdings, Inc. | | | 10,146 | | | | 440,235 | |
| | | |
Oil & Gas – 1.0% | | | | | | | | |
Anadarko Petroleum Corp.(b) | | | 11,062 | | | | 805,867 | |
Chevron Corp. | | | 904 | | | | 108,534 | |
Occidental Petroleum Corp. | | | 2,616 | | | | 154,030 | |
| | | | | | | 1,068,431 | |
| | |
Packaging & Containers – 0.7% | | | | | |
Multi-Color Corp.(a) | | | 3,064 | | | | 152,894 | |
RPC Group PLC | | | 65,833 | | | | 678,532 | |
| | | | | | | 831,426 | |
| | | |
Pharmaceuticals – 0.4% | | | | | | | | |
BTG PLC* | | | 43,257 | | | | 471,282 | |
| | | |
Real Estate – 0.2% | | | | | | | | |
HFF, Inc., Class A(a) | | | 5,344 | | | | 254,321 | |
| | |
Real Estate Investment Trusts – 1.0% | | | | | |
InfraREIT, Inc.(a) | | | 28,815 | | | | 606,556 | |
MedEquities Realty Trust, Inc. | | | 17,566 | | | | 188,132 | |
Tier REIT, Inc.(a) | | | 9,792 | | | | 277,505 | |
| | | | | | | 1,072,193 | |
| | | |
Semiconductors – 0.7% | | | | | | | | |
Mellanox Technologies Ltd.(a)(b)* | | | 6,216 | | | | 747,785 | |
| | | |
Software – 3.1% | | | | | | | | |
First Data Corp., Class A(a)* | | | 45,462 | | | | 1,175,647 | |
Red Hat, Inc.(a)(b)* | | | 6,807 | | | | 1,242,482 | |
Ultimate Software Group (The), Inc.* | | | 3,182 | | | | 1,052,128 | |
| | | | | | | | 3,470,257 | |
See accompanying Notes to Financial Statements
148
Morningstar Funds Trust April 30, 2019
Schedule of Investments(continued)
Morningstar Alternatives Fund
| | | | | | | | |
| | | Number
of Shares | | | Value | |
| | | |
Telecommunications – 0.7% | | | | | | | | |
DNA OYJ | | | 3,266 | | | $ | 77,811 | |
Inmarsat PLC | | | 16,826 | | | | 119,950 | |
KCOM Group PLC | | | 61,704 | | | | 78,772 | |
Manx Telecom PLC | | | 28,296 | | | | 79,146 | |
Quantenna Communications, Inc.(a)* | | | 16,871 | | | | 410,809 | |
| | | | | | | 766,488 | |
| | | |
Total Common Stocks
(Cost $20,994,257) | | | | | | | 21,351,126 | |
Convertible Preferred Stocks – 3.2% | |
Banks – 0.3% | | | | | | | | |
Bank of America Corp., 7.25%(a) | | | 90 | | | | 118,846 | |
Wells Fargo & Co., 7.50%(a) | | | 180 | | | | 235,339 | |
| | | | | | | 354,185 | |
| | | |
Chemicals – 0.2% | | | | | | | | |
A Schulman, Inc., 6.00%(a) | | | 161 | | | | 167,227 | |
| | | |
Computers – 0.3% | | | | | | | | |
NCR Corp., 5.50%(a)(d) | | | 270 | | | | 302,783 | |
| | |
Diversified Financial Services – 0.5% | | | | | |
AMG Capital Trust II, 5.15%(a) | | | 5,668 | | | | 284,199 | |
Cowen, Inc., 5.63%(a) | | | 262 | | | | 192,693 | |
Virtus Investment Partners, Inc., 7.25% | | | 945 | | | | 97,534 | |
| | | | | | | 574,426 | |
| | | |
Electric – 0.4% | | | | | | | | |
CenterPoint Energy, Inc. (Frankfurt Exchange), 7.00% | | | 3,398 | | | | 180,910 | |
Vistra Energy Corp., 7.00%(a) | | | 2,522 | | | | 253,814 | |
| | | | | | | 434,724 | |
| |
Electrical Component & Equipment – 0.2% | |
Energizer Holdings, Inc., 7.50%(a) | | | 2,371 | | | | 243,028 | |
| | | |
Gas – 0.2% | | | | | | | | |
South Jersey Industries, Inc., 7.25% | | | 3,435 | | | | 177,349 | |
| | | |
Hand/Machine Tools – 0.3% | | | | | | | | |
Colfax Corp. (Stuttgart Exchange), 5.75%(a) | | | 2,401 | | | | 321,878 | |
| | | |
Oil & Gas – 0.1% | | | | | | | | |
Nabors Industries Ltd., 6.00%(a) | | | 3,346 | | | | 89,974 | |
| | | | | | | | |
| | | Number
of Shares | | | Value | |
| |
Real Estate Investment Trusts – 0.4% | |
iStar, Inc., 4.50%(a) | | | 5,799 | | | $ | 251,411 | |
QTS Realty Trust, Inc., 6.50%(a) | | | 2,171 | | | | 239,765 | |
| | | | | | | 491,176 | |
| | | |
Savings & Loans – 0.3% | | | | | | | | |
New York Community Capital Trust V, 6.00%(a) | | | 7,446 | | | | 363,588 | |
| | | |
Water – 0.0%(e) | | | | | | | | |
Aqua America, Inc., 6.00%* | | | 734 | | | | 40,062 | |
| | | |
Total Convertible Preferred Stocks
(Cost $3,503,037) | | | | | | | 3,560,400 | |
| | |
| | | Par | | | | |
Convertible Bonds – 20.2% | | | | | |
Aerospace/Defense – 0.3% | | | | | | | | |
Aerojet Rocketdyne Holdings, Inc., 2.25%, 12/15/23(a) | | $ | 247,000 | | | | 353,391 | |
| | | |
Auto Parts & Equipment – 0.2% | | | | | | | | |
Meritor, Inc., 3.25%, 10/15/37(a) | | | 246,000 | | | | 253,582 | |
| | | |
Banks – 0.3% | | | | | | | | |
Hope Bancorp, Inc., 2.00%, 5/15/38(a)(c) | | | 361,000 | | | | 325,425 | |
| | | |
Biotechnology – 2.3% | | | | | | | | |
Alder Biopharmaceuticals, Inc.,
2.50%, 2/01/25(a) | | | 190,000 | | | | 182,240 | |
Exact Sciences Corp., 1.00%, 1/15/25(a) | | | 205,000 | | | | 308,951 | |
Innoviva, Inc., 2.12%, 1/15/23(a) | | | 284,000 | | | | 290,552 | |
Insmed, Inc., 1.75%, 1/15/25(a) | | | 164,000 | | | | 170,663 | |
Ionis Pharmaceuticals, Inc.,
1.00%, 11/15/21(a) | | | 299,000 | | | | 384,372 | |
Ligand Pharmaceuticals, Inc.,
0.75%, 5/15/23(a)(c) | | | 342,000 | | | | 296,371 | |
Medicines (The) Co., 2.75%, 7/15/23(a) | | | 384,000 | | | | 351,206 | |
Radius Health, Inc., 3.00%, 9/01/24 | | | 282,000 | | | | 244,492 | |
Retrophin, Inc., 2.50%, 9/15/25(a) | | | 186,000 | | | | 164,855 | |
See accompanying Notes to Financial Statements
149
Morningstar Funds Trust April 30, 2019
Schedule of Investments(continued)
Morningstar Alternatives Fund
| | | | | | | | |
| | | Par | | | Value | |
| | |
Biotechnology (Continued) | | | | | | | | |
Theravance Biopharma, Inc., 3.25%, 11/01/23(a) | | $ | 189,000 | | | $ | 187,665 | |
Verastem, Inc., 5.00%, 11/01/48(a) | | | 50,000 | | | | 36,548 | |
| | | | | | | 2,617,915 | |
| | | |
Building Materials – 0.2% | | | | | | | | |
Cemex S.A.B. de C.V., 3.72%, 3/15/20(a) | | | 243,000 | | | | 241,772 | |
| | | |
Commercial Services – 1.2% | | | | | | | | |
Chegg, Inc., 0.25%, 5/15/23(a) | | | 222,000 | | | | 319,125 | |
FTI Consulting, Inc., 2.00%, 8/15/23(a)(c) | | | 252,000 | | | | 269,987 | |
Huron Consulting | | | | | | | | |
Group, Inc., 1.25%, 10/01/19(a) | | | 250,000 | | | | 246,460 | |
Square, Inc., 0.50%, 5/15/23(a)(c) | | | 270,000 | | | | 322,372 | |
Team, Inc., 5.00%, 8/01/23(a) | | | 151,000 | | | | 160,292 | |
| | | | | | | 1,318,236 | |
| | | |
Computers – 0.4% | | | | | | | | |
Pure Storage, Inc., 0.13%, 4/15/23(a) | | | 144,000 | | | | 158,967 | |
Rapid7, Inc., 1.25%, 8/01/23(a)(c) | | | 171,000 | | | | 247,184 | |
| | | | | | | 406,151 | |
| |
Diversified Financial Services – 0.7% | |
Encore Capital Europe Finance Ltd., 4.50%, 9/01/23(a) | | | 46,000 | | | | 41,716 | |
Encore Capital Group, Inc., | | | | | | | | |
3.00%, 7/01/20(a) | | | 43,000 | | | | 41,223 | |
2.88%, 3/15/21(a) | | | 136,000 | | | | 127,441 | |
Hannon Armstrong Sustainable Infrastructure Capital, Inc., 4.12%, 9/01/22(a) | | | 112,000 | | | | 115,345 | |
PRA Group, Inc., | | | | | | | | |
3.50%, 6/01/23(a) | | | 217,000 | | | | 200,199 | |
3.00%, 8/01/20(a) | | | 200,000 | | | | 191,032 | |
| | | | | | | 716,956 | |
| | | |
Electric – 0.1% | | | | | | | | |
NRG Energy, Inc., 2.75%, 6/01/48(c) | | | 75,000 | | | | 84,410 | |
| |
Electrical Component & Equipment – 0.3% | |
SunPower Corp., 4.00%, 1/15/23(a) | | | 369,000 | | | | 305,347 | |
| | | | | | | | |
| | | Par | | | Value | |
| | |
Electronics – 0.6% | | | | | | | | |
II-VI, Inc., 0.25%, 9/01/22(a) | | $ | 182,000 | | | $ | 198,759 | |
Knowles Corp., 3.25%, 11/01/21(a) | | | 207,000 | | | | 250,739 | |
OSI Systems, Inc., 1.25%, 9/01/22(a) | | | 245,000 | | | | 253,784 | |
| | | | | | | 703,282 | |
| | | |
Healthcare - Products – 0.4% | | | | | | | | |
Insulet Corp., 1.25%, 9/15/21 | | | 61,000 | | | | 92,110 | |
Wright Medical Group N.V., 2.25%, 11/15/21(a) | | | 268,000 | | | | 393,844 | |
| | | | | | | 485,954 | |
| | | |
Insurance – 0.7% | | | | | | | | |
AXA S.A., 7.25%, 5/15/21(c) | | | 361,000 | | | | 393,201 | |
MGIC Investment Corp., 9.00%, 4/01/63(a)(c) | | | 305,000 | | | | 403,592 | |
| | | | | | | 796,793 | |
| | | |
Internet – 1.5% | | | | | | | | |
FireEye, Inc., 1.62%, 6/01/35(a) | | | 58,000 | | | | 54,085 | |
MercadoLibre, Inc., 2.00%, 8/15/28(a)(c) | | | 185,000 | | | | 238,881 | |
Pandora Media LLC, 1.75%, 12/01/23 | | | 220,000 | | | | 246,989 | |
Perficient, Inc., 2.37%, 9/15/23(a)(c) | | | 181,000 | | | | 182,463 | |
Wayfair, Inc., 0.38%, 9/01/22(a) | | | 318,000 | | | | 523,309 | |
Weibo Corp., 1.25%, 11/15/22 | | | 198,000 | | | | 187,515 | |
Zillow Group, Inc., 2.00%, 12/01/21(a) | | | 237,000 | | | | 240,111 | |
| | | | | | | 1,673,353 | |
| |
Investment Management Companies – 0.5% | |
BlackRock TCP Capital Corp., 5.25%, 12/15/19 | | | 67,000 | | | | 67,503 | |
New Mountain Finance Corp., 5.75%, 8/15/23(a) | | | 150,000 | | | | 150,898 | |
Prospect Capital Corp., 6.37%, 3/01/25 | | | 336,000 | | | | 333,060 | |
| | | | | | | 551,461 | |
| | | |
Iron/Steel – 0.3% | | | | | | | | |
Cleveland-Cliffs, Inc., 1.50%, 1/15/25(a) | | | 262,000 | | | | 360,602 | |
See accompanying Notes to Financial Statements
150
Morningstar Funds Trust April 30, 2019
Schedule of Investments(continued)
Morningstar Alternatives Fund
| | | | | | | | |
| | | Par | | | Value | |
| | |
Media – 0.6% | | | | | | | | |
Liberty Interactive LLC, 3.50%, 1/15/31(a) | | $ | 547,000 | | | $ | 420,343 | |
Liberty Media Corp., 2.25%, 12/01/48(a)(c) | | | 261,000 | | | | 293,970 | |
| | | | | | | 714,313 | |
| | | |
Mining – 0.2% | | | | | | | | |
First Majestic Silver Corp., 1.88%, 3/01/23(a) | | | 259,000 | | | | 244,269 | |
| | | |
Oil & Gas Services – 0.2% | | | | | | | | |
Helix Energy Solutions | | | | | | | | |
Group, Inc., 4.13%, 9/15/23(a) | | | 63,000 | | | | 70,087 | |
Newpark Resources, Inc., 4.00%, 12/01/21 | | | 148,000 | | | | 162,908 | |
| | | | | | | 232,995 | |
| | | |
Pharmaceuticals – 0.9% | | | | | | | | |
Flexion Therapeutics, Inc., 3.37%, 5/01/24(a) | | | 201,000 | | | | 167,978 | |
Horizon Pharma Investment Ltd.,
2.50%, 3/15/22(a) | | | 150,000 | | | | 168,281 | |
Ironwood Pharmaceuticals, Inc., 2.25%, 6/15/22(a) | | | 363,000 | | | | 402,967 | |
Neurocrine Biosciences, Inc., 2.25%, 5/15/24(a) | | | 175,000 | | | | 211,196 | |
| | | | | | | 950,422 | |
| | | |
Pipelines – 0.3% | | | | | | | | |
Cheniere Energy, Inc., 4.25%, 3/15/45(a) | | | 395,000 | | | | 312,050 | |
| | | |
Private Equity – 0.2% | | | | | | | | |
Hercules Capital, Inc., 4.38%, 2/01/22(a) | | | 241,000 | | | | 239,512 | |
| | | |
Real Estate – 0.2% | | | | | | | | |
Forestar Group, Inc., 3.75%, 3/01/20(a) | | | 165,000 | | | | 163,996 | |
| | |
Real Estate Investment Trusts – 2.3% | | | | | |
Apollo Commercial Real Estate Finance, Inc., | | | | | | | | |
4.75%, 8/23/22(a) | | | 42,000 | | | | 41,652 | |
5.38%, 10/15/23(a) | | | 290,000 | | | | 287,743 | |
Blackstone Mortgage Trust, Inc., | | | | | | | | |
4.75%, 3/15/23(a) | | | 95,000 | | | | 96,781 | |
4.38%, 5/05/22(a) | | | 81,000 | | | | 82,193 | |
Granite Point Mortgage Trust, Inc., | | | | | | | | |
6.37%, 10/01/23(a) | | | 25,000 | | | | 25,524 | |
5.62%, 12/01/22(c) | | | 198,000 | | | | 200,933 | |
| | | | | | | | |
| | | Par | | | Value | |
| |
Real Estate Investment Trusts (Continued) | | | | | |
IH Merger Sub LLC, 3.50%, 1/15/22(a) | | $ | 285,000 | | | $ | 330,589 | |
iStar, Inc., 3.13%, 9/15/22(a) | | | 178,000 | | | | 165,095 | |
KKR Real Estate Finance Trust, Inc., 6.12%, 5/15/23(a)(c) | | | 244,000 | | | | 250,642 | |
PennyMac Corp., 5.38%, 5/01/20(a) | | | 344,000 | | | | 344,027 | |
Redwood Trust, Inc., | | | | | | | | |
4.75%, 8/15/23 | | | 251,000 | | | | 240,538 | |
5.62%, 7/15/24 | | | 158,000 | | | | 154,766 | |
Two Harbors Investment Corp.,
6.25%, 1/15/22(a) | | | 291,000 | | | | 294,638 | |
| | | | | | | 2,515,121 | |
| | | |
Retail – 0.2% | | | | | | | | |
EZCORP, Inc., 2.38%, 5/01/25(c) | | | 207,000 | | | | 194,312 | |
Guess?, Inc., 2.00%, 4/15/24(c) | | | 70,000 | | | | 72,687 | |
| | | | | | | 266,999 | |
| | | |
Semiconductors – 1.2% | | | | | | | | |
Cree, Inc., 0.88%, 9/01/23(a)(c) | | | 120,000 | | | | 151,930 | |
Cypress Semiconductor Corp.,
4.50%, 1/15/22(a) | | | 139,000 | | | | 193,761 | |
Microchip Technology, Inc.,
1.62%, 2/15/27(a) | | | 372,000 | | | | 482,618 | |
ON Semiconductor Corp., 1.62%, 10/15/23 | | | 115,000 | | | | 151,001 | |
Synaptics, Inc., 0.50%, 6/15/22(a) | | | 267,000 | | | | 243,771 | |
Veeco Instruments, Inc., 2.70%, 1/15/23(a) | | | 190,000 | | | | 164,140 | |
| | | | | | | 1,387,221 | |
| | | |
Software – 2.9% | | | | | | | | |
Atlassian, Inc., 0.63%, 5/01/23(a)(c) | | | 179,000 | | | | 264,702 | |
Bilibili, Inc., 1.37%, 4/01/26(c) | | | 194,000 | | | | 191,263 | |
Envestnet, Inc., 1.75%, 6/01/23(a)(c) | | | 212,000 | | | | 255,115 | |
Evolent Health, Inc., 1.50%, 10/15/25(a)(c) | | | 302,000 | | | | 247,831 | |
j2 Global, Inc., 3.25%, 6/15/29(a) | | | 302,000 | | | | 409,776 | |
Momo, Inc., 1.25%, 7/01/25(a)(c) | | | 334,000 | | | | 312,499 | |
MongoDB, Inc., 0.75%, 6/15/24(a)(c) | | | 150,000 | | | | 319,365 | |
See accompanying Notes to Financial Statements
151
Morningstar Funds Trust April 30, 2019
Schedule of Investments(continued)
Morningstar Alternatives Fund
| | | | | | | | |
| | | Par | | | Value | |
| | |
Software (Continued) | | | | | | | | |
New Relic, Inc., 0.50%, 5/01/23(a)(c) | | | $140,000 | | | $ | 163,252 | |
RealPage, Inc., 1.50%, 11/15/22 | | | 118,000 | | | | 192,563 | |
Splunk, Inc., 1.12%, 9/15/25(a)(c) | | | 202,000 | | | | 235,195 | |
Tabula Rasa HealthCare, Inc., 1.75%, 2/15/26(c) | | | 157,000 | | | | 163,228 | |
Twilio, Inc., 0.25%, 6/01/23(a)(c) | | | 88,000 | | | | 176,211 | |
Workday, Inc., 0.25%, 10/01/22(a) | | | 229,000 | | | | 339,889 | |
| | | | | | | 3,270,889 | |
| | | |
Telecommunications – 0.2% | | | | | | | | |
CalAmp Corp., 2.00%, 8/01/25(a)(c) | | | 211,000 | | | | 176,705 | |
Harmonic, Inc., 4.00%, 12/01/20(a) | | | 64,000 | | | | 74,725 | |
| | | | | | | 251,430 | |
| | | |
Transportation – 0.8% | | | | | | | | |
Atlas Air Worldwide | | | | | | | | |
Holdings, Inc., 1.88%, 6/01/24(a) | | | 390,000 | | | | 409,071 | |
SEACOR Holdings, Inc., 3.25%, 5/15/30(a) | | | 332,000 | | | | 304,993 | |
Ship Finance International Ltd., 4.87%, 5/01/23(a) | | | 154,000 | | | | 154,837 | |
| | | | | | | 868,901 | |
| | | |
Total Convertible Bonds
(Cost $21,862,907) | | | | | | | 22,612,748 | |
Corporate Bonds – 0.4% | | | | | |
Media – 0.2% | | | | | | | | |
Tribune Media Co., 5.88%, 7/15/22 | | | 211,000 | | | | 213,954 | |
| | | |
Software – 0.2% | | | | | | | | |
First Data Corp., | | | | | | | | |
5.00%, 1/15/24(c) | | | 169,000 | | | | 173,243 | |
5.75%, 1/15/24(c) | | | 65,000 | | | | 66,991 | |
| | | | | | | 240,234 | |
| | | |
Total Corporate Bonds
(Cost $456,267) | | | | | | | 454,188 | |
| | |
| | | Number
of Shares | | | | |
|
Master Limited Partnerships – 1.5% | |
Gas – 0.5% | | | | | | | | |
AmeriGas Partners L.P. | | | 16,097 | | | | 583,677 | |
| | | | | | | | | | |
| | | | | Number
of Shares | | | Value | |
|
Investment Management Companies – 1.0% | |
Oaktree Capital Group LLC(a) | | | | | 21,287 | | | $ | 1,077,548 | |
| | | |
Total Master Limited Partnerships
(Cost $1,623,437) | | | | | | | 1,661,225 | |
| |
Investment Companies – 41.7% | | | | | |
Eaton Vance Global Macro Absolute Return Fund | | | | | 4,961,596 | | | | 42,520,876 | |
ProShares UltraShort 20+ Year Treasury | | | | | 4,403 | | | | 148,425 | |
Vanguard Market Neutral Fund | | | | | 374,746 | | | | 4,013,526 | |
| | | | |
Total Investment Companies
(Cost $46,864,860) | | | | | | | | | 46,682,827 | |
| |
Short-Term Investments – 15.6% | | | | | |
Money Market Fund – 15.6% | | | | | | | | |
Northern Institutional Funds - Treasury Portfolio (Premier), 2.29%(f) | | | | | 17,445,136 | | | | 17,445,136 | |
| | | | |
Total Short-Term Investments
(Cost $17,445,136) | | | | | | | | | 17,445,136 | |
| | | |
| | | | | Number
of Shares | | | Value | |
| | | |
Rights – 0.0%(e) | | | | | | | | | | |
Pharmaceuticals – 0.0%(e) | | | | | | | | |
Corium International, Inc.(g)* | | | | | $3,858 | | | | 723 | |
| | | | |
Total Rights
(Cost $695) | | | | | | | | | 723 | |
| | |
Number of Contracts | | Notional
Amount | | | | |
| |
Purchased Options – 0.0%(e) | | | | | |
| |
Call Options – 0.0%(e) | | | | | |
BB&T Corp., Strike Price $50.00, Expires 6/21/19 | | 19 | | | 97,280 | | | | 4,028 | |
Chemical Financial Corp., Strike Price $45.00, Expires 5/17/19 | | 7 | | | 30,751 | | | | 385 | |
Strike Price $55.00, Expires 6/21/19 | | 33 | | | 144,969 | | | | 743 | |
Fidelity National Information Services Inc., | | | | | | | | | | |
Strike Price $125.00, Expires 7/19/19 | | 23 | | | 266,639 | | | | 2,875 | |
Strike Price $120.00, Expires 7/19/19 | | 11 | | | 127,523 | | | | 2,750 | |
See accompanying Notes to Financial Statements
152
Morningstar Funds Trust April 30, 2019
Schedule of Investments(continued)
Morningstar Alternatives Fund
| | | | | | | | | | | | |
Number of Contracts | | | Notional
Amount | | | Value | |
| | | |
Call Options (Continued) | | | | | | | | | |
WellCare Health Plans, Inc., | | | | | | | | | | | | |
Strike Price $310.00, Expires 6/21/19 | | | 4 | | | | $103,340 | | | $ | 480 | |
Strike Price $300.00, Expires 6/21/19 | | | 2 | | | | 51,670 | | | | 204 | |
Strike Price $290.00, Expires 6/21/19 | | | 1 | | | | 25,835 | | | | 175 | |
Strike Price $47.50, Expires 6/21/19 | | | 3 | | | | 77,505 | | | | 1,770 | |
| | | | | | | | | | | 13,410 | |
| | | |
Put Options – 0.0%(e) | | | | | | | | | |
Anadarko Petroleum Corp., | | | | | | | | | | | | |
Strike Price $72.50, Expires 6/21/19 | | | 23 | | | | 167,555 | | | | 7,360 | |
Strike Price $70.00, Expires 7/19/19 | | | 40 | | | | 291,400 | | | | 5,700 | |
Luxoft Holding Inc., Strike
Price $45.00, Expires
7/19/19 | | | 53 | | | | 309,626 | | | | 927 | |
Mellanox Technologies Ltd., | | | | | | | | | | | | |
Strike Price $90.00, Expires 12/20/19 | | | 14 | | | | 168,420 | | | | 525 | |
Strike Price $105.00, Expires 12/20/19 | | | 12 | | | | 144,360 | | | | 1,200 | |
Red Hat Inc., | | | | | | | | | | | | |
Strike Price $165.00, Expires 9/20/19 | | | 2 | | | | 36,506 | | | | 460 | |
Strike Price $170.00, Expires 1/17/20 | | | 2 | | | | 36,506 | | | | 600 | |
Versum Materials Inc., Strike Price $40.00, Expires 6/21/19 | | | 7 | | | | 36,526 | | | | 140 | |
| | | | | | | | | | | 16,912 | |
| | | | |
Total Purchased Options
(Cost $35,332) | | | | | | | | | | | 30,322 | |
| | | |
Total Long Positions – 101.7%
(Cost $112,785,928) | | | | | | | | 113,798,695 | |
| | | |
| | | | | | Number
of Shares | | | Value | |
| |
Short Positions – (16.3)% | | | | | |
Common Stocks – (16.0)% | | | | | |
Aerospace/Defense – (1.8)% | | | | | | | | | |
Aerojet Rocketdyne Holdings, Inc.(b)* | | | | | | | (7,285 | ) | | | (246,670 | ) |
Harris Corp. | | | | | | | (10,157 | ) | | | (1,711,455 | ) |
| | | | | | | | | | | (1,958,125 | ) |
| | |
Auto Parts & Equipment – (0.1)% | | | | | |
Meritor, Inc.* | | | | | | | (3,580 | ) | | | (86,851 | ) |
| | | | | | | | |
| | | Number
of Shares | | | Value | |
| | | |
Banks – (0.9)% | | | | | | | | |
BB&T Corp.(b) | | | (12,193 | ) | | $ | (624,282 | ) |
Chemical Financial Corp.(b) | | | (6,059 | ) | | | (266,172 | ) |
Hope Bancorp, Inc. | | | (4,889 | ) | | | (68,739 | ) |
| | | | | | | (959,193 | ) |
| | | |
Biotechnology – (1.0)% | | | | | | | | |
Alder Biopharmaceuticals, Inc.* | | | (6,396 | ) | | | (86,922 | ) |
Exact Sciences Corp.(b)* | | | (2,056 | ) | | | (202,907 | ) |
Innoviva, Inc.* | | | (7,680 | ) | | | (107,750 | ) |
Insmed, Inc.* | | | (3,018 | ) | | | (91,868 | ) |
Ionis Pharmaceuticals, Inc.(b)* | | | (2,998 | ) | | | (222,841 | ) |
Ligand Pharmaceuticals, Inc.* | | | (582 | ) | | | (73,245 | ) |
Medicines (The) Co.(b)* | | | (3,097 | ) | | | (98,949 | ) |
Radius Health, Inc.* | | | (2,930 | ) | | | (64,519 | ) |
Retrophin, Inc.* | | | (2,775 | ) | | | (52,947 | ) |
Theravance Biopharma, Inc.* | | | (3,460 | ) | | | (82,521 | ) |
Verastem, Inc.* | | | (3,141 | ) | | | (6,690 | ) |
| | | | | | | (1,091,159 | ) |
| | | |
Commercial Services – (0.5)% | | | | | | | | |
Chegg, Inc.(b)* | | | (6,426 | ) | | | (229,087 | ) |
FTI Consulting, Inc.* | | | (1,492 | ) | | | (126,790 | ) |
Square, Inc., Class A(b)* | | | (2,376 | ) | | | (173,020 | ) |
Team, Inc.* | | | (4,495 | ) | | | (75,966 | ) |
| | | | | | | (604,863 | ) |
| | | |
Computers – (0.4)% | | | | | | | | |
Luxoft Holding, Inc.(b)* | | | (508 | ) | | | (29,678 | ) |
NCR Corp.* | | | (6,319 | ) | | | (182,935 | ) |
Pure Storage, Inc., Class A* | | | (3,465 | ) | | | (79,210 | ) |
Rapid7, Inc.(b)* | | | (3,074 | ) | | | (167,041 | ) |
| | | | | | | (458,864 | ) |
| | |
Diversified Financial Services – (0.3)% | | | | | |
Affiliated Managers Group, Inc. | | | (321 | ) | | | (35,605 | ) |
Cowen, Inc.* | | | (7,273 | ) | | | (121,823 | ) |
Encore Capital Group, Inc.* | | | (1,390 | ) | | | (39,281 | ) |
Hannon Armstrong Sustainable Infrastructure Capital, Inc. | | | (167 | ) | | | (4,441 | ) |
PRA Group, Inc.* | | | (2,430 | ) | | | (68,332 | ) |
Virtus Investment Partners, Inc. | | | (566 | ) | | | (69,397 | ) |
| | | | | | | (338,879 | ) |
| | | |
Electric – (0.2)% | | | | | | | | |
CenterPoint Energy, Inc. | | | (3,961 | ) | | | (122,791 | ) |
See accompanying Notes to Financial Statements
153
Morningstar Funds Trust April 30, 2019
Schedule of Investments(continued)
Morningstar Alternatives Fund
| | | | | | |
| | | Number
of Shares | | Value | |
| | | |
Electric (Continued) | | | | | | |
NRG Energy, Inc. | | (1,115) | | $ | (45,905 | ) |
Vistra Energy Corp. | | (3,302) | | | (89,979 | ) |
| | | | | (258,675 | ) |
| |
Electrical Component & Equipment – (0.2)% | |
Energizer Holdings, Inc. | | (3,609) | | | (172,835 | ) |
SunPower Corp.* | | (120) | | | (866 | ) |
| | | | | (173,701 | ) |
| | | |
Electronics – (0.3)% | | | | | | |
II-VI, Inc.* | | (2,478) | | | (98,723 | ) |
Knowles Corp.* | | (7,864) | | | (148,472 | ) |
OSI Systems, Inc.* | | (1,381) | | | (124,470 | ) |
| | | | | (371,665 | ) |
| | | |
Entertainment – (0.1)% | | | | | | |
Live Nation Entertainment, Inc.* | | (2,309) | | | (150,870 | ) |
| | | |
Gas – (0.5)% | | | | | | |
South Jersey Industries, Inc. | | (3,984) | | | (127,966 | ) |
UGI Corp. | | (8,027) | | | (437,552 | ) |
| | | | | (565,518 | ) |
| | | |
Hand/Machine Tools – (0.2)% | | | | | | |
Colfax Corp.* | | (8,825) | | | (266,250 | ) |
| | | |
Healthcare - Products – (0.4)% | | | | | | |
Insulet Corp.* | | (940) | | | (81,075 | ) |
Wright Medical Group N.V.* | | (10,916) | | | (322,786 | ) |
| | | | | (403,861 | ) |
| | | |
Insurance – (0.3)% | | | | | | |
AXA Equitable Holdings, Inc. | | (13,397) | | | (303,978 | ) |
MGIC Investment Corp.* | | (452) | | | (6,617 | ) |
| | | | | (310,595 | ) |
| | | |
Internet – (0.8)% | | | | | | |
Expedia Group, Inc. | | (1,256) | | | (163,079 | ) |
FireEye, Inc.* | | (58) | | | (929 | ) |
MercadoLibre, Inc.* | | (315) | | | (152,504 | ) |
Perficient, Inc.* | | (2,504) | | | (73,718 | ) |
Wayfair, Inc., Class A* | | (2,643) | | | (428,562 | ) |
Weibo Corp. ADR* | | (573) | | | (39,251 | ) |
Zillow Group, Inc., Class C* | | (1,766) | | | (58,984 | ) |
| | | | | (917,027 | ) |
| |
Investment Management Companies – (0.0)% | |
New Mountain Finance Corp. | | (52) | | | (731 | ) |
| | | | | | | | |
| | | Number
of Shares | | | Value | |
| | | |
Iron/Steel – (0.2)% | | | | | | | | |
Cleveland-Cliffs, Inc.(b) | | | (26,421 | ) | | $ | (263,946 | ) |
| | | |
Media – (0.1)% | | | | | | | | |
Sirius XM Holdings, Inc. | | | (19,196 | ) | | | (111,529 | ) |
| | | |
Mining – (0.1)% | | | | | | | | |
First Majestic Silver Corp.(b)* | | | (11,727 | ) | | | (72,004 | ) |
| | | |
Oil & Gas – (0.4)% | | | | | | | | |
Chevron Corp. | | | (2,893 | ) | | | (347,334 | ) |
Nabors Industries Ltd. (Tokyo Exchange) | | | (18,349 | ) | | | (64,221 | ) |
| | | | | | | (411,555 | ) |
| | | |
Oil & Gas Services – (0.1)% | | | | | | | | |
Helix Energy Solutions Group, Inc.* | | | (4,725 | ) | | | (36,950 | ) |
Newpark Resources, Inc.* | | | (10,015 | ) | | | (73,109 | ) |
| | | | | | | (110,059 | ) |
| | | |
Pharmaceuticals – (0.7)% | | | | | | | | |
Bristol-Myers Squibb Co. | | | (5,843 | ) | | | (271,291 | ) |
Elanco Animal Health, Inc.* | | | (3,508 | ) | | | (110,502 | ) |
Flexion Therapeutics, Inc.* | | | (3,453 | ) | | | (36,602 | ) |
Horizon Pharma PLC(b)* | | | (2,197 | ) | | | (56,089 | ) |
Ironwood Pharmaceuticals, Inc.(b)* | | | (14,215 | ) | | | (169,016 | ) |
Neurocrine Biosciences, Inc.(b)* | | | (1,638 | ) | | | (118,329 | ) |
| | | | | | | (761,829 | ) |
| | | |
Pipelines – (0.0)%(e) | | | | | | | | |
Cheniere Energy, Inc.* | | | (798 | ) | | | (51,351 | ) |
| | | |
Private Equity – (0.5)% | | | | | | | | |
Brookfield Asset Management, Inc., Class A | | | (11,467 | ) | | | (552,595 | ) |
| | | |
Real Estate – (0.1)% | | | | | | | | |
Jones Lang LaSalle, Inc. | | | (804 | ) | | | (124,274 | ) |
| | |
Real Estate Investment Trusts – (0.9)% | | | | | |
Apollo Commercial Real Estate Finance, Inc. | | | (915 | ) | | | (17,147 | ) |
Blackstone Mortgage Trust, Inc., Class A | | | (246 | ) | | | (8,755 | ) |
Cousins Properties, Inc. | | | (29,180 | ) | | | (279,253 | ) |
Granite Point Mortgage Trust, Inc. | | | (500 | ) | | | (9,615 | ) |
Invitation Homes, Inc. | | | (8,358 | ) | | | (207,780 | ) |
iStar, Inc. | | | (14,310 | ) | | | (124,068 | ) |
KKR Real Estate Finance Trust, Inc. | | | (409 | ) | | | (8,249 | ) |
See accompanying Notes to Financial Statements
154
Morningstar Funds Trust April 30, 2019
Schedule of Investments(continued)
Morningstar Alternatives Fund
| | | | | | | | |
| | | Number
of Shares | | | Value | |
| |
Real Estate Investment Trusts (Continued) | |
Omega Healthcare Investors, Inc. | | | (4,126 | ) | | $ | (146,019 | ) |
QTS Realty Trust, Inc., Class A | | | (3,225 | ) | | | (146,254 | ) |
Redwood Trust, Inc. | | | (865 | ) | | | (14,151 | ) |
Two Harbors Investment Corp. | | | (902 | ) | | | (12,502 | ) |
| | | | | | | (973,793 | ) |
| | | |
Retail – (0.1)% | | | | | | | | |
EZCORP, Inc., Class A* | | | (8,722 | ) | | | (94,808 | ) |
Guess?, Inc. | | | (1,629 | ) | | | (33,183 | ) |
| | | | | | | (127,991 | ) |
| | | |
Semiconductors – (0.7)% | | | | | | | | |
Cree, Inc.* | | | (1,481 | ) | | | (97,879 | ) |
Cypress Semiconductor Corp. | | | (6,962 | ) | | | (119,607 | ) |
Microchip Technology, Inc.(b) | | | (4,104 | ) | | | (409,949 | ) |
ON Semiconductor Corp.* | | | (4,094 | ) | | | (94,408 | ) |
Synaptics, Inc.(b)* | | | (1,087 | ) | | | (40,947 | ) |
Veeco Instruments, Inc.* | | | (1,186 | ) | | | (14,445 | ) |
| | | | | | | (777,235 | ) |
| | | |
Software – (3.4)% | | | | | | | | |
Atlassian Corp. PLC, Class A(b)* | | | (1,633 | ) | | | (179,875 | ) |
Bilibili, Inc. ADR* | | | (5,129 | ) | | | (91,296 | ) |
Envestnet, Inc.(b)* | | | (2,035 | ) | | | (144,465 | ) |
Evolent Health, Inc., Class A* | | | (4,246 | ) | | | (57,533 | ) |
Fidelity National Information Services, Inc.(b) | | | (4,380 | ) | | | (507,773 | ) |
Fiserv, Inc.* | | | (13,779 | ) | | | (1,202,080 | ) |
j2 Global, Inc. | | | (3,685 | ) | | | (322,880 | ) |
Momo, Inc. ADR | | | (2,782 | ) | | | (97,565 | ) |
MongoDB, Inc.* | | | (2,025 | ) | | | (285,363 | ) |
New Relic, Inc.* | | | (884 | ) | | | (93,032 | ) |
RealPage, Inc.* | | | (2,418 | ) | | | (157,678 | ) |
Splunk, Inc.* | | | (977 | ) | | | (134,865 | ) |
Tabula Rasa HealthCare, Inc.* | | | (1,604 | ) | | | (85,429 | ) |
Twilio, Inc., Class A(b)* | | | (943 | ) | | | (129,323 | ) |
Workday, Inc., Class A* | | | (1,265 | ) | | | (260,122 | ) |
| | | | | | | | (3,749,279 | ) |
| | | | | | | | |
| | | Number
of Shares | | | Value | |
| | |
Telecommunications – (0.4)% | | | | | |
CalAmp Corp.* | | | (3,651 | ) | | $ | (53,341 | ) |
Harmonic, Inc.* | | | (7,572 | ) | | | (42,858 | ) |
Motorola Solutions, Inc. | | | (2,612 | ) | | | (378,505 | ) |
| | | | | | | (474,704 | ) |
| | | |
Transportation – (0.3)% | | | | | | | | |
Atlas Air Worldwide Holdings, Inc.* | | | (4,392 | ) | | | (212,090 | ) |
SEACOR Holdings, Inc.* | | | (2,456 | ) | | | (109,390 | ) |
Ship Finance International Ltd. | | | (5,102 | ) | | | (65,101 | ) |
| | | | | | | (386,581 | ) |
| | | |
Water – (0.0)%(e) | | | | | | | | |
Aqua America, Inc. | | | (685 | ) | | | (26,756 | ) |
| | | |
Total Common Stocks
(Proceeds $(17,128,173)) | | | | | | | (17,892,308 | ) |
| |
Investment Companies – (0.3)% | | | | | |
Invesco QQQ Trust Series 1 | | | (1,168 | ) | | | (221,383 | ) |
SPDR S&P Oil & Gas Exploration & Production ETF | | | (4,892 | ) | | | (151,407 | ) |
| | | |
Total Investment Companies(Proceeds $(366,383)) | | | | | | | (372,790 | ) |
| | |
Rights—(0.0)%(e) | | | | | | | | |
Celgene Corp.(g)* | | | (1,461 | ) | | | (3,141 | ) |
| | |
Total Rights
(Proceeds $(3,097)) | | | | | | | (3,141 | ) |
| | |
Total Short Positions – (16.3)%
(Proceeds $(17,497,653)) | | | | | | | (18,268,239 | ) |
| | |
Total Written Options – (0.0)%
(Premiums Received $(30,037)) | | | | | | | (31,109 | ) |
| | |
Other Assets – 14.6% | | | | | | | 16,357,952 | |
| | | |
NET ASSETS – 100.0% | | | | | | $ | 111,857,299 | |
| (a) | All or a portion of the security was held as collateral for open futures, options, securities sold short and/or swap agreements. |
| (b) | Security represents underlying investment on open options contracts. |
| (c) | Securities exempt from registration under Rule 144A of the Securities Act of 1933. These securities may be resold in transactions exempt from registration, normally to qualified institutional buyers. The value of these securities is determined by valuations supplied by a pricing service or brokers, or, if not available, in accordance with procedures established by the Board of Trustees of Morningstar Funds. |
| (d) | Security is a paymentin-kind bond (PIK), distributions receivedin-kind unless otherwise noted in the description. |
See accompanying Notes to Financial Statements
155
Morningstar Funds Trust April 30, 2019
Schedule of Investments(continued)
Morningstar Alternatives Fund
| (e) | Amount rounds to less than 0.05%. |
| (f) | 7-day current yield as of April 30, 2019 is disclosed. |
| (g) | Security is valued at fair value by the Valuation Committee (see Note 4 in Notes to Financial Statements). |
| * | Non-Income Producing Security |
Percentages shown are based on Net Assets
| | |
Abbreviations: | | |
| |
ADR | | American Depositary Receipt |
| |
ETF | | Exchange-Traded Fund |
| |
PLC | | Public Limited Company |
| |
REIT | | Real Estate Investment Trust |
| |
S&P | | Standards & Poor’s |
| |
SPDR | | Standard & Poor’s Depositary Receipt |
Forward Foreign Currency Contracts outstanding at April 30, 2019:
| | | | | | | | | | | | | | | | | | | | | | | | |
Expiration Date | | Currency
Purchased | | | Amount
of Currency
Purchased | | | Currency Sold | | | Amount
of Currency
Sold | | | Counterparty | | | Unrealized
Appreciation
(Depreciation) | |
| |
| | | | | | |
06/14/19 | | | U.S. Dollars | | | | 1,198,614 | | | | British Pounds | | | | 910,600 | | | | Morgan Stanley | | | | $ 8,255 | |
06/14/19 | | | U.S. Dollars | | | | 812,789 | | | | Euro | | | | 715,310 | | | | Morgan Stanley | | | | 7,289 | |
06/14/19 | | | U.S. Dollars | | | | 200,231 | | | | Swedish Kronor | | | | 1,846,800 | | | | Morgan Stanley | | | | 5,047 | |
06/14/19 | | | U.S. Dollars | | | | 634,552 | | | | Canadian Dollars | | | | 844,400 | | | | Morgan Stanley | | | | 3,503 | |
06/14/19 | | | U.S. Dollars | | | | 76,695 | | | | New Zealand Dollars | | | | 113,100 | | | | Morgan Stanley | | | | 1,090 | |
06/14/19 | | | U.S. Dollars | | | | 58,009 | | | | Swiss Francs | | | | 57,800 | | | | Morgan Stanley | | | | 1,028 | |
06/14/19 | | | Canadian Dollars | | | | 231,480 | | | | U.S. Dollars | | | | 172,329 | | | | Morgan Stanley | | | | 664 | |
06/14/19 | | | Euro | | | | 71,380 | | | | U.S. Dollars | | | | 79,949 | | | | Morgan Stanley | | | | 431 | |
06/14/19 | | | British Pounds | | | | 24,600 | | | | U.S. Dollars | | | | 31,895 | | | | Morgan Stanley | | | | 263 | |
| |
Total Unrealized Appreciation | | | | | | | | | | | | | | | | | | | | $27,570 | |
| |
| | | | | | |
06/14/19 | | | U.S. Dollars | | | | 7,186 | | | | New Zealand Dollars | | | | 10,800 | | | | Morgan Stanley | | | | $ (33 | ) |
06/14/19 | | | New Zealand Dollars | | | | 3,800 | | | | U.S. Dollars | | | | 2,597 | | | | Morgan Stanley | | | | (57 | ) |
06/14/19 | | | Canadian Dollars | | | | 64,550 | | | | U.S. Dollars | | | | 48,317 | | | | Morgan Stanley | | | | (76 | ) |
06/14/19 | | | Swedish Kronor | | | | 1,846,800 | | | | U.S. Dollars | | | | 195,282 | | | | Morgan Stanley | | | | (97 | ) |
06/14/19 | | | U.S. Dollars | | | | 80,722 | | | | Euro | | | | 71,960 | | | | Morgan Stanley | | | | (312 | ) |
06/14/19 | | | Swiss Francs | | | | 57,800 | | | | U.S. Dollars | | | | 57,614 | | | | Morgan Stanley | | | | (634 | ) |
06/14/19 | | | U.S. Dollars | | | | 155,847 | | | | British Pounds | | | | 120,100 | | | | Morgan Stanley | | | | (1,150 | ) |
06/14/19 | | | Euro | | | | 385,210 | | | | U.S. Dollars | | | | 435,014 | | | | Morgan Stanley | | | | (1,235 | ) |
| |
Total Unrealized Depreciation | | | | | | | | | | | | | | | | | | | | $(3,594 | ) |
| |
Net Unrealized Appreciation/Depreciation | | | | | | | | | | | | | | | | $23,976 | |
| |
See accompanying Notes to Financial Statements
156
Morningstar Funds Trust April 30, 2019
Schedule of Investments(continued)
Morningstar Alternatives Fund
Written Call Option Contracts outstanding at April 30, 2019:
Exchange Traded
| | | | | | | | | | | | | | | | | | | | | | | | | | | | | | |
Description | | Counterparty | | Number of
Contracts | | | | | | Notional
Amount | | | | | | Exercise
Price | | | Expiration
Date | | | Value | |
Aerojet Rocketdyne
Holdings, Inc. | | Cornerstone Macro LLC | | | 5 | | | | USD | | | | (16,930 | ) | | | USD | | | | 35.00 | | | | 5/17/2019 | | | $ | (563 | ) |
Anadarko
Petroleum Corp. | | Goldman Sachs | | | 13 | | | | USD | | | | (94,705 | ) | | | USD | | | | 75.00 | | | | 7/19/2019 | | | | (2,184 | ) |
Atlassian Corp. Plc. | | Cornerstone Macro LLC | | | 2 | | | | GBP | | | | (22,030 | ) | | | GBP | | | | 115.00 | | | | 6/21/2019 | | | | (820 | ) |
Chegg, Inc. | | Cornerstone Macro LLC | | | 12 | | | | USD | | | | (42,780 | ) | | | USD | | | | 40.00 | | | | 5/17/2019 | | | | (180 | ) |
Cleveland-Cliffs, Inc. | | Isi Group, Inc. | | | 14 | | | | USD | | | | (13,986 | ) | | | USD | | | | 10.00 | | | | 5/17/2019 | | | | (539 | ) |
Envestnet, Inc. | | Cornerstone Macro LLC | | | 2 | | | | USD | | | | (14,198 | ) | | | USD | | | | 65.00 | | | | 5/17/2019 | | | | (1,370 | ) |
Exact Sciences Corp. | | Cornerstone Macro LLC | | | 4 | | | | USD | | | | (39,476 | ) | | | USD | | | | 90.00 | | | | 5/17/2019 | | | | (4,544 | ) |
First Majestic
Silver Corp. | | Isi Group, Inc. | | | 41 | | | | CAD | | | | (25,174 | ) | | | CAD | | | | 6.00 | | | | 5/17/2019 | | | | (1,435 | ) |
Horizon Pharma Plc. | | Cornerstone Macro LLC | | | 8 | | | | EUR | | | | (20,424 | ) | | | EUR | | | | 26.00 | | | | 5/17/2019 | | | | (840 | ) |
Ionis
Pharmaceuticals, Inc. | | Cornerstone Macro LLC | | | 7 | | | | USD | | | | (52,031 | ) | | | USD | | | | 73.50 | | | | 5/17/2019 | | | | (3,220 | ) |
Ironwood
Pharmaceuticals, Inc. | | Cornerstone Macro LLC | | | 14 | | | | USD | | | | (16,646 | ) | | | USD | | | | 12.50 | | | | 5/17/2019 | | | | (686 | ) |
Medicines (The) Co. | | Cornerstone Macro LLC | | | 12 | | | | USD | | | | (38,340 | ) | | | USD | | | | 30.00 | | | | 7/19/2019 | | | | (5,640 | ) |
Microchip
Technology, Inc. | | Cornerstone Macro LLC | | | 6 | | | | USD | | | | (59,934 | ) | | | USD | | | | 100.00 | | | | 6/21/2019 | | | | (2,820 | ) |
Neurocrine Biosciences, Inc. | | Cornerstone Macro LLC | | | 2 | | | | USD | | | | (14,448 | ) | | | USD | | | | 85.00 | | | | 5/17/2019 | | | | (50 | ) |
Rapid7, Inc. | | Cornerstone Macro LLC | | | 3 | | | | USD | | | | (16,302 | ) | | | USD | | | | 50.00 | | | | 5/17/2019 | | | | (1,695 | ) |
Square, Inc. | | Cornerstone Macro LLC | | | 2 | | | | USD | | | | (14,564 | ) | | | USD | | | | 75.00 | | | | 5/17/2019 | | | | (433 | ) |
Synaptics, Inc. | | Cornerstone Macro LLC | | | 2 | | | | USD | | | | (7,534 | ) | | | USD | | | | 35.00 | | | | 6/21/2019 | | | | (900 | ) |
Twilio, Inc. | | Cornerstone Macro LLC | | | 2 | | | | USD | | | | (27,428 | ) | | | USD | | | | 125.00 | | | | 5/17/2019 | | | | (3,190 | ) |
| | | | | | |
Total Written Call Options Contracts (Premiums Received $30,037) | | | | | | | | | | | | | | | | | | | $ | (31,109 | ) |
See accompanying Notes to Financial Statements
157
Morningstar Funds Trust April 30, 2019
Schedule of Investments(continued)
Morningstar Alternatives Fund
Valuation Hierarchy
The following is a summary of the inputs used, as of April 30, 2019, in valuing the Fund’s investments carried at fair value:
| | | | | | | | | | | | | | | | |
| Morningstar Alternatives Fund | | Level 1 | | | Level 2 | | | Level 3 | | | Totals | |
| | | | |
Investments | | | | | | | | | | | | | | | | |
Assets: | | | | | | | | | | | | | | | | |
Investments in Securities: | | | | | | | | | | | | | | | | |
Common Stocks | | $ | 19,628,420 | | | $ | 1,722,706 | | | | $— | | | $ | 21,351,126 | |
Convertible Preferred Stocks | | | 3,006,206 | | | | 554,194 | | | | — | | | | 3,560,400 | |
Convertible Bonds | | | — | | | | 22,612,748 | | | | — | | | | 22,612,748 | |
Corporate Bonds | | | — | | | | 454,188 | | | | — | | | | 454,188 | |
Master Limited Partnerships | | | 1,661,225 | | | | — | | | | — | | | | 1,661,225 | |
Investment Companies | | | 46,682,827 | | | | — | | | | — | | | | 46,682,827 | |
Short-Term Investments | | | 17,445,136 | | | | — | | | | — | | | | 17,445,136 | |
Rights | | | — | | | | 723 | | | | — | | | | 723 | |
Purchased Options | | | 30,322 | | | | — | | | | — | | | | 30,322 | |
| | | | | |
Total Assets – Investments at value | | $ | 88,454,136 | | | $ | 25,344,559 | | | | $— | | | $ | 113,798,695 | |
| | | | |
Liabilities: | | | | | | | | | | | | | | | | |
Common Stocks | | $ | (17,892,308 | ) | | $ | — | | | | $— | | | $ | (17,892,308 | ) |
Investment Companies | | | (372,790 | ) | | | — | | | | — | | | | (372,790 | ) |
Rights | | | — | | | | (3,141 | ) | | | — | | | | (3,141 | ) |
| | | | | |
Total Liabilities – Investments at value | | $ | (18,265,098 | ) | | $ | (3,141 | ) | | | $— | | | $ | (18,268,239 | ) |
| | | | | |
Total Investments | | $ | 70,189,038 | | | $ | 25,341,418 | | | | $— | | | $ | 95,530,456 | |
| | | | | | | | | | | | | | | | |
| Morningstar Alternatives Fund | | Level 1 | | | Level 2 | | | Level 3 | | | Totals | |
| | | | |
Derivative Financial Instruments | | | | | | | | | | | | | | | | |
Assets: | | | | | | | | | | | | | | | | |
Forward foreign currency exchange contracts | | | $ — | | | | $27,570 | | | | $— | | | | $27,570 | |
| | | | | |
Total Assets - Derivative Financial Instruments | | | $ — | | | | $27,570 | | | | $— | | | | $27,570 | |
| | | | |
Liabilities: | | | | | | | | | | | | | | | | |
Forward foreign currency exchange contracts | | | $ — | | | | $(3,594) | | | | $— | | | | $(3,594 | ) |
Written Options | | | (31,109) | | | | — | | | | — | | | | (31,109 | ) |
| | | | | |
Total Liabilities - Derivative Financial Instruments | | | $(31,109) | | | | $(3,594) | | | | $— | | | | $(34,703 | ) |
| | | | |
Total Net Derivative Financial Instruments | | | $(31,109) | | | | $23,976 | | | | $— | | | | $(7,133 | ) |
See accompanying Notes to Financial Statements
158
Morningstar Funds Trust April 30, 2019
Statements of Assets and Liabilities
| | | | | | | | | | | | | | | | | | | | |
| | | Morningstar
U.S. Equity
Fund | | | Morningstar
International
Equity Fund | | | Morningstar
Global
Income Fund | | | Morningstar
Total Return
Bond Fund | | | Morningstar
Municipal
Bond Fund | |
Assets | | | | | | | | | | | | | | | | | | | | |
Investments innon-affiliates, at value | | $ | 676,510,143 | | | $ | 467,352,845 | | | $ | 185,387,389 | | | $ | 503,712,365 | | | $ | 106,610,893 | |
Repurchase agreements, at value | | | — | | | | — | | | | — | | | | 286,905 | | | | — | |
Foreign currencies, at value | | | 11 | | | | 240,620 | | | | — | | | | 411,197 | | | | — | |
Due from broker | | | — | | | | — | | | | — | | | | 3,408,609 | | | | — | |
Receivable from adviser | | | 130,026 | | | | 151,543 | | | | 141,102 | | | | 91,371 | | | | 36,893 | |
Receivable for: | | | | | | | | | | | | | | | | | | | | |
Dividends and interest | | | 398,848 | | | | 1,124,671 | | | | 111,695 | | | | 2,454,054 | | | | 962,231 | |
Foreign tax reclaims | | | 18,177 | | | | 122,487 | | | | 48,987 | | | | 10,533 | | | | — | |
Investments sold | | | 3,360,271 | | | | 933,450 | | | | — | | | | 96,230,412 | | | | 101,474 | |
Fund shares sold | | | 728,157 | | | | 508,902 | | | | 159,208 | | | | 459,917 | | | | 123,273 | |
Variation margin on futures contracts | | | — | | | | — | | | | — | | | | 135,881 | | | | — | |
Variation margin on exchange traded swap agreements | | | — | | | | — | | | | — | | | | 49,097 | | | | — | |
Unrealized appreciation on OTC swap agreements | | | — | | | | — | | | | — | | | | 12,465 | | | | — | |
Unrealized appreciation on forward foreign currency exchange contracts | | | — | | | | 50,360 | | | | — | | | | 23,166 | | | | — | |
Upfront premiums paid on swap agreements | | | — | | | | — | | | | — | | | | 1,168,147 | | | | — | |
Prepaid expenses and other assets | | | 58,179 | | | | 46,126 | | | | 24,333 | | | | 39,754 | | | | 18,638 | |
Total assets | | | 681,203,812 | | | | 470,531,004 | | | | 185,872,714 | | | | 608,493,873 | | | | 107,853,402 | |
Liabilities | | | | | | | | | | | | | | | | | | | | |
Investments sold short, at value | | | — | | | | — | | | | — | | | | 9,701,065 | | | | — | |
Written options, at value | | | — | | | | — | | | | — | | | | 52,624 | | | | — | |
Due to broker | | | — | | | | — | | | | — | | | | 1,790,203 | | | | — | |
Unrealized depreciation on OTC swap agreements | | | — | | | | — | | | | — | | | | 11,958 | | | | — | |
Unrealized depreciation on forward foreign currency exchange contracts | | | — | | | | — | | | | — | | | | 51,722 | | | | — | |
Payable for: | | | | | | | | | | | | | | | | | | | | |
Investments sold on a delayed-delivery basis | | | — | | | | — | | | | — | | | | 129,111,017 | | | | 353,396 | |
Investments purchased | | | 1,663,968 | | | | 628,489 | | | | — | | | | 51,898,997 | | | | 2,655,916 | |
Variation margin on futures contracts | | | — | | | | — | | | | — | | | | 134,184 | | | | — | |
Variation margin on exchange traded swap agreements | | | — | | | | — | | | | — | | | | 112,791 | | | | — | |
Fund shares redeemed | | | 1,021,839 | | | | 694,970 | | | | 154,236 | | | | 405,692 | | | | 54,867 | |
Dividends on short sales | | | — | | | | — | | | | — | | | | 1,199 | | | | — | |
Deferred capital gains tax | | | 8,034 | | | | 76,858 | | | | — | | | | — | | | | — | |
Upfront premiums received from swap agreements | | | — | | | | — | | | | — | | | | 299,820 | | | | — | |
Accrued management fees | | | 343,921 | | | | 298,128 | | | | 57,073 | | | | 138,819 | | | | 36,941 | |
Accrued trustee fees | | | 13,613 | | | | 9,650 | | | | 4,721 | | | | 8,042 | | | | 3,353 | |
See accompanying Notes to Financial Statements
159
Morningstar Funds Trust April 30, 2019
Statements of Assets and Liabilities(continued)
| | | | | | | | | | | | | | | | | | | | |
| | | Morningstar
U.S. Equity
Fund | | | Morningstar
International
Equity Fund | | | Morningstar
Global
Income Fund | | | Morningstar
Total Return
Bond Fund | | | Morningstar
Municipal
Bond Fund | |
Accrued expenses | | | 225,766 | | | | 194,376 | | | | 125,239 | | | | 144,645 | | | | 75,943 | |
Total liabilities | | | 3,277,141 | | | | 1,902,471 | | | | 341,269 | | | | 193,862,778 | | | | 3,180,416 | |
Net assets | | $ | 677,926,671 | | | $ | 468,628,533 | | | $ | 185,531,445 | | | $ | 414,631,095 | | | $ | 104,672,986 | |
| | | | | |
Analysis of net assets: | | | | | | | | | | | | | | | | | | | | |
Paid in capital | | $ | 631,960,176 | | | $ | 441,072,023 | | | $ | 177,198,425 | | | $ | 406,315,761 | | | $ | 102,462,087 | |
Distributable earnings (loss) | | | 45,966,495 | | | | 27,556,510 | | | | 8,333,020 | | | | 8,315,334 | | | | 2,210,899 | |
Net assets | | $ | 677,926,671 | | | $ | 468,628,533 | | | $ | 185,531,445 | | | $ | 414,631,095 | | | $ | 104,672,986 | |
Shares outstanding: | | | 63,469,600 | | | | 43,442,673 | | | | 17,537,072 | | | | 39,562,671 | | | | 10,085,535 | |
Net asset value, offering price and redemption price per share: | | $ | 10.68 | | | $ | 10.79 | | | $ | 10.58 | | | $ | 10.48 | | | $ | 10.38 | |
Investments innon-affiliates, at
cost | | $ | 634,061,628 | | | $ | 442,072,192 | | | $ | 177,801,209 | | | $ | 497,835,109 | | | $ | 104,787,317 | |
Repurchase agreements, at cost | | $ | — | | | $ | — | | | $ | — | | | $ | 286,905 | | | $ | — | |
Foreign currencies, at cost | | $ | 11 | | | $ | 240,776 | | | $ | — | | | $ | 411,399 | | | $ | — | |
Investments sold short proceeds | | $ | — | | | $ | — | | | $ | — | | | $ | 9,696,927 | | | $ | — | |
Written option premiums | | $ | — | | | $ | — | | | $ | — | | | $ | 70,870 | | | $ | — | |
See accompanying Notes to Financial Statements
160
Morningstar Funds Trust April 30, 2019
Statements of Assets and Liabilities(continued)
| | | | | | | | | | | | | | | | |
| | | Morningstar
Defensive
Bond Fund | | | Morningstar
Multisector
Bond Fund | | | Morningstar
Unconstrained
Allocation Fund | | | Morningstar
Alternatives
Fund | |
Assets | | | | | | | | | | | | | | | | |
Investments innon-affiliates, at value | | $ | 162,090,626 | | | $ | 158,674,592 | | | | $43,877,744 | | | $ | 113,798,695 | |
Cash | | | — | | | | — | | | | — | | | | 16,820,742 | |
Foreign currencies, at value | | | — | | | | 75,460 | | | | 30,304 | | | | — | |
Due from broker | | | — | | | | 1,233,657 | | | | — | | | | — | |
Receivable from adviser | | | 31,931 | | | | 35,552 | | | | 44,180 | | | | 123,137 | |
Receivable for: | | | | | | | | | | | | | | | | |
Dividends and interest | | | 172,957 | | | | 2,130,736 | | | | 18,608 | | | | 386,772 | |
Foreign tax reclaims | | | — | | | | 6,180 | | | | 2,882 | | | | 42 | |
Investments sold | | | 499,967 | | | | 720,764 | | | | 17,196,036 | | | | 1,444,329 | |
Fund shares sold | | | 164,238 | | | | 164,512 | | | | 35,836 | | | | 97,933 | |
Unrealized appreciation on forward foreign currency exchange contracts | | | — | | | | 481,365 | | | | — | | | | 27,570 | |
Upfront premiums paid on swap agreements | | | — | | | | 187,778 | | | | — | | | | — | |
Prepaid expenses and other assets | | | 19,802 | | | | 23,507 | | | | 15,161 | | | | 16,061 | |
Total assets | | | 162,979,521 | | | | 163,734,103 | | | | 61,220,751 | | | | 132,715,281 | |
Liabilities | | | | | | | | | | | | | | | | |
Investments sold short, at value | | | — | | | | — | | | | — | | | | 18,268,239 | |
Written options, at value | | | — | | | | — | | | | — | | | | 31,109 | |
Due to broker | | | — | | | | 713,366 | | | | — | | | | 43,774 | |
Unrealized depreciation on forward foreign currency exchange contracts | | | — | | | | 242,461 | | | | — | | | | 3,594 | |
Payable for: | | | | | | | | | | | | | | | | |
Investments sold on a delayed-delivery basis | | | 5,476,567 | | | | 200,000 | | | | — | | | | — | |
Investments purchased | | | 1,195,950 | | | | 803,769 | | | | 4,757,798 | | | | 2,315,215 | |
Variation margin on exchange traded swap agreements | | | — | | | | 112,373 | | | | — | | | | — | |
Fund shares redeemed | | | 98,377 | | | | 111,691 | | | | 87,685 | | | | 23,799 | |
Dividends on short sales | | | — | | | | — | | | | — | | | | 19,442 | |
Accrued management fees | | | 42,655 | | | | 76,827 | | | | 21,731 | | | | 70,648 | |
Accrued trustee fees | | | 2,933 | | | | 3,823 | | | | 1,036 | | | | 1,734 | |
Accrued expenses | | | 74,378 | | | | 100,622 | | | | 57,780 | | | | 80,428 | |
Total liabilities | | | 6,890,860 | | | | 2,364,932 | | | | 4,926,030 | | | | 20,857,982 | |
Net assets | | $ | 156,088,661 | | | $ | 161,369,171 | | | | $56,294,721 | | | $ | 111,857,299 | |
| | | | |
Analysis of net assets: | | | | | | | | | | | | | | | | |
Paid in capital | | $ | 155,199,564 | | | $ | 159,330,360 | | | | $54,675,836 | | | $ | 111,244,268 | |
Distributable earnings (loss) | | | 889,097 | | | | 2,038,811 | | | | 1,618,885 | | | | 613,031 | |
Net assets | | $ | 156,088,661 | | | $ | 161,369,171 | | | | $56,294,721 | | | $ | 111,857,299 | |
Shares outstanding: | | | 15,455,473 | | | | 15,691,768 | | | | 5,423,585 | | | | 11,070,439 | |
Net asset value, offering price and redemption
price per share: | | $ | 10.10 | | | $ | 10.28 | | | | $ 10.38 | | | $ | 10.10 | |
Investments innon-affiliates, at cost | | $ | 161,428,051 | | | $ | 157,504,889 | | | | $42,857,054 | | | $ | 112,785,928 | |
Foreign currencies, at cost | | $ | — | | | $ | 75,852 | | | | $ 30,080 | | | $ | — | |
Investments sold short proceeds | | $ | — | | | $ | — | | | | $ — | | | $ | 17,497,653 | |
Written option premiums | | $ | — | | | $ | — | | | | $ — | | | $ | 30,037 | |
See accompanying Notes to Financial Statements
161
Morningstar Funds Trust April 30, 2019
Statements of Operations
| | | | | | | | | | | | | | | | | | | | |
| | | Morningstar
U.S. Equity
Fund | | | Morningstar
International
Equity Fund | | | Morningstar
Global
Income Fund | | | Morningstar
Total Return
Bond Fund | | | Morningstar
Municipal
Bond Fund | |
Investment income | | | | | | | | | | | | | | | | | | | | |
Dividend income fromnon-affiliates (net of foreign withholding taxes) | | $ | 2,963,897 | | | $ | 3,085,737 | | | $ | 1,829,934 | | | $ | 291,061 | | | $ | 180,035 | |
Interest income (net of foreign withholding taxes) | | | 6,660 | | | | — | | | | 47,436 | | | | 3,135,612 | | | | 842,897 | |
Total investment income | | | 2,970,557 | | | | 3,085,737 | | | | 1,877,370 | | | | 3,426,673 | | | | 1,022,932 | |
Expenses | | | | | | | | | | | | | | | | | | | | |
Management fees (Note 5) | | | 1,107,521 | | | | 986,935 | | | | 175,381 | | | | 439,907 | | | | 146,797 | |
Administration and custody fees | | | 94,917 | | | | 76,409 | | | | 32,716 | | | | 45,245 | | | | 24,821 | |
Transfer agent fees | | | 2,826 | | | | 2,826 | | | | 2,826 | | | | 2,825 | | | | 2,825 | |
Sub-accounting fees | | | 151,886 | | | | 111,216 | | | | 52,224 | | | | 93,240 | | | | 37,398 | |
Audit and tax fees | | | 33,411 | | | | 58,861 | | | | 66,561 | | | | 47,911 | | | | 35,311 | |
Legal fees | | | 93,192 | | | | 68,467 | | | | 25,493 | | | | 56,826 | | | | 19,985 | |
Trustees’ fees | | | 176,208 | | | | 130,265 | | | | 44,072 | | | | 109,184 | | | | 36,486 | |
Registration and filing fees | | | 70,215 | | | | 55,905 | | | | 37,727 | | | | 49,527 | | | | 34,915 | |
Printing and postage fees | | | 37,801 | | | | 28,210 | | | | 10,863 | | | | 24,050 | | | | 9,163 | |
Dividend and interest on securities sold short | | | — | | | | — | | | | — | | | | 1,559 | | | | — | |
Other expenses | | | 16,901 | | | | 13,297 | | | | 4,925 | | | | 13,261 | | | | 3,964 | |
Total Expenses | | | 1,784,878 | | | | 1,532,391 | | | | 452,788 | | | | 883,535 | | | | 351,665 | |
Less waiver of management fees (Note 5) | | | (402,512 | ) | | | (394,777 | ) | | | (155,083 | ) | | | (335,964 | ) | | | (146,797 | ) |
Less reimbursement of operating expenses by adviser (Note 5) | | | — | | | | — | | | | — | | | | — | | | | (6,178 | ) |
Less waiver of administration and custody fees (Note 5) | | | (26,895 | ) | | | (19,879 | ) | | | (7,071 | ) | | | (16,124 | ) | | | (5,185 | ) |
Net expenses | | | 1,355,471 | | | | 1,117,735 | | | | 290,634 | | | | 531,447 | | | | 193,505 | |
Net investment income | | | 1,615,086 | | | | 1,968,002 | | | | 1,586,736 | | | | 2,895,226 | | | | 829,427 | |
Realized and unrealized gains (losses) | | | | | | | | | | | | | | | | | | | | |
Net realized gains (losses) on: | | | | | | | | | | | | | | | | | | | | |
Investments | | | 2,329,969 | | | | 845,532 | | | | 92,893 | | | | 2,530,739 | | | | 345,693 | |
Investments sold short | | | — | | | | — | | | | — | | | | (71,537 | ) | | | — | |
Swap agreements | | | — | | | | — | | | | — | | | | 430,108 | | | | — | |
Futures contracts | | | — | | | | — | | | | — | | | | (950,221 | ) | | | — | |
Options contracts | | | — | | | | — | | | | — | | | | 175,460 | | | | — | |
Forward foreign currency exchange contracts | | | — | | | | — | | | | — | | | | (69,787 | ) | | | — | |
Foreign currency transactions | | | 3,612 | | | | 40,805 | | | | 27,460 | | | | 3,518 | | | | — | |
Net realized gains | | | 2,333,581 | | | | 886,337 | | | | 120,353 | | | | 2,048,280 | | | | 345,693 | |
Net change in unrealized appreciation | | | | | | | | | | | | | | | | | | | | |
(depreciation) on: | | | | | | | | | | | | | | | | | | | | |
Investments | | | 42,440,481 | 1 | | | 25,203,795 | 1 | | | 7,586,180 | | | | 5,877,256 | | | | 1,823,576 | |
Investments sold short | | | — | | | | — | | | | — | | | | (4,138 | ) | | | — | |
Swap agreements | | | — | | | | — | | | | — | | | | 313,068 | | | | — | |
Future contracts | | | — | | | | — | | | | — | | | | 14,189 | | | | — | |
Options contracts | | | — | | | | — | | | | — | | | | 18,247 | | | | — | |
Forward foreign currency exchange
contracts | | | — | | | | 50,360 | | | | — | | | | (28,556 | ) | | | — | |
See accompanying Notes to Financial Statements
162
Morningstar Funds Trust April 30, 2019
Statements of Operations(continued)
| | | | | | | | | | | | | | | | | | | | |
| | | Morningstar
U.S. Equity
Fund | | | Morningstar
International
Equity Fund | | | Morningstar
Global
Income Fund | | | Morningstar
Total Return
Bond Fund | | | Morningstar
Municipal
Bond Fund | |
Foreign currency transactions | | | (115 | ) | | | (1,060 | ) | | | (452 | ) | | | (1,177 | ) | | | — | |
Net change in unrealized appreciation | | | 42,440,366 | | | | 25,253,095 | | | | 7,585,728 | | | | 6,188,889 | | | | 1,823,576 | |
Net realized and unrealized gains | | | 44,773,947 | | | | 26,139,432 | | | | 7,706,081 | | | | 8,237,169 | | | | 2,169,269 | |
Net increase in net assets resulting from operations | | $ | 46,389,033 | | | $ | 28,107,434 | | | $ | 9,292,817 | | | $ | 11,132,395 | | | $ | 2,998,696 | |
Foreign withholding taxes on dividend income | | $ | 26,884 | | | $ | 319,889 | | | $ | 98,494 | | | $ | — | | | $ | — | |
Foreign withholding taxes on interest
income | | $ | — | | | $ | — | | | $ | — | | | $ | 15,837 | | | $ | — | |
| 1 | Net of deferred foreign capital gains tax expense of $8,034 and $76,858, respectively. |
See accompanying Notes to Financial Statements
163
Morningstar Funds Trust April 30, 2019
Statements of Operations(continued)
| | | | | | | | | | | | | | | | |
| | | Morningstar
Defensive
Bond Fund | | | Morningstar
Multisector
Bond Fund | | | Morningstar
Unconstrained
Allocation Fund | | | Morningstar
Alternatives
Fund | |
Investment income | | | | | | | | | | | | | | | | |
Dividend income fromnon-affiliates (net of foreign withholding taxes) | | $ | 287,488 | | | $ | 124,977 | | | | $ 390,634 | | | $ | 362,985 | |
Interest income (net of foreign withholding taxes) | | | 752,303 | | | | 2,604,529 | | | | 18,692 | | | | 119,815 | |
Total investment income | | | 1,039,791 | | | | 2,729,506 | | | | 409,326 | | | | 482,800 | |
Expenses | | | | | | | | | | | | | | | | |
Management fees (Note 5) | | | 135,622 | | | | 268,223 | | | | 63,662 | | | | 201,224 | |
Administration and custody fees | | | 24,996 | | | | 37,831 | | | | 22,059 | | | | 27,556 | |
Transfer agent fees | | | 2,826 | | | | 2,825 | | | | 2,826 | | | | 2,579 | |
Sub-accounting fees | | | 37,939 | | | | 45,252 | | | | 16,531 | | | | 32,503 | |
Audit and tax fees | | | 38,211 | | | | 47,911 | | | | 39,411 | | | | 49,511 | |
Legal fees | | | 21,366 | | | | 23,120 | | | | 7,973 | | | | 13,593 | |
Trustees’ fees | | | 41,278 | | | | 40,748 | | | | 15,672 | | | | 27,289 | |
Registration and filing fees | | | 32,164 | | | | 35,252 | | | | 25,062 | | | | 27,892 | |
Printing and postage fees | | | 10,116 | | | | 10,290 | | | | 4,633 | | | | 6,924 | |
Dividend and interest on securities sold short | | | — | | | | — | | | | — | | | | 45,404 | |
Other expenses | | | 4,721 | | | | 5,589 | | | | 3,252 | | | | 18,141 | |
Total Expenses | | | 349,239 | | | | 517,041 | | | | 201,081 | | | | 452,616 | |
Less waiver of management fees (Note 5) | | | (135,622 | ) | | | (158,306 | ) | | | (63,662 | ) | | | (201,224 | ) |
Less reimbursement of operating expenses by adviser
(Note 5) | | | (26,569 | ) | | | — | | | | (48,430 | ) | | | (19,483 | ) |
Less waiver of administration and custody fees (Note 5) | | | (6,219 | ) | | | (6,964 | ) | | | (2,300 | ) | | | (4,220 | ) |
Net expenses | | | 180,829 | | | | 351,771 | | | | 86,689 | | | | 227,689 | |
Net investment income | | | 858,962 | | | | 2,377,735 | | | | 322,637 | | | | 255,111 | |
Realized and unrealized gains (losses) | | | | | | | | | | | | | | | | |
Net realized gains (losses) on: | | | | | | | | | | | | | | | | |
Investments | | | 33,464 | | | | 424,914 | | | | 530,687 | | | | 34,682 | |
Investments sold short | | | — | | | | — | | | | — | | | | 141,295 | |
Swap agreements | | | — | | | | 157,119 | | | | — | | | | — | |
Options contracts | | | — | | | | — | | | | — | | | | 3,067 | |
Forward foreign currency exchange contracts | | | — | | | | 228,191 | | | | — | | | | 2,207 | |
Foreign currency transactions | | | — | | | | (42,963 | ) | | | 2,739 | | | | (1,870 | ) |
Net realized gains | | | 33,464 | | | | 767,261 | | | | 533,426 | | | | 179,381 | |
Net change in unrealized appreciation (depreciation) on: | | | | | | | | | | | | | | | | |
Investments | | | 662,575 | | | | 1,169,703 | | | | 1,020,690 | | | | 1,012,767 | |
Investments sold short | | | — | | | | — | | | | — | | | | (770,586 | ) |
Swap agreements | | | — | | | | (229,813 | ) | | | — | | | | — | |
Options contracts | | | — | | | | — | | | | — | | | | (1,072 | ) |
Forward foreign currency exchange contracts | | | — | | | | 238,904 | | | | — | | | | 23,976 | |
Foreign currency transactions | | | — | | | | (11,244 | ) | | | (670 | ) | | | (31 | ) |
Net change in unrealized appreciation | | | 662,575 | | | | 1,167,550 | | | | 1,020,020 | | | | 265,054 | |
Net realized and unrealized gains | | | 696,039 | | | | 1,934,811 | | | | 1,553,446 | | | | 444,435 | |
Net increase in net assets resulting from operations | | $ | 1,555,001 | | | $ | 4,312,546 | | | | $1,876,083 | | | $ | 699,546 | |
Foreign withholding taxes on dividend income | | $ | — | | | $ | — | | | | $ 4,421 | | | $ | 179 | |
Foreign withholding taxes on interest income | | $ | 605 | | | $ | 63,438 | | | | $ — | | | $ | — | |
See accompanying Notes to Financial Statements
164
Morningstar Funds Trust April 30, 2019
Statements of Changes in Net Assets
| | | | | | | | |
| | | Morningstar U.S.
Equity Fund | | | Morningstar International
Equity Fund | |
| | | Since Inception
April 30, 20191 | | | Since Inception
April 30, 20191 | |
Operations: | | | | | | | | |
Net investment income | | $ | 1,615,086 | | | | $ 1,968,002 | |
Net realized gains | | | 2,333,581 | | | | 886,337 | |
Net change in unrealized appreciation | | | 42,440,366 | | | | 25,253,095 | |
Net increase in net assets resulting from operations | | | 46,389,033 | | | | 28,107,434 | |
Distributions paid from: | | | | | | | | |
Distributable earnings | | | (422,538 | ) | | | (550,924 | ) |
Total distributions paid | | | (422,538 | ) | | | (550,924 | ) |
Capital share transactions: | | | | | | | | |
Proceeds from shares sold | | | 679,811,818 | | | | 478,546,770 | |
Reinvestment of dividends | | | 422,538 | | | | 550,924 | |
Payments for shares redeemed | | | (48,574,180 | ) | | | (38,025,671 | ) |
Net increase (decrease) in net assets from capital share transactions | | | 631,660,176 | | | | 441,072,023 | |
Total increase (decrease) in net assets | | | 677,626,671 | | | | 468,628,533 | |
Net assets: | | | | | | | | |
Beginning of period | | | 300,000 | | | | — | |
End of period | | $ | 677,926,671 | | | | $468,628,533 | |
Capital share transactions | | | | | | | | |
Shares sold | | | 68,242,367 | | | | 47,103,913 | |
Shares from reinvested dividends | | | 47,263 | | | | 58,734 | |
Shares redeemed | | | (4,850,030 | ) | | | (3,719,974 | ) |
Net increase | | | 63,439,600 | | | | 43,442,673 | |
| 1 | Commencement of operations was November 02, 2018. |
See accompanying Notes to Financial Statements
165
Morningstar Funds Trust April 30, 2019
Statements of Changes in Net Assets(continued)
| | | | | | | | |
| | | Morningstar Global
Income Fund | | | Morningstar Total Return
Bond Fund | |
| | | Since Inception
April 30, 20191 | | | Since Inception
April 30, 20191 | |
Operations: | | | | | | | | |
Net investment income | | | $ 1,586,736 | | | | $ 2,895,226 | |
Net realized gains | | | 120,353 | | | | 2,048,280 | |
Net change in unrealized appreciation | | | 7,585,728 | | | | 6,188,889 | |
Net increase in net assets resulting from operations | | | 9,292,817 | | | | 11,132,395 | |
Distributions paid from: | | | | | | | | |
Distributable earnings | | | (959,797 | ) | | | (2,817,061 | ) |
Total distributions paid | | | (959,797 | ) | | | (2,817,061 | ) |
Capital share transactions: | | | | | | | | |
Proceeds from shares sold | | | 198,945,395 | | | | 429,820,699 | |
Reinvestment of dividends | | | 959,797 | | | | 2,817,061 | |
Payments for shares redeemed | | | (22,706,767 | ) | | | (26,321,999 | ) |
Net increase (decrease) in net assets from capital share transactions | | | 177,198,425 | | | | 406,315,761 | |
Total increase (decrease) in net assets | | | 185,531,445 | | | | 414,631,095 | |
Net assets: | | | | | | | | |
Beginning of period | | | — | | | | — | |
End of period | | | $185,531,445 | | | | $414,631,095 | |
Capital share transactions | | | | | | | | |
Shares sold | | | 19,666,797 | | | | 41,836,843 | |
Shares from reinvested dividends | | | 94,998 | | | | 271,267 | |
Shares redeemed | | | (2,224,723 | ) | | | (2,545,439 | ) |
Net increase | | | 17,537,072 | | | | 39,562,671 | |
| 1 | Commencement of operations was November 02, 2018. |
See accompanying Notes to Financial Statements
166
Morningstar Funds Trust April 30, 2019
Statements of Changes in Net Assets(continued)
| | | | | | | | |
| | | Morningstar Municipal
Bond Fund | | | Morningstar Defensive
Bond Fund | |
| | | Since Inception
April 30, 20191 | | | Since Inception
April 30, 20191 | |
Operations: | | | | | | | | |
Net investment income | | | $ 829,427 | | | | $ 858,962 | |
Net realized gains | | | 345,693 | | | | 33,464 | |
Net change in unrealized appreciation | | | 1,823,576 | | | | 662,575 | |
Net increase in net assets resulting from operations | | | 2,998,696 | | | | 1,555,001 | |
Distributions paid from: | | | | | | | | |
Distributable earnings | | | (787,797 | ) | | | (665,904 | ) |
Total distributions paid | | | (787,797 | ) | | | (665,904 | ) |
Capital share transactions: | | | | | | | | |
Proceeds from shares sold | | | 110,443,570 | | | | 168,407,510 | |
Reinvestment of dividends | | | 787,797 | | | | 665,904 | |
Payments for shares redeemed | | | (8,769,280 | ) | | | (13,873,850 | ) |
Net increase (decrease) in net assets from capital share transactions | | | 102,462,087 | | | | 155,199,564 | |
Total increase (decrease) in net assets | | | 104,672,986 | | | | 156,088,661 | |
Net assets: | | | | | | | | |
Beginning of period | | | — | | | | — | |
End of period | | | $104,672,986 | | | | $156,088,661 | |
Capital share transactions | | | | | | | | |
Shares sold | | | 10,863,064 | | | | 16,768,927 | |
Shares from reinvested dividends | | | 76,489 | | | | 66,189 | |
Shares redeemed | | | (854,018 | ) | | | (1,379,643 | ) |
Net increase | | | 10,085,535 | | | | 15,455,473 | |
| 1 | Commencement of operations was November 02, 2018. |
See accompanying Notes to Financial Statements
167
Morningstar Funds Trust April 30, 2019
Statements of Changes in Net Assets(continued)
| | | | | | | | |
| | | Morningstar Multisector
Bond Fund | | | Morningstar Unconstrained
Allocation Fund | |
| | | Since Inception
April 30, 20191 | | | Since Inception
April 30, 20191 | |
Operations: | | | | | | | | |
Net investment income | | | $ 2,377,735 | | | | $ 322,637 | |
Net realized gains | | | 767,261 | | | | 533,426 | |
Net change in unrealized appreciation | | | 1,167,550 | | | | 1,020,020 | |
Net increase in net assets resulting from operations | | | 4,312,546 | | | | 1,876,083 | |
Distributions paid from: | | | | | | | | |
Distributable earnings | | | (2,273,735 | ) | | | (257,198 | ) |
Total distributions paid | | | (2,273,735 | ) | | | (257,198 | ) |
Capital share transactions: | | | | | | | | |
Proceeds from shares sold | | | 172,916,801 | | | | 64,408,010 | |
Reinvestment of dividends | | | 2,273,735 | | | | 257,198 | |
Payments for shares redeemed | | | (15,860,176 | ) | | | (9,989,372 | ) |
Net increase (decrease) in net assets from capital share transactions | | | 159,330,360 | | | | 54,675,836 | |
Total increase (decrease) in net assets | | | 161,369,171 | | | | 56,294,721 | |
Net assets: | | | | | | | | |
Beginning of period | | | — | | | | — | |
End of period | | | $161,369,171 | | | | $56,294,721 | |
Capital share transactions | | | | | | | | |
Shares sold | | | 17,018,078 | | | | 6,400,453 | |
Shares from reinvested dividends | | | 221,834 | | | | 27,159 | |
Shares redeemed | | | (1,548,144 | ) | | | (1,004,027 | ) |
Net increase | | | 15,691,768 | | | | 5,423,585 | |
| 1 | Commencement of operations was November 02, 2018. |
See accompanying Notes to Financial Statements
168
Morningstar Funds Trust April 30, 2019
Statements of Changes in Net Assets(continued)
| | | | |
| | | Morningstar Alternatives Fund | |
| | | Since Inception
April 30, 20191 | |
Operations: | | | | |
Net investment income | | | $ 255,111 | |
Net realized gains | | | 179,381 | |
Net change in unrealized appreciation | | | 265,054 | |
Net increase in net assets resulting from operations | | | 699,546 | |
Distributions paid from: | | | | |
Distributable earnings | | | (86,515 | ) |
Total distributions paid | | | (86,515 | ) |
Capital share transactions: | | | | |
Proceeds from shares sold | | | 118,245,172 | |
Reinvestment of dividends | | | 86,515 | |
Payments for shares redeemed | | | (7,087,419 | ) |
Net increase (decrease) in net assets from capital share transactions | | | 111,244,268 | |
Total increase (decrease) in net assets | | | 111,857,299 | |
Net assets: | | | | |
Beginning of period | | | — | |
End of period | | | $111,857,299 | |
Capital share transactions | | | | |
Shares sold | | | 11,767,095 | |
Shares from reinvested dividends | | | 8,678 | |
Shares redeemed | | | (705,334 | ) |
Net increase | | | 11,070,439 | |
| 1 | Commencement of operations was November 02, 2018. |
See accompanying Notes to Financial Statements
169
Morningstar Funds Trust April 30, 2019
Financial Highlights
Morningstar U.S. Equity Fund
| | | | |
| | | Since
Inception1 | |
Selected per share data | | | 2019 | |
Net asset value, beginning of period | | | $10.00 | |
Income (loss) from investment operations: | | | | |
Net investment income | | | 0.05 | |
Net realized and unrealized gains | | | 0.64 | |
Total income from investment operations | | | 0.69 | |
Less distributions paid: | | | | |
From net investment income | | | (0.01 | ) |
Total distributions paid | | | (0.01 | ) |
Net asset value, end of period | | | $10.68 | |
Total return2 | | | 6.98% | |
Supplemental data and ratios: | | | | |
Net assets, end of period (millions) | | | $678 | |
Ratio to average net assets of:3 | | | | |
Total expenses before waivers/reimbursements | | | 1.08% | |
Total expenses after waivers/reimbursements | | | 0.82% | |
Net investment income, net of waivers/reimbursements | | | 0.98%4 | |
Net investment income, before waivers/reimbursements | | | 0.72%4 | |
Portfolio turnover rate5 | | | 20% | |
| 1 | Commencement of operations was November 02, 2018. |
| 2 | Assumes investment at net asset value at the beginning of the period, reinvestment of all dividends and distributions, and a complete redemption of the investment at net asset value at the end of the period. The total return is not annualized for periods less than one year. |
| 3 | Ratios are annualized for periods less than one year. |
| 4 | As the Fund commenced investment operations on November 02, 2018, annualized net investment income ratios may not be reflective of actual amounts the Fund might obtain in a full year of operation. |
| 5 | Portfolio turnover rate is not annualized for periods less than one year. |
See accompanying Notes to Financial Statements
170
Morningstar Funds Trust April 30, 2019
Financial Highlights(continued)
Morningstar International Equity Fund
| | | | |
| | | Since
Inception1 | |
Selected per share data | | | 2019 | |
Net asset value, beginning of period | | | $10.00 | |
Income (loss) from investment operations: | | | | |
Net investment income | | | 0.08 | |
Net realized and unrealized gains | | | 0.74 | |
Total income from investment operations | | | 0.82 | |
Less distributions paid: | | | | |
From net investment income | | | (0.03 | ) |
Total distributions paid | | | (0.03 | ) |
Net asset value, end of period | | | $10.79 | |
Total return2 | | | 8.19% | |
Supplemental data and ratios: | | | | |
Net assets, end of period (millions) | | | $469 | |
Ratio to average net assets of:3 | | | | |
Total expenses before waivers/reimbursements | | | 1.29% | |
Total expenses after waivers/reimbursements | | | 0.94% | |
Net investment income, net of waivers/reimbursements | | | 1.66%4 | |
Net investment income, before waivers/reimbursements | | | 1.31%4 | |
Portfolio turnover rate5 | | | 19% | |
| 1 | Commencement of operations was November 02, 2018. |
| 2 | Assumes investment at net asset value at the beginning of the period, reinvestment of all dividends and distributions, and a complete redemption of the investment at net asset value at the end of the period. The total return is not annualized for periods less than one year. |
| 3 | Ratios are annualized for periods less than one year. |
| 4 | As the Fund commenced investment operations on November 02, 2018, annualized net investment income ratios may not be reflective of actual amounts the Fund might obtain in a full year of operation. |
| 5 | Portfolio turnover rate is not annualized for periods less than one year. |
See accompanying Notes to Financial Statements
171
Morningstar Funds Trust April 30, 2019
Financial Highlights(continued)
Morningstar Global Income Fund
| | | | |
| | | Since
Inception1 | |
Selected per share data | | | 2019 | |
Net asset value, beginning of period | | | $10.00 | |
Income (loss) from investment operations: | | | | |
Net investment income | | | 0.16 | |
Net realized and unrealized gains | | | 0.52 | |
Total income from investment operations | | | 0.68 | |
Less distributions paid: | | | | |
From net investment income | | | (0.10 | ) |
Total distributions paid | | | (0.10 | ) |
Net asset value, end of period | | | $10.58 | |
Total return2 | | | 6.85% | |
Supplemental data and ratios: | | | | |
Net assets, end of period (millions) | | | $186 | |
Ratio to average net assets of:3 | | | | |
Total expenses before waivers/reimbursements | | | 0.90% | |
Total expenses after waivers/reimbursements | | | 0.58% | |
Net investment income, net of waivers/reimbursements | | | 3.15%4 | |
Net investment income, before waivers/reimbursements | | | 2.83%4 | |
Portfolio turnover rate5 | | | 27% | |
| 1 | Commencement of operations was November 02, 2018. |
| 2 | Assumes investment at net asset value at the beginning of the period, reinvestment of all dividends and distributions, and a complete redemption of the investment at net asset value at the end of the period. The total return is not annualized for periods less than one year. |
| 3 | Ratios are annualized for periods less than one year. |
| 4 | As the Fund commenced investment operations on November 02, 2018, annualized net investment income ratios may not be reflective of actual amounts the Fund might obtain in a full year of operation. |
| 5 | Portfolio turnover rate is not annualized for periods less than one year. |
See accompanying Notes to Financial Statements
172
Morningstar Funds Trust April 30, 2019
Financial Highlights(continued)
Morningstar Total Return Bond Fund
| | | | |
| | | Since
Inception1 | |
Selected per share data | | | 2019 | |
Net asset value, beginning of period | | | $10.00 | |
Income (loss) from investment operations: | | | | |
Net investment income | | | 0.15 | |
Net realized and unrealized gains | | | 0.45 | |
Total income from investment operations | | | 0.60 | |
Less distributions paid: | | | | |
From net investment income | | | (0.12 | ) |
Total distributions paid | | | (0.12 | ) |
Net asset value, end of period | | | $10.48 | |
Total return2 | | | 6.01% | |
Supplemental data and ratios: | | | | |
Net assets, end of period (millions) | | | $415 | |
Ratio to average net assets of:3 | | | | |
Total expenses before waivers/reimbursements4 | | | 0.88% | |
Total expenses after waivers/reimbursements4 | | | 0.53% | |
Net investment income, net of waivers/reimbursements | | | 2.89%5 | |
Net investment income, before waivers/reimbursements | | | 2.54%5 | |
Portfolio turnover rate6 | | | 318% | |
| 1 | Commencement of operations was November 02, 2018. |
| 2 | Assumes investment at net asset value at the beginning of the period, reinvestment of all dividends and distributions, and a complete redemption of the investment at net asset value at the end of the period. The total return is not annualized for periods less than one year. |
| 3 | Ratios are annualized for periods less than one year. |
| 4 | Expenses include dividends and interest expense of less than 0.01% |
| 5 | As the Fund commenced investment operations on November 02, 2018, annualized net investment income ratios may not be reflective of actual amounts the Fund might obtain in a full year of operation. |
| 6 | Portfolio turnover rate is not annualized for periods less than one year. |
See accompanying Notes to Financial Statements
173
Morningstar Funds Trust April 30, 2019
Financial Highlights(continued)
Morningstar Municipal Bond Fund
| | | | |
| | | Since
Inception1 | |
Selected per share data | | | 2019 | |
Net asset value, beginning of period | | | $10.00 | |
Income (loss) from investment operations: | | | | |
Net investment income | | | 0.12 | |
Net realized and unrealized gains | | | 0.36 | |
Total income from investment operations | | | 0.48 | |
Less distributions paid: | | | | |
From net investment income | | | (0.10 | ) |
Total distributions paid | | | (0.10 | ) |
Net asset value, end of period | | | $10.38 | |
Total return2 | | | 4.79% | |
Supplemental data and ratios: | | | | |
Net assets, end of period (millions) | | | $105 | |
Ratio to average net assets of:3 | | | | |
Total expenses before waivers/reimbursements | | | 1.05% | |
Total expenses after waivers/reimbursements | | | 0.58% | |
Net investment income, net of waivers/reimbursements | | | 2.48%4 | |
Net investment income, before waivers/reimbursements | | | 2.01%4 | |
Portfolio turnover rate5 | | | 115% | |
| 1 | Commencement of operations was November 02, 2018. |
| 2 | Assumes investment at net asset value at the beginning of the period, reinvestment of all dividends and distributions, and a complete redemption of the investment at net asset value at the end of the period. The total return is not annualized for periods less than one year. |
| 3 | Ratios are annualized for periods less than one year. |
| 4 | As the Fund commenced investment operations on November 02, 2018, annualized net investment income ratios may not be reflective of actual amounts the Fund might obtain in a full year of operation. |
| 5 | Portfolio turnover rate is not annualized for periods less than one year. |
See accompanying Notes to Financial Statements
174
Morningstar Funds Trust April 30, 2019
Financial Highlights(continued)
Morningstar Defensive Bond Fund
| | | | |
| | | Since
Inception1 | |
Selected per share data | | | 2019 | |
Net asset value, beginning of period | | | $10.00 | |
Income (loss) from investment operations: | | | | |
Net investment income | | | 0.11 | |
Net realized and unrealized gains | | | 0.08 | |
Total income from investment operations | | | 0.19 | |
Less distributions paid: | | | | |
From net investment income | | | (0.09 | ) |
Total distributions paid | | | (0.09 | ) |
Net asset value, end of period | | | $10.10 | |
Total return2 | | | 1.87% | |
Supplemental data and ratios: | | | | |
Net assets, end of period (millions) | | | $156 | |
Ratio to average net assets of:3 | | | | |
Total expenses before waivers/reimbursements | | | 0.93% | |
Total expenses after waivers/reimbursements | | | 0.48% | |
Net investment income, net of waivers/reimbursements | | | 2.28%4 | |
Net investment income, before waivers/reimbursements | | | 1.83%4 | |
Portfolio turnover rate5 | | | 4% | |
| 1 | Commencement of operations was November 02, 2018. |
| 2 | Assumes investment at net asset value at the beginning of the period, reinvestment of all dividends and distributions, and a complete redemption of the investment at net asset value at the end of the period. The total return is not annualized for periods less than one year. |
| 3 | Ratios are annualized for periods less than one year. |
| 4 | As the Fund commenced investment operations on November 02, 2018, annualized net investment income ratios may not be reflective of actual amounts the Fund might obtain in a full year of operation. |
| 5 | Portfolio turnover rate is not annualized for periods less than one year. |
See accompanying Notes to Financial Statements
175
Morningstar Funds Trust April 30, 2019
Financial Highlights(continued)
Morningstar Multisector Bond Fund
| | | | |
| | | Since
Inception1 | |
Selected per share data | | | 2019 | |
Net asset value, beginning of period | | | $10.00 | |
Income (loss) from investment operations: | | | | |
Net investment income | | | 0.27 | |
Net realized and unrealized gains | | | 0.21 | |
Total income from investment operations | | | 0.48 | |
Less distributions paid: | | | | |
From net investment income | | | (0.20 | ) |
Total distributions paid | | | (0.20 | ) |
Net asset value, end of period | | | $10.28 | |
Total return2 | | | 4.86% | |
Supplemental data and ratios: | | | | |
Net assets, end of period (millions) | | | $161 | |
Ratio to average net assets of:3 | | | | |
Total expenses before waivers/reimbursements | | | 1.18% | |
Total expenses after waivers/reimbursements | | | 0.80% | |
Net investment income, net of waivers/reimbursements | | | 5.41%4 | |
Net investment income, before waivers/reimbursements | | | 5.03%4 | |
Portfolio turnover rate5 | | | 53% | |
| 1 | Commencement of operations was November 02, 2018. |
| 2 | Assumes investment at net asset value at the beginning of the period, reinvestment of all dividends and distributions, and a complete redemption of the investment at net asset value at the end of the period. The total return is not annualized for periods less than one year. |
| 3 | Ratios are annualized for periods less than one year. |
| 4 | As the Fund commenced investment operations on November 02, 2018, annualized net investment income ratios may not be reflective of actual amounts the Fund might obtain in a full year of operation. |
| 5 | Portfolio turnover rate is not annualized for periods less than one year. |
See accompanying Notes to Financial Statements
176
Morningstar Funds Trust April 30, 2019
Financial Highlights(continued)
Morningstar Unconstrained Allocation Fund
| | | | |
| | | Since
Inception1 | |
Selected per share data | | | 2019 | |
Net asset value, beginning of period | | | $10.00 | |
Income (loss) from investment operations: | | | | |
Net investment income | | | 0.12 | |
Net realized and unrealized gains | | | 0.37 | |
Total income from investment operations | | | 0.49 | |
Less distributions paid: | | | | |
From net investment income | | | (0.11 | ) |
Total distributions paid | | | (0.11 | ) |
Net asset value, end of period | | | $10.38 | |
Total return2 | | | 4.97% | |
Supplemental data and ratios: | | | | |
Net assets, end of period (millions) | | | $56 | |
Ratio to average net assets of:3 | | | | |
Total expenses before waivers/reimbursements | | | 1.48% | |
Total expenses after waivers/reimbursements | | | 0.64% | |
Net investment income, net of waivers/reimbursements | | | 2.38%4 | |
Net investment income, before waivers/reimbursements | | | 1.54%4 | |
Portfolio turnover rate5 | | | 76% | |
| 1 | Commencement of operations was November 02, 2018. |
| 2 | Assumes investment at net asset value at the beginning of the period, reinvestment of all dividends and distributions, and a complete redemption of the investment at net asset value at the end of the period. The total return is not annualized for periods less than one year. |
| 3 | Ratios are annualized for periods less than one year. |
| 4 | As the Fund commenced investment operations on November 02, 2018, annualized net investment income ratios may not be reflective of actual amounts the Fund might obtain in a full year of operation. |
| 5 | Portfolio turnover rate is not annualized for periods less than one year. |
See accompanying Notes to Financial Statements
177
Morningstar Funds Trust April 30, 2019
Financial Highlights(continued)
Morningstar Alternatives Fund
| | | | |
| | | Since
Inception1 | |
Selected per share data | | | 2019 | |
Net asset value, beginning of period | | | $10.00 | |
Income (loss) from investment operations: | | | | |
Net investment income | | | 0.05 | |
Net realized and unrealized gains | | | 0.08 | |
Total income from investment operations | | | 0.13 | |
Less distributions paid: | | | | |
From net investment income | | | (0.03 | ) |
Total distributions paid | | | (0.03 | ) |
Net asset value, end of period | | | $10.10 | |
Total return2 | | | 1.26% | |
Supplemental data and ratios: | | | | |
Net assets, end of period (millions) | | | $112 | |
Ratio to average net assets of:3 | | | | |
Total expenses before waivers/reimbursements | | | 1.91% | |
Total expenses after waivers/reimbursements | | | 0.96% | |
Total expenses after waivers/reimbursements and excluding dividend and interest expense | | | 0.77% | |
Net investment income, net of waivers/reimbursements | | | 1.08%4 | |
Net investment income, before waivers/reimbursements | | | 0.13%4 | |
Portfolio turnover rate5 | | | 103% | |
| 1 | Commencement of operations was November 02, 2018. |
| 2 | Assumes investment at net asset value at the beginning of the period, reinvestment of all dividends and distributions, and a complete redemption of the investment at net asset value at the end of the period. The total return is not annualized for periods less than one year. |
| 3 | Ratios are annualized for periods less than one year. |
| 4 | As the Fund commenced investment operations on November 02, 2018, annualized net investment income ratios may not be reflective of actual amounts the Fund might obtain in a full year of operation. |
| 5 | Portfolio turnover rate is not annualized for periods less than one year. |
See accompanying Notes to Financial Statements
178
Morningstar Funds Trust April 30, 2019
Notes to Financial Statements
1. Organization
Morningstar Funds Trust (the “Trust”) was organized as a Delaware statutory trust on March 1, 2017. The Trust is registered with the Securities and Exchange Commission (the “SEC”) as anopen-end management investment company under the Investment Company Act of 1940, as amended (the “1940 Act”). The Trust has authorized capital of unlimited shares of beneficial interest at no par value, which may be issued in one or more series of the Trust.
The Trust is currently authorized to offer shares in nine separate series (each a “Fund” and collectively, the “Funds”):
| | |
Morningstar U.S. Equity Fund | | Morningstar Defensive Bond Fund |
Morningstar International Equity Fund | | Morningstar Multisector Bond Fund |
Morningstar Global Income Fund | | Morningstar Unconstrained Allocation Fund |
Morningstar Total Return Bond Fund | | Morningstar Alternatives Fund |
Morningstar Municipal Bond Fund | | |
Each Fund represents a distinct portfolio with its own investment objectives and is treated as a separate legal entity. Each Fund, except for the Morningstar Multisector Bond Fund, is classified and operates as a diversified fund under the 1940 Act. The Morningstar Multisector Bond Fund is classified as nondiversified. Morningstar Investment Management, LLC (the “Adviser”) serves as the investment adviser of each Fund.
The investment objective of each Fund is as follows:
| | |
| Fund | | Investment Objective |
| |
Morningstar U.S. Equity Fund | | Long-term capital appreciation |
Morningstar International Equity Fund | | Long-term capital appreciation |
Morningstar Global Income Fund | | Current income and long-term capital appreciation |
Morningstar Total Return Bond Fund | | Total return maximization, income and capital preservation |
Morningstar Municipal Bond Fund | | Federaltax-exempt income and capital preservation |
Morningstar Defensive Bond Fund | | Capital preservation |
Morningstar Multisector Bond Fund | | Total return through a combination of current income and capital appreciation |
Morningstar Unconstrained Allocation Fund | | Long-term capital appreciation over a full market cycle |
Morningstar Alternatives Fund | | Long-term capital appreciation and low sensitivity to traditional U.S. asset classes |
2. Significant Accounting Policies
The following is a summary of significant accounting policies consistently followed by the Funds in the preparation of the financial statements. These policies are in conformity with accounting principles generally accepted in the United States of America (“U.S. GAAP”).
The Trust follows accounting and reporting guidance under Financial Accounting Standards Board (“FASB”) Accounting Standards Codification Topic 946,Financial Services-Investment Companies.
179
Morningstar Funds Trust April 30, 2019
Notes to Financial Statements(continued)
Use of Estimates:The preparation of financial statements in conformity with U.S. GAAP requires management to make estimates and assumptions that affect the reported amounts of assets and liabilities and disclosure of contingent assets and liabilities at the date of the financial statements and the reported amounts of revenues and expenses during the reporting period. Actual results could differ from those estimates and such differences could be material.
Valuation of Investments:All securities and other investments are valued at their estimated fair value, as described in Note 4.
Cash:Cash comprises U.S. Dollar and foreign currency deposits held at a bank(s) or custodian bank(s) which may exceed insured limits.
Due to/from Brokers:Due to/from brokers represents cash balances and securities on deposit with, or cash balances owed to, the Funds’ prime brokers and counterparties. The Funds are subject to credit risk should the prime brokers and counterparties be unable to meet their obligations to the Funds.
ForeignCurrencyTranslation:The books and records of the Funds are maintained in U.S. Dollars. The Funds’ assets and liabilities in foreign currencies are translated into U.S. Dollars at the prevailing exchange rate at the valuation date. Transactions denominated in foreign currencies are translated into U.S. Dollars at the prevailing exchange rate on the date of the transaction. The Funds’ income earned and expense incurred in foreign denominated currencies are translated into U.S. Dollars at the prevailing exchange rate on the date of such activity.
The Funds do not isolate that portion of the results of operations arising from changes in the foreign exchange rates on investments and derivatives from the fluctuations that result from changes in the market prices of investments and derivatives held or sold during the period. Accordingly, such foreign currency gains (losses) are included in the reported net realized gain (loss) from transactions in investment securities and derivatives and net change in unrealized appreciation (depreciation) on investment securities and derivatives on the Statements of Operations.
Realized gains (losses) from settlement of foreign currency and foreign currency transactions reported on the Statements of Operations arise from the disposition of foreign currency and a change between the amounts of dividends, interest and foreign withholding taxes recorded on the Funds’ books on the transaction date and the U.S. Dollar equivalent of the amounts actually received or paid. Changes in unrealized appreciation (depreciation) on foreign currency and foreign currency translations reported on the Statements of Operations arise from changes (due to the changes in the exchange rate) in the value of foreign currency and assets and liabilities (other than investments) denominated in foreign currencies, which are held at period end.
Investment Transactions and Investment Income:Investment transactions are accounted as of trade date. Realized gains and losses on investment transactions are recorded on a specifically identified cost basis. Interest income is recorded on an accrual basis and includes the accretion of discounts and amortization of premiums using the effective yield method. Dividend income (expense) net of foreign taxes withheld, if any, is recorded on theex-dividend date or when the Fund first learns of theex-date dividend notification.
180
Morningstar Funds Trust April 30, 2019
Notes to Financial Statements(continued)
Expenses:Each Fund is charged for those expenses that are directly attributable to that Fund. Expenses incurred which do not specifically relate to an individual Fund generally are allocated among all Funds in the Trust in proportion to each Fund’s relative net assets.
FederalIncomeTaxes:Each Fund’s policy is to comply with all sections of Subchapter M of the Internal Revenue Code of 1986, as amended (“Code”), necessary to qualify for federal income tax purposes as a regulated investment company and to distribute substantially all of its taxable income and capital gains to shareholders as required thereunder. No provision for federal income or excise taxes is thus required. Each Fund is treated as a separate entity for federal income tax purposes.
The Funds may be subject to taxes imposed by countries on securities sold or held in certain foreign jurisdictions. Such taxes are generally based on income and/or capital gains earned or repatriated. The Funds accrue such taxes when the related income is earned. Gains realized by the Funds on the sale of securities in certain countries are subject to non-U.S. taxes. The Funds record a liability based on unrealized gains to provide for potential non-U.S. taxes payable upon the sale of these securities. For the period ended April 30, 2019, the U.S. Equity Fund and International Equity Fund accrued non-U.S. taxes on unrealized gains of $8,034 and $76,858, respectively.
Management has analyzed each Fund’s tax positions for the open period, including all positions expected to be taken upon filing the 2019 tax return, in all material jurisdictions where each Fund operates, and has concluded that no provision for income tax is required in the Funds’ financial statements. Each Fund will recognize interest and penalties, if any, related to unrecognized tax benefits as an income tax expense in the Statement of Operations.
Distributions to Shareholders:Distributions to shareholders are recorded on theex-dividend date. Distributions of net investment income, if any, are declared and paid as follows:
| | |
| Fund | | Frequency |
| |
Morningstar U.S. Equity Fund | | Annually |
Morningstar International Equity Fund | | Annually |
Morningstar Global Income Fund | | Quarterly |
Morningstar Total Return Bond Fund | | Monthly |
Morningstar Municipal Bond Fund | | Monthly |
Morningstar Defensive Bond Fund | | Quarterly |
Morningstar Multisector Bond Fund | | Monthly |
Morningstar Unconstrained Allocation Fund | | Annually |
Morningstar Alternatives Fund | | Annually |
Distributions of net realized capital gains, if any, are declared and paid at least annually. Income and capital gain distributions will be determined in accordance with federal income tax regulations which may differ from U.S. GAAP. Differences may be permanent or temporary. Permanent differences are reclassified among capital accounts in the financial statements to reflect their tax character. Temporary differences arise when certain items of income, expense, gain, or loss are recognized in different periods for financial statement and tax purposes. These differences will reverse at some time in the future. Differences in classification may also result
181
Morningstar Funds Trust April 30, 2019
Notes to Financial Statements(continued)
from the treatment of short-term gains as ordinary income for tax purposes. As a result, income dividends and capital gain distributions declared during a fiscal period may differ significantly from the net investment income (loss) and realized gain (loss) reported on the Funds’ financial statements presented under U.S. GAAP.
Organization and Offering Costs:Organization costs consist of costs incurred to establish the Trust and enable it legally to do business and primarily include legal fees. Offering costs include legal fees regarding the preparation of the initial registration statement. The organization expenses and offering costs incurred to date were paid by the Adviser on behalf of the Funds. The Adviser does not intend to seek reimbursement for these expenses.
Indemnifications:Under the Trust’s organizational documents, its officers and trustees are indemnified against certain liabilities arising out of the performance of their duties to the Trust. In addition, in the normal course of business the Trust enters into contracts that provide general indemnifications to other parties.
3. Investment Types
The Funds may utilize the following types of investments described below to execute their investment strategy to the extent permitted by the Fund’s investment policies.
Collateralized Bond Obligations (CBOs), CLOs, and Other CDOs:A CBO is a trust which is often backed by a pool of high risk, below investment grade fixed-income securities, such as high-yield bonds, privately issued mortgage-related securities, commercial mortgage-related securities, trust preferred securities, or emerging-market debt. A CLO is a trust typically backed by a pool of loans, which may include senior secured loans, senior unsecured loans, and subordinate corporate loans, including loans that may be below investment grade. Other CDOs are trusts backed by other types of assets. The assets backing a CBO, CLO, or CDO trust may be referred to as “the collateral.” CBOs, CLOs and other CDOs may charge management fees and administrative expenses. The cash flows from the trust are split into two or more portions, called tranches, varying in risk and yield. Senior tranches can often be rated investment grade. CBO, CLO or other CDO tranches can experience substantial losses due to defaults, deterioration of protecting tranches, market participants’ perception of credit risk, as well as aversion to these securities generally. The risks of an investment in a CBO, CLO or other CDO often depend on the collateral securities and the particular tranche in which the Fund invests. These securities are often privately offered and not registered under securities laws. In addition to the normal risks associated with fixed-income securities (e.g., interest-rate risk and credit risk), CBOs, CLOs and other CDOs carry additional risks including the possibility that distributions from collateral securities will not be adequate to make interest or other payments, the possibility that the quality of the collateral may decline in value or default, the risk that a Fund may invest in CBOs, CLOs or other CDOs that are subordinate to other tranches, as well as risks related to the complexity of the security and its structure.
Convertible Securities:Convertible securities are securities (such as debt securities or preferred stock) that may be converted into or exchanged for a specified amount of common stock of the same or different issuer within a particular period of time at a specified price or formula. Convertible securities also include corporate bonds, notes, and preferred stock. A convertible security entitles the holder to receive interest paid or accrued on debt or dividends paid on preferred stock until the convertible stock matures or is redeemed, converted or exchanged. While no investment is without some risk, investments in convertible securities generally entail less risk than an issuer’s common stock. However, any reduction in risk depends in large measure upon the
182
Morningstar Funds Trust April 30, 2019
Notes to Financial Statements(continued)
degree to which the convertible security sells above its value as a fixed income security. In addition to the general risks associated with equity securities discussed above, the market value of convertible securities is also affected by prevailing interest rates, the credit quality of the issuer, and any call provisions. While convertible securities generally offer lower interest or dividend yields than nonconvertible debt securities of similar quality, they do enable the investor to benefit from increases in the market price of the underlying common stock. The premiums attributable to the conversion feature are not amortized, but they are capitalized into the cost basis.
Equity-Linked Investments:Equity-linked investments are subject to the same risks as direct investments in securities of the underlying investment. If the underlying investment decreases in value, the value of the equity-linked investment will decrease; however, the performance of such investments may not correlate exactly to the performance of the underlying investment that they seek to replicate. Equity-linked investments are also subject to counterparty risk, which is the risk that the issuer of such investment — which is different from the issuer of the underlying investment — may be unwilling or unable to fulfill its obligations. There is no guarantee that a liquid market will exist or that the counterparty or issuer of such investments will be willing to repurchase them when a Fund wishes to sell them.
Mortgage DollarRolls:A Fund may enter into mortgage dollar rolls with a bank or a broker-dealer. A mortgage dollar roll is a transaction in which a Fund sells mortgage-related securities for immediate settlement and simultaneously purchases the same type of securities for forward settlement at a discount. While a Fund begins accruing interest on the newly purchased securities from the purchase or trade date, it is able to invest the proceeds from the sale of its previously owned securities, which will be used to pay for the new securities. The use of mortgage dollar rolls is a speculative technique involving leverage and can have an economic effect similar to borrowing money for investment purposes.
Inflation-ProtectedSecurities:A Fund may invest in U.S. Treasury Inflation Protected Securities (U.S. TIPS), which are fixed-income securities issued by the U.S. Department of Treasury, the principal amounts of which are adjusted daily based upon changes in the rate of inflation. A Fund may also invest in other inflation-protected securities issued by non-U.S. governments or by private issuers. U.S. TIPS pay interest on a semi-annual basis, equal to a fixed percentage of the inflation-adjusted principal amount. The interest rate on these bonds is fixed at issuance, but over the life of the bond this interest may be paid on an increasing or decreasing principal value that has been adjusted for inflation.
In general, the value of inflation-protected bonds is expected to fluctuate in response to changes in real interest rates, which are in turn tied to the relationship between nominal interest rates and the rate of inflation. Therefore, if inflation were to rise at a faster rate than nominal interest rates, real interest rates might decline, leading to an increase in value of inflation-protected bonds. In contrast, if nominal interest rates increased at a faster rate than inflation, real interest rates might rise, leading to a decrease in value of inflation-protected bonds. If inflation is lower than expected during the period a Fund holds the security, the Fund may earn less on the security than on a conventional bond. Any increase in principal value is taxable in the year the increase occurs, even though holders do not receive cash representing the increase at that time. As a result, if a Fund invests in inflation-protected securities, it could be required at times to liquidate other investments, including when it is not advantageous to do so, to satisfy its distribution requirements as a RIC and to eliminate any fund-level income tax liability under the Code.
183
Morningstar Funds Trust April 30, 2019
Notes to Financial Statements(continued)
Loan Participations, Assignments and Unfunded Commitments:Certain Funds invest in loan participations and assignments. When a Fund purchases a loan participation, the Fund enters into a contractual relationship with the lender or a third party selling such participations (“Selling Participant”), but not the borrower. In this case, the Fund assumes the credit risk of the borrower and the Selling Participant and any other persons inter-positioned between the Fund and the borrower (“Intermediate Participants”). In contrast, when one of the Funds purchases an assignment, the contractual relationship is with the borrower and the credit risk assumed by the Fund is only with the borrower. Although certain loan participations or assignments are secured by collateral, the Fund could experience delays or limitations in realizing such collateral or have its interest subordinated to other indebtedness of the obligor.
The Funds may also enter into unfunded commitments, which are contractual obligations for future funding. These unfunded commitments represent a future obligation in full, even though a percentage of the commitment may not be utilized by the borrower. These types of investments may include standby financing commitments, such as revolving credit facilities, which obligate the Fund to supply additional cash to the borrower on demand. The value of the unfunded portion of the investment is determined using apro-rata allocation, based on its par value relative to the par value of the entire investment. The unfunded commitments are marked to market daily and any unrealized appreciation (depreciation) from unfunded commitments is reported in the Statements of Assets and Liabilities as well as the Statements of Operations. When investing in a loan participation, the Fund has the right to receive payments of principal, interest and any fees to which it is entitled only from the lender selling the loan agreement and only upon receipt of payments by the lender from the borrower. The Fund may receive a commitment fee based on the undrawn portion of the underlying line of credit portion of a loan. In certain circumstances, the Fund may receive a penalty fee upon the prepayment of a loan by a borrower. Fees earned or paid are recorded as a component of interest income or interest expense, respectively, on the Statements of Operations. In addition, loan participations and assignments are vulnerable to market conditions such that economic conditions or other events may reduce the demand for loan participations and assignments and certain loan participations and assignments which were liquid, when purchased, may become illiquid.
Securities Sold Short:Certain Funds may sell securities they do not own (a short sale) as a hedge against some of their long positions and/or in anticipation of a decline in the market value of that security. When one of the Funds makes a short sale, it must borrow the security sold short and deliver it to the broker through which it made the short sale. The Fund may have to pay a fee to borrow the particular security and may be obligated to remit any interest or dividends received on such borrowed securities. Dividends declared on short positions are recorded on theex-date as an expense. A gain, limited to the price at which the Fund sold the security short, or a loss, which could be unlimited in magnitude, will be recognized upon the termination of a short sale if the market price at termination is less than or greater than, respectively, the proceeds originally received. The Fund is also subject to the risk that it may be unable to reacquire a security to terminate a short position except at a price substantially in excess of the last quoted price. The Fund is also subject to risk of loss if the broker were to fail to perform its obligations under the contractual terms. Liabilities for securities sold short are reported at market value on the Statements of Assets and Liabilities and the change in market value is recorded as unrealized gain or loss on the Statements of Operations.
184
Morningstar Funds Trust April 30, 2019
Notes to Financial Statements(continued)
The Funds are required to pledge cash or liquid securities to the broker as collateral for securities sold short. Collateral requirements are calculated daily based on the current market value of the short positions. Daily market fluctuations and trading activity could cause the value of securities sold short to be more or less than the value of the collateral segregated. Cash deposited with the broker for collateral for securities sold short is recorded as an asset on the Statements of Assets and Liabilities and securities segregated as collateral are denoted in the Schedules of Investments. The Funds may receive or pay the net of the following amounts: (i) a portion of the income from the investment of cash collateral; (ii) the broker’s fee on the borrowed securities; and (iii) a financing charge for the difference in the market value of the short position and cash collateral deposited with the broker. This income or fee is calculated daily based upon the market value of each borrowed security and a variable rate that is dependent on the availability of the security.
Repurchase Agreements:Certain Funds may enter into repurchase agreements. In a repurchase agreement, a Fund takes possession of an underlying debt obligation (collateral) subject to an obligation of the seller to repurchase, and a Fund to resell, the obligation at an agreed-upon price and time. Under the terms of a master repurchase agreement, the underlying securities for all repurchase agreements are held in safekeeping at the Fund’s custodian or designatedsub-custodians undertri-party repurchase agreements. Securities purchased under repurchase agreements are reflected as an asset on the Statements of Assets and Liabilities. Interest earned is recorded as a component of interest income on the Statements of Operations. In periods of increased demand for collateral, a Fund may pay a fee for receipt of collateral, which may result in interest expense to the Fund. Generally, in the event of counterparty default, a Fund has the right to use the collateral to offset losses incurred. If the counterparty should default, a Fund may seek to sell the securities which it holds as collateral. This could involve procedural costs or delays in addition to a loss on the securities if their value should fall below their repurchase price. Repurchase agreements outstanding at period end, if any, including the underlying debt obligation (collateral) assigned to each agreement, are included within each Fund’s Schedule of Investments.
Zero Coupon and PaymentIn-Kind Bonds:A Fund may invest without limit inso-calledzero-coupon bonds andpayment-in-kind bonds. Zero-coupon bonds are issued at a significant discount from their principal amount in lieu of paying interest periodically.Payment-in-kind bonds allow the issuer, at its option, to make current interest payments on the bonds either in cash or in additional bonds. Becausezero-coupon andpayment-in-kind bonds do not pay current interest in cash, their value is subject to greater fluctuation in response to changes in market interest rates than bonds that pay interest currently. Both zero coupon andpayment-in-kind bonds allow an issuer to avoid the need to generate cash to meet current interest payments. Accordingly, such bonds may involve greater credit risks than bonds paying interest currently in cash. A Fund is required to accrue interest income on such investments and to distribute such amounts at least annually to shareholders even though the investments do not make any current interest payments. The daily market quotations of the original bonds may include the accrued interest (referred to as a dirty price) and require a pro rata adjustment, if any, from the unrealized appreciation (depreciation) on investments to interest receivable on the Statement of Assets and Liabilities.
Private Placement and Restricted Securities:A Fund may invest in securities that are purchased in private placements and, accordingly, are subject to restrictions on resale as a matter of contract or under federal securities laws. Because there may be relatively few potential purchasers for such investments, especially under adverse market or economic conditions or in the event of adverse changes in the financial condition of the
185
Morningstar Funds Trust April 30, 2019
Notes to Financial Statements(continued)
issuer, a Fund could find it more difficult to sell such securities when a subadviser believes it advisable to do so or may be able to sell such securities only at prices lower than if such securities were more widely held. At times, it may also be more difficult to determine the fair value of such securities for purposes of computing a Fund’s net asset value.
While such private placements may offer attractive opportunities for investment not otherwise available on the open market, the securities so purchased are often restricted securities, i.e., securities which cannot be sold to the public without registration under the Securities Act or the availability of an exemption from registration (such as Rules 144 or 144A), or which are not readily marketable because they are subject to other legal or contractual delays in or restrictions on resale.
The absence of a trading market can make it difficult to ascertain a market value for illiquid investments. Disposing of illiquid investments may involve time-consuming negotiation and legal expenses, and it may be difficult or impossible for a Fund to sell them promptly at an acceptable price. A Fund may have to bear the extra expense of registering such securities for resale and the risk of substantial delay in effecting such registration. In addition, market quotations are less readily available. The judgment of a subadviser may at times play a greater role in valuing these securities than in the case of publicly traded securities.
Generally speaking, restricted securities may be sold only to qualified institutional buyers, or in a privately negotiated transaction to a limited number of purchasers, or in limited quantities after they have been held for a specified period of time and other conditions are met pursuant to an exemption from registration, or in a public offering for which a registration statement is in effect under the Securities Act. A Fund may be deemed to be an underwriter for purposes of the Securities Act when selling restricted securities to the public, and in such event the Fund may be liable to purchasers of such securities if the registration statement prepared by the issuer, or the Prospectuses forming a part of it, is materially inaccurate or misleading.
Restricted securities held by each Fund at April 30, 2019 are disclosed in the Notes to Schedule of Investments.
Forward Commitments and Dollar Rolls:A Fund may enter into contracts to purchase mortgage securities for a fixed price at a future date beyond customary settlement time (forward commitments) if the Fund sets aside on its books liquid assets in an amount sufficient to meet the purchase price, or if the Fund enters into offsetting contracts for the forward sale of other securities it owns. In the case ofto-be-announced (TBA) mortgage purchase commitments, the unit price and the estimated principal amount are established when a Fund enters into a contract, with the actual principal amount being within a specified range of the estimate. TBA mortgages shall not exceed 20% of a Fund’s net assets. For these obligations, a Fund will segregate or earmark liquid assets in an amount sufficient to cover its obligations. Forward commitments may be considered securities in themselves and involve a risk of loss if the value of the security to be purchased declines before the settlement date, which risk is in addition to the risk of decline in the value of a Fund’s other assets. Where such purchases are made through dealers, a Fund relies on the dealer to consummate the sale. The dealer’s failure to do so may result in the loss to a Fund of an advantageous yield or price. Although a Fund will generally enter into forward commitments with the intention of acquiring securities for its portfolio, the Fund may dispose of a commitment before settlement if a subadviser deems it appropriate to do so. A Fund may realize short-term profits or losses upon the sale of forward commitments.
186
Morningstar Funds Trust April 30, 2019
Notes to Financial Statements(continued)
A Fund may enter into TBA sale commitments to hedge its portfolio positions or to sell securities it owns under delayed delivery arrangements. Proceeds of TBA sale commitments are not received until the contractual settlement date. Unsettled TBA sale commitments are valued at current market value of the underlying securities. If the TBA sale commitment is closed through the acquisition of an offsetting purchase commitment, a Fund realizes a gain or loss on the commitment without regard to any unrealized gain or loss on the underlying security. If a Fund delivers securities under the commitment, the Fund realizes a gain or loss from the sale of the securities based upon the unit price established at the date the commitment was entered into.
A Fund may enter into mortgage dollar roll transactions (generally using TBAs) in which it sells a fixed-income security for delivery in the current month and simultaneously contracts to purchase similar securities (for example, same type, coupon and maturity) at an agreed upon future time. By engaging in a dollar roll transaction, a Fund foregoes principal and interest paid on the security that is sold but receives the difference between the current sales price and the forward price for the future purchase. A Fund would also be able to earn interest on the proceeds of the sale before they are reinvested. A Fund accounts for dollar rolls as purchases and sales. Dollar rolls may be used to create investment leverage and may increase a Fund’s risk and volatility.
The obligation to purchase securities on a specified future date involves the risk that the market value of the securities that a Fund is obligated to purchase may decline below the purchase price. In addition, in the event the other party to the transaction files for bankruptcy, becomes insolvent or defaults on its obligation, a Fund may be adversely affected.
When-Issued and Delayed Delivery Securities:Certain Funds may purchase or sell securities on a when-issued or delayed delivery basis. When-issued and delayed delivery securities in which the Funds may invest include U.S. Treasury Securities, municipal bonds, bank loans, and other similar instruments. The price of the underlying securities and date when the securities will be delivered and paid for are fixed at the time the transaction is negotiated. Losses may arise due to changes in the market value of the securities or from the inability of counterparties to meet the terms of the contract. In connection with such purchases, the Funds may hold liquid assets as collateral with the Funds’ custodian sufficient to cover the purchase price.
4. Investment Valuation and Fair Value Measurements
Investment Valuation Policies:The Net Asset Value (“NAV”) of the Funds’ shares are valued as of the close of regular trading on the New York Stock Exchange (“NYSE”) (generally 4:00 p.m. Eastern time) on each day that the NYSE is open (each a “Business Day”). The NAV per share of each Fund is computed by dividing the total current value of the assets of such Fund, less liabilities, by the total number of shares of the Fund outstanding at the time the computation is made.
Generally, a Fund’s investments are valued at market value or, in the absence of a market value, at fair value as determined in good faith by the Adviser’s Pricing Committee pursuant to procedures approved by or under the direction of the Board of Trustees of Morningstar Funds Trust (“the Board”). Pursuant to those procedures, the Pricing Committee considers, among other things: (1) the last sales price on the securities exchange, if any, on which a security is primarily traded; (2) the mean between the bid and asked prices; (3) price quotations from an approved pricing service, and (4) other factors as necessary to determine a fair value under certain circumstances.
187
Morningstar Funds Trust April 30, 2019
Notes to Financial Statements(continued)
Securities primarily traded in the NASDAQ Global Market® for which market quotations are readily available shall be valued using the NASDAQ® Official Closing Price (“NOCP”). If the NOCP is not available, such securities shall be valued at the last sale price on the day of valuation, or if there has been no sale on such day, at the mean between the bid and asked prices. OTC securities which are not traded in the NASDAQ Global Market® shall be valued at the most recent trade price. Securities and assets for which market quotations are not readily available (including restricted securities which are subject to limitations as to their sale) are valued at fair value as determined in good faith under procedures approved by or under the direction of the Board.
Short-term debt obligations with remaining maturities in excess of 60 days are valued at current market prices, as discussed above. To reflect their fair value, short-term securities with 60 days or less remaining to maturity may, unless conditions indicate otherwise, utilize amortized cost to maturity based on their cost to the Fund.
The securities in a Fund, which are traded on securities exchanges are valued at the last sale price on the exchange on which such securities are traded, as of the close of business on the day the securities are being valued or, lacking any reported sales, at the mean between the last available bid and asked price. Securities that are traded on more than one exchange are valued on the exchange on which the security is principally traded.
Each Fund may invest in foreign securities, and as a result, the calculation of the Fund’s NAV may not take place contemporaneously with the determination of the prices of certain of the Fund securities used in the calculation. Occasionally, events which affect the values of such securities and such exchange rates may occur between the times at which they are determined and the close of the NYSE and will therefore not be reflected in the computation of a Fund’s NAV. If events materially affecting the value of such securities occur during such period, then these securities may be valued at their fair value as determined in good faith under procedures established by and under the supervision of the Board as described above. Portfolio securities that are traded both on an exchange and in the OTC market will be valued according to the broadest and most representative market. All assets and liabilities initially expressed in foreign currency values will be converted into U.S. dollar values at the mean between the bid and offered quotations of the currencies against U.S. dollars as last quoted by any recognized dealer. When portfolio securities are traded, the valuation will be the last reported sale price on the day of valuation.
All other assets of a Fund are valued in such manner as the Board in good faith deems appropriate to reflect their fair value. U.S. GAAP defines fair value as the price the Funds would receive to sell an asset or pay to transfer a liability in an orderly transaction between market participants at the measurement date.
Valuation Techniques:The following inputs and techniques may be used by the Funds to evaluate how to classify each major category of assets and liabilities into the appropriate fair value hierarchy in accordance with U.S. GAAP.
Equity securities, including securities sold short, rights, exchange options, warrants, Exchange-Traded Funds (“ETFs”) andclosed-end investment companies, are valued at the last quoted sales prices or official closing prices taken from the primary market, or composite in which each security trades and are therefore classified Level 1.
188
Morningstar Funds Trust April 30, 2019
Notes to Financial Statements(continued)
An equity for which no sales are reported, as in the case of a security that is traded in theover-the-counter (“OTC”) market or a less liquid listed equity, is valued at its last bid price (in the case of short sales, at the ask price) and is therefore classified Level 2.
To address this issue, the Board has approved the daily use of independently provided quantitative models that may adjust the closing prices of certain foreign equity and fixed income securities based on information that becomes available after the foreign market closes, through the application of an adjustment factor to such securities’ closing price. Adjustment factors may be greater than, less than, or equal to 1. Thus, use of these quantitative models could cause a Fund to value a security higher, lower or equal to its closing market price, which in turn could cause the Fund’s NAV per share to differ from that which would have been calculated using closing market prices. The use of these quantitative models is also intended to decrease the opportunities for persons to engage in ‘‘time zone arbitrage,’’ i.e., trading intended to take advantage of stale closing prices in foreign markets that could affect the NAV of the Funds. Securities subjected to an adjustment factor due to the use of these quantitative models are not specifically designated on the Funds’ Schedule of Investments as being “fair valued,” are therefore classified as Level 2.
Fixed income securities (other than certain short-term investments maturing in 60 days or less) and other investments that trade in markets that are not considered to be active, are valued based on quoted market prices, dealer quotations or alternative pricing sources supported by observable inputs and are also classified within Level 2. These include certain U.S. government and sovereign obligations, most government agency securities, investment-grade corporate bonds, money market funds and less liquid listed equities. Corporate and sovereign bonds and other fixed-income instruments are valued at estimated fair value using the latest bid prices or evaluated quotes furnished by independent pricing services, as well as quotations from counterparties and other market participants. Evaluated quotes are based on a matrix system, which may consider such factors as quoted prices for identical or similar assets, yields, maturities and ratings and are not necessarily reliant on quoted prices. Short-term debt investments of sufficient credit quality maturing in 60 days or less are generally valued at amortized cost, which approximates fair value. These investments are categorized as Level 2 within the fair value hierarchy.
Investments classified within Level 3, if any, have significant unobservable inputs, as they trade infrequently or not at all. Level 3 instruments may include illiquid securities. When observable prices are not available for these securities, the Funds may use one or more valuation approaches (e.g., the market approach or the income approach), including proprietary models for which sufficient and reliable data is available. Within Level 3, the market approach generally is based on the technique of using comparable market transactions, while the use of the income approach includes the estimation of future cash flows discounted to calculate fair value. Discounts may also be applied due to the nature or durations of any restrictions on the disposition of the investment or adjusted as appropriate for credit, market and/or other risk factors.
The inputs used by the Funds in estimating the value of Level 3 investments may include the original transaction price, recent transactions in the same or similar instruments, completed or pending third-party transactions in the underlying investment or comparable issuers, subsequent rounds of financing, recapitalizations and other transactions across the capital structure, offerings in the equity or debt capital markets, changes in financial ratios or cash flows, benchmark yield curves, credit spreads, estimated default rates, underlying collateral, and other unique security features. Level 3 investments may also be adjusted to reflect illiquidity and/or
189
Morningstar Funds Trust April 30, 2019
Notes to Financial Statements(continued)
non-transferability, with the amount of such discount estimated by the Adviser in the absence of market information. Assumptions used by the Funds due to the lack of observable inputs may significantly impact the fair value of the investment.
Exchange-traded derivatives, such as futures contracts, forward contracts, and exchange-traded option contracts, are typically classified within Level 1 or Level 2 of the fair value hierarchy depending on whether or not they are deemed to be actively traded. Futures and option contracts that are listed on national exchanges and are freely transferable are valued at fair value based on their last sales price on the date of determination on the exchange their constitutes the principal market or, if no sales occurred on such date, at the bid price on such exchange at the close of business on such date. Centrally cleared swaps listed or traded on a multilateral trade facility platform, such as a registered exchange, are valued on a daily basis using quotations provided by an independent pricing service.
OTC derivatives, including options on forward contracts, put and call options, and swap contracts, are valued by the Funds on a daily basis using observable inputs, such as quotations provided by an independent pricing service, the counterparty, dealers or brokers, whenever available and considered reliable.
The U.S. Dollar value of forward foreign currency exchange contracts is determined using current forward currency exchange rates supplied by an independent pricing service.
The Funds value the repurchase agreements they have entered based on the respective contract amounts, which approximate fair value. As such, repurchase agreements are carried at the amount of cash paid plus accrued interest receivable (or interest payable in periods of increased demand for collateral).
Shares ofopen-end investment companies, other than exchange-traded funds, are valued at their NAV.
Fair Valuation Hierarchy:Fair value is defined as the price that a Fund would receive to sell an asset or pay to transfer a liability in an orderly transaction between market participants at the measurement date. It establishes a framework and requires disclosure of a fair value hierarchy, separately for each major category of assets and liabilities that segregates fair value measurements into levels (Levels 1, 2, and 3). Categorizations of fair value measurements, and the criteria used to determine each categorization, are as follows:
| | ● | | Level 1 – quoted prices in active markets for identical assets and liabilities (e.g. equity securities andopen-end investment companies) |
| | ● | | Level 2 – prices determined using other significant observable inputs including, but not limited to, quoted prices for similar assets and liabilities in markets that are not active, inputs other than quoted prices that are observable for the assets or liabilities (such as interest rates, yield curves, prepayment speeds, credit risk, etc.) or other market corroborated inputs |
| | ● | | Level 3 – prices determined using significant unobservable inputs (including the Pricing Committee’s own assumptions in determining the fair value of investments) |
190
Morningstar Funds Trust April 30, 2019
Notes to Financial Statements(continued)
Valuation levels are not necessarily an indication of the risk associated with investing in those securities. Changes in valuation techniques may result in transfers into or out of an assigned level within the disclosure hierarchy. Transfers between different levels of the fair value disclosure hierarchy are deemed to have occurred as of the end of the reporting period.
A valuation hierarchy including information regarding Level 3 securities, where applicable, is shown at the end of each Fund’s Schedule of Investments.
5. Investment Advisory and Other Agreements
The Trust has an Investment Advisory Agreement (the “Agreement”) with the Adviser, with whom certain officers and trustees of the Trust are affiliated, to furnish certain portfolio management services to the Funds.
Pursuant to the Agreement, the Funds have contractually agreed to pay the Adviser a management fee calculated on the average daily net assets for each Fund, in the annual ratios below.
| | |
| Fund | | Ratio |
| |
Morningstar U.S. Equity Fund | | 0.67% |
Morningstar International Equity Fund | | 0.83% |
Morningstar Global Income Fund | | 0.35% |
Morningstar Total Return Bond Fund | | 0.44% |
Morningstar Municipal Bond Fund | | 0.44% |
Morningstar Defensive Bond Fund | | 0.36% |
Morningstar Multisector Bond Fund | | 0.61% |
Morningstar Unconstrained Allocation Fund | | 0.47% |
Morningstar Alternatives Fund | | 0.85% |
The Trust and the Adviser have entered into a Voluntary Expense Limitation Agreement whereby the Adviser has agreed to waive all or a portion of its fees or assume certain other expenses of each Fund at least through August 31, 2020, to the extent necessary to ensure that the total annual fund operating expenses (excluding taxes, interest, brokerage commissions, trading costs, acquired fund fees and expenses, litigation, dividend and interest expense related to short sales and extraordinary expenses) do not exceed the following rates, based on each Fund’s average daily net assets. The amount the Adviser owes a Fund as of the reporting date is recorded as a Receivable from Adviser in the Statements of Assets and Liabilities. The Adviser reimburses the Funds on a monthly basis. For the period ended April 30, 2019 the Funds’ Adviser contractually waived fees and/or reimbursed expenses for each of the Funds as follows:
| | | | | | | | | | | | |
| Fund | | Expense Cap | | | Management Fees Waived | | | Expense Reimbursements | |
| | | |
Morningstar U.S. Equity Fund | | | 0.85% | | | | $352,921 | | | | $— | |
Morningstar International Equity Fund | | | 1.00% | | | | 323,432 | | | | — | |
Morningstar Global Income Fund | | | 0.89% | | | | — | | | | — | |
Morningstar Total Return Bond Fund | | | 0.53% | | | | 335,964 | | | | — | |
Morningstar Municipal Bond Fund | | | 0.59% | | | | 146,797 | | | | 2,842 | |
Morningstar Defensive Bond Fund | | | 0.48% | | | | 135,622 | | | | 26,569 | |
Morningstar Multisector Bond Fund | | | 0.80% | | | | 158,306 | | | | — | |
Morningstar Unconstrained Allocation Fund | | | 1.00% | | | | 63,329 | | | | — | |
191
Morningstar Funds Trust April 30, 2019
Notes to Financial Statements(continued)
| | | | | | | | | | | | |
| Fund | | Expense Cap | | | Management Fees Waived | | | Expense Reimbursements | |
| | | |
Morningstar Alternatives Fund | | | 1.29% | | | | $97,607 | | | | $— | |
With respect to the following Funds, the Adviser voluntarily waived its management fees or assumed certain other expenses of each Fund to the extent necessary to reduce the Funds’ expected total annual operating expenses. This management fee waiver and/or expense reimbursement will not be subject to future recoupment. For the period ended April 30, 2019, the Funds’ Adviser voluntarily waived fees and/or reimbursed expenses for each of the Funds as follows:
| | | | | | | | |
| Fund | | Management Fees Waived | | | Expense Reimbursements | |
| | |
Morningstar U.S. Equity Fund | | | $49,591 | | | | $— | |
Morningstar International Equity Fund | | | 71,345 | | | | — | |
Morningstar Global Income Fund | | | 155,083 | | | | — | |
Morningstar Municipal Bond Fund | | | — | | | | 3,336 | |
Morningstar Unconstrained Allocation Fund | | | 333 | | | | 48,430 | |
Morningstar Alternatives Fund | | | 103,617 | | | | 19,483 | |
Pursuant to the Agreement, the Adviser is responsible for performing and overseeing portfolio management services to the Funds. In addition to selecting the overall investment strategies of the Funds, the Adviser oversees and monitors the selection and performance of the subadvisers and allocates assets among the subadvisers. The subadvisers manage each Fund’s investment portfolio pursuant to sub-advisory agreements with the Adviser. The Adviser manages the cash portion of each Fund which may include ETFs, mutual funds and money market fund investments.
As of April 30, 2019, the Trust has entered intosub-advisory agreements with the following entities by Fund:
| | |
| Fund | | Subadvisers |
| |
Morningstar U.S. Equity Fund | | ClearBridge Investments, LLC |
| | Diamond Hill Capital Management, Inc. |
| | Levin Easterly Partners LLC |
| | Massachusetts Financial Services Company, d/b/a |
| | MFS Investment Management |
| | Wasatch Advisors, Inc. |
| | Westwood Management Corp. |
Morningstar International Equity Fund | | Harding Loevner LP |
| | Harris Associates L.P. |
| | Lazard Asset Management LLC |
| | T. Rowe Price Associates, Inc. |
Morningstar Global Income Fund | | Schafer Cullen Capital Management, Inc. |
Morningstar Total Return Bond Fund | | BlackRock Financial Management, Inc. |
| | Western Asset Management Company |
Morningstar Municipal Bond Fund | | T. Rowe Price Associates, Inc. |
| | | Wells Capital Management, Inc. |
Morningstar Defensive Bond Fund | | First Pacific Advisors, LLC |
192
Morningstar Funds Trust April 30, 2019
Notes to Financial Statements(continued)
| | |
| Fund | | Subadvisers |
| |
Morningstar Multisector Bond Fund | | Franklin Advisers, Inc. |
| | Loomis, Sayles & Company, L.P. |
| | | TCW Investment Management Company LLC |
Morningstar Unconstrained Allocation Fund | | Brandywine Global Investment Management, LLC |
| | | Lazard Asset Management LLC |
Morningstar Alternatives Fund | | SSI Investment Management, Inc. (now SSI |
| | Investment Management, LLC) |
| | | Water Island Capital, LLC |
Pursuant to thesub-advisory agreements between the subadvisers, the Adviser and the Trust, the Adviser will pay the subadvisers out of the management fees it receives from the Funds.
The Trust has an administration agreement with The Northern Trust Company (“Northern Trust”), which provides certain accounting, clerical and bookkeeping services, Blue Sky, corporate secretarial services and assistance in the preparation and filing of tax returns and reports to shareholders and the SEC. Northern Trust also serves as custodian of each Fund’s securities and cash, transfer agent and dividend disbursing agent. Northern Trust has agreed to waive a portion of their administration and custody fees for the Funds for a period of twelve months from the commencement of operations of each Fund (through October 31, 2019). The amounts waived are captioned as “Less waiver of administration and custody fees” on the Statements of Operations.
Foreside Fund Services, LLC (the “Distributor”), a registered broker-dealer and member of the Financial Industry Regulatory Authority, Inc. (“FINRA”), serves as the principal underwriter and distributor of the Trust’s shares.
The Trust, on behalf of the Funds, has agreements with various financial intermediaries and “mutual fund supermarkets”, under which customers of these intermediaries may purchase and hold Fund shares. These intermediaries assess fees in consideration for providing certain account maintenance, record keeping and transactional and other shareholder services (collectively, “Shareholder Services”). Because of the contractual expense limits on certain Funds’ fees and expenses, the Investment Adviser paid a portion of the Funds’ share of these fees during the period ended April 30, 2019. Such payments, if any, are included in the table above under the caption “Expense Reimbursements”.
6. Investment Transactions
During the period ended April 30, 2019, the cost of purchases and the proceeds from sales of investments (excludingin-kind, swap contracts, forward foreign currency exchange contracts, futures contracts and short-term investments) were as follows:
| | | | | | | | | | | | | | | | | | | | | | | | |
| | | Purchases | | | | | | | | | Sales | | | | | | | |
| Fund | | U.S. Government | | | Other | | | U.S. Government | | | Other | | | Securities
Sold Short | | | Covers on
Securities
Sold Short | |
| | | | | | |
Morningstar U.S. Equity Fund | | $ | — | | | $ | 680,358,540 | | | $ | — | | | $ | 74,044,112 | | | $ | — | | | $ | — | |
Morningstar International Equity Fund | | | — | | | | 476,384,671 | | | | — | | | | 49,276,126 | | | | — | | | | — | |
193
Morningstar Funds Trust April 30, 2019
Notes to Financial Statements(continued)
| | | | | | | | | | | | | | | | | | | | | | | | |
| | | | | | Purchases | | | | | | Sales | | | | | | | |
| Fund | | U.S. Government | | | Other | | | U.S. Government | | | Other | | | Securities
Sold Short | | | Covers on
Securities
Sold Short | |
| | | | | | |
Morningstar Global Income Fund | | $ | — | | | $ | 198,875,330 | | | $ | — | | | $ | 28,464,440 | | | $ | — | | | $ | — | |
Morningstar Total Return Bond Fund | | | 259,669,118 | | | | 833,951,471 | | | | 177,308,826 | | | | 483,771,508 | | | | 116,670,836 | | | | 101,227,306 | |
Morningstar Municipal Bond Fund | | | — | | | | 175,011,323 | | | | — | | | | 73,723,392 | | | | — | | | | — | |
Morningstar Defensive Bond Fund | | | 4,655,613 | | | | 118,256,645 | | | | 703,436 | | | | 1,958,610 | | | | — | | | | — | |
Morningstar Multisector Bond Fund | | | 10,104,752 | | | | 149,857,988 | | | | 8,450,603 | | | | 32,320,519 | | | | — | | | | — | |
Morningstar Unconstrained Allocation Fund | | | — | | | | 61,448,346 | | | | — | | | | 20,980,622 | | | | — | | | | — | |
Morningstar Alternatives Fund | | | — | | | | 118,123,766 | | | | — | | | | 22,955,543 | | | | 23,370,528 | | | | 5,695,037 | |
7. Financial Derivative Instruments
Certain Funds may invest in derivatives as part of their principal investment strategies in an attempt to achieve their investment objective. The Funds’ derivative contracts are not accounted for as hedging instruments under U.S. GAAP. For financial reporting purposes, the Funds do not offset financial assets and financial liabilities that are subject to master netting arrangements or similar agreements on the Statements of Assets and Liabilities.
Forward Foreign Currency Exchange Contracts: A forward foreign currency contract is an obligation to purchase or sell a specificnon-U.S. currency in exchange for another currency, which may be U.S. dollars, at an agreed exchange rate (price) at a future date. Currency forwards are typically individually negotiated and privately traded by currency traders and their customers in the interbank market. A forward foreign currency contract will tend to reduce or eliminate exposure to the currency that is sold, and increase exposure to the currency that is purchased, similar to when a Fund sells a security denominated in one currency and purchases a security denominated in another currency.
At the maturity of a forward foreign currency contract, a Fund may either exchange the currencies specified at the maturity of a forward foreign currency contract or, prior to maturity, the Fund may enter into a closing transaction involving the purchase or sale of an offsetting contract. Closing transactions with respect to forward foreign currency contract are usually effected with the counterparty to the original forward contract. A Fund may also enter into forward foreign currency contracts that do not provide for physical settlement of the two currencies but instead provide for settlement by a single cash payment calculated as the difference between the agreed upon exchange rate and the spot rate at settlement based upon an agreed upon notional amount (non-deliverable forwards).
194
Morningstar Funds Trust April 30, 2019
Notes to Financial Statements(continued)
The successful use of these transactions will usually depend on the adviser’s or a subadviser’s ability to accurately forecast currency exchange rate movements. Should exchange rates move in an unexpected manner, a Fund may not achieve the anticipated benefits of the transaction, or it may realize losses. In addition, these techniques could result in a loss if the counterparty to the transaction does not perform as promised, including because of the counterparty’s bankruptcy or insolvency. In unusual or extreme market conditions, a counterparty’s creditworthiness and ability to perform may deteriorate rapidly, and the availability of suitable replacement counterparties may become limited.
Forward foreign currency contracts may limit potential gain from a positive change in the relationship between the U.S. dollar and foreign currencies. Unanticipated changes in currency prices may result in poorer overall performance for a Fund than if it had not engaged in such contracts. Moreover, there may be an imperfect correlation between a Fund’s portfolio holdings of securities denominated in a particular currency and the currencies bought or sold in the forward foreign currency contract entered into by the Fund. This imperfect correlation may cause a Fund to sustain losses that will prevent the Fund from achieving a complete hedge or expose the Fund to risk of foreign exchange loss.
Forward foreign currency exchange contracts outstanding at period end, if any, are listed after each Fund’s Schedule of Investments. Any resulting unrealized gains or losses are recorded in Net change in unrealized appreciation (depreciation) on forward foreign currency exchange contracts in the Statements of Operations. Gains or losses are recorded for financial statement purposes as unrealized until settlement date. Realized gains or losses, if any, are included in Net realized gains (losses) on forward foreign currency exchange contracts in the Statements of Operations.
FuturesContracts:A Fund may enter into futures contracts. Generally, a futures contract is a standard binding agreement to buy or sell a specified quantity of an underlying reference instrument, such as a specific security, rate, currency or commodity, at a specified price at a specified later date. Each Fund may purchase or sell interest rate futures for the purpose of hedging some or all of the value of its portfolio securities against changes in prevailing interest rates or to manage its duration or effective maturity. If the adviser or a subadviser anticipates that interest rates may rise and, concomitantly, the price of certain of its portfolio securities may fall, a Fund may sell futures contracts. If declining interest rates are anticipated, a Fund may purchase futures contracts to protect against a potential increase in the price of securities the Fund intends to purchase. Subsequently, appropriate securities may be purchased by a Fund in an orderly fashion; as securities are purchased, corresponding futures positions would be terminated by offsetting sales of contracts.
When a Fund enters into a futures contract, it must deliver to an account controlled by a futures commission merchant a futures commission merchant (FCM) an amount referred to as “initial margin” that is typically calculated as an amount equal to the volatility in market value of a contract over a fixed period. Initial margin requirements are determined by the respective exchanges on which the futures contracts are traded and the FCM. Thereafter, a “variation margin” amount may be required to be paid by the Fund or received by the Fund in accordance with margin controls set for such accounts, depending upon changes in themarked-to-market value of the futures contract. The account ismarked-to-market daily and the variation margin is monitored by the Fund’s investment manager and custodian on a daily basis. When the futures contract is closed out, if the
195
Morningstar Funds Trust April 30, 2019
Notes to Financial Statements(continued)
Fund has a loss equal to or greater than the margin amount, the margin amount is paid to the FCM along with any loss in excess of the margin amount. If the Fund has a loss of less than the margin amount, the excess margin is returned to the Fund. If the Fund has a gain, the full margin amount and the amount of the gain is paid to the Fund.
A Fund’s use of futures contracts is subject to the risks associated with derivative instruments generally. In addition, if the adviser’s or a subadviser’s judgment about the general direction of interest rates or markets is wrong, a Fund’s overall performance may be poorer than if no financial futures contracts had been entered into. For example, in some cases, securities called for by a financial futures contract may not have been issued at the time the contract was written. In addition, the market prices of financial futures contracts may be affected by certain factors.
There is a risk of loss by the Fund of the initial and variation margin deposits in the event of bankruptcy of the FCM with which the Fund has an open position in a futures contract. The assets of a Fund may not be fully protected in the event of the bankruptcy of the FCM or central counterparty because the Fund might be limited to recovering only a pro rata share of all available Funds and margin segregated on behalf of an FCM’s customers. If an FCM does not provide accurate reporting, a Fund is also subject to the risk that the FCM could use the Fund’s assets, which are held in an omnibus account with assets belonging to the FCM’s other customers, to satisfy its own financial obligations or the payment obligations of another customer to the central counterparty.
The risk of loss in trading financial futures can be substantial due to the low margin deposits required and the extremely high degree of leverage involved in futures pricing. Relatively small price movements in a financial futures contract could have an immediate and substantial impact, which may be favorable or unfavorable to a Fund. It is possible for a price-related loss to exceed the amount of a Fund’s margin deposit.
Each Fund will incur brokerage fees in connection with its futures transactions. In addition, while futures contracts will be purchased and sold to reduce certain risks, those transactions themselves entail certain other risks. Thus, while a Fund may benefit from the use of futures, unanticipated changes in interest rates or stock price movements may result in a poorer overall performance for the Fund than if it had not entered into any futures contracts. Moreover, in the event of an imperfect correlation between the futures position and the portfolio position that is intended to be protected, the desired protection may not be obtained and the Fund may be exposed to risk of loss.
Although some financial futures contracts by their terms call for the actual delivery or acquisition of securities at expiration, in most cases the contractual commitment is closed out before expiration. The offsetting of a contractual obligation is accomplished by purchasing (or selling as the case may be) on a commodities or futures exchange an identical financial futures contract calling for delivery in the same month. Such a transaction, if effected through a member of an exchange, cancels the obligation to make or take delivery of the securities. A Fund will incur brokerage fees when it purchases or sells financial futures contracts, and will be required to maintain margin deposits. If a liquid secondary market does not exist when a Fund wishes to close out a financial futures contract, it will not be able to do so and will continue to be required to make daily cash payments of variation margin in the event of adverse price movements. There is no assurance that the Fund will be able to enter into closing transactions.
196
Morningstar Funds Trust April 30, 2019
Notes to Financial Statements(continued)
Futures contracts outstanding at period end, if any, are listed after each Fund’s Schedule of Investments. The Statements of Operations include any realized gains or losses on closed futures contracts in Net realized gains (losses) on futures contracts, and any unrealized gains or losses on open futures contracts in Net change in unrealized appreciation (depreciation) on futures contracts. At April 30, 2019, Morningstar Total Return Bond Fund pledged cash to cover margin requirements for open future positions in an amount of $547,245, which is included in Due to/from Broker on Statement of Assets and Liabilities.
Options: A Fund may purchase and sell call and put options. An option is a contract that gives the purchaser of the option, in return for the premium paid, the right to buy an underlying reference instrument, such as a specified security, currency, index, or other instrument, from the writer of the option (in the case of a call option), or to sell a specified reference instrument to the writer of the option (in the case of a put option) at a designated price during the term of the option. The premium paid by the buyer of an option will reflect, among other things, the relationship of the exercise price to the market price and the volatility of the underlying reference instrument, the remaining term of the option, supply, demand, interest rates and/or currency exchange rates. An American style put or call option may be exercised at any time during the option period while a European style put or call option may be exercised only upon expiration or during a fixed period prior thereto. Put and call options are traded on national securities exchanges and in the OTC market.
As the buyer of a call option, a Fund has a right to buy the underlying reference instrument (e.g., a currency or security) at the exercise price at any time during the option period (for American style options). The Fund may enter into closing sale transactions with respect to call options, exercise them, or permit them to expire. Unless the price of the underlying reference instrument changes sufficiently, a call option purchased by the Fund may expire without any value to the Fund, in which case the Fund would experience a loss to the extent of the premium paid for the option plus related transaction costs.
As the buyer of a put option, a Fund has the right to sell the underlying reference instrument at the exercise price at any time during the option period (for American style options). Like a call option, the Fund may enter into closing sale transactions with respect to put options, exercise them or permit them to expire. If a put option is not terminated in a closing sale transaction when it has remaining value, and if the market price of the underlying reference instrument remains equal to or greater than the exercise price during the life of the put option, the buyer would not make any gain upon exercise of the option and would experience a loss to the extent of the premium paid for the option plus related transaction costs. In order for the purchase of a put option to be profitable, the market price of the underlying reference instrument must decline sufficiently below the exercise price to cover the premium and transaction costs.
Writing options may permit the writer to generate additional income in the form of the premium received for writing the option. The writer of an option may have no control over when the underlying reference instruments must be sold (in the case of a call option) or purchased (in the case of a put option) because the writer may be notified of exercise at any time prior to the expiration of the option (for American style options). In general, though, options are infrequently exercised prior to expiration. Whether or not an option expires unexercised, the writer retains the amount of the premium. Writing “covered” call options means that the writer owns the underlying reference instrument that is subject to the call option. Call options may also be written on reference instruments that the writer does not own.
197
Morningstar Funds Trust April 30, 2019
Notes to Financial Statements(continued)
If a call option written by a Fund expires unexercised, the Fund will realize a gain in the amount of the premium received. If the market price of the underlying reference instrument decreases, the call option will not be exercised and the Fund will be able to use the amount of the premium received to hedge against the loss in value of the underlying reference instrument. The exercise price of a call option will be chosen based upon the expected price movement of the underlying reference instrument. The exercise price of a call option may be below, equal to(at-the money), or above the current value of the underlying reference instrument at the time the option is written.
As the writer of a put option, a Fund has a risk of loss should the underlying reference instrument decline in value. If the value of the underlying reference instrument declines below the exercise price of the put option and the put option is exercised, the Fund, as the writer of the put option, will be required to buy the instrument at the exercise price, which will exceed the market value of the underlying reference instrument at that time. The Fund will incur a loss to the extent that the current market value of the underlying reference instrument is less than the exercise price of the put option. However, the loss will be offset in part by the premium received from the buyer of the put. If a put option written by the Fund expires unexercised, the Fund will realize a gain in the amount of the premium received.
Options involve certain risks, including general risks related to derivative instruments. There can be no assurance that a liquid secondary market on an exchange will exist for any particular option, or at any particular time, and the Fund may have difficulty effecting closing transactions in particular options. Therefore, the Fund would have to exercise the options it purchased in order to realize any profit, thus taking or making delivery of the underlying reference instrument when not desired. The Fund could then incur transaction costs upon the sale of the underlying reference instruments. Similarly, when the Fund cannot effect a closing transaction with respect to a put option it wrote, and the buyer exercises, the Fund would be required to take delivery and would incur transaction costs upon the sale of the underlying reference instruments purchased. If the Fund, as a covered call option writer, is unable to effect a closing purchase transaction in a secondary market, it will not be able to sell the underlying reference instrument until the option expires, it delivers the underlying instrument upon exercise, or it segregates enough liquid assets to purchase the underlying reference instrument at themarked-to-market price during the term of the option. When trading options onnon-U.S. exchanges or in the OTC market, many of the protections afforded to exchange participants will not be available. For example, there may be no daily price fluctuation limits, and adverse market movements could therefore continue to an unlimited extent over an indefinite period of time.
The effectiveness of an options strategy for hedging depends on the degree to which price movements in the underlying reference instruments correlate with price movements in the relevant portion of the Fund’s portfolio that is being hedged. In addition, the Fund bears the risk that the prices of its portfolio investments will not move in the same amount as the option it has purchased or sold for hedging purposes, or that there may be a negative correlation that would result in a loss on both the investments and the option. If the investment manager is not successful in using options in managing the Fund’s investments, the Fund’s performance will be worse than if the investment manager did not employ such strategies.
Swaptions: An option on an interest-rate swap (sometimes referred to as a “swaption”) is a contract that gives the purchaser the right, but not the obligation, in return for payment of a premium, to enter into a new interest-rate swap. Options on swap agreements involve the risks associated with derivative instruments
198
Morningstar Funds Trust April 30, 2019
Notes to Financial Statements(continued)
generally, as well as the additional risks associated with both options and swaps generally. A pay fixed option on an interest-rate swap gives the buyer the right to establish a position in an interest-rate swap where the buyer will pay (and the writer will receive) the fixed-rate cash flows and receive (and the writer will pay) the floating-rate cash flows. In general, most options on interest-rate swaps are “European” exercise, which means that they can only be exercised at the end of the option term.
Depending on the movement of interest rates between the time of purchase and expiration, the value of the underlying interest-rate swap and therefore also the value of the option on the interest-rate swap will change. When a Fund purchases an option on a swap agreement, it risks losing only the amount of the premium it has paid should it decide to let the option expire unexercised, plus any related transaction costs. However, if a Fund writes (sells) a swaption, the Fund is bound by the terms of the underlying swap agreement upon exercise of the option by the buyer, which may result in losses to the Fund in excess of the premium it received.
Options on swap agreements are considered to be swaps for purposes of CFTC regulation. Although they are traded OTC, the CFTC may in the future designate certain options on swaps as subject to mandatory clearing.
When the Fund purchases a swaption, an amount equal to the premium paid by the Fund is recorded as an investment on the Schedule of Investments, the value of which ismarked-to-market daily to reflect the current market value of the swaption purchased. If the swaption expires, the Fund realizes a loss equal to the amount of the premium paid.
Swaptions aremarked-to-market daily based upon quotations from market makers. Changes in the value of the swaption are reported as unrealized gains or losses.
Interest Rate, Inflation Index and Total Return Swap Contracts: A Fund may purchase interest-rate swaps. A Fund may use interest-rate swaps to increase or decrease exposure to a particular interest rate or rates, which may result in the Fund experiencing a gain or loss depending on whether the interest rates increased or decreased during the term of the agreement. A Fund may also enter into inflation index swaps to manage exposure to inflation risk. An inflation index swap is an agreement between two parties, whereby one party makes payments based on the cumulative percentage increase in an index that serves as a measure of inflation (typically, the Consumer Price Index) and the other party makes a regular payment based on a compounded fixed rate. The value of an inflation index swap is expected to change in response to changes in the rate of inflation. If inflation increases at a faster rate than anticipated at the time the swap is entered into, the swap will increase in value. Similarly, if inflation increases at a rate slower than anticipated at the time the swap is entered into, the swap will decrease in value. A Fund may also engage in total return swaps, in which payments made by the Fund or the counterparty are based on the total return of a particular reference asset or assets (such as a fixed-income security, a combination of securities, or an index). The value of a Fund’s swap positions would increase or decrease depending on the changes in value of the underlying rates, currency values, volatility or other indexes or measures. Caps and floors have an effect similar to buying or writing options. Depending on how they are used, swap agreements may increase or decrease the overall volatility of the Fund’s investments and its share price. A Fund’s ability to engage in certain swap transactions may be limited by tax considerations.
199
Morningstar Funds Trust April 30, 2019
Notes to Financial Statements(continued)
A Fund’s ability to realize a profit from such transactions will depend on the ability of the financial institutions with which it enters into the transactions to meet their obligations to the Fund. If a counterparty’s creditworthiness declines, the value of the agreement would be likely to decline, potentially resulting in losses. If a default occurs by the other party to such transaction, a Fund will have contractual remedies pursuant to the agreements related to the transaction, which may be limited by applicable law in the case of a counterparty’s insolvency. Under certain circumstances, suitable transactions may not be available to a Fund, or the Fund may be unable to close out its position under such transactions at the same time, or at the same price, as if it had purchased comparable publicly traded securities. Swaps carry counterparty risks that cannot be fully anticipated. Also, because swap transactions typically involve a contract between the two parties, such swap investments can be extremely illiquid, as it is uncertain as to whether another counterparty would wish to take assignment of the rights under the swap contract at a price acceptable to a Fund.
For centrally cleared swaps, the Schedules of Investments includes the cumulative appreciation (depreciation), while only the current day’s variation margin is reported within the Statements of Assets and Liabilities. For credit default and interest rate contracts, anup-front payment received by a Fund is recorded as a liability and an upfront payment made by a Fund is recorded as an asset on the Fund’s Statement of Assets and Liabilities. Upfront payments are amortized over the term of the contract. If there is no upfront payment or receipt, market value will equal unrealized appreciation (depreciation). Periodic payments received (paid) by a Fund are recorded as realized gains (losses) from the expiration or closing of swap contracts on the Fund’s Statement of Assets and Liabilities.
Periodic payments received (paid) by the Funds are recorded as realized gains (losses). Interest rate swaps are marked to market daily and the change is recorded as unrealized gain (loss) on swap contracts in the Statements of Operations. The Funds’ risk of loss associated with these instruments may exceed their value, as recorded in the Schedule of Investments.Non-deliverable interest rate swap contracts are settled with the counterparty in U.S. Dollars without the delivery of foreign currency. Centrally cleared interest rate swaps may have forward effective dates. The amortization of the upfront premiums (if applicable) and payments related to these swap contracts begin on the effective date of the contract. Interest rate contracts outstanding, including their respective notional amounts at period end, if any, are listed after each Fund’s Schedule of Investments.
Credit Default Swap Contracts: A Fund may purchase credit default swaps. A credit default swap is an agreement between a Fund and a counterparty that enables the Fund to buy or sell protection against a credit event related to a particular issuer. One party, acting as a protection buyer, makes periodic payments, which may be based on, among other things, a fixed or floating rate of interest, to the other party, a protection seller, in exchange for a promise by the protection seller to make a payment to the protection buyer if a negative credit event (such as a delinquent payment or default) occurs with respect to a referenced bond or group of bonds. Credit default swaps may also be structured based on the debt of a basket of issuers, rather than a single issuer, and may be customized with respect to the default event that triggers purchase or other factors, or defaults by a particular combination of issuers within the basket, may trigger a payment obligation). As a credit protection seller in a credit default swap contract, a Fund would be required to pay the par (or other agreed-upon) value of a referenced debt obligation to the counterparty following certain negative credit events as to a specified third-party debtor, such as default by a U.S. ornon-U.S. corporate issuer on its debt obligations. In return for its obligation, a Fund would receive from the counterparty a periodic stream of payments, which may be based on, among other things, a fixed or floating rate of interest, over the term of the contract provided that no event of
200
Morningstar Funds Trust April 30, 2019
Notes to Financial Statements(continued)
default has occurred. If no default occurs, a Fund would keep the stream of payments, and would have no payment obligations to the counterparty. A Fund may sell credit protection to earn additional income and/or to take a synthetic long position in the underlying security or basket of securities.
A Fund may enter into credit default swap contracts as protection buyer to hedge against the risk of default on the debt of a particular issuer or basket of issuers or attempt to profit from a deterioration or perceived deterioration in the creditworthiness of the particular issuer(s) (also known as buying credit protection). This would involve the risk that the investment may expire worthless and would only generate gain in the event of an actual default by the issuer(s) of the underlying obligation(s) (or, as applicable, a credit downgrade or other indication of financial instability). It would also involve the risk that the seller may fail to satisfy its payment obligations to a Fund. The purchase of credit default swaps involves costs, which will reduce a Fund’s return.
Credit default swaps involve a number of special risks. A protection seller may have to pay out amounts following a negative credit event greater than the value of the reference obligation delivered to it by its counterparty and the amount of periodic payments previously received by it from the counterparty. When a Fund acts as a seller of a credit default swap, it is exposed to, among other things, leverage risk because if an event of default occurs the seller must pay the buyer the full notional value of the reference obligation. Each party to a credit default swap is subject to the credit risk of its counterparty (the risk that its counterparty may be unwilling or unable to perform its obligations on the swap as they come due). The value of the credit default swap to each party will change based on changes in the actual or perceived creditworthiness of the underlying issuer.
A protection buyer may lose its investment and recover nothing should an event of default not occur. A Fund may seek to realize gains on its credit default swap positions, or limit losses on its positions, by selling those positions in the secondary market. There can be no assurance that a liquid secondary market will exist at any given time for any particular credit default swap or for credit default swaps generally.
The market for credit default swaps has become more volatile in recent years as the creditworthiness of certain counterparties has been questioned and/or downgraded. The parties to a credit default swap may be required to post collateral to each other. If a Fund posts initial or periodic collateral to its counterparty, it may not be able to recover that collateral from the counterparty in accordance with the terms of the swap. In addition, if the Fund receives collateral from its counterparty, it may be delayed or prevented from realizing on the collateral in the event of the insolvency or bankruptcy of the counterparty. A Fund may exit its obligations under a credit default swap only by terminating the contract and paying applicable breakage fees, or by entering into an offsetting credit default swap position, which may cause the Fund to incur more losses.
The credit default contracts are marked to market daily and the change, if any, is recorded as an unrealized gain or loss. Changes in market value are accounted for as unrealized appreciation or depreciation until the contract is closed, at which time the gains or losses are realized. Upon the occurrence of a credit event, the difference between the par value and market value of the reference obligation, net of any proportional amount of theup-front payment, is recorded as a realized gain or loss on swap contracts in the Statements of Operations.
201
Morningstar Funds Trust April 30, 2019
Notes to Financial Statements(continued)
The Fund’s risk of loss associated with these instruments may exceed their value, as recorded in the Schedule of Investments. Credit default contracts outstanding, including their respective notional amounts at period end, if any, are listed after each Fund’s Schedule of Investments.
Implied credit spreads, represented in absolute terms, utilized in determining the market value of credit default contracts on corporate issues or sovereign issues of an emerging country as of period end are disclosed in the Schedules of Investments and serve as an indicator of the current status of the payment/performance risk and represent the likelihood or risk of default for the credit derivative. The implied credit spread of a particular referenced entity reflects the cost of buying/selling protection and may include upfront payments required to be made to enter into the agreement. For credit default contracts on asset-backed securities and credit indices, the quoted market prices and resulting values serve as the indicator of the current status of the payment/performance risk. Wider credit spreads and increasing market values, in absolute terms when compared to the notional amount of the swap, represent a deterioration of the referenced entity’s credit soundness and a greater likelihood or risk of default or other credit event occurring as defined under the terms of the agreement.
Master Agreements: Certain Funds are parties to master netting arrangements with counterparties (“Master Agreements”). Master Agreements govern the terms of certain like transactions, and reduce the counterparty risk associated with relevant transactions by specifying payment netting mechanisms across multiple transactions and providing standardization that improves legal certainty. Since different types of transactions have different mechanics and are sometimes traded by different legal entities of a particular counterparty organization, each type of transaction may be covered by a different Master Agreement, resulting in the need for multiple Master Agreements with a counterparty and its affiliates.
As the Master Agreements are specific to unique operations of different asset types, they allow the Funds to i) close out and net their total exposure to a counterparty in the event of a default with respect to all the transactions governed under a single Master Agreement with a counterparty, ii) exit transactions through means other than sale, such as through a negotiated agreement with the Funds’ counterparty, a transfer to another party, or close out of the position through execution of an offsetting transaction.
Master Repurchase Agreements govern repurchase, or reverse repurchase transactions, relating to government bonds between certain Funds and select counterparties. Master Repurchase Agreements maintain provisions for initiation, income payments, events of default, and maintenance of collateral.
Prime Broker Arrangements may be entered into to facilitate execution and/or clearing of equities, bonds, equity options or short sales of securities between certain Funds and selected counterparties. These arrangements provide financing terms for such transactions and include guidelines surrounding the rights, obligations, and other events, including, but not limited to, margin, execution, and settlement. These agreements maintain provisions for payments, maintenance of collateral, events of default, and termination. Margin and other assets delivered as collateral are typically held by the prime broker and offset any obligations due to the prime broker.
202
Morningstar Funds Trust April 30, 2019
Notes to Financial Statements(continued)
Customer Account Agreements govern cleared derivatives transactions and exchange-traded futures and options transactions. Upon entering into an exchange-traded or centrally cleared derivative contract, the Funds are required to deposit with the relevant clearing organization cash or securities, which is referred to as the initial margin. Securities deposited as initial margin are designated on the Schedules of Investments and cash deposited is recorded as Deposits with brokers for centrally cleared swaps and Deposits with brokers for futures contracts on the Statements of Assets and Liabilities. For exchange-traded futures or centrally cleared swaps, initial margin is posted, and daily changes in fair value are recorded as a payable or receivable on the Statement of Assets and Liabilities as Variation margin on centrally cleared swaps and Variation margin on futures contracts. Variation margin is determined separately for exchange-traded futures and centrally cleared swaps and cannot be netted.
International Swaps and Derivatives Association, Inc. Master Agreements and Credit Support Annexes (“ISDA Master Agreements”) govern OTC derivative transactions entered into between certain Funds and a counterparty. ISDA Master Agreements maintain provisions for general obligations, representations, netting of settlement payments, agreements to deliver supporting documents, collateral transfer and events of default or termination. Events of termination include a decline in the Fund’s net assets below a specified threshold over a certain period of time or a decline in the counterparty’s long-term and short-term credit ratings below a specified level. In each case, upon occurrence, the other party may elect to terminate early and cause settlement of all OTC contracts outstanding, including the payment of any losses and costs resulting from such early termination, as reasonably determined by the terminating party. Any decision by a party to elect early termination could be material to the financial statements and impact a Fund’s future derivative activity.
Collateral and margin requirements differ according to the terms of each type of Master Agreement. Collateral is routinely transferred if the total net exposure net of existing collateral already in place governed under the relevant Master Agreement with a counterparty in a given account exceeds a specified threshold. Collateral can be in the form of cash, debt securities issued by the U.S. government, money market funds and other securities as agreed to by the Fund and the applicable counterparty, or as permitted by the clearing house or exchange.
Collateral pledged by a Fund for OTC derivatives pursuant to a Master Agreement is segregated by the Fund’s custodian and identified as an asset in the Statements of Assets and Liabilities either as a component of Investments in securities, at value (securities) or in Due from brokers (cash). Segregation of a Fund’s collateral in the custodian account helps mitigate counterparty risk.
Collateral posted for the benefit of a Fund pursuant to a Master Agreement is held by a custodian of the Fund. Amounts which can be invested or repledged, are presented in the Fund’s Schedule of Investments. Collateral received is reflected as a liability within Due to brokers in the Statements of Assets and Liabilities.
203
Morningstar Funds Trust April 30, 2019
Notes to Financial Statements(continued)
The Funds use derivative instruments as part of their principal investment strategy to achieve their investment objectives. The Funds’ derivative contracts are not accounted for as hedging instruments under GAAP. The effect of such derivative instruments on the Funds’ financial position and financial performance for the period ended April 30, 2019 are as follows:
| | | | | | | | | | | | | | | | | | | | | | | | | | | | | | | | | | | | | | | | |
| | | Assets | | Liabilities |
| Fund | | Unrealized
Appreciation
on Futures
Contracts(1) | | Swaps at
Value(2) | | Unrealized
Appreciation
on Forward
Currency
Exchange
Contracts | | Purchased
Options at
Market
Value | | Unrealized
Depreciation
on Futures
Contracts(1) | | Swaps at
Value(2) | | Unrealized
Depreciation
on Forward
Currency
Exchange
Contracts | | Written
Options at
Market
Value |
| | | | | | | | |
Credit Risk Exposure: | | | | | | | | | | | | | | | | | | | | | | | | | | | | | | | | | | | | | | | | |
Morningstar Total Return Bond Fund | | | $ | — | | | | $ | 1,183,061 | | | | $ | — | | | | $ | — | | | | $ | — | | | | $ | 8,412 | | | | $ | — | | | | $ | — | |
Morningstar Multisector Bond Fund | | | | — | | | | | 202,552 | | | | | — | | | | | — | | | | | — | | | | | — | | | | | — | | | | | — | |
Equity Risk Exposure: | | | | | | | | | | | | | | | | | | | | | | | | | | | | | | | | | | | | | | | | |
Morningstar Alternatives Fund | | | | — | | | | | — | | | | | — | | | | | 30,322 | | | | | — | | | | | — | | | | | — | | | | | 31,109 | |
Foreign Exchange Rate Risk Exposure: | | | | | | | | | | | | | | | | | | | | | | | | | | | | | | | | | | | | | | | | |
Morningstar International Equity Fund | | | | — | | | | | — | | | | | 50,360 | | | | | — | | | | | — | | | | | — | | | | | — | | | | | — | |
Morningstar Total Return Bond Fund | | | | — | | | | | — | | | | | 23,166 | | | | | 16,180 | | | | | — | | | | | — | | | | | 51,722 | | | | | 4,412 | |
Morningstar Multisector Bond Fund | | | | — | | | | | — | | | | | 481,365 | | | | | 2,434 | | | | | — | | | | | — | | | | | 242,461 | | | | | — | |
Morningstar Alternatives Fund | | | | — | | | | | — | | | | | 27,570 | | | | | — | | | | | — | | | | | — | | | | | 3,594 | | | | | — | |
Inflation Risk Exposure: | | | | | | | | | | | | | | | | | | | | | | | | | | | | | | | | | | | | | | | | |
Morningstar Total Return Bond Fund | | | | — | | | | | 18,568 | | | | | — | | | | | — | | | | | — | | | | | 21,334 | | | | | — | | | | | — | |
Interest Rate Risk Exposure: | | | | | | | | | | | | | | | | | | | | | | | | | | | | | | | | | | | | | | | | |
Morningstar Total Return Bond Fund | | | | 296,152 | | | | | 417,885 | | | | | — | | | | | — | | | | | 281,963 | | | | | 408,375 | | | | | — | | | | | 48,212 | |
Morningstar Multisector Bond Fund | | | | — | | | | | — | | | | | — | | | | | — | | | | | — | | | | | 244,587 | | | | | — | | | | | — | |
Netting: | | | | | | | | | | | | | | | | | | | | | | | | | | | | | | | | | | | | | | | | |
Morningstar International Equity Fund | | | | — | | | | | — | | | | | — | | | | | — | | | | | — | | | | | — | | | | | — | | | | | — | |
Morningstar Total Return Bond Fund | | | | (281,963 | ) | | | | (438,121 | ) | | | | (23,166 | ) | | | | (16,180 | ) | | | | (281,963 | ) | | | | (438,121 | ) | | | | (23,166 | ) | | | | (16,180 | ) |
Morningstar Multisector Bond Fund | | | | — | | | | | (202,552 | ) | | | | (242,461 | ) | | | | — | | | | | — | | | | | (202,552 | ) | | | | (242,461 | ) | | | | — | |
Morningstar Alternatives Fund | | | | — | | | | | — | | | | | (3,594 | ) | | | | (30,322 | ) | | | | — | | | | | — | | | | | (3,594 | ) | | | | (30,322 | ) |
Net Fair Value of Derivative Contracts: | | | | | | | | | | | | | | | | | | | | | | | | | | | | | | | | | | | | | | | | |
Morningstar International Equity Fund | | | | — | | | | | — | | | | | 50,360 | | | | | — | | | | | — | | | | | — | | | | | — | | | | | — | |
Morningstar Total Return Bond Fund | | | | 14,189 | | | | | 1,181,393 | | | | | — | | | | | — | | | | | — | | | | | — | | | | | 28,556 | | | | | 36,444 | |
Morningstar Multisector Bond Fund | | | | — | | | | | — | | | | | 238,904 | | | | | 2,434 | | | | | — | | | | | 42,035 | | | | | — | | | | | — | |
Morningstar Alternatives Fund | | | | — | | | | | — | | | | | 23,976 | | | | | — | | | | | — | | | | | — | | | | | — | | | | | 787 | |
| 1 | Includes cumulative appreciation/depreciation on futures contracts as reported in the Schedule of Investments’ footnotes. Only the current day’s variation margin is reported within the Statements of Assets and Liabilities. |
| 2 | Includes cumulative appreciation/depreciation on centrally-cleared swap agreements as reported in the Schedule of Investments’ footnotes. Only the current day’s variation margin is reported within the Statements of Assets and Liabilities. |
The following table indicates the effect of derivative instruments, by primary underlying risk exposure and contract type, on the Statement of Operations for the period ended April 30, 2019:
| | | | | | | | | | | | | | | | | | | | | | | | | | | | | | | | | | | | | | | | |
| | | Realized Gain (Loss) on Derivatives Recognized as a Result from Operations | | Net Change in Unrealized Appreciation (Depreciation) on Derivatives Recognized as a Result from Operations |
| Fund | | Futures
Contracts | | Swap
Contracts | | Forward
Currency
Exchange
Contracts | | Purchased
Options | | Futures
Contracts | | Swap
Contracts | | Forward
Currency
Exchange
Contracts | | Purchased
Options |
Credit Risk Exposure: | | | | | | | | | | | | | | | | | | | | | | | | | | | | | | | | | | | | | | | | |
Morningstar Total Return Bond Fund | | | $ | — | | | | $ | 363,618 | | | | $ | — | | | | $ | — | | | | $ | — | | | | $ | 171,124 | | | | $ | — | | | | $ | — | |
Morningstar Multisector Bond Fund | | | | — | | | | | 126,468 | | | | | — | | | | | — | | | | | — | | | | | 14,774 | | | | | — | | | | | — | |
Equity Risk Exposure: | | | | | | | | | | | | | | | | | | | | | | | | | | | | | | | | | | | | | | | | |
Morningstar Alternatives Fund | | | | — | | | | | — | | | | | — | | | | | 3,067 | | | | | — | | | | | — | | | | | — | | | | | (1,072 | ) |
204
Morningstar Funds Trust April 30, 2019
Notes to Financial Statements(continued)
| | | | | | | | | | | | | | | | | | | | | | | | | | | | | | | | | | | | | | | | |
| | | Realized Gain (Loss) on Derivatives Recognized as a Result from Operations | | Net Change in Unrealized Appreciation (Depreciation) on Derivatives Recognized as a Result from Operations |
| Fund | | Futures
Contracts | | Swap
Contracts | | Forward
Currency
Exchange
Contracts | | Purchased
Options | | Futures
Contracts | | Swap
Contracts | | Forward
Currency
Exchange
Contracts | | Purchased
Options |
| | | | | | | | |
Foreign Exchange Rate Risk Exposure: | | | | | | | | | | | | | | | | | | | | | | | | | | | | | | | | | | | | | | | | |
Morningstar International Equity Fund | | | $ | — | | | | $ | — | | | | $ | — | | | | $ | — | | | | $ | — | | | | $ | — | | | | $ | 50,360 | | | | $ | — | |
Morningstar Total Return Bond Fund | | | | — | | | | | — | | | | | (69,787 | ) | | | | 16,417 | | | | | — | | | | | — | | | | | (28,556 | ) | | | | 5,233 | |
Morningstar Multisector Bond Fund | | | | — | | | | | — | | | | | 228,191 | | | | | — | | | | | — | | | | | — | | | | | 238,904 | | | | | — | |
Morningstar Alternatives Fund | | | | — | | | | | — | | | | | 2,207 | | | | | — | | | | | — | | | | | — | | | | | 23,976 | | | | | — | |
Interest Rate Risk Exposure: | | | | | | | | | | | | | | | | | | | | | | | | | | | | | | | | | | | | | | | | |
Morningstar Total Return Bond Fund | | | | (950,221 | ) | | | | 66,490 | | | | | — | | | | | 159,043 | | | | | 14,189 | | | | | 141,944 | | | | | — | | | | | 13,014 | |
Morningstar Multisector Bond Fund | | | | — | | | | | 30,651 | | | | | — | | | | | — | | | | | — | | | | | (244,587 | ) | | | | — | | | | | — | |
The following tables present the Funds’ gross OTC derivative assets and liabilities by counterparty and contract type net of amounts available for offset under netting arrangements and any related collateral received or posted by the Funds’ as of April 30, 2019.
Morningstar International Equity Fund
| | | | | | | | | | |
| Derivative Financial Instruments: | | Assets | | Liabilities |
| | |
Forward foreign currency exchange contracts | | | $ | 50,360 | | | | $ | — | |
| | |
Total gross amount of derivatives in the Statement of Assets and liabilities | | | | 50,360 | | | | | — | |
Less: Derivatives not subject to MNA or similar agreements | | | | — | | | | | — | |
| | |
Total gross amount of derivatives subject to MNA or similar agreement | | | $ | 50,360 | | | | $ | — | |
| | | | | | | | | | | | | | | | | | | | | | | | | |
| Counterparty | | Gross
Assets | | Offset | | Net Amount
Before
Collateral | | Collateral
(Received)
Pledged | | Net Exposure |
| | | | | |
Northern Trust | | | $ | 50,360 | | | | | — | | | | $ | 50,360 | | | | | — | | | | $ | 50,360 | |
Morningstar Total Return Bond Fund
| | | | | | | | | | |
| Financial Instruments: | | Assets | | Liabilities |
| | |
Forward foreign currency exchange contracts | | | $ | 23,166 | | | | $ | 51,722 | |
Futures contracts | | | | 296,152 | | | | | 281,963 | |
Purchased options | | | | 16,180 | | | | | — | |
Repurchase agreements | | | | 286,905 | | | | | — | |
Written options | | | | — | | | | | 52,624 | |
Interest rate swap contracts* | | | | 417,885 | | | | | 408,375 | |
Inflation swap contracts* | | | | 18,568 | | | | | 21,334 | |
Credit default swap contracts* | | | | 1,183,061 | | | | | 8,412 | |
| | |
Total gross amount of derivatives in the Statement of Assets and Liabilities | | | $ | 2,241,917 | | | | $ | 824,430 | |
Less: Securities not subject to MNA or similar agreements | | | | (1,868,192 | ) | | | | (764,273 | ) |
| | |
Total gross amount of derivatives subject to MNA or similar agreement | | | $ | 373,725 | | | | $ | 60,157 | |
| * | The values of swap agreements are the market values listed on the Schedules of Investments. |
205
Morningstar Funds Trust April 30, 2019
Notes to Financial Statements(continued)
Morningstar Total Return Bond Fund (continued)
| | | | | | | | | | | | | | | | | | | | | | | | | |
| Counterparty | | Gross
Assets | | Offset | | Net Amount
Before
Collateral | | Collateral
(Received)
Pledged | | Net Exposure |
| | | | | |
Bank of America | | | $ | 289,910 | | | | $ | — | | | | $ | 289,910 | | | | $ | (286,987 | ) | | | $ | 2,923 | |
Barclays | | | | 1,400 | | | | | (1,400 | ) | | | | — | | | | | — | | | | | — | |
BNP | | | | 23,013 | | | | | (12,678 | ) | | | | 10,335 | | | | | — | | | | | 10,335 | |
Citibank | | | | 18,507 | | | | | (15,355 | ) | | | | 3,152 | | | | | — | | | | | 3,152 | |
Deutsche Bank | | | | 4,056 | | | | | (954 | ) | | | | 3,102 | | | | | — | | | | | 3,102 | |
Goldman Sachs(a) | | | | 10,377 | | | | | (3,002 | ) | | | | 7,375 | | | | | (7,375 | ) | | | | — | |
HSBC(b) | | | | 8,696 | | | | | (35 | ) | | | | 8,661 | | | | | (8,661 | ) | | | | — | |
JP Morgan Chase | | | | 2,054 | | | | | (2,054 | ) | | | | — | | | | | — | | | | | — | |
Morgan Stanley | | | | 14,143 | | | | | (14,143 | ) | | | | — | | | | | — | | | | | — | |
State Street | | | | 1,128 | | | | | (1,128 | ) | | | | — | | | | | — | | | | | — | |
Toronto Dominion Bank | | | | 340 | | | | | — | | | | | 340 | | | | | — | | | | | 340 | |
Union Bank of Switzerland | | | | 101 | | | | | (101 | ) | | | | — | | | | | — | | | | | — | |
| | | | | |
Total | | | $ | 373,725 | | | | $ | (50,850 | ) | | | $ | 322,875 | | | | $ | (303,023 | ) | | | $ | 19,852 | |
| | | | | | | | | | | | | | | | | | | | | | | | | |
| Counterparty | | Gross
Liabilities | | Offset | | Net Amount
Before
Collateral | | Collateral
(Received)
Pledged | | Net Exposure |
| | | | | |
Barclays | | | $ | (2,134 | ) | | | $ | 1,400 | | | | $ | (734 | ) | | | $ | — | | | | $ | (734 | ) |
BNP | | | | (12,678 | ) | | | | 12,678 | | | | | — | | | | | — | | | | | — | |
Citibank | | | | (15,355 | ) | | | | 15,355 | | | | | — | | | | | — | | | | | — | |
Deutsche Bank | | | | (954 | ) | | | | 954 | | | | | — | | | | | — | | | | | — | |
Goldman Sachs | | | | (3,002 | ) | | | | 3,002 | | | | | — | | | | | — | | | | | — | |
HSBC | | | | (35 | ) | | | | 35 | | | | | — | | | | | — | | | | | — | |
JP Morgan Chase(c) | | | | (7,748 | ) | | | | 2,054 | | | | | (5,694 | ) | | | | 5,694 | | | | | — | |
Morgan Stanley | | | | (14,183 | ) | | | | 14,143 | | | | | (40 | ) | | | | — | | | | | (40 | ) |
Standard Chartered Bank | | | | (1,137 | ) | | | �� | — | | | | | (1,137 | ) | | | | — | | | | | (1,137 | ) |
State Street | | | | (1,753 | ) | | | | 1,128 | | | | | (625 | ) | | | | — | | | | | (625 | ) |
Union Bank of Switzerland | | | | (1,178 | ) | | | | 101 | | | | | (1,077 | ) | | | | — | | | | | (1,077 | ) |
| | | | | |
Total | | | $ | (60,157 | ) | | | $ | 50,850 | | | | $ | (9,307 | ) | | | $ | 5,694 | | | | $ | (3,613 | ) |
| (a) | Actual amount of collateral received from Goldman Sachs exceeded the net amount before collateral and is included included in “Due to broker” in the Statements of Assets and Liabilities. |
| (b) | Actual amount of collateral received from HSBC exceeded the net amount before collateral and is included included in “Due to broker” in the Statements of Assets and Liabilities. |
| (c) | Actual amount of collateral pledged by the Fund to JP Morgan Chase exceeded the net amount before collateral and is included in “Due from broker” in the Statements of Assets and Liabilities. |
Morningstar Multisector Bond Fund
| | | | | | | | | | |
| Derivative Financial Instruments: | | Assets | | Liabilities |
| | |
Forward foreign currency exchange contracts | | | $ | 481,365 | | | | $ | 242,461 | |
Purchased options | | | | 2,433 | | | | | — | |
Interest rate swap contracts* | | | | — | | | | | 244,587 | |
Credit default swap contracts* | | | | 202,552 | | | | | — | |
206
Morningstar Funds Trust April 30, 2019
Notes to Financial Statements(continued)
Morningstar Multisector Bond Fund (continued)
| | | | | | | | |
| Derivative Financial Instruments: | | Assets | | | Liabilities | |
| | |
Total gross amount of derivatives in the Statement of Assets and Liabilities | | $ | 686,350 | | | $ | 487,048 | |
Less: Derivatives not subject to MNA or similar agreements | | | (202,552 | ) | | | (244,587 | ) |
| | |
Total gross amount of derivatives subject to MNA or similar agreement | | $ | 483,799 | | | $ | 242,461 | |
| * | The values of swap agreements are the market values listed on the Schedules of Investments. |
| | | | | | | | | | | | | | | | | | | | | | | | | |
| Counterparty | | Gross
Assets | | Offset | | Net Amount
Before
Collateral | | Collateral
(Received)
Pledged | | Net Exposure |
| | | | | |
Bank of America | | | $ | 45,656 | | | | $ | (45,656 | ) | | | $ | — | | | | $ | — | | | | $ | — | |
Barclays | | | | 9,173 | | | | | (9,173 | ) | | | | — | | | | | — | | | | | — | |
BNP | | | | 19,884 | | | | | (19,884 | ) | | | | — | | | | | — | | | | | — | |
JP Morgan Chase | | | | 13,997 | | | | | (13,997 | ) | | | | — | | | | | — | | | | | — | |
Citibank(a) | | | | 130,223 | | | | | (42,200 | ) | | | | 88,023 | | | | | (88,023 | ) | | | | — | |
Deutshe Bank | | | | 106,210 | | | | | — | | | | | 106,210 | | | | | — | | | | | 106,210 | |
Goldman Sachs | | | | 8,008 | | | | | (8,008 | ) | | | | — | | | | | — | | | | | — | |
HSBC | | | | 150,648 | | | | | (2,194 | ) | | | | 148,454 | | | | | (132,064 | ) | | | | 16,390 | |
| | | | | |
Total | | | $ | 483,799 | | | | $ | (141,112 | ) | | | $ | 342,687 | | | | $ | (220,087 | ) | | | $ | 122,600 | |
| | | | | | | | | | | | | | | | | | | | | | | | | |
| Counterparty | | Gross
Liabilties | | Offset | | Net Amount
Before
Collateral | | Collateral
(Received)
Pledged | | Net Exposure |
| | | | | |
Bank of America | | | $ | (79,748 | ) | | | $ | 45,656 | | | | $ | (34,092 | ) | | | $ | — | | | | $ | (34,092 | ) |
Barclays | | | | (14,770 | ) | | | | 9,173 | | | | | (5,597 | ) | | | | — | | | | | (5,597 | ) |
BNP | | | | (44,284 | ) | | | | 19,884 | | | | | (24,400 | ) | | | | — | | | | | (24,400 | ) |
JP Morgan Chase | | | | (34,037 | ) | | | | 13,997 | | | | | (20,040 | ) | | | | — | | | | | (20,040 | ) |
Citibank | | | | (42,200 | ) | | | | 42,200 | | | | | — | | | | | — | | | | | — | |
Goldman Sachs | | | | (15,678 | ) | | | | 8,008 | | | | | (7,670 | ) | | | | — | | | | | (7,670 | ) |
HSBC | | | | (2,194 | ) | | | | 2,194 | | | | | — | | | | | — | | | | | — | |
Standard Chartered | | | | (9,550 | ) | | | | — | | | | | (9,550 | ) | | | | — | | | | | (9,550 | ) |
| | | | | |
Total | | | $ | (242,461 | ) | | | $ | 141,112 | | | | $ | (101,349 | ) | | | $ | — | | | | $ | (101,349 | ) |
| (a) | Actual amount of collateral pledged by the Fund to Citibank exceeded the net amount before collateral and is included in “Due from broker” in the Statement of Assets and Liabilities. |
Morningstar Alternatives Fund
| | | | | | | | | | |
| Derivative Financial Instruments: | | Assets | | Liabilities |
| | |
Forward foreign currency exchange contracts | | | $ | 27,570 | | | | $ | 3,594 | |
Purchased options | | | | 30,322 | | | | | — | |
Written options | | | | — | | | | | 31,109 | |
| | |
Total gross amount of derivatives in the Statement of Assets and Liabilities | | | $ | 57,892 | | | | $ | 34,703 | |
Less: Derivatives not subject to MNA or similar agreements | | | | (30,322 | ) | | | | (31,109 | ) |
| | |
Total gross amount of derivatives subject to MNA or similar agreement | | | $ | 27,570 | | | | $ | 3,594 | |
207
Morningstar Funds Trust April 30, 2019
Notes to Financial Statements(continued)
Morningstar Alternatives Fund (continued)
| | | | | | | | | | | | | | | | | | | | |
| Counterparty | | Gross
Assets | | | Offset | | | Net Amount
Before
Collateral | | | Collateral
(Received)
Pledged | | | Net Exposure | |
| | | | | |
Morgan Stanley | | | $27,570 | | | | $(3,594 | ) | | | $23,976 | | | | $— | | | | $23,976 | |
| | | | | |
| Counterparty | | Gross
Liabilties | | | Offset | | | Net Amount
Before
Collateral | | | Collateral
(Received)
Pledged | | | Net Exposure | |
| | | | | |
Morgan Stanley | | | $(3,594 | ) | | | $3,594 | | | | $— | | | | $— | | | | $— | |
For the period ended April 30, 2019 the quarterly average notional values were as follows and are representative of the trading volume of the derivatives held by the Funds.
| | | | | | | | | | | | | | | | |
| | | Morningstar
International
Equity Fund | | | Morningstar
Total Return
Bond Fund | | | Morningstar
Multisector
Bond Fund | | | Morningstar
Alternatives
Fund | |
| | | | |
Futures Contracts: | | | | | | | | | | | | | | | | |
Average Notional Balance - Long | | $ | — | | | $ | 121,460,969 | | | $ | — | | | $ | — | |
Average Notional Balance - Short | | | — | | | | 77,737,158 | | | | — | | | | — | |
Ending Notional Balance - Long | | | — | | | | 142,277,004 | | | | — | | | | — | |
Ending Notional Balance - Short | | | — | | | | 87,725,723 | | | | — | | | | — | |
Forward Foreign Currency Exchange Contracts: | | | | | | | | | | | | | | | | |
Average Settlement Value - Purchased | | | 1,270,416 | | | | 2,241,274 | | | | 37,191,936 | | | | 2,056,588 | |
Average Settlement Value - Sold | | | — | | | | 2,166,569 | | | | 9,913,619 | | | | 653,553 | |
Ending Settlement Value - Purchased | | | 1,270,416 | | | | 2,796,116 | | | | 48,370,382 | | | | 3,224,645 | |
Ending Settlement Value - Sold | | | — | | | | 2,781,464 | | | | 13,330,185 | | | | 1,022,997 | |
Inflation Swaps: | | | | | | | | | | | | | | | | |
Average Notional Balance - Pays Fixed Rate | | | — | | | | 2,727,500 | | | | — | | | | — | |
Average Notional Balance - Receives Fixed Rate | | | — | | | | 3,367,500 | | | | — | | | | — | |
Ending Notional Balance - Pays Fixed Rate | | | — | | | | 5,455,000 | | | | — | | | | — | |
Ending Notional Balance - Receives Fixed Rate | | | — | | | | 6,735,000 | | | | — | | | | — | |
Interest Rate Swaps: | | | | | | | | | | | | | | | | |
Average Notional Balance - Pays Fixed Rate | | | — | | | | 36,667,000 | | | | 7,600,000 | | | | — | |
Average Notional Balance - Receives Fixed Rate | | | — | | | | 109,778,946 | | | | — | | | | — | |
Ending Notional Balance - Pays Fixed Rate | | | — | | | | 62,296,000 | | | | 10,760,000 | | | | — | |
Ending Notional Balance - Receives Fixed Rate | | | — | | | | 147,093,673 | | | | — | | | | — | |
Credit Default Swaps: | | | | | | | | | | | | | | | | |
Average Notional Balance - Buy Protection | | | — | | | | 2,093,000 | | | | — | | | | — | |
Average Notional Balance - Sell Protection | | | — | | | | 46,000,000 | | | | 3,530,700 | | | | — | |
Ending Notional Balance - Buy Protection | | | — | | | | 2,510,000 | | | | — | | | | — | |
Ending Notional Balance - Sell Protection | | | — | | | | 52,660,000 | | | | 2,475,000 | | | | — | |
Options: | | | | | | | | | | | | | | | | |
Average Notional Balance - Purchased | | | — | | | | 5,310,914 | | | | 302,500 | | | | 1,290,604 | |
208
Morningstar Funds Trust April 30, 2019
Notes to Financial Statements(continued)
Morningstar Alternatives Fund (continued)
| | | | | | | | | | | | | | | | | | | | |
| | | Morningstar
International
Equity Fund | | Morningstar
Total Return
Bond Fund | | Morningstar
Multisector
Bond Fund | | Morningstar
Alternatives
Fund |
| | | | |
Average Notional Balance - Written | | | $ | — | | | | $ | 23,777,680 | | | | $ | — | | | | $ | 322,662 | |
Ending Notional Balance - Purchased | | | | — | | | | | 3,193,240 | | | | | 605,000 | | | | | 2,116,411 | |
Ending Notional Balance - Written | | | | — | | | | | 24,852,470 | | | | | — | | | | | 536,930 | |
8. Federal Income Tax Matters
As of April 30, 2019, the cost and aggregate gross unrealized appreciation (depreciation) of long security positions, short security positions and derivative instruments for federal income tax purposes were as follows:
| | | | | | | | | | | | | | | | |
| Fund | | Cost of
Investments | | | Gross
Unrealized
Appreciation | | | Gross
Unrealized
Depreciation | | | Net
Unrealized
Appreciation
(Depreciation) | |
| | | | |
Morningstar U.S. Equity Fund | | $ | 634,956,711 | | | $ | 48,018,303 | | | $ | (6,464,871 | ) | | $ | 41,553,432 | |
Morningstar International Equity Fund | | | 442,601,223 | | | | 28,203,544 | | | | (3,451,921 | ) | | | 24,751,623 | |
Morningstar Global Income Fund | | | 178,410,207 | | | | 7,401,021 | | | | (423,840 | ) | | | 6,977,181 | |
Morningstar Total Return Bond Fund | | | 489,185,501 | | | | 5,699,791 | | | | (516,884 | ) | | | 5,182,907 | |
Morningstar Municipal Bond Fund | | | 104,787,447 | | | | 1,837,866 | | | | (14,420 | ) | | | 1,823,446 | |
Morningstar Defensive Bond Fund | | | 161,514,866 | | | | 801,181 | | | | (225,421 | ) | | | 575,760 | |
Morningstar Multisector Bond Fund | | | 157,824,315 | | | | 2,084,370 | | | | (1,521,211 | ) | | | 563,159 | |
Morningstar Unconstrained Allocation Fund | | | 42,885,233 | | | | 1,300,125 | | | | (307,614 | ) | | | 992,511 | |
Morningstar Alternatives Fund | | | 95,435,631 | | | | 1,462,585 | | | | (1,398,869 | ) | | | 63,716 | |
The differences between book basis and tax basis appreciation (depreciation) on investments is primarily attributable to wash sale loss deferrals, mark to market on passive foreign investment companies (“PFICs”), and timing of income recognition from Real Estate Investment Trusts (“REITs”).
As of April 30, 2019, the components of distributable earnings (loss) (excluding paid in capital) on a tax basis were as follows:
| | | | | | | | | | | | | | | | | | | | | | | | | |
| Fund | | Tax-Exempt
Income | | Current
Distributable
Ordinary
Income | | Current
Distributable
Long-Term
Capital Gain
or Tax Basis
Capital Loss
Carryforwards | | Net
Unrealized
Appreciation
(Depreciation) | | Total
Accumulated
Earnings |
| | | | | |
Morningstar U.S. Equity Fund | | | | $— | | | | | $4,404,209 | | | | | $17,003 | | | | | $41,545,283 | | | | | $45,966,495 | |
Morningstar International Equity Fund | | | | — | | | | | 2,882,718 | | | | | 28 | | | | | 24,673,764 | | | | | 27,556,510 | |
Morningstar Global Income Fund | | | | — | | | | | 1,342,301 | | | | | 13,989 | | | | | 6,976,730 | | | | | 8,333,020 | |
Morningstar Total Return Bond Fund | | | | — | | | | | 3,129,142 | | | | | — | | | | | 5,186,192 | | | | | 8,315,334 | |
209
Morningstar Funds Trust April 30, 2019
Notes to Financial Statements(continued)
| | | | | | | | | | | | | | | | | | | | | | | | | |
| Fund | | Tax-Exempt
Income | | Current
Distributable
Ordinary
Income | | Current
Distributable
Long-Term
Capital Gain
or Tax Basis
Capital Loss
Carryforwards | | Net
Unrealized
Appreciation
(Depreciation) | | Total
Accumulated
Earnings |
| | | | | |
Morningstar Municipal Bond Fund | | | $ | 41,630 | | | | $ | 345,806 | | | | $ | 17 | | | | $ | 1,823,446 | | | | $ | 2,210,899 | |
Morningstar Defensive Bond Fund | | | | — | | | | | 313,301 | | | | | 36 | | | | | 575,760 | | | | | 889,097 | |
Morningstar Multisector Bond Fund | | | | — | | | | | 1,420,552 | | | | | 77 | | | | | 618,182 | | | | | 2,038,811 | |
Morningstar Unconstrained Allocation Fund | | | | — | | | | | 626,141 | | | | | — | | | | | 992,744 | | | | | 1,618,885 | |
Morningstar Alternatives Fund | | | | — | | | | | 548,189 | | | | | 1,157 | | | | | 63,685 | | | | | 613,031 | |
The tax character of distributions paid during the fiscal period-ended April 30, 2019 were as follows:
| | | | | | | | | | | | |
| | | Fiscal Period Ended April 30, 2019 | | | | |
| Fund | | Tax-Exempt Income | | | Ordinary Income | | | Total Distributions Paid | |
| | | |
Morningstar U.S. Equity Fund | | | $ — | | | | $ 422,538 | | | | $ 422,538 | |
Morningstar International Equity Fund | | | — | | | | 550,924 | | | | 550,924 | |
Morningstar Global Income Fund | | | — | | | | 959,797 | | | | 959,797 | |
Morningstar Total Return Bond Fund | | | — | | | | 2,817,061 | | | | 2,817,061 | |
Morningstar Municipal Bond Fund | | | 743,422 | | | | 44,375 | | | | 787,797 | |
Morningstar Defensive Bond Fund | | | — | | | | 665,904 | | | | 665,904 | |
Morningstar Multisector Bond Fund | | | — | | | | 2,273,735 | | | | 2,273,735 | |
Morningstar Unconstrained Allocation Fund | | | — | | | | 257,198 | | | | 257,198 | |
Morningstar Alternatives Fund | | | — | | | | 86,515 | | | | 86,515 | |
Under the Regulated Investment Company Modernization Act of 2010, Funds are permitted to carry forward capital losses incurred in taxable years beginning after December 22, 2010 for an unlimited period. Capital loss carry forwards with no expiration will retain their character as either short-term or long-term capital losses.
At April 30, 2019, the Funds had no capital loss carryforwards to offset future capital gains, due to the Funds commencing operations on November 2, 2018.
9. Principal Risks and Concentrations
Multimanager and Subadviser Selection Risk:To a significant extent, the Funds’ performance depends on Morningstar’s skill in selecting subadvisers and each subadviser’s skill in selecting securities and executing its strategy. Subadviser strategies may occasionally be out of favor and subadvisers may underperform relative to their peers or benchmarks.
Foreign Securities Risk:Securities ofnon-U.S. issuers may be less liquid, more volatile, and harder to value than U.S. securities. They may also be subject to political, economic and regulatory risks, and market instability.
210
Morningstar Funds Trust April 30, 2019
Notes to Financial Statements(continued)
Emerging-Markets Risk:Emerging-market countries may have relatively unstable governments and economies based on only a few industries, which can cause greater instability. These countries are also more likely to experience higher levels of inflation, deflation, or currency devaluations, which could hurt their economies and securities markets.
Geographic Concentration Risk:To the extent that a Fund invests a significant portion of its assets in a particular country, region or continent, economic, political, social and environmental conditions in such country, region or continent will have a greater effect on the Fund’s performance than they would in a more geographically diversified equity fund.
Currency Risk: Because some of the Funds invest in foreign securities, changes in currency exchange rates could hurt performance. Morningstar or a subadviser may decide not to hedge, or may not be successful in hedging, its currency exposure.
Interest-Rate Risk:The value of fixed-income securities will typically decline when interest rates rise.
Credit Risk:Issuers of fixed-income securities could default or be downgraded if they fail to make required payments of principal or interest.
Derivatives Risk:A derivative is an instrument with a value based on the performance of an underlying currency, security, index, or other reference asset. Derivatives involve risks different from, or possibly greater than, the risks of investing in more traditional investments. Derivatives involve costs, may create leverage, and may be illiquid, volatile, or difficult to value. In addition, derivatives could cause losses if the counterparty to the transaction does not perform as promised. The investment results achieved by using derivatives may not match or fully offset changes in the value of the underlying currency, security, index, or other reference asset that a Fund was attempting to hedge or the investment opportunity it was trying to pursue.
10. Principal Ownership
As of April 30, 2019, the Funds had omnibus accounts owning more than 5% of the total shares outstanding of each Fund as follows:
| | | | | | | | |
| Fund | | Number of
Shareholders | | | % Ownership1 | |
| | |
Morningstar U.S. Equity Fund | | | 3 | | | | 96% | |
Morningstar International Equity Fund | | | 3 | | | | 95% | |
Morningstar Global Income Fund | | | 3 | | | | 96% | |
Morningstar Total Return Bond Fund | | | 3 | | | | 95% | |
Morningstar Municipal Bond Fund | | | 3 | | | | 94% | |
Morningstar Defensive Bond Fund | | | 3 | | | | 94% | |
Morningstar Multisector Bond Fund | | | 3 | | | | 95% | |
Morningstar Unconstrained Allocation Fund | | | 3 | | | | 95% | |
Morningstar Alternatives Fund | | | 3 | | | | 93% | |
|
1Includes omnibus positions of broker-dealers representing numerous shareholder accounts. | |
211
Morningstar Funds Trust April 30, 2019
Notes to Financial Statements(continued)
Investment activities of these shareholders may have a material effect on the Funds.
11. Line of Credit
The Funds have a $50 million line of credit agreement with Northern Trust. Borrowings are made solely to facilitate the handling of redemptions or unusual or unanticipated short-term cash requirements. Because several Funds participate and collateral requirements apply, there is no assurance that an individual Fund will have access to the entire $50 million at any particular time. Interest is charged to each Fund based on its borrowings at an amount above the Federal Funds rate. In addition, an administration fee of $20,000 was incurred by the Funds at inception of the agreement, $10,000 payable annually thereafter, and allocated among the Funds.
For the period ended April 30, 2019, the Funds made no borrowings against the line of credit.
12. New Accounting Pronouncements and Regulations
On March 30, 2017, the FASB issued Accounting Standards Update (ASU)2017-08 “Premium Amortization on Purchased Callable Debt Securities”, which amends the amortization period for certain purchased callable debt securities held at premium, shortening such period to the earliest call date. The new guidance requires an entity to amortize the premium on a callable debt security within its scope to the earliest call date, unless the guidance for considering estimated prepayments is applied. If the call option is not exercised at the earliest call date, the yield is reset to the effective yield using the payment terms of the security. If the security has more than one call date and the premium was amortized to a call price greater than the next call price, any excess of the amortized cost basis over the amount repayable at the next call date will be amortized to that date. If there are no other call dates, any excess of the amortized cost basis over the par amount will be amortized to maturity. Discounts on purchased callable debt securities will continue to be amortized to the security’s maturity date. ASU2017-08 is effective for public business entities for fiscal years, and interim periods within those fiscal years, beginning after December 15, 2018. For all other entities, ASU2017-08 is effective for fiscal years beginning after December 15, 2019, and interim periods within fiscal years beginning after December 15, 2020. Earlier application is permitted for all entities, including adoption in an interim period. If an entity early adopts the ASU in an interim period, any adjustments must be reflected as of the beginning of the fiscal year that includes that interim period. Management is assessing the impact of the adoption of ASU2017-08 on the financial statements.
On August 28, 2018, the FASB issued ASU2018-13, “Disclosure Framework — Changes to the Disclosure Requirements for Fair Value Measurement,” which amends the fair value measurement disclosure requirements of ASC 820. The amendments of ASU2018-13 include new, eliminated, and modified disclosure requirements of ASC 820. The ASU is effective for all entities for fiscal years beginning after December 15, 2019, including interim periods therein. Early adoption is permitted for any eliminated or modified disclosures upon issuance of this ASU. The Funds have early adopted ASU2018-13 for these financial statements.
13. Subsequent Events
Management has evaluated subsequent events after the balance sheet date through the date that the financial statements were issued and has not identified any events or transactions that would require recognition or disclosure in the financial statements.
212
Morningstar Funds Trust April 30, 2019
Report of Independent Registered Public Accounting Firm
To the Shareholders and the Board of Trustees of Morningstar Funds Trust
Opinion on the Financial Statements
We have audited the accompanying statements of assets and liabilities of Morningstar Funds Trust (comprising the Morningstar U.S. Equity Fund, Morningstar International Equity Fund, Morningstar Global Income Fund, Morningstar Total Return Bond Fund, Morningstar Municipal Bond Fund, Morningstar Defensive Bond Fund, Morningstar Multisector Bond Fund, Morningstar Unconstrained Allocation Fund, and Morningstar Alternatives Fund (collectively referred to as the “Funds”)), including the schedules of investments, as of April 30, 2019, and the related statements of operations and changes in net assets, and the financial highlights for the period from November 2, 2018 (commencement of operations) through April 30, 2019 and the related notes (collectively referred to as the “financial statements”). In our opinion, the financial statements present fairly, in all material respects, the financial position of each of the Funds comprising Morningstar Funds Trust at April 30, 2019, the results of their operations and the changes in their net assets, and their financial highlights for the period from November 2, 2018 (commencement of operations) through April 30, 2019, in conformity with U.S. generally accepted accounting principles.
Basis for Opinion
These financial statements are the responsibility of the Trust’s management. Our responsibility is to express an opinion on each of the Funds’ financial statements based on our audits. We are a public accounting firm registered with the Public Company Accounting Oversight Board (United States) (“PCAOB”) and are required to be independent with respect to the Trust in accordance with the U.S. federal securities laws and the applicable rules and regulations of the Securities and Exchange Commission and the PCAOB.
We conducted our audits in accordance with the standards of the PCAOB. Those standards require that we plan and perform the audit to obtain reasonable assurance about whether the financial statements are free of material misstatement, whether due to error or fraud. The Trust is not required to have, nor were we engaged to perform, an audit of the Trust’s internal control over financial reporting. As part of our audits we are required to obtain an understanding of internal control over financial reporting but not for the purpose of expressing an opinion on the effectiveness of the Trust’s internal control over financial reporting. Accordingly, we express no such opinion.
Our audits included performing procedures to assess the risks of material misstatement of the financial statements, whether due to error or fraud, and performing procedures that respond to those risks. Such procedures included examining, on a test basis, evidence regarding the amounts and disclosures in the financial statements. Our procedures included confirmation of securities owned as of April 30, 2019, by correspondence with the custodian and brokers or by other appropriate auditing procedures where replies from brokers were not received. Our audits also included evaluating the accounting principles used and significant estimates made by management, as well as evaluating the overall presentation of the financial statements. We believe that our audits provide a reasonable basis for our opinion.
ERNST & YOUNG LLP
We have served as the Trust’s auditor since 2018.
Chicago, Illinois
June 28, 2019
213
Morningstar Funds Trust April 30, 2019
Fund Expenses(unaudited)
As a shareholder of a Morningstar Funds Trust, you incur ongoing costs, including management fees, administration, custody,sub-accounting, trustees and other fund expenses. The following examples are intended to help you understand your ongoing costs (in dollars and cents) of investing in a Fund and to compare these costs with the ongoing costs of investing in other mutual funds.
The examples are based on an investment of $1,000 invested at the beginning of a six month period and held for the entire period, November 2, 2018 through April 30, 2019.
Actual Expenses
The three columns for each Fund in the table under the “Actual” heading provide information about actual account values and actual expenses. You may use the information in these columns, together with the amount you invested, to estimate the expenses that you paid over the period. Simply divide your account value by $1,000 (for example, an $8,600 account value divided by $1,000 = 8.6), then multiply the result by the number in the second column for your Fund under the heading entitled “Expenses Paid During Period” to estimate the expenses you paid on your account during this period.
Hypothetical Example for Comparison Purposes
The last three columns for each Fund in the table under the “Hypothetical (5% return)” heading provides information about hypothetical account values and hypothetical expenses based on the Fund’s actual expense ratio and an assumed rate of return of 5% per year before expenses, which is not the Fund’s actual return. The hypothetical account values and expenses may not be used to estimate the actual ending account balance or expenses you paid for the period. You may use this information to compare the ongoing costs of investing in your Fund and other funds. To do so, compare this 5% hypothetical example with the 5% hypothetical examples that appear in the shareholder reports of the other funds. Please note that the expenses shown in the table are meant to highlight your ongoing costs only. Therefore, the last three columns for each Fund in the table is useful in comparing ongoing costs only and will not help you determine the relative total costs of owning different funds.
| | | | | | | | | | | | | | | | | | | | | | | | | | | | | | | | | | | |
| | | | | Actual | | Hypothetical (5% return) |
| | | Annualized
Expense
Ratio | | Beginning
Account Value | | Ending
Account Value | | Expenses Paid
During Period | | Beginning
Account Value | | Ending
Account Value | | Expenses Paid
During Period |
| | | | | | | |
Morningstar
U.S. Equity
Fund | | | | 0.82% | | | | $ | 1,000.00 | | | | $ | 1,069.80 | | | | $ | 4.16 | | | | $ | 1,000.00 | | | | $ | 1,020.50 | | | | $ | 4.06 | |
Morningstar
International
Equity Fund | | | | 0.94 | | | | | 1,000.00 | | | | | 1,081.90 | | | | | 4.80 | | | | | 1,000.00 | | | | | 1,019.91 | | | | | 4.66 | |
Morningstar
Global
Income Fund | | | | 0.58 | | | | | 1,000.00 | | | | | 1,068.50 | | | | | 2.94 | | | | | 1,000.00 | | | | | 1,021.68 | | | | | 2.88 | |
Morningstar
Total Return
Bond Fund | | | | 0.53 | | | | | 1,000.00 | | | | | 1,060.10 | | | | | 2.68 | | | | | 1,000.00 | | | | | 1,021.92 | | | | | 2.63 | |
Morningstar
Municipal
Bond Fund | | | | 0.58 | | | | | 1,000.00 | | | | | 1,047.90 | | | | | 2.91 | | | | | 1,000.00 | | | | | 1,021.68 | | | | | 2.88 | |
214
Morningstar Funds Trust April 30, 2019
Fund Expenses(unaudited)(continued)
| | | | | | | | | | | | | | | | | | | | | | | | | | | | | | | | | | | |
| | | | | Actual | | Hypothetical (5% return) |
| | | Annualized
Expense
Ratio | | Beginning
Account Value | | Ending
Account Value | | Expenses Paid
During Period | | Beginning
Account Value | | Ending
Account Value | | Expenses Paid
During Period |
Morningstar
Defensive
Bond Fund | | | | 0.48% | | | | $ | 1,000.00 | | | | $ | 1,018.70 | | | | $ | 2.38 | | | | $ | 1,000.00 | | �� | | $ | 1,022.17 | | | | $ | 2.38 | |
Morningstar
Multisector Bond Fund | | | | 0.80 | | | | | 1,000.00 | | | | | 1,048.60 | | | | | 4.02 | | | | | 1,000.00 | | | | | 1,020.60 | | | | | 3.96 | |
Morningstar
Unconstrained
Allocation
Fund | | | | 0.64 | | | | | 1,000.00 | | | | | 1,049.70 | | | | | 3.22 | | | | | 1,000.00 | | | | | 1,021.38 | | | | | 3.17 | |
Morningstar
Alternatives
Fund | | | | 0.77 | | | | | 1,000.00 | | | | | 1,012.60 | | | | | 3.80 | | | | | 1,000.00 | | | | | 1,020.74 | | | | | 3.82 | |
215
Morningstar Funds Trust April 30, 2019
Tax Information(unaudited)
LONG-TERM CAPITAL GAIN— The following Funds designated the below amounts as long-term capital gains, pursuant to Section 852(b)(3)(C) of the Code, for the fiscal period ended April 30, 2019:
| | | | |
| Fund | | Long-Term
Capital Gain | |
| |
Morningstar U.S. Equity Fund | | | $17,003 | |
Morningstar International Equity Fund | | | 28 | |
Morningstar Global Income Fund | | | 13,989 | |
Morningstar Municipal Bond Fund | | | 17 | |
Morningstar Defensive Bond Fund | | | 36 | |
Morningstar Multisector Bond Fund | | | 77 | |
Morningstar Alternatives Fund | | | 1,157 | |
CORPORATE DIVIDENDS-RECEIVED DEDUCTION (DRD)— A percentage of the dividends distributed during the fiscal period ended April 30, 2019 for the following Funds qualifies for the dividends-received deduction for corporate shareholders:
| | | | |
| Fund | | Corporate DRD
Percentage (%) | |
| |
Morningstar U.S. Equity Fund | | | 100 | |
Morningstar Global Income Fund | | | 12 | |
Morningstar Unconstrained Allocation Fund | | | 6 | |
Morningstar Alternatives Fund | | | 4 | |
QUALIFIED DIVIDEND INCOME (QDI)— Under the Jobs and Growth Tax Relief Reconciliation Act of 2003 (the “Act”), the following percentages of ordinary dividends paid during the fiscal period ended April 30, 2019, are designated as “qualified dividend income”, as defined in the Act:
| | | | |
| Fund | | QDI
Percentage (%) | |
| |
Morningstar U.S. Equity Fund | | | 100 | |
Morningstar International Equity Fund | | | 100 | |
Morningstar Global Income Fund | | | 100 | |
Morningstar Unconstrained Allocation Fund | | | 96 | |
Morningstar Alternatives Fund | | | 72 | |
FOREIGN TAX CREDIT— The Funds below intends to make an election that will allow shareholders to treat their proportionate share of foreign taxes paid by the Fund as having been paid by them. The amounts per share which represent income from sources within, and taxes paid to, foreign countries are as follows:
| | | | | | | | |
| Fund | | Foreign Tax Credit | | | Foreign Source Income | |
| | |
Morningstar International Equity Fund | | | $0.006 | | | | $0.04 | |
216
Morningstar Funds Trust April 30, 2019
Trustees and Officers(unaudited)
| | | | | | | | | | |
Name and Year of Birth | | Position with
the Trust,
Term of Office
and Length of
Time Served | | Principal Occupation During Past Five Years | | Number of
Portfolios
in Fund
Complex
Overseen by
Trustees | | | Other
Directorships
Held During
Past Five Years |
Independent Trustees of the Trust(1) | | | | | | | | | | |
Theresa Hamacher (1960) | | Trustee and Chairperson of the Board since March 2018 | | President of Versanture Consulting since 2015; President of NICSA, Inc.(non-profit association global asset management industry participants) from 2008 to 2015 | | | 9 | | | Calamos Investment Trust from 2015 to 2017 |
Enrique M. Vasquez (1965) | | Trustee since March 2018 | | President of Wealth Management at Blucora, Inc. since 2019; Owner of Embrace Care, Inc. d/b/a CareBuilders at Home since 2015; President and CEO of Cetera Financial Specialists from 2004 to 2016 | | | 9 | | | Teachers Retirement System of Illinois from 2012 to 2014 |
Linda D. Taylor (1952) | | Trustee since April 2018 | | Chairman and Chief Executive Officer of Clifford Swan Investment Counselors since 2010 | | | 9 | | | San Pasqual Fiduciary Trust Company Since 2013 |
Barry P. Benjamin (1957) | | Trustee since July 2018 | | Partner at PricewaterhouseCoopers LLP from 1991 to 2018; Global Asset and Wealth Management Sector Leader at PricewaterhouseCoopers LLP from 2010 to 2017; U.S. Asset and Wealth Management Sector Leader at PricewaterhouseCoopers LLP from 2006 to 2015 | | | 9 | | | None |
Daniel E. Needham(2)(1978) | | Trustee President and Principal Executive Officer since 2017 | | President of Morningstar Inc.’s investment management group, Morningstar Investment Management, LLC and Morningstar Investment Services, LLC since 2015; Chief Investment Officer of Morningstar, Inc.’s investment management group since 2013 | | | 9 | | | None |
217
Morningstar Funds Trust April 30, 2019
Trustees and Officers(unaudited)(continued)
| | | | | | | | | | |
Name and Year of Birth | | Position with
the Trust,
Term of Office
and Length of
Time Served | | Principal Occupation During Past Five Years | | Number of
Portfolios
in Fund
Complex
Overseen by
Trustees | | | Other
Directorships
Held During
Past Five Years |
Officers of the Trust | | | | | | | | | | |
Tracy L. Dotolo (1976) | | Principal Financial Officer and Treasurer since March 2018 | | Fund Principal Financial Officer at Foreside, Inc. since May 2016; Vice President—Global Fund Services at JPMorgan Chase from May 2009 to April 2016. | | | N/A | | | N/A |
Nicholas M. Grove (1976) | | Assistant Treasurer since March 2018 | | Director of Finance at Morningstar, Inc. since May 2018; Global Controller at Morningstar, Inc. From February 2014 to May 2018; U.S. Controller at Morningstar, Inc. from July 2009 to February 2014. | | | N/A | | | N/A |
D. Scott Schilling (1960) | | Chief Compliance Officer,Anti-Money Laundering Compliance Officer, and Secretary since March 2018 | | Global Chief Compliance Officer at Morningstar, Inc. since July 2013; Chief Compliance Officer at Morningstar Investment Management, LLC since January 2000; Chief Compliance Officer at Morningstar Investment Services LLC since July 2001; and Chief Compliance Officer at Morningstar Research Services LLC since its inception in November 2016. | | | N/A | | | N/A |
F. Allen Bliss (1965) | | Assistant Secretary since March 2018 | | Associate General Counsel for Morningstar, Inc. since July 2003 and Assistant Corporate Secretary for Morningstar, Inc. since May 2015. | | | N/A | | | N/A |
| (1) | The trustees of the Trust who are not “interested persons” of the Trust as defined under the 1940 Act (independent trustees). |
| (2) | Daniel Needham is an “interested person” of the Trust as defined by the 1940 Act because he is an affiliated person of the adviser. |
Availability of Additional Information About the Trustees and Officers
The Statement of Additional Information includes additional information about the Trustees and Officers and is available without charge, upon request by calling (877)626-3224.
218
| | | | | | | | |
| | | | Morningstar Funds Trust Privacy Policy |
| | |
| | | | | Please read “Other Important Information” section below for information about Morningstar Funds Trust access to your personal information |
| | |
| Why? | | | | Financial companies can choose how they share your personal information. Federal law gives consumers the right to limit some, but not all sharing. Federal law also requires us to tell you how we collect, share, and protect your personal information. Please read this notice carefully to understand how Morningstar Funds Trust collects, shares, and protects your personal information. Please read “Other Important Information” section below for information about Morningstar Funds Trust access to your personal information |
| | | |
| What? | | | | The types of personal information that Morningstar Funds Trust collects includes, but is not limited to: |
| | u | | Your name, address, phone number, and email address; |
| | u | | Your social security number or other unique identifier; |
| | u | | Your account information, such as account balance and transactions (including account transaction history); |
| | | u | | Your demographic information, such as age, income, investment preferences, investment experience, and risk profile. |
| | |
| How? | | | | All financial companies need to share clients’ personal information to run their everyday business. In the section below, we list the reasons financial companies can share their clients’ personal information; the reasons, if any, Morningstar Funds Trust chooses to share; and whether you can limit this sharing. |
| | | | | | | | |
| | | | Reasons financial companies can share your personal information | | Does Morningstar Funds Trust share? | | Can you limit this sharing? |
| | | | For our everyday business purposes—such as to process your transactions, maintain your account(s), or respond to court orders and legal investigations. | | See “Other Important Information” below. | | No |
| | | | For our marketing purposes—to offer our products and services. | | No | | N/A |
| | | | For joint marketing with other financial companies. | | No | | N/A |
| | | | For our affiliates’ everyday business purposes—information about your transactions and experiences. | | No | | N/A |
| | | | For our affiliates’ everyday business purposes—information about your creditworthiness. | | No | | N/A |
| | | | For our affiliates to market to you. | | No | | N/A |
| | | | | For nonaffiliates to market to you. | | No | | N/A |
| | | | |
Who we are | | | | Who is providing this notice?Morningstar Funds Trust | | | | |
| | | |
| What we do | | | | How does Morningstar Funds Trust protect your personal information? | | |
| | | | In compliance with applicable law, Morningstar Funds Trust has adopted policies and procedures that address administrative, technical, and physical safeguards for the protection of your personal information. Security measures are in place to protect against unauthorized access to, or unauthorized alteration, disclosure or destruction of personal information. Secure data networks are protected by firewall and password protection systems and are located in secured buildings. |
| | | |
| | | | How does Morningstar Funds Trust collect your personal information? | | |
| | | | We would collect your personal information if you open an account directly with us or if you gave us your personal information; however, please read the “Other Important Information” section below. |
219
| | | | | | | | | | |
| | | | | | Why can’t you limit sharing? |
| | | | | | Federal law gives you the right to limit only: |
| | | u | | | sharing for affiliates’ everyday business purposes—information about your creditworthiness; |
| | | u | | | affiliates from using your information to market to you; |
| | | u | | | sharing for nonaffiliates to market to you. |
| | | | | | | State laws and individual companies’ policies may give you additional rights to limit sharing. |
| | |
| Definitions | | | | | | Affiliates |
| | | | | | Companies related by common ownership or control. They can be financial and nonfinancial companies. |
| | | u | | | Morningstar Funds Trust’s investment adviser is Morningstar Investment Management, LLC, a wholly-owned subsidiary of Morningstar, Inc. Morningstar Investment Services, LLC, a wholly-owned subsidiary of Morningstar Investment Management, LLC, is the sponsor of the Morningstar Managed Portfolios advisory service. |
| | |
| | | | | | Nonaffiliates |
| | | | | | Companies not related by common ownership or control. They can be financial and nonfinancial companies. |
| | | u | | | Morningstar Funds Trust does not share your personal information with nonaffiliates for their marketing their services to you. |
| | |
| | | | | | Joint marketing |
| | | | | | A formal agreement between nonaffiliated financial companies that together market financial products or services to you. |
| | | | u | | | Morningstar Funds Trust does not have such an agreement in place. |
| | |
| Other Important Information | | | | | | Morningstar Funds Trust (“Morningstar Funds”) is only available through the Morningstar Managed Portfolios advisory service. The Morningstar Managed Portfolios advisory service is made available to nonaffiliated financial institutions (e.g., financial advisers) who may use the service in connection with their giving investment advice to their clients. The financial institution’s client’s assets are held at a nonaffiliated custodian (“Custodian”). Custodians report buy/sells of Morningstar Funds shares to the Morningstar Fund’s transfer agent at an aggregate level (e.g., omnibus). Because of this structure, under normal circumstances, the Morningstar Funds do not have personal information of the shareholders of the Morningstar Funds. Fromtime-to-time, Morningstar Funds may seek shareholder’s personal information to fulfill regulatory requirements and/or obligations. In those instances, Morningstar Funds will not make your personal information available to anyone other than the above-mentioned affiliates. Morningstar Funds reserves the right to change this policy at any time by distributing and/or posting a new privacy policy without notice. |
| | |
| Questions? | | | | | | Your privacy is very important to us. If you have further questions, please contact us at877-626-3224. |
220
Morningstar Funds Trust April 30, 2019
Board Approval of Investment Advisory andSub-Advisory Agreements(unaudited)
The Morningstar Funds Trust (the “Trust”) is a Delaware statutory trust organized under the laws of the State of Delaware on March 1, 2017 and registered with the U.S. Securities and Exchange Commission under the Investment Company Act of 1940.
Each of the Funds that forms a series of the Trust has an Investment Advisory Agreement with Morningstar Investment Management, LLC (“Morningstar”). Each of the Funds also has at least oneSub-Advisory Agreement with a Subadviser to that Fund.
The Funds and their Subadvisers are:
| | ● | | Morningstar U.S. Equity Fund |
| | ○ | | ClearBridge Investments, LLC |
| | ○ | | Diamond Hill Capital Management, Inc. |
| | ○ | | Levin Easterly Partners LLC |
| | ○ | | Massachusetts Financial Services Company, d/b/a MFS Investment Management |
| | ○ | | Westwood Management Corp. |
| | ● | | Morningstar International Equity Fund |
| | ○ | | Lazard Asset Management LLC |
| | ○ | | T. Rowe Price Associates, Inc. |
| | ● | | Morningstar Global Income Fund |
| | ○ | | Schafer Cullen Capital Management, Inc. |
| | ● | | Morningstar Total Return Bond Fund |
| | ○ | | BlackRock Financial Management, Inc. |
| | ○ | | Western Asset Management Company |
| | ● | | Morningstar Municipal Bond Fund |
| | ○ | | T. Rowe Price Associates, Inc. |
| | ○ | | Wells Capital Management, Inc. |
| | ● | | Morningstar Defensive Bond Fund |
| | ○ | | First Pacific Advisors, LLC |
| | ● | | Morningstar Multisector Bond Fund |
221
Morningstar Funds Trust April 30, 2019
Board Approval of Investment Advisory andSub-Advisory Agreements(unaudited)(continued)
| | ○ | | Franklin Advisers, Inc. |
| | ○ | | Loomis, Sayles & Company, L.P. |
| | ○ | | TCW Investment Management Company LLC |
| | ● | | Morningstar Unconstrained Allocation Fund |
| | ○ | | Brandywine Global Investment Management, LLC |
| | ○ | | Lazard Asset Management LLC |
| | ● | | Morningstar Alternatives Fund |
| | ○ | | SSI Investment Management, LLC |
| | ○ | | Water Island Capital, LLC |
Statement of Shareholder Rights
When you buy shares in a mutual fund, you become a shareholder in an investment company. As an owner, you have certain rights and protections, chief among them an independent board of trustees, whose main role is to represent your interests.
The Trustees are responsible for the overall management of the Trust, including general supervision and review of the investment activities of each Fund. The Trustees, in turn, elect the officers of the Trust, who are responsible for administering theday-to-day operations of the Trust and its separate series, including the Funds.
The “Independent Trustees” are Trustees who are not “interested persons” of the Trust, as that term is defined in the Investment Company Act of 1940.
More information about the Trustees is availablehttps://www.morningstar.com/company/morningstar-funds-governance.
Approval of the Investment Advisory Agreement and theSub-Advisory Agreements
At a board meeting on March 9, 2018, the Trustees, including the Independent Trustees, unanimously approved the Investment Advisory Agreement and theSub-Advisory Agreements, except for theSub-Advisory Agreement with Wells Capital Management, which was unanimously approved by the Trustees, including the Independent Trustees, at a board meeting on April 19, 2018. The Trustees determined that the Investment Advisory Agreement and theSub-Advisory Agreements, including the investment advisory andsub-advisory fees in the agreements, were fair and reasonable.
Prior to making these approvals, the Trustees considered materials and presentations related to the proposed Investment Advisory Agreement and theSub-Advisory Agreements. Among the topics addressed by these materials and presentations were:
| | ● | | The services that Morningstar and each Subadviser would provide to each Fund. |
222
Morningstar Funds Trust April 30, 2019
Board Approval of Investment Advisory andSub-Advisory Agreements(unaudited)(continued)
| | ● | | Morningstar’s investment management operations. |
| | ● | | The proposed investment approach for each Fund. |
| | ● | | The due diligence conducted on each Subadviser by Morningstar, and Morningstar’s reasons for recommending each Subadviser and Subadvisory Agreement. |
| | ● | | The due diligence conducted by the Trust’s Chief Compliance Officer with regard to compliance programs and capabilities. |
| | ● | | The services that the custodian, fund administrator, transfer agent and distributor would provide to each Fund. |
| | ● | | The proposed fees to be paid to service providers to each Fund, including Morningstar and eachSub- adviser. |
| | ● | | The estimated expense ratio for each Fund, reflecting both the fees to be paid to service providers and expenses to be incurred directly by each Fund. |
| | ● | | Proposed expense limitation arrangements, to be achieved by fee waivers and expense reimbursements by Morningstar. |
The Trustees reviewed an “Expense Analysis” prepared by Morningstar using information provided by an independent third-party consultant (“Consultant”). The Expense Analysis compared each Fund’s proposed expenses with the expenses of a “Comparative Group” of mutual funds with characteristics in common with each Fund. The Comparative Group was selected by the Consultant from other “solution” funds designed to be used within asset management programs.
Throughout the approval process, the Independent Trustees received assistance from independent counsel. The Independent Trustees met separately with Independent Counsel. The Independent Trustees also met with and interviewed officers of Morningstar, the custodian, the fund administrator, the transfer agent and the distributor.
Factors Considered
In making their determination, the Trustees considered multiple factors. In view of the wide variety of factors considered, the Trustees did not quantify or assign relative weights to the factors. Each Trustee may have assigned different weights to various factors.
The factors considered included:
| | ● | | Morningstar’s guiding principles for investment management. |
| | ● | | The form of the proposed agreements with service providers, including Morningstar. |
| | ● | | The nature, extent and quality of services that Morningstar and each Subadviser would provide to each Fund. |
223
Morningstar Funds Trust April 30, 2019
Board Approval of Investment Advisory andSub-Advisory Agreements(unaudited)(continued)
| | ● | | The background, experience, personnel, operations, policies, procedures and compliance functions of Morningstar and each Subadviser, including their experience as managers of other funds and accounts, their investment management approaches and resources, their financial condition and their reputation in the industry. |
| | ● | | Each Subadviser’s plans for the integration of their operations, policies, procedures and compliance functions with those of Morningstar and other proposed service providers to the Funds. |
| | ● | | The impact that management of the Funds would have on Morningstar and each Subadviser. |
| | ● | | The Chief Compliance Officer’s review of the compliance programs and capabilities of Morningstar and of each Subadviser, including the policies and procedures in place to address potential conflicts of interest. |
| | ● | | Morningstar’s risk management program, especially those aspects of the program related to selecting and overseeing the Subadvisers to each Fund. |
| | ● | | The proposed use of derivatives and other complex instruments to carry out each Fund’s investment goals. |
| | ● | | Each Subadviser’s risk management program. |
| | ● | | The fairness of the compensation under the proposed Investment Advisory Agreement andSub- Advisory Agreements. |
| | ● | | The estimated expense ratio to be borne by shareholders, considering the combined effect of the pricing structure of each Fund and proposed fee waivers. |
| | ● | | Profitability matters and economies of scale. |
The following discussion reviews some of the primary components of the Trustees’ decision to approve the agreements. This discussion is not intended to be exhaustive, but rather summarizes certain factors considered by the Trustees.
Nature, Extent and Quality of Services Provided
The Trustees reviewed each Fund’s investment goal, Morningstar’s and each Subadviser’s proposed investment strategy to achieve that goal, and Morningstar’s and each Subadviser’s ability to implement that investment strategy.
The Trustees reviewed Morningstar’s guiding principles, as well as Morningstar’s values and culture. They concluded that the principles were consistent with shareholder interests and, in light of Morningstar’s values and culture, believe Morningstar will be able to manage the Funds consistent with those principles.
The Trustees took note of Morningstar’s responsibilities as the investment adviser to each Fund which include:
| | ● | | Performance of due diligence of each Subadviser’s risk management, operations, trading activities and financial condition. |
224
Morningstar Funds Trust April 30, 2019
Board Approval of Investment Advisory andSub-Advisory Agreements(unaudited)(continued)
| | ● | | Oversight and monitoring of theday-to-day investment activities of the Subadvisers and the ongoing assessment of their performance. |
| | ● | | Portfolio construction for each Fund, involving asset allocation among Subadvisers, exchange-traded funds, cash and other investments. |
| | ● | | Provision of investment oversight in certain instances. |
| | ● | | Oversight and monitoring of the Subadvisers’ compliance with the investment mandate, compliance policies and procedures and federal securities laws. |
| | ● | | Reporting to the Trustees. |
| | ● | | The implementation of the Trustee’s directives with regard to the Funds. |
The Trustees considered Morningstar’s experience in evaluating the investment performance of investment advisers as part of the investment advisory services it provides to clients.
With respect to the services to be provided by the Subadvisers, the Trustees took note of the responsibilities that each Subadviser would have with respect to the portion of a Fund’s assets allocated to the Subadviser by Morningstar. These responsibilities include implementing the investment strategies for that portion of the Fund’s assets and ensuring compliance with the investment policies and limitations. The Trustees considered each Subadviser’s performance managing other investment products, including other mutual funds, with similar investment strategies.
The Trustees reviewed the portfolio management team assigned to each Fund by Morningstar and each Subadviser and considered each team’s past performance, skills and compensation structure, along with overall staffing levels.
The Trustees considered other investment advisory services offered by Morningstar and each Subadviser; they reviewed the allocation of assets and expenses among these services, as well as their fees, the reasons for differences in fees and any potential conflicts in connection with providing these services.
Based on their review, the Trustees were satisfied with the nature, extent and quality of the overall services to be provided by Morningstar and each Subadviser to each Fund and its shareholders. They were confident in the abilities of Morningstar and each Subadviser to implement the respective proposed investment strategy and to provide quality services to each Fund and its shareholders.
Investment Performance of Morningstar, the Subadvisers and the Funds
Because the Funds had not yet commenced investment operations, there was no investment performance for the Funds. As noted, the Trustees considered the investment performance of Morningstar and each Subadviser in managing other investment products, including other mutual funds, with similar investment strategies. The
225
Morningstar Funds Trust April 30, 2019
Board Approval of Investment Advisory andSub-Advisory Agreements(unaudited)(continued)
Trustees also considered the performance benchmarks for each Fund recommended by Morningstar, the process used by Morningstar to develop its recommendations, and how these benchmarks would be used to evaluate the performance of each Fund, of Morningstar and of each Subadviser.
The Costs of the Services to be Provided and Profits to be Realized from a Relationship with Funds
The Trustees considered the anticipated cost of the services to be provided and the anticipated profits to be realized by Morningstar and each Subadviser from a relationship with the Funds. Because the Funds had not yet commenced investment operations, the Trustees noted that Morningstar and the Subadvisers could not provide any profitability information with respect to the Funds. The Trustees considered that each Fund is expected to incur considerable expenses in its first year of operation which will largely be absorbed by Morningstar through fee waivers and/or expense reimbursements covering any expenses that exceed the limits agreed to by Morningstar and the Funds. In addition, Morningstar has agreed to pay certain organizational and offering related costs that otherwise could have been charged to the Funds.
In considering the appropriateness of the investment advisory fee to be charged to each Fund, the Trustees reviewed the proposed fee in light of the nature, extent and quality of the investment advisory services expected to be provided by Morningstar and each Subadviser, as discussed above. The Trustees considered the allocation of the investment advisory fee between Morningstar and each Subadviser in light of their respective responsibilities and noted that thesub-advisory fees would be paid by Morningstar to each Subadviser and would not be additional fees borne by each Fund. The Trustees also noted that thesub-advisory fees to be paid by Morningstar to each Subadviser were the product of arms-length negotiations between Morningstar and each Subadviser.
The Trustees considered other actual and potential benefits to Morningstar and each of the Subadvisers from managing the Funds, including the acquisition and use of research services with commissions generated by the Funds, in concluding that the investment advisory,sub-advisory and other fees are fair and reasonable for each Fund.
With regard to the Expense Analysis, the Trustees noted meaningful differences between funds in the Comparative Group and the Funds. Specifically, some of the funds in the Comparative Group have a large asset base and scale and are distributed through propriety sales channels, while the Funds will be distributed throughnon-proprietary channels. The Trustees considered the effect that these differences could have on expenses. Morningstar advised the Trustees that, at present, there are a limited number of funds that can be considered as directly comparable to the Funds (that is, funds that are institutional share class, multi-manager, subadvised and distributed throughnon-proprietary channels). While noting the limitations of the Expense Analysis, the Trustees concluded that it was helpful.
The Trustees also noted that the net investment advisory fee (including administrative charges) of each Fund was below or near the average net investment advisory fees charged by the Comparative Group of funds used in the Expense Analysis. The Trustees also noted that the expected total expenses (including the proposed fee waiver and expense reimbursement arrangements) of each Fund were below or near the average total expenses for the Comparative Group (including the fee waiver and expense reimbursement arrangements of funds in the Comparative Group).
226
Morningstar Funds Trust April 30, 2019
Board Approval of Investment Advisory andSub-Advisory Agreements(unaudited)(continued)
Based upon its consideration of all these factors, the Trustees determined that the investment advisory andsub-advisory fee structure was fair and reasonable.
The Extent to which Economies of Scale would be Realized as each Fund Grows, and whether Current Fee Levels Reflect these Economies of Scale for the Benefit of Fund Investors
The Trustees considered economies of scale that may be realized by Morningstar and each Subadviser as each Fund grows larger and the extent to which these economies would be shared with each Fund’s shareholders. The Trustees noted that Morningstar had proposed an expense limitation arrangement which it willre-evaluate periodically. Because the Funds have not yet commenced operations, the Trustees concluded that economies of scale were difficult to evaluate at this time.
Conclusion
After consideration of the foregoing factors, and such other matters as were deemed relevant, and with no single factor being determinative to their decision, the Trustees—including a majority of the Independent Trustees with the assistance of independent counsel—approved the Investment Advisory Agreement and theSub-Advisory Agreements and concluded that the investment advisory andsub-advisory fee structure provided for in the agreements was fair and reasonable.
March 13, 2019 Board Meeting
Approval ofSub-Advisory Agreements
Levin Capital Strategies, L.P. (“Levin Capital”) has served as a subadviser to the Morningstar Equity Fund since May 1, 2018. At a board meeting on March 13, 2019 (the “March Meeting”), the Trustees, including the Independent Trustees, unanimously approved a newSub-Advisory Agreement between Morningstar Investment Management, LLC (“Morningstar”) and Levin Easterly Partners LLC (“Levin Easterly”) for the Morningstar Equity Fund as a result of the acquisition by Levin Easterly of Levin Capital’s institutional asset management business and related operations.
SSI Investment Management, Inc. (“SSI”) has served as a subadviser to the Morningstar Equity Fund since May 3, 2018. At the March Meeting, the Trustees, including the Independent Trustees, also unanimously approved a newSub-Advisory Agreement between Morningstar and SSI Investment Management LLC (“SSI LLC”) for the Morningstar Alternatives Fund as a result of the acquisition by Resolute Managers, Inc. (“Resolute”) of a majority interest in SSI LLC. SSI, the then current subadviser of the Morningstar Alternatives Fund, transferred substantially all of its assets and services, including its role as a subadviser to the Morningstar Alternatives Fund, to SSI LLC in connection with Resolute’s acquisition of a majority interest in SSI LLC. (Levin Easterly and SSI LLC are sometimes referred to herein as a “Subadviser” or the “Subadvisers” and the Morningstar Equity Fund and Morningstar Alternatives Fund are sometimes referred to herein as a “Fund” or the “Funds”.)
227
Morningstar Funds Trust April 30, 2019
Board Approval of Investment Advisory andSub-Advisory Agreements(unaudited)(continued)
Each transaction constituted a “change of control” of Levin and SSI, respectively, under applicable provisions of the Investment Company Act of 1940, and therefore, an “assignment” and automatic termination of the existingSub-Advisory Agreement between Morningstar and each of Levin and SSI.
Prior to approving each newSub-Advisory Agreement, the Trustees considered materials and presentations related to each newSub-Advisory Agreement. Among the topics addressed by these materials and presentations were:
| | ● | | The services that each Subadviser would provide to each Fund. |
| | ● | | The proposed investment approach for each Fund to be carried out by each Subadviser and the nature and quality of the services provided by each Subadviser’s predecessor. |
| | ● | | The due diligence conducted on each Subadviser by Morningstar in connection with each “change of control” transaction. |
| | ● | | The due diligence conducted by the Trust’s Chief Compliance Officer with regard to compliancepro- grams and capabilities. |
| | ● | | The proposed fees to be paid to each Subadviser. |
Throughout the approval process, the Independent Trustees received assistance from independent counsel. The Independent Trustees met separately with Independent Counsel. The Independent Trustees also met with and interviewed officers of Morningstar and each Subadviser.
Factors Considered
In making their determination, the Trustees considered multiple factors. In view of the wide variety of factors considered, the Trustees did not quantify or assign relative weights to the factors. Each Trustee may have assigned different weights to various factors.
The factors considered included:
| | ● | | The form of the proposedSub-Advisory Agreement with each Subadviser, which was substantially similar to theSub-Advisory Agreement with each Subadviser’s predecessor. |
| | ● | | The nature, extent and quality of services each Subadviser would provide to each Fund. |
| | ● | | The background, experience, personnel, operations, policies, procedures and compliance functions of each Subadviser, including how such matters may be affected by the “change of control” transaction. |
| | ● | | The Chief Compliance Officer’s views on the impact of the “change of control transaction” on each Subadviser. |
| | ● | | The fairness of the compensation under the newSub-Advisory Agreements. |
| | ● | | Profitability matters and economies of scale. |
228
Morningstar Funds Trust April 30, 2019
Board Approval of Investment Advisory and Sub-Advisory Agreements(unaudited)(continued)
The following discussion reviews some of the primary components of the Trustees’ decision to approve the agreements. This discussion is not intended to be exhaustive, but rather summarizes certain factors considered by the Trustees.
Nature, Extent and Quality of Services Provided
The Trustees reviewed each Fund’s investment goal and each Subadviser’s proposed investment strategy to achieve that goal and each Subadviser’s ability to implement that investment strategy.
The Trustees took note of the responsibilities that each Subadviser would have with respect to the portion of a Fund’s assets allocated to the Subadviser by Morningstar. These responsibilities include implementing the investment strategies for that portion of the Fund’s assets and ensuring compliance with the investment policies and limitations. The Trustees considered each Subadviser’s performance managing its respective Fund since May 2018 and other investment products with similar investment strategies.
The Trustees reviewed the portfolio management team assigned to each Fund by each Subadviser and considered each team’s past performance, skills and compensation structure, along with overall staffing levels. The Board also considered the benefits of providing consistency of portfolio management, and placed weight on each Subadviser’s representation that there were no planned changes with respect to the personnel who managed the Fund or theday-to-day operations with respect to managing the Fund as a result of the “change of control” transactions.
Based on their review, the Trustees were satisfied with the nature, extent and quality of the overall services to be provided by each Subadviser to each Fund and its shareholders. They were confident in the abilities of each Subadviser to implement the respective proposed investment strategy and to provide quality services to each Fund and its shareholders.
Investment Performance of the Subadvisers and the Funds
Because each Subadviser had only commenced providing services to its respective Fund in May 2018, there was limited investment performance for the Funds to evaluate. As noted, the Trustees considered the investment performance of each Subadviser in managing other investment products with similar investment strategies.
The Costs of the Services to be Provided and Profits to be Realized from a Relationship with the Funds
The Trustees considered the anticipated cost of the services to be provided and the anticipated profits to be realized by each Subadviser from a relationship with its respective Fund. Because each Subadviser had only commenced providing services to its respective Fund in May 2018, the Trustees noted the Subadvisers could not provide any meaningful profitability information with respect to the Funds.
The Board was provided with a description of fees to be charged by each Subadviser under the newSub-Advisory Agreement and noted that the fees under each newSub-Advisory Agreement were identical to those in the existingSub-Advisory Agreement. The Board also noted that the investment advisory fee paid by each Fund to Morningstar would stay the same, and that Morningstar’s profitability will not be impacted by the
229
Morningstar Funds Trust April 30, 2019
Board Approval of Investment Advisory andSub-Advisory Agreements(unaudited)(continued)
terms of each newSub-Advisory Agreement. The Trustees noted that thesub-advisory fees would be paid by Morningstar to each Subadviser and would not be additional fees borne by each Fund. The Trustees also noted that thesub-advisory fees to be paid by Morningstar to each Subadviser were the product of arms-length negotiations between Morningstar and each Subadviser.
The Trustees considered other actual and potential benefits to each of the Subadvisers from managing the Funds, including the acquisition and use of research services with commissions generated by the Funds, in concluding that thesub-advisory fees are fair and reasonable for each Fund.
Based upon its consideration of all these factors, the Trustees determined that the investment advisory andsub-advisory fee structure was fair and reasonable.
The Extent to which Economies of Scale would be Realized as each Fund Grows, and whether Current Fee Levels Reflect these Economies of Scale for the Benefit of Fund Investors
The Trustees considered economies of scale that may be realized by each Subadviser as each Fund grows larger and the extent to which these economies would be shared with each Fund’s shareholders. The Trustees noted that Morningstar had proposed an expense limitation arrangement which it willre-evaluate periodically. Because the Funds had only recently commenced operations, the Trustees concluded that economies of scale were difficult to evaluate at this time.
Conclusion
After consideration of the foregoing factors, and such other matters as were deemed relevant, and with no single factor being determinative to their decision, the Trustees—including a majority of the Independent Trustees with the assistance of independent counsel—approved each newSub-Advisory Agreement and concluded that thesub-advisory fee structure provided for in the agreements was fair and reasonable.
Additional Considerations
During the period, the Board approved a contract with an additional subadviser, however, the Adviser ultimately determined not to move forward with that subadviser.
230
Morningstar Funds Trust April 30, 2019
Additional Information
Proxy Voting Policies and Proxy Voting Record
The Board has delegated responsibility for decisions regarding proxy voting for securities held by the Funds to the Adviser, which, in turn, has delegated such responsibility to the subadvisers. Each subadviser will vote such proxies in accordance with its proxy policies and procedures, which are available, free of charge, by calling877-626-3224. Information about how each Fund voted proxies relating to portfolio securities during the most recent12-month period ended June 30 may be obtained (1) without charge, upon request, by call877-626-3224 and (2) on the SEC’s website at http://sec.gov.
FormN-Q Disclosure
The Trust files its complete schedule of portfolio holdings with the Securities and Exchange Commission for the first and third quarters of each fiscal year on FormN-Q. The Trust’s FormN-Q filings are available on the Securities and Exchange Commission’s website at http://www.sec.gov. Information regarding the Trust’s FormN-Q filings is also available, without charge, by calling,877-626-3224.
231
| | |
Morningstar Funds Trust is only available to citizens or legal residents of the United States or its territories through the Morningstar Managed Portfolios advisory service. Adviser Morningstar Investment Management, LLC 22 West Washington Street Chicago, Illinois 60602 Distributor Foreside Fund Services, LLC Three Canal Plaza, Suite 100 Portland, ME 04101 Prospectus Please go to http://connect.rightprospectus.com/Morningstar to access the Morningstar Funds Trust prospectus. | | Shareholder Rights When you buy shares in a fund of the Morningstar Funds Trust, you become a shareholder of that fund. As a shareholder, you have certain rights and protections, chief among them an independent board of trustees, whose main role is to represent your interests. The Board of Trustees for the Morningstar Funds Trust is committed to representing your interests as well as implementing and maintaining sound fund governance principles. To learn more about the Board of Trustees please go to https://www.morningstar.com/company/
morningstarfunds-governance This report is for the general information of the shareholders of the Morningstar Funds. It is not authorized for distribution to prospective investors unless preceded or accompanied by the Funds’ current prospectus. Past performance results shown in this report should not be considered a representation of future performance. Investment returns and principal value of shares will fluctuate so that shares, when redeemed, may be worth more or less than their original cost. Views, opinions, portfolio holdings and other information expressed or noted herein are as of the end of the reporting period and are subject to change. Such views and opinions are not to be viewed as investment advice. |
| | |
| | |
| |  |
Item 2. Code of Ethics.
| (a) | As of April 30, 2019, the registrant has adopted a code of ethics that applies to its principal executive officer, principal financial officer, principal accounting officer or controller, or persons performing similar functions, regardless of whether these individuals are employed by the registrant or a third party (the “Code of Ethics”). |
| (c) | The registrant has not amended its Code of Ethics during the period covered by this report. |
| (d) | The registrant has not granted any waivers, including an implicit waiver, from any provisions of its Code of Ethics during the period covered by this report. |
Item 3. Audit Committee Financial Expert.
The registrant’s Board of Trustees has determined that the registrant has at least one “audit committee financial expert” (as defined in Item 3 of FormN-CSR), serving on its audit committee. Barry P. Benjamin and Theresa Hamacher are the “audit committee financial experts” and are “independent” (as each term is defined in Item 3 of FormN-CSR).
Under applicable securities laws and regulations, a person who is determined to be an audit committee financial expert will not be deemed an “expert” for any purpose, including without limitation for purposes of Section 11 of the Securities Act of 1933, as amended, as a result of being designated or identified as an audit committee financial expert. The designation or identification of a person as an audit committee financial expert does not impose on such person any duties, obligations, or liability that are greater than the duties, obligations, and liability imposed on such person as a member of the registrant’s Audit Committee and Board of Trustees in the absence of such designation or identification. The designation or identification of a person as an audit committee financial expert does not affect the duties, obligations or liability of any other member of the registrant’s Audit Committee or Board of Trustees.
3
Item 4. Principal Accountant Fees and Services.
Item 4(a): Audit Fees
The aggregate fees billed for each of the last two fiscal years for professional services rendered by Ernst & Young LLP (“E&Y”), independent registered public accounting firm, for the audit of the registrant’s annual financial statements or services that are normally provided by the accountant in connection with statutory and regulatory filings or engagements are $285,000 in 2019 and $15,000 in 2018.
Item 4(b): Audit-Related Fees
The aggregate fees billed in each of the last two fiscal years for assurance and related services by E&Y that are reasonably related to the performance of the audit of the registrant’s financial statements and are not reported under paragraph (a) of this Item are NONE.
Item 4(c):Tax Fees
The aggregate fees billed in each of the last two fiscal years for professional services rendered by E&Y for RIC tax compliance and diversification review and tax return revieware $35,000 in 2019 and NONE in 2018.
Item 4(d):All Other Fees
The aggregate fees billed in each of the last two fiscal years for products and services provided by E&Y, other than the services reported in paragraphs (a) through (c) of this Item are NONE.
Item 4(e)(1):Pre-Approval Policies and Procedures
Pursuant to the registrant’s Audit Committee Charter adopted on March 9, 2018, the Audit Committee shall, to the extent required by applicable regulations,pre-approve (i) all audit and permittednon-audit services rendered by the independent auditors to a Fund and (ii) allnon-audit services rendered by the independent auditors to a Fund’s investment adviser(s) (including anysub-advisers) and to certain of the investment adviser’s affiliates, as applicable. The Audit Committee may implement policies and procedures by which such services arepre-approved other than by the full Committee (for example, by the Committee chair).
Item 4(e)(2):Percentage of FeesPre-Approved Pursuant to Waiver Provision of Paragraph (c)(7)(i)(C) of Rule2-01 of RegulationS-X
No percentage of the principal accountant’s fees or services were approved pursuant to the waiver provision of paragraph (c)(7)(i)(C) of Rule2-01 of RegulationS-X.
Item 4(f): Work Performed by Persons Other than the Principal Accountant
Not applicable.
Item 4(g): AggregateNon-Audit Fees Disclosure
The aggregatenon-audit fees and services billed by E&Y for services rendered to the registrant and service affiliates for the last fiscal year was $35,000 in 2019 and NONE in 2018.
Item 4(h):Non-Audit Services and Independent Accountant’s Independence
4
The registrant’s Audit Committee has considered whether the provision ofnon-audit services to service affiliates, notpre-approved pursuant to paragraph (c)(7)(ii) of Rule2-01 of RegulationS-X, is compatible with maintaining the registered public accountant’s independence in performing audit services.
Item 5. Audit Committee of Listed Registrants.
Not applicable.
Item 6. Investments.
| (a) | The registrant has elected to include the schedule of investments in securities of unaffiliated issuers as part of the report to shareholders filed under Item 1 of this report on FormN-CSR. |
Item 7. Disclosure of Proxy Voting Policies and Procedures forClosed-End Management Investment Companies.
Not applicable.
Item 8. Portfolio Managers ofClosed-End Management Investment Companies.
Not applicable.
Item 9. Purchases of Equity Securities byClosed-End Management Investment Company and Affiliated Purchasers.
Not applicable.
Item 10. Submission of Matters to a Vote of Security Holders.
There have been no material changes to the procedures by which shareholders may recommend nominees to the registrant’s Board of Trustees.
Item 11. Controls and Procedures.
| (a) | The registrant’s principal executive and principal financial officers, or persons performing similar functions, have concluded that the registrant’s disclosure controls and procedures (as defined in Rule30a-3(c) under the Investment Company Act of 1940 (the “1940 Act”)) are effective, based on the evaluation of these controls and procedures required by Rule30a-3(b) under the 1940 Act and Rules13a-15(b) or15d-15(b) under the Securities Exchange Act of 1934 as of a date within 90 days of the filing date of this report. |
| (b) | There were no changes in the registrant’s internal control over financial reporting (as defined in Rule30a-3(d) under the 1940 Act) that occurred during the period covered by |
5
| | this report that have materially affected, or are reasonably likely to materially affect, the registrant’s internal control over financial reporting. |
Item 12. Disclosure of Securities Lending Activities forClosed-End Management Investment Companies.
Not applicable.
Item 13. Exhibits.
(a)(1) Exhibit 99.CODE: Code of Ethics pursuant to Item 2 of FormN-CSR.
(a)(2) Exhibit 99.CERT: Certifications pursuant to Section 302 of the Sarbanes-Oxley Act of 2002.
(a)(3) Not applicable.
(a)(4) Not applicable.
| (b) | Exhibit 99.906 CERT: Certifications pursuant to Section 906 of the Sarbanes-Oxley Act of 2002. |
6
SIGNATURES
Pursuant to the requirements of the Securities Exchange Act of 1934 and the Investment Company Act of 1940, the registrant has duly caused this report to be signed on its behalf by the undersigned, thereunto duly authorized.
| | |
| Morningstar Funds Trust |
| |
| By | | /s/ Daniel E. Needham |
| | Daniel E. Needham, President (Principal Executive Officer) |
Date: July 5, 2019
Pursuant to the requirements of the Securities Exchange Act of 1934 and the Investment Company Act of 1940, this report has been signed below by the following persons on behalf of the registrant and in the capacities and on the dates indicated.
| | |
| By | | /s/ Daniel E. Needham |
| | Daniel E. Needham, President (Principal Executive Officer) |
Date: July 5, 2019
| | |
| By | | /s/ Tracy L. Dotolo |
| | Tracy L. Dotolo, Treasurer (Principal Financial Officer) |
Date: July 5, 2019
6