UNITED STATES
SECURITIES AND EXCHANGE COMMISSION
Washington, D.C. 20549
FORM N-CSR
CERTIFIED SHAREHOLDER REPORT OF REGISTERED MANAGEMENT
INVESTMENT COMPANIES
Investment Company Act file number 811-23235
Morningstar Funds Trust
(Exact name of registrant as specified in charter)
Morningstar Funds Trust
22 W. Washington Street
Chicago, IL 60602
(Address of principal executive offices) (Zip code)
D. Scott Schilling
Morningstar Funds Trust
22 W. Washington Street
Chicago, IL 60602
With a copy to:
Eric S. Purple
Stradley Ronon Stevens & Young, LLP
2000 K Street, N.W., Suite 700
Washington, District of Columbia, 20006
(Name and address of agent for service)
Registrant’s telephone number, including area code: (312) 696-6000
Date of fiscal year end: April 30
Date of reporting period: April 30, 2020
Item 1. Reports to Stockholders.
| | |
| |
| | April 30, 2020 |
| |
A N N U A L R E P O R T | | |
Morningstar Funds Trust | | Morningstar U.S. Equity Fund Morningstar International Equity Fund Morningstar Global Income Fund Morningstar Total Return Bond Fund Morningstar Municipal Bond Fund Morningstar Defensive Bond Fund Morningstar Multisector Bond Fund Morningstar Unconstrained Allocation Fund Morningstar Alternatives Fund |
| | Important Notice Beginning on January 1, 2021, as permitted by regulations adopted by the Securities and Exchange Commission, paper copies of the Funds’ shareholder reports will no longer be sent by mail, unless you specifically request paper copies of the reports from your financial intermediary (e.g., custodian, financial adviser through which you invest or sponsor of the investment advisory program). Instead, the reports will be made available on a website (http://connect.rightprospectus.com/Morningstar), and you will be notified by mail or by such other manner as you have agreed upon with your financial intermediary each time a report is posted and provided with a website link to access the report. If you already elected to receive shareholder reports electronically, you will not be affected by this change and you need not take any action. You may elect to receive shareholder reports and other communications from the Fund on your financial intermediary electronically by contacting your financial intermediary. You may elect to receive all future reports in paper free of charge. If you invest through a financial intermediary (including through an investment advisory program sponsored by Morningstar Investment Services LLC or another financial institution), you can contact your financial intermediary to inform it that you wish to continue receiving paper copies of your shareholder reports. Your election to receive reports in paper will to apply to all Morningstar Funds held with your financial intermediary. |

Morningstar Funds Trust April 30, 2020
Introduction
Morningstar Investment Management, LLC launched an open-end management investment company consisting of nine separate portfolios (each a fund) that span the investment opportunity set1. Most of these Funds were designed to provide exposure to a broad asset class, such as U.S. equities, while our active management of each Fund’s asset allocation and active managers (known as “subadvisers”) will adjust exposures to subasset classes (such as small-cap value) based on our valuation views and those of the subadvisers.
Concept and Structure
We created the Morningstar Funds Trust using an open architecture, multimanager approach, hiring as active subadvisers both institutional managers and other managers whose mutual funds were previously used in Morningstar® Managed PortfoliosSM. Our analysts and portfolio managers continually use research, data, and analysis from Morningstar, Inc. and its affiliates to study the subadvisers and their investments closely and determine which fit best with our investment philosophy and the investment objectives of each Morningstar Fund2. We have selected managers we believed were independent, skilled investors in their respective asset classes.
Consistent with our investment approach, our asset allocation process for the Morningstar Funds is based on fundamentals and driven by valuations. We look for asset classes and sub-asset classes around the globe that, in our view, offer fundamental value relative to price. Allocations within each Fund are in line with what we believe to reflect the best risk-adjusted opportunities.
How to Read This Report
This report outlines the structure and performance of the assets comprised by the Morningstar Funds Trust from May 1, 2019 through April 30, 2020. Included are fund holdings, positioning and performance summaries, including relevant commentary and examples that may aid understanding of returns for the year.
The commentary, views, and opinions in this report were current as of April 30, 2020. Our views reflect performance results net of fees and expenses as of the end of the reporting year.
Statements made within this report are not guarantees of future performance or investment results and should not be taken as investment advice. Investment decisions reflect a variety of factors, and we reserve the right to change views about individual holdings, sectors, and markets at any time. As a result, the views expressed should not be relied upon as a forecast of the Morningstar Funds’ future investment intent.
1All references to “we” or “our” in this report, including the funds’ performance summaries, refer to Morningstar Investment Management, LLC.
2 Morningstar Funds Trust is an open-end management investment company registered under the Investment Company Act of 1940 (as amended). Use of the term “Morningstar Funds” hereafter refers to Morningstar Funds Trust, or its individual series, as applicable.
Morningstar Funds Trust April 30, 2020
Table of Contents
Morningstar Funds Trust April 30, 2020
Statement of Shareholder Rights
It is important to note that as a shareholder, you have certain rights and protections, chief among them an independent board of trustees, whose main role is to represent your interests.
The Trustees are responsible for the overall management of the Trust, including general supervision and review of the investment activities of each Fund. The Trustees, in turn, elect the officers of the Trust, who are responsible for administering the day-to-day operations of the Trust and its separate series, including the Funds.
The “Independent Trustees” are Trustees who are not “interested persons” of the Trust, as that term is defined in the Investment Company Act of 1940 (e.g. not a Morningstar employee).
More information about the Trustees is available at https://www.morningstar.com/company/morningstar-funds-governance.
The Board of Trustees for the Morningstar Funds Trust is committed to representing your interests as well as implementing and maintaining sound fund governance principles. If you have comments or questions with respect to your investment in the Morningstar Funds, you may direct them to the Board of Trustees in the following ways:
By email: BoardofTrustees.MorningstarFundsTrust@morningstar.com
| | |
| By mail: | | Chair of the Board of Trustees of Morningstar Funds Trust c/o D. Scott Schilling, Chief Compliance Officer |
| | 22 West Washington Street Chicago, IL 60602 |
1
Morningstar Funds Trust April 30, 2020
Letter to Shareholders
To Our Shareholders:
Morningstar Funds Trust’s first full year in operation was one of the most extraordinary years in market history, with the coronavirus response igniting volatility and wrapping the near-term economic outlook with uncertainty. Whether we are entering a recovery and have experienced the lows of this cycle, or whether there will be a second wave of infections and markets fall, will only be known in the future.
As long-term investors we are fortunate that our investment approach doesn’t require an accurate rendering of the next 12 months. While the future is always uncertain, we believe that the prospective range of outcomes for markets and economies over the next 12 to 24 months is wider and less certain than any time since World War II.
To combat this uncertainty, we remain faithful adherents to our investment principles, which empower our investment decision-making and behaviors across market environments. And we continue to manage the Funds the Morningstar way—with independence, transparency, and for the long term.
Given our belief that the long term is what matters for investment success, we’ll avoid getting caught in a short-term relative performance derby1 in these annual letters. You will find comments on the investment results later in the report.
This letter will focus primarily on our investment approach, how we expect to deliver returns over time, and how we’ve responded to this uncertain period. I’ll aim to explain the elements that we view as important, and how we think about portfolio construction. As an investor (or shareholder) in the Funds, you’ll want to understand how the investments are managed. We’d expect the same if we found ourselves in your shoes. Near the end, we will provide brief updates on our efforts to keep costs low and on the Funds’ assets under management, or AUM.
Our Investment Approach
We believe that how we manage money is important for our investors to understand—if for no other reason than to interpret investment returns. Our approach is long-established, yet we believe it’s also unique in the market of multi-asset portfolio providers. Simply put, our high-conviction, active approach aims to outperform, but we would expect any outperformance to be lumpy, not a consistent string of wins.
The Morningstar Funds are actively managed in two ways. Across the Funds, we as the manager (or adviser) select active managers (or subadvisers) who make security-level decisions in their specialized area of expertise. And within the Funds, we actively allocate assets among subadvisers and ETFs based on our valuation-driven approach.
That is, we seek to find managers that are able to find investment opportunities, we allocate across these managers, and we identify asset allocation opportunities across markets. There will be more on these two key
1 Seth Klarman used this term in Margin of Safety. “Like dogs chasing their own tails, most institutional investors have become locked into a short-term, relative-performance derby. Numerous managers are provided daily comparisons of their results with those of managers at other firms. Frequent comparative ranking can only reinforce a short-term investment perspective. It is understandably difficult to maintain a long-term view when, faced with the penalties for poor short-term performance, the long-term view may well be from the unemployment line.”
2
Morningstar Funds Trust April 30, 2020
Letter to Shareholders (continued)
elements of our investment approach—manager selection and asset allocation—later in the letter. Note that these services are generally equal in importance, depending on the Fund or if looked at from the managed portfolio perspective, however here we focus on selection first given the significant role of subadvisers in the Funds.
Across Funds, our investment principles guide our research and decision-making, and identifying subadvisers and investment opportunities (via ETFs) that we think may help deliver long-term risk-adjusted returns is where we spend all our time. The one key element that binds our approach and investment principles is time horizon.
Investing for the Long Term
While most advisors and investors are not aware of it, they have an advantage over most institutions, even without specialized investment skill or significant resources. Yet they struggle to take advantage of it. It’s an edge that hides in plain sight.
This edge is so well-hidden, in fact, that it’s often mistaken for error or poor investing skill. The edge is, simply, investing for the long run.
In 1936, British economist and investor John Maynard Keynes wrote the following insightful and timeless words:
Finally it is the long-term investor, he who most promotes the public interest, who will in practice come in for most criticism, wherever investment funds are managed by committees or boards or banks. For it is in the essence of his behavior that he should be eccentric, unconventional and rash in the eyes of average opinion. If he is successful, that will only confirm the general belief in his rashness; and if in the short run he is unsuccessful, which is very likely, he will not receive much mercy. Worldly wisdom teaches that it is better for reputation to fail conventionally than to succeed unconventionally.
The combination of an extended time horizon and an ability to ignore the opinions of the crowd means individuals and advisors are not subject to the same extreme pressure that professional money managers are under to outperform over the short term. Time horizon—and a willingness to be different—are arguably the two most important traits for successful long-term investors.
Now, clearly there’s a catch. If it were that easy, all professional money managers would develop their own idiosyncratic approach, hold investments through thick and thin, and be willing to often look out of step with the crowd. The catch is the institutional forces at work that make this approach next to impossible for many asset managers. But not for individuals and advisors.
The right investment approach for an individual is tailoring a strategy that is consistent with one’s goals. And provided the investments deliver the required returns over the long term, whether the underlying investments are ahead of a benchmark or competitor after three months is of little consequence.
Because the Morningstar Funds are designed as the core building blocks within our multi-asset strategies, we believe we are better able to take long-term investment views with less-certain payoff periods than if they were run in the more common way, as narrow asset class strategies (like large-cap growth or small-cap value).
3
Morningstar Funds Trust April 30, 2020
Letter to Shareholders (continued)
Changing Nature of Active Management
We think the changing nature of active management is another advantage for us. The shortening of investment horizons is arguably tied to the rise of passive management, which appears to be a contradiction given passive funds’ apparent low turnover rates. If index-tracking ETFs aren’t frequently buying and selling stocks, how could they contribute to shortening horizons? Because as active management wanes in one part of the investing world, it seems to be rising in another.
There is much written about the future of active management and the transition from active mutual funds to passive mutual funds and ETFs. This is arguably one of the most powerful forces in the asset management industry, past or present. What qualifies as active management is complicated, but to simplify we suggest that any investor that doesn’t replicate the market capitalization of all tradable, investable assets, is in some way active.
Whether you are building a portfolio of individual stocks to try to outperform the market or seeking to own a personalized, goals-based strategy, you are taking an active position relative to the broader market, which is classically defined as all investable assets held in proportion to their abundance in the world. When looked at this way, the move-to-passive story becomes less clear. In our opinion, while the move to ETFs has led to less active security selection, especially in equity funds, it has likely been replaced by even more active management at the fund or strategy level. That is, those buying ETFs aren’t buying them for keeps. They’re using them to express active investment views and trading them frequently, invalidating the term “passive.”
This means to us that active management may not be in decline, rather that the type of active management is changing. More research is required to draw definitive conclusions about the impact of the rise of active asset allocation through ETFs on market prices and efficiency. On balance, we think it increases the opportunity set for fund managers who are able to take broader views on asset classes, sectors, industries, and other characteristics.
This opportunity may be through active asset allocation of sectors, industries, and countries across equity markets, and for bottom-up investors that can take more active risk by including focused exposure to these areas. While the game may be getting harder in the more narrowly defined subsectors, it may be an opening for those with a long time horizon and a high active share.
High Active Share
Active share is loosely defined as how different an investment strategy is from its benchmark. There’s been much debate on the merits of active share, often between firms defending their high- or low-active-share approaches. Still, the arguments are persuasive on both sides of the debate.
First, high active share should not be interpreted as having a higher likelihood of outperformance on its own. There is no evidence to support this claim when making appropriate adjustments. Like all things, one should be cautious in drawing conclusions from a single metric.
Second, if one is paying for the opportunity to outperform then the fees and expectations for this should be commensurate with the active share. It is hard to see justification for high active management fees if the strategy hugs an index.
4
Morningstar Funds Trust April 30, 2020
Letter to Shareholders (continued)
We like to simplify things, and Sir John Templeton, one of the great investors of the 20th century, was a master at packing maximum wisdom in the fewest words. According to Sir John, it’s impossible to produce superior performance unless you do something different from the majority. We think the market does a good job of representing the majority, and high active share represents a form of doing something different. High active share equals opportunity, but the key ingredient is the insight to know what to own and what not to own.
If high active share were the road to outperformance, then one would need only an ability to randomly select a handful of stocks and wait for the money to roll in. Clearly, this is nonsense. A high-active-share strategy must be accompanied by an intelligent investment process, which again is the key ingredient. If you can combine both, then opportunity for outperformance is high. Far from a guarantee, as with all things investing, but high.
Author and academic Martijn Cremers, who coauthored a 2009 paper2 that introduced the active share concept, identified in a 2016 paper one key attribute that explains the apparent outperformance of high-active-share U.S. equity managers. And this relates to the holding period, or duration of the funds. Those funds with high active share and low turnover tended to do better on average. This makes sense to us.
Exhibit 1 More-Active Strategies Tend to Outperform Over the Long Term
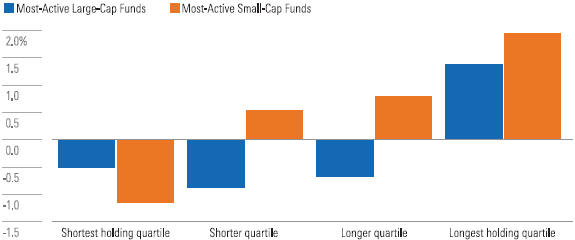
Source: Cremers, M. 2016. “Active Share and the Three Pillars of Active Management: Skill, Conviction and Opportunity.” See online appendix at https://papers.ssrn.com/sol3/papers.cfm?abstract id=2891047
In our opinion, while certain strategies with lower active share and higher turnover can and do outperform, for fundamental investors time horizon seems to be the road less traveled. This concept of patient capital3 has been described as time horizon arbitrage and is tied to the idea of limits to arbitrage.
Why We Believe Patience Pays
Arbitrage typically refers to different prices set for the same asset, a condition that generally requires not enough market participants seeing the big picture. The astute investor can buy at the lower price and sell at the higher one, keeping the difference.
2 Cremers, M. & Petajisto, A. 2009. “How Active Is Your Fund Manager? A New Measure That Predicts Performance.” The Review of Financial Studies, Vol. 22, Iss. 9, P. 3329.
3 Cremers, M. & Pareek, A. 2016. “Patient capital outperformance: The investment skill of high active share managers who trade infrequently.” Journal of Financial Economics, Vol. 122, Iss. 2, P. 288.
5
Morningstar Funds Trust April 30, 2020
Letter to Shareholders (continued)
Time horizon arbitrage is the idea that many investors are so focused on the short term, with lots of competition for investment results, that they don’t see the big picture, in this case the value of the investment for a long-term owner. Whether due to incentives or to psychology or career risk, there’s a reluctance to extend one’s horizon. With all the focus on winning over the short-term, this reduces the competition for information that is only relevant over the long term.
While there are no doubt opportunities over short horizons for talented investors and traders, as the time horizon extends, competition appears to decline. The desire or need for quick results is the siren song for most investors. This presents an arbitrage opportunity for those willing to tie themselves to the mast and wait patiently for potential returns.
This concept aligns to Andrei Shleifer and Robert Vishny’s seminal 1997 paper on the limits of arbitrage. Essentially, limits to arbitrage mean that there are barriers to asset prices reflecting all relevant information due to the realities of how markets work and constraints on real-world money management. While there are several limits identified in the current literature, Shleifer and Vishny4 pointed out that taking advantage of long-term mispricing is generally more challenging because arbitrageurs manage other people’s money, and the fund manager may be fired before their long-term investments deliver results. Despite attractive opportunities, these institutional forces can prevent professional managers from taking advantage.
The irony of the lack of competition for long-term investment ideas due to the institutional limits to arbitrage is that the benefits of compounding returns is best over very long horizons. Albert Einstein supposedly said that compound interest was the eighth wonder of the world, and even modest returns compounded over very long time periods turn into large sums. Legendary investor Warren Buffett said his life has been the product of compound interest.
Time horizon turns out to be critical for taking advantage of investment opportunities for truly active management and receiving the benefits of compound interest. One dollar invested in the U.S. large-cap stock market in 1926 would have been worth $9,244 at the close of 2019, according to the 2020 SBBI Classic Yearbook. That’s powerful compounding, but few people have the luxury of investing for 94 years.
Still, consider this: Of those 94 years, 73% yielded positive returns—roughly three of every four years. Yet, when the holding period rises to 10 years, the historical likelihood of positive returns jumps to 95%. And there has never been a 20-year period in which stocks lost ground5. We firmly believe that active management makes sense and feel it should be accompanied by long-term practices.
Active Management Across the Funds
As outlined in last year’s letter, Morningstar Funds serve two primary purposes: to achieve the investment objectives as outlined within the Funds’ prospectus, and to be the primary building blocks within some of our managed portfolios strategies. We manage the Funds differently from the average mutual fund to fulfill this dual purpose in two important ways.
4 Shleifer, A. & Vishny, R.W. 1997. “The Limits of Arbitrage.” The Journal of Finance, Vol. 52, No. 1., P. 35.
5 While the probability of potential negative returns decreases with time, the magnitude of potential losses increases with a longer investment horizon. Only when returns are mean-reverting (i.e., exhibit negative serial correlation) does the dispersion of returns decrease with an increasing investment horizon. See for example, Pastor & Stambaugh. 2012. “Are stocks really less volatile in the long run?” Journal of Finance, Vol. 67, P. 431.
6
Morningstar Funds Trust April 30, 2020
Letter to Shareholders (continued)
First, for the benefit of implementation efficiency and investment flexibility, we designed the Funds to each be a large building block, like U.S. equity, rather than creating funds by style or market capitalization, as typically seen in the market.
And second, we express investment views within the Funds that deviate materially from benchmarks and category peers, leading to wider short-term relative return variation—and this is an essential feature of our investment approach and critical to our goal of long-term success.
Our active management ideas are built upon data and research from Morningstar, Inc. and are implemented through manager selection and asset allocation. We deploy subadvisers to manage a portion of the Funds’ assets to identify opportunities through active security selection. And we allocate across ETFs and subadvisers to reflect our valuation-driven investment views, which we will cover in greater detail later in the letter.
Our approach to manager (i.e., subadviser) selection is to conduct significant amounts of work up front and hold them for the long term. We typically identify managers that share many of the core investment principles that guide us when building and managing investment strategies. For example, the subadvisers in the Morningstar Funds typically define their investment time horizons in years, rather than quarters, echoing our own emphasis on investing for the long term.
The Problem of Overdiversification
One of the major challenges when one investment manager (or adviser) hires other managers (or subadvisers) to manage sleeves of assets within a portfolio is overdiversification. While diversification is sensible and what legendary investor Benjamin Graham called “the companion (to) the margin-of-safety principle,”6 it can also be overdone in this so-called manager-of-managers structure.
To that end, we—as a manager of managers—seek subadvisers that we have a high conviction in over the long term. Through the avoidance of process and opportunity set duplication, we seek to get the benefits of diversification with the fewest subadvisers necessary. Having unique investment advantages and appropriately resourced organizations is critical for an effective subadviser, we believe. Also, we prefer investment teams unfettered by business risk constraints; those who operate with an alignment of interest with underlying investors through co-investment, ownership, and incentives; specialized teams not trying to do many different things; and those with experience managing over multiple market cycles together.
And as you can imagine, investment teams that tick many of these boxes don’t grow on trees. We’d much prefer to operate with a broader mandate and allocate more to our top managers than operate in a more diversified way, just for the sake of diversification, and go with our 38th, 39th, and 40th picks, for example. We spend lots of time upfront working across a very large universe of possible managers to arrive at our list of subadvisers. And assuming these attributes remain intact, to paraphrase Warren Buffett, our favorite holding period is forever7.
6 See Graham, B. 2006. The Intelligent Investor: The Definitive Book on Value Investing (New York: HarperCollins). The concept of a margin of safety is to buy an asset at a substantial discount to its intrinsic value to protect against loss. Graham writes that “there is a close logical connection between the concept of a safety margin and the principle of diversification” because “even with the margin in the investor’s favor, an individual security may work out badly … but as the number of such commitments is increased the more certain does it become that the aggregate of the profits will exceed the aggregate of the losses.”
7 In his 1998 Letter to Berkshire Hathaway Letter to Shareholders, Warren Buffett wrote that “when we own portions of outstanding businesses with outstanding managements, our favorite holding period is forever.”
7
Morningstar Funds Trust April 30, 2020
Letter to Shareholders (continued)
The Problem of Turnover
Another major challenge facing a manager-of-managers structure is turnover. Short time frames for evaluating subadvisers combined with the human desire to be doing something at all times destines many strategies for higher activity. To the man with the hammer, every problem looks like a nail, and in a manager-of-managers structure the solution is often subadviser replacement. Compounding this psychological predisposition to make a change is the external pressure of wanting to see “something be done,” particularly if performance over a short-term period is at or below the benchmark. Like the soccer goalkeeper defending a penalty kick, standing in the middle and not moving one way or another doesn’t play well as a strategy in his or her mind nor as a potential explanation to coaches, fans, or the media. Far less courage is needed to dive left or right to block the shot than to stand still knowing that doing so increases your chances of success.
Unfortunately, the exiting manager fired for short-term underperformance likely holds an attractive portfolio, and the manager being appointed almost certainly has performed better recently and is more likely to carry a portfolio that is overvalued. Yet, presentations to boards or committees with managers at the bottom of categories over the last three or five years are as rare as hen’s teeth. While uncommon, using poor recent performance as a selection trait may well be better than using recent outperformance. It’s likely another argument for sitting pat and doing nothing, as studies of goalkeeper penalty shots highlighted8. But like the goalie afraid to lose his job, the person in charge of a manager-of-managers strategy may find it a hard strategy to defend to superiors.
Selecting subadvisers that we hope will outperform over the long term should be a very challenging, time-consuming, and expensive undertaking. And while it may be necessary to change a subadviser from time-to-time—perhaps due to process drift or a loss of talent—excessive manager turnover is one of the dangers and destroyers of value for investors. We are acutely aware of this risk and work hard to avoid this common pitfall.
To achieve our Funds’ investment objectives, we have assembled what we believe to be some of the most talented subadvisers. We’ve combined them thoughtfully, with an eye toward holistic portfolio construction within each Fund. All the while we have been mindful to focus on having fewer subadvisers and to do plenty of work up front to allow us to avoid the unnecessary manager turnover.
Valuation-Driven Asset Allocation
The second—and equally important—pillar to actively managing the Morningstar Funds is our valuation-driven investment views. The nine Funds are used as multi-asset building blocks in our managed portfolios, and being able to allocate to attractive markets is essential for this purpose. Through fundamental research we identify attractive equity, fixed income, and currency markets. And we use this research to take advantage of the attractive reward/risk opportunities around the world. Given our desire to leave subadvisers to do what they do best, we seek to use fundamental analysis and valuation work to shift mutual fund allocations toward the desired exposures. ETFs are the primary tool for expressing our more targeted asset allocations views beyond those represented by our allocations to the bottom-up exposures of the subadvisers.
8 In the fascinating paper, researchers showed that goal keepers moved left or right 94% of the time, while the direction of the kick was right down the middle 39% of the time. Cleary doing nothing was the better move. Journal of Economic Psychology (2007), “Action bias among elite soccer goalkeepers: The case of penalty kicks”
8
Morningstar Funds Trust April 30, 2020
Letter to Shareholders (continued)
We implement allocation ideas using ETFs in two main ways: to increase exposures to our best asset allocation investment ideas and for diversification. In the case of the former, we use ETFs where the aggregation of subadviser positions lacks exposure to parts of the markets we find attractive. This diversification use is much less common, but we may include ETFs that we think can balance concentrated portfolio exposures, especially if the exposures depend on particular market conditions such as inflation, growth, or recession.
How we use ETFs to implement our best ideas depends on the Fund. In Funds with greater asset allocation latitude, such as Morningstar Global Income and Morningstar Unconstrained Allocation, we own ETFs that reflect our highest conviction investment ideas. Meanwhile in our Funds that have less latitude for asset allocation, such as Morningstar U.S. Equity and Morningstar International Equity, we seek to hold positions in our highest conviction ideas in weights that are unlikely to be able to be reflected in the aggregation of subadviser views. It’s a subtle difference; the important point is that we use ETFs to implement our own active investment ideas.
With valuation-driven asset allocation being such an important element of our approach, we’d like to devote some time explaining the core element of this process. To start, it’s important to remember that, in the case of investing in stocks, ultimately we’re investing in a fraction of a company or group of companies. Bonds may be issued by companies or governments and are really loans representing a series of contractual cash flows to the investor. Whether investing in stocks or bonds, the value for the owner comes from cash flows expected to be received in the future.
These cash flows are coupons for bonds and dividends and share buybacks for stocks. For stocks, we would expect those cash flows to grow as the underlying business grows, largely due to reinvestment back into businesses. Also, it’s very important to remember that stock prices follow the cash flows that companies deliver over time. We are long-term investors, which here means that to arrive at a value for a security or group of securities like an ETF, we need to estimate cash flows and the rate they might grow over the very long-term, rather than just the next quarter or next year.
Using this information, we estimate the intrinsic value, or what we would pay today to receive all of those future cash flows, discounted back to the present using a rate that compensates investors for the uncertainty of the cash flow. That may sound complicated, but the goal is simple: Estimating the intrinsic value allows us to compare what we think a stock is worth to its price. If we think an investment is worth more than its price, we think eventually the market will recognize this and the price will rise to the fair value or beyond it.
To compare assets to one another, we calculate another figure, called the expected return implied by our valuations and prices, which we term Valuation-Implied Return. The implied return estimate is the annualized return we would expect if we invested in an asset class and reinvested the cash flow over the next decade, assuming prices end up at our fair value price. Also, we adjust these estimates for inflation, so we would expect the actual annual returns to be higher than our estimates by about 2 percentage points (or the anticipated rate of inflation).
9
Morningstar Funds Trust April 30, 2020
Letter to Shareholders (continued)
Exhibit 2 Employing Fundamentals to Calculate Expected Returns
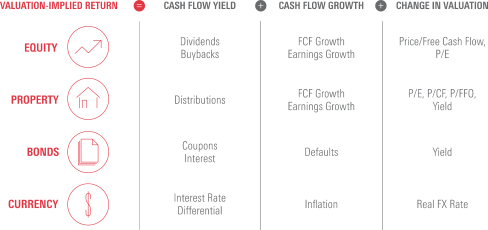
Source: Morningstar Investment Management. For illustrative purposes only.
These are just estimates based on our research; in reality, returns can be very different, and it helps to think about them as the mid-point in a range of potential outcomes. We believe it’s best to think about potential investment outcomes probabilistically. This doesn’t come naturally to most, but an analogy that helps illustrate this approach is thinking about odds in horse racing. Many outcomes are possible for each race, but the bettor at the track needs to consider what the odds are relative to the probability that each horse wins. We might think of the odds as a market pricing mechanism prone to the impact of popularity—the more people bet on a horse, the lower its odds go (i.e., the lower the potential payoff), and vice versa.
Our valuation-driven approach covers more than 200 equity markets, 150 fixed-income markets and more than 30 currencies. We simply seek to invest in assets with the highest expected returns implied by our valuations, and the lowest expected downside, across this universe, recognizing that things can and will deviate from these estimates.
This approach allows us to take active investment positions that reflect both the views of the underlying sub-advisers and our valuation-driven asset allocation. Having a long time horizon, high active share, and the ability to take advantage of a broader opportunity set may be benefiting from the rise of short-term active asset allocation through ETFs. We feel being able to utilize both levers improves our chances of long-term success.
Investing Through Uncertainty
In last year’s letter, we pointed out that “at the index level, price/earnings ratios are elevated, and bond yields and corporate spreads are low. While uncertainty remains high, markets appear to be reflecting lower levels of risk aversion from investors in what could be described as complacency. This is an environment where we believe more caution is warranted, balanced against generating long-term returns.”
While our suggestion for caution was warranted, we in no way predicted the events of early 2020 and COVID-19. While we are grateful that we weren’t overweight risk assets, the markets that we encountered in 2020 were not kind to our investment positioning. Before delving into this, we’d like to share some perspective on this market environment and its implications.
10
Morningstar Funds Trust April 30, 2020
Letter to Shareholders (continued)
First, we think it is important to point out that the COVID-19 crisis is a unique event that has no real parallel in history. There have been pandemics and recessions, but something of this nature is unique. And while there is still great uncertainty about the duration of the coronavirus and the potential for a second or third wave, the severity is becoming better understood and treatments are becoming more effective. We are not epidemiologists; however, we are hopeful that the worst case is off the table and it is a matter of waiting for a vaccine, improving medical treatment, practicing commerce-friendly social distancing, and building herd immunity. The range of outcomes on the health side seem to have narrowed.
Economies and markets are always uncertain, however the extremity of this event makes it particularly challenging. The decision to shut down large parts of the global economy at close to the same time is unprecedented, meaning we don’t have handy analogues or base cases to help us understand the impact and potential paths out of this event. Given the significance of the shutdown there is a wider range of outcomes on the economic impact, and the road to recovery.
The good news is that governments around the world responded quickly and significantly. Central banks are designed to be the lender and financial asset buyer of last resort in each country, and national treasuries are the spender and employer of last resort, and they are performing their roles.
During periods of economic contraction, fiscal policy is an effective tool for stimulating demand and almost all developed governments have the tools they will need to respond. There will be much debate about the long-term implications of the central banks entering capital markets more fully and governments running large deficits. However, these are frankly considerations that should be dealt with in the future, as the prospect of double-digit unemployment and annualized quarterly GDP contractions of greater than 20% should remain front of mind.
Importantly, the drivers of this contraction are the shutdowns and self-imposed restrictions, and the biggest stimulus will be a return to our day-to-day lives—governments need to help us get there and bridge the gap. The debate now is really about the duration of the contraction, the speed of the recovery, and the long-term impact on consumer behavior and corporate spending patterns.
We don’t know what the short-term path will be, however over the longer term we can be a lot more confident that economies and companies will recover. And that much more will be the same than different with consumer behavior and corporate spending patterns.
Positioning for Long-Term Performance
While we remained positive on the long-term prospects for economies and markets during the sell-off this spring, it was clear things were going to get worse in the short term. During March, markets appeared to be pricing that things would get worse and stay worse in certain parts of the market. In fact, prices suggested very negative outcomes and, in some areas, outright disaster.
This meant that the potential reward for bearing risk improved materially, following one of the most rapid changes in the investment environment we’ve ever seen. For long-term, value investors like ourselves, the
11
Morningstar Funds Trust April 30, 2020
Letter to Shareholders (continued)
opportunity set got a lot better and meant the potential for higher returns for our shareholders increased. The tail end of February, March, and April were a time to lengthen one’s investment horizon and to take advantage of the market environment, if you could.
An improved opportunity set also meant that in general many of the stocks or bonds that we and our subadvisors liked didn’t fare as well as the broader market. For example, the pandemic and subsequent lockdowns favored companies that would benefit from work-from-home consumers or were internet-related, had strong balance sheets, benefited from globally diversified revenues, or their businesses were defensive by nature (meaning demand for their products is less dependent on the strength of the economy). The communications, consumer staples, healthcare, and information technology sectors performed well, especially IT.
We had some exposure to those markets—we liked U.S. consumer staples and European healthcare, for example, since we viewed both as better priced than the broader global equity market. However, by and large, the stocks we preferred were stocks that would be classified as “value” with low price-to-earnings, low price-to-cash flow and price-to-book ratios (“growth” stocks tend to be those trading at high P/E, high P/CF ratios and P/B ratios), and cyclical sectors like financials and energy. At the same time, U.S. stocks appeared overpriced relative to international and emerging-markets stocks. At the multi-asset level, we were underweight stocks, held higher-quality fixed-income portfolios, and had higher cash levels, which insulated portfolios somewhat. However, the severity of the sell-off in equity markets was concentrated in the energy and cyclical sectors, causing many of our Funds to underperform during 2020.
This is a short time period, and, as we explained, we are long-term investors. We highlight this for two reasons. First, we talked about caution being warranted last year, and it’s more than fair to ask about how we did during this challenging period. And second, the things that we liked at the beginning of the year across our subadvisers and valuation-driven investment strategy became a lot more attractive during March. While markets have rallied since late March, it has been far from even and has generally continued to favor internet-related businesses over value stocks.
Of course, the Funds vary in their investment strategy and cover different asset classes, geographies, and investment styles. The comments that follow will relate to some but not all Funds, however these are big themes influencing our investment strategy and decisions.
With that said, there are two main themes to the current investment environment that we feel are important to understand as investors. Stocks classified as “value” are trading at low levels relative to stocks classified as “growth,” and international (both developed- and emerging-markets) stocks are cheap relative to U.S. stocks. However, stocks, in aggregate, have rallied a lot, which makes the current environment especially tricky.
First, the spread between value and growth stocks in the U.S. is about as wide as it has ever been. While there are legitimate reasons to like the companies that make up the largest part of the growth index, they are priced for their tremendous success to continue and then some. The following chart demonstrates the spread—growth (5th percentile) is near an all-time high P/CF multiple, while value (95th percentile) is near an all-time low:
12
Morningstar Funds Trust April 30, 2020
Letter to Shareholders (continued)
Exhibit 3 Price to Cash Flow (P/CF) Multiples (y-axis) for Growth and Value Show Widening Spread Over Time
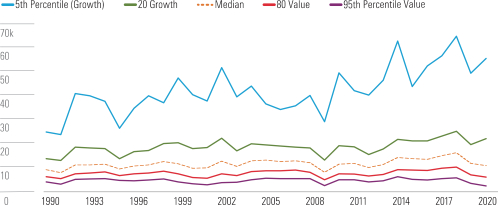
Source: Ken French Data Library, Verdad Advisers, Morningstar Investment Management. P/CF multiples are a valuation metric that represent the ratio of an asset’s price to its trailing 12-month cash flows. For illustrative purposes only.
This spread corresponds to high-P/CF, large, growth companies and low-P/CF, small, value companies. We believe the Funds are generally positioned to take advantage of a narrowing of this spread.
Second, international stocks in U.S. dollars have experienced their worst relative performance decade on record. While international stocks have faced more challenges, the U.S. has benefited from positive tailwinds, such as emerging as the world’s superpower after World War II and being home to arguably the best companies in the world. Still, what matters is what’s priced into markets.
The higher that U.S. stock prices rise relative to international developed- and emerging-markets stock prices, the more certainty is required to believe these advantages will continue into the future, forever. The following chart highlights the valuation comparison for U.S. stocks:
Exhibit 4 CAPE Ratios Show Valuation Gap Between U.S. and International Markets
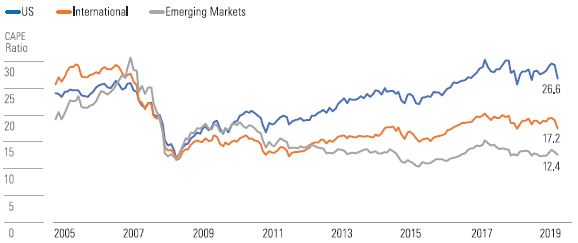
Source: Morningstar Investment Management LLC. For illustrative purposes only. Cyclically-adjusted Price to Earnings (or CAPE) ratios are a valuation metric that compare an asset’s price to its per-share earnings averaged over the past 10 years.
13
Morningstar Funds Trust April 30, 2020
Letter to Shareholders (continued)
When we convert the spread between large growth and small value; international developed, emerging markets and U.S.; and U.S. energy and U.S. information technology, we get the following forward-looking valuation-implied expected returns over the next decade:
Exhibit 5 Our Estimates Show Gaps in Expected Returns Across Select Geographies, Sizes/Styles, and Sectors
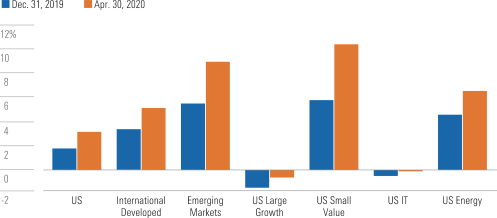
Source: Morningstar Investment Management. For illustrative purposes only. Expected return estimates are forecasts based on our research and beliefs and do not guarantee future results; they estimate annual performance over the next full market cycle (10 years). Data as of 04/30/2020.
Our understanding of the data leaves us very constructive on value, cyclical sectors like energy, and international developed- and emerging-markets stocks. At present, the market strongly prefers the opposite, and this has meant that our portfolios have looked out of step with the crowd.
Of course, we are aware that valuation discrepancies don’t indicate timing—and in fact, as Keynes said, “markets can remain irrational longer than you can remain solvent”—so we regularly play devil’s advocate with our views and include diversifying exposures where we think they can act as true hedges. However, given the magnitude of the current spreads between value/growth and U.S /international relative to history, we believe we would be doing investors a disservice if we weren’t able to weather shorter-term underperformance for what appears to us to be extremely attractive opportunity for potential long-term returns.
Although we delved into the current positioning, it’s important to remember that we are managing these Funds for the long term. Through designing the Funds as building blocks with wider mandates, we are better able to navigate through different environments. And past performance experiences do not indicate future results, so we will strive to take advantage of our long horizon, investing with conviction via our subadvisers and our actively managed allocations.
We’ve Taken Further Strides to Lower Fees
Much of last year’s annual letter was devoted to explaining the mutual fund fees and how we believed investors should interpret them.
Since last year, we included a portion of the Acquired Fund Fees and Expenses (AFFE) as part of a new contractual waiver to ensure these costs borne by shareholders are in line with the commitments that we made
14
Morningstar Funds Trust April 30, 2020
Letter to Shareholders (continued)
when the Funds were created. Previously we waived the fees using a voluntary waiver, and that created differences in expense ratios reported between the annual report and prospectus. As we mentioned last year:
We remain committed to waiving fees to the equivalent of Total Annual Operating Expenses listed in the initial prospectuses— we don’t expect to include dividend & interest expense on shorts in the voluntary waiver.
The voluntary waiver will no longer be required as the implementation will occur in a similar way to the implementation of the contractual waivers for the expense caps. These are now committed as lower fees and reflected in the prospectus.
This a further step for us to honor the commitment we have made to be transparent on fees and deliver on the fees when we set up the Funds. As mentioned above, last year we devoted the letter mostly to fees and this year we have emphasized how we are managing the Funds.
Assets Under Management (AUM) Grew 60%
Morningstar Funds were not built to raise assets within a category or part of the market, unlike some mutual fund families in the market. Morningstar Funds were created to play a critical role in the managed portfolios of the clients of the numerous financial advisors that we serve across the United States.
Why does AUM matter? Because scale drives costs lower for investors. The Funds’ growth will enable us to honor the fee levels we communicated when we designed the Funds without the need to have contractual waivers.
Over the course of the year, the Funds’ AUM increased to $3.7 billion from $2.3 billion, which is encouraging to see. This involved the migration of assets across our managed portfolios offerings.
Summary
This is our first full year of operations, and we felt it was important to explain our investment approach and how we have built and are managing the Funds. The Funds have been designed to form the building blocks for multi-asset strategies to take advantage of investment opportunities across individual securities and asset classes.
There’s been much discussion and debate about the future of active management. To state it clearly, we are firm believers in active management and our Funds reflect this conviction. Actively managed, they’re designed to deliver results over the long term, guided by our research, we believe.
With the rise of ETF-based active asset allocation and the desire to hew more closely to benchmarks and produce results over shorter time periods, we are optimistic about the long-term opportunity for active management. This improving opportunity aligns well with a long horizon and a willingness to be different.
The combination of what we believe to be outstanding subadvisers and our valuation-driven asset allocation over the long term are the key ingredients to our strategy. One should expect relative results to be lumpy, as
15
Morningstar Funds Trust April 30, 2020
Letter to Shareholders (continued)
we take a patient approach and at times deviate materially from indexes and categories. This, we believe, is essential for long-term success.
We thank you for the trust you and your financial advisor have placed in us, and look forward to managing these Funds for decades to come.
Best Regards,

Daniel Needham
President and CIO
Morningstar Investment Management
16
Morningstar Funds Trust April 30, 2020
Fund Information (unaudited)
|
Morningstar U.S. Equity Fund |
| | |
General Information | | |
Net Asset Value Per Share | | $9.27 |
Total Net Assets (millions) | | $1,179 |
Net Expense Ratio(a) | | 0.81% |
Gross Expense Ratio(a) | | 0.93% |
Portfolio Turnover Rate | | 58% |
Number of Companies | | 307 |
Fund Inception | | November 2, 2018 |
No sales charges or distribution fees | | |
| | | |
| | |
Portfolio Characteristics | | |
Weighted Average Market Capitalization (billions) | | $28.83 |
Price-to-Earnings Ratio(b) | | 15.56 |
| | | |
Ten Largest Equities (%)(c)(d)(e) | | |
Amazon.com, Inc. | | 1.8 |
Apple, Inc. | | 1.3 |
Pfizer, Inc. | | 1.3 |
JPMorgan Chase & Co. | | 1.2 |
Microsoft Corp. | | 1.2 |
AbbVie, Inc. | | 1.2 |
Archer-Daniels-Midland Co. | | 1.1 |
DuPont de Nemours, Inc. | | 1.0 |
Facebook, Inc., Class A | | 1.0 |
Intel Corp. | | 1.0 |
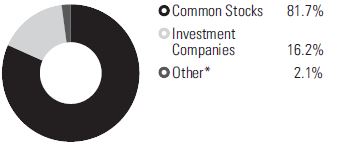
Asset Allocation
| | | | |
Sector Diversification (%)(c)(d) | | | | |
Consumer, Noncyclical | | | 19.1 | |
Financial | | | 16.9 | |
Technology | | | 11.2 | |
Industrial | | | 9.6 | |
Consumer, Cyclical | | | 8.5 | |
Communications | | | 7.4 | |
Basic Materials | | | 3.5 | |
Utilities | | | 3.5 | |
Energy | | | 2.0 | |
* Includes, if any, cash, short-term investments, receivables, payables and investments rounding to less than 0.05%.
(a) Net expense ratio reflects fee waivers and/or expense reimbursements, if any, pursuant to an agreement that is in effect to cap the expenses whereas the gross expense ratio does not. The Adviser has contractually agreed, through at least August 31, 2020, to waive all or a portion of its advisory fees and, if necessary, to assume certain other expenses (to the extent permitted by the Internal Revenue Code of 1986, as amended) to ensure that the Fund’s Total Annual Fund Operating Expenses (excluding taxes, interest, brokerage commissions, trading costs, acquired fund fees and expenses (AFFE), short sale dividend and interest expenses, litigation expenses, and extraordinary expenses) do not exceed 0.85% (the Base Expense Limitation Agreement). In addition to the Base Limitation Agreement, Morningstar has contractually agreed, through at least August 31, 2020, to waive all or a portion of its advisory fees and, if necessary, to assume certain other expenses (to the extent permitted by the Internal Revenue Code of 1986, as amended) to ensure that the Fund’s Total Annual Fund Operating Expenses (excluding the above listed expenses other than AFFE) do not exceed 0.85% (the Supplemental Expense Limitation Agreement).
(b) Price-to-earnings (P/E) ratio is calculated using 12-month forward earnings estimates from third-party sources deemed reliable.
(c) Percentages shown are based on Net Assets
(d) Excludes Investment Companies and Other.
(e) The Fund’s portfolio holdings are subject to change without notice. The mention of specific securities is not a recommendation to buy, sell, or hold any particular security and is not indicative of current or future trading activity.
17
Morningstar Funds Trust April 30, 2020
Performance Summary (unaudited)
|
Morningstar U.S. Equity Fund |
Investment Objective
Morningstar U.S. Equity Fund seeks long-term capital appreciation.
Investment Strategies
In seeking long-term capital appreciation, the Fund will normally invest at least 80% of its assets in equity securities of U.S.-based companies, and may invest up to 100% of its assets in such securities. The Fund seeks to provide broad U.S. equity exposure across market capitalizations and investment styles and has the flexibility to invest in large-cap, mid-cap, and small-cap common stocks across the growth and value style spectrum. The Fund may also invest in real estate investment trusts (REITs) and non-U.S. companies. The Fund may invest in derivatives, including futures and forward foreign currency contracts, for risk management purposes or as part of its investment strategies. The Fund may also invest in investment companies such as mutual funds and exchange traded funds (ETFs), which could represent a significant percentage of assets. The Fund employs a multimanager, subadvised structure.
Investment Commentary
The Morningstar U.S. Equity Fund returned -11.42% over the fiscal year ending April 30, 2020. The Fund’s benchmark, the Morningstar U.S. Market Index (the “Index”), posted only a modestly negative return of -0.56%. Global markets sold off several times during the period, including downturns in May and August of 2019. But most notably, stocks plunged into a full-fledged bear market in February and March of 2020 in response to the COVID-19 pandemic, which spurred a dramatic shut-down of the world economy. In all three of these downturns, value stocks were punished more severely than growth stocks. Indeed, for the 12-month period ending April 30, 2020, the Morningstar U.S. Value Index notched a loss of -12.69%, in glaring contrast to the Morningstar U.S. Growth Index’s 12.85% gain. The spread between the performance of growth stocks and value stocks, by that measure, was a whopping 25 percentage points. Meanwhile, small-cap stocks were hit hard relative to large-cap names, particularly in the February-March 2020 selloff. For example, the Morningstar U.S. Small Value Index lost -29.41% in March alone. It was down -28.78% for the 12-month period.
If nothing else, we are valuation-driven investors. And given what we considered high 2019 valuations in traditional growth sectors, such as technology and communications services (where some social-media and streaming companies are housed), the Fund was positioned more like a value fund than usual during the period. It had overweights to traditional value sectors such as financials, energy, and industrials, with underweights to technology and communications services. The Fund thus performed more in line with the value indexes than the growth indexes over this period. Amid the pandemic-driven market decline, investors fled economically sensitive stocks like those of banks and manufacturers. Energy-related stocks—including the pipeline/infrastructure stocks we had been favoring—were hit first by a spat between OPEC and Russia in early March 2020 that led to a supply glut, and then again by a plunge in oil demand following global stay-at-home orders. These sectors took a toll on the portfolio during the downturn. Meanwhile, given that the Fund was designed to provide participation in the full range of U.S. market capitalization, it diversifies meaningfully into mid-and small-cap stocks. As mentioned above, small-cap stocks were hit hard by the COVID-19 market meltdown. With regard to the Fund’s subadvisers, Levin Easterly Partners LLC had a tough performance stretch in 2019. Diamond Hill Capital Management, Inc.’s mid-cap portfolio was positioned with more of a cyclical cast than usual, so it suffered disproportionately on the downside. And while large-growth manager, ClearBridge Investments, LLC, benefited from the outperformance of growth stocks, it nonetheless trailed its large-growth style benchmark by some six percentage points over the one-year period.
18
Morningstar Funds Trust April 30, 2020
Performance Summary (unaudited) (continued)
Morningstar U.S. Equity Fund
We did maintain dedicated ETF positions in health care and consumer staples for defensive cushioning, and those sectors held up well when other sectors fell. Also, the Fund’s growth-style subadvisers outperformed the value subadvisers over the past year as one would have expected, given the return disparity between growth and value stocks. But the portfolio’s overall value leanings dominated for the period.
After the market bottom on March 23, 2020, some of the economically sensitive stocks that sold off amid the February/March panic rebounded powerfully. As an extreme example, the two energy ETFs owned in the portfolio were each up more than 56% from March 24 through April 30. (We added to the energy position near the bottom, and that helped returns in the rebound.) But other hard-hit areas also bounced strongly, including small-caps. As a result, the Fund’s performance was fairly robust following the March 23 market bottom. From March 24 through April 30, the Fund gained 33.00%, a couple of percentage points more than the Index.
There is a wide performance dispersion between value and growth stocks looking back not only one year, but for the two-and three-year periods as well. We believe these types of dislocations tend to even out over time. We are paying plenty of attention to the overall balance of the portfolio, but we think value stocks have further room to improve relative to growth stocks. So far this year we have witnessed an historically unusual market environment, to be sure. As always, we endeavor to look through the present noise toward the future. Taking advantage of our team’s deep research and valuation analysis, our focus is positioning the portfolio in the best-valued opportunities with a three- to five-year mindset.
Investment Subadvisers:
ClearBridge Investments, LLC
Diversified large-cap growth equity across stable, cyclical and select growth companies.
Diamond Hill Capital Management, Inc.
Targeted exposure to U.S. mid-cap value companies.
Levin Easterly Partners LLC
Provides large-cap blend U.S equity exposure.
Massachusetts Financial Services Company, d/b/a MFS Investment Management
Provides large-cap value exposure, favoring higher-quality, value companies with stronger balance sheets and more consistent profitability.
Wasatch Advisors, Inc.
Small-/mid-cap growth companies with the potential to deliver more stable profits while avoiding earlier-stage companies that may lack a proven track record of revenues and earnings.
Westwood Management Corp.
Provides small-cap equity with an emphasis on value.
19
Morningstar Funds Trust April 30, 2020
Performance Summary (unaudited) (continued)
Morningstar U.S. Equity Fund
Performance at a glance
| | | | | | | | |
| Average Total Returns as of 04/30/20 | | 1 year2 | | | Since Inception3 | |
Morningstar U.S. Equity Fund | | | -11.42 | % | | | -3.55 | % |
Morningstar U.S. Market Index1 | | | -0.56 | % | | | 5.71 | % |
Illustration of an assumed investment of $10,000
The following graph depicts the performance of Morningstar U.S. Equity Fund shares versus the Morningstar U.S. Market Index (“the Index”) from its inception (November 2, 2018) to April 30, 2020 (the Fund’s fiscal year end). Shares held through advisory programs may be subject to a program fee, which, if included, would have reduced performance. The performance provided does not reflect the deduction of taxes that a shareholder would pay on Fund distributions or the redemption of Fund shares. Past performance is no guarantee of future results. Share price and returns will vary with market conditions; investors may realize a gain or loss upon redemption. It is important to note that Morningstar U.S. Equity Fund is a professionally managed portfolio while the Index is not available for direct investment, is unmanaged and does not include fees, expenses or taxes. The comparison is shown for illustration purposes only.
Morningstar U.S. Equity Fund
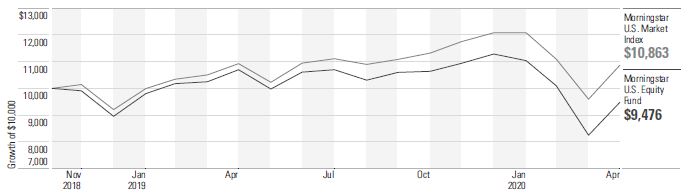
This chart does not imply future performance.
1The Morningstar U.S. Market Index is a diversified, broad-market index that targets 97% market capitalization coverage of the U.S. stock market. Investors should note that indices do not reflect the deduction of fees, expenses or taxes.
2Represents performance from May 1, 2019 to April 30, 2020.
3Inception Date is November 2, 2018. Returns are annualized for periods greater than 1 year.
Past performance does not predict future performance, and the performance information provided, does not reflect the deduction of taxes that a shareholder would pay on Fund distributions or the redemption of Fund shares. Shares held through advisory programs are subject to a program fee, which, if included, would have reduced performance. The return and principal value of an investment will fluctuate, so that an investor’s shares, when redeemed, may be worth more or less than their original cost. Performance results assume reinvestment of all dividends and capital gain distributions at net asset value on the ex-dividend dates. Current performance may be higher or lower than the performance data quoted.
20
Morningstar Funds Trust April 30, 2020
Fund Information (unaudited)
|
Morningstar International Equity Fund |
| | | | |
| | |
General Information | | | | |
Net Asset Value Per Share | | | $8.76 | |
Total Net Assets (millions) | | | $764 | |
Net Expense Ratio(a) | | | 0.92% | |
Gross Expense Ratio(a) | | | 1.14% | |
Portfolio Turnover Rate | | | 36% | |
Number of Companies | | | 232 | |
Fund Inception | | | November 2, 2018 | |
No sales charges or distribution fees | | | | |
| | | | |
| | | | |
| | |
Portfolio Characteristics | | | | |
Weighted Average Market Capitalization (billions) | | | $30.67 | |
Price-to-Earnings Ratio(b) | | | 12.69 | |
Countries Represented | | | 44 | |
Emerging Markets(c)(d) | | | 25.6% | |
| | | | |
| | |
Ten Largest Equities (%)(c)(d)(e) | | | | |
Allianz S.E. | | | 1.5 | |
Glencore PLC | | | 1.4 | |
Daimler A.G. | | | 1.3 | |
BNP Paribas S.A. | | | 1.3 | |
Bayerische Motoren Werke A.G. | | | 1.1 | |
Lloyds Banking Group PLC | | | 1.1 | |
Credit Suisse Group A.G. | | | 1.1 | |
Continental A.G. | | | 1.1 | |
Intesa Sanpaolo S.p.A. | | | 1.1 | |
Tencent Holdings Ltd. | | | 1.1 | |
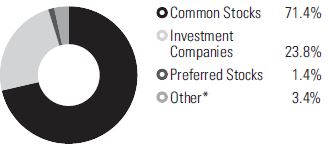
Asset Allocation
| | | | |
| | |
Sector Diversification (%)(c)(d) | | | | |
Financial | | | 17.3 | |
Consumer, Noncyclical | | | 12.5 | |
Consumer, Cyclical | | | 11.3 | |
Industrial | | | 8.7 | |
Communications | | | 8.5 | |
Technology | | | 7.7 | |
Basic Materials | | | 4.5 | |
Energy | | | 2.0 | |
Diversified | | | 0.2 | |
Utilities | | | 0.1 | |
| | | | |
Region Diversification (%)(c)(d) | | | | |
Europe (excluding United Kingdom) | | | 31.2 | |
Pacific (excluding Japan) | | | 21.5 | |
United Kingdom | | | 8.5 | |
Japan | | | 4.5 | |
Latin America | | | 3.1 | |
Africa | | | 1.6 | |
Canada | | | 1.2 | |
Middle East | | | 0.9 | |
United States | | | 0.3 | |
* Includes, if any, cash, short-term investments, receivables, payables, derivatives and investments rounding to less than 0.05%.
(a) Net expense ratio reflects fee waivers and/or expense reimbursements, if any, pursuant to an agreement that is in effect to cap the expenses whereas the gross expense ratio does not. The Adviser has contractually agreed, through at least August 31, 2020, to waive all or a portion of its advisory fees and, if necessary, to assume certain other expenses (to the extent permitted by the Internal Revenue Code of 1986, as amended) to ensure that the Fund’s Total Annual Fund Operating Expenses (excluding taxes, interest, brokerage commissions, trading costs, acquired fund fees and expenses (AFFE), short sale dividend and interest expenses, litigation expenses, and extraordinary expenses) do not exceed 1.00% (the Base Expense Limitation Agreement). In addition to the Base Limitation Agreement, Morningstar has contractually agreed, through at least August 31, 2020, to waive all or a portion of its advisory fees and, if necessary, to assume certain other expenses (to the extent permitted by the Internal Revenue Code of 1986, as amended) to ensure that the Fund’s Total Annual Fund Operating Expenses (excluding the above listed expenses other than AFFE) do not exceed 1.00% (the Supplemental Expense Limitation Agreement).
(b) Price-to-earnings (P/E) ratio is calculated using 12-month forward earnings estimates from third-party sources deemed reliable.
(c) Percentages shown are based on Net Assets.
(d) Excludes Investment Companies and Other.
(e) The Fund’s portfolio holdings are subject to change without notice. The mention of specific securities is not a recommendation to buy, sell, or hold any particular security and is not indicative of current or future trading activity.
21
Morningstar Funds Trust April 30, 2020
Performance Summary (unaudited)
|
Morningstar International Equity Fund |
Investment Objective
Morningstar International Equity Fund seeks long-term capital appreciation.
Investment Strategies
In seeking long-term capital appreciation, the Fund will normally invest at least 80% of its assets in equity securities. Under normal circumstances, the Fund will invest approximately 80-100% of its assets in securities of issuers domiciled outside of the United States. The Fund may invest in developed and emerging markets and will typically invest in a minimum of 10 countries. The Fund seeks to provide broad international equity exposure across market capitalizations and investment styles and has the flexibility to invest in large-cap, mid-cap, and small-cap common stocks across the growth and value style spectrum. The Fund may also invest in derivatives, including futures and forward foreign currency contracts, for risk management purposes or as part of its investment strategies. The Fund may also invest in investment companies such as mutual funds and exchange traded funds (ETFs), which could represent a significant percentage of assets. The Fund employs a multimanager, subadvised structure.
Investment Commentary
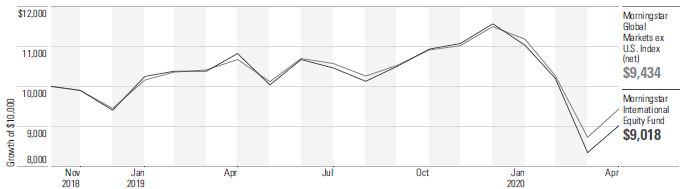
The Morningstar International Equity Fund had a total return of -16.65% for the fiscal year ending April 30, 2020, compared to -11.59% for the Morningstar Global Markets ex U.S. Index (net) (the “Index”).
After posting healthy gains through 2019, global stocks declined swiftly in March of 2020 as fears related to the COVID-19 pandemic took hold. All regions and sectors were negatively impacted, with defensive sectors such as consumer staples and health care holding up relatively well. Japanese stocks also performed better than the broader market, as investors sought out the safety of companies with healthy balance sheets.
While the International Equity Fund held positions in some of the aforementioned defensive areas of the market, the portfolio’s strong tilt toward more value-oriented sectors weighed heavily on its returns. Positions in European financials, consumer discretionary, and energy names witnessed steep losses as investors began to fret about the impact of the virus on economic growth and the prospect of low interest rates. Energy stocks were the worst performing sector as demand for oil crumbled, leaving the oil market oversupplied even after belated production cuts from OPEC. By the end of the fiscal year, the spread between value and growth stocks had reached extreme levels, with MSCI EAFE Growth index outperforming the MSCI EAFE Value index by more than 18 percentage points over the one-year period.
From a country perspective, much of the Fund’s underperformance versus the Index owed to its overweight in the U.K. and Germany, both of which trace indirectly to our allocation to Harris Associates L.P.’s investment mandate, along with a UK-focused ETF position. Lazard Asset Management LLC, the Fund’s subadviser that focuses on value-oriented stocks within emerging-market equities, lagged its style benchmark for the one-year period, due to overweights in Latin America and Russia.
There were some relative bright spots. The Fund’s growth-oriented subadvisers T. Rowe Price Associates, Inc. and Harding Loevner L.P. contributed positively to the Fund’s results, outperforming their respective style benchmarks. The Fund’s position in a Japan-focused ETF also provided ballast.
22
Morningstar Funds Trust April 30, 2020
Performance Summary (unaudited) (continued)
Morningstar International Equity Fund
Despite the Fund’s disappointing absolute and relative results, we remain committed to our valuation-oriented approach and with lower valuations across much of the portfolio, we remain optimistic about the Fund’s prospects.
Investment Subadvisers:
Harding Loevner L.P.
Provides growth-leaning exposure to non-U.S. developed equity markets.
Harris Associates L.P.
Provides exposure to value-leaning, non-U.S. developed equity markets.
Lazard Asset Management LLC
Provides active equity exposure to emerging-markets value companies.
T. Rowe Price Associates, Inc.
Provides active exposure to emerging-markets growth companies.
23
Morningstar Funds Trust April 30, 2020
Performance Summary (unaudited) (continued)
Morningstar International Equity Fund
Performance at a glance
| | | | | | | | |
| Average Total Returns as of 04/30/20 | | 1 year2 | | | Since Inception3 | |
Morningstar International Equity Fund | | | -16.65 | % | | | -6.70 | % |
Morningstar Global Markets ex U.S. Index (net)1 | | | -11.59 | % | | | -3.83 | % |
Illustration of an assumed investment of $10,000
The following graph depicts the performance of Morningstar International Equity Fund shares versus the Morningstar Global Markets ex U.S. Index (net) ( “the Index” ) from its inception (November 2, 2018) to April 30, 2020 (the Fund’s fiscal year end). Shares held through advisory programs may be subject to a program fee, which, if included, would have reduced performance. The performance provided does not reflect the deduction of taxes that a shareholder would pay on Fund distributions or the redemption of Fund shares. Past performance is no guarantee of future results. Share price and returns will vary with market conditions; investors may realize a gain or loss upon redemption. It is important to note that Morningstar International Equity Fund is a professionally managed portfolio while the Index is not available for direct investment, is unmanaged and does not include fees, expenses or certain taxes. The comparison is shown for illustration purposes only.
Morningstar International Equity Fund
This chart does not imply future performance.
1The Morningstar Global Markets ex U.S. Index (net) captures the performance of the stocks located in the developed and emerging countries across the world, excluding the United States. Stocks in the index are weighted by their float capital, which removes corporate cross-ownership, government holdings and other locked-in shares. Net total return indices reinvest dividends after the deduction of withholding taxes, using a tax rate applicable to non-resident individuals who do not benefit from double taxation treaties. Investors should note that such indices do not reflect the deduction of fees, expenses or other taxes.
2Represents performance from May 1, 2019 to April 30, 2020.
3Inception Date is November 2, 2018. Returns are annualized for periods greater than 1 year.
Past performance does not predict future performance, and the performance information provided, does not reflect the deduction of taxes that a shareholder would pay on Fund distributions or the redemption of Fund shares. Shares held through advisory programs are subject to a program fee, which, if included, would have reduced performance. The return and principal value of an investment will fluctuate, so that an investor’s shares, when redeemed, may be worth more or less than their original cost. Performance results assume reinvestment of all dividends and capital gain distributions at net asset value on the ex-dividend dates. Current performance may be higher or lower than the performance data quoted.
24
Morningstar Funds Trust April 30, 2020
Fund Information (unaudited)
|
Morningstar Global Income Fund |
| | | | |
| | |
General Information | | | | |
Net Asset Value Per Share | | | $9.54 | |
Total Net Assets (millions) | | | $235 | |
Net Expense Ratio(a) | | | 0.58 | % |
Gross Expense Ratio(a) | | | 0.64 | % |
Portfolio Turnover Rate | | | 62 | % |
Fund Inception | | | November 2, 2018 | |
No sales charges or distribution fees | | | | |
| | | | |
| | | | |
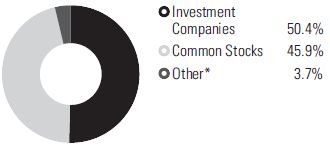
Number of Common Stocks | | | 36 | |
| | | | |
| | |
Five Largest Sectors (%)(b)(c) | | | | |
Consumer, Noncyclical | | | 11.5 | |
Financial | | | 10.5 | |
Utilities | | | 6.6 | |
Communications | | | 6.5 | |
Industrial | | | 2.9 | |
| | | | |
| | |
Ten Largest Equities (%)(b)(c)(d) | | | | |
Ascendas Real Estate Investment Trust | | | 2.0 | |
Novartis A.G. ADR | | | 2.0 | |
GlaxoSmithKline PLC | | | 1.9 | |
Iberdrola S.A. | | | 1.9 | |
NextEra Energy, Inc. | | | 1.8 | |
Sanofi ADR | | | 1.8 | |
BCE, Inc. | | | 1.8 | |
Softbank Corp. | | | 1.7 | |
Sonic Healthcare Ltd. | | | 1.6 | |
AT&T, Inc. | | | 1.6 | |
Asset Allocation
* Includes, if any, cash, short-term investments, receivables, payables, derivatives and investments rounding to less than 0.05%.
(a) Net expense ratio reflects fee waivers and/or expense reimbursements, if any, pursuant to an agreement that is in effect to cap the expenses whereas the gross expense ratio does not. The Adviser has contractually agreed, through at least August 31, 2020, to waive all or a portion of its advisory fees and, if necessary, to assume certain other expenses (to the extent permitted by the Internal Revenue Code of 1986, as amended) to ensure that the Fund’s Total Annual Fund Operating Expenses (excluding taxes, interest, brokerage commissions, trading costs, acquired fund fees and expenses (AFFE), short sale dividend and interest expenses, litigation expenses, and extraordinary expenses) do not exceed 0.89% (the Base Expense Limitation Agreement). In addition to the Base Limitation Agreement, Morningstar has contractually agreed, through at least August 31, 2020, to waive all or a portion of its advisory fees and, if necessary, to assume certain other expenses (to the extent permitted by the Internal Revenue Code of 1986, as amended) to ensure that the Fund’s Total Annual Fund Operating Expenses (excluding the above listed expenses other than AFFE) do not exceed 0.75% (the Supplemental Expense Limitation Agreement).
(b) Percentages shown are based on Net Assets.
(c) Excludes Investment Companies and Other.
(d) The Fund’s portfolio holdings are subject to change without notice. The mention of specific securities is not a recommendation to buy, sell, or hold any particular security and is not indicative of current or future trading activity.
25
Morningstar Funds Trust April 30, 2020
Performance Summary (unaudited)
|
Morningstar Global Income Fund |
Investment Objective
Morningstar Global Income Fund seeks current income and long-term capital appreciation.
Investment Strategies
In seeking current income and long-term capital appreciation, the Fund has significant flexibility and invests across asset classes and geographies, according to the portfolio management team’s assessment of their valuations, fundamental health, and income levels. Under normal circumstances, the Fund will invest at least 20% (or, if market conditions are unfavorable, at least 10%) of assets in securities of issuers domiciled outside of the United States and may invest up to 100% assets in such securities.
The Fund invests in income-generating equity securities, which may include common stocks, convertible securities, preferred stocks, real estate investment trusts (REITs), and master limited partnerships (MLPs). The Fund may invest in companies of any size from any country, including emerging markets.
The Fund also invests in fixed-income securities of varying maturity, duration, and quality. These may include U.S. and non-U.S. corporate debt securities, U.S. and non-U.S. government debt securities, emerging-market debt securities, mortgage-backed and asset-backed securities, and floating-rate notes. The Fund may invest without limit in fixed-income securities that are rated below investment grade (commonly known as junk bonds) or, if unrated, are determined by the Fund’s subadviser(s) to be of comparable quality.
The Fund may also invest in derivatives, including options, futures, swaps, and forward foreign currency contracts, for risk management purposes or as part of its investment strategies. The Fund may also invest in investment companies such as mutual funds and exchange traded funds (ETFs), which could represent a significant percentage of assets. The Fund employs a multimanager, subadvised structure.
Investment Commentary
The Morningstar Global Income Fund lost -5.73% for the fiscal year ending April 30, 2020, underperforming the Fund’s blended benchmark (75% Morningstar Global Ex U.S. Index (net), 25% Bloomberg Barclays Multiverse Total Return Index), which lost -2.78% for the same period.
The trailing 12 months were a tough period for income producing asset classes. The typical higher-yielding equity sectors, including energy, REITs, and financials, all underperformed the broad equity market despite falling rates. On the fixed-income side, credit exposures were hit hard during the sell-off in the first quarter of 2020, while Treasury bonds served as safe heaven assets, with long-term Treasury bonds generating the best performance across all asset classes in the Fund over the past 12 months.
The Fund’s holdings generally gained ground through 2019, with the largest gains coming from Schafer Cullen Capital Management, Inc., which is the sole subadviser that invests in global dividend stocks. During the sell-off in the first quarter of 2020, the Fund’s equity exposures were the main performance detractors. Particular exposures, including exposure to MLPs and energy infrastructure, U.K. equities, and European telecom dragged on returns. Strong performance from long-term Treasuries helped close the gap. Allocations to intermediate-term bonds and agency mortgage-backed securities also contributed positively to the relative performance.
26
Morningstar Funds Trust April 30, 2020
Performance Summary (unaudited) (continued)
Morningstar Global Income Fund
Investment Subadviser:
Schafer Cullen Capital Management, Inc.
Global income that seeks exposure to attractively priced, high-quality, dividend-paying companies in the U.S. and international markets, including emerging markets.
27
Morningstar Funds Trust April 30, 2020
Performance Summary (unaudited) (continued)
Morningstar Global Income Fund
Performance at a glance
| | | | | | | | |
| Average Total Returns as of 04/30/20 | | 1 year2 | | | Since Inception3 | |
Morningstar Global Income Fund | | | -5.73 | % | | | 0.49 | % |
Morningstar Global Income Blended Index1 | | | -2.78 | % | | | 2.75 | % |
Illustration of an assumed investment of $10,000
The following graph depicts the performance of Morningstar Global Income Fund shares versus the Morningstar Global Income Blended Index (“the Index”) from its inception (November 2, 2018) to April 30, 2020 (the Fund’s fiscal year end). Shares held through advisory programs may be subject to a program fee, which, if included, would have reduced performance. The performance provided does not reflect the deduction of taxes that a shareholder would pay on Fund distributions or the redemption of Fund shares. Past performance is no guarantee of future results. Share price and returns will vary with market conditions; investors may realize a gain or loss upon redemption. It is important to note that Morningstar Global Income Fund is a professionally managed portfolio while the Index is not available for direct investment, is unmanaged and does not include fees, expenses or certain taxes. The comparison is shown for illustration purposes only.
Morningstar Global Income Fund
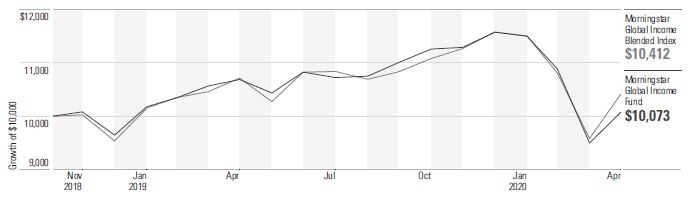
This chart does not imply future performance.
1The Morningstar Global Income Blended Index is composed of 75% Morningstar Global Ex U.S. Index (net) and 25% Bloomberg Barclays Multiverse Total Return Index. The Morningstar Global Ex U.S. Index (net) captures the performance of the stocks located in the developed and emerging countries across the world, excluding the United States. The Bloomberg Barclays Multiverse Total Return Index provides a broad-based measure of the global fixed-income bond market. Net total return indices reinvest dividends after the deduction of withholding taxes, using a tax rate applicable to non-resident individuals who do not benefit from double taxation treaties. Investors should note that such indices do not reflect the deduction of fees, expenses or other taxes.
2Represents performance from May 1, 2019 to April 30, 2020.
3Inception Date is November 2, 2018. Returns are annualized for periods greater than 1 year.
Past performance does not predict future performance, and the performance information provided, does not reflect the deduction of taxes that a shareholder would pay on Fund distributions or the redemption of Fund shares. Shares held through advisory programs are subject to a program fee, which, if included, would have reduced performance. The return and principal value of an investment will fluctuate, so that an investor’s shares, when redeemed, may be worth more or less than their original cost. Performance results assume reinvestment of all dividends and capital gain distributions at net asset value on the ex-dividend dates. Current performance may be higher or lower than the performance data quoted.
28
Morningstar Funds Trust April 30, 2020
Fund Information (unaudited)
|
Morningstar Total Return Bond Fund |
| | |
General Information | | |
Net Asset Value Per Share | | $10.88 |
Total Net Assets (millions) | | $519 |
Net Expense Ratio(a) | | 0.53% |
Gross Expense Ratio(a) | | 0.81% |
Portfolio Turnover Rate | | 612% |
Number of Issuers | | 710 |
Fund Inception | | November 2, 2018 |
No sales charges or distribution fees | | |
Asset Allocation
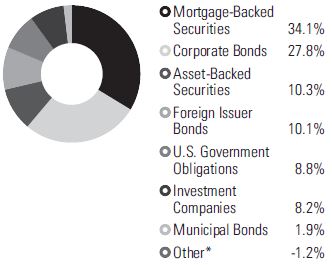
| | |
Portfolio Characteristics | | |
Effective Duration (years)(b) | | 5.8 |
Non-USD Exposure(c)(d)(e) | | 0.4% |
| | | |
Five Largest Issuers (%)(c)(d)(f) | | |
Federal National Mortgage Association | | 15.1 |
U.S. Treasury | | 8.7 |
Federal Home Loan Mortgage Corporation | | 7.5 |
Federal Housing Finance Agency | | 6.3 |
Government National Mortgage Association | | 5.4 |
| | | |
Credit Quality (%)(c)(d)(g) | | |
U.S. Treasury | | 8.7 |
U.S. Agency | | 34.4 |
AAA | | 5.5 |
AA | | 4.5 |
A | | 16.9 |
BBB | | 17.6 |
BB | | 2.0 |
B | | 0.8 |
CCC | | 0.3 |
CC | | 0.1 |
Not Rated | | 2.2 |
| | | | |
Sector Diversification (%)(c)(d) | | | | |
Mortgage Securities | | | 39.2 | |
Government | | | 13.5 | |
Financial | | | 10.3 | |
Consumer, Noncyclical | | | 6.2 | |
Asset Backed Securities | | | 5.3 | |
Energy | | | 4.0 | |
Communications | | | 3.7 | |
Industrial | | | 3.3 | |
Technology | | | 2.6 | |
Utilities | | | 1.9 | |
Consumer, Cyclical | | | 1.8 | |
Basic Materials | | | 1.2 | |
| | | | |
Region Diversification (%)(c)(d) | | | | |
United States | | | 79.5 | |
Latin America | | | 5.8 | |
Europe (excluding United Kingdom) | | | 3.5 | |
United Kingdom | | | 1.3 | |
Pacific (excluding Japan) | | | 1.3 | |
Middle East | | | 0.7 | |
Japan | | | 0.4 | |
Canada | | | 0.4 | |
Africa | | | 0.1 | |
* Includes, if any, cash, short-term investments, receivables, payables, derivatives and investments rounding to less than 0.05%.
(a) Net expense ratio reflects fee waivers and/or expense reimbursements, if any, pursuant to an agreement that is in effect to cap the expenses whereas the gross expense ratio does not. The Adviser has contractually agreed, through at least August 31, 2020, to waive all or a portion of its advisory fees and, if necessary, to assume certain other expenses (to the extent permitted by the Internal Revenue Code of 1986, as amended) to ensure that the Fund’s Total Annual Fund Operating Expenses (excluding taxes, interest, brokerage commissions, trading costs, acquired fund fees and expenses (AFFE), short sale dividend and interest expenses, litigation expenses, and extraordinary expenses) do not exceed 0.53% (the Base Expense Limitation Agreement). In addition to the Base Limitation Agreement, Morningstar has contractually agreed, through at least August 31, 2020, to waive all or a portion of its advisory fees and, if necessary, to assume certain other expenses (to the extent permitted by the Internal Revenue Code of 1986, as amended) to ensure that the Fund’s Total Annual Fund Operating Expenses (excluding the above listed expenses other than AFFE) do not exceed 0.54% (the Supplemental Expense Limitation Agreement).
29
Morningstar Funds Trust April 30, 2020
Fund Information (unaudited) (continued)
Morningstar Total Return Bond Fund
(b) Effective duration is measure of a Fund’s interest-rate sensitivity—the longer a Fund’s duration, the more sensitive the Fund is to shifts in interest rates. Duration is determined by a formula that includes coupon rates and bond maturities. Small coupons tend to increase duration, while shorter maturities and higher coupons shorten duration.
(c) Percentages shown are based on Net Assets.
(d) Excludes Investment Companies and Other.
(e) Non-USD currency exposure for the Fund reflects the value of the portfolio’s non-U.S. dollar denominated investments, as well as the impact of currency derivatives.
(f) The Fund’s portfolio holdings are subject to change without notice. The mention of specific securities is not a recommendation to buy, sell, or hold any particular security and is not indicative of current or future trading activity.
(g) Credit quality ratings are based on the conservative average of Moody’s, S&P Global and Fitch ratings. If ratings from all three rating agencies disagree, the model assigns the middle rating to the security. If two of the three agree, the model assigns the rating from those two to the security. If none of these three rating agencies has assigned a rating, the Fund will assign a rating of not rated. The ratings, expressed in S&P Global’s nomenclature, range from AAA (extremely strong capacity to meet its financial commitment) to D (in default). Short-term ratings, expressed in S&P Global’s nomenclature, range from A1 to D (in default). The ratings represent the rating agencies’ opinions of the quality of the securities they rate. Ratings are relative and subjective and are not absolute standards of quality.
30
Morningstar Funds Trust April 30, 2020
Performance Summary (unaudited)
|
Morningstar Total Return Bond Fund |
Investment Objective
Morningstar Total Return Bond Fund seeks to maximize total return while also generating income and preserving capital.
Investment Strategies
In seeking to maximize total return while also generating income and preserving capital, the Fund will normally invest at least 80% of its assets in debt securities (commonly referred to as “bonds”) of varying maturity, duration, and quality.
The Fund invests primarily in investment-grade fixed-income securities. These may include U.S. and non-U.S. investment-grade corporate debt securities, U.S. government debt securities including Treasury Inflation Protected Bond Securities and zero-coupon securities, non-U.S. government debt securities, emerging-market debt securities, and mortgage-backed and asset-backed securities. The Fund may also invest up to 20% of its assets in fixed-income securities that are rated below investment grade (commonly known as junk bonds), or if unrated, are determined by the Fund’s subadviser(s) to be of comparable quality.
In addition, the Fund may invest up to 15% of its assets in collateralized debt obligations (CDOs), of which 10% (as a percentage of the Fund’s assets) may be in collateralized loan obligations (CLOs). CDOs are types of asset-backed securities. CLOs are ordinarily issued by a trust or other special purpose entity and are typically collateralized by a pool of loans, which may include, among others, domestic and non-U.S. senior secured loans, senior unsecured loans, and subordinate corporate loans, including loans that may be rated below investment grade or equivalent unrated loans, held by such issuer.
The Fund may invest up to 20% of its assets in securities denominated in foreign currencies. The Fund may also invest in securities acquired in a private placement, such as Rule 144A securities, as well as derivatives, including options, futures, swaps, and forward foreign currency contracts, for risk management purposes or as part of its investment strategies. The Fund may also enter into reverse repurchase agreements and dollar rolls. The Fund may also invest in investment companies such as mutual funds and exchange traded funds (ETFs). The Fund employs a multimanager, subadvised structure.
Investment Commentary
The Morningstar Total Return Bond Fund returned 9.13% for the fiscal year ending April 30, 2020, underperforming the Fund’s benchmark, Bloomberg Barclays U.S. Aggregate Bond Index, which returned 10.84% for the same period.
On an absolute basis, the twelve-month period ending April 30, 2020 was a very constructive environment for the U.S. investment-grade bond market in which this Fund primarily invests. U.S. Treasury yields declined meaningfully over that stretch, and particularly so during the first several months of 2020 as the COVID-19 pandemic and ensuing economic fallout led investors to seek safety in U.S Treasuries. The 10-year U.S. Treasury yield ultimately hit record lows during March 2020, fueling strong gains for intermediate- and long-term U.S. Treasury bonds. Other areas of the U.S. bond market, including investment-grade corporate bonds and agency mortgage-backed securities, also produced high single-digit gains for the fiscal year, but U.S Treasuries were the best performing segment over that period.
31
Morningstar Funds Trust April 30, 2020
Performance Summary (unaudited) (continued)
Morningstar Total Return Bond Fund
A key contributor to the Fund’s underperformance versus its benchmark was a meaningful underweight to U.S. Treasuries, particularly during the market sell-off in 2020. A small allocation to a long-term U.S. Treasuries ETF during the period helped to modestly offset the negative impact of the underweight, which was driven by the underlying subadvisers’ positioning. In lieu of U.S. Treasuries, the Fund has long held an overweight to agency mortgage-backed securities, which underperformed relative to other segments of the investment-grade bond market and was another detractor from relative results. Finally, an out-of-benchmark allocation to hard-currency emerging markets debt and an overweight to credit-sensitive securitized products also contributed to relative underperformance as these areas of the market experienced significant losses during the market sell-off.
Investment Subadvisers:
BlackRock Financial Management, Inc.
Core-plus total return objective; aims to primarily invest in investment-grade, domestic fixed-income securities with opportunistic, out-of-benchmark allocations and derivatives.
Western Asset Management Company
Provides core-bond exposure seeking exposure to investment-grade, domestic fixed-income securities.
32
Morningstar Funds Trust April 30, 2020
Performance Summary (unaudited) (continued)
Morningstar Total Return Bond Fund
Performance at a glance
| | | | | | | | |
| Average Total Returns as of 04/30/20 | | 1 year2 | | | Since Inception3 | |
Morningstar Total Return Bond Fund | | | 9.13 | % | | | 10.28 | % |
Bloomberg Barclays U.S. Aggregate Bond Index1 | | | 10.84 | % | | | 11.27 | % |
Illustration of an assumed investment of $10,000
The following graph depicts the performance of Morningstar Total Return Bond Fund shares versus the Bloomberg Barclays U.S. Aggregate Bond Index (“the Index”) from its inception (November 2, 2018) to April 30, 2020 (the Fund’s fiscal year end). Shares held through advisory programs may be subject to a program fee, which, if included, would have reduced performance. The performance provided does not reflect the deduction of taxes that a shareholder would pay on Fund distributions or the redemption of Fund shares. Past performance is no guarantee of future results. Share price and returns will vary with market conditions; investors may realize a gain or loss upon redemption. It is important to note that Morningstar Total Return Bond Fund is a professionally managed portfolio while the Index is not available for direct investment, is unmanaged and does not include fees, expenses or taxes. The comparison is shown for illustration purposes only.
Morningstar Total Return Bond Fund
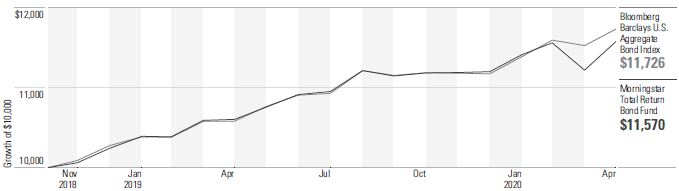
This chart does not imply future performance.
1The Bloomberg Barclays U.S. Aggregate Bond Index is a broad-based, flagship benchmark that measures the investment grade, U.S.-dollar-denominated, fixed-rate, taxable bond market. Investors should note that indices do not reflect the deduction of fees, expenses or taxes.
2Represents performance from May 1, 2019 to April 30, 2020.
3Inception Date is November 2, 2018. Returns are annualized for periods greater than 1 year.
Past performance does not predict future performance, and the performance information provided, does not reflect the deduction of taxes that a shareholder would pay on Fund distributions or the redemption of Fund shares. Shares held through advisory programs are subject to a program fee, which, if included, would have reduced performance. The return and principal value of an investment will fluctuate, so that an investor’s shares, when redeemed, may be worth more or less than their original cost. Performance results assume reinvestment of all dividends and capital gain distributions at net asset value on the ex-dividend dates. Current performance may be higher or lower than the performance data quoted.
33
Morningstar Funds Trust April 30, 2020
Fund Information (unaudited)
|
Morningstar Municipal Bond Fund |
| | |
General Information | | |
Net Asset Value Per Share | | $10.14 |
Total Net Assets (millions) | | $340 |
Net Expense Ratio(a) | | 0.58% |
Gross Expense Ratio(a) | | 0.77% |
Portfolio Turnover Rate | | 127% |
Number of Issuers | | 349 |
Fund Inception | | November 2, 2018 |
No sales charges or distribution fees | | |
| | | |
| | |
Portfolio Characteristics | | |
Effective Duration (years)(b) | | 4.6 |
| | | |
Five Largest Issuers (%)(c)(d)(e) | | |
Illinois Finance Authority | | 1.8 |
New York State Dormitory Authority | | 1.7 |
Metropolitan Transportation Authority | | 1.7 |
Mizuho Floater/Residual Trust Various States Floaters Revenue | | 1.2 |
RBC Municipal Products Inc., Trust Floater Certificates Revenue | | 1.2 |
| | | |
Credit Quality (%)(c)(d)(f) | | |
AAA | | 3.8 |
AA | | 28.0 |
A | | 29.5 |
BBB | | 10.4 |
BB | | 1.5 |
C | | 0.1 |
A1+ (Short Term) | | 0.2 |
A1 (Short Term) | | 2.8 |
A2 (Short Term) | | 0.2 |
Not Rated | | 8.2 |
Asset Allocation

| | |
Sector Diversification (%)(c)(d) | | |
Medical | | 15.8 |
General | | 9.5 |
Transportation | | 8.7 |
Multifamily Housing | | 7.7 |
General Obligation | | 6.7 |
Development | | 6.3 |
Airport | | 5.5 |
Higher Education | | 4.9 |
Education | | 3.8 |
Other | | 3.6 |
Water | | 3.6 |
School District | | 3.5 |
Power | | 2.8 |
Utilities | | 1.3 |
Nursing Home | | 1.0 |
* Includes, if any, cash, short-term investments, receivables, payables, derivatives and investments rounding to less than 0.05%.
(a) Net expense ratio reflects fee waivers and/or expense reimbursements, if any, pursuant to an agreement that is in effect to cap the expenses whereas the gross expense ratio does not. The Adviser has contractually agreed, through at least August 31, 2020, to waive all or a portion of its advisory fees and, if necessary, to assume certain other expenses (to the extent permitted by the Internal Revenue Code of 1986, as amended) to ensure that the Fund’s Total Annual Fund Operating Expenses (excluding taxes, interest, brokerage commissions, trading costs, acquired fund fees and expenses (AFFE), short sale dividend and interest expenses, litigation expenses, and extraordinary expenses) do not exceed 0.59% (the Base Expense Limitation Agreement). In addition to the Base Limitation Agreement, Morningstar has contractually agreed, through at least August 31, 2020, to waive all or a portion of its advisory fees and, if necessary, to assume certain other expenses (to the extent permitted by the Internal Revenue Code of 1986, as amended) to ensure that the Fund’s Total Annual Fund Operating Expenses (excluding the above listed expenses other than AFFE) do not exceed 0.59% (the Supplemental Expense Limitation Agreement).
(b) Effective duration is measure of a Fund’s interest-rate sensitivity—the longer a Fund’s duration, the more sensitive the Fund is to shifts in interest rates. Duration is determined by a formula that includes coupon rates and bond maturities. Small coupons tend to increase duration, while shorter maturities and higher coupons shorten duration.
(c) Percentages shown are based on Net Assets.
(d) Excludes Investment Companies and Other.
(e) The Fund’s portfolio holdings are subject to change without notice. The mention of specific securities is not a recommendation to buy, sell, or hold any particular security and is not indicative of current or future trading activity.
34
Morningstar Funds Trust April 30, 2020
Fund Information (unaudited) (continued)
Morningstar Municipal Bond Fund
(f) Credit quality ratings are based on the conservative average of Moody’s, S&P Global and Fitch ratings. If ratings from all three rating agencies disagree, the model assigns the middle rating to the security. If two of the three agree, the model assigns the rating from those two to the security. If none of these three rating agencies has assigned a rating, the Fund will assign a rating of not rated. The ratings, expressed in S&P Global’s nomenclature, range from AAA (extremely strong capacity to meet its financial commitment) to D (in default). Short-term ratings, expressed in S&P Global’s nomenclature, range from A1 to D (in default). The ratings represent the rating agencies’ opinions of the quality of the securities they rate. Ratings are relative and subjective and are not absolute standards of quality.
35
Morningstar Funds Trust April 30, 2020
Performance Summary (unaudited)
|
Morningstar Municipal Bond Fund |
Investment Objective
Morningstar Municipal Bond Fund seeks to generate income exempt from federal income taxes as well as capital preservation.
Investment Strategies
In seeking income exempt from federal income taxes as well as capital preservation, the Fund will normally invest at least 80% of its assets in debt securities (commonly referred to as “bonds”) from municipal issuers within the United States or its territories.
The Fund’s dividends are generally exempt from federal income tax, although a portion may be an item of tax preference for purposes of the federal alternative minimum tax (“Tax Preference Item”). A portion of the dividends may also be exempt from state and local income taxes, depending on where you live. Under normal market conditions, the Fund is not considered an optimal investment for tax-advantaged retirement accounts, such as 401(k) plan accounts or individual retirement accounts, or for investors in low tax brackets, because such investors may not take advantage of the tax benefits of the Fund.
The Fund intends to invest primarily in investment-grade municipal securities, but may invest up to 35% of assets in high-yield fixed-income securities that are rated below investment grade (commonly known as junk bonds) or, if unrated, are determined by the Fund’s subadviser(s) to be of comparable quality. The Fund may also invest in derivatives, including options, futures, swaps, and inverse floating-rate debt instruments (inverse floaters), for risk management purposes or as part of its investment strategies. The Fund may also invest in investment companies such as mutual funds and exchange traded funds (ETFs). The Fund employs a multimanager, subadvised structure.
Investment Commentary
The Morningstar Municipal Bond Fund returned 0.11% for the fiscal year ending April 30, 2020, underperforming the Fund’s blended benchmark, (60% Bloomberg Barclays Municipal Bond Index, 40% Bloomberg Barclays Municipal 1-3 Year Bond Index), which returned 2.10% for the same period.
The fiscal year ending April 30, 2020, was a tale of two markets for the municipal bond market: the period throughout 2019 was a meaningfully positive one for the asset class: municipal bond yields continued to decline to historic lows, supported by record inflows to municipal bond funds throughout the year. However, as the COVID-19 pandemic and ensuing economic fallout hit markets in 2020, municipal bond yields decoupled from Treasury yields. In the crisis, Treasury yields decreased meaningfully in a flight-to-safety while municipal bond yields, particularly those with some embedded credit sensitivity, moved higher. Technical challenges exacerbated losses, as municipal bond investors sought liquidity and forced selling put upward pressure on yields. Lower quality municipal bonds were particularly challenged during this environment, experiencing the biggest losses during the market selloff. The performance result for the full period was muted, low single-digit returns for the broad municipal bond market and modestly negative returns for the lower-quality segments of the market.
36
Morningstar Funds Trust April 30, 2020
Performance Summary (unaudited) (continued)
Morningstar Municipal Bond Fund
The Morningstar Municipal Bond Fund was particularly challenged during the market sell-off in 2020, and ultimately underperformed its blended benchmark for the fiscal year. Modest out-of-benchmark exposure to below investment-grade municipal bonds, an overweight to the lowest quality rungs of investment-grade municipal bonds, and a preference for revenue bonds over general obligation (GO) bonds weighed on relative performance. This also included modest energy-related exposure and dedicated-tax bonds related to areas of the market expected to be impacted the most by the COVID-19 pandemic, such as convention centers and hotels, which meaningfully underperformed the broader market. Additionally, an overweight to intermediate-term municipal bonds relative to the benchmark detracted from results as short-term municipal bonds held up better during the risk-off environment.
Investment Subadvisers:
T. Rowe Price Associates, Inc.
Core-plus exposure to intermediate and long-term municipal bonds and derivatives, including both investment-grade and below-investment-grade securities.
Wells Capital Management, Inc.
Exposure to intermediate and short-term municipal bonds and derivatives, including investment-grade and below-investment-grade securities.
37
Morningstar Funds Trust April 30, 2020
Performance Summary (unaudited) (continued)
Morningstar Municipal Bond Fund
Performance at a glance
| | | | | | | | |
| Average Total Returns as of 04/30/20 | | 1 year2 | | | Since Inception3 | |
Morningstar Municipal Bond Fund | | | 0.11 | % | | | 3.27 | % |
Morningstar Municipal Bond Blended Index1 | | | 2.10 | % | | | 4.34 | % |
Illustration of an assumed investment of $10,000
The following graph depicts the performance of Morningstar Municipal Bond Fund shares versus the Morningstar Municipal Bond Blended Index (“the Index”) from its inception (November 2, 2018) to April 30, 2020 (the Fund’s fiscal year end). Shares held through advisory programs may be subject to a program fee, which, if included, would have reduced performance. The performance provided does not reflect the deduction of taxes that a shareholder would pay on Fund distributions or the redemption of Fund shares. Past performance is no guarantee of future results. Share price and returns will vary with market conditions; investors may realize a gain or loss upon redemption. It is important to note that Morningstar Municipal Bond Fund is a professionally managed portfolio while the Index is not available for direct investment, is unmanaged and does not include fees, expenses or taxes. The comparison is shown for illustration purposes only.
Morningstar Municipal Bond Fund

This chart does not imply future performance.
1The Morningstar Municipal Bond Blended Index is composed of 60% Bloomberg Barclays Municipal Bond Index and 40% Bloomberg Barclays Municipal 1-3 Year Bond Index. The Bloomberg Barclays Municipal Bond Index is an unmanaged index that is considered representative of the broad market for investment grade, tax-exempt bonds with a maturity of at least one year. Bloomberg Barclays Municipal 1-3 Year Bond Index consists of a broad selection of investment grade general obligation and revenue bonds of maturities ranging from one year to three years. Investors should note that indices do not reflect the deduction of fees, expenses or taxes.
2Represents performance from May 1, 2019 to April 30, 2020.
3Inception Date is November 2, 2018. Returns are annualized for periods greater than 1 year.
Past performance does not predict future performance, and the performance information provided, does not reflect the deduction of taxes that a shareholder would pay on Fund distributions or the redemption of Fund shares. Shares held through advisory programs are subject to a program fee, which, if included, would have reduced performance. The return and principal value of an investment will fluctuate, so that an investor’s shares, when redeemed, may be worth more or less than their original cost. Performance results assume reinvestment of all dividends and capital gain distributions at net asset value on the ex-dividend dates. Current performance may be higher or lower than the performance data quoted.
38
Morningstar Funds Trust April 30, 2020
Fund Information (unaudited)
|
Morningstar Defensive Bond Fund |
| | |
General Information | | |
Net Asset Value Per Share | | $10.17 |
Total Net Assets (millions) | | $183 |
Net Expense Ratio(a) | | 0.48% |
Gross Expense Ratio(a) | | 0.66% |
Portfolio Turnover Rate | | 88% |
Number of Issuers | | 110 |
Fund Inception | | November 2, 2018 |
No sales charges or distribution fees | | |
|
Asset Allocation |
|

|
| | |
Portfolio Characteristics | | |
Effective Duration (years)(b) | | 1.9 |
Non-USD Exposure(c)(d)(e) | | 0.0% |
| | | |
Five Largest Issuers (%)(c)(d)(f) | | |
Verizon Owner Trust | | 1.7 |
Federal Home Loan Mortgage Corporation | | 1.5 |
Government National Mortgage Association | | 1.0 |
Carmax Auto Owner Trust | | 0.9 |
PFS Financing Corp. | | 0.9 |
| | | |
Credit Quality (%)(c)(d)(g) | | |
U.S. Agency | | 2.9 |
AAA | | 21.2 |
AA | | 4.7 |
A | | 1.1 |
BBB | | 0.4 |
BB | | 0.2 |
B | | 1.3 |
CCC | | 1.0 |
CC | | 0.1 |
A1+ (Short Term) | | 0.9 |
Not Rated | | 3.2 |
| | |
Sector Diversification (%)(c)(d) | | |
Asset Backed Securities | | 25.6 |
Mortgage Securities | | 7.3 |
Communications | | 1.7 |
Energy | | 0.8 |
Consumer, Noncyclical | | 0.8 |
Consumer, Cyclical | | 0.7 |
Industrial | | 0.1 |
| | | |
Region Diversification (%)(c)(d) | | |
United States | | 30.6 |
Latin America | | 5.4 |
Canada | | 0.5 |
Europe (excluding United Kingdom) | | 0.4 |
Pacific (excluding Japan) | | 0.1 |
* Includes, if any, cash, short-term investments, receivables, payables, derivatives and investments rounding to less than 0.05%.
(a) Net expense ratio reflects fee waivers and/or expense reimbursements, if any, pursuant to an agreement that is in effect to cap the expenses whereas the gross expense ratio does not. The Adviser has contractually agreed, through at least August 31, 2020, to waive all or a portion of its advisory fees and, if necessary, to assume certain other expenses (to the extent permitted by the Internal Revenue Code of 1986, as amended) to ensure that the Fund’s Total Annual Fund Operating Expenses (excluding taxes, interest, brokerage commissions, trading costs, acquired fund fees and expenses (AFFE), short sale dividend and interest expenses, litigation expenses, and extraordinary expenses) do not exceed 0.48% (the Base Expense Limitation Agreement). In addition to the Base Limitation Agreement, Morningstar has contractually agreed, through at least August 31, 2020, to waive all or a portion of its advisory fees and, if necessary, to assume certain other expenses (to the extent permitted by the Internal Revenue Code of 1986, as amended) to ensure that the Fund’s Total Annual Fund Operating Expenses (excluding the above listed expenses other than AFFE) do not exceed 0.55% (the Supplemental Expense Limitation Agreement).
(b) Effective duration is measure of a Fund’s interest-rate sensitivity—the longer a Fund’s duration, the more sensitive the Fund is to shifts in interest rates. Duration is determined by a formula that includes coupon rates and bond maturities. Small coupons tend to increase duration, while shorter maturities and higher coupons shorten duration.
39
Morningstar Funds Trust April 30, 2020
Fund Information (unaudited) (continued)
Morningstar Defensive Bond Fund
(c) Percentages shown are based on Net Assets.
(d) Excludes Investment Companies and Other.
(e) Non-USD currency exposure for the Fund reflects the value of the portfolio’s non-U.S. dollar denominated investments, as well as the impact of currency derivatives.
(f) The Fund’s portfolio holdings are subject to change without notice. The mention of specific securities is not a recommendation to buy, sell, or hold any particular security and is not indicative of current or future trading activity.
(g) Credit quality ratings are based on the conservative average of Moody’s, S&P Global and Fitch ratings. If ratings from all three rating agencies disagree, the model assigns the middle rating to the security. If two of the three agree, the model assigns the rating from those two to the security. If none of these three rating agencies has assigned a rating, the Fund will assign a rating of not rated. The ratings, expressed in S&P Global’s nomenclature, range from AAA (extremely strong capacity to meet its financial commitment) to D (in default). Short-term ratings, expressed in S&P Global’s nomenclature, range from A1 to D (in default). The ratings represent the rating agencies’ opinions of the quality of the securities they rate. Ratings are relative and subjective and are not absolute standards of quality.
40
Morningstar Funds Trust April 30, 2020
Performance Summary (unaudited)
|
Morningstar Defensive Bond Fund |
Investment Objective
Morningstar Defensive Bond Fund seeks capital preservation.
Investment Strategies
In seeking capital preservation, the Fund will normally invest at least 80% of its assets in a diversified portfolio of debt securities (commonly referred to as “bonds”) of varying maturity, duration, and quality. Under normal conditions, the Fund intends to pursue a defensive strategy of limiting its interest-rate sensitivity by maintaining a portfolio duration of three years or less.
The Fund invests primarily in short and intermediate-term investment-grade fixed-income securities. These may include U.S. and non-U.S. investment-grade corporate debt securities, U.S. and non-U.S. government debt securities, and mortgage-backed and asset-backed securities. In most market environments, the Fund will not invest more than 20% of assets in fixed-income securities that are rated below investment grade (commonly known as junk bonds), or if unrated, are determined by the Fund’s subadviser(s) to be of comparable quality.
In addition, the Fund may invest a significant portion of its assets in collateralized debt obligations (CDOs), including collateralized loan obligations (CLOs). CDOs are types of asset-backed securities. CLOs are ordinarily issued by a trust or other special purpose entity and are typically collateralized by a pool of loans, which may include, among others, domestic and non-U.S. senior secured loans, senior unsecured loans, and subordinate corporate loans, including loans that may be rated below investment grade or equivalent unrated loans, held by such issuer.
The Fund may also invest in investment companies such as mutual funds and exchange traded funds (ETFs), which could represent a significant percentage of assets. The Fund employs a multimanager, subadvised structure.
Investment Commentary
The Morningstar Defensive Bond Fund returned 3.36% for the fiscal year ending April 30, 2020, underperforming the Bloomberg Barclays U.S. Aggregate 1-3 Year Index, which returned 4.97% for the same year.
The intense economic disruption caused by the coronavirus outbreak dominated the return landscape for the period and produced emergency monetary and fiscal responses from the authorities, with the Federal Reserve Board (the “Fed”) funds rate cut towards zero and quantitative easing restarted, pinning the short and intermediate parts of the yield curve at extreme low levels. After some initial dislocation, even in Treasury markets, sovereign duration generated positive returns, with intermediate Treasuries generating the strongest positive contribution for the full reporting period.
Through most of the period, credit was a steady driver, even with spreads tight relative to historical norms, and allocations via short-term corporate debt and aggregate ETFs contributed positively. This was shaken as even investment-grade bonds suffered significant falls amidst the initial virus outbreak, but credit recovered meaningfully after the Fed’s fiscally backed emergency response helped repair much of the dislocations.
41
Morningstar Funds Trust April 30, 2020
Performance Summary (unaudited) (continued)
Morningstar Defensive Bond Fund
Money market and three-month Treasury-bill allocations were left behind. With the short-end rate cut towards zero, the yield on offer fell meaningfully. The Fund’s external subadviser First Pacific Advisors, LLC had considered both Treasury yields and credit spreads unattractive through most of the period and had positioned cautiously on both with lower duration and credit exposure. That positioning led to underperformance relative to the benchmark. Given the higher allocation this subadviser represents, this was the main negative contribution in the period.
Investment Subadviser:
First Pacific Advisors, LLC
Diversified portfolio of short-duration, fixed-income securities designed to anchor a portfolio of defensive assets.
42
Morningstar Funds Trust April 30, 2020
Performance Summary (unaudited) (continued)
Morningstar Defensive Bond Fund
Performance at a glance
| | | | | | | | |
| Average Total Returns as of 04/30/20 | | 1 year3 | | | Since Inception4 | |
Morningstar Defensive Bond Fund | | | 3.36% | | | | 3.52% | |
Bloomberg Barclays U.S. Aggregate Bond Index1 | | | 10.84% | | | | 11.27% | |
Bloomberg Barclays U.S. Aggregate 1-3 Year Index2 | | | 4.97% | | | | 5.09% | |
Illustration of an assumed investment of $10,000
The following graph depicts the performance of Morningstar Defensive Bond Fund shares versus the Bloomberg Barclays U.S. Aggregate Bond Index and the Bloomberg Barclays U.S. Aggregate 1-3 Year Index (“the Indicies”) from its inception (November 2, 2018) to April 30, 2020 (the Fund’s fiscal year end). Shares held through advisory programs may be subject to a program fee, which, if included, would have reduced performance. The performance provided does not reflect the deduction of taxes that a shareholder would pay on Fund distributions or the redemption of Fund shares. Past performance is no guarantee of future results. Share price and returns will vary with market conditions; investors may realize a gain or loss upon redemption. It is important to note that Morningstar Defensive Bond Fund is a professionally managed portfolio while the Indices are not available for direct investment, are unmanaged and do not include fees, expenses or taxes. The comparison is shown for illustration purposes only.
Morningstar Defensive Bond Fund

This chart does not imply future performance.
1The Bloomberg Barclays U.S. Aggregate Bond Index is a broad-based, flagship benchmark that measures the investment grade, U.S.-dollar-denominated, fixed-rate, taxable bond market. Investors should note that indices do not reflect the deduction of fees, expenses or taxes.
2The Bloomberg Barclays U.S. Aggregate 1-3 Year Index consists of publicly issued, investment-grade corporate, U.S. Treasury and government agency securities with remaining maturities of one to three years. Investors should note that indices do not reflect the deduction of fees, expenses or taxes.
3Represents performance from May 1, 2019 to April 30, 2020.
4Inception Date is November 2, 2018. Returns are annualized for periods greater than 1 year.
Past performance does not predict future performance, and the performance information provided, does not reflect the deduction of taxes that a shareholder would pay on Fund distributions or the redemption of Fund shares. Shares held through advisory programs are subject to a program fee, which, if included, would have reduced performance. The return and principal value of an investment will fluctuate, so that an investor’s shares, when redeemed, may be worth more or less than their original cost. Performance results assume reinvestment of all dividends and capital gain distributions at net asset value on the ex-dividend dates. Current performance may be higher or lower than the performance data quoted.
43
Morningstar Funds Trust April 30, 2020
Fund Information (unaudited)
|
Morningstar Multisector Bond Fund |
| | |
General Information | | |
Net Asset Value Per Share | | $9.39 |
Total Net Assets (millions) | | $192 |
Net Expense Ratio(a) | | 0.79% |
Gross Expense Ratio(a) | | 0.98% |
Portfolio Turnover Rate | | 138% |
Number of Issuers | | 376 |
Fund Inception | | November 2, 2018 |
No sales charges or distribution fees | | |
|
| Asset Allocation |
|
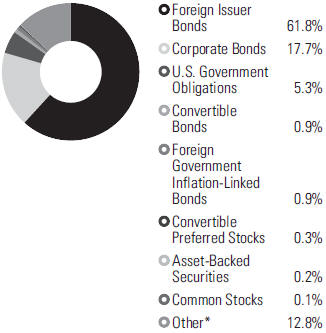 |
| | | | |
Portfolio Characteristics | | | | |
Effective Duration (years)(b) | | | 4.6 | |
Emerging Markets(c)(d) | | | 45.2% | |
Non-USD Exposure(c)(d)(e) | | | 37.6% | |
| | | | |
Five Largest Issuers (%)(c)(d)(f) | | | | |
U.S. Treasury | | | 5.3 | |
Mexican Bonos Desarollo | | | 5.2 | |
Korea Treasury Bond | | | 3.7 | |
Government of Indonesia | | | 3.3 | |
Japan Treasury Discount Bill | | | 2.7 | |
| | | | |
Credit Quality (%)(c)(d)(g) | | | | |
U.S. Treasury | | | 5.3 | |
AAA | | | 0.9 | |
AA | | | 2.6 | |
A | | | 5.4 | |
BBB | | | 17.8 | |
BB | | | 23.4 | |
B | | | 12.6 | |
CCC | | | 3.8 | |
CC | | | 0.3 | |
C | | | 0.2 | |
Not Rated | | | 14.5 | |
| | | | |
Sector Diversification (%)(c)(d) | | | | |
Government | | | 54.0 | |
Financial | | | 6.6 | |
Communications | | | 5.6 | |
Energy | | | 5.3 | |
Consumer, Noncyclical | | | 4.5 | |
Consumer, Cyclical | | | 3.5 | |
Industrial | | | 2.6 | |
Basic Materials | | | 2.4 | |
Utilities | | | 1.6 | |
Technology | | | 0.6 | |
Asset Backed Securities | | | 0.1 | |
| | | | |
Region Diversification (%)(c)(d) | | | | |
United States | | | 24.1 | |
Latin America | | | 21.1 | |
Pacific (excluding Japan) | | | 16.5 | |
Europe (excluding United Kingdom) | | | 10.0 | |
Middle East | | | 5.7 | |
Africa | | | 5.4 | |
Japan | | | 2.7 | |
Canada | | | 0.9 | |
United Kingdom | | | 0.4 | |
* Includes, if any, cash, short-term investments, receivables, payables, derivatives and investments rounding to less than 0.05%.
(a) Net expense ratio reflects fee waivers and/or expense reimbursements, if any, pursuant to an agreement that is in effect to cap the expenses whereas the gross expense ratio does not. The Adviser has contractually agreed, through at least August 31, 2020, to waive all or a portion of its advisory fees and, if necessary, to assume certain other expenses (to the extent permitted by the Internal Revenue Code of 1986, as amended) to ensure that the Fund’s Total Annual Fund Operating Expenses (excluding taxes, interest, brokerage commissions, trading costs, acquired fund fees and expenses (AFFE), short sale dividend and interest expenses, litigation expenses, and extraordinary expenses) do not exceed 0.80% (the Base Expense Limitation Agreement). In
44
Morningstar Funds Trust April 30, 2020
Fund Information (unaudited) (continued)
Morningstar Multisector Bond Fund
addition to the Base Limitation Agreement, Morningstar has contractually agreed, through at least August 31, 2020, to waive all or a portion of its advisory fees and, if necessary, to assume certain other expenses (to the extent permitted by the Internal Revenue Code of 1986, as amended) to ensure that the Fund’s Total Annual Fund Operating Expenses (excluding the above listed expenses other than AFFE) do not exceed 0.80% (the Supplemental Expense Limitation Agreement).
(b) Effective duration is measure of a Fund’s interest-rate sensitivity—the longer a Fund’s duration, the more sensitive the Fund is to shifts in interest rates. Duration is determined by a formula that includes coupon rates and bond maturities. Small coupons tend to increase duration, while shorter maturities and higher coupons shorten duration.
(c) Percentages shown are based on Net Assets.
(d) Excludes Common Stocks, Convertible Preferred Stocks, and Other.
(e) Non-USD currency exposure for the Fund reflects the value of the portfolio’s non-U.S. dollar denominated investments, as well as the impact of currency derivatives.
(f) The Fund’s portfolio holdings are subject to change without notice. The mention of specific securities is not a recommendation to buy, sell, or hold any particular security and is not indicative of current or future trading activity.
(g) Credit quality ratings are based on the conservative average of Moody’s, S&P Global and Fitch ratings. If ratings from all three rating agencies disagree, the model assigns the middle rating to the security. If two of the three agree, the model assigns the rating from those two to the security. If none of these three rating agencies has assigned a rating, the Fund will assign a rating of not rated. The ratings, expressed in S&P Global’s nomenclature, range from AAA (extremely strong capacity to meet its financial commitment) to D (in default). Short-term ratings, expressed in S&P Global’s nomenclature, range from A1 to D (in default). The ratings represent the rating agencies’ opinions of the quality of the securities they rate. Ratings are relative and subjective and are not absolute standards of quality.
45
Morningstar Funds Trust April 30, 2020
Performance Summary (unaudited)
|
Morningstar Multisector Bond Fund |
Investment Objective
Morningstar Multisector Bond Fund seeks total return through a combination of current income and capital appreciation.
Investment Strategies
In seeking total return through a combination of current income and capital appreciation, the Fund will normally invest at least 80% of its assets in debt securities (commonly referred to as “bonds”) of varying maturity, duration, and quality across various sectors of the fixed-income market. These may include U.S. and non-U.S. corporate debt securities, U.S. and non-U.S. government debt securities, emerging-market debt securities, mortgage-backed and asset-backed securities, municipal securities, and floating-rate notes.
The Fund may invest without limit in fixed-income securities that are rated below investment grade (commonly known as junk bonds), or if unrated, are determined by the Fund’s subadviser(s) to be of comparable quality. The Fund may invest without limit in securities denominated in foreign currencies and in U.S. dollar denominated securities of foreign issuers.
The Fund may invest in securities acquired in a private placement, such as Rule 144A securities, as well as derivatives, including options, futures, swaps, and forward foreign currency contracts, for risk management purposes or as part of its investment strategies. Due to the opportunistic nature of its strategy, the Fund may also invest up to 20% of its assets in equity securities, including common stocks and convertible securities. The Fund may also invest in investment companies such as mutual funds and exchange traded funds (ETFs). The Fund employs a multimanager, subadvised structure.
Investment Commentary
The Morningstar Multisector Bond Fund returned -3.97% for the fiscal year ending April 30, 2020, underperforming the Fund’s blended benchmark (50% Bloomberg Barclays U.S. Corporate High Yield Index, 25% J.P. Morgan EMBI Global TR Index, 25% JPM GBI-EM Global Diversified), which returned -3.50% for the same period.
The fiscal year began with robust gains for areas of the fixed-income market that this Fund invests, including U.S. high yield bonds and emerging-market debt. However, during the first quarter of 2020, the COVID-19 pandemic and ensuing economic fallout brought severe stress to corporate credit markets as well as emerging markets. Credit spreads increased dramatically on U.S. high yield and hard-currency emerging market debt. Many emerging market currencies dropped significantly against the U.S. dollar, wiping out gains earlier in the fiscal year and driving the Fund into negative territory for the full period. Our decision to meaningfully underweight U.S. high yield bonds in favor of a global bond strategy managed by Franklin Advisers, Inc. was a meaningful benchmark relative tailwind during the market sell-off of 2020, and as a result, the global bond strategy was also a contributor for the fiscal year as it beat the Fund’s benchmark over that time period. While the performance of Loomis, Sayles & Company, L.P.’s sleeve within the Fund was also a contributor relative to its strategy benchmark, the Barclays U.S. Corporate High Yield index, underperformance by TCW Investment Management Company LLC’s emerging market debt strategy in 2020 left its fiscal year performance underwater relative to its blended emerging market debt benchmark.
46
Morningstar Funds Trust April 30, 2020
Performance Summary (unaudited) (continued)
Morningstar Multisector Bond Fund
The Fund’s overweight positioning to emerging market debt relative to U.S. high-yield was a contributor to performance for the fiscal year. However, the Fund’s overweight to non-U.S. dollar currencies was a drag on performance for the fiscal year as the U.S. dollar appreciated versus most currencies over that stretch.
Investment Subadvisers:
Franklin Advisers, Inc.
Benchmark-agnostic investment strategy with opportunistic exposure to interest rates, credit and currencies across both developed and emerging bond markets.
Loomis, Sayles & Company, L.P.
High-yield bond exposure with opportunistic bond allocations to bank loans, convertible bonds, investment-grade credit, agency and non-agency mortgage-backed securities.
TCW Investment Management Company LLC
Diversified, emerging-markets bond exposure across hard-currency, local-currency, and corporate emerging-markets debt.
47
Morningstar Funds Trust April 30, 2020
Performance Summary (unaudited) (continued)
Morningstar Multisector Bond Fund
Performance at a glance
| | | | | | | | |
| Average Total Returns as of 04/30/20 | | 1 year2 | | | Since Inception3 | |
Morningstar Multisector Bond Fund | | | -3.97% | | | | 0.47% | |
Morningstar Multisector Bond Blended Index1 | | | -3.50% | | | | 1.47% | |
Illustration of an assumed investment of $10,000
The following graph depicts the performance of Morningstar Multisector Bond Fund shares versus the Morningstar Multisector Bond Blended Index (“the Index”) from its inception (November 2, 2018) to April 30, 2020 (the Fund’s fiscal year end). Shares held through advisory programs may be subject to a program fee, which, if included, would have reduced performance. The performance provided does not reflect the deduction of taxes that a shareholder would pay on Fund distributions or the redemption of Fund shares. Past performance is no guarantee of future results. Share price and returns will vary with market conditions; investors may realize a gain or loss upon redemption. It is important to note that Morningstar Multisector Bond Fund is a professionally managed portfolio while the Index is not available for direct investment, is unmanaged and does not include fees, expenses or taxes. The comparison is shown for illustration purposes only.
Morningstar Multisector Bond Fund

This chart does not imply future performance.
1The Morningstar Multisector Bond Blended Index is composed of 50% Bloomberg Barclays U.S. Corporate High Yield Index, 25% J.P. Morgan EMBI Global TR Index, and 25% J.P. Morgan Government Bond Index-Emerging Markets Global Diversified. The Bloomberg Barclays U.S. Corporate High Yield Index represents the universe of fixed rate, non-investment grade securities in which the Fund invests. Investors should note that indices do not reflect the deduction of fees, expenses or taxes.
2Represents performance from May 1, 2019 to April 30, 2020.
3Inception Date is November 2, 2018. Returns are annualized for periods greater than 1 year.
Past performance does not predict future performance, and the performance information provided, does not reflect the deduction of taxes that a shareholder would pay on Fund distributions or the redemption of Fund shares. Shares held through advisory programs are subject to a program fee, which, if included, would have reduced performance. The return and principal value of an investment will fluctuate, so that an investor’s shares, when redeemed, may be worth more or less than their original cost. Performance results assume reinvestment of all dividends and capital gain distributions at net asset value on the ex-dividend dates. Current performance may be higher or lower than the performance data quoted.
48
Morningstar Funds Trust April 30, 2020
Fund Information (unaudited)
|
Morningstar Unconstrained Allocation Fund |
| | |
General Information | | |
Net Asset Value Per Share | | $9.28 |
Total Net Assets (millions) | | $138 |
Net Expense Ratio(a) | | 0.73% |
Gross Expense Ratio(a) | | 0.94% |
Portfolio Turnover Rate | | 66% |
Fund Inception | | November 2, 2018 |
No sales charges or distribution fees | | |
|
Asset Allocation |
|
 |
| | | | |
Number of Common Stocks | | | 26 | |
| | | | |
Five Largest Sectors (%)(b)(c) | | | | |
Consumer, Noncyclical | | | 7.3 | |
Industrial | | | 3.4 | |
Communications | | | 2.8 | |
Technology | | | 2.2 | |
Consumer, Cyclical | | | 1.7 | |
| | | | |
Ten Largest Equities (%)(b)(c)(d) | | | | |
Fresenius Medical Care A.G. & Co. KGaA | | | 1.1 | |
SES S.A. | | | 1.0 | |
Nielsen Holdings PLC | | | 1.0 | |
H&R Block, Inc. | | | 1.0 | |
Cognizant Technology Solutions Corp., Class A | | | 0.9 | |
Omnicom Group, Inc. | | | 0.9 | |
Stericycle, Inc. | | | 0.9 | |
Ferrovial S.A. | | | 0.9 | |
CVS Health Corp. | | | 0.8 | |
International Game Technology PLC | | | 0.8 | |
| | | | |
Fixed Income Portfolio (11.5%) | | | | |
| | | | | |
| | | | |
Number of Issuers | | | 53 | |
| | | | |
Sector Diversification (%)(b)(c) | | | | |
Government | | | 8.8 | |
Financial | | | 1.0 | |
Technology | | | 0.5 | |
Industrial | | | 0.5 | |
Consumer, Noncyclical | | | 0.3 | |
Energy | | | 0.2 | |
Consumer, Cyclical | | | 0.1 | |
Utilities | | | 0.1 | |
| | | | |
Five Largest Issuers (%)(b)(c)(d) | | | | |
U.S. Treasury | | | 4.3 | |
Mexican Bonos Desarollo | | | 1.2 | |
Malaysia Government | | | 0.6 | |
Titulos De Tesoreria | | | 0.5 | |
Indonesia Government | | | 0.5 | |
| | | | |
Credit Quality (%)(b)(c)(e) | | | | |
U.S. Treasury | | | 4.3 | |
AAA | | | 0.4 | |
AA | | | 0.5 | |
A | | | 2.3 | |
BBB | | | 2.9 | |
BB | | | 0.9 | |
Not Rated | | | 0.2 | |
* Includes, if any, cash, short-term investments, receivables, payables, derivatives and investments rounding to less than 0.05%.
(a) Net expense ratio reflects fee waivers and/or expense reimbursements, if any, pursuant to an agreement that is in effect to cap the expenses whereas the gross expense ratio does not. The Adviser has contractually agreed, through at least August 31, 2020, to waive all or a portion of its advisory fees and, if necessary, to assume certain other expenses (to the extent permitted by the Internal Revenue Code of 1986, as amended) to ensure that the Fund’s Total Annual Fund Operating Expenses (excluding taxes, interest, brokerage commissions, trading costs, acquired fund fees and expenses (AFFE), short sale dividend and interest expenses, litigation expenses, and extraordinary expenses) do not exceed 1.00% (the Base Expense Limitation Agreement). In addition to the Base Limitation Agreement, Morningstar has contractually agreed, through at least August 31, 2020, to waive all or a portion of its advisory fees and, if necessary, to assume certain other expenses (to the extent permitted by the Internal Revenue Code of 1986, as amended) to ensure
49
Morningstar Funds Trust April 30, 2020
Fund Information (unaudited) (continued)
Morningstar Unconstrained Allocation Fund
that the Fund’s Total Annual Fund Operating Expenses (excluding the above listed expenses other than AFFE) do not exceed 0.93% (the Supplemental Expense Limitation Agreement).
(b) Percentages shown are based on Net Assets.
(c) Excludes Investment Companies and Other.
(d) The Fund’s portfolio holdings are subject to change without notice. The mention of specific securities is not a recommendation to buy, sell, or hold any particular security and is not indicative of current or future trading activity.
(e) Credit quality ratings are based on the conservative average of Moody’s, S&P Global and Fitch ratings. If ratings from all three rating agencies disagree, the model assigns the middle rating to the security. If two of the three agree, the model assigns the rating from those two to the security. If none of these three rating agencies has assigned a rating, the Fund will assign a rating of not rated. The ratings, expressed in S&P Global’s nomenclature, range from AAA (extremely strong capacity to meet its financial commitment) to D (in default). Short-term ratings, expressed in S&P Global’s nomenclature, range from A1 to D (in default). The ratings represent the rating agencies’ opinions of the quality of the securities they rate. Ratings are relative and subjective and are not absolute standards of quality.
50
Morningstar Funds Trust April 30, 2020
Performance Summary (unaudited)
|
Morningstar Unconstrained Allocation Fund |
Investment Objective
Morningstar Unconstrained Allocation Fund seeks long-term capital appreciation over a full market cycle.
Investment Strategies
In seeking long-term capital appreciation over a full market cycle, the Fund has significant flexibility and invests across asset classes and geographies according to the portfolio management team’s assessment of their valuations and fundamental health.
The Fund invests in equity securities, which may include common stocks and real estate investment trusts (REITs). The Fund may invest in companies of any size from any country, including emerging markets.
To meet its objective, the Fund may also invest in fixed-income securities of varying maturity, duration, and quality. These may include U.S. and non-U.S. corporate debt securities, U.S. government debt securities including Treasury Inflation Protected Bond Securities and zero-coupon securities, non-U.S. government debt securities, emerging-market debt securities, and mortgage-backed and asset-backed securities. The Fund may invest without limit in fixed-income securities that are rated below investment grade (commonly known as junk bonds) or, if unrated, are determined by the Fund’s subadviser(s) to be of comparable quality.
The Fund may also invest in derivatives, including options, futures, swaps, and forward foreign currency contracts, for risk management purposes or as part of its investment strategies. The Fund may also invest in investment companies such as mutual funds and exchange traded funds (ETFs), which could represent a significant percentage of assets. The Fund employs a multimanager, subadvised structure.
Investment Commentary
The Morningstar Unconstrained Allocation Fund lost -7.07% for the fiscal year ending April 30, 2020, underperforming the Fund’s blended benchmark (50% Bloomberg Barclays Multiverse Total Return Index, 50% Morningstar Global Ex-U.S. Index (net)), which gained 0.28% for the same period.
Gains by U.S. stocks and U.S. Treasuries fueled benchmark performance throughout 2019. Amid the sell-off in the first months of 2020, U.S. Treasuries climbed as yields declined, while U.S. technology proved resilient and bolstered the broad U.S. equity market. More cyclical exposures, including energy, suffered steep declines during the 2020 sell-off, as did credit markets and non-U.S. equities. Currency exposure further exacerbated declines as the U.S. dollar acted as a safe haven during the first quarter.
Losses experienced by subadviser’s Lazard Asset Management, LLC sleeve dragged on the Fund’s 12-month absolute and relative returns, as did losses in Brandywine Global Investment Management, LLC’s sleeve, which runs an unconstrained bond mandate. An emphasis on global energy and select non-U.S. exposures such as European financials, European telecom, and broad UK exposure further detracted from results.
Offsetting the declines were gains in long- and intermediate-term Treasuries, Treasury Inflation-Protected Securities, and mortgage-backed bonds, which acted as hedges against the Fund’s cyclical exposures. Within equities, a handful of targeted positions aided relative results, including exposure to Japan, U.S. consumer staples, European healthcare, and Russia.
51
Morningstar Funds Trust April 30, 2020
Performance Summary (unaudited) (continued)
Morningstar Unconstrained Allocation Fund
Investment Subadviser:
Lazard Asset Management, LLC
Anchor global equity exposure focused on quality, attractively valued stocks, which have appeal throughout a market cycle.
Brandywine Global Investment Management, LLC
Global fixed income strategy designed to serve as an anchor position.
52
Morningstar Funds Trust April 30, 2020
Performance Summary (unaudited) (continued)
Morningstar Unconstrained Allocation Fund
Performance at a glance
| | | | | | | | |
| Average Total Returns as of 04/30/20 | | 1 year2 | | | Since Inception3 | |
Morningstar Unconstrained Allocation Fund | | | -7.07% | | | | -1.65% | |
Morningstar Unconstrained Allocation Blended Index1 | | | 0.28% | | | | 4.34% | |
Illustration of an assumed investment of $10,000
The following graph depicts the performance of Morningstar Unconstrained Allocation Fund shares versus the Morningstar Unconstrained Allocation Blended Index (“the Index”) from its inception (November 2, 2018) to April 30, 2020 (the Fund’s fiscal year end). Shares held through advisory programs may be subject to a program fee, which, if included, would have reduced performance. The performance provided does not reflect the deduction of taxes that a shareholder would pay on Fund distributions or the redemption of Fund shares. Past performance is no guarantee of future results. Share price and returns will vary with market conditions; investors may realize a gain or loss upon redemption. It is important to note that Morningstar Unconstrained Allocation Fund is a professionally managed portfolio while the Index is not available for direct investment, is unmanaged and does not include fees, expenses or certain taxes. The comparison is shown for illustration purposes only.
Morningstar Unconstrained Allocation Fund
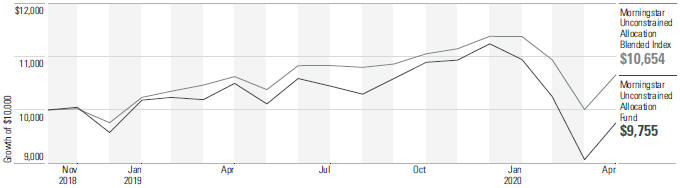
This chart does not imply future performance.
1The Morningstar Unconstrained Allocation Blended Index is composed of 50% Morningstar Global Ex-U.S. Index (net) and 50% Bloomberg Barclays Multiverse Total Return Index. The Morningstar Global Ex-U.S. Index (net) captures the performance of the stocks located in the developed and emerging countries across the world, excluding the United States. The Bloomberg Barclays Multiverse Total Return Index provides a broad-based measure of the global fixed-income bond market. Net total return indices reinvest dividends after the deduction of withholding taxes, using a tax rate applicable to non-resident individuals who do not benefit from double taxation treaties. Investors should note that such indices do not reflect the deduction of fees, expenses or other taxes.
2Represents performance from May 1, 2019 to April 30, 2020.
3Inception Date is November 2, 2018. Returns are annualized for periods greater than 1 year.
Past performance does not predict future performance, and the performance information provided, does not reflect the deduction of taxes that a shareholder would pay on Fund distributions or the redemption of Fund shares. Shares held through advisory programs are subject to a program fee, which, if included, would have reduced performance. The return and principal value of an investment will fluctuate, so that an investor’s shares, when redeemed, may be worth more or less than their original cost. Performance results assume reinvestment of all dividends and capital gain distributions at net asset value on the ex-dividend dates. Current performance may be higher or lower than the performance data quoted.
53
Morningstar Funds Trust April 30, 2020
Fund Information (unaudited)
|
Morningstar Alternatives Fund |
| | |
General Information | | |
Net Asset Value Per Share | | $10.12 |
Total Net Assets (millions) | | $186 |
Net Expense Ratio(a) | | 1.13% |
Gross Expense Ratio(a) | | 1.48% |
Portfolio Turnover Rate | | 154% |
Fund Inception | | November 2, 2018 |
No sales charges or distribution fees | | |
|
Asset Allocation |
|
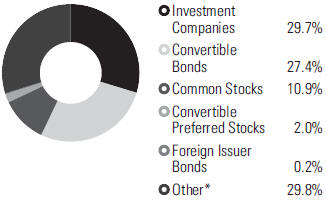 |
| | | | |
Allocation Strategy Type (%) | | | | |
Global Macro | | | 37.4 | |
Convertible Arbitrage | | | 24.3 | |
Merger Arbitrage | | | 26.8 | |
Short-term investments and ETFs | | | 11.5 | |
| | | | |
Region Diversification (%)(b)(c) | | | | |
United States | | | 36.2 | |
Europe (excluding United Kingdom) | | | 1.7 | |
Pacific (excluding Japan) | | | 1.2 | |
Canada | | | 0.9 | |
Latin America | | | 0.3 | |
Middle East | | | 0.1 | |
United Kingdom | | | 0.1 | |
* Includes, if any, cash, short-term investments, receivables, payables, derivatives and investments rounding to less than 0.05%.
(a) Net expense ratio reflects fee waivers and/or expense reimbursements, if any, pursuant to an agreement that is in effect to cap the expenses whereas the gross expense ratio does not. The Adviser has contractually agreed, through at least August 31, 2020, to waive all or a portion of its advisory fees and, if necessary, to assume certain other expenses (to the extent permitted by the Internal Revenue Code of 1986, as amended) to ensure that the Fund’s Total Annual Fund Operating Expenses (excluding taxes, interest, brokerage commissions, trading costs, acquired fund fees and expenses (AFFE), short sale dividend and interest expenses, litigation expenses, and extraordinary expenses) do not exceed 1.29% (the Base Expense Limitation Agreement). In addition to the Base Limitation Agreement, Morningstar has contractually agreed, through at least August 31, 2020, to waive all or a portion of its advisory fees and, if necessary, to assume certain other expenses (to the extent permitted by the Internal Revenue Code of 1986, as amended) to ensure that the Fund’s Total Annual Fund Operating Expenses (excluding the above listed expenses other than AFFE) do not exceed 1.20% (the Supplemental Expense Limitation Agreement).
(b) Percentages shown are based on Net Assets.
(c) Excludes Investment Companies and Other.
54
Morningstar Funds Trust April 30, 2020
Performance Summary (unaudited)
|
Morningstar Alternatives Fund |
Investment Objective
Morningstar Alternatives Fund seeks long-term capital appreciation and low sensitivity to traditional U.S. asset classes.
Investment Strategies
In seeking long-term capital appreciation and low sensitivity to traditional U.S. asset classes, the Fund allocates assets to strategies that provide alternative sources of return including (i) core allocation across fixed-income and equity markets; (ii) long/short macro strategies; (iii) long/short alpha strategies; (iv) merger arbitrage strategy; and (v) convertible arbitrage strategy. The Fund will normally invest in both U.S. and non-U.S. securities, including securities of companies located in emerging markets. The Fund may invest in non-U.S. dollar denominated investments, including investments denominated in European and Asian currencies and in other non-U.S. and emerging market currencies. In particular, the Fund has the latitude to invest in the following alternative strategies:
Long-Short Equity—Combines long equity positions with short equity positions (selling borrowed securities). Since the strategy is both long and short, total net exposure is typically less than 100%.
Convertible Arbitrage—Includes the purchase of convertible securities and the sale of the underlying common stock. These securities tend to be convertible bonds or convertible preferred stocks that may be converted into the stock of the same company.
Merger Arbitrage—Seeks to profit from the successful completion of corporate organizations. The process typically involves purchasing shares of an announced acquisition target company at a discount to their expected value upon completion of the acquisition. Hedging strategies may be used to reduce market exposure and volatility.
Credit Arbitrage—Seeks to exploit the mispricing of different classes of securities that are usually of the same company, and may include investments in investment-grade and/or non-investment-grade corporate debt (otherwise known as junk bonds), credit derivatives, loans, equities, credit index securities, and private debt.
Global Macro—Establishes long (number of contracts bought exceeds number sold) with a short (number of contracts sold exceeds number bought) exposures around the globe to take advantage of what the subadviser believe to be attractive opportunities. This strategy may include investments in fixed-income and equity securities and a wide variety of derivative instruments. Such investments will likely have significant exposure to foreign investments and may be concentrated in a geographic region or country.
Hedged Equity—Seeks to limit investment loss by creating a transaction that offsets an existing position in a contract that provides the right to buy or sell shares of a security at a specific price for a certain time. Specifically, this strategy attempts to reduce the systematic risk created by factors such as exposures to sectors, market-cap ranges, investment styles, currencies, and/or countries; the strategy strives to achieve this by matching short positions within each area against long positions. This strategy may be managed as beta neutral, dollar-neutral, or sector-neutral in order to achieve low beta exposures to certain market indexes.
55
Morningstar Funds Trust April 30, 2020
Performance Summary (unaudited) (continued)
Morningstar Alternatives Fund
Market Neutral—Attempts to significantly reduce the systematic risk created by factors such as exposures to sectors, market-cap ranges, investment styles, currencies, and/or countries. This strategy seeks to achieve this by matching short positions within each area against long positions, and the strategy may be managed as beta-neutral, dollar-neutral, or sector-neutral. In attempting to significantly reduce systematic risk, issue selection may be emphasized, with profits dependent on the ability to sell short and buy long the chosen securities.
Nontraditional Bond—Pursues strategies that diverge in one or more ways from conventional practice in the broader bond-fund universe. In pursuing this strategy, the Fund may seek to avoid losses and produce returns uncorrelated with the overall bond market and may employ a variety of methods to achieve those aims, including investing tactically across a wide swath of individual sectors, including high-yield and foreign debt.
The Fund may invest in derivatives, including options, futures, swaps, and forward foreign currency contracts, for risk management purposes or as part of its investment strategies. The Fund may also invest in investment companies such as mutual funds and exchange traded funds (ETFs), which could represent a significant percentage of assets. The Fund employs a multimanager, subadvised structure.
Investment Commentary
The Morningstar Alternatives Fund returned 1.94% for the fiscal year ending April 30, 2020, slightly outperforming the Morningstar U.S. Cash T-bill TR USD, which returned 1.88% for the same period.
The Fund gained ground in 2019 alongside traditional equity and fixed-income asset classes. The Fund’s benchmark also generated a positive return during 2019 as short-term interest rates, measured by the Federal funds rate, hovered between 1.5% to 2.5% throughout the year. In the first quarter of 2020, equity and credit markets suffered steep declines amid the coronavirus crisis and short-term interest rates plummeted into near-zero territory. The Fund experienced a modest loss during this turbulent period while the benchmark recorded a small gain.
Subadviser Water Island Capital, LLC, which manages a merger-arbitrage sleeve for the Fund, contributed positively to performance, while SSI Investment Management, LLC, which manages a convertible-arbitrage sleeve, dragged modestly on results relative to the Fund’s benchmark. Eaton Vance Global Macro, a third-party mutual fund held within the Fund, was the largest contributor to overall performance, turning in particularly strong results during 2019.
Investment Subadvisers:
SSI Investment Management, LLC
Short-term cash exposure that pursues minimal correlation to broad markets and bond-like volatility through an unlevered convertible arbitrage strategy.
Water Island Capital, LLC
Seeks to provide cash-plus returns while remaining broadly uncorrelated to equity markets.
56
Morningstar Funds Trust April 30, 2020
Performance Summary (unaudited) (continued)
Morningstar Alternatives Fund
Performance at a glance
| | | | | | | | |
| Average Total Returns as of 04/30/20 | | 1 year3 | | | Since Inception4 | |
Morningstar Alternatives Fund | | | 1.94% | | | | 2.15% | |
Bloomberg Barclays U.S. Aggregate Bond Index1 | | | 10.84% | | | | 11.27% | |
Morningstar U.S. Cash T-bill TR USD2 | | | 1.88% | | | | 2.04% | |
Illustration of an assumed investment of $10,000
The following graph depicts the performance of Morningstar Alternatives Fund shares versus the Bloomberg Barclays U.S. Aggregate Bond Index and the Morningstar U.S. Cash T-bill TR USD (“the Indicies”) from its inception (November 2, 2018) to April 30, 2020 (the Fund’s fiscal year end). Shares held through advisory programs may be subject to a program fee, which, if included, would have reduced performance. The performance provided does not reflect the deduction of taxes that a shareholder would pay on Fund distributions or the redemption of Fund shares. Past performance is no guarantee of future results. Share price and returns will vary with market conditions; investors may realize a gain or loss upon redemption. It is important to note that Morningstar Alternatives Fund is a professionally managed portfolio while the Indices are not available for direct investment, are unmanaged and do not include fees, expenses or taxes. The comparison is shown for illustration purposes only.
Morningstar Alternatives Fund
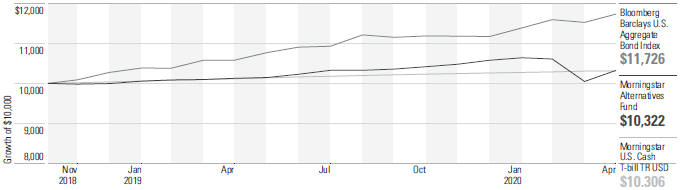
This chart does not imply future performance.
1The Bloomberg Barclays U.S. Aggregate Bond Index is a broad-based, flagship benchmark that measures the investment grade, U.S.-dollar-denominated, fixed-rate, taxable bond market. Investors should note that indices do not reflect the deduction of fees, expenses or taxes. The Bloomberg Barclays U.S. Aggregate Bond Index has been added in order to provide shareholders with a broader market comparison.
2The Morningstar U.S. Cash T-bill TR USD index measures the performance of a 13-week U.S. Treasury Bill, and is the index against which the Fund is primarily managed. Investors should note that indices do not reflect the deduction of fees, expenses or taxes. The Fund replaced FTSE, its prior U.S. Treasury bill index provider, with Morningstar in order to reduce licensing fees borne by the Fund.
3Represents performance from May 1, 2019 to April 30, 2020.
4Inception Date is November 2, 2018. Returns are annualized for periods greater than 1 year.
Past performance does not predict future performance, and the performance information provided, does not reflect the deduction of taxes that a shareholder would pay on Fund distributions or the redemption of Fund shares. Shares held through advisory programs are subject to a program fee, which, if included, would have reduced performance. The return and principal value of an investment will fluctuate, so that an investor’s shares, when redeemed, may be worth more or less than their original cost. Performance results assume reinvestment of all dividends and capital gain distributions at net asset value on the ex-dividend dates. Current performance may be higher or lower than the performance data quoted.
57
Morningstar Funds Trust April 30, 2020
Schedule of Investments
|
Morningstar U.S. Equity Fund |
| | | | | | | | |
| | | Number | | | | |
| | | of Shares | | | Value | |
|
| |
Common Stocks – 81.7% | |
Aerospace/Defense – 1.9% | | | | | | | | |
Barnes Group, Inc. | | | 52,342 | | | $ | 2,008,886 | |
General Dynamics Corp. | | | 15,418 | | | | 2,013,899 | |
Kaman Corp. | | | 37,525 | | | | 1,454,469 | |
Lockheed Martin Corp. | | | 7,267 | | | | 2,827,299 | |
Northrop Grumman Corp. | | | 16,791 | | | | 5,552,280 | |
Raytheon Technologies Corp. | | | 136,973 | | | | 8,877,220 | |
| | | | | | | 22,734,053 | |
|
| |
| | |
Agriculture – 1.5% | | | | | | | | |
Archer-Daniels-Midland Co. | | | 360,338 | | | | 13,382,953 | |
Philip Morris International, Inc. | | | 60,764 | | | | 4,532,995 | |
| | | | | | | 17,915,948 | |
|
| |
Airlines – 0.5% | | | | | | | | |
Alaska Air Group, Inc. | | | 83,560 | | | | 2,717,371 | |
Allegiant Travel Co. | | | 14,492 | | | | 1,137,332 | |
United Airlines Holdings, Inc.* | | | 53,826 | | | | 1,592,173 | |
| | | | | | | 5,446,876 | |
|
| |
| | |
Apparel – 0.6% | | | | | | | | |
Carter’s, Inc. | | | 18,263 | | | | 1,428,167 | |
Hanesbrands, Inc. | | | 203,391 | | | | 2,021,706 | |
Oxford Industries, Inc. | | | 42,768 | | | | 1,792,835 | |
VF Corp. | | | 30,580 | | | | 1,776,698 | |
| | | | | | | 7,019,406 | |
|
| |
| | |
Auto Manufacturers – 0.6% | | | | | | | | |
General Motors Co. | | | 322,530 | | | | 7,189,194 | |
|
| |
| | |
Auto Parts & Equipment – 0.8% | | | | | | | | |
Aptiv PLC | | | 49,367 | | | | 3,433,475 | |
BorgWarner, Inc. | | | 156,682 | | | | 4,476,405 | |
Douglas Dynamics, Inc. | | | 35,710 | | | | 1,319,841 | |
| | | | | | | 9,229,721 | |
|
| |
| | |
Banks – 6.3% | | | | | | | | |
Bank OZK | | | 142,162 | | | | 3,215,704 | |
BankUnited, Inc. | | | 146,160 | | | | 2,895,430 | |
BOK Financial Corp. | | | 36,364 | | | | 1,883,291 | |
Central Pacific Financial Corp. | | | 66,177 | | | | 1,157,436 | |
Citigroup, Inc. | | | 202,144 | | | | 9,816,113 | |
City Union Bank Ltd. (India) | | | 445,767 | | | | 850,957 | |
Columbia Banking System, Inc. | | | 31,266 | | | | 843,869 | |
Eagle Bancorp, Inc. | | | 19,080 | | | | 669,326 | |
First Republic Bank | | | 45,758 | | | | 4,772,102 | |
Goldman Sachs Group (The), Inc. | | | 18,642 | | | | 3,419,316 | |
| | | | | | | | |
| | | Number | | | | |
| | | of Shares | | | Value | |
|
| |
Banks (Continued) | | | | | | | | |
Great Western Bancorp, Inc. | | | 83,658 | | | $ | 1,572,770 | |
Heritage Commerce Corp. | | | 59,100 | | | | 524,808 | |
Hilltop Holdings, Inc. | | | 92,162 | | | | 1,778,727 | |
JPMorgan Chase & Co. | | | 151,240 | | | | 14,482,742 | |
Morgan Stanley | | | 247,146 | | | | 9,744,967 | |
PNC Financial Services Group (The), Inc. | | | 20,446 | | | | 2,180,975 | |
Renasant Corp. | | | 65,713 | | | | 1,723,652 | |
Sandy Spring Bancorp, Inc. | | | 69,058 | | | | 1,760,979 | |
State Street Corp. | | | 23,105 | | | | 1,456,539 | |
SVB Financial Group* | | | 14,867 | | | | 2,871,858 | |
Truist Financial Corp. | | | 58,912 | | | | 2,198,596 | |
U.S. Bancorp | | | 85,046 | | | | 3,104,179 | |
Webster Financial Corp. | | | 39,731 | | | | 1,122,401 | |
Wells Fargo & Co. | | | 3,392 | | | | 98,538 | |
| | | | | | | 74,145,275 | |
|
| |
| | |
Beverages – 1.9% | | | | | | | | |
Anheuser-Busch InBev S.A./N.V. ADR (Belgium) | | | 43,517 | | | | 2,024,411 | |
Diageo PLC (United Kingdom) | | | 94,226 | | | | 3,244,187 | |
Farmer Bros Co.* | | | 203,253 | | | | 1,878,058 | |
Molson Coors Beverage Co., Class B | | | 62,910 | | | | 2,579,939 | |
Monster Beverage Corp.* | | | 42,462 | | | | 2,624,576 | |
PepsiCo, Inc. | | | 10,121 | | | | 1,338,907 | |
Primo Water Corp. | | | 830,299 | | | | 8,518,868 | |
| | | | | | | 22,208,946 | |
|
| |
| | |
Biotechnology – 1.5% | | | | | | | | |
Alexion Pharmaceuticals, Inc.* | | | 32,446 | | | | 3,486,972 | |
Amgen, Inc. | | | 18,521 | | | | 4,430,594 | |
BioMarin Pharmaceutical, Inc.* | | | 28,568 | | | | 2,628,827 | |
Bio-Rad Laboratories, Inc., Class A* | | | 11,745 | | | | 5,168,974 | |
Corteva, Inc. | | | 10,145 | | | | 265,698 | |
Ligand Pharmaceuticals, Inc.* | | | 11,958 | | | | 1,178,700 | |
| | | | | | | 17,159,765 | |
|
| |
| | |
Building Materials – 0.8% | | | | | | | | |
Apogee Enterprises, Inc. | | | 41,238 | | | | 842,905 | |
Carrier Global Corp.* | | | 25,017 | | | | 443,051 | |
Johnson Controls International PLC | | | 65,407 | | | | 1,903,998 | |
Masco Corp. | | | 37,757 | | | | 1,549,547 | |
Trex Co., Inc.* | | | 29,474 | | | | 2,806,514 | |
UFP Industries, Inc. | | | 40,074 | | | | 1,647,843 | |
| | | | | | | 9,193,858 | |
|
| |
See accompanying Notes to Financial Statements
58
Morningstar Funds Trust April 30, 2020
Schedule of Investments (continued)
Morningstar U.S. Equity Fund
| | | | | | | | |
| | | Number | | | | |
| | | of Shares | | | Value | |
|
| |
Chemicals – 3.2% | | | | | | | | |
Ashland Global Holdings, Inc. | | | 59,976 | | | $ | 3,699,919 | |
Axalta Coating Systems Ltd.* | | | 136,625 | | | | 2,696,978 | |
Balchem Corp. | | | 14,190 | | | | 1,266,316 | |
DuPont de Nemours, Inc. | | | 258,165 | | | | 12,138,918 | |
Ecolab, Inc. | | | 20,001 | | | | 3,870,193 | |
Innospec, Inc. | | | 21,863 | | | | 1,585,505 | |
PPG Industries, Inc. | | | 36,551 | | | | 3,319,927 | |
RPM International, Inc. | | | 21,930 | | | | 1,456,371 | |
Sherwin-Williams (The) Co. | | | 4,934 | | | | 2,646,450 | |
Valvoline, Inc. | | | 115,950 | | | | 1,993,181 | |
W.R. Grace & Co. | | | 64,292 | | | | 3,036,511 | |
| | | | | | | 37,710,269 | |
|
| |
| | |
Commercial Services – 2.1% | | | | | | | | |
Aaron’s, Inc. | | | 36,607 | | | | 1,168,129 | |
Avalara, Inc.* | | | 18,806 | | | | 1,680,692 | |
Cimpress PLC (Ireland)* | | | 19,807 | | | | 1,441,751 | |
Clarivate Analytics PLC (United Kingdom)* | | | 67,670 | | | | 1,555,057 | |
Equifax, Inc. | | | 15,583 | | | | 2,164,479 | |
Euronet Worldwide, Inc.* | | | 25,621 | | | | 2,350,983 | |
HealthEquity, Inc.* | | | 31,699 | | | | 1,783,703 | |
IHS Markit Ltd. | | | 55,800 | | | | 3,755,340 | |
Monro, Inc. | | | 42,583 | | | | 2,362,931 | |
Moody’s Corp. | | | 6,227 | | | | 1,518,765 | |
Paylocity Holding Corp.* | | | 24,200 | | | | 2,771,626 | |
Repay Holdings Corp.* | | | 103,446 | | | | 1,848,580 | |
WEX, Inc.* | | | 2,894 | | | | 382,934 | |
| | | | | | | 24,784,970 | |
|
| |
| | |
Computers – 3.0% | | | | | | | | |
Accenture PLC, Class A | | | 29,482 | | | | 5,459,772 | |
Apple, Inc. | | | 53,408 | | | | 15,691,270 | |
Check Point Software Technologies Ltd. (Israel)* | | | 39,100 | | | | 4,134,434 | |
Cognizant Technology Solutions Corp., Class A | | | 57,337 | | | | 3,326,693 | |
CyberArk Software Ltd.* | | | 19,319 | | | | 1,907,944 | |
EPAM Systems, Inc.* | | | 8,161 | | | | 1,802,683 | |
International Business Machines Corp. | | | 26,669 | | | | 3,348,560 | |
| | | | | | | 35,671,356 | |
|
| |
| |
Cosmetics/Personal Care – 0.0%(a) | | | | | |
Colgate-Palmolive Co. | | | 6,942 | | | | 487,814 | |
|
| |
Distribution/Wholesale – 0.8% | | | | | | | | |
Pool Corp. | | | 13,718 | | | | 2,903,552 | |
SiteOne Landscape Supply, Inc.* | | | 13,572 | | | | 1,202,886 | |
| | | | | | | | |
| | | Number | | | | |
| | | of Shares | | | Value | |
|
| |
| |
Distribution/Wholesale (Continued) | | | | | |
W.W. Grainger, Inc. | | | 12,889 | | | $ | 3,551,951 | |
WESCO International, Inc.* | | | 62,092 | | | | 1,606,320 | |
| | | | | | | 9,264,709 | |
|
| |
| |
Diversified Financial Services – 3.1% | | | | | |
American Express Co. | | | 56,475 | | | | 5,153,344 | |
BlackRock, Inc. | | | 5,043 | | | | 2,531,788 | |
Charles Schwab (The) Corp. | | | 64,857 | | | | 2,446,406 | |
Cohen & Steers, Inc. | | | 31,660 | | | | 1,828,048 | |
Discover Financial Services | | | 49,080 | | | | 2,108,967 | |
Franklin Resources, Inc. | | | 68,533 | | | | 1,291,162 | |
Hamilton Lane, Inc., Class A | | | 35,482 | | | | 2,301,008 | |
Houlihan Lokey, Inc. | | | 14,528 | | | | 862,673 | |
Moelis & Co., Class A | | | 55,323 | | | | 1,652,498 | |
Mr. Cooper Group, Inc.* | | | 171,042 | | | | 1,638,582 | |
Nasdaq, Inc. | | | 28,369 | | | | 3,111,228 | |
T. Rowe Price Group, Inc. | | | 10,487 | | | | 1,212,612 | |
Visa, Inc., Class A | | | 55,418 | | | | 9,904,305 | |
| | | | | | | 36,042,621 | |
|
| |
| | |
Electric – 2.8% | | | | | | | | |
American Electric Power Co., Inc. | | | 15,692 | | | | 1,304,162 | |
Avista Corp. | | | 36,316 | | | | 1,563,041 | |
CenterPoint Energy, Inc. | | | 515,551 | | | | 8,779,834 | |
Duke Energy Corp. | | | 63,444 | | | | 5,371,169 | |
Exelon Corp. | | | 93,294 | | | | 3,459,341 | |
FirstEnergy Corp. | | | 70,955 | | | | 2,928,313 | |
NorthWestern Corp. | | | 28,458 | | | | 1,641,742 | |
PNM Resources, Inc. | | | 39,274 | | | | 1,590,204 | |
Southern (The) Co. | | | 78,199 | | | | 4,436,229 | |
Xcel Energy, Inc. | | | 21,784 | | | | 1,384,591 | |
| | | | | | | 32,458,626 | |
|
| |
| |
Electrical Component & Equipment – 0.3% | | | | | |
Novanta, Inc.* | | | 39,907 | | | | 3,467,519 | |
|
| |
| | |
Electronics – 1.3% | | | | | | | | |
Avnet, Inc. | | | 41,262 | | | | 1,238,685 | |
Fluidigm Corp.* | | | 453,418 | | | | 1,015,657 | |
Honeywell International, Inc. | | | 63,640 | | | | 9,030,516 | |
Sensata Technologies Holding PLC* | | | 113,971 | | | | 4,146,265 | |
| | | | | | | 15,431,123 | |
|
| |
Engineering & Construction – 0.1% | | | | | |
Comfort Systems USA, Inc. | | | 50,374 | | | | 1,677,454 | |
|
| |
See accompanying Notes to Financial Statements
59
Morningstar Funds Trust April 30, 2020
Schedule of Investments (continued)
Morningstar U.S. Equity Fund
| | | | | | | | |
| | | Number | | | | |
| | | of Shares | | | Value | |
|
| |
| | |
Entertainment – 0.6% | | | | | | | | |
Red Rock Resorts, Inc., Class A | | | 284,138 | | | $ | 3,114,152 | |
Vail Resorts, Inc. | | | 22,230 | | | | 3,801,330 | |
| | | | | | | 6,915,482 | |
|
| |
| | |
Environmental Control – 0.2% | | | | | | | | |
Stericycle, Inc.* | | | 54,447 | | | | 2,657,014 | |
|
| |
| | |
Food – 2.2% | | | | | | | | |
Danone S.A. (France) | | | 13,526 | | | | 942,723 | |
Flowers Foods, Inc. | | | 79,876 | | | | 1,779,637 | |
Hostess Brands, Inc.* | | | 130,404 | | | | 1,567,456 | |
J&J Snack Foods Corp. | | | 13,949 | | | | 1,771,941 | |
JM Smucker (The) Co. | | | 6,028 | | | | 692,678 | |
Nestle S.A. (Switzerland)(b) | | | 39,638 | | | | 4,198,062 | |
Post Holdings, Inc.* | | | 76,113 | | | | 6,990,979 | |
TreeHouse Foods, Inc.* | | | 153,504 | | | | 7,940,762 | |
| | | | | | | 25,884,238 | |
|
| |
| |
Forest Products & Paper – 0.3% | | | | | |
International Paper Co. | | | 113,502 | | | | 3,887,443 | |
|
| |
| | |
Gas – 0.7% | | | | | | | | |
South Jersey Industries, Inc. | | | 151,289 | | | | 4,325,352 | |
UGI Corp. | | | 138,543 | | | | 4,181,228 | |
| | | | | | | 8,506,580 | |
|
| |
| | |
Hand/Machine Tools – 0.5% | | | | | | | | |
Colfax Corp.* | | | 164,666 | | | | 4,246,736 | |
Stanley Black & Decker, Inc. | | | 17,835 | | | | 1,965,417 | |
| | | | | | | 6,212,153 | |
|
| |
| | |
Healthcare - Products – 3.0% | | | | | | | | |
Abbott Laboratories | | | 38,157 | | | | 3,513,878 | |
Alcon, Inc. (Switzerland)* | | | 25,594 | | | | 1,351,619 | |
Boston Scientific Corp.* | | | 149,732 | | | | 5,611,955 | |
Cantel Medical Corp. | | | 15,415 | | | | 570,355 | |
CONMED Corp. | | | 24,406 | | | | 1,803,848 | |
Danaher Corp. | | | 24,832 | | | | 4,059,039 | |
Medtronic PLC | | | 66,062 | | | | 6,449,633 | |
Merit Medical Systems, Inc.* | | | 25,151 | | | | 1,026,664 | |
Patterson Cos., Inc. | | | 48,876 | | | | 893,453 | |
Thermo Fisher Scientific, Inc. | | | 30,041 | | | | 10,054,122 | |
| | | | | | | 35,334,566 | |
|
| |
| | |
Healthcare - Services – 1.5% | | | | | | | | |
Ensign Group (The), Inc. | | | 56,303 | | | | 2,106,295 | |
ICON PLC (Ireland)* | | | 19,448 | | | | 3,120,821 | |
Magellan Health, Inc.* | | | 15,790 | | | | 958,927 | |
Medpace Holdings, Inc.* | | | 25,535 | | | | 2,039,225 | |
| | | | | | | | |
| | | Number | | | | |
| | | of Shares | | | Value | |
|
| |
| |
Healthcare - Services (Continued) | | | | | |
Pennant Group (The), Inc.* | | | 34,949 | | | $ | 691,641 | |
U.S. Physical Therapy, Inc. | | | 7,594 | | | | 573,347 | |
UnitedHealth Group, Inc. | | | 27,448 | | | | 8,027,716 | |
| | | | | | | 17,517,972 | |
|
| |
| | |
Home Builders – 0.5% | | | | | | | | |
Century Communities, Inc.* | | | 53,258 | | | | 1,140,787 | |
Installed Building Products, Inc.* | | | 20,317 | | | | 1,001,831 | |
NVR, Inc.* | | | 1,382 | | | | 4,284,200 | |
| | | | | | | 6,426,818 | |
|
| |
| |
Household Products/Wares – 0.3% | | | | | |
Central Garden & Pet Co., Class A* | | | 52,318 | | | | 1,590,990 | |
Kimberly-Clark Corp. | | | 8,414 | | | | 1,165,171 | |
Reckitt Benckiser Group PLC (United Kingdom) | | | 13,351 | | | | 1,112,135 | |
| | | | | | | 3,868,296 | |
|
| |
| | |
Insurance – 4.3% | | | | | | | | |
American International Group, Inc. | | | 398,256 | | | | 10,127,650 | |
Aon PLC | | | 28,815 | | | | 4,975,486 | |
Argo Group International Holdings Ltd. | | | 45,475 | | | | 1,607,996 | |
Brighthouse Financial, Inc.* | | | 62,126 | | | | 1,597,259 | |
BRP Group, Inc., Class A* | | | 69,116 | | | | 692,542 | |
Chubb Ltd. | | | 36,165 | | | | 3,906,182 | |
Enstar Group Ltd.* | | | 8,297 | | | | 1,199,912 | |
Hartford Financial Services Group (The), Inc. | | | 72,502 | | | | 2,754,351 | |
James River Group Holdings Ltd. | | | 46,314 | | | | 1,643,221 | |
Loews Corp. | | | 213,217 | | | | 7,390,101 | |
Marsh & McLennan Cos., Inc. | | | 41,975 | | | | 4,085,427 | |
Mercury General Corp. | | | 19,071 | | | | 781,148 | |
Reinsurance Group of America, Inc. | | | 15,093 | | | | 1,579,935 | |
RenaissanceRe Holdings Ltd. | | | 16,447 | | | | 2,401,427 | |
Travelers (The) Cos., Inc. | | | 34,443 | | | | 3,485,976 | |
Willis Towers Watson PLC | | | 15,262 | | | | 2,721,062 | |
| | | | | | | 50,949,675 | |
|
| |
| | |
Internet – 5.2% | | | | | | | | |
1-800-Flowers.com, Inc., Class A* | | | 54,200 | | | | 1,040,098 | |
Alibaba Group Holding Ltd. ADR (China)* | | | 21,254 | | | | 4,307,548 | |
Alphabet, Inc., Class A* | | | 2,142 | | | | 2,884,632 | |
See accompanying Notes to Financial Statements
60
Morningstar Funds Trust April 30, 2020
Schedule of Investments (continued)
Morningstar U.S. Equity Fund
| | | | | | | | |
| | | Number | | | | |
| | | of Shares | | | Value | |
|
| |
| | |
Internet (Continued) | | | | | | | | |
Alphabet, Inc., Class C* | | | 5,398 | | | $ | 7,280,067 | |
Amazon.com, Inc.* | | | 8,455 | | | | 20,917,670 | |
Booking Holdings, Inc.* | | | 1,804 | | | | 2,670,948 | |
Facebook, Inc., Class A* | | | 59,137 | | | | 12,105,935 | |
Palo Alto Networks, Inc.* | | | 14,269 | | | | 2,804,001 | |
Proofpoint, Inc.* | | | 23,600 | | | | 2,872,828 | |
Q2 Holdings, Inc.* | | | 24,934 | | | | 1,987,739 | |
Uber Technologies, Inc.* | | | 97,849 | | | | 2,961,889 | |
| | | | | | | 61,833,355 | |
|
| |
| | |
Leisure Time – 0.3% | | | | | | | | |
Camping World Holdings, Inc., Class A | | | 68,508 | | | | 607,666 | |
Fox Factory Holding Corp.* | | | 9,104 | | | | 464,395 | |
Planet Fitness, Inc., Class A* | | | 32,788 | | | | 1,978,100 | |
YETI Holdings, Inc.* | | | 15,808 | | | | 436,459 | |
| | | | | | | 3,486,620 | |
|
| |
| | |
Lodging – 0.1% | | | | | | | | |
Marriott International, Inc., Class A | | | 10,342 | | | | 940,501 | |
|
| |
| | |
Machinery - Diversified – 1.0% | | | | | | | | |
Alamo Group, Inc. | | | 8,250 | | | | 812,130 | |
Altra Industrial Motion Corp. | | | 106,373 | | | | 2,968,870 | |
Columbus McKinnon Corp. | | | 32,135 | | | | 870,216 | |
Kadant, Inc. | | | 18,797 | | | | 1,580,640 | |
Otis Worldwide Corp.* | | | 117,725 | | | | 5,993,380 | |
| | | | | | | 12,225,236 | |
|
| |
| | |
Media – 1.7% | | | | | | | | |
Comcast Corp., Class A | | | 284,006 | | | | 10,687,146 | |
Liberty Media Corp.-Liberty Formula One, Class C* | | | 83,233 | | | | 2,679,270 | |
Walt Disney (The) Co. | | | 57,605 | | | | 6,229,981 | |
| | | | | | | 19,596,397 | |
|
| |
| |
Metal Fabricate/Hardware – 0.3% | | | | | |
Helios Technologies, Inc. | | | 34,545 | | | | 1,228,766 | |
RBC Bearings, Inc.* | | | 21,406 | | | | 2,711,712 | |
| | | | | | | 3,940,478 | |
|
| |
| |
Miscellaneous Manufacturing – 1.6% | | | | | |
Eaton Corp. PLC | | | 32,879 | | | | 2,745,397 | |
Fabrinet (Thailand)* | | | 40,246 | | | | 2,525,437 | |
Federal Signal Corp. | | | 60,111 | | | | 1,618,789 | |
General Electric Co. | | | 284,905 | | | | 1,937,354 | |
Illinois Tool Works, Inc. | | | 24,525 | | | | 3,985,312 | |
Parker-Hannifin Corp. | | | 24,177 | | | | 3,822,867 | |
Trane Technologies PLC | | | 22,252 | | | | 1,945,270 | |
| | | | | | | 18,580,426 | |
|
| |
| | | | | | | | |
| | | Number | | | | |
| | | of Shares | | | Value | |
|
| |
| | |
Office Furnishings – 0.3% | | | | | | | | |
Interface, Inc. | | | 165,842 | | | $ | 1,532,380 | |
Knoll, Inc. | | | 164,970 | | | | 1,923,550 | |
| | | | | | | 3,455,930 | |
|
| |
| | |
Oil & Gas – 1.6% | | | | | | | | |
Chevron Corp. | | | 42,586 | | | | 3,917,912 | |
Cimarex Energy Co. | | | 69,737 | | | | 1,772,715 | |
ConocoPhillips | | | 41,955 | | | | 1,766,305 | |
EOG Resources, Inc. | | | 22,237 | | | | 1,056,480 | |
Hess Corp. | | | 65,266 | | | | 3,174,538 | |
Noble Energy, Inc. | | | 191,918 | | | | 1,882,716 | |
PDC Energy, Inc.* | | | 74,458 | | | | 967,209 | |
Phillips 66 | | | 22,764 | | | | 1,665,642 | |
Pioneer Natural Resources Co. | | | 12,363 | | | | 1,104,140 | |
Suncor Energy, Inc. (Canada) | | | 71,438 | | | | 1,273,818 | |
| | | | | | | 18,581,475 | |
|
| |
| | |
Pharmaceuticals – 5.1% | | | | | | | | |
AbbVie, Inc. | | | 165,892 | | | | 13,636,322 | |
Cigna Corp. | | | 27,778 | | | | 5,438,377 | |
Johnson & Johnson | | | 64,673 | | | | 9,703,537 | |
McKesson Corp. | | | 12,290 | | | | 1,735,963 | |
Merck & Co., Inc. | | | 64,519 | | | | 5,118,937 | |
Neogen Corp.* | | | 21,449 | | | | 1,342,493 | |
Pfizer, Inc. | | | 404,970 | | | | 15,534,649 | |
Roche Holding A.G. (Genusschein) (Switzerland) | | | 3,556 | | | | 1,231,434 | |
Zoetis, Inc. | | | 46,810 | | | | 6,053,001 | |
| | | | | | | 59,794,713 | |
|
| |
| | |
Pipelines – 0.4% | | | | | | | | |
Williams (The) Cos., Inc. | | | 264,832 | | | | 5,129,796 | |
|
| |
| | |
Real Estate – 0.1% | | | | | | | | |
Jones Lang LaSalle, Inc. | | | 12,074 | | | | 1,274,773 | |
|
| |
| |
Real Estate Investment Trusts – 2.5% | | | | | |
American Campus Communities, Inc. | | | 92,024 | | | | 3,247,527 | |
Columbia Property Trust, Inc. | | | 123,157 | | | | 1,759,913 | |
CubeSmart | | | 191,108 | | | | 4,815,922 | |
Douglas Emmett, Inc. | | | 76,818 | | | | 2,342,181 | |
Easterly Government Properties, Inc. | | | 57,935 | | | | 1,559,031 | |
Equinix, Inc. | | | 6,989 | | | | 4,718,973 | |
Mid-America Apartment Communities, Inc. | | | 16,814 | | | | 1,881,823 | |
Monmouth Real Estate Investment Corp. | | | 166,367 | | | | 2,260,927 | |
See accompanying Notes to Financial Statements
61
Morningstar Funds Trust April 30, 2020
Schedule of Investments (continued)
Morningstar U.S. Equity Fund
| | | | | | | | |
| | | Number | | | | |
| | | of Shares | | | Value | |
|
| |
|
Real Estate Investment Trusts (Continued) | |
National Storage Affiliates Trust | | | 122,702 | | | $ | 3,494,553 | |
PotlatchDeltic Corp. | | | 32,106 | | | | 1,127,242 | |
Public Storage | | | 4,071 | | | | 754,967 | |
RPT Realty | | | 134,107 | | | | 914,610 | |
Summit Hotel Properties, Inc. | | | 178,822 | | | | 1,083,661 | |
| | | | | | | 29,961,330 | |
|
| |
| | |
Retail – 3.4% | | | | | | | | |
Advance Auto Parts, Inc. | | | 36,775 | | | | 4,446,465 | |
BJ’s Wholesale Club Holdings, Inc.* | | | 58,319 | | | | 1,534,373 | |
Bloomin’ Brands, Inc. | | | 139,557 | | | | 1,681,662 | |
Costco Wholesale Corp. | | | 13,475 | | | | 4,082,925 | |
Five Below, Inc.* | | | 22,965 | | | | 2,070,525 | |
Floor & Decor Holdings, Inc., Class A* | | | 30,386 | | | | 1,288,366 | |
Home Depot (The), Inc. | | | 18,882 | | | | 4,150,830 | |
Lowe’s Cos., Inc. | | | 89,451 | | | | 9,369,992 | |
National Vision Holdings, Inc.* | | | 46,151 | | | | 1,223,002 | |
Ollie’s Bargain Outlet Holdings, Inc.* | | | 29,286 | | | | 1,988,812 | |
Papa John’s International, Inc. | | | 21,822 | | | | 1,569,438 | |
TJX (The) Cos., Inc. | | | 57,787 | | | | 2,834,452 | |
Walmart, Inc. | | | 27,503 | | | | 3,342,990 | |
| | | | | | | 39,583,832 | |
|
| |
| | |
Savings & Loans – 0.6% | | | | | | | | |
Berkshire Hills Bancorp, Inc. | | | 94,408 | | | | 1,608,712 | |
Sterling Bancorp | | | 282,389 | | | | 3,481,857 | |
Washington Federal, Inc. | | | 58,981 | | | | 1,577,152 | |
| | | | | | | 6,667,721 | |
|
| |
| | |
Semiconductors – 3.1% | | | | | | | | |
Amkor Technology, Inc.* | | | 89,435 | | | | 883,618 | |
Analog Devices, Inc. | | | 13,826 | | | | 1,515,330 | |
Intel Corp. | | | 199,931 | | | | 11,991,861 | |
Lattice Semiconductor Corp.* | | | 74,785 | | | | 1,683,410 | |
Monolithic Power Systems, Inc. | | | 11,059 | | | | 2,210,805 | |
NVIDIA Corp. | | | 15,707 | | | | 4,590,842 | |
NXP Semiconductors N.V. (Netherlands) | | | 16,997 | | | | 1,692,391 | |
QUALCOMM, Inc. | | | 57,237 | | | | 4,502,835 | |
Texas Instruments, Inc. | | | 66,913 | | | | 7,766,592 | |
| | | | | | | 36,837,684 | |
|
| |
| | |
Software – 5.1% | | | | | | | | |
Adobe, Inc.* | | | 20,166 | | | | 7,131,504 | |
| | | | | | | | |
| | | Number | | | | |
| | | of Shares | | | Value | |
|
| |
| | |
Software (Continued) | | | | | | | | |
Akamai Technologies, Inc.* | | | 50,068 | | | $ | 4,892,144 | |
DocuSign, Inc.* | | | 16,174 | | | | 1,694,227 | |
Fidelity National Information Services, Inc. | | | 52,553 | | | | 6,931,215 | |
Fiserv, Inc.* | | | 33,594 | | | | 3,462,198 | |
Five9, Inc.* | | | 21,794 | | | | 2,019,650 | |
Guidewire Software, Inc.* | | | 17,844 | | | | 1,620,949 | |
HubSpot, Inc.* | | | 7,158 | | | | 1,207,054 | |
Medallia, Inc.* | | | 64,452 | | | | 1,384,429 | |
Microsoft Corp. | | | 77,987 | | | | 13,976,050 | |
Nutanix, Inc., Class A* | | | 65,519 | | | | 1,342,484 | |
Omnicell, Inc.* | | | 21,879 | | | | 1,594,979 | |
salesforce.com, Inc.* | | | 23,338 | | | | 3,779,589 | |
Splunk, Inc.* | | | 27,267 | | | | 3,827,196 | |
Tyler Technologies, Inc.* | | | 5,542 | | | | 1,777,264 | |
VMware, Inc., Class A* | | | 22,648 | | | | 2,978,665 | |
| | | | | | | 59,619,597 | |
|
| |
| | |
Telecommunications – 0.5% | | | | | | | | |
Corning, Inc. | | | 90,062 | | | | 1,982,265 | |
Juniper Networks, Inc. | | | 74,665 | | | | 1,612,764 | |
Verizon Communications, Inc. | | | 16,692 | | | | 958,955 | |
Viavi Solutions, Inc.* | | | 125,809 | | | | 1,519,773 | |
| | | | | | | 6,073,757 | |
|
| |
| | |
Textiles – 0.1% | | | | | | | | |
UniFirst Corp. | | | 9,376 | | | | 1,576,574 | |
|
| |
| | |
Transportation – 1.5% | | | | | | | | |
C.H. Robinson Worldwide, Inc. | | | 19,507 | | | | 1,383,046 | |
Canadian National Railway Co. (Canada) | | | 15,726 | | | | 1,303,214 | |
Hub Group, Inc., Class A* | | | 39,348 | | | | 1,893,032 | |
Kirby Corp.* | | | 78,313 | | | | 4,183,480 | |
Old Dominion Freight Line, Inc. | | | 9,647 | | | | 1,401,613 | |
Union Pacific Corp. | | | 18,549 | | | | 2,963,945 | |
United Parcel Service, Inc., Class B | | | 44,775 | | | | 4,238,401 | |
| | | | | | | 17,366,731 | |
|
| |
Total Common Stocks
(Cost $961,914,791) | | | | | | | 963,926,666 | |
|
| |
| |
Investment Companies – 16.2% | | | | | |
Energy Select Sector SPDR Fund | | | 968,758 | | | | 36,812,804 | |
Global X MLP & Energy Infrastructure ETF | | | 3,000,754 | | | | 73,668,519 | |
Vanguard Financials ETF | | | 618,932 | | | | 34,542,595 | |
See accompanying Notes to Financial Statements
62
Morningstar Funds Trust April 30, 2020
Schedule of Investments (continued)
Morningstar U.S. Equity Fund
| | | | | | | | |
| | | Number | | | | |
| | | of Shares | | | Value | |
|
| |
Vanguard Health Care ETF | | | 242,802 | | | $ | 45,748,753 | |
|
| |
Total Investment Companies
(Cost $199,984,790) | | | | | | | 190,772,671 | |
|
| |
Short-Term Investments – 3.3% | |
| | |
Money Market Fund – 3.3% | | | | | | | | |
Northern Institutional Funds - Treasury Portfolio (Premier), 0.22%(c) | | | 38,771,671 | | | | 38,771,671 | |
|
| |
Total Short-Term Investments
(Cost $38,771,671) | | | | | | | 38,771,671 | |
|
| |
Total Investments – 101.2%
(Cost $1,200,671,252) | | | | | | | 1,193,471,008 | |
|
| |
Liabilities less Other Assets – (1.2)% | | | | | | | (14,104,616 | ) |
|
| |
NET ASSETS – 100.0% | | | | | | $ | 1,179,366,392 | |
|
| |
Percentages shown are based on Net Assets.
All securities are United States companies, unless noted otherwise in parentheses.
| (a) | Amount rounds to less than 0.05%. |
| (b) | Security sold outside United States without registration under the Securities Act of 1933. |
| (c) | 7-day current yield as of April 30, 2020 is disclosed. |
| * | Non-Income Producing Security |
| | |
Abbreviations: | | |
ADR | | American Depositary Receipt |
ETF | | Exchange-Traded Fund |
MLP | | Master Limited Partnership |
PLC | | Public Limited Company |
SPDR | | Standard & Poor’s Depositary Receipt |
Valuation Hierarchy
The following is a summary of the inputs used, as of April 30, 2020, in valuing the Fund’s investments carried at fair value:
| | | | | | | | | | | | | | |
| Morningstar U.S. Equity Fund | | Level 1 | | | Level 2 | | | Level 3 | | | Totals |
| | | | |
Investments | | | | | | | | | | | | | | |
Common Stocks | | | $ 952,347,168 | | | | $11,579,498 | | | | $— | | | $ 963,926,666 |
Investment Companies | | | 190,772,671 | | | | — | | | | — | | | 190,772,671 |
Short-Term Investments | | | 38,771,671 | | | | — | | | | — | | | 38,771,671 |
| | | | | |
Total Investments | | | $1,181,891,510 | | | | $11,579,498 | | | | $— | | | $1,193,471,008 |
See accompanying Notes to Financial Statements
63
Morningstar Funds Trust April 30, 2020
Schedule of Investments
|
Morningstar International Equity Fund |
| | | | | | | | |
| | | Number | | | | |
| | | of Shares | | | Value | |
|
| |
Common Stocks – 71.4% | |
Advertising – 1.1% | | | | | | | | |
Publicis Groupe S.A. (France) | | | 154,364 | | | $ | 4,556,667 | |
WPP PLC (United Kingdom) | | | 505,100 | | | | 3,919,136 | |
| | | | | | | 8,475,803 | |
|
| |
| | |
Aerospace/Defense – 0.6% | | | | | | | | |
Rolls-Royce Holdings PLC (United Kingdom)* | | | 1,076,000 | | | | 4,453,515 | |
|
| |
| | |
Agriculture – 0.1% | | | | | | | | |
British American Tobacco Malaysia Bhd. (Malaysia) | | | 400 | | | | 1,171 | |
KT&G Corp. (South Korea) | | | 10,800 | | | | 721,088 | |
| | | | | | | 722,259 | |
|
| |
| | |
Airlines – 0.8% | | | | | | | | |
Ryanair Holdings PLC ADR (Ireland)* | | | 100,955 | | | | 6,407,614 | |
|
| |
| | |
Apparel – 0.4% | | | | | | | | |
adidas A.G. (Germany) | | | 11,907 | | | | 2,725,900 | |
|
| |
| | |
Auto Manufacturers – 3.5% | | | | | | | | |
Bayerische Motoren Werke A.G. (Germany) | | | 149,220 | | | | 8,777,905 | |
Daimler A.G. (Germany)(a) | | | 294,490 | | | | 10,072,447 | |
Maruti Suzuki India Ltd. (India) | | | 3,170 | | | | 225,044 | |
Toyota Motor Corp. (Japan) | | | 50,000 | | | | 3,091,343 | |
Volvo AB, Class B (Sweden) | | | 368,300 | | | | 4,719,606 | |
| | | | | | | 26,886,345 | |
|
| |
| | |
Auto Parts & Equipment – 2.0% | | | | | | | | |
Continental A.G. (Germany) | | | 100,775 | | | | 8,420,911 | |
Hyundai Mobis Co. Ltd. (South Korea) | | | 6,990 | | | | 988,248 | |
Valeo S.A. (France) | | | 217,407 | | | | 4,983,601 | |
Weichai Power Co. Ltd., Class H (China) | | | 713,000 | | | | 1,252,747 | |
| | | | | | | 15,645,507 | |
|
| |
| | |
Banks – 10.5% | | | | | | | | |
Al Rajhi Bank (Saudi Arabia) | | | 33,118 | | | | 503,422 | |
Axis Bank Ltd. (India) | | | 575,392 | | | | 3,361,701 | |
Banco Bilbao Vizcaya Argentaria S.A. (Spain) | | | 825,500 | | | | 2,698,380 | |
Banco do Brasil S.A. (Brazil)* | | | 267,200 | | | | 1,392,040 | |
Banco Santander Chile ADR (Chile) | | | 39,885 | | | | 670,866 | |
Bank Central Asia Tbk PT (Indonesia) | | | 360,700 | | | | 624,801 | |
| | | | | | | | |
| | | Number | | | | |
| | | of Shares | | | Value | |
|
| |
Banks (Continued) | | | | | | | | |
Bank Mandiri Persero Tbk PT (Indonesia) | | | 10,754,300 | | | $ | 3,196,838 | |
BNP Paribas S.A. (France) | | | 319,805 | | | | 10,047,104 | |
China Construction Bank Corp., Class H (China) | | | 4,738,000 | | | | 3,803,020 | |
China Merchants Bank Co. Ltd., Class H (China) | | | 409,000 | | | | 1,935,516 | |
Commercial International Bank Egypt S.A.E. GDR (Egypt)(a) | | | 258,248 | | | | 990,259 | |
Credicorp Ltd. (Peru) | | | 5,727 | | | | 853,438 | |
Credit Suisse Group A.G. (Switzerland)(a) | | | 941,500 | | | | 8,596,495 | |
DBS Group Holdings Ltd. (Singapore) | | | 287,000 | | | | 4,040,705 | |
First Abu Dhabi Bank PJSC (United Arab Emirates) | | | 178,845 | | | | 557,697 | |
FirstRand Ltd. (South Africa) | | | 147,375 | | | | 321,647 | |
Habib Bank Ltd. (Pakistan) | | | 105,500 | | | | 66,224 | |
HDFC Bank Ltd. (India) | | | 69,265 | | | | 909,571 | |
HDFC Bank Ltd. ADR (India) | | | 47,076 | | | | 2,040,745 | |
ICICI Bank Ltd. ADR (India) | | | 236,882 | | | | 2,311,968 | |
Intesa Sanpaolo S.p.A. (Italy) | | | 5,303,400 | | | | 8,281,283 | |
Kasikornbank PCL (Thailand)(a) | | | 210,100 | | | | 548,033 | |
Komercni banka A.S. (Czech Republic) | | | 9,024 | | | | 191,081 | |
Lloyds Banking Group PLC (United Kingdom) | | | 21,479,500 | | | | 8,690,792 | |
National Bank of Kuwait S.A.K.P. (Kuwait) | | | 80,570 | | | | 193,195 | |
National Commercial Bank (Saudi Arabia) | | | 28,238 | | | | 278,690 | |
Nedbank Group Ltd. (South Africa) | | | 51,174 | | | | 297,498 | |
OTP Bank Nyrt. (Hungary) | | | 64,095 | | | | 1,898,238 | |
Royal Bank of Scotland Group PLC (United Kingdom) | | | 2,384,200 | | | | 3,326,226 | |
Sberbank of Russia PJSC (Russia) | | | 438,799 | | | | 1,156,339 | |
Sberbank of Russia PJSC (Moscow Exchange) (Russia) | | | 380,547 | | | | 1,015,066 | |
Sberbank of Russia PJSC ADR (Russia) | | | 187,938 | | | | 1,995,234 | |
Shinhan Financial Group Co. Ltd. (South Korea) | | | 53,011 | | | | 1,343,965 | |
See accompanying Notes to Financial Statements
64
Morningstar Funds Trust April 30, 2020
Schedule of Investments (continued)
Morningstar International Equity Fund
| | | | | | | | |
| | | Number | | | | |
| | | of Shares | | | Value | |
|
| |
|
Banks (Continued) | |
Standard Bank Group Ltd. (South Africa) | | | 78,971 | | | $ | 435,128 | |
Standard Chartered PLC (United Kingdom) | | | 281,415 | | | | 1,437,943 | |
| | | | | | | 80,011,148 | |
|
| |
| | |
Beverages – 1.1% | | | | | | | | |
Ambev S.A. ADR (Brazil)* | | | 1,145,207 | | | | 2,462,195 | |
Anheuser-Busch InBev S.A./N.V. (Belgium) | | | 10,136 | | | | 472,034 | |
China Resources Beer Holdings Co. Ltd. (China) | | | 102,000 | | | | 480,401 | |
Diageo PLC (United Kingdom) | | | 93,837 | | | | 3,230,794 | |
Fomento Economico Mexicano S.A.B. de C.V. ADR (Mexico) | | | 21,753 | | | | 1,399,371 | |
Kweichow Moutai Co. Ltd., Class A (China) | | | 3,700 | | | | 656,725 | |
| | | | | | | 8,701,520 | |
|
| |
| | |
Building Materials – 0.8% | | | | | | | | |
Anhui Conch Cement Co. Ltd., Class H (China) | | | 406,500 | | | | 3,205,407 | |
LafargeHolcim Ltd. (Switzerland)(a)* | | | 71,605 | | | | 2,973,970 | |
| | | | | | | 6,179,377 | |
|
| |
| | |
Chemicals – 1.4% | | | | | | | | |
Air Liquide S.A. (France) | | | 14,998 | | | | 1,905,561 | |
Linde PLC (United Kingdom) | | | 15,071 | | | | 2,779,146 | |
Novozymes A/S, Class B (Denmark) | | | 36,869 | | | | 1,808,670 | |
Symrise A.G. (Germany) | | | 29,742 | | | | 3,013,152 | |
UPL Ltd. (India) | | | 156,307 | | | | 864,954 | |
| | | | | | | 10,371,483 | |
|
| |
| | |
Coal – 0.1% | | | | | | | | |
China Shenhua Energy Co. Ltd., Class H (China) | | | 353,000 | | | | 625,370 | |
Coal India Ltd. (India) | | | 281,179 | | | | 549,825 | |
| | | | | | | 1,175,195 | |
|
| |
| | |
Commercial Services – 2.8% | | | | | | | | |
Adyen N.V. (Netherlands)(b)* | | | 3,430 | | | | 3,387,400 | |
Amadeus IT Group S.A. (Spain) | | | 49,953 | | | | 2,384,382 | |
Ashtead Group PLC (United Kingdom) | | | 200,550 | | | | 5,478,075 | |
Brambles Ltd. (Australia) | | | 332,600 | | | | 2,377,280 | |
Bureau Veritas S.A. (France) | | | 98,759 | | | | 2,050,232 | |
CCR S.A. (Brazil) | | | 415,560 | | | | 949,127 | |
| | | | | | | | |
| | | Number | | | | |
| | | of Shares | | | Value | |
|
| |
|
Commercial Services (Continued) | |
Cielo S.A. (Brazil) | | | 404,000 | | | $ | 304,603 | |
G4S PLC (United Kingdom) | | | 1,090,500 | | | | 1,497,020 | |
SGS S.A. (Switzerland)(a) | | | 782 | | | | 1,763,959 | |
StoneCo Ltd., Class A (Brazil)* | | | 10,317 | | | | 272,162 | |
TAL Education Group ADR (China)* | | | 11,484 | | | | 622,318 | |
| | | | | | | 21,086,558 | |
|
| |
| | |
Computers – 0.8% | | | | | | | | |
Check Point Software Technologies Ltd. (Israel)* | | | 28,107 | | | | 2,972,034 | |
Infosys Ltd. (India) | | | 68,046 | | | | 636,035 | |
Infosys Ltd. ADR (India) | | | 124,728 | | | | 1,151,240 | |
Tata Consultancy Services Ltd. (India) | | | 50,544 | | | | 1,338,018 | |
| | | | | | | 6,097,327 | |
|
| |
| |
Cosmetics/Personal Care – 2.2% | | | | | |
LG Household & Health | | | | | | | | |
Care Ltd. (South Korea) | | | 1,961 | | | | 2,223,767 | |
L’Oreal S.A. (France) | | | 21,442 | | | | 6,234,074 | |
Unicharm Corp. (Japan) | | | 125,500 | | | | 4,625,119 | |
Unilever N.V. (United Kingdom) | | | 21,994 | | | | 1,095,286 | |
Unilever PLC (United Kingdom) | | | 57,093 | | | | 2,939,843 | |
| | | | | | | 17,118,089 | |
|
| |
| | |
Distribution/Wholesale – 0.7% | | | | | | | | |
Bunzl PLC (United Kingdom) | | | 135,800 | | | | 2,947,507 | |
Ferguson PLC | | | 31,085 | | | | 2,241,299 | |
| | | | | | | 5,188,806 | |
|
| |
| |
Diversified Financial Services – 1.0% | | | | | |
B3 S.A. - Brasil Bolsa Balcao (Brazil) | | | 71,900 | | | | 505,742 | |
Capitec Bank Holdings Ltd. (South Africa) | | | 3,698 | | | | 180,274 | |
Housing Development Finance Corp. Ltd. (India) | | | 56,715 | | | | 1,434,595 | |
KB Financial Group, Inc. (South Korea) | | | 41,651 | | | | 1,191,690 | |
Network International Holdings PLC (United Arab Emirates)(b)* | | | 45,812 | | | | 238,938 | |
Pagseguro Digital Ltd., Class A (Brazil)* | | | 8,633 | | | | 218,674 | |
Schroders PLC (United Kingdom) | | | 110,800 | | | | 3,700,675 | |
XP, Inc., Class A (Brazil)* | | | 8,017 | | | | 201,708 | |
| | | | | | | 7,672,296 | |
|
| |
See accompanying Notes to Financial Statements
65
Morningstar Funds Trust April 30, 2020
Schedule of Investments (continued)
Morningstar International Equity Fund
| | | | | | | | |
| | | Number | | | | |
| | | of Shares | | | Value | |
|
| |
|
Electric – 0.0%(c) | |
Power Grid Corp. of India Ltd. (India) | | | 6,674 | | | $ | 14,305 | |
|
| |
|
Electrical Component & Equipment – 0.5% | |
Schneider Electric S.E. (France) | | | 43,942 | | | | 4,060,786 | |
|
| |
| | |
Electronics – 0.3% | | | | | | | | |
AAC Technologies Holdings, Inc. (China) | | | 138,153 | | | | 653,407 | |
Hangzhou Hikvision Digital Technology Co. Ltd., Class A (China) | | | 113,830 | | | | 509,192 | |
Hon Hai Precision Industry Co. Ltd. (Taiwan) | | | 472,000 | | | | 1,213,025 | |
| | | | | | | 2,375,624 | |
|
| |
| |
Engineering & Construction – 0.1% | | | | | |
Airports of Thailand PCL (Thailand)(a) | | | 159,800 | | | | 308,487 | |
Grupo Aeroportuario del Sureste S.A.B. de C.V. ADR (Mexico) | | | 2,638 | | | | 263,035 | |
Shanghai International Airport Co. Ltd., Class A (China) | | | 30,300 | | | | 299,416 | |
| | | | | | | 870,938 | |
|
| |
| | |
Food – 1.2% | | | | | | | | |
BIM Birlesik Magazalar A.S. (Turkey) | | | 30,296 | | | | 240,559 | |
China Mengniu Dairy Co. Ltd. (China)* | | | 338,000 | | | | 1,196,895 | |
Magnit PJSC GDR (Russia)(a) | | | 67,061 | | | | 739,633 | |
Nestle S.A. (Switzerland)(a) | | | 800 | | | | 84,728 | |
Nestle S.A. ADR (Switzerland) | | | 43,249 | | | | 4,545,470 | |
Shoprite Holdings Ltd. (South Africa) | | | 178,896 | | | | 1,033,969 | |
Uni-President Enterprises Corp. (Taiwan) | | | 167,000 | | | | 388,841 | |
Universal Robina Corp. (Philippines) | | | 159,950 | | | | 395,904 | |
X5 Retail Group N.V. GDR (Russia)(a) | | | 16,860 | | | | 497,593 | |
| | | | | | | 9,123,592 | |
|
| |
| |
Forest Products & Paper – 0.4% | | | | | |
Mondi PLC (United Kingdom) | | | 38,947 | | | | 687,778 | |
Suzano S.A. (Brazil)* | | | 27,960 | | | | 202,171 | |
UPM-Kymmene OYJ (Finland) | | | 78,900 | | | | 2,163,847 | |
| | | | | | | 3,053,796 | |
|
| |
| | | | | | | | |
| | | Number | | | | |
| | | of Shares | | | Value | |
|
| |
| | |
Gas – 0.1% | | | | | | | | |
ENN Energy Holdings Ltd. (China) | | | 84,000 | | | $ | 946,887 | |
|
| |
| | |
Healthcare - Products – 1.2% | | | | | | | | |
Alcon, Inc. (Switzerland)* | | | 12,131 | | | | 640,638 | |
EssilorLuxottica S.A. (France) | | | 14,785 | | | | 1,836,659 | |
Hengan International Group Co. Ltd. (China) | | | 186,500 | | | | 1,658,535 | |
Sonova Holding A.G. (Switzerland)(a) | | | 12,663 | | | | 2,287,112 | |
Sysmex Corp. (Japan) | | | 37,900 | | | | 2,618,407 | |
| | | | | | | 9,041,351 | |
|
| |
| | |
Healthcare - Services – 0.7% | | | | | | | | |
Life Healthcare Group Holdings Ltd. (South Africa) | | | 481,485 | | | | 463,938 | |
Lonza Group A.G. (Switzerland)(a) | | | 10,646 | | | | 4,648,742 | |
| | | | | | | 5,112,680 | |
|
| |
|
Holding Companies - Diversified – 0.2% | |
KOC Holding A.S. (Turkey) | | | 365,553 | | | | 802,113 | |
Siam Cement (The) PCL (Thailand)(a) | | | 55,500 | | | | 591,527 | |
| | | | | | | 1,393,640 | |
|
| |
| | |
Home Furnishings – 0.2% | | | | | | | | |
Coway Co. Ltd. (South Korea) | | | 15,336 | | | | 777,256 | |
Gree Electric Appliances, Inc. of Zhuhai, Class A (China) | | | 65,000 | | | | 495,472 | |
Midea Group Co. Ltd., Class A (China) | | | 36,800 | | | | 274,751 | |
| | | | | | | 1,547,479 | |
|
| |
| |
Household Products/Wares – 0.3% | | | | | |
Henkel A.G. & Co. KGaA (Germany) | | | 8,300 | | | | 647,013 | |
Kimberly-Clark de Mexico S.A.B. de C.V., Series A (Mexico) | | | 429,100 | | | | 606,235 | |
Reckitt Benckiser Group PLC (United Kingdom) | | | 9,040 | | | | 753,030 | |
| | | | | | | 2,006,278 | |
|
| |
| | |
Insurance – 4.6% | | | | | | | | |
AIA Group Ltd. (Hong Kong) | | | 877,600 | | | | 8,054,410 | |
Allianz S.E. (Germany)(a) | | | 63,238 | | | | 11,637,779 | |
AMP Ltd. (Australia)* | | | 2,971,700 | | | | 2,741,865 | |
BB Seguridade Participacoes S.A. (Brazil) | | | 202,200 | | | | 986,106 | |
See accompanying Notes to Financial Statements
66
Morningstar Funds Trust April 30, 2020
Schedule of Investments (continued)
Morningstar International Equity Fund
| | | | | | | | |
| | | Number | | | | |
| | | of Shares | | | Value | |
|
| |
|
Insurance (Continued) | |
IRB Brasil Resseguros S/A (Brazil) | | | 301,700 | | | $ | 572,564 | |
Ping An Insurance Group Co. of China Ltd., Class H (China) | | | 564,500 | | | | 5,744,500 | |
Porto Seguro S.A. (Brazil) | | | 19,300 | | | | 162,090 | |
Prudential PLC (United Kingdom) | | | 286,800 | | | | 4,046,008 | |
Sanlam Ltd. (South Africa) | | | 276,273 | | | | 883,221 | |
| | | | | | | 34,828,543 | |
|
| |
| | |
Internet – 5.1% | | | | | | | | |
58.com, Inc. ADR (China)* | | | 3,576 | | | | 185,773 | |
Alibaba Group Holding Ltd. ADR (China)* | | | 33,327 | | | | 6,754,383 | |
Baidu, Inc. ADR (China)* | | | 58,464 | | | | 5,900,772 | |
MercadoLibre, Inc. (Argentina)* | | | 1,174 | | | | 685,041 | |
Naspers Ltd., Class N (South Africa) | | | 36,785 | | | | 5,725,531 | |
NAVER Corp. (South Korea) | | | 35,355 | | | | 5,732,126 | |
Prosus N.V. (China)* | | | 3,280 | | | | 248,660 | |
Tencent Holdings Ltd. (China) | | | 154,700 | | | | 8,132,492 | |
Tencent Music Entertainment Group ADR (China)* | | | 13,946 | | | | 159,124 | |
Trip.com Group Ltd. ADR (China)* | | | 99,837 | | | | 2,571,801 | |
Yandex N.V., Class A (Russia)* | | | 68,525 | | | | 2,588,875 | |
| | | | | | | 38,684,578 | |
|
| |
|
Investment Management Companies – 0.7% | |
EXOR N.V. (Netherlands) | | | 102,800 | | | | 5,606,149 | |
|
| |
| | |
Iron/Steel – 0.4% | | | | | | | | |
Ternium S.A. ADR (Netherlands) | | | 38,032 | | | | 516,855 | |
thyssenkrupp A.G. (Germany)* | | | 388,100 | | | | 2,581,723 | |
| | | | | | | 3,098,578 | |
|
| |
| | |
Leisure Time – 0.2% | | | | | | | | |
Bajaj Auto Ltd. (India) | | | 20,824 | | | | 724,157 | |
Hero MotoCorp Ltd. (India) | | | 31,352 | | | | 894,266 | |
| | | | | | | 1,618,423 | |
|
| |
| | |
Lodging – 0.7% | | | | | | | | |
Accor S.A. (France) | | | 185,935 | | | | 5,172,418 | |
|
| |
| | | | | | | | |
| | | Number | | | | |
| | | of Shares | | | Value | |
|
| |
|
Machinery - Construction & Mining – 1.2% | |
Epiroc AB, Class A (Sweden) | | | 181,987 | | | $ | 1,821,259 | |
Komatsu Ltd. (Japan) | | | 378,800 | | | | 7,167,249 | |
| | | | | | | 8,988,508 | |
|
| |
|
Machinery - Diversified – 2.8% | |
Atlas Copco AB, Class A (Sweden) | | | 158,519 | | | | 5,463,274 | |
CNH Industrial N.V. (United Kingdom)* | | | 1,181,473 | | | | 7,390,349 | |
FANUC Corp. (Japan) | | | 10,700 | | | | 1,746,383 | |
Keyence Corp. (Japan) | | | 11,200 | | | | 3,998,536 | |
Kubota Corp. (Japan) | | | 206,700 | | | | 2,566,945 | |
| | | | | | | 21,165,487 | |
|
| |
| | |
Media – 0.8% | | | | | | | | |
Grupo Televisa S.A.B. ADR (Mexico) | | | 355,700 | | | | 1,902,995 | |
Liberty Global PLC, Class A (United Kingdom)* | | | 128,900 | | | | 2,503,238 | |
Liberty Global PLC, Class C (United Kingdom)* | | | 113,600 | | | | 2,080,016 | |
| | | | | | | 6,486,249 | |
|
| |
|
Metal Fabricate/Hardware – 0.7% | |
Catcher Technology Co. Ltd. (Taiwan) | | | 90,000 | | | | 681,705 | |
SKF AB, Class B (Sweden) | | | 280,600 | | | | 4,428,885 | |
Tenaris S.A. ADR (Netherlands) | | | 23,250 | | | | 318,060 | |
| | | | | | | 5,428,650 | |
|
| |
| | |
Mining – 2.3% | | | | | | | | |
Alrosa PJSC (Russia) | | | 280,422 | | | | 232,259 | |
Alrosa PJSC (Moscow Exchange) (Russia) | | | 871,769 | | | | 733,265 | |
Anglo American PLC (South Africa) | | | 35,640 | | | | 633,860 | |
Glencore PLC (Switzerland)* | | | 5,794,789 | | | | 10,856,195 | |
Grupo Mexico S.A.B. de C.V., Series B (Mexico) | | | 511,600 | | | | 1,087,901 | |
Rio Tinto PLC (Australia) | | | 73,212 | | | | 3,398,403 | |
Southern Copper Corp. (Peru) | | | 11,400 | | | | 369,816 | |
| | | | | | | 17,311,699 | |
|
| |
|
Miscellaneous Manufacturing – 1.3% | |
Alfa Laval AB (Sweden)* | | | 118,453 | | | | 2,213,525 | |
CRRC Corp. Ltd., Class H (China) | | | 619,000 | | | | 327,673 | |
Largan Precision Co. Ltd. (Taiwan) | | | 11,000 | | | | 1,499,449 | |
Orica Ltd. (Australia) | | | 311,920 | | | | 3,614,747 | |
See accompanying Notes to Financial Statements
67
Morningstar Funds Trust April 30, 2020
Schedule of Investments (continued)
Morningstar International Equity Fund
| | | | | | | | |
| | | Number | | | | |
| | | of Shares | | | Value | |
|
| |
|
Miscellaneous Manufacturing (Continued) | |
Smiths Group PLC (United Kingdom) | | | 122,500 | | | $ | 1,907,378 | |
Sunny Optical Technology Group Co. Ltd. (China) | | | 19,700 | | | | 274,333 | |
| | | | | | | 9,837,105 | |
|
| |
| | |
Oil & Gas – 1.8% | | | | | | | | |
Bharat Petroleum Corp. Ltd. (India) | | | 136,134 | | | | 666,011 | |
Cenovus Energy, Inc. (Canada) | | | 820,500 | | | | 2,976,777 | |
CNOOC Ltd. (China) | | | 1,431,217 | | | | 1,582,386 | |
Galp Energia SGPS S.A. (Portugal) | | | 52,753 | | | | 608,829 | |
LUKOIL PJSC ADR (Russia) | | | 18,281 | | | | 1,192,611 | |
LUKOIL PJSC ADR (OTC Exchange) (Russia) | | | 38,121 | | | | 2,461,473 | |
Oil & Natural Gas Corp. Ltd. (India) | | | 593,879 | | | | 628,449 | |
Pakistan Petroleum Ltd. (Pakistan) | | | 287,800 | | | | 163,852 | |
Royal Dutch Shell PLC, Class B (Netherlands) | | | 168,960 | | | | 2,704,822 | |
Tupras Turkiye Petrol Rafinerileri A.S. (Turkey)* | | | 71,344 | | | | 926,480 | |
| | | | | | | 13,911,690 | |
|
| |
| | |
Pharmaceuticals – 2.7% | | | | | | | | |
Bayer A.G. (Germany)(a) | | | 89,760 | | | | 5,903,461 | |
Chugai Pharmaceutical Co. Ltd. (Japan) | | | 35,600 | | | | 4,243,581 | |
CSPC Pharmaceutical Group Ltd. (China) | | | 162,000 | | | | 320,714 | |
Roche Holding A.G. (Genusschein) (Switzerland) | | | 20,660 | | | | 7,154,504 | |
Shionogi & Co. Ltd. (Japan) | | | 36,400 | | | | 2,010,282 | |
Sino Biopharmaceutical Ltd. (Hong Kong) | | | 96,000 | | | | 139,929 | |
Sinopharm Group Co. Ltd., Class H (China) | | | 407,123 | | | | 1,097,751 | |
| | | | | | | 20,870,222 | |
|
| |
| | |
Retail – 2.7% | | | | | | | | |
Alimentation Couche-Tard, Inc., Class B (Canada) | | | 73,873 | | | | 2,061,301 | |
Astra International Tbk PT (Indonesia) | | | 3,653,200 | | | | 934,366 | |
Bidvest Group (The) Ltd. (South Africa) | | | 62,466 | | | | 507,282 | |
Cie Financiere Richemont S.A. (Switzerland)(a) | | | 58,180 | | | | 3,300,753 | |
| | | | | | | | |
| | | Number | | | | |
| | | of Shares | | | Value | |
|
| |
| | |
Retail (Continued) | | | | | | | | |
Clicks Group Ltd. (South Africa) | | | 20,358 | | | $ | 253,394 | |
CP ALL PCL (Thailand)(a) | | | 529,200 | | | | 1,152,024 | |
Hennes & Mauritz AB, Class B (Sweden) | | | 342,400 | | | | 4,680,470 | |
Lojas Renner S.A. (Brazil) | | | 66,193 | | | | 468,521 | |
Nitori Holdings Co. Ltd. (Japan) | | | 13,300 | | | | 2,038,567 | |
President Chain Store Corp. (Taiwan) | | | 58,000 | | | | 599,762 | |
Raia Drogasil S.A. (Brazil) | | | 37,208 | | | | 720,978 | |
SM Investments Corp. (Philippines) | | | 47,280 | | | | 788,045 | |
Swatch Group (The) A.G. (Bearer) (Switzerland) | | | 12,750 | | | | 2,558,437 | |
Wal-Mart de Mexico S.A.B. de C.V. (Mexico) | | | 223,301 | | | | 538,958 | |
Yifeng Pharmacy Chain Co. Ltd., Class A (China) | | | 19,120 | | | | 254,515 | |
| | | | | | | 20,857,373 | |
|
| |
| | |
Semiconductors – 4.6% | | | | | | | | |
ASM Pacific Technology Ltd. (Hong Kong) | | | 104,100 | | | | 1,051,900 | |
Infineon Technologies A.G. (Germany) | | | 274,447 | | | | 5,102,226 | |
Novatek Microelectronics Corp. (Taiwan) | | | 112,000 | | | | 696,524 | |
Samsung Electronics Co. Ltd. (South Korea) | | | 183,951 | | | | 7,563,617 | |
Samsung Electronics Co. Ltd. GDR (South Korea)(a) | | | 2,755 | | | | 2,862,808 | |
SK Hynix, Inc. (South Korea) | | | 57,083 | | | | 3,928,313 | |
Taiwan Semiconductor Manufacturing Co. Ltd. (Taiwan) | | | 571,945 | | | | 5,769,667 | |
Taiwan Semiconductor Manufacturing Co. Ltd. ADR (Taiwan) | | | 151,952 | | | | 8,073,210 | |
Vanguard International Semiconductor Corp. (Taiwan) | | | 60,000 | | | | 139,201 | |
| | | | | | | 35,187,466 | |
|
| |
| | |
Software – 1.8% | | | | | | | | |
Dassault Systemes S.E. (France) | | | 19,967 | | | | 2,924,576 | |
HCL Technologies Ltd. (India) | | | 193,411 | | | | 1,387,124 | |
Mail.Ru Group Ltd. GDR (Russia)(a)* | | | 14,861 | | | | 267,755 | |
NetEase, Inc. ADR (China) | | | 3,499 | | | | 1,207,015 | |
See accompanying Notes to Financial Statements
68
Morningstar Funds Trust April 30, 2020
Schedule of Investments (continued)
Morningstar International Equity Fund
| | | | | | | | |
| | | Number | | | | |
| | | of Shares | | | Value | |
|
| |
|
Software (Continued) | |
Open Text Corp. (Canada) | | | 62,600 | | | $ | 2,365,573 | |
SAP S.E. ADR (Germany) | | | 48,403 | | | | 5,737,692 | |
| | | | | | | 13,889,735 | |
|
| |
|
Telecommunications – 1.5% | |
America Movil S.A.B. de C.V., Series L ADR (Mexico) | | | 148,468 | | | | 1,787,555 | |
Bharti Infratel Ltd. (India) | | | 277,539 | | | | 642,120 | |
China Mobile Ltd. ADR (China) | | | 143,716 | | | | 5,744,328 | |
Mobile TeleSystems PJSC ADR (Russia) | | | 136,583 | | | | 1,170,516 | |
Telekomunikasi Indonesia Persero Tbk PT ADR (Indonesia) | | | 57,714 | | | | 1,251,817 | |
Vodacom Group Ltd. (South Africa) | | | 124,440 | | | | 827,250 | |
| | | | | | | 11,423,586 | |
|
| |
|
Transportation – 0.4% | |
Canadian National Railway Co. (Canada) | | | 24,001 | | | | 1,988,963 | |
Kuehne + Nagel International A.G. (Switzerland)(a) | | | 6,060 | | | | 866,836 | |
| | | | | | | 2,855,799 | |
|
| |
Total Common Stocks
(Cost $600,020,710) | | | | | | | 545,688,356 | |
|
| |
|
Preferred Stocks – 1.4% | |
| | |
Banks – 0.6% | | | | | | | | |
Banco Bradesco S.A., 10.23% (Brazil)(d) | | | 155,752 | | | | 550,212 | |
Grupo Aval Acciones y Valores S.A., 7.25% (Colombia)(d) | | | 24,419 | | | | 102,560 | |
Itau Unibanco Holding S.A., 0.82% (Brazil)(d) | | | 289,756 | | | | 1,221,814 | |
Itau Unibanco Holding S.A. ADR, 0.88% (Brazil)(d) | | | 570,992 | | | | 2,403,876 | |
| | | | | | | 4,278,462 | |
|
| |
| | |
Chemicals – 0.1% | | | | | | | | |
FUCHS PETROLUB S.E., 2.81% (Germany)(d) | | | 24,764 | | | | 960,238 | |
|
| |
| | | | | | | | |
| | | Number | | | | |
| | | of Shares | | | Value | |
|
| |
| |
Household Products/Wares – 0.2% | | | | | |
Henkel A.G. & Co. KGaA, 2.34% (Germany)(d) | | | 18,800 | | | $ | 1,669,188 | |
|
| |
| | |
Semiconductors – 0.5% | | | | | | | | |
Samsung Electronics Co. Ltd., 3.44% (South Korea)(d) | | | 13,868 | | | | 480,743 | |
Samsung Electronics Co. Ltd. GDR, 3.43% (South Korea)(a)(d) | | | 3,409 | | | | 3,000,449 | |
| | | | | | | 3,481,192 | |
|
| |
Total Preferred Stocks
(Cost $12,460,050) | | | | | | | 10,389,080 | |
|
| |
| |
Investment Companies – 23.8% | | | | | |
iShares Global Energy ETF | | | 1,146,908 | | | | 22,525,273 | |
iShares MSCI South Korea ETF | | | 140,406 | | | | 7,247,758 | |
iShares MSCI United Kingdom ETF | | | 2,224,879 | | | | 56,178,195 | |
JPMorgan BetaBuilders Japan ETF | | | 3,578,966 | | | | 76,554,083 | |
Xtrackers MSCI Europe Hedged Equity ETF | | | 760,172 | | | | 19,536,420 | |
|
| |
Total Investment Companies
(Cost $203,802,350) | | | | | | | 182,041,729 | |
|
| |
|
Short-Term Investments – 2.9% | |
| | |
Money Market Fund – 2.9% | | | | | | | | |
Northern Institutional Funds - Treasury Portfolio (Premier), 0.22%(e) | | | 22,470,929 | | | | 22,470,929 | |
|
| |
| | |
Total Short-Term Investments
(Cost $22,470,929) | | | | | | | 22,470,929 | |
|
| |
| | |
Total Investments – 99.5%
(Cost $838,754,039) | | | | | | | 760,590,094 | |
|
| |
| | |
Other Assets less Liabilities – 0.5%(f) | | | | | | | 3,809,111 | |
|
| |
| | |
NET ASSETS – 100.0% | | | | | | $ | 764,399,205 | |
|
| |
Percentages shown are based on Net Assets.
All securities are United States companies, unless noted otherwise in parentheses.
| (a) | Security sold outside United States without registration under the Securities Act of 1933. |
| (b) | Securities exempt from registration under Rule 144A of the Securities Act of 1933. These securities may be resold in transactions exempt from registration, normally to qualified institutional buyers. The value of these securities is determined by valuations supplied by a pricing service or brokers, or, if not available, in accordance with procedures established by the Board of Trustees of Morningstar Funds Trust. |
| (c) | Amount rounds to less than 0.05%. |
See accompanying Notes to Financial Statements
69
Morningstar Funds Trust April 30, 2020
Schedule of Investments (continued)
Morningstar International Equity Fund
| (d) | Current yield is disclosed. Dividends are calculated based on a percentage of the issuer’s net income. |
| (e) | 7-day current yield as of April 30, 2020 is disclosed. |
| (f) | Includes appreciation/ (depreciation) on forward foreign currency exchange contracts. |
| * | Non-Income Producing Security |
| | |
Abbreviations: | | |
ADR | | American Depositary Receipt |
ETF | | Exchange-Traded Fund |
GDR | | Global Depositary Receipt |
MSCI | | Morgan Stanley Capital International |
PCL | | Public Company Limited |
PJSC | | Public Joint Stock Company |
PLC | | Public Limited Company |
| | |
Concentration by Currency (%) | | |
U.S. Dollar | | 36.7 |
Euro | | 18.6 |
British Pound | | 9.0 |
Hong Kong Dollar | | 5.6 |
All other currencies less than 5% | | 30.1 |
Total | | 100.0 |
Forward Foreign Currency Contracts outstanding at April 30, 2020:
| | | | | | | | | | | | | | | | | | |
Expiration Date | | Currency Purchased | | Amount of Currency Purchased | | | Currency Sold | | Amount of Currency Sold | | | Counterparty | | Unrealized Appreciation (Depreciation) | |
| |
| | | | | | |
| 06/17/20 | | Swiss Francs | | | 54,000 | | | U.S. Dollars | | | 55,498 | | | Northern Trust | | | $ 524 | |
| | | | | | |
| 06/17/20 | | U.S. Dollars | | | 1,610,813 | | | Swiss Francs | | | 1,566,000 | | | Northern Trust | | | (13,837 | ) |
| |
Net Unrealized Depreciation | | | | | | | | | | | | | | | $(13,313 | ) |
| |
See accompanying Notes to Financial Statements
70
Morningstar Funds Trust April 30, 2020
Schedule of Investments (continued)
Morningstar International Equity Fund
Valuation Hierarchy
The following is a summary of the inputs used, as of April 30, 2020, in valuing the Fund’s investments carried at fair value:
| | | | | | | | | | | | | | | | |
| |
| Morningstar International Equity Fund | | Level 1 | | | Level 2 | | | Level 3 | | | Totals | |
| |
| | | | |
Investments | | | | | | | | | | | | | | | | |
| | | | |
Assets: | | | | | | | | | | | | | | | | |
Common Stocks | | | $100,641,812 | | | | $445,046,544 | | | | $— | | | | $545,688,356 | |
Preferred Stocks | | | 4,278,462 | | | | 6,110,618 | | | | — | | | | 10,389,080 | |
Investment Companies | | | 182,041,729 | | | | — | | | | — | | | | 182,041,729 | |
Short-Term Investments | | | 22,470,929 | | | | — | | | | — | | | | 22,470,929 | |
| |
| | | | |
Total Investments | | | $309,432,932 | | | | $451,157,162 | | | | $— | | | | $760,590,094 | |
| |
| | | | | | | | | | | | | | | | |
| |
| | | | |
| Morningstar International Equity Fund | | Level 1 | | | Level 2 | | | Level 3 | | | Totals | |
| |
| | | | |
Derivative Financial Instruments | | | | | | | | | | | | | | | | |
| | | | |
Assets: | | | | | | | | | | | | | | | | |
Forward foreign currency exchange contracts | | | $— | | | | $ 524 | | | | $— | | | | $ 524 | |
| |
| | | | |
Total Assets - Derivative Financial Instruments | | | $— | | | | $ 524 | | | | $— | | | | $ 524 | |
| |
| | | | |
Liabilities: | | | | | | | | | | | | | | | | |
Forward foreign currency exchange contracts | | | $— | | | | $(13,837 | ) | | | $— | | | | $(13,837 | ) |
| |
| | | | |
Total Liabilities - Derivative Financial Instruments | | | $— | | | | $(13,837 | ) | | | $— | | | | $(13,837 | ) |
| |
| | | | |
Total Net Derivative Financial Instruments | | | $— | | | | $(13,313 | ) | | | $— | | | | $(13,313 | ) |
| |
See accompanying Notes to Financial Statements
71
Morningstar Funds Trust April 30, 2020
Schedule of Investments
|
Morningstar Global Income Fund |
| | | | | | | | |
| | | Number of Shares | | | Value | |
|
Common Stocks – 45.9% | |
| | |
Agriculture – 2.7% | | | | | | | | |
British American Tobacco PLC ADR (United Kingdom) | | | 94,000 | | | $ | 3,586,100 | |
Imperial Brands PLC (United Kingdom) | | | 131,475 | | | | 2,766,034 | |
| | | | | | | | 6,352,134 | |
|
Auto Manufacturers – 1.1% | |
Toyota Motor Corp. ADR (Japan) | | | 21,745 | | | | 2,687,465 | |
|
Auto Parts & Equipment – 0.5% | |
Cie Generale des Etablissements Michelin S.C.A. (France) | | | 13,385 | | | | 1,293,274 | |
| | |
Banks – 2.6% | | | | | | | | |
BNP Paribas S.A. (France) | | | 27,680 | | | | 869,604 | |
JPMorgan Chase & Co. | | | 32,722 | | | | 3,133,459 | |
United Overseas Bank Ltd. (Singapore) | | | 155,645 | | | | 2,224,030 | |
| | | | | | | | 6,227,093 | |
| | |
Building Materials – 2.1% | | | | | | | | |
Johnson Controls International PLC | | | 70,275 | | | | 2,045,705 | |
Xinyi Glass Holdings Ltd. (Hong Kong) | | | 2,429,765 | | | | 2,814,049 | |
| | | | | | | | 4,859,754 | |
|
Cosmetics/Personal Care – 1.5% | |
Unilever N.V. (United Kingdom)(a) | | | 69,340 | | | | 3,426,783 | |
| | |
Electric – 6.6% | | | | | | | | |
Duke Energy Corp. | | | 45,057 | | | | 3,814,526 | |
Enel S.p.A. (Italy) | | | 428,000 | | | | 2,923,433 | |
Iberdrola S.A. (Spain) | | | 440,315 | | | | 4,380,160 | |
NextEra Energy, Inc. | | | 18,700 | | | | 4,321,944 | |
| | | | | | | | 15,440,063 | |
|
Forest Products & Paper – 2.0% | |
Smurfit Kappa Group PLC (Ireland) | | | 83,090 | | | | 2,602,899 | |
Smurfit Kappa Group PLC (Euronext Dublin Exchange) (Ireland) | | | 9,300 | | | | 299,939 | |
UPM-Kymmene OYJ (Finland) | | | 65,665 | | | | 1,800,875 | |
| | | | | | | | 4,703,713 | |
|
Healthcare - Services – 1.6% | |
Sonic Healthcare Ltd. (Australia) | | | 219,300 | | | | 3,872,892 | |
| | | | | | | | |
| | | Number of Shares | | | Value | |
| | |
Insurance – 3.0% | | | | | | | | |
Allianz S.E. (Germany)(a) | | | 14,292 | | | $ | 2,630,177 | |
NN Group N.V. (Netherlands) | | | 21,955 | | | | 635,105 | |
Zurich Insurance Group A.G. (Switzerland) | | | 11,795 | | | | 3,739,656 | |
| | | | | | | | 7,004,938 | |
|
Mining – 0.7% | |
MMC Norilsk Nickel PJSC ADR (Russia) | | | 61,000 | | | | 1,667,740 | |
| | |
Oil & Gas – 0.7% | | | | | | | | |
LUKOIL PJSC ADR (Russia) | | | 24,740 | | | | 1,597,462 | |
|
Pharmaceuticals – 5.7% | |
GlaxoSmithKline PLC (United Kingdom) | | | 212,770 | | | | 4,438,935 | |
Novartis A.G. ADR (Switzerland) | | | 54,201 | | | | 4,592,451 | |
Sanofi ADR (France) | | | 92,170 | | | | 4,316,321 | |
| | | | | | | | 13,347,707 | |
|
Real Estate Investment Trusts – 4.9% | |
Ascendas Real Estate Investment Trust (Singapore) | | | 2,271,650 | | | | 4,750,659 | |
Embassy Office Parks REIT (India) | | | 586,800 | | | | 2,880,168 | |
Healthpeak Properties, Inc. | | | 46,350 | | | | 1,211,589 | |
PLA Administradora Industrial S. de R.L. de C.V. (Mexico) | | | 2,529,160 | | | | 2,620,353 | |
| | | | | | | | 11,462,769 | |
|
Semiconductors – 2.9% | |
Intel Corp. | | | 53,010 | | | | 3,179,540 | |
Taiwan Semiconductor Manufacturing Co. Ltd. (Taiwan) | | | 352,055 | | | | 3,551,460 | |
| | | | | | | | 6,731,000 | |
|
Telecommunications – 6.5% | |
AT&T, Inc. | | | 125,430 | | | | 3,821,852 | |
BCE, Inc. (Canada) | | | 101,745 | | | | 4,114,568 | |
Cisco Systems, Inc. | | | 82,210 | | | | 3,484,060 | |
Softbank Corp. (Japan) | | | 290,395 | | | | 3,954,592 | |
| | | | | | | | 15,375,072 | |
|
Transportation – 0.8% | |
Globaltrans Investment PLC GDR (Russia)(a) | | | 334,640 | | | | 1,894,554 | |
Total Common Stocks
(Cost $110,639,990) | | | | | | | 107,944,413 | |
See accompanying Notes to Financial Statements
72
Morningstar Funds Trust April 30, 2020
Schedule of Investments (continued)
Morningstar Global Income Fund
| | | | | | | | |
| | | Number of Shares | | | Value | |
|
Investment Companies – 50.4% | |
Global X MLP & Energy Infrastructure ETF | | | 707,720 | | | $ | 17,374,518 | |
Global X U.S. Preferred ETF | | | 315,493 | | | | 7,464,564 | |
iShares Broad USD High Yield Corporate Bond ETF | | | 374,010 | | | | 13,849,590 | |
iShares MSCI United Kingdom ETF | | | 883,591 | | | | 22,310,673 | |
iShares STOXX Europe 600 Telecommunications UCITS ETF DE (Germany) | | | 1,060,555 | | | | 21,219,617 | |
SPDR Bloomberg Barclays Convertible Securities ETF | | | 248,113 | | | | 13,207,055 | |
Vanguard Intermediate-Term Corporate Bond ETF | | | 25,650 | | | | 2,343,127 | |
Vanguard Long-Term Corporate Bond ETF | | | 22,580 | | | | 2,307,676 | |
Vanguard Long-Term Treasury ETF | | | 145,839 | | | | 14,849,327 | |
| | | | | | | | |
| | | Number of Shares | | | Value | |
| | |
Vanguard Mortgage-Backed Securities ETF | | | 64,534 | | | $ | 3,526,138 | |
Total Investment Companies
(Cost $127,379,154) | | | | | | | 118,452,285 | |
|
Short-Term Investments – 4.4% | |
Money Market Fund – 4.4% | |
Northern Institutional Funds - Treasury Portfolio (Premier),
0.22%(b) | | | 10,372,616 | | | | 10,372,616 | |
Total Short-Term Investments
(Cost $10,372,616) | | | | | | | 10,372,616 | |
Total Investments – 100.7%
(Cost $248,391,760) | | | | | | | 236,769,314 | |
| |
Liabilities less Other Assets – (0.7)% | | | | (1,709,135 | ) |
| | |
NET ASSETS – 100.0% | | | | | | | $235,060,179 | |
Percentages shown are based on Net Assets.
All securities are United States companies, unless noted otherwise in parentheses.
| (a) | Security sold outside United States without registration under the Securities Act of 1933. |
| (b) | 7-day current yield as of April 30, 2020 is disclosed. |
| | |
| Abbreviations: |
| ADR | | American Depositary Receipt |
| ETF | | Exchange-Traded Fund |
| GDR | | Global Depositary Receipt |
| MLP | | Master Limited Partnership |
| MSCI | | Morgan Stanley Capital International |
| PJSC | | Public Joint Stock Company |
| PLC | | Public Limited Company |
| REIT | | Real Estate Investment Trust |
| SPDR | | Standard & Poor’s Depositary Receipt |
| UCITS | | Undertakings for Collective Investment in Transferable Securities |
| USD | | United States Dollar |
| | | | |
Concentration by Currency (%) | | | | |
U.S. Dollar | | | 63.9 | |
Euro | | | 16.4 | |
All other currencies less than 5% | | | 19.7 | |
Total | | | 100.0 | |
| | | | |
Country Diversification (%) | | | | |
United States | | | 52.0 | |
Germany | | | 10.1 | |
United Kingdom | | | 6.1 | |
All other countries less than 5% | | | 31.8 | |
Total | | | 100.0 | |
See accompanying Notes to Financial Statements
73
Morningstar Funds Trust April 30, 2020
Schedule of Investments (continued)
Morningstar Global Income Fund
Valuation Hierarchy
The following is a summary of the inputs used, as of April 30, 2020, in valuing the Fund’s investments carried at fair value:
| | | | | | | | | | | | | | | | |
| Morningstar Global Income Fund | | Level 1 | | | Level 2 | | | Level 3 | | | Totals | |
Investments | | | | | | | | | | | | | | | | |
Common Stocks | | $ | 53,621,918 | | | $ | 54,322,495 | | | | $— | | | $ | 107,944,413 | |
Investment Companies | | | 118,452,285 | | | | — | | | | — | | | | 118,452,285 | |
Short-Term Investments | | | 10,372,616 | | | | — | | | | — | | | | 10,372,616 | |
Total Investments | | $ | 182,446,819 | | | $ | 54,322,495 | | | | $— | | | $ | 236,769,314 | |
See accompanying Notes to Financial Statements
74
Morningstar Funds Trust April 30, 2020
Schedule of Investments
|
Morningstar Total Return Bond Fund |
| | | | | | | | |
| | | Par(a) | | | Value | |
|
Long Positions – 111.9% | |
| |
Asset-Backed Securities – 10.3% | | | | | |
| | |
Automobile – 0.2% | | | | | | | | |
Avis Budget Rental Car Funding AESOP LLC, Series 2019-2A, Class A, 3.35%, 9/22/25(b) | | $ | 740,000 | | | $ | 685,225 | |
Hertz Vehicle Financing II L.P., Series 2018-1A, Class A,
3.29%, 2/25/24(b) | | | 350,000 | | | | 326,461 | |
| | | | | | | | 1,011,686 | |
|
Commercial Mortgage-Backed Securities – 3.3% | |
245 Park Avenue Trust, Series 2017-245P, Class E,
3.78%, 6/05/37(b)(c) | | | 880,000 | | | | 806,492 | |
AOA Mortgage Trust, Series 2015-1177, Class C,
3.11%, 12/13/29(b)(c) | | | 113,000 | | | | 112,702 | |
BANK, | | | | | | | | |
Series 2017-BNK7, Class A5, 3.44%, 9/15/60 | | | 100,000 | | | | 108,308 | |
Series 2018-BN13, Class A5, 4.22%, 8/15/61 | | | 480,000 | | | | 547,485 | |
Bayview Commercial Asset Trust, Series 2006-1A, Class A1, (1M USD LIBOR + 0.27%),
0.76%, 4/25/36(b)(d) | | | 437,698 | | | | 368,402 | |
Bear Stearns Commercial Mortgage Securities Trust, Series 2007-T26, Class AM, 5.51%, 1/12/45(c) | | | 93,366 | | | | 86,137 | |
Benchmark Mortgage Trust, | | | | | | | | |
Series 2020-IG1, Class AS, 2.91%, 9/15/43 | | | 720,000 | | | | 701,624 | |
Series 2018-B2, Class A5, 3.88%, 2/15/51 | | | 390,000 | | | | 436,166 | |
Series 2019-B9, Class XA, 1.21%, 3/15/52(c) | | | 2,890,472 | | | | 204,793 | |
Series 2019-B10, Class A4, 3.72%, 3/15/62 | | | 500,000 | | | | 558,784 | |
BHMS, Series 2018-ATLS, Class A, (1M USD LIBOR + 1.25%, 1.25% Floor), 2.06%, 7/15/35(b)(d) | | | 1,190,000 | | | | 1,104,839 | |
| | | | | | | | |
| | | Par(a) | | | Value | |
| |
Commercial Mortgage-Backed Securities (Continued) | | | | | |
BXP Trust, Series 2017-GM, Class D, 3.54%, 6/13/39(b)(c) | | $ | 370,000 | | | $ | 361,290 | |
CAMB Commercial Mortgage Trust, | | | | | | | | |
Series 2019-LIFE, Class A, (1M USD LIBOR + 1.07%, 1.07% Floor), 1.88%, 12/15/37(b)(d) | | | 590,000 | | | | 568,054 | |
Series 2019-LIFE, Class D, (1M USD LIBOR + 1.75%, 1.75% Floor), 2.57%, 12/15/37(b)(d) | | | 100,000 | | | | 95,254 | |
CFK Trust, Series 2019-FAX, Class D, 4.64%, 1/15/39(b)(c) | | | 100,000 | | | | 94,170 | |
Citigroup Commercial Mortgage Trust, | | | | | | | | |
Series 2019-SMRT, Class D, 4.90%, 1/10/36(b)(c) | | | 500,000 | | | | 444,212 | |
Series 2019-SMRT, Class E, 4.90%, 1/10/36(b)(c) | | | 500,000 | | | | 434,985 | |
Series 2019-SST2, Class A, (1M USD LIBOR + 0.92%, 0.92% Floor), 1.73%, 12/15/36(b)(d) | | | 300,000 | | | | 289,062 | |
Series 2016-P3, Class D, 2.81%, 4/15/49(b) | | | 62,515 | | | | 37,797 | |
Series 2016-C1, Class D, 5.12%, 5/10/49(b)(c) | | | 250,000 | | | | 182,219 | |
Series 2017-C4, Class A4, 3.47%, 10/12/50 | | | 420,000 | | | | 450,877 | |
CSAIL Commercial Mortgage Trust, Series 2019-C15, Class C,
5.15%, 3/15/52(c) | | | 142,018 | | | | 116,555 | |
CSMC OA LLC, Series 2014-USA, Class B, 4.19%, 9/15/37(b) | | | 530,000 | | | | 494,512 | |
DBGS Mortgage Trust, Series 2019-1735, Class X, 0.43%, 4/10/37(b)(c) | | | 13,945,000 | | | | 339,610 | |
Exantas Capital Corp. Ltd., Series 2019-RSO7, Class AS, (1M USD LIBOR + 1.50%, 1.50% Floor), 2.25%, 4/15/36(b)(d) | | | 500,000 | | | | 456,342 | |
GRACE Mortgage Trust, Series 2014-GRCE, Class F, 3.71%, 6/10/28(b)(c) | | | 100,000 | | | | 99,171 | |
See accompanying Notes to Financial Statements
75
Morningstar Funds Trust April 30, 2020
Schedule of Investments (continued)
Morningstar Total Return Bond Fund
| | | | | | | | |
| | | Par(a) | | | Value | |
| |
Commercial Mortgage-Backed Securities (Continued) | | | | | |
GS Mortgage Securities Corp. Trust, | | | | | | | | |
Series 2017-500K, Class E, (1M USD LIBOR + 1.50%, 1.75% Floor), 2.31%, 7/15/32(b)(d) | | $ | 110,000 | | | $ | 104,829 | |
Series 2020-DUNE, Class A, (1M USD LIBOR + 1.10%, 1.10% Floor), 1.91%, 12/15/36(b)(d) | | | 960,000 | | | | 784,405 | |
Series 2019-BOCA, Class A, (1M USD LIBOR + 1.20%, 1.20% Floor), 2.01%, 6/15/38(b)(d) | | | 100,000 | | | | 92,229 | |
Series 2019-BOCA, Class B, (1M USD LIBOR + 1.50%, 1.50% Floor), 2.31%, 6/15/38(b)(d) | | | 620,000 | | | | 536,082 | |
Series 2019-BOCA, Class C, (1M USD LIBOR + 1.73%, 1.73% Floor), 2.54%, 6/15/38(b)(d) | | | 530,000 | | | | 442,329 | |
GS Mortgage Securities Trust, | | | | | | | | |
Series 2017-GS7, Class A4, 3.43%, 8/10/50 | | | 220,000 | | | | 238,436 | |
Series 2017-GS7, Class E,
3.00%, 8/10/50(b) | | | 70,000 | | | | 42,120 | |
Series 2017-GS8, Class A4, 3.47%, 11/10/50 | | | 240,000 | | | | 259,440 | |
JPMorgan Chase Commercial Mortgage Securities Trust, | | | | | | | | |
Series 2020-MKST, Class D, (1M USD LIBOR + 1.50%, 1.50% Floor), 2.31%, 12/15/36(b)(d) | | | 710,000 | | | | 664,100 | |
Series 2017-JP6, Class A5, 3.49%, 7/15/50 | | | 235,000 | | | | 254,155 | |
LSTAR Commercial Mortgage Trust, Series 2015-3, Class AS, 3.28%, 4/20/48(b)(c) | | | 500,000 | | | | 498,584 | |
Morgan Stanley Bank of America Merrill Lynch Trust, Series 2015-C25, Class A5, 3.64%, 10/15/48 | | | 450,000 | | | | 473,462 | |
Morgan Stanley Capital I Trust, Series 2019-BPR, Class A, (1M USD LIBOR + 1.40%, 1.40% Floor), 2.21%, 5/15/36(b)(d) | | | 410,000 | | | | 358,610 | |
| | | | | | | | |
| | | Par(a) | | | Value | |
| |
Commercial Mortgage-Backed Securities (Continued) | | | | | |
Morgan Stanley Capital I Trust, Series 2019-L2, Class XA,
1.20%, 3/15/52(c) | | $ | 2,565,599 | | | $ | 180,042 | |
PFP Ltd., Series 2019-5, Class A, (1M USD LIBOR + 0.97%, 0.97% Floor), 1.77%, 4/14/36(b)(d) | | | 314,471 | | | | 295,603 | |
Rosslyn Portfolio Trust, Series 2017-ROSS, Class A, (1M USD LIBOR + 0.95%, 1.94% Floor),
1.94%, 6/15/33(b)(d) | | | 1,493,000 | | | | 1,435,785 | |
Wells Fargo Commercial Mortgage Trust, | | | | | | | | |
Series 2015-C28, Class A4, 3.54%, 5/15/48 | | | 240,000 | | | | 252,616 | |
Series 2015-P2, Class D, 3.24%, 12/15/48(b) | | | 250,000 | | | | 159,446 | |
Series 2017-C38, Class A5, 3.45%, 7/15/50 | | | 315,000 | | | | 338,323 | |
| | | | | | | | 16,910,438 | |
| | |
Home Equity – 0.1% | | | | | | | | |
GSAA Home Equity Trust, Series 2006-4, Class 1A1,
3.61%, 3/25/36(c) | | | 68,827 | | | | 51,599 | |
Option One Mortgage Loan Trust, Series 2004-3, Class M1, (1M USD LIBOR + 0.78%, 0.52% Floor),
1.27%, 11/25/34(d) | | | 396,899 | | | | 383,967 | |
Renaissance Home Equity Loan Trust, Series 2005-2, Class AV3, (1M USD LIBOR + 0.37%, 0.37% Floor, 14.00% Cap),
0.86%, 8/25/35(d) | | | 376,097 | | | | 325,789 | |
| | | | | | | | 761,355 | |
| | |
Other – 4.4% | | | | | | | | |
Ajax Mortgage Loan Trust, | | | | | | | | |
Series 2018-G, Class A, 4.37%, 6/25/57(b)(c) | | | 74,558 | | | | 71,230 | |
Series 2019-A, Class A, 3.75%, 8/25/57(b)(c) | | | 377,225 | | | | 380,177 | |
Series 2018-F, Class A, 4.37%, 11/25/58(b)(c) | | | 175,077 | | | | 167,700 | |
Series 2019-B, Class A, 3.75%, 1/25/59(b)(c) | | | 470,503 | | | | 473,940 | |
Allegro CLO IV Ltd., Series 2016-1A, Class AR, (3M USD LIBOR + 1.15%), 2.37%, 1/15/30(b)(d) | | | 250,000 | | | | 245,738 | |
See accompanying Notes to Financial Statements
76
Morningstar Funds Trust April 30, 2020
Schedule of Investments (continued)
Morningstar Total Return Bond Fund
| | | | | | | | |
| | | Par(a) | | | Value | |
| | |
Other (Continued) | | | | | | | | |
ALM VII Ltd., Series 2012-7A, Class A1A2, (3M USD LIBOR + 1.17%, 1.17% Floor), 2.39%, 7/15/29(b)(d) | | $ | 250,000 | | | $ | 237,722 | |
Ameriquest Mortgage Securities, Inc. Asset-Backed Pass-Through Certificates, Series 2005-R7, Class M2, (1M USD LIBOR + 0.50%, 0.50% Floor), 0.99%, 9/25/35(d) | | | 367,803 | | | | 363,275 | |
AMMC CLO LTD., Series 2017-21A, Class A, (3M USD LIBOR + 1.25%), 3.01%, 11/02/30(b)(d) | | | 250,000 | | | | 238,089 | |
Anchorage Capital CLO Ltd., Series 2013-1A, Class A1R, (3M USD LIBOR + 1.25%), 2.56%, 10/13/30(b)(d) | | | 500,000 | | | | 476,958 | |
Applebee’s Funding LLC/IHOP Funding LLC, Series 2019-1A, Class A2I,
4.19%, 6/07/49(b) | | | 380,000 | | | | 320,101 | |
Ares XXIX CLO Ltd., Series 2014-1A, Class A1R, (3M USD LIBOR + 1.19%), 2.32%, 4/17/26(b)(d) | | | 126,352 | | | | 125,596 | |
Atrium IX, (3M USD LIBOR + 1.24%), 2.85%, 5/28/30(b)(d) | | | 500,000 | | | | 482,386 | |
Avery Point IV CLO Ltd., Series 2014-1A, Class AR, (3M USD LIBOR + 1.10%), 2.09%, 4/25/26(b)(d) | | | 107,794 | | | | 106,751 | |
Babson CLO Ltd., Series 2015-IA, Class AR, (3M USD LIBOR + 0.99%, 0.99% Floor), 2.13%, 1/20/31(b)(d) | | | 250,000 | | | | 231,081 | |
Ballyrock CLO Ltd., | | | | | | | | |
Series 2019-2, Class A1B, (3M USD LIBOR + 1.75%, 1.75% Floor),
3.65%, 11/20/30(b)(d) | | | 250,000 | | | | 239,996 | |
Series 2018-1A, Class A1, (3M USD LIBOR + 1.00%), 2.14%, 4/20/31(b)(d) | | | 250,000 | | | | 231,274 | |
| | | | | | | | |
| | | Par(a) | | | Value | |
| | |
Other (Continued) | | | | | | | | |
Battalion CLO X Ltd., | | | | | | | | |
Series 2016-10A, Class A1R, (3M USD LIBOR + 1.25%, 1.25% Floor), 2.27%, 1/24/29(b)(d) | | $ | 310,000 | | | $ | 300,451 | |
Series 2016-10A, Class A2R, (3M USD LIBOR + 1.80%, 1.80% Floor),
2.82%, 1/24/29(b)(d) | | | 260,000 | | | | 244,229 | |
Bayview Commercial Asset Trust, Series 2007-4A, Class A1, (1M USD LIBOR + 0.45%, 0.45% Floor), 0.94%, 9/25/37(b)(d) | | | 493,921 | | | | 377,808 | |
BCC Funding Corp. XVI LLC, Series 2019-1A, Class A2, 2.46%, 8/20/24(b) | | | 500,000 | | | | 489,579 | |
Benefit Street Partners CLO II Ltd., Series 2013-IIA, Class A2R, (3M USD LIBOR + 1.75%), 2.97%, 7/15/29(b)(d) | | | 500,000 | | | | 452,221 | |
Benefit Street Partners CLO IV Ltd., Series 2014-IVA, Class A1RR, (3M USD LIBOR + 1.25%, 1.25% Floor), 2.38%, 1/20/29(b)(d) | | | 500,000 | | | | 482,878 | |
BlueMountain CLO Ltd., | | | | | | | | |
Series 2013-1A, Class A1R2, (3M USD LIBOR + 1.23%, 1.23% Floor),
2.37%, 1/20/29(b)(d) | | | 495,349 | | | | 478,901 | |
Series 2015-3A, Class A1R, (3M USD LIBOR + 1.00%), 2.14%, 4/20/31(b)(d) | | | 250,000 | | | | 233,959 | |
California Street CLO XII Ltd., Series 2013-12A, Class AR, (3M USD LIBOR + 1.03%), 2.25%, 10/15/25(b)(d) | | | 122,942 | | | | 121,307 | |
Carlyle Global Market Strategies CLO Ltd., | | | | | | | | |
Series 2014-2RA, Class A1, (3M USD LIBOR + 1.05%), 2.74%, 5/15/31(b)(d) | | | 740,000 | | | | 685,541 | |
Series 2014-3RA, Class A1A, (3M USD LIBOR + 1.05%), 2.04%, 7/27/31(b)(d) | | | 248,021 | | | | 237,721 | |
See accompanying Notes to Financial Statements
77
Morningstar Funds Trust April 30, 2020
Schedule of Investments (continued)
Morningstar Total Return Bond Fund
| | | | | | | | |
| | | Par(a) | | | Value | |
| | |
Other (Continued) | | | | | | | | |
Citigroup Mortgage Loan Trust, Inc., Series 2007-WFH4, Class M3A, (1M USD LIBOR + 2.50%, 2.50% Floor),
2.99%, 7/25/37(d) | | $ | 500,000 | | | $ | 461,230 | |
Cumberland Park CLO Ltd., Series 2015-2A, Class BR, (3M USD LIBOR + 1.40%), 2.53%, 7/20/28(b)(d) | | | 350,000 | | | | 327,255 | |
Cutwater Ltd., Series 2014-1A, Class A1AR, (3M USD LIBOR + 1.25%),
2.47%, 7/15/26(b)(d) | | | 145,836 | | | | 144,210 | |
Dryden XXV Senior Loan Fund, Series 2012-25A, Class ARR, (3M USD LIBOR + 0.90%), 2.12%, 10/15/27(b)(d) | | | 486,800 | | | | 467,475 | |
Elm CLO, | | | | | | | | |
Series 2014-1A, Class ARR, (3M USD LIBOR + 1.17%), 2.30%, 1/17/29(b)(d) | | | 250,000 | | | | 238,798 | |
Series 2014-1A, Class BRR, (3M USD LIBOR + 1.75%), 2.88%, 1/17/29(b)(d) | | | 250,000 | | | | 231,634 | |
First Franklin Mortgage Loan Trust, | | | | | | | | |
Series 2003-FF4, Class M1, (1M USD LIBOR + 1.80%, 1.20% Floor), 2.78%, 10/25/33(d) | | | 423,723 | | | | 394,336 | |
Series 2006-FF13, Class A1, (1M USD LIBOR + 0.12%, 0.12% Floor), 0.61%, 10/25/36(d) | | | 35,245 | | | | 24,784 | |
Flatiron CLO 17 Ltd., Series 2017-1A, Class A, (3M USD LIBOR + 1.25%), 2.94%, 5/15/30(b)(d) | | | 300,000 | | | | 286,603 | |
Galaxy XIX CLO Ltd., Series 2015-19A, Class A1R, (3M USD LIBOR + 1.22%), 2.24%, 7/24/30(b)(d) | | | 250,000 | | | | 237,875 | |
Halsey Point CLO I Ltd., Series 2019-1A, Class A1A1, (3M USD LIBOR + 1.35%, 1.35% Floor), 3.26%, 1/20/33(b)(d) | | | 360,000 | | | | 338,741 | |
| | | | | | | | |
| | | Par(a) | | | Value | |
| | |
Other (Continued) | | | | | | | | |
ICG US CLO Ltd., Series 2015-2RA, Class A1, (3M USD LIBOR + 1.37%, 1.37% Floor), 3.08%, 1/16/33(b)(d) | | $ | 500,000 | | | $ | 471,760 | |
JFIN CLO Ltd., Series 2014-1A, Class AR, (3M USD LIBOR + 0.95%),
2.09%, 4/21/25(b)(d) | | | 138,357 | | | | 136,758 | |
KKR CLO 16 Ltd., | | | | | | | | |
Series 16, Class A2R, (3M USD LIBOR + 1.80%, 1.80% Floor), 2.93%, 1/20/29(b)(d) | | | 250,000 | | | | 226,385 | |
Series 16, Class A1R, (3M USD LIBOR + 1.25%, 1.25% Floor), 2.38%, 1/20/29(b)(d) | | | 250,000 | | | | 243,535 | |
KKR CLO Ltd., Series 21, Class A, (3M USD LIBOR + 1.00%), 2.22%, 4/15/31(b)(d) | | | 250,000 | | | | 229,034 | |
LCM Loan Income Fund I Income Note Issuer Ltd., Series 27A, Class A1, (3M USD LIBOR + 1.08%), 2.26%, 7/16/31(b)(d) | | | 250,000 | | | | 237,795 | |
LCM XXIV Ltd., Series 24A, Class A, (3M USD LIBOR + 1.31%, 1.31% Floor), 2.44%, 3/20/30(b)(d) | | | 750,000 | | | | 706,038 | |
Legacy Mortgage Asset Trust, | | | | | | | | |
Series 2019-SL1, Class A,
4.00%, 12/28/54(b) | | | 289,749 | | | | 276,902 | |
Series 2019-GS5, Class A1, (Step to 6.20% on 8/25/22), 3.20%, 5/25/59(b)(e) | | | 922,456 | | | | 842,012 | |
Long Beach Mortgage Loan Trust, Series 2006-6, Class 2A3, (1M USD LIBOR + 0.15%, 0.15% Floor), 0.64%, 7/25/36(d) | | | 883,221 | | | | 380,963 | |
Madison Park Funding XI Ltd., Series 2013-11A, Class AR, (3M USD LIBOR + 1.16%), 2.20%, 7/23/29(b)(d) | | | 500,000 | | | | 481,577 | |
Madison Park Funding XIII Ltd., Series 2014-13A, Class AR2, (3M USD LIBOR + 0.95%, 0.95% Floor), 2.09%, 4/19/30(b)(d) | | | 500,000 | | | | 478,177 | |
See accompanying Notes to Financial Statements
78
Morningstar Funds Trust April 30, 2020
Schedule of Investments (continued)
Morningstar Total Return Bond Fund
| | | | | | | | |
| | | Par(a) | | | Value | |
| | |
Other (Continued) | | | | | | | | |
Madison Park Funding XVI Ltd., Series 2015-16A, Class A1R, (3M USD LIBOR + 1.33%), 2.46%, 4/20/26(b)(d) | | $ | 346,965 | | | $ | 342,509 | |
Mariner CLO Ltd., Series 2017-4A, Class A, (3M USD LIBOR + 1.21%), 2.20%, 10/26/29(b)(d) | | | 250,000 | | | | 241,193 | |
Mill City Mortgage Loan Trust, Series 2018-2, Class B4, 3.96%, 5/25/58(b)(c) | | | 714,973 | | | | 285,032 | |
Myers Park CLO Ltd., Series 2018-1A, Class B1, (3M USD LIBOR + 1.60%, 1.60% Floor), 2.73%, 10/20/30(b)(d) | | | 250,000 | | | | 227,625 | |
Oaktree CLO Ltd., Series 2015-1A, Class A1R, (3M USD LIBOR + 0.87%), 2.01%, 10/20/27(b)(d) | | | 466,764 | | | | 457,168 | |
OFSI Fund VI Ltd., Series 2014-6A, Class BR, (3M USD LIBOR + 1.50%), 2.72%, 3/20/25(b)(d) | | | 500,000 | | | | 472,548 | |
OFSI Fund VII Ltd., Series 2014-7A, Class AR, (3M USD LIBOR + 0.90%), 2.04%, 10/18/26(b)(d) | | | 9,743 | | | | 9,637 | |
Owl Rock CLO III Ltd., Series 2020-3A, Class A1L, (3M USD LIBOR + 1.80%), 2.97%, 4/20/32(b)(d) | | | 270,000 | | | | 255,828 | |
Palmer Square CLO Ltd., Series 2018-2A, Class A1A, (3M USD LIBOR + 1.10%), 2.28%, 7/16/31(b)(d) | | | 500,000 | | | | 482,188 | |
Riserva CLO Ltd., Series 2016-3A, Class AR, (3M USD LIBOR + 1.14%), 2.28%, 10/18/28(b)(d) | | | 250,000 | | | | 242,340 | |
RR 3 Ltd., Series 2018-3A, Class A1R2, (3M USD LIBOR + 1.09%, 1.09% Floor), 2.31%, 1/15/30(b)(d) | | | 250,000 | | | | 237,507 | |
SBA Small Business Investment Cos., Series 2019-10A, Class 1, 3.11%, 3/10/29 | | | 90,295 | | | | 96,326 | |
Sound Point CLO XXIII, Series 2019-2A, Class A1, (3M USD LIBOR + 1.40%, 1.40% Floor), 2.62%, 4/15/32(b)(d) | | | 250,000 | | | | 242,850 | |
| | | | | | | | |
| | | Par(a) | | | Value | |
| | |
Other (Continued) | | | | | | | | |
Thacher Park CLO Ltd., Series 2014-1A, Class AR, (3M USD LIBOR + 1.16%),
2.30%, 10/20/26(b)(d) | | $ | 141,793 | | | $ | 140,206 | |
Towd Point Mortgage Trust, Series 2019-SJ2, Class M1,
4.50%, 11/25/58(b) | | | 500,000 | | | | 498,653 | |
Tralee CLO VI Ltd., Series 2019-6A, Class AS, (3M USD LIBOR + 1.30%), 2.29%, 10/25/32(b)(d) | | | 250,000 | | | | 235,803 | |
United States Small Business Administration, | | | | | | | | |
Series 2019-20D, Class 1, 2.98%, 4/01/39 | | | 47,679 | | | | 50,439 | |
Series 2019-25G, Class 1, 2.69%, 7/01/44 | | | 78,775 | | | | 82,596 | |
Venture 31 CLO Ltd., Series 2018-31A, Class A1, (3M USD LIBOR + 1.03%, 1.03% Floor), 2.17%, 4/20/31(b)(d) | | | 410,000 | | | | 376,377 | |
Vericrest Opportunity Loan Trust, Series 2019-NPL2, Class A1, (Step to 6.97% on 3/25/22),
3.97%, 2/25/49(b)(e) | | | 106,086 | | | | 96,626 | |
Westcott Park CLO Ltd., Series 2016-1A, Class AR, (3M USD LIBOR + 1.21%), 2.35%, 7/20/28(b)(d) | | | 500,000 | | | | 488,370 | |
York CLO-3 Ltd., Series 2016-1A, Class BR, (3M USD LIBOR + 1.75%), 2.88%, 10/20/29(b)(d) | | | 500,000 | | | | 466,753 | |
Zais CLO 13 Ltd., Series 2019-13A, Class A1A, (3M USD LIBOR + 1.49%), 2.71%, 7/15/32(b)(d) | | | 250,000 | | | | 233,988 | |
Zais CLO 5 Ltd., Series 2016-2A, Class A1, (3M USD LIBOR + 1.53%), 2.75%, 10/15/28(b)(d) | | | 495,828 | | | | 482,953 | |
| | | | | | | | 23,106,001 | |
| | |
Student Loan – 0.5% | | | | | | | | |
Navient Private Education Refinancing Loan Trust, Series 2019-CA, Class A2, 3.13%, 2/15/68(b) | | | 510,000 | | | | 512,323 | |
See accompanying Notes to Financial Statements
79
Morningstar Funds Trust April 30, 2020
Schedule of Investments (continued)
Morningstar Total Return Bond Fund
| | | | | | | | |
| | | Par(a) | | | Value | |
| | |
Student Loan (Continued) | | | | | | | | |
Navient Student Loan Trust, | | | | | | | | |
Series 2015-1, Class A2, (1M USD LIBOR + 0.60%, 0.60% Floor), 1.09%, 4/25/40(d) | | $ | 120,232 | | | $ | 113,530 | |
Series 2017-1A, Class A3, (1M USD LIBOR + 1.15%),
1.63%, 7/26/66(b)(d) | | | 260,000 | | | | 244,903 | |
Series 2017-2A, Class A, (1M USD LIBOR + 1.05%),
1.54%, 12/27/66(b)(d) | | | 121,170 | | | | 113,638 | |
SLM Student Loan Trust, Series 2006-10, Class A6, (3M USD LIBOR + 0.15%), 1.14%, 3/25/44(d) | | | 300,000 | | | | 272,649 | |
Sofi Professional Loan Program LLC, Series 2019-A, Class A2FX, 3.69%, 6/15/48(b) | | | 660,000 | | | | 676,912 | |
Sofi Professional Loan Program Trust, | | | | | | | | |
Series 2018-B, Class A2FX, 3.34%, 8/25/47(b) | | | 250,000 | | | | 252,295 | |
Series 2018-B, Class A2FX, 3.60%, 2/25/48(b) | | | 200,000 | | | | 206,014 | |
| | | | | | | | 2,392,264 | |
| | |
Whole Loan – 1.8% | | | | | | | | |
Adjustable Rate Mortgage Trust, Series 2005-9, Class 5A1, (1M USD LIBOR + 0.54%, 0.27% Floor, 11.00% Cap), 1.03%, 11/25/35(d) | | | 330,231 | | | | 310,469 | |
CSMC, Series 2019-NQM1, Class A2, (Step to 3.86% on 12/25/23),
2.86%, 10/25/59(b)(e) | | | 587,432 | | | | 587,365 | |
CSMC Trust, Series 2019-RPL8, Class A1, 3.32%, 10/25/58(b)(c) | | | 569,702 | | | | 547,729 | |
FHLMC Structured Agency Credit Risk Debt Notes, Series 2014-DN3, Class M3, (1M USD LIBOR + 4.00%), 4.49%, 8/25/24(d) | | | 147,690 | | | | 117,298 | |
FNMA Connecticut Avenue Securities, | | | | | | | | |
Series 2014-C04, Class 1M2, (1M USD LIBOR + 4.90%),
5.39%, 11/25/24(d) | | | 213,512 | | | | 167,650 | |
| | | | | | | | |
| | | Par(a) | | | Value | |
| | |
Whole Loan (Continued) | | | | | | | | |
FNMA Connecticut Avenue Securities, | | | | | | | | |
Series 2016-C02, Class 1M2, (1M USD LIBOR + 6.00%), 6.48%, 9/25/28(d) | | $ | 567,833 | | | $ | 577,793 | |
Series 2016-C03, Class 1M2, (1M USD LIBOR + 5.30%), 5.79%, 10/25/28(d) | | | 473,566 | | | | 480,112 | |
Series 2016-C04, Class 1M2, (1M USD LIBOR + 4.25%), 4.74%, 1/25/29(d) | | | 244,100 | | | | 239,731 | |
Series 2017-C03, Class 1M1, (1M USD LIBOR + 0.95%), 1.44%, 10/25/29(d) | | | 110,723 | | | | 110,214 | |
GSR Mortgage Loan Trust, Series 2007-1F, Class 2A4, 5.50%, 1/25/37 | | | 503,696 | | | | 544,102 | |
Impac CMB Trust, Series 2007-A, Class A, (1M USD LIBOR + 0.50%, 0.25% Floor, 11.50% Cap), 0.99%, 5/25/37(b)(d) | | | 336,457 | | | | 305,765 | |
MASTR Asset Securitization Trust, | | | | | | | | |
Series 2007-1, Class 1A4, 6.50%, 11/25/37 | | | 797,656 | | | | 459,151 | |
Series 2007-2, Class A2, 6.25%, 1/25/38 | | | 570,757 | | | | 440,110 | |
MCM Trust, Series 2018-NPL2, Class A, (Step to 7.00% on 1/25/22), 4.00%, 10/25/28(b)(e) | | | 86,111 | | | | 76,810 | |
Merrill Lynch Mortgage Investors Trust, Series 2004-A1, Class 2A2, 3.70%, 2/25/34(c) | | | 424,556 | | | | 405,293 | |
Morgan Stanley Resecuritization Trust, Series 2015-R2, Class 2A1, (12MTA + 1.09%, 1.09% Floor),
4.05%, 12/26/46(b)(d) | | | 264,792 | | | | 259,315 | |
New Residential Mortgage Loan Trust, | | | | | | | | |
Series 2018-3A, Class A1, 4.50%, 5/25/58(b)(c) | | | 1,197,629 | | | | 1,259,420 | |
Series 2019-NQM4, Class A1, 2.49%, 9/25/59(b) | | | 499,805 | | | | 483,776 | |
Series 2019-6A, Class A1B, 3.50%, 9/25/59(b)(c) | | | 605,477 | | | | 613,896 | |
See accompanying Notes to Financial Statements
80
Morningstar Funds Trust April 30, 2020
Schedule of Investments (continued)
Morningstar Total Return Bond Fund
| | | | | | | | |
| | | Par(a) | | | Value | |
| | |
Whole Loan (Continued) | | | | | | | | |
Residential Mortgage Loan Trust, Series 2019-2, Class A1,
2.91%, 5/25/59(b) | | $ | 505,305 | | | $ | 501,085 | |
Thornburg Mortgage Securities Trust, Series 2004-2, Class A4, (1M USD LIBOR + 0.68%, 0.34% Floor, 11.50% Cap),
1.17%, 6/25/44(d) | | | 580,912 | | | | 534,291 | |
Voyager OPTONE Delaware Trust, Series 2009-1, Class SAA7,
3.38%, 2/25/38(b)(c) | | | 200,069 | | | | 65,457 | |
WaMu Mortgage Pass-Through Certificate, Series, Series 2006-AR13, Class 1A, (12MTA + 0.88%, 0.88% Floor),
2.75%, 10/25/46(d) | | | 427,482 | | | | 353,819 | |
| | |
| | | | | | | | 9,440,651 | |
| | |
Total Asset-Backed Securities
(Cost $56,436,860) | | | | | | | 53,622,395 | |
|
Corporate Bonds – 27.8% | |
| | |
Advertising – 0.0%(f) | | | | | | | | |
Lamar Media Corp., | | | | | | | | |
5.75%, 2/01/26 | | | 29,000 | | | | 29,496 | |
3.75%, 2/15/28(b) | | | 5,000 | | | | 4,603 | |
Omnicom Group, Inc./Omnicom Capital, Inc., 3.65%, 11/01/24 | | | 10,000 | | | | 10,627 | |
Outfront Media Capital LLC/Outfront Media Capital Corp., | | | | | | | | |
5.00%, 8/15/27(b) | | | 56,000 | | | | 53,474 | |
4.63%, 3/15/30(b) | | | 5,000 | | | | 4,575 | |
| | |
| | | | | | | | 102,775 | |
| | |
Aerospace/Defense – 1.2% | | | | | | | | |
Boeing (The) Co., | | | | | | | | |
4.51%, 5/01/23 | | | 100,000 | | | | 100,000 | |
4.88%, 5/01/25 | | | 460,000 | | | | 460,000 | |
3.10%, 5/01/26 | | | 40,000 | | | | 36,637 | |
2.70%, 2/01/27 | | | 30,000 | | | | 26,624 | |
2.80%, 3/01/27 | | | 40,000 | | | | 34,973 | |
3.20%, 3/01/29 | | | 130,000 | | | | 114,197 | |
5.15%, 5/01/30 | | | 170,000 | | | | 170,000 | |
3.25%, 2/01/35 | | | 290,000 | | | | 240,201 | |
5.70%, 5/01/40 | | | 140,000 | | | | 140,000 | |
3.65%, 3/01/47 | | | 12,000 | | | | 9,261 | |
3.75%, 2/01/50 | | | 50,000 | | | | 39,966 | |
5.80%, 5/01/50 | | | 330,000 | | | | 330,000 | |
5.93%, 5/01/60 | | | 205,000 | | | | 205,000 | |
| | | | | | | | |
| | | Par(a) | | | Value | |
| | |
Aerospace/Defense (Continued) | | | | | | | | |
General Dynamics Corp., | | | | | | | | |
3.25%, 4/01/25 | | $ | 145,000 | | | $ | 158,248 | |
3.50%, 5/15/25 | | | 40,000 | | | | 44,047 | |
3.75%, 5/15/28 | | | 60,000 | | | | 68,122 | |
3.63%, 4/01/30 | | | 45,000 | | | | 51,859 | |
4.25%, 4/01/40 | | | 10,000 | | | | 12,303 | |
4.25%, 4/01/50 | | | 81,000 | | | | 104,658 | |
L3Harris Technologies, Inc., | | | | | | | | |
3.85%, 6/15/23(b) | | | 30,000 | | | | 31,437 | |
3.95%, 5/28/24(b) | | | 115,000 | | | | 122,741 | |
3.83%, 4/27/25 | | | 8,000 | | | | 8,597 | |
3.85%, 12/15/26(b) | | | 145,000 | | | | 158,397 | |
4.40%, 6/15/28 | | | 297,000 | | | | 335,407 | |
4.40%, 6/15/28(b) | | | 46,000 | | | | 51,949 | |
4.85%, 4/27/35 | | | 2,000 | | | | 2,474 | |
5.05%, 4/27/45 | | | 53,000 | | | | 66,414 | |
Lockheed Martin Corp., | | | | | | | | |
3.55%, 1/15/26 | | | 500,000 | | | | 561,570 | |
3.60%, 3/01/35 | | | 78,000 | | | | 92,991 | |
3.80%, 3/01/45 | | | 40,000 | | | | 48,199 | |
Northrop Grumman Corp., | | | | | | | | |
2.93%, 1/15/25 | | | 267,000 | | | | 283,739 | |
3.25%, 1/15/28 | | | 510,000 | | | | 553,748 | |
4.03%, 10/15/47 | | | 19,000 | | | | 22,908 | |
5.25%, 5/01/50 | | | 145,000 | | | | 205,794 | |
Raytheon Co., | | | | | | | | |
3.15%, 12/15/24 | | | 55,000 | | | | 58,974 | |
7.20%, 8/15/27 | | | 26,000 | | | | 35,179 | |
7.00%, 11/01/28 | | | 90,000 | | | | 122,845 | |
4.20%, 12/15/44 | | | 35,000 | | | | 43,806 | |
Raytheon Technologies Corp., | | | | | | | | |
3.65%, 8/16/23 | | | 32,000 | | | | 34,584 | |
3.95%, 8/16/25 | | | 220,000 | | | | 247,983 | |
4.13%, 11/16/28 | | | 149,000 | | | | 172,936 | |
5.40%, 5/01/35 | | | 22,000 | | | | 29,554 | |
4.45%, 11/16/38 | | | 30,000 | | | | 37,347 | |
4.50%, 6/01/42 | | | 32,000 | | | | 40,691 | |
4.15%, 5/15/45 | | | 10,000 | | | | 12,229 | |
4.63%, 11/16/48 | | | 40,000 | | | | 53,614 | |
Rockwell Collins, Inc., 3.20%, 3/15/24 | | | 126,000 | | | | 133,704 | |
TransDigm, Inc., | | | | | | | | |
8.00%, 12/15/25(b) | | | 140,000 | | | | 145,600 | |
6.25%, 3/15/26(b) | | | 346,000 | | | | 338,647 | |
| | |
| | | | | | | | 6,400,154 | |
| | |
Agriculture – 0.6% | | | | | | | | |
Altria Group, Inc., | | | | | | | | |
3.49%, 2/14/22 | | | 100,000 | | | | 103,386 | |
2.85%, 8/09/22 | | | 70,000 | | | | 71,983 | |
4.00%, 1/31/24 | | | 80,000 | | | | 86,179 | |
See accompanying Notes to Financial Statements
81
Morningstar Funds Trust April 30, 2020
Schedule of Investments (continued)
Morningstar Total Return Bond Fund
| | | | | | | | | | | | |
| | | | | | Par(a) | | | Value | |
| |
Agriculture (Continued) | | | | | |
Altria Group, Inc., | | | | | | | | | | | | |
3.80%, 2/14/24 | | | | | | $ | 40,000 | | | $ | 42,831 | |
4.40%, 2/14/26 | | | | | | | 693,000 | | | | 768,574 | |
4.80%, 2/14/29 | | | | | | | 510,000 | | | | 570,841 | |
5.80%, 2/14/39 | | | | | | | 278,000 | | | | 331,893 | |
5.95%, 2/14/49 | | | | | | | 185,000 | | | | 232,057 | |
6.20%, 2/14/59 | | | | | | | 78,000 | | | | 98,381 | |
Cargill, Inc., 1.38%, 7/23/23(b) | | | | | | | 80,000 | | | | 80,407 | |
Darling Ingredients, Inc., 5.25%, 4/15/27(b) | | | | | | | 23,000 | | | | 23,201 | |
Philip Morris International, Inc., | | | | | | | | | | | | |
2.50%, 8/22/22 | | | | | | | 330,000 | | | | 340,991 | |
1.13%, 5/01/23 | | | | | | | 76,000 | | | | 75,869 | |
2.12%, 5/10/23 | | | | | | | 30,000 | | | | 30,765 | |
2.87%, 5/01/24 | | | | | | | 44,000 | | | | 46,278 | |
2.10%, 5/01/30 | | | | | | | 70,000 | | | | 69,420 | |
1.45%, 8/01/39 | | | EUR | | | | 100,000 | | | | 98,288 | |
4.50%, 3/20/42 | | | | | | | 60,000 | | | | 69,999 | |
| | | |
| | | | | | | | | | | | 3,141,343 | |
| | | |
Airlines – 0.1% | | | | | | | | | | | | |
American Airlines Pass Through Trust, | | | | | | | | | | | | |
Series 2014-1, Class B, 4.37%, 10/01/22 | | | | | | | 2,038 | | | | 1,605 | |
Series 2015-2, Class B, 4.40%, 9/22/23 | | | | | | | 18,886 | | | | 13,013 | |
Series 2016-1, Class B, 5.25%, 1/15/24 | | | | | | | 115,997 | | | | 83,072 | |
Series 2017-1, Class B,
4.95%, 2/15/25 | | | | | | | 16,318 | | | | 11,586 | |
Series 2016-3, Class B,
3.75%, 10/15/25 | | | | | | | 1,558 | | | | 1,048 | |
Series 2017-2, Class B,
3.70%, 10/15/25 | | | | | | | 27,923 | | | | 18,884 | |
Series 2015-2, Class AA,
3.60%, 9/22/27 | | | | | | | 14,590 | | | | 14,004 | |
Series 2016-1, Class AA,
3.58%, 1/15/28 | | | | | | | 83,312 | | | | 77,532 | |
Series 2019-1, Class B,
3.85%, 2/15/28 | | | | | | | 77,878 | | | | 50,621 | |
Series 2016-2, Class AA,
3.20%, 6/15/28 | | | | | | | 25,635 | | | | 23,525 | |
Series 2016-3, Class AA,
3.00%, 10/15/28 | | | | | | | 40,647 | | | | 36,248 | |
Series 2017-1, Class AA,
3.65%, 2/15/29 | | | | | | | 22,165 | | | | 19,943 | |
Series 2019-1, Class AA,
3.15%, 2/15/32 | | | | | | | 73,845 | | | | 65,059 | |
Delta Air Lines Pass Through Trust, Series 2019-1, Class AA, 3.20%, 4/25/24 | | | | | | | 44,000 | | | | 40,251 | |
| | | | | | | | |
| | | Par(a) | | | Value | |
| | |
Airlines (Continued) | | | | | | | | |
United Airlines Pass Through Trust, | | | | | | | | |
Series 2014-2, Class B, 4.62%, 9/03/22 | | $ | 5,228 | | | $ | 4,603 | |
Series 2016-2, Class B, 3.65%, 10/07/25 | | | 3,144 | | | | 2,146 | |
Series 2016-1, Class B, 3.65%, 1/07/26 | | | 9,944 | | | | 7,163 | |
Series 2015-1, Class AA, 3.45%, 12/01/27 | | | 831 | | | | 758 | |
Series 2019-2, Class B, 3.50%, 5/01/28 | | | 61,000 | | | | 40,884 | |
Series 2016-1, Class AA, 3.10%, 7/07/28 | | | 2,604 | | | | 2,255 | |
Series 2016-2, Class AA, 2.88%, 10/07/28 | | | 19,093 | | | | 16,237 | |
Series 2018-1, Class AA, 3.50%, 3/01/30 | | | 16,794 | | | | 14,769 | |
Series 2019-2, Class AA, 2.70%, 5/01/32 | | | 60,000 | | | | 52,782 | |
| | |
| | | | | | | | 597,988 | |
| | |
Apparel – 0.2% | | | | | | | | |
Hanesbrands, Inc., | | | | | | | | |
4.63%, 5/15/24(b) | | | 39,000 | | | | 38,988 | |
4.87%, 5/15/26(b) | | | 8,000 | | | | 8,051 | |
NIKE, Inc., | | | | | | | | |
2.40%, 3/27/25 | | | 145,000 | | | | 152,783 | |
2.75%, 3/27/27 | | | 130,000 | | | | 140,052 | |
2.85%, 3/27/30 | | | 100,000 | | | | 108,541 | |
3.25%, 3/27/40 | | | 70,000 | | | | 76,056 | |
3.38%, 3/27/50 | | | 275,000 | | | | 308,327 | |
Under Armour, Inc., 3.25%, 6/15/26 | | | 5,000 | | | | 4,505 | |
William Carter (The) Co.,
5.62%, 3/15/27(b) | | | 23,000 | | | | 23,316 | |
| | |
| | | | | | | | 860,619 | |
| | |
Auto Manufacturers – 0.3% | | | | | | | | |
Ford Motor Credit Co. LLC, 3.34%, 3/18/21 | | | 245,000 | | | | 235,195 | |
General Motors Co., | | | | | | | | |
4.87%, 10/02/23 | | | 210,000 | | | | 206,994 | |
5.00%, 4/01/35 | | | 3,000 | | | | 2,541 | |
6.60%, 4/01/36 | | | 52,000 | | | | 47,724 | |
6.25%, 10/02/43 | | | 45,000 | | | | 39,390 | |
5.40%, 4/01/48 | | | 11,000 | | | | 8,771 | |
5.95%, 4/01/49 | | | 70,000 | | | | 59,548 | |
General Motors Financial Co., Inc., | | | | | | | | |
4.15%, 6/19/23 | | | 75,000 | | | | 72,815 | |
3.50%, 11/07/24 | | | 62,000 | | | | 57,207 | |
4.00%, 1/15/25 | | | 88,000 | | | | 82,538 | |
4.35%, 4/09/25 | | | 48,000 | | | | 45,466 | |
See accompanying Notes to Financial Statements
82
Morningstar Funds Trust April 30, 2020
Schedule of Investments (continued)
Morningstar Total Return Bond Fund
| | | | | | | | |
| | | Par(a) | | | Value | |
|
Auto Manufacturers (Continued) | |
General Motors Financial Co., Inc., | | | | | | | | |
4.00%, 10/06/26 | | $ | 6,000 | | | $ | 5,449 | |
4.35%, 1/17/27 | | | 2,000 | | | | 1,825 | |
Hyundai Capital America, | | | | | | | | |
3.95%, 2/01/22(b) | | | 247,000 | | | | 248,548 | |
2.38%, 2/10/23(b) | | | 245,000 | | | | 235,746 | |
Toyota Motor Credit Corp., 3.37%, 4/01/30 | | | 88,000 | | | | 96,269 | |
| | |
| | | | | | | | 1,446,026 | |
| |
Auto Parts & Equipment – 0.0%(f) | | | | | |
American Axle & Manufacturing, Inc., 6.25%, 4/01/25 | | | 27,000 | | | | 20,561 | |
Aptiv PLC, 5.40%, 3/15/49 | | | 10,000 | | | | 9,888 | |
Lear Corp., 5.25%, 5/15/49 | | | 10,000 | | | | 9,006 | |
| | |
| | | | | | | | 39,455 | |
| | |
Banks – 5.9% | | | | | | | | |
Bank of America Corp., 2.63%, 4/19/21 | | | 38,000 | | | | 38,605 | |
(3M USD LIBOR + 0.66%), 2.37%, 7/21/21(g) | | | 353,000 | | | | 353,195 | |
(3M USD LIBOR + 0.37%), 2.74%, 1/23/22(g) | | | 281,000 | | | | 282,740 | |
(3M USD LIBOR + 0.63%), 3.50%, 5/17/22(g) | | | 50,000 | | | | 51,016 | |
3.30%, 1/11/23 | | | 270,000 | | | | 282,984 | |
(3M USD LIBOR + 1.02%), 2.88%, 4/24/23(g) | | | 10,000 | | | | 10,218 | |
4.20%, 8/26/24 | | | 170,000 | | | | 183,939 | |
4.00%, 1/22/25 | | | 10,000 | | | | 10,804 | |
(3M USD LIBOR + 0.81%), 3.37%, 1/23/26(g) | | | 3,000 | | | | 3,201 | |
4.45%, 3/03/26 | | | 194,000 | | | | 214,128 | |
4.25%, 10/22/26 | | | 320,000 | | | | 351,162 | |
4.18%, 11/25/27 | | | 13,000 | | | | 14,172 | |
(3M USD LIBOR + 1.58%), 3.82%, 1/20/28(g) | | | 459,000 | | | | 501,935 | |
(3M USD LIBOR + 2.93%), 5.87%, 3/15/28(g)(h) | | | 131,000 | | | | 133,642 | |
(3M USD LIBOR + 1.51%), 3.71%, 4/24/28(g) | | | 333,000 | | | | 363,418 | |
(3M USD LIBOR + 1.37%), 3.59%, 7/21/28(g) | | | 194,000 | | | | 209,203 | |
(3M USD LIBOR + 1.04%), 3.42%, 12/20/28(g) | | | 861,000 | | | | 924,087 | |
(3M USD LIBOR + 1.07%), 3.97%, 3/05/29(g) | | | 163,000 | | | | 181,370 | |
(3M USD LIBOR + 1.31%), 4.27%, 7/23/29(g) | | | 4,000 | | | | 4,548 | |
(3M USD LIBOR + 1.21%), 3.97%, 2/07/30(g) | | | 960,000 | | | | 1,079,423 | |
| | | | | | | | |
| | | Par(a) | | | Value | |
|
Banks (Continued) | |
Bank of America Corp., | | | | | | | | |
(3M USD LIBOR + 1.18%),
3.19%, 7/23/30(g) | | $ | 28,000 | | | $ | 29,866 | |
(3M USD LIBOR + 0.99%),
2.50%, 2/13/31(g) | | | 277,000 | | | | 280,452 | |
(SOFR + 2.15%), 2.59%, 4/29/31(g) | | | 140,000 | | | | 143,662 | |
5.00%, 1/21/44 | | | 170,000 | | | | 222,264 | |
(3M USD LIBOR + 1.52%),
4.33%, 3/15/50(g) | | | 30,000 | | | | 37,390 | |
(3M USD LIBOR + 3.15%),
4.08%, 3/20/51(g) | | | 450,000 | | | | 540,363 | |
Bank of New York Mellon (The) Corp., | | | | | | | | |
(3M USD LIBOR + 3.42%),
4.95%, 6/20/20(g)(h) | | | 105,000 | | | | 100,538 | |
3.65%, 2/04/24 | | | 2,000 | | | | 2,186 | |
1.60%, 4/24/25 | | | 60,000 | | | | 60,865 | |
2.45%, 8/17/26 | | | 20,000 | | | | 20,900 | |
(3M USD LIBOR + 3.13%),
4.62%, 9/20/26(g)(h) | | | 136,000 | | | | 132,600 | |
(3M USD LIBOR + 1.07%),
3.44%, 2/07/28(g) | | | 89,000 | | | | 96,911 | |
Citigroup, Inc., | | | | | | | | |
2.75%, 4/25/22 | | | 1,000 | | | | 1,024 | |
(3M USD LIBOR + 0.95%),
2.88%, 7/24/23(g) | | | 80,000 | | | | 81,895 | |
(3M USD LIBOR + 1.02%),
4.04%, 6/01/24(g) | | | 3,000 | | | | 3,202 | |
(3M USD LIBOR + 0.90%),
3.35%, 4/24/25(g) | | | 6,000 | | | | 6,306 | |
4.40%, 6/10/25 | | | 105,000 | | | | 114,023 | |
5.50%, 9/13/25 | | | 120,000 | | | | 137,529 | |
(SOFR + 2.75%),
3.11%, 4/08/26(g) | | | 50,000 | | | | 52,382 | |
4.45%, 9/29/27 | | | 76,000 | | | | 83,254 | |
(3M USD LIBOR + 1.56%), 3.89%, 1/10/28(g) | | | 390,000 | | | | 421,221 | |
(3M USD LIBOR + 1.39%),
3.67%, 7/24/28(g) | | | 204,000 | | | | 217,565 | |
(3M USD LIBOR + 1.15%),
3.52%, 10/27/28(g) | | | 340,000 | | | | 362,208 | |
(3M USD LIBOR + 1.19%),
4.07%, 4/23/29(g) | | | 150,000 | | | | 165,800 | |
(3M USD LIBOR + 1.34%),
3.98%, 3/20/30(g) | | | 550,000 | | | | 605,813 | |
(SOFR + 3.91%),
4.41%, 3/31/31(g) | | | 202,000 | | | | 232,553 | |
8.12%, 7/15/39 | | | 582,000 | | | | 960,278 | |
4.65%, 7/23/48 | | | 32,000 | | | | 39,322 | |
Citizens Financial | | | | | | | | |
Group, Inc., 2.38%, 7/28/21 | | | 100,000 | | | | 100,698 | |
Discover Bank, 4.65%, 9/13/28 | | | 300,000 | | | | 314,748 | |
See accompanying Notes to Financial Statements
83
Morningstar Funds Trust April 30, 2020
Schedule of Investments (continued)
Morningstar Total Return Bond Fund
| | | | | | | | |
| | | Par(a) | | | Value | |
| | |
Banks (Continued) | | | | | | | | |
Fifth Third Bancorp, 3.65%, 1/25/24 | | $ | 23,000 | | | $ | 24,304 | |
Fifth Third Bank, 2.25%, 6/14/21 | | | 260,000 | | | | 263,006 | |
Goldman Sachs Group (The), Inc., | | | | | | | | |
5.25%, 7/27/21 | | | 86,000 | | | | 89,738 | |
5.75%, 1/24/22 | | | 39,000 | | | | 41,747 | |
3.00%, 4/26/22 | | | 21,000 | | | | 21,274 | |
(3M USD LIBOR + 0.82%), 2.88%, 10/31/22(g) | | | 230,000 | | | | 233,643 | |
3.20%, 2/23/23 | | | 40,000 | | | | 41,497 | |
3.63%, 2/20/24 | | | 120,000 | | | | 127,115 | |
3.85%, 7/08/24 | | | 30,000 | | | | 32,038 | |
3.50%, 1/23/25 | | | 85,000 | | | | 89,896 | |
3.50%, 4/01/25 | | | 345,000 | | | | 367,103 | |
3.75%, 5/22/25 | | | 31,000 | | | | 33,115 | |
(3M USD LIBOR + 1.20%), 3.27%, 9/29/25(g) | | | 248,000 | | | | 259,278 | |
3.50%, 11/16/26 | | | 40,000 | | | | 42,503 | |
3.85%, 1/26/27 | | | 244,000 | | | | 264,372 | |
(3M USD LIBOR + 1.51%), 3.69%, 6/05/28(g) | | | 267,000 | | | | 284,960 | |
(3M USD LIBOR + 1.30%), 4.22%, 5/01/29(g) | | | 1,530,000 | | | | 1,698,458 | |
4.80%, 7/08/44 | | | 7,000 | | | | 8,522 | |
5.15%, 5/22/45 | | | 110,000 | | | | 133,656 | |
4.75%, 10/21/45 | | | 460,000 | | | | 558,171 | |
Huntington National Bank (The), 3.25%, 5/14/21 | | | 250,000 | | | | 254,930 | |
JPMorgan Chase & Co., | | | | | | | | |
2.55%, 3/01/21 | | | 44,000 | | | | 44,534 | |
4.35%, 8/15/21 | | | 69,000 | | | | 71,731 | |
(3M USD LIBOR + 0.70%),
3.21%, 4/01/23(g) | | | 85,000 | | | | 87,686 | |
(3M USD LIBOR + 0.89%),
3.80%, 7/23/24(g) | | | 441,000 | | | | 470,833 | |
3.87%, 9/10/24 | | | 20,000 | | | | 21,595 | |
(3M USD LIBOR + 1.00%),
4.02%, 12/05/24(g) | | | 1,156,000 | | | | 1,251,306 | |
3.13%, 1/23/25 | | | 14,000 | | | | 14,816 | |
3.90%, 7/15/25 | | | 162,000 | | | | 178,330 | |
(SOFR + 1.16%),
2.30%, 10/15/25(g) | | | 195,000 | | | | 199,057 | |
(SOFR + 1.85%),
2.08%, 4/22/26(g) | | | 200,000 | | | | 202,809 | |
2.95%, 10/01/26 | | | 10,000 | | | | 10,487 | |
4.12%, 12/15/26 | | | 5,000 | | | | 5,525 | |
(3M USD LIBOR + 1.25%),
3.96%, 1/29/27(g) | | | 250,000 | | | | 276,954 | |
4.25%, 10/01/27 | | | 9,000 | | | | 10,064 | |
(3M USD LIBOR + 1.34%),
3.78%, 2/01/28(g) | | | 362,000 | | | | 395,617 | |
| | | | | | | | |
| | | Par(a) | | | Value | |
| | |
Banks (Continued) | | | | | | | | |
JPMorgan Chase & Co., | | | | | | | | |
(3M USD LIBOR + 1.38%),
3.54%, 5/01/28(g) | | $ | 263,000 | | | $ | 283,479 | |
(3M USD LIBOR + 1.12%),
4.00%, 4/23/29(g) | | | 10,000 | | | | 11,130 | |
(3M USD LIBOR + 1.33%),
4.45%, 12/05/29(g) | | | 840,000 | | | | 970,458 | |
(3M USD LIBOR + 1.16%),
3.70%, 5/06/30(g) | | | 147,000 | | | | 162,547 | |
(SOFR + 1.51%),
2.74%, 10/15/30(g) | | | 13,000 | | | | 13,466 | |
(SOFR + 2.04%),
2.52%, 4/22/31(g) | | | 110,000 | | | | 112,468 | |
(3M USD LIBOR + 1.36%),
3.88%, 7/24/38(g) | | | 33,000 | | | | 37,282 | |
4.95%, 6/01/45 | | | 220,000 | | | | 278,977 | |
(SOFR + 2.44%),
3.11%, 4/22/51(g) | | | 315,000 | | | | 326,190 | |
KeyBank N.A., 3.38%, 3/07/23 | | | 250,000 | | | | 263,280 | |
KeyCorp, | | | | | | | | |
4.15%, 10/29/25 | | | 18,000 | | | | 19,866 | |
4.10%, 4/30/28 | | | 2,000 | | | | 2,181 | |
2.55%, 10/01/29 | | | 61,000 | | | | 58,800 | |
Morgan Stanley, | | | | | | | | |
2.63%, 11/17/21 | | | 111,000 | | | | 112,766 | |
2.75%, 5/19/22 | | | 92,000 | | | | 94,245 | |
3.13%, 1/23/23 | | | 62,000 | | | | 64,488 | |
(3M USD LIBOR + 0.85%),
3.74%, 4/24/24(g) | | | 2,000 | | | | 2,121 | |
(SOFR + 1.99%), 2.19%,
4/28/26(g) | | | 655,000 | | | | 663,008 | |
3.63%, 1/20/27 | | | 539,000 | | | | 586,336 | |
(3M USD LIBOR + 1.34%),
3.59%, 7/22/28(g) | | | 101,000 | | | | 109,524 | |
(3M USD LIBOR + 1.14%),
3.77%, 1/24/29(g) | | | 110,000 | | | | 120,804 | |
(3M USD LIBOR + 1.63%),
4.43%, 1/23/30(g) | | | 260,000 | | | | 300,719 | |
(SOFR + 1.14%),
2.70%, 1/22/31(g) | | | 432,000 | | | | 441,439 | |
(SOFR + 3.12%),
3.62%, 4/01/31(g) | | | 360,000 | | | | 395,073 | |
(SOFR + 4.84%),
5.60%, 3/24/51(g) | | | 40,000 | | | | 57,477 | |
National Securities Clearing Corp., 1.20%, 4/23/23(b) | | | 250,000 | | | | 250,114 | |
State Street Corp., | | | | | | | | |
(3M USD LIBOR + 2.54%),
5.62%, 12/15/23(g)(h) | | | 292,000 | | | | 284,700 | |
(3M USD LIBOR + 0.77%),
3.78%, 12/03/24(g) | | | 16,000 | | | | 17,326 | |
3.55%, 8/18/25 | | | 25,000 | | | | 27,456 | |
See accompanying Notes to Financial Statements
84
Morningstar Funds Trust April 30, 2020
Schedule of Investments (continued)
Morningstar Total Return Bond Fund
| | | | | | | | |
| | | Par(a) | | | Value | |
| | |
Banks (Continued) | | | | | | | | |
State Street Corp., | | | | | | | | |
2.65%, 5/19/26 | | $ | 18,000 | | | $ | 18,983 | |
(SOFR + 2.65%),
3.15%, 3/30/31(b)(g) | | | 3,000 | | | | 3,284 | |
Truist Bank, | | | | | | | | |
2.80%, 5/17/22 | | | 60,000 | | | | 61,878 | |
3.20%, 4/01/24 | | | 1,000 | | | | 1,055 | |
U.S. Bancorp, | | | | | | | | |
2.95%, 7/15/22 | | | 86,000 | | | | 89,113 | |
2.40%, 7/30/24 | | | 105,000 | | | | 109,426 | |
3.10%, 4/27/26 | | | 12,000 | | | | 12,748 | |
3.15%, 4/27/27 | | | 2,000 | | | | 2,174 | |
Wells Fargo & Co., | | | | | | | | |
2.10%, 7/26/21 | | | 158,000 | | | | 159,391 | |
3.75%, 1/24/24 | | | 160,000 | | | | 170,770 | |
3.55%, 9/29/25 | | | 148,000 | | | | 159,846 | |
(3M USD LIBOR + 0.83%), 2.41%, 10/30/25(g) | | | 56,000 | | | | 56,855 | |
3.00%, 4/22/26 | | | 234,000 | | | | 245,314 | |
(SOFR + 2.00%),
2.19%, 4/30/26(g) | | | 200,000 | | | | 201,290 | |
3.00%, 10/23/26 | | | 81,000 | | | | 84,753 | |
(3M USD LIBOR + 1.17%), 3.20%, 6/17/27(g) | | | 30,000 | | | | 31,721 | |
4.30%, 7/22/27 | | | 270,000 | | | | 294,365 | |
(3M USD LIBOR + 1.31%),
3.58%, 5/22/28(g) | | | 383,000 | | | | 411,566 | |
4.15%, 1/24/29 | | | 820,000 | | | | 927,697 | |
(3M USD LIBOR + 1.17%), 2.88%, 10/30/30(g) | | | 250,000 | | | | 255,823 | |
(3M USD LIBOR + 3.77%), 4.48%, 4/04/31(g) | | | 80,000 | | | | 92,848 | |
(SOFR + 2.53%),
3.07%, 4/30/41(g) | | | 260,000 | | | | 257,904 | |
4.40%, 6/14/46 | | | 40,000 | | | | 45,078 | |
4.75%, 12/07/46 | | | 370,000 | | | | 438,644 | |
(3M USD LIBOR + 4.24%), 5.01%, 4/04/51(g) | | | 1,000,000 | | | | 1,312,837 | |
Wells Fargo Bank N.A., (3M USD LIBOR + 0.61%),
2.90%, 5/27/22(g) | | | 260,000 | | | | 263,702 | |
| | |
| | | | | | | | 30,649,063 | |
| | |
Beverages – 0.3% | | | | | | | | |
Coca-Cola (The) Co., | | | | | | | | |
2.20%, 5/25/22 | | | 4,000 | | | | 4,127 | |
2.95%, 3/25/25 | | | 50,000 | | | | 54,295 | |
2.25%, 9/01/26 | | | 75,000 | | | | 79,649 | |
1.45%, 6/01/27 | | | 80,000 | | | | 80,019 | |
4.12%, 3/25/40 | | | 30,000 | | | | 37,392 | |
4.20%, 3/25/50 | | | 250,000 | | | | 323,631 | |
Keurig Dr. Pepper, Inc., 4.06%, 5/25/23 | | | 70,000 | | | | 75,041 | |
| | | | | | | | |
| | | Par(a) | | | Value | |
| | |
Beverages (Continued) | | | | | | | | |
Keurig Dr. Pepper, Inc., 3.40%, 11/15/25 | | $ | 120,000 | | | $ | 128,504 | |
Molson Coors Beverage Co., | | | | | | | | |
5.00%, 5/01/42 | | | 30,000 | | | | 32,632 | |
4.20%, 7/15/46 | | | 15,000 | | | | 14,191 | |
PepsiCo, Inc., | | | | | | | | |
0.75%, 5/01/23 | | | 120,000 | | | | 119,779 | |
2.25%, 3/19/25 | | | 80,000 | | | | 84,672 | |
2.63%, 3/19/27 | | | 10,000 | | | | 10,799 | |
1.63%, 5/01/30 | | | 110,000 | | | | 108,822 | |
4.45%, 4/14/46 | | | 40,000 | | | | 52,782 | |
3.45%, 10/06/46 | | | 10,000 | | | | 11,466 | |
3.37%, 7/29/49 | | | 17,000 | | | | 19,395 | |
2.88%, 10/15/49 | | | 40,000 | | | | 42,878 | |
3.62%, 3/19/50 | | | 20,000 | | | | 24,136 | |
3.87%, 3/19/60 | | | 30,000 | | | | 37,527 | |
| | |
| | | | | | | | 1,341,737 | |
| | |
Biotechnology – 0.2% | | | | | | | | |
Amgen, Inc., | | | | | | | | |
3.63%, 5/22/24 | | | 95,000 | | | | 103,389 | |
1.90%, 2/21/25 | | | 50,000 | | | | 51,171 | |
2.20%, 2/21/27 | | | 20,000 | | | | 20,533 | |
2.45%, 2/21/30 | | | 77,000 | | | | 79,356 | |
4.95%, 10/01/41 | | | 19,000 | | | | 24,567 | |
5.15%, 11/15/41 | | | 16,000 | | | | 21,485 | |
4.40%, 5/01/45 | | | 98,000 | | | | 120,103 | |
4.66%, 6/15/51 | | | 27,000 | | | | 35,327 | |
Baxalta, Inc., 5.25%, 6/23/45 | | | 9,000 | | | | 12,635 | |
Biogen, Inc., 2.25%, 5/01/30 | | | 48,000 | | | | 47,935 | |
Gilead Sciences, Inc., | | | | | | | | |
3.50%, 2/01/25 | | | 132,000 | | | | 145,192 | |
4.60%, 9/01/35 | | | 71,000 | | | | 91,610 | |
4.80%, 4/01/44 | | | 25,000 | | | | 32,973 | |
4.50%, 2/01/45 | | | 17,000 | | | | 21,930 | |
4.75%, 3/01/46 | | | 80,000 | | | | 108,084 | |
| | |
| | | | | | | | 916,290 | |
| | |
Building Materials – 0.2% | | | | | | | | |
Carrier Global Corp., | | | | | | | | |
1.92%, 2/15/23(b) | | | 219,000 | | | | 220,371 | |
2.24%, 2/15/25(b) | | | 370,000 | | | | 367,284 | |
2.49%, 2/15/27(b) | | | 20,000 | | | | 19,161 | |
2.72%, 2/15/30(b) | | | 170,000 | | | | 160,682 | |
3.38%, 4/05/40(b) | | | 160,000 | | | | 143,444 | |
3.58%, 4/05/50(b) | | | 60,000 | | | | 54,117 | |
Johnson Controls International PLC, 4.63%, 7/02/44 | | | 20,000 | | | | 22,313 | |
See accompanying Notes to Financial Statements
85
Morningstar Funds Trust April 30, 2020
Schedule of Investments (continued)
Morningstar Total Return Bond Fund
| | | | | | | | | | | | |
| | | | | | Par(a) | | | Value | |
| |
Building Materials (Continued) | | | | | |
Masonite International Corp., 5.38%, 2/01/28(b) | | | | | | $ | 23,000 | | | $ | 21,907 | |
Owens Corning, | | | | | | | | | | | | |
3.95%, 8/15/29 | | | | | | | 30,000 | | | | 31,066 | |
4.30%, 7/15/47 | | | | | | | 4,000 | | | | 3,847 | |
Standard Industries, Inc., | | | | | | | | | | | | |
6.00%, 10/15/25(b) | | | | | | | 10,000 | | | | 10,300 | |
5.00%, 2/15/27(b) | | | | | | | 23,000 | | | | 23,057 | |
4.75%, 1/15/28(b) | | | | | | | 9,000 | | | | 8,804 | |
Summit Materials LLC/Summit Materials Finance Corp.,
6.12%, 7/15/23 | | | | | | | 22,000 | | | | 22,021 | |
U.S. Concrete, Inc.,
6.37%, 6/01/24 | | | | | | | 20,000 | | | | 18,885 | |
| | | |
| | | | | | | | | | | | 1,127,259 | |
| | | |
Chemicals – 0.1% | | | | | | | | | | | | |
Dow Chemical (The) Co., | | | | | | | | | | | | |
4.55%, 11/30/25 | | | | | | | 26,000 | | | | 28,339 | |
1.88%, 3/15/40 | | | EUR | | | | 200,000 | | | | 197,060 | |
DuPont de Nemours, Inc.,
4.49%, 11/15/25 | | | | | | | 50,000 | | | | 55,065 | |
LYB International Finance III LLC, 4.20%, 10/15/49 | | | | | | | 50,000 | | | | 51,043 | |
RPM International, Inc., | | | | | | | | | | | | |
4.55%, 3/01/29 | | | | | | | 5,000 | | | | 5,241 | |
4.25%, 1/15/48 | | | | | | | 3,000 | | | | 2,860 | |
Sherwin-Williams (The) Co., | | | | | | | | | | | | |
4.20%, 1/15/22 | | | | | | | 205,000 | | | | 212,423 | |
2.95%, 8/15/29 | | | | | | | 6,000 | | | | 6,221 | |
4.00%, 12/15/42 | | | | | | | 18,000 | | | | 19,251 | |
3.30%, 5/15/50 | | | | | | | 5,000 | | | | 5,116 | |
| | | |
| | | | | | | | | | | | 582,619 | |
|
Commercial Services – 0.2% | |
Cintas Corp. No. 2, | | | | | | | | | | | | |
2.90%, 4/01/22 | | | | | | | 20,000 | | | | 20,638 | |
3.70%, 4/01/27 | | | | | | | 20,000 | | | | 21,617 | |
Claremont Mckenna College, 3.38%, 1/01/50 | | | | 45,000 | | | | 45,465 | |
Conservation Fund A Nonprofit (The) Corp., 3.47%, 12/15/29 | | | | | | | 18,000 | | | | 19,122 | |
Global Payments, Inc., | | | | | | | | | | | | |
3.80%, 4/01/21 | | | | | | | 2,000 | | | | 2,028 | |
3.75%, 6/01/23 | | | | | | | 30,000 | | | | 31,608 | |
4.80%, 4/01/26 | | | | | | | 47,000 | | | | 53,739 | |
Herc Holdings, Inc.,
5.50%, 7/15/27(b) | | | | | | | 50,000 | | | | 46,870 | |
Moody’s Corp.,
2.75%, 12/15/21 | | | | | | | 2,000 | | | | 2,038 | |
| | | | | | | | | | | | |
| | | | | | Par(a) | | | Value | |
|
Commercial Services (Continued) | |
Moody’s Corp., | | | | | | | | | | | | |
4.87%, 2/15/24 | | | | | | $ | 78,000 | | | $ | 86,414 | |
3.75%, 3/24/25 | | | | | | | 64,000 | | | | 69,117 | |
Nielsen (The) Co. Luxembourg S.a.r.l., 5.00%, 2/01/25(b) | | | | | | | 20,000 | | | | 19,300 | |
PayPal Holdings, Inc., | | | | | | | | | | | | |
2.40%, 10/01/24 | | | | | | | 35,000 | | | | 36,330 | |
2.65%, 10/01/26 | | | | | | | 45,000 | | | | 47,204 | |
President & Fellows of Harvard College, 4.87%, 10/15/40 | | | | | | | 147,000 | | | | 202,407 | |
United Rentals North America, Inc., | | | | | | | | | | | | |
4.63%, 10/15/25 | | | | | | | 32,000 | | | | 31,440 | |
5.87%, 9/15/26 | | | | | | | 44,000 | | | | 45,210 | |
6.50%, 12/15/26 | | | | | | | 51,000 | | | | 52,785 | |
5.50%, 5/15/27 | | | | | | | 44,000 | | | | 44,440 | |
3.88%, 11/15/27 | | | | | | | 7,000 | | | | 6,843 | |
4.88%, 1/15/28 | | | | | | | 71,000 | | | | 71,156 | |
5.25%, 1/15/30 | | | | | | | 7,000 | | | | 7,017 | |
| | | |
| | | | | | | | | | | | 962,788 | |
| | | |
Computers – 0.6% | | | | | | | | | | | | |
Apple, Inc., | | | | | | | | | | | | |
2.85%, 2/23/23 | | | | | | | 30,000 | | | | 31,666 | |
2.75%, 1/13/25 | | | | | | | 21,000 | | | | 22,681 | |
2.45%, 8/04/26 | | | | | | | 100,000 | | | | 107,427 | |
2.90%, 9/12/27 | | | | | | | 250,000 | | | | 272,922 | |
3.85%, 5/04/43 | | | | | | | 144,000 | | | | 173,667 | |
Dell International LLC/EMC Corp., | | | | | | | | | | | | |
4.42%, 6/15/21(b) | | | | | | | 360,000 | | | | 365,846 | |
5.85%, 7/15/25(b) | | | | | | | 20,000 | | | | 21,755 | |
8.10%, 7/15/36(b) | | | | | | | 70,000 | | | | 85,462 | |
8.35%, 7/15/46(b) | | | | | | | 5,000 | | | | 6,245 | |
DXC Technology Co.,
4.00%, 4/15/23 | | | | | | | 75,000 | | | | 75,170 | |
Hewlett Packard Enterprise Co., | | | | | | | | | | | | |
4.40%, 10/15/22 | | | | | | | 350,000 | | | | 367,306 | |
4.45%, 10/02/23 | | | | | | | 250,000 | | | | 263,235 | |
4.65%, 10/01/24 | | | | | | | 145,000 | | | | 153,993 | |
HP, Inc., 6.00%, 9/15/41 | | | | | | | 20,000 | | | | 22,100 | |
International Business Machines Corp., | | | | | | | | | | | | |
3.00%, 5/15/24 | | | | | | | 420,000 | | | | 449,720 | |
3.30%, 5/15/26 | | | | | | | 230,000 | | | | 253,595 | |
1.95%, 5/15/30 | | | | | | | 100,000 | | | | 99,629 | |
4.15%, 5/15/39 | | | | | | | 100,000 | | | | 116,863 | |
1.20%, 2/11/40 | | | EUR | | | | 100,000 | | | | 110,245 | |
2.85%, 5/15/40 | | | | | | | 100,000 | | | | 99,139 | |
See accompanying Notes to Financial Statements
86
Morningstar Funds Trust April 30, 2020
Schedule of Investments (continued)
Morningstar Total Return Bond Fund
| | | | | | | | |
| | | Par(a) | | | Value | |
| | |
Computers (Continued) | | | | | | | | |
Seagate HDD Cayman,
5.75%, 12/01/34 | | $ | 20,000 | | | $ | 20,269 | |
| | |
| | | | | | | | 3,118,935 | |
|
Cosmetics/Personal Care – 0.1% | |
Procter & Gamble (The) Co., | | | | | | | | |
2.45%, 3/25/25 | | | 50,000 | | | | 53,573 | |
2.80%, 3/25/27 | | | 20,000 | | | | 21,999 | |
3.00%, 3/25/30 | | | 60,000 | | | | 68,173 | |
3.55%, 3/25/40 | | | 70,000 | | | | 84,200 | |
3.60%, 3/25/50 | | | 110,000 | | | | 139,948 | |
| | |
| | | | | | | | 367,893 | |
| | |
Distribution/Wholesale – 0.1% | | | | | | | | |
American Builders & Contractors Supply Co., Inc., | | | | | | | | |
5.87%, 5/15/26(b) | | | 25,000 | | | | 24,750 | |
4.00%, 1/15/28(b) | | | 33,000 | | | | 31,311 | |
H&E Equipment Services, Inc.,
5.62%, 9/01/25 | | | 81,000 | | | | 77,161 | |
HD Supply, Inc.,
5.38%, 10/15/26(b) | | | 25,000 | | | | 25,497 | |
KAR Auction Services, Inc.,
5.13%, 6/01/25(b) | | | 40,000 | | | | 34,068 | |
Performance Food Group, Inc.,
5.50%, 10/15/27(b) | | | 44,000 | | | | 41,801 | |
| | |
| | | | | | | | 234,588 | |
|
Diversified Financial Services – 0.6% | |
American Express Co., | | | | | | | | |
3.38%, 5/17/21 | | | 5,000 | | | | 5,092 | |
3.40%, 2/22/24 | | | 299,000 | | | | 316,881 | |
2.50%, 7/30/24 | | | 410,000 | | | | 421,809 | |
4.20%, 11/06/25 | | | 181,000 | | | | 203,819 | |
3.13%, 5/20/26 | | | 155,000 | | | | 166,549 | |
American Express Credit Corp., | | | | | | | | |
2.25%, 5/05/21 | | | 76,000 | | | | 76,796 | |
2.70%, 3/03/22 | | | 2,000 | | | | 2,050 | |
Capital One Financial Corp., | | | | | | | | |
3.45%, 4/30/21 | | | 7,000 | | | | 7,100 | |
4.75%, 7/15/21 | | | 22,000 | | | | 22,710 | |
3.75%, 3/09/27 | | | 45,000 | | | | 45,795 | |
Charles Schwab (The) Corp., | | | | | | | | |
3.85%, 5/21/25 | | | 5,000 | | | | 5,623 | |
3.20%, 3/02/27 | | | 44,000 | | | | 46,891 | |
Discover Financial Services,
4.50%, 1/30/26 | | | 30,000 | | | | 31,198 | |
| | | | | | | | |
| | | Par(a) | | | Value | |
|
Diversified Financial Services (Continued) | |
Intercontinental Exchange, Inc., | | | | | | | | |
4.00%, 10/15/23 | | $ | 15,000 | | | $ | 16,537 | |
3.75%, 12/01/25 | | | 10,000 | | | | 11,056 | |
3.10%, 9/15/27 | | | 22,000 | | | | 23,807 | |
3.75%, 9/21/28 | | | 54,000 | | | | 61,790 | |
International Lease Finance Corp., 5.87%, 8/15/22 | | | 230,000 | | | | 224,513 | |
Mastercard, Inc., | | | | | | | | |
3.30%, 3/26/27 | | | 70,000 | | | | 78,046 | |
2.95%, 6/01/29 | | | 85,000 | | | | 93,294 | |
3.35%, 3/26/30 | | | 112,000 | | | | 127,518 | |
3.85%, 3/26/50 | | | 27,000 | | | | 33,673 | |
Nationstar Mortgage Holdings, Inc., | | | | | | | | |
8.12%, 7/15/23(b) | | | 40,000 | | | | 38,400 | |
9.12%, 7/15/26(b) | | | 33,000 | | | | 31,556 | |
Navient Corp., | | | | | | | | |
5.87%, 3/25/21 | | | 23,000 | | | | 22,598 | |
6.62%, 7/26/21 | | | 27,000 | | | | 26,865 | |
6.50%, 6/15/22 | | | 36,000 | | | | 34,830 | |
7.25%, 9/25/23 | | | 22,000 | | | | 21,065 | |
5.88%, 10/25/24 | | | 20,000 | | | | 18,200 | |
6.75%, 6/25/25 | | | 21,000 | | | | 19,425 | |
6.75%, 6/15/26 | | | 20,000 | | | | 18,050 | |
Nuveen LLC, 4.00%, 11/01/28(b) | | | 100,000 | | | | 115,535 | |
Quicken Loans, Inc., | | | | | | | | |
5.75%, 5/01/25(b) | | | 43,000 | | | | 42,140 | |
5.25%, 1/15/28(b) | | | 44,000 | | | | 42,715 | |
Synchrony Financial, | | | | | | | | |
4.38%, 3/19/24 | | | 83,000 | | | | 81,551 | |
4.50%, 7/23/25 | | | 2,000 | | | | 1,964 | |
USAA Capital Corp., 2.13%, 5/01/30(b) | | | 150,000 | | | | 154,791 | |
Visa, Inc., | | | | | | | | |
3.15%, 12/14/25 | | | 241,000 | | | | 266,056 | |
1.90%, 4/15/27 | | | 100,000 | | | | 103,466 | |
2.75%, 9/15/27 | | | 79,000 | | | | 85,650 | |
2.70%, 4/15/40 | | | 98,000 | | | | 101,870 | |
4.30%, 12/14/45 | | | 70,000 | | | | 92,685 | |
| | |
| | | | | | | | 3,341,959 | |
| | |
Electric – 1.7% | | | | | | | | |
AEP Texas, Inc., | | | | | | | | |
3.95%, 6/01/28 | | | 163,000 | | | | 183,634 | |
3.45%, 1/15/50 | | | 10,000 | | | | 11,015 | |
AEP Transmission Co. LLC, | | | | | | | | |
3.75%, 12/01/47 | | | 54,000 | | | | 64,091 | |
3.80%, 6/15/49 | | | 65,000 | | | | 78,284 | |
3.15%, 9/15/49 | | | 40,000 | | | | 44,069 | |
See accompanying Notes to Financial Statements
87
Morningstar Funds Trust April 30, 2020
Schedule of Investments (continued)
Morningstar Total Return Bond Fund
| | | | | | | | |
| | | Par(a) | | | Value | |
| | |
Electric (Continued) | | | | | | | | |
Alabama Power Co., | | | | | | | | |
3.55%, 12/01/23 | | $ | 10,000 | | | $ | 10,824 | |
3.85%, 12/01/42 | | | 40,000 | | | | 45,746 | |
3.75%, 3/01/45 | | | 106,000 | | | | 122,305 | |
Ameren Illinois Co., | | | | | | | | |
3.80%, 5/15/28 | | | 46,000 | | | | 52,386 | |
3.25%, 3/15/50 | | | 60,000 | | | | 67,286 | |
Baltimore Gas & Electric Co., | | | | | | | | |
3.50%, 8/15/46 | | | 49,000 | | | | 55,386 | |
3.75%, 8/15/47 | | | 62,000 | | | | 72,696 | |
4.25%, 9/15/48 | | | 10,000 | | | | 12,733 | |
3.20%, 9/15/49 | | | 40,000 | | | | 43,707 | |
Calpine Corp., 5.50%, 2/01/24 | | | 20,000 | | | | 19,825 | |
CenterPoint Energy Houston Electric LLC, | | | | | | | | |
3.55%, 8/01/42 | | | 23,000 | | | | 26,311 | |
4.50%, 4/01/44 | | | 8,000 | | | | 10,187 | |
4.25%, 2/01/49 | | | 2,000 | | | | 2,578 | |
Commonwealth Edison Co., | | | | | | | | |
2.95%, 8/15/27 | | | 11,000 | | | | 11,851 | |
4.60%, 8/15/43 | | | 5,000 | | | | 6,436 | |
Consolidated Edison Co. of New York, Inc., | | | | | | | | |
3.35%, 4/01/30 | | | 50,000 | | | | 54,994 | |
3.95%, 4/01/50 | | | 20,000 | | | | 23,903 | |
Consumers Energy Co., | | | | | | | | |
3.25%, 8/15/46 | | | 18,000 | | | | 20,565 | |
3.75%, 2/15/50 | | | 53,000 | | | | 66,978 | |
3.10%, 8/15/50 | | | 85,000 | | | | 96,881 | |
3.50%, 8/01/51 | | | 75,000 | | | | 90,953 | |
Dayton Power & Light (The) Co., 3.95%, 6/15/49 | | | 81,000 | | | | 87,955 | |
DTE Electric Co., | | | | | | | | |
4.05%, 5/15/48 | | | 10,000 | | | | 12,505 | |
3.95%, 3/01/49 | | | 98,000 | | | | 121,648 | |
Duke Energy Carolinas LLC, | | | | | | | | |
3.05%, 3/15/23 | | | 15,000 | | | | 15,825 | |
3.95%, 11/15/28 | | | 28,000 | | | | 32,816 | |
2.45%, 8/15/29 | | | 75,000 | | | | 79,611 | |
2.45%, 2/01/30 | | | 74,000 | | | | 78,828 | |
5.30%, 2/15/40 | | | 25,000 | | | | 34,618 | |
4.00%, 9/30/42 | | | 62,000 | | | | 74,124 | |
3.70%, 12/01/47 | | | 10,000 | | | | 12,042 | |
3.95%, 3/15/48 | | | 7,000 | | | | 8,689 | |
3.20%, 8/15/49 | | | 55,000 | | | | 61,853 | |
Duke Energy Florida LLC, | | | | | | | | |
3.80%, 7/15/28 | | | 40,000 | | | | 45,786 | |
2.50%, 12/01/29 | | | 220,000 | | | | 235,652 | |
6.40%, 6/15/38 | | | 35,000 | | | | 54,264 | |
| | | | | | | | |
| | | Par(a) | | | Value | |
| | |
Electric (Continued) | | | | | | | | |
Duke Energy Florida LLC, | | | | | | | | |
3.85%, 11/15/42 | | $ | 53,000 | | | $ | 61,638 | |
3.40%, 10/01/46 | | | 10,000 | | | | 11,178 | |
Duke Energy Ohio, Inc., 3.65%, 2/01/29 | | | 200,000 | | | | 229,766 | |
Duke Energy Progress LLC, | | | | | | | | |
3.00%, 9/15/21 | | | 22,000 | | | | 22,450 | |
3.25%, 8/15/25 | | | 65,000 | | | | 71,157 | |
3.70%, 9/01/28 | | | 159,000 | | | | 183,148 | |
3.45%, 3/15/29 | | | 84,000 | | | | 95,428 | |
4.10%, 5/15/42 | | | 40,000 | | | | 48,464 | |
4.10%, 3/15/43 | | | 30,000 | | | | 35,940 | |
3.70%, 10/15/46 | | | 25,000 | | | | 29,275 | |
Edison International, | | | | | | | | |
3.13%, 11/15/22 | | | 15,000 | | | | 15,338 | |
3.55%, 11/15/24 | | | 60,000 | | | | 62,909 | |
Entergy Louisiana LLC, | | | | | | | | |
5.40%, 11/01/24 | | | 18,000 | | | | 20,686 | |
4.20%, 9/01/48 | | | 96,000 | | | | 123,118 | |
Eversource Energy, 2.90%, 10/01/24 | | | 44,000 | | | | 46,012 | |
Exelon Corp., 5.10%, 6/15/45 | | | 29,000 | | | | 37,227 | |
FirstEnergy Corp., | | | | | | | | |
4.25%, 3/15/23 | | | 110,000 | | | | 119,022 | |
2.05%, 3/01/25 | | | 22,000 | | | | 22,040 | |
3.90%, 7/15/27 | | | 340,000 | | | | 374,268 | |
2.65%, 3/01/30 | | | 36,000 | | | | 36,601 | |
7.37%, 11/15/31 | | | 410,000 | | | | 601,531 | |
4.85%, 7/15/47 | | | 100,000 | | | | 129,017 | |
3.40%, 3/01/50 | | | 51,000 | | | | 54,311 | |
FirstEnergy Transmission LLC, | | | | | | | | |
4.35%, 1/15/25(b) | | | 244,000 | | | | 269,886 | |
4.55%, 4/01/49(b) | | | 84,000 | | | | 99,585 | |
Florida Power & Light Co., (3M USD LIBOR + 0.40%), | | | | | | | | |
0.94%, 5/06/22(d) | | | 370,000 | | | | 366,711 | |
2.85%, 4/01/25 | | | 10,000 | | | | 10,836 | |
5.25%, 2/01/41 | | | 5,000 | | | | 6,842 | |
3.70%, 12/01/47 | | | 98,000 | | | | 121,028 | |
3.95%, 3/01/48 | | | 55,000 | | | | 70,347 | |
3.15%, 10/01/49 | | | 70,000 | | | | 80,400 | |
ITC Holdings Corp., 2.70%, 11/15/22 | | | 65,000 | | | | 66,570 | |
MidAmerican Energy Co., | | | | | | | | |
3.65%, 4/15/29 | | | 265,000 | | | | 308,071 | |
4.25%, 7/15/49 | | | 55,000 | | | | 73,510 | |
3.15%, 4/15/50 | | | 40,000 | | | | 45,337 | |
Northern States Power Co., 3.40%, 8/15/42 | | | 78,000 | | | | 89,444 | |
See accompanying Notes to Financial Statements
88
Morningstar Funds Trust April 30, 2020
Schedule of Investments (continued)
Morningstar Total Return Bond Fund
| | | | | | | | |
| | | Par(a) | | | Value | |
| | |
Electric (Continued) | | | | | | | | |
Northern States Power Co.,
2.90%, 3/01/50 | | $ | 50,000 | | | $ | 54,818 | |
NRG Energy, Inc., | | | | | | | | |
7.25%, 5/15/26 | | | 44,000 | | | | 47,300 | |
6.62%, 1/15/27 | | | 54,000 | | | | 57,645 | |
5.75%, 1/15/28 | | | 36,000 | | | | 38,700 | |
5.25%, 6/15/29(b) | | | 32,000 | | | | 34,240 | |
4.45%, 6/15/29(b) | | | 25,000 | | | | 25,691 | |
NSTAR Electric Co., | | | | | | | | |
3.20%, 5/15/27 | | | 17,000 | | | | 18,695 | |
3.25%, 5/15/29 | | | 10,000 | | | | 11,275 | |
Ohio Power Co., | | | | | | | | |
6.60%, 2/15/33 | | | 60,000 | | | | 82,770 | |
4.15%, 4/01/48 | | | 14,000 | | | | 17,149 | |
4.00%, 6/01/49 | | | 20,000 | | | | 24,868 | |
Oncor Electric Delivery Co. LLC, | | | | | | | | |
3.70%, 11/15/28 | | | 75,000 | | | | 87,449 | |
5.75%, 3/15/29 | | | 44,000 | | | | 57,870 | |
4.55%, 12/01/41 | | | 10,000 | | | | 13,062 | |
5.30%, 6/01/42 | | | 18,000 | | | | 25,858 | |
3.80%, 6/01/49 | | | 20,000 | | | | 25,036 | |
3.10%, 9/15/49 | | | 20,000 | | | | 22,581 | |
Progress Energy, Inc., 7.75%, 3/01/31 | | | 180,000 | | | | 255,810 | |
Public Service Electric & Gas Co., | | | | | | | | |
3.00%, 5/15/25 | | | 9,000 | | | | 9,663 | |
3.00%, 5/15/27 | | | 15,000 | | | | 16,228 | |
3.70%, 5/01/28 | | | 14,000 | | | | 15,951 | |
3.65%, 9/01/28 | | | 3,000 | | | | 3,430 | |
3.20%, 5/15/29 | | | 80,000 | | | | 89,701 | |
Southern California Edison Co., | | | | | | | | |
2.90%, 3/01/21 | | | 30,000 | | | | 30,276 | |
1.85%, 2/01/22 | | | 14,286 | | | | 14,235 | |
3.70%, 8/01/25 | | | 165,000 | | | | 179,691 | |
2.25%, 6/01/30 | | | 126,000 | | | | 123,974 | |
3.65%, 2/01/50 | | | 75,000 | | | | 81,533 | |
Tampa Electric Co., | | | | | | | | |
4.35%, 5/15/44 | | | 10,000 | | | | 11,884 | |
4.45%, 6/15/49 | | | 17,000 | | | | 21,400 | |
Trans-Allegheny Interstate Line Co.,
3.85%, 6/01/25(b) | | | 239,000 | | | | 266,228 | |
Virginia Electric & Power Co., | | | | | | | | |
3.45%, 9/01/22 | | | 62,000 | | | | 64,819 | |
2.75%, 3/15/23 | | | 90,000 | | | | 93,826 | |
3.50%, 3/15/27 | | | 79,000 | | | | 88,124 | |
4.45%, 2/15/44 | | | 105,000 | | | | 132,814 | |
| | | | | | | | |
| | | Par(a) | | | Value | |
| | |
Electric (Continued) | | | | | | | | |
Virginia Electric & Power Co.,
3.30%, 12/01/49 | | $ | 26,000 | | | $ | 28,801 | |
Vistra Operations Co. LLC, | | | | | | | | |
5.50%, 9/01/26(b) | | | 44,000 | | | | 45,298 | |
5.63%, 2/15/27(b) | | | 58,000 | | | | 61,045 | |
5.00%, 7/31/27(b) | | | 56,000 | | | | 57,114 | |
4.30%, 7/15/29(b) | | | 165,000 | | | | 164,027 | |
| | |
| | | | | | | | 8,791,810 | |
| | |
Electronics – 0.1% | | | | | | | | |
Agilent Technologies, Inc., | | | | | | | | |
3.88%, 7/15/23 | | | 12,000 | | | | 12,665 | |
3.05%, 9/22/26 | | | 152,000 | | | | 158,485 | |
2.75%, 9/15/29 | | | 40,000 | | | | 41,459 | |
Honeywell International, Inc.,
2.70%, 8/15/29 | | | 127,000 | | | | 137,612 | |
| | |
| | | | | | | | 350,221 | |
| | |
Entertainment – 0.1% | | | | | | | | |
Caesars Resort Collection LLC/CRC Finco, Inc., 5.25%, 10/15/25(b) | | | 68,000 | | | | 53,400 | |
Cedar Fair L.P., 5.25%, 7/15/29(b) | | | 45,000 | | | | 38,700 | |
Cedar Fair L.P./Canada’s Wonderland Co./Magnum Management Corp./Millennium Operations LLC, | | | | | | | | |
5.50%, 5/01/25(b) | | | 27,000 | | | | 27,000 | |
5.37%, 4/15/27 | | | 43,000 | | | | 38,270 | |
Churchill Downs, Inc., | | | | | | | | |
5.50%, 4/01/27(b) | | | 50,000 | | | | 48,109 | |
4.75%, 1/15/28(b) | | | 25,000 | | | | 23,275 | |
Eldorado Resorts, Inc., 6.00%, 9/15/26 | | | 22,000 | | | | 22,103 | |
Scientific Games International, Inc., 5.00%, 10/15/25(b) | | | 43,000 | | | | 37,552 | |
Six Flags Entertainment Corp., | | | | | | | | |
4.88%, 7/31/24(b) | | | 44,000 | | | | 38,729 | |
5.50%, 4/15/27(b) | | | 25,000 | | | | 21,643 | |
Wynn Resorts Finance LLC/Wynn Resorts Capital Corp.,
5.13%, 10/01/29(b) | | | 37,000 | | | | 34,687 | |
| | |
| | | | | | | | 383,468 | |
| | |
Environmental Control – 0.3% | | | | | | | | |
Clean Harbors, Inc., 4.87%, 7/15/27(b) | | | 23,000 | | | | 23,748 | |
See accompanying Notes to Financial Statements
89
Morningstar Funds Trust April 30, 2020
Schedule of Investments (continued)
Morningstar Total Return Bond Fund
| | | | | | | | |
| | | Par(a) | | | Value | |
|
Environmental Control (Continued) | |
Republic Services, Inc., | | | | | | | | |
3.55%, 6/01/22 | | $ | 29,000 | | | $ | 30,265 | |
4.75%, 5/15/23 | | | 71,000 | | | | 78,096 | |
2.50%, 8/15/24 | | | 145,000 | | | | 150,970 | |
2.90%, 7/01/26 | | | 41,000 | | | | 43,572 | |
3.95%, 5/15/28 | | | 178,000 | | | | 203,041 | |
Waste Management, Inc., | | | | | | | | |
3.50%, 5/15/24 | | | 70,000 | | | | 75,804 | |
2.95%, 6/15/24 | | | 180,000 | | | | 192,003 | |
3.13%, 3/01/25 | | | 18,000 | | | | 19,370 | |
3.20%, 6/15/26 | | | 40,000 | | | | 43,859 | |
3.45%, 6/15/29 | | | 40,000 | | | | 45,446 | |
3.90%, 3/01/35 | | | 20,000 | | | | 23,534 | |
4.00%, 7/15/39 | | | 237,000 | | | | 284,175 | |
4.15%, 7/15/49 | | | 70,000 | | | | 89,019 | |
Waste Pro USA, Inc., 5.50%, 2/15/26(b) | | | 20,000 | | | | 19,800 | |
| | |
| | | | | | | | 1,322,702 | |
| | |
Food – 0.3% | | | | | | | | |
Albertsons Cos, Inc./Safeway, Inc./New Albertsons L.P./Albertsons LLC, | | | | | | | | |
3.50%, 2/15/23(b) | | | 33,000 | | | | 32,340 | |
6.62%, 6/15/24 | | | 43,000 | | | | 44,451 | |
5.75%, 3/15/25 | | | 104,000 | | | | 106,860 | |
7.50%, 3/15/26(b) | | | 55,000 | | | | 60,156 | |
4.63%, 1/15/27(b) | | | 12,000 | | | | 12,120 | |
5.87%, 2/15/28(b) | | | 39,000 | | | | 40,743 | |
4.88%, 2/15/30(b) | | | 9,000 | | | | 9,124 | |
General Mills, Inc., 2.88%, 4/15/30 | | | 5,000 | | | | 5,349 | |
JBS USA LUX S.A./JBS USA Finance, Inc., | | | | | | | | |
5.75%, 6/15/25(b) | | | 35,000 | | | | 35,394 | |
6.75%, 2/15/28(b) | | | 43,000 | | | | 46,051 | |
JBS USA LUX S.A./JBS USA Food Co./JBS USA Finance, Inc., | | | | | | | | |
6.50%, 4/15/29(b) | | | 66,000 | | | | 69,796 | |
5.50%, 1/15/30(b) | | | 11,000 | | | | 11,138 | |
Kraft Heinz Foods Co., 3.00%, 6/01/26 | | | 110,000 | | | | 109,330 | |
Kroger (The) Co., 2.65%, 10/15/26 | | | 57,000 | | | | 59,646 | |
Lamb Weston Holdings, Inc., | | | | | | | | |
4.63%, 11/01/24(b) | | | 37,000 | | | | 37,722 | |
4.87%, 11/01/26(b) | | | 37,000 | | | | 37,185 | |
Mars, Inc., | | | | | | | | |
2.70%, 4/01/25(b) | | | 90,000 | | | | 95,057 | |
3.20%, 4/01/30(b) | | | 180,000 | | | | 199,724 | |
| | | | | | | | |
| | | Par(a) | | | Value | |
| | |
Food (Continued) | | | | | | | | |
Mondelez International, Inc., | | | | | | | | |
2.13%, 4/13/23 | | $ | 170,000 | | | $ | 173,039 | |
1.50%, 5/04/25 | | | 90,000 | | | | 89,518 | |
Pilgrim’s Pride Corp., 5.87%, 9/30/27(b) | | | 73,000 | | | | 73,872 | |
Post Holdings, Inc., | | | | | | | | |
5.00%, 8/15/26(b) | | | 60,000 | | | | 59,292 | |
5.75%, 3/01/27(b) | | | 55,000 | | | | 56,306 | |
5.62%, 1/15/28(b) | | | 40,000 | | | | 40,700 | |
5.50%, 12/15/29(b) | | | 32,000 | | | | 32,160 | |
Simmons Foods, Inc., 5.75%, 11/01/24(b) | | | 21,000 | | | | 19,530 | |
| | |
| | | | | | | | 1,556,603 | |
| | |
Food Service – 0.0%(f) | | | | | | | | |
Aramark Services, Inc., | | | | | | | | |
4.75%, 6/01/26 | | | 22,000 | | | | 21,010 | |
5.00%, 2/01/28(b) | | | 51,000 | | | | 49,597 | |
| | |
| | | | | | | | 70,607 | |
| | |
Forest Products & Paper – 0.1% | | | | | | | | |
Georgia-Pacific LLC, | | | | | | | | |
3.73%, 7/15/23(b) | | | 18,000 | | | | 19,126 | |
3.60%, 3/01/25(b) | | | 126,000 | | | | 134,601 | |
1.75%, 9/30/25(b) | | | 5,000 | | | | 5,012 | |
7.38%, 12/01/25 | | | 45,000 | | | | 57,536 | |
2.10%, 4/30/27(b) | | | 6,000 | | | | 6,001 | |
7.75%, 11/15/29 | | | 18,000 | | | | 26,346 | |
8.87%, 5/15/31 | | | 13,000 | | | | 18,423 | |
International Paper Co., | | | | | | | | |
5.00%, 9/15/35 | | | 14,000 | | | | 16,500 | |
6.00%, 11/15/41 | | | 38,000 | | | | 48,157 | |
4.80%, 6/15/44 | | | 20,000 | | | | 22,526 | |
| | |
| | | | | | | | 354,228 | |
| | |
Gas – 0.0%(f) | | | | | | | | |
Atmos Energy Corp., | | | | | | | | |
4.12%, 10/15/44 | | | 5,000 | | | | 6,207 | |
3.38%, 9/15/49 | | | 30,000 | | | | 33,699 | |
Dominion Energy Gas Holdings LLC, 4.80%, 11/01/43 | | | 15,000 | | | | 16,331 | |
| | |
| | | | | | | | 56,237 | |
| | |
Hand/Machine Tools – 0.0%(f) | | | | | | | | |
Colfax Corp., 6.00%, 2/15/24(b) | | | 27,000 | | | | 27,405 | |
| | |
Healthcare - Products – 0.2% | | | | | | | | |
Abbott Laboratories, | | | | | | | | |
3.75%, 11/30/26 | | | 390,000 | | | | 450,202 | |
4.90%, 11/30/46 | | | 10,000 | | | | 14,083 | |
See accompanying Notes to Financial Statements
90
Morningstar Funds Trust April 30, 2020
Schedule of Investments (continued)
Morningstar Total Return Bond Fund
| | | | | | | | | | | | |
| | | | | | Par(a) | | | Value | |
|
Healthcare - Products (Continued) | |
Avantor, Inc., 6.00%, 10/01/24(b) | | | $ | 53,000 | | | $ | 55,889 | |
Boston Scientific Corp., 3.45%, 3/01/24 | | | | | | | 197,000 | | | | 208,721 | |
Covidien International Finance S.A., 2.95%, 6/15/23 | | | | | | | 35,000 | | | | 37,001 | |
Teleflex, Inc., 4.62%, 11/15/27 | | | | | | | 23,000 | | | | 23,575 | |
Thermo Fisher Scientific, Inc., | | | | | | | | | | | | |
3.00%, 4/15/23 | | | | | | | 15,000 | | | | 15,761 | |
4.13%, 3/25/25 | | | | | | | 100,000 | | | | 112,831 | |
2.95%, 9/19/26 | | | | | | | 8,000 | | | | 8,656 | |
4.50%, 3/25/30 | | | | | | | 13,000 | | | | 15,804 | |
1.88%, 10/01/49 | | | EUR | | | | 100,000 | | | | 110,971 | |
| | | | | | | | | | | | 1,053,494 | |
|
Healthcare - Services – 1.0% | |
Aetna, Inc., | | | | | | | | | | | | |
2.80%, 6/15/23 | | | | | | | 90,000 | | | | 93,445 | |
4.50%, 5/15/42 | | | | | | | 44,000 | | | | 50,229 | |
Anthem, Inc., | | | | | | | | | | | | |
2.95%, 12/01/22 | | | | | | | 30,000 | | | | 31,134 | |
3.65%, 12/01/27 | | | | | | | 107,000 | | | | 116,846 | |
4.10%, 3/01/28 | | | | | | | 42,000 | | | | 46,995 | |
2.88%, 9/15/29 | | | | | | | 5,000 | | | | 5,202 | |
Baylor Scott & White Holdings, 3.97%, 11/15/46 | | | | | | | 126,000 | | | | 143,476 | |
Centene Corp., | | | | | | | | | | | | |
5.25%, 4/01/25(b) | | | | | | | 37,000 | | | | 38,573 | |
5.37%, 6/01/26(b) | | | | | | | 78,000 | | | | 82,586 | |
5.37%, 8/15/26(b) | | | | | | | 32,000 | | | | 34,083 | |
4.25%, 12/15/27(b) | | | | | | | 108,000 | | | | 112,995 | |
4.63%, 12/15/29(b) | | | | | | | 32,000 | | | | 35,040 | |
Charles River Laboratories International, Inc., 4.25%, 5/01/28(b) | | | | | | | 5,000 | | | | 5,044 | |
Charles River Laboratories, Inc., 5.50%, 4/01/26(b) | | | | | | | 18,000 | | | | 18,763 | |
CHRISTUS Health, 4.34%, 7/01/28 | | | | | | | 735,000 | | | | 810,421 | |
Cottage Health Obligated Group, 3.30%, 11/01/49 | | | | | | | 2,000 | | | | 2,038 | |
DaVita, Inc., 5.00%, 5/01/25 | | | | | | | 63,000 | | | | 63,945 | |
Encompass Health Corp., | | | | | | | | | | | | |
4.50%, 2/01/28 | | | | | | | 20,000 | | | | 20,000 | |
4.75%, 2/01/30 | | | | | | | 20,000 | | | | 20,003 | |
HCA, Inc., | | | | | | | | | | | | |
4.75%, 5/01/23 | | | | | | | 143,000 | | | | 152,415 | |
5.00%, 3/15/24 | | | | | | | 150,000 | | | | 162,716 | |
| | | | | | | | | | | | |
| | | | | | Par(a) | | | Value | |
|
Healthcare - Services (Continued) | |
HCA, Inc., | | | | | | | | | | | | |
5.37%, 2/01/25 | | | | | | $ | 24,000 | | | $ | 25,803 | |
5.25%, 4/15/25 | | | | | | | 314,000 | | | | 350,478 | |
5.87%, 2/15/26 | | | | | | | 14,000 | | | | 15,649 | |
5.25%, 6/15/26 | | | | | | | 14,000 | | | | 15,610 | |
5.37%, 9/01/26 | | | | | | | 9,000 | | | | 9,743 | |
4.50%, 2/15/27 | | | | | | | 7,000 | | | | 7,574 | |
5.62%, 9/01/28 | | | | | | | 14,000 | | | | 15,513 | |
5.87%, 2/01/29 | | | | | | | 9,000 | | | | 10,312 | |
Humana, Inc., | | | | | | | | | | | | |
4.50%, 4/01/25 | | | | | | | 65,000 | | | | 72,538 | |
3.95%, 3/15/27 | | | | | | | 140,000 | | | | 153,443 | |
4.88%, 4/01/30 | | | | | | | 55,000 | | | | 66,068 | |
Molina Healthcare, Inc., 5.37%, 11/15/22 | | | | | | | 30,000 | | | | 31,013 | |
RWJ Barnabas Health, Inc., 3.48%, 7/01/49 | | | | | | | 20,000 | | | | 20,318 | |
Select Medical Corp., 6.25%, 8/15/26(b) | | | | 23,000 | | | | 22,151 | |
Tenet Healthcare Corp., | | | | | | | | | | | | |
4.63%, 7/15/24 | | | | | | | 62,000 | | | | 61,193 | |
4.63%, 9/01/24(b) | | | | | | | 25,000 | | | | 24,500 | |
5.12%, 5/01/25 | | | | | | | 117,000 | | | | 109,395 | |
4.87%, 1/01/26(b) | | | | | | | 90,000 | | | | 88,533 | |
6.25%, 2/01/27(b) | | | | | | | 129,000 | | | | 127,013 | |
5.12%, 11/01/27(b) | | | | | | | 14,000 | | | | 13,825 | |
UnitedHealth Group, Inc., | | | | | | | | | | | | |
2.38%, 10/15/22 | | | | | | | 20,000 | | | | 20,692 | |
3.50%, 6/15/23 | | | | | | | 30,000 | | | | 32,573 | |
2.38%, 8/15/24 | | | | | | | 25,000 | | | | 26,323 | |
3.75%, 7/15/25 | | | | | | | 418,000 | | | | 467,995 | |
3.70%, 12/15/25 | | | | | | | 16,000 | | | | 17,966 | |
3.10%, 3/15/26 | | | | | | | 115,000 | | | | 125,619 | |
2.95%, 10/15/27 | | | | | | | 145,000 | | | | 157,511 | |
3.85%, 6/15/28 | | | | | | | 186,000 | | | | 212,715 | |
3.88%, 12/15/28 | | | | | | | 110,000 | | | | 127,179 | |
2.88%, 8/15/29 | | | | | | | 7,000 | | | | 7,588 | |
5.70%, 10/15/40 | | | | | | | 25,000 | | | | 35,620 | |
4.75%, 7/15/45 | | | | | | | 52,000 | | | | 68,960 | |
4.25%, 6/15/48 | | | | | | | 30,000 | | | | 37,505 | |
4.45%, 12/15/48 | | | | | | | 20,000 | | | | 25,734 | |
3.70%, 8/15/49 | | | | | | | 185,000 | | | | 217,295 | |
3.88%, 8/15/59 | | | | | | | 70,000 | | | | 85,250 | |
| | | | | | | | | | | | 4,953,146 | |
| | | |
Home Builders – 0.0%(f) | | | | | | | | | | | | |
Century Communities, Inc., 6.75%, 6/01/27 | | | | | | | 22,000 | | | | 18,920 | |
Lennar Corp., | | | | | | | | | | | | |
4.75%, 4/01/21 | | | | | | | 17,000 | | | | 17,095 | |
4.13%, 1/15/22 | | | | | | | 19,000 | | | | 19,075 | |
See accompanying Notes to Financial Statements
91
Morningstar Funds Trust April 30, 2020
Schedule of Investments (continued)
Morningstar Total Return Bond Fund
| | | | | | | | |
| | | Par(a) | | | Value | |
| | |
Home Builders (Continued) | | | | | | | | |
Lennar Corp., | | | | | | | | |
4.50%, 4/30/24 | | $ | 23,000 | | | $ | 23,460 | |
4.75%, 5/30/25 | | | 5,000 | | | | 5,137 | |
4.75%, 11/29/27 | | | 8,000 | | | | 8,200 | |
PulteGroup, Inc., | | | | | | | | |
5.50%, 3/01/26 | | | 6,000 | | | | 6,383 | |
5.00%, 1/15/27 | | | 5,000 | | | | 5,199 | |
Taylor Morrison Communities, Inc., 5.87%, 6/15/27(b) | | | 5,000 | | | | 4,600 | |
| | | | | | | | 108,069 | |
| | |
Home Furnishings – 0.0%(f) | | | | | | | | |
Tempur Sealy International, Inc., 5.50%, 6/15/26 | | | 50,000 | | | | 47,652 | |
|
Household Products/Wares – 0.0%(f) | |
Clorox (The) Co., 3.10%, 10/01/27 | | | 15,000 | | | | 16,177 | |
Kimberly-Clark Corp., 3.10%, 3/26/30 | | | 30,000 | | | | 33,494 | |
Spectrum Brands, Inc., 5.75%, 7/15/25 | | | 36,000 | | | | 35,910 | |
| | | | | | | | 85,581 | |
| | |
Housewares – 0.0%(f) | | | | | | | | |
Newell Brands, Inc., | | | | | | | | |
4.35%, 4/01/23 | | | 68,000 | | | | 69,190 | |
4.70%, 4/01/26 | | | 18,000 | | | | 18,037 | |
| | | | | | | | 87,227 | |
| | |
Insurance – 0.2% | | | | | | | | |
American International Group, Inc., 4.20%, 4/01/28 | | | 40,000 | | | | 43,502 | |
Aon Corp., | | | | | | | | |
4.50%, 12/15/28 | | | 202,000 | | | | 232,923 | |
3.75%, 5/02/29 | | | 95,000 | | | | 104,170 | |
Aon PLC, | | | | | | | | |
4.00%, 11/27/23 | | | 2,000 | | | | 2,124 | |
4.60%, 6/14/44 | | | 15,000 | | | | 17,998 | |
4.75%, 5/15/45 | | | 7,000 | | | | 8,573 | |
Berkshire Hathaway Finance Corp., 4.25%, 1/15/49 | | | 150,000 | | | | 190,086 | |
Equitable Holdings, Inc., | | | | | | | | |
3.90%, 4/20/23 | | | 2,000 | | | | 2,078 | |
5.00%, 4/20/48 | | | 22,000 | | | | 22,919 | |
Hartford Financial Services Group (The), Inc., 5.95%, 10/15/36 | | | 20,000 | | | | 25,586 | |
Marsh & McLennan Cos., Inc., 3.30%, 3/14/23 | | | 55,000 | | | | 57,189 | |
| | | | | | | | |
| | | Par(a) | | | Value | |
| | |
Insurance (Continued) | | | | | | | | |
Marsh & McLennan Cos., Inc., | | | | | | | | |
4.05%, 10/15/23 | | $ | 18,000 | | | $ | 19,135 | |
3.88%, 3/15/24 | | | 252,000 | | | | 274,121 | |
MetLife, Inc., | | | | | | | | |
6.40%, 12/15/36 | | | 100,000 | | | | 111,905 | |
4.05%, 3/01/45 | | | 5,000 | | | | 5,851 | |
Principal Financial Group, Inc., 3.70%, 5/15/29 | | | 35,000 | | | | 38,787 | |
Trinity Acquisition PLC, 4.40%, 3/15/26 | | | 21,000 | | | | 23,291 | |
Willis North America, Inc., | | | | | | | | |
3.60%, 5/15/24 | | | 42,000 | | | | 44,160 | |
5.05%, 9/15/48 | | | 19,000 | | | | 24,725 | |
| | | | | | | | 1,249,123 | |
| | |
Internet – 0.2% | | | | | | | | |
Amazon.com, Inc., | | | | | | | | |
3.15%, 8/22/27 | | | 140,000 | | | | 157,271 | |
3.88%, 8/22/37 | | | 95,000 | | | | 115,690 | |
4.95%, 12/05/44 | | | 2,000 | | | | 2,833 | |
4.05%, 8/22/47 | | | 140,000 | | | | 182,983 | |
4.25%, 8/22/57 | | | 30,000 | | | | 41,052 | |
Booking Holdings, Inc., 4.10%, 4/13/25 | | | 279,000 | | | | 296,343 | |
E*TRADE Financial Corp., 3.80%, 8/24/27 | | | 10,000 | | | | 10,759 | |
Expedia Group, Inc., | | | | | | | | |
5/01/25(b)(i) | | | 73,000 | | | | 74,445 | |
3.80%, 2/15/28 | | | 55,000 | | | | 47,710 | |
3.25%, 2/15/30 | | | 170,000 | | | | 141,894 | |
Netflix, Inc., | | | | | | | | |
5.50%, 2/15/22 | | | 24,000 | | | | 24,960 | |
5.87%, 2/15/25 | | | 7,000 | | | | 7,720 | |
4.38%, 11/15/26 | | | 9,000 | | | | 9,456 | |
4.88%, 4/15/28 | | | 14,000 | | | | 14,888 | |
5.87%, 11/15/28 | | | 17,000 | | | | 19,224 | |
6.37%, 5/15/29 | | | 7,000 | | | | 8,207 | |
5.37%, 11/15/29(b) | | | 8,000 | | | | 8,786 | |
4.88%, 6/15/30(b) | | | 9,000 | | | | 9,548 | |
| | | | | | | | 1,173,769 | |
| | |
Iron/Steel – 0.0%(f) | | | | | | | | |
Steel Dynamics, Inc., 2.80%, 12/15/24 | | | 50,000 | | | | 48,908 | |
| | |
Leisure Time – 0.0%(f) | | | | | | | | |
NCL Corp. Ltd., 3.63%, 12/15/24(b) | | | 5,000 | | | | 3,213 | |
Viking Cruises Ltd., 5.87%, 9/15/27(b) | | | 35,000 | | | | 23,537 | |
| | | | | | | | 26,750 | |
See accompanying Notes to Financial Statements
92
Morningstar Funds Trust April 30, 2020
Schedule of Investments (continued)
Morningstar Total Return Bond Fund
| | | | | | | | |
| | | Par(a) | | | Value | |
| | |
Lodging – 0.1% | | | | | | | | |
Boyd Gaming Corp., | | | | | | | | |
6.37%, 4/01/26 | | $ | 27,000 | | | $ | 24,319 | |
6.00%, 8/15/26 | | | 25,000 | | | | 22,625 | |
Hilton Domestic Operating Co., Inc., | | | | | | | | |
5.12%, 5/01/26 | | | 53,000 | | | | 52,327 | |
4.88%, 1/15/30 | | | 9,000 | | | | 8,595 | |
Hilton Worldwide Finance LLC/Hilton Worldwide Finance Corp., | | | | | | | | |
4.63%, 4/01/25 | | | 39,000 | | | | 38,220 | |
4.88%, 4/01/27 | | | 25,000 | | | | 24,240 | |
Hyatt Hotels Corp., 5.37%, 4/23/25 | | | 23,000 | | | | 23,397 | |
Las Vegas Sands Corp., 3.20%, 8/08/24 | | | 160,000 | | | | 155,504 | |
Marriott Ownership Resorts, Inc./ILG LLC, 6.50%, 9/15/26 | | | 33,000 | | | | 31,267 | |
MGM Resorts International, | | | | | | | | |
5.75%, 6/15/25 | | | 6,000 | | | | 5,760 | |
4.63%, 9/01/26 | | | 4,000 | | | | 3,580 | |
5.50%, 4/15/27 | | | 6,000 | | | | 5,512 | |
Station Casinos LLC, 5.00%, 10/01/25(b) | | | 22,000 | | | | 18,341 | |
Wyndham Hotels & Resorts, Inc., 5.37%, 4/15/26(b) | | | 23,000 | | | | 21,045 | |
Wynn Las Vegas LLC/Wynn Las Vegas Capital Corp., | | | | | | | | |
5.50%, 3/01/25(b) | | | 91,000 | | | | 80,990 | |
5.25%, 5/15/27(b) | | | 45,000 | | | | 39,150 | |
| | | | | | | | 554,872 | |
|
Machinery - Construction & Mining – 0.0%(f) | |
Caterpillar Financial Services Corp., 3.75%, 11/24/23 | | | 75,000 | | | | 82,051 | |
Terex Corp., 5.63%, 2/01/25(b) | | | 49,000 | | | | 44,448 | |
| | | | | | | | 126,499 | |
|
Machinery - Diversified – 0.1% | |
Deere & Co., | |
2.75%, 4/15/25 | | | 45,000 | | | | 47,909 | |
3.10%, 4/15/30 | | | 30,000 | | | | 33,170 | |
3.75%, 4/15/50 | | | 120,000 | | | | 143,600 | |
John Deere Capital Corp., 3.65%, 10/12/23 | | | 45,000 | | | | 48,892 | |
Otis Worldwide Corp., 2.06%, 4/05/25(b) | | | 206,000 | | | | 209,833 | |
| | | | | | | | |
| | | Par(a) | | | Value | |
|
Machinery - Diversified (Continued) | |
Otis Worldwide Corp., | | | | | | | | |
2.29%, 4/05/27(b) | | $ | 70,000 | | | $ | 70,589 | |
2.56%, 2/15/30(b) | | | 180,000 | | | | 181,395 | |
| | | | | | | | 735,388 | |
| | |
Media – 1.8% | | | | | | | | |
AMC Networks, Inc., | | | | | | | | |
5.00%, 4/01/24 | | | 44,000 | | | | 42,658 | |
4.75%, 8/01/25 | | | 33,000 | | | | 30,141 | |
CCO Holdings LLC/CCO Holdings Capital Corp., | | | | | | | | |
5.75%, 2/15/26(b) | | | 83,000 | | | | 86,527 | |
5.50%, 5/01/26(b) | | | 49,000 | | | | 50,965 | |
5.87%, 5/01/27(b) | | | 27,000 | | | | 28,119 | |
5.13%, 5/01/27(b) | | | 108,000 | | | | 112,142 | |
5.00%, 2/01/28(b) | | | 83,000 | | | | 85,215 | |
5.37%, 6/01/29(b) | | | 51,000 | | | | 53,806 | |
4.75%, 3/01/30(b) | | | 60,000 | | | | 61,032 | |
Charter Communications Operating LLC/Charter Communications Operating Capital, | | | | | | | | |
4.50%, 2/01/24 | | | 7,000 | | | | 7,586 | |
4.91%, 7/23/25 | | | 225,000 | | | | 253,947 | |
4.20%, 3/15/28 | | | 132,000 | | | | 146,116 | |
5.05%, 3/30/29 | | | 480,000 | | | | 563,749 | |
5.37%, 4/01/38 | | | 120,000 | | | | 141,534 | |
6.48%, 10/23/45 | | | 233,000 | | | | 304,588 | |
5.75%, 4/01/48 | | | 85,000 | | | | 107,251 | |
5.13%, 7/01/49 | | | 81,000 | | | | 96,410 | |
4.80%, 3/01/50 | | | 110,000 | | | | 123,820 | |
Clear Channel Worldwide Holdings, Inc., 5.13%, 8/15/27(b) | | | 51,000 | | | | 47,920 | |
Comcast Corp., | | | | | | | | |
3.13%, 7/15/22 | | | 6,000 | | | | 6,312 | |
3.00%, 2/01/24 | | | 7,000 | | | | 7,465 | |
3.60%, 3/01/24 | | | 30,000 | | | | 32,717 | |
3.70%, 4/15/24 | | | 78,000 | | | | 85,443 | |
3.10%, 4/01/25 | | | 110,000 | | | | 118,675 | |
3.95%, 10/15/25 | | | 480,000 | | | | 540,371 | |
3.15%, 3/01/26 | | | 50,000 | | | | 54,551 | |
2.35%, 1/15/27 | | | 125,000 | | | | 130,384 | |
3.15%, 2/15/28 | | | 75,000 | | | | 81,270 | |
4.15%, 10/15/28 | | | 330,000 | | | | 386,301 | |
3.40%, 4/01/30 | | | 460,000 | | | | 516,509 | |
4.25%, 10/15/30 | | | 560,000 | | | | 673,904 | |
4.25%, 1/15/33 | | | 10,000 | | | | 12,101 | |
4.20%, 8/15/34 | | | 15,000 | | | | 18,052 | |
6.50%, 11/15/35 | | | 3,000 | | | | 4,535 | |
3.20%, 7/15/36 | | | 18,000 | | | | 19,608 | |
6.45%, 3/15/37 | | | 3,000 | | | | 4,350 | |
See accompanying Notes to Financial Statements
93
Morningstar Funds Trust April 30, 2020
Schedule of Investments (continued)
Morningstar Total Return Bond Fund
| | | | | | | | | | | | |
| | | | | | Par(a) | | | Value | |
| | | |
Media (Continued) | | | | | | | | | | | | |
Comcast Corp., | | | | | | | | | | | | |
3.25%, 11/01/39 | | | | | | $ | 20,000 | | | $ | 21,790 | |
1.25%, 2/20/40 | | | EUR | | | | 100,000 | | | | 110,533 | |
3.75%, 4/01/40 | | | | | | | 34,000 | | | | 39,023 | |
4.50%, 1/15/43 | | | | | | | 61,000 | | | | 75,097 | |
3.40%, 7/15/46 | | | | | | | 20,000 | | | | 22,125 | |
3.97%, 11/01/47 | | | | | | | 14,000 | | | | 16,625 | |
4.00%, 3/01/48 | | | | | | | 20,000 | | | | 23,981 | |
4.70%, 10/15/48 | | | | | | | 95,000 | | | | 124,585 | |
4.00%, 11/01/49 | | | | | | | 212,000 | | | | 251,776 | |
3.45%, 2/01/50 | | | | | | | 130,000 | | | | 145,856 | |
4.05%, 11/01/52 | | | | | | | 59,000 | | | | 72,018 | |
4.95%, 10/15/58 | | | | | | | 2,000 | | | | 2,837 | |
Cox Communications, Inc., | | | | | | | | | | | | |
3.25%, 12/15/22(b) | | | | | | | 40,000 | | | | 41,638 | |
3.15%, 8/15/24(b) | | | | | | | 106,000 | | | | 112,021 | |
3.85%, 2/01/25(b) | | | | | | | 90,000 | | | | 96,933 | |
3.35%, 9/15/26(b) | | | | | | | 14,000 | | | | 14,895 | |
4.70%, 12/15/42(b) | | | | | | | 3,000 | | | | 3,271 | |
Diamond Sports Group LLC/Diamond Sports Finance Co., | | | | | | | | | | | | |
5.38%, 8/15/26(b) | | | | | | | 28,000 | | | | 21,280 | |
6.62%, 8/15/27(b) | | | | | | | 75,000 | | | | 41,062 | |
Discovery Communications LLC, | | | | | | | | | | | | |
3.30%, 5/15/22 | | | | | | | 21,000 | | | | 21,172 | |
3.80%, 3/13/24 | | | | | | | 20,000 | | | | 20,959 | |
5.00%, 9/20/37 | | | | | | | 110,000 | | | | 121,212 | |
4.88%, 4/01/43 | | | | | | | 15,000 | | | | 16,236 | |
5.20%, 9/20/47 | | | | | | | 30,000 | | | | 34,169 | |
Fox Corp., | | | | | | | | | | | | |
4.03%, 1/25/24 | | | | | | | 23,000 | | | | 24,848 | |
3.05%, 4/07/25 | | | | | | | 24,000 | | | | 25,471 | |
5.48%, 1/25/39 | | | | | | | 450,000 | | | | 568,025 | |
Gray Television, Inc., | | | | | | | | | | | | |
5.87%, 7/15/26(b) | | | | | | | 29,000 | | | | 27,840 | |
7.00%, 5/15/27(b) | | | | | | | 33,000 | | | | 33,165 | |
iHeartCommunications, Inc., | | | | | | | | | | | | |
6.37%, 5/01/26 | | | | | | | 36,000 | | | | 34,020 | |
5.25%, 8/15/27(b) | | | | | | | 32,000 | | | | 29,040 | |
4.75%, 1/15/28(b) | | | | | | | 5,000 | | | | 4,375 | |
Meredith Corp., 6.87%, 2/01/26 | | | | | | | 53,000 | | | | 45,421 | |
NBCUniversal Enterprise, Inc., 5.25%, 3/19/21(b)(h) | | | | | | | 430,000 | | | | 435,934 | |
NBCUniversal Media LLC, 5.95%, 4/01/41 | | | | | | | 122,000 | | | | 173,163 | |
Nexstar Broadcasting, Inc., 5.62%, 7/15/27(b) | | | | | | | 47,000 | | | | 44,885 | |
| | | | | | | | | | | | |
| | | | | | Par(a) | | | Value | |
| | | |
Media (Continued) | | | | | | | | | | | | |
Sirius XM Radio, Inc., | | | | | | | | | | | | |
3.88%, 8/01/22(b) | | | | | | $ | 35,000 | | | $ | 35,219 | |
4.63%, 7/15/24(b) | | | | | | | 64,000 | | | | 65,254 | |
5.37%, 4/15/25(b) | | | | | | | 35,000 | | | | 36,094 | |
5.37%, 7/15/26(b) | | | | | | | 35,000 | | | | 36,312 | |
5.00%, 8/01/27(b) | | | | | | | 67,000 | | | | 68,654 | |
5.50%, 7/01/29(b) | | | | | | | 54,000 | | | | 56,948 | |
TEGNA, Inc., | | | | | | | | | | | | |
4.63%, 3/15/28(b) | | | | | | | 9,000 | | | | 8,066 | |
5.00%, 9/15/29(b) | | | | | | | 10,000 | | | | 8,878 | |
Time Warner Cable LLC, | | | | | | | | | | | | |
4.13%, 2/15/21 | | | | | | | 113,000 | | | | 113,613 | |
6.55%, 5/01/37 | | | | | | | 20,000 | | | | 24,786 | |
5.87%, 11/15/40 | | | | | | | 130,000 | | | | 154,454 | |
5.50%, 9/01/41 | | | | | | | 26,000 | | | | 30,380 | |
Time Warner Entertainment Co. L.P., 8.37%, 7/15/33 | | | | | | | 170,000 | | | | 247,301 | |
ViacomCBS, Inc., | | | | | | | | | | | | |
4.25%, 9/01/23 | | | | | | | 25,000 | | | | 26,268 | |
4.75%, 5/15/25 | | | | | | | 5,000 | | | | 5,352 | |
6.87%, 4/30/36 | | | | | | | 26,000 | | | | 31,176 | |
4.38%, 3/15/43 | | | | | | | 55,000 | | | | 53,555 | |
5.85%, 9/01/43 | | | | | | | 16,000 | | | | 18,204 | |
Walt Disney (The) Co., | | | | | | | | | | | | |
3.35%, 3/24/25 | | | | | | | 185,000 | | | | 201,406 | |
6.20%, 12/15/34 | | | | | | | 9,000 | | | | 12,819 | |
4.75%, 9/15/44 | | | | | | | 25,000 | | | | 31,767 | |
4.70%, 3/23/50 | | | | | | | 126,000 | | | | 168,574 | |
| | | | | | | | | | | | 9,368,435 | |
| | | |
Mining – 0.0%(f) | | | | | | | | | | | | |
Freeport-McMoRan, Inc., | | | | | | | | | | | | |
5.00%, 9/01/27 | | | | | | | 5,000 | | | | 4,875 | |
5.25%, 9/01/29 | | | | | | | 5,000 | | | | 4,938 | |
Newmont Corp., | | | | | | | | | | | | |
2.80%, 10/01/29 | | | | | | | 40,000 | | | | 41,022 | |
2.25%, 10/01/30 | | | | | | | 12,000 | | | | 11,882 | |
| | | | | | | | | | | | 62,717 | |
|
Miscellaneous Manufacturing – 0.5% | |
3M Co., | | | | | | | | | | | | |
3.38%, 3/01/29 | | | | | | | 45,000 | | | | 50,031 | |
2.38%, 8/26/29 | | | | | | | 310,000 | | | | 322,261 | |
3.05%, 4/15/30 | | | | | | | 30,000 | | | | 32,752 | |
3.70%, 4/15/50 | | | | | | | 160,000 | | | | 191,052 | |
Eaton Corp., | | | | | | | | | | | | |
2.75%, 11/02/22 | | | | | | | 40,000 | | | | 41,381 | |
4.15%, 11/02/42 | | | | | | | 30,000 | | | | 34,843 | |
General Electric Co., | | | | | | | | | | | | |
3.10%, 1/09/23 | | | | | | | 240,000 | | | | 243,936 | |
3.45%, 5/01/27 | | | | | | | 20,000 | | | | 20,358 | |
See accompanying Notes to Financial Statements
94
Morningstar Funds Trust April 30, 2020
Schedule of Investments (continued)
Morningstar Total Return Bond Fund
| | | | | | | | |
| | | Par(a) | | | Value | |
|
Miscellaneous Manufacturing (Continued) | |
General Electric Co., | | | | | | | | |
3.63%, 5/01/30 | | $ | 40,000 | | | $ | 40,148 | |
6.75%, 3/15/32 | | | 20,000 | | | | 24,803 | |
5.87%, 1/14/38 | | | 136,000 | | | | 154,558 | |
6.87%, 1/10/39 | | | 800,000 | | | | 995,866 | |
4.25%, 5/01/40 | | | 60,000 | | | | 60,204 | |
4.35%, 5/01/50 | | | 60,000 | | | | 60,457 | |
Parker-Hannifin Corp., | | | | | | | | |
2.70%, 6/14/24 | | | 110,000 | | | | 112,409 | |
3.25%, 6/14/29 | | | 90,000 | | | | 95,016 | |
Textron, Inc., | | | | | | | | |
3.87%, 3/01/25 | | | 40,000 | | | | 41,321 | |
3.65%, 3/15/27 | | | 40,000 | | | | 39,803 | |
3.90%, 9/17/29 | | | 122,000 | | | | 123,354 | |
| | | | | | | | 2,684,553 | |
| | |
Oil & Gas – 1.4% | | | | | | | | |
Apache Corp., | | | | | | | | |
4.38%, 10/15/28 | | | 540,000 | | | | 429,775 | |
4.75%, 4/15/43 | | | 100,000 | | | | 68,462 | |
4.25%, 1/15/44 | | | 380,000 | | | | 248,865 | |
BP Capital Markets America, Inc., | | | | | | | | |
2.94%, 4/06/23 | | | 10,000 | | | | 10,321 | |
3.22%, 11/28/23 | | | 70,000 | | | | 73,325 | |
3.79%, 2/06/24 | | | 30,000 | | | | 31,730 | |
3.22%, 4/14/24 | | | 56,000 | | | | 58,962 | |
3.80%, 9/21/25 | | | 41,000 | | | | 44,465 | |
3.41%, 2/11/26 | | | 70,000 | | | | 74,236 | |
3.12%, 5/04/26 | | | 276,000 | | | | 288,987 | |
3.94%, 9/21/28 | | | 242,000 | | | | 264,010 | |
3.63%, 4/06/30 | | | 80,000 | | | | 86,230 | |
3.00%, 2/24/50 | | | 290,000 | | | | 273,485 | |
Chevron Corp., 3.33%, 11/17/25 | | | 45,000 | | | | 49,202 | |
Cimarex Energy Co., | | | | | | | | |
4.38%, 6/01/24 | | | 26,000 | | | | 23,859 | |
3.90%, 5/15/27 | | | 315,000 | | | | 278,579 | |
4.38%, 3/15/29 | | | 160,000 | | | | 139,168 | |
Citgo Holding, Inc., 9.25%, 8/01/24(b) | | | 41,000 | | | | 36,900 | |
Concho Resources, Inc., | | | | | | | | |
3.75%, 10/01/27 | | | 163,000 | | | | 159,032 | |
4.30%, 8/15/28 | | | 210,000 | | | | 213,547 | |
Continental Resources, Inc., | | | | | | | | |
4.50%, 4/15/23 | | | 100,000 | | | | 88,437 | |
3.80%, 6/01/24 | | | 130,000 | | | | 108,251 | |
4.37%, 1/15/28 | | | 200,000 | | | | 154,000 | |
CrownRock L.P./CrownRock Finance, Inc., 5.62%, 10/15/25(b) | | | 24,000 | | | | 19,443 | |
| | | | | | | | |
| | | Par(a) | | | Value | |
| | |
Oil & Gas (Continued) | | | | | | | | |
Devon Energy Corp., | | | | | | | | |
5.85%, 12/15/25 | | $ | 90,000 | | | $ | 87,515 | |
5.60%, 7/15/41 | | | 180,000 | | | | 146,322 | |
5.00%, 6/15/45 | | | 150,000 | | | | 122,553 | |
Diamondback Energy, Inc., | | | | | | | | |
2.88%, 12/01/24 | | | 50,000 | | | | 45,479 | |
5.37%, 5/31/25 | | | 30,000 | | | | 28,624 | |
3.25%, 12/01/26 | | | 50,000 | | | | 43,152 | |
3.50%, 12/01/29 | | | 215,000 | | | | 184,733 | |
EOG Resources, Inc., | | | | | | | | |
4.15%, 1/15/26 | | | 80,000 | | | | 88,246 | |
4.38%, 4/15/30 | | | 35,000 | | | | 38,859 | |
3.90%, 4/01/35 | | | 188,000 | | | | 203,221 | |
4.95%, 4/15/50 | | | 50,000 | | | | 59,930 | |
Exxon Mobil Corp., | | | | | | | | |
1.90%, 8/16/22 | | | 20,000 | | | | 20,450 | |
2.73%, 3/01/23 | | | 20,000 | | | | 20,793 | |
1.57%, 4/15/23 | | | 295,000 | | | | 298,771 | |
2.02%, 8/16/24 | | | 20,000 | | | | 20,536 | |
2.99%, 3/19/25 | | | 300,000 | | | | 320,379 | |
3.04%, 3/01/26 | | | 107,000 | | | | 114,649 | |
2.28%, 8/16/26 | | | 72,000 | | | | 74,635 | |
2.44%, 8/16/29 | | | 240,000 | | | | 247,505 | |
3.48%, 3/19/30 | | | 120,000 | | | | 133,765 | |
4.11%, 3/01/46 | | | 20,000 | | | | 23,793 | |
4.33%, 3/19/50 | | | 10,000 | | | | 12,240 | |
Marathon Petroleum Corp., | | | | | | | | |
4.50%, 5/01/23 | | | 25,000 | | | | 25,044 | |
3.63%, 9/15/24 | | | 40,000 | | | | 38,468 | |
4.75%, 9/15/44 | | | 8,000 | | | | 7,271 | |
4.50%, 4/01/48 | | | 28,000 | | | | 23,938 | |
Matador Resources Co., 5.87%, 9/15/26 | | | 10,000 | | | | 5,000 | |
Noble Energy, Inc., | | | | | | | | |
3.85%, 1/15/28 | | | 90,000 | | | | 71,899 | |
6.00%, 3/01/41 | | | 70,000 | | | | 55,699 | |
4.95%, 8/15/47 | | | 20,000 | | | | 14,286 | |
Occidental Petroleum Corp., | | | | | | | | |
2.60%, 8/13/21 | | | 70,000 | | | | 65,450 | |
2.70%, 8/15/22 | | | 100,000 | | | | 87,000 | |
6.95%, 7/01/24 | | | 200,000 | | | | 171,920 | |
2.90%, 8/15/24 | | | 180,000 | | | | 135,000 | |
5.55%, 3/15/26 | | | 160,000 | | | | 123,776 | |
3.00%, 2/15/27 | | | 220,000 | | | | 152,900 | |
7.87%, 9/15/31 | | | 210,000 | | | | 159,600 | |
0.00%, 10/10/36(j) | | | 210,000 | | | | 88,200 | |
4.50%, 7/15/44 | | | 80,000 | | | | 48,400 | |
6.60%, 3/15/46 | | | 150,000 | | | | 111,000 | |
4.10%, 2/15/47 | | | 50,000 | | | | 30,000 | |
4.20%, 3/15/48 | | | 230,000 | | | | 137,425 | |
See accompanying Notes to Financial Statements
95
Morningstar Funds Trust April 30, 2020
Schedule of Investments (continued)
Morningstar Total Return Bond Fund
| | | | | | | | |
| | | Par(a) | | | Value | |
| | |
Oil & Gas (Continued) | | | | | | | | |
SM Energy Co., | | | | | | | | |
5.62%, 6/01/25 | | $ | 5,000 | | | $ | 1,400 | |
6.75%, 9/15/26 | | | 5,000 | | | | 1,362 | |
6.62%, 1/15/27 | | | 5,000 | | | | 1,400 | |
Sunoco L.P./Sunoco Finance Corp., | | | | | | | | |
4.87%, 1/15/23 | | | 20,000 | | | | 19,400 | |
5.50%, 2/15/26 | | | 16,000 | | | | 15,440 | |
6.00%, 4/15/27 | | | 12,000 | | | | 11,700 | |
| | | | | | | | 7,162,399 | |
| | |
Oil & Gas Services – 0.1% | | | | | | | | |
Halliburton Co., | | | | | | | | |
3.50%, 8/01/23 | | | 370,000 | | | | 364,661 | |
3.80%, 11/15/25 | | | 5,000 | | | | 4,829 | |
| | | | | | | | 369,490 | |
|
Packaging & Containers – 0.0%(f) | |
Ball Corp., | | | | | | | | |
5.25%, 7/01/25 | | | 9,000 | | | | 9,945 | |
4.88%, 3/15/26 | | | 7,000 | | | | 7,525 | |
Owens-Brockway Glass Container, Inc., | | | | | | | | |
5.00%, 1/15/22(b) | | | 20,000 | | | | 20,200 | |
5.87%, 8/15/23(b) | | | 29,000 | | | | 29,290 | |
| | | | | | | | 66,960 | |
| | |
Pharmaceuticals – 2.3% | | | | | | | | |
AbbVie, Inc., | | | | | | | | |
2.30%, 11/21/22(b) | | | 555,000 | | | | 568,807 | |
3.75%, 11/14/23 | | | 60,000 | | | | 64,570 | |
2.60%, 11/21/24(b) | | | 1,360,000 | | | | 1,415,090 | |
3.60%, 5/14/25 | | | 50,000 | | | | 54,356 | |
2.95%, 11/21/26(b) | | | 173,000 | | | | 182,592 | |
3.20%, 11/21/29(b) | | | 815,000 | | | | 865,902 | |
4.50%, 5/14/35 | | | 163,000 | | | | 189,976 | |
4.87%, 11/14/48 | | | 5,000 | | | | 6,130 | |
4.25%, 11/21/49(b) | | | 45,000 | | | | 51,883 | |
Allergan Funding SCS, | | | | | | | | |
3.45%, 3/15/22 | | | 100,000 | | | | 102,491 | |
3.80%, 3/15/25 | | | 346,000 | | | | 369,345 | |
4.55%, 3/15/35 | | | 105,000 | | | | 121,230 | |
Bausch Health Americas, Inc., | | | | | | | | |
9.25%, 4/01/26(b) | | | 57,000 | | | | 62,985 | |
8.50%, 1/31/27(b) | | | 67,000 | | | | 73,861 | |
Bausch Health Cos., Inc., | | | | | | | | |
5.50%, 11/01/25(b) | | | 63,000 | | | | 65,489 | |
9.00%, 12/15/25(b) | | | 57,000 | | | | 62,159 | |
5.75%, 8/15/27(b) | | | 18,000 | | | | 18,983 | |
7.00%, 1/15/28(b) | | | 28,000 | | | | 29,050 | |
7.25%, 5/30/29(b) | | | 28,000 | | | | 29,881 | |
| | | | | | | | |
| | | Par(a) | | | Value | |
| | |
Pharmaceuticals (Continued) | | | | | | | | |
Becton Dickinson and Co., | | | | | | | | |
2.89%, 6/06/22 | | $ | 90,000 | | | $ | 92,282 | |
3.36%, 6/06/24 | | | 190,000 | | | | 201,977 | |
4.68%, 12/15/44 | | | 16,000 | | | | 19,442 | |
Bristol-Myers Squibb Co., | | | | | | | | |
2.25%, 8/15/21(b) | | | 10,000 | | | | 10,167 | |
2.60%, 5/16/22(b) | | | 110,000 | | | | 113,686 | |
3.25%, 8/15/22(b) | | | 159,000 | | | | 167,441 | |
2.75%, 2/15/23(b) | | | 198,000 | | | | 208,120 | |
2.90%, 7/26/24(b) | | | 330,000 | | | | 357,158 | |
3.88%, 8/15/25(b) | | | 170,000 | | | | 193,678 | |
3.20%, 6/15/26(b) | | | 424,000 | | | | 467,908 | |
3.40%, 7/26/29(b) | | | 400,000 | | | | 457,715 | |
5.00%, 8/15/45(b) | | | 90,000 | | | | 124,530 | |
4.25%, 10/26/49(b) | | | 5,000 | | | | 6,532 | |
Cigna Corp., | | | | | | | | |
3.40%, 9/17/21 | | | 20,000 | | | | 20,577 | |
3.75%, 7/15/23 | | | 187,000 | | | | 199,756 | |
3.00%, 7/15/23(b) | | | 20,000 | | | | 20,829 | |
3.50%, 6/15/24(b) | | | 130,000 | | | | 138,904 | |
3.25%, 4/15/25(b) | | | 53,000 | | | | 56,524 | |
4.12%, 11/15/25 | | | 40,000 | | | | 44,847 | |
3.40%, 3/01/27(b) | | | 55,000 | | | | 58,814 | |
4.37%, 10/15/28 | | | 680,000 | | | | 778,520 | |
CVS Health Corp., | | | | | | | | |
3.35%, 3/09/21 | | | 75,000 | | | | 76,222 | |
2.63%, 8/15/24 | | | 2,000 | | | | 2,082 | |
4.10%, 3/25/25 | | | 450,000 | | | | 496,397 | |
3.63%, 4/01/27 | | | 40,000 | | | | 43,643 | |
4.30%, 3/25/28 | | | 1,041,000 | | | | 1,180,459 | |
3.75%, 4/01/30 | | | 375,000 | | | | 416,566 | |
4.78%, 3/25/38 | | | 200,000 | | | | 236,070 | |
4.13%, 4/01/40 | | | 40,000 | | | | 44,886 | |
5.12%, 7/20/45 | | | 173,000 | | | | 216,240 | |
5.05%, 3/25/48 | | | 235,000 | | | | 297,797 | |
Elanco Animal Health, Inc., | | | | | | | | |
4.66%, 8/27/21 | | | 17,000 | | | | 17,386 | |
5.02%, 8/28/23 | | | 32,000 | | | | 33,760 | |
5.65%, 8/28/28 | | | 7,000 | | | | 7,753 | |
Johnson & Johnson, | | | | | | | | |
2.95%, 3/03/27 | | | 68,000 | | | | 75,608 | |
3.63%, 3/03/37 | | | 70,000 | | | | 83,798 | |
Merck & Co., Inc., | | | | | | | | |
3.40%, 3/07/29 | | | 95,000 | | | | 109,560 | |
3.90%, 3/07/39 | | | 2,000 | | | | 2,469 | |
Pfizer, Inc., | | | | | | | | |
3.45%, 3/15/29 | | | 44,000 | | | | 50,730 | |
2.63%, 4/01/30 | | | 110,000 | | | | 119,462 | |
7.20%, 3/15/39 | | | 45,000 | | | | 75,394 | |
4.20%, 9/15/48 | | | 29,000 | | | | 38,516 | |
See accompanying Notes to Financial Statements
96
Morningstar Funds Trust April 30, 2020
Schedule of Investments (continued)
Morningstar Total Return Bond Fund
| | | | | | | | |
| | | Par(a) | | | Value | |
|
Pharmaceuticals (Continued) | |
Shire Acquisitions Investments Ireland DAC, | | | | | | | | |
2.88%, 9/23/23 | | $ | 59,000 | | | $ | 61,350 | |
3.20%, 9/23/26 | | | 185,000 | | | | 200,919 | |
Wyeth LLC, | | | | | | | | |
6.45%, 2/01/24 | | | 9,000 | | | | 10,731 | |
5.95%, 4/01/37 | | | 44,000 | | | | 64,409 | |
| | | | | | | | 12,036,394 | |
| | |
Pipelines – 1.6% | | | | | | | | |
Boardwalk Pipelines L.P., 4.80%, 5/03/29 | | | 20,000 | | | | 17,612 | |
Buckeye Partners L.P., 3.95%, 12/01/26 | | | 5,000 | | | | 4,525 | |
Cameron LNG LLC, | | | | | | | | |
2.90%, 7/15/31(b) | | | 40,000 | | | | 38,795 | |
3.30%, 1/15/35(b) | | | 540,000 | | | | 536,842 | |
3.40%, 1/15/38(b) | | | 129,000 | | | | 116,173 | |
Cheniere Corpus Christi Holdings LLC, | | | | | | | | |
5.87%, 3/31/25 | | | 184,000 | | | | 190,472 | |
5.13%, 6/30/27 | | | 261,000 | | | | 260,515 | |
Cheniere Energy Partners L.P., | | | | | | | | |
5.25%, 10/01/25 | | | 30,000 | | | | 28,638 | |
5.63%, 10/01/26 | | | 22,000 | | | | 21,023 | |
4.50%, 10/01/29(b) | | | 14,000 | | | | 12,915 | |
DCP Midstream Operating L.P., | | | | | | | | |
5.38%, 7/15/25 | | | 7,000 | | | | 5,653 | |
5.13%, 5/15/29 | | | 5,000 | | | | 3,724 | |
Energy Transfer Operating L.P., | | | | | | | | |
4.25%, 3/15/23 | | | 86,000 | | | | 85,232 | |
4.20%, 9/15/23 | | | 20,000 | | | | 19,668 | |
4.50%, 4/15/24 | | | 30,000 | | | | 29,628 | |
2.90%, 5/15/25 | | | 395,000 | | | | 367,673 | |
4.20%, 4/15/27 | | | 12,000 | | | | 11,304 | |
5.50%, 6/01/27 | | | 41,000 | | | | 41,613 | |
4.95%, 6/15/28 | | | 20,000 | | | | 19,575 | |
5.25%, 4/15/29 | | | 60,000 | | | | 60,249 | |
3.75%, 5/15/30 | | | 370,000 | | | | 336,741 | |
6.50%, 2/01/42 | | | 85,000 | | | | 85,719 | |
5.15%, 3/15/45 | | | 24,000 | | | | 21,313 | |
5.30%, 4/15/47 | | | 26,000 | | | | 22,660 | |
6.25%, 4/15/49 | | | 20,000 | | | | 19,291 | |
Energy Transfer Partners L.P./Regency Energy Finance Corp., | | | | | | | | |
5.87%, 3/01/22 | | | 115,000 | | | | 116,937 | |
5.00%, 10/01/22 | | | 60,000 | | | | 60,096 | |
| | | | | | | | |
| | | Par(a) | | | Value | |
| | |
Pipelines (Continued) | | | | | | | | |
Enterprise Products Operating LLC, | | | | | | | | |
3.35%, 3/15/23 | | $ | 10,000 | | | $ | 10,365 | |
3.90%, 2/15/24 | | | 15,000 | | | | 15,905 | |
4.15%, 10/16/28 | | | 270,000 | | | | 292,169 | |
3.13%, 7/31/29 | | | 50,000 | | | | 49,885 | |
2.80%, 1/31/30 | | | 400,000 | | | | 393,447 | |
6.87%, 3/01/33 | | | 17,000 | | | | 20,117 | |
7.55%, 4/15/38 | | | 10,000 | | | | 12,887 | |
5.95%, 2/01/41 | | | 16,000 | | | | 17,979 | |
4.45%, 2/15/43 | | | 52,000 | | | | 52,722 | |
4.85%, 3/15/44 | | | 14,000 | | | | 15,102 | |
5.10%, 2/15/45 | | | 99,000 | | | | 108,255 | |
4.80%, 2/01/49 | | | 10,000 | | | | 10,844 | |
4.20%, 1/31/50 | | | 30,000 | | | | 29,755 | |
3.70%, 1/31/51 | | | 70,000 | | | | 65,668 | |
3.95%, 1/31/60 | | | 60,000 | | | | 55,216 | |
Kinder Morgan Energy Partners L.P., | | | | | | | | |
4.15%, 3/01/22 | | | 80,000 | | | | 81,154 | |
4.25%, 9/01/24 | | | 100,000 | | | | 106,346 | |
6.50%, 2/01/37 | | | 5,000 | | | | 5,738 | |
6.95%, 1/15/38 | | | 85,000 | | | | 101,340 | |
5.50%, 3/01/44 | | | 56,000 | | | | 63,225 | |
5.40%, 9/01/44 | | | 4,000 | | | | 4,489 | |
Kinder Morgan, Inc., | | | | | | | | |
4.30%, 6/01/25 | | | 90,000 | | | | 96,240 | |
4.30%, 3/01/28 | | | 60,000 | | | | 63,683 | |
7.75%, 1/15/32 | | | 45,000 | | | | 57,780 | |
5.55%, 6/01/45 | | | 80,000 | | | | 91,819 | |
5.05%, 2/15/46 | | | 40,000 | | | | 44,173 | |
5.20%, 3/01/48 | | | 60,000 | | | | 68,417 | |
MPLX L.P., | | | | | | | | |
4.25%, 12/01/27(b) | | | 35,000 | | | | 33,653 | |
4.00%, 3/15/28 | | | 200,000 | | | | 189,640 | |
4.80%, 2/15/29 | | | 30,000 | | | | 30,160 | |
4.50%, 4/15/38 | | | 90,000 | | | | 80,356 | |
4.70%, 4/15/48 | | | 90,000 | | | | 80,266 | |
5.50%, 2/15/49 | | | 90,000 | | | | 89,302 | |
NGPL PipeCo LLC, | | | | | | | | |
4.38%, 8/15/22(b) | | | 64,000 | | | | 64,185 | |
4.88%, 8/15/27(b) | | | 140,000 | | | | 142,664 | |
7.77%, 12/15/37(b) | | | 20,000 | | | | 22,026 | |
Northwest Pipeline LLC, 4.00%, 4/01/27 | | | 186,000 | | | | 186,366 | |
Sabine Pass Liquefaction LLC, | | | | | | | | |
5.62%, 4/15/23 | | | 100,000 | | | | 104,282 | |
5.75%, 5/15/24 | | | 200,000 | | | | 208,986 | |
5.62%, 3/01/25 | | | 355,000 | | | | 372,037 | |
5.87%, 6/30/26 | | | 37,000 | | | | 39,493 | |
See accompanying Notes to Financial Statements
97
Morningstar Funds Trust April 30, 2020
Schedule of Investments (continued)
Morningstar Total Return Bond Fund
| | | | | | | | |
| | | Par(a) | | | Value | |
| | |
Pipelines (Continued) | | | | | | | | |
Sabine Pass Liquefaction LLC, | | | | | | | | |
5.00%, 3/15/27 | | $ | 30,000 | | | $ | 30,752 | |
4.20%, 3/15/28 | | | 65,000 | | | | 63,609 | |
Southern Natural Gas Co. LLC, 8.00%, 3/01/32 | | | 80,000 | | | | 104,433 | |
Spectra Energy Partners L.P., 5.95%, 9/25/43 | | | 41,000 | | | | 46,779 | |
Sunoco Logistics Partners Operations L.P., | | | | | | | | |
4.25%, 4/01/24 | | | 16,000 | | | | 15,771 | |
5.30%, 4/01/44 | | | 15,000 | | | | 13,028 | |
5.40%, 10/01/47 | | | 2,000 | | | | 1,811 | |
Targa Resources Partners L.P./Targa Resources Partners Finance Corp., | | | | | | | | |
6.75%, 3/15/24 | | | 19,000 | | | | 17,955 | |
5.13%, 2/01/25 | | | 22,000 | | | | 19,800 | |
5.87%, 4/15/26 | | | 44,000 | | | | 39,446 | |
5.38%, 2/01/27 | | | 23,000 | | | | 19,550 | |
6.50%, 7/15/27 | | | 36,000 | | | | 32,400 | |
5.00%, 1/15/28 | | | 7,000 | | | | 5,845 | |
6.87%, 1/15/29 | | | 36,000 | | | | 33,016 | |
5.50%, 3/01/30(b) | | | 9,000 | | | | 7,672 | |
Tennessee Gas Pipeline Co. LLC, 2.90%, 3/01/30(b) | | | 380,000 | | | | 362,502 | |
Texas Eastern Transmission L.P., | | | | | | | | |
3.50%, 1/15/28(b) | | | 107,000 | | | | 104,834 | |
4.15%, 1/15/48(b) | | | 36,000 | | | | 33,995 | |
Transcontinental Gas Pipe Line Co. LLC, | | | | | | | | |
7.85%, 2/01/26 | | | 536,000 | | | | 632,539 | |
4.00%, 3/15/28 | | | 113,000 | | | | 116,896 | |
4.45%, 8/01/42 | | | 14,000 | | | | 14,733 | |
4.60%, 3/15/48 | | | 10,000 | | | | 10,912 | |
Western Midstream Operating L.P., | | | | | | | | |
(3M USD LIBOR + 0.85%), 2.16%, 1/13/23(d) | | | 40,000 | | | | 32,604 | |
3.10%, 2/01/25 | | | 50,000 | | | | 45,625 | |
4.65%, 7/01/26 | | | 90,000 | | | | 79,650 | |
4.05%, 2/01/30 | | | 110,000 | | | | 100,375 | |
Williams (The) Cos., Inc., | | | | | | | | |
3.60%, 3/15/22 | | | 150,000 | | | | 151,739 | |
3.90%, 1/15/25 | | | 28,000 | | | | 28,544 | |
8.75%, 3/15/32 | | | 20,000 | | | | 26,020 | |
4.85%, 3/01/48 | | | 110,000 | | | | 112,139 | |
| | | | | | | | 8,417,696 | |
| | | | | | | | |
| | | Par(a) | | | Value | |
| | |
Real Estate – 0.0%(f) | | | | | | | | |
Howard Hughes (The) Corp.,
5.38%, 3/15/25(b) | | $ | 44,000 | | | $ | 42,651 | |
|
Real Estate Investment Trusts – 0.4% | |
American Tower Corp., | | | | | | | | |
3.38%, 5/15/24 | | | 50,000 | | | | 53,354 | |
2.95%, 1/15/25 | | | 12,000 | | | | 12,588 | |
2.40%, 3/15/25 | | | 163,000 | | | | 167,890 | |
4.00%, 6/01/25 | | | 31,000 | | | | 34,138 | |
2.75%, 1/15/27 | | | 40,000 | | | | 41,450 | |
3.95%, 3/15/29 | | | 30,000 | | | | 33,579 | |
3.80%, 8/15/29 | | | 91,000 | | | | 101,725 | |
Boston Properties L.P., 3.85%, 2/01/23 | | | 193,000 | | | | 203,094 | |
Crown Castle International Corp., | | | | | | | | |
4.87%, 4/15/22 | | | 24,000 | | | | 25,547 | |
3.15%, 7/15/23 | | | 140,000 | | | | 146,654 | |
3.20%, 9/01/24 | | | 32,000 | | | | 33,966 | |
4.45%, 2/15/26 | | | 45,000 | | | | 50,529 | |
3.70%, 6/15/26 | | | 2,000 | | | | 2,172 | |
3.65%, 9/01/27 | | | 63,000 | | | | 68,631 | |
3.10%, 11/15/29 | | | 245,000 | | | | 261,496 | |
5.20%, 2/15/49 | | | 20,000 | | | | 26,084 | |
4.15%, 7/01/50 | | | 17,000 | | | | 19,912 | |
Equinix, Inc., 2.63%, 11/18/24 | | | 61,000 | | | | 62,705 | |
ESH Hospitality, Inc., | | | | | | | | |
5.25%, 5/01/25(b) | | | 55,000 | | | | 51,700 | |
4.62%, 10/01/27(b) | | | 7,000 | | | | 6,335 | |
MGM Growth Properties Operating Partnership L.P./MGP Finance Co-Issuer, Inc., | | | | | | | | |
5.62%, 5/01/24 | | | 92,000 | | | | 93,399 | |
4.50%, 9/01/26 | | | 25,000 | | | | 24,188 | |
5.75%, 2/01/27 | | | 40,000 | | | | 40,500 | |
MPT Operating Partnership L.P./MPT Finance Corp., | | | | | | | | |
5.25%, 8/01/26 | | | 5,000 | | | | 5,050 | |
5.00%, 10/15/27 | | | 62,000 | | | | 63,240 | |
4.62%, 8/01/29 | | | 8,000 | | | | 7,955 | |
National Retail Properties, Inc., 2.50%, 4/15/30 | | | 68,000 | | | | 59,633 | |
Realty Income Corp., | | | | | | | | |
4.65%, 8/01/23 | | | 10,000 | | | | 10,647 | |
4.13%, 10/15/26 | | | 35,000 | | | | 38,313 | |
3.00%, 1/15/27 | | | 15,000 | | | | 15,145 | |
Ryman Hospitality Properties, Inc., 4.75%, 10/15/27(b) | | | 34,000 | | | | 29,665 | |
See accompanying Notes to Financial Statements
98
Morningstar Funds Trust April 30, 2020
Schedule of Investments (continued)
Morningstar Total Return Bond Fund
| | | | | | | | |
| | | Par(a) | | | Value | |
|
Real Estate Investment Trusts (Continued) | |
Service Properties Trust,
4.35%, 10/01/24 | | $ | 20,000 | | | $ | 16,937 | |
VICI Properties L.P./VICI Note Co., Inc., | | | | | | | | |
3.50%, 2/15/25(b) | | | 32,000 | | | | 30,080 | |
4.25%, 12/01/26(b) | | | 11,000 | | | | 10,280 | |
3.75%, 2/15/27(b) | | | 7,000 | | | | 6,510 | |
4.62%, 12/01/29(b) | | | 9,000 | | | | 8,370 | |
4.13%, 8/15/30(b) | | | 9,000 | | | | 8,190 | |
| | | | | | | | 1,871,651 | |
| | |
Retail – 0.7% | | | | | | | | |
Beacon Roofing Supply, Inc., 4.87%, 11/01/25(b) | | | 50,000 | | | | 44,187 | |
Costco Wholesale Corp., | | | | | | | | |
1.38%, 6/20/27 | | | 160,000 | | | | 160,921 | |
1.60%, 4/20/30 | | | 100,000 | | | | 99,248 | |
Dollar General Corp., | | | | | | | | |
4.12%, 5/01/28 | | | 2,000 | | | | 2,248 | |
4.12%, 4/03/50 | | | 9,000 | | | | 10,531 | |
Home Depot (The), Inc., | | | | | | | | |
2.50%, 4/15/27 | | | 50,000 | | | | 52,879 | |
2.80%, 9/14/27 | | | 19,000 | | | | 20,239 | |
3.90%, 12/06/28 | | | 24,000 | | | | 27,749 | |
2.95%, 6/15/29 | | | 66,000 | | | | 71,706 | |
2.70%, 4/15/30 | | | 80,000 | | | | 85,630 | |
5.87%, 12/16/36 | | | 20,000 | | | | 28,510 | |
3.30%, 4/15/40 | | | 60,000 | | | | 65,556 | |
3.90%, 6/15/47 | | | 20,000 | | | | 23,603 | |
3.35%, 4/15/50 | | | 258,000 | | | | 285,722 | |
Lowe’s Cos., Inc., | | | | | | | | |
4.00%, 4/15/25 | | | 185,000 | | | | 205,235 | |
4.50%, 4/15/30 | | | 50,000 | | | | 59,050 | |
5.00%, 4/15/40 | | | 40,000 | | | | 49,542 | |
4.65%, 4/15/42 | | | 20,000 | | | | 23,871 | |
3.70%, 4/15/46 | | | 75,000 | | | | 81,568 | |
4.05%, 5/03/47 | | | 15,000 | | | | 16,854 | |
5.12%, 4/15/50 | | | 180,000 | | | | 234,951 | |
McDonald’s Corp., | | | | | | | | |
3.38%, 5/26/25 | | | 20,000 | | | | 21,915 | |
3.30%, 7/01/25 | | | 60,000 | | | | 65,371 | |
1.45%, 9/01/25 | | | 140,000 | | | | 139,748 | |
3.70%, 1/30/26 | | | 70,000 | | | | 78,213 | |
3.50%, 3/01/27 | | | 30,000 | | | | 33,036 | |
3.80%, 4/01/28 | | | 270,000 | | | | 303,455 | |
2.13%, 3/01/30 | | | 70,000 | | | | 69,809 | |
3.60%, 7/01/30 | | | 80,000 | | | | 90,270 | |
6.30%, 3/01/38 | | | 36,000 | | | | 50,657 | |
3.63%, 5/01/43 | | | 113,000 | | | | 119,336 | |
4.87%, 12/09/45 | | | 11,000 | | | | 13,760 | |
4.45%, 9/01/48 | | | 65,000 | | | | 79,675 | |
| | | | | | | | |
| | | Par(a) | | | Value | |
| | |
Retail (Continued) | | | | | | | | |
McDonald’s Corp., | | | | | | | | |
3.63%, 9/01/49 | | $ | 52,000 | | | $ | 56,914 | |
4.20%, 4/01/50 | | | 110,000 | | | | 131,007 | |
Target Corp., 2.25%, 4/15/25 | | | 165,000 | | | | 173,781 | |
TJX (The) Cos., Inc., 3.50%, 4/15/25 | | | 70,000 | | | | 75,492 | |
Walgreens Boots Alliance, Inc., | | | | | | | | |
3.80%, 11/18/24 | | | 7,000 | | | | 7,450 | |
4.80%, 11/18/44 | | | 5,000 | | | | 5,334 | |
Walmart, Inc., | | | | | | | | |
3.40%, 6/26/23 | | | 40,000 | | | | 43,187 | |
2.85%, 7/08/24 | | | 115,000 | | | | 123,582 | |
3.70%, 6/26/28 | | | 380,000 | | | | 440,139 | |
3.95%, 6/28/38 | | | 10,000 | | | | 12,419 | |
| | | | | | | | 3,784,350 | |
| | |
Semiconductors – 1.1% | | | | | | | | |
Analog Devices, Inc., | | | | | | | | |
2.95%, 4/01/25 | | | 57,000 | | | | 59,447 | |
3.90%, 12/15/25 | | | 16,000 | | | | 17,439 | |
3.50%, 12/05/26 | | | 26,000 | | | | 27,844 | |
Applied Materials, Inc., | | | | | | | | |
3.90%, 10/01/25 | | | 75,000 | | | | 84,601 | |
5.85%, 6/15/41 | | | 38,000 | | | | 55,526 | |
Broadcom Corp./Broadcom Cayman Finance Ltd., 3.87%, 1/15/27 | | | 169,000 | | | | 176,179 | |
Broadcom, Inc., | | | | | | | | |
3.13%, 4/15/21(b) | | | 10,000 | | | | 10,067 | |
3.62%, 10/15/24(b) | | | 110,000 | | | | 115,931 | |
4.70%, 4/15/25(b) | | | 566,000 | | | | 624,101 | |
4.25%, 4/15/26(b) | | | 300,000 | | | | 321,520 | |
Intel Corp., | | | | | | | | |
3.70%, 7/29/25 | | | 20,000 | | | | 22,461 | |
4.00%, 12/15/32 | | | 3,000 | | | | 3,729 | |
4.60%, 3/25/40 | | | 50,000 | | | | 65,515 | |
4.75%, 3/25/50 | | | 420,000 | | | | 591,669 | |
4.95%, 3/25/60 | | | 120,000 | | | | 171,144 | |
KLA Corp., | | | | | | | | |
4.10%, 3/15/29 | | | 125,000 | | | | 141,646 | |
3.30%, 3/01/50 | | | 258,000 | | | | 252,352 | |
Lam Research Corp., | | | | | | | | |
2.80%, 6/15/21 | | | 15,000 | | | | 15,285 | |
3.75%, 3/15/26 | | | 161,000 | | | | 180,282 | |
1.90%, 6/15/30 | | | 20,000 | | | | 19,934 | |
4.87%, 3/15/49 | | | 48,000 | | | | 65,350 | |
3.13%, 6/15/60 | | | 8,000 | | | | 7,976 | |
Micron Technology, Inc., 2.50%, 4/24/23 | | | 100,000 | | | | 101,795 | |
See accompanying Notes to Financial Statements
99
Morningstar Funds Trust April 30, 2020
Schedule of Investments (continued)
Morningstar Total Return Bond Fund
| | | | | | | | | | | | |
| | | | | | Par(a) | | | Value | |
| |
Semiconductors (Continued) | | | | | |
NVIDIA Corp., | | | | | | | | | | | | |
3.20%, 9/16/26 | | | | | | $ | 403,000 | | | $ | 445,655 | |
2.85%, 4/01/30 | | | | | | | 250,000 | | | | 272,397 | |
3.50%, 4/01/40 | | | | | | | 190,000 | | | | 213,560 | |
3.50%, 4/01/50 | | | | | | | 470,000 | | | | 539,318 | |
3.70%, 4/01/60 | | | | | | | 100,000 | | | | 117,005 | |
QUALCOMM, Inc., | | | | | | | | | | | | |
2.60%, 1/30/23 | | | | | | | 30,000 | | | | 31,308 | |
2.90%, 5/20/24 | | | | | | | 45,000 | | | | 48,024 | |
3.45%, 5/20/25 | | | | | | | 30,000 | | | | 32,950 | |
3.25%, 5/20/27 | | | | | | | 12,000 | | | | 13,104 | |
4.65%, 5/20/35 | | | | | | | 16,000 | | | | 20,398 | |
4.80%, 5/20/45 | | | | | | | 25,000 | | | | 31,926 | |
4.30%, 5/20/47 | | | | | | | 31,000 | | | | 37,640 | |
Texas Instruments, Inc., | | | | | | | | | | | | |
1.38%, 3/12/25 | | | | | | | 235,000 | | | | 237,747 | |
2.90%, 11/03/27 | | | | | | | 150,000 | | | | 164,380 | |
5/04/30(i) | | | | | | | 91,000 | | | | 91,121 | |
| | | | | | | | | | | | 5,428,326 | |
| | | |
Shipbuilding – 0.0%(f) | | | | | | | | | | | | |
Huntington Ingalls Industries, Inc., | | | | | | | | | | | | |
3.84%, 5/01/25(b) | | | | | | | 75,000 | | | | 78,853 | |
4.20%, 5/01/30(b) | | | | | | | 100,000 | | | | 105,742 | |
| | | | | | | | | | | | 184,595 | |
| | | |
Software – 0.8% | | | | | | | | | | | | |
Adobe, Inc., 2.30%, 2/01/30 | | | | | | | 360,000 | | | | 378,327 | |
Autodesk, Inc., | | | | | | | | | | | | |
3.60%, 12/15/22 | | | | | | | 35,000 | | | | 36,504 | |
3.50%, 6/15/27 | | | | | | | 196,000 | | | | 210,552 | |
2.85%, 1/15/30 | | | | | | | 3,000 | | | | 3,139 | |
Fidelity National Information Services, Inc., | | | | | | | | | | | | |
3.00%, 8/15/26 | | | | | | | 62,000 | | | | 65,824 | |
3.75%, 5/21/29 | | | | | | | 8,000 | | | | 8,980 | |
2.95%, 5/21/39 | | | EUR | | | | 100,000 | | | | 128,299 | |
Fiserv, Inc., | | | | | | | | | | | | |
3.85%, 6/01/25 | | | | | | | 18,000 | | | | 19,800 | |
3.20%, 7/01/26 | | | | | | | 406,000 | | | | 434,742 | |
3.50%, 7/01/29 | | | | | | | 190,000 | | | | 208,321 | |
Microsoft Corp., | | | | | | | | | | | | |
2.40%, 8/08/26 | | | | | | | 60,000 | | | | 64,758 | |
3.30%, 2/06/27 | | | | | | | 900,000 | | | | 1,015,588 | |
3.50%, 2/12/35 | | | | | | | 182,000 | | | | 216,743 | |
4.20%, 11/03/35 | | | | | | | 76,000 | | | | 96,810 | |
3.50%, 11/15/42 | | | | | | | 17,000 | | | | 20,160 | |
4.45%, 11/03/45 | | | | | | | 45,000 | | | | 61,165 | |
4.50%, 2/06/57 | | | | | | | 2,000 | | | | 2,897 | |
| | | | | | | | | | | | |
| | | | | | Par(a) | | | Value | |
| | | |
Software (Continued) | | | | | | | | | | | | |
Oracle Corp., | | | | | | | | | | | | |
3.63%, 7/15/23 | | | | | | $ | 18,000 | | | $ | 19,471 | |
2.65%, 7/15/26 | | | | | | | 122,000 | | | | 129,877 | |
4.30%, 7/08/34 | | | | | | | 7,000 | | | | 8,577 | |
3.80%, 11/15/37 | | | | | | | 191,000 | | | | 217,478 | |
3.60%, 4/01/40 | | | | | | | 136,000 | | | | 153,425 | |
5.37%, 7/15/40 | | | | | | | 43,000 | | | | 58,585 | |
3.60%, 4/01/50 | | | | | | | 271,000 | | | | 307,837 | |
salesforce.com, Inc., 3.70%, 4/11/28 | | | | | | | 430,000 | | | | 490,424 | |
| | | | | | | | | | | | 4,358,283 | |
|
Telecommunications – 1.3% | |
AT&T, Inc., | | | | | | | | | | | | |
3.00%, 2/15/22 | | | | | | | 220,000 | | | | 226,299 | |
3.20%, 3/01/22 | | | | | | | 3,000 | | | | 3,111 | |
3.80%, 3/15/22 | | | | | | | 4,000 | | | | 4,175 | |
3.40%, 6/15/22 | | | | | | | 12,000 | | | | 12,553 | |
3.00%, 6/30/22 | | | | | | | 10,000 | | | | 10,281 | |
3.80%, 3/01/24 | | | | | | | 30,000 | | | | 32,039 | |
3.90%, 3/11/24 | | | | | | | 60,000 | | | | 64,507 | |
4.45%, 4/01/24 | | | | | | | 75,000 | | | | 81,925 | |
3.55%, 6/01/24 | | | | | | | 45,000 | | | | 47,734 | |
3.40%, 5/15/25 | | | | | | | 525,000 | | | | 555,991 | |
3.60%, 7/15/25 | | | | | | | 35,000 | | | | 37,562 | |
3.80%, 2/15/27 | | | | | | | 192,000 | | | | 208,469 | |
4.25%, 3/01/27 | | | | | | | 12,000 | | | | 13,224 | |
4.10%, 2/15/28 | | | | | | | 2,000 | | | | 2,209 | |
4.35%, 3/01/29 | | | | | | | 10,000 | | | | 11,237 | |
4.30%, 2/15/30(b) | | | | | | | 105,000 | | | | 118,060 | |
4.30%, 2/15/30 | | | | | | | 17,000 | | | | 19,114 | |
4.50%, 5/15/35 | | | | | | | 210,000 | | | | 235,098 | |
3.15%, 9/04/36 | | | EUR | | | | 100,000 | | | | 129,131 | |
5.25%, 3/01/37 | | | | | | | 10,000 | | | | 11,864 | |
6.00%, 8/15/40 | | | | | | | 20,000 | | | | 26,289 | |
6.37%, 3/01/41 | | | | | | | 4,000 | | | | 5,380 | |
5.55%, 8/15/41 | | | | | | | 5,000 | | | | 6,098 | |
5.15%, 3/15/42 | | | | | | | 88,000 | | | | 105,355 | |
4.30%, 12/15/42 | | | | | | | 24,000 | | | | 26,096 | |
4.80%, 6/15/44 | | | | | | | 178,000 | | | | 203,894 | |
4.85%, 7/15/45 | | | | | | | 5,000 | | | | 5,740 | |
5.15%, 11/15/46 | | | | | | | 26,000 | | | | 31,212 | |
5.45%, 3/01/47 | | | | | | | 52,000 | | | | 65,922 | |
Cisco Systems, Inc., 2.95%, 2/28/26 | | | | | | | 12,000 | | | | 13,207 | |
Corning, Inc., | | | | | | | | | | | | |
3.70%, 11/15/23 | | | | | | | 9,000 | | | | 9,385 | |
4.37%, 11/15/57 | | | | | | | 69,000 | | | | 75,055 | |
Frontier Communications Corp., 8.00%, 4/01/27(b)(k) | | | | | | | 68,000 | | | | 69,340 | |
See accompanying Notes to Financial Statements
100
Morningstar Funds Trust April 30, 2020
Schedule of Investments (continued)
Morningstar Total Return Bond Fund
| | | | | | | | | | | | |
| | | | | | Par(a) | | | Value | |
|
Telecommunications (Continued) | |
Level 3 Financing, Inc., | | | | | | | | | | | | |
5.12%, 5/01/23 | | | | | | $ | 23,000 | | | $ | 22,885 | |
5.25%, 3/15/26 | | | | | | | 33,000 | | | | 33,743 | |
4.62%, 9/15/27(b) | | | | | | | 9,000 | | | | 8,917 | |
Motorola Solutions, Inc., | | | | | | | | | | | | |
4.60%, 2/23/28 | | | | | | | 40,000 | | | | 44,378 | |
4.60%, 5/23/29 | | | | | | | 140,000 | | | | 158,994 | |
5.50%, 9/01/44 | | | | | | | 105,000 | | | | 112,468 | |
Sprint Corp., | | | | | | | | | | | | |
7.62%, 2/15/25 | | | | | | | 65,000 | | | | 74,588 | |
7.62%, 3/01/26 | | | | | | | 66,000 | | | | 78,019 | |
Sprint Spectrum Co. LLC/Sprint Spectrum Co. II LLC/Sprint Spectrum Co. III LLC,
3.36%, 9/20/21(b) | | | | | | | 75,000 | | | | 75,188 | |
T-Mobile USA, Inc., | | | | | | | | | | | | |
3.50%, 4/15/25(b) | | | | | | | 250,000 | | | | 264,355 | |
3.75%, 4/15/27(b) | | | | | | | 197,000 | | | | 211,584 | |
3.88%, 4/15/30(b) | | | | | | | 260,000 | | | | 285,332 | |
Verizon Communications, Inc., | | | | | | | | | | | | |
3.38%, 2/15/25 | | | | | | | 300,000 | | | | 327,995 | |
2.63%, 8/15/26 | | | | | | | 10,000 | | | | 10,608 | |
4.13%, 3/16/27 | | | | | | | 528,000 | | | | 612,868 | |
3.00%, 3/22/27 | | | | | | | 40,000 | | | | 43,269 | |
4.33%, 9/21/28 | | | | | | | 250,000 | | | | 295,735 | |
3.88%, 2/08/29 | | | | | | | 30,000 | | | | 34,584 | |
3.15%, 3/22/30 | | | | | | | 90,000 | | | | 99,778 | |
4.50%, 8/10/33 | | | | | | | 710,000 | | | | 883,291 | |
4.40%, 11/01/34 | | | | | | | 16,000 | | | | 19,383 | |
4.27%, 1/15/36 | | | | | | | 176,000 | | | | 211,114 | |
5.25%, 3/16/37 | | | | | | | 5,000 | | | | 6,660 | |
2.88%, 1/15/38 | | | EUR | | | | 100,000 | | | | 136,269 | |
3.85%, 11/01/42 | | | | | | | 50,000 | | | | 59,466 | |
4.13%, 8/15/46 | | | | | | | 70,000 | | | | 86,047 | |
4.86%, 8/21/46 | | | | | | | 40,000 | | | | 54,283 | |
4.52%, 9/15/48 | | | | | | | 40,000 | | | | 52,726 | |
4.00%, 3/22/50 | | | | | | | 110,000 | | | | 137,022 | |
| | | | | | | | | | | | 6,909,105 | |
|
Toys/Games/Hobbies – 0.0%(f) | |
Hasbro, Inc., | | | | | | | | | | | | |
2.60%, 11/19/22 | | | | | | | 175,000 | | | | 176,748 | |
3.90%, 11/19/29 | | | | | | | 25,000 | | | | 24,124 | |
| | | | | | | | | | | | 200,872 | |
| | | |
Transportation – 0.6% | | | | | | | | | | | | |
Burlington Northern Santa Fe LLC, | | | | | | | | | | | | |
3.00%, 4/01/25 | | | | | | | 5,000 | | | | 5,386 | |
6.15%, 5/01/37 | | | | | | | 45,000 | | | | 62,284 | |
5.75%, 5/01/40 | | | | | | | 27,000 | | | | 37,584 | |
| | | | | | | | |
| | | Par(a) | | | Value | |
| | |
Transportation (Continued) | | | | | | | | |
Burlington Northern Santa Fe LLC, | | | | | | | | |
5.40%, 6/01/41 | | $ | 10,000 | | | $ | 13,523 | |
4.95%, 9/15/41 | | | 2,000 | | | | 2,543 | |
CSX Corp., | | | | | | | | |
4.25%, 3/15/29 | | | 30,000 | | | | 34,991 | |
6.15%, 5/01/37 | | | 5,000 | | | | 6,858 | |
4.75%, 5/30/42 | | | 44,000 | | | | 55,011 | |
4.10%, 3/15/44 | | | 25,000 | | | | 28,958 | |
4.30%, 3/01/48 | | | 33,000 | | | | 40,326 | |
4.75%, 11/15/48 | | | 20,000 | | | | 26,078 | |
3.35%, 9/15/49 | | | 25,000 | | | | 26,713 | |
3.95%, 5/01/50 | | | 11,000 | | | | 12,959 | |
4.25%, 11/01/66 | | | 53,000 | | | | 60,764 | |
FedEx Corp., | | | | | | | | |
3.80%, 5/15/25 | | | 117,000 | | | | 125,322 | |
3.10%, 8/05/29 | | | 50,000 | | | | 50,593 | |
3.90%, 2/01/35 | | | 27,000 | | | | 28,092 | |
3.87%, 8/01/42 | | | 14,000 | | | | 13,302 | |
4.10%, 4/15/43 | | | 32,000 | | | | 31,470 | |
4.55%, 4/01/46 | | | 31,000 | | | | 33,167 | |
4.95%, 10/17/48 | | | 2,000 | | | | 2,255 | |
Norfolk Southern Corp., | | | | | | | | |
2.90%, 6/15/26 | | | 132,000 | | | | 139,634 | |
2.55%, 11/01/29 | | | 5,000 | | | | 5,194 | |
4.84%, 10/01/41 | | | 18,000 | | | | 22,806 | |
4.10%, 5/15/49 | | | 15,000 | | | | 18,015 | |
3.40%, 11/01/49 | | | 50,000 | | | | 53,557 | |
4.05%, 8/15/52 | | | 30,000 | | | | 35,439 | |
Ryder System, Inc., 3.45%, 11/15/21 | | | 7,000 | | | | 7,036 | |
Union Pacific Corp., | | | | | | | | |
3.50%, 6/08/23 | | | 45,000 | | | | 47,861 | |
2.75%, 3/01/26 | | | 53,000 | | | | 56,300 | |
2.15%, 2/05/27 | | | 120,000 | | | | 122,711 | |
3.95%, 9/10/28 | | | 220,000 | | | | 251,420 | |
3.70%, 3/01/29 | | | 10,000 | | | | 11,196 | |
2.40%, 2/05/30 | | | 220,000 | | | | 226,106 | |
3.38%, 2/01/35 | | | 56,000 | | | | 62,454 | |
3.60%, 9/15/37 | | | 60,000 | | | | 64,938 | |
3.55%, 8/15/39 | | | 11,000 | | | | 11,902 | |
3.95%, 8/15/59 | | | 16,000 | | | | 18,148 | |
3.84%, 3/20/60(b) | | | 194,000 | | | | 215,536 | |
3.75%, 2/05/70 | | | 130,000 | | | | 139,278 | |
United Parcel Service, Inc., | | | | | | | | |
2.50%, 4/01/23 | | | 8,000 | | | | 8,358 | |
3.90%, 4/01/25 | | | 170,000 | | | | 189,280 | |
3.40%, 3/15/29 | | | 52,000 | | | | 57,691 | |
2.50%, 9/01/29 | | | 82,000 | | | | 85,204 | |
4.45%, 4/01/30 | | | 170,000 | | | | 205,993 | |
6.20%, 1/15/38 | | | 2,000 | | | | 2,907 | |
See accompanying Notes to Financial Statements
101
Morningstar Funds Trust April 30, 2020
Schedule of Investments (continued)
Morningstar Total Return Bond Fund
| | | | | | | | |
| | | Par(a) | | | Value | |
| | |
Transportation (Continued) | | | | | | | | |
United Parcel Service, Inc., | | | | | | | | |
5.20%, 4/01/40 | | $ | 94,000 | | | $ | 125,050 | |
XPO Logistics, Inc., | | | | | | | | |
6.12%, 9/01/23(b) | | | 18,000 | | | | 18,225 | |
6.75%, 8/15/24(b) | | | 46,000 | | | | 47,362 | |
| | | | | | | | 2,947,780 | |
| | |
Trucking & Leasing – 0.1% | | | | | | | | |
Penske Truck Leasing Co. L.P./PTL Finance Corp., | | | | | | | | |
4.25%, 1/17/23(b) | | | 4,000 | | | | 4,178 | |
2.70%, 3/14/23(b) | | | 10,000 | | | | 10,043 | |
3.95%, 3/10/25(b) | | | 30,000 | | | | 31,514 | |
4.00%, 7/15/25(b) | | | 85,000 | | | | 89,963 | |
4.45%, 1/29/26(b) | | | 10,000 | | | | 10,702 | |
3.40%, 11/15/26(b) | | | 21,000 | | | | 21,136 | |
4.20%, 4/01/27(b) | | | 55,000 | | | | 59,288 | |
3.35%, 11/01/29(b) | | | 20,000 | | | | 20,603 | |
| | | | | | | | 247,427 | |
| | |
Total Corporate Bonds
(Cost $139,934,052) | | | | | | | 144,538,934 | |
|
Foreign Issuer Bonds – 10.1% | |
| | |
Argentina – 0.0%(f) | | | | | | | | |
Argentine Republic Government International Bond, | | | | | | | | |
5.88%, 1/11/28 | | | 69,000 | | | | 17,354 | |
7.12%, 7/06/36 | | | 154,000 | | | | 36,961 | |
6.87%, 1/11/48 | | | 74,000 | | | | 17,206 | |
| | | | | | | | 71,521 | |
| | |
Australia – 0.2% | | | | | | | | |
Australia & New Zealand Banking Group Ltd., 2.63%, 11/09/22 | | | 300,000 | | | | 310,247 | |
BHP Billiton Finance USA Ltd., | | | | | | | | |
5.00%, 9/30/43 | | | 20,000 | | | | 27,446 | |
(5Y USD Swap Rate + 5.09%), 6.75%, 10/19/75(b)(g) | | | 400,000 | | | | 442,000 | |
FMG Resources (August 2006) Pty. Ltd., | | | | | | | | |
4.75%, 5/15/22(b) | | | 32,000 | | | | 32,144 | |
5.12%, 3/15/23(b) | | | 23,000 | | | | 23,216 | |
5.12%, 5/15/24(b) | | | 32,000 | | | | 32,470 | |
4.50%, 9/15/27(b) | | | 5,000 | | | | 4,885 | |
| | | | | | | | 872,408 | |
| | | | | | | | |
| | | Par(a) | | | Value | |
| | |
Belgium – 0.5% | | | | | | | | |
Anheuser-Busch Cos. LLC/Anheuser-Busch InBev Worldwide, Inc., | | | | | | | | |
3.65%, 2/01/26 | | $ | 80,000 | | | $ | 87,167 | |
4.70%, 2/01/36 | | | 412,000 | | | | 461,166 | |
Anheuser-Busch InBev Finance, Inc., 3.65%, 2/01/26 | | | 97,000 | | | | 105,116 | |
Anheuser-Busch InBev Worldwide, Inc., | | | | | | | | |
3.50%, 1/12/24 | | | 180,000 | | | | 193,499 | |
4.15%, 1/23/25 | | | 200,000 | | | | 222,680 | |
4.00%, 4/13/28 | | | 163,000 | | | | 180,918 | |
4.75%, 1/23/29 | | | 502,000 | | | | 580,753 | |
3.50%, 6/01/30 | | | 60,000 | | | | 64,285 | |
5.45%, 1/23/39 | | | 57,000 | | | | 68,675 | |
4.35%, 6/01/40 | | | 130,000 | | | | 142,242 | |
4.60%, 4/15/48 | | | 10,000 | | | | 11,085 | |
5.55%, 1/23/49 | | | 220,000 | | | | 275,058 | |
4.50%, 6/01/50 | | | 353,000 | | | | 395,069 | |
| | | | | | | | 2,787,713 | |
| | |
Brazil – 0.4% | | | | | | | | |
Banco Bradesco S.A., 3.20%, 1/27/25(b) | | | 270,000 | | | | 256,500 | |
Gol Finance S.A., 7.00%, 1/31/25(b) | | | 80,000 | | | | 41,400 | |
Oi S.A., 10.00%, 7/27/25(l) | | | 5,000 | | | | 3,725 | |
Rumo Luxembourg S.a.r.l., 5.87%, 1/18/25(b) | | | 200,000 | | | | 197,980 | |
Suzano Austria GmbH, 6.00%, 1/15/29 | | | 720,000 | | | | 721,584 | |
Vale Overseas Ltd., 6.25%, 8/10/26 | | | 650,000 | | | | 712,400 | |
| | | | | | | | 1,933,589 | |
| | |
Canada – 0.4% | | | | | | | | |
1011778 B.C. ULC/New
Red Finance, Inc., | | | | | | | | |
5.00%, 10/15/25(b) | | | 112,000 | | | | 112,560 | |
3.88%, 1/15/28(b) | | | 7,000 | | | | 6,789 | |
Air Canada Pass Through Trust, | | | | | | | | |
Series 2015-2, Class B, 5.00%, 12/15/23(b) | | | 12,120 | | | | 10,754 | |
Series 2013-1, Class A, 4.13%, 5/15/25(b) | | | 53,537 | | | | 49,334 | |
Series 2017-1, Class AA, 3.30%, 1/15/30(b) | | | 16,618 | | | | 14,349 | |
Alimentation Couche-Tard, Inc., 3.55%, 7/26/27(b) | | | 175,000 | | | | 177,427 | |
Bank of Montreal, | | | | | | | | |
3.10%, 4/13/21 | | | 17,000 | | | | 17,354 | |
1.90%, 8/27/21 | | | 2,000 | | | | 2,023 | |
See accompanying Notes to Financial Statements
102
Morningstar Funds Trust April 30, 2020
Schedule of Investments (continued)
Morningstar Total Return Bond Fund
| | | | | | | | |
| | | Par(a) | | | Value | |
| | |
Canada (Continued) | | | | | | | | |
Bank of Montreal, | | | | | | | | |
2.90%, 3/26/22 | | $ | 28,000 | | | $ | 28,827 | |
3.30%, 2/05/24 | | | 19,000 | | | | 20,062 | |
2.50%, 6/28/24 | | | 34,000 | | | | 35,101 | |
1.85%, 5/01/25 | | | 210,000 | | | | 210,715 | |
(5Y USD Swap Rate + 1.43%), 3.80%, 12/15/32(g) | | | 40,000 | | | | 41,280 | |
Barrick North America Finance LLC, 5.75%, 5/01/43 | | | 190,000 | | | | 267,759 | |
Barrick PD Australia Finance Pty. Ltd., 5.95%, 10/15/39 | | | 6,000 | | | | 8,127 | |
Brookfield Residential Properties, Inc./Brookfield Residential US Corp., 6.25%, 9/15/27(b) | | | 51,000 | | | | 46,665 | |
Canadian Pacific Railway Co., 2.05%, 3/05/30 | | | 14,000 | | | | 13,923 | |
Enbridge, Inc., | | | | | | | | |
2.90%, 7/15/22 | | | 36,000 | | | | 36,200 | |
5.50%, 12/01/46 | | | 5,000 | | | | 5,619 | |
Mattamy Group Corp., 5.25%, 12/15/27(b) | | | 5,000 | | | | 4,688 | |
Royal Bank of Canada, | | | | | | | | |
3.20%, 4/30/21 | | | 220,000 | | | | 225,053 | |
1.60%, 4/17/23 | | | 190,000 | | | | 190,893 | |
Suncor Energy, Inc., | | | | | | | | |
6.80%, 5/15/38 | | | 30,000 | | | | 32,847 | |
6.50%, 6/15/38 | | | 16,000 | | | | 17,323 | |
Teck Resources Ltd., | | | | | | | | |
6.12%, 10/01/35 | | | 10,000 | | | | 10,004 | |
6.00%, 8/15/40 | | | 3,000 | | | | 2,779 | |
6.25%, 7/15/41 | | | 17,000 | | | | 16,022 | |
Toronto-Dominion Bank (The), 3.25%, 6/11/21 | | | 220,000 | | | | 225,561 | |
TransCanada PipeLines Ltd., | | | | | | | | |
3.75%, 10/16/23 | | | 3,000 | | | | 3,121 | |
5.85%, 3/15/36 | | | 71,000 | | | | 85,375 | |
6.20%, 10/15/37 | | | 2,000 | | | | 2,468 | |
| | | | | | | | 1,921,002 | |
| | |
Chile – 0.1% | | | | | | | | |
Corp. Nacional del Cobre de Chile, 3.63%, 8/01/27(b) | | | 330,000 | | | | 333,644 | |
| | | | | | | | | | | | |
| | | | | | Par(a) | | | Value | |
| | | |
Chile (Continued) | | | | | | | | | | | | |
Empresa Nacional de Telecomunicaciones S.A., 4.75%, 8/01/26(b) | | | | | | $ | 200,000 | | | $ | 204,975 | |
Kenbourne Invest S.A., 6.87%, 11/26/24(b) | | | | | | | 200,000 | | | | 187,000 | |
| | | | | | | | | | | | 725,619 | |
| | | |
China – 0.2% | | | | | | | | | | | | |
CNOOC Finance 2015 USA LLC, 3.50%, 5/05/25 | | | | | | | 410,000 | | | | 435,125 | |
Sinopec Group Overseas Development 2014 Ltd., 4.37%, 4/10/24(b) | | | | | | | 290,000 | | | | 313,672 | |
Tencent Holdings Ltd., 3.60%, 1/19/28(b) | | | | | | | 220,000 | | | | 236,960 | |
| | | | | | | | | | | | 985,757 | |
| | | |
Colombia – 0.5% | | | | | | | | | | | | |
Bancolombia S.A., 3.00%, 1/29/25 | | | | | | | 200,000 | | | | 185,126 | |
Colombia Government International Bond, | | | | | | | | | | | | |
3.88%, 4/25/27 | | | | | | | 615,000 | | | | 607,312 | |
5.00%, 6/15/45 | | | | | | | 610,000 | | | | 609,396 | |
5.20%, 5/15/49 | | | | | | | 460,000 | | | | 472,921 | |
Ecopetrol S.A., | | | | | | | | | | | | |
5.38%, 6/26/26 | | | | | | | 94,000 | | | | 93,061 | |
6.87%, 4/29/30 | | | | | | | 61,000 | | | | 62,373 | |
5.87%, 5/28/45 | | | | | | | 510,000 | | | | 447,321 | |
| | | | | | | | | | | | 2,477,510 | |
| | | |
Denmark – 0.3% | | | | | | | | | | | | |
Danske Bank A/S, | | | | | | | | | | | | |
5.00%, 1/12/22(b) | | | | | | | 400,000 | | | | 413,520 | |
3.88%, 9/12/23(b) | | | | | | | 400,000 | | | | 412,621 | |
5.37%, 1/12/24(b) | | | | | | | 400,000 | | | | 432,097 | |
(3M USD LIBOR + 1.59%), 3.24%, 12/20/25(b)(g) | | | | | | | 200,000 | | | | 200,076 | |
| | | | | | | | | | | | 1,458,314 | |
| | | |
Egypt – 0.0%(f) | | | | | | | | | | | | |
Egypt Government Bond, | | | | | | | | | | | | |
15.90%, 7/02/24 | | | EGP | | | | 185,000 | | | | 12,729 | |
16.10%, 5/07/29 | | | | | | | 1,718,000 | | | | 123,481 | |
| | | | | | | | | | | | 136,210 | |
| | | |
France – 0.2% | | | | | | | | | | | | |
BNP Paribas S.A., | | | | | | | | | | | | |
5.00%, 1/15/21 | | | | | | | 200,000 | | | | 205,598 | |
3.80%, 1/10/24(b) | | | | | | | 400,000 | | | | 421,335 | |
(3M USD LIBOR + 2.24%), 4.71%, 1/10/25(b)(g) | | | | | | | 200,000 | | | | 216,216 | |
Danone S.A.,
2.95%, 11/02/26(b) | | | | | | | 200,000 | | | | 212,975 | |
See accompanying Notes to Financial Statements
103
Morningstar Funds Trust April 30, 2020
Schedule of Investments (continued)
Morningstar Total Return Bond Fund
| | | | | | | | | | | | |
| | | | | | Par(a) | | | Value | |
|
France (Continued) | |
Total Capital International S.A., | | | | | | | | | | | | |
2.75%, 6/19/21 | | | | | | $ | 10,000 | | | $ | 10,145 | |
2.43%, 1/10/25 | | | | | | | 150,000 | | | | 154,355 | |
| | | | | | | | | | | | 1,220,624 | |
|
Germany – 0.1% | |
BMW US Capital LLC, 3.90%, 4/09/25(b) | | | | | | | 95,000 | | | | 100,727 | |
Deutsche Bank A.G., 4.25%, 2/04/21 | | | | | | | 229,000 | | | | 229,449 | |
Deutsche Telekom International Finance B.V.,
3.60%, 1/19/27(b) | | | | | | | 150,000 | | | | 163,161 | |
| | | | | | | | | | | | 493,337 | |
|
Hungary – 0.0%(f) | |
Hungary Government International Bond, 5.38%, 3/25/24 | | | | | | | 122,000 | | | | 135,779 | |
|
India – 0.0%(f) | |
Export-Import Bank of India,
3.38%, 8/05/26(b) | | | | | | | 200,000 | | | | 196,336 | |
|
Indonesia – 0.5% | |
Indonesia Government International Bond, | | | | | | | | | | | | |
4.10%, 4/24/28 | | | | | | | 200,000 | | | | 209,754 | |
4.35%, 1/11/48 | | | | | | | 850,000 | | | | 876,514 | |
3.70%, 10/30/49 | | | | | | | 330,000 | | | | 321,732 | |
Indonesia Treasury Bond, | | | | | | | | | | | | |
6.63%, 5/15/33 | | | IDR | | | | 357,000,000 | | | | 21,146 | |
7.50%, 6/15/35 | | | | | | | 2,094,000,000 | | | | 134,157 | |
8.37%, 4/15/39 | | | | | | | 3,353,000,000 | | | | 228,162 | |
Pertamina Persero PT,
6.00%, 5/03/42(b) | | | | | | | 280,000 | | | | 295,299 | |
Perusahaan Listrik Negara PT,
5.45%, 5/21/28(b) | | | | | | | 480,000 | | | | 516,600 | |
| | | | | | | | | | | | 2,603,364 | |
|
Israel – 0.1% | |
Israel Government International Bond, 2.75%, 7/03/30 | | | | | | | 200,000 | | | | 210,000 | |
|
Italy – 0.2% | |
Intesa Sanpaolo S.p.A.,
3.13%, 7/14/22(b) | | | | | | | 840,000 | | | | 838,327 | |
|
Japan – 0.4% | |
Mitsubishi UFJ Financial Group, Inc., | | | | | | | | | | | | |
2.62%, 7/18/22 | | | | | | | 280,000 | | | | 285,670 | |
2.66%, 7/25/22 | | | | | | | 4,000 | | | | 4,078 | |
3.76%, 7/26/23 | | | | | | | 201,000 | | | | 212,713 | |
| | | | | | | | |
| | | Par(a) | | | Value | |
| | |
Japan (Continued) | | | | | | | | |
Mitsubishi UFJ Financial Group, Inc., 3.29%, 7/25/27 | | $ | 20,000 | | | $ | 21,273 | |
Mizuho Financial Group, Inc., | | | | | | | | |
2.95%, 2/28/22 | | | 475,000 | | | | 485,735 | |
(3M USD LIBOR + 1.10%), 2.56%, 9/13/25(g) | | | 200,000 | | | | 202,605 | |
Sumitomo Mitsui Financial Group, Inc., | | | | | | | | |
2.06%, 7/14/21 | | | 70,000 | | | | 70,475 | |
2.78%, 7/12/22 | | | 75,000 | | | | 76,676 | |
2.35%, 1/15/25 | | | 400,000 | | | | 405,439 | |
Takeda Pharmaceutical Co. Ltd., 5.00%, 11/26/28 | | | 200,000 | | | | 241,225 | |
| | | | | | | | 2,005,889 | |
| | |
Kazakhstan – 0.1% | | | | | | | | |
Kazakhstan Government International Bond, 4.88%, 10/14/44 | | | 200,000 | | | | 228,230 | |
KazMunayGas National Co. JSC, 6.37%, 10/24/48(b) | | | 220,000 | | | | 227,734 | |
| | | | | | | | 455,964 | |
| | |
Kuwait – 0.1% | | | | | | | | |
Equate Petrochemical B.V., 4.25%, 11/03/26(b) | | | 210,000 | | | | 203,700 | |
Kuwait International Government Bond, 3.50%, 3/20/27(b) | | | 210,000 | | | | 230,212 | |
| | | | | | | | 433,912 | |
| | |
Luxembourg – 0.1% | | | | | | | | |
ArcelorMittal S.A., | | | | | | | | |
3.60%, 7/16/24 | | | 110,000 | | | | 105,556 | |
4.55%, 3/11/26 | | | 360,000 | | | | 346,724 | |
| | | | | | | | 452,280 | |
| | |
Macau – 0.1% | | | | | | | | |
Sands China Ltd., 5.13%, 8/08/25 | | | 500,000 | | | | 521,985 | |
| | |
Malaysia – 0.0%(f) | | | | | | | | |
Petronas Capital Ltd., 3.50%, 4/21/30(b) | | | 200,000 | | | | 209,450 | |
| | |
Mexico – 0.6% | | | | | | | | |
America Movil S.A.B. de C.V., 3.13%, 7/16/22 | | | 200,000 | | | | 204,195 | |
Comision Federal de Electricidad, 4.75%, 2/23/27(b) | | | 200,000 | | | | 191,500 | |
Grupo KUO S.A.B. de C.V., 5.75%, 7/07/27(b) | | | 200,000 | | | | 165,660 | |
See accompanying Notes to Financial Statements
104
Morningstar Funds Trust April 30, 2020
Schedule of Investments (continued)
Morningstar Total Return Bond Fund
| | | | | | | | | | | | |
| | | | | | Par(a) | | | Value | |
|
Mexico (Continued) | |
Mexican Bonos, | | | | | | | | | | | | |
7.75%, 11/23/34 | | | MXN | | | $ | 2,390,000 | | | $ | 105,194 | |
7.75%, 11/13/42 | | | | | | | 2,050,000 | | | | 84,678 | |
Mexico Government International Bond, | | | | | | | | | | | | |
4.15%, 3/28/27 | | | | | | | 467,000 | | | | 467,000 | |
4.75%, 3/08/44 | | | | | | | 1,060,000 | | | | 982,101 | |
4.50%, 1/31/50 | | | | | | | 220,000 | | | | 198,000 | |
Petroleos Mexicanos, | | | | | | | | | | | | |
5.50%, 1/21/21 | | | | | | | 10,000 | | | | 9,850 | |
4.25%, 1/15/25 | | | | | | | 46,000 | | | | 37,697 | |
4.50%, 1/23/26 | | | | | | | 96,000 | | | | 73,920 | |
6.50%, 3/13/27 | | | | | | | 128,000 | | | | 104,320 | |
6.62%, 6/15/35 | | | | | | | 50,000 | | | | 35,250 | |
5.62%, 1/23/46 | | | | | | | 620,000 | | | | 403,000 | |
7.69%, 1/23/50(b) | | | | | | | 239,000 | | | | 175,665 | |
6.95%, 1/28/60(b) | | | | | | | 58,000 | | | | 40,601 | |
| | | | | | | | | | | | 3,278,631 | |
|
Morocco – 0.0%(f) | |
OCP S.A., 4.50%, 10/22/25(b) | | | | | | | 200,000 | | | | 206,348 | |
|
Netherlands – 0.6% | |
Cooperatieve Rabobank U.A., | | | | | | | | | | | | |
4.62%, 12/01/23 | | | | | | | 250,000 | | | | 266,396 | |
4.37%, 8/04/25 | | | | | | | 440,000 | | | | 475,463 | |
ING Groep N.V., 4.10%, 10/02/23 | | | | | | | 400,000 | | | | 428,038 | |
NXP B.V./NXP Funding LLC, | | | | | | | | | | | | |
4.13%, 6/01/21(b) | | | | | | | 200,000 | | | | 204,314 | |
3.88%, 9/01/22(b) | | | | | | | 200,000 | | | | 207,224 | |
4.62%, 6/01/23(b) | | | | | | | 245,000 | | | | 261,156 | |
4.87%, 3/01/24(b) | | | | | | | 50,000 | | | | 54,281 | |
NXP B.V./NXP Funding LLC/NXP USA, Inc., | | | | | | | | | | | | |
2.70%, 5/01/25(b) | | | | | | | 60,000 | | | | 60,666 | |
3.15%, 5/01/27(b) | | | | | | | 20,000 | | | | 20,207 | |
Shell International Finance B.V., | | | | | | | | | | | | |
1.88%, 5/10/21 | | | | | | | 25,000 | | | | 25,100 | |
2.25%, 1/06/23 | | | | | | | 8,000 | | | | 8,147 | |
3.50%, 11/13/23 | | | | | | | 170,000 | | | | 180,968 | |
2.88%, 5/10/26 | | | | | | | 140,000 | | | | 148,336 | |
2.38%, 11/07/29 | | | | | | | 200,000 | | | | 200,982 | |
2.75%, 4/06/30 | | | | | | | 100,000 | | | | 104,637 | |
4.55%, 8/12/43 | | | | | | | 18,000 | | | | 21,371 | |
4.37%, 5/11/45 | | | | | | | 124,000 | | | | 146,035 | |
4.00%, 5/10/46 | | | | | | | 110,000 | | | | 125,236 | |
3.25%, 4/06/50 | | | | | | | 170,000 | | | | 174,512 | |
| | | | | | | | | | | | 3,113,069 | |
| | | | | | | | | | | | |
| | | | | | Par(a) | | | Value | |
|
Panama – 0.3% | |
Panama Government International Bond, | | | | | | | | | | | | |
3.88%, 3/17/28 | | | | | | $ | 200,000 | | | $ | 215,502 | |
6.70%, 1/26/36 | | | | | | | 580,000 | | | | 762,706 | |
4.30%, 4/29/53 | | | | | | | 400,000 | | | | 435,004 | |
| | | | | | | | | | | | 1,413,212 | |
|
Peru – 0.4% | |
Inkia Energy Ltd., 5.87%, 11/09/27(b) | | | | | | | 200,000 | | | | 188,000 | |
Peruvian Government International Bond, | | | | | | | | | | | | |
4.13%, 8/25/27 | | | | | | | 152,000 | | | | 170,431 | |
6.55%, 3/14/37 | | | | | | | 130,000 | | | | 186,551 | |
5.62%, 11/18/50 | | | | | | | 270,000 | | | | 404,325 | |
Petroleos del Peru S.A., 4.75%, 6/19/32(b) | | | | | | | 500,000 | | | | 485,005 | |
Southern Copper Corp., 5.25%, 11/08/42 | | | | | | | 600,000 | | | | 630,163 | |
| | | | | | | | | | | | 2,064,475 | |
|
Philippines – 0.1% | |
Philippine Government International Bond, | | | | | | | | | | | | |
4.20%, 1/21/24 | | | | | | | 400,000 | | | | 428,231 | |
3.00%, 2/01/28 | | | | | | | 200,000 | | | | 210,533 | |
| | | | | | | | | | | | 638,764 | |
|
Poland – 0.1% | |
Republic of Poland Government International Bond, 4.00%, 1/22/24 | | | | | | | 500,000 | | | | 546,146 | |
|
Qatar – 0.2% | |
Qatar Government International Bond, | | | | | | | | | | | | |
3.87%, 4/23/23(b) | | | | | | | 200,000 | | | | 211,854 | |
3.75%, 4/16/30(b) | | | | | | | 200,000 | | | | 218,352 | |
4.82%, 3/14/49(b) | | | | | | | 520,000 | | | | 625,448 | |
| | | | | | | | | | | | 1,055,654 | |
|
Russia – 0.3% | |
Russian Federal Bond - OFZ, | | | | | | | | | | | | |
8.15%, 2/03/27 | | | RUB | | | | 7,757,000 | | | | 118,940 | |
6.90%, 5/23/29 | | | | | | | 6,523,000 | | | | 93,972 | |
8.50%, 9/17/31 | | | | | | | 19,120,000 | | | | 308,914 | |
Russian Foreign Bond - Eurobond, | | | | | | | | | | | | |
4.38%, 3/21/29 | | | | | | | 200,000 | | | | 220,669 | |
5.62%, 4/04/42(b) | | | | | | | 600,000 | | | | 762,612 | |
| | | | | | | | | | | | 1,505,107 | |
See accompanying Notes to Financial Statements
105
Morningstar Funds Trust April 30, 2020
Schedule of Investments (continued)
Morningstar Total Return Bond Fund
| | | | | | | | |
| | | Par(a) | | | Value | |
| | |
Saudi Arabia – 0.1% | | | | | | | | |
Saudi Government International Bond, 2.90%, 10/22/25(b) | | $ | 328,000 | | | $ | 332,100 | |
| | |
South Africa – 0.1% | | | | | | | | |
Anglo American Capital PLC,
4.00%, 9/11/27(b) | | | 400,000 | | | | 399,411 | |
| | |
Spain – 0.1% | | | | | | | | |
Banco Santander S.A., | | | | | | | | |
4.38%, 4/12/28 | | | 200,000 | | | | 216,843 | |
3.31%, 6/27/29 | | | 200,000 | | | | 208,598 | |
Telefonica Emisiones S.A.,
4.10%, 3/08/27 | | | 150,000 | | | | 161,961 | |
| | | | | | | | 587,402 | |
| | |
Switzerland – 0.9% | | | | | | | | |
Credit Suisse A.G., 2.95%, 4/09/25 | | | 500,000 | | | | 526,092 | |
Credit Suisse Group A.G., | | | | | | | | |
(SOFR + 1.56%), 2.59%, 9/11/25(b)(g) | | | 250,000 | | | | 249,491 | |
(SOFR + 3.73%), 4.19%, 4/01/31(b)(g) | | | 250,000 | | | | 272,659 | |
Credit Suisse Group Funding Guernsey Ltd., 3.80%, 9/15/22 | | | 350,000 | | | | 363,716 | |
Glencore Funding LLC, | | | | | | | | |
4.12%, 3/12/24(b) | | | 400,000 | | | | 410,324 | |
4.00%, 3/27/27(b) | | | 380,000 | | | | 385,044 | |
3.88%, 10/27/27(b) | | | 80,000 | | | | 79,640 | |
Novartis Capital Corp., | | | | | | | | |
3.40%, 5/06/24 | | | 70,000 | | | | 76,565 | |
2.20%, 8/14/30 | | | 34,000 | | | | 36,068 | |
Tyco Electronics Group S.A., 3.13%, 8/15/27 | | | 18,000 | | | | 18,797 | |
UBS A.G., 1.75%, 4/21/22(b) | | | 200,000 | | | | 200,844 | |
UBS Group A.G., | | | | | | | | |
(3M USD LIBOR + 0.95%), 2.86%, 8/15/23(b)(g) | | | 200,000 | | | | 204,055 | |
(5Y USD Swap Rate + 4.34%),
7.00%, 1/31/24(b)(g)(h) | | | 200,000 | | | | 205,740 | |
4.12%, 4/15/26(b) | | | 200,000 | | | | 218,998 | |
4.25%, 3/23/28(b) | | | 770,000 | | | | 851,764 | |
(3M USD LIBOR + 1.47%), 3.13%, 8/13/30(b)(g) | | | 470,000 | | | | 490,061 | |
| | | | | | | | 4,589,858 | |
| | |
Ukraine – 0.0%(f) | | | | | | | | |
Ukraine Government International Bond, 9.75%, 11/01/28 | | | 200,000 | | | | 196,311 | |
| | | | | | | | |
| | | Par(a) | | | Value | |
| | |
United Arab Emirates – 0.3% | | | | | | | | |
Abu Dhabi Government International Bond, | | | | | | | | |
2.50%, 10/11/22(b) | | $ | 610,000 | | | $ | 622,200 | |
3.13%, 9/30/49(b) | | | 480,000 | | | | 459,840 | |
DP World PLC, 5.62%, 9/25/48(b) | | | 300,000 | | | | 286,500 | |
MDGH - GMTN B.V., 2.50%, 11/07/24(b) | | | 200,000 | | | | 200,000 | |
| | | | | | | | 1,568,540 | |
| | |
United Kingdom – 1.3% | | | | | | | | |
BAE Systems Holdings, Inc., | | | | | | | | |
3.80%, 10/07/24(b) | | | 16,000 | | | | 17,019 | |
3.85%, 12/15/25(b) | | | 425,000 | | | | 460,380 | |
Barclays PLC, (3M USD LIBOR + 1.90%), 4.97%, 5/16/29(g) | | | 400,000 | | | | 451,869 | |
BAT Capital Corp., | | | | | | | | |
4.70%, 4/02/27 | | | 95,000 | | | | 104,783 | |
3.56%, 8/15/27 | | | 300,000 | | | | 308,188 | |
4.91%, 4/02/30 | | | 75,000 | | | | 84,429 | |
4.54%, 8/15/47 | | | 245,000 | | | | 256,542 | |
BP Capital Markets PLC, | | | | | | | | |
3.81%, 2/10/24 | | | 116,000 | | | | 123,297 | |
3.54%, 11/04/24 | | | 2,000 | | | | 2,118 | |
GlaxoSmithKline Capital PLC, 3.38%, 6/01/29 | | | 112,000 | | | | 127,539 | |
GlaxoSmithKline | | | | | | | | |
Capital, Inc., | | | | | | | | |
3.88%, 5/15/28 | | | 26,000 | | | | 30,244 | |
6.37%, 5/15/38 | | | 5,000 | | | | 7,809 | |
HSBC Holdings PLC, | | | | | | | | |
(3M USD LIBOR + 1.55%),
4.04%, 3/13/28(g) | | | 235,000 | | | | 253,777 | |
(3M USD LIBOR + 1.53%),
4.58%, 6/19/29(g) | | | 700,000 | | | | 791,492 | |
4.95%, 3/31/30 | | | 200,000 | | | | 236,498 | |
(3M USD LIBOR + 1.61%),
3.97%, 5/22/30(g) | | | 750,000 | | | | 821,550 | |
Lloyds Banking Group PLC, | | | | | | | | |
(3M USD LIBOR + 0.81%),
2.91%, 11/07/23(g) | | | 270,000 | | | | 274,499 | |
4.37%, 3/22/28 | | | 290,000 | | | | 322,940 | |
RELX Capital, Inc., | | | | | | | | |
3.50%, 3/16/23 | | | 372,000 | | | | 387,098 | |
4.00%, 3/18/29 | | | 161,000 | | | | 175,815 | |
Reynolds American, Inc., | | | | | | | | |
4.45%, 6/12/25 | | | 245,000 | | | | 266,394 | |
6.15%, 9/15/43 | | | 18,000 | | | | 21,860 | |
5.85%, 8/15/45 | | | 120,000 | | | | 138,696 | |
See accompanying Notes to Financial Statements
106
Morningstar Funds Trust April 30, 2020
Schedule of Investments (continued)
Morningstar Total Return Bond Fund
| | | | | | | | |
| | | Par(a) | | | Value | |
| | |
United Kingdom (Continued) | | | | | | | | |
Royal Bank of Scotland Group PLC, | | | | | | | | |
(3M USD LIBOR + 1.76%), 4.27%, 3/22/25(g) | | | $400,000 | | | $ | 423,610 | |
(3M USD LIBOR + 1.91%), 5.08%, 1/27/30(g) | | | 200,000 | | | | 229,979 | |
Santander UK Group Holdings PLC, 3.13%, 1/08/21 | | | 50,000 | | | | 50,465 | |
Vodafone Group PLC, | | | | | | | | |
3.75%, 1/16/24 | | | 85,000 | | | | 91,723 | |
4.13%, 5/30/25 | | | 39,000 | | | | 43,493 | |
4.37%, 5/30/28 | | | 197,000 | | | | 225,546 | |
5.00%, 5/30/38 | | | 9,000 | | | | 10,699 | |
4.37%, 2/19/43 | | | 86,000 | | | | 96,904 | |
5.25%, 5/30/48 | | | 96,000 | | | | 120,011 | |
5.12%, 6/19/59 | | | 1,000 | | | | 1,260 | |
| | | | | | | | 6,958,526 | |
| | |
Uruguay – 0.2% | | | | | | | | |
Uruguay Government International Bond, | | | | | | | | |
4.37%, 10/27/27 | | | 70,000 | | | | 76,388 | |
4.38%, 1/23/31 | | | 230,000 | | | | 253,290 | |
5.10%, 6/18/50 | | | 560,000 | | | | 635,606 | |
| | | | | | | | 965,284 | |
| | |
Total Foreign Issuer Bonds
(Cost $51,992,966) | | | | | | | 52,565,728 | |
Term Loans – 0.0%(d)(f) | |
|
Distribution/Wholesale – 0.0%(f) | |
KAR Auction Services, Inc., Tranche B-6 Term Loan, (1M USD LIBOR + 2.25%), 2.88%, 9/19/26(b) | | | 14,750 | | | | 13,349 | |
| | |
Total Term Loans
(Cost $14,716) | | | | | | | 13,349 | |
| | |
| | | Par | | | Value | |
Mortgage-Backed Securities – 35.4% | |
|
Federal Home Loan Mortgage Corporation – 4.3% | |
Multifamily Structured Pass Through Certificates, Series K736, Class X1, 1.44%, 7/25/26(c) | | | 1,999,634 | | | | 128,816 | |
Series K091, Class A2,
3.51%, 3/25/29 | | | 210,000 | | | | 244,646 | |
Series K095, Class XAM,
1.37%, 6/25/29(c) | | | 500,000 | | | | 48,524 | |
Series K099, Class X1,
1.01%, 9/25/29(c) | | | 1,089,102 | | | | 73,722 | |
| | | | | | | | |
| | | Par | | | Value | |
|
Federal Home Loan Mortgage Corporation (Continued) | |
Pool, | | | | |
#ZJ9284, 5.00%, 9/01/24 | | $ | 99,990 | | | $ | 108,508 | |
#ZM1677, 3.00%, 9/01/46 | | | 1,099,712 | | | | 1,182,671 | |
#ZM5146, 12/01/47(i) | | | 337,950 | | | | 361,564 | |
#ZM6880, 6/01/48(i) | | | 57,754 | | | | 62,404 | |
#ZM7693, 4.00%, 8/01/48 | | | 199,980 | | | | 213,221 | |
#ZS4786, 8/01/48(i) | | | 51,672 | | | | 55,781 | |
#ZS4791, 9/01/48(i) | | | 260,315 | | | | 280,568 | |
#ZT1320, 4.00%, 11/01/48 | | | 441,457 | | | | 469,774 | |
#ZA5940, 11/01/48(i) | | | 71,480 | | | | 77,926 | |
#ZT1640, 4.50%, 1/01/49 | | | 293,854 | | | | 321,048 | |
#ZT1857, 4.50%, 3/01/49 | | | 1,933,186 | | | | 2,180,615 | |
#ZA6531, 3/01/49(i) | | | 73,893 | | | | 80,432 | |
#ZN5955, 3.50%, 5/01/49 | | | 7,263 | | | | 7,671 | |
#ZT1952, 4.00%, 5/01/49 | | | 825,919 | | | | 878,897 | |
#QA0639, 4.00%, 6/01/49 | | | 630,673 | | | | 684,081 | |
#RA1103, 3.00%, 7/01/49 | | | 185,691 | | | | 197,418 | |
#RA1084, 7/01/49(i) | | | 161,136 | | | | 175,249 | |
#RA1293, 3.00%, 9/01/49 | | | 284,443 | | | | 305,361 | |
#RA1341, 3.00%, 9/01/49 | | | 96,970 | | | | 103,094 | |
#RA1343, 3.00%, 9/01/49 | | | 95,984 | | | | 101,648 | |
#RA1340, 3.00%, 9/01/49 | | | 379,973 | | | | 402,576 | |
#SD0289, 4.00%, 9/01/49 | | | 2,699,732 | | | | 2,876,305 | |
#RA1493, 3.00%, 10/01/49 | | | 387,280 | | | | 411,205 | |
#RA1496, 3.00%, 10/01/49 | | | 289,998 | | | | 307,204 | |
#RA1460, 3.00%, 10/01/49 | | | 191,794 | | | | 203,203 | |
#RA1741, 3.50%, 11/01/49 | | | 1,149,423 | | | | 1,227,415 | |
#SD8026, 4.00%, 11/01/49 | | | 177,598 | | | | 189,177 | |
#RA1878, 3.50%, 12/01/49 | | | 60,120 | | | | 64,126 | |
#RA1980, 3.00%, 1/01/50 | | | 685,679 | | | | 726,468 | |
#RA1981, 3.00%, 1/01/50 | | | 292,880 | | | | 310,302 | |
#QA6173, 3.00%, 1/01/50 | | | 97,352 | | | | 103,214 | |
#RA2016, 3.00%, 1/01/50 | | | 1,578,738 | | | | 1,672,654 | |
See accompanying Notes to Financial Statements
107
Morningstar Funds Trust April 30, 2020
Schedule of Investments (continued)
Morningstar Total Return Bond Fund
| | | | | | | | |
| | | Par | | | Value | |
|
Federal Home Loan Mortgage Corporation (Continued) | |
Pool, | | | | | | | | |
#RA2010, 3.50%, 1/01/50 | | $ | 5,942 | | | $ | 6,273 | |
#QA6625, 3.00%, 2/01/50 | | | 98,438 | | | | 104,031 | |
#QA7356, 3.00%, 2/01/50 | | | 398,715 | | | | 421,367 | |
#RA2117, 3.00%, 2/01/50 | | | 593,878 | | | | 631,016 | |
#QA7238, 3.50%, 2/01/50 | | | 98,995 | | | | 106,498 | |
#QA7415, 3.50%, 2/01/50 | | | 99,713 | | | | 105,369 | |
#RA2140, 3.50%, 2/01/50 | | | 198,019 | | | | 211,688 | |
#RA2141, 4.00%, 2/01/50 | | | 99,352 | | | | 105,829 | |
#RA2145, 4.50%, 2/01/50 | | | 288,310 | | | | 311,390 | |
#RA2332, 3.00%, 3/01/50 | | | 695,780 | | | | 737,569 | |
#RA2335, 3.00%, 3/01/50 | | | 695,821 | | | | 739,333 | |
#RA2362, 3.50%, 3/01/50 | | | 199,686 | | | | 212,244 | |
#RA2313, 3.50%, 3/01/50 | | | 497,516 | | | | 533,697 | |
#RA2358, 4.00%, 3/01/50 | | | 98,853 | | | | 105,596 | |
#RA2353, 4.50%, 3/01/50 | | | 99,879 | | | | 107,709 | |
#SD0291, 3/01/50(i) | | | 451,229 | | | | 489,873 | |
#RA2389, 4.50%, 4/01/50 | | | 198,611 | | | | 214,510 | |
Real Estate Mortgage Investment Conduits, Series 2019-RR01, Class X,
1.53%, 6/25/28 | | | 2,500,000 | | | | 277,197 | |
| | | | | | | | 22,258,677 | |
|
Federal Home Loan Mortgage Corporation Gold – 3.4% | |
Pool, | | | | | | | | |
#Q41209, 3.50%, 6/01/46 | | | 64,028 | | | | 69,295 | |
#G61813, 3.00%, 7/01/46 | | | 448,549 | | | | 481,613 | |
#G08747, 3.00%, 2/01/47 | | | 619,148 | | | | 656,640 | |
#G08750, 3.00%, 3/01/47 | | | 409,793 | | | | 433,198 | |
#G61677, 4.50%, 4/01/47 | | | 134,897 | | | | 151,413 | |
#G60972, 4.50%, 5/01/47 | | | 51,090 | | | | 56,786 | |
#Q48752, 3.50%, 6/01/47 | | | 69,139 | | | | 74,313 | |
#G61047, 4.50%, 7/01/47 | | | 214,758 | | | | 238,700 | |
#G61079, 4.50%, 7/01/47 | | | 64,930 | | | | 71,440 | |
#G08779, 3.50%, 9/01/47 | | | 830,103 | | | | 882,080 | |
| | | | | | | | |
| | | Par | | | Value | |
|
Federal Home Loan Mortgage Corporation Gold (Continued) | |
Pool, | | | | | | | | |
#G08791, 3.00%, 12/01/47 | | $ | 677,367 | | | $ | 716,594 | |
#Q53534, 3.00%, 1/01/48 | | | 33,231 | | | | 35,157 | |
#G08799, 3.00%, 2/01/48 | | | 138,538 | | | | 146,375 | |
#G08800, 3.50%, 2/01/48 | | | 215,268 | | | | 228,248 | |
#G61374, 4/01/48(i) | | | 206,216 | | | | 224,618 | |
#V84260, 3.50%, 6/01/48 | | | 321,680 | | | | 345,612 | |
#Q59918, 4.50%, 7/01/48 | | | 407,847 | | | | 453,121 | |
#Q57853, 4.50%, 8/01/48 | | | 168,410 | | | | 187,101 | |
#G67715, 4.50%, 8/01/48 | | | 310,076 | | | | 344,489 | |
#G61739, 3.00%, 9/01/48 | | | 428,803 | | | | 460,436 | |
#G08835, 3.50%, 9/01/48 | | | 198,151 | | | | 209,751 | |
#G08837, 4.50%, 9/01/48 | | | 554,265 | | | | 597,569 | |
#G08841, 3.50%, 10/01/48 | | | 1,763,299 | | | | 1,863,297 | |
#G08846, 3.50%, 11/01/48 | | | 1,019,166 | | | | 1,077,027 | |
#G61727, 4.00%, 11/01/48 | | | 213,780 | | | | 228,065 | |
#G08861, 3.50%, 2/01/49 | | | 362,519 | | | | 382,934 | |
#G08865, 3.50%, 3/01/49 | | | 600,476 | | | | 634,242 | |
#V85283, 3.50%, 3/01/49 | | | 240,044 | | | | 256,142 | |
#G61989, 3.50%, 4/01/49 | | | 5,100,850 | | | | 5,604,415 | |
#G67721, 4/01/49(i) | | | 255,507 | | | | 280,107 | |
| | | | | | | | 17,390,778 | |
|
Federal National Mortgage Association – 14.8% | |
Alternative Credit Enhancement Securities, | | | | | | | | |
Series 2019-M6, Class A2, 3.45%, 1/01/29 | | | 210,000 | | | | 237,197 | |
Series 2019-M5, Class A2, 3.27%, 1/25/29 | | | 110,000 | | | | 123,638 | |
Series 2019-M4, Class A2, 3.61%, 2/25/31 | | | 100,000 | | | | 117,167 | |
Series 2019-M23, Class 3A3, 2.72%, 10/25/31 | | | 99,989 | | | | 107,260 | |
Series 2019-M27, Class A2, 2.70%, 11/25/40 | | | 100,000 | | | | 111,631 | |
Series 2013-M6, Class 1AC, 3.56%, 2/25/43(c) | | | 85,505 | | | | 94,439 | |
Pool, | | | | | | | | |
#AS0496, 3.00%, 9/01/28 | | | 29,396 | | | | 31,167 | |
#BL2454, 3.16%, 5/01/29 | | | 59,313 | | | | 67,330 | |
#BL2465, 3.24%, 5/01/29 | | | 100,000 | | | | 114,782 | |
#BL2457, 3.26%, 5/01/29 | | | 40,000 | | | | 45,876 | |
#AW1281, 3.00%, 7/01/29 | | | 11,922 | | | | 12,652 | |
See accompanying Notes to Financial Statements
108
Morningstar Funds Trust April 30, 2020
Schedule of Investments (continued)
Morningstar Total Return Bond Fund
| | | | | | | | |
| | | Par | | | Value | |
|
Federal National Mortgage Association (Continued) | |
Pool, | | | | | | | | |
#AW4229, 3.00%, 7/01/29 | | $ | 53,057 | | | $ | 56,500 | |
#BL3561, 2.74%, 8/01/29 | | | 40,000 | | | | 44,588 | |
#BL3540, 2.79%, 8/01/29 | | | 300,000 | | | | 336,791 | |
#AX6435, 3.00%, 1/01/30 | | | 36,327 | | | | 38,576 | |
#BL5850, 2.26%, 4/01/30 | | | 200,000 | | | | 215,658 | |
#890696, 3.00%, 9/01/30 | | | 175,359 | | | | 186,250 | |
#BL3771, 2.77%, 8/01/31 | | | 200,000 | | | | 222,911 | |
#BL3776, 2.77%, 8/01/31 | | | 100,000 | | | | 111,408 | |
#BL3152, 2.84%, 8/01/31 | | | 100,000 | | | | 112,078 | |
#BL3648, 2.85%, 8/01/31 | | | 100,000 | | | | 112,266 | |
#BL3644, 2.85%, 8/01/31 | | | 400,000 | | | | 449,066 | |
#BL3681, 2.86%, 8/01/31 | | | 100,000 | | | | 112,272 | |
#BL3643, 2.91%, 8/01/31 | | | 100,000 | | | | 111,960 | |
#BL3700, 2.92%, 8/01/31 | | | 100,000 | | | | 112,164 | |
#BL3619, 2.92%, 8/01/31 | | | 900,000 | | | | 1,008,492 | |
#BL3677, 2.93%, 8/01/31 | | | 200,000 | | | | 224,671 | |
#BM5304, 3.00%, 9/01/32 | | | 53,660 | | | | 57,386 | |
#BH9243, 3.00%, 1/01/33 | | | 391,467 | | | | 413,276 | |
#BM4614, 3.00%, 3/01/33 | | | 64,399 | | | | 68,122 | |
#FM1680, 2.50%, 12/01/33 | | | 252,110 | | | | 263,785 | |
#CA3022, 3.50%, 1/01/34 | | | 176,494 | | | | 190,660 | |
#BM6019, 3.50%, 5/01/34 | | | 388,631 | | | | 417,913 | |
#MA3831, 3.00%, 11/01/39 | | | 88,083 | | | | 93,154 | |
#AK6740, 4.00%, 3/01/42 | | | 1,589,255 | | | | 1,781,550 | |
#AL3311, 3.50%, 3/01/43 | | | 2,438,156 | | | | 2,681,853 | |
#BM4751, 3.50%, 3/01/43 | | | 159,188 | | | | 171,653 | |
#AU6873, 4.50%, 11/01/43 | | | 140,169 | | | | 159,623 | |
#AL5597, 4.50%, 6/01/44 | | | 267,358 | | | | 297,217 | |
#AS2947, 4.00%, 7/01/44 | | | 809,638 | | | | 889,770 | |
#AS5480, 4.50%, 7/01/45 | | | 78,634 | | | | 87,837 | |
#AL9475, 4.50%, 11/01/45 | | | 101,366 | | | | 112,636 | |
#AS7313, 3.50%, 6/01/46 | | | 658,408 | | | | 712,344 | |
#AS7488, 3.00%, 7/01/46 | | | 1,085,117 | | | | 1,178,634 | |
#BM1922, 4.50%, 7/01/46 | | | 193,656 | | | | 220,389 | |
| | | | | | | | |
| | | Par | | | Value | |
|
Federal National Mortgage Association (Continued) | |
Pool, | | | | | | | | |
#AS7726, 3.00%, 8/01/46 | | $ | 780,304 | | | $ | 839,168 | |
#BC1509, 3.00%, 8/01/46 | | | 139,008 | | | | 147,830 | |
#AS7844, 3.00%, 9/01/46 | | | 205,880 | | | | 218,947 | |
#BC2817, 3.00%, 9/01/46 | | | 274,250 | | | | 292,195 | |
#AL9397, 3.00%, 10/01/46 | | | 215,389 | | | | 229,060 | |
#AS8269, 3.00%, 11/01/46 | | | 1,502,420 | | | | 1,596,848 | |
#BM4897, 3.50%, 12/01/46 | | | 165,037 | | | | 176,515 | |
#BM4226, 3.00%, 1/01/47 | | | 2,373,882 | | | | 2,559,069 | |
#BM5520, 3.50%, 2/01/47 | | | 961,216 | | | | 1,026,491 | |
#BM4696, 3.00%, 3/01/47 | | | 1,215,837 | | | | 1,300,628 | |
#FM1349, 3.50%, 3/01/47 | | | 536,385 | | | | 579,807 | |
#CA0148, 8/01/47(i) | | | 104,041 | | | | 112,075 | |
#890843, 3.00%, 9/01/47 | | | 81,830 | | | | 87,540 | |
#BE2735, 4.50%, 10/01/47 | | | 16,636 | | | | 18,485 | |
#BH5764, 4.50%, 11/01/47 | | | 71,210 | | | | 78,324 | |
#BM3208, 4.50%, 11/01/47 | | | 126,328 | | | | 138,948 | |
#CA0717, 11/01/47(i) | | | 287,481 | | | | 311,273 | |
#MA3210, 3.50%, 12/01/47 | | | 1,146,948 | | | | 1,218,255 | |
#CA0858, 3.50%, 12/01/47 | | | 383,245 | | | | 407,249 | |
#FM1002, 3.50%, 1/01/48 | | | 1,195,805 | | | | 1,284,854 | |
#CA1021, 4.50%, 1/01/48 | | | 175,826 | | | | 193,391 | |
#BM5526, 3.50%, 2/01/48 | | | 242,434 | | | | 256,957 | |
#BM5073, 3.00%, 4/01/48 | | | 1,096,216 | | | | 1,173,873 | |
#CA1565, 4/01/48(i) | | | 361,297 | | | | 389,363 | |
#BJ9172, 4.50%, 5/01/48 | | | 351,914 | | | | 390,856 | |
#BM5896, 4.50%, 5/01/48 | | | 184,121 | | | | 204,452 | |
#BJ9257, 6/01/48(i) | | | 76,689 | | | | 84,319 | |
#CA2055, 7/01/48(i) | | | 57,798 | | | | 62,392 | |
#CA2047, 7/01/48(i) | | | 220,924 | | | | 242,902 | |
#BK4764, 4.00%, 8/01/48 | | | 5,200,002 | | | | 5,533,553 | |
#BN0691, 4.50%, 8/01/48 | | | 72,736 | | | | 79,643 | |
#BM4351, 4.50%, 8/01/48 | | | 130,992 | | | | 145,487 | |
See accompanying Notes to Financial Statements
109
Morningstar Funds Trust April 30, 2020
Schedule of Investments (continued)
Morningstar Total Return Bond Fund
| | | | | | | | |
| | | Par | | | Value | |
|
Federal National Mortgage Association (Continued) | |
Pool, | | | | | | | | |
#CA2207, 4.50%, 8/01/48 | | $ | 885,786 | | | $ | 957,590 | |
#CA2199, 8/01/48(i) | | | 296,123 | | | | 325,582 | |
#CA2205, 8/01/48(i) | | | 166,821 | | | | 179,940 | |
#CA2251, 5.00%, 8/01/48 | | | 52,560 | | | | 57,118 | |
#BK4814, 9/01/48(i) | | | 60,777 | | | | 65,534 | |
#CA2491, 4.50%, 10/01/48 | | | 138,631 | | | | 149,734 | |
#BK7603, 10/01/48(i) | | | 76,849 | | | | 83,960 | |
#CA2482, 10/01/48(i) | | | 298,821 | | | | 328,001 | |
#CA2493, 10/01/48(i) | | | 220,004 | | | | 237,175 | |
#BN1623, 11/01/48(i) | | | 272,217 | | | | 299,298 | |
#CA2588, 4.50%, 11/01/48 | | | 63,419 | | | | 68,380 | |
#MA3527, 11/01/48(i) | | | 320,894 | | | | 348,708 | |
#FM1866, 4.00%, 12/01/48 | | | 2,476,619 | | | | 2,635,480 | |
#BN3996, 4.00%, 12/01/48 | | | 200,000 | | | | 212,980 | |
#MA3537, 4.50%, 12/01/48 | | | 1,432,047 | | | | 1,543,846 | |
#CA2855, 4.50%, 12/01/48 | | | 180,691 | | | | 194,779 | |
#CA2803, 4.50%, 12/01/48 | | | 57,989 | | | | 62,509 | |
#CA2805, 4.50%, 12/01/48 | | | 423,875 | | | | 457,292 | |
#BN0302, 12/01/48(i) | | | 405,072 | | | | 440,013 | |
#CA2801, 12/01/48(i) | | | 67,644 | | | | 73,705 | |
#BN0341, 5.00%, 12/01/48 | | | 306,522 | | | | 332,773 | |
#BM5317, 1/01/49(i) | | | 141,194 | | | | 153,356 | |
#BN3933, 4.50%, 1/01/49 | | | 429,721 | | | | 467,746 | |
#BM5862, 4.50%, 2/01/49 | | | 394,700 | | | | 438,318 | |
#CA3094, 4.50%, 2/01/49 | | | 693,540 | | | | 788,791 | |
#BM5629, 2/01/49(i) | | | 74,142 | | | | 80,936 | |
#CA3055, 2/01/49(i) | | | 135,926 | | | | 147,634 | |
#CA3092, 2/01/49(i) | | | 69,990 | | | | 76,184 | |
#CA3471, 3.50%, 5/01/49 | | | 332,775 | | | | 355,108 | |
#BN6625, 3.50%, 5/01/49 | | | 756,727 | | | | 831,177 | |
#CA3472, 3.50%, 5/01/49 | | | 84,904 | | | | 90,420 | |
#CA3516, 4.50%, 5/01/49 | | | 580,450 | | | | 660,172 | |
#MA3665, 4.50%, 5/01/49 | | | 353,631 | | | | 380,912 | |
| | | | | | | | |
| | | Par | | | Value | |
|
Federal National Mortgage Association (Continued) | |
Pool, | | | | | | | | |
#FM1637, 4.50%, 5/01/49 | | $ | 329,687 | | | $ | 358,859 | |
#FM1991, 4.50%, 5/01/49 | | | 404,843 | | | | 437,693 | |
#CA3634, 3.50%, 6/01/49 | | | 184,354 | | | | 198,088 | |
#CA3645, 3.50%, 6/01/49 | | | 1,571,400 | | | | 1,715,466 | |
#BN6688, 4.00%, 6/01/49 | | | 394,242 | | | | 436,117 | |
#BO0968, 4.00%, 6/01/49 | | | 89,465 | | | | 95,325 | |
#BN9558, 3.00%, 7/01/49 | | | 169,677 | | | | 179,252 | |
#CA3809, 3.00%, 7/01/49 | | | 187,672 | | | | 199,483 | |
#FM1263, 4.50%, 7/01/49 | | | 78,978 | | | | 85,848 | |
#CA3842, 7/01/49(i) | | | 164,795 | | | | 179,429 | |
#CA4033, 8/01/49(i) | | | 165,106 | | | | 179,766 | |
#FM1468, 5.00%, 8/01/49 | | | 721,367 | | | | 783,378 | |
#CA4133, 3.00%, 9/01/49 | | | 287,491 | | | | 307,579 | |
#CA4134, 3.00%, 9/01/49 | | | 478,888 | | | | 507,302 | |
#BN7753, 3.00%, 9/01/49 | | | 491,648 | | | | 524,523 | |
#CA4122, 3.50%, 9/01/49 | | | 654,291 | | | | 698,686 | |
#CA4164, 3.50%, 9/01/49 | | | 3,960 | | | | 4,182 | |
#CA5242, 3.50%, 9/01/49 | | | 10,543 | | | | 11,150 | |
#MA3801, 2.50%, 10/01/49 | | | 100,000 | | | | 104,173 | |
#BO2256, 3.00%, 10/01/49 | | | 485,480 | | | | 514,360 | |
#BO2252, 3.50%, 10/01/49 | | | 96,507 | | | | 103,697 | |
#CA4430, 3.50%, 10/01/49 | | | 1,242,267 | | | | 1,326,557 | |
#BO2249, 3.50%, 10/01/49 | | | 2,664 | | | | 2,812 | |
#MA3804, 4.00%, 10/01/49 | | | 525,968 | | | | 559,706 | |
#FM1789, 3.00%, 11/01/49 | | | 573,753 | | | | 609,986 | |
#FM1962, 3.50%, 11/01/49 | | | 2,868 | | | | 3,055 | |
#BO6985, 3.50%, 11/01/49 | | | 98,664 | | | | 105,267 | |
#CA4564, 3.50%, 11/01/49 | | | 8,294 | | | | 8,847 | |
See accompanying Notes to Financial Statements
110
Morningstar Funds Trust April 30, 2020
Schedule of Investments (continued)
Morningstar Total Return Bond Fund
| | | | | | | | |
| | | Par | | | Value | |
|
Federal National Mortgage Association (Continued) | |
Pool, | | | | | | | | |
#FM3002, 4.50%, 11/01/49 | | $ | 100,000 | | | $ | 107,828 | |
#FM2075, 3.00%, 12/01/49 | | | 392,224 | | | | 416,016 | |
#MA3871, 3.00%, 12/01/49 | | | 2,799,762 | | | | 2,957,358 | |
#CA4794, 3.00%, 12/01/49 | | | 1,454,074 | | | | 1,538,351 | |
#CA4823, 4.00%, 12/01/49 | | | 191,697 | | | | 204,368 | |
#BO8932, 3.00%, 1/01/50 | | | 99,432 | | | | 105,833 | |
#MA3905, 3.00%, 1/01/50 | | | 1,299,872 | | | | 1,373,040 | |
#CA4979, 3.00%, 1/01/50 | | | 594,775 | | | | 628,704 | |
#BO9692, 3.00%, 1/01/50 | | | 130,857 | | | | 139,121 | |
#BP1585, 3.50%, 1/01/50 | | | 98,252 | | | | 104,884 | |
#CA5021, 3.50%, 1/01/50 | | | 1,915 | | | | 2,042 | |
#FM2378, 4.50%, 1/01/50 | | | 185,236 | | | | 200,791 | |
#BO9019, 3.00%, 2/01/50 | | | 199,275 | | | | 210,503 | |
#BO9033, 3.00%, 2/01/50 | | | 99,641 | | | | 105,425 | |
#BP0209, 3.00%, 2/01/50 | | | 299,053 | | | | 316,044 | |
#BP1631, 3.00%, 2/01/50 | | | 295,985 | | | | 315,209 | |
#CA5216, 3.00%, 2/01/50 | | | 1,940,923 | | | | 2,062,265 | |
#CA5217, 3.00%, 2/01/50 | | | 750,067 | | | | 795,229 | |
#CA5225, 3.00%, 2/01/50 | | | 792,497 | | | | 848,549 | |
#CA5226, 3.00%, 2/01/50 | | | 495,717 | | | | 526,715 | |
#BO7601, 3.00%, 2/01/50 | | | 172,099 | | | | 182,089 | |
#FM2331, 3.50%, 2/01/50 | | | 292,938 | | | | 312,493 | |
#BP1293, 3.50%, 2/01/50 | | | 199,418 | | | | 210,731 | |
#BP1662, 3.50%, 2/01/50 | | | 97,715 | | | | 103,258 | |
#FM2333, 3.50%, 2/01/50 | | | 293,374 | | | | 314,542 | |
#BP2866, 3.00%, 3/01/50 | | | 99,840 | | | | 105,512 | |
#CA5307, 3.00%, 3/01/50 | | | 1,133,747 | | | | 1,201,840 | |
#BO7625, 3.00%, 3/01/50 | | | 199,617 | | | | 211,329 | |
#BP3074, 3.00%, 3/01/50 | | | 198,929 | | | | 210,231 | |
#MA3960, 3.00%, 3/01/50 | | | 600,001 | | | | 633,774 | |
| | | | | | | | |
| | | Par | | | Value | |
|
Federal National Mortgage Association (Continued) | |
Pool, | | | | | | | | |
#CA5364, 4.00%, 3/01/50 | | $ | 493,373 | | | $ | 535,063 | |
#BP2389, 4.50%, 4/01/50 | | | 100,000 | | | | 108,556 | |
#BP2770, 2.50%, 5/01/50 | | | 300,000 | | | | 312,592 | |
#FM2934, 5/01/50(i) | | | 37,807 | | | | 40,481 | |
#FM2965, 5/01/50(i) | | | 49,825 | | | | 53,349 | |
| | | | | | | | 76,957,193 | |
|
Government National Mortgage Association – 3.1% | |
Pool TBA, | | | | | | | | |
5/01/50(i) | | | 12,264,000 | | | | 13,053,674 | |
6/01/50(i) | | | 1,972,000 | | | | 2,091,559 | |
5/01/70(i) | | | 200,000 | | | | 206,656 | |
Series 2013-107, Class AD, 2.69%, 11/16/47(c) | | | 188,583 | | | | 197,930 | |
Series 2014-17, Class AM, 2.57%, 6/16/48(c) | | | 74,292 | | | | 77,394 | |
Series 2014-H20, Class FA, (1M USD LIBOR + 0.43%, 0.43% Floor), 1.79%, 10/20/64(d) | | | 277,522 | | | | 275,733 | |
Series 2019-123, Class A, 3.00%, 10/20/49 | | | 99,226 | | | | 106,531 | |
Series 2020-H04, Class FP, (1M USD LIBOR + 0.50%, 0.50% Floor), 1.86%, 6/20/69(d) | | | 297,290 | | | | 295,450 | |
| | | | | | | | 16,304,927 | |
|
Government National Mortgage Association I – 0.1% | |
Pool, | | | | | | | | |
#AB2892, 3.00%, 9/15/42 | | | 251,920 | | | | 269,253 | |
#AB9108, 3.00%, 10/15/42 | | | 168,251 | | | | 179,801 | |
#784571, 3.50%, 6/15/48 | | | 153,623 | | | | 164,567 | |
| | | | | | | | 613,621 | |
|
Government National Mortgage Association II – 3.4% | |
Pool, | | | | | | | | |
#MA2677, 3.00%, 3/20/45 | | | 470,007 | | | | 502,675 | |
#MA2678, 3.50%, 3/20/45 | | | 31,367 | | | | 33,760 | |
#MA2753, 3.00%, 4/20/45 | | | 1,597,923 | | | | 1,708,812 | |
#MA2754, 3.50%, 4/20/45 | | | 22,236 | | | | 23,930 | |
#MA3173, 3.50%, 10/20/45 | | | 22,745 | | | | 24,593 | |
#MA3310, 3.50%, 12/20/45 | | | 111,932 | | | | 120,490 | |
#MA3376, 3.50%, 1/20/46 | | | 23,169 | | | | 24,936 | |
See accompanying Notes to Financial Statements
111
Morningstar Funds Trust April 30, 2020
Schedule of Investments (continued)
Morningstar Total Return Bond Fund
| | | | | | | | |
| | | Par | | | Value | |
|
Government National Mortgage Association II
(Continued) | |
Pool, | | | | | | | | |
#MA3663, 3.50%, 5/20/46 | | $ | 904,971 | | | $ | 973,548 | |
#MA3736, 3.50%, 6/20/46 | | | 1,194,947 | | | | 1,283,593 | |
#MA3937, 3.50%, 9/20/46 | | | 106,582 | | | | 114,521 | |
#MA4068, 3.00%, 11/20/46 | | | 62,556 | | | | 66,671 | |
#MA4384, 4.50%, 4/20/47 | | | 434,614 | | | | 475,636 | |
#MA4511, 4.00%, 6/20/47 | | | 672,678 | | | | 729,024 | |
#784577, 4.00%, 7/20/47 | | | 1,175,652 | | | | 1,264,439 | |
#MA4837, 3.50%, 11/20/47 | | | 821,512 | | | | 877,537 | |
#MA4838, 4.00%, 11/20/47 | | | 466,292 | | | | 500,054 | |
#MA4899, 3.00%, 12/20/47 | | | 158,601 | | | | 168,983 | |
#MA4901, 4.00%, 12/20/47 | | | 201,686 | | | | 216,176 | |
#MA5019, 3.50%, 2/20/48 | | | 272,247 | | | | 290,851 | |
#MA5020, 4.00%, 2/20/48 | | | 117,174 | | | | 126,467 | |
#MA5078, 4.00%, 3/20/48 | | | 622,192 | | | | 665,513 | |
#784674, 3.50%, 4/20/48 | | | 176,877 | | �� | | 190,375 | |
#MA5137, 4.00%, 4/20/48 | | | 111,029 | | | | 118,485 | |
#MA5265, 4.50%, 6/20/48 | | | 282,762 | | | | 305,121 | |
#MA5331, 4.50%, 7/20/48 | | | 149,783 | | | | 160,420 | |
#MA5467, 4.50%, 9/20/48 | | | 352,710 | | | | 379,592 | |
#MA5529, 10/20/48(i) | | | 296,163 | | | | 319,028 | |
#MA5596, 4.50%, 11/20/48 | | | 1,255,309 | | | | 1,342,857 | |
#MA5711, 4.50%, 1/20/49 | | | 691,267 | | | | 740,241 | |
#MA5762, 3.50%, 2/20/49 | | | 185,962 | | | | 197,423 | |
#MA5764, 4.50%, 2/20/49 | | | 27,557 | | | | 29,508 | |
#MA5818, 4.50%, 3/20/49 | | | 103,659 | | | | 111,106 | |
#MA5877, 4.50%, 4/20/49 | | | 379,815 | | | | 406,395 | |
#BM7486, 3.50%, 7/20/49 | | | 491,875 | | | | 523,793 | |
#784825, 3.50%, 10/20/49 | | | 182,240 | | | | 186,246 | |
| | | | | | | | |
| | | Par | | | Value | |
|
Government National Mortgage Association II
(Continued) | |
Pool, | | | | | | | | |
#BM9743, 4.00%, 11/20/49 | | $ | 397,231 | | | $ | 431,374 | |
#MA6341, 4.50%, | | | | | | | | |
12/20/49 | | | 237,882 | | | | 254,375 | |
#784905, 3.00%, 1/20/50 | | | 99,651 | | | | 106,193 | |
#MA6412, 4.50%, 1/20/50 | | | 124,481 | | | | 133,155 | |
#BM7534, 3.50%, 2/20/50 | | | 99,680 | | | | 106,581 | |
#BS1742, 4.00%, 2/20/50 | | | 99,724 | | | | 108,534 | |
#MA6477, 2/20/50(i) | | | 424,772 | | | | 455,797 | |
#MA6544, 3/20/50(i) | | | 243,809 | | | | 261,733 | |
#BS8420, 4.00%, 4/20/50 | | | 200,000 | | | | 217,545 | |
#MA6602, 4.50%, 4/20/50 | | | 334,000 | | | | 359,695 | |
| | | | | | | | 17,637,781 | |
|
Uniform Mortgage-Backed Securities – 6.3% | |
Pool TBA, | | | | | | | | |
5/01/35(i) | | | 10,560,000 | | | | 10,996,517 | |
5/01/35(i) | | | 17,632,029 | | | | 18,781,967 | |
5/01/50(i) | | | 895,000 | | | | 981,843 | |
7/01/50(i) | | | 1,729,000 | | | | 1,872,893 | |
| | | | | | | | 32,633,220 | |
| |
Total Mortgage-Backed Securities
(Cost $178,211,320) | | | | 183,796,197 | |
Municipal Bonds – 1.9% | |
| | |
Arizona – 0.2% | | | | | | | | |
Arizona State IDA Revenue Bonds, Series 2019-2 Class A Certificates, 3.63%, 5/20/33 | | | 991,708 | | | | 938,354 | |
| | |
California – 0.4% | | | | | | | | |
Bay Area Toll Authority Toll Bridge Subordinate Revenue Bonds, Series S1, Build America Bonds, 7.04%, 4/01/50 | | | 120,000 | | | | 200,171 | |
Bay Area Toll Authority Toll Bridge Taxable Revenue Bonds, Series S3, Build America Bonds, 6.91%, 10/01/50 | | | 50,000 | | | | 83,888 | |
California State Health Facilities Financing Authority Taxable Revenue Bonds, Senior-No Place Like Home, 2.93%, 6/01/32 | | | 10,000 | | | | 9,782 | |
California State Taxable GO Unlimited Refunding Bonds, 4.60%, 4/01/38 | | | 215,000 | | | | 241,183 | |
See accompanying Notes to Financial Statements
112
Morningstar Funds Trust April 30, 2020
Schedule of Investments (continued)
Morningstar Total Return Bond Fund
| | | | | | | | |
| | | Par | | | Value | |
| | |
California (Continued) | | | | | | | | |
California State University Taxable Revenue Refunding Bonds, Series B, 2.97%, 11/01/51 | | $ | 150,000 | | | $ | 148,875 | |
California State Various Purpose Bid Group Taxable GO Unlimited Bonds, 2.65%, 4/01/26 | | | 255,000 | | | | 267,446 | |
California State Various Purpose Taxable GO Unlimited Bonds, Build America Bonds, | | | | | | | | |
7.50%, 4/01/34 | | | 35,000 | | | | 54,942 | |
7.55%, 4/01/39 | | | 80,000 | | | | 134,164 | |
Los Angeles Community College District GO Unlimited Bonds, Build America Bonds, 6.60%, 8/01/42 | | | 45,000 | | | | 74,306 | |
Los Angeles Unified School District GO Unlimited Bonds, Series RY, Build America Bonds, 6.76%, 7/01/34 | | | 115,000 | | | | 163,648 | |
Sacramento County Sanitation Districts Financing Authority Variable Revenue Refunding Bonds, Series B, Sacramento County Regional (NATL Insured), (3M USD LIBOR + 0.53%), 1.59%, 12/01/35(d) | | | 140,000 | | | | 132,483 | |
San Francisco City & County Airports Commission International Airport Revenue Bonds, Series F,
5.00%, 5/01/50 | | | 40,000 | | | | 46,432 | |
San Jose Redevelopment Agency Successor Agency Senior Tax Allocation Taxable Refunding Bonds, Series A-T, 3.18%, 8/01/26 | | | 30,000 | | | | 31,706 | |
University of California Revenue Bonds, Build America Bonds, 5.77%, 5/15/43 | | | 5,000 | | | | 7,029 | |
University of California Taxable General Revenue Bonds, Series AD, 4.86%, 5/15/12(m) | | | 15,000 | | | | 20,351 | |
| | | | | | | | |
| | | Par | | | Value | |
| | |
California (Continued) | | | | | | | | |
University of California Taxable General Revenue Bonds, Series AJ, 4.60%, 5/15/31 | | $ | 35,000 | | | $ | 41,512 | |
University of California Taxable General Revenue Bonds, Series BD, 3.35%, 7/01/29 | | | 95,000 | | | | 105,861 | |
| | | | | | | | 1,763,779 | |
| | |
Colorado – 0.1% | | | | | | | | |
Colorado State Building Excellent Schools Today COPS, Series N, 5.00%, 3/15/38 | | | 120,000 | | | | 143,182 | |
Colorado State Health Facilities Authority Hospital Revenue Refunding Bonds, Series A-1, Commonspirit Health, 5.00%, 8/01/44 | | | 180,000 | | | | 192,022 | |
| | | | | | | | 335,204 | |
| | |
Connecticut – 0.0%(f) | | | | | | | | |
Connecticut State Taxable GO Unlimited Bonds, Series A, 5.85%, 3/15/32 | | | 70,000 | | | | 88,773 | |
| | |
Delaware – 0.0%(f) | | | | | | | | |
Delaware State GO Unlimited Bonds, 5.00%, 2/01/24 | | | 150,000 | | | | 171,738 | |
| | |
District of Columbia – 0.1% | | | | | | | | |
District of Columbia Income Tax Secured Revenue Bonds, Series E, Build America Bonds, 5.59%, 12/01/34 | | | 350,000 | | | | 456,806 | |
| | |
Florida – 0.0%(f) | | | | | | | | |
Broward County Airport System Taxable Revenue Refunding Bonds, Series C, | | | | | | | | |
2.81%, 10/01/31 | | | 20,000 | | | | 19,961 | |
2.92%, 10/01/32 | | | 20,000 | | | | 19,943 | |
Miami-Dade County Aviation Taxable Revenue Refunding Bonds, Series E, 2.53%, 10/01/30 | | | 75,000 | | | | 72,392 | |
| | | | | | | | 112,296 | |
| | |
Georgia – 0.0%(f) | | | | | | | | |
Atlanta Water & Wastewater Revenue Refunding Bonds, 5.00%, 11/01/40 | | | 90,000 | | | | 101,845 | |
See accompanying Notes to Financial Statements
113
Morningstar Funds Trust April 30, 2020
Schedule of Investments (continued)
Morningstar Total Return Bond Fund
| | | | | | | | |
| | | Par | | | Value | |
| | |
Georgia (Continued) | | | | | | | | |
Metropolitan Atlanta Rapid Transit Authority Sales TRB, Series A, 5.00%, 7/01/41 | | $ | 40,000 | | | $ | 44,877 | |
Municipal Electric Authority of Georgia Revenue Bonds, Build America Bonds, 6.65%, 4/01/57 | | | 14,000 | | | | 19,001 | |
Municipal Electric Authority of Georgia Taxable Revenue Bonds, Build America Bonds, 6.64%, 4/01/57 | | | 21,000 | | | | 27,941 | |
| | | | | | | | 193,664 | |
| | |
Illinois – 0.0%(f) | | | | | | | | |
Illinois State GO Unlimited Bonds, Taxable Pension, 5.10%, 6/01/33 | | | 200,000 | | | | 180,156 | |
| | |
Indiana – 0.1% | | | | | | | | |
Indiana Finance Authority Wastewater Utility Revenue Bonds, Series A, First Lien, 5.00%, 10/01/45 | | | 150,000 | | | | 167,908 | |
Indiana Finance Authority Wastewater Utility Revenue Bonds, Series A, First Lien, CWA Authority Project Green Bonds, 5.00%, 10/01/46 | | | 50,000 | | | | 56,871 | |
| | | | | | | | 224,779 | |
| | |
Maryland – 0.0%(f) | | | | | | | | |
Maryland State Health & Higher Educational Facilities Authority Revenue Refunding Bonds, Medstar Health, Inc., 5.00%, 8/15/27 | | | 20,000 | | | | 22,274 | |
| | |
Massachusetts – 0.0%(f) | | | | | | | | |
Massachusetts State GO Limited Bonds, Build America Bonds Consolidated Loan, 5.45%, 12/01/39 | | | 5,000 | | | | 6,719 | |
| | | | | | | | |
| | | Par | | | Value | |
| | |
Massachusetts (Continued) | | | | | | | | |
Massachusetts State GO Limited Bonds, Series H, Taxable Consolidated Loan of 2019, 2.90%, 9/01/49 | | $ | 25,000 | | | $ | 25,367 | |
Massachusetts State School Building Authority Subordinated Dedicated Sales Refunding TRB, Series B, 2.97%, 10/15/32 | | | 60,000 | | | | 63,154 | |
| | | | | | | | 95,240 | |
| | |
Michigan – 0.0%(f) | | | | | | | | |
Michigan State Finance Authority Revenue Refunding Bonds, Henry Ford Health System, 5.00%, 11/15/28 | | | 20,000 | | | | 22,817 | |
| | |
Mississippi – 0.0%(f) | | | | | | | | |
Mississippi State Hospital Equipment & Facilities Authority Revenue Bonds, Baptist Memorial Health Corp., 5.00%, 9/01/46 | | | 90,000 | | | | 91,251 | |
| | |
Missouri – 0.0%(f) | | | | | | | | |
Missouri State Health & Educational Facilities Authority Educational Facilities Taxable Revenue Refunding Bonds, The Washington University, 3.23%, 5/15/50 | | | 115,000 | | | | 127,017 | |
| | |
Nevada – 0.0%(f) | | | | | | | | |
North Las Vegas GO Limited Refunding Bonds (BAM Insured), 5.00%, 6/01/28 | | | 140,000 | | | | 173,415 | |
| | |
New Jersey – 0.1% | | | | | | | | |
New Jersey State Transportation Trust Fund Authority Taxable Revenue Bonds, Series C, Build America Bonds, 5.75%, 12/15/28 | | | 30,000 | | | | 34,965 | |
New Jersey State Turnpike Authority Taxable Revenue Bonds, Build America Bonds, 7.42%, 1/01/40 | | | 100,000 | | | | 157,044 | |
See accompanying Notes to Financial Statements
114
Morningstar Funds Trust April 30, 2020
Schedule of Investments (continued)
Morningstar Total Return Bond Fund
| | | | | | | | |
| | | Par | | | Value | |
| | |
New Jersey (Continued) | | | | | | | | |
Rutgers State University Taxable Revenue Refunding Bonds, Series R, | | | | | | | | |
2.89%, 5/01/32 | | $ | 265,000 | | | $ | 270,502 | |
3.27%, 5/01/43 | | | 40,000 | | | | 40,803 | |
| | | | | | | | 503,314 | |
| | |
New York – 0.5% | | | | | | | | |
Metropolitan Transportation Authority Dedicated Tax Fund Taxable Revenue Bonds, Build America Bonds, 7.33%, 11/15/39 | | | 50,000 | | | | 73,094 | |
Metropolitan Transportation Authority Revenue Bonds, Build America Bonds, 5.87%, 11/15/39 | | | 25,000 | | | | 27,736 | |
Metropolitan Transportation Authority Revenue Bonds, Series C, Group 1, Green Bonds (AGM, CR Insured), 5.00%, 11/15/41 | | | 30,000 | | | | 33,909 | |
New York City Municipal Water Finance Authority Water & Sewer System Revenue Bonds, Build America Bonds, 5.44%, 6/15/43 | | | 120,000 | | | | 173,466 | |
New York City Municipal Water Finance Authority Water & Sewer System Second General Resolution Taxable Revenue Bonds, 5.88%, 6/15/44 | | | 15,000 | | | | 22,934 | |
New York City Municipal Water Finance Authority Water & Sewer System Taxable Revenue Bonds, Build America Bonds, 6.01%, 6/15/42 | | | 15,000 | | | | 22,766 | |
New York City Transitional Finance Authority Future Tax Secured Subordinate Revenue Bonds, | | | | | | | | |
3.75%, 11/01/25 | | | 55,000 | | | | 58,867 | |
3.90%, 8/01/31 | | | 25,000 | | | | 27,690 | |
New York City Transitional Finance Authority Taxable Future Tax Secured Revenue Bonds, 3.35%, 11/01/30 | | | 85,000 | | | | 92,135 | |
| | | | | | | | |
| | | Par | | | Value | |
| | |
New York (Continued) | | | | | | | | |
New York City Transitional Finance Authority Taxable Subordinate Revenue Bonds, Series B2, 2.79%, 8/01/25 | | $ | 225,000 | | | $ | 235,316 | |
New York GO Unlimited Bonds, Subseries F-1, 5.00%, 4/01/43 | | | 40,000 | | | | 46,024 | |
New York State Dormitory Authority Non State Supported Debt Taxable Revenue Refunding Bonds, Series B, 3.14%, 7/01/43 | | | 390,000 | | | | 382,531 | |
New York State Dormitory Authority Personal Income TRB, Build America Bonds, 5.39%, 3/15/40 | | | 30,000 | | | | 38,501 | |
New York State Dormitory Authority State Personal Income Tax Taxable Revenue Refunding Bonds, Series F, 3.19%, 2/15/43 | | | 65,000 | | | | 61,217 | |
New York State Taxable GO Unlimited Refunding Bonds, Series B, 2.80%, 2/15/32 | | | 70,000 | | | | 72,461 | |
New York State Transportation Development Corp., Special Facility Revenue Bonds (AMT), LaGuardia Airport Terminal B Redevelopment, | | | | | | | | |
5.00%, 7/01/46 | | | 90,000 | | | | 91,180 | |
5.25%, 1/01/50 | | | 90,000 | | | | 91,947 | |
New York State Urban Development Corp., Taxable Sales Revenue Refunding Bonds, Series B, 2.35%, 3/15/27 | | | 80,000 | | | | 80,727 | |
New York Taxable GO Unlimited Bonds, Series A, Fiscal 2020, | | | | | | | | |
2.85%, 8/01/31 | | | 30,000 | | | | 30,097 | |
2.90%, 8/01/32 | | | 125,000 | | | | 125,332 | |
New York Taxable GO Unlimited Bonds, Subseries D-2, Fiscal 2019, | | | | | | | | |
3.53%, 12/01/25 | | | 45,000 | | | | 49,196 | |
3.76%, 12/01/27 | | | 15,000 | | | | 16,514 | |
See accompanying Notes to Financial Statements
115
Morningstar Funds Trust April 30, 2020
Schedule of Investments (continued)
Morningstar Total Return Bond Fund
| | | | | | | | |
| | | Par | | | Value | |
| | |
New York (Continued) | | | | | | | | |
Port Authority of New York & New Jersey Consolidated 164th Taxable Revenue Bonds, 5.65%, 11/01/40 | | $ | 70,000 | | | $ | 92,214 | |
Port Authority of New York & New Jersey Consolidated 168th Revenue Bonds, 4.93%, 10/01/51 | | | 330,000 | | | | 420,806 | |
Port Authority of New York & New Jersey Consolidated Taxable Revenue Bonds, Series 181, 4.96%, 8/01/46 | | | 30,000 | | | | 39,554 | |
| | |
| | | | | | | | 2,406,214 | |
| | |
Ohio – 0.1% | | | | | | | | |
American Municipal Power-Ohio, Inc., Revenue Bonds, Subseries B, Build America Bonds, 6.45%, 2/15/44 | | | 35,000 | | | | 49,111 | |
American Municipal Power-Ohio, Inc., Taxable Revenue Bonds, Series B, Combined Hydroelectric Projects, | | | | | | | | |
7.83%, 2/15/41 | | | 65,000 | | | | 96,843 | |
8.08%, 2/15/50 | | | 40,000 | | | | 67,474 | |
JobsOhio Beverage System Statewide Liquor Profits Taxable Revenue Bonds, Series B, 3.99%, 1/01/29 | | | 55,000 | | | | 60,946 | |
JobsOhio Beverage System Statewide Liquor Profits Taxable Revenue Refunding Bonds, Series A, 2.83%, 1/01/38 | | | 20,000 | | | | 20,061 | |
| | |
| | | | | | | | 294,435 | |
| | |
Oregon – 0.1% | | | | | | | | |
Oregon State School Boards Association Short-Term Borrowing Program Certificates Taxable Pension GO Limited Bonds, Series B (NATL Insured), | | | | | | | | |
5.55%, 6/30/28 | | | 100,000 | | | | 116,796 | |
5.68%, 6/30/28 | | | 140,000 | | | | 166,197 | |
| | |
| | | | | | | | 282,993 | |
| | | | | | | | |
| | | Par | | | Value | |
| | |
Pennsylvania – 0.0%(f) | | | | | | | | |
Commonwealth Financing Authority Taxable Revenue Bonds, Series A, 3.81%, 6/01/41 | | $ | 155,000 | | | $ | 169,964 | |
| | | |
South Carolina – 0.0%(f) | | | | | | | | |
South Carolina State Public Services Authority Taxable Obligations Revenue Bonds, Series D, 2.39%, 12/01/23 | | | 35,000 | | | | 35,637 | |
South Carolina State Public Services Authority Taxable Obligations Revenue Bonds, Series E, 3.72%, 12/01/23 | | | 53,000 | | | | 55,985 | |
South Carolina State Public Services Authority Taxable Obligations Revenue Bonds, Series E, Build America Bonds, 6.45%, 1/01/50 | | | 35,000 | | | | 53,916 | |
| | |
| | | | | | | | 145,538 | |
| | |
Texas – 0.1% | | | | | | | | |
Dallas-Fort Worth International Airport Taxable Revenue Refunding Bonds, Series A, 3.14%, 11/01/45 | | | 35,000 | | | | 32,891 | |
San Antonio Electric & Gas Revenue Bonds, Build America Bonds, 5.72%, 2/01/41 | | | 45,000 | | | | 61,107 | |
San Antonio Electric & Gas Revenue Bonds, Junior Lien, Build America Bonds,
5.81%, 2/01/41 | | | 40,000 | | | | 56,862 | |
Texas State Taxable GO Unlimited Bonds, Build America Bonds, 5.52%, 4/01/39 | | | 150,000 | | | | 218,850 | |
| | |
| | | | | | | | 369,710 | |
| | |
Virginia – 0.0%(f) | | | | | | | | |
Virginia Small Business Financing Authority Private Activity Revenue Bonds (AMT), Transform 66 P3 Project, 5.00%, 12/31/52 | | | 90,000 | | | | 90,370 | |
| | | |
Washington – 0.1% | | | | | | | | |
Seattle Municipal Light & Power Improvement Revenue Bonds, 5.00%, 4/01/44 | | | 275,000 | | | | 332,189 | |
See accompanying Notes to Financial Statements
116
Morningstar Funds Trust April 30, 2020
Schedule of Investments (continued)
Morningstar Total Return Bond Fund
| | | | | | | | |
| | | Par | | | Value | |
| | |
Washington (Continued) | | | | | | | | |
Seattle Municipal Light & Power Improvement Revenue Bonds, | | | | | | | | |
5.00%, 4/01/45 | | $ | 150,000 | | | $ | 178,735 | |
5.00%, 4/01/48 | | | 70,000 | | | | 83,166 | |
| | |
| | | | | | | | 594,090 | |
| | |
Total Municipal Bonds
(Cost $9,811,191) | | | | | | | 9,854,191 | |
U.S. Government Obligations – 9.2% | |
| |
U.S. Treasury Bonds – 0.4% | | | | | |
4.25%, 5/15/39(n) | | | 5,000 | | | | 7,836 | |
4.50%, 8/15/39(n) | | | 5,000 | | | | 8,076 | |
4.37%, 11/15/39 | | | 5,000 | | | | 7,970 | |
3.12%, 2/15/43 | | | 22,000 | | | | 30,319 | |
2.88%, 5/15/43(n) | | | 22,000 | | | | 29,226 | |
3.62%, 8/15/43(n) | | | 22,000 | | | | 32,685 | |
3.75%, 11/15/43 | | | 22,000 | | | | 33,342 | |
2.88%, 11/15/46(n) | | | 23,000 | | | | 31,346 | |
3.00%, 2/15/48(n) | | | 23,000 | | | | 32,288 | |
2.25%, 8/15/49(n) | | | 828,000 | | | | 1,024,262 | |
2.38%, 11/15/49 | | | 570,000 | | | | 724,145 | |
| | |
| | | | | | | | 1,961,495 | |
|
U.S. Treasury Inflation-Indexed Bonds – 7.9% | |
0.50%, 4/15/24 | | | 18,273,000 | | | | 19,222,452 | |
0.13%, 10/15/24 | | | 7,173,200 | | | | 7,398,734 | |
0.25%, 1/15/25 | | | 2,726,200 | | | | 3,054,276 | |
0.13%, 4/15/25 | | | 1,199,900 | | | | 1,232,275 | |
1.37%, 2/15/44 | | | 940,000 | | | | 1,417,489 | |
0.75%, 2/15/45 | | | 310,000 | | | | 414,877 | |
1.00%, 2/15/46 | | | 500,000 | | | | 708,286 | |
1.00%, 2/15/48 | | | 580,000 | | | | 802,234 | |
1.00%, 2/15/49 | | | 3,620,000 | | | | 4,973,935 | |
0.25%, 2/15/50 | | | 1,440,000 | | | | 1,633,375 | |
| | |
| | | | | | | | 40,857,933 | |
|
U.S. Treasury Notes – 0.9% | |
1.13%, 7/31/21 | | | 92,000 | | | | 93,107 | |
1.75%, 7/31/21(n) | | | 46,000 | | | | 46,909 | |
1.50%, 1/31/22 | | | 81,000 | | | | 82,832 | |
1.75%, 4/30/22(n) | | | 79,000 | | | | 81,444 | |
1.50%, 9/15/22 | | | 75,000 | | | | 77,285 | |
1.38%, 10/15/22 | | | 84,000 | | | | 86,362 | |
2.12%, 12/31/22(n) | | | 50,000 | | | | 52,512 | |
2.75%, 5/31/23 | | | 50,000 | | | | 53,822 | |
2.13%, 7/31/24(n) | | | 50,000 | | | | 53,787 | |
1.50%, 9/30/24 | | | 384,000 | | | | 403,650 | |
1.75%, 12/31/24(n) | | | 887,000 | | | | 944,794 | |
2.00%, 2/15/25 | | | 60,000 | | | | 64,685 | |
2.12%, 5/15/25 | | | 45,000 | | | | 48,927 | |
1.50%, 8/15/26(n) | | | 63,000 | | | | 66,982 | |
| | | | | | | | |
| | | Par | | | Value | |
|
U.S. Treasury Notes (Continued) | |
0.50%, 4/30/27 | | $ | 2,230,000 | | | $ | 2,227,735 | |
2.25%, 8/15/27(n) | | | 50,000 | | | | 56,191 | |
2.87%, 8/15/28(n) | | | 19,000 | | | | 22,545 | |
3.12%, 11/15/28(n) | | | 19,000 | | | | 23,029 | |
1.63%, 8/15/29(n) | | | 334,000 | | | | 364,934 | |
| | |
| | | | | | | | 4,851,532 | |
| | |
Total U.S. Government Obligations
(Cost $45,279,608) | | | | | | | 47,670,960 | |
| | |
| | | Number
of Shares | | | Value | |
Investment Companies – 8.2% | |
BlackRock Allocation Target Shares - BATS, Series A | | | 1,743,169 | | | | 16,211,477 | |
iShares iBoxx $ Investment Grade Corporate Bond ETF | | | 21,400 | | | | 2,764,238 | |
Schwab U.S. TIPS ETF | | | 400,044 | | | | 23,630,599 | |
| | |
Total Investment Companies
(Cost $42,572,688) | | | | 42,606,314 | |
| | |
| | | Par | | | Value | |
Short-Term Investments – 9.0% | |
|
Borrowed Bond Agreements – 0.4% | |
BofA Securities, Inc., 0.00%, Open (Purchased on 4/30/20 to be repurchased at $154,811, collateralized by U.S. Treasury Notes, 1.75%, due 11/15/29, par and fair value of $139,000 and $154,457, respectively)(o) | | | 154,811 | | | | 154,811 | |
BofA Securities, Inc., 0.02%, Open (Purchased on 4/30/20 to be repurchased at $40,898, collateralized by U.S. Treasury Notes, 2.00%, due 5/31/24, par and fair value of $38,000 and $40,736, respectively)(o) | | | 40,898 | | | | 40,898 | |
See accompanying Notes to Financial Statements
117
Morningstar Funds Trust April 30, 2020
Schedule of Investments (continued)
Morningstar Total Return Bond Fund
| | | | | | | | |
| | | Par | | | Value | |
|
Borrowed Bond Agreements (Continued) | |
BofA Securities, Inc., 0.02%, Open (Purchased on 4/30/20 to be repurchased at $83,148, collateralized by U.S. Treasury Notes, 1.50%, due 10/31/24, par and fair value of $79,000 and $83,013, respectively)(o) | | $ | 83,147 | | | $ | 83,147 | |
BofA Securities, Inc., 0.00%, Open (Purchased on 4/30/20 to be repurchased at $44,123, collateralized by U.S. Treasury Bonds, 2.00%, due 2/15/50, par and fair value of $37,000 and $44,060, respectively)(o) | | | 44,123 | | | | 44,123 | |
BofA Securities, Inc., 0.00%, Open (Purchased on 4/30/20 to be repurchased at $441,525, collateralized by U.S. Treasury Notes, 1.50%, due 2/15/30, par and fair value of $406,000 and $439,454, respectively)(o) | | | 441,525 | | | | 441,525 | |
BofA Securities, Inc., 0.00%, Open (Purchased on 4/30/20 to be repurchased at $499,344, collateralized by U.S. Treasury Notes, 1.38%, due 1/31/25, par and fair value of $475,000 and $498,940, respectively)(o) | | | 499,344 | | | | 499,344 | |
BofA Securities, Inc., 0.02%, Open (Purchased on 4/30/20 to be repurchased at $101,123, collateralized by U.S. Treasury Notes, 1.25%, due 8/31/24, par and fair value of $97,000 and $100,958, respectively)(o) | | | 101,123 | | | | 101,123 | |
BofA Securities, Inc., 0.02%, Open (Purchased on 4/30/20 to be repurchased at $139,695, collateralized by U.S. Treasury Notes, 1.63%, due 12/15/22, par and fair value of $134,000 and $139,467, respectively)(o) | | | 139,695 | | | | 139,695 | |
| | | | | | | | |
| | | Par | | | Value | |
|
Borrowed Bond Agreements (Continued) | |
BofA Securities, Inc., 0.02%, Open (Purchased on 4/30/20 to be repurchased at $249,100, collateralized by U.S. Treasury Notes, 1.50%, due 11/30/24, par and fair value of $235,000 and $249,100, respectively)(o) | | $ | 249,100 | | | $ | 249,100 | |
BofA Securities, Inc., 0.02%, Open (Purchased on 4/30/20 to be repurchased at $258,125, collateralized by U.S. Treasury Notes, 1.50%, due 8/15/22, par and fair value of $250,000 and $257,700, respectively)(o) | | | 258,125 | | | | 258,125 | |
BofA Securities, Inc., 0.02%, Open (Purchased on 4/30/20 to be repurchased at $290,858, collateralized by U.S. Treasury Notes, 1.63%, due 11/15/22, par and fair value of $279,000 and $290,383, respectively)(o) | | | 290,857 | | | | 290,857 | |
| | |
| | | | | | | | 2,302,748 | |
| | |
Corporate Bonds – 0.2% | | | | | | | | |
CNH Industrial Capital LLC, 4.37%, 11/06/20 | | | 200,000 | | | | 200,555 | |
Commonwealth Edison Co., 4.00%, 8/01/20 | | | 20,000 | | | | 20,030 | |
Express Scripts Holding Co., 2.60%, 11/30/20 | | | 45,000 | | | | 45,249 | |
General Motors Financial Co., Inc., 2.45%, 11/06/20 | | | 235,000 | | | | 232,558 | |
Georgia-Pacific LLC, 5.40%, 11/01/20(b) | | | 26,000 | | | | 26,548 | |
IBM Credit LLC, 3.45%, 11/30/20 | | | 100,000 | | | | 101,595 | |
Intercontinental Exchange, Inc., 2.75%, 12/01/20 | | | 2,000 | | | | 2,015 | |
JPMorgan Chase & Co., 4.25%, 10/15/20 | | | 20,000 | | | | 20,289 | |
Marsh & McLennan Cos., Inc., 3.50%, 12/29/20 | | | 53,000 | | | | 53,757 | |
See accompanying Notes to Financial Statements
118
Morningstar Funds Trust April 30, 2020
Schedule of Investments (continued)
Morningstar Total Return Bond Fund
| | | | | | | | |
| | | Par | | | Value | |
| |
Corporate Bonds (Continued) | | | | | |
Southern (The) Co.,
2.75%, 6/15/20 | | $ | 90,000 | | | $ | 90,067 | |
Travelers (The) Cos., Inc., 3.90%, 11/01/20 | | | 28,000 | | | | 28,439 | |
| | |
| | | | | | | | 821,102 | |
| |
Foreign Issuer Bonds – 0.2% | | | | | |
Bank of Montreal, 3.10%, 7/13/20 | | | 2,000 | | | | 2,009 | |
Daimler Finance North America LLC, 2.20%, 5/05/20(b) | | | 150,000 | | | | 150,003 | |
Santander UK Group Holdings PLC, 2.88%, 10/16/20 | | | 134,000 | | | | 134,775 | |
Svenska Handelsbanken AB, 1.95%, 9/08/20 | | | 500,000 | | | | 501,599 | |
| | |
| | | | | | | | 788,386 | |
| |
Money Market Fund – 8.0% | | | | | |
Northern Institutional Funds - Treasury Portfolio (Premier), 0.22%(p) | | | 41,448,801 | | | | 41,448,801 | |
|
U.S. Government Agencies – 0.2% | |
Federal Home Loan Banks, (SOFR + 0.12%), 0.16%, 10/07/20(d) | | | 550,000 | | | | 549,951 | |
Federal Home Loan Mortgage Corporation, (SOFR + 0.04%), 0.08%, 9/10/20(d) | | | 340,000 | | | | 339,926 | |
| | |
| | | | | | | | 889,877 | |
|
U.S. Treasury Notes – 0.0%(f) | |
U.S. Treasury Notes, | | | | | | | | |
2.00%, 7/31/20 | | | 81,000 | | | | 81,384 | |
2.50%, 12/31/20 | | | 61,000 | | | | 61,963 | |
| | |
| | | | | | | | 143,347 | |
| | |
Total Short-Term Investments
(Cost $46,392,203) | | | | | | | 46,394,261 | |
| | | | | | | | | | | | |
| | | Number of
Contracts | | | Notional
Amount | | | Value | |
Purchased Options – 0.0%(f) | | | | | |
| |
Call Interest Rate Caps – 0.0%(f) | | | | | |
10Y - 2Y CMS Index Cap, Exercise Rate 0.50%, Expires 5/06/20* | | | 1 | | | | 28,796,000 | | | | — | |
|
Call Options – 0.0%(f) | |
Brazilian Real vs. U.S. Dollar, Strike Price $5.60, Expires 6/25/20 | | | 1 | | | | 243,000 | | | | 6,205 | |
| | | | | | | | | | | | |
| | | Number of
Contracts | | | Notional
Amount | | | Value | |
| |
Call Options (Continued) | | | | | |
Brazilian Real vs. U.S. Dollar, Strike Price $5.70, Expires 5/27/20 | | | 1 | | | $ | 98,000 | | | $ | 1,122 | |
Canadian Dollar vs. U.S. Dollar, Strike Price $1.41, Expires 5/08/20 | | | 1 | | | | 94,000 | | | | 93 | |
Mexican Peso vs. U.S. Dollar, Strike Price $25.50, Expires 5/21/20 | | | 1 | | | | 48,000 | | | | 300 | |
South African Rand vs. U.S. Dollar, Strike Price $15.80, Expires 6/04/20 | | | 1 | | | | 207,000 | | | | 31,197 | |
South African Rand vs. U.S. Dollar, Strike Price $19.20, Expires 5/05/20 | | | 1 | | | | 94,000 | | | | 138 | |
Turkish Lira vs. U.S. Dollar, Strike Price $7.00, Expires 6/12/20 | | | 1 | | | | 83,000 | | | | 2,535 | |
| | | |
| | | | | | | | | | | | 41,590 | |
| |
Call Swaptions – 0.0%(f) | | | | | |
Markit CDX North America Investment Grade Index Series 33 (Pay Quarterly): Credit Default Swap Maturing 12/20/2024, Strike Price $65.00, Expires 5/20/20 | | | 1 | | | | 2,800,000 | | | | 230 | |
| | |
Put Options – 0.0%(f) | | | | | |
10-Year U.S. Treasury Note, Strike Price $137.00, Expires 5/22/20 | | | 26 | | | | 3,617,656 | | | | 2,031 | |
10-Year U.S. Treasury Note, Strike Price $138.75, Expires 5/22/20 | | | 5 | | | | 695,703 | | | | 2,109 | |
10-Year U.S. Treasury Note, Strike Price $139.00, Expires 5/22/20 | | | 13 | | | | 1,808,828 | | | | 6,906 | |
Japanese Yen vs. U.S. Dollar, Strike Price $104.00, Expires 5/01/20* | | | 1 | | | | 125,000 | | | | — | |
Japanese Yen vs. U.S. Dollar, Strike Price $108.00, Expires 5/27/20 | | | 1 | | | | 172,000 | | | | 1,930 | |
Mexican Peso vs. U.S. Dollar, Strike Price $24.00, Expires 6/26/20 | | | 1 | | | | 98,000 | | | | 2,279 | |
Mexican Peso vs. U.S. Dollar, Strike Price $24.40, Expires 6/25/20 | | | 1 | | | | 97,000 | | | | 3,151 | |
Russian Ruble vs. U.S. Dollar, Strike Price $75.00, Expires 5/22/20 | | | 1 | | | | 97,000 | | | | 2,118 | |
Russian Ruble vs. U.S. Dollar, Strike Price $78.00, Expires 5/22/20 | | | 1 | | | | 61,000 | | | | 3,275 | |
See accompanying Notes to Financial Statements
119
Morningstar Funds Trust April 30, 2020
Schedule of Investments (continued)
Morningstar Total Return Bond Fund
| | | | | | | | | | | | |
| | | Number of
Contracts | | | Notional Amount | | | Value | |
| |
Put Options (Continued) | | | | | |
Russian Ruble vs. U.S. Dollar, Strike Price $78.00, Expires 7/02/20 | | | 1 | | | | $ 469,000 | | | | $27,159 | |
South African Rand vs. U.S. Dollar, Strike Price $17.50, Expires 5/22/20 | | | 1 | | | | 42,000 | | | | 72 | |
South African Rand vs. U.S. Dollar, Strike Price $18.00, Expires 5/14/20 | | | 2 | | | | 194,600 | | | | 762 | |
U.S. Dollar vs. Australian Dollar, Strike Price $0.60, Expires 5/05/20 | | | 1 | | | | 117,000 | | | | 1 | |
| | | |
| | | | | | | | | | | | 51,793 | |
| |
Put Swaptions – 0.0%(f) | | | | | |
Pay 1.88% (Semi-Annually); Receive 3-Month LIBOR (Quarterly): Interest Rate Swap Maturing 08/03/2050, Strike Price $1.88, Expires 7/30/20 | | | 2 | | | | 920,000 | | | | 875 | |
Pay 1.91% (Semi-Annually); Receive 3-Month LIBOR (Quarterly): Interest Rate Swap Maturing 08/21/2050, Strike Price $1.91, Expires 8/19/20 | | | 1 | | | | 1,040,000 | | | | 1,423 | |
Pay 1.92% (Semi-Annually); Receive 3-Month LIBOR (Quarterly): Interest Rate Swap Maturing 08/03/2050, Strike Price $1.92, Expires 7/30/20 | | | 1 | | | | 740,000 | | | | 610 | |
| | | |
| | | | | | | | | | | | 2,908 | |
| | |
Total Purchased Options
(Premiums Received $164,592) | | | | | | | | 96,521 | |
| | |
Total Long Positions –111.9%
(Cost $570,810,196) | | | | | | | | 581,158,850 | |
| | | | | | | | |
| | | Par | | | Value | |
| |
Short Positions – (1.7)% | | | | | |
|
Mortgage-Backed Securities – (1.3)% | |
Pool TBA(i) | | $ | (6,210,000 | ) | | $ | (6,563,094 | ) |
| | |
Total Mortgage-Backed Securities
(Proceeds $6,562,732) | | | | | | | (6,563,094 | ) |
|
U.S. Government Obligations – (0.4)% | |
| |
U.S. Treasury Bonds – (0.0)%(f) | | | | | |
2.00%, 2/15/50(n) | | | (90,000 | ) | | | (106,161 | ) |
| |
U.S. Treasury Notes – (0.4)% | | | | | |
1.50%, 8/15/22(n) | | | (250,000 | ) | | | (257,354 | ) |
1.62%, 11/15/22(n) | | | (279,000 | ) | | | (288,830 | ) |
1.63%, 12/15/22(n) | | | (134,000 | ) | | | (138,894 | ) |
2.00%, 5/31/24(n) | | | (38,000 | ) | | | (40,598 | ) |
1.25%, 8/31/24(n) | | | (97,000 | ) | | | (100,857 | ) |
1.50%, 10/31/24(n) | | | (79,000 | ) | | | (83,095 | ) |
1.50%, 11/30/24(n) | | | (235,000 | ) | | | (247,512 | ) |
1.38%, 1/31/25(n) | | | (475,000 | ) | | | (497,971 | ) |
1.75%, 11/15/29(n) | | | (139,000 | ) | | | (153,698 | ) |
1.50%, 2/15/30(n) | | | (406,000 | ) | | | (439,717 | ) |
| | |
| | | | | | | | (2,248,526 | ) |
| |
Total U.S. Government Obligations
(Proceeds $2,256,692) | | | | (2,354,687 | ) |
| | |
Total Short Positions – (1.7)%
(Proceeds $8,819,424) | | | | | | | (8,917,781 | ) |
| | |
Total Written Options – (0.1)%
(Premiums Received $349,511) | | | | | | | (141,673 | ) |
| |
Liabilities less Other Assets – (10.1)%(q) | | | | (52,637,518 | ) |
| | |
NET ASSETS – 100.0% | | | | | | $ | 519,461,878 | |
Percentages shown are based on Net Assets.
| (a) | Par value is in USD unless otherwise indicated. |
| (b) | Securities exempt from registration under Rule 144A of the Securities Act of 1933. These securities may be resold in transactions exempt from registration, normally to qualified institutional buyers. The value of these securities is determined by valuations supplied by a pricing service or brokers, or, if not available, in accordance with procedures established by the Board of Trustees of Morningstar Funds Trust. |
| (c) | Variable or floating rate security, the interest rate of which adjusts periodically based on changes in current interest rates and prepayments on the underlying pool of assets. Rate as of April 30, 2020 is disclosed. |
| (d) | Variable rate security. Rate as of April 30, 2020 is disclosed. |
| (e) | Step coupon bond. Rate as of April 30, 2020 is disclosed. |
| (f) | Amount rounds to less than 0.05%. |
| (g) | Variable rate security. Security issued at a fixed coupon rate, which converts to a variable rate at a future date. Rate as of April 30, 2020 is disclosed. |
| (h) | Perpetual bond. Maturity date represents next call date. |
| (i) | When-Issued Security. Coupon rate was not yet in effect at April 30, 2020. |
See accompanying Notes to Financial Statements
120
Morningstar Funds Trust April 30, 2020
Schedule of Investments (continued)
Morningstar Total Return Bond Fund
| (k) | Issuer has defaulted on terms of debt obligation. |
| (l) | Security is a payment in-kind bond (PIK), distributions received in-kind unless otherwise noted in the description. |
| (m) | Century bond maturing in 2112. |
| (n) | All or a portion of the security was held as collateral for open futures, options, securities sold short and/or swap agreements. |
| (o) | The amount to be repurchased assumes the maturity will be the day after the period end. |
| (p) | 7-day current yield as of April 30, 2020 is disclosed. |
| (q) | Includes appreciation/ (depreciation) on forward foreign currency exchange, futures and swap contracts. |
| * | Amount rounds to less than one dollar. |
| | |
| Abbreviations: |
| 1M | | 1 Month |
| 2Y | | 2 Year |
| 3M | | 3 Month |
| 5Y | | 5 Year |
| 10Y | | 10 Year |
| 12MTA | | 12 Month Treasury Average |
| AGM | | Assured Guarantee Municipal Corporation |
| AMT | | Alternative Minimum Tax |
| BAM | | Build America Mutual |
| BATS | | Better Alternative Trading System |
| CLO | | Collateralized Loan Obligation |
| CMS | | Constant Maturity Swap |
| COPS | | Certificates of Participation |
| CR | | Custody Receipt |
| CWA | | Clean Water Act |
| EGP | | Egyptian Pound |
| ETF | | Exchange-Traded Fund |
| EUR | | Euro |
| FHLMC | | Federal Home Loan Mortgage Corporation |
| FNMA | | Federal National Mortgage Association |
| GMTN | | Global Medium Term Note |
| GO | | Government Obligation |
| IDA | | Industrial Development Authority |
| IDR | | Indonesian Rupiah |
| LIBOR | | London Interbank Offered Rate |
| LLC | | Limited Liability Company |
| MXN | | Mexican Peso |
| NATL | | National Public Finance Guarantee Corporation |
| PLC | | Public Limited Company |
| RUB | | Russian Ruble |
| SOFR | | United States Secured Overnight Financing Rate |
| TBA | | To be announced |
| TIPS | | Treasury Inflation Protected Securities |
| TRB | | Tax Revenue Bonds |
| USD | | United States Dollar |
See accompanying Notes to Financial Statements
121
Morningstar Funds Trust April 30, 2020
Schedule of Investments (continued)
Morningstar Total Return Bond Fund
Futures Contracts outstanding at April 30, 2020:
Exchange Traded
| | | | | | | | | | | | | | | | | | | | |
| Description | | Number of
Contracts | | | Expiration
Date | | | Trading
Currency | | | Notional
Amount | | | Unrealized
Appreciation
(Depreciation) | |
| |
Long Contracts | | | | | | | | | | | | | | | | | | | | |
Euro-BTP | | | 5 | | | | 6/08/2020 | | | | EUR | | | | 759,424 | | | $ | 1,720 | |
90-Day Eurodollar | | | 327 | | | | 6/15/2020 | | | | USD | | | | 81,467,963 | | | | 71,838 | |
10-Year U.S. Treasury Note | | | 20 | | | | 6/19/2020 | | | | USD | | | | 2,781,250 | | | | (1,786 | ) |
U.S. Treasury Long Bond | | | 22 | | | | 6/19/2020 | | | | USD | | | | 3,982,688 | | | | 17,875 | |
Ultra U.S. Treasury Bond | | | 90 | | | | 6/19/2020 | | | | USD | | | | 20,230,313 | | | | 489,142 | |
2-Year U.S. Treasury Note | | | 75 | | | | 6/30/2020 | | | | USD | | | | 16,532,227 | | | | 1,217 | |
5-Year U.S. Treasury Note | | | 220 | | | | 6/30/2020 | | | | USD | | | | 27,606,563 | | | | 66,221 | |
| |
Total Long Contracts | | | | | | | | | | | | | | | | | | $ | 646,227 | |
| |
Short Contracts | | | | | | | | | | | | | | | | | | | | |
30-Year Euro Buxl | | | (4 | ) | | | 6/08/2020 | | | | EUR | | | | 960,841 | | | $ | (11,548 | ) |
Euro Bund | | | (4 | ) | | | 6/08/2020 | | | | EUR | | | | 764,597 | | | | (1,972 | ) |
10-Year U.S. Treasury Note | | | (6 | ) | | | 6/19/2020 | | | | USD | | | | 834,375 | | | | 1,219 | |
U.S. Treasury Long Bond | | | (85 | ) | | | 6/19/2020 | | | | USD | | | | 15,387,656 | | | | (47,827 | ) |
Ultra 10-Year U.S. Treasury Note | | | (5 | ) | | | 6/19/2020 | | | | USD | | | | 785,157 | | | | (23,938 | ) |
5-Year U.S. Treasury Note | | | (122 | ) | | | 6/30/2020 | | | | USD | | | | 15,309,094 | | | | (10,609 | ) |
90-Day Eurodollar | | | (183 | ) | | | 3/15/2021 | | | | USD | | | | 45,633,338 | | | | (40,775 | ) |
90-Day Eurodollar | | | (126 | ) | | | 6/14/2021 | | | | USD | | | | 31,419,675 | | | | (335,615 | ) |
90-Day Eurodollar | | | (171 | ) | | | 12/13/2021 | | | | USD | | | | 42,632,438 | | | | (241,241 | ) |
| |
Total Short Contracts | | | | | | | | | | | | | | | | | | $ | (712,306 | ) |
| |
| | | | | | | | | | | | | | | | | | $ | (66,079 | ) |
| |
Forward Foreign Currency Contracts outstanding at April 30, 2020:
| | | | | | | | | | | | | | | | | | |
Expiration Date | | Currency Purchased | | Amount of Currency
Purchased | | | Currency Sold | | Amount of Currency
Sold | | | Counterparty | | Unrealized
Appreciation (Depreciation) | |
| |
06/17/20 | | British Pounds | | | 2,079,130 | | | Euro | | | 2,282,000 | | | Morgan Stanley | | $ | 115,987 | |
06/17/20 | | U.S. Dollars | | | 807,706 | | | Russian Rubles | | | 54,645,317 | | | Citibank | | | 79,353 | |
06/17/20 | | Australian Dollars | | | 1,034,701 | | | Canadian Dollars | | | 880,478 | | | Citibank | | | 41,747 | |
06/17/20 | | Indonesian Rupiahs | | | 6,144,924,576 | | | U.S. Dollars | | | 363,154 | | | BNP | | | 38,429 | |
06/17/20 | | Australian Dollars | | | 885,000 | | | Canadian Dollars | | | 752,931 | | | JPMorgan Chase | | | 35,821 | |
06/17/20 | | U.S. Dollars | | | 448,284 | | | Indonesian Rupiahs | | | 6,466,725,258 | | | JPMorgan Chase | | | 25,671 | |
07/15/20 | | U.S. Dollars | | | 442,547 | | | Indonesian Rupiahs | | | 6,466,725,258 | | | JPMorgan Chase | | | 23,135 | |
05/06/20 | | Russian Rubles | | | 22,671,168 | | | U.S. Dollars | | | 293,000 | | | Citibank | | | 11,955 | |
05/06/20 | | U.S. Dollars | | | 115,000 | | | Russian Rubles | | | 7,661,300 | | | Deutsche Bank | | | 11,946 | |
05/05/20 | | U.S. Dollars | | | 751,267 | | | Euro | | | 680,000 | | | UBS | | | 6,016 | |
06/17/20 | | Indonesian Rupiahs | | | 1,115,236,000 | | | U.S. Dollars | | | 67,857 | | | HSBC | | | 5,026 | |
05/04/20 | | Australian Dollars | | | 76,000 | | | U.S. Dollars | | | 46,588 | | | Deutsche Bank | | | 2,938 | |
05/05/20 | | Euro | | | 261,000 | | | U.S. Dollars | | | 283,114 | | | Morgan Stanley | | | 2,931 | |
See accompanying Notes to Financial Statements
122
Morningstar Funds Trust April 30, 2020
Schedule of Investments (continued)
Morningstar Total Return Bond Fund
| | | | | | | | | | | | | | | | | | |
Expiration Date | | Currency Purchased | | Amount of Currency
Purchased | | | Currency Sold | | Amount of Currency
Sold | | | Counterparty | | Unrealized
Appreciation (Depreciation) | |
| |
05/27/20 | | Mexican Pesos | | | 3,612,313 | | | U.S. Dollars | | | 146,500 | | | UBS | | $ | 2,688 | |
05/11/20 | | Australian Dollars | | | 57,000 | | | U.S. Dollars | | | 35,229 | | | UBS | | | 1,916 | |
05/06/20 | | U.S. Dollars | | | 176,000 | | | Turkish Lira | | | 1,218,642 | | | Citibank | | | 1,855 | |
05/18/20 | | South African Rand | | | 1,274,474 | | | U.S. Dollars | | | 67,000 | | | Bank of America | | | 1,620 | |
05/29/20 | | U.S. Dollars | | | 74,000 | | | South African Rand | | | 1,346,257 | | | Deutsche Bank | | | 1,604 | |
05/06/20 | | Russian Rubles | | | 5,693,250 | | | U.S. Dollars | | | 75,000 | | | JPMorgan Chase | | | 1,581 | |
05/05/20 | | Brazilian Reals | | | 339,740 | | | U.S. Dollars | | | 61,000 | | | Citibank | | | 1,448 | |
06/17/20 | | Russian Rubles | | | 6,321,860 | | | U.S. Dollars | | | 83,094 | | | Barclays | | | 1,168 | |
05/26/20 | | Norwegian Kroner | | | 256,978 | | | U.S. Dollars | | | 24,000 | | | Deutsche Bank | | | 1,087 | |
06/17/20 | | Russian Rubles | | | 4,695,000 | | | U.S. Dollars | | | 61,674 | | | HSBC | | | 904 | |
05/29/20 | | U.S. Dollars | | | 88,000 | | | South African Rand | | | 1,619,673 | | | Standard Chartered Bank | | | 901 | |
06/02/20 | | Brazilian Reals | | | 206,675 | | | U.S. Dollars | | | 37,000 | | | Deutsche Bank | | | 898 | |
06/17/20 | | Russian Rubles | | | 3,160,000 | | | U.S. Dollars | | | 41,405 | | | Bank of America | | | 714 | |
05/13/20 | | U.S. Dollars | | | 35,000 | | | Colombian Pesos | | | 135,975,000 | | | Citibank | | | 699 | |
05/07/20 | | Chilean Pesos | | | 49,825,500 | | | U.S. Dollars | | | 59,000 | | | Citibank | | | 688 | |
05/06/20 | | U.S. Dollars | | | 479,000 | | | Russian Rubles | | | 35,560,960 | | | JPMorgan Chase | | | 662 | |
05/18/20 | | U.S. Dollars | | | 72,000 | | | South African Rand | | | 1,325,808 | | | Bank of America | | | 616 | |
05/07/20 | | U.S. Dollars | | | 94,000 | | | Japanese Yen | | | 10,020,588 | | | Citibank | | | 616 | |
05/29/20 | | Norwegian Kroner | | | 385,045 | | | U.S. Dollars | | | 37,000 | | | Deutsche Bank | | | 589 | |
05/07/20 | | Norwegian Kroner | | | 208,262 | | | U.S. Dollars | | | 19,848 | | | Deutsche Bank | | | 481 | |
06/17/20 | | U.S. Dollars | | | 50,392 | | | Mexican Pesos | | | 1,213,000 | | | HSBC | | | 457 | |
05/07/20 | | Japanese Yen | | | 10,134,054 | | | U.S. Dollars | | | 94,000 | | | Deutsche Bank | | | 442 | |
06/17/20 | | Russian Rubles | | | 1,689,165 | | | U.S. Dollars | | | 22,073 | | | Goldman Sachs | | | 441 | |
05/07/20 | | Euro | | | 49,000 | | | Japanese Yen | | | 5,716,420 | | | JPMorgan Chase | | | 431 | |
05/04/20 | | Euro | | | 86,000 | | | U.S. Dollars | | | 93,906 | | | JPMorgan Chase | | | 344 | |
05/05/20 | | Brazilian Reals | | | 72,516 | | | U.S. Dollars | | | 13,000 | | | JPMorgan Chase | | | 329 | |
05/04/20 | | U.S. Dollars | | | 204,171 | | | Euro | | | 186,000 | | | Bank of America | | | 326 | |
05/27/20 | | Mexican Pesos | | | 1,181,143 | | | U.S. Dollars | | | 48,500 | | | Bank of America | | | 281 | |
06/04/20 | | U.S. Dollars | | | 60,856 | | | Australian Dollars | | | 93,000 | | | BNP | | | 245 | |
05/29/20 | | Australian Dollars | | | 38,000 | | | U.S. Dollars | | | 24,548 | | | Standard Chartered Bank | | | 217 | |
06/16/20 | | Colombian Pesos | | | 92,036,000 | | | U.S. Dollars | | | 22,969 | | | Barclays | | | 179 | |
06/17/20 | | U.S. Dollars | | | 50,214 | | | Russian Rubles | | | 3,759,537 | | | JPMorgan Chase | | | 104 | |
06/17/20 | | U.S. Dollars | | | 13,325 | | | Russian Rubles | | | 992,689 | | | Barclays | | | 94 | |
05/07/20 | | Norwegian Kroner | | | 33,074 | | | U.S. Dollars | | | 3,152 | | | UBS | | | 77 | |
07/16/20 | | U.S. Dollars | | | 23,142 | | | Colombian Pesos | | | 92,036,000 | | | BNP | | | 47 | |
05/29/20 | | Australian Dollars | | | 38,000 | | | U.S. Dollars | | | 24,719 | | | JPMorgan Chase | | | 46 | |
05/06/20 | | Russian Rubles | | | 2,196,275 | | | U.S. Dollars | | | 29,500 | | | Deutsche Bank | | | 43 | |
| |
Total Unrealized Appreciation | | | | | $ | 427,793 | |
| |
| | | | | | |
05/27/20 | | Mexican Pesos | | | 883,231 | | | U.S. Dollars | | | 36,500 | | | Bank of America | | $ | (23 | ) |
05/07/20 | | Japanese Yen | | | 5,757,801 | | | Euro | | | 49,000 | | | Deutsche Bank | | | (46 | ) |
05/18/20 | | South African Rand | | | 91,743 | | | U.S. Dollars | | | 5,000 | | | Goldman Sachs | | | (60 | ) |
See accompanying Notes to Financial Statements
123
Morningstar Funds Trust April 30, 2020
Schedule of Investments (continued)
Morningstar Total Return Bond Fund
| | | | | | | | | | | | | | | | | | |
Expiration Date | | Currency Purchased | | Amount of Currency
Purchased | | | Currency Sold | | Amount of Currency
Sold | | | Counterparty | | Unrealized
Appreciation (Depreciation) | |
| |
06/03/20 | | U.S. Dollars | | | 6,516 | | | Euro | | | 6,000 | | | Bank of America | | $ | (63 | ) |
05/15/20 | | Norwegian Kroner | | | 234,362 | | | U.S. Dollars | | | 23,000 | | | Morgan Stanley | | | (123 | ) |
05/15/20 | | Canadian Dollars | | | 49,908 | | | U.S. Dollars | | | 36,000 | | | Deutsche Bank | | | (145 | ) |
05/15/20 | | U.S. Dollars | | | 23,000 | | | Norwegian Kroner | | | 237,341 | | | Morgan Stanley | | | (168 | ) |
05/04/20 | | Euro | | | 34,000 | | | U.S. Dollars | | | 37,458 | | | JPMorgan Chase | | | (196 | ) |
05/29/20 | | U.S. Dollars | | | 176,000 | | | Turkish Lira | | | 1,239,216 | | | JPMorgan Chase | | | (272 | ) |
05/27/20 | | U.S. Dollars | | | 20,000 | | | Mexican Pesos | | | 492,210 | | | Bank of America | | | (328 | ) |
05/26/20 | | U.S. Dollars | | | 72,000 | | | Russian Rubles | | | 5,410,800 | | | Citibank | | | (372 | ) |
05/06/20 | | Turkish Lira | | | 1,228,480 | | | U.S. Dollars | | | 176,000 | | | JPMorgan Chase | | | (449 | ) |
05/13/20 | | Colombian Pesos | | | 136,710,000 | | | U.S. Dollars | | | 35,000 | | | Citibank | | | (514 | ) |
05/04/20 | | Euro | | | 66,000 | | | U.S. Dollars | | | 72,876 | | | UBS | | | (544 | ) |
05/07/20 | | U.S. Dollars | | | 23,000 | | | Norwegian Kroner | | | 241,477 | | | UBS | | | (571 | ) |
05/29/20 | | U.S. Dollars | | | 37,000 | | | Norwegian Kroner | | | 385,026 | | | Deutsche Bank | | | (587 | ) |
06/02/20 | | Brazilian Reals | | | 329,431 | | | U.S. Dollars | | | 61,000 | | | Citibank | | | (592 | ) |
05/29/20 | | U.S. Dollars | | | 74,000 | | | South African Rand | | | 1,387,437 | | | UBS | | | (611 | ) |
05/07/20 | | U.S. Dollars | | | 31,000 | | | South African Rand | | | 586,437 | | | Bank of America | | | (614 | ) |
05/26/20 | | U.S. Dollars | | | 36,000 | | | Colombian Pesos | | | 145,908,000 | | | JPMorgan Chase | | | (758 | ) |
05/26/20 | | U.S. Dollars | | | 24,000 | | | Norwegian Kroner | | | 254,157 | | | Deutsche Bank | | | (811 | ) |
05/07/20 | | South African Rand | | | 1,615,840 | | | U.S. Dollars | | | 88,000 | | | Standard Chartered Bank | | | (893 | ) |
07/24/20 | | Kazakhstan Tenge | | | 3,737,085 | | | U.S. Dollars | | | 9,570 | | | Citibank | | | (1,077 | ) |
07/24/20 | | Kazakhstan Tenge | | | 3,892,500 | | | U.S. Dollars | | | 10,000 | | | Goldman Sachs | | | (1,154 | ) |
06/17/20 | | U.S. Dollars | | | 55,409 | | | Mexican Pesos | | | 1,378,000 | | | Deutsche Bank | | | (1,318 | ) |
06/02/20 | | U.S. Dollars | | | 35,500 | | | Brazilian Reals | | | 200,797 | | | BNP | | | (1,320 | ) |
06/17/20 | | Russian Rubles | | | 6,435,000 | | | U.S. Dollars | | | 87,099 | | | HSBC | | | (1,329 | ) |
06/17/20 | | U.S. Dollars | | | 84,908 | | | Mexican Pesos | | | 2,096,000 | | | Bank of America | | | (1,377 | ) |
05/05/20 | | Brazilian Reals | | | 187,920 | | | U.S. Dollars | | | 36,000 | | | Citibank | | | (1,458 | ) |
05/11/20 | | U.S. Dollars | | | 35,507 | | | Australian Dollars | | | 57,000 | | | Morgan Stanley | | | (1,639 | ) |
05/06/20 | | Russian Rubles | | | 11,319,350 | | | U.S. Dollars | | | 154,000 | | | Deutsche Bank | | | (1,741 | ) |
06/02/20 | | U.S. Dollars | | | 48,500 | | | Brazilian Reals | | | 274,308 | | | JPMorgan Chase | | | (1,800 | ) |
06/17/20 | | Russian Rubles | | | 7,830,000 | | | U.S. Dollars | | | 106,197 | | | Barclays | | | (1,833 | ) |
05/07/20 | | South African Rand | | | 1,598,036 | | | U.S. Dollars | | | 88,000 | | | BNP | | | (1,852 | ) |
05/26/20 | | Russian Rubles | | | 35,668,639 | | | U.S. Dollars | | | 479,000 | | | JPMorgan Chase | | | (1,913 | ) |
05/27/20 | | U.S. Dollars | | | 48,500 | | | Mexican Pesos | | | 1,221,269 | | | UBS | | | (1,938 | ) |
05/07/20 | | U.S. Dollars | | | 59,000 | | | Chilean Pesos | | | 51,005,500 | | | Deutsche Bank | | | (2,102 | ) |
06/17/20 | | U.S. Dollars | | | 145,557 | | | Russian Rubles | | | 11,079,862 | | | HSBC | | | (2,123 | ) |
05/27/20 | | U.S. Dollars | | | 64,500 | | | Mexican Pesos | | | 1,621,974 | | | Deutsche Bank | | | (2,487 | ) |
05/05/20 | | U.S. Dollars | | | 110,000 | | | Brazilian Reals | | | 613,064 | | | Citibank | | | (2,689 | ) |
05/06/20 | | U.S. Dollars | | | 102,000 | | | Russian Rubles | | | 7,813,710 | | | BNP | | | (3,104 | ) |
05/04/20 | | U.S. Dollars | | | 46,402 | | | Australian Dollars | | | 76,000 | | | Deutsche Bank | | | (3,124 | ) |
05/29/20 | | U.S. Dollars | | | 235,642 | | | South African Rand | | | 4,448,803 | | | JPMorgan Chase | | | (3,597 | ) |
05/07/20 | | U.S. Dollars | | | 145,000 | | | South African Rand | | | 2,762,033 | | | Citibank | | | (3,897 | ) |
06/03/20 | | U.S. Dollars | | | 645,780 | | | Euro | | | 596,000 | | | Morgan Stanley | | | (7,793 | ) |
05/06/20 | | Russian Rubles | | | 9,845,775 | | | U.S. Dollars | | | 144,500 | | | Citibank | | | (12,062 | ) |
See accompanying Notes to Financial Statements
124
Morningstar Funds Trust April 30, 2020
Schedule of Investments (continued)
Morningstar Total Return Bond Fund
| | | | | | | | | | | | | | | | | | |
Expiration Date | | Currency Purchased | | Amount of Currency
Purchased | | | Currency Sold | | Amount of Currency
Sold | | | Counterparty | | Unrealized
Appreciation (Depreciation) | |
| |
06/17/20 | | Euro | | | 2,282,000 | | | British Pounds | | | 2,021,660 | | | Morgan Stanley | | | $ (43,588) | |
06/17/20 | | Canadian Dollars | | | 1,671,710 | | | Australian Dollars | | | 1,919,701 | | | Morgan Stanley | | | (50,049) | |
| |
Total Unrealized Depreciation | | | | | | | | | | | | $(167,104) | |
| |
Net Unrealized Appreciation | | | | | | | | | | | | $ 260,689 | |
| |
Written Call Option Contracts outstanding at April 30, 2020:
Exchange Traded
| | | | | | | | | | | | | | | | | | | | | | | | | | |
| Description | | Counterparty | | Number of
Contracts | | | Notional Amount | | | Exercise
Price | | | Expiration
Date | | | Value | |
| |
10-Year U.S. Treasury Note | | UBS | | | 2 | | | | USD | | | | 278,281 | | | | 138.50 | | | | 5/22/2020 | | | $ | (1,781 | ) |
10-Year U.S. Treasury Note | | UBS | | | 4 | | | | USD | | | | 556,563 | | | | 139.25 | | | | 5/22/2020 | | | | (1,938 | ) |
10-Year U.S. Treasury Note | | UBS | | | 6 | | | | USD | | | | 834,844 | | | | 139.50 | | | | 5/22/2020 | | | | (2,250 | ) |
10-Year U.S. Treasury Note | | UBS | | | 7 | | | | USD | | | | 973,984 | | | | 139.00 | | | | 5/22/2020 | | | | (4,156 | ) |
10-Year U.S. Treasury Note | | UBS | | | 5 | | | | USD | | | | 695,703 | | | | 139.00 | | | | 6/26/2020 | | | | (4,062 | ) |
U.S. Treasury Long Bond | | UBS | | | 2 | | | | USD | | | | 363,125 | | | | 181.00 | | | | 5/22/2020 | | | | (3,563 | ) |
U.S. Treasury Long Bond | | UBS | | | 4 | | | | USD | | | | 726,250 | | | | 182.00 | | | | 5/22/2020 | | | | (5,375 | ) |
U.S. Treasury Long Bond | | UBS | | | 4 | | | | USD | | | | 726,250 | | | | 182.50 | | | | 5/22/2020 | | | | (4,688 | ) |
| |
Total Written Call Options Contracts (Premiums Received $34,394) | | | $ | (27,813 | ) |
| |
Written Put Option Contracts outstanding at April 30, 2020:
Exchange Traded
| | | | | | | | | | | | | | | | | | | | | | | | | | |
| Description | | Counterparty | | Number of
Contracts | | | Notional Amount | | | Exercise
Price | | | Expiration
Date | | | Value | |
| |
10-Year U.S. Treasury Note | | UBS | | | 2 | | | | USD | | | | 278,281 | | | | 138.50 | | | | 5/1/2020 | | | $ | (31 | ) |
10-Year U.S. Treasury Note | | UBS | | | 9 | | | | USD | | | | 1,252,266 | | | | 137.50 | | | | 5/22/2020 | | | | (1,125 | ) |
10-Year U.S. Treasury Note | | UBS | | | 10 | | | | USD | | | | 1,391,406 | | | | 138.50 | | | | 5/22/2020 | | | | (3,281 | ) |
10-Year U.S. Treasury Note | | UBS | | | 11 | | | | USD | | | | 1,530,547 | | | | 138.00 | | | | 5/22/2020 | | | | (2,234 | ) |
10-Year U.S. Treasury Note | | Merrill Lynch | | | 78 | | | | USD | | | | 10,852,969 | | | | 135.00 | | | | 5/22/2020 | | | | (2,438 | ) |
5-Year U.S. Treasury Note | | UBS | | | 2 | | | | USD | | | | 250,969 | | | | 124.75 | | | | 5/22/2020 | | | | (125 | ) |
5-Year U.S. Treasury Note | | UBS | | | 8 | | | | USD | | | | 1,003,875 | | | | 125.25 | | | | 5/22/2020 | | | | (1,313 | ) |
5-Year U.S. Treasury Note | | UBS | | | 17 | | | | USD | | | | 2,133,234 | | | | 125.00 | | | | 5/22/2020 | | | | (1,727 | ) |
5-Year U.S. Treasury Note | | UBS | | | 48 | | | | USD | | | | 6,023,250 | | | | 124.50 | | | | 5/22/2020 | | | | (2,250 | ) |
5-Year U.S. Treasury Note | | UBS | | | 81 | | | | USD | | | | 10,164,234 | | | | 124.00 | | | | 5/22/2020 | | | | (1,898 | ) |
U.S. Treasury Long Bond | | UBS | | | 1 | | | | USD | | | | 181,563 | | | | 181.00 | | | | 5/1/2020 | | | | (438 | ) |
U.S. Treasury Long Bond | | UBS | | | 1 | | | | USD | | | | 181,563 | | | | 175.00 | | | | 5/22/2020 | | | | (234 | ) |
U.S. Treasury Long Bond | | UBS | | | 1 | | | | USD | | | | 181,563 | | | | 177.00 | | | | 5/22/2020 | | | | (469 | ) |
U.S. Treasury Long Bond | | UBS | | | 3 | | | | USD | | | | 544,688 | | | | 179.00 | | | | 5/22/2020 | | | | (2,859 | ) |
U.S. Treasury Long Bond | | UBS | | | 12 | | | | USD | | | | 2,178,750 | | | | 180.00 | | | | 5/22/2020 | | | | (15,750 | ) |
U.S. Treasury Long Bond | | UBS | | | 14 | | | | USD | | | | 2,541,875 | | | | 178.00 | | | | 5/22/2020 | | | | (9,406 | ) |
| |
Total Written Put Options Contracts (Premiums Received $151,681) | | | | | | | | | | | $ | (45,578 | ) |
| |
See accompanying Notes to Financial Statements
125
Morningstar Funds Trust April 30, 2020
Schedule of Investments (continued)
Morningstar Total Return Bond Fund
Written Call Option Contracts outstanding at April 30, 2020:
Over the Counter
| | | | | | | | | | | | | | | | | | | | | | | | |
| Description | | Counterparty | | Number of Contracts | | | | | Notional
Amount | | | Exercise Price | | | Expiration Date | | | Value | |
| |
Brazilian Real vs. U.S. Dollar | | Deutsche Bank | | | 1 | | | USD | | | 146,000 | | | | 6.00 | | | | 5/27/2020 | | | $ | (661 | ) |
Brazilian Real vs. U.S. Dollar | | Deutsche Bank | | | 1 | | | USD | | | 243,000 | | | | 6.00 | | | | 6/25/2020 | | | | (2,655 | ) |
Canadian Dollar vs. U.S. Dollar | | Deutsche Bank | | | 1 | | | USD | | | 94,000 | | | | 1.45 | | | | 5/8/2020 | | | | (9 | ) |
Mexican Peso vs. U.S. Dollar | | Deutsche Bank | | | 1 | | | USD | | | 48,000 | | | | 25.50 | | | | 5/21/2020 | | | | (300 | ) |
Mexican Peso vs. U.S. Dollar | | Bank of America | | | 1 | | | USD | | | 36,000 | | | | 25.50 | | | | 5/22/2020 | | | | (239 | ) |
South African Rand vs. U.S. Dollar | | Morgan Stanley | | | 2 | | | USD | | | 97,200 | | | | 19.00 | | | | 5/14/2020 | | | | (796 | ) |
South African Rand vs. U.S. Dollar | | Deutsche Bank | | | 1 | | | USD | | | 304,000 | | | | 17.00 | | | | 6/4/2020 | | | | (26,521 | ) |
U.S. Dollar vs. Australian Dollar | | Deutsche Bank | | | 1 | | | AUD | | | 98,000 | | | | 0.62 | | | | 5/5/2020 | | | | (3,115 | ) |
| |
Total Written OTC Call Options Contracts (Premiums Received $10,801) | | | | | | | | | | | $ | (34,296 | ) |
| |
Written Put Option Contracts outstanding at April 30, 2020:
Over the Counter
| | | | | | | | | | | | | | | | | | | | | | | | |
| Description | | Counterparty | | Number of Contracts | | | | | Notional Amount | | | Exercise Price | | | Expiration Date | | | Value | |
| |
Brazilian Real vs. U.S. Dollar | | Deutsche Bank | | | 1 | | | USD | | | 122,000 | | | | 5.40 | | | | 6/25/2020 | | | $ | (3,476 | ) |
Canadian Dollar vs. U.S. Dollar | | Deutsche Bank | | | 1 | | | USD | | | 47,000 | | | | 1.38 | | | | 5/8/2020 | | | | (63 | ) |
Japanese Yen vs. U.S. Dollar | | Citibank | | | 1 | | | USD | | | 125,000 | | | | 104.00 | | | | 5/1/2020 | | | | — | |
Japanese Yen vs. U.S. Dollar | | Morgan Stanley | | | 1 | | | USD | | | 229,000 | | | | 103.00 | | | | 5/27/2020 | | | | (164 | ) |
Mexican Peso vs. U.S. Dollar | | Bank of America | | | 1 | | | USD | | | 146,000 | | | | 23.50 | | | | 6/25/2020 | | | | (2,022 | ) |
Mexican Peso vs. U.S. Dollar | | Deutsche Bank | | | 1 | | | USD | | | 122,000 | | | | 23.00 | | | | 6/26/2020 | | | | (961 | ) |
Russian Ruble vs. U.S. Dollar | | Deutsche Bank | | | 1 | | | USD | | | 82,000 | | | | 75.00 | | | | 4/30/2020 | | | | (2,142 | ) |
Russian Ruble vs. U.S. Dollar | | Deutsche Bank | | | 1 | | | USD | | | 92,000 | | | | 75.00 | | | | 5/22/2020 | | | | (2,009 | ) |
Russian Ruble vs. U.S. Dollar | | JPMorgan Chase | | | 1 | | | USD | | | 134,000 | | | | 72.00 | | | | 5/22/2020 | | | | (606 | ) |
Russian Ruble vs. U.S. Dollar | | Citibank | | | 1 | | | USD | | | 469,000 | | | | 75.00 | | | | 7/2/2020 | | | | (13,781 | ) |
South African Rand vs. U.S. Dollar | | Deutsche Bank | | | 1 | | | USD | | | 62,000 | | | | 16.50 | | | | 5/22/2020 | | | | (4 | ) |
Turkish Lira vs. U.S. Dollar | | Citibank | | | 1 | | | USD | | | 83,000 | | | | 6.65 | | | | 6/12/2020 | | | | (351 | ) |
U.S. Dollar vs. Australian Dollar | | Deutsche Bank | | | 1 | | | AUD | | | 176,000 | | | | 0.57 | | | | 5/5/2020 | | | | — | |
| |
Total Written OTC Put Options Contracts (Premiums Received $20,735) | | | | | | | | | | | $ | (25,579 | ) |
| |
Written Put Interest Rate Swaption Contracts outstanding at April 30, 2020:
Over the Counter
| | | | | | | | | | | | | | | | | | | | | | | | | | | | | | |
| Description | | Pay Rate Index/ Pay Rate | | Receive Rate Index/ Receive Rate | | | Counterparty | | | Expiration Date | | | Exercise Rate | | | | | | Notional Amount | | | Value | |
| |
Interest Rate Swap Maturing 06/09/2022 | | 0.62% Semi-Annually | | | 3M USD LIBOR Quarterly | | | | Morgan Stanley | | | | 6/5/2020 | | | | 0.62 | % | | | USD | | | | 5,430,000 | | | $ | (3 | ) |
Interest Rate Swap Maturing 06/09/2025 | | 0.73% Semi-Annually | | | 3M USD LIBOR Quarterly | | | | Morgan Stanley | | | | 6/5/2020 | | | | 0.73 | | | | USD | | | | 5,430,000 | | | | (299 | ) |
Interest Rate Swap Maturing 08/03/2025 | | 1.60% Semi-Annually | | | 3M USD LIBOR Quarterly | | | | Morgan Stanley | | | | 7/30/2020 | | | | 1.60 | | | | USD | | | | 3,710,000 | | | | (11 | ) |
See accompanying Notes to Financial Statements
126
Morningstar Funds Trust April 30, 2020
Schedule of Investments (continued)
Morningstar Total Return Bond Fund
| | | | | | | | | | | | | | | | | | | | |
| Description | | Pay Rate Index/ Pay Rate | | Receive Rate Index/ Receive Rate | | Counterparty | | Expiration Date | | Exercise Rate | | | | Notional Amount | | | Value | |
| |
Interest Rate Swap Maturing 08/03/2025 | | 1.55% Semi-Annually | | 3M USD LIBOR Quarterly | | Morgan Stanley | | 7/30/2020 | | 1.55% | | USD | | | 5,080,000 | | | $ | (19 | ) |
Interest Rate Swap Maturing 08/21/2025 | | 1.60% Semi-Annually | | 3M USD LIBOR Quarterly | | Morgan Stanley | | 8/19/2020 | | 1.60 | | USD | | | 5,200,000 | | | | (39 | ) |
| |
Total Written OTC Put Swaptions Contracts (Premiums Received $124,620) | | | $ | (371 | ) |
| |
Written Put Credit Default Swaptions Sell Protection outstanding at April 30, 2020:
Over the Counter
| | | | | | | | | | | | | | | | | | | | | | | | |
| Description | | Fixed Deal (Pay) Rate | | Counterparty | | | Expiration Date | | Exercise Price | | | | | | Notional Amount | | | Value | |
| |
Markit CDX North America Investment Grade Index Series 33 (Pay Quarterly): Credit Default Swap Maturing 12/20/2024 | | 1.00% | |
| Bank
of
America |
| | 5/20/2020 | | | 85.00 | | | | USD | | | | 2,800,000 | | | $ | (8,036 | ) |
| |
Total Written OTC Put Credit Default Swaption Contracts (Premiums Received $7,280) | | | | | | | $ | (8,036 | ) |
| |
Interest Rate Swap Contracts outstanding at April 30, 2020:
Exchange Traded
| | | | | | | | | | | | | | | | | | | | | | | | |
| Pay Rate Index/ Pay Rate | | Receive Rate Index/ Receive Rate | | Maturity Date | | | | | Notional Amount | | | Market Value | | | Upfront Premiums Paid (Received) | | | Unrealized Appreciation (Depreciation) | |
| |
1-Day U.S. Federal Funds Rate (Annually) | | 0.18% (Annually) | | | 3/15/2022 | | | USD | | | 63,200,000 | | | | $ 141,132 | | | | $ 62,173 | | | | $ 78,959 | |
3M USD LIBOR (Quarterly) | | 0.60% (Semi-Annually) | | | 3/23/2022 | | | USD | | | 11,619,000 | | | | 46,135 | | | | 1,709 | | | | 44,426 | |
0.73% (Semi-Annually) | | 3M CAD CIDOR (Semi-Annually) | | | 4/5/2022 | | | CAD | | | 16,875,000 | | | | (16,518 | ) | | | — | | | | (16,518 | ) |
0.77% (Semi-Annually) | | 3M CAD CIDOR (Semi-Annually) | | | 4/7/2022 | | | CAD | | | 8,410,000 | | | | (10,474 | ) | | | — | | | | (10,474 | ) |
2.85% (Semi-Annually) | | 3M USD LIBOR (Quarterly) | | | 8/31/2022 | | | USD | | | 3,181,000 | | | | (193,613 | ) | | | (29,074 | ) | | | (164,539 | ) |
3M CAD CIDOR (Semi-Annually) | | 1.09% (Semi-Annually) | | | 4/3/2024 | | | CAD | | | 16,875,000 | | | | 23,204 | | | | — | | | | 23,204 | |
3M CAD CIDOR (Semi-Annually) | | 1.22% (Semi-Annually) | | | 4/10/2024 | | | CAD | | | 8,410,000 | | | | 18,981 | | | | — | | | | 18,981 | |
28-Day MXN-TIIE-BANXICO (Monthly) | | 6.67% (Monthly) | | | 8/12/2024 | | | MXN | | | 3,513,241 | | | | 7,831 | | | | — | | | | 7,831 | |
28-Day MXN-TIIE-BANXICO (Monthly) | | 6.72% (Monthly) | | | 8/13/2024 | | | MXN | | | 3,023,000 | | | | 6,961 | | | | — | | | | 6,961 | |
3M USD LIBOR (Quarterly) | | 0.42% (Semi-Annually) | | | 8/31/2024 | | | USD | | | 23,260,000 | | | | 68,184 | | | | (4,509 | ) | | | 72,693 | |
3M USD LIBOR (Quarterly) | | 0.38% (Semi-Annually) | | | 8/31/2024 | | | USD | | | 22,896,000 | | | | 29,111 | | | | 2,274 | | | | 26,837 | |
28-Day MXN-TIIE-BANXICO (Monthly) | | 6.59% (Monthly) | | | 11/8/2024 | | | MXN | | | 2,592,058 | | | | 5,446 | | | | — | | | | 5,446 | |
3M USD LIBOR (Quarterly) | | 0.70% (Semi-Annually) | | | 3/23/2025 | | | USD | | | 6,770,000 | | | | 92,150 | | | | (5,338 | ) | | | 97,488 | |
3M CAD CIDOR (Semi-Annually) | | 0.93% (Semi-Annually) | | | 4/1/2025 | | | CAD | | | 1,687,000 | | | | 8,130 | | | | — | | | | 8,130 | |
See accompanying Notes to Financial Statements
127
Morningstar Funds Trust April 30, 2020
Schedule of Investments (continued)
Morningstar Total Return Bond Fund
| | | | | | | | | | | | | | | | | | | | | | | | | | |
Pay Rate Index/ Pay
Rate | | Receive Rate Index/ Receive Rate | | Maturity Date | | | | | | Notional Amount | | | Market Value | | | Upfront Premiums Paid (Received) | | | Unrealized Appreciation (Depreciation) | |
| |
3M CAD CIDOR (Semi-Annually) | | 0.95% (Semi-Annually) | | | 4/2/2025 | | | | CAD | | | | 1,688,000 | | | | $ 9,517 | | | | $ — | | | | $ 9,517 | |
3M CAD CIDOR (Semi-Annually) | | 0.97% (Semi-Annually) | | | 4/2/2025 | | | | CAD | | | | 125,000 | | | | 784 | | | | — | | | | 784 | |
3M CAD CIDOR (Semi-Annually) | | 1.01% (Semi-Annually) | | | 4/6/2025 | | | | CAD | | | | 885,000 | | | | 7,592 | | | | — | | | | 7,592 | |
3M CAD CIDOR (Semi-Annually) | | 1.02% (Semi-Annually) | | | 4/6/2025 | | | | CAD | | | | 880,000 | | | | 7,868 | | | | — | | | | 7,868 | |
0.80% (Semi-Annually) | | 3M CAD CIDOR (Semi-Annually) | | | 4/15/2025 | | | | CAD | | | | 631,000 | | | | (793 | ) | | | — | | | | (793 | ) |
0.83% (Semi-Annually) | | 3M CAD CIDOR (Semi-Annually) | | | 4/15/2025 | | | | CAD | | | | 1,755,000 | | | | (4,101 | ) | | | — | | | | (4,101 | ) |
0.78% (Semi-Annually) | | 3M CAD CIDOR (Semi-Annually) | | | 4/16/2025 | | | | CAD | | | | 1,124,000 | | | | (410 | ) | | | — | | | | (410 | ) |
1.55% (Semi-Annually) | | 3M USD LIBOR (Quarterly) | | | 6/30/2026 | | | | USD | | | | 12,340,000 | | | | (855,771 | ) | | | 34,381 | | | | (890,152 | ) |
1.52% (Semi-Annually) | | 3M USD LIBOR (Quarterly) | | | 7/31/2026 | | | | USD | | | | 12,688,000 | | | | (872,616 | ) | | | 87,305 | | | | (959,921 | ) |
1.60% (Semi-Annually) | | 3M USD LIBOR (Quarterly) | | | 11/15/2026 | | | | USD | | | | 8,040,000 | | | | (583,226 | ) | | | 2,141 | | | | (585,367 | ) |
1.65% (Semi-Annually) | | 3M USD LIBOR (Quarterly) | | | 11/15/2026 | | | | USD | | | | 3,191,000 | | | | (242,003 | ) | | | (11,592 | ) | | | (230,411 | ) |
0.30% (Annually) | | 1-Day U.S. Federal Funds Rate (Annually) | | | 2/15/2027 | | | | USD | | | | 7,036,000 | | | | (20,116 | ) | | | 21,280 | | | | (41,396 | ) |
0.75% (Semi-Annually) | | 3M USD LIBOR (Quarterly) | | | 2/15/2027 | | | | USD | | | | 7,458,000 | | | | (126,650 | ) | | | 1,350 | | | | (128,000 | ) |
1-Day U.S. Federal Funds Rate (Annually) | | 0.35% (Annually) | | | 2/15/2027 | | | | USD | | | | 7,600,000 | | | | 47,130 | | | | (3,435 | ) | | | 50,565 | |
3M USD LIBOR (Quarterly) | | 0.55% (Semi-Annually) | | | 2/15/2027 | | | | USD | | | | 11,110,000 | | | | 42,237 | | | | 722 | | | | 41,515 | |
3M USD LIBOR (Quarterly) | | 0.77% (Semi-Annually) | | | 3/24/2027 | | | | USD | | | | 8,700,000 | | | | 146,974 | | | | 63,494 | | | | 83,480 | |
1.85% (Semi-Annually) | | 3M USD LIBOR (Quarterly) | | | 11/15/2044 | | | | USD | | | | 3,488,000 | | | | (849,307 | ) | | | 9,309 | | | | (858,616 | ) |
0.60% (Semi-Annually) | | 3M USD LIBOR (Quarterly) | | | 11/15/2045 | | | | USD | | | | 950,000 | | | | 49,689 | | | | 1,213 | | | | 48,476 | |
0.90% (Semi-Annually) | | 3M USD LIBOR (Quarterly) | | | 3/17/2050 | | | | USD | | | | 1,000,000 | | | | (21,347 | ) | | | 16,889 | | | | (38,236 | ) |
0.79% (Semi-Annually) | | 3M USD LIBOR (Quarterly) | | | 3/18/2050 | | | | USD | | | | 506,000 | | | | 4,470 | | | | — | | | | 4,470 | |
0.82% (Semi-Annually) | | 3M USD LIBOR (Quarterly) | | | 3/19/2050 | | | | USD | | | | 510,000 | | | | 1,003 | | | | — | | | | 1,003 | |
| |
Total | | | | | | | | | | | | | 284,016,299 | | | | $(3,032,416 | ) | | | $250,292 | | | | $(3,282,708 | ) |
| |
Interest Rate Swap Contracts outstanding at April 30, 2020:
Over the Counter
| | | | | | | | | | | | | | | | | | | | | | | | | | | | |
Pay Rate Index/ Pay Rate | | Receive Rate Index/ Receive Rate | | Counterparty | | Maturity Date | | | | | | Notional Amount | | | Market Value | | | Upfront Premiums Paid (Received) | | | Unrealized Appreciation (Depreciation) | |
| |
1-Day Brazil CETIP Interbank Deposit Rate (At Maturity) | | 5.13% (At Maturity) | | JPMorgan Chase | | | 1/2/2023 | | | | BRL | | | | 809,926 | | | | $1,556 | | | | $— | | | | $1,556 | |
1-Day Brazil CETIP Interbank Deposit Rate (At Maturity) | | 5.45% (Annually) | | UBS | | | 1/2/2024 | | | | BRL | | | | 1,564,187 | | | | (1,817 | ) | | | — | | | | (1,817 | ) |
1-Day Brazil CETIP Interbank Deposit Rate (At Maturity) | | 5.60% (At Maturity) | | UBS | | | 1/2/2024 | | | | BRL | | | | 842,022 | | | | (633 | ) | | | — | | | | (633 | ) |
See accompanying Notes to Financial Statements
128
Morningstar Funds Trust April 30, 2020
Schedule of Investments (continued)
Morningstar Total Return Bond Fund
| | | | | | | | | | | | | | | | | | | | | | | | | | | | |
Pay Rate Index/ Pay Rate | | Receive Rate Index/ Receive Rate | | Counterparty | | Maturity Date | | | | | | Notional Amount | | | Market Value | | | Upfront Premiums Paid (Received) | | | Unrealized Appreciation (Depreciation) | |
| |
1-Day Brazil CETIP Interbank Deposit Rate (At Maturity) | | 7.20% (At Maturity) | | Citibank | | | 1/4/2027 | | | | BRL | | | | 896,472 | | | | $659 | | | | $— | | | | $ 659 | |
1-Day Brazil CETIP Interbank Deposit Rate (At Maturity) | | 7.40% (At Maturity) | | JPMorgan Chase | | | 1/4/2027 | | | | BRL | | | | 332,263 | | | | 1,127 | | | | — | | | | 1,127 | |
1-Day Brazil CETIP Interbank Deposit Rate (At Maturity) | | 7.45% (At Maturity) | | JPMorgan Chase | | | 1/4/2027 | | | | BRL | | | | 294,591 | | | | 1,192 | | | | — | | | | 1,192 | |
1-Day Brazil CETIP Interbank Deposit Rate (At Maturity) | | 7.52% (At Maturity) | | JPMorgan Chase | | | 1/4/2027 | | | | BRL | | | | 147,235 | | | | 731 | | | | — | | | | 731 | |
| |
Total | | | | | | | | | | | | | | | 4,886,696 | | | | $2,815 | | | | $— | | | | $2,815 | |
| |
Credit Default Swap Contracts outstanding - Sell Protection as of April 30, 2020:
Exchange Traded
| | | | | | | | | | | | | | | | | | | | | | | | | | | | | | | | |
Reference
Obligation | | Implied Credit Spread | | | Fixed Deal (Pay) Rate | | | Maturity Date | | | Counterparty | | | Notional Amount(1) | | | Market Value | | | Upfront Premiums Paid/ (Received) | | | Unrealized Appreciation (Depreciation) | |
| |
Markit CDX North America Investment Grade Index Series 34 (Pay Quarterly) | | | 0.87% | | | | 1.00% | | | | 6/20/2025 | | | | UBS | | | | USD 29,410,000 | | | | $225,264 | | | | $(117,165 | ) | | | $342,429 | |
| |
Total | | | | | | | | | | | | | | | | | | | 29,410,000 | | | | $225,264 | | | | $(117,165 | ) | | | $342,429 | |
| |
| (1) | The maximum potential amount the Fund may pay should a negative credit event take place as defined under the terms of the agreement. |
Credit Default Swap Contracts outstanding - Buy Protection at April 30, 2020:
Over the Counter
| | | | | | | | | | | | | | | | | | | | | | | | | | | | | | | | |
| Reference Obligation | | Fixed Deal (Pay) Rate | | | Maturity Date | | | Counterparty | | | | | | Notional Amount | | | Market Value | | | Upfront
Premiums
Paid/ (Received) | | | Unrealized Appreciation (Depreciation) | |
| |
Federal Republic Of Brazil, 4.25%, Due: 1/7/2025 (Pay Quarterly) | | | 1.00% | | | | 6/20/2025 | | | | Morgan Stanley | | | | USD | | | | 116,000 | | | | $11,350 | | | | $16,748 | | | | $(5,398 | ) |
Republic of Chile, 3.88%,
Due: 8/5/2020 (Pay Quarterly) | | | 1.00% | | | | 6/20/2025 | | | | Citibank | | | | USD | | | | 79,000 | | | | 137 | | | | 2,553 | | | | (2,416 | ) |
Republic of Philippines, 10.63%, Due: 3/16/2025 (Pay Quarterly) | | | 1.00% | | | | 6/20/2025 | | | | Citibank | | | | USD | | | | 198,809 | | | | (2,078 | ) | | | 6,456 | | | | (8,534 | ) |
Republic of South Africa, 5.88%, Due: 9/16/2025 (Pay Quarterly) | | | 1.00% | | | | 6/20/2025 | | | | Morgan Stanley | | | | USD | | | | 357,852 | | | | 50,214 | | | | 49,594 | | | | 620 | |
See accompanying Notes to Financial Statements
129
Morningstar Funds Trust April 30, 2020
Schedule of Investments (continued)
Morningstar Total Return Bond Fund
| | | | | | | | | | | | | | | | | | | | | | | | | | | | | | | | |
| Reference Obligation | | Fixed Deal (Pay) Rate | | | Maturity Date | | | Counterparty | | | | | | Notional Amount | | | Market Value | | | Upfront
Premiums
Paid/ (Received) | | | Unrealized Appreciation (Depreciation) | |
| |
United Mexican States, 4.15% Due: 3/28/2027 (Pay Quarterly) | | | 1.00% | | | | 6/20/2025 | | | | Citibank | | | | USD | | | | 111,000 | | | | $ 8,169 | | | | $11,271 | | | | $ (3,102 | ) |
| |
Total | | | | | | | | | | | | | | | | | | | 862,661 | | | | $67,792 | | | | $86,622 | | | | $(18,830 | ) |
| |
Inflation Swap Contracts outstanding at April 30, 2020:
Exchange Traded
| | | | | | | | | | | | | | | | | | | | | | | | | | |
Pay Rate Index/ Pay Rate | | Receive Rate Index/ Receive Rate | | Maturity Date | | | | | | Notional Amount | | | Market Value | | | Upfront Premiums Paid/ (Received) | | | Unrealized Appreciation (Depreciation) | |
| |
0.33% (At Maturity) | | 1-Day EURIBOR (At Maturity) | | | 4/15/2025 | | | | EUR | | | | 940,000 | | | | $ — | | | | $— | | | | $ — | |
0.38% (At Maturity) | | 1-Day EURIBOR (At Maturity) | | | 4/15/2025 | | | | EUR | | | | 945,000 | | | | (1,080 | ) | | | — | | | | (1,080 | ) |
1-Day EURIBOR (At Maturity) | | 0.69% (At Maturity) | | | 4/15/2030 | | | | EUR | | | | 945,000 | | | | 6,486 | | | | — | | | | 6,486 | |
1-Day EURIBOR (At Maturity) | | 0.62% (At Maturity) | | | 4/15/2030 | | | | EUR | | | | 940,000 | | | | — | | | | — | | | | — | |
| |
Total | | | | | | | | | | | | | 3,770,000 | | | | $5,406 | | | | $— | | | | $5,406 | |
| |
See accompanying Notes to Financial Statements
130
Morningstar Funds Trust April 30, 2020
Schedule of Investments (continued)
Morningstar Total Return Bond Fund
Valuation Hierarchy
The following is a summary of the inputs used, as of April 30, 2020, in valuing the Fund’s investments carried at fair value:
| | | | | | | | | | | | | | | | |
| |
| Morningstar Total Return Bond Fund | | Level 1 | | | Level 2 | | | Level 3 | | | Totals | |
| |
Investments | | | | | | | | | | | | | | | | |
Assets: | | | | | | | | | | | | | | | | |
Asset-Backed Securities | | $ | — | | | $ | 53,622,395 | | | | $— | | | $ | 53,622,395 | |
Corporate Bonds | | | — | | | | 144,538,934 | | | | — | | | | 144,538,934 | |
Foreign Issuer Bonds | | | — | | | | 52,565,728 | | | | — | | | | 52,565,728 | |
Term Loans | | | — | | | | 13,349 | | | | — | | | | 13,349 | |
Mortgage-Backed Securities | | | — | | | | 183,796,197 | | | | — | | | | 183,796,197 | |
Municipal Bonds | | | — | | | | 9,854,191 | | | | — | | | | 9,854,191 | |
U.S. Government Obligations | | | — | | | | 47,670,960 | | | | — | | | | 47,670,960 | |
Investment Companies | | | 42,606,314 | | | | — | | | | — | | | | 42,606,314 | |
Short-Term Investments | | | 41,448,801 | | | | 4,945,460 | | | | — | | | | 46,394,261 | |
Purchased Options | | | 11,046 | | | | 85,475 | | | | — | | | | 96,521 | |
| |
Total Assets – Investments at value | | $ | 84,066,161 | | | $ | 497,092,689 | | | | $— | | | $ | 581,158,850 | |
| |
Liabilities: | | | | | | | | | | | | | | | | |
Mortgage-Backed Securities | | $ | — | | | $ | (6,563,094 | ) | | | $— | | | $ | (6,563,094 | ) |
U.S. Government Obligations | | | — | | | | (2,354,687 | ) | | | — | | | | (2,354,687 | ) |
| |
Total Liabilities – Investments at value | | $ | — | | | $ | (8,917,781 | ) | | | $— | | | $ | (8,917,781 | ) |
| |
Total Investments | | $ | 84,066,161 | | | $ | 488,174,908 | | | | $— | | | $ | 572,241,069 | |
| |
| | | | | | | | | | | | | | | | |
| |
| Morningstar Total Return Bond Fund | | Level 1 | | | Level 2 | | | Level 3 | | | Totals | |
| |
Derivative Financial Instruments | | | | | | | | | | | | | | | | |
Assets: | | | | | | | | | | | | | | | | |
Futures contracts | | | $ 649,232 | | | | $ — | | | | $— | | | | $ 649,232 | |
Forward foreign currency exchange contracts | | | — | | | | 427,793 | | | | — | | | | 427,793 | |
Swap agreements at fair value | | | — | | | | 1,071,414 | | | | — | | | | 1,071,414 | |
| |
Total Assets - Derivative Financial Instruments | | | $ 649,232 | | | | $ 1,499,207 | | | | $— | | | | $ 2,148,439 | |
| |
Liabilities: | | | | | | | | | | | | | | | | |
Futures contracts | | | $ (715,311 | ) | | | $ — | | | | $— | | | | $ (715,311 | ) |
Forward foreign currency exchange contracts | | | — | | | | (167,104 | ) | | | — | | | | (167,104 | ) |
Written Options | | | (73,391 | ) | | | (68,282 | ) | | | — | | | | (141,673 | ) |
Swap agreements at fair value | | | — | | | | (3,802,553 | ) | | | — | | | | (3,802,553 | ) |
| |
Total Liabilities - Derivative Financial Instruments | | | $ (788,702 | ) | | | $(4,037,939 | ) | | | $— | | | | $(4,826,641 | ) |
| |
Total Net Derivative Financial Instruments | | | $ (139,470 | ) | | | $(2,538,732 | ) | | | $— | | | | $(2,678,202 | ) |
| |
See accompanying Notes to Financial Statements
131
Morningstar Funds Trust April 30, 2020
Schedule of Investments
|
Morningstar Municipal Bond Fund |
| | | | | | |
| | | Par | | | Value |
| | |
Municipal Bonds – 84.7% | | | | | | |
| | |
Alabama – 1.0% | | | | | | |
Alabama Federal Aid Highway Finance Authority Special Obligation Revenue Bonds, Series A, Garvee, 5.00%, 6/01/37 | | $ | 545,000 | | | $ 644,206 |
Black Belt Energy Gas District Gas Prepay Revenue Bonds, Series A-1, Project No.4, 4.00%, 6/01/24 | | | 500,000 | | | 529,660 |
Black Belt Energy Gas District Gas Prepay Revenue Bonds, Series A-1, Project No.5, 4.00%, 10/01/26(a)(b)(c) | | | 500,000 | | | 535,855 |
Jefferson County Sewer Revenue Bonds, Warrants Senior Lien, Series A (AGM Insured), 5.50%, 10/01/53 | | | 300,000 | | | 332,382 |
Lower Alabama Gas District Gas Project Revenue Bonds, 4.00%, 12/01/25(a)(b)(c) | | | 500,000 | | | 531,910 |
Tuscaloosa County IDA Gulf Opportunity Zone Revenue Refunding Bonds, Series A, Hunt Refining Project, 5.25%, 5/01/44(d) | | | 185,000 | | | 183,008 |
University of West Alabama University Revenue Refunding Bonds (AGM Insured), 5.00%, 1/01/27 | | | 505,000 | | | 585,633 |
| | | | | | | 3,342,654 |
| | |
Arizona – 0.9% | | | | | | |
Arizona Board of Regents Refunding COPS, Series C, University of Arizona,
5.00%, 6/01/28 | | | 400,000 | | | 430,672 |
Chandler IDA Industrial Development Variable Revenue Bonds (AMT), Intel Corp., Project, 2.70%, 8/14/23(a)(b)(c) | | | 500,000 | | | 512,285 |
Maricopa County IDA Revenue Refunding Bonds, Banner Health Obligation Group, 5.00%, 1/01/27 | | | 475,000 | | | 559,479 |
Phoenix Civic Improvement Corp., Rental Car Facility Revenue Bonds, Series A,
4.00%, 7/01/45 | | | 350,000 | | | 351,767 |
| | | | | | |
| | | Par | | | Value |
| | |
Arizona (Continued) | | | | | | |
Pima County IDA Education Revenue Facility Revenue Bonds, Paideia Academies Project, 6.13%, 7/01/45(d) | | $ | 240,000 | | | $ 232,651 |
Salt River Project Agricultural Improvement & Power District Electric Revenue Bonds, Salt River Project, 5.00%, 1/01/32 | | | 400,000 | | | 513,832 |
Salt River Project Agricultural Improvement & Power District Electric Revenue Refunding Bonds, Series A, 5.00%, 12/01/28 | | | 300,000 | | | 318,531 |
| | | | | | | 2,919,217 |
| | |
Arkansas – 0.1% | | | | | | |
Arkansas Development Finance Authority Healthcare Revenue Bonds, Baptist Health, 5.00%, 12/01/47 | | | 250,000 | | | 278,813 |
| | |
California – 5.7% | | | | | | |
Anaheim Housing & Public Improvement Authority Revenue Bonds, Series A,
5.00%, 10/01/50 | | | 900,000 | | | 1,016,469 |
Anaheim Public Financing Authority Lease Revenue Refunding Bonds, Series A, 5.00%, 5/01/46 | | | 250,000 | | | 260,410 |
Bay Area Toll Authority Toll Bridge Variable Revenue Bonds, San Francisco Bay Area, (SIFMA Municipal Swap Index Yield + 0.90%), 1.12%, 5/01/23(a)(c) | | | 700,000 | | | 687,470 |
California HFA Municipal Certificates Revenue Bonds, Series 2, Class A, 4.00%, 3/20/33 | | | 248,760 | | | 239,187 |
California PFA Revenue Refunding Bonds, Henry Mayo Newhall Hospital,
5.00%, 10/15/47 | | | 400,000 | | | 412,704 |
California State GO Unlimited Refunding Bonds, 4.00%, 10/01/37 | | | 300,000 | | | 338,031 |
California State Health Facilities Financing Authority Revenue Bonds, City of Hope Obligated Group, 5.00%, 11/15/49 | | | 500,000 | | | 554,500 |
See accompanying Notes to Financial Statements
132
Morningstar Funds Trust April 30, 2020
Schedule of Investments (continued)
Morningstar Municipal Bond Fund
| | | | | | |
| | | Par | | | Value |
| | |
California (Continued) | | | | | | |
California State Health Facilities Financing Authority Revenue Bonds, Series A, Sutter Health, 5.00%, 11/15/41 | | $ | 500,000 | | | $ 549,835 |
California State Health Facilities Financing Authority Revenue Refunding Bonds, Marshall Medical Center (California Mortgage Insured), 4.00%, 11/01/40 | | | 750,000 | | | 817,290 |
California State Infrastructure & Economic Development Bank Variable Revenue Refunding Bonds, Series S, J. Paul Getty Trust, (1M USD LIBOR + 0.33%),
0.59%, 4/01/22(a)(c) | | | 1,000,000 | | | 981,980 |
California State Municipal Finance Authority Revenue Bonds, Charter School John Adams Academies-Lincoln Project, 5.00%, 10/01/57(d) | | | 330,000 | | | 286,687 |
California State Municipal Finance Authority Student Housing Revenue Bonds, UCR North District Phase 1 (BAM Insured), 5.00%, 5/15/28 | | | 500,000 | | | 566,470 |
California State Pollution Control Finance Authority Solid Waste Disposal Variable Revenue Bonds, Republic Services, Inc. (AMT), 1.95%, 7/15/20(a)(b)(c)(d) | | | 1,500,000 | | | 1,500,195 |
California State Various Purpose Bid Group GO Unlimited Refunding Bonds,
5.00%, 8/01/30 | | | 600,000 | | | 746,328 |
California Statewide Communities Development Authority Revenue Bonds, Loma Linda University Medical,
5.50%, 12/01/58(d) | | | 500,000 | | | 506,445 |
California Statewide Communities Development Authority Revenue Bonds, Series A, Loma Linda University Medical Center, 5.25%, 12/01/56(d) | | | 250,000 | | | 249,548 |
| | | | | | |
| | | Par | | | Value |
| | |
California (Continued) | | | | | | |
California Statewide Communities Development Authority Special Assessment Bonds, Statewide Community Infrastructure Program, 5.00%, 9/02/34 | | $ | 100,000 | | | $ 112,146 |
Carpinteria Valley Water District Revenue Refunding Bonds, Series A,
5.00%, 7/01/34 | | | 1,000,000 | | | 1,246,030 |
Los Angeles Department of Airports Airport Subordinate Revenue Bonds (AMT), Los Angeles International Airport,
5.00%, 5/15/34 | | | 500,000 | | | 556,955 |
Mizuho Floater/Residual Trust Various States Floaters Revenue Bonds, Series 2019-Miz9007 (Mizuho Capital Markets LLC LOC), 0.47%, 6/08/20(a)(c)(d)(e) | | | 4,000,000 | | | 4,000,000 |
Rocklin Community Facilities District No. 10 Special Tax Bonds, 5.00%, 9/01/34 | | | 150,000 | | | 162,246 |
Sacramento County Airport System Revenue Refunding Bonds, Series B,
5.00%, 7/01/21 | | | 1,950,000 | | | 2,030,340 |
Sacramento County Sanitation Districts Financing Authority Variable Revenue Refunding Bonds, Series B, Sacramento County Regional (NATL Insured), (3M USD LIBOR + 0.53%),
1.59%, 12/01/35(c) | | | 100,000 | | | 94,631 |
San Diego County Regional Airport Authority Subordinate Revenue Refunding Bonds, Series A, 4.00%, 7/01/37 | | | 300,000 | | | 320,385 |
San Francisco City & County Airports Commission International Airport Revenue Bonds, Series A (AMT), 5.00%, 5/01/44 | | | 250,000 | | | 282,075 |
See accompanying Notes to Financial Statements
133
Morningstar Funds Trust April 30, 2020
Schedule of Investments (continued)
Morningstar Municipal Bond Fund
| | | | | | |
| | | Par | | | Value |
| | |
California (Continued) | | | | | | |
Susanville Natural Gas Revenue Refunding Bonds, Natural Gas Enterprise (AGM Insured), 3.00%, 6/01/26 | | $ | 595,000 | | | $ 621,829 |
Tobacco Securitization Authority of Southern California Tobacco Settlement Revenue Refunding Bonds, San Diego Asset Securities, 5.00%, 6/01/35 | | | 100,000 | | | 114,564 |
| | | | | | | 19,254,750 |
| | |
Colorado – 1.9% | | | | | | |
Colorado Educational & Cultural Authority Revenue Refunding Bonds, Prospect Ridge Academy Project (Moral Obligation Insured), | | | | | | |
5.00%, 3/15/25 | | | 485,000 | | | 549,520 |
5.00%, 3/15/26 | | | 510,000 | | | 587,520 |
5.00%, 3/15/29 | | | 590,000 | | | 712,608 |
5.00%, 3/15/30 | | | 310,000 | | | 378,268 |
5.00%, 3/15/35 | | | 590,000 | | | 692,949 |
Colorado High Performance Transportation Enterprise Revenue Bonds, C-470 Express Lane, 5.00%, 12/31/56 | | | 500,000 | | | 461,465 |
Colorado State Health Facilities Authority Hospital Revenue Refunding Bonds, Sanford Health, Series A,
5.00%, 11/01/34 | | | 200,000 | | | 229,718 |
Colorado State Health Facilities Authority Hospital Revenue Refunding Bonds,
Series A-1, Commonspirit Health,
5.00%, 8/01/44 | | | 330,000 | | | 352,041 |
Colorado State Health Facilities Authority Revenue Bonds, Series A, Catholic Health, Prerefunded, 5.00%, 2/01/21(f) | | | 380,000 | | | 391,947 |
Denver City & County Airport System Subordinate Revenue Refunding Bonds, Series A (AMT), 5.25%, 12/01/43 | | | 500,000 | | | 576,665 |
| | | | | | |
| | | Par | | | Value |
| | |
Colorado (Continued) | | | | | | |
Denver Convention Center Hotel Authority Senior Revenue Refunding Bonds,
5.00%, 12/01/40 | | $ | 250,000 | | | $ 250,895 |
E-470 Public Highway Authority Senior Variable Revenue Refunding Bonds, Libor Index, (1M USD LIBOR + 0.42%),
0.64%, 9/01/21(a)(c) | | | 500,000 | | | 495,430 |
Park Creek Metropolitan District Revenue Refunding Bonds, Series A (NATL, IBC Insured), 5.00%, 12/01/45 | | | 500,000 | | | 567,390 |
University of Colorado Enterprise Variable Revenue Bonds, Series C, Green Bond, 2.00%, 10/15/24(a)(b)(c) | | | 250,000 | | | 254,245 |
| | | | | | | 6,500,661 |
| | |
Connecticut – 1.1% | | | | | | |
Connecticut State GO Unlimited Bonds,
Series A, 5.00%, 3/15/22 | | | 795,000 | | | 845,944 |
Connecticut State Health & Educational Facilities Authority Revenue Refunding Bonds, Series B-1, 5.00%, 1/01/25(a)(b)(c) | | | 500,000 | | | 574,915 |
Connecticut State Health & Educational Facilities Authority Revenue Refunding Bonds, Series F, Masonicare Issue,
5.00%, 7/01/27 | | | 220,000 | | | 215,411 |
Connecticut State Health & Educational Facilities Authority Revenue Refunding Bonds, University of Hartford, | | | | | | |
5.00%, 7/01/24 | | | 240,000 | | | 251,011 |
5.00%, 7/01/25 | | | 260,000 | | | 272,917 |
5.00%, 7/01/31 | | | 500,000 | | | 520,175 |
4.00%, 7/01/39 | | | 120,000 | | | 107,102 |
Hamden Revenue Refunding Bonds, Whitney Center Project, 5.00%, 1/01/40 | | | 125,000 | | | 108,465 |
Hartford County Metropolitan District GO Unlimited Bonds, 5.00%, 7/15/35 | | | 750,000 | | | 874,950 |
| | | | | | | 3,770,890 |
See accompanying Notes to Financial Statements
134
Morningstar Funds Trust April 30, 2020
Schedule of Investments (continued)
Morningstar Municipal Bond Fund
| | | | | | |
| | | Par | | | Value |
| | |
Delaware – 0.6% | | | | | | |
Delaware State Health Facilities Authority Revenue Bonds, Beebe Medical Center, 5.00%, 6/01/48 | | $ | 500,000 | | | $ 534,825 |
Delaware State Health Facilities Authority Revenue Refunding Bonds, Christiana Health Care System, 5.00%, 10/01/45 | | | 1,000,000 | | | 1,173,020 |
Kent County Student Housing & Dining Facilities Revenue Bonds, CHF-Dover LLC-Delaware State University Project, | | | | | | |
5.00%, 7/01/32 | | | 250,000 | | | 239,860 |
5.00%, 7/01/48 | | | 100,000 | | | 85,877 |
| | | | | | | 2,033,582 |
| | |
District of Columbia – 1.6% | | | | | | |
District of Columbia Revenue Bonds, KIPP DC Project, 4.00%, 7/01/39 | | | 100,000 | | | 92,185 |
District of Columbia Revenue Refunding Bonds, National Public Radio,
4.00%, 4/01/33 | | | 250,000 | | | 268,990 |
District of Columbia University Revenue Refunding Bonds, Georgetown University, 5.00%, 4/01/29 | | | 350,000 | | | 395,980 |
District of Columbia Water & Sewer Authority Public Utility Revenue Bonds, Series B, 5.00%, 10/01/49 | | | 500,000 | | | 589,550 |
District of Columbia Water & Sewer Authority Public Utility Revenue Subordinate Lien Bonds, Series A, Prerefunded,
5.00%, 10/01/23(f) | | | 650,000 | | | 740,428 |
District of Columbia Water & Sewer Authority Public Utility Revenue Subordinate Lien Bonds, Series B, 5.00%, 10/01/37 | | | 750,000 | | | 870,562 |
Metropolitan Washington Airports Authority Dulles Toll Road Revenue Refunding Bonds, Dulles Metrorail & Capital Improvement Projects, 5.00%, 10/01/53 | | | 750,000 | | | 766,328 |
| | | | | | |
| | | Par | | | Value |
| |
District of Columbia (Continued) | | | |
Metropolitan Washington Airports Authority Dulles Toll Road Subordinate Lien Revenue Refunding Bonds, Dulles Metrorail & Capital Improvement Projects, Series B, | | | | | | |
4.00%, 10/01/35 | | $ | 250,000 | | | $ 253,370 |
5.00%, 10/01/47 | | | 200,000 | | | 214,050 |
Metropolitan Washington Airports Authority System Revenue Refunding Bonds,
Series A (AMT), 5.00%, 10/01/20 | | | 500,000 | | | 507,190 |
Washington Metropolitan Area Transit Authority Gross Revenue Bonds,
5.00%, 7/01/43 | | | 300,000 | | | 340,935 |
Washington Metropolitan Area Transit Authority Gross Revenue Bonds, Series B, 5.00%, 7/01/35 | | | 345,000 | | | 401,297 |
| | | | | | | 5,440,865 |
| | |
Florida – 4.6% | | | | | | |
Alachua County Health Facilities Authority Revenue Bonds, Shands Teaching Hospital & Clinics, | | | | | | |
5.00%, 12/01/44 | | | 500,000 | | | 530,985 |
4.00%, 12/01/49 | | | 1,000,000 | | | 984,500 |
Broward County Airport System Revenue Bonds, Series A (AMT), 5.00%, 10/01/36 | | | 750,000 | | | 859,845 |
Broward County Port Facilities Senior Revenue Bonds, Series B (AMT),
4.00%, 9/01/39 | | | 250,000 | | | 265,945 |
Central Florida Expressway Authority Revenue Refunding Bonds, Senior Lien, 5.00%, 7/01/42 | | | 350,000 | | | 394,362 |
Davie Educational Facilities Revenue Bonds, Series B, Nova Southeastern University Project, 5.00%, 4/01/24 | | | 250,000 | | | 266,258 |
Florida State Board of Education Public Education GO Unlimited Refunding Bonds, Capital Outlay, Series E,
5.00%, 6/01/31 | | | 1,000,000 | | | 1,169,860 |
See accompanying Notes to Financial Statements
135
Morningstar Funds Trust April 30, 2020
Schedule of Investments (continued)
Morningstar Municipal Bond Fund
| | | | | | |
| | | Par | | | Value |
| | |
Florida (Continued) | | | | | | |
Florida State Housing Finance Corp., Multi Family Mortgage Adjustable Revenue Bonds, Series A, Parrish Oaks,
1.25%, 2/01/22(a)(b)(c) | | $ | 1,000,000 | | | $ 996,430 |
Florida State Municipal Power Agency Revenue Refunding Bonds, Series A, 5.00%, 10/01/31 | | | 300,000 | | | 350,748 |
Greater Orlando Aviation Authority Airport Facilities Revenue Bonds, Series A (AMT), | | | | | | |
5.00%, 10/01/40 | | | 500,000 | | | 543,800 |
5.00%, 10/01/44 | | | 1,000,000 | | | 1,111,970 |
Hillsborough County Aviation Authority Subordinate Revenue Bonds, Series B, Tampa International Airport, 5.00%, 10/01/40 | | | 470,000 | | | 504,305 |
Jacksonville Health Care Facilities Variable Revenue Refunding Bonds, Baptist Health, 0.20%, 5/11/20(a)(c)(e) | | | 2,000,000 | | | 2,000,000 |
JEA Bulk Power Supply System Revenue Bonds, Scherer 4 Project, Series A, 3.00%, 10/01/22 | | | 225,000 | | | 225,248 |
Lee Memorial Health System Hospital Revenue Refunding Bonds, Series A-1, 5.00%, 4/01/44 | | | 600,000 | | | 668,172 |
Leon County School District Sales TRB, 4.00%, 9/01/26 | | | 800,000 | | | 865,568 |
Miami-Dade County Aviation Revenue Refunding Bonds, Series A (AMT),
5.00%, 10/01/33 | | | 500,000 | | | 547,690 |
Miami-Dade County Educational Facilities Authority Revenue Refunding Bonds, Series A, University of Miami,
5.00%, 4/01/30 | | | 250,000 | | | 273,317 |
Miami-Dade County HFA MFH Variable Revenue Bonds, 1.40%, 4/01/22(a)(b)(c) | | | 500,000 | | | 499,895 |
Orange County Health Facilities Authority Revenue Bonds, Orlando Health Obligated Group, 5.00%, 10/01/47 | | | 500,000 | | | 554,225 |
| | | | | | |
| | | Par | | | Value |
| | |
Florida (Continued) | | | | | | |
Orlando Community Redevelopment Agency Tax Increment Revenue Refunding Bonds, Republic Drive/Universal,
5.00%, 4/01/22 | | $ | 200,000 | | | $ 212,806 |
Osceola County Florida Transportation Revenue Refunding CABS, Series A-2, | | | | | | |
0.00%, 10/01/25(g) | | | 125,000 | | | 110,506 |
0.00%, 10/01/26(g) | | | 275,000 | | | 235,920 |
0.00%, 10/01/27(g) | | | 360,000 | | | 299,563 |
Village Community Development District No. 13 Special Assessment, Limited Offering, 2.62%, 5/01/24 | | | 500,000 | | | 489,800 |
Volusia County Educational Facilities Authority Revenue Refunding Bonds, Embry-Riddle Aeronautical, 5.00%, 10/15/44 | | | 500,000 | | | 543,195 |
| | | | | | | 15,504,913 |
| | |
Georgia – 2.6% | | | | | | |
Atlanta Development Authority Revenue Bonds, Series A-1, Senior Lien,
5.00%, 7/01/30 | | | 200,000 | | | 209,746 |
Atlanta Urban Residential Finance Authority MFH Revenue Bonds, Creekside at Adamsville Place, 1.95%, 5/01/21(a)(b)(c) | | | 500,000 | | | 502,895 |
Bartow County Development Authority Revenue Bonds, Georgia Power Company Plant Bowen Project, 1.55%, 8/19/22(a)(b)(c) | | | 500,000 | | | 487,150 |
Bartow County Development Authority Revenue Refunding Bonds, Series B, Georgia Power Company Plant Bowen Project, 2.05%, 11/19/21(a)(b)(c) | | | 275,000 | | | 275,085 |
Bartow County Development Authority Variable Revenue Refunding Bonds, Georgia Power Company Plant Bowen Project, 2.75%, 3/15/23(a)(b)(c) | | | 500,000 | | | 499,800 |
See accompanying Notes to Financial Statements
136
Morningstar Funds Trust April 30, 2020
Schedule of Investments (continued)
Morningstar Municipal Bond Fund
| | | | | | |
| | | Par | | | Value |
| | |
Georgia (Continued) | | | | | | |
Burke County Development Authority PCR Refunding Bonds, Georgia Power Company Plant Vogtle Project,
1.55%, 8/19/22(a)(b)(c) | | $ | 100,000 | | | $ 97,408 |
Fulton County Development Authority Transportation Corp., Toll Revenue Refunding Bonds, Robert W. Woodruff Arts Center, Inc., Project, 5.00%, 3/15/32 | | | 200,000 | | | 236,886 |
Gainesville & Hall County Hospital Authority Revenue Refunding Bonds, Northeast Georgia Health System, Inc., Project, 5.00%, 2/15/37 | | | 500,000 | | | 552,730 |
Gainesville & Hall County Hospital Authority Revenue Refunding Bonds, Series S, Northeast Georgia Health System, Inc., Project (County Gtd), 5.50%, 8/15/54 | | | 500,000 | | | 573,150 |
Glynn-Brunswick Memorial Hospital Authority Revenue Refunding Anticipation Certificates Bonds, Southeast Georgia Health System, 5.00%, 8/01/34 | | | 500,000 | | | 540,360 |
Griffin-Spalding County Hospital Authority Revenue Anticipation Certificates Bonds, Wellstar, 5.00%, 4/01/35 | | | 150,000 | | | 166,605 |
Main Street Natural Gas Inc., Gas Supply Variable Revenue Bonds, Series B, | | | | | | |
4.00%, 12/01/23 | | | 355,000 | | | 379,878 |
4.00%, 12/02/24(a)(b)(c) | | | 100,000 | | | 107,249 |
Main Street Natural Gas, Inc., Gas Supply Revenue Bonds, Series A, | | | | | | |
5.00%, 5/15/21 | | | 750,000 | | | 766,920 |
4.00%, 9/01/23(a)(b)(c) | | | 350,000 | | | 369,723 |
Main Street Natural Gas, Inc., Gas Supply Revenue Bonds, Series C,
4.00%, 9/01/26(a)(b)(c) | | | 1,110,000 | | | 1,188,621 |
| | | | | | |
| | | Par | | | Value |
| | |
Georgia (Continued) | | | | | | |
Main Street Natural Gas, Inc., Gas Supply Revenue Bonds, Subseries C,
4.00%, 12/01/23(a)(b)(c) | | $ | 500,000 | | | $ 529,450 |
Metropolitan Atlanta Rapid Transit Authority Sales Tax Revenue Refunding Bonds, Series A, Third Indenture Series,
4.00%, 7/01/44 | | | 300,000 | | | 311,163 |
Municipal Electric Authority of Georgia Power Revenue Refunding Bonds, Series HH, 5.00%, 1/01/29 | | | 500,000 | | | 561,850 |
Northwest Georgia Housing Authority MFH Revenue Bonds, Charles Height Apartments Project (FHA 221(D4) Insured),
1.54%, 8/01/21(a)(b)(c) | | | 400,000 | | | 400,688 |
| | | | | | | 8,757,357 |
| | |
Idaho – 0.2% | | | | | | |
Idaho State Health Facilities Authority Hospital Variable Revenue Bonds, CHE Trinity Health Credit Group, 0.70%, 8/03/20(a)(b)(c) | | | 600,000 | | | 600,000 |
| | |
Illinois – 8.1% | | | | | | |
Barrington Alternative Revenue Source GO Unlimited Bonds, 4.50%, 12/15/34 | | | 235,000 | | | 268,055 |
Bensenville GO Unlimited Bonds, Series B (AGM Insured), 5.00%, 12/30/24 | | | 245,000 | | | 260,457 |
Chicago Board of Education GO Unlimited Refunding Bonds, Series C,
5.00%, 12/01/20 | | | 200,000 | | | 201,756 |
Chicago City Colleges Capital Appreciation GO Unlimited Bonds (NATL Insured),
0.00%, 1/01/30(g) | | | 750,000 | | | 489,818 |
Chicago GO Unlimited Bonds, Series A, | | | | | | |
5.00%, 12/01/21 | | | 500,000 | | | 502,485 |
5.50%, 1/01/49 | | | 100,000 | | | 98,661 |
Chicago GO Unlimited Refunding Bonds, Project Series A, 5.00%, 1/01/35 | | | 350,000 | | | 344,341 |
See accompanying Notes to Financial Statements
137
Morningstar Funds Trust April 30, 2020
Schedule of Investments (continued)
Morningstar Municipal Bond Fund
| | | | | | |
| | | Par | | | Value |
| | |
Illinois (Continued) | | | | | | |
Chicago GO Unlimited Refunding Bonds, Series A, | | | | | | |
5.00%, 1/01/22 | | $ | 300,000 | | | $ 303,981 |
5.00%, 1/01/23 | | | 400,000 | | | 406,652 |
Chicago Midway Airport Revenue Refunding Bonds, Series A (AMT), Second Lien, 5.00%, 1/01/31 | | | 1,000,000 | | | 1,058,960 |
Chicago O’Hare International Airport Revenue Refunding Bonds, Senior Lien, Series A (AMT), 5.00%, 1/01/31 | | | 250,000 | | | 287,365 |
Chicago Park District GO Limited Tax Refunding Bonds, Series B,
5.00%, 1/01/26 | | | 395,000 | | | 420,647 |
Chicago Wastewater Transmission Revenue Bonds, Second Lien, 5.00%, 1/01/39 | | | 500,000 | | | 524,200 |
Cook County Sales TRB, 5.00%, 11/15/37 | | | 500,000 | | | 542,060 |
Cook County Township High School District No. 227 Rich Township GO Unlimited Bonds, Series A, 1.37%, 12/01/40(b)(c) | | | 250,000 | | | 249,395 |
Hillside Incremental Tax Allocation Revenue Refunding Bonds, 5.00%, 1/01/24 | | | 100,000 | | | 100,413 |
Illinois State Finance Authority Revenue Bonds, Series A, Carle Foundation,
5.00%, 8/15/21 | | | 500,000 | | | 520,995 |
Illinois State Finance Authority Revenue Refunding Bonds, Series A, Lutheran Communities, 5.00%, 11/01/40 | | | 350,000 | | | 309,036 |
Illinois State Finance Authority Revenue Refunding Bonds, Series C, Presence Health Network, 5.00%, 2/15/23 | | | 500,000 | | | 543,235 |
Illinois State Finance Authority Revenue Refunding Bonds, Southern Illinois Healthcare, 5.00%, 3/01/22 | | | 300,000 | | | 319,386 |
| | | | | | |
| | | Par | | | Value |
| | |
Illinois (Continued) | | | | | | |
Illinois State Finance Authority Variable Revenue Refunding Bonds, Northwestern Memorial Hospital, 0.12%, 5/04/20(a)(c)(e) | | $ | 300,000 | | | $ 300,000 |
Illinois State Finance Authority Variable Revenue Refunding Bonds, Series B, Bradley University (PNC Bank N.A. LOC), 0.23%, 5/11/20(a)(c)(e) | | | 4,000,000 | | | 4,000,000 |
Illinois State GO Unlimited Bonds, | | | | | | |
5.00%, 7/01/20 | | | 440,000 | | | 440,348 |
5.50%, 7/01/26 | | | 460,000 | | | 460,662 |
Illinois State GO Unlimited Bonds, Series C, 5.00%, 11/01/29 | | | 250,000 | | | 240,493 |
Illinois State GO Unlimited Bonds, Series D, 5.00%, 11/01/20 | | | 225,000 | | | 225,614 |
Illinois State GO Unlimited Refunding Bonds, 5.00%, 8/01/24 | | | 400,000 | | | 396,368 |
Illinois State Housing Development Authority MFH Variable Revenue Bonds, Marshall Field Garden (FNMA LOC), (SIFMA Municipal Swap Index Yield + 1.00%), 1.22%, 5/15/25(a)(c) | | | 500,000 | | | 500,460 |
Illinois State Sales Tax Junior Obligations Revenue Bonds, Series A (BAM Insured), 4.00%, 6/15/34 | | | 620,000 | | | 622,499 |
Illinois State Sales Tax Revenue Refunding Bonds, Subseries D (BAM Insured), 3.00%, 6/15/31 | | | 390,000 | | | 352,868 |
Illinois State Sales TRB, Build Illinois - Junior Obligation, 5.00%, 6/15/20 | | | 500,000 | | | 501,185 |
Illinois State Sports Facilities Authority State Tax Supported Revenue CABS (AMBAC Insured), | | | | | | |
0.00%, 6/15/21(g) | | | 410,000 | | | 394,760 |
0.00%, 6/15/25(g) | | | 95,000 | | | 77,378 |
Illinois State Sports Facilities Authority State Tax Supported Revenue Refunding Bonds (AGM Insured), 5.00%, 6/15/27 | | | 400,000 | | | 425,896 |
See accompanying Notes to Financial Statements
138
Morningstar Funds Trust April 30, 2020
Schedule of Investments (continued)
Morningstar Municipal Bond Fund
| | | | | | |
| | | Par | | | Value |
| | |
Illinois (Continued) | | | | | | |
Illinois State Toll Highway Authority Senior Revenue Refunding Bonds, Series A,
5.00%, 1/01/31 | | $ | 500,000 | | | $607,855 |
Kane, Cook & Dupage Counties, Illinois School District, GO Unlimited Refunding Bonds, Series D, 5.00%, 1/01/28 | | | 200,000 | | | 225,316 |
Kane, McHenry, Cook & DeKalb Counties, Illinois School District, GO Unlimited Refunding Bonds, 4.25%, 1/01/23 | | | 500,000 | | | 508,450 |
Macon County School District No. 61 GO Unlimited Bonds, Series A (AGM Insured), 5.25%, 1/01/25 | | | 745,000 | | | 764,616 |
Madison, Macoupin Etc. Counties Community College District No. 536 GO Unlimited Bonds, Lewis & Clark Community (AGM Insured), | | | | | | |
4.00%, 5/01/21 | | | 675,000 | | | 694,048 |
4.00%, 5/01/23 | | | 700,000 | | | 752,402 |
Metropolitan Pier and Exposition Authority Revenue Refunding Bonds, Mccormick Place Expansion Project, 5.00%, 6/15/50 | | | 500,000 | | | 454,325 |
Moline GO Unlimited Refunding Bonds,
Series F, 5.00%, 11/01/24 | | | 750,000 | | | 764,452 |
Peoria County School District No. 150 GO Unlimited Refunding Bonds, Series A (AGM Insured), 4.00%, 12/01/26 | | | 390,000 | | | 445,907 |
Regional Transportation Authority Revenue Bonds, Series A (AGM Insured),
5.75%, 6/01/34 | | | 750,000 | | | 977,130 |
Regional Transportation Authority Revenue Bonds, Series B (NATL Insured),
5.50%, 6/01/27 | | | 350,000 | | | 409,899 |
Sales Tax Securitization Corp., Revenue Refunding Bonds, Second Lien Series A, 4.00%, 1/01/38 | | | 250,000 | | | 241,035 |
| | | | | | |
| | | Par | | | Value |
| | |
Illinois (Continued) | | | | | | |
Southern Illinois State University Revenue Bonds, Series A, Housing & Auxiliary Facilities System (NATL Insured), 5.25%, 4/01/21 | | $ | 1,000,000 | | | $ 1,033,140 |
Waukegan GO Unlimited Bonds, Series A (AGM Insured), 5.00%, 12/30/32 | | | 250,000 | | | 285,748 |
Will County Community High School District No. 210 Lincoln-Way Refunding GO Unlimited Bonds (AGM Insured), | | | | | | |
4.00%, 1/01/22 | | | 975,000 | | | 1,003,216 |
4.00%, 1/01/34 | | | 650,000 | | | 685,048 |
Will County Community School District No.161 Summit Hill Refunding GO Unlimited Bonds, 4.00%, 1/01/24 | | | 470,000 | | | 507,905 |
Winnebago Boone Etc. Counties Community College District No. 511 GO Unlimited Refunding Bonds, Series A, Rock Valley College (AGM Insured), 5.00%, 1/01/21 | | | 500,000 | | | 511,645 |
| | | | | | | 27,562,566 |
| | |
Indiana – 1.9% | | | | | | |
Clarksville Sewage Works Revenue BANS, 2.75%, 12/11/23 | | | 400,000 | | | 400,152 |
Indiana Bond Bank Revenue CABS, Hamilton Co., Projects, | | | | | | |
0.00%, 7/15/25(g) | | | 450,000 | | | 413,847 |
0.00%, 7/15/28(g) | | | 900,000 | | | 765,171 |
0.00%, 1/15/29(g) | | | 560,000 | | | 465,718 |
Indiana Finance Authority Midwestern Disaster Relief Revenue Bonds, Series A, Ohio Valley Electric Corp., Project, 5.00%, 6/01/39 | | | 100,000 | | | 101,558 |
Indiana State Finance Authority Hospital Revenue Bonds, Indiana University Health Obligated Group,
1.65%, 7/01/22(a)(b)(c) | | | 50,000 | | | 50,162 |
See accompanying Notes to Financial Statements
139
Morningstar Funds Trust April 30, 2020
Schedule of Investments (continued)
Morningstar Municipal Bond Fund
| | | | | | |
| | | Par | | | Value |
| | |
Indiana (Continued) | | | | | | |
Indiana State Finance Authority Private Activity Revenue Bonds (AMT), Ohio River Bridges East End Crossing Project,
5.25%, 1/01/51 | | $ | 600,000 | | | $ 616,812 |
Indiana State Finance Authority Revenue Refunding Bonds, Valparaiso University Project, | | | | | | |
5.00%, 10/01/22 | | | 265,000 | | | 278,012 |
5.00%, 10/01/23 | | | 585,000 | | | 622,621 |
Indianapolis Local Public Improvement Bond Bank Revenue Notes, Series B, Fieldhouse Project, 1.45%, 6/01/21 | | | 1,000,000 | | | 1,000,160 |
Indianapolis MFH Revenue Bonds, Regency Park Apartments, Series A,
1.40%, 9/01/21(a)(b)(c) | | | 1,000,000 | | | 1,000,830 |
Knox Middle School Building Corp., Revenue Bonds (State Intercept), 5.00%, 1/15/27 | | | 440,000 | | | 521,941 |
Whiting Environmental Facilities Revenue Refunding Bonds (AMT), BP Products North America, 5.00%, 6/05/26(a)(b)(c) | | | 275,000 | | | 305,638 |
| | | | | | | 6,542,622 |
| | |
Iowa – 0.1% | | | | | | |
Iowa State Finance Authority Midwestern Disaster Area Revenue Refunding Bonds, Iowa Fertilizer Company Project,
3.13%, 12/01/22 | | | 100,000 | | | 98,261 |
PEFA, Inc. Gas Project Revenue Bonds, 5.00%, 9/01/26(a)(b)(c) | | | 150,000 | | | 168,903 |
| | | | | | | 267,164 |
| | |
Kentucky – 2.6% | | | | | | |
Kenton County Airport Board Revenue Refunding Bonds, 5.00%, 1/01/32 | | | 400,000 | | | 454,940 |
Kentucky State Economic Development Finance Authority Health System Revenue Refunding Bonds, Norton Healthcare, Inc., Series B (NATL Insured), | | | | | | |
0.00%, 10/01/22(g) | | | 500,000 | | | 471,475 |
0.00%, 10/01/24(g) | | | 280,000 | | | 248,881 |
| | | | | | |
| | | Par | | | Value |
| | |
Kentucky (Continued) | | | | | | |
Kentucky State Economic Development Finance Authority Revenue Bonds, Owensboro Health, 5.25%, 6/01/50 | | $ | 250,000 | | | $ 260,695 |
Kentucky State Economic Development Finance Authority Revenue Refunding Bonds, Masonic Home Independent Living, 5.00%, 5/15/46 | | | 100,000 | | | 79,602 |
Kentucky State Economic Development Finance Authority Revenue Refunding Bonds, Series B, Owensboro Health, 5.00%, 6/01/40 | | | 300,000 | | | 317,682 |
Kentucky State Housing Corp., Revenue Bonds, City View Park Project,
1.16%, 8/01/22(a)(b)(c) | | | 2,000,000 | | | 1,993,200 |
Kentucky State Housing Corp., Variable Revenue Bonds, Beecher Phase I Project, 2.00%, 9/01/21(a)(b)(c) | | | 480,000 | | | 483,787 |
Kentucky State Public Energy Authority Gas Supply Revenue Bonds, Series A,
4.00%, 4/01/24(a)(b)(c) | | | 445,000 | | | 466,841 |
Kentucky State Public Energy Authority Gas Supply Revenue Bonds, Series A-1, 4.00%, 6/01/25(a)(b)(c) | | | 250,000 | | | 265,105 |
Kentucky State Public Energy Authority Revenue Bonds, Series B, Gas Supply, 4.00%, 1/01/25(a)(b)(c) | | | 650,000 | | | 675,363 |
Lexington-Fayette Urban County Government Lease Revenue Bonds, Series A, 5.25%, 6/01/26 | | | 500,000 | | | 516,360 |
Louisville & Jefferson County Metropolitan Government Health System Variable Revenue Bonds, Norton Healthcare, Inc., 5.00%, 10/01/26(a)(b)(c) | | | 1,000,000 | | | 1,145,310 |
See accompanying Notes to Financial Statements
140
Morningstar Funds Trust April 30, 2020
Schedule of Investments (continued)
Morningstar Municipal Bond Fund
| | | | | | |
| | | Par | | | Value |
| | |
Kentucky (Continued) | | | | | | |
Louisville & Jefferson County Metropolitan Government Pollution Control Variable Revenue Refunding Bonds, Louisville Gas & Electric Company Project, 1.85%, 4/01/21(a)(b)(c) | | $ | 905,000 | | | $ 908,330 |
Louisville Regional Airport Authority Airport System Revenue Refunding Bonds, Series A (AMT), 5.00%, 7/01/23 | | | 500,000 | | | 546,720 |
| | | | | | | 8,834,291 |
| | |
Louisiana – 0.5% | | | | | | |
Louisiana State Housing Corp., MFH Variable Revenue Bonds, Hollywood Acres & Hollywood Heights Project, Series 2019, 1.44%, 12/01/21(a)(b)(c) | | | 1,000,000 | | | 1,001,160 |
Louisiana State Offshore Terminal Authority Deepwater Port Variable Revenue Bonds, Loop LLC Project, 2.00%, 10/01/22(a)(b)(c) | | | 515,000 | | | 513,579 |
Louisiana State Public Facilities Authority Revenue Refunding CABS, Loyola University Project, 0.00%, 10/01/22(g) | | | 300,000 | | | 276,447 |
Saint John The Baptist Parish Revenue Refunding Bonds, Marathon Oil Corp., 2.00%, 4/01/23(a)(b)(c) | | | 100,000 | | | 89,590 |
| | | | | | | 1,880,776 |
| | |
Maine – 0.4% | | | | | | |
Maine Health & Higher Educational Facilities Authority Revenue Refunding Bonds, Series A (State Aid Withholding), 5.00%, 7/01/28 | | | 650,000 | | | 732,433 |
Maine State Finance Authority Student Loan Revenue Refunding Bonds (AMT) (AGM Insured), 5.00%, 12/01/24 | | | 500,000 | | | 561,065 |
| | | | | | | 1,293,498 |
| | | | | | |
| | | Par | | | Value |
| | |
Maryland – 2.4% | | | | | | |
Anne Arundel County GO Limited Bonds, 10/01/34(h) | | $ | 1,000,000 | | | $1,156,780 |
Baltimore Convention Center Hotel Revenue Refunding Bonds, Convention Center Hotel, 5.00%, 9/01/39 | | | 750,000 | | | 646,890 |
Maryland State & Local Facilities GO Unlimited Bonds, Loan of 2013-1,
4.00%, 3/01/26 | | | 600,000 | | | 615,600 |
Maryland State Community Development Administration Department Housing & Community Development MFH Revenue Bonds, Series A, Bay Country Apartments, 2.52%, 2/01/21(d) | | | 1,000,000 | | | 1,004,600 |
Maryland State Department of Transportation Consolidated Transportation Revenue Bonds, 5.00%, 2/01/22 | | | 260,000 | | | 278,283 |
Maryland State Economic Development Corp., PCR Refunding Bonds, Potomac Electric Power Company, 1.70%, 9/01/22 | | | 500,000 | | | 503,340 |
Maryland State Economic Development Corp., Private Activity Revenue Bonds (AMT), Purple Line Light Rail Projects, | | | | | | |
5.00%, 3/31/24 | | | 260,000 | | | 257,387 |
5.00%, 3/31/36 | | | 100,000 | | | 96,278 |
5.00%, 3/31/51 | | | 100,000 | | | 94,015 |
Maryland State Economic Development Corp., Revenue Bonds (AMT), Seagirt Marine Terminal Projects,
5.00%, 6/01/44 | | | 500,000 | | | 470,730 |
Maryland State Health & Higher Educational Facilities Authority Revenue Bonds, Adventist Healthcare Obligated,
5.50%, 1/01/31 | | | 300,000 | | | 337,347 |
Maryland State Health & Higher Educational Facilities Authority Revenue Bonds, Medstar Health Issue, Series A,
5.00%, 5/15/45 | | | 405,000 | | | 440,158 |
See accompanying Notes to Financial Statements
141
Morningstar Funds Trust April 30, 2020
Schedule of Investments (continued)
Morningstar Municipal Bond Fund
| | | | | | |
| | | Par | | | Value |
| | |
Maryland (Continued) | | | | | | |
Maryland State Health & Higher Educational Facilities Authority Revenue Bonds, Peninsula Regional Health System, | | | | | | |
7/01/24(h) | | $ | 350,000 | | | $ 387,405 |
7/01/27(h) | | | 1,320,000 | | | 1,522,528 |
Maryland State Health & Higher Educational Facilities Authority Revenue Refunding Bonds, Arundel Health Systems, 5.00%, 7/01/29 | | | 250,000 | | | 286,290 |
Maryland State Health & Higher Educational Facilities Authority Revenue Refunding Bonds, Series A, Broadmead Issue, 4.00%, 7/01/35 | | | 185,000 | | | 184,489 |
| | | | | | | 8,282,120 |
| | |
Massachusetts – 1.5% | | | | | | |
Massachusetts State Consolidated Loan GO Limited Bonds, Series E, 5.25%, 9/01/48 | | | 500,000 | | | 602,905 |
Massachusetts State Department of Transportation Metropolitan Highway System Variable Revenue Refunding Bonds, Series A, 5.00%, 1/01/23(a)(b)(c) | | | 500,000 | | | 548,510 |
Massachusetts State Development Finance Agency Revenue Refunding Bonds, Beth Israel Lahey Health, 5.00%, 7/01/38 | | | 100,000 | | | 113,660 |
Massachusetts State Development Finance Agency Variable Revenue Refunding Bonds, Partners Healthcare, (SIFMA Municipal Swap Index Yield + 0.50%), 0.72%, 1/26/23(a)(c) | | | 500,000 | | | 494,495 |
Massachusetts State Educational Financing Authority Revenue Bonds, Series J (AMT), 5.00%, 7/01/21 | | | 500,000 | | | 515,895 |
Massachusetts State HFA Housing Single Family Revenue Refunding Bonds, Series 189 (FNMA Insured), 1.50%, 7/01/20(a)(b)(c) | | | 1,000,000 | | | 999,970 |
| | | | | | |
| | | Par | | | Value |
| | |
Massachusetts (Continued) | | | | | | |
Massachusetts State HFA Revenue Bonds, Colonial Village Projects,
1.45%, 1/01/22(a)(b)(c) | | $ | 760,000 | | | $ 759,476 |
Massachusetts State Variable GO Limited Bonds, Series D, Consolidated Loan of 2014, 1.05%, 7/01/20(a)(b)(c) | | | 1,000,000 | | | 999,990 |
| | | | | | | 5,034,901 |
| | |
Michigan – 1.4% | | | | | | |
Detroit Downtown Development Authority Tax Allocation Increment Revenue Refunding Bonds, Series A, Catalyst Development Project (AGM Insured), | | | | | | |
5.00%, 7/01/22 | | | 500,000 | | | 538,215 |
5.00%, 7/01/43 | | | 100,000 | | | 110,288 |
5.00%, 7/01/48 | | | 200,000 | | | 220,160 |
Detroit GO Unlimited Bonds,
5.00%, 4/01/27 | | | 50,000 | | | 51,309 |
Great Lakes Water Authority Sewage Disposal System Revenue Refunding Bonds Second Lien, Series C,
5.00%, 7/01/36 | | | 370,000 | | | 428,963 |
Michigan State Finance Authority Local Government Loan Program Revenue Refunding Bonds, | | | | | | |
5.00%, 7/01/29 | | | 425,000 | | | 478,839 |
4.50%, 10/01/29 | | | 250,000 | | | 255,650 |
Michigan State Finance Authority Revenue Refunding Bonds, Trinity Health Corp., Prerefunded, 5.00%, 6/01/22(f) | | | 250,000 | | | 270,807 |
Michigan State Finance Authority Revenue Refunding Bonds, Trinity Health Credit Group, 4.00%, 12/01/35 | | | 500,000 | | | 528,895 |
Michigan State Finance Authority Variable Revenue Bonds, Bronson Healthcare Group, 3.50%, 11/15/22(a)(b)(c) | | | 250,000 | | | 261,447 |
Michigan State Hospital Finance Authority Revenue Refunding Bonds, Ascenion Senior, 5.00%, 11/15/47 | | | 420,000 | | | 472,979 |
See accompanying Notes to Financial Statements
142
Morningstar Funds Trust April 30, 2020
Schedule of Investments (continued)
Morningstar Municipal Bond Fund
| | | | | | | | |
| | | Par | | | Value | |
| |
| | |
Michigan (Continued) | | | | | | | | |
Michigan State Strategic Fund Limited Obligation Adjustable Revenue Refunding Bonds, Detroit Edison Co., Pollution Control Bonds Project,
1.45%, 9/01/21(a)(b)(c) | | $ | 600,000 | | | $ | 598,506 | |
Michigan State Strategic Fund Limited Obligation Variable Revenue Bonds (AMT), Consumers Energy Co.,
1.80%, 10/01/24(a)(b)(c) | | | 500,000 | | | | 504,865 | |
| | | | | | | 4,720,923 | |
| |
| | |
Minnesota – 0.9% | | | | | | | | |
Brooklyn Center MFH Development Variable Revenue Bonds, Sonder House Apartments Project, 1.35%, 7/01/22(a)(b)(c) | | | 1,500,000 | | | | 1,500,585 | |
City of Shakopee Senior Housing Revenue Bonds, Benedictine Living Community of Shakopee LLC Project,
5.85%, 11/01/25(a)(b)(c)(d) | | | 250,000 | | | | 238,165 | |
Goodhue County Education District No. 6051 COPS, 5.00%, 2/01/21 | | | 340,000 | | | | 349,428 | |
Minnesota State HFA Housing Bonds, White Oak Estates, Series F (HUD Sector 8 Program), 1.35%, 8/01/21 | | | 1,000,000 | | | | 1,000,370 | |
| | | | | | | 3,088,548 | |
| |
| | |
Mississippi – 0.2% | | | | | | | | |
Mississippi State Hospital Equipment & Facilities Authority Adjustable Revenue Refunding Bonds, North Mississippi Health,
5.00%, 3/01/27(a)(b)(c) | | | 250,000 | | | | 295,025 | |
Mississippi State Hospital Equipment & Facilities Authority Revenue Refunding Bonds, Forrest Country General Hospital Project,
5.00%, 1/01/24 | | | 400,000 | | | | 441,292 | |
| | | | | | | 736,317 | |
| |
| | | | | | | | |
| | | Par | | | Value | |
| |
| | |
Missouri – 1.5% | | | | | | | | |
Missouri State Health & Educational Facilities Authority Educational Facilities Revenue Refunding Bonds, A.T. Still University Health Science,
5.00%, 10/01/22 | | $ | 725,000 | | | $ | 750,157 | |
Missouri State Health & Educational Facilities Authority Health Facilities Revenue Refunding Bonds,
Series A, St. Luke’s Health System, Inc., 5.00%, 11/15/30 | | | 250,000 | | | | 277,908 | |
RBC Municipal Products Inc., Trust Floater Certificates Revenue Bonds, Series C-16 for Missouri Health (Royal Bank of Canada LOC),
0.29%, 5/11/20(a)(c)(d)(e) | | | 4,000,000 | | | | 4,000,000 | |
Saint Louis County IDA Senior Living Facilities Revenue Refunding Bonds, Friendship Village St. Louis,
5.00%, 9/01/48 | | | 300,000 | | | | 248,751 | |
| | | | | | | 5,276,816 | |
| |
| | |
Nebraska – 0.2% | | | | | | | | |
Central Plains Energy Gas Project Revenue Bonds, Project No.
3, 5.00%, 9/01/22 | | | 500,000 | | | | 527,390 | |
Central Plains Energy Project Gas Supply Revenue Refunding Bonds,
4.00%, 8/01/25(a)(b)(c) | | | 225,000 | | | | 243,311 | |
| | | | | | | 770,701 | |
| |
| | |
Nevada – 1.9% | | | | | | | | |
Clark County School District GO Limited Refunding Bonds, Series C, Building, 5.00%, 6/15/23 | | | 500,000 | | | | 544,700 | |
Clark County School District GO Limited Refunding Bonds, Series D,
5.00%, 6/15/23 | | | 300,000 | | | | 326,820 | |
Clark County School District GO Limited Refunding Bonds, Series E,
5.00%, 6/15/25 | | | 1,330,000 | | | | 1,506,212 | |
See accompanying Notes to Financial Statements
143
Morningstar Funds Trust April 30, 2020
Schedule of Investments (continued)
Morningstar Municipal Bond Fund
| | | | | | | | |
| | | Par | | | Value | |
| |
| | |
Nevada (Continued) | | | | | | | | |
Clark County Stadium Improvement GO Limited Bonds, Series A,
5.00%, 5/01/48 | | $ | 500,000 | | | $ | 578,250 | |
Director of the State of Nevada Department of Business & Industry Variable Revenue Bonds (AMT), Republic Services Project,
1.47%, 6/01/20(a)(b)(c)(d) | | | 400,000 | | | | 399,960 | |
Las Vegas Convention & Visitors Authority Convention Center Expansion Revenue Bonds, Series B, 5.00%, 7/01/43 | | | 250,000 | | | | 258,845 | |
Las Vegas New Convention & Visitors Authority Revenue Bonds, Series B, 5.00%, 7/01/37 | | | 1,000,000 | | | | 1,047,070 | |
Las Vegas Special Improvement District No. 814 Summerlin Village 21 & 24A Special Assessment Bonds,
4.00%, 6/01/49 | | | 100,000 | | | | 81,336 | |
Nevada State Housing Division Multi-Unit Holding Revenue Bonds, Silver Terrace Apartments,
1.19%, 4/01/21(a)(b)(c) | | | 500,000 | | | | 499,460 | |
Reno Sales Tax Revenue Refunding Bonds, First Lien, Retrac-Reno Transportation Rail Access Corridor Project,
5.00%, 6/01/48 | | | 500,000 | | | | 525,935 | |
Sparks Nevada Tourism Improvement District No. 1 Revenue Refunding Bonds, Series A, Sales Tax Senior Lien, 2.50%, 6/15/24(d) | | | 350,000 | | | | 336,689 | |
Washoe County Water Facilities Variable Revenue Refunding Bonds (AMT), Sierra Pacific,
2.05%, 4/15/22(a)(b)(c) | | | 500,000 | | | | 503,410 | |
| | | | | | | 6,608,687 | |
| |
| | | | | | | | |
| | | Par | | | Value | |
| |
| | |
New Hampshire – 0.8% | | | | | | | | |
National Finance Authority Exempt Facilities Revenue Refunding Bonds (AMT), Emerald Renewable Diesel LLC Project,
2.00%, 8/31/20(a)(b)(c)(d) | | $ | 2,000,000 | | | $ | 2,002,320 | |
National Finance Authority Municipal Certificates Revenue Bonds, Series 1-A, 4.13%, 1/20/34 | | | 722,642 | | | | 692,884 | |
| | | | | | | 2,695,204 | |
| |
| | |
New Jersey – 3.1% | | | | | | | | |
Garden State Preservation Trust Open Space & Farmland Preservation Revenue Bonds, Series A (AGM Insured),
5.75%, 11/01/28 | | | 1,140,000 | | | | 1,415,823 | |
New Jersey State EDA Energy Facility Revenue Bonds, Series A (AMT), UMM Energy Partners, | | | | | | | | |
5.00%, 6/15/37 | | | 100,000 | | | | 104,444 | |
5.12%, 6/15/43 | | | 350,000 | | | | 365,589 | |
New Jersey State EDA Motor Vehicle Surcharge Revenue Refunding Bonds, Subseries A, 3.38%, 7/01/30 | | | 250,000 | | | | 229,265 | |
New Jersey State EDA Private Activity Revenue Bonds (AMT), The Goethals Project, | | | | | | | | |
5.00%, 1/01/24 | | | 150,000 | | | | 155,619 | |
5.25%, 1/01/25 | | | 100,000 | | | | 104,313 | |
5.37%, 1/01/43 | | | 100,000 | | | | 101,650 | |
New Jersey State EDA Revenue Refunding Bonds, School Facilities Construction, Unrefunded Balance, 5.00%, 3/01/21 | | | 400,000 | | | | 404,556 | |
New Jersey State EDA Revenue Refunding Bonds, Series A, United Methodist Homes, 5.00%, 7/01/29 | | | 100,000 | | | | 97,344 | |
New Jersey State EDA Revenue Refunding Bonds, Series XX, 5.00%, 6/15/23 | | | 170,000 | | | | 174,561 | |
New Jersey State EDA Special Facility Revenue Refunding Bonds (AMT), Port Newark Container, 5.00%, 10/01/47 | | | 100,000 | | | | 103,053 | |
See accompanying Notes to Financial Statements
144
Morningstar Funds Trust April 30, 2020
Schedule of Investments (continued)
Morningstar Municipal Bond Fund
| | | | | | | | |
| | | Par | | | Value | |
| |
| | |
New Jersey (Continued) | | | | | | | | |
New Jersey State EDA Water Facilities Revenue Refunding Bonds (AMT), New Jersey American Water Co., Inc. Project, 2.20%, 12/03/29(a)(b)(c) | | $ | 775,000 | | | $ | 759,508 | |
New Jersey State Health Care Facilities Financing Authority Revenue Bonds, Valley Health System Obligated Group Series, | | | | | | | | |
5.00%, 7/01/32 | | | 500,000 | | | | 582,640 | |
5.00%, 7/01/33 | | | 1,000,000 | | | | 1,158,360 | |
New Jersey State Transportation Trust Fund Authority Revenue Bonds, Transportation Program,
5.25%, 6/15/43 | | | 625,000 | | | | 632,513 | |
New Jersey State Transportation Trust Fund Authority Transportation System Revenue Bonds, Series A,
5.25%, 12/15/22 | | | 1,000,000 | | | | 1,031,140 | |
New Jersey State Transportation Trust Fund Authority Transportation System Revenue Refunding Bonds,
5.00%, 12/15/25 | | | 100,000 | | | | 103,632 | |
New Jersey State Turnpike Authority Revenue Bonds, Series A, | | | | | | | | |
5.00%, 1/01/27 | | | 305,000 | | | | 358,210 | |
5.00%, 1/01/33 | | | 230,000 | | | | 251,468 | |
New Jersey State Turnpike Authority Turnpike Revenue Refunding Bonds, Series E, 5.00%, 1/01/31 | | | 255,000 | | | | 299,865 | |
Newark Housing Authority Port Newark Marine Terminal Rental Revenue Refunding Bonds, Additional Newark Redevelopment Project (NATL Insured),
5.25%, 1/01/24 | | | 500,000 | | | | 532,155 | |
Union County Utilities Authority Resource Recovery Facility Lease Revenue Refunding Bonds (AMT), Series A, Covanta Union, Inc., 5.25%, 12/01/31 | | | 1,500,000 | | | | 1,566,480 | |
| | | | | | | 10,532,188 | |
| |
| | | | | | | | |
| | | Par | | | Value | |
| |
| | |
New Mexico – 0.3% | | | | | | | | |
New Mexico State Hospital Equipment Loan Council Variable Revenue Bonds,
Series B, 5.00%, 8/01/25(a)(b)(c) | | $ | 500,000 | | | $ | 566,795 | |
New Mexico State Municipal Energy Acquisition Authority Gas Supply Revenue Refunding Bonds, Series A,
5.00%, 5/01/25(a)(b)(c) | | | 275,000 | | | | 309,273 | |
| | | | | | | 876,068 | |
| |
| | |
New York – 6.8% | | | | | | | | |
Hudson Yards Infrastructure Corp., Senior Revenue Bonds Fiscal 2012,
5.75%, 2/15/47 | | | 300,000 | | | | 309,801 | |
Liberty Development Corp., Revenue Bonds, 5.50%, 10/01/37 | | | 110,000 | | | | 140,821 | |
Long Island Power Authority Electric System Revenue Bonds, 5.00%, 9/01/35 | | | 300,000 | | | | 351,222 | |
Metropolitan Transportation Authority Revenue BANS, Series A-1, 5.00%, 2/01/23 | | | 750,000 | | | | 747,097 | |
Metropolitan Transportation Authority Revenue BANS, Series A-2S, 4.00%, 2/01/22 | | | 750,000 | | | | 736,027 | |
Metropolitan Transportation Authority Revenue BANS, Series B-2A, 5.00%, 5/15/21 | | | 875,000 | | | | 871,150 | |
Metropolitan Transportation Authority Revenue BANS, Series D2, 4.00%, 7/01/20 | | | 200,000 | | | | 199,426 | |
Metropolitan Transportation Authority Revenue BANS, Series E, 4.00%, 9/01/20 | | | 500,000 | | | | 496,875 | |
Metropolitan Transportation Authority Revenue Bonds, Series A-1-Group 1, Green Bond, 5.00%, 11/15/49 | | | 500,000 | | | | 501,165 | |
Metropolitan Transportation Authority Transportation Revenue Bonds, Series E, 4.00%, 11/15/23 | | | 535,000 | | | | 519,218 | |
See accompanying Notes to Financial Statements
145
Morningstar Funds Trust April 30, 2020
Schedule of Investments (continued)
Morningstar Municipal Bond Fund
| | | | | | | | |
| | | Par | | | Value | |
| |
| | |
New York (Continued) | | | | | | | | |
Metropolitan Transportation Authority Transportation Revenue Refunding Bonds, Green Bonds, Climate,
4.00%, 11/15/22 | | $ | 730,000 | | | $ | 714,188 | |
Metropolitan Transportation Authority, New York Transportation Variable Rate Revenue Refunding Bonds, Subseries G-3, (SIFMA Municipal Swap Index Yield + 0.43%), 0.65%, 2/01/25(a)(c) | | | 1,000,000 | | | | 909,790 | |
Nassau County Local Economic Assistance Corp., Revenue Refunding Bonds, South Nassau Communities Hospital Project, 5.00%, 7/01/21 | | | 715,000 | | | | 742,778 | |
New York City Housing Development Corp., MFH Revenue Bonds,
Series C-2-A, 2.35%, 7/01/22 | | | 500,000 | | | | 504,035 | |
New York City Municipal Water Finance Authority Water & Sewer System Revenue Bonds,
Series DD1, 5.00%, 6/15/48 | | | 1,000,000 | | | | 1,154,950 | |
New York City Transitional Finance Authority Future Tax Secured Subordinate Revenue Bonds, 4.00%, 11/01/40 | | | 400,000 | | | | 432,260 | |
New York GO Unlimited Bonds,
Series 1, 4.00%, 8/01/27 | | | 625,000 | | | | 713,788 | |
New York GO Unlimited Bonds,
Series D, Subseries D1,
5.00%, 12/01/42 | | | 250,000 | | | | 290,653 | |
New York State Convention Center Development Corp., Revenue Refunding Bonds, Hotel Unit Fee Secured,
5.00%, 11/15/40 | | | 600,000 | | | | 624,870 | |
New York State Dormitory Authority Non State Supported Debt Revenue Bonds, Fordham University,
4.00%, 7/01/50 | | | 600,000 | | | | 621,282 | |
| | | | | | | | |
| | | Par | | | Value | |
| |
| | |
New York (Continued) | | | | | | | | |
New York State Dormitory Authority Non State Supported Debt Revenue Bonds, Series A, 4.00%, 7/01/50 | | $ | 1,000,000 | | | $ | 1,009,730 | |
New York State Dormitory Authority Non State Supported Debt Revenue Refunding Bonds, Catholic Health System Obligated, 5.00%, 7/01/36 | | | 400,000 | | | | 462,452 | |
New York State Dormitory Authority Non State Supported Debt Revenue Refunding Bonds, Series A, Barnard College,
4.00%, 7/01/49 | | | 300,000 | | | | 311,883 | |
New York State Dormitory Authority Revenues Non State Supported Debt Revenue Bonds, Master Boces Program (State Aid Withholding),
5.00%, 8/15/26 | | | 455,000 | | | | 545,486 | |
New York State Dormitory Authority Revenues Non State Supported Debt Revenue Bonds, Northwell Health Obligated Group, 5.00%, 5/01/24(a)(b)(c) | | | 1,250,000 | | | | 1,376,512 | |
New York State Dormitory Authority Revenues Non State Supported Debt Revenue Refunding Bonds, Memorial Sloan Kettering Cancer Center,
5.00%, 7/01/42 | | | 200,000 | | | | 229,790 | |
New York State Dormitory Authority Revenues Non State Supported Debt Revenue Refunding Bonds, Series A, Montefiore Obligated Group,
4.00%, 9/01/50 | | | 1,000,000 | | | | 934,230 | |
New York State Dormitory Authority State Personal Income Tax Revenue Refunding Bonds, Series D,
4.00%, 2/15/39 | | | 500,000 | | | | 546,240 | |
New York State Dormitory Authority State Personal Income Tax Revenue Refunding Bonds, Series E,
5.00%, 2/15/44 | | | 400,000 | | | | 448,564 | |
See accompanying Notes to Financial Statements
146
Morningstar Funds Trust April 30, 2020
Schedule of Investments (continued)
Morningstar Municipal Bond Fund
| | | | | | | | |
| | | Par | | | Value | |
| |
| | |
New York (Continued) | | | | | | | | |
New York State Housing Finance Agency Variable Revenue Refunding Bonds, Affordable Housing (SonyMA Insured), 1.80%, 5/01/50(b)(c) | | $ | 315,000 | | | $ | 315,000 | |
New York State Liberty Development Corp., Revenue Refunding Bonds, Class 2, 3 World Trade Center Project, | | | | | | | | |
5.15%, 11/15/34(d) | | | 500,000 | | | | 495,455 | |
5.37%, 11/15/40(d) | | | 150,000 | | | | 147,345 | |
New York State Mortgage Agency Homeowner Mortgage Revenue Refunding Bonds, Series 214 (AMT), | | | | | | | | |
2.85%, 4/01/22 | | | 360,000 | | | | 369,238 | |
2.90%, 10/01/22 | | | 140,000 | | | | 144,571 | |
Niagara Frontier Transportation Authority Revenue Refunding Bonds (AMT), Buffalo Niagara International Airport, 5.00%, 4/01/26 | | | 250,000 | | | | 289,580 | |
Onondaga County Trust Cultural Resource Revenue Refunding Bonds, Syracuse University Project, 4.00%, 12/01/47 | | | 500,000 | | | | 540,120 | |
Port Authority of New York & New Jersey Consolidated 211th Revenue Refunding Bonds, 5.00%, 9/01/48 | | | 830,000 | | | | 941,892 | |
Port Authority of New York & New Jersey Consolidated Revenue Bonds, Series 218 (AMT),
5.00%, 11/01/31 | | | 1,000,000 | | | | 1,187,540 | |
Sales Tax Asset Receivable Corp., Revenue Refunding Bonds,
Series A, Fiscal 2015,
5.00%, 10/15/30 | | | 245,000 | | | | 282,181 | |
Suffolk County New York GO Limited TANS, Series I, 2.50%, 7/23/20 | | | 1,000,000 | | | | 999,350 | |
Yonkers Economic Development Corp., Educational Revenue Bonds, Charter School Educational Excellence Project, 5.00%, 10/15/49 | | | 100,000 | | | | 92,746 | |
| | | | | | | 23,251,301 | |
| |
| | | | | | | | |
| | | Par | | | Value | |
| |
| | |
North Carolina – 1.2% | | | | | | | | |
North Carolina State Medical Care Commission Health Care Facilities Revenue Refunding Bonds, Vidant Health, 5.00%, 6/01/45 | | $ | 500,000 | | | $ | 538,630 | |
North Carolina State Medical Care Commission Hospital Variable Revenue Bonds, Series B, Moses Cone Health System, 0.12%, 5/04/20(a)(c)(e) | | | 700,000 | | | | 700,000 | |
North Carolina State Medical Care Commission Retirement Facilities Revenue Refunding Bonds, First Mortgage, 4.00%, 1/01/25 | | | 250,000 | | | | 245,095 | |
North Carolina State Medical Care Commission Retirement Facilities Revenue Refunding Bonds, First Mortgage, United Church Services, 5.00%, 9/01/37 | | | 155,000 | | | | 144,922 | |
North Carolina State Medical Care Commission Retirement Facilities Revenue Refunding Bonds, Series A, Sharon Towers,
5.00%, 7/01/49 | | | 100,000 | | | | 99,084 | |
North Carolina State Turnpike Authority Revenue Refunding Bonds, Senior Lien, 5.00%, 1/01/40 | | | 550,000 | | | | 578,567 | |
North Carolina State Turnpike Authority Senior Lien Revenue Bonds, Triangle Expressway, 4.00%, 1/01/55 | | | 200,000 | | | | 176,602 | |
North Carolina State Turnpike Authority Senior Lien Revenue Bonds, Triangle Expressway (AGM Insured), 5.00%, 1/01/49 | | | 500,000 | | | | 568,755 | |
See accompanying Notes to Financial Statements
147
Morningstar Funds Trust April 30, 2020
Schedule of Investments (continued)
Morningstar Municipal Bond Fund
| | | | | | | | |
| | | Par | | | Value | |
| |
|
North Carolina (Continued) | |
Raleigh Durham Airport Authority Revenue Refunding Bonds, Series A (AMT),
5.00%, 5/01/36 | | $ | 500,000 | | | $ | 578,470 | |
University of North Carolina At Chapel Hill Revenue Bonds, University of North Carolina Hospital,
4.00%, 2/01/38 | | | 350,000 | | | | 382,501 | |
| | | | | | | 4,012,626 | |
| |
| | |
North Dakota – 0.4% | | | | | | | | |
University of North Dakota COPS, Infrastructure Energy Improvement, 5.00%, 4/01/48 | | | 500,000 | | | | 569,215 | |
Watford City North Dakota State Aid Certificates Indebtedness Revenue Refunding Bonds (AGM Insured),
3.00%, 12/01/23 | | | 800,000 | | | | 836,472 | |
| | | | | | | 1,405,687 | |
| |
| | |
Ohio – 3.5% | | | | | | | | |
Allen County Ohio Hospital Facilities Revenue Refunding Bonds, Bon Secours Mercy Health, Inc.,
5.00%, 12/01/28 | | | 400,000 | | | | 481,168 | |
American Municipal Power Ohio, Inc., Revenue BANS, Carey Village Project, Electric System (State Standby Note Purchase Insured), 2.25%, 12/03/20 | | | 765,000 | | | | 767,134 | |
American Municipal Power-Ohio, Inc., Revenue Refunding Bonds, Combined Hydroelectric Projects, | | | | | | | | |
5.00%, 2/15/23 | | | 600,000 | | | | 663,078 | |
5.00%, 2/15/24 | | | 1,000,000 | | | | 1,137,510 | |
American Municipal Power-Ohio, Inc., Variable Revenue Refunding Bonds, Series A, 2.30%, 2/15/22(a)(b)(c) | | | 1,250,000 | | | | 1,240,450 | |
Buckeye Tobacco Settlement Financing Authority Revenue Refunding Bonds, Senior-Class 2, Series B-2, | | | | | | | | |
4.00%, 6/01/39 | | | 650,000 | | | | 683,046 | |
5.00%, 6/01/55 | | | 550,000 | | | | 489,505 | |
| | | | | | | | |
| | | Par | | | Value | |
| |
| | |
Ohio (Continued) | | | | | | | | |
Cleveland-Cuyahoga County Port Authority Cultural Facilities Revenue Refunding Bonds, Playhouse Square Foundation Project, 5.50%, 12/01/43 | | $ | 175,000 | | | $ | 162,159 | |
Cleveland-Cuyahoga County Port Authority Euclid Avenue Development Corp., Revenue Refunding Bonds,
5.00%, 8/01/23 | | | 370,000 | | | | 401,868 | |
Conotton Valley Union Local School District COPS, School Facilities Project (FHLMC Insured), 4.00%, 12/01/42 | | | 500,000 | | | | 531,055 | |
Franklin County Convention Facilities Authority Hotel Project Revenue Bonds, Greater Columbus Convention Center, | | | | | | | | |
5.00%, 12/01/34 | | | 170,000 | | | | 146,783 | |
5.00%, 12/01/35 | | | 525,000 | | | | 446,670 | |
5.00%, 12/01/36 | | | 305,000 | | | | 255,883 | |
Franklin County MFH Variable Revenue Bonds, Sawyer & Trevitt Project,
1.77%, 6/01/20(i) | | | 200,000 | | | | 200,054 | |
Franklin County Revenue Bonds, Series A, 5.00%, 12/01/36 | | | 300,000 | | | | 344,397 | |
Marion County Health Care Facilities Revenue Refunding Bonds, United Church Homes, Inc., 5.13%, 12/01/49 | | | 100,000 | | | | 78,982 | |
Miami Valley Career Technology Center GO Unlimited Bonds, 4.00%, 12/01/37 | | | 250,000 | | | | 278,468 | |
Ohio State Air Quality Development Authority Revenue Refunding Bonds (AMT), American Electric Power Company Project,
2.10%, 10/01/24(a)(b)(c) | | | 500,000 | | | | 484,775 | |
Ohio State Air Quality Development Authority Revenue Refunding Bonds, Ohio Valley Electric Corp., 3.25%, 9/01/29 | | | 50,000 | | | | 45,827 | |
Ohio State Hospital Revenue Refunding Bonds, Series A, 4.00%, 1/15/50 | | | 325,000 | | | | 322,705 | |
See accompanying Notes to Financial Statements
148
Morningstar Funds Trust April 30, 2020
Schedule of Investments (continued)
Morningstar Municipal Bond Fund
| | | | | | | | |
| | | Par | | | Value | |
| |
| | |
Ohio (Continued) | | | | | | | | |
Ohio State Housing Finance Agency MFH Revenue Notes, Wesley Tower Apartments Project,
1.40%, 6/01/21(a)(b)(c) | | $ | 1,500,000 | | | $ | 1,501,005 | |
Ohio State Water Development Authority Water PCR Loan Fund Bonds,
Series A, 5.00%, 12/01/50 | | | 1,000,000 | | | | 1,226,740 | |
| | | | | | | 11,889,262 | |
| |
| | |
Oklahoma – 1.5% | | | | | | | | |
Bryan County School Finance Authority Educational Facilities Lease Revenue Refunding Bonds, Durant Public Schools Project, 4.00%, 12/01/23 | | | 620,000 | | | | 678,280 | |
Carter County Public Facilities Authority Educational Facilities Lease Revenue Bonds, 5.00%, 9/01/27 | | | 500,000 | | | | 576,095 | |
Kingfisher Special Projects Authority Educational Facilities Lease Revenue Bonds, Kingfisher Public Schools Project, 4.00%, 3/01/24 | | | 550,000 | | | | 603,812 | |
Muskogee Industrial Trust Educational Lease Revenue Bonds, Muskogee Public Schools Project,
5.00%, 9/01/23 | | | 900,000 | | | | 998,829 | |
Oklahoma County Finance Authority Revenue Refunding Bonds, Series A, Epworth Villa Project, 5.88%, 4/01/30 | | | 50,000 | | | | 46,226 | |
Oklahoma State Development Finance Authority Revenue Refunding Bonds, Oklahoma City University Project, 5.00%, 8/01/24 | | | 590,000 | | | | 637,365 | |
Wagoner County School Development Authority Educational Facilities Lease Revenue Bonds, Wagoner Public Schools Project, | | | | | | | | |
4.00%, 9/01/23 | | | 1,060,000 | | | | 1,147,588 | |
4.00%, 9/01/28 | | | 300,000 | | | | 347,538 | |
| | | | | | | 5,035,733 | |
| |
| | | | | | | | |
| | | Par | | | Value | |
| |
| | |
Oregon – 1.0% | | | | | | | | |
Metro GO Unlimited Bonds, Series A,
4.00%, 6/01/34 | | $ | 580,000 | | | $ | 682,567 | |
Multnomah County Hospital Facilities Authority Revenue Refunding Bonds, Adventist Health System,
5.00%, 3/01/25(a)(b)(c) | | | 500,000 | | | | 549,945 | |
Multnomah County School District No. 1J Portland GO Unlimited Bonds (School Board Guaranty Program),
5.00%, 6/15/24 | | | 250,000 | | | | 288,747 | |
Oregon State Housing & Community Services Department Housing Development Revenue Bonds, Series I, Ya Po Ah Terrace Project (HUD Sector 8 Program),
2.20%, 5/01/21(a)(b)(c) | | | 500,000 | | | | 504,170 | |
Port of Portland Airport Revenue Refunding Bonds, Portland International Airport, 5.00%, 7/01/40 | | | 615,000 | | | | 712,238 | |
Port of Portland Airport Revenue Refunding Bonds, Portland International Airport (AMT), 5.00%, 7/01/25 | | | 750,000 | | | | 845,400 | |
| | | | | | | 3,583,067 | |
| |
| | |
Pennsylvania – 4.9% | | | | | | | | |
Allegheny County Hospital Development Authority Revenue Refunding Bonds, University of Pittsburgh Medical Center, 5.00%, 7/15/21 | | | 100,000 | | | | 104,001 | |
Berks County Municipal Authority Revenue Refunding Bonds, Series B, Tower Health Project, | | | | | | | | |
5.00%, 2/01/25(a)(b)(c) | | | 500,000 | | | | 541,260 | |
5.00%, 2/01/27(a)(b)(c) | | | 500,000 | | | | 555,010 | |
Commonwealth Financing Authority Taxable Revenue Refunding Bonds, Series B-1, 5.00%, 6/01/26 | | | 300,000 | | | | 348,252 | |
Cumberland County Municipal Authority Revenue Bonds, AICUP Financing Program-Messiah College Project,
3.75%, 4/30/22(a)(b)(c) | | | 500,000 | | | | 500,000 | |
See accompanying Notes to Financial Statements
149
Morningstar Funds Trust April 30, 2020
Schedule of Investments (continued)
Morningstar Municipal Bond Fund
| | | | | | | | |
| | | Par | | | Value | |
| |
| | |
Pennsylvania (Continued) | | | | | | | | |
Delaware County Authority Neumann University Revenue Bonds, 5.00%, 10/01/20 | | $ | 375,000 | | | $ | 378,157 | |
Delaware Valley Regional Financial Authority Revenue Bonds, Series A (AMBAC Insured), 5.50%, 8/01/28 | | | 200,000 | | | | 249,438 | |
Doylestown Hospital Authority Revenue Bonds, Series A, Doylestown Hospital,
5.00%, 7/01/49 | | | 165,000 | | | | 170,620 | |
Lancaster County GO Unlimited Refunding Bonds, Series A, 4.00%, 11/01/25 | | | 275,000 | | | | 313,187 | |
Lancaster County Hospital Authority Healthcare Facilities Revenue Bonds, Series B, Maravian Manors, Inc., Project, 2.87%, 12/15/23 | | | 250,000 | | | | 235,148 | |
Lehigh County General Purpose Authority Revenue Refunding Bonds, Muhlenberg College Project, (SIFMA Municipal Swap Index Yield + 0.58%), 0.80%, 11/01/24(a)(c) | | | 480,000 | | | | 480,475 | |
Lehigh County IDA Revenue Refunding Bonds, PPL Electric Utilities Corp., Project,
1.80%, 8/15/22(a)(b)(c) | | | 330,000 | | | | 325,717 | |
Luzerne County IDA Revenue Refunding Bonds (AMT), Pennsylvania-American Water Co., Project, 2.45%, 12/03/29(a)(b)(c) | | | 750,000 | | | | 769,425 | |
Octorara Area School District GO Limited Refunding Bonds (AGM State Aid Withholding), 4.00%, 4/01/27 | | | 700,000 | | | | 802,865 | |
Pennsylvania State Economic Development Financing Authority Solid Waste Disposal Variable Revenue Bonds (AMT), Waste Management, Inc., Project,
1.90%, 8/03/20(a)(b)(c) | | | 750,000 | | | | 750,000 | |
| | | | | | | | |
| | | Par | | | Value | |
| |
| | |
Pennsylvania (Continued) | | | | | | | | |
Pennsylvania State Economic Development Financing Authority Solid Waste Disposal Variable Revenue Refunding Bonds (AMT), Republic Services,
1.95%, 7/15/20(a)(b)(c) | | $ | 900,000 | | | $ | 900,117 | |
Pennsylvania State Economic Development Financing Authority UPMC Revenue Bonds, Series A-1, | | | | | | | | |
5.00%, 4/15/24 | | | 1,200,000 | | | | 1,331,472 | |
5.00%, 4/15/25 | | | 200,000 | | | | 226,088 | |
4.00%, 4/15/45 | | | 500,000 | | | | 507,795 | |
Pennsylvania State Higher Educational Facilities Authority Revenue Refunding Bonds, Thomas Jefferson University, 5.00%, 9/01/39 | | | 500,000 | | | | 529,295 | |
Pennsylvania State Higher Educational Facilities Authority Variable Revenue Refunding Bonds, AICUP Financing Program-York College of Pennsylvania Project, 2.87%, 4/30/21(a)(b)(c) | | | 500,000 | | | | 500,000 | |
Pennsylvania State Housing Finance Agency SFM Revenue Refunding Bonds (AMT), Series 125A, 2.38%, 10/01/25 | | | 1,210,000 | | | | 1,233,534 | |
Pennsylvania State Housing Finance Agency Special Limited Obligation MFH Revenue Bonds, Norris Homes Phase V, 1.40%, 1/01/23(a)(b)(c) | | | 1,000,000 | | | | 998,030 | |
Pennsylvania State Turnpike Commission Turnpike Variable Revenue Refunding Bonds, Series B, (SIFMA Municipal Swap Index Yield + 0.70%),
0.92%, 12/01/23(c) | | | 500,000 | | | | 488,580 | |
Philadelphia Airport Revenue Refunding Bonds, Series B (AMT), | | | | | | | | |
5.00%, 7/01/30 | | | 495,000 | | | | 563,607 | |
5.00%, 7/01/33 | | | 400,000 | | | | 448,212 | |
5.00%, 7/01/35 | | | 100,000 | | | | 111,322 | |
See accompanying Notes to Financial Statements
150
Morningstar Funds Trust April 30, 2020
Schedule of Investments (continued)
Morningstar Municipal Bond Fund
| | | | | | | | |
| | | Par | | | Value | |
| |
| | |
Pennsylvania (Continued) | | | | | | | | |
Philadelphia Airport Revenue Refunding Bonds, Series D (AMT), 5.00%, 6/15/21 | | $ | 350,000 | | | $ | 351,340 | |
Philadelphia Authority for Industrial Development Temple University Revenue Refunding Bonds,
Series 1-2015, 5.00%, 4/01/33 | | | 400,000 | | | | 451,236 | |
Philadelphia Authority for Industrial Development University Revenue Refunding Bonds, Saint Joseph’s University, 4.00%, 11/01/45 | | | 500,000 | | | | 502,055 | |
Philadelphia School District GO Limited Bonds, Series A (State Aid Withholding), 4.00%, 9/01/35 | | | 300,000 | | | | 331,011 | |
Philadelphia School District GO Limited Refunding Bonds, Series C (State Aid Withholding), 5.00%, 9/01/33 | | | 500,000 | | | | 608,245 | |
Wilkes-Barre Area School District GO Limited Bonds (BAM State Aid Withholding), 5.00%, 4/15/23 | | | 200,000 | | | | 220,202 | |
| | | | | | | 16,825,696 | |
| |
| | |
Puerto Rico – 0.3% | | | | | | | | |
Puerto Rico Commonwealth Aqueduct & Sewer Authority Revenue Bonds, Series A, Senior Lien, 5.25%, 7/01/42 | | | 525,000 | | | | 493,500 | |
Puerto Rico Electric Power Authority Power Revenue Bonds, Series TT-RSA-1, | | | | | | | | |
5.00%, 7/01/32(j) | | | 65,000 | | | | 38,594 | |
5.00%, 7/01/37(j) | | | 240,000 | | | | 142,500 | |
Puerto Rico Electric Power Authority Power Revenue Refunding Bonds, Series ZZ-RSA-1, 5.25%, 7/01/23(j) | | | 175,000 | | | | 103,906 | |
| | | | | | | | |
| | | Par | | | Value | |
| |
| | |
Puerto Rico (Continued) | | | | | | | | |
Puerto Rico Sales Tax Financing Corp., Restructured TRB, Series A-1,
4.75%, 7/01/53 | | $ | 90,000 | | | $ | 81,428 | |
Puerto Rico Sales Tax Financing Corp., Sales Tax Revenue CABS, Series A-1, 0.00%, 7/01/27(g) | | | 225,000 | | | | 169,472 | |
| | | | | | | 1,029,400 | |
| |
| | |
Rhode Island – 0.1% | | | | | | | | |
Rhode Island Commerce Corp., First Lien Special Facility Revenue Refunding Bonds, Rhode Island Airport Corp., International, 5.00%, 7/01/31 | | | 500,000 | | | | 519,735 | |
| |
| | |
South Carolina – 0.6% | | | | | | | | |
Connector 2000 Association, Inc. Toll Road Revenue CABS, Senior
Series A-1, 0.00%, 1/01/32(g) | | | 400,000 | | | | 158,100 | |
South Carolina State Jobs EDA Hospital Revenue Refunding Bonds, Prisma Health Obligated Group, | | | | | | | | |
5.00%, 5/01/38 | | | 400,000 | | | | 432,656 | |
5.00%, 5/01/43 | | | 415,000 | | | | 445,478 | |
South Carolina State Jobs EDA Hospital Variable Revenue Bonds, Bon Secours Mercy Health, 5.00%, 10/01/25(a)(b)(c) | | | 850,000 | | | | 959,080 | |
| | | | | | | 1,995,314 | |
| |
| | |
Tennessee – 0.9% | | | | | | | | |
Greeneville Health & Educational Facilities Board MFH Revenue Bonds, People RD Portfolio Project, 1.45%, 12/01/21(a)(b)(c) | | | 500,000 | | | | 502,840 | |
Metropolitan Government Nashville & Davidson County Health & Educational Facility Board Revenue Bonds, Vanderbilt University Medical Center, 5.00%, 7/01/46 | | | 100,000 | | | | 107,736 | |
See accompanying Notes to Financial Statements
151
Morningstar Funds Trust April 30, 2020
Schedule of Investments (continued)
Morningstar Municipal Bond Fund
| | | | | | | | |
| | | Par | | | Value | |
| |
| | |
Tennessee (Continued) | | | | | | | | |
Metropolitan Government Nashville & Davidson County Health & Educational Facility Board Revenue Refunding Bonds, Trevecca Nazarene University,
3.00%, 10/01/24 | | $ | 520,000 | | | $ | 509,236 | |
Metropolitan Government of Nashville & Davidson County Health & Education Facilities Board Revenue Bonds, Vanderbilt Medical Center,
5.00%, 7/01/40 | | | 400,000 | | | | 434,876 | |
Metropolitan Nashville Airport Authority Subordinate Revenue Bonds,
Series B (AMT), 5.00%, 7/01/39 | | | 1,000,000 | | | | 1,136,550 | |
Tennessee State Energy Acquisition Corp., Revenue Bonds, Series A, Gas Project, 4.00%, 5/01/23(a)(b)(c) | | | 400,000 | | | | 415,444 | |
| | | | | | 3,106,682 | |
| |
| | |
Texas – 6.5% | | | | | | | | |
Austin Airport System Revenue Bonds, Series A, 5.00%, 11/15/46 | | | 380,000 | | | | 419,159 | |
Austin Airport System Revenue Bonds, Series B (AMT),
5.00%, 11/15/32 | | | 100,000 | | | | 114,318 | |
Austin Convention Enterprises, Inc., Convention Center Revenue Refunding Bonds, First Tier,
5.00%, 1/01/32 | | | 400,000 | | | | 375,720 | |
Board of Managers Joint Guadalupe County-City of Seguin Hospital Mortgage Revenue Refunding Bonds, 5.00%, 12/01/40 | | | 200,000 | | | | 201,396 | |
Central Regional Mobility Authority Revenue Refunding Bonds,
Series A, Senior Lien, | | | | | | | | |
5.00%, 1/01/22 | | | 300,000 | | | | 319,017 | |
5.00%, 1/01/33 | | | 635,000 | | | | 662,172 | |
Central Texas Regional Mobility Authority Revenue Refunding Bonds, Senior Lien, Series A, 5.00%, 1/01/49 | | | 500,000 | | | | 538,455 | |
| | | | | | | | |
| | | Par | | | Value | |
| |
| | |
Texas (Continued) | | | | | | | | |
Dallas Independent School District GO Unlimited Bonds, 2020-Multi-Modal (PSF, Gtd), Unrefunded Balance,
5.00%, 2/15/22(a)(b)(c) | | $ | 195,000 | | | $ | 207,369 | |
Dallas Texas Housing Finance Corp., Estates at Shiloh Revenue Bonds, 1.51%, 7/01/23(a)(b)(c) | | | 500,000 | | | | 498,540 | |
Dallas-Fort Worth International Airport Improvement Revenue Bonds, Series B, 5.00%, 11/01/44 | | | 350,000 | | | | 367,878 | |
Dallas-Fort Worth International Airport Joint Improvement Revenue Bonds, Series C, 5.00%, 11/01/34 | | | 445,000 | | | | 480,653 | |
Dallas-Fort Worth International Airport Revenue Bonds, Series H (AMT),
5.00%, 11/01/42 | | | 400,000 | | | | 412,004 | |
El Paso Texas Airport Revenue Bonds (AMT), 5.00%, 8/15/27 | | | 350,000 | | | | 407,557 | |
Grand Parkway Transportation Corp., System Toll Revenue Refunding Bonds, Grand Parkway System - First,
4.00%, 10/01/45 | | | 1,250,000 | | | | 1,328,137 | |
Gulf Coast Waste Disposal Authority Variable Revenue Bonds, Series B, Exxonmobil Project (AMT),
0.15%, 5/04/20(a)(c)(e) | | | 750,000 | | | | 750,000 | |
Harris County Cultural Education Facilities Finance Corp., Variable Revenue Bonds, Memorial Hermann Health System, | | | | | | | | |
5.00%, 12/01/22(a)(b)(c) | | | 100,000 | | | | 108,705 | |
5.00%, 12/01/24(a)(b)(c) | | | 1,000,000 | | | | 1,132,380 | |
Harris County Cultural Educational Facilities Finance Corp., Revenue Refunding Bonds, Hospital Memorial Hermann Health, 5.00%, 12/01/25 | | | 300,000 | | | | 321,987 | |
See accompanying Notes to Financial Statements
152
Morningstar Funds Trust April 30, 2020
Schedule of Investments (continued)
Morningstar Municipal Bond Fund
| | | | | | | | |
| | | Par | | | Value | |
| |
| | |
Texas (Continued) | | | | | | | | |
Harris County Cultural Educational Facilities Finance Corp., Revenue Refunding Bonds, Texas Children’s Hospital, 4.00%, 10/01/38 | | $ | 350,000 | | | $ | 386,907 | |
Harris County Health Facilities Development Corp., Variable Revenue Refunding Bonds, Methodist Hospital System, 0.09%, 5/04/20(a)(c)(e) | | | 500,000 | | | | 500,000 | |
Houston Airport System Revenue Refunding Bonds, Series B-2 (AMT), 5.00%, 7/15/20 | | | 200,000 | | | | 199,326 | |
Houston Airport System Revenue Refunding Bonds, Subseries D,
5.00%, 7/01/22 | | | 150,000 | | | | 160,701 | |
Houston Hotel Occupancy Tax & Special Revenue Refunding Bonds, Convention & Entertainment,
5.00%, 9/01/36 | | | 510,000 | | | | 498,729 | |
Leander Independent School District GO Unlimited CABS, Series C, School Building (PSF, Gtd), Prerefunded, 0.00%, 8/15/24(k) | | | 1,000,000 | | | | 324,970 | |
New Hope Cultural Educational Facilities Finance Corp., Retirement Facilities Revenue Refunding Bonds, Presbyterian Village North Project, 5.25%, 10/01/49 | | | 100,000 | | | | 81,142 | |
New Hope Cultural Educational Facilities Finance Corp., Retirement Facilities Revenue Refunding Bonds, Westminster Manor Project,
5.00%, 11/01/31 | | | 250,000 | | | | 259,248 | |
North Texas Tollway Authority Revenue Refunding Bonds, Series A,
5.00%, 1/01/26 | | | 70,000 | | | | 77,749 | |
Northside Texas Independent School District GO Unlimited Refunding Bonds (PSF, Gtd), 1.60%, 8/01/24(a)(b)(c) | | | 350,000 | | | | 347,851 | |
| | | | | | | | |
| | | Par | | | Value | |
| |
| | |
Texas (Continued) | | | | | | | | |
Northside Texas Independent School District Variable GO Unlimited Bonds (PSF, Gtd), 2.75%, 8/01/23(a)(b)(c) | | $ | 1,000,000 | | | $ | 1,035,210 | |
Port Beaumont Navigation District Dock & Wharf Facility Revenue Refunding Bonds (AMT), Jefferson Gulf Coast Energy Project, 4.00%, 1/01/50(d) | | | 375,000 | | | | 277,414 | |
San Antonio Airport System Revenue Refunding Bonds, Subordinate Lien, Series A (AMT), 5.00%, 7/01/30 | | | 250,000 | | | | 287,490 | |
San Antonio Housing Trust Finance Corp., MFH Variable Revenue Bonds, Majestic Ranch Apartments (FHA 221(D4) Insured), 1.40%, 1/01/22(a)(b)(c) | | | 1,000,000 | | | | 1,000,290 | |
San Antonio Water Variable Revenue Bonds, Series A, Junior Lien,
2.62%, 5/01/24(a)(b)(c) | | | 1,125,000 | | | | 1,165,624 | |
Tarrant County Cultural Education Facilities Finance Corp., Hospital Revenue Refunding Bonds, Cook Children’s Medical Center,
4.00%, 12/01/45 | | | 1,030,000 | | | | 1,089,740 | |
Tarrant County Cultural Education Facilities Finance Corp., Retirement Facility Revenue Refunding Bonds, Buckner Retirement Services,
5.00%, 11/15/20 | | | 185,000 | | | | 187,962 | |
Tarrant County Cultural Educational Facilities Finance Corp., Revenue Refunding Bonds, Texas Health Resources System Obligation, | | | | | | | | |
5.00%, 2/15/34 | | | 400,000 | | | | 460,676 | |
5.00%, 2/15/47 | | | 700,000 | | | | 783,293 | |
Texas State PFA Lease Revenue Refunding Bonds, 4.00%, 2/01/36 | | | 250,000 | | | | 287,720 | |
See accompanying Notes to Financial Statements
153
Morningstar Funds Trust April 30, 2020
Schedule of Investments (continued)
Morningstar Municipal Bond Fund
| | | | | | | | |
| | | Par | | | Value | |
| |
| | |
Texas (Continued) | | | | | | | | |
Texas State Private Activity Bond Surface Transportation Corp., Revenue Bonds (AMT), Segment 3C Project,
5.00%, 6/30/58 | | $ | 500,000 | | | $ | 521,615 | |
Texas State Private Activity Bond Surface Transportation Corp., Revenue Bonds (AMT), Senior Lien, Blueridge Transportation, | | | | | | | | |
5.00%, 12/31/45 | | | 500,000 | | | | 483,825 | |
5.00%, 12/31/55 | | | 200,000 | | | | 189,500 | |
Texas State Private Activity Bond Surface Transportation Corp., Revenue Refunding Bonds, Senior Lien, North Tarrant Express, 4.00%, 12/31/38 | | | 750,000 | | | | 730,695 | |
Texas State Transportation Commission Central Turnpike System Revenue Refunding Bonds, Series A,
5.00%, 8/15/39 | | | 750,000 | | | | 897,090 | |
Texas State Transportation Commission Central Turnpike System Subordinate Revenue Refunding Bonds, Series C, 5.00%, 8/15/42 | | | 100,000 | | | | 103,534 | |
Texas State Transportation Commission First Tier Toll Revenue Bonds, State Highway, 5.00%, 8/01/57 | | | 100,000 | | | | 101,693 | |
Texas State Transportation Commission First Tier Toll Revenue CABS,
0.00%, 8/01/29(g) | | | 480,000 | | | | 329,218 | |
Texas State Water Development Board Revenue Bonds, State Water Implementation Fund, 4.00%, 10/15/38 | | | 500,000 | | | | 568,465 | |
| | | | | | 21,983,124 | |
| |
| | |
Utah – 0.5% | | | | | | | | |
Murray City Hospital Variable Revenue Bonds, Series B, IHC Health Services, Inc., 0.09%, 5/04/20(a)(c)(e) | | | 700,000 | | | | 700,000 | |
| | | | | | | | |
| | | Par | | | Value | |
| |
| | |
Utah (Continued) | | | | | | | | |
Salt Lake City Airport Revenue Bonds, Series A (AMT), 5.00%, 7/01/47 | | $ | 350,000 | | | $ | 380,264 | |
Utah State Housing Corp., MFH Revenue Bonds, Lincoln Apartments Project, 1.54%, 8/01/21(a)(b)(c) | | | 500,000 | | | | 500,860 | |
| | | | | | 1,581,124 | |
| |
| | |
Virginia – 2.8% | | | | | | | | |
Botetourt County Residential Care Facility Revenue Refunding Bonds, Series A, Glebe, Inc., 4.75%, 7/01/23 | | | 225,000 | | | | 222,973 | |
Chesapeake Bay Bridge & Tunnel District Revenue Bonds, First Tier General Resolution (AGM Insured), 5.00%, 7/01/41 | | | 1,000,000 | | | | 1,143,880 | |
Chesapeake Bay Bridge & Tunnel District Revenue First Tier General Resolution Revenue BANS, 5.00%, 11/01/23 | | | 250,000 | | | | 265,390 | |
Chesapeake Bay Bridge & Tunnel District Revenue First Tier General Resolution Revenue Bonds, 5.00%, 7/01/51 | | | 500,000 | | | | 525,540 | |
Chesapeake Transportation System Senior Toll Road Revenue Bonds, Series A, 5.00%, 7/15/47 | | | 500,000 | | | | 510,580 | |
Fairfax County EDA Residential Care Facilities Revenue Bonds, Series A, Vinson Hall LLC, 5.00%, 12/01/42 | | | 80,000 | | | | 77,678 | |
Fairfax County EDA Residential Care Facilities Revenue Refunding Bonds, Series A, Goodwin House, Inc.,
5.00%, 10/01/36 | | | 150,000 | | | | 152,792 | |
Fairfax County IDA Health Care Revenue Bonds, Inova Health System,
4.00%, 5/15/42 | | | 250,000 | | | | 255,415 | |
Fairfax County IDA Health Care Revenue Refunding Bonds, Inova Health System, 5.00%, 5/15/23(a)(b)(c) | | | 500,000 | | | | 541,325 | |
See accompanying Notes to Financial Statements
154
Morningstar Funds Trust April 30, 2020
Schedule of Investments (continued)
Morningstar Municipal Bond Fund
| | | | | | | | |
| | | Par | | | Value | |
| |
| | |
Virginia (Continued) | | | | | | | | |
Fairfax County Redevelopment & Housing Authority MFH Variable Revenue Bonds, Parkwood Apartments Project,
2.21%, 8/01/20(a)(b)(c) | | $ | 500,000 | | | $ | 501,160 | |
Fairfax County Water Authority Revenue Refunding Bonds, 5.00%, 4/01/45 | | | 500,000 | | | | 588,945 | |
Hampton Roads Transportation Accountability Commission Revenue BANS, Series A, 5.00%, 7/01/22 | | | 750,000 | | | | 813,180 | |
Hampton Roads Transportation Accountability Commission Revenue Bonds, Series A, Senior Lien, 5.50%, 7/01/57 | | | 300,000 | | | | 363,507 | |
James City County EDA Residential Care Facilities Variable Revenue Bonds, United Methodist Home, 6.00%, 6/01/43 | | | 64,843 | | | | 57,469 | |
Spotsylvania County EDA Housing Revenue Bonds, Palmers Creek Apartments Project (FHA 221(D4) GNMA Insured),
1.45%, 2/01/22(a)(b)(c) | | | 500,000 | | | | 500,525 | |
Virginia Small Business Financing Authority Private Activity Revenue Bonds (AMT), Transform 66 P3 Project, | | | | | | | | |
5.00%, 12/31/49 | | | 475,000 | | | | 478,092 | |
5.00%, 12/31/56 | | | 50,000 | | | | 50,086 | |
Virginia State Small Business Financing Authority Revenue Bonds (AMT), 95 Express Lanes LLC Project,
5.00%, 1/01/44 | | | 225,000 | | | | 221,913 | |
Virginia State Small Business Financing Authority Revenue Bonds (AMT), Senior Lien, 95 Express Lane, 5.00%, 7/01/34 | | | 300,000 | | | | 301,107 | |
| | | | | | | | |
| | | Par | | | Value | |
| |
| | |
Virginia (Continued) | | | | | | | | |
Virginia State Small Business Financing Authority Revenue Bonds (AMT), Senior Lien, Elizabeth River Crossings OpCo, LLC Project, | | | | | | | | |
4.50%, 1/01/23 | | $ | 135,000 | | | $ | 135,528 | |
5.00%, 1/01/27 | | | 250,000 | | | | 252,277 | |
Westmoreland County IDA Lease Revenue BANS, Westmoreland Co., High School, 2.00%, 6/01/22 | | | 500,000 | | | | 507,440 | |
York County EDA PCR Bonds,
Series A, Electric & Power,
1.90%, 6/01/23(a)(b)(c) | | | 1,000,000 | | | | 1,014,350 | |
| | | | | | 9,481,152 | |
| |
| | |
Washington – 2.5% | | | | | | | | |
Chelan County Public Utility District No.1 Revenue Refunding Bonds, Series A, 4.00%, 7/01/39 | | | 1,000,000 | | | | 1,133,930 | |
King County Public Hospital District No. 1 GO Limited Tax Refunding Bonds, Valley Medical Center, 5.00%, 12/01/26 | | | 500,000 | | | | 572,825 | |
King County School District No. 210 Federal Way GO Unlimited Bonds (School Board Guaranty Program), 4.00%, 12/01/33 | | | 500,000 | | | | 568,995 | |
King County Sewer Revenue Refunding Bonds, 5.00%, 7/01/42 | | | 250,000 | | | | 294,358 | |
Port of Seattle Airport Revenue Bonds Intermediate Lien (AMT),
5.00%, 4/01/44 | | | 500,000 | | | | 550,780 | |
Seattle Municipal Light & Power Variable Revenue Refunding Bonds, (SIFMA Municipal Swap Index Yield + 0.35%), 0.57%, 11/01/22(c) | | | 900,000 | | | | 885,105 | |
Snohomish County Housing Authority Revenue Bonds, 5.00%, 4/01/21 | | | 545,000 | | | | 562,941 | |
Washington State GO Unlimited Bonds, Series C, 5.00%, 2/01/40 | | | 2,000,000 | | | | 2,475,980 | |
See accompanying Notes to Financial Statements
155
Morningstar Funds Trust April 30, 2020
Schedule of Investments (continued)
Morningstar Municipal Bond Fund
| | | | | | | | |
| | | Par | | | Value | |
| |
| | |
Washington (Continued) | | | | | | | | |
Washington State Health Care Facilities Authority Revenue Bonds, Series A, Providence Health & Services,
4.00%, 10/01/34 | | $ | 500,000 | | | $ | 512,470 | |
Washington State Housing Finance Commission Revenue Bonds, Columbia Park Apartments Project (FHA/GNMA Insured), 1.39%, 7/01/21(a)(b)(c) | | | 1,000,000 | | | | 1,000,880 | |
| | | | | | 8,558,264 | |
| |
| | |
West Virginia – 0.1% | | | | | | | | |
Princeton Hospital Revenue Refunding Bonds, Princeton Community Hospital Project, 5.00%, 5/01/22 | | | 500,000 | | | | 529,775 | |
| |
| | |
Wisconsin – 3.0% | | | | | | | | |
Barneveld School District Revenue BANS, 4.00%, 3/01/24 | | | 500,000 | | | | 509,930 | |
Milwaukee Corp., Purpose GO Unlimited Bonds, Series B3,
4.00%, 4/01/26 | | | 1,000,000 | | | | 1,094,410 | |
PFA Education Revenue Bonds, North Carolina Leadership Academy,
5.00%, 6/15/49(d) | | | 100,000 | | | | 87,797 | |
PFA Educational Revenue Bonds, Piedmont Community Charter School, | | | | | | | | |
5.00%, 6/15/39 | | | 490,000 | | | | 522,560 | |
5.00%, 6/15/49 | | | 150,000 | | | | 157,490 | |
PFA Exempt Facilities Revenue Refunding Bonds (AMT), National Gypsum Co., 4.00%, 8/01/35 | | | 370,000 | | | | 310,489 | |
PFA Hospital Revenue Refunding Bonds, Series A, WakeMed Hospital,
4.00%, 10/01/49 | | | 500,000 | | | | 503,320 | |
PFA Revenue Bonds, Roseman University of Health System,
5.00%, 4/01/50(d) | | | 250,000 | | | | 220,740 | |
PFA Solid Waste Disposal Revenue Refunding Bonds (AMT), Waste Management, Inc.,
1.90%, 8/03/20(a)(b)(c) | | | 1,500,000 | | | | 1,500,000 | |
| | | | | | | | |
| | | Par | | | Value | |
| |
| | |
Wisconsin (Continued) | | | | | | | | |
University of Wisconsin Hospitals & Clinics Authority Variable Revenue Refunding Bonds,
0.09%, 5/04/20(a)(c)(e) | | $ | 750,000 | | | $ | 750,000 | |
Wisconsin State COPS,
5.00%, 3/01/23 | | | 500,000 | | | | 515,965 | |
Wisconsin State Health & Educational Facilities Authority Revenue Bonds, Series B, Marshfield Clinic,
5.00%, 2/15/24 | | | 1,000,000 | | | | 1,051,050 | |
Wisconsin State Health & Educational Facilities Authority Revenue Refunding Bonds, Beloit Health System, Inc., 5.00%, 7/01/23 | | | 645,000 | | | | 703,405 | |
Wisconsin State Health & Educational Facilities Authority Revenue Refunding Bonds, Benevolent Corp., Cedar Community, 5.00%, 6/01/41 | | | 250,000 | | | | 212,100 | |
Wisconsin State Health & Educational Facilities Authority Revenue Refunding Bonds, Series B1, Ascension Health Credit Group, 5.00%, 11/15/39 | | | 350,000 | | | | 392,280 | |
Wisconsin State Health & Educational Facilities Authority Revenue Refunding Bonds, Series B5, 5.00%, 12/03/24(a)(b)(c) | | | 1,000,000 | | | | 1,139,570 | |
Wisconsin State Transportation Revenue Refunding Bonds,
Series 1, 4.50%, 7/01/33 | | | 400,000 | | | | 422,944 | |
| | | | | | 10,094,050 | |
| |
Total Municipal Bonds
(Cost $295,240,982) | | | | | | | 288,289,084 | |
| |
| | |
| | | Number of Shares | | | | |
| |
|
Investment Companies – 13.2% | |
iShares National Muni Bond ETF | | | 402,135 | | | | 44,729,476 | |
| |
Total Investment Companies
(Cost $45,657,595) | | | | | | | 44,729,476 | |
| |
See accompanying Notes to Financial Statements
156
Morningstar Funds Trust April 30, 2020
Schedule of Investments (continued)
Morningstar Municipal Bond Fund
| | | | | | | | |
| | | Number of Shares | | | Value | |
| |
Short-Term Investments – 2.9% | | | | | |
| | |
Money Market Fund – 2.9% | | | | | | | | |
Northern Institutional Funds - Treasury Portfolio (Premier), 0.22%(l) | | | 10,007,607 | | | $ | 10,007,607 | |
| |
Total Short-Term Investments
(Cost $10,007,607) | | | | | | | 10,007,607 | |
| |
Total Investments – 100.8%
(Cost $350,906,184) | | | | | | | 343,026,167 | |
| |
Liabilities less Other Assets – (0.8)% | | | | | | | (2,839,406 | ) |
| |
NET ASSETS – 100.0% | | | | | | $ | 340,186,761 | |
| |
Percentages shown are based on Net Assets.
| (a) | Maturity date represents the puttable date. |
| (b) | These securities are remarketed by an agent, and the interest rate is determined by general market conditions and supply and demand. |
| (c) | Variable rate security. Rate as of April 30, 2020 is disclosed. |
| (d) | Securities exempt from registration under Rule 144A of the Securities Act of 1933. These securities may be resold in transactions exempt from registration, normally to qualified institutional buyers. The value of these securities is determined by valuations supplied by a pricing service or brokers, or, if not available, in accordance with procedures established by the Board of Trustees of Morningstar Funds Trust. |
| (e) | Rate is determined by a Remarketing Agent which, in its judgment, on the basis of prevailing financial markets, will be the lowest interest rate necessary to enable the remarketing agent to sell the bonds at a price equal to 100% of the principal amount. |
| (f) | Maturity date represents the prerefunded date. |
| (h) | When-Issued Security. Coupon rate was not yet in effect at April 30, 2020. |
| (i) | Security has converted to a fixed rate as of June 3, 2019, and will be going forward. |
| (j) | Issuer has defaulted on terms of debt obligation. Income is not being accrued. |
| (k) | Zero coupon bond. Maturity date represents the prerefunded date. |
| (l) | 7-day current yield as of April 30, 2020 is disclosed. |
| | |
| Abbreviations: | | |
| |
| 1M | | 1 Month |
| 3M | | 3 Month |
| AGM | | Assured Guarantee Municipal Corporation |
| AMBAC | | American Municipal Bond Assurance Corporation |
| AMT | | Alternative Minimum Tax |
| BAM | | Build America Mutual |
| BANS | | Bond Anticipation Notes |
| CABS | | Capital Appreciation Bonds |
| COPS | | Certificates of Participation |
| EDA | | Economic Development Authority |
| ETF | | Exchange-Traded Fund |
| FHA | | Federal Housing Administration |
| FHLMC | | Federal Home Loan Mortgage Corporation |
| FNMA | | Federal National Mortgage Association |
| GNMA | | Government National Mortgage Association |
| GO | | Government Obligation |
| Gtd | | Guaranteed |
| HFA | | Housing Finance Authority |
| IBC | | Insured Bond Certificates |
See accompanying Notes to Financial Statements
157
Morningstar Funds Trust April 30, 2020
Schedule of Investments (continued)
Morningstar Municipal Bond Fund
| | |
| IDA | | Industrial Development Authority |
| LIBOR | | London Interbank Offered Rate |
| LLC | | Limited Liability Company |
| LOC | | Letter of Credit |
| MFH | | Multifamily Housing |
| NATL | | National Public Finance Guarantee Corporation |
| PCR | | Pollution Control Revenue |
| PFA | | Public Finance Authority |
| PSF | | Permanent School Fund |
| SFM | | Single Family Mortgage |
| SIFMA | | Securities Industry and Financial Markets Association |
| SonyMA | | State of New York Mortgage Agency |
| TANS | | Tax Anticipation Notes |
| TRB | | Tax Revenue Bonds |
| USD | | United States Dollar |
| | | | |
| |
|
Municipal Issue Type (%)(a) | |
|
Revenue Bonds | | | 72.0 | |
General Obligation Unlimited Bonds | | | 7.4 | |
General Obligation Limited Bonds | | | 2.6 | |
Revenue Notes | | | 1.2 | |
Certificates of Participation | | | 0.7 | |
Tax Allocation Bonds | | | 0.3 | |
General Obligation Limited Notes | | | 0.3 | |
Special Assessment Bonds | | | 0.2 | |
| |
| |
Total | | | 84.7 | |
| |
| (a) | Percentages shown are based on net assets, excludes Investment Companies, Short-Term Investments and Other. |
Valuation Hierarchy
The following is a summary of the inputs used, as of April 30, 2020, in valuing the Fund’s investments carried at fair value:
| | | | | | | | | | | | | | | | |
| |
| Morningstar Municipal Bond Fund | | Level 1 | | | Level 2 | | | Level 3 | | | Totals | |
| |
Investments | | | | | | | | | | | | | | | | |
Municipal Bonds | | $ | — | | | | $288,289,084 | | | | $— | | | | $288,289,084 | |
Investment Companies | | | 44,729,476 | | | | — | | | | — | | | | 44,729,476 | |
Short-Term Investments | | | 10,007,607 | | | | — | | | | — | | | | 10,007,607 | |
| |
Total Investments | | $ | 54,737,083 | | | | $288,289,084 | | | | $— | | | | $343,026,167 | |
| |
See accompanying Notes to Financial Statements
158
Morningstar Funds Trust April 30, 2020
Schedule of Investments
|
Morningstar Defensive Bond Fund |
| | | | | | | | |
| | | Par | | | Value | |
| |
Asset-Backed Securities – 30.0% | | | | | |
| | |
Automobile – 9.2% | | | | | | | | |
Ally Auto Receivables Trust, Series 2019-1, Class A4, 3.02%, 4/15/24 | | $ | 308,000 | | | $ | 319,616 | |
ARI Fleet Lease Trust, Series 2018-B, Class A3, 3.43%, 8/16/27(a) | | | 302,000 | | | | 308,126 | |
Avis Budget Rental Car Funding AESOP LLC, | | | | | | | | |
Series 2019-1A, Class A, 3.45%, 3/20/23(a) | | | 302,000 | | | | 293,231 | |
Series 2017-1A, Class A, 3.07%, 9/20/23(a) | | | 307,000 | | | | 287,258 | |
Series 2017-2A, Class A, 2.97%, 3/20/24(a) | | | 322,000 | | | | 305,528 | |
Carmax Auto Owner Trust, | | | | | | | | |
Series 2020-2, Class A1, 1.25%, 5/17/21 | | | 269,000 | | | | 269,295 | |
Series 2020-2, Class A2A, 1.75%, 1/17/23 | | | 511,000 | | | | 511,896 | |
Series 2019-1, Class A4, 3.26%, 8/15/24 | | | 240,000 | | | | 249,450 | |
Series 2019-3, Class A3, 2.18%, 8/15/24 | | | 479,000 | | | | 485,624 | |
Series 2019-1, Class B, 3.45%, 11/15/24 | | | 129,000 | | | | 130,349 | |
Chesapeake Funding II LLC, | | | | | | | | |
Series 2017-2A, Class A1, 1.99%, 5/15/29(a) | | | 128,460 | | | | 127,961 | |
Series 2017-4A, Class C, 2.76%, 11/15/29(a) | | | 142,000 | | | | 137,570 | |
Series 2019-1A, Class B, 3.11%, 4/15/31(a) | | | 324,000 | | | | 327,840 | |
Enterprise Fleet Financing LLC, Series 2020-1, Class A2, 1.78%, 12/22/25(a) | | | 262,000 | | | | 262,898 | |
Ford Credit Auto Lease Trust, | | | | | | | | |
Series 2019-B, Class B, 2.36%, 1/15/23 | | | 292,000 | | | | 291,878 | |
Series 2020-A, Class A4, 1.88%, 5/15/23 | | | 158,000 | | | | 157,465 | |
Ford Credit Auto Owner Trust, Series 2019-A, Class A4, 2.85%, 8/15/24 | | | 324,000 | | | | 336,292 | |
GM Financial Automobile Leasing Trust, | | | | | | | | |
Series 2019-2, Class B, 2.89%, 3/20/23 | | | 594,000 | | | | 596,692 | |
Series 2020-1, Class B, 1.84%, 12/20/23 | | | 133,000 | | | | 130,255 | |
| | | | | | | | |
| | | Par | | | Value | |
| |
Automobile (Continued) | | | | | | | | |
GM Financial Consumer Automobile Receivables Trust, Series 2020-2, Class A1, 1.26%, 4/16/21 | | $ | 170,000 | | | $ | 170,190 | |
Honda Auto Receivables Owner Trust, | | | | | | | | |
Series 2020-1, Class A3, 1.61%, 4/22/24 | | | 505,000 | | | | 510,836 | |
Series 2019-1, Class A4, 2.90%, 6/18/24 | | | 302,000 | | | | 313,445 | |
Series 2019-2, Class A4, 2.54%, 3/21/25 | | | 605,000 | | | | 622,551 | |
Hyundai Auto Lease Securitization Trust, | | | | | | | | |
Series 2019-A, Class A2, 2.92%, 7/15/21(a) | | | 81,803 | | | | 82,082 | |
Series 2020-A, Class B, 2.12%, 5/15/24(a) | | | 157,000 | | | | 154,130 | |
Hyundai Auto Receivables Trust, | | | | | | | | |
Series 2020-A, Class A1, 1.20%, 5/17/21 | | | 128,000 | | | | 128,000 | |
Series 2020-A, Class A2, 1.51%, 4/17/23 | | | 489,000 | | | | 488,902 | |
Mercedes-Benz Auto Lease Trust, Series 2020-A, Class A4, 1.88%, 9/15/25 | | | 793,000 | | | | 798,923 | |
Nissan Auto Lease Trust, | | | | | | | | |
Series 2020-A, Class A3, 1.84%, 1/17/23 | | | 537,000 | | | | 542,408 | |
Series 2020-A, Class A4, 1.88%, 4/15/25 | | | 256,000 | | | | 258,521 | |
Nissan Auto Receivables Owner Trust, | | | | | | | | |
Series 2020-A, Class A1, 0.98%, 4/15/21 | | | 169,000 | | | | 169,134 | |
Series 2020-A, Class A2, 1.45%, 12/15/22 | | | 281,000 | | | | 281,211 | |
Series 2019-C, Class A3, 1.93%, 7/15/24 | | | 318,000 | | | | 323,366 | |
Series 2018-B, Class A4, 3.16%, 12/16/24 | | | 245,000 | | | | 254,412 | |
Series 2019-A, Class A4, 3.00%, 9/15/25 | | | 308,000 | | | | 322,463 | |
Prestige Auto Receivables Trust, Series 2019-1A, Class B, 2.53%, 1/16/24(a) | | | 156,000 | | | | 156,406 | |
Santander Drive Auto Receivables Trust, Series 2020-1, Class A1, 1.65%, 4/15/21 | | | 391,000 | | | | 391,123 | |
See accompanying Notes to Financial Statements
159
Morningstar Funds Trust April 30, 2020
Schedule of Investments (continued)
Morningstar Defensive Bond Fund
| | | | | | | | |
| | | Par | | | Value | |
| |
| | |
Automobile (Continued) | | | | | | | | |
Toyota Auto Receivables Owner Trust, | | | | | | | | |
Series 2020-B, Class A1,
1.14%, 5/17/21 | | $ | 209,000 | | | $ | 209,229 | |
Series 2020-B, Class A2,
1.38%, 12/15/22 | | | 306,000 | | | | 307,210 | |
Series 2019-C, Class A3,
1.91%, 9/15/23 | | | 119,000 | | | | 120,946 | |
Series 2019-A, Class A4,
3.00%, 5/15/24 | | | 308,000 | | | | 323,830 | |
Series 2020-A, Class A3,
1.66%, 5/15/24 | | | 554,000 | | | | 561,071 | |
Volkswagen Auto Lease Trust, | | | | | | | | |
Series 2019-A, Class A3,
1.99%, 11/21/22 | | | 176,000 | | | | 175,565 | |
Series 2019-A, Class A4,
2.02%, 8/20/24 | | | 143,000 | | | | 141,485 | |
Westlake Automobile Receivables Trust, Series 2020-1A, Class C,
2.52%, 4/15/25(a) | | | 761,000 | | | | 734,792 | |
Wheels SPV 2 LLC, Series 2019-1A, Class A3, 2.35%, 5/22/28(a) | | | 621,000 | | | | 591,233 | |
World Omni Auto Receivables Trust, | | | | | | | | |
Series 2020-A, Class A3,
1.70%, 1/17/23 | | | 412,000 | | | | 409,284 | |
Series 2019-A, Class A3,
3.04%, 5/15/24 | | | 426,000 | | | | 434,997 | |
Series 2019-C, Class A3,
1.96%, 12/16/24 | | | 704,000 | | | | 715,452 | |
Series 2019-A, Class B, 3.34%, 6/16/25 | | | 304,000 | | | | 312,490 | |
World Omni Automobile Lease Securitization Trust, | | | | | | | | |
Series 2019-B, Class A4,
2.07%, 2/18/25 | | | 194,000 | | | | 192,241 | |
Series 2019-B, Class B, 2.13%, 2/18/25 | | | 109,000 | | | | 107,070 | |
| | | | | | | 16,834,222 | |
| |
| | |
Automobile Floor Plan – 0.4% | | | | | | | | |
NextGear Floorplan Master Owner Trust, | | | | | | | | |
Series 2018-2A, Class A2, 3.69%, 10/15/23(a) | | | 204,000 | | | | 201,624 | |
Series 2019-1A, Class A2, 3.21%, 2/15/24(a) | | | 302,000 | | | | 290,035 | |
Series 2019-2A, Class A2,
2.07%, 10/15/24(a) | | | 263,000 | | | | 253,677 | |
| | | | | | | 745,336 | |
| |
| | | | | | | | |
| | | Par | | | Value | |
| |
|
Commercial Mortgage-Backed Securities – 3.8% | |
Citigroup Commercial Mortgage Trust, | | | | | | | | |
Series 2012-GC8, Class A4,
3.02%, 9/10/45 | | $ | 37,290 | | | $ | 37,932 | |
Series 2013-GC11, Class A3,
2.82%, 4/10/46 | | | 471,866 | | | | 481,065 | |
Commercial Mortgage Trust, | | | | | | | | |
Series 2012-CCRE2, Class A4,
3.15%, 8/15/45 | | | 148,000 | | | | 151,150 | |
Series 2012-CCRE5, Class A3,
2.54%, 12/10/45 | | | 475,745 | | | | 476,585 | |
Series 2013-LC6, Class A4,
2.94%, 1/10/46 | | | 320,949 | | | | 327,351 | |
Series 2015-CR22, Class A3,
3.21%, 3/10/48 | | | 81,000 | | | | 82,337 | |
GS Mortgage Securities Corp. Trust, Series 2012-ALOHA, Class A, 3.55%, 4/10/34(a) | | | 588,000 | | | | 593,628 | |
JPMorgan Chase Commercial Mortgage Securities Trust, | | | | | | | | |
Series 2012-HSBC, Class A, 3.09%, 7/05/32(a) | | | 532,572 | | | | 536,702 | |
Series 2012-C8, Class A3, 3.42%, 10/15/45(a) | | | 313,000 | | | | 310,509 | |
Series 2015-C30, Class ASB, 3.56%, 7/15/48 | | | 587,995 | | | | 608,746 | |
RETL, Series 2019-RVP, Class B, (1M USD LIBOR + 1.55%, 1.55% Floor), 2.36%, 3/15/36(a)(b) | | | 265,000 | | | | 231,232 | |
UBS Commercial Mortgage Trust, Series 2012-C1, Class A3, 3.40%, 5/10/45 | | | 438,403 | | | | 445,133 | |
VNDO Mortgage Trust, | | | | | | | | |
Series 2012-6AVE, Class A, 3.00%, 11/15/30(a) | | | 55,000 | | | | 55,670 | |
Series 2012-6AVE, Class B, 3.30%, 11/15/30(a) | | | 775,000 | | | | 753,044 | |
Wells Fargo Commercial Mortgage Trust, Series 2012-LC5, Class A3, 2.92%, 10/15/45 | | | 333,480 | | | | 340,884 | |
See accompanying Notes to Financial Statements
160
Morningstar Funds Trust April 30, 2020
Schedule of Investments (continued)
Morningstar Defensive Bond Fund
| | | | | | | | |
| | | Par | | | Value | |
| |
|
Commercial Mortgage-Backed Securities (Continued) | |
WFRBS Commercial Mortgage Trust, | | | | | | | | |
Series 2013-C11, Class A5,
3.07%, 3/15/45 | | $ | 124,000 | | | $ | 125,800 | |
Series 2012-C8, Class A3,
3.00%, 8/15/45 | | | 617,000 | | | | 628,972 | |
Series 2012-C9, Class A3,
2.87%, 11/15/45 | | | 682,488 | | | | 689,975 | |
| | | | | | | 6,876,715 | |
| |
| | |
Credit Card – 1.3% | | | | | | | | |
American Express Credit Account Master Trust, | | | | | | | | |
Series 2019-1, Class A, 2.87%, 10/15/24 | | | 760,000 | | | | 789,598 | |
Series 2019-2, Class A, 2.67%, 11/15/24 | | | 152,000 | | | | 157,511 | |
Series 2019-2, Class B, 2.86%, 11/15/24 | | | 551,000 | | | | 565,345 | |
Capital One Multi-Asset Execution Trust, Series 2019-2, Class A2, 1.72%, 8/15/24 | | | 24,000 | | | | 24,483 | |
Synchrony Card Funding LLC, | | | | | | | | |
Series 2019-A1, Class A, 2.95%, 3/15/25 | | | 296,000 | | | | 298,516 | |
Series 2019-A2, Class A, 2.34%, 6/15/25 | | | 622,000 | | | | 622,611 | |
| | | | | | | 2,458,064 | |
| |
| | |
Other – 14.7% | | | | | | | | |
Ascentium Equipment Receivables, | | | | | | | | |
Series 2019-1A, Class A3,
2.83%, 5/12/25(a) | | | 603,000 | | | | 606,567 | |
Series 2019-2A, Class A3,
2.19%, 11/10/26(a) | | | 423,000 | | | | 418,841 | |
Black Diamond CLO Ltd., Series 2014-1A, Class A1R, (3M USD LIBOR + 1.15%), 2.28%, 10/17/26(a)(b) | | | 39,744 | | | | 39,514 | |
BlueMountain CLO Ltd., Series 2012-2A, Class AR2, (3M USD LIBOR + 1.05%, 1.05% Floor), 2.74%, 11/20/28(a)(b) | | | 300,000 | | | | 286,639 | |
California Street CLO XII Ltd., Series 2013-12A, Class AR, (3M USD LIBOR + 1.03%), 2.25%, 10/15/25(a)(b) | | | 420,952 | | | | 415,356 | |
| | | | | | | | |
| | | Par | | | Value | |
| |
| | |
Other (Continued) | | | | | | | | |
Canyon Capital CLO Ltd., Series 2014-2A, Class AS, (3M USD LIBOR + 1.25%),
2.47%, 4/15/29(a)(b) | | $ | 373,000 | | | $ | 356,964 | |
Carlyle Global Market Strategies CLO Ltd., Series 2015-2A, Class A1R, (3M USD LIBOR + 0.78%), 1.77%, 4/27/27(a)(b) | | | 228,126 | | | | 221,775 | |
CARS-DB4 L.P., Series 2020-1A, Class A1, 2.69%, 2/15/50(a) | | | 160,297 | | | | 153,200 | |
Cerberus Loan Funding XXI L.P., Series 2017-4A, Class A, (3M USD LIBOR + 1.45%, 1.45% Floor), 2.67%, 10/15/27(a)(b) | | | 463,748 | | | | 452,042 | |
Cerberus Loan Funding XXIII L.P., Series 2018-2A, Class A, (3M USD LIBOR + 1.00%, 1.00% Floor), 2.22%, 4/15/28(a)(b) | | | 364,207 | | | | 354,137 | |
Cerberus Loan Funding XXV L.P., Series 2018-4RA, Class A1TR, (3M USD LIBOR + 1.53%, 1.53% Floor), 2.75%, 10/15/30(a)(b) | | | 797,000 | | | | 730,003 | |
CIFC Funding Ltd., Series 2015-4A, Class A1R, (3M USD LIBOR + 1.15%, 1.15% Floor), 2.29%, 10/20/27(a)(b) | | | 300,000 | | | | 287,599 | |
Coinstar Funding LLC, Series 2017-1A, Class A2, 5.22%, 4/25/47(a) | | | 410,310 | | | | 400,150 | |
CoreVest American Finance Trust, Series 2018-1, Class A, 3.80%, 6/15/51(a) | | | 317,546 | | | | 324,497 | |
Daimler Trucks Retail Trust, Series 2019-1, Class A4, 2.79%, 5/15/25(a) | | | 603,000 | | | | 609,944 | |
Dell Equipment Finance Trust, | | | | | | | | |
Series 2020-1, Class A1, 1.98%, 5/21/21(a) | | | 363,000 | | | | 363,000 | |
Series 2020-1, Class C, 4.26%, 6/22/23(a) | | | 336,000 | | | | 335,960 | |
Series 2019-2, Class A3,
1.91%, 10/22/24(a) | | | 147,000 | | | | 145,311 | |
Series 2019-2, Class B, 2.06%, 10/22/24(a) | | | 198,000 | | | | 197,041 | |
See accompanying Notes to Financial Statements
161
Morningstar Funds Trust April 30, 2020
Schedule of Investments (continued)
Morningstar Defensive Bond Fund
| | | | | | | | |
| | | Par | | | Value | |
| |
| | |
Other (Continued) | | | | | | | | |
Finance of America HECM Buyout, | | | | | | | | |
Series 2020-HB1, Class M1,
2.10%, 2/25/30(a) | | $ | 104,000 | | | $ | 104,322 | |
Series 2019-AB1, Class A, 2.66%, 12/27/49(a) | | | 348,992 | | | | 344,167 | |
Fortress Credit Opportunities IX CLO Ltd., | | | | | | | | |
Series 2016-7A, Class BR, (3M USD LIBOR + 2.45%, 2.45% Floor), 3.19%, 12/15/28(a)(b) | | | 395,000 | | | | 350,528 | |
Series 2017-9A, Series A1T, (3M USD LIBOR + 1.55%), 3.24%, 11/15/29(a)(b) | | | 569,000 | | | | 533,955 | |
Fortress Credit Opportunities VII CLO Ltd., Series 2016-7I, Class E, (3M USD LIBOR + 7.49%), 8.23%, 12/15/28(b) | | | 302,000 | | | | 240,765 | |
Great American Auto Leasing, Inc., | | | | | | | | |
Series 2019-1, Class A4,
3.21%, 2/18/25(a) | | | 302,000 | | | | 309,408 | |
Series 2019-1, Class B, 3.37%, 2/18/25(a) | | | 308,000 | | | | 315,016 | |
GreatAmerica Leasing Receivables Funding LLC, | | | | | | | | |
Series 2020-1, Class A3,
1.76%, 8/15/23(a) | | | 192,000 | | | | 187,726 | |
Series 2018-1, Class B,
2.99%, 6/17/24(a) | | | 306,000 | | | | 307,843 | |
Hercules Capital Funding Trust, | | | | | | | | |
Series 2018-1A, Class A,
4.60%, 11/22/27(a) | | | 695,000 | | | | 697,450 | |
Series 2019-1A, Class A,
4.70%, 2/20/28(a) | | | 450,000 | | | | 451,797 | |
HPEFS Equipment Trust, | | | | | | | | |
Series 2019-1A, Class B,
2.32%, 9/20/29(a) | | | 100,000 | | | | 98,253 | |
Series 2020-1A, Class C,
2.03%, 2/20/30(a) | | | 334,000 | | | | 321,975 | |
Ivy Hill Middle Market Credit Fund X Ltd., Series 10A, Class A1AR, (3M USD LIBOR + 1.25%), 2.39%, 7/18/30(a)(b) | | | 273,000 | | | | 253,750 | |
John Deere Owner Trust, Series 2019-A, Class A4, 3.00%, 1/15/26 | | | 299,000 | | | | 305,308 | |
| | | | | | | | |
| | | Par | | | Value | |
| |
| | |
Other (Continued) | | | | | | | | |
Kubota Credit Owner Trust, | | | | | | | | |
Series 2020-1A, Class A1,
5/17/21(a)(c) | | $ | 100,000 | | | $ | 99,980 | |
Series 2020-1A, Class A2,
12/15/22(a)(c) | | | 212,000 | | | | 211,979 | |
MelTel Land Funding LLC,
Series 2019-1A, Class C,
6.07%, 4/15/49(a) | | | 188,000 | | | | 170,407 | |
MMAF Equipment Finance LLC, | | | | | | | | |
Series 2017-B, Class A4, 2.41%, 11/15/24(a) | | | 595,000 | | | | 599,162 | |
Series 2018-A, Class A4,
3.39%, 1/10/25(a) | | | 500,000 | | | | 512,115 | |
Nassau Ltd., Series 2017-IA, Class A1AS, (3M USD LIBOR + 1.15%), 2.37%, 10/15/29(a)(b) | | | 491,000 | | | | 462,293 | |
Nationstar HECM Loan Trust, | | | | | | | | |
Series 2019-1A, Class M1, 2.66%, 6/25/29(a) | | | 606,000 | | | | 585,724 | |
Series 2019-2A, Class M1, 2.36%, 11/25/29(a) | | | 100,000 | | | | 100,341 | |
New Residential Advance Receivables Trust Advance Receivables Backed, Series 2019-T3, Class AT3, 2.51%, 9/15/52(a) | | | 285,000 | | | | 275,359 | |
New Residential Mortgage LLC, Series 2018-FNT1, Class A, 3.61%, 5/25/23(a) | | | 357,121 | | | | 354,077 | |
NRZ Excess Spread-Collateralized Notes, Series 2018-PLS1, Class A, 3.19%, 1/25/23(a) | | | 491,009 | | | | 492,173 | |
Owl Rock CLO III Ltd., Series 2020-3A, Class A1L, (3M USD LIBOR + 1.80%),
2.97%, 4/20/32(a)(b) | | | 400,000 | | | | 379,004 | |
PFS Financing Corp., | | | | | | | | |
Series 2018-F, Class A,
3.52%, 10/15/23(a) | | | 405,000 | | | | 406,180 | |
Series 2019-A, Class A2,
2.86%, 4/15/24(a) | | | 603,000 | | | | 587,651 | |
Series 2019-A, Class B, 3.13%, 4/15/24(a) | | | 603,000 | | | | 584,165 | |
Silvermore CLO Ltd., Series 2014-1A, Class A1R, (3M USD LIBOR + 1.17%), 2.86%, 5/15/26(a)(b) | | | 108,135 | | | | 107,091 | |
See accompanying Notes to Financial Statements
162
Morningstar Funds Trust April 30, 2020
Schedule of Investments (continued)
Morningstar Defensive Bond Fund
| | | | | | | | |
| | | Par | | | Value | |
| |
| | |
Other (Continued) | | | | | | | | |
Sound Point CLO XII Ltd., | | | | | | | | |
Series 2016-2A, Class AR, (3M USD LIBOR + 1.29%, 1.29% Floor), 2.43%, 10/20/28(a)(b) | | $ | 301,000 | | | $ | 291,752 | |
Sound Point CLO XVII, | | | | | | | | |
Series 2017-3A, Class A1A, (3M USD LIBOR + 1.22%), 2.36%, 10/20/30(a)(b) | | | 263,000 | | | | 250,421 | |
Series 2017-3A, Class A1B, (3M USD LIBOR + 1.22%), 2.36%, 10/20/30(a)(b) | | | 263,000 | | | | 251,031 | |
Telos CLO Ltd., | | | | | | | | |
Series 2013-3, Class AR, (3M USD LIBOR + 1.30%, 1.30% Floor), 2.43%, 7/17/26(a)(b) | | | 291,517 | | | | 287,904 | |
Series 2014-5A, Class A1R, (3M USD LIBOR + 0.95%, 0.95% Floor), 2.08%, 4/17/28(a)(b) | | | 247,329 | | | | 241,861 | |
Towd Point Mortgage Trust, | | | | | | | | |
Series 2017-2, Class A1,
2.75%, 4/25/57(a) | | | 548,286 | | | | 549,739 | |
Series 2018-2, Class A1,
3.25%, 3/25/58(a) | | | 586,905 | | | | 597,411 | |
Trinitas CLO V Ltd., Series 2016-5A, Class AR, (3M USD LIBOR +1.39%, 1.39% Floor), 2.38%, 10/25/28(a)(b) | | | 372,000 | | | | 362,313 | |
VB-S1 Issuer LLC, Series 2016-1A,
Class F, 6.90%, 6/15/46(a) | | | 364,000 | | | | 366,474 | |
VCO CLO LLC, Series 2018-1A, Class A, (3M USD LIBOR +1.50%, 1.50% Floor), 2.64%, 7/20/30(a)(b) | | | 302,000 | | | | 290,737 | |
Venture XVII CLO Ltd., Series 2014-17A, Class ARR, (3M USD LIBOR + 0.88%), 2.10%, 4/15/27(a)(b) | | | 581,495 | | | | 549,141 | |
Venture XXIX CLO Ltd., Series 2017-29A, Class A, (3M USD LIBOR + 1.28%), 2.97%, 9/07/30(a)(b) | | | 324,000 | | | | 306,983 | |
Venture XXV CLO Ltd., | | | | | | | | |
Series 2016-25A, Class AR, (3M USD LIBOR + 1.23%), 2.37%, 4/20/29(a)(b) | | | 335,000 | | | | 317,054 | |
| | | | | | | | |
| | | Par | | | Value | |
| |
| | |
Other (Continued) | | | | | | | | |
Verizon Owner Trust, | | | | | | | | |
Series 2018-A, Class B, 3.38%, 4/20/23 | | | $276,000 | | | | $282,844 | |
Series 2019-A, Class A1A, 2.93%, 9/20/23 | | | 420,000 | | | | 429,216 | |
Series 2019-A, Class B, 3.02%, 9/20/23 | | | 585,000 | | | | 598,166 | |
Series 2019-B, Class A1A, 2.33%, 12/20/23 | | | 71,000 | | | | 72,290 | |
Series 2019-B, Class B, 2.40%, 12/20/23 | | | 605,000 | | | | 612,813 | |
Series 2019-C, Class A1A, 1.94%, 4/22/24 | | | 759,000 | | | | 767,123 | |
Series 2019-C, Class B, 2.06%, 4/22/24 | | | 375,000 | | | | 374,550 | |
Volvo Financial Equipment LLC, Series, Series 2019-1A, Class A4, 3.13%, 11/15/23(a) | | | 302,000 | | | | 306,676 | |
Wellfleet CLO Ltd., Series 2016-1A, Class AR, (3M USD LIBOR + 0.91%), 2.05%, 4/20/28(a)(b) | | | 300,000 | | | | 290,907 | |
West CLO Ltd., Series 2014-2A,
Series A1BR, 2.72%, 1/16/27(a) | | | 102,239 | | | | 100,068 | |
Zais CLO 14 Ltd., Series 2020-14A, Class A1A, (3M USD LIBOR + 1.40%, 1.40% Floor), 1.96%, 4/15/32(a)(b) | | | 697,000 | | | | 676,257 | |
Zais CLO 7 Ltd., Series 2017-2A, Class A, (3M USD LIBOR + 1.29%), 2.51%, 4/15/30(a)(b) | | | 316,644 | | | | 293,732 | |
| | |
| | | | | | | 26,915,967 | |
| |
| | |
Whole Loan – 0.6% | | | | | | | | |
BRAVO Residential Funding Trust,
Series 2019-1, Class A1C, 3.50%, 3/25/58(a) | | | 453,360 | | | | 457,130 | |
CIM Trust, | | | | | | | | |
Series 2017-7, Class A, 3.00%, 4/25/57(a) | | | 231,213 | | | | 228,744 | |
Series 2018-R3, Class A1, 5.00%, 12/25/57(a) | | | 443,060 | | | | 448,949 | |
| | |
| | | | | | | 1,134,823 | |
| |
| | |
Total Asset-Backed Securities
(Cost $55,407,209) | | | | | | | 54,965,127 | |
| |
See accompanying Notes to Financial Statements
163
Morningstar Funds Trust April 30, 2020
Schedule of Investments (continued)
Morningstar Defensive Bond Fund
| | | | | | |
| | | Number of Shares | | | Value |
|
Common Stocks – 0.1% |
| | |
Oil & Gas Services – 0.1% | | | | | | |
PHI Group, Inc.(d)(e)* | | | 30,348 | | | $197,262 |
| | |
Total Common Stocks
(Cost $252,192) | | | | | | 197,262 |
| | |
| | | Par(f) | | | |
|
Corporate Bonds – 0.9% |
| | |
Airlines – 0.2% | | | | | | |
American Airlines Pass Through Trust, Series 2016-2, Class A, 3.65%, 6/15/28 | | | $547,734 | | | 417,861 |
| | |
Chemicals – 0.1% | | | | | | |
Neon Holdings, Inc.,
10.12%, 4/01/26(a) | | | 143,000 | | | 128,700 |
| | |
Coal – 0.1% | | | | | | |
Natural Resource Partners L.P./NRP Finance Corp., 9.12%, 6/30/25(a) | | | 323,000 | | | 271,320 |
| | |
Commercial Services – 0.4% | | | | | | |
StoneMor Partners L.P./Cornerstone Family Services of West Virginia Subsidiary, 11.50%, 6/30/24(a)(g) | | | 678,721 | | | 651,572 |
| | |
Food Service – 0.1% | | | | | | |
Aramark Services, Inc., 6.38%, 5/01/25(a) | | | 159,000 | | | 165,360 |
| | |
Internet – 0.0%(h) | | | | | | |
Expedia Group, Inc., 5/01/25(a)(c) | | | 83,000 | | | 84,448 |
| | |
Total Corporate Bonds
(Cost $1,761,097) | | | | | | 1,719,261 |
|
Foreign Issuer Bonds – 0.1% |
| | |
Ireland – 0.1% | | | | | | |
Cimpress PLC, 7.00%, 6/15/26(a) | | | 175,000 | | | 127,067 |
| | |
Total Foreign Issuer Bonds
(Cost $148,013) | | | | | | 127,067 |
| | | | | | |
| | |
| | | Par(f) | | | Value |
|
Term Loans – 3.1%(b) |
| |
Advertising – 0.4% | | | |
ABG Intermediate Holdings 2 LLC, Initial Term Loan, 9/27/24(a)(i) | | $ | 474,000 | | | $412,527 |
CB Poly Investments LLC, Closing Date Term Loan, (3M USD LIBOR+ 4.50%, 1.00% Floor), 5.95%, 8/16/23 | | | 377,810 | | | 275,801 |
| | | | | | | 688,328 |
| |
Airlines – 0.1% | | | |
Delta Air Lines, Inc., Term
Loan, 4/29/23(i) | | | 166,000 | | | 165,100 |
| |
Coal – 0.2% | | | |
Murray Energy Corp., Initial Term Loan, (1M USD LIBOR+ 11.00%, 2.00% Floor), 13.00%, 7/31/20 | | | 640,000 | | | 352,000 |
| |
Commercial Services – 0.3% | | | |
MediaCo Holding, Inc., Term Loan, (1M USD LIBOR+ 7.50%, 1.00% Floor), 8.48%, 11/25/24(j) | | | 714,968 | | | 637,583 |
| |
Oil & Gas Services – 0.4% | | | |
PHI Group, Inc., Loan, (3M USD LIBOR+ 7.00%, 1.00% Floor), 8.00%, 9/04/24 | | | 746,457 | | | 709,134 |
| |
Retail – 0.3% | | | |
General Nutrition Centers, Inc., FILO Term Loan, | | | | | | |
(1M USD LIBOR+ 7.00%), 7.41%, 12/31/22 | | | 568,000 | | | 502,839 |
12/31/22(i) | | | 21,000 | | | 18,591 |
J.C. Penney Corp., Inc., Loan, (2M USD LIBOR+ 4.25%, 1.00% Floor), 5.86%, 6/23/23 | | | 278,009 | | | 126,842 |
| | | | | | | 648,272 |
| |
Telecommunications – 1.3% | | | |
Cincinnati Bell, Inc., Tranche B Term Loan, (1M USD LIBOR+ 3.25%, 1.00% Floor), 4.25%, 10/02/24 | | | 328,167 | | | 320,967 |
Consolidated Communications, Inc., Initial Term Loan, 10/05/23(i) | | | 331,147 | | | 292,512 |
See accompanying Notes to Financial Statements
164
Morningstar Funds Trust April 30, 2020
Schedule of Investments (continued)
Morningstar Defensive Bond Fund
| | | | | | |
| | | Par(f) | | | Value |
|
Telecommunications (Continued) |
Frontier Communications Corp., | | | | | | |
Term B-1 Loan, | | | | | | |
(3M USD LIBOR+ 3.75%, 0.75% Floor), 5.35%, 6/15/24(k) | | | $688,266 | | | $ 667,371 |
(3M USD LIBOR+ 3.75%, 0.75% Floor), 5.21%, 6/15/24(k) | | | 2,300 | | | 2,230 |
LOGIX Holding Co. LLC, Initial Term Loan, (1M USD LIBOR+ 5.75%, 1.00% Floor), 6.75%, 12/22/24 | | | 205,026 | | | 161,970 |
Windstream Services LLC, Term Facility, (1M USD LIBOR+ 2.50%), 2.91%, 2/26/21 | | | 300,000 | | | 293,250 |
Windstream Services LLC, Tranche B-7 Term Loan, (3M USD Prime Rate+ 4.25%, 1.75% Floor), 7.50%, 2/17/24 | | | 305,000 | | | 169,528 |
Xplornet Communications, Inc., Term B Loan, (3M USD LIBOR+ 4.00%, 1.00% Floor), 5.45%, 9/09/21 | | | 442,086 | | | 430,482 |
| | |
| | | | | | | 2,338,310 |
| | |
Transportation – 0.1% | | | | | | |
| | |
Hanjin International Corp., Initial Term Loan, (1M USD LIBOR+ 2.50%), 2.90%, 10/19/20 | | | 158,000 | | | 131,140 |
| | |
Total Term Loans
(Cost $6,550,130) | | | | | | 5,669,867 |
| | |
| | | Number of Shares | | | |
|
Warrants – 0.0%(h) |
|
Oil & Gas Services – 0.0%(h) |
PHI Group, Inc. (e)(l)* | | | 14,039 | | | 91,254 |
| | |
Total Warrants
(Cost $110,837) | | | | | | 91,254 |
| | | | | | |
| | | Par | | | Value |
|
Mortgage-Backed Securities – 2.9% |
|
Federal Home Loan Mortgage Corporation – 1.5% |
Multifamily Structured Pass Through Certificates, | | | | | | |
Series K024, Class A2, 2.57%, 9/25/22 | | $ | 52,000 | | | $ 53,889 |
Series K042, Class A1, 2.27%, 6/25/24 | | | 129,675 | | | 133,578 |
Real Estate Mortgage Investment Conduits, | | | | | | |
Series 4336, Class WV, 3.00%, 10/15/25 | | | 291,735 | | | 302,867 |
Series 4387, Class VA, 3.00%, 2/15/26 | | | 382,931 | | | 396,731 |
Series 4220, Class EH, 2.50%, 6/15/28 | | | 682,191 | | | 705,392 |
Series 4311, Class QC, 2.25%, 10/15/28 | | | 688,528 | | | 705,185 |
Series 4162, Class P, 3.00%, 2/15/33 | | | 454,285 | | | 476,128 |
| | | | | | | 2,773,770 |
|
Federal National Mortgage Association – 0.4% |
Interest Strip, Series 284, Class 1, 0.00%, 7/25/27(m) | | | 167,814 | | | 158,278 |
Real Estate Mortgage Investment Conduits, | | | | | | |
Series 2014-3, Class AM, 2.50%, 1/25/32 | | | 437,900 | | | 450,401 |
Series 2012-144, Class PD, 3.50%, 4/25/42 | | | 222,286 | | | 235,083 |
| | | | | | | 843,762 |
|
Government National Mortgage Association – 1.0% |
Series 2010-161, Class B,
3.00%, 7/16/40 | | | 100,381 | | | 101,019 |
Series 2011-9, Class C,
3.49%, 9/16/41 | | | 21,202 | | | 21,214 |
Series 2012-150, Class IO,
0.68%, 11/16/52(n) | | | 2,382,518 | | | 80,609 |
Series 2014-138, Class A,
2.70%, 1/16/44 | | | 217,449 | | | 219,522 |
Series 2014-148, Class A,
2.65%, 11/16/43 | | | 546,008 | | | 551,860 |
Series 2015-108, Class IO,
0.83%, 10/16/56(n) | | | 759,209 | | | 35,281 |
Series 2015-47, Class IO,
0.80%, 10/16/56(n) | | | 4,039,950 | | | 187,208 |
See accompanying Notes to Financial Statements
165
Morningstar Funds Trust April 30, 2020
Schedule of Investments (continued)
Morningstar Defensive Bond Fund
| | | | | | |
| | | Par | | | Value |
|
Government National Mortgage Association (Continued) |
Series 2015-7, Class IO,
0.74%, 1/16/57(n) | | $ | 4,545,663 | | | $ 201,501 |
Series 2019-39, Class A, 3.10%, 5/16/59 | | | 375,284 | | | 385,662 |
| | | | | | | 1,783,876 |
| |
Total Mortgage-Backed Securities
(Cost $5,384,611) | | | 5,401,408 |
| | |
| | | Number of Shares | | | |
|
Investment Companies – 49.5% |
Schwab Intermediate-Term U.S. Treasury ETF | | | 452,618 | | | 26,582,255 |
Schwab Short-Term U.S. Treasury ETF | | | 511,750 | | | 26,462,593 |
Vanguard Intermediate-Term Corporate Bond ETF | | | 15,104 | | | 1,379,750 |
Vanguard Mortgage-Backed Securities ETF | | | 100,926 | | | 5,514,597 |
Vanguard Short-Term Corporate Bond ETF | | | 143,551 | | | 11,639,115 |
Vanguard Short-Term Inflation-Protected Securities ETF | | | 389,666 | | | 19,253,397 |
Total Investment Companies
(Cost $88,277,487) | | | | | | 90,831,707 |
| | | | | | | | |
| | | Number of Shares | | | Value | |
| |
|
Short-Term Investments – 13.8% | |
|
Money Market Fund – 9.8% | |
Northern Institutional Funds - Treasury Portfolio (Premier),
0.22%(o) | | | 17,893,943 | | | | $ 17,893,943 | |
| |
|
U.S. Treasury Bills – 4.0% | |
U.S. Treasury Bill, 0.07%, 5/05/20(p) | | | 4,827,000 | | | | 4,826,974 | |
U.S. Treasury Bill, 0.08%, 5/12/20(p) | | | 2,519,000 | | | | 2,518,950 | |
| | |
| | | | | | | 7,345,924 | |
| |
| | |
Total Short-Term Investments
(Cost $25,239,844) | | | | | | | 25,239,867 | |
| |
| | |
Total Investments – 100.4%
(Cost $183,131,420) | | | | | | | 184,242,820 | |
| |
| |
Liabilities less Other Assets – (0.4)% | | | | (768,172 | ) |
| |
| | |
NET ASSETS – 100.0% | | | | | | $ | 183,474,648 | |
| |
Percentages shown are based on Net Assets.
| (a) | Securities exempt from registration under Rule 144A of the Securities Act of 1933. These securities may be resold in transactions exempt from registration, normally to qualified institutional buyers. The value of these securities is determined by valuations supplied by a pricing service or brokers, or, if not available, in accordance with procedures established by the Board of Trustees of Morningstar Funds Trust. |
| (b) | Variable rate security. Rate as of April 30, 2020 is disclosed. |
| (c) | When-Issued Security. Coupon rate was not yet in effect at April 30, 2020. |
| (d) | This is a Level 3 asset which is fair valued by the Pricing Committee (see Note 4 in Notes to Financial Statements). The fair value price of $6.50 is based on recent trade activity obtained from market makers in the security. During the fiscal year, the Fund purchased $252,192 of this security. |
| (e) | This restricted security constituted 0.16% of total net assets at April 30, 2020. This security is not registered and may not be sold to the public. There are legal and/or contractual restrictions on resale. |
| (f) | Par value is in USD unless otherwise indicated. |
| (g) | Security is a payment in-kind bond (PIK), distributions received in-kind unless otherwise noted in the description. |
| (h) | Amount rounds to less than 0.05%. |
| (i) | Position is unsettled. Contract rate was not determined at April 30, 2020 and does not take effect until settlement date. |
| (j) | This is a Level 3 asset which is fair valued by the Pricing Committee (see Note 4 in Notes to Financial Statements). The fair value price of $89.17 is derived using a pricing model which involves amortized cost and a 10% discount. If the financial condition of the underlying assets were to deteriorate, or if the market comparables were to fall, the value of the investment could be lower. During the fiscal year, the Fund purchased $714,727 of this security. |
| (k) | Issuer has defaulted on terms of debt obligation. |
See accompanying Notes to Financial Statements
166
Morningstar Funds Trust April 30, 2020
Schedule of Investments (continued)
Morningstar Defensive Bond Fund
| (l) | This is a Level 3 asset which is fair valued by the Pricing Committee (see Note 4 in Notes to Financial Statements). The fair value price of $6.50 is based on recent trade activity obtained from market makers in the security. During the fiscal year, the Fund purchased $110,837 of this security. |
| (n) | Variable or floating rate security, the interest rate of which adjusts periodically based on changes in current interest rates and prepayments on the underlying pool of assets. Rate as of April 30, 2020 is disclosed. |
| (o) | 7-day current yield as of April 30, 2020 is disclosed. |
| (p) | Discount rate at the time of purchase. |
| * | Non-Income Producing Security |
| | |
| Abbreviations: | | |
| |
| 1M | | 1 Month |
| |
| 2M | | 2 Month |
| |
| 3M | | 3 Month |
| |
| CLO | | Collateralized Loan Obligation |
| |
| ETF | | Exchange-Traded Fund |
| |
| IO | | Interest Only |
| |
| LIBOR | | London Interbank Offered Rate |
| |
| LLC | | Limited Liability Company |
| |
| PLC | | Public Limited Company |
| |
| Strip | | Separate Trading of Registered Interest and Principal |
| |
| USD | | United States Dollar |
Valuation Hierarchy
The following is a summary of the inputs used, as of April 30, 2020, in valuing the Fund’s investments carried at fair value:
| | | | | | | | | | | | | | |
| Morningstar Defensive Bond Fund | | Level 1 | | | Level 2 | | | Level 3 | | | Totals |
| | | | |
Investments | | | | | | | | | | | | | | |
Asset-Backed Securities | | $ | — | | | | $54,965,127 | | | $ | — | | | $ 54,965,127 |
Common Stocks | | | — | | | | — | | | | 197,262 | | | 197,262 |
Corporate Bonds | | | — | | | | 1,719,261 | | | | — | | | 1,719,261 |
Foreign Issuer Bonds | | | — | | | | 127,067 | | | | — | | | 127,067 |
Term Loans | | | — | | | | 5,032,284 | | | | 637,583 | | | 5,669,867 |
Mortgage-Backed Securities | | | — | | | | 5,401,408 | | | | — | | | 5,401,408 |
Investment Companies | | | 90,831,707 | | | | — | | | | — | | | 90,831,707 |
Short-Term Investments | | | 17,893,943 | | | | 7,345,924 | | | | — | | | 25,239,867 |
Warrants | | | — | | | | — | | | | 91,254 | | | 91,254 |
| | | | | |
Total Investments | | $ | 108,725,650 | | | | $74,591,071 | | | | $926,099 | | | $184,242,820 |
Investments classified within Level 3 of the fair value hierarchy are valued by the Adviser in good faith under procedures adopted by authority of the Fund’s Board of Trustees. The Adviser employs various methods to determine fair valuations including regular review of key inputs and assumptions, and review of related market activity, if any. However, there are generally no observable trade activities in these securities. The Adviser reports to the Board of Trustees at their regularly scheduled quarterly meetings, or more often if warranted. The report includes a summary of the results of the process, the key inputs and assumptions noted, and any changes
See accompanying Notes to Financial Statements
167
Morningstar Funds Trust April 30, 2020
Schedule of Investments (continued)
Morningstar Defensive Bond Fund
to the inputs and assumptions used. When appropriate, the Adviser will recommend changes to the procedures and process employed. The value determined for an investment using the fair value procedures may differ significantly from the value realized upon the sale of such investment.
See accompanying Notes to Financial Statements
168
Morningstar Funds Trust April 30, 2020
Schedule of Investments
|
Morningstar Multisector Bond Fund |
| | | | | | | | |
| | | Par(a) | | | Value | |
| |
|
Asset-Backed Securities – 0.2% | |
| | |
Other – 0.2% | | | | | | | | |
Legacy Mortgage Asset Trust, Series 2018-GS2, Class A1, (Step to 7.00% on 7/26/21), 4.00%, 4/25/58(b)(c) | | $ | 87,063 | | | $ | 81,669 | |
Tricon American Homes Trust, Series 2017-SFR1, Class F, 5.15%, 9/17/34(b) | | | 200,000 | | | | 185,101 | |
| | | | | | | 266,770 | |
| |
| | |
Whole Loan – 0.0%(d) | | | | | | | | |
Fannie Mae Connecticut Avenue Securities, Series 2017-C07, Class 1M2, (1M USD LIBOR + 2.40%, 2.40% Floor), 2.89%, 5/25/30(e) | | | 35,000 | | �� | | 31,285 | |
| |
Total Asset-Backed Securities
(Cost $295,294) | | | | | | | 298,055 | |
| |
| | |
| | | Number
of Shares | | | | |
| |
|
Common Stocks – 0.1% | |
| | |
Chemicals – 0.0%(d) | | | | | | | | |
Hexion Holdings Corp., Class B* | | | 434 | | | | 2,430 | |
| |
| | |
Oil & Gas – 0.0%(d) | | | | | | | | |
Battalion Oil Corp.* | | | 363 | | | | 1,779 | |
| |
| | |
Telecommunications – 0.1% | | | | | | | | |
AT&T, Inc. | | | 3,702 | | | | 112,800 | |
| |
Total Common Stocks
(Cost $161,541) | | | | | | | 117,009 | |
| |
|
Convertible Preferred Stocks – 0.3% | |
| | |
Agriculture – 0.3% | | | | | | | | |
Bunge Ltd., 4.88%, | | | 5,250 | | | | 488,250 | |
| |
| | |
Semiconductors – 0.0%(d) | | | | | | | | |
Broadcom, Inc., 8.00%, 9/30/22 | | | 62 | | | | 63,081 | |
| |
Total Convertible Preferred Stocks
(Cost $583,180) | | | | | | | 551,331 | |
| |
| | |
| | | Par(a) | | | | |
| |
|
Convertible Bonds – 0.9% | |
| | |
Biotechnology – 0.3% | | | | | | | | |
BioMarin Pharmaceutical, Inc.,
0.60%, 8/01/24 | | | 375,000 | | | | 402,139 | |
| | | | | | | | |
| | | Par(a) | | | Value | |
| |
|
Biotechnology (Continued) | |
Intercept Pharmaceuticals, Inc.,
3.25%, 7/01/23 | | $ | 55,000 | | | $ | 48,588 | |
PTC Therapeutics, Inc., 3.00%, 8/15/22 | | | 45,000 | | | | 51,505 | |
| | | | | | | 502,232 | |
| |
| | |
Healthcare - Products – 0.0%(d) | | | | | | | | |
Integra LifeSciences Holdings Corp., 0.50%, 8/15/25(b) | | | 80,000 | | | | 75,142 | |
| |
| | |
Media – 0.3% | | | | | | | | |
DISH Network Corp., | | | | | | | | |
2.38%, 3/15/24 | | | 170,000 | | | | 142,931 | |
3.37%, 8/15/26 | | | 515,000 | | | | 415,507 | |
| | | | | | | 558,438 | |
| |
| | |
Oil & Gas – 0.0%(d) | | | | | | | | |
Chesapeake Energy Corp., 5.50%, 9/15/26 | | | 205,000 | | | | 10,250 | |
Nabors Industries, Inc., 0.75%, 1/15/24 | | | 80,000 | | | | 8,800 | |
PDC Energy, Inc., 1.12%, 9/15/21 | | | 30,000 | | | | 24,640 | |
| | | | | | | 43,690 | |
| |
| | |
Oil & Gas Services – 0.0%(d) | | | | | | | | |
Oil States International, Inc.,
1.50%, 2/15/23 | | | 70,000 | | | | 25,434 | |
| |
| | |
Pharmaceuticals – 0.0%(d) | | | | | | | | |
Aerie Pharmaceuticals, Inc.,
1.50%, 10/01/24(b) | | | 45,000 | | | | 42,062 | |
Flexion Therapeutics, Inc., 3.37%, 5/01/24 | | | 25,000 | | | | 18,491 | |
| | | | | | | 60,553 | |
| |
| | |
Semiconductors – 0.0%(d) | | | | | | | | |
Microchip Technology, Inc., 1.63%, 2/15/27 | | | 40,000 | | | | 49,987 | |
| |
| | |
Software – 0.1% | | | | | | | | |
Avaya Holdings Corp., 2.25%, 6/15/23 | | | 105,000 | | | | 83,344 | |
| |
| | |
Telecommunications – 0.1% | | | | | | | | |
CalAmp Corp., 2.00%, 8/01/25 | | | 150,000 | | | | 112,125 | |
| |
| | |
Trucking & Leasing – 0.1% | | | | | | | | |
Greenbrier (The) Cos., Inc.,
2.88%, 2/01/24 | | | 180,000 | | | | 144,399 | |
| |
Total Convertible Bonds
(Cost $2,024,291) | | | | | | | 1,655,344 | |
| |
See accompanying Notes to Financial Statements
169
Morningstar Funds Trust April 30, 2020
Schedule of Investments (continued)
Morningstar Multisector Bond Fund
| | | | | | | | |
| | | Par(a) | | | Value | |
| |
|
Corporate Bonds – 17.7% | |
| | |
Advertising – 0.1% | | | | | | | | |
Lamar Media Corp., | | | | | | | | |
5.75%, 2/01/26 | | $ | 40,000 | | | $ | 40,684 | |
3.75%, 2/15/28(b) | | | 85,000 | | | | 78,253 | |
4.00%, 2/15/30(b) | | | 80,000 | | | | 73,200 | |
Outfront Media Capital LLC/Outfront Media Capital Corp., 5.00%, 8/15/27(b) | | | 5,000 | | | | 4,775 | |
Terrier Media Buyer, Inc., 8.88%, 12/15/27(b) | | | 45,000 | | | | 37,125 | |
| | | | | | | 234,037 | |
| |
|
Aerospace/Defense – 0.8% | |
Boeing (The) Co., | | | | | | | | |
5.15%, 5/01/30 | | | 300,000 | | | | 300,000 | |
5.80%, 5/01/50 | | | 300,000 | | | | 300,000 | |
Moog, Inc., 4.25%, 12/15/27(b) | | | 15,000 | | | | 14,062 | |
Signature Aviation U.S. Holdings, Inc., 4.00%, 3/01/28(b) | | | 175,000 | | | | 148,750 | |
Spirit AeroSystems, Inc., | | | | | | | | |
7.50%, 4/15/25(b) | | | 230,000 | | | | 226,550 | |
4.60%, 6/15/28 | | | 100,000 | | | | 79,000 | |
TransDigm, Inc., | | | | | | | | |
6.25%, 3/15/26(b) | | | 260,000 | | | | 254,475 | |
5.50%, 11/15/27(b) | | | 225,000 | | | | 190,125 | |
| | | | | | | 1,512,962 | |
| |
| | |
Airlines – 0.0%(d) | | | | | | | | |
American Airlines Group, Inc., 5.00%, 6/01/22(b) | | | 10,000 | | | | 5,637 | |
| |
| | |
Apparel – 0.1% | | | | | | | | |
Hanesbrands, Inc., | | | | | | | | |
4.63%, 5/15/24(b) | | | 85,000 | | | | 84,973 | |
4.88%, 5/15/26(b) | | | 35,000 | | | | 35,224 | |
William Carter (The) Co., | | | | | | | | |
5.62%, 3/15/27(b) | | | 110,000 | | | | 111,514 | |
| | | | | | | 231,711 | |
| |
| | |
Auto Manufacturers – 1.2% | | | | | | | | |
Ford Motor Co., | | | | | | | | |
8.50%, 4/21/23 | | | 370,000 | | | | 364,913 | |
9.00%, 4/22/25 | | | 435,000 | | | | 423,581 | |
9.62%, 4/22/30 | | | 95,000 | | | | 94,646 | |
Ford Motor Credit Co. LLC, 4.14%, 2/15/23 | | | 500,000 | | | | 461,250 | |
General Motors Co., | | | | | | | | |
5.00%, 4/01/35 | | | 30,000 | | | | 25,414 | |
6.60%, 4/01/36 | | | 115,000 | | | | 105,542 | |
5.15%, 4/01/38 | | | 35,000 | | | | 28,831 | |
| | | | | | | | |
| | | Par(a) | | | Value | |
| |
| | |
Auto Manufacturers (Continued) | | | | | | | | |
General Motors Co., | | | | | | | | |
6.25%, 10/02/43 | | $ | 305,000 | | | $ | 266,976 | |
6.75%, 4/01/46 | | | 75,000 | | | | 69,627 | |
General Motors Financial Co., Inc., | | | | | | | | |
3.20%, 7/06/21 | | | 60,000 | | | | 58,734 | |
3.45%, 4/10/22 | | | 165,000 | | | | 158,898 | |
3.15%, 6/30/22 | | | 55,000 | | | | 52,405 | |
3.70%, 5/09/23 | | | 135,000 | | | | 129,527 | |
| | | | | | | 2,240,344 | |
| |
|
Auto Parts & Equipment – 0.2% | |
American Axle & Manufacturing, Inc., 6.25%, 4/01/25 | | | 120,000 | | | | 91,380 | |
Dana Financing Luxembourg S.a.r.l., 5.75%, 4/15/25(b) | | | 23,000 | | | | 20,873 | |
Delphi Technologies PLC, 5.00%, 10/01/25(b) | | | 47,000 | | | | 43,945 | |
Goodyear Tire & Rubber (The) Co., 5.00%, 5/31/26 | | | 75,000 | | | | 65,250 | |
Panther BF Aggregator 2 L.P./Panther Finance Co., Inc., 8.50%, 5/15/27(b) | | | 105,000 | | | | 88,987 | |
| | | | | | | 310,435 | |
| |
| | |
Banks – 0.2% | | | | | | | | |
CIT Group, Inc., | | | | | | | | |
4.13%, 3/09/21 | | | 75,000 | | | | 73,687 | |
5.00%, 8/01/23 | | | 75,000 | | | | 73,408 | |
5.25%, 3/07/25 | | | 130,000 | | | | 129,415 | |
Provident Funding Associates L.P./PFG Finance Corp., 6.37%, 6/15/25(b) | | | 30,000 | | | | 25,425 | |
| | | | | | | 301,935 | |
| |
| | |
Building Materials – 0.4% | | | | | | | | |
Builders FirstSource, Inc., | | | | | | | | |
6.75%, 6/01/27(b) | | | 130,000 | | | | 133,900 | |
5.00%, 3/01/30(b) | | | 170,000 | | | | 145,877 | |
James Hardie International Finance DAC, 4.75%, 1/15/25(b) | | | 240,000 | | | | 234,096 | |
JELD-WEN, Inc., 4.63%, 12/15/25(b) | | | 43,000 | | | | 38,265 | |
Masonite International Corp., 5.38%, 2/01/28(b) | | | 40,000 | | | | 38,100 | |
U.S. Concrete, Inc., 6.37%, 6/01/24 | | | 239,000 | | | | 225,676 | |
| | | | | | | 815,914 | |
| |
See accompanying Notes to Financial Statements
170
Morningstar Funds Trust April 30, 2020
Schedule of Investments (continued)
Morningstar Multisector Bond Fund
| | | | | | | | |
| | | Par(a) | | | Value | |
| |
| | |
Chemicals – 0.2% | | | | | | | | |
Chemours (The) Co., | | | | | | | | |
7.00%, 5/15/25 | | $ | 25,000 | | | $ | 23,493 | |
5.38%, 5/15/27 | | | 95,000 | | | | 78,850 | |
Hexion, Inc., 7.87%, 7/15/27(b) | | | 45,000 | | | | 41,175 | |
Olin Corp., | | | | | | | | |
5.13%, 9/15/27 | | | 15,000 | | | | 13,701 | |
5.00%, 2/01/30 | | | 55,000 | | | | 48,026 | |
PolyOne Corp., 5/15/25(b)(f) | | | 115,000 | | | | 116,437 | |
| | | | | | | 321,682 | |
| |
|
Commercial Services – 0.6% | |
Hertz (The) Corp.,
7.12%, 8/01/26(b) | | | 35,000 | | | | 7,088 | |
MPH Acquisition Holdings LLC, 7.12%, 6/01/24(b) | | | 105,000 | | | | 93,578 | |
Nielsen Finance LLC/Nielsen Finance Co., 5.00%, 4/15/22(b) | | | 330,000 | | | | 325,086 | |
Prime Security Services Borrower LLC/Prime Finance, Inc., 6.25%, 1/15/28(b) | | | 295,000 | | | | 261,753 | |
United Rentals North America, Inc., | | | | | | | | |
4.63%, 10/15/25 | | | 121,000 | | | | 118,883 | |
5.87%, 9/15/26 | | | 40,000 | | | | 41,100 | |
6.50%, 12/15/26 | | | 75,000 | | | | 77,625 | |
3.88%, 11/15/27 | | | 30,000 | | | | 29,325 | |
4.00%, 7/15/30 | | | 230,000 | | | | 217,350 | |
| | | | | | | 1,171,788 | |
| |
| | |
Computers – 0.1% | | | | | | | | |
NCR Corp., 8.12%, 4/15/25(b) | | | 25,000 | | | | 26,500 | |
Presidio Holdings, Inc., | | | | | | | | |
4.88%, 2/01/27(b) | | | 25,000 | | | | 24,625 | |
8.25%, 2/01/28(b) | | | 25,000 | | | | 24,670 | |
Science Applications International Corp., 4.88%, 4/01/28(b) | | | 5,000 | | | | 4,896 | |
Western Digital Corp., 4.75%, 2/15/26 | | | 73,000 | | | | 74,528 | |
| | | | | | | 155,219 | |
| |
|
Distribution/Wholesale – 0.1% | |
American Builders & Contractors Supply Co., Inc., 4.00%, 1/15/28(b) | | | 35,000 | | | | 33,209 | |
| | | | | | | | |
| | | Par(a) | | | Value | |
| |
|
Distribution/Wholesale (Continued) | |
Performance Food Group, Inc., 5.50%, 10/15/27(b) | | $ | 45,000 | | | $ | 42,751 | |
Wolverine Escrow LLC, 9.00%, 11/15/26(b) | | | 60,000 | | | | 41,598 | |
| | | | | | | 117,558 | |
| |
|
Diversified Financial Services – 1.1% | |
Aircastle Ltd., 5.50%, 2/15/22 | | | 148,000 | | | | 141,137 | |
Ally Financial, Inc., | | | | | | | | |
4.13%, 2/13/22 | | | 77,000 | | | | 78,019 | |
5.75%, 11/20/25 | | | 240,000 | | | | 246,000 | |
Nationstar Mortgage Holdings, Inc., | | | | | | | | |
8.12%, 7/15/23(b) | | | 155,000 | | | | 148,800 | |
9.12%, 7/15/26(b) | | | 75,000 | | | | 71,719 | |
6.00%, 1/15/27(b) | | | 160,000 | | | | 136,496 | |
Navient Corp., | | | | | | | | |
7.25%, 1/25/22 | | | 117,000 | | | | 114,660 | |
6.50%, 6/15/22 | | | 20,000 | | | | 19,350 | |
5.50%, 1/25/23 | | | 65,000 | | | | 60,288 | |
6.13%, 3/25/24 | | | 130,000 | | | | 119,600 | |
5.00%, 3/15/27 | | | 180,000 | | | | 151,560 | |
Quicken Loans, Inc., | | | | | | | | |
5.75%, 5/01/25(b) | | | 205,000 | | | | 200,900 | |
5.75%, 5/01/25 | | | 65,000 | | | | 63,700 | |
5.25%, 1/15/28(b) | | | 150,000 | | | | 145,620 | |
Springleaf Finance Corp., | | | | | | | | |
6.87%, 3/15/25 | | | 60,000 | | | | 56,742 | |
7.12%, 3/15/26 | | | 295,000 | | | | 278,038 | |
5.38%, 11/15/29 | | | 80,000 | | | | 66,415 | |
| | | | | | | 2,099,044 | |
| |
| | |
Electric – 0.8% | | | | | | | | |
AES (The) Corp., | | | | | | | | |
4.00%, 3/15/21 | | | 152,000 | | | | 152,000 | |
5.50%, 4/15/25 | | | 36,000 | | | | 36,900 | |
6.00%, 5/15/26 | | | 37,000 | | | | 38,850 | |
5.12%, 9/01/27 | | | 160,000 | | | | 166,800 | |
Calpine Corp., 5.13%, 3/15/28(b) | | | 415,000 | | | | 404,625 | |
NRG Energy, Inc., | | | | | | | | |
5.75%, 1/15/28 | | | 205,000 | | | | 220,375 | |
5.25%, 6/15/29(b) | | | 10,000 | | | | 10,700 | |
Tallen Energy Supply LLC,
10.50%, 1/15/26(b) | | | 70,000 | | | | 57,755 | |
Vistra Operations Co. LLC, | | | | | | | | |
5.50%, 9/01/26(b) | | | 160,000 | | | | 164,720 | |
3.70%, 1/30/27(b) | | | 220,000 | | | | 216,458 | |
| | | | | | | 1,469,183 | |
| |
See accompanying Notes to Financial Statements
171
Morningstar Funds Trust April 30, 2020
Schedule of Investments (continued)
Morningstar Multisector Bond Fund
| | | | | | | | |
| | | Par(a) | | | Value | |
| |
| | |
Entertainment – 0.2% | | | | | | | | |
AMC Entertainment Holdings, Inc., 10.50%, 4/15/25(b) | | $ | 120,000 | | | $ | 105,750 | |
Caesars Resort Collection LLC/CRC Finco, Inc., 5.25%, 10/15/25(b) | | | 80,000 | | | | 62,824 | |
Live Nation Entertainment, Inc., 4.75%, 10/15/27(b) | | | 140,000 | | | | 118,300 | |
Scientific Games International, Inc., | | | | | | | | |
7.00%, 5/15/28(b) | | | 40,000 | | | | 28,800 | |
7.25%, 11/15/29(b) | | | 35,000 | | | | 24,937 | |
Speedway Motorsports LLC/Speedway Funding II, Inc., 4.88%, 11/01/27(b) | | | 60,000 | | | | 49,800 | |
Wynn Resorts Finance LLC/Wynn Resorts Capital Corp., 5.12%, 10/01/29(b) | | | 80,000 | | | | 75,000 | |
| | | | | | | 465,411 | |
| |
| | |
Food – 0.6% | | | | | | | | |
Albertsons Cos, Inc./Safeway, Inc./New Albertsons L.P./Albertsons LLC, | | | | | | | | |
3.50%, 2/15/23(b) | | | 90,000 | | | | 88,200 | |
4.63%, 1/15/27(b) | | | 90,000 | | | | 90,900 | |
4.87%, 2/15/30(b) | | | 90,000 | | | | 91,238 | |
B&G Foods, Inc., 5.25%, 4/01/25 | | | 93,000 | | | | 94,163 | |
JBS USA LUX S.A./JBS USA Finance, Inc., 5.75%, 6/15/25(b) | | | 32,000 | | | | 32,360 | |
JBS USA LUX S.A./JBS USA Food Co./JBS USA Finance, Inc., | | | | | | | | |
6.50%, 4/15/29(b) | | | 95,000 | | | | 100,463 | |
5.50%, 1/15/30(b) | | | 5,000 | | | | 5,063 | |
Kraft Heinz Foods Co., | | | | | | | | |
5.00%, 6/04/42 | | | 65,000 | | | | 66,030 | |
4.38%, 6/01/46 | | | 55,000 | | | | 52,387 | |
4.87%, 10/01/49(b) | | | 130,000 | | | | 129,518 | |
Pilgrim’s Pride Corp., | | | | | | | | |
5.75%, 3/15/25(b) | | | 79,000 | | | | 79,800 | |
5.87%, 9/30/27(b) | | | 40,000 | | | | 40,478 | |
Post Holdings, Inc., | | | | | | | | |
5.00%, 8/15/26 | | | 180,000 | | | | 177,876 | |
5.75%, 3/01/27(b) | | | 71,000 | | | | 72,686 | |
5.50%, 12/15/29(b) | | | 5,000 | | | | 5,025 | |
4.63%, 4/15/30(b) | | | 135,000 | | | | 132,299 | |
| | | | | | | 1,258,486 | |
| |
| | | | | | | | |
| | | Par(a) | | | Value | |
| |
| | |
Food Service – 0.1% | | | | | | | | |
Aramark Services, Inc., | | | | | | | | |
6.38%, 5/01/25(b) | | $ | 115,000 | | | $ | 119,600 | |
4.75%, 6/01/26 | | | 15,000 | | | | 14,325 | |
5.00%, 2/01/28(b) | | | 20,000 | | | | 19,450 | |
| | | | | | | 153,375 | |
| |
|
Healthcare - Products – 0.0%(d) | |
Hill-Rom Holdings, Inc., 4.38%, 9/15/27(b) | | | 20,000 | | | | 20,250 | |
Hologic, Inc., 4.37%, 10/15/25(b) | | | 70,000 | | | | 70,322 | |
| | | | | | | 90,572 | |
| |
| | |
Healthcare - Services – 1.5% | | | | | | | | |
Catalent Pharma Solutions, Inc., 4.88%, 1/15/26(b) | | | 55,000 | | | | 56,375 | |
Centene Corp., | | | | | | | | |
4.75%, 1/15/25 | | | 150,000 | | | | 154,642 | |
4.75%, 1/15/25(b) | | | 50,000 | | | | 51,548 | |
4.25%, 12/15/27(b) | | | 150,000 | | | | 156,937 | |
4.63%, 12/15/29(b) | | | 70,000 | | | | 76,650 | |
CHS/Community Health Systems, Inc., | | | | | | | | |
6.25%, 3/31/23 | | | 15,000 | | | | 14,100 | |
6.62%, 2/15/25(b) | | | 340,000 | | | | 311,950 | |
8.00%, 3/15/26(b) | | | 185,000 | | | | 177,337 | |
8.00%, 3/15/26 | | | 20,000 | | | | 19,172 | |
DaVita, Inc., 5.12%, 7/15/24 | | | 45,000 | | | | 45,675 | |
Encompass Health Corp., | | | | | | | | |
4.50%, 2/01/28 | | | 65,000 | | | | 65,000 | |
4.75%, 2/01/30 | | | 70,000 | | | | 70,009 | |
HCA, Inc., 5.37%, 2/01/25 | | | 400,000 | | | | 430,056 | |
IQVIA, Inc., 5.00%, 10/15/26(b) | | | 200,000 | | | | 206,000 | |
Polaris Intermediate Corp., (100% Cash), 8.50%, 12/01/22(b)(g) | | | 177,000 | | | | 148,238 | |
Select Medical Corp.,
6.25%, 8/15/26(b) | | | 30,000 | | | | 28,893 | |
Tenet Healthcare Corp., | | | | | | | | |
6.75%, 6/15/23 | | | 570,000 | | | | 569,430 | |
5.13%, 5/01/25 | | | 110,000 | | | | 102,850 | |
6.25%, 2/01/27(b) | | | 150,000 | | | | 147,690 | |
| | | | | | | 2,832,552 | |
| |
| | |
Home Builders – 0.2% | | | | | | | | |
Installed Building Products, Inc., 5.75%, 2/01/28(b) | | | 25,000 | | | | 24,000 | |
KB Home, 4.80%, 11/15/29 | | | 50,000 | | | | 46,750 | |
See accompanying Notes to Financial Statements
172
Morningstar Funds Trust April 30, 2020
Schedule of Investments (continued)
Morningstar Multisector Bond Fund
| | | | | | | | |
| | | Par(a) | | | Value | |
| |
| | |
Home Builders (Continued) | | | | | | | | |
Lennar Corp., | | | | | | | | |
4.75%, 11/15/22 | | $ | 74,000 | | | $ | 75,480 | |
4.75%, 5/30/25 | | | 255,000 | | | | 262,005 | |
Taylor Morrison Communities, Inc., 5.75%, 1/15/28(b) | | | 35,000 | | | | 31,675 | |
| | | | | | | 439,910 | |
| |
|
Household Products/Wares – 0.0%(d) | |
Prestige Brands, Inc., 5.13%, 1/15/28(b) | | | 40,000 | | | | 40,460 | |
| |
| | |
Insurance – 0.0%(d) | | | | | | | | |
AmWINS Group, Inc., 7.75%, 7/01/26(b) | | | 10,000 | | | | 10,300 | |
| |
| | |
Internet – 0.9% | | | | | | | | |
Expedia Group, Inc., | | | | | | | | |
5/01/25(b)(f) | | | 225,000 | | | | 229,455 | |
5/01/25(b)(f) | | | 115,000 | | | | 117,006 | |
3.25%, 2/15/30 | | | 160,000 | | | | 133,547 | |
Netflix, Inc., | | | | | | | | |
4.88%, 4/15/28 | | | 182,000 | | | | 193,544 | |
5.37%, 11/15/29(b) | | | 65,000 | | | | 71,390 | |
Uber Technologies, Inc., | | | | | | | | |
8.00%, 11/01/26(b) | | | 650,000 | | | | 666,257 | |
7.50%, 9/15/27(b) | | | 290,000 | | | | 295,829 | |
| | | | | | | 1,707,028 | |
| |
| | |
Investment Companies – 0.4% | | | | | | | | |
Icahn Enterprises L.P./Icahn Enterprises Finance Corp., | | | | | | | | |
6.75%, 2/01/24 | | | 55,000 | | | | 55,138 | |
4.75%, 9/15/24 | | | 170,000 | | | | 159,888 | |
6.25%, 5/15/26 | | | 165,000 | | | | 162,132 | |
5.25%, 5/15/27 | | | 415,000 | | | | 394,254 | |
| | | | | | | 771,412 | |
| |
| | |
Iron/Steel – 0.2% | | | | | | | | |
Allegheny Technologies, Inc., | | | | | | | | |
7.87%, 8/15/23 | | | 85,000 | | | | 77,936 | |
5.88%, 12/01/27 | | | 60,000 | | | | 49,500 | |
Cleveland-Cliffs, Inc., 9.87%, 10/17/25(b) | | | 60,000 | | | | 59,400 | |
Commercial Metals Co., 4.88%, 5/15/23 | | | 119,000 | | | | 118,417 | |
United States Steel Corp., | | | | | | | | |
6.87%, 8/15/25 | | | 20,000 | | | | 13,500 | |
6.25%, 3/15/26 | | | 45,000 | | | | 28,611 | |
| | | | | | | 347,364 | |
| |
| | | | | | | | |
| | | Par(a) | | | Value | |
| |
| | |
Leisure Time – 0.2% | | | | | | | | |
Carnival Corp., 11.50%, 4/01/23(b) | | $ | 200,000 | | | $ | 208,969 | |
Sabre GLBL, Inc., | | | | | | | | |
5.25%, 11/15/23(b) | | | 93,000 | | | | 86,025 | |
9.25%, 4/15/25(b) | | | 40,000 | | | | 42,184 | |
| | | | | | | 337,178 | |
| |
| | |
Lodging – 0.5% | | | | | | | | |
Boyd Gaming Corp., | | | | | | | | |
6.37%, 4/01/26 | | | 15,000 | | | | 13,510 | |
6.00%, 8/15/26 | | | 55,000 | | | | 49,775 | |
4.75%, 12/01/27(b) | | | 90,000 | | | | 77,535 | |
Hyatt Hotels Corp., | | | | | | | | |
5.38%, 4/23/25 | | | 40,000 | | | | 40,690 | |
5.75%, 4/23/30 | | | 75,000 | | | | 77,478 | |
Marriott Ownership Resorts, Inc., 4.75%, 1/15/28(b) | | | 115,000 | | | | 100,625 | |
Marriott Ownership Resorts, Inc./ILG LLC, 6.50%, 9/15/26 | | | 61,000 | | | | 57,797 | |
MGM Resorts International, 5.50%, 4/15/27 | | | 195,000 | | | | 179,156 | |
Wyndham Destinations, Inc., | | | | | | | | |
5.62%, 3/01/21 | | | 150,000 | | | | 143,625 | |
4.63%, 3/01/30(b) | | | 65,000 | | | | 55,250 | |
Wynn Las Vegas LLC/Wynn Las Vegas Capital Corp., 5.50%, 3/01/25(b) | | | 175,000 | | | | 155,750 | |
| | | | | | | 951,191 | |
| |
| | |
Media – 1.6% | | | | | | | | |
Block Communications, Inc., 4.88%, 3/01/28(b) | | | 20,000 | | | | 19,900 | |
CCO Holdings LLC/CCO Holdings Capital Corp., | | | | | | | | |
5.13%, 5/01/27(b) | | | 215,000 | | | | 223,245 | |
5.37%, 6/01/29(b) | | | 185,000 | | | | 195,177 | |
4.75%, 3/01/30(b) | | | 705,000 | | | | 717,126 | |
4.50%, 8/15/30(b) | | | 105,000 | | | | 106,344 | |
4.50%, 5/01/32(b) | | | 55,000 | | | | 54,639 | |
Clear Channel Worldwide Holdings, Inc., 9.25%, 2/15/24(b) | | | 65,000 | | | | 54,113 | |
CSC Holdings LLC, | | | | | | | | |
6.75%, 11/15/21 | | | 121,000 | | | | 126,205 | |
5.50%, 4/15/27(b) | | | 200,000 | | | | 207,938 | |
5.75%, 1/15/30(b) | | | 220,000 | | | | 228,731 | |
See accompanying Notes to Financial Statements
173
Morningstar Funds Trust April 30, 2020
Schedule of Investments (continued)
Morningstar Multisector Bond Fund
| | | | | | | | |
| | | Par(a) | | | Value | |
| |
| | |
Media (Continued) | | | | | | | | |
Diamond Sports Group LLC/Diamond Sports Finance Co., 5.38%, 8/15/26(b) | | $ | 285,000 | | | $ | 216,600 | |
DISH DBS Corp., 7.75%, 7/01/26 | | | 165,000 | | | | 162,525 | |
Gray Television, Inc., 5.13%, 10/15/24(b) | | | 35,000 | | | | 34,286 | |
iHeartCommunications, Inc., | | | | | | | | |
6.37%, 5/01/26 | | | 10,000 | | | | 9,450 | |
8.37%, 5/01/27 | | | 675,000 | | | | 555,660 | |
4.75%, 1/15/28(b) | | | 65,000 | | | | 56,875 | |
Meredith Corp., 6.87%, 2/01/26 | | | 76,000 | | | | 65,132 | |
Nexstar Broadcasting, Inc., 5.62%, 7/15/27(b) | | | 20,000 | | | | 19,100 | |
| | | | | | | 3,053,046 | |
| |
| | |
Mining – 0.3% | | | | | | | | |
Freeport-McMoRan, Inc., | | | | | | | | |
5.00%, 9/01/27 | | | 80,000 | | | | 78,000 | |
4.13%, 3/01/28 | | | 125,000 | | | | 115,938 | |
4.25%, 3/01/30 | | | 265,000 | | | | 246,741 | |
5.40%, 11/14/34 | | | 155,000 | | | | 145,312 | |
Novelis Corp., 4.75%, 1/30/30(b) | | | 105,000 | | | | 92,201 | |
| | | | | | | 678,192 | |
| |
|
Office/Business Equipment – 0.0%(d) | |
CDW LLC/CDW Finance Corp., 4.25%, 4/01/28 | | | 95,000 | | | | 95,437 | |
| |
| | |
Oil & Gas – 1.0% | | | | | | | | |
Bruin E&P Partners LLC, 8.87%, 8/01/23(b) | | | 199,000 | | | | 4,975 | |
California Resources Corp., 8.00%, 12/15/22(b) | | | 164,000 | | | | 5,740 | |
Centennial Resource Production LLC, | | | | | | | | |
5.38%, 1/15/26(b) | | | 60,000 | | | | 18,000 | |
6.87%, 4/01/27(b) | | | 105,000 | | | | 31,500 | |
Continental Resources, Inc., | | | | | | | | |
4.50%, 4/15/23 | | | 30,000 | | | | 26,531 | |
3.80%, 6/01/24 | | | 105,000 | | | | 87,433 | |
Denbury Resources, Inc.,
7.75%, 2/15/24(b) | | | 38,000 | | | | 6,840 | |
Diamondback Energy, Inc., 3.50%, 12/01/29 | | | 15,000 | | | | 12,888 | |
EQT Corp., | | | | | | | | |
6.13%, 2/01/25 | | | 25,000 | | | | 23,813 | |
7.00%, 2/01/30 | | | 105,000 | | | | 99,225 | |
Gulfport Energy Corp., 6.00%, 10/15/24 | | | 185,000 | | | | 92,037 | |
| | | | | | | | |
| | | Par(a) | | | Value | |
| |
| | |
Oil & Gas (Continued) | | | | | | | | |
Gulfport Energy Corp., | | | | | | | | |
6.37%, 5/15/25 | | $ | 55,000 | | | $ | 25,861 | |
6.37%, 1/15/26 | | | 29,000 | | | | 13,195 | |
Hess Corp., 5.60%, 2/15/41 | | | 70,000 | | | | 61,233 | |
Montage Resources Corp., 8.87%, 7/15/23 | | | 108,000 | | | | 88,052 | |
Oasis Petroleum, Inc., 6.87%, 3/15/22 | | | 59,000 | | | | 8,703 | |
Occidental Petroleum Corp., | | | | | | | | |
2.70%, 8/15/22 | | | 80,000 | | | | 69,600 | |
2.70%, 2/15/23 | | | 100,000 | | | | 85,900 | |
2.90%, 8/15/24 | | | 405,000 | | | | 303,750 | |
3.50%, 6/15/25 | | | 280,000 | | | | 202,160 | |
5.55%, 3/15/26 | | | 65,000 | | | | 50,284 | |
3.40%, 4/15/26 | | | 20,000 | | | | 14,200 | |
3.20%, 8/15/26 | | | 25,000 | | | | 18,000 | |
3.00%, 2/15/27 | | | 35,000 | | | | 24,325 | |
3.50%, 8/15/29 | | | 70,000 | | | | 48,300 | |
4.20%, 3/15/48 | | | 5,000 | | | | 2,988 | |
4.40%, 8/15/49 | | | 155,000 | | | | 92,806 | |
Parsley Energy LLC/Parsley Finance Corp., | | | | | | | | |
5.38%, 1/15/25(b) | | | 30,000 | | | | 26,925 | |
5.25%, 8/15/25(b) | | | 10,000 | | | | 8,825 | |
5.63%, 10/15/27(b) | | | 100,000 | | | | 85,500 | |
SM Energy Co., 5.00%, 1/15/24 | | | 95,000 | | | | 29,963 | |
Transocean Guardian Ltd.,
5.88%, 1/15/24(b) | | | 56,780 | | | | 43,437 | |
Transocean Pontus Ltd.,
6.12%, 8/01/25(b) | | | 4,175 | | | | 3,382 | |
Transocean Sentry Ltd.,
5.38%, 5/15/23(b) | | | 160,000 | | | | 121,600 | |
Vine Oil & Gas L.P./Vine Oil & Gas Finance Corp., 9.75%, 4/15/23(b) | | | 50,000 | | | | 25,000 | |
Viper Energy Partners L.P., 5.38%, 11/01/27(b) | | | 10,000 | | | | 8,950 | |
Whiting Petroleum Corp., | | | | | | | | |
5.75%, 3/15/21(h) | | | 50,000 | | | | 5,000 | |
6.25%, 4/01/23(h) | | | 160,000 | | | | 15,600 | |
6.62%, 1/15/26(h) | | | 75,000 | | | | 7,500 | |
WPX Energy, Inc., 5.25%, 10/15/27 | | | 30,000 | | | | 26,100 | |
| | | | | | | 1,926,121 | |
| |
See accompanying Notes to Financial Statements
174
Morningstar Funds Trust April 30, 2020
Schedule of Investments (continued)
Morningstar Multisector Bond Fund
| | | | | | | | |
| | | Par(a) | | | Value | |
| |
| | |
Oil & Gas Services – 0.1% | | | | | | | | |
McDermott Technology Americas, Inc./McDermott Technology U.S., Inc., 10.63%, 5/01/24(b)(h) | | $ | 178,000 | | | $ | 8,900 | |
Transocean Proteus Ltd., 6.25%, 12/01/24(b) | | | 131,600 | | | | 111,268 | |
| | | | | | | 120,168 | |
| |
| | |
Packaging & Containers – 0.1% | | | | | | | | |
Berry Global, Inc., 4.50%, 2/15/26(b) | | | 55,000 | | | | 54,290 | |
Crown Americas LLC/Crown Americas Capital Corp. VI, 4.75%, 2/01/26 | | | 39,000 | | | | 40,073 | |
Mauser Packaging Solutions Holding Co., 7.25%, 4/15/25(b) | | | 110,000 | | | | 86,075 | |
Silgan Holdings, Inc., 4.75%, 3/15/25 | | | 95,000 | | | | 96,425 | |
| | | | | | | 276,863 | |
| |
| | |
Pharmaceuticals – 0.4% | | | | | | | | |
Bausch Health Americas, Inc., | | | | | | | | |
9.25%, 4/01/26(b) | | | 75,000 | | | | 82,875 | |
8.50%, 1/31/27(b) | | | 10,000 | | | | 11,024 | |
Bausch Health Cos., Inc., | | | | | | | | |
5.50%, 3/01/23(b) | | | 3,000 | | | | 2,970 | |
5.88%, 5/15/23(b) | | | 2,000 | | | | 1,985 | |
6.12%, 4/15/25(b) | | | 80,000 | | | | 81,000 | |
9.00%, 12/15/25(b) | | | 195,000 | | | | 212,647 | |
5.00%, 1/30/28(b) | | | 100,000 | | | | 95,969 | |
7.25%, 5/30/29(b) | | | 50,000 | | | | 53,359 | |
5.25%, 1/30/30(b) | | | 100,000 | | | | 99,001 | |
Endo Dac/Endo Finance LLC/Endo Finco, Inc., 6.00%, 2/01/25(b) | | | 200,000 | | | | 143,000 | |
| | | | | | | 783,830 | |
| |
| | |
Pipelines – 0.6% | | | | | | | | |
Enable Midstream Partners L.P., | | | | | | | | |
4.40%, 3/15/27 | | | 35,000 | | | | 27,123 | |
4.95%, 5/15/28 | | | 65,000 | | | | 49,949 | |
Energy Transfer Operating L.P., (3M USD LIBOR + 4.03%), 6.25%, 2/15/23(i)(j) | | | 152,000 | | | | 106,400 | |
EnLink Midstream Partners L.P., | | | | | | | | |
5.60%, 4/01/44 | | | 10,000 | | | | 4,000 | |
5.05%, 4/01/45 | | | 5,000 | | | | 2,025 | |
5.45%, 6/01/47 | | | 215,000 | | | | 87,344 | |
| | | | | | | | |
| | | Par(a) | | | Value | |
| |
| | |
Pipelines (Continued) | | | | | | | | |
EQM Midstream Partners L.P., 5.50%, 7/15/28 | | $ | 25,000 | | | $ | 22,250 | |
Genesis Energy L.P./Genesis Energy Finance Corp., 7.75%, 2/01/28 | | | 75,000 | | | | 63,750 | |
Hess Midstream Operations L.P., 5.63%, 2/15/26(b) | | | 244,000 | | | | 226,920 | |
NGPL PipeCo LLC, 4.88%, 8/15/27(b) | | | 38,000 | | | | 38,723 | |
NuStar Logistics L.P., 5.62%, 4/28/27 | | | 120,000 | | | | 108,000 | |
Tallgrass Energy Partners L.P./Tallgrass Energy Finance Corp., 6.00%, 3/01/27(b) | | | 90,000 | | | | 59,850 | |
Targa Resources Partners L.P./Targa Resources Partners Finance Corp., | | | | | | | | |
5.25%, 5/01/23 | | | 113,000 | | | | 106,740 | |
5.87%, 4/15/26 | | | 80,000 | | | | 71,720 | |
5.50%, 3/01/30(b) | | | 45,000 | | | | 38,363 | |
Western Midstream Operating L.P., 4.05%, 2/01/30 | | | 85,000 | | | | 77,562 | |
| | | | | | | 1,090,719 | |
| |
|
Real Estate Investment Trusts – 1.0% | |
Brookfield Property REIT, Inc./BPR Cumulus LLC/BPR Nimbus LLC/GGSI Sellco LLC, 5.75%, 5/15/26(b) | | | 325,000 | | | | 260,000 | |
Iron Mountain, Inc., 4.87%, 9/15/29(b) | | | 335,000 | | | | 320,762 | |
iStar, Inc., 5.25%, 9/15/22 | | | 38,000 | | | | 34,390 | |
Ladder Capital Finance Holdings LLLP/Ladder Capital Finance Corp., | | | | | | | | |
5.87%, 8/01/21(b) | | | 231,000 | | | | 204,435 | |
5.25%, 3/15/22(b) | | | 85,000 | | | | 70,125 | |
5.25%, 10/01/25(b) | | | 215,000 | | | | 156,413 | |
4.25%, 2/01/27(b) | | | 150,000 | | | | 104,250 | |
MGM Growth Properties Operating Partnership L.P./MGP Finance Co-Issuer, Inc., | | | | | | | | |
5.75%, 2/01/27 | | | 35,000 | | | | 35,438 | |
4.50%, 1/15/28 | | | 246,000 | | | | 231,240 | |
Service Properties Trust, | | | | | | | | |
4.35%, 10/01/24 | | | 140,000 | | | | 118,557 | |
4.75%, 10/01/26 | | | 65,000 | | | | 53,271 | |
See accompanying Notes to Financial Statements
175
Morningstar Funds Trust April 30, 2020
Schedule of Investments (continued)
Morningstar Multisector Bond Fund
| | | | | | | | |
| | | Par(a) | | | Value | |
| |
|
Real Estate Investment Trusts (Continued) | |
Starwood Property Trust, Inc., | | | | | | | | |
3.63%, 2/01/21 | | $ | 29,000 | | | $ | 27,260 | |
4.75%, 3/15/25 | | | 147,000 | | | | 124,215 | |
Uniti Group L.P./Uniti Fiber Holdings, Inc./CSL Capital LLC,
7.87%, 2/15/25(b) | | | 45,000 | | | | 43,200 | |
Uniti Group L.P./Uniti Group Finance, Inc./CSL Capital LLC, 8.25%, 10/15/23 | | | 60,000 | | | | 49,782 | |
VICI Properties L.P./VICI Note Co., Inc., | | | | | | | | |
3.50%, 2/15/25(b) | | | 45,000 | | | | 42,300 | |
3.75%, 2/15/27(b) | | | 65,000 | | | | 60,450 | |
4.13%, 8/15/30(b) | | | 70,000 | | | | 63,700 | |
| | | | | | | 1,999,788 | |
| |
| | |
Retail – 0.5% | | | | | | | | |
Asbury Automotive Group, Inc., | | | | | | | | |
4.50%, 3/01/28(b) | | | 19,000 | | | | 15,954 | |
4.75%, 3/01/30(b) | | | 22,000 | | | | 18,433 | |
IRB Holding Corp., 6.75%, 2/15/26(b) | | | 85,000 | | | | 70,550 | |
KFC Holding Co./Pizza Hut Holdings LLC/Taco Bell of America LLC, 5.25%, 6/01/26(b) | | | 115,000 | | | | 117,588 | |
L Brands, Inc., | | | | | | | | |
5.25%, 2/01/28 | | | 90,000 | | | | 64,575 | |
6.88%, 11/01/35 | | | 110,000 | | | | 81,004 | |
6.75%, 7/01/36 | | | 65,000 | | | | 46,800 | |
Murphy Oil USA, Inc., 4.75%, 9/15/29 | | | 20,000 | | | | 20,594 | |
PetSmart, Inc., | | | | | | | | |
7.12%, 3/15/23(b) | | | 315,000 | | | | 301,612 | |
8.87%, 6/01/25(b) | | | 25,000 | | | | 24,250 | |
QVC, Inc., 4.85%, 4/01/24 | | | 5,000 | | | | 4,794 | |
Staples, Inc., 7.50%, 4/15/26(b) | | | 225,000 | | | | 177,750 | |
Yum! Brands, Inc., 4.75%, 1/15/30(b) | | | 10,000 | | | | 10,200 | |
| | | | | | | 954,104 | |
| |
| | |
Software – 0.3% | | | | | | | | |
Camelot Finance S.A.,
4.50%, 11/01/26(b) | | | 75,000 | | | | 75,562 | |
CDK Global, Inc., 5.25%, 5/15/29(b) | | | 20,000 | | | | 20,400 | |
Dun & Bradstreet (The) Corp., 6.87%, 8/15/26(b) | | | 120,000 | | | | 126,300 | |
| | | | | | | | |
| | | Par(a) | | | Value | |
| |
| | |
Software (Continued) | | | | | | | | |
MSCI, Inc., | | | | | | | | |
4.00%, 11/15/29(b) | | $ | 30,000 | | | $ | 31,368 | |
3.63%, 9/01/30(b) | | | 75,000 | | | | 75,937 | |
PTC, Inc., | | | | | | | | |
3.62%, 2/15/25(b) | | | 45,000 | | | | 44,303 | |
4.00%, 2/15/28(b) | | | 65,000 | | | | 63,700 | |
SS&C Technologies, Inc., 5.50%, 9/30/27(b) | | | 115,000 | | | | 117,875 | |
| | | | | | | 555,445 | |
| |
| | |
Telecommunications – 1.1% | | | | | | | | |
CenturyLink, Inc., | | | | | | | | |
5.80%, 3/15/22 | | | 38,000 | | | | 38,910 | |
5.63%, 4/01/25 | | | 50,000 | | | | 50,000 | |
5.13%, 12/15/26(b) | | | 95,000 | | | | 90,013 | |
CommScope Technologies LLC, | | | | | | | | |
6.00%, 6/15/25(b) | | | 40,000 | | | | 35,596 | |
5.00%, 3/15/27(b) | | | 315,000 | | | | 270,112 | |
CommScope, Inc., | | | | | | | | |
5.50%, 3/01/24(b) | | | 70,000 | | | | 70,000 | |
8.25%, 3/01/27(b) | | | 115,000 | | | | 110,228 | |
Frontier Communications Corp., 8.00%, 4/01/27(b)(h) | | | 155,000 | | | | 158,053 | |
Intelsat Jackson Holdings S.A., | | | | | | | | |
5.50%, 8/01/23 | | | 70,000 | | | | 37,450 | |
8.50%, 10/15/24(b) | | | 90,000 | | | | 52,200 | |
9.75%, 7/15/25(b) | | | 90,000 | | | | 50,850 | |
Level 3 Financing, Inc.,
4.63%, 9/15/27(b) | | | 185,000 | | | | 183,298 | |
Sprint Capital Corp., 6.87%, 11/15/28 | | | 210,000 | | | | 252,913 | |
Sprint Corp., | | | | | | | | |
7.25%, 9/15/21 | | | 198,000 | | | | 207,652 | |
7.87%, 9/15/23 | | | 20,000 | | | | 22,477 | |
7.12%, 6/15/24 | | | 200,000 | | | | 224,504 | |
T-Mobile USA, Inc., | | | | | | | | |
4.00%, 4/15/22 | | | 150,000 | | | | 153,375 | |
4.50%, 2/01/26 | | | 55,000 | | | | 56,667 | |
| | | | | | | 2,064,298 | |
| |
| | |
Toys/Games/Hobbies – 0.0%(d) | | | | | | | | |
Mattel, Inc., 5.88%, 12/15/27(b) | | | 30,000 | | | | 29,196 | |
| |
Total Corporate Bonds
(Cost $35,779,843) | | | | | | | 34,019,895 | |
| |
See accompanying Notes to Financial Statements
176
Morningstar Funds Trust April 30, 2020
Schedule of Investments (continued)
Morningstar Multisector Bond Fund
| | | | | | | | | | | | |
| | | | | | Par(a) | | | Value | |
| |
|
Foreign Government Inflation-Linked Bonds – 0.9% | |
| | | |
Sovereign – 0.9% | | | | | | | | | | | | |
Argentina Treasury Bond, 1.10%, 4/17/21 | | | ARS | | | $ | 1,809,000 | | | $ | 24,714 | |
1.20%, 3/18/22 | | | ARS | | | | 42,118,125 | | | | 557,870 | |
1.40%, 3/25/23 | | | ARS | | | | 42,293,339 | | | | 503,849 | |
1.50%, 3/25/24 | | | ARS | | | | 42,293,347 | | | | 448,683 | |
Brazil Notas do Tesouro Nacional, Serie B, 6.00%, 5/15/35 | | | BRL | | | | 230,000 | | | | 164,536 | |
| | | | | | | | | | | 1,699,652 | |
| |
Total Foreign Government Inflation-Linked Bonds
(Cost $1,842,535) | | | | 1,699,652 | |
| |
| |
Foreign Issuer Bonds – 61.8% | | | | | |
| | | |
Angola – 0.2% | | | | | | | | | | | | |
Angolan Government International Bond, | | | | | | | | | | | | |
8.25%, 5/09/28(b) | | | | | | | 260,000 | | | | 113,110 | |
9.37%, 5/08/48(b) | | | | | | | 200,000 | | | | 85,247 | |
9.13%, 11/26/49(b) | | | | | | | 400,000 | | | | 171,307 | |
| | | | | | | | | | | 369,664 | |
| |
| | | |
Argentina – 0.5% | | | | | | | | | | | | |
Argentine Bonos del Tesoro, | | | | | | | | | | | | |
18.20%, 10/03/21 | | | ARS | | | | 9,000,000 | | | | 93,342 | |
15.50%, 10/17/26 | | | ARS | | | | 3,952,000 | | | | 31,311 | |
Argentine Republic Government International Bond, | | | | | | | | | | | | |
6.87%, 1/26/27 | | | | | | | 990,000 | | | | 247,510 | |
5.88%, 1/11/28 | | | | | | | 881,000 | | | | 221,581 | |
Letras de la Nacion Argentina con Ajuste por CER, 0.00%, 12/04/20(k) | | | ARS | | | | 16,116,100 | | | | 225,350 | |
YPF S.A., | | | | | | | | | | | | |
(Argentina Deposit Rates Badlar Private Banks 30-35 Days + 4.00%), 31.44%, 7/07/20(b)(e) | | | | | | | 24,000 | | | | 3,825 | |
6.95%, 7/21/27(b) | | | | | | | 120,000 | | | | 53,401 | |
| | | | | | | | | | | 876,320 | |
| |
| | | |
Armenia – 0.1% | | | | | | | | | | | | |
Ardshinbank CJSC Via Dilijan Finance B.V., 6.50%, 1/28/25(b) | | | | | | | 200,000 | | | | 162,348 | |
| |
| | | | | | | | | | | | |
| | | | | | Par(a) | | | Value | |
| |
| | | |
Australia – 0.2% | | | | | | | | | | | | |
FMG Resources (August 2006) Pty. Ltd., 5.13%, 5/15/24(b) | | | | | | $ | 95,000 | | | $ | 96,396 | |
Mineral Resources Ltd., 8.12%, 5/01/27(b) | | | | | | | 265,000 | | | | 272,619 | |
| | | | | | | | | | | 369,015 | |
| |
| | | |
Bahrain – 0.6% | | | | | | | | | | | | |
Bahrain Government International Bond, | | | | | | | | | | | | |
6.75%, 9/20/29 | | | | | | | 400,000 | | | | 388,452 | |
5.62%, 9/30/31(b) | | | | | | | 400,000 | | | | 359,000 | |
6.00%, 9/19/44 | | | | | | | 200,000 | | | | 170,714 | |
7.50%, 9/20/47 | | | | | | | 200,000 | | | | 191,780 | |
| | | | | | | | | | | 1,109,946 | |
| |
| | | |
Belgium – 0.2% | | | | | | | | | | | | |
Telenet Finance Luxembourg Notes S.a.r.l.,
5.50%, 3/01/28(b) | | | | | | | 400,000 | | | | 409,954 | |
| |
| | | |
Brazil – 5.2% | | | | | | | | | | | | |
Andrade Gutierrez International S.A., 9.50%, 12/30/24(b) | | | | | | | 245,000 | | | | 171,500 | |
Banco BTG Pactual S.A., (5Y US Treasury CMT + 5.26%), 7.75%, 2/15/29(b)(j) | | | | | | | 200,000 | | | | 184,600 | |
Banco do Brasil S.A., (10Y US Treasury CMT + 4.40%), 6.25%, 4/15/24(i)(j) | | | | | | | 600,000 | | | | 490,500 | |
Brazil Letras do Tesouro Nacional, | | | | | | | | | | | | |
0.00%, 7/01/20(k) | | | BRL | | | | 2,950,000 | | | | 539,797 | |
0.00%, 10/01/20(k) | | | BRL | | | | 3,140,000 | | | | 570,469 | |
0.00%, 4/01/21(k) | | | BRL | | | | 170,000 | | | | 30,434 | |
0.00%, 7/01/21(k) | | | BRL | | | | 4,660,000 | | | | 826,050 | |
0.00%, 1/01/22(k) | | | BRL | | | | 6,100,000 | | | | 1,054,321 | |
Brazil Notas do Tesouro Nacional, Serie F, | | | | | | | | | | | | |
10.00%, 1/01/23 | | | BRL | | | | 6,294,000 | | | | 1,296,690 | |
10.00%, 1/01/25 | | | BRL | | | | 6,000,000 | | | | 1,256,067 | |
10.00%, 1/01/27 | | | BRL | | | | 1,794,000 | | | | 377,100 | |
10.00%, 1/01/29 | | | BRL | | | | 2,910,000 | | | | 615,808 | |
CSN Islands XI Corp., 6.75%, 1/28/28(b) | | | | | | | 200,000 | | | | 130,500 | |
CSN Islands XII Corp., 7.00%, 6/23/20(i) | | | | | | | 100,000 | | | | 60,001 | |
Embraer Netherlands Finance B.V., | | | | | | | | | | | | |
5.05%, 6/15/25 | | | | | | | 60,000 | | | | 50,400 | |
5.40%, 2/01/27 | | | | | | | 10,000 | | | | 8,450 | |
See accompanying Notes to Financial Statements
177
Morningstar Funds Trust April 30, 2020
Schedule of Investments (continued)
Morningstar Multisector Bond Fund
| | | | | | |
| | | Par(a) | | | Value |
| | |
Brazil (Continued) | | | | | | |
Globo Comunicacao e Participacoes S.A., 4.88%, 1/22/30(b) | | $ | 200,000 | | | $ 178,000 |
Klabin Austria GmbH, 7.00%, 4/03/49(b) | | | 400,000 | | | 389,500 |
MARB BondCo PLC, 6.87%, 1/19/25(b) | | | 200,000 | | | 192,000 |
MV24 Capital B.V., 6.75%, 6/01/34(b) | | | 197,212 | | | 166,153 |
NBM US Holdings, inc., 7.00%, 5/14/26(b) | | | 200,000 | | | 192,500 |
Petrobras Global Finance B.V., | | | | | | |
5.75%, 2/01/29 | | | 175,000 | | | 166,250 |
6.90%, 3/19/49 | | | 90,000 | | | 87,300 |
6.85%, 6/05/15(l) | | | 683,000 | | | 638,605 |
Rede D’or Finance S.a.r.l.,
4.50%, 1/22/30(b) | | | 200,000 | | | 169,260 |
Usiminas International S.a.r.l.,
5.87%, 7/18/26(b) | | | 200,000 | | | 175,752 |
| | | | | | | 10,018,007 |
| | |
Canada – 0.8% | | | | | | |
1011778 B.C. ULC/New Red Finance, Inc., | | | | | | |
5.00%, 10/15/25(b) | | | 104,000 | | | 104,520 |
3.88%, 1/15/28(b) | | | 85,000 | | | 82,442 |
4.38%, 1/15/28(b) | | | 120,000 | | | 116,034 |
Baytex Energy Corp., 5.62%, 6/01/24(b) | | | 123,000 | | | 45,510 |
Bombardier, Inc., | | | | | | |
8.75%, 12/01/21(b) | | | 50,000 | | | 41,600 |
6.00%, 10/15/22(b) | | | 205,000 | | | 153,750 |
6.12%, 1/15/23(b) | | | 360,000 | | | 257,400 |
7.87%, 4/15/27(b) | | | 125,000 | | | 80,938 |
Brookfield Residential Properties, Inc./Brookfield Residential US Corp., 4.88%, 2/15/30(b) | | | 55,000 | | | 45,166 |
Cenovus Energy, Inc., | | | | | | |
3.00%, 8/15/22 | | | 45,000 | | | 39,716 |
4.25%, 4/15/27 | | | 15,000 | | | 11,799 |
5.25%, 6/15/37 | | | 10,000 | | | 6,767 |
5.40%, 6/15/47 | | | 115,000 | | | 75,690 |
Mattamy Group Corp., 4.63%, 3/01/30(b) | | | 65,000 | | | 57,551 |
Open Text Corp., | | | | | | |
5.87%, 6/01/26(b) | | | 24,000 | | | 25,200 |
3.88%, 2/15/28(b) | | | 115,000 | | | 112,700 |
Parkland Fuel Corp., | | | | | | |
6.00%, 4/01/26(b) | | | 164,000 | | | 157,850 |
5.87%, 7/15/27(b) | | | 80,000 | | | 76,800 |
| | | | | | | | | | |
| | | | | | Par(a) | | | Value |
| | | |
Canada (Continued) | | | | | | | | | | |
Seven Generations Energy Ltd., | | | | | | | | | | |
6.87%, 6/30/23(b) | | | | | | $ | 27,000 | | | $ 24,408 |
5.38%, 9/30/25(b) | | | | | | | 141,000 | | | 112,447 |
| | | | | | | | | | | 1,628,288 |
| | | |
Chile – 1.3% | | | | | | | | | | |
AES Gener S.A., (5Y USD Swap Rate + 4.64%),
7.12%, 3/26/79(b)(j) | | | | | | | 200,000 | | | 190,968 |
Bonos de la Tesoreria de la Republica en pesos, | | | | | | | | | | |
4.70%, 9/01/30(b) | | | CLP | | | | 425,000,000 | | | 602,138 |
5.00%, 3/01/35 | | | CLP | | | | 145,000,000 | | | 218,052 |
Chile Government International Bond, | | | | | | | | | | |
2.55%, 1/27/32 | | | | | | | 425,000 | | | 424,579 |
3.50%, 1/25/50 | | | | | | | 400,000 | | | 406,000 |
Corp. Nacional del Cobre de Chile, | | | | | | | | | | |
3.15%, 1/14/30(b) | | | | | | | 200,000 | | | 193,080 |
3.70%, 1/30/50(b) | | | | | | | 200,000 | | | 180,831 |
Kenbourne Invest S.A., 6.88%, 11/26/24(b) | | | | | | | 200,000 | | | 187,000 |
Latam Finance Ltd., 7.00%, 3/01/26(b) | | | | | | | 200,000 | | | 83,000 |
| | | | | | | | | | | 2,485,648 |
| | | |
China – 2.3% | | | | | | | | | | |
Agricultural Development Bank of China, 3.75%, 1/25/29 | | | CNY | | | | 6,540,000 | | | 976,580 |
CFLD Cayman Investment Ltd., 8.60%, 4/08/24 | | | | | | | 200,000 | | | 179,989 |
China Development Bank, 3.48%, 1/08/29 | | | CNY | | | | 3,990,000 | | | 586,355 |
China Evergrande Group, 8.25%, 3/23/22 | | | | | | | 600,000 | | | 535,513 |
Easy Tactic Ltd., 8.12%, 2/27/23 | | | | | | | 200,000 | | | 181,241 |
Fantasia Holdings Group Co. Ltd., 7.38%, 10/04/21 | | | | | | | 200,000 | | | 191,086 |
Greenland Global Investment Ltd., 5.88%, 7/03/24 | | | | | | | 200,000 | | | 182,292 |
Kaisa Group Holdings Ltd., | | | | | | | | | | |
8.50%, 6/30/22 | | | | | | | 400,000 | | | 374,512 |
11.95%, 10/22/22 | | | | | | | 200,000 | | | 194,750 |
New Metro Global Ltd., 6.50%, 4/23/21 | | | | | | | 200,000 | | | 198,602 |
Ronshine China Holdings Ltd., 8.75%, 10/25/22 | | | | | | | 200,000 | | | 200,275 |
See accompanying Notes to Financial Statements
178
Morningstar Funds Trust April 30, 2020
Schedule of Investments (continued)
Morningstar Multisector Bond Fund
| | | | | | | | | | |
| | | | | | Par(a) | | | Value |
| |
China (Continued) | | | |
Sunac China Holdings Ltd., | | | | | | | | | | |
7.87%, 2/15/22 | | | | | | $ | 200,000 | | | $ 200,779 |
7.50%, 2/01/24 | | | | | | | 200,000 | | | 193,457 |
Yuzhou Properties Co. Ltd., 8.30%, 5/27/25 | | | | | | | 200,000 | | | 175,930 |
| | | | | | | | | | | 4,371,361 |
| |
Colombia – 1.9% | | | |
Bancolombia S.A., (5Y US Treasury
CMT + 2.94%), 4.63%, 12/18/29(j) | | | | | | | 200,000 | | | 172,500 |
Colombia Government International Bond, 3.00%, 1/30/30 | | | | | | | 400,000 | | | 363,204 |
Colombian TES, | | | | | | | | | | |
10.00%, 7/24/24 | | | COP | | | | 2,467,700,000 | | | 733,897 |
7.50%, 8/26/26 | | | COP | | | | 1,643,000,000 | | | 444,067 |
6.00%, 4/28/28 | | | COP | | | | 2,617,000,000 | | | 631,163 |
7.75%, 9/18/30 | | | COP | | | | 755,100,000 | | | 201,996 |
Ecopetrol S.A., | | | | | | | | | | |
6.87%, 4/29/30 | | | | | | | 185,000 | | | 189,162 |
5.87%, 5/28/45 | | | | | | | 330,000 | | | 289,443 |
Geopark Ltd., 5.50%, 1/17/27(b) | | | | | | | 200,000 | | | 127,002 |
Grupo Aval Ltd., 4.38%, 2/04/30(b) | | | | | | | 200,000 | | | 168,000 |
Millicom International Cellular S.A., | | | | | | | | | | |
5.12%, 1/15/28 | | | | | | | 200,000 | | | 183,660 |
6.25%, 3/25/29(b) | | | | | | | 200,000 | | | 196,000 |
| | | | | | | | | | | 3,700,094 |
| |
Costa Rica – 0.2% | | | |
Costa Rica Government International Bond, 6.13%, 2/19/31(b) | | | | | | | 400,000 | | | 323,000 |
| |
Czech Republic – 0.7% | | | |
Czech Republic Government Bond, | | | | | | | | | | |
2.50%, 8/25/28 | | | CZK | | | | 6,570,000 | | | 294,568 |
2.75%, 7/23/29 | | | CZK | | | | 8,230,000 | | | 377,952 |
0.95%, 5/15/30 | | | CZK | | | | 5,740,000 | | | 225,460 |
2.00%, 10/13/33 | | | CZK | | | | 12,070,000 | | | 527,325 |
| | | | | | | | | | | 1,425,305 |
| |
Dominican Republic – 0.7% | | | |
Dominican Republic International Bond, | | | | | | | | | | |
5.95%, 1/25/27(b) | | | | | | | 150,000 | | | 135,375 |
4.50%, 1/30/30(b) | | | | | | | 725,000 | | | 599,937 |
6.40%, 6/05/49(b) | | | | | | | 570,000 | | | 468,825 |
5.87%, 1/30/60(b) | | | | | | | 290,000 | | | 231,275 |
| | | | | | | | | | | 1,435,412 |
| | | | | | | | | | |
| | | | | | Par(a) | | | Value |
| |
Ecuador – 0.2% | | | |
Ecuador Government International Bond, | | | | | | | | | | |
7.88%, 3/27/25(b) | | | | | | $ | 200,000 | | | $ 57,356 |
8.87%, 10/23/27 | | | | | | | 340,000 | | | 96,904 |
7.87%, 1/23/28(b) | | | | | | | 220,000 | | | 62,427 |
9.50%, 3/27/30(b) | | | | | | | 650,000 | | | 188,500 |
| | | | | | | | | | | 405,187 |
Egypt – 0.8% | | | |
Egypt Government International Bond, | | | | | | | | | | |
7.60%, 3/01/29(b) | | | | | | | 200,000 | | | 189,582 |
7.05%, 1/15/32(b) | | | | | | | 635,000 | | | 564,573 |
8.50%, 1/31/47 | | | | | | | 600,000 | | | 538,914 |
8.70%, 3/01/49(b) | | | | | | | 250,000 | | | 224,049 |
| | | | | | | | | | | 1,517,118 |
| |
El Salvador – 0.2% | | | |
El Salvador Government International Bond, | | | | | | | | | | |
5.88%, 1/30/25 | | | | | | | 255,000 | | | 203,362 |
6.37%, 1/18/27 | | | | | | | 225,000 | | | 178,313 |
| | | | | | | | | | | 381,675 |
| |
Finland – 0.1% | | | |
Nokia OYJ, 4.38%, 6/12/27 | | | | | | | 249,000 | | | 252,735 |
| |
Germany – 0.1% | | | |
Deutsche Bank A.G., (5Y USD Swap Rate + 2.55%), 4.88%, 12/01/32(j) | | | | | | | 200,000 | | | 179,420 |
| |
Ghana – 0.7% | | | |
Ghana Government International Bond, | | | | | | | | | | |
8.12%, 3/26/32(b) | | | | | | | 515,000 | | | 391,400 |
7.88%, 2/11/35(b) | | | | | | | 200,000 | | | 150,300 |
8.95%, 3/26/51(b) | | | | | | | 400,000 | | | 301,905 |
Ghana Treasury Note, 19.75%, 3/08/21 | | | GHS | | | | 220,000 | | | 39,223 |
Republic of Ghana Government Bonds, | | | | | | | | | | |
17.50%, 8/17/20 | | | GHS | | | | 220,000 | | | 38,464 |
24.50%, 6/21/21 | | | GHS | | | | 580,000 | | | 108,142 |
24.75%, 7/19/21 | | | GHS | | | | 678,000 | | | 126,613 |
18.25%, 7/25/22 | | | GHS | | | | 1,530,000 | | | 258,588 |
| | | | | | | | | | | 1,414,635 |
| |
Guatemala – 0.1% | | | |
Guatemala Government Bond, 6.13%, 6/01/50(b) | | | | | | | 250,000 | | | 260,875 |
See accompanying Notes to Financial Statements
179
Morningstar Funds Trust April 30, 2020
Schedule of Investments (continued)
Morningstar Multisector Bond Fund
| | | | | | | | | | | | |
| | | | | | Par(a) | | | Value | |
| | | |
Hungary – 0.7% | | | | | | | | | | | | |
Hungary Government Bond, | | | | | | | | | | | | |
2.50%, 10/24/24 | | | HUF | | | $ | 64,000,000 | | | $ | 208,799 | |
2.75%, 12/22/26 | | | HUF | | | | 102,000,000 | | | | 339,088 | |
3.00%, 8/21/30 | | | HUF | | | | 17,860,000 | | | | 61,556 | |
3.25%, 10/22/31 | | | HUF | | | | 223,740,000 | | | | 789,034 | |
| | | | | | | | | | | | 1,398,477 | |
| | | |
India – 1.4% | | | | | | | | | | | | |
Adani Ports & Special Economic Zone Ltd., 4.37%, 7/03/29(b) | | | | | | | 200,000 | | | | 170,916 | |
Delhi International Airport Ltd., 6.45%, 6/04/29(b) | | | | | | | 200,000 | | | | 174,100 | |
Greenko Mauritius Ltd., 6.25%, 2/21/23(b) | | | | | | | 200,000 | | | | 184,500 | |
India Government Bond, 8.15%, 6/11/22 | | | INR | | | | 112,800,000 | | | | 1,612,153 | |
Network i2i Ltd., (5Y US Treasury CMT + 4.27%), 5.65%, 1/15/25(i)(j) | | | | | | | 200,000 | | | | 177,000 | |
ReNew Power Pvt. Ltd., 6.45%, 9/27/22(b) | | | | | | | 300,000 | | | | 261,930 | |
Vedanta Resources Finance II PLC, 9.25%, 4/23/26(b) | | | | | | | 200,000 | | | | 81,000 | |
| | | | | | | | | | | | 2,661,599 | |
| | | |
Indonesia – 4.9% | | | | | | | | | | | | |
Indonesia Asahan Aluminium Persero PT, | | | | | | | | | | | | |
6.53%, 11/15/28(b) | | | | | | | 200,000 | | | | 216,500 | |
6.76%, 11/15/48(b) | | | | | | | 250,000 | | | | 267,392 | |
Indonesia Government International Bond, | | | | | | | | | | | | |
3.85%, 7/18/27 | | | | | | | 200,000 | | | | 206,037 | |
3.85%, 10/15/30 | | | | | | | 450,000 | | | | 466,340 | |
Indonesia Treasury Bond, 7.00%, 5/15/22 | | | IDR | | | | 33,712,000,000 | | | | 2,296,949 | |
5.63%, 5/15/23 | | | IDR | | | | 1,596,000,000 | | | | 103,785 | |
8.37%, 3/15/24 | | | IDR | | | | 9,026,000,000 | | | | 628,879 | |
8.12%, 5/15/24 | | | IDR | | | | 4,600,000,000 | | | | 317,516 | |
8.37%, 9/15/26 | | | IDR | | | | 13,328,000,000 | | | | 924,843 | |
9.00%, 3/15/29 | | | IDR | | | | 2,444,000,000 | | | | 175,180 | |
8.25%, 5/15/29 | | | IDR | | | | 656,000,000 | | | | 44,939 | |
7.50%, 8/15/32 | | | IDR | | | | 10,750,000,000 | | | | 691,032 | |
8.37%, 3/15/34 | | | IDR | | | | 15,953,000,000 | | | | 1,087,217 | |
Minejesa Capital B.V., | | | | | | | | | | | | |
4.63%, 8/10/30 | | | | | | | 400,000 | | | | 381,880 | |
5.63%, 8/10/37(b) | | | | | | | 400,000 | | | | 378,000 | |
Pertamina Persero PT, 4.15%, 2/25/60(b) | | | | | | | 400,000 | | | | 328,107 | |
| | | | | | | | | | | | |
| | | | | | Par(a) | | | Value | |
| | |
Indonesia (Continued) | | | | | | | | | |
Perusahaan Penerbit SBSN Indonesia III, 4.15%, 3/29/27 | | | | | | $ | 530,000 | | | $ | 556,129 | |
Saka Energi Indonesia PT, 4.45%, 5/05/24(b) | | | | | | | 400,000 | | | | 343,088 | |
| | | | | | | | | | | | 9,413,813 | |
| | | |
Iraq – 0.1% | | | | | | | | | | | | |
Iraq International Bond, 5.80%, 1/15/28 | | | | | | | 250,000 | | | | 183,750 | |
| | | |
Israel – 0.8% | | | | | | | | | | | | |
Israel Government International Bond, | | | | | | | | | | | | |
2.75%, 7/03/30 | | | | | | | 200,000 | | | | 210,000 | |
3.87%, 7/03/50 | | | | | | | 325,000 | | | | 359,482 | |
4.50%, 4/03/20(m) | | | | | | | 200,000 | | | | 232,447 | |
Teva Pharmaceutical Finance Netherlands III B.V., | | | | | | | | | | | | |
2.80%, 7/21/23 | | | | | | | 35,000 | | | | 32,156 | |
3.15%, 10/01/26 | | | | | | | 255,000 | | | | 221,850 | |
4.10%, 10/01/46 | | | | | | | 527,000 | | | | 408,425 | |
| | | | | | | | | | | | 1,464,360 | |
| | | |
Italy – 0.3% | | | | | | | | | | | | |
Intesa Sanpaolo S.p.A., 5.02%, 6/26/24(b) | | | | | | | 400,000 | | | | 399,886 | |
Telecom Italia Capital S.A., | | | | | | | | | | | | |
6.37%, 11/15/33 | | | | | | | 60,000 | | | | 64,656 | |
6.00%, 9/30/34 | | | | | | | 10,000 | | | | 10,359 | |
7.20%, 7/18/36 | | | | | | | 39,000 | | | | 43,770 | |
| | | | | | | | | | | | 518,671 | |
| | | |
Ivory Coast – 0.3% | | | | | | | | | | | | |
Ivory Coast Government International Bond, | | | | | | | | | | | | |
5.88%, 10/17/31(b) | | | EUR | | | | 200,000 | | | | 178,860 | |
6.87%, 10/17/40(b) | | | EUR | | | | 445,000 | | | | 401,303 | |
| | | | | | | | | | | | 580,163 | |
| | | |
Jamaica – 0.1% | | | | | | | | | | | | |
Jamaica Government International Bond, 8.00%, 3/15/39 | | | | | | | 200,000 | | | | 211,500 | |
| | | |
Japan – 2.7% | | | | | | | | | | | | |
Japan Treasury Discount Bill, | | | | | | | | | | | | |
0.00%, 5/07/20(k) | | | JPY | | | | 83,800,000 | | | | 780,894 | |
0.00%, 5/11/20(k) | | | JPY | | | | 30,500,000 | | | | 284,219 | |
0.00%, 5/20/20(k) | | | JPY | | | | 3,000,000 | | | | 27,957 | |
0.00%, 5/25/20(k) | | | JPY | | | | 143,800,000 | | | | 1,340,111 | |
0.00%, 7/06/20(k) | | | JPY | | | | 142,000,000 | | | | 1,323,584 | |
0.00%, 7/10/20(k) | | | JPY | | | | 41,900,000 | | | | 390,557 | |
See accompanying Notes to Financial Statements
180
Morningstar Funds Trust April 30, 2020
Schedule of Investments (continued)
Morningstar Multisector Bond Fund
| | | | | | | | | | | | |
| | | | | | Par(a) | | | Value | |
| | | |
Japan (Continued) | | | | | | | | | | | | |
Japan Treasury Discount Bill, | | | | | | | | | | | | |
0.00%, 8/11/20(k) | | | JPY | | | $ | 4,000,000 | | | $ | 37,290 | |
0.00%, 9/10/20(k) | | | JPY | | | | 34,800,000 | | | | 324,472 | |
0.00%, 9/23/20(k) | | | JPY | | | | 32,000,000 | | | | 298,385 | |
0.00%, 10/12/20(k) | | | JPY | | | | 36,000,000 | | | | 335,717 | |
| | | | | | | | | | | | 5,143,186 | |
| | | |
Kazakhstan – 0.3% | | | | | | | | | | | | |
KazMunayGas National Co. JSC, 5.38%, 4/24/30(b) | | | | | | | 580,000 | | | | 574,336 | |
| | | |
Kenya – 0.2% | | | | | | | | | | | | |
Kenya Government International Bond, | | | | | | | | | | | | |
8.00%, 5/22/32(b) | | | | | | | 200,000 | | | | 181,000 | |
8.25%, 2/28/48 | | | | | | | 200,000 | | | | 180,146 | |
| | | | | | | | | | | | 361,146 | |
| | | |
Lebanon – 0.1% | | | | | | | | | | | | |
Lebanon Government International Bond, 8.25%, 5/17/34(h) | | | | | | | 1,050,000 | | | | 175,875 | |
| | | |
Luxembourg – 0.2% | | | | | | | | | | | | |
Altice France Holding S.A., 10.50%, 5/15/27(b) | | | | | | | 200,000 | | | | 216,042 | |
ARD Finance S.A., 6.50%, 6/30/27(b)(g) | | | | | | | 200,000 | | | | 185,640 | |
Intelsat Connect Finance S.A., 9.50%, 2/15/23(b) | | | | | | | 60,000 | | | | 11,400 | |
| | | | | | | | | | | | 413,082 | |
| | | |
Malaysia – 1.4% | | | | | | | | | | | | |
Malaysia Government Bond, | | | | | | | | | | | | |
3.88%, 3/10/22 | | | MYR | | | | 1,460,000 | | | | 348,873 | |
3.48%, 3/15/23 | | | MYR | | | | 1,650,000 | | | | 395,199 | |
4.18%, 7/15/24 | | | MYR | | | | 2,250,000 | | | | 557,319 | |
3.90%, 11/16/27 | | | MYR | | | | 1,775,000 | | | | 443,796 | |
3.89%, 8/15/29 | | | MYR | | | | 1,305,000 | | | | 328,386 | |
3.84%, 4/15/33 | | | MYR | | | | 471,000 | | | | 116,677 | |
4.89%, 6/08/38 | | | MYR | | | | 545,000 | | | | 152,092 | |
Petronas Capital Ltd., 3.50%, 4/21/30(b) | | | | | | | 270,000 | | | | 281,294 | |
| | | | | | | | | | | | 2,623,636 | |
| | | |
Mauritius – 0.1% | | | | | | | | | | | | |
Neerg Energy Ltd., 6.00%, 2/13/22 | | | | | | | 200,000 | | | | 184,088 | |
| | | |
Mexico – 7.2% | | | | | | | | | | | | |
Aerovias de Mexico S.A. de C.V., 7.00%, 2/05/25(b) | | | | | | | 200,000 | | | | 75,000 | |
| | | | | | | | | | | | |
| | | | | | Par(a) | | | Value | |
| | | |
Mexico (Continued) | | | | | | | | | | | | |
Alpek S.A.B. de C.V., 4.25%, 9/18/29(b) | | | | | | $ | 200,000 | | | $ | 173,600 | |
Banco Mercantil del Norte S.A., | | | | | | | | | | | | |
(5Y US Treasury CMT + 5.04%),
6.87%, 7/06/22(b)(i)(j) | | | | | | | 200,000 | | | | 157,002 | |
(10Y US Treasury CMT + 5.47%),
7.50%, 6/27/29(b)(i)(j) | | | | | | | 200,000 | | | | 164,040 | |
Banco Santander Mexico S.A. Institucion de Banca Multiple Grupo Financiero Santander, 5.38%, 4/17/25(b) | | | | | | | 150,000 | | | | 153,938 | |
Braskem Idesa SAPI, 7.45%, 11/15/29(b) | | | | | | | 220,000 | | | | 163,548 | |
Cemex S.A.B. de C.V., 5.70%, 1/11/25 | | | | | | | 200,000 | | | | 181,050 | |
Industrias Penoles S.A.B. de C.V., 5.65%, 9/12/49(b) | | | | | | | 200,000 | | | | 192,000 | |
Mexican Bonos, | | | | | | | | | | | | |
6.50%, 6/09/22 | | | MXN | | | | 78,367,000 | | | | 3,332,653 | |
6.75%, 3/09/23 | | | MXN | | | | 1,680,000 | | | | 72,423 | |
8.00%, 12/07/23 | | | MXN | | | | 49,990,000 | | | | 2,251,883 | |
8.00%, 9/05/24 | | | MXN | | | | 7,920,000 | | | | 360,417 | |
10.00%, 12/05/24 | | | MXN | | | | 38,320,000 | | | | 1,875,615 | |
5.75%, 3/05/26 | | | MXN | | | | 18,425,000 | | | | 758,780 | |
7.50%, 6/03/27 | | | MXN | | | | 8,850,000 | | | | 394,477 | |
8.50%, 5/31/29 | | | MXN | | | | 4,600,000 | | | | 215,657 | |
7.75%, 5/29/31 | | | MXN | | | | 14,140,000 | | | | 623,413 | |
8.50%, 11/18/38 | | | MXN | | | | 3,370,000 | | | | 152,716 | |
Mexico Government International Bond, 4.75%, 4/27/32 | | | | | | | 200,000 | | | | 201,500 | |
Petroleos Mexicanos, | | | | | | | | | | | | |
5.13%, 3/15/23 | | | EUR | | | | 125,000 | | | | 124,266 | |
6.87%, 8/04/26 | | | | | | | 135,000 | | | | 111,848 | |
6.49%, 1/23/27(b) | | | | | | | 200,000 | | | | 162,980 | |
6.50%, 3/13/27 | | | | | | | 135,000 | | | | 110,025 | |
5.35%, 2/12/28 | | | | | | | 610,000 | | | | 454,456 | |
5.95%, 1/28/31(b) | | | | | | | 1,060,000 | | | | 767,758 | |
6.62%, 6/15/35 | | | | | | | 175,000 | | | | 123,375 | |
6.38%, 1/23/45 | | | | | | | 390,000 | | | | 262,080 | |
Unifin Financiera S.A.B. de C.V., 7.25%, 9/27/23(b) | | | | | | | 200,000 | | | | 96,030 | |
| | | | | | | | | | | | 13,712,530 | |
| | | |
Mongolia – 0.1% | | | | | | | | | | | | |
Development Bank of Mongolia LLC, 7.25%, 10/23/23(b) | | | | | | | 200,000 | | | | 172,501 | |
See accompanying Notes to Financial Statements
181
Morningstar Funds Trust April 30, 2020
Schedule of Investments (continued)
Morningstar Multisector Bond Fund
| | | | | | | | | | | | |
| | | | | | Par(a) | | | Value | |
| | | |
Netherlands – 0.4% | | | | | | | | | | | | |
Ziggo B.V., | | | | | | | | | | | | |
5.50%, 1/15/27(b) | | | | | | $ | 472,000 | | | $ | 480,118 | |
4.88%, 1/15/30(b) | | | | | | | 200,000 | | | | 197,660 | |
| | | | | | | | | | | | 677,778 | |
| | | |
Nigeria – 0.6% | | | | | | | | | | | | |
IHS Netherlands Holdco B.V., 7.13%, 3/18/25(b) | | | | | | | 200,000 | | | | 182,040 | |
Nigeria Government International Bond, | | | | | | | | | | | | |
7.14%, 2/23/30(b) | | | | | | | 270,000 | | | | 202,500 | |
7.87%, 2/16/32 | | | | | | | 200,000 | | | | 152,679 | |
7.70%, 2/23/38(b) | | | | | | | 500,000 | | | | 367,516 | |
7.62%, 11/28/47 | | | | | | | 300,000 | | | | 221,700 | |
| | | | | | | | | | | | 1,126,435 | |
| | | |
Norway – 1.2% | | | | | | | | | | | | |
Aker BP ASA, 5.87%, 3/31/25(b) | | | | | | | 215,000 | | | | 200,934 | |
Norway Government Bond, | | | | | | | | | | | | |
3.75%, 5/25/21(b) | | | NOK | | | | 1,858,000 | | | | 187,970 | |
2.00%, 5/24/23(b) | | | NOK | | | | 6,265,000 | | | | 642,778 | |
3.00%, 3/14/24(b) | | | NOK | | | | 5,676,000 | | | | 610,124 | |
1.75%, 3/13/25(b) | | | NOK | | | | 2,002,000 | | | | 208,316 | |
1.50%, 2/19/26(b) | | | NOK | | | | 1,186,000 | | | | 122,931 | |
Norway Treasury Bill, | | | | | | | | | | | | |
0.00%, 6/17/20(b)(k) | | | NOK | | | | 1,086,000 | | | | 105,939 | |
0.00%, 9/16/20(b)(k) | | | NOK | | | | 2,647,000 | | | | 257,733 | |
| | | | | | | | | | | | 2,336,725 | |
| | | |
Oman – 0.2% | | | | | | | | | | | | |
Oman Government International Bond, | | | | | | | | | | | | |
5.63%, 1/17/28(b) | | | | | | | 245,000 | | | | 186,547 | |
6.75%, 1/17/48 | | | | | | | 300,000 | | | | 212,814 | |
| | | | | | | | | | | | 399,361 | |
| | | |
Panama – 0.6% | | | | | | | | | | | | |
Aeropuerto Internacional de Tocumen S.A., 6.00%, 11/18/48(b) | | | | | | | 200,000 | | | | 202,000 | |
Global Bank Corp., (3M USD LIBOR + 3.30%), 5.25%, 4/16/29(b)(j) | | | | | | | 250,000 | | | | 235,125 | |
Panama Government International Bond, | | | | | | | | | | | | |
3.16%, 1/23/30 | | | | | | | 450,000 | | | | 459,005 | |
4.50%, 4/01/56 | | | | | | | 200,000 | | | | 224,500 | |
| | | | | | | | | | | | 1,120,630 | |
| | | | | | | | | | | | |
| | | | | | Par(a) | | | Value | |
| | | |
Paraguay – 0.4% | | | | | | | | | | | | |
Paraguay Government International Bond, | | | | | | | | | | | | |
5.60%, 3/13/48 | | | | | | $ | 500,000 | | | $ | 525,755 | |
5.40%, 3/30/50(b) | | | | | | | 200,000 | | | | 207,000 | |
| | | | | | | | | | | | 732,755 | |
| | | |
Peru – 1.2% | | | | | | | | | | | | |
Peru Government Bond, | | | | | | | | | | | | |
6.15%, 8/12/32(b) | | | PEN | | | | 1,350,000 | | | | 444,426 | |
5.40%, 8/12/34(b) | | | PEN | | | | 70,000 | | | | 21,382 | |
Peruvian Government International Bond, | | | | | | | | | | | | |
2.39%, 1/23/26 | | | | | | | 85,000 | | | | 86,700 | |
2.78%, 1/23/31 | | | | | | | 140,000 | | | | 144,340 | |
6.95%, 8/12/31 | | | PEN | | | | 2,775,000 | | | | 974,488 | |
6.90%, 8/12/37 | | | PEN | | | | 1,651,000 | | | | 559,442 | |
Southern Copper Corp., 5.88%, 4/23/45 | | | | | | | 50,000 | | | | 56,121 | |
| | | | | | | | | | | | 2,286,899 | |
| | | |
Philippines – 0.2% | | | | | | | | | | | | |
Philippine Government Bond, 5.50%, 3/08/23 | | | PHP | | | | 4,120,000 | | | | 86,945 | |
Philippine Government International Bond, 2.46%, 5/05/30 | | | | | | | 225,000 | | | | 229,444 | |
| | | | | | | | | | | | 316,389 | |
| | | |
Poland – 1.7% | | | | | | | | | | | | |
Republic of Poland Government Bond, | | | | | | | | | | | | |
2.25%, 4/25/22 | | | PLN | | | | 650,000 | | | | 161,834 | |
2.50%, 7/25/27 | | | PLN | | | | 3,474,000 | | | | 950,734 | |
2.75%, 10/25/29 | | | PLN | | | | 7,929,000 | | | | 2,134,089 | |
| | | | | | | | | | | | 3,246,657 | |
| | | |
Qatar – 0.8% | | | | | | | | | | | | |
Qatar Government International Bond, | | | | | | | | | | | | |
3.75%, 4/16/30(b) | | | | | | | 1,025,000 | | | | 1,119,054 | |
4.40%, 4/16/50(b) | | | | | | | 425,000 | | | | 483,250 | |
| | | | | | | | | | | | 1,602,304 | |
| | | |
Romania – 0.7% | | | | | | | | | | | | |
Romania Government Bond, | | | | | | | | | | | | |
4.25%, 6/28/23 | | | RON | | | | 2,170,000 | | | | 498,113 | |
5.00%, 2/12/29 | | | RON | | | | 1,010,000 | | | | 232,242 | |
3.65%, 9/24/31 | | | RON | | | | 480,000 | | | | 96,663 | |
Romanian Government International Bond, | | | | | | | | | | | | |
4.62%, 4/03/49 | | | EUR | | | | 275,000 | | | | 304,202 | |
3.38%, 1/28/50 | | | EUR | | | | 250,000 | | | | 233,130 | |
| | | | | | | | | | | | 1,364,350 | |
See accompanying Notes to Financial Statements
182
Morningstar Funds Trust April 30, 2020
Schedule of Investments (continued)
Morningstar Multisector Bond Fund
| | | | | | | | | | | | |
| | | | | | Par(a) | | | Value | |
| | | |
Russia – 1.8% | | | | | | | | | | | | |
Credit Bank of Moscow Via CBOM Finance PLC, 4.70%, 1/29/25(b) | | | | | | $ | 200,000 | | | $ | 189,801 | |
Russian Federal Bond - OFZ, | | | | | | | | | | | | |
7.40%, 12/07/22 | | | RUB | | | | 24,985,000 | | | | 353,984 | |
6.50%, 2/28/24 | | | RUB | | | | 43,924,000 | | | | 613,368 | |
7.10%, 10/16/24 | | | RUB | | | | 41,700,000 | | | | 595,880 | |
7.75%, 9/16/26 | | | RUB | | | | 7,400,000 | | | | 110,874 | |
7.05%, 1/19/28 | | | RUB | | | | 29,100,000 | | | | 422,186 | |
6.90%, 5/23/29 | | | RUB | | | | 45,121,000 | | | | 650,024 | |
8.50%, 9/17/31 | | | RUB | | | | 26,300,000 | | | | 424,918 | |
7.70%, 3/23/33 | | | RUB | | | | 11,250,000 | | | | 172,891 | |
| | | | | | | | | | | | 3,533,926 | |
| | | |
Saudi Arabia – 0.9% | | | | | | | | | | | | |
Saudi Arabian Oil Co., 4.25%, 4/16/39(b) | | | | | | | 200,000 | | | | 206,088 | |
Saudi Government International Bond, | | | | | | | | | | | | |
2.90%, 10/22/25(b) | | | | | | | 350,000 | | | | 354,375 | |
3.25%, 10/22/30(b) | | | | | | | 200,000 | | | | 201,920 | |
4.50%, 4/22/60(b) | | | | | | | 1,025,000 | | | | 1,020,541 | |
Valaris PLC, 4.87%, 6/01/22 | | | | | | | 125,000 | | | | 15,313 | |
| | | | | | | | | | | | 1,798,237 | |
| | | |
Serbia – 0.3% | | | | | | | | | | | | |
Serbia Treasury Bond, 4.50%, 1/11/26 | | | RSD | | | | 50,300,000 | | | | 506,583 | |
| | | |
South Africa – 2.1% | | | | | | | | | | | | |
Eskom Holdings SOC Ltd., | | | | | | | | | | | | |
6.75%, 8/06/23 | | | | | | | 200,000 | | | | 151,202 | |
7.13%, 2/11/25 | | | | | | | 400,000 | | | | 294,788 | |
Republic of South Africa Government Bond, | | | | | | | | | | | | |
8.00%, 1/31/30 | | | ZAR | | | | 24,200,000 | | | | 1,117,104 | |
7.00%, 2/28/31 | | | ZAR | | | | 2,500,000 | | | | 103,979 | |
8.25%, 3/31/32 | | | ZAR | | | | 8,300,000 | | | | 370,994 | |
8.87%, 2/28/35 | | | ZAR | | | | 5,800,000 | | | | 257,343 | |
8.50%, 1/31/37 | | | ZAR | | | | 15,080,000 | | | | 628,629 | |
8.75%, 1/31/44 | | | ZAR | | | | 12,038,898 | | | | 489,569 | |
8.75%, 2/28/48 | | | ZAR | | | | 6,700,000 | | | | 270,682 | |
Republic of South Africa Government International Bond, 4.30%, 10/12/28 | | | | | | | 350,000 | | | | 294,007 | |
| | | | | | | | | | | | 3,978,297 | |
| | | |
South Korea – 3.7% | | | | | | | | | | | | |
Korea Treasury Bond, 1.38%, 12/10/29 | | | KRW | | | | 8,853,400,000 | | | | 7,179,916 | |
| | | | | | | | | | | | |
| | | | | | Par(a) | | | Value | |
| | | |
Sri Lanka – 0.5% | | | | | | | | | | | | |
Sri Lanka Government International Bond, | | | | | | | | | | | | |
6.25%, 7/27/21 | | | | | | $ | 200,000 | | | $ | 144,000 | |
5.75%, 4/18/23(b) | | | | | | | 425,000 | | | | 252,875 | |
6.85%, 3/14/24(b) | | | | | | | 200,000 | | | | 121,001 | |
6.82%, 7/18/26 | | | | | | | 200,000 | | | | 114,000 | |
6.75%, 4/18/28 | | | | | | | 200,000 | | | | 114,984 | |
7.85%, 3/14/29(b) | | | | | | | 200,000 | | | | 113,002 | |
7.55%, 3/28/30(b) | | | | | | | 200,000 | | | | 113,982 | |
| | | | | | | | | | | | 973,844 | |
| | | |
Thailand – 1.3% | | | | | | | | | | | | |
Thailand Government Bond, | | | | | | | | | | | | |
2.88%, 12/17/28 | | | THB | | | | 18,700,000 | | | | 657,539 | |
3.30%, 6/17/38 | | | THB | | | | 47,568,000 | | | | 1,876,929 | |
| | | | | | | | | | | | 2,534,468 | |
| | | |
Turkey – 1.5% | | | | | | | | | | | | |
Turkey Government Bond, | | | | | | | | | | | | |
9.50%, 1/12/22 | | | TRY | | | | 4,932,847 | | | | 712,456 | |
11.00%, 2/24/27 | | | TRY | | | | 928,012 | | | | 130,382 | |
Turkey Government International Bond, | | | | | | | | | | | | |
4.88%, 10/09/26 | | | | | | | 555,000 | | | | 486,550 | |
5.12%, 2/17/28 | | | | | | | 200,000 | | | | 173,460 | |
6.12%, 10/24/28 | | | | | | | 200,000 | | | | 182,204 | |
5.25%, 3/13/30 | | | | | | | 918,000 | | | | 761,940 | |
4.88%, 4/16/43 | | | | | | | 200,000 | | | | 144,770 | |
5.75%, 5/11/47 | | | | | | | 400,000 | | | | 303,894 | |
| | | | | | | | | | | | 2,895,656 | |
| | | |
Ukraine – 1.6% | | | | | | | | | | | | |
Metinvest B.V., 7.75%, 10/17/29(b) | | | | | | | 200,000 | | | | 128,144 | |
Ukraine Government International Bond, | | | | | | | | | | | | |
14.30%, 5/06/20(b) | | | UAH | | | | 3,731,000 | | | | 138,313 | |
14.64%, 6/10/20(b) | | | UAH | | | | 3,926,000 | | | | 145,047 | |
14.50%, 8/19/20(b) | | | UAH | | | | 3,500,000 | | | | 130,069 | |
17.25%, 9/30/20(b) | | | UAH | | | | 4,894,000 | | | | 184,054 | |
16.75%, 6/02/21(b) | | | UAH | | | | 10,229,000 | | | | 384,133 | |
16.42%, 11/17/21(b) | | | UAH | | | | 3,267,000 | | | | 123,868 | |
7.75%, 9/01/22 | | | | | | | 200,000 | | | | 191,452 | |
7.75%, 9/01/26 | | | | | | | 315,000 | | | | 292,197 | |
7.75%, 9/01/27 | | | | | | | 300,000 | | | | 275,919 | |
4.38%, 1/27/30 | | | EUR | | | | 200,000 | | | | 170,436 | |
7.37%, 9/25/32 | | | | | | | 205,000 | | | | 181,970 | |
0.52%, 5/31/40(n) | | | | | | | 866,000 | | | �� | 644,319 | |
| | | | | | | | | | | | 2,989,921 | |
See accompanying Notes to Financial Statements
183
Morningstar Funds Trust April 30, 2020
Schedule of Investments (continued)
Morningstar Multisector Bond Fund
| | | | | | |
| | | Par(a) | | | Value |
| | |
United Arab Emirates – 0.7% | | | | | | |
Abu Dhabi Government International Bond, | | | | | | |
2.50%, 9/30/29(b) | | $ | 225,000 | | | $ 228,681 |
3.13%, 4/16/30(b) | | | 250,000 | | | 265,675 |
3.12%, 9/30/49(b) | | | 650,000 | | | 622,700 |
DP World PLC, 4.70%, 9/30/49(b) | | | 200,000 | | | 172,000 |
Shelf Drilling Holdings Ltd., 8.25%, 2/15/25(b) | | | 184,000 | | | 53,360 |
| | | | | | | 1,342,416 |
| | |
United Kingdom – 0.4% | | | | | | |
Ardonagh Midco 3 PLC, 8.62%, 7/15/23(b) | | | 200,000 | | | 188,500 |
Ashtead Capital, Inc., 4.13%, 8/15/25(b) | | | 200,000 | | | 198,000 |
Connect Finco S.a.r.l./Connect US Finco LLC, 6.75%, 10/01/26(b) | | | 200,000 | | | 189,500 |
Virgin Media Secured Finance PLC, 5.50%, 5/15/29(b) | | | 230,000 | | | 238,786 |
| | | | | | | 814,786 |
| | |
Uruguay – 0.4% | | | | | | |
Uruguay Government International Bond, | | | | | | |
4.38%, 1/23/31 | | | 265,000 | | | 291,834 |
4.97%, 4/20/55 | | | 470,000 | | | 529,930 |
| | | | | | | 821,764 |
| | |
Vietnam – 0.1% | | | | | | |
Mong Duong Finance Holdings B.V., 5.13%, 5/07/29(b) | | | 250,000 | | | 237,342 |
| | |
Zambia – 0.5% | | | | | | |
First Quantum Minerals Ltd., | | | | | | |
7.25%, 4/01/23(b) | | | 230,000 | | | 208,748 |
6.88%, 3/01/26(b) | | | 800,000 | | | 701,600 |
| | | | | | | 910,348 |
| | |
Total Foreign Issuer Bonds
(Cost $132,379,712) | | | | | | 118,616,507 |
| | | | | | |
| | | Par(a) | | | Value |
|
U.S. Government Obligations – 5.3% |
U.S. Treasury Notes – 5.3% | | | | | | |
1.38%, 1/31/22 | | $ | 5,005,000 | | | $ 5,107,251 |
1.37%, 1/31/25 | | | 4,875,000 | | | 5,110,752 |
| | | | | | | 10,218,003 |
| | |
Total U.S. Government Obligations
(Cost $10,212,326) | | | | | | 10,218,003 |
| | |
| | | Number of Shares | | | |
|
Short-Term Investments – 10.4% |
Money Market Fund – 8.0% | | | |
Northern Institutional Funds - Treasury Portfolio (Premier), 0.22%(o) | | | 15,328,577 | | | 15,328,577 |
| |
U.S. Government Agencies – 2.4% | | | |
FHLB Discount Notes 0.00%, 5/01/20(k) | | | 4,580,000 | | | 4,580,000 |
| | |
Total Short-Term Investments
(Cost $19,908,577) | | | | | | 19,908,577 |
| | |
Total Investments – 97.6%
(Cost $203,187,299) | | | | | | 187,084,373 |
| | |
Other Assets less Liabilities – 2.4%(p) | | | | | | 4,687,028 |
| | |
NET ASSETS – 100.0% | | | | | | $191,771,401 |
Percentages shown are based on Net Assets.
| (a) | Par value is in USD unless otherwise indicated. |
| (b) | Securities exempt from registration under Rule 144A of the Securities Act of 1933. These securities may be resold in transactions exempt from registration, normally to qualified institutional buyers. The value of these securities is determined by valuations supplied by a pricing service or brokers, or, if not available, in accordance with procedures established by the Board of Trustees of Morningstar Funds Trust. |
| (c) | Step coupon bond. Rate as of April 30, 2020 is disclosed. |
| (d) | Amount rounds to less than 0.05%. |
| (e) | Variable rate security. Rate as of April 30, 2020 is disclosed. |
See accompanying Notes to Financial Statements
184
Morningstar Funds Trust April 30, 2020
Schedule of Investments (continued)
Morningstar Multisector Bond Fund
| (f) | When-Issued Security. Coupon rate was not yet in effect at April 30, 2020. |
| (g) | Security is a payment in-kind bond (PIK), distributions received in-kind unless otherwise noted in the description. |
| (h) | Issuer has defaulted on terms of debt obligation. Income is not being accrued. |
| (i) | Perpetual bond. Maturity date represents next call date. |
| (j) | Variable rate security. Security issued at a fixed coupon rate, which converts to a variable rate at a future date. Rate as of April 30, 2020 is disclosed. |
| (l) | Century bond maturing in 2115. |
| (m) | Century bond maturing in 2120. |
| (n) | Discount rate at the time of purchase. |
| (o) | 7-day current yield as of April 30, 2020 is disclosed. |
| (p) | Includes appreciation/ (depreciation) on forward foreign currency exchange and swap contracts. |
| * | Non-Income Producing Security |
| | |
| Abbreviations: | | |
| |
| 1M | | 1 Month |
| 3M | | 3 Month |
| 5Y | | 5 Year |
| 10Y | | 10 Year |
| ARS | | Argentine Peso |
| BRL | | Brazilian Real |
| CLP | | Chilean Peso |
| CMT | | Constant Maturity |
| CNY | | Chinese Offshore Yuan |
| COP | | Colombian Peso |
| CZK | | Czech Republic Koruna |
| EUR | | Euro |
| Fannie Mae | | Federal National Mortgage Association |
| FHLB | | Federal Home Loan Bank |
| GHS | | Ghanaian Cedi |
| HUF | | Hungarian Forint |
| IDR | | Indonesian Rupiah |
| INR | | Indian Rupee |
| JPY | | Japanese Yen |
| KRW | | South Korean Won |
| LIBOR | | London Interbank Offered Rate |
| LLC | | Limited Liability Company |
| MSCI | | Morgan Stanley Capital International |
| MXN | | Mexican Peso |
| MYR | | Malaysian Ringgit |
| NOK | | Norwegian Kroner |
| PEN | | Peruvian Nuevo Sole |
| PHP | | Philippine Peso |
| PLC | | Public Limited Company |
| PLN | | Polish Zloty |
| REIT | | Real Estate Investment Trust |
| RON | | Romania New Leu |
| RSD | | Serbia Dinar |
| RUB | | Russian Ruble |
| THB | | Thai Baht |
| TRY | | Turkish Lira |
| UAH | | Ukraine Hryvna |
| USD | | United States Dollar |
| ZAR | | South African Rand |
See accompanying Notes to Financial Statements
185
Morningstar Funds Trust April 30, 2020
Schedule of Investments (continued)
Morningstar Multisector Bond Fund
| | | | |
Concentration by Currency (%) | | | | |
U.S. Dollar | | | 50.5 | |
Mexican Peso | | | 5.2 | |
All other currencies less than 5% | | | 44.3 | |
| |
Total | | | 100.0 | |
| | | | |
Composition by Type (%) | | | | |
Sovereign | | | 56.4 | |
Non-Government | | | 41.2 | |
Others | | | 2.4 | |
| | |
Total | | | 100.0 | |
Forward Foreign Currency Contracts outstanding at April 30, 2020:
| | | | | | | | | | | | | | | | | | |
Expiration
Date | | Currency
Purchased | | Amount of Currency
Purchased | | | Currency Sold | | Amount of Currency
Sold | | | Counterparty | | Unrealized
Appreciation
(Depreciation) | |
| 10/07/20 | | U.S. Dollars | | | 1,357,149 | | | Mexican Pesos | | | 28,320,000 | | | HSBC | | | $ 208,861 | |
| 05/29/20 | | U.S. Dollars | | | 969,259 | | | Mexican Pesos | | | 19,470,000 | | | Citibank | | | 165,429 | |
| 05/08/20 | | Swiss Francs | | | 4,016,000 | | | Euro | | | 3,653,334 | | | Citibank | | | 157,373 | |
| 06/10/20 | | U.S. Dollars | | | 1,020,000 | | | Mexican Pesos | | | 20,984,358 | | | Barclays | | | 155,235 | |
| 06/15/20 | | Australian Dollars | | | 3,880,000 | | | U.S. Dollars | | | 2,388,206 | | | Morgan Stanley | | | 140,550 | |
| 06/16/20 | | Australian Dollars | | | 5,500,000 | | | Japanese Yen | | | 371,025,516 | | | HSBC | | | 124,748 | |
| 07/17/20 | | U.S. Dollars | | | 1,804,256 | | | South Korean Won | | | 2,073,000,000 | | | HSBC | | | 95,451 | |
| 10/15/20 | | U.S. Dollars | | | 498,161 | | | Mexican Pesos | | | 10,264,000 | | | Citibank | | | 82,426 | |
| 10/16/20 | | U.S. Dollars | | | 460,332 | | | Mexican Pesos | | | 9,398,000 | | | Citibank | | | 79,724 | |
| 05/29/20 | | U.S. Dollars | | | 6,091,467 | | | Japanese Yen | | | 645,280,000 | | | Morgan Stanley | | | 76,109 | |
| 06/17/20 | | U.S. Dollars | | | 457,736 | | | Mexican Pesos | | | 9,306,000 | | | Citibank | | | 74,641 | |
| 05/18/20 | | U.S. Dollars | | | 1,451,715 | | | Indian Rupees | | | 104,538,000 | | | HSBC | | | 66,478 | |
| 07/02/20 | | U.S. Dollars | | | 923,517 | | | Brazilian Reals | | | 4,684,800 | | | JPMorgan Chase | | | 65,865 | |
| 08/25/20 | | Japanese Yen | | | 128,936,024 | | | Australian Dollars | | | 1,747,000 | | | JPMorgan Chase | | | 65,289 | |
| 07/16/20 | | U.S. Dollars | | | 2,734,037 | | | Euro | | | 2,433,283 | | | Deutsche Bank | | | 63,148 | |
| 09/25/20 | | U.S. Dollars | | | 4,147,987 | | | South Korean Won | | | 4,950,000,000 | | | Standard Chartered Bank | | | 60,821 | |
| 05/05/20 | | U.S. Dollars | | | 253,867 | | | Brazilian Reals | | | 1,052,300 | | | JPMorgan Chase | | | 60,441 | |
| 10/13/20 | | U.S. Dollars | | | 337,215 | | | Mexican Pesos | | | 6,973,000 | | | Citibank | | | 54,705 | |
| 06/12/20 | | Japanese Yen | | | 100,485,219 | | | Australian Dollars | | | 1,360,000 | | | JPMorgan Chase | | | 50,601 | |
| 05/26/20 | | Australian Dollars | | | 1,101,466 | | | Japanese Yen | | | 71,852,127 | | | Citibank | | | 48,053 | |
| 06/02/20 | | U.S. Dollars | | | 410,535 | | | Brazilian Reals | | | 1,980,100 | | | JPMorgan Chase | | | 47,443 | |
| 08/04/20 | | U.S. Dollars | | | 257,595 | | | Brazilian Reals | | | 1,163,300 | | | JPMorgan Chase | | | 44,990 | |
| 05/11/20 | | U.S. Dollars | | | 255,000 | | | South African Rand | | | 3,909,660 | | | Bank of America | | | 44,331 | |
| 05/26/20 | | Japanese Yen | | | 81,460,052 | | | Australian Dollars | | | 1,101,466 | | | Citibank | | | 41,509 | |
| 05/18/20 | | U.S. Dollars | | | 446,856 | | | Colombian Pesos | | | 1,612,778,573 | | | BNP | | | 40,224 | |
| 05/18/20 | | U.S. Dollars | | | 2,433,372 | | | Euro | | | 2,185,984 | | | Deutsche Bank | | | 37,009 | |
| 07/14/20 | | Japanese Yen | | | 58,245,330 | | | Australian Dollars | | | 780,000 | | | JPMorgan Chase | | | 35,038 | |
| 05/18/20 | | Indian Rupees | | | 104,538,000 | | | U.S. Dollars | | | 1,350,795 | | | HSBC | | | 34,443 | |
| 05/11/20 | | U.S. Dollars | | | 648,645 | | | South African Rand | | | 11,418,834 | | | BNP | | | 33,349 | |
| 05/07/20 | | U.S. Dollars | | | 228,640 | | | Brazilian Reals | | | 1,067,750 | | | BNP | | | 32,410 | |
| 05/11/20 | | U.S. Dollars | | | 180,000 | | | South African Rand | | | 2,742,300 | | | Standard Chartered Bank | | | 32,233 | |
| 06/12/20 | | Japanese Yen | | | 66,675,335 | | | Australian Dollars | | | 905,000 | | | HSBC | | | 31,885 | |
| 09/30/20 | | Japanese Yen | | | 225,500,000 | | | U.S. Dollars | | | 2,075,281 | | | HSBC | | | 31,819 | |
| 05/29/20 | | Japanese Yen | | | 645,280,000 | | | U.S. Dollars | | | 5,985,600 | | | Morgan Stanley | | | 29,758 | |
See accompanying Notes to Financial Statements
186
Morningstar Funds Trust April 30, 2020
Schedule of Investments (continued)
Morningstar Multisector Bond Fund
| | | | | | | | | | | | | | | | | | |
Expiration
Date | | Currency
Purchased | | Amount of Currency
Purchased | | | Currency Sold | | Amount of Currency
Sold | | | Counterparty | | Unrealized
Appreciation
(Depreciation) | |
| 06/05/20 | | U.S. Dollars | | | 683,657 | | | Indian Rupees | | | 49,948,000 | | | Deutsche Bank | | | $ 24,615 | |
| 06/05/20 | | U.S. Dollars | | | 686,031 | | | Indian Rupees | | | 50,142,000 | | | JPMorgan Chase | | | 24,428 | |
| 10/02/20 | | U.S. Dollars | | | 476,790 | | | Brazilian Reals | | | 2,486,700 | | | JPMorgan Chase | | | 23,251 | |
| 08/24/20 | | Japanese Yen | | | 124,412,605 | | | Australian Dollars | | | 1,747,000 | | | JPMorgan Chase | | | 23,029 | |
| 10/08/20 | | U.S. Dollars | | | 135,150 | | | Mexican Pesos | | | 2,785,000 | | | Citibank | | | 22,241 | |
| 05/05/20 | | U.S. Dollars | | | 401,136 | | | Brazilian Reals | | | 2,062,600 | | | Citibank | | | 22,005 | |
| 06/03/20 | | U.S. Dollars | | | 479,361 | | | Indian Rupees | | | 34,689,900 | | | Standard Chartered Bank | | | 21,494 | |
| 06/09/20 | | Japanese Yen | | | 146,437,054 | | | Australian Dollars | | | 2,062,000 | | | Citibank | | | 21,489 | |
| 07/02/20 | | U.S. Dollars | | | 396,544 | | | Brazilian Reals | | | 2,056,400 | | | Citibank | | | 20,077 | |
| 08/27/20 | | U.S. Dollars | | | 379,073 | | | Indian Rupees | | | 27,679,000 | | | Standard Chartered Bank | | | 18,279 | |
| 05/21/20 | | U.S. Dollars | | | 798,570 | | | Euro | | | 712,500 | | | Bank of America | | | 17,453 | |
| 06/30/20 | | Chilean Pesos | | | 706,330,000 | | | U.S. Dollars | | | 830,000 | | | Citibank | | | 17,452 | |
| 10/09/20 | | U.S. Dollars | | | 101,374 | | | Mexican Pesos | | | 2,092,000 | | | Citibank | | | 16,572 | |
| 06/03/20 | | U.S. Dollars | | | 400,344 | | | South Korean Won | | | 466,000,000 | | | HSBC | | | 16,565 | |
| 09/30/20 | | Japanese Yen | | | 109,211,087 | | | Euro | | | 913,200 | | | Citibank | | | 16,367 | |
| 09/30/20 | | U.S. Dollars | | | 2,120,314 | | | Japanese Yen | | | 225,500,000 | | | HSBC | | | 13,215 | |
| 06/29/20 | | Japanese Yen | | | 41,771,600 | | | U.S. Dollars | | | 377,000 | | | BNP | | | 12,614 | |
| 08/24/20 | | Japanese Yen | | | 77,972,429 | | | Australian Dollars | | | 1,098,534 | | | Citibank | | | 12,057 | |
| 08/27/20 | | Japanese Yen | | | 54,060,400 | | | U.S. Dollars | | | 493,578 | | | JPMorgan Chase | | | 11,223 | |
| 05/11/20 | | U.S. Dollars | | | 411,727 | | | South Korean Won | | | 488,000,000 | | | HSBC | | | 10,723 | |
| 07/09/20 | | Hungarian Forints | | | 146,651,975 | | | U.S. Dollars | | | 445,000 | | | JPMorgan Chase | | | 10,471 | |
| 07/16/20 | | Euro | | | 1,627,000 | | | U.S. Dollars | | | 1,775,527 | | | Deutsche Bank | | | 10,346 | |
| 08/31/20 | | U.S. Dollars | | | 624,614 | | | Japanese Yen | | | 65,814,000 | | | Citibank | | | 10,011 | |
| 06/03/20 | | Indian Rupees | | | 34,689,900 | | | U.S. Dollars | | | 449,316 | | | Standard Chartered Bank | | | 8,551 | |
| 06/16/20 | | Swedish Krona | | | 4,791,000 | | | Euro | | | 440,386 | | | Deutsche Bank | | | 8,255 | |
| 05/11/20 | | U.S. Dollars | | | 515,000 | | | Singapore Dollars | | | 715,541 | | | BNP | | | 7,556 | |
| 07/08/20 | | Thai Baht | | | 11,887,000 | | | U.S. Dollars | | | 359,978 | | | Barclays | | | 7,438 | |
| 06/29/20 | | Japanese Yen | | | 41,208,928 | | | U.S. Dollars | | | 377,000 | | | Barclays | | | 7,366 | |
| 05/18/20 | | Euro | | | 1,000,000 | | | U.S. Dollars | | | 1,088,891 | | | Deutsche Bank | | | 7,349 | |
| 05/11/20 | | U.S. Dollars | | | 515,000 | | | Singapore Dollars | | | 716,004 | | | JPMorgan Chase | | | 7,227 | |
| 07/21/20 | | Russian Rubles | | | 15,618,000 | | | U.S. Dollars | | | 200,000 | | | Bank of America | | | 7,206 | |
| 06/29/20 | | U.S. Dollars | | | 1,038,230 | | | Euro | | | 940,000 | | | Goldman Sachs | | | 6,824 | |
| 06/09/20 | | Australian Dollars | | | 2,062,000 | | | Japanese Yen | | | 143,561,595 | | | Citibank | | | 5,321 | |
| 05/11/20 | | Singapore Dollars | | | 716,545 | | | U.S. Dollars | | | 503,351 | | | JPMorgan Chase | | | 4,806 | |
| 05/26/20 | | U.S. Dollars | | | 1,077,378 | | | Chilean Pesos | | | 895,215,000 | | | Barclays | | | 4,462 | |
| 06/05/20 | | Indian Rupees | | | 16,215,676 | | | U.S. Dollars | | | 209,776 | | | JPMorgan Chase | | | 4,183 | |
| 08/28/20 | | U.S. Dollars | | | 89,732 | | | Indian Rupees | | | 6,581,000 | | | Standard Chartered Bank | | | 3,959 | |
| 06/18/20 | | Japanese Yen | | | 37,213,000 | | | U.S. Dollars | | | 343,214 | | | HSBC | | | 3,812 | |
| 06/23/20 | | Colombian Pesos | | | 2,567,970,480 | | | U.S. Dollars | | | 642,635 | | | Bank of America | | | 2,875 | |
| 05/08/20 | | Euro | | | 1,742,144 | | | Swiss Francs | | | 1,840,000 | | | Citibank | | | 2,761 | |
| 06/12/20 | | Australian Dollars | | | 905,000 | | | Japanese Yen | | | 62,969,121 | | | HSBC | | | 2,673 | |
See accompanying Notes to Financial Statements
187
Morningstar Funds Trust April 30, 2020
Schedule of Investments (continued)
Morningstar Multisector Bond Fund
| | | | | | | | | | | | | | | | | | |
Expiration
Date | | Currency
Purchased | | Amount of Currency
Purchased | | | Currency Sold | | Amount of Currency
Sold | | | Counterparty | | Unrealized
Appreciation
(Depreciation) | |
| |
| 06/19/20 | | U.S. Dollars | | | 959,833 | | | Norwegian Kroner | | | 9,808,100 | | | JPMorgan Chase | | $ | 2,205 | |
| 06/18/20 | | U.S. Dollars | | | 349,186 | | | Japanese Yen | | | 37,213,000 | | | HSBC | | | 2,160 | |
| 06/08/20 | | U.S. Dollars | | | 208,133 | | | Japanese Yen | | | 22,103,150 | | | JPMorgan Chase | | | 2,050 | |
| 08/27/20 | | U.S. Dollars | | | 303,268 | | | Japanese Yen | | | 32,277,000 | | | JPMorgan Chase | | | 1,875 | |
| 09/21/20 | | U.S. Dollars | | | 841,217 | | | Norwegian Kroner | | | 8,594,500 | | | JPMorgan Chase | | | 1,833 | |
| 05/11/20 | | U.S. Dollars | | | 54,000 | | | South African Rand | | | 970,380 | | | Barclays | | | 1,712 | |
| 06/22/20 | | U.S. Dollars | | | 404,377 | | | Japanese Yen | | | 43,177,330 | | | JPMorgan Chase | | | 1,703 | |
| 05/29/20 | | U.S. Dollars | | | 1,320,475 | | | Swedish Krona | | | 12,864,000 | | | Deutsche Bank | | | 1,505 | |
| 07/10/20 | | Polish Zloty | | | 988,836 | | | U.S. Dollars | | | 236,918 | | | Barclays | | | 1,356 | |
| 05/14/20 | | U.S. Dollars | | | 35,358 | | | Indian Rupees | | | 2,564,000 | | | JPMorgan Chase | | | 1,345 | |
| 05/04/20 | | U.S. Dollars | | | 31,547 | | | Indian Rupees | | | 2,277,559 | | | HSBC | | | 1,251 | |
| 06/10/20 | | U.S. Dollars | | | 369,975 | | | Mexican Pesos | | | 8,948,397 | | | JPMorgan Chase | | | 1,211 | |
| 07/21/20 | | Russian Rubles | | | 14,856,800 | | | U.S. Dollars | | | 196,000 | | | JPMorgan Chase | | | 1,107 | |
| 05/05/20 | | U.S. Dollars | | | 26,925 | | | Indian Rupees | | | 1,949,000 | | | HSBC | | | 1,007 | |
| 11/04/20 | | U.S. Dollars | | | 376,607 | | | Brazilian Reals | | | 2,062,600 | | | Citibank | | | 805 | |
| 06/08/20 | | U.S. Dollars | | | 217,784 | | | Japanese Yen | | | 23,272,620 | | | HSBC | | | 796 | |
| 06/30/20 | | Japanese Yen | | | 53,796,513 | | | Euro | | | 456,600 | | | Citibank | | | 771 | |
| 05/04/20 | | Indian Rupees | | | 2,277,559 | | | U.S. Dollars | | | 29,548 | | | HSBC | | | 748 | |
| 06/29/20 | | U.S. Dollars | | | 110,380 | | | Euro | | | 100,000 | | | BNP | | | 656 | |
| 05/05/20 | | Indian Rupees | | | 1,949,000 | | | U.S. Dollars | | | 25,279 | | | HSBC | | | 639 | |
| 05/14/20 | | U.S. Dollars | | | 13,587 | | | Indian Rupees | | | 977,223 | | | HSBC | | | 623 | |
| 05/18/20 | | U.S. Dollars | | | 18,672 | | | Indian Rupees | | | 1,375,000 | | | JPMorgan Chase | | | 452 | |
| 05/14/20 | | Indian Rupees | | | 977,223 | | | U.S. Dollars | | | 12,642 | | | HSBC | | | 321 | |
| 06/09/20 | | U.S. Dollars | | | 215,000 | | | Czech Republic Koruna | | | 5,309,016 | | | Citibank | | | 208 | |
| 05/15/20 | | U.S. Dollars | | | 22,154 | | | Indian Rupees | | | 1,655,100 | | | Citibank | | | 204 | |
| |
| | | | |
Total Unrealized Appreciation | | | | | | | | | | | $ | 2,939,533 | |
| |
| | | | | | |
| 06/30/20 | | Chilean Pesos | | | 49,148,475 | | | U.S. Dollars | | | 59,000 | | | Citibank | | $ | (32 | ) |
| 06/29/20 | | U.S. Dollars South | | | 43,822 | | | Euro | | | 40,000 | | | Barclays | | | (68 | ) |
| 05/11/20 | | African Rand | | | 4,431,896 | | | U.S. Dollars | | | 239,000 | | | Bank of America | | | (190 | ) |
| 06/29/20 | | U.S. Dollars | | | 73,311 | | | Euro | | | 67,000 | | | Citibank | | | (204 | ) |
| 06/10/20 | | Mexican Pesos | | | 2,902,977 | | | U.S. Dollars | | | 120,000 | | | BNP | | | (368 | ) |
| 09/08/20 | | Japanese Yen | | | 59,383,740 | | | U.S. Dollars | | | 555,040 | | | HSBC | | | (397 | ) |
| 10/06/20 | | U.S. Dollars | | | 1,538,929 | | | Mexican Pesos | | | 37,970,000 | | | HSBC | | | (839 | ) |
| 05/05/20 | | Brazilian Reals | | | 1,052,300 | | | U.S. Dollars | | | 194,331 | | | JPMorgan Chase | | | (905 | ) |
| 05/13/20 | | Euro | | | 32,770 | | | Swedish Krona | | | 360,000 | | | Deutsche Bank | | | (985 | ) |
| 10/30/20 | | Japanese Yen | | | 159,249,500 | | | U.S. Dollars | | | 1,490,002 | | | Deutsche Bank | | | (1,026 | ) |
| 05/05/20 | | Brazilian Reals | | | 2,062,600 | | | U.S. Dollars | | | 380,203 | | | Citibank | | | (1,072 | ) |
| 06/16/20 | | U.S. Dollars | | | 933,574 | | | Norwegian Kroner | | | 9,574,400 | | | JPMorgan Chase | | | (1,218 | ) |
| 05/11/20 | | U.S. Dollars | | | 77,558 | | | South African Rand | | | 1,461,968 | | | BNP | | | (1,219 | ) |
| 06/15/20 | | U.S. Dollars | | | 938,931 | | | Norwegian Kroner | | | 9,633,000 | | | JPMorgan Chase | | | (1,576 | ) |
| 06/15/20 | | Euro | | | 469,699 | | | Swedish Krona | | | 5,040,000 | | | Deutsche Bank | | | (1,642 | ) |
See accompanying Notes to Financial Statements
188
Morningstar Funds Trust April 30, 2020
Schedule of Investments (continued)
Morningstar Multisector Bond Fund
| | | | | | | | | | | | | | | | | | |
Expiration
Date | | Currency
Purchased | | Amount of Currency
Purchased | | | Currency Sold | | Amount of Currency
Sold | | | Counterparty | | Unrealized
Appreciation
(Depreciation) | |
| |
| 09/09/20 | | Japanese Yen | | | 23,272,620 | | | U.S. Dollars | | | 219,220 | | | HSBC | | | $ (1,850 | ) |
| 05/13/20 | | Swedish Krona | | | 4,791,000 | | | Euro | | | 450,075 | | | Deutsche Bank | | | (2,184 | ) |
| 07/14/20 | | Euro | | | 788,656 | | | Norwegian Kroner | | | 8,890,000 | | | JPMorgan Chase | | | (2,486 | ) |
| 07/03/20 | | Japanese Yen | | | 78,040,676 | | | Euro | | | 665,700 | | | JPMorgan Chase | | | (2,540 | ) |
| 06/09/20 | | U.S. Dollars | | | 310,000 | | | Czech Republic Koruna | | | 7,727,990 | | | Goldman Sachs | | | (2,659 | ) |
| 05/12/20 | | Romanian Leu | | | 1,124,632 | | | U.S. Dollars | | | 257,000 | | | JPMorgan Chase | | | (2,750 | ) |
| 06/29/20 | | U.S. Dollars | | | 457,759 | | | Euro | | | 420,000 | | | Standard Chartered Bank | | | (3,082 | ) |
| 07/09/20 | | U.S. Dollars | | | 452,211 | | | Hungarian Forints | | | 146,651,975 | | | JPMorgan Chase | | | (3,260 | ) |
| 07/21/20 | | U.S. Dollars | | | 424,000 | | | Peruvian Nuevo Soles | | | 1,449,953 | | | Citibank | | | (3,604 | ) |
| 06/08/20 | | Japanese Yen | | | 23,272,620 | | | U.S. Dollars | | | 220,636 | | | HSBC | | | (3,649 | ) |
| 10/08/20 | | U.S. Dollars | | | 106,352 | | | Mexican Pesos | | | 2,714,000 | | | Citibank | | | (3,678 | ) |
| 06/08/20 | | Japanese Yen | | | 22,103,150 | | | U.S. Dollars | | | 209,793 | | | JPMorgan Chase | | | (3,709 | ) |
| 06/30/20 | | U.S. Dollars | | | 164,672 | | | Chilean Pesos | | | 140,811,504 | | | JPMorgan Chase | | | (4,273 | ) |
| 06/15/20 | | U.S. Dollars | | | 2,523,979 | | | Australian Dollars | | | 3,880,000 | | | Morgan Stanley | | | (4,778 | ) |
| 07/27/20 | | U.S. Dollars | | | 383,000 | | | Malaysian Ringgit | | | 1,679,838 | | | Barclays | | | (5,378 | ) |
| 06/22/20 | | Japanese Yen | | | 43,177,330 | | | U.S. Dollars | | | 408,289 | | | JPMorgan Chase | | | (5,614 | ) |
| 06/09/20 | | U.S. Dollars | | | 200,000 | | | Czech Republic Koruna | | | 5,088,000 | | | Barclays | | | (5,850 | ) |
| 05/11/20 | | Singapore Dollars | | | 715,000 | | | U.S. Dollars | | | 513,797 | | | BNP | | | (6,736 | ) |
| 05/18/20 | | Euro | | | 1,150,000 | | | U.S. Dollars | | | 1,267,530 | | | Deutsche Bank | | | (6,854 | ) |
| 07/31/20 | | Japanese Yen | | | 52,970,622 | | | Euro | | | 456,600 | | | Citibank | | | (6,995 | ) |
| 08/13/20 | | Swedish Krona | | | 4,791,000 | | | Euro | | | 454,329 | | | Deutsche Bank | | | (7,415 | ) |
| 06/10/20 | | Mexican Pesos | | | 2,512,485 | | | U.S. Dollars | | | 111,000 | | | Bank of America | | | (7,461 | ) |
| 06/10/20 | | Mexican Pesos | | | 8,548,480 | | | U.S. Dollars | | | 361,000 | | | Citibank | | | (8,717 | ) |
| 07/29/20 | | U.S. Dollars | | | 798,402 | | | South Korean Won | | | 979,000,000 | | | HSBC | | | (8,788 | ) |
| 07/17/20 | | U.S. Dollars | | | 186,000 | | | Indonesian Rupiahs | | | 3,009,480,000 | | | Bank of America | | | (9,108 | ) |
| 06/15/20 | | Swedish Krona | | | 9,582,000 | | | Euro | | | 904,580 | | | Deutsche Bank | | | (9,594 | ) |
| 07/28/20 | | U.S. Dollars | | | 270,000 | | | Brazilian Reals | | | 1,536,832 | | | Citibank | | | (10,946 | ) |
| 09/14/20 | | Japanese Yen | | | 40,313,035 | | | Australian Dollars | | | 595,000 | | | HSBC | | | (11,228 | ) |
| 06/30/20 | | U.S. Dollars | | | 423,645 | | | Chilean Pesos | | | 363,055,000 | | | BNP | | | (11,947 | ) |
| 09/14/20 | | Japanese Yen | | | 47,524,435 | | | Australian Dollars | | | 700,000 | | | JPMorgan Chase | | | (12,301 | ) |
| 06/09/20 | | U.S. Dollars | | | 355,000 | | | Czech Republic Koruna | | | 9,131,951 | | | BNP | | | (14,460 | ) |
| 07/14/20 | | Norwegian Kroner | | | 18,402,600 | | | Euro | | | 1,651,932 | | | JPMorgan Chase | | | (16,134 | ) |
| 05/19/20 | | U.S. Dollars | | | 230,166 | | | Uruguayan Pesos | | | 10,667,270 | | | Citibank | | | (20,245 | ) |
| 08/31/20 | | Japanese Yen | | | 65,814,000 | | | U.S. Dollars | | | 636,810 | | | Citibank | | | (22,207 | ) |
| 05/19/20 | | Uruguayan Pesos | | | 10,667,270 | | | U.S. Dollars | | | 277,000 | | | Citibank | | | (26,590 | ) |
| 05/18/20 | | Colombian Pesos | | | 764,739,417 | | | U.S. Dollars | | | 225,687 | | | Bank of America | | | (32,872 | ) |
| 06/23/20 | | U.S. Dollars | | | 611,000 | | | Colombian Pesos | | | 2,567,970,480 | | | Barclays | | | (34,511 | ) |
| 05/29/20 | | Swedish Krona | | | 12,864,000 | | | U.S. Dollars | | | 1,353,624 | | | Deutsche Bank | | | (34,655 | ) |
| 05/18/20 | | Colombian Pesos | | | 848,039,156 | | | U.S. Dollars | | | 249,313 | | | Citibank | | | (35,496 | ) |
| 05/26/20 | | Chilean Pesos | | | 895,215,000 | | | U.S. Dollars | | | 1,110,000 | | | JPMorgan Chase | | | (37,084 | ) |
| 11/09/20 | | Japanese Yen | | | 327,883,800 | | | Euro | | | 2,830,000 | | | Deutsche Bank | | | (48,290 | ) |
See accompanying Notes to Financial Statements
189
Morningstar Funds Trust April 30, 2020
Schedule of Investments (continued)
Morningstar Multisector Bond Fund
| | | | | | | | | | | | | | | | | | | | | | | | |
| |
Expiration Date | | Currency Purchased | | | Amount of Currency Purchased | | | Currency Sold | | | Amount of Currency Sold | | | Counterparty | | | Unrealized Appreciation (Depreciation) | |
| |
| | | | | | |
05/07/20 | | | Brazilian Reals | | | | 1,067,750 | | | | U.S. Dollars | | | | 250,000 | | | | Citibank | | | | $ (53,770 | ) |
06/09/20 | | | Czech Republic Koruna | | | | 28,993,500 | | | | U.S. Dollars | | | | 1,275,000 | | | | Bank of America | | | | (101,981 | ) |
06/15/20 | | | Norwegian Kroner | | | | 9,633,000 | | | | U.S. Dollars | | | | 1,052,678 | | | | JPMorgan Chase | | | | (112,171 | ) |
09/21/20 | | | Norwegian Kroner | | | | 8,594,500 | | | | U.S. Dollars | | | | 952,581 | | | | JPMorgan Chase | | | | (113,197 | ) |
06/16/20 | | | Norwegian Kroner | | | | 9,574,400 | | | | U.S. Dollars | | | | 1,052,680 | | | | JPMorgan Chase | | | | (117,888 | ) |
06/19/20 | | | Norwegian Kroner | | | | 9,808,100 | | | | U.S. Dollars | | | | 1,088,253 | | | | JPMorgan Chase | | | | (130,625 | ) |
06/16/20 | | | Japanese Yen | | | | 513,245,304 | | | | Australian Dollars | | | | 7,821,000 | | | | HSBC | | | | (311,234 | ) |
| |
Total Unrealized Depreciation | | | | | | | | | | | | | | | | $(1,454,585 | ) |
| |
Net Unrealized Appreciation | | | | | | | | | | | | | | | | $1,484,948 | |
| |
Credit Default Swap Contracts outstanding - Sell Protection as of April 30, 2020:
Exchange Traded
| | | | | | | | | | | | | | | | | | | | | | | | | | | | | | |
Reference Obligation | | Implied Credit Spread | | | Fixed Deal (Pay) Rate | | | Maturity Date | | | Counterparty | | | Notional Amount(1) | | | Market Value | | | Upfront
Premiums
Paid/ (Received) | | | Unrealized
Appreciation (Depreciation) |
Markit CDX North America Investment Grade Index Series 34 (Pay Quarterly) | | | 6.28% | | | | 5.00% | | | | 6/20/2025 | | | | Morgan Stanley | | | | USD 10,805,000 | | | | $(503,924 | ) | | | $(517,444 | ) | | $13,520 |
| | | | | | | | | |
Total | | | | | | | | | | | | | | | | | | | 10,805,000 | | | | $(503,924 | ) | | | $(517,444 | ) | | $13,520 |
| (1) | The maximum potential amount the Fund may pay should a negative credit event take place as defined under the terms of the agreement. |
Credit Default Swap Contracts outstanding - Sell Protection as of April 30, 2020:
Over the Counter
| | | | | | | | | | | | | | | | | | | | | | | | | | | | | | | | |
Reference Obligation | | Implied Credit Spread | | | Fixed Deal (Pay) Rate | | | Maturity Date | | | Counterparty | | | Notional Amount(1) | | | Market Value | | | Upfront Premiums Paid/ (Received) | | | Unrealized Appreciation (Depreciation) | |
| |
Markit CDX Emerging Markets Series 33 (Pay Quarterly) | | | 3.35% | | | | 1.00% | | | | 06/20/2025 | | | | Barclays | | | | USD 200,000 | | | | $(21,408 | ) | | | $(19,820 | ) | | | $(1,588 | ) |
Markit CDX Emerging Markets Series 33 (Pay Quarterly) | | | 3.35% | | | | 1.00% | | | | 06/20/2025 | | |
| Bank Of
America |
| | | USD 433,890 | | | | (46,444 | ) | | | (45,858 | ) | | | (586 | ) |
| |
Total | | | | | | | | | | | | | | | | | | | 633,890 | | | | $(67,852 | ) | | | $(65,678 | ) | | | $(2,174 | ) |
| |
| (1) | The maximum potential amount the Fund may pay should a negative credit event take place as defined under the terms of the agreement. |
See accompanying Notes to Financial Statements
190
Morningstar Funds Trust April 30, 2020
Schedule of Investments (continued)
Morningstar Multisector Bond Fund
Valuation Hierarchy
The following is a summary of the inputs used, as of April 30, 2020, in valuing the Fund’s investments carried at fair value:
| | | | | | | | | | | | | | | | |
| |
| Morningstar Multisector Bond Fund | | Level 1 | | | Level 2 | | | Level 3 | | | Totals | |
| |
Investments | | | | | | | | | | | | | | | | |
Assets: | | | | | | | | | | | | | | | | |
Asset-Backed Securities | | $ | — | | | $ | 298,055 | | | | $— | | | $ | 298,055 | |
Common Stocks | | | 114,579 | | | | 2,430 | | | | — | | | | 117,009 | |
Convertible Preferred Stocks | | | 63,081 | | | | 488,250 | | | | — | | | | 551,331 | |
Convertible Bonds | | | — | | | | 1,655,344 | | | | — | | | | 1,655,344 | |
Corporate Bonds | | | — | | | | 34,019,895 | | | | — | | | | 34,019,895 | |
Foreign Government Inflation-Linked Bonds | | | — | | | | 1,699,652 | | | | — | | | | 1,699,652 | |
Foreign Issuer Bonds | | | — | | | | 118,616,507 | | | | — | | | | 118,616,507 | |
U.S. Government Obligations | | | — | | | | 10,218,003 | | | | — | | | | 10,218,003 | |
Short-Term Investments | | | 15,328,577 | | | | 4,580,000 | | | | — | | | | 19,908,577 | |
| |
Total Investments | | $ | 15,506,237 | | | $ | 171,578,136 | | | | $— | | | $ | 187,084,373 | |
| |
| | | | | | | | | | | | | | | | |
| | | | | | | | | | | | | | | | |
| |
| Morningstar Multisector Bond Fund | | Level 1 | | | Level 2 | | | Level 3 | | | Totals | |
| |
Derivative Financial Instruments | | | | | | | | | | | | | | | | |
Assets: | | | | | | | | | | | | | | | | |
Forward foreign currency exchange contracts | | | $— | | | $ | 2,939,533 | | | | $— | | | $ | 2,939,533 | |
| |
Total Assets - Derivative Financial Instruments | | | $— | | | $ | 2,939,533 | | | | $— | | | $ | 2,939,533 | |
| |
Liabilities: | | | | | | | | | | | | | | | | |
Forward foreign currency exchange contracts | | | $— | | | $ | (1,454,585 | ) | | | $— | | | $ | (1,454,585 | ) |
Swap agreements at fair value | | | — | | | | (571,776 | ) | | | — | | | | (571,776 | ) |
| |
Total Liabilities - Derivative Financial Instruments | | | $— | | | $ | (2,026,361 | ) | | | $— | | | $ | (2,026,361 | ) |
| |
Total Net Derivative Financial Instruments | | | $— | | | $ | 913,172 | | | | $— | | | $ | 913,172 | |
| |
See accompanying Notes to Financial Statements
191
Morningstar Funds Trust April 30, 2020
Schedule of Investments
|
Morningstar Unconstrained Allocation Fund |
| | | | | | | | |
| | | Par(a) | | | Value | |
|
Asset-Backed Securities – 0.1% | |
|
Commercial Mortgage-Backed Securities – 0.1% | |
Benchmark Mortgage Trust, Series 2020-B17, Class A2, 2.21%, 3/15/53 | | | $45,000 | | | | $45,128 | |
Total Asset-Backed Securities
(Cost $45,633) | | | | | | | 45,128 | |
| | |
| | | Number
of Shares | | | | |
| | |
Common Stocks – 17.4% | | | | | | | | |
| | |
Advertising – 0.9% | | | | | | | | |
Omnicom Group, Inc. | | | 22,549 | | | | 1,285,969 | |
| | |
Apparel – 0.7% | | | | | | | | |
Tapestry, Inc. | | | 68,188 | | | | 1,014,637 | |
| | |
Beverages – 0.5% | | | | | | | | |
Anheuser-Busch InBev S.A./N.V. (Belgium) | | | 16,424 | | | | 764,867 | |
| | |
Commercial Services – 3.1% | | | | | | | | |
Atlantia S.p.A. (Italy) | | | 27,499 | | | | 450,798 | |
Bureau Veritas S.A. (France) | | | 45,998 | | | | 954,916 | |
H&R Block, Inc. | | | 85,023 | | | | 1,415,633 | |
Nielsen Holdings PLC | | | 96,375 | | | | 1,419,604 | |
| | | | | | | | 4,240,951 | |
| | |
Computers – 0.9% | | | | | | | | |
Cognizant Technology Solutions Corp., Class A | | | 22,598 | | | | 1,311,136 | |
|
Engineering & Construction – 0.9% | |
Ferrovial S.A. (Spain) | | | 47,127 | | | | 1,180,053 | |
| | |
Entertainment – 0.8% | | | | | | | | |
International Game Technology PLC | | | 149,118 | | | | 1,124,350 | |
|
Environmental Control – 0.9% | |
Stericycle, Inc.* | | | 25,149 | | | | 1,227,271 | |
| | |
Healthcare - Products – 1.0% | | | | | | | | |
Henry Schein, Inc.* | | | 13,262 | | | | 723,575 | |
Medtronic PLC | | | 7,138 | | | | 696,883 | |
| | | | | | | | 1,420,458 | |
|
Healthcare - Services – 1.8% | |
Fresenius Medical Care A.G. & Co. KGaA (Germany) | | | 19,964 | | | | 1,564,591 | |
MEDNAX, Inc.* | | | 62,120 | | | | 901,982 | |
| | | | | | | | 2,466,573 | |
| | | | | | | | |
| | | Number
of Shares | | | Value | |
| | |
Internet – 0.4% | | | | | | | | |
Alphabet, Inc., Class C* | | | 181 | | | $ | 244,108 | |
Booking Holdings, Inc.* | | | 169 | | | | 250,216 | |
| | | | | | | | 494,324 | |
| | |
Pharmaceuticals – 0.8% | | | | | | | | |
CVS Health Corp. | | | 18,940 | | | | 1,165,757 | |
| | |
Retail – 0.2% | | | | | | | | |
Lowe’s Cos., Inc. | | | 2,408 | | | | 252,238 | |
| | |
Semiconductors – 0.6% | | | | | | | | |
IPG Photonics Corp.* | | | 6,043 | | | | 781,541 | |
| | |
Software – 0.7% | | | | | | | | |
Oracle Corp. | | | 17,328 | | | | 917,864 | |
| | |
Telecommunications – 1.5% | | | | | | | | |
Cisco Systems, Inc. | | | 16,816 | | | | 712,662 | |
SES S.A. (France) | | | 215,199 | | | | 1,433,655 | |
| | | | | | | | 2,146,317 | |
| | |
Transportation – 1.7% | | | | | | | | |
CSX Corp. | | | 11,508 | | | | 762,175 | |
Norfolk Southern Corp. | | | 4,554 | | | | 779,189 | |
Union Pacific Corp. | | | 4,662 | | | | 744,941 | |
| | | | | | | | 2,286,305 | |
Total Common Stocks
(Cost $23,592,452) | | | | | | | 24,080,611 | |
| | |
| | | Par(a) | | | | |
|
Corporate Bonds – 2.1% | |
|
Aerospace/Defense – 0.2% | |
Boeing (The) Co., | | | | | | | | |
5.71%, 5/01/40 | | $ | 50,000 | | | | 50,000 | |
5.80%, 5/01/50 | | | 55,000 | | | | 55,000 | |
3.95%, 8/01/59 | | | 40,000 | | | | 31,324 | |
5.93%, 5/01/60 | | | 55,000 | | | | 55,000 | |
General Dynamics Corp., | | | | | | | | |
4.25%, 4/01/40 | | | 20,000 | | | | 24,605 | |
4.25%, 4/01/50 | | | 5,000 | | | | 6,460 | |
Northrop Grumman Corp., | | | | | | | | |
5.15%, 5/01/40 | | | 10,000 | | | | 13,324 | |
5.25%, 5/01/50 | | | 10,000 | | | | 14,193 | |
| | | | | | | | 249,906 | |
| | |
Apparel – 0.0%(b) | | | | | | | | |
NIKE, Inc., | | | | | | | | |
3.25%, 3/27/40 | | | 10,000 | | | | 10,865 | |
3.38%, 3/27/50 | | | 10,000 | | | | 11,212 | |
| | | | | | | | 22,077 | |
See accompanying Notes to Financial Statements
192
Morningstar Funds Trust April 30, 2020
Schedule of Investments (continued)
Morningstar Unconstrained Allocation Fund
| | | | | | | | |
| | | Par(a) | | | Value | |
| | |
Auto Manufacturers – 0.0%(b) | | | | | | | | |
Toyota Motor Credit Corp., 3.38%, 4/01/30 | | $ | 25,000 | | | $ | 27,349 | |
| | |
Banks – 0.5% | | | | | | | | |
Bank of America Corp., (3M USD LIBOR + 3.15%), 4.08%, 3/20/51(c) | | | 300,000 | | | | 360,242 | |
JPMorgan Chase & Co., (SOFR + 2.44%), 3.11%, 4/22/51(c) | | | 55,000 | | | | 56,954 | |
Wells Fargo & Co., | | | | | | | | |
(3M USD LIBOR + 3.77%),
4.48%, 4/04/31(c) | | | 130,000 | | | | 150,878 | |
(3M USD LIBOR + 4.24%),
5.01%, 4/04/51(c) | | | 90,000 | | | | 118,155 | |
| | | | | | | | 686,229 | |
| | |
Beverages – 0.0%(b) | | | | | | | | |
Coca-Cola (The) Co., | | | | | | | | |
4.13%, 3/25/40 | | | 10,000 | | | | 12,464 | |
4.20%, 3/25/50 | | | 20,000 | | | | 25,890 | |
| | | | | | | | 38,354 | |
| | |
Chemicals – 0.1% | | | | | | | | |
LYB International Finance III LLC,
4.20%, 5/01/50 | | | 50,000 | | | | 50,613 | |
| | |
Computers – 0.1% | | | | | | | | |
Hewlett Packard Enterprise Co., | | | | | | | | |
6.20%, 10/15/35 | | | 10,000 | | | | 11,823 | |
6.35%, 10/15/45 | | | 130,000 | | | | 155,602 | |
| | | | | | | | 167,425 | |
| | |
Cosmetics/Personal Care – 0.0%(b) | | | | | | | | |
Procter & Gamble (The) Co., | | | | | | | | |
3.55%, 3/25/40 | | | 10,000 | | | | 12,029 | |
3.60%, 3/25/50 | | | 10,000 | | | | 12,722 | |
| | | | | | | | 24,751 | |
|
Diversified Financial Services – 0.0%(b) | |
Mastercard, Inc., | | | | | | | | |
3.35%, 3/26/30 | | | 10,000 | | | | 11,386 | |
3.85%, 3/26/50 | | | 10,000 | | | | 12,471 | |
| | | | | | | | 23,857 | |
| | |
Electric – 0.1% | | | | | | | | |
Consolidated Edison Co. of New York, Inc., 3.95%, 4/01/50 | | | 25,000 | | | | 29,879 | |
Exelon Corp., | | | | | | | | |
4.05%, 4/15/30 | | | 20,000 | | | | 22,834 | |
4.70%, 4/15/50 | | | 25,000 | | | | 32,162 | |
| | | | | | | | 84,875 | |
| | | | | | | | |
| | | Par(a) | | | Value | |
| | |
Insurance – 0.2% | | | | | | | | |
American International Group, Inc.,
4.50%, 7/16/44 | | $ | 65,000 | | | $ | 71,802 | |
Metropolitan Life Global Funding I, (SOFR + 0.57%), 0.61%, 1/13/23(d)(e) | | | 150,000 | | | | 144,682 | |
New York Life Insurance Co.,
3.75%, 5/15/50(d) | | | 25,000 | | | | 28,362 | |
Prudential Financial, Inc., 4.35%, 2/25/50 | | | 15,000 | | | | 17,161 | |
| | | | | | | | 262,007 | |
| | |
Media – 0.1% | | | | | | | | |
Comcast Corp., | | | | | | | | |
3.40%, 4/01/30 | | | 15,000 | | | | 16,843 | |
3.75%, 4/01/40 | | | 5,000 | | | | 5,738 | |
Walt Disney (The) Co., | | | | | | | | |
4.62%, 3/23/40 | | | 10,000 | | | | 12,405 | |
4.70%, 3/23/50 | | | 25,000 | | | | 33,447 | |
| | | | | | | | 68,433 | |
|
Miscellaneous Manufacturing – 0.1% | |
3M Co., 3.70%, 4/15/50 | | | 35,000 | | | | 41,793 | |
General Electric Co., 4.35%, 5/01/50 | | | 125,000 | | | | 125,951 | |
| | | | | | | | 167,744 | |
| | |
Oil & Gas – 0.1% | | | | | | | | |
Exxon Mobil Corp., 3.45%, 4/15/51 | | | 100,000 | | | | 109,378 | |
| | |
Pharmaceuticals – 0.0%(b) | | | | | | | | |
CVS Health Corp., | | | | | | | | |
4.12%, 4/01/40 | | | 20,000 | | | | 22,443 | |
4.25%, 4/01/50 | | | 20,000 | | | | 23,417 | |
| | | | | | | | 45,860 | |
| | |
Retail – 0.1% | | | | | | | | |
Home Depot (The), Inc., | | | | | | | | |
3.30%, 4/15/40 | | | 15,000 | | | | 16,389 | |
3.35%, 4/15/50 | | | 10,000 | | | | 11,074 | |
Lowe’s Cos., Inc., | | | | | | | | |
5.00%, 4/15/40 | | | 10,000 | | | | 12,386 | |
5.12%, 4/15/50 | | | 25,000 | | | | 32,632 | |
McDonald’s Corp., | | | | | | | | |
3.60%, 7/01/30 | | | 10,000 | | | | 11,284 | |
3.63%, 9/01/49 | | | 15,000 | | | | 16,418 | |
4.20%, 4/01/50 | | | 20,000 | | | | 23,819 | |
| | | | | | | | 124,002 | |
| | |
Semiconductors – 0.1% | | | | | | | | |
Intel Corp., 4.75%, 3/25/50 | | | 55,000 | | | | 77,481 | |
See accompanying Notes to Financial Statements
193
Morningstar Funds Trust April 30, 2020
Schedule of Investments (continued)
Morningstar Unconstrained Allocation Fund
| | | | | | | | | | |
| | | | | Par(a) | | | Value | |
| |
Semiconductors (Continued) | | | | | |
Intel Corp., 4.95%, 3/25/60 | | | | $ | 20,000 | | | $ | 28,524 | |
NVIDIA Corp., | | | | | | | | | | |
3.50%, 4/01/40 | | | | | 25,000 | | | | 28,100 | |
3.50%, 4/01/50 | | | | | 40,000 | | | | 45,899 | |
| | | | | | | | | | 180,004 | |
| | | |
Software – 0.2% | | | | | | | | | | |
Oracle Corp., | | | | | | | | | | |
3.60%, 4/01/50 | | | | | 130,000 | | | | 147,671 | |
3.85%, 4/01/60 | | | | | 120,000 | | | | 139,033 | |
| | | | | | | | | | 286,704 | |
| | | |
Transportation – 0.2% | | | | | | | | | | |
Burlington Northern Santa Fe LLC, 4.70%, 9/01/45 | | | | | 10,000 | | | | 12,863 | |
FedEx Corp., 5.25%, 5/15/50 | | | | | 115,000 | | | | 138,629 | |
United Parcel Service, Inc., | | | | | | | | | | |
5.20%, 4/01/40 | | | | | 10,000 | | | | 13,303 | |
5.30%, 4/01/50 | | | | | 30,000 | | | | 42,893 | |
| | | | | | | | | | 207,688 | |
Total Corporate Bonds
(Cost $2,511,118) | | | | | | | | | 2,827,256 | |
| |
Foreign Issuer Bonds – 5.0% | | | | | |
| | | |
Australia – 0.6% | | | | | | | | | | |
Australia Government Bond,
5.75%, 7/15/22 | | AUD | | | 535,000 | | | | 390,865 | |
New South Wales Treasury Corp.,
4.00%, 4/08/21 | | AUD | | | 125,000 | | | | 84,236 | |
Queensland Treasury Corp.,
5.50%, 6/21/21 | | AUD | | | 250,000 | | | | 172,330 | |
Western Australian Treasury Corp., 7.00%, 7/15/21 | | AUD | | | 245,000 | | | | 172,241 | |
| | | | | | | | | | 819,672 | |
| | | |
Belgium – 0.2% | | | | | | | | | | |
Anheuser-Busch InBev Worldwide, Inc., | | | | | | | | | | |
4.50%, 6/01/50 | | | | | 160,000 | | | | 179,068 | |
4.60%, 6/01/60 | | | | | 55,000 | | | | 60,513 | |
| | | | | | | | | | 239,581 | |
| | | |
Brazil – 0.4% | | | | | | | | | | |
Brazil Notas do Tesouro Nacional, Serie F, | | | | | | | | | | |
10.00%, 1/01/23 | | BRL | | | 1,130,000 | | | | 232,804 | |
10.00%, 1/01/27 | | BRL | | | 1,770,000 | | | | 372,056 | |
| | | | | | | | | | 604,860 | |
| | | | | | | | | | |
| | | | | Par(a) | | | Value | |
| | | |
Canada – 0.3% | | | | | | | | | | |
Bank of Montreal, (SOFR + 0.68%), 0.83%, 3/10/23(e) | | | | $ | 195,000 | | | $ | 187,836 | |
Canadian Imperial Bank of Commerce, (SOFR + 0.80%), 0.84%, 3/17/23(e) | | | | | 205,000 | | | | 197,638 | |
| | | | | | | | | | 385,474 | |
| | | |
Colombia – 0.5% | | | | | | | | | | |
Colombian TES, | | | | | | | | | | |
6.25%, 11/26/25 | | COP | | | 1,010,000,000 | | | | 259,435 | |
6.00%, 4/28/28 | | COP | | | 1,730,000,000 | | | | 417,238 | |
| | | | | | | | | | 676,673 | |
| | | |
Indonesia – 0.4% | | | | | | | | | | |
Indonesia Treasury Bond, 9.00%, 3/15/29 | | IDR | | | 8,500,000,000 | | | | 609,260 | |
| | | |
Malaysia – 0.6% | | | | | | | | | | |
Malaysia Government Bond, | | | | | | | | | | |
3.88%, 3/10/22 | | MYR | | | 2,560,000 | | | | 611,723 | |
3.90%, 11/16/27 | | MYR | | | 900,000 | | | | 225,023 | |
| | | | | | | | | | 836,746 | |
| | | |
Mexico – 1.3% | | | | | | | | | | |
Mexican Bonos, | | | | | | | | | | |
8.50%, 5/31/29 | | MXN | | | 9,000,000 | | | | 421,937 | |
7.75%, 11/23/34 | | MXN | | | 2,960,000 | | | | 130,282 | |
8.50%, 11/18/38 | | MXN | | | 9,500,000 | | | | 430,506 | |
7.75%, 11/13/42 | | MXN | | | 11,950,000 | | | | 493,614 | |
8.00%, 11/07/47 | | MXN | | | 3,900,000 | | | | 166,863 | |
Petroleos Mexicanos, | | | | | | | | | | |
6.75%, 9/21/47 | | | | | 25,000 | | | | 17,187 | |
7.69%, 1/23/50(d) | | | | | 190,000 | | | | 139,650 | |
| | | | | | | | | | 1,800,039 | |
| | | |
Poland – 0.1% | | | | | | | | | | |
Republic of Poland Government Bond, | | | | | | | | | | |
5.25%, 10/25/20 | | PLN | | | 360,000 | | | | 88,808 | |
2.00%, 4/25/21 | | PLN | | | 426,000 | | | | 104,280 | |
| | | | | | | | | | 193,088 | |
| | | |
Russia – 0.0%(b) | | | | | | | | | | |
Russian Federal Bond - OFZ, 7.65%, 4/10/30 | | RUB | | | 3,000,000 | | | | 45,333 | |
| | | |
South Africa – 0.4% | | | | | | | | | | |
Republic of South Africa Government Bond, | | | | | | | | | | |
6.50%, 2/28/41 | | ZAR | | | 6,610,000 | | | | 213,257 | |
8.75%, 2/28/48 | | ZAR | | | 6,860,000 | | | | 277,146 | |
| | | | | | | | | | 490,403 | |
See accompanying Notes to Financial Statements
194
Morningstar Funds Trust April 30, 2020
Schedule of Investments (continued)
Morningstar Unconstrained Allocation Fund
| | | | | | | | | | | | |
| | | | Par(a) | | | Value | |
| |
Spain – 0.2% | | | | | |
Spain Government Bond, 1.00%, 10/31/50(d) | | | EUR | | | $ | 235,000 | | | $ | 225,778 | |
Total Foreign Issuer Bonds
(Cost $7,503,818) | | | | 6,926,907 | |
|
U.S. Government Obligations – 4.3% | |
| |
U.S. Treasury Bonds – 0.2% | | | | | |
2.37%, 11/15/49 | | | | 200,000 | | | | 254,086 | |
|
U.S. Treasury Floating Rate Notes – 4.1% | |
(3M US Treasury MMY + 0.22%), 0.34%, 7/31/21(e) | | | | 465,000 | | | | 465,912 | |
(3M US Treasury MMY + 0.30%), 0.42%, 10/31/21(e) | | | | 1,830,000 | | | | 1,836,466 | |
(3M US Treasury MMY + 0.15%), 0.28%, 1/31/22(e) | | | | 3,295,000 | | | | 3,298,813 | |
(3M US Treasury MMY + 0.11%), 0.23%, 4/30/22(e) | | | | 85,000 | | | | 85,009 | |
| | | | | 5,686,200 | |
Total U.S. Government Obligations
(Cost $5,933,363) | | | | 5,940,286 | |
| | |
| | | | Number of Shares | | | | |
|
Investment Companies – 64.4% | |
iShares Broad USD High Yield Corporate Bond ETF | | | | 50,449 | | | | 1,868,127 | |
iShares Core DAX UCITS ETF DE (Germany)* EUR | | | | 58,894 | | | | 5,994,382 | |
iShares Global Energy ETF | | | | 570,155 | | | | 11,197,844 | |
iShares MSCI Europe Financials ETF | | | | 552,148 | | | | 7,222,096 | |
| | | | | | | | |
| | | Number
of Shares | | | Value | |
iShares MSCI South Korea ETF | | | 104,411 | | | $ | 5,389,696 | |
iShares MSCI United Kingdom ETF | | | 432,988 | | | | 10,932,947 | |
iShares STOXX Europe 600 Telecommunications UCITS ETF DE (Germany) EUR | | | 202,389 | | | | 4,049,405 | |
JPMorgan BetaBuilders Japan ETF | | | 655,096 | | | | 14,012,503 | |
Schwab Fundamental Emerging Markets Large Company Index ETF | | | 375,283 | | | | 8,248,720 | |
Schwab U.S. TIPS ETF | | | 30,081 | | | | 1,776,885 | |
Vanguard Consumer Staples ETF | | | 30,260 | | | | 4,477,572 | |
Vanguard Long-Term Treasury ETF | | | 36,426 | | | | 3,708,895 | |
Vanguard Small-Cap ETF | | | 29,949 | | | | 3,960,456 | |
Vanguard Total Stock Market ETF | | | 42,371 | | | | 6,179,387 | |
Total Investment Companies
(Cost $86,613,185) | | | | | | | 89,018,915 | |
|
Short-Term Investments – 6.8% | |
| | |
Money Market Fund – 6.8% | | | | | | | | |
Northern Institutional Funds - Treasury Portfolio (Premier), 0.22%(f) | | | 9,428,084 | | | | 9,428,084 | |
Total Short-Term Investments
(Cost $9,428,084) | | | | | | | 9,428,084 | |
Total Investments – 100.1%
(Cost $135,627,653) | | | | | | | 138,267,187 | |
Liabilities less Other Assets – (0.1)%(g) | | | | | | | (73,521 | ) |
NET ASSETS – 100.0% | | | | | | $ | 138,193,666 | |
Percentages shown are based on Net Assets.
All securities are United States companies, unless noted otherwise in parentheses.
| (a) | Par value is in USD unless otherwise indicated. |
| (b) | Amount rounds to less than 0.05%. |
| (c) | Variable rate security. Security issued at a fixed coupon rate, which converts to a variable rate at a future date. Rate as of April 30, 2020 is disclosed. |
| (d) | Securities exempt from registration under Rule 144A of the Securities Act of 1933. These securities may be resold in transactions exempt from registration, normally to qualified institutional buyers. The value of these securities is determined by valuations supplied by a pricing service or brokers, or, if not available, in accordance with procedures established by the Board of Trustees of Morningstar Funds Trust. |
| (e) | Variable rate security. Rate as of April 30, 2020 is disclosed. |
| (f) | 7-day current yield as of April 30, 2020 is disclosed. |
| (g) | Includes appreciation/ (depreciation) on forward foreign currency exchange contracts and futures contracts. |
| * | Non-Income Producing Security |
See accompanying Notes to Financial Statements
195
Morningstar Funds Trust April 30, 2020
Schedule of Investments (continued)
Morningstar Unconstrained Allocation Fund
| | |
AUD | | Australian Dollar |
BRL | | Brazilian Real |
COP | | Colombian Peso |
DAX | | Deutscher Aktienindex |
ETF | | Exchange-Traded Fund |
EUR | | Euro |
IDR | | Indonesian Rupiah |
LIBOR | | London Interbank Offered Rate |
LLC | | Limited Liability Company |
MMY | | Money Market Yield |
MSCI | | Morgan Stanley Capital International |
MXN | | Mexican Peso |
MYR | | Malaysian Ringgit |
PLC | | Public Limited Company |
PLN | | Polish Zloty |
RUB | | Russian Ruble |
SOFR | | United States Secured Overnight Financing Rate |
TIPS | | Treasury Inflation Protected Securities |
UCITS | | Undertakings for Collective Investment in Transferable Securities |
USD | | United States Dollar |
ZAR | | South African Rand |
Futures Contracts outstanding at April 30, 2020:
Exchange Traded
| | | | | | | | | | | | | | | | | | | | |
| Description | | Number of Contracts | | | Expiration Date | | | Trading Currency | | | Notional Amount | | | Unrealized Appreciation (Depreciation) | |
Long Contracts | | | | | | | | | | | | | | | | | | | | |
Euro-BTP | | | 13 | | | | 6/08/2020 | | | | EUR | | | | 1,974,503 | | | | $30,785 | |
Forward Foreign Currency Contracts outstanding at April 30, 2020:
| | | | | | | | | | | | | | | | | | | | | | | | |
Expiration Date | | Currency
Purchased | | | Amount of Currency Purchased | | | Currency Sold | | | Amount of Currency
Sold | | | Counterparty | | | Unrealized Appreciation (Depreciation) | |
| | | | | | |
06/16/20 | | | British Pounds | | | | 480,000 | | | | U.S. Dollars | | | | 554,219 | | | | HSBC | | | | $ 50,465 | |
05/29/20 | | | Australian Dollars | | | | 670,000 | | | | U.S. Dollars | | | | 389,086 | | | | Morgan Stanley | | | | 47,565 | |
05/13/20 | | | U.S. Dollars | | | | 164,052 | | | | Mexican Pesos | | | | 3,100,000 | | | | Citibank | | | | 35,713 | |
06/09/20 | | | U.S. Dollars | | | | 221,907 | | | | South African Rand | | | | 3,500,000 | | | | Barclays | | | | 33,888 | |
05/12/20 | | | U.S. Dollars | | | | 169,607 | | | | South African Rand | | | | 2,590,000 | | | | HSBC | | | | 30,062 | |
06/05/20 | | | Norwegian Kroner | | | | 2,500,000 | | | | U.S. Dollars | | | | 220,360 | | | | Morgan Stanley | | | | 23,709 | |
06/11/20 | | | Japanese Yen | | | | 37,000,000 | | | | U.S. Dollars | | | | 334,444 | | | | HSBC | | | | 10,552 | |
07/22/20 | | | New Zealand Dollars | | | | 1,060,000 | | | | U.S. Dollars | | | | 639,938 | | | | HSBC | | | | 9,948 | |
07/17/20 | | | Norwegian Kroner | | | | 3,400,000 | | | | U.S. Dollars | | | | 322,633 | | | | HSBC | | | | 9,385 | |
05/15/20 | | | Chilean Pesos | | | | 220,000,000 | | | | U.S. Dollars | | | | 256,261 | | | | HSBC | | | | 7,339 | |
06/19/20 | | | South Korean Won | | | | 260,000,000 | | | | U.S. Dollars | | | | 207,784 | | | | Citibank | | | | 6,417 | |
05/12/20 | | | U.S. Dollars | | | | 138,629 | | | | South African Rand | | | | 2,460,000 | | | | Morgan Stanley | | | | 6,088 | |
07/27/20 | | | Indonesian Rupiahs | | | | 1,880,000,000 | | | | U.S. Dollars | | | | 117,032 | | | | JPMorgan Chase | | | | 4,606 | |
See accompanying Notes to Financial Statements
196
Morningstar Funds Trust April 30, 2020
Schedule of Investments (continued)
Morningstar Unconstrained Allocation Fund
| | | | | | | | | | | | | | | | | | |
Expiration Date | | Currency Purchased | | Amount of Currency Purchased | | | Currency Sold | | Amount of Currency Sold | | | Counterparty | | Unrealized
Appreciation
(Depreciation) | |
| |
07/22/20 | | British Pounds | | | 300,000 | | | U.S. Dollars | | | 374,105 | | | Citibank | | | $ 3,875 | |
07/15/20 | | Polish Zloty | | | 2,030,000 | | | U.S. Dollars | | | 485,291 | | | Citibank | | | 3,866 | |
07/28/20 | | South Korean Won | | | 320,000,000 | | | U.S. Dollars | | | 260,438 | | | Citibank | | | 3,398 | |
07/31/20 | | Polish Zloty | | | 830,000 | | | U.S. Dollars | | | 197,824 | | | Citibank | | | 2,179 | |
06/05/20 | | Norwegian Kroner | | | 1,700,000 | | | U.S. Dollars | | | 163,907 | | | National Australia Bank | | | 2,060 | |
07/24/20 | | Chilean Pesos | | | 60,000,000 | | | U.S. Dollars | | | 70,081 | | | HSBC | | | 1,959 | |
06/16/20 | | British Pounds | | | 210,000 | | | U.S. Dollars | | | 262,749 | | | JPMorgan Chase | | | 1,800 | |
05/13/20 | | U.S. Dollars | | | 141,964 | | | Mexican Pesos | | | 3,400,000 | | | HSBC | | | 1,206 | |
07/20/20 | | Czech Republic Koruna | | | 1,400,000 | | | U.S. Dollars | | | 56,045 | | | JPMorgan Chase | | | 622 | |
07/13/20 | | South Korean Won | | | 300,000,000 | | | U.S. Dollars | | | 247,219 | | | Citibank | | | 57 | |
06/12/20 | | U.S. Dollars | | | 43,880 | | | Euro | | | 40,000 | | | Citibank | | | 7 | |
| |
| | | |
Total Unrealized Appreciation | | | | | | | | | $296,766 | |
| |
| | | | | | |
07/29/20 | | Russian Rubles | | | 11,500,000 | | | U.S. Dollars | | | 152,670 | | | Citibank | | | $ (267 | ) |
08/04/20 | | New Zealand Dollars | | | 830,000 | | | U.S. Dollars | | | 509,267 | | | JPMorgan Chase | | | (437 | ) |
05/18/20 | | U.S. Dollars | | | 70,620 | | | Thai Baht | | | 2,300,000 | | | HSBC | | | (466 | ) |
05/12/20 | | U.S. Dollars | | | 52,841 | | | South African Rand | | | 1,000,000 | | | Citibank | | | (1,037 | ) |
07/13/20 | | South Korean Won | | | 540,000,000 | | | U.S. Dollars | | | 446,238 | | | Citibank | | | (1,142 | ) |
05/15/20 | | U.S. Dollars | | | 46,647 | | | Chilean Pesos | | | 40,000,000 | | | HSBC | | | (1,280 | ) |
06/12/20 | | U.S. Dollars | | | 173,616 | | | Euro | | | 160,000 | | | Citibank | | | (1,875 | ) |
05/13/20 | | U.S. Dollars | | | 134,391 | | | Mexican Pesos | | | 3,300,000 | | | Goldman Sachs | | | (2,228 | ) |
06/09/20 | | South African Rand | | | 400,000 | | | U.S. Dollars | | | 23,860 | | | Citibank | | | (2,372 | ) |
06/19/20 | | South Korean Won | | | 210,000,000 | | | U.S. Dollars | | | 175,395 | | | Citibank | | | (2,386 | ) |
06/09/20 | | South African Rand | | | 800,000 | | | U.S. Dollars | | | 45,479 | | | HSBC | | | (2,503 | ) |
05/13/20 | | Mexican Pesos | | | 300,000 | | | U.S. Dollars | | | 15,046 | | | UBS | | | (2,626 | ) |
07/20/20 | | Czech Republic Koruna | | | 6,500,000 | | | U.S. Dollars | | | 265,974 | | | JPMorgan Chase | | | (2,877 | ) |
07/22/20 | | U.S. Dollars | | | 113,411 | | | New Zealand Dollars | | | 190,000 | | | HSBC | | | (3,078 | ) |
05/13/20 | | Mexican Pesos | | | 300,000 | | | U.S. Dollars | | | 15,511 | | | HSBC | | | (3,092 | ) |
06/16/20 | | U.S. Dollars | | | 487,894 | | | British Pounds | | | 390,000 | | | JPMorgan Chase | | | (3,412 | ) |
06/12/20 | | South Korean Won | | | 250,000,000 | | | U.S. Dollars | | | 209,460 | | | HSBC | | | (3,529 | ) |
05/18/20 | | U.S. Dollars | �� | | 354,447 | | | Thai Baht | | | 11,600,000 | | | JPMorgan Chase | | | (4,075 | ) |
05/13/20 | | U.S. Dollars | | | 168,618 | | | Mexican Pesos | | | 4,200,000 | | | Citibank | | | (5,260 | ) |
05/29/20 | | U.S. Dollars | | | 222,442 | | | Australian Dollars | | | 350,000 | | | JPMorgan Chase | | | (5,659 | ) |
05/12/20 | | South African Rand | | | 650,000 | | | U.S. Dollars | | | 40,867 | | | Citibank | | | (5,846 | ) |
07/10/20 | | U.S. Dollars | | | 168,545 | | | Brazilian Reals | | | 960,000 | | | HSBC | | | (7,126 | ) |
05/29/20 | | Australian Dollars | | | 640,000 | | | U.S. Dollars | | | 425,078 | | | Morgan Stanley | | | (7,979 | ) |
05/29/20 | | U.S. Dollars | | | 271,777 | | | Australian Dollars | | | 430,000 | | | HSBC | | | (8,461 | ) |
05/13/20 | | Mexican Pesos | | | 12,700,000 | | | U.S. Dollars | | | 537,550 | | | Citibank | | | (11,777 | ) |
06/16/20 | | British Pounds | | | 340,000 | | | U.S. Dollars | | | 445,869 | | | Barclays | | | (17,552 | ) |
06/11/20 | | U.S. Dollars | | | 1,107,511 | | | Japanese Yen | | | 121,000,000 | | | Citibank | | | (20,720 | ) |
06/05/20 | | Norwegian Kroner | | | 2,200,000 | | | U.S. Dollars | | | 238,601 | | | HSBC | | | (23,821 | ) |
See accompanying Notes to Financial Statements
197
Morningstar Funds Trust April 30, 2020
Schedule of Investments (continued)
Morningstar Unconstrained Allocation Fund
| | | | | | | | | | | | | | | | | | | | | | | | |
Expiration Date | | Currency Purchased | | | Amount of Currency Purchased | | | Currency Sold | | | Amount of Currency Sold | | | Counterparty | | | Unrealized Appreciation (Depreciation) | |
| |
05/15/20 | | | Chilean Pesos | | | | 470,000,000 | | | | U.S. Dollars | | | | 591,664 | | | | HSBC | | | | $ (28,518 | ) |
06/11/20 | | | Japanese Yen | | | | 84,000,000 | | | | U.S. Dollars | | | | 824,180 | | | | Citibank | | | | (40,945 | ) |
05/29/20 | | | U.S. Dollars | | | | 583,147 | | | | Australian Dollars | | | | 960,000 | | | | Morgan Stanley | | | | (42,502 | ) |
| |
Total Unrealized Depreciation | | | | | | | | | | | | | | | | $(264,848 | ) |
| |
Net Unrealized Appreciation | | | | | | | | | | | | | | | | $ 31,918 | |
| |
Valuation Hierarchy
The following is a summary of the inputs used, as of April 30, 2020, in valuing the Fund’s investments carried at fair value:
| | | | | | | | | | | | | | | | |
| |
| Morningstar Unconstrained Allocation Fund | | Level 1 | | | Level 2 | | | Level 3 | | | Totals | |
| |
Investments | | | | | | | | | | | | |
Assets: | | | | | | | | | | | | |
Asset-Backed Securities | | $ | — | | | $ | 45,128 | | | | $— | | | $ | 45,128 | |
Common Stocks | | | 17,731,731 | | | | 6,348,880 | | | | — | | | | 24,080,611 | |
Corporate Bonds | | | — | | | | 2,827,256 | | | | — | | | | 2,827,256 | |
Foreign Issuer Bonds | | | — | | | | 6,926,907 | | | | — | | | | 6,926,907 | |
U.S. Government Obligations | | | — | | | | 5,940,286 | | | | — | | | | 5,940,286 | |
Investment Companies | | | 89,018,915 | | | | — | | | | — | | | | 89,018,915 | |
Short-Term Investments | | | 9,428,084 | | | | — | | | | — | | | | 9,428,084 | |
| |
| | | | |
Total Investments | | $ | 116,178,730 | | | $ | 22,088,457 | | | | $— | | | $ | 138,267,187 | |
| |
| | | | |
| | | | | | | | | | | | | | | | | |
| |
| Morningstar Unconstrained Allocation Fund | | Level 1 | | | Level 2 | | | Level 3 | | | Totals | |
| |
Derivative Financial Instruments | | | | | | | | | | | | |
Assets: | | | | | | | | | | | | |
Futures contracts | | | $30,785 | | | | $ — | | | | $— | | | | $ 30,785 | |
Forward foreign currency exchange contracts | | | — | | | | 296,766 | | | | — | | | | 296,766 | |
| |
Total Assets - Derivative Financial Instruments | | | $30,785 | | | | $ 296,766 | | | | $— | | | | $ 327,551 | |
| |
Liabilities: | | | | | | | | | | | | |
Forward foreign currency exchange contracts | | | $ — | | | | $(264,848 | ) | | | $— | | | | $ (264,848 | ) |
| |
Total Liabilities - Derivative Financial Instruments | | | $ — | | | | $(264,848 | ) | | | $— | | | | $ (264,848 | ) |
| |
Total Net Derivative Financial Instruments | | | $30,785 | | | | $ 31,918 | | | | $— | | | | $ 62,703 | |
| |
See accompanying Notes to Financial Statements
198
Morningstar Funds Trust April 30, 2020
Schedule of Investments
| | | | |
Morningstar Alternatives Fund |
| | | | | | | | |
| | | Number of Shares | | | Value | |
|
Long Positions – 94.5% | |
|
Common Stocks – 26.1% | |
|
Auto Parts & Equipment – 1.0% | |
Delphi Technologies PLC(a)(b)* | | | 13,738 | | | $ | 137,243 | |
WABCO Holdings, Inc.* | | | 13,429 | | | | 1,804,589 | |
| | | | | | | | 1,941,832 | |
| | |
Banks – 0.1% | | | | | | | | |
IBERIABANK Corp. | | | 3,274 | | | | 135,740 | |
| | |
Biotechnology – 0.2% | | | | | | | | |
Pacific Biosciences of California,
Inc.(a)* | | | 113,494 | | | | 375,098 | |
| | |
Computers – 1.1% | | | | | | | | |
ForeScout Technologies, Inc.* | | | 58,842 | | | | 1,868,822 | |
Ingenico Group S.A. (France) | | | 1,012 | | | | 127,328 | |
| | | | | | | | 1,996,150 | |
| | |
Distribution/Wholesale – 1.4% | | | | | | | | |
Anixter International, Inc.* | | | 28,605 | | | | 2,656,260 | |
| |
Diversified Financial Services – 1.8% | | | | | |
Bolsas y Mercados Espanoles SHMSF S.A. (Spain) | | | 22,913 | | | | 836,059 | |
Legg Mason, Inc.(a) | | | 51,785 | | | | 2,580,447 | |
| | | | | | | | 3,416,506 | |
|
Electrical Component & Equipment – 0.4% | |
OSRAM Licht A.G. (Germany)* | | | 16,193 | | | | 712,565 | |
| | |
Electronics – 3.9% | | | | | | | | |
Isra Vision A.G. (Germany) | | | 5,881 | | | | 322,235 | |
KEMET Corp.(a) | | | 79,852 | | | | 2,156,802 | |
Tech Data Corp.* | | | 33,533 | | | | 4,716,081 | |
| | | | | | | | 7,195,118 | |
| | |
Entertainment – 0.2% | | | | | | | | |
Flutter Entertainment PLC (Canada)* | | | 3,416 | | | | 423,874 | |
| | |
Healthcare - Products – 1.5% | | | | | | | | |
Qiagen N.V.* | | | 13,812 | | | | 575,163 | |
Wright Medical Group N.V.* | | | 75,356 | | | | 2,194,367 | |
| | | | | | | | 2,769,530 | |
| | | | | | | | |
| | | Number of Shares | | | Value | |
| | |
Insurance – 0.6% | | | | | | | | |
TOWER Ltd. (New Zealand)* | | | 192,415 | | | $ | 70,187 | |
Willis Towers Watson PLC | | | 6,005 | | | | 1,070,631 | |
| | | | | | | | 1,140,818 | |
| | |
Internet – 2.6% | | | | | | | | |
E*TRADE Financial Corp.(a) | | | 34,319 | | | | 1,393,695 | |
Meet Group (The), Inc.(a)* | | | 70,708 | | | | 436,268 | |
TD Ameritrade Holding Corp.(a) | | | 74,383 | | | | 2,921,020 | |
| | | | | | | | 4,750,983 | |
| | |
Lodging – 1.5% | | | | | | | | |
Caesars Entertainment Corp.(a)* | | | 296,422 | | | | 2,863,436 | |
| | |
Pharmaceuticals – 2.8% | | | | | | | | |
Allergan PLC | | | 27,370 | | | | 5,127,496 | |
| | |
Real Estate – 0.3% | | | | | | | | |
Godewind Immobilien A.G. (Germany)(c)* | | | 85,388 | | | | 598,864 | |
|
Real Estate Investment Trusts – 1.6% | |
Front Yard | | | | | | | | |
Residential Corp. | | | 7,053 | | | | 80,475 | |
iStar, Inc. | | | 27,237 | | | | 272,915 | |
Northview Apartment Real Estate Investment Trust (Canada) | | | 31,680 | | | | 801,132 | |
Taubman Centers, Inc.(a) | | | 41,096 | | | | 1,771,237 | |
| | | | | | | | 2,925,759 | |
| | |
Retail – 2.1% | | | | | | | | |
Tiffany & Co. | | | 30,931 | | | | 3,912,771 | |
| | |
Semiconductors – 0.2% | | | | | | | | |
Adesto Technologies Corp.(a)* | | | 37,757 | | | | 447,420 | |
| | |
Software – 0.5% | | | | | | | | |
RIB Software S.E. (Germany)* | | | 28,736 | | | | 911,331 | |
| | |
Telecommunications – 2.3% | | | | | | | | |
Cincinnati Bell, Inc.* | | | 20,414 | | | | 299,065 | |
Gilat Satellite Networks Ltd. (Israel)(a)* | | | 26,737 | | | | 228,601 | |
LogMeIn, Inc. | | | 44,889 | | | | 3,836,214 | |
| | | | | | | | 4,363,880 | |
Total Common Stocks
(Cost $49,269,737) | | | | | | | 48,665,431 | |
See accompanying Notes to Financial Statements
199
Morningstar Funds Trust April 30, 2020
Schedule of Investments (continued)
Morningstar Alternatives Fund
| | | | | | | | |
| | | Number of Shares | | | Value | |
|
Convertible Preferred Stocks – 2.0% | |
| | |
Chemicals – 0.3% | | | | | | | | |
Lyondellbasell Advanced Polymers, Inc., 6.00% | | | 669 | | | $ | 651,940 | |
| | |
Computers – 0.2% | | | | | | | | |
NCR Corp., 5.50%(d) | | | 370 | | | | 345,062 | |
| |
Diversified Financial Services – 0.7% | | | | | |
AMG Capital Trust II, 5.15%(a) | | | 21,379 | | | | 855,160 | |
Cowen, Inc., 5.63%(a) | | | 581 | | | | 393,832 | |
| | | | | | | | 1,248,992 | |
| |
Real Estate Investment Trusts – 0.4% | | | | | |
QTS Realty Trust, Inc., 6.50%(a) | | | 4,994 | | | | 701,857 | |
| | |
Savings & Loans – 0.4% | | | | | | | | |
New York Community Capital Trust V, 6.00% | | | 15,754 | | | | 691,196 | |
Total Convertible Preferred Stocks (Cost $3,893,958) | | | | | | | 3,639,047 | |
| | |
| | | Par(e) | | | | |
|
Convertible Bonds – 27.4% | |
| | |
Aerospace/Defense – 0.1% | | | | | | | | |
Kaman Corp., 3.25%, 5/01/24(a) | | $ | 255,000 | | | | 240,483 | |
| | |
Airlines – 0.6% | | | | | | | | |
Copa Holdings S.A., 4.50%, 4/15/25(c) | | | 405,000 | | | | 410,246 | |
Southwest Airlines Co.,
1.25%, 5/01/25 | | | 608,000 | | | | 671,027 | |
| | | | | | | | 1,081,273 | |
|
Auto Manufacturers – 0.2% | |
Tesla, Inc., 2.38%, 3/15/22(a) | | | 161,000 | | | | 394,410 | |
|
Auto Parts & Equipment – 0.2% | |
Meritor, Inc., 3.25%, 10/15/37(a) | | | 346,000 | | | | 332,160 | |
| | |
Banks – 0.3% | | | | | | | | |
Hope Bancorp, Inc., 2.00%, 5/15/38(a) | | | 774,000 | | | | 626,166 | |
| | |
Biotechnology – 2.8% | | | | | | | | |
Apellis Pharmaceuticals, Inc.,
3.50%, 9/15/26(a)(c) | | | 228,000 | | | | 265,228 | |
Exact Sciences Corp.,
1.00%, 1/15/25(a) | | | 220,000 | | | | 282,501 | |
| | | | | | | | |
| | | Par(e) | | | Value | |
| | |
Biotechnology (Continued) | | | | | | | | |
Exact Sciences Corp., 0.38%, 3/15/27 | | $ | 691,000 | | | $ | 670,695 | |
Halozyme Therapeutics, Inc.,
1.25%, 12/01/24(a)(c) | | | 571,000 | | | | 655,016 | |
Innoviva, Inc., 2.13%, 1/15/23(a) | | | 558,000 | | | | 550,323 | |
Insmed, Inc., 1.75%, 1/15/25(a) | | | 495,000 | | | | 464,681 | |
Ionis Pharmaceuticals, Inc.,
0.13%, 12/15/24(a)(c) | | | 558,000 | | | | 533,027 | |
Ligand Pharmaceuticals, Inc.,
0.75%, 5/15/23(a) | | | 821,000 | | | | 721,217 | |
Radius Health, Inc.,
3.00%, 9/01/24(a) | | | 647,000 | | | | 493,111 | |
Retrophin, Inc., 2.50%, 9/15/25(a) | | | 368,000 | | | | 277,840 | |
Theravance Biopharma, Inc.,
3.25%, 11/01/23(a) | | | 322,000 | | | | 353,238 | |
| | | | | | | | 5,266,877 | |
| | |
Commercial Services – 1.3% | | | | | | | | |
2U, Inc., 2.25%, 5/01/25(c) | | | 269,000 | | | | 273,733 | |
Chegg, Inc., 0.13%, 3/15/25 | | | 639,000 | | | | 670,405 | |
FTI Consulting, Inc., 2.00%, 8/15/23(a) | | | 520,000 | | | | 718,301 | |
Square, Inc., 0.50%, 5/15/23(a) | | | 594,000 | | | | 666,765 | |
| | | | | | | | 2,329,204 | |
| | |
Computers – 0.7% | | | | | | | | |
Lumentum Holdings, Inc.,
0.50%, 12/15/26(a)(c) | | | 619,000 | | | | 655,125 | |
Rapid7, Inc., 1.25%, 8/01/23(a) | | | 450,000 | | | | 560,812 | |
| | | | | | | | 1,215,937 | |
|
Diversified Financial Services – 0.6% | |
Encore Capital Europe Finance Ltd.,
4.50%, 9/01/23(a) | | | 251,000 | | | | 200,219 | |
Encore Capital Group, Inc.,
2.88%, 3/15/21(a) | | | 339,000 | | | | 310,841 | |
PRA Group, Inc., | | | | | | | | |
3.50%, 6/01/23(a) | | | 473,000 | | | | 397,893 | |
3.00%, 8/01/20(a) | | | 306,000 | | | | 296,441 | |
| | | | | | | | 1,205,394 | |
See accompanying Notes to Financial Statements
200
Morningstar Funds Trust April 30, 2020
Schedule of Investments (continued)
Morningstar Alternatives Fund
| | | | | | | | |
| | | Par(e) | | | Value | |
| | |
Electric – 0.4% | | | | | | | | |
CenterPoint Energy, Inc.,
4.57%, 9/15/29 | | $ | 297,700 | | | $ | 156,680 | |
NRG Energy, Inc.,
2.75%, 6/01/48(a) | | | 583,000 | | | | 588,971 | |
| | | | | | | | 745,651 | |
| | |
Electronics – 1.0% | | | | | | | | |
II-VI, Inc., 0.25%, 9/01/22(a) | | | 609,000 | | | | 601,235 | |
Knowles Corp., 3.25%, 11/01/21(a) | | | 357,000 | | | | 383,775 | |
OSI Systems, Inc., 1.25%, 9/01/22(a) | | | 478,000 | | | | 458,003 | |
Vishay Intertechnology, Inc.,
2.25%, 6/15/25(a) | | | 389,000 | | | | 358,497 | |
| | | | | | | | 1,801,510 | |
|
Energy - Alternate Sources – 0.7% | |
Enphase Energy, Inc.,
0.25%, 3/01/25(c) | | | 693,000 | | | | 631,890 | |
SunPower Corp., 4.00%, 1/15/23(a) | | | 859,000 | | | | 675,389 | |
| | | | | | | | 1,307,279 | |
|
Engineering & Construction – 0.1% | |
Granite Construction, Inc.,
2.75%, 11/01/24(a)(c) | | | 339,000 | | | | 260,275 | |
| | |
Food – 0.1% | | | | | | | | |
Chefs’ Warehouse (The), Inc.,
1.88%, 12/01/24(a)(c) | | | 290,000 | | | | 200,100 | |
| | |
Healthcare - Products – 0.1% | | | | | | | | |
NanoString Technologies, Inc.,
2.63%, 3/01/25(c) | | | 150,000 | | | | 144,837 | |
| | |
Healthcare - Services – 0.2% | | | | | | | | |
Invitae Corp., 2.00%, 9/01/24(a)(c) | | | 351,000 | | | | 322,199 | |
| | |
Home Builders – 0.2% | | | | | | | | |
Winnebago Industries, Inc.,
1.50%, 4/01/25(a)(c) | | | 473,000 | | | | 446,086 | |
| | |
Insurance – 0.4% | | | | | | | | |
MGIC Investment Corp.,
9.00%, 4/01/63(a)(c) | | | 555,000 | | | | 717,338 | |
| | |
Internet – 5.3% | | | | | | | | |
Boingo Wireless, Inc.,
1.00%, 10/01/23(a) | | | 557,000 | | | | 502,692 | |
Etsy, Inc., 0.13%, 10/01/26(c) | | | 462,000 | | | | 468,111 | |
| | | | | | | | |
| | | Par(e) | | | Value | |
| | |
Internet (Continued) | | | | | | | | |
Farfetch Ltd., 3.75%, 5/01/27(c) | | $ | 270,000 | | | $ | 288,884 | |
FireEye, Inc., 1.63%, 6/01/35(a) | | | 346,000 | | | | 322,004 | |
IAC Financeco 3, Inc.,
2.00%, 1/15/30(a)(c) | | | 865,000 | | | | 903,406 | |
iQYI, Inc., 2.00%, 4/01/25 | | | 625,000 | | | | 528,824 | |
JOYY, Inc., 1.38%, 6/15/26(a)(c) | | | 666,000 | | | | 607,309 | |
MercadoLibre, Inc., 2.00%, 8/15/28 | | | 416,000 | | | | 615,039 | |
Momo, Inc., 1.25%, 7/01/25(a) | | | 802,000 | | | | 647,226 | |
Palo Alto Networks, Inc.,
0.75%, 7/01/23 | | | 568,000 | | | | 581,916 | |
Perficient, Inc., 2.38%, 9/15/23(a) | | | 452,000 | | | | 501,437 | |
Q2 Holdings, Inc., 0.75%, 6/01/26(c) | | | 462,000 | | | | 495,420 | |
Snap, Inc., 0.25%, 5/01/25(c) | | | 943,000 | | | | 990,769 | |
Wayfair, Inc., 1.13%, 11/01/24 | | | 568,000 | | | | 698,285 | |
Weibo Corp., 1.25%, 11/15/22(a) | | | 708,000 | | | | 642,481 | |
Zillow Group, Inc., 0.75%, 9/01/24(a)(c) | | | 840,000 | | | | 980,196 | |
| | | | | | | | 9,773,999 | |
|
Investment Management Companies – 0.3% | |
New Mountain Finance Corp.,
5.75%, 8/15/23(a) | | | 666,000 | | | | 564,347 | |
| | |
Leisure Time – 0.4% | | | | | | | | |
Callaway Golf Co., 2.75%, 5/01/26(c) | | | 337,000 | | | | 348,641 | |
Sabre GLBL, Inc., 4.00%, 4/15/25(c) | | | 403,000 | | | | 477,702 | |
| | | | | | | | 826,343 | |
| | |
Media – 0.7% | | | | | | | | |
Liberty Interactive LLC,
3.50%, 1/15/31(a) | | | 984,000 | | | | 744,790 | |
Liberty Media Corp.,
2.25%, 12/01/48(a)(c) | | | 534,000 | | | | 530,996 | |
| | | | | | | | 1,275,786 | |
| | |
Mining – 0.2% | | | | | | | | |
First Majestic Silver Corp.,
1.88%, 3/01/23(a) | | | 259,000 | | | | 284,097 | |
| | |
Oil & Gas Services – 0.1% | | | | | | | | |
Helix Energy Solutions Group, Inc., 4.13%, 9/15/23(a) | | | 273,000 | | | | 202,880 | |
See accompanying Notes to Financial Statements
201
Morningstar Funds Trust April 30, 2020
Schedule of Investments (continued)
Morningstar Alternatives Fund
| | | | | | | | |
| | | Par(e) | | | Value | |
| | |
Pharmaceuticals – 1.2% | | | | | | | | |
Aerie Pharmaceuticals, Inc.,
1.50%, 10/01/24(a)(c) | | $ | 404,000 | | | $ | 377,618 | |
Coherus Biosciences, Inc.,
1.50%, 4/15/26(c) | | | 254,000 | | | | 267,867 | |
Ironwood Pharmaceuticals, Inc., | | | | | | | | |
2.25%, 6/15/22(a) | | | 449,000 | | | | 465,837 | |
1.50%, 6/15/26(c) | | | 306,000 | | | | 309,057 | |
Jazz Investments I Ltd., 1.50%, 8/15/24 | | | 719,000 | | | | 659,406 | |
Neurocrine Biosciences, Inc.,
2.25%, 5/15/24(a) | | | 161,000 | | | | 225,584 | |
| | | | | | | | 2,305,369 | |
| | |
Pipelines – 0.2% | | | | | | | | |
Cheniere Energy, Inc., 4.25%, 3/15/45(a) | | | 799,000 | | | | 424,839 | |
| |
Real Estate Investment Trusts – 2.7% | | | | | |
Apollo Commercial Real Estate Finance, Inc., | | | | | | | | |
4.75%, 8/23/22(a) | | | 233,000 | | | | 162,534 | |
5.38%, 10/15/23 | | | 603,000 | | | | 410,501 | |
Arbor Realty Trust, Inc.,
4.75%, 11/01/22(a)(c) | | | 234,000 | | | | 196,560 | |
Chimera Investment Corp.,
7.00%, 4/01/23 | | | 86,000 | | | | 102,448 | |
Granite Point Mortgage Trust, Inc., | | | | | | | | |
6.38%, 10/01/23(a) | | | 219,000 | | | | 111,549 | |
5.63%, 12/01/22(c) | | | 590,000 | | | | 295,000 | |
iStar, Inc., 3.13%, 9/15/22(a) | | | 335,000 | | | | 313,000 | |
KKR Real Estate Finance Trust, Inc.,
6.13%, 5/15/23(a) | | | 694,000 | | | | 600,744 | |
MFA Financial, Inc., 6.25%, 6/15/24 | | | 692,000 | | | | 477,047 | |
New York Mortgage Trust, Inc.,
6.25%, 1/15/22 | | | 644,000 | | | | 489,440 | |
PennyMac Corp., | | | | | | | | |
5.38%, 5/01/20 | | | 344,000 | | | | 342,925 | |
5.50%, 11/01/24(a)(c) | | | 450,000 | | | | 344,812 | |
Redwood Trust, Inc.,
4.75%, 8/15/23 | | | 359,000 | | | | 249,056 | |
Two Harbors Investment Corp.,
6.25%, 1/15/22(a) | | | 664,000 | | | | 644,495 | |
Western Asset Mortgage Capital Corp., 6.75%, 10/01/22 | | | 491,000 | | | | 267,002 | |
| | | | | | | | 5,007,113 | |
| | | | | | | | |
| | | Par(e) | | | Value | |
| | |
Retail – 0.9% | | | | | | | | |
American Eagle Outfitters, Inc.,
3.75%, 4/15/25(c) | | $ | 808,000 | | | $ | 885,778 | |
Burlington Stores, Inc., 2.25%, 4/15/25(c) | | | 306,000 | | | | 324,267 | |
Dick’s Sporting Goods, Inc.,
3.25%, 4/15/25(c) | | | 403,000 | | | | 429,414 | |
| | | | | | | | 1,639,459 | |
| | |
Semiconductors – 0.5% | | | | | | | | |
Cree, Inc., 0.88%, 9/01/23(a) | | | 618,000 | | | | 623,794 | |
ON Semiconductor Corp.,
1.63%, 10/15/23(a) | | | 321,000 | | | | 349,811 | |
| | | | | | | | 973,605 | |
| | |
Software – 4.0% | | | | | | | | |
Allscripts Healthcare Solutions, Inc.,
0.88%, 1/01/27(a)(c) | | | 301,000 | | | | 230,417 | |
Alteryx, Inc., 1.00%, 8/01/26(a)(c) | | | 452,000 | | | | 426,281 | |
Bilibili, Inc., 1.38%, 4/01/26(a)(c) | | | 678,000 | | | | 866,569 | |
Envestnet, Inc., 1.75%, 6/01/23(a) | | | 377,000 | | | | 418,941 | |
Everbridge, Inc., 0.13%, 12/15/24(a)(c) | | | 231,000 | | | | 272,891 | |
Health Catalyst, Inc., 2.50%, 4/15/25(c) | | | 122,000 | | | | 133,041 | |
i3 Verticals LLC, 1.00%, 2/15/25(c) | | | 383,000 | | | | 326,823 | |
j2 Global, Inc., 1.75%, 11/01/26(c) | | | 670,000 | | | | 626,836 | |
New Relic, Inc., 0.50%, 5/01/23(a) | | | 718,000 | | | | 648,426 | |
Nuance Communications, Inc.,
1.00%, 12/15/35 | | | 336,000 | | | | 349,650 | |
RealPage, Inc., 1.50%, 11/15/22(a) | | | 296,000 | | | | 474,033 | |
Sailpoint Technologies Holdings, Inc., 0.13%, 9/15/24(c) | | | 573,000 | | | | 536,751 | |
Slack Technologies, Inc.,
0.50%, 4/15/25(c) | | | 340,000 | | | | 376,661 | |
Splunk, Inc., 1.13%, 9/15/25(a) | | | 449,000 | | | | 525,425 | |
Tabula Rasa HealthCare, Inc.,
1.75%, 2/15/26(a)(c) | | | 458,000 | | | | 505,407 | |
Workday, Inc., 0.25%, 10/01/22(a) | | | 210,000 | | | | 256,890 | |
Workiva, Inc., 1.13%, 8/15/26(a)(c) | | | 606,000 | | | | 487,250 | |
| | | | | | | | 7,462,292 | |
See accompanying Notes to Financial Statements
202
Morningstar Funds Trust April 30, 2020
Schedule of Investments (continued)
Morningstar Alternatives Fund
| | | | | | | | |
| | | Par(e) | | | Value | |
|
Telecommunications – 0.2% | |
Infinera Corp.,
2.50%, 3/01/27(c) | | $ | 75,000 | | | $ | 74,580 | |
Vonage Holdings Corp.,
1.75%, 6/01/24(a)(c) | | | 356,000 | | | | 319,135 | |
| | | | | | | | 393,715 | |
|
Transportation – 0.7% | |
Air Transport Services Group, Inc., 1.13%, 10/15/24 | | | 455,000 | | | | 405,819 | |
SEACOR Holdings, Inc., 3.25%, 5/15/30(a) | | | 694,000 | | | | 545,318 | |
SFL Corp. Ltd.,
4.88%, 5/01/23(a) | | | 336,000 | | | | 310,221 | |
| | | | | | | | 1,261,358 | |
| |
Total Convertible Bonds
(Cost $52,013,278) | | | | 51,032,381 | |
|
Foreign Issuer Bonds – 0.2% | |
| | |
Canada – 0.2% | | | | | | | | |
Stars Group Holdings B.V./Stars Group US Co-Borrower LLC, 7.00%, 7/15/26(c) | | | 351,000 | | | | 360,828 | |
|
Total Foreign Issuer Bonds
(Cost $381,656) 360,828 | |
| | |
| | | Number of Shares | | | | |
|
Master Limited Partnerships – 0.0%(f) | |
| | |
Pipelines – 0.0%(f) | | | | | | | | |
MPLX L.P. | | | 1 | | | | 16 | |
| |
Total Master Limited Partnerships
(Cost $28) | | | | 16 | |
| |
Investment Companies – 29.7% | | | | | |
Eaton Vance Global Macro Absolute Return Fund | | | 6,611,692 | | | | 55,207,632 | |
| |
Total Investment Companies
(Cost $57,141,646) | | | | 55,207,632 | |
|
Short-Term Investments – 9.1% | |
|
Money Market Fund – 9.1% | |
Northern Institutional Funds - Treasury Portfolio (Premier), 0.22%(g) | | | 16,975,378 | | | | 16,975,378 | |
| |
Total Short-Term Investments
(Cost $16,975,378) | | | | 16,975,378 | |
| | | | | | | | |
| | | Number
of Shares | | | Value | |
| | |
Rights – 0.0%(f) | | | | | | | | |
|
Pharmaceuticals – 0.0%(f) | |
Elanco Animal Health, Inc.* | | | 22,842 | | | | $— | |
Total Rights
(Cost $—) | | | | | | | — | |
| | |
Number of Contracts | | Notional
Amount | | | | |
| |
Purchased Options – 0.0%(f) | | | | | |
| | |
Call Option – 0.0%(f) | | | | | | | | |
Stars Group (The), Inc., Strike Price $25.00, Expires 8/21/20 8 | | | 23,288 | | | | 2,400 | |
| |
Total Purchased Options
(Cost $1,310) | | | | 2,400 | |
| |
Total Long Positions – 94.5%
(Cost $179,676,991) | | | | 175,883,113 | |
See accompanying Notes to Financial Statements
203
Morningstar Funds Trust April 30, 2020
Schedule of Investments (continued)
Morningstar Alternatives Fund
| | | | | | | | |
| | | Number
of Shares | | | Value | |
|
Short Positions – (15.2)% | |
|
Common Stocks – (15.2)% | |
| | |
Aerospace/Defense – (0.0)%(f) | | | | | | | | |
Kaman Corp. | | | (1,367 | ) | | $ | (52,985 | ) |
| | |
Airlines – (0.3)% | | | | | | | | |
Copa Holdings S.A., Class A | | | (4,725 | ) | | | (208,892 | ) |
Southwest Airlines Co. | | | (9,485 | ) | | | (296,406 | ) |
| | | | | | | | (505,298 | ) |
|
Auto Manufacturers – (0.2)% | |
Tesla, Inc.* | | | (467 | ) | | | (365,138 | ) |
|
Auto Parts & Equipment – (0.1)% | |
BorgWarner, Inc. | | | (3,999 | ) | | | (114,251 | ) |
Meritor, Inc.* | | | (3,469 | ) | | | (71,115 | ) |
| | | | | | | | (185,366 | ) |
| | |
Banks – (0.9)% | | | | | | | | |
First Horizon National Corp. | | | (15,004 | ) | | | (136,236 | ) |
Hope Bancorp, Inc. | | | (3,489 | ) | | | (34,716 | ) |
Morgan Stanley | | | (35,804 | ) | | | (1,411,752 | ) |
| | | | | | | | (1,582,704 | ) |
| | |
Biotechnology – (0.9)% | | | | | | | | |
Apellis Pharmaceuticals, Inc.* | | | (4,333 | ) | | | (148,492 | ) |
Exact Sciences Corp.* | | | (5,552 | ) | | | (438,497 | ) |
Halozyme Therapeutics, Inc.* | | | (13,453 | ) | | | (304,778 | ) |
Innoviva, Inc.* | | | (12,722 | ) | | | (180,398 | ) |
Insmed, Inc.* | | | (5,438 | ) | | | (125,074 | ) |
Ionis Pharmaceuticals, Inc.* | | | (3,497 | ) | | | (194,188 | ) |
Ligand Pharmaceuticals, Inc.* | | | (496 | ) | | | (48,891 | ) |
Radius Health, Inc.* | | | (4,374 | ) | | | (68,628 | ) |
Retrophin, Inc.* | | | (3,796 | ) | | | (57,775 | ) |
Theravance Biopharma, Inc.* | | | (6,139 | ) | | | (179,013 | ) |
| | | | | | | | (1,745,734 | ) |
| | |
Commercial Services – (0.8)% | | | | | | | | |
2U, Inc.* | | | (5,245 | ) | | | (124,569 | ) |
Chegg, Inc.* | | | (6,018 | ) | | | (257,269 | ) |
FTI Consulting, Inc.* | | | (4,079 | ) | | | (519,501 | ) |
Sabre Corp. | | | (34,267 | ) | | | (249,121 | ) |
Square, Inc., Class A* | | | (3,693 | ) | | | (240,562 | ) |
Worldline S.A. (France)(c)* | | | (1,590 | ) | | | (107,690 | ) |
| | | | | | | | (1,498,712 | ) |
| | |
Computers – (0.5)% | | | | | | | | |
Lumentum Holdings, Inc.* | | | (4,168 | ) | | | (337,233 | ) |
| | | | | | | | |
| | | Number
of Shares | | | Value | |
| | |
Computers (Continued) | | | | | | | | |
NCR Corp.* | | | (7,427 | ) | | $ | (152,402 | ) |
Rapid7, Inc.* | | | (7,672 | ) | | | (349,460 | ) |
| | | | | | | | (839,095 | ) |
|
Distribution/Wholesale – (0.0)%(f) | |
WESCO International, Inc.* | | | (3,378 | ) | | | (87,389 | ) |
| |
Diversified Financial Services – (2.0)% | | | | | |
Affiliated Managers Group, Inc. | | | (1,510 | ) | | | (105,640 | ) |
Charles Schwab (The) Corp. | | | (80,610 | ) | | | (3,040,609 | ) |
Cowen, Inc., Class A | | | (14,374 | ) | | | (157,395 | ) |
Encore Capital Group, Inc.* | | | (4,283 | ) | | | (111,272 | ) |
I3 Verticals, Inc., Class A* | | | (5,085 | ) | | | (118,176 | ) |
PRA Group, Inc.* | | | (5,114 | ) | | | (141,862 | ) |
| | | | | | | | (3,674,954 | ) |
| | |
Electric – (0.1)% | | | | | | | | |
NRG Energy, Inc. | | | (5,027 | ) | | | (168,555 | ) |
| | |
Electronics – (0.3)% | | | | | | | | |
Comtech Telecommunications Corp. | | | (2,253 | ) | | | (41,703 | ) |
II-VI, Inc.* | | | (5,179 | ) | | | (178,261 | ) |
Knowles Corp.* | | | (8,719 | ) | | | (135,580 | ) |
OSI Systems, Inc.* | | | (1,557 | ) | | | (112,696 | ) |
Vishay Intertechnology, Inc. | | | (5,564 | ) | | | (92,307 | ) |
| | | | | | | | (560,547 | ) |
| |
Energy - Alternate Sources – (0.2)% | | | | | |
Enphase Energy, Inc.* | | | (5,376 | ) | | | (251,758 | ) |
SunPower Corp.* | | | (4,937 | ) | | | (36,287 | ) |
| | | | | | | | (288,045 | ) |
| |
Engineering & Construction – (0.0)%(f) | | | | | |
Granite Construction, Inc. | | | (5,382 | ) | | | (88,480 | ) |
| | |
Entertainment – (0.5)% | | | | | | | | |
Eldorado Resorts, Inc.* | | | (20,096 | ) | | | (430,858 | ) |
Flutter Entertainment PLC (Ireland) | | | (3,415 | ) | | | (419,951 | ) |
Flutter Entertainment PLC | | | | | | | | |
(Canada)(b)* | | | (277 | ) | | | (34,447 | ) |
Live Nation Entertainment, Inc.* | | | (2,417 | ) | | | (108,451 | ) |
| | | | | | | | (993,707 | ) |
|
Environmental Control – (0.2)% | |
Advanced Disposal Services, Inc.* | | | (10,554 | ) | | | (340,367 | ) |
| | |
Food – (0.1)% | | | | | | | | |
Chefs’ Warehouse (The), Inc.* | | | (6,561 | ) | | | (92,379 | ) |
See accompanying Notes to Financial Statements
204
Morningstar Funds Trust April 30, 2020
Schedule of Investments (continued)
Morningstar Alternatives Fund
| | | | | | | | |
| | | Number
of Shares | | | Value | |
|
Healthcare - Products – (0.0)%(f) | |
NanoString Technologies, Inc.* | | | (1,726 | ) | | $ | (54,818 | ) |
|
Healthcare - Services – (0.0)%(f) | |
Invitae Corp.* | | | (4,720 | ) | | | (78,116 | ) |
| | |
Home Builders – (0.1)% | | | | | | | | |
Winnebago Industries, Inc. | | | (3,917 | ) | | | (173,797 | ) |
| | |
Insurance – (0.6)% | | | | | | | | |
Aon PLC | | | (6,474 | ) | | | (1,117,866 | ) |
MGIC Investment Corp. | | | (452 | ) | | | (3,304 | ) |
| | | | | | | | (1,121,170 | ) |
| | |
Internet – (2.1)% | | | | | | | | |
Boingo Wireless, Inc.* | | | (1,972 | ) | | | (27,490 | ) |
Etsy, Inc.* | | | (2,911 | ) | | | (188,837 | ) |
Farfetch Ltd., Class A (United Kingdom)* | | | (10,044 | ) | | | (132,983 | ) |
IAC/InterActiveCorp* | | | (1,939 | ) | | | (433,328 | ) |
iQIYI, Inc. ADR (China)* | | | (12,227 | ) | | | (207,492 | ) |
JOYY, Inc. ADR (China)* | | | (3,806 | ) | | | (232,014 | ) |
MercadoLibre, Inc. (Argentina)* | | | (773 | ) | | | (451,053 | ) |
Momo, Inc. ADR (China) | | | (3,986 | ) | | | (95,983 | ) |
Palo Alto Networks, Inc.* | | | (795 | ) | | | (156,225 | ) |
Perficient, Inc.* | | | (7,263 | ) | | | (252,970 | ) |
Q2 Holdings, Inc.* | | | (3,534 | ) | | | (281,730 | ) |
Snap, Inc., Class A(b)* | | | (22,377 | ) | | | (394,059 | ) |
Wayfair, Inc., Class A* | | | (3,363 | ) | | | (417,146 | ) |
Weibo Corp. ADR (China)* | | | (495 | ) | | | (18,577 | ) |
Zillow Group, Inc., Class C* | | | (13,455 | ) | | | (591,482 | ) |
| | | | | | | | (3,881,369 | ) |
|
Investment Management Companies – (0.0)%(f) | |
New Mountain Finance Corp. | | | (52 | ) | | | (398 | ) |
| | |
Leisure Time – (0.1)% | | | | | | | | |
Callaway Golf Co. | | | (12,456 | ) | | | (178,370 | ) |
| | |
Media – (0.0)%(f) | | | | | | | | |
Charter Communications, Inc.,
Class A* | | | (182 | ) | | | (90,132 | ) |
| | |
Mining – (0.1)% | | | | | | | | |
First Majestic Silver Corp. (Canada)* | | | (11,883 | ) | | | (95,896 | ) |
| | |
Oil & Gas Services – (0.0)%(f) | | | | | | | | |
Helix Energy Solutions Group, Inc.* | | | (16,750 | ) | | | (42,545 | ) |
| | | | | | | | |
| | | Number
of Shares | | | Value | |
| | |
Pharmaceuticals – (1.5)% | | | | | | | | |
AbbVie, Inc. | | | (23,695 | ) | | $ | (1,947,729 | ) |
Aerie Pharmaceuticals, Inc.* | | | (8,415 | ) | | | (128,245 | ) |
Coherus Biosciences, Inc.* | | | (8,560 | ) | | | (142,096 | ) |
Ironwood Pharmaceuticals, Inc.* | | | (31,531 | ) | | | (315,310 | ) |
Jazz Pharmaceuticals PLC* | | | (801 | ) | | | (88,310 | ) |
Neurocrine Biosciences, Inc.* | | | (1,484 | ) | | | (145,640 | ) |
| | | | | | | | (2,767,330 | ) |
| | |
Pipelines – (0.0)%(f) | | | | | | | | |
Cheniere Energy, Inc.* | | | (654 | ) | | | (30,535 | ) |
|
Real Estate Investment Trusts – (0.6)% | |
Apollo Commercial Real Estate Finance, Inc. | | | (1,362 | ) | | | (11,100 | ) |
Arbor Realty Trust, Inc. | | | (524 | ) | | | (3,610 | ) |
Chimera Investment Corp. | | | (3,440 | ) | | | (26,729 | ) |
Granite Point Mortgage Trust, Inc. | | | (1,558 | ) | | | (7,759 | ) |
iStar, Inc. | | | (38,457 | ) | | | (385,339 | ) |
KKR Real Estate Finance Trust, Inc. | | | (7,013 | ) | | | (110,665 | ) |
PennyMac Mortgage Investment Trust | | | (203 | ) | | | (2,111 | ) |
QTS Realty Trust, Inc., Class A | | | (9,030 | ) | | | (564,646 | ) |
Two Harbors Investment Corp. | | | (1,736 | ) | | | (7,934 | ) |
| | | | | | | | (1,119,893 | ) |
| | |
Retail – (0.4)% | | | | | | | | |
American Eagle Outfitters, Inc. | | | (55,375 | ) | | | (440,231 | ) |
Burlington Stores, Inc.* | | | (906 | ) | | | (165,517 | ) |
Dick’s Sporting Goods, Inc. | | | (6,851 | ) | | | (201,351 | ) |
| | | | | | | | (807,099 | ) |
| | |
Semiconductors – (0.2)% | | | | | | | | |
Cree, Inc.* | | | (4,170 | ) | | | (179,852 | ) |
ON Semiconductor Corp.* | | | (7,326 | ) | | | (117,546 | ) |
| | | | | | | | (297,398 | ) |
| | |
Software – (1.7)% | | | | | | | | |
Allscripts Healthcare Solutions, Inc.* | | | (11,300 | ) | | | (73,450 | ) |
Alteryx, Inc., Class A* | | | (1,402 | ) | | | (158,678 | ) |
Bilibili, Inc. ADR (China)* | | | (21,913 | ) | | | (600,197 | ) |
Envestnet, Inc.(b)* | | | (3,166 | ) | | | (197,938 | ) |
Everbridge, Inc.* | | | (1,439 | ) | | | (160,276 | ) |
Health Catalyst, Inc.* | | | (2,440 | ) | | | (65,075 | ) |
j2 Global, Inc. | | | (2,551 | ) | | | (205,713 | ) |
New Relic, Inc.* | | | (1,611 | ) | | | (86,494 | ) |
See accompanying Notes to Financial Statements
205
Morningstar Funds Trust April 30, 2020
Schedule of Investments (continued)
Morningstar Alternatives Fund
| | | | | | | | |
| | | Number
of Shares | | | Value | |
| | |
Software (Continued) | | | | | | | | |
Nuance Communications, Inc.* | | | (5,578 | ) | | $ | (112,676 | ) |
RealPage, Inc.* | | | (5,666 | ) | | | (365,400 | ) |
Sailpoint Technologies Holdings, Inc.* | | | (12,573 | ) | | | (233,732 | ) |
Slack Technologies, Inc., Class A* | | | (7,130 | ) | | | (190,300 | ) |
Splunk, Inc.* | | | (1,936 | ) | | | (271,737 | ) |
Tabula Rasa HealthCare, Inc.* | | | (4,317 | ) | | | (273,439 | ) |
Workday, Inc., Class A(b)* | | | (823 | ) | | | (126,660 | ) |
Workiva, Inc.* | | | (3,408 | ) | | | (130,697 | ) |
| | | | | | | | (3,252,462 | ) |
|
Telecommunications – (0.5)% | |
AT&T, Inc. | | | (2,138 | ) | | | (65,145 | ) |
Infinera Corp.* | | | (4,898 | ) | | | (30,196 | ) |
Motorola Solutions, Inc. | | | (4,791 | ) | | | (688,994 | ) |
Vonage Holdings Corp.* | | | (7,463 | ) | | | (62,390 | ) |
| | | | | | | | (846,725 | ) |
| | |
Transportation – (0.2)% | | | | | | | | |
Air Transport Services Group, Inc.* | | | (7,123 | ) | | | (144,170 | ) |
SEACOR Holdings, Inc.* | | | (3,116 | ) | | | (88,058 | ) |
SFL Corp. Ltd. (Norway) | | | (11,712 | ) | | | (132,228 | ) |
| | | | | | | | (364,456 | ) |
Total Common Stocks
(Proceeds $28,355,176) | | | | | | | (28,271,964 | ) |
| | | | | | | | |
| | | Number
of Shares | | | Value | |
|
Master Limited Partnerships – (0.0)%(f) | |
| | |
Pipelines – (0.0)%(f) | | | | | | | | |
Energy Transfer L.P. | | | (1 | ) | | $ | (7 | ) |
| |
Total Master Limited Partnerships
(Proceeds $10) | | | | (7 | ) |
| |
Total Short Positions – (15.2)%
(Proceeds $28,355,186) | | | | (28,271,971 | ) |
| |
Total Written Options – (0.0)%(f)
(Premiums Received $25,846) | | | | (21,895 | ) |
| |
Other Assets less Liabilities – 20.7%(h) | | | | 38,530,419 | |
| |
NET ASSETS – 100.0% | | | $ | 186,119,666 | |
Percentages shown are based on Net Assets.
All securities are United States companies, unless noted otherwise in parentheses.
| (a) | All or a portion of the security was held as collateral for open futures, options, securities sold short and/or swap agreements. |
| (b) | Security represents underlying investment on open options contracts. |
| (c) | Securities exempt from registration under Rule 144A of the Securities Act of 1933. These securities may be resold in transactions exempt from registration, normally to qualified institutional buyers. The value of these securities is determined by valuations supplied by a pricing service or brokers, or, if not available, in accordance with procedures established by the Board of Trustees of Morningstar Funds Trust. |
| (d) | Security is a payment in-kind bond (PIK), distributions received in-kind unless otherwise noted in the description. |
| (e) | Par value is in USD unless otherwise indicated. |
| (f) | Amount rounds to less than 0.05%. |
| (g) | 7-day current yield as of April 30, 2020 is disclosed. |
| (h) | Includes appreciation/ (depreciation) on forward foreign currency exchange contracts. |
| * | Non-Income Producing Security |
| | |
| Abbreviations: |
| ADR | | American Depositary Receipt |
| LLC | | Limited Liability Company |
| PLC | | Public Limited Company |
See accompanying Notes to Financial Statements
206
Morningstar Funds Trust April 30, 2020
Schedule of Investments (continued)
Morningstar Alternatives Fund
Forward Foreign Currency Contracts outstanding at April 30, 2020:
| | | | | | | | | | | | | | | | | | | | | | | | |
Expiration Date | | Currency
Purchased | | | Amount of Currency Purchased | | | Currency Sold | | | Amount of Currency Sold | | | Counterparty | | | Unrealized Appreciation (Depreciation) | |
| |
| | | | | | |
06/15/20 | | | U.S. Dollars | | | | 766,338 | | | | South African Rand | | | | 12,796,300 | | | | Morgan Stanley | | | | $ 79,311 | |
06/15/20 | | | U.S. Dollars | | | | 2,703,244 | | | | Euro | | | | 2,403,140 | | | | Morgan Stanley | | | | 67,252 | |
06/15/20 | | | British Pounds | | | | 384,400 | | | | U.S. Dollars | | | | 453,387 | | | | Morgan Stanley | | | | 30,862 | |
06/15/20 | | | U.S. Dollars | | | | 951,518 | | | | Canadian Dollars | | | | 1,314,820 | | | | Morgan Stanley | | | | 6,841 | |
06/15/20 | | | Canadian Dollars | | | | 886,380 | | | | U.S. Dollars | | | | 633,453 | | | | Morgan Stanley | | | | 3,397 | |
06/15/20 | | | New Zealand Dollars | | | | 45,300 | | | | U.S. Dollars | | | | 26,774 | | | | Morgan Stanley | | | | 1,005 | |
06/15/20 | | | Euro | | | | 70,220 | | | | U.S. Dollars | | | | 76,136 | | | | Morgan Stanley | | | | 887 | |
06/15/20 | | | U.S. Dollars | | | | 80,710 | | | | New Zealand Dollars | | | | 130,800 | | | | Morgan Stanley | | | | 496 | |
06/15/20 | | | U.S. Dollars | | | | 484,311 | | | | British Pounds | | | | 384,400 | | | | Morgan Stanley | | | | 63 | |
| |
Total Unrealized Appreciation | | | | | | | | | | | | | | | | $ 190,114 | |
| |
| | | | | | |
06/15/20 | | | Canadian Dollars | | | | 60,720 | | | | U.S. Dollars | | | | 44,014 | | | | Morgan Stanley | | | | $ (388 | ) |
06/15/20 | | | U.S. Dollars | | | | 17,750 | | | | New Zealand Dollars | | | | 29,900 | | | | Morgan Stanley | | | | (584 | ) |
06/15/20 | | | Euro | | | | 118,910 | | | | U.S. Dollars | | | | 132,052 | | | | Morgan Stanley | | | | (1,621 | ) |
06/15/20 | | | U.S. Dollars | | | | 528,477 | | | | Canadian Dollars | | | | 750,270 | | | | Morgan Stanley | | | | (10,580 | ) |
06/15/20 | | | U.S. Dollars | | | | 1,473,388 | | | | Euro | | | | 1,354,700 | | | | Morgan Stanley | | | | (12,574 | ) |
06/15/20 | | | South African Rand | | | | 12,796,300 | | | | U.S. Dollars | | | | 721,294 | | | | Morgan Stanley | | | | (34,267 | ) |
| |
Total Unrealized Depreciation | | | | | | | | | | | | | | | | $ (60,014 | ) |
| |
Net Unrealized Appreciation | | | | | | | | | | | | | | | | $130,100 | |
| |
Written Call Option Contracts outstanding at April 30, 2020:
Exchange Traded
| | | | | | | | | | | | | | | | | | | | | | |
| Description | | Counterparty | | Number of Contracts | | | Notional Amount | | | Exercise Price | | | Expiration Date | | | Value | |
| |
Delphi Technologies PLC | | Morgan Stanley | | | 46 | | | USD | 43,976 | | | | 8.00 | | | | 5/15/2020 | | | | $(10,350 | ) |
Delphi Technologies PLC | | Morgan Stanley | | | 7 | | | USD | 6,692 | | | | 9.00 | | | | 5/15/2020 | | | | (1,120 | ) |
Envestnet, Inc. | | Instinet | | | 8 | | | USD | 49,040 | | | | 75.00 | | | | 5/15/2020 | | | | (80 | ) |
Snap, Inc. | | Cornerstone Macro | | | 25 | | | USD | 41,975 | | | | 17.00 | | | | 1/15/2021 | | | | (8,875 | ) |
Workday, Inc. | | Instinet | | | 3 | | | USD | 43,998 | | | | 170.00 | | | | 6/19/2020 | | | | (1,470 | ) |
| |
Total Written Call Options Contracts (Premiums Received $25,846) | | | | | | | | | | | | $(21,895 | ) |
| |
See accompanying Notes to Financial Statements
207
Morningstar Funds Trust April 30, 2020
Schedule of Investments (continued)
Morningstar Alternatives Fund
Valuation Hierarchy
The following is a summary of the inputs used, as of April 30, 2020, in valuing the Fund’s investments carried at fair value:
| | | | | | | | | | | | | | | | |
| |
| Morningstar Alternatives Fund | | Level 1 | | | Level 2 | | | Level 3 | | | Totals | |
| |
Investments | | | | | | | | | | | | | | | | |
Assets: | | | | | | | | | | | | | | | | |
Common Stocks | | $ | 45,745,265 | | | $ | 2,920,166 | | | | $— | | | $ | 48,665,431 | |
Convertible Preferred Stocks | | | 2,554,019 | | | | 1,085,028 | | | | — | | | | 3,639,047 | |
Convertible Bonds | | | — | | | | 51,032,381 | | | | — | | | | 51,032,381 | |
Foreign Issuer Bonds | | | — | | | | 360,828 | | | | — | | | | 360,828 | |
Master Limited Partnerships | | | 16 | | | | — | | | | — | | | | 16 | |
Investment Companies | | | 55,207,632 | | | | — | | | | — | | | | 55,207,632 | |
Short-Term Investments | | | 16,975,378 | | | | — | | | | — | | | | 16,975,378 | |
Rights | | | — | | | | —* | | | | — | | | | —* | |
Purchased Options | | | 2,400 | | | | — | | | | — | | | | 2,400 | |
| |
Total Assets – Investments at value | | $ | 120,484,710 | | | $ | 55,398,403 | | | | $— | | | $ | 175,883,113 | |
| |
Liabilities: | | | | | | | | | | | | | | | | |
Common Stocks | | $ | (27,744,323 | ) | | $ | (527,641 | ) | | | $— | | | $ | (28,271,964 | ) |
Master Limited Partnerships | | | (7 | ) | | | — | | | | — | | | | (7 | ) |
| |
Total Liabilities – Investments at value | | $ | (27,744,330) | | | $ | (527,641 | ) | | | $— | | | $ | (28,271,971 | ) |
| |
Total Investments | | $ | 92,740,380 | | | $ | 54,870,762 | | | | $— | | | $ | 147,611,142 | |
| |
| *Amount rounds to less than one dollar. | | | | | | | | | | | | | | | | |
| | | | | | | | | | | | | | | | |
| |
| Morningstar Alternatives Fund | | Level 1 | | | Level 2 | | | Level 3 | | | Totals | |
| |
Derivative Financial Instruments | | | | | | | | | | | | | | | | |
Assets: | | | | | | | | | | | | | | | | |
Forward foreign currency exchange contracts | | | $ — | | | | $190,114 | | | | $— | | | | $190,114 | |
| |
Total Assets - Derivative Financial Instruments | | | $ — | | | | $190,114 | | | | $— | | | | $190,114 | |
| |
Liabilities: | | | | | | | | | | | | | | | | |
Forward foreign currency exchange contracts | | | $ — | | | | $(60,014 | ) | | | $— | | | | $(60,014 | ) |
Written Options | | | (21,895 | ) | | | — | | | | — | | | | (21,895 | ) |
| |
Total Liabilities - Derivative Financial Instruments | | | $(21,895 | ) | | | $(60,014 | ) | | | $— | | | | $(81,909 | ) |
| |
Total Net Derivative Financial Instruments | | | $(21,895 | ) | | | $130,100 | | | | $— | | | | $108,205 | |
| |
See accompanying Notes to Financial Statements
208
Morningstar Funds Trust April 30, 2020
Statements of Assets and Liabilities
| | | | | | | | | | | | | | | | | | | | |
| | | Morningstar U.S. Equity Fund | | | Morningstar International Equity Fund | | | Morningstar Global Income Fund | | | Morningstar Total Return Bond Fund | | | Morningstar Municipal Bond Fund | |
| |
Assets | | | | | | | | | | | | | | | | | | | | |
Investments in non-affiliates, at value | | | $1,193,471,008 | | | | $760,590,094 | | | | $236,769,314 | | | | $581,158,850 | | | | $343,026,167 | |
Foreign currencies, at value | | | 70,785 | | | | 293,901 | | | | 138 | | | | 1,013,784 | | | | — | |
Due from broker | | | — | | | | — | | | | — | | | | 7,769,593 | | | | — | |
Receivable from adviser | | | 133,372 | | | | 149,401 | | | | 6,772 | | | | 131,182 | | | | 58,007 | |
Receivable for: | | | | | | | | | | | | | | | | | | | | |
Dividends and interest | | | 527,829 | | | | 1,044,930 | | | | 499,832 | | | | 2,408,970 | | | | 2,786,948 | |
Foreign tax reclaims | | | 63,546 | | | | 361,652 | | | | 130,779 | | | | 21,144 | | | | — | |
Investments sold | | | 4,933,677 | | | | 13,884,167 | | | | 743,651 | | | | 63,344,512 | | | | 1,760,635 | |
Fund shares sold | | | 416,785 | | | | 466,218 | | | | 146,691 | | | | 368,564 | | | | 129,065 | |
Variation margin on futures contracts | | | — | | | | — | | | | — | | | | 80,636 | | | | — | |
Variation margin on exchange traded swap agreements | | | — | | | | — | | | | — | | | | 53,197 | | | | — | |
Unrealized appreciation on OTC swap agreements | | | — | | | | — | | | | — | | | | 5,885 | | | | — | |
Unrealized appreciation on forward foreign currency exchange contracts | | | — | | | | 524 | | | | — | | | | 427,793 | | | | — | |
Upfront premiums paid on swap agreements | | | — | | | | — | | | | — | | | | 390,862 | | | | — | |
Prepaid expenses and other assets | | | 20,554 | | | | 17,209 | | | | 10,081 | | | | 15,095 | | | | 11,390 | |
| |
Total assets | | | 1,199,637,556 | | | | 776,808,096 | | | | 238,307,258 | | | | 657,190,067 | | | | 347,772,212 | |
| |
Liabilities | | | | | | | | | | | | | | | | | | | | |
Investments sold short, at value | | | — | | | | — | | | | — | | | | 8,917,781 | | | | — | |
Written options, at value | | | — | | | | — | | | | — | | | | 141,673 | | | | — | |
Due to broker | | | — | | | | — | | | | — | | | | 4,328,623 | | | | — | |
Unrealized depreciation on OTC swap agreements | | | — | | | | — | | | | — | | | | 21,900 | | | | — | |
Unrealized depreciation on forward foreign currency exchange contracts | | | — | | | | 13,837 | | | | — | | | | 167,104 | | | | — | |
Payable for: | | | | | | | | | | | | | | | | | | | | |
Investments purchased on a delayed-delivery basis | | | — | | | | — | | | | — | | | | 116,645,705 | | | | 3,096,102 | |
Investments purchased | | | 17,237,020 | | | | 11,077,346 | | | | 2,890,133 | | | | 6,314,533 | | | | 4,186,781 | |
Variation margin on futures contracts | | | — | | | | — | | | | — | | | | 126,140 | | | | — | |
Variation margin on exchange traded swap agreements | | | — | | | | — | | | | — | | | | 183,938 | | | | — | |
Fund shares redeemed | | | 2,124,379 | | | | 585,054 | | | | 176,025 | | | | 256,935 | | | | 79,882 | |
Distributions | | | — | | | | — | | | | 741 | | | | 4,327 | | | | 74 | |
Dividends on short sales | | | — | | | | — | | | | — | | | | 20,020 | | | | — | |
Deferred capital gains tax | | | — | | | | — | | | | 12,184 | | | | — | | | | — | |
Upfront premiums received from swap agreements | | | — | | | | — | | | | — | | | | 171,113 | | | | — | |
Accrued management fees | | | 569,933 | | | | 467,189 | | | | 64,144 | | | | 184,479 | | | | 103,724 | |
Accrued trustee fees | | | 11,530 | | | | 7,481 | | | | 2,225 | | | | 7,538 | | | | 4,928 | |
See accompanying Notes to Financial Statements
209
Morningstar Funds Trust April 30, 2020
Statements of Assets and Liabilities (continued)
| | | | | | | | | | | | | | | | | | | | |
| | | Morningstar U.S. Equity Fund | | | Morningstar International Equity Fund | | | Morningstar Global Income Fund | | | Morningstar Total Return Bond Fund | | | Morningstar Municipal Bond Fund | |
| |
Accrued expenses | | | 328,302 | | | | 257,984 | | | | 101,627 | | | | 236,380 | | | | 113,960 | |
| |
Total liabilities | | | 20,271,164 | | | | 12,408,891 | | | | 3,247,079 | | | | 137,728,189 | | | | 7,585,451 | |
| |
Net assets | | $ | 1,179,366,392 | | | $ | 764,399,205 | | | $ | 235,060,179 | | | $ | 519,461,878 | | | $ | 340,186,761 | |
| |
Analysis of net assets: | | | | | | | | | | | | | | | | | | | | |
Paid in capital | | $ | 1,213,280,447 | | | $ | 847,717,709 | | | $ | 247,845,003 | | | $ | 498,748,858 | | | $ | 349,044,489 | |
Distributable earnings (loss) | | | (33,914,055 | ) | | | (83,318,504 | ) | | | (12,784,824 | ) | | | 20,713,020 | | | | (8,857,728 | ) |
| |
Net assets | | $ | 1,179,366,392 | | | $ | 764,399,205 | | | $ | 235,060,179 | | | $ | 519,461,878 | | | $ | 340,186,761 | |
| |
Shares outstanding: | | | 127,285,172 | | | | 87,239,323 | | | | 24,638,932 | | | | 47,728,885 | | | | 33,543,958 | |
Net asset value, offering price and redemption price per share: | | $ | 9.27 | | | $ | 8.76 | | | $ | 9.54 | | | $ | 10.88 | | | $ | 10.14 | |
| |
Investments in non-affiliates, at cost | | $ | 1,200,671,252 | | | $ | 838,754,039 | | | $ | 248,391,760 | | | $ | 570,810,196 | | | $ | 350,906,184 | |
Foreign currencies, at cost | | $ | 70,102 | | | $ | 293,795 | | | $ | 137 | | | $ | 1,010,969 | | | $ | — | |
Investments sold short proceeds | | $ | — | | | $ | — | | | $ | — | | | $ | 8,819,424 | | | $ | — | |
Written option premiums | | $ | — | | | $ | — | | | $ | — | | | $ | 349,511 | | | $ | — | |
See accompanying Notes to Financial Statements
210
Morningstar Funds Trust April 30, 2020
Statements of Assets and Liabilities (continued)
| | | | | | | | | | | | | | | | |
| | | Morningstar Defensive Bond Fund | | | Morningstar Multisector Bond Fund | | | Morningstar Unconstrained Allocation Fund | | | Morningstar Alternatives Fund | |
| |
Assets | | | | | | | | | | | | | | | | |
Investments in non-affiliates, at value | | $ | 184,242,820 | | | $ | 187,084,373 | | | $ | 138,267,187 | | | $ | 175,883,113 | |
Cash | | | — | | | | — | | | | — | | | | 33,954,333 | |
Foreign currencies, at value | | | — | | | | 364,392 | | | | 70,623 | | | | — | |
Due from broker | | | — | | | | 2,490,217 | | | | 189,175 | | | | — | |
Receivable from adviser | | | 42,036 | | | | 25,960 | | | | 13,562 | | | | 63,507 | |
Receivable for: | | | | | | | | | | | | | | | | |
Dividends and interest | | | 226,181 | | | | 2,409,898 | | | | 140,733 | | | | 447,212 | |
Foreign tax reclaims | | | — | | | | 2,441 | | | | 5,424 | | | | 907 | |
Investments sold | | | 2,094,209 | | | | 3,590,847 | | | | 348 | | | | 8,322,595 | |
Fund shares sold | | | 253,792 | | | | 111,929 | | | | 47,679 | | | | 147,803 | |
Variation margin on futures contracts | | | — | | | | 9,843 | | | | — | | | | — | |
Unrealized appreciation on forward foreign currency exchange contracts | | | — | | | | 2,939,533 | | | | 296,766 | | | | 190,114 | |
Prepaid expenses and other assets | | | 10,763 | | | | 9,578 | | | | 13,803 | | | | 10,215 | |
| |
Total assets | | | 186,869,801 | | | | 199,039,011 | | | | 139,045,300 | | | | 219,019,799 | |
| |
Liabilities | | | | | | | | | | | | | | | | |
Investments sold short, at value | | | — | | | | — | | | | — | | | | 28,271,971 | |
Written options, at value | | | — | | | | — | | | | — | | | | 21,895 | |
Due to broker | | | — | | | | 1,037,506 | | | | — | | | | 1,243,092 | |
Unrealized depreciation on OTC swap agreements | | | — | | | | 2,174 | | | | — | | | | — | |
Unrealized depreciation on forward foreign currency exchange contracts | | | — | | | | 1,454,585 | | | | 264,848 | | | | 60,014 | |
Payable for: | | | | | | | | | | | | | | | | |
Investments purchased on a delayed-delivery basis | | | 394,989 | | | | 455,000 | | | | — | | | | — | |
Investments purchased | | | 2,697,157 | | | | 3,459,293 | | | | 383,191 | | | | 2,931,755 | |
Variation margin on futures contracts | | | — | | | | — | | | | 1,567 | | | | — | |
Fund shares redeemed | | | 166,636 | | | | 81,584 | | | | 86,160 | | | | 112,720 | |
Distributions | | | 1,444 | | | | — | | | | — | | | | — | |
Dividends on short sales | | | — | | | | — | | | | — | | | | 38,138 | |
Upfront premiums received from swap agreements | | | — | | | | 583,122 | | | | — | | | | — | |
Accrued management fees | | | 53,296 | | | | 93,114 | | | | 48,393 | | | | 125,068 | |
Accrued trustee fees | | | 3,583 | | | | 1,336 | | | | 2,861 | | | | 3,043 | |
Accrued expenses | | | 78,048 | | | | 99,896 | | | | 64,614 | | | | 92,437 | |
| |
Total liabilities | | | 3,395,153 | | | | 7,267,610 | | | | 851,634 | | | | 32,900,133 | |
| |
Net assets | | $ | 183,474,648 | | | $ | 191,771,401 | | | $ | 138,193,666 | | | $ | 186,119,666 | |
| |
Analysis of net assets: | | | | | | | | | | | | | | | | |
Paid in capital | | $ | 181,762,036 | | | $ | 213,671,003 | | | $ | 136,362,782 | | | $ | 187,399,931 | |
Distributable earnings (loss) | | | 1,712,612 | | | | (21,899,602 | ) | | | 1,830,884 | | | | (1,280,265 | ) |
| |
Net assets | | $ | 183,474,648 | | | $ | 191,771,401 | | | $ | 138,193,666 | | | $ | 186,119,666 | |
| |
Shares outstanding: | | | 18,033,051 | | | | 20,432,149 | | | | 14,884,336 | | | | 18,388,270 | |
Net asset value, offering price and redemption price per share: | | $ | 10.17 | | | $ | 9.39 | | | $ | 9.28 | | | $ | 10.12 | |
| |
Investments in non-affiliates, at cost | | $ | 183,131,420 | | | $ | 203,187,299 | | | $ | 135,627,653 | | | $ | 179,676,991 | |
Foreign currencies, at cost | | $ | — | | | $ | 362,647 | | | $ | 70,126 | | | $ | — | |
Investments sold short proceeds | | $ | — | | | $ | — | | | $ | — | | | $ | 28,355,186 | |
Written option premiums | | $ | — | | | $ | — | | | $ | — | | | $ | 25,846 | |
See accompanying Notes to Financial Statements
211
Morningstar Funds Trust April 30, 2020
Statements of Operations
| | | | | | | | | | | | | | | | | | | | |
| | | Morningstar U.S. Equity Fund | | | Morningstar International Equity Fund | | | Morningstar Global Income Fund | | | Morningstar Total Return Bond Fund | | | Morningstar Municipal Bond Fund | |
| |
Investment income | | | | | | | | | | | | | | | | | | | | |
Dividend income from non-affiliates (net of foreign withholding taxes) | | $ | 16,525,737 | | | $ | 16,775,321 | | | $ | 8,485,266 | | | $ | 465,018 | | | $ | 303,390 | |
Interest income (net of foreign withholding taxes) | | | 1,312 | | | | — | | | | 80,349 | | | | 14,186,438 | | | | 4,541,435 | |
| |
Total investment income | | | 16,527,049 | | | | 16,775,321 | | | | 8,565,615 | | | | 14,651,456 | | | | 4,844,825 | |
| |
Expenses | | | | | | | | | | | | | | | | | | | | |
Management fees (Note 5) | | | 5,384,148 | | | | 4,638,386 | | | | 732,078 | | | | 2,176,944 | | | | 776,206 | |
Administration and custody fees | | | 553,749 | | | | 605,462 | | | | 150,243 | | | | 847,764 | | | | 188,588 | |
Transfer agent fees | | | 6,015 | | | | 5,807 | | | | 5,804 | | | | 5,817 | | | | 5,793 | |
Sub-accounting fees | | | 823,866 | | | | 578,468 | | | | 215,686 | | | | 514,334 | | | | 170,215 | |
Audit and tax fees | | | 69,083 | | | | 92,449 | | | | 52,641 | | | | 71,202 | | | | 40,743 | |
Legal fees | | | 162,026 | | | | 112,917 | | | | 41,972 | | | | 102,216 | | | | 32,108 | |
Trustees’ fees | | | 168,189 | | | | 116,701 | | | | 44,345 | | | | 105,783 | | | | 34,857 | |
Registration and filing fees | | | 145,679 | | | | 111,302 | | | | 45,967 | | | | 75,003 | | | | 64,183 | |
Printing and postage fees | | | 59,609 | | | | 38,438 | | | | 16,145 | | | | 34,588 | | | | 10,826 | |
Dividend and interest on securities sold short | | | — | | | | — | | | | — | | | | 17,205 | | | | — | |
Other expenses | | | 100,809 | | | | 74,463 | | | | 36,080 | | | | 67,388 | | | | 26,527 | |
| |
Total Expenses | | | 7,473,173 | | | | 6,374,393 | | | | 1,340,961 | | | | 4,018,244 | | | | 1,350,046 | |
| |
Less waiver of management fees (Note 5) | | | (962,124 | ) | | | (1,201,608 | ) | | | (112,363 | ) | | | (1,373,461 | ) | | | (324,384 | ) |
Less waiver of administration and custody fees (Note 5) | | | (30,092 | ) | | | (20,675 | ) | | | (8,301 | ) | | | (19,096 | ) | | | (4,858 | ) |
| |
Net expenses | | | 6,480,957 | | | | 5,152,110 | | | | 1,220,297 | | | | 2,625,687 | | | | 1,020,804 | |
| |
Net investment income | | | 10,046,092 | | | | 11,623,211 | | | | 7,345,318 | | | | 12,025,769 | | | | 3,824,021 | |
| |
Realized and unrealized gains (losses) | | | | | | | | | | | | | | | | | | | | |
Net realized gains (losses) on: | | | | | | | | | | | | | | | | | | | | |
Investments | | | (21,649,595 | ) | | | (1,665,729 | ) | | | 133,065 | | | | 20,060,393 | | | | (789,489 | ) |
Investments sold short | | | — | | | | — | | | | — | | | | (77,908 | ) | | | — | |
Swap agreements | | | — | | | | — | | | | — | | | | (2,678,549 | ) | | | — | |
Futures contracts | | | — | | | | — | | | | — | | | | 5,274,078 | | | | — | |
Written options contracts | | | — | | | | — | | | | — | | | | 2,251,844 | | | | — | |
Forward foreign currency exchange contracts | | | — | | | | 27,851 | | | | — | | | | (94,111 | ) | | | — | |
Foreign currency transactions | | | (3,257 | ) | | | (117,719 | ) | | | (24,364 | ) | | | 111,078 | | | | — | |
| |
Net realized gains (losses) | | | (21,652,852 | ) | | | (1,755,597 | ) | | | 108,701 | | | | 24,846,825 | | | | (789,489 | ) |
| |
Net change in unrealized appreciation (depreciation) on: | | | | | | | | | | | | | | | | | | | | |
Investments | | | (49,640,725 | )1 | | | (103,367,740 | )1 | | | (19,220,810 | )1 | | | 4,471,398 | | | | (9,703,593 | ) |
Investments sold short | | | — | | | | — | | | | — | | | | (94,219 | ) | | | — | |
Swap agreements | | | — | | | | — | | | | — | | | | (3,263,952 | ) | | | — | |
Futures contracts | | | — | | | | — | | | | — | | | | (80,268 | ) | | | — | |
Written options contracts | | | — | | | | — | | | | — | | | | 189,592 | | | | — | |
Forward foreign currency exchange contracts | | | — | | | | (63,673 | ) | | | — | | | | 289,245 | | | | — | |
See accompanying Notes to Financial Statements
212
Morningstar Funds Trust April 30, 2020
Statements of Operations (continued)
| | | | | | | | | | | | | | | | | | | | |
| | | Morningstar U.S. Equity Fund | | | Morningstar International Equity Fund | | | Morningstar Global Income Fund | | | Morningstar Total Return Bond Fund | | | Morningstar Municipal Bond Fund | |
| |
Foreign currency transactions | | | 1,459 | | | | 9,808 | | | | 1,419 | | | | 78 | | | | — | |
| |
Net change in unrealized appreciation (depreciation) | | | (49,639,266 | ) | | | (103,421,605 | ) | | | (19,219,391 | ) | | | 1,511,874 | | | | (9,703,593 | ) |
| |
Net realized and unrealized gains (losses) | | | (71,292,118 | ) | | | (105,177,202 | ) | | | (19,110,690 | ) | | | 26,358,699 | | | | (10,493,082 | ) |
| |
Net increase (decrease) in net assets resulting from operations | | $ | (61,246,026 | ) | | $ | (93,553,991 | ) | | $ | (11,765,372 | ) | | $ | 38,384,468 | | | $ | (6,669,061 | ) |
| |
Foreign withholding taxes on dividend income | | $ | 80,805 | | | $ | 1,312,954 | | | $ | 383,847 | | | $ | — | | | $ | — | |
Foreign withholding taxes on interest income | | $ | — | | | $ | — | | | $ | — | | | $ | 9,432 | | | $ | — | |
| 1 | Net of change in deferred foreign capital gains tax expense of $8,034, $76,858 and $(12,184), respectively. |
See accompanying Notes to Financial Statements
213
Morningstar Funds Trust April 30, 2020
Statements of Operations (continued)
| | | | | | | | | | | | | | | | |
| | | Morningstar Defensive Bond Fund | | | Morningstar Multisector Bond Fund | | | Morningstar Unconstrained Allocation Fund | | | Morningstar Alternatives Fund | |
| |
Investment income | | | | | | | | | | | | | | | | |
Dividend income from non-affiliates (net of foreign withholding taxes) | | $ | 1,681,808 | | | $ | 170,179 | | | $ | 1,607,159 | | | $ | 1,826,647 | |
Interest income (net of foreign withholding taxes) | | | 2,791,104 | | | | 10,355,513 | | | | 457,311 | | | | 3,553,955 | |
| |
Total investment income | | | 4,472,912 | | | | 10,525,692 | | | | 2,064,470 | | | | 5,380,602 | |
| |
Expenses | | | | | | | | | | | | | | | | |
Management fees (Note 5) | | | 645,130 | | | | 1,211,238 | | | | 322,323 | | | | 1,277,392 | |
Administration and custody fees | | | 131,120 | | | | 269,184 | | | | 106,752 | | | | 179,681 | |
Transfer agent fees | | | 5,817 | | | | 5,760 | | | | 5,804 | | | | 6,058 | |
Sub-accounting fees | | | 186,514 | | | | 209,301 | | | | 66,197 | | | | 160,580 | |
Audit and tax fees | | | 44,315 | | | | 72,583 | | | | 40,884 | | | | 46,027 | |
Legal fees | | | 38,188 | | | | 39,451 | | | | 14,428 | | | | 30,526 | |
Trustees’ fees | | | 39,628 | | | | 40,868 | | | | 15,438 | | | | 31,453 | |
Registration and filing fees | | | 40,213 | | | | 46,839 | | | | 38,922 | | | | 46,421 | |
Printing and postage fees | | | 21,902 | | | | 18,168 | | | | 9,969 | | | | 22,326 | |
Dividend and interest on securities sold short | | | — | | | | — | | | | — | | | | 386,382 | |
Other expenses | | | 29,849 | | | | 33,869 | | | | 18,589 | | | | 42,852 | |
| |
Total Expenses | | | 1,182,676 | | | | 1,947,261 | | | | 639,306 | | | | 2,229,698 | |
| |
Less waiver of management fees (Note 5) | | | (315,381 | ) | | | (374,325 | ) | | | (139,036 | ) | | | (524,984 | ) |
Less waiver of administration and custody fees (Note 5) | | | (7,121 | ) | | | (7,429 | ) | | | (2,420 | ) | | | (5,151 | ) |
| |
Net expenses | | | 860,174 | | | | 1,565,507 | | | | 497,850 | | | | 1,699,563 | |
| |
Net investment income | | | 3,612,738 | | | | 8,960,185 | | | | 1,566,620 | | | | 3,681,039 | |
| |
Realized and unrealized gains (losses) | | | | | | | | | | | | | | | | |
Net realized gains (losses) on: | | | | | | | | | | | | | | | | |
Investments | | | 1,485,475 | | | | (3,431,780 | ) | | | 226,966 | | | | (1,298,478 | ) |
Investments sold short | | | — | | | | — | | | | — | | | | 2,275,462 | |
Swap agreements | | | — | | | | (4,677,711 | ) | | | — | | | | — | |
Futures contracts | | | — | | | | — | | | | (74,280 | ) | | | — | |
Written options contracts | | | — | | | | — | | | | — | | | | 415,730 | |
Forward foreign currency exchange contracts | | | — | | | | 1,879,255 | | | | (429,817 | ) | | | 132,809 | |
Foreign currency transactions | | | — | | | | (698,796 | ) | | | 84,013 | | | | (30,962 | ) |
| |
Net realized gains (losses) | | | 1,485,475 | | | | (6,929,032 | ) | | | (193,118 | ) | | | 1,494,561 | |
| |
Net change in unrealized appreciation (depreciation) on: | | | | | | | | | | | | | | | | |
Investments | | | 448,825 | | | | (17,272,629 | ) | | | 1,618,844 | | | | (4,806,645 | ) |
Investments sold short | | | — | | | | — | | | | — | | | | 853,801 | |
Swap agreements | | | — | | | | 241,159 | | | | — | | | | — | |
Futures contracts | | | — | | | | — | | | | 30,785 | | | | — | |
Written options contracts | | | — | | | | — | | | | — | | | | 5,023 | |
Forward foreign currency exchange contracts | | | — | | | | 1,246,044 | | | | 31,918 | | | | 106,124 | |
Foreign currency transactions | | | — | | | | (58,802 | ) | | | (6,401 | ) | | | (1,615 | ) |
| |
Net change in unrealized appreciation (depreciation) | | | 448,825 | | | | (15,844,228 | ) | | | 1,675,146 | | | | (3,843,312 | ) |
| |
Net realized and unrealized gains (losses) | | | 1,934,300 | | | | (22,773,260 | ) | | | 1,482,028 | | | | (2,348,751 | ) |
| |
Net increase (decrease) in net assets resulting from operations | | $ | 5,547,038 | | | $ | (13,813,075 | ) | | $ | 3,048,648 | | | $ | 1,332,288 | |
| |
Foreign withholding taxes on dividend income | | $ | — | | | $ | — | | | $ | 24,794 | | | $ | 6,777 | |
Foreign withholding taxes on interest income | | $ | 3,188 | | | $ | 198,642 | | | $ | 8,555 | | | $ | — | |
See accompanying Notes to Financial Statements
214
Morningstar Funds Trust April 30, 2020
Statements of Changes in Net Assets
| | | | | | | | | | | | | | | | |
| | | Morningstar U.S. Equity Fund | | | Morningstar International Equity Fund | |
| | | | |
| | | Year Ended
April 30, 2020 | | | Since Inception
April 30, 20191 | | | Year Ended
April 30, 2020 | | | Since Inception
April 30, 20191 | |
| |
Operations: | | | | | | | | | | | | | | | | |
Net investment income | | $ | 10,046,092 | | | $ | 1,615,086 | | | $ | 11,623,211 | | | $ | 1,968,002 | |
Net realized gains (losses) | | | (21,652,852 | ) | | | 2,333,581 | | | | (1,755,597 | ) | | | 886,337 | |
Net change in unrealized appreciation (depreciation) | | | (49,639,266 | ) | | | 42,440,366 | | | | (103,421,605 | ) | | | 25,253,095 | |
| |
Net increase (decrease) in net assets resulting from operations | | | (61,246,026 | ) | | | 46,389,033 | | | | (93,553,991 | ) | | | 28,107,434 | |
| |
Distributions paid from: | | | | | | | | | | | | | | | | |
Distributable earnings | | | (18,634,524 | ) | | | (422,538 | ) | | | (17,321,023 | ) | | | (550,924 | ) |
| |
Total distributions paid | | | (18,634,524 | ) | | | (422,538 | ) | | | (17,321,023 | ) | | | (550,924 | ) |
| |
Capital share transactions: | | | | | | | | | | | | | | | | |
Proceeds from shares sold | | | 794,376,814 | | | | 679,811,818 | | | | 550,873,414 | | | | 478,546,770 | |
Reinvestment of dividends | | | 18,624,492 | | | | 422,538 | | | | 17,311,550 | | | | 550,924 | |
Payments for shares redeemed | | | (231,681,035 | ) | | | (48,574,180 | ) | | | (161,539,278 | ) | | | (38,025,671 | ) |
| |
Net increase (decrease) in net assets from capital share transactions | | | 581,320,271 | | | | 631,660,176 | | | | 406,645,686 | | | | 441,072,023 | |
| |
Total increase (decrease) in net assets | | | 501,439,721 | | | | 677,626,671 | | | | 295,770,672 | | | | 468,628,533 | |
| |
Net assets: | | | | | | | | | | | | | | | | |
Beginning of year | | | 677,926,671 | | | | 300,000 | | | | 468,628,533 | | | | — | |
| |
End of year | | $ | 1,179,366,392 | | | $ | 677,926,671 | | | $ | 764,399,205 | | | $ | 468,628,533 | |
| |
Capital share transactions | | | | | | | | | | | | | | | | |
Shares sold | | | 85,340,677 | | | | 68,242,367 | | | | 58,658,336 | | | | 47,103,913 | |
Shares from reinvested dividends | | | 1,684,010 | | | | 47,263 | | | | 1,537,824 | | | | 58,734 | |
Shares redeemed | | | (23,209,115 | ) | | | (4,850,030 | ) | | | (16,399,510 | ) | | | (3,719,974 | ) |
| |
Net increase | | | 63,815,572 | | | | 63,439,600 | | | | 43,796,650 | | | | 43,442,673 | |
| |
| 1 | Commencement of operations was November 2, 2018. |
See accompanying Notes to Financial Statements
215
Morningstar Funds Trust April 30, 2020
Statements of Changes in Net Assets (continued)
| | | | | | | | | | | | | | | | |
| | | Morningstar Global Income Fund | | | Morningstar Total Return Bond Fund | |
| | | | |
| | | Year Ended
April 30, 2020 | | | Since Inception
April 30, 20191 | | | Year Ended
April 30, 2020 | | | Since Inception
April 30, 20191 | |
| |
Operations: | | | | | | | | | | | | | | | | |
Net investment income | | $ | 7,345,318 | | | $ | 1,586,736 | | | $ | 12,025,769 | | | $ | 2,895,226 | |
Net realized gains (losses) | | | 108,701 | | | | 120,353 | | | | 24,846,825 | | | | 2,048,280 | |
Net change in unrealized appreciation (depreciation) | | | (19,219,391 | ) | | | 7,585,728 | | | | 1,511,874 | | | | 6,188,889 | |
| |
Net increase (decrease) in net assets resulting from operations | | | (11,765,372 | ) | | | 9,292,817 | | | | 38,384,468 | | | | 11,132,395 | |
| |
Distributions paid from: | | | | | | | | | | | | | | | | |
Distributable earnings | | | (9,352,472 | ) | | | (959,797 | ) | | | (25,988,634 | ) | | | (2,817,061 | ) |
| |
Total distributions paid | | | (9,352,472 | ) | | | (959,797 | ) | | | (25,988,634 | ) | | | (2,817,061 | ) |
| |
Capital share transactions: | | | | | | | | | | | | | | | | |
Proceeds from shares sold | | | 123,726,471 | | | | 198,945,395 | | | | 306,942,888 | | | | 429,820,699 | |
Reinvestment of dividends | | | 9,348,867 | | | | 959,797 | | | | 25,965,152 | | | | 2,817,061 | |
Payments for shares redeemed | | | (62,428,760 | ) | | | (22,706,767 | ) | | | (240,473,091 | ) | | | (26,321,999 | ) |
| |
Net increase (decrease) in net assets from capital share transactions | | | 70,646,578 | | | | 177,198,425 | | | | 92,434,949 | | | | 406,315,761 | |
| |
Total increase (decrease) in net assets | | | 49,528,734 | | | | 185,531,445 | | | | 104,830,783 | | | | 414,631,095 | |
| |
Net assets: | | | | | | | | | | | | | | | | |
Beginning of year | | | 185,531,445 | | | | — | | | | 414,631,095 | | | | — | |
| |
End of year | | $ | 235,060,179 | | | $ | 185,531,445 | | | $ | 519,461,878 | | | $ | 414,631,095 | |
| |
Capital share transactions | | | | | | | | | | | | | | | | |
Shares sold | | | 12,277,449 | | | | 19,666,797 | | | | 28,515,303 | | | | 41,836,843 | |
Shares from reinvested dividends | | | 886,549 | | | | 94,998 | | | | 2,427,437 | | | | 271,267 | |
Shares redeemed | | | (6,062,138 | ) | | | (2,224,723 | ) | | | (22,776,526 | ) | | | (2,545,439 | ) |
| |
Net increase | | | 7,101,860 | | | | 17,537,072 | | | | 8,166,214 | | | | 39,562,671 | |
| |
| 1 | Commencement of operations was November 2, 2018. |
See accompanying Notes to Financial Statements
216
Morningstar Funds Trust April 30, 2020
Statements of Changes in Net Assets (continued)
| | | | | | | | | | | | | | | | |
| | | Morningstar Municipal Bond Fund | | | Morningstar Defensive Bond Fund | |
| | | | |
| | | Year Ended
April 30, 2020 | | | Since Inception
April 30, 20191 | | | Year Ended
April 30, 2020 | | | Since Inception
April 30, 20191 | |
| |
Operations: | | | | | | | | | | | | | | | | |
Net investment income | | $ | 3,824,021 | | | $ | 829,427 | | | $ | 3,612,738 | | | $ | 858,962 | |
Net realized gains (losses) | | | (789,489 | ) | | | 345,693 | | | | 1,485,475 | | | | 33,464 | |
Net change in unrealized appreciation (depreciation) | | | (9,703,593 | ) | | | 1,823,576 | | | | 448,825 | | | | 662,575 | |
| |
Net increase (decrease) in net assets resulting from operations | | | (6,669,061 | ) | | | 2,998,696 | | | | 5,547,038 | | | | 1,555,001 | |
| |
Distributions paid from: | | | | | | | | | | | | | | | | |
Distributable earnings | | | (4,399,566 | ) | | | (787,797 | ) | | | (4,723,523 | ) | | | (665,904 | ) |
| |
Total distributions paid | | | (4,399,566 | ) | | | (787,797 | ) | | | (4,723,523 | ) | | | (665,904 | ) |
| |
Capital share transactions: | | | | | | | | | | | | | | | | |
Proceeds from shares sold | | | 332,149,054 | | | | 110,443,570 | | | | 122,856,335 | | | | 168,407,510 | |
Reinvestment of dividends | | | 4,398,578 | | | | 787,797 | | | | 4,716,027 | | | | 665,904 | |
Payments for shares redeemed | | | (89,965,230 | ) | | | (8,769,280 | ) | | | (101,009,890 | ) | | | (13,873,850 | ) |
| |
Net increase (decrease) in net assets from capital share transactions | | | 246,582,402 | | | | 102,462,087 | | | | 26,562,472 | | | | 155,199,564 | |
| |
Total increase (decrease) in net assets | | | 235,513,775 | | | | 104,672,986 | | | | 27,385,987 | | | | 156,088,661 | |
| |
Net assets: | | | | | | | | | | | | | | | | |
Beginning of year | | | 104,672,986 | | | | — | | | | 156,088,661 | | | | — | |
| |
End of year | | $ | 340,186,761 | | | $ | 104,672,986 | | | $ | 183,474,648 | | | $ | 156,088,661 | |
| |
Capital share transactions | | | | | | | | | | | | | | | | |
Shares sold | | | 31,722,432 | | | | 10,863,064 | | | | 12,118,403 | | | | 16,768,927 | |
Shares from reinvested dividends | | | 418,670 | | | | 76,489 | | | | 465,247 | | | | 66,189 | |
Shares redeemed | | | (8,682,679 | ) | | | (854,018 | ) | | | (10,006,072 | ) | | | (1,379,643 | ) |
| |
Net increase | | | 23,458,423 | | | | 10,085,535 | | | | 2,577,578 | | | | 15,455,473 | |
| |
| 1 | Commencement of operations was November 2, 2018. |
See accompanying Notes to Financial Statements
217
Morningstar Funds Trust April 30, 2020
Statements of Changes in Net Assets (continued)
| | | | | | | | | | | | | | | | |
| | | Morningstar Multisector Bond Fund | | | Morningstar Unconstrained Allocation Fund | |
| | | | | | | | |
| | | Year Ended
April 30, 2020 | | | Since Inception
April 30, 20191 | | | Year Ended
April 30, 2020 | | | Since Inception
April 30, 20191 | |
| |
Operations: | | | | | | | | | | | | | | | | |
Net investment income | | $ | 8,960,185 | | | $ | 2,377,735 | | | $ | 1,566,620 | | | $ | 322,637 | |
Net realized gains (losses) | | | (6,929,032 | ) | | | 767,261 | | | | (193,118 | ) | | | 533,426 | |
Net change in unrealized appreciation (depreciation) | | | (15,844,228 | ) | | | 1,167,550 | | | | 1,675,146 | | | | 1,020,020 | |
| |
Net increase (decrease) in net assets resulting from operations | | | (13,813,075 | ) | | | 4,312,546 | | | | 3,048,648 | | | | 1,876,083 | |
| |
Distributions paid from: | | | | | | | | | | | | | | | | |
Distributable earnings | | | (10,125,732 | ) | | | (2,273,735 | ) | | | (2,836,649 | ) | | | (257,198 | ) |
| |
Total distributions paid | | | (10,125,732 | ) | | | (2,273,735 | ) | | | (2,836,649 | ) | | | (257,198 | ) |
| |
Capital share transactions: | | | | | | | | | | | | | | | | |
Proceeds from shares sold | | | 154,111,386 | | | | 172,916,801 | | | | 104,191,817 | | | | 64,408,010 | |
Reinvestment of dividends | | | 10,121,184 | | | | 2,273,735 | | | | 2,835,207 | | | | 257,198 | |
Payments for shares redeemed | | | (109,891,533 | ) | | | (15,860,176 | ) | | | (25,340,078 | ) | | | (9,989,372 | ) |
| |
Net increase (decrease) in net assets from capital share transactions | | | 54,341,037 | | | | 159,330,360 | | | | 81,686,946 | | | | 54,675,836 | |
| |
Total increase (decrease) in net assets | | | 30,402,230 | | | | 161,369,171 | | | | 81,898,945 | | | | 56,294,721 | |
| |
Net assets: | | | | | | | | | | | | | | | | |
Beginning of year | | | 161,369,171 | | | | — | | | | 56,294,721 | | | | — | |
| |
End of year | | $ | 191,771,401 | | | $ | 161,369,171 | | | $ | 138,193,666 | | | $ | 56,294,721 | |
| |
Capital share transactions | | | | | | | | | | | | | | | | |
Shares sold | | | 15,221,049 | | | | 17,018,078 | | | | 11,774,435 | | | | 6,400,453 | |
Shares from reinvested dividends | | | 979,145 | | | | 221,834 | | | | 263,569 | | | | 27,159 | |
Shares redeemed | | | (11,459,813 | ) | | | (1,548,144 | ) | | | (2,577,253 | ) | | | (1,004,027 | ) |
| |
Net increase | | | 4,740,381 | | | | 15,691,768 | | | | 9,460,751 | | | | 5,423,585 | |
| |
| 1 | Commencement of operations was November 2, 2018. |
See accompanying Notes to Financial Statements
218
Morningstar Funds Trust April 30, 2020
Statements of Changes in Net Assets (continued)
| | | | | | | | |
| | | Morningstar Alternatives Fund | |
| | | | |
| | | Year Ended
April 30, 2020 | | | Since Inception
April 30, 20191 | |
| |
Operations: | | | | | | | | |
Net investment income | | $ | 3,681,039 | | | $ | 255,111 | |
Net realized gains (losses) | | | 1,494,561 | | | | 179,381 | |
Net change in unrealized appreciation (depreciation) | | | (3,843,312 | ) | | | 265,054 | |
| |
Net increase (decrease) in net assets resulting from operations | | | 1,332,288 | | | | 699,546 | |
| |
Distributions paid from: | | | | | | | | |
Distributable earnings | | | (3,242,453 | ) | | | (86,515 | ) |
| |
Total distributions paid | | | (3,242,453 | ) | | | (86,515 | ) |
| |
Capital share transactions: | | | | | | | | |
Proceeds from shares sold | | | 126,616,742 | | | | 118,245,172 | |
Reinvestment of dividends | | | 3,239,760 | | | | 86,515 | |
Payments for shares redeemed | | | (53,683,970 | ) | | | (7,087,419 | ) |
| |
Net increase (decrease) in net assets from capital share transactions | | | 76,172,532 | | | | 111,244,268 | |
| |
Total increase (decrease) in net assets | | | 74,262,367 | | | | 111,857,299 | |
| |
Net assets: | | | | | | | | |
Beginning of year | | | 111,857,299 | | | | — | |
| |
End of year | | $ | 186,119,666 | | | $ | 111,857,299 | |
| |
Capital share transactions | | | | | | | | |
Shares sold | | | 12,285,126 | | | | 11,767,095 | |
Shares from reinvested dividends | | | 311,889 | | | | 8,678 | |
Shares redeemed | | | (5,279,184 | ) | | | (705,334 | ) |
| |
Net increase | | | 7,317,831 | | | | 11,070,439 | |
| |
| 1 | Commencement of operations was November 2, 2018. |
See accompanying Notes to Financial Statements
219
Morningstar Funds Trust April 30, 2020
Financial Highlights
Morningstar U.S. Equity Fund
| | | | | | | | |
| | | | | | Since Inception1 | |
| | | | |
| Selected per share data | | 2020 | | | 2019 | |
| |
Net asset value, beginning of period | | | $10.68 | | | | $10.00 | |
| |
Income (loss) from investment operations: | | | | | | | | |
Net investment income | | | 0.13 | | | | 0.05 | |
Net realized and unrealized gains (losses) | | | (1.31 | ) | | | 0.64 | |
| |
Total income (loss) from investment operations | | | (1.18 | ) | | | 0.69 | |
| |
Less distributions paid: | | | | | | | | |
From net investment income | | | (0.09 | ) | | | (0.01 | ) |
From realized gains | | | (0.14 | ) | | | — | |
| |
Total distributions paid | | | (0.23 | ) | | | (0.01 | ) |
| |
Net asset value, end of year | | | $9.27 | | | | $10.68 | |
| |
Total return2 | | | (11.42% | ) | | | 6.98% | |
Supplemental data and ratios: | | | | | | | | |
Net assets, end of year (millions) | | | $1,179 | | | | $678 | |
| |
Ratio to average net assets of:3 | | | | | | | | |
Total expenses before waivers/reimbursements | | | 0.93% | | | | 1.08% | |
| |
Total expenses after waivers/reimbursements | | | 0.81% | | | | 0.82% | |
| |
Net investment income, net of waivers/reimbursements | | | 1.25% | | | | 0.98%4 | |
| |
Net investment income, before waivers/reimbursements | | | 1.13% | | | | 0.72%4 | |
| |
Portfolio turnover rate5 | | | 58% | | | | 20% | |
| |
| 1 | Commencement of operations was November 2, 2018. |
| 2 | Assumes investment at net asset value at the beginning of the year, reinvestment of all dividends and distributions, and a complete redemption of the investment at net asset value at the end of the year. The total return is not annualized for periods less than one year. |
| 3 | Ratios are annualized for periods less than one year. |
| 4 | As the Fund commenced investment operations on November 2, 2018, annualized net investment income ratios may not be reflective of actual amounts the Fund might obtain in a full year of operation. |
| 5 | Portfolio turnover rate is not annualized for periods less than one year. |
See accompanying Notes to Financial Statements
220
Morningstar Funds Trust April 30, 2020
Financial Highlights (continued)
Morningstar International Equity Fund
| | | | | | | | |
| | | | | | Since Inception1 | |
| | | | |
| Selected per share data | | 2020 | | | 2019 | |
| |
Net asset value, beginning of period | | | $10.79 | | | | $10.00 | |
| |
Income (loss) from investment operations: | | | | | | | | |
Net investment income | | | 0.21 | | | | 0.08 | |
Net realized and unrealized gains (losses) | | | (1.94 | ) | | | 0.74 | |
| |
Total income (loss) from investment operations | | | (1.73 | ) | | | 0.82 | |
| |
Less distributions paid: | | | | | | | | |
From net investment income | | | (0.19 | ) | | | (0.03 | ) |
From realized gains | | | (0.11 | ) | | | — | |
| |
Total distributions paid | | | (0.30 | ) | | | (0.03 | ) |
| |
Net asset value, end of year | | | $8.76 | | | | $10.79 | |
| |
Total return2 | | | (16.65% | ) | | | 8.19% | |
Supplemental data and ratios: | | | | | | | | |
Net assets, end of year (millions) | | | $764 | | | | $469 | |
| |
Ratio to average net assets of:3 | | | | | | | | |
Total expenses before waivers/reimbursements | | | 1.14% | | | | 1.29% | |
| |
Total expenses after waivers/reimbursements | | | 0.92% | | | | 0.94% | |
| |
Net investment income, net of waivers/reimbursements | | | 2.08% | | | | 1.66%4 | |
| |
Net investment income, before waivers/reimbursements | | | 1.86% | | | | 1.31%4 | |
| |
Portfolio turnover rate5 | | | 36% | | | | 19% | |
| |
| 1 | Commencement of operations was November 2, 2018. |
| 2 | Assumes investment at net asset value at the beginning of the year, reinvestment of all dividends and distributions, and a complete redemption of the investment at net asset value at the end of the year. The total return is not annualized for periods less than one year. |
| 3 | Ratios are annualized for periods less than one year. |
| 4 | As the Fund commenced investment operations on November 2, 2018, annualized net investment income ratios may not be reflective of actual amounts the Fund might obtain in a full year of operation. |
| 5 | Portfolio turnover rate is not annualized for periods less than one year. |
See accompanying Notes to Financial Statements
221
Morningstar Funds Trust April 30, 2020
Financial Highlights (continued)
Morningstar Global Income Fund
| | | | | | | | |
| | | | | | Since
Inception1 | |
| | | | |
| Selected per share data | | 2020 | | | 2019 | |
| |
Net asset value, beginning of period | | | $10.58 | | | | $10.00 | |
| |
Income (loss) from investment operations: | | | | | | | | |
Net investment income | | | 0.37 | | | | 0.16 | |
Net realized and unrealized gains (losses) | | | (0.94 | ) | | | 0.52 | |
| |
Total income (loss) from investment operations | | | (0.57 | ) | | | 0.68 | |
| |
Less distributions paid: | | | | | | | | |
From net investment income | | | (0.42 | ) | | | (0.10 | ) |
From realized gains | | | (0.05 | ) | | | — | |
| |
Total distributions paid | | | (0.47 | ) | | | (0.10 | ) |
| |
Net asset value, end of year | | | $9.54 | | | | $10.58 | |
| |
Total return2 | | | (5.73% | ) | | | 6.85% | |
Supplemental data and ratios: | | | | | | | | |
Net assets, end of year (millions) | | | $235 | | | | $186 | |
| |
Ratio to average net assets of:3 | | | | | | | | |
Total expenses before waivers/reimbursements | | | 0.64% | | | | 0.90% | |
| |
Total expenses after waivers/reimbursements | | | 0.58% | | | | 0.58% | |
| |
Net investment income, net of waivers/reimbursements | | | 3.52% | | | | 3.15%4 | |
| |
Net investment income, before waivers/reimbursements | | | 3.46% | | | | 2.83%4 | |
| |
Portfolio turnover rate5 | | | 62% | | | | 27% | |
| |
| 1 | Commencement of operations was November 2, 2018. |
| 2 | Assumes investment at net asset value at the beginning of the year, reinvestment of all dividends and distributions, and a complete redemption of the investment at net asset value at the end of the year. The total return is not annualized for periods less than one year. |
| 3 | Ratios are annualized for periods less than one year. |
| 4 | As the Fund commenced investment operations on November 2, 2018, annualized net investment income ratios may not be reflective of actual amounts the Fund might obtain in a full year of operation. |
| 5 | Portfolio turnover rate is not annualized for periods less than one year. |
See accompanying Notes to Financial Statements
222
Morningstar Funds Trust April 30, 2020
Financial Highlights (continued)
Morningstar Total Return Bond Fund
| | | | | | | | |
| | | | | | Since
Inception1 | |
| | | | |
| Selected per share data | | 2020 | | | 2019 | |
| |
Net asset value, beginning of period | | | $10.48 | | | | $10.00 | |
| |
Income (loss) from investment operations: | | | | | | | | |
Net investment income | | | 0.26 | | | | 0.15 | |
Net realized and unrealized gains | | | 0.68 | | | | 0.45 | |
| |
Total income from investment operations | | | 0.94 | | | | 0.60 | |
| |
Less distributions paid: | | | | | | | | |
From net investment income | | | (0.28 | ) | | | (0.12 | ) |
From realized gains | | | (0.26 | ) | | | — | |
| |
Total distributions paid | | | (0.54 | ) | | | (0.12 | ) |
| |
Net asset value, end of year | | | $10.88 | | | | $10.48 | |
| |
Total return2 | | | 9.13% | | | | 6.01% | |
Supplemental data and ratios: | | | | | | | | |
Net assets, end of year (millions) | | | $519 | | | | $415 | |
| |
Ratio to average net assets of:3 | | | | | | | | |
Total expenses before waivers/reimbursements4 | | | 0.81% | | | | 0.88% | |
| |
Total expenses after waivers/reimbursements4 | | | 0.53% | | | | 0.53% | |
| |
Net investment income, net of waivers/reimbursements | | | 2.43% | | | | 2.89%5 | |
| |
Net investment income, before waivers/reimbursements | | | 2.15% | | | | 2.54%5 | |
| |
Portfolio turnover rate6 | | | 612% | | | | 318% | |
| |
| 1 | Commencement of operations was November 2, 2018. |
| 2 | Assumes investment at net asset value at the beginning of the year, reinvestment of all dividends and distributions, and a complete redemption of the investment at net asset value at the end of the year. The total return is not annualized for periods less than one year. |
| 3 | Ratios are annualized for periods less than one year. |
| 4 | Expenses include dividends and interest expense of less than 0.01% |
| 5 | As the Fund commenced investment operations on November 2, 2018, annualized net investment income ratios may not be reflective of actual amounts the Fund might obtain in a full year of operation. |
| 6 | Portfolio turnover rate is not annualized for periods less than one year. |
See accompanying Notes to Financial Statements
223
Morningstar Funds Trust April 30, 2020
Financial Highlights (continued)
Morningstar Municipal Bond Fund
| | | | | | | | |
| | | | | | Since
Inception1 | |
| | | | |
| Selected per share data | | 2020 | | | 2019 | |
| |
Net asset value, beginning of period | | | $10.38 | | | | $10.00 | |
| |
Income (loss) from investment operations: | | | | | | | | |
Net investment income | | | 0.23 | | | | 0.12 | |
Net realized and unrealized gains (losses) | | | (0.21 | ) | | | 0.36 | |
| |
Total income from investment operations | | | 0.02 | | | | 0.48 | |
| |
Less distributions paid: | | | | | | | | |
From net investment income | | | (0.23 | ) | | | (0.10 | ) |
From realized gains | | | (0.03 | ) | | | — | |
| |
Total distributions paid | | | (0.26 | ) | | | (0.10 | ) |
| |
Net asset value, end of year | | | $10.14 | | | | $10.38 | |
| |
Total return2 | | | 0.11% | | | | 4.79% | |
Supplemental data and ratios: | | | | | | | | |
Net assets, end of year (millions) | | | $340 | | | | $105 | |
| |
Ratio to average net assets of:3 | | | | | | | | |
Total expenses before waivers/reimbursements | | | 0.77% | | | | 1.05% | |
| |
Total expenses after waivers/reimbursements | | | 0.58% | | | | 0.58% | |
| |
Net investment income, net of waivers/reimbursements | | | 2.17% | | | | 2.48%4 | |
| |
Net investment income, before waivers/reimbursements | | | 1.98% | | | | 2.01%4 | |
| |
Portfolio turnover rate5 | | | 127% | | | | 115% | |
| |
| 1 | Commencement of operations was November 2, 2018. |
| 2 | Assumes investment at net asset value at the beginning of the year, reinvestment of all dividends and distributions, and a complete redemption of the investment at net asset value at the end of the year. The total return is not annualized for periods less than one year. |
| 3 | Ratios are annualized for periods less than one year. |
| 4 | As the Fund commenced investment operations on November 2, 2018, annualized net investment income ratios may not be reflective of actual amounts the Fund might obtain in a full year of operation. |
| 5 | Portfolio turnover rate is not annualized for periods less than one year. |
See accompanying Notes to Financial Statements
224
Morningstar Funds Trust April 30, 2020
Financial Highlights (continued)
Morningstar Defensive Bond Fund
| | | | | | | | |
| | | | | | Since
Inception1 | |
| | | | |
| Selected per share data | | 2020 | | | 2019 | |
| |
Net asset value, beginning of period | | | $10.10 | | | | $10.00 | |
| |
Income (loss) from investment operations: | | | | | | | | |
Net investment income | | | 0.20 | | | | 0.11 | |
Net realized and unrealized gains | | | 0.13 | | | | 0.08 | |
| |
Total income from investment operations | | | 0.33 | | | | 0.19 | |
| |
Less distributions paid: | | | | | | | | |
From net investment income | | | (0.23 | ) | | | (0.09 | ) |
From realized gains | | | (0.03 | ) | | | — | |
| |
Total distributions paid | | | (0.26 | ) | | | (0.09 | ) |
| |
Net asset value, end of year | | | $10.17 | | | | $10.10 | |
| |
Total return2 | | | 3.36% | | | | 1.87% | |
Supplemental data and ratios: | | | | | | | | |
Net assets, end of year (millions) | | | $183 | | | | $156 | |
| |
Ratio to average net assets of:3 | | | | | | | | |
Total expenses before waivers/reimbursements | | | 0.66% | | | | 0.93% | |
| |
Total expenses after waivers/reimbursements | | | 0.48% | | | | 0.48% | |
| |
Net investment income, net of waivers/reimbursements | | | 2.02% | | | | 2.28%4 | |
| |
Net investment income, before waivers/reimbursements | | | 1.84% | | | | 1.83%4 | |
| |
Portfolio turnover rate5 | | | 88% | | | | 4% | |
| |
| 1 | Commencement of operations was November 2, 2018. |
| 2 | Assumes investment at net asset value at the beginning of the year, reinvestment of all dividends and distributions, and a complete redemption of the investment at net asset value at the end of the year. The total return is not annualized for periods less than one year. |
| 3 | Ratios are annualized for periods less than one year. |
| 4 | As the Fund commenced investment operations on November 2, 2018, annualized net investment income ratios may not be reflective of actual amounts the Fund might obtain in a full year of operation. |
| 5 | Portfolio turnover rate is not annualized for periods less than one year. |
See accompanying Notes to Financial Statements
225
Morningstar Funds Trust April 30, 2020
Financial Highlights (continued)
Morningstar Multisector Bond Fund
| | | | | | | | |
| | | | | | Since
Inception1 | |
| | | | |
| Selected per share data | | 2020 | | | 2019 | |
| |
Net asset value, beginning of period | | | $10.28 | | | | $10.00 | |
| |
Income (loss) from investment operations: | | | | | | | | |
Net investment income | | | 0.46 | | | | 0.27 | |
Net realized and unrealized gains (losses) | | | (0.83 | ) | | | 0.21 | |
| |
Total income (loss) from investment operations | | | (0.37 | ) | | | 0.48 | |
| |
Less distributions paid: | | | | | | | | |
From net investment income | | | (0.43 | ) | | | (0.20 | ) |
From realized gains | | | (0.09 | ) | | | — | |
| |
Total distributions paid | | | (0.52 | ) | | | (0.20 | ) |
| |
Net asset value, end of year | | | $9.39 | | | | $10.28 | |
| |
Total return2 | | | (3.97% | ) | | | 4.86% | |
Supplemental data and ratios: | | | | | | | | |
Net assets, end of year (millions) | | | $192 | | | | $161 | |
| |
Ratio to average net assets of:3 | | | | | | | | |
Total expenses before waivers/reimbursements | | | 0.98% | | | | 1.18% | |
| |
Total expenses after waivers/reimbursements | | | 0.79% | | | | 0.80% | |
| |
Net investment income, net of waivers/reimbursements | | | 4.52% | | | | 5.41%4 | |
| |
Net investment income, before waivers/reimbursements | | | 4.33% | | | | 5.03%4 | |
| |
Portfolio turnover rate5 | | | 138% | | | | 53% | |
| |
| 1 | Commencement of operations was November 2, 2018. |
| 2 | Assumes investment at net asset value at the beginning of the year, reinvestment of all dividends and distributions, and a complete redemption of the investment at net asset value at the end of the year. The total return is not annualized for periods less than one year. |
| 3 | Ratios are annualized for periods less than one year. |
| 4 | As the Fund commenced investment operations on November 2, 2018, annualized net investment income ratios may not be reflective of actual amounts the Fund might obtain in a full year of operation. |
| 5 | Portfolio turnover rate is not annualized for periods less than one year. |
See accompanying Notes to Financial Statements
226
Morningstar Funds Trust April 30, 2020
Financial Highlights (continued)
Morningstar Unconstrained Allocation Fund
| | | | | | | | |
| | | | | | Since
Inception1 | |
| | | | |
| Selected per share data | | 2020 | | | 2019 | |
| |
Net asset value, beginning of period | | | $10.38 | | | | $10.00 | |
| |
Income (loss) from investment operations: | | | | | | | | |
Net investment income | | | 0.23 | | | | 0.12 | |
Net realized and unrealized gains (losses) | | | (0.91 | ) | | | 0.37 | |
| |
Total income (loss) from investment operations | | | (0.68 | ) | | | 0.49 | |
| |
Less distributions paid: | | | | | | | | |
From net investment income | | | (0.21 | ) | | | (0.11 | ) |
From realized gains | | | (0.21 | ) | | | — | |
| |
Total distributions paid | | | (0.42 | ) | | | (0.11 | ) |
| |
Net asset value, end of year | | | $9.28 | | | | $10.38 | |
| |
Total return2 | | | (7.07% | ) | | | 4.97% | |
Supplemental data and ratios: | | | | | | | | |
Net assets, end of year (millions) | | | $138 | | | | $56 | |
| |
Ratio to average net assets of:3 | | | | | | | | |
Total expenses before waivers/reimbursements | | | 0.94% | | | | 1.48% | |
| |
Total expenses after waivers/reimbursements | | | 0.73% | | | | 0.64% | |
| |
Net investment income, net of waivers/reimbursements | | | 2.29% | | | | 2.38%4 | |
| |
Net investment income, before waivers/reimbursements | | | 2.08% | | | | 1.54%4 | |
| |
Portfolio turnover rate5 | | | 66% | | | | 76% | |
| |
| 1 | Commencement of operations was November 2, 2018. |
| 2 | Assumes investment at net asset value at the beginning of the year, reinvestment of all dividends and distributions, and a complete redemption of the investment at net asset value at the end of the year. The total return is not annualized for periods less than one year. |
| 3 | Ratios are annualized for periods less than one year. |
| 4 | As the Fund commenced investment operations on November 2, 2018, annualized net investment income ratios may not be reflective of actual amounts the Fund might obtain in a full year of operation. |
| 5 | Portfolio turnover rate is not annualized for periods less than one year. |
See accompanying Notes to Financial Statements
227
Morningstar Funds Trust April 30, 2020
Financial Highlights (continued)
Morningstar Alternatives Fund
| | | | | | | | |
| | | | | | Since
Inception1 | |
| | | | |
| Selected per share data | | 2020 | | | 2019 | |
| |
Net asset value, beginning of period | | | $10.10 | | | | $10.00 | |
| |
Income (loss) from investment operations: | | | | | | | | |
Net investment income | | | 0.25 | | | | 0.05 | |
Net realized and unrealized gains (losses) | | | (0.05 | ) | | | 0.08 | |
| |
Total income from investment operations | | | 0.20 | | | | 0.13 | |
| |
Less distributions paid: | | | | | | | | |
From net investment income | | | (0.14 | ) | | | (0.03 | ) |
From realized gains | | | (0.04 | ) | | | — | |
| |
Total distributions paid | | | (0.18 | ) | | | (0.03 | ) |
| |
Net asset value, end of year | | | $10.12 | | | | $10.10 | |
| |
Total return2 | | | 1.94% | | | | 1.26% | |
Supplemental data and ratios: | | | | | | | | |
Net assets, end of year (millions) | | | $186 | | | | $112 | |
| |
Ratio to average net assets of:3 | | | | | | | | |
Total expenses before waivers/reimbursements | | | 1.48% | | | | 1.91% | |
| |
Total expenses after waivers/reimbursements | | | 1.13% | | | | 0.96% | |
| |
Total expenses after waivers/reimbursements and excluding dividend and interest expense | | | 0.87% | | | | 0.77% | |
| |
Net investment income, net of waivers/reimbursements | | | 2.45% | | | | 1.08%4 | |
| |
Net investment income, before waivers/reimbursements | | | 2.10% | | | | 0.13%4 | |
| |
Portfolio turnover rate5 | | | 154% | | | | 103% | |
| |
| 1 | Commencement of operations was November 2, 2018. |
| 2 | Assumes investment at net asset value at the beginning of the year, reinvestment of all dividends and distributions, and a complete redemption of the investment at net asset value at the end of the year. The total return is not annualized for periods less than one year. |
| 3 | Ratios are annualized for periods less than one year. |
| 4 | As the Fund commenced investment operations on November 2, 2018, annualized net investment income ratios may not be reflective of actual amounts the Fund might obtain in a full year of operation. |
| 5 | Portfolio turnover rate is not annualized for periods less than one year. |
See accompanying Notes to Financial Statements
228
Morningstar Funds Trust April 30, 2020
Notes to Financial Statements
1. Organization
Morningstar Funds Trust (the “Trust”) was organized as a Delaware statutory trust on March 1, 2017. The Trust is registered with the Securities and Exchange Commission (the “SEC”) as an open-end management investment company under the Investment Company Act of 1940, as amended (the “1940 Act”). The Trust has authorized capital of unlimited shares of beneficial interest at no par value, which may be issued in one or more series of the Trust.
The Trust is currently authorized to offer shares in nine separate series (each a “Fund” and collectively, the “Funds”):
| | |
| Morningstar U.S. Equity Fund | | Morningstar Defensive Bond Fund |
| Morningstar International Equity Fund | | Morningstar Multisector Bond Fund |
| Morningstar Global Income Fund | | Morningstar Unconstrained Allocation Fund |
| Morningstar Total Return Bond Fund | | Morningstar Alternatives Fund |
| Morningstar Municipal Bond Fund | | |
Each Fund represents a distinct portfolio with its own investment objectives and is treated as a separate legal entity. Each Fund, except for the Morningstar Multisector Bond Fund, is classified and operates as a diversified fund under the 1940 Act. The Morningstar Multisector Bond Fund is classified as nondiversified. Morningstar Investment Management, LLC (the “Adviser”) serves as the investment adviser of each Fund.
The investment objective of each Fund is as follows:
| | |
| Fund | | Investment Objective |
| Morningstar U.S. Equity Fund | | Long-term capital appreciation |
| Morningstar International Equity Fund | | Long-term capital appreciation |
| Morningstar Global Income Fund | | Current income and long-term capital appreciation |
| Morningstar Total Return Bond Fund | | Total return maximization, income and capital preservation |
| Morningstar Municipal Bond Fund | | Federal tax-exempt income and capital preservation |
| Morningstar Defensive Bond Fund | | Capital preservation |
| Morningstar Multisector Bond Fund | | Total return through a combination of current income and capital appreciation |
| Morningstar Unconstrained Allocation Fund | | Long-term capital appreciation over a full market cycle |
| Morningstar Alternatives Fund | | Long-term capital appreciation and low sensitivity to traditional U.S. asset classes |
2. Significant Accounting Policies
The following is a summary of significant accounting policies consistently followed by the Funds in the preparation of the financial statements. These policies are in conformity with accounting principles generally accepted in the United States of America (“U.S. GAAP”).
The Trust follows accounting and reporting guidance under Financial Accounting Standards Board (“FASB”) Accounting Standards Codification Topic 946, Financial Services-Investment Companies.
229
Morningstar Funds Trust April 30, 2020
Notes to Financial Statements (continued)
Use of Estimates: The preparation of financial statements in conformity with U.S. GAAP requires management to make estimates and assumptions that affect the reported amounts of assets and liabilities and disclosure of contingent assets and liabilities at the date of the financial statements and the reported amounts of revenues and expenses during the reporting period. Actual results could differ from those estimates and such differences could be material.
Valuation of Investments: All securities and other investments are valued at their estimated fair value, as described in Note 4.
Cash and Foreign Currencies: Cash comprises U.S. Dollar and foreign currency deposits held at a bank(s) or custodian bank(s) which may exceed insured limits.
Due to/from Brokers: Due to/from brokers represents cash balances and securities on deposit with, or cash balances owed to, the Funds’ prime brokers and counterparties. The Funds are subject to credit risk should the prime brokers and counterparties be unable to meet their obligations to the Funds.
Foreign Currency Translation: The books and records of the Funds are maintained in U.S. Dollars. The Funds’ assets and liabilities in foreign currencies are translated into U.S. Dollars at the prevailing exchange rate at the valuation date. Transactions denominated in foreign currencies are translated into U.S. Dollars at the prevailing exchange rate on the date of the transaction. The Funds’ income earned and expense incurred in foreign denominated currencies are translated into U.S. Dollars at the prevailing exchange rate on the date of such activity.
The Funds do not isolate that portion of the results of operations arising from changes in the foreign exchange rates on investments and derivatives from the fluctuations that result from changes in the market prices of investments and derivatives held or sold during the year. Accordingly, such foreign currency gains (losses) are included in the reported net realized gain (loss) from transactions in investment securities and derivatives and net change in unrealized appreciation (depreciation) on investment securities and derivatives on the Statements of Operations.
Realized gains (losses) from settlement of foreign currency and foreign currency transactions reported on the Statements of Operations arise from the disposition of foreign currency and a change between the amounts of dividends, interest and foreign withholding taxes recorded on the Funds’ books on the transaction date and the U.S. Dollar equivalent of the amounts actually received or paid. Changes in unrealized appreciation (depreciation) on foreign currency and foreign currency translations reported on the Statements of Operations arise from changes (due to the changes in the exchange rate) in the value of foreign currency and assets and liabilities (other than investments) denominated in foreign currencies, which are held at year end.
Investment Transactions and Investment Income: Investment transactions are accounted as of trade date. Realized gains and losses on investment transactions are recorded on a specifically identified cost basis. Interest income is recorded on an accrual basis and includes the accretion of discounts and amortization of premiums using the effective yield method. In the case of the defaulted debt obligation, the accrual of interest
230
Morningstar Funds Trust April 30, 2020
Notes to Financial Statements (continued)
income is halted when management becomes aware that the interest income is not collectible. Dividend income (expense) net of foreign taxes withheld, if any, is recorded on the ex-dividend date or when the Fund first learns of the ex-date dividend notification.
Expenses: Each Fund is charged for those expenses that are directly attributable to that Fund. Expenses incurred which do not specifically relate to an individual Fund generally are allocated among all Funds in the Trust in proportion to each Fund’s relative net assets.
Federal Income Taxes: Each Fund’s policy is to comply with all sections of Subchapter M of the Internal Revenue Code of 1986, as amended (“Code”), necessary to qualify for federal income tax purposes as a regulated investment company and to distribute substantially all of its taxable income and capital gains to shareholders as required. No provision for federal income or excise taxes is thus required. Each Fund is treated as a separate entity for federal income tax purposes.
The Funds may be subject to taxes imposed by countries on securities sold or held in certain foreign jurisdictions. Such taxes are generally based on income and/or capital gains earned or repatriated. The Funds accrue such taxes when the related income is earned. Gains realized by the Funds on the sale of securities in certain countries are subject to non-U.S. taxes. The Funds record a liability based on unrealized gains to provide for potential non-U.S. taxes payable upon the sale of these securities. For the year ended April 30, 2020, the Global Income Fund accrued non-U.S. taxes of $12,184, which is included in net of change in unrealized appreciation (depreciation) on investments in the Statements of Operations.
Management has analyzed each Fund’s tax positions for the period from 2019, including all positions expected to be taken upon filing the 2020 tax return, in all material jurisdictions where each Fund operates, and has concluded that no provision for income tax is required in the Funds’ financial statements. Each Fund will recognize interest and penalties, if any, related to unrecognized tax benefits as an income tax expense in the Statement of Operations.
Distributions to Shareholders: Distributions to shareholders are recorded on the ex-dividend date. Distributions of net investment income, if any, are declared and paid as follows:
| | |
| Fund | | Frequency |
| Morningstar U.S. Equity Fund | | Annually |
| Morningstar International Equity Fund | | Annually |
| Morningstar Global Income Fund | | Monthly |
| Morningstar Total Return Bond Fund | | Monthly |
| Morningstar Municipal Bond Fund | | Monthly |
| Morningstar Defensive Bond Fund | | Monthly |
| Morningstar Multisector Bond Fund | | Monthly |
| Morningstar Unconstrained Allocation Fund | | Annually |
| Morningstar Alternatives Fund | | Annually |
Distributions of net realized capital gains, if any, are declared and paid at least annually. Income and capital gain distributions will be determined in accordance with federal income tax regulations which may differ from U.S. GAAP. Differences may be permanent or temporary. Permanent differences are reclassified among capital
231
Morningstar Funds Trust April 30, 2020
Notes to Financial Statements (continued)
accounts in the financial statements to reflect their tax character. Temporary differences arise when certain items of income, expense, gain, or loss are recognized in different periods for financial statement and tax purposes. These differences will reverse at some time in the future. Differences in classification may also result from the treatment of short-term gains as ordinary income for tax purposes. As a result, income dividends and capital gain distributions declared during a fiscal year may differ significantly from the net investment income (loss) and realized gain (loss) reported on the Funds’ financial statements presented under U.S. GAAP.
Indemnifications: Under the Trust’s organizational documents, its officers and trustees are indemnified against certain liabilities arising out of the performance of their duties to the Trust. In addition, in the normal course of business the Trust enters into contracts that provide general indemnifications to other parties.
Recently Adopted Accounting Pronouncement: On March 30, 2017, the FASB issued Accounting Standard Update (ASU) 2017-08 “Premium Amortization on Purchased Callable Debt Securities” (the “ASU”), which amends the amortization period for certain purchased callable debt securities held at premium shortening such period to the earliest call date. The new guidance requires an entity to amortize the premium on callable debt security within its scope to the earliest call date. If the call option is not exercised at the earliest call date, the yield is reset to the effective yield using the payment terms of the security. If the security has more than one call date and the premium was amortized to a call price greater than the next call price, any excess of the amortized cost basis over the amount repayable at the next call date will be amortized to that date. If there are no other call dates, any excess of the amortized cost basis over the par amount will be amortized to maturity. Discounts on purchased callable debt securities will continue to be amortized to the security’s maturity date. The ASU is effective for public business entities for fiscal years, and interim periods within those fiscal years, beginning after December 15, 2018. The Funds have adopted the ASU. The adoption of the ASU did not have a material impact on the financial statements.
3. Investment Types
The Funds may utilize the following types of investments described below to execute their investment strategy to the extent permitted by the Funds’ investment policies.
Borrowed Bond Agreements: Repurchase agreements may be referred to as borrowed bond agreements when entered into in connection with short sales of bonds. In a borrowed bond agreement, the Fund borrows a bond from a counterparty in exchange for cash collateral. The agreement contains a commitment that the security and the cash will be returned to the counterparty and the Fund at a mutually agreed upon date. Certain agreements have no stated maturity and can be terminated by either party at any time. Earnings on cash collateral and compensation to the lender of the bond are based on agreed upon rates between the Fund and the counterparty. The value of the underlying cash collateral approximates the market value and accrued interest of the borrowed bond. To the extent that a borrowed bond transaction exceeds one business day, the value of the cash collateral in the possession of the counterparty is monitored on a daily basis to ensure the adequacy of the collateral. As the market value of the borrowed bond changes, the cash collateral is periodically increased or decreased with a frequency and in amounts prescribed in the borrowed bond agreement. The Fund may also experience delays in gaining access to the collateral.
232
Morningstar Funds Trust April 30, 2020
Notes to Financial Statements (continued)
Collateralized Bond Obligations (CBOs), CLOs, and Other CDOs: A CBO is a trust which is often backed by a pool of high risk, below investment grade fixed-income securities, such as high-yield bonds, privately issued mortgage-related securities, commercial mortgage-related securities, trust preferred securities, or emerging-market debt. A CLO is a trust typically backed by a pool of loans, which may include senior secured loans, senior unsecured loans, and subordinate corporate loans, including loans that may be below investment grade. Other CDOs are trusts backed by other types of assets. The assets backing a CBO, CLO, or CDO trust may be referred to as “the collateral.” CBOs, CLOs and other CDOs may charge management fees and administrative expenses. The cash flows from the trust are split into two or more portions, called tranches, varying in risk and yield. Senior tranches can often be rated investment grade. CBO, CLO or other CDO tranches can experience substantial losses due to defaults, deterioration of protecting tranches, market participants’ perception of credit risk, as well as aversion to these securities generally. The risks of an investment in a CBO, CLO or other CDO often depend on the collateral securities and the particular tranche in which the Fund invests. These securities are often privately offered and not registered under securities laws. In addition to the normal risks associated with fixed-income securities (e.g., interest-rate risk and credit risk), CBOs, CLOs and other CDOs carry additional risks including the possibility that distributions from collateral securities will not be adequate to make interest or other payments, the possibility that the quality of the collateral may decline in value or default, the risk that a Fund may invest in CBOs, CLOs or other CDOs that are subordinate to other tranches, as well as risks related to the complexity of the security and its structure.
Convertible Securities: Convertible securities are securities (such as debt securities or preferred stock) that may be converted into or exchanged for a specified amount of common stock of the same or different issuer within a particular period of time at a specified price or formula. Convertible securities also include corporate bonds, notes, and preferred stock. A convertible security entitles the holder to receive interest paid or accrued on debt or dividends paid on preferred stock until the convertible stock matures or is redeemed, converted or exchanged. While no investment is without some risk, investments in convertible securities generally entail less risk than an issuer’s common stock. However, any reduction in risk depends in large measure upon the degree to which the convertible security sells above its value as a fixed income security. In addition to the general risks associated with equity securities, the market value of convertible securities is also affected by prevailing interest rates, the credit quality of the issuer, and any call provisions. While convertible securities generally offer lower interest or dividend yields than nonconvertible debt securities of similar quality, they do enable the investor to benefit from increases in the market price of the underlying common stock. The premiums attributable to the conversion feature are not amortized, but they are capitalized into the cost basis.
Equity-Linked Investments: Equity-linked investments are subject to the same risks as direct investments in securities of the underlying investment. If the underlying investment decreases in value, the value of the equity-linked investment will decrease; however, the performance of such investments may not correlate exactly to the performance of the underlying investment that they seek to replicate. Equity-linked investments are also subject to counterparty risk, which is the risk that the issuer of such investment — which is different from the issuer of the underlying investment — may be unwilling or unable to fulfill its obligations. There is no guarantee that a liquid market will exist or that the counterparty or issuer of such investments will be willing to repurchase them when a Fund wishes to sell them.
233
Morningstar Funds Trust April 30, 2020
Notes to Financial Statements (continued)
Forward Commitments and Dollar Rolls: A Fund may enter into contracts to purchase mortgage securities for a fixed price at a future date beyond customary settlement time (forward commitments) if the Fund sets aside on its books liquid assets in an amount sufficient to meet the purchase price, or if the Fund enters into offsetting contracts for the forward sale of other securities it owns. In the case of to-be-announced (TBA) mortgage purchase commitments, the unit price and the estimated principal amount are established when a Fund enters into a contract, with the actual principal amount being within a specified range of the estimate. TBA mortgages shall not exceed 20% of a Fund’s net assets. For these obligations, a Fund will segregate or earmark liquid assets in an amount sufficient to cover its obligations. Forward commitments may be considered securities in themselves and involve a risk of loss if the value of the security to be purchased declines before the settlement date, which is in addition to the risk of decline in the value of a Fund’s other assets. Where such purchases are made through dealers, a Fund relies on the dealer to consummate the sale. The dealer’s failure to do so may result in the loss to a Fund of an advantageous yield or price. Although a Fund will generally enter into forward commitments with the intention of acquiring securities for its portfolio, the Fund may dispose of a commitment before settlement if a subadviser deems it appropriate to do so. A Fund may realize short-term profits or losses upon the sale of forward commitments.
A Fund may enter into TBA sale commitments to hedge its portfolio positions or to sell securities it owns under delayed delivery arrangements. Proceeds of TBA sale commitments are not received until the contractual settlement date. Unsettled TBA sale commitments are valued at current market value of the underlying securities. If the TBA sale commitment is closed through the acquisition of an offsetting purchase commitment, a Fund realizes a gain or loss on the commitment without regard to any unrealized gain or loss on the underlying security. If a Fund delivers securities under the commitment, the Fund realizes a gain or loss from the sale of the securities based upon the unit price established at the date the commitment was entered into.
A Fund may enter into mortgage dollar roll transactions (generally using TBAs) in which it sells a fixed-income security for delivery in the current month and simultaneously contracts to purchase similar securities (for example, same type, coupon and maturity) at an agreed upon future time. By engaging in a dollar roll transaction, a Fund foregoes principal and interest paid on the security that is sold but receives the difference between the current sales price and the forward price for the future purchase. A Fund would also be able to earn interest on the proceeds of the sale before they are reinvested. A Fund accounts for dollar rolls as purchases and sales. Dollar rolls may be used to create investment leverage and may increase a Fund’s risk and volatility.
The obligation to purchase securities on a specified future date involves the risk that the market value of the securities that a Fund is obligated to purchase may decline below the purchase price. In addition, in the event the other party to the transaction files for bankruptcy, becomes insolvent or defaults on its obligation, a Fund may be adversely affected.
Inflation-Protected Securities: A Fund may invest in U.S. Treasury Inflation Protected Securities (U.S. TIPS), which are fixed-income securities issued by the U.S. Department of Treasury, the principal amounts of which are adjusted daily based upon changes in the rate of inflation. A Fund may also invest in other inflation-protected securities issued by non-U.S. governments or by private issuers. U.S. TIPS pay interest on a semi-annual basis, equal to a fixed percentage of the inflation-adjusted principal amount. The interest rate on these bonds is fixed at issuance, but over the life of the bond this interest may be paid on an increasing or decreasing principal value that has been adjusted for inflation.
234
Morningstar Funds Trust April 30, 2020
Notes to Financial Statements (continued)
In general, the value of inflation-protected bonds is expected to fluctuate in response to changes in real interest rates, which are in turn tied to the relationship between nominal interest rates and the rate of inflation. Therefore, if inflation were to rise at a faster rate than nominal interest rates, real interest rates might decline, leading to an increase in value of inflation-protected bonds. In contrast, if nominal interest rates increased at a faster rate than inflation, real interest rates might rise, leading to a decrease in value of inflation-protected bonds. If inflation is lower than expected during the period a Fund holds the security, the Fund may earn less on the security than on a conventional bond. Any increase in principal value is taxable in the year the increase occurs, even though holders do not receive cash representing the increase at that time. As a result, if a Fund invests in inflation-protected securities, it could be required at times to liquidate other investments, including when it is not advantageous to do so, to satisfy its distribution requirements as a RIC and to eliminate any fund-level income tax liability under the Code.
Loan Participations, Assignments and Unfunded Commitments: Certain Funds invest in loan participations and assignments. When a Fund purchases a loan participation, the Fund enters into a contractual relationship with the lender or a third party selling such participations (“Selling Participant”), but not the borrower. In this case, the Fund assumes the credit risk of the borrower and the Selling Participant and any other persons inter-positioned between the Fund and the borrower (“Intermediate Participants”). In contrast, when one of the Funds purchases an assignment, the contractual relationship is with the borrower and the credit risk assumed by the Fund is only with the borrower. Although certain loan participations or assignments are secured by collateral, the Fund could experience delays or limitations in realizing such collateral or have its interest subordinated to other indebtedness of the obligor.
The Funds may also enter into unfunded commitments, which are contractual obligations for future funding. These unfunded commitments represent a future obligation in full, even though a percentage of the commitment may not be utilized by the borrower. These types of investments may include standby financing commitments, such as revolving credit facilities, which obligate the Fund to supply additional cash to the borrower on demand. The value of the unfunded portion of the investment is determined using a pro-rata allocation, based on its par value relative to the par value of the entire investment. The unfunded commitments are marked to market daily and any unrealized appreciation (depreciation) from unfunded commitments is reported in the Statements of Assets and Liabilities as well as the Statements of Operations. When investing in a loan participation, the Fund has the right to receive payments of principal, interest and any fees to which it is entitled only from the lender selling the loan agreement and only upon receipt of payments by the lender from the borrower. The Fund may receive a commitment fee based on the undrawn portion of the underlying line of credit portion of a loan. In certain circumstances, the Fund may receive a penalty fee upon the prepayment of a loan by a borrower. Fees earned or paid are recorded as a component of interest income or interest expense, respectively, on the Statements of Operations. In addition, loan participations and assignments are vulnerable to market conditions such that economic conditions or other events may reduce the demand for loan participations and assignments and certain loan participations and assignments which were liquid, when purchased, may become illiquid.
Mortgage Dollar Rolls: A Fund may enter into mortgage dollar rolls with a bank or a broker-dealer. A mortgage dollar roll is a transaction in which a Fund sells mortgage-related securities for immediate settlement and simultaneously purchases the same type of securities for forward settlement at a discount. While a Fund begins accruing interest on the newly purchased securities from the purchase or trade date, it is able to invest
235
Morningstar Funds Trust April 30, 2020
Notes to Financial Statements (continued)
the proceeds from the sale of its previously owned securities, which will be used to pay for the new securities. The use of mortgage dollar rolls is a speculative technique involving leverage and can have an economic effect similar to borrowing money for investment purposes.
Private Placement and Restricted Securities: A Fund may invest in securities that are purchased in private placements and, accordingly, are subject to restrictions on resale as a matter of contract or under federal securities laws. Because there may be relatively few potential purchasers for such investments, especially under adverse market or economic conditions or in the event of adverse changes in the financial condition of the issuer, a Fund could find it more difficult to sell such securities when a subadviser believes it advisable to do so or may be able to sell such securities only at prices lower than if such securities were more widely held. At times, it may also be more difficult to determine the fair value of such securities for purposes of computing a Fund’s net asset value.
While such private placements may offer attractive opportunities for investment not otherwise available on the open market, the securities so purchased are often restricted securities, i.e., securities which cannot be sold to the public without registration under the Securities Act of 1993, as amended (the “Securities Act”) or the availability of an exemption from registration (such as Rules 144 or 144A), or which are not readily marketable because they are subject to other legal or contractual delays in or restrictions on resale.
The absence of a trading market can make it difficult to ascertain a market value for illiquid investments. Disposing of illiquid investments may involve time-consuming negotiation and legal expenses, and it may be difficult or impossible for a Fund to sell them promptly at an acceptable price. A Fund may have to bear the extra expense of registering such securities for resale and the risk of substantial delay in effecting such registration. In addition, market quotations are less readily available. The judgment of a subadviser may at times play a greater role in valuing these securities than in the case of publicly traded securities.
Generally speaking, restricted securities may be sold only to qualified institutional buyers, or in a privately negotiated transaction to a limited number of purchasers, or in limited quantities after they have been held for a specified period of time and other conditions are met pursuant to an exemption from registration, or in a public offering for which a registration statement is in effect under the Securities Act. A Fund may be deemed to be an underwriter for purposes of the Securities Act when selling restricted securities to the public, and in such event the Fund may be liable to purchasers of such securities if the registration statement prepared by the issuer, or the Prospectuses forming a part of it, is materially inaccurate or misleading.
Restricted securities held by each Fund at April 30, 2020 are disclosed in the Schedules of Investments.
Securities Sold Short: Certain Funds may sell securities they do not own (a short sale) as a hedge against some of their long positions and/or in anticipation of a decline in the market value of that security. When a Fund makes a short sale, it must borrow the security sold short and deliver it to the broker through which it made the short sale. The Fund may have to pay a fee to borrow the particular security and may be obligated to remit any interest or dividends received on such borrowed securities. Dividends declared on short positions are recorded on the ex-date as an expense. A gain, limited to the price at which the Fund sold the security short, or a loss, which could be unlimited in magnitude, will be recognized upon the termination of a short sale if the market price at termination is less than or greater than, respectively, the proceeds originally received. The Fund is also
236
Morningstar Funds Trust April 30, 2020
Notes to Financial Statements (continued)
subject to the risk that it may be unable to reacquire a security to terminate a short position except at a price substantially in excess of the last quoted price. The Fund is also subject to risk of loss if the broker were to fail to perform its obligations under the contractual terms. Liabilities for securities sold short are reported at market value on the Statements of Assets and Liabilities and the change in market value is recorded as net change in unrealized appreciation (depreciation) on the Statements of Operations.
The Funds are required to pledge cash or liquid securities to the broker as collateral for securities sold short. Collateral requirements are calculated daily based on the current market value of the short positions. Daily market fluctuations and trading activity could cause the value of securities sold short to be more or less than the value of the collateral segregated. Cash deposited with the broker for collateral for securities sold short is recorded as an asset on the Statements of Assets and Liabilities and securities segregated as collateral are denoted in the Schedules of Investments. The Funds may receive or pay the net of the following amounts: (i) a portion of the income from the investment of cash collateral; (ii) the broker’s fee on the borrowed securities; and (iii) a financing charge for the difference in the market value of the short position and cash collateral deposited with the broker. This income or fee is calculated daily based upon the market value of each borrowed security and a variable rate that is dependent on the availability of the security.
When-Issued and Delayed Delivery Securities: Certain Funds may purchase or sell securities on a when-issued or delayed delivery basis. When-issued and delayed delivery securities in which the Funds may invest include U.S. Treasury Securities, municipal bonds, bank loans, and other similar instruments. The price of the underlying securities and date when the securities will be delivered and paid for are fixed at the time the transaction is negotiated. Losses may arise due to changes in the market value of the securities or from the inability of counterparties to meet the terms of the contract. In connection with such purchases, the Funds may hold liquid assets as collateral with the Funds’ custodian sufficient to cover the purchase price.
Zero Coupon and Payment In-Kind Bonds: A Fund may invest without limit in so-called zero-coupon bonds and payment-in-kind bonds. Zero-coupon bonds are issued at a significant discount from their principal amount in lieu of paying interest periodically. Payment-in-kind bonds allow the issuer, at its option, to make current interest payments on the bonds either in cash or in additional bonds. Because zero-coupon and payment-in-kind bonds do not pay current interest in cash, their value is subject to greater fluctuation in response to changes in market interest rates than bonds that pay interest currently. Both zero coupon and payment-in-kind bonds allow an issuer to avoid the need to generate cash to meet current interest payments. Accordingly, such bonds may involve greater credit risks than bonds paying interest currently in cash. A Fund is required to accrue interest income on such investments and to distribute such amounts at least annually to shareholders even though the investments do not make any current interest payments. The daily market quotations of the original bonds may include the accrued interest (referred to as a dirty price) and require a pro rata adjustment, if any, from the unrealized appreciation (depreciation) on investments to interest receivable on the Statements of Assets and Liabilities.
237
Morningstar Funds Trust April 30, 2020
Notes to Financial Statements (continued)
4. Investment Valuation and Fair Value Measurements
Investment Valuation Policies: The Net Asset Value (“NAV”) of the Funds’ shares are valued as of the close of regular trading on the New York Stock Exchange (“NYSE”) (generally 4:00 p.m. Eastern time) on each day that the NYSE is open (each a “Business Day”). The NAV per share of each Fund is computed by dividing the total current value of the assets of such Fund, less liabilities, by the total number of shares of the Fund outstanding at the time the computation is made.
Generally, investments for which market quotations are readily available will be valued at a current market price or, in the absence of a market price, at fair value as determined in good faith by the Adviser’s Pricing Committee pursuant to procedures approved by or under the direction of the Board of Trustees of Morningstar Funds Trust (“the Board”). Pursuant to those procedures, the Pricing Committee considers, among other things: (1) the last sales price on the securities exchange, if any, on which a security is primarily traded; (2) the mean between the bid and asked prices; (3) price quotations from an approved pricing service, and (4) other factors as necessary to determine a fair value under certain circumstances.
Securities primarily traded in the NASDAQ Global Market® for which market quotations are readily available shall be valued using the NASDAQ® Official Closing Price (“NOCP”). If the NOCP is not available, such securities shall be valued at the last sale price on the day of valuation, or if there has been no sale on such day, at the mean between the bid and asked prices. OTC securities which are not traded in the NASDAQ Global Market® shall be valued at the most recent trade price. Securities and assets for which market quotations are not readily available (including restricted securities which are subject to limitations as to their sale) are valued at fair value as determined in good faith under procedures approved by or under the direction of the Board.
Short-term debt obligations with remaining maturities in excess of 60 days are valued at current market prices, as discussed above. To reflect their fair value, short-term securities with 60 days or less remaining to maturity may, unless conditions indicate otherwise, utilize amortized cost to maturity based on their cost to the Fund.
The securities in a Fund, which are traded on a securities exchange are valued at the last sale price on the exchange on which such securities are traded, as of the close of business on the day the securities are being valued or, lacking any reported sales, at the mean between the last available bid and asked price. Securities that are traded on more than one exchange are valued on the exchange on which the security is principally traded.
Each Fund may invest in foreign securities, and as a result, the calculation of the Fund’s NAV may not take place contemporaneously with the determination of the prices of certain of the Fund securities used in the calculation. Occasionally, events which affect the values of such securities and such exchange rates may occur between the times at which they are determined and the close of the NYSE and will therefore not be reflected in the computation of a Fund’s NAV. If events materially affecting the value of such securities occur during such period, then these securities may be valued at their fair value as determined in good faith under procedures established by and under the supervision of the Board as described above. Portfolio securities that are traded both on an exchange and in the OTC market will be valued according to the broadest and most representative market. All assets and liabilities initially expressed in foreign currency values will be converted into U.S. dollar
238
Morningstar Funds Trust April 30, 2020
Notes to Financial Statements (continued)
values at the mean between the bid and offered quotations of the currencies against U.S. dollars as last quoted by any recognized dealer. When portfolio securities are traded, the valuation will be the last reported sale price on the day of valuation.
To address this issue, the Board has approved the daily use of independently provided quantitative models that may adjust the closing prices of certain foreign equity and fixed income securities based on information that becomes available after the foreign market closes, through the application of an adjustment factor to such securities’ closing price. Adjustment factors may be greater than, less than, or equal to 1. Thus, use of these quantitative models could cause a Fund to value a security higher, lower or equal to its closing market price, which in turn could cause the Fund’s NAV per share to differ from that which would have been calculated using closing market prices. The use of these quantitative models is also intended to decrease the opportunities for persons to engage in ‘‘time zone arbitrage,’’ i.e., trading intended to take advantage of stale closing prices in foreign markets that could affect the NAV of the Funds. Securities subjected to an adjustment factor due to the use of these quantitative models are not specifically designated as such on the Funds’ Schedule of Investments.
All other assets of a Fund are valued in such manner as the Board in good faith deems appropriate to reflect their fair value. U.S. GAAP defines fair value as the price the Funds would receive to sell an asset or pay to transfer a liability in an orderly transaction between market participants at the measurement date.
Valuation Techniques: The following inputs and techniques may be used by the Funds to evaluate how to classify each major category of assets and liabilities into the appropriate fair value hierarchy in accordance with U.S. GAAP.
Equity securities, including securities sold short, rights, exchange options, warrants, Exchange-Traded Funds (“ETFs”) and closed-end investment companies, are valued at the last quoted sales prices or official closing prices taken from the primary market, or composite in which each security trades and are therefore classified Level 1.
An equity for which no sales are reported, as in the case of a security that is traded in the over-the-counter (“OTC”) market or a less liquid listed equity, is valued at its last bid price (in the case of short sales, at the asked price) and is therefore classified Level 2.
Fixed income securities (other than certain short-term investments maturing in 60 days or less) and other investments that trade in markets that are not considered to be active, are valued based on quoted market prices, dealer quotations or alternative pricing sources supported by observable inputs and are also classified within Level 2. These include certain U.S. government and sovereign obligations, most government agency securities, investment-grade corporate bonds and less liquid listed equities. Corporate and sovereign bonds and other fixed-income instruments are valued at estimated fair value using the latest bid prices or evaluated quotes furnished by independent pricing services, as well as quotations from counterparties and other market participants. Evaluated quotes are based on a matrix system, which may consider such factors as quoted prices for identical or similar assets, yields, maturities and ratings and are not necessarily reliant on quoted prices. Short-term debt investments of sufficient credit quality maturing in 60 days or less are generally valued at amortized cost, which approximates fair value. These investments are categorized as Level 2 within the fair value hierarchy.
239
Morningstar Funds Trust April 30, 2020
Notes to Financial Statements (continued)
Investments classified within Level 3, if any, have significant unobservable inputs, as they trade infrequently or not at all. Level 3 instruments may include illiquid securities. When observable prices are not available for these securities, the Funds may use one or more valuation approaches (e.g., the market approach or the income approach), including proprietary models for which sufficient and reliable data is available. Within Level 3, the market approach generally is based on the technique of using comparable market transactions/multiples, while the use of the income approach includes the estimation of future cash flows discounted to calculate fair value. Discounts may also be applied due to the nature or durations of any restrictions on the disposition of the investment or adjusted as appropriate for credit, market and/or other risk factors.
The inputs used by the Funds in estimating the value of Level 3 investments may include the original transaction price, recent transactions in the same or similar instruments, completed or pending third-party transactions in the underlying investment or comparable issuers, subsequent rounds of financing, recapitalizations and other transactions across the capital structure, offerings in the equity or debt capital markets, changes in financial ratios or cash flows, benchmark yield curves, credit spreads, estimated default rates, underlying collateral, and other unique security features. Level 3 investments may also be adjusted to reflect illiquidity and/or non-transferability, with the amount of such discount estimated by the Adviser in the absence of market information. Assumptions used by the Funds due to the lack of observable inputs may significantly impact the fair value of the investment.
Exchange-traded derivatives, such as futures contracts, forward contracts, and exchange-traded option contracts, are typically classified within Level 1 or Level 2 of the fair value hierarchy depending on whether or not they are deemed to be actively traded. Futures and option contracts that are listed on national exchanges and are freely transferable are valued at fair value based on their last sales price on the date of determination on the exchange their constitutes the principal market or, if no sales occurred on such date, at the bid price on such exchange at the close of business on such date. Centrally cleared swaps listed or traded on a multilateral trade facility platform, such as a registered exchange, are valued on a daily basis using quotations provided by an independent pricing service.
OTC derivatives, including options on forward contracts, put and call options, and swap contracts, are valued by the Funds on a daily basis using observable inputs, such as quotations provided by an independent pricing service, the counterparty, dealers or brokers, whenever available and considered reliable.
The U.S. Dollar value of forward foreign currency exchange contracts is determined using current forward currency exchange rates supplied by an independent pricing service.
Shares of open-end investment companies, other than exchange-traded funds, are valued at their NAV.
Fair Valuation Hierarchy: Fair value is defined as the price that a Fund would receive to sell an asset or pay to transfer a liability in an orderly transaction between market participants at the measurement date. It establishes a framework and requires disclosure of a fair value hierarchy, separately for each major category of assets and liabilities that segregates fair value measurements into levels (Levels 1, 2, and 3). Categorizations of fair value measurements, and the criteria used to determine each categorization, are as follows:
| | ● | | Level 1 – quoted prices in active markets for identical assets and liabilities (e.g. equity securities and open-end investment companies) |
240
Morningstar Funds Trust April 30, 2020
Notes to Financial Statements (continued)
| | ● | | Level 2 – prices determined using other significant observable inputs including, but not limited to, quoted prices for similar assets and liabilities in markets that are not active, inputs other than quoted prices that are observable for the assets or liabilities (such as interest rates, yield curves, prepayment speeds, credit risk, etc.) or other market corroborated inputs |
| | ● | | Level 3 – prices determined using significant unobservable inputs (including the Pricing Committee’s own assumptions in determining the fair value of investments) |
Valuation levels are not necessarily an indication of the risk associated with investing in those securities. Changes in valuation techniques may result in transfers into or out of an assigned level within the disclosure hierarchy. Transfers between different levels of the fair value disclosure hierarchy are deemed to have occurred as of the end of the reporting period.
A valuation hierarchy including information regarding Level 3 securities, where applicable, is shown at the end of each Fund’s Schedule of Investments.
5. Investment Advisory and Other Agreements
The Trust has an Investment Advisory Agreement (the “Agreement”) with the Adviser, with whom certain officers and trustees of the Trust are affiliated, to furnish certain portfolio management services to the Funds.
Pursuant to the Agreement, the Funds have contractually agreed to pay the Adviser a management fee calculated on the average daily net assets for each Fund, in the annual ratios below.
| | | | |
| Fund | | Ratio | |
| |
Morningstar U.S. Equity Fund | | | 0.67% | |
Morningstar International Equity Fund | | | 0.83% | |
Morningstar Global Income Fund | | | 0.35% | |
Morningstar Total Return Bond Fund | | | 0.44% | |
Morningstar Municipal Bond Fund | | | 0.44% | |
Morningstar Defensive Bond Fund | | | 0.36% | |
Morningstar Multisector Bond Fund | | | 0.61% | |
Morningstar Unconstrained Allocation Fund | | | 0.47% | |
Morningstar Alternatives Fund | | | 0.85% | |
Pursuant to the Agreement, the Adviser is responsible for performing and overseeing portfolio management services to the Funds. In addition to selecting the overall investment strategies of the Funds, the Adviser oversees and monitors the selection and performance of the subadvisers and allocates assets among the subadvisers. The subadvisers manage each Fund’s investment portfolio pursuant to sub-advisory agreements with the Adviser. The Adviser manages the cash portion of each Fund which may include ETFs, mutual funds and money market fund investments.
The Trust and the Adviser have entered into a contractual expense limitation agreement (Base Expense Limitation Agreement) whereby the Adviser agreed to waive all or a portion of its fees or assume certain other expenses of each Fund at least through August 31, 2020, to the extent necessary to ensure that the total annual fund operating expenses (excluding taxes, interest, brokerage commissions, trading costs, acquired fund fees and expenses, litigation, dividend and interest expense related to short sales and extraordinary expenses) do
241
Morningstar Funds Trust April 30, 2020
Notes to Financial Statements (continued)
not exceed the following rates, based on each Fund’s average daily net assets. The amount the Adviser owes a Fund as of the reporting date is recorded as a Receivable from Adviser in the Statements of Assets and Liabilities. The Adviser reimburses the Funds on a monthly basis. This management fee waiver and/or expense reimbursement will not be subject to future recoupment. For the year ended April 30, 2020, the Funds’ Adviser contractually waived fees and/or reimbursed expenses for each of the Funds as follows:
| | | | |
| Fund | | Base Expense Cap | | Management Fees Waived |
Morningstar U.S. Equity Fund | | 0.85% | | $612,452 |
Morningstar International Equity Fund | | 1.00% | | 765,298 |
Morningstar Global Income Fund | | 0.89% | | — |
Morningstar Total Return Bond Fund | | 0.53% | | 1,359,720 |
Morningstar Municipal Bond Fund | | 0.59% | | 304,126 |
Morningstar Defensive Bond Fund | | 0.48% | | 315,381 |
Morningstar Multisector Bond Fund | | 0.80% | | 351,322 |
Morningstar Unconstrained Allocation Fund | | 1.00% | | — |
Morningstar Alternatives Fund | | 1.29% | | — |
The Trust and the Adviser have entered into a supplemental expense limitation agreement (Supplemental Expense Limitation Agreement) whereby the Adviser has agreed to waive all or a portion of its fees or assume certain other expenses of each Fund at least through August 31, 2020, to the extent necessary to ensure that the total annual fund operating expenses (excluding the above listed expenses other than acquired fund fees and expenses) do not exceed the following rates, based on each Fund’s average daily net assets. The amount the Adviser owes a Fund as of the reporting date is recorded as a Receivable from Adviser in the Statement of Assets and Liabilities. The Adviser reimburses the Funds on a monthly basis. This management fee waiver and/or expense reimbursement will not be subject to future recoupment. For the year ended April 30, 2020, the Funds’ Adviser waived fees and/or reimbursed expenses for each of the Funds as follows:
| | | | |
| Fund | | Supplemental Expense Cap | | Management Fees Waived |
Morningstar U.S. Equity Fund | | 0.85% | | $349,672 |
Morningstar International Equity Fund | | 1.00% | | 436,310 |
Morningstar Global Income Fund | | 0.75% | | 112,363 |
Morningstar Total Return Bond Fund | | 0.54% | | 13,741 |
Morningstar Municipal Bond Fund | | 0.59% | | 20,258 |
Morningstar Defensive Bond Fund | | 0.55% | | — |
Morningstar Multisector Bond Fund | | 0.80% | | 23,003 |
Morningstar Unconstrained Allocation Fund | | 0.93% | | 139,036 |
Morningstar Alternatives Fund | | 1.20% | | 524,984 |
As of April 30, 2020, the Trust has entered into sub-advisory agreements with the following entities by Fund:
242
Morningstar Funds Trust April 30, 2020
Notes to Financial Statements (continued)
| | |
| Fund | | Subadvisers |
| |
| Morningstar U.S. Equity Fund | | ClearBridge Investments, LLC |
| | Diamond Hill Capital Management, Inc. |
| | Levin Easterly Partners LLC |
| | Massachusetts Financial Services Company, d/b/a |
| | MFS Investment Management |
| | Wasatch Advisors, Inc. |
| | Westwood Management Corp. |
| Morningstar International Equity Fund | | Harding Loevner LP |
| | Harris Associates L.P. |
| | Lazard Asset Management LLC |
| | T. Rowe Price Associates, Inc. |
| Morningstar Global Income Fund | | Schafer Cullen Capital Management, Inc. |
| Morningstar Total Return Bond Fund | | BlackRock Financial Management, Inc. |
| | Western Asset Management Company |
| Morningstar Municipal Bond Fund | | T. Rowe Price Associates, Inc. |
| | Wells Capital Management, Inc. |
| Morningstar Defensive Bond Fund | | First Pacific Advisors, LLC |
| Morningstar Multisector Bond Fund | | Franklin Advisers, Inc. |
| | Loomis, Sayles & Company, L.P. |
| | TCW Investment Management Company LLC |
| Morningstar Unconstrained Allocation Fund | | Brandywine Global Investment Management, LLC |
| | Lazard Asset Management LLC |
| Morningstar Alternatives Fund | | SSI Investment Management, LLC |
| | | Water Island Capital, LLC |
Pursuant to the sub-advisory agreements between the subadvisers, the Adviser and the Trust, the Adviser will pay the subadvisers out of the management fees from the Funds.
The Trust has an administration agreement with The Northern Trust Company (“Northern Trust”), which provides certain accounting, clerical and bookkeeping services, Blue Sky, corporate secretarial services and assistance in the preparation and filing of tax returns and reports to shareholders and the SEC. Northern Trust also serves as custodian of each Fund’s securities and cash, transfer agent and dividend disbursing agent. Northern Trust voluntarily agreed to waive a portion of their administration and custody fees for the Funds for a period of twelve months from the commencement of operations of each Fund (through October 31, 2019). The amounts waived are captioned as “Less waiver of administration and custody fees” on the Statements of Operations.
Foreside Fund Services, LLC (the “Distributor”), a registered broker-dealer and member of the Financial Industry Regulatory Authority, Inc. (“FINRA”), serves as the principal underwriter and distributor of the Trust’s shares. Foreside Management Services, LLC (“FMS”) provides a Principal Financial Officer to the Trust. FMS has no role in determining the investment policies or which securities are to be sold or purchased by the Trust or its funds.
243
Morningstar Funds Trust April 30, 2020
Notes to Financial Statements (continued)
The Trust, on behalf of the Funds, has agreements with various financial intermediaries and “mutual fund supermarkets”, under which customers of these intermediaries may purchase and hold Fund shares. These intermediaries assess fees in consideration for providing certain account maintenance, record keeping and transactional and other shareholder services (collectively, “Sub-accounting fees”).
6. Investment Transactions
During the year ended April 30, 2020, the cost of purchases and the proceeds from sales of investments (excluding in-kind, swap contracts, forward foreign currency exchange contracts, futures contracts and short-term investments) were as follows:
| | | | | | | | | | | | | | | | | | | | | | |
| | | | | | Purchases | | | | | | Sales | | | | | | |
| Fund | | U.S. Government | | | Other | | | U.S. Government | | | Other | | | Securities Sold Short | | | Covers on Securities Sold Short |
Morningstar U.S. Equity Fund | | $ | — | | | $ | 1,033,496,911 | | | $ | — | | | $ | 457,564,639 | | | $ | — | | | $ — |
Morningstar International Equity Fund | | | — | | | | 584,858,420 | | | | — | | | | 194,969,271 | | | | — | | | — |
Morningstar Global Income Fund | | | — | | | | 190,498,032 | | | | — | | | | 122,975,699 | | | | — | | | — |
Morningstar Total Return Bond Fund | | | 157,646,115 | | | | 2,586,430,302 | | | | 250,869,770 | | | | 2,428,649,925 | | | | 560,048,019 | | | 558,764,222 |
Morningstar Municipal Bond Fund | | | — | | | | 463,043,837 | | | | — | | | | 225,530,442 | | | | — | | | — |
Morningstar Defensive Bond Fund | | | 21,234,087 | | | | 143,479,188 | | | | 23,707,648 | | | | 106,493,855 | | | | — | | | — |
Morningstar Multisector Bond Fund | | | 50,162,365 | | | | 214,301,250 | | | | 41,995,452 | | | | 164,176,251 | | | | — | | | — |
Morningstar Unconstrained Allocation Fund | | | 17,651,718 | | | | 111,377,409 | | | | 12,147,980 | | | | 32,011,951 | | | | — | | | — |
Morningstar Alternatives Fund | | | — | | | | 241,316,496 | | | | — | | | | 170,576,133 | | | | 68,867,417 | | | 54,469,702 |
| | | | | | | | | | | | | | | | | | | | | | |
7. Financial Derivative Instruments
Certain Funds may invest in derivatives as part of their principal investment strategies in an attempt to achieve their investment objective. The Funds’ derivative contracts are not accounted for as hedging instruments under U.S. GAAP. For financial reporting purposes, the Funds do not offset financial assets and financial liabilities that are subject to master netting arrangements or similar agreements on the Statements of Assets and Liabilities.
244
Morningstar Funds Trust April 30, 2020
Notes to Financial Statements (continued)
Forward Foreign Currency Exchange Contracts: A forward foreign currency exchange contract is an obligation to purchase or sell a specific non-U.S. currency in exchange for another currency, which may be U.S. dollars, at an agreed exchange rate (price) at a future date. Currency forwards are typically individually negotiated and privately traded by currency traders and their customers in the interbank market. A forward foreign currency exchange contract will tend to reduce or eliminate exposure to the currency that is sold, and increase exposure to the currency that is purchased, similar to when a Fund sells a security denominated in one currency and purchases a security denominated in another currency.
At the maturity of a forward foreign currency exchange contract, a Fund may either exchange the currencies specified at the maturity of a forward foreign currency exchange contract or, prior to maturity, the Fund may enter into a closing transaction involving the purchase or sale of an offsetting contract. Closing transactions with respect to forward foreign currency exchange contract are usually effected with the counterparty to the original forward contract. A Fund may also enter into forward foreign currency exchange contracts that do not provide for physical settlement of the two currencies but instead provide for settlement by a single cash payment calculated as the difference between the agreed upon exchange rate and the spot rate at settlement based upon an agreed upon notional amount (non-deliverable forwards).
The successful use of these transactions will usually depend on the adviser’s or a subadviser’s ability to accurately forecast currency exchange rate movements. Should exchange rates move in an unexpected manner, a Fund may not achieve the anticipated benefits of the transaction, or it may realize losses. In addition, these techniques could result in a loss if the counterparty to the transaction does not perform as promised, including because of the counterparty’s bankruptcy or insolvency. In unusual or extreme market conditions, a counterparty’s creditworthiness and ability to perform may deteriorate rapidly, and the availability of suitable replacement counterparties may become limited.
Forward foreign currency exchange contracts may limit potential gain from a positive change in the relationship between the U.S. dollar and foreign currencies. Unanticipated changes in currency prices may result in poorer overall performance for a Fund than if it had not engaged in such contracts. Moreover, there may be an imperfect correlation between a Fund’s portfolio holdings of securities denominated in a particular currency and the currencies bought or sold in the forward foreign currency exchange contract entered into by the Fund. This imperfect correlation may cause a Fund to sustain losses that will prevent the Fund from achieving a complete hedge or expose the Fund to risk of foreign exchange loss.
Forward foreign currency exchange contracts outstanding at year end, if any, are listed after each Fund’s Schedule of Investments. Any resulting unrealized gains or losses are recorded in Net change in unrealized appreciation (depreciation) on forward foreign currency exchange contracts in the Statements of Operations. Gains or losses are recorded for financial statement purposes as unrealized until settlement date. Realized gains or losses, if any, are included in Net realized gains (losses) on forward foreign currency exchange contracts in the Statements of Operations.
Futures Contracts: A Fund may enter into futures contracts. Generally, a futures contract is a standard binding agreement to buy or sell a specified quantity of an underlying reference instrument, such as a specific security, rate, currency or commodity, at a specified price at a specified later date. Each Fund may purchase or sell interest rate futures for the purpose of hedging some or all of the value of its portfolio securities against
245
Morningstar Funds Trust April 30, 2020
Notes to Financial Statements (continued)
changes in prevailing interest rates or to manage its duration or effective maturity. If the adviser or a subadviser anticipates that interest rates may rise and, concomitantly, the price of certain of its portfolio securities may fall, a Fund may sell futures contracts. If declining interest rates are anticipated, a Fund may purchase futures contracts to protect against a potential increase in the price of securities the Fund intends to purchase. Subsequently, appropriate securities may be purchased by a Fund in an orderly fashion; as securities are purchased, corresponding futures positions would be terminated by offsetting sales of contracts.
When a Fund enters into a futures contract, it must deliver to an account controlled by a futures commission merchant (FCM) an amount referred to as “initial margin” that is typically calculated as an amount equal to the volatility in market value of a contract over a fixed period. Initial margin requirements are determined by the respective exchanges on which the futures contracts are traded and the FCM. Thereafter, a “variation margin” amount may be required to be paid by the Fund or received by the Fund in accordance with margin controls set for such accounts, depending upon changes in the marked-to-market value of the futures contract. The account is marked-to-market daily and the variation margin is monitored by the Fund’s investment manager and custodian on a daily basis. When the futures contract is closed out, if the Fund has a loss equal to or greater than the margin amount, the margin amount is paid to the FCM along with any loss in excess of the margin amount. If the Fund has a loss of less than the margin amount, the excess margin is returned to the Fund. If the Fund has a gain, the full margin amount and the amount of the gain is paid to the Fund.
A Fund’s use of futures contracts is subject to the risks associated with derivative instruments generally. In addition, if the adviser’s or a subadviser’s judgment about the general direction of interest rates or markets is wrong, a Fund’s overall performance may be poorer than if no financial futures contracts had been entered into. For example, in some cases, securities called for by a financial futures contract may not have been issued at the time the contract was written. In addition, the market prices of financial futures contracts may be affected by certain factors.
There is a risk of loss by the Fund of the initial and variation margin deposits in the event of bankruptcy of the FCM with which the Fund has an open position in a futures contract. The assets of a Fund may not be fully protected in the event of the bankruptcy of the FCM or central counterparty because the Fund might be limited to recovering only a pro rata share of all available Funds and margin segregated on behalf of an FCM’s customers. If an FCM does not provide accurate reporting, a Fund is also subject to the risk that the FCM could use the Fund’s assets, which are held in an omnibus account with assets belonging to the FCM’s other customers, to satisfy its own financial obligations or the payment obligations of another customer to the central counterparty.
The risk of loss in trading financial futures can be substantial due to the low margin deposits required and the extremely high degree of leverage involved in futures pricing. Relatively small price movements in a financial futures contract could have an immediate and substantial impact, which may be favorable or unfavorable to a Fund. It is possible for a price-related loss to exceed the amount of a Fund’s margin deposit.
Each Fund will incur brokerage fees in connection with its futures transactions. In addition, while futures contracts will be purchased and sold to reduce certain risks, those transactions themselves entail certain other risks. Thus, while a Fund may benefit from the use of futures, unanticipated changes in interest rates or stock price movements may result in a poorer overall performance for the Fund than if it had not entered into any
246
Morningstar Funds Trust April 30, 2020
Notes to Financial Statements (continued)
futures contracts. Moreover, in the event of an imperfect correlation between the futures position and the portfolio position that is intended to be protected, the desired protection may not be obtained and the Fund may be exposed to risk of loss.
Although some financial futures contracts by their terms call for the actual delivery or acquisition of securities at expiration, in most cases the contractual commitment is closed out before expiration. The offsetting of a contractual obligation is accomplished by purchasing (or selling as the case may be) on a commodities or futures exchange an identical financial futures contract calling for delivery in the same month. Such a transaction, if effected through a member of an exchange, cancels the obligation to make or take delivery of the securities. A Fund will incur brokerage fees when it purchases or sells financial futures contracts, and will be required to maintain margin deposits. If a liquid secondary market does not exist when a Fund wishes to close out a financial futures contract, it will not be able to do so and will continue to be required to make daily cash payments of variation margin in the event of adverse price movements. There is no assurance that the Fund will be able to enter into closing transactions.
Futures contracts outstanding at year end, if any, are listed after each Fund’s Schedule of Investments. The Statements of Operations include any realized gains or losses on closed futures contracts in Net realized gains (losses) on futures contracts, and any unrealized gains or losses on open futures contracts in Net change in unrealized appreciation (depreciation) on futures contracts. At April 30, 2020, the Morningstar Total Return Bond Fund and Morningstar Unconstrained Allocation Fund pledged cash to cover margin requirements for open futures positions in an amount of $1,848,079 and $118,391, respectively, which is included in Due from Broker on the Statements of Assets and Liabilities.
Interest rate caps and floors: Interest rate caps and floors are entered into to gain or reduce exposure to interest rates (interest rate risk and/or other risk). Caps are agreements whereby one party agrees to make payments to the other, in return for a premium, to the extent that interest rate indexes exceed a specified rate, or “cap.” Floors are agreements whereby one party agrees to make payments to the other, in return for a premium, to the extent that interest rate indexes fall below a specified rate, or “floor.” The maximum potential amount of future payments that the Fund would be required to make under an interest rate cap would be the notional amount times the percentage increase in interest rates determined by difference between the interest rate index current value at the time the cap was entered into.
Options: A Fund may purchase and sell call and put options. An option is a contract that gives the purchaser of the option, in return for the premium paid, the right to buy an underlying reference instrument, such as a specified security, currency, index, or other instrument, from the writer of the option (in the case of a call option), or to sell a specified reference instrument to the writer of the option (in the case of a put option) at a designated price during the term of the option. The premium paid by the buyer of an option will reflect, among other things, the relationship of the exercise price to the market price and the volatility of the underlying reference instrument, the remaining term of the option, supply, demand, interest rates and/or currency exchange rates. An American style put or call option may be exercised at any time during the option period while a European style put or call option may be exercised only upon expiration or during a fixed period prior thereto. Put and call options are traded on national securities exchanges and in the OTC market.
247
Morningstar Funds Trust April 30, 2020
Notes to Financial Statements (continued)
As the buyer of a call option, a Fund has a right to buy the underlying reference instrument (e.g., a currency or security) at the exercise price at any time during the option period (for American style options). The Fund may enter into closing sale transactions with respect to call options, exercise them, or permit them to expire. Unless the price of the underlying reference instrument changes sufficiently, a call option purchased by the Fund may expire without any value to the Fund, in which case the Fund would experience a loss to the extent of the premium paid for the option plus related transaction costs.
As the buyer of a put option, a Fund has the right to sell the underlying reference instrument at the exercise price at any time during the option period (for American style options). Like a call option, the Fund may enter into closing sale transactions with respect to put options, exercise them or permit them to expire. If a put option is not terminated in a closing sale transaction when it has remaining value, and if the market price of the underlying reference instrument remains equal to or greater than the exercise price during the life of the put option, the buyer would not make any gain upon exercise of the option and would experience a loss to the extent of the premium paid for the option plus related transaction costs. In order for the purchase of a put option to be profitable, the market price of the underlying reference instrument must decline sufficiently below the exercise price to cover the premium and transaction costs.
Writing options may permit the writer to generate additional income in the form of the premium received for writing the option. The writer of an option may have no control over when the underlying reference instruments must be sold (in the case of a call option) or purchased (in the case of a put option) because the writer may be notified of exercise at any time prior to the expiration of the option (for American style options). In general, though, options are infrequently exercised prior to expiration. Whether or not an option expires unexercised, the writer retains the amount of the premium. Writing “covered” call options means that the writer owns the underlying reference instrument that is subject to the call option. Call options may also be written on reference instruments that the writer does not own.
If a call option written by a Fund expires unexercised, the Fund will realize a gain in the amount of the premium received. If the market price of the underlying reference instrument decreases, the call option will not be exercised and the Fund will be able to use the amount of the premium received to hedge against the loss in value of the underlying reference instrument. The exercise price of a call option will be chosen based upon the expected price movement of the underlying reference instrument. The exercise price of a call option may be below, equal to (at-the money), or above the current value of the underlying reference instrument at the time the option is written.
As the writer of a put option, a Fund has a risk of loss should the underlying reference instrument decline in value. If the value of the underlying reference instrument declines below the exercise price of the put option and the put option is exercised, the Fund, as the writer of the put option, will be required to buy the instrument at the exercise price, which will exceed the market value of the underlying reference instrument at that time. The Fund will incur a loss to the extent that the current market value of the underlying reference instrument is less than the exercise price of the put option. However, the loss will be offset in part by the premium received from the buyer of the put. If a put option written by the Fund expires unexercised, the Fund will realize a gain in the amount of the premium received.
248
Morningstar Funds Trust April 30, 2020
Notes to Financial Statements (continued)
Options involve certain risks, including general risks related to derivative instruments. There can be no assurance that a liquid secondary market on an exchange will exist for any particular option, or at any particular time, and the Fund may have difficulty effecting closing transactions in particular options. Therefore, the Fund would have to exercise the options it purchased in order to realize any profit, thus taking or making delivery of the underlying reference instrument when not desired. The Fund could then incur transaction costs upon the sale of the underlying reference instruments. Similarly, when the Fund cannot effect a closing transaction with respect to a put option it wrote, and the buyer exercises, the Fund would be required to take delivery and would incur transaction costs upon the sale of the underlying reference instruments purchased. If the Fund, as a covered call option writer, is unable to effect a closing purchase transaction in a secondary market, it will not be able to sell the underlying reference instrument until the option expires, it delivers the underlying instrument upon exercise, or it segregates enough liquid assets to purchase the underlying reference instrument at the marked-to-market price during the term of the option. When trading options on non-U.S. exchanges or in the OTC market, many of the protections afforded to exchange participants will not be available. For example, there may be no daily price fluctuation limits, and adverse market movements could therefore continue to an unlimited extent over an indefinite period of time.
The effectiveness of an options strategy for hedging depends on the degree to which price movements in the underlying reference instruments correlate with price movements in the relevant portion of the Fund’s portfolio that is being hedged. In addition, the Fund bears the risk that the prices of its portfolio investments will not move in the same amount as the option it has purchased or sold for hedging purposes, or that there may be a negative correlation that would result in a loss on both the investments and the option. If the investment manager is not successful in using options in managing the Fund’s investments, the Fund’s performance will be worse than if the investment manager did not employ such strategies.
Swaptions: An option on an interest-rate swap (sometimes referred to as a “swaption”) is a contract that gives the purchaser the right, but not the obligation, in return for payment of a premium, to enter into a new interest-rate swap. Options on swap agreements involve the risks associated with derivative instruments generally, as well as the additional risks associated with both options and swaps generally. A pay fixed option on an interest-rate swap gives the buyer the right to establish a position in an interest-rate swap where the buyer will pay (and the writer will receive) the fixed-rate cash flows and receive (and the writer will pay) the floating-rate cash flows. In general, most options on interest-rate swaps are “European” exercise, which means that they can only be exercised at the end of the option term.
Depending on the movement of interest rates between the time of purchase and expiration, the value of the underlying interest-rate swap and therefore also the value of the option on the interest-rate swap will change. When a Fund purchases an option on a swap agreement, it risks losing only the amount of the premium it has paid should it decide to let the option expire unexercised, plus any related transaction costs. However, if a Fund writes (sells) a swaption, the Fund is bound by the terms of the underlying swap agreement upon exercise of the option by the buyer, which may result in losses to the Fund in excess of the premium it received.
Options on swap agreements are considered to be swaps for purposes of Commodity Futures Trading Commission (CFTC) regulation. Although they are traded OTC, the CFTC may in the future designate certain options on swaps as subject to mandatory clearing.
249
Morningstar Funds Trust April 30, 2020
Notes to Financial Statements (continued)
When the Fund purchases a swaption, an amount equal to the premium paid by the Fund is recorded as an investment on the Schedules of Investments, the value of which is marked-to-market daily to reflect the current market value of the swaption purchased. If the swaption expires, the Fund realizes a loss equal to the amount of the premium paid.
Swaptions are marked-to-market daily based upon quotations from market makers. Changes in the value of the swaption are reported as unrealized gains or losses.
Interest Rate, Inflation Index and Total Return Swap Contracts: A Fund may purchase interest-rate swaps. A Fund may use interest-rate swaps to increase or decrease exposure to a particular interest rate or rates, which may result in the Fund experiencing a gain or loss depending on whether the interest rates increased or decreased during the term of the agreement. A Fund may also enter into inflation index swaps to manage exposure to inflation risk. An inflation index swap is an agreement between two parties, whereby one party makes payments based on the cumulative percentage increase in an index that serves as a measure of inflation (typically, the Consumer Price Index) and the other party makes a regular payment based on a compounded fixed rate. The value of an inflation index swap is expected to change in response to changes in the rate of inflation. If inflation increases at a faster rate than anticipated at the time the swap is entered into, the swap will increase in value. Similarly, if inflation increases at a rate slower than anticipated at the time the swap is entered into, the swap will decrease in value. A Fund may also engage in total return swaps, in which payments made by the Fund or the counterparty are based on the total return of a particular reference asset or assets (such as a fixed-income security, a combination of securities, or an index). The value of a Fund’s swap positions would increase or decrease depending on the changes in value of the underlying rates, currency values, volatility or other indexes or measures. Caps and floors have an effect similar to buying or writing options. Depending on how they are used, swap agreements may increase or decrease the overall volatility of the Fund’s investments and its share price. A Fund’s ability to engage in certain swap transactions may be limited by tax considerations.
A Fund’s ability to realize a profit from such transactions will depend on the ability of the financial institutions with which it enters into the transactions to meet their obligations to the Fund. If a counterparty’s creditworthiness declines, the value of the agreement would be likely to decline, potentially resulting in losses. If a default occurs by the other party to such transaction, a Fund will have contractual remedies pursuant to the agreements related to the transaction, which may be limited by applicable law in the case of a counterparty’s insolvency. Under certain circumstances, suitable transactions may not be available to a Fund, or the Fund may be unable to close out its position under such transactions at the same time, or at the same price, as if it had purchased comparable publicly traded securities. Swaps carry counterparty risks that cannot be fully anticipated. Also, because swap transactions typically involve a contract between the two parties, such swap investments can be extremely illiquid, as it is uncertain as to whether another counterparty would wish to take assignment of the rights under the swap contract at a price acceptable to a Fund.
For centrally cleared swaps, the Schedules of Investments include the cumulative appreciation (depreciation), while only the current day’s variation margin is reported within the Statements of Assets and Liabilities. For credit default and interest rate contracts, an up-front payment received by a Fund is recorded as a liability and an upfront payment made by a Fund is recorded as an asset on the Fund’s Statement of Assets and Liabilities. Upfront payments are amortized over the term of the contract. If there is no upfront payment or receipt, market
250
Morningstar Funds Trust April 30, 2020
Notes to Financial Statements (continued)
value will equal unrealized appreciation(depreciation). Periodic payments received (paid) by a Fund are recorded as realized gains (losses) from the expiration or closing of swap contracts on the Fund’s Statement of Assets and Liabilities.
Interest rate swaps are marked to market daily and the change is recorded as unrealized gain (loss) on swap contracts in the Statements of Operations. The Funds’ risk of loss associated with these instruments may exceed their value, as recorded in the Schedules of Investments. Non-deliverable interest rate swap contracts are settled with the counterparty in U.S. Dollars without the delivery of foreign currency. Centrally cleared interest rate swaps may have forward effective dates. The amortization of the upfront premiums (if applicable) and payments related to these swap contracts begin on the effective date of the contract. Interest rate contracts outstanding, including their respective notional amounts at period end, if any, are listed after each Fund’s Schedule of Investments.
Credit Default Swap Contracts: A Fund may purchase credit default swaps. A credit default swap is an agreement between a Fund and a counterparty that enables the Fund to buy or sell protection against a credit event related to a particular issuer. One party, acting as a protection buyer, makes periodic payments, which may be based on, among other things, a fixed or floating rate of interest, to the other party, a protection seller, in exchange for a promise by the protection seller to make a payment to the protection buyer if a negative credit event (such as a delinquent payment or default) occurs with respect to a referenced bond or group of bonds. Credit default swaps may also be structured based on the debt of a basket of issuers, rather than a single issuer, and may be customized with respect to the default event that triggers purchase or other factors, or defaults by a particular combination of issuers within the basket, may trigger a payment obligation). As a credit protection seller in a credit default swap contract, a Fund would be required to pay the par (or other agreed-upon) value of a referenced debt obligation to the counterparty following certain negative credit events as to a specified third-party debtor, such as default by a U.S. or non-U.S. corporate issuer on its debt obligations. In return for its obligation, a Fund would receive from the counterparty a periodic stream of payments, which may be based on, among other things, a fixed or floating rate of interest, over the term of the contract provided that no event of default has occurred. If no default occurs, a Fund would keep the stream of payments, and would have no payment obligations to the counterparty. A Fund may sell credit protection to earn additional income and/or to take a synthetic long position in the underlying security or basket of securities.
A Fund may enter into credit default swap contracts as protection buyer to hedge against the risk of default on the debt of a particular issuer or basket of issuers or attempt to profit from a deterioration or perceived deterioration in the creditworthiness of the particular issuer(s) (also known as buying credit protection). This would involve the risk that the investment may expire worthless and would only generate gain in the event of an actual default by the issuer(s) of the underlying obligation(s) (or, as applicable, a credit downgrade or other indication of financial instability). It would also involve the risk that the seller may fail to satisfy its payment obligations to a Fund. The purchase of credit default swaps involves costs, which will reduce a Fund’s return.
Credit default swaps involve a number of special risks. A protection seller may have to pay out amounts following a negative credit event greater than the value of the reference obligation delivered to it by its counterparty and the amount of periodic payments previously received by it from the counterparty. When a Fund acts as a seller of a credit default swap, it is exposed to, among other things, leverage risk because if an event of default occurs the seller must pay the buyer the full notional value of the reference obligation. Each party to
251
Morningstar Funds Trust April 30, 2020
Notes to Financial Statements (continued)
a credit default swap is subject to the credit risk of its counterparty (the risk that its counterparty may be unwilling or unable to perform its obligations on the swap as they come due). The value of the credit default swap to each party will change based on changes in the actual or perceived creditworthiness of the underlying issuer.
A protection buyer may lose its investment and recover nothing should an event of default not occur. A Fund may seek to realize gains on its credit default swap positions, or limit losses on its positions, by selling those positions in the secondary market. There can be no assurance that a liquid secondary market will exist at any given time for any particular credit default swap or for credit default swaps generally.
The market for credit default swaps has become more volatile in recent years as the creditworthiness of certain counterparties has been questioned and/or downgraded. The parties to a credit default swap may be required to post collateral to each other. If a Fund posts initial or periodic collateral to its counterparty, it may not be able to recover that collateral from the counterparty in accordance with the terms of the swap. In addition, if the Fund receives collateral from its counterparty, it may be delayed or prevented from realizing on the collateral in the event of the insolvency or bankruptcy of the counterparty. A Fund may exit its obligations under a credit default swap only by terminating the contract and paying applicable breakage fees, or by entering into an offsetting credit default swap position, which may cause the Fund to incur more losses.
The credit default contracts are marked to market daily and the change, if any, is recorded as an unrealized gain or loss. Changes in market value are accounted for as unrealized appreciation or depreciation until the contract is closed, at which time the gains or losses are realized. Upon the occurrence of a credit event, the difference between the par value and market value of the reference obligation, net of any proportional amount of the up-front payment, is recorded as a realized gain or loss on swap contracts in the Statements of Operations.
Each Fund’s risk of loss associated with these instruments may exceed their fair value, as recorded in the Schedules of Investments. Credit default contracts outstanding, including their respective notional amounts at year end, if any, are listed after each Fund’s Schedule of Investments.
Implied credit spreads, represented in absolute terms, utilized in determining the market value of credit default contracts on corporate issues or sovereign issues of an emerging country as of year end are disclosed in the Schedules of Investments and serve as an indicator of the current status of the payment/performance risk and represent the likelihood or risk of default for the credit derivative. The implied credit spread of a particular referenced entity reflects the cost of buying/selling protection and may include upfront payments required to be made to enter into the agreement. For credit default contracts on asset-backed securities and credit indices, the quoted market prices and resulting values serve as the indicator of the current status of the payment/performance risk. Wider credit spreads and increasing market values, in absolute terms when compared to the notional amount of the swap, represent a deterioration of the referenced entity’s credit soundness and a greater likelihood or risk of default or other credit event occurring as defined under the terms of the agreement.
Master Agreements: Certain Funds are parties to master netting arrangements with counterparties (“Master Agreements”). Master Agreements govern the terms of certain like transactions, and reduce the counterparty risk associated with relevant transactions by specifying payment netting mechanisms across multiple
252
Morningstar Funds Trust April 30, 2020
Notes to Financial Statements (continued)
transactions and providing standardization that improves legal certainty. Since different types of transactions have different mechanics and are sometimes traded by different legal entities of a particular counterparty organization, each type of transaction may be covered by a different Master Agreement, resulting in the need for multiple Master Agreements with a counterparty and its affiliates.
As the Master Agreements are specific to unique operations of different asset types, they allow the Funds to i) close out and net their total exposure to a counterparty in the event of a default with respect to all the transactions governed under a single Master Agreement with a counterparty, ii) exit transactions through means other than sale, such as through a negotiated agreement with the Funds’ counterparty, a transfer to another party, or close out of the position through execution of an offsetting transaction.
Master Repurchase Agreements govern repurchase, or reverse repurchase transactions, relating to government bonds between certain Funds and select counterparties. Master Repurchase Agreements maintain provisions for initiation, income payments, events of default, and maintenance of collateral.
Prime Broker Arrangements may be entered into to facilitate execution and/or clearing of equities, bonds, equity options or short sales of securities between certain Funds and selected counterparties. These arrangements provide financing terms for such transactions and include guidelines surrounding the rights, obligations, and other events, including, but not limited to, margin, execution, and settlement. These agreements maintain provisions for payments, maintenance of collateral, events of default, and termination. Margin and other assets delivered as collateral are typically held by the prime broker and offset any obligations due to the prime broker.
Customer Account Agreements govern cleared derivatives transactions and exchange-traded futures and options transactions. Upon entering into an exchange-traded or centrally cleared derivative contract, the Funds are required to deposit with the relevant clearing organization cash or securities, which is referred to as the initial margin. Securities deposited as initial margin are designated on the Schedules of Investments and cash deposited is recorded as Deposits with brokers for centrally cleared swaps and Deposits with brokers for futures contracts on the Statements of Assets and Liabilities. For exchange-traded futures or centrally cleared swaps, initial margin is posted, and daily changes in fair value are recorded as a payable or receivable on the Statement of Assets and Liabilities as Variation margin on centrally cleared swaps and Variation margin on futures contracts. Variation margin is determined separately for exchange-traded futures and centrally cleared swaps and cannot be netted.
International Swaps and Derivatives Association, Inc. Master Agreements and Credit Support Annexes (“ISDA Master Agreements”) govern OTC derivative transactions entered into between certain Funds and a counterparty. ISDA Master Agreements maintain provisions for general obligations, representations, netting of settlement payments, agreements to deliver supporting documents, collateral transfer and events of default or termination. Events of termination include a decline in the Fund’s net assets below a specified threshold over a certain period of time or a decline in the counterparty’s long-term and short-term credit ratings below a specified level. In each case, upon occurrence, the other party may elect to terminate early and cause settlement of all OTC contracts outstanding, including the payment of any losses and costs resulting from such early termination, as reasonably determined by the terminating party. Any decision by a party to elect early termination could be material to the financial statements and impact a Fund’s future derivative activity.
253
Morningstar Funds Trust April 30, 2020
Notes to Financial Statements (continued)
Collateral and margin requirements differ according to the terms of each type of Master Agreement. Collateral is routinely transferred if the total net exposure net of existing collateral already in place governed under the relevant Master Agreement with a counterparty in a given account exceeds a specified threshold. Collateral can be in the form of cash, debt securities issued by the U.S. government, money market funds and other securities as agreed to by the Fund and the applicable counterparty, or as permitted by the clearing house or exchange.
Collateral pledged by a Fund for OTC derivatives pursuant to a Master Agreement is segregated by the Fund’s custodian and identified as an asset in the Statements of Assets and Liabilities either as a component of Investments in non-affiliates, at value (securities) or in Due from broker (cash). Segregation of a Fund’s collateral in the custodian account helps mitigate counterparty risk.
Collateral posted for the benefit of a Fund pursuant to a Master Agreement is held by a custodian of the Fund. Amounts which can be invested or repledged, are presented in each Fund’s Schedule of Investments. Collateral received is reflected as a liability within Due to broker in the Statements of Assets and Liabilities.
The Funds use derivative instruments as part of their principal investment strategy to achieve their investment objectives. The Funds’ derivative contracts are not accounted for as hedging instruments under GAAP. The effect of such derivative instruments on the Funds’ financial position and financial performance for the year ended April 30, 2020 are as follows:
| | | | | | | | | | | | | | | | | | | | | | | | | | | | | | | | | | | | | | | | | | | | | | | | | | | | | | | | | | | | | | | | | | | | |
| | | | | | | | | | | | | | | | | | | | | | | | Assets | | | | | | Liabilities | |
| | | | |
| | | | | | | | | | |
| | | Unrealized Appreciation on Futures Contracts(1) | | | Swaps at Fair Value(2) | | | Unrealized Appreciation on Forward Currency Exchange Contracts | | | Purchased Options at Fair Market Value | | | Total | | | Unrealized Depreciation on Futures
Contracts(1) | | | Swaps at Fair Value(2) | | | Unrealized Depreciation on Forward Currency Exchange Contracts | | | Written Options at Fair Market Value | | | Total | |
| |
| | | | | | | | | | |
Morningstar International Equity Fund | | | | | | | | | | | | | | | | | | | | | | | | | | | | | | | | | | | | | | | | | |
| Foreign exchange rate risk | | | $— | | | | | | | $ | — | | | | | | | $ | 524 | | | | | | | $ | — | | | $ | 524 | | | | | | | | $— | | | | | | | $ | — | | | | | | | $ | 13,837 | | | | | | | $ | — | | | $ | 13,837 | |
| |
| | | | | | | | | | | | | | | | | |
Total | | | — | | | | | | | | — | | | | | | | | 524 | | | | | | | | — | | | | 524 | | | | | | | | — | | | | | | | | — | | | | | | | | 13,837 | | | | | | | | — | | | | 13,837 | |
Netting positions | | | — | | | | | | | | — | | | | | | | | (524 | ) | | | | | | | — | | | | (524 | ) | | | | | | | — | | | | | | | | — | | | | | | | | (524 | ) | | | | | | | — | | | | (524 | ) |
| |
| Net Fair Value of Derivative Contracts | | | $— | | | | | | | $ | — | | | | | | | $ | — | | | | | | | $ | — | | | $ | — | | | | | | | | $— | | | | | | | $ | — | | | | | | | $ | 13,313 | | | | | | | $ | — | | | $ | 13,313 | |
| |
| | | | | | | | | | |
Morningstar Total Return Bond Fund | | | | | | | | | | | | | | | | | | | | | | | | | | | | | | | | | | | | | | | | | |
Credit risk | | | $— | | | | | | | $ | 295,134 | | | | | | | $ | — | | | | | | | $ | 230 | | | $ | 295,364 | | | | | | | | $— | | | | | | | $ | 2,078 | | | | | | | $ | — | | | | | | | $ | 8,036 | | | $ | 10,114 | |
| Foreign exchange rate risk | | | — | | | | | | | | — | | | | | | | | 427,793 | | | | | | | | 82,337 | | | | 510,130 | | | | | | | | — | | | | | | | | — | | | | | | | | 167,104 | | | | | | | | 59,875 | | | | 226,979 | |
| Inflation risk | | | — | | | | | | | | 6,486 | | | | | | | | — | | | | | | | | — | | | | 6,486 | | | | | | | | — | | | | | | | | 1,080 | | | | | | | | — | | | | | | | | — | | | | 1,080 | |
254
Morningstar Funds Trust April 30, 2020
Notes to Financial Statements (continued)
| | | | | | | | | | | | | | | | | | | | | | | | | | | | | | | | | | | | | | | | | | | | | | | | | | | | | | | | | | | | | | | | | | | | |
| | | | | | | | | | | | | | | | | | | | | | | | Assets | | | | | | Liabilities | |
| | | | |
| | | | | | | | | | |
| | | Unrealized Appreciation on Futures Contracts(1) | | | Swaps at Fair Value(2) | | | Unrealized Appreciation on Forward Currency Exchange Contracts | | | Purchased Options at Fair Market Value | | | Total | | | Unrealized Depreciation on Futures
Contracts(1) | | | Swaps at Fair Value(2) | | | Unrealized Depreciation on Forward Currency Exchange Contracts | | | Written Options at Fair Market Value | | | Total | |
| |
| | | | | | | | | |
Morningstar Total Return Bond Fund (continued) | | | | | | | | | | | | | | | | | | | | | | | | | | | | | | | | | | | | | |
| Interest rate risk | | $ | 649,232 | | | | | | | $ | 769,794 | | | | | | | $ | — | | | | | | | $ | 13,954 | | | $ | 1,432,980 | | | | | | | $ | 715,311 | | | | | | | $ | 3,799,395 | | | | | | | $ | — | | | | | | | $ | 73,762 | | | $ | 4,588,468 | |
| |
Total | | | 649,232 | | | | | | | | 1,071,414 | | | | | | | | 427,793 | | | | | | | | 96,521 | | | | 2,244,960 | | | | | | | | 715,311 | | | | | | | | 3,802,553 | | | | | | | | 167,104 | | | | | | | | 141,673 | | | | 4,826,641 | |
Netting positions | | | (649,232 | ) | | | | | | | (1,071,414 | ) | | | | | | | (167,104 | ) | | | | | | | (96,521 | ) | | | (1,984,271 | ) | | | | | | | (649,232 | ) | | | | | | | (1,071,414 | ) | | | | | | | (167,104 | ) | | | | | | | (96,521 | ) | | | (1,984,271 | ) |
| |
| Net Fair Value of Derivative Contracts | | $ | — | | | | | | | $ | — | | | | | | | $ | 260,689 | | | | | | | $ | — | | | $ | 260,689 | | | | | | | $ | 66,079 | | | | | | | $ | 2,731,139 | | | | | | | $ | — | | | | | | | $ | 45,152 | | | $ | 2,842,370 | |
| |
| | | | | | | | | |
Morningstar Multisector Bond Fund | | | | | | | | | | | | | | | | | | | | | | | | | | | | | | | | | | | | | |
| Credit risk | | $ | — | | | | | | | $ | — | | | | | | | $ | — | | | | | | | $ | — | | | $ | — | | | | | | | $ | — | | | | | | | $ | 571,776 | | | | | | | $ | — | | | | | | | $ | — | | | $ | 571,776 | |
| Foreign exchange rate risk | | | — | | | | | | | | — | | | | | | | | 2,939,533 | | | | | | | | — | | | | 2,939,533 | | | | | | | | — | | | | | | | | — | | | | | | | | 1,454,585 | | | | | | | | — | | | | 1,454,585 | |
| |
Total | | | — | | | | | | | | — | | | | | | | | 2,939,533 | | | | | | | | — | | | | 2,939,533 | | | | | | | | — | | | | | | | | 571,776 | | | | | | | | 1,454,585 | | | | | | | | — | | | | 2,026,361 | |
Netting positions | | | — | | | | | | | | — | | | | | | | | (1,454,585 | ) | | | | | | | — | | | | (1,454,585 | ) | | | | | | | — | | | | | | | | — | | | | | | | | (1,454,585 | ) | | | | | | | — | | | | (1,454,585 | ) |
| |
| Net Fair Value of Derivative Contracts | | $ | — | | | | | | | $ | — | | | | | | | $ | 1,484,948 | | | | | | | $ | — | | | $ | 1,484,948 | | | | | | | $ | — | | | | | | | $ | 571,776 | | | | | | | $ | — | | | | | | | $ | — | | | $ | 571,776 | |
| |
| | | | | | | | | |
Morningstar Unconstrained Allocation Fund | | | | | | | | | | | | | | | | | | | | | | | | | | | | | | | | | | | | | |
| Foreign exchange rate risk | | $ | — | | | | | | | $ | — | | | | | | | $ | 296,766 | | | | | | | $ | — | | | $ | 296,766 | | | | | | | $ | — | | | | | | | $ | — | | | | | | | $ | 264,848 | | | | | | | $ | — | | | $ | 264,848 | |
| | | | | | | | | | | | | | | | | |
| Interest rate risk | | | 30,785 | | | | | | | | — | | | | | | | | — | | | | | | | | — | | | | 30,785 | | | | | | | | — | | | | | | | | — | | | | | | | | — | | | | | | | | — | | | | — | |
| |
Total | | | 30,785 | | | | | | | | — | | | | | | | | 296,766 | | | | | | | | — | | | | 327,551 | | | | | | | | — | | | | | | | | — | | | | | | | | 264,848 | | | | | | | | — | | | | 264,848 | |
Netting positions | | | — | | | | | | | | — | | | | | | | | (264,848 | ) | | | | | | | — | | | | (264,848 | ) | | | | | | | — | | | | | | | | — | | | | | | | | (264,848 | ) | | | | | | | — | | | | (264,848 | ) |
| |
| Net Fair Value of Derivative Contracts | | $ | 30,785 | | | | | | | $ | — | | | | | | | $ | 31,918 | | | | | | | $ | — | | | $ | 62,703 | | | | | | | $ | — | | | | | | | $ | — | | | | | | | $ | — | | | | | | | $ | — | | | $ | — | |
| |
| | | | | | | | | |
Morningstar Alternatives Fund | | | | | | | | | | | | | | | | | | | | | | | | | | | | | | | | | | | | | |
| Equity risk | | $ | — | | | | | | | $ | — | | | | | | | $ | — | | | | | | | $ | 2,400 | | | $ | 2,400 | | | | | | | $ | — | | | | | | | $ | — | | | | | | | $ | — | | | | | | | $ | 21,895 | | | $ | 21,895 | |
| Foreign exchange rate risk | | | — | | | | | | | | — | | | | | | | | 190,114 | | | | | | | | — | | | | 190,114 | | | | | | | | — | | | | | | | | — | | | | | | | | 60,014 | | | | | | | | — | | | | 60,014 | |
| |
Total | | | — | | | | | | | | — | | | | | | | | 190,114 | | | | | | | | 2,400 | | | | 192,514 | | | | | | | | — | | | | | | | | — | | | | | | | | 60,014 | | | | | | | | 21,895 | | | | 81,909 | |
Netting positions | | | — | | | | | | | | — | | | | | | | | (60,014 | ) | | | | | | | (2,400 | ) | | | (62,414 | ) | | | | | | | — | | | | | | | | — | | | | | | | | (60,014 | ) | | | | | | | (2,400 | ) | | | (62,414 | ) |
| |
| Net Fair Value of Derivative Contracts | | $ | — | | | | | | | $ | — | | | | | | | $ | 130,100 | | | | | | | $ | — | | | $ | 130,100 | | | | | | | $ | — | | | | | | | $ | — | | | | | | | $ | — | | | | | | | $ | 19,495 | | | $ | 19,495 | |
| |
| 1 | Includes cumulative appreciation/depreciation on futures contracts as reported in the Schedule of Investments’ footnotes. Only the current day’s variation margin is reported within the Statements of Assets and Liabilities. |
| 2 | Includes cumulative appreciation/depreciation on centrally-cleared swap agreements as reported in the Schedule of Investments’ footnotes. Only the current day’s variation margin is reported within the Statements of Assets and Liabilities. |
255
Morningstar Funds Trust April 30, 2020
Notes to Financial Statements (continued)
The following table indicates the effect of derivative instruments, by primary underlying risk exposure and contract type, on the Statements of Operations for the year ended April 30, 2020:
| | | | | | | | | | | | | | | | | | | | | | | | | | | | | | | | | | | | | | | | | | | | | | | | | | | | | | | | | | | | | | | | | | | | |
| | | Net Realized Gain (Loss) on Derivatives Recognized as a Result from Operations | | | | | | Net Change in Unrealized Appreciation (Depreciation) on Derivatives Recognized as a Result from Operations | |
| | | | |
| | | | | | | | | | |
| | | Futures
Contracts | | | Swaps Contracts | | | Forward Currency Exchange Contracts | | | Purchased/ Written Options | | | Total | | | Futures
Contracts | | | Swaps Contracts | | | Forward Currency Exchange Contracts | | | Purchased/
Written
Options | | | Total | |
| |
| | | | | | | | | |
Morningstar International Equity Fund | | | | | | | | | | | | | | | | | | | | | | | | | | | | | | | | | | | | | |
| Foreign exchange rate risk | | $ | — | | | | | | | $ | — | | | | | | | $ | 27,851 | | | | | | | $ | — | | | $ | 27,851 | | | | | | | $ | — | | | | | | | $ | — | | | | | | | $ | (63,673 | ) | | | | | | $ | — | | | $ | (63,673 | ) |
| |
Total | | $ | — | | �� | | | | | $ | — | | | | | | | $ | 27,851 | | | | | | | $ | — | | | $ | 27,851 | | | | | | | $ | — | | | | | | | $ | — | | | | | | | $ | (63,673 | ) | | | | | | $ | — | | | $ | (63,673 | ) |
| |
| | | | | | | | | |
Morningstar Total Return Bond Fund | | | | | | | | | | | | | | | | | | | | | | | | | | | | | | | | | | | | | |
| Credit risk | | $ | — | | | | | | | $ | (81,883 | ) | | | | | | $ | — | | | | | | | $ | — | | | $ | (81,883 | ) | | | | | | $ | — | | | | | | | $ | 152,476 | | | | | | | $ | — | | | | | | | $ | (7,526 | ) | | $ | 144,950 | |
| Foreign exchange rate risk | | | — | | | | | | | | — | | | | | | | | (94,111 | ) | | | | | | | (161,767 | ) | | | (255,878 | ) | | | | | | | — | | | | | | | | — | | | | | | | | 289,245 | | | | | | | | 12,129 | | | | 301,374 | |
| Inflation risk | | | — | | | | | | | | 49,398 | | | | | | | | — | | | | | | | | — | | | | 49,398 | | | | | | | | — | | | | | | | | 8,172 | | | | | | | | — | | | | | | | | — | | | | 8,172 | |
| Interest rate risk | | | 5,274,078 | | | | | | | | (2,646,064 | ) | | | | | | | — | | | | | | | | 1,498,577 | | | | 4,126,591 | | | | | | | | (80,268 | ) | | | | | | | (3,424,600 | ) | | | | | | | — | | | | | | | | 135,841 | | | | (3,369,027 | ) |
| |
Total | | $ | 5,274,078 | | | | | | | $ | (2,678,549 | ) | | | | | | $ | (94,111 | ) | | | | | | $ | 1,336,810 | | | $ | 3,838,228 | | | | | | | $ | (80,268 | ) | | | | | | $ | (3,263,952 | ) | | | | | | $ | 289,245 | | | | | | | $ | 140,444 | | | $ | (2,914,531 | ) |
| |
| | | | | | | | | |
Morningstar Multisector Bond Fund | | | | | | | | | | | | | | | | | | | | | | | | | | | | | | | | | | | | | |
| Credit risk | | $ | — | | | | | | | $ | (1,037,668 | ) | | | | | | $ | — | | | | | | | $ | — | | | $ | (1,037,668 | ) | | | | | | $ | — | | | | | | | $ | (3,428 | ) | | | | | | $ | — | | | | | | | $ | — | | | $ | (3,428 | ) |
| Foreign exchange rate risk | | | — | | | | | | | | — | | | | | | | | 1,879,255 | | | | | | | | (47,436 | ) | | | 1,831,819 | | | | | | | | — | | | | | | | | — | | | | | | | | 1,246,044 | | | | | | | | 6,659 | | | | 1,252,703 | |
| Interest rate risk | | | — | | | | | | | | (3,640,043 | ) | | | | | | | — | | | | | | | | — | | | | (3,640,043 | ) | | | | | | | — | | | | | | | | 244,587 | | | | | | | | — | | | | | | | | — | | | | 244,587 | |
| |
Total | | $ | — | | | | | | | $ | (4,677,711 | ) | | | | | | $ | 1,879,255 | | | | | | | $ | (47,436 | ) | | $ | (2,845,892 | ) | | | | | | $ | — | | | | | | | $ | 241,159 | | | | | | | $ | 1,246,044 | | | | | | | $ | 6,659 | | | $ | 1,493,862 | |
| |
| | | | | | | | | |
Morningstar Unconstrained Allocation Fund | | | | | | | | | | | | | | | | | | | | | | | | | | | | | | | | | | | | | |
| Foreign exchange rate risk | | $ | — | | | | | | | $ | — | | | | | | | $ | (429,817 | ) | | | | | | $ | — | | | $ | (429,817 | ) | | | | | | $ | — | | | | | | | $ | — | | | | | | | $ | 31,918 | | | | | | | $ | — | | | $ | 31,918 | |
| Interest rate risk | | | (74,280 | ) | | | | | | | — | | | | | | | | — | | | | | | | | — | | | | (74,280 | ) | | | | | | | 30,785 | | | | | | | | — | | | | | | | | — | | | | | | | | — | | | | 30,785 | |
| |
Total | | $ | (74,280 | ) | | | | | | $ | — | | | | | | | $ | (429,817 | ) | | | | | | $ | — | | | $ | (504,097 | ) | | | | | | $ | 30,785 | | | | | | | $ | — | | | | | | | $ | 31,918 | | | | | | | $ | — | | | $ | 62,703 | |
| |
| | | | | | | | | |
Morningstar Alternatives Fund | | | | | | | | | | | | | | | | | | | | | | | | | | | | | | | | | | | | | |
| Equity risk | | $ | — | | | | | | | $ | — | | | | | | | $ | — | | | | | | | $ | 312,342 | | | $ | 312,342 | | | | | | | $ | — | | | | | | | $ | — | | | | | | | $ | — | | | | | | | $ | 11,123 | | | $ | 11,123 | |
| Foreign exchange rate risk | | | — | | | | | | | | — | | | | | | | | 132,809 | | | | | | | | — | | | | 132,809 | | | | | | | | — | | | | | | | | — | | | | | | | | 106,124 | | | | | | | | — | | | | 106,124 | |
| |
Total | | $ | — | | | | | | | $ | — | | | | | | | $ | 132,809 | | | | | | | $ | 312,342 | | | $ | 445,151 | | | | | | | $ | — | | | | | | | $ | — | | | | | | | $ | 106,124 | | | | | | | $ | 11,123 | | | $ | 117,247 | |
| |
The following tables present the Funds’ gross OTC derivative assets and liabilities by counterparty and contract type net of amounts available for offset under netting arrangements and any related collateral received or posted by the Funds’ as of April 30, 2020.
Morningstar International Equity Fund
| | | | | | | | |
| Derivative Financial Instruments: | | Assets | | | Liabilities | |
Forward foreign currency exchange contracts | | | $524 | | | | $13,837 | |
Total gross amount of derivatives in the Statement of Assets and Liabilities | | | $524 | | | | $13,837 | |
Less: Derivatives not subject to MNA or similar agreements | | | — | | | | — | |
Total gross amount of derivatives subject to MNA or similar agreement | | | $524 | | | | $13,837 | |
256
Morningstar Funds Trust April 30, 2020
Notes to Financial Statements (continued)
Morningstar International Equity Fund (continued)
| | | | | | | | | | | | | | | | | | | | |
| Counterparty | | Gross
Assets | | | Offset | | | Net Amount
Before
Collateral | | | Collateral
(Received)
Pledged | | | Net Exposure | |
| |
Northern Trust | | | $524 | | | | $(524 | ) | | | $— | | | | $— | | | | $— | |
| | | | | |
| Counterparty | | Gross
Liabilities | | | Offset | | | Net Amount
Before
Collateral | | | Collateral
(Received)
Pledged | | | Net Exposure | |
| |
Northern Trust | | | $(13,837 | ) | | | $524 | | | | $(13,313 | ) | | | $— | | | | $(13,313 | ) |
| | | | | |
| Morningstar Total Return Bond Fund | | | | | | | | | | | | | | | | | | | | |
| | | | | |
| Derivative Financial Instruments: | | | | | | | | | | | Assets | | | Liabilities | |
| |
Forward foreign currency exchange contracts | | | | | | | | | | | | | | $ | 427,793 | | | $ | 167,104 | |
Futures contracts | | | | | | | | | | | | | | | 649,232 | | | | 715,311 | |
Purchased options | | | | | | | | | | | | | | | 93,383 | | | | — | |
Written options | | | | | | | | | | | | | | | — | | | | 133,266 | |
Interest rate swap contracts* | | | | | | | | | | | | | | | 769,794 | | | | 3,799,395 | |
Credit default swap contracts* | | | | | | | | | | | | | | | 295,134 | | | | 2,078 | |
Inflation swap contracts* | | | | | | | | | | | | | | | 6,486 | | | | 1,080 | |
Purchased swaptions | | | | | | | | | | | | | | | 3,138 | | | | — | |
Written swaptions | | | | | | | | | | | | | | | — | | | | 8,407 | |
| |
Total gross amount of derivatives in the Statement of Assets and Liabilities | | | $ | 2,244,960 | | | $ | 4,826,641 | |
| |
Less: Derivatives not subject to MNA or similar agreements | | | | | | | | | | | | (1,656,560 | ) | | | (4,586,729 | ) |
| |
Total gross amount of derivatives subject to MNA or similar agreement | | | $ | 588,400 | | | $ | 239,912 | |
| |
| * | The values of swap agreements are the market values listed on the Schedules of Investments. |
| | | | | | | | | | | | | | | | | | | | |
| Counterparty | | Gross
Assets | | | Offset | | | Net Amount
Before
Collateral | | | Collateral
(Received)
Pledged | | | Net Exposure | |
| |
Morgan Stanley | | $ | 186,082 | | | $ | (104,691 | ) | | | $ 81,391 | | | | $— | | | | $ 81,391 | |
Citibank | | | 177,020 | | | | (38,872 | ) | | | 138,148 | | | | — | | | | 138,148 | |
BNP | | | 38,859 | | | | (6,276 | ) | | | 32,583 | | | | — | | | | 32,583 | |
JPMorgan Chase | | | 95,148 | | | | (9,591 | ) | | | 85,557 | | | | — | | | | 85,557 | |
Deutsche Bank | | | 64,268 | | | | (54,273 | ) | | | 9,995 | | | | — | | | | 9,995 | |
UBS | | | 10,697 | | | | (6,114 | ) | | | 4,583 | | | | — | | | | 4,583 | |
HSBC | | | 6,387 | | | | (3,452 | ) | | | 2,935 | | | | — | | | | 2,935 | |
Standard Chartered Bank | | | 1,118 | | | | (893 | ) | | | 225 | | | | — | | | | 225 | |
Bank of America | | | 6,939 | | | | (6,939 | ) | | | — | | | | — | | | | — | |
Goldman Sachs | | | 441 | | | | (441 | ) | | | — | | | | — | | | | — | |
Barclays | | | 1,441 | | | | (1,441 | ) | | | — | | | | — | | | | — | |
| |
Total | | $ | 588,400 | | | $ | (232,983 | ) | | | $355,417 | | | | $— | | | | $355,417 | |
| |
257
Morningstar Funds Trust April 30, 2020
Notes to Financial Statements (continued)
Morningstar Total Return Bond Fund (continued)
| | | | | | | | | | | | | | | | | | | | |
| Counterparty | | Gross
Liabilities | | | Offset | | | Net Amount
Before
Collateral | | | Collateral
(Received)
Pledged | | | Net Exposure | |
| |
Morgan Stanley | | | $(104,691 | ) | | | $104,691 | | | | $ — | | | | $— | | | | $ — | |
Citibank | | | (38,872 | ) | | | 38,872 | | | | — | | | | — | | | | — | |
BNP | | | (6,276 | ) | | | 6,276 | | | | — | | | | — | | | | — | |
JPMorgan Chase | | | (9,591 | ) | | | 9,591 | | | | — | | | | — | | | | — | |
Deutsche Bank | | | (54,273 | ) | | | 54,273 | | | | — | | | | — | | | | — | |
UBS | | | (6,114 | ) | | | 6,114 | | | | — | | | | — | | | | — | |
HSBC | | | (3,452 | ) | | | 3,452 | | | | — | | | | — | | | | — | |
Standard Chartered Bank | | | (893 | ) | | | 893 | | | | — | | | | — | | | | — | |
Bank of America | | | (12,703 | ) | | | 6,939 | | | | (5,764 | ) | | | — | | | | (5,764 | ) |
Goldman Sachs | | | (1,214 | ) | | | 441 | | | | (773 | ) | | | — | | | | (773 | ) |
Barclays | | | (1,833 | ) | | | 1,441 | | | | (392 | ) | | | — | | | | (392 | ) |
| |
Total | | | $(239,912 | ) | | | $232,983 | | | | $(6,929 | ) | | | $— | | | | $(6,929 | ) |
| |
Morningstar Multisector Bond Fund
| | | | | | | | |
| Derivative Financial Instruments: | | Assets | | | Liabilities | |
| |
Forward foreign currency exchange contracts | | | $2,939,533 | | | | $1,454,585 | |
Credit default swap contracts* | | | — | | | | 571,776 | |
| |
Total gross amount of derivatives in the Statement of Assets and Liabilities | | | $2,939,533 | | | | $2,026,361 | |
| |
Less: Derivatives not subject to MNA or similar agreements | | | — | | | | (503,924 | ) |
| |
Total gross amount of derivatives subject to MNA or similar agreement | | | $2,939,533 | | | | $1,522,437 | |
| |
| * | The values of swap agreements are the market values listed on the Schedules of Investments. |
| | | | | | | | | | | | | | | | | | | | |
| Counterparty | | Gross
Assets | | | Offset | | | Net Amount
Before
Collateral | | | Collateral
(Received)
Pledged | | | Net Exposure | |
| |
Bank of America | | $ | 71,862 | | | $ | (71,862 | ) | | $ | — | | | $ | — | | | $ | — | |
Barclays | | | 177,569 | | | | (67,215 | ) | | | 110,354 | | | | — | | | | 110,354 | |
BNP | | | 126,809 | | | | (34,730 | ) | | | 92,079 | | | | — | | | | 92,079 | |
Citibank(a) | | | 872,202 | | | | (193,556 | ) | | | 678,646 | | | | (678,646 | ) | | | — | |
Deutsche Bank(a) | | | 152,227 | | | | (112,645 | ) | | | 39,582 | | | | (39,582 | ) | | | — | |
Goldman Sachs | | | 6,824 | | | | (2,659 | ) | | | 4,165 | | | | — | | | | 4,165 | |
HSBC(b) | | | 648,220 | | | | (337,985 | ) | | | 310,235 | | | | (202,000 | ) | | | 108,235 | |
JPMorgan Chase | | | 492,066 | | | | (492,066 | ) | | | — | | | | — | | | | — | |
Morgan Stanley(a) | | | 246,417 | | | | (4,778 | ) | | | 241,639 | | | | (241,639 | ) | | | — | |
Standard Chartered Bank(a) | | | 145,337 | | | | (3,082 | ) | | | 142,255 | | | | (142,255 | ) | | | — | |
| |
Total | | $ | 2,939,533 | | | $ | (1,320,578 | ) | | $ | 1,618,955 | | | $ | (1,304,122 | ) | | $ | 314,833 | |
| |
258
Morningstar Funds Trust April 30, 2020
Notes to Financial Statements (continued)
Morningstar Multisector Bond Fund (continued)
| | | | | | | | | | | | | | | | | | | | |
| Counterparty | | Gross
Liabilities | | | Offset | | | Net Amount
Before
Collateral | | | Collateral
(Received)
Pledged | | | Net Exposure | |
| |
Bank of America | | $ | (198,056 | ) | | $ | 71,862 | | | | $(126,194 | ) | | | $ — | | | | $(126,194 | ) |
Barclays | | | (67,215 | ) | | | 67,215 | | | | — | | | | — | | | | — | |
BNP | | | (34,730 | ) | | | 34,730 | | | | — | | | | — | | | | — | |
Citibank | | | (193,556 | ) | | | 193,556 | | | | — | | | | — | | | | — | |
Deutsche Bank | | | (112,645 | ) | | | 112,645 | | | | — | | | | — | | | | — | |
Goldman Sachs | | | (2,659 | ) | | | 2,659 | | | | — | | | | — | | | | — | |
HSBC | | | (337,985 | ) | | | 337,985 | | | | — | | | | — | | | | — | |
JPMorgan Chase(b) | | | (567,731 | ) | | | 492,066 | | | | (75,665 | ) | | | 60,000 | | | | (15,665 | ) |
Morgan Stanley | | | (4,778 | ) | | | 4,778 | | | | — | | | | — | | | | — | |
Standard Chartered Bank | | | (3,082 | ) | | | 3,082 | | | | — | | | | — | | | | — | |
| |
Total | | $ | (1,522,437 | ) | | $ | 1,320,578 | | | | $(201,859 | ) | | | $60,000 | | | | $(141,859 | ) |
| |
| (a) | Actual amount of collateral received from Citibank, Deutsche Bank, Morgan Stanley, and Standard Chartered Bank exceeded the net amount before collateral and is included in “Due to broker” in the Statements of Assets and Liabilities. |
| (b) | Actual amount of collateral received from HSBC and pledged by the Fund to JPMorgan Chase is included in “Due from broker” and “Due to broker” respectively, in the Statements of Assets and Liabilities. |
Morningstar Unconstrained Allocation Fund
| | | | | | | | |
| Derivative Financial Instruments: | | Assets | | | Liabilities | |
| |
Forward foreign currency exchange contracts | | $ | 296,766 | | | $ | 264,848 | |
Futures contracts | | | 30,785 | | | | — | |
| |
Total gross amount of derivatives in the Statement of Assets and Liabilities | | $ | 327,551 | | | $ | 264,848 | |
| |
Less: Derivatives not subject to MNA or similar agreements | | | (30,785 | ) | | | — | |
| |
Total gross amount of derivatives subject to MNA or similar agreement | | $ | 296,766 | | | $ | 264,848 | |
| |
| | | | | | | | | | | | | | | | | | | | |
| Counterparty | | Gross
Assets | | | Offset | | | Net Amount
Before
Collateral | | | Collateral
(Received)
Pledged | | | Net Exposure | |
| |
Barclays | | | $ 33,888 | | | | $ (17,552 | ) | | | $16,336 | | | | $— | | | | $16,336 | |
Citibank | | | 55,512 | | | | (55,512 | ) | | | — | | | | — | | | | — | |
HSBC | | | 120,916 | | | | (81,874 | ) | | | 39,042 | | | | — | | | | 39,042 | |
JPMorgan Chase | | | 7,028 | | | | (7,028 | ) | | | — | | | | — | | | | — | |
Morgan Stanley | | | 77,362 | | | | (50,481 | ) | | | 26,881 | | | | — | | | | 26,881 | |
National Australia Bank | | | 2,060 | | | | — | | | | 2,060 | | | | — | | | | 2,060 | |
| |
Total | | | $296,766 | | | | $(212,447 | ) | | | $84,319 | | | | $— | | | | $84,319 | |
| |
| | | | | |
| Counterparty | | Gross
Liabilities | | | Offset | | | Net Amount
Before
Collateral | | | Collateral
(Received)
Pledged | | | Net Exposure | |
| |
Barclays | | | $(17,552 | ) | | | $17,552 | | | | $— | | | | $— | | | | $— | |
259
Morningstar Funds Trust April 30, 2020
Notes to Financial Statements (continued)
Morningstar Unconstrained Allocation Fund (continued)
| | | | | | | | | | | | | | | | | | | | |
| Counterparty | | Gross
Liabilities | | | Offset | | | Net Amount
Before
Collateral | | | Collateral
(Received)
Pledged | | | Net Exposure | |
| |
Citibank | | | (93,627 | ) | | | 55,512 | | | | (38,115 | ) | | | — | | | | (38,115 | ) |
HSBC | | | (81,874 | ) | | | 81,874 | | | | — | | | | — | | | | — | |
JPMorgan Chase | | | (16,460 | ) | | | 7,028 | | | | (9,432 | ) | | | — | | | | (9,432 | ) |
Morgan Stanley | | | (50,481 | ) | | | 50,481 | | | | — | | | | — | | | | — | |
Goldman Sachs(a) | | | (2,228 | ) | | | — | | | | (2,228 | ) | | | 2,228 | | | | — | |
UBS | | | (2,626 | ) | | | — | | | | (2,626 | ) | | | — | | | | (2,626 | ) |
| |
| | | | | |
Total | | | $(264,848 | ) | | | $212,447 | | | | $(52,401 | ) | | | $2,228 | | | | $(50,173 | ) |
| |
| (a) | Actual amount of collateral pledged by the Fund to Goldman Sachs exceeded the net amount before collateral and is included in “Due from broker” in the Statements of Assets and Liabilities. |
Morningstar Alternatives Fund
| | | | | | | | |
| Derivative Financial Instruments: | | Assets | | | Liabilities | |
| |
Forward foreign currency exchange contracts | | | $190,114 | | | | $60,014 | |
Purchased options | | | 2,400 | | | | — | |
Written options | | | — | | | | 21,895 | |
| |
Total gross amount of derivatives in the Statement of Assets and Liabilities | | | $192,514 | | | | $81,909 | |
| |
Less: Derivatives not subject to MNA or similar agreements | | | (2,400 | ) | | | (21,895 | ) |
| |
Total gross amount of derivatives subject to MNA or similar agreement | | | $190,114 | | | | $60,014 | |
| |
| | | | | | | | | | | | | | | | | | | | |
| Counterparty | | Gross
Assets | | | Offset | | | Net Amount
Before
Collateral | | | Collateral
(Received)
Pledged | | | Net Exposure | |
| |
Morgan Stanley | | | $190,114 | | | | $(60,014 | ) | | | $130,100 | | | | $— | | | | $130,100 | |
| | | | | |
| Counterparty | | Gross
Liabilities | | | Offset | | | Net Amount
Before
Collateral | | | Collateral
(Received)
Pledged | | | Net Exposure | |
| |
Morgan Stanley | | | $(60,014 | ) | | | $60,014 | | | | $— | | | | $— | | | | $— | |
For the year ended April 30, 2020, the quarterly average notional values were as follows and are representative of the trading volume of the derivatives held by the Funds.
| | | | | | | | | | | | | | | | | | | | |
| | | Morningstar
International
Equity Fund | | | Morningstar
Total Return
Bond Fund | | | Morningstar
Multisector
Bond Fund | | | Morningstar
Unconstrained
Allocation Fund | | | Morningstar
Alternatives
Fund | |
| |
| | | | | |
Futures Contracts: | | | | | | | | | | | | | | | | | | | | |
Average Notional Balance - Long | | | $— | | | | $181,677,260 | | | | $— | | | | $ 803,165 | | | | $— | |
| | | | | |
Average Notional Balance - Short | | | — | | | | 109,834,181 | | | | — | | | | 757,444 | | | | — | |
Ending Notional Balance - Long | | | — | | | | 153,360,425 | | | | — | | | | 1,974,503 | | | | — | |
260
Morningstar Funds Trust April 30, 2020
Notes to Financial Statements (continued)
| | | | | | | | | | | | | | | | | | | | |
| | | Morningstar
International
Equity Fund | | | Morningstar
Total Return
Bond Fund | | | Morningstar
Multisector
Bond Fund | | | Morningstar
Unconstrained
Allocation Fund | | | Morningstar
Alternatives
Fund | |
| |
Futures Contracts: (continued) | | | | | | | | | | | | | |
Ending Notional Balance - Short | | $ | — | | | $ | 153,727,170 | | | $ | — | | | $ | — | | | $ | — | |
Forward Foreign Currency Exchange Contracts: | | | | | | | | | |
Average Settlement Value - Purchased | | | 1,549,856 | | | | 14,688,812 | | | | 52,875,284 | | | | 2,297,367 | | | | 6,965,786 | |
Average Settlement Value - Sold | | | 13,874 | | | | 5,553,046 | | | | 30,670,029 | | | | 7,308,586 | | | | 2,516,960 | |
Ending Settlement Value - Purchased | | | 1,610,813 | | | | 6,369,625 | | | | 56,078,153 | | | | 4,835,946 | | | | 7,005,739 | |
Ending Settlement Value - Sold | | | 55,498 | | | | 3,899,031 | | | | 36,525,002 | | | | 10,122,124 | | | | 2,087,113 | |
Inflation Swaps: | | | | | | | | | | | | | | | | | | | | |
Average Notional Balance - Pays Fixed Rate | | | — | | | | 1,187,500 | | | | — | | | | — | | | | — | |
Average Notional Balance - Receives Fixed Rate | | | — | | | | 816,250 | | | | — | | | | — | | | | — | |
Ending Notional Balance - Pays Fixed Rate | | | — | | | | 3,770,000 | | | | — | | | | — | | | | — | |
Interest Rate Swaps: | | | | | | | | | | | | | | | | | | | | |
Average Notional Balance - Pays Fixed Rate | | | — | | | | 237,303,267 | | | | 10,206,667 | | | | — | | | | — | |
Average Notional Balance - Receives Fixed Rate | | | — | | | | 94,010,471 | | | | — | | | | — | | | | — | |
Ending Notional Balance - Pays Fixed Rate | | | — | | | | 288,902,995 | | | | — | | | | — | | | | — | |
Credit Default Swaps: | | | | | | | | | | | | | | | | | | | | |
Average Notional Balance - Buy Protection | | | — | | | | 6,955,880 | | | | 8,167 | | | | — | | | | — | |
Average Notional Balance - Sell Protection | | | — | | | | 32,589,375 | | | | 5,093,247 | | | | — | | | | — | |
Ending Notional Balance - Buy Protection | | | — | | | | 862,661 | | | | — | | | | — | | | | — | |
Ending Notional Balance - Sell Protection | | | — | | | | 29,410,000 | | | | 11,438,890 | | | | — | | | | — | |
Options: | | | | | | | | | | | | | | | | | | | | |
Average Notional Balance - Purchased | | | — | | | | 62,281,752 | | | | 523,543 | | | | — | | | | 1,042,134 | |
Average Notional Balance - Written | | | — | | | | 93,300,521 | | | | — | | | | — | | | | 1,120,586 | |
Ending Notional Balance - Purchased | | | — | | | | 37,257,788 | | | | — | | | | — | | | | 23,288 | |
Ending Notional Balance - Written | | | — | | | | 48,801,231 | | | | — | | | | — | | | | 185,681 | |
Swaptions: | | | | | | | | | | | | | | | | | | | | |
Average Notional Balance - Purchased | | | — | | | | 4,118,500 | | | | — | | | | — | | | | — | |
261
Morningstar Funds Trust April 30, 2020
Notes to Financial Statements (continued)
| | | | | | | | | | | | | | | | | | | | |
| | | Morningstar
International
Equity Fund | | | Morningstar
Total Return
Bond Fund | | | Morningstar
Multisector
Bond Fund | | | Morningstar
Unconstrained
Allocation Fund | | | Morningstar
Alternatives Fund | |
| |
Swaptions (continued): | | | | | | | | | | | | | | | | | | | | |
Average Notional Balance - Written | | | $— | | | | $11,769,000 | | | | $— | | | | $— | | | | $— | |
Ending Notional Balance - Purchased | | | — | | | | 5,500,000 | | | | — | | | | — | | | | — | |
Ending Notional Balance - Written | | | — | | | | 27,650,000 | | | | — | | | | — | | | | — | |
| | | | |
8. Federal Income Tax Matters
As of April 30, 2020, the cost and aggregate gross unrealized appreciation (depreciation) of long security positions, short security positions and derivative instruments for federal income tax purposes were as follows:
| | | | | | | | | | | | | | | | |
| Fund | | Cost of
Investments | | | Gross
Unrealized
Appreciation | | | Gross
Unrealized
Depreciation | | | Net Unrealized
Appreciation
(Depreciation) | |
| |
| | | | |
Morningstar U.S. Equity Fund | | | $1,214,648,773 | | | | $79,217,790 | | | | $(100,395,555 | ) | | | $(21,177,765 | ) |
Morningstar International Equity Fund | | | 852,043,773 | | | | 18,302,933 | | | | (109,762,867 | ) | | | (91,459,934 | ) |
Morningstar Global Income Fund | | | 249,768,030 | | | | 8,032,125 | | | | (21,030,841 | ) | | | (12,998,716 | ) |
Morningstar Total Return Bond Fund | | | 562,992,798 | | | | 19,164,962 | | | | (12,691,375 | ) | | | 6,473,587 | |
Morningstar Municipal Bond Fund | | | 351,000,987 | | | | 1,215,041 | | | | (9,189,860 | ) | | | (7,974,819 | ) |
Morningstar Defensive Bond Fund | | | 183,502,980 | | | | 2,715,579 | | | | (1,975,739 | ) | | | 739,840 | |
Morningstar Multisector Bond Fund | | | 203,834,609 | | | | 2,014,861 | | | | (19,395,603 | ) | | | (17,380,742 | ) |
Morningstar Unconstrained Allocation Fund | | | 138,481,989 | | | | 3,114,954 | | | | (3,329,692 | ) | | | (214,738 | ) |
Morningstar Alternatives Fund | | | 153,028,209 | | | | 5,572,223 | | | | (11,011,185 | ) | | | (5,438,962 | ) |
The differences between book basis and tax basis appreciation (depreciation) on investments is primarily attributable to wash sale loss deferrals, mark to market on credit default swaps, futures contracts, foreign exchange contracts and passive foreign investment companies (“PFICs”), straddle loss deferrals, investment in interest only (“IO”) securities and contingent payment debt instruments (“CPDIs”), and timing of income recognition from Real Estate Investment Trusts (“REITs”).
As of April 30, 2020, the components of distributable earnings (loss) (excluding paid in capital) on a tax basis were as follows:
| | | | | | | | | | | | | | | | | | | | | | | | |
| Fund | | Currenct
Distributable
Tax-Exempt
Income | | | Current
Distributable
Ordinary
Income | | | Current
Distributable
Long-Term
Capital Gain
or Tax Basis
Capital Loss
Carryforwards | | | Net Unrealized
Appreciation
(Depreciation) | | | Accumulated
Capital and
Other Losses | | | Total
Accumulated
Earnings | |
| |
Morningstar U.S. Equity Fund | | | $— | | | | $3,730,855 | | | | $ — | | | | $(21,176,420 | ) | | | $(16,468,490 | ) | | | $(33,914,055 | ) |
Morningstar International Equity Fund | | | — | | | | 1,555,832 | | | | 6,576,850 | | | | (91,451,186 | ) | | | — | | | | (83,318,504 | ) |
262
Morningstar Funds Trust April 30, 2020
Notes to Financial Statements (continued)
| | | | | | | | | | | | | | | | | | | | | | | | |
| Fund | | Currenct Distributable Tax-Exempt Income | | | Current Distributable Ordinary Income | | | Current Distributable Long-Term Capital Gain or Tax Basis Capital Loss Carryforwards | | | Net Unrealized Appreciation (Depreciation) | | | Accumulated Capital and Other Losses | | | Total Accumulated Earnings | |
Morningstar Global Income Fund | | $ | — | | | $ | 225,849 | | | $ | — | | | | (13,009,933 | ) | | $ | (740 | ) | | | (12,784,824 | ) |
Morningstar Total Return Bond Fund | | | — | | | | 9,974,630 | | | | 4,270,224 | | | | 6,472,493 | | | | (4,327 | ) | | | 20,713,020 | |
Morningstar Municipal Bond Fund | | | 81,113 | | | | — | | | | — | | | | (7,974,819 | ) | | | (964,022 | ) | | | (8,857,728 | ) |
Morningstar Defensive Bond Fund | | | — | | | | 675,650 | | | | 298,566 | | | | 739,840 | | | | (1,444 | ) | | | 1,712,612 | |
Morningstar Multisector Bond Fund | | | — | | | | 989,103 | | | | — | | | | (17,450,788 | ) | | | (5,437,917 | ) | | | (21,899,602 | ) |
Morningstar Unconstrained Allocation Fund | | | — | | | | 2,019,128 | | | | 33,566 | | | | (221,810 | ) | | | — | | | | 1,830,884 | |
Morningstar Alternatives Fund | | | — | | | | 4,325,758 | | | | — | | | | (5,440,609 | ) | | | (165,414 | ) | | | (1,280,265 | ) |
Income dividends and capital gains distributions are determined in accordance with federal income tax regulations. Such amounts may differ from income and capital gains recorded in accordance with U.S. GAAP. Accordingly, the Funds may periodically make reclassifications among certain of their capital accounts to reflect differences between financial reporting and federal income tax basis distributions. These reclassifications are reported in order to reflect the tax treatment for certain permanent differences that exist between income tax regulations and U.S. GAAP. These reclassifications have no impact on the total net assets or the net asset values per share of the Funds. At April 30, 2020, the following reclassification was recorded:
| | | | | | | | | | | | |
| Fund | | | | | Accumulated Distributable Earnings (Losses) | | | Paid-in Capital | |
| |
Morningstar Total Return Bond Fund | | | | | | | $ 1,852 | | | | $ (1,852 | ) |
Morningstar Multisector Bond Fund | | | | | | | 394 | | | | (394 | ) |
Morningstar Alternatives Fund | | | | | | | 16,869 | | | | (16,869 | ) |
| | | | | | | | |
The tax character of distributions paid during the fiscal year-ended April 30, 2020 were as follows:
| | | | | | | | | | | | | | | | |
| | | Fiscal Year Ended April 30, 2020 | |
| | | | |
| Fund | | Tax-Exempt Income | | | Ordinary Income | | | Capital Gains | | | Total Distributions Paid | |
Morningstar U.S. Equity Fund | | | $ — | | | | $18,559,105 | | | | $ 75,419 | | | | $18,634,524 | |
Morningstar International Equity Fund | | | — | | | | 17,320,965 | | | | 58 | | | | 17,321,023 | |
Morningstar Global Income Fund | | | — | | | | 9,337,742 | | | | 13,989 | | | | 9,351,731 | |
Morningstar Total Return Bond Fund | | | — | | | | 25,566,475 | | | | 417,832 | | | | 25,984,307 | |
Morningstar Municipal Bond Fund | | | 3,722,036 | | | | 677,440 | | | | 17 | | | | 4,399,493 | |
Morningstar Defensive Bond Fund | | | — | | | | 4,722,041 | | | | 38 | | | | 4,722,079 | |
263
Morningstar Funds Trust April 30, 2020
Notes to Financial Statements (continued)
| | | | | | | | | | | | | | | | |
| | | Fiscal Year Ended April 30, 2020 | |
| | | | |
| | | | |
| Fund | | Tax-Exempt Income | | | Ordinary Income | | | Capital Gains | | | Total Distributions Paid | |
| |
Morningstar Multisector Bond Fund | | | $— | | | | $10,125,655 | | | | $ 77 | | | | $10,125,732 | |
Morningstar Unconstrained Allocation Fund | | | — | | | | 2,836,649 | | | | — | | | | 2,836,649 | |
Morningstar Alternatives Fund | | | — | | | | 3,235,052 | | | | 7,401 | | | | 3,242,453 | |
The tax character of distributions paid during the fiscal period-ended April 30, 2019 were as follows:
| | | | | | | | | | | | |
| | | Fiscal Period Ended April 30, 2019 | |
| | | |
| Fund | | Tax Exempt Income | | | Ordinary Income | | | Total Distributions Paid | |
Morningstar U.S. Equity Fund | | | $ — | | | | $ 422,538 | | | | $ 422,538 | |
Morningstar International Equity Fund | | | — | | | | 550,924 | | | | 550,924 | |
Morningstar Global Income Fund | | | — | | | | 959,797 | | | | 959,797 | |
Morningstar Total Return Bond Fund | | | — | | | | 2,817,061 | | | | 2,817,061 | |
Morningstar Municipal Bond Fund | | | 743,422 | | | | 44,375 | | | | 787,797 | |
Morningstar Defensive Bond Fund | | | — | | | | 665,904 | | | | 665,904 | |
Morningstar Multisector Bond Fund | | | — | | | | 2,273,735 | | | | 2,273,735 | |
Morningstar Unconstrained Allocation Fund | | | — | | | | 257,198 | | | | 257,198 | |
Morningstar Alternatives Fund | | | — | | | | 86,515 | | | | 86,515 | |
Under the Regulated Investment Company Modernization Act of 2010, Funds are permitted to carry forward capital losses incurred in taxable years beginning after December 22, 2010 for an unlimited period. Capital loss carry forwards with no expiration will retain their character as either short-term or long-term capital losses.
At April 30, 2020, the Funds had no capital loss carryforwards to offset future capital gains.
For the period subsequent to October 31, 2019, through the fiscal year ended April 30, 2020, the following Funds incurred net capital losses and/or late year ordinary losses for which each Fund intends to treat as having been incurred in the following fiscal year:
| | | | |
| Fund | | | |
Morningstar U.S. Equity Fund | | | $16,468,490 | |
Morningstar Municipal Bond Fund | | | 963,948 | �� |
Morningstar Multisector Bond Fund | | | 5,437,917 | |
Morningstar Alternatives Fund | | | 165,414 | |
264
Morningstar Funds Trust April 30, 2020
Notes to Financial Statements (continued)
9. Principal Risks and Concentrations
Multimanager and Subadviser Selection Risk: To a significant extent, the Funds’ performance depends on Morningstar’s skill in selecting subadvisers and each subadviser’s skill in selecting securities and executing its strategy. Subadviser strategies may occasionally be out of favor and subadvisers may underperform relative to their peers or benchmarks.
Foreign Securities Risk: Securities of non-U.S. issuers may be less liquid, more volatile, and harder to value than U.S. securities. They may also be subject to political, economic and regulatory risks, and market instability.
Emerging-Markets Risk: Emerging-market countries may have relatively unstable governments and economies based on only a few industries, which can cause greater instability. These countries are also more likely to experience higher levels of inflation, deflation, or currency devaluations, which could hurt their economies and securities markets.
Geographic Concentration Risk: To the extent that a Fund invests a significant portion of its assets in a particular country, region or continent, economic, political, social and environmental conditions in such country, region or continent will have a greater effect on the Fund’s performance than they would in a more geographically diversified equity fund.
Currency Risk: Because some of the Funds invest in foreign securities, changes in currency exchange rates could hurt performance. Morningstar or a subadviser may decide not to hedge, or may not be successful in hedging, its currency exposure.
Interest-Rate Risk: The value of fixed-income securities will typically decline when interest rates rise.
Credit Risk: Issuers of fixed-income securities could default or be downgraded if they fail to make required payments of principal or interest.
Derivatives Risk: A derivative is an instrument with a value based on the performance of an underlying currency, security, index, or other reference asset. Derivatives involve risks different from, or possibly greater than, the risks of investing in more traditional investments. Derivatives involve costs, may create leverage, and may be illiquid, volatile, or difficult to value. In addition, derivatives could cause losses if the counterparty to the transaction does not perform as promised. The investment results achieved by using derivatives may not match or fully offset changes in the value of the underlying currency, security, index, or other reference asset that a Fund was attempting to hedge or the investment opportunity it was trying to pursue.
Market Risk: The value of stocks and other securities can be highly volatile and prices may fluctuate widely, which means you should expect a wide range of returns and could lose money, even over a long time period. Various economic, industry, regulatory, political or other factors (such as natural disasters, epidemics and pandemics, terrorism, conflicts or social unrest) may disrupt U.S. and world economies and can dramatically affect markets generally, certain industry sectors, and/or individual companies.
265
Morningstar Funds Trust April 30, 2020
Notes to Financial Statements (continued)
10. Principal Ownership
As of April 30, 2020, the Funds had omnibus accounts owning more than 5% of the total shares outstanding of each Fund as follows:
| | | | | | | | |
| Fund | | Number of Shareholders | | | % Ownership1 | |
Morningstar U.S. Equity Fund | | | 4 | | | | 94% | |
Morningstar International Equity Fund | | | 4 | | | | 94% | |
Morningstar Global Income Fund | | | 4 | | | | 94% | |
Morningstar Total Return Bond Fund | | | 5 | | | | 97% | |
Morningstar Municipal Bond Fund | | | 5 | | | | 99% | |
Morningstar Defensive Bond Fund | | | 5 | | | | 96% | |
Morningstar Multisector Bond Fund | | | 4 | | | | 93% | |
Morningstar Unconstrained Allocation Fund | | | 5 | | | | 98% | |
Morningstar Alternatives Fund | | | 3 | | | | 90% | |
1Includes omnibus positions of broker-dealers representing numerous shareholder accounts.
Investment activities of these shareholders may have a material effect on the Funds.
11. Line of Credit
The Funds have a $50 million line of credit agreement with Northern Trust. Borrowings are made solely to facilitate the handling of redemptions or unusual or unanticipated short-term cash requirements. Because several Funds participate and collateral requirements apply, there is no assurance that an individual Fund will have access to the entire $50 million at any particular time. Interest is charged to each Fund based on its borrowings at an amount above the Federal Funds rate. In addition, an administration fee of $10,000 is payable annually and allocated among the Funds based on net assets.
During the year ended April 30, 2020, Morningstar Municipal Bond Fund had an outstanding balance for 2 days with a maximum balance of $1,200,000 at an average weighted interest rate of 3.63%.
12. New Accounting Pronouncements and Regulations
Certain of the Funds’ investments, payment obligations and financing terms may be based on floating rates, such as London Interbank Offered Rate (“LIBOR”), Euro Interbank Offered Rate and other similar types of reference rates (each, a “Reference Rate”). On July 27, 2017, the Chief Executive of the UK Financial Conduct Authority (FCA), which regulates LIBOR, announced that the FCA will no longer persuade nor compel banks to submit rates for the calculation of LIBOR and certain other Reference Rates after 2021. Such announcement indicates that the continuation of LIBOR and other Reference Rates on the current basis cannot and will not be guaranteed after 2021. The transition away from Reference Rates may lead to increased volatility and illiquidity in markets that are tied to such Reference Rates and reduced values of Reference Rate-related instruments.
13. Subsequent Events
Management has evaluated subsequent events for the Funds through the date this report was issued and has concluded that no subsequent events occurred which required recognition or disclosure.
266
Morningstar Funds Trust April 30, 2020
Report of Independent Registered Public Accounting Firm
To the Shareholders and the Board of Trustees of Morningstar Funds Trust
Opinion on the Financial Statements
We have audited the accompanying statements of assets and liabilities of Morningstar Funds Trust (comprising the Morningstar U.S. Equity Fund, Morningstar International Equity Fund, Morningstar Global Income Fund, Morningstar Total Return Bond Fund, Morningstar Municipal Bond Fund, Morningstar Defensive Bond Fund, Morningstar Multisector Bond Fund, Morningstar Unconstrained Allocation Fund, and Morningstar Alternatives Fund (collectively referred to as the “Funds”)), including the schedules of investments, as of April 30, 2020, and the related statements of operations for the year then ended and the statements of changes in net assets and the financial highlights for the year then ended and for the period from November 2, 2018 (commencement of operations) through April 30, 2019 and the related notes (collectively referred to as the “financial statements”). In our opinion, the financial statements present fairly, in all material respects, the financial position of each of the Funds comprising Morningstar Funds Trust at April 30, 2020 and the results of their operations for the year then ended and the changes in their net assets and their financial highlights for the year then ended and for the period from November 2, 2018 (commencement of operations) through April 30, 2019, in conformity with U.S. generally accepted accounting principles.
Basis for Opinion
These financial statements are the responsibility of the Trust’s management. Our responsibility is to express an opinion on each of the Funds’ financial statements based on our audits. We are a public accounting firm registered with the Public Company Accounting Oversight Board (United States) (“PCAOB”) and are required to be independent with respect to the Trust in accordance with the U.S. federal securities laws and the applicable rules and regulations of the Securities and Exchange Commission and the PCAOB.
We conducted our audits in accordance with the standards of the PCAOB. Those standards require that we plan and perform the audit to obtain reasonable assurance about whether the financial statements are free of material misstatement, whether due to error or fraud. The Trust is not required to have, nor were we engaged to perform, an audit of the Trust’s internal control over financial reporting. As part of our audits we are required to obtain an understanding of internal control over financial reporting but not for the purpose of expressing an opinion on the effectiveness of the Trust’s internal control over financial reporting. Accordingly, we express no such opinion.
Our audits included performing procedures to assess the risks of material misstatement of the financial statements, whether due to error or fraud, and performing procedures that respond to those risks. Such procedures included examining, on a test basis, evidence regarding the amounts and disclosures in the financial statements. Our procedures included confirmation of securities owned as of April 30, 2020, by correspondence with the custodian, brokers, or agent banks or by other appropriate auditing procedures where replies from brokers or agent banks were not received. Our audits also included evaluating the accounting principles used and significant estimates made by management, as well as evaluating the overall presentation of the financial statements. We believe that our audits provide a reasonable basis for our opinion.
ERNST & YOUNG LLP
We have served as the Trust’s auditor since 2018.
Chicago, Illinois
June 29, 2020
267
Morningstar Funds Trust April 30, 2020
Fund Expenses (unaudited)
As a shareholder of Morningstar Funds Trust, you incur ongoing costs, including management fees, administration, custody, sub-accounting, trustees and other fund expenses. The following examples are intended to help you understand your ongoing costs (in dollars and cents) of investing in a Fund and to compare these costs with the ongoing costs of investing in other mutual funds.
The examples are based on an investment of $1,000 invested at the beginning of a six month period and held for the entire period, November 1, 2019 through April 30, 2020.
Actual Expenses
The three columns for each Fund in the table under the “Actual” heading provide information about actual account values and actual expenses. You may use the information in these columns, together with the amount you invested, to estimate the expenses that you paid over the period. Simply divide your account value by $1,000 (for example, an $8,600 account value divided by $1,000 = 8.6), then multiply the result by the number in the second column for your Fund under the heading entitled “Expenses Paid During Period” to estimate the expenses you paid on your account during this period.
Hypothetical Example for Comparison Purposes
The last three columns for each Fund in the table under the “Hypothetical (5% return)” heading provides information about hypothetical account values and hypothetical expenses based on the Fund’s actual expense ratio and an assumed rate of return of 5% per year before expenses, which is not the Fund’s actual return. The hypothetical account values and expenses may not be used to estimate the actual ending account balance or expenses you paid for the period. You may use this information to compare the ongoing costs of investing in your Fund and other funds. To do so, compare this 5% hypothetical example with the 5% hypothetical examples that appear in the shareholder reports of the other funds. Please note that the expenses shown in the table are meant to highlight your ongoing costs only. Therefore, the last three columns for each Fund in the table is useful in comparing ongoing costs only and will not help you determine the relative total costs of owning different funds.
| | | | | | | | | | | | | | | | | | | | | | | | | | |
| | | | | Actual | | | Hypothetical (5% return) | |
| | | | | | | |
| | | Annualized
Expense
Ratio | | Beginning Account Value | | | Ending Account Value | | | Expenses Paid During Period | | | Beginning Account Value | | | Ending Account Value | | | Expenses Paid During Period | |
Morningstar U.S. Equity Fund | | 0.80% | | | $1,000.00 | | | | $ 890.80 | | | | $3.76 | | | | $1,000.00 | | | | $1,020.89 | | | | $4.02 | |
Morningstar International Equity Fund | | 0.92 | | | 1,000.00 | | | | 825.10 | | | | 4.17 | | | | 1,000.00 | | | | 1,020.29 | | | | 4.62 | |
Morningstar Global Income Fund | | 0.58 | | | 1,000.00 | | | | 895.00 | | | | 2.73 | | | | 1,000.00 | | | | 1,021.98 | | | | 2.92 | |
Morningstar Total Return Bond Fund | | 0.53 | | | 1,000.00 | | | | 1,034.90 | | | | 2.68 | | | | 1,000.00 | | | | 1,022.23 | | | | 2.66 | |
Morningstar Municipal Bond Fund | | 0.57 | | | 1,000.00 | | | | 970.70 | | | | 2.79 | | | | 1,000.00 | | | | 1,022.03 | | | | 2.87 | |
268
Morningstar Funds Trust April 30, 2020
Fund Expenses (unaudited) (continued)
| | | | | | | | | | | | | | | | | | | | | | | | | | |
| | | | | Actual | | | Hypothetical (5% return) | |
| | | | | | | |
| | | Annualized Expense Ratio | | Beginning Account Value | | | Ending Account Value | | | Expenses Paid During Period | | | Beginning Account Value | | | Ending Account Value | | | Expenses Paid During Period | |
Morningstar Defensive Bond Fund | | 0.48% | | | $1,000.00 | | | | $1,016.60 | | | | $2.41 | | | | $1,000.00 | | | | $1,022.48 | | | | $2.41 | |
Morningstar Multisector Bond Fund | | 0.79 | | | 1,000.00 | | | | 928.60 | | | | 3.79 | | | | 1,000.00 | | | | 1,020.93 | | | | 3.97 | |
Morningstar Unconstrained Allocation Fund | | 0.71 | | | 1,000.00 | | | | 895.60 | | | | 3.35 | | | | 1,000.00 | | | | 1,021.33 | | | | 3.57 | |
Morningstar Alternatives Fund | | 0.90 | | | 1,000.00 | | | | 991.00 | | | | 4.46 | | | | 1,000.00 | | | | 1,020.39 | | | | 4.52 | |
| | | | | | | | | | | | | | | | | | | | | | | | | | |
269
Morningstar Funds Trust April 30, 2020
Tax Information (unaudited)
LONG-TERM CAPITAL GAIN — The following Funds designated the below amounts as long-term capital gains, pursuant to Section 852(b)(3)(C) of the Code, for the fiscal year ended April 30, 2020:
| | | | |
| Fund | | Long-Term
Capital Gain | |
Morningstar International Equity Fund | | $ | 6,576,850 | |
Morningstar Total Return Bond Fund | | | 4,270,224 | |
Morningstar Defensive Bond Fund | | | 298,566 | |
Morningstar Unconstrained Allocation Fund | | | 33,566 | |
CORPORATE DIVIDENDS-RECEIVED DEDUCTION (DRD) — A percentage of the dividends distributed during the fiscal year ended April 30, 2020 for the following Funds qualifies for the dividends-received deduction for corporate shareholders:
| | | | |
| Fund | | Corporate DRD Percentage (%) | |
Morningstar U.S. Equity Fund | | | 26 | |
Morningstar International Equity Fund | | | — | * |
Morningstar Global Income Fund | | | 16 | |
Morningstar Unconstrained Allocation Fund | | | 2 | |
Morningstar Alternatives Fund | | | 5 | |
* Amount rounds to less than 0.05%
QUALIFIED DIVIDEND INCOME (QDI) — Under the Jobs and Growth Tax Relief Reconciliation Act of 2003 (the “Act”), the following percentages of ordinary dividends paid during the fiscal year ended April 30, 2020, are designated as “qualified dividend income”, as defined in the Act:
| | | | |
| Fund | | QDI Percentage (%) | |
Morningstar U.S. Equity Fund | | | 32 | |
Morningstar International Equity Fund | | | 53 | |
Morningstar Global Income Fund | | | 60 | |
Morningstar Unconstrained Allocation Fund | | | 15 | |
Morningstar Alternatives Fund | | | 11 | |
FOREIGN TAX CREDIT — The Funds below intend to make an election that will allow shareholders to treat their proportionate share of foreign taxes paid by the Fund as having been paid by them. The amounts per share which represent income from sources within, and taxes paid to, foreign countries are as follows:
| | | | | | | | | | | | |
| Fund | | | | | Foreign Tax Credit | | | Foreign Source Income | |
| |
Morningstar International Equity Fund | | | | | | | $0.01 | | | | $0.11 | |
| | | | | | | | |
270
Morningstar Funds Trust April 30, 2020
Trustees and Officers (unaudited)
| | | | | | | | |
Name and Year of Birth | | Position with the Trust, Term of Office and Length of Time Served | | Principal Occupation During Past Five Years | | Number of Portfolios in Fund Complex Overseen by Trustees | | Other Directorships Held During Past Five Years |
| Independent | | | | | | | | |
Trustees of the Trust(1) | | | | | | | | |
| | | | |
Theresa Hamacher (1960) | | Trustee and Chairperson of the Board since March 2018 | | President of Versanture Consulting since 2015; President of NICSA, Inc. (non-profit association global asset management industry participants) from 2008 to 2015 | | 9 | | Calamos Investment Trust from 2015 to 2017 |
| | | | |
Enrique M. Vasquez (1965) | | Trustee since March 2018 | | President of Wealth Management at Blucora, Inc. since 2019; Owner of Embrace Care, Inc. d/b/a CareBuilders at Home since 2015; President and CEO of Cetera Financial Specialists from 2004 to 2016 | | 9 | | Teachers Retirement System of Illinois from 2012 to 2014 |
| | | | |
Linda D. Taylor (1952) | | Trustee since April 2018 | | Chairman and Chief Executive Officer of Clifford Swan Investment Counselors since 2010 | | 9 | | San Pasqual Fiduciary Trust Company Since 2013 |
| | | | |
| Barry P. Benjamin (1957) | | Trustee since July 2018 | | Partner at PricewaterhouseCoopers LLP from 1991 to 2018; Global Asset and Wealth Management Sector Leader at PricewaterhouseCoopers LLP from 2010 to 2017; U.S. Asset and Wealth Management Sector Leader at PricewaterhouseCoopers LLP from 2006 to 2015 | | 9 | | None |
| | | | |
Daniel E. Needham(2) (1978) | | Trustee President and Principal Executive Officer since 2017 | | President of Morningstar Inc.’s investment management group, Morningstar Investment Management, LLC and Morningstar Investment Services, LLC since 2015; Chief Investment Officer of Morningstar, Inc.’s investment management group since 2013 | | 9 | | None |
271
Morningstar Funds Trust April 30, 2020
Trustees and Officers (unaudited) (continued)
| | | | | | | | |
Name and Year of Birth | | Position with the Trust, Term of Office and Length of Time Served | | Principal Occupation During Past Five Years | | Number of Portfolios in Fund Complex Overseen by Trustees | | Other Directorships Held During Past Five Years |
Officers of the Trust | | | | | | | | |
| | | | |
Tracy L. Dotolo (1976) | | Principal Financial Officer and Treasurer since March 2018 | | Fund Principal Financial Officer at Foreside, Inc. since May 2016; Vice President—Global Fund Services at JPMorgan Chase from May 2009 to April 2016. | | N/A | | N/A |
| | | | |
Illinan Sary (1977) | | Assistant Treasurer since December 2019 | | Mutual Fund Accounting Director, Morningstar Investment Management, since December 2019; Manager of Fund Administration, Ariel Investments, July 2016 to November 2019; Client Service Manager, Northern Trust, April 2013 to July 2016 | | N/A | | N/A |
| | | | |
D. Scott Schilling (1960) | | Chief Compliance Officer, Anti-Money Laundering Compliance Officer, and Secretary since March 2018 | | Global Chief Compliance Officer at Morningstar, Inc. since July 2013; Chief Compliance Officer at Morningstar Investment Management, LLC since January 2000; Chief Compliance Officer at Morningstar Investment Services LLC since July 2001; and Chief Compliance Officer at Morningstar Research Services LLC since its inception in November 2016. | | N/A | | N/A |
| | | | |
F. Allen Bliss (1965) | | Assistant Secretary since March 2018 | | Associate General Counsel for Morningstar, Inc. since July 2003 and Assistant Corporate Secretary for Morningstar, Inc. since May 2015. | | N/A | | N/A |
(1) The trustees of the Trust who are not “interested persons” of the Trust as defined under the 1940 Act (independent trustees).
(2) Daniel Needham is an “interested person” of the Trust as defined by the 1940 Act because he is an affiliated person of the adviser.
Availability of Additional Information About the Trustees and Officers
The Statement of Additional Information includes additional information about the Trustees and Officers and is available without charge, upon request by calling (877) 626-3224.
272
| | | | | | | | |
| | | | | Morningstar Funds Trust Privacy Policy Please read “Other Important Information” section below for information about Morningstar Funds Trust access to your personal information |
| | |
| Why? | | | | Financial companies can choose how they share your personal information. Federal law gives consumers the right to limit some, but not all sharing. Federal law also requires us to tell you how we collect, share, and protect your personal information. Please read this notice carefully to understand Morningstar Funds Trust access to your personal information. |
| |
| What? | | Personal information includes, but is not limited to: u Your name, address, phone number, and email address; u Your social security number or other unique identifier; u Your account information, such as account balance and transactions (including account transaction history); u Your demographic information, such as age, income, investment preferences, investment experience, and risk profile. |
| | |
| How? | | | | All financial companies need to share clients’ personal information to run their everyday business. In the section below, we list the reasons financial companies can share their clients’ personal information; the reasons, Trust chooses to share; and whether you can limit this sharing. |
| | | | |
| | | | | Reasons financial companies can share your personal information | | Does Morningstar Funds Trust share? | | Can you limit this sharing? |
| | | | |
| | | | For our everyday business purposes—such as to process your transactions, maintain your account(s), or respond to court orders and legal investigations. | | See “Other Important Information” below. | | No |
| | | | |
| | | | For our marketing purposes—to offer our products and services. | | No | | N/A |
| | | | |
| | | | For joint marketing with other financial companies. | | No | | N/A |
| | | | |
| | | | For our affiliates’ everyday business purposes—information about your transactions and experiences. | | No | | N/A |
| | | | |
| | | | For our affiliates’ everyday business purposes—information about your creditworthiness. | | No | | N/A |
| | | | |
| | | | For our affiliates to market to you. | | No | | N/A |
| | | | |
| | | | | For nonaffiliates to market to you. | | No | | N/A |
| | |
| Who we are | | | | Who is providing this notice? Morningstar Funds Trust |
| | |
| What we do | | | | How does Morningstar Funds Trust protect your personal information? Security measures are in place to protect against unauthorized access to, or unauthorized alteration, disclosure or destruction of personal information. Secure data networks are protected by industry standard firewall and password protection systems. |
| | |
| | | | How does Morningstar Funds Trust collect your personal information? We would collect your personal information if you open an account directly with us or if you gave us your personal information; however, please read the “Other Important Information” section below. |
| |
| | Why can’t you limit sharing? Federal law gives you the right to limit only: u sharing for affiliates’ everyday business purposes—information about your creditworthiness; u affiliates from using your information to market to you; |
273
| | |
| | | u sharing for nonaffiliates to market to you. State laws and individual companies’ policies may give you additional rights to limit sharing. |
| |
| Definitions | | Affiliates Companies related by common ownership or control. They can be financial and nonfinancial companies. |
| | u Morningstar Funds Trust’s investment adviser is Morningstar Investment Management, LLC, a wholly-owned subsidiary of Morningstar, Inc. Morningstar Investment Services, LLC, a wholly-owned subsidiary of Morningstar Investment Management, LLC, is the sponsor of the Morningstar Managed Portfolios advisory service. |
| |
| | Nonaffiliates Companies not related by common ownership or control. They can be financial and nonfinancial companies. u The Trust does not share your personal information with nonaffiliates for marketing their services to you. |
| |
| | | Joint marketing A formal agreement between nonaffiliated financial companies that together market financial products or services to you. u The Trust does not have such an agreement in place. |
| |
| Other Important Information | | Morningstar Funds Trust (“Morningstar Funds”) is only available through model portfolios designed and maintained by Morningstar Investment Management, LLC (“Model Portfolios”). Model Portfolios are made available to nonaffiliated financial institutions (e.g., financial advisers, retirement plan, recordkeepers) who may use the Model Portfolios as part of an investment advisory solution offered to their clients. The financial institution’s client’s assets are held at a nonaffiliated custodian (“Custodian”). Custodians report buy/sells of Morningstar Funds shares to the Trust’s transfer agent at an aggregate level (e.g., omnibus). Because of this structure, under normal circumstances, the Trust does not have personal information of the shareholders of the Morningstar Funds. From time-to-time, Morningstar Funds Trust may seek shareholder’s personal information to fulfill regulatory requirements and/or obligations. In those instances, Morningstar Funds Trust will not make your personal information available to anyone other than the above-mentioned affiliates. Morningstar Funds reserves the right to change this policy at any time by distributing and/or posting a new privacy policy without notice. |
| |
| Questions? | | Your privacy is very important to us. If you have further questions, please contact us at (877) 626-3224. |
274
Morningstar Funds Trust April 30, 2020
Board Approval of Investment Advisory and Subadvisory Agreements (unaudited)
The Morningstar Funds Trust (the “Trust”) is a Delaware statutory trust organized under the laws of the State of Delaware on March 1, 2017 and registered with the U.S. Securities and Exchange Commission under the Investment Company Act of 1940.
Each of the Funds that forms a series of the Trust has an Investment Advisory Agreement with Morningstar Investment Management, LLC (“Morningstar”). Each of the Funds also has at least one Subadvisory Agreement with a Subadviser to that Fund.
The Funds and their Subadvisers are:
| | ● | | Morningstar U.S. Equity Fund |
| | ° | | ClearBridge Investments, LLC |
| | ° | | Diamond Hill Capital Management, Inc. |
| | ° | | Levin Easterly Partners LLC |
| | ° | | Massachusetts Financial Services Company, d/b/a MFS Investment Management |
| | ° | | Westwood Management Corp. |
| | ● | | Morningstar International Equity Fund |
| | ° | | Lazard Asset Management LLC |
| | ° | | T. Rowe Price Associates, Inc. |
| | ● | | Morningstar Global Income Fund |
| | ° | | Schafer Cullen Capital Management, Inc. |
| | ● | | Morningstar Total Return Bond Fund |
| | ° | | BlackRock Financial Management, Inc. |
| | ° | | Western Asset Management Company |
| | ● | | Morningstar Municipal Bond Fund |
| | ° | | T. Rowe Price Associates, Inc. |
| | ° | | Wells Capital Management, Inc. |
| | ● | | Morningstar Defensive Bond Fund |
| | ° | | First Pacific Advisors, LLC |
| | ● | | Morningstar Multisector Bond Fund |
275
Morningstar Funds Trust April 30, 2020
Board Approval of Investment Advisory and Subadvisory Agreements (unaudited)(continued)
| | ° | | Franklin Advisers, Inc. |
| | ° | | Loomis, Sayles & Company, L.P. |
| | ° | | TCW Investment Management Company LLC |
| | ● | | Morningstar Unconstrained Allocation Fund |
| | ° | | Brandywine Global Investment Management, LLC |
| | ° | | Lazard Asset Management LLC |
| | ● | | Morningstar Alternatives Fund |
| | ° | | SSI Investment Management, LLC |
| | ° | | Water Island Capital, LLC |
Statement of Shareholder Rights
When you buy shares in a mutual fund, you become a shareholder in an investment company. As an owner, you have certain rights and protections, chief among them an independent board of trustees, whose main role is to represent your interests.
The Trustees are responsible for the overall management of the Trust, including general supervision and review of the investment activities of each Fund. The Trustees, in turn, elect the officers of the Trust, who are responsible for administering the day-to-day operations of the Trust and its separate series, including the Funds.
The “Independent Trustees” are Trustees who are not “interested persons” of the Trust, as that term is defined in the Investment Company Act of 1940.
More information about the Trustees is available https://www.morningstar.com/company/morningstar-funds-governance.
Board Renewal of the Investment Advisory Agreement and the Subadvisory Agreements
Introductory Note to Shareholders
One of the primary responsibilities of the Board of Trustees of the Funds (the “Board”) is to determine whether to renew the Funds’ Investment Advisory Agreement with Morningstar and the Funds’ Sub-Advisory Agreements (together, the “Agreements”). The Funds’ Investment Advisory Agreement and Sub-Advisory Agreements were scheduled to expire at the end of April 2020. In March 2020, the Board met to consider whether to renew these Agreements for a one-year period, through April 2021.
276
Morningstar Funds Trust April 30, 2020
Board Approval of Investment Advisory and Subadvisory Agreements (unaudited)(continued)
The Board decided to renew the Agreements. This note reviews the factors that the Board considered and discusses its conclusions. This introductory section of this note highlights key considerations in the renewal process. The body of this note, which follows, provides more details of the review process undertaken by and the conclusions reached by the Board.
Key Considerations
While the Board reviewed many factors as part of its decision-making process, the Board would like to highlight two of those factors: fund expenses and investment performance.
| | ● | | Fund Expenses – The Board believes that fund expenses are an important factor because they directly affect shareholder returns. The Board noted that one of Morningstar’s investment principles – minimizing costs – is consistent with this view. The Board was encouraged by Morningstar’s commitment to lowering costs to shareholders, notably through its implementation of voluntary expense waivers and expense reimbursements. In its review of Fund expenses, the Board noted that, for seven of the nine Funds, total expenses as a percentage of average net assets were either at or below the median total expenses for a peer group of comparable funds. For one of these Funds, the Municipal Bond Fund, total expenses as a percentage of average net assets exceeded the peer group median by 0.008%. For the U.S. Equity Fund, total expenses exceeded the peer group median by 0.06%. The Board noted that for all Funds, the actual management fee paid was below the peer group median for all Funds. The Board discussed plans for increasing assets with Morningstar management as a way of reducing the total expense levels.The Board concluded that these fees were fair and reasonable. For more information, see “Fund Expenses” below. Information about the peer groups can be found below under “Renewal of the Agreements.” |
| | ● | | Investment Performance – Fund performance was also very important to the Board. In evaluating performance, the Board looked at each Fund’s performance relative to other funds with the same investment objective, its performance relative to an index benchmark, and its risk-adjusted performance. The Board also considered the limited performance history of the Funds. Performance as compared to peer funds for calendar 2019 was mixed: |
| | ° | | The Global Income Fund and the Total Return Bond Fund performed in the best performing quintile of their categories (i.e., 1st out of 5 performing quintile, with 1st quintile being the best performing quintile); |
| | ° | | The International Equity Fund performed in the second-best performing quintile of its category (i.e., 2nd out of 5 performing quintile); |
| | ° | | The Multisector Bond Fund and the Unconstrained Allocation Fund performed in the middle quintile of their categories (i.e., 3rd out of 5 performing quintile); |
| | ° | | The Alternatives Fund, the Municipal Bond Fund and the U.S. Equity Fund performed in the second-lowest performing quintile of their peer groups (i.e., 4th out of 5 performing quintile); and |
| | ° | | The Defensive Bond Fund performed in the lowest-performing quintile of its category (i.e., 5th out of 5 performing quintile). |
277
Morningstar Funds Trust April 30, 2020
Board Approval of Investment Advisory and Subadvisory Agreements (unaudited)(continued)
The Board focused on those Funds with underperformance and extensively discussed the underperformance with Morningstar. The Board noted that Morningstar had implemented changes with regard to monitoring and review of underperforming investments. The Board did not believe that any additional changes with respect to these Funds were warranted at the time, especially considering the limited performance history of the Funds, and noted that it would continue to monitor future performance.
For more information, including a discussion of the performance of individual Funds, see “Investment Performance” below.
The Board invites comments from shareholders on this disclosure and how it may be enhanced. Shareholders may email the Board with their suggestions at BoardofTrustees.MorningstarFundsTrust@morningstar.com
Renewal of the Agreements
At a Board of Trustees meeting on March 11, 2020, the Board unanimously approved the renewal of the Agreements. The Board determined that the Agreements, including the investment advisory and subadvisory fees in the Agreements, were fair and reasonable.
Prior to making these approvals, the Board considered materials and presentations related to the Agreements. Among the topics addressed by these materials and presentations were:
| | ● | | The services that Morningstar and each Subadviser provided and would provide to each Fund. |
| | ● | | Morningstar’s investment management operations. |
| | ● | | The investment approach for each Fund and whether this investment approach was being followed by Morningstar and each Subadviser. |
| | ● | | The due diligence conducted on each Subadviser by Morningstar, and Morningstar’s reasons for recommending the retention of each Subadviser and Subadvisory Agreement. |
| | ● | | The due diligence conducted by the Trust’s Chief Compliance Officer with regard to compliance programs and capabilities of Morningstar and each Subadviser. |
| | ● | | The services that the custodian, fund administrator, transfer agent and distributor provided and would provide to each Fund. |
| | ● | | The fees paid and to be paid to service providers to each Fund, including Morningstar and each Subadviser. |
| | ● | | The expense ratio for each Fund, reflecting both the fees paid and to be paid to service providers and expenses incurred and to be incurred directly by each Fund. |
| | ● | | Expense limitation arrangements, to be achieved by fee waivers and expense reimbursements by Morningstar. |
The information obtained by the Board during the renewal process included a special report prepared by Broadridge Financial Solutions, Inc. (“Broadridge”), an independent analyst. The analysis in the report was based on data from Lipper, Inc.
278
Morningstar Funds Trust April 30, 2020
Board Approval of Investment Advisory and Subadvisory Agreements (unaudited)(continued)
The report from Broadridge analyzed each Fund’s performance and risk relative to all other funds with a similar investment objective. The analysis covered performance for the calendar year 2019.
In addition, the report analyzed each Fund’s expenses relative to a smaller group of comparable funds selected by Broadridge. These “peer groups” of comparable funds were composed of funds with similar investment objectives that were distributed in a similar manner to the Funds (e.g., funds with similar distribution platforms and that are sold as part of a multi-asset solution program).
Because these peer groups contained a limited number of funds, the Board requested that Broadridge prepare “supplemental peer groups” that included funds that are available outside of multi-asset solution programs and received the results of these supplemental peer groups. As a general matter, the “supplemental peer groups” were not significantly larger than the original peer groups and the quintile rankings for the Funds in the original peer groups as compared to the rankings in the supplemental peer groups were very similar. As such, the information presented under “Fund Expenses” below is from the original peer group.
The Board noted meaningful differences between the peer groups and the Funds. Specifically, some of the funds in the peer groups have a larger asset base and longer performance history than the Funds. In addition, some of the funds in the peer groups are distributed through propriety sales channels, while the Funds are distributed through non-proprietary channels. Despite these differences, the Board concluded that the Broad-ridge report was helpful in the review process.
In addition, the Board’s deliberations were also informed by meetings that the Board had held since the establishment of the Funds with officers of Morningstar and certain Subadvisers.
Throughout the approval process, the Independent Trustees received assistance from independent counsel. The Independent Trustees met separately with independent counsel. More information about the Independent Trustees and their role is available at https://www.morningstar.com/company/morningstar-funds-governance.
Factors Considered
In making their determination, the Board considered multiple factors. The Board did not quantify or assign relative weights to the factors. Each member of the Board may have assigned different weights to the factors.
The factors considered included:
| | ● | | The investment performance of each Fund and the performance of Morningstar and each Subadviser in achieving this performance. |
| | ● | | Whether each Fund had operated in accordance with its investment objective. |
| | ● | | The fairness of the compensation under the Investment Advisory Agreement and Subadvisory Agreements. |
| | ● | | The expense ratio to be borne by shareholders, considering the combined effect of the pricing structure of each Fund and existing fee waivers and expense reimbursements. |
| | ● | | Morningstar’s investment principles. |
279
Morningstar Funds Trust April 30, 2020
Board Approval of Investment Advisory and Subadvisory Agreements (unaudited)(continued)
| | ● | | The nature, extent and quality of services that Morningstar and each Subadviser provided and would be expected to provide to each Fund. |
| | ● | | The background, experience, personnel, operations, technology, policies, procedures and compliance functions of Morningstar and each Subadviser, including their experience as managers of other funds and accounts, their investment management approaches and resources, their financial condition and their reputation in the industry. |
| | ● | | The compatibility of each Subadviser’s operations, policies, procedures and compliance functions with those of Morningstar and other service providers to the Funds. |
| | ● | | The Chief Compliance Officer’s review of the compliance programs and capabilities of Morningstar and of each Subadviser, including the policies and procedures in place to address actual and potential conflicts of interest. |
| | ● | | Morningstar’s risk management program, especially those aspects of the program related to selecting and overseeing the Subadvisers to each Fund. |
| | ● | | The use of derivatives and other complex instruments to carry out each Fund’s investment goals. |
| | ● | | Each Subadviser’s risk management program. |
| | ● | | Profitability matters and economies of scale. |
The following discussion reviews some of the primary components of the Board’s decision to approve the renewal of the agreements. This discussion is not intended to be exhaustive, but rather summarizes certain factors considered by the Board.
Services Provided
The Board reviewed each Fund’s investment goal, Morningstar’s and each Subadviser’s investment strategy to achieve that goal, and Morningstar’s and each Subadviser’s success in achieving, and ability to continue to achieve, that investment strategy.
The Board considered Morningstar’s investment principles, as well as Morningstar’s values and culture. They concluded that the principles were consistent with shareholder interests and, in light of Morningstar’s values and culture, believe Morningstar has, and will continue to be able to, manage the Funds in a manner consistent with those principles.
The Board took note of Morningstar’s responsibilities as the investment adviser to each Fund which include:
| | ● | | Performance of due diligence of each Subadviser’s risk management, operations, trading activities, technology and financial condition. |
| | ● | | Oversight and monitoring of the day-to-day investment activities of the Subadvisers and the ongoing assessment of their performance. |
| | ● | | Portfolio construction for each Fund, involving asset allocation among Subadvisers, exchange-traded funds, cash and other investments. |
280
Morningstar Funds Trust April 30, 2020
Board Approval of Investment Advisory and Subadvisory Agreements (unaudited)(continued)
| | · | | Provision of investment oversight in certain instances. |
| | · | | Oversight and monitoring of the Subadvisers’ compliance with the investment mandate, compliance policies and procedures and federal securities laws. |
| | · | | Reporting to the Board. |
| | · | | The implementation of the Board’s directives with regard to the Funds. |
With respect to the services provided by the Subadvisers, the Board took note of the responsibilities that each Subadviser has with respect to the portion of a Fund’s assets allocated to the Subadviser by Morningstar. These responsibilities include implementing the investment strategies for that portion of each Fund’s assets and ensuring compliance with the investment policies and limitations. The Board considered the performance of the Subadvisers in managing the Funds. The Board considered Morningstar’s rationale for recommending the continued retention of each Subadviser.
The Board considered other investment advisory services offered by Morningstar and each Subadviser; the Board reviewed the allocation of assets and expenses among these services, as well as their fees, the reasons for differences in fees and any potential conflicts in connection with providing these services.
Based on their review, the Board was satisfied with the nature, extent and quality of the overall services provided and to be provided by Morningstar and each Subadviser. The Board was confident in the abilities of Morningstar and each Subadviser to continue to implement the respective investment strategy and to continue to provide quality services to each Fund.
281
Morningstar Funds Trust April 30, 2020
Board Approval of Investment Advisory and Subadvisory Agreements (unaudited)(continued)
Investment Performance
Fund performance was also very important to the Board. In evaluating performance, the Board looked at each Fund’s performance relative to other funds with the same investment objective, its performance relative to its index benchmark, and its risk-adjusted performance. The Board also considered the limited performance history of the Funds.
The Board also considered whether each Fund had operated in accordance with its investment objective, as well as its record of compliance with its investment restrictions and its performance. The Board took into account discussions at Board meetings since the launch of the Funds with representatives of Morningstar about Fund investment performance.
In addition to reviewing absolute and relative Fund performance, the Board periodically considers the appropriateness of Fund performance metrics in evaluating the results achieved. The Board periodically reviews the performance benchmarks for each Fund recommended by Morningstar and the process used by Morningstar to develop its benchmark recommendations; the Board also periodically reviews how these benchmarks are used to evaluate the performance of each Fund, of Morningstar and of each Subadviser.
A summary of the Board’s review of each Fund’s performance follows:
Morningstar Alternatives Fund – The Fund had total returns in the second-lowest performing quintile of multialternative funds (i.e., 4th out of 5 quintiles, with 1st quintile being the best performing quintile) for the one-year period ended December 31, 2019. The Fund outperformed the 3-month U.S. Treasury Bill Index. The Fund had strong risk-adjusted performance; the Fund had the highest Sharpe Ratio in the category. The Board discussed with Morningstar the reasons for the relative underperformance. The Board noted that a lower risk profile was consistent with the Fund’s objective. In light of the Fund’s objective and given the strong risk-adjusted performance, the Board did not believe that any changes with respect to the Fund were warranted at the time and noted that it would continue to monitor future performance.
Morningstar Defensive Bond Fund – The Fund had total returns in the lowest performing quintile of short-term bond funds (i.e., 5th out of 5 quintiles, with 1st quintile being the best performing quintile) for the one-year period ended December 31, 2019. The Fund underperformed the Bloomberg Barclays U.S. Aggregate 1-3 Year Index. While the Fund’s volatility was below average, its risk-adjusted return was also below average. The Board discussed with Morningstar the reasons for the underperformance, which primarily was due to the Fund’s expected defensive positioning. The Board also took into account the limited performance history of the Fund when evaluating the overall performance of the Fund. Given these considerations, the Board did not believe that any changes with respect to the Fund were warranted at the time and noted that it would continue to monitor future performance.
Morningstar Global Income Fund – The Fund had total returns in the best performing quintile of world allocation funds (i.e., 1st out of 5 performing quintiles, with 1st quintile being the best performing quintile) for the one-year period ended December 31, 2019. The Fund had strong risk-adjusted performance as well.
282
Morningstar Funds Trust April 30, 2020
Board Approval of Investment Advisory and Subadvisory Agreements (unaudited)(continued)
However, the Fund underperformed its benchmark of the Morningstar Global Income Blended Index. The Board took into account the limited performance history of the Fund, and the Board concluded that no changes with respect to the Fund were warranted at the time and noted that it would continue to monitor future performance.
Morningstar International Equity Fund –The Fund had total returns in the second-best performing quintile of foreign large blend funds (i.e., 2nd out of 5 performing quintiles, with 1st quintile being the best performing quintile) for the one-year period ended December 31, 2019. The Fund outperformed its benchmark of the Morningstar Global Markets Ex-U.S. Index (net). However, the Fund’s risk-adjusted performance was below average. The Board took into account the limited performance history of the Fund, and the Board concluded that no changes with respect to the Fund were warranted at the time and noted that it would continue to monitor future performance.
Morningstar Multisector Bond Fund – The Fund had total returns in the middle performing quintile of multisector bond funds (i.e., 3rd out of 5 performing quintiles, with 1st quintile being the best performing quintile) for the one-year period ended December 31, 2019. The Fund had unfavorable risk-adjusted performance, and it underperformed its benchmark of the Morningstar Multisector Bond Blended Index. The Board took into account the limited performance history of the Fund, and the Board concluded that no changes with respect to the Fund were warranted at the time and noted that it would continue to monitor future performance.
Morningstar Municipal Bond Fund – The Fund had total returns in the second-lowest performing quintile of muni national intermediate funds (i.e., 4th out of 5 performing quintiles, with 1st quintile being the best performing quintile) for the one-year period ended December 31, 2019. The Fund outperformed its benchmark of the Morningstar Municipal Bond Blended Index. The Fund’s volatility was below average, and its risk-adjusted return was average. The Board took into account the limited performance history of the Fund, and the Board concluded that no changes with respect to the Fund were warranted at the time and noted that it would continue to monitor future performance.
Morningstar Total Return Bond Fund – The Fund had total returns in the best performing quintile of intermediate core bond funds (i.e., 1st out of 5 performing quintiles, with 1st quintile being the best performing quintile) for the one-year period ended December 31, 2019. The Fund outperformed its benchmark of the Bloomberg Barclays U.S. Aggregate Bond Index and had above-average risk-adjusted performance. The Board took into account the limited performance history of the Fund, and the Board concluded that no changes with respect to the Fund were warranted at the time and noted that it would continue to monitor future performance.
Morningstar Unconstrained Allocation Fund – The Fund had total returns in the middle performing quintile of world allocation funds (i.e.,3rd out of 5 performing quintiles, with 1st quintile being the best performing quintile) for the one-year period ended December 31, 2019. The Fund outperformed its benchmark of the Morningstar Unconstrained Allocation Blended Index but had below-average risk-adjusted performance. The Board took into account the limited performance history of the Fund, and the Board concluded that no changes with respect to the Fund were warranted at the time and noted that it would continue to monitor future performance.
283
Morningstar Funds Trust April 30, 2020
Board Approval of Investment Advisory and Subadvisory Agreements (unaudited)(continued)
Morningstar U.S. Equity Fund – The Fund had total returns in the second-lowest performing quintile of large blend funds (i.e., 4th out of 5 performing quintiles, with 1st quintile being the best performing quintile) for the one-year period ended December 31, 2019. The Fund underperformed its benchmark of the Morningstar U.S. Market Index and had below-average risk-adjusted performance. The Board noted the magnitude of the underperformance and discussed with Morningstar the reasons for the underperformance, which primarily were the underperformance of one of the Subadvisers and the underperformance of an energy-related ETF (exchange-traded fund) holding.
Morningstar discussed with the Board the steps that it had taken in light of the underperformance. It had instituted a heightened level of review of the Subadviser, and it had implemented changes to its procedures for review of all underperforming allocations. Morningstar also discussed with the Board potential alternatives if underperformance continues. Given Morningstar’s response to the underperformance and considering the limited performance history of the Fund, the Board did not believe that any changes with respect to the Fund were warranted at the time and noted that it would continue to monitor future performance.
The Cost of Services
The Board considered the cost of the services provided and to be provided and the losses realized by Morningstar and each Subadviser from a relationship with the Funds.
As requested by the Board, Morningstar provided profitability information for each Fund, as well as aggregate profitability information for all of the Funds, using a revenue and cost allocation methodology that was reviewed and discussed with the Board.
The Board noted that each Fund had incurred considerable expenses since its formation and that these expenses were largely absorbed by Morningstar through fee waivers and expense reimbursements. Beyond the waiver and reimbursement agreements, Morningstar paid certain start-up costs that otherwise could have been borne by the Funds.
The Board also considered the fees charged by Morningstar to other clients. The Board noted that Morningstar charges lower fees to some other clients but that the services provided to those accounts are not similar. Morningstar reviewed with the Board the broader scope of services it provides to the Funds, including management of cash flows as a result of redemptions and purchases, oversight of service providers, preparation of annual registration statement updates, preparation of financial information, and compliance with federal and state laws and regulations. These services require a higher level of infrastructure, including personnel, office space, technology and legal support. Morningstar also highlighted the significant business, reputational and other risks associated with launching, sponsoring and maintaining the Funds.
The Board noted that Morningstar does not have an affiliated entity providing transfer agent, custodial, broker-dealer, fund administration or other services to the Funds. Therefore, Morningstar does not generate additional fees for itself through Fund services provided by related entities. The lack of supplemental sources of revenue was a significant factor to the Trustees.
284
Morningstar Funds Trust April 30, 2020
Board Approval of Investment Advisory and Subadvisory Agreements (unaudited)(continued)
With regard to the Subadvisers, the Board noted that the subadvisory fees are paid to each Subadviser by Morningstar and are not additional fees borne by each Fund. These fees were the product of arms-length negotiations between Morningstar and each Subadviser. As a result, the costs of the services and the profits of the Subadvisers from their relationships with the Funds were not a material factor in the Board’s consideration of the Subadvisory Agreements.
The Board considered other actual and potential benefits (often called “fall-out benefits”) that accrue to Morningstar and each of the Subadvisers from managing the Funds. These benefits include the acquisition and use of research services by the Subadvisers with commissions generated by the Funds (known as “soft dollar” arrangements). The Board noted that soft dollar arrangements may result in the Funds bearing costs to purchase research that may be used by the Subadvisers with other clients and may reduce the Subadvisers’ expenses. The Board also considered reviews undertaken by the Funds’ Chief Compliance Officer concluding that these arrangements are consistent with regulatory requirements. The Board noted that Morningstar itself does not use soft dollar arrangements.
The Board considered the substantial costs incurred by Morningstar related to the launch of the Funds and was satisfied that the profitability was not excessive as Morningstar did not generate profits with respect to the operations of any of the Funds.
Fund Expenses
The Board believes that fund expenses are an important factor because they directly affect shareholder returns. In reviewing fund expenses, the Board placed emphasis on total expenses as a percentage of assets (i.e., after fee waivers and expense reimbursements by Morningstar) because they represent the total costs to shareholders of investing in the Funds. However, the Board also considered the components of total expenses, namely the actual management fee paid (after fee waivers and expense reimbursements by Morningstar), transfer agent expenses, custodial expenses and other expenses. The Board also reviewed, but placed less emphasis on, the contractual management fee before waivers and expense reimbursements.
The Board noted that one of Morningstar’s investment principles for investment management is minimizing costs. In this regard, the Board was encouraged by Morningstar’s commitment to lowering costs to shareholders, notably through its implementation of fee waivers and expense reimbursements by Morningstar.
In its review of fund expenses, the Board noted that, for seven of the nine Funds, total expenses as a percentage of average net assets were either at or below the median total expenses for a peer group of comparable funds. For one of these Funds, the Municipal Bond Fund, total expenses as a percentage of assets exceeded the peer group median by 0.008%. For the U.S. Equity Fund, total expenses exceeded the peer group median by 0.06%.
The Board noted that for all Funds, the actual management fee paid to Morningstar was below the peer group median for all Funds. Therefore, when total expenses exceeded the peer group, it was a result of non-management expenses. The Board noted that these expenses tend to decrease as assets increase and that many of the funds included in the peer groups had a higher level of assets. The Board discussed plans for increasing assets with Morningstar management as a way of reducing the total expense levels.
285
Morningstar Funds Trust April 30, 2020
Board Approval of Investment Advisory and Subadvisory Agreements (unaudited)(continued)
Based upon its consideration of all these factors, the Trustees determined that the investment advisory and subadvisory fee structure for each Fund was fair and reasonable.
Economies of Scale
The Board considered economies of scale that may be realized by Morningstar and each Subadviser as each Fund grows larger and the extent to which these economies would be shared with each Fund’s shareholders, including through increased services to the Funds, through expense limitation arrangements, or through fee or expense ratio reductions (such as breakpoints in the fee schedule). The Board noted that Morningstar implemented an expense limitation arrangement which has been and will continue to be re-evaluated periodically.
The Board concluded that economies of scale were not a significant factor with regard to the management fee at this time given the current assets in the Funds and the limited operating history of the Funds and that the expense limitation arrangement is in effect. As noted earlier, as a percentage of assets, transfer agent, custodian and other expenses are expected to decline as assets increase.
Conclusion
After consideration of the foregoing factors, and such other matters as were deemed relevant, and with no single factor being determinative to their decision, the Board—including a majority of the Independent Trustees with the assistance of independent counsel—approved the renewal of the Agreements and concluded that the investment advisory and subadvisory fee structure provided for in the Agreements was fair and reasonable.
Morningstar Alternatives Fund
Please note, the below pertains to action taken by the Board of Trustees at the March 11, 2020 meeting in connection with BlackRock Financial Management, Inc. (“BlackRock”) being approved as a subadviser to the Morningstar Alternatives Fund. BlackRock commenced investment management of its portion of the assets of the Morningstar Alternatives Fund on June 8, 2020, joining Water Island Capital, LLC and SSI Investment Management LLC as a subadviser to the Morningstar Alternatives Fund.
Morningstar Funds Trust
Board Approval of Subadvisory and Sub-subadvisory Agreements
At a meeting of the Board of Trustees of the Trust (the “Board”) on March 11, 2020, the Board unanimously approved a new subadvisory agreement (the “Subadvisory Agreement”) between Morningstar Investment Management LLC (“Morningstar”) and BlackRock Financial Management, Inc. (“BlackRock”) for the Morningstar Alternatives Fund (the “Fund”). In connection with the Board’s approval of the Subadvisory Agreement, the Board also approved a related sub-subadvisory agreement between BlackRock and BlackRock International Limited (“BIL”), a wholly owned subsidiary of BlackRock, Inc. (the “BIL Agreement”). The discussion of
286
Morningstar Funds Trust April 30, 2020
Board Approval of Investment Advisory and Subadvisory Agreements (unaudited)(continued)
BlackRock and the Subadvisory Agreement should be read as encompassing information, as relevant, about BIL and the BIL Agreement. The Board determined that the Subadvisory Agreement, including the Subadvisory fees in the agreement, were fair and reasonable.
Prior to approving the Subadvisory Agreement, the Board considered materials and presentations related to the Subadvisory Agreement. Among the topics addressed by these materials and presentations were:
| | · | | The services the Subadviser would provide to the Fund. |
| | · | | The proposed investment approach for the Fund to be carried out by the Subadviser. |
| | · | | The due diligence conducted on the Subadviser by Morningstar, and Morningstar’s reasons for recommending the Subadviser and Subadvisory Agreement. |
| | · | | The due diligence conducted by the Trust’s Chief Compliance Officer with regard to compliance programs and capabilities. |
| | · | | The proposed fees to be paid to the Subadviser. |
Throughout the approval process, the Independent Trustees received assistance from independent counsel. The Independent Trustees met separately with independent counsel. The Independent Trustees also met with and interviewed officers of Morningstar and the Subadviser.
Factors Considered
In making their determination, the Board considered multiple factors. The Board did not quantify or assign relative weights to the factors. Each member of the Board may have assigned different weights to the factors.
The factors considered included:
| | · | | The form of the proposed Subadvisory Agreement. |
| | · | | The nature, extent and quality of services that the Subadviser would provide to the Fund. |
| | · | | The background, experience, personnel, operations, technology, policies, procedures and compliance functions of the Subadviser, including their experience as managers of other funds and accounts, their investment management approaches and resources, their financial condition and their reputation in the industry. |
| | · | | The Subadviser’s plans for the integration of their operations, policies, procedures and compliance functions with those of Morningstar and other proposed service providers to the Fund. |
| | · | | The impact that management of the Fund would have on the Subadviser. |
| | · | | The Chief Compliance Officer’s review of the compliance programs and capabilities of the Subadviser, including the policies and procedures in place to address potential conflicts of interest. |
| | · | | The proposed use of derivatives and other complex instruments to carry out the Fund’s investment goals. |
| | · | | The Subadviser’s risk management program. |
287
Morningstar Funds Trust April 30, 2020
Board Approval of Investment Advisory and Subadvisory Agreements (unaudited)(continued)
| | · | | The fairness of the compensation under the proposed Subadvisory Agreement. |
| | · | | Profitability matters and economies of scale. |
The following discussion reviews some of the primary components of the Board’s decision to approve the agreement. This discussion is not intended to be exhaustive, but rather summarizes certain factors considered by the Board.
Services Provided
The Board reviewed the Fund’s investment goal, the Subadviser’s proposed investment strategy to achieve that goal, and the Subadviser’s ability to implement that investment strategy.
The Board took note of the responsibilities that the Subadviser would have with respect to the portion of the Fund’s assets allocated to the Subadviser by Morningstar. These responsibilities include implementing the investment strategies for that portion of the Fund’s assets and ensuring compliance with the investment policies and limitations. The Board considered the Subadviser’s performance managing other investment products, including other mutual funds, with similar investment strategies.
The Board reviewed the portfolio management team assigned to the Fund by the Subadviser and considered the team’s past performance and skills, along with overall staffing levels.
The Board considered other investment advisory services offered by the Subadviser; they reviewed the allocation of assets and expenses among these services, as well as their fees, the reasons for differences in fees and any potential conflicts in connection with providing these services.
Based on their review, the Board was satisfied with the nature, extent and quality of the overall services to be provided by the Subadviser to the Fund and its shareholders. The Board was confident in the abilities of the Subadviser to implement the proposed investment strategy and to provide quality services to the Fund and its shareholders.
Investment Performance
The Board noted that, as the Subadviser had not provided any services to the Fund, there was no investment performance of the Subadviser with respect to the Fund. As noted, the Board considered the investment performance of the Subadviser in managing other investment products, including other mutual funds, with similar investment strategies. The Board also considered the performance benchmarks for the Fund recommended by Morningstar, and how these benchmarks would be used to evaluate the performance of the Subadviser.
288
Morningstar Funds Trust April 30, 2020
Board Approval of Investment Advisory and Subadvisory Agreements (unaudited)(continued)
The Costs of the Services and Fund Expenses
The Board considered the anticipated cost of the services to be provided and the anticipated profits to be realized by the Subadviser from their relationship with the Fund. The Board noted that it could not evaluate the Subadviser’s profitability with respect to the Fund since no assets had yet been allocated to the Subadviser.
In considering the appropriateness of the investment advisory fee to be charged to the Fund, the Board reviewed the proposed fee in light of the nature, extent and quality of the investment advisory services expected to be provided by Morningstar and the Subadviser, as discussed above. The Board considered the allocation of the investment advisory fee between Morningstar and the Subadviser in light of their respective responsibilities and noted that the Subadvisory fees would be paid by Morningstar to the Subadviser and would not be additional fees borne by the Fund. The Board also noted that the Subadvisory fees to be paid by Morningstar to the Subadviser were the product of arms-length negotiations between Morningstar and the Subadviser.
With respect to the impact on Morningstar’s profitability as a result of hiring the Subadviser as a Subadviser to the Fund, the Board considered the fee waiver and expense limitation arrangements in effect and Morningstar’s belief that the hiring of the Subadviser will not have any demonstrable impact on Morningstar’s profitability.
The Board considered other actual and potential benefits (often called “fall-out benefits”) that accrue to the Subadviser from managing the Fund. These benefits include the acquisition and use of research services by the Subadviser with commissions generated by the Fund (known as “soft dollar” arrangements). The Board noted that soft dollar arrangements may result in the Fund bearing costs to purchase research that may be used by the Subadviser with other clients and may reduce the Subadviser’s expenses. The Board also considered reviews undertaken by the Fund’s Chief Compliance Officer concluding that these arrangements are consistent with regulatory requirements.
Based upon its consideration of all these factors, the Board determined that the Subadvisory fee structure was fair and reasonable.
Economies of Scale
The Board considered economies of scale that may be realized by the Subadviser as the Fund grows larger and the extent to which these economies would be shared with the Fund’s shareholders. The Board noted that Morningstar had implemented an expense limitation arrangement which has been and will continue to be re-evaluated periodically. Because of the limiting operating history of the Fund, the Board concluded that economies of scale were difficult to evaluate at this time.
Conclusion
After consideration of the foregoing factors, and such other matters as were deemed relevant, and with no single factor being determinative to their decision, the Board—including a majority of the Independent Trustees with the assistance of independent counsel— approved the Subadvisory Agreement and concluded that the Subadvisory fee structure provided for in the agreements was fair and reasonable.
289
Morningstar Funds Trust April 30, 2020
Additional Information
Proxy Voting Policies and Proxy Voting Record
The Board has delegated responsibility for decisions regarding proxy voting for securities held by the Funds to the Adviser, which, in turn, has delegated such responsibility to the subadvisers. Each subadviser will vote such proxies in accordance with its proxy policies and procedures, which are available, free of charge, by calling 877-626-3224. Information about how each Fund voted proxies relating to portfolio securities during the most recent 12-month period ended June 30 may be obtained (1) without charge, upon request, by call 877-626-3224 and (2) on the SEC’s website at http://sec.gov.
Form N-PORT Disclosure
The Trust files its complete schedule of portfolio holdings with the U.S. Securities and Exchange Commission (“SEC”) for the first and third quarters of each fiscal year as an exhibit to its reports on Form N-PORT. The Trust’s Form N-PORT (and its predecessor form, Form N-Q) filings are available on the SEC’s website at http://www.sec.gov.
290
| | | | | | | | |
| | | | | | | | | |
| | | | | | | | | |
| | | | | | | | | |
| | | | | | | | | |
| | | | | |
| | | Morningstar Funds Trust is only available to citizens or legal residents of the United States or its territories through model portfolios designed and maintained by the Adviser. Adviser Morningstar Investment Management, LLC 22 West Washington Street Chicago, Illinois 60602 Distributor Foreside Fund Services, LLC Three Canal Plaza, Suite 100 Portland, ME 04101 Prospectus Please go to http://connect.rightprospectus.com/Morningstar to access the Morningstar Funds Trust prospectus. | | | | Shareholder Rights When you buy shares in a fund of the Morningstar Funds Trust, you become a shareholder of that fund. As a shareholder, you have certain rights and protections, chief among them an independent board of trustees, whose main role is to represent your interests. The Board of Trustees for the Morningstar Funds Trust is committed to representing your interests as well as implementing and maintaining sound fund governance principles. To learn more about the Board of Trustees please go to https://www.morningstar.com/company/morningstar- funds-governance. This report is for the general information of the shareholders of the Morningstar Funds. It is not authorized for distribution to prospective investors unless preceded or accompanied by the Funds’ current prospectus. Past performance results shown in this report should not be considered a representation of future performance. Investment returns and principal value of shares will fluctuate so that shares, when redeemed, may be worth more or less than their original cost. Views, opinions, portfolio holdings and other information expressed or noted herein are as of the end of the reporting period and are subject to change. Such views and opinions are not to be viewed as investment advice. | | |
| | | | | | | | | |
| | | | | | | | | |
| | | | | | | | | |
| | | | | | | | | |
| | | | | |
| | | | | | |  | | |
| | | | | |
| | | | | | | | | |
| | | | | |
| | | | | | | | | |
Item 2. Code of Ethics.
| (a) | As of April 30, 2020, the registrant has adopted a code of ethics that applies to its principal executive officer, principal financial officer, principal accounting officer or controller, or persons performing similar functions, regardless of whether these individuals are employed by the registrant or a third party (the “Code of Ethics”). |
| (c) | The registrant has not amended its Code of Ethics during the period covered by this report. |
| (d) | The registrant has not granted any waivers, including an implicit waiver, from any provisions of its Code of Ethics during the period covered by this report. |
Item 3. Audit Committee Financial Expert.
The registrant’s Board of Trustees has determined that the registrant has at least one “audit committee financial expert” (as defined in Item 3 of Form N-CSR), serving on its audit committee. Barry P. Benjamin and Theresa Hamacher are the “audit committee financial experts” and are “independent” (as each term is defined in Item 3 of Form N-CSR).
Under applicable securities laws and regulations, a person who is determined to be an audit committee financial expert will not be deemed an “expert” for any purpose, including without limitation for purposes of Section 11 of the Securities Act of 1933, as amended, as a result of being designated or identified as an audit committee financial expert. The designation or identification of a person as an audit committee financial expert does not impose on such person any duties, obligations, or liability that are greater than the duties, obligations, and liability imposed on such person as a member of the registrant’s Audit Committee and Board of Trustees in the absence of such designation or identification. The designation or identification of a person as an audit committee financial expert does not affect the duties, obligations or liability of any other member of the registrant’s Audit Committee or Board of Trustees.
Item 4. Principal Accountant Fees and Services.
Item 4(a): Audit Fees
The aggregate fees billed for each of the last two fiscal years for professional services rendered by Ernst & Young LLP (“E&Y”), independent registered public accounting firm, for the audit of the registrant’s annual financial statements or services that are normally provided by the accountant in connection with statutory and regulatory filings or engagements are $300,000 in 2020 and $285,000 in 2019.
Item 4(b): Audit-Related Fees
The aggregate fees billed in each of the last two fiscal years for assurance and related services by E&Y that are reasonably related to the performance of the audit of the registrant’s financial
statements and are not reported under paragraph (a) of this Item are NONE in 2020 and NONE in 2019.
Item 4(c): Tax Fees
The aggregate fees billed in each of the last two fiscal years for professional services rendered by E&Y for RIC tax compliance and diversification review and tax return review are $242,850 in 2020 and $35,000 in 2019.
Item 4(d): All Other Fees
The aggregate fees billed in each of the last two fiscal years for products and services provided by E&Y, other than the services reported in paragraphs (a) through (c) of this Item are NONE in 2020 and NONE in 2019.
Item 4(e)(1): Pre-Approval Policies and Procedures
Pursuant to the registrant’s Audit Committee Charter adopted on March 9, 2018, the Audit Committee shall, to the extent required by applicable regulations, pre-approve (i) all audit and permitted non-audit services rendered by the independent auditors to a Fund and (ii) all non-audit services rendered by the independent auditors to a Fund’s investment adviser(s) (including any sub-advisers) and to certain of the investment adviser’s affiliates, as applicable. The Audit Committee may implement policies and procedures by which such services are pre-approved other than by the full Committee (for example, by the Committee chair).
Item 4(e)(2): Percentage of Fees Pre-Approved Pursuant to Waiver Provision of Paragraph (c)(7)(i)(C) of Rule 2-01 of Regulation S-X
No percentage of the principal accountant’s fees or services were approved pursuant to the waiver provision of paragraph (c)(7)(i)(C) of Rule 2-01 of Regulation S-X.
Item 4(f): Work Performed by Persons Other than the Principal Accountant
Not applicable.
Item 4(g): Aggregate Non-Audit Fees Disclosure
The aggregate non-audit fees and services billed by E&Y for services rendered to the registrant and service affiliates for the last fiscal year was $242,850 in 2020 and $35,000 in 2019.
Item 4(h): Non-Audit Services and Independent Accountant’s Independence
The registrant’s Audit Committee has considered whether the provision of non-audit services to service affiliates, not pre-approved pursuant to paragraph (c)(7)(ii) of Rule 2-01 of Regulation S-X, is compatible with maintaining the registered public accountant’s independence in performing audit services.
Item 5. Audit Committee of Listed Registrants.
Not applicable.
Item 6. Investments.
| (a) | The registrant has elected to include the schedule of investments in securities of unaffiliated issuers as part of the report to shareholders filed under Item 1 of this report on Form N-CSR. |
Item 7. Disclosure of Proxy Voting Policies and Procedures for Closed-End Management Investment Companies.
Not applicable.
Item 8. Portfolio Managers of Closed-End Management Investment Companies.
Not applicable.
Item 9. Purchases of Equity Securities by Closed-End Management Investment Company and Affiliated Purchasers.
Not applicable.
Item 10. Submission of Matters to a Vote of Security Holders.
There have been no material changes to the procedures by which shareholders may recommend nominees to the registrant’s Board of Trustees.
Item 11. Controls and Procedures.
| (a) | The registrant’s principal executive and principal financial officers, or persons performing similar functions, have concluded that the registrant’s disclosure controls and procedures (as defined in Rule 30a-3(c) under the Investment Company Act of 1940 (the “1940 Act”)) are effective, based on the evaluation of these controls and procedures required by Rule 30a-3(b) under the 1940 Act and Rules 13a-15(b) or 15d-15(b) under the Securities Exchange Act of 1934, as of a date within 90 days of the filing date of this report. |
| (b) | There were no changes in the registrant’s internal control over financial reporting (as defined in Rule 30a-3(d) under the 1940 Act) that occurred during the period covered by this report that have materially affected, or are reasonably likely to materially affect, the registrant’s internal control over financial reporting. |
Item 12. Disclosure of Securities Lending Activities for Closed-End Management Investment Companies.
Not applicable.
Item 13. Exhibits.
SIGNATURES
Pursuant to the requirements of the Securities Exchange Act of 1934 and the Investment Company Act of 1940, the registrant has duly caused this report to be signed on its behalf by the undersigned, thereunto duly authorized.
Morningstar Funds Trust
| | |
| By | | /s/ Daniel E. Needham |
| | Daniel E. Needham, President |
| | (Principal Executive Officer) |
Date: July 7, 2020
Pursuant to the requirements of the Securities Exchange Act of 1934 and the Investment Company Act of 1940, this report has been signed below by the following persons on behalf of the registrant and in the capacities and on the dates indicated.
| | |
| By | | /s/ Daniel E. Needham |
| | Daniel E. Needham, President |
| | (Principal Executive Officer) |
|
| Date: July 7, 2020 |
| |
| By | | /s/ Tracy L. Dotolo |
| | Tracy L. Dotolo, Treasurer |
| | (Principal Financial Officer) |
|
| Date: July 7, 2020 |