UNITED STATES
SECURITIES AND EXCHANGE COMMISSION
Washington, D.C. 20549
FORM 1-U
CURRENT REPORT
Pursuant to Regulation A of the Securities Act of 1933
March 6, 2024
(Date of Report (Date of earliest event reported))
RealtyMogul Apartment Growth REIT, Inc.
(Exact name of issue as specified in its charter)
| Maryland | | 81-5263630 |
| (State or other jurisdiction | | (I.R.S. Employer |
| of incorporation or organization) | | Identification No.) |
10573 W Pico Blvd,
PMB #603
Los Angeles, CA, 90064
(Full mailing address of
principal executive offices)
(877) 781-7153
(Issuer’s telephone number, including area code)
Common Stock
(Title of each class of securities issued pursuant to Regulation A)
Item 9. Other Events.
On March 6, 2024, RealtyMogul Apartment Growth REIT, Inc. issued an investor communication relating to the quarter ended December 31, 2023. The text of the investor communication is set forth below.
Q4 2023*
To discuss your REIT holdings, schedule a call with Investor Relations at:
https://calendly.com/realtymogul-investor-relations or call 877-781-7062
REALTYMOGUL APARTMENT GROWTH REIT
| OFFERING OVERVIEW | | TOTAL ASSET VALUE1 | | $ | 270,000,000 | |
| | | NUMBER OF INVESTMENTS2 | | | 9 | |
| RealtyMogul Apartment Growth REIT is a non-traded REIT, investing both preferred and joint venture equity in value-add multifamily apartment buildings, with a focus on providing capital appreciation to investors. | | TOTAL NUMBER OF MULTIFAMILY UNITS2 | | | 1,609 | |
| | | INCEPTION TO DATE RETURN3 | | | 5.8 | % |
| | | FIVE-YEAR RETURN3 | | | 6.6 | % |
| | | THREE-YEAR RETURN3 | | | 8.3 | % |
| | | ONE-YEAR RETURN3 | | | -5.1 | % |
| | | Q4 ANNUALIZED DISTRIBUTION RATE4 | | | 4.5 | % |
| | | DISTRIBUTION FREQUENCY | | | Quarterly | |
| | | TAX REPORTING FORM | | | 1099-DIV | |
| | | CONSECUTIVE DISTRIBUTIONS4 | | | 24 Quarters | |
KEY OBJECTIVES
● To realize capital appreciation in the value of our investments over the long term
● To pay attractive and stable cash distributions.
PORTFOLIO STATISTICS5
*All data as of December 31, 2023 unless otherwise specified.
1 Aggregate value of all underlying properties in RealtyMogul Apartment Growth REIT, Inc. based on the most recent internal valuations as of the end of the fiscal quarter upon which our most recently announced net asset value (“NAV”) per share is based pursuant to our valuation policies; provided, however, the value of properties underlying investments acquired since the effective date of the most recently announced NAV per share is based on the most recent purchase price of such properties. As with any methodology used to estimate value, the methodology employed by our affiliates’ internal accountants or asset managers is based upon a number of estimates and assumptions about future events that may not be accurate or complete. For more information, see the “Description of Our Common Stock – Valuation Policies” section of our offering circular.
2 Based on the current outstanding investments as of January 31, 2024.
3 Returns shown reflect the percent change in the NAV per share from the beginning of the applicable period, plus the amount of any distribution per share declared in the period. All returns shown assume reinvestment of quarterly distributions pursuant to RealtyMogul Apartment Growth REIT’s distribution reinvestment plan, are derived from unaudited financial information and are net of all RealtyMogul Apartment Growth REIT expenses, including management fees. An individual stockholder’s total return may vary from the total return, and there is no assurance that stockholders will be able to realize the estimated NAV per share upon attempting to sell their shares. Past performance is historical and not a guarantee of future results. Additional return metrics can be found at the RealtyMogul website.
4 There is no guarantee that stockholders will receive a distribution, and distributions have been paid from sources other than cash flow from operations, including net proceeds from our offering, cash advances by our Manager, cash resulting from a waiver of fees or reimbursements due to our Manager, borrowings in anticipation of future operating cash flow and the issuance of additional securities. The board of directors may in the future declare lower distributions or no distributions at all for any given period.
5 Based on the original real estate investment amounts as of January 31, 2024.
MARKET UPDATES
VIEWS FROM MANAGEMENT
Dear Investor,
Thank you for your continued support of RealtyMogul Apartment Growth REIT. We have now provided 24 consecutive quarters of distributions, totaling over $12,000,000. Currently, over 3,600 investors are invested, and RealtyMogul Apartment Growth REIT holds investments in over $270 million6 of real estate. We are also happy to share that as of January 2024, approximately 62% of investors have enrolled in the distribution reinvestment plan (the “DRIP”), allowing for their distributions to compound over time. If you would like to participate in the DRIP, simply log into your account and then select “Reinvest Distributions.”
As of January 2024, Apartment Growth REIT has 9 real estate investments, including 8 joint venture equity investments and one preferred equity investment, with the underlying real estate spread across seven states. Of the 16 investments that we have originated since inception, 7 have paid off in full, totaling over $15 million.
In 2023, 100% of our distributions were classified as non-dividend distributions, or return of capital, which distributions are non-taxable in certain instances.7,8 This classification was due in part to depreciation and amortization from our real estate investments.7,8 We believe this is a benefit for our REIT investors.8
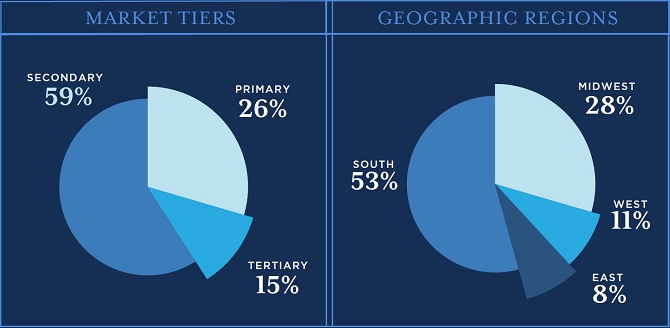
Apartment Growth REIT focuses solely on multifamily apartment communities with two main types of business plans – the first is value-add apartment communities that can benefit from a full-scale interior and exterior renovation and the second is stabilized apartment communities that have high projected occupancy. We have invested the majority of our time and capital into value-add projects, focusing on business plans that target higher growth coming from renovations. In terms of asset geography, we have focused on primary and secondary markets, primarily in the Sun Belt. Historically, that is where we have seen the best opportunities for value-add assets. Out of the 16 investments that we have made to date, 7 have been in the state of Texas. We have invested in Texas due to the significant growth potential of the Texas Triangle, which is Austin, DFW, Houston and San Antonio and what we feel is a favorable business climate in the state.
6 Aggregate value of all underlying properties in RealtyMogul Apartment Growth REIT, Inc. based on the most recent internal valuations as of the end of the fiscal quarter upon which our most recently announced NAV per share is based pursuant to our valuation policies; provided, however, the value of properties underlying investments acquired since the effective date of the most recently announced NAV per share is based on the most recent purchase price of such properties. As with any methodology used to estimate value, the methodology employed by our affiliates’ internal accountants or asset managers is based upon a number of estimates and assumptions about future events that may not be accurate or complete. For more information, see the “Description of Our Common Stock – Valuation Policies” section of our offering circular.
7There is no guarantee that stockholders will receive a distribution, and distributions have been paid from sources other than cash flow from operations, including net proceeds from our offering, cash advances by our Manager, cash resulting from a waiver of fees or reimbursements due to our Manager, borrowings in anticipation of future operating cash flow and the issuance of additional securities. The board of directors may in the future declare lower distributions or no distributions at all for any given period
8Each investor’s tax considerations are different and consulting a tax advisor is recommended. Any of the data provided herein should not be construed as investment, tax, accounting or legal advice. Return of capital reduces the shareholder’s tax basis in the year the distribution is received, and generally defers taxes on that portion until the capital asset is sold. Certain non-cash deductions, such as depreciation and amortization, lower the taxable income for distributions. A portion of distributions may be tax deferred given the ability to characterize ordinary income as return of capital. Certain non-cash deductions, such as depreciation and amortization, lower the taxable income for distributions. Investors should be aware that a REIT’s return on capital percentage may vary significantly in a given year and, as a result, the impact of the tax law and any related advantages may vary significantly from year to year
More generally, we feel that the multifamily asset class produces one of the best risk-adjusted returns in real estate. First, we believe the United States currently has a housing supply shortage, which we believe has been exacerbated by current mortgage holders, 60% of which have loans with interest rates below 4%. With record home prices, higher interest rates on 30-year fixed rate mortgages relative to the last two decades and the basic need for housing, we believe there is strong short-term downside protection for this asset class. We also believe this asset class also has built in inflation protection as rents can be reset on an annual basis.
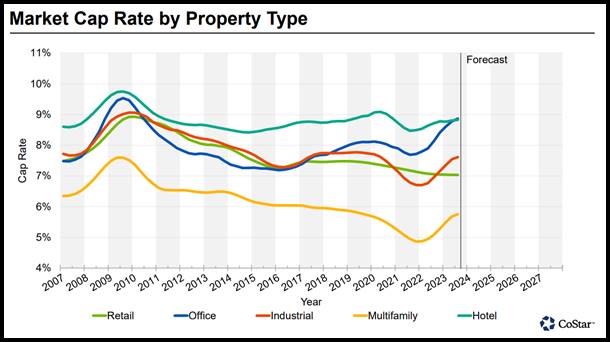
In the wake of the rising interest rate environment of 2022 and 2023, commercial property values have decreased according to Green Street. Since January 2022, short- and long-term interest rates have increased significantly, with the Federal Funds Rate increasing over 5% and the 10-year U.S. Treasury increasing by almost 3%. We believe that cap rates and interest rates are positively correlated. As a result, as interest rates increased over the past two years, cap rates increased across four of the five major asset classes, which we believe is due to a buyers need to compensate oneself for the decreased cash flow caused by the higher interest rates.
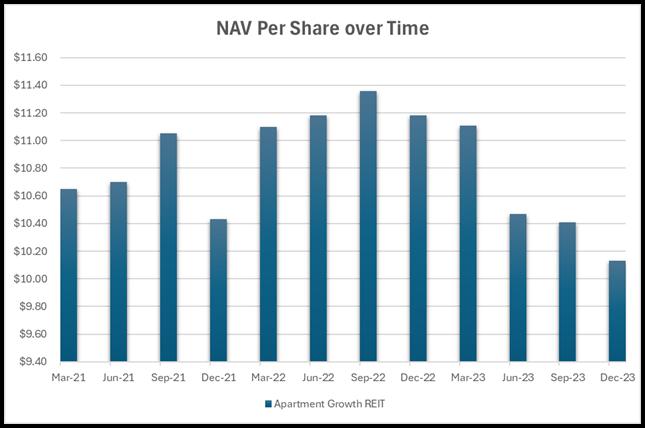
As it relates to Apartment Growth REIT, we saw a similar trend in our NAV per share. Changes to our NAV per share are primarily driven by the value of the real estate in our portfolio. For Q4 2023, NAV per share decreased from $10.41 to $10.13, reflecting a 2.7% decrease quarter over quarter. The Q4 distribution reflected an approximately 4.50% annual distribution rate based on a $10.41 NAV per share. The NAV per share calculation as of December 31, 2023 reflects the total value of Apartment Growth REIT’s assets minus the total value of our liabilities, divided by the number of shares outstanding as of December 31, 2023. Since Apartment Growth REIT’s NAV per share peak in June 2022, we have seen a decrease in NAV per share by 9.4%, which we believe was caused, in part, by cap rate increases having a downward impact on real estate prices.
Although values are down year-over-year, we believe the underlying property fundamentals in Apartment Growth REIT’s portfolio remain strong. As of 4Q23, occupancy for the underlying properties in the portfolio has averaged 91%, and rent collection has averaged 95%. Moreover, for YTD 2022 versus YTD 2023, the underlying properties in the portfolio have averaged net operating income increases of 4.4%, and we have maintained our distributions for 24 consecutive quarters.6 Lastly, the weighted average interest rate on the property-level mortgages for Apartment Growth REIT sits at 4.74% as of 4Q23.9
In 2023, we began to see buying signals for value-add assets as we started to see property values decrease and value investment opportunities increase. We acquired one preferred equity investment, Restoration on Candlewood, an apartment community located in Oklahoma City. Rather than investing in common equity, we felt more comfortable investing as preferred equity, which we believe is a more secure position of the capital stack. In connection with this investment, any distributions to equity are made first to pay down our preferred equity investment and only after our investment is paid off are common equity investors paid.
We were also active in acquiring joint venture equity investments with our affiliate, RM Communities. In April 2023, we acquired Ridgeline View Townhomes, a Class A townhome community located in Vancouver, Washington. This was a brand-new asset that RM Communities sourced from a developer with whom they had already purchased two other assets. The business plan was to acquire the property at an attractive basis and burn off concessions from the initial lease-up. We felt a newer vintage asset helped to round out and diversify our traditionally value-add portfolio. The next two acquisitions, Brookside Apartments, a low-rise apartment community located in Raleigh, North Carolina acquired in June 2023, and Hunters Ridge, a Class B apartment community located in East Lansing, Michigan acquired in December 2023, were true value-add plays, with planned unit renovations and exterior improvements. Brookside also represented the REIT’s first investment into the Raleigh-Durham MSA, a market on which we are bullish.
Lastly, we invested a portion of our outstanding cash in short-term U.S. T-bills, which yielded approximately 4.9% on a blended basis. For comparison, from March 2020 to January 2022, 3-month T-bills yielded less than 1%. We felt this was a good investment at this time while we continued to search for additional real estate asset acquisitions.
We saw value opportunities arise in 2023, and we are starting to see further buying opportunities in the market as there are signals that interest rates may have peaked. There is also significant maturing debt that is coming due for many real estate assets across asset classes, which may lead to increased distressed buying opportunities.
9 Certain mortgages for the underlying properties within the Apartment Growth REIT are floating rate mortgages with an interest rate cap agreement executed. The weighted average interest rates for Apartment Growth REIT assume the highest possible interest rate based on the caps in place at the properties.
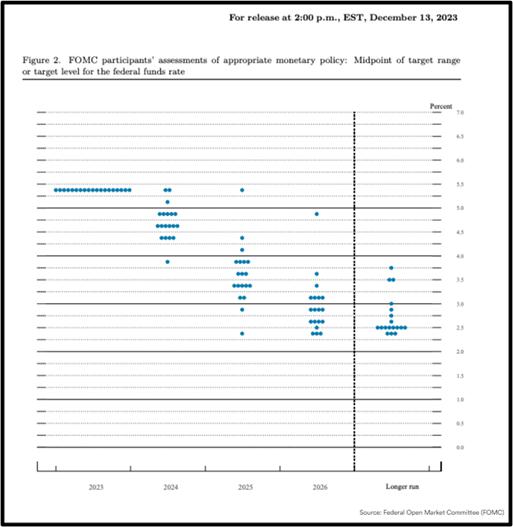
We believe interest rates are one of the largest drivers of commercial real estate activity. In September 2023, the Fed paused interest rate hikes of the Federal Funds Rate, the overnight rate set by the Fed at which banks borrow and lend their reserves to one another overnight. Similarly, the Fed has indicated that it will begin to explore interest rate decreases in 2024. The graph below reflects the projection of the members of the Fed for the appropriate midpoint of the Federal Funds Rate. Currently, the majority of the Fed members are indicating a Federal Funds Rate of 4.25% to 5%, which would reflect a decrease of 50 to 100 basis points from today’s rate. We believe this would have a positive impact on real estate values.
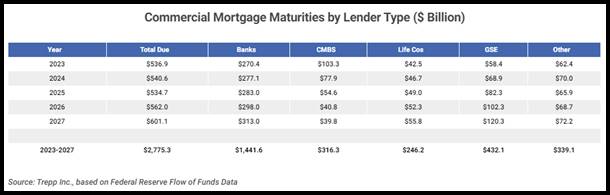
One of the interesting items to note is the impending maturity of over $500 billion of commercial mortgages. We had thought distress due to floating rate debt would present itself in the market sooner, but we did not see this and it inhibited, in part, our buying opportunities. We believe some of this distress will appear in 2024, and we want to be ready for buying opportunities that we feel will arise from this distress.
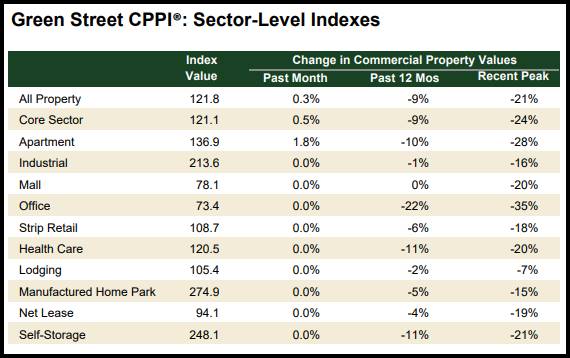
Lastly, property values are off between 7% and 35% from their March 2022 peaks according to Green Street’s Commercial Property Price Index (CPPI), with multifamily properties specifically down 28% based on this index. We see this as a buying opportunity for 2024.
For our multifamily acquisition targets, we believe there is still more price discovery to be done in this “new normal” interest rate environment. One of the main barometers for our multifamily underwriting is to compare the affordability of our underwritten rents to median incomes in the area. We believe affordability to be around 25-30% of area median income, and we typically target underwritten rents that support that range. Secondly, we want to be smart about using leverage for our acquisitions. There are still instances in which operators are acquiring properties with negative leverage given how high interest rates still are relative to cap rates. In most cases, we want to avoid negative leverage. Lastly, we want to prudently manage our cash positions and reserves throughout 2024. While the macro climate is looking better, went want to proceed cautiously. We want to protect the REIT by keeping some cash invested in our money market account or U.S. treasuries. As of year-end 2023, approximately 28% of Apartment Growth REIT’s assets were in cash and liquid securities. As we enter 2024, we want to strike a balance between being prudent with our cash position while also taking advantage of the buying opportunities that we believe will arise in the market.
INVESTMENT ACTIVITY
DISTRIBUTIONS
RealtyMogul Apartment Growth REIT has declared distributions for 24 consecutive quarters. The board of directors authorized a distribution for each month of the fourth quarter of 2023 on September 28, 2023. Exclusive of special distributions, distributions have been paid on a quarterly basis since January 1, 2018 and equate to approximately 4.5% on an annualized basis based upon the then current per share purchase price.
PORTFOLIO OVERVIEW10
| ASSET | | LOCATION | | ACQUISITION DATE | | PROPERTY TYPE | | INVESTMENT TYPE | | INVESTMENT
AMOUNT | | | INTEREST RATE | |
| Brooklyn Portfolio | | Brooklyn, NY | | 11/30/17 | | Multifamily | | JV Equity | | $ | 3,000,000 | | | | N/A | |
| Ninety-Nine44 Apartments | | Dallas, TX | | 9/9/20 | | Multifamily | | JV Equity | | $ | 4,000,000 | | | | N/A | |
| The Orion | | Orion Township, MI | | 3/23/21 | | Multifamily | | JV Equity | | $ | 5,000,000 | | | | N/A | |
| Lotus Village | | Austin, TX | | 6/25/21 | | Multifamily | | JV Equity | | $ | 2,776,192 | | | | N/A | |
| Sherwood Oaks | | Riverview, FL | | 11/30/21 | | Multifamily | | JV Equity | | $ | 4,402,871 | | | | N/A | |
| Restoration on Candlewood | | Oklahoma City, OK | | 3/21/23 | | Multifamily | | Preferred Equity | | $ | 5,250,000 | | | | 15.50 | % |
| Ridgeline View Townhomes | | Vancouver, WA | | 5/19/23 | | Multifamily | | JV Equity | | $ | 4,000,000 | | | | N/A | |
| Brookside Apartments | | Raleigh, NC | | 6/30/23 | | Multifamily | | JV Equity | | $ | 3,000,000 | | | | N/A | |
| Hunters Ridge | | East Lansing, MI | | 12/7/23 | | Multifamily | | JV Equity | | $ | 5,500,000 | | | | N/A | |
| Total | | | | | | | | | | $ | 36,929,063 | | | | | |
10 All data as of January 31, 2024 unless otherwise specified. All preferred equity investments are performing as of January 31, 2024.
INVESTMENT UPDATES
| BROOKLYN PORTFOLIO | | NINETY-NINE44 APARTMENTS |

| | 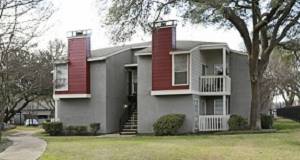 |
Location: Brooklyn, NY Equity Investment: $3,000,000 Business Plan: Acquire nine rent-stabilized properties, maximize occupancy and increase rents as allowed. Investment Type: Joint Venture Equity Acquisition Date: 11/30/2017 Asset Management Update: Portfolio occupancy remained static quarter over quarter, ending Q4 at 100%, with zero vacant units in the 112-unit portfolio. The real estate company has been leasing, and will continue to lease, units according to the legal rents set by the New York Rent Guidelines Board. For the time period from October 2023 to September 2024, the Rent Guidelines Board has allowed for increases of 3.00% for one-year leases and 5.95% for two-year leases. The property averaged 95% rent collection for Q4 2023. | | Location: Dallas, TX Equity Investment: $4,000,000 Business Plan: Acquire and renovate a garden-style apartment community. Investment Type: Joint Venture Equity Acquisition Date: 9/9/2020 Asset Management Update: Property occupancy decreased 1% quarter over quarter, ending Q4 at 88% occupied. As of December 2023, the real estate company renovated 53 units. Of those 53 units, 51 have been leased and have achieved an average premium of $169/month, or 19% over prior rents. The real estate company has completed exterior capex work, including landscaping, parking lot repairs, parking lot restriping, trip hazard repairs, laundry room improvements, carport replacement, and fitness center improvements. The real estate company plans to improve the fans, lighting, and air conditioning for the fitness center as well as playground and private yard improvements in the coming quarters. The property averaged 92% rent collection for Q4 2023. |
THE ORION 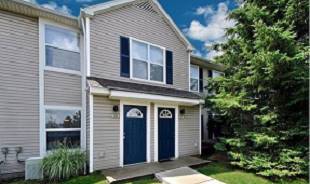
Location: Orion Township, MI Equity Investment: $5,000,000 Business Plan: Acquire and renovate a garden-style apartment community. Investment Type: Joint Venture Equity Acquisition Date: 3/23/2021 Asset Management Update: Property occupancy decreased 1% quarter over quarter, ending Q4 at 96% occupancy. As of December 2023, 103 of the 200 units have been renovated since acquisition. Of those 103 units, 102 have been leased and have achieved an average premium of $319/month, or 28% over prior rents. The real estate company has completed exterior improvements, including the clubhouse remodel, BBQ area, new exterior paint, new signage, new dog park, parking lot projects, playground area, and irrigation system work have been completed. Based on completed work, exterior improvements were completed below budget. The property averaged 97% rent collection for Q4 2023. | | LOTUS VILLAGE 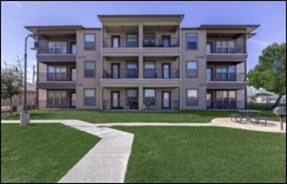
Location: Austin, TX Equity Investment: $2,776,192 Business Plan: Acquire and renovate a low-rise apartment community. Investment Type: Joint Venture Equity Acquisition Date: 6/25/2021 Asset Management Update: Property occupancy decreased 8% quarter over quarter, ending Q4 at 86% occupancy due to regular seasonal tenant turnover. As of December 2023, 54 of the 222 units have been renovated since acquisition. Of those 54 units, 53 have been leased and have achieved an average premium of $212/month, or 17% over prior rents. The real estate company has completed capex work, including fitness center renovations, pool repairs, signage enhancement, BBQ area updates, dog park updates, landscaping, and garage repairs. The property averaged 96% rent collection for Q4 2023. During Q2 2023, the real estate company funded a capital call totaling $276,192 to purchase an interest rate cap related to an extension of the loan and provide working capital in anticipation of a 2024 sale of the property. |
SHERWOOD OAKS 
Location: Riverview, FL Equity Investment: $4,402,871 Business Plan: Acquire and renovate a garden-style apartment community. Investment Type: Joint Venture Equity Acquisition Date: 11/30/2021 Asset Management Update: Property occupancy increased 3% quarter over quarter, ending Q4 at 94% occupancy. The capital improvements budget includes solely exterior work as the prior owner previously renovated all unit interiors. The dog park, pool, parking lot, wastewater facility, fitness center, outdoor amenities, drainage, HVAC replacements, and landscaping improvements have all been completed. The property averaged 98% rent collection for Q4 2023. | | RESTORATION ON CANDLEWOOD 
Location: Oklahoma City, OK Equity Investment: $5,250,000 Business Plan: The borrower used to proceeds of the investment to acquire and lease-up a garden style apartment community. Investment Type: Preferred Equity Acquisition Date: 3/21/2023 Required Redemption Date: 3/31/2026 Asset Management Update: Property occupancy increased 13% quarter over quarter, ending Q4 at 80% occupancy. Since quarter end, the property has increased to 90% leased as of February 6, 2024. The real estate company is performing regular unit turns as the prior owner previously renovated all unit interiors. The property averaged 98% rent collection for Q4 2023. |
RIDGELINE VIEW TOWNHOMES 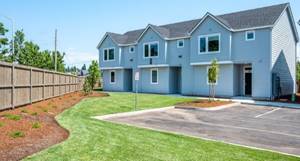
Location: Vancouver, WA Equity Investment: $4,000,000 Business Plan: Acquire a 2022-built, Class A townhome community and grow revenues by reducing concessions associated with initial lease up. Investment Type: Joint Venture Equity Acquisition Date: 5/19/2023 Asset Management Update: Property occupancy increased 2%, or one unit, quarter over quarter, ending Q4 at 88% occupancy. The real estate company is in the process of adding technology packages to the units as part of the business plan to increase rental rates. The property averaged 87% rent collection for Q4 2023. | | BROOKSIDE APARTMENTS 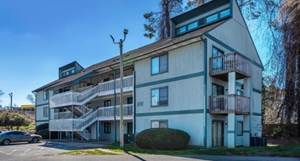
Location: Raleigh, NC Equity Investment: $3,000,000 Business Plan: Acquire and renovate a low-rise apartment community. Investment Type: Joint Venture Equity Acquisition Date: 6/30/2023 Asset Management Update: Property occupancy decreased 16%, or 11 units, quarter over quarter, ending Q4 at 77%, which decrease we believe is due to units being scheduled for renovation. The real estate company is expected to start unit interior renovation work in Q1 2024. Additionally, the real estate company has completed capex work, including plumbing replacements, siding repairs, and exterior paint. The property averaged 92% rent collection for Q4 2023. |
HUNTERS RIDGE 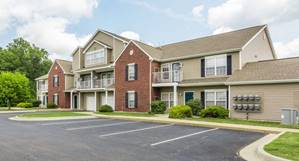
Location: East Lansing, MI Equity Investment: $5,500,000 Business Plan: Acquire and renovate a garden-style apartment community. Investment Type: Joint Venture Equity Acquisition Date: 12/7/2023 Asset Management Update: The property was acquired in December 2023, and the real estate company is implementing its business plan for the property. The property is 98% occupied as of December 2023. | | |
INVESTMENT PAYOFFS
VILLAS DEL SOL I & II (FKA PLANO MULTIFAMILY PORTFOLIO) 
Location: Plano, TX Equity Investment: $1,000,000 Business Plan: Acquire and renovate a portfolio of garden-style apartment buildings. Investment Type: Joint Venture Equity Acquisition Date: 01/09/2018 Date Sold: 12/22/2023 Asset Management Update: On December 22, 2023, the property was sold. As a result of the business plan for the renovation of the property, since its acquisition, 67 of the 156 units had been renovated. The exterior and common area improvements were completed, including an updated leasing office, new gazebos, the addition of BBQ grills, an upgraded laundry room, and an upgraded soccer court. The initial underwriting projected a property-level internal rate of return (“IRR”) of 23.6%, a 2.6x equity multiple and 12.0% average cash-on-cash return throughout a 5-year hold period. Based on the property’s sale price, we believe the property will achieve approximately a 37.1% property-level IRR, a 3.2x equity multiple and 14.3% average cash-on-cash return over the 6.0-year hold period. | | |
NET ASSET VALUE (NAV)
| PRICE PER SHARE (AS OF 1/9/24)* | | | NAV PER SHARE (AS OF 12/31/23) | |
| $ | 10.13 | | | $ | 10.13 | |
*Our offering price per share equals our most recently announced NAV per share and will be adjusted at the beginning of every fiscal quarter (or as soon as commercially reasonable thereafter). On January 9, 2024, we announced that our NAV per share is $10.13, as of December 31, 2023. Accordingly, effective January 9, 2024, the offering price per share is $10.13. The price per share pursuant to our distribution reinvestment plan will equal our most recently announced NAV per share and any repurchases of shares made pursuant to our share repurchase program will be made at the most recent NAV per share (less any applicable discounts, as set forth in our offering circular).
The NAV per share calculation reflects the total value of our assets minus the total value of our liabilities, divided by the number of shares outstanding.
As with any methodology used to estimate value, the methodology employed calculating our NAV per share is based upon a number of estimates and assumptions about future events that may not be accurate or complete. Further, different parties using different assumptions and estimates could derive a different NAV per share, which could be significantly different from our calculated NAV per share. Our NAV will fluctuate over time and does not represent: (i) the price at which our shares would trade on a national securities exchange, (ii) the amount per share a stockholder would obtain if he, she or it tried to sell his, her or its shares or (iii) the amount per share stockholders would receive if we liquidated our assets and distributed the proceeds after paying all our expenses and liabilities.
Copyright © 2024 RM Adviser, LLC, All rights reserved.
Previous Updates
Please follow the below links to access updates from the prior four quarters. Historical quarterly updates can also be found on the SEC EDGAR website.
Q3 2023 Shareholder Letter
Q2 2023 Shareholder Letter
Q1 2023 Shareholder Letter
Q4 2022 Shareholder Letter
As always, please feel free to contact us at info@realtymogul.com or call directly with any questions you may have.
Sincerely,
| /s/ Jilliene Helman | | /s/ Eric Levy |
| Jilliene Helman | | Eric Levy |
| CEO, RM Adviser, LLC | | Vice President, Portfolio Manager, RM Adviser, LLC |
Forward-Looking Statements
This Current Report on Form 1-U contains forward-looking statements within the meaning of the federal securities laws. The words “believe,” “estimate,” “expect,” “anticipate,” “intend,” “plan,” “seek,” “may,” “continue,” “could,” “might,” “potential,” “predict,” “should,” “will,” “would,” and similar expressions or statements regarding future periods or the negative of these terms are intended to identify forward-looking statements. These forward-looking statements involve known and unknown risks, uncertainties and other important factors that could cause our actual results, performance or achievements, or industry results, to differ materially from any predictions of future results, performance or achievements that we express or imply in this Current Report on Form 1-U.
SIGNATURES
Pursuant to the requirements of Regulation A, the issuer has duly caused this report to be signed on its behalf by the undersigned, thereunto duly authorized.
| | REALTYMOGUL APARTMENT GROWTH REIT, INC. |
| | | |
| | By: | /s/ Jilliene Helman |
| | Name: | Jilliene Helman |
| | Title: | Chief Executive Officer and President |
| | | |
| | By: | /s/ Eric Levy |
| | Name: | Eric Levy |
| | Title: | Vice President, Portfolio Manager, RM Adviser, LLC |
| | | |
| | Date: | March 6, 2024 |