UNITED STATES
SECURITIES AND EXCHANGE COMMISSION
Washington, D.C. 20549
FORM 1-U
CURRENT REPORT
Pursuant to Regulation A of the Securities Act of 1933
June 10, 2024
(Date of Report (Date of earliest event reported))
RealtyMogul Apartment Growth REIT, Inc.
(Exact name of issue as specified in its charter)
| Maryland | | 81-5263630 |
| (State or other jurisdiction | | (I.R.S. Employer |
| of incorporation or organization) | | Identification No.) |
10573 W Pico Blvd,
PMB #603
Los Angeles, CA, 90064
(Full mailing address of
principal executive offices)
(877) 781-7153
(Issuer’s telephone number, including area code)
Common Stock
(Title of each class of securities issued pursuant to Regulation A)
Item 9. Other Events.
On June 10, 2024, RealtyMogul Apartment Growth REIT, Inc. issued an investor communication relating to the quarter ended March 31, 2024. The text of the investor communication is set forth below.
Q1 2024*
To discuss your REIT holdings, schedule a call with Investor Relations at:
https://calendly.com/realtymogul-investor-relations or call 877-781-7062
REALTYMOGUL APARTMENT GROWTH REIT
| OFFERING OVERVIEW | | TOTAL ASSET VALUE1 | | | $263,000,000 | |
| | | NUMBER OF INVESTMENTS2 | | | 9 | |
| RealtyMogul Apartment Growth REIT is a non-traded REIT, investing both preferred and joint venture equity in value-add multifamily apartment buildings, with a focus on providing capital appreciation to investors. | | TOTAL NUMBER OF MULTIFAMILY UNITS2 | | | 1,609 | |
| | | INCEPTION TO DATE RETURN3 | | | 5.2 | % |
| | | FIVE-YEAR RETURN3 | | | 5.8 | % |
| | | THREE-YEAR RETURN3 | | | 6.1 | % |
| | | ONE-YEAR RETURN3 | | | -8.1 | % |
| | | Q1 ANNUALIZED DISTRIBUTION RATE4 | | | 4.5 | % |
| | | DISTRIBUTION FREQUENCY | | | Quarterly | |
| | | TAX REPORTING FORM | | | 1099-DIV | |
| | | CONSECUTIVE DISTRIBUTIONS4 | | | 25 Quarters | |
KEY OBJECTIVES
● To realize capital appreciation in the value of our investments over the long term
● To pay attractive and stable cash distributions.
PORTFOLIO STATISTICS5
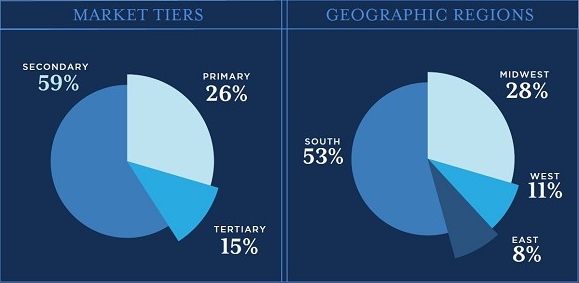
*All data as of March 31, 2024 unless otherwise specified.
1 Aggregate value of all underlying properties in RealtyMogul Apartment Growth REIT, Inc. based on the most recent internal valuations as of the end of the fiscal quarter upon which our most recently announced net asset value (“NAV”) per share is based pursuant to our valuation policies; provided, however, the value of properties underlying investments acquired since the effective date of the most recently announced NAV per share is based on the most recent purchase price of such properties. As with any methodology used to estimate value, the methodology employed by our affiliates’ internal accountants or asset managers is based upon a number of estimates and assumptions about future events that may not be accurate or complete. For more information, see the “Description of Our Common Stock – Valuation Policies” section of our offering circular.
2 Based on the current outstanding investments as of April 30, 2024.
3 Returns shown reflect the percent change in the NAV per share from the beginning of the applicable period, plus the amount of any distribution per share declared in the period. All returns shown assume reinvestment of quarterly distributions pursuant to RealtyMogul Apartment Growth REIT’s distribution reinvestment plan, are derived from unaudited financial information and are net of all RealtyMogul Apartment Growth REIT expenses, including management fees. An individual stockholder’s total return may vary from the total return, and there is no assurance that stockholders will be able to realize the estimated NAV per share upon attempting to sell their shares. Past performance is historical and not a guarantee of future results. Additional return metrics can be found at the RealtyMogul website.
4 There is no guarantee that stockholders will receive a distribution, and distributions have been paid from sources other than cash flow from operations, including net proceeds from our offering, cash advances by our Manager, cash resulting from a waiver of fees or reimbursements due to our Manager, borrowings in anticipation of future operating cash flow and the issuance of additional securities. The board of directors may in the future declare lower distributions or no distributions at all for any given period.
5 Based on the original real estate investment amounts as of April 30, 2024.
MARKET UPDATES
VIEWS FROM MANAGEMENT
Dear Investor,
Thank you for your continued support of RealtyMogul Apartment Growth REIT. We have now provided 25 consecutive quarters of distributions, totaling over $12,600,000. Currently, over 3,600 investors are invested, and RealtyMogul Apartment Growth REIT holds investments in over $263 million6 of real estate. We are also happy to share that as of April 2024, approximately 60% of investors have enrolled in the distribution reinvestment plan (the “DRIP”), allowing for their distributions to compound over time. If you would like to participate in the DRIP, simply log into your account and then select “Reinvest Distributions.”
As of April 2024, Apartment Growth REIT has 9 real estate investments, including 8 joint venture equity investments and one preferred equity investment, with the underlying real estate spread across seven states. Of the 16 investments that we have originated since inception, 7 have paid off in full, totaling over $15 million.
In 2023, 100% of our distributions were classified as non-dividend distributions, or return of capital, which distributions are non-taxable in certain instances.7,8 This classification was due in part to depreciation and amortization from our real estate investments.7,8 We believe this is a benefit for our REIT investors.8
As it relates to the broader macroeconomic climate, interest rates in the United States – short-term rates set by the Federal Reserve (the “Fed”) as well as long-term rates determined by the treasury markets – remain elevated compared to the last 20 years. The Fed, which originally indicated that they would consider reducing the benchmark Federal Funds Rate in 2024, has yet to make any changes. In early 2024, we saw market predictions of six interest-rate cuts in 2024 as compared to our current anticipation of at most two interest-rate cuts, with the possibility of no interest-rate cuts as of the date of this communication.
The Fed has commented that it will hold off on lowering rates until inflation retreats to its annual target of 2%. Two indices the Fed uses to evaluate inflation, the Consumer Price Index (“CPI”) and the Personal Consumption Expenditure Index (“PCE”), sit at 3.4% year-over-year and 2.7% year-over-year as of April 2024, respectively. Shelter and housing costs reflect 33% of CPI and 16% of PCE, and we believe are one of the main reasons for the stickiness of the current inflationary environment. Shelter and housing are considered lagging indicators, and we believe that the outsized rent growth of the last two years has given way to rent growth that is in line with historical norms, which we may see reflected in inflation readings going forward.
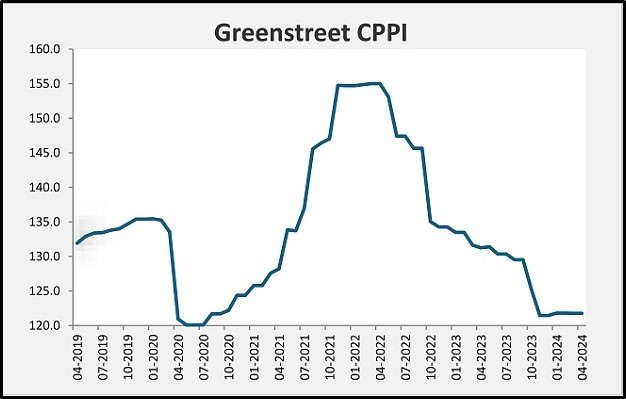
As a result of sticky inflation, interest rates have remained elevated for a longer period than originally anticipated. The effect of a higher for longer interest rate environment on real estate has been felt in all asset classes. Greenstreet’s Commercial Property Price Index (“CPPI”), a measure of pricing for institutional quality real estate, is down 7% over the past year as of April 2024 and 21% since its March 2022 peak. Similarly, NAREIT’s Equity Apartments Index reflects a 2% decrease and a 32% decrease over the same time periods.
6 Aggregate value of all underlying properties in RealtyMogul Apartment Growth REIT, Inc. based on the most recent internal valuations as of the end of the fiscal quarter upon which our most recently announced NAV per share is based pursuant to our valuation policies; provided, however, the value of properties underlying investments acquired since the effective date of the most recently announced NAV per share is based on the most recent purchase price of such properties. As with any methodology used to estimate value, the methodology employed by our affiliates’ internal accountants or asset managers is based upon a number of estimates and assumptions about future events that may not be accurate or complete. For more information, see the “Description of Our Common Stock – Valuation Policies” section of our offering circular.
7 There is no guarantee that stockholders will receive a distribution, and distributions have been paid from sources other than cash flow from operations, including net proceeds from our offering, cash advances by our Manager, cash resulting from a waiver of fees or reimbursements due to our Manager, borrowings in anticipation of future operating cash flow and the issuance of additional securities. The board of directors may in the future declare lower distributions or no distributions at all for any given period.
8 Each investor’s tax considerations are different and consulting a tax advisor is recommended. Any of the data provided herein should not be construed as investment, tax, accounting or legal advice. Return of capital reduces the shareholder’s tax basis in the year the distribution is received, and generally defers taxes on that portion until the capital asset is sold. Certain non-cash deductions, such as depreciation and amortization, lower the taxable income for distributions. A portion of distributions may be tax deferred given the ability to characterize ordinary income as return of capital. Certain non-cash deductions, such as depreciation and amortization, lower the taxable income for distributions. Investors should be aware that a REIT’s return on capital percentage may vary significantly in a given year and, as a result, the impact of the tax law and any related advantages may vary significantly from year to year.
Real estate values, both in the private and public sectors, have been impacted by this elevated interest rate environment due, in part, to what we believe to be a positive correlation between cap rates and interest rates. As a result, as interest rates increased over the past two years, cap rates increased across four of the five major asset classes, which we believe was due to a buyer’s need to compensate itself for the decreased cash flow caused by the higher interest rates.
Further, a wave of debt maturities, particularly floating-rate debt originated from 2020 through 2022, is forcing some owners to sell assets out of necessity rather than attempting to achieve peak pricing with the goal of avoiding default on their loans and/or foreclosure of their properties.
Apartment Growth REIT is experiencing the same valuation pressures as is the broader market, which are reflected in the REIT’s NAV. Changes to our NAV are primarily driven by the value of the underlying real estate in our portfolio. Over the past year, our NAV per share decreased by 12%, and it is down 14% from its September 2022 peak. For Q1 2024, NAV per share decreased from $10.13 to $9.75, reflecting a 3.8% decrease quarter over quarter.
Of the eight joint venture equity investments in Apartment Growth REIT’s portfolio, six properties have fixed-rate debt and five have maturities in 2028 and beyond. There are two properties in the portfolio that have floating-rate debt with maturities in 2024, whose loans mature in July and November.
The strategy for each of these properties is to pursue three paths simultaneously to preserve optionality – extend with the current lender, refinance with a new lender and sell the asset. Any refinance or loan extension will require an additional cash contribution. Additional cash is needed for a loan extension primarily because of the cost to purchase an interest rate cap, an insurance policy that limits how high an interest rate can rise on variable rate debt, which is a typical requirement for a floating-rate loan. For a refinance, additional cash is needed because the proceeds of a new loan will need to be supplemented to fully retire the existing loan. We are evaluating all such options in real time.
Although values are down year-over-year, we believe the underlying property fundamentals in Apartment Growth REIT’s portfolio remain strong. As of 1Q24, portfolio occupancy has exceeded 89% since 4Q20 and rent collection averaged 93% for the quarter. We have also maintained our distributions for 25 consecutive quarters.7 Lastly, the weighted average interest rate on the property-level mortgages for Apartment Growth REIT sits at 4.74% as of 1Q24.9
9 Certain mortgages for the underlying properties within the Apartment Growth REIT are floating-rate mortgages with an interest rate cap agreement executed. The weighted average interest rates for Apartment Growth REIT assume the highest possible interest rate based on the caps in place at the properties.
The flip side to the slump in commercial real estate is the potential for buying opportunities. From an investment strategy perspective, we still feel that the multifamily asset class produces one of the best risk-adjusted returns in real estate. First, we believe the United States currently has a housing supply shortage, which we believe has been exacerbated by current mortgage holders, 60% of which have loans with interest rates below 4%. With record home prices, higher interest rates on 30-year fixed-rate mortgages relative to the last two decades and the basic need for housing, we believe there is strong short-term downside protection for this asset class. We also believe this asset class has built in inflation protection as rents can be reset on an annual basis.
We believe there will be buying opportunities as a result of the decrease in property values in the real estate sector. It is impossible to time the bottom of the market, but, beginning in 2023, we have been buying real estate on the way down in anticipation of real estate markets stabilizing and rebounding. Last year, we purchased four investments totaling $17.75 million.
The current commercial real estate market appears to be bifurcated between the haves and the have-nots. With debt capital markets remaining tight due to elevated interest rates, those with liquidity will have optionality. While we believe the market is showing signs of bottoming, we want to proceed cautiously. Due to the wide range of potential cash needs for the loan maturities in 2024, we have maintained approximately $14 million, or 27% of the REIT’s NAV, in cash and liquid securities as of May 2024. We want to maintain enough liquidity to preserve existing investments, cover REIT-level cash needs and acquire new assets to the extent opportunities arise. We believe this is the best path forward for protecting and maximizing value for REIT investors.
INVESTMENT ACTIVITY
DISTRIBUTIONS
RealtyMogul Apartment Growth REIT has declared distributions for 25 consecutive quarters. The board of directors authorized a distribution for each month of the first quarter of 2024 on December 26, 2023. Exclusive of special distributions, distributions have been paid on a quarterly basis since January 1, 2018 and equate to approximately 4.5% on an annualized basis based upon the then current per share purchase price.
PORTFOLIO OVERVIEW10
| ASSET | | LOCATION | | ACQUISITION DATE | | PROPERTY TYPE | | INVESTMENT TYPE | | INVESTMENT
AMOUNT | | | INTEREST RATE | |
| Brooklyn Portfolio | | Brooklyn, NY | | 11/30/17 | | Multifamily | | JV Equity | | $ | 3,000,000 | | | | N/A | |
| Ninety-Nine44 Apartments | | Dallas, TX | | 9/9/20 | | Multifamily | | JV Equity | | $ | 4,000,000 | | | | N/A | |
| The Orion | | Orion Township, MI | | 3/23/21 | | Multifamily | | JV Equity | | $ | 5,000,000 | | | | N/A | |
| Lotus Village | | Austin, TX | | 6/25/21 | | Multifamily | | JV Equity | | $ | 2,776,192 | | | | N/A | |
| Sherwood Oaks | | Riverview, FL | | 11/30/21 | | Multifamily | | JV Equity | | $ | 4,402,871 | | | | N/A | |
| Restoration on Candlewood11 | | Oklahoma City, OK | | 3/21/23 | | Multifamily | | Preferred Equity | | $ | 5,250,000 | | | | 15.50 | % |
| Ridgeline View Townhomes | | Vancouver, WA | | 5/19/23 | | Multifamily | | JV Equity | | $ | 4,000,000 | | | | N/A | |
| Brookside Apartments | | Raleigh, NC | | 6/30/23 | | Multifamily | | JV Equity | | $ | 3,000,000 | | | | N/A | |
| Hunters Ridge | | East Lansing, MI | | 12/7/23 | | Multifamily | | JV Equity | | $ | 5,500,000 | | | | N/A | |
| Total | | | | | | | | | | $ | 36,929,063 | | | | | |
10 All data as of April 30, 2024 unless otherwise specified. All preferred equity investments are performing as of April 30, 2024.
11 There is no current pay requirement; interest accrues on a monthly basis and is cumulative and compounding to the extent unpaid.
INVESTMENT UPDATES
| BROOKLYN PORTFOLIO | | NINETY-NINE44 APARTMENTS |

| | 
|
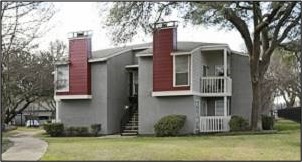
Location: Brooklyn, NY Equity Investment: $3,000,000 Business Plan: Acquire nine rent-stabilized properties, maximize occupancy and increase rents as allowed. Investment Type: Joint Venture Equity Acquisition Date: 11/30/2017 Asset Management Update: Portfolio occupancy ended Q1 at 100%, with zero vacant units in the 112-unit portfolio. The real estate company has been leasing, and will continue to lease, units according to the legal rents set by the New York Rent Guidelines Board. For the time period from October 2023 to September 2024, the Rent Guidelines Board has allowed for increases of 3.00% for one-year leases and 5.95% for two-year leases. In light of the upcoming loan maturity in September, 2025, the property is simultaneously working on refinance, extension, and sale options in order to determine the best path forward. | | Location: Dallas, TX Equity Investment: $4,000,000 Business Plan: Acquire and renovate a garden-style apartment community. Investment Type: Joint Venture Equity Acquisition Date: 9/9/2020 Asset Management Update: Property occupancy ended Q1 at 91%. As of March 2024, the real estate company renovated 53 units. Of those 53 units, 51 have been leased and have achieved an average premium of $169/month, or 19% over prior rents. The real estate company has completed exterior capex work, including landscaping, parking lot repairs, parking lot restriping, trip hazard repairs, laundry room improvements, carport replacement, and fitness center improvements. The real estate company plans to improve the playground and implement private yards in the coming quarters. |
THE ORION 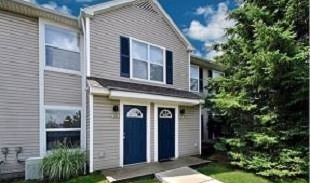
Location: Orion Township, MI Equity Investment: $5,000,000 Business Plan: Acquire and renovate a garden-style apartment community. Investment Type: Joint Venture Equity Acquisition Date: 3/23/2021 Asset Management Update: Property occupancy ended Q1 at 98%. As of March 2024, 108 of the 200 units have been renovated since acquisition. Of those 108 units, 104 have been leased and have achieved an average premium of $320/month, or 24% over prior rents. The real estate company has completed exterior improvements, including the clubhouse remodel, BBQ area, new exterior paint, new signage, new dog park, parking lot projects, playground area, and irrigation system work. Based on completed work, exterior improvements were completed below budget. | | LOTUS VILLAGE 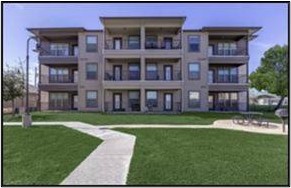
Location: Austin, TX Equity Investment: $2,776,192 Business Plan: Acquire and renovate a low-rise apartment community. Investment Type: Joint Venture Equity Acquisition Date: 6/25/2021 Asset Management Update: Property occupancy ended Q1 at 90%. As of March 2024, 54 of the 222 units have been renovated since acquisition. Of those 54 units, all have been leased and have achieved an average premium of $137/month, or 12% over prior rents. The real estate company has completed capex work, including fitness center renovations, pool repairs, signage enhancement, BBQ area updates, dog park updates, landscaping, and garage repairs. Due to an upcoming loan maturity, sale, extension and refinance options are currently being explored. |
SHERWOOD OAKS 
Location: Riverview, FL Equity Investment: $4,402,871 Business Plan: Acquire and renovate a garden-style apartment community. Investment Type: Joint Venture Equity Acquisition Date: 11/30/2021 Asset Management Update: Property occupancy ended Q1 at 95%. The capital improvements budget includes solely exterior work as the prior owner previously renovated all unit interiors. The dog park, pool, parking lot, wastewater facility, fitness center, outdoor amenities, drainage, HVAC replacements, and landscaping improvements have all been completed. Due to an upcoming loan maturity, sale, extension and refinance options are currently being explored. | | RESTORATION ON CANDLEWOOD 
Location: Oklahoma City, OK Equity Investment: $5,250,000 Business Plan: The borrower used proceeds of the investment to acquire and lease-up a garden-style apartment community. Investment Type: Preferred Equity Acquisition Date: 3/21/2023 Required Redemption Date: 3/31/2026 Asset Management Update: Property occupancy ended Q1 at 91%. The real estate company is performing regular unit turns as the prior owner previously renovated all unit interiors. |
RIDGELINE VIEW TOWNHOMES 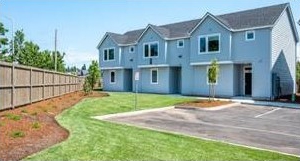
Location: Vancouver, WA Equity Investment: $4,000,000 Business Plan: Acquire a 2022-built, Class A townhome community and grow revenues by reducing concessions associated with initial lease up. Investment Type: Joint Venture Equity Acquisition Date: 5/19/2023 Asset Management Update: Property occupancy ended Q1 at 82%. The real estate company is in the process of adding technology packages to the units as part of the business plan to increase rental rates. | | BROOKSIDE APARTMENTS 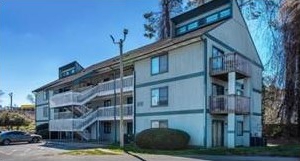
Location: Raleigh, NC Equity Investment: $3,000,000 Business Plan: Acquire and renovate a low-rise apartment community. Investment Type: Joint Venture Equity Acquisition Date: 6/30/2023 Asset Management Update: Property occupancy ended Q1 at 71%. As of March 2024, six of the 31 units have been renovated since acquisition. Of those six units, none have been leased as of March, 2024. Additionally, the real estate company has completed capex work, including plumbing replacements, siding repairs, and exterior paint. |
HUNTERS RIDGE 
Location: East Lansing, MI Equity Investment: $5,500,000 Business Plan: Acquire and renovate a garden-style apartment community. Investment Type: Joint Venture Equity Acquisition Date: 12/7/2023 Asset Management Update: Property occupancy ended Q1 at 91%. As of March 2024, eight of the 132 units have been renovated since acquisition. Of those eight units, five have been leased and have achieved an average premium of $322/month, or 21% over prior rents. Additionally, the real estate company has capex work in process, including fitness center upgrades, roof repairs, and updated signage. | | |
NET ASSET VALUE (NAV)
| PRICE PER SHARE (AS OF 4/24/24)* | | | NAV PER SHARE (AS OF 3/31/24) | |
| $ | 9.75 | | | $ | 9.75 | |
*Our offering price per share equals our most recently announced NAV per share and will be adjusted at the beginning of every fiscal quarter (or as soon as commercially reasonable thereafter). On April 24, 2024, we announced that our NAV per share is $9.75, as of March 31, 2024. Accordingly, effective April 24, 2024, the offering price per share is $9.75. The price per share pursuant to our distribution reinvestment plan will equal our most recently announced NAV per share and any repurchases of shares made pursuant to our share repurchase program will be made at the most recent NAV per share (less any applicable discounts, as set forth in our offering circular).
The NAV per share calculation reflects the total value of our assets minus the total value of our liabilities, divided by the number of shares outstanding.
As with any methodology used to estimate value, the methodology employed calculating our NAV per share is based upon a number of estimates and assumptions about future events that may not be accurate or complete. Further, different parties using different assumptions and estimates could derive a different NAV per share, which could be significantly different from our calculated NAV per share. Our NAV will fluctuate over time and does not represent: (i) the price at which our shares would trade on a national securities exchange, (ii) the amount per share a stockholder would obtain if he, she or it tried to sell his, her or its shares or (iii) the amount per share stockholders would receive if we liquidated our assets and distributed the proceeds after paying all our expenses and liabilities.
Copyright © 2024 RM Adviser, LLC, All rights reserved.
Previous Updates
Please follow the below links to access updates from the prior four quarters. Historical quarterly updates can also be found on the SEC EDGAR website.
Q4 2023 Shareholder Letter
Q3 2023 Shareholder Letter
Q2 2023 Shareholder Letter
Q1 2023 Shareholder Letter
As always, please feel free to contact us at info@realtymogul.com or call directly with any questions you may have.
Sincerely,
| /s/ Jilliene Helman | | /s/ Eric Levy |
| Jilliene Helman | | Eric Levy |
| CEO, RM Adviser, LLC | | Vice President, Portfolio Manager, RM Adviser, LLC |
Forward-Looking Statements
This Current Report on Form 1-U contains forward-looking statements within the meaning of the federal securities laws. The words “believe,” “estimate,” “expect,” “anticipate,” “intend,” “plan,” “seek,” “may,” “continue,” “could,” “might,” “potential,” “predict,” “should,” “will,” “would,” and similar expressions or statements regarding future periods or the negative of these terms are intended to identify forward-looking statements. These forward-looking statements involve known and unknown risks, uncertainties and other important factors that could cause our actual results, performance or achievements, or industry results, to differ materially from any predictions of future results, performance or achievements that we express or imply in this Current Report on Form 1-U.
SIGNATURES
Pursuant to the requirements of Regulation A, the issuer has duly caused this report to be signed on its behalf by the undersigned, thereunto duly authorized.
| | REALTYMOGUL APARTMENT GROWTH REIT, INC. |
| | | |
| | By: | /s/ Jilliene Helman |
| | Name: | Jilliene Helman |
| | Title: | Chief Executive Officer and President |
| | | |
| | By: | /s/ Eric Levy |
| | Name: | Eric Levy |
| | Title: | Vice President, Portfolio Manager, RM Adviser, LLC |
| | | |
| | Date: | June 10, 2024 |