UNITED STATES SECURITIES AND EXCHANGE COMMISSION
Washington, D.C. 20549
FORM 1‑SA
SPECIAL FINANCIAL REPORT PURSUANT TO REGULATION A
For the fiscal semiannual period ended June 30, 2018
MOGULREIT II, Inc.
(Exact name of issue as specified in its charter)
|
|
|
Maryland |
| 81-5263630 |
(State or other jurisdiction |
| (I.R.S. Employer |
of incorporation or organization) |
| Identification No.) |
|
|
|
10780 Santa Monica Blvd, Suite 140 |
|
|
Los Angeles, CA |
| 90025 |
(Full mailing address of |
| (Zip code) |
principal executive offices) |
|
|
(877) 781‑7153
(Issuer’s telephone number, including area code)
Item 1. Management’s Discussion and Analysis of Financial Condition and Results of Operations
An investment in our common stock involves substantial risks. You should carefully consider the risk factors in addition to the other information contained in our offering circular before purchasing shares. The occurrence of the stated risks might cause you to lose a significant part, or all, of your investment. The risks and uncertainties discussed in the offering circular are not the only ones we face, but do represent those risks and uncertainties that we believe are most significant to our business, operating results, prospects and financial condition. Some statements in this semiannual report constitute forward-looking statements. These forward-looking statements involve known and unknown risks, uncertainties and other important factors that could cause our actual results, performance or achievements, or industry results, to differ materially from those expressed or implied by these forward-looking statements, and you are cautioned not to place undue reliance on any forward-looking statements included in this semiannual report. Except as otherwise required by federal securities laws, we do not undertake to publicly update or revise any forward-looking statements, whether as a result of new information, future events or otherwise.
Operating Results
Overview
MogulREIT II, Inc. is a Maryland corporation formed on January 13, 2017 to own and manage a diversified portfolio of preferred equity and joint venture equity investments in multifamily properties located in target markets throughout the United States. The use of the terms “MogulREIT II”, the “Company”, “we”, “us”, or “our” in this semiannual report refer to MogulREIT II, Inc., unless the context indicates otherwise. We are externally managed by RM Adviser, LLC, (our “Manager”), which is an investment adviser registered with the Securities and Exchange Commission (“SEC”) and a wholly-owned subsidiary of RM Sponsor, LLC (our “Sponsor”). Both our Manager and our Sponsor are wholly-owned subsidiaries of Realty Mogul, Co. Although our Manager manages our day-to-day operations, we operate under the direction of our board of directors, majority of whom are independent directors. Our affiliate, RM Technologies, LLC operates an online investment platform, www.realtymogul.com. We currently are offering, pursuant to Regulation A of the Securities Act, up to $50,000,000 in shares of our common stock, including any shares that may be sold pursuant to our distribution reinvestment plan (the “Offering”) and such shares are being offered in the Offering exclusively through the aforementioned platform. We commenced operations on September 18, 2017.
Pursuant to the Offering, we are offering and will continue to offer up to $50,000,000 in shares of our common stock, including any shares that may be sold pursuant to our distribution reinvestment plan. As of June 30, 2018, we had raised total gross offering proceeds of approximately $9,774,852 from settled subscriptions and issued an aggregate of 977,485 shares of our common stock. Assuming the settlement for all subscriptions received, as of June 30, 2018, approximately 4,022,515 in shares of our common stock remained available for sale to the public pursuant to the Offering. We intend to use substantially all of the net proceeds from the Offering (after paying or reimbursing organization and offering expenses) to invest in and manage a diverse portfolio of preferred equity and joint venture equity investments in multifamily properties located in target markets throughout the United States.
Results of Operations
On August 23, 2017, our Offering was qualified by the SEC and we commenced operations on September 18, 2017. Our consolidated financial statements are presented for the six months ended June 30, 2018, resulting in a consolidated loss of $347,079, of which $185,472 was attributable to MogulREIT II, Inc. GAAP requires any subsidiaries or affiliates under common control to be consolidated. The consolidated financial statements include the financial statements of the Company and its controlled joint ventures, Travertine North Park Investors, LLC, and Vinegar Hill Asset, LLC, which were acquired during 2017.
Sources of Operating Revenue and Cash Flows
Our revenue is mainly generated from rental income and tenant reimbursements of our consolidated investments, equity in earnings of our unconsolidated joint ventures and accrued interest in our preferred equity investments.
1
Revenue
For the six months ended June 30, 2018, we earned net rental income of $2.2 million. For the six months ended June 30, 2018 we recorded $312,634 in equity in earnings from our unconsolidated joint ventures. We earned no revenues during the period from January 13, 2017 (inception) through June 30, 2017.
Expenses
For the six months ended June 30, 2018, we incurred depreciation and amortization expenses of $1,005,291. For the six months ended June 30, 2018, we incurred general and administrative expenses of $539,825, which includes professional fees and other costs associated with running our business. For the six months ended June 30, 2018, we incurred real estate expenses of $608,355. For the six months ended June 30, 2018, we incurred interest expense of $720,561. We incurred expenses of approximately $2,000 during the period from January 13, 2017 (inception) through June 30, 2017, which were related to organizational costs.
Distributions
Our board of directors has declared and paid, and we expect that our board of directors will continue to declare and pay, distributions quarterly in arrears. Stockholders who are record holders with respect to declared distributions will be entitled to such distributions until such time as the stockholders have had their shares repurchased by us.
On December 15, 2017, our board of directors authorized a special daily cash distribution of $0.0057682365 per share of the Company’s common stock to stockholders of record as of the close of business on each day of the period commencing on December 17, 2017 and ending on December 31, 2017 (the “Special Distribution Period”), which was payable to stockholders of record as of the close of business on each day of the Special Distribution Period. On December 22, 2017, our board of directors authorized a daily cash distribution of $0.0012328767 per share of the Company’s common stock to stockholders of record as of the close of business on each day of the period commencing on January 1, 2018 and ending on March 31, 2018 (the “Q1 Distribution Period”), which was payable to stockholders of record as of the close of each business day of the Q1 Distribution Period. On March 21, 2018, our board of directors authorized a daily cash distribution of $0.0012328767 per share of the Company’s common stock to stockholders of record as of the close of business each day of the period commencing on April 1, 2018 (the “Q2 Distribution Period”) and ending on June 30, 2018, which was payable to stockholders of record as of the close of business on each day of the Q2 Distribution Period. Our board of directors has declared quarterly distributions for stockholders of record as of the close of business on the last day of each quarter, as shown in the table below.
|
|
|
|
|
Distribution Period for Daily Record Dates | Date of Authorization | Payment Date(1) | Cash Distribution Amount per Share of Common Stock | Annualized Yield |
12/17/2017 - 12/31/2017 | 12/15/2017 | 1/15/2018 | $0.0057682365 | 2.1%(2) |
1/30/2018 - 03/31/2018 | 12/22/2017 | 4/13/2018 | $0.0012328767 | 4.5%(2) |
4/1/2018 - 06/30/2018 | 3/21/2018 | 7/16/2018 | $0.0012328767 | 4.5%(2) |
(1) Dates presented are the dates on which the distributions were scheduled to be distributed; actual distribution dates may vary.
(2) Annualized yield represents the annualized yield amount of each distribution calculated on an annualized basis at the then current rate, assuming a $10.00 per share purchase price.
For the six months ended June 30, 2018, we have made cash distributions to our stockholders totaling $149,727. Our distributions for the six months ended June 30, 2018, including shares issued pursuant to the distribution reinvestment plan, were fully funded by cash flows from operations.
Liquidity and Capital Resources
We require capital to fund our investment activities and operating expenses. Our capital sources may include net proceeds from the Offering, cash flow from operations and borrowings under credit facilities.
2
We are dependent upon the net proceeds from the Offering to conduct our proposed operations. We currently obtain the capital required to purchase real estate-related investments and conduct our operations from the proceeds of the Offering and any future offerings we may conduct, from secured or unsecured financings from banks and other lenders and from any undistributed funds from our operations. As of June 30, 2018, we had made six investments with a net investment value of approximately $11.4 million and had cash of approximately $1.2 million. We anticipate that proceeds from the Offering will provide sufficient liquidity to meet future funding commitments as of June 30, 2018 as well as our operational cost.
If we raise substantially less than $50,000,000 in gross offering proceeds, we will make fewer investments resulting in less diversification in terms of the type, number and size of investments we make and the value of an investment in us will fluctuate more with the performance of the specific assets we acquire. Further, we will have certain fixed operating expenses, including certain expenses as a publicly offered REIT, regardless of whether we are able to raise substantial funds in this Offering. Our inability to raise substantial funds would increase our fixed operating expenses as a percentage of gross income, reducing our net income and limiting our ability to make distributions.
We expect to selectively employ leverage to enhance total returns to our stockholders. Our targeted portfolio-wide leverage after we have acquired an initial substantial portfolio of diversified investments is up to 75% of the fair market value or expected fair market value (for a value-add acquisition) of our assets; provided, however, we may exceed this limit for certain temporary bridge financings. During the period when we are acquiring our initial portfolio, we may employ greater leverage on individual assets (that will also result in greater leverage of the initial portfolio) in order to quickly build a diversified portfolio of assets. As of June 30, 2018, we had no outstanding borrowings other than those owed to related parties and mortgages outstanding on our consolidated investments.
In addition to making investments in accordance with our investment objectives, we expect to use our capital resources to make certain payments to our Manager. During our organization and offering stage, these payments will include payments for reimbursement of certain organization and offering expenses. We expect aggregate organization and offering expenses to be approximately $1,500,000 or, if we raise the maximum offering amount, approximately 3% of gross offering proceeds. If the Offering is not successfully completed, we will not be obligated to pay the remaining offering and organizational costs owed to our Manager. Real estate sponsors may make payments to our Sponsor or its affiliates in connection with the selection or purchase of investments. We will pay the Manager a quarterly asset management fee of one-fourth of 1.25%, which, until September 30, 2018, will be based on our net offering proceeds as of the end of each quarter, and thereafter will be based on the average investment value of our assets. During our acquisition stage, we also expect to make payments to our Manager in connection with the purchase of investments of up to 3% of the contract purchase price of each asset and for costs incurred by our Manager in providing services to us. When assets are disposed of, we expect to make payments to our Manager of up to 2% of the contract sales prices of each property sold.
Cash Flow
The following presents our cash flows for the period January 1, 2018 through June 30, 2018 (in thousands):
|
|
|
|
|
| For the six months ended | |
Operating activities: |
| $ | 428 |
Investing activities: |
|
| (5,805) |
Financing activities: |
|
| 5,425 |
Net increase in cash and cash equivalents |
|
| 48 |
Cash and cash equivalents, beginning of period |
|
| 1,169 |
Cash and cash equivalents, end of period |
| $ | 1,217 |
Net cash provided by operating activities was $428,253 and related to net income after adjustments related to depreciation, amortization, and equity in earnings of unconsolidated joint ventures of $428,530.
3
Net cash used in investing activities was $5,804,677 and related to the acquisition of unconsolidated investments in real estate joint ventures of $4,440,000 and capital improvements of $1,431,488.
Net cash provided by financing activities was $5,424,526 million and related to $5,868,345 in new proceeds from the issuance of shares of our common stock pursuant to the Offering and approximately $5,755,270 in debt proceeds, net of $6,041,079 in debt repayments.
Outlook and Recent Trends
We continue to believe that the near and intermediate-term market for investment in commercial real estate debt securities, commercial real estate-related equity securities and other real estate related assets remains compelling from a risk-return perspective. Given the prospect of moderate growth for the economy, we favor a strategy that targets senior and mezzanine debt to maximize current income, with significant subordinate capital and downside structural protections, and equity securities to share the upside of asset appreciation with our shareholders. Our flexible approach to investing in any U.S. geography and in any of the major commercial real estate property types, including apartment buildings, self-storage facilities, retail centers and office buildings, enables us to quickly take advantage of opportunities created by market changes. We believe that our investment strategy, combined with the expertise of our Manager’s management team, will provide opportunities to invest in assets with attractive returns and structural features.
GDP GROWTH
We believe one important indicator of economic health is the real gross domestic product (“GDP”) growth rate as a positive growth rate indicates an expanding economy. As depicted in the chart below from the U.S. Bureau of Economic Analysis, GDP growth in the second quarter of 2018 reached its highest rate in approximately four years and has averaged over 2% since 2010.
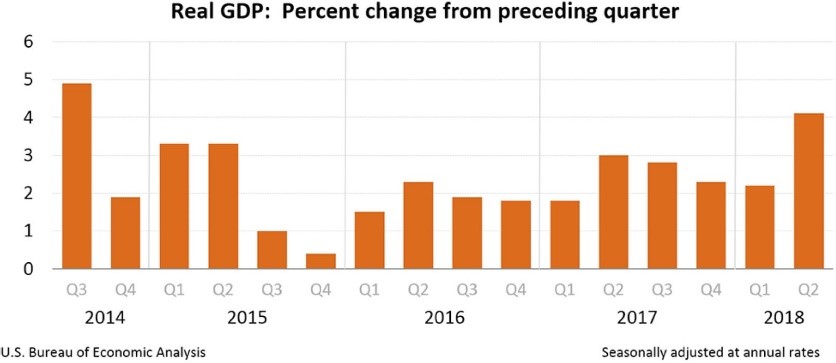
4
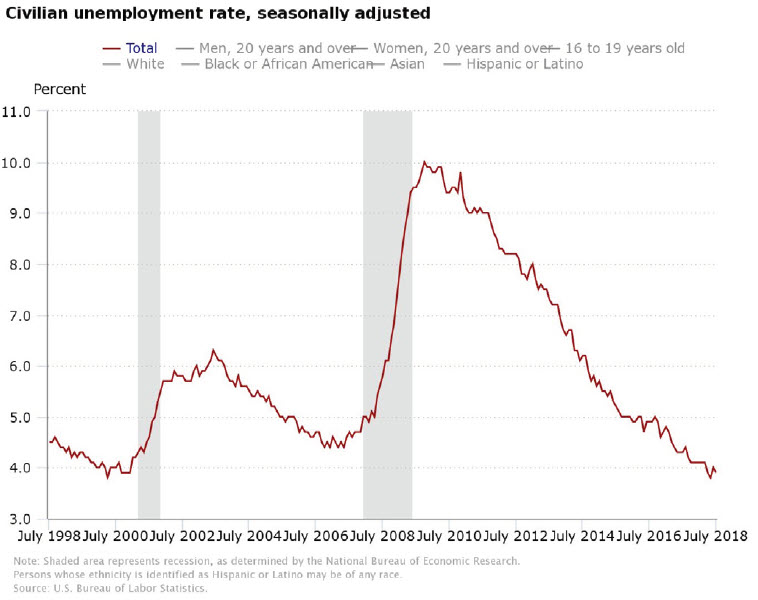
EMPLOYMENT GROWTH
Job growth has also remained strong, and unemployment rates are at their lowest levels in a decade, ending the second quarter of 2018 at 4.0%. We believe that this is one of the most important macroeconomic indicators for real estate.
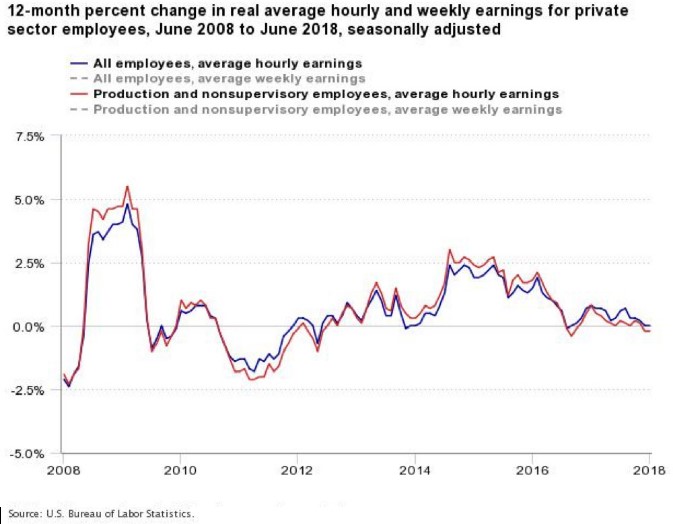
RISK MITIGATION
While the real GDP growth and unemployment metrics are strong, there are certain macroeconomic indicators that we are consistently monitoring for the purposes of risk mitigation. Firstly, although employment growth is positive,
5
wage growth has remained static. As a result, we believe that consumers may not be capturing the full benefit of the growing economy.
Further, one of the drawbacks of high real GDP growth may be an increase in inflation, which would partially erase gains as the dollar becomes less valuable. The U.S. Bureau of Labor Statistics’ Consumer Price Index, or CPI, measures the price changes in consumer goods and services. As indicated in the chart to the right, CPI has been steadily increasing since June 2014.
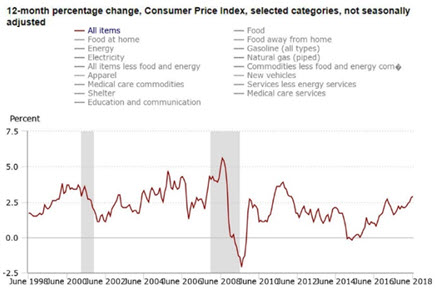
6
POTENTIAL CONSEQUENCES OF CONTINUED GROWTH
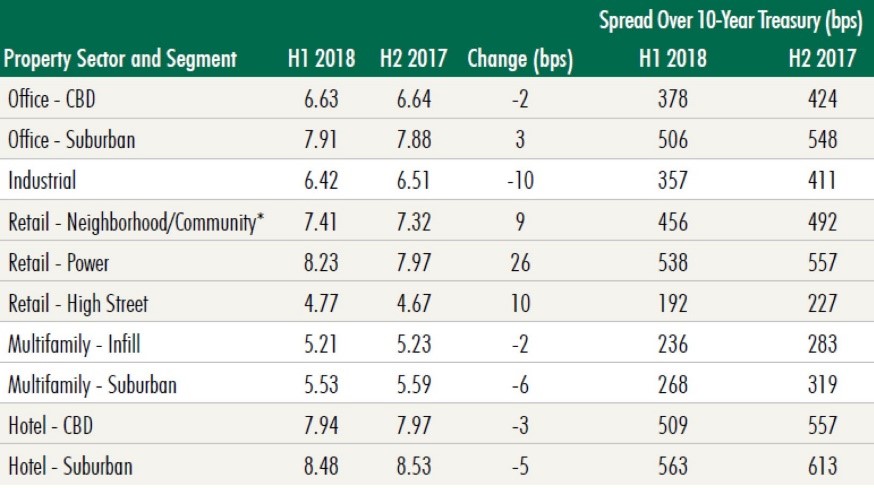
Though a high GDP and rising CPI indicate an expanding economy, there may be other consequences if such growth becomes unmanageable. In order to curb excessive inflation, the Federal Reserve may raise interest rates, which would decrease the money supply and encourage saving rather than spending. The Federal Reserve raised rates three times in 2017 and twice in 2018.
In a rising interest rate environment, one might expect to see capitalization (“cap”) rates rise with interest rates as valuations decrease due to the increased financing costs; however, as interest rates have risen over the past two years, cap rates have decreased. According to CBRE’s Cap Rate Survey for the first half of 2018, cap rates have decreased year-over-year for all sectors aside from retail and suburban office despite a narrowing spread against the 10-year treasury.
Cap rates have continued to fall leading to higher valuations. Despite this sentiment, we believe that MogulREIT II can differentiate itself as an investment vehicle as we rely on our stringent underwriting and pipeline of investments generated by our proprietary technology to continue to source deals that we believe are in the best interests of our investors.
MULTIFAMILY MARKET GROWTH
Multifamily assets in particular have exemplified the strong growth and high valuations of the overall market. Since the 2008 recession, the rental vacancy rate has fallen by approximately 4% compared to a 1% drop in homeowner vacancy. We believe that this indicates a growing demand for rental units compared to home purchases.
7
Further, during the same period, homeownership rates have fallen by approximately 3% despite a 1% uptick in the past two years.
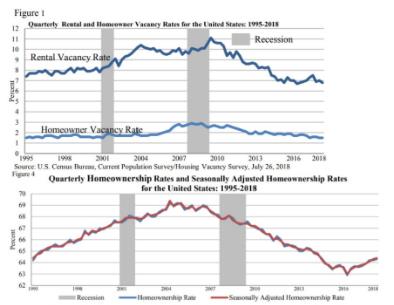
Source: U.S. Census Bureau
TEXAS MULTIFAMILY SPOTLIGHT
MogulREIT II has invested in four multifamily assets in Texas, representing 61.2% of the total REIT.
|
|
|
|
|
|
|
|
|
|
|
|
|
|
PROPERTY | DATE | CITY | STATE | UNITS | INVESTMENT AMOUNT | % OF |
Serendipity Apartments | 9/1/17 | Dallas | TX | 343 | $4,000,000 | 35.0% |
Plano Portfolio | 1/9/18 | Plano | TX | 156 | $1,000,000 | 8.7% |
Tuscany at Westover Hill | 1/31/18 | San Antonio | TX | 190 | $1,000,000 | 8.7% |
Villas del Mar | 2/28/18 | Fort Worth | TX | 263 | $1,000,000 | 8.7% |
|
|
|
|
| $7,000,000 | 61.2% |
We have targeted this allocation given the long-term outperformance of the Texas market when compared to other regional submarkets. According to the second quarter of 2018 NCREIF Property Index, the Southwest sub-region generated returns of 6.88% over the past year, which ranks 4th out of the 8sub-regions; however, over the 10-year period since 2008, it has generated returns of 7.37%, the highest of all sub-regions.
The multifamily-specific metrics reveal a similar trend. The 5.40% return over the past year ranks 5th of the 8 sub-regions, but the 10-year return of 7.33% ranks first. The long-term stability of the Southwest sub-region is a cornerstone of our investment thesis.
Lastly, according to the second quarter of 2018 NCREIF Property Index, garden-style multifamily assets in the Dallas- Plano-Irving MSA have achieved 6.27% returns, composed of 1.42% appreciation and 4.79% income.
8
Critical Accounting Policies
The preparation of financial statements in accordance with GAAP requires management to use judgment in the application of accounting policies, including making estimates and assumptions. Such judgments are based on our management’s experience, our historical experience, the experience of our Manager’s affiliates, and the industry. We consider these policies critical because we believe that understanding these policies is critical to understanding and evaluating our reported financial results. Additionally, these policies may involve significant management judgments and assumptions, or require estimates about matters that are inherently uncertain. These judgments will affect the reported amounts of assets and liabilities and our disclosure of contingent assets and liabilities at the date of the financial statements and the reported amounts of revenue and expenses during the reporting periods. With different estimates or assumptions, materially different amounts could be reported in our financial statements. Additionally, other companies may utilize different estimates that may impact the comparability of our results of operations to those of companies in similar businesses.
Please refer to “Note 2 — Summary of Significant Accounting Policies,” in Item 3. “Financial Statements” contained in this report, for a more thorough discussion of our accounting policies and procedures.
Off-Balance Sheet Arrangements
As of June 30, 2018, we had no off-balance sheet arrangements.
Related Party Arrangements
For further details, please see “Note 6 ─ Related Party Arrangements” in Item 3 “Financial Statements” below.
9
Non-GAAP Financial Measures
Our Manager believes that funds from operations, or FFO, and modified funds from operations, or MFFO, each of which are non-GAAP measures, are additional appropriate measures of the operating performance of a REIT and of our company in particular. We compute FFO in accordance with the standards established by the National Association of Real Estate Investment Trusts, or NAREIT, as net income or loss (computed in accordance with GAAP), excluding gains or losses from sales of depreciable properties, the cumulative effect of changes in accounting principles, real estate-related depreciation and amortization, and after adjustments for unconsolidated/uncombined partnerships and joint ventures. FFO, as defined by NAREIT, is a computation made by analysts and investors to measure a real estate company’s cash flow generated by operations.
This presentation contains modified funds from operations (“MFFO”), a non-GAAP measure which the Investment Program Association (“IPA”) has recommended as a supplemental measure for publicly registered, non-listed REITs. We believe MFFO is reflective of the ongoing operating performance of publicly registered, non-listed REITs by adjusting for those costs that are more reflective of acquisitions and investment activity, along with other items the IPA believes are not indicative of the ongoing operating performance of a publicly registered, non-listed REIT, such as straight-lining of rents as required by GAAP. We believe that MFFO can provide, on a going-forward basis, an indication of the sustainability (that is, the capacity to continue to be maintained) of our operating performance after the period in which we are acquiring properties and once our portfolio is stabilized. MFFO is not equivalent to our net income or loss as determined under GAAP.
Not all publicly registered, non-listed REITs calculate MFFO the same way. Accordingly, comparisons with other non-listed REITs may not be meaningful. Furthermore, MFFO is not indicative of cash flow available to fund cash needs and should not be considered as an alternative to net income (loss) or income (loss) from continuing operations as determined under GAAP as an indication of our performance, as an alternative to cash flows from operations, as an indication of our liquidity, or indicative of funds available to fund our cash needs including our ability to make distributions to our stockholders. MFFO should be reviewed in conjunction with other GAAP measurements and should not be construed to be more relevant or accurate than the current GAAP methodology
Our unaudited MFFO calculation for the six months ended June 30, 2018, is as follows:
|
|
|
|
|
|
| |
|
| For the | |
|
| six months | |
|
| ended | |
|
| June 30, | |
|
| 2018 | |
GAAP net income attributable to MogulREIT II, Inc. |
| $ | (185,472) |
Add: depreciation and amortization of properties |
|
| 577,867 |
Add: amortization of lease intangibles |
|
| 427,424 |
Adjustments for noncontrolling interests |
|
| (466,864) |
Funds from operations ("FFO") applicable to common stock |
|
| 352,955 |
Add: amortization of deferred financing costs and discount |
|
| 82,951 |
Adjustments for noncontrolling interests |
|
| (49,575) |
Modified funds from operations ("MFFO") applicable to common stock |
| $ | 386,331 |
10
Item 2.Other Information
None.
11
Item 3. Financial Statements
MogulREIT II, Inc.
12
MogulREIT II, Inc.
As of June 30, 2018 (unaudited) and December 31, 2017 (audited)
(Amounts in thousands, except share and per share data)
|
|
|
|
|
|
| |
|
| As of June 30, 2018 |
|
| As of December 31, | ||
|
|
|
|
| 2017 | ||
ASSETS |
|
|
|
|
|
| |
Real estate investments, at cost |
|
|
|
|
|
| |
Land |
| $ | 15,592 |
| $ | 15,592 | |
Buildings and improvements |
|
| 33,072 |
|
| 31,641 | |
Total real estate investments, at cost |
|
| 48,664 |
|
| 47,233 | |
Less accumulated depreciation |
|
| (812) |
|
| (234) | |
Real estate investments, net |
|
| 47,852 |
|
| 46,999 | |
Investments in unconsolidated joint ventures |
|
| 3,277 |
|
| - | |
Real estate preferred equity investments |
|
| 1,440 |
|
| - | |
Cash and cash equivalents |
|
| 1,217 |
|
| 1,169 | |
Restricted cash |
|
| 16 |
|
| 48 | |
Shareholder funds receivable |
|
| 195 |
|
| - | |
Rent receivable |
|
| 265 |
|
| 16 | |
Unamortized intangible lease asset, net |
|
| 57 |
|
| 484 | |
Deferred offering costs, net of accumulated amortization of $290 and $24 |
|
| 327 |
|
| 318 | |
Prepaid expenses |
|
| 87 |
|
| 63 | |
Escrow, deposits and other assets |
|
| 339 |
|
| 228 | |
Total Assets |
| $ | 55,072 |
| $ | 49,325 | |
|
|
|
|
|
|
| |
LIABILITIES AND STOCKHOLDERS' EQUITY |
|
|
|
|
|
| |
Liabilities: |
|
|
|
|
|
| |
Mortgages payable, net of $75 and $93 of deferred financing costs and $273 and $338 discount |
| $ | 35,554 |
| $ | 34,372 | |
Accounts payable and accrued expenses |
|
| 464 |
|
| 504 | |
Deferred offering costs payable |
|
| 616 |
|
| 342 | |
Loans payable- related party |
|
| 1,910 |
|
| 3,295 | |
Distributions payable |
|
| 90 |
|
| 33 | |
Other current liabilities |
|
| 598 |
|
| 175 | |
Total Liabilities |
|
| 39,232 |
|
| 38,721 | |
|
|
|
|
|
|
| |
Stockholders' Equity: |
|
|
|
|
|
| |
Common Stock, $0.01 par value; 9,000,000 shares authorized; 977,485 and 371,106 shares issued and outstanding, net of offering costs |
|
| 10 |
|
| 4 | |
Preferred Shares; $0.01 par value; 1,000,000 shares authorized; no shares issued and outstanding |
|
| - |
|
| - | |
Additional paid-in capital |
|
| 9,293 |
|
| 3,650 | |
Accumulated earnings (deficit) |
|
| (859) |
|
| (674) | |
Total MogulREIT II, Inc. stockholders' equity |
|
| 8,444 |
|
| 2,980 | |
Noncontrolling interests in consolidated joint ventures |
|
| 7,396 |
|
| 7,624 | |
Total Stockholders' Equity |
|
| 15,840 |
|
| 10,604 | |
|
|
|
|
|
|
| |
Total Liabilities and Stockholders' Equity |
| $ | 55,072 |
| $ | 49,325 | |
The accompanying Notes to Financial Statements are an integral part of these financial statements.
13
MogulREIT II, Inc.
Consolidated Statements of Operations
For the Six Months Ended June 30, 2018 (unaudited) and the Period January 13, 2017 (Inception) through June 30, 2017 (unaudited)
amounts in thousands)
|
|
|
|
|
|
|
|
|
|
|
|
|
| For the Period | |
|
|
|
| For the |
| January 13, 2017 | |
|
|
|
| six months |
| (Inception) | |
|
|
|
| Ended |
| through | |
|
|
|
| June 30, |
| June 30, | |
|
|
|
| 2018 |
| 2017 | |
Revenues |
|
|
|
|
|
|
|
Rental income, net |
|
| $ | 2,236 |
| $ | - |
Tenant reimbursements |
|
|
| 181 |
|
| - |
Tenant fee revenue |
|
|
| 85 |
|
| - |
Equity in earnings of unconsolidated joint ventures |
|
|
| 313 |
|
| - |
Total revenues |
|
|
| 2,815 |
|
| - |
|
|
|
|
|
|
|
|
Operating expenses |
|
|
|
|
|
|
|
Depreciation and amortization |
|
|
| 1,005 |
|
| - |
General and administrative expenses |
|
|
| 540 |
|
| - |
Real estate expenses |
|
|
| 609 |
|
| - |
Management fees |
|
|
| 148 |
|
| - |
Total operating expenses |
|
|
| 2,302 |
|
| - |
Operating income |
|
|
| 513 |
|
| - |
Other income and expenses |
|
|
|
|
|
|
|
Interest: |
|
|
|
|
|
|
|
Expense |
|
|
| 721 |
|
| - |
Amortization of deferred financing costs |
|
|
| 83 |
|
| - |
Other expenses |
|
|
| 56 |
|
| 2 |
Consolidated loss |
|
|
| (347) |
|
| (2) |
Net loss attributable to noncontrolling interests |
|
|
| (162) |
|
| - |
Net loss attributable to MogulREIT II, Inc. |
|
| $ | (185) |
| $ | (2) |
The accompanying Notes to Financial Statements are an integral part of these financial statements.
14
MogulREIT II, Inc.
Consolidated Statement of Stockholders’ Equity
For the period January 1, 2018 through June 30, 2018 (unaudited)
(Amounts in thousands, except share data)
|
|
|
|
|
|
|
|
|
|
|
|
|
|
|
|
|
|
|
|
|
|
|
|
|
|
|
|
|
| Noncontrolling |
|
|
| ||||
|
| Shares of Common Stock |
| interests in |
| Total Company's | ||||||||||||
|
|
|
|
|
|
| Additional |
| Accumulated |
| consolidated |
| Stockholders' | |||||
|
| Shares |
| Amount |
| Paid-in Capital |
| Deficit |
| joint ventures |
| Equity | ||||||
Balance as of January 1, 2018 |
| 371,106 |
| $ | 4 |
| $ | 3,650 |
| $ |
| (674) |
| $ | 7,624 |
| $ | 10,604 |
Proceeds from issuance of common stock |
| 586,834 |
|
| 6 |
|
| 5,863 |
|
|
| - |
|
| - |
|
| 5,869 |
Shareholder funds receivable |
| 19,545 |
|
| - |
|
| 195 |
|
|
|
|
|
|
|
|
| 195 |
Amortization of deferred offering costs |
| - |
|
|
|
|
| (265) |
|
|
| - |
|
| - |
|
| (265) |
Distributions declared on common stock |
|
|
|
|
|
|
| (150) |
|
|
|
|
|
|
|
|
| (150) |
Distributions to noncontrolling interests |
|
|
|
|
|
|
|
|
|
|
|
|
|
| (66) |
|
| (66) |
Net loss |
| - |
|
| - |
|
|
|
|
|
| (185) |
|
| (162) |
|
| (347) |
Balance as of June 30, 2018 |
| 977,485 |
| $ | 10 |
| $ | 9,293 |
| $ |
| (859) |
| $ | 7,396 |
| $ | 15,840 |
The accompanying Notes to Financial Statements are an integral part of these financial statements.
15
MogulREIT II, Inc.
Consolidated Statement of Cash Flows
For the Six Months Ended June 30, 2018 (unaudited) and the Period January 13, 2017 (Inception) through June 30, 2017 (unaudited)
(Amounts in thousands)
|
|
|
|
|
|
| |
|
|
|
| For the Period | |||
|
| For the |
| January 13, 2017 | |||
|
| six months |
| (inception) | |||
|
| ended |
| through | |||
|
| June 30, |
| June 30, | |||
|
| 2018 |
| 2017 | |||
OPERATING ACTIVITIES: |
|
|
|
|
|
| |
Consolidated loss |
| $ | (347) |
| $ | (2) | |
Adjustments to reconcile consolidated loss to net cash used in |
|
|
|
|
|
| |
operating activities: |
|
|
|
|
|
| |
Depreciation |
| 578 |
|
| - | ||
Amortization of intangibles relating to leases |
| 427 |
|
| - | ||
Amortization of deferred financing costs and discount |
| 83 |
|
| - | ||
Equity in earnings of unconsolidated joint ventures |
| (313) |
|
| - | ||
Net change in rent receivable |
| (248) |
|
| - | ||
Net change in escrows, deposits and other assets |
| (111) |
|
| - | ||
Net change in prepaids |
| (24) |
|
| - | ||
Net change in accounts payable and accrued expenses |
| 21 |
|
| 2 | ||
Net change in other liabilities |
| 362 |
|
| - | ||
Net cash provided by operating activities |
| 428 |
|
| - | ||
INVESTING ACTIVITIES: |
|
|
|
|
| ||
Improvements to real estate |
| (1,432) |
|
| - | ||
Investments in unconsolidated joint ventures |
| (3,000) |
|
| - | ||
Distributions from unconsolidated joint ventures |
| 35 |
|
| - | ||
Investment in real estate preferred equity investments |
| (1,440) |
|
|
| ||
Change in restricted cash |
| 32 |
|
| - | ||
Net cash used in investing activities |
| (5,805) |
|
| - | ||
FINANCING ACTIVITIES: |
|
|
|
|
| ||
Proceeds from the issuance of common stock |
| 5,868 |
|
| 100 | ||
Payment of cash distributions |
| (92) |
|
|
| ||
Proceeds from the issuance of debt |
| 5,755 |
|
| - | ||
Repayment of debt |
| (6,040) |
|
| - | ||
Distributions to noncontrolling interests |
| (66) |
|
| - | ||
Net cash provided by financing activities |
| 5,425 |
|
| 100 | ||
|
|
|
|
|
| ||
Net increase in cash and cash equivalents |
| 48 |
|
| 100 | ||
Cash and cash equivalents, beginning of period |
| 1,169 |
|
| - | ||
Cash and cash equivalents, end of period |
| $ | 1,217 |
| $ | 100 | |
|
|
|
|
|
| ||
|
|
|
|
|
| ||
SUPPLEMENTAL DISCLOSURE OF NON-CASH FINANCING ACTIVITY: |
|
|
|
|
| ||
Deferred offering costs payable |
| $ | 274 |
| $ | 165 | |
Distributions declared but not paid |
| $ | 58 |
| $ | - | |
The accompanying Notes to Financial Statements are an integral part of these financial statements.
16
Note 1 - Organization and nature of operation
MogulREIT II, Inc. (the "Company") was formed as a Maryland corporation on January 13, 2017 to own and manage a diversified portfolio of preferred equity and joint venture equity investments in multifamily properties located in target markets throughout the United States. The use of the terms “MogulREIT II”, the “Company”, “we”, “us”, or “our” in this report refer to MogulREIT II, Inc., unless the context indicates otherwise.
The Company is externally managed by RM Adviser, LLC (“Manager”), which is an affiliate of the Company’s sponsor, RM Sponsor, LLC (“Sponsor”). Our Manager and our Sponsor are each wholly-owned subsidiaries of Realty Mogul, Co. (“RM”). Our Manager is an investment adviser registered with the Securities and Exchange Commission (“SEC”). Although our Manager manages our day-to-day operations, we operate under the direction of our board of directors, a majority of whom are independent directors.
The Company’s investing and management activities related to commercial real estate are all considered a single reportable business segment for financial reporting purposes. All of the investments the Company has made to date have been in domestic commercial real estate assets with similar economic characteristics, and the Company evaluates the performance of all of its investments using similar criterion.
We believe we have operated in such a manner as to qualify as a real estate investment trust (“REIT”) for federal income tax purposes as of and for the year ending December 31, 2018. We hold substantially all of our assets directly, and as of the date of these financial statements have not established an operating partnership or any taxable REIT subsidiary or qualified REIT subsidiary.
Pursuant to the Form 1-A filed with the SEC with respect to our offering (the “Offering”) of up to $50,000,000 in shares of common stock, the purchase price for all shares was $10.00 per share as of June 30, 2018. The Offering was qualified by the SEC on August 23, 2017, and we commenced operations as of September 18, 2017. As of June 30, 2018, the Company has issued 977,485 shares, including 10,000 shares issued to our Sponsor, for an aggregate purchase price of $100,000. The Company has the authority to issue 9,000,000 shares of common stock.
Note 2 – Summary of significant accounting policies
Basis of Presentation and Principles of Consolidation
The accompanying consolidated balance sheet, statement of operations, statement of stockholders’ equity, statement of cash flows and related notes to the financial statements of the Company are prepared in accordance with accounting principles generally accepted in the United States of America (“GAAP”). The Company has adopted a calendar year basis of reporting.
GAAP requires any subsidiaries or affiliates under common control to be consolidated. The consolidated financial statements include the financial statements of the Company and its controlled joint ventures, Travertine North Park Investors, LLC, and Vinegar Hill Asset, LLC, which were acquired during 2017. See Note 4 – Variable Interest Entities.
All significant intercompany balances and transactions are eliminated in consolidation.
In the opinion of management, all adjustments considered necessary for a fair presentation of the Company’s financial position, results of operations and cash flows have been included and are of a normal and recurring nature. Interim results are not necessarily indicative of operating results for any other interim period or for the entire year. These financial statements should be read in conjunction with the Company’s consolidated financial statements and notes thereto included in the Company’s Form 1-K for the fiscal year ended December 31, 2017, which was filed with the SEC on April 30, 2018.
17
Reclassification of Prior Year Presentation
Certain prior year amounts have been reclassified for consistency with the current period presentation. These reclassifications had no effect on the reported consolidated statements of operations.
Use of Estimates
The preparation of the financial statements in conformity with GAAP requires management to make estimates and assumptions that affect the reported amounts of assets and liabilities and disclosure of contingent assets and liabilities at the date of the financial statements. Actual events and results could differ from those assumptions and estimates.
Cash and Cash Equivalents
Cash and cash equivalents consist of demand deposits. Cash and cash equivalents are carried at cost which approximates fair value.
Concentration of Credit Risk
At times, our cash may exceed the Federal Deposit Insurance Corporation deposit insurance limit of $250,000 per institution. The Company mitigates credit risk by placing cash with major financial institutions. To date, the Company has not experienced any losses on cash.
Geographic concentration
As of June 30, 2018, the Company's investments in real estate operate in Brooklyn, New York, Dallas, Texas, Plano, Texas, San Antonio, Texas, Fort Worth, Texas, and Chicago, Illinois. Future operations could be affected by changes in economic or other conditions in those geographical areas or the demand for such housing.
Organizational, Offering and Related Costs
Organizational and offering costs of the Company are initially being paid by the Manager on behalf of the Company. These organizational and offering costs include all expenses to be paid by the Company in connection with the formation of the Company and the qualification of the Offering, and the marketing and distribution of shares, including, without limitation, expenses for printing, and amending offering statements or supplementing offering circulars, mailing and distributing costs, advertising and marketing expenses, charges of experts and fees, expenses and taxes related to the filing, registration and qualification of the sale of shares under federal and state laws, including taxes and fees and accountants’ and attorneys’ fees.
The Company expenses organization costs as incurred and offering costs, when incurred, will be deferred and charged to additional paid-in capital. The deferred offering costs will be charged against the gross proceeds of the Offering when received or written off in the event that the Offering is not successfully completed. The Manager and/or affiliates will be reimbursed for organizational and offering expenses incurred in conjunction with the Offering subject to achieving a minimum capital raise of $1,000,000. The Company was not required to reimburse any organizational and offering costs before June 30, 2018.
As of June 30, 2018 and December 31, 2017, the Manager had incurred offering costs of $616,291 and $341,868, respectively, on behalf of the Company, including the full amount of legal fees of $250,000. As of June 30, 2018 and December 31, 2017, $290,246 and $24,690, respectively, of offering costs had been amortized and were included in the consolidated statement of stockholders’ equity.
Variable Interest Entities
A variable interest entity (“VIE”) is an entity that lacks one or more of the characteristics of a voting interest entity. A VIE is defined as an entity in which equity investors do not have the characteristics of a controlling financial interest or do not have sufficient equity at risk for the entity to finance its activities without additional subordinated financial support from other parties. The determination of whether an entity is a VIE includes consideration of various factors. These factors include review of the formation and design of the entity, its organizational structure including
18
decision-making ability and relevant financial agreements, and analysis of the forecasted cash flows of the entity. We make an initial determination upon acquisition of a VIE, and reassesses the initial evaluation of an entity as a VIE upon the occurrence of certain events.
A VIE must be consolidated only by its primary beneficiary, which is defined as the party who, along with its affiliates and agents has both the: (i) power to direct the activities that most significantly impact the VIE’s performance; and (ii) obligation to absorb the losses of the VIE or the right to receive the benefits from the VIE, which could be significant to the VIE. We determine whether we are the primary beneficiary of a VIE by considering various factors, including, but not limited to: which activities most significantly impact the VIE’s economic performance and which party controls such activities; the amount and characteristics of its investment; the obligation or likelihood for us or other interests to provide financial support; consideration of the VIE’s purpose and design, including the risks the VIE was designed to create and pass through to its variable interest holders and the similarity with and significance to the business activities of our interest and the other interests. We reassess our determination of whether we are the primary beneficiary of a VIE each reporting period. Significant judgments related to these determinations include estimates about the future performance of investments held by VIEs and general market conditions. The maximum risk of loss related to our investments is limited to our recorded investment in such entities, if any.
As of June 30, 2018, we held investments in two entities which are considered to be VIEs. See Note 3 – Variable Interest Entities.
Investments in Unconsolidated Joint Ventures
The Company accounts for its investments in unconsolidated joint ventures using the equity method of accounting as the Company exercises significant influence, but does not control these entities. Under the equity method of accounting, the net equity investment of the Company is reflected in the accompanying consolidated balance sheets and the Company's share of net income from the joint ventures is included in the accompanying consolidated statements of operations.
On a periodic basis, management assesses whether there are any indicators that the value of the Company's investments in unconsolidated joint ventures may be other-than-temporarily-impaired. An investment is impaired only if management's estimate of the value of the investment is less than the carrying value of the investment, and such decline in value is deemed to be other-than-temporary. To the extent impairment has occurred, the loss is measured as the excess of the carrying amount of the investment over the estimated fair value of the investment. The estimated fair value of the investments is determined using a discounted cash flow model which is a Level 3 valuation under ASC 820, "Fair Value Measurement." The Company considers a number of assumptions that are subject to economic and market uncertainties including, among others, demand for space, competition for tenants, changes in market rental rates, operating costs, capitalization rates, holding periods and discount rates.
No other-than-temporary impairment losses on the Company's investments in unconsolidated joint ventures were recognized during the six months ended June 30, 2018.
As of June 30, 2018, we held four investments in unconsolidated joint ventures. See Note 4 – Investments in Unconsolidated Joint Ventures.
Real Estate Preferred Equity Investments
We have certain investments that are legally structured as equity investments with rights to receive preferred economic returns. We report these investments as real estate preferred equity investments when the common equity holders have a contractual obligation to redeem our preferred equity interest at a specified date.
As of June 30, 2018, none of our real estate preferred equity investments were considered impaired, and no impairment charges were recorded in the financial statements. We held one preferred equity investment amounting to $1.4 million as of June 30, 2018. See Note 5 – Real Estate Preferred Equity Investments.
Income Taxes
The Company intends to operate and be taxed as a REIT for federal income tax purposes. To qualify as a REIT, the Company must meet certain organizational and operational requirements, including a requirement to distribute at least
19
90% of its taxable income to its stockholders. As a REIT, the Company generally is not subject to federal corporate income tax on that portion of its taxable income that is currently distributed to stockholders. Even if the Company qualifies for taxation as a REIT, it may be subject to certain state and local taxes on its income and property, and federal income and excise taxes on its undistributed income. No material provisions have been made for federal income taxes in the accompanying consolidated financial statements, and no gross deferred tax assets or liabilities have been recorded as of June 30, 2018.
For the six months ended June 30, 2018, and for the period from inception through December 31, 2017, $149,727 and $32,593, respectively, in distributions have been made to stockholders, which were classified for tax purposes as ordinary income. The Company expects its distributions to be characterized for federal income tax purposes as (i) ordinary income, (ii) non-taxable return of capital, or (iii) long-term capital gain. Distributions that exceed current or accumulated taxable earnings and profits constitute a return of capital for tax purposes and reduce the stockholders’ basis in the shares of common stock. To the extent that distributions exceed both current and accumulated earnings and profits and the shareholders’ basis in shares of common stock, they will generally be treated as a gain or loss upon the sale or exchange of our stockholders’ shares of common stock. When we begin to make distributions to our stockholders, we will report the taxability of such distributions in information returns that will be provided to our stockholders and filed with the Internal Revenue Service in the year following such distributions. This information will be provided annually beginning in the first year that distributions occur.
All tax periods since inception remain open to examination by the major taxing authorities in all jurisdictions where we are subject to taxation.
Revenue Recognition
Rental income is recognized as rentals become due. Rental payments received in advance are deferred until earned. All leases between the Company and tenants of the property are operating leases and are one year or less.
For certain properties, in addition to contractual base rent, the tenants pay their share of utilities to the Company. The income and expenses associated with these properties are generally recorded on a gross basis when the Company is the primary obligor. For the six months ended June 30, 2018, the Company recorded reimbursements of expenses of $180,787, which are reported as Tenant reimbursements in the accompanying consolidated statements of operations.
Tenant fees, such as application fees, administrative fees, late fees, and other revenues from tenants are recorded when earned.
Purchase Accounting for Acquisition of Real Estate
The Company has recorded acquired real estate investments as business combinations when the real estate is occupied, at least in part, at acquisition. Costs directly related to the acquisition of such investments have been expensed as incurred. The Company allocates the purchase price of real estate among land, building, improvements and intangibles, such as the value of above, below and at-market leases, and origination costs associated with in-place leases at the acquisition date. The Company assesses the fair value of the tangible assets of an acquired property by valuing the property as if it were vacant. The value, as determined, is allocated to land, building and improvements based on management's determination of the relative fair values of these assets.
The Company assesses the fair value of lease intangibles based on estimated cash flow projections that utilize appropriate discount rates and available market information. Such inputs are categorized as Level 3 in the fair value hierarchy. In valuing an acquired property's intangibles, factors considered by management include an estimate of carrying costs during the expected lease-up periods, such as real estate taxes, insurance, other operating expenses, and estimates of lost rental revenue during the expected lease-up periods based on its evaluation of current market demand. Management also estimates costs to execute similar leases, including leasing commissions and tenant improvements.
The value of lease intangibles is recorded to amortization expense over the remaining terms of the respective leases. If a lease were to be terminated prior to its contractual expiration date or not renewed, all unamortized amounts relating to that lease would be recognized in operations at that time. The estimated useful lives of intangible assets is 10 months. Amortization expense related to intangible lease assets amounted to $427,424 and $0 for the six months ended June 30, 2018 and the period from inception through June 30, 2017, respectively.
20
The Company assesses the fair value of assumed debt based on estimated cash flow projections that utilize appropriate discount rates and available market information. Such inputs are categorized as Level 3 in the fair value hierarchy. The difference between the fair value and the stated principal of assumed debt is amortized using the effective interest method basis over the terms of the respective debt obligation.
Accounting for Long-Lived Assets and Impairment of Real Estate Owned
The Company reviews its real estate portfolio on a quarterly basis to ascertain if there are any indicators of impairment to the value of any of its real estate assets, including deferred costs and intangibles, to determine if there is any need for an impairment charge. In reviewing the portfolio, the Company examines one or more of the following: the type of asset, the current financial statements or other available financial information of the asset, and the economic situation in the area in which the asset is located. For each real estate asset owned for which indicators of impairment exist, management performs a recoverability test by comparing the sum of the estimated undiscounted future cash flows attributable to the asset to its carrying amount. If the aggregate undiscounted cash flows are less than the asset's carrying amount, an impairment loss is recorded to the extent that the estimated fair value is less than the asset's carrying amount. The estimated fair value is determined using a discounted cash flow model of the expected future cash flows through the useful life of the property. The analysis includes an estimate of the future cash flows that are expected to result from the real estate investment's use and eventual disposition. These cash flows consider factors such as expected future operating income, trends and prospects, the effects of leasing demand, competition and other factors.
Escrows
Real estate taxes, insurance and other escrows aggregating $307,280 and $201,725, respectively, at June 30, 2018 and December 31, 2017, are included in Escrow, deposits and other assets.
Allowance for Doubtful Accounts
The Company maintains an allowance for doubtful accounts for estimated losses resulting from the inability of a tenant to make required rent payments. At June 30, 2018 and December 31, 2017, there was no balance in the allowance for doubtful accounts. The Company records bad debt expense as a reduction of rental income and/or tenant reimbursements.
Depreciation and Amortization
Depreciation of buildings is computed on the straight-line method over an estimated useful life ranging from 30 to 40 years. Depreciation of building improvements is computed on the straight-line method over the estimated useful life of the improvements. Depreciation of furniture, fixtures and equipment is computed on the straight-line method over an estimated useful life of 5 years. Depreciation expense amounted to $577,867 for the six months ended June 30, 2018.
Amortization of intangible lease assets related to the 2017 acquisitions is computed on a straight-line method over an estimated useful life of 10 months. At June 30, 2018, accumulated amortization of intangible lease assets was $655,575.
For the six months ended June 30, 2018, the Company recognized amortization expense of $427,424 relating to the amortization of intangible lease assets, which is included in Depreciation and amortization expense.
The unamortized balance of intangible lease assets at June 30, 2018 of $56,798 will be charged to amortization expense during the second half of 2018.
Deferred Financing Costs
Mortgage costs are deferred and amortized using the effective interest method over the terms of the respective debt obligations. At June 30, 2018, deferred financing costs amounted to $75,407, net of accumulated amortization of $29,003. The Company presents unamortized deferred financing costs as a direct deduction from the carrying amount of the related debt liability.
21
Minimum Future Rents
The rental properties owned at June 30, 2018 are leased under 12-month operating leases with current expirations throughout 2018 and 2019, with certain tenant renewal rights.
Note 3 – Variable Interest Entities
With respect to the two consolidated joint ventures in which the Company holds a 34% and 63% interest, respectively, the Company has determined that such ventures are VIEs because we hold substantive kick-out or participating rights.
In each of these joint ventures, the Company has determined it is the primary beneficiary of the VIE, as it has the power to remove the VIE manager with or without cause, and thus, can direct the activities that most significantly impact each joint venture's performance including management, approval of expenditures, and the obligation to absorb the losses or rights to receive benefits. Accordingly, the Company has consolidated the operations of these joint ventures for financial statement purposes. The joint ventures' creditors do not have recourse to the assets of the Company other than those held by these joint ventures.
The following is a summary of the consolidated VIEs' carrying amounts and classification in the Company's consolidated balance sheet:
|
|
|
|
|
|
|
|
|
|
| June 30, 2018 |
|
|
|
|
| (in thousands) |
Land |
|
|
| $ | 15,592 |
Buildings and improvements, net of accumulated depreciation of $811,585 |
|
|
|
| 32,261 |
Cash and cash equivalents |
|
|
|
| 1,126 |
Restricted cash |
|
|
|
| 16 |
Rent receivable |
|
|
|
| 265 |
Unamortized intangible lease asset, net |
|
|
|
| 57 |
Prepaid expenses |
|
|
|
| 81 |
Escrow, deposits and other assets |
|
|
|
| 339 |
Mortgages payable, net of $92,809 of deferred financing costs and $338,674 discount |
|
|
|
| 35,554 |
Accounts payable and accrued expenses |
|
|
|
| 384 |
Other current liabilities |
|
|
|
| 333 |
Noncontrolling interests in consolidated joint ventures |
|
|
|
| 7,397 |
Note 4 – Investments in Unconsolidated Joint Ventures
The table below presents the activity of the Company's investments in unconsolidated joint ventures as of and for the periods presented (amounts in thousands):
|
|
|
|
|
|
|
|
|
|
|
|
|
|
|
|
| For the Period |
|
|
|
|
| For the |
|
| January 13, 2017 |
|
|
|
|
| six months |
|
| (inception) |
|
|
|
|
| ended |
|
| through |
|
|
|
| June 30, 2018 |
|
| June 30, | |
Investments in Equity Method Investees: |
|
|
|
| (in thousands) |
|
| 2017 |
Beginning balance |
|
|
| $ | - |
| $ | - |
New investments in equity method investees |
|
|
|
| 3,000 |
|
| - |
Distributions received |
|
|
|
| (35) |
|
| - |
Equity in earnings of equity method investees |
|
|
|
| 313 |
|
| - |
Ending balance |
|
|
| $ | 3,277 |
| $ | - |
22
As of June 30, 2018 and December 31, 2017, the Company's investments in unconsolidated joint ventures that are accounted for under the equity method of accounting consist of the following:
1) | Acquired in January 2018 a 31% non-controlling member interest in Plano Oak Gate CRP 27, LLC and Plano Collin Park CRP 28, LLC (collectively the “Plano Multifamily Portfolio”), whose activities are carried out through the following wholly-owned assets: Villas del Sol 1, a 96-unit garden-style apartment community located in Plano, Texas, and Villas del Sol II, a 60-unit garden-style apartment community located in Plano, Texas, |
2) | Acquired in January 2018, a 27% non-controlling member interest in Tuscany CRP 29, LLC, whose activities are carried out through the following wholly-owned assets: Villas de Toscana, a 190-unit, 21-building apartment complex in the Far West submarket of San Antonio, Texas. |
3) | Acquired in February 2018, a 27% non-controlling member interest in Villas del Mar Partners 29, LLC, whose activities are carried out through the following wholly-owned assets: a 263-unit, 35-building apartment complex in the Southwest submarket of Fort Worth, Texas. |
The combined results of operations and financial position of the Company’s equity method investments are summarized below as of and for the six months ended June 30, 2018 (amounts in thousands):
|
|
|
|
|
|
|
|
|
|
|
|
|
|
|
|
|
|
|
| Plano |
|
| Plano |
|
|
|
|
| Villas del |
|
|
|
|
| Oak Gate |
|
| Collin Park |
|
| Tuscany |
|
| Mar Partners |
|
|
|
|
| CRP 27, LLC |
|
| CRP 28, LLC |
|
| CRP 29, LLC |
|
| 29, LLC |
|
|
|
| As of |
|
| As of |
|
| As of |
|
| As of | |
Condensed balance sheet information |
|
|
|
| June 30, 2018 |
|
| June 30, 2018 |
|
| June 30, 2018 |
|
| June 30, 2018 |
Real estate assets, net |
|
|
| $ | 6,048 |
| $ | 3,798 |
| $ | 13,308 |
| $ | 13,454 |
Other assets |
|
|
|
| 1,439 |
|
| 835 |
|
| 3,037 |
|
| 3,289 |
Total assets |
|
|
| $ | 7,487 |
| $ | 4,633 |
| $ | 16,345 |
| $ | 16,743 |
|
|
|
|
|
|
|
|
|
|
|
|
|
|
|
Mortgage notes payable |
|
|
| $ | 5,336 |
| $ | 3,304 |
| $ | 12,155 |
| $ | 12,658 |
Other liabilities |
|
|
|
| 82 |
|
| 50 |
|
| 237 |
|
| 278 |
Equity |
|
|
|
| 2,070 |
|
| 1,280 |
|
| 3,953 |
|
| 3,807 |
Total liabilities and equity |
|
|
| $ | 7,487 |
| $ | 4,633 |
| $ | 16,345 |
| $ | 16,743 |
Company's equity investment |
|
|
| $ | 618 |
| $ | 382 |
| $ | 1,000 |
| $ | 1,000 |
|
|
|
|
|
|
|
|
|
|
|
|
|
|
|
|
|
|
|
| Plano |
|
| Plano |
|
|
|
|
| Villas del |
|
|
|
|
| Oak Gate |
|
| Collin Park |
|
| Tuscany |
|
| Mar Partners |
|
|
|
|
| CRP 27, LLC |
|
| CRP 28, LLC |
|
| CRP 29, LLC |
|
| 29, LLC |
|
|
|
|
| For the six |
|
| For the six |
|
| For the six |
|
| For the six |
|
|
|
| months ended |
|
| months ended |
|
| months ended |
|
| months ended | |
Condensed income statement information |
|
|
|
| June 30, 2018 |
|
| June 30, 2018 |
|
| June 30, 2018 |
|
| June 30, 2018 |
Total revenue |
|
|
| $ | 462 |
| $ | 269 |
| $ | 719 |
| $ | 794 |
Total expenses |
|
|
|
| 189 |
|
| 130 |
|
| 362 |
|
| 439 |
Net income (loss) |
|
|
| $ | 272 |
| $ | 139 |
| $ | 357 |
| $ | 355 |
Company's equity in net income of investee |
|
|
| $ | 84 |
| $ | 43 |
| $ | 92 |
| $ | 94 |
The Company did not have any equity method investments as of December 31, 2017 or during the period from January 13, 2017 (inception) through June 30, 2017.
23
Note 5 - Real Estate Preferred Equity Investments
The following table describes our real estate preferred equity investment activity (amounts in thousands):
|
|
|
|
|
|
|
|
|
|
|
|
| For the Period |
|
|
| For the |
|
| January 13, 2017 |
|
|
| six months |
|
| (inception) |
|
|
| ended |
|
| through |
|
|
| June 30, 2018 |
|
| June 30, |
Real Estate Preferred Equity Investments: |
|
| (in thousands) |
|
| 2017 |
Beginning balance |
| $ | - |
| $ | - |
Investments |
|
| 1,440 |
|
| - |
Principal repayments |
|
| - |
|
| - |
Ending balance |
| $ | 1,440 |
| $ | - |
\
The following table presents the Company’s investments in real estate preferred equity investments, as of June 30, 2018:
|
|
|
|
|
|
|
|
|
|
|
|
|
| Number |
|
| Principal Amount or Cost |
| Carrying Value |
| Average Investment Return |
| |||
Preferred Equity |
| 1 |
|
| $ | 1,440 |
| $ | 1,440 |
| 15.00% |
|
Balance as of June 30, 2018 |
| 1 |
|
| $ | 1,440 |
| $ | 1,440 |
| 15.00% |
|
|
|
|
|
|
|
|
|
|
|
|
|
|
The Company did not have any real estate preferred equity investments as of December 31, 2017.
Note 6 – Borrowings
Mortgages Payable
The following table details the Mortgages payable, net, balances per the consolidated balance sheet:
|
|
|
|
|
|
|
|
|
| As of June 30, 2018 (in thousands) | |
Mortgages payable, gross |
|
|
| $ | 35,901 |
Unamortized discount |
|
|
|
| (272) |
Unamortized deferred financing costs |
|
|
|
| (75) |
Mortgages payable, net |
|
|
| $ | 35,554 |
24
Scheduled principal repayments during the next five years and thereafter are as follows:
|
|
|
|
|
|
Year Ending December 31, |
|
|
| As of June 30, 2018 (in thousands) | |
| 2018 |
|
|
| $ | 223 |
| 2019 |
|
|
|
| 541 |
| 2020 |
|
|
|
| 742 |
| 2021 |
|
|
|
| 769 |
| 2022 |
|
|
|
| 798 |
Thereafter |
|
|
|
| 32,829 |
Total |
|
|
| $ | 35,901 |
|
|
|
|
|
|
Related Party Loans
On August 31, 2017, the Company entered into an unsecured promissory note for approximately $4 million with Realty Mogul Commercial Capital, LLC (“RMCC”), an affiliate of the Manager. The proceeds from the loan were used to purchase the Company’s first asset. The promissory note matures on August 31, 2022 and accrues interest at an annual rate of LIBOR plus 2%. As of June 30, 2018, the balance has been fully paid off.
On November 30, 2017, the Company entered into an unsecured promissory note for approximately $3 million with RMCC. The proceeds from the loan were used to purchase the Company’s second asset. The promissory note matures on November 30, 2022 and accrues interest at an annual rate of LIBOR plus 2%. As of June 30, 2018, the balance has been fully paid off.
On January 8, 2018, the Company entered into an unsecured promissory note for approximately $1 million with RMCC. The proceeds from the loan were used to purchase the Company’s third asset. The promissory note matures on January 8, 2023 and accrues interest at an annual rate of LIBOR plus 2%. As of June 30, 2018, the balance has been fully paid off.
On January 30, 2018, the Company entered into an unsecured promissory note for approximately $1 million with RMCC. The proceeds from the loan were used to purchase the Company’s fourth asset. The promissory note matures on January 30, 2023 and accrues interest at an annual rate of LIBOR plus 2%. As of June 30, 2018, the balance has been fully paid off.
On February 27, 2018, the Company entered into an unsecured promissory note for approximately $1 million with RMCC. The proceeds from the loan were used to purchase the Company’s fifth asset. The promissory note matures on February 27, 2023 and accrues interest at an annual rate of LIBOR plus 2%. During the six months ended June 30, 2018, approximately $0.5 million was paid off.
On June 22, 2018, the Company entered into an unsecured promissory note for approximately $1.4 million with RMCC. The proceeds from the loan were used to purchase the Company’s sixth asset. The promissory note matures on June 29, 2023 and accrues interest at an annual rate of LIBOR plus 2%.
As of June 30, 2018, an aggregate amount of approximately $1.9 million was outstanding on these related party loans. For the six months ended June 30, 2018, $60,188 was incurred in interest expense to RMCC pursuant to these loans, which remains outstanding as of June 30, 2018.
Note 7 – Related Party Arrangements
RM Adviser, LLC, Manager
Subject to certain restrictions and limitations, the Manager is responsible for managing the Company’s affairs on a day-to-day basis and for identifying and making investments on behalf of the Company.
25
The Manager and certain affiliates of the Manager receive fees and compensation in connection with the Company’s public offering, and the acquisition and management of the Company’s real estate investments.
The Manager will be reimbursed for organizational and offering expenses incurred in conjunction with the Offering. The Company will reimburse the Manager for actual expenses incurred on behalf of the Company in connection with the selection or acquisition of an investment, to the extent not reimbursed by the borrower, whether or not the Company ultimately acquires the investment. The Company will reimburse the Manager for out-of-pocket expenses paid to third parties in connection with providing services to the Company. This does not include the Manager’s overhead, employee costs borne by the Manager, utilities or technology costs. Expense reimbursements payable to the Manager also may include expenses incurred by the Sponsor in the performance of services pursuant to a shared services agreement between the Manager and the Sponsor, including any increases in insurance attributable to the management or operation of the Company. See Note 2 – Summary of Significant Accounting Policies – Organizational, Offering and Related Costs.
As of June 30, 2018 and 2017, the Company owed its Manager $616,291 and $0, respectively, in deferred offering costs. As of June 30, 2018 and 2017, $290,246 and $0, respectively, of offering costs were amortized against stockholders’ equity, which represents the ratable portion of proceeds raised to date to the total amount of proceeds expected to be raised from the Offering.
As of June 30, 2018, the Company owed its Manager $155,363 for operating expenses that the Manager paid on the Company’s behalf. The majority of this amount is related to legal, audit, and tax expenses and other administrative expenses unrelated to the Offering. This amount is included under other current liabilities on the consolidated balance sheet.
The Company will pay the Manager a quarterly asset management fee of one-fourth of 1.00%, which, until September 30, 2017, will be based on our net offering proceeds as of the end of each quarter and thereafter will be based on our NAV at the end of each prior quarter. During the six months ended June 30, 2018, $49,792, was charged by the Manager and is included in other current liabilities on the consolidated balance sheet.
Realty Mogul, Co. and affiliates
If the Company has insufficient funds to acquire all or a portion of an investment, then it may obtain a related party loan from an RM Originator or one of its affiliates on commercially reasonable terms. Our charter authorizes us to enter into related party loans. Related party loans would require prior approval from the Board. However, neither Realty Mogul, Co. nor its affiliates are obligated to make a related party loan to the Company at any time. See Note 4 ─ Borrowings.
An entity managed by an affiliate of Realty Mogul, Co. holds a 27% noncontrolling interest in Travertine North Park Investors, LLC., The entity’s equity investment in Travertine was approximately $1,670,000 as of June 30, 2018.
An entity managed by an affiliate of Realty Mogul, Co. holds a 24% noncontrolling interest in Vinegar Hill Asset, LLC. The entity’s equity investment in Vinegar Hill was approximately $2,070,000 as of June 30, 2018.
An entity managed by an affiliate of Realty Mogul, Co. holds a 50% noncontrolling interest in Plano Oak Gate CRP 27, LLC. The entity’s equity investment in Plano Oak Gate was approximately $1,075,000 as of June 30, 2018.
An entity managed by an affiliate of Realty Mogul, Co. holds a 50% noncontrolling interest in Plano Collin Park CRP 28, LLC. The entity’s equity investment in Plano Collin Park was approximately $675,000 as of June 30, 2018.
An entity managed by an affiliate of Realty Mogul, Co. holds a 61% noncontrolling interest in Tuscany CRP 29, LLC. The entity’s equity investment in Tuscany was approximately $2,360,000 as of June 30, 2018.
An entity managed by an affiliate of Realty Mogul, Co. holds a 50% noncontrolling interest in Villas del Mar Partners CRP 29, LLC. The entity’s equity investment in Villas del Mar Partners was approximately $1,860,000 as of June 30, 2018.
26
RM Sponsor, LLC, Stockholder and Sponsor
RM Sponsor, LLC is a stockholder of the Company and holds 10,000 shares of our common stock as of December 31, 2017.
Joint Venture Partners and Affiliates
During the period from inception through December 31, 2017, the Company paid an aggregate of $98,552 to its joint venture partners or other affiliates of its consolidated joint ventures for property management fees, which are included in Real estate expenses and Real estate acquisition costs on the consolidated statements of income.
Executive Officers of our Manager
As of the date of these financial statements, the executive officers of the Company’s Manager and their positions and offices are as follows:
|
|
|
|
|
Name |
| Age |
| Position |
Jilliene Helman |
| 31 |
| Chief Executive Officer and Secretary |
Justin Hughes |
| 36 |
| Senior Managing Director |
Elizabeth Braman |
| 44 |
| Senior Managing Director |
Karen Fleck |
| 35 |
| Chief Financial Officer, Vice President and Treasurer |
Jilliene Helman has served as Chief Executive Officer and Secretary of our Manager since its inception.
Justin Hughes has served as Senior Managing Director of our Manager since its inception.
Elizabeth Braman has served as Senior Managing Director of our Manager since its inception.
Karen Fleck has served as Chief Financial Officer, Vice President and Treasurer of our Manager since its inception.
Note 8 – Economic Dependency
Under various agreements, the Company has engaged or will engage RM Adviser, LLC and its affiliates to provide certain services that are essential to the Company, including asset management services, asset acquisition and disposition decisions, the sale of the Company’s shares of our common stock available for issue, as well as other administrative responsibilities for the Company including accounting services and investor relations. As a result of these relationships, the Company is dependent upon RM Adviser, LLC and its affiliates. In the event that these companies were unable to provide the Company with the respective services, the Company would be required to find alternative providers of these services.
Note 9 – Commitments and Contingencies
Legal Proceedings
As of June 30, 2018, we were not named as a defendant in any active or pending litigation. However, it is possible that the Company could become involved in various litigation matters arising in the ordinary course of our business. Although we are unable to predict with certainty the eventual outcome of any litigation, management is not aware of any litigation likely to occur that we currently assess as being significant to us.
27
Note 10 – Subsequent Events
Events that occur after the balance sheet date, but before the consolidated financial statements were available to be issued, must be evaluated for recognition or disclosure. The effects of subsequent events that provide evidence about conditions that existed at the consolidated balance sheet date are recognized in the accompanying consolidated financial statements. Subsequent events which provide evidence about conditions that existed after the consolidated balance sheet date require disclosure in the accompanying notes. Management has evaluated the activity of the Company through September 30, 2018, the date the consolidated financial statements were available to be issued.
Offering Proceeds
As of September 25, 2018, we had raised total gross offering proceeds of approximately $11,061,000 from settled subscriptions and had issued an aggregate of 1,106,184 shares of our common stock. As of September 25, 2018, 7,893,816 shares of our common stock remained available for sale to the public pursuant to the Offering.
28
Item 4. Exhibits
INDEX TO EXHIBITS
|
|
Exhibit No. | Description |
2.1 | Articles of Amendment and Restatement of MogulREIT II, Inc. (Incorporated by reference to Exhibit 2.1 to the Company’s Offering Statement on Form 1-A/A, filed on August 4, 2017) |
2.2 | Amended and Restated Bylaws of MogulREIT II, Inc. (Incorporated by reference to Exhibit 2.3 to the Company’s Offering Statement on Form 1-A, filed on June 28, 2017) |
4.1 | Form of Subscription Package (Incorporated by reference to Exhibit 4.1 to the Company’s Offering Statement on Form 1-A/A, filed on June 28, 2017) |
4.2 | Distribution Reinvestment Plan (Incorporated by reference to Exhibit 4.2 to the Company’s Offering Statement on Form 1-A/A, filed on June 28, 2017) |
6.1 | Form of Management Agreement between MogulREIT II, Inc. and RM Adviser, LLC (Incorporated by reference to Exhibit 6.1 to the Company’s Offering Statement on Form 1-A/A, filed on June 28, 2017) |
6.2 | Agreement of Limited Partnership of MogulREIT II Operating Partnership, L.P. (Incorporated by reference to Exhibit 6.2 to the Company’s Offering Statement on Form 1-A/A, filed on June 28, 2017) |
6.3 | Form of License Agreement between MogulREIT II, Inc. and Realty Mogul, Co. (Incorporated by reference to Exhibit 6.3 to the Company’s Offering Statement on Form 1-A/A, filed on June 28, 2017) |
6.4 | Form of Master Technology and Services Agreement among RM Technologies, LLC, RM Sponsor, LLC and MogulREIT II, Inc. (Incorporated by reference to Exhibit 6.4 to the Company’s Offering Statement on Form 1-A/A, filed on June 28, 2017) |
6.5 | Investment Sub-Management Agreement by and among MogulREIT II, Inc., RM Adviser, LLC and American Assets Capital Advisers, LLC (Incorporated by reference to Exhibit 6.5 to the Company’s Offering Statement on Form 1-A/A, filed on June 28, 2017) |
29
Pursuant to the requirements of Regulation A, the issuer has duly caused this report to be signed on its behalf by the undersigned, thereunto duly authorized in Los Angeles, California on September 28, 2018.
|
|
|
|
|
| MOGULREIT II, INC. | |
|
|
| |
|
| By: RM Adviser, LLC, its Manager | |
|
|
| |
|
| By: | /s/ Jilliene Helman |
|
| Name: | Jilliene Helman |
|
| Title: | Chief Executive Officer |
Pursuant to the requirements of Regulation A, this report has been signed below by the following persons on behalf of the issuer and in the capacities and on the dates indicated.
Signature |
| Title |
| Date |
|
|
|
|
|
|
| Chief Executive Officer of RM Adviser, LLC |
|
|
/s/ Jilliene Helman |
|
| September 28, 2018 | |
Jilliene Helman |
| (Principal Executive Officer) |
|
|
|
|
|
|
|
|
|
|
|
|
|
| Chief Financial Officer of RM Adviser, LLC |
|
|
/s/ Karen Fleck |
|
| September 28, 2018 | |
Karen Fleck |
| (Principal Financial Officer and Principal Accounting Officer) |
|
|
|
|
|
|
|