UNITED STATES
SECURITIES AND EXCHANGE COMMISSION
Washington, D.C. 20549
Form N-CSR
CERTIFIED SHAREHOLDER REPORT OF REGISTERED
MANAGEMENT INVESTMENT COMPANIES
Investment Company Act File Number: 811-23240
Eaton Vance Floating-Rate 2022 Target Term Trust
(Exact Name of Registrant as Specified in Charter)
Two International Place, Boston, Massachusetts 02110
(Address of Principal Executive Offices)
Maureen A. Gemma
Two International Place, Boston, Massachusetts 02110
(Name and Address of Agent for Services)
(617) 482-8260
(Registrant’s Telephone Number)
June 30
Date of Fiscal Year End
December 31, 2017
Date of Reporting Period
Item 1. Reports to Stockholders

Eaton Vance
Floating-Rate 2022 Target Term Trust (EFL)
Semiannual Report
December 31, 2017

Commodity Futures Trading Commission Registration. Effective December 31, 2012, the Commodity Futures Trading Commission (“CFTC”) adopted certain regulatory changes that subject registered investment companies and advisers to regulation by the CFTC if a fund invests more than a prescribed level of its assets in certain CFTC-regulated instruments (including futures, certain options and swap agreements) or markets itself as providing investment exposure to such instruments. The Fund has claimed an exclusion from the definition of the term “commodity pool operator” under the Commodity Exchange Act. Accordingly, neither the Fund nor the adviser with respect to the operation of the Fund is subject to CFTC regulation. Because of its management of other strategies, the Fund’s adviser is registered with the CFTC as a commodity pool operator and a commodity trading advisor.
Fund shares are not insured by the FDIC and are not deposits or other obligations of, or guaranteed by, any depository institution. Shares are subject to investment risks, including possible loss of principal invested.
Semiannual Report December 31, 2017
Eaton Vance
Floating-Rate 2022 Target Term Trust
Table of Contents
| | | | |
Performance | | | 2 | |
| |
Fund Profile | | | 3 | |
| |
Endnotes and Additional Disclosures | | | 4 | |
| |
Financial Statements | | | 5 | |
| |
Dividend Reinvestment Plan | | | 28 | |
| |
Board of Trustees’ Contract Approval | | | 30 | |
| |
Officers and Trustees | | | 33 | |
| |
Important Notices | | | 34 | |
Eaton Vance
Floating-Rate 2022 Target Term Trust
December 31, 2017
Performance1,2
Portfolio Managers Scott H. Page, CFA and Craig P. Russ
| | | | | | | | | | | | | | | | | | | | |
| % Cumulative Total Returns | | Inception Date | | | Six Months | | | One Year | | | Five Years | | | Since
Inception | |
Fund at NAV | | | 07/31/2017 | | | | — | | | | — | | | | — | | | | 1.04 | % |
Fund at Market Price | | | — | | | | — | | | | — | | | | — | | | | –4.25 | |
S&P/LSTA Leveraged Loan Index | | | — | | | | 2.16 | % | | | 4.12 | % | | | 4.03 | % | | | 1.46 | % |
| | | | | |
| | | | | | | | | | | | | | | | | | | | |
| % Premium/Discount to NAV3 | | | | | | | | | | | | | | | |
| | | | | | | | | | | | | | | | | | | –5.23 | % |
| | | | | |
| | | | | | | | | | | | | | | | | | | | |
| Distributions4 | | | | | | | | | | | | | | | |
Total Distributions per share for the period | | | | | | | | | | | | | | | | | | $ | 0.198 | |
Distribution Rate at NAV | | | | | | | | | | | | | | | | | | | 4.92 | % |
Distribution Rate at Market Price | | | | | | | | | | | | | | | | | | | 5.19 | % |
| | | | | |
| | | | | | | | | | | | | | | | | | | | |
| % Total Leverage5 | | | | | | | | | | | | | | | |
Borrowings | | | | | | | | | | | | | | | | | | | 28.00 | % |
Variable Rate Term Preferred Shares (VRTP Shares) | | | | | | | | | | | | | | | | | | | 8.78 | |
See Endnotes and Additional Disclosures in this report.
Past performance is no guarantee of future results. Returns are historical and are calculated by determining the percentage change in net asset value (NAV) or market price (as applicable) with all distributions reinvested and include management fees and other expenses. Fund performance at market price will differ from its results at NAV due to factors such as changing perceptions about the Fund, market conditions, fluctuations in supply and demand for Fund shares, or changes in Fund distributions. Investment return and principal value will fluctuate so that shares, when sold, may be worth more or less than their original cost. Performance less than or equal to one year is cumulative. Performance is for the stated time period only; due to market volatility, current Fund performance may be lower or higher than the quoted return. For performance as of the most recent month-end, please refer to eatonvance.com.
Eaton Vance
Floating-Rate 2022 Target Term Trust
December 31, 2017
Fund Profile
Top 10 Issuers (% of total investments)6
| | | | |
Infor (US), Inc. | | | 1.4 | % |
| |
TransDigm, Inc. | | | 1.4 | |
| |
Sprint Communications, Inc. | | | 1.4 | |
| |
Change Healthcare Holdings, Inc. | | | 1.1 | |
| |
Avolon TLB Borrower 1 (Luxembourg) S.a.r.l. | | | 1.1 | |
| |
Jaguar Holding Company II | | | 0.9 | |
| |
Golden Nugget, Inc. | | | 0.9 | |
| |
Asurion, LLC | | | 0.8 | |
| |
National CineMedia, LLC | | | 0.8 | |
| |
A. Schulman, Inc. | | | 0.8 | |
| |
Total | | | 10.6 | % |
Top 10 Sectors (% of total investments)6
| | | | |
Health Care | | | 12.3 | % |
| |
Electronics/Electrical | | | 8.6 | |
| |
Lodging and Casinos | | | 6.1 | |
| |
Chemicals and Plastics | | | 6.0 | |
| |
Business Equipment and Services | | | 5.7 | |
| |
Industrial Equipment | | | 5.5 | |
| |
Telecommunications | | | 4.8 | |
| |
Cable and Satellite Television | | | 4.1 | |
| |
Oil and Gas | | | 4.1 | |
| |
Drugs | | | 3.3 | |
| |
Total | | | 60.5 | % |
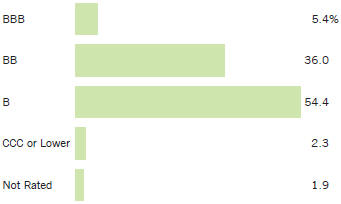
Credit Quality (% of bonds and loans)7
See Endnotes and Additional Disclosures in this report.
Eaton Vance
Floating-Rate 2022 Target Term Trust
December 31, 2017
Endnotes and Additional Disclosures
| 1 | S&P/LSTA Leveraged Loan Index is an unmanaged index of the institutional leveraged loan market. Unless otherwise stated, index returns do not reflect the effect of any applicable sales charges, commissions, expenses, taxes or leverage, as applicable. It is not possible to invest directly in an index. |
| 2 | Performance results reflect the effects of leverage. Performance since inception for an index, if presented, is the performance since the Fund’s or oldest share class’ inception, as applicable. |
| 3 | The shares of the Fund often trade at a discount or premium from their net asset value. The discount or premium of the Fund may vary over time and may be higher or lower than what is quoted in this report. For up-to-date premium/discount information, please refer to http://eatonvance.com/closedend. |
| 4 | The Distribution Rate is based on the Fund’s last regular distribution per share in the period (annualized) divided by the Fund’s NAV or market price at the end of the period. The Fund’s distributions may be comprised of amounts characterized for federal income tax purposes as qualified and non-qualified ordinary dividends, capital gains and nondividend distributions, also known as return of capital. For additional information about nondividend distributions, please refer to Eaton Vance Closed-End Fund Distribution Notices (19a) posted on our website, eatonvance.com. The Fund will determine the federal income tax character of distributions paid to a shareholder after the end of the calendar year. This is reported on the IRS form 1099-DIV and provided to the shareholder shortly after each year-end. The Fund’s distributions are determined by the investment adviser based on its current assessment of the Fund’s long-term return potential. Fund distributions may be affected by numerous factors including changes in Fund performance, the cost of financing for leverage, portfolio holdings, realized and projected returns, and other factors. As portfolio and market conditions change, the rate of distributions paid by the Fund could change. |
| 5 | Leverage represents the liquidation value of the Fund’s VRTP Shares and borrowings outstanding as a percentage of Fund net assets applicable to common shares plus VRTP Shares and borrowings outstanding. Use of leverage creates an opportunity for income, but creates risks including greater price volatility. The cost of leverage rises and falls with changes in short-term interest rates. The Fund may be required to maintain prescribed asset coverage for its leverage and may be required to reduce its leverage at an inopportune time. |
| 6 | Excludes cash and cash equivalents. |
| 7 | Credit ratings are categorized using S&P. Ratings, which are subject to change, apply to the creditworthiness of the issuers of the underlying securities and not to the Fund or its shares. Credit ratings measure the quality of a bond based on the issuer’s creditworthiness, with ratings ranging from AAA, being the highest, to D, being the lowest based on S&P’s measures. Ratings of BBB or higher by S&P are considered to be investment-grade quality. Credit ratings are based largely on the ratings agency’s analysis at the time of rating. The rating assigned to any particular security is not necessarily a reflection of the issuer’s current financial condition and does not necessarily reflect its assessment of the volatility of a security’s market value or of the liquidity of an investment in the security. Holdings designated as “Not Rated” are not rated by S&P. |
| | Fund profile subject to change due to active management. |
Eaton Vance
Floating-Rate 2022 Target Term Trust
December 31, 2017
Portfolio of Investments (Unaudited)
| | | | | | | | |
| Senior Floating-Rate Loans — 127.1%(1) | |
| | |
| | | | | | | | |
| Borrower/Tranche Description | | Principal
Amount
(000’s omitted) | | | Value | |
|
Aerospace and Defense — 1.6% | |
Accudyne Industries, LLC | | | | | | | | |
Term Loan, 5.32%, (1 mo. USD LIBOR + 3.75%), Maturing August 2, 2024 | | $ | 748 | | | $ | 753,619 | |
TransDigm, Inc. | | | | | | | | |
Term Loan, 4.36%, (USD LIBOR + 2.75%), Maturing June 9, 2023(2) | | | 2,985 | | | | 2,993,500 | |
| | |
| | | | | | $ | 3,747,119 | |
| | |
|
Automotive — 1.6% | |
Apro, LLC | | | | | | | | |
Term Loan, 5.35%, (2 mo. USD LIBOR + 4.00%), Maturing August 8, 2024 | | $ | 1,273 | | | $ | 1,279,281 | |
Belron S.A. | | | | | | | | |
Term Loan, 3.89%, (3 mo. USD LIBOR + 2.50%), Maturing November 7, 2024 | | | 225 | | | | 227,461 | |
Chassix Holdings, Inc. | | | | | | | | |
Term Loan, 7.06%, (USD LIBOR + 5.50%), Maturing November 15, 2023(2) | | | 250 | | | | 249,063 | |
Federal-Mogul Holdings Corporation | | | | | | | | |
Term Loan, 5.25%, (1 mo. USD LIBOR + 3.75%), Maturing April 15, 2021 | | | 2,000 | | | | 2,017,292 | |
| | |
| | | | | | $ | 3,773,097 | |
| | |
|
Beverage and Tobacco — 0.1% | |
Refresco Group B.V. | | | | | | | | |
Term Loan, Maturing September 26, 2024(3) | | $ | 150 | | | $ | 150,844 | |
| | |
| | | | | | $ | 150,844 | |
| | |
|
Building and Development — 2.5% | |
Beacon Roofing Supply, Inc. | | | | | | | | |
Term Loan, Maturing August 23, 2024(3) | | $ | 225 | | | $ | 225,944 | |
DTZ U.S. Borrower, LLC | | | | | | | | |
Term Loan, 4.71%, (3 mo. USD LIBOR + 3.25%), Maturing November 4, 2021 | | | 1,990 | | | | 1,966,523 | |
Quikrete Holdings, Inc. | | | | | | | | |
Term Loan, 4.32%, (1 mo. USD LIBOR + 2.75%), Maturing November 15, 2023 | | | 1,933 | | | | 1,939,049 | |
VICI Properties 1, LLC | | | | | | | | |
Term Loan, 3.78%, (3 mo. USD LIBOR + 2.25%), Maturing October 14, 2022 | | | 850 | | | | 851,506 | |
Werner FinCo L.P. | | | | | | | | |
Term Loan, 5.36%, (1 mo. USD LIBOR + 4.00%), Maturing July 24, 2024 | | | 875 | | | | 879,375 | |
| | |
| | | | | | $ | 5,862,397 | |
| | |
| | | | | | | | |
| Borrower/Tranche Description | | Principal
Amount
(000’s omitted) | | | Value | |
|
Business Equipment and Services — 9.0% | |
AlixPartners, LLP | | | | | | | | |
Term Loan, 4.44%, (3 mo. USD LIBOR + 2.75%), Maturing April 4, 2024 | | $ | 1,293 | | | $ | 1,302,107 | |
Camelot UK Holdco Limited | | | | | | | | |
Term Loan, 4.82%, (1 mo. USD LIBOR + 3.25%), Maturing October 3, 2023 | | | 796 | | | | 801,473 | |
Change Healthcare Holdings, Inc. | | | | | | | | |
Term Loan, 4.32%, (1 mo. USD LIBOR + 2.75%), Maturing March 1, 2024 | | | 3,980 | | | | 3,990,831 | |
EAB Global, Inc. | | | | | | | | |
Term Loan, 5.24%, (1 mo. USD LIBOR + 3.75%), Maturing September 6, 2024 | | | 550 | | | | 554,125 | |
EIG Investors Corp. | | | | | | | | |
Term Loan, 5.46%, (3 mo. USD LIBOR + 4.00%), Maturing February 9, 2023 | | | 1,907 | | | | 1,922,642 | |
GreenSky Holdings, LLC | | | | | | | | |
Term Loan, 5.63%, (1 mo. USD LIBOR + 4.00%), Maturing August 26, 2024 | | | 1,596 | | | | 1,605,975 | |
ION Trading Technologies S.a.r.l. | | | | | | | | |
Term Loan, 4.32%, (1 mo. USD LIBOR + 2.75%), Maturing November 30, 2024 | | | 875 | | | | 876,094 | |
J.D. Power and Associates | | | | | | | | |
Term Loan, 5.94%, (3 mo. USD LIBOR + 4.25%), Maturing September 7, 2023 | | | 1,293 | | | | 1,298,301 | |
Kronos Incorporated | | | | | | | | |
Term Loan, 4.90%, (3 mo. USD LIBOR + 3.50%), Maturing November 1, 2023 | | | 2,487 | | | | 2,506,836 | |
LegalZoom.com, Inc. | | | | | | | | |
Term Loan, 5.94%, (3 mo. USD LIBOR + 4.50%), Maturing November 21, 2024 | | | 300 | | | | 299,250 | |
Term Loan - Second Lien, 9.94%, (3 mo. USD LIBOR + 8.50%), Maturing November 21, 2025 | | | 225 | | | | 223,875 | |
Prime Security Services Borrower, LLC | | | | | | | | |
Term Loan, 4.32%, (1 mo. USD LIBOR + 2.75%), Maturing May 2, 2022 | | | 1,294 | | | | 1,304,241 | |
Red Ventures, LLC | | | | | | | | |
Term Loan, 5.57%, (1 mo. USD LIBOR + 4.00%), Maturing November 8, 2024 | | | 374 | | | | 374,483 | |
Spin Holdco, Inc. | | | | | | | | |
Term Loan, 5.15%, (2 mo. USD LIBOR + 3.75%), Maturing November 14, 2022 | | | 1,294 | | | | 1,304,171 | |
Travelport Finance (Luxembourg) S.a.r.l. | | | | | | | | |
Term Loan, 4.17%, (3 mo. USD LIBOR + 2.75%), Maturing September 2, 2021 | | | 1,395 | | | | 1,397,072 | |
Vantiv, LLC | | | | | | | | |
Term Loan, 3.48%, (1 mo. USD LIBOR + 2.00%), Maturing August 7, 2024 | | | 425 | | | | 427,893 | |
Term Loan, Maturing March 31,
2025(3) | | | 125 | | | | 125,664 | |
| | | | |
| | 5 | | See Notes to Financial Statements. |
Eaton Vance
Floating-Rate 2022 Target Term Trust
December 31, 2017
Portfolio of Investments (Unaudited) — continued
| | | | | | | | |
| Borrower/Tranche Description | | Principal
Amount
(000’s omitted) | | | Value | |
|
Business Equipment and Services (continued) | |
West Corporation | | | | | | | | |
Term Loan, 5.35%, (1 mo. USD LIBOR + 4.00%), Maturing October 10, 2024 | | $ | 400 | | | $ | 401,972 | |
| | | | | | | | | |
| | | | | | $ | 20,717,005 | |
| | | | | | | | | |
|
Cable and Satellite Television — 4.8% | |
Charter Communications Operating, LLC | | | | | | | | |
Term Loan, Maturing April 30, 2025(3) | | $ | 1,325 | | | $ | 1,327,484 | |
Numericable Group S.A. | | | | | | | | |
Term Loan, 4.35%, (3 mo. USD LIBOR + 3.00%), Maturing January 31, 2026 | | | 1,300 | | | | 1,257,208 | |
Radiate Holdco, LLC | | | | | | | | |
Term Loan, 4.57%, (1 mo. USD LIBOR + 3.00%), Maturing February 1, 2024 | | | 746 | | | | 741,577 | |
Term Loan, Maturing February 1, 2024(3) | | | 150 | | | | 148,902 | |
Telenet International Finance S.a.r.l. | | | | | | | | |
Term Loan, 3.92%, (1 mo. USD LIBOR + 2.50%), Maturing March 2, 2026 | | | 1,825 | | | | 1,832,984 | |
UPC Financing Partnership | | | | | | | | |
Term Loan, 3.98%, (1 mo. USD LIBOR + 2.50%), Maturing January 15, 2026 | | | 2,700 | | | | 2,701,941 | |
Virgin Media Bristol, LLC | | | | | | | | |
Term Loan, 3.98%, (1 mo. USD LIBOR + 2.50%), Maturing January 15, 2026 | | | 3,000 | | | | 3,003,750 | |
| | | | | | | | | |
| | | | | | $ | 11,013,846 | |
| | | | | | | | | |
|
Chemicals and Plastics — 8.6% | |
A. Schulman, Inc. | | | | | | | | |
Term Loan, 4.66%, (1 mo. USD LIBOR + 3.25%), Maturing June 1, 2022 | | $ | 2,983 | | | $ | 3,010,636 | |
Alpha 3 B.V. | | | | | | | | |
Term Loan, 4.69%, (3 mo. USD LIBOR + 3.00%), Maturing January 31, 2024 | | | 1,294 | | | | 1,303,403 | |
Avantor, Inc. | | | | | | | | |
Term Loan, 5.51%, (3 mo. USD LIBOR + 4.00%), Maturing November 21, 2024 | | | 525 | | | | 528,047 | |
Axalta Coating Systems US Holdings, Inc. | | | | | | | | |
Term Loan, 3.69%, (3 mo. USD LIBOR + 2.00%), Maturing June 1, 2024 | | | 2,940 | | | | 2,955,702 | |
Ineos US Finance, LLC | | | | | | | | |
Term Loan, 3.57%, (1 mo. USD LIBOR + 2.00%), Maturing March 31, 2024 | | | 1,300 | | | | 1,303,340 | |
Kraton Polymers, LLC | | | | | | | | |
Term Loan, 4.57%, (1 mo. USD LIBOR + 3.00%), Maturing January 6, 2022 | | | 1,399 | | | | 1,415,302 | |
| | | | | | | | |
| Borrower/Tranche Description | | Principal
Amount
(000’s omitted) | | | Value | |
|
Chemicals and Plastics (continued) | |
MacDermid, Inc. | | | | | | | | |
Term Loan, 4.57%, (1 mo. USD LIBOR + 3.00%), Maturing June 7, 2023 | | $ | 1,849 | | | $ | 1,861,680 | |
PPC Industries, Inc. | | | | | | | | |
Term Loan, 4.83%, (3 mo. USD LIBOR + 3.50%), Maturing May 8, 2024 | | | 997 | | | | 998,741 | |
PQ Corporation | | | | | | | | |
Term Loan, 4.63%, (3 mo. USD LIBOR + 3.25%), Maturing November 4, 2022 | | | 1,987 | | | | 2,006,384 | |
Proampac PG Borrower, LLC | | | | | | | | |
Term Loan, 4.95%, (USD LIBOR + 3.50%), Maturing November 18, 2023(2) | | | 738 | | | | 745,292 | |
Solenis International L.P. | | | | | | | | |
Term Loan, 4.73%, (3 mo. USD LIBOR + 3.25%), Maturing July 31, 2021 | | | 1,000 | | | | 1,005,536 | |
Tronox Blocked Borrower, LLC | | | | | | | | |
Term Loan, 4.69%, (3 mo. USD LIBOR + 3.00%), Maturing September 22, 2024 | | | 431 | | | | 433,968 | |
Tronox Finance, LLC | | | | | | | | |
Term Loan, 4.69%, (3 mo. USD LIBOR + 3.00%), Maturing September 22, 2024 | | | 994 | | | | 1,001,464 | |
Venator Materials Corporation | | | | | | | | |
Term Loan, 4.38%, (3 mo. USD LIBOR + 3.00%), Maturing August 8, 2024 | | | 1,297 | | | | 1,306,071 | |
| | | | | | | | | |
| | | | | | $ | 19,875,566 | |
| | | | | | | | | |
|
Conglomerates — 0.9% | |
Penn Engineering & Manufacturing Corp. | | | | | | | | |
Term Loan, 4.32%, (1 mo. USD LIBOR + 2.75%), Maturing June 27, 2024 | | $ | 1,990 | | | $ | 1,999,950 | |
| | | | | | | | | |
| | | | | | $ | 1,999,950 | |
| | | | | | | | | |
|
Containers and Glass Products — 4.5% | |
BWAY Holding Company | | | | | | | | |
Term Loan, 4.60%, (3 mo. USD LIBOR + 3.25%), Maturing April 3, 2024 | | $ | 746 | | | $ | 750,331 | |
Flex Acquisition Company, Inc. | | | | | | | | |
Term Loan, 4.34%, (3 mo. USD LIBOR + 3.00%), Maturing December 29, 2023 | | | 2,494 | | | | 2,510,360 | |
Libbey Glass, Inc. | | | | | | | | |
Term Loan, 4.43%, (1 mo. USD LIBOR + 3.00%), Maturing April 9, 2021 | | | 1,890 | | | | 1,822,712 | |
Reynolds Group Holdings, Inc. | | | | | | | | |
Term Loan, 4.32%, (1 mo. USD LIBOR + 2.75%), Maturing February 5, 2023 | | | 2,985 | | | | 3,002,909 | |
| | | | |
| | 6 | | See Notes to Financial Statements. |
Eaton Vance
Floating-Rate 2022 Target Term Trust
December 31, 2017
Portfolio of Investments (Unaudited) — continued
| | | | | | | | |
| Borrower/Tranche Description | | Principal
Amount
(000’s omitted) | | | Value | |
|
Containers and Glass Products (continued) | |
Ring Container Technologies Group, LLC | | | | | | | | |
Term Loan, 4.32%, (1 mo. USD LIBOR + 2.75%), Maturing October 31, 2024 | | $ | 300 | | | $ | 300,938 | |
SIG Combibloc US Acquisition, Inc. | | | | | | | | |
Term Loan, 4.57%, (1 mo. USD LIBOR + 3.00%), Maturing March 13, 2022 | | | 1,895 | | | | 1,906,085 | |
Tekni-Plex, Inc. | | | | | | | | |
Term Loan, 4.67%, (2 mo. USD LIBOR + 3.25%), Maturing October 17, 2024 | | | 125 | | | | 125,820 | |
| | | | | | | | | |
| | | | | | $ | 10,419,155 | |
| | | | | | | | | |
|
Drugs — 4.7% | |
Albany Molecular Research, Inc. | | | | | | | | |
Term Loan, 4.82%, (1 mo. USD LIBOR + 3.25%), Maturing August 30, 2024 | | $ | 748 | | | $ | 740,644 | |
Term Loan - Second Lien, 8.57%, (1 mo. USD LIBOR + 7.00%), Maturing August 30, 2025 | | | 500 | | | | 493,125 | |
Endo Luxembourg Finance Company I S.a.r.l. | | | | | | | | |
Term Loan, 5.88%, (1 mo. USD LIBOR + 4.25%), Maturing April 29, 2024 | | | 2,985 | | | | 3,007,653 | |
Horizon Pharma, Inc. | | | | | | | | |
Term Loan, 4.75%, (1 mo. USD LIBOR + 3.25%), Maturing March 29, 2024 | | | 1,297 | | | | 1,303,766 | |
Jaguar Holding Company II | | | | | | | | |
Term Loan, 4.38%, (USD LIBOR + 2.75%), Maturing August 18,
2022(2) | | | 2,985 | | | | 2,993,836 | |
Mallinckrodt International Finance S.A. | | | | | | | | |
Term Loan, 4.44%, (3 mo. USD LIBOR + 2.75%), Maturing September 24, 2024 | | | 1,990 | | | | 1,990,528 | |
PharMerica Corporation | | | | | | | | |
Term Loan, 4.90%, (3 mo. USD LIBOR + 3.50%), Maturing December 6, 2024 | | | 325 | | | | 326,991 | |
| | | | | | | | | |
| | | | | | $ | 10,856,543 | |
| | | | | | | | | |
|
Ecological Services and Equipment — 1.5% | |
Advanced Disposal Services, Inc. | | | | | | | | |
Term Loan, 3.74%, (1 week USD LIBOR + 2.25%), Maturing November 10, 2023 | | $ | 2,985 | | | $ | 2,996,926 | |
Charah, LLC | | | | | | | | |
Term Loan, 7.71%, (3 mo. USD LIBOR + 6.25%), Maturing October 25, 2024 | | | 200 | | | | 202,000 | |
Wrangler Buyer Corp. | | | | | | | | |
Term Loan, 4.57%, (1 mo. USD LIBOR + 3.00%), Maturing September 27, 2024 | | | 225 | | | | 226,728 | |
| | | | | | | | | |
| | | | | | $ | 3,425,654 | |
| | | | | | | | | |
| | | | | | | | |
| Borrower/Tranche Description | | Principal
Amount
(000’s omitted) | | | Value | |
|
Electronics / Electrical — 12.2% | |
Almonde, Inc. | | | | | | | | |
Term Loan, 4.98%, (3 mo. USD LIBOR + 3.50%), Maturing June 13, 2024 | | $ | 1,297 | | | $ | 1,301,886 | |
Answers Finance, LLC | | | | | | | | |
Term Loan, 6.57%, (1 mo. USD LIBOR + 5.00%), Maturing April 15, 2021 | | | 597 | | | | 582,068 | |
Term Loan - Second Lien, 9.00%, (3 mo. USD Prime + 7.90%, Cap 1.10%), Maturing September 15, 2021 | | | 267 | | | | 261,803 | |
Applied Systems, Inc. | | | | | | | | |
Term Loan, 4.94%, (3 mo. USD LIBOR + 3.25%), Maturing September 19, 2024 | | | 948 | | | | 958,615 | |
Aptean, Inc. | | | | | | | | |
Term Loan, 5.95%, (3 mo. USD LIBOR + 4.25%), Maturing December 20, 2022 | | | 1,293 | | | | 1,305,341 | |
Avast Software B.V. | | | | | | | | |
Term Loan, 4.44%, (3 mo. USD LIBOR + 2.75%), Maturing September 30, 2023 | | | 1,268 | | | | 1,277,686 | |
CPI International, Inc. | | | | | | | | |
Term Loan, 5.07%, (1 mo. USD LIBOR + 3.50%), Maturing July 26, 2024 | | | 748 | | | | 754,048 | |
Cypress Semiconductor Corporation | | | | | | | | |
Term Loan, 4.26%, (1 mo. USD LIBOR + 2.75%), Maturing July 5, 2021 | | | 1,283 | | | | 1,295,122 | |
DigiCert, Inc. | | | | | | | | |
Term Loan, 6.13%, (3 mo. USD LIBOR + 4.75%), Maturing October 31, 2024 | | | 400 | | | | 405,650 | |
Electro Rent Corporation | | | | | | | | |
Term Loan, 6.62%, (2 mo. USD LIBOR + 5.00%), Maturing January 19, 2024 | | | 746 | | | | 756,492 | |
Exact Merger Sub, LLC | | | | | | | | |
Term Loan, 5.94%, (3 mo. USD LIBOR + 4.25%), Maturing September 27, 2024 | | | 249 | | | | 252,025 | |
EXC Holdings III Corp. | | | | | | | | |
Term Loan, 5.16%, (6 mo. USD LIBOR + 3.50%), Maturing December 2, 2024 | | | 175 | | | | 176,641 | |
GTCR Valor Companies, Inc. | | | | | | | | |
Term Loan, 5.94%, (3 mo. USD LIBOR + 4.25%), Maturing June 16, 2023 | | | 748 | | | | 758,145 | |
Infoblox, Inc. | | | | | | | | |
Term Loan, 6.57%, (1 mo. USD LIBOR + 5.00%), Maturing November 7, 2023 | | | 746 | | | | 751,380 | |
Infor (US), Inc. | | | | | | | | |
Term Loan, 4.44%, (3 mo. USD LIBOR + 2.75%), Maturing February 1, 2022 | | | 2,985 | | | | 2,996,156 | |
Informatica Corporation | | | | | | | | |
Term Loan, 5.19%, (3 mo. USD LIBOR + 3.50%), Maturing August 5, 2022 | | | 1,990 | | | | 1,997,771 | |
| | | | |
| | 7 | | See Notes to Financial Statements. |
Eaton Vance
Floating-Rate 2022 Target Term Trust
December 31, 2017
Portfolio of Investments (Unaudited) — continued
| | | | | | | | |
| Borrower/Tranche Description | | Principal
Amount
(000’s omitted) | | | Value | |
|
Electronics / Electrical (continued) | |
Lattice Semiconductor Corporation | | | | | | | | |
Term Loan, 5.65%, (1 mo. USD LIBOR + 4.25%), Maturing March 10, 2021 | | $ | 1,293 | | | $ | 1,308,784 | |
MA FinanceCo., LLC | | | | | | | | |
Term Loan, 4.32%, (1 mo. USD LIBOR + 2.75%), Maturing June 21, 2024 | | | 258 | | | | 258,988 | |
Seattle Spinco, Inc. | | | | | | | | |
Term Loan, 4.32%, (1 mo. USD LIBOR + 2.75%), Maturing June 21, 2024 | | | 1,742 | | | | 1,748,764 | |
SkillSoft Corporation | | | | | | | | |
Term Loan, 6.32%, (1 mo. USD LIBOR + 4.75%), Maturing April 28, 2021 | | | 2,500 | | | | 2,412,052 | |
Syncsort Incorporated | | | | | | | | |
Term Loan, 6.69%, (3 mo. USD LIBOR + 5.00%), Maturing August 9, 2024 | | | 1,297 | | | | 1,268,789 | |
Uber Technologies | | | | | | | | |
Term Loan, 5.55%, (1 mo. USD LIBOR + 4.00%), Maturing July 13, 2023 | | | 1,990 | | | | 2,005,098 | |
Veritas Bermuda Ltd. | | | | | | | | |
Term Loan, 6.19%, (3 mo. USD LIBOR + 4.50%), Maturing January 27, 2023 | | | 746 | | | | 749,272 | |
VF Holding Corp. | | | | | | | | |
Term Loan, 4.82%, (1 mo. USD LIBOR + 3.25%), Maturing June 30, 2023 | | | 995 | | | | 1,003,202 | |
Wall Street Systems Delaware, Inc. | | | | | | | | |
Term Loan, 4.57%, (1 mo. USD LIBOR + 3.00%), Maturing November 21, 2024 | | | 275 | | | | 275,859 | |
Western Digital Corporation | | | | | | | | |
Term Loan, 3.57%, (1 mo. USD LIBOR + 2.00%), Maturing April 29, 2023 | | | 1,293 | | | | 1,300,228 | |
| | |
| | | | | | $ | 28,161,865 | |
| | |
|
Equipment Leasing — 1.3% | |
Avolon TLB Borrower 1 (Luxembourg) S.a.r.l. | | | | | | | | |
Term Loan, 3.75%, (1 mo. USD LIBOR + 2.25%), Maturing April 3, 2022 | | $ | 2,985 | | | $ | 2,966,732 | |
| | |
| | | | | | $ | 2,966,732 | |
| | |
|
Financial Intermediaries — 3.4% | |
Americold Realty Operating Partnership L.P. | | | | | | | | |
Term Loan, 5.32%, (1 mo. USD LIBOR + 3.75%), Maturing December 1, 2022 | | $ | 1,990 | | | $ | 2,012,285 | |
Clipper Acquisitions Corp. | | | | | | | | |
Term Loan, Maturing December 11, 2024(3) | | | 450 | | | | 451,691 | |
Donnelley Financial Solutions, Inc. | | | | | | | | |
Term Loan, 4.55%, (1 mo. USD LIBOR + 3.00%), Maturing October 2, 2023 | | | 953 | | | | 958,540 | |
| | | | | | | | |
| Borrower/Tranche Description | | Principal
Amount
(000’s omitted) | | | Value | |
|
Financial Intermediaries (continued) | |
Freedom Mortgage Corporation | | | | | | | | |
Term Loan, 6.96%, (6 mo. USD LIBOR + 5.50%), Maturing February 23, 2022 | | $ | 1,975 | | | $ | 2,005,700 | |
Greenhill & Co., Inc. | | | | | | | | |
Term Loan, 5.19%, (USD LIBOR + 3.75%), Maturing October 12, 2022(2) | | | 425 | | | | 427,656 | |
Quality Care Properties, Inc. | | | | | | | | |
Term Loan, 6.82%, (1 mo. USD LIBOR + 5.25%), Maturing October 31, 2022 | | | 1,990 | | | | 1,997,412 | |
| | |
| | | | | | $ | 7,853,284 | |
| | |
|
Food Products — 2.3% | |
Alphabet Holding Company, Inc. | | | | | | | | |
Term Loan, 5.07%, (1 mo. USD LIBOR + 3.50%), Maturing September 26, 2024 | | $ | 1,397 | | | $ | 1,358,096 | |
American Seafoods Group, LLC | | | | | | | | |
Term Loan, 4.79%, (3 mo. USD LIBOR + 3.25%), Maturing August 21, 2023 | | | 750 | | | | 759,375 | |
Del Monte Foods, Inc. | | | | | | | | |
Term Loan, 4.70%, (3 mo. USD LIBOR + 3.25%), Maturing February 18, 2021 | | | 598 | | | | 481,749 | |
HLF Financing S.a.r.l. | | | | | | | | |
Term Loan, 7.07%, (1 mo. USD LIBOR + 5.50%), Maturing February 15, 2023 | | | 721 | | | | 721,788 | |
JBS USA, LLC | | | | | | | | |
Term Loan, 4.10%, (3 mo. USD LIBOR + 2.50%), Maturing October 30, 2022 | | | 1,990 | | | | 1,956,643 | |
| | |
| | | | | | $ | 5,277,651 | |
| | |
|
Food Service — 1.5% | |
1011778 B.C. Unlimited Liability Company | | | | | | | | |
Term Loan, 3.87%, (USD LIBOR + 2.25%), Maturing February 16, 2024(2) | | $ | 2,985 | | | $ | 2,988,197 | |
Aramark Services, Inc. | | | | | | | | |
Term Loan, 3.57%, (1 mo. USD LIBOR + 2.00%), Maturing March 11, 2025 | | | 350 | | | | 352,406 | |
| | |
| | | | | | $ | 3,340,603 | |
| | |
|
Food / Drug Retailers — 1.8% | |
Albertsons, LLC | | | | | | | | |
Term Loan, 4.46%, (3 mo. USD LIBOR + 3.00%), Maturing June 22, 2023 | | $ | 2,985 | | | $ | 2,928,658 | |
Supervalu, Inc. | | | | | | | | |
Term Loan, 5.07%, (1 mo. USD LIBOR + 3.50%), Maturing June 8, 2024 | | | 485 | | | | 471,596 | |
Term Loan, 5.07%, (1 mo. USD LIBOR + 3.50%), Maturing June 8, 2024 | | | 808 | | | | 785,994 | |
| | |
| | | | | | $ | 4,186,248 | |
| | |
| | | | |
| | 8 | | See Notes to Financial Statements. |
Eaton Vance
Floating-Rate 2022 Target Term Trust
December 31, 2017
Portfolio of Investments (Unaudited) — continued
| | | | | | | | |
| Borrower/Tranche Description | | Principal
Amount
(000’s omitted) | | | Value | |
|
Forest Products — 0.1% | |
Expera Specialty Solutions, LLC | | | | | | | | |
Term Loan, 5.82%, (1 mo. USD LIBOR + 4.25%), Maturing November 3, 2023 | | $ | 323 | | | $ | 325,788 | |
| | |
| | | | | | $ | 325,788 | |
| | |
|
Health Care — 18.2% | |
Alliance Healthcare Services, Inc. | | | | | | | | |
Term Loan, 5.88%, (3 mo. USD LIBOR + 4.50%), Maturing October 24, 2023 | | $ | 250 | | | $ | 250,469 | |
Auris Luxembourg III S.a.r.l. | | | | | | | | |
Term Loan, 4.69%, (3 mo. USD LIBOR + 3.00%), Maturing January 17, 2022 | | | 2,487 | | | | 2,512,117 | |
BioClinica, Inc. | | | | | | | | |
Term Loan, 5.63%, (3 mo. USD LIBOR + 4.25%), Maturing October 20, 2023 | | | 746 | | | | 731,306 | |
Carestream Dental Equipment, Inc. | | | | | | | | |
Term Loan, 4.94%, (3 mo. USD LIBOR + 3.25%), Maturing September 1, 2024 | | | 748 | | | | 748,827 | |
Certara L.P. | | | | | | | | |
Term Loan, 5.69%, (3 mo. USD LIBOR + 4.00%), Maturing August 3, 2024 | | | 998 | | | | 1,005,812 | |
CHG Healthcare Services, Inc. | | | | | | | | |
Term Loan, 4.48%, (1 mo. USD LIBOR + 3.00%), Maturing June 7, 2023 | | | 2,339 | | | | 2,357,271 | |
Community Health Systems, Inc. | | | | | | | | |
Term Loan, 4.48%, (3 mo. USD LIBOR + 3.00%), Maturing January 27, 2021 | | | 2,560 | | | | 2,445,419 | |
CryoLife, Inc. | | | | | | | | |
Term Loan, 5.36%, (1 mo. USD LIBOR + 4.00%), Maturing November 14, 2024 | | | 175 | | | | 175,219 | |
Davis Vision Incorporated | | | | | | | | |
Term Loan, 4.49%, (3 mo. USD LIBOR + 3.00%), Maturing November 1, 2024 | | | 175 | | | | 176,750 | |
Diplomat Pharmacy, Inc. | | | | | | | | |
Term Loan, 8.00%, (3 mo. USD Prime + 3.50%), Maturing December 12, 2024 | | | 225 | | | | 227,391 | |
DJO Finance, LLC | | | | | | | | |
Term Loan, 4.70%, (USD LIBOR + 3.25%), Maturing June 8, 2020(2) | | | 1,297 | | | | 1,281,772 | |
Envision Healthcare Corporation | | | | | | | | |
Term Loan, 4.57%, (1 mo. USD LIBOR + 3.00%), Maturing December 1, 2023 | | | 2,985 | | | | 2,996,118 | |
GHX Ultimate Parent Corporation | | | | | | | | |
Term Loan, 4.69%, (3 mo. USD LIBOR + 3.00%), Maturing June 28, 2024 | | | 1,294 | | | | 1,299,159 | |
| | | | | | | | |
| Borrower/Tranche Description | | Principal
Amount
(000’s omitted) | | | Value | |
|
Health Care (continued) | |
Greatbatch Ltd. | | | | | | | | |
Term Loan, 4.66%, (1 mo. USD LIBOR + 3.25%), Maturing October 27, 2022 | | $ | 983 | | | $ | 992,022 | |
Indivior Finance S.a.r.l. | | | | | | | | |
Term Loan, 6.11%, (3 mo. USD LIBOR + 4.50%), Maturing December 6, 2024 | | | 325 | | | | 326,625 | |
Kindred Healthcare, Inc. | | | | | | | | |
Term Loan, 4.88%, (3 mo. USD LIBOR + 3.50%), Maturing April 9, 2021 | | | 2,985 | | | | 3,005,068 | |
KUEHG Corp. | | | | | | | | |
Term Loan, 5.44%, (3 mo. USD LIBOR + 3.75%), Maturing August 13, 2022 | | | 1,393 | | | | 1,399,912 | |
MPH Acquisition Holdings, LLC | | | | | | | | |
Term Loan, 4.69%, (3 mo. USD LIBOR + 3.00%), Maturing June 7, 2023 | | | 2,905 | | | | 2,914,217 | |
Navicure, Inc. | | | | | | | | |
Term Loan, 5.11%, (1 mo. USD LIBOR + 3.75%), Maturing October 3, 2024 | | | 200 | | | | 200,000 | |
Opal Acquisition, Inc. | | | | | | | | |
Term Loan, 5.53%, (3 mo. USD LIBOR + 4.00%), Maturing November 27, 2020 | | | 746 | | | | 701,969 | |
Ortho-Clinical Diagnostics S.A. | | | | | | | | |
Term Loan, 5.44%, (3 mo. USD LIBOR + 3.75%), Maturing June 30, 2021 | | | 1,293 | | | | 1,298,048 | |
Parexel International Corporation | | | | | | | | |
Term Loan, 4.57%, (1 mo. USD LIBOR + 3.00%), Maturing September 27, 2024 | | | 973 | | | | 978,235 | |
Quintiles IMS Incorporated | | | | | | | | |
Term Loan, 3.69%, (3 mo. USD LIBOR + 2.00%), Maturing March 7, 2024 | | | 2,985 | | | | 3,002,180 | |
Select Medical Corporation | | | | | | | | |
Term Loan, 4.85%, (3 mo. USD LIBOR + 3.50%), Maturing March 1, 2021 | | | 1,990 | | | | 2,014,229 | |
Sotera Health Holdings, LLC | | | | | | | | |
Term Loan, 4.57%, (1 mo. USD LIBOR + 3.00%), Maturing May 15, 2022 | | | 1,443 | | | | 1,445,211 | |
Surgery Center Holdings, Inc. | | | | | | | | |
Term Loan, 4.82%, (1 mo. USD LIBOR + 3.25%), Maturing September 2, 2024 | | | 1,995 | | | | 1,975,882 | |
Team Health Holdings, Inc. | | | | | | | | |
Term Loan, 4.32%, (1 mo. USD LIBOR + 2.75%), Maturing February 6, 2024 | | | 2,985 | | | | 2,914,069 | |
Tecomet, Inc. | | | | | | | | |
Term Loan, Maturing May 1, 2024(3) | | | 1,300 | | | | 1,314,625 | |
U.S. Anesthesia Partners, Inc. | | | | | | | | |
Term Loan, 4.82%, (1 mo. USD LIBOR + 3.25%), Maturing June 23, 2024 | | | 1,294 | | | | 1,298,351 | |
| | |
| | | | | | $ | 41,988,273 | |
| | |
| | | | |
| | 9 | | See Notes to Financial Statements. |
Eaton Vance
Floating-Rate 2022 Target Term Trust
December 31, 2017
Portfolio of Investments (Unaudited) — continued
| | | | | | | | |
| Borrower/Tranche Description | | Principal
Amount
(000’s omitted) | | | Value | |
|
Home Furnishings — 1.4% | |
Bright Bidco B.V. | | | | | | | | |
Term Loan, 6.17%, (USD LIBOR + 4.50%), Maturing June 30, 2024(2) | | $ | 1,294 | | | $ | 1,303,741 | |
Serta Simmons Bedding, LLC | | | | | | | | |
Term Loan, 4.85%, (3 mo. USD LIBOR + 3.50%), Maturing November 8, 2023 | | | 1,995 | | | | 1,835,377 | |
| | |
| | | | | | $ | 3,139,118 | |
| | |
|
Industrial Equipment — 8.7% | |
Apex Tool Group, LLC | | | | | | | | |
Term Loan, 4.82%, (1 mo. USD LIBOR + 3.25%), Maturing January 31, 2020 | | $ | 1,876 | | | $ | 1,874,120 | |
Clark Equipment Company | | | | | | | | |
Term Loan, 4.19%, (3 mo. USD LIBOR + 2.50%), Maturing May 18, 2024 | | | 2,761 | | | | 2,779,188 | |
Delachaux S.A. | | | | | | | | |
Term Loan, 5.19%, (3 mo. USD LIBOR + 3.50%), Maturing October 28, 2021 | | | 740 | | | | 743,359 | |
DXP Enterprises, Inc. | | | | | | | | |
Term Loan, 7.07%, (1 mo. USD LIBOR + 5.50%), Maturing August 14, 2023 | | | 200 | | | | 201,495 | |
Engineered Machinery Holdings, Inc. | | | | | | | | |
Term Loan, 4.94%, (3 mo. USD LIBOR + 3.25%), Maturing July 19, 2024 | | | 86 | | | | 86,445 | |
Term Loan, 4.94%, (3 mo. USD LIBOR + 3.25%), Maturing July 19, 2024 | | | 664 | | | | 664,961 | |
EWT Holdings III Corp. | | | | | | | | |
Term Loan, 4.69%, (3 mo. USD LIBOR + 3.00%), Maturing December 20, 2024 | | | 1,768 | | | | 1,781,247 | |
Filtration Group Corporation | | | | | | | | |
Term Loan, 4.38%, (3 mo. USD LIBOR + 3.00%), Maturing November 21, 2020 | | | 1,293 | | | | 1,306,531 | |
Gardner Denver, Inc. | | | | | | | | |
Term Loan, 4.44%, (3 mo. USD LIBOR + 2.75%), Maturing July 30, 2024 | | | 474 | | | | 475,738 | |
Gates Global, LLC | | | | | | | | |
Term Loan, 4.69%, (3 mo. USD LIBOR + 3.00%), Maturing April 1, 2024 | | | 1,990 | | | | 2,002,593 | |
Hayward Industries, Inc. | | | | | | | | |
Term Loan, 5.07%, (1 mo. USD LIBOR + 3.50%), Maturing August 5, 2024 | | | 748 | | | | 751,398 | |
Paladin Brands Holding, Inc. | | | | | | | | |
Term Loan, 7.19%, (3 mo. USD LIBOR + 5.50%), Maturing August 15, 2022 | | | 420 | | | | 422,835 | |
Rexnord, LLC | | | | | | | | |
Term Loan, 3.80%, (1 mo. USD LIBOR + 2.25%), Maturing August 21, 2024 | | | 1,502 | | | | 1,508,660 | |
| | | | | | | | |
| Borrower/Tranche Description | | Principal
Amount
(000’s omitted) | | | Value | |
|
Industrial Equipment (continued) | |
Robertshaw US Holding Corp. | | | | | | | | |
Term Loan, 6.13%, (1 mo. USD LIBOR + 4.50%), Maturing August 10, 2024 | | $ | 1,297 | | | $ | 1,308,097 | |
Signode Industrial Group US, Inc. | | | | | | | | |
Term Loan, 4.38%, (USD LIBOR + 2.75%), Maturing May 4, 2021(2) | | | 2,773 | | | | 2,787,200 | |
Tank Holding Corp. | | | | | | | | |
Term Loan, 5.59%, (USD LIBOR + 4.25%), Maturing March 16, 2022(2) | | | 1,264 | | | | 1,269,141 | |
Thermon Industries, Inc. | | | | | | | | |
Term Loan, 5.13%, (1 mo. USD LIBOR + 3.75%), Maturing October 24, 2024 | | | 125 | | | | 126,094 | |
| | |
| | | | | | $ | 20,089,102 | |
| | |
|
Insurance — 2.8% | |
Alliant Holdings I, Inc. | | | | | | | | |
Term Loan, 4.80%, (1 mo. USD LIBOR + 3.25%), Maturing August 12, 2022 | | $ | 746 | | | $ | 750,930 | |
Asurion, LLC | | | | | | | | |
Term Loan, 4.32%, (1 mo. USD LIBOR + 2.75%), Maturing August 4, 2022 | | | 1,493 | | | | 1,501,961 | |
Term Loan - Second Lien, 7.57%, (1 mo. USD LIBOR + 6.00%), Maturing August 4, 2025 | | | 1,500 | | | | 1,544,375 | |
Hub International Limited | | | | | | | | |
Term Loan, 4.41%, (3 mo. USD LIBOR + 3.00%), Maturing October 2, 2020 | | | 249 | | | | 250,759 | |
NFP Corp. | | | | | | | | |
Term Loan, 5.07%, (1 mo. USD LIBOR + 3.50%), Maturing January 8, 2024 | | | 746 | | | | 751,595 | |
Sedgwick Claims Management Services, Inc. | | | | | | | | |
Term Loan, Maturing February 26,
2021(3) | | | 400 | | | | 400,600 | |
USI, Inc. | | | | | | | | |
Term Loan, 4.69%, (3 mo. USD LIBOR + 3.00%), Maturing May 16, 2024 | | | 1,297 | | | | 1,297,830 | |
| | |
| | | | | | $ | 6,498,050 | |
| | |
|
Leisure Goods / Activities / Movies — 4.5% | |
Ancestry.com Operations, Inc. | | | | | | | | |
Term Loan, 4.66%, (1 mo. USD LIBOR + 3.25%), Maturing October 19, 2023 | | $ | 1,621 | | | $ | 1,632,040 | |
ClubCorp Club Operations, Inc. | | | | | | | | |
Term Loan, 4.94%, (3 mo. USD LIBOR + 3.25%), Maturing September 18, 2024 | | | 661 | | | | 664,547 | |
Live Nation Entertainment, Inc. | | | | | | | | |
Term Loan, 3.88%, (1 mo. USD LIBOR + 2.25%), Maturing October 31, 2023 | | | 2,985 | | | | 3,004,084 | |
| | | | |
| | 10 | | See Notes to Financial Statements. |
Eaton Vance
Floating-Rate 2022 Target Term Trust
December 31, 2017
Portfolio of Investments (Unaudited) — continued
| | | | | | | | |
| Borrower/Tranche Description | | Principal
Amount
(000’s omitted) | | | Value | |
|
Leisure Goods / Activities / Movies (continued) | |
National CineMedia, LLC | | | | | | | | |
Term Loan, 4.32%, (1 mo. USD LIBOR + 2.75%), Maturing November 26, 2019 | | $ | 3,000 | | | $ | 3,011,250 | |
Steinway Musical Instruments, Inc. | | | | | | | | |
Term Loan, 5.13%, (3 mo. USD LIBOR + 3.75%), Maturing September 19, 2019 | | | 930 | | | | 924,239 | |
Travel Leaders Group, LLC | | | | | | | | |
Term Loan, 5.92%, (3 mo. USD LIBOR + 4.50%), Maturing January 25, 2024 | | | 995 | | | | 1,011,169 | |
| | |
| | | | | | $ | 10,247,329 | |
| | |
|
Lodging and Casinos — 8.7% | |
Amaya Holdings B.V. | | | | | | | | |
Term Loan, 5.19%, (3 mo. USD LIBOR + 3.50%), Maturing August 1, 2021 | | $ | 2,487 | | | $ | 2,504,191 | |
Aristocrat Leisure Limited | | | | | | | | |
Term Loan, Maturing September 19, 2024(3) | | | 250 | | | | 250,977 | |
Boyd Gaming Corporation | | | | | | | | |
Term Loan, 3.98%, (1 week USD LIBOR + 2.50%), Maturing September 15, 2023 | | | 2,806 | | | | 2,824,687 | |
Cyan Blue Holdco 3 Limited | | | | | | | | |
Term Loan, 5.19%, (3 mo. USD LIBOR + 3.50%), Maturing July 26, 2024 | | | 746 | | | | 753,480 | |
Four Seasons Hotels Limited | | | | | | | | |
Term Loan, 4.07%, (1 mo. USD LIBOR + 2.50%), Maturing November 30, 2023 | | | 2,985 | | | | 3,006,067 | |
Gateway Casinos & Entertainment Limited | | | | | | | | |
Term Loan, 5.44%, (3 mo. USD LIBOR + 3.75%), Maturing February 22, 2023 | | | 746 | | | | 754,412 | |
Golden Nugget, Inc. | | | | | | | | |
Term Loan, 4.77%, (2 mo. USD LIBOR + 3.25%), Maturing October 4, 2023 | | | 3,308 | | | | 3,336,890 | |
Hanjin International Corp. | | | | | | | | |
Term Loan, 3.85%, (3 mo. USD LIBOR + 2.50%), Maturing September 20, 2020 | | | 200 | | | | 200,875 | |
Hilton Worldwide Finance, LLC | | | | | | | | |
Term Loan, 3.55%, (1 mo. USD LIBOR + 2.00%), Maturing October 25, 2023 | | | 2,985 | | | | 3,003,278 | |
Las Vegas Sands, LLC | | | | | | | | |
Term Loan, 3.57%, (1 mo. USD LIBOR + 2.00%), Maturing March 29, 2024 | | | 2,985 | | | | 3,003,995 | |
Playa Resorts Holding B.V. | | | | | | | | |
Term Loan, 4.62%, (3 mo. USD LIBOR + 3.25%), Maturing April 5, 2024 | | | 424 | | | | 426,584 | |
| | |
| | | | | | $ | 20,065,436 | |
| | |
| | | | | | | | |
| Borrower/Tranche Description | | Principal
Amount
(000’s omitted) | | | Value | |
|
Nonferrous Metals / Minerals — 1.6% | |
Dynacast International, LLC | | | | | | | | |
Term Loan, 4.94%, (3 mo. USD LIBOR + 3.25%), Maturing January 28, 2022 | | $ | 1,293 | | | $ | 1,302,242 | |
Fairmount Santrol, Inc. | | | | | | | | |
Term Loan, 7.69%, (3 mo. USD LIBOR + 6.00%), Maturing November 1, 2022 | | | 700 | | | | 705,542 | |
Murray Energy Corporation | | | | | | | | |
Term Loan, 8.94%, (3 mo. USD LIBOR + 7.25%), Maturing April 16, 2020 | | | 746 | | | | 661,928 | |
Oxbow Carbon, LLC | | | | | | | | |
Term Loan - Second Lien, 10.50%, (3 mo. USD Prime + 6.00%), Maturing January 17, 2020 | | | 1,000 | | | | 1,003,750 | |
| | |
| | | | | | $ | 3,673,462 | |
| | |
|
Oil and Gas — 3.2% | |
Aquilex Holdings, LLC | | | | | | | | |
Term Loan, 5.71%, (3 mo. USD LIBOR + 4.25%), Maturing October 3, 2024 | | $ | 300 | | | $ | 300,000 | |
CITGO Holding, Inc. | | | | | | | | |
Term Loan, 9.84%, (3 mo. USD LIBOR + 8.50%), Maturing May 12, 2018 | | | 648 | | | | 652,978 | |
CITGO Petroleum Corporation | | | | | | | | |
Term Loan, 4.84%, (3 mo. USD LIBOR + 3.50%), Maturing July 29, 2021 | | | 1,995 | | | | 1,972,416 | |
Fieldwood Energy, LLC | | | | | | | | |
Term Loan, 8.69%, (3 mo. USD LIBOR + 7.00%), Maturing August 31, 2020 | | | 1,500 | | | | 1,370,625 | |
Green Plains Renewable Energy, Inc. | | | | | | | | |
Term Loan, 7.07%, (1 mo. USD LIBOR + 5.50%), Maturing August 18, 2023 | | | 873 | | | | 881,541 | |
Medallion Midland Acquisition, LLC | | | | | | | | |
Term Loan, 4.82%, (1 mo. USD LIBOR + 3.25%), Maturing October 30, 2024 | | | 200 | | | | 200,500 | |
MEG Energy Corp. | | | | | | | | |
Term Loan, 5.20%, (3 mo. USD LIBOR + 3.50%), Maturing December 31, 2023 | | | 1,990 | | | | 1,995,105 | |
| | |
| | | | | | $ | 7,373,165 | |
| | |
|
Publishing — 1.4% | |
Ascend Learning, LLC | | | | | | | | |
Term Loan, 4.57%, (1 mo. USD LIBOR + 3.00%), Maturing July 12, 2024 | | $ | 1,297 | | | $ | 1,306,151 | |
Harland Clarke Holdings Corp. | | | | | | | | |
Term Loan, 6.44%, (3 mo. USD LIBOR + 4.75%), Maturing November 1, 2023 | | | 639 | | | | 643,032 | |
| | | | |
| | 11 | | See Notes to Financial Statements. |
Eaton Vance
Floating-Rate 2022 Target Term Trust
December 31, 2017
Portfolio of Investments (Unaudited) — continued
| | | | | | | | |
| Borrower/Tranche Description | | Principal
Amount
(000’s omitted) | | | Value | |
|
Publishing (continued) | |
Multi Color Corporation | | | | | | | | |
Term Loan, 3.82%, (1 mo. USD LIBOR + 2.25%), Maturing October 31, 2024 | | $ | 150 | | | $ | 151,125 | |
ProQuest, LLC | | | | | | | | |
Term Loan, 5.32%, (1 mo. USD LIBOR + 3.75%), Maturing October 24, 2021 | | | 1,055 | | | | 1,071,151 | |
| | |
| | | | | | $ | 3,171,459 | |
| | |
|
Radio and Television — 2.9% | |
CBS Radio, Inc. | | | | | | | | |
Term Loan, 4.17%, (3 mo. USD LIBOR + 2.75%), Maturing November 17, 2024 | | $ | 1,300 | | | $ | 1,308,937 | |
E.W. Scripps Company (The) | | | | | | | | |
Term Loan, 3.82%, (1 mo. USD LIBOR + 2.25%), Maturing October 2, 2024 | | | 150 | | | | 150,467 | |
Entravision Communications Corporation | | | | | | | | |
Term Loan, Maturing November 29, 2024(3) | | | 425 | | | | 426,859 | |
Hubbard Radio, LLC | | | | | | | | |
Term Loan, 4.82%, (1 mo. USD LIBOR + 3.25%), Maturing May 27, 2022 | | | 1,187 | | | | 1,190,419 | |
Raycom TV Broadcasting, LLC | | | | | | | | |
Term Loan, 4.32%, (1 mo. USD LIBOR + 2.75%), Maturing August 23, 2024 | | | 399 | | | | 402,990 | |
Sinclair Television Group, Inc. | | | | | | | | |
Term Loan, Maturing May 10, 2024(3) | | | 1,100 | | | | 1,100,337 | |
Univision Communications, Inc. | | | | | | | | |
Term Loan, 4.32%, (1 mo. USD LIBOR + 2.75%), Maturing March 15, 2024 | | | 1,989 | | | | 1,985,609 | |
| | |
| | | | | | $ | 6,565,618 | |
| | |
|
Retailers (Except Food and Drug) — 1.8% | |
Ascena Retail Group, Inc. | | | | | | | | |
Term Loan, 6.13%, (1 mo. USD LIBOR + 4.50%), Maturing August 21, 2022 | | $ | 700 | | | $ | 583,625 | |
Global Appliance, Inc. | | | | | | | | |
Term Loan, 5.57%, (1 mo. USD LIBOR + 4.00%), Maturing September 29, 2024 | | | 399 | | | | 406,222 | |
Go Wireless, Inc. | | | | | | | | |
Term Loan, Maturing December 20, 2024(3) | | | 275 | | | | 272,938 | |
LSF9 Atlantis Holdings, LLC | | | | | | | | |
Term Loan, 7.36%, (1 mo. USD LIBOR + 6.00%), Maturing May 1, 2023 | | | 741 | | | | 738,773 | |
Staples, Inc. | | | | | | | | |
Term Loan, 5.49%, (3 mo. USD LIBOR + 4.00%), Maturing September 12, 2024 | | | 225 | | | | 220,584 | |
| | | | | | | | |
| Borrower/Tranche Description | | Principal
Amount
(000’s omitted) | | | Value | |
|
Retailers (Except Food and Drug) (continued) | |
Toys ‘R’ Us Property Company I, LLC | | | | | | | | |
Term Loan, 6.57%, (1 mo. USD LIBOR + 5.00%), Maturing August 21, 2019 | | $ | 1,300 | | | $ | 1,176,500 | |
Vivid Seats Ltd. | | | | | | | | |
Term Loan, 5.49%, (1 week USD LIBOR + 4.00%), Maturing June 30, 2024 | | | 746 | | | | 746,250 | |
| | |
| | | | | | $ | 4,144,892 | |
| | |
|
Steel — 1.7% | |
Atkore International, Inc. | | | | | | | | |
Term Loan, 4.70%, (3 mo. USD LIBOR + 3.00%), Maturing December 22, 2023 | | $ | 1,990 | | | $ | 2,005,495 | |
Zekelman Industries, Inc. | | | | | | | | |
Term Loan, 4.41%, (3 mo. USD LIBOR + 2.75%), Maturing June 14, 2021 | | | 1,792 | | | | 1,804,918 | |
| | |
| | | | | | $ | 3,810,413 | |
| | |
|
Surface Transport — 0.7% | |
Agro Merchants NAI Holdings, LLC | | | | | | | | |
Term Loan, 5.32%, (1 mo. USD LIBOR + 3.75%), Maturing November 16, 2024 | | $ | 150 | | | $ | 151,500 | |
Kenan Advantage Group, Inc. | | | | | | | | |
Term Loan, 4.57%, (1 mo. USD LIBOR + 3.00%), Maturing July 31, 2022 | | | 302 | | | | 303,001 | |
Term Loan, 4.57%, (1 mo. USD LIBOR + 3.00%), Maturing July 31, 2022 | | | 991 | | | | 994,835 | |
PODS, LLC | | | | | | | | |
Term Loan, 4.40%, (1 mo. USD LIBOR + 3.00%), Maturing November 21, 2024 | | | 224 | | | | 226,027 | |
| | |
| | | | | | $ | 1,675,363 | |
| | |
|
Telecommunications — 5.3% | |
Colorado Buyer, Inc. | | | | | | | | |
Term Loan, 4.38%, (3 mo. USD LIBOR + 3.00%), Maturing May 1, 2024 | | $ | 746 | | | $ | 752,033 | |
Consolidated Communications, Inc. | | | | | | | | |
Term Loan, 4.57%, (1 mo. USD LIBOR + 3.00%), Maturing October 4, 2023 | | | 1,295 | | | | 1,277,816 | |
Global Eagle Entertainment, Inc. | | | | | | | | |
Term Loan, 8.96%, (3 mo. USD LIBOR + 7.50%), Maturing January 6, 2023 | | | 795 | | | | 793,281 | |
Intelsat Jackson Holdings S.A. | | | | | | | | |
Term Loan, 4.21%, (3 mo. USD LIBOR + 2.75%), Maturing June 30, 2019 | | | 1,460 | | | | 1,466,329 | |
Term Loan, Maturing January 14, 2024(3) | | | 650 | | | | 659,750 | |
| | | | |
| | 12 | | See Notes to Financial Statements. |
Eaton Vance
Floating-Rate 2022 Target Term Trust
December 31, 2017
Portfolio of Investments (Unaudited) — continued
| | | | | | | | |
| Borrower/Tranche Description | | Principal
Amount
(000’s omitted) | | | Value | |
|
Telecommunications (continued) | |
Mitel Networks Corporation | | | | | | | | |
Term Loan, 5.13%, (3 mo. USD LIBOR + 3.75%), Maturing September 25, 2023 | | $ | 200 | | | $ | 201,744 | |
Onvoy, LLC | | | | | | | | |
Term Loan, 6.19%, (3 mo. USD LIBOR + 4.50%), Maturing February 10, 2024 | | | 796 | | | | 688,531 | |
Sprint Communications, Inc. | | | | | | | | |
Term Loan, 4.13%, (1 mo. USD LIBOR + 2.50%), Maturing February 2, 2024 | | | 2,985 | | | | 2,987,139 | |
Telesat Canada | | | | | | | | |
Term Loan, 4.70%, (3 mo. USD LIBOR + 3.00%), Maturing November 17, 2023 | | | 2,985 | | | | 3,004,046 | |
Unitymedia Finance, LLC | | | | | | | | |
Term Loan, Maturing January 15, 2026(3) | | | 300 | | | | 299,875 | |
| | |
| | | | | | $ | 12,130,544 | |
| | |
|
Utilities — 1.8% | |
Calpine Corporation | | | | | | | | |
Term Loan, 4.20%, (3 mo. USD LIBOR + 2.50%), Maturing January 15, 2024 | | $ | 1,990 | | | $ | 1,992,283 | |
Granite Acquisition, Inc. | | | | | | | | |
Term Loan, 4.84%, (3 mo. USD LIBOR + 3.50%), Maturing December 19, 2021 | | | 1,247 | | | | 1,259,739 | |
Term Loan, 5.19%, (3 mo. USD LIBOR + 3.50%), Maturing December 19, 2021 | | | 50 | | | | 50,314 | |
Talen Energy Supply, LLC | | | | | | | | |
Term Loan, 5.57%, (1 mo. USD LIBOR + 4.00%), Maturing July 15, 2023 | | | 846 | | | | 854,021 | |
| | |
| | | | | | $ | 4,156,357 | |
| | |
| |
Total Senior Floating-Rate Loans
(identified cost $293,421,699) | | | $ | 292,681,928 | |
| | |
|
| Corporate Bonds & Notes — 23.8% | |
| | |
| | | | | | | | |
| Security | | Principal
Amount
(000’s omitted) | | | Value | |
|
Aerospace and Defense — 1.4% | |
Air Canada | | | | | | | | |
7.75%, 4/15/21(4) | | $ | 1,000 | | | $ | 1,145,000 | |
TransDigm, Inc. | | | | | | | | |
5.50%, 10/15/20 | | | 1,000 | | | | 1,013,750 | |
6.00%, 7/15/22 | | | 1,000 | | | | 1,025,000 | |
| | | | | | | | |
| Security | | Principal
Amount
(000’s omitted) | | | Value | |
|
Aerospace and Defense (continued) | |
United Continental Holdings, Inc. | | | | | | | | |
4.25%, 10/1/22 | | $ | 85 | | | $ | 85,319 | |
| | |
| | | | | | $ | 3,269,069 | |
| | |
|
Automotive — 0.7% | |
American Axle & Manufacturing, Inc. | | | | | | | | |
6.625%, 10/15/22 | | $ | 1,000 | | | $ | 1,038,750 | |
ZF North America Capital, Inc. | | | | | | | | |
4.50%, 4/29/22(4) | | | 545 | | | | 574,294 | |
| | |
| | | | | | $ | 1,613,044 | |
| | |
|
Building and Development — 0.9% | |
Reliance Intermediate Holdings, L.P. | | | | | | | | |
6.50%, 4/1/23(4) | | $ | 1,000 | | | $ | 1,060,000 | |
Standard Industries, Inc. | | | | | | | | |
5.50%, 2/15/23(4) | | | 1,000 | | | | 1,045,000 | |
| | |
| | | | | | $ | 2,105,000 | |
| | |
|
Cable and Satellite Television — 1.7% | |
Cablevision Systems Corp. | | | | | | | | |
5.875%, 9/15/22 | | $ | 1,000 | | | $ | 987,500 | |
CCO Holdings, LLC/CCO Holdings Capital Corp. | | | | | | | | |
5.125%, 2/15/23 | | | 1,000 | | | | 1,025,000 | |
Cequel Communications Holdings I, LLC/Cequel Capital Corp. | |
5.125%, 12/15/21(4) | | | 1,000 | | | | 1,005,000 | |
DISH DBS Corp. | | | | | | | | |
5.00%, 3/15/23 | | | 1,000 | | | | 953,750 | |
| | |
| | | | | | $ | 3,971,250 | |
| | |
|
Chemicals and Plastics — 0.8% | |
Platform Specialty Products Corp. | | | | | | | | |
6.50%, 2/1/22(4) | | $ | 735 | | | $ | 760,725 | |
Tronox Finance, LLC | | | | | | | | |
7.50%, 3/15/22(4) | | | 1,000 | | | | 1,047,500 | |
| | |
| | | | | | $ | 1,808,225 | |
| | |
|
Consumer Products — 0.5% | |
HRG Group, Inc. | | | | | | | | |
7.75%, 1/15/22 | | $ | 1,000 | | | $ | 1,040,000 | |
| | |
| | | | | | $ | 1,040,000 | |
| | |
| | | | |
| | 13 | | See Notes to Financial Statements. |
Eaton Vance
Floating-Rate 2022 Target Term Trust
December 31, 2017
Portfolio of Investments (Unaudited) — continued
| | | | | | | | |
| Security | | Principal
Amount
(000’s omitted) | | | Value | |
|
Containers and Glass Products — 0.4% | |
Ardagh Packaging Finance PLC/Ardagh Holdings USA, Inc. | |
4.25%, 9/15/22(4) | | $ | 1,000 | | | $ | 1,020,000 | |
| | |
| | | | | | $ | 1,020,000 | |
| | |
|
Distribution & Wholesale — 0.2% | |
American Tire Distributors, Inc. | | | | | | | | |
10.25%, 3/1/22(4) | | $ | 500 | | | $ | 517,500 | |
| | |
| | | | | | $ | 517,500 | |
| | |
|
Diversified Financial Services — 1.2% | |
FBM Finance, Inc. | | | | | | | | |
8.25%, 8/15/21(4) | | $ | 2,680 | | | $ | 2,860,900 | |
| | |
| | | | | | $ | 2,860,900 | |
| | |
|
Drugs — 0.5% | |
Valeant Pharmaceuticals International, Inc. | | | | | | | | |
6.50%, 3/15/22(4) | | $ | 1,000 | | | $ | 1,052,500 | |
| | |
| | | | | | $ | 1,052,500 | |
| | |
|
Electronics / Electrical — 1.4% | |
Anixter, Inc. | | | | | | | | |
5.50%, 3/1/23 | | $ | 1,000 | | | $ | 1,080,300 | |
Infor (US), Inc. | | | | | | | | |
6.50%, 5/15/22 | | | 1,000 | | | | 1,040,000 | |
Veritas US, Inc./Veritas Bermuda, Ltd. | | | | | | | | |
7.50%, 2/1/23(4) | | | 1,000 | | | | 1,050,000 | |
| | |
| | | | | | $ | 3,170,300 | |
| | |
|
Financial Intermediaries — 1.1% | |
Ally Financial, Inc. | | | | | | | | |
4.625%, 5/19/22 | | $ | 1,000 | | | $ | 1,042,500 | |
Icahn Enterprises, L.P./Icahn Enterprises Finance Corp. | |
6.25%, 2/1/22 | | | 500 | | | | 512,500 | |
Navient Corp. | | | | | | | | |
5.50%, 1/25/23 | | | 1,007 | | | | 1,008,259 | |
| | |
| | | | | | $ | 2,563,259 | |
| | |
|
Health Care — 1.2% | |
Eagle Holding Co. II, LLC | | | | | | | | |
7.625%, (7.625% cash or 8.375% PIK), 5/15/22(4)(5) | | $ | 455 | | | $ | 464,100 | |
HCA, Inc. | | | | | | | | |
7.50%, 2/15/22 | | | 1,000 | | | | 1,127,500 | |
| | | | | | | | |
| Security | | Principal
Amount
(000’s omitted) | | | Value | |
|
Health Care (continued) | |
Kinetic Concepts, Inc./KCI USA, Inc. | | | | | | | | |
12.50%, 11/1/21(4) | | $ | 1,000 | | | $ | 1,127,500 | |
| | |
| | | | | | $ | 2,719,100 | |
| | |
|
Internet Software & Services — 0.5% | |
Netflix, Inc. | | | | | | | | |
5.50%, 2/15/22 | | $ | 1,000 | | | $ | 1,056,250 | |
| | |
| | | | | | $ | 1,056,250 | |
| | |
|
Leisure Goods / Activities / Movies — 0.4% | |
Sabre GLBL, Inc. | | | | | | | | |
5.375%, 4/15/23(4) | | $ | 1,000 | | | $ | 1,035,000 | |
| | |
| | | | | | $ | 1,035,000 | |
| | |
|
Lodging and Casinos — 0.9% | |
Jack Ohio Finance, LLC/Jack Ohio Finance 1 Corp. | | | | | | | | |
6.75%, 11/15/21(4) | | $ | 1,000 | | | $ | 1,055,000 | |
MGM Resorts International | | | | | | | | |
6.00%, 3/15/23 | | | 1,000 | | | | 1,082,500 | |
| | |
| | | | | | $ | 2,137,500 | |
| | |
|
Metals / Mining — 0.5% | |
Hudbay Minerals, Inc. | | | | | | | | |
7.25%, 1/15/23(4) | | $ | 1,000 | | | $ | 1,065,000 | |
| | |
| | | | | | $ | 1,065,000 | |
| | |
|
Nonferrous Metals / Minerals — 0.4% | |
Teck Resources, Ltd. | | | | | | | | |
3.75%, 2/1/23 | | $ | 1,000 | | | $ | 1,006,250 | |
| | |
| | | | | | $ | 1,006,250 | |
| | |
|
Oil and Gas — 3.3% | |
Antero Resources Corp. | | | | | | | | |
5.125%, 12/1/22 | | $ | 1,000 | | | $ | 1,025,000 | |
Energy Transfer Equity, L.P. | | | | | | | | |
4.25%, 3/15/23 | | | 1,000 | | | | 995,000 | |
Great Western Petroleum, LLC/Great Western Finance Corp. | |
9.00%, 9/30/21(4) | | | 500 | | | | 522,500 | |
Matador Resources Co. | | | | | | | | |
6.875%, 4/15/23 | | | 1,000 | | | | 1,055,000 | |
Oasis Petroleum, Inc. | | | | | | | | |
6.875%, 3/15/22 | | | 1,000 | | | | 1,028,750 | |
| | | | |
| | 14 | | See Notes to Financial Statements. |
Eaton Vance
Floating-Rate 2022 Target Term Trust
December 31, 2017
Portfolio of Investments (Unaudited) — continued
| | | | | | | | |
| Security | | Principal
Amount
(000’s omitted) | | | Value | |
|
Oil and Gas (continued) | |
Resolute Energy Corp. | | | | | | | | |
8.50%, 5/1/20 | | $ | 315 | | | $ | 322,087 | |
Sunoco, L.P./Sunoco Finance Corp. | | | | | | | | |
6.375%, 4/1/23 | | | 1,000 | | | | 1,056,250 | |
Tervita Escrow Corp. | | | | | | | | |
7.625%, 12/1/21(4) | | | 1,500 | | | | 1,511,250 | |
| | |
| | | | | | $ | 7,515,837 | |
| | |
|
Publishing — 0.2% | |
MHGE Parent, LLC/MHGE Parent Finance, Inc. | | | | | | | | |
8.50%, (8.50% cash or 9.25% PIK), 8/1/19(4)(5) | | $ | 439 | | | $ | 438,868 | |
| | |
| | | | | | $ | 438,868 | |
| | |
|
Road & Rail — 0.5% | |
Watco Cos., LLC/Watco Finance Corp. | | | | | | | | |
6.375%, 4/1/23(4) | | $ | 1,000 | | | $ | 1,040,000 | |
| | |
| | | | | | $ | 1,040,000 | |
| | |
|
Software and Services — 0.4% | |
Infor Software Parent, LLC/Infor Software Parent, Inc. | |
7.125%, (7.125% cash or 7.875% PIK), 5/1/21(4)(5) | | $ | 1,000 | | | $ | 1,027,500 | |
| | |
| | | | | | $ | 1,027,500 | |
| | |
|
Steel — 0.4% | |
Allegheny Technologies, Inc. | | | | | | | | |
5.95%, 1/15/21 | | $ | 1,000 | | | $ | 1,025,000 | |
| | |
| | | | | | $ | 1,025,000 | |
| | |
|
Surface Transport — 0.9% | |
Park Aerospace Holdings, Ltd. | | | | | | | | |
5.25%, 8/15/22(4) | | $ | 1,000 | | | $ | 997,500 | |
XPO Logistics, Inc. | | | | | | | | |
6.50%, 6/15/22(4) | | | 1,000 | | | | 1,047,500 | |
| | |
| | | | | | $ | 2,045,000 | |
| | |
|
Technology — 0.5% | |
Dell International, LLC/EMC Corp. | | | | | | | | |
5.875%, 6/15/21(4) | | $ | 1,000 | | | $ | 1,040,000 | |
| | |
| | | | | | $ | 1,040,000 | |
| | |
|
Telecommunications — 2.4% | |
Altice Financing S.A. | | | | | | | | |
6.625%, 2/15/23(4) | | $ | 335 | | | $ | 351,616 | |
| | | | | | | | |
| Security | | Principal
Amount
(000’s omitted) | | | Value | |
|
Telecommunications (continued) | |
CenturyLink, Inc. | | | | | | | | |
5.80%, 3/15/22 | | $ | 1,000 | | | $ | 983,150 | |
SBA Communications Corp. | | | | | | | | |
4.00%, 10/1/22(4) | | | 90 | | | | 90,563 | |
Sprint Communications, Inc. | | | | | | | | |
6.00%, 11/15/22 | | | 2,000 | | | | 2,005,000 | |
T-Mobile USA, Inc. | | | | | | | | |
6.00%, 3/1/23 | | | 1,000 | | | | 1,049,500 | |
Zayo Group, LLC/Zayo Capital, Inc. | | | | | | | | |
6.00%, 4/1/23 | | | 1,000 | | | | 1,046,550 | |
| | |
| | | | | | $ | 5,526,379 | |
| | |
|
Utilities — 0.5% | |
AES Corp. (The) | | | | | | | | |
7.375%, 7/1/21 | | $ | 1,000 | | | $ | 1,127,500 | |
| | |
| | | | | | $ | 1,127,500 | |
| | |
| |
Total Corporate Bonds & Notes
(identified cost $55,214,804) | | | $ | 54,796,231 | |
| | |
|
| Convertible Bonds — 0.8% | |
| | |
| | | | | | | | |
| Security | | Principal
Amount
(000’s omitted) | | | Value | |
|
Utilities — 0.8% | |
NRG Yield, Inc. | | | | | | | | |
3.25%, 6/1/20(4) | | $ | 1,000 | | | $ | 991,875 | |
SolarCity Corp. | | | | | | | | |
1.625%, 11/1/19 | | | 1,000 | | | | 930,625 | |
| | |
| | |
Total Convertible Bonds
(identified cost $1,956,980) | | | | | | $ | 1,922,500 | |
| | |
| | | | |
| | 15 | | See Notes to Financial Statements. |
Eaton Vance
Floating-Rate 2022 Target Term Trust
December 31, 2017
Portfolio of Investments (Unaudited) — continued
| | | | | | | | |
| Short-Term Investments — 6.4% | |
| | |
| | | | | | | | |
| Description | | Units | | | Value | |
Eaton Vance Cash Reserves Fund, LLC, 1.50%(6) | | | 14,843,505 | | | $ | 14,842,021 | |
| | |
| |
Total Short-Term Investments
(identified cost $14,844,525) | | | $ | 14,842,021 | |
| | |
| |
Total Investments — 158.1%
(identified cost $365,438,008) | | | $ | 364,242,680 | |
| | |
| |
Notes Payable — (44.3)% | | | $ | (102,000,000 | ) |
| | |
| |
Variable Rate Term Preferred Shares, at Liquidation Value
(net of unamortized deferred debt issuance costs) — (13.8)% | | | $ | (31,901,081 | ) |
| | |
| |
Other Assets, Less Liabilities — (0.0)%(7) | | | $ | (25,806 | ) |
| | |
| |
Net Assets Applicable to Common Shares — 100.0% | | | $ | 230,315,793 | |
| | |
The percentage shown for each investment category in the Portfolio of Investments is based on net assets applicable to common shares.
| (1) | Senior floating-rate loans (Senior Loans) often require prepayments from excess cash flows or permit the borrowers to repay at their election. The degree to which borrowers repay, whether as a contractual requirement or at their election, cannot be predicted with accuracy. As a result, the actual remaining maturity may be substantially less than the stated maturities shown. However, Senior Loans will typically have an expected average life of approximately two to four years. Senior Loans typically have rates of interest which are redetermined periodically by reference to a base lending rate, plus a spread. These base lending rates are primarily the London Interbank Offered Rate (“LIBOR”) and secondarily, the prime rate offered by one or more major United States banks (the “Prime Rate”). Base lending rates may be subject to a floor, or minimum rate. |
| (2) | The stated interest rate represents the weighted average interest rate at December 31, 2017 of contracts within the senior loan facility. Interest rates on contracts are primarily redetermined either weekly, monthly or quarterly by reference to the indicated base lending rate and spread and the reset period. |
| (3) | This Senior Loan will settle after December 31, 2017, at which time the interest rate will be determined. |
| (4) | Security exempt from registration pursuant to Rule 144A under the Securities Act of 1933, as amended. These securities may be sold in certain transactions in reliance on an exemption from registration (normally to qualified institutional buyers). At December 31, 2017, the aggregate value of these securities is $26,944,191 or 11.7% of the Trust’s net assets applicable to common shares. |
| (5) | Represents a payment-in-kind security which may pay interest in additional principal at the issuer’s discretion. |
| (6) | Affiliated investment company, available to Eaton Vance portfolios and funds, which invests in high quality, U.S. dollar denominated money market instruments. The rate shown is the annualized seven-day yield as of December 31, 2017. |
| (7) | Amount is less than (0.05)%. |
Abbreviations:
| | | | |
| LIBOR | | – | | London Interbank Offered Rate |
| PIK | | – | | Payment In Kind |
Currency Abbreviations:
| | | | |
| USD | | – | | United States Dollar |
| | | | |
| | 16 | | See Notes to Financial Statements. |
Eaton Vance
Floating-Rate 2022 Target Term Trust
December 31, 2017
Statement of Assets and Liabilities (Unaudited)
| | | | |
| Assets | | December 31, 2017 | |
Unaffiliated investments, at value (identified cost, $350,593,483) | | $ | 349,400,659 | |
Affiliated investment, at value (identified cost, $14,844,525) | | | 14,842,021 | |
Cash | | | 5,037,066 | |
Interest receivable | | | 1,547,689 | |
Dividends receivable from affiliated investment | | | 13,646 | |
Receivable for investments sold | | | 2,160,919 | |
Prepaid upfront fees on variable rate term preferred shares | | | 145,046 | |
Prepaid upfront fees on notes payable | | | 35,399 | |
Prepaid expenses | | | 60,827 | |
Total assets | | $ | 373,243,272 | |
|
| Liabilities | |
Notes payable | | $ | 102,000,000 | |
Variable rate term preferred shares, at liquidation value (net of unamortized deferred debt issuance costs of $98,919) | | | 31,901,081 | |
Payable for investments purchased | | | 7,347,134 | |
Distributions payable | | | 944,470 | |
Payable to affiliates: | | | | |
Investment adviser fee | | | 217,040 | |
Trustees’ fees | | | 3,283 | |
Interest expense and fees payable | | | 488,680 | |
Accrued expenses | | | 25,791 | |
Total liabilities | | $ | 142,927,479 | |
Net assets applicable to common shares | | $ | 230,315,793 | |
|
| Sources of Net Assets | |
Common shares, $0.01 par value, unlimited number of shares authorized, 23,611,740 shares issued and outstanding | | $ | 236,117 | |
Additional paid-in capital | | | 231,868,991 | |
Accumulated distributions in excess of net investment income | | | (596,291 | ) |
Accumulated net realized gain | | | 2,304 | |
Net unrealized depreciation | | | (1,195,328 | ) |
Net assets applicable to common shares | | $ | 230,315,793 | |
| |
| Net Asset Value Per Common Share | | | | |
($230,315,793 ÷ 23,611,740 common shares issued and outstanding) | | $ | 9.75 | |
| | | | |
| | 17 | | See Notes to Financial Statements. |
Eaton Vance
Floating-Rate 2022 Target Term Trust
December 31, 2017
Statement of Operations (Unaudited)
| | | | |
| Investment Income | | Period Ended
December 31, 2017(1) | |
Interest | | $ | 6,171,784 | |
Dividends from affiliated investment | | | 145,234 | |
Total investment income | | $ | 6,317,018 | |
|
| Expenses | |
Investment adviser fee | | $ | 945,994 | |
Trustees’ fees and expenses | | | 3,283 | |
Custodian fee | | | 31,567 | |
Transfer and dividend disbursing agent fees | | | 9,727 | |
Legal and accounting services | | | 57,929 | |
Printing and postage | | | 8,019 | |
Interest expense and fees | | | 1,119,982 | |
Miscellaneous | | | 66,444 | |
Total expenses | | $ | 2,242,945 | |
| |
Net investment income | | $ | 4,074,073 | |
|
| Realized and Unrealized Gain (Loss) | |
Net realized gain (loss) — | | | | |
Investment transactions | | $ | 6,758 | |
Investment transactions — affiliated investment | | | (4,454 | ) |
Net realized gain | | $ | 2,304 | |
Change in unrealized appreciation (depreciation) — | | | | |
Investments | | $ | (1,192,824 | ) |
Investments — affiliated investment | | | (2,504 | ) |
Net change in unrealized appreciation (depreciation) | | $ | (1,195,328 | ) |
| |
Net realized and unrealized loss | | $ | (1,193,024 | ) |
| |
Net increase in net assets from operations | | $ | 2,881,049 | |
| (1) | For the period from the start of business, July 31, 2017, to December 31, 2017. |
| | | | |
| | 18 | | See Notes to Financial Statements. |
Eaton Vance
Floating-Rate 2022 Target Term Trust
December 31, 2017
Statement of Changes in Net Assets (Unaudited)
| | | | |
| Increase (Decrease) in Net Assets | | Period Ended December 31, 2017(1) | |
From operations — | | | | |
Net investment income | | $ | 4,074,073 | |
Net realized gain | | | 2,304 | |
Net change in unrealized appreciation (depreciation) | | | (1,195,328 | ) |
Net increase in net assets from operations | | $ | 2,881,049 | |
Distributions to common shareholders — | | | | |
From net investment income | | $ | (4,670,364 | ) |
Total distributions to common shareholders | | $ | (4,670,364 | ) |
Capital share transactions — | | | | |
Proceeds from sale of common shares(2) | | $ | 232,472,214 | |
Reinvestment of distributions to common shareholders | | | 4,919 | |
Offering costs on common shares | | | (472,025 | ) |
Net increase in net assets from capital share transactions | | $ | 232,005,108 | |
| |
Net increase in net assets | | $ | 230,215,793 | |
|
| Net Assets Applicable to Common Shares | |
At beginning of period | | $ | 100,000 | |
At end of period | | $ | 230,315,793 | |
|
| Accumulated distributions in excess of net investment income | |
At end of period | | $ | (596,291 | ) |
| (1) | For the period from the start of business, July 31, 2017, to December 31, 2017. |
| (2) | Proceeds from sale of common shares are net of sales load paid of $3,540,186 and include shares sold from the exercise of the underwriters’ over-allotment option of $26,012,400 (see Note 6). |
| | | | |
| | 19 | | See Notes to Financial Statements. |
Eaton Vance
Floating-Rate 2022 Target Term Trust
December 31, 2017
Statement of Cash Flows (Unaudited)
| | | | |
| Cash Flows From Operating Activities | | Period Ended
December 31, 2017(1) | |
Net increase in net assets from operations | | $ | 2,881,049 | |
Adjustments to reconcile net increase in net assets from operations to net cash used in operating activities: | | | | |
Investments purchased | | | (395,620,819 | ) |
Investments sold and principal repayments | | | 49,811,905 | |
Increase in short-term investments, net | | | (14,848,979 | ) |
Net amortization/accretion of premium (discount) | | | 408,404 | |
Amortization of prepaid upfront fees on variable rate term preferred shares | | | 14,954 | |
Amortization of deferred debt issuance costs on variable rate term preferred shares | | | 11,193 | |
Amortization of prepaid upfront fees on notes payable | | | 16,601 | |
Increase in interest receivable | | | (1,547,689 | ) |
Increase in dividends receivable from affiliated investment | | | (13,646 | ) |
Increase in prepaid expenses | | | (60,827 | ) |
Increase in payable to affiliate for investment adviser fee | | | 217,040 | |
Increase in interest expense and fees payable | | | 488,680 | |
Increase in accrued expenses | | | 29,074 | |
Net change in unrealized (appreciation) depreciation from investments | | | 1,195,328 | |
Net realized gain from investments | | | (2,304 | ) |
Net cash used in operating activities | | $ | (357,020,036 | ) |
| |
| Cash Flows From Financing Activities | | | | |
Distributions paid to common shareholders, net of reinvestments | | $ | (3,720,975 | ) |
Proceeds from common shares sold(2) | | | 232,472,214 | |
Offering costs on common shares | | | (472,025 | ) |
Proceeds from notes payable | | | 102,000,000 | |
Proceeds from variable rate term preferred shares issued | | | 32,000,000 | |
Payment of deferred debt issuance costs on variable rate term preferred shares | | | (110,112 | ) |
Payment of prepaid upfront fees on variable rate term preferred shares | | | (160,000 | ) |
Payment of prepaid upfront fees on notes payable | | | (52,000 | ) |
Net cash provided by financing activities | | $ | 361,957,102 | |
| |
Net increase in cash | | $ | 4,937,066 | |
| |
Cash at beginning of period | | $ | 100,000 | |
| |
Cash at end of period | | $ | 5,037,066 | |
| |
| Supplemental disclosure of cash flow information: | | | | |
Noncash financing activities not included herein consist of: | | | | |
Reinvestment of dividends and distributions | | $ | 4,919 | |
Cash paid for interest and fees on borrowings and variable rate term preferred shares | | | 910,666 | |
| (1) | For the period from the start of business, July 31, 2017, to December 31, 2017. |
| (2) | Proceeds from sale of common shares are net of sales load paid of $3,540,186 and include shares sold from the exercise of the underwriters’ over-allotment option of $26,012,400 (see Note 6). |
| | | | |
| | 20 | | See Notes to Financial Statements. |
Eaton Vance
Floating-Rate 2022 Target Term Trust
December 31, 2017
Financial Highlights (Unaudited)
Selected data for a common share outstanding during the periods stated
| | | | |
| | | Period Ended December 31, 2017(1) | |
Net asset value — Beginning of period (Common shares) | | $ | 9.850 | (2) |
|
| Income (Loss) From Operations | |
Net investment income(3) | | $ | 0.178 | |
Net realized and unrealized loss | | | (0.064 | ) |
| |
Total income from operations | | $ | 0.114 | |
|
| Less Distributions to Common Shareholders | |
From net investment income | | $ | (0.198 | ) |
| |
Total distributions to common shareholders | | $ | (0.198 | ) |
| |
Offering costs charged to paid-in capital(3) | | $ | (0.021 | ) |
| |
Premium related to exercise of underwriters’ over-allotment option(3) | | $ | 0.005 | |
| |
Net asset value — End of period (Common shares) | | $ | 9.750 | |
| |
Market value — End of period (Common shares) | | $ | 9.240 | |
| |
Total Investment Return on Net Asset Value(4) | | | 1.04 | %(5)(6) |
| |
Total Investment Return on Market Value(4) | | | (4.25 | )%(5)(6) |
|
| Ratios/Supplemental Data | |
Net assets applicable to common shares, end of period (000’s omitted) | | $ | 230,316 | |
Ratios (as a percentage of average daily net assets applicable to common shares):† | | | | |
Expenses excluding interest and fees | | | 1.19 | %(7) |
Interest and fee expense(8) | | | 1.18 | %(7) |
Total expenses | | | 2.37 | %(7) |
Net investment income | | | 4.30 | %(7) |
Portfolio Turnover | | | 15 | %(6) |
Senior Securities: | | | | |
Total notes payable outstanding (in 000’s) | | $ | 102,000 | |
Asset coverage per $1,000 of notes payable(9) | | $ | 3,572 | |
Total variable rate term preferred shares outstanding | | | 320 | |
Asset coverage per variable rate term preferred share(10) | | $ | 271,877 | |
Involuntary liquidation preference per variable rate term preferred share(11) | | $ | 100,000 | |
Approximate market value per variable rate term preferred share(11) | | $ | 100,000 | |
| (1) | For the period from the start of business, July 31, 2017, to December 31, 2017. |
| (2) | Net asset value at beginning of period reflects the deduction of the sales charge of $0.15 per share paid by the shareholders from the $10.00 offering price. |
| (3) | Computed using average common shares outstanding. |
| (4) | Returns are historical and are calculated by determining the percentage change in net asset value or market value with all distributions reinvested. Distributions are assumed to be reinvested at prices obtained under the Trust’s dividend reinvestment plan. |
| (5) | Total investment return on net asset value is calculated assuming a purchase at the offering price of $10.00 less the sales load of $0.15 per share paid by the shareholder on the first day and a sale at the net asset value on the last day of the period reported with all distributions reinvested. Total investment return on market value is calculated assuming a purchase at the offering price of $10.00 less the sales load of $0.15 per share paid by the shareholder on the first day and a sale at the current market price on the last day of the period reported with all distributions reinvested. |
| (8) | Interest and fee expense relates to the variable rate term preferred shares (see Note 2) and the notes payable, for the purpose of financial leverage (see Note 7). |
| (9) | Calculated by subtracting the Trust’s total liabilities (not including the notes payable and variable rate term preferred shares) from the Trust’s total assets, and dividing the result by the notes payable balance in thousands. |
| | | | |
| | 21 | | See Notes to Financial Statements. |
Eaton Vance
Floating-Rate 2022 Target Term Trust
December 31, 2017
Financial Highlights (Unaudited) — continued
| (10) | Calculated by subtracting the Trust’s total liabilities (not including the notes payable and variable rate term preferred shares) from the Trust’s total assets, dividing the result by the sum of the value of the notes payable and liquidation value of the variable rate term preferred shares, and multiplying the result by the liquidation value of one variable rate term preferred share. Such amount equates to 272% at December 31, 2017. |
| (11) | Plus accumulated and unpaid dividends. |
| † | Ratios based on net assets applicable to common shares plus variable rate term preferred shares and borrowings are presented below. Ratios for periods less than one year are annualized. |
| | | | |
| | | Period Ended
December 31, 2017(1) | |
Expenses excluding interest and fees | | | 0.83 | % |
Interest and fee expense | | | 0.83 | % |
Total expenses | | | 1.66 | % |
Net investment income | | | 3.02 | % |
| (1) | For the period from the start of business, July 31, 2017, to December 31, 2017. |
| | | | |
| | 22 | | See Notes to Financial Statements. |
Eaton Vance
Floating-Rate 2022 Target Term Trust
December 31, 2017
Notes to Financial Statements (Unaudited)
1 Significant Accounting Policies
Eaton Vance Floating-Rate 2022 Target Term Trust (the Trust) is a Massachusetts business trust registered under the Investment Company Act of 1940, as amended (the 1940 Act), as a diversified, closed-end management investment company. The Trust was organized on March 16, 2017 and remained inactive until July 31, 2017, except for matters relating to its organization, including the sale of 10,000 shares for $100,000 to Eaton Vance Management (EVM). The Trust’s investment objectives are high current income and to return $9.85 per share, the original net asset value per common share before deducting offering costs of $0.02 per common share (“Original NAV”), to holders of common shares of record on or about October 31, 2022 (the “Termination Date”). On or about the Termination Date, the Trust intends to cease its investment operations, liquidate its portfolio, retire or redeem its leverage facilities, and seek to return Original NAV to common shareholders, unless the term is extended for one period of up to twelve months and one additional period of up to six months by a vote of the Trust’s Board of Trustees.
The following is a summary of significant accounting policies of the Trust. The policies are in conformity with accounting principles generally accepted in the United States of America (U.S. GAAP). The Trust is an investment company and follows accounting and reporting guidance in the Financial Accounting Standards Board (FASB) Accounting Standards Codification Topic 946.
A Investment Valuation — The following methodologies are used to determine the market value or fair value of investments.
Senior Floating-Rate Loans. Interests in senior floating-rate loans (Senior Loans) for which reliable market quotations are readily available are valued generally at the average mean of bid and ask quotations obtained from a third party pricing service. Other Senior Loans are valued at fair value by the investment adviser under procedures approved by the Trustees. In fair valuing a Senior Loan, the investment adviser utilizes one or more of the valuation techniques described in (i) through (iii) below to assess the likelihood that the borrower will make a full repayment of the loan underlying such Senior Loan relative to yields on other Senior Loans issued by companies of comparable credit quality. If the investment adviser believes that there is a reasonable likelihood of full repayment, the investment adviser will determine fair value using a matrix pricing approach that considers the yield on the Senior Loan. If the investment adviser believes there is not a reasonable likelihood of full repayment, the investment adviser will determine fair value using analyses that include, but are not limited to: (i) a comparison of the value of the borrower’s outstanding equity and debt to that of comparable public companies; (ii) a discounted cash flow analysis; or (iii) when the investment adviser believes it is likely that a borrower will be liquidated or sold, an analysis of the terms of such liquidation or sale. In certain cases, the investment adviser will use a combination of analytical methods to determine fair value, such as when only a portion of a borrower’s assets are likely to be sold. In conducting its assessment and analyses for purposes of determining fair value of a Senior Loan, the investment adviser will use its discretion and judgment in considering and appraising relevant factors. Fair value determinations are made by the portfolio managers of the Trust based on information available to such managers. The portfolio managers of other funds managed by the investment adviser that invest in Senior Loans may not possess the same information about a Senior Loan borrower as the portfolio managers of the Trust. At times, the fair value of a Senior Loan determined by the portfolio managers of other funds managed by the investment adviser that invest in Senior Loans may vary from the fair value of the same Senior Loan determined by the portfolio managers of the Trust. The fair value of each Senior Loan is periodically reviewed and approved by the investment adviser’s Valuation Committee and by the Trustees based upon procedures approved by the Trustees. Junior Loans (i.e., subordinated loans and second lien loans) are valued in the same manner as Senior Loans.
Debt Obligations. Debt obligations are generally valued on the basis of valuations provided by third party pricing services, as derived from such services’ pricing models. Inputs to the models may include, but are not limited to, reported trades, executable bid and asked prices, broker/dealer quotations, prices or yields of securities with similar characteristics, interest rates, anticipated prepayments, benchmark curves or information pertaining to the issuer, as well as industry and economic events. The pricing services may use a matrix approach, which considers information regarding securities with similar characteristics to determine the valuation for a security. Short-term obligations purchased with a remaining maturity of sixty days or less for which a valuation from a third party pricing service is not readily available may be valued at amortized cost, which approximates fair value.
Affiliated Fund. The Trust may invest in Eaton Vance Cash Reserves Fund, LLC (Cash Reserves Fund), an affiliated investment company managed by EVM. While Cash Reserves Fund is not a registered money market mutual fund, it conducts all of its investment activities in accordance with the requirements of Rule 2a-7 under the 1940 Act. Investments in Cash Reserves Fund are valued at the closing net asset value per unit on the valuation day. Cash Reserves Fund generally values its investment securities based on available market quotations provided by a third party pricing service.
Fair Valuation. Investments for which valuations or market quotations are not readily available or are deemed unreliable are valued at fair value using methods determined in good faith by or at the direction of the Trustees of the Trust in a manner that fairly reflects the security’s value, or the amount that the Trust might reasonably expect to receive for the security upon its current sale in the ordinary course. Each such determination is based on a consideration of relevant factors, which are likely to vary from one pricing context to another. These factors may include, but are not limited to, the type of security, the existence of any contractual restrictions on the security’s disposition, the price and extent of public trading in similar securities of the issuer or of comparable companies or entities, quotations or relevant information obtained from broker/dealers or other market participants, information obtained from the issuer, analysts, and/or the appropriate stock exchange (for exchange-traded securities), an analysis of the company’s or entity’s financial condition, and an evaluation of the forces that influence the issuer and the market(s) in which the security is purchased and sold.
B Investment Transactions — Investment transactions for financial statement purposes are accounted for on a trade date basis. Realized gains and losses on investments sold are determined on the basis of identified cost.
C Income — Interest income is recorded on the basis of interest accrued, adjusted for amortization of premium or accretion of discount. Fees associated with loan amendments are recognized immediately. Dividend income is recorded on the ex-dividend date for dividends received in cash and/or securities.
Eaton Vance
Floating-Rate 2022 Target Term Trust
December 31, 2017
Notes to Financial Statements (Unaudited) — continued
D Federal Taxes — The Trust intends to make monthly distributions of net investment income and any net realized capital gains in amounts necessary to maintain its taxation as a regulated investment company for U.S. federal income tax purposes. For the purpose of pursuing its investment objective of returning Original NAV, the Trust may retain a portion of its net investment income and some or all of its net capital gains, which would result in the Trust paying U.S. federal excise and corporate income taxes.
As of December 31, 2017, the Trust had no uncertain tax positions that would require financial statement recognition, de-recognition, or disclosure. The Trust files a U.S. federal income tax return annually after its fiscal year-end, which is subject to examination by the Internal Revenue Service for a period of three years from the date of filing.
E Organization and Offering Costs — Organization costs paid in connection with the organization of the Trust were borne directly by EVM, the Trust’s investment adviser. EVM agreed to pay all common share offering costs (other than sales loads) that exceed $0.02 per common share. Costs incurred by the Trust in connection with the offering of its common shares are recorded as a reduction of additional paid-in capital.
F Use of Estimates — The preparation of the financial statements in conformity with U.S. GAAP requires management to make estimates and assumptions that affect the reported amounts of assets and liabilities at the date of the financial statements and the reported amounts of income and expense during the reporting period. Actual results could differ from those estimates.
G Indemnifications — Under the Trust’s organizational documents, its officers and Trustees may be indemnified against certain liabilities and expenses arising out of the performance of their duties to the Trust. Under Massachusetts law, if certain conditions prevail, shareholders of a Massachusetts business trust (such as the Trust) could be deemed to have personal liability for the obligations of the Trust. However, the Trust’s Declaration of Trust contains an express disclaimer of liability on the part of Trust shareholders and the By-laws provide that the Trust shall assume the defense on behalf of any Trust shareholders. Moreover, the By-laws also provide for indemnification out of Trust property of any shareholder held personally liable solely by reason of being or having been a shareholder for all loss or expense arising from such liability. Additionally, in the normal course of business, the Trust enters into agreements with service providers that may contain indemnification clauses. The Trust’s maximum exposure under these arrangements is unknown as this would involve future claims that may be made against the Trust that have not yet occurred.
H Statement of Cash Flows — The cash amount shown in the Statement of Cash Flows of the Trust is the amount included in the Trust’s Statement of Assets and Liabilities and represents the cash on hand at its custodian and does not include any short-term investments.
I Interim Financial Statements — The interim financial statements relating to December 31, 2017 and for the period then ended have not been audited by an independent registered public accounting firm, but in the opinion of the Trust’s management, reflect all adjustments, consisting only of normal recurring adjustments, necessary for the fair presentation of the financial statements.
2 Variable Rate Term Preferred Shares
On September 6, 2017, the Trust issued 320 shares of Series C-1 Variable Rate Term Preferred Shares (VRTP Shares) in a private offering to a commercial paper conduit sponsored by a large financial institution (the Conduit), all of which are outstanding at December 31, 2017.
The VRTP Shares are a form of preferred shares that represent stock of the Trust. They have a par value of $0.01 per share, a liquidation preference of $100,000 per share and a mandatory redemption date of September 8, 2020, unless extended. Dividends on the VRTP Shares are determined each day based on a spread of 1.85% to three-month LIBOR. Such spread is determined based on the current credit rating of the VRTP Shares, which is provided by Moody’s Investor Service.
The VRTP Shares are redeemable at the option of the Trust at a redemption price equal to $100,000 per share, plus accumulated and unpaid dividends, on any business day and solely for the purpose of reducing the leverage of the Trust. The VRTP Shares are also subject to mandatory redemption at a redemption price equal to $100,000 per share, plus accumulated and unpaid dividends, if the Trust is in default for an extended period on its asset maintenance or leverage ratio requirements with respect to the VRTP Shares. Six months prior to the mandatory redemption date, the Trust is required to segregate in a liquidity account with its custodian investments equal to 110% of the VRTP Shares’ redemption price, and over the six-month period execute a series of liquidation transactions to assure sufficient liquidity to redeem the VRTP Shares. The holders of the VRTP Shares, voting as a class, are entitled to elect two Trustees of the Trust. If the dividends on the VRTP Shares remain unpaid in an amount equal to two full years’ dividends, the holders of the VRTP Shares as a class have the right to elect a majority of the Board of Trustees.
For financial reporting purposes, the liquidation value of the VRTP Shares (net of unamortized deferred debt issuance costs) is presented as a liability on the Statement of Assets and Liabilities and unpaid dividends are included in interest expense and fees payable. Dividends accrued on VRTP Shares are treated as interest payments for financial reporting purposes and are included in interest expense and fees on the Statement of Operations. In connection with the issuance of VRTP Shares, the Trust paid an upfront fee of $160,000 and debt issuance costs of $110,112, both of which are being amortized to interest expense and fees over a period of three years. The unamortized amount of the debt issuance costs as of December 31, 2017 is presented as a deduction of the liability for variable rate term preferred shares on the Statement of Assets and Liabilities.
The carrying amount of the VRTP Shares at December 31, 2017 represents its liquidation value, which approximates fair value. If measured at fair value, the VRTP Shares would have been considered as Level 2 in the fair value hierarchy (see Note 9) at December 31, 2017. The average liquidation
Eaton Vance
Floating-Rate 2022 Target Term Trust
December 31, 2017
Notes to Financial Statements (Unaudited) — continued
preference of the VRTP Shares during the portion of the period ended December 31, 2017 in which the VRTP Shares were outstanding was $32,000,000.
3 Distributions to Shareholders and Income Tax Information
The Trust intends to make monthly distributions of net investment income to common shareholders, after payment of any dividends on any outstanding VRTP Shares. The Trust may also distribute net realized capital gains, if any, generally not more than once per year. Distributions to common shareholders are recorded on the ex-dividend date. Dividends to variable rate term preferred shareholders are accrued daily and payable monthly. The dividend rate on the VRTP Shares at December 31, 2017 was 3.54%. The amount of dividends accrued and the average annual dividend rate of the VRTP Shares during the period ended December 31, 2017 were $324,974 and 3.17%, respectively.
Distributions to shareholders are determined in accordance with income tax regulations, which may differ from U.S. GAAP. As required by U.S. GAAP, only distributions in excess of tax basis earnings and profits are reported in the financial statements as a return of capital. Permanent differences between book and tax accounting relating to distributions are reclassified to paid-in capital. For tax purposes, distributions from short-term capital gains are considered to be from ordinary income.
The cost and unrealized appreciation (depreciation) of investments of the Trust at December 31, 2017, as determined on a federal income tax basis, were as follows:
| | | | |
| |
Aggregate cost | | $ | 365,895,579 | |
| |
Gross unrealized appreciation | | $ | 912,049 | |
Gross unrealized depreciation | | | (2,564,948 | ) |
| |
Net unrealized depreciation | | $ | (1,652,899 | ) |
4 Investment Adviser Fee and Other Transactions with Affiliates
The investment adviser fee is earned by EVM as compensation for investment advisory services rendered to the Trust. The fee is computed at an annual rate of 0.70% of the Trust’s average daily managed assets for years one through five of the Trust’s term and is payable monthly. Managed assets as referred to herein represent total assets of the Trust (including assets attributable to borrowings, any outstanding preferred shares, or other forms of leverage) less accrued liabilities (other than liabilities representing borrowings or such other forms of leverage). For the period ended December 31, 2017, the Trust’s investment adviser fee amounted to $945,994. The Trust invests its cash in Cash Reserves Fund. EVM does not currently receive a fee for investment advisory services provided to Cash Reserves Fund. EVM also serves as administrator of the Trust, but receives no compensation.
Trustees and officers of the Trust who are members of EVM’s organization receive remuneration for their services to the Trust out of the investment adviser fee. Trustees of the Trust who are not affiliated with EVM may elect to defer receipt of all or a percentage of their annual fees in accordance with the terms of the Trustees Deferred Compensation Plan. For the period ended December 31, 2017, no significant amounts have been deferred. Certain officers and Trustees of the Trust are officers of EVM.
5 Purchases and Sales of Investments
Purchases and sales of investments, other than short-term obligations and including maturities and principal repayments on Senior Loans, aggregated $402,967,953 and $51,972,824, respectively, for the period ended December 31, 2017.
Eaton Vance
Floating-Rate 2022 Target Term Trust
December 31, 2017
Notes to Financial Statements (Unaudited) — continued
6 Common Shares of Beneficial Interest
In connection with the initial public offering of the Trust’s common shares, the underwriters were granted an option to purchase additional common shares at a price of $9.85 (after deduction of the sales load). Additional shares were issued by the Trust on September 11, 2017 pursuant to the exercise of the over-allotment option. The Trust’s net asset value per share on such date was $9.81, resulting in a premium of $104,050. The Trust may issue common shares pursuant to its dividend reinvestment plan. Transactions in common shares were as follows:
| | | | |
| | | Period Ended
December 31, 2017(1) | |
| |
Sales (initial public offering) | | | 21,000,000 | |
Exercise of over-allotment option by underwriters | | | 2,601,240 | |
Issued to shareholders electing to receive payments of distributions in Trust shares | | | 500 | |
| |
Net increase | | | 23,601,740 | |
| (1) | For the period from the start of business, July 31, 2017, to December 31, 2017. |
7 Credit Agreement
On August 18, 2017, the Trust entered into a Credit Agreement (the Agreement) with a bank to borrow up to a limit of $91 million. On September 14, 2017, the limit was increased to $104 million. Borrowings under the Agreement are secured by the assets of the Trust. Interest is charged at a rate above the London Interbank Offered Rate (LIBOR) and is payable monthly. Under the terms of the Agreement, in effect through August 17, 2018, the Trust pays a facility fee of 0.15% per annum on the borrowing limit. The Trust also paid an initial upfront fee of $45,500 and an additional upfront fee of $6,500 on September 14, 2017 in connection with the increase in the credit facility. These amounts are being amortized to interest expense over a period of one year through August 2018. The unamortized balance at December 31, 2017 is approximately $35,000 and is included in prepaid upfront fees on notes payable in the Statement of Assets and Liabilities. The Trust is required to maintain certain net asset levels during the term of the Agreement. At December 31, 2017, the Trust had borrowings outstanding under the Agreement of $102,000,000 at an interest rate of 2.38%. Based on the short-term nature of the borrowings under the Agreement and the variable interest rate, the carrying amount of the borrowings at December 31, 2017 approximated its fair value. If measured at fair value, borrowings under the Agreement would have been considered as Level 2 in the fair value hierarchy (see Note 9) at December 31, 2017. Facility fees for the period ended December 31, 2017 totaled $55,954 and are included in interest expense and fees on the Statement of Operations. For the period from August 18, 2017 through December 31, 2017, the average borrowings under the Agreement and average annual interest rate (excluding fees) were $82,029,412 and 2.28%, respectively.
8 Credit Risk
The Trust invests primarily in below investment grade floating-rate loans, which are considered speculative because of the credit risk of their issuers. Changes in economic conditions or other circumstances are more likely to reduce the capacity of issuers of these securities to make principal and interest payments. Such companies are more likely to default on their payments of interest and principal owed than issuers of investment grade bonds. An economic downturn generally leads to a higher non-payment rate, and a loan or other debt obligation may lose significant value before a default occurs. Lower rated investments also may be subject to greater price volatility than higher rated investments. Moreover, the specific collateral used to secure a loan may decline in value or become illiquid, which would adversely affect the loan’s value.
9 Fair Value Measurements
Under generally accepted accounting principles for fair value measurements, a three-tier hierarchy to prioritize the assumptions, referred to as inputs, is used in valuation techniques to measure fair value. The three-tier hierarchy of inputs is summarized in the three broad levels listed below.
| • | | Level 1 – quoted prices in active markets for identical investments |
| • | | Level 2 – other significant observable inputs (including quoted prices for similar investments, interest rates, prepayment speeds, credit risk, etc.) |
| • | | Level 3 – significant unobservable inputs (including a fund’s own assumptions in determining the fair value of investments) |
In cases where the inputs used to measure fair value fall in different levels of the fair value hierarchy, the level disclosed is determined based on the lowest level input that is significant to the fair value measurement in its entirety. The inputs or methodology used for valuing securities are not necessarily an indication of the risk associated with investing in those securities.
Eaton Vance
Floating-Rate 2022 Target Term Trust
December 31, 2017
Notes to Financial Statements (Unaudited) — continued
At December 31, 2017, the hierarchy of inputs used in valuing the Trust��s investments, which are carried at value, were as follows:
| | | | | | | | | | | | | | | | |
| Asset Description | | Level 1 | | | Level 2 | | | Level 3 | | | Total | |
| | | | |
Senior Floating-Rate Loans | | $ | — | | | $ | 292,681,928 | | | $ | — | | | $ | 292,681,928 | |
Corporate Bonds & Notes | | | — | | | | 54,796,231 | | | | — | | | | 54,796,231 | |
Convertible Bonds | | | — | | | | 1,922,500 | | | | — | | | | 1,922,500 | |
Short-Term Investments | | | — | | | | 14,842,021 | | | | — | | | | 14,842,021 | |
| | | | |
Total Investments | | $ | — | | | $ | 364,242,680 | | | $ | — | | | $ | 364,242,680 | |
Eaton Vance
Floating-Rate 2022 Target Term Trust
December 31, 2017
Dividend Reinvestment Plan
The Trust offers a dividend reinvestment plan (Plan) pursuant to which shareholders automatically have distributions reinvested in common shares (Shares) of the Trust unless they elect otherwise through their investment dealer. On the distribution payment date, if the NAV per Share is equal to or less than the market price per Share plus estimated brokerage commissions, then new Shares will be issued. The number of Shares shall be determined by the greater of the NAV per Share or 95% of the market price. Otherwise, Shares generally will be purchased on the open market by American Stock Transfer & Trust Company, LLC, the Plan agent (Agent). Distributions subject to income tax (if any) are taxable whether or not Shares are reinvested.
If your Shares are in the name of a brokerage firm, bank, or other nominee, you can ask the firm or nominee to participate in the Plan on your behalf. If the nominee does not offer the Plan, you will need to request that the Trust’s transfer agent re-register your Shares in your name or you will not be able to participate.
The Agent’s service fee for handling distributions will be paid by the Trust. Plan participants will be charged their pro rata share of brokerage commissions on all open-market purchases.
Plan participants may withdraw from the Plan at any time by writing to the Agent at the address noted on the following page. If you withdraw, you will receive Shares in your name for all Shares credited to your account under the Plan. If a participant elects by written notice to the Agent to sell part or all of his or her Shares and remit the proceeds, the Agent is authorized to deduct a $5.00 fee plus brokerage commissions from the proceeds.
If you wish to participate in the Plan and your Shares are held in your own name, you may complete the form on the following page and deliver it to the Agent. Any inquiries regarding the Plan can be directed to the Agent at 1-866-439-6787.
Eaton Vance
Floating-Rate 2022 Target Term Trust
December 31, 2017
Application for Participation in Dividend Reinvestment Plan
This form is for shareholders who hold their common shares in their own names. If your common shares are held in the name of a brokerage firm, bank, or other nominee, you should contact your nominee to see if it will participate in the Plan on your behalf. If you wish to participate in the Plan, but your brokerage firm, bank, or nominee is unable to participate on your behalf, you should request that your common shares be re-registered in your own name which will enable your participation in the Plan.
The following authorization and appointment is given with the understanding that I may terminate it at any time by terminating my participation in the Plan as provided in the terms and conditions of the Plan.
Please print exact name on account
Shareholder signature Date
Shareholder signature Date
Please sign exactly as your common shares are registered. All persons whose names appear on the share certificate must sign.
YOU SHOULD NOT RETURN THIS FORM IF YOU WISH TO RECEIVE YOUR DISTRIBUTIONS IN CASH. THIS IS NOT A PROXY.
This authorization form, when signed, should be mailed to the following address:
Eaton Vance Floating-Rate 2022 Target Term Trust
c/o American Stock Transfer & Trust Company, LLC
P.O. Box 922
Wall Street Station
New York, NY 10269-0560
Number of Employees
The Trust is organized as a Massachusetts business trust and is registered under the Investment Company Act of 1940, as amended, as a closed-end management investment company, and has no employees.
Number of Shareholders
As of December 31, 2017, Trust records indicate that there are 2 registered shareholders and approximately 3,929 shareholders owning the Trust shares in street name, such as through brokers, banks and financial intermediaries.
If you are a street name shareholder and wish to receive Trust reports directly, which contain important information about the Trust, please write or call:
Eaton Vance Distributors, Inc.
Two International Place
Boston, MA 02110
1-800-262-1122
New York Stock Exchange symbol
The New York Stock Exchange symbol is EFL.
Eaton Vance
Floating-Rate 2022 Target Term Trust
December 31, 2017
Board of Trustees’ Contract Approval
Overview of the Contract Review Process
The Investment Company Act of 1940, as amended (the “1940 Act”), provides, in substance, that for a fund to enter into an investment advisory agreement with an investment adviser, the fund’s board of trustees, including a majority of the trustees who are not “interested persons” of the fund (“Independent Trustees”), must approve the agreement and its terms at an in-person meeting called for the purpose of considering such approval.
At a meeting of the board of trustees of the Eaton Vance Floating-Rate 2022 Target Term Trust (the “Fund”) held on April 13, 2017 (the “Meeting”), the board, including a majority of the Independent Trustees, voted to approve the investment advisory and administrative agreement of the Fund with Eaton Vance Management (the “Adviser”). The members of the board of the Fund also serve as members of the boards of other registered investment companies advised by either the Adviser or Boston Management and Research, an affiliate of the Adviser (such registered investment companies, including the Fund, being referred to as the “Eaton Vance Funds” and such boards, including the board of the Fund, being referred to as the “Board”).
Prior to voting its approval of the investment advisory and administrative agreement, the Board received information from the Adviser that the Board considered reasonably necessary to evaluate the terms of the agreement. The Board considered information furnished by the Adviser for the Meeting relating specifically to the Fund, as well as information furnished for prior meetings of the Board and its committees. The Board also considered information provided in connection with the annual contract review process for other Eaton Vance Funds.
The information that the Board considered included, among other things, the following:
Information about Fees and Expenses
| • | | The advisory and related fees payable by the Fund and the anticipated expense ratio of the Fund; |
| • | | Information comparing the advisory and related fees to be payable by the Fund with fees paid by comparable funds, as identified by an independent data provider (“comparable funds”); |
| • | | Information comparing the expected total expense ratio and its components to comparable funds; |
| • | | Pro forma profitability analyses for the Adviser with respect to the Fund; |
Information about Portfolio Management and Trading
| • | | Descriptions of the investment management services provided by the Adviser, including the investment strategies and processes it employs; |
| • | | The procedures and processes used to determine the fair value of fund assets and actions taken to monitor and test the effectiveness of such procedures and processes; |
| • | | Information about policies and practices with respect to trading, including processes for monitoring best execution of portfolio transactions; |
| • | | Information about the allocation of brokerage transactions and the benefits received by the Adviser as a result of brokerage allocation, including information concerning the acquisition of research through client commission arrangements and policies with respect to “soft dollars”; |
Information about the Adviser
| • | | Reports detailing the financial results and condition of the Adviser; |
| • | | Descriptions of the qualifications, education and experience of the individual investment professionals whose responsibilities will include portfolio management and investment research for the Fund, and information relating to their compensation and responsibilities with respect to managing other mutual funds and investment accounts; |
| • | | The Codes of Ethics of the Adviser and its affiliates, together with information relating to compliance with and the administration of such codes; |
| • | | Policies and procedures relating to proxy voting and the handling of corporate actions and class actions; |
| • | | Information concerning the resources devoted to compliance efforts undertaken by the Adviser and its affiliates (including descriptions of various compliance programs) and their record of compliance; |
| • | | Information concerning the business continuity and disaster recovery plans of the Adviser and its affiliates; |
Other Relevant Information
| • | | Information concerning the nature, cost and character of the administrative and other non-investment advisory services provided by the Adviser and its affiliates; |
| • | | Information concerning management of the relationship with the custodian, subcustodians and fund accountants by the Adviser and its affiliates; and |
| • | | The terms of the investment advisory and administrative agreement. |
Results of the Process
Based on its consideration of the foregoing, and such other information as it deemed relevant, including the factors and conclusions described below, the Board concluded that the terms of the Fund’s investment advisory and administrative agreement with the Adviser, including its fee structure, are in the interests of shareholders and, therefore, the Board, including a majority of the Independent Trustees, voted to approve the agreement for the Fund. The
Eaton Vance
Floating-Rate 2022 Target Term Trust
December 31, 2017
Board of Trustees’ Contract Approval — continued
conclusions reached with respect to the agreement were based on a comprehensive evaluation of all the information provided and not any single factor. Moreover, each member of the Board may have placed varying emphasis on particular factors in reaching conclusions with respect to the agreement.
Nature, Extent and Quality of Services
In considering whether to approve the investment advisory and administrative agreement of the Fund, the Board evaluated the nature, extent and quality of services to be provided to the Fund by the Adviser.
The Board considered the Adviser’s management capabilities and investment process with respect to the types of investments to be held by the Fund, including the education, experience and number of its investment professionals and other personnel who will provide portfolio management, investment research, and similar services to the Fund. In particular, the Board considered the abilities and experience of the Adviser’s investment professionals in analyzing special considerations relevant to investing in senior floating rate loans. In this regard, the Board considered the experience of the Adviser’s large group of bank loan investment professionals and other personnel who manage other accounts, including other Eaton Vance Funds, that invest in senior floating rate loans. The Board also considered information regarding the management of the Fund’s portfolio in the context of the contemplated target term structure and noted the Adviser’s experience with this structure. The Board also took into account the resources dedicated to portfolio management and other services, as well as the compensation methods of the Adviser and other factors, such as the reputation and resources of the Adviser to recruit and retain highly qualified research, advisory and supervisory investment professionals. In addition, the Board considered the time and attention expected to be devoted to the Eaton Vance Funds, including the Fund, by senior management, as well as the infrastructure, operational capabilities and support staff in place to assist in the portfolio management and operations of the Fund, including the provision of administrative services. The Board also considered the business-related and other risks to which the Adviser or its affiliates may be subject in managing the Fund.
The Board considered the compliance programs of the Adviser and relevant affiliates thereof. Among other matters, the Board considered compliance and reporting matters relating to personal trading by investment professionals, selective disclosure of portfolio holdings, late trading, frequent trading, portfolio valuation, business continuity and the allocation of investment opportunities. The Board also considered the responses of the Adviser and its affiliates to requests in recent years from regulatory authorities such as the Securities and Exchange Commission and the Financial Industry Regulatory Authority.
The Board considered shareholder and other administrative services to be provided or managed by the Adviser and its affiliates, including transfer agency and accounting services. The Board evaluated the benefits to shareholders of investing in a fund that is a part of a large fund complex offering exposure to a variety of asset classes and investment disciplines.
After consideration of the foregoing factors, among others, the Board concluded that the nature, extent and quality of services to be provided by the Adviser, taken as a whole, will be appropriate and consistent with the terms of the investment advisory and administrative agreement.
Fund Performance
Because the Fund had not yet commenced operations when the agreement was approved, the Fund had no performance record.
Management Fees and Expenses
The Board considered contractual fee rates to be payable by the Fund for advisory and administrative services (referred to collectively as “management fees”). As part of its review, the Board considered the Fund’s management fees and estimated total expense ratio for a one-year period, as compared to those of comparable funds, before and after giving effect to any undertaking to waive fees or reimburse expenses.
After considering the foregoing information, and in light of the nature, extent and quality of the services to be provided by the Adviser, the Board concluded that the management fees proposed to be charged for advisory and related services are reasonable.
Profitability and Other “Fall-Out” Benefits
The Board considered the level of profits projected to be realized by the Adviser and relevant affiliates thereof in providing investment advisory and administrative services to the Fund. The Board considered the level of profits expected to be realized without regard to marketing support or other payments expected to be made by the Adviser and its affiliates to third parties in respect of distribution services. The Board also considered other direct or indirect fall-out benefits expected to be received by the Adviser and its affiliates in connection with their relationships with the Fund, including the benefits of research services that may be available to the Adviser as a result of securities transactions effected for the Fund and other investment advisory clients.
The Board concluded that, in light of the foregoing factors and the nature, extent and quality of the services to be rendered to the Fund, the profits expected to be realized by the Adviser and its affiliates with respect to the Fund are deemed not to be excessive.
Eaton Vance
Floating-Rate 2022 Target Term Trust
December 31, 2017
Board of Trustees’ Contract Approval — continued
Economies of Scale
In reviewing management fees and profitability, the Board also considered the extent to which the Adviser and its affiliates, on the one hand, and the Fund, on the other hand, can expect to realize benefits from economies of scale as the assets of the Fund increase. The Board acknowledged the difficulty in accurately measuring the benefits resulting from economies of scale, if any, with respect to the management of any specific fund or group of funds. Based upon the foregoing, the Board concluded that, assuming reasonably foreseeable asset levels of the Fund, the Fund can be expected to share in any benefits from economies of scale in the future. The Board also considered the fact that the Fund will not be continuously offered and that the Fund’s assets, following its initial offering, are not expected to increase materially in the foreseeable future. The Board concluded that, in light of the level of the Adviser’s expected profits with respect to the Fund, the implementation of breakpoints in the advisory fee schedule is not warranted at this time.
Eaton Vance
Floating-Rate 2022 Target Term Trust
December 31, 2017
Officers and Trustees
Officers of Eaton Vance Floating-Rate 2022 Target Term Trust
Payson F. Swaffield
President
Maureen A. Gemma
Vice President, Secretary and
Chief Legal Officer
James F. Kirchner
Treasurer
Richard F. Froio
Chief Compliance Officer
Trustees of Eaton Vance Floating-Rate 2022 Target Term Trust
William H. Park
Chairperson
Thomas E. Faust Jr.*
Mark R. Fetting
Cynthia E. Frost
George J. Gorman
Valerie A. Mosley
Helen Frame Peters
Susan J. Sutherland
Harriett Tee Taggart
Scott E. Wennerholm
Eaton Vance Funds
IMPORTANT NOTICES
Privacy. The Eaton Vance organization is committed to ensuring your financial privacy. Each of the financial institutions identified below has in effect the following policy (“Privacy Policy”) with respect to nonpublic personal information about its customers:
| • | | Only such information received from you, through application forms or otherwise, and information about your Eaton Vance fund transactions will be collected. This may include information such as name, address, social security number, tax status, account balances and transactions. |
| • | | None of such information about you (or former customers) will be disclosed to anyone, except as permitted by law (which includes disclosure to employees necessary to service your account). In the normal course of servicing a customer’s account, Eaton Vance may share information with unaffiliated third parties that perform various required services such as transfer agents, custodians and broker-dealers. |
| • | | Policies and procedures (including physical, electronic and procedural safeguards) are in place that are designed to protect the confidentiality of such information. |
| • | | We reserve the right to change our Privacy Policy at any time upon proper notification to you. Customers may want to review our Privacy Policy periodically for changes by accessing the link on our homepage: www.eatonvance.com. |
Our pledge of privacy applies to the following entities within the Eaton Vance organization: the Eaton Vance Family of Funds, Eaton Vance Management, Eaton Vance Investment Counsel, Eaton Vance Distributors, Inc., Eaton Vance Trust Company, Eaton Vance Management (International) Limited, Eaton Vance Advisers International Ltd., Eaton Vance Management’s Real Estate Investment Group and Boston Management and Research. In addition, our Privacy Policy applies only to those Eaton Vance customers who are individuals and who have a direct relationship with us. If a customer’s account (i.e., fund shares) is held in the name of a third-party financial advisor/broker-dealer, it is likely that only such advisor’s privacy policies apply to the customer. This notice supersedes all previously issued privacy disclosures. For more information about Eaton Vance’s Privacy Policy, please call 1-800-262-1122.
Delivery of Shareholder Documents. The Securities and Exchange Commission (SEC) permits funds to deliver only one copy of shareholder documents, including prospectuses, proxy statements and shareholder reports, to fund investors with multiple accounts at the same residential or post office box address. This practice is often called “householding” and it helps eliminate duplicate mailings to shareholders. American Stock Transfer & Trust Company, LLC (“AST”), the closed-end funds transfer agent, or your financial advisor, may household the mailing of your documents indefinitely unless you instruct AST, or your financial advisor, otherwise. If you would prefer that your Eaton Vance documents not be householded, please contact AST or your financial advisor. Your instructions that householding not apply to delivery of your Eaton Vance documents will typically be effective within 30 days of receipt by AST or your financial advisor.
Portfolio Holdings. Each Eaton Vance Fund and its underlying Portfolio(s) (if applicable) will file a schedule of portfolio holdings on Form N-Q with the SEC for the first and third quarters of each fiscal year. The Form N-Q will be available on the Eaton Vance website at www.eatonvance.com, by calling Eaton Vance at 1-800-262-1122 or in the EDGAR database on the SEC’s website at www.sec.gov. Form N-Q may also be reviewed and copied at the SEC’s public reference room in Washington, D.C. (call 1-800-732-0330 for information on the operation of the public reference room).
Proxy Voting. From time to time, funds are required to vote proxies related to the securities held by the funds. The Eaton Vance Funds or their underlying Portfolios (if applicable) vote proxies according to a set of policies and procedures approved by the Funds’ and Portfolios’ Boards. You may obtain a description of these policies and procedures and information on how the Funds or Portfolios voted proxies relating to portfolio securities during the most recent 12-month period ended June 30, without charge, upon request, by calling 1-800-262-1122 and by accessing the SEC’s website at www.sec.gov.
Additional Notice to Shareholders. If applicable, a Fund may also redeem or purchase its outstanding preferred shares in order to maintain compliance with regulatory requirements, borrowing or rating agency requirements or for other purposes as it deems appropriate or necessary.
Closed-End Fund Information. Eaton Vance closed-end funds make fund performance data and certain information about portfolio characteristics available on the Eaton Vance website shortly after the end of each month. Other information about the funds is available on the website. The funds’ net asset value per share is readily accessible on the Eaton Vance website. Portfolio holdings for the most recent month-end are also posted to the website approximately 30 days following the end of the month. This information is available at www.eatonvance.com on the fund information pages under “Individual Investors — Closed-End Funds”.
This Page Intentionally Left Blank
This Page Intentionally Left Blank
Investment Adviser and Administrator
Eaton Vance Management
Two International Place
Boston, MA 02110
Custodian
State Street Bank and Trust Company
State Street Financial Center, One Lincoln Street
Boston, MA 02111
Transfer Agent
American Stock Transfer & Trust Company, LLC
6201 15th Avenue
Brooklyn, NY 11219
Fund Offices
Two International Place
Boston, MA 02110
27977 12.31.17
Item 2. Code of Ethics
Not required in this filing.
Item 3. Audit Committee Financial Expert
Not required in this filing.
Item 4. Principal Accountant Fees and Services
Rule 2-01(c)(1)(ii)(A) of Regulation S-X (the “Loan Rule”) prohibits an accounting firm, such as the Trust’s principal accountant, Deloitte & Touche LLP (“D&T”), from having certain financial relationships with their audit clients and affiliated entities. Specifically, the Loan Rule provides, in relevant part, that an accounting firm generally would not be independent if it or a “covered person” of the accounting firm (within the meaning of applicable SEC rules relating to auditor independence) receives a loan from a lender that is a “record or beneficial owner of more than ten percent of the audit client’s equity securities.” Based on information provided to the Audit Committee of the Board of Trustees (the “Audit Committee”) of the Eaton Vance family of funds by D&T, certain relationships between D&T and its affiliates (“Deloitte Entities”) and one or more lenders who are record owners of shares of one or more funds within the Eaton Vance family of funds (the “Funds”) implicate the Loan Rule, calling into question D&T’s independence with respect to the Funds. The Funds are providing this disclosure to explain the facts and circumstances as well as D&T’s conclusions concerning D&T’s objectivity and impartiality with respect to the audits of the Funds notwithstanding the existence of one or more breaches of the Loan Rule.
On June 20, 2016, the U.S. Securities and Exchange Commission (the “SEC”) issued no-action relief to another mutual fund complex (see Fidelity Management & Research Company et al., No-Action Letter (June 20, 2016) (the “No-Action Letter”)) related to an auditor independence issue arising under the Loan Rule. In the No-Action Letter, the SEC indicated that it would not recommend enforcement action against the fund group if the auditor is not in compliance with the Loan Rule provided that: (1) the auditor has complied with PCAOB Rule 3526(b)(1) and 3526(b)(2); (2) the auditor’s non-compliance under the Loan Rule is with respect to certain lending relationships; and (3) notwithstanding such non-compliance, the auditor has concluded that it is objective and impartial with respect to the issues encompassed within its engagement as auditor of the funds.
Based on information provided by D&T to the Audit Committee, the requirements of the No-Action Letter appear to be met with respect to D&T’s lending relationships described above. Among other things, D&T has advised the Audit Committee of its conclusion that the consequences of the breach of the Loan Rule have been satisfactorily addressed, that D&T’s objectivity and impartiality in the planning and conduct of the audits of the Fund’s financial statements has not been compromised and that, notwithstanding the breach, D&T is in a position to continue as the auditor for the Funds and D&T does not believe any actions need to be taken with respect to previously issued reports by D&T. D&T has advised the Audit Committee that these conclusions were based in part on its consideration of the No-Action Letter and other relevant information communicated to the Audit Committee.
Item 5. Audit Committee of Listed Registrants
Not required in this filing.
Item 6. Schedule of Investments
Please see schedule of investments contained in the Report to Stockholders included under Item 1 of this Form N-CSR.
Item 7. Disclosure of Proxy Voting Policies and Procedures for Closed-End Management Investment Companies
Not required in this filing.
Item 8. Portfolio Managers of Closed-End Management Investment Companies
Not required in this filing.
Item 9. Purchases of Equity Securities by Closed-End Management Investment Company and Affiliated Purchasers
No such purchases this period.
Item 10. Submission of Matters to a Vote of Security Holders
No material changes.
Item 11. Controls and Procedures
(a) It is the conclusion of the registrant’s principal executive officer and principal financial officer that the effectiveness of the registrant’s current disclosure controls and procedures (such disclosure controls and procedures having been evaluated within 90 days of the date of this filing) provide reasonable assurance that the information required to be disclosed by the registrant has been recorded, processed, summarized and reported within the time period specified in the Commission’s rules and forms and that the information required to be disclosed by the registrant has been accumulated and communicated to the registrant’s principal executive officer and principal financial officer in order to allow timely decisions regarding required disclosure.
(b) There have been no changes in the registrant’s internal controls over financial reporting during the second fiscal quarter of the period covered by this report that has materially affected, or is reasonably likely to materially affect, the registrant’s internal control over financial reporting.
Item 12. Disclosure of Securities Lending Activities for Closed-End Management Investment Companies
The Fund does not engage in securities lending.
Item 13. Exhibits
| | |
| (a)(1) | | Registrant’s Code of Ethics – Not applicable (please see Item 2). |
| |
| (a)(2)(i) | | Treasurer’s Section 302 certification. |
| |
| (a)(2)(ii) | | President’s Section 302 certification. |
| |
| (b) | | Combined Section 906 certification. |
Signatures
Pursuant to the requirements of the Securities Exchange Act of 1934 and the Investment Company Act of 1940, the registrant has duly caused this report to be signed on its behalf by the undersigned, thereunto duly authorized.
Eaton Vance Floating-Rate 2022 Target Term Trust
| | |
| By: | | /s/ Payson F. Swaffield |
| | Payson F. Swaffield |
| | President |
| |
| Date: | | February 22, 2018 |
Pursuant to the requirements of the Securities Exchange Act of 1934 and the Investment Company Act of 1940, this report has been signed below by the following persons on behalf of the registrant and in the capacities and on the dates indicated.
| | |
| By: | | /s/ James F. Kirchner |
| | James F. Kirchner |
| | Treasurer |
| |
| Date: | | February 22, 2018 |
| | |
| By: | | /s/ Payson F. Swaffield |
| | Payson F. Swaffield |
| | President |
| |
| Date: | | February 22, 2018 |