UNITED STATES
SECURITIES AND EXCHANGE COMMISSION
Washington, D.C. 20549
FormN-CSR
CERTIFIED SHAREHOLDER REPORT OF REGISTERED
MANAGEMENT INVESTMENT COMPANIES
Investment Company Act File Number:811-23240
Eaton Vance Floating-Rate 2022 Target Term Trust
(Exact Name of Registrant as Specified in Charter)
Two International Place, Boston, Massachusetts 02110
(Address of Principal Executive Offices)
Maureen A. Gemma
Two International Place, Boston, Massachusetts 02110
(Name and Address of Agent for Services)
(617)482-8260
(Registrant’s Telephone Number)
June 30
Date of Fiscal Year End
December 31, 2019
Date of Reporting Period
Item 1. Reports to Stockholders

Eaton Vance
Floating-Rate 2022 Target Term Trust (EFL)
Semiannual Report
December 31, 2019
Important Note. Beginning on January 1, 2021, as permitted by regulations adopted by the Securities and Exchange Commission, paper copies of the Fund’s annual and semi-annual shareholder reports will no longer be sent by mail unless you specifically request paper copies of the reports. Instead, the reports will be made available on the Fund’s website(funds.eatonvance.com/closed-end-fund-and-term-trust-documents.php), and you will be notified by mail each time a report is posted and provided with a website address to access the report.
If you already elected to receive shareholder reports electronically, you will not be affected by this change and you need not take any action. If you hold shares at the Fund’s transfer agent, American Stock Transfer & Trust Company, LLC (“AST”), you may elect to receive shareholder reports and other communications from the Fund electronically by contacting AST. If you own your shares through a financial intermediary (such as a broker-dealer or bank), you must contact your financial intermediary to sign up.
You may elect to receive all future Fund shareholder reports in paper free of charge. If you hold shares at AST, you can inform AST that you wish to continue receiving paper copies of your shareholder reports by calling1-866-439-6787. If you own these shares through a financial intermediary, you must contact your financial intermediary or follow instructions included with this disclosure, if applicable, to elect to continue to receive paper copies of your shareholder reports. Your election to receive reports in paper will apply to all funds held with AST or to all funds held through your financial intermediary, as applicable.

Commodity Futures Trading Commission Registration. Effective December 31, 2012, the Commodity Futures Trading Commission (“CFTC”) adopted certain regulatory changes that subject registered investment companies and advisers to regulation by the CFTC if a fund invests more than a prescribed level of its assets in certain CFTC-regulated instruments (including futures, certain options and swap agreements) or markets itself as providing investment exposure to such instruments. The Fund has claimed an exclusion from the definition of the term “commodity pool operator” under the Commodity Exchange Act. Accordingly, neither the Fund nor the adviser with respect to the operation of the Fund is subject to CFTC regulation. Because of its management of other strategies, the Fund’s adviser is registered with the CFTC as a commodity pool operator and a commodity trading advisor.
Fund shares are not insured by the FDIC and are not deposits or other obligations of, or guaranteed by, any depository institution. Shares are subject to investment risks, including possible loss of principal invested.
Semiannual ReportDecember 31, 2019
Eaton Vance
Floating-Rate 2022 Target Term Trust
Table of Contents
| | | | |
Performance | | | 2 | |
| |
Fund Profile | | | 3 | |
| |
Endnotes and Additional Disclosures | | | 4 | |
| |
Financial Statements | | | 5 | |
| |
Officers and Trustees | | | 31 | |
| |
Important Notices | | | 32 | |
Eaton Vance
Floating-Rate 2022 Target Term Trust
December 31, 2019
Performance1,2
Portfolio Managers Craig P. Russ, Andrew N. Sveen, CFA, Catherine C. McDermott, William E. Holt, CFA and Daniel P. McElaney, CFA
| | | | | | | | | | | | | | | | | | | | |
| % Average Annual Total Returns | | Inception Date | | | Six Months | | | One Year | | | Five Years | | | Since
Inception | |
Fund at NAV | | | 07/31/2017 | | | | 3.67 | % | | | 11.41 | % | | | — | | | | 4.18 | % |
Fund at Market Price | | | — | | | | 4.07 | | | | 15.68 | | | | — | | | | 3.41 | |
S&P/LSTA Leveraged Loan Index | | | — | | | | 2.74 | % | | | 8.64 | % | | | 4.44 | % | | | 4.30 | % |
| | | | | |
| | | | | | | | | | | | | | | | | | | | |
| % Premium/Discount to NAV3 | | | | | | | | | | | | | | | |
| | | | | | | | | | | | | | | | | | | –1.79 | % |
| | | | | |
| | | | | | | | | | | | | | | | | | | | |
| Distributions4 | | | | | | | | | | | | | | | |
Total Distributions per share for the period | | | | | | | | | | | | | | | | | | $ | 0.318 | |
Distribution Rate at NAV | | | | | | | | | | | | | | | | | | | 5.68 | % |
Distribution Rate at Market Price | | | | | | | | | | | | | | | | | | | 5.78 | % |
| | | | | |
| | | | | | | | | | | | | | | | | | | | |
| % Total Leverage5 | | | | | | | | | | | | | | | |
Borrowings | | | | | | | | | | | | | | | | | | | 26.39 | % |
Variable Rate Term Preferred Shares (VRTP Shares) | | | | | | | | | | | | | | | | | | | 9.18 | |
See Endnotes and Additional Disclosures in this report.
Past performance is no guarantee of future results. Returns are historical and are calculated net of management fees and other expenses by determining the percentage change in net asset value (NAV) or market price (as applicable) with all distributions reinvested in accordance with the Fund’s Dividend Reinvestment Plan. Performance at market price will differ from performance at NAV due to variations in the Fund’s market price versus NAV, which may reflect factors such as fluctuations in supply and demand for Fund shares, changes in Fund distributions, shifting market expectations for the Fund’s future returns and distribution rates, and other considerations affecting the trading prices ofclosed-end funds. Investment return and principal value will fluctuate so that shares, when sold, may be worth more or less than their original cost. Performance for periods less than or equal to one year is cumulative. Performance is for the stated time period only; due to market volatility, current Fund performance may be lower or higher than the quoted return. For performance as of the most recentmonth-end, please refer to eatonvance.com.
Eaton Vance
Floating-Rate 2022 Target Term Trust
December 31, 2019
Fund Profile
Top 10 Issuers (% of total investments)6
| | | | |
| |
Sprint Communications, Inc. | | | 1.5 | % |
| |
Reynolds Group Holdings, Inc. | | | 1.3 | |
| |
Infor (US), Inc. | | | 1.1 | |
| |
Jaguar Holding Company II | | | 1.0 | |
| |
CITGO Petroleum Corporation | | | 1.0 | |
| |
CenturyLink, Inc. | | | 0.9 | |
| |
TransDigm, Inc. | | | 0.9 | |
| |
Virgin Media Bristol, LLC | | | 0.9 | |
| |
Asurion, LLC | | | 0.9 | |
| |
Golden Nugget, Inc. | | | 0.9 | |
| |
Total | | | 10.4 | % |
Top 10 Sectors (% of total investments)6
| | | | |
| |
Electronics/Electrical | | | 12.7 | % |
| |
Health Care | | | 9.5 | |
| |
Business Equipment and Services | | | 5.8 | |
| |
Telecommunications | | | 4.7 | |
| |
Chemicals and Plastics | | | 4.3 | |
| |
Cable and Satellite Television | | | 4.3 | |
| |
Lodging and Casinos | | | 4.3 | |
| |
Oil and Gas | | | 4.2 | |
| |
Industrial Equipment | | | 3.8 | |
| |
Containers and Glass Products | | | 3.7 | |
| |
Total | | | 57.3 | % |
Credit Quality (% of bonds and loans)7
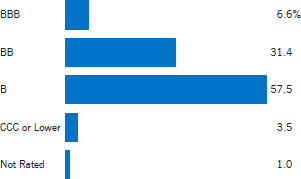
See Endnotes and Additional Disclosures in this report.
Eaton Vance
Floating-Rate 2022 Target Term Trust
December 31, 2019
Endnotes and Additional Disclosures
| 1 | S&P/LSTA Leveraged Loan Index is an unmanaged index of the institutional leveraged loan market. S&P/LSTA Leveraged Loan indices are a product of S&P Dow Jones Indices LLC (“S&P DJI”) and have been licensed for use. S&P® is a registered trademark of S&P DJI; Dow Jones® is a registered trademark of Dow Jones Trademark Holdings LLC (“Dow Jones”); LSTA is a trademark of Loan Syndications and Trading Association, Inc. S&P DJI, Dow Jones, their respective affiliates and their third party licensors do not sponsor, endorse, sell or promote the Fund, will not have any liability with respect thereto and do not have any liability for any errors, omissions, or interruptions of the S&P Dow Jones Indices. Unless otherwise stated, index returns do not reflect the effect of any applicable sales charges, commissions, expenses, taxes or leverage, as applicable. It is not possible to invest directly in an index. |
| 2 | Performance results reflect the effects of leverage. Performance since inception for an index, if presented, is the performance since the Fund’s or oldest share class’ inception, as applicable. |
| 3 | The shares of the Fund often trade at a discount or premium to their net asset value. The discount or premium may vary over time and may be higher or lower than what is quoted in this report. Forup-to-date premium/discount information, please refer tohttps://funds.eatonvance.com/closed-end-fund-prices.php. |
| 4 | The Distribution Rate is based on the Fund’s last regular distribution per share in the period (annualized) divided by the Fund’s NAV or market price at the end of the period. The Fund’s distributions may be comprised of amounts characterized for federal income tax purposes as qualified andnon-qualified ordinary dividends, capital gains and nondividend distributions, also known as return of capital. For additional information about nondividend distributions, please refer to Eaton Vance Closed-End Fund Distribution Notices (19a) posted on our website, eatonvance.com. The Fund will determine the federal income tax character of distributions paid to a shareholder after the end of the calendar year. This is reported on the IRS form1099-DIV and provided to the shareholder shortly after eachyear-end. For information about the tax character of distributions made in prior calendar years, please refer toPerformance-Tax Character of Distributions on the Fund’s webpage available at eatonvance.com. The Fund’s distributions are determined by the investment adviser based on its current assessment of the Fund’s long-term return potential. Fund distributions may be affected by numerous factors including changes in Fund performance, the cost of financing for leverage, portfolio holdings, realized and projected returns, and other factors. As portfolio and market conditions change, the rate of distributions paid by the Fund could change. |
| 5 | Leverage represents the liquidation value of the Fund’s VRTP Shares and borrowings outstanding as a percentage of Fund net assets applicable to common shares plus VRTP Shares and borrowings outstanding. Use of leverage creates an opportunity for income, but creates risks including greater price volatility. The cost of leverage rises and falls with changes in short-term interest rates. The Fund may be required to maintain prescribed asset coverage for its leverage and may be required to reduce its leverage at an inopportune time. |
| 6 | Excludes cash and cash equivalents. |
| 7 | Credit ratings are categorized using S&P Global Ratings (“S&P”). Ratings, which are subject to change, apply to the creditworthiness of the issuers of the underlying securities and not to the Fund or its shares. Credit ratings measure the quality of a bond based on the issuer’s creditworthiness, with ratings ranging from AAA, being the highest, to D, being the lowest based on S&P’s measures. Ratings of BBB or higher by S&P are considered to be investment-grade quality. Credit ratings are based largely on the ratings agency’s analysis at the time of rating. The rating assigned to any particular security is not necessarily a reflection of the issuer’s current financial condition and does not necessarily reflect its assessment of the volatility of a security’s market value or of the liquidity of an investment in the security. Holdings designated as “Not Rated” (if any) are not rated by S&P. |
| | Fund profile subject to change due to active management. |
Important Notice to Shareholders
| | Effective November 1, 2019, the Fund is managed by Craig P. Russ, Andrew N. Sveen, Catherine C. McDermott, William E. Holt and Daniel P. McElaney. |
Eaton Vance
Floating-Rate 2022 Target Term Trust
December 31, 2019
Portfolio of Investments (Unaudited)
| | | | | | | | |
| Senior Floating-Rate Loans — 128.5%(1) | |
| Borrower/Tranche Description | | Principal Amount (000’s omitted) | | | Value | |
|
| Aerospace and Defense — 1.5% | |
|
| TransDigm, Inc. | |
| | |
Term Loan, 4.30%, (1 mo. USD LIBOR + 2.50%), Maturing June 9, 2023 | | $ | 2,925 | | | $ | 2,938,002 | |
| | |
Term Loan, 4.30%, (1 mo. USD LIBOR + 2.50%), Maturing August 22, 2024 | | | 199 | | | | 199,886 | |
|
| WP CPP Holdings, LLC | |
| | |
Term Loan, 5.68%, (3 mo. USD LIBOR + 3.75%), Maturing April 30, 2025 | | | 247 | | | | 246,012 | |
| | |
| | | | | | | $ | 3,383,900 | |
|
| Automotive — 2.2% | |
|
| Adient US, LLC | |
| | |
Term Loan, 6.18%, (3 mo. USD LIBOR + 4.25%), Maturing May 6, 2024 | | $ | 522 | | | $ | 526,184 | |
|
| Autokiniton US Holdings, Inc. | |
| | |
Term Loan, 8.17%, (1 mo. USD LIBOR + 6.38%), Maturing May 22, 2025 | | | 296 | | | | 283,680 | |
|
| Bright Bidco B.V. | |
| | |
Term Loan, 5.40%, (USD LIBOR + 3.50%), Maturing June 30, 2024(2) | | | 741 | | | | 441,946 | |
|
| Chassix, Inc. | |
| | |
Term Loan, 7.44%, (USD LIBOR + 5.50%), Maturing November 15, 2023(2) | | | 245 | | | | 226,625 | |
|
| Garrett LX III S.a.r.l. | |
| | |
Term Loan, 4.45%, (3 mo. USD LIBOR + 2.50%), Maturing September 27, 2025 | | | 99 | | | | 98,657 | |
|
| IAA, Inc. | |
| | |
Term Loan, 4.06%, (1 mo. USD LIBOR + 2.25%), Maturing June 28, 2026 | | | 218 | | | | 220,022 | |
|
| Panther BF Aggregator 2 L.P. | |
| | |
Term Loan, 5.30%, (1 mo. USD LIBOR + 3.50%), Maturing April 30, 2026 | | | 1,421 | | | | 1,430,013 | |
|
| Tenneco, Inc. | |
| | |
Term Loan, 4.80%, (1 mo. USD LIBOR + 3.00%), Maturing October 1, 2025 | | | 1,411 | | | | 1,383,593 | |
|
| Thor Industries, Inc. | |
| | |
Term Loan, 5.50%, (1 mo. USD LIBOR + 3.75%), Maturing February 1, 2026 | | | 427 | | | | 428,900 | |
| | |
| | | | | | | $ | 5,039,620 | |
|
| Beverage and Tobacco — 0.1% | |
|
| Arterra Wines Canada, Inc. | |
| | |
Term Loan, 4.65%, (1 mo. USD LIBOR + 2.75%), Maturing December 15, 2023 | | $ | 147 | | | $ | 147,434 | |
| | |
| | | | | | | $ | 147,434 | |
| | | | | | | | |
| Borrower/Tranche Description | | Principal Amount (000’s omitted) | | | Value | |
|
| Brokerage / Securities Dealers / Investment Houses — 0.2% | |
|
| Clipper Acquisitions Corp. | |
| | |
Term Loan, 3.45%, (1 mo. USD LIBOR + 1.75%), Maturing December 27, 2024 | | $ | 441 | | | $ | 444,848 | |
|
| OZ Management L.P. | |
| | |
Term Loan, 6.50%, (1 mo. USD LIBOR + 4.75%), Maturing April 10, 2023 | | | 45 | | | | 45,056 | |
| | |
| | | | | | | $ | 489,904 | |
|
| Building and Development — 3.4% | |
|
| Advanced Drainage Systems, Inc. | |
| | |
Term Loan, 4.00%, (1 mo. USD LIBOR + 2.25%), Maturing July 31, 2026 | | $ | 116 | | | $ | 117,377 | |
|
| American Builders & Contractors Supply Co., Inc. | |
| | |
Term Loan, 3.80%, (1 mo. USD LIBOR + 2.00%), Maturing January 15, 2027 | | | 948 | | | | 952,068 | |
|
| APi Group DE, Inc. | |
| | |
Term Loan, 4.30%, (1 mo. USD LIBOR + 2.50%), Maturing October 1, 2026 | | | 575 | | | | 580,301 | |
|
| Beacon Roofing Supply, Inc. | |
| | |
Term Loan, 4.05%, (1 mo. USD LIBOR + 2.25%), Maturing January 2, 2025 | | | 221 | | | | 222,375 | |
|
| Brookfield Property REIT, Inc. | |
| | |
Term Loan, 4.30%, (1 mo. USD LIBOR + 2.50%), Maturing August 27, 2025 | | | 370 | | | | 368,461 | |
|
| Core & Main L.P. | |
| | |
Term Loan, 4.53%, (USD LIBOR + 2.75%), Maturing August 1, 2024(2) | | | 124 | | | | 124,416 | |
|
| Cushman & Wakefield U.S. Borrower, LLC | |
| | |
Term Loan, 5.05%, (1 mo. USD LIBOR + 3.25%), Maturing August 21, 2025 | | | 2,173 | | | | 2,183,701 | |
|
| NCI Building Systems, Inc. | |
| | |
Term Loan, 5.49%, (1 mo. USD LIBOR + 3.75%), Maturing April 12, 2025 | | | 296 | | | | 296,115 | |
|
| Quikrete Holdings, Inc. | |
| | |
Term Loan, 4.55%, (1 mo. USD LIBOR + 2.75%), Maturing November 15, 2023 | | | 1,933 | | | | 1,944,992 | |
|
| Werner FinCo L.P. | |
| | |
Term Loan, 5.80%, (1 mo. USD LIBOR + 4.00%), Maturing July 24, 2024 | | | 856 | | | | 855,619 | |
| | |
| | | | | | | $ | 7,645,425 | |
|
| Business Equipment and Services — 9.0% | |
|
| Adtalem Global Education, Inc. | |
| | |
Term Loan, 4.80%, (1 mo. USD LIBOR + 3.00%), Maturing April 11, 2025 | | $ | 148 | | | $ | 147,996 | |
| | | | |
| | 5 | | See Notes to Financial Statements. |
Eaton Vance
Floating-Rate 2022 Target Term Trust
December 31, 2019
Portfolio of Investments (Unaudited) — continued
| | | | | | | | |
| Borrower/Tranche Description | | Principal Amount (000’s omitted) | | | Value | |
|
| Business Equipment and Services (continued) | |
|
| AlixPartners, LLP | |
| | |
Term Loan, 4.55%, (1 mo. USD LIBOR + 2.75%), Maturing April 4, 2024 | | $ | 1,390 | | | $ | 1,400,263 | |
|
| Allied Universal Holdco, LLC | |
| | |
Term Loan, 6.05%, (1 mo. USD LIBOR + 4.25%), Maturing July 10, 2026 | | | 1,206 | | | | 1,214,824 | |
| | |
Term Loan, 6.05%, (1 mo. USD LIBOR + 4.25%), Maturing July 10, 2026 | | | 119 | | | | 120,280 | |
|
| AppLovin Corporation | |
| | |
Term Loan, 5.30%, (1 mo. USD LIBOR + 3.50%), Maturing August 15, 2025 | | | 1,615 | | | | 1,626,652 | |
|
| ASGN Incorporated | |
| | |
Term Loan, 3.55%, (1 mo. USD LIBOR + 1.75%), Maturing April 2, 2025 | | | 104 | | | | 105,207 | |
|
| Belfor Holdings, Inc. | |
| | |
Term Loan, 5.69%, (1 mo. USD LIBOR + 4.00%), Maturing April 6, 2026 | | | 199 | | | | 200,244 | |
|
| BidFair MergeRight, Inc. | |
| | |
Term Loan, 7.24%, (1 mo. USD LIBOR + 5.50%), Maturing January 15, 2027 | | | 250 | | | | 248,125 | |
|
| Bracket Intermediate Holding Corp. | |
| | |
Term Loan, 6.35%, (3 mo. USD LIBOR + 4.25%), Maturing September 5, 2025 | | | 346 | | | | 344,761 | |
|
| Camelot U.S. Acquisition 1 Co. | |
| | |
Term Loan, 5.05%, (1 mo. USD LIBOR + 3.25%), Maturing October 31, 2026 | | | 600 | | | | 604,375 | |
|
| Ceridian HCM Holding, Inc. | |
| | |
Term Loan, 4.80%, (1 mo. USD LIBOR + 3.00%), Maturing April 30, 2025 | | | 568 | | | | 572,189 | |
|
| Cypress Intermediate Holdings III, Inc. | |
| | |
Term Loan, 4.55%, (1 mo. USD LIBOR + 2.75%), Maturing April 29, 2024 | | | 691 | | | | 695,459 | |
|
| Deerfield Dakota Holding, LLC | |
| | |
Term Loan, 5.05%, (1 mo. USD LIBOR + 3.25%), Maturing February 13, 2025 | | | 496 | | | | 495,592 | |
|
| EAB Global, Inc. | |
| | |
Term Loan, 5.74%, (USD LIBOR + 3.75%), Maturing November 15, 2024(2) | | | 540 | | | | 542,401 | |
|
| EIG Investors Corp. | |
| | |
Term Loan, 5.67%, (3 mo. USD LIBOR + 3.75%), Maturing February 9, 2023 | | | 1,631 | | | | 1,617,405 | |
|
| Garda World Security Corporation | |
| | |
Term Loan, 6.66%, (3 mo. USD LIBOR + 4.75%), Maturing October 30, 2026 | | | 775 | | | | 780,489 | |
|
| IG Investment Holdings, LLC | |
| | |
Term Loan, 5.80%, (1 mo. USD LIBOR + 4.00%), Maturing May 23, 2025 | | | 172 | | | | 173,129 | |
| | | | | | | | |
| Borrower/Tranche Description | | Principal Amount (000’s omitted) | | | Value | |
|
| Business Equipment and Services (continued) | |
|
| IRI Holdings, Inc. | |
| | |
Term Loan, 6.30%, (USD LIBOR + 4.50%), Maturing December 1, 2025(2) | | $ | 619 | | | $ | 608,437 | |
|
| Iron Mountain, Inc. | |
| | |
Term Loan, 3.55%, (1 mo. USD LIBOR + 1.75%), Maturing January 2, 2026 | | | 344 | | | | 343,586 | |
|
| KAR Auction Services, Inc. | |
| | |
Term Loan, 4.06%, (1 mo. USD LIBOR + 2.25%), Maturing September 19, 2026 | | | 249 | | | | 251,607 | |
|
| Kronos Incorporated | |
| | |
Term Loan, 4.91%, (3 mo. USD LIBOR + 3.00%), Maturing November 1, 2023 | | | 2,444 | | | | 2,459,213 | |
|
| KUEHG Corp. | |
| | |
Term Loan, 5.69%, (3 mo. USD LIBOR + 3.75%), Maturing February 21, 2025 | | | 1,390 | | | | 1,394,942 | |
|
| Pike Corporation | |
| | |
Term Loan, 5.05%, (1 mo. USD LIBOR + 3.25%), Maturing July 24, 2026 | | | 195 | | | | 196,916 | |
|
| Pre-Paid Legal Services, Inc. | |
| | |
Term Loan, 5.05%, (1 mo. USD LIBOR + 3.25%), Maturing May 1, 2025 | | | 202 | | | | 203,060 | |
|
| Prime Security Services Borrower, LLC | |
| | |
Term Loan, 4.94%, (1 mo. USD LIBOR + 3.25%), Maturing September 23, 2026 | | | 1,111 | | | | 1,115,637 | |
|
| Prometric Holdings, Inc. | |
| | |
Term Loan, 4.79%, (1 mo. USD LIBOR + 3.00%), Maturing January 29, 2025 | | | 98 | | | | 98,319 | |
|
| Red Ventures, LLC | |
| | |
Term Loan, 4.80%, (1 mo. USD LIBOR + 3.00%), Maturing November 8, 2024 | | | 427 | | | | 431,416 | |
|
| SMG US Midco 2, Inc. | |
| | |
Term Loan, 4.80%, (1 mo. USD LIBOR + 3.00%), Maturing January 23, 2025 | | | 98 | | | | 98,864 | |
|
| Spin Holdco, Inc. | |
| | |
Term Loan, 5.25%, (3 mo. USD LIBOR + 3.25%), Maturing November 14, 2022 | | | 1,416 | | | | 1,408,523 | |
|
| Trans Union, LLC | |
| | |
Term Loan, 3.55%, (1 mo. USD LIBOR + 1.75%), Maturing November 16, 2026 | | | 168 | | | | 168,759 | |
|
| West Corporation | |
| | |
Term Loan, 5.43%, (3 mo. USD LIBOR + 3.50%), Maturing October 10, 2024 | | | 123 | | | | 103,912 | |
| | |
Term Loan, 5.93%, (3 mo. USD LIBOR + 4.00%), Maturing October 10, 2024 | | | 392 | | | | 333,200 | |
| | |
| | | | | | | $ | 20,105,782 | |
| | | | |
| | 6 | | See Notes to Financial Statements. |
Eaton Vance
Floating-Rate 2022 Target Term Trust
December 31, 2019
Portfolio of Investments (Unaudited) — continued
| | | | | | | | |
| Borrower/Tranche Description | | Principal Amount (000’s omitted) | | | Value | |
|
| Cable and Satellite Television — 5.2% | |
|
| Altice France S.A. | |
| | |
Term Loan, 5.43%, (1 mo. USD LIBOR + 3.69%), Maturing January 31, 2026 | | $ | 1,274 | | | $ | 1,277,975 | |
| | |
Term Loan, 5.74%, (1 mo. USD LIBOR + 4.00%), Maturing August 14, 2026 | | | 497 | | | | 500,286 | |
|
| Charter Communications Operating, LLC | |
| | |
Term Loan, 3.55%, (1 mo. USD LIBOR + 1.75%), Maturing February 1, 2027 | | | 1,299 | | | | 1,308,398 | |
|
| CSC Holdings, LLC | |
| | |
Term Loan, 3.99%, (1 mo. USD LIBOR + 2.25%), Maturing January 15, 2026 | | | 397 | | | | 398,389 | |
| | |
Term Loan, 4.24%, (1 mo. USD LIBOR + 2.50%), Maturing April 15, 2027 | | | 469 | | | | 472,190 | |
|
| Radiate Holdco, LLC | |
| | |
Term Loan, 4.80%, (1 mo. USD LIBOR + 3.00%), Maturing February 1, 2024 | | | 583 | | | | 585,515 | |
|
| Telenet Financing USD, LLC | |
| | |
Term Loan, 3.99%, (1 mo. USD LIBOR + 2.25%), Maturing August 15, 2026 | | | 1,450 | | | | 1,460,422 | |
|
| Virgin Media Bristol, LLC | |
| | |
Term Loan, 4.24%, (1 mo. USD LIBOR + 2.50%), Maturing January 31, 2028 | | | 3,100 | | | | 3,123,250 | |
|
| Ziggo Secured Finance Partnership | |
| | |
Term Loan, 4.24%, (1 mo. USD LIBOR + 2.50%), Maturing April 15, 2025 | | | 2,650 | | | | 2,656,074 | |
| | |
| | | | | | | $ | 11,782,499 | |
|
| Chemicals and Plastics — 6.6% | |
|
| Alpha 3 B.V. | |
| | |
Term Loan, 4.94%, (3 mo. USD LIBOR + 3.00%), Maturing January 31, 2024 | | $ | 1,244 | | | $ | 1,249,197 | |
|
| Axalta Coating Systems US Holdings, Inc. | |
| | |
Term Loan, 3.69%, (3 mo. USD LIBOR + 1.75%), Maturing June 1, 2024 | | | 2,881 | | | | 2,891,625 | |
|
| Ferro Corporation | |
| | |
Term Loan, 4.19%, (3 mo. USD LIBOR + 2.25%), Maturing February 14, 2024 | | | 134 | | | | 133,892 | |
| | |
Term Loan, 4.19%, (3 mo. USD LIBOR + 2.25%), Maturing February 14, 2024 | | | 137 | | | | 136,802 | |
|
| Hexion, Inc. | |
| | |
Term Loan, 5.60%, (3 mo. USD LIBOR + 3.50%), Maturing July 1, 2026 | | | 299 | | | | 300,358 | |
|
| INEOS Enterprises Holdings US Finco, LLC | |
| | |
Term Loan, 5.91%, (3 mo. USD LIBOR + 4.00%), Maturing August 31, 2026 | | | 100 | | | | 100,280 | |
| | | | | | | | |
| Borrower/Tranche Description | | Principal Amount (000’s omitted) | | | Value | |
|
| Chemicals and Plastics (continued) | |
|
| INEOS US Finance, LLC | |
| | |
Term Loan, 3.80%, (1 mo. USD LIBOR + 2.00%), Maturing March 31, 2024 | | $ | 1,274 | | | $ | 1,276,468 | |
|
| Kraton Polymers, LLC | |
| | |
Term Loan, 4.30%, (1 mo. USD LIBOR + 2.50%), Maturing March 5, 2025 | | | 811 | | | | 808,772 | |
|
| Messer Industries GmbH | |
| | |
Term Loan, 4.44%, (3 mo. USD LIBOR + 2.50%), Maturing March 1, 2026 | | | 1,019 | | | | 1,025,240 | |
|
| Momentive Performance Materials, Inc. | |
| | |
Term Loan, 5.05%, (1 mo. USD LIBOR + 3.25%), Maturing May 15, 2024 | | | 672 | | | | 667,847 | |
|
| PMHC II, Inc. | |
| | |
Term Loan, 5.44%, (3 mo. USD LIBOR + 3.50%), Maturing March 31, 2025 | | | 741 | | | | 659,783 | |
|
| PQ Corporation | |
| | |
Term Loan, 4.43%, (3 mo. USD LIBOR + 2.50%), Maturing February 8, 2025 | | | 1,711 | | | | 1,721,731 | |
|
| Pregis TopCo Corporation | |
| | |
Term Loan, 5.80%, (1 mo. USD LIBOR + 4.00%), Maturing July 31, 2026 | | | 250 | | | | 250,469 | |
|
| Spectrum Holdings III Corp. | |
| | |
Term Loan, 5.05%, (1 mo. USD LIBOR + 3.25%), Maturing January 31, 2025 | | | 134 | | | | 125,059 | |
|
| Starfruit Finco B.V. | |
| | |
Term Loan, 4.96%, (1 mo. USD LIBOR + 3.25%), Maturing October 1, 2025 | | | 1,088 | | | | 1,090,762 | |
|
| Tronox Finance, LLC | |
| | |
Term Loan, 4.61%, (USD LIBOR + 2.75%), Maturing September 23, 2024(2) | | | 1,202 | | | | 1,205,150 | |
|
| Venator Materials Corporation | |
| | |
Term Loan, 4.80%, (1 mo. USD LIBOR + 3.00%), Maturing August 8, 2024 | | | 1,271 | | | | 1,265,985 | |
| | |
| | | | | | | $ | 14,909,420 | |
|
| Conglomerates — 1.0% | |
|
| Kronos Acquisition Holdings, Inc. | |
| | |
Term Loan, 8.80%, (1 mo. USD LIBOR + 7.00%), Maturing May 15, 2023 | | $ | 620 | | | $ | 615,660 | |
|
| Penn Engineering & Manufacturing Corp. | |
| | |
Term Loan, 4.55%, (1 mo. USD LIBOR + 2.75%), Maturing June 27, 2024 | | | 1,668 | | | | 1,669,963 | |
| | |
| | | | | | | $ | 2,285,623 | |
| | | | |
| | 7 | | See Notes to Financial Statements. |
Eaton Vance
Floating-Rate 2022 Target Term Trust
December 31, 2019
Portfolio of Investments (Unaudited) — continued
| | | | | | | | |
| Borrower/Tranche Description | | Principal Amount (000’s omitted) | | | Value | |
|
| Containers and Glass Products — 5.3% | |
|
| Berlin Packaging, LLC | |
| | |
Term Loan, 4.72%, (USD LIBOR + 3.00%), Maturing November 7, 2025(2) | | $ | 99 | | | $ | 98,043 | |
|
| Berry Global, Inc. | |
| | |
Term Loan, 4.22%, (1 mo. USD LIBOR + 2.50%), Maturing July 1, 2026 | | | 373 | | | | 374,809 | |
|
| BWAY Holding Company | |
| | |
Term Loan, 5.23%, (3 mo. USD LIBOR + 3.25%), Maturing April 3, 2024 | | | 731 | | | | 729,993 | |
|
| Flex Acquisition Company, Inc. | |
| | |
Term Loan, 5.09%, (USD LIBOR + 3.00%), Maturing December 29, 2023(2) | | | 2,212 | | | | 2,198,746 | |
| | |
Term Loan, 5.35%, (3 mo. USD LIBOR + 3.25%), Maturing June 29, 2025 | | | 587 | | | | 584,029 | |
|
| Libbey Glass, Inc. | |
| | |
Term Loan, 4.71%, (1 mo. USD LIBOR + 3.00%), Maturing April 9, 2021 | | | 1,847 | | | | 1,516,684 | |
|
| Pelican Products, Inc. | |
| | |
Term Loan, 5.24%, (1 mo. USD LIBOR + 3.50%), Maturing May 1, 2025 | | | 246 | | | | 226,550 | |
|
| Proampac PG Borrower, LLC | |
| | |
Term Loan, 5.38%, (USD LIBOR + 3.50%), Maturing November 20, 2023(2) | | | 721 | | | | 713,291 | |
|
| Reynolds Group Holdings, Inc. | |
| | |
Term Loan, 4.55%, (1 mo. USD LIBOR + 2.75%), Maturing February 5, 2023 | | | 4,409 | | | | 4,429,315 | |
|
| Ring Container Technologies Group, LLC | |
| | |
Term Loan, 4.55%, (1 mo. USD LIBOR + 2.75%), Maturing October 31, 2024 | | | 340 | | | | 341,687 | |
|
| Trident TPI Holdings, Inc. | |
| | |
Term Loan, 4.80%, (1 mo. USD LIBOR + 3.00%), Maturing October 17, 2024 | | | 763 | | | | 743,922 | |
| | |
| | | | | | | $ | 11,957,069 | |
|
| Cosmetics / Toiletries — 0.1% | |
|
| KIK Custom Products, Inc. | |
| | |
Term Loan, 5.79%, (31 mo. USD LIBOR + 4.00%), Maturing May 15, 2023 | | $ | 250 | | | $ | 246,406 | |
| | |
| | | | | | | $ | 246,406 | |
|
| Drugs — 5.2% | |
|
| Akorn, Inc. | |
| | |
Term Loan, 11.81%, (11.06% cash (1 mo. USD LIBOR + 9.25%), 0.75% PIK), Maturing April 16, 2021 | | $ | 514 | | | $ | 494,108 | |
|
| Albany Molecular Research, Inc. | |
| | |
Term Loan, 5.05%, (1 mo. USD LIBOR + 3.25%), Maturing August 30, 2024 | | | 733 | | | | 732,667 | |
| | | | | | | | |
| Borrower/Tranche Description | | Principal Amount (000’s omitted) | | | Value | |
|
| Drugs (continued) | |
|
| Albany Molecular Research, Inc. (continued) | |
| | |
Term Loan - Second Lien, 8.80%, (1 mo. USD LIBOR + 7.00%), Maturing August 30, 2025 | | $ | 500 | | | $ | 500,000 | |
|
| Amneal Pharmaceuticals, LLC | |
| | |
Term Loan, 5.31%, (1 mo. USD LIBOR + 3.50%), Maturing May 4, 2025 | | | 1,379 | | | | 1,247,013 | |
|
| Bausch Health Companies, Inc. | |
| | |
Term Loan, 4.74%, (1 mo. USD LIBOR + 3.00%), Maturing June 2, 2025 | | | 445 | | | | 448,267 | |
|
| Catalent Pharma Solutions, Inc. | |
| | |
Term Loan, 4.05%, (1 mo. USD LIBOR + 2.25%), Maturing May 18, 2026 | | | 323 | | | | 324,579 | |
|
| Endo Luxembourg Finance Company I S.a.r.l. | |
| | |
Term Loan, 6.06%, (1 mo. USD LIBOR + 4.25%), Maturing April 29, 2024 | | | 2,925 | | | | 2,786,586 | |
|
| Jaguar Holding Company II | |
| | |
Term Loan, 4.30%, (1 mo. USD LIBOR + 2.50%), Maturing August 18, 2022 | | | 2,923 | | | | 2,942,554 | |
|
| Mallinckrodt International Finance S.A. | |
| | |
Term Loan, 4.69%, (3 mo. USD LIBOR + 2.75%), Maturing September 24, 2024 | | | 2,376 | | | | 1,937,414 | |
| | |
Term Loan, 4.91%, (3 mo. USD LIBOR + 3.00%), Maturing February 24, 2025 | | | 218 | | | | 178,078 | |
| | |
| | | | | | | $ | 11,591,266 | |
|
| Ecological Services and Equipment — 2.3% | |
|
| Advanced Disposal Services, Inc. | |
| | |
Term Loan, 3.85%, (1 week USD LIBOR + 2.25%), Maturing November 10, 2023 | | $ | 2,806 | | | $ | 2,820,697 | |
|
| EnergySolutions, LLC | |
| | |
Term Loan, 5.69%, (3 mo. USD LIBOR + 3.75%), Maturing May 9, 2025 | | | 666 | | | | 631,380 | |
|
| GFL Environmental, Inc. | |
| | |
Term Loan, 4.80%, (1 mo. USD LIBOR + 3.00%), Maturing May 30, 2025 | | | 1,359 | | | | 1,362,381 | |
|
| Terrapure Environmental Ltd. | |
| | |
Term Loan, Maturing November 25, 2026(3) | | | 175 | | | | 175,875 | |
|
| US Ecology Holdings, Inc. | |
| | |
Term Loan, 4.30%, (1 mo. USD LIBOR + 2.50%), Maturing August 14, 2026 | | | 100 | | | | 100,906 | |
| | |
| | | | | | | $ | 5,091,239 | |
|
| Electronics / Electrical — 18.6% | |
|
| Almonde, Inc. | |
| | |
Term Loan, 5.70%, (6 mo. USD LIBOR + 3.50%), Maturing June 13, 2024 | | $ | 1,404 | | | $ | 1,398,017 | |
| | | | |
| | 8 | | See Notes to Financial Statements. |
Eaton Vance
Floating-Rate 2022 Target Term Trust
December 31, 2019
Portfolio of Investments (Unaudited) — continued
| | | | | | | | |
| Borrower/Tranche Description | | Principal Amount (000’s omitted) | | | Value | |
|
| Electronics / Electrical (continued) | |
|
| Applied Systems, Inc. | |
| | |
Term Loan, 5.19%, (3 mo. USD LIBOR + 3.25%), Maturing September 19, 2024 | | $ | 1,921 | | | $ | 1,931,113 | |
| | |
Term Loan - Second Lien, Maturing September 19, 2025(3) | | | 175 | | | | 179,594 | |
|
| Aptean, Inc. | |
| | |
Term Loan, 6.19%, (3 mo. USD LIBOR + 4.25%), Maturing April 23, 2026 | | | 199 | | | | 197,880 | |
|
| Avast Software B.V. | |
| | |
Term Loan, 4.19%, (3 mo. USD LIBOR + 2.25%), Maturing September 29, 2023 | | | 351 | | | | 354,603 | |
|
| Banff Merger Sub, Inc. | |
| | |
Term Loan, 6.05%, (1 mo. USD LIBOR + 4.25%), Maturing October 2, 2025 | | | 1,386 | | | | 1,372,356 | |
|
| Barracuda Networks, Inc. | |
| | |
Term Loan, 5.16%, (3 mo. USD LIBOR + 3.25%), Maturing February 12, 2025 | | | 865 | | | | 871,270 | |
|
| Canyon Valor Companies, Inc. | |
| | |
Term Loan, 4.55%, (1 mo. USD LIBOR + 2.75%), Maturing June 16, 2023 | | | 697 | | | | 697,764 | |
|
| CDW, LLC | |
| | |
Term Loan, 3.55%, (1 mo. USD LIBOR + 1.75%), Maturing October 13, 2026 | | | 499 | | | | 502,448 | |
|
| Celestica, Inc. | |
| | |
Term Loan, 4.29%, (1 mo. USD LIBOR + 2.50%), Maturing June 27, 2025 | | | 124 | | | | 123,866 | |
|
| Cohu, Inc. | |
| | |
Term Loan, 4.80%, (1 mo. USD LIBOR + 3.00%), Maturing October 1, 2025 | | | 296 | | | | 294,769 | |
|
| CommScope, Inc. | |
| | |
Term Loan, 5.05%, (1 mo. USD LIBOR + 3.25%), Maturing April 6, 2026 | | | 698 | | | | 703,658 | |
|
| CPI International, Inc. | |
| | |
Term Loan, 5.30%, (1 mo. USD LIBOR + 3.50%), Maturing July 26, 2024 | | | 733 | | | | 706,549 | |
|
| Datto, Inc. | |
| | |
Term Loan, 6.05%, (1 mo. USD LIBOR + 4.25%), Maturing April 2, 2026 | | | 124 | | | | 125,541 | |
|
| ECI Macola/Max Holding, LLC | |
| | |
Term Loan, 6.19%, (3 mo. USD LIBOR + 4.25%), Maturing September 27, 2024 | | | 319 | | | | 319,831 | |
|
| Electro Rent Corporation | |
| | |
Term Loan, 6.94%, (3 mo. USD LIBOR + 5.00%), Maturing January 31, 2024 | | | 731 | | | | 737,248 | |
|
| Energizer Holdings, Inc. | |
| | |
Term Loan, 4.00%, (1 mo. USD LIBOR + 2.25%), Maturing December 17, 2025 | | | 149 | | | | 149,473 | |
| | | | | | | | |
| Borrower/Tranche Description | | Principal Amount (000’s omitted) | | | Value | |
|
| Electronics / Electrical (continued) | |
|
| Epicor Software Corporation | |
| | |
Term Loan, 5.05%, (1 mo. USD LIBOR + 3.25%), Maturing June 1, 2022 | | $ | 2,555 | | | $ | 2,575,721 | |
|
| EXC Holdings III Corp. | |
| | |
Term Loan, 5.44%, (3 mo. USD LIBOR + 3.50%), Maturing December 2, 2024 | | | 172 | | | | 171,281 | |
|
| Financial & Risk US Holdings, Inc. | |
| | |
Term Loan, 5.05%, (1 mo. USD LIBOR + 3.25%), Maturing October 1, 2025 | | | 446 | | | | 449,769 | |
|
| Flexera Software, LLC | |
| | |
Term Loan, 5.30%, (1 mo. USD LIBOR + 3.50%), Maturing February 26, 2025 | | | 663 | | | | 666,109 | |
|
| GlobalLogic Holdings, Inc. | |
| | |
Term Loan, 5.05%, (1 mo. USD LIBOR + 3.25%), Maturing August 1, 2025 | | | 173 | | | | 174,139 | |
|
| Hyland Software, Inc. | |
| | |
Term Loan, 5.30%, (1 mo. USD LIBOR + 3.50%), Maturing July 1, 2024 | | | 2,751 | | | | 2,776,992 | |
|
| Infoblox, Inc. | |
| | |
Term Loan, 6.30%, (1 mo. USD LIBOR + 4.50%), Maturing November 7, 2023 | | | 716 | | | | 719,731 | |
|
| Infor (US), Inc. | |
| | |
Term Loan, 4.69%, (3 mo. USD LIBOR + 2.75%), Maturing February 1, 2022 | | | 2,921 | | | | 2,937,748 | |
|
| Informatica, LLC | |
| | |
Term Loan, 5.05%, (1 mo. USD LIBOR + 3.25%), Maturing August 5, 2022 | | | 248 | | | | 249,453 | |
|
| MA FinanceCo., LLC | |
| | |
Term Loan, 4.30%, (1 mo. USD LIBOR + 2.50%), Maturing June 21, 2024 | | | 247 | | | | 247,603 | |
|
| MACOM Technology Solutions Holdings, Inc. | |
| | |
Term Loan, 4.05%, (1 mo. USD LIBOR + 2.25%), Maturing May 17, 2024 | | | 575 | | | | 550,730 | |
|
| Marcel LUX IV S.a.r.l. | |
| | |
Term Loan, 5.05%, (1 mo. USD LIBOR + 3.25%), Maturing March 15, 2026 | | | 598 | | | | 596,626 | |
|
| Microchip Technology Incorporated | |
| | |
Term Loan, 3.80%, (1 mo. USD LIBOR + 2.00%), Maturing May 29, 2025 | | | 604 | | | | 609,673 | |
|
| MKS Instruments, Inc. | |
| | |
Term Loan, 3.55%, (1 mo. USD LIBOR + 1.75%), Maturing February 2, 2026 | | | 141 | | | | 141,676 | |
|
| NCR Corporation | |
| | |
Term Loan, 4.30%, (1 mo. USD LIBOR + 2.50%), Maturing August 28, 2026 | | | 374 | | | | 376,400 | |
|
| Renaissance Holding Corp. | |
| | |
Term Loan, 5.05%, (1 mo. USD LIBOR + 3.25%), Maturing May 30, 2025 | | | 493 | | | | 491,422 | |
| | | | |
| | 9 | | See Notes to Financial Statements. |
Eaton Vance
Floating-Rate 2022 Target Term Trust
December 31, 2019
Portfolio of Investments (Unaudited) — continued
| | | | | | | | |
| Borrower/Tranche Description | | Principal Amount (000’s omitted) | | | Value | |
|
| Electronics / Electrical (continued) | |
|
| Seattle Spinco, Inc. | |
| | |
Term Loan, 4.30%, (1 mo. USD LIBOR + 2.50%), Maturing June 21, 2024 | | $ | 1,666 | | | $ | 1,672,124 | |
|
| SGS Cayman L.P. | |
| | |
Term Loan, 7.32%, (3 mo. USD LIBOR + 5.38%), Maturing April 23, 2021 | | | 148 | | | | 147,022 | |
|
| SkillSoft Corporation | |
| | |
Term Loan, 6.95%, (6 mo. USD LIBOR + 4.75%), Maturing April 28, 2021 | | | 1,964 | | | | 1,528,422 | |
|
| SolarWinds Holdings, Inc. | |
| | |
Term Loan, 4.55%, (1 mo. USD LIBOR + 2.75%), Maturing February 5, 2024 | | | 1,436 | | | | 1,448,787 | |
|
| Solera, LLC | |
| | |
Term Loan, 4.55%, (1 mo. USD LIBOR + 2.75%), Maturing March 3, 2023 | | | 2,517 | | | | 2,525,276 | |
|
| Sparta Systems, Inc. | |
| | |
Term Loan, 5.44%, (3 mo. USD LIBOR + 3.50%), Maturing August 21, 2024 | | | 474 | | | | 412,196 | |
|
| SS&C Technologies Holdings Europe S.a.r.l. | |
| | |
Term Loan, 4.05%, (1 mo. USD LIBOR + 2.25%), Maturing April 16, 2025 | | | 318 | | | | 320,562 | |
|
| SS&C Technologies, Inc. | |
| | |
Term Loan, 4.05%, (1 mo. USD LIBOR + 2.25%), Maturing April 16, 2025 | | | 459 | | | | 462,338 | |
|
| Sutherland Global Services, Inc. | |
| | |
Term Loan, 7.32%, (3 mo. USD LIBOR + 5.38%), Maturing April 23, 2021 | | | 637 | | | | 631,598 | |
|
| TriTech Software Systems | |
| | |
Term Loan, 5.55%, (1 mo. USD LIBOR + 3.75%), Maturing August 29, 2025 | | | 322 | | | | 308,344 | |
|
| TTM Technologies, Inc. | |
| | |
Term Loan, 4.19%, (1 mo. USD LIBOR + 2.50%), Maturing September 28, 2024 | | | 106 | | | | 106,631 | |
|
| Uber Technologies, Inc. | |
| | |
Term Loan, 5.30%, (1 mo. USD LIBOR + 3.50%), Maturing July 13, 2023 | | | 1,950 | | | | 1,950,841 | |
| | |
Term Loan, 5.74%, (1 mo. USD LIBOR + 4.00%), Maturing April 4, 2025 | | | 591 | | | | 592,847 | |
|
| Ultimate Software Group, Inc. (The) | |
| | |
Term Loan, 5.55%, (1 mo. USD LIBOR + 3.75%), Maturing May 4, 2026 | | | 648 | | | | 652,698 | |
|
| Ultra Clean Holdings, Inc. | |
| | |
Term Loan, 6.30%, (1 mo. USD LIBOR + 4.50%), Maturing August 27, 2025 | | | 300 | | | | 300,562 | |
|
| Verifone Systems, Inc. | |
| | |
Term Loan, 5.90%, (3 mo. USD LIBOR + 4.00%), Maturing August 20, 2025 | | | 1,114 | | | | 1,103,105 | |
| | | | | | | | |
| Borrower/Tranche Description | | Principal Amount (000’s omitted) | | | Value | |
|
| Electronics / Electrical (continued) | |
|
| Veritas Bermuda, Ltd. | |
| | |
Term Loan, 6.32%, (USD LIBOR + 4.50%), Maturing January 27, 2023(2) | | $ | 731 | | | $ | 706,525 | |
|
| Vero Parent, Inc. | |
| | |
Term Loan, 8.16%, (3 mo. USD LIBOR + 6.25%), Maturing August 16, 2024 | | | 1,271 | | | | 1,223,253 | |
|
| Vungle, Inc. | |
| | |
Term Loan, 7.30%, (1 mo. USD LIBOR + 5.50%), Maturing September 30, 2026 | | | 274 | | | | 271,912 | |
|
| Western Digital Corporation | |
| | |
Term Loan, 3.45%, (1 mo. USD LIBOR + 1.75%), Maturing April 29, 2023 | | | 949 | | | | 955,223 | |
| | |
| | | | | | | $ | 41,721,319 | |
|
| Equipment Leasing — 0.9% | |
|
| Avolon TLB Borrower 1 (US), LLC | |
| | |
Term Loan, 3.51%, (1 mo. USD LIBOR + 1.75%), Maturing January 15, 2025 | | $ | 1,883 | | | $ | 1,897,288 | |
|
| IBC Capital Limited | |
| | |
Term Loan, 5.65%, (3 mo. USD LIBOR + 3.75%), Maturing September 11, 2023 | | | 221 | | | | 221,615 | |
| | |
| | | | | | | $ | 2,118,903 | |
|
| Financial Intermediaries — 2.9% | |
|
| Apollo Commercial Real Estate Finance, Inc. | |
| | |
Term Loan, 4.49%, (1 mo. USD LIBOR + 2.75%), Maturing May 15, 2026 | | $ | 149 | | | $ | 149,996 | |
|
| Aretec Group, Inc. | |
| | |
Term Loan, 6.05%, (1 mo. USD LIBOR + 4.25%), Maturing October 1, 2025 | | | 1,515 | | | | 1,499,768 | |
|
| Claros Mortgage Trust, Inc. | |
| | |
Term Loan, 4.96%, (1 mo. USD LIBOR + 3.25%), Maturing August 9, 2026 | | | 299 | | | | 301,494 | |
|
| EIG Management Company, LLC | |
| | |
Term Loan, 5.55%, (1 mo. USD LIBOR + 3.75%), Maturing February 22, 2025 | | | 98 | | | | 98,434 | |
|
| Focus Financial Partners, LLC | |
| | |
Term Loan, 4.30%, (1 mo. USD LIBOR + 2.50%), Maturing July 3, 2024 | | | 1,137 | | | | 1,145,966 | |
|
| Franklin Square Holdings L.P. | |
| | |
Term Loan, 4.06%, (1 mo. USD LIBOR + 2.25%), Maturing August 1, 2025 | | | 197 | | | | 198,241 | |
|
| Greenhill & Co., Inc. | |
| | |
Term Loan, 4.99%, (1 mo. USD LIBOR + 3.25%), Maturing April 12, 2024 | | | 536 | | | | 530,217 | |
| | | | |
| | 10 | | See Notes to Financial Statements. |
Eaton Vance
Floating-Rate 2022 Target Term Trust
December 31, 2019
Portfolio of Investments (Unaudited) — continued
| | | | | | | | |
| Borrower/Tranche Description | | Principal Amount (000’s omitted) | | | Value | |
|
| Financial Intermediaries (continued) | |
|
| GreenSky Holdings, LLC | |
| | |
Term Loan, 5.06%, (1 mo. USD LIBOR + 3.25%), Maturing March 31, 2025 | | $ | 1,326 | | | $ | 1,329,691 | |
|
| Harbourvest Partners, LLC | |
| | |
Term Loan, 3.99%, (1 mo. USD LIBOR + 2.25%), Maturing March 3, 2025 | | | 171 | | | | 171,799 | |
|
| Starwood Property Trust, Inc. | |
| | |
Term Loan, 4.30%, (1 mo. USD LIBOR + 2.50%), Maturing July 27, 2026 | | | 200 | | | | 201,119 | |
|
| StepStone Group L.P. | |
| | |
Term Loan, 5.84%, (2 mo. USD LIBOR + 4.00%), Maturing March 27, 2025 | | | 246 | | | | 245,318 | |
|
| Victory Capital Holdings, Inc. | |
| | |
Term Loan, 5.35%, (3 mo. USD LIBOR + 3.25%), Maturing July 1, 2026 | | | 476 | | | | 480,016 | |
|
| Virtus Investment Partners, Inc. | |
| | |
Term Loan, 3.94%, (1 mo. USD LIBOR + 2.25%), Maturing June 1, 2024 | | | 59 | | | | 59,427 | |
| | |
| | | | | | | $ | 6,411,486 | |
|
| Food Products — 2.9% | |
|
| Alphabet Holding Company, Inc. | |
| | |
Term Loan, 5.30%, (1 mo. USD LIBOR + 3.50%), Maturing September 26, 2024 | | $ | 1,369 | | | $ | 1,322,884 | |
|
| Atkins Nutritionals Holdings II, Inc. | |
| | |
Term Loan, 5.73%, (3 mo. USD LIBOR + 3.75%), Maturing July 7, 2024 | | | 150 | | | | 151,875 | |
|
| B&G Foods, Inc. | |
| | |
Term Loan, 4.30%, (1 mo. USD LIBOR + 2.50%), Maturing October 10, 2026 | | | 100 | | | | 100,748 | |
|
| Badger Buyer Corp. | |
| | |
Term Loan, 5.30%, (1 mo. USD LIBOR + 3.50%), Maturing September 30, 2024 | | | 491 | | | | 439,629 | |
|
| CHG PPC Parent, LLC | |
| | |
Term Loan, 4.55%, (1 mo. USD LIBOR + 2.75%), Maturing March 31, 2025 | | | 197 | | | | 197,985 | |
|
| Del Monte Foods, Inc. | |
| | |
Term Loan, 5.16%, (3 mo. USD LIBOR + 3.25%), Maturing February 18, 2021 | | | 833 | | | | 743,635 | |
|
| Hearthside Food Solutions, LLC | |
| | |
Term Loan, 5.49%, (1 mo. USD LIBOR + 3.69%), Maturing May 23, 2025 | | | 667 | | | | 662,270 | |
| | |
Term Loan, 5.80%, (1 mo. USD LIBOR + 4.00%), Maturing May 23, 2025 | | | 173 | | | | 173,250 | |
|
| HLF Financing S.a.r.l. | |
| | |
Term Loan, 4.55%, (1 mo. USD LIBOR + 2.75%), Maturing August 18, 2025 | | | 420 | | | | 422,048 | |
| | | | | | | | |
| Borrower/Tranche Description | | Principal Amount (000’s omitted) | | | Value | |
|
| Food Products (continued) | |
|
| JBS USA Lux S.A. | |
| | |
Term Loan, 3.80%, (1 mo. USD LIBOR + 2.00%), Maturing May 1, 2026 | | $ | 2,111 | | | $ | 2,128,583 | |
|
| Nomad Foods Europe Midco Limited | |
| | |
Term Loan, 3.99%, (1 mo. USD LIBOR + 2.25%), Maturing May 15, 2024 | | | 247 | | | | 248,389 | |
| | |
| | | | | | | $ | 6,591,296 | |
|
| Food Service — 2.0% | |
|
| 1011778 B.C. Unlimited Liability Company | |
| | |
Term Loan, 3.55%, (1 mo. USD LIBOR + 1.75%), Maturing November 19, 2026 | | $ | 2,300 | | | $ | 2,305,736 | |
|
| Aramark Services, Inc. | |
| | |
Term Loan, 3.55%, (1 mo. USD LIBOR + 1.75%), Maturing March 11, 2025 | | | 326 | | | | 328,217 | |
|
| IRB Holding Corp. | |
| | |
Term Loan, 5.22%, (3 mo. USD LIBOR + 3.25%), Maturing February 5, 2025 | | | 714 | | | | 718,925 | |
|
| Restaurant Technologies, Inc. | |
| | |
Term Loan, 5.05%, (1 mo. USD LIBOR + 3.25%), Maturing October 1, 2025 | | | 74 | | | | 74,807 | |
|
| US Foods, Inc. | |
| | |
Term Loan, 3.55%, (1 mo. USD LIBOR + 1.75%), Maturing June 27, 2023 | | | 319 | | | | 320,694 | |
| | |
Term Loan, 3.80%, (1 mo. USD LIBOR + 2.00%), Maturing September 13, 2026 | | | 648 | | | | 651,948 | |
| | |
| | | | | | | $ | 4,400,327 | |
|
| Food / Drug Retailers — 1.0% | |
|
| Albertsons, LLC | |
| | |
Term Loan, 4.55%, (1 mo. USD LIBOR + 2.75%), Maturing August 17, 2026 | | $ | 1,750 | | | $ | 1,768,955 | |
|
| Allsup’s Convenience Stores, Inc. | |
| | |
Term Loan, 8.00%, (1 mo. USD LIBOR + 6.25%), Maturing November 18, 2024 | | | 250 | | | | 249,375 | |
|
| Diplomat Pharmacy, Inc. | |
| | |
Term Loan, 6.41%, (3 mo. USD LIBOR + 4.50%), Maturing December 20, 2024 | | | 178 | | | | 173,770 | |
| | |
| | | | | | | $ | 2,192,100 | |
|
| Health Care — 13.4% | |
|
| ADMI Corp. | |
| | |
Term Loan, 4.55%, (1 mo. USD LIBOR + 2.75%), Maturing April 30, 2025 | | $ | 690 | | | $ | 691,655 | |
|
| Alliance Healthcare Services, Inc. | |
| | |
Term Loan, 6.30%, (1 mo. USD LIBOR + 4.50%), Maturing October 24, 2023 | | | 238 | | | | 217,312 | |
| | | | |
| | 11 | | See Notes to Financial Statements. |
Eaton Vance
Floating-Rate 2022 Target Term Trust
December 31, 2019
Portfolio of Investments (Unaudited) — continued
| | | | | | | | |
| Borrower/Tranche Description | | Principal Amount (000’s omitted) | | | Value | |
|
| Health Care (continued) | |
|
| athenahealth, Inc. | |
| | |
Term Loan, 6.40%, (3 mo. USD LIBOR + 4.50%), Maturing February 11, 2026 | | $ | 744 | | | $ | 749,331 | |
|
| Athletico Management, LLC | |
| | |
Term Loan, 5.24%, (1 mo. USD LIBOR + 3.50%), Maturing October 31, 2025 | | | 223 | | | | 223,307 | |
|
| Avantor, Inc. | |
| | |
Term Loan, 4.80%, (1 mo. USD LIBOR + 3.00%), Maturing November 21, 2024 | | | 182 | | | | 183,175 | |
|
| BioClinica, Inc. | |
| | |
Term Loan, 6.06%, (1 mo. USD LIBOR + 4.25%), Maturing October 20, 2023 | | | 731 | | | | 712,572 | |
|
| BW NHHC Holdco, Inc. | |
| | |
Term Loan, 6.91%, (3 mo. USD LIBOR + 5.00%), Maturing May 15, 2025 | | | 394 | | | | 325,050 | |
|
| Carestream Dental Equipment, Inc. | |
| | |
Term Loan, 5.05%, (1 mo. USD LIBOR + 3.25%), Maturing September 1, 2024 | | | 484 | | | | 472,878 | |
|
| Certara L.P. | |
| | |
Term Loan, 5.44%, (3 mo. USD LIBOR + 3.50%), Maturing August 15, 2024 | | | 978 | | | | 977,500 | |
|
| Change Healthcare Holdings, LLC | |
| | |
Term Loan, 4.30%, (1 mo. USD LIBOR + 2.50%), Maturing March 1, 2024 | | | 1,915 | | | | 1,924,442 | |
|
| CHG Healthcare Services, Inc. | |
| | |
Term Loan, 4.80%, (1 mo. USD LIBOR + 3.00%), Maturing June 7, 2023 | | | 2,299 | | | | 2,317,598 | |
|
| CryoLife, Inc. | |
| | |
Term Loan, 5.19%, (3 mo. USD LIBOR + 3.25%), Maturing November 14, 2024 | | | 172 | | | | 172,429 | |
|
| Da Vinci Purchaser Corp. | |
| | |
Term Loan, Maturing December 3, 2026(3) | | | 150 | | | | 150,188 | |
|
| Ensemble RCM, LLC | |
| | |
Term Loan, 5.66%, (3 mo. USD LIBOR + 3.75%), Maturing August 3, 2026 | | | 200 | | | | 201,121 | |
|
| Envision Healthcare Corporation | |
| | |
Term Loan, 5.55%, (1 mo. USD LIBOR + 3.75%), Maturing October 10, 2025 | | | 2,503 | | | | 2,144,437 | |
|
| Gentiva Health Services, Inc. | |
| | |
Term Loan, 5.56%, (1 mo. USD LIBOR + 3.75%), Maturing July 2, 2025 | | | 970 | | | | 975,992 | |
|
| GHX Ultimate Parent Corporation | |
| | |
Term Loan, 5.21%, (3 mo. USD LIBOR + 3.25%), Maturing June 28, 2024 | | | 1,366 | | | | 1,368,546 | |
|
| Greatbatch Ltd. | |
| | |
Term Loan, 4.22%, (1 mo. USD LIBOR + 2.50%), Maturing October 27, 2022 | | | 628 | | | | 630,069 | |
| | | | | | | | |
| Borrower/Tranche Description | | Principal Amount (000’s omitted) | | | Value | |
|
| Health Care (continued) | |
|
| Grifols Worldwide Operations USA, Inc. | |
| | |
Term Loan, 3.74%, (1 mo. USD LIBOR + 2.00%), Maturing November 15, 2027 | | $ | 350 | | | $ | 353,303 | |
|
| Hanger, Inc. | |
| | |
Term Loan, 5.30%, (1 mo. USD LIBOR + 3.50%), Maturing March 6, 2025 | | | 418 | | | | 419,781 | |
|
| Inovalon Holdings, Inc. | |
| | |
Term Loan, 5.25%, (1 mo. USD LIBOR + 3.50%), Maturing April 2, 2025 | | | 468 | | | | 471,362 | |
|
| IQVIA, Inc. | |
| | |
Term Loan, 3.69%, (3 mo. USD LIBOR + 1.75%), Maturing March 7, 2024 | | | 1,344 | | | | 1,351,362 | |
|
| Medical Solutions, LLC | |
| | |
Term Loan, 6.30%, (1 mo. USD LIBOR + 4.50%), Maturing June 14, 2024 | | | 150 | | | | 149,391 | |
|
| MPH Acquisition Holdings, LLC | |
| | |
Term Loan, 4.69%, (3 mo. USD LIBOR + 2.75%), Maturing June 7, 2023 | | | 1,802 | | | | 1,782,343 | |
|
| National Mentor Holdings, Inc. | |
| | |
Term Loan, 5.80%, (1 mo. USD LIBOR + 4.00%), Maturing March 9, 2026 | | | 10 | | | | 10,336 | |
| | |
Term Loan, 5.80%, (1 mo. USD LIBOR + 4.00%), Maturing March 9, 2026 | | | 188 | | | | 190,352 | |
|
| Navicure, Inc. | |
| | |
Term Loan, 5.80%, (1 mo. USD LIBOR + 4.00%), Maturing October 22, 2026 | | | 375 | | | | 376,641 | |
|
| One Call Corporation | |
| | |
Term Loan, 7.16%, (3 mo. USD LIBOR + 5.25%), Maturing November 25, 2022 | | | 479 | | | | 445,860 | |
|
| Ortho-Clinical Diagnostics S.A. | |
| | |
Term Loan, 5.31%, (3 mo. USD LIBOR + 3.25%), Maturing June 30, 2025 | | | 1,781 | | | | 1,762,772 | |
|
| Parexel International Corporation | |
| | |
Term Loan, 4.55%, (1 mo. USD LIBOR + 2.75%), Maturing September 27, 2024 | | | 859 | | | | 843,069 | |
|
| Phoenix Guarantor, Inc. | |
| | |
Term Loan, 6.21%, (1 mo. USD LIBOR + 4.50%), Maturing March 5, 2026 | | | 746 | | | | 751,380 | |
|
| Radiology Partners Holdings, LLC | |
| | |
Term Loan, 6.66%, (USD LIBOR + 4.75%), Maturing July 9, 2025(2) | | | 198 | | | | 199,047 | |
|
| Select Medical Corporation | |
| | |
Term Loan, 4.58%, (3 mo. USD LIBOR + 2.50%), Maturing March 6, 2025 | | | 2,144 | | | | 2,150,973 | |
|
| Sound Inpatient Physicians | |
| | |
Term Loan, 4.55%, (1 mo. USD LIBOR + 2.75%), Maturing June 27, 2025 | | | 197 | | | | 198,067 | |
| | | | |
| | 12 | | See Notes to Financial Statements. |
Eaton Vance
Floating-Rate 2022 Target Term Trust
December 31, 2019
Portfolio of Investments (Unaudited) — continued
| | | | | | | | |
| Borrower/Tranche Description | | Principal Amount (000’s omitted) | | | Value | |
|
| Health Care (continued) | |
|
| Surgery Center Holdings, Inc. | |
| | |
Term Loan, 5.05%, (1 mo. USD LIBOR + 3.25%), Maturing September 2, 2024 | | $ | 727 | | | $ | 725,713 | |
|
| Team Health Holdings, Inc. | |
| | |
Term Loan, 4.55%, (1 mo. USD LIBOR + 2.75%), Maturing February 6, 2024 | | | 739 | | | | 600,906 | |
|
| Tecomet, Inc. | |
| | |
Term Loan, 4.99%, (1 mo. USD LIBOR + 3.25%), Maturing May 1, 2024 | | | 1,267 | | | | 1,271,658 | |
|
| U.S. Anesthesia Partners, Inc. | |
| | |
Term Loan, 4.80%, (1 mo. USD LIBOR + 3.00%), Maturing June 23, 2024 | | | 718 | | | | 714,735 | |
|
| Verscend Holding Corp. | |
| | |
Term Loan, 6.30%, (1 mo. USD LIBOR + 4.50%), Maturing August 27, 2025 | | | 593 | | | | 597,314 | |
|
| Viant Medical Holdings, Inc. | |
| | |
Term Loan, 5.69%, (3 mo. USD LIBOR + 3.75%), Maturing July 2, 2025 | | | 198 | | | | 194,126 | |
|
| Wink Holdco, Inc. | |
| | |
Term Loan, 4.80%, (1 mo. USD LIBOR + 3.00%), Maturing December 2, 2024 | | | 172 | | | | 171,607 | |
| | |
| | | | | | | $ | 30,169,700 | |
|
| Home Furnishings — 0.6% | |
|
| Serta Simmons Bedding, LLC | |
| | |
Term Loan, 5.25%, (1 mo. USD LIBOR + 3.50%), Maturing November 8, 2023 | | $ | 2,203 | | | $ | 1,433,374 | |
| | |
| | | | | | | $ | 1,433,374 | |
|
| Industrial Equipment — 5.9% | |
|
| AI Alpine AT Bidco GmbH | |
| | |
Term Loan, 4.60%, (2 mo. USD LIBOR + 2.75%), Maturing October 31, 2025 | | $ | 99 | | | $ | 97,515 | |
|
| Altra Industrial Motion Corp. | |
| | |
Term Loan, 3.80%, (1 mo. USD LIBOR + 2.00%), Maturing October 1, 2025 | | | 266 | | | | 267,637 | |
|
| Apex Tool Group, LLC | |
| | |
Term Loan, 7.30%, (1 mo. USD LIBOR + 5.50%), Maturing August 1, 2024 | | | 927 | | | | 914,892 | |
|
| Carlisle Foodservice Products, Inc. | |
| | |
Term Loan, 4.80%, (1 mo. USD LIBOR + 3.00%), Maturing March 20, 2025 | | | 98 | | | | 97,162 | |
|
| CPM Holdings, Inc. | |
| | |
Term Loan, 5.55%, (1 mo. USD LIBOR + 3.75%), Maturing November 17, 2025 | | | 124 | | | | 123,028 | |
| | | | | | | | |
| Borrower/Tranche Description | | Principal Amount (000’s omitted) | | | Value | |
|
| Industrial Equipment (continued) | |
|
| Delachaux Group S.A. | |
| | |
Term Loan, 6.50%, (3 mo. USD LIBOR + 4.50%), Maturing April 16, 2026 | | $ | 175 | | | $ | 173,523 | |
|
| DXP Enterprises, Inc. | |
| | |
Term Loan, 6.54%, (1 mo. USD LIBOR + 4.75%), Maturing August 29, 2023 | | | 196 | | | | 195,989 | |
|
| Dynacast International, LLC | |
| | |
Term Loan, 5.19%, (3 mo. USD LIBOR + 3.25%), Maturing January 28, 2022 | | | 1,267 | | | | 1,235,083 | |
|
| Engineered Machinery Holdings, Inc. | |
| | |
Term Loan, 4.94%, (3 mo. USD LIBOR + 3.00%), Maturing July 19, 2024 | | | 858 | | | | 851,426 | |
|
| EWT Holdings III Corp. | |
| | |
Term Loan, 4.80%, (1 mo. USD LIBOR + 3.00%), Maturing December 20, 2024 | | | 1,905 | | | | 1,916,205 | |
|
| Filtration Group Corporation | |
| | |
Term Loan, 4.80%, (1 mo. USD LIBOR + 3.00%), Maturing March 29, 2025 | | | 1,112 | | | | 1,117,789 | |
|
| Gardner Denver, Inc. | |
| | |
Term Loan, 4.55%, (1 mo. USD LIBOR + 2.75%), Maturing July 30, 2024 | | | 343 | | | | 345,285 | |
|
| Gates Global, LLC | |
| | |
Term Loan, 4.55%, (1 mo. USD LIBOR + 2.75%), Maturing April 1, 2024 | | | 1,950 | | | | 1,954,975 | |
|
| Hayward Industries, Inc. | |
| | |
Term Loan, 5.30%, (1 mo. USD LIBOR + 3.50%), Maturing August 5, 2024 | | | 720 | | | | 716,423 | |
|
| LTI Holdings, Inc. | |
| | |
Term Loan, 5.30%, (1 mo. USD LIBOR + 3.50%), Maturing September 6, 2025 | | | 173 | | | | 156,611 | |
| | |
Term Loan, 6.55%, (1 mo. USD LIBOR + 4.75%), Maturing July 24, 2026 | | | 75 | | | | 68,640 | |
|
| Pro Mach Group, Inc. | |
| | |
Term Loan, 4.54%, (1 mo. USD LIBOR + 2.75%), Maturing March 7, 2025 | | | 98 | | | | 97,544 | |
|
| Rexnord, LLC | |
| | |
Term Loan, 3.54%, (1 mo. USD LIBOR + 1.75%), Maturing August 21, 2024 | | | 1,173 | | | | 1,180,422 | |
|
| Robertshaw US Holding Corp. | |
| | |
Term Loan, 5.06%, (1 mo. USD LIBOR + 3.25%), Maturing February 28, 2025 | | | 393 | | | | 359,595 | |
|
| Shape Technologies Group, Inc. | |
| | |
Term Loan, 4.93%, (3 mo. USD LIBOR + 3.00%), Maturing April 21, 2025 | | | 49 | | | | 43,885 | |
|
| Thermon Industries, Inc. | |
| | |
Term Loan, 5.44%, (1 mo. USD LIBOR + 3.75%), Maturing October 24, 2024 | | | 89 | | | | 89,871 | |
| | | | |
| | 13 | | See Notes to Financial Statements. |
Eaton Vance
Floating-Rate 2022 Target Term Trust
December 31, 2019
Portfolio of Investments (Unaudited) — continued
| | | | | | | | |
| Borrower/Tranche Description | | Principal Amount (000’s omitted) | | | Value | |
|
| Industrial Equipment (continued) | |
|
| Titan Acquisition Limited | |
| | |
Term Loan, 4.80%, (1 mo. USD LIBOR + 3.00%), Maturing March 28, 2025 | | $ | 1,154 | | | $ | 1,137,410 | |
| | |
| | | | | | | $ | 13,140,910 | |
|
| Insurance — 5.1% | |
|
| Alliant Holdings Intermediate, LLC | |
| | |
Term Loan, 4.80%, (1 mo. USD LIBOR + 3.00%), Maturing May 9, 2025 | | $ | 881 | | | $ | 882,365 | |
| | |
Term Loan, 4.99%, (1 mo. USD LIBOR + 3.25%), Maturing May 9, 2025 | | | 174 | | | | 174,669 | |
|
| AmWINS Group, Inc. | |
| | |
Term Loan, 4.53%, (1 mo. USD LIBOR + 2.75%), Maturing January 25, 2024 | | | 894 | | | | 901,713 | |
|
| Asurion, LLC | |
| | |
Term Loan, 4.80%, (1 mo. USD LIBOR + 3.00%), Maturing August 4, 2022 | | | 1,180 | | | | 1,188,672 | |
| | |
Term Loan - Second Lien, 8.30%, (1 mo. USD LIBOR + 6.50%), Maturing August 4, 2025 | | | 1,875 | | | | 1,902,656 | |
|
| FrontDoor, Inc. | |
| | |
Term Loan, 4.31%, (1 mo. USD LIBOR + 2.50%), Maturing August 16, 2025 | | | 173 | | | | 173,458 | |
|
| Hub International Limited | |
| | |
Term Loan, 4.69%, (3 mo. USD LIBOR + 2.75%), Maturing April 25, 2025 | | | 1,896 | | | | 1,897,754 | |
| | |
Term Loan, 5.90%, (3 mo. USD LIBOR + 4.00%), Maturing April 25, 2025 | | | 700 | | | | 707,657 | |
|
| NFP Corp. | |
| | |
Term Loan, 4.80%, (1 mo. USD LIBOR + 3.00%), Maturing January 8, 2024 | | | 1,388 | | | | 1,384,350 | |
|
| Sedgwick Claims Management Services, Inc. | |
| | |
Term Loan, 5.05%, (1 mo. USD LIBOR + 3.25%), Maturing December 31, 2025 | | | 470 | | | | 471,308 | |
|
| USI, Inc. | |
| | |
Term Loan, 4.94%, (3 mo. USD LIBOR + 3.00%), Maturing May 16, 2024 | | | 1,271 | | | | 1,272,180 | |
| | |
Term Loan, 5.94%, (3 mo. USD LIBOR + 4.00%), Maturing December 2, 2026 | | | 550 | | | | 552,750 | |
| | |
| | | | | | | $ | 11,509,532 | |
|
| Leisure Goods / Activities / Movies — 4.8% | |
|
| AMC Entertainment Holdings, Inc. | |
| | |
Term Loan, 4.80%, (1 mo. USD LIBOR + 3.00%), Maturing April 22, 2026 | | $ | 720 | | | $ | 725,679 | |
|
| Ancestry.com Operations, Inc. | |
| | |
Term Loan, 6.05%, (1 mo. USD LIBOR + 4.25%), Maturing August 27, 2026 | | | 1,592 | | | | 1,569,115 | |
| | | | | | | | |
| Borrower/Tranche Description | | Principal Amount (000’s omitted) | | | Value | |
|
| Leisure Goods / Activities / Movies (continued) | |
|
| ClubCorp Holdings, Inc. | |
| | |
Term Loan, 4.69%, (3 mo. USD LIBOR + 2.75%), Maturing September 18, 2024 | | $ | 660 | | | $ | 626,547 | |
|
| Crown Finance US, Inc. | |
| | |
Term Loan, 4.05%, (1 mo. USD LIBOR + 2.25%), Maturing February 28, 2025 | | | 613 | | | | 612,900 | |
| | |
Term Loan, 4.30%, (1 mo. USD LIBOR + 2.50%), Maturing September 30, 2026 | | | 574 | | | | 574,996 | |
|
| Delta 2 (LUX) S.a.r.l. | |
| | |
Term Loan, 4.30%, (1 mo. USD LIBOR + 2.50%), Maturing February 1, 2024 | | | 1,000 | | | | 1,006,406 | |
|
| Live Nation Entertainment, Inc. | |
| | |
Term Loan, 3.50%, (1 mo. USD LIBOR + 1.75%), Maturing October 17, 2026 | | | 2,925 | | | | 2,939,590 | |
|
| Motion Finco S.a.r.l. | |
| | |
Term Loan, 0.50%, Maturing November 4, 2026(4) | | | 26 | | | | 26,463 | |
| | |
Term Loan, 5.15%, (2 mo. USD LIBOR + 3.25%), Maturing November 13, 2026 | | | 199 | | | | 201,349 | |
|
| NASCAR Holdings, Inc. | |
| | |
Term Loan, 4.49%, (1 mo. USD LIBOR + 2.75%), Maturing October 19, 2026 | | | 284 | | | | 287,137 | |
|
| Playtika Holding Corp. | |
| | |
Term Loan, 7.80%, (1 mo. USD LIBOR + 6.00%), Maturing December 10, 2024 | | | 1,325 | | | | 1,341,563 | |
|
| Steinway Musical Instruments, Inc. | |
| | |
Term Loan, 5.49%, (1 mo. USD LIBOR + 3.75%), Maturing February 14, 2025 | | | 344 | | | | 343,445 | |
|
| Travel Leaders Group, LLC | |
| | |
Term Loan, 5.79%, (1 mo. USD LIBOR + 4.00%), Maturing January 25, 2024 | | | 369 | | | | 371,453 | |
|
| UFC Holdings, LLC | |
| | |
Term Loan, 5.05%, (1 mo. USD LIBOR + 3.25%), Maturing April 29, 2026 | | | 174 | | | | 175,493 | |
| | |
| | | | | | | $ | 10,802,136 | |
|
| Lodging and Casinos — 5.8% | |
|
| Aimbridge Acquisition Co., Inc. | |
| | |
Term Loan, 5.54%, (1 mo. USD LIBOR + 3.75%), Maturing February 2, 2026 | | $ | 99 | | | $ | 100,244 | |
|
| Aristocrat Technologies, Inc. | |
| | |
Term Loan, 3.72%, (3 mo. USD LIBOR + 1.75%), Maturing October 19, 2024 | | | 204 | | | | 205,185 | |
|
| Boyd Gaming Corporation | |
| | |
Term Loan, 3.85%, (1 week USD LIBOR + 2.25%), Maturing September 15, 2023 | | | 1,906 | | | | 1,922,117 | |
|
| CCM Merger, Inc. | |
| | |
Term Loan, 4.05%, (1 mo. USD LIBOR + 2.25%), Maturing August 8, 2021 | | | 851 | | | | 855,702 | |
| | | | |
| | 14 | | See Notes to Financial Statements. |
Eaton Vance
Floating-Rate 2022 Target Term Trust
December 31, 2019
Portfolio of Investments (Unaudited) — continued
| | | | | | | | |
| Borrower/Tranche Description | | Principal Amount (000’s omitted) | | | Value | |
|
| Lodging and Casinos (continued) | |
|
| CityCenter Holdings, LLC | |
| | |
Term Loan, 4.05%, (1 mo. USD LIBOR + 2.25%), Maturing April 18, 2024 | | $ | 196 | | | $ | 197,561 | |
|
| Four Seasons Hotels Limited | |
| | |
Term Loan, 3.80%, (1 mo. USD LIBOR + 2.00%), Maturing November 30, 2023 | | | 2,925 | | | | 2,956,712 | |
|
| Golden Nugget, Inc. | |
| | |
Term Loan, 4.69%, (USD LIBOR + 2.75%), Maturing October 4, 2023(2) | | | 3,004 | | | | 3,018,904 | |
|
| GVC Holdings PLC | |
| | |
Term Loan, 4.45%, (6 mo. USD LIBOR + 2.25%), Maturing March 29, 2024 | | | 418 | | | | 420,346 | |
|
| Hanjin International Corp. | |
| | |
Term Loan, 4.30%, (1 mo. USD LIBOR + 2.50%), Maturing October 18, 2020 | | | 200 | | | | 199,750 | |
|
| Playa Resorts Holding B.V. | |
| | |
Term Loan, 4.55%, (1 mo. USD LIBOR + 2.75%), Maturing April 29, 2024 | | | 465 | | | | 464,160 | |
|
| Stars Group Holdings B.V. (The) | |
| | |
Term Loan, 5.44%, (3 mo. USD LIBOR + 3.50%), Maturing July 10, 2025 | | | 1,418 | | | | 1,431,840 | |
|
| VICI Properties 1, LLC | |
| | |
Term Loan, 3.79%, (1 mo. USD LIBOR + 2.00%), Maturing December 20, 2024 | | | 811 | | | | 816,040 | |
|
| Wyndham Hotels & Resorts, Inc. | |
| | |
Term Loan, 3.55%, (1 mo. USD LIBOR + 1.75%), Maturing May 30, 2025 | | | 494 | | | | 497,029 | |
| | |
| | | | | | | $ | 13,085,590 | |
|
| Nonferrous Metals / Minerals — 0.3% | |
|
| Murray Energy Corporation | |
| | |
DIP Loan, 13.00%, (1 mo. USD LIBOR + 11.00%, Floor 2.00%), Maturing July 31, 2020 | | $ | 204 | | | $ | 209,240 | |
| | |
Term Loan, 0.00%, Maturing October 17, 2022(5) | | | 735 | | | | 162,834 | |
|
| Oxbow Carbon, LLC | |
| | |
Term Loan, 5.55%, (1 mo. USD LIBOR + 3.75%), Maturing January 4, 2023 | | | 225 | | | | 225,562 | |
| | |
| | | | | | | $ | 597,636 | |
|
| Oil and Gas — 4.1% | |
|
| Apergy Corporation | |
| | |
Term Loan, 4.42%, (1 mo. USD LIBOR + 2.50%), Maturing May 9, 2025 | | $ | 96 | | | $ | 96,102 | |
|
| Blackstone CQP Holdco L.P. | |
| | |
Term Loan, 5.41%, (3 mo. USD LIBOR + 3.50%), Maturing September 30, 2024 | | | 398 | | | | 400,798 | |
| | | | | | | | |
| Borrower/Tranche Description | | Principal Amount (000’s omitted) | | | Value | |
|
| Oil and Gas (continued) | |
|
| Buckeye Partners L.P. | |
| | |
Term Loan, 4.44%, (1 mo. USD LIBOR + 2.75%), Maturing November 1, 2026 | | $ | 1,050 | | | $ | 1,060,282 | |
|
| Centurion Pipeline Company, LLC | |
| | |
Term Loan, 5.05%, (1 mo. USD LIBOR + 3.25%), Maturing September 29, 2025 | | | 99 | | | | 99,124 | |
|
| CITGO Holding, Inc. | |
| | |
Term Loan, 8.80%, (1 mo. USD LIBOR + 7.00%), Maturing August 1, 2023 | | | 100 | | | | 101,870 | |
|
| CITGO Petroleum Corporation | |
| | |
Term Loan, 6.44%, (3 mo. USD LIBOR + 4.50%), Maturing July 29, 2021 | | | 1,949 | | | | 1,958,937 | |
| | |
Term Loan, 6.94%, (3 mo. USD LIBOR + 5.00%), Maturing March 28, 2024 | | | 968 | | | | 973,736 | |
|
| Delek US Holdings, Inc. | |
| | |
Term Loan, 4.05%, (1 mo. USD LIBOR + 2.25%), Maturing March 31, 2025 | | | 74 | | | | 74,418 | |
|
| Equitrans Midstream Corporation | |
| | |
Term Loan, 6.30%, (1 mo. USD LIBOR + 4.50%), Maturing January 31, 2024 | | | 743 | | | | 740,412 | |
|
| Fieldwood Energy, LLC | |
| | |
Term Loan, 7.18%, (3 mo. USD LIBOR + 5.25%), Maturing April 11, 2022 | | | 1,500 | | | | 1,261,249 | |
|
| McDermott Technology Americas, Inc. | |
| | |
Term Loan, 7.56%, (USD LIBOR + 10.00%), Maturing October 21, 2021(2)(4) | | | 275 | | | | 281,531 | |
| | |
Term Loan, 6.94%, (3 mo. USD LIBOR + 5.00%), Maturing May 9, 2025 | | | 491 | | | | 289,019 | |
|
| Prairie ECI Acquiror L.P. | |
| | |
Term Loan, 6.69%, (3 mo. USD LIBOR + 4.75%), Maturing March 11, 2026 | | | 1,123 | | | | 1,117,238 | |
|
| PSC Industrial Holdings Corp. | |
| | |
Term Loan, 5.49%, (1 mo. USD LIBOR + 3.75%), Maturing October 3, 2024 | | | 294 | | | | 292,530 | |
|
| UGI Energy Services, LLC | |
| | |
Term Loan, 5.55%, (1 mo. USD LIBOR + 3.75%), Maturing August 13, 2026 | | | 398 | | | | 400,488 | |
| | |
| | | | | | | $ | 9,147,734 | |
|
| Publishing — 1.8% | |
|
| Ascend Learning, LLC | |
| | |
Term Loan, 4.80%, (1 mo. USD LIBOR + 3.00%), Maturing July 12, 2024 | | $ | 1,271 | | | $ | 1,279,751 | |
|
| Getty Images, Inc. | |
| | |
Term Loan, 6.31%, (1 mo. USD LIBOR + 4.50%), Maturing February 19, 2026 | | | 719 | | | | 722,389 | |
| | | | |
| | 15 | | See Notes to Financial Statements. |
Eaton Vance
Floating-Rate 2022 Target Term Trust
December 31, 2019
Portfolio of Investments (Unaudited) — continued
| | | | | | | | |
| Borrower/Tranche Description | | Principal Amount (000’s omitted) | | | Value | |
|
| Publishing (continued) | |
|
| Harland Clarke Holdings Corp. | |
| | |
Term Loan, 6.69%, (3 mo. USD LIBOR + 4.75%), Maturing November 3, 2023 | | $ | 567 | | | $ | 443,116 | |
|
| ProQuest, LLC | |
| | |
Term Loan, 5.30%, (1 mo. USD LIBOR + 3.50%), Maturing October 23, 2026 | | | 900 | | | | 901,687 | |
|
| Terrier Media Buyer, Inc. | |
| | |
Term Loan, 6.15%, (3 mo. USD LIBOR + 4.25%), Maturing December 17, 2026 | | | 700 | | | | 707,875 | |
| | |
| | | | | | | $ | 4,054,818 | |
|
| Radio and Television — 3.7% | |
|
| Cumulus Media New Holdings, Inc. | |
| | |
Term Loan, 5.55%, (1 mo. USD LIBOR + 3.75%), Maturing March 31, 2026 | | $ | 200 | | | $ | 201,911 | |
|
| Diamond Sports Group, LLC | |
| | |
Term Loan, 5.03%, (1 mo. USD LIBOR + 3.25%), Maturing August 24, 2026 | | | 1,671 | | | | 1,670,813 | |
|
| Entercom Media Corp. | |
| | |
Term Loan, 4.30%, (1 mo. USD LIBOR + 2.50%), Maturing November 18, 2024 | | | 753 | | | | 760,158 | |
|
| Entravision Communications Corporation | |
| | |
Term Loan, 4.55%, (1 mo. USD LIBOR + 2.75%), Maturing November 29, 2024 | | | 309 | | | | 301,200 | |
|
| Gray Television, Inc. | |
| | |
Term Loan, 4.20%, (1 mo. USD LIBOR + 2.50%), Maturing January 2, 2026 | | | 234 | | | | 235,141 | |
|
| Hubbard Radio, LLC | |
| | |
Term Loan, 5.30%, (1 mo. USD LIBOR + 3.50%), Maturing March 28, 2025 | | | 1,169 | | | | 1,170,569 | |
|
| iHeartCommunications, Inc. | |
| | |
Term Loan, 5.69%, (1 mo. USD LIBOR + 4.00%), Maturing May 1, 2026 | | | 871 | | | | 880,888 | |
|
| Mission Broadcasting, Inc. | |
| | |
Term Loan, 3.94%, (1 mo. USD LIBOR + 2.25%), Maturing January 17, 2024 | | | 133 | | | | 133,711 | |
|
| Nexstar Broadcasting, Inc. | |
| | |
Term Loan, 4.05%, (1 mo. USD LIBOR + 2.25%), Maturing January 17, 2024 | | | 670 | | | | 672,912 | |
| | |
Term Loan, 4.45%, (1 mo. USD LIBOR + 2.75%), Maturing September 18, 2026 | | | 200 | | | | 201,333 | |
|
| Sinclair Television Group, Inc. | |
| | |
Term Loan, 4.24%, (1 mo. USD LIBOR + 2.50%), Maturing September 30, 2026 | | | 249 | | | | 250,583 | |
|
| Univision Communications, Inc. | |
| | |
Term Loan, 4.55%, (1 mo. USD LIBOR + 2.75%), Maturing March 15, 2024 | | | 1,914 | | | | 1,892,875 | |
| | |
| | | | | | | $ | 8,372,094 | |
| | | | | | | | |
| Borrower/Tranche Description | | Principal Amount (000’s omitted) | | | Value | |
|
| Rail Industries — 0.2% | |
|
| Genesee & Wyoming, Inc. | |
| | |
Term Loan, 3.91%, (3 mo. USD LIBOR + 2.00%), Maturing November 6, 2026 | | $ | 375 | | | $ | 379,102 | |
| | |
| | | | | | | $ | 379,102 | |
|
| Retailers (Except Food and Drug) — 2.5% | |
|
| Apro, LLC | |
| | |
Term Loan, 2.00%, Maturing November 14, 2026(4) | | $ | 289 | | | $ | 291,417 | |
| | |
Term Loan, 5.84%, (2 mo. USD LIBOR + 4.00%), Maturing November 14, 2026 | | | 1,011 | | | | 1,019,958 | |
|
| Ascena Retail Group, Inc. | |
| | |
Term Loan, 6.31%, (1 mo. USD LIBOR + 4.50%), Maturing August 21, 2022 | | | 860 | | | | 589,921 | |
|
| BJ’s Wholesale Club, Inc. | |
| | |
Term Loan, 4.49%, (1 mo. USD LIBOR + 2.75%), Maturing February 3, 2024 | | | 946 | | | | 953,232 | |
|
| Global Appliance, Inc. | |
| | |
Term Loan, 5.80%, (1 mo. USD LIBOR + 4.00%), Maturing September 29, 2024 | | | 380 | | | | 379,932 | |
|
| Hoya Midco, LLC | |
| | |
Term Loan, 5.30%, (1 mo. USD LIBOR + 3.50%), Maturing June 30, 2024 | | | 730 | | | | 728,971 | |
|
| LSF9 Atlantis Holdings, LLC | |
| | |
Term Loan, 7.74%, (1 mo. USD LIBOR + 6.00%), Maturing May 1, 2023 | | | 369 | | | | 342,688 | |
|
| PetSmart, Inc. | |
| | |
Term Loan, 5.74%, (1 mo. USD LIBOR + 4.00%), Maturing March 11, 2022 | | | 1,225 | | | | 1,214,792 | |
| | |
| | | | | | | $ | 5,520,911 | |
|
| Steel — 2.2% | |
|
| Atkore International, Inc. | |
| | |
Term Loan, 4.70%, (3 mo. USD LIBOR + 2.75%), Maturing December 22, 2023 | | $ | 1,982 | | | $ | 1,993,990 | |
|
| GrafTech Finance, Inc. | |
| | |
Term Loan, 5.30%, (1 mo. USD LIBOR + 3.50%), Maturing February 12, 2025 | | | 922 | | | | 920,700 | |
|
| Phoenix Services International, LLC | |
| | |
Term Loan, 5.49%, (1 mo. USD LIBOR + 3.75%), Maturing March 1, 2025 | | | 344 | | | | 325,821 | |
|
| Zekelman Industries, Inc. | |
| | |
Term Loan, 4.04%, (1 mo. USD LIBOR + 2.25%), Maturing June 14, 2021 | | | 1,735 | | | | 1,739,893 | |
| | |
| | | | | | | $ | 4,980,404 | |
| | | | |
| | 16 | | See Notes to Financial Statements. |
Eaton Vance
Floating-Rate 2022 Target Term Trust
December 31, 2019
Portfolio of Investments (Unaudited) — continued
| | | | | | | | |
| Borrower/Tranche Description | | Principal Amount (000’s omitted) | | | Value | |
| | |
| Surface Transport — 0.8% | | | | | | |
|
| Agro Merchants NAI Holdings, LLC | |
| | |
Term Loan, 5.69%, (3 mo. USD LIBOR + 3.75%), Maturing December 6, 2024 | | $ | 147 | | | $ | 145,613 | |
|
| Kenan Advantage Group, Inc. | |
| | |
Term Loan, 4.80%, (1 mo. USD LIBOR + 3.00%), Maturing July 31, 2022 | | | 296 | | | | 294,430 | |
| | |
Term Loan, 4.80%, (1 mo. USD LIBOR + 3.00%), Maturing July 31, 2022 | | | 971 | | | | 966,710 | |
|
| PODS, LLC | |
| | |
Term Loan, 4.49%, (1 mo. USD LIBOR + 2.75%), Maturing December 6, 2024 | | | 220 | | | | 221,348 | |
|
| XPO Logistics, Inc. | |
| | |
Term Loan, 3.80%, (1 mo. USD LIBOR + 2.00%), Maturing February 24, 2025 | | | 225 | | | | 226,219 | |
| | |
| | | | | | | $ | 1,854,320 | |
| | |
| Telecommunications — 4.3% | | | | | | |
|
| CenturyLink, Inc. | |
| | |
Term Loan, 4.55%, (1 mo. USD LIBOR + 2.75%), Maturing January 31, 2025 | | $ | 2,074 | | | $ | 2,085,290 | |
|
| Colorado Buyer, Inc. | |
| | |
Term Loan, 4.74%, (1 mo. USD LIBOR + 3.00%), Maturing May 1, 2024 | | | 733 | | | | 651,259 | |
|
| Global Eagle Entertainment, Inc. | |
| | |
Term Loan, 9.71%, (USD LIBOR + 7.50%), Maturing January 6, 2023(2) | | | 755 | | | | 685,565 | |
|
| Intelsat Jackson Holdings S.A. | |
| | |
Term Loan, 5.68%, (6 mo. USD LIBOR + 3.75%), Maturing November 27, 2023 | | | 900 | | | | 902,925 | |
|
| Onvoy, LLC | |
| | |
Term Loan, 6.30%, (1 mo. USD LIBOR + 4.50%), Maturing February 10, 2024 | | | 780 | | | | 707,804 | |
|
| Plantronics, Inc. | |
| | |
Term Loan, 4.30%, (1 mo. USD LIBOR + 2.50%), Maturing July 2, 2025 | | | 495 | | | | 484,809 | |
|
| Sprint Communications, Inc. | |
| | |
Term Loan, 4.31%, (1 mo. USD LIBOR + 2.50%), Maturing February 2, 2024 | | | 2,925 | | | | 2,905,599 | |
| | |
Term Loan, 4.81%, (1 mo. USD LIBOR + 3.00%), Maturing February 2, 2024 | | | 297 | | | | 296,625 | |
|
| Syniverse Holdings, Inc. | |
| | |
Term Loan, 6.85%, (2 mo. USD LIBOR + 5.00%), Maturing March 9, 2023 | | | 368 | | | | 343,261 | |
|
| Telesat Canada | |
| | |
Term Loan, 4.63%, (3 mo. USD LIBOR + 2.75%), Maturing December 7, 2026 | | | 550 | | | | 554,125 | |
| | |
| | | | | | | $ | 9,617,262 | |
| | | | | | | | |
| Borrower/Tranche Description | | Principal Amount (000’s omitted) | | | Value | |
| | |
| Utilities — 2.6% | | | | | | |
|
| Brookfield WEC Holdings, Inc. | |
| | |
Term Loan, 5.30%, (1 mo. USD LIBOR + 3.50%), Maturing August 1, 2025 | | $ | 1,288 | | | $ | 1,298,189 | |
|
| Calpine Corporation | |
| | |
Term Loan, 4.20%, (3 mo. USD LIBOR + 2.25%), Maturing January 15, 2024 | | | 1,949 | | | | 1,962,379 | |
| | |
Term Loan, 4.20%, (3 mo. USD LIBOR + 2.25%), Maturing April 5, 2026 | | | 348 | | | | 350,737 | |
|
| Granite Acquisition, Inc. | |
| | |
Term Loan, 5.44%, (3 mo. USD LIBOR + 3.50%), Maturing December 19, 2021 | | | 1,223 | | | | 1,229,578 | |
|
| Talen Energy Supply, LLC | |
| | |
Term Loan, 5.55%, (1 mo. USD LIBOR + 3.75%), Maturing July 8, 2026 | | | 299 | | | | 300,365 | |
|
| USIC Holdings, Inc. | |
| | |
Term Loan, 5.05%, (1 mo. USD LIBOR + 3.25%), Maturing December 8, 2023 | | | 319 | | | | 318,230 | |
| | |
| Vistra Operations Company, LLC | | | | | | |
| | |
Term Loan, 3.54%, (1 mo. USD LIBOR + 1.75%), Maturing December 31, 2025 | | | 394 | | | | 396,972 | |
| | |
| | | | | | | $ | 5,856,450 | |
| |
Total Senior Floating-Rate Loans
(identified cost $292,577,780) | | | $ | 288,632,991 | |
|
| Corporate Bonds & Notes — 21.6% | |
| Security | | Principal Amount (000’s omitted) | | | Value | |
|
| Aerospace and Defense — 2.1% | |
| | |
| Air Canada | | | | | | |
| | |
7.75%, 4/15/21(6) | | $ | 2,000 | | | $ | 2,133,000 | |
| | |
| American Airlines Group, Inc. | | | | | | |
| | |
5.00%, 6/1/22(6) | | | 500 | | | | 523,750 | |
| | |
| Bombardier, Inc. | | | | | | |
| | |
6.125%, 1/15/23(6) | | | 1,000 | | | | 1,027,585 | |
| | |
| United Airlines Holdings, Inc. | | | | | | |
| | |
4.25%, 10/1/22 | | | 1,000 | | | | 1,046,250 | |
| | |
| | | | | | | $ | 4,730,585 | |
|
| Automotive — 0.2% | |
| | |
| ZF North America Capital, Inc. | | | | | | |
| | |
4.50%, 4/29/22(6) | | $ | 545 | | | $ | 561,798 | |
| | |
| | | | | | | $ | 561,798 | |
| | | | |
| | 17 | | See Notes to Financial Statements. |
Eaton Vance
Floating-Rate 2022 Target Term Trust
December 31, 2019
Portfolio of Investments (Unaudited) — continued
| | | | | | | | |
| Security | | Principal Amount (000’s omitted) | | | Value | |
|
| Building and Development — 1.4% | |
| | |
| Griffon Corp. | | | | | | |
| | |
5.25%, 3/1/22 | | $ | 1,150 | | | $ | 1,157,179 | |
| | |
| Reliance Intermediate Holdings, L.P. | | | | | | |
| | |
6.50%, 4/1/23(6) | | | 1,000 | | | | 1,027,915 | |
| | |
| Standard Industries, Inc. | | | | | | |
| | |
5.50%, 2/15/23(6) | | | 1,000 | | | | 1,018,740 | |
| | |
| | | | | | | $ | 3,203,834 | |
|
| Cable and Satellite Television — 1.3% | |
| | |
| Cablevision Systems Corp. | | | | | | |
| | |
5.875%, 9/15/22 | | $ | 925 | | | $ | 998,334 | |
| | |
| CCO Holdings, LLC/CCO Holdings Capital Corp. | | | | | | |
| | |
5.125%, 2/15/23 | | | 1,000 | | | | 1,012,490 | |
| | |
| DISH DBS Corp. | | | | | | |
| | |
5.00%, 3/15/23 | | | 1,000 | | | | 1,028,340 | |
| | |
| | | | | | | $ | 3,039,164 | |
|
| Containers and Glass Products — 0.4% | |
| | |
Ardagh Packaging Finance PLC/Ardagh Holdings USA,
Inc. | | | | | | |
| | |
4.25%, 9/15/22(6) | | $ | 1,000 | | | $ | 1,014,593 | |
| | |
| | | | | | | $ | 1,014,593 | |
| | |
| Drugs — 0.5% | | | | | | |
| | |
| Bausch Health Companies, Inc. | | | | | | |
| | |
6.50%, 3/15/22(6) | | $ | 1,000 | | | $ | 1,023,750 | |
| | |
| | | | | | | $ | 1,023,750 | |
|
| Ecological Services and Equipment — 0.7% | |
| | |
| GFL Environmental, Inc. | | | | | | |
| | |
5.375%, 3/1/23(6) | | $ | 1,600 | | | $ | 1,652,000 | |
| | |
| | | | | | | $ | 1,652,000 | |
|
| Electronics / Electrical — 1.1% | |
| | |
| Anixter, Inc. | | | | | | |
| | |
5.50%, 3/1/23 | | $ | 1,000 | | | $ | 1,055,415 | |
| | |
| CommScope, Inc. | | | | | | |
| | |
5.00%, 6/15/21(6) | | | 300 | | | | 301,020 | |
| | |
| Infor (US), Inc. | | | | | | |
| | |
6.50%, 5/15/22 | | | 1,000 | | | | 1,016,780 | |
| | |
| | | | | | | $ | 2,373,215 | |
| | | | | | | | |
| Security | | Principal Amount (000’s omitted) | | | Value | |
| | |
| Energy — 0.5% | | | | | | |
| | |
| Sunoco, L.P./Sunoco Finance Corp. | | | | | | |
| | |
4.875%, 1/15/23 | | $ | 1,000 | | | $ | 1,025,435 | |
| | |
| | | | | | | $ | 1,025,435 | |
| | |
| Financial Intermediaries — 1.3% | | | | | | |
| | |
| Ally Financial, Inc. | | | | | | |
| | |
4.625%, 5/19/22 | | $ | 1,000 | | | $ | 1,050,312 | |
| | |
| Ford Motor Credit Co., LLC | | | | | | |
| | |
5.875%, 8/2/21 | | | 300 | | | | 314,079 | |
| | |
Icahn Enterprises, L.P./Icahn Enterprises
Finance Corp. | | | | | | |
| | |
6.25%, 2/1/22 | | | 500 | | | | 510,390 | |
| | |
| Navient Corp. | | | | | | |
| | |
5.50%, 1/25/23 | | | 1,007 | | | | 1,077,490 | |
| | |
| | | | | | | $ | 2,952,271 | |
| | |
| Food / Drug Retailers — 0.0%(7) | | | | | | |
| | |
| Safeway, Inc. | | | | | | |
| | |
3.95%, 8/15/20 | | $ | 100 | | | $ | 100,539 | |
| | |
4.75%, 12/1/21 | | | 9 | | | | 9,251 | |
| | |
| | | | | | | $ | 109,790 | |
| | |
| Health Care — 1.2% | | | | | | |
| | |
| Eagle Holding Co. II, LLC | | | | | | |
| | |
7.625%, (7.625% cash or 8.375% PIK), 5/15/22(6)(8) | | $ | 455 | | | $ | 463,296 | |
| | |
7.75%, (7.75% cash or 8.50% PIK), 5/15/22(6)(8) | | | 206 | | | | 209,535 | |
| | |
| HCA, Inc. | | | | | | |
| | |
7.50%, 2/15/22 | | | 1,000 | | | | 1,106,780 | |
| | |
| Kinetic Concepts, Inc./KCI USA, Inc. | | | | | | |
| | |
12.50%, 11/1/21(6) | | | 836 | | | | 862,459 | |
| | |
| | | | | | | $ | 2,642,070 | |
|
| Internet Software & Services — 0.5% | |
| | |
| Netflix, Inc. | | | | | | |
| | |
5.50%, 2/15/22 | | $ | 1,000 | | | $ | 1,061,250 | |
| | |
| | | | | | | $ | 1,061,250 | |
|
| Leisure Goods / Activities / Movies — 0.5% | |
| | |
| Sabre GLBL, Inc. | | | | | | |
| | |
5.375%, 4/15/23(6) | | $ | 1,000 | | | $ | 1,026,585 | |
| | |
| | | | | | | $ | 1,026,585 | |
| | | | |
| | 18 | | See Notes to Financial Statements. |
Eaton Vance
Floating-Rate 2022 Target Term Trust
December 31, 2019
Portfolio of Investments (Unaudited) — continued
| | | | | | | | |
| Security | | Principal Amount (000’s omitted) | | | Value | |
|
| Lodging and Casinos — 0.8% | |
| | |
| RHP Hotel Properties, L.P./RHP Finance Corp. | | | | | | |
| | |
5.00%, 4/15/23 | | $ | 676 | | | $ | 691,491 | |
| | |
| Studio City Co., Ltd. | | | | | | |
| | |
7.25%, 11/30/21(6) | | | 1,000 | | | | 1,024,750 | |
| | |
| | | | | | | $ | 1,716,241 | |
|
| Metals / Mining — 0.9% | |
| | |
| Hecla Mining Co. | | | | | | |
| | |
6.875%, 5/1/21 | | $ | 1,065 | | | $ | 1,063,935 | |
| | |
| Hudbay Minerals, Inc. | | | | | | |
| | |
7.25%, 1/15/23(6) | | | 1,000 | | | | 1,039,790 | |
| | |
| | | | | | | $ | 2,103,725 | |
|
| Nonferrous Metals / Minerals — 0.1% | |
| | |
| First Quantum Minerals, Ltd. | | | | | | |
| | |
7.25%, 4/1/23(6) | | $ | 200 | | | $ | 207,473 | |
| | |
| New Gold, Inc. | | | | | | |
| | |
6.25%, 11/15/22(6) | | | 62 | | | | 61,864 | |
| | |
| | | | | | | $ | 269,337 | |
|
| Oil and Gas — 2.5% | |
| | |
Ascent Resources Utica Holdings, LLC/ARU
Finance Corp. | | | | | | |
| | |
10.00%, 4/1/22(6) | | $ | 775 | | | $ | 772,771 | |
| | |
| CITGO Petroleum Corp. | | | | | | |
| | |
6.25%, 8/15/22(6) | | | 500 | | | | 508,122 | |
| | |
| Energy Transfer Operating, L.P. | | | | | | |
| | |
4.25%, 3/15/23 | | | 1,000 | | | | 1,044,637 | |
| | |
Great Western Petroleum, LLC/Great Western
Finance Corp. | | | | | | |
| | |
9.00%, 9/30/21(6) | | | 500 | | | | 448,325 | |
| | |
| Precision Drilling Corp. | | | | | | |
| | |
6.50%, 12/15/21 | | | 740 | | | | 740,486 | |
| | |
| Tervita Escrow Corp. | | | | | | |
| | |
7.625%, 12/1/21(6) | | | 1,287 | | | | 1,297,939 | |
| | |
| Transocean, Inc. | | | | | | |
| | |
8.375%, 12/15/21 | | | 750 | | | | 770,925 | |
| | |
| | | | | | | $ | 5,583,205 | |
|
| Real Estate Investment Trusts (REITs) — 0.3% | |
| | |
| iStar, Inc. | | | | | | |
| | |
5.25%, 9/15/22 | | $ | 600 | | | $ | 617,437 | |
| | |
| | | | | | | $ | 617,437 | |
| | | | | | | | |
| Security | | Principal Amount (000’s omitted) | | | Value | |
|
| Road & Rail — 0.7% | |
| | |
| Watco Cos., LLC/Watco Finance Corp. | | | | | | |
| | |
6.375%, 4/1/23(6) | | $ | 1,500 | | | $ | 1,526,872 | |
| | |
| | | | | | | $ | 1,526,872 | |
|
| Surface Transport — 1.3% | |
| | |
| DAE Funding, LLC | | | | | | |
| | |
5.25%, 11/15/21(6) | | $ | 1,000 | | | $ | 1,039,750 | |
|
| Park Aerospace Holdings, Ltd. | |
| | |
5.25%, 8/15/22(6) | | | 1,000 | | | | 1,068,212 | |
|
| XPO Logistics, Inc. | |
| | |
6.50%, 6/15/22(6) | | | 750 | | | | 765,585 | |
| | |
| | | | | | | $ | 2,873,547 | |
|
| Technology — 0.3% | |
| | |
| Dell International, LLC/EMC Corp. | | | | | | |
| | |
5.875%, 6/15/21(6) | | $ | 662 | | | $ | 673,175 | |
| | |
| | | | | | | $ | 673,175 | |
|
| Telecommunications — 3.0% | |
| | |
| Altice Financing S.A. | | | | | | |
| | |
6.625%, 2/15/23(6) | | $ | 335 | | | $ | 341,561 | |
|
| CenturyLink, Inc. | |
| | |
5.80%, 3/15/22 | | | 1,000 | | | | 1,053,050 | |
|
| Hughes Satellite Systems Corp. | |
| | |
7.625%, 6/15/21 | | | 1,000 | | | | 1,070,270 | |
|
| SBA Communications Corp. | |
| | |
4.00%, 10/1/22 | | | 90 | | | | 91,912 | |
|
| Sprint Communications, Inc. | |
| | |
6.00%, 11/15/22 | | | 2,000 | | | | 2,101,060 | |
|
| T-Mobile USA, Inc. | |
| | |
6.00%, 3/1/23 | | | 1,000 | | | | 1,020,085 | |
|
| Zayo Group, LLC/Zayo Capital, Inc. | |
| | |
6.00%, 4/1/23 | | | 1,000 | | | | 1,024,585 | |
| | |
| | | | | | | $ | 6,702,523 | |
| |
Total Corporate Bonds & Notes
(identified cost $47,766,871) | | | $ | 48,482,402 | |
| | | | |
| | 19 | | See Notes to Financial Statements. |
Eaton Vance
Floating-Rate 2022 Target Term Trust
December 31, 2019
Portfolio of Investments (Unaudited) — continued
| | | | | | | | |
| Convertible Bonds — 0.1% | |
| Security | | Principal Amount (000’s omitted) | | | Value | |
|
| Technology — 0.1% | |
|
| Rovi Corp. | |
| | |
0.50%, 3/1/20 | | $ | 292 | | | $ | 290,329 | |
| |
Total Convertible Bonds
(identified cost $290,197) | | | $ | 290,329 | |
| | |
| Short-Term Investments — 4.2% | | | | | | | | |
| Description | | Units | | | Value | |
| | |
Eaton Vance Cash Reserves Fund, LLC, 1.78%(9) | | | 9,291,983 | | | $ | 9,291,983 | |
| | |
Total Short-Term Investments
(identified cost $9,291,734) | | | | | | $ | 9,291,983 | |
| |
Total Investments — 154.4%
(identified cost $349,926,582) | | | $ | 346,697,705 | |
| |
Less Unfunded Loan Commitments — (0.2)% | | | $ | (420,794 | ) |
| |
Net Investments — 154.2%
(identified cost $349,505,788) | | | $ | 346,276,911 | |
| |
Notes Payable — (41.0)% | | | $ | (92,000,000 | ) |
| |
Variable Rate Term Preferred Shares, at Liquidation Value (net of unamortized deferred debt issuance costs) — (14.2)% | | | $ | (31,974,536 | ) |
| |
Other Assets, Less Liabilities — 1.0% | | | $ | 2,250,738 | |
| |
Net Assets Applicable to Common Shares — 100.0% | | | $ | 224,553,113 | |
The percentage shown for each investment category in the Portfolio of Investments is based on net assets applicable to common shares.
| | (1) | Senior floating-rate loans (Senior Loans) often require prepayments from excess cash flows or permit the borrowers to repay at their election. The degree to which borrowers repay, whether as a contractual requirement or at their election, cannot be predicted with accuracy. As a result, the actual remaining maturity may be substantially less than the stated maturities shown. However, Senior Loans will typically have an expected average life of approximately two to four years. Senior Loans typically have rates of interest which are redetermined periodically by reference to a base lending rate, plus a spread. These base lending rates are primarily the London Interbank Offered Rate (“LIBOR”) and secondarily, the prime rate offered by one or more major United States banks (the “Prime Rate”). Base lending rates may be subject to a floor, or minimum rate. |
| | (2) | The stated interest rate represents the weighted average interest rate at December 31, 2019 of contracts within the senior loan facility. Interest rates on contracts are primarily redetermined either weekly, monthly or quarterly by reference to the indicated base lending rate and spread and the reset period. |
| | (3) | This Senior Loan will settle after December 31, 2019, at which time the interest rate will be determined. |
| | (4) | Unfunded or partially unfunded loan commitments. The stated interest rate reflects the weighted average of the reference rate and spread for the funded portion, if any, and the commitment fees on the portion of the loan that is unfunded. At December 31, 2019, the total value of unfunded loan commitments is $426,161. See Note 1E for description. |
| | (5) | Issuer is in default with respect to interest and/or principal payments. For a variable rate security, interest rate has been adjusted to reflectnon-accrual status. |
| | (6) | Security exempt from registration pursuant to Rule 144A under the Securities Act of 1933, as amended. These securities may be sold in certain transactions in reliance on an exemption from registration (normally to qualified institutional buyers). At December 31, 2019, the aggregate value of these securities is $23,622,215 or 10.5% of the Trust’s net assets applicable to common shares. |
| | (7) | Amount is less than 0.05%. |
| | (8) | Represents apayment-in-kind security which may pay interest in additional principal at the issuer’s discretion. |
| | (9) | Affiliated investment company, available to Eaton Vance portfolios and funds, which invests in high quality, U.S. dollar denominated money market instruments. The rate shown is the annualizedseven-day yield as of December 31, 2019. |
Abbreviations:
| | | | |
| | |
| DIP | | — | | Debtor In Possession |
| | |
| LIBOR | | — | | London Interbank Offered Rate |
| | |
| PIK | | — | | Payment In Kind |
Currency Abbreviations: |
| | |
| USD | | — | | United States Dollar |
| | | | |
| | 20 | | See Notes to Financial Statements. |
Eaton Vance
Floating-Rate 2022 Target Term Trust
December 31, 2019
Statement of Assets and Liabilities (Unaudited)
| | | | |
| Assets | | December 31, 2019 | |
| |
Unaffiliated investments, at value (identified cost, $340,214,054) | | $ | 336,984,928 | |
| |
Affiliated investment, at value (identified cost, $9,291,734) | | | 9,291,983 | |
| |
Cash | | | 2,978,637 | |
| |
Interest receivable | | | 1,260,427 | |
| |
Dividends receivable from affiliated investment | | | 15,043 | |
| |
Receivable for investments sold | | | 441,132 | |
| |
Prepaid upfront fees on variable rate term preferred shares | | | 36,999 | |
| |
Prepaid upfront fees on notes payable | | | 11,300 | |
| |
Prepaid expenses | | | 16,894 | |
| |
Total assets | | $ | 351,037,343 | |
| |
| Liabilities | | | | |
| |
Notes payable | | $ | 92,000,000 | |
| |
Variable rate term preferred shares, at liquidation value (net of unamortized deferred debt issuance costs of $25,464) | | | 31,974,536 | |
| |
Payable for investments purchased | | | 496,313 | |
| |
Distributions payable | | | 1,062,528 | |
| |
Payable to affiliates: | | | | |
| |
Investment adviser fee | | | 208,426 | |
| |
Trustees’ fees | | | 4,403 | |
| |
Interest expense and fees payable | | | 564,524 | |
| |
Accrued expenses | | | 173,500 | |
| |
Total liabilities | | $ | 126,484,230 | |
| |
Net assets applicable to common shares | | $ | 224,553,113 | |
| |
| Sources of Net Assets | | | | |
| |
Common shares, $0.01 par value, unlimited number of shares authorized, 23,611,740 shares issued and outstanding | | $ | 236,117 | |
| |
Additionalpaid-in capital | | | 231,888,379 | |
| |
Accumulated loss | | | (7,571,383 | ) |
| |
Net assets applicable to common shares | | $ | 224,553,113 | |
| |
| Net Asset Value Per Common Share | | | | |
| |
($224,553,113 ÷ 23,611,740 common shares issued and outstanding) | | $ | 9.51 | |
| | | | |
| | 21 | | See Notes to Financial Statements. |
Eaton Vance
Floating-Rate 2022 Target Term Trust
December 31, 2019
Statement of Operations (Unaudited)
| | | | |
| Investment Income | | Six Months Ended December 31, 2019 | |
| |
Interest and other income | | $ | 9,400,085 | |
| |
Dividends from affiliated investment | | | 84,587 | |
| |
Total investment income | | $ | 9,484,672 | |
|
| Expenses | |
| |
Investment adviser fee | | $ | 1,229,908 | |
| |
Trustees’ fees and expenses | | | 8,226 | |
| |
Custodian fee | | | 66,366 | |
| |
Transfer and dividend disbursing agent fees | | | 10,660 | |
| |
Legal and accounting services | | | 33,382 | |
| |
Printing and postage | | | 18,006 | |
| |
Interest expense and fees | | | 2,181,821 | |
| |
Miscellaneous | | | 21,006 | |
| |
Total expenses | | $ | 3,569,375 | |
| |
Net investment income | | $ | 5,915,297 | |
|
| Realized and Unrealized Gain (Loss) | |
|
Net realized gain (loss) — | |
| |
Investment transactions | | $ | (790,925 | ) |
| |
Investment transactions — affiliated investment | | | (363 | ) |
| |
Net realized loss | | $ | (791,288 | ) |
| |
Change in unrealized appreciation (depreciation) — | | | | |
| |
Investments | | $ | 2,779,234 | |
| |
Investments — affiliated investment | | | 249 | |
| |
Net change in unrealized appreciation (depreciation) | | $ | 2,779,483 | |
| |
Net realized and unrealized gain | | $ | 1,988,195 | |
| |
Net increase in net assets from operations | | $ | 7,903,492 | |
| | | | |
| | 22 | | See Notes to Financial Statements. |
Eaton Vance
Floating-Rate 2022 Target Term Trust
December 31, 2019
Statements of Changes in Net Assets
| | | | | | | | |
| Increase (Decrease) in Net Assets | | Six Months Ended December 31, 2019
(Unaudited) | | | Year Ended June 30, 2019 | |
| | |
From operations — | | | | | | | | |
| | |
Net investment income | | $ | 5,915,297 | | | $ | 11,864,847 | |
| | |
Net realized loss | | | (791,288 | ) | | | (670,371 | ) |
| | |
Net change in unrealized appreciation (depreciation) | | | 2,779,483 | | | | (2,912,554 | ) |
| | |
Net increase in net assets from operations | | $ | 7,903,492 | | | $ | 8,281,922 | |
| | |
Distributions to common shareholders | | $ | (7,508,533 | ) | | $ | (12,585,057 | ) |
| | |
Net increase (decrease) in net assets | | $ | 394,959 | | | $ | (4,303,135 | ) |
|
| Net Assets Applicable to Common Shares | |
| | |
At beginning of period | | $ | 224,158,154 | | | $ | 228,461,289 | |
| | |
At end of period | | $ | 224,553,113 | | | $ | 224,158,154 | |
| | | | |
| | 23 | | See Notes to Financial Statements. |
Eaton Vance
Floating-Rate 2022 Target Term Trust
December 31, 2019
Statement of Cash Flows (Unaudited)
| | | | |
| Cash Flows From Operating Activities | | Six Months Ended December 31, 2019 | |
| |
Net increase in net assets from operations | | $ | 7,903,492 | |
| |
Adjustments to reconcile net increase in net assets from operations to net cash provided by operating activities: | | | | |
| |
Investments purchased | | | (51,888,057 | ) |
| |
Investments sold and principal repayments | | | 54,478,585 | |
| |
Increase in short-term investments, net | | | (2,564,981 | ) |
| |
Net amortization/accretion of premium (discount) | | | 165,895 | |
| |
Amortization of prepaid upfront fees on variable rate term preferred shares | | | 27,030 | |
| |
Amortization of deferred debt issuance costs on variable rate term preferred shares | | | 18,602 | |
| |
Amortization of prepaid upfront fees on notes payable | | | 27,600 | |
| |
Decrease in interest receivable | | | 42,012 | |
| |
Increase in dividends receivable from affiliated investment | | | (7,600 | ) |
| |
Increase in prepaid expenses | | | (49 | ) |
| |
Increase in payable to affiliate for investment adviser fee | | | 7,938 | |
| |
Decrease in payable to affiliate for Trustees’ fees | | | (580 | ) |
| |
Decrease in interest expense and fees payable | | | (84,230 | ) |
| |
Increase in accrued expenses | | | 44,862 | |
| |
Increase in unfunded loan commitments | | | 420,794 | |
| |
Net change in unrealized (appreciation) depreciation from investments | | | (2,779,483 | ) |
| |
Net realized loss from investments | | | 791,288 | |
| |
Net cash provided by operating activities | | $ | 6,603,118 | |
| |
| Cash Flows From Financing Activities | | | | |
| |
Cash distributions paid to common shareholders | | $ | (6,446,005 | ) |
| |
Proceeds from notes payable | | | 9,000,000 | |
| |
Repayments of notes payable | | | (9,000,000 | ) |
| |
Net cash used in financing activities | | $ | (6,446,005 | ) |
| |
Net increase in cash | | $ | 157,113 | |
| |
Cash at beginning of period | | $ | 2,821,524 | |
| |
Cash at end of period | | $ | 2,978,637 | |
|
| Supplemental disclosure of cash flow information: | |
| |
Cash paid for interest and fees on borrowings and variable rate term preferred shares | | $ | 2,192,819 | |
| | | | |
| | 24 | | See Notes to Financial Statements. |
Eaton Vance
Floating-Rate 2022 Target Term Trust
December 31, 2019
Financial Highlights
Selected data for a common share outstanding during the periods stated
| | | | | | | | | | | | |
| | | Six Months Ended
December 31, 2019
(Unaudited) | | | Year Ended
June 30, 2019 | | | Period Ended June 30, 2018(1) | |
| | | | |
Net asset value — Beginning of period (Common shares) | | $ | 9.490 | | | $ | 9.680 | | | $ | 9.850 | (2) |
| | | |
| Income (Loss) From Operations | | | | | | | | | | | | |
| | | |
Net investment income(3) | | $ | 0.251 | | | $ | 0.502 | | | $ | 0.404 | |
| | | |
Net realized and unrealized gain (loss) | | | 0.087 | | | | (0.159 | ) | | | (0.152 | ) |
| | | |
Total income from operations | | $ | 0.338 | | | $ | 0.343 | | | $ | 0.252 | |
| | | |
| Less Distributions to Common Shareholders | | | | | | | | | | | | |
| | | |
From net investment income | | $ | (0.318 | ) | | $ | (0.533 | ) | | $ | (0.406 | ) |
| | | |
Total distributions to common shareholders | | $ | (0.318 | ) | | $ | (0.533 | ) | | $ | (0.406 | ) |
| | | |
Offering costs charged topaid-in capital(3) | | $ | — | | | $ | — | | | $ | (0.020 | ) |
| | | |
Premium related to exercise of underwriters’ over-allotment option(3) | | $ | — | | | $ | — | | | $ | 0.004 | |
| | | |
Net asset value — End of period (Common shares) | | $ | 9.510 | | | $ | 9.490 | | | $ | 9.680 | |
| | | |
Market value — End of period (Common shares) | | $ | 9.340 | | | $ | 9.290 | | | $ | 9.440 | |
| | | |
Total Investment Return on Net Asset Value(4) | | | 3.67 | %(5) | | | 3.86 | % | | | 2.55 | %(5)(6) |
| | | |
Total Investment Return on Market Value(4) | | | 4.07 | %(5) | | | 4.20 | % | | | 0.01 | %(5)(6) |
| | | | |
| | 25 | | See Notes to Financial Statements. |
Eaton Vance
Floating-Rate 2022 Target Term Trust
December 31, 2019
Financial Highlights — continued
Selected data for a common share outstanding during the periods stated
| | | | | | | | | | | | |
| Ratios/Supplemental Data | | Six Months Ended
December 31, 2019
(Unaudited) | | | Year Ended
June 30, 2019 | | | Period Ended June 30, 2018(1) | |
| | | | |
Net assets applicable to common shares, end of period (000’s omitted) | | $ | 224,553 | | | $ | 224,158 | | | $ | 228,461 | |
| | | |
Ratios (as a percentage of average daily net assets applicable to common shares):† | | | | | | | | | | | | |
| | | |
Expenses excluding interest and fees | | | 1.24 | %(7) | | | 1.25 | % | | | 1.24 | %(7) |
| | | |
Interest and fee expense(8) | | | 1.95 | %(7) | | | 2.12 | % | | | 1.53 | %(7) |
| | | |
Total expenses | | | 3.19 | %(7) | | | 3.37 | % | | | 2.77 | %(7) |
| | | |
Net investment income | | | 5.28 | %(7) | | | 5.25 | % | | | 4.50 | %(7) |
| | | |
Portfolio Turnover | | | 14 | %(5) | | | 22 | % | | | 30 | %(5) |
| | | |
Senior Securities: | | | | | | | | | | | | |
| | | |
Total notes payable outstanding (in 000’s) | | $ | 92,000 | | | $ | 92,000 | | | $ | 100,000 | |
| | | |
Asset coverage per $1,000 of notes payable(9) | | $ | 3,789 | | | $ | 3,784 | | | $ | 3,605 | |
| | | |
Total variable rate term preferred shares outstanding | | | 320 | | | | 320 | | | | 320 | |
| | | |
Asset coverage per variable rate term preferred share(10) | | $ | 281,091 | | | $ | 280,773 | | | $ | 273,077 | |
| | | |
Involuntary liquidation preference per variable rate term preferred share(11) | | $ | 100,000 | | | $ | 100,000 | | | $ | 100,000 | |
| | | |
Approximate market value per variable rate term preferred share(11) | | $ | 100,000 | | | $ | 100,000 | | | $ | 100,000 | |
| (1) | For the period from the start of business, July 31, 2017, to June 30, 2018. |
| (2) | Net asset value at beginning of period reflects the deduction of the sales charge of $0.15 per share paid by the shareholders from the $10.00 offering price. |
| (3) | Computed using average common shares outstanding. |
| (4) | Returns are historical and are calculated by determining the percentage change in net asset value or market value with all distributions reinvested. Distributions are assumed to be reinvested at prices obtained under the Trust’s dividend reinvestment plan. |
| (6) | Total investment return on net asset value is calculated assuming a purchase at the offering price of $10.00 less the sales load of $0.15 per share paid by the shareholder on the first day and a sale at the net asset value on the last day of the period reported with all distributions reinvested. Total investment return on market value is calculated assuming a purchase at the offering price of $10.00 less the sales load of $0.15 per share paid by the shareholder on the first day and a sale at the current market price on the last day of the period reported with all distributions reinvested. |
| (8) | Interest and fee expense relates to the variable rate term preferred shares (see Note 2) and the notes payable (see Note 7) for the purpose of financial leverage. |
| (9) | Calculated by subtracting the Trust’s total liabilities (not including the notes payable and variable rate term preferred shares) from the Trust’s total assets, and dividing the result by the notes payable balance in thousands. |
| (10) | Calculated by subtracting the Trust’s total liabilities (not including the notes payable and variable rate term preferred shares) from the Trust’s total assets, dividing the result by the sum of the value of the notes payable and liquidation value of the variable rate term preferred shares, and multiplying the result by the liquidation value of one variable rate term preferred share. Such amount equates to 281%, 281% and 273% at December 31, 2019, June 30, 2019 and June 30, 2018, respectively. |
| (11) | Plus accumulated and unpaid dividends. |
| † | Ratios based on net assets applicable to common shares plus variable rate term preferred shares and borrowings are presented below. Ratios for periods less than one year are annualized. |
| | | | | | | | | | | | |
| | | Six Months Ended
December 31, 2019
(Unaudited) | | | Year Ended
June 30, 2019 | | | Period Ended June 30, 2018(1) | |
| | | |
Expenses excluding interest and fees | | | 0.79 | % | | | 0.80 | % | | | 0.83 | % |
| | | |
Interest and fee expense | | | 1.24 | % | | | 1.35 | % | | | 1.02 | % |
| | | |
Total expenses | | | 2.03 | % | | | 2.15 | % | | | 1.85 | % |
| | | |
Net investment income | | | 3.37 | % | | | 3.35 | % | | | 3.00 | % |
| (1) | For the period from the start of business, July 31, 2017, to June 30, 2018. |
| | | | |
| | 26 | | See Notes to Financial Statements. |
Eaton Vance
Floating-Rate 2022 Target Term Trust
December 31, 2019
Notes to Financial Statements (Unaudited)
1 Significant Accounting Policies
Eaton Vance Floating-Rate 2022 Target Term Trust (the Trust) is a Massachusetts business trust registered under the Investment Company Act of 1940, as amended (the 1940 Act), as a diversified,closed-end management investment company. The Trust’s investment objectives are high current income and to return $9.85 per share, the original net asset value per common share before deducting offering costs of $0.02 per common share (“Original NAV”), to holders of common shares of record on or about October 31, 2022 (the “Termination Date”). On or about the Termination Date, the Trust intends to cease its investment operations, liquidate its portfolio, retire or redeem its leverage facilities, and seek to return Original NAV to common shareholders, unless the term is extended for one period of up to twelve months and one additional period of up to six months by a vote of the Trust’s Board of Trustees.
The following is a summary of significant accounting policies of the Trust. The policies are in conformity with accounting principles generally accepted in the United States of America (U.S. GAAP). The Trust is an investment company and follows accounting and reporting guidance in the Financial Accounting Standards Board (FASB) Accounting Standards Codification Topic 946.
A Investment Valuation — The following methodologies are used to determine the market value or fair value of investments.
Senior Floating-Rate Loans. Interests in senior floating-rate loans (Senior Loans) for which reliable market quotations are readily available are valued generally at the average mean of bid and ask quotations obtained from a third party pricing service. Other Senior Loans are valued at fair value by the investment adviser under procedures approved by the Trustees. In fair valuing a Senior Loan, the investment adviser utilizes one or more of the valuation techniques described in (i) through (iii) below to assess the likelihood that the borrower will make a full repayment of the loan underlying such Senior Loan relative to yields on other Senior Loans issued by companies of comparable credit quality. If the investment adviser believes that there is a reasonable likelihood of full repayment, the investment adviser will determine fair value using a matrix pricing approach that considers the yield on the Senior Loan. If the investment adviser believes there is not a reasonable likelihood of full repayment, the investment adviser will determine fair value using analyses that include, but are not limited to: (i) a comparison of the value of the borrower’s outstanding equity and debt to that of comparable public companies; (ii) a discounted cash flow analysis; or (iii) when the investment adviser believes it is likely that a borrower will be liquidated or sold, an analysis of the terms of such liquidation or sale. In certain cases, the investment adviser will use a combination of analytical methods to determine fair value, such as when only a portion of a borrower’s assets are likely to be sold. In conducting its assessment and analyses for purposes of determining fair value of a Senior Loan, the investment adviser will use its discretion and judgment in considering and appraising relevant factors. Fair value determinations are made by the portfolio managers of the Trust based on information available to such managers. The portfolio managers of other funds managed by the investment adviser that invest in Senior Loans may not possess the same information about a Senior Loan borrower as the portfolio managers of the Trust. At times, the fair value of a Senior Loan determined by the portfolio managers of other funds managed by the investment adviser that invest in Senior Loans may vary from the fair value of the same Senior Loan determined by the portfolio managers of the Trust. The fair value of each Senior Loan is periodically reviewed and approved by the investment adviser’s Valuation Committee and by the Trustees based upon procedures approved by the Trustees. Junior Loans (i.e., subordinated loans and second lien loans) are valued in the same manner as Senior Loans.
Debt Obligations. Debt obligations are generally valued on the basis of valuations provided by third party pricing services, as derived from such services’ pricing models. Inputs to the models may include, but are not limited to, reported trades, executable bid and ask prices, broker/dealer quotations, prices or yields of securities with similar characteristics, interest rates, anticipated prepayments, benchmark curves or information pertaining to the issuer, as well as industry and economic events. The pricing services may use a matrix approach, which considers information regarding securities with similar characteristics to determine the valuation for a security.Short-term debt obligations purchased with a remaining maturity of sixty days or less for which a valuation from a third party pricing service is not readily available may be valued at amortized cost, which approximates fair value.
Affiliated Fund. The Trust may invest in Eaton Vance Cash Reserves Fund, LLC (Cash Reserves Fund), an affiliated investment company managed by Eaton Vance Management (EVM). While Cash Reserves Fund is not a registered money market mutual fund, it conducts all of its investment activities in accordance with the requirements of Rule2a-7 under the 1940 Act. Investments in Cash Reserves Fund are valued at the closing net asset value per unit on the valuation day. Cash Reserves Fund generally values its investment securities based on available market quotations provided by a third party pricing service.
Fair Valuation. Investments for which valuations or market quotations are not readily available or are deemed unreliable are valued at fair value using methods determined in good faith by or at the direction of the Trustees of the Trust in a manner that most fairly reflects the security’s “fair value”, which is the amount that the Trust might reasonably expect to receive for the security upon its current sale in the ordinary course. Each such determination is based on a consideration of relevant factors, which are likely to vary from one pricing context to another. These factors may include, but are not limited to, the type of security, the existence of any contractual restrictions on the security’s disposition, the price and extent of public trading in similar securities of the issuer or of comparable companies or entities, quotations or relevant information obtained from broker/dealers or other market participants, information obtained from the issuer, analysts, and/or the appropriate stock exchange (for exchange-traded securities), an analysis of the company’s or entity’s financial statements, and an evaluation of the forces that influence the issuer and the market(s) in which the security is purchased and sold.
B Investment Transactions — Investment transactions for financial statement purposes are accounted for on a trade date basis. Realized gains and losses on investments sold are determined on the basis of identified cost.
C Income — Interest income is recorded on the basis of interest accrued, adjusted for amortization of premium or accretion of discount. Fees associated with loan amendments are recognized immediately. Dividend income is recorded on theex-dividend date for dividends received in cash and/or securities.
Eaton Vance
Floating-Rate 2022 Target Term Trust
December 31, 2019
Notes to Financial Statements (Unaudited) — continued
D Federal Taxes — The Trust intends to make monthly distributions of net investment income and any net realized capital gains in amounts necessary to maintain its taxation as a regulated investment company for U.S. federal income tax purposes. For the purpose of pursuing its investment objective of returning Original NAV, the Trust may retain a portion of its net investment income and some or all of its net capital gains, which would result in the Trust paying U.S. federal excise and corporate income taxes.
As of December 31, 2019, the Trust had no uncertain tax positions that would require financial statement recognition,de-recognition, or disclosure. The Trust files a U.S. federal income tax return annually after its fiscalyear-end, which is subject to examination by the Internal Revenue Service for a period of three years from the date of filing.
E Unfunded Loan Commitments — The Trust may enter into certain loan agreements all or a portion of which may be unfunded. The Trust is obligated to fund these commitments at the borrower’s discretion. These commitments are disclosed in the accompanying Portfolio of Investments. At December 31, 2019, the Trust had sufficient cash and/or securities to cover these commitments.
F Use of Estimates — The preparation of the financial statements in conformity with U.S. GAAP requires management to make estimates and assumptions that affect the reported amounts of assets and liabilities at the date of the financial statements and the reported amounts of income and expense during the reporting period. Actual results could differ from those estimates.
G Indemnifications — Under the Trust’s organizational documents, its officers and Trustees may be indemnified against certain liabilities and expenses arising out of the performance of their duties to the Trust. Under Massachusetts law, if certain conditions prevail, shareholders of a Massachusetts business trust (such as the Trust) could be deemed to have personal liability for the obligations of the Trust. However, the Trust’s Declaration of Trust contains an express disclaimer of liability on the part of Trust shareholders and theBy-laws provide that the Trust shall assume, upon request by the shareholder, the defense on behalf of any Trust shareholders. Moreover, the By-laws also provide for indemnification out of Trust property of any shareholder held personally liable solely by reason of being or having been a shareholder for all loss or expense arising from such liability. Additionally, in the normal course of business, the Trust enters into agreements with service providers that may contain indemnification clauses. The Trust’s maximum exposure under these arrangements is unknown as this would involve future claims that may be made against the Trust that have not yet occurred.
H Interim Financial Statements — The interim financial statements relating to December 31, 2019 and for the six months then ended have not been audited by an independent registered public accounting firm, but in the opinion of the Trust’s management, reflect all adjustments, consisting only of normal recurring adjustments, necessary for the fair presentation of the financial statements.
2 Variable Rate Term Preferred Shares
Variable rate term preferred shares are a form of preferred shares that represent stock of the Trust. They have a par value of $0.01 per share and a liquidation preference of $100,000 per share.
On September 6, 2017, the Trust issued 320 shares of SeriesC-1 Variable Rate Term Preferred Shares (VRTP Shares) in a private offering to a commercial paper conduit sponsored by a large financial institution (the Conduit), with a mandatory redemption date of September 8, 2020, unless extended. Dividends on the VRTP Shares are determined each day based on a spread of 1.85% to three-month LIBOR. Such spread is determined based on the current credit rating of the VRTP Shares, which is provided by Moody’s Investor Service.
The VRTP Shares are redeemable at the option of the Trust at a redemption price equal to $100,000 per share, plus accumulated and unpaid dividends, on any business day and solely for the purpose of reducing the leverage of the Trust. The VRTP Shares are also subject to mandatory redemption at a redemption price equal to $100,000 per share, plus accumulated and unpaid dividends, if the Trust is in default for an extended period on its asset maintenance or leverage ratio requirements with respect to the VRTP Shares. Six months prior to the mandatory redemption date, the Trust is required to segregate in a liquidity account with its custodian investments equal to 110% of the VRTP Shares’ redemption price, and over thesix-month period execute a series of liquidation transactions to assure sufficient liquidity to redeem the VRTP Shares. The holders of the VRTP Shares, voting as a class, are entitled to elect two Trustees of the Trust. If the dividends on the VRTP Shares remain unpaid in an amount equal to two full years’ dividends, the holders of the VRTP Shares as a class have the right to elect a majority of the Board of Trustees.
For financial reporting purposes, the liquidation value of the VRTP Shares (net of unamortized deferred debt issuance costs) is presented as a liability on the Statement of Assets and Liabilities and unpaid dividends are included in interest expense and fees payable. Dividends accrued on VRTP Shares are treated as interest payments for financial reporting purposes and are included in interest expense and fees on the Statement of Operations. In connection with the issuance of VRTP Shares, the Trust paid an upfront fee of $160,000 and debt issuance costs of $110,112, both of which are being amortized to interest expense and fees over a period of three years. The unamortized amount of the debt issuance costs as of December 31, 2019 is presented as a reduction of the liability for VRTP Shares on the Statement of Assets and Liabilities.
The carrying amount of the VRTP Shares at December 31, 2019 represents its liquidation value, which approximates fair value. If measured at fair value, the VRTP Shares would have been considered as Level 2 in the fair value hierarchy (see Note 10) at December 31, 2019. The average liquidation preference of the VRTP Shares during the six months ended December 31, 2019 was $32,000,000.
Eaton Vance
Floating-Rate 2022 Target Term Trust
December 31, 2019
Notes to Financial Statements (Unaudited) — continued
3 Distributions to Shareholders and Income Tax Information
The Trust intends to make monthly distributions of net investment income to common shareholders, after payment of any dividends on any outstanding VRTP Shares. The Trust may also distribute net realized capital gains, if any, generally not more than once per year. Distributions to common shareholders are recorded on theex-dividend date. Dividends to variable rate term preferred shareholders are accrued daily and payable quarterly. The dividend rate on the VRTP Shares at December 31, 2019 was 3.95%. The amount of dividends accrued and the average annual dividend rate of the VRTP Shares during the six months ended December 31, 2019 were $663,832 and 4.13%, respectively.
Distributions to shareholders are determined in accordance with income tax regulations, which may differ from U.S. GAAP. As required by U.S. GAAP, only distributions in excess of tax basis earnings and profits are reported in the financial statements as a return of capital. Permanent differences between book and tax accounting relating to distributions are reclassified topaid-in capital. For tax purposes, distributions from short-term capital gains are considered to be from ordinary income.
At June 30, 2019, the Trust, for federal income tax purposes, had deferred capital losses of $1,449,062 which would reduce its taxable income arising from future net realized gains on investment transactions, if any, to the extent permitted by the Internal Revenue Code, and thus would reduce the amount of distributions to shareholders, which would otherwise be necessary to relieve the Trust of any liability for federal income or excise tax. The deferred capital losses are treated as arising on the first day of the Trust’s next taxable year and retain the same short-term or long-term character as when originally deferred. Of the deferred capital losses at June 30, 2019, $876,280 are short-term and $572,782 are long-term.
The cost and unrealized appreciation (depreciation) of investments of the Trust at December 31, 2019, as determined on a federal income tax basis, were as follows:
| | | | |
| |
Aggregate cost | | $ | 351,064,171 | |
| |
Gross unrealized appreciation | | $ | 1,885,559 | |
| |
Gross unrealized depreciation | | | (6,672,819 | ) |
| |
Net unrealized depreciation | | $ | (4,787,260 | ) |
4 Investment Adviser Fee and Other Transactions with Affiliates
The investment adviser fee is earned by EVM as compensation for investment advisory services rendered to the Trust. The fee is computed at an annual rate of 0.70% of the Trust’s average daily total managed assets and is payable monthly. During any extension period of the Trust’s term, the fee will be reduced to 0.35% of the Trust’s average daily total managed assets. Total managed assets as referred to herein represent total assets of the Trust (including assets attributable to borrowings, any outstanding preferred shares, or other forms of leverage) less accrued liabilities (other than liabilities representing borrowings or such other forms of leverage). For the six months ended December 31, 2019, the Trust’s investment adviser fee amounted to $1,229,908. The Trust invests its cash in Cash Reserves Fund. EVM does not currently receive a fee for investment advisory services provided to Cash Reserves Fund. EVM also serves as administrator of the Trust, but receives no compensation.
Trustees and officers of the Trust who are members of EVM’s organization receive remuneration for their services to the Trust out of the investment adviser fee. Trustees of the Trust who are not affiliated with EVM may elect to defer receipt of all or a percentage of their annual fees in accordance with the terms of the Trustees Deferred Compensation Plan. For the six months ended December 31, 2019, no significant amounts have been deferred. Certain officers and Trustees of the Trust are officers of EVM.
5 Purchases and Sales of Investments
Purchases and sales of investments, other than short-term obligations and including maturities and principal repayments on Senior Loans, aggregated $46,624,562 and $54,487,273, respectively, for the six months ended December 31, 2019.
6 Common Shares of Beneficial Interest
The Trust may issue common shares pursuant to its dividend reinvestment plan. There were no common shares issued by the Trust for the six months ended December 31, 2019 and the year ended June 30, 2019.
7 Credit Agreement
The Trust has entered into a Credit Agreement, as amended (the Agreement) with a bank to borrow up to a limit of $109 million. Borrowings under the Agreement are secured by the assets of the Trust. Interest is charged at a rate above the London Interbank Offered Rate (LIBOR) and is payable monthly.
Eaton Vance
Floating-Rate 2022 Target Term Trust
December 31, 2019
Notes to Financial Statements (Unaudited) — continued
Under the terms of the Agreement, in effect through March 17, 2020, the Trust pays a facility fee of 0.15% on the borrowing limit. In connection with the renewal of the Agreement on March 19, 2019, the Trust paid an upfront fee of $54,500, which is being amortized to interest expense over a period of one year. The unamortized balance as of December 31, 2019 is approximately $11,000 and is included in prepaid upfront fees on notes payable on the Statement of Assets and Liabilities. The Trust is required to maintain certain net asset levels during the term of the Agreement. At December 31, 2019, the Trust had borrowings outstanding under the Agreement of $92,000,000 at an annual interest rate of 2.45%. Based on the short-term nature of the borrowings under the Agreement and the variable interest rate, the carrying amount of the borrowings at December 31, 2019 approximated its fair value. If measured at fair value, borrowings under the Agreement would have been considered as Level 2 in the fair value hierarchy (see Note 10) at December 31, 2019. For the six months ended December 31, 2019, the average borrowings under the Agreement and the average annual interest rate (excluding fees) were $94,619,565 and 2.84%, respectively.
8 Credit Risk
The Trust invests primarily in below investment grade floating-rate loans, which are considered speculative because of the credit risk of their issuers. Changes in economic conditions or other circumstances are more likely to reduce the capacity of issuers of these securities to make principal and interest payments. Such companies are more likely to default on their payments of interest and principal owed than issuers of investment grade bonds. An economic downturn generally leads to a highernon-payment rate, and a loan or other debt obligation may lose significant value before a default occurs. Lower rated investments also may be subject to greater price volatility than higher rated investments. Moreover, the specific collateral used to secure a loan may decline in value or become illiquid, which would adversely affect the loan’s value.
9 Investments in Affiliated Funds
At December 31, 2019, the value of the Trust’s investment in affiliated funds was $9,291,983, which represents 4.2% of the Trust’s net assets applicable to common shares. Transactions in affiliated funds by the Trust for the six months ended December 31, 2019 were as follows:
| | | | | | | | | | | | | | | | | | | | | | | | | | | | | | | | |
| Name of affiliated fund | | Value,
beginning
of period | | | Purchases | | | Sales
proceeds | | | Net
realized
gain (loss) | | | Change in
unrealized
appreciation
(depreciation) | | | Value, end of
period | | | Dividend
income | | | Units, end
of period | |
|
Short-Term Investments | |
| | | | | | | | |
Eaton Vance Cash Reserves Fund, LLC, 1.78% | | $ | 6,727,116 | | | $ | 70,781,384 | | | $ | (68,216,403 | ) | | $ | (363 | ) | | $ | 249 | | | $ | 9,291,983 | | | $ | 84,587 | | | | 9,291,983 | |
10 Fair Value Measurements
Under generally accepted accounting principles for fair value measurements, a three-tier hierarchy to prioritize the assumptions, referred to as inputs, is used in valuation techniques to measure fair value. The three-tier hierarchy of inputs is summarized in the three broad levels listed below.
| • | | Level 1 – quoted prices in active markets for identical investments |
| • | | Level 2 – other significant observable inputs (including quoted prices for similar investments, interest rates, prepayment speeds, credit risk, etc.) |
| • | | Level 3 – significant unobservable inputs (including a fund’s own assumptions in determining the fair value of investments) |
In cases where the inputs used to measure fair value fall in different levels of the fair value hierarchy, the level disclosed is determined based on the lowest level input that is significant to the fair value measurement in its entirety. The inputs or methodology used for valuing securities are not necessarily an indication of the risk associated with investing in those securities.
At December 31, 2019, the hierarchy of inputs used in valuing the Trust’s investments, which are carried at value, were as follows:
| | | | | | | | | | | | | | | | |
| Asset Description | | Level 1 | | | Level 2 | | | Level 3 | | | Total | |
| | | | |
Senior Floating-Rate Loans (Less Unfunded Loan Commitments) | | $ | — | | | $ | 288,212,197 | | | $ | — | | | $ | 288,212,197 | |
| | | | |
Corporate Bonds & Notes | | | — | | | | 48,482,402 | | | | — | | | | 48,482,402 | |
| | | | |
Convertible Bonds | | | — | | | | 290,329 | | | | — | | | | 290,329 | |
| | | | |
Short-Term Investments | | | — | | | | 9,291,983 | | | | — | | | | 9,291,983 | |
| | | | |
Total Investments | | $ | — | | | $ | 346,276,911 | | | $ | — | | | $ | 346,276,911 | |
Eaton Vance
Floating-Rate 2022 Target Term Trust
December 31, 2019
Officers and Trustees
Officers
Payson F. Swaffield
President
Maureen A. Gemma
Vice President, Secretary and Chief Legal Officer
James F. Kirchner
Treasurer
Richard F. Froio
Chief Compliance Officer
Trustees
William H. Park
Chairperson
Thomas E. Faust Jr.*
Mark R. Fetting
Cynthia E. Frost
George J. Gorman
Valerie A. Mosley
Helen Frame Peters
Keith Quinton
Marcus L. Smith
Susan J. Sutherland
Scott E. Wennerholm
Eaton Vance Funds
IMPORTANT NOTICES
Privacy. The Eaton Vance organization is committed to ensuring your financial privacy. Each entity listed below has adopted a privacy policy and procedures (“Privacy Program”) Eaton Vance believes is reasonably designed to protect your personal information and to govern when and with whom Eaton Vance may share your personal information.
| • | | At the time of opening an account, Eaton Vance generally requires you to provide us with certain information such as name, address, social security number, tax status, account numbers, and account balances. This information is necessary for us to both open an account for you and to allow us to satisfy legal requirements such as applicable anti-money laundering reviews and know-your-customer requirements. |
| • | | On an ongoing basis, in the normal course of servicing your account, Eaton Vance may share your information with unaffiliated third parties that perform various services for Eaton Vance and/or your account. These third parties include transfer agents, custodians, broker/dealers and our professional advisers, including auditors, accountants, and legal counsel. Eaton Vance may additionally share your personal information with our affiliates. |
| • | | We believe our Privacy Program is reasonably designed to protect the confidentiality of your personal information and to prevent unauthorized access to that information. |
| • | | We reserve the right to change our Privacy Program at any time upon proper notification to you. You may want to review our Privacy Program periodically for changes by accessing the link on our homepage: www.eatonvance.com. |
Our pledge of protecting your personal information applies to the following entities within the Eaton Vance organization: the Eaton Vance Family of Funds, Eaton Vance Management, Eaton Vance Investment Counsel, Eaton Vance Distributors, Inc., Eaton Vance Trust Company, Eaton Vance Management (International) Limited, Eaton Vance Advisers International Limited, Eaton Vance Global Advisors Limited, Eaton Vance Management’s Real Estate Investment Group, Boston Management and Research, Calvert Research and Management, and Calvert Funds. This Privacy Notice supersedes all previously issued privacy disclosures. For more information about our Privacy Program or about how your personal information may be used, please call1-800-262-1122.
Delivery of Shareholder Documents. The Securities and Exchange Commission (SEC) permits funds to deliver only one copy of shareholder documents, including prospectuses, proxy statements and shareholder reports, to fund investors with multiple accounts at the same residential or post office box address. This practice is often called “householding” and it helps eliminate duplicate mailings to shareholders. American Stock Transfer & Trust Company, LLC (“AST”), theclosed-end funds transfer agent, or your financial intermediary, may household the mailing of your documents indefinitely unless you instruct AST, or your financial intermediary, otherwise. If you would prefer that your Eaton Vance documents not be householded, please contact AST or your financial intermediary. Your instructions that householding not apply to delivery of your Eaton Vance documents will typically be effective within 30 days of receipt by AST or your financial intermediary.
Portfolio Holdings. Each Eaton Vance Fund and its underlying Portfolio(s) (if applicable) files a schedule of portfolio holdings on Part F toForm N-PORT with the SEC for the first and third quarters of each fiscal year. The FormN-PORT will be available on the Eaton Vance website at www.eatonvance.com, by calling Eaton Vance at1-800-262-1122 or in the EDGAR database on the SEC’s website at www.sec.gov.
Proxy Voting. From time to time, funds are required to vote proxies related to the securities held by the funds. The Eaton Vance Funds or their underlying Portfolios (if applicable) vote proxies according to a set of policies and procedures approved by the Funds’ and Portfolios’ Boards. You may obtain a description of these policies and procedures and information on how the Funds or Portfolios voted proxies relating to portfolio securities during the most recent12-month period ended June 30, without charge, upon request, by calling1-800-262-1122 and by accessing the SEC’s website at www.sec.gov.
Additional Notice to Shareholders. If applicable, a Fund may also redeem or purchase its outstanding preferred shares in order to maintain compliance with regulatory requirements, borrowing or rating agency requirements or for other purposes as it deems appropriate or necessary.
Closed-End Fund Information. Eaton Vanceclosed-end funds make fund performance data and certain information about portfolio characteristics available on the Eaton Vance website shortly after the end of each month. Other information about the funds is available on the website. The funds’ net asset value per share is readily accessible on the Eaton Vance website. Portfolio holdings for the most recentmonth-end are also posted to the website approximately 30 days following the end of the month. This information is available at www.eatonvance.com on the fund information pages under “Individual Investors —Closed-End Funds”.
Investment Adviser and Administrator
Eaton Vance Management
Two International Place
Boston, MA 02110
Custodian
State Street Bank and Trust Company
State Street Financial Center, One Lincoln Street
Boston, MA 02111
Transfer Agent
American Stock Transfer & Trust Company, LLC
6201 15th Avenue
Brooklyn, NY 11219
Fund Offices
Two International Place
Boston, MA 02110

27977 12.31.19
Item 2. Code of Ethics
Not required in this filing.
Item 3. Audit Committee Financial Expert
Not required in this filing.
Item 4. Principal Accountant Fees and Services
Not required in this filing.
Item 5. Audit Committee of Listed Registrants
Not required in this filing.
Item 6. Schedule of Investments
Please see schedule of investments contained in the Report to Stockholders included under Item 1 of this FormN-CSR.
Item 7. Disclosure of Proxy Voting Policies and Procedures forClosed-End Management Investment Companies
Not required in this filing.
Item 8. Portfolio Managers ofClosed-End Management Investment Companies
Not required in this filing.
Item 9. Purchases of Equity Securities byClosed-End Management Investment Company and Affiliated Purchasers
No such purchases this period.
Item 10. Submission of Matters to a Vote of Security Holders
No material changes.
Item 11. Controls and Procedures
(a) It is the conclusion of the registrant’s principal executive officer and principal financial officer that the effectiveness of the registrant’s current disclosure controls and procedures (such disclosure controls and procedures having been evaluated within 90 days of the date of this filing) provide reasonable assurance that the information required to be disclosed by the registrant has been recorded, processed, summarized and reported within the time period specified in the Commission’s rules and forms and that the information required to be disclosed by the registrant has been accumulated and communicated to the registrant’s principal executive officer and principal financial officer in order to allow timely decisions regarding required disclosure.
(b) There have been no changes in the registrant’s internal controls over financial reporting during the period covered by this report that has materially affected, or is reasonably likely to materially affect, the registrant’s internal control over financial reporting.
Item 12. Disclosure of Securities Lending Activities forClosed-End Management Investment Companies
No activity to report for the registrant’s most recent fiscal year end.
Item 13. Exhibits
| | |
| |
| (a)(1) | | Registrant’s Code of Ethics – Not applicable (please see Item 2). |
| |
| (a)(2)(i) | | Treasurer’s Section 302 certification. |
| |
| (a)(2)(ii) | | President’s Section 302 certification. |
| |
| (b) | | Combined Section 906 certification. |
Signatures
Pursuant to the requirements of the Securities Exchange Act of 1934 and the Investment Company Act of 1940, the registrant has duly caused this report to be signed on its behalf by the undersigned, thereunto duly authorized.
Eaton Vance Floating-Rate 2022 Target Term Trust
| | |
| By: | | /s/ Payson F. Swaffield |
| | Payson F. Swaffield |
| | President |
| |
| Date: | | February 24, 2020 |
Pursuant to the requirements of the Securities Exchange Act of 1934 and the Investment Company Act of 1940, this report has been signed below by the following persons on behalf of the registrant and in the capacities and on the dates indicated.
| | |
| By: | | /s/ James F. Kirchner |
| | James F. Kirchner |
| | Treasurer |
| |
| Date: | | February 24, 2020 |
| | |
| By: | | /s/ Payson F. Swaffield |
| | Payson F. Swaffield |
| | President |
| |
| Date: | | February 24, 2020 |