Investor Presentation – February 2021 Exhibit 99.1
Forward-Looking Statements This communication contains forward-looking statements within the meaning of the U.S. federal securities laws. Forward-looking statements include, without limitation, statements concerning plans, estimates, calculations, forecasts and projections with respect to the anticipated future performance of the Company. These statements are often, but not always, made through the use of words or phrases such as ‘‘may’’, ‘‘might’’, ‘‘should’’, ‘‘could’’, ‘‘predict’’, ‘‘potential’’, ‘‘believe’’, ‘‘expect’’, ‘‘continue’’, ‘‘will’’, ‘‘anticipate’’, ‘‘seek’’, ‘‘estimate’’, ‘‘intend’’, ‘‘plan’’, ‘‘projection’’, ‘‘would’’, ‘‘annualized’’, “target” and ‘‘outlook’’, or the negative version of those words or other comparable words or phrases of a future or forward-looking nature. Forward-looking statements involve estimates and known and unknown risks, and reflect various assumptions and involve elements of subjective judgement and analysis, which may or may not prove to be correct, and which are subject to uncertainties and contingencies outside the control of Byline and its respective affiliates, directors, employees and other representatives, which could cause actual results to differ materially from those presented in this communication. The COVID-19 pandemic is adversely affecting us, our employees, customers, counterparties and third-party service providers, and the ultimate extent of the impacts on our business, financial position, results of operations, liquidity, and prospects is uncertain. Continued deterioration in general business and economic conditions, including further increases in unemployment rates, or turbulence in U.S. or global financial markets could adversely affect our revenues and the values of our assets and liabilities, reduce the availability of funding, lead to a tightening of credit, and further increase stock price volatility. In addition, changes to statutes, regulations, or regulatory policies or practices as a result of, or in response to COVID-19, could affect us in substantial and unpredictable ways. No representations, warranties or guarantees are or will be made by Byline as to the reliability, accuracy or completeness of any forward-looking statements contained in this communication or that such forward-looking statements are or will remain based on reasonable assumptions. You should not place undue reliance on any forward-looking statements contained in this communication. Certain risks and important factors that could affect Byline’s future results are identified in its Annual Report on Form 10-K and other reports filed with the Securities and Exchange Commission, including among other things under the heading “Risk Factors” in its Annual Report on Form 10-K, for the year ended December 31, 2019, and its Quarterly Reports on Form 10-Q for the quarters ended March 31, 2020, and June 30, 2020. Any forward-looking statement speaks only as of the date on which it is made, and Byline undertakes no obligation to update any forward-looking statement, whether to reflect events or circumstances after the date on which the statement is made, to reflect new information or the occurrence of unanticipated events, or otherwise unless required under the federal securities laws. 2
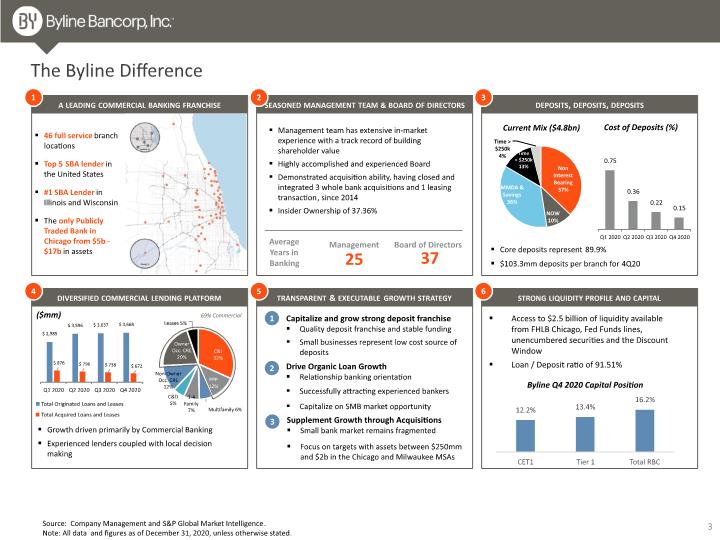
Management team has extensive in-market experience with a track record of building shareholder value Highly accomplished and experienced Board Demonstrated acquisition ability, having closed and integrated 3 whole bank acquisitions and 1 leasing transaction, since 2014 Insider Ownership of 37.36% Supplement Growth through Acquisitions Small bank market remains fragmented Focus on targets with assets between $250mm and $2b in the Chicago and Milwaukee MSAs Total Acquired Loans and Leases Total Originated Loans and Leases The Byline Difference Source: Company Management and S&P Global Market Intelligence. Note: All data and figures as of December 31, 2020, unless otherwise stated. a leading commercial banking franchise deposits, deposits, deposits diversified commercial lending platform transparent & executable growth strategy strong liquidity profile and capital 1 3 4 5 6 46 full service branch locations Top 5 SBA lender in the United States #1 SBA Lender in Illinois and Wisconsin The only Publicly Traded Bank in Chicago from $5b - $17b in assets Core deposits represent 89.9% $103.3mm deposits per branch for 4Q20 Growth driven primarily by Commercial Banking Experienced lenders coupled with local decision making ($mm) Current Mix ($4.8bn) Cost of Deposits (%) seasoned management team & board of directors Average Years in Banking Management Board of Directors 2 3 1 2 Capitalize and grow strong deposit franchise Quality deposit franchise and stable funding Small businesses represent low cost source of deposits Drive Organic Loan Growth Relationship banking orientation Successfully attracting experienced bankers Capitalize on SMB market opportunity Access to $2.5 billion of liquidity available from FHLB Chicago, Fed Funds lines, unencumbered securities and the Discount Window Loan / Deposit ratio of 91.51% 3 Byline Q4 2020 Capital Position 69% Commercial 25 37
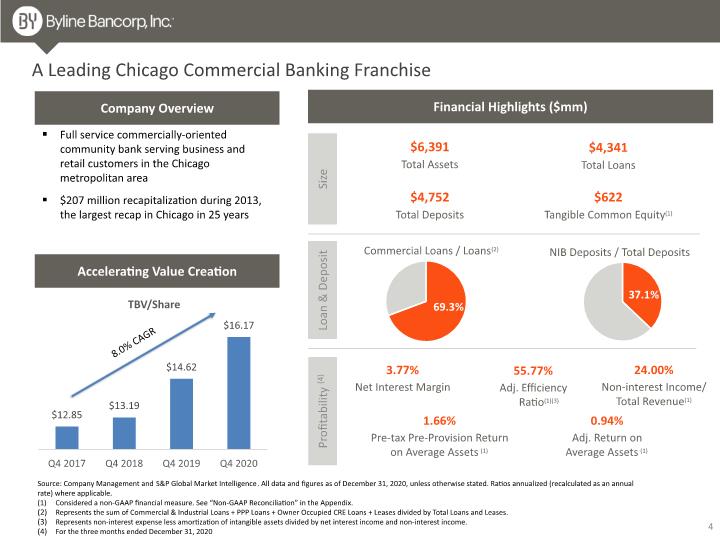
A Leading Chicago Commercial Banking Franchise Financial Highlights ($mm) Size Loan & Deposit Profitability (4) 4 Source: Company Management and S&P Global Market Intelligence. All data and figures as of December 31, 2020, unless otherwise stated. Ratios annualized (recalculated as an annual rate) where applicable. (1) Considered a non-GAAP financial measure. See “Non-GAAP Reconciliation” in the Appendix. Represents the sum of Commercial & Industrial Loans + PPP Loans + Owner Occupied CRE Loans + Leases divided by Total Loans and Leases. Represents non-interest expense less amortization of intangible assets divided by net interest income and non-interest income. For the three months ended December 31, 2020 Full service commercially-oriented community bank serving business and retail customers in the Chicago metropolitan area $207 million recapitalization during 2013, the largest recap in Chicago in 25 years Accelerating Value Creation Company Overview $6,391 Total Assets $4,341 Total Loans $4,752 Total Deposits $622 Tangible Common Equity(1) Commercial Loans / Loans(2) NIB Deposits / Total Deposits 3.77% Net Interest Margin 55.77% Adj. Efficiency Ratio(1)(3) 24.00% Non-interest Income/ Total Revenue(1) 1.66% Pre-tax Pre-Provision Return on Average Assets (1) 0.94% Adj. Return on Average Assets (1) 8.0% CAGR 69.4%
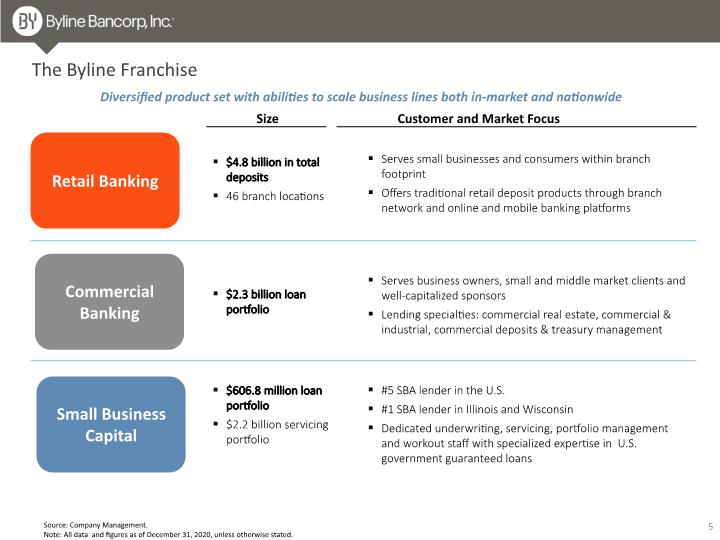
The Byline Franchise 5 Size Customer and Market Focus $4.8 billion in total deposits 46 branch locations Serves small businesses and consumers within branch footprint Offers traditional retail deposit products through branch network and online and mobile banking platforms $2.3 billion loan portfolio Serves business owners, small and middle market clients and well-capitalized sponsors Lending specialties: commercial real estate, commercial & industrial, commercial deposits & treasury management $606.8 million loan portfolio $2.2 billion servicing portfolio #5 SBA lender in the U.S. #1 SBA lender in Illinois and Wisconsin Dedicated underwriting, servicing, portfolio management and workout staff with specialized expertise in U.S. government guaranteed loans Source: Company Management. Note: All data and figures as of December 31, 2020, unless otherwise stated. Diversified product set with abilities to scale business lines both in-market and nationwide Retail Banking Commercial Banking Small Business Capital
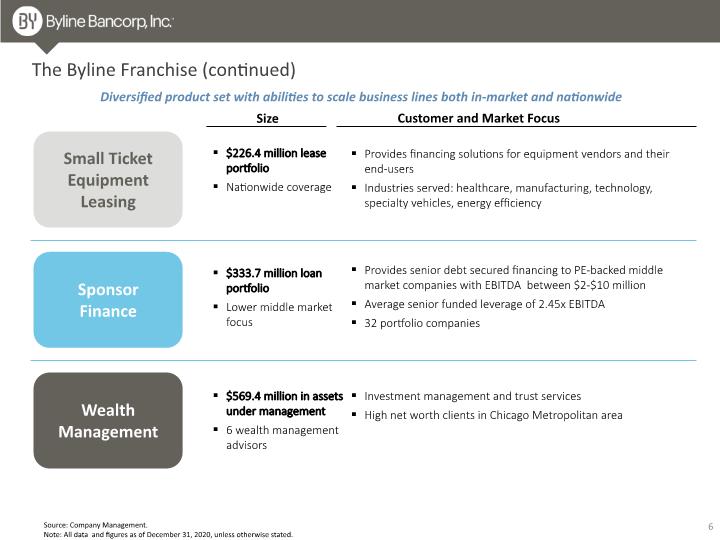
6 Size Customer and Market Focus $226.4 million lease portfolio Nationwide coverage Provides financing solutions for equipment vendors and their end-users Industries served: healthcare, manufacturing, technology, specialty vehicles, energy efficiency $333.7 million loan portfolio Lower middle market focus Provides senior debt secured financing to PE-backed middle market companies with EBITDA between $2-$10 million Average senior funded leverage of 2.45x EBITDA 32 portfolio companies $569.4 million in assets under management 6 wealth management advisors Investment management and trust services High net worth clients in Chicago Metropolitan area Source: Company Management. Note: All data and figures as of December 31, 2020, unless otherwise stated. Diversified product set with abilities to scale business lines both in-market and nationwide Small Ticket Equipment Leasing Sponsor Finance Wealth Management The Byline Franchise (continued)
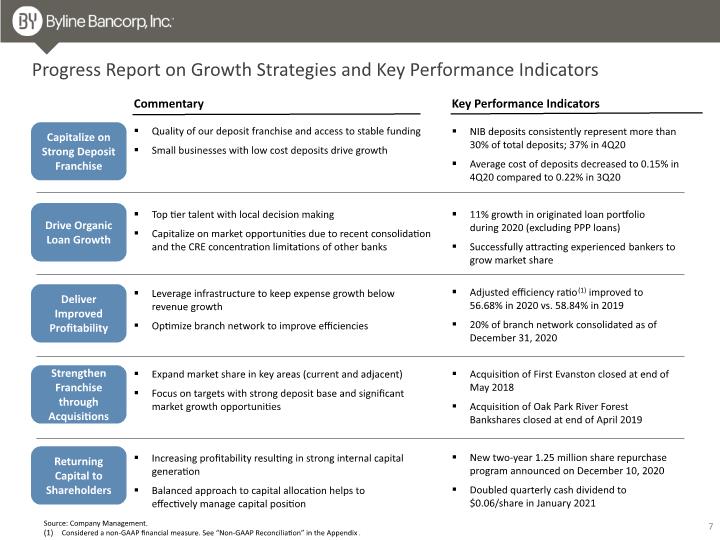
Drive Organic Loan Growth Deliver Improved Profitability Strengthen Franchise through Acquisitions Top tier talent with local decision making Capitalize on market opportunities due to recent consolidation and the CRE concentration limitations of other banks Leverage infrastructure to keep expense growth below revenue growth Optimize branch network to improve efficiencies Expand market share in key areas (current and adjacent) Focus on targets with strong deposit base and significant market growth opportunities Capitalize on Strong Deposit Franchise Quality of our deposit franchise and access to stable funding Small businesses with low cost deposits drive growth 7 Progress Report on Growth Strategies and Key Performance Indicators Commentary Key Performance Indicators NIB deposits consistently represent more than 30% of total deposits; 37% in 4Q20 Average cost of deposits decreased to 0.15% in 4Q20 compared to 0.22% in 3Q20 11% growth in originated loan portfolio during 2020 (excluding PPP loans) Successfully attracting experienced bankers to grow market share Adjusted efficiency ratio(1) improved to 56.68% in 2020 vs. 58.84% in 2019 20% of branch network consolidated as of December 31, 2020 Acquisition of First Evanston closed at end of May 2018 Acquisition of Oak Park River Forest Bankshares closed at end of April 2019 Source: Company Management. Considered a non-GAAP financial measure. See “Non-GAAP Reconciliation” in the Appendix. Returning Capital to Shareholders Increasing profitability resulting in strong internal capital generation Balanced approach to capital allocation helps to effectively manage capital position New two-year 1.25 million share repurchase program announced on December 10, 2020 Doubled quarterly cash dividend to $0.06/share in January 2021
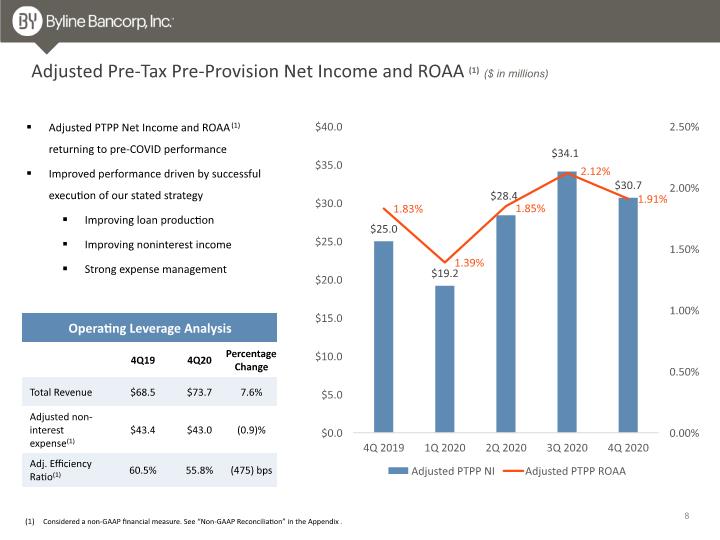
Adjusted Pre-Tax Pre-Provision Net Income and ROAA(1) ($ in millions) 8 Adjusted PTPP Net Income and ROAA(1) returning to pre-COVID performance Improved performance driven by successful execution of our stated strategy Improving loan production Improving noninterest income Strong expense management Considered a non-GAAP financial measure. See “Non-GAAP Reconciliation” in the Appendix.
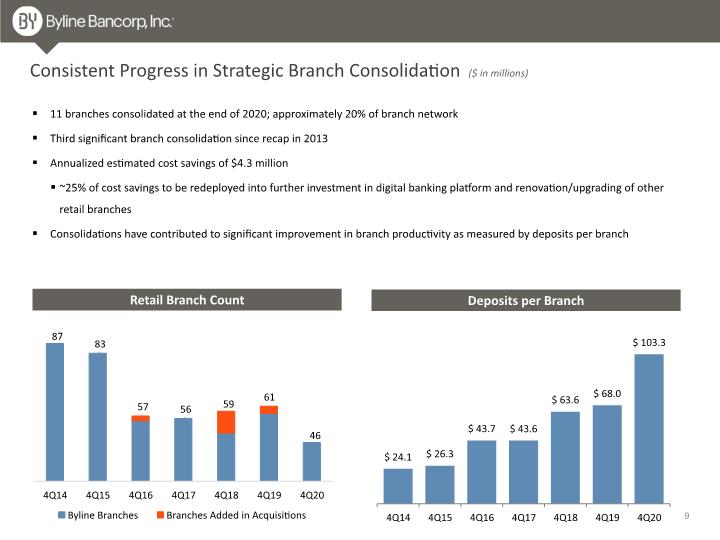
Consistent Progress in Strategic Branch Consolidation ($ in millions) 9 11 branches consolidated at the end of 2020; approximately 20% of branch network Third significant branch consolidation since recap in 2013 Annualized estimated cost savings of $4.3 million ~25% of cost savings to be redeployed into further investment in digital banking platform and renovation/upgrading of other retail branches Consolidations have contributed to significant improvement in branch productivity as measured by deposits per branch Retail Branch Count Deposits per Branch
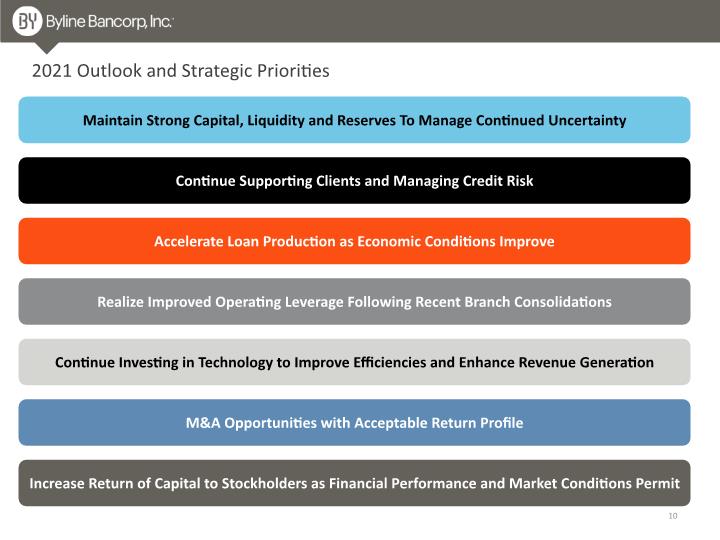
2021 Outlook and Strategic Priorities 10 Maintain Strong Capital, Liquidity and Reserves To Manage Continued Uncertainty Continue Supporting Clients and Managing Credit Risk Accelerate Loan Production as Economic Conditions Improve Realize Improved Operating Leverage Following Recent Branch Consolidations M&A Opportunities with Acceptable Return Profile Increase Return of Capital to Stockholders as Financial Performance and Market Conditions Permit Continue Investing in Technology to Improve Efficiencies and Enhance Revenue Generation
Positioned to Manage Through the COVID-19 Environment
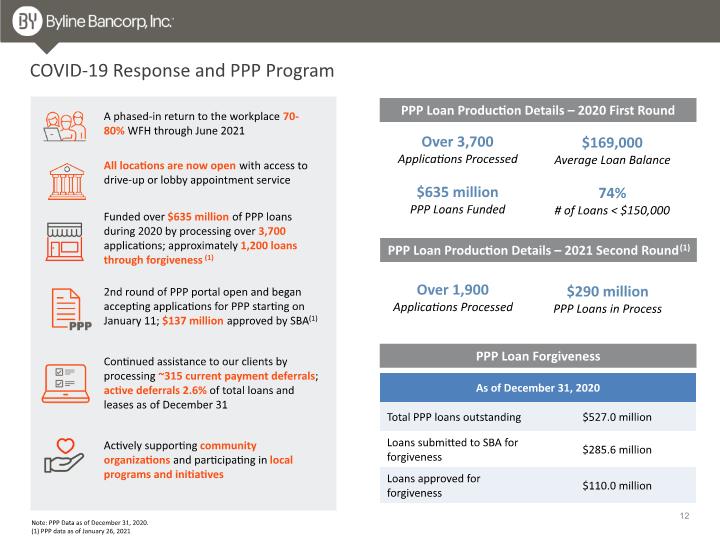
COVID-19 Response and PPP Program 12 Note: PPP Data as of December 31, 2020. (1) PPP data as of January 26, 2021 A phased-in return to the workplace 70- 80% WFH through June 2021 All locations are now open with access to drive-up or lobby appointment service Funded over $635 million of PPP loans during 2020 by processing over 3,700 applications; approximately 1,200 loans through forgiveness (1) 2nd round of PPP portal open and began accepting applications for PPP starting on January 11; $137 million approved by SBA(1) Continued assistance to our clients by processing ~315 current payment deferrals; active deferrals 2.6% of total loans and leases as of December 31 Actively supporting community organizations and participating in local programs and initiatives PPP Loan Forgiveness PPP Loan Production Details – 2020 First Round Over 3,700 Applications Processed $635 million PPP Loans Funded $169,000 Average Loan Balance 74% # of Loans < $150,000 PPP Loan Production Details – 2021 Second Round(1) Over 1,900 Applications Processed $290 million PPP Loans in Process
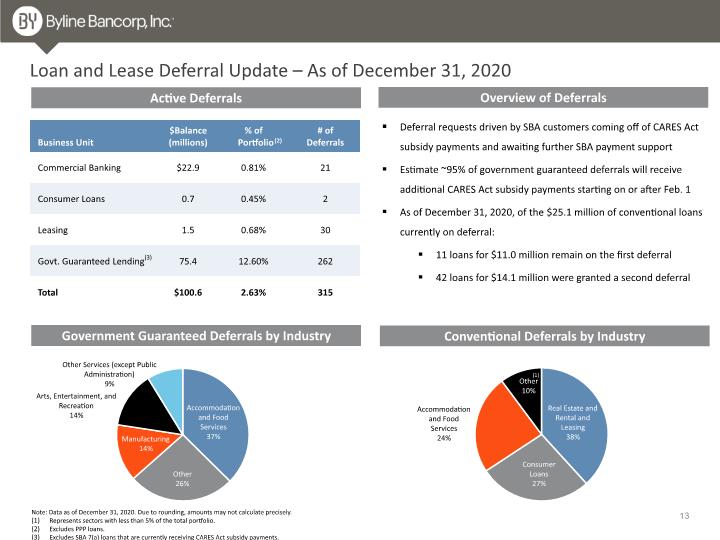
Loan and Lease Deferral Update – As of December 31, 2020 Conventional Deferrals by Industry Note: Data as of December 31, 2020. Due to rounding, amounts may not calculate precisely. Represents sectors with less than 5% of the total portfolio. Excludes PPP loans. Excludes SBA 7(a) loans that are currently receiving CARES Act subsidy payments. 13 (1) Overview of Deferrals Deferral requests driven by SBA customers coming off of CARES Act subsidy payments and awaiting further SBA payment support Estimate ~95% of government guaranteed deferrals will receive additional CARES Act subsidy payments starting on or after Feb. 1 As of December 31, 2020, of the $25.1 million of conventional loans currently on deferral: 11 loans for $11.0 million remain on the first deferral 42 loans for $14.1 million were granted a second deferral Active Deferrals Government Guaranteed Deferrals by Industry (1)
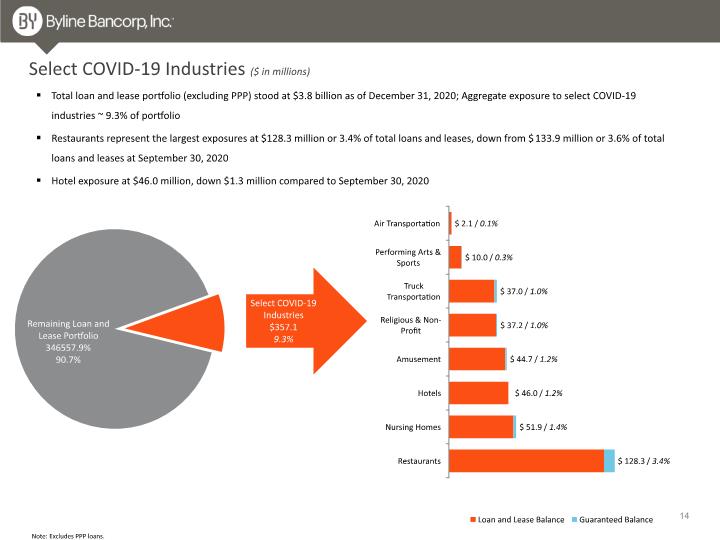
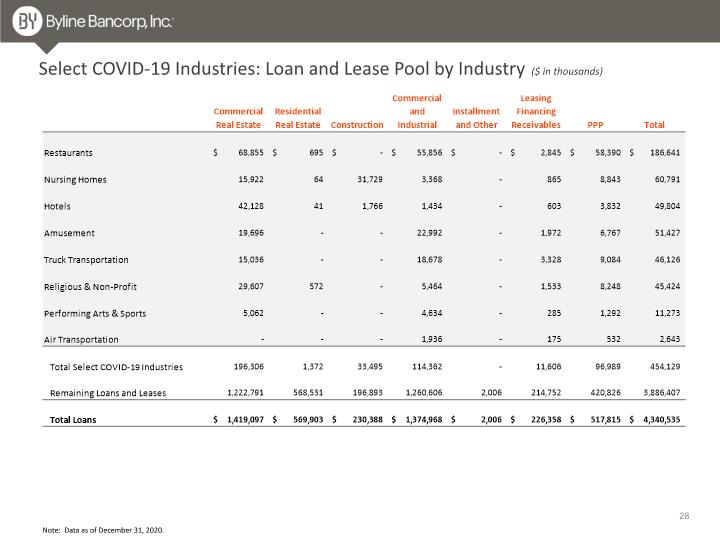
Select COVID-19 Industries ($ in millions) Total loan and lease portfolio (excluding PPP) stood at $3.8 billion as of December 31, 2020; Aggregate exposure to select COVID-19 industries ~ 9.3% of portfolio Restaurants represent the largest exposures at $128.3 million or 3.4% of total loans and leases, down from $133.9 million or 3.6% of total loans and leases at September 30, 2020 Hotel exposure at $46.0 million, down $1.3 million compared to September 30, 2020 14 Note: Excludes PPP loans. Select COVID-19 Industries $357.1 9.3% Remaining Loan and Lease Portfolio $3,722.9 90.2%
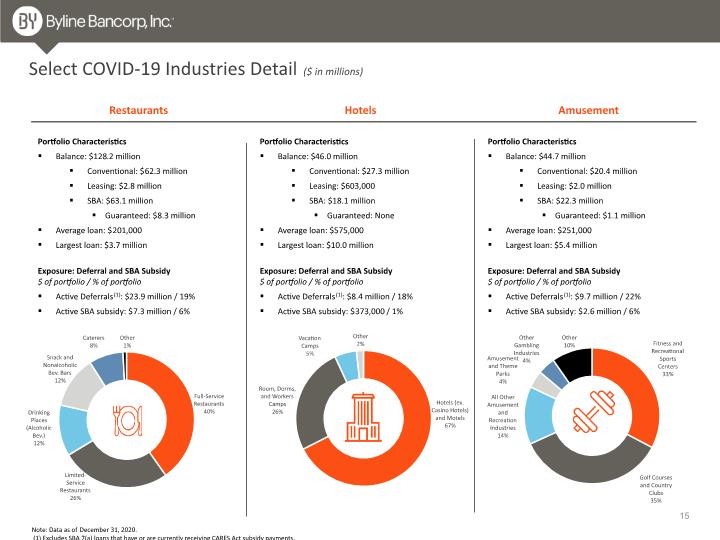
Hotels Portfolio Characteristics Balance: $46.0 million Conventional: $27.3 million Leasing: $603,000 SBA: $18.1 million Guaranteed: None Average loan: $575,000 Largest loan: $10.0 million Exposure: Deferral and SBA Subsidy $ of portfolio / % of portfolio Active Deferrals(1): $8.4 million / 18% Active SBA subsidy: $373,000 / 1% Restaurants Portfolio Characteristics Balance: $128.2 million Conventional: $62.3 million Leasing: $2.8 million SBA: $63.1 million Guaranteed: $8.3 million Average loan: $201,000 Largest loan: $3.7 million Exposure: Deferral and SBA Subsidy $ of portfolio / % of portfolio Active Deferrals(1): $23.9 million / 19% Active SBA subsidy: $7.3 million / 6% Amusement Portfolio Characteristics Balance: $44.7 million Conventional: $20.4 million Leasing: $2.0 million SBA: $22.3 million Guaranteed: $1.1 million Average loan: $251,000 Largest loan: $5.4 million Exposure: Deferral and SBA Subsidy $ of portfolio / % of portfolio Active Deferrals(1): $9.7 million / 22% Active SBA subsidy: $2.6 million / 6% Note: Data as of December 31, 2020. (1) Excludes SBA 7(a) loans that have or are currently receiving CARES Act subsidy payments. 15 Select COVID-19 Industries Detail ($ in millions)
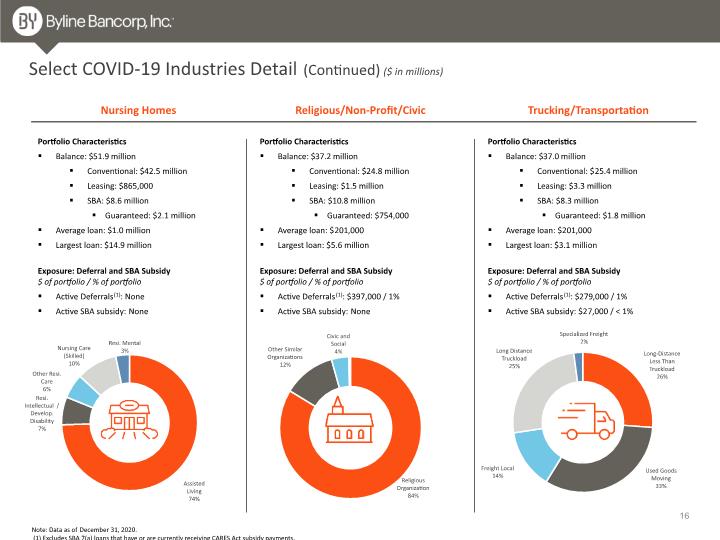
Religious/Non-Profit/Civic Portfolio Characteristics Balance: $37.2 million Conventional: $24.8 million Leasing: $1.5 million SBA: $10.8 million Guaranteed: $754,000 Average loan: $201,000 Largest loan: $5.6 million Exposure: Deferral and SBA Subsidy $ of portfolio / % of portfolio Active Deferrals(1): $397,000 / 1% Active SBA subsidy: None Nursing Homes Portfolio Characteristics Balance: $51.9 million Conventional: $42.5 million Leasing: $865,000 SBA: $8.6 million Guaranteed: $2.1 million Average loan: $1.0 million Largest loan: $14.9 million Exposure: Deferral and SBA Subsidy $ of portfolio / % of portfolio Active Deferrals(1): None Active SBA subsidy: None Trucking/Transportation Portfolio Characteristics Balance: $37.0 million Conventional: $25.4 million Leasing: $3.3 million SBA: $8.3 million Guaranteed: $1.8 million Average loan: $201,000 Largest loan: $3.1 million Exposure: Deferral and SBA Subsidy $ of portfolio / % of portfolio Active Deferrals(1): $279,000 / 1% Active SBA subsidy: $27,000 / < 1% 16 Select COVID-19 Industries Detail (Continued) ($ in millions) Note: Data as of December 31, 2020. (1) Excludes SBA 7(a) loans that have or are currently receiving CARES Act subsidy payments.
Full Year and Fourth Quarter 2020 Financial Review
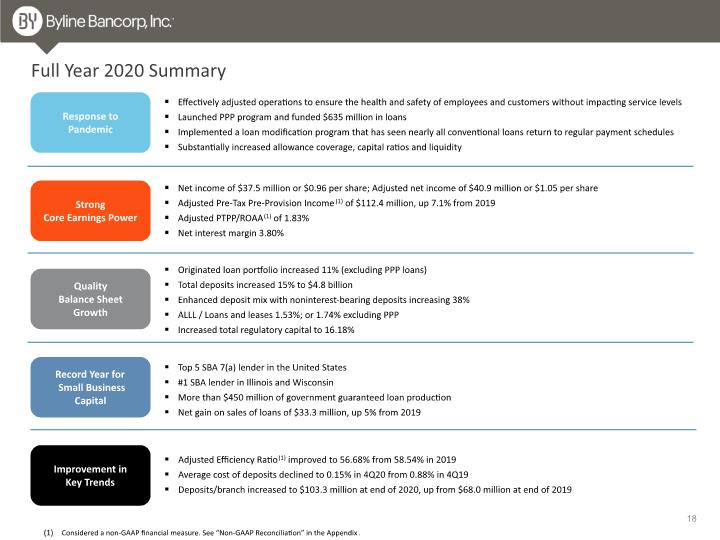
Full Year 2020 Summary Strong Core Earnings Power Response to Pandemic Record Year for Small Business Capital Top 5 SBA 7(a) lender in the United States #1 SBA lender in Illinois and Wisconsin More than $450 million of government guaranteed loan production Net gain on sales of loans of $33.3 million, up 5% from 2019 Improvement in Key Trends Adjusted Efficiency Ratio(1) improved to 56.68% from 58.54% in 2019 Average cost of deposits declined to 0.15% in 4Q20 from 0.88% in 4Q19 Deposits/branch increased to $103.3 million at end of 2020, up from $68.0 million at end of 2019 Effectively adjusted operations to ensure the health and safety of employees and customers without impacting service levels Launched PPP program and funded $635 million in loans Implemented a loan modification program that has seen nearly all conventional loans return to regular payment schedules Substantially increased allowance coverage, capital ratios and liquidity Net income of $37.5 million or $0.96 per share; Adjusted net income of $40.9 million or $1.05 per share Adjusted Pre-Tax Pre-Provision Income(1) of $112.4 million, up 7.1% from 2019 Adjusted PTPP/ROAA(1) of 1.83% Net interest margin 3.80% 18 Quality Balance Sheet Growth Originated loan portfolio increased 11% (excluding PPP loans) Total deposits increased 15% to $4.8 billion Enhanced deposit mix with noninterest-bearing deposits increasing 38% ALLL / Loans and leases 1.53%; or 1.74% excluding PPP Increased total regulatory capital to 16.18% Considered a non-GAAP financial measure. See “Non-GAAP Reconciliation” in the Appendix.
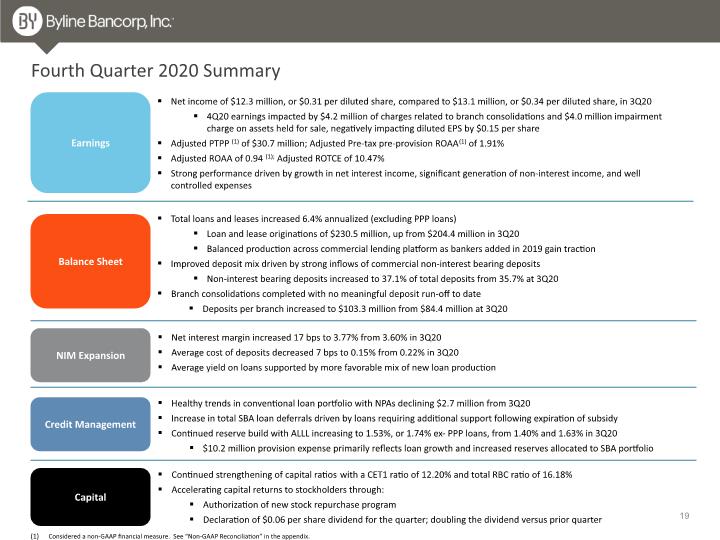
Fourth Quarter 2020 Summary Balance Sheet Earnings Credit Management Healthy trends in conventional loan portfolio with NPAs declining $2.7 million from 3Q20 Increase in total SBA loan deferrals driven by loans requiring additional support following expiration of subsidy Continued reserve build with ALLL increasing to 1.53%, or 1.74% ex- PPP loans, from 1.40% and 1.63% in 3Q20 $10.2 million provision expense primarily reflects loan growth and increased reserves allocated to SBA portfolio Capital Continued strengthening of capital ratios with a CET1 ratio of 12.20% and total RBC ratio of 16.18% Accelerating capital returns to stockholders through: Authorization of new stock repurchase program Declaration of $0.06 per share dividend for the quarter; doubling the dividend versus prior quarter Considered a non-GAAP financial measure. See “Non-GAAP Reconciliation” in the appendix. Net income of $12.3 million, or $0.31 per diluted share, compared to $13.1 million, or $0.34 per diluted share, in 3Q20 4Q20 earnings impacted by $4.2 million of charges related to branch consolidations and $4.0 million impairment charge on assets held for sale, negatively impacting diluted EPS by $0.15 per share Adjusted PTPP (1) of $30.7 million; Adjusted Pre-tax pre-provision ROAA(1) of 1.91% Adjusted ROAA of 0.94 (1); Adjusted ROTCE of 10.47% Strong performance driven by growth in net interest income, significant generation of non-interest income, and well controlled expenses Total loans and leases increased 6.4% annualized (excluding PPP loans) Loan and lease originations of $230.5 million, up from $204.4 million in 3Q20 Balanced production across commercial lending platform as bankers added in 2019 gain traction Improved deposit mix driven by strong inflows of commercial non-interest bearing deposits Non-interest bearing deposits increased to 37.1% of total deposits from 35.7% at 3Q20 Branch consolidations completed with no meaningful deposit run-off to date Deposits per branch increased to $103.3 million from $84.4 million at 3Q20 19 NIM Expansion Net interest margin increased 17 bps to 3.77% from 3.60% in 3Q20 Average cost of deposits decreased 7 bps to 0.15% from 0.22% in 3Q20 Average yield on loans supported by more favorable mix of new loan production
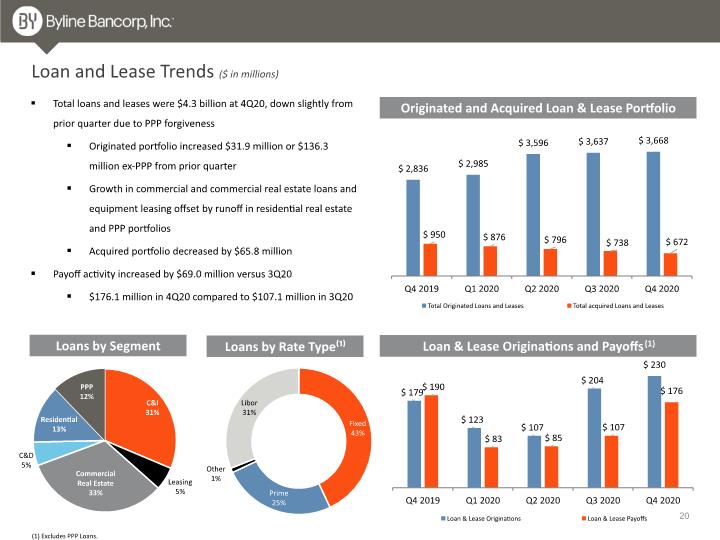
Loan and Lease Trends ($ in millions) Loan & Lease Originations and Payoffs(1) Loans by Segment Originated and Acquired Loan & Lease Portfolio Total loans and leases were $4.3 billion at 4Q20, down slightly from prior quarter due to PPP forgiveness Originated portfolio increased $31.9 million or $136.3 million ex-PPP from prior quarter Growth in commercial and commercial real estate loans and equipment leasing offset by runoff in residential real estate and PPP portfolios Acquired portfolio decreased by $65.8 million Payoff activity increased by $69.0 million versus 3Q20 $176.1 million in 4Q20 compared to $107.1 million in 3Q20 (1) Excludes PPP Loans. Loans by Rate Type⁽¹⁾ 20
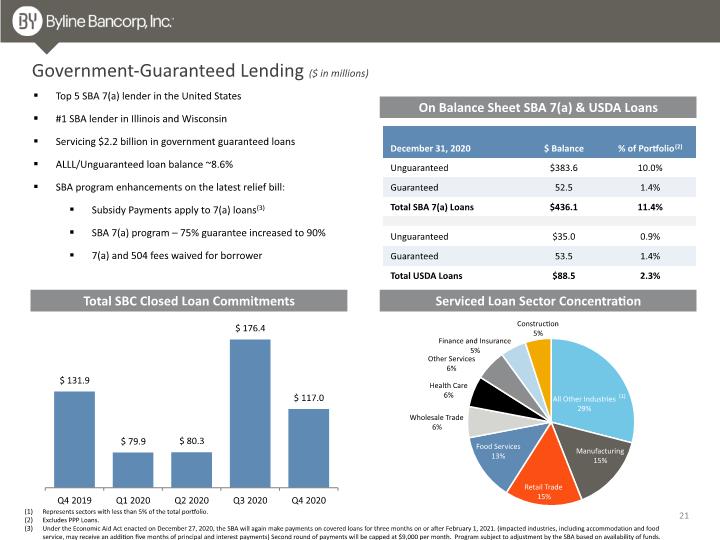
Government-Guaranteed Lending ($ in millions) On Balance Sheet SBA 7(a) & USDA Loans Top 5 SBA 7(a) lender in the United States #1 SBA lender in Illinois and Wisconsin Servicing $2.2 billion in government guaranteed loans ALLL/Unguaranteed loan balance ~8.6% SBA program enhancements on the latest relief bill: Subsidy Payments apply to 7(a) loans(3) SBA 7(a) program – 75% guarantee increased to 90% 7(a) and 504 fees waived for borrower Serviced Loan Sector Concentration Total SBC Closed Loan Commitments 21 (1) Represents sectors with less than 5% of the total portfolio. Excludes PPP Loans. Under the Economic Aid Act enacted on December 27, 2020, the SBA will again make payments on covered loans for three months on or after February 1, 2021. (impacted industries, including accommodation and food service, may receive an addition five months of principal and interest payments) Second round of payments will be capped at $9,000 per month. Program subject to adjustment by the SBA based on availability of funds.
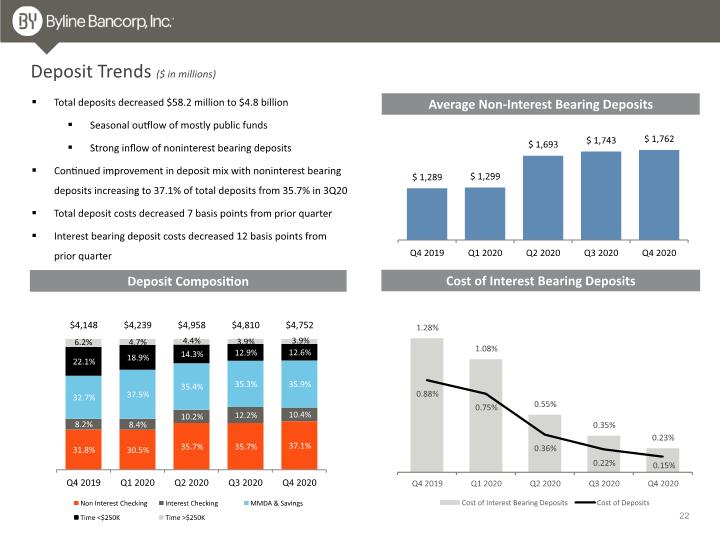
Total deposits decreased $58.2 million to $4.8 billion Seasonal outflow of mostly public funds Strong inflow of noninterest bearing deposits Continued improvement in deposit mix with noninterest bearing deposits increasing to 37.1% of total deposits from 35.7% in 3Q20 Total deposit costs decreased 7 basis points from prior quarter Interest bearing deposit costs decreased 12 basis points from prior quarter Deposit Trends ($ in millions) Average Non-Interest Bearing Deposits Deposit Composition Cost of Interest Bearing Deposits 22
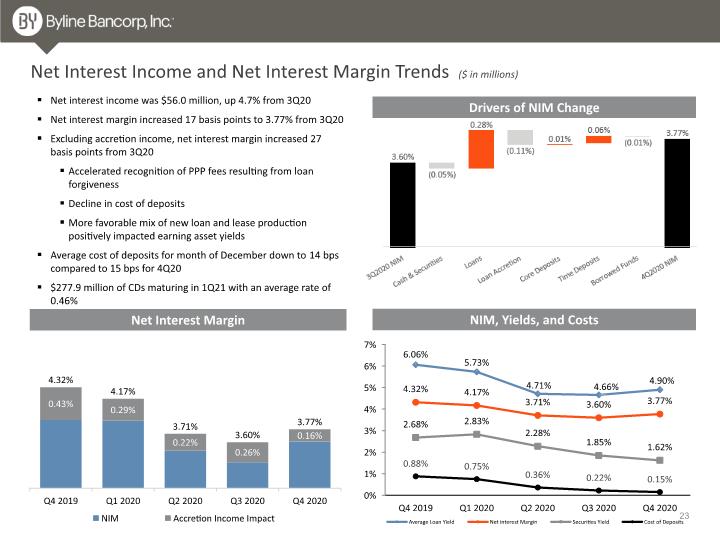
Net Interest Income and Net Interest Margin Trends ($ in millions) Net interest income was $56.0 million, up 4.7% from 3Q20 Net interest margin increased 17 basis points to 3.77% from 3Q20 Excluding accretion income, net interest margin increased 27 basis points from 3Q20 Accelerated recognition of PPP fees resulting from loan forgiveness Decline in cost of deposits More favorable mix of new loan and lease production positively impacted earning asset yields Average cost of deposits for month of December down to 14 bps compared to 15 bps for 4Q20 $277.9 million of CDs maturing in 1Q21 with an average rate of 0.46% Net Interest Margin Drivers of NIM Change NIM, Yields, and Costs 23
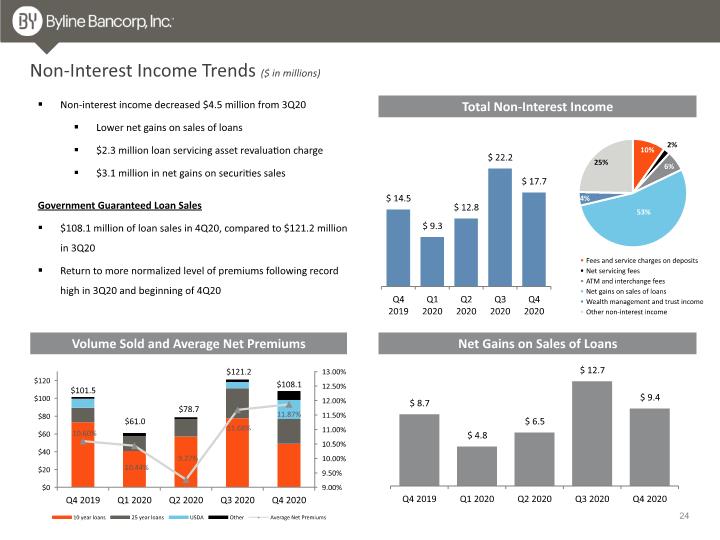
Total Non-Interest Income Non-Interest Income Trends ($ in millions) Non-interest income decreased $4.5 million from 3Q20 Lower net gains on sales of loans $2.3 million loan servicing asset revaluation charge $3.1 million in net gains on securities sales Volume Sold and Average Net Premiums Net Gains on Sales of Loans Government Guaranteed Loan Sales $108.1 million of loan sales in 4Q20, compared to $121.2 million in 3Q20 Return to more normalized level of premiums following record high in 3Q20 and beginning of 4Q20 24
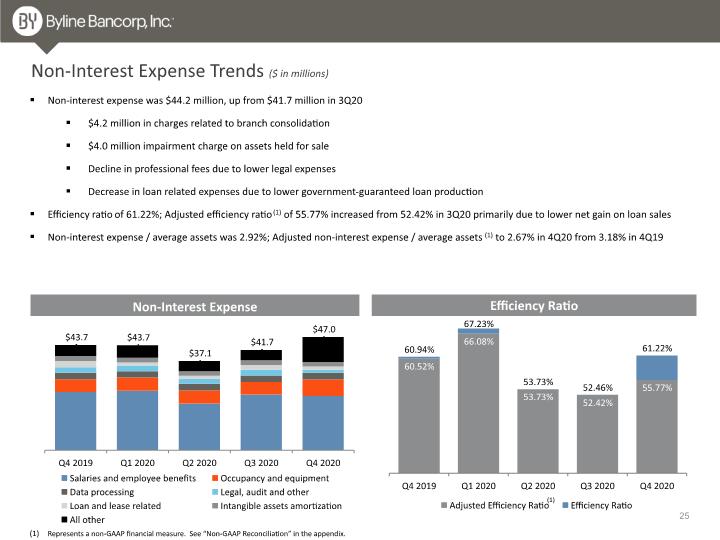
Non-Interest Expense Trends ($ in millions) Non-interest expense was $44.2 million, up from $41.7 million in 3Q20 $4.2 million in charges related to branch consolidation $4.0 million impairment charge on assets held for sale Decline in professional fees due to lower legal expenses Decrease in loan related expenses due to lower government-guaranteed loan production Efficiency ratio of 61.22%; Adjusted efficiency ratio(1) of 55.77% increased from 52.42% in 3Q20 primarily due to lower net gain on loan sales Non-interest expense / average assets was 2.92%; Adjusted non-interest expense / average assets(1) to 2.67% in 4Q20 from 3.18% in 4Q19 Efficiency Ratio Non-Interest Expense Represents a non-GAAP financial measure. See “Non-GAAP Reconciliation” in the appendix. 25
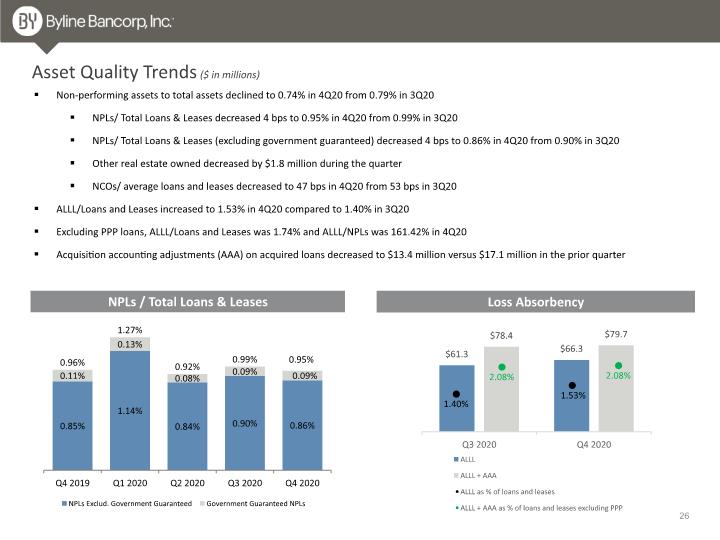
Asset Quality Trends ($ in millions) Non-performing assets to total assets declined to 0.74% in 4Q20 from 0.79% in 3Q20 NPLs/ Total Loans & Leases decreased 4 bps to 0.95% in 4Q20 from 0.99% in 3Q20 NPLs/ Total Loans & Leases (excluding government guaranteed) decreased 4 bps to 0.86% in 4Q20 from 0.90% in 3Q20 Other real estate owned decreased by $1.8 million during the quarter NCOs/ average loans and leases decreased to 47 bps in 4Q20 from 53 bps in 3Q20 ALLL/Loans and Leases increased to 1.53% in 4Q20 compared to 1.40% in 3Q20 Excluding PPP loans, ALLL/Loans and Leases was 1.74% and ALLL/NPLs was 161.42% in 4Q20 Acquisition accounting adjustments (AAA) on acquired loans decreased to $13.4 million versus $17.1 million in the prior quarter NPLs / Total Loans & Leases Loss Absorbency 26
Appendix
Select COVID-19 Industries: Loan and Lease Pool by Industry ($ in thousands) Note: Data as of December 31, 2020. 28
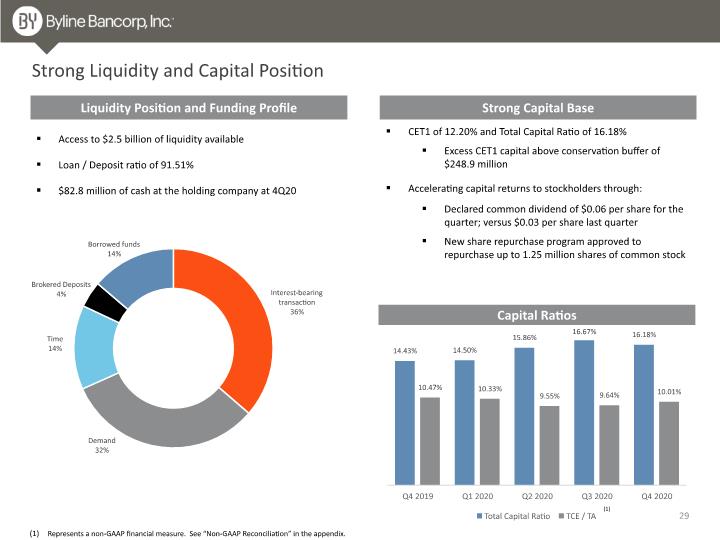
Project Sox Offer Migration Strong Liquidity and Capital Position Liquidity Position and Funding Profile Strong Capital Base Access to $2.5 billion of liquidity available Loan / Deposit ratio of 91.51% $82.8 million of cash at the holding company at 4Q20 CET1 of 12.20% and Total Capital Ratio of 16.18% Excess CET1 capital above conservation buffer of $248.9 million Accelerating capital returns to stockholders through: Declared common dividend of $0.06 per share for the quarter; versus $0.03 per share last quarter New share repurchase program approved to repurchase up to 1.25 million shares of common stock Capital Ratios 29 Represents a non-GAAP financial measure. See “Non-GAAP Reconciliation” in the appendix.
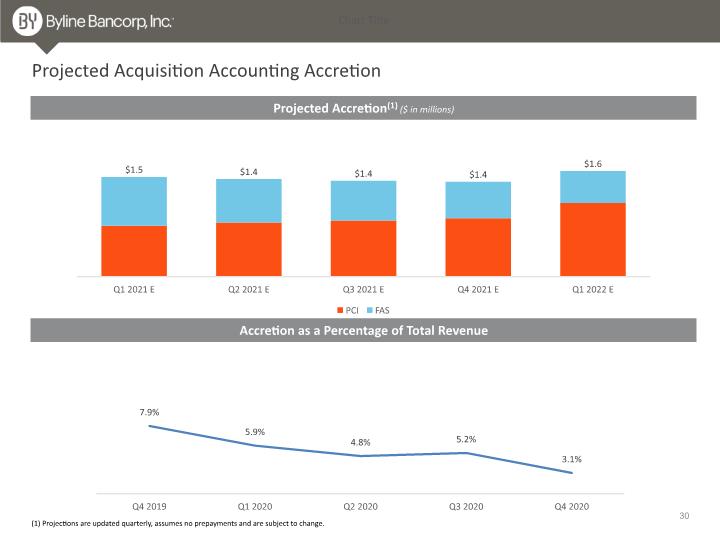
Projected Acquisition Accounting Accretion Projected Accretion(1) ($ in millions) (1) Projections are updated quarterly, assumes no prepayments and are subject to change. Accretion as a Percentage of Total Revenue 30
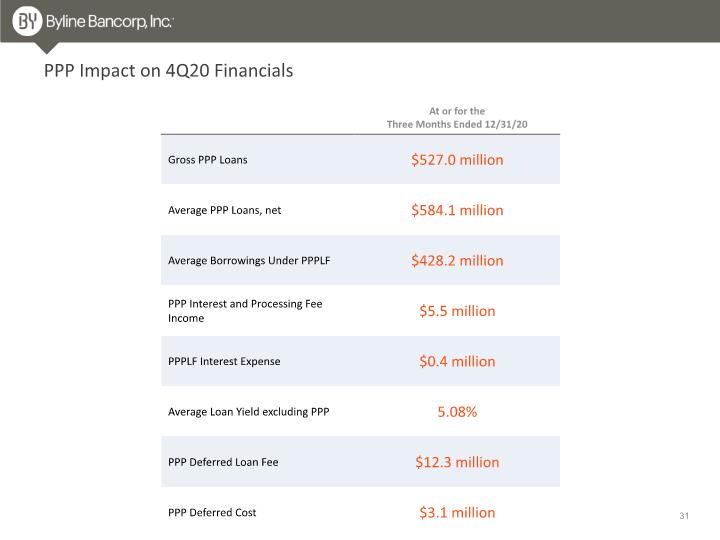
PPP Impact on 4Q20 Financials 31
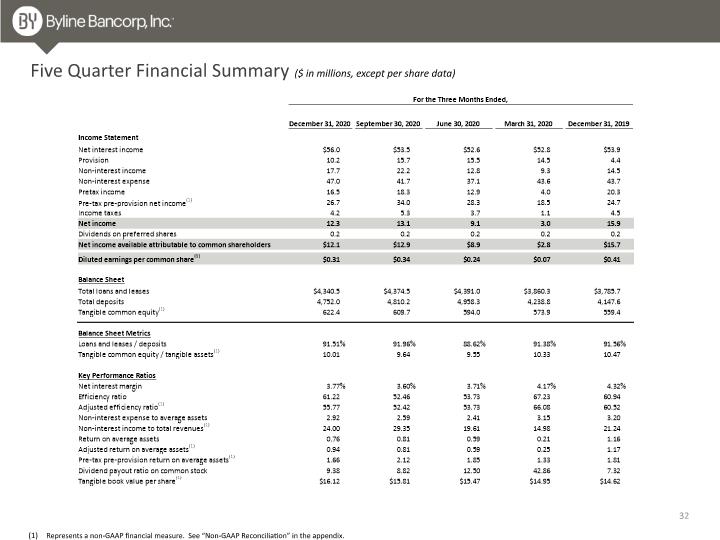
Five Quarter Financial Summary ($ in millions, except per share data) Represents a non-GAAP financial measure. See “Non-GAAP Reconciliation” in the appendix. 32
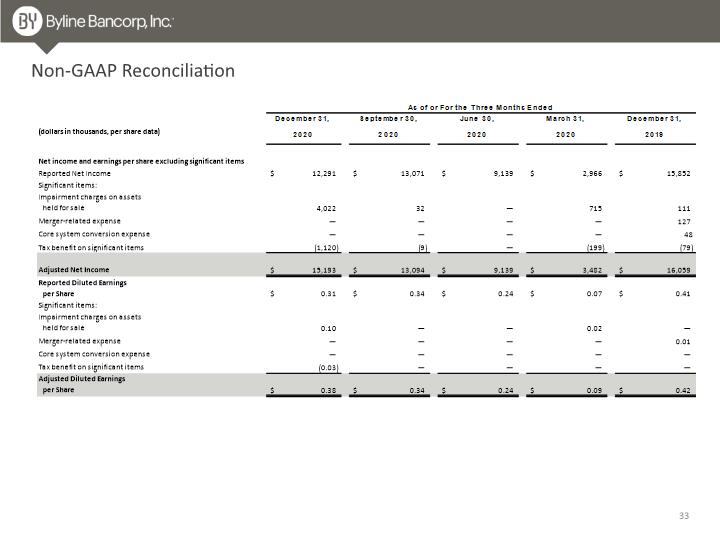
Non-GAAP Reconciliation 33
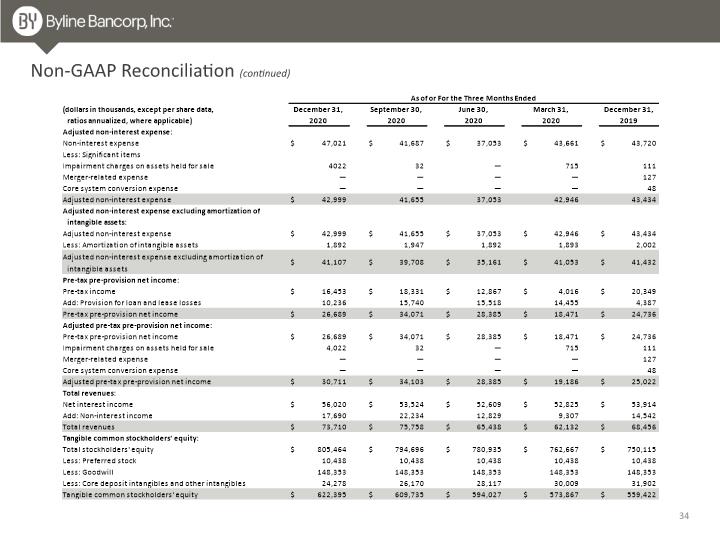
Non-GAAP Reconciliation (continued) 34
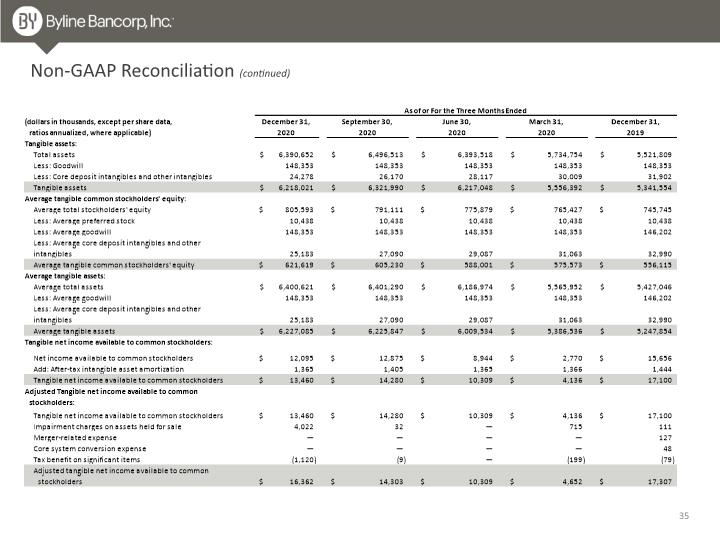
Non-GAAP Reconciliation (continued) 35
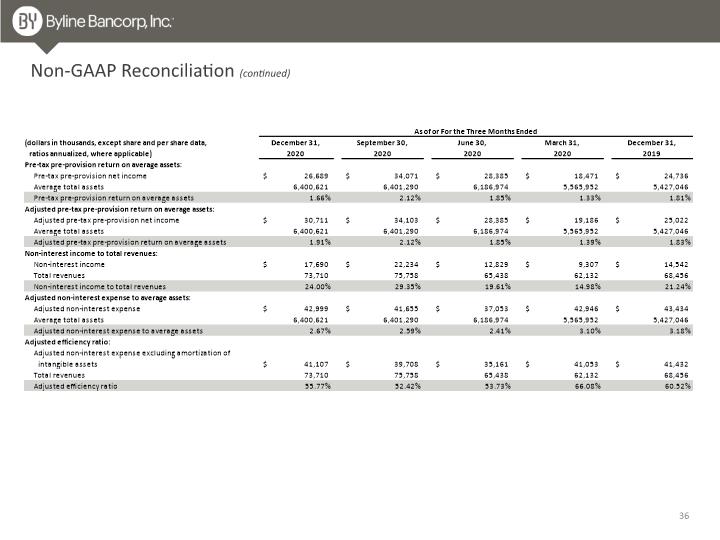
Non-GAAP Reconciliation (continued) 36
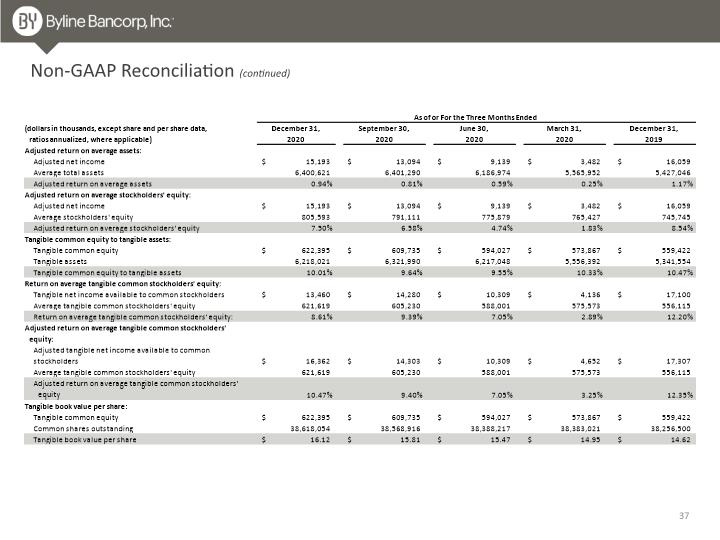
Non-GAAP Reconciliation (continued) 37
