UNITED STATES
SECURITIES AND EXCHANGE COMMISSION
Washington, D.C. 20549
FORM N-CSR
CERTIFIED SHAREHOLDER REPORT OF REGISTERED
MANAGEMENT INVESTMENT COMPANIES
811-23247
(Investment Company Act File Number)
XAI Octagon Floating Rate & Alternative Income Term Trust
(Exact Name of Registrant as Specified in Charter)
321 North Clark Street, Suite 2430
Chicago, IL 60654
(Address of Principal Executive Offices)
John P. McGarrity, Esq.
XA Investments LLC
321 North Clark Street, Suite 2430
Chicago, IL 60654
(Name and Address of Agent for Service)
(312) 374-6930
(Registrant’s Telephone Number)
Date of Fiscal Year End: September 30
Date of Reporting Period: March 31, 2018
Item 1. Reports to Stockholders.
| Shareholder Letter | 1 |
| Questions & Answers | 2 |
| Trust Performance | 7 |
| Schedule of Investments | 9 |
| Statement of Assets & Liabilities | 17 |
| Statement of Operations | 18 |
| Statement of Changes In Net Assets | 19 |
| Statement of Cash Flows | 20 |
| Financial Highlights | 21 |
| Notes to Financial Statements | 22 |
| Additional Information | 30 |
XAI Octagon Floating Rate &
Alternative Income Term Trust | Shareholder Letter |
March 31, 2018 (Unaudited)
Dear Shareholder:
We thank you for your investment in XAI Octagon Floating Rate & Alternative Income Term Trust (the “Trust”). This semi-annual report covers the six-month period ended March 31, 2018.
XA Investments LLC (“XAI”) serves as the investment adviser to the Trust. Octagon Credit Investors, LLC (“Octagon”) serves as the Trust’s investment sub-adviser and is responsible for the management of the Trust’s portfolio of investments. The investment objective of the Trust is to seek attractive total return with an emphasis on income generation across multiple stages of the credit cycle. The Trust seeks to achieve its investment objective by investing in a dynamically managed portfolio of opportunities primarily within the private credit markets. Under normal market conditions, the Trust will invest at least 80% of its Managed Assets in floating-rate credit instruments and other structured credit investments. There can be no assurance that the Trust will achieve its investment objective.
The last six months were characterized by strong growth in corporate earnings, rising LIBOR, and compressing loan spreads. We expect economic growth in the US to be bolstered by ongoing deregulation, tax reform, and continued improvement in unemployment figures and wage growth. Credit metrics for below investment grade issuers remain healthy, with borrowers demonstrating generally positive revenue growth and interest coverage in recent quarters. The broader financial markets experienced heightened volatility in early 2018, as interest rates rose reflecting investors’ expectations of the unwinding of central bank balance sheets, and increased inflation. While the US Federal Reserve seems confident the US economy can withstand higher interest rates, we expect inflation perceptions and rising interest rates will remain at the forefront of investor concerns. Resurfacing rate concerns strengthened investor demand for floating rate products, and the leveraged loan market has remained relatively insulated from broader market turbulence. Ongoing loan spread compression due to improving credit fundamentals and market technicals has been more than offset by rising LIBOR for leveraged loans, with all-in loan coupons increasing to a nine-year high of 5.33% (on average) as of April 30, 20181. Year-to-date through April 30, 2018, the average LIBOR contract rate for outstanding loans within the S&P/LSTA Leveraged Loan Index increased by 65 bps, compared to -10 bps of spread compression2. Meanwhile, CLO equity valuations remained relatively stable during the last six months, and CLO debt continued to generate positive returns.
For the six months ended March 31, 2018, the S&P 500 Index, Bank of America Merrill Lynch US High Yield Master II Index and S&P/LSTA Leveraged Loan 100 Index generated returns of 5.84%, -0.51%, and 2.37%, respectively3.
For the six months ended March 31, 2018, the Trust generated a net increase in net assets resulting from operations of $2.7 million, or $0.33 per weighted average common share (inclusive of unrealized gains). This represents a non-annualized return on our common equity of approximately 3.43% since September 30, 2017.
From September 30, 2017 through March 31, 2018, the Trust’s net asset value (“NAV”) decreased by 0.20% from $9.78 per common share to $9.76 per common share. As described below, during the last six months, the Trust paid aggregate distributions totaling $0.276 per share of common stock with respect to distributions declared (the Trust also declared a distribution of $0.069 per share of common stock on March 1, 2018 that was paid on April 2, 2018).
The closing price per share of our common shares was $9.45 on March 29, 2018, representing a 3.18% discount to NAV per share as of such date. From the Trust’s IPO through March 31, 2018, the Trust’s common shares have traded on average at a 2.26% premium to NAV.
We appreciate your investment and look forward to serving your investment needs in the future. For the most up-to-date information on your investment, please visit the Trust’s website at www.xainvestments.com/funds.
Sincerely,
Kimberly Flynn
Managing Director
XA Investments LLC
May 30, 2018
| 1 | Sources: S&P/LSTA Leveraged Loan Index and S&P Capital IQ/SNL Financial Leveraged Commentary & Data (April 30, 2018). All-in Rate is calculated as the sum of the nominal spread plus the average Libor contract rate for all outstanding loans in the S&P/LSTA Leveraged Loan Index. |
| 2 | Sources: S&P/LSTA Leveraged Loan Index and S&P Capital IQ/SNL Financial Leveraged Commentary & Data (April 30, 2018). |
| 3 | Sources: S&P/LSTA Leveraged Loan Index and S&P Capital IQ/SNL Financial Leveraged Commentary & Data, Bloomberg. |
| Semi-Annual Report | March 31, 2018 | 1 |
XAI Octagon Floating Rate & Alternative Income Term Trust | Questions & Answers |
March 31, 2018 (Unaudited)
May 30, 2018
XAI Octagon Floating Rate & Alternative Income Term Trust (the “Trust”) is managed by Octagon and a team of its seasoned professionals who are all members of Octagon’s Investment Committee. This team includes Andrew D. Gordon, Octagon’s co-founder, Chief Executive Officer and Co-Chief Investment Officer; Michael B. Nechamkin, Co-Chief Investment Officer and Senior Portfolio Manager; Lauren M. Basmadjian, Senior Portfolio Manager; and Gretchen M. Lam, CFA, Senior Portfolio Manager. Lauren Law, Portfolio Manager, and Matthew Lee, Head of Research, are also members of Octagon’s Investment Committee. In the following interview, Lauren Basmadjian, the Trust’s portfolio manager, discusses the market environment and the Trust’s performance for the 6-month period ended March 31, 2018.
What is the Trust’s investment objective and how is it pursued?
The Trust’s investment objective is to seek attractive total return with an emphasis on income generation across multiple stages of the credit cycle. The Trust seeks to achieve its investment objective by investing in a dynamically managed portfolio of opportunities primarily within the private credit markets. Under normal market conditions, the Trust will invest at least 80% of its Managed Assets in floating rate credit instruments and other structured credit investments.
The Trust’s investments include (i) structured credit investments, including collateralized loan obligation (“CLO”) debt and subordinated (i.e., residual or equity) securities; (ii) traditional corporate credit investments, including leveraged loans and high yield bonds; (iii) opportunistic credit investments, including stressed and distressed credit situations and long/short credit investments; and (iv) other credit-related instruments.
Leveraged loans are debt obligations (also commonly referred to as “senior loans” or “floating rate loans”) issued by a bank to a corporation that generally holds legal claim to the borrower’s assets above all other debt obligations. Leveraged loans have floating rates that typically fluctuate according to LIBOR. LIBOR stands for London Interbank Offered Rate and is the benchmark rate that most of the world’s leading banks charge each other for short-term loans.
CLOs are a type of structured credit vehicle which typically invest in a diverse portfolio of broadly syndicated leveraged loans. CLOs finance this pool of loans with a capital structure that consists of debt and equity. CLO debt includes senior and mezzanine debt (collectively, “liabilities”) of a CLO structure with tranches rated from AAA down to B. Interest earned from the underlying loan collateral pool of a CLO is used to pay the coupon interest on the CLO liabilities. CLO debt investors earn returns based on spreads above 3-month LIBOR. CLO equity represents a residual stake in the CLO structure and is the first loss position in the event of defaults and credit losses. CLO equity investors receive the excess spread between the CLO assets and liabilities and expenses. CLO equity (also referred to as the “residual” or subordinated notes) are junior in priority of payment and are subject to certain payment restrictions generally set forth in an indenture governing the notes.
The Trust pursues its investment objective by investing primarily in below investment grade credit instruments but may invest without limitation in investment grade credit instruments. Below investment grade credit instruments are regarded as having predominantly speculative characteristics with respect to capacity to pay interest and to repay principal. The Trust may invest without limitation in credit instruments that are illiquid.
The Trust uses leverage to seek to enhance total return and income. The Trust uses leverage through borrowing from financial institutions. Although leverage may create an opportunity for increased return and income for shareholders, it also results in additional risks and can magnify the effect of any losses. There is no assurance that the strategy will be successful. If income and gains on securities purchased with leverage proceeds are greater than the cost of the leverage, common shareholders’ return will be greater than if leverage had not been used. Conversely, if the income or gains from the securities purchased with the proceeds of leverage are less than the cost of leverage, common shareholders’ return will be less than if leverage had not been used.
What were the significant events affecting the economy and market environment over the past 6 months?
From a fiscal perspective, the trend towards deregulation and the passage of the Tax Cuts and Jobs Act of 2017 (signed into law in December) represented the most significant economic/market events over the past six months. The new tax policy seems to reinforce expectations that the current long-mature credit cycle still has room to run. On a more local level, the below investment grade corporate credit markets have seen increased M&A activity thanks to increased policy certainty following the passage of tax reform legislation, and the associated implications are projected to benefit the majority of the underlying corporate credits comprising Octagon’s overall investment universe.
The past six months have underscored the benefits of the loan asset class, with loans remaining relatively insulated from broader market volatility driven by rising interest rates, particularly during the first quarter of 2018. While January represented a strong start for global markets as investors embraced the passage of US tax reform and continuing deregulation, investor sentiment downshifted with the January employment release at month-end as rising wages sparked inflation fears and equity market turbulence. Thus far, the volatility in equities has not spilled into the leveraged loan market, though we note that any normalized market volatility could create attractive buying opportunities for the Trust.
XAI Octagon Floating Rate & Alternative Income Term Trust | Questions & Answers |
March 31, 2018 (Unaudited)
The US Federal Reserve seems confident that US economic momentum can withstand higher interest rates, and in March revised expectations for the pace of future interest rate increases. The markets are pricing in more rate hikes, leading to a rise in US government bond yields (10-year US Treasury yields recently hit 3%+, a level not seen since 2014, meanwhile 3-month LIBOR rose to 2.31% by the end of the first quarter of 2018). We expect inflation perceptions and rising interest rates will remain at the forefront of investor concerns. Financing the new tax act will increase budget deficits; as quantitative easing ends, incremental government debt will need to be issued and financed, which could pressure interest rates further. This should ultimately result in stronger bids for floating rate debt. Given these myriad forces, active portfolio management is ever more required to successfully navigate the current market environment.
From a monetary standpoint, rising LIBOR has had the greatest impact on the leveraged loan market within the past six months. Rising LIBOR, driven by shifting corporate finance dynamics on the back of tax reform, heavy short-end Treasury supply, and rising Fed Funds rates4, has positively impacted floating rate loans. 3-month LIBOR has increased 66 bps year-to-date as of April 30, 2018; year-to-date through April 30, 2018, the average LIBOR contract rate for outstanding loans within the S&P/LSTA Leveraged Loan Index increased by 65 bps, compared to 10 bps of loan spread compression1. We believe that loans offer investors valuable protection from potential rate volatility and stand to benefit from further LIBOR increases.
We have also witnessed secular changes in many industries over the past several months, driven by increasingly available technological innovation. In certain instances, the pace and implementation of technological change(s) has impacted the risk profile of borrowers in our markets. Technological advancements may augur the decline of existing business models, or new and improved technology can represent a substantial advantage, possibly best illustrated in the retail industry. Although we remain in the “expansion” phase of the credit cycle, we have also seen “rolling recessions” in certain sectors in recent years, including energy and metals and mining. Retail has represented the latest sector recession, and we anticipate concerns over traditional brick-and-mortar retail may spill over into commercial real estate in the medium term (owing to store closing, rent negotiations, etc.). While mini-default cycles in the energy and retail sectors have provided the Trust with select attractive opportunities within its Opportunistic Loan portfolio segment, the strength of Octagon’s platform has allowed it to continue to source attractive idiosyncratic opportunities with strong return potential in an environment where broad credit fundamentals remain strong and most loans continue to trade near or above par.
Describe the current market conditions for the leveraged loan market and Octagon’s outlook.
Credit metrics for below investment grade issuers remain healthy, and economic growth should continue in 2018 as unemployment and wage growth continue to improve. Borrowers in the leveraged loan market have shown generally positive revenue growth, EBITDA growth, and interest coverage in recent quarters, and we expect these trends to continue throughout the year. Loan defaults remain below historical averages; as of March 31, 2018, the lagging-12-month loan default rate was 2.42% (compared to the historical average of 2.95%5), however it bears noting that the recent increase in the default rate was primarily driven by a few large pre-crisis LBOs that we do not consider reflective of the current environment. We anticipate a continued low default environment in 2018, with defaults concentrated in specific sectors such as retail.
We expect demand for leveraged loans to remain strong due in large part to robust new CLO volume. The pace of retail loan mutual fund inflows has accelerated over the past few months, including $2.9 billion of inflows in the month of March, the highest reading since March 20176. We expect this trend to continue throughout 2018 if rate expectations do not change. Loan supply has increased in recent weeks, which has partially offset the strong investor demand for loans; nevertheless, we expect to see continued spread tightening and repricing activity in the near term, although not as aggressively as in prior quarters. As previously discussed, leveraged loan spread compression over the past six months has largely been offset by rising LIBOR.
We do not anticipate a significant downturn in the business cycle in the medium term, and we expect defaults to remain low and concentrated in certain industries. Weaker deal terms and protections, including the loosening of loan agreements, are among the risks that Octagon continues to monitor. We maintain the view that looser terms will likely not increase default rates in the near term, but could potentially lead to lower recovery rates in the future. More recently, trade policy has become a greater concern for the borrowers in our market, and we continue to evaluate the potential impact if significant changes were to occur. Other potential volatility drivers remain largely external, such as the impact of Fed rate changes, QE unwind, geopolitical risks and their impact on commodity prices, and inflation perceptions.
Describe the current market conditions for the CLO market and Octagon’s outlook.
We have continued to see outsized new issue CLO supply over the past six months, including $33 billion of new CLO issuance over the first quarter of 2018, as well as $21 billion of refinancing or reset deals7. CLO refinancings and resets have generally reduced existing CLO liability costs, offsetting pressure from lower loan spreads. CLO refinancings and resets have allowed some of the Trust’s CLO investments to lock in lower financing costs, thereby offsetting pressure from lower loan spreads.
Since the April 5th certification of the court decision reversing Risk Retention requirements for open market CLOs, which required CLO sponsors to retain risk exposure in CLOs they sponsor, we have seen a steady supply of both newly issued CLOs and refinancing/reset volumes. Additionally, it is reasonable to expect some CLO managers to sell or reduce their required Risk Retention positions as a result of the recent ruling, thus freeing up capital for other activities. We do not believe the elimination of Risk Retention requirements for broadly syndicated loan CLO managers will have a material long term impact on the CLO market.
| Semi-Annual Report | March 31, 2018 | 3 |
XAI Octagon Floating Rate & Alternative Income Term Trust | Questions & Answers |
March 31, 2018 (Unaudited)
After modest widening in late-March and April due to the increased volume of refinancing/reset transactions (particularly within the mezzanine debt tranches that the Trust invests in) that were required to close by the April quarterly payment date, CLO spreads have stabilized (or even tightened) over the past few weeks. While CLO equity distributions are facing near-term pressure as a result of loan spread compression and, the basis risk between 1-month and 3-month LIBOR (CLOs finance at 3-month LIBOR, while underlying borrowers have the option to pay 1-month versus 3-month LIBOR), we hold a constructive view of CLO equity as liability costs remain near post-crisis tights. Locking in tighter liability costs should significantly benefit CLO equity investors over the long term.
While fundamentals remain supportive of CLO debt spread tightening in the medium-term, we recognize that heightened supply or other technical factors could drive periods of market weakness. We believe managers of structured credit portfolios that opportunistically manage their portfolios will outperform in the current environment.
How did the Trust perform for the 6 months ended March 31, 2018?
All Trust returns cited – whether based on net asset value (“NAV”) or market price – assume the reinvestment of all distributions. For the 6-month period ended March 31, 2018, the Trust provided a total return on market price of 3.22% and a total return based on NAV of 3.43%. NAV return includes the deduction of management fees, operating expenses, and all other Trust expenses.
As of March 31, 2018, the Trust’s market price of $9.45 represented a discount of 3.18% to its NAV of $9.76. The market value of the Trust’s shares fluctuates from time to time and may be higher or lower than the Trust’s NAV. Past performance is not a guarantee of future results.
What were the distributions over the period?
From December 1, 2017 through March 2018, the Trust paid a monthly distribution of $0.069 per share (although two such distributions were made in December and none in January). The Trust declared its first distribution on November 1, 2017 which was payable on December 1, 2017. The March distribution represents an annualized distribution rate of 8.76% based on the Trust’s closing market price of $9.45 on March 29, 2018. The Trust’s distribution rate is not constant, and the amount of distributions, when declared by the Trust’s Board of Trustees, is subject to change based on the performance of the Trust. Please see Note 4 on page 25 for more information on distributions for the period.
What influenced the Trust’s performance for the period ended March 31, 2018?
During the period, the Trust’s portfolio generated positive performance in each of its asset class segments. The Trust’s investments in senior loans (first lien and second lien loans), which comprised a greater portion of the Trust’s total portfolio during the initial ramp period between October 2017 and January 2018, represented the largest asset class contributor to the Trust’s total gross return for the period ended March 31, 2018. The Trust’s senior loan positions contributed 2.42% of the Trust’s total gross return of 5.57% for the period (inclusive of leverage), followed by the Trust’s CLO equity positions, which contributed 1.63% to the Trust’s total gross return for the period8.
Relevant indices for the markets in which the Trust invests include the S&P/LSTA 100 Leveraged Loan Index, which returned 2.37% for the 6-month period, the Bank of America Merrill Lynch US High Yield Master II Index, which returned -0.51% for the period, and the JP Morgan BB/B CLO Debt Index, which returned 5.32%9 for the period. There is no representative benchmark index for CLO equity in the marketplace.
How is the Trust positioned for the remainder of 2018?
Looking ahead, we believe that the Trust is well-positioned across its primary investment segments to meet its investment objectives. As of March 31, 2018, the Trust is invested predominantly in floating rate first lien loans (36.8% of the total portfolio as of March 31, 2018), second lien loans (8.4%), CLO equity (33.8%) and CLO debt securities (15.1%)8. In the current market environment, we are focused on loans offering attractive spreads (300 bps+) and call protection. We believe the Trust’s loan positions are well diversified across industry sectors, with business equipment and services, electronics and telecom representing the largest exposures as of March 31, 2018. We generally expect to maintain the Trust’s current allocations to CLO equity and debt. The Trust’s CLO debt investments are presently skewed towards BB rated tranches versus single-B tranches. We maintain a generally constructive view of CLO equity over the longer term, and we expect our CLO equity investments’ cash flows to decline over the near term due to spread compression on the underlying loan collateral. Unless the market experiences volatility, we anticipate that CLO equity NAVs will remain stable given the lack of stress in underlying collateral portfolios. Lastly, the Trust has maintained low exposure to high yield bonds over the period; as of March 31, 2018, high yield bond positions represented less than 3.5% of the Trust’s portfolio on a market value basis. We expect to keep the Trust’s bond exposure relatively low, reflecting our low duration bias in a rising rate environment. We continue to prefer loans that offer comparable all-in yields, with lower duration risk, seniority, collateral, and floating rate coupons.
XAI Octagon Floating Rate & Alternative Income Term Trust | Questions & Answers |
March 31, 2018 (Unaudited)
How is the Trust positioned to perform in a rising interest environment?
The Trust is positioned conservatively in terms of duration, with predominately all of the Trust’s investments in floating rate or adjustable securities based on changes in LIBOR. Approximately 95% of the Trust’s portfolio as of March 31, 2018 was invested in leveraged loans, CLO debt and CLO equity8. We will continue to actively position the Trust to take advantage of a benign credit environment, while pursuing return opportunities that may benefit from rising LIBOR.
Leveraged loan investors earn returns based on spreads above LIBOR. The rates on leveraged loans typically reset at fixed intervals, usually a monthly or quarterly basis. Leveraged loans do not move in tandem with U.S. Treasuries, but rather with LIBOR. The benefit of the floating rate is that it provides an element of protection against rising short-term interest rates.
CLOs may offer a natural hedge to rising interest rates with little rate duration risk. As LIBOR increases, CLO debt distributions generally increase. CLO equity is more nuanced; once LIBOR has risen above a specified floor, “the spread” paid to equity holders increases as interest rates rise. In contrast, interest rates on traditional fixed income investments are locked and adversely impacted by a rising rate environment. Given the floating rate nature of their coupon payments, CLOs are well-positioned for a rising interest rate environment.
Discuss the Trust’s use of leverage.
The Trust uses leverage as part of its investment strategy, to finance the purchase of additional securities that provide increased income and potentially greater appreciation potential to common shareholders than could be achieved from a portfolio that is not leveraged. With the low cost of borrowing and relatively low default rates generally among U.S. companies, the amount of leverage used by the Trust is highly accretive to income generation. The Trust currently employs leverage through bank borrowing. As of March 31, 2018, the amount of leverage was approximately 32.3% of Managed Assets (including proceeds of leverage). While leverage increases the income of the Trust in yield terms, it also amplifies the effects of changing market prices in the portfolio and can cause the Trust’s NAV to change to a greater degree than the market as a whole. This can create volatility in Trust pricing but should not affect the Trust’s ability to pay distributions under normal circumstances.
Index Definitions
The Trust will not seek to track any index. Index returns are for illustrative purposes only, do not reflect the deduction of fees and expenses and do not represent the performance of the Trust. It is not possible to invest directly in an index.
Bank of America Merrill Lynch US High Yield Master II Index tracks the performance of USD-denominated below investment grade corporate debt publicly issued in the US domestic market. It is not possible to invest directly in this index.
JP Morgan CLO Debt Index represents the post-crisis J.P. Morgan Collateralized Loan Obligation Index (“CLOIE”). The CLOIE is a benchmark to track the market for US dollar denominated broadly-syndicated, arbitrage CLOs. The CLOIE is divided by origination (pre-versus post-crisis) and is broken out further into six original rating classes (AAA, AA, A, BBB, BB, B).
S&P/LSTA U.S. Leveraged Loan 100 Index is a market value-weighted index designed to measure the performance of the U.S. leveraged loan market. In conjunction with Standard & Poor's/LCD, the Leveraged Syndications & Trading Association (“LSTA”) developed the S&P/LSTA US Leveraged Loan 100 Index (“L100”). The L100 is designed to reflect the largest loan facilities in the leveraged loan market. It mirrors the market-value-weighted performance of the 100 largest institutional leveraged loans based upon actual market weightings, spreads and interest payments. The L100 utilizes LSTA/LPC Mark-to-Market Pricing, which is based on bid/ask quotes gathered from dealers and is not based upon derived pricing models. The index uses the average bid for its market value calculation. Each loan facility’s total return is calculated by aggregating the interest return (reflecting the return due to interest paid and accrued interest), and price return (reflecting the gains or losses due to changes in the end of day prices and principal repayments). The return of each loan facility is weighted in the index based upon its market value outstanding, which reflects both the prior period’s prices as well as accrued interest. The overall index return is the aggregate of each component loan facility’s return multiplied by the market value outstanding from the prior time period.
Risks and Other Considerations
Investing involves risk, including the possible loss of principal and fluctuation of value.
The views expressed in this report reflect those of the portfolio managers only through the report period as stated on the cover. These views are expressed for informational purposes only and are subject to change at any time, based on market and other conditions, and may not come to pass. These views should not be construed as research, investment advice or a recommendation of any kind regarding the Trust or any issuer or security, do not constitute a solicitation to buy or sell any security and should not be considered specific legal, investment or tax advice. The information provided does not take into account the specific objectives, financial situation or particular needs of any specific investor.
| Semi-Annual Report | March 31, 2018 | 5 |
XAI Octagon Floating Rate & Alternative Income Term Trust | Questions & Answers |
March 31, 2018 (Unaudited)
The views expressed in this report may also include forward looking statements that involve risk and uncertainty, and there is no guarantee that any predictions will come to pass. Actual results or events may differ materially from those projected, estimated, assumed or anticipated in any such forward looking statements. Important factors that could result in such differences, in addition to the other factors noted with such forward-looking statements, include general economic conditions such as inflation, recession and interest rates.
There can be no assurance that the Trust will achieve its investment objective or that any investment strategies or techniques discussed herein will be effective. The value of the Trust will fluctuate with the value of the underlying securities. Historically, closed-end funds often trade at a discount to their net asset value.
Performance data quoted represents past performance, which is no guarantee of future results and current performance may be lower or higher than the figures shown.
Please see www.xainvestments.com/funds for a detailed discussion of the Trust’s risks and considerations.
This material is not intended as a recommendation or as investment advice of any kind, including in connection with rollovers, transfers, and distributions. Such material is not provided in a fiduciary capacity, may not be relied upon for or in connection with the making of investment decisions, and does not constitute a solicitation of an offer to buy or sell securities. All content has been provided for informational or educational purposes only and is not intended to be and should not be construed as legal or tax advice and/or legal opinion. Always consult a financial, tax and/or legal professional regarding your specific situation.
| 4 | As a general matter, LIBOR closely tracks the Federal Funds Rate, which is set by the US Federal Reserve (the “Fed”) to control inflation and maintain healthy US economic growth. As such, LIBOR is likely to adjust when the Fed changes or is preparing to change the Federal Funds Rate. |
| 5 | Source: Standard & Poor’s/LCD News (March 31, 2018). S&P/LSTA Leveraged Loan Index default rate represents lagging 12-month default rate by principal amount as of the respective period presented. Historical LTM default rate includes EFH (aka TXU), which was included in the default rate from April 2014-March 2015. The S&P/LSTA Leveraged Loan Index generally mirrors the universe of leveraged loans syndicated in the US. Defaults for the S&P/LSTA Leveraged Loan Index do not represent the default experience of any particular investment manager or manager peer set. Index default rate is calculated as the amount defaulted over the last 12 months divided by the amount outstanding at the beginning of the 12-month period. Defaults represent all loans including loans not included in the LSTA/LPC mark-to-market service. The vast majority are institutional tranches. |
| 6 | Source: J.P. Morgan North America Credit Research Credit Strategy Weekly Update (April 20, 2018). |
| 7 | Source: Wells Fargo Structured Product Research, CLO Monthly Market Overview (April 2, 2018). |
| 8 | Source: Octagon Credit Investors, LLC. Represents unaudited figures. |
| 9 | Sources: S&P/LSTA Leveraged Loan Index and S&P Capital IQ/SNL Financial Leveraged Commentary & Data, Bloomberg, J.P. Morgan Markets DataQuery (March 31, 2018). |
XAI Octagon Floating Rate & Alternative Income Term Trust | Trust Performance |
March 31, 2018 (Unaudited)
Growth of a $10,000 Investment at Market Value (as of March 31, 2018)
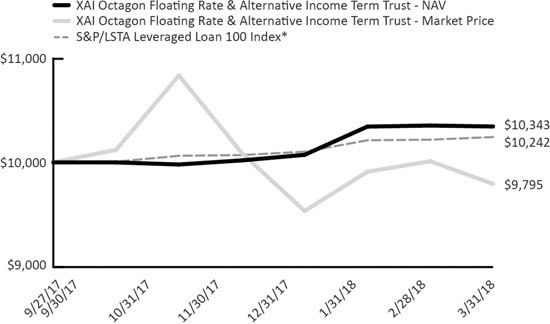
The chart above represents historical performance of a hypothetical investment of $10,000 in the Trust since inception. Past performance does not guarantee future results. This chart does not reflect the deduction of taxes that a shareholder would pay on Trust distributions or the redemption of Trust shares. The chart assumes that distributions from the Trust are reinvested.
Summary Performance (as of March 31, 2018)
| | 1 Month | 3 Months | 6 Months | Since the Trust’s Inception (September 27, 2017) |
| XAI Octagon Floating Rate & Alternative Income Term Trust - NAV | -0.08% | 2.69% | 3.43% | 3.43% |
| XAI Octagon Floating Rate & Alternative Income Term Trust - Market | -2.16% | 2.71% | -3.22% | -2.05% |
| S&P/LSTA Leveraged Loan 100 Index* | 0.24% | 1.38% | 2.35% | 2.42% |
| * | The S&P/LSTA (Loan Syndications and Trading Association) U.S. Leveraged Loan 100 Index was the first to track the investable senior loan market. This rules-based index consists of the 100 largest loan facilities in the benchmark S&P/LSTA Leveraged Loan Index (LLI). |
Performance data quoted represents past performance. Past performance does not guarantee future results. Investment return and principal value of an investment will fluctuate so that an investor’s shares, when sold or redeemed, may be worth more or less than the original cost. Current performance data may be higher or lower than actual data quoted.
| Semi-Annual Report | March 31, 2018 | 7 |
XAI Octagon Floating Rate & Alternative Income Term Trust | Trust Performance |
March 31, 2018 (Unaudited)
Top Ten Portfolio Holdings (as a % of Total Investments)*
| Ares, Ltd. 2017 – 46A | 3.41% |
| RR 1, LLC 2017 – 1A | 3.28% |
| Madison Park Funding, Ltd. 2015 – 18A | 3.19% |
| Apidos 2017 – 28A | 2.75% |
| OZLM, Ltd. 2017 – 19A | 2.74% |
| Thacher Park CLO, Ltd. 2014 – 1A | 2.56% |
| Carlyle Global Market Strategies, Ltd. 2013 – 1A | 2.46% |
| CIFC Funding, Ltd. 2017 – 5A | 2.36% |
| Marble Point, Ltd. 2017 – 2A | 2.32% |
| Dryden, Ltd. 2014 – 34A | 2.11% |
| * | Holdings are subject to change |
Asset Allocation (as a % of Total Investments)
| Senior Secured First Lien Loans | 37.67% |
| CLO Equity | 34.55% |
| CLO Debt | 15.42% |
| Secured Second Lien Loans | 8.57% |
| Corporate Bonds (High Yield) | 3.32% |
| Money Market Mutual Funds | 0.47% |
XAI Octagon Floating Rate &
Alternative Income Term Trust | Schedule of Investments |
March 31, 2018 (Unaudited)
| | | Coupon(a) | | | Reference Rate
& Spread | | Maturity Date | | Principal Amount | | | Value | |
| CORPORATE BONDS - 4.88%* (3.32% of Total Investments) | | | | | |
| Diversified Telecommunication Services - 0.28% (0.19% of Total Investments) | | | | | |
| Consolidated Communications, Inc., Senior Unsecured | | | 6.50 | % | | N/A | | 10/01/2022 | | $ | 250,000 | | | $ | 223,437 | |
| | | | | | | | | | | | | | | | | |
| Wireless Telecommunication Services - 0.64% (0.43% of Total Investments) | | | | | | | |
| Digicel Group, Ltd., Senior Unsecured(b) | | | 8.25 | % | | N/A | | 09/30/2020 | | | 500,000 | | | | 428,750 | |
| Sprint Corp., Senior Unsecured | | | 7.63 | % | | N/A | | 03/01/2026 | | | 91,000 | | | | 88,839 | |
| Total Wireless Telecommunication Services | | | | | | | | | | | 591,000 | | | | 517,589 | |
| | | | | | | | | | | | | | | | | |
| Hotels, Restaurants & Leisure - 1.45% (0.99% of Total Investments) | | | | | |
| Golden Nugget, Inc., Subordinated(b) | | | 8.75 | % | | N/A | | 10/01/2025 | | | 1,000,000 | | | | 1,037,660 | |
| IRB Holding Corp., Senior Unsecured(b) | | | 6.75 | % | | N/A | | 02/15/2026 | | | 150,000 | | | | 147,015 | |
| Total Hotels, Restaurants & Leisure | | | | | | | | | | | 1,150,000 | | | | 1,184,675 | |
| | | | | | | | | | | | | | | | | |
| Pharmaceuticals - 1.52% (1.03% of Total Investments) | | | | | | | | |
| Mallinckrodt International Finance SA, Senior Unsecured | | | 4.75 | % | | N/A | | 04/15/2023 | | | 250,000 | | | | 195,063 | |
| Mallinckrodt International Finance SA / Mallinckrodt CB, LLC, Senior Unsecured(b) | | | 5.75 | % | | N/A | | 08/01/2022 | | | 250,000 | | | | 216,875 | |
| Valeant Pharmaceuticals International, Inc., Senior Unsecured(b) | | | 9.00 | % | | N/A | | 12/15/2025 | | | 400,000 | | | | 396,174 | |
| Valeant Pharmaceuticals International, Inc., Senior Unsecured(b) | | | 6.13 | % | | N/A | | 04/15/2025 | | | 500,000 | | | | 430,000 | |
| Total Pharmaceuticals | | | | | | | | | | | 1,400,000 | | | | 1,238,112 | |
| | | | | | | | | | | | | | | | | |
| Health Care Providers & Services - 0.30% (0.21% of Total Investments) | | | | | | | | |
| Teva Pharmaceutical Finance Netherlands III BV, Senior Unsecured(b) | | | 6.75 | % | | N/A | | 03/01/2028 | | | 250,000 | | | | 246,875 | |
| | | | | | | | | | | | | | | | | |
| Internet Software & Services - 0.57% (0.39% of Total Investments) | | | | | | | | |
| Veritas US, Inc. / Veritas Bermuda, Ltd., Senior Unsecured(b) | | | 10.50 | % | | N/A | | 02/01/2024 | | | 500,000 | | | | 467,604 | |
| | | | | | | | | | | | | | | | | |
| Industrial Conglomerates - 0.12% (0.08% of Total Investments) | | | | | |
| Williams Scotsman International, Inc., Senior Secured(b) | | | 7.88 | % | | N/A | | 12/15/2022 | | | 95,000 | | | | 98,206 | |
| | | | | | | | | | | | | | | | | |
| Total Corporate Bonds (Cost $4,053,940) | | | | | | | | | | | 4,236,000 | | | | 3,976,498 | |
| | | | | | | | | | | | | | | | | |
| SECURED SECOND LIEN LOANS - 12.59% (8.57% of Total Investments)(c) | | | | |
| Chemicals - 0.30% (0.20% of Total Investments) | | | |
| Utex Industries, Inc., Initial Term Loan | | | 9.13 | % | | 1M US L + 7.25% | | 05/22/2022 | | | 250,000 | | | | 240,625 | |
| | | | | | | | | | | | | | | | | |
| Commercial Services & Supplies - 0.99% (0.67% of Total Investments) | | | | |
| AVSC Holding Corp., Initial Term Loan | | | 9.26 | % | | 3M US L + 7.25% | | 09/01/2025 | | | 805,556 | | | | 806,562 | |
| | | | | | | | | | | | | | | | | |
| Electronic Equipment, Instruments & Components - 0.31% (0.21% of Total Investments) | | | |
| LTI Holdings, Inc., Initial Term Loan | | | 10.63 | % | | 1M US L + 8.75% | | 05/16/2025 | | | 250,000 | | | | 252,500 | |
| | | | | | | | | | | | | | | | | |
| Hotels, Restaurants & Leisure - 2.51% (1.71% of Total Investments) | | |
| Affinity Gaming, LLC, Initial Term Loan | | | 10.13 | % | | 1M US L + 8.25% | | 01/31/2025 | | | 392,857 | | | | 397,564 | |
See Notes to Financial Statements.
| Semi-Annual Report | March 31, 2018 | 9 |
XAI Octagon Floating Rate &
Alternative Income Term Trust | Schedule of Investments |
March 31, 2018 (Unaudited)
| | | Coupon(a) | | | Reference Rate & Spread | | Maturity Date | | Principal Amount | | | Value | |
| SECURED SECOND LIEN LOANS (continued) | | | | |
| Hotels, Restaurants & Leisure (continued) | | | | | | | |
| Casablanca US Holdings, Inc., Initial Term Loan | | | 10.77 | % | | 3M US L + 9.00% | | 03/31/2025 | | $ | 833,333 | | | $ | 843,750 | |
| Golden Entertainment, Inc., Term B Facility Loan | | | 8.86 | % | | 1M US L + 7.00% | | 10/20/2025 | | | 800,000 | | | | 804,000 | |
| Total Hotels, Restaurants & Leisure | | | | | | | | | | | 2,026,190 | | | | 2,045,314 | |
| | | | | | | | | | | | | | | | | |
| Insurance - 2.14% (1.46% of Total Investments) | | | | | | | |
| Asurion, LLC, Replacement B-2 Term Loan | | | 7.88 | % | | 1M US L + 6.00% | | 08/04/2025 | | | 1,700,000 | | | | 1,743,775 | |
| | | | | | | | | | | | | | | | | |
| Media - 0.90% (0.61% of Total Investments) | | | | | | | |
| Red Ventures, LLC & New Imagitas, Inc., Term Loan | | | 9.88 | % | | 1M US L + 8.00% | | 11/08/2025 | | | 725,000 | | | | 735,426 | |
| | | | | | | | | | | | | | | | | |
| Real Estate Investment Trusts (REITs) - 1.05% (0.72% of Total Investments) | | | | | | | |
| Capital Automotive LP, New Term Loan | | | 7.88 | % | | 1M US L + 6.00% | | 03/17/2025 | | | 850,000 | | | | 856,910 | |
| | | | | | | | | | | | | | | | | |
| Software - 4.24% (2.88% of Total Investments) | | | | | | | |
| Finastra Group Holdings Limited, Dollar Term Loan | | | 9.23 | % | | 3M US L + 7.25% | | 06/13/2025 | | | 1,700,000 | | | | 1,682,201 | |
| McAfee, LLC, Initial Term Loan | | | 10.38 | % | | 1M US L + 8.50% | | 09/29/2025 | | | 1,000,000 | | | | 1,010,500 | |
| Micro Holding Corp. & MH Sub I, LLC, Term Loan | | | 9.28 | % | | 1M US L + 7.50% | | 08/16/2025 | | | 750,000 | | | | 756,562 | |
| Total Software | | | | | | | | | | | 3,450,000 | | | | 3,449,263 | |
| | | | | | | | | | | | | | | | | |
| Transportation Infrastructure - 0.15% (0.11% of Total Investments) | | | | | | | |
| Direct Chassislink, Inc., Term Loan | | | 7.88 | % | | 1M US L + 6.00% | | 06/15/2023 | | | 123,711 | | | | 125,567 | |
| | | | | | | | | | | | | | | | | |
Total Secured Second Lien Loans (Cost $10,287,281) | | | | | | | | | | | 10,180,457 | | | | 10,255,942 | |
| | | | | | | | | | | | | | | | | |
| SENIOR SECURED FIRST LIEN LOANS - 55.35% (37.67% of Total Investments)(c) | | | | | | | |
| Aerospace & Defense - 0.95% (0.65% of Total Investments) | | | | | | | |
| Constellis Holdings, LLC, Term B Loan | | | 7.30 | % | | 3M US L + 5.00% | | 04/21/2024 | | | 768,319 | | | | 775,041 | |
| | | | | | | | | | | | | | | | | |
| Airlines - 0.03% (0.02% of Total Investments) | | | | | | | |
| LifeMiles Finance, LLC (LifeMiles, Ltd.), Initial Term Loan(d) | | | 7.37 | % | | 1M US L + 5.50% | | 08/18/2022 | | | 27,778 | | | | 28,334 | |
| | | | | | | | | | | | | | | | | |
| Auto Components - 1.37% (0.93% of Total Investments) | | | | | | | |
| Bright Bidco B.V. (Lumileds), Refinancing Term B Loan | | | 5.73 | % | | 3M US L + 3.50% | | 06/30/2024 | | | 696,491 | | | | 706,068 | |
| Navistar, Inc., Tranche B Term Loan | | | 5.21 | % | | 1M US L + 3.50% | | 11/06/2024 | | | 407,718 | | | | 409,585 | |
| Total Auto Components | | | | | | | | | | | 1,104,209 | | | | 1,115,653 | |
| | | | | | | | | | | | | | | | | |
| Automobiles - 0.61% (0.42% of Total Investments) | | | | | | | |
| Truck Hero, Inc., Initial Term Loan | | | 6.22 | % | | 3M US L + 4.00% | | 04/21/2024 | | | 497,494 | | | | 499,732 | |
| | | | | | | | | | | | | | | | | |
| Beverages - 0.54% (0.37% of Total Investments) | | | | | | | |
| Sunshine Investments BV, Facility B3 Loan | | | 3.25 | % | | 1M US L + 3.25% | | 03/28/2025 | | | 440,238 | | | | 439,137 | |
| | | | | | | | | | | | | | | | | |
| Chemicals - 1.39% (0.94% of Total Investments) | | | | | | | |
| Graftech Finance, Inc., Initial Term Loan | | | 5.24 | % | | 1M US L + 3.50% | | 02/12/2025 | | | 663,265 | | | | 663,265 | |
See Notes to Financial Statements.
XAI Octagon Floating Rate &
Alternative Income Term Trust | Schedule of Investments |
March 31, 2018 (Unaudited)
| | | Coupon(a) | | | Reference Rate & Spread | | Maturity Date | | Principal Amount | | | Value | |
| SENIOR SECURED FIRST LIEN LOANS (continued) | | | | | | | |
| Chemicals (continued) | | | | | | | | | | | | | | | | |
| Utex Industries, Inc., Initial Term Loan | | | 5.88 | % | | 1M US L + 4.00% | | 05/22/2021 | | $ | 477,519 | | | $ | 467,573 | |
| Total Chemicals | | | | | | | | | | | 1,140,784 | | | | 1,130,838 | |
| | | | | | | | | | | | | | | | | |
| Communications Equipment - 1.78% (1.21% of Total Investments) | | | | | | | |
| Global Tel Link Corp., Term Loan | | | 6.30 | % | | 3M US L + 4.00% | | 05/23/2020 | | | 463,984 | | | | 466,304 | |
| Intelsat Jackson Holdings S.A., Term B-4 Loan | | | 6.46 | % | | 3M US L + 4.50% | | 01/02/2024 | | | 253,165 | | | | 259,674 | |
| Mitel US Holdings, Inc., Incremental Term Loan | | | 5.63 | % | | 1M US L + 3.75% | | 09/25/2023 | | | 721,375 | | | | 725,436 | |
| Total Communications Equipment | | | | | | | | | | | 1,438,524 | | | | 1,451,414 | |
| | | | | | | | | | | | | | | | | |
| Construction & Engineering - 2.07% (1.41% of Total Investments) | | | | | | | |
| Brand Energy & Infrastructure Services, Initial Term Loan | | | 5.99 | % | | 3M US L + 4.25% | | 06/21/2024 | | | 746,241 | | | | 752,352 | |
| KBR, Inc., Term B Loan(d) | | | N/A | | | L + 3.75% | | 04/02/2025 | | | 737,762 | | | | 735,918 | |
| Pike Corp., Initial Term Loan | | | 5.39 | % | | 1M US L + 3.50% | | 03/21/2025 | | | 193,751 | | | | 195,446 | |
| Total Construction & Engineering | | | | | | | | | | | 1,677,753 | | | | 1,683,716 | |
| | | | | | | | | | | | | | | | | |
| Diversified Financial Services - 2.17% (1.48% of Total Investments) | | | | | | | |
| Deerfield Holdings Corp., Term B Loan(d) | | | 5.55 | % | | 3M US L + 3.25% | | 02/13/2025 | | | 1,000,000 | | | | 1,001,250 | |
| Pi US Mergerco, Facility B1 Loan | | | 3.50 | % | | 1M US L + 3.50% | | 01/03/2025 | | | 433,498 | | | | 434,582 | |
| VFH Parent, LLC, Initial Term Loan | | | 4.94 | % | | 3M US L + 3.25% | | 12/30/2021 | | | 328,421 | | | | 331,705 | |
| Total Diversified Financial Services | | | | | | | | | | | 1,761,919 | | | | 1,767,537 | |
| | | | | | | | | | | | | | | | | |
| Diversified Telecommunication Services - 2.69% (1.83% of Total Investments) | | | | | | | |
| Neustar, Inc. (Aerial Merger Sub, Inc.), Term B-4 Loan | | | 5.38 | % | | 1M US L + 3.50% | | 08/08/2024 | | | 696,500 | | | | 698,533 | |
| Syniverse Holdings, Inc., Tranche C Term Loan | | | 6.72 | % | | 1M US L + 5.00% | | 03/09/2023 | | | 782,124 | | | | 790,485 | |
| Wide Open West Finance, LLC, Refinancing Term B Loan | | | 5.10 | % | | 1M US L + 3.25% | | 08/18/2023 | | | 721,375 | | | | 704,697 | |
| Total Diversified Telecommunication Services | | | | | | | | | | | 2,199,999 | | | | 2,193,715 | |
| | | | | | | | | | | | | | | | | |
| Electronic Equipment, Instruments & Components - 0.91% (0.62% of Total Investments) | | | | | | | |
| LTI Holdings, Inc. | | | | | | | | | | | | | | | | |
| Initial Term Loan | | | 6.63 | % | | 1M US L + 4.75% | | 05/16/2024 | | | 491,275 | | | | 492,503 | |
| Second Amendment Incremental Term Loan | | | 5.38 | % | | 1M US L + 3.50% | | 05/16/2024 | | | 245,614 | | | | 245,921 | |
| Total Electronic Equipment, Instruments & Components | | | | | | | | | | | 736,889 | | | | 738,424 | |
| | | | | | | | | | | | | | | | | |
| Energy Equipment & Services - 2.64% (1.80% of Total Investments) | | | | | | | |
| FTS International, LLC, Initial Term Loan | | | 6.63 | % | | 1M US L + 4.75% | | 04/16/2021 | | | 325,175 | | | | 325,988 | |
| KCA Deutag US Finance, Original Term Loan | | | N/A | | | L + 6.75% | | 05/16/2020 | | | 998,876 | | | | 996,379 | |
| Seadrill Partners Finco, LLC, Initial Term Loan | | | 8.30 | % | | 3M US L + 6.00% | | 02/21/2021 | | | 992,862 | | | | 829,864 | |
| Total Energy Equipment & Services | | | | | | | | | | | 2,316,913 | | | | 2,152,231 | |
| | | | | | | | | | | | | | | | | |
| Health Care Equipment & Supplies - 0.62% (0.42% of Total Investments) | | | | | | | |
| Exactech, Inc., Closing Date Term Loan | | | 5.74 | % | | 2M US L + 3.75% | | 02/14/2025 | | | 77,419 | | | | 77,806 | |
| Hanger, Inc. (fka Hanger Orthopedic Group), Term B Loan | | | 5.38 | % | | 1M US L + 3.50% | | 03/06/2025 | | | 429,329 | | | | 429,329 | |
| Total Health Care Equipment & Supplies | | | | | | | | | | | 506,748 | | | | 507,135 | |
| | | | | | | | | | | | | | | | | |
| Health Care Providers & Services - 2.67% (1.82% of Total Investments) | | | | | | | |
| Air Medical Group Holdings, Inc. (AMGH Holding Corp.), Term Loan | | | 4.94 | % | | 1M US L + 3.25% | | 04/28/2022 | | | 970,105 | | | | 973,472 | |
See Notes to Financial Statements.
| Semi-Annual Report | March 31, 2018 | 11 |
XAI Octagon Floating Rate &
Alternative Income Term Trust | Schedule of Investments |
March 31, 2018 (Unaudited)
| | | Coupon(a) | | | Reference Rate & Spread | | Maturity Date | | Principal Amount | | | Value | |
| SENIOR SECURED FIRST LIEN LOANS (continued) | | | | | | | |
| Health Care Providers & Services (continued) | | | | | | | |
| Diplomat Pharmacy, Inc., Initial Term B Loan | | | 6.38 | % | | 1M US L + 4.50% | | 12/20/2024 | | $ | 227,096 | | | $ | 228,515 | |
| Heartland Dental Care, LLC, Term Loan | | | 6.45 | % | | 3M US L + 4.75% | | 08/01/2023 | | | 498,750 | | | | 498,855 | |
| Medical Solutions Holdings, Inc., Closing Date Term Loan | | | 5.63 | % | | 1M US L + 3.75% | | 06/14/2024 | | | 224,143 | | | | 224,565 | |
| US Renal Care, Inc., Initial Term Loan | | | 6.55 | % | | 3M US L + 4.25% | | 12/30/2022 | | | 248,093 | | | | 248,919 | |
| Total Health Care Providers & Services | | | | | | | | | | | 2,168,188 | | | | 2,174,326 | |
| | | | | | | | | | | | | | | | | |
| Hotels, Restaurants & Leisure - 3.59% (2.44% of Total Investments) | | | | | | | |
| Amaya Gaming Group, Inc. | | | | | | | | | | | | | | | | |
| Initial Term B-3 Loan | | | 5.80 | % | | 3M US L + 3.50% | | 08/01/2021 | | | 497,442 | | | | 499,432 | |
| Term Loan(d) | | | N/A | | | L + 3.00% | | 03/28/2025 | | | 412,278 | | | | 413,309 | |
| CEC Entertainment, Term B Loan | | | 5.13 | % | | 1M US L + 3.25% | | 02/12/2021 | | | 587,847 | | | | 552,330 | |
| Intrawest Resorts Holdings, Inc., Initial Term Loan | | | 5.13 | % | | 1M US L + 3.25% | | 07/31/2024 | | | 473,813 | | | | 475,788 | |
| IRB Holding Corp. (Arby's / Buffalo Wild Wings), Term B Loan | | | 4.94 | % | | 1M US L + 3.25% | | 02/05/2025 | | | 314,050 | | | | 317,288 | |
| Kingpin Intermediate Holdings, LLC, Initial Term Loan | | | 5.92 | % | | 1M US L + 4.25% | | 07/03/2024 | | | 248,747 | | | | 251,234 | |
| Wyndham Hotels & Resorts, Inc., Term B Loan(d) | | | N/A | | | L + 1.75% | | 03/28/2025 | | | 413,174 | | | | 414,207 | |
| Total Hotels, Restaurants & Leisure | | | | | | | | | | | 2,947,351 | | | | 2,923,588 | |
| | | | | | | | | | | | | | | | | |
| Household Products - 0.62% (0.42% of Total Investments) | | | | | | | |
| TKC Holdings, Inc., Initial Term Loan | | | 6.03 | % | | 1M US L + 4.25% | | 02/01/2023 | | | 497,487 | | | | 501,840 | |
| | | | | | | | | | | | | | | | | |
| Independent Power/Renewable Electricity Producers - 0.41% (0.28% of Total Investments) | | | | | | | |
| Compass Power Generation, LLC, Term Loan | | | 6.05 | % | | 3M US L + 3.75% | | 12/20/2024 | | | 329,609 | | | | 333,419 | |
| | | | | | | | | | | | | | | | | |
| Industrial Conglomerates - 1.43% (0.98% of Total Investments) | | | | | | | |
| Blount International, Inc., Initial Term Loan | | | 5.92 | % | | 1M US L + 4.25% | | 04/12/2023 | | | 750,000 | | | | 759,375 | |
| CIRCOR International, Inc., Initial Term Loan | | | 5.24 | % | | 1M US L + 3.50% | | 12/11/2024 | | | 406,470 | | | | 407,743 | |
| Total Industrial Conglomerates | | | | | | | | | | | 1,156,470 | | | | 1,167,118 | |
| | | | | | | | | | | | | | | | | |
| Insurance - 0.62% (0.42% of Total Investments) | | | | | | | |
| Hyperion Refinance S.a.r.l, Initial Dollar Term Loan | | | 5.44 | % | | 1M US L + 3.50% | | 12/20/2024 | | | 498,750 | | | | 503,239 | |
| | | | | | | | | | | | | | | | | |
| Internet Software & Services - 1.80% (1.23% of Total Investments) | | | | | | | |
| EIG Investors Corp., Refinancing Loan | | | 5.96 | % | | 3M US L + 4.00% | | 02/09/2023 | | | 473,067 | | | | 476,023 | |
| Veritas US, Inc., Initial Dollar Term B-1 Loan | | | 6.80 | % | | 3M US L + 4.50% | | 01/27/2023 | | | 994,975 | | | | 990,358 | |
| Total Internet Software & Services | | | | | | | | | | | 1,468,041 | | | | 1,466,381 | |
| | | | | | | | | | | | | | | | | |
| IT Services - 5.26% (3.58% of Total Investments) | | | | | | | |
| Avaya, Inc., Initial Term Loan | | | 6.54 | % | | 1M US L + 4.75% | | 12/13/2024 | | | 970,171 | | | | 976,235 | |
| Convergeone Holdings Corp., Term Loan | | | 6.63 | % | | 1M US L + 4.75% | | 06/20/2024 | | | 746,241 | | | | 746,860 | |
| Optiv, Inc., Initial Term Loan | | | 5.13 | % | | 1M US L + 3.25% | | 02/01/2024 | | | 770,981 | | | | 743,033 | |
| SCS Holdings I, Inc., Term B Loan | | | 6.13 | % | | 1M US L + 4.25% | | 10/30/2022 | | | 713,388 | | | | 719,630 | |
| West Corp., Term B Loan | | | 5.88 | % | | 1M US L + 4.00% | | 10/10/2024 | | | 745,043 | | | | 751,458 | |
| Zotec Partners, LLC, Term Loan | | | 6.77 | % | | 1M US L + 5.00% | | 02/14/2024 | | | 345,178 | | | | 343,452 | |
| Total IT Services | | | | | | | | | | | 4,291,002 | | | | 4,280,668 | |
See Notes to Financial Statements.
XAI Octagon Floating Rate &
Alternative Income Term Trust | Schedule of Investments |
March 31, 2018 (Unaudited)
| | | Coupon(a) | | | Reference Rate & Spread | | Maturity Date | | Principal Amount | | | Value | |
| SENIOR SECURED FIRST LIEN LOANS (continued) | | | | | | | | | | |
| Media - 1.54% (1.04% of Total Investments) | | | | | | | | | | | | | |
| MediArena Acquisition B.V., Dollar Term B Loan | | | 7.44 | % | | 3M US L + 5.75% | | 08/13/2021 | | $ | 248,069 | | | $ | 247,935 | |
| Red Ventures, LLC & New Imagitas, Inc., Term Loan | | | 5.88 | % | | 1M US L + 4.00% | | 11/08/2024 | | | 995,000 | | | | 1,002,672 | |
| Total Media | | | | | | | | | | | 1,243,069 | | | | 1,250,607 | |
| | | | | | | | | | | | | | | | | |
| Metals & Mining - 1.07% (0.73% of Total Investments) | | | | | | | | | | | | | |
| Big River Steel, Closing Date Term Loan | | | 7.30 | % | | 3M US L + 5.00% | | 08/23/2023 | | | 497,500 | | | | 503,719 | |
| Oxbow Carbon, LLC, Tranche B Term Loan | | | 5.63 | % | | 1M US L + 3.75% | | 01/04/2023 | | | 179,545 | | | | 181,341 | |
| Phoenix Services International, LLC, Term B Loan | | | 5.41 | % | | 1M US L + 3.75% | | 03/01/2025 | | | 186,916 | | | | 188,551 | |
| Total Metals & Mining | | | | | | | | | | | 863,961 | | | | 873,611 | |
| | | | | | | | | | | | | | | | | |
| Personal Products - 1.33% (0.91% of Total Investments) | | | | | | | | | | |
| CNT Holdings III Corp., Term Loan | | | 5.13 | % | | 1M US L + 3.25% | | 01/22/2023 | | | 497,481 | | | | 480,069 | |
| Revlon Consumer Products Corp., Initial Term B Loan | | | 5.38 | % | | 1M US L + 3.50% | | 09/07/2023 | | | 771,086 | | | | 603,699 | |
| Total Personal Products | | | | | | | | | | | 1,268,567 | | | | 1,083,768 | |
| | | | | | | | | | | | | | | | | |
| Pharmaceuticals - 2.86% (1.95% of Total Investments) | | | | | | | | | | |
| Amneal Pharmaceuticals, LLC, Initial Term Loan(d) | | | N/A | | | L + 3.50% | | 04/01/2025 | | | 688,596 | | | | 688,596 | |
| Endo Pharmaceuticals Holdings, Inc., Initial Term Loan | | | 6.19 | % | | 1M US L + 4.25% | | 04/29/2024 | | | 722,689 | | | | 720,579 | |
| HLF Financing US, LLC, Term Loan | | | 7.38 | % | | 1M US L + 5.50% | | 02/15/2023 | | | 912,987 | | | | 921,551 | |
| Total Pharmaceuticals | | | | | | | | | | | 2,324,272 | | | | 2,330,726 | |
| | | | | | | | | | | | | | | | | |
| Real Estate Management & Development - 0.33% (0.22% of Total Investments) | | | | | | | | | | |
| DTZ US Borrower, LLC, Term Loan | | | 5.18 | % | | 2M US L + 3.25% | | 11/04/2021 | | | 266,667 | | | | 265,184 | |
| | | | | | | | | | | | | | | | | |
| Road & Rail - 0.61% (0.41% of Total Investments) | | | | | | | | | | |
| YRC Worldwide, Inc., Term B-1 Loan | | | 10.27 | % | | 1M US L + 8.50% | | 07/26/2022 | | | 492,200 | | | | 495,011 | |
| | | | | | | | | | | | | | | | | |
| Software - 6.91% (4.70% of Total Investments) | | | | | | | | | | | | | |
| Blackboard, Inc., Term B-4 Loan | | | 6.73 | % | | 3M US L + 5.00% | | 06/30/2021 | | | 498,737 | | | | 464,295 | |
| Cvent, Inc., Term B Loan | | | 5.63 | % | | 1M US L + 3.75% | | 11/29/2024 | | | 221,343 | | | | 222,450 | |
| Digicert Holdings, Inc., Term Loan | | | 6.52 | % | | 1M US L + 4.75% | | 10/31/2024 | | | 1,000,000 | | | | 1,010,630 | |
| Finastra Group Holdings Limited, Dollar Term Loan | | | 5.48 | % | | 3M US L + 3.50% | | 06/13/2024 | | | 246,250 | | | | 245,913 | |
| Greeneden US Holdings II, LLC (Genesys Telecom Holdings, US), Tranche B-3 Dollar Term Loans | | | 5.80 | % | | 3M US L + 3.50% | | 12/01/2023 | | | 746,250 | | | | 750,451 | |
| Idera, Inc., Initial Term Loan | | | 6.38 | % | | 1M US L + 4.50% | | 06/28/2024 | | | 497,542 | | | | 501,273 | |
| Legalzoom.com, Inc., Initial Term Loan | | | 6.34 | % | | 1M US L + 4.50% | | 11/21/2024 | | | 564,872 | | | | 567,697 | |
| McAfee, LLC, Term Loan | | | 6.38 | % | | 1M US L + 4.50% | | 09/30/2024 | | | 856,891 | | | | 865,100 | |
| Micro Holding Corp. & MH Sub I, LLC, Term Loan | | | 5.53 | % | | 1M US L + 3.75% | | 09/13/2024 | | | 497,500 | | | | 497,410 | |
| Project Leopard Holdings, Inc. (Kofax), Repricing Term Loan | | | 5.88 | % | | 1M US L + 4.00% | | 07/07/2023 | | | 497,503 | | | | 501,234 | |
| Total Software | | | | | | | | | | | 5,626,888 | | | | 5,626,453 | |
| | | | | | | | | | | | | | | | | |
| Specialty Retail - 3.23% (2.20% of Total Investments) | | | | | | | | | | |
| EG America, LLC, Incremental Term Loan(d) | | | N/A | | | L + 4.00% | | 02/06/2025 | | | 800,000 | | | | 797,800 | |
| Office Depot, Inc., Initial Term Loan | | | 8.72 | % | | 3M US L + 7.00% | | 11/08/2022 | | | 669,737 | | | | 680,621 | |
| Payless, Inc. | | | | | | | | | | | | | | | | |
| Tranche A-1 Term Loan | | | 9.74 | % | | 1M US L + 8.00% | | 02/10/2022 | | | 362,558 | | | | 355,760 | |
See Notes to Financial Statements.
| Semi-Annual Report | March 31, 2018 | 13 |
XAI Octagon Floating Rate &
Alternative Income Term Trust | Schedule of Investments |
March 31, 2018 (Unaudited)
| | | Coupon(a) | | | Reference Rate & Spread | | Maturity Date | | Principal Amount | | | Value | |
| SENIOR SECURED FIRST LIEN LOANS (continued) | | | | | | | | | | | | | |
| Specialty Retail (continued) | | | | | | | | | | | | | | | | |
| Tranche A-2 Term Loan | | | 10.74 | % | | 1M US L + 9.00% | | 08/10/2022 | | $ | 648,375 | | | $ | 581,378 | |
| Petsmart, Inc., Term B-2 Loan | | | 4.68 | % | | 1M US L + 3.00% | | 03/05/2022 | | | 273,593 | | | | 218,968 | |
| Total Specialty Retail | | | | | | | | | | | 2,754,264 | | | | 2,634,527 | |
| | | | | | | | | | | | | | | | | |
| Textiles, Apparel & Luxury Goods - 1.05% (0.71% of Total Investments) | | | | | | | | | |
| Varsity Brands Holding Co., Inc., Initial Term Loan | | | 5.38 | % | | 1M US L + 3.50% | | 12/15/2024 | | | 849,223 | | | | 855,804 | |
| | | | | | | | | | | | | | | | | |
| Transportation Infrastructure - 0.59% (0.40% of Total Investments) | | | | | | | | | | |
| Uber Technologies, Inc., Term Loan(d) | | | N/A | | | L + 4.00% | | 03/26/2025 | | | 479,839 | | | | 481,638 | |
| | | | | | | | | | | | | | | | | |
| Wireless Telecommunication Services - 1.66% (1.13% of Total Investments) | | | | | | | | | |
| Digicel International Finance, Ltd., Initial Term B Loan | | | 5.02 | % | | 3M US L + 3.25% | | 05/27/2024 | | | 603,961 | | | | 600,567 | |
| Sable Int'l Finance, Ltd. and Coral-US-Co-Borrower, LLC, Additional Term B-4 Loan | | | 5.13 | % | | 1M US L + 3.25% | | 02/02/2026 | | | 750,000 | | | | 751,875 | |
| Total Wireless Telecommunication Services | | | | | | | | | | | 1,353,961 | | | | 1,352,442 | |
| | | | | | | | | | | | | | | | | |
| Total Senior Secured First Lien Loans (Cost $44,995,115) | | | | | | | | | | | 45,497,377 | | | | 45,083,257 | |
| | | | | | | | | | | | | | | | | |
| CLO DEBT(c)(e)- 22.65% (15.42% of Total Investments) | | | | | | | | | | | | |
| Apidos, Series 2017-28A(b) | | | 7.20 | % | | 3M US L + 5.50% | | 01/20/2031 | | | 1,000,000 | | | | 998,384 | |
| Carlyle Global Market Strategies, Ltd., Series 2013-3A(b) | | | 7.22 | % | | 3M US L + 5.50% | | 10/15/2030 | | | 2,500,000 | | | | 2,481,076 | |
| CIFC Funding, Ltd. | | | | | | | | | | | | | | | | |
| Series 2015-1A(b) | | | 7.74 | % | | 3M US L + 6.00% | | 01/22/2031 | | | 500,000 | | | | 506,434 | |
| Series 2017-2A(b) | | | 7.70 | % | | 3M US L + 5.95% | | 04/20/2030 | | | 500,000 | | | | 510,121 | |
| Series 2017-5A(b) | | | 7.68 | % | | 3M US L + 6.10% | | 11/16/2030 | | | 1,000,000 | | | | 1,008,762 | |
| Dryden, Ltd., Series 2018-64A(b) | | | N/A | (d) | | 3M US L + 5.60% | | 04/18/2031 | | | 500,000 | | | | 495,000 | |
| Goldentree Loan Management, Ltd., Series 2017-1A(b) | | | 7.34 | % | | 3M US L + 5.60% | | 04/20/2029 | | | 1,000,000 | | | | 920,022 | |
| Goldentree Loan Opportunities, Ltd., Series 2017-11A(b) | | | 7.13 | % | | 3M US L + 5.40% | | 01/18/2031 | | | 750,000 | | | | 748,901 | |
| Highbridge Loan Management, Ltd. | | | | | | | | | | | | | | | | |
| Series 2014-3A(b) | | | 8.23 | % | | 3M US L + 6.50% | | 07/18/2029 | | | 1,000,000 | | | | 1,017,611 | |
| Series 2017-11A(b) | | | 9.64 | % | | 3M US L + 7.85% | | 05/06/2030 | | | 1,000,000 | | | | 976,307 | |
| Madison Park Funding, Ltd., Series 2017-17A(b) | | | 9.22 | % | | 3M US L + 7.48% | | 07/21/2030 | | | 1,000,000 | | | | 985,991 | |
| Marble Point, Ltd., Series 2017-1A(b) | | | 7.19 | % | | 3M US L + 5.60% | | 12/18/2030 | | | 1,000,000 | | | | 993,207 | |
| Neuberger Berman, Ltd., Series 2017-14A(b) | | | 8.21 | % | | 3M US L + 6.45% | | 01/28/2030 | | | 1,000,000 | | | | 1,015,594 | |
| OZLM Funding, Ltd. | | | | | | | | | | | | | | | | |
| Series 2012-1A(b) | | | 8.42 | % | | 3M US L + 6.67% | | 07/23/2029 | | | 1,000,000 | | | | 1,025,156 | |
| Series 2018-22A(b) | | | 7.01 | % | | 3M US L + 5.30% | | 01/17/2031 | | | 500,000 | | | | 499,619 | |
| Sound Point, Ltd. | | | | | | | | | | | | | | | | |
| Series 2013-1A(b) | | | 7.25 | % | | 3M US L + 5.50% | | 01/26/2031 | | | 250,000 | | | | 249,880 | |
| Series 2017-4A(b) | | | 7.30 | % | | 3M US L + 5.50% | | 01/20/2031 | | | 500,000 | | | | 499,028 | |
| Symphony, Ltd., Series 2016-18A(b) | | | 8.09 | % | | 3M US L + 6.35% | | 01/23/2028 | | | 1,000,000 | | | | 1,015,879 | |
| THL Credit Wind River, Series 2017-4A(b) | | | 7.68 | % | | 3M US L + 5.80% | | 11/20/2030 | | | 500,000 | | | | 502,271 | |
| Voya, Ltd. | | | | | | | | | | | | | | | | |
| Series 2013-1A(b) | | | 8.20 | % | | 3M US L + 6.48% | | 10/15/2030 | | | 1,000,000 | | | | 1,014,305 | |
See Notes to Financial Statements.
XAI Octagon Floating Rate &
Alternative Income Term Trust | Schedule of Investments |
March 31, 2018 (Unaudited)
| | | Coupon(a) | | | Reference Rate & Spread | | Maturity Date | | Principal Amount | | | Value | |
| CLO DEBT(c)(e) (continued) | | | | | | | | | | | | | | | | |
| Series 2018-2A(b) | | | 7.94 | % | | 3M US L + 5.60% | | 04/25/2031 | | $ | 1,000,000 | | | $ | 990,000 | |
| Total CLO Debt (Cost $18,427,880) | | | | | | | | | | | 18,500,000 | | | | 18,453,548 | |
| | | | | | | | | | | | | | | | | |
| CLO EQUITY(c)(e)(f)- 50.77% (34.55% of Total Investments) | | | | | | | | | | | | |
| ALM V, Ltd., Series 2012-5A(b) | | | N/A | | | Estimated yield of 12.98% | | 10/18/2027 | | | 2,000,000 | | | | 1,206,732 | |
| Anchorage Capital, Ltd., Series 2018-3RA(b) | | | N/A | | | Estimated yield of 10.93% | | 01/28/2031 | | | 1,400,000 | | | | 1,284,791 | |
| Apidos, Series 2017-28A(b) | | | N/A | | | Estimated yield of 9.87% | | 01/20/2031 | | | 3,500,000 | | | | 3,291,701 | |
| Ares, Ltd. | | | | | | | | | | | | | | | | |
| Series 2017-46A(b) | | | N/A | | | Estimated yield of 12.77% | | 01/15/2030 | | | 4,050,000 | | | | 4,085,697 | |
| Series 2018-47A(b) | | | N/A | | | Estimated yield of 12.65%(g) | | 04/16/2030 | | | 2,000,000 | | | | 1,805,286 | |
| Carlyle Global Market Strategies, Ltd., Series 2013-1A(b) | | | N/A | | | Estimated yield of 11.86% | | 08/14/2030 | | | 3,500,000 | | | | 2,946,569 | |
| CIFC Funding, Ltd., Series 2017-5A(b) | | | N/A | | | Estimated yield of 10.06% | | 11/16/2030 | | | 3,000,000 | | | | 2,825,916 | |
| Dryden, Ltd., Series 2014-34A(b) | | | N/A | | | Estimated yield of 6.35% | | 10/15/2026 | | | 5,000,000 | | | | 2,525,760 | |
| Goldentree Loan Opportunities, Ltd., Series 2015-11A(b) | | | N/A | | | Estimated yield of 15.12% | | 04/18/2027 | | | 2,500,000 | | | | 2,023,820 | |
| Madison Park Funding, Ltd., Series 2015-18A(b) | | | N/A | | | Estimated yield of 6.81% | | 10/21/2027 | | | 4,000,000 | | | | 3,822,324 | |
| Marble Point, Ltd., Series 2017-2A(b) | | | N/A | | | Estimated yield of 11.75% | | 12/18/2030 | | | 3,000,000 | | | | 2,775,000 | |
| OZLM, Ltd. | | | | | | | | | | | | | | | | |
| Series 2017-16A(b) | | | N/A | | | Estimated yield of 9.90% | | 05/16/2030 | | | 1,250,000 | | | | 1,050,000 | |
| Series 2017-19A(b) | | | N/A | | | Estimated yield of 10.35% | | 11/22/2030 | | | 3,500,000 | | | | 3,278,054 | |
| RR 1, LLC, Series 2017-1A(b) | | | N/A | | | Estimated yield of 10.69% | | 07/15/2029 | | | 4,500,000 | | | | 3,922,970 | |
| Thacher Park, Ltd., Series 2014-1A(b) | | | N/A | | | Estimated yield of 9.50% | | 10/20/2026 | | | 6,000,000 | | | | 3,060,000 | |
| Voya, Ltd., Series 2017-4A(b) | | | N/A | | | Estimated yield of 7.66% | | 10/15/2030 | | | 1,500,000 | | | | 1,449,926 | �� |
| Total CLO Equity (Cost $41,414,927) | | | | | | | | | | | 50,700,000 | | | | 41,354,546 | |
| | | | | | | | | | | | Shares | | | | | |
| MONEY MARKET MUTUAL FUNDS - 0.69% (0.47% of Total Investments) | | | | | | | |
| Invesco Short Term Investments Trust Treasury Portfolio, Institutional Class | | | | | | | | | | | | | |
| (1.561% 7-Day Yield) | | | | | | | | | | | 559,021 | | | | 559,021 | |
| Total Money Market Mutual Funds (Cost $559,021) | | | | | | | | | | | 559,021 | | | | 559,021 | |
| | | | | | | | | | | | | | | | | |
| Total Investments: 146.93% (Cost $119,738,164) | | | | | | | | | | | | | | | 119,682,812 | |
| Other Assets in Excess of Liabilities: 0.63% | | | | | | | | | | | | | | | 639,368 | |
| Leverage Facility: (47.71)% | | | | | | | | | | | | | | | (38,865,000 | ) |
| Net Assets: 100.00% | | | | | | | | | | | | | | $ | 81,457,180 | |
| * | Amounts above are shown as a percentage of net assets as of March 31, 2018. |
| (a) | The rate shown is the coupon as of the end of the reporting period. |
| (b) | Security exempt from registration under Rule 144A of the Securities Act of 1933, as amended. Total market value of Rule 144A securities amounts to $63,277,253, which represents approximately 77.68% of net assets as of March 31, 2018. Such securities may normally be sold to qualified institutional buyers in transactions exempt from registration. |
| (c) | Variable rate investment. Interest rates reset periodically. Interest rate shown reflects the rate in effect at March 31, 2018. For securities based on a published reference rate and spread, the reference rate and spread are indicated in the description above. Certain variable rate securities are not based on a published reference rate and spread but are determined by the issuer or agent and are based on current market conditions. These securities do not indicate a reference rate and spread in their description above. |
| (d) | All or a portion of this position has not settled as of the period end. The interest rate shown represents the stated spread over the London Interbank Offered Rate ("LIBOR" or "L") or the applicable LIBOR floor; the Trust will not accrue interest until the settlement date, at which point LIBOR will be established. The total of cost of positions that are securities purchased on a when issued or delayed basis was $5,039,043 as of March 31, 2018. |
See Notes to Financial Statements.
| Semi-Annual Report | March 31, 2018 | 15 |
XAI Octagon Floating Rate &
Alternative Income Term Trust | Schedule of Investments |
March 31, 2018 (Unaudited)
| (e) | As a result of the use of significant unobservable inputs to determine fair value, these investments have been classified as Level 3 assets. See also footnote 2 to the financial statements for additional information. |
| (f) | CLO subordinated notes and income notes are considered CLO equity positions. CLO equity positions are entitled to recurring distributions which are generally equal to the remaining cash flow of payments made by underlying securities less contractual payments to debt holders and fund expenses. The effective yield is estimated based upon the current projection of the amount and timing of these recurring distributions in addition to the estimated amount of terminal principal payment. Effective yields for the CLO equity positions are updated generally once a quarter or on a transaction such as a partial sale, add-on purchase, refinancing or reset. The estimated yield and investment cost may ultimately not be realized. |
| (g) | This security is unsettled and does not accrue interest until the settle date. The total of cost of positions that are securities purchased on a when issued or delayed basis was $1,805,286 as of March 31, 2018. |
All securities held as of March 31, 2018 are pledged as collateral for the leverage facility.
See Notes to Financial Statements.
XAI Octagon Floating Rate & Alternative Income Term Trust | Statement of Assets and Liabilities |
March 31, 2018 (Unaudited)
| ASSETS: | | | |
| Investments, at value (Cost $119,738,164) | | $ | 119,682,812 | |
| Cash | | | 2,757,087 | |
| Receivable for investment securities sold | | | 9,687,034 | |
| Interest receivable | | | 546,283 | |
| Prepaid expenses and other assets | | | 32,040 | |
| Total Assets | | | 132,705,256 | |
| | | | | |
| LIABILITIES: | | | | |
| Payable for legal and audit fees | | | 8,819 | |
| Payable to transfer agent | | | 2,594 | |
| Payable for investor support services fees (Note 3) | | | 20,534 | |
| Payable for printing | | | 26,979 | |
| Payable for custodian fees | | | 3,306 | |
| Payable for investment securities purchased | | | 11,405,230 | |
| Leverage facility (Net of $127,364 deferred costs) (Note 6) | | | 38,737,636 | |
| Interest due on leverage facility (Note 6) | | | 283,445 | |
| Distributions payable to common shareholders | | | 576,011 | |
| Accrued investment advisory fee payable (Note 3) | | | 125,332 | |
| Accrued fund accounting and administration fees payable | | | 45,047 | |
| Accrued chief compliance officer fee payable | | | 2,454 | |
| Accrued trustees' fees payable | | | 2,344 | |
| Other payables and accrued expenses | | | 8,345 | |
| Total Liabilities | | | 51,248,076 | |
| Net Assets | | $ | 81,457,180 | |
| | | | | |
| COMPOSITION OF NET ASSETS: | | | | |
| Paid-in capital | | $ | 81,643,540 | |
| Distributions in excess of net investment income | | | (730,724 | ) |
| Accumulated net realized gain | | | 599,716 | |
| Net unrealized depreciation | | | (55,352 | ) |
| Net Assets | | $ | 81,457,180 | |
| | | | | |
| Common shares of beneficial interest outstanding, at $0.01 par value, and unlimited common shares authorized | | | 8,347,991 | |
| Net Asset Value per Common Share | | $ | 9.76 | |
See Notes to Financial Statements.
| Semi-Annual Report | March 31, 2018 | 17 |
XAI Octagon Floating Rate & Alternative Income Term Trust | Statement of Operations |
For the Six Months Ended March 31, 2018 (Unaudited)
| INVESTMENT INCOME: | | | |
| Dividends | | $ | 29,050 | |
| Interest | | | 3,958,918 | |
| Total Investment Income | | | 3,987,968 | |
| | | | | |
| EXPENSES: | | | | |
| Investment advisory fees (Note 3) | | $ | 986,249 | |
| Fund accounting and administration fees | | | 130,894 | |
| Legal and audit fees | | | 126,810 | |
| Custodian fees | | | 8,749 | |
| Chief compliance officer fees (Note 3) | | | 14,959 | |
| Trustees' fees and expenses | | | 84,344 | |
| Printing expense | | | 20,596 | |
| Transfer agent fees | | | 23,602 | |
| Investor support services fees (Note 3) | | | 116,029 | |
| Loan commitment fees | | | 31,064 | |
| Interest on leverage facility | | | 514,248 | |
| Other expenses | | | 44,175 | |
| Total Expenses Before Waivers | | | 2,101,719 | |
| Fees waived or reimbursed by the Advisor (Note 3) | | | (280,182 | ) |
| Net Expenses | | | 1,821,537 | |
| Net Investment Income | | | 2,166,431 | |
| | | | | |
| REALIZED AND UNREALIZED GAIN ON INVESTMENTS: | | | | |
| Net realized gain on: | | | | |
| Investment securities | | | 599,716 | |
| Change in unrealized appreciation/(depreciation) on: | | | | |
| Investment securities | | | (55,352 | ) |
| Net Realized and Unrealized gain on Investments | | | 544,364 | |
| Net Increase in Net Assets from Operations | | $ | 2,710,795 | |
See Notes to Financial Statements.
XAI Octagon Floating Rate & Alternative Income Term Trust | Statement of Changes in Net Assets |
| | | For the Six Months Ended March 31, 2018 (Unaudited) | | | For the Period September 27, 2017 (Commencement of Operations) to September 30, 2017 | |
| OPERATIONS: | | | | | | |
| Net investment income/(loss) | | $ | 2,166,431 | | | $ | (17,117 | ) |
| Net realized gain | | | 599,716 | | | | – | |
| Change in unrealized appreciation/(depreciation) | | | (55,352 | ) | | | – | |
| Net Increase/(Decrease) in Net Assets from Operations | | | 2,710,795 | | | | (17,117 | ) |
| | | | | | | | | |
| DISTRIBUTIONS TO SHAREHOLDERS: | | | | | | | | |
| From net investment income | | | (2,880,038 | ) | | | – | |
| Net Decrease in Net Assets from Distributions to Common Shareholders | | | (2,880,038 | ) | | | – | |
| | | | | | | | | |
| CAPITAL SHARE TRANSACTIONS: | | | | | | | | |
| Proceeds from sale of common shares (net of offering costs of $21,750 and $145,000) | | | 10,635,750 | | | | 70,905,000 | |
| Net asset value of common shares issued to stockholders from reinvestment of dividends | | | 2,781 | | | | – | |
| Net Increase from Capital Share Transactions | | | 10,638,531 | | | | 70,905,000 | |
| Net Increase in Net Assets | | | 10,469,288 | | | | 70,887,883 | |
| | | | | | | | | |
| NET ASSETS: | | | | | | | | |
| Beginning of period | | $ | 70,987,892 | | | $ | 100,009 | |
| End of period* | | $ | 81,457,180 | | | $ | 70,987,892 | |
| | | | | | | | | |
| * Including distributions in excess of net investment income: | | $ | (730,724 | ) | | $ | (17,117 | ) |
See Notes to Financial Statements.
| Semi-Annual Report | March 31, 2018 | 19 |
XAI Octagon Floating Rate & Alternative Income Term Trust | Statement of Cash Flows |
For the Six Months Ended March 31, 2018 (Unaudited)
| CASH FLOWS FROM OPERATING ACTIVITIES: | | | |
| Net increase in net assets from operations | | $ | 2,710,795 | |
| Adjustments to reconcile net increase in net assets from operations to net cash used in operating activities: | | | – | |
| Purchases of investment securities | | | (198,031,342 | ) |
| Proceeds from disposition of investment securities | | | 79,601,858 | |
| Discounts accreted/premiums amortized | | | (102,437 | ) |
| Reductions to CLO Equity cost basis | | | (47,506 | ) |
| Net realized gain on: | | | (599,716 | ) |
| Investment securities | | | (599,716 | ) |
| Net change in unrealized depreciation on: | | | | |
| Investment securities | | | 55,352 | |
| Net purchase of short-term investment securities | | | (559,021 | ) |
| Amortization of deferred costs | | | 104,064 | |
| (Increase)/Decrease in assets: | | | | |
| Receivable for investment securities sold | | | 9,687,034 | |
| Interest receivable | | | (546,283 | ) |
| Receivable due from advisor | | | 8,570 | |
| Prepaid expenses and other assets | | | (32,040 | ) |
| Increase/(Decrease) in liabilities: | | | | |
| Payable for investment securities purchased | | | 11,405,230 | |
| Interest due on loan facility | | | 283,445 | |
| Accrued investment advisory fees payable | | | 125,332 | |
| Accrued fund accounting and administration expense | | | 42,773 | |
| Accrued audit and legal expense | | | (3,181 | ) |
| Accrued trustees' fees payable | | | 2,344 | |
| Payable for investor support services fees | | | 18,978 | |
| Accrued printing expense | | | 19,029 | |
| Accrued custody expense | | | 3,111 | |
| Accrued chief compliance officer fee payable | | | 2,125 | |
| Accrued transfer agency expense | | | 2,334 | |
| Other payables and accrued expenses | | | 7,222 | |
| Net Cash Used in Operating Activities | | | (115,215,998 | ) |
| | | | | |
| CASH FLOWS FROM FINANCING ACTIVITIES: | | | | |
| Proceeds from leverage facility (Net of $231,428 deferred costs) | | | 38,633,572 | |
| Proceeds from shares sold - common shares | | | 10,657,500 | |
| Distributions paid - common shareholders | | | (2,301,246 | ) |
| Offering costs paid for sale of shares | | | (166,750 | ) |
| Net Cash Provided by Financing Activities | | | 46,823,076 | |
| | | | | |
| Net Decrease in Cash | | | (68,392,922 | ) |
| Cash, beginning balance | | $ | 71,150,009 | |
| Cash, ending balance | | $ | 2,757,087 | |
| | | | | |
| Supplemental disclosure of cash flow information: | | | | |
| Cash paid on interest on leverage facility | | $ | 261,867 | |
| | | | | |
| Reinvestment of distributions | | $ | 2,781 | |
See Notes to Financial Statements.
XAI Octagon Floating Rate & Alternative Income Term Trust | Financial Highlights |
For a Share Outstanding Throughout the Periods Presented
| | | For the Six Months Ended March 31, 2018 (Unaudited) | | | For the Period September 27, 2017 (Commencement of Operations) to September 30, 2017 | |
| PER COMMON SHARE OPERATING PERFORMANCE: | | | | | | |
| Net asset value - beginning of period | | $ | 9.78 | | | $ | 9.78 | (a) |
| INCOME/(LOSS) FROM INVESTMENT OPERATIONS: | | | | | | | | |
| Net investment income/(loss)(b) | | | 0.26 | | | | (0.00 | )(c) |
| Net realized and unrealized gain on investments | | | 0.07 | | | | – | |
| Total Income from Investment Operations | | | 0.33 | | | | (0.00 | )(c) |
| | | | | | | | | |
| DISTRIBUTIONS TO COMMON SHAREHOLDERS: | | | | | | | | |
| From net investment income | | | (0.35 | ) | | | – | |
| Total Distributions to Common Shareholders | | | (0.35 | ) | | | – | |
| | | | | | | | | |
| Net asset value per common share - end of period | | $ | 9.76 | | | $ | 9.78 | |
| Market price per common share - end of period | | $ | 9.45 | | | $ | 10.12 | |
| | | | | | | | | |
| Total Investment Return - Net Asset Value(d) | | | 3.43 | % | | | 0.00 | % |
| Total Investment Return - Market Price(d) | | | (3.22 | %) | | | 1.20 | % |
| | | | | | | | | |
| RATIOS AND SUPPLEMENTAL DATA: | | | | | | | | |
| Net assets attributable to common shares, end of period (000s) | | $ | 81,457 | | | $ | 70,988 | |
| Ratio of expenses excluding waivers to average net assets | | | 5.28 | %(e) | | | 5.00 | %(e) |
| Ratio of expenses including waivers to average net assets | | | 4.57 | %(e) | | | 2.20 | %(e) |
| Ratio of expenses excluding interest on loan | | | 3.20 | %(e) | | | 2.20 | %(e) |
| Ratio of net investment income including waivers to average net assets | | | 5.44 | %(e) | | | (2.20 | %)(e) |
| Portfolio turnover rate | | | 79 | % | | | 0 | % |
| | | | | | | | | |
| LEVERAGE FACILITY: | | | | | | | | |
| Aggregate principal amount, end of period (000s) | | $ | 38,738 | | | $ | N/A | |
| Average borrowings outstanding during the period (000s) | | $ | 36,392 | | | $ | N/A | |
| Asset coverage, end of period per $1,000 | | $ | 3,103 | | | $ | N/A | |
| (a) | After deduction of offering expenses charged to capital. |
| (b) | Calculated using average common shares outstanding. |
| (c) | Less than $(0.005) per share. |
| (d) | Total investment return is calculated assuming a purchase of common share at the opening on the first day and a sale at closing on the last day of each period reported. Dividends and distributions are assumed for purposes of this calculation to be reinvested at prices obtained under the Trust's dividend reinvestment plan. Total investment returns do not reflect brokerage commissions, if any, and are not annualized. |
See Notes to Financial Statements.
| Semi-Annual Report | March 31, 2018 | 21 |
| XAI Octagon Floating Rate & | |
| Alternative Income Term Trust | Notes to Financial Statements |
March 31, 2018 (Unaudited)
1. ORGANIZATION
XAI Octagon Floating Rate & Alternative Income Term Trust (the “Trust”) is a recently-organized, diversified, closed-end management investment company registered under the Investment Company Act of 1940, as amended (the “1940 Act”). The Trust commenced operations on September 27, 2017.
The Trust seeks to achieve its investment objective by investing in a dynamically managed portfolio of opportunities primarily within the private credit markets. Under normal market conditions, the Trust will invest at least 80% of its Managed Assets in floating rate credit instruments and other structured credit investments. “Managed Assets” means the total assets of the Trust, including assets attributable to the Trust’s use of leverage, minus the sum of its accrued liabilities (other than liabilities incurred for the purpose of creating leverage).
2. SIGNIFICANT ACCOUNTING POLICIES
Organizational Expenses: XA Investments LLC (the “Adviser”), paid all of the Trust’s organizational expenses. As a result, any organizational expenses of the Trust are not reflected in the Trust’s financial statements.
Offering Costs: Offering costs were incurred by the Trust. The Adviser paid the amount by which the Trust’s offering costs (other than the sales load) exceeded $0.02 per share (0.20% of the offering price).
Use of Estimates: The preparation of the financial statements in accordance with accounting principles generally accepted in the United States of America (“U.S. GAAP”) requires management to make estimates and assumptions that affect the reported amounts and disclosures in the financial statements during the period reported. Management believes the estimates and security valuations are appropriate; however, actual results may differ from those estimates, and the security valuations reflected in the financial statements may differ from the value the Trust ultimately realizes upon sale of the securities. The Trust is considered an investment company under U.S. GAAP and follows the accounting and reporting guidance applicable to investment companies in the Financial Accounting Standards Board Accounting Standards Codification Topic 946. The financial statements have been prepared as of the close of the New York Stock Exchange (“NYSE”) on March 29, 2018.
Expense Recognition: Expenses are recorded on the accrual basis of accounting.
Portfolio Valuation: The net asset value per common share of the Trust is determined daily, on each day that the NYSE is open for trading, as of the close of regular trading on the NYSE (normally 4:00 p.m. New York time). The Trust’s net asset value per common share is calculated by dividing the value of the Trust’s total assets, less its liabilities by the number of shares outstanding.
Cash & Cash Equivalents: The Trust considers its investment in a FDIC insured interest bearing account to be cash. Cash and cash equivalents are valued at cost plus any accrued interest. The Trust maintains cash balances, which, at times may exceed federally insured limits. The Trust maintains these balances with a high quality financial institution. There were no cash equivalents as of March 31, 2018.
Securities Transactions and Investment Income: Investment security transactions are accounted for on a trade date basis. Dividend income is recorded on the ex-dividend date. Realized gains and losses from securities transactions and unrealized appreciation and depreciation of securities are determined using the identified cost basis method for financial reporting purposes.
Interest income from investments in CLO debt is recorded using the accrual basis of accounting to the extent such amounts are expected to be collected. Amortization of premium or accretion of discount is recognized using the effective interest method. CLO equity investments and fee rebates (where applicable) recognize investment income for U.S. GAAP purposes on the accrual basis utilizing an effective interest methodology based upon an effective yield to maturity utilizing projected cash flows. ASC Topic 325-40, Beneficial Interests in Securitized Financial Assets, requires investment income from CLO equity investments and fee rebates to be recognized under the effective interest method, with any difference between the cash distribution and the amount calculated pursuant to the effective interest method being recorded as an adjustment to the cost basis of the investment. There were no fee rebates for CLO equity investments held by the Trust as of March 31, 2018.
Effective yields for the Trust’s CLO equity positions are monitored and evaluated at least on a quarterly basis. The Trust also updates a CLO equity investment’s effective yield in each instance where there is a respective partial sale, add-on purchase, refinancing or reset involving the CLO equity investment held.
Fair Value Measurements: The Trust discloses the classification of its fair value measurements following a three-tier hierarchy based on the inputs used to measure fair value. Inputs refer broadly to the assumptions that market participants would use in pricing the asset or liability, including assumptions about risk. Inputs may be observable or unobservable. Observable inputs reflect the assumptions market participants would use in pricing the asset or liability that are developed based on market data obtained from sources independent of the reporting entity. Unobservable inputs reflect the reporting entity’s own assumptions about the assumptions market participants would use in pricing the asset or liability that are developed based on the best information available.
| XAI Octagon Floating Rate & | |
| Alternative Income Term Trust | Notes to Financial Statements |
March 31, 2018 (Unaudited)
Various inputs are used in determining the value of the Trust’s investments as of the end of the reporting period. When inputs used fall into different levels of the fair value hierarchy, the level in the hierarchy within which the fair value measurement falls is determined based on the lowest level input that is significant to the fair value measurement in its entirety. The designated input levels are not necessarily an indication of the risk or liquidity associated with these investments.
These inputs are categorized in the following hierarchy under applicable financial accounting standards:
| Level 1 — | Unadjusted quoted prices in active markets for identical investments, unrestricted assets or liabilities that the Trust has the ability to access at the measurement date; |
| Level 2 — | Quoted prices which are not active, quoted prices for similar assets or liabilities in active markets or inputs other than quoted prices that are observable (either directly or indirectly) for substantially the full term of the asset or liability; and |
| Level 3 — | Significant unobservable prices or inputs (including the Trust’s own assumptions in determining the fair value of investments) where there is little or no market activity for the asset or liability at the measurement date. |
The following is a summary of the inputs used to value the Trust’s investments as of March 31, 2018:
| Investments in Securities at Value* | | Level 1 - Quoted Prices | | | Level 2 - Significant Observable Inputs | | | Level 3 - Significant Unobservable Inputs | | | Total | |
| Corporate Bonds | | $ | – | | | $ | 3,976,498 | | | $ | – | | | $ | 3,976,498 | |
| Secured Second Lien Loans | | | – | | | | 10,255,942 | | | | – | | | | 10,255,942 | |
| Senior Secured First Lien Loans | | | – | | | | 45,083,257 | | | | – | | | | 45,083,257 | |
| CLO Debt | | | – | | | | – | | | | 18,453,548 | | | | 18,453,548 | |
| CLO Equity | | | – | | | | – | | | | 41,354,546 | | | | 41,354,546 | |
| Money Market Mutual Funds | | | 559,021 | | | | – | | | | – | | | | 559,021 | |
| Total | | $ | 559,021 | | | $ | 59,315,697 | | | $ | 59,808,094 | | | $ | 119,682,812 | |
The Trust recognizes transfers between the levels as of the end of the period. For the period ended March 31, 2018, the Trust did not have any transfers between Level 1 and Level 2 securities.
The changes of the fair value of investments for which the Trust has used Level 3 inputs to determine the fair value are as follows:
| | | CLO Debt | | | CLO Equity | | | Total | |
| Balance as of September 30, 2017 | | $ | – | | | $ | – | | | $ | – | |
| Amortization | | | 1,255 | | | | – | | | | 1,255 | |
| Reductions to CLO Equity Cost Basis(a) | | | – | | | | (47,506 | ) | | | (47,506 | ) |
| Change in Unrealized Appreciation/(Depreciation) | | | 25,668 | | | | (60,381 | ) | | | (34,713 | ) |
| Purchases | | | 18,426,625 | | | | 41,462,433 | | | | 59,889,058 | |
| Balance as of March 31, 2018 | | $ | 18,453,548 | | | $ | 41,354,546 | | | $ | 59,808,094 | |
| Net change in unrealized appreciation/(depreciation) included in the Statements of Operations attributable to Level 3 investments held at March 31, 2018 | | $ | 25,668 | | | $ | (60,381 | ) | | $ | (34,713 | ) |
| (a) | Reduction to cost value on CLO equity investments represents the difference between distributions received, or entitled to be received, and income earned for the six-month period ended March 31, 2018. |
The following table summarizes the quantitative inputs and assumptions used for investments categorized in Level 3 of the fair value hierarchy as of the end of the reporting period. In addition to the techniques and inputs noted in the table below, according to the Trust’s valuation policy, the Adviser may use other valuation techniques and methodologies when determining the Trust’s fair value measurements as provided for in the valuation policy and approved by the Board. The table below is not intended to be all-inclusive, but rather provides information on the significant Level 3 inputs as they relate to the fair value measurements as of the end of the reporting period.
| Semi-Annual Report | March 31, 2018 | 23 |
| XAI Octagon Floating Rate & | |
| Alternative Income Term Trust | Notes to Financial Statements |
March 31, 2018 (Unaudited)
| | Quantitative Information about Level 3 Value Measurements |
| Assets | Value as of March 31, 2018 | Valuation Methodologies | Unobservable Input | Range/Weighted Average(2) |
| CLO Debt | 18,453,548 | Market Quotes | NBIB(1) | 92.00 – 102.52 / 99.75 |
| CLO Equity | 41,354,546 | Market Quotes | NBIB(1) | 50.52 – 100.88 / 81.57 |
| Total Level 3 assets | 59,808,094 | | | |
| (1) | The Trust generally uses non-binding indicative bid (“NBIB”) prices provided by an independent pricing service or broker on or near the valuation date as the primary basis for the fair value determination for CLO debt and equity investments, which may be adjusted for pending equity distributions as of the valuation date. These bid prices are non-binding, and may not be determinative of fair value. In valuing the Trust’s investments in CLO Debt and CLO equity, in addition to non-binding indicative bid prices provided by an independent pricing service or broker, the Trust also may consider a variety of relevant factors as set forth in the Trust’s valuation policy, including recent trading prices for specific investments, recent purchases and sales known to the Trust in similar securities, other information known to the Trust relating to the securities, and discounted cash flows based on output from a third-party financial model, using projected future cash flows. |
| (2) | Weighted averages are calculated based on the value of investments on March 31, 2018. |
Significant increases or decreases in any of the unobservable inputs in isolation may result in a significantly lower or higher fair value measurement.
Indemnification: The Trust indemnifies its Officers and Trustees for certain liabilities that may arise from the performance of their duties to the Trust. Additionally, in the normal course of business, the Trust enters into contracts that contain a variety of representations and warranties and which provide general indemnities. The Trust’s maximum exposure under these arrangements is unknown, as this would involve future claims that may be made against the Trust that have not yet occurred. However, based on industry experience, the Trust expects the risk of loss due to these warranties and indemnities to be remote.
3. INVESTMENT ADVISORY AND OTHER AGREEMENTS
XA Investments LLC serves as the investment adviser to the Trust and is responsible for overseeing the Trust’s overall investment strategy and its implementation. Octagon Credit Investors, LLC (“Octagon” or the “Sub-Adviser”) serves as the investment sub-adviser of the Trust and is responsible for investing the Trust’s assets. The Trust pays an advisory fee to the Adviser. The Adviser pays to the Sub-Adviser a sub-advisory fee out of the advisory fee received by the Adviser.
Pursuant to an investment advisory agreement between the Trust and the Adviser, the Trust pays the Adviser a fee, payable monthly in arrears, in an annual amount equal to 1.70% of the Trust’s average daily Managed Assets. “Managed Assets” means the total assets of the Trust, including assets attributable to the Trust’s use of leverage, minus the sum of its accrued liabilities (other than liabilities incurred for the purpose of creating leverage). For the six-month period ended March 31, 2018 the Trust incurred $986,249 in advisory fees.
The sub-advisory fee, payable monthly in arrears to the sub-adviser, is calculated as a specified percentage of the advisory fee payable by the Trust to the Adviser (before giving effect to any fees waived or expenses reimbursed by the Adviser). The specified percentage is equal to the blended percentage computed by applying the following percentages to the aggregate average daily Managed Assets of all registered investment companies in the XAI fund complex for which the Sub-Adviser (or an affiliate of the Sub-Adviser) serves as investment sub-adviser, including the Trust (“Eligible Funds”):
| Aggregate Eligible Funds Average Daily Managed Assets | Percentage of Advisory Fee |
| First $500 million | 60% |
| Over $500 million | 50% |
The Trust is currently the only Eligible Fund and the sub-advisory fee equals 60% of the advisory fee payable to the Adviser.
The Trust pays all costs and expenses of its operations in addition to the advisory fee and investor support services and secondary market support services fee paid to the adviser. The Adviser has contractually agreed to waive a portion of the advisory fee and/or reimburse the Trust for certain operating expenses so that the annual expenses of the Trust do not exceed 0.30% of the Trust’s Managed Assets (exclusive of investment advisory fees, investor support and secondary market services fees, taxes, expenses incurred directly or indirectly by the Trust as a result of an investment in a permitted investment (including, without limitation, acquired fund fees and expenses), expenses associated with the acquisition or disposition of portfolio investments (including, without limitation, brokerage commissions and other trading or transaction expenses), leverage expenses (including, without limitation, costs associated with the issuance or incurrence of leverage, commitment fees, interest expense or dividends on preferred shares), expenses incurred in connection with issuances and sales of shares of the Trust (including, without limitation, fees, commissions and offering costs), dividends on short sales, if any, securities lending costs, if any, expenses of holding, and soliciting proxies for, meetings of shareholders of the Trust (except to the extent relating to routine items such as the election of trustees), expenses of a reorganization, restructuring, reconciling or merger of the Trust or the acquisition of all or substantially all of the assets of another fund, or any extraordinary expenses not incurred in the ordinary course of the Trust’s business (including, without limitation, expenses related to litigation, derivative actions, demands related to litigation, regulatory or other government investigations and proceeding). The Adviser may recoup waived or reimbursed amounts for three years following the date of such waiver or reimbursement, provided total expenses, including such recoupment, do not exceed the lesser of the annual expense limit at the time such expenses were waived or reimbursed or the annual expense limit at the time of recoupment. For the period ended March 31, 2018, the fee waivers and/or reimbursements were $280,182.
| XAI Octagon Floating Rate & | |
| Alternative Income Term Trust | Notes to Financial Statements |
March 31, 2018 (Unaudited)
As of March 31, 2018, the following amounts were available for recoupment by the Adviser based upon their expiration dates:
| | | | Expires 2020 | | | Expires 2021 | |
| | | | | $ | 21,797 | | | $ | 280,182 | |
The Trust has also retained the Adviser to provide investor support services and secondary market support services in connection with the ongoing operation of the Trust. Such services include providing ongoing contact with respect to the Trust with financial intermediaries, communicating with the NYSE specialist for the shares, and with the closed-end fund analyst community regarding the Trust on a regular basis, and hosting and maintaining a website for the Trust. The Trust will pay the Adviser a service fee, payable monthly in arrears, in an annual amount equal to 0.20% of the Trust’s average daily Managed Assets.
ALPS Fund Services, Inc. (“ALPS”) serves as the Trust’s Administrator and Accounting Agent and receives customary fees from the Trust for such services.
ALPS provides services that assist the Trust’s chief compliance officer in monitoring and testing the policies and procedures of the Trust in conjunction with requirements under Rule 38a-1 under the 1940 Act and receives an annual base fee. ALPS is reimbursed for certain out-of-pocket expenses by the Trust. Compliance service fees paid by the Trust for the period ended March 31, 2018 are disclosed in the Statement of Operations.
DST Systems Inc., an affiliate of ALPS, serves as transfer, dividend paying and shareholder servicing agent for the Trust. U.S. Bank N.A. serves as the Trust’s custodian.
4. DISTRIBUTIONS
The Trust intends to pay substantially all of its net investment income, if any, to common shareholders through monthly distributions. The Trust intends to distribute any net long-term capital gains to common shareholders at least annually. The Trust expects to declare distributions monthly. To permit the Trust to maintain more stable monthly distributions, the Trust may distribute more or less than the amount of the net income earned in a particular period. There is no assurance the Trust will continue to pay regular monthly distributions or that it will do so at a particular rate. Distributions may be paid by the Trust from any permitted source and, from time to time, all or a portion of a distribution may be a return of capital. Shareholders should not assume that the source of the distribution from the Trust is net income or profit.
5. CAPITAL TRANSACTIONS
Pursuant to the Trust’s Agreement and Declaration of Trust, the Trust is authorized to issue an unlimited number of common shares of beneficial interest, par value $0.01 per share (“Common Shares”). Each Common Share has one vote and, when issued and paid for in accordance with the terms of this offering, will be fully paid and non-assessable. All Common Shares are equal as to dividends, assets and voting privileges and have no conversion, preemptive or other subscription rights. The Trust will send annual and semi-annual reports, including financial statements, to all holders of its shares.
Any additional offerings of Common Shares will require approval by the Board of Trustees. Any additional offering of Common Shares will be subject to the requirements of the 1940 Act, which provides that shares may not be issued at a price below the then current net asset value, exclusive of sales load, except in connection with an offering to existing Common Shareholders or with the consent of a majority of the Trust’s outstanding voting securities.
| Semi-Annual Report | March 31, 2018 | 25 |
| XAI Octagon Floating Rate & | |
| Alternative Income Term Trust | Notes to Financial Statements |
March 31, 2018 (Unaudited)
| | | For the Six Months Ended March 31, 2018 (Unaudited) | | | For the Period September 27, 2017 (Commencement of Operations) to September 30, 2017 | |
| Common Shares outstanding - beginning of period | | | 7,260,205 | | | | – | |
| Common Shares issued pursuant to exercise of the over-allotment option in connection with initial public offering | | | 1,087,500 | | | | 7,260,205 | |
| Common Shares issued as reinvestment of dividends | | | 286 | | | | – | |
| Common Shares outstanding - end of period | | | 8,347,991 | | | | 7,260,205 | |
In connection with its initial public offering, the Trust granted to the underwriters of that offering an option, exercisable for 45 days from September 27, 2017, to purchase up to an additional 1,087,500 Common Shares to cover over-allotments, if any, at the initial offering price. The Trust issued 500,000 Common Shares on October 13, 2017 and 587,500 Common Shares on November 10, 2017 pursuant to this option. These Common Shares were issued at $10.00 per share before the underwriting discount of $0.20 per share. Offering costs of $21,750 (representing
$0.02 per Common Share) were offset against the net proceeds of the offering and have been charged to paid-in capital of the Common Shares. The Adviser agreed to pay those offering costs of the Trust (other than the sales load) that exceeded $0.02 per Common Share. These offering costs paid by the Adviser are not subject to recoupment from the Trust.
6. LEVERAGE
The Trust uses leverage to seek to enhance total return and income. The Trust may use leverage through (i) the issuance of senior securities representing indebtedness, including through borrowing from financial institutions or issuance of debt securities, including notes or commercial paper (collectively, “Indebtedness”), (ii) the issuance of preferred shares (“Preferred Shares”) and/or (iii) reverse repurchase agreements, securities lending, short sales or derivatives, such as swaps, futures or forward contracts, that have the effect of leverage (“portfolio leverage”). The Trust currently intends to use leverage through Indebtedness and may use Indebtedness to the maximum extent permitted under the 1940 Act. Under the 1940 Act, the Trust may utilize Indebtedness up to 33 1/3% of its Managed Assets (specifically, the Trust may not incur Indebtedness if, immediately after incurring such Indebtedness, the Trust would have asset coverage (as defined in the 1940 Act) of less than 300%). The Trust will not utilize leverage, either through Indebtedness, Preferred Shares or portfolio leverage, in an aggregate amount in excess of 40% of the Trust’s Managed Assets (including the proceeds of leverage).
On October 6, 2017, the Trust entered into a Credit Agreement (the “Credit Agreement”) with Societe Generale (the “Lender”) that established a revolving credit facility (the “Facility”) of up to $40,000,000. Interest on the amount borrowed is based on three-month LIBOR plus 1.20%. The Trust’s borrowings are secured by eligible securities held in its portfolio of investments. The Credit Agreement includes usual and customary covenants. Among other things, these covenants place limitations or restrictions on the Trust’s ability to (i) incur other indebtedness, (ii) change certain investment policies, (iii) pledge or create liens upon the assets of the Trust. In addition, the Trust is required to deliver financial information to the Lender, maintain an asset coverage ratio of not less than 300% and maintain its registration as a closed-end management investment company.
For the six months ended March 31, 2018, the average amount borrowed under the Credit Agreement and the average interest rate for the amount borrowed was $37,639,633 and 2.80%, respectively. As of March 31, 2018, the amount of such outstanding borrowings was $38,865,000. The interest rate applicable to the borrowings on March 31, 2018 was 2.95%. All securities held as of March 31, 2018 are pledged as collateral for the leverage facility.
The use of leverage is a speculative technique that involves special risks. The Trust currently anticipates utilizing leverage to seek to enhance total return and income. There can be no assurance that the Adviser’s and the Sub-Adviser’s expectations will be realized or that a leveraging strategy will be successful in any particular time period. Use of leverage creates an opportunity for increased income and capital appreciation but, at the same time, creates special risks. Leverage exposes the Trust to greater risk and increased costs than if it were not implemented. The more leverage that is utilized by the Trust, the more exposed the Trust will be to the risks of leverage. The use of leverage by the Trust causes the net asset value of the common shares to fluctuate significantly in response to changes in interest rates and other economic indicators. As a result, the net asset value, market price and dividend rate of the common shares is likely to be more volatile than those of a fund that is not exposed to leverage. Leverage increases operating costs, which may reduce total return. The Trust pays interest on its borrowings, which may reduce the Trust’s return. Increases in interest rates that the Trust must pay on its borrowings will increase the cost of leverage and may reduce the return to common shareholders. The risk of increases in interest rates may be greater in the current market environment because interest rates are near historically low levels. During the time in which the Trust is utilizing leverage, the amount of the investment advisory fee paid by the Trust will be higher than if the Trust did not utilize leverage because the fees paid will be calculated based on the Trust’s Managed Assets (including proceeds of leverage). Common shareholders bear the portion of the management fee attributable to assets purchased with the proceeds of leverage, which means that common shareholders effectively bear the entire management fee.
| XAI Octagon Floating Rate & | |
| Alternative Income Term Trust | Notes to Financial Statements |
March 31, 2018 (Unaudited)
7. PORTFOLIO INFORMATION
Purchase and Sales of Securities: For the period ended March 31, 2018, the cost of purchases and proceeds from sales of securities, excluding short-term obligations were as follows:
| Cost of Investments Purchased | | $ | 198,031,342 | |
| Proceeds from Investments Sold | | $ | 79,601,858 | |
8. TAXES
Classification of Distributions: Net investment income/(loss) and net realized gain/(loss) may differ for financial statement and tax purposes. The character of distributions made during the year from net investment income or net realized gains may differ from its ultimate characterization for federal income tax purposes. Also, due to the timing of dividend distributions, the fiscal year in which amounts are distributed may differ from the fiscal year in which the income or realized gain was recorded by the Trust. No distributions were paid in the period ended September 30, 2017.
Components of Earnings: The amounts and characteristics of tax basis distributions and composition of distributable earnings/(accumulated losses) are finalized at fiscal year end; accordingly, tax basis balances have not been determined as of March 31, 2018.
Tax Basis of Investments: Net unrealized appreciation/(depreciation) of investments based on federal tax cost as of March 31, 2018, was as follows:
| Cost of investments for income tax purposes | | $ | 119,738,164 | |
| Gross appreciation (excess of value over tax cost) | | $ | 1,233,152 | |
| Gross depreciation (excess of tax cost over value) | | | (1,288,504 | ) |
| Net unrealized depreciation | | $ | (55,352 | ) |
Federal Income Tax Status: For federal income tax purposes, the Trust currently qualifies, and intends to remain qualified, as a regulated investment company under the provisions of Subchapter M of the Internal Revenue Code of 1986, as amended, by distributing substantially all of its investment company taxable net income and realized gain, not offset by capital loss carryforwards, if any, to its shareholders. No provision for federal income taxes has been made.
As of and during the period ended March 31, 2018, the Trust did not have a liability for any unrecognized tax benefits. The Trust files U.S. federal, state, and local tax returns as required. The Trust’s tax returns are subject to examination by the relevant tax authorities until expiration of the applicable statute of limitations which is generally three years after the filing of the tax return.
9. RISK FACTORS
In the normal course of business, the Trust invests in financial instruments and enters into financial transactions where risk of potential loss exists due to such things as changes in the market (market risk) or failure or inability of the other party to a transaction to perform (credit and counterparty risk). See below for a detailed description of select principal risks. The following list is not intended to be a comprehensive listing of all of the potential risks associated with the Trust. Please see www.xainvestments.com/funds for a detailed discussion of the Trust’s risks and considerations.
Concentration of Credit Risk: The Trust places its cash with a banking institution, which is insured by Federal Deposit Insurance Corporation (FDIC). The FDIC limit is $250,000. At various times throughout the year, the amount on deposit may exceed the FDIC limit and subject the Trust to a credit risk. The Trust does not believe that such deposits are subject to any unusual risk associated with investment activities.
Debt Securities Risk: When the Trust invests in debt securities, the value of an investment in the Trust will fluctuate with changes in interest rates. Typically, a rise in interest rates causes a decline in the value of debt securities. In general, the market price of debt securities with longer maturities will increase or decrease more in response to changes in interest rates than shorter-term securities. Other risk factors include credit risk (the debtor may default) and prepayment risk (the debtor may pay its obligation early, reducing the amount of interest payments). These risks could affect the value of a particular investment, possibly causing the Trust’s share price and total return to be reduced and fluctuate more than other types of investments.
| Semi-Annual Report | March 31, 2018 | 27 |
| XAI Octagon Floating Rate & | |
| Alternative Income Term Trust | Notes to Financial Statements |
March 31, 2018 (Unaudited)
Secured Debt Risk: Secured debt holds the most senior position in the capital structure of a borrower. Secured debt in most circumstances is fully collateralized by assets of the borrower. Thus, it is generally repaid before unsecured bank loans, corporate bonds, subordinated debt, trade creditors, and preferred or common stockholders. Substantial increases in interest rates may cause an increase in loan defaults as borrowers may lack resources to meet higher debt service requirements. The value of the Trust’s assets may also be affected by other uncertainties such as economic developments affecting the market for senior secured term loans or affecting borrowers generally. Moreover, the security for the Trust’s investments in secured debt may not be recognized for a variety of reasons, including the failure to make required filings by lenders, trustees or other responsible parties and, as a result, the Trust may not have priority over other creditors as anticipated.
Secured debt may include restrictive covenants, which must be maintained by the borrower. The Trust may have an obligation with respect to certain senior secured term loan investments to make additional loans upon demand by the borrower. Such instruments, unlike certain bonds, usually do not have call protection. This means that such interests, while having a stated term, may be prepaid, often without penalty. The rate of such prepayments may be affected by, among other things, general business and economic conditions, as well as the financial status of the borrower. Prepayment would cause the actual duration of a senior loan to be shorter than its stated maturity.
Secured debt typically will be secured by pledges of collateral from the borrower in the form of tangible and intangible assets. In some instances, the Trust may invest in secured debt that is secured only by stock of the borrower or its subsidiaries or affiliates. The value of the collateral may decline below the principal amount of the senior secured term loans subsequent to an investment by the Trust.
Subordinated and Unsecured or Partially Secured Loans Risk: The Trust may invest in unsecured loans and secured subordinated loans, including second and lower lien loans. Second lien loans are generally second in line in terms of repayment priority. A second lien loan may have a claim on the same collateral pool as the first lien or it may be secured by a separate set of assets. Second lien loans generally give investors priority over general unsecured creditors in the event of an asset sale. The priority of the collateral claims of third or lower lien loans ranks below holders of second lien loans and so on. Such junior loans are subject to the same general risks inherent to any loan investment, including credit risk, market and liquidity risk, and interest rate risk. Due to their lower place in the borrower’s capital structure and possible unsecured or partially secured status, such loans involve a higher degree of overall risk than senior loans of the same borrower.
Structured Products Risk: The Trust may invest in Collateralized Loan Obligations (“CLOs”) and other structured products, consisting of Collateralized Debt Obligations (“CDOs”), Collateralized Bond Obligations, and credit-linked notes. Holders of structured products bear risks of the underlying investments, index or reference obligation and are subject to counterparty risk.
The Trust may have the right to receive payments only from the structured product, and generally does not have direct rights against the issuer or the entity that sold the assets to be securitized. While certain structured products enable the investor to acquire interests in a pool of securities without the brokerage and other expenses associated with directly holding the same securities, investors in structured products generally pay their share of the structured product’s administrative and other expenses. Although it is difficult to predict whether the prices of indices and securities underlying structured products will rise or fall, these prices (and, therefore, the prices of structured products) will be influenced by the same types of political and economic events that affect issuers of securities and capital markets generally. If the issuer of a structured product uses shorter term financing to purchase longer term securities, the issuer may be forced to sell its securities at below market prices if it experiences difficulty in obtaining short-term financing, which may adversely affect the value of the structured products owned by the Trust.
Certain structured products may be thinly traded or have a limited trading market. CLOs and credit-linked notes are typically privately offered and sold.
Loan Participations and Assignments: The Trust may invest in loans arranged through private negotiation between one or more financial institutions. The Trust’s investment in any such loan may be in the form of a participation in or an assignment of the loan. In connection with purchasing participations, the Trust generally will have no right to enforce compliance by the borrower with the terms of the loan agreement relating to the loan, nor any rights of set-off against the borrower and the Trust may not benefit directly from any collateral supporting the loan in which they have purchased the participation.
While some loans are collateralized and senior to an issuer’s other debt securities, other loans may be unsecured and/or subordinated to other securities. Some loans may be considered illiquid, and are generally less liquid than exchange-traded debt instruments.
| XAI Octagon Floating Rate & | |
| Alternative Income Term Trust | Notes to Financial Statements |
March 31, 2018 (Unaudited)
CLO Risk: In addition to the general risks associated with debt securities and structured products discussed herein, CLOs carry additional risks, including, but not limited to (i) the possibility that distributions from collateral securities will not be adequate to make interest or other payments; (ii) the quality of the collateral may decline in value or default; (iii) the possibility that the investments in CLOs are subordinate to other classes or tranches thereof; and (iv) the complex structure of the security may not be fully understood at the time of investment and may produce disputes with the issuer or unexpected investment results.
CLO equity and junior debt securities that the Trust may acquire are subordinated to more senior tranches of CLO debt. CLO equity and junior debt securities are subject to increased risks of default relative to the holders of superior priority interests in the same securities. In addition, at the time of issuance, the CLO may not be fully invested. Until the CLO is fully invested, the debt service of the CLO may exceed the amount of interest earned from the CLO’s portfolio. Though not exclusively, the Trust will typically be in a first loss or subordinated position with respect to realized losses on the assets of the CLOs in which it is invested. The Trust may recognize phantom taxable income from its investments in the subordinated tranches of CLOs and structured notes.
Between the closing date and the effective date of a CLO, the CLO collateral manager will generally expect to purchase additional collateral obligations for the CLO. During this period, the price and availability of these collateral obligations may be adversely affected by a number of market factors, including price volatility and availability of investments suitable for the CLO, which could hamper the ability of the collateral manager to acquire a portfolio of collateral obligations that will satisfy specified concentration limitations and allow the CLO to reach the initial par amount of collateral prior to the effective date. An inability or delay in reaching the target initial par amount of collateral may adversely affect the timing and amount of interest or principal payments received by the holders of the CLO debt securities and distributions of the CLO on equity securities and could result in early redemptions which may cause CLO debt and equity investors to receive less than the face value of their investment.
The failure by a CLO in which the Trust invests to satisfy financial covenants, including with respect to adequate collateralization and/or interest coverage tests, could lead to a reduction in the CLO’s payments to the Trust. In the event that a CLO fails certain tests, holders of CLO senior debt may be entitled to additional payments that would, in turn, reduce the payments the Trust would otherwise be entitled to receive. Separately, the Trust may incur expenses to the extent necessary to seek recovery upon default or to negotiate new terms, which may include the waiver of certain financial covenants, with a defaulting CLO or any other investment the Trust may make. If any of these occur, it could adversely affect the Trust’s operating results and cash flows.
The Trust’s CLO investments are exposed to leveraged credit risk. If certain minimum collateral value ratios and/or interest coverage ratios are not met by a CLO, primarily due to senior secured loan defaults, then cash flow that otherwise would have been available to pay distributions to the Trust on its CLO investments may instead be used to redeem any senior notes or to purchase additional senior secured loans, until the ratios again exceed the minimum required levels or any senior notes are repaid in full. The Trust’s CLO investments and/or the underlying senior secured loans may prepay more quickly than expected, which could have an adverse impact on the Company’s net assets.
10. RECENT ACCOUNTING PRONOUNCEMENTS
In March 2017, the Financial Accounting Standards Board issued Accounting Standards Update “Premium Amortization on Purchased Callable Debt Securities” which amends the amortization period for a callable debt security held at a premium from the maturity date to the earliest call date. The guidance is effective for annual periods beginning after December 15, 2018, and interim periods within those annual periods. At this time, management is evaluating the implications of these changes on the Trust.
In November 2016, the FASB issued Accounting Standards Update “Restricted Cash” which will require entities to include the total of cash, cash equivalents, restricted cash, and restricted cash equivalents in the beginning and ending cash balances in the Statement of Cash Flows. The guidance is effective for fiscal years beginning after December 15, 2017, and interim periods within those years. At this time, management is evaluating the impact, if any, of this guidance on the Trust’s presentation in the Statement of Cash Flows.
| Semi-Annual Report | March 31, 2018 | 29 |
| XAI Octagon Floating Rate & | |
| Alternative Income Term Trust | Additional Information |
March 31, 2018 (Unaudited)
DIVIDEND REINVESTMENT PLAN
Under the Trust’s Dividend Reinvestment Plan (the “Plan”), a holder of Common Shares (“Common Shareholder”) whose Common Shares are registered in his or her own name will have all distributions reinvested automatically by DST Systems, Inc., which is agent under the Plan (the “Plan Agent”), unless the Common Shareholder elects to receive cash.
Distributions with respect to Common Shares registered in the name of a broker-dealer or other nominee (that is, in “street name”) will be reinvested in additional Common Shares under the Plan, unless the broker or nominee does not participate in the Plan or the Common Shareholder elects to receive distributions in cash. Investors who own Common Shares registered in street name should consult their broker-dealers for details regarding reinvestment. All distributions to investors who do not participate in the Plan will be paid by check mailed directly to the record holder by DST Systems, Inc., as dividend disbursing agent. A participant in the Plan who wishes to opt out of the Plan and elect to receive distributions in cash should contact DST Systems, Inc. in writing at the address specified below or by calling the telephone number specified below.
Under the Plan, whenever the market price of the Common Shares is equal to or exceeds net asset value at the time Common Shares are valued for purposes of determining the number of Common Shares equivalent to the cash dividend or capital gains distribution, participants in the Plan are issued new Common Shares from the Trust, valued at the greater of (i) the net asset value as most recently determined or (ii) 95% of the then-current market price of the Common Shares. The valuation date is the dividend or distribution payment date or, if that date is not a NYSE trading day, the next preceding trading day. If the net asset value of the Common Shares at the time of valuation exceeds the market price of the Common Shares, the Plan Agent will buy the Common Shares for the Plan in the open market, on the NYSE or elsewhere, for the participants’ accounts, except that the Plan Agent will endeavor to terminate purchases in the open market and cause the Trust to issue Common Shares at the greater of net asset value or 95% of market value if, following the commencement of such purchases, the market value of the Common Shares exceeds net asset value. If the Trust should declare a distribution or capital gains distribution payable only in cash, the Plan Agent will buy the Common Shares for the Plan in the open market, on the NYSE or elsewhere, for the participants’ accounts. There is no charge from the Trust for reinvestment of dividends or distributions in Common Shares pursuant to the Plan and no brokerage charges will be incurred with respect to Common Shares issued directly by the Trust pursuant to the Plan; however, all participants will pay a pro rata share of brokerage commissions incurred by the Plan Agent when it makes open-market purchases.
The Plan Agent maintains all shareholder accounts in the Plan and furnishes written confirmations of all transactions in the account, including information needed by shareholders for personal and tax records. Common Shares in the account of each Plan participant will be held by the Plan Agent in non-certificated form in the name of the participant.
In the case of shareholders such as banks, brokers or nominees, which hold Common Shares for others who are the beneficial owners, and participate in the Plan, the Plan Agent will administer the Plan on the basis of the number of Common Shares certified from time to time by the Common Shareholder as representing the total amount registered in the shareholder’s name and held for the account of beneficial owners who participate in the Plan.
Participants that request a sale of shares through the Plan Agent will incur brokerage charges in connection with such sales.
The automatic reinvestment of dividends and other distributions will not relieve participants of any income tax that may be payable or required to be withheld on such dividends or distributions.
Experience under the Plan may indicate that changes are desirable. Accordingly, the Trust reserves the right to amend or terminate its Plan as applied to any voluntary cash payments made and any dividend or distribution paid subsequent to written notice of the change sent to the members of such Plan at least 90 days before the record date for such dividend or distribution. The Plan also may be amended or terminated by the Plan Agent on at least 90 days’ prior written notice to the participants in such Plan. All correspondence concerning the Plan should be directed to the Plan Agent, DST Systems, Inc., 430 W. 7th Street, Kansas City, Missouri 64105-1594.
PROXY VOTING
Information on how the Trust voted proxies relating to portfolio securities during the most recent twelve-month period ended June 30 will be available without charge, upon request, by calling (888) 903-3358. This information is also available on the SEC’s website at www.sec.gov.
| XAI Octagon Floating Rate & | |
| Alternative Income Term Trust | Additional Information |
March 31, 2018 (Unaudited)
DISTRIBUTIONS
The following table sets forth the distributions paid by the Trust and estimated amount of the sources of distribution calculated in accordance with Section 19 of the 1940 Act and the related rules adopted thereunder. The Trust estimates the following percentages of each distribution per share attributable to (i) current and prior fiscal year net investment income, (ii) net realized short-term capital gain, (iii) net realized long-term capital gain and (iv) return of capital or other capital source as a percentage of the total distribution amount. The amounts and sources of distributions reported in the 19(a) notices are only estimates and not for tax reporting purposes. The actual amounts and sources of the amounts for tax reporting purposes will depend upon the Trust’s investment experience during the remainder of the calendar year and may be subject to changes based on tax regulations. The Trust will send investors a Form 1099-DIV for the calendar year that will tell investors how to report these distributions for federal income tax purposes.
| Distributions for the six months ended March 31, 2018 | | | % Breakdown of the Distributions for the six months ended March 31, 2018 | |
| | | | | |
Distribution Payment Date | | | Net Investment Income | | | Net Realized Short-Term Capital Gains** | | | Return of Capital | | | Total Per Common Share | | | Net Investment Income | | | Net Realized Short-Term Capital Gains** | | | Return of Capital | | | Total Per Common Share | |
| 12/1/2017* | | | $ | 0.034 | | | $ | 0.017 | | | $ | 0.018 | | | $ | 0.069 | | | | 49.78 | % | | | 24.32 | % | | | 25.09 | % | | | 100.00 | % |
| 12/29/2017 | | | $ | 0.059 | | | $ | 0.010 | | | $ | – | | | $ | 0.069 | | | | 84.80 | % | | | 15.20 | % | | | 0.00 | % | | | 100.00 | % |
| 2/1/2018* | | | $ | 0.053 | | | $ | 0.016 | | | $ | – | | | $ | 0.069 | | | | 76.94 | % | | | 23.06 | % | | | 0.00 | % | | | 100.00 | % |
| 3/1/2018* | | | $ | 0.058 | | | $ | 0.011 | | | $ | – | | | $ | 0.069 | | | | 84.25 | % | | | 15.75 | % | | | 0.00 | % | | | 100.00 | % |
| * | For certain distributions the Trust provided a written statement contemporaneously with the distribution identifying the sources of the distribution in accordance with Rule 19a-1 under the 1940 Act and for certain distributions the Trust determined that no such written statement was required, in each case on the basis of the Trust’s reasonable estimates prior to the end of the period for which such distribution was paid. In certain instances, such estimates were subsequently ascertained to be inaccurate. Therefore, the table above corrects such estimates and written statements. |
| ** | There were no long-term capital gains earned during the period. |
NOTICE TO STOCKHOLDERS
Notice is hereby given in accordance with Section 23(c) of the 1940 Act, that the Trust from time to time may purchase shares of its common stock in the open market or in private transactions.
PRIVACY PRINCIPLES OF THE TRUST
The Trust is committed to maintaining the privacy of its shareholders and to safeguarding their non-public personal information. The following information is provided to help you understand what personal information the Trust collects, how the Trust protects that information and why, in certain cases, the Trust may share information with select other parties.
Generally, the Trust does not receive any non-public personal information relating to its shareholders, although certain non-public personal information of its shareholders may become available to the Trust. The Trust does not disclose any non-public personal information about its shareholders or former shareholders to anyone except as permitted by law or as is necessary in order to service shareholder accounts (for example, to a transfer agent or third party administrator).
The Trust restricts access to non-public personal information about its shareholders to employees of the Adviser and its delegates and affiliates with a legitimate business need for the information. The Trust maintains physical, electronic and procedural safeguards designed to protect the non-public personal information of its shareholders.
TRANSFER AGENT AND CUSTODIAN
DST Systems, Inc., 430 W. 7th Street, Kansas City, Missouri 64105, serves as the Trust’s transfer agent and registrar.
U.S. Bank N.A., 1555 N. River Center Drive, Milwaukee, Wisconsin 53212, serves as the custodian of the Trust.
| Semi-Annual Report | March 31, 2018 | 31 |
| XAI Octagon Floating Rate & | |
| Alternative Income Term Trust | Additional Information |
March 31, 2018 (Unaudited)
LEGAL COUNSEL
Skadden, Arps, Slate Meagher & Flom LLP, 155 North Wacker Drive, Chicago, Illinois 60606, serves as legal counsel to the Trust.
INDEPENDENT REGISTERED PUBLIC ACCOUNTING FIRM
KPMG LLP, 200 E. Randolph Drive, Chicago, IL 60601, is the independent registered public accounting firm of the Trust.

Item 2. Code of Ethics.
Not applicable.
Item 3. Audit Committee Financial Expert.
Not applicable.
Item 4. Principal Accountant Fees and Services.
Not applicable.
Item 5. Audit Committee of Listed Registrants.
Not applicable.
Item 6. Investments.
| (a) | The Schedule of Investments is included as part of the Report to Stockholders filed under Item 1 of this report. |
Item 7. Disclosure of Proxy Voting Policies and Procedures for Closed-End Management Investment Companies.
Not applicable.
Item 8. Portfolio Managers of Closed-End Management Investment Companies.
Item 9. Purchases of Equity Securities by Closed-End Management Investment Company and Affiliated Purchasers.
None.
Item 10. Submission of Matters to a Vote of Security Holders.
There have been no material changes to the procedures by which shareholders may recommend nominees to the Board of Trustees of the Registrant.
Item 11. Controls and Procedures.
| (a) | The Registrant’s principal executive officer and principal financial officer have concluded that the Registrant’s disclosure controls and procedures (as defined in Rule 30a-3(c) under the Investment Company Act of 1940, as amended) are effective based on their evaluation of these controls and procedures as of a date within 90 days of the filing date of this document. |
| (b) | There was no change in the Registrant’s internal control over financial reporting (as defined in Rule 30a-3(d) under the Investment Company Act of 1940, as amended) during the second fiscal quarter of the period covered by this report that has materially affected, or is reasonably likely to materially affect, the Registrant’s internal control over financial reporting. |
Item 12. Disclosure of Securities Lending Activities for Closed-End Management Investment Companies.
Not applicable.
Item 13. Exhibits.
| (a)(2) | Certifications required by Item 13(a)(2) of Form N-CSR are filed herewith as Exhibit 99.CERT. |
| (b) | Certifications required by Item 13(b) of Form N-CSR are filed herewith as Exhibit 99.906CERT. |
SIGNATURES
Pursuant to the requirements of the Securities Exchange Act of 1934 and the Investment Company Act of 1940, the registrant has duly caused this report to be signed on its behalf by the undersigned, thereunto duly authorized.
XAI OCTAGON FLOATING RATE & ALTERNATIVE INCOME TERM TRUST
| By: | (Signature and Title) | /s/ Theodore J. Brombach | |
| | | Theodore J. Brombach | |
| Date: | June 6, 2018 | President and Chief Executive Officer | |
| | | (Principal Executive Officer) | |
Pursuant to the requirements of the Securities Exchange Act of 1934 and the Investment Company Act of 1940, this report has been signed below by the following persons on behalf of the registrant and in the capacities and on the dates indicated.
| By: | (Signature and Title) | /s/ Theodore J. Brombach | |
| | | Theodore J. Brombach | |
| Date: | June 6, 2018 | President and Chief Executive Officer | |
| | | (Principal Executive Officer) | |
| | | | |
| By: | (Signature and Title) | /s/ John “Yogi” Spence | |
| | | John “Yogi” Spence | |
| Date: | June 6, 2018 | Treasurer and Chief Financial Officer | |
| | | (Principal Financial Officer) | |