UNITED STATES
SECURITIES AND EXCHANGE COMMISSION
Washington, D.C. 20549
FORM N-CSR
CERTIFIED SHAREHOLDER REPORT OF REGISTERED
MANAGEMENT INVESTMENT COMPANIES
811-23247
(Investment Company Act File Number)
XAI Octagon Floating Rate & Alternative Income Term Trust
(Exact Name of Registrant as Specified in Charter)
321 North Clark Street, Suite 2430
Chicago, IL 60654
(Address of Principal Executive Offices)
John P. McGarrity, Esq.
XA Investments LLC
321 North Clark Street, Suite 2430
Chicago, IL 60654
(Name and Address of Agent for Service)
(312) 374-6930
(Registrant’s Telephone Number)
Date of Fiscal Year End:September 30
Date of Reporting Period:March 31, 2019
| Item 1. | Reports to Stockholders. |
TABLE OF CONTENTS
| Shareholder Letter | 1 |
| Questions & Answers | 2 |
| Trust Portfolio Information | 8 |
| Schedule of Investments | 10 |
| Statement of Assets and Liabilities | 17 |
| Statement of Operations | 18 |
| Statements of Changes In Net Assets | 19 |
| Statement of Cash Flows | 20 |
| Financial Highlights | 21 |
| Notes to Financial Statements | 22 |
| Additional Information | 31 |
Beginning on January 1, 2021, as permitted by regulations adopted by the SEC, paper copies of XAI Octagon Floating Rate & Alternative Income Term Trust’s (“the Trust”) annual and semi-annual shareholder reports will no longer be sent by mail, unless you specifically request paper copies of the reports from the Trust or from your financial intermediary, such as a broker-dealer or bank. Instead, the reports will be made available on the Trust’s website (www.xainvestments.com/XFLT), and you will be notified by mail each time a report is posted and provided with a website link to access the report.
If you already elected to receive shareholder reports electronically, you will not be affected by this change and you need not take any action. You may elect to receive shareholder reports and other communications from the Trust by contacting your financial intermediary, such as a broker-dealer or bank.
Beginning January 1, 2019, you may elect to receive all future reports in paper free of charge. If you own these shares through a financial intermediary, such as a broker-dealer or bank, you may contact your financial intermediary to request that you continue to receive paper copies of your shareholder reports. If you invest directly with the Trust, you can inform the Trust that you wish to continue receiving paper copies of your shareholder reports by calling (888) 903-3358. Your election to receive reports in paper will apply to all funds held with the fund complex if you invest directly with the Trust or to all funds held in your account if you invest through your financial intermediary.
| XAI Octagon Floating Rate & | |
| Alternative Income Term Trust | Shareholder Letter |
March 31, 2019 (Unaudited)
Dear Shareholder:
We thank you for your investment in XAI Octagon Floating Rate & Alternative Income Term Trust (the “Trust”). This semi-annual report covers the six-month period ended March 31, 2019.
XA Investments LLC (“XAI”) serves as the investment adviser to the Trust. Octagon Credit Investors, LLC (“Octagon”) serves as the Trust’s investment sub-adviser and is responsible for the management of the Trust’s portfolio of investments. The investment objective of the Trust is to seek attractive total return with an emphasis on income generation across multiple stages of the credit cycle. The Trust seeks to achieve its investment objective by investing in a dynamically managed portfolio of opportunities primarily within the private credit markets. Under normal market conditions, the Trust will invest at least 80% of its Managed Assets in floating-rate credit instruments and other structured credit investments. There can be no assurance that the Trust will achieve its investment objective.
The last six-months were characterized by market turbulence as retail loan fund outflows accelerated in the fourth quarter of 2018 and continued into 2019, reflecting investor concerns over the U.S. Federal Reserve’s (the “Fed”) more dovish stance on interest rates. Loan and collateralized loan obligation (“CLO”) prices rebounded in early 2019, as institutional investors perceived the most compelling yields and appreciation potential in senior loans in quite some time. In the context of healthy credit fundamentals, we expect the loan asset class to remain an attractive allocation within fixed income markets, despite technical volatility. The stable U.S. economic outlook further supports the case for loans and CLO debt and equity. We expect continued institutional demand for floating rate products given attractive relative yields compared to other fixed income asset classes without the attendant interest rate duration risk. Though we recognize the potential for bouts of market volatility owing to exogenous issues such as trade policy, interest rate movements, and other political/international uncertainties, we remain constructive on the fundamental soundness of the U.S. credit markets. Nevertheless, we will continue to closely monitor these risks, which may also potentially create attractive buying opportunities for the Trust.
For the six-months ended March 31, 2019, the S&P 500 Index, the Bloomberg Barclays U.S. High Yield 1% Issuer Capped Index and the Trust’s benchmark, the S&P/LSTA Leveraged Loan 100 Index, generated returns of 1.75%, -2.27%, and -0.40%1, respectively.
For the six-months ended March 31, 2019, the Trust experienced a decline in net assets resulting from operations of approximately $2.4 million, or -$0.30 per average common share (inclusive of unrealized gains). This represents an annualized return on the Trust’s common equity of approximately -2.88% since September 30, 2018.
From October 1, 2018 through March 31, 2019, the Trust’s net asset value (“NAV”) decreased by 7.47% from $9.50 per common share to $8.79 per common share largely reflecting unrealized losses due to valuation changes for the Trust’s investments in CLO debt, CLO equity, and opportunistic loan segments. As described below, during the last six-months, the Trust paid aggregate distributions totaling $0.414 per common share with respect to distributions declared. The distribution declared April 1, 2019 represents an annualized distribution rate of 9.54% based on the Trust’s closing market price of $8.68 per common share on March 29, 2019.
The closing price per share of the Trust’s common shares was $8.68 on March 29, 2019, representing a 1.25% discount to NAV per common share as of such date. From the Trust’s IPO on September 27, 2017 through March 31, 2019, the Trust’s common shares have traded on average at a 0.77% discount to NAV.
We appreciate your investment and look forward to serving your investment needs in the future. For the most up-to-date information on your investment, please visit the Trust’s website at www.xainvestments.com/XFLT.
Sincerely,
Kimberly Flynn
Managing Director
XA Investments LLC
May 21, 2019
| Semi-Annual Report | March 31, 2019 | 1 |
| XAI Octagon Floating Rate & | |
| Alternative Income Term Trust | Questions & Answers |
March 31, 2019 (Unaudited)
Lauren M. Basmadjian, Senior Portfolio Manager at Octagon Credit Investors, LLC (“Octagon”) and a member of the firm’s Investment Committee, serves as lead portfolio manager of XAI Octagon Floating Rate & Alternative Income Term Trust (the “Trust”). Ms. Basmadjian is supported by a team of Octagon investment professionals in the day-to-day management of the Trust’s portfolio, including the following members of the firm’s Investment Committee: Andrew D. Gordon (Octagon’s co-founder, Chief Executive Officer and Co-Chief Investment Officer), Michael B. Nechamkin (Co-Chief Investment Officer and Senior Portfolio Manager), Gretchen M. Lam (Senior Portfolio Manager) and Lauren B. Law (Portfolio Manager). Herein, Ms. Basmadjian discusses the market environment and the Trust’s performance for the six-month period ended March 31, 2019.
What is the Trust’s investment objective and how is it pursued?
The Trust’s investment objective is to seek attractive total return with an emphasis on income generation across multiple stages of the credit cycle. The Trust seeks to achieve its investment objective by investing in a dynamically managed portfolio of opportunities primarily within the private credit markets. Under normal market conditions, the Trust will invest at least 80% of its Managed Assets in floating rate credit instruments and other structured credit investments.
The Trust’s investments include (i) structured credit investments, including collateralized loan obligation (“CLO”) debt and subordinated (i.e., residual or equity) securities; (ii) traditional corporate credit investments, including leveraged loans and high yield bonds; (iii) opportunistic credit investments, including stressed and distressed credit situations and long/short credit investments; and (iv) other credit-related instruments.
Leveraged loans are debt obligations (also commonly referred to as “senior loans” or “floating rate loans”) issued by a bank to a corporation that generally holds legal claim to the borrower’s assets above all other debt obligations. Leveraged loans have floating rates that typically fluctuate according to LIBOR. LIBOR stands for London Interbank Offered Rate and is the benchmark rate that most of the world’s leading banks charge each other for short-term loans.
CLOs are a type of structured credit vehicle which typically invest in a diverse portfolio of broadly syndicated leveraged loans. CLOs finance this pool of loans with a capital structure that consists of debt and equity. CLO debt includes senior and mezzanine debt (collectively, “liabilities”) of a CLO structure with tranches rated from AAA down to BB or B. Interest earned from the underlying loan collateral pool of a CLO is used to pay the coupon interest on the CLO liabilities. CLO debt investors earn returns based on spreads above 3-month LIBOR. CLO equity represents a residual stake in the CLO structure and is the first loss position in the event of defaults and credit losses. CLO equity investors receive the excess spread between the CLO assets and liabilities and expenses. CLO equity is junior in priority of payment and is subject to certain payment restrictions generally set forth in an indenture governing the notes.
The Trust pursues its investment objective by investing primarily in below investment grade credit instruments but may invest without limitation in investment grade credit instruments. Below investment grade credit instruments are regarded as having predominantly speculative characteristics with respect to capacity to pay interest and to repay principal. The Trust may invest without limitation in credit instruments that are illiquid.
The Trust uses leverage to seek to enhance total return and income. The Trust uses leverage through borrowing from a financial institution. Although leverage may create an opportunity for increased return and income for shareholders, it also results in additional risks and can magnify the effect of any losses. There is no assurance that the strategy will be successful. If income and gains on securities purchased with leverage proceeds are greater than the cost of the leverage, common shareholders’ return will be greater than if leverage had not been used. Conversely, if the income or gains from the securities purchased with the proceeds of leverage are less than the cost of leverage, common shareholders’ return will be less than if leverage had not been used.
What were the significant events affecting the economy and market environment over the past six months?
Global financial markets experienced pronounced volatility during the fourth quarter of 2018 in response to mounting macro concerns, notably escalating U.S./China trade war tensions, weaker economic data and slowing growth in the EU, China, and Japan, sharp declines in commodity prices, and shifting interest rate expectations. The uncertain economic outlook arrested expectations for forecasted rate hikes that were reflected in the flattening of the yield curve (with temporary inversions between the two-year and the five-year) and the 10-year moving from a 3.26% peak in October to a sub-2.6% trough by year-end. In mid-December, the U.S. Federal Reserve (the “Fed”) delivered its ninth rate hike in three years but also made a dovish pivot, and subsequently reinforced its stance at the Federal Open Market Committee meeting in March by indicating no expected rate hikes in 2019. As a result, investors rotated to a “duration on” positioning in fixed rate assets and shifted away from floating rate products, which led to retail outflows from the loan asset class. The Fed is currently targeting 2.25-2.50% on its benchmark rate, and we expect inflation perceptions and interest rate movements will remain at the forefront of investor concerns. Financing the 2018 tax act will increase budget deficits; as quantitative easing ends, incremental government debt will need to be issued and financed, which could pressure interest rates.
The broader markets rallied in January and February, supported by increasingly accommodative central bank actions, positive macroeconomic developments, and better-than-expected corporate earnings. Loan prices rebounded in January and February but retreated in March, as the pace of retail loan fund outflows accelerated over the month following the Fed’s announcement to maintain benchmark rates. In the absence of mounting credit stress (as indicated by low default rates and generally healthy corporate earnings), we welcome such technically-driven market movements. At current trading levels, we believe loans offer meaningful risk-adjusted yields and convexity and alpha opportunities for fundamental credit pickers.
| XAI Octagon Floating Rate & | |
| Alternative Income Term Trust | Questions & Answers |
March 31, 2019 (Unaudited)
The imposition of tariffs and escalating concerns of a trade war with China also represented a significant development within the past year. Given the heightened threat of increased tariffs against China and the EU, and potential retaliatory actions, trade policy has become a greater concern for the borrowers in the U.S. loan market. The risks surrounding trade policy will likely translate to higher cost of goods sold in some industries, although projections are difficult due to the uncertainty of the ultimate/final policy, increased complexity of many supply chains, moves to alternate sourcing in cheaper countries, foreign exchange fluctuations, and the ability to increase prices in a strong U.S. economy. We are carefully monitoring and analyzing the impact of these developments on specific sectors and credits in the market.
We also continue to witness secular changes in several industry sectors, driven by increasingly available technological innovation. In certain instances, the pace and implementation of technological change(s) has impacted the risk profile of borrowers in the U.S. loan markets. Technological advancements may augur the decline of existing business models, or new and improved technology can represent a substantial advantage, possibly best illustrated in the retail industry. Although we remain in the “expansion” phase of the credit cycle, we also have seen “rolling recessions” in certain sectors in recent years, including energy and metals and mining. Retail represents the latest sector recession, and we anticipate concerns over traditional brick-and-mortar retail may spill over into commercial real estate in the medium term (owing to store closings, rent negotiations, etc.). Mini-default cycles in the energy and retail sectors have provided the Trust with select attractive opportunistic loan investment opportunities, and Octagon remains focused on sourcing idiosyncratic opportunities with strong return potential in the context of a relatively benign fundamental credit environment.
How does Octagon view covenant-lite or “cov-lite” loans in today’s marketplace?
Covenant-lite or “cov-lite” loans are a type of loan that is issued with fewer restrictions on the borrower and fewer protections for the lender than historically required by credit markets. Covenant-lite loan issuance is the norm in today’s loan markets, and currently represent nearly 80% of total outstanding loan issuance.1 Fewer covenants can offer more flexibility for struggling companies to work out of their stress, but also result in a lower recovery for lenders in the event of a default.
It is important to consider the loan holder’s security within the asset collateral pool. Recoveries are driven by collateral quality, not covenants, in the event of default. We believe that the perception that cov-lite loans are more likely to default than loans with financial maintenance covenants is misplaced, as evidenced by lower historical default rates for cov-lite loans compared to cov-heavy loans (S&P Global Market Intelligence has reported that loans with traditional protections barely fare any better in recovery than cov-lite loans issued before 20102). While any measure of lender protection is preferred, Octagon is thoroughly capable of evaluating the creditworthiness of a cov-lite borrower and assessing relative value. We believe it is more important to focus on certain covenant terms such as restricted payment baskets, unrestricted subsidiaries, and incremental debt incurrence terms, among others. While we have seen deterioration of credit agreements for new issue loans in the recent past, market corrections within the past six months have brought some level of increased discipline in issuer terms.
Describe the current market conditions for the leveraged loan market and Octagon’s outlook.
Leveraged loan market conditions have improved over the first few months of 2019, following a turbulent fourth quarter of 2018 driven by technical disruptions. Amid broader market turmoil, loan prices began to soften in late-October due to outflows from retail loan investors (mutual funds and exchange traded funds (“ETFs”)). The uncertain economic outlook precipitated changes to forecasted rate hikes that were reflected in the flattening yield curve. We believe that shifting rate expectations and yield curve movements were the major driver of loans’ negative performance through year-end. All told, retail loan investors withdrew $19.7 billion in the fourth quarter, including $14.6 billion in December – a period when liquidity is typically limited.3 Retail fund managers sold their most liquid loans to meet investor redemptions, resulting in heightened price volatility for those assets. Forced sellers created compelling relative value opportunities in the secondary market, and Octagon took advantage of price weakness to buy performing credits at prices we considered attractive (bid price range of $95 - $98). As of April 3, 2019, retail loan funds have reported 20 straight weeks of net outflows, and retail buyers’ share of the loan market has decreased to roughly 10%.4 It bears noting that periods of technically driven market volatility tend to create buying opportunities for the Trust, as has been the case over the past six months.
Looking at another key technical driver for the loan market, the pace of new CLO formation has picked up after a slow start in January. Improving loan prices over the first quarter brought many open warehouses back to breakeven levels following the late-2018 market sell-off. New CLO issuance totaled $29.3 billion in the first quarter of 2019, on track to meet full-year primary supply forecasts of $110-125 billion.5 Importantly, CLOs comprise roughly 60% of the primary institutional loan market investor base and represent stable, locked-up pools of capital that are not subject to redemptions or forced selling. While CLOs trade loans in smaller increments compared to loan mutual funds which transact in larger blocks that can meaningfully move asset prices, increased CLO demand for loans should help offset price pressures during periods of retail fund outflows.
| Semi-Annual Report | March 31, 2019 | 3 |
XAI Octagon Floating Rate &
Alternative Income Term Trust | Questions & Answers |
March 31, 2019 (Unaudited)
With respect to new issue loan supply, over the past six months, primary loan issuance was driven by M&A transactions, with significantly less refinancing and repricing activity than in prior quarters due to spread widening. Despite a turbulent fourth quarter, M&A-related institutional loan issuance reached an all-time record in 2018. New issue institutional loan volume in the first quarter of 2019 totaled $77.9 billion, slightly above that of the previous quarter, but representing the second lightest quarter since the first quarter of 2016.6 We believe the relatively light forward new issue calendar should provide support for loan prices.
Although recent news articles have focused on increasing leverage levels and deteriorating lending standards in the U.S. loan market, we believe the loan asset class remains fundamentally sound. Recent LBOs have typically been for well-performing companies demonstrating growth trends, and the higher purchase price multiples for these transactions have usually reflected increased equity contributions from sponsors rather than excessive leverage as seen in previous cycles, creating additional subordination for lenders. Moreover, borrowers in the U.S. loan markets have been supported by strong earnings growth, which helped offset rising interest expense and bolstered cash flow coverage (or the number of times financial obligations of a company are covered by its earnings, which has increased to over 3.6x on average as of year-end 2018, compared to 2.1x in 20077(even incorporating nine increases in the Fed Funds rate within the past three years)). On average, below investment grade issuers reported revenue growth of 6.4% in the fourth quarter of 2018, which represented the tenth consecutive quarter of year-over-year increases.8 Meanwhile, EBITDA for below investment grade borrowers grew 13.5% year-over-year as of December 31, 2018.8 Leverage for below investment grade borrowers declined for the tenth consecutive quarter to a six-year low of 3.98x in the fourth quarter of 2018.8 Despite strong earnings growth, some companies are facing inflationary pressures from both wage growth and raw material price increases. We believe many borrowers will attempt to find new efficiencies or try to raise prices to pass through these costs. Furthermore, consumer spending should increase as more jobs are created and wages move higher, to the benefit of the overall economy.
We do not anticipate a significant downturn in the business cycle in the medium term, and we expect defaults to remain low and concentrated in certain industries. We agree with economists’ consensus estimates that U.S. GDP will grow at a healthy (albeit likely slower) rate in 2019.9 While overall corporate earnings are positive, we expect increased dispersion among issuers. We recognize the potential for wage inflation, commodity price increases, and the strong U.S. dollar/trade policy (among other factors) to impact margins for certain borrowers in the U.S. credit markets. We also continue to monitor the risks of weaker deal terms and protections (including the loosening of covenant structures), as well as the higher amount of pro forma adjustments to EBITDA/add-backs that could understate true borrower leverage.
Describe the current market conditions for the CLO market and Octagon’s outlook.
2018 was the busiest year so far in the CLO 2.0 era (post 2008 financial crisis issuance), with $127 billion of new CLO issuances, as well as $122 billion of refinancing or reset deals.10 However, CLO liability spreads ended 2018 meaningfully wider on the year, as spread widening intensified in the fourth quarter in tandem with the loan market sell-off. Primary CLO liability spreads continued to widen in the first quarter of 2019 due to reduced investor demand as LIBOR decreased. CLO equity investors saw lower distributions over the past year due to weighted average spread compression for the underlying loan assets in CLOs, and the basis risk between 1-month and 3-month LIBOR (CLOs finance at 3-month LIBOR, while underlying borrowers have the option to pay 1-month versus 3-month LIBOR). As the weighted average spread for underlying collateral portfolios has widened, CLO equity distributions should increase, a major positive development for equity following months of loan spread tightening.
In our view, today’s environment represents an opportunity for CLO managers to capture price appreciation in loans (or “build par” in CLO parlance), compared to prior quarters. CLO debt and equity investors should continue to benefit from CLO managers’ ability to successfully build par through discounted purchases of performing loan assets. The median annualized equity distribution for reinvesting U.S. CLOs is 14.6% as of mid-March 2019.11 Wider loan spreads and relatively favorable CLO liability spreads combined with par building opportunities should significantly benefit CLO equity investors over the long-term. Potential bouts of market turbulence may also benefit CLO equity. When credit spreads widen, loan prepayments and amortizations are recycled into discounted/higher yielding assets during periods of market volatility, while CLO liability spreads are fixed, resulting in higher CLO equity distributions. We therefore believe CLO equity continues to offer compelling risk-adjusted returns to long-term investors seeking income strategies, especially in more volatile loan markets.
CLO primary demand has been impacted by a dovish Fed outlook and investors’ recalibrated rate expectations, resulting in wider CLO liability spreads particularly at the top of the CLO liability stack (AAA rated debt tranches). After a slow start to the year, the pace of new CLO issuance picked up later in the first quarter of 2019, and the large pipeline of deals (100+ open warehouses as of March 31) suggests new CLO formation should continue to be healthy in the second quarter, further supported by compelling relative value of CLO AAA paper for Japanese buyers due to lower JPY/USD hedging costs, an influx of capital from dedicated CLO equity investment vehicles raised in 2016-2018, and new/debut CLO managers with large internal equity commitments continuing to enter the market. Higher new issue deal supply, relatively muted domestic AAA demand, and investor focus away from floating rate assets should limit any sustained tightening in CLO debt tranches in the near-to medium-term. We currently see attractive value in BB rated CLO debt tranches, with all-in yields for new issue BB notes coming at an L+700 bps context. In our view, CLO debt has become more compelling as trading prices now present greater convexity and total return potential than in prior quarters.
XAI Octagon Floating Rate &
Alternative Income Term Trust | Questions & Answers |
March 31, 2019 (Unaudited)
How did the Trust perform for the six months ended March 31, 2019?
For the six-month period ended March 31, 2019, the Trust provided a total return on market price of -7.03% and a total return based on NAV of -2.88%. NAV return includes the deduction of management fees, operating expenses, and all other Trust expenses. All Trust returns cited – whether based on net asset value (“NAV”) or market price – assume the reinvestment of all distributions. As of March 31, 2019, the Trust’s market price of $8.68 represented a discount of 1.25% to its NAV of $8.79. The market value of the Trust’s shares fluctuates from time-to-time and may be higher or lower than the Trust’s NAV. Performance data quoted represents past performance. Past performance does not guarantee future results. Current performance may be lower or higher than the performance data quoted.
What were the distributions over the period?
From October 1, 2018 through March 31, 2019, the Trust paid a monthly distribution of $0.069 per share. The Trust declared its first distribution for the period on September 4, 2018 which was payable on October 1, 2018. The distribution declared April 1, 2019 represents an annualized distribution rate of 9.54% based on the Trust’s closing market price of $8.68 on March 29, 2019. The Trust’s distribution rate is not constant, and the amount of distributions, when declared by the Trust’s Board of Trustees, is subject to change based on the performance of the Trust. Please see Note 4 on page 25, and the “Distributions” section of Additional Information on page 32 for more information on distributions for the period.
What influenced the Trust’s performance for the six-months ended March 31, 2019?
Pronounced volatility in the fourth quarter was reflected in lower valuations across most assets, which negatively impacted the Trust’s performance for the six-month period ended March 31, 2019. While the Trust generated strong returns in the first quarter of 2019 as asset prices improved, performance for the six-month period was weighed down by outsized unrealized losses in the prior quarter. During the six-month period, the Trust’s portfolio generated a net gain in its senior loan segment (first lien and second lien loans) driven by interest income, but experienced net investment losses in all other asset class segments, including CLO equity, CLO debt, high yield bonds & equity, and opportunistic loans. The Trust’s CLO equity, CLO debt, and opportunistic loan segments experienced the largest net losses; for the period, approximate net losses for each segment were ($0.04) per share, or ($0.12) per share on a combined basis. The majority of the Trust’s largest performance detractors during the period were CLO equity positions. As asset prices decreased and loan spreads widened in the second half of the fourth quarter, CLO equity NAVs decreased. The Trust’s CLO equity positions collected quarterly distribution payments totaling $3,615,901, or $0.43 per share, during the six-month period, which were offset by market value losses of $2,283,258, or ($.27) per share. It bears noting that the recent market volatility may help boost quarterly equity payments, to the benefit of the Trust.
Relevant indices for the markets in which the Trust invests include the Trust’s benchmark, the S&P/LSTA 100 Leveraged Loan Index, which returned -0.40% for the six-month period, the Bloomberg Barclays U.S. High Yield 1% Issuer Capped Index, which returned -2.27% for the six-month period, and the JP Morgan BB/B CLO Debt Index, which returned 0.54% for the six-month period.12 There is no representative benchmark index for CLO equity in the marketplace.
How is the Trust positioned for the remainder of 2019?
Looking ahead, we believe that the Trust is well-positioned across its primary investment segments to meet its investment objective. As of March 31, 2019, the Trust is invested in floating-rate first lien loans (40.9% of the total portfolio on a market value basis), second lien loans (7.9%), CLO equity (33.4%) and CLO debt securities (15.0%). In the current market environment, we are focused on loans offering attractive spreads and call protection. We believe the Trust’s loan positions are well diversified across industry sectors, with health care providers and services, software, and hotels, restaurants & leisure representing the largest exposures as of March 31, 2019. We generally expect to maintain the Trust’s current allocations to CLO equity and CLO debt. The Trust’s CLO debt investments are presently skewed towards BB-rated tranches versus single-B tranches. We maintain a generally constructive view of CLO equity over the longer term. Lastly, the Trust has maintained low exposure to high yield bonds over the period; as of March 31, 2019, high yield bond positions represented approximately 1.1% of the Trust’s portfolio on a market value basis. We expect to keep the Trust’s bond exposure relatively low, as we continue to prefer loans that offer comparable all-in yields, with lower duration risk, seniority, collateral, and floating rate coupons.
How is the Trust positioned to perform the current interest rate environment?
The Trust is positioned conservatively in terms of duration, with predominantly all of the Trust’s investments in floating-rate or adjustable securities based on changes in LIBOR. Over 95% of the Trust’s portfolio as of March 31, 2019 was invested in leveraged loans, CLO debt and CLO equity.13 We will continue to actively position the Trust to take advantage of a relatively benign credit environment.
The Fed is undoubtedly more dovish today than it appeared towards the end of 2018. From a fundamental perspective, we believe a dovish Fed and lower rates will improve the loan market over time by helping to keep defaults low and supporting economic growth. However, a dovish Fed could have negative implications on market technicals in the near-term, as the probability of rate hikes recedes. At present, we think many asset prices and new issue deals are attractive, and we continue to believe it is still a good time to buy loans. Nevertheless, we do perceive crosswinds in the coming months, such as continued retail loan fund outflows and possible first quarter earnings surprises on a credit-by-credit basis creating opportunities for credit pickers. In today’s environment, we believe active portfolio management and strong fundamental credit work will be key to outperformance.
| Semi-Annual Report | March 31, 2019 | 5 |
XAI Octagon Floating Rate &
Alternative Income Term Trust | Questions & Answers |
March 31, 2019 (Unaudited)
Credit spreads currently remain attractive relative to post-crisis levels, and all-in loan coupons have increased to a high of 5.98% for the S&P/LSTA Leveraged Loan Index.14 Current loan yields are at the widest levels since 2009, save for in 2016 when defaults were higher due to increased stress in certain industry sectors. In March, the trailing 12-month loan default rate dropped to 0.93% - the lowest level in nearly seven years.1 We expect defaults to increase modestly as the year progresses, but in the near-term we do not anticipate defaults to reach 2016 levels. Defaults are likely to be more idiosyncratic, as opposed to widespread across the loan market.
Leveraged loan investors earn returns based on spreads above LIBOR. The rates on leveraged loans typically reset at fixed intervals, usually a monthly or quarterly basis. Leveraged loans do not move in tandem with U.S. Treasuries, but rather with LIBOR. The benefit of the floating rate is that it provides an element of protection against duration risk resulting from rising short-term interest rates.
CLOs are floating-rate instruments designed to mitigate duration risk and therefore may not directly suffer the same adverse effects from rising rates as traditional fixed income investments. As LIBOR increases, CLO debt distributions increase (notwithstanding any fixed rate tranches). CLO equity is more nuanced; once LIBOR has risen above a specified floor, “the spread” paid to equity holders increases as interest rates rise. In contrast, interest rates on traditional fixed income investments are locked and adversely impacted by a rising rate environment. Given the floating-rate nature of their coupon payments, CLOs are well-positioned for a rising interest rate environment.
Discuss the Trust’s use of leverage.
The Trust uses leverage as part of its investment strategy, to finance the purchase of additional securities that may provide increased income and greater appreciation potential to common shareholders than could be achieved from a portfolio that is unlevered. With the low cost of borrowing and relatively low default rates generally among U.S. companies, the amount of leverage used by the Trust is highly accretive to income generation. The Trust currently employs leverage through bank borrowing. As of March 31, 2019, the amount of leverage was approximately 32.88% of the Trust’s Managed Assets (including proceeds of leverage). While leverage increases the income of the Trust in yield terms, it also amplifies the effects of changing market prices in the portfolio and can cause the Trust’s NAV to change to a greater degree than the market as a whole. This change in NAV can create volatility in Trust pricing but should not affect the Trust’s ability to pay distributions under normal circumstances.
Index Definitions
The Trust does not seek to track any index. Index returns are for illustrative purposes only, do not reflect the deduction of fees and expenses and do not represent the performance of the Trust. It is not possible to invest directly in an index.
Bloomberg Barclays U.S. High Yield 1% Issuer Capped Index measures the performance of high-yield bonds, with an individual issuer cap of 1%.
J.P. Morgan CLO Debt Index represents the post-crisis J.P. Morgan Collateralized Loan Obligation Index (“CLOIE”). The CLOIE is a benchmark to track the market for U.S. dollar denominated broadly-syndicated, arbitrage CLOs. The CLOIE is divided by origination (pre- versus post-crisis) and is broken out further into six original rating classes (AAA, AA, A, BBB, BB, B).
S&P/LSTA U.S. Leveraged Loan 100 Index is a market value-weighted index designed to measure the performance of the U.S. leveraged loan market. In conjunction with Standard & Poor's/LCD, the Leveraged Syndications & Trading Association (“LSTA”) developed the S&P/LSTA U.S. Leveraged Loan 100 Index (“L100”). The L100 is designed to reflect the largest loan facilities in the leveraged loan market. It mirrors the market-value-weighted performance of the 100 largest institutional leveraged loans based upon actual market weightings, spreads and interest payments. The L100 utilizes LSTA/LPC Mark-to-Market Pricing, which is based on bid/ask quotes gathered from dealers and is not based upon derived pricing models. The index uses the average bid for its market value calculation. Each loan facility’s total return is calculated by aggregating the interest return (reflecting the return due to interest paid and accrued interest), and price return (reflecting the gains or losses due to changes in the end of day prices and principal repayments). The return of each loan facility is weighted in the index based upon its market value outstanding, which reflects both the prior period’s prices as well as accrued interest. The overall index return is the aggregate of each component loan facility’s return multiplied by the market value outstanding from the prior time period.
Risks and Other Considerations
Investing involves risk, including the possible loss of principal and fluctuation of value.
The views expressed in this report reflect those of the portfolio managers only through the report period as stated on the cover. These views are expressed for informational purposes only and are subject to change at any time, based on market and other conditions, and may not come to pass. These views should not be construed as research, investment advice or a recommendation of any kind regarding the Trust or any issuer or security, do not constitute a solicitation to buy or sell any security and should not be considered specific legal, investment or tax advice. The information provided does not take into account the specific objectives, financial situation or particular needs of any specific investor.
XAI Octagon Floating Rate &
Alternative Income Term Trust | Questions & Answers |
March 31, 2019 (Unaudited)
The views expressed in this report may also include forward-looking statements that involve risk and uncertainty, and there is no guarantee that any predictions will come to pass. Actual results or events may differ materially from those projected, estimated, assumed or anticipated in any such forward looking statements. Important factors that could result in such differences, in addition to the other factors noted with such forward-looking statements, include general economic conditions such as inflation, recession and interest rates. Neither XAI or Octagon has any obligation to update or otherwise revise any forward-looking statements, including any revision to reflect changes in any circumstances arising after the date hereof relating to any assumptions or otherwise.
There can be no assurance that the Trust will achieve its investment objective or that any investment strategies or techniques discussed herein will be effective. The value of the Trust will fluctuate with the value of the underlying securities. Historically, closed-end funds often trade at a discount to their net asset value.
Performance data quoted represents past performance. Past performance does not guarantee future results. Current performance may be lower or higher than the performance data quoted.
Please see www.xainvestments.com/XFLT for a detailed discussion of the Trust’s risks and considerations. The Trust regularly updates performance and certain other data and publishes material information as necessary from time to time on its website. Investors and others are advised to check the website for updated performance information and the release of other material information about the Trust. References herein to the Trust’s website are intended to allow investors public access to information regarding the Trust and does not, and is not intended to, incorporate the Trust’s website in this report.
This material is not intended as a recommendation or as investment advice of any kind, including in connection with rollovers, transfers, and distributions. Such material is not provided in a fiduciary capacity, may not be relied upon for or in connection with the making of investment decisions, and does not constitute a solicitation of an offer to buy or sell securities. All content has been provided for informational or educational purposes only and is not intended to be and should not be construed as legal or tax advice and/or legal opinion. Always consult a financial, tax and/or legal professional regarding your specific situation.
| 1 | As of March 31, 2019. Sources: S&P Global Market Intelligence and S&P/LSTA Leveraged Loan Index. |
| 2 | Sufficient data is not available at this time for loans issued after 2010. |
| 3 | Source: S&P Global Market Intelligence LCD News “US leveraged loans lose 2.54% in December rout, gain 0.44% in 2018” (January 2, 2019). |
| 4 | Source: J.P. Morgan US High Yield & Leveraged Loan Strategy Credit Strategy Weekly Update (April 12, 2019). |
| 5 | Wells Fargo Securities CLO and Commercial ABS Research team projects $110B in full-year 2019 (“FY”) new CLO issuance (Source: CLO Monthly Market Overview, April 1, 2019). JPMorgan CLO Research team projects $115-125B for FY new CLO issuance (Source: JPMorgan CLO Research, April 1, 2019). |
| 6 | Source: S&P Global Market Intelligence LCD Quarterly Review – First Quarter 2019. |
| 7 | Represents average cash flow coverage of outstanding loans, which is a ratio calculated as EBITDA less capital expenditures to cash interest. Source: S&P Capital IQ/SNL Financial LCD News (April 1, 2019). |
| 8 | Based on a quarterly analysis of 489 U.S. high yield companies, excluding the financials and utilities sectors. The financial data is derived from JPMorgan High Yield Credit analysts and Capital IQ. Source: J.P. Morgan North America Credit Research Credit Strategy Weekly Update (March 22, 2019). |
| 9 | Source: Bloomberg Article “Big Start to Year for U.S. Growth Seen Fizzling Later in 2019” (May 9, 2019). |
| 10 | Source: Wells Fargo Research “The CLO Salmagundi: US CLO 2018 Year in Review” (January 7, 2019). |
| 11 | Source: Wells Fargo Securities Structured Products Research, The U.S. CLO Manager Style Guide, March 25, 2019. Past performance has been achieved during a period of relative economic stability, and is not necessarily indicative of future results. |
| 12 | Sources: S&P/LSTA Leveraged Loan Index and S&P Capital IQ/SNL Financial Leveraged Commentary & Data, Bloomberg, J.P. Morgan Markets DataQuery. |
| 13 | As calculated by Octagon Credit Investors, LLC. Represents unaudited figures. |
| 14 | Sources: S&P/LSTA Leveraged Loan Index and S&P Capital IQ/SNL Financial Leveraged Commentary & Data. All-in Rate is calculated as the sum of the nominal spread plus the average LIBOR contract rate for all outstanding loans in the S&P/LSTA Leveraged Loan Index. |
| Semi-Annual Report | March 31, 2019 | 7 |
XAI Octagon Floating Rate &
Alternative Income Term Trust | Trust Portfolio Information |
March 31, 2019 (Unaudited)
Growth of a $10,000 Investment(as of March 31, 2019)
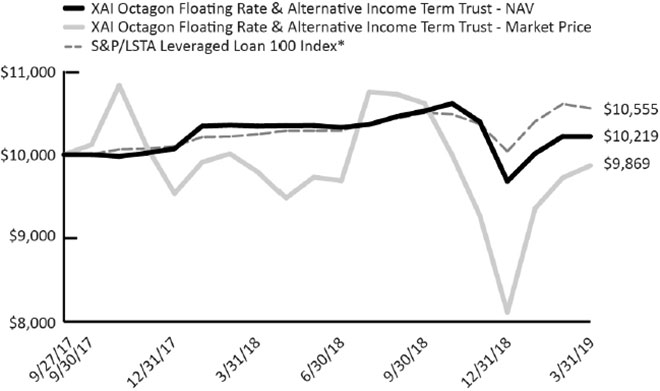
The chart above represents historical performance of a hypothetical investment of $10,000 in the Trust since inception.Past performance does not guarantee future results. This chart does not reflect the deduction of taxes that a shareholder would pay on Trust distributions or the redemption of Trust shares. The chart assumes that distributions from the Trust are reinvested.
Summary Performance(as of March 31, 2019)
| | 1 Month | 3 Months | 6 Months | 1 Year | Since the Trust’s Inception (September 27, 2017)^ |
| XAI Octagon Floating Rate & Alternative Income Term Trust - NAV | -0.01% | 5.54% | -2.88% | -1.21% | 1.44% |
| XAI Octagon Floating Rate & Alternative Income Term Trust – Market Price | 1.49% | 21.61% | -7.03% | 0.76% | -0.87% |
| S&P/LSTA Leveraged Loan 100 Index* | -0.48% | 5.13% | 0.49% | 3.03% | 3.64% |
| * | The S&P/LSTA (Loan Syndications and Trading Association) U.S. Leveraged Loan 100 Index was the first to track the investable senior loan market. This rules-based index consists of the 100 largest loan facilities in the benchmark S&P/LSTA Leveraged Loan Index (LLI). |
Performance data quoted represents past performance. Past performance does not guarantee future results. Investment return and principal value of an investment will fluctuate so that an investor’s shares, when sold or redeemed, may be worth more or less than the original cost. Current performance may be lower or higher than performance data quoted.
XAI Octagon Floating Rate &
Alternative Income Term Trust | Trust Portfolio Information |
March 31, 2019 (Unaudited)
Top Ten Portfolio Holdings(as a % of Total Investments)*
| Name | | Type | | |
| Madison Park Funding XVIII, Ltd. | | CLO Equity | | | 2.87% |
| CIFC Funding 2018-I, Ltd. | | CLO Equity | | | 2.78% |
| Apidos CLO XXVIII | | CLO Equity | | | 2.59% |
| THL Credit Wind River 2016-1 CLO, Ltd. | | CLO Equity | | | 2.50% |
| OZLM XIX, Ltd. | | CLO Equity | | | 2.35% |
| CIFC Funding 2017-V, Ltd. | | CLO Equity | | | 2.21% |
| Carlyle Global Market Strategies CLO 2013-1, Ltd. | | CLO Equity | | | 2.04% |
| Marble Point CLO XI, Ltd. | | CLO Equity | | | 1.96% |
| Thacher Park CLO, Ltd. | | CLO Equity | | | 1.84% |
| Asurion LLC | | Secured Second Lien Loan | | | 1.55% |
| Total | | | | | 22.69% |
| * | Holdings are subject to change |
Asset Allocation(as a % of Total Investments)
| Senior Secured First Lien Loans | | | 40.86% |
| CLO Equity | | | 33.36% |
| CLO Debt | | | 14.98% |
| Secured Second Lien Loans | | | 7.86% |
| Corporate Bonds | | | 1.10% |
| Money Market Mutual Funds | | | 1.84% |
| Semi-Annual Report | March 31, 2019 | 9 |
| XAI Octagon Floating Rate & | |
| Alternative Income Term Trust | Schedule of Investments |
March 31, 2019 (Unaudited)
| | | Coupon(a) | | Reference Rate & Spread | | Maturity Date | | Principal Amount | | | Value | |
| CORPORATE BONDS - 1.67%* (1.10% of Total Investments) |
| Health Care Providers & Services - 0.74% (0.49% of Total Investments) |
| Envision Healthcare Corp., Senior Unsecured(b) | | 8.75% | | N/A | | 10/15/2026 | | $ | 333,000 | | | $ | 296,370 | |
| Verscend Escrow Corp., Senior Unsecured(b) | | 9.75% | | N/A | | 08/31/2026 | | | 250,000 | | | | 248,594 | |
| Total Health Care Providers & Services | | | | | | | | | 583,000 | | | | 544,964 | |
| | | | | | | | | | | | | | | |
| Internet Software & Services - 0.61% (0.40% of Total Investments) |
| Veritas US, Inc. / Veritas Bermuda, Ltd., Senior Unsecured(b) | | 10.50% | | N/A | | 02/01/2024 | | | 500,000 | | | | 445,312 | |
| | | | | | | | | | | | | | | |
| Wireless Telecommunication Services - 0.32% (0.21% of Total Investments) |
| Digicel Group One, Ltd., Senior Secured First Lien(b) | | 8.25% | | N/A | | 12/30/2022 | | | 257,000 | | | | 154,200 | |
| Digicel Group Two, Ltd., Senior Unsecured(b) | | 8.25% | | N/A | | 09/30/2022 | | | 243,000 | | | | 82,620 | |
| Total Wireless Telecommunication Services | | | | | | | | | 500,000 | | | | 236,820 | |
| | | | | | | | | | | | | | | |
| Total Corporate Bonds (Cost $1,553,891) | | | | | | | | $ | 1,583,000 | | | $ | 1,227,096 | |
| | | | | | | | | | | | | | | |
| SECURED SECOND LIEN LOANS(c)- 11.88% (7.86% of Total Investments) |
| Commercial Services & Supplies - 1.02% (0.68% of Total Investments) |
| AVSC Holding Corp., Initial | | 9.99% | | 3M US L + 7.25% | | 09/01/2025 | | | 805,556 | | | | 751,181 | |
| | | | | | | | | | | | | | | |
| Communications Equipment - 0.46% (0.30% of Total Investments) |
| Global Tel*Link Corp. | | 10.75% | | 1M US L + 8.25% | | 11/29/2026 | | | 347,222 | | | | 339,121 | |
| | | | | | | | | | | | | | | |
| Construction & Engineering - 0.68% (0.45% of Total Investments) |
| Brookfield WEC Holdings, Inc., Initial | | 9.25% | | 1M US L + 6.75% | | 08/03/2026 | | | 498,810 | | | | 498,312 | |
| | | | | | | | | | | | | | | |
| Health Care Providers & Services - 1.35% (0.89% of Total Investments) |
| Albany Molecular Research, Inc., Initial | | 9.50% | | 1M US L + 7.00% | | 08/30/2025 | | | 126,466 | | | | 124,569 | |
| CVS Holdings I LP, Initial | | 9.25% | | 1M US L + 6.75% | | 02/06/2026 | | | 102,612 | | | | 100,303 | |
| Gentiva Health Services, Inc., Initial | | 9.50% | | 3M US L + 7.00% | | 07/02/2026 | | | 752,980 | | | | 768,040 | |
| Total Health Care Providers & Services | | | | | | | | | 982,058 | | | | 992,912 | |
| | | | | | | | | | | | | | | |
| Hotels, Restaurants & Leisure - 0.51% (0.34% of Total Investments) |
| Affinity Gaming, Initial | | 10.75% | | 1M US L + 8.25% | | 01/31/2025 | | | 392,857 | | | | 374,852 | |
| | | | | | | | | | | | | | | |
| Insurance - 2.34% (1.55% of Total Investments) |
| Asurion LLC, Replacement B-2 | | 9.00% | | 1M US L + 6.50% | | 08/04/2025 | | | 1,700,000 | | | | 1,720,536 | |
| | | | | | | | | | | | | | | |
| Real Estate Investment Trusts (REITs) - 1.10% (0.73% of Total Investments) |
| Capital Automotive LP, Initial Tranche B | | 8.50% | | 1M US L + 6.00% | | 03/24/2025 | | | 807,643 | | | | 806,133 | |
| | | | | | | | | | | | | | | |
| Software - 4.42% (2.92% of Total Investments) |
| EagleView Technology Corp. | | 9.98% | | 3M US L + 7.50% | | 08/14/2026 | | | 442,623 | | | | 430,451 | |
| McAfee LLC, Initial | | 11.00% | | 1M US L + 8.50% | | 09/29/2025 | | | 916,667 | | | | 922,167 | |
| MH Sub I LLC, Amendment No. 2 Initial | | 9.99% | | 1M US L + 7.50% | | 09/15/2025 | | | 750,000 | | | | 735,937 | |
See Notes to Financial Statements.
| XAI Octagon Floating Rate & | |
| Alternative Income Term Trust | Schedule of Investments |
March 31, 2019 (Unaudited)
| | | Coupon(a) | | Reference Rate & Spread | | Maturity Date | | Principal Amount | | | Value | |
| SECURED SECOND LIEN LOANS(c)(continued) |
| Software (continued) |
| Misys, Ltd., Dollar Term Loan | | 9.85% | | 1M US L + 7.25% | | 06/13/2025 | | $ | 1,200,000 | | | $ | 1,153,752 | |
| Total Software | | | | | | | | | 3,309,290 | | | | 3,242,307 | |
| | | | | | | | | | | | | | | |
| Total Secured Second Lien Loans (Cost $8,929,911) | | | | | | | | $ | 8,843,436 | | | $ | 8,725,354 | |
| | | | | | | | | | | | | | | |
| SENIOR SECURED FIRST LIEN LOANS(c)- 61.81% (40.86% of Total Investments) |
| Aerospace & Defense - 1.48% (0.98% of Total Investments) |
| Constellis Holdings LLC, B | | 7.74% | | 3M US L + 5.00% | | 04/21/2024 | | | 760,577 | | | | 722,549 | |
| Maxar Technologies, Inc., Initial B | | 5.25% | | 1M US L + 2.75% | | 10/04/2024 | | | 468,472 | | | | 362,733 | |
| Total Aerospace & Defense | | | | | | | | | 1,229,049 | | | | 1,085,282 | |
| | | | | | | | | | | | | | | |
| Airlines - 0.73% (0.48% of Total Investments) |
| Allegiant Travel Co., Class B | | 7.23% | | 3M US L + 4.50% | | 02/05/2024 | | | 392,758 | | | | 390,794 | |
| LifeMiles Finance, LLC (LifeMiles, Ltd.), Initial Term Loan | | 8.00% | | 3M US L + 5.50% | | 08/18/2022 | | | 146,653 | | | | 147,203 | |
| Total Airlines | | | | | | | | | 539,411 | | | | 537,997 | |
| | | | | | | | | | | | | | | |
| Auto Components - 0.66% (0.44% of Total Investments) |
| Panther BF Aggregator 2 L P, B(d) | | N/A | | L + 3.50% | | 03/18/2026 | | | 490,196 | | | | 484,377 | |
| | | | | | | | | | | | | | | |
| Automobiles - 1.55% (1.03% of Total Investments) |
| Thor Industries, Inc., Initial USD | | 6.25% | | 1M US L + 3.75% | | 02/01/2026 | | | 777,568 | | | | 739,903 | |
| Truck Hero, Inc., Initial | | 6.25% | | 1M US L + 3.75% | | 04/22/2024 | | | 414,268 | | | | 398,861 | |
| Total Automobiles | | | | | | | | | 1,191,836 | | | | 1,138,764 | |
| | | | | | | | | | | | | | | |
| Building Products - 1.80% (1.19% of Total Investments) |
| Ply Gem Midco, Inc., Initial | | 6.55% | | 3M US L + 3.75% | | 04/12/2025 | | | 492,657 | | | | 471,104 | |
| SRS Distribution, Inc., Initial | | 5.75% | | 2M US L + 3.25% | | 05/23/2025 | | | 894,382 | | | | 852,086 | |
| Total Building Products | | | | | | | | | 1,387,039 | | | | 1,323,190 | |
| | | | | | | | | | | | | | | |
| Chemicals - 1.83% (1.21% of Total Investments) |
| Innovative Water Care Global Corp., Initial | | 7.60% | | 3M US L + 5.00% | | 02/27/2026 | | | 742,857 | | | | 707,571 | |
| Solenis Holdings LLC, Initial Dollar | | 6.63% | | 3M US L + 4.00% | | 06/26/2025 | | | 644,481 | | | | 633,203 | |
| Total Chemicals | | | | | | | | | 1,387,338 | | | | 1,340,774 | |
| | | | | | | | | | | | | | | |
| Commercial Services & Supplies - 2.24% (1.48% of Total Investments) |
| Belfor Holdings, Inc., B(d) | | N/A | | L + 4.00% | | 02/13/2026 | | | 153,121 | | | | 154,270 | |
| Dun & Bradstreet Corp., Initial Borrowing | | 7.49% | | 1M US L + 5.00% | | 02/06/2026 | | | 961,744 | | | | 948,520 | |
| Harland Clarke Holdings Corp., Initial | | 7.35% | | 3M US L + 4.75% | | 11/03/2023 | | | 609,875 | | | | 545,838 | |
| Total Commercial Services & Supplies | | | | | | | | | 1,724,740 | | | | 1,648,628 | |
| | | | | | | | | | | | | | | |
| Communications Equipment - 0.62% (0.41% of Total Investments) |
| Global Tel*Link Corp. | | 6.75% | | 1M US L + 4.25% | | 11/29/2025 | | | 462,920 | | | | 459,217 | |
| | | | | | | | | | | | | | | |
| Construction & Engineering - 1.17% (0.77% of Total Investments) |
| Brand Energy & Infrastructure Services, Inc., Initial | | 6.96% | | 3M US L + 4.25% | | 06/21/2024 | | | 330,937 | | | | 316,365 | |
See Notes to Financial Statements.
| Semi-Annual Report | March 31, 2019 | 11 |
| XAI Octagon Floating Rate & | |
| Alternative Income Term Trust | Schedule of Investments |
March 31, 2019 (Unaudited)
| | | Coupon(a) | | Reference Rate & Spread | | Maturity Date | | Principal Amount | | | Value | |
| SENIOR SECURED FIRST LIEN LOANS(c)(continued) |
| Construction & Engineering (continued) |
| Brookfield WEC Holdings, Inc., Initial | | 6.25% | | 1M US L + 3.75% | | 08/01/2025 | | $ | 541,629 | | | $ | 539,901 | |
| Total Construction & Engineering | | | | | | | | | 872,566 | | | | 856,266 | |
| | | | | | | | | | | | | | | |
| Distributors - 1.17% (0.77% of Total Investments) |
| United Natural Foods, Inc., Initial | | 6.75% | | 1M US L + 4.25% | | 10/22/2025 | | | 1,000,000 | | | | 859,000 | |
| | | | | | | | | | | | | | | |
| Diversified Consumer Services - 2.17% (1.43% of Total Investments) |
| Staples, Inc., Closing Date | | 6.49% | | 1M US L + 4.00% | | 09/12/2024 | | | 735,849 | | | | 729,145 | |
| Travelport Finance S.à r.l., Initial(d) | | N/A | | L + 5.00% | | 03/18/2026 | | | 886,897 | | | | 861,399 | |
| Total Diversified Consumer Services | | | | | | | | | 1,622,746 | | | | 1,590,544 | |
| | | | | | | | | | | | | | | |
| Diversified Financial Services - 0.84% (0.55% of Total Investments) |
| Financial & Risk US Holdings, Inc., Initial Dollar | | 6.25% | | 1M US L + 3.75% | | 10/01/2025 | | | 634,562 | | | | 615,639 | |
| | | | | | | | | | | | | | | |
| Diversified Telecommunication Services - 3.27% (2.16% of Total Investments) |
| Altice France S.A., USD TLB-13 Incremental | | 6.48% | | 3M US L + 4.00% | | 08/14/2026 | | | 816,137 | | | | 780,226 | |
| Sorenson Communications LLC(d) | | N/A | | L + 6.50% | | 03/15/2024 | | | 229,770 | | | | 226,611 | |
| Syniverse Holdings, Inc., Tranche C | | 7.48% | | 1M US L + 5.00% | | 03/09/2023 | | | 774,303 | | | | 709,261 | |
| WideOpenWest Finance LLC, Eighth Amendment B | | 5.74% | | 1M US L + 3.25% | | 08/18/2023 | | | 714,125 | | | | 686,453 | |
| Total Diversified Telecommunication Services | | | | | | | | | 2,534,335 | | | | 2,402,551 | |
| | | | | | | | | | | | | | | |
| Electrical Equipment - 0.45% (0.30% of Total Investments) |
| AI Ladder Subco S.a r.l., Facility B | | 7.10% | | 3M US L + 4.50% | | 07/09/2025 | | | 105,593 | | | | 103,416 | |
| Energy Acquisition LP, Initial | | 6.85% | | 3M US L + 4.25% | | 06/26/2025 | | | 240,123 | | | | 230,518 | |
| Total Electrical Equipment | | | | | | | | | 345,716 | | | | 333,934 | |
| | | | | | | | | | | | | | | |
| Electronic Equipment, Instruments & Components - 3.09% (2.05% of Total Investments) |
| ConvergeOne Holdings, Corp., Initial | | 7.50% | | 1M US L + 5.00% | | 01/04/2026 | | | 875,091 | | | | 836,263 | |
| Mavenir Systems, Inc., Initial | | 8.50% | | 1M US L + 6.00% | | 05/08/2025 | | | 743,753 | | | | 738,175 | |
| Triton Solar US Acquisition Co., Initial | | 8.50% | | 1M US L + 6.00% | | 10/29/2024 | | | 293,393 | | | | 270,288 | |
| Ultra Clean Holdings, Inc., B | | 7.00% | | 1M US L + 4.50% | | 08/27/2025 | | | 445,685 | | | | 427,582 | |
| Total Electronic Equipment, Instruments & Components | | | | | | | | | 2,357,922 | | | | 2,272,308 | |
| | | | | | | | | | | | | | | |
| Energy Equipment & Services - 2.32% (1.54% of Total Investments) |
| KCA Deutag US Finance LLC, 2018 Extended | | 9.35% | | 3M US L + 6.75% | | 02/28/2023 | | | 988,816 | | | | 841,117 | |
| McDermott International, Inc. | | 7.50% | | 1M US L + 5.00% | | 05/12/2025 | | | 904,327 | | | | 864,862 | |
| Total Energy Equipment & Services | | | | | | | | | 1,893,143 | | | | 1,705,979 | |
| | | | | | | | | | | | | | | |
| Food Products - 1.65% (1.09% of Total Investments) |
| Chobani LLC, New | | 6.00% | | 1M US L + 3.50% | | 10/10/2023 | | | 508,763 | | | | 486,505 | |
| Give and Go Prepared Foods Corp., 2017 | | 6.85% | | 3M US L + 4.25% | | 07/29/2023 | | | 258,773 | | | | 235,807 | |
| H-Food Holdings LLC, 2018 Incremental B-2 | | 6.50% | | 1M US L + 4.00% | | 05/23/2025 | | | 498,750 | | | | 490,127 | |
| Total Food Products | | | | | | | | | 1,266,286 | | | | 1,212,439 | |
| | | | | | | | | | | | | | | |
| Health Care Equipment & Supplies - 1.20% (0.79% of Total Investments) |
| Femur Buyer, Inc., Initial | | 7.10% | | 3M US L + 4.50% | | 03/05/2026 | | | 437,321 | | | | 437,867 | |
See Notes to Financial Statements.
| XAI Octagon Floating Rate & | |
| Alternative Income Term Trust | Schedule of Investments |
March 31, 2019 (Unaudited)
| | | Coupon(a) | | Reference Rate & Spread | | Maturity Date | | Principal Amount | | | Value | |
| SENIOR SECURED FIRST LIEN LOANS(c)(continued) |
| Health Care Equipment & Supplies (continued) |
| Lanai Holdings II, Inc., Initial | | 7.49% | | 3M US L + 4.75% | | 08/29/2022 | | $ | 462,430 | | | $ | 442,777 | |
| Total Health Care Equipment & Supplies | | | | | | | | | 899,751 | | | | 880,644 | |
| | | | | | | | | | | | | | | |
| Health Care Providers & Services - 8.41% (5.56% of Total Investments) |
| Air Medical Group Holdings, Inc. | | | | | | | | | | | | | | |
| 2018 | | 5.56% | | 1M US L + 3.25% | | 04/28/2022 | | | 465,392 | | | | 437,665 | |
| 2018 New | | 6.74% | | 1M US L + 4.25% | | 03/14/2025 | | | 248,741 | | | | 233,505 | |
| BW NHHC Holdco, Inc., Initial | | 7.49% | | 1M US L + 5.00% | | 05/15/2025 | | | 870,778 | | | | 845,377 | |
| Envision Healthcare Corp., Initial | | 6.25% | | 1M US L + 3.75% | | 10/10/2025 | | | 785,852 | | | | 734,120 | |
| Gentiva Health Services, Inc., Closing Date Initial | | 6.25% | | 3M US L + 3.75% | | 07/02/2025 | | | 786,803 | | | | 787,786 | |
| Phoenix Guarantor, Inc., Initial(e) | | 6.98% | | 1M US L + 4.50% | | 03/05/2026 | | | 963,121 | | | | 946,989 | |
| Radiology Partners, Inc., B | | 7.42% | | 3M US L + 4.75% | | 07/09/2025 | | | 96,727 | | | | 96,807 | |
| Regionalcare Hospital Partners Holdings, Inc., B | | 6.98% | | 1M US L + 4.50% | | 11/16/2025 | | | 1,026,467 | | | | 1,014,119 | |
| Verscend Holding Corp., B | | 7.00% | | 1M US L + 4.50% | | 08/27/2025 | | | 1,090,711 | | | | 1,081,167 | |
| Total Health Care Providers & Services | | | | | | | | | 6,334,592 | | | | 6,177,535 | |
| | | | | | | | | | | | | | | |
| Health Care Technology - 1.34% (0.89% of Total Investments) |
| athenahealth, Inc., B | | 7.20% | | 3M US L + 4.50% | | 02/11/2026 | | | 997,586 | | | | 982,622 | |
| | | | | | | | | | | | | | | |
| Hotels, Restaurants & Leisure - 2.97% (1.96% of Total Investments) |
| AMC Entertainment Holdings, Inc., B(d) | | N/A | | L + 3.00% | | 03/20/2026 | | | 436,919 | | | | 433,424 | |
| Bulldog Purchaser, Inc., Initial(e) | | 6.25% | | 1M US L + 3.75% | | 09/05/2025 | | | 84,942 | | | | 83,615 | |
| Casablanca US Holdings, Inc., Amendment No. 2 Initial | | 6.74% | | 3M US L + 4.00% | | 03/29/2024 | | | 837,759 | | | | 808,438 | |
| NPC International, Inc., Initial | | 6.05% | | 1M US L + 3.50% | | 04/19/2024 | | | 130,519 | | | | 116,596 | |
| Red Lobster Management LLC, Initial | | 7.75% | | 1M US L + 5.25% | | 07/28/2021 | | | 745,454 | | | | 736,136 | |
| Total Hotels, Restaurants & Leisure | | | | | | | | | 2,235,593 | | | | 2,178,209 | |
| | | | | | | | | | | | | | | |
| Household Products - 0.62% (0.41% of Total Investments) |
| American Greetings Corp., Initial | | 7.00% | | 1M US L + 4.50% | | 04/06/2024 | | | 454,397 | | | | 453,261 | |
| | | | | | | | | | | | | | | |
| Industrial Conglomerates - 0.74% (0.49% of Total Investments) |
| WireCo WorldGroup, Inc., Initial | | 7.50% | | 1M US L + 5.00% | | 09/29/2023 | | | 543,806 | | | | 542,615 | |
| | | | | | | | | | | | | | | |
| Internet Software & Services - 1.84% (1.22% of Total Investments) |
| EIG Investors Corp., 2018 Refinancing | | 6.39% | | 3M US L + 3.75% | | 02/09/2023 | | | 443,041 | | | | 440,272 | |
| Veritas US, Inc., New Dollar B | | 7.02% | | 1M US L + 4.50% | | 01/27/2023 | | | 984,925 | | | | 909,361 | |
| Total Internet Software & Services | | | | | | | | | 1,427,966 | | | | 1,349,633 | |
| | | | | | | | | | | | | | | |
| IT Services - 3.46% (2.29% of Total Investments) |
| Avaya, Inc., Tranche B | | 6.78% | | 1M US L + 4.25% | | 12/15/2024 | | | 960,445 | | | | 955,442 | |
| ION Trading Technologies S.a.r.l., 2018 Initial Dollar | | 6.65% | | 3M US L + 4.00% | | 11/21/2024 | | | 930,590 | | | | 901,174 | |
| West Corp., Initial B | | 6.63% | | 1M US L + 4.00% | | 10/10/2024 | | | 727,987 | | | | 681,709 | |
| Total IT Services | | | | | | | | | 2,619,022 | | | | 2,538,325 | |
| | | | | | | | | | | | | | | |
| Media - 1.43% (0.94% of Total Investments) |
| MediArena Acquisition B.V., Dollar B | | 8.55% | | 3M US L + 5.75% | | 08/13/2021 | | | 742,894 | | | | 737,790 | |
See Notes to Financial Statements.
| Semi-Annual Report | March 31, 2019 | 13 |
| XAI Octagon Floating Rate & | |
| Alternative Income Term Trust | Schedule of Investments |
March 31, 2019 (Unaudited)
| | | Coupon(a) | | Reference Rate & Spread | | Maturity Date | | Principal Amount | | | Value | |
| SENIOR SECURED FIRST LIEN LOANS(c)(continued) | | | | | | | | | | | | | | |
| Media (continued) |
| Quad/Graphics, Inc., B | | 7.50% | | 1M US L + 5.00% | | 02/02/2026 | | $ | 310,304 | | | $ | 309,916 | |
| Total Media | | | | | | | | | 1,053,198 | | | | 1,047,706 | |
| | | | | | | | | | | | | | | |
| Oil, Gas & Consumable Fuels - 0.57% (0.38% of Total Investments) |
| Permian Production Partners LLC, Initial Advances | | 8.49% | | 1M US L + 6.00% | | 05/20/2024 | | | 438,786 | | | | 421,235 | |
| | | | | | | | | | | | | | | |
| Personal Products - 0.75% (0.50% of Total Investments) |
| Revlon Consumer Products Corp., Initial B | | 6.13% | | 3M US L + 3.50% | | 09/07/2023 | | | 763,258 | | | | 550,820 | |
| | | | | | | | | | | | | | | |
| Pharmaceuticals - 1.46% (0.96% of Total Investments) |
| Endo Pharmaceuticals Holdings, Inc., Initial Term Loan | | 6.75% | | 1M US L + 4.25% | | 04/29/2024 | | | 967,893 | | | | 948,380 | |
| Mallinckrodt International Finance S.A., 2018 Incremental(d) | | N/A | | L + 3.00% | | 02/24/2025 | | | 128,620 | | | | 121,009 | |
| Total Pharmaceuticals | | | | | | | | | 1,096,513 | | | | 1,069,389 | |
| | | | | | | | | | | | | | | |
| Real Estate Management & Development - 0.63% (0.41% of Total Investments) |
| Forest City Enterprises LP, Initial | | 6.48% | | 1M US L + 4.00% | | 12/08/2025 | | | 458,386 | | | | 459,532 | |
| | | | | | | | | | | | | | | |
| Road & Rail - 0.67% (0.44% of Total Investments) |
| YRC Worldwide, Inc., Term B-1 Loan | | 11.24% | | 1M US L + 8.50% | | 07/26/2022 | | | 499,252 | | | | 490,870 | |
| | | | | | | | | | | | | | | |
| Software - 4.42% (2.92% of Total Investments) |
| Blackboard, Inc., B-4 | | 7.78% | | 3M US L + 5.00% | | 06/30/2021 | | | 122,424 | | | | 120,159 | |
| Datto, Inc., Cov-Lite TLB(d) | | N/A | | L + 4.75% | | 04/02/2026 | | | 143,236 | | | | 143,236 | |
| DiscoverOrg LLC, Initial | | 7.24% | | 3M US L + 4.50% | | 02/02/2026 | | | 739,910 | | | | 728,811 | |
| LegalZoom.com, Inc., 2018 | | 6.99% | | 1M US L + 4.50% | | 11/21/2024 | | | 560,575 | | | | 559,875 | |
| McAfee LLC, B USD | | 6.25% | | 1M US L + 3.75% | | 09/30/2024 | | | 838,820 | | | | 837,420 | |
| Project Alpha Intermediate Holding, Inc., B(d) | | N/A | | L + 4.50% | | 04/26/2024 | | | 374,365 | | | | 370,621 | |
| Project Leopard Holdings, Inc., 2018 Repricing | | 7.00% | | 1M US L + 4.50% | | 07/07/2023 | | | 492,516 | | | | 485,438 | |
| Total Software | | | | | | | | | 3,271,846 | | | | 3,245,560 | |
| | | | | | | | | | | | | | | |
| Specialty Retail - 1.76% (1.16% of Total Investments) |
| Bass Pro Group LLC, Initial | | 7.50% | | 1M US L + 5.00% | | 09/25/2024 | | | 762,294 | | | | 743,999 | |
| Payless, Inc. | | | | | | | | | | | | | | |
| Term Loan(d) | | N/A | | L + 8.00% | | 09/30/2019 | | | 146,987 | | | | 144,782 | |
| Tranche A-1 | | 10.78% | | 3M US L + 9.00% | | 02/10/2022 | | | 359,832 | | | | 178,718 | |
| Tranche A-2 | | 11.78% | | 3M US L + 10.00% | | 08/10/2022 | | | 643,500 | | | | 222,007 | |
| Total Specialty Retail | | | | | | | | | 1,912,613 | | | | 1,289,506 | |
| | | | | | | | | | | | | | | |
| Textiles, Apparel & Luxury Goods - 1.78% (1.18% of Total Investments) |
| Champ Acquisition Corp., Initial | | 8.10% | | 3M US L + 5.50% | | 12/19/2025 | | | 549,391 | | | | 549,051 | |
| Elevate Textiles, Inc., Initial | | 7.49% | | 1M US L + 5.00% | | 05/01/2024 | | | 790,900 | | | | 759,264 | |
| Total Textiles, Apparel & Luxury Goods | | | | | | | | | 1,340,291 | | | | 1,308,315 | |
See Notes to Financial Statements.
| XAI Octagon Floating Rate & | |
| Alternative Income Term Trust | Schedule of Investments |
March 31, 2019 (Unaudited)
| | | Coupon(a) | | Reference Rate & Spread | | Maturity Date | | Principal Amount | | | Value | |
| SENIOR SECURED FIRST LIEN LOANS(c)(continued) |
| Wireless Telecommunication Services - 0.72% (0.48% of Total Investments) |
| Digicel International Finance, Ltd., Initial B | | 5.88% | | 3M US L + 3.25% | | 05/27/2024 | | $ | 599,255 | | | $ | 530,718 | |
| | | | | | | | | | | | | | | |
| Total Senior Secured First Lien Loans (Cost $47,262,288) | | | | | | | | $ | 47,885,916 | | | $ | 45,383,384 | |
| | | | | | | | | | | | | | | |
| CLO DEBT(c)(f)- 22.67% (14.98% of Total Investments) |
| Anchorage Capital CLO 2018-10, Ltd., Series 2018-10A(b) | | 8.18% | | 3M US L + 5.75% | | 10/15/2031 | | | 500,000 | | | | 458,574 | |
| Apidos CLO XXVIII, Series 2017-28A(b) | | 8.26% | | 3M US L + 5.50% | | 01/20/2031 | | | 1,000,000 | | | | 929,345 | |
| Atrium XIV LLC, Series 2018-14A(b) | | 8.43% | | 3M US L + 5.65% | | 08/23/2030 | | | 500,000 | | | | 468,752 | |
| CIFC Funding 2015-I, Ltd., Series 2015-1A(b) | | 8.76% | | 3M US L + 6.00% | | 01/22/2031 | | | 500,000 | | | | 477,037 | |
| CIFC Funding 2017-II, Ltd., Series 2017-2A(b) | | 8.71% | | 3M US L + 5.95% | | 04/20/2030 | | | 500,000 | | | | 478,807 | |
| CIFC Funding 2017-V, Ltd., Series 2017-5A(b) | | 8.87% | | 3M US L + 6.10% | | 11/16/2030 | | | 1,000,000 | | | | 970,411 | |
| Dryden 64 CLO, Ltd., Series 2018-64A(b) | | 8.38% | | 3M US L + 5.60% | | 04/18/2031 | | | 500,000 | | | | 461,965 | |
| GoldenTree Loan Management US CLO 1, Ltd., Series 2017-1A(b) | | 8.36% | | 3M US L + 5.60% | | 04/20/2029 | | | 1,000,000 | | | | 853,243 | |
| GoldenTree Loan Opportunities XI, Ltd., Series 2015-11A(b) | | 8.18% | | 3M US L + 5.40% | | 01/18/2031 | | | 750,000 | | | | 679,165 | |
| Halcyon Loan Advisors Funding 2018-2, Ltd., Series 2018-2A(b) | | 9.75% | | 3M US L + 6.90% | | 01/22/2031 | | | 500,000 | | | | 501,848 | |
| HPS Loan Management 11-2017, Ltd., Series 2017-11A(b) | | 10.58% | | 3M US L + 7.85% | | 05/06/2030 | | | 1,000,000 | | | | 911,394 | |
| Madison Park Funding XVII, Ltd., Series 2015-17A(b) | | 10.24% | | 3M US L + 7.48% | | 07/21/2030 | | | 1,000,000 | | | | 893,726 | |
| Marble Point CLO XI, Ltd., Series 2017-2A E(b) | | 8.38% | | 3M US L + 5.60% | | 12/18/2030 | | | 1,000,000 | | | | 907,841 | |
| Neuberger Berman CLO XIV, Ltd., Series 2013-14A(b) | | 9.21% | | 3M US L + 6.45% | | 01/28/2030 | | | 1,000,000 | | | | 962,956 | |
| OZLM Funding, Ltd., Series 2012-1A(b) | | 9.43% | | 3M US L + 6.67% | | 07/23/2029 | | | 1,000,000 | | | | 991,428 | |
| OZLM XXII, Ltd., Series 2018-22A(b) | | 8.07% | | 3M US L + 5.30% | | 01/17/2031 | | | 500,000 | | | | 451,216 | |
| Sound Point CLO II, Ltd., Series 2013-1A(b) | | 8.26% | | 3M US L + 5.50% | | 01/26/2031 | | | 250,000 | | | | 233,293 | |
| Sound Point CLO XVIII, Ltd., Series 2017-4A(b) | | 8.26% | | 3M US L + 5.50% | | 01/20/2031 | | | 500,000 | | | | 466,030 | |
| Symphony CLO XVIII, Ltd., Series 2016-18A(b) | | 9.12% | | 3M US L + 6.35% | | 01/23/2028 | | | 1,500,000 | | | | 1,458,071 | |
| THL Credit Wind River 2017-4 CLO, Ltd., Series 2017-4A(b) | | 8.44% | | 3M US L + 5.80% | | 11/20/2030 | | | 500,000 | | | | 469,548 | |
| THL Credit Wind River 2019-1 CLO, Ltd., Series 2019-1A(b) | | N/A | | 3M US L + 6.72% | | 04/20/2031 | | | 750,000 | | | | 738,750 | |
| Voya CLO 2013-1, Ltd., Series 2013-1A(b) | | 9.27% | | 3M US L + 6.48% | | 10/15/2030 | | | 1,000,000 | | | | 965,247 | |
| Voya CLO 2013-2, Ltd., Series 2013-2A(b) | | 8.37% | | 3M US L + 5.60% | | 04/25/2031 | | | 1,000,000 | | | | 915,317 | |
| Total CLO Debt (Cost $17,614,014) | | | | | | | | $ | 17,750,000 | | | $ | 16,643,964 | |
| | | | | | | | | | | | | | | |
| CLO EQUITY(f)(g)- 50.47% (33.36% of Total Investments) |
| ALM V, Ltd., Series 2012-5A(b) | | N/A | | Estimated yield of 11.79% | | 10/18/2027 | | | 2,000,000 | | | | 822,568 | |
| Anchorage Capital CLO 1-R, Ltd., Series 2018-1RA(b) | | N/A | | Estimated yield of 11.53% | | 04/13/2031 | | | 2,000,000 | | | | 1,627,442 | |
| Anchorage Capital CLO 3-R, Ltd., Series 2014-3RA(b) | | N/A | | Estimated yield of 13.41% | | 01/28/2031 | | | 1,400,000 | | | | 1,141,749 | |
| Apidos CLO XXI, Series 2015-21A(b) | | N/A | | Estimated yield of 17.77% | | 07/18/2027 | | | 750,000 | | | | 448,538 | |
| Apidos CLO XXVIII, Series 2017-28A(b) | | N/A | | Estimated yield of 10.68% | | 01/20/2031 | | | 3,500,000 | | | | 2,876,223 | |
| Ares XLIX CLO, Ltd., Series 2018-49A(b) | | N/A | | Estimated yield of 12.79% | | 07/22/2030 | | | 2,000,000 | | | | 1,650,000 | |
| Ares XLVII CLO, Ltd., Series 2018-47A(b) | | N/A | | Estimated yield of 11.57% | | 04/16/2030 | | | 2,000,000 | | | | 1,650,540 | |
| Carlyle Global Market Strategies CLO 2013-1, Ltd., Series 2013-1A(b) | | N/A | | Estimated yield of 19.99% | | 08/14/2030 | | | 3,500,000 | | | | 2,262,935 | |
| Carlyle Global Market Strategies CLO 2016-1, Ltd., Series 2016-1A(b) | | N/A | | Estimated yield of 14.82% | | 04/20/2027 | | | 598,000 | | | | 520,261 | |
| Carlyle US CLO 2018-2, Ltd., Series 2018-2A(b) | | N/A | | Estimated yield of 11.83% | | 10/15/2031 | | | 933,000 | | | | 766,489 | |
| Catamaran CLO 2015-1, Ltd., Series 2015-1A(b) | | N/A | | Estimated yield of 27.49% | | 04/22/2027 | | | 750,000 | | | | 349,692 | |
| CIFC Funding 2017-III, Ltd., Series 2017-3A(b) | | N/A | | Estimated yield of 17.10% | | 07/30/2030 | | | 750,000 | | | | 611,514 | |
| CIFC Funding 2017-V, Ltd., Series 2017-5A(b) | | N/A | | Estimated yield of 13.32% | | 11/16/2030 | | | 3,000,000 | | | | 2,457,279 | |
See Notes to Financial Statements.
| Semi-Annual Report | March 31, 2019 | 15 |
| XAI Octagon Floating Rate & | |
| Alternative Income Term Trust | Schedule of Investments |
March 31, 2019 (Unaudited)
| | | Coupon(a) | | Reference Rate & Spread | | Maturity Date | | Principal Amount | | | Value | |
| CLO EQUITY(f)(g) (continued) |
| CIFC Funding 2018-I, Ltd., Series 2018-1A(b) | | N/A | | Estimated yield of 15.24% | | 04/18/2031 | | $ | 3,250,000 | | | $ | 3,093,512 | |
| Dryden 34 Senior Loan Fund, Series 2014-34A(b) | | N/A | | Estimated yield of 0.00% | | 10/15/2026 | | | 5,000,000 | | | | 65,750 | |
| Madison Park Funding XVIII, Ltd., Series 2015-18A(b) | | N/A | | Estimated yield of 9.61% | | 10/21/2027 | | | 4,000,000 | | | | 3,188,440 | |
| Marble Point CLO XI, Ltd., Series 2017-2A INC(b) | | N/A | | Estimated yield of 14.75% | | 12/18/2030 | | | 3,000,000 | | | | 2,182,500 | |
| OZLM XIX, Ltd., Series 2017-19A(b) | | N/A | | Estimated yield of 12.35% | | 11/22/2030 | | | 3,500,000 | | | | 2,611,907 | |
| OZLM XVI, Ltd., Series 2017-16A(b) | | N/A | | Estimated yield of 10.52% | | 05/16/2030 | | | 1,250,000 | | | | 811,661 | |
| Sound Point CLO III, Ltd., Series 2017-3A(b) | | N/A | | Estimated yield of 17.61% | | 10/20/2030 | | | 1,500,000 | | | | 1,389,933 | |
| Sound Point CLO III-R, Ltd., Series 2013-2RA(b) | | N/A | | Estimated yield of 18.13% | | 04/15/2029 | | | 1,000,000 | | | | 445,964 | |
| Thacher Park CLO, Ltd., Series 2014-1A(b) | | N/A | | Estimated yield of 12.79% | | 10/20/2026 | | | 6,000,000 | | | | 2,042,640 | |
| THL Credit Wind River 2016-1 CLO, Ltd., Series 2016-1A(b) | | N/A | | Estimated yield of 18.76% | | 07/15/2028 | | | 4,000,000 | | | | 2,773,288 | |
| Voya CLO 2017-4, Ltd., Series 2017-4A(b) | | N/A | | Estimated yield of 12.48% | | 10/15/2030 | | | 1,500,000 | | | | 1,267,292 | |
| Total CLO Equity (Cost $41,292,446) | | | | | | | | $ | 57,181,000 | | | $ | 37,058,117 | |
| | | | | | | | | | | | | | | |
| | | Shares | | | | | |
| MONEY MARKET MUTUAL FUNDS - 2.78%(1.84% of Total Investments) | | | | | | | | |
| Invesco Short Term Investments Trust Treasury Portfolio, Institutional Class (2.299% 7-Day Yield) | | | 2,043,080 | | | | 2,043,080 | |
| Total Money Market Mutual Funds (Cost $2,043,080) | | $ | 2,043,080 | | | $ | 2,043,080 | |
| | | | | | | | | |
| Total Investments - 151.28% (Cost $$118,695,630) | | | | | | $ | 111,080,995 | |
| Liabilities in Excess of Other Assets - (2.24)% | | | | | | | (1,649,149 | ) |
| Leverage Facility (Net of 59,107 Deferred Costs) - (49.04)% | | | | | | | (36,005,893 | ) |
| Net Assets - 100.00% | | | | | | $ | 73,425,953 | |
| * | Amounts above are shown as a percentage of net assets as of March 31, 2019. |
| (a) | The rate shown is the coupon as of the end of the reporting period. |
| (b) | Security exempt from registration under Rule 144A of the Securities Act of 1933. Total market value of Rule 144A securities amounts to $54,929,177, which represents approximately 74.81% of net assets as of March 31, 2019. Such securities may normally be sold to qualified institutional buyers in transactions exempt from registration. |
| (c) | Variable rate investment. Interest rates reset periodically. Interest rate shown reflects the rate in effect at March 31, 2019. For securities based on a published reference rate and spread, the reference rate and spread are indicated in the description above. Certain variable rate securities are not based on a published reference rate and spread but are determined by the issuer or agent and are based on current market conditions. These securities do not indicate a reference rate and spread in their description above. |
| (d) | All or a portion of this position has not settled as of the period end. The interest rate shown represents the stated spread over the London Interbank Offered Rate ("LIBOR" or "L") or the applicable LIBOR floor; the Trust will not accrue interest until the settlement date, at which point LIBOR will be established. The total cost of securities purchased on a when issued or delivery delayed basis was $2,946,649 as of March 31, 2019. |
| (e) | This investment has an unfunded commitment as of March 31, 2019. For further details, see Note 8. |
| (f) | As a result of the use of significant unobservable inputs to determine fair value, these investments have been classified as Level 3 assets. See also Note 2 to the Financial Statements for additional information. |
| (g) | CLO subordinated notes are considered CLO equity positions. CLO equity positions are entitled to recurring distributions which are generally equal to the remaining cash flow of payments made by underlying securities less contractual payments to debt holders and fund expenses. The effective yield is estimated based upon the current projection of the amount and timing of these recurring distributions in addition to the estimated amount of terminal principal payment. Effective yields for the CLO equity positions are updated generally once a quarter or on a transaction such as an add-on purchase, refinancing or reset. The estimated yield and investment cost may ultimately not be realized. |
All securities held as of March 31, 2019 are pledged as collateral for the leverage facility.
See Notes to Financial Statements.
| XAI Octagon Floating Rate & | |
| Alternative Income Term Trust | Statement of Assets and Liabilities |
March 31, 2019 (Unaudited)
| ASSETS: | | |
| Investments, at value (Cost $118,695,630) | | $ | 111,080,995 | |
| Cash | | | 617,797 | |
| Receivable for investment securities sold | | | 5,478,584 | |
| Interest receivable | | | 551,620 | |
| Deferred offering costs | | | 193,809 | |
| Prepaid expenses and other assets | | | 23,641 | |
| Total Assets | | | 117,946,446 | |
| | | | | |
| LIABILITIES: | | | | |
| Payable for legal and audit fees | | | 166,428 | |
| Payable to transfer agent | | | 4,670 | |
| Payable for investor support services fees (Note 3) | | | 18,648 | |
| Payable for printing | | | 23,003 | |
| Payable for custodian fees | | | 5,984 | |
| Payable for investment securities purchased | | | 7,423,577 | |
| Leverage facility (Net of $59,107 deferred costs) (Note 6) | | | 36,005,893 | |
| Interest due on leverage facility (Note 6) | | | 114,907 | |
| Distributions payable to common shareholders | | | 576,112 | |
| Accrued investment advisory fees payable (Note 3) | | | 91,319 | |
| Accrued fund accounting and administration fees payable | | | 69,149 | |
| Accrued chief compliance officer fees payable | | | 4,972 | |
| Accrued trustees’ fees payable | | | 873 | |
| Other payables and accrued expenses | | | 14,958 | |
| Total Liabilities | | | 44,520,493 | |
| Net Assets | | $ | 73,425,953 | |
| Commitment (Note 8) | | | | |
| | | | | |
| COMPOSITION OF NET ASSETS: | | | | |
| Paid-in capital | | $ | 79,106,494 | |
| Total distributable earnings | | | (5,680,541 | ) |
| Net Assets | | $ | 73,425,953 | |
| | | | | |
| Common shares of beneficial interest outstanding, at $0.01 par value, and unlimited common shares authorized | | | 8,349,459 | |
| Net Asset Value per Common Share | | $ | 8.79 | |
See Notes to Financial Statements.
| Semi-Annual Report | March 31, 2019 | 17 |
| XAI Octagon Floating Rate & | |
| Alternative Income Term Trust | Statement of Operations |
For the Six Months Ended March 31, 2019 (Unaudited)
| INVESTMENT INCOME: | | |
| Dividends | | $ | 31,244 | |
| Interest | | | 5,690,379 | |
| Total Investment Income | | | 5,721,623 | |
| | | | | |
| EXPENSES: | | | | |
| Investment advisory fees (Note 3) | | | 944,981 | |
| Fund accounting and administration fees | | | 152,413 | |
| Legal and audit fees | | | 156,949 | |
| Custodian fees | | | 10,397 | |
| Chief compliance officer fees (Note 3) | | | 14,972 | |
| Trustees’ fees and expenses | | | 84,874 | |
| Printing expense | | | 10,179 | |
| Transfer agent fees | | | 15,092 | |
| Investor support services fees (Note 3) | | | 111,174 | |
| Interest expense and amortization of deferred borrowing costs | | | 717,629 | |
| Other expenses | | | 44,560 | |
| Total Expenses Before Waivers | | | 2,263,220 | |
| Fees waived or reimbursed by the Advisor (Note 3) | | | (322,806 | ) |
| Net Expenses | | | 1,940,414 | |
| Net Investment Income | | | 3,781,209 | |
| | | | | |
| REALIZED AND UNREALIZED GAIN ON INVESTMENTS: | | | | |
| Net realized loss on: | | | | |
| Investment securities | | | (790,976 | ) |
| Change in unrealized appreciation/(depreciation) on: | | | | |
| Investment securities | | | (5,434,353 | ) |
| Net Realized and Unrealized Loss on Investments | | | (6,225,329 | ) |
| Net Decrease in Net Assets from Operations | | $ | (2,444,120 | ) |
See Notes to Financial Statements.
| XAI Octagon Floating Rate & | |
| Alternative Income Term Trust | Statements of Changes in Net Assets |
| | | For the Six-Month Period Ended March 31, 2019 (Unaudited) | | | For the Year Ended September 30, 2018 | |
| OPERATIONS: | | | | | | | | |
| Net investment income | | $ | 3,781,209 | | | $ | 5,253,538 | |
| Net realized gain/loss | | | (790,976 | ) | | | 949,311 | |
| Change in unrealized appreciation/(depreciation) | | | (5,434,353 | ) | | | (2,180,282 | ) |
| Net Increase/(Decrease) in Net Assets from Operations | | | (2,444,120 | ) | | | 4,022,567 | |
| | | | | | | | | |
| TOTAL DISTRIBUTIONS TO SHAREHOLDERS: | | | | | | | | |
| From ordinary income and gains | | | (3,456,676 | ) | | | (3,785,195 | ) |
| From tax return of capital | | | – | | | | (2,551,001 | ) |
| TOTAL DISTRIBUTIONS TO SHAREHOLDERS | | | (3,456,676 | ) | | | (6,336,196 | ) |
| | | | | | | | | |
| CAPITAL SHARE TRANSACTIONS: | | | | | | | | |
| Proceeds from sale of common shares (net of offering costs of $0 and $21,750) | | | – | | | | 10,635,750 | |
| Net asset value of common shares issued to shareholders from reinvestment of dividends | | | 5,137 | | | | 11,599 | |
| Net Increase from Capital Share Transactions | | | 5,137 | | | | 10,647,349 | |
| Net Increase/(Decrease) in Net Assets | | | (5,895,659 | ) | | | 8,333,720 | |
| | | | | | | | | |
| NET ASSETS: | | | | | | | | |
| Beginning of period | | $ | 79,321,612 | | | $ | 70,987,892 | |
| End of period | | $ | 73,425,953 | | | $ | 79,321,612 | |
See Notes to Financial Statements.
| Semi-Annual Report | March 31, 2019 | 19 |
| XAI Octagon Floating Rate & | |
| Alternative Income Term Trust | Statement of Cash Flows |
For the Six-Months Ended March 31, 2019 (Unaudited)
| CASH FLOWS FROM OPERATING ACTIVITIES: | | |
| Net decrease in net assets from operations | | $ | (2,444,120 | ) |
| Adjustments to reconcile net decrease in net assets from operations to net cash provided by operating activities: | | | | |
| Purchases of investment securities | | | (54,424,343 | ) |
| Proceeds from disposition of investment securities | | | 57,137,722 | |
| Discounts accreted/premiums amortized | | | (54,269 | ) |
| Reductions to CLO equity cost basis | | | 1,005,790 | |
| Net realized loss on: | | | | |
| Investment securities | | | 790,976 | |
| Net change in unrealized appreciation/(depreciation) on: | | | | |
| Investment securities | | | 5,434,353 | |
| Net purchase of short-term investment securities | | | (45,851 | ) |
| (Increase)/Decrease in assets: | | | | |
| Receivable for investment securities sold | | | 1,213,563 | |
| Interest receivable | | | 29,317 | |
| Prepaid expenses and other assets | | | (23,641 | ) |
| Increase/(Decrease) in liabilities: | | | | |
| Payable for investment securities purchased | | | (1,861,314 | ) |
| Interest due on leverage facility | | | (236,308 | ) |
| Accrued investment advisory fees payable | | | 2,278 | |
| Accrued fund accounting and administration fees payable | | | 7,627 | |
| Payable for legal and audit fees | | | 33,954 | |
| Accrued trustees’ fees payable | | | 873 | |
| Payable for investor support services fees | | | (827 | ) |
| Payable for printing | | | (4,123 | ) |
| Payable for custodian fees | | | (1,232 | ) |
| Accrued chief compliance officer fees payable | | | (28 | ) |
| Payable to transfer agent | | | (2,380 | ) |
| Other payables and accrued expenses | | | 10,386 | |
| Net Cash Provided by Operating Activities | | | 6,568,403 | |
| | | | | |
| CASH FLOWS FROM FINANCING ACTIVITIES: | | | | |
| Payments on leverage facility | | | (2,800,000 | ) |
| Distributions paid - common shareholders | | | (3,451,502 | ) |
| Net Cash Used in Financing Activities | | | (6,251,502 | ) |
| | | | | |
| Net Increase in Cash | | | 316,901 | |
| Cash, beginning balance | | | 300,896 | |
| Cash, ending balance | | $ | 617,797 | |
| | | | | |
| Supplemental disclosure of cash flow information: | | | | |
| Cash paid for interest on leverage facility | | $ | 897,082 | |
| | | | | |
| Non-cash activity: | | | | |
| Reinvestment of distributions | | $ | 5,137 | |
See Notes to Financial Statements.
| XAI Octagon Floating Rate & | |
| Alternative Income Term Trust | Financial Highlights |
For a Share Outstanding Throughout the Periods Presented
| | | For the Six-Month Period Ended March 31, 2019 (Unaudited) | | | For the Year Ended September 30, 2018 | | | For the Period September 27, 2017 (Commencement of Operations) to September 30, 2017 | |
| PER COMMON SHARE OPERATING PERFORMANCE: | | | | | | | | | | | | |
| Net asset value - beginning of period | | $ | 9.50 | | | $ | 9.78 | | | $ | 9.78 | (a) |
| INCOME/(LOSS) FROM INVESTMENT OPERATIONS: | | | | | | | | | | | | |
| Net investment income/(loss)(b) | | | 0.45 | | | | 0.64 | | | | (0.00 | )(c) |
| Net realized and unrealized loss on investments | | | (0.75 | ) | | | (0.16 | ) | | | – | |
| Total Income/(Loss) from Investment Operations | | | (0.30 | ) | | | 0.48 | | | | (0.00 | )(c) |
| | | | | | | | | | | | | |
| DISTRIBUTIONS TO COMMON SHAREHOLDERS:(d) | | | | | | | | | | | | |
| From ordinary income | | | (0.41 | ) | | | (0.45 | ) | | | – | |
| From tax return of capital | | | – | | | | (0.31 | ) | | | – | |
| Total Distributions to Common Shareholders | | | (0.41 | ) | | | (0.76 | ) | | | – | |
| | | | | | | | | | | | | |
| Net asset value per common share - end of period | | $ | 8.79 | | | $ | 9.50 | | | $ | 9.78 | |
| Market price per common share - end of period | | $ | 8.68 | | | $ | 9.80 | | | $ | 10.12 | |
| | | | | | | | | | | | | |
| Total Investment Return - Net Asset Value(e) | | | (2.88 | %) | | | 5.22 | % | | | 0.00 | % |
| Total Investment Return - Market Price(e) | | | (7.03 | %) | | | 4.89 | % | | | 1.20 | % |
| | | | | | | | | | | | | |
| RATIOS AND SUPPLEMENTAL DATA: | | | | | | | | | | | | |
| Net assets attributable to common shares, end of period (000s) | | $ | 73,426 | | | $ | 79,322 | | | $ | 70,988 | |
| Ratio of expenses excluding waivers to average net assets | | | 6.03 | %(f) | | | 5.60 | % | | | 5.00 | %(f) |
| Ratio of expenses including waivers to average net assets | | | 5.17 | %(f) | | | 4.87 | % | | | 2.20 | %(f) |
| Ratio of expenses excluding interest expense to average net assets | | | 3.26 | %(f)(g) | | | 3.35 | %(g) | | | 2.20 | %(f) |
| Ratio of net investment income including waivers to average net assets | | | 10.07 | %(f) | | | 6.57 | % | | | (2.20 | %)(f) |
| Portfolio turnover rate | | | 49 | % | | | 119 | % | | | 0 | % |
| | | | | | | | | | | | | |
| LEVERAGE FACILITY: | | | | | | | | | | | | |
| Aggregate principal amount, end of period (000s) | | $ | 36,065 | | | $ | 38,865 | | | $ | N/A | |
| Asset coverage, end of period per $1,000 | | $ | 3,036 | | | $ | 3,041 | | | $ | N/A | |
| (a) | After deduction of offering expenses charged to capital. |
| (b) | Calculated using average common shares outstanding. |
| (c) | Less than $(0.005) per share. |
| (d) | The per share amounts of distributions related to ordinary income and tax return of capital are based on amounts determined under U.S. federal income tax regulations which differs from the per share amounts from investment operations which are based on amounts determined under U.S. GAAP. |
| (e) | Total investment return is calculated assuming a purchase of a common share at the opening on the first day and a sale at closing on the last day of each period reported. Dividends and distributions are assumed for purposes of this calculation to be reinvested at prices obtained under the Trust’s dividend reinvestment plan. Total investment returns do not reflect brokerage commissions, if any, and are not annualized. |
| (g) | Includes amortization of deferred borrowing costs. |
See Notes to Financial Statements.
| Semi-Annual Report | March 31, 2019 | 21 |
XAI Octagon Floating Rate &
Alternative Income Term Trust | Notes to Financial Statements |
March 31, 2019 (Unaudited)
1. ORGANIZATION
XAI Octagon Floating Rate & Alternative Income Term Trust (the “Trust”) is a diversified, closed-end management investment company registered under the Investment Company Act of 1940, as amended (the “1940 Act”). The Trust commenced operations on September 27, 2017.
The Trust seeks to achieve its investment objective by investing in a dynamically managed portfolio of opportunities primarily within the private credit markets. Under normal market conditions, the Trust will invest at least 80% of its Managed Assets in floating rate credit instruments and other structured credit investments. “Managed Assets” means the total assets of the Trust, including assets attributable to the Trust’s use of leverage, minus the sum of its accrued liabilities (other than liabilities incurred for the purpose of creating leverage).
2. SIGNIFICANT ACCOUNTING POLICIES
Use of Estimates:The preparation of the financial statements in accordance with accounting principles generally accepted in the United States of America (“U.S. GAAP”) requires management to make estimates and assumptions that affect the reported amounts and disclosures in the financial statements during the period reported. Management believes the estimates and security valuations are appropriate; however, actual results may differ from those estimates, and the security valuations reflected in the financial statements may differ from the value the Trust ultimately realizes upon sale of the securities. The Trust is considered an investment company under U.S. GAAP and follows the accounting and reporting guidance applicable to investment companies in the Financial Accounting Standards Board (“FASB”)Accounting Standards Codification(“ASC”) Topic 946. The financial statements have been prepared as of the close of the New York Stock Exchange (“NYSE”) on March 29, 2019.
Expense Recognition:Expenses are recorded on the accrual basis of accounting.
Portfolio Valuation:The net asset value per common share of the Trust is determined daily, on each day that the NYSE is open for trading, as of the close of regular trading on the NYSE (normally 4:00 p.m. New York time). The Trust’s net asset value per common share is calculated by dividing the value of the Trust’s total assets, less its liabilities by the number of shares outstanding.
Cash & Cash Equivalents:The Trust considers its investment in an FDIC insured interest bearing account to be cash. Cash and cash equivalents are valued at cost plus any accrued interest. The Trust maintains cash balances, which at times may exceed federally insured limits. The Trust maintains these balances with a high quality financial institution.
Securities Transactions and Investment Income:Investment security transactions are accounted for on a trade date basis. Dividend income is recorded on the ex-dividend date. Realized gains and losses from securities transactions and unrealized appreciation and depreciation of securities are determined using the identified cost basis method for financial reporting purposes.
Interest income from investments is recorded using the accrual basis of accounting to the extent such amounts are expected to be collected. Amortization of premium or accretion of discount is recognized using the effective interest method. Collateralized loan obligation (“CLO”) equity investments recognize investment income on the accrual basis utilizing an effective interest methodology based upon an effective yield to maturity utilizing projected cash flows. ASC Topic 325-40, Beneficial Interests in Securitized Financial Assets, requires investment income from CLO equity investments and fee rebates to be recognized under the effective interest method, with any difference between the cash distribution and the amount calculated pursuant to the effective interest method being recorded as an adjustment to the cost basis of the investment. There were no fee rebates for CLO equity investments held by the Trust as of March 31, 2019.
Effective yields for the Trust’s CLO equity positions are monitored and evaluated on a quarterly basis. The Trust also updates a CLO equity investment’s effective yield in each instance where there is a respective add-on purchase, refinancing or reset involving the CLO equity investment held. The effective yield will be set to 0.00% if: (1) the aggregate projected amount of future recurring distributions is less than the amortized investment cost, and/or (2) there is significant uncertainty with respect to the timing of future residual distributions. The future distributions for CLO equity positions with a 0.00% effective yield will be recognized solely as return of capital until the aggregate projected amount of future recurring distributions exceeds the amortized investment cost.
Fair Value Measurements:The Trust discloses the classification of its fair value measurements following a three-tier hierarchy based on the inputs used to measure fair value. Inputs refer broadly to the assumptions that market participants would use in pricing the asset or liability, including assumptions about risk. Inputs may be observable or unobservable. Observable inputs reflect the assumptions market participants would use in pricing the asset or liability that are developed based on market data obtained from sources independent of the reporting entity. Unobservable inputs reflect the reporting entity’s own assumptions about the assumptions market participants would use in pricing the asset or liability that are developed based on the best information available.
XAI Octagon Floating Rate &
Alternative Income Term Trust | Notes to Financial Statements |
March 31, 2019 (Unaudited)
Various inputs are used in determining the value of the Trust’s investments as of the end of the reporting period. When inputs used fall into different levels of the fair value hierarchy, the level in the hierarchy within which the fair value measurement falls is determined based on the lowest level input that is significant to the fair value measurement in its entirety. The designated input levels are not necessarily an indication of the risk or liquidity associated with these investments.
These inputs are categorized in the following hierarchy under applicable financial accounting standards:
| Level 1— | Unadjusted quoted prices in active markets for identical investments, unrestricted assets or liabilities that the Trust has the ability to access at the measurement date; |
| Level 2— | Quoted prices which are not active, quoted prices for similar assets or liabilities in active markets or inputs other than quoted prices that are observable (either directly or indirectly) for substantially the full term of the asset or liability; and |
| Level 3— | Significant unobservable prices or inputs (including the Trust’s own assumptions in determining the fair value of investments) where there is little or no market activity for the asset or liability at the measurement date. |
The following is a summary of the inputs used to value the Trust’s investments as of March 31, 2019:
| Investments in Securities at Value* | | Level 1 - Quoted Prices | | | Level 2 - Significant Observable Inputs | | | Level 3 - Significant Unobservable Inputs | | | Total | |
| Corporate Bonds | | $ | – | | | $ | 1,227,096 | | | $ | – | | | $ | 1,227,096 | |
| Secured Second Lien Loans | | | – | | | | 8,725,354 | | | | – | | | | 8,725,354 | |
| Senior Secured First Lien Loans | | | – | | | | 45,383,384 | | | | – | | | | 45,383,384 | |
| CLO Debt | | | – | | | | – | | | | 16,643,964 | | | | 16,643,964 | |
| CLO Equity | | | – | | | | – | | | | 37,058,117 | | | | 37,058,117 | |
| Money Market Mutual Funds | | | 2,043,080 | | | | – | | | | – | | | | 2,043,080 | |
| Total | | $ | 2,043,080 | | | $ | 55,335,834 | | | $ | 53,702,081 | | | $ | 111,080,995 | |
| * | For detailed descriptions, see the accompanying Schedule of Investments. |
The changes of the fair value of investments for which the Trust has used Level 3 inputs to determine the fair value are as follows:
| | | CLO Debt | | | CLO Equity | | | Total | |
| Balance as of September 30, 2018 | | $ | 17,845,594 | | | $ | 40,780,021 | | | $ | 58,625,615 | |
| Accrued Discount/Premium | | | 2,339 | | | | – | | | | 2,339 | |
| Reductions to CLO Equity Cost Basis(a) | | | – | | | | (1,005,790 | ) | | | (1,005,790 | ) |
| Realized Gain/(Loss) | | | (182,490 | ) | | | (749,298 | ) | | | (931,788 | ) |
| Change in Unrealized Appreciation/(Depreciation) | | | (896,228 | ) | | | (2,283,258 | ) | | | (3,179,486 | ) |
| Purchases | | | 1,704,750 | | | | 9,086,692 | | | | 10,791,442 | |
| Sales Proceeds | | | (1,830,001 | ) | | | (8,770,250 | ) | | | (10,600,251 | ) |
| Transfer into Level 3 | | | – | | | | – | | | | – | |
| Transfer out of Level 3 | | | – | | | | – | | | | – | |
| Balance as of March 31, 2019 | | $ | 16,643,964 | | | $ | 37,058,117 | | | $ | 53,702,081 | |
| Net change in unrealized appreciation/(depreciation) included in the Statements of Operations attributable to Level 3 investments held at March 31, 2019 | | $ | (906,511 | ) | | $ | (2,542,009 | ) | | $ | (3,448,520 | ) |
| (a) | Reduction to cost value on CLO equity investments represents the difference between distributions received, or entitled to be received, and income earned for the six-month period ended March 31, 2019. |
| Semi-Annual Report | March 31, 2019 | 23 |
XAI Octagon Floating Rate &
Alternative Income Term Trust | Notes to Financial Statements |
March 31, 2019 (Unaudited)
The following table summarizes the quantitative inputs and assumptions used for investments categorized in Level 3 of the fair value hierarchy as of the end of the reporting period. In addition to the techniques and inputs noted in the table below, according to the Trust's valuation policy, the Trust may use other valuation techniques and methodologies when determining the Trust's fair value measurements as provided for in the valuation policy and approved by the Board. The table below is not intended to be all-inclusive, but rather provides information on the significant Level 3 inputs as they relate to the fair value measurements as of the end of the reporting period.
| | | Quantitative Information about Level 3 Value Measurements |
| Assets | | Value as of March 31, 2019 | | | Valuation Methodologies | | Unobservable Input | | Range/Weighted Average(2) |
| CLO Debt | | | 16,643,964 | | | NBIB(1) | | NBIB(1) | | 85.32 – 100.37 / 93.77 |
| CLO Equity | | | 37,058,117 | | | NBIB(1) | | NBIB(1) | | 1.32 – 95.19 / 64.81 |
| Total Level 3 assets | | | 53,702,081 | | | | | | | |
| (1) | The Trust generally uses non-binding indicative bid ("NBIB") prices provided by an independent pricing service or broker on or near the valuation date as the primary basis for the fair value determination for CLO debt and CLO equity investments, which may be adjusted for pending equity distributions as of the valuation date. These bid prices are non-binding, and may not be determinative of an actual transaction price. In valuing the Trust’s investments in CLO debt and CLO equity, in addition to NBIB prices provided by an independent pricing service or broker, the Trust also may consider a variety of relevant factors as set forth in the Trust’s valuation policy, including recent trading prices for specific investments, recent purchases and sales known to the Trust in similar securities, other information known to the Trust relating to the securities, and discounted cash flows based on output from a third-party financial model, using projected future cash flows. |
| (2) | Weighted averages are calculated based on the value of investments on March 31, 2019. |
Significant increases or decreases in any of the unobservable inputs in isolation may result in a significantly lower or higher fair value measurement.
Indemnification:The Trust indemnifies its Officers and Trustees for certain liabilities that may arise from the performance of their duties to the Trust. Additionally, in the normal course of business, the Trust enters into contracts that contain a variety of representations and warranties and which provide general indemnities. The Trust’s maximum exposure under these arrangements is unknown, as this would involve future claims that may be made against the Trust that have not yet occurred. However, based on industry experience, the Trust expects the risk of loss due to these warranties and indemnities to be remote.
3. INVESTMENT ADVISORY AND OTHER AGREEMENTS
XA Investments LLC (“XAI” or the “Adviser”) serves as the investment adviser to the Trust and is responsible for overseeing the Trust’s overall investment strategy and its implementation. Octagon Credit Investors, LLC (“Octagon” or the “Sub-Adviser”) serves as the investment sub-adviser of the Trust and is responsible for investing the Trust’s assets. The Trust pays an advisory fee to the Adviser. The Adviser pays to the Sub-Adviser a sub-advisory fee out of the advisory fee received by the Adviser.
Pursuant to an investment advisory agreement between the Trust and the Adviser, the Trust pays the Adviser a fee, payable monthly in arrears, in an annual amount equal to 1.70% of the Trust’s average daily Managed Assets. “Managed Assets” means the total assets of the Trust, including assets attributable to the Trust’s use of leverage, minus the sum of its accrued liabilities (other than liabilities incurred for the purpose of creating leverage). For the six-month period ended March 31, 2019 the Trust incurred $944,981 in advisory fees.
The sub-advisory fee, payable monthly in arrears to the Sub-Adviser, is calculated as a specified percentage of the advisory fee payable by the Trust to the Adviser (before giving effect to any fees waived or expenses reimbursed by the Adviser). The specified percentage is equal to the blended percentage computed by applying the following percentages to the aggregate average daily Managed Assets of all registered investment companies in the XAI fund complex for which the Sub-Adviser (or an affiliate of the Sub-Adviser) serves as investment sub-adviser, including the Trust (“Eligible Funds”):
Aggregate Eligible Funds Average Daily Managed Assets | Percentage of Advisory Fee |
| First $500 million | 60% |
| Over $500 million | 50% |
XAI Octagon Floating Rate &
Alternative Income Term Trust | Notes to Financial Statements |
March 31, 2019 (Unaudited)
As of March 31, 2019, the Trust was the only Eligible Fund and the sub-advisory fee equals 60% of the advisory fee payable to the Adviser.
The Trust pays all costs and expenses of its operations in addition to the advisory fee and investor support services and secondary market support services fee paid to the adviser. The Adviser has contractually agreed to waive a portion of the advisory fee and/or reimburse the Trust for certain operating expenses so that the annual expenses of the Trust do not exceed 0.30% of the Trust’s Managed Assets (exclusive of investment advisory fees, investor support and secondary market services fees, taxes, expenses incurred directly or indirectly by the Trust as a result of an investment in a permitted investment (including, without limitation, acquired fund fees and expenses), expenses associated with the acquisition or disposition of portfolio investments (including, without limitation, brokerage commissions and other trading or transaction expenses), leverage expenses (including, without limitation, costs associated with the issuance or incurrence of leverage, commitment fees, interest expense or dividends on preferred shares), expenses incurred in connection with issuances and sales of shares of the Trust (including, without limitation, fees, commissions and offering costs), dividends on short sales, if any, securities lending costs, if any, expenses of holding, and soliciting proxies for, meetings of shareholders of the Trust (except to the extent relating to routine items such as the election of trustees), expenses of a reorganization, restructuring, reconciling or merger of the Trust or the acquisition of all or substantially all of the assets of another fund, or any extraordinary expenses not incurred in the ordinary course of the Trust’s business (including, without limitation, expenses related to litigation, derivative actions, demands related to litigation, regulatory or other government investigations and proceeding)). The contractual fee waiver is for a two-year period, expiring September 27, 2019. The Adviser may recoup waived or reimbursed amounts for three years following the date of such waiver or reimbursement, provided total expenses, including such recoupment, do not exceed the lesser of the annual expense limit at the time such expenses were waived or reimbursed or the annual expense limit at the time of recoupment. For the six-month period ended March 31, 2019, the fee waivers and/or reimbursements were $322,806.
As of March 31, 2019, the following amounts were available for recoupment by the Adviser based upon their expiration dates:
| | | Expires 2020 | | | Expires 2021 | | | Expires 2022 | |
| | | $ | 21,797 | | | $ | 580,682 | | | $ | 322,806 | |
The Trust has also retained the Adviser to provide investor support services and secondary market support services in connection with the ongoing operation of the Trust. Such services include providing ongoing contact with respect to the Trust with financial intermediaries, communicating with the NYSE specialist for the shares and with the closed-end fund analyst community regarding the Trust on a regular basis, and hosting and maintaining a website for the Trust. The Trust pays the Adviser a service fee, payable monthly in arrears, in an annual amount equal to 0.20% of the Trust’s average daily Managed Assets.
ALPS Fund Services, Inc. (“ALPS”) serves as the Trust’s administrator and accounting agent and receives customary fees from the Trust for such services.
ALPS provides services that assist the Trust’s chief compliance officer in monitoring and testing the policies and procedures of the Trust in conjunction with requirements under Rule 38a-1 under the 1940 Act and receives an annual base fee. ALPS is reimbursed for certain out-of-pocket expenses by the Trust. Compliance service fees paid by the Trust for the six-month period ended March 31, 2019 are disclosed in the Statement of Operations.
DST Systems Inc., an affiliate of ALPS, serves as transfer, dividend paying and shareholder servicing agent for the Trust. U.S. Bank N.A. serves as the Trust’s custodian.
4. DISTRIBUTIONS
The Trust intends to pay substantially all of its net investment income, if any, to common shareholders through monthly distributions. The Trust intends to distribute any net long-term capital gains to common shareholders at least annually. The Trust expects to declare distributions monthly. To permit the Trust to maintain more stable monthly distributions, the Trust may distribute more or less than the amount of the net income earned in a particular period. There is no assurance the Trust will continue to pay regular monthly distributions or that it will do so at a particular rate. Distributions may be paid by the Trust from any permitted source and, from time to time, all or a portion of a distribution may be a return of capital. Shareholders should not assume that the source of the distribution from the Trust is net income or profit.
On September 4, 2018, and during each of the five months following, the Trust declared separate monthly distributions of $0.069 per common share, payable on each of October 1, 2018, November 1, 2018, December 3, 2018, December 31, 2018, February 1, 2019 and March 1, 2019. For the six months ended March 31, 2019, the Trust paid distributions of $0.414 per common share, or $3,456,676 in the aggregate.
| Semi-Annual Report | March 31, 2019 | 25 |
| XAI Octagon Floating Rate & | |
| Alternative Income Term Trust | Notes to Financial Statements |
March 31, 2019 (Unaudited)
The characterization of distributions paid to common shareholders reflect estimates made by the Trust for U.S. GAAP purposes. Such estimates are subject to be characterized differently for federal income tax purposes at year-end.
5. CAPITAL TRANSACTIONS
Pursuant to the Trust’s Agreement and Declaration of Trust, the Trust is authorized to issue an unlimited number of common shares of beneficial interest, par value $0.01 per share (“Common Shares”).
| | | For the Six-Months Ended March 31, 2019 (Unaudited) | | For the Year Ended September 30, 2018 |
| Common Shares outstanding - beginning of period | | | 8,348,918 | | | | 7,260,205 | |
| Common Shares issued pursuant to exercise of the over-allotment option in connection with initial public offering | | | – | | | | 1,087,500 | |
| Common Shares issued in connection to initial public offering | | | – | | | | – | |
| Common Shares issued as reinvestment of dividends | | | 541 | | | | 1,213 | |
| Common shares outstanding - end of period | | | 8,349,459 | | | | 8,348,918 | |
The Board is authorized to classify and reclassify any unissued shares into other classes or series of shares and authorize the issuance of shares without obtaining stockholder approval.
On October 1, 2018, the Trust filed with the SEC a shelf registration statement on Form N-2 allowing for delayed or continuous offering of up to $100,000,000 aggregate initial offering price of Common Shares. The shelf registration statement was declared effective on March 12, 2019.
On March 28, 2019, the Trust entered into a Distribution Agreement with Foreside Fund Services, LLC (the “Distributor”), pursuant to which the Trust may offer and sell up to 2,250,000 Common Shares, from time to time, through the Distributor, in transactions that are deemed to be “at-the-market” as defined in Rule 415 under the Securities Act of 1933. The minimum price on any day at which Common Shares may be sold will not be less than the then current NAV per Common Share plus any commissions to be paid to the Distributor. For the period ended March 31, 2019, the Trust did not issue any Common Shares in the at-the-market program.
Management currently estimates that the total offering costs related to the shelf registration statement are approximately $554,000. The Statement of Assets and Liabilities reflects the incurred offering costs of $193,809 as deferred offering costs. These offering costs, as well as offering costs incurred subsequent to March 31, 2019, will be charged to paid-in-capital upon the issuance of shares.
6. LEVERAGE
The Trust uses leverage to seek to enhance total return and income. The Trust may use leverage through (i) the issuance of senior securities representing indebtedness, including through borrowing from financial institutions or issuance of debt securities, including notes or commercial paper (collectively, “Indebtedness”), (ii) the issuance of preferred shares (“Preferred Shares”) and/or (iii) reverse repurchase agreements, securities lending, short sales or derivatives, such as swaps, futures or forward contracts, that have the effect of leverage (“portfolio leverage”). The Trust currently intends to use leverage through Indebtedness and may use Indebtedness to the maximum extent permitted under the 1940 Act. Under the 1940 Act, the Trust may utilize Indebtedness up to 33 1/3% of its Managed Assets (specifically, the Trust may not incur Indebtedness if, immediately after incurring such Indebtedness, the Trust would have asset coverage (as defined in the 1940 Act) of less than 300%). The Trust will not utilize leverage, either through Indebtedness, Preferred Shares or portfolio leverage, in an aggregate amount in excess of 40% of the Trust’s Managed Assets (including the proceeds of leverage).
On October 6, 2017, the Trust entered into a Credit Agreement (the “Credit Agreement”) with Société Générale (the “Lender”) that established a revolving credit facility (the “Facility”) of up to $40,000,000. On September 20, 2018, the Trust entered into an amendment to its Credit Agreement pursuant to which interest on amount borrowed is based on one-month LIBOR plus 1.20%. The Trust’s borrowings are secured by eligible securities held in its portfolio of investments. The Credit Agreement includes usual and customary covenants. Among other things, these covenants place limitations or restrictions on the Trust’s ability to (i) incur other indebtedness, (ii) change certain investment policies, or (iii) pledge or create liens upon the assets of the Trust. In addition, the Trust is required to deliver financial information to the Lender, maintain an asset coverage ratio of not less than 300% and maintain its registration as a closed-end management investment company.
| XAI Octagon Floating Rate & | |
| Alternative Income Term Trust | Notes to Financial Statements |
March 31, 2019 (Unaudited)
For the six-month period ended March 31, 2019, the average amount borrowed under the Credit Agreement and the average interest rate for the amount borrowed was $36,099,066 and 3.62%, respectively. As of March 31, 2019, the amount of such outstanding borrowings was $36,065,000. The interest rate applicable to the borrowings on March 31, 2019 was 3.70%. All securities held as of March 31, 2019 are pledged as collateral for the leverage facility.
The use of leverage is a speculative technique that involves special risks. There can be no assurance that the Adviser’s and the Sub-Adviser’s expectations will be realized or that a leveraging strategy will be successful in any particular time period. Use of leverage creates an opportunity for increased income and capital appreciation but, at the same time, creates special risks. Leverage exposes the Trust to greater risk and increased costs than if it were not implemented. The more leverage that is utilized by the Trust, the more exposed the Trust will be to the risks of leverage. The use of leverage by the Trust causes the net asset value of the common shares to fluctuate significantly in response to changes in interest rates and other economic indicators. As a result, the net asset value, market price and dividend rate of the common shares is likely to be more volatile than those of a fund that is not exposed to leverage. Leverage increases operating costs, which may reduce total return. The Trust pays interest on its borrowings, which may reduce the Trust’s return. Increases in interest rates that the Trust must pay on its borrowings will increase the cost of leverage and may reduce the return to common shareholders. The risk of increases in interest rates may be greater in the current market environment. During the time in which the Trust is utilizing leverage, the amount of the investment advisory fee paid by the Trust will be higher than if the Trust did not utilize leverage because the fees paid will be calculated based on the Trust’s Managed Assets (including proceeds of leverage). Common shareholders bear the portion of the management fee attributable to assets purchased with the proceeds of leverage, which means that common shareholders effectively bear the entire management fee.
7. PORTFOLIO INFORMATION
Purchase and Sales of Securities:For the period ended March 31, 2019, the cost of purchases and proceeds from sales of securities, excluding short-term obligations were as follows:
| Cost of Investments Purchased | | $ | 54,424,343 | |
| Proceeds from Investments Sold | | $ | 57,100,994 | |
8. UNFUNDED COMMITMENTS
The Trust may enter into certain credit agreements, all or a portion of which may be unfunded. The Trust is obligated to fund these loan commitments at the borrowers’ discretion. Unfunded loan commitments and funded portions of credit agreements are marked-to-market daily. Net unrealized appreciation/depreciation on unfunded commitments is reflected in other assets and payable for investment securities purchased in the Statements of Assets and Liabilities and unrealized appreciation (depreciation) on investments in the Statements of Operations. At March 31, 2019 the trust had an unfunded commitment with Bulldog Purchaser, Inc. in the amount of $10,296 and with Phoenix Guarantor, Inc. in the amount of $87,510.
9. TAXES
Classification of Distributions:Because U.S. federal income tax regulations differ from U.S. GAAP, net investment income and net realized gains may differ for financial statement and tax purposes. The “tax return of capital” referenced in the Trust’s Statement of Changes in Net Assets and Financial Highlights is based on the characterization under tax regulations. Temporary differences arise when certain items of income, expense, gain or loss are recognized at some time in the future. For the Trust, these differences are due to temporary book/tax differences arising primarily from the income recognition deferral for distributions received from certain CLO equity positions that qualify as passive foreign investment companies. Also, due to the timing of dividend distributions, the fiscal year in which the amounts are distributed for tax purposes may differ from the fiscal year in which the income or realized gain was recorded by the Trust.
| Semi-Annual Report | March 31, 2019 | 27 |
| XAI Octagon Floating Rate & | |
| Alternative Income Term Trust | Notes to Financial Statements |
March 31, 2019 (Unaudited)
The tax character of distributions paid by the Trust during the year ended September 30, 2018, was as follows:
| 2018 | | |
| Distributions Paid From: | | | | |
| Ordinary Income | | $ | 3,195,302 | |
| Long-Term Capital Gain | | | 13,818 | |
| Return of Capital | | | 2,551,001 | |
| Total | | $ | 5,760,121 | |
Tax Basis of Investments: Net unrealized appreciation/(depreciation) of investments based on federal tax cost as of March 31, 2019, was as follows:
| Cost of investments for income tax purposes | | $ | 118,695,630 | |
| Gross appreciation (excess of value over tax cost) | | $ | 265,773 | |
| Gross depreciation (excess of tax cost over value) | | | (7,880,408 | ) |
| Net unrealized depreciation | | $ | (7,614,635 | ) |
Federal Income Tax Status:For federal income tax purposes, the Trust currently qualifies, and intends to remain qualified, as a regulated investment company under the provisions of Subchapter M of the Internal Revenue Code of 1986, as amended, by distributing substantially all of its investment company taxable net income and realized gain, not offset by capital loss carryforwards, if any, to its shareholders. No provision for federal income taxes has been made.
As of and during the six-month period ended March 31, 2019, the Trust did not have a liability for any unrecognized tax benefits. The Trust files U.S. federal, state, and local tax returns as required. The Trust’s tax returns are subject to examination by the relevant tax authorities until expiration of the applicable statute of limitations which is generally three years after the filing of the tax return.
10. RISK FACTORS
In the normal course of business, the Trust invests in financial instruments and enters into financial transactions where risk of potential loss exists due to such things as changes in the market (market risk) or failure or inability of the other party to a transaction to perform (credit and counterparty risk). See below for a detailed description of select principal risks. The following list is not intended to be a comprehensive listing of all of the potential risks associated with the Trust. The Trust’s prospectus provides a detailed discussion of the Trust’s risks and considerations.
Concentration of Credit Risk: The Trust places its cash with a banking institution, which is insured by Federal Deposit Insurance Corporation (FDIC). The FDIC limit is $250,000. At various times throughout the year, the amount on deposit may exceed the FDIC limit and subject the Trust to a credit risk. The Trust does not believe that such deposits are subject to any unusual risk associated with investment activities.
Secured Loan Risk:Secured loans hold the most senior position in the capital structure of a borrower. Secured loans in most circumstances are fully collateralized by assets of the borrower. Thus, secured loans are generally repaid before unsecured bank loans, corporate bonds, subordinated debt, trade creditors, and preferred or common stockholders. Substantial increases in interest rates may cause an increase in loan defaults as borrowers may lack resources to meet higher debt service requirements. The value of the Trust’s assets may also be affected by other uncertainties such as economic developments affecting the market for senior secured term loans or affecting borrowers generally. Moreover, the security for the Trust’s investments in secured loans may not be recognized for a variety of reasons, including the failure to make required filings by lenders, trustees or other responsible parties and, as a result, the Trust may not have priority over other creditors as anticipated.
Secured loans may include restrictive covenants, which must be maintained by the borrower. The Trust may have an obligation with respect to certain senior secured term loan investments to make additional loans upon demand by the borrower. In general, loans unlike certain bonds, usually do not have call protection. This means that such interests, while having a stated term, may be prepaid, often without penalty. The rate of such prepayments may be affected by, among other things, general business and economic conditions, as well as the financial status of the borrower. Prepayment would cause the actual duration of a senior loan to be shorter than its stated maturity.
| XAI Octagon Floating Rate & | |
| Alternative Income Term Trust | Notes to Financial Statements |
March 31, 2019 (Unaudited)
Secured loans typically will be secured by pledges of collateral from the borrower in the form of tangible and intangible assets. In some instances, the Trust may invest in secured debt that is secured only by stock of the borrower or its subsidiaries or affiliates. The value of the collateral may decline below the principal amount of the senior secured term loans subsequent to an investment by the Trust.
CLO Risk:In addition to the general risks associated with debt securities and structured products discussed herein, CLOs carry additional risks, including, but not limited to (i) the possibility that distributions from collateral securities will not be adequate to make interest or other payments; (ii) the quality of the collateral may decline in value or default; (iii) the possibility that the investments in CLOs are subordinate to other classes or tranches thereof; and (iv) the complex structure of the security may not be fully understood at the time of investment and may produce disputes with the issuer or unexpected investment results. In addition, at the time of issuance, the CLO may not be fully invested. Until the CLO is fully invested, the debt service of the CLO may exceed the amount of interest earned from the CLO’s portfolio. Though not exclusively, the Trust will typically be in a first loss or subordinated position with respect to realized losses on the assets of the CLOs in which it is invested. The Trust may recognize phantom taxable income from its investments in the subordinated tranches of CLOs and structured notes.
Between the closing date and the effective date of a CLO, the CLO collateral manager will generally expect to purchase additional collateral obligations for the CLO. During this period, the price and availability of these collateral obligations may be adversely affected by a number of market factors, including price volatility and availability of investments suitable for the CLO, which could hamper the ability of the collateral manager to acquire a portfolio of collateral obligations that will satisfy specified concentration limitations and allow the CLO to reach the initial par amount of collateral prior to the effective date. An inability or delay in reaching the target initial par amount of collateral may adversely affect the timing and amount of interest or principal payments received by the holders of the CLO debt securities and distributions of the CLO on equity securities and could result in early redemptions which may cause CLO debt and equity investors to receive less than the cost of their investment.
The failure by a CLO in which the Trust invests to satisfy financial covenants, including with respect to adequate collateralization and/or interest coverage tests, could lead to a reduction in the CLO’s payments to the Trust. In the event that a CLO fails certain tests, holders of CLO senior debt may be entitled to accelerated payments that would, in turn, reduce the payments the Trust would otherwise be entitled to receive as described below. Separately, the Trust may incur expenses to the extent necessary to seek recovery upon default or to negotiate new terms, which may include the waiver of certain financial covenants, with a defaulting CLO or any other investment the Trust may make. If any of these occur, it could adversely affect the Trust’s operating results and cash flows.
The Trust’s CLO investments are exposed to leveraged credit risk. If certain minimum collateral value ratios and/or interest coverage ratios are not met by a CLO, primarily due to senior secured loan defaults, then cash flow that otherwise would have been available to pay distributions to the Trust on its CLO investments may instead be used to redeem any senior notes or to purchase additional senior secured loans, until the ratios again exceed the minimum required levels or any senior notes are repaid in full. The Trust’s CLO investments and/or the underlying senior secured loans may prepay more quickly than expected, which could have an adverse impact on the Trust’s net assets.
Subordinated and Unsecured or Partially Secured Loans Risk:The Trust may invest in unsecured loans and secured subordinated loans, including second and lower lien loans. Second lien loans are generally second in line in terms of repayment priority. A second lien loan may have a claim on the same collateral pool as the first lien or it may be secured by a separate set of assets. Second lien loans generally give investors priority over general unsecured creditors in the event of an asset sale. The priority of the collateral claims of third or lower lien loans ranks below holders of second lien loans and so on. Such junior loans are subject to the same general risks inherent to any loan investment, including credit risk, market and liquidity risk, and interest rate risk. Due to their lower place in the borrower’s capital structure and possible unsecured or partially secured status, such loans involve a higher degree of overall risk than senior loans of the same borrower.
Structured Products Risk:The Trust may invest in CLOs and other structured products. Holders of structured products bear risks of the underlying investments, index or reference obligation and are subject to counterparty risk.
The Trust may have the right to receive payments only from the structured product, and generally does not have direct rights against the issuer or the entity that sold the assets to be securitized. While certain structured products enable the investor to acquire interests in a pool of securities without the brokerage and other expenses associated with directly holding the same securities, investors in structured products generally pay their share of the structured product’s administrative and other expenses. Although it is difficult to predict whether the prices of indices and securities underlying structured products will rise or fall, these prices (and, therefore, the prices of structured products) will be influenced by the same types of political and economic events that affect issuers of securities and capital markets generally. If the issuer of a structured product uses shorter term financing to purchase longer term securities, the issuer may be forced to sell its securities at below market prices if it experiences difficulty in obtaining short-term financing, which may adversely affect the value of the structured products owned by the Trust.
Certain structured products may be thinly traded or have a limited trading market. CLOs and credit-linked notes are typically privately offered and sold.
| Semi-Annual Report | March 31, 2019 | 29 |
| XAI Octagon Floating Rate & | |
| Alternative Income Term Trust | Notes to Financial Statements |
March 31, 2019 (Unaudited)
Loan Participations and Assignments:The Trust may invest in loans arranged through private negotiation between one or more financial institutions. The Trust’s investment in any such loan may be in the form of a participation in or an assignment of the loan. In connection with purchasing participations, the Trust generally will have no right to enforce compliance by the borrower with the terms of the loan agreement relating to the loan, nor any rights of set-off against the borrower and the Trust may not benefit directly from any collateral supporting the loan in which they have purchased the participation.
While some loans are collateralized and senior to an issuer’s other debt securities, other loans may be unsecured and/or subordinated to other securities. Some loans may be considered illiquid, and are generally less liquid than exchange-traded debt instruments.
Debt Securities Risk:When the Trust invests in debt securities, the value of an investment in the Trust will fluctuate with changes in interest rates. Typically, a rise in interest rates causes a decline in the value of debt securities. In general, the market price of debt securities with longer maturities will increase or decrease more in response to changes in interest rates than shorter-term securities. Other risk factors include credit risk (the debtor may default) and prepayment risk (the debtor may pay its obligation early, reducing the amount of interest payments). These risks could affect the value of a particular investment, possibly causing the Trust’s share price and total return to be reduced and fluctuate more than other types of investments.
11. SUBSEQUENT EVENTS
On March 1, 2019, the Trust declared a distribution of $0.069 per Common Share, which was paid on April 1, 2019 to common shareholders of record on March 15, 2019.
On April 1, 2019, the Trust declared a distribution of $0.069 per Common Share, which was paid on May 1, 2019 to common shareholders of record on April 16, 2019.
On May 1, 2019, the Trust declared a distribution of $0.073 per Common Share, payable on June 3, 2019 to common shareholders of record on May 15, 2019. The amount of the distribution represented a 5.8% increase from the previous month’s distribution amount of $0.069 per Common Share.
| XAI Octagon Floating Rate & | |
| Alternative Income Term Trust | Additional Information |
March 31, 2019 (Unaudited)
DIVIDEND REINVESTMENT PLAN
Under the Trust’s Dividend Reinvestment Plan (the “Plan”), a holder of Common Shares (“Common Shareholder”) whose Common Shares are registered in his or her own name will have all distributions reinvested automatically by DST Systems, Inc., which is agent under the Plan (the “Plan Agent”), unless the Common Shareholder elects to receive cash.
Distributions with respect to Common Shares registered in the name of a broker-dealer or other nominee (that is, in “street name”) will be reinvested in additional Common Shares under the Plan, unless the broker or nominee does not participate in the Plan or the Common Shareholder elects to receive distributions in cash. Investors who own Common Shares registered in street name should consult their broker-dealers for details regarding reinvestment. All distributions to investors who do not participate in the Plan will be paid by check mailed directly to the record holder by DST Systems, Inc., as dividend disbursing agent. A participant in the Plan who wishes to opt out of the Plan and elect to receive distributions in cash should contact DST Systems, Inc. in writing at the address specified below or by calling the telephone number specified below.
Under the Plan, whenever the market price of the Common Shares is equal to or exceeds net asset value at the time Common Shares are valued for purposes of determining the number of Common Shares equivalent to the cash dividend or capital gains distribution, participants in the Plan are issued new Common Shares from the Trust, valued at the greater of (i) the net asset value as most recently determined or (ii) 95% of the then-current market price of the Common Shares. The valuation date is the dividend or distribution payment date or, if that date is not a NYSE trading day, the next preceding trading day. If the net asset value of the Common Shares at the time of valuation exceeds the market price of the Common Shares, the Plan Agent will buy the Common Shares for the Plan in the open market, on the NYSE or elsewhere, for the participants’ accounts, except that the Plan Agent will endeavor to terminate purchases in the open market and cause the Trust to issue Common Shares at the greater of net asset value or 95% of market value if, following the commencement of such purchases, the market value of the Common Shares exceeds net asset value. If the Trust should declare a distribution or capital gains distribution payable only in cash, the Plan Agent will buy the Common Shares for the Plan in the open market, on the NYSE or elsewhere, for the participants’ accounts. There is no charge from the Trust for reinvestment of dividends or distributions in Common Shares pursuant to the Plan and no brokerage charges will be incurred with respect to Common Shares issued directly by the Trust pursuant to the Plan; however, all participants will pay a pro rata share of brokerage commissions incurred by the Plan Agent when it makes open-market purchases.
The Plan Agent maintains all shareholder accounts in the Plan and furnishes written confirmations of all transactions in the account, including information needed by shareholders for personal and tax records. Common Shares in the account of each Plan participant will be held by the Plan Agent in non-certificated form in the name of the participant.
In the case of shareholders such as banks, brokers or nominees, which hold Common Shares for others who are the beneficial owners, and participate in the Plan, the Plan Agent will administer the Plan on the basis of the number of Common Shares certified from time to time by the Common Shareholder as representing the total amount registered in the shareholder’s name and held for the account of beneficial owners who participate in the Plan.
Participants that request a sale of shares through the Plan Agent will incur brokerage charges in connection with such sales.
The automatic reinvestment of dividends and other distributions will not relieve participants of any income tax that may be payable or required to be withheld on such dividends or distributions.
Experience under the Plan may indicate that changes are desirable. Accordingly, the Trust reserves the right to amend or terminate its Plan as applied to any voluntary cash payments made and any dividend or distribution paid subsequent to written notice of the change sent to the members of such Plan at least 90 days before the record date for such dividend or distribution. The Plan also may be amended or terminated by the Plan Agent on at least 90 days’ prior written notice to the participants in such Plan. All correspondence concerning the Plan should be directed to the Plan Agent, DST Systems, Inc., 430 W. 7th Street, Kansas City, Missouri 64105-1594.
PROXY VOTING
Information on how the Trust voted proxies relating to portfolio securities during the most recent twelve-month period ended June 30 is available without charge, upon request, by calling (888) 903-3358. This information is also available on the SEC’s website atwww.sec.gov.
| Semi-Annual Report | March 31, 2019 | 31 |
| XAI Octagon Floating Rate & | |
| Alternative Income Term Trust | Additional Information |
March 31, 2019 (Unaudited)
DISTRIBUTIONS
The Trust estimated that the sources of distributions paid during the six-month period ended March 31, 2019, calculated in accordance with Section 19 of the 1940 Act and the related rules adopted hereunder, were entirely from current and prior fiscal year net investment income.
The amounts and sources of distributions reported in the 19(a) notices are only estimates and not for tax reporting purposes. The actual amounts and sources of the amounts for tax reporting purposes will depend upon the Trust’s investment experience during the remainder of the calendar year and may be subject to changes based on tax regulations. Also, because U.S. federal income tax regulations differ from U.S. GAAP, distributions in accordance with tax regulations may differ from the underlying character of net investment income and realized gains recognized for financial reporting purposes. The Trust will send investors a Form 1099-DIV for the calendar year that will tell investors how to report these distributions for federal income tax purposes.
NOTICE TO SHAREHOLDERS
Notice is hereby given in accordance with Section 23(c) of the 1940 Act, that the Trust from time to time may purchase its Common Shares in the open market or in private transactions.
RESULTS OF SHAREHOLDERS VOTES
The Annual Meeting of Shareholders of the Trust was held on May 13, 2019. Common shareholders voted on the election of the following Trustees, and the results were as follows:
| | # of Shares in Favor | # of Shares Against | # of Shares Abstain |
| Gregory G. Dingens | 7,009,162.753 | 75,728.375 | 85,137.298 |
| Philip G. Franklin | 7,009,162.753 | 71,443.304 | 89,422.369 |
The other Trustees of the Trust not up for election in 2019 are Danielle Cupps, Theodore J. Brombach and Scott Craven Jones.
TRUST CERTIFICATIONS
The Trust’s Chief Executive Officer (“CEO”) has submitted to the New York Stock Exchange (“NYSE”) the annual CEO certification as required by Section 303A.12(a) of the NYSE Listed Company Manual. The Trust has filed with the SEC the certification of its CEO and Chief Financial Officer required by Section 302 of the Sarbanes-Oxley Act.
QUARTERLY FORM N-Q PORTFOLIO OF INVESTMENTS INFORMATION
The Trust is required to file its complete schedule of portfolio holdings with the Securities and Exchange Commission (“SEC”) for the first and third quarters of each fiscal year on Form N-Q. You may obtain this information directly from the SEC. Visit the SEC on-line at http://www.sec.gov or in person at the SEC’s Public Reference Room in Washington, D.C. Call the SEC toll-free at (800) SEC-0330 for room hours and operation.
AVAILABILITY OF TRUST UPDATES
The Trust regularly updates performance and certain other data and publishes material information as necessary from time to time on its website at www.xainvestments.com/XFLT. Investors and others are advised to check the website for updated performance information and the release of other material information about the Trust. References herein to the Trust’s website are intended to allow investors public access to information regarding the Trust and do not, and are not intended to, incorporate the Trust’s website in this report.
PRIVACY PRINCIPLES OF THE TRUST
The Trust is committed to maintaining the privacy of its shareholders and to safeguarding their non-public personal information. The following information is provided to help you understand what personal information the Trust collects, how the Trust protects that information and why, in certain cases, the Trust may share information with select other parties.
| XAI Octagon Floating Rate & | |
| Alternative Income Term Trust | Additional Information |
March 31, 2019 (Unaudited)
Generally, the Trust does not receive any non-public personal information relating to its shareholders, although certain non-public personal information of its shareholders may become available to the Trust. The Trust does not disclose any non-public personal information about its shareholders or former shareholders to anyone except as permitted by law or as is necessary in order to service shareholder accounts (for example, to a transfer agent or third party administrator).
The Trust restricts access to non-public personal information about its shareholders to employees of the Adviser and its delegates and affiliates with a legitimate business need for the information. The Trust maintains physical, electronic and procedural safeguards designed to protect the non-public personal information of its shareholders.
TRANSFER AGENT AND CUSTODIAN
DST Systems, Inc., 430 W. 7th Street, Kansas City, Missouri 64105, serves as the Trust’s transfer agent and registrar.
U.S. Bank N.A., 1555 N. River Center Drive, Milwaukee, Wisconsin 53212, serves as the Trust’s custodian.
LEGAL COUNSEL
Skadden, Arps, Slate, Meagher & Flom LLP, 155 North Wacker Drive, Chicago, Illinois 60606, serves as the Trust’s legal counsel.
INDEPENDENT REGISTERED PUBLIC ACCOUNTING FIRM
KPMG LLP, 200 E. Randolph Street, Chicago, Illinois 60601, is the Trust’s independent registered public accounting firm.
| Semi-Annual Report | March 31, 2019 | 33 |

Item 2. Code of Ethics.
Not applicable.
Item 3. Audit Committee Financial Expert.
Not applicable.
Item 4. Principal Accountant Fees and Services.
Not applicable.
Item 5. Audit Committee of Listed Registrants.
Not applicable.
Item 6. Investments.
| (a) | The Schedule of Investments is included as part of the Semi-Annual Report to Stockholders filed under Item 1 of this report. |
Item 7. Disclosure of Proxy Voting Policies and Procedures for Closed-End Management Investment Companies.
Not applicable.
Item 8. Portfolio Managers of Closed-End Management Investment Companies.
Item 9. Purchases of Equity Securities by Closed-End Management Investment Company and Affiliated Purchasers.
None.
| Item 10. | Submission of Matters to a Vote of Security Holders. |
There have been no material changes to the procedures by which shareholders may recommend nominees to the Board of Directors of the Registrant.
| Item 11. | Controls and Procedures. |
| (a) | The Registrant’s principal executive officer and principal financial officer have concluded that the Registrant’s disclosure controls and procedures (as defined in Rule 30a-3(c) under the Investment Company Act of 1940, as amended) are effective based on their evaluation of these controls and procedures as of a date within 90 days of the filing date of this document. |
| (b) | There was no change in the Registrant's internal control over financial reporting (as defined in Rule 30a-3(d) under the Investment Company Act of 1940, as amended) during the second fiscal quarter of the period covered by this report that has materially affected, or is reasonably likely to materially affect, the Registrant's internal control over financial reporting. |
Item 12. Disclosure of Securities Lending Activities for Closed-End Management Investment Companies.
Not applicable.
Item 13. Exhibits.
| (a)(1) | Not applicable to semi-annual report. |
| (a)(2) | Certifications required by Item 13(a)(2) of Form N-CSR are filed herewith as Exhibit 99.CERT. |
| (b) | Certifications required by Item 13(b) of Form N-CSR are filed herewith as Exhibit 99.906CERT. |
SIGNATURES
Pursuant to the requirements of the Securities Exchange Act of 1934 and the Investment Company Act of 1940, the registrant has duly caused this report to be signed on its behalf by the undersigned, thereunto duly authorized.
XAI OCTAGON FLOATING RATE & ALTERNATIVE INCOME TERM TRUST
| By: | (Signature and Title) | /s/ Theodore J. Brombach | |
| | | Theodore J. Brombach | |
| Date: | May 24, 2019 | President and Chief Executive Officer | |
| | | (Principal Executive Officer) | |
Pursuant to the requirements of the Securities Exchange Act of 1934 and the Investment Company Act of 1940, this report has been signed below by the following persons on behalf of the registrant and in the capacities and on the dates indicated.
| By: | (Signature and Title) | /s/ Theodore J. Brombach | |
| | | Theodore J. Brombach | |
| Date: | May 24, 2019 | President and Chief Executive Officer | |
| | | (Principal Executive Officer) | |
| By: | (Signature and Title) | /s/ John “Yogi” Spence | |
| | | John “Yogi” Spence | |
| Date: | May 24, 2019 | Treasurer and Chief Financial Officer | |
| | | (Principal Financial Officer) | |
| | | | |