UNITED STATES
SECURITIES AND EXCHANGE COMMISSION
Washington, D.C. 20549
FORM N-CSR
CERTIFIED SHAREHOLDER REPORT OF REGISTERED
MANAGEMENT INVESTMENT COMPANIES
811-23247
(Investment Company Act File Number)
XAI Octagon Floating Rate & Alternative Income Term Trust
(Exact Name of Registrant as Specified in Charter)
321 North Clark Street, Suite 2430
Chicago, IL 60654
(Address of Principal Executive Offices)
Benjamin McCulloch, Esq.
XA Investments LLC
321 North Clark Street, Suite 2430
Chicago, IL 60654
(Name and Address of Agent for Service)
(312) 374-6930
(Registrant’s Telephone Number)
Date of Fiscal Year End:September 30
Date of Reporting Period:September 30, 2019
| Item 1. | Reports to Stockholders. |
TABLE OF CONTENTS
| Shareholder Letter | 1 |
| Questions & Answers | 2 |
| Trust Portfolio Information | 8 |
| Schedule of Investments | 10 |
| Statement of Assets and Liabilities | 17 |
| Statement of Operations | 18 |
| Statements of Changes In Net Assets | 19 |
| Statement of Cash Flows | 20 |
| Financial Highlights | 21 |
| Notes to Financial Statements | 22 |
| Report of Independent Registered Public Accounting Firm | 32 |
| Additional Information | 33 |
| Trustees and Officers | 35 |
Beginning on January 1, 2021, as permitted by regulations adopted by the SEC, paper copies of XAI Octagon Floating Rate & Alternative Income Term Trust’s (the “Trust”) annual and semi-annual shareholder reports will no longer be sent by mail, unless you specifically request paper copies of the reports from the Trust or from your financial intermediary, such as a broker-dealer or bank. Instead, the reports will be made available on the Trust’s website (www.xainvestments.com/XFLT), and you will be notified by mail each time a report is posted and provided with a website link to access the report.
If you already elected to receive shareholder reports electronically, you will not be affected by this change and you need not take any action. You may elect to receive shareholder reports and other communications electronically from the Trust by contacting your financial intermediary, such as a broker-dealer or bank.
You may elect to receive all future reports in paper free of charge. If you own these shares through a financial intermediary, such as a broker-dealer or bank, you may contact your financial intermediary to request that you continue to receive paper copies of your shareholder reports. If you invest directly with the Trust, you can inform the Trust that you wish to continue receiving paper copies of your shareholder reports by calling (888) 903-3358. Your election to receive reports in paper will apply to all funds held with the fund complex if you invest directly with the Trust or to all funds held in your account if you invest through your financial intermediary.
| XAI Octagon Floating Rate & | |
| Alternative Income Term Trust | Shareholder Letter |
September 30, 2019 (Unaudited)
Dear Shareholder:
We thank you for your investment in XAI Octagon Floating Rate & Alternative Income Term Trust (the “Trust”). This annual report covers the twelve-month period ended September 30, 2019.
XA Investments LLC (“XAI”) serves as the investment adviser to the Trust. Octagon Credit Investors, LLC (“Octagon”) serves as the Trust’s investment sub-adviser and is responsible for the management of the Trust’s portfolio of investments. The investment objective of the Trust is to seek attractive total return with an emphasis on income generation across multiple stages of the credit cycle. The Trust seeks to achieve its investment objective by investing in a dynamically managed portfolio of opportunities primarily within the private credit markets. Under normal market conditions, the Trust will invest at least 80% of its Managed Assets in floating-rate credit instruments and other structured credit investments. There can be no assurance that the Trust will achieve its investment objective.
For the twelve months ended September 30, 2019, the Trust experienced a decline in net assets from operations of approximately $4.4 million, or -$0.43 per average common share (inclusive of unrealized losses). This represents an annualized net asset value return on the Trust’s common equity of approximately -4.55% since September 30, 2018.
For the twelve months ended September 30, 2019, the S&P 500 Index, the Bloomberg Barclays U.S. High Yield 1% Issuer Capped Index and the Trust’s benchmark, the S&P/LSTA Leveraged Loan 100 Index, generated returns of 4.25%, 6.20%, and 3.44%,1 respectively. For the nine months ending September 30, 2019, the S&P 500 Index, the Bloomberg Barclays U.S. High Yield 1% Issuer Capped Index and the Trust’s benchmark, the S&P/LSTA Leveraged Loan 100 Index, generated returns of 20.55%, 11.34%, and 8.21%, respectively.1
From October 1, 2018 through September 30, 2019, the Trust’s net asset value (“NAV”) decreased by 13.47% from $9.50 per common share to $8.22 per common share largely reflecting unrealized losses due to valuation changes for the Trust’s investments in collateralized loan obligation (“CLO”) debt, CLO equity, and opportunistic loan segments. As described below, during the last twelve months, the Trust had aggregate distributions totaling $0.848 per common share with respect to distributions declared. The distribution declared September 3, 2019 represents an annualized distribution rate of 9.79% based on the Trust’s closing market price of $8.95 per common share on September 30, 2019.
The closing price per share of the Trust’s common shares was $8.95 on September 30, 2019, representing an 8.88% premium to NAV per common share as of such date. From the Trust’s IPO on September 27, 2017 through September 30, 2019, the Trust’s common shares have traded on average at a 0.53% premium to NAV. As of the date of this letter, November 21, 2019, the closing price per common share was $8.43 representing a 9.48% premium to NAV per common share.
The Trust has sold 1,799,427 common shares, which resulted in $16,305,512 of net proceeds, through the At-the-Market issuance between May 1, 2019 and October 30, 2019. The At-the-Market program originally authorized the issuance of up to 2,250,000 common shares. The Trust sold an additional 1,098,500 common shares through an overnight offering of common shares that settled on November 19, 2019. The overnight offering resulted in proceeds of $9,183,460 (before deduction of the sales load and offering expenses).
The last twelve months were characterized by market turbulence as retail loan fund outflows accelerated in the fourth quarter of 2018 and continued into 2019, reflecting investor concerns over the U.S. Federal Reserve’s (the “Fed”) more dovish stance on interest rates. Loan and CLO prices have since improved, despite periodic bouts of market volatility over the course of 2019. Notably, credit fundamentals are still supported by positive (albeit slow) U.S. GDP growth and continued healthy interest coverage for many borrowers. Although we have observed more weakness within certain sectors than we did a year ago, we do not yet see the signs of a broad recession in the U.S. U.S. economic growth, however, is decelerating—but remains positive—and the U.S. consumer remains strong despite global softening. Corporate earnings growth continues, but with greater performance dispersion among issuers and more ratings downgrades resulting from lower profitability of certain companies versus original expectations, and tariffs and other headwinds negatively impacting global growth. We believe that strong fundamental credit analysis and active portfolio management will be key to outperformance in a weaker growth environment. Broader market volatility and increasing risk aversion are underscoring the later stage of the credit cycle; nevertheless, we expect continued institutional demand for floating-rate assets given attractive relative yields compared to other fixed income asset classes without the attendant interest rate duration risk.
We appreciate your investment and look forward to serving your investment needs in the future. For the most up-to-date information on your investment, please visit the Trust’s website at www.xainvestments.com/XFLT.
Sincerely,
Kimberly Flynn
Managing Director
XA Investments LLC
November 21, 2019
| Annual Report | September 30, 2019 | 1 |
XAI Octagon Floating Rate & | |
| Alternative Income Term Trust | Questions & Answers |
September 30, 2019 (Unaudited)
Lauren M. Basmadjian, Senior Portfolio Manager at Octagon Credit Investors, LLC (“Octagon”) and a member of Octagon’s Investment Committee, serves as lead portfolio manager of XAI Octagon Floating Rate & Alternative Income Term Trust (the “Trust”). Ms. Basmadjian is supported by a team of Octagon investment professionals in the day-to-day management of the Trust’s portfolio, including the following additional members of Octagon’s Investment Committee: Andrew D. Gordon (Octagon’s co-founder, Chief Executive Officer and Co-Chief Investment Officer), Michael B. Nechamkin (Co-Chief Investment Officer and Senior Portfolio Manager), Gretchen M. Lam (Senior Portfolio Manager) and Lauren B. Law (Portfolio Manager). Herein, Ms. Basmadjian discusses the market environment and the Trust’s performance for the twelve-month period ended September 30, 2019.
What is the Trust’s investment objective and how is it pursued?
The Trust’s investment objective is to seek attractive total return with an emphasis on income generation across multiple stages of the credit cycle. The Trust seeks to achieve its investment objective by investing in a dynamically managed portfolio of opportunities primarily within the private credit markets. Under normal market conditions, the Trust will invest at least 80% of its Managed Assets in floating-rate credit instruments and other structured credit investments.
The Trust’s investments include (i) structured credit investments, including collateralized loan obligation (“CLO”) debt and subordinated (i.e., residual or equity) securities; (ii) traditional corporate credit investments, including leveraged loans and high yield bonds; (iii) opportunistic credit investments, including stressed and distressed credit situations and long/short credit investments; and (iv) other credit-related instruments.
Leveraged loans are debt obligations (also commonly referred to as “senior loans” or “floating-rate loans”) issued by a bank to a corporation that generally holds legal claim to the borrower’s assets above all other debt obligations. Leveraged loans have floating rates that typically fluctuate according to LIBOR. LIBOR stands for London Interbank Offered Rate and is the benchmark rate that most of the world’s leading banks charge each other for short-term loans.
CLOs are a type of structured credit vehicle that typically invest in a diverse portfolio of broadly syndicated leveraged loans. CLOs finance this pool of loans with a capital structure that consists of debt and equity. CLO debt includes senior and mezzanine debt (collectively, “liabilities”) of a CLO structure with tranches rated from AAA down to BB or B. Interest earned from the underlying loan collateral pool of a CLO is used to pay the coupon interest on the CLO liabilities. CLO debt investors earn returns based on spreads above 3-month LIBOR. CLO equity represents a residual stake in the CLO structure and is the first loss position in the event of defaults and credit losses. CLO equity investors receive the excess spread between the CLO assets and liabilities and expenses. CLO equity is junior in priority of payment and is subject to certain payment restrictions generally set forth in an indenture governing the notes.
The Trust pursues its investment objective by investing primarily in below investment grade credit instruments that are regarded as having predominantly speculative characteristics with respect to capacity to pay interest and to repay principal. The Trust may invest without limitation in credit instruments that are illiquid.
The Trust uses leverage to seek to enhance total return and income. Although leverage may create an opportunity for increased return and income for shareholders, it also results in additional risks and can magnify the effect of any losses. There is no assurance that the leverage strategy will be successful. If income and gains on securities purchased with leverage proceeds are greater than the cost of the leverage, common shareholders’ return will be greater than if leverage had not been used. Conversely, if the income or gains from the securities purchased with the proceeds of leverage are less than the cost of leverage, common shareholders’ return will be less than if leverage had not been used.
Describe the current market conditions for the leveraged loan market and Octagon’s outlook.
Following a turbulent fourth quarter of 2018 driven by technical disruptions, leveraged loans have returned 6.79% year-to-date as of September 30, 20191, driven by market value gains among higher quality (BB) and more liquid loans (which experienced the largest price declines during the fourth quarter of 2018). The loan market has bifurcated significantly over 2019 as economic risk has increased and corporate earnings growth have softened. High quality credits have generally performed well; however, a growing number of borrowers have reported weaker results, and their loans have suffered in turn. Companies experiencing operating weakness or facing increased downgrade risk have seen their loan prices fall sharply, and discount margins have widened. While spreads for high quality assets should remain stable, spreads for lower quality loans will likely widen, with more borrowers moving into the latter category. We expect this dispersion in operating performance and loan price movement will continue in the context of a loan market with few incremental buyers of risk.
Increased performance dispersion among issuers has been driven in certain instances by negative impacts of trade policy/tariffs and weaker global (non-U.S.) economic growth on certain sectors. Credit fundamentals are still supported by positive (albeit slowing) U.S. GDP growth and continued healthy interest coverage for many borrowers. While we have observed more weakness within certain sectors than we did a year ago, we do not yet see the signs of a broad recession in the U.S. In our view, the near-to-medium term economic outlook for below investment grade corporate credit is relatively benign, though less so than last year due to slower GDP and earnings growth, more ratings downgrades, higher leverage levels, and weaker credit agreements. On the other hand, borrower interest coverage ratios remain high, and higher purchase price multiples for LBOs and sponsor equity contributions imply positive growth trends among private equity-backed businesses. The trailing twelve-month loan default rate stands at 1.29% as of September 30, still low relative to the long-term average of 3.1%,2 though we expect defaults to modestly increase, as credit conditions among borrowers are showing some signs of deterioration. While we believe that loan issuers in Octagon’s investments are largely well-positioned, we expect the flight-to-quality trend will dominate loan market dynamics through the remainder of the year.
| XAI Octagon Floating Rate & | |
| Alternative Income Term Trust | Questions & Answers |
September 30, 2019 (Unaudited)
Shifting interest rate outlooks and broader market volatility have impacted loan market technicals over the past twelve months. Retail loan fund redemptions have continued over the course of 2019, though at a more modest pace as the year has progressed. The expectation for further rate cuts implies the likelihood of additional retail fund redemptions, though the contracting size of the retail fund complex (which currently represents approximately 12% of the loan market) should diminish the impact of future outflows. Meanwhile, CLOs continue to represent the lion’s share of loan demand. New CLO formation totaled $90 billion year-to-date as of September 303 and is on track to meet full-year projections of $110-$125 billion of new deals.4 With respect to loan supply, year-to-date institutional new issue volume of $237 billion as of September 30 remains subdued compared to prior years (down 35% versus the same period in 2018)5, with significantly less refinancing and repricing activity than in prior quarters due to spread widening.
We retain a cautious outlook as 2019 comes to a close, and anticipate periodic bouts of market turbulence given slowing economic growth, corporate earnings volatility, various geopolitical risks (both domestic and foreign), and investors’ ongoing aversion to risk. In a potential weaker growth environment, strong bottom-up fundamental credit research, proactive risk and portfolio management and prudent relative value focus will be paramount to loss avoidance. We will continue to focus on credits with strong underlying fundamentals and attractive terms, and will seek to proactively manage the Trust’s risk profile to withstand heightened volatility. Despite potential headwinds, we believe the loan market will continue to offer attractive risk/return opportunities for fundamental credit pickers like Octagon. At current levels, loans offer high current income compared to other fixed income asset classes. At 6.62% as of September 30, the average current loan yield remains elevated despite lower LIBOR levels or rates.1 Moreover, we believe loans’ senior priority and secured nature can help portfolios withstand challenging market conditions.
Describe the current market conditions for the CLO market and Octagon’s outlook.
The pace of new CLO issuance has been steady year-to-date; at $90 billion as of September 30, year-to-date new CLO issuance represents the third highest reading of any comparable period.3 CLO reset/refinancing activity remains muted compared to prior years due to wider CLO tranche spreads; only $35.3 billion of deals have been refinanced or reset year-to-date, compared to $124.6 billion over the same timeframe in 2018 (a 72% year-over-year decline).3 Meanwhile, secondary CLO trading levels have been elevated throughout 2019, with year-to-date Bids Wanted In Competition supply already surpassing full-year 2018 supply.6 Despite the challenging arbitrage, we believe new CLO issuance will remain healthy through the remainder of the year, driven by a large deal pipeline, new/debut managers with large internal equity commitments continuing to enter the market, and continued AAA demand from both foreign and domestic investors.
CLO liability spreads ended 2018 meaningfully wider on the year, as spread widening intensified in the fourth quarter in tandem with the loan market sell-off. Primary CLO debt spreads have continued to widen over much of 2019, though we saw some spread tightening midway through the second quarter as new CLO issuance increased. Of note, as overseas AAA buyers reduced purchase activity in the second quarter due to regulatory scrutiny, domestic buyers stepped in and the average AAA spread for top-tier managers tightened to approximately 130 basis points (“bps”) in the second quarter compared to 138 bps in the first quarter, helping to alleviate some pressure on the arbitrage.7 Mezzanine debt spreads (BB and B rated) widened modestly over the first half of 2019, driven by elevated secondary supply and investor focus away from floating-rate assets. In the third quarter, new issue CLO spreads widened slightly across the capital stack. We believe CLO debt spreads will remain relatively rangebound, with a bias towards modest widening. Deals with less subordination or underperforming/riskier collateral portfolios should continue to trade wider, reflecting investors’ focus on collateral managers’ ability to manage tail risk in underlying portfolios.10 As the year has progressed, we have observed ongoing tiering among collateral managers, particularly at the bottom of the capital stack.8 Tiering occurs in the CLO market as investors’ views towards collateral managers are reflected in pricing and trading levels—more established, seasoned managers generally considered “top-tier” will see their deals price and trade tighter to those of a smaller, less experienced manager. In the context of increasing idiosyncratic credit issues and loan downgrades, we expect further tiering and disparity in CLO manager performance.
In our view, the current market environment is reasonably supportive for CLO investors. There is healthy investor demand for CLO debt tranches, and loan market conditions are supportive for collateral managers. Fewer loans are trading above par,9 which allows managers to ramp collateral portfolios efficiently via the secondary market. Both CLO debt and equity investors should continue to benefit from CLO managers who are able to successfully minimize credit losses and increase coupon through buying loans in the primary market. As of September 30, 65.9% of loans were trading below par in the secondary market, which suggests that there are opportunities to buy assets in the secondary market to offset credit losses. The median annualized equity distribution for reinvesting U.S. CLOs is currently 14.7%.6 Wider loan spreads and relatively favorable CLO liability spreads combined with lower loan prices should significantly benefit CLO equity investors over the long-term. Potential bouts of market turbulence may also benefit CLO equity. When credit spreads widen, loan prepayments and amortizations are typically recycled into discounted/higher yielding assets during periods of market volatility, while CLO liability spreads are fixed, resulting in higher CLO equity distributions. We therefore believe CLO equity continues to offer compelling risk-adjusted returns to long-term investors seeking income strategies, especially in more volatile loan markets.
| Annual Report | September 30, 2019 | 3 |
| XAI Octagon Floating Rate & | |
| Alternative Income Term Trust | Questions & Answers |
September 30, 2019 (Unaudited)
How did the Trust perform for the twelve months ended September 30, 2019?
For the twelve-month period ended September 30, 2019, the Trust provided a total return on market price of 0.75% and a total return based on net asset value (“NAV”) of -4.55%. NAV return includes the deduction of management fees, operating expenses, and all other Trust expenses. All Trust returns cited – whether based on NAV or market price – assume the reinvestment of all distributions. As of September 30, 2019, the Trust’s market price of $8.95 represented a premium of 8.88% to its NAV of $8.22. The market value of the Trust’s shares fluctuates from time-to-time and may be higher or lower than the Trust’s NAV. Performance data quoted represents past performance. Past performance does not guarantee future results. Current performance may be lower or higher than the performance data quoted.
What were the distributions over the period?
From October 1, 2018 through May 1, 2019, the Trust paid a monthly distribution of $0.069 per share. For the remainder of the twelve-month period ended September 30, 2019, the Trust increased the monthly distribution to $0.073 per share, beginning with the distribution paid on June 3, 2019. The distribution declared September 3, 2019 represents an annualized distribution rate of 9.79% based on the Trust’s closing market price of $8.95 per common share on September 30, 2019. The Trust’s distribution rate is not constant, and the amount of distributions, when declared by the Trust’s Board of Trustees, is subject to change based on the performance of the Trust. Please see Note 4 on page 25 for more information on distributions for the period.11
What influenced the Trust’s performance for the twelve months ended September 30, 2019?
Pronounced volatility towards year-end 2018 was reflected in lower valuations across most assets in the Trust’s portfolio, which negatively impacted the Trust’s performance for the fourth quarter of 2018. While the Trust generated strong returns in the first and second quarters of 2019 as asset prices rebounded, performance in the third quarter was weighed down by outsized unrealized losses among the Trust’s CLO equity positions. During the twelve-month period, the Trust’s portfolio generated a net gain in its senior loan segment (first lien and second lien loans) driven by interest income, but experienced net investment losses in all other asset class segments (CLO equity, CLO debt, high yield bonds, and opportunistic loans). The Trust’s CLO equity segment experienced a net loss at approximately ($0.12) per share for the period; the Trust’s CLO equity positions collected quarterly distribution payments totaling $7,571,109, or $0.88 per share, during the twelve-month period, which were offset by market value losses of $8,634,120, or ($1.00) per share. The majority of the Trust’s largest performance detractors during the period were CLO equity positions, reflecting lower CLO equity NAVs owing to lower underlying loan prices. It bears noting that recent market volatility may help boost quarterly CLO equity payments, to the benefit of the Trust.
Relevant indices for the markets in which the Trust invests include the Trust’s benchmark, the S&P/LSTA Leveraged Loan 100 Index, which returned 3.44% for the twelve-month period, the Bloomberg Barclays U.S. High Yield 1% Issuer Capped Index, which returned 6.20% for the twelve-month period, and the JP Morgan BB/B CLO Debt Index, which returned 2.69% for the twelve-month period.11 There is no representative benchmark index for CLO equity in the marketplace.
How is the Trust positioned for the remainder of 2019?
Looking ahead, we believe that the Trust is well-positioned across its primary investment segments to meet its investment objective. As of September 30, 2019, the Trust is invested predominantly in floating-rate assets, comprising first and second lien loans (48.7% of the total portfolio on a market value basis as of September 30, 2019), CLO equity (32.1%) and CLO debt securities (14.0%). We believe the Trust’s loan positions are appropriately diversified across industry sectors, with software, health care providers and services, and commercial services and supplies representing the largest exposures as of September 30, 2019. We generally expect to maintain the Trust’s current allocations to CLO equity and CLO debt, which have benefited from the Trust’s at-the-market share issuance (“ATM”) program during the period, in that proceeds from the ATM program have helped fund the Trust’s purchases of more accretive CLO equity and debt positions. The Trust’s CLO debt investments remain predominantly comprised of BB-rated tranches versus single-B tranches. We maintain a generally constructive view of CLO equity over the longer term. Lastly, we expect to maintain the Trust’s low exposure to high yield bonds, as we continue to prefer loans that offer comparable all-in yields with lower duration risk, seniority, collateral, and floating-rate coupons.
| XAI Octagon Floating Rate & | |
| Alternative Income Term Trust | Questions & Answers |
September 30, 2019 (Unaudited)
Discuss the Trust’s secondary market performance and the ATM program.
On March 12, 2019, the Trust established a shelf registration to issue shares into the secondary market. On March 28, 2019, the Trust entered into a Distribution Agreement with Foreside Fund Services, LLC (the “Distributor”), pursuant to which the Trust may offer and sell up to 2,250,000 Common Shares, from time to time, through the Distributor, in transactions that are deemed to be “at-the-market.” The Trust began to issue common shares through its ATM program on May 15, 2019. For the twelve months ended September 30, 2019, the Trust issued 1,221,261 common shares pursuant to the ATM program.
The ATM program is a form of continuous follow-on offering of the Trust’s common shares. The goal of the Trust’s ATM program is to enhance secondary market liquidity for shareholders by growing the size of the Trust over time and reducing operating expenses per share. In an ATM offering, newly issued shares are sold incrementally into the secondary trading market through a placement agent at prevailing market prices. The placement agent sells the common shares in the open market and the Trust receives cash proceeds from the transaction to be invested pursuant to the Trust’s investment objectives. Octagon has been able to deploy the investment proceeds from the Trust’s ATM program in what it believes are attractive investment opportunities in CLO debt and CLO equity, which have been accretive to the Trust.
ATM sales are possible for closed end funds if the fund is trading at a sufficient premium to NAV to cover the issuance costs. From May 15, 2019 to September 30, 2019, when the Trust was active with the ATM program, the Trust traded at an average 6.44% premium to its NAV and has had average daily trading volumes of 57,264 common shares. For the twelve-month period ended September 30, 2019, the Trust traded at an average 0.22% premium to its NAV and has had average daily trading volumes of 37,685 common shares. ATM daily issuance totals depend on the Trust’s average daily trading volumes.
How is the Trust positioned to perform in the current interest rate environment?
The Trust is positioned conservatively in terms of duration, with predominantly all of the Trust’s investments in floating-rate or adjustable securities based on changes in LIBOR. While three-month LIBOR has decreased from 240 bps as of September 30, 2018 to 209 bps as of September 30, 2019, we believe the loan market currently offers high yields and select convexity opportunities. Credit spreads currently remain attractive relative to post-crisis levels, and all-in current loan yields have increased to 6.62% for the S&P/LSTA Leveraged Loan Index.1 Accommodative global central bank policy should continue to be supportive of risk assets and overall economic growth. At present, we think many asset prices and new issue deals are attractive, and we continue to believe it is still a good time to buy loans. Nevertheless, credit fundamentals have become more mixed, underscoring the importance of research-driven credit analysis and relative value-focused asset selection. Lower LIBOR should also limit any sustained tightening in CLO debt tranches, and result in lower all-in yields.
Discuss the Trust’s use of leverage.
The Trust uses leverage as part of its investment strategy to finance the purchase of additional securities that may provide increased income and greater appreciation potential to common shareholders than could be achieved from a portfolio that is unlevered. With the low cost of borrowing and relatively low default rates generally among U.S. companies, the amount of leverage used by the Trust is highly accretive to income generation. The Trust currently employs leverage through a bank borrowing. As of September 30, 2019, the amount of leverage was approximately 33.11% of the Trust’s Managed Assets (including proceeds of leverage). While leverage increases the income of the Trust in yield terms, it also amplifies the effects of changing market prices in the portfolio and can cause the Trust’s NAV to change to a greater degree than the market as a whole. This change in NAV can create volatility in Trust pricing but should not affect the Trust’s ability to pay distributions under normal circumstances.
Index Definitions
The Trust does not seek to track any index. Index returns are stated for illustrative purposes only, do not reflect the deduction of fees and expenses, and do not represent the performance of the Trust. It is not possible to invest directly in an index.
Bloomberg Barclays U.S. High Yield 1% Issuer Capped Index measures the U.S. dollar-denominated, high yield, fixed-rate corporate bond markets. Securities are classified as high yield if the middle rating of the Moody’s, Fitch, and S&P is Ba1/BB+/BB+ or below. Issuers are capped at 1% of the index.
J.P. Morgan CLO Debt Index represents the post-crisis J.P. Morgan Collateralized Loan Obligation Index (“CLOIE”). The CLOIE is an index that tracks the market for U.S. dollar-denominated broadly syndicated, arbitrage CLOs. The CLOIE is divided by origination (pre- versus post-crisis) and is broken out further into six original rating classes (AAA, AA, A, BBB, BB, B). The sub-index we reference here tracks BB-rated CLO debt.
S&P/LSTA U.S. Leveraged Loan 100 Index is a market value-weighted index designed to measure the performance of the U.S. leveraged loan market. In conjunction with Standard & Poor's/LCD, the Leveraged Syndications & Trading Association (“LSTA”) developed the S&P/LSTA U.S. Leveraged Loan 100 Index. The S&P/LSTA U.S. Leveraged Loan 100 Index is designed to reflect the 100 largest loan facilities in the leveraged loan market. It mirrors the market-value-weighted performance of the 100 largest institutional leveraged loans based upon actual market weightings, spreads and interest payments. The S&P/LSTA U.S. Leveraged Loan 100 Index utilizes LSTA/LPC Mark-to-Market Pricing, which is based on bid/ask quotes gathered from dealers and is not based upon derived pricing models. The index uses the average bid for its market value calculation. Each loan facility’s total return is calculated by aggregating the interest return (reflecting the return due to interest paid and accrued interest) and price return (reflecting the gains or losses due to changes in the end of day prices and principal repayments). The return of each loan facility is weighted in the index based upon its market value outstanding, which reflects both the prior period’s prices as well as accrued interest. The overall index return is the aggregate of each component loan facility’s return multiplied by the market value outstanding from the prior time period.
| Annual Report | September 30, 2019 | 5 |
| XAI Octagon Floating Rate & | |
| Alternative Income Term Trust | Questions & Answers |
September 30, 2019 (Unaudited)
Risks and Other Considerations
Investing involves risk, including the possible loss of principal and fluctuation in value.
The views expressed in this report reflect those of the portfolio managers only through the report period as stated on the cover. These views are expressed for informational purposes only and are subject to change at any time, based on market and other conditions, and may not come to pass. These views should not be construed as research, investment advice or a recommendation of any kind regarding the Trust or any issuer or security, do not constitute a solicitation to buy or sell any security, and should not be considered specific legal, investment or tax advice. The information provided does not take into account the specific objectives, financial situation, or particular needs of any specific investor.
The views expressed in this report may also include forward-looking statements that involve risk and uncertainty, and there is no guarantee that any predictions will come to pass. Actual results or events may differ materially from those projected, estimated, assumed, or anticipated in any such forward looking statements. Important factors that could result in such differences, in addition to the other factors noted with such forward-looking statements, include general economic conditions such as inflation, recession, and interest rates. Neither XAI nor Octagon has any obligation to update or otherwise revise any forward-looking statements, including any revision to reflect changes in any circumstances arising after the date hereof relating to any assumptions or otherwise.
There can be no assurance that the Trust will achieve its investment objective or that any investment strategies or techniques discussed herein will be effective. The value of the Trust will fluctuate with the value of the underlying securities. Historically, closed-end funds often trade at a discount to their net asset value.
Performance data quoted represents past performance. Past performance does not guarantee future results. Current performance may be lower or higher than the performance data quoted.
Please see www.xainvestments.com/XFLT for a detailed discussion of the Trust’s risks and considerations. The Trust regularly updates performance and certain other data and publishes material information as necessary from time to time on its website. Investors and others are advised to check the website for updated performance information and the release of other material information about the Trust. References herein to the Trust’s website are intended to allow investors public access to information regarding the Trust and do not, and are not intended to, incorporate the Trust’s website in this report.
This material is not intended as a recommendation or as investment advice of any kind, including in connection with rollovers, transfers, and distributions. Such material is not provided in a fiduciary capacity, may not be relied upon for or in connection with the making of investment decisions, and does not constitute a solicitation of an offer to buy or sell securities. All content has been provided for informational or educational purposes only and is not intended to be, and should not be construed as, legal or tax advice and/or legal opinion. Always consult a financial, tax, and/or legal professional regarding your specific situation.
| 1 | Source: S&P Capital IQ/SNL Financial Leveraged Commentary & Data. Represents metrics for the S&P/LSTA Leveraged Loan Index (September 30, 2019). |
| 2 | Source: S&P Capital/SNL Financial LCD News, “Leveraged loans gain 0.47% in September amid busy market” (October 1, 2019). Represents lagging 12-month default rate for the S&P/LSTA Leveraged Loan Index by principal amount as of September 30, 2019. Default rate is calculated as the amount defaulted over the last 12 months divided by the amount outstanding at the beginning of the 12-month period. Represents all loans including loans not included in the LSTA/LPC mark-to-market service. Source: LCD News (September 30, 2019). Long-term average loan default rate is calculated as the straight average of the monthly LTM loan default rate for the 20-year period through September 2019. Past defaults are not an indication of future default rates. |
| 3 | Source: S&P Capital IQ/SNL Financial LCD Research, Global CLO Databank (October 1, 2019). |
| XAI Octagon Floating Rate & | |
| Alternative Income Term Trust | Questions & Answers |
September 30, 2019 (Unaudited)
| 4 | Wells Fargo Securities CLO and Commercial ABS Research team projects $110B in full-year 2019 (“FY”) new CLO issuance (Source: CLO Monthly Market Overview, July 2, 2019). JPMorgan CLO Research team projects $115-125B for FY new CLO issuance (Source: JPMorgan CLO Research, April 1, 2019). |
| 5 | Source: LCD Quarterly Review, Third Quarter 2019 (September 30, 2019). |
| 6 | Source: Wells Fargo Securities Structured Products Research, The U.S. CLO Manager Style Guide, October 25, 2019. Past performance has been achieved during a period of relative economic stability, and is not necessarily indicative of future results. |
| 7 | Source: S&P Global Market Intelligence LCD Quarterly Review – Second Quarter 2019 (July 2, 2019). |
| 8 | The capital stack refers to the various debt and equity issuances and their priority to recoup assets from an issuer in the case of default. |
| 9 | As of September 30, 2019. Source: J.P. Morgan Research, “JPM High-Yield and Leveraged Loan Morning Intelligence” (October 1, 2019). |
| 10 | Tail risk is the possibility of a loss that might occur as per a prediction of probability distribution due to a rare event. A short-term movement of three times the standard deviation is considered to represent a tail risk. |
| Annual Report | September 30, 2019 | 7 |
| XAI Octagon Floating Rate & | |
| Alternative Income Term Trust | Trust Portfolio Information |
September 30, 2019 (Unaudited)
Growth of a $10,000 Investment(as of September 30, 2019)
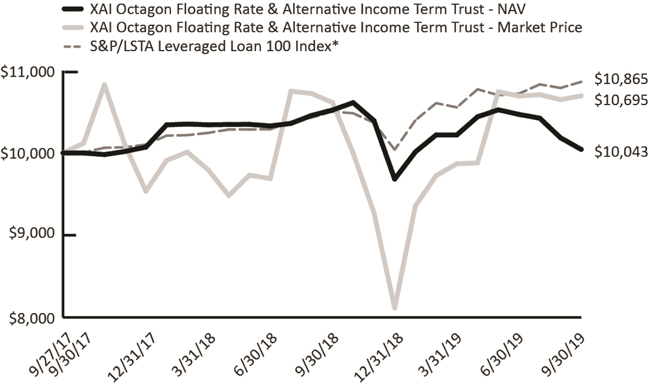
The chart above represents historical performance of a hypothetical investment of $10,000 in the Trust since inception.Past performance does not guarantee future results. This chart does not reflect the deduction of taxes that a shareholder would pay on Trust distributions or the redemption of Trust shares. The chart assumes that distributions from the Trust are reinvested.
Summary Performance(as of September 30, 2019)
| | 1 Month | 3 Months | 6 Months | 1 Year | Since the Trust’s Inception (September 27, 2017)^ |
| XAI Octagon Floating Rate & AlternativeIncome Term Trust - NAV | -1.39% | -4.06% | -1.72% | -4.55% | 0.22% |
| XAI Octagon Floating Rate & AlternativeIncome Term Trust – Market Price | 0.44% | 0.02% | 8.37% | 0.75% | 3.40% |
| S&P/LSTA Leveraged Loan 100 Index* | 0.68% | 1.33% | 2.93% | 3.44% | 4.21% |
| * | The S&P/LSTA (Loan Syndications and Trading Association) U.S. Leveraged Loan 100 Index was the first to track the investable senior loan market. This rules-based index consists of the 100 largest loan facilities in the benchmark S&P/LSTA Leveraged Loan Index (LLI). |
Performance data quoted represents past performance. Past performance does not guarantee future results. Investment return and principal value of an investment will fluctuate so that an investor’s shares, when sold or redeemed, may be worth more or less than the original cost. Current performance may be lower or higher than performance data quoted.
| XAI Octagon Floating Rate & | |
| Alternative Income Term Trust | Trust Portfolio Information |
September 30, 2019 (Unaudited)
Top Ten Portfolio Holdings(as a % of Total Investments)*
| Name | | Type | | |
| Anchorage Capital CLO 1-R, Ltd. 2018-1RA | | CLO Equity | | | 2.70% |
| Madison Park Funding XVIII, Ltd. 2015-18A | | CLO Equity | | | 2.32% |
| CIFC Funding 2018-I, Ltd. | | CLO Equity | | | 2.22% |
| Apidos CLO XXVIII 2017-28A | | CLO Equity | | | 2.20% |
| THL Credit Wind River 2018-3 CLO, Ltd. | | CLO Equity | | | 2.15% |
| THL Credit Wind River 2016-1 CLO, Ltd. | | CLO Equity | | | 1.99% |
| Anchorage Capital CLO 4-R, Ltd. 2018-4RA | | CLO Equity | | | 1.94% |
| CIFC Funding 2017-V, Ltd. | | CLO Equity | | | 1.78% |
| THL Credit Wind River 2018-2 CLO, Ltd. | | CLO Equity | | | 1.66% |
| OHA Credit Partners XI, Ltd. 2015-11A | | CLO Equity | | | 1.60% |
| Total | | | | | 20.56% |
| * | Holdings are subject to change |
Asset Allocation(as a % of Total Investments)
| Senior Secured First Lien Loans | | | 42.05% |
| CLO Equity | | | 32.14% |
| CLO Debt | | | 14.02% |
| Secured Second Lien Loans | | | 6.48% |
| Corporate Bonds | | | 0.14% |
| Money Market Mutual Funds | | | 5.17% |
| Annual Report | September 30, 2019 | 9 |
| XAI Octagon Floating Rate & | |
| Alternative Income Term Trust | Schedule of Investments |
September 30, 2019
| | | Coupon(a) | | Reference Rate & Spread | | Maturity Date | | Principal Amount | | | Value | |
| CORPORATE BONDS - 0.22%* (0.14% of Total Investments) | | | | | | | | |
| Energy Equipment & Services - 0.22% (0.14% of Total Investments) | | | | | | | | |
| McDermott Technology Americas, Inc. / McDermott Technology US, Inc., Senior Unsecured(b) | | 10.63% | | N/A | | 05/01/2024 | | $ | 750,000 | | | $ | 174,375 | |
| | | | | | | | | | | | | | | |
| Total Corporate Bonds (Cost $700,077) | | | | | | | | $ | 750,000 | | | $ | 174,375 | |
| | | | | | | | | | | | | | | |
| SECURED SECOND LIEN LOANS(c)- 10.16%*(6.48% of Total Investments) | | | | | | | | |
| Commercial Services & Supplies - 0.97% (0.62% of Total Investments) | | | | | | | | |
| AVSC Holding Corp., Initial | | 9.50% | | 3M US L + 7.25% | | 09/01/2025 | | | 805,556 | | | | 765,278 | |
| | | | | | | | | | | | | | | |
| Communications Equipment - 0.42% (0.27% of Total Investments) | | | | | | | | |
| Global Tel*Link Corp. | | 10.29% | | 1M US L + 8.25% | | 11/29/2026 | | | 347,222 | | | | 327,910 | |
| | | | | | | | | | | | | | | |
| Diversified Financial Services - 0.63% (0.40% of Total Investments) | | | | | | | | |
| Edelman Financial Center LLC, Initial(d) | | N/A | | L + 6.75% | | 07/20/2026 | | | 500,000 | | | | 498,750 | |
| | | | | | | | | | | | | | | |
| Health Care Providers & Services - 0.16% (0.10% of Total Investments) | | | | | | | | |
| Albany Molecular Research, Inc., Initial | | 9.04% | | 1M US L + 7.00% | | 08/30/2025 | | | 126,466 | | | | 125,201 | |
| | | | | | | | | | | | | | | |
| Hotels, Restaurants & Leisure - 0.41% (0.26% of Total Investments) | | | | | | | | |
| Affinity Gaming, Initial | | 10.29% | | 1M US L + 8.25% | | 01/31/2025 | | | 340,006 | | | | 324,025 | |
| | | | | | | | | | | | | | | |
| Insurance - 2.19% (1.40% of Total Investments) | | | | | | | | |
| Asurion LLC, Replacement B-2 | | 8.54% | | 1M US L + 6.50% | | 08/04/2025 | | | 1,700,000 | | | | 1,726,350 | |
| | | | | | | | | | | | | | | |
| Real Estate Investment Trusts (REITs) - 0.79% (0.50% of Total Investments) | | | | | | | | |
| Capital Automotive LP, Initial Tranche B | | 8.04% | | 1M US L + 6.00% | | 03/24/2025 | | | 620,378 | | | | 621,544 | |
| | | | | | | | | | | | | | | |
| Software - 3.76% (2.40% of Total Investments) | | | | | | | | |
| EagleView Technology Corp. | | 9.55% | | 1M US L + 7.50% | | 08/14/2026 | | | 442,623 | | | | 420,492 | |
| McAfee LLC, Initial | | 10.54% | | 1M US L + 8.50% | | 09/29/2025 | | | 875,000 | | | | 882,114 | |
| MH Sub I LLC, Amendment No. 2 Initial | | 9.54% | | 1M US L + 7.50% | | 09/15/2025 | | | 750,000 | | | | 751,875 | |
| Misys, Ltd., Dollar Term Loan | | 9.45% | | 6M US L + 7.25% | | 06/13/2025 | | | 950,000 | | | | 905,473 | |
| Total Software | | | | | | | | | 3,017,623 | | | | 2,959,954 | |
| | | | | | | | | | | | | | | |
| Transportation Infrastructure - 0.83% (0.53% of Total Investments) | | | | | | | | |
| Drive Chassis Holdco LLC, B | | 10.59% | | 3M US L + 8.25% | | 04/10/2026 | | | 687,838 | | | | 650,007 | |
| | | | | | | | | | | | | | | |
| Total Secured Second Lien Loans (Cost $8,177,497) | | | | | | | | $ | 8,145,089 | | | $ | 7,999,019 | |
| | | | | | | | | | | | | | | |
| SENIOR SECURED FIRST LIEN LOANS(c)- 65.93%* (42.05% of Total Investments) | | | | | | | | |
| Aerospace & Defense - 0.56% (0.36% of Total Investments) | | | | | | | | |
| Constellis Holdings LLC, B | | 7.26% | | 3M US L + 5.00% | | 04/21/2024 | | | 756,707 | | | | 439,972 | |
| | | | | | | | | | | | | | | |
| Airlines - 0.67% (0.43% of Total Investments) | | | | | | | | |
| Allegiant Travel Company, Class B | | 6.71% | | 3M US L + 4.50% | | 02/05/2024 | | | 390,794 | | | | 393,725 | |
| LifeMiles Finance, LLC / LifeMiles, Ltd., Initial Term Loan | | 7.54% | | 1M US L + 5.50% | | 08/18/2022 | | | 139,136 | | | | 132,875 | |
| Total Airlines | | | | | | | | | 529,930 | | | | 526,600 | |
See Notes to Financial Statements.
| XAI Octagon Floating Rate & | |
| Alternative Income Term Trust | Schedule of Investments |
September 30, 2019
| | | Coupon(a) | | Reference Rate & Spread | | Maturity Date | | Principal Amount | | | Value | |
| SENIOR SECURED FIRST LIEN LOANS(c)(continued) | | | | | | | | |
| Automobiles - 0.49% (0.31% of Total Investments) | | | | | | | | |
| Truck Hero, Inc., Initial | | 5.79% | | 1M US L + 3.75% | | 04/22/2024 | | $ | 412,160 | | | $ | 384,854 | |
| | | | | | | | | | | | | | | |
| Chemicals - 1.81% (1.16% of Total Investments) | | | | | | | | |
| Ascend Performance Materials Operations LLC, Initial | | 7.35% | | 1M US L + 5.25% | | 08/27/2026 | | | 763,577 | | | | 764,058 | |
| INEOS Enterprises Holdings US Finco LLC, Initial Tranche B Dollar | | 6.12% | | 3M US L + 4.00% | | 08/28/2026 | | | 267,539 | | | | 268,208 | |
| Innovative Water Care Global Corp., Initial | | 7.10% | | 3M US L + 5.00% | | 02/27/2026 | | | 434,537 | | | | 395,429 | |
| Total Chemicals | | | | | | | | | 1,465,653 | | | | 1,427,695 | |
| | | | | | | | | | | | | | | |
| Commercial Services & Supplies - 3.65% (2.33% of Total Investments) | | | | | | | | |
| Allied Universal Holdco LLC, Initial(e) | | 6.51% | | 3M US L + 4.25% | | 07/10/2026 | | | 795,122 | | | | 795,496 | |
| Belfor Holdings, Inc., Initial | | 6.04% | | 1M US L + 4.00% | | 04/06/2026 | | | 651,488 | | | | 653,117 | |
| Dun & Bradstreet Corp., Initial Borrowing | | 7.05% | | 1M US L + 5.00% | | 02/06/2026 | | | 961,744 | | | | 967,409 | |
| Harland Clarke Holdings Corp., Initial | | 6.85% | | 3M US L + 4.75% | | 11/03/2023 | | | 591,270 | | | | 459,712 | |
| Total Commercial Services & Supplies | | | | | | | | | 2,999,624 | | | | 2,875,734 | |
| | | | | | | | | | | | | | | |
| Communications Equipment - 1.84% (1.18% of Total Investments) | | | | | | | | |
| Global Tel*Link Corp. | | 6.29% | | 1M US L + 4.25% | | 11/29/2025 | | | 460,600 | | | | 440,794 | |
| Intelsat Jackson Holdings S.A., Term B-4 Loan | | 6.55% | | 1M US L + 4.50% | | 01/02/2024 | | | 1,000,000 | | | | 1,010,830 | |
| Total Communications Equipment | | | | | | | | | 1,460,600 | | | | 1,451,624 | |
| | | | | | | | | | | | | | | |
| Construction Materials - 0.28% (0.18% of Total Investments) | | | | | | | | |
| Tailwind Smith Cooper Intermediate Corp., Initial | | 7.05% | | 1M US L + 5.00% | | 05/28/2026 | | | 238,532 | | | | 223,027 | |
| | | | | | | | | | | | | | | |
| Containers & Packaging - 0.30% (0.19% of Total Investments) | | | | | | | | |
| Pregis TopCo LLC, Initial | | 6.25% | | 3M US L + 4.00% | | 07/31/2026 | | | 238,650 | | | | 237,755 | |
| | | | | | | | | | | | | | | |
| Distributors - 1.59% (1.01% of Total Investments) | | | | | | | | |
| BCPE Empire Holdings, Inc., Initial(e) | | 6.04% | | 1M US L + 4.00% | | 06/11/2026 | | | 428,850 | | | | 422,687 | |
| United Natural Foods, Inc., Initial | | 6.29% | | 1M US L + 4.25% | | 10/22/2025 | | | 995,000 | | | | 829,044 | |
| Total Distributors | | | | | | | | | 1,423,850 | | | | 1,251,731 | |
| | | | | | | | | | | | | | | |
| Diversified Consumer Services - 3.82% (2.43% of Total Investments) | | | | | | | | |
| Cast & Crew Payroll LLC, Initial | | 6.05% | | 1M US L + 4.00% | | 02/09/2026 | | | 497,500 | | | | 500,764 | |
| Sotheby's Holdings, Inc., B(d) | | N/A | | L + 5.50% | | 01/22/2027 | | | 504,883 | | | | 498,890 | |
| Staples, Inc., 2019 Refinancing New B-1 | | 7.12% | | 3M US L + 5.00% | | 04/16/2026 | | | 995,235 | | | | 980,515 | |
| Travelport Finance S.à r.l., Initial | | 7.10% | | 3M US L + 5.00% | | 05/29/2026 | | | 1,136,897 | | | | 1,024,833 | |
| Total Diversified Consumer Services | | | | | | | | | 3,134,515 | | | | 3,005,002 | |
| | | | | | | | | | | | | | | |
| Diversified Financial Services - 1.12% (0.72% of Total Investments) | | | | | | | | |
| Refinitiv US Holdings, Inc., Initial Dollar | | 5.79% | | 1M US L + 3.75% | | 10/01/2025 | | | 880,128 | | | | 884,528 | |
| | | | | | | | | | | | | | | |
| Diversified Telecommunication Services - 2.60% (1.66% of Total Investments) | | | | | | | | |
| Altice France S.A., USD TLB-13 Incremental | | 6.03% | | 1M US L + 4.00% | | 08/14/2026 | | | 812,046 | | | | 809,341 | |
| Sorenson Communications LLC, Initial | | 8.60% | | 3M US L + 6.50% | | 04/29/2024 | | | 207,725 | | | | 207,466 | |
| Syniverse Holdings, Inc., Tranche C | | 7.03% | | 1M US L + 5.00% | | 03/09/2023 | | | 618,634 | | | | 581,226 | |
See Notes to Financial Statements.
| Annual Report | September 30, 2019 | 11 |
| XAI Octagon Floating Rate & | |
| Alternative Income Term Trust | Schedule of Investments |
September 30, 2019
| | | Coupon(a) | | Reference Rate & Spread | | Maturity Date | | Principal Amount | | | Value | |
| SENIOR SECURED FIRST LIEN LOANS(c)(continued) | | | | | | | | |
| Diversified Telecommunication Services (continued) | | | | | | | | |
| WideOpenWest Finance LLC, Eighth Amendment B | | 5.29% | | 1M US L + 3.25% | | 08/18/2023 | | $ | 461,769 | | | $ | 445,030 | |
| Total Diversified Telecommunication Services | | | | | | | | | 2,100,174 | | | | 2,043,063 | |
| | | | | | | | | | | | | | | |
| Electronic Equipment, Instruments & Components - 1.76% (1.12% of Total Investments) | | | | |
| ConvergeOne Holdings, Corp., Initial | | 7.04% | | 1M US L + 5.00% | | 01/04/2026 | | | 435,403 | | | | 389,250 | |
| Mavenir Systems, Inc., Initial | | 8.34% | | 3M US L + 6.00% | | 05/08/2025 | | | 740,006 | | | | 727,056 | |
| Triton Solar US Acquisition Co., Initial | | 8.04% | | 1M US L + 6.00% | | 10/29/2024 | | | 289,679 | | | | 269,947 | |
| Total Electronic Equipment, Instruments & Components | | | | | | | | | 1,465,088 | | | | 1,386,253 | |
| | | | | | | | | | | | | | | |
| Energy Equipment & Services - 1.38% (0.88% of Total Investments) | | | | | | | | |
| McDermott International, Inc. | | 7.10% | | 3M US L + 5.00% | | 05/09/2025 | | | 651,023 | | | | 409,331 | |
| WaterBridge Midstream Operating LLC, Initial | | 7.83% | | 6M US L + 5.75% | | 06/22/2026 | | | 702,586 | | | | 677,117 | |
| Total Energy Equipment & Services | | | | | | | | | 1,353,609 | | | | 1,086,448 | |
| | | | | | | | | | | | | | | |
| Food Products - 1.53% (0.98% of Total Investments) | | | | | | | | |
| 8th Avenue Food & Provisions, Inc. | | 5.79% | | 1M US L + 3.75% | | 10/01/2025 | | | 497,494 | | | | 498,325 | |
| Give & Go Prepared Foods Corp., 2017 | | 6.29% | | 1M US L + 4.25% | | 07/29/2023 | | | 257,460 | | | | 240,511 | |
| Sage Borrowco LLC, B | | 7.13% | | 3M US L + 4.75% | | 06/20/2026 | | | 464,397 | | | | 465,850 | |
| Total Food Products | | | | | | | | | 1,219,351 | | | | 1,204,686 | |
| | | | | | | | | | | | | | | |
| Health Care Equipment & Supplies - 2.26% (1.44% of Total Investments) | | | | | | | | |
| Aldevron LLC, B(d) | | N/A | | L + 4.25% | | 09/18/2026 | | | 458,674 | | | | 459,821 | |
| Curium BidCo S.à r.l., Facility B | | 6.10% | | 3M US L + 4.00% | | 07/09/2026 | | | 379,315 | | | | 379,789 | |
| Femur Buyer, Inc., Initial | | 6.38% | | 3M US L + 4.25% | | 03/05/2026 | | | 934,977 | | | | 934,977 | |
| Total Health Care Equipment & Supplies | | | | | | | | | 1,772,966 | | | | 1,774,587 | |
| | | | | | | | | | | | | | | |
| Health Care Providers & Services - 8.82% (5.63% of Total Investments) | | | | | | | | |
| Air Medical Group Holdings, Inc., 2018 New | | 6.29% | | 1M US L + 4.25% | | 03/14/2025 | | | 496,215 | | | | 463,753 | |
| BW NHHC Holdco, Inc., Initial | | 7.05% | | 1M US L + 5.00% | | 05/15/2025 | | | 773,622 | | | | 642,107 | |
| Envision Healthcare Corp., Initial | | 5.79% | | 1M US L + 3.75% | | 10/10/2025 | | | 316,390 | | | | 257,164 | |
| Gentiva Health Services, Inc., Closing Date Initial | | 5.81% | | 1M US L + 3.75% | | 07/02/2025 | | | 834,982 | | | | 839,157 | |
| Phoenix Guarantor, Inc., Initial | | 6.57% | | 1M US L + 4.50% | | 03/05/2026 | | | 664,390 | | | | 665,081 | |
| Radiology Partners, Inc., B | | 7.19% | | 3M US L + 4.75% | | 07/09/2025 | | | 974,142 | | | | 958,663 | |
| Regionalcare Hospital Partners Holdings, Inc., B | | 6.55% | | 1M US L + 4.50% | | 11/16/2025 | | | 1,021,322 | | | | 1,021,486 | |
| Verscend Holding Corp., B | | 6.54% | | 1M US L + 4.50% | | 08/27/2025 | | | 1,085,230 | | | | 1,087,943 | |
| WP CityMD Bidco LLC, Initial | | 6.60% | | 3M US L + 4.50% | | 08/13/2026 | | | 1,019,951 | | | | 1,008,160 | |
| Total Health Care Providers & Services | | | | | | | | | 7,186,244 | | | | 6,943,514 | |
| | | | | | | | | | | | | | | |
| Health Care Technology - 2.69% (1.72% of Total Investments) | | | | | | | | |
| athenahealth, Inc., B | | 6.68% | | 3M US L + 4.50% | | 02/11/2026 | | | 1,241,972 | | | | 1,237,314 | |
| Zelis Healthcare Corp., B(d) | | N/A | | L + 4.75% | | 09/10/2026 | | | 889,472 | | | | 881,689 | |
| Total Health Care Technology | | | | | | | | | 2,131,444 | | �� | | 2,119,003 | |
| | | | | | | | | | | | | | | |
| Hotels, Restaurants & Leisure - 4.01% (2.55% of Total Investments) | | | | | | | | |
| Bulldog Purchaser, Inc., Initial(e) | | 5.79% | | 1M US L + 3.75% | | 09/05/2025 | | | 84,516 | | | | 83,390 | |
| Casablanca US Holdings, Inc., Amendment No. 2 Initial | | 6.26% | | 3M US L + 4.00% | | 03/29/2024 | | | 833,528 | | | | 803,938 | |
| CEC Entertainment, Inc., B | | 8.54% | | 1M US L + 6.50% | | 08/30/2026 | | | 986,012 | | | | 963,826 | |
See Notes to Financial Statements.
| XAI Octagon Floating Rate & | |
| Alternative Income Term Trust | Schedule of Investments |
September 30, 2019
| | | Coupon(a) | | Reference Rate & Spread | | Maturity Date | | Principal Amount | | | Value | |
| SENIOR SECURED FIRST LIEN LOANS(c)(continued) | | | | | | | | |
| Hotels, Restaurants & Leisure (continued) | | | | | | | | |
| NPC International, Inc., Initial | | 5.54% | | 1M US L + 3.50% | | 04/19/2024 | | $ | 378,840 | | | $ | 234,070 | |
| Red Lobster Management LLC, Initial | | 7.29% | | 1M US L + 5.25% | | 07/28/2021 | | | 743,503 | | | | 736,068 | |
| United PF Holdings LLC(e) | | 6.54% | | 1M US L + 4.50% | | 06/10/2026 | | | 332,794 | | | | 331,130 | |
| Total Hotels, Restaurants & Leisure | | | | | | | | | 3,359,193 | | | | 3,152,422 | |
| | | | | | | | | | | | | | | |
| Household Products - 1.50% (0.96% of Total Investments) | | | | | | | | |
| Sunshine Luxembourg VII SARL, Facility B1(d) | | N/A | | L + 4.25% | | 09/23/2026 | | | 1,173,747 | | | | 1,178,642 | |
| | | | | | | | | | | | | | | |
| Industrial Conglomerates - 0.56% (0.35% of Total Investments) | | | | | | | | |
| J2 Acquisition, Ltd., B(d) | | N/A | | L + 2.50% | | 09/25/2026 | | | 187,365 | | | | 187,833 | |
| Sundyne US Purchaser, Inc., Initial | | 6.04% | | 1M US L + 4.00% | | 05/15/2026 | | | 250,567 | | | | 250,254 | |
| Total Industrial Conglomerates | | | | | | | | | 437,932 | | | | 438,087 | |
| | | | | | | | | | | | | | | |
| Insurance - 0.34% (0.22% of Total Investments) | | | | | | | | |
| Sedgwick Claims Management Services, Inc., 2019 | | 6.04% | | 1M US L + 4.00% | | 09/03/2026 | | | 266,712 | | | | 266,912 | |
| | | | | | | | | | | | | | | |
| Internet Software & Services - 2.53% (1.61% of Total Investments) | | | | | | | | |
| EIG Investors Corp., 2018 Refinancing | | 5.88% | | 3M US L + 3.75% | | 02/09/2023 | | | 321,209 | | | | 314,094 | |
| Ellie Mae, Inc. | | 6.04% | | 1M US L + 4.00% | | 04/17/2026 | | | 1,022,088 | | | | 1,022,517 | |
| Imperva, Inc. | | 6.30% | | 3M US L + 4.00% | | 01/12/2026 | | | 498,750 | | | | 483,788 | |
| Veritas US, Inc., New Dollar B | | 6.55% | | 1M US L + 4.50% | | 01/27/2023 | | | 176,968 | | | | 166,847 | |
| Total Internet Software & Services | | | | | | | | | 2,019,015 | | | | 1,987,246 | |
| | | | | | | | | | | | | | | |
| IT Services - 1.99% (1.27% of Total Investments) | | | | | | | | |
| Merrill Communications LLC, B(d) | | N/A | | L + 5.00% | | 09/25/2026 | | | 350,554 | | | | 347,925 | |
| Rackspace Hosting, Inc., B | | 5.29% | | 3M US L + 3.00% | | 11/03/2023 | | | 498,728 | | | | 456,879 | |
| ThoughtWorks, Inc., Replacement | | 6.04% | | 1M US L + 4.00% | | 10/11/2024 | | | 211,266 | | | | 211,266 | |
| West Corp., Initial B | | 6.06% | | 1M US L + 4.00% | | 10/10/2024 | | | 613,764 | | | | 547,226 | |
| Total IT Services | | | | | | | | | 1,674,312 | | | | 1,563,296 | |
| | | | | | | | | | | | | | | |
| Media - 3.12% (1.99% of Total Investments) | | | | | | | | |
| Ancestry.com Operations, Inc., Extended(d) | | N/A | | L + 4.25% | | 08/27/2026 | | | 748,125 | | | | 730,357 | |
| Clear Channel Outdoor Holdings, Inc., B | | 5.54% | | 1M US L + 3.50% | | 08/21/2026 | | | 117,513 | | | | 117,765 | |
| Cumulus Media New Holdings, Inc., Initial(d) | | N/A | | L + 3.75% | | 03/31/2026 | | | 324,423 | | | | 324,828 | |
| Diamond Sports Group LLC | | 5.30% | | 1M US L + 3.25% | | 08/24/2026 | | | 550,120 | | | | 552,871 | |
| MediArena Acquisition B.V., Dollar B | | 8.07% | | 3M US L + 5.75% | | 08/13/2021 | | | 739,004 | | | | 728,318 | |
| Total Media | | | | | | | | | 2,479,185 | | | | 2,454,139 | |
| | | | | | | | | | | | | | | |
| Oil, Gas & Consumable Fuels - 0.36% (0.23% of Total Investments) | | | | | | | | |
| ARGUS MEDIA LIMITED(d) | | N/A | | L + 3.25% | | 09/24/2026 | | | 70,028 | | | | 70,290 | |
| Permian Production Partners LLC, Initial Advances | | 8.05% | | 1M US L + 6.00% | | 05/20/2024 | | | 433,088 | | | | 216,544 | |
| Total Oil, Gas & Consumable Fuels | | | | | | | | | 503,116 | | | | 286,834 | |
| | | | | | | | | | | | | | | |
| Pharmaceuticals - 0.27% (0.17% of Total Investments) | | | | | | | | |
| Amneal Pharmaceuticals, LLC, Initial Term Loan | | 5.56% | | 1M US L + 3.50% | | 05/04/2025 | | | 249,151 | | | | 211,778 | |
See Notes to Financial Statements.
| Annual Report | September 30, 2019 | 13 |
| XAI Octagon Floating Rate & | |
| Alternative Income Term Trust | Schedule of Investments |
September 30, 2019
| | | Coupon(a) | | Reference Rate & Spread | | Maturity Date | | Principal Amount | | | Value | |
| SENIOR SECURED FIRST LIEN LOANS(c)(continued) | | | | | | | | |
| Professional Services - 1.01% (0.64% of Total Investments) | | | | | | | | |
| AQ Carver Buyer, INC.(d) | | N/A | | L + 5.00% | | 09/23/2025 | | $ | 467,890 | | | $ | 463,211 | |
| National Intergovernmental Purchasing Alliance Company AKA Omnia Partners, Initial Term Loans | | 5.85% | | 3M US L + 3.75% | | 05/23/2025 | | | 336,507 | | | | 331,460 | |
| Total Professional Services | | | | | | | | | 804,397 | | | | 794,671 | |
| | | | | | | | | | | | | | | |
| Real Estate Management & Development - 0.58% (0.37% of Total Investments) | | | | | | | | |
| Forest City Enterprises LP, Initial | | 6.04% | | 1M US L + 4.00% | | 12/08/2025 | | | 456,089 | | | | 458,939 | |
| | | | | | | | | | | | | | | |
| Software - 8.85% (5.64% of Total Investments) | | | | | | | | |
| Carbonite, Inc., Initial | | 6.01% | | 1M US L + 3.75% | | 03/26/2026 | | | 489,899 | | | | 489,693 | |
| Datto, Inc., Cov-Lite TLB | | 6.29% | | 1M US L + 4.25% | | 04/02/2026 | | | 142,878 | | | | 143,950 | |
| DigiCert Holdings, Inc., B(d) | | N/A | | L + 4.00% | | 08/07/2026 | | | 796,742 | | | | 793,754 | |
| DiscoverOrg LLC, Initial | | 6.54% | | 1M US L + 4.50% | | 02/02/2026 | | | 988,060 | | | | 983,426 | |
| LegalZoom.com, Inc., 2018 | | 6.54% | | 1M US L + 4.50% | | 11/21/2024 | | | 557,766 | | | | 559,160 | |
| McAfee LLC, B USD | | 5.79% | | 1M US L + 3.75% | | 09/30/2024 | | | 834,605 | | | | 836,124 | |
| Perforce Software, Inc., B | | 6.54% | | 1M US L + 4.50% | | 07/01/2026 | | | 783,683 | | | | 782,703 | |
| Project Alpha Intermediate Holding, Inc., 2019 | | | | | | | | | | | | | | |
| Incremental | | 6.56% | | 3M US L + 4.25% | | 04/26/2024 | | | 596,587 | | | | 595,842 | |
| TIBCO Software, Inc., B-2 | | 6.07% | | 1M US L + 4.00% | | 06/30/2026 | | | 952,097 | | | | 952,497 | |
| Upland Software, Inc., Initial | | 5.79% | | 1M US L + 3.75% | | 08/06/2026 | | | 825,846 | | | | 826,879 | |
| Total Software | | | | | | | | | 6,968,163 | | | | 6,964,028 | |
| | | | | | | | | | | | | | | |
| Specialty Retail - 1.54% (0.98% of Total Investments) | | | | | | | | |
| Bass Pro Group LLC, Initial | | 7.04% | | 1M US L + 5.00% | | 09/25/2024 | | | 758,425 | | | | 729,226 | |
| Payless, Inc. | | | | | | | | | | | | | | |
| Tranche A-1(f) | | 14.25% | | 1M US L + 7.00% | | 02/09/2022 | | | 359,832 | | | | 251,882 | |
| Tranche A-2(f) | | 15.25% | | 3M US L + 8.00% | | 08/09/2022 | | | 643,500 | | | | 231,660 | |
| Total Specialty Retail | | | | | | | | | 1,761,757 | | | | 1,212,768 | |
| | | | | | | | | | | | | | | |
| Textiles, Apparel & Luxury Goods - 1.45% (0.92% of Total Investments) | | | | | | | | |
| Champ Acquisition Corp., Initial | | 7.60% | | 3M US L + 5.50% | | 12/19/2025 | | | 544,572 | | | | 542,873 | |
| Elevate Textiles, Inc., Initial | | 7.03% | | 1M US L + 5.00% | | 05/01/2024 | | | 708,227 | | | | 594,910 | |
| Total Textiles, Apparel & Luxury Goods | | | | | | | | | 1,252,799 | | | | 1,137,783 | |
| | | | | | | | | | | | | | | |
| Wireless Telecommunication Services - 0.65% (0.42% of Total Investments) | | | | | | | | |
| Digicel International Finance, Ltd., Initial B | | 5.34% | | 3M US L + 3.25% | | 05/27/2024 | | | 596,214 | | | | 515,230 | |
| | | | | | | | | | | | | | | |
| Total Senior Secured First Lien Loans (Cost $54,199,182) | | | | | | | | $ | 54,771,007 | | | $ | 51,888,851 | |
| | | | | | | | | | | | | | | |
| CLO DEBT(c)(g)- 21.98%* (14.02% of Total Investments) | | | | | | | | |
| Anchorage Capital CLO 2018-10, Ltd., Series 2018-10A(b) | | 8.05% | | 3M US L + 5.75% | | 10/15/2031 | | | 500,000 | | | | 452,658 | |
| Apidos CLO XXVIII, Series 2017-28A(b) | | 7.78% | | 3M US L + 5.50% | | 01/20/2031 | | | 1,000,000 | | | | 921,441 | |
| Atrium XIV LLC, Series 2018-14A(b) | | 7.97% | | 3M US L + 5.65% | | 08/23/2030 | | | 500,000 | | | | 461,352 | |
| CIFC Funding 2015-I, Ltd., Series 2015-1A(b) | | 8.28% | | 3M US L + 6.00% | | 01/22/2031 | | | 500,000 | | | | 461,865 | |
| CIFC Funding 2017-II, Ltd., Series 2017-2A(b) | | 8.23% | | 3M US L + 5.95% | | 04/20/2030 | | | 500,000 | | | | 465,302 | |
| CIFC Funding 2017-V, Ltd., Series 2017-5A(b) | | 8.40% | | 3M US L + 6.10% | | 11/16/2030 | | | 1,000,000 | | | | 945,687 | |
| Dryden 64 CLO, Ltd., Series 2018-64A(b) | | 7.90% | | 3M US L + 5.60% | | 04/18/2031 | | | 500,000 | | | | 449,023 | |
See Notes to Financial Statements.
| XAI Octagon Floating Rate & | |
| Alternative Income Term Trust | Schedule of Investments |
September 30, 2019
| | | Coupon(a) | | Reference Rate & Spread | | Maturity Date | | Principal Amount | | | Value | |
| CLO DEBT(c)(g) (continued) | | | | | | | | | | | | | | |
| GoldenTree Loan Management US CLO 1, Ltd., Series 2017-1A(b) | | 7.88% | | 3M US L + 5.60% | | 04/20/2029 | | $ | 1,000,000 | | | $ | 813,850 | |
| GoldenTree Loan Opportunities XI, Ltd., Series 2015- 11A(b) | | 7.70% | | 3M US L + 5.40% | | 01/18/2031 | | | 750,000 | | | | 654,494 | |
| Halcyon Loan Advisors Funding 2018-2, Ltd., Series 2018- 2A(b) | | 9.18% | | 3M US L + 6.90% | | 01/22/2031 | | | 500,000 | | | | 483,584 | |
| HPS Loan Management 11-2017, Ltd., Series 2017-11A(b) | | 10.09% | | 3M US L + 7.85% | | 05/06/2030 | | | 1,000,000 | | | | 875,271 | |
| Madison Park Funding XVII, Ltd., Series 2015-17A(b) | | 9.76% | | 3M US L + 7.48% | | 07/21/2030 | | | 1,000,000 | | | | 834,141 | |
| Madison Park Funding XXIV, Ltd., Series 2019-24A(b) | | 9.38% | | 3M US L + 7.20% | | 10/20/2029 | | | 250,000 | | | | 245,014 | |
| Marble Point CLO XI, Ltd., Series 2017-2A E(b) | | 7.90% | | 3M US L + 5.60% | | 12/18/2030 | | | 1,000,000 | | | | 843,160 | |
| Neuberger Berman CLO XIV, Ltd., Series 2013-14A(b) | | 8.71% | | 3M US L + 6.45% | | 01/28/2030 | | | 1,000,000 | | | | 923,363 | |
| OZLM Funding, Ltd., Series 2012-1A(b) | | 8.95% | | 3M US L + 6.67% | | 07/23/2029 | | | 1,000,000 | | | | 986,459 | |
| OZLM XXII, Ltd., Series 2018-22A(b) | | 7.60% | | 3M US L + 5.30% | | 01/17/2031 | | | 500,000 | | | | 434,474 | |
| Sound Point CLO II, Ltd., Series 2013-1A(b) | | 7.77% | | 3M US L + 5.50% | | 01/26/2031 | | | 250,000 | | | | 211,843 | |
| Sound Point CLO XVIII, Ltd., Series 2017-4A(b) | | 7.78% | | 3M US L + 5.50% | | 01/20/2031 | | | 500,000 | | | | 428,673 | |
| Symphony CLO XVIII, Ltd., Series 2016-18A(b) | | 8.61% | | 3M US L + 6.35% | | 01/23/2028 | | | 1,500,000 | | | | 1,428,785 | |
| Symphony CLO XXI, Ltd., Series 2019-21A(b) | | 9.11% | | 3M US L + 6.75% | | 07/15/2032 | | | 1,000,000 | | | | 974,682 | |
| THL Credit Wind River 2017-4 CLO, Ltd., Series 2017-4A(b) | | 7.94% | | 3M US L + 5.80% | | 11/20/2030 | | | 500,000 | | | | 463,918 | |
| THL Credit Wind River 2019-1 CLO, Ltd., Series 2019-1A(b) | | 9.31% | | 3M US L + 6.72% | | 04/20/2031 | | | 750,000 | | | | 728,942 | |
| Voya CLO 2013-1, Ltd., Series 2013-1A(b) | | 8.78% | | 3M US L + 6.48% | | 10/15/2030 | | | 1,000,000 | | | | 921,060 | |
| Voya CLO 2013-2, Ltd., Series 2013-2A(b) | | 7.88% | | 3M US L + 5.60% | | 04/25/2031 | | | 1,000,000 | | | | 893,529 | |
| Total CLO Debt (Cost $18,864,987) | | | | | | | | $ | 19,000,000 | | | $ | 17,302,570 | |
| | | | | | | | | | | | | | | |
| CLO EQUITY(g)(h)- 50.40%* (32.14% of Total Investments) | | | | | | | | |
| ALM V, Ltd., Series 2012-5A(b) | | N/A | | Estimated yield of 11.77% | | 10/18/2027 | | | 2,000,000 | | | | 790,422 | |
| Anchorage Capital CLO 1-R, Ltd., Series 2018-1RA(b) | | N/A | | Estimated yield of 17.38% | | 04/13/2031 | | | 4,150,000 | | | | 3,334,301 | |
| Anchorage Capital CLO 3-R, Ltd., Series 2014-3RA(b) | | N/A | | Estimated yield of 16.30% | | 01/28/2031 | | | 1,400,000 | | | | 1,120,629 | |
| Anchorage Capital CLO 4-R, Ltd., Series 2018-4RA(b) | | N/A | | Estimated yield of 16.94% | | 01/28/2031 | | | 3,000,000 | | | | 2,402,097 | |
| Anchorage Capital CLO 9, Ltd., Series 2016-9A(b) | | N/A | | Estimated yield of 17.96% | | 07/15/2032 | | | 2,500,000 | | | | 1,196,685 | |
| Apidos CLO XXVII, Series 2017-27A(b) | | N/A | | Estimated yield of 16.21% | | 07/17/2030 | | | 1,300,000 | | | | 791,094 | |
| Apidos CLO XXVIII, Series 2017-28A(b) | | N/A | | Estimated yield of 11.42% | | 01/20/2031 | | | 3,500,000 | | | | 2,714,418 | |
| Carlyle Global Market Strategies CLO 2013-1, Ltd., Series 2013-1A(b) | | N/A | | Estimated yield of 13.90% | | 08/14/2030 | | | 3,500,000 | | | | 1,868,926 | |
| Carlyle Global Market Strategies CLO 2016-1, Ltd., Series 2016-1A(b) | | N/A | | Estimated yield of 10.35% | | 04/20/2027 | | | 598,000 | | | | 433,569 | |
| Carlyle US CLO 2018-2, Ltd., Series 2018-2A(b) | | N/A | | Estimated yield of 13.60% | | 10/15/2031 | | | 933,000 | | | | 722,890 | |
| Catamaran CLO 2015-1, Ltd., Series 2015-1A(b) | | N/A | | Estimated yield of 23.10% | | 04/22/2027 | | | 750,000 | | | | 286,129 | |
| CIFC Funding 2017-III, Ltd., Series 2017-3A(b) | | N/A | | Estimated yield of 16.99% | | 07/30/2030 | | | 1,400,000 | | | | 1,108,463 | |
| CIFC Funding 2017-V, Ltd., Series 2017-5A(b) | | N/A | | Estimated yield of 13.27% | | 11/16/2030 | | | 3,000,000 | | | | 2,195,577 | |
| CIFC Funding 2018-I, Ltd., Series 2018-1A(b) | | N/A | | Estimated yield of 15.04% | | 04/18/2031 | | | 3,250,000 | | | | 2,746,126 | |
| CIFC Funding 2019-III, Ltd., Series 2019-3A(b) | | N/A | | Estimated yield of 13.21% | | 07/16/2032 | | | 750,000 | | | | 623,918 | |
| Dryden 34 Senior Loan Fund, Series 2014-34A(b) | | N/A | | Estimated yield of 0.00% | | 10/15/2026 | | | 5,000,000 | | | | 29,000 | |
| Madison Park Funding XVIII, Ltd., Series 2015-18A(b) | | N/A | | Estimated yield of 6.80% | | 10/21/2030 | | | 4,000,000 | | | | 2,871,452 | |
| Oak Hill Credit Partners X-R, Ltd., Series 2014-10RA(b) | | N/A | | Estimated yield of 17.21% | | 12/20/2030 | | | 4,800,000 | | | | 1,911,432 | |
| OHA Credit Partners XI, Ltd., Series 2015-11A(b) | | N/A | | Estimated yield of 17.43% | | 01/20/2032 | | | 2,750,000 | | | | 1,972,960 | |
| Sound Point CLO III, Ltd., Series 2017-3A(b) | | N/A | | Estimated yield of 18.25% | | 10/20/2030 | | | 1,500,000 | | | | 1,108,953 | |
| Sound Point CLO III-R, Ltd., Series 2013-2RA(b) | | N/A | | Estimated yield of 17.34% | | 04/15/2029 | | | 1,000,000 | | | | 379,271 | |
| Sound Point CLO VI-R, Ltd., Series 2014-2RA(b) | | N/A | | Estimated yield of 19.05% | | 10/20/2031 | | | 2,000,000 | | | | 703,986 | |
| Thacher Park CLO, Ltd., Series 2014-1A(b) | | N/A | | Estimated yield of 0.00% | | 10/20/2026 | | | 6,000,000 | | | | 1,197,240 | |
See Notes to Financial Statements.
| Annual Report | September 30, 2019 | 15 |
| XAI Octagon Floating Rate & | |
| Alternative Income Term Trust | Schedule of Investments |
September 30, 2019
| | | Coupon(a) | | Reference Rate & Spread | | Maturity Date | | Principal Amount | | | Value | |
| CLO EQUITY(g)(h) (continued) | | | | | | | | | | | | | | |
| THL Credit Wind River 2016-1 CLO, Ltd., Series 2016-1A(b) | | N/A | | Estimated yield of 21.92% | | 07/15/2028 | | $ | 4,000,000 | | | $ | 2,454,752 | |
| THL Credit Wind River 2018-2 CLO, Ltd., Series 2018-2A(b) | | N/A | | Estimated yield of 14.76% | | 07/15/2030 | | | 2,500,000 | | | | 2,050,370 | |
| THL Credit Wind River 2018-3 CLO, Ltd., Series 2018-3A(b) | | N/A | | Estimated yield of 16.24% | | 01/20/2031 | | | 3,000,000 | | | | 2,652,084 | |
| Total CLO Equity (Cost $45,660,130) | | | | | | | | $ | 68,581,000 | | | $ | 39,666,744 | |
| | | Shares | | | | |
| MONEY MARKET MUTUAL FUNDS - 8.10%*(5.17% of Total Investments) | | | | | | | | |
| Invesco Short Term Investments Trust Treasury Portfolio, Institutional Class | | | | | | | | |
| (1.779% 7-Day Yield) | | | 6,377,104 | | | | 6,377,104 | |
| Total Money Market Mutual Funds (Cost $6,377,104) | | $ | 6,377,104 | | | $ | 6,377,104 | |
| | | | | | | | | |
| Total Investments - 156.79% (Cost $133,978,977) | | | | | | $ | 123,408,663 | |
| Liabilities in Excess of Other Assets - (7.32)% | | | | | | | (5,761,035 | ) |
| Leverage Facility (Net of $24,570 Deferred Leverage Costs) - (49.47)% | | | | | | | (38,940,430 | ) |
| Net Assets - 100.00% | | | | | | $ | 78,707,198 | |
| * | Amounts above are shown as a percentage of net assets as of September 30, 2019. |
| (a) | The rate shown is the coupon as of the end of the reporting period. |
| (b) | Security exempt from registration under Rule 144A of the Securities Act of 1933. Total market value of Rule 144A securities amounts to $57,143,689, which represents approximately 72.60% of net assets as of September 30, 2019. Such securities may normally be sold to qualified institutional buyers in transactions exempt from registration. |
| (c) | Variable rate investment. Interest rates reset periodically. Interest rate shown reflects the rate in effect at September 30, 2019. For securities based on a published reference rate and spread, the reference rate and spread are indicated in the description above. Certain variable rate securities are not based on a published reference rate and spread but are determined by the issuer or agent and are based on current market conditions. These securities do not indicate a reference rate and spread in their description above. |
| (d) | All or a portion of this position has not settled as of the period end. The interest rate shown represents the stated spread over the London Interbank Offered Rate ("LIBOR" or "L") or the applicable LIBOR floor; the Trust will not accrue interest until the settlement date, at which point LIBOR will be established. The total cost of securities purchased on a when issued or delivery delayed basis was $6,425,887 as of September 30, 2019. |
| (e) | This investment has an unfunded commitment as of September 30, 2019. For further details, see Note 8. |
| (f) | Issuer was in default and is non-income producing. Partial or no payments were paid on the last payment date. The aggregate value of these securities represented 0.61% of the Trust’s net assets. |
| (g) | As a result of the use of significant unobservable inputs to determine fair value, these investments have been classified as Level 3 assets. See also Note 2 to the Financial Statements for additional information. |
| (h) | CLO subordinated notes are considered CLO equity positions. CLO equity positions are entitled to recurring distributions which are generally equal to the remaining cash flow of payments made by underlying securities less contractual payments to debt holders and fund expenses. The effective yield is estimated based upon the current projection of the amount and timing of these recurring distributions in addition to the estimated amount of terminal principal payment. Effective yields for the CLO equity positions are updated generally once a quarter or on a transaction such as an add-on purchase, refinancing or reset. The estimated yield and investment cost may ultimately not be realized. |
All securities held as of September 30, 2019 are pledged as collateral for the leverage facility.
See Notes to Financial Statements.
| XAI Octagon Floating Rate & | |
| Alternative Income Term Trust | Statement of Assets and Liabilities |
September 30, 2019
| ASSETS: | | | |
| Investments, at value (Cost $133,978,977) | | $ | 123,408,663 | |
| Cash | | | 459,879 | |
| Receivable for investment securities sold | | | 6,323,963 | |
| Interest receivable | | | 648,428 | |
| Receivable for fund shares sold | | | 121,736 | |
| Deferred offering costs, net (Note 5) | | | 137,024 | |
| Prepaid expenses and other assets | | | 4,095 | |
| Total Assets | | | 131,103,788 | |
| | | | | |
| LIABILITIES: | | | | |
| Payable for professional fees | | | 115,647 | |
| Payable to transfer agent | | | 7,730 | |
| Payable for investor support services fees (Note 3) | | | 19,450 | |
| Payable for printing | | | 5,315 | |
| Payable for custodian fees | | | 5,405 | |
| Payable for investment securities purchased | | | 12,293,798 | |
| Leverage facility (Net of $24,570 deferred leverage costs) (Note 6) | | | 38,940,430 | |
| Interest due on leverage facility (Note 6) | | | 102,339 | |
| Distributions payable to common shareholders | | | 693,198 | |
| Accrued investment advisory fees payable (Note 3) | | | 78,843 | |
| Accrued fund accounting and administration fees payable | | | 48,726 | |
| Accrued chief compliance officer fees payable | | | 5,175 | |
| Accrued trustees fees payable | | | 38,000 | |
| Other payables and accrued expenses | | | 42,534 | |
| Total Liabilities | | | 52,396,590 | |
| Net Assets | | $ | 78,707,198 | |
| Commitment (Note 8) | | | | |
| | | | | |
| COMPOSITION OF NET ASSETS: | | | | |
| Paid-in capital | | $ | 89,580,531 | |
| Total distributable earnings | | | (10,873,333 | ) |
| Net Assets | | $ | 78,707,198 | |
| | | | | |
| Common shares of beneficial interest outstanding, at $0.01 par value, and unlimited common shares authorized | | | 9,574,537 | |
| Net Asset Value per Common Share | | $ | 8.22 | |
See Notes to Financial Statements.
| Annual Report | September 30, 2019 | 17 |
| XAI Octagon Floating Rate & | |
| Alternative Income Term Trust | Statement of Operations |
For the Year Ended September 30, 2019
| INVESTMENT INCOME: | | | |
| Dividends | | $ | 81,902 | |
| Interest | | | 11,583,362 | |
| Total Investment Income | | | 11,665,264 | |
| | | | | |
| EXPENSES: | | | | |
| Investment advisory fees (Note 3) | | | 1,931,774 | |
| Fund accounting and administration fees | | | 333,683 | |
| Professional fees | | | 379,294 | |
| Custodian fees | | | 20,931 | |
| Chief compliance officer fees (Note 3) | | | 30,525 | |
| Trustees fees and expenses | | | 168,000 | |
| Printing expenses | | | 8,634 | |
| Transfer agent fees | | | 33,441 | |
| Investor support services fees (Note 3) | | | 227,267 | |
| Interest expense and amortization of deferred borrowing costs | | | 1,488,609 | |
| Other expenses | | | 90,149 | |
| Total Expenses Before Waivers | | | 4,712,307 | |
| Fees waived or reimbursed by the Advisor (Note 3) | | | (718,370 | ) |
| Net Expenses | | | 3,993,937 | |
| Net Investment Income | | | 7,671,327 | |
| | | | | |
| REALIZED AND UNREALIZED LOSS ON INVESTMENTS: | | | | |
| Net realized loss on: | | | | |
| Investment securities | | | (3,725,716 | ) |
| Change in unrealized appreciation/(depreciation) on: | | | | |
| Investment securities | | | (8,390,032 | ) |
| Net Realized and Unrealized Loss on Investments | | | (12,115,748 | ) |
| Net Decrease in Net Assets from Operations | | $ | (4,444,421 | ) |
See Notes to Financial Statements.
| XAI Octagon Floating Rate & | |
| Alternative Income Term Trust | Statements of Changes in Net Assets |
| | | For the Year Ended September 30, 2019 | | | For theYear EndedSeptember 30, 2018 | |
| OPERATIONS: | | | | | | | | |
| Net investment income | | $ | 7,671,327 | | | $ | 5,253,538 | |
| Net realized gain/loss | | | (3,725,716 | ) | | | 949,311 | |
| Change in unrealized appreciation/(depreciation) | | | (8,390,032 | ) | | | (2,180,282 | ) |
| Net Increase/(Decrease) in Net Assets from Operations | | | (4,444,421 | ) | | | 4,022,567 | |
| | | | | | | | | |
| TOTAL DISTRIBUTIONS TO SHAREHOLDERS: | | | | | | | | |
| From net investment income | | | (6,645,148 | ) | | | (3,785,195 | ) |
| From tax return of capital | | | (682,271 | ) | | | (2,551,001 | ) |
| TOTAL DISTRIBUTIONS TO SHAREHOLDERS | | | (7,327,419 | ) | | | (6,336,196 | ) |
| | | | | | | | | |
| CAPITAL SHARE TRANSACTIONS: | | | | | | | | |
| Proceeds from sale of common shares (net of offering costs of $66,707 and $21,750) | | | 11,118,846 | | | | 10,635,750 | |
| Net asset value of common shares issued to shareholders from reinvestment of dividends | | | 38,580 | | | | 11,599 | |
| Net Increase from Capital Share Transactions | | | 11,157,426 | | | | 10,647,349 | |
| Net Increase/(Decrease) in Net Assets | | | (614,414 | ) | | | 8,333,720 | |
| | | | | | | | | |
| NET ASSETS: | | | | | | | | |
| Beginning of year | | $ | 79,321,612 | | | $ | 70,987,892 | |
| End of year | | $ | 78,707,198 | | | $ | 79,321,612 | |
See Notes to Financial Statements.
| Annual Report | September 30, 2019 | 19 |
| XAI Octagon Floating Rate & | |
| Alternative Income Term Trust | Statement of Cash Flows |
For the Year Ended September 30, 2019
| CASH FLOWS FROM OPERATING ACTIVITIES: | | | |
| Net decrease in net assets from operations | | $ | (4,444,421 | ) |
| Adjustments to reconcile net decrease in net assets from operations to net cash used in operating activities: | | | | |
| Purchases of investment securities | | | (118,194,858 | ) |
| Proceeds from disposition of investment securities | | | 106,254,501 | |
| Discounts accreted/premiums amortized | | | (89,801 | ) |
| Reductions to CLO equity cost basis | | | 1,936,687 | |
| Net realized loss on: | | | | |
| Investment securities | | | 3,725,716 | |
| Net change in unrealized appreciation/(depreciation) on: | | | | |
| Investment securities | | | 8,390,032 | |
| Net purchase of short-term investment securities | | | (4,379,875 | ) |
| Amortization of deferred leverage costs | | | (91,155 | ) |
| (Increase)/Decrease in assets: | | | | |
| Receivable for investment securities sold | | | 368,184 | |
| Interest receivable | | | (67,491 | ) |
| Prepaid expenses and other assets | | | (4,095 | ) |
| Increase/(Decrease) in liabilities: | | | | |
| Payable for investment securities purchased | | | 3,008,907 | |
| Interest due on leverage facility | | | (248,876 | ) |
| Accrued investment advisory fees payable | | | (10,198 | ) |
| Accrued fund accounting and administration fees payable | | | (12,796 | ) |
| Payable for professional fees | | | (16,827 | ) |
| Accrued trustees fees payable | | | 38,000 | |
| Payable for investor support services fees | | | (25 | ) |
| Payable for printing | | | (21,811 | ) |
| Payable for custodian fees | | | (1,811 | ) |
| Accrued chief compliance officer fees payable | | | 175 | |
| Payable to transfer agent | | | 680 | |
| Other payables and accrued expenses | | | 37,962 | |
| Net Cash Used in Operating Activities | | | (3,823,196 | ) |
| | | | | |
| CASH FLOWS FROM FINANCING ACTIVITIES: | | | | |
| Proceeds from leverage facility | | | 5,650,000 | |
| Payments on leverage facility | | | (5,550,000 | ) |
| Proceeds from shares sold - common shares | | | 11,063,817 | |
| Distributions paid - common shareholders | | | (7,171,716 | ) |
| Offering costs | | | (203,731 | ) |
| Net Cash Provided by Financing Activities | | | 3,788,370 | |
| | | | | |
| Net Decrease in Cash | | | (34,826 | ) |
| Cash, beginning balance | | | 494,705 | |
| Cash, ending balance | | $ | 459,879 | |
| | | | | |
| Supplemental disclosure of cash flow information: | | | | |
| Cash paid for interest on leverage facility | | $ | 1,605,800 | |
| | | | | |
| Non-cash activity: | | | | |
| Reinvestment of distributions | | $ | 38,580 | |
See Notes to Financial Statements.
| XAI Octagon Floating Rate & | |
| Alternative Income Term Trust | Financial Highlights |
For a Share Outstanding Throughout the Periods Presented
| | | For the Year Ended September 30, 2019 | | | For the Year Ended September 30, 2018 | | | For the Period September 27, 2017 (Commencement of Operations) to September 30, 2017 | |
| PER COMMON SHARE OPERATING PERFORMANCE: | | | | | | | | | | | | |
| Net asset value - beginning of period | | $ | 9.50 | | | $ | 9.78 | | | $ | 9.78 | (a) |
| INCOME/(LOSS) FROM INVESTMENT OPERATIONS: | | | | | | | | | | | | |
| Net investment income/(loss)(b) | | | 0.89 | | | | 0.64 | | | | (0.00 | )(c) |
| Net realized and unrealized loss on investments | | | (1.32 | ) | | | (0.16 | ) | | | – | |
| Total Income/(Loss) from Investment Operations | | | (0.43 | ) | | | 0.48 | | | | (0.00 | )(c) |
| | | | | | | | | | | | | |
| DISTRIBUTIONS TO COMMON SHAREHOLDERS:(d) | | | | | | | | | | | | |
| From net investment income | | | (0.77 | ) | | | (0.45 | ) | | | – | |
| From tax return of capital | | | (0.08 | ) | | | (0.31 | ) | | | – | |
| Total Distributions to Common Shareholders | | | (0.85 | ) | | | (0.76 | ) | | | – | |
| | | | | | | | | | | | | |
| CAPITAL SHARE TRANSACTIONS: | | | | | | | | | | | | |
| Impact of Capital Share Transactions(b) | | | 0.00 | (c) | | | – | | | | – | |
| Total Capital Share Transactions | | | 0.00 | (c) | | | – | | | | – | |
| | | | | | | | | | | | | |
| Net asset value per common share - end of period | | $ | 8.22 | | | $ | 9.50 | | | $ | 9.78 | |
| Market price per common share - end of period | | $ | 8.95 | | | $ | 9.80 | | | $ | 10.12 | |
| | | | | | | | | | | | | |
| Total Investment Return - Net Asset Value(e) | | | (4.55 | %) | | | 5.22 | % | | | 0.00 | % |
| Total Investment Return - Market Price(e) | | | 0.75 | % | | | 4.89 | % | | | 1.20 | % |
| | | | | | | | | | | | | |
| RATIOS AND SUPPLEMENTAL DATA: | | | | | | | | | | | | |
| Net assets attributable to common shares, end of period (000s) | | $ | 78,707 | | | $ | 79,322 | | | $ | 70,988 | |
| Ratio of expenses excluding waivers to average net assets | | | 6.16 | % | | | 5.60 | % | | | 5.00 | %(f) |
| Ratio of expenses including waivers to average net assets | | | 5.22 | % | | | 4.87 | % | | | 2.20 | %(f) |
| Ratio of expenses excluding interest expense to average net assets | | | 3.27 | %(g) | | | 3.35 | %(g) | | | 2.20 | %(f) |
| Ratio of net investment income including waivers to average net assets | | | 10.03 | % | | | 6.57 | % | | | (2.20 | %)(f) |
| Portfolio turnover rate | | | 94 | % | | | 119 | % | | | 0 | % |
| | | | | | | | | | | | | |
| LEVERAGE FACILITY: | | | | | | | | | | | | |
| Aggregate principal amount, end of period (000s) | | $ | 38,965 | | | $ | 38,865 | | | $ | N/A | |
| Asset coverage, end of period per $1,000 | | $ | 3,020 | | | $ | 3,041 | | | $ | N/A | |
| (a) | After deduction of offering expenses charged to capital. |
| (b) | Calculated using average common shares outstanding. |
| (c) | Less than $0.005 or greater than $(0.005) per share. |
| (d) | The per share amounts of distributions related to net investment income and tax return of capital are based on amounts determined under U.S. federal income tax regulations which differs from the per share amounts from investment operations which are based on amounts determined under U.S. GAAP. |
| (e) | Total investment return is calculated assuming a purchase of a common share at the opening on the first day and a sale at closing on the last day of each period reported. Dividends and distributions are assumed for purposes of this calculation to be reinvested at prices obtained under the Trust's dividend reinvestment plan. Total investment returns do not reflect brokerage commissions, if any, and are not annualized. |
| (g) | Includes amortization of deferred leverage costs. |
See Notes to Financial Statements.
| Annual Report | September 30, 2019 | 21 |
| XAI Octagon Floating Rate & | |
| Alternative Income Term Trust | Notes to Financial Statements |
September 30, 2019
1. ORGANIZATION
XAI Octagon Floating Rate & Alternative Income Term Trust (the “Trust”) is a diversified, closed-end management investment company registered under the Investment Company Act of 1940, as amended (the “1940 Act”). The Trust commenced operations on September 27, 2017.
The Trust seeks to achieve its investment objective by investing in a dynamically managed portfolio of opportunities primarily within the private credit markets. Under normal market conditions, the Trust will invest at least 80% of its Managed Assets in floating rate credit instruments and other structured credit investments. “Managed Assets” means the total assets of the Trust, including assets attributable to the Trust’s use of leverage, minus the sum of its accrued liabilities (other than liabilities incurred for the purpose of creating leverage).
2. SIGNIFICANT ACCOUNTING POLICIES
Use of Estimates: The preparation of the financial statements in accordance with accounting principles generally accepted in the United States of America (“U.S. GAAP”) requires management to make estimates and assumptions that affect the reported amounts and disclosures in the financial statements during the period reported. Management believes the estimates and security valuations are appropriate; however, actual results may differ from those estimates, and the security valuations reflected in the financial statements may differ from the value the Trust ultimately realizes upon sale of the securities. The Trust is considered an investment company under U.S. GAAP and follows the accounting and reporting guidance applicable to investment companies in the Financial Accounting Standards Board (“FASB”)Accounting Standards Codification (“ASC”) Topic 946. The financial statements have been prepared as of the close of the New York Stock Exchange (“NYSE”) on September 30, 2019.
Expense Recognition: Expenses are recorded on the accrual basis of accounting.
Portfolio Valuation: The net asset value per common share of the Trust is determined daily, on each day that the NYSE is open for trading, as of the close of regular trading on the NYSE (normally 4:00 p.m. Eastern Time). The Trust’s net asset value per common share is calculated by dividing the value of the Trust’s total assets, less its liabilities by the number of shares outstanding.
Cash & Cash Equivalents: The Trust considers its investment in an FDIC insured interest bearing account to be cash. Cash and cash equivalents are valued at cost plus any accrued interest. The Trust maintains cash balances, which at times may exceed federally insured limits. The Trust maintains these balances with a high quality financial institution.
Securities Transactions and Investment Income: Investment security transactions are accounted for on a trade date basis. Dividend income is recorded on the ex-dividend date. Realized gains and losses from securities transactions and unrealized appreciation and depreciation of securities are determined using the identified cost basis method for financial reporting purposes.
Interest income from investments is recorded using the accrual basis of accounting to the extent such amounts are expected to be collected. Amortization of premium or accretion of discount is recognized using the effective interest method. Collateralized loan obligation (“CLO”) equity investments recognize investment income on the accrual basis utilizing an effective interest methodology based upon an effective yield to maturity utilizing projected cash flows. ASC Topic 325-40, Beneficial Interests in Securitized Financial Assets, requires investment income from CLO equity investments and fee rebates to be recognized under the effective interest method, with any difference between the cash distribution and the amount calculated pursuant to the effective interest method being recorded as an adjustment to the cost basis of the investment. There were no fee rebates for CLO equity investments held by the Trust as of September 30, 2019.
Effective yields for the Trust’s CLO equity positions are monitored and evaluated on a quarterly basis. The Trust also updates a CLO equity investment’s effective yield in each instance where there is a respective add-on purchase, refinancing or reset involving the CLO equity investment held. The effective yield will be set to 0.00% if: (1) the aggregate projected amount of future recurring distributions is less than the amortized investment cost, and/or (2) there is significant uncertainty with respect to the timing of future residual distributions. The future distributions for CLO equity positions with a 0.00% effective yield will be recognized solely as return of cost basis until the aggregate projected amount of future recurring distributions exceeds the amortized investment cost.
Fair Value Measurements: The Trust discloses the classification of its fair value measurements following a three-tier hierarchy based on the inputs used to measure fair value. Inputs refer broadly to the assumptions that market participants would use in pricing the asset or liability, including assumptions about risk. Inputs may be observable or unobservable. Observable inputs reflect the assumptions market participants would use in pricing the asset or liability that are developed based on market data obtained from sources independent of the reporting entity. Unobservable inputs reflect the reporting entity’s own assumptions about the assumptions market participants would use in pricing the asset or liability that are developed based on the best information available.
| XAI Octagon Floating Rate & | |
| Alternative Income Term Trust | Notes to Financial Statements |
September 30, 2019
Various inputs are used in determining the value of the Trust’s investments as of the end of the reporting period. When inputs used fall into different levels of the fair value hierarchy, the level in the hierarchy within which the fair value measurement falls is determined based on the lowest level input that is significant to the fair value measurement in its entirety. The designated input levels are not necessarily an indication of the risk or liquidity associated with these investments.
These inputs are categorized in the following hierarchy under applicable financial accounting standards:
| | Level 1 — | Unadjusted quoted prices in active markets for identical investments, unrestricted assets or liabilities that the Trust has the ability to access at the measurement date; |
| | | |
| | Level 2 — | Quoted prices which are not active, quoted prices for similar assets or liabilities in active markets or inputs other than quoted prices that are observable (either directly or indirectly) for substantially the full term of the asset or liability; and |
| | | |
| | Level 3 — | Significant unobservable prices or inputs (including the Trust’s own assumptions in determining the fair value of investments) where there is little or no market activity for the asset or liability at the measurement date. |
The following is a summary of the inputs used to value the Trust’s investments as of September 30, 2019:
| Investments in Securities at Value* | | Level 1 - Quoted Prices | | | Level 2 - Significant Observable Inputs | | | Level 3 - Significant Unobservable Inputs | | | Total | |
| Corporate Bonds | | $ | – | | | $ | 174,375 | | | $ | – | | | $ | 174,375 | |
| Secured Second Lien Loans | | | – | | | | 7,999,019 | | | | – | | | | 7,999,019 | |
| Senior Secured First Lien Loans | | | – | | | | 51,888,851 | | | | – | | | | 51,888,851 | |
| CLO Debt | | | – | | | | – | | | | 17,302,570 | | | | 17,302,570 | |
| CLO Equity | | | – | | | | – | | | | 39,666,744 | | | | 39,666,744 | |
| Money Market Mutual Funds | | | 6,377,104 | | | | – | | | | – | | | | 6,377,104 | |
| Total | | $ | 6,377,104 | | | $ | 60,062,245 | | | $ | 56,969,314 | | | $ | 123,408,663 | |
| * | For detailed descriptions, see the accompanying Schedule of Investments. |
The changes of the fair value of investments for which the Trust has used Level 3 inputs to determine the fair value are as follows:
| | | CLO Debt | | | CLO Equity | | | Total | |
| Balance as of September 30, 2018 | | $ | 17,845,594 | | | $ | 40,780,021 | | | $ | 58,625,615 | |
| Accrued Discount/Premium | | | 5,811 | | | | – | | | | 5,811 | |
| Reductions to CLO Equity Cost Basis(a) | | | – | | | | (1,936,687 | ) | | | (1,936,687 | ) |
| Realized Gain/(Loss) | | | (182,490 | ) | | | (2,655,118 | ) | | | (2,837,608 | ) |
| Change in Unrealized Appreciation/(Depreciation) | | | (1,488,595 | ) | | | (4,042,316 | ) | | | (5,530,911 | ) |
| Purchases | | | 2,952,250 | | | | 26,424,676 | | | | 29,376,926 | |
| Sales Proceeds | | | (1,830,000 | ) | | | (18,903,832 | ) | | | (20,733,832 | ) |
| Transfer into Level 3 | | | – | | | | – | | | | – | |
| Transfer out of Level 3 | | | – | | | | – | | | | – | |
| Balance as of September 30, 2019 | | $ | 17,302,570 | | | $ | 39,666,744 | | | $ | 56,969,314 | |
| Net change in unrealized appreciation/(depreciation) included in the Statements of Operations attributable to Level 3 investments held at September 30, 2019 | | $ | (1,498,878 | ) | | $ | (5,145,587 | ) | | $ | (6,644,465 | ) |
| (a) | Reduction to cost value on CLO equity investments represents the difference between distributions received, or entitled to be received, and income earned for the year ended September 30, 2019. |
The following table summarizes the quantitative inputs and assumptions used for investments categorized in Level 3 of the fair value hierarchy as of the end of the reporting period. In addition to the techniques and inputs noted in the table below, according to the Trust's valuation policy, the Trust may use other valuation techniques and methodologies when determining the Trust's fair value measurements as provided for in the valuation policy and approved by the Board. The table below is not intended to be all-inclusive, but rather provides information on the significant Level 3 inputs as they relate to the fair value measurements as of the end of the reporting period.
| Annual Report | September 30, 2019 | 23 |
| XAI Octagon Floating Rate & | |
| Alternative Income Term Trust | Notes to Financial Statements |
September 30, 2019
| | | Quantitative Information about Level 3 Value Measurements |
| Assets | | Value as of September 30, 2019 | | | Valuation Methodologies | | Unobservable Input | | Range/Weighted Average(2) |
| CLO Debt | | | 17,302,570 | | | NBIB(1) | | NBIB(1) | | 81.39 – 98.65 / 91.07 |
| CLO Equity | | | 39,666,744 | | | NBIB(1) | | NBIB(1) | | 0.58 – 88.40 / 57.84 |
| Total Level 3 assets | | | 56,969,314 | | | | | | | |
| (1) | The Trust generally uses non-binding indicative bid ("NBIB") prices provided by an independent pricing service or broker on or near the valuation date as the primary basis for the fair value determination for CLO debt and CLO equity investments, which may be adjusted for pending equity distributions as of the valuation date. These bid prices are non-binding, and may not be determinative of an actual transaction price. In valuing the Trust’s investments in CLO debt and CLO equity, in addition to NBIB prices provided by an independent pricing service or broker, the Trust also may consider a variety of relevant factors as set forth in the Trust’s valuation policy, including recent trading prices for specific investments, recent purchases and sales known to the Trust in similar securities, other information known to the Trust relating to the securities, and discounted cash flows based on output from a third-party financial model, using projected future cash flows. |
| (2) | Weighted averages are calculated based on the value of investments on September 30, 2019. |
Significant increases or decreases in any of the unobservable inputs in isolation may result in a significantly lower or higher fair value measurement.
Indemnification: The Trust indemnifies its Officers and Trustees for certain liabilities that may arise from the performance of their duties to the Trust. Additionally, in the normal course of business, the Trust enters into contracts that contain a variety of representations and warranties and which provide general indemnities. The Trust’s maximum exposure under these arrangements is unknown, as this would involve future claims that may be made against the Trust that have not yet occurred. However, based on industry experience, the Trust expects the risk of loss due to these warranties and indemnities to be remote.
3. INVESTMENT ADVISORY AND OTHER AGREEMENTS
XA Investments LLC (“XAI” or the “Adviser”) serves as the investment adviser to the Trust and is responsible for overseeing the Trust’s overall investment strategy and its implementation. Octagon Credit Investors, LLC (“Octagon” or the “Sub-Adviser”) serves as the investment sub-adviser of the Trust and is responsible for investing the Trust’s assets. The Trust pays an advisory fee to the Adviser. The Adviser pays to the Sub-Adviser a sub-advisory fee out of the advisory fee received by the Adviser.
Pursuant to an investment advisory agreement between the Trust and the Adviser, the Trust pays the Adviser a fee, payable monthly in arrears, in an annual amount equal to 1.70% of the Trust’s average daily Managed Assets. “Managed Assets” means the total assets of the Trust, including assets attributable to the Trust’s use of leverage, minus the sum of its accrued liabilities (other than liabilities incurred for the purpose of creating leverage). For the year ended September 30, 2019, the Trust incurred $1,931,774 in advisory fees.
The sub-advisory fee, payable monthly in arrears to the Sub-Adviser, is calculated as a specified percentage of the advisory fee payable by the Trust to the Adviser (before giving effect to any fees waived or expenses reimbursed by the Adviser). The specified percentage is equal to the blended percentage computed by applying the following percentages to the aggregate average daily Managed Assets of all registered investment companies in the XAI fund complex for which the Sub-Adviser (or an affiliate of the Sub-Adviser) serves as investment sub-adviser, including the Trust (“Eligible Funds”):
| Aggregate Eligible Funds Average Daily Managed Assets | Percentage of Advisory Fee |
| First $500 million | 60% |
| Over $500 million | 50% |
As of September 30, 2019, the Trust was the only Eligible Fund and the sub-advisory fee equals 60% of the advisory fee payable to the Adviser.
The Trust pays all costs and expenses of its operations in addition to the advisory fee and investor support services and secondary market support services fee paid to the adviser. For the period from September 27, 2017 to September 27, 2019, the Adviser and the Trust entered into a fee waiver agreement. The fee waiver agreement expired on September 27, 2019. Under the fee waiver agreement, the Adviser had contractually agreed to waive a portion of the advisory fee and/or reimburse the Trust for certain operating expenses so that the annual expenses of the Trust did not exceed 0.30% of the Trust’s Managed Assets (exclusive of investment advisory fees, investor support and secondary market services fees, taxes, expenses incurred directly or indirectly by the Trust as a result of an investment in a permitted investment (including, without limitation, acquired fund fees and expenses), expenses associated with the acquisition or disposition of portfolio investments (including, without limitation, brokerage commissions and other trading or transaction expenses), leverage expenses (including, without limitation, costs associated with the issuance or incurrence of leverage, commitment fees, interest expense or dividends on preferred shares), expenses incurred in connection with issuances and sales of shares of the Trust (including, without limitation, fees, commissions and offering costs), dividends on short sales, if any, securities lending costs, if any, expenses of holding and soliciting proxies for meetings of shareholders of the Trust (except to the extent relating to routine items such as the election of trustees), expenses of a reorganization, restructuring, reconciling or merger of the Trust or the acquisition of all or substantially all of the assets of another fund, or any extraordinary expenses not incurred in the ordinary course of the Trust’s business (including, without limitation, expenses related to litigation, derivative actions, demands related to litigation, regulatory or other government investigations and proceeding)). The Adviser may recoup waived or reimbursed amounts for three years following the date of such waiver or reimbursement, provided total expenses, including such recoupment, do not exceed the lesser of the annual expense limit at the time such expenses were waived or reimbursed or the annual expense limit at the time of recoupment. For the year ended September 30, 2019, the fee waivers and/or reimbursements were $718,370.
| XAI Octagon Floating Rate & | |
| Alternative Income Term Trust | Notes to Financial Statements |
September 30, 2019
As of September 30, 2019, the following amounts were available for recoupment by the Adviser based upon the following expiration dates:
| | | Expires 2020 | | | Expires 2021 | | | Expires 2022 | |
| | $ | 21,797 | | | $ | 580,682 | | | $ | 718,370 | |
The Trust has also retained the Adviser to provide investor support services and secondary market support services in connection with the ongoing operation of the Trust. Such services include providing ongoing contact with respect to the Trust with financial intermediaries, communicating with the NYSE specialist for the shares and with the closed-end fund analyst community regarding the Trust on a regular basis, and hosting and maintaining a website for the Trust. The Trust pays the Adviser a service fee, payable monthly in arrears, in an annual amount equal to 0.20% of the Trust’s average daily Managed Assets.
ALPS Fund Services, Inc. (“ALPS”) serves as the Trust’s administrator and accounting agent and receives customary fees from the Trust for such services.
ALPS provides services that assist the Trust’s chief compliance officer in monitoring and testing the policies and procedures of the Trust in conjunction with requirements under Rule 38a-1 under the 1940 Act and receives an annual base fee. ALPS is reimbursed for certain out-of-pocket expenses by the Trust. Compliance service fees paid by the Trust for the year ended September 30, 2019 are disclosed in the Statement of Operations.
DST Systems Inc., an affiliate of ALPS, serves as transfer, dividend paying and shareholder servicing agent for the Trust. U.S. Bank N.A. serves as the Trust’s custodian.
4. DISTRIBUTIONS
The Trust intends to pay substantially all of its net investment income, if any, to common shareholders through monthly distributions. The Trust intends to distribute any net long-term capital gains to common shareholders at least annually. The Trust expects to declare distributions monthly. To permit the Trust to maintain more stable monthly distributions, the Trust may distribute more or less than the amount of the net income earned in a particular period. There is no assurance the Trust will continue to pay regular monthly distributions or that it will do so at a particular rate. Distributions may be paid by the Trust from any permitted source and, from time to time, all or a portion of a distribution may be a return of capital. Shareholders should not assume that the source of the distribution from the Trust is net income or profit.
On September 4, 2018, and during each of the seven months following, the Trust declared separate monthly distributions of $0.069 per common share, payable on each of October 1, 2018, November 1, 2018, December 3, 2018, December 31, 2018, February 1, 2019, March 1, 2019, April 1, 2019 and May 1, 2019. On May 1, 2019, the Trust declared separate monthly distributions of $0.073 per common share, payable on June 3, 2019, July 1, 2019, August 1, 2019, September 3, 2019, and October 1, 2019. For the twelve months ended September 30, 2019, the Trust declared distributions of $0.85 per common share, or $7,327,419 in the aggregate.
| Annual Report | September 30, 2019 | 25 |
| XAI Octagon Floating Rate & | |
| Alternative Income Term Trust | Notes to Financial Statements |
September 30, 2019
The characterization of distributions paid to common shareholders reflect estimates made by the Trust for U.S. GAAP purposes. Such estimates are subject to be characterized differently for federal income tax purposes at year-end.
5. CAPITAL TRANSACTIONS
Pursuant to the Trust’s Agreement and Declaration of Trust, the Trust is authorized to issue an unlimited number of common shares of beneficial interest, par value $0.01 per share (“Common Shares”).
| | | For the Year Ended September 30, 2019 | | | For the Year Ended September 30, 2018 | |
| Common Shares outstanding - beginning of period | | | 8,348,918 | | | | 7,260,205 | |
| Common Shares issued pursuant to exercise of the over-allotment option in connection with initial public offering | | | – | | | | 1,087,500 | |
| Common Shares issued in connection with the at-the-market offering | | | 1,221,261 | | | | – | |
| Common Shares issued as reinvestment of dividends | | | 4,358 | | | | 1,213 | |
| Common shares outstanding - end of period | | | 9,574,537 | | | | 8,348,918 | |
The Board is authorized to classify and reclassify any unissued shares into other classes or series of shares and authorize the issuance of shares without obtaining stockholder approval.
On October 1, 2018, the Trust filed with the SEC a shelf registration statement on Form N-2 allowing for delayed or continuous offering of up to $100,000,000 aggregate initial offering price of Common Shares. The shelf registration statement was declared effective on March 12, 2019.
On March 28, 2019, the Trust entered into a Distribution Agreement with Foreside Fund Services, LLC (the “Distributor”), pursuant to which the Trust may offer and sell up to 2,250,000 Common Shares, from time to time, through the Distributor, in transactions that are deemed to be “at-the-market” as defined in Rule 415 under the Securities Act of 1933. The minimum price on any day at which Common Shares may be sold will not be less than the then current NAV per Common Share plus any commissions to be paid to the Distributor. For the year ended September 30, 2019, the Trust issued 1,221,261 Common Shares pursuant to the at-the-market program.
The Trust paid $203,731 in offering costs during the year relating to the at-the-market program; offering costs are charged to paid-in capital upon the issuance of shares. For the year ended September 30, 2019, the Trust deducted $66,707 of offering costs from paid-in capital. The Statement of Assets and Liabilities as of September 30, 2019 reflects $137,024 of deferred offering costs outstanding.
6. LEVERAGE
The Trust uses leverage to seek to enhance total return and income. The Trust may use leverage through (i) the issuance of senior securities representing indebtedness, including through borrowing from financial institutions or issuance of debt securities, including notes or commercial paper (collectively, “Indebtedness”), (ii) the issuance of preferred shares (“Preferred Shares”) and/or (iii) reverse repurchase agreements, securities lending, short sales or derivatives, such as swaps, futures or forward contracts, that have the effect of leverage (“portfolio leverage”). The Trust currently intends to use leverage through Indebtedness and may use Indebtedness to the maximum extent permitted under the 1940 Act. Under the 1940 Act, the Trust may utilize Indebtedness up to 33 1/3% of its Managed Assets (specifically, the Trust may not incur Indebtedness if, immediately after incurring such Indebtedness, the Trust would have asset coverage (as defined in the 1940 Act) of less than 300%). The Trust will not utilize leverage, either through Indebtedness, Preferred Shares or portfolio leverage, in an aggregate amount in excess of 40% of the Trust’s Managed Assets (including the proceeds of leverage).
On October 6, 2017, the Trust entered into a Credit Agreement (the “Credit Agreement”) with Société Générale (the “Lender”) that established a revolving credit facility (the “Facility”) of up to $40,000,000, with a maturity date of October 6, 2019. On September 20, 2018, the Trust entered into an amendment to its Credit Agreement pursuant to which interest on amount borrowed is based on one-month LIBOR plus 1.20%. On July 29, 2019, the Trust entered into an amendment to its Credit Agreement to increase the commitment under the Facility to $45,000,000. On October 4, 2019, the Trust entered into an amendment to the Credit Agreement to extend the Facility’s maturity date until October 6, 2021, subject to certain reciprocal termination rights; to reduce interest on amounts borrowed to be based on one-month LIBOR plus 1.10%; and to make certain other revisions. The Trust’s borrowings are secured by eligible securities held in its portfolio of investments. The Credit Agreement includes usual and customary covenants. Among other things, these covenants place limitations or restrictions on the Trust’s ability to (i) incur other indebtedness, (ii) change certain investment policies, or (iii) pledge or create liens upon the assets of the Trust. In addition, the Trust is required to deliver financial information to the Lender, maintain an asset coverage ratio of not less than 300% and maintain its registration as a closed-end management investment company.
| XAI Octagon Floating Rate & | |
| Alternative Income Term Trust | Notes to Financial Statements |
September 30, 2019
For the year ended September 30, 2019, the average amount borrowed under the Credit Agreement and the average interest rate for the amount borrowed was $37,065,137 and 3.61%, respectively. As of September 30, 2019, the amount of such outstanding borrowings was $38,965,000. The interest rate applicable to the borrowings on September 30, 2019 was 3.32%. All securities held as of September 30, 2019 are pledged as collateral for the leverage facility.
The use of leverage is a speculative technique that involves special risks. There can be no assurance that the Adviser’s and the Sub-Adviser’s expectations will be realized or that a leveraging strategy will be successful in any particular time period. Use of leverage creates an opportunity for increased income and capital appreciation but, at the same time, creates special risks. Leverage exposes the Trust to greater risk and increased costs than if it were not implemented. The more leverage that is utilized by the Trust, the more exposed the Trust will be to the risks of leverage. The use of leverage by the Trust causes the net asset value of the common shares to fluctuate significantly in response to changes in interest rates and other economic indicators. As a result, the net asset value, market price and dividend rate of the common shares is likely to be more volatile than those of a fund that is not exposed to leverage. Leverage increases operating costs, which may reduce total return. The Trust pays interest on its borrowings, which may reduce the Trust’s return. Increases in interest rates that the Trust must pay on its borrowings will increase the cost of leverage and may reduce the return to common shareholders. The risk of increases in interest rates may be greater in the current market environment. During the time in which the Trust is utilizing leverage, the amount of the investment advisory fee paid by the Trust will be higher than if the Trust did not utilize leverage because the fees paid will be calculated based on the Trust’s Managed Assets (including proceeds of leverage). Common shareholders bear the portion of the management fee attributable to assets purchased with the proceeds of leverage, which means that common shareholders effectively bear the entire management fee.
7. PORTFOLIO INFORMATION
Purchase and Sales of Securities:For the year ended September 30, 2019, the cost of purchases and proceeds from sales of securities, excluding short-term obligations were as follows:
| Cost of Investments Purchased | | $ | 118,194,858 | |
| Proceeds from Investments Sold | | $ | 106,254,501 | |
8. UNFUNDED COMMITMENTS
The Trust may enter into certain credit agreements, all or a portion of which may be unfunded. The Trust is obligated to fund these loan commitments at the borrowers’ discretion. Unfunded loan commitments and funded portions of credit agreements are marked-to-market daily. Net unrealized appreciation/depreciation on unfunded commitments is reflected in other assets and payable for investment securities purchased in the Statements of Assets and Liabilities and unrealized appreciation (depreciation) on investments in the Statements of Operations. At September 30, 2019, the Trust had an unfunded commitment with the following securities:
| Allied Universal Holdco LLC | | $ | 78,762 | |
| BCPE Empire Holdings, Inc. | | | 83,257 | |
| Bulldog Purchaser, Inc. | | | 6,182 | |
| United PF Holdings LLC | | | 45,426 | |
| | | $ | 213,627 | |
9. TAXES
Classification of Distributions: Because U.S. federal income tax regulations differ from U.S. GAAP, net investment income and net realized gains may differ for financial statement and tax purposes. The “tax return of capital” referenced in the Trust’s Statement of Changes in Net Assets and Financial Highlights is based on the characterization under tax regulations. Temporary differences arise when certain items of income, expense, gain or loss are recognized at some time in the future. For the Trust, these differences are due to temporary book/tax differences arising primarily from the income recognition deferral for distributions received from certain CLO equity positions that qualify as passive foreign investment companies. Also, due to the timing of dividend distributions, the fiscal year in which the amounts are distributed for tax purposes may differ from the fiscal year in which the income or realized gain was recorded by the Trust.
| Annual Report | September 30, 2019 | 27 |
| XAI Octagon Floating Rate & | |
| Alternative Income Term Trust | Notes to Financial Statements |
September 30, 2019
The tax character of distributions paid by the Trust during the year ended September 30, 2019, was as follows:
| 2019 | | | |
| Distributions Paid From: | | | | |
| Ordinary income | | $ | 6,528,025 | |
| Long-term capital gain | | | – | |
| Return of capital | | | 682,271 | |
| Total | | $ | 7,210,296 | |
The tax character of distributions paid by the Trust during the year ended September 30, 2018, was as follows:
| 2018 | | | |
| Distributions Paid From: | | | | |
| Ordinary income | | $ | 3,195,302 | |
| Long-term capital gain | | | 13,818 | |
| Return of capital | | | 2,551,001 | |
| Total | | $ | 5,760,121 | |
Reclassifications, which are determined in accordance with federal income tax regulations, result primarily from the differing book and tax treatment of premium amortization on callable bonds.
| | | Paid-in capital | | | Distributable Earnings | |
| | $ | 4,019 | | | $ | (4,019 | ) |
At September 30, 2019, the components of distributable earnings on a tax basis for the Trust were as follows:
| Undistributed ordinary income | | $ | – | |
| Accumulated capital losses | | | (3,005,565 | ) |
| Unrealized depreciation | | | (7,174,570 | ) |
| Other cumulative effect of timing differences | | | (693,198 | ) |
| Total | | $ | (10,873,333 | ) |
Tax Basis of Investments: Net unrealized appreciation/(depreciation) of investments based on federal tax cost as of September 30, 2019, was as follows:
| | | | |
| Cost of investments for income tax purposes | | $ | 130,583,233 | |
| Gross appreciation (excess of value over tax cost) | | $ | 3,779,473 | |
| Gross depreciation (excess of tax cost over value) | | | (10,954,043 | ) |
| Net unrealized depreciation | | $ | (7,174,570 | ) |
The Trust elects to treat post-October capital losses of $3,005,565 as having been incurred in the following fiscal year ending September 30, 2020.
Federal Income Tax Status:For federal income tax purposes, the Trust currently qualifies, and intends to remain qualified, as a regulated investment company under the provisions of Subchapter M of the Internal Revenue Code of 1986, as amended, by distributing substantially all of its investment company taxable net income and realized gain, not offset by capital loss carryforwards, if any, to its shareholders. No provision for federal income taxes has been made.
| XAI Octagon Floating Rate & | |
| Alternative Income Term Trust | Notes to Financial Statements |
September 30, 2019
As of and during the year ended September 30, 2019, the Trust did not have a liability for any unrecognized tax benefits. The Trust files U.S. federal, state, and local tax returns as required. The Trust’s tax returns are subject to examination by the relevant tax authorities until expiration of the applicable statute of limitations which is generally three years after the filing of the tax return.
10. RISK FACTORS
In the normal course of business, the Trust invests in financial instruments and enters into financial transactions where risk of potential loss exists due to such things as changes in the market (market risk) or failure or inability of the other party to a transaction to perform (credit and counterparty risk). See below for a detailed description of select principal risks. The following list is not intended to be a comprehensive listing of all of the potential risks associated with the Trust. The Trust’s prospectus provides a detailed discussion of the Trust’s risks and considerations.
CLO Risk: In addition to the general risks associated with debt securities and structured products discussed herein, CLOs carry additional risks, including, but not limited to (i) the possibility that distributions from collateral securities will not be adequate to make interest or other payments; (ii) the quality of the collateral may decline in value or default; (iii) the possibility that the investments in CLOs are subordinate to other classes or tranches thereof; and (iv) the complex structure of the security may not be fully understood at the time of investment and may produce disputes with the issuer or unexpected investment results. In addition, at the time of issuance, the CLO may not be fully invested. Until the CLO is fully invested, the debt service of the CLO may exceed the amount of interest earned from the CLO’s portfolio. Though not exclusively, the Trust will typically be in a first loss or subordinated position with respect to realized losses on the assets of the CLOs in which it is invested. The Trust may recognize phantom taxable income from its investments in the subordinated tranches of CLOs and structured notes.
Between the closing date and the effective date of a CLO, the CLO collateral manager will generally expect to purchase additional collateral obligations for the CLO. During this period, the price and availability of these collateral obligations may be adversely affected by a number of market factors, including price volatility and availability of investments suitable for the CLO, which could hamper the ability of the collateral manager to acquire a portfolio of collateral obligations that will satisfy specified concentration limitations and allow the CLO to reach the initial par amount of collateral prior to the effective date. An inability or delay in reaching the target initial par amount of collateral may adversely affect the timing and amount of interest or principal payments received by the holders of the CLO debt securities and distributions of the CLO on equity securities and could result in early redemptions which may cause CLO debt and equity investors to receive less than the cost of their investment.
The failure by a CLO in which the Trust invests to satisfy financial covenants, including with respect to adequate collateralization and/or interest coverage tests, could lead to a reduction in the CLO’s payments to the Trust. In the event that a CLO fails certain tests, holders of CLO senior debt may be entitled to accelerated payments that would, in turn, reduce the payments the Trust would otherwise be entitled to receive as described below. Separately, the Trust may incur expenses to the extent necessary to seek recovery upon default or to negotiate new terms, which may include the waiver of certain financial covenants, with a defaulting CLO or any other investment the Trust may make. If any of these occur, it could adversely affect the Trust’s operating results and cash flows.
The Trust’s CLO investments are exposed to leveraged credit risk. If certain minimum collateral value ratios and/or interest coverage ratios are not met by a CLO, primarily due to senior secured loan defaults, then cash flow that otherwise would have been available to pay distributions to the Trust on its CLO investments may instead be used to redeem any senior notes or to purchase additional senior secured loans, until the ratios again exceed the minimum required levels or any senior notes are repaid in full. The Trust’s CLO investments and/or the underlying senior secured loans may prepay more quickly than expected, which could have an adverse impact on the Trust’s net assets.
Concentration of Credit Risk: The Trust places its cash with a banking institution, which is insured by Federal Deposit Insurance Corporation (FDIC). The FDIC limit is $250,000. At various times throughout the year, the amount on deposit may exceed the FDIC limit and subject the Trust to a credit risk. The Trust does not believe that such deposits are subject to any unusual risk associated with investment activities.
Debt Securities Risk: When the Trust invests in debt securities, the value of an investment in the Trust will fluctuate with changes in interest rates. Typically, a rise in interest rates causes a decline in the value of debt securities. In general, the market price of debt securities with longer maturities will increase or decrease more in response to changes in interest rates than shorter-term securities. Other risk factors include credit risk (the debtor may default) and prepayment risk (the debtor may pay its obligation early, reducing the amount of interest payments). These risks could affect the value of a particular investment, possibly causing the Trust’s share price and total return to be reduced and fluctuate more than other types of investments.
LIBOR Risk: Instruments in which the Trust invests may pay interest at floating rates based on LIBOR or may be subject to interest caps or floors based on LIBOR. The Trust and issuers of instruments in which the Trust invests may also obtain financing at floating rates based on LIBOR. Derivative instruments utilized by the Trust and/or issuers of instruments in which the Trust may invest may also reference LIBOR. The Trust utilizes leverage or borrowings primarily based on LIBOR. In July 2017, the head of the United Kingdom Financial Conduct Authority announced the desire to phase out the use of LIBOR by the end of 2021. There is currently no definitive information regarding the future utilization of LIBOR or of any particular replacement rate. Abandonment of or modifications to LIBOR could have adverse impacts on newly-issued financial instruments and existing financial instruments which reference LIBOR. Abandonment of or modifications to LIBOR could lead to significant short-term and long-term uncertainty and market instability. It remains uncertain how such changes would be implemented and the effects such changes would have on the Trust, issuers of instruments in which the Trust invests and financial markets generally.
| Annual Report | September 30, 2019 | 29 |
| XAI Octagon Floating Rate & | |
| Alternative Income Term Trust | Notes to Financial Statements |
September 30, 2019
Loan Participations and Assignments: The Trust may invest in loans arranged through private negotiation between one or more financial institutions. The Trust’s investment in any such loan may be in the form of a participation in or an assignment of the loan. In connection with purchasing participations, the Trust generally will have no right to enforce compliance by the borrower with the terms of the loan agreement relating to the loan, nor any rights of set-off against the borrower and the Trust may not benefit directly from any collateral supporting the loan in which they have purchased the participation.
While some loans are collateralized and senior to an issuer’s other debt securities, other loans may be unsecured and/or subordinated to other securities. Some loans may be considered illiquid, and are generally less liquid than exchange-traded debt instruments.
Secured Loan Risk: Secured loans hold the most senior position in the capital structure of a borrower. Secured loans in most circumstances are fully collateralized by assets of the borrower. Thus, secured loans are generally repaid before unsecured bank loans, corporate bonds, subordinated debt, trade creditors, and preferred or common stockholders. Substantial increases in interest rates may cause an increase in loan defaults as borrowers may lack resources to meet higher debt service requirements. The value of the Trust’s assets may also be affected by other uncertainties such as economic developments affecting the market for senior secured term loans or affecting borrowers generally. Moreover, the security for the Trust’s investments in secured loans may not be recognized for a variety of reasons, including the failure to make required filings by lenders, trustees or other responsible parties and, as a result, the Trust may not have priority over other creditors as anticipated.
Secured loans may include restrictive covenants, which must be maintained by the borrower. The Trust may have an obligation with respect to certain senior secured term loan investments to make additional loans upon demand by the borrower. In general, loans unlike certain bonds, usually do not have call protection. This means that such interests, while having a stated term, may be prepaid, often without penalty. The rate of such prepayments may be affected by, among other things, general business and economic conditions, as well as the financial status of the borrower. Prepayment would cause the actual duration of a senior loan to be shorter than its stated maturity.
Secured loans typically will be secured by pledges of collateral from the borrower in the form of tangible and intangible assets. In some instances, the Trust may invest in secured debt that is secured only by stock of the borrower or its subsidiaries or affiliates. The value of the collateral may decline below the principal amount of the senior secured term loans subsequent to an investment by the Trust.
Structured Products Risk: The Trust may invest in CLOs and other structured products. Holders of structured products bear risks of the underlying investments, index or reference obligation and are subject to counterparty risk.
The Trust may have the right to receive payments only from the structured product, and generally does not have direct rights against the issuer or the entity that sold the assets to be securitized. While certain structured products enable the investor to acquire interests in a pool of securities without the brokerage and other expenses associated with directly holding the same securities, investors in structured products generally pay their share of the structured product’s administrative and other expenses. Although it is difficult to predict whether the prices of indices and securities underlying structured products will rise or fall, these prices (and, therefore, the prices of structured products) will be influenced by the same types of political and economic events that affect issuers of securities and capital markets generally. If the issuer of a structured product uses shorter term financing to purchase longer term securities, the issuer may be forced to sell its securities at below market prices if it experiences difficulty in obtaining short-term financing, which may adversely affect the value of the structured products owned by the Trust.
Certain structured products may be thinly traded or have a limited trading market. CLOs and credit-linked notes are typically privately offered and sold.
Subordinated and Unsecured or Partially Secured Loans Risk: The Trust may invest in unsecured loans and secured subordinated loans, including second and lower lien loans. Second lien loans are generally second in line in terms of repayment priority. A second lien loan may have a claim on the same collateral pool as the first lien or it may be secured by a separate set of assets. Second lien loans generally give investors priority over general unsecured creditors in the event of an asset sale. The priority of the collateral claims of third or lower lien loans ranks below holders of second lien loans and so on. Such junior loans are subject to the same general risks inherent to any loan investment, including credit risk, market and liquidity risk, and interest rate risk. Due to their lower place in the borrower’s capital structure and possible unsecured or partially secured status, such loans involve a higher degree of overall risk than senior loans of the same borrower.
| XAI Octagon Floating Rate & | |
| Alternative Income Term Trust | Notes to Financial Statements |
September 30, 2019
11. RECENT ACCOUNTING PRONOUNCEMENTS
In August 2018, the Financial Accounting Standards Board (“FASB”) issued Accounting Standards Update (“ASU”) 2018-13, Fair Value Measurement (Topic 820): Disclosure Framework – changes to the Disclosure Requirements for Fair Value Measurements, which amended guidance on the disclosure requirements for fair value measurement. The update to Topic 820 includes added, eliminated, and modified disclosure requirements for investments measured at fair value. ASU 2018-13 is effective for fiscal years beginning after December 15, 2019, including interim periods. Early adoption is permitted for any eliminated or modified disclosures. The impact of the amended guidance on the Fund was the removal of the requirements to disclose (a) amounts of and reasons for transfers between Level 1 and 2 fair value measurements, (b) the valuation process for Level 3 fair value measurements, and (c) the policy for timing of transfers between levels. The Trust adopted the added, eliminated, and modified disclosure under the ASU.
12. SUBSEQUENT EVENTS
On September 3, 2019, the Trust declared a distribution of $0.073 per Common Share, which was paid on October 1, 2019 to common shareholders of record on September 16, 2019.
On October 1, 2019, the Trust declared a distribution of $0.073 per Common Share, which was paid on November 1, 2019 to common shareholders of record on October 15, 2019.
On October 4, 2019, the Trust entered into an amendment to the Credit Agreement to extend the Facility’s maturity date until October 6, 2021 subject to certain reciprocal termination rights; to reduce interest on amounts borrowed to be based on one month LIBOR + 1.10%; and to make certain other revisions.
On November 1, 2019, the Trust declared a distribution of $0.073 per Common Share, payable on December 2, 2019 to common shareholders of record on November 15, 2019.
On November 15, 2019, the Trust entered into an underwriting agreement among the Trust, the Adviser, Sub-Adviser and National Securities Corporation to sell 960,000 Common Shares (exclusive of 144,000 Common Shares that the underwriters had the right to purchase pursuant to a 45-day option to cover overallotments, if any) at a price to the public of $8.36 per share. On November 18, 2019, the underwriters partially exercised the overallotment option to purchase 138,500 Common Shares. On November 19, 2019, the Trust issued and sold to the underwriters 1,098,500 Common Shares at a total public offering price (before deduction of the sales load and offering expenses) of $9,183,460. Pursuant to the terms of the underwriting agreement, the Trust agreed not to issue, offer or sell Common Shares for a period of 45 days after the date of the underwriting agreement.
| Annual Report | September 30, 2019 | 31 |
| XAI Octagon Floating Rate & | Report of Independent Registered |
| Alternative Income Term Trust | Public Accounting Firm |
To the Shareholders and Board of Trustees
XAI Octagon Floating Rate & Alternative Income Term Trust:
Opinion on the Financial Statements
We have audited the accompanying statement of assets and liabilities of XAI Octagon Floating Rate & Alternative Income Term Trust (the Trust), including the schedule of investments, as of September 30, 2019, the related statements of operations and cash flows for the year then ended, the statements of changes in net assets for each of the years in the two year period then ended, and the related notes (collectively, the financial statements) and the financial highlights for each of the years in the two-year period then ended and the period from September 27, 2017 (commencement of operations) through September 30, 2017. In our opinion, the financial statements and financial highlights present fairly, in all material respects, the financial position of the Trust as of September 30, 2019, the results of its operations and cash flows for the year then ended, the changes in its net assets for each of the years in the two year period then ended, and the financial highlights for each of the years in the two-year period then ended and the period from September 27, 2017 through September 30, 2017, in conformity with U.S. generally accepted accounting principles.
Basis for Opinion
These financial statements and financial highlights are the responsibility of the Trust’s management. Our responsibility is to express an opinion on these financial statements and financial highlights based on our audits. We are a public accounting firm registered with the Public Company Accounting Oversight Board (United States) (PCAOB) and are required to be independent with respect to the Trust in accordance with the U.S. federal securities laws and the applicable rules and regulations of the Securities and Exchange Commission and the PCAOB.
We conducted our audits in accordance with the standards of the PCAOB. Those standards require that we plan and perform the audit to obtain reasonable assurance about whether the financial statements and financial highlights are free of material misstatement, whether due to error or fraud. Our audits included performing procedures to assess the risks of material misstatement of the financial statements and financial highlights, whether due to error or fraud, and performing procedures that respond to those risks. Such procedures included examining, on a test basis, evidence regarding the amounts and disclosures in the financial statements and financial highlights. Such procedures also included confirmation of securities owned as of September 30, 2019, by correspondence with custodians and brokers and other appropriate auditing procedures. Our audits also included evaluating the accounting principles used and significant estimates made by management, as well as evaluating the overall presentation of the financial statements and financial highlights. We believe that our audits provide a reasonable basis for our opinion.
/s/ KPMG LLP
We have served as the auditor of one or more XAI investment companies since 2017.
Chicago, Illinois
November 26, 2019
| XAI Octagon Floating Rate & | |
| Alternative Income Term Trust | Additional Information |
September 30, 2019 (Unaudited)
DIVIDEND REINVESTMENT PLAN
Under the Trust’s Dividend Reinvestment Plan (the “Plan”), a holder of Common Shares (“Common Shareholder”) whose Common Shares are registered in his or her own name will have all distributions reinvested automatically by DST Systems, Inc., which is agent under the Plan (the “Plan Agent”), unless the Common Shareholder elects to receive cash.
Distributions with respect to Common Shares registered in the name of a broker-dealer or other nominee (that is, in “street name”) will be reinvested in additional Common Shares under the Plan, unless the broker or nominee does not participate in the Plan or the Common Shareholder elects to receive distributions in cash. Investors who own Common Shares registered in street name should consult their broker-dealers for details regarding reinvestment. All distributions to investors who do not participate in the Plan will be paid by check mailed directly to the record holder by DST Systems, Inc., as dividend disbursing agent. A participant in the Plan who wishes to opt out of the Plan and elect to receive distributions in cash should contact DST Systems, Inc. in writing at the address specified below or by calling the telephone number specified below.
Under the Plan, whenever the market price of the Common Shares is equal to or exceeds net asset value at the time Common Shares are valued for purposes of determining the number of Common Shares equivalent to the cash dividend or capital gains distribution, participants in the Plan are issued new Common Shares from the Trust, valued at the greater of (i) the net asset value as most recently determined or (ii) 95% of the then-current market price of the Common Shares. The valuation date is the dividend or distribution payment date or, if that date is not a NYSE trading day, the next preceding trading day. If the net asset value of the Common Shares at the time of valuation exceeds the market price of the Common Shares, the Plan Agent will buy the Common Shares for the Plan in the open market, on the NYSE or elsewhere, for the participants’ accounts, except that the Plan Agent will endeavor to terminate purchases in the open market and cause the Trust to issue Common Shares at the greater of net asset value or 95% of market value if, following the commencement of such purchases, the market value of the Common Shares exceeds net asset value. If the Trust should declare a distribution or capital gains distribution payable only in cash, the Plan Agent will buy the Common Shares for the Plan in the open market, on the NYSE or elsewhere, for the participants’ accounts. There is no charge from the Trust for reinvestment of dividends or distributions in Common Shares pursuant to the Plan and no brokerage charges will be incurred with respect to Common Shares issued directly by the Trust pursuant to the Plan; however, all participants will pay a pro rata share of brokerage commissions incurred by the Plan Agent when it makes open-market purchases.
The Plan Agent maintains all shareholder accounts in the Plan and furnishes written confirmations of all transactions in the account, including information needed by shareholders for personal and tax records. Common Shares in the account of each Plan participant will be held by the Plan Agent in non-certificated form in the name of the participant.
In the case of shareholders such as banks, brokers or nominees, which hold Common Shares for others who are the beneficial owners, and participate in the Plan, the Plan Agent will administer the Plan on the basis of the number of Common Shares certified from time to time by the Common Shareholder as representing the total amount registered in the shareholder’s name and held for the account of beneficial owners who participate in the Plan.
Participants that request a sale of shares through the Plan Agent will incur brokerage charges in connection with such sales.
The automatic reinvestment of dividends and other distributions will not relieve participants of any income tax that may be payable or required to be withheld on such dividends or distributions.
Experience under the Plan may indicate that changes are desirable. Accordingly, the Trust reserves the right to amend or terminate its Plan as applied to any voluntary cash payments made and any dividend or distribution paid subsequent to written notice of the change sent to the members of such Plan at least 90 days before the record date for such dividend or distribution. The Plan also may be amended or terminated by the Plan Agent on at least 90 days’ prior written notice to the participants in such Plan. All correspondence concerning the Plan should be directed to the Plan Agent, DST Systems, Inc., 430 W. 7th Street, Kansas City, Missouri 64105-1594.
PROXY VOTING
Information on how the Trust voted proxies relating to portfolio securities during the most recent twelve-month period ended June 30 is available without charge, upon request, by calling (888) 903-3358. This information is also available on the SEC’s website atwww.sec.gov.
| Annual Report | September 30, 2019 | 33 |
| XAI Octagon Floating Rate & | |
| Alternative Income Term Trust | Additional Information |
September 30, 2019 (Unaudited)
NOTICE TO SHAREHOLDERS
Notice is hereby given in accordance with Section 23(c) of the 1940 Act, that the Trust from time to time may purchase its Common Shares in the open market or in private transactions.
TRUST CERTIFICATIONS
The Trust’s Chief Executive Officer (“CEO”) has submitted to the New York Stock Exchange (“NYSE”) the annual CEO certification as required by Section 303A.12(a) of the NYSE Listed Company Manual. The Trust has filed with the SEC the certification of its CEO and Chief Financial Officer required by Section 302 of the Sarbanes-Oxley Act.
QUARTERLY FORM N-Q PORTFOLIO OF INVESTMENTS INFORMATION
The Trust is required to file its complete schedule of portfolio holdings with the Securities and Exchange Commission (“SEC”) for the first and third quarters of each fiscal year on Form N-Q. You may obtain this information directly from the SEC. Visit the SEC on-line at http://www.sec.gov.
AVAILABILITY OF TRUST UPDATES
The Trust regularly updates performance and certain other data and publishes material information as necessary from time to time on its website at www.xainvestments.com/XFLT. Investors and others are advised to check the website for updated performance information and the release of other material information about the Trust. References herein to the Trust’s website are intended to allow investors public access to information regarding the Trust and do not, and are not intended to, incorporate the Trust’s website in this report.
PRIVACY PRINCIPLES OF THE TRUST
The Trust is committed to maintaining the privacy of its shareholders and to safeguarding their non-public personal information. The following information is provided to help you understand what personal information the Trust collects, how the Trust protects that information and why, in certain cases, the Trust may share information with select other parties.
Generally, the Trust does not receive any non-public personal information relating to its shareholders, although certain non-public personal information of its shareholders may become available to the Trust. The Trust does not disclose any non-public personal information about its shareholders or former shareholders to anyone except as permitted by law or as is necessary in order to service shareholder accounts (for example, to a transfer agent or third party administrator).
The Trust restricts access to non-public personal information about its shareholders to employees of the Adviser and its delegates and affiliates with a legitimate business need for the information. The Trust maintains physical, electronic and procedural safeguards designed to protect the non-public personal information of its shareholders.
TRANSFER AGENT AND CUSTODIAN
DST Systems, Inc., 430 W. 7th Street, Kansas City, Missouri 64105, serves as the Trust’s transfer agent and registrar.
U.S. Bank N.A., 1555 N. River Center Drive, Milwaukee, Wisconsin 53212, serves as the Trust’s custodian.
LEGAL COUNSEL
Skadden, Arps, Slate, Meagher & Flom LLP, 155 North Wacker Drive, Chicago, Illinois 60606, serves as the Trust’s legal counsel.
INDEPENDENT REGISTERED PUBLIC ACCOUNTING FIRM
KPMG LLP, 200 E. Randolph Street, Chicago, Illinois 60601, is the Trust’s independent registered public accounting firm.
| XAI Octagon Floating Rate & | |
| Alternative Income Term Trust | Trustees and Officers |
September 30, 2019 (Unaudited)
INDEPENDENT TRUSTEES
| Name, Business Address(1) and Year of Birth | Position(s) Held with Trust | Term of Office and Length of Time Served | Principal Occupation During The Past Five Years | Number of Portfolios in Fund Complex(2) Overseen by Trustee | Other Directorships held by Trustee During the Past Five Years |
Danielle Cupps Year of Birth: 1970 | Trustee | Trustee since 2017 | Current: Director, CEO & Financial Communications, McDonald’s Corporation (2019-present). Former: Managing Director, Kinzie Capital Partners (2017-2018) (private equity); Managing Director, BLG Capital Advisors (2016-2017) (family office); Director, Finance and Chief of Staff to CFO, Boeing Company (2006-2012); Vice President, Code Hennessy & Simmons LLC (2000-2005) (private equity); Associate, Goldman, Sachs & Co. (1998-2000). | 2 | None. |
Gregory G. Dingens Year of Birth: 1964 | Trustee (Chair of the Board) | Trustee since 2017 | Current: Executive Vice President, Monroe Financial Partners, Inc. (2006-present) (investment banking and trading); Member, Siena Capital Partners GP LLC (2006-present) (private investment fund); Director, Qwickrate LLC (2012-present) (online marketplace for financial institutions). Former: Managing Director, Lehman Brothers (2004-2006); Managing Director, Merrill Lynch (1993-2003). | 2 | None. |
Philip G. Franklin Year of Birth: 1951 | Trustee | Trustee since 2017 | Former: Chief Financial Officer and Executive Vice President, Littelfuse, Inc. (1998-2016) (electronics components); Chief Financial Officer and Vice President, OmniQuip International (1995-1998) (construction equipment). | 2 | Current: TTM Technologies Inc. (2014-present); Tronc, Inc. (formerly Tribune Publishing) (2014-present). |
Scott Craven Jones Year of Birth: 1962 | Trustee | Trustee since 2017 | Current: Director, Carne Global Financial Services (US) LLC (2013-present). Former: Adviser, Wanzenburg Partners LLC (2012-2013); Chief Operating Officer, Chief Financial Officer and Treasurer, Aurora Investment Management LLC (2010-2012); Executive Vice President and Chief Administrative Officer, Calamos Asset Management, Inc. (2005-2008); Managing Director, Northern Trust Global Investments (2000-2005). | 2 | Current: Madison Funds (18 portfolios) (2019- present); Manager Directed Portfolios, a U.S. Bancorp series trust (2016-present). Former: Guestlogix Inc. (2015-2016) (travel technology). |
| Annual Report | September 30, 2019 | 35 |
| XAI Octagon Floating Rate & | |
| Alternative Income Term Trust | Trustees and Officers |
September 30, 2019 (Unaudited)
INTERESTED TRUSTEE
| Name, Business Address(1) and Year of Birth | Position(s) Held with Trust | Term of Office and Length of Time Served | Principal Occupation During The Past Five Years | Number of Portfolios in Fund Complex(2) Overseen by Trustee | Other Directorships held by Trustee During the Past Five Years |
Theodore J. Brombach* Year of Birth: 1963 | Trustee, President and Chief Executive Officer | Trustee since 2017 | Current: Co-Chief Executive Officer of XAI (2016-present); Co-Founding Partner of XMS Capital Partners, LLC (2006-present). Former: Co-Head of Midwest Investment Banking, Managing Director, Founding Member of Financial Sponsors Group at Morgan Stanley (1990-2006); Analyst, Kidder, Peabody & Co. (1985-1988). | 2 | Current: RiverWood Bank (2006-present). |
| * | Mr. Brombach is an interested person of the Trust because of his position as an officer of the Adviser and certain of its affiliates. |
| (1) | The business address of each Trustee of the Trust is 321 North Clark Street, Suite 2430, Chicago, Illinois 60654, unless otherwise noted. |
| (2) | As of the date of this report, there are two funds, including the Trust, in the Fund Complex. |
The following information relates to the executive officers of the Trust who are not Trustees. The officers of the Trust appointed by the Board will serve until their respective successors are chosen and qualified. The principal business address of each executive officer is 321 North Clark Street, Suite 2430, Chicago, Illinois 60654.
EXECUTIVE OFFICERS
| Name, Business Address(1) and Year of Birth | Position | Term of Office and Length of Time Served | Principal Occupation During The Past Five Years |
John “Yogi” Spence Year of Birth: 1962 | Chief Financial Officer and Treasurer | Officer since 2017 | Current: Co-Chief Executive Officer, XAI (2016-present); Co-Founding Partner, XMS Capital Partners, LLC (2006-present). |
Benjamin D. McCulloch Year of Birth: 1981 | Chief Legal Officer and Secretary | Officer since 2019 | Current: Managing Director, XAI (2019-present). Former: Associate, Drinker Biddle & Reath LLP (2015 to 2019); Associate Counsel, First Trust Portfolios LP (2012-2015). |
Kimberly Ann Flynn Year of Birth: 1977 | Vice President | Officer since 2017 | Current: Managing Director, XAI (2016-present). Former: Senior Vice President, Head of Product Development (2013-2016), Vice President (2009-2013), Assistant Vice President (2004-2007) and Associate (2004-2007), Nuveen Investments, Inc. |
Theodore J. Uhl Year of Birth: 1974 Address: c/o ALPS Fund Services, Inc. 1290 Broadway, #1100 Denver, CO 80203 | Chief Compliance Officer | Officer since 2017 | Current: Vice President and Deputy Chief Compliance Officer, ALPS Fund Services, Inc. (2006-present); Chief Compliance Officer, Financial Investors Trust (2010-present), Centre Funds (2013-present), Reality Shares ETF Trust (2014-present), Reaves Utility Income Fund (2015-present), Boulder Growth & Income Fund, Inc. (2015-present), Index Funds (2016-present), and Elevation ETF Trust (2016-present). Former: Internal Audit Manager/Senior Risk Manager, ALPS Funds Services, Inc. (2006-2010). |
| (1) | The business address of each Officer of the Trust is 321 North Clark Street, Suite 2430, Chicago, Illinois 60654, unless otherwise noted. |
| (2) | Officers serve at the pleasure of the Board and until his or her successor is appointed and qualified or until his or her earlier resignation or removal. |

| (a) | The Registrant, as of the end of the period covered by the report, has adopted a Code of Ethics that applies to the Registrant’s Principal Executive Officer, Principal Financial Officer, Principal Accounting Officer or Controller or any persons performing similar functions on behalf of the Registrant. |
| (b) | For purposes of this item, “code of ethics” means written standards that are reasonably designed to deter wrongdoing and to promote: |
| 1. | Honest and ethical conduct, including the ethical handling of actual or apparent conflicts of interest between personal and professional relationships; |
| 2. | Full, fair, accurate, timely, and understandable disclosure in reports and documents that a registrant files with, or submits to, the Commission and in other public communications made by the registrant; |
| 3. | Compliance with applicable governmental laws, rules, and regulations; |
| 4. | The prompt internal reporting of violations of the code to an appropriate person or persons identified in the code; and |
| 5. | Accountability for adherence to the code |
| (c) | During the period covered by this report, no amendments were made to the provisions of the Code of Ethics referenced in 2 (a) above. |
| (d) | During the period covered by this report, no implicit or explicit waivers to the provision of the Code of Ethics referenced in 2 (a) above were granted. |
| (f) | The Registrant's code of ethics referred to in Item 2(a) above is attached as an Ex99.13(a)(1) Code of Ethics, hereto. |
| Item 3. | Audit Committee Financial Expert. |
The Registrant’s Board of Directors has determined that the Registrant has as least one audit committee financial expert serving on its Audit Committee. The Board of Directors has designated Scott C. Jones as the Registrant’s “audit committee financial expert.” Mr. Scott C. Jones is “independent” as defined in paragraph (a)(2) of Item 3 to Form N-CSR.
| Item 4. | Principal Accountant Fees and Services. |
| (a) | Audit Fees: The aggregate fees billed for professional services rendered by KPMG LLP (“KPMG”) for the last two fiscal years ended September 30, 2018 and September 30, 2019 for the audit of the Registrant's annual financial statements or services that are normally provided by the accountant in connection with statutory and regulatory filings or engagements was $73,000 and $95,000 |
| (b) | Audit-Related Fees: The aggregate fees billed for the last two fiscal years ended September 30, 2018 and September 30, 2019 for assurance and related services by KPMG that are reasonably related to the performance of the audit of the Registrant's financial statements and are not reported under paragraph (a) of this Item was $0 and $0. |
| (c) | Tax Fees: The aggregate fees billed for the last two fiscal years ended September 30, 2018 and September 30, 2019 for professional services rendered by KPMG for tax compliance, tax advice, and tax planning was $5,000 and $27,674. These fees are comprised of fees relating income tax return preparation fees, excise tax return preparation fees and review of dividend distribution calculation fees. |
| (d) | All Other Fees: The aggregate fees billed for the last two fiscal years ended September 30, 2018 and September 30, 2019 for products and services provided by KPMG, other than the services reported in paragraphs (a) through (c) of this Item was $0 and $0. |
| (e)(1) | Audit Committee Pre-Approval Policies and Procedures: All services to be performed by the Registrant's principal auditors must be pre-approved by the Registrant's Audit Committee or by the Audit Committee’s designee pursuant to the Audit Committee’s Pre-Approval Policies and Procedures. |
| (e)(2) | No services described in paragraphs (b) through (d) were approved pursuant to paragraph (c)(7)(i)(C) of Rule 2-01 of Regulation S-X. |
| (g) | The aggregate non-audit fees billed by the Registrant’s accountant for services rendered to the Registrant, and rendered to the Registrant’s investment adviser, and any entity controlling, controlled by, or under common control with the investment adviser that provides ongoing services to the Registrant for the last two fiscal years ended September 30, 2018 and September 30, 2019 was $0 and $0. For the last two fiscal years ended September 30, 2019 and September 30, 2019, KPMG did not bill the Registrant for products and services other than the services reported above. |
| Item 5. | Audit Committee of Listed Registrants. |
The Registrant has a separately designated standing Audit Committee established in accordance with Section 3(a)(58)(A) of the Exchange Act and is comprised of the following members:
Scott C. Jones, Chairman
Danielle Cupps
Gregory G. Dingens
Philip G. Franklin
| Item 6. | Schedule of Investments. |
| (a) | Schedule of Investments is included as part of the Report to Stockholders filed under Item 1 of this form. |
| Item 7. | Disclosure of Proxy Voting Policies and Procedures for Closed-End Management Investment Companies. |
See attached Appendix A for a copy of the policies and procedures of the Registrant.
| Item 8. | Portfolio Managers of Closed-End Management Investment Companies. |
As of the date of this report.
| Portfolio Managers Name | | Title | | Length of Service | | Business Experience: 5 Years |
| Andrew D. Gordon | | Chief Executive Officer and Co-Chief Investment Officer | | Since Inception | | Chief Executive Officer, Co-Chief Investment Officer and member of the Investment Committee of the Sub-Adviser. |
| Michael B. Nechamkin | | Co-Chief Investment Officer and Senior Portfolio Manager | | Since Inception | | Co-Chief Investment Officer (2016 to present), Senior Portfolio Manager and member of the Investment Committee of the Sub-Adviser. |
| Lauren M. Basmadjian | | Senior Portfolio Manager | | Since Inception | | Senior Portfolio Manager and member of the Investment Committee of the Sub-Adviser. |
| Gretchen M. Lam, CFA | | Senior Portfolio Manager | | Since Inception | | Senior Portfolio Manager and member of the Investment Committee of the Sub-Adviser (2013 to present). Principal of Sub-Adviser 2006-2013. |
| Lauren B. Law, CFA | | Portfolio Manager | | January 2018 | | Portfolio Manager and member of the Investment Committee of the Sub-Adviser (January 2018 to present). Principal of Sub-Adviser 2010-2018. |
Andrew D. Gordon, Chief Executive Officer, Co-Chief Investment Officer and member of the Investment Committee of the Sub-Adviser. Mr. Gordon co-founded Octagon in 1994 and subsequently managed numerous Octagon funds before assuming his current position. He has over 30 years of experience in the below-investment grade leveraged loan and high yield bond asset classes, in both sell-side and buy-side capacities. Prior to co-founding Octagon, Mr. Gordon was a Managing Director at Chemical Securities, Inc., where he focused primarily on the oil and gas industries. Mr. Gordon advised on and arranged below-investment grade loans for corporate clients, while also undertaking special projects in M&A advisory and distressed credit situations. He previously served as Vice President in the Acquisition Finance Division of Manufacturers Hanover Trust Company. In this capacity, Mr. Gordon structured, syndicated and managed leveraged buyout transactions. Mr. Gordon graduatedcum laude with an A.B. in Economics from Duke University.
Michael B. Nechamkin, Co-Chief Investment Officer, Senior Portfolio Manager and member of the Investment Committee of the Sub-Adviser. Mr. Nechamkin joined Octagon in 1999. He has 29 years of industry experience, including 20 years at Octagon. Mr. Nechamkin is a member of Octagon’s Investment Committee and serves as the Senior Portfolio Manager of five CLOs, four Separately Managed Accounts, and five Private Commingled Funds. Prior to joining Octagon, Mr. Nechamkin was a Vice President in the High Yield Research Group at Bankers Trust. He previously served as a Convertible Securities Analyst at Mabon Securities and a Financial Consultant at Merrill Lynch. Mr. Nechamkin holds a Bachelor’s degree and a Masters of Talmudic Law and an M.B.A from the University of Baltimore.
Lauren M. Basmadjian, Senior Portfolio Manager and member of the Investment Committee of the Sub-Adviser. Ms. Basmadjian joined Octagon in 2001. She has 18 years of industry experience. Ms. Basmadjian is a member of Octagon’s Investment Committee and serves as the Portfolio Manager of eleven CLOs, two Separately Managed Accounts, and three Private Commingled Funds. Prior to becoming a Portfolio Manager, Ms. Basmadjian managed Octagon’s workout efforts and also oversaw Octagon’s investments in the leisure and entertainment, retail, consumer products, business services, food and beverage and technology industries. Prior to joining Octagon, Ms. Basmadjian worked in the Acquisition Finance Group at Chase Securities, Inc. She graduatedcum laude from the Stern School of Business at New York University with a B.S. in Finance and Economics.
Gretchen M. Lam, CFA, Senior Portfolio Manager and member of the Investment Committee of the Sub-Adviser. Ms. Lam joined Octagon in 1999. She has 20 years of industry experience. Ms. Lam is a member of Octagon’s Investment Committee and serves as the Portfolio Manager of eight CLOs, five Separately Managed Accounts, and three Private Commingled Funds. Prior to becoming a Portfolio Manager, Ms. Lam oversaw Octagon’s investments in the software, business services, finance and insurance, paper and packaging, gaming and lodging, homebuilding and real estate industries. She was also responsible for the structured credit exposure held in Octagon’s CLO vehicles. Ms. Lam received her CFA Charter in 2006. She graduatedsumma cum laude from Babson College with a B.S. in Investments.
Lauren B. Law, CFA, Portfolio Manager and member of the Investment Committee of the Sub-Adviser. Ms. Law is a member of Octagon’s Investment Committee and serves as the Portfolio Manager of eight CLOs and three Separately Managed Accounts. Ms. Law joined Octagon in 2004. In addition, she helps oversee the Firm’s CLO debt and equity investments. Prior to becoming a Portfolio Manager, Ms. Law was an Investment Team Principal whose coverage areas included healthcare, industrials, financials, business services, and the firm’s CLO debt and equity investments. She holds a Bachelor of Science from Babson College, where she graduated Magna Cum Laude. She received her CFA Charter in 2009.
| (a)(2) | As of September 30, 2019, the Portfolio Managers listed above are also responsible for the day-to-day management of the following: |
| Portfolio Managers Name | | Registered Investment Companies | | Other Pooled Investment Vehicles | | Other Accounts |
| Andrew D. Gordon | | 0 | $0 | | 0 | $0 | | 0 | $0 |
| Michael B. Nechamkin | | 0 | $0 | | 10 | $4,189,502,308 | | 4 | $2,769,080,780 |
| Lauren M. Basmadjian | | 0 | $0 | | 13 | $7,023,597,239 | | 2 | $375,939,217 |
| Gretchen M. Lam, CFA | | 0 | $0 | | 11 | $4,630,005,177 | | 5 | $683,554,739 |
| Lauren B. Law, CFA | | 0 | $0 | | 8 | $4,242,684,372 | | 3 | $833,312,113 |
| (a)(3) | Compensation of Portfolio Managers and Material Conflicts of Interest |
Compensation of Portfolio Managers. Octagon investment professionals receive a fixed base salary and annual discretionary bonus, each determined by the Compensation Committee, which is a committee of the Board of Managers of the Sub-Adviser. The fixed base salary is reviewed periodically and is intended to reflect a base compensation that is competitive with base salaries provided by similar investment adviser firms in the industry. The discretionary bonus is determined taking into account the overall performance and profitability of the Sub-Adviser, and an individual’s contributions and achievement of objectives linked to their function, including both quantitative performance, and qualitative factors. Portions of the discretionary bonus are paid on a deferred basis over several years. In addition, certain members of senior management, including the portfolio managers, own interests in the Sub-Adviser, and therefore participate in the long-term growth and performance of the firm.
Material Conflicts of Interest. Such conflicts are typically based on the specific facts and circumstances associated with the issues that are the subject of the proxy and Octagon’s and its employees’ business dealings with a particular proxy issuer or closely affiliated entity. A material conflict of interest may exist where, for example: (1) the company soliciting the proxy, or a person known to be an affiliate of such company, is known to be a Client of, or an investor in an Account managed, by Octagon; (2) the company soliciting the proxy, or a person known to be an affiliate of such company, to the knowledge of the individual(s) charged with voting the proxy, is being actively solicited to be a Client of Octagon (or an investor in an Octagon Account); (3) a Client or investor, or an interest group supported by Client or investor, actively supports a proxy proposal; or (4) Octagon or an employee has personal or other business relationships with participants in proxy contests, corporate directors or candidates for corporate directorships, or in any other matter coming before shareholders.
| (a)(4) | Dollar Range of Securities Owned as of September 30, 2019 |
| Portfolio Managers | | Dollar Range of the Registrant’s Securities Owned by the Portfolio Managers |
| Andrew D. Gordon | | None |
| Michael B. Nechamkin | | None |
| Lauren M. Basmadjian | | $50,001 - $100,000 |
| Gretchen M. Lam, CFA | | None |
| Lauren B. Law, CFA | | None |
| Octagon Credit Investors, LLC | | Over $100,000 |
| Item 9. | Purchases of Equity Securities by Closed-End Management Company and Affiliated Purchasers. |
None
| Item 10. | Submission of Matters to a Vote of Security Holders. |
There have been no material changes to the procedures by which shareholders may recommend nominees to the Board of Trustees of the Registrant.
| Item 11. | Controls and Procedures. |
| (a) | The Registrant’s principal executive officer and principal financial officer have concluded that the Registrant’s disclosure controls and procedures (as defined in Rule 30a-3(c) under the Investment Company Act of 1940, as amended) are effective based on their evaluation of these controls and procedures as of a date within 90 days of the filing date of this document. |
| (b) | There was no change in the registrant's internal control over financial reporting (as defined in Rule 30a-3(d) under the Investment Company Act of 1940, as amended) that occurred during the period covered by this report that has materially affected, or is reasonably likely to materially affect, the registrant's internal control over financial reporting. |
| Item 12. | Disclosure of Securities Lending Activities for Closed-End Management Investment Companies. |
None
| (a)(1) | Registrant’s Code of Ethics for registrant’s principal executive officer and principal financial officer, which is the subject of the disclosure required by Item 2 of Form N-CSR, is attached hereto as Ex99.13(a)(1) Code of Ethics. |
| (a)(2). | The certifications required by Rule 30a-2(a) of the Investment Company Act of 1940, as amended, and Section 302 of the Sarbanes-Oxley Act of 2002 are attached hereto as exhibit Ex-99.Cert. |
| (b) | A certification for the Registrant’s Principal Executive Officer and Principal Financial Officer, as required by Rule 30a-2(b) of the Investment Company Act of 1940, as amended, and Section 906 of the Sarbanes-Oxley Act of 2002 are attached hereto as exhibit Ex-99.906Cert. |
SIGNATURES
Pursuant to the requirements of the Securities Exchange Act of 1934 and the Investment Company Act of 1940, the registrant has duly caused this report to be signed on its behalf by the undersigned, thereunto duly authorized.
XAI OCTAGON FLOATING RATE & ALTERNATIVE INCOME TERM TRUST
| By: | (Signature and Title) | /s/ Theodore J. Brombach | |
| | | Theodore J. Brombach | |
| Date: | December 2, 2019 | President and Chief Executive Officer | |
| | | (principal executive officer) | |
Pursuant to the requirements of the Securities Exchange Act of 1934 and the Investment Company Act of 1940, this report has been signed below by the following persons on behalf of the registrant and in the capacities and on the dates indicated.
| By: | (Signature and Title) | /s/ Theodore J. Brombach | |
| | | Theodore J. Brombach | |
| Date: | December 2, 2019 | President and Chief Executive Officer | |
| | | (principal executive officer) | |
| | | | |
| By: | (Signature and Title) | /s/ John “Yogi” Spence | |
| | | John “Yogi” Spence | |
| Date: | December 2, 2019 | Treasurer and Chief Financial Officer | |
| | | (principal financial officer) | |