UNITED STATES
SECURITIES AND EXCHANGE COMMISSION
Washington, D.C. 20549
FORM N-CSR
CERTIFIED SHAREHOLDER REPORT OF REGISTERED
MANAGEMENT INVESTMENT COMPANIES
| | |
Investment Company Act file number | | 811-23262 |
Nuveen Emerging Markets Debt 2022 Target Term Fund
(Exact name of registrant as specified in charter)
Nuveen Investments
333 West Wacker Drive
Chicago, IL 60606
(Address of principal executive offices) (Zip code)
Gifford R. Zimmerman
Nuveen Investments
333 West Wacker Drive
Chicago, IL 60606
(Name and address of agent for service)
Registrant’s telephone number, including area code: (312) 917-7700
Date of fiscal year end: December 31
Date of reporting period: December 31, 2018
Form N-CSR is to be used by management investment companies to file reports with the Commission not later than 10 days after the transmission to stockholders of any report that is required to be transmitted to stockholders under Rule 30e-1 under the Investment Company Act of 1940 (17 CFR 270.30e-1). The Commission may use the information provided on Form N-CSR in its regulatory, disclosure review, inspection, and policymaking roles.
A registrant is required to disclose the information specified by Form N-CSR, and the Commission will make this information public. A registrant is not required to respond to the collection of information contained in Form N-CSR unless the Form displays a currently valid Office of Management and Budget (“OMB”) control number. Please direct comments concerning the accuracy of the information collection burden estimate and any suggestions for reducing the burden to Secretary, Securities and Exchange Commission, 450 Fifth Street, NW, Washington, DC 20549-0609. The OMB has reviewed this collection of information under the clearance requirements of 44 U.S.C. ss. 3507.
ITEM 1. REPORTS TO STOCKHOLDERS.

Closed-End Funds
31 December
2018
Nuveen Closed-End Funds
| | |
| JEMD | | Nuveen Emerging Markets Debt 2022 Target Term Fund |
Beginning on January 1, 2021, as permitted by regulations adopted by the Securities and Exchange Commission, paper copies of the Fund’s annual and semi-annual shareholder reports will no longer be sent by mail, unless you specifically request paper copies of the reports. Instead, the reports will be made available on the Fund’s website (www.nuveen.com), and you will be notified by mail each time a report is posted and provided with a website link to access the report.
If you have already elected to receive shareholder reports electronically, you will not be affected by this change and you need not take any action. You may elect to receive shareholder reports and other communications from the Fund electronically anytime by contacting the financial intermediary (such as a broker-dealer or bank) through which you hold your Fund shares or, if you are a direct investor, by enrolling at www.nuveen.com/e-reports.
You may elect to receive all future shareholder reports in paper free of charge at any time by contacting your financial intermediary or, if you are a direct investor, (i) by calling 800-257-8787 and selecting option #2 or (ii) by logging into your Investor Center account at www.computershare.com/investor and clicking on “Communication Preferences.” Your election to receive reports in paper will apply to all funds held in your account with your financial intermediary or, if you are a direct investor, to all your directly held Nuveen Funds and any other directly held funds within the same group of related investment companies.
Annual Report
Life is Complex.
Nuveen makes things e-simple.
It only takes a minute to sign up fore-Reports. Once enrolled, you’ll receive ane-mail as soon as your Nuveen Fund information is ready. No more waiting for delivery by regular mail. Just click on the link within thee-mail to see the report and save it on your computer if you wish.
Free e-Reports right to your email!
www.investordelivery.com
If you receive your Nuveen Fund distributions and statements from your financial advisor or brokerage account.
or
www.nuveen.com/client-access
If you receive your Nuveen Fund distributions and statements directly from Nuveen.
NOT FDIC INSURED MAY LOSE VALUE NO BANK GUARANTEE
Table of Contents
3
Chairman’s Letter to Shareholders

Dear Shareholders,
The global economy seemed to reach a turning point in 2018. Growth was peaking in the U.S. and slowing elsewhere. Deregulation and tax law changes, which lowered corporate and individual tax rates and encouraged companies to repatriate overseas profits, helped boost U.S. economic growth and amplify corporate earnings during 2018. Meanwhile, a weakening housing market and a flattening yield curve in the U.S. and disappointing economic growth across Europe, China and Japan signaled caution. As the year developed, future corporate profit growth was looking less certain than at the start of the year. Adding to the uncertainty were the removal of U.S. central bank monetary stimulus, rising interest rates, a stronger U.S. dollar, trade negotiations and unpredictable politics, including Brexit and a prolonged U.S. government shutdown. Bearish sentiment intensified at the end of 2018, pressuring stocks, corporate bonds and commodities alike.
Although downside risks have been rising, the likelihood of a near-term recession remains low. Global growth is indeed slowing, but it’s still positive. The U.S. economy remains strong, even in the face of late-cycle pressures. Low unemployment and firming wages should continue to support consumer spending, and the Novembermid-term elections resulted in change, but no major surprises. In China, the government remains committed to using fiscal stimulus to offset softening exports. Europe also remains vulnerable to trade policy as well as Brexit uncertainty, but underlying strengths in European economies, including low unemployment that drives domestic demand, remain supportive of a mild expansion. In a slower growth environment, there are opportunities for investors who seek them more selectively.
We expect volatility and challenging conditions to persist in 2019 but also think there is potential for upside. You can prepare your investment portfolio by working with your financial advisor to review your goals, timeline and risk tolerance. On behalf of the other members of the Nuveen Fund Board, we look forward to continuing to earn your trust in the months and years ahead.
Sincerely,

Terence J. Toth
Chairman of the Board
February 22, 2018
4
Portfolio Managers’ Comments
Nuveen Emerging Markets Debt 2022 Target Term Fund (JEMD)
The Fund features portfolio management by Teachers Advisors, LLC, an affiliate of Nuveen Fund Advisors, LLC. Portfolio managers Anupam Damani, CFA, and Katherine Renfrew discuss U.S. economic and global market conditions, key investment strategies and the twelve-month performance of JEMD. Anupam and Katherine have managed the Fund since its inception.
What factors affected the U.S. economy and global markets during the twelve-month reporting period ended December 31, 2018?
The U.S. economy accelerated in this reporting period, with gross domestic product (GDP) growth reaching 4.2% (annualized) in the second quarter of 2018, the fastest pace since 2014, then receding to a still relatively robust 3.4% annualized rate in the third quarter of 2018, according to the Bureau of Economic Analysis “third” estimate. GDP is the value of goods and services produced by the nation’s economy less the value of the goods and services used up in production, adjusted for price changes. The boost in economic activity during the second quarter of 2018 was attributed to robust spending by consumers, businesses and the government, as well as a temporary increase in exports, as farmers rushed soybean shipments ahead of China’s retaliatory tariffs. While consumer and government spending continued to drive economic growth in the third quarter, the export contribution declined as expected and both business spending and housing investment weakened. The government’s fourth quarter 2018 GDP growth estimate was not yet available due to the partial government shutdown from late December 2018 to late January 2019.
Consumer spending, the largest driver of the economy, remained well supported by low unemployment, wage gains and tax cuts. As reported by the Bureau of Labor Statistics, the unemployment rate fell to 3.9% in December 2018 from 4.1% in December 2017 and job gains averaged around 219,000 per month for the past twelve months. The jobs market has continued to tighten, while average hourly earnings grew at an annualized rate of 3.2% in December 2018. The Consumer Price Index (CPI) increased 1.9% over the twelve-month reporting period ended December 31, 2018 on a seasonally adjusted basis, as reported by the Bureau of Labor Statistics.
Low mortgage rates and low inventory drove home prices higher during this recovery cycle. But the price momentum slowed in recent months as mortgage rates began to drift higher and homes have become less affordable. The S&P CoreLogic Case-Shiller U.S. National Home Price Index, which covers all nine U.S. census divisions, was up 5.2% year-over-year in November 2018 (most recent data available at the time this report was prepared). The10-City and20-City Composites reported year-over-year increases of 4.3% and 4.7%, respectively.
This material is not intended to be a recommendation or investment advice, does not constitute a solicitation to buy or sell securities, and is not provided in a fiduciary capacity. The information provided does not take into account the specific objectives or circumstances of any particular investor, or suggest any specific course of action. Investment decisions should be made based on an investor’s objectives and circumstances and in consultation with his or her advisors.
Certain statements in this report are forward-looking statements. Discussions of specific investments are for illustration only and are not intended as recommendations of individual investments. The forward-looking statements and other views expressed herein are those of the portfolio managers as of the date of this report. Actual future results or occurrences may differ significantly from those anticipated in any forward-looking statements and the views expressed herein are subject to change at any time, due to numerous market and other factors. The Fund disclaims any obligation to update publicly or revise any forward-looking statements or views expressed herein.
For financial reporting purposes, the ratings disclosed are the highest rating given by one of the following national rating agencies: Standard & Poor’s (S&P), Moody’s Investors Service, Inc. (Moody’s) or Fitch, Inc. (Fitch). This treatment of split-rated securities may differ from that used for other purposes, such as for Fund investment policies. Credit ratings are subject to change. AAA, AA, A and BBB are investment grade ratings; BB, B, CCC, CC, C and D are below investment grade ratings. Holdings designated N/R are not rated by these national rating agencies.
Refer to the Glossary of Terms Used in this Report for further definition of the terms used within this section.
5
Portfolio Managers’ Comments(continued)
With the U.S. economy delivering a sustainable growth rate and employment strengthening, the Federal Reserve’s (Fed) policy making committee continued to incrementally raise its main benchmark interest rate. The most recent increase, in December 2018, was the fourth rate hike in 2018 and the ninth rate hike since December 2015. Fed Chair Janet Yellen’s term expired in February 2018, and the new Chairman Jerome Powell maintained the Fed’s gradual pace of interest rate hikes. However, amid signs that economic growth might have peaked, the markets’ unease about the future pace of monetary tightening, along with other factors, drove sharp volatility in the final months of 2018. Additionally, the Fed continued reducing its balance sheet by allowing a small amount of maturing Treasury and mortgage securities to roll off each month without reinvestment.
During the twelve-month reporting period, geopolitical news remained a prominent market driver. The U.S. moved forward with tariffs on imported goods from China, as well as on steel and aluminum from Canada, Mexico and Europe. These countries announced retaliatory measures in kind, intensifying concerns about a trade war, although there have been some positive developments. In July 2018, the U.S. and the European Union announced they would refrain from further tariffs while they negotiate trade terms, and in October 2018, the U.S., Mexico and Canada agreed to a new trade deal to replace the North American Free Trade Agreement. At the November 2018G-20 summit, the U.S. and China agreed to a90-day trade truce, although the details were murky. Brexit negotiations continued to be uncertain and Prime Minister Theresa May faced significant difficulty getting a plan approved in Parliament. Elsewhere in Europe, markets remained nervous about Italy’s new euroskeptic coalition government, immigration policy and political risk in Turkey. The U.S. Treasury issued additional sanctions on Russia in April 2018 andre-imposed sanctions on Iran following the U.S. withdrawal from the 2015 nuclear agreement. Bearish crude oil supply news, along with heightened tensions between the U.S. and Saudi Arabia after the disappearance of a Saudi journalist, drove oil price volatility. On the Korean peninsula, the leaders of South Korea and North Korea met during April 2018 and jointly announced a commitment toward peace, while the U.S.-North Korea summit yielded an agreement with few additional details. In the final week of the reporting period, the U.S. government began a prolonged partial shutdown due to an impasse on border security funding (which ended in late January, subsequent to the close of the reporting period, when a temporary funding measure was passed).
During the first half of 2018, emerging markets came into the crosshairs of volatility arising from higher U.S. interest rates, a stronger U.S. dollar, trade tensions and home-grown problems in some countries. As a result, asset class returns suffered as spreads widened. However, as the second half of 2018 progressed, the pressure of many of these macro-driven catalysts ebbed. For example, dollar strength appeared to peak, trade tensions between China and the U.S. cooled modestly and many of the idiosyncratic country-specific issues (i.e., Turkey and Argentina) mitigated. As a result, some of the losses from earlier in the year were retraced, although the asset class still had a negative total return for the year. From a credit ratings perspective, investment grade debt outperformed high yield debt for the reporting period overall.
What strategies were used to manage the Fund during the twelve-month reporting period ended December 31, 2018?
The Fund seeks to provide a high level of current income and return the original $9.85 net asset value (NAV) per common share on or about December 1, 2022.
JEMD seeks to provide high current income from a portfolio of shorter maturity, emerging market sovereign, quasi-sovereign and corporate debt securities, including high yield securities. The Fund invests at least 80% of its managed assets in emerging market debt securities and may invest without limit in investment grade securities and securities rated below investment grade (BB+/Ba1 or lower). However, the Fund invests no more than 10% of its managed assets in securities rated belowB-/B3 or that are unrated but judged by the managers to be of comparable quality. The Fund invests 100% of its managed assets in U.S. dollar denominated securities. No more than 25% is invested in securities of issuers located in a single country.
6
In seeking to return the original NAV on or about December 1, 2022, the Fund intends to utilize various portfolio and cash flow management techniques, including setting aside a portion of its net investment income, possibly retaining gains and limiting the longest effective maturity on any holding to no later than June 1, 2023. This Fund uses leverage. Leverage is discussed in more detail later in the Fund Leverage Section of this report.
How did the Fund perform during the twelve-month reporting period ended December 31, 2018?
The table in the Performance Overview and Holding Summaries section of this report provides total return performance for the Fund for theone-year reporting and since inception periods ended December 31, 2018. The Fund’s total returns at net asset value (NAV) are compared with the performance of a corresponding market index. For the twelve-month reporting period ended December 31, 2018, the Fund underperformed the JP Morgan EMBI Global Diversified Index.
The Fund lagged the benchmark as the bulk of the securities the Fund holds are high yield in nature (with an average portfolio rating of B+), which hurt the Fund as the high yield segment underperformed in this reporting period. However, the Fund’s shorter duration posture (due to its shorter maturity mandate) versus the benchmark helped alleviate a portion of the deficit as longer-dated credits underperformed.
At a country level, the largest detractors were Barbados, Argentina, Zambia and Turkey. Barbados sovereign debt was the single biggest cause for underperformance due to the newly elected government announcing it will suspend payments on external debt while it negotiated with the International Monetary Fund on a program and concluded wider restructuring. Argentina sovereign paper and Turkish bank paper also contributed negatively due to challenging economic, political and policy environments. The largest detractor on the corporate debt side was Digicel, a pan-Caribbean telecom, where holding company debt prices suffered as investors became increasingly concerned over an upcoming maturity. Other country-level detractors included Ukraine, Ecuador and Lebanon. On the positive side, our African selections (outside of Zambia) performed well, including Ghana (both sovereign and corporate), Rwanda and Nigeria (both sovereign and banks).
7
Fund Leverage
IMPACT OF THE FUND’S LEVERAGE STRATEGIES ON PERFORMANCE
One important factor impacting the returns of the Fund’s common shares relative to its comparative benchmark was the Fund’s use of leverage through the use of reverse repurchase agreements. The Fund uses leverage because our research has shown that, over time, leveraging provides opportunities for additional income and total return, particularly in the recent market environment where short-term market rates are at or near historical lows, meaning that the short-term rates the Fund has been paying on its leveraging instruments in recent years have been much lower than the interest the Fund has been earning on its portfolio securities that it has bought with the proceeds of that leverage.
However, use of leverage can expose Fund common shares to additional price volatility. When the Fund uses leverage, the Fund common shares will experience a greater increase in their net asset value if the securities acquired through the use of leverage increase in value, but will also experience a correspondingly larger decline in their net asset value if the securities acquired through leverage decline in value, which will make the shares’ net asset value more volatile, and total return performance more variable, over time.
In addition, common share income in levered funds will typically decrease in comparison to unlevered funds when short-term interest rates increase and increase when short-term interest rates decrease. Over the last few quarters, short-term interest rates have indeed increased from their extended lows after the 2007-09 financial crisis. This increase has reduced common share net income, and also reduced potential for long-term total returns. Nevertheless, the ability to effectively borrow at current short-term rates is still resulting in enhanced common share income, and management believes that the advantages of continuation of leverage outweigh the associated increase in risk and volatility described above.
The Fund’s use of leverage had a negative impact on total return performance during this reporting period.
As of December 31, 2018, the Fund’s percentages of leverage are as shown in the accompanying table.
| | | | |
| | | JEMD | |
Effective Leverage* | | | 28.00 | % |
Regulatory Leverage* | | | 0.00 | % |
| * | Effective leverage is the Fund’s effective economic leverage, and includes both regulatory leverage and the leverage effects of certain derivative and other investments in the Fund’s portfolio that increase the Fund’s investment exposure. Regulatory leverage consists of borrowings of the Fund, which is part of the Fund’s capital structure. The Fund, however, may from time to time borrow on a typically transient basis in connection with its day-to-day operations, primarily in connection with the need to settle portfolio trades. Such incidental borrowings are excluded from the calculation of the Fund’s effective leverage ratio. Regulatory leverage is subject to asset coverage limits set forth in the Investment Company Act of 1940. |
THE FUND’S LEVERAGE
Reverse Repurchase Agreements
As noted above, the Fund utilized reverse repurchase agreements. The Fund’s transactions in reverse repurchase agreements are as shown in the accompanying table.
| | | | | | | | | | | | | | | | | | | | | | | | | | | | | | | | | | |
| Current Reporting Period | | | | | | Subsequent to the Close of
the Reporting Period | |
| January 1, 2018 | | | Purchases | | | Sales | | | December 31, 2018 | | | Average Balance
Outstanding | | | | | | Purchases | | | Sales | | | February 28, 2019 | |
| | $47,000,000 | | | $ | — | | | $ | — | | | $ | 47,000,000 | | | $ | 47,000,000 | | | | | | | $ | — | | | $ | — | | | $ | 47,000,000 | |
Refer to Notes to Financial Statements, Note 8 – Fund Leverage for further details.
8
Common Share Information
DISTRIBUTION INFORMATION
The following information regarding the Fund’s distributions is current as of December 31, 2018. The Fund’s distribution levels may vary over time based on the Fund’s investment activity and portfolio investment value changes.
During the current reporting period, the Fund’s distributions to shareholders were as shown in the accompanying table.
| | | | |
| Monthly Distributions(Ex-Dividend Date) | | Per
Share
Amounts | |
January 2018 | | $ | 0.0435 | |
February | | | 0.0435 | |
March | | | 0.0435 | |
April | | | 0.0435 | |
May | | | 0.0435 | |
June | | | 0.0435 | |
July | | | 0.0435 | |
August | | | 0.0435 | |
September | | | 0.0435 | |
October | | | 0.0435 | |
November | | | 0.0375 | |
December 2018 | | | 0.0375 | |
Total Distributions | | $ | 0.5100 | |
| |
Current Distribution Rate* | | | 5.90 | % |
| * | Current distribution rate is based on the Fund’s current annualized monthly distribution divided by the Fund’s current market price. The Fund’s monthly distributions to its shareholders may be comprised of ordinary income, net realized capital gains and, if at the end of the fiscal year the Fund’s cumulative net ordinary income and net realized gains are less than the amount of the Fund’s distributions, a return of capital for tax purposes. |
The Fund seeks to pay regular monthly dividends out of its net investment income at a rate that reflects its past and projected net income performance. To permit the Fund to maintain a more stable monthly dividend, the Fund may pay dividends at a rate that may be more or less than the amount of net income actually earned by the Fund during the period. Distributions to shareholders are determined on a tax basis, which may differ from amounts recorded in the accounting records. In instances where the monthly dividend exceeds the earned net investment income, the Fund would report a negative undistributed net ordinary income. Refer to Note 6 – Income Tax Information for additional information regarding the amounts of undistributed net ordinary income and undistributed net long-term capital gains and the character of the actual distributions paid by the Fund during the period.
All monthly dividends paid by the Fund during the current reporting period were paid from net investment income. If a portion of the Fund’s monthly distributions is sourced or comprised of elements other than net investment income, including capital gains and/or a return of capital, shareholders will be notified of those sources. For financial reporting purposes, the per share amounts of the Fund’s distributions for the reporting period are presented in this report’s Financial Highlights. For income tax purposes, distribution information for the Fund as of its most recent tax year end is presented in Note 6 – Income Tax Information within the Notes to Financial Statements of this report.
COMMON SHARE REPURCHASES
During August 2018, the Fund’s Board of Trustees authorized the Fund to participate in Nuveen’s closed-end fund complex-wide share repurchase program, allowing the Fund to repurchase an aggregate of up to approximately 10% of its outstanding shares.
9
Common Share Information(continued)
As of December 31, 2018, and since the inception of the Fund’s repurchase program, the Fund has cumulatively repurchased and retired its outstanding common shares as shown in the accompanying table.
| | | | |
| | | JEMD | |
Common shares cumulatively repurchased and retired | | | — | |
Common shares authorized for repurchase | | | 1,425,000 | |
OTHER SHARE INFORMATION
As of December 31, 2018, and during the current reporting period, the Fund’s common share price was trading at a premium/(discount) to its NAV as shown in the accompanying table.
| | | | |
Common share NAV | | $ | 8.49 | |
Common share price | | $ | 7.63 | |
Premium/(Discount) to NAV | | | (10.13 | )% |
12-month average premium/(discount) to NAV | | | (5.58 | )% |
The Fund has an investment objective to return $9.85 (the original net asset value following the Fund’s initial public offering (the “Original NAV”)) to shareholders on or about the end of the Fund’s term. There can be no assurance that the Fund will be able to return the Original NAV to shareholders, and such return is not backed or otherwise guaranteed by the Fund’s investment adviser, Nuveen Fund Advisors, LLC (the “Adviser”), or any other entity.
The Fund’s ability to return Original NAV to shareholders on or about its termination date will depend on market conditions and the success of various portfolio and cash flow management techniques. The Fund currently intends to set aside and retain in its net assets a portion of its net investment income and possibly all or a portion of its gains. This will reduce the amounts otherwise available for distribution prior to the liquidation of the Fund, and the Fund may incur taxes on such retained amount, which will reduce the overall amounts that the Fund would have otherwise been able to distribute. Such retained income or gains, net of any taxes, would constitute a portion of the liquidating distribution returned to investors at the end of the Fund’s term. In addition, the Fund’s investment in shorter term and lower yielding securities, especially as the Fund nears the end of its term, may reduce investment income and, therefore, the monthly dividends during the period prior to termination. Investors that purchase shares in the secondary market (particularly if their purchase price differs meaningfully from the Original NAV) may receive more or less than their original investment.
10
Risk Considerations
Fund shares are not guaranteed or endorsed by any bank or other insured depository institution, and are not federally insured by the Federal Deposit Insurance Corporation.
Nuveen Emerging Markets Debt 2022 Target Term Fund (JEMD)
Investing in closed-end funds involves risk; principal loss is possible. There is no guarantee the Fund’s investment objectives will be achieved. Closed-end fund shares may frequently trade at a discount or premium to their net asset value.Emerging markets, particularly including frontier markets,involve additional risks, including smaller capitalization, illiquidity, price volatility, political and economic instability that could lead to diminished security values, and different legal and accounting standards.Debt or fixed income securities such as those held by the Fund, are subject to market risk, credit risk, interest rate risk, derivatives risk, liquidity risk, and income risk. As interest rates rise, bond prices fall.Lower creditdebt securities may be more likely to fail to make timely interest or principal payments.Leverage increases return volatility and magnifies the Fund’s potential return and its risks; there is no guarantee a fund’s leverage strategy will be successful. These and other risk considerations such aslimited term riskare described in more detail on the Fund’s web page atwww.nuveen.com/JEMD.
11
| | |
| JEMD | | Nuveen Emerging Markets Debt 2022 Target Term Fund Performance Overview and Holding Summaries as of December 31, 2018 |
Refer to the Glossary of Terms Used in this Report for further definition of the terms used within this section.
Average Annual Total Returns as of December 31, 2018
| | | | | | | | |
| | | Average Annual | |
| | | 1-Year | | | Since
Inception | |
| JEMD at Common Share NAV | | | (8.71)% | | | | (6.39)% | |
| JEMD at Common Share Price | | | (13.85)% | | | | (14.78)% | |
| JP Morgan EMBI Global Diversified Index | | | (4.26)% | | | | (2.55)% | |
Since inception returns are from 9/26/17. Past performance is not predictive of future results. Current performance may be higher or lower than the data shown. Returns do not reflect the deduction of taxes that shareholders may have to pay on Fund distributions or upon the sale of Fund shares. Returns at NAV are net of Fund expenses, and assume reinvestment of distributions. Comparative index return information is provided for the Fund’s shares at NAV only. Indexes are not available for direct investment.
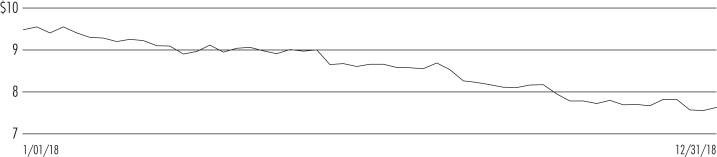
Common Share Price Performance —Weekly Closing Price
12
This data relates to the securities held in the Fund’s portfolio of investments as of the end of the reporting period. It should not be construed as a measure of performance for the Fund itself. Holdings are subject to change.
For financial reporting purposes, the ratings disclosed are the highest rating given by one of the following national rating agencies: Standard & Poor’s Group, Moody’s Investors Service, Inc. or Fitch, Inc. This treatment of split-rated securities may differ from that used for other purposes, such as for Fund investment policies. Credit ratings are subject to change. AAA, AA, A and BBB are investment grade ratings; BB, B, CCC, CC, C and D are below-investment grade ratings. Holdings designated N/R are not rated by these national rating agencies.
Fund Allocation
(% of net assets)
| | | | |
| Emerging Markets Debt | | | 73.6% | |
| Corporate Bonds | | | 61.5% | |
| U.S. Government and Agency Obligations | | | 1.4% | |
| Other Assets Less Liabilities | | | 2.4% | |
Net Assets Plus Reverse Repurchase Agreements | | | 138.9% | |
| Reverse Repurchase Agreements | | | (38.9)% | |
Net Assets | | | 100% | |
Portfolio Credit Quality
(% of total investments)
| | | | |
| BBB | | | 1.9% | |
| BB or Lower | | | 97.1% | |
| N/R | | | 1.0% | |
Total | | | 100% | |
Portfolio Composition
(% of total investments)
| | | | |
| Emerging Markets Debt | | | 54.0% | |
| Banks | | | 17.4% | |
| Oil, Gas & Consumable Fuels | | | 4.9% | |
| Metals & Mining | | | 3.9% | |
| Electric Utilities | | | 2.9% | |
| Real Estate Management & Development | | | 2.8% | |
| Other | | | 13.1% | |
| U.S. Government and Agency Obligations | | | 1.0% | |
Total | | | 100% | |
Top Five Issuers
(% of total investments)
| | | | |
| Republic of Rwanda | | | 5.0% | |
| Republic of Lebanon | | | 4.6% | |
| Republic of Ecuador | | | 4.5% | |
| Republic of Iraq | | | 4.3% | |
| Republic of Ukraine | | | 4.2% | |
Country Allocation¹
(% of total investments)
| | | | |
Ukraine | | | 8.4% | |
| Turkey | | | 7.6% | |
| South Africa | | | 6.6% | |
| Rwanda | | | 5.0% | |
| Nigeria | | | 4.8% | |
| Lebanon | | | 4.6% | |
| Ecuador | | | 4.5% | |
| Iraq | | | 4.3% | |
| El Salvador | | | 4.0% | |
| Argentina | | | 3.7% | |
| Ghana | | | 3.7% | |
| Egypt | | | 3.4% | |
| Zambia | | | 3.3% | |
| United States | | | 3.2% | |
| Barbados | | | 2.9% | |
| China | | | 2.8% | |
| Mongolia | | | 2.7% | |
| Russia | | | 2.6% | |
| Kazakhstan | | | 2.3% | |
| Other | | | 19.6% | |
Total | | | 100% | |
| 1 | Includes 95.6% (as a percentage of total investments) in emerging markets countries. |
13
Report of Independent Registered
Public Accounting Firm
To the Shareholders and Board of Trustees of
Nuveen Emerging Markets Debt 2022 Target Term Fund:
Opinion on the Financial Statements
We have audited the accompanying statement of assets and liabilities, including the portfolio of investments, of Nuveen Emerging Markets Debt 2022 Target Term Fund (the “Fund”) as of December 31, 2018, the related statements of operations and cash flows for the year then ended, the statements of changes in net assets for the year then ended and the period from September 26, 2017 (commencement of operations) to December 31, 2017, and the related notes (collectively, the “financial statements”) and the financial highlights for the year then ended and the period from September 26, 2017 to December 31, 2017. In our opinion, the financial statements and financial highlights present fairly, in all material respects, the financial position of the Fund as of December 31, 2018, the results of its operations and its cash flows for the year then ended, and the changes in its net assets and the financial highlights for the year then ended and the period from September 26, 2017 to December 31, 2017, in conformity with U.S. generally accepted accounting principles.
Basis for Opinion
These financial statements and financial highlights are the responsibility of the Fund’s management. Our responsibility is to express an opinion on these financial statements and financial highlights based on our audits. We are a public accounting firm registered with the Public Company Accounting Oversight Board (United States) (“PCAOB”) and are required to be independent with respect to the Fund in accordance with the U.S. federal securities laws and the applicable rules and regulations of the Securities and Exchange Commission and the PCAOB.
We conducted our audits in accordance with the standards of the PCAOB. Those standards require that we plan and perform the audit to obtain reasonable assurance about whether the financial statements and financial highlights are free of material misstatement, whether due to error or fraud. Our audits included performing procedures to assess the risks of material misstatement of the financial statements and financial highlights, whether due to error or fraud, and performing procedures that respond to those risks. Such procedures included examining, on a test basis, evidence regarding the amounts and disclosures in the financial statements and financial highlights. Such procedures also included confirmation of securities owned as of December 31, 2018, by correspondence with the custodian and brokers or other appropriate auditing procedures. Our audits also included evaluating the accounting principles used and significant estimates made by management, as well as evaluating the overall presentation of the financial statements and financial highlights. We believe that our audits provide a reasonable basis for our opinion.
/s/ KPMG LLP
We have served as the auditor of one or more Nuveen investment companies since 2014.
Chicago, Illinois
February 28, 2019
14
| | |
| JEMD | | Nuveen Emerging Markets Debt
2022 Target Term Fund Portfolio of Investments December 31, 2018 |
| | | | | | | | | | | | | | | | | | | | |
Principal
Amount (000) | | | Description (1) | | Coupon | | | Maturity | | | Ratings (2) | | | Value | |
| | |
| | | | LONG-TERM INVESTMENTS – 135.1% (99.0% of Total Investments) | | | | | |
| | |
| | | | EMERGING MARKETS DEBT – 73.6% (54.0% of Total Investments) | | | | |
| | | | | |
| | | | Argentina – 5.0% | | | | | | | | | | | | |
| | | | | |
| $ | 7,575 | | | Province of Buenos Aires, 144A | | | 6.500% | | | | 2/15/23 | | | | B | | | $ | 6,097,875 | |
| | | | | |
| | | | Bahrain – 1.4% | | | | | | | | | | | | |
| | | | | |
| | 1,675 | | | Kingdom of Bahrain, 144A, (3) | | | 6.125% | | | | 7/05/22 | | | | BB– | | | | 1,706,825 | |
| | | | | |
| | | | Barbados – 3.9% | | | | | | | | | | | | |
| | | | | |
| | 650 | | | Barbados Government, 144A | | | 7.250% | | | | 12/15/21 | | | | Caa3 | | | | 356,687 | |
| | 7,500 | | | Barbados Government, 144A | | | 7.000% | | | | 8/04/22 | | | | D | | | | 4,115,625 | |
| | 517 | | | Barbados Government, Reg S | | | 7.000% | | | | 8/04/22 | | | | D | | | | 283,704 | |
| | 8,667 | | | Total Barbados | | | | | | | | | | | | | | | 4,756,016 | |
| | | | | |
| | | | Belarus – 0.6% | | | | | | | | | | | | |
| | | | | |
| | 750 | | | Republic of Belarus, 144A | | | 6.875% | | | | 2/28/23 | | | | B | | | | 764,055 | |
| | | | | |
| | | | Costa Rica – 1.8% | | | | | | | | | | | | |
| | | | | |
| | 2,400 | | | Republic of Costa Rica, 144A, (3) | | | 4.250% | | | | 1/26/23 | | | | BB | | | | 2,112,000 | |
| | | | | |
| | | | Dominican Republic – 0.5% | | | | | | | | | | | | |
| | | | | |
| | 600 | | | Dominican Republic, 144A, (3) | | | 7.500% | | | | 5/06/21 | | | | BB– | | | | 619,500 | |
| | | | | |
| | | | Ecuador – 6.1% | | | | | | | | | | | | |
| | | | | |
| | 7,350 | | | Republic of Ecuador, 144A | | | 10.750% | | | | 3/28/22 | | | | B– | | | | 7,414,312 | |
| | | | | |
| | | | Egypt – 4.7% | | | | | | | | | | | | |
| | | | | |
| | 5,775 | | | Arab Republic of Egypt, 144A, (3) | | | 6.125% | | | | 1/31/22 | | | | B | | | | 5,665,737 | |
| | | | | |
| | | | El Salvador – 5.4% | | | | | | | | | | | | |
| | | | | |
| | 6,375 | | | Republic of El Salvador, 144A, (3) | | | 7.750% | | | | 1/24/23 | | | | B– | | | | 6,558,281 | |
| | | | | |
| | | | Ghana – 3.4% | | | | | | | | | | | | |
| | | | | |
| | 3,750 | | | Republic of Ghana, 144A, (3) | | | 9.250% | | | | 9/15/22 | | | | B | | | | 4,128,975 | |
| | | | | |
| | | | Honduras – 0.9% | | | | | | | | | | | | |
| | | | | |
| | 1,000 | | | Honduras Government, 144A | | | 8.750% | | | | 12/16/20 | | | | BB– | | | | 1,062,250 | |
| | | | | |
| | | | Iraq – 5.9% | | | | | | | | | | | | |
| | | | | |
| | 7,500 | | | Republic of Iraq, 144A, (3) | | | 6.752% | | | | 3/09/23 | | | | B– | | | | 7,123,740 | |
| | | | | |
| | | | Lebanon – 6.3% | | | | | | | | | | | | |
| | | | | |
| | 5,000 | | | Republic of Lebanon, Reg S | | | 6.000% | | | | 1/27/23 | | | | B– | | | | 4,222,800 | |
| | 4,000 | | | Republic of Lebanon | | | 6.400% | | | | 5/26/23 | | | | B– | | | | 3,385,680 | |
| | 9,000 | | | Total Lebanon | | | | | | | | | | | | | | | 7,608,480 | |
| | | | | |
| | | | Mongolia – 3.6% | | | | | | | | | | | | |
| | | | | |
| | 3,000 | | | Mongolia Government International Bond, 144A, (3) | | | 5.125% | | | | 12/05/22 | | | | B | | | | 2,813,007 | |
| | 1,650 | | | Mongolia Government International Bond, 144A | | | 5.625% | | | | 5/01/23 | | | | B | | | | 1,559,336 | |
| | 4,650 | | | Total Mongolia | | | | | | | | | | | | | | | 4,372,343 | |
| | | | | |
| | | | Nigeria – 1.2% | | | | | | | | | | | | |
| | | | | |
| | 1,500 | | | Nigerian Government International Bond, (3) | | | 5.625% | | | | 6/27/22 | | | | B+ | | | | 1,451,580 | |
| | | | | |
| | | | Pakistan – 0.8% | | | | | | | | | | | | |
| | | | | |
| | 1,000 | | | Third Pakistan International Sukuk Co Ltd., 144A | | | 5.625% | | | | 12/05/22 | | | | B | | | | 944,522 | |
15
| | |
| |
| JEMD | | Nuveen Emerging Markets Debt 2022 Target Term Fund(continued) |
| | Portfolio of Investments December 31, 2018 |
| | | | | | | | | | | | | | | | | | | | |
Principal
Amount (000) | | | Description (1) | | Coupon | | | Maturity | | | Ratings (2) | | | Value | |
| | | | | |
| | | | Paraguay – 0.4% | | | | | | | | | | | | |
| | | | | |
| $ | 500 | | | Republic of Paraguay, 144A, (3) | | | 4.625% | | | | 1/25/23 | | | | Ba1 | | | $ | 500,750 | |
| | | | | |
| | | | Rwanda – 6.9% | | | | | | | | | | | | |
| | | | | |
| | 8,400 | | | Republic of Rwanda, 144A, (3) | | | 6.625% | | | | 5/02/23 | | | | B+ | | | | 8,316,000 | |
| | | | | |
| | | | Senegal – 1.0% | | | | | | | | | | | | |
| | | | | |
| | 925 | | | Republic of Senegal, 144A | | | 8.750% | | | | 5/13/21 | | | | Ba3 | | | | 980,796 | |
| | 235 | | | Republic of Senegal, Reg S | | | 8.750% | | | | 5/13/21 | | | | Ba3 | | | | 249,175 | |
| | 1,160 | | | Total Senegal | | | | | | | | | | | | | | | 1,229,971 | |
| | | | | |
| | | | Sri Lanka – 2.8% | | | | | | | | | | | | |
| | | | | |
| | 600 | | | Republic of Sri Lanka, 144A, (3) | | | 5.875% | | | | 7/25/22 | | | | B | | | | 561,103 | |
| | 3,000 | | | Sri Lanka Government International Bond, 144A, (3) | | | 5.750% | | | | 4/18/23 | | | | B | | | | 2,760,570 | |
| | 3,600 | | | Total Sri Lanka | | | | | | | | | | | | | | | 3,321,673 | |
| | | | | |
| | | | Turkey – 0.8% | | | | | | | | | | | | |
| | | | | |
| | 1,000 | | | Export Credit Bank of Turkey, 144A | | | 4.250% | | | | 9/18/22 | | | | BB– | | | | 903,232 | |
| | | | | |
| | | | Ukraine – 5.8% | | | | | | | | | | | | |
| | | | | |
| | 7,650 | | | Republic of Ukraine, 144A, (3) | | | 7.750% | | | | 9/01/22 | | | | B– | | | | 7,010,154 | |
| | | | | |
| | | | Zambia – 4.4% | | | | | | | | | | | | |
| | | | | |
| | 7,500 | | | Republic of Zambia, 144A, (3) | | | 5.375% | | | | 9/20/22 | | | | B– | | | | 5,362,200 | |
| $ | 99,377 | | | Total Emerging Markets Debt (cost $101,541,425) | | | | | | | | | | | | | | | 89,030,471 | |
| | | | | |
Principal
Amount (000) | | | Description (1) | | Coupon | | | Maturity | | | Ratings (2) | | | Value | |
| | |
| | | | CORPORATE BONDS – 61.5% (45.0% of Total Investments) | | | | | |
| | | | | |
| | | | Banks – 23.8% | | | | | | | | | | | | |
| | | | | |
| $ | 750 | | | Akbank TAS, 144A | | | 5.000% | | | | 10/24/22 | | | | B1 | | | $ | 701,218 | |
| | 600 | | | Banco De Bogota, 144A | | | 5.375% | | | | 2/19/23 | | | | BBB– | | | | 595,500 | |
| | 750 | | | Banco Do Brasil, 144A | | | 5.875% | | | | 1/19/23 | | | | Ba3 | | | | 768,750 | |
| | 2,500 | | | Credit Bank of Moscow Via CBOM Finance PLC, 144A | | | 5.875% | | | | 11/07/21 | | | | BB– | | | | 2,453,780 | |
| | 2,000 | | | Credit Bank of Moscow Via CBOM Finance PLC, 144A | | | 5.550% | | | | 2/14/23 | | | | BB– | | | | 1,871,616 | |
| | 3,900 | | | Kazkommertsbank, 144A | | | 5.500% | | | | 12/21/22 | | | | BB | | | | 3,821,922 | |
| | 4,000 | | | TC Ziraat Bankasi AS, 144A, (3) | | | 5.125% | | | | 5/03/22 | | | | B1 | | | | 3,662,320 | |
| | 1,200 | | | Trade and Development Bank of Mongolia, 144A, (3) | | | 9.375% | | | | 5/19/20 | | | | B | | | | 1,249,225 | |
| | 300 | | | Turkiye IS Bankasi (Isbank), 144A | | | 5.250% | | | | 9/13/22 | | | | BB– | | | | 282,127 | |
| | 5,000 | | | Turkiye IS Bankasi (Isbank), 144A, (3) | | | 6.000% | | | | 10/24/22 | | | | B | | | | 4,137,550 | |
| | 3,304 | | | Turkiye Vakiflar Bankasi T.A.O, 144A | | | 6.000% | | | | 11/01/22 | | | | B | | | | 2,786,798 | |
| | 3,000 | | | United Bank for Africa PLC, 144A, (3) | | | 7.750% | | | | 6/08/22 | | | | B+ | | | | 2,962,380 | |
| | 3,500 | | | Zenith Bank PLC, 144A, (3) | | | 7.375% | | | | 5/30/22 | | | | B+ | | | | 3,470,229 | |
| | 30,804 | | | Total Banks | | | | | | | | | | | | | | | 28,763,415 | |
| | | | | |
| | | | Commercial Services & Supplies – 2.0% | | | | | | | | | | | | |
| | | | | |
| | 2,500 | | | Atento Luxco 1 SA, 144A | | | 6.125% | | | | 8/10/22 | | | | BB | | | | 2,425,000 | |
| | | | | |
| | | | Communications Equipment – 2.7% | | | | | | | | | | | | |
| | | | | |
| | 3,250 | | | IHS Netherlands Holdco B.V, 144A, (3) | | | 9.500% | | | | 10/27/21 | | | | B+ | | | | 3,268,083 | |
| | | | | |
| | | | Diversified Financial Services – 3.5% | | | | | | | | | | | | |
| | | | | |
| | 4,300 | | | Ukreximbank Via Biz Finance PLC, 144A | | | 9.625% | | | | 4/27/22 | | | | B– | | | | 4,206,260 | |
| | | | | |
| | | | Diversified Telecommunication Services – 0.8% | | | | | | | | | | | | |
| | | | | |
| | 1,000 | | | Colombia Telecommunicaciones S.A. ESP, 144A, (3) | | | 5.375% | | | | 9/27/22 | | | | BB+ | | | | 995,000 | |
| | | | | |
| | | | Electric Utilities – 3.9% | | | | | | | | | | | | |
| | | | | |
| | 5,000 | | | Esckom Holdings Limited, 144A, (3) | | | 5.750% | | | | 1/26/21 | | | | B3 | | | | 4,710,240 | |
16
| | | | | | | | | | | | | | | | | | | | |
| | | | | |
Principal
Amount (000) | | | Description (1) | | Coupon | | | Maturity | | | Ratings (2) | | | Value | |
| | | | | |
| | | | Food Products – 2.1% | | | | | | | | | | | | |
| | | | | |
| $ | 2,700 | | | Kernel Holding SA, 144A, (3) | | | 8.750% | | | | 1/31/22 | | | | B+ | | | $ | 2,586,568 | |
| | |
| | | | Independent Power & Renewable Electricity Producers – 1.7% | | | | |
| | | | | |
| | 2,250 | | | Azure Power Energy Ltd, 144A, (3) | | | 5.500% | | | | 11/03/22 | | | | Ba3 | | | | 2,109,825 | |
| | | | | |
| | | | Metals & Mining – 5.3% | | | | | | | | | | | | |
| | | | | |
| | 3,000 | | | Petra Diamonds US Treasury PLC, 144A, (3) | | | 7.250% | | | | 5/01/22 | | | | B | | | | 2,775,000 | |
| | 4,000 | | | Vedanta Resources PLC, 144A, (3) | | | 7.125% | | | | 5/31/23 | | | | B+ | | | | 3,592,000 | |
| | 7,000 | | | Total Metals & Mining | | | | | | | | | | | | | | | 6,367,000 | |
| | | | | |
| | | | Oil, Gas & Consumable Fuels – 6.7% | | | | | | | | | | | | |
| | | | | |
| | 2,000 | | | Azerbaijan State Oil Company, Reg S | | | 4.750% | | | | 3/13/23 | | | | BB+ | | | | 1,990,520 | |
| | 1,500 | | | Medco Straits Services PTE LTD, 144A | | | 8.500% | | | | 8/17/22 | | | | B | | | | 1,461,234 | |
| | 2,800 | | | Petrobras Global Finance BV | | | 4.375% | | | | 5/20/23 | | | | Ba2 | | | | 2,670,836 | |
| | 2,000 | | | Tullow Oil PLC, 144A | | | 6.250% | | | | 4/15/22 | | | | B+ | | | | 1,925,000 | |
| | 8,300 | | | Total Oil, Gas & Consumable Fuels | | | | | | | | | | | | | | | 8,047,590 | |
| | | | | |
| | | | Pharmaceuticals – 0.8% | | | | | | | | | | | | |
| | | | | |
| | 1,100 | | | Teva Pharmaceutical Finance Company B.V., Series D | | | 2.950% | | | | 12/18/22 | | | | BB | | | | 972,743 | |
| | | | | |
| | | | Real Estate Management & Development – 3.9% | | | | | | | | | | | | |
| | | | | |
| | 3,200 | | | China Evergrande Group, Reg S | | | 8.250% | | | | 3/23/22 | | | | B+ | | | | 3,072,474 | |
| | 1,750 | | | Country Garden Holding Company, Reg S | | | 4.750% | | | | 7/25/22 | | | | BBB– | | | | 1,589,214 | |
| | 4,950 | | | Total Real Estate Management & Development | | | | | | | | | | | | | | | 4,661,688 | |
| | | | | |
| | | | Road & Rail – 0.9% | | | | | | | | | | | | |
| | | | | |
| | 1,100 | | | Transnet SOC Limited, 144A | | | 4.000% | | | | 7/26/22 | | | | Baa3 | | | | 1,029,195 | |
| | | | | |
| | | | Wireless Telecommunication Services – 3.4% | | | | | | | | | | | | |
| | | | | |
| | 3,700 | | | Digicel Group, Limited, 144A | | | 7.125% | | | | 4/01/22 | | | | Caa3 | | | | 1,720,500 | |
| | | | | |
| | 2,525 | | | MTN Mauritius Investments Ltd, 144A, (3) | | | 5.373% | | | | 2/13/22 | | | | BB+ | | | | 2,448,720 | |
| | 6,225 | | | Total Wireless Telecommunication Services | | | | | | | | | | | | | | | 4,169,220 | |
| $ | 80,479 | | | Total Corporate Bonds (cost $81,744,510) | | | | | | | | | | | | | | | 74,311,827 | |
| | | | Total Long-Term Investments (cost $183,285,935) | | | | | | | | | | | | | | | 163,342,298 | |
| | | | | |
Principal
Amount (000) | | | Description (1) | | Coupon | | | Maturity | | | Ratings (2) | | | Value | |
| | |
| | | | SHORT-TERM INVESTMENTS – 1.4% (1.0% of Total Investments) | | | | | |
| | | |
| | | | U.S. GOVERNMENT AND AGENCY OBLIGATIONS – 1.4% (1.0% of Total Investments) | | | | | | | |
| | | | | |
| $ | 1,630 | | | Federal Home Loan Bank Discount Notes | | | 0.000% | | | | 1/02/19 | | | | N/R | | | $ | 1,629,903 | |
| | | | Total Short-Term Investments (cost $1,629,903) | | | | | | | | | | | | | | | 1,629,903 | |
| | | | Total Investments (cost $184,915,838) – 136.5% | | | | | | | | | | | | | | | 164,972,201 | |
| | | | Reverse Repurchase Agreements – (38.9)% (4) | | | | | | | | | | | | | | | (47,000,000 | ) |
| | | | Other Assets Less Liabilities – 2.4% | | | | | | | | | | | | | | | 2,898,387 | |
| | | | Net Assets Applicable to Common Shares – 100% | | | | | | | | | | | | | | $ | 120,870,588 | |
17
| | |
| |
| JEMD | | Nuveen Emerging Markets Debt 2022 Target Term Fund(continued) |
| | Portfolio of Investments December 31, 2018 |
Summary of Investments in Emerging Markets Countries
| | | | |
| Ukraine | | | 8.4% | |
| Turkey | | | 7.6% | |
| South Africa | | | 6.6% | |
| Rwanda | | | 5.0% | |
| Nigeria | | | 4.8% | |
| Lebanon | | | 4.6% | |
| Ecuador | | | 4.5% | |
| Iraq | | | 4.3% | |
| El Salvador | | | 4.0% | |
| Argentina | | | 3.7% | |
| Ghana | | | 3.7% | |
| Egypt | | | 3.4% | |
| Zambia | | | 3.3% | |
| Barbados | | | 2.9% | |
| China | | | 2.8% | |
| Mongolia | | | 2.7% | |
| Russia | | | 2.6% | |
| Kazakhstan | | | 2.3% | |
| Bahamas | | | 2.2% | |
| | | | |
| Brazil | | | 2.1% | |
| Sri Lanka | | | 2.0% | |
| Mauritius | | | 2.0% | |
| Costa Rica | | | 1.3% | |
| India | | | 1.3% | |
| Azerbaijan | | | 1.2% | |
| Bermuda | | | 1.0% | |
| Bahrain | | | 1.0% | |
| Indonesia | | | 0.9% | |
| Senegal | | | 0.7% | |
| Honduras | | | 0.6% | |
| Pakistan | | | 0.6% | |
| Belarus | | | 0.5% | |
| Dominican Republic | | | 0.4% | |
| Colombia | | | 0.3% | |
| Paraguay | | | 0.3% | |
Total Emerging Markets Countries | | | 95.6% | |
Total Developed Countries | | | 4.4% | |
Total Investments | | | 100% | |
For Fund portfolio compliance purposes, the Fund’s industry classifications refer to any one or more of the industrysub-classifications used by one or more widely recognized market indexes or ratings group indexes, and/or as defined by Fund management. This definition may not apply for purposes of this report, which may combine industrysub-classifications into sectors for reporting ease.
| (1) | All percentages shown in the Portfolio of Investments are based on net assets applicable to common shares unless otherwise noted. |
| (2) | For financial reporting purposes, the ratings disclosed are the highest of Standard & Poor’s Group (“Standard & Poor’s”), Moody’s Investors Service, Inc. (“Moody’s”) or Fitch, Inc. (“Fitch”) rating. This treatment of split-rated securities may differ from that used for other purposes, such as for Fund investment policies. Ratings below BBB by Standard & Poor’s, Baa by Moody’s or BBB by Fitch are considered to be below investment grade. Holdings designated N/R are not rated by any of these national rating agencies. Ratings are not covered by the report of independent registered public accounting firm. |
| (3) | Investment, or portion of investment, has been pledged to collateralize the net payment obligations for investments in reverse repurchase agreements. |
| (4) | Reverse repurchase agreements as a percentage of Total Investments is 28.5%. |
| 144A | Investment is exempt from registration under Rule 144A of the Securities Act of 1933, as amended. These investments may only be resold in transactions exempt from registration, which are normally those transactions with qualified institutional buyers. |
| Reg S | Regulation S allows U.S. companies to sell securities to persons or entities located outside of the United States without registering those securities with the Securities and Exchange Commission. Specifically, Regulation S provides a safe harbor from the registration requirements of the Securities Act for the offers and sales of securities by both foreign and domestic issuers that are made outside the United States. |
See accompanying notes to financial statements.
18
Statement of Assets and Liabilities
December 31, 2018
| | | | |
Assets | | | | |
Long-term investments, at value (cost $183,285,935) | | $ | 163,342,298 | |
Short-term investments, at value (cost approximates value) | | | 1,629,903 | |
Receivable for interest | | | 3,289,100 | |
Other assets | | | 1,237 | |
Total assets | | | 168,262,538 | |
Liabilities | | | | |
Reverse repurchase agreements | | | 47,000,000 | |
Cash overdraft | | | 101,904 | |
Accrued expenses: | | | | |
Interest | | | 86,106 | |
Management fees | | | 137,026 | |
Trustees fees | | | 1,067 | |
Other | | | 65,847 | |
Total liabilities | | | 47,391,950 | |
Net assets applicable to common shares | | $ | 120,870,588 | |
Common shares outstanding | | | 14,235,550 | |
Net asset value (“NAV”) per common share outstanding | | $ | 8.49 | |
Net assets applicable to common shares consist of: | | | | |
Common shares, $0.01 par value per share | | $ | 142,356 | |
Paid-in surplus | | | 139,777,946 | |
Total distributable earnings | | | (19,049,714 | ) |
Net assets applicable to common shares | | $ | 120,870,588 | |
Authorized common shares | | | Unlimited | |
See accompanying notes to financial statements.
19
Statement of Operations
Year Ended December 31, 2018
| | | | |
Investment Income | | $ | 10,814,821 | |
Expenses | | | | |
Management fees | | | 1,691,015 | |
Interest expense | | | 1,220,091 | |
Custodian fees | | | 33,888 | |
Trustees fees | | | 4,503 | |
Professional fees | | | 81,266 | |
Shareholder reporting expenses | | | 25,592 | |
Shareholder servicing agent fees | | | 167 | |
Stock exchange listing fees | | | 6,771 | |
Investor relations expense | | | 12,434 | |
Other | | | 5,415 | |
Total expenses | | | 3,081,142 | |
Net investment income (loss) | | | 7,733,679 | |
Realized and Unrealized Gain (Loss) | | | | |
Net realized gain (loss) from investments | | | (37,508 | ) |
Change in net unrealized appreciation (depreciation) of investments | | | (19,642,595 | ) |
Net realized and unrealized gain (loss) | | | (19,680,103 | ) |
Net increase (decrease) in net assets from operations | | $ | (11,946,424 | ) |
See accompanying notes to financial statements.
20
Statement of Changes in Net Assets
| | | | | | | | |
| | | Year Ended 12/31/18 | | | For the period September 26, 2017(1)
(commencement of operations)
through December 31, 2017 | |
Operations | | | | | | | | |
Net investment income (loss) | | $ | 7,733,679 | | | $ | 1,655,173 | |
Net realized gain (loss) from investments | | | (37,508 | ) | | | 25,841 | |
Change in net unrealized appreciation (depreciation) of investments | | | (19,642,595 | ) | | | (301,042 | ) |
Net increase (decrease) in net assets applicable to common shares from operations | | | (11,946,424 | ) | | | 1,379,972 | |
Distributions to Common Shareholders(2) | | | | | | | | |
Dividends(3) | | | (7,260,130 | ) | | | (1,238,476 | ) |
Decrease in net assets applicable to common shares from distributions to common shareholders | | | (7,260,130 | ) | | | (1,238,476 | ) |
Capital Share Transactions | | | | | | | | |
Proceeds from sale of common shares, net of offering costs | | | — | | | | 139,831,750 | |
Proceeds from common shares issued to shareholders due to reinvestment of distributions | | | — | | | | 3,820 | |
Net increase (decrease) in net assets applicable to common shares from capital share transactions | | | — | | | | 139,835,570 | |
Net increase (decrease) in net assets applicable to common shares | | | (19,206,554 | ) | | | 139,977,066 | |
Net assets applicable to common shares at the beginning of period | | | 140,077,142 | | | | 100,076 | |
Net assets applicable to common shares at the end of period | | $ | 120,870,588 | | | $ | 140,077,142 | |
| (1) | Prior period amounts have been conformed to current year presentation. See Notes to Financial Statements, Note 10 – New Accounting Pronouncements for further details. |
| (2) | The composition and per share amounts of the Fund’s distributions are presented in the Financial Highlights. The distribution information for the Fund as of its most recent tax year end is presented within the Notes to Financial Statements, Note 6 – Income Tax Information. |
| (3) | For the period September 26, 2017 (commencement of operations) through December 31, 2017, the Fund’s distributions to shareholders were paid from net investment income and accumulated net realized gains. |
See accompanying notes to financial statements.
21
Statement of Cash Flows
Year Ended December 31, 2018
| | | | |
Cash Flows from Operating Activities: | | | | |
Net Increase (Decrease) in Net Assets Applicable to Common Shares from Operations | | $ | (11,946,424 | ) |
Adjustments to reconcile the net increase (decrease) in net assets applicable to common shares from operations
to net cash provided by (used in) operating activities: | | | | |
Purchases of investments | | | (12,816,005 | ) |
Proceeds from sales and maturities of investments | | | 12,671,550 | |
Proceeds from (Purchases of) short-term investments, net | | | (1,629,903 | ) |
Taxes paid | | | (15,344 | ) |
Amortization (Accretion) of premiums and discounts, net | | | 989,067 | |
(Increase) Decrease in: | | | | |
Receivable for interest | | | 104,654 | |
Receivable for investments sold | | | 421,179 | |
Other assets | | | (1,237 | ) |
Increase (Decrease) in: | | | | |
Payable for investments purchased | | | (1,133,291 | ) |
Accrued interest | | | 24,372 | |
Accrued management fees | | | (15,159 | ) |
Accrued Trustees fees | | | (425 | ) |
Accrued other expenses | | | (7,036 | ) |
Net realized (gain) loss from investments | | | 37,508 | |
Change in net unrealized (appreciation) depreciation of investments | | | 19,642,595 | |
Net cash provided by (used in) operating activities | | | 6,326,101 | |
Cash Flows from Financing Activities: | | | | |
Cash distributions paid to common shareholders | | | (7,260,130 | ) |
Increase (Decrease) in cash overdraft | | | 101,904 | |
Net cash provided by (used in) financing activities | | | (7,158,226 | ) |
Net Increase (Decrease) in Cash | | | (832,125 | ) |
Cash at the beginning of period | | | 832,125 | |
Cash at the end of period | | $ | — | |
| |
| Supplemental Disclosure of Cash Flow Information | | | |
Cash paid for interest (excluding costs) | | $ | 1,195,719 | |
See accompanying notes to financial statements.
22
THIS PAGE INTENTIONALLY LEFT BLANK
23
Financial Highlights
Selected data for a common share outstanding throughout each period:
| | | | | | | | | | | | | | | | | | | | | | | | | | | | | | | | | | | | | | | | |
| | | | | | | | | | | | | | | | |
| | | | | | Investment Operations | | | Less Distributions to
Common Shareholders | | | | | | Common Share | |
| | | Beginning
Common
Share
NAV | | | Net
Investment
Income (Loss)(a) | | | Net
Realized/
Unrealized
Gain (Loss) | | | Total | | | From Net
Investment
Income | | | From
Accumulated
Net Realized
Gains | | | Total | | | Offering
Costs | | | Ending
NAV | | | Ending
Share
Price | |
Year Ended 12/31: | |
2018 | | $ | 9.84 | | | $ | 0.54 | | | $ | (1.38 | ) | | $ | (0.84 | ) | | $ | (0.51 | ) | | $ | — | | | $ | (0.51 | ) | | $ | — | | | $ | 8.49 | | | $ | 7.63 | |
2017(e) | | | 9.85 | | | | 0.12 | | | | (0.02 | ) | | | 0.10 | | | | (0.09 | ) | | | — | * | | | (0.09 | ) | | | (0.02 | ) | | | 9.84 | | | | 9.40 | |
24
| | | | | | | | | | | | | | | | | | | | | | |
| | | | | | | Common Share Supplemental Data/
Ratios Applicable to Common Shares | |
Common Share
Total Returns | | | | | | Ratios to Average Net Assets(c) | | | | |
Based
on
NAV(b) | | | Based
on
Share
Price(b) | | | Ending
Net
Assets
(000) | | | Expenses | | | Net
Investment
Income (Loss) | | | Portfolio
Turnover
Rate(d) | |
| | | | | | | | | | | | | | | | | | | | | | |
| | (8.71 | )% | | | (13.85 | )% | | $ | 120,871 | | | | 2.38 | % | | | 5.98 | % | | | 9 | % |
| | 0.79 | | | | (5.15 | ) | | | 140,077 | | | | 1.85 | ** | | | 4.70 | ** | | | 7 | |
| (a) | Per share Net Investment Income (Loss) is calculated using the average daily shares method. |
| (b) | Total Return Based on Common Share NAV is the combination of changes in common share NAV, reinvested dividend income at NAV and reinvested capital gains distributions at NAV, if any. The last dividend declared in the period, which is typically paid on the first business day of the following month, is assumed to be reinvested at the ending NAV. The actual reinvest price for the last dividend declared in the period may often be based on the Fund’s market price (and not its NAV), and therefore may be different from the price used in the calculation. Total returns are not annualized. |
Total Return Based on Common Share Price is the combination of changes in the market price per share and the effect of reinvested dividend income and reinvested capital gains distributions, if any, at the average price paid per share at the time of reinvestment. The last dividend declared in the period, which is typically paid on the first business day of the following month, is assumed to be reinvested at the ending market price. The actual reinvestment for the last dividend declared in the period may take place over several days, and in some instances may not be based on the market price, so the actual reinvestment price may be different from the price used in the calculation. Total returns are not annualized.
| | | | |
| (c) | | • | | Net Investment Income (Loss) ratios reflect income earned and expense incurred on assets attributable to reverse repurchase agreements (as described in Note 8 – Fund Leverage, Reverse Repurchase Agreements), where applicable. |
| | • | | Each ratio includes the effect of all interest expenses paid and other costs related to reverse repurchase agreements, where applicable, as follows: |
| | | | |
Ratio of Interest Expense to Average Net Assets Applicable to Common Shares | |
Year Ended 12/31: | |
2018 | | | 0.94 | % |
2017(e) | | | 0.48 | ** |
| (d) | Portfolio Turnover Rate is calculated based on the lesser of long-term purchases or sales (as disclosed in Note 5 – Investment Transactions) divided by the average long-term market value during the period. |
| (e) | For the period September 26, 2017 (commencement of operations) through December 31, 2017. |
| * | Rounds to less than $0.01 per share. |
See accompanying notes to financial statements.
25
Notes to Financial Statements
1. General Information and Significant Accounting Policies
General Information
Fund Information
Nuveen Emerging Markets Debt 2022 Target Term Fund (the “Fund”) is registered under the Investment Company Act of 1940, as amended, as anon-diversified,closed-end management investment company. The Fund’s shares are listed on the New York Stock Exchange (“NYSE”) and trade under the ticker symbol “JEMD.” The Fund was organized as a Massachusetts business trust on June 1, 2017.
The end of the reporting period for the Fund is December 31, 2018, and the period covered by these Notes to Financial Statements is for the fiscal year ended December 31, 2018 (the “current fiscal period”).
Investment Adviser
The Fund’s investment adviser is Nuveen Fund Advisors, LLC (the “Adviser”), a subsidiary of Nuveen, LLC (“Nuveen”). Nuveen is the investment management arm of Teachers Insurance and Annuity Association of America (TIAA). The Adviser has overall responsibility for management of the Fund, oversees the management of the Fund’s portfolio, manages the Fund’s business affairs and provides certain clerical, bookkeeping and other administrative services, and, if necessary, asset allocation decisions. The Adviser has entered into asub-advisory agreement with Teachers Advisors, LLC (the“Sub-Adviser”), an affiliate of the Adviser, under which theSub-Adviser manages the Fund’s investment portfolio.
Investment Objectives and Principal Investment Strategies
The Fund seeks to provide a high level of current income and return the original $9.85 net asset value (“NAV”) per share on or about December 1, 2022 (the “Termination Date”). The Fund generally invests in a portfolio of below investment grade emerging market debt securities. At least 80% of the Fund’s managed assets (as defined in Note 7 – Management Fees) will be in emerging market debt securities. However, the Fund invests no more than 10% of its managed assets in securities rated belowB-/B3 or that are unrated but judged by the Sub-Adviser to be of comparable quality. The Fund invests 100% of its managed assets in U.S. dollar denominated securities. No more than 25% is invested in securities of issuers located in a single country.
Significant Accounting Policies
The Fund is an investment company and follows accounting and reporting guidance under Financial Accounting Standards Board (“FASB”) Accounting Standards Codification (ASC) Topic 946 “Financial Services-Investment Companies.” The following is a summary of significant accounting policies followed by the Fund in the preparation of its financial statements in accordance with U.S. generally accepted accounting principles (“U.S. GAAP”).
Investment Transactions
Investment transactions are recorded on a trade date basis. Realized gains and losses from investment transactions are determined on the specific identification method, which is the same basis used for federal income tax purposes. Investments purchased on a when-issued/delayed delivery basis may have extended settlement periods. Any investments so purchased are subject to market fluctuation during this period. The Fund has earmarked securities in its portfolio with a current value at least equal to the amount of the when-issued/delayed delivery purchase commitments.
As of the end of the reporting period, the Fund did not have any outstanding when-issued/delayed delivery purchase commitments.
Investment Income
Investment income is comprised of interest income, which reflects the amortization of premiums and accretion of discounts for financial reporting purposes, and is recorded on an accrual basis. Investment income also reflectspayment-in-kind (“PIK”) interest, fees earned from reverse repurchase agreements and paydown gains and losses, if any. PIK interest represents income received in the form of securities in lieu of cash.
Professional Fees
Professional fees presented on the Statement of Operations consist of legal fees incurred in the normal course of operations, audit fees, tax consulting fees and, in some cases, workout expenditures. Workout expenditures are incurred in an attempt to protect or enhance an investment or to pursue other claims or legal actions on behalf of Fund shareholders. If a refund is received for workout expenditures paid in a prior reporting period, such amounts will be recognized as “Legal fee refund” on the Statement of Operations.
26
Dividends and Distributions to Common Shareholders
Dividends to common shareholders, if any, are declared monthly. Net realized capital gains from investment transactions, if any, are declared and distributed to shareholders at least annually. However, in seeking to achieve its investment objectives, the Fund currently intends to set aside and retain in its net assets (and therefore its NAV) a portion of its net investment income, and possibly all or a portion of its gains. This will reduce the amounts otherwise available for distribution prior to the liquidation of the Fund, and the Fund may incur taxes on such retained amount. Such retained income or gains, net of any taxes, would constitute a portion of the liquidating distribution returned to investors on or about the Termination Date. Furthermore, capital gains are distributed only to the extent they exceed available capital loss carryforwards.
Distributions to common shareholders are recorded on theex-dividend date. The amount and timing of distributions are determined in accordance with federal income tax regulations, which may differ from U.S. GAAP.
Compensation
The Fund pays no compensation directly to those of its trustees who are affiliated with the Adviser or to its officers, all of whom receive renumeration for their services to the Fund from the Adviser or its affiliates. The Fund’s Board of Trustees (the “Board”) has adopted a deferred compensation plan for independent trustees that enables trustees to elect to defer receipt of all or a portion of the annual compensation they are entitled to receive from certain Nuveen-advised funds. Under the plan, deferred amounts are treated as though equal dollar amounts had been invested in shares of select Nuveen-advised funds.
Indemnifications
Under the Fund’s organizational documents, its officers and trustees are indemnified against certain liabilities arising out of the performance of their duties to the Fund. In addition, in the normal course of business, the Fund enters into contracts that provide general indemnifications to other parties. The Fund’s maximum exposure under these arrangements is unknown as this would involve future claims that may be made against the Fund that have not yet occurred. However, the Fund has not had prior claims or losses pursuant to these contracts and expects the risk of loss to be remote.
Netting Agreements
In the ordinary course of business, the Fund may enter into transactions subject to enforceable master repurchase agreements, International Swaps and Derivatives Association, Inc. (ISDA) master agreements or other similar arrangements (“netting agreements”). Generally, the right to offset in netting agreements allows the Fund to offset certain securities and derivatives with a specific counterparty, when applicable, as well as any collateral received or delivered to that counterparty based on the terms of the agreements. Generally, the Fund manages its cash collateral and securities collateral on a counterparty basis.
The Fund’s investments subject to netting agreements as of the end of the reporting period, if any, are further described in Note 3 – Portfolio Securities and Investments in Derivatives.
Use of Estimates
The preparation of financial statements in conformity with U.S. GAAP requires management to make estimates and assumptions that affect the reported amounts of assets and liabilities at the date of the financial statements and the reported amounts of increases and decreases in net assets applicable to common shares from operations during the current fiscal period. Actual results may differ from those estimates.
2. Investment Valuation and Fair Value Measurements
The fair valuation input levels as described below are for fair value measurement purposes.
Fair value is defined as the price that would be received upon selling an investment or transferring a liability in an orderly transaction to an independent buyer in the principal or most advantageous market for the investment. A three-tier hierarchy is used to maximize the use of observable market data and minimize the use of unobservable inputs and to establish classification of fair value measurements for disclosure purposes. Observable inputs reflect the assumptions market participants would use in pricing the asset or liability. Observable inputs are based on market data obtained from sources independent of the reporting entity. Unobservable inputs reflect the reporting entity’s own assumptions about the assumptions market participants would use in pricing the asset or liability. Unobservable inputs are based on the best information available in the circumstances. The following is a summary of the three-tiered hierarchy of valuation input levels.
| | | | |
| Level 1 – | | Inputs are unadjusted and prices are determined using quoted prices in active markets for identical securities. |
| Level 2 – | | Prices are determined using other significant observable inputs (including quoted prices for similar securities, interest rates, credit spreads, etc.). |
| Level 3 – | | Prices are determined using significant unobservable inputs (including management’s assumptions in determining the fair value of investments). |
27
Notes to Financial Statements(continued)
Prices of fixed-income securities are provided by an independent pricing service (“pricing service”) approved by the Board. The pricing service establishes a security’s fair value using methods that may include consideration of the following: yields or prices of investments of comparable quality, type of issue, coupon, maturity and rating, market quotes or indications of value from security dealers, evaluations of anticipated cash flows or collateral, general market conditions and other information and analysis, including the obligor’s credit characteristics considered relevant. These securities are generally classified as Level 2. In pricing certain securities, particularly less liquid and lower quality securities, the pricing service may consider information about a security, its issuer or market activity provided by the Adviser. These securities are generally classified as Level 2 or Level 3 depending on the observability of the significant inputs.
Certain securities may not be able to be priced by thepre-established pricing methods as described above. Such securities may be valued by the Board and/or its appointee at fair value. These securities generally include, but are not limited to, restricted securities (securities which may not be publicly sold without registration under the Securities Act of 1933, as amended) for which a pricing service is unable to provide a market price; securities whose trading has been formally suspended; debt securities that have gone into default and for which there is no current market quotation; a security whose market price is not available from apre-established pricing source; a security with respect to which an event has occurred that is likely to materially affect the value of the security after the market has closed but before the calculation of the Fund’s NAV (as may be the case innon-U.S. markets on which the
security is primarily traded) or make it difficult or impossible to obtain a reliable market quotation; and a security whose price, as provided by the pricing service, is not deemed to reflect the security’s fair value. As a general principle, the fair value of a security would appear to be the amount that the owner might reasonably expect to receive for it in a current sale. A variety of factors may be considered in determining the fair value of such securities, which may include consideration of the following: yields or prices of investments of comparable quality, type of issue, coupon, maturity and rating, market quotes or indications of value from security dealers, evaluations of anticipated cash flows or collateral, general market conditions and other information and analysis, including the obligor’s credit characteristics considered relevant. These securities are generally classified as Level 2 or Level 3 depending on the observability of the significant inputs. Regardless of the method employed to value a particular security, all valuations are subject to review by the Board and/or its appointee.
The inputs or methodologies used for valuing securities are not an indication of the risks associated with investing in those securities. The following is a summary of the Fund’s fair value measurements as of the end of the reporting period:
| | | | | | | | | | | | | | | | |
| | | Level 1 | | | Level 2 | | | Level 3 | | | Total | |
Long-Term Investments*: | | | | | | | | | | | | | | | | |
Emerging Markets Debt | | $ | — | | | $ | 89,030,471 | | | $ | — | | | $ | 89,030,471 | |
Corporate Bonds | | | — | | | | 74,311,827 | | | | — | | | | 74,311,827 | |
| | | | |
Short-Term Investments: | | | | | | | | | | | | | | | | |
U.S. Government and Agency Obligations | | | — | | | | 1,629,903 | | | | — | | | | 1,629,903 | |
Total | | $ | — | | | $ | 164,972,201 | | | $ | — | | | $ | 164,972,201 | |
| * | Refer to the Fund’s Portfolio of Investments for industry and country classifications, where applicable. |
3. Portfolio Securities and Investments in Derivatives
Portfolio Securities
Zero Coupon Securities
A zero coupon security does not pay a regular interest coupon to its holders during the life of the security. Income to the holder of the security comes from accretion of the difference between the original purchase price of the security at issuance and the par value of the security at maturity and is effectively paid at maturity. The market prices of zero coupon securities generally are more volatile than the market prices of securities that pay interest periodically.
Investments in Derivatives
The Fund is authorized to invest in certain derivative instruments, such as futures, options and swap contracts. The Fund limits its investments in futures, options on futures and swap contracts to the extent necessary for the Adviser to claim the exclusion from registration by the Commodity Futures Trading Commission as a commodity pool operator with respect to the Fund. The Fund records derivative instruments at fair value, with changes in fair value recognized on the Statement of Operations, when applicable. Even though the Fund’s investments in derivatives may represent economic hedges, they are not considered to be hedge transactions for financial reporting purposes.
Although the Fund is authorized to invest in derivative instruments, and may do so in the future, it did not make any such investments during the current fiscal period.
28
Market and Counterparty Credit Risk
In the normal course of business the Fund may invest in financial instruments and enter into financial transactions where risk of potential loss exists due to changes in the market (market risk) or failure of the other party to the transaction to perform (counterparty credit risk). The potential loss could exceed the value of the financial assets recorded on the financial statements. Financial assets, which potentially expose the Fund to counterparty credit risk, consist principally of cash due from counterparties on forward, option and swap transactions, when applicable. The extent of the Fund’s exposure to counterparty credit risk in respect to these financial assets approximates their carrying value as recorded on the Statement of Assets and Liabilities.
The Fund helps manage counterparty credit risk by entering into agreements only with counterparties the Adviser believes have the financial resources to honor their obligations and by having the Adviser monitor the financial stability of the counterparties. Additionally, counterparties may be required to pledge collateral daily (based on the daily valuation of the financial asset) on behalf of the Fund with a value approximately equal to the amount of any unrealized gain above apre-determined threshold. Reciprocally, when the Fund has an unrealized loss, the Fund has instructed the custodian to pledge assets of the Fund as collateral with a value approximately equal to the amount of the unrealized loss above apre-determined threshold. Collateral pledges are monitored and subsequently adjusted if and when the valuations fluctuate, either up or down, by at least thepre-determined threshold amount.
4. Fund Shares
Common Share Transactions
Transactions in common shares during the Fund’s current and prior fiscal period were as follows:
| | | | | | | | |
| | | Year Ended 12/31/18 | | | For the Period 9/26/17
(commencement of operations)
through 12/31/17 | |
Common Shares:* | | | | | | | | |
Sold | | | — | | | | 14,225,000 | |
Issued to shareholders due to reinvestment of distributions | | | — | | | | 390 | |
Total | | | — | | | | 14,225,390 | |
| * | Prior to the commencement of operations, the Adviser purchased 10,160 common shares, which are still held as of the end of the reporting period. |
5. Investment Transactions
Long-term purchases and sales (including maturities) during the current fiscal period aggregated $12,816,005 and $12,671,550, respectively.
6. Income Tax Information
The Fund intends to distribute substantially all of its net investment company taxable income to shareholders and to otherwise comply with the requirements of Subchapter M of the Internal Revenue Code applicable to regulated investment companies. In any year when the Fund realizes net capital gains, the Fund may choose to distribute all or a portion of its net capital gains to shareholders, or alternatively, to retain all or a portion of its net capital gains and pay federal corporate income taxes on such retained gains.
For all open tax years and all major taxing jurisdictions, management of the Fund has concluded that there are no significant uncertain tax positions that would require recognition in the financial statements. Open tax years are those that are open for examination by taxing authorities (i.e., generally the last four tax year ends and the interim tax period since then). Furthermore, management of the Fund is also not aware of any tax positions for which it is reasonably possible that the total amounts of unrecognized tax benefits will significantly change in the next twelve months.
The following information is presented on an income tax basis. Differences between amounts for financial statement and federal income tax purposes are primarily due to timing differences in recognizing certain gains and losses on investment transactions. To the extent that differences arise that are permanent in nature, such amounts are reclassified within the capital accounts as detailed below. Temporary differences do not require reclassification. Temporary and permanent differences do not impact the NAV of the Fund.
The table below presents the cost and unrealized appreciation (depreciation) of the Fund’s investment portfolio, as determined on a federal income tax basis, as of December 31, 2018.
| | | | |
Tax cost of investments | | | $184,915,838 | |
Gross unrealized: | | | | |
Appreciation | | $ | 2,273 | |
Depreciation | | | (19,945,910 | ) |
Net unrealized appreciation (depreciation) of investments | | $ | (19,943,637 | ) |
29
Notes to Financial Statements (continued)
Permanent differences, primarily due to federal taxes paid, resulted in reclassifications among the Fund’s components of net assets as of December 31, 2018, the Fund’s tax year end.
The tax components of undistributed net ordinary income and net long-term capital gains as of December 31, 2018, the Fund’s tax year end, were as follows:
| | | | |
Undistributed net ordinary income1 | | $ | 916,087 | |
Undistributed net long-term capital gains | | | — | |
|
1 Net ordinary income consists of net taxable income derived from dividends, interest, and net short-term capital gains, if any. | |
The tax character of distributions paid during the Fund’s tax years ended December 31, 2018 and December 31, 2017 was designated for purposes of the dividends paid deduction as follows:
| | | | |
| 2018 | | | |
Distributions from net ordinary income¹ | | $ | 7,260,130 | |
Distributions from net long-term capital gains | | | — | |
| |
| 2017 | | | |
Distributions from net ordinary income¹ | | $ | 1,238,476 | |
Distributions from net long-term capital gains | | | — | |
|
1 Net ordinary income consists of net taxable income derived from dividends, interest, and net short-term capital gains, if any. | |
As of December 31, 2018, the Fund’s tax year end, the Fund had unused capital losses carrying forward available for federal income tax purposes to be applied against future capital gains, if any. The capital losses are not subject to expiration.
| | | | |
Not subject to expiration: | | | | |
Short-term | | $ | 22,164 | |
Long-term | | | — | |
Total | | $ | 22,164 | |
7. Management Fees
The Fund’s management fee compensates the Adviser for overall investment advisory and administrative services and general office facilities. TheSub-Adviser is compensated for its services to the Fund from the management fees paid to the Adviser.
The Fund’s management fee consists of two components – a fund-level fee, based only on the amount of assets within the Fund, and a complex-level fee, based on the aggregate amount of all eligible fund assets managed by the Adviser. This pricing structure enables Fund shareholders to benefit from growth in the assets within the Fund as well as from growth in the amount of complex-wide assets managed by the Adviser.
The annual fund-level fee, payable monthly, is calculated according to the following schedule:
| | | | |
| Average Daily Managed Assets* | | Fund-Level Fee Rate | |
For the first $500 million | | | 0.8000 | % |
For the next $250 million | | | 0.7875 | |
For managed assets over $750 million | | | 0.7750 | |
30
The annual complex-level fee, payable monthly, is calculated by multiplying the current complex-wide fee rate, determined according to the following schedule by the Fund’s daily managed assets:
| | | | |
| Complex-Level Eligible Asset Breakpoint Level* | | Effective Complex-Level Fee Rate at Breakpoint Level | |
$55 billion | | | 0.2000 | % |
$56 billion | | | 0.1996 | |
$57 billion | | | 0.1989 | |
$60 billion | | | 0.1961 | |
$63 billion | | | 0.1931 | |
$66 billion | | | 0.1900 | |
$71 billion | | | 0.1851 | |
$76 billion | | | 0.1806 | |
$80 billion | | | 0.1773 | |
$91 billion | | | 0.1691 | |
$125 billion | | | 0.1599 | |
$200 billion | | | 0.1505 | |
$250 billion | | | 0.1469 | |
$300 billion | | | 0.1445 | |
| * | For the complex-level fees, managed assets includeclosed-end fund assets managed by the Adviser that are attributable to certain types of leverage. For these purposes, leverage includes the funds’ use of preferred stock and borrowings and certain investments in the residual interest certificates (also called inverse floating rate securities) in tender option bond (TOB) trusts, including the portion of assets held by a TOB trust that has been effectively financed by the trust’s issuance of floating rate securities, subject to an agreement by the Adviser as to certain funds to limit the amount of such assets for determining managed assets in certain circumstances. The complex-level fee is calculated based upon the aggregate daily managed assets of all Nuveen open-end and closed-end Funds that constitute “eligible assets.” Eligible assets do not include assets attributable to investments in other Nuveen Funds or assets in excess of a determined amount (originally $2 billion) added to the Nuveen fund complex in connection with the Adviser’s assumption of the management of the former First American Funds effective January 1, 2011. As of December 31, 2018, the complex-level fee for the Fund was 0.1602%. |
8. Fund Leverage
Reverse Repurchase Agreements
During the current fiscal period, the Fund used reverse repurchase agreements as a means of leverage.
In a reverse repurchase agreement, the Fund sells to a counterparty a security that it holds with a contemporaneous agreement to repurchase the same security at an agreed-upon price and date, with the Fund retaining the risk of loss that is associated with that security. The Fund segregates or identifies on its books and records cash or other unencumbered liquid assets that have a market value at least equal to the amount of its future repurchase obligations, which enables the Fund to exclude reverse repurchase agreements from being treated as a senior securities under the 1940 Act. Securities sold under reverse repurchase agreements are recorded as a liability and recognized as “Reverse repurchase agreements” on the Statement of Assets and Liabilities.
Payments made on reverse repurchase agreements are recognized as a component of “Interest expense” on the Statement of Operations.
As of the end of the reporting period, the Fund’s outstanding balances on its reverse repurchase agreements were as follows:
| | | | | | | | | | | | | | | | | | | | |
| Counterparty | | Coupon | | | Principal
Amount | | | Maturity | | | Value | | | Value and
Accrued Interest | |
JP Morgan Chase Bank N.A. | | | 3.090 | % | | $ | (25,000,000 | ) | | | N/A | | | $ | (25,000,000 | ) | | $ | (25,023,604 | ) |
Societe Generale | | | 3.150 | | | | (22,000,000 | ) | | | N/A | | | | (22,000,000 | ) | | | (22,062,502 | ) |
| | | | | | | $ | (47,000,000 | ) | | | | | | $ | (47,000,000 | ) | | $ | (47,086,106 | ) |
N/A – Maturity is not applicable. The final repurchase date will be established following pre-specified advance notice by the Fund or the counterparty to the reverse repurchase agreement.
During the current fiscal period, the average daily balance outstanding and average interest rate on the Fund’s reverse repurchase agreements were as follows:
| | | | |
Average daily balance outstanding | | | $47,000,000 | |
Average interest rate | | | 2.60 | % |
31
Notes to Financial Statements(continued)
The following table presents the reverse repurchase agreements subject to netting agreements and the collateral delivered related to those reverse repurchase agreements.
| | | | | | | | | | | | |
| Counterparty | | Reverse Repurchase*
Agreements | | | Collateral Pledged**
to Counterparty | | | Net
Exposure | |
JP Morgan Chase Bank N.A. | | $ | (25,023,604 | ) | | $ | 25,023,604 | | | $ | — | |
Societe General | | | (22,062,502 | ) | | | 22,062,502 | | | | — | |
| | | $ | (47,086,106 | ) | | $ | 47,086,106 | | | $ | — | |
| * | Represents gross value and accrued interest for the counterparty as reported in the preceding table. |
| ** | As of the end of the reporting period, the value of the collateral pledged to the counterparty exceeded the value of the reverse repurchase agreements. |
9. Inter-Fund Lending
Inter-Fund Borrowing and Lending
The Securities and Exchange Commission (“SEC”) has granted an exemptive order permitting registeredopen-end andclosed-end Nuveen funds to participate in an inter-fund lending facility whereby the Nuveen funds may directly lend to and borrow money from each other for temporary purposes (e.g., to satisfy redemption requests or when a sale of securities “fails,” resulting in an unanticipated cash shortfall) (the “Inter-Fund Program”). Theclosed-end Nuveen funds, including the Fund covered by this shareholder report, will participate only as lenders, and not as borrowers, in the Inter-Fund Program because suchclosed-end funds rarely, if ever, need to borrow cash to meet redemptions. The Inter-Fund Program is subject to a number of conditions, including, among other things, the requirements that (1) no fund may borrow or lend money through the Inter-Fund Program unless it receives a more favorable interest rate than is typically available from a bank or other financial institution for a comparable transaction; (2) no fund may borrow on an unsecured basis through the Inter-Fund Program unless the fund’s outstanding borrowings from all sources immediately after the inter-fund borrowing total 10% or less of its total assets; provided that if the borrowing fund has a secured borrowing outstanding from any other lender, including but not limited to another fund, the inter-fund loan must be secured on at least an equal priority basis with at least an equivalent percentage of collateral to loan value; (3) if a fund’s total outstanding borrowings immediately after an inter-fund borrowing would be greater than 10% of its total assets, the fund may borrow through the inter-fund loan on a secured basis only; (4) no fund may lend money if the loan would cause its aggregate outstanding loans through the Inter-Fund Program to exceed 15% of its net assets at the time of the loan; (5) a fund’s inter-fund loans to any one fund shall not exceed 5% of the lending fund’s net assets; (6) the duration of inter-fund loans will be limited to the time required to receive payment for securities sold, but in no event more than seven days; and (7) each inter-fund loan may be called on one business day’s notice by a lending fund and may be repaid on any day by a borrowing fund. In addition, a Nuveen fund may participate in the Inter-Fund Program only if and to the extent that such participation is consistent with the fund’s investment objective and investment policies. The Board is responsible for overseeing the Inter-Fund Program.
The limitations detailed above and the other conditions of the SEC exemptive order permitting the Inter-Fund Program are designed to minimize the risks associated with Inter-Fund Program for both the lending fund and the borrowing fund. However, no borrowing or lending activity is without risk. When a fund borrows money from another fund, there is a risk that the loan could be called on one day’s notice or not renewed, in which case the fund may have to borrow from a bank at a higher rate or take other actions to payoff such loan if an inter-fund loan is not available from another fund. Any delay in repayment to a lending fund could result in a lost investment opportunity or additional borrowing costs.
During the current reporting period, the Fund did not enter into any inter-fund loan activity.
10. New Accounting Pronouncements
Disclosure Update and Simplification
During August 2018, the SEC issued Final Rule Release No. 33-10532,Disclosure Update and Simplification (“Final Rule Release No. 33-10532”). Final Rule Release No. 33-10532 amends certain financial statement disclosure requirements to conform to U.S. GAAP. The amendments to Rule 6-04.17 of Regulation S-X (balance sheet) remove the requirement to separately state the book basis components of net assets: undistributed (over-distribution of) net investment income (“UNII”), accumulated undistributed net realized gains (losses), and net unrealized appreciation (depreciation) at the balance sheet date. Instead, consistent with U.S. GAAP, funds will be required to disclose total distributable earnings. The amendments to Rule 6-09 of Regulation S-X (statement of changes in net assets) remove the requirement to separately state the sources of distributions paid. Instead, consistent with U.S. GAAP, funds will be required to disclose the total amount of distributions paid, except that any tax return of capital must be separately disclosed. The amendments also remove the requirement to parenthetically state the book basis amount of UNII on the statement of changes in net assets.
The requirements of Final Rule Release No. 33-10532 are effective November 5, 2018, and the Fund’s Statement of Assets and Liabilities and Statement of Changes in Net Assets for the current reporting period have been modified accordingly. In addition, certain amounts within the Fund’s Statement of Changes in Net Assets for the prior fiscal period have been modified to conform to Final Rule Release No. 33-10532.
32
For the prior fiscal period, the total amount of distributions paid to shareholders from net investment income and from accumulated net realized gains, if any, are recognized as “Dividends” on the Statement of Changes in Net Assets.
For the period September 26, 2017 (commencement of operations) through December 31, 2017, the Fund’s Statement of Changes in Net Assets reflected the following balances.
| | | | |
Distributions to Shareholders | | | | |
From net investment income | | $ | (1,212,635 | ) |
From accumulated net realized gains | | | (25,841 | ) |
Decrease in net assets applicable to common shares from distributions to common shareholders | | | (1,238,476 | ) |
UNII at the end of period | | $ | 442,538 | |
FASB Accounting Standards Update (“ASU”)2017-08 (“ASU2017-08”) Premium Amortization on Purchased Callable Debt Securities
The FASB has issued ASU2017-08, which shortens the premium amortization period for purchasednon-contingently callable debt securities. ASU2017-08 specifies that the premium amortization period ends at the earliest call date, for purchasednon-contingently callable debt securities. ASU2017-08 is effective for fiscal years, and interim periods within those fiscal years, beginning after December 15, 2018. Management is currently evaluating the implications of ASU2017-08, if any.
Fair Value Measurement: Disclosure Framework
During August 2018, the FASB issued ASU 2018-13 (“ASU 2018-13”),Fair Value Measurement: Disclosure Framework – Changes to the Disclosure Requirements for Fair Value Measurements. ASU 2018-13 modifies the disclosures required by Topic 820,Fair Value Measurements. The amendments in ASU 2018-13 are effective for all entities for fiscal years, and interim periods within those fiscal years, beginning after December 15, 2019. During the current reporting period, management early implemented this guidance. This implementation did not have a material impact on the Fund’s financial statements.
33
Additional Fund Information(Unaudited)
| | | | | | | | | | |
| Board of Trustees | | | | | | | | | | |
| Margo Cook* | | Jack B. Evans | | William C. Hunter | | Albin F. Moschner | | John K. Nelson | | William J. Schneider** |
| Judith M. Stockdale | | Carole E. Stone | | Terence J. Toth | | Margaret L. Wolff | | Robert L. Young | | |
| * | Interested Board Member. |
| ** | Retired from the Funds’ Board of Trustees effective December 31, 2018. |
| | | | | | | | |
| | | | | |
Fund Manager Nuveen Fund Advisors, LLC 333 West Wacker Drive Chicago, IL 60606 | | Custodian State Street Bank
& Trust Company One Lincoln Street Boston, MA 02111 | | Legal Counsel Chapman and Cutler LLP Chicago, IL 60603 | | Independent Registered
Public Accounting Firm KPMG LLP 200 East Randolph Street Chicago, IL 60601 | | Transfer Agent and
Shareholder Services Computershare Trust Company, N.A. 250 Royall Street Canton, MA 02021 (800) 257-8787 |
Quarterly Portfolio of Investments Information
The Fund is required to file its complete schedule of portfolio holdings with the Securities and Exchange Commission (SEC) for the first and third quarters of each fiscal year on Form N-Q. You may obtain this information directly from the SEC. Visit the SEC on-line at http://www.sec.gov or in person at the SEC’s Public Reference Room in Washington, D.C. Call the SEC toll-free at (800) SEC-0330 for room hours and operation.
Nuveen Funds’ Proxy Voting Information
You may obtain (i) information regarding how each fund voted proxies relating to portfolio securities held during the most recent twelve-month period ended June 30, without charge, upon request, by calling Nuveen toll-free at (800) 257-8787 or on Nuveen’s website at www.nuveen.com and (ii) a description of the policies and procedures that each fund used to determine how to vote proxies relating to portfolio securities without charge, upon request, by calling Nuveen toll free at (800) 257-8787. You may also obtain this information directly from the SEC. Visit the SEC on-line at http://www.sec.gov.
CEO Certification Disclosure
The Fund’s Chief Executive Officer (CEO) has submitted to the New York Stock Exchange (NYSE) the annual CEO certification as required by Section 303A.12(a) of the NYSE Listed Company Manual. The Fund has filed with the SEC the certification of its CEO and Chief Financial Officer required by Section 302 of the Sarbanes-Oxley Act.
Common Share Repurchases
The Fund intends to repurchase, through its open-market share repurchase program, shares of its own common stock at such times and in such amounts as is deemed advisable. During the period covered by this report, the Fund repurchased shares of its common stock as shown in the accompanying table. Any future repurchases will be reported to shareholders in the next annual or semi-annual report.
| | | | |
| | | JEMD | |
Common shares repurchased | | | — | |
FINRA BrokerCheck
The Financial Industry Regulatory Authority (FINRA) provides information regarding the disciplinary history of FINRA member firms and associated investment professionals. This information as well as an investor brochure describing FINRA BrokerCheck is available to the public by calling the FINRA BrokerCheck Hotline number at (800) 289-9999 or by visiting www.FINRA.org.
34
Glossary of Terms Used in this Report(Unaudited)
| ∎ | | Average Annual Total Return: This is a commonly used method to express an investment’s performance over a particular, usually multi-year time period. It expresses the return that would have been necessary each year to equal the investment’s actual cumulative performance (including change in NAV or market price and reinvested dividends and capital gains distributions, if any) over the time period being considered. |
| ∎ | | Duration: Duration is a measure of the expected period over which a bond’s principal and interest will be paid, and consequently is a measure of the sensitivity of a bond’s or bond fund’s value to changes when market interest rates change. Generally, the longer a bond’s or fund’s duration, the more the price of the bond or fund will change as interest rates change. |
| ∎ | | Effective Leverage: Effective leverage is a fund’s effective economic leverage, and includes both regulatory leverage (see below) and the leverage effects of certain derivative investments in the fund’s portfolio. |
| ∎ | | Gross Domestic Product (GDP): The total market value of all final goods and services produced in a country/region in a given year, equal to total consumer, investment and government spending, plus the value of exports, minus the value of imports. |
| ∎ | | JP Morgan EMBI Global Diversified Index:A uniquely-weighted version of the JP Morgan EMBI Global Index. It limits the weights of those index countries with larger debt stocks by only including specified portions of these countries’ eligible current face amounts of debt outstanding. The countries covered are identical to those covered by the JP Morgan EMBI Global Index which tracks total returns for U.S.-dollar denominated debt instruments issued by emerging market sovereign and quasi-sovereign entities: Brady bonds, loans, Eurobonds. Index returns assume reinvestment of distributions, but do not reflect any applicable sales charges or management fees. |
| ∎ | | Leverage: Leverage is created whenever a fund has investment exposure (both reward and/or risk) equivalent to more than 100% of the investment capital. |
| ∎ | | Net Asset Value (NAV) Per Share: A fund’s Net Assets is equal to its total assets (securities, cash, accrued earnings and receivables) less its total liabilities. NAV per share is equal to the fund’s Net Assets divided by its number of shares outstanding. |
| ∎ | | Regulatory Leverage: Regulatory leverage consists of preferred shares issued by or borrowings of a fund. Both of these are part of a fund’s capital structure. Regulatory leverage is subject to asset coverage limits set in the Investment Company Act of 1940. |
35
Reinvest Automatically, Easily and Conveniently
Nuveen makes reinvesting easy. A phone call is all it takes to set up your reinvestment account.
Nuveen Closed-End Funds Automatic Reinvestment Plan
Your Nuveen Closed-End Fund allows you to conveniently reinvest distributions in additional Fund shares.
By choosing to reinvest, you’ll be able to invest money regularly and automatically, and watch your investment grow through the power of compounding. Just like distributions in cash, there may be times when income or capital gains taxes may be payable on distributions that are reinvested.
It is important to note that an automatic reinvestment plan does not ensure a profit, nor does it protect you against loss in a declining market.
Easy and convenient
To make recordkeeping easy and convenient, each quarter you’ll receive a statement showing your total distributions, the date of investment, the shares acquired and the price per share, and the total number of shares you own.
How shares are purchased
The shares you acquire by reinvesting will either be purchased on the open market or newly issued by the Fund. If the shares are trading at or above net asset value at the time of valuation, the Fund will issue new shares at the greater of the net asset value or 95% of the then-current market price. If the shares are trading at less than net asset value, shares for your account will be purchased on the open market. If the Plan Agent begins purchasing Fund shares on the open market while shares are trading below net asset value, but the Fund’s shares subsequently trade at or above their net asset value before the Plan Agent is able to complete its purchases, the Plan Agent may cease open-market purchases and may invest the uninvested portion of the distribution in newly-issued Fund shares at a price equal to the greater of the shares’ net asset value or 95% of the shares’ market value on the last business day immediately prior to the purchase date. Distributions received to purchase shares in the open market will normally be invested shortly after the distribution payment date. No interest will be paid on distributions awaiting reinvestment. Because the market price of the shares may increase before purchases are completed, the average purchase price per share may exceed the market price at the time of valuation, resulting in the acquisition of fewer shares than if the distribution had been paid in shares issued by the Fund. A pro rata portion of any applicable brokerage commissions on open market purchases will be paid by Plan participants. These commissions usually will be lower than those charged on individual transactions.
Flexible
You may change your distribution option or withdraw from the Plan at any time, should your needs or situation change.
You can reinvest whether your shares are registered in your name, or in the name of a brokerage firm, bank, or other nominee. Ask your investment advisor if his or her firm will participate on your behalf. Participants whose shares are registered in the name of one firm may not be able to transfer the shares to another firm and continue to participate in the Plan.
The Fund reserves the right to amend or terminate the Plan at any time. Although the Fund reserves the right to amend the Plan to include a service charge payable by the participants, there is no direct service charge to participants in the Plan at this time.
Call today to start reinvesting distributions
For more information on the Nuveen Automatic Reinvestment Plan or to enroll in or withdraw from the Plan, speak with your financial advisor or call us at (800) 257-8787.
36
Board Members & Officers
(Unaudited)
The management of the Funds, including general supervision of the duties performed for the Funds by the Adviser, is the responsibility of the Board of Trustees of the Funds. The number of trustees of the Funds is set at ten. None of the trustees who are not “interested” persons of the Funds (referred to herein as “independent board members”) has ever been a director or employee of, or consultant to, Nuveen or its affiliates. The names and business addresses of the trustees and officers of the Funds, their principal occupations and other affiliations during the past five years, the number of portfolios each oversees and other directorships they hold are set forth below.
| | | | | | | | |
| | | | |
| | | | | | | | | |
Name, Year of Birth & Address | | Position(s) Held with the Funds | | Year First Elected or Appointed and Term(1) | | Principal Occupation(s) Including other Directorships During Past 5 Years | | Number of Portfolios in Fund Complex Overseen by Board Member |
| | | | |
| | | | | | | | | |
| | |
| Independent Board Members: | | | | |
| | | | |
∎ TERENCE J. TOTH | | | | | | Formerly, aCo-Founding Partner, Promus Capital (2008-2017); Director, Fulcrum IT Service LLC (since 2010) and Quality Control Corporation (since 2012); member: Catalyst Schools of Chicago Board (since 2008) and Mather Foundation Board (since 2012), and chair of its Investment Committee; formerly, Director, Legal & General Investment Management America, Inc. (2008-2013); formerly, CEO and President, Northern Trust Global Investments (2004-2007): Executive Vice President, Quantitative Management & Securities Lending (2000-2004); prior thereto, various positions with Northern Trust Company (since 1994); formerly, Member, Northern Trust Mutual Funds Board (2005-2007), Northern Trust Global Investments Board (2004-2007), Northern Trust Japan Board (2004-2007), Northern Trust Securities Inc. Board (2003-2007) and Northern Trust Hong Kong Board (1997-2004). | | |
1959 333 W. Wacker Drive Chicago, IL 60606 | | Chairman and Board Member | | 2008 Class II | | 168 |
| | | | | | |
| | | | |
∎ JACK B. EVANS | | | | | | Chairman (since 2019), formerly, President (1996-2019), The Hall-Perrine Foundation, a private philanthropic corporation; Director and Chairman, United Fire Group, a publicly held company; Director, Public Member, American Board of Orthopaedic Surgery (since 2015); Life Trustee of Coe College and the Iowa College Foundation; formerly, PresidentPro-Tem of the Board of Regents for the State of Iowa University System; formerly, Director, Alliant Energy and The Gazette Company; formerly, Director, Federal Reserve Bank of Chicago; formerly, President and Chief Operating Officer, SCI Financial Group, Inc., a regional financial services firm. | | |
1948 333 W. Wacker Drive Chicago, IL 60606 | | Board Member | | 1999 Class III | | 168 |
| | | | | | |
| | | | |
∎ WILLIAM C. HUNTER | | | | | | Dean Emeritus, formerly, Dean, Tippie College of Business, University of Iowa (2006-2012); Director of Wellmark, Inc. (since 2009); past Director (2005-2015), and past President (2010-2014) Beta Gamma Sigma, Inc., The International Business Honor Society; formerly, Director (2004-2018) of Xerox Corporation; Dean and Distinguished Professor of Finance, School of Business at the University of Connecticut (2003-2006); previously, Senior Vice President and Director of Research at the Federal Reserve Bank of Chicago (1995-2003); formerly, Director (1997-2007), Credit Research Center at Georgetown University. | | |
1948 333 W. Wacker Drive Chicago, IL 60606 | | Board Member | | 2003 Class I | | 168 |
| | | | | | |
| | | | |
∎ ALBIN F. MOSCHNER | | | | | | Founder and Chief Executive Officer, Northcroft Partners, LLC, a management consulting firm (since 2012); Chairman (since 2009), and Director (since 2012), USA Technologies, Inc., a provider of solutions and services to facilitate electronic payment transactions (since 2012); formerly, Director, Wintrust Financial Corporation (1996-2016); previously, held positions at Leap Wireless International, Inc., including Consultant (2011-2012), Chief Operating Officer (2008-2011), and Chief Marketing Officer (2004-2008); formerly, President, Verizon Card Services division of Verizon Communications, Inc. (2000-2003); formerly, President, One Point Services at One Point Communications (1999-2000); formerly, Vice Chairman of the Board, Diba, Incorporated (1996-1997); formerly, various executive positions and Chief Executive Officer of Zenith Electronics Corporation (1991-1996). | | |
1952 333 W. Wacker Drive Chicago, IL 60606 | | Board Member | | 2016 Class III | | 168 |
| | | | | | |
37
Board Members & Officers(continued)
(Unaudited)
| | | | | | | | |
| | | | |
| | | | | | | | | |
Name, Year of Birth & Address | | Position(s) Held with the Funds | | Year First Elected or Appointed and Term(1) | | Principal Occupation(s) Including other Directorships During Past 5 Years | | Number of Portfolios in Fund Complex Overseen by Board Member |
| | | | |
| | | | | | | | | |
| | |
| Independent Board Members (continued): | | | | |
| | | | |
∎ JOHN K. NELSON | | | | | | Member of Board of Directors of Core12 LLC (since 2008), a private firm which develops branding, marketing and communications strategies for clients; serves on The President’s Council, Fordham University (since 2010); and previously was a Director of The Curran Center for Catholic American Studies (2009-2018) formerly, senior external advisor to the financial services practice of Deloitte Consulting LLP (2012-2014): formerly, Chairman of the Board of Trustees of Marian University (2010 as trustee, 2011-2014 as Chairman); formerly, Chief Executive Officer of ABN AMRO N.V. North America, and Global Head of its Financial Markets Division (2007-2008); prior senior positions held at ABN AMRO include Corporate Executive Vice President and Head of GlobalMarkets-the Americas (2006-2007), CEO of Wholesale Banking North America and Global Head of Foreign Exchange and Futures Markets (2001-2006), and Regional Commercial Treasurer and Senior Vice President Trading-North America (1996-2001); formerly, Trustee at St. Edmund Preparatory School in New York City. | | |
1962 333 W. Wacker Drive Chicago, IL 60606 | | Board Member | | 2013 Class II | | 168 |
| | | | | | |
| | | | |
∎ JUDITH M. STOCKDALE | | | | | | Board Member, Land Trust Alliance (since 2013) and U.S. Endowment for Forestry and Communities (since 2013); formerly, Executive Director (1994-2012), Gaylord and Dorothy Donnelley Foundation; prior thereto, Executive Director, Great Lakes Protection Fund (1990-1994). | | |
1947 333 W. Wacker Drive Chicago, IL 60606 | | Board Member | | 1997 Class I | | 168 |
| | | | |
∎ CAROLE E. STONE | | | | | | Former Director, Chicago Board Options Exchange, Inc. (2006-2017); and C2 Options Exchange, Incorporated (2009-2017); Director, Cboe, L.C. Global Markets, Inc., formerly, CBOE Holdings, Inc. (since 2010); formerly, Commissioner, New York State Commission on Public Authority Reform (2005-2010). | | |
1947 333 W. Wacker Drive Chicago, IL 60606 | | Board Member | | 2007 Class I | | 168 |
| | | | |
∎ MARGARET L. WOLFF | | | | | | Formerly, member of the Board of Directors (2013-2017) of Travelers Insurance Company of Canada and The Dominion of Canada General Insurance Company (each, a part of Travelers Canada, the Canadian operation of The Travelers Companies, Inc.); formerly, Of Counsel, Skadden, Arps, Slate, Meagher & Flom LLP (Mergers & Acquisitions Group) (2005-2014); Member of the Board of Trustees of New York-Presbyterian Hospital (since 2005); Member (since 2004) and Chair (since 2015) of the Board of Trustees of The John A. Hartford Foundation (a philanthropy dedicated to improving the care of older adults); formerly, Member (2005-2015) and Vice Chair (2011-2015) of the Board of Trustees of Mt. Holyoke College. | | |
1955 333 W. Wacker Drive Chicago, IL 60606 | | Board Member | | 2016 Class I | | 168 |
| | | | | | |
| | | | |
∎ ROBERT L. YOUNG(2) | | | | | | Formerly, Chief Operating Officer and Director, J.P.Morgan Investment Management Inc. (2010-2016); formerly, President and Principal Executive Officer (2013-2016), and Senior Vice President and Chief Operating Officer (2005-2010), of J.P.Morgan Funds; formerly, Director and various officer positions for J.P.Morgan Investment Management Inc. (formerly, JPMorgan Funds Management, Inc. and formerly, One Group Administrative Services) and JPMorgan Distribution Services, Inc. (formerly, One Group Dealer Services, Inc.) (1999-2017). | | |
1963 333 W. Wacker Drive Chicago, IL 60606 | | Board Member | | 2017 Class II | | 166 |
| | | | | | |
38
| | | | | | | | |
| | | | |
| | | | | | | | | |
Name, Year of Birth & Address | | Position(s) Held with the Funds | | Year First Elected or Appointed and Term(1) | | Principal Occupation(s) Including other Directorships During Past 5 Years | | Number of Portfolios in Fund Complex Overseen by Board Member |
| | | | |
| | | | | | | | | |
| | |
| Interested Board Member: | | | | |
| | | | |
∎ MARGO L. COOK(3) | | | | | | President (since 2017), formerly,Co-Chief Executive Officer andCo-President (2016-2017), formerly, Senior Executive Vice President of Nuveen Investments, Inc.; President, Global Products and Solutions (since 2017), and,Co-Chief Executive Officer (since 2015), formerly, Executive Vice President (2013-2015), of Nuveen Securities, LLC; Executive Vice President (since 2017) of Nuveen, LLC; President (since August 2017), formerlyCo-President (2016- 2017), formerly, Senior Executive Vice President of Nuveen Fund Advisors, LLC (Executive Vice President since 2011); President (since 2017), Nuveen Alternative Investments, LLC; Chartered Financial Analyst. | | |
1964 333 W. Wacker Drive Chicago, IL 60606 | | Board Member | | 2016 Class III | | 168 |
| | | | | | |
| | | | |
| | | | | | | | | |
Name, Year of Birth & Address | | Position(s) Held
with the Funds | | Year First
Elected or
Appointed(4)
| | Principal Occupation(s) During Past 5 Years | | Number
of Portfolios
in Fund Complex
Overseen by
Officer |
| | | | |
| | | | | | | | | |
| | |
| Officers of the Funds: | | | | |
| | |
∎ CEDRIC H. ANTOSIEWICZ | | Senior Managing Director (since 2017), formerly, Managing Director (2004-2017) of Nuveen Securities, LLC; Senior Managing Director (since 2017), formerly, Managing Director (2014-2017) of Nuveen Fund Advisors, LLC. | | |
1962 333 W. Wacker Drive Chicago, IL 60606 | | Chief Administrative Officer | | 2007 | | 74 |
| | | | |
∎ STEPHEN D. FOY | | | | | | Managing Director (since 2014), formerly, Senior Vice President (2013- 2014) and Vice President (2005-2013) of Nuveen Fund Advisors, LLC; Managing Director (since 2016) of Nuveen Securities, LLC Managing Director (since 2016) of Nuveen Alternative Investments, LLC; Certified Public Accountant. | | |
1954 333 W. Wacker Drive Chicago, IL 60606 | | Vice President and Controller | | 1998 | | 168 |
| | | | | | |
| | | | |
∎ NATHANIEL T. JONES | | | | | | Managing Director (since 2017), formerly, Senior Vice President (2016- 2017), formerly, Vice President (2011-2016) of Nuveen; Managing Director of Nuveen Fund Advisors, LLC; Chartered Financial Analyst. | | |
1979 333 W. Wacker Drive Chicago, IL 60606 | | Vice President and Treasurer | | 2016 | | 168 |
| | | | |
∎ WALTER M. KELLY | | | | | | Managing Director (since 2017), formerly, Senior Vice President (2008-2017) of Nuveen. | | |
1970 333 W. Wacker Drive Chicago, IL 60606 | | Chief Compliance Officer and Vice President | | 2003 | | 168 |
| | | | |
∎ DAVID J. LAMB | | | | | | Managing Director (since 2017), formerly, Senior Vice President of Nuveen (since 2006), Vice President prior to 2006. | | |
1963 333 W. Wacker Drive Chicago, IL 60606 | | Vice President | | 2015 | | 74 |
| | | | |
∎ TINA M. LAZAR | | | | | | Managing Director (since 2017), formerly, Senior Vice President (2014-2017) of Nuveen Securities, LLC. | | |
1961 333 W. Wacker Drive Chicago, IL 60606 | | Vice President | | 2002 | | 168 |
39
Board Members & Officers(continued)
(Unaudited)
| | | | | | | | |
| | | | |
| | | | | | | | | |
Name, Year of Birth & Address | | Position(s) Held
with the Funds | | Year First
Elected or
Appointed(4)
| | Principal Occupation(s) During Past 5 Years | | Number
of Portfolios
in Fund Complex
Overseen by
Officer |
| | | | |
| | | | | | | | | |
| | |
| Officers of the Funds (continued): | | | | |
| | | | |
∎ KEVIN J. MCCARTHY | | | | | | Senior Managing Director (since 2017) and Secretary and General Counsel (since 2016) of Nuveen Investments, Inc., formerly, Executive Vice President (2016-2017) and Managing Director and Assistant Secretary (2008-2016); Senior Managing Director (since 2017) and Assistant Secretary (since 2008) of Nuveen Securities, LLC, formerly Executive Vice President (2016-2017) and Managing Director (2008-2016); Senior Managing Director (since 2017), Secretary (since 2016) andCo-General Counsel (since 2011) of Nuveen Fund Advisors, LLC, formerly, Executive Vice President (2016-2017), Managing Director (2008-2016) and Assistant Secretary (2007-2016); Senior Managing Director (since 2017), Secretary (since 2016) and Associate General Counsel (since 2011) of Nuveen Asset Management, LLC, formerly Executive Vice President (2016-2017) and Managing Director and Assistant Secretary(2011-2016); Senior Managing Director (since 2017) and Secretary (since 2016) of Nuveen Investments Advisers, LLC, formerly Executive Vice President(2016-2017); Vice President (since 2007) and Secretary (since 2016), formerly, Assistant Secretary, of NWQ Investment Management Company, LLC, Symphony Asset Management LLC, Santa Barbara Asset Management, LLC and Winslow Capital Management, LLC (since 2010). Senior Managing Director (since 2017) and Secretary (since 2016) of Nuveen Alternative Investments, LLC. | | |
1966 333 W. Wacker Drive Chicago, IL 60606 | | Vice President and Assistant Secretary | | 2007 | | 168 |
| | | | | | |
| | | | |
∎ WILLIAM T. MEYERS | | | | | | Senior Managing Director (since 2017), formerly, Managing Director (2016-2017), Senior Vice President (2010-2016) of Nuveen Securities, LLC; and Nuveen Fund Advisors, LLC; Senior Managing Director (since 2017), formerly, Managing Director (2016-2017), Senior Vice President (2010-2016) of Nuveen, has held various positions with Nuveen since 1991. | | |
1966 333 W. Wacker Drive Chicago, IL 60606 | | Vice President | | 2018 | | 74 |
| | | | | | |
| | | | |
∎ MICHAEL A. PERRY | | | | | | Executive Vice President (since 2017), previously Managing Director from 2016), of Nuveen Fund Advisors, LLC and Nuveen Alternative Investments, LLC; Executive Vice President (since 2017), formerly, Managing Director (2015-2017), of Nuveen Securities, LLC; formerly, Managing Director (2010-2015) of UBS Securities, LLC. | | |
1967 333 W. Wacker Drive Chicago, IL 60606 | | Vice President | | 2017 | | 74 |
| | | | | | | |
| | | | |
∎ CHRISTOPHER M. ROHRBACHER | | | | | | Managing Director (since 2017) and Assistant Secretary of Nuveen Securities, LLC; Managing Director (since 2017), formerly, Senior Vice President (2016-2017) and Assistant Secretary (since 2016) of Nuveen Fund Advisors, LLC. | | |
1971 333 W. Wacker Drive Chicago, IL 60606 | | Vice President and Assistant Secretary | | 2008 | | 168 |
| | | | |
∎ WILLIAM A. SIFFERMANN | | | | | | Managing Director (since 2017), formerly Senior Vice President (2016-2017) and Vice President (2011-2016) of Nuveen. | | |
1975 333 W. Wacker Drive Chicago, IL 60606 | | Vice President | | 2017 | | 168 |
| | | | |
∎ JOEL T. SLAGER | | | | | | Fund Tax Director for Nuveen Funds (since 2013); previously, Vice President of Morgan Stanley Investment Management, Inc., Assistant Treasurer of the Morgan Stanley Funds (from 2010 to 2013). | | |
1978 333 W. Wacker Drive Chicago, IL 60606 | | Vice President and Assistant Secretary | | 2013 | | 168 |
| | | | |
∎ MARK L. WINGET | | | | | | Vice President and Assistant Secretary of Nuveen Securities, LLC (since 2008); Vice President (since 2010) and Associate General Counsel (since 2008) of Nuveen. | | |
1968 333 W. Wacker Drive Chicago, IL 60606 | | Vice President and Assistant Secretary | | 2008 | | 168 |
40
| | | | | | | | |
| | | | |
| | | | | | | | | |
Name, Year of Birth & Address | | Position(s) Held
with the Funds | | Year First
Elected or
Appointed(4)
| | Principal Occupation(s) During Past 5 Years | | Number
of Portfolios
in Fund Complex
Overseen by
Officer |
| | | | |
| | | | | | | | | |
| | |
| Officers of the Funds (continued): | | | | |
| | | | |
∎ GIFFORD R. ZIMMERMAN | | | | | | Managing Director (since 2002), and Assistant Secretary of Nuveen Securities, LLC; Managing Director (since 2004) and Assistant Secretary (since 1994) of Nuveen Investments, Inc.; Managing Director (since 2002), Assistant Secretary (since 1997) andCo-General Counsel (since 2011) of Nuveen Fund Advisors, LLC; Managing Director, Assistant Secretary and Associate General Counsel of Nuveen Asset Management, LLC (since 2011); Vice President (since 2017), formerly, Managing Director (2003-2017) and Assistant Secretary (since 2003) of Symphony Asset Management LLC; Managing Director and Assistant Secretary (since 2002) of Nuveen Investments Advisers, LLC; Vice President and Assistant Secretary of NWQ Investment Management Company, LLC (since 2002), Santa Barbara Asset Management, LLC (since 2006), and of Winslow Capital Management, LLC, (since 2010); Chartered Financial Analyst. | | |
1956 333 W. Wacker Drive Chicago, IL 60606 | | Vice President Secretary | | 1988 | | 168 |
| | | | | | |
| (1) | The Board of Trustees is divided into three classes, Class I, Class II, and Class III, with each being elected to serve until the third succeeding annual shareholders’ meeting subsequent to its election or thereafter in each case when its respective successors are duly elected or appointed, except two board members are elected by the holders of Preferred Shares, when applicable, to serve until the next annual shareholders’ meeting subsequent to its election or thereafter in each case when its respective successors are duly elected or appointed. The year first elected or appointed represents the year in which the board member was first elected or appointed to any fund in the Nuveen Complex. |
| (2) | On May 25, 2017, Mr. Young was appointed as a Board Member, effective July 1, 2017. He is a Board Member of each of the Nuveen Funds, except Nuveen Diversified Dividend and Income Fund and Nuveen Real Estate Income Fund. |
| (3) | “Interested person” as defined in the 1940 Act, by reason of her position with Nuveen, LLC. and certain of its subsidiaries, which are affiliates of the Nuveen Funds. |
| (4) | Officers serve one year terms through August of each year. The year first elected or appointed represents the year in which the Officer was first elected or appointed to any fund in the Nuveen Complex. |
41
Notes
42
Notes
43
Nuveen:
Serving Investors for Generations
Since 1898, financial advisors and their clients have relied on Nuveen to provide
dependable investment solutions through continued adherence to proven, long-term investing
principles. Today, we offer a range of high quality solutions designed to
be integral components of a well-diversified core portfolio.
Focused on meeting investor needs.
Nuveen is the investment manager of TIAA. We have grown into one of the world’s premier global asset managers, with specialist knowledge across all major asset classes and particular strength in solutions that provide income for investors and that draw on our expertise in alternatives and responsible investing. Nuveen is driven not only by the independent investment processes across the firm, but also the insights, risk management, analytics and other tools and resources that a truly world-class platform provides. As a global asset manager, our mission is to work in partnership with our clients to create solutions which help them secure their financial future.
Find out how we can help you.
To learn more about how the products and services of Nuveen may be able to help you meet your financial goals, talk to your financial advisor, or call us at(800) 257-8787. Please read the information provided carefully before you invest. Investors should consider the investment objective and policies, risk considerations, charges and expenses of any investment carefully.
Learn more about Nuveen Funds at:www.nuveen.com/closed-end-funds
| | | | |
| Nuveen Securities, LLC, member FINRA and SIPC | 333 West Wacker Drive Chicago, IL 60606 | www.nuveen.com | |  | | EAN-L-1218D
741767-INV-Y-02/19 |
ITEM 2. CODE OF ETHICS.
As of the end of the period covered by this report, the registrant has adopted a code of ethics that applies to the registrant’s principal executive officer, principal financial officer, principal accounting officer or controller, or persons performing similar functions. There were no amendments to or waivers from the Code during the period covered by this report. The registrant has posted the code of ethics on its website at www.nuveen.com/CEF/Shareholder/FundGovernance.aspx. (To view the code, click on Code of Conduct.)
ITEM 3. AUDIT COMMITTEE FINANCIAL EXPERT.
As of the end of the period covered by this report, the registrant’s Board of Directors or Trustees (“Board”) determined that the registrant has at least one “audit committee financial expert” (as defined in Item 3 of Form N-CSR) serving on its Audit Committee. The registrant’s audit committee financial experts are Carole E. Stone, Jack B. Evans and William C. Hunter who are “independent” for purposes of Item 3 of Form N-CSR.
Ms. Stone served for five years as Director of the New York State Division of the Budget. As part of her role as Director, Ms. Stone was actively involved in overseeing the development of the State’s operating, local assistance and capital budgets, its financial plan and related documents; overseeing the development of the State’s bond-related disclosure documents and certifying that they fairly presented the State’s financial position; reviewing audits of various State and local agencies and programs; and coordinating the State’s system of internal audit and control. Prior to serving as Director, Ms. Stone worked as a budget analyst/examiner with increasing levels of responsibility over a 30 year period, including approximately five years as Deputy Budget Director. Ms. Stone has also served as Chair of the New York State Racing Association Oversight Board, as Chair of the Public Authorities Control Board, as a Commissioner on the New York State Commission on Public Authority Reform and as a member of the Boards of Directors of several New York State public authorities. These positions have involved overseeing operations and finances of certain entities and assessing the adequacy of project/entity financing and financial reporting. Currently, Ms. Stone is on the Board of Directors of CBOE Holdings, Inc., of the Chicago Board Options Exchange, and of C2 Options Exchange. Ms. Stone’s position on the boards of these entities and as a member of both CBOE Holdings’ Audit Committee and its Finance Committee has involved, among other things, the oversight of audits, audit plans and preparation of financial statements.
Mr. Evans was formerly President and Chief Operating Officer of SCI Financial Group, Inc., a full service registered broker-dealer and registered investment adviser (“SCI”). As part of his role as President and Chief Operating Officer, Mr. Evans actively supervised the Chief Financial Officer (the “CFO”) and actively supervised the CFO’s preparation of financial statements and other filings with various regulatory authorities. In such capacity, Mr. Evans was actively involved in the preparation of SCI’s financial statements and the resolution of issues raised in connection therewith. Mr. Evans has also served on the audit committee of various reporting companies. At such companies, Mr. Evans was involved in the oversight of audits, audit plans, and the preparation of financial statements. Mr. Evans also formerly chaired the audit committee of the Federal Reserve Bank of Chicago.
Mr. Hunter was formerly a Senior Vice President at the Federal Reserve Bank of Chicago. As part of his role as Senior Vice President, Mr. Hunter was the senior officer responsible for all operations of each of the Economic Research, Statistics, and Community and Consumer Affairs units at the Federal Reserve Bank of Chicago. In such capacity, Mr. Hunter oversaw the subunits of the Statistics and Community and Consumer Affairs divisions responsible for the analysis and evaluation of bank and bank holding company financial statements and financial filings. Prior to serving as Senior Vice President at the Federal Reserve Bank of Chicago, Mr. Hunter was the Vice President of the Financial Markets unit at the Federal Reserve Bank of Atlanta where he supervised financial staff and bank holding company analysts who analyzed and evaluated bank and bank holding company financial statements. Mr. Hunter also currently serves on the Boards of Directors of Xerox Corporation and Wellmark, Inc. as well as on the Audit Committees of such Boards. As an Audit Committee member, Mr. Hunter’s responsibilities include, among other things, reviewing financial statements, internal audits and internal controls over financial reporting. Mr. Hunter also formerly was a Professor of Finance at the University of Connecticut School of Business and has authored numerous scholarly articles on the topics of finance, accounting and economics.
ITEM 4. PRINCIPAL ACCOUNTANT FEES AND SERVICES.
The following tables show the amount of fees that KPMG LLP, the Fund’s auditor, billed to the Fund during the Fund’s last two full fiscal years. For engagements with KPMG LLP the Audit Committee approved in advance all audit services and non-audit services that KPMG LLP provided to the Fund, except for those non-audit services that were subject to the pre-approval exception under Rule 2-01 of Regulation S-X (the “pre-approval exception”). The pre-approval exception for services provided directly to the Fund waives the pre-approval requirement for services other than audit, review or attest services if: (A) the aggregate amount of all such services provided constitutes no more than 5% of the total amount of revenues paid by the Fund to its accountant during the fiscal year in which the services are provided; (B) the Fund did not recognize the services as non-audit services at the time of the engagement; and (C) the services are promptly brought to the Audit Committee’s attention, and the Committee (or its delegate) approves the services before the audit is completed.
The Audit Committee has delegated certain pre-approval responsibilities to its Chairman (or, in his absence, any other member of the Audit Committee).
SERVICES THAT THE FUND’S AUDITOR BILLED TO THE FUND
| | | | | | | | | | | | | | | | |
Fiscal Year Ended5 | | Audit Fees Billed
to Fund1 | | | Audit-Related Fees
Billed to Fund2 | | | Tax Fees
Billed to Fund 3 | | | All Other Fees
Billed to Fund 4 | |
December 31, 2018 | | $ | 34,420 | | | $ | 5,000 | | | $ | 0 | | | $ | 0 | |
| | | | | | | | | | | | | | | | |
| | | | | | | | | | | | | | | | |
Percentage approved pursuant to pre-approval exception | | | 0 | % | | | 0 | % | | | 0 | % | | | 0 | % |
| | | | | | | | | | | | | | | | |
| | | | | | | | | | | | | | | | |
December 31, 2017 | | $ | 33,500 | | | $ | 0 | | | $ | 0 | | | $ | 0 | |
| | | | | | | | | | | | | | | | |
| | | | | | | | | | | | | | | | |
Percentage approved pursuant to pre-approval exception | | | 0 | % | | | 0 | % | | | 0 | % | | | 0 | % |
| | | | | | | | | | | | | | | | |
1 “Audit Fees” are the aggregate fees billed for professional services for the audit of the Fund’s annual financial statements and services provided in connection with statutory and regulatory filings or engagements.
2 “Audit Related Fees” are the aggregate fees billed for assurance and related services reasonably related to the performance of the audit or review of financial statements that are not reported under “Audit Fees”. These fees include offerings related to the Fund’s common shares and leverage.
3 “Tax Fees” are the aggregate fees billed for professional services for tax advice, tax compliance, and tax planning. These fees include: all global withholding tax services; excise and state tax reviews; capital gain, tax equalization and taxable basis calculation performed by the principal accountant.
4 “All Other Fees” are the aggregate fees billed for products and services other than “Audit Fees”, “Audit-Related Fees” and “Tax Fees”. These fees represent all “Agreed-Upon Procedures” engagements pertaining to the Fund’s use of leverage.
SERVICES THAT THE FUND’S AUDITOR BILLED TO THE
ADVISER AND AFFILIATED FUND SERVICE PROVIDERS
The following tables show the amount of fees billed by KPMG LLP to Nuveen Fund Advisors, LLC (formerly Nuveen Fund Advisors, Inc.) (the “Adviser”), and any entity controlling, controlled by or under common control with the Adviser that provides ongoing services to the Fund (“Affiliated Fund Service Provider”), for engagements directly related to the Fund’s operations and financial reporting, during the Fund’s last two full fiscal years.
The tables also show the percentage of fees subject to the pre-approval exception. The pre-approval exception for services provided to the Adviser and any Affiliated Fund Service Provider (other than audit, review or attest services) waives the pre-approval requirement if: (A) the aggregate amount of all such services provided constitutes no more than 5% of the total amount of revenues paid to KPMG LLP by the Fund, the Adviser and Affiliated Fund Service Providers during the fiscal year in which the services are provided that would have to be pre-approved by the Audit Committee; (B) the Fund did not recognize the services as non-audit services at the time of the engagement; and (C) the services are promptly brought to the Audit Committee’s attention, and the Committee (or its delegate) approves the services before the Fund’s audit is completed.
| | | | | | | | | | | | |
Fiscal Year Ended | | Audit-Related Fees
Billed to Adviser and
Affiliated Fund Service
Providers | | | Tax Fees Billed to
Adviser and
Affiliated Fund
Service Providers | | | All Other Fees
Billed to Adviser
and Affiliated Fund
Service Providers | |
December 31, 2018 | | $ | 0 | | | $ | 0 | | | $ | 0 | |
| | | | | | | | | | | | |
| | | | | | | | | | | | |
Percentage approved pursuant to pre-approval exception | | | 0 | % | | | 0 | % | | | 0 | % |
| | | | | | | | | | | | |
| | | | | | | | | | | | |
December 31, 2017 | | $ | 0 | | | $ | 0 | | | $ | 0 | |
| | | | | | | | | | | | |
| | | | | | | | | | | | |
Percentage approved pursuant to pre-approval exception | | | 0 | % | | | 0 | % | | | 0 | % |
| | | | | | | | | | | | |
NON-AUDIT SERVICES
The following table shows the amount of fees that KPMG LLP billed during the Fund’s last two full fiscal years for non-audit services. The Audit Committee is required to pre-approve non-audit services that KPMG LLP provides to the Adviser and any Affiliated Fund Services Provider, if the engagement related directly to the Fund’s operations and financial reporting (except for those subject to the pre-approval exception described above). The Audit Committee requested and received information from KPMG LLP about any non-audit services that KPMG LLP rendered during the Fund’s last fiscal year to the Adviser and any Affiliated Fund Service Provider. The Committee considered this information in evaluating KPMG LLP independence.
| | | | | | | | | | | | | | | | |
Fiscal Year Ended | | Total Non-Audit Fees
Billed to Fund | | | Total Non-Audit Fees
billed to Adviser and
Affiliated Fund Service
Providers (engagements
related directly to the
operations and financial
reporting of the Fund) | | | Total Non-Audit Fees
billed to Adviser and
Affiliated Fund Service
Providers (all other
engagements) | | | Total | |
December 31, 2018 | | $ | 0 | | | $ | 0 | | | $ | 0 | | | $ | 0 | |
December 31, 2017 | | $ | 0 | | | $ | 0 | | | $ | 0 | | | $ | 0 | |
“Non-Audit Fees billed to Fund” for both fiscal year ends represent “Tax Fees” and “All Other Fees” billed to Fund in their respective amounts from the previous table.
Less than 50 percent of the hours expended on the principal accountant’s engagement to audit the registrant’s financial statements for the most recent fiscal year were attributed to work performed by persons other than the principal accountant’s full-time, permanent employees.
Audit Committee Pre-Approval Policies and Procedures. Generally, the Audit Committee must approve (i) all non-audit services to be performed for the Fund by the Fund’s independent accountants and (ii) all audit and non-audit services to be performed by the Fund’s independent accountants for the Affiliated Fund Service Providers with respect to operations and financial reporting of the Fund. Regarding tax and research projects conducted by the independent accountants for the Fund and Affiliated Fund Service Providers (with respect to operations and financial reports of the Fund) such engagements will be (i) pre-approved by the Audit Committee if they are expected to be for amounts greater than $10,000; (ii) reported to the Audit Committee chairman for his verbal approval prior to engagement if they are expected to be for amounts under $10,000 but greater than $5,000; and (iii) reported to the Audit Committee at the next Audit Committee meeting if they are expected to be for an amount under $5,000.
ITEM 5. AUDIT COMMITTEE OF LISTED REGISTRANTS.
The registrant’s Board has a separately designated Audit Committee established in accordance with Section 3(a)(58)(A) of the Securities Exchange Act of 1934, as amended (15 U.S.C. 78c(a)(58)(A)). As of the end of the period covered by this report, the members of the audit committee are Jack B. Evans, William C. Hunter, John K. Nelson, Carole E. Stone and Terence J. Toth.
ITEM 6. SCHEDULE OF INVESTMENTS.
(a) See Portfolio of Investments in Item 1.
(b) Not applicable.
ITEM 7. DISCLOSURE OF PROXY VOTING POLICIES AND PROCEDURES FORCLOSED-END MANAGEMENT INVESTMENT COMPANIES.
Nuveen Fund Advisors, LLC is the registrant’s investment adviser (also referred to as the “Adviser”). The Adviser is responsible for theon-going monitoring of the Fund’s investment portfolio, managing the Fund’s business affairs and providing certain clerical, bookkeeping and administrative services. The Adviser has engaged Teachers Advisors, LLC (“Teachers Advisors” or“Sub-Adviser”) asSub-Adviser to provide discretionary investment advisory services. As part of these services, the Adviser has delegated to theSub-Adviser the full responsibility for proxy voting on securities held in the registrant’s portfolio and related duties in accordance with theSub-Adviser’s policies and procedures. The Adviser periodically monitors theSub-Adviser’s voting to ensure that it is carrying out its duties. TheSub-Adviser’s proxy voting policies and procedures are summarized as follows:
Proxy Voting Guidelines
A. Introduction
TIAA’s voting practices are guided by our mission and obligations to our participants and shareholders. As indicated in this Policy Statement, we monitor portfolio companies’ governance, social and environmental practices to ensure that boards consider these factors in the context of their strategic deliberations.
The following guidelines are intended to assist portfolio companies, participants and shareholders and other interested parties in understanding how TIAA is likely to vote on governance, compensation, social and environmental issues. The list is not exhaustive and does not necessarily represent how TIAA will vote on any particular proposal. We vote proxies in accordance to what we believe is in the best interest of our participants and shareholders. In making those decisions the Corporate Governance staff takes into account many factors, including input from our Asset Management Group and third-party research. We consider specific company context, including governance practices and financial performance. It is our belief that aone-size-fits-all approach to proxy voting is not appropriate.
We establish voting policies with respect to both management proposals and shareholder resolutions. Our proxy voting decisions with respect to shareholder resolutions may be influenced by several additional factors: (i) whether the shareholder resolution process is the appropriate means of addressing the issue; (ii) whether the resolution promotes good corporate governance and is related to economic performance and shareholder value; and (iii) whether the information and actions recommended by the resolution are reasonable and practical. In instances where we agree with the concerns raised by proponents but do not believe that the policies or actions requested are appropriate, TIAA will generally abstain on the resolution.
Where appropriate, we will accompany our vote with a letter of explanation.
B. Guidelines for board-related issues
Policy governing votes on directors:
General Policy: TIAA will generally vote in favor of the board’s nominees. However, we will consider withholding or voting against some or all directors in the following circumstances:
| | • | | When we conclude that the actions of directors are unlawful, unethical, negligent, or do not meet fiduciary standards of care and loyalty, or are otherwise not in the best interest of shareholders. Such actions would include: issuance of backdated or spring loaded options, excessively dilutive equity grants, egregious compensation practices, unequal treatment of shareholders, adoption of inappropriate antitakeover devices, and unjustified dismissal of auditors. |
| | • | | When directors have failed to disclose, resolve or eliminate conflicts of interest that affect their decisions. |
| | • | | When less than a majority of the company’s directors are independent, by TIAA standards of independence. |
| | • | | When a director has consistently failed to attend board and committee meetings without an appropriate rationale being provided. |
In cases where TIAA decides to withhold or vote against the entire board of directors, we will also abstain or vote against a provision on the proxy granting discretionary power to vote on “other business” arising at the shareholders’ meeting.
Contested elections:
General Policy: TIAA will generally vote for the candidates we believe will best represent the interests of long-term shareholders.
Majority vote for the election of directors:
General Policy: As indicated in Section IV of this Policy Statement, TIAA will generally support shareholder resolutions asking that companies amend their governance documents to provide for director election by majority vote.
Reimbursement of expenses for dissident shareholder nominees:
General Policy: TIAA will consider on acase-by-case basis shareholder resolutions asking that the company reimburse certain expenses related to the cost of dissident short-slate director campaigns or election contests.
Establish specific board committees:
General Policy: TIAA will generally vote against shareholder resolutions asking the company to establish specific board committees unless we believe specific circumstances dictate otherwise.
Annual election of directors:
General Policy: TIAA will generally support shareholder resolutions asking that each member of the board stand for reelection annually.
Cumulative voting:
General Policy: TIAA will generally not support proposals asking that shareholders be allowed to cumulate votes in director elections, as this practice may encourage the election of “special interest” directors.
C. Guidelines for other governance issues
Separation of Chairman and Chief Executive Officer:
General Policy: TIAA will generally not support shareholder resolutions asking that the roles of Chairman and CEO be separated. However we may support such resolutions where we believe that there is not a bona-fide lead independent director and the company’s corporate governance practices or business performance are materially deficient.
Ratification of auditor:
General Policy: TIAA will generally support the board’s choice of auditor and believe we should be able to do so annually. However, TIAA will consider voting against the ratification of an audit firm wherenon-audit fees are excessive, where the firm has been involved in conflict of interest or fraudulent activities in connection with the company’s audit, or where the auditors’ independence is questionable.
Supermajority vote requirements:
General Policy: TIAA will generally support shareholder resolutions asking for the elimination of supermajority vote requirements.
Dual-class common stock and unequal voting rights:
General Policy: TIAA will generally support shareholder resolutions asking for the elimination of dual classes of common stock with unequal voting rights or special privileges.
Right to call a special meeting:
General Policy: TIAA will generally support shareholder resolutions asking for the right to call a special meeting. However, we believe a 25% ownership level is reasonable and generally would not be supportive of proposals to lower the threshold if it is already at that level.
Right to act by written consent:
General Policy: TIAA will consider on acase-by-case basis shareholder resolutions asking that they be granted the ability to act by written consent.
Antitakeover devices (Poison Pills):
General Policy: TIAA will consider on acase-by-case basis proposals relating to the adoption or rescission of anti-takeover devices with attention to the following criteria:
| | • | | Whether the company has demonstrated a need for antitakeover protection; |
| | • | | Whether the provisions of the device are in line with generally accepted governance principles; |
| | • | | Whether the company has submitted the device for shareholder approval; and |
| | • | | Whether the proposal arises in the context of a takeover bid or contest for control. |
TIAA will generally support shareholder resolutions asking to rescind or put to a shareholder vote antitakeover devices that were adopted without shareholder approval.
Reincorporation:
General Policy: TIAA will evaluate on acase-by-case basis proposals for reincorporation taking into account the intention of the proposal, established laws of the new domicile and jurisprudence of the target domicile. We will not support the proposal if we believe the intention is to take advantage of laws or judicial interpretations that provide antitakeover protection or otherwise reduce shareholder rights.
D. Guidelines for compensation issues
Equity-based compensation plans:
General Policy: TIAA will review equity-based compensation plans on acase-by-case basis, giving closer scrutiny to companies where plans include features that are not performance-based or where total potential dilution from equity compensation exceeds 10%. As a practical matter, we recognize that more dilutive broad-based plans may be appropriate for human-capital intensive industries and for small- ormid-capitalization firms andstart-up companies.
We generally note the following red flags when evaluating executive compensation:
| | • | | Excessive Equity Grants: TIAA will examine a company’s past grants to determine the rate at which shares are being issued. We will also seek to ensure that equity is being offered to more than just the top executives at the company. A pattern of excessive grants can indicate failure by the board to properly monitor executive compensation and its costs. |
| | • | | Lack of Minimum Vesting Requirements: TIAA believes that companies should establish minimum vesting guidelines for senior executives who receive stock grants. Vesting requirements help influence executives to focus on maximizing the company’s long-term performance rather than managing for short-term gain. |
| | • | | Undisclosed or Inadequate Performance Metrics: TIAA believes that performance goals for equity grants should be disclosed meaningfully. Performance hurdles should not be too easily attainable. Disclosure of these metrics should enable shareholders to assess whether the equity plan will drive long-term value creation. |
| | • | | Misalignment of Interests: TIAA supports equity ownership requirements for senior executives and directors to align their interests with those of shareholders. |
| | • | | Reload Options: TIAA will generally not support “reload” options that are automatically replaced at market price following exercise of initial grants. Reload options can lead to excessive dilution and overgenerous benefits and allow recipients to lock in increases in stock price that occur over the duration of the option plan with no attendant risk. |
| | • | | Mega Grants: TIAA will generally not support mega grants. A company’s history of such excessive grant practices may prompt TIAA to vote against the stock plans and the directors who approve them. Mega grants include equity grants that are excessive in relation to other forms of compensation or to the compensation of other employees and grants that transfer disproportionate value to senior executives without relation to their performance. |
| | • | | Undisclosed or Inappropriate Option Pricing: TIAA will generally not support plans that fail to specify exercise prices or that establish exercise prices below fair market value on the date of grant. |
| | • | | Repricing Options: TIAA will generally not support plans that authorize repricing. However, we will consider on acase-by-case basis management proposals seeking shareholder approval to reprice options. We are more likely to vote in favor of repricing in cases where the company excludes named executive officers and board members and ties the repricing to a significant reduction in the number of options. |
| | • | | Excess Discretion: TIAA will generally not support plans where significant terms of awards—such as coverage, option price, or type of awards—are unspecified, or where the board has too much discretion to override minimum vesting and/or performance requirements. |
| | • | | Evergreen Features: TIAA will generally not support option plans that contain evergreen features which reserve a specified percentage of outstanding shares for award each year and lack a termination date. Evergreen features can undermine control of stock issuance and lead to excessive dilution. |
Shareholder resolutions on executive compensation:
General Policy: TIAA will consider on acase-by-case basis shareholder resolutions related to specific compensation practices. Generally, we believe specific practices are the purview of the board.
Advisory vote on compensation disclosure:
General Policy: TIAA prefers that companies offer an annualnon-binding vote on executive compensation (“say on pay”). In absence of an annual vote, companies should clearly articulate the rationale behind offering the vote less frequently. We will consider on acase-by-case basis advisory votes on executive compensation proposals with reference to our compensation disclosure principles noted in Section IV of this Policy Statement.
Golden parachutes:
General Policy: TIAA will vote on acase-by-case basis on golden parachute proposals taking into account the structure of the agreement and the circumstances of the situation. However, we would prefer to see a double trigger on all change of control agreements.
E. Guidelines for environmental and social issues
As indicated in Section V, TIAA will generally support shareholder resolutions seeking reasonable disclosure of the environmental or social impact of a company’s policies, operations or products. We believe that a company’s management and directors have the responsibility to determine the strategic impact of environmental and social issues and that they should disclose to shareholders how they are dealing with these issues.
Global climate change:
General Policy: TIAA will generally support reasonable shareholder resolutions seeking disclosure of greenhouse gas emissions, the impact of climate change on a company’s business activities and products and strategies designed to reduce the company’s long-term impact on the global climate.
Use of natural resources:
General Policy: TIAA will generally support reasonable shareholder resolutions seeking disclosure or reports relating to a company’s use of natural resources, the impact on its business of declining resources and its plans to improve the efficiency of its use of natural resources.
Impact on ecosystems:
General Policy: TIAA will generally support reasonable shareholder resolutions seeking disclosure or reports relating to a company’s initiatives to reduce any harmful impacts or other hazards that result from its operations or activities to local, regional or global ecosystems.
Global labor standards:
General Policy: TIAA will generally support reasonable shareholder resolutions seeking a review of a company’s labor standards and enforcement practices, as well as the establishment of global labor policies based upon internationally recognized standards.
Diversity andnon-discrimination:
General Policies:
| | • | | TIAA will generally support reasonable shareholder resolutions seeking disclosure or reports relating to a company’snon-discrimination policies and practices, or seeking to implement such policies, including equal employment opportunity standards. |
| | • | | TIAA will generally support reasonable shareholder resolutions seeking disclosure or reports relating to a company’s workforce and board diversity policies and practices. |
Global human rights codes of conduct:
General Policy: TIAA will generally support reasonable shareholder resolutions seeking a review of a company’s human rights standards and the establishment of global human rights policies, especially regarding company operations in conflict zones or weak governance.
Corporate response to global health risks:
General Policy: TIAA will generally support reasonable shareholder resolutions seeking disclosure or reports relating to significant public health impacts resulting from company operations and products, as well as the impact of global health pandemics on the company’s operations and long-term growth.
Corporate political influence:
General Policies:
| | • | | TIAA will generally support reasonable shareholder resolutions seeking disclosure or reports relating to a company’s political expenditures, including board oversight procedures, direct political expenditures, and contributions to third parties for the purpose of influencing election results. |
| | • | | TIAA will generally support reasonable shareholder resolutions seeking disclosure or reports relating to a company’s charitable contributions and other philanthropic activities. |
| | • | | TIAA may consider not supporting shareholder resolutions that appear to promote a political agenda that is contrary to the mission or values of TIAA or the long-term health of the corporation. |
Animal welfare:
General Policy: TIAA will generally support reasonable shareholder resolutions asking for reports on the company’s impact on animal welfare.
Product responsibility:
General Policy: TIAA will generally support reasonable shareholder resolutions seeking disclosure relating to the safety and impact of a company’s products on the customers and communities it serves.
Predatory lending:
General Policy: TIAA will generally support reasonable shareholder resolutions asking companies for disclosure about the impact of lending activities on borrowers and policies designed to prevent predatory lending practices.
Tobacco:
General Policies:
| | • | | TIAA will generally support reasonable shareholder resolutions seeking disclosure or reports relating to risks associated with tobacco use and efforts by a company to reduce exposure to tobacco products among the young or other vulnerable populations. |
| | • | | TIAA will generally not support shareholder resolutions seeking to alter the investment policies of financial institutions or to require divestment of tobacco company stocks. |
ITEM 8. PORTFOLIO MANAGERS OFCLOSED-END MANAGEMENT INVESTMENT COMPANIES
Nuveen Fund Advisors, LLC is the registrant’s investment adviser (also referred to as the “Adviser”). The Adviser is responsible for the selection andon-going monitoring of the Fund’s investment portfolio, managing the Fund’s business affairs and providing certain clerical, bookkeeping and administrative services. The Adviser has engaged Teachers Advisors LLC (“Teachers Advisors”) also referred to as the(“Sub-Adviser”), assub-adviser to provide discretionary investment advisory services with respect to the registrant’s investments in senior loans and other debt instruments and equity investments. The following section provides information on the portfolio managers of theSub-Adviser.
| Item 8(a)(1). | PORTFOLIO MANAGER BIOGRAPHIES |
As of the date of filing this report, the following individuals at theSub-Adviser (the “Portfolio Managers”) have primary responsibility for theday-to-day implementation of the Fund’s investment strategy:
Anupam Damani (a “Portfolio Manager”) is Lead Portfolio Manager and a managing director and portfolio manager for the TIAA organization. Ms. Damani is responsible for managing international fixed income in sovereign credit, interest rate, and currency markets. She is the lead portfolio manager on the Emerging Markets Local Currency strategy, Emerging Markets High Yield strategy, and International Bond strategy. She is theco-portfolio manager for emerging markets debt blended investment strategies, including the TIAA-CREF Emerging Markets Debt strategy and the Emerging Market Debt portfolio for the General Account. She is also the sector portfolio manager for emerging and developed market sovereign exposures within TIAA multi-sector total return strategies. Previously, Ms. Damani was the sovereign research analyst for Central and Eastern Europe, Middle East and Africa regions, lead emerging markets debt trader, and portfolio manager for Eurozone Debt. She joined TIAA in 2005. Ms. Damani has over 22 years of investment experience. Prior to joining TIAA, she was a portfolio manager and trader for emerging markets debt portfolios at Citigroup for over nine years.
Katherine Renfrew (a “Portfolio Manager”) isCo-Portfolio Manager and portfolio manager for the TIAA organization. Ms. Renfrewco-manages TIAA’s Global Asset Management’s Emerging Markets Debt investment strategy and the emerging markets debt portfolios for TIAA’s General Account and for its actively managed total return funds. She is the lead portfolio manager for blended emerging markets debt strategies as well as sector specialist portfolio manager for all Emerging Markets Corporates and Quasi Sovereigns and also for all Developed Markets Quasi-Sovereigns (excluding U.S. and Canada). From 2005-2013, she served as portfolio manager for the Emerging Markets Debt strategy with responsibility for Sovereigns, Quasi-Sovereigns, and Corporates (both hard and local currency). Prior to this role from 2001 to 2005, she was the South American regional analyst and trader as well as the portfolio manager for TIAA’s Eastern Europe, Middle East and Africa (EMEA) regions. From 1998 to 2001, she was TIAA’s Asian and EMEA regional analyst and trader. Before joining the Emerging Markets team, she was a member of TIAA’s Structured Finance team in which she analyzed and invested in a variety of asset-backed securitization products. She joined TIAA in 1997. Ms. Renfrew has 24 years of investment experience, including her role as a fixed-income securities analyst at MONY Capital Management. In addition, she worked for 2 years as a financial analyst at Mattel Toys.
| Item 8(a)(2). | OTHER ACCOUNTS MANAGED BY PORTFOLIO MANAGERS |
In addition to serving as a portfolio manager to the Fund, the portfolio managers are also primarily responsible for theday-to-day portfolio management of the following accounts. Information is provided as of December 31, 2018.
| | | | | | | | | | | | | | | | | | |
Portfolio Manager | | Type of Account Managed | | Number
of Accounts | | | Assets
(millions) | | | Number of
Accounts with
Performance-
Based Fees | | | Assets of
Accounts with
Performance-
Based Fees | |
Anupam Damani | | Registered Investment Companies | | | 2 | | | $ | 820 | | | | 0 | | | $ | 0 | |
| | Other Pooled Investment Vehicles | | | 1 | | | $ | 34 | | | | 0 | | | $ | 0 | |
| | Other Accounts | | | 0 | | | $ | 0 | | | | 0 | | | $ | 0 | |
Katherine Renfrew | | Registered Investment Companies | | | 1 | | | $ | 445 | | | | 0 | | | $ | 0 | |
| | Other Pooled Investment Vehicles | | | 1 | | | $ | 34 | | | | 0 | | | $ | 0 | |
| | Other Accounts | | | 0 | | | $ | 0 | | | | 0 | | | $ | 0 | |
POTENTIAL MATERIAL CONFLICTS OF INTEREST
Portfolio Managers of the Fund may also manage other registered investment companies or unregistered investment pools and investment accounts, including accounts for TIAA, its affiliated investment advisers, including Teachers Advisors, or other client or proprietary accounts (collectively, “Accounts”), which may raise potential conflicts of interest. Teachers Advisors has put in place policies and procedures designed to mitigate any such conflicts. Additionally, TIAA or its affiliates, including Teachers Advisors, may be involved in certain investment opportunities that have the effect of restricting or limiting the Fund’s participation in such investment opportunities.
TIAA or its affiliates, including Teachers Advisors, sponsor an array of financial products for retirement and other investment goals, and provide services worldwide to a diverse customer base. Accordingly, from time to time, the Fund may be restricted from purchasing or selling securities, or from engaging in other investment activities because of regulatory, legal or contractual restrictions that arise due to an Account’s investments and/or the internal policies of TIAA or its affiliates, including Teachers Advisors, designed to comply with such restrictions. As a result, there may be periods, for example, when Teachers Advisors will not initiate or recommend certain types of transactions in certain securities or instruments with respect to which investment limits have been reached.
The investment activities of TIAA or its affiliates, including Teachers Advisors, may also limit the investment strategies and rights of the Fund. For example, in certain circumstances where the Fund invests in securities issued by companies that operate in certain emerging or international markets, or are subject to corporate or regulatory ownership definitions, or invest in certain futures and derivative transactions, there may be limits on the aggregate amount invested by TIAA or its affiliates, including Teachers Advisors, for the Fund and Accounts that may not be exceeded without the grant of a license or other regulatory or corporate consent. If certain aggregate ownership thresholds are reached or certain transactions undertaken, the ability of Teachers Advisors, on behalf of the Fund or Accounts, to purchase or dispose of investments or exercise rights or undertake business transactions may be restricted by regulation or otherwise impaired. As a result, Teachers Advisors, on behalf of the Fund or Accounts, may limit purchases, sell existing investments, or otherwise restrict or limit the exercise of rights (including voting rights) when Teachers Advisors, in its sole discretion, deems it appropriate in light of potential regulatory or other restrictions on ownership or other consequences resulting from reaching investment thresholds.
Conflicting Positions. Investment decisions made for the Fund may differ from, and may conflict with, investment decisions made by Teachers Advisors or any of its affiliated investment advisers for Accounts due to differences in investment objectives, investment strategies, account benchmarks, client risk profiles and other factors. As a result of such differences, if an Account were to sell a significant position in a security while the Fund maintained its position in that security, the market price of such security could decrease and adversely impact the Fund’s performance. In the case of a short sale, the selling Account would benefit from any decrease in price.
Conflicts may also arise in cases where one or more funds or Accounts are invested in different parts of an issuer’s capital structure. For example, a fund (or an Account) could acquire debt obligations of a company while an Account (or a fund) acquires an equity investment in the same company. In negotiating the terms and conditions of any such investments, Teachers Advisors (or, in the case of an Account, an affiliated investment adviser) may find that the interests of the debt-holding fund (or Account) and the equity-holding Account (or fund) may conflict. If that issuer encounters financial problems, decisions over the terms of the workout could raise conflicts of interest (including, for example, conflicts over proposed waivers and amendments to debt covenants). For example, a debt holding fund (or Account) may be better served by a liquidation of an issuer in which they could be paid in full, while equity holding Account (or fund) might prefer a reorganization of the issuer that would have the potential to retain value for the equity holder. As another example, holders of an issuer’s senior securities may be able to act to direct cash flows away from junior security holders, and both the junior and senior security holders may be a fund (or an Account). Any of the foregoing conflicts of interest will be discussed and resolved on acase-by-case basis pursuant to policies and procedures designed to mitigate any such conflicts. Any such discussions will factor in the interests of the relevant parties and applicable laws and regulations. Teachers Advisors may seek to avoid such conflicts, and, as a result, Teachers Advisors may choose not to make such investments on behalf of the Fund, which may adversely affect the Fund’s performance if similarly attractive opportunities are not available or identified.
Allocation of Investment Opportunities. Even where Accounts have similar investment mandates as the Fund, Teachers Advisors may determine that investment opportunities, strategies or particular purchases or sales are appropriate for one or more Accounts, but not for the Fund, or are appropriate for the Fund but in different amounts, terms or timing than is appropriate for an Account. As a result, the amount, terms or timing of an investment by the Fund may differ from, and performance may be lower than, investments and performance of an Account.
Aggregation and Allocation of Orders. Teachers Advisors may aggregate orders of the Fund and Accounts, in each case consistent with Teachers Advisors’ policy to seek best execution for all orders. Although aggregating orders is a common means of reducing transaction costs for participating Accounts and the Fund, Teachers Advisors may be perceived as causing the Fund or Account to participate in an aggregated transaction in order to increase Teachers Advisors’ overall allocation of securities in that transaction or future transactions. Allocations of aggregated trades may also be perceived as creating an incentive for Teachers Advisors to disproportionately allocate securities expected to increase in value to certain Accounts at the expense of the Fund.
Teachers Advisors has adopted procedures designed to mitigate the foregoing conflicts of interest by treating each fund and Account it advises fairly and equitably over time in the allocation of investment opportunities and the aggregation and allocation of orders. The procedures also are designed to mitigate conflicts in potentially inconsistent trading and provide guidelines for trading priority. Moreover, Teachers Advisors’ trading activities are subject to supervisory review and compliance monitoring to help address and mitigate conflicts of interest and ensure that the Fund and Accounts are being treated fairly and equitably over time. For example, in allocating investment opportunities, a Portfolio Manager considers an Account’s or the Fund’s investment objectives, investment restrictions, cash position, need for liquidity, sector concentration and other objective criteria. In addition, orders for the same single security are generally aggregated with other orders for the same single security received at the same time. If aggregated orders are fully executed, each participating Account and the Fund is allocated its pro rata share on an average price and trading cost basis. In the event the order is only partially filled, each participating Account and the Fund receive a pro rata share. Portfolio Managers are also subject to restrictions on potentially inconsistent trading of single securities, although a Portfolio Manager may sell a single security short if the security is included in an Account’s or fund’s benchmark and the Portfolio Manager is underweight in that security relative to the applicable Account’s or fund’s benchmark. Moreover, the procedures set forth guidelines under which trading for long sales of single securities over short sales of the same or closely related securities are monitored to ensure that the trades are treated fairly and equitably. Additionally, the Fund’s Portfolio Managers’ decisions for executing those trades are also monitored.
| Item 8(a)(3). | FUND MANAGER COMPENSATION |
As of the most recently completed fiscal year end, the primary portfolio managers compensation is as follows:
Fixed-income Portfolio Managers are compensated through a combination of base salary, annual performance awards, and long-term compensation awards. Currently, the annual performance awards and long-term compensation awards are determined by investment performance ratings, which reflect investment performance using risk-adjusted returns and Morningstar ranking (60%), manager-subjective ratings (25%), and internal peer review (15%).
The variable component of a Portfolio Manager’s compensation is remunerated as: (1) a current year cash bonus; and (2) a long-term performance award, which is on a3-year cliff vesting cycle. Fifty percent (50%) of the long-term award is based on the account(s) managed by the Portfolio Manager during the3-year vesting period, while the value of the remainder of the long-term award is based on the performance of the TIAA organization as a whole.
Risk-adjusted investment performance is calculated, where records are available, over one, three, and five years, each ending December 31. For each year, the gross excess return (on abefore-tax basis) of a Portfolio Manager’s mandate(s) is calculated versus each mandate’s assigned benchmark. For managers with less than a5-year track record, there is a 40% weighting for the1-year return and a 60% weighting for the3-year return. An Information Ratio is then calculated utilizing the gross excess return in the numerator and the52-week realized Active Risk (tracking error), in the denominator to generate risk adjusted investment performance. Investment performance relative to industry peers is evaluated using Morningstar percentile rankings with equal weighting to each of the1-,3-, and5-year rankings.
Utilizing the three variables discussed above (investment performance, manager assessment and internal peer ratings), total compensation is calculated and then compared to the compensation data obtained from surveys that include comparable investment firms. It should be noted that the total compensation can be increased or decreased based on the performance of the fixed-income group as a unit and the relative success of the TIAA organization in achieving its financial and operational objectives.
| Item 8(a)(4). | OWNERSHIP OF JEMD SECURITIES AS OF DECEMBER 31, 2018 |
| | | | | | | | | | | | | | | | | | | | | | | | | | |
Name of Portfolio Manager | | None | | $1-
$10,000 | | | $10,001-
$50,000 | | | $50,001-
$100,000 | | | $100,001-
$500,000 | | | $500,001-
$1,000,000 | | | Over $1,000,000 | |
Anupam Damani | | X | | | | | | | | | | | | | | | | | | | | | | | | |
Katherine Renfrew | | X | | | | | | | | | | | | | | | | | | | | | | | | |
ITEM 9. PURCHASES OF EQUITY SECURITIES BY CLOSED-END MANAGEMENT INVESTMENT COMPANY AND AFFILIATED PURCHASERS.
Not applicable.
ITEM 10. SUBMISSION OF MATTERS TO A VOTE OF SECURITY HOLDERS.
There have been no material changes to the procedures by which shareholders may recommend nominees to the registrant’s Board implemented after the registrant last provided disclosure in response to this Item.
ITEM 11. CONTROLS AND PROCEDURES.
| | (a) | The registrant’s principal executive and principal financial officers, or persons performing similar functions, have concluded that the registrant’s disclosure controls and procedures (as defined in Rule 30a-3(c) under the Investment Company Act of 1940, as amended (the “1940 Act”) (17 CFR 270.30a-3(c))) are effective, as of a date within 90 days of the filing date of this report that includes the disclosure required by this paragraph, based on their evaluation of the controls and procedures required by Rule 30a-3(b) under the 1940 Act (17 CFR 270.30a-3(b)) and Rules 13a-15(b) or 15d-15 (b) under the Securities Exchange Act of 1934, as amended (the “Exchange Act”) (17 CFR 240.13a-15(b) or 240.15d-15 (b)). |
| | (b) | There were no changes in the registrant’s internal control over financial reporting (as defined in Rule 30a-3(d) under the 1940 Act (17 CFR 270.30a-3(d)) that occurred during the period covered by this report that has materially affected, or is reasonably likely to materially affect, the registrant’s internal control over financial reporting. |
ITEM 12. DISCLOSURE OF SECURITIES LENDING ACTIVITIES FOR CLOSED-END MANAGEMENT INVESTMENT COMPANIES.
Not applicable.
ITEM 13. EXHIBITS.
File the exhibits listed below as part of this Form.
(a)(1) Any code of ethics, or amendment thereto, that is the subject of the disclosure required by Item 2, to the extent that the registrant intends to satisfy the Item 2 requirements through filing of an exhibit: Not applicable because the code is posted on registrant’s website at www.nuveen.com/CEF/Shareholder/FundGovernance.aspx and there were no amendments during the period covered by this report. (To view the code, click on Code of Conduct.)
(a)(2) A separate certification for each principal executive officer and principal financial officer of the registrant as required by Rule 30a-2(a) under the 1940 Act (17 CFR 270.30a-2(a)) in the exact form set forth below: Ex-99.CERT Attached hereto.
(a)(3) Any written solicitation to purchase securities under Rule 23c-1 under the 1940 Act (17 CFR 270.23c-1) sent or given during the period covered by the report by or on behalf of the registrant to 10 or more persons. Not applicable.
(a)(4) Change in registrant’s independent public accountant. Not applicable.
(b) If the report is filed under Section 13(a) or 15(d) of the Exchange Act, provide the certifications required by Rule 30a-2(b) under the 1940 Act (17 CFR 270.30a-2(b)); Rule 13a-14(b) or Rule 15d-14(b) under the Exchange Act (17 CFR 240.13a-14(b) or 240.15d-14(b)), and Section 1350 of Chapter 63 of Title 18 of the United States Code (18 U.S.C. 1350) as an exhibit. A certification furnished pursuant to this paragraph will not be deemed “filed” for purposes of Section 18 of the Exchange Act (15 U.S.C. 78r), or otherwise subject to the liability of that section. Such certification will not be deemed to be incorporated by reference into any filing under the Securities Act of 1933 or the Exchange Act, except to the extent that the registrant specifically incorporates it by reference. Ex-99.906 CERT attached hereto.
SIGNATURES
Pursuant to the requirements of the Securities Exchange Act of 1934 and the Investment Company Act of 1940, the registrant has duly caused this report to be signed on its behalf by the undersigned, thereunto duly authorized.
(Registrant) Nuveen Emerging Markets Debt 2022 Target Term Fund
| | | | |
| By (Signature and Title) | | /s/ Gifford R. Zimmerman | | |
| | Gifford R. Zimmerman | | |
| | Vice President and Secretary | | |
| |
| Date: March 8, 2019 | | |
Pursuant to the requirements of the Securities Exchange Act of 1934 and the Investment Company Act of 1940, this report has been signed below by the following persons on behalf of the registrant and in the capacities and on the dates indicated.
| | | | |
| By (Signature and Title) | | /s/ Cedric H. Antosiewicz | | |
| | Cedric H. Antosiewicz | | |
| | Chief Administrative Officer | | |
| | (principal executive officer) | | |
| |
| Date: March 8, 2019 | | |
| | |
| By (Signature and Title) | | /s/ Stephen D. Foy | | |
| | Stephen D. Foy | | |
| | Vice President and Controller | | |
| | (principal financial officer) | | |
| |
| Date: March 8, 2019 | | |