UNITED STATES
SECURITIES AND EXCHANGE COMMISSION
Washington, D.C. 20549
FORM N-CSR
CERTIFIED SHAREHOLDER REPORT OF REGISTERED
MANAGEMENT INVESTMENT COMPANIES
Investment Company Act file number: 811-23270
Blackstone Floating Rate Enhanced Income Fund
(exact name of Registrant as specified in charter)
345 Park Avenue, 31st Floor
New York, New York 10154
(Address of principal executive offices) (Zip code)
(Name and address of agent for service)
Marisa Beeney
Blackstone Alternative Credit Advisors LP
345 Park Avenue, 31st Floor
New York, New York 10154
Registrant’s telephone number, including area code: (877) 876-1121
Date of fiscal year end: September 30
Date of reporting period: March 31, 2024
| Item 1. | Report to Stockholders. |

Table of Contents
| Manager Commentary | 2 |
| Fund Summary | 4 |
| Portfolio of Investments | 7 |
| Statement of Assets and Liabilities | 25 |
| Statement of Operations | 27 |
| Statements of Changes in Net Assets | 28 |
| Statement of Cash Flows | 30 |
| Financial Highlights | 31 |
| Notes to Financial Statements | 36 |
| Additional Information | 54 |
| Privacy Procedures | 55 |
| Trustees & Officers | 66 |
| Blackstone Floating Rate Enhanced Income Fund | Manager Commentary |
March 31, 2024 (Unaudited)
To Our Shareholders:
A strong, persistent technical backdrop; supportive macroeconomic themes; and a dovish U.S. Federal Reserve (the “Fed”) fueled a five-month rally across U.S. broadly syndicated loans. The market recorded gains in each of the past six months to outperform all other credit asset classes, returning 5.4% over the period.1
The Fed held rates steady over the period, and hopes for a pivot to decreasing rates in 2024 moved the market into risk-on mode. Last year’s recession concerns were replaced with a focus on a soft landing at the start of 2024, before shifting again to economic growth prospects; U.S. growth is holding up2 and Europe’s economy is showing signs of a recovery.3
Higher base rates have supported an attractive carry for loan investors over the near term.4 The additional yield available due to elevated base rates has revived demand for floating rate assets, including loans and collateralized loan obligations (“CLOs”), pushing loan spreads tighter. Loan interest return, which reflects the base rate and nominal coupon on the loan, accounts for 2.34% of the 1Q24 total return, and has roughly doubled from 2021 through 2023.5
Regarding demand, the CLO buyer base recorded its strongest start to a year since the 2008 Global Financial Crisis, pricing $49 billion of new deals over the quarter and taking new issuance for the six-month period to $81 billion.6 Retail demand also picked up, and the $4.7 billion of inflows into loan mutual funds and exchange-traded funds (“ETFs”) over the six-month period as compared to outflows of $7.1 billion over the previous six months as recession fears caused investors to withdraw funds.7 Non-traditional loan accounts, including high yield and crossover accounts, also flocked to the loan market to benefit from the increased carry available relative to high yield.8
Demand reversed an initial sell-off in October 2023 to push average loan prices two points higher over the period, ending the first quarter of 2024 at $96.6, their highest level since May 2022.9 Elevated index prices pushed investors further down the ratings spectrum in search of yield. The average bid of loans to borrowers rated B-minus rose 0.8% from the end of 2023 to the end of March, compared with a 0.4% rise of the average bid of the B-flat sub-index.10
This supportive backdrop kick-started primary issuance after last year’s lackluster supply. Corporate borrowers priced nearly $200 billion of new loan transactions over the period, with that supply concentrated in the first quarter of 2024.11 Refinancings and extensions dominated,12 with the slight increase in new money M&A loan financings insufficient to sate demand. As the percentage of loans priced above par crossed above 40% in January, borrowers also took advantage of the strong secondary prices to price a slew of opportunistic transactions, including dividend recaps and repricings, so that roughly 10% of U.S. loans repriced in 2024.13
From a fundamental perspective, higher rates continued to pressure corporate interest burdens, pushing coverage ratios for loan issuers to a two-year low.14 Companies are responding by slowing debt growth, and reducing leverage to a post-pandemic low.15 As rate cuts materialize amid a still-growing economy, we expect a bullish credit scenario to emerge that will ease the pressure on corporate balance sheets, reducing potential stress.16 Meanwhile, the loan default rate increased over the period, settling just above the historical average at 3.52%.17
High yield and leveraged loan borrowers also continued their efforts to push out near-term debt maturities, reducing debt due in 2024 through 2026 by $329 billion, which, although still elevated by historical standards, is 40% lower than a year ago.18
As such, we are relatively positive about loan performance over the next quarter. We believe that reduced expectations for Fed rate cuts following the recent upside surprises in core consumer price index should continue to support an attractive carry environment for loans. Additionally, we expect ongoing demand for these higher-yielding assets should limit price volatility given our expectations for a low risk of retail outflows, robust CLO creation and light net new issue supply. Loan assets have minimal exposure to duration and rate volatility, which is another benefit in our view.
Still, we believe markets and the macro backdrop remain dynamic. The emergence of a handful of idiosyncratic developments over the first quarter of 202419 reminded us of the importance of identifying problematic credits ahead of time, while also maintaining our bias towards higher-quality assets as the market adjusts to the higher-rate environment. As ever, we emphasize an active management approach that is responsive and open to a range of possible outcomes.
Please note that on May 13, 2024, the Adviser announced that the Fund’s Board of Trustees approved a Plan of Liquidation for the Fund in connection with the Fund’s orderly liquidation. Under the Plan of Liquidation, the Fund will liquidate portfolio assets and unwind its affairs in an orderly fashion over time.
| Blackstone Floating Rate Enhanced Income Fund | Manager Commentary |
March 31, 2024 (Unaudited)
At Blackstone Credit, we value your continued investment and confidence in us and in our family of funds. Additional information about our funds is available on our website at www.blackstone-credit.com and www.bgflx.com.
Sincerely,
Blackstone Liquid Credit Strategies LLC
| 1 | Morningstar LSTA Leveraged Loan Index, as of March 31, 2024. |
| 2 | Blackstone Investment Strategy Views and Believes, as of April 28, 2024. Referencing data from the US Bureau of Economic Analysis and Bloomberg (as of March 31, 2024) that shows that while the recent Q1 GDP report revealed a notable decline versus the previous quarter, the weakness stemmed largest from volatile exports which detracted from what was another quarter of strong underlying consumer demand, and a 3% rise in real GDP from a year ago. Core GDP is comprised of personal consumption expenditures, fixed investment, government consumption expenditures and gross government investment. Non-core GDP is comprised of net exports and change in private inventories. |
| 3 | BBG, Euro-Zone Recession Ends But Inflation Proves Sticky: GDP Latest, as of April 30, 2024. |
| 4 | BBG, Powell Signals Rate-Cut Delay After Run of Inflation Surprises, as of April 17, 2024. |
| 5 | Morningstar LSTA Leveraged Loan Index, as of March 31, 2024. |
| 6 | Pitchbook LCD, CLO data, as of March 31, 2024. |
| 7 | JP Morgan, Lipper, as of March 31, 2024. |
| 8 | BXCI views and opinions, as of March 22, 2024. |
| 9 | Morningstar LSTA Leveraged Loan Index, as of March 31, 2024. |
| 10 | Morningstar LSTA Leveraged Loan Index, as of March 31, 2024. |
| 11 | Pitchbook LCD, New Issue Data, as of March 31, 2024. |
| 12 | Pitchbook LCD, New Issue Data, as of March 31, 2024. |
| 13 | Pitchbook LCD, Q1 US Leveraged Loan Market Wrap: As prices rally, opportunistic activity soars, as of March 26, 2024. |
| 14 | JP Morgan 4Q23 Leveraged Loan Credit Fundamentals: Credit metrics continue to erode off a strong base, particularly for private loan borrowers, as of April 10, 2024. |
| 15 | JP Morgan 4Q23 Leveraged Loan Credit Fundamentals: Credit metrics continue to erode off a strong base, particularly for private loan borrowers, as of April 10. 2024. |
| 16 | BofA CLO Research, CLO Weekly: Can you see CCCs: Evolution of CCCs in CLOs and price transitions – Global, as of March 22, 2024. |
| 17 | JPM Default Monitor, as of March 31, 2024. |
| 18 | BofA US High Yield Strategy, as of March 22, 2024. |
| 19 | Pitchbook LCD, LCD News Today, Europe, as of March 26, 2024. |
| Semi-Annual Report | March 31, 2024 | 3 |
| Blackstone Floating Rate Enhanced Income Fund | Fund Summary |
March 31, 2024 (Unaudited)
Fund Overview
Blackstone Floating Rate Enhanced Income Fund (the “Fund”) is a diversified, closed-end management investment company that continuously offers its shares and is operated as an “interval fund.” The Fund’s investment objective is to provide attractive current income with low sensitivity to rising interest rates. Under normal market conditions, the Fund will invest at least 80% of its Managed Assets in floating rate loans, notes or bonds. “Managed Assets” means net assets plus the amount of any borrowings for investment purposes. In addition, the Fund may invest up to 20% of its Managed Assets in each of (i) structured products, (ii) derivatives, (iii) warrants and equity securities that are incidental to the Fund’s purchase of floating rate instruments or acquired in connection with a reorganization of a Borrower (as defined below) or issuer, (iv) fixed rate instruments, and (v) equity investments in other investment companies, including ETFs. In pursuing the Fund’s investment objective, the Adviser will seek to enhance the Fund’s return with the use of leverage.
Portfolio Management Commentary
Fund Performance
As of March 31, 2024, the Fund’s Class I shares outperformed the Fund’s benchmark, the Morningstar LSTA US Leveraged Loan Index (“Morningstar LLI”) for the six-month, one-year, five-year, and since inception periods and underperformed for the three-year period. The Fund’s Class T and Class D shares outperformed the Morningstar LLI for the six-month and one-year periods and underperformed for the three-year, five-year, and since inception periods. The Fund’s Class T-I and Class U shares outperformed the Morningstar LLI for the six-month and one-year periods and underperformed for the three-year and since inception periods.
NAV Performance Factors
The Fund’s performance relative to the benchmark for the six months ended March 31, 2024 was primarily attributable to the Fund’s use of leverage, credit selection within its loan allocation, and its allocation to high yield bonds. By issuer, the largest positive contributors to total return were Global Medical Response, Envision Healthcare and Radiology Partners, and the most significant detractors were Magenta Buyer, Carestream Health Holdings and Pediatric Associates.
Portfolio Activity and Positioning
During the period, we continued to dynamically manage the Fund to take advantage of relative value opportunities between loans, high yield and CLO securities. The Fund’s largest sector overweights were Financial Services, Professional Services and Capital Markets; the largest sector underweights included Chemicals, Media and Software. The Fund increased its allocation to CLO securities during the period.
As of March 31, 2024, the Fund held 87.2% of its Managed Assets in first lien loans, 2.2% in second lien loans, 2.8% in corporate bonds, 5.8% in CLO securities and 3.8% in equities and warrants. The Fund has an average position size representing 0.22% of Managed Assets of the Fund.
Note: Data is as of March 31, 2024 unless otherwise indicated. Reflects Blackstone Credit & Insurance’s views and beliefs. Past performance does not predict future returns and there can be no assurance that the fund will achieve results comparable to those of any of Blackstone Credit & Insurance’s prior funds or be able to implement its strategy or achieve its investment objectives, including due to an inability to access sufficient investment opportunities.
Certain information contained in this communication constitutes “forward looking statements” within the meaning of the federal securities laws and the Private Securities Litigation Reform Act of 1995. These forward-looking statements can be identified by the use of forward-looking terminology, such as “outlook,” “indicator,” “believes,” “expects,” “potential,” “continues,” “may,” “can,” “will,” “should,” “seeks,” “approximately,” “predicts,” “intends,” “plans,” “estimates,” “anticipates”, “confident,” “conviction,” “identified” or the negative versions of these words or other comparable words thereof. These may include financial projections and estimates and their underlying assumptions, statements about plans, objectives and expectations with respect to future operations, statements regarding future performance, statements regarding economic and market trends and statements regarding identified but not yet closed investments. Such forward-looking statements are inherently subject to various risks and uncertainties. Accordingly, there are or will be important factors that could cause actual outcomes or results to differ materially from those indicated in such statements. BGFLX believes these factors also include but are not limited to those described under the section entitled “Risks” in its prospectus, and any such updated factors included in its periodic filings with the Securities and Exchange Commission (the “SEC”), which are accessible on the SEC’s website at www.sec.gov. These factors should not be construed as exhaustive and should be read in conjunction with the other cautionary statements that are included in this document (or BGFLX’s prospectus and other filings). Except as otherwise required by federal securities laws, BGFLX undertakes no obligation to publicly update or revise any forward-looking statements, whether as a result of new information, future developments or otherwise.
| Blackstone Floating Rate Enhanced Income Fund | Fund Summary |
March 31, 2024 (Unaudited)
Performance Summary
Performance quoted represents past performance, which is no guarantee of future results. Past performance is not indicative of future results. Investment returns and principal value of an investment will fluctuate so that an investor’s shares, when repurchased, may be worth more or less than their original cost. The returns shown do not reflect taxes that an investor would pay on fund distributions or on the sale of fund shares. To obtain the most recent month-end performance, visit www.bgflx.com.
Value of a $1,000,000 Investment Since Inception at Net Asset Value*

| * | The line graph represents historical performance of a hypothetical investment of $1,000,000 in Class I Shares of the Fund from January 18, 2018 (commencement of operations) to March 31, 2024, assuming the reinvestment of distributions. |
Total Return (as of March 31, 2024)
| | 3 Month | 6 Month^ | 1 Year | 3 Year | 5 Year | Since Inception |
| Class I* | 3.50% | 7.27% | 16.50% | 5.45% | 5.64% | 5.19% |
| Class T* | 3.37% | 7.00% | 15.92% | 4.91% | 5.12% | 4.70% |
| Class T* w/ 2.5% Sales Load** | 0.80% | 4.31% | 13.02% | 4.04% | 4.59% | 4.25% |
| Class D* | 3.43% | 7.08% | 16.14% | 5.15% | 5.39% | 4.94% |
| Class T-I* | 3.35% | 7.00% | 15.88% | 4.91% | N/A | 4.89% |
| Class T-I* w/ 3.5% Sales Load*** | -0.25% | 3.24% | 11.83% | 3.67% | N/A | 4.14% |
| Class U* | 3.38% | 6.96% | 15.87% | 4.90% | N/A | 5.14% |
| Morningstar LSTA US Leveraged Loan Index**** | 3.26% | 5.40% | 11.49% | 5.69% | 5.26% | 4.97% |
| * | Assumes distributions are reinvested pursuant to the Fund's dividend reinvestment plan. Performance data quoted represents past performance and does not guarantee future results. |
| ** | Assumes payment of the full front-end 2.5% sales load at initial subscription. |
| *** | Assumes payment of the full front-end 3.5% sales load at initial subscription. |
| **** | Inception to date returns for the Morningstar LLI are based on the I Share inception date of January 18, 2018. |
| ^ | Excludes adjustments in accordance with the accounting principles generally accepted in the United States of America and as such, the net asset value and total return for shareholder transactions reported to the market at period ended March 31, 2024 may differ from the net asset value for financial reporting purposes. |
| Semi-Annual Report | March 31, 2024 | 5 |
| Blackstone Floating Rate Enhanced Income Fund | Fund Summary |
March 31, 2024 (Unaudited)
Portfolio Composition*

| * | The Fund’s Cash & Other Assets less Liabilities represents net cash and other assets and liabilities, which includes amounts payable for investments purchased but not yet settled and amounts receivable for investments sold but not yet settled. At period end, the amounts payable for investments purchased but not yet settled exceeded the amount of cash on hand. The Fund uses sales proceeds or its leverage program to settle amounts payable for investments purchased, but such amounts are not reflected in the Fund’s net cash. |
Moody’s Rating Distribution**
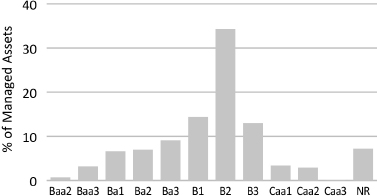
| ** | For more information on Moody's ratings and descriptions refer to www.moodys.com. |
Portfolio Characteristics
| Weighted Average Coupon | 8.63% |
| Current Dividend Yield – I Share^ | 11.29% |
| Current Dividend Yield – T Share^ | 10.79% |
| Current Dividend Yield – D Share^ | 11.08% |
| Current Dividend Yield – T-I Share^ | 10.78% |
| Current Dividend Yield – U Share^ | 10.79% |
| Average Duration^^ | 0.19 yr |
| Average Position* | 0.22% |
| Leverage* | 31.93% |
| ^ | Represents annualized distribution rate of I Share, T Share, D Share, T-I Share and U Share. Reflects March month cumulative distribution rate annualized. The cumulative distribution rate for the month presented represents the sum of the daily dividend distribution rate as calculated by dividing the daily dividend per share by the daily net asset value (“NAV”) per share, for each respective class, for each day in the month for which a daily dividend is declared. |
| ^^ | Loan durations are based on the actual remaining time until respective reference rates are reset for each individual loan. |
| * | As a percentage of Managed Assets. |
Top 10 Issuers*
| Spdr Blackstone Senior Loan ETF | 3.7% |
| Coherent Corp | 1.5% |
| Cloud Software Group Inc. | 1.2% |
| Atlas CC Acquisition Corp. | 0.9% |
| Help/Systems Holdings, Inc. | 0.9% |
| Cornerstone OnDemand, Inc. | 0.9% |
| Halseypoint Clo Ltd. | 0.9% |
| Central Parent Inc. | 0.8% |
| Precisely Software Incorporated | 0.8% |
| Heartland Dental LLC | 0.8% |
| Top 10 Issuers | 12.4% |
| * | As a percentage of Managed Assets. |
Portfolio holdings and distributions are subject to change and are not recommendations to buy or sell any security.
Top 5 Industries*^
| Software | 10.7% |
| Professional Services | 7.4% |
| Capital Markets | 7.3% |
| Financial Services | 7.3% |
| Health Care Providers & Services | 6.8% |
| Top 5 Industries | 39.5% |
| * | As a percentage of Managed Assets. |
| ^ | Global Industry Classification Standard (GICS) |
| Blackstone Floating Rate Enhanced Income Fund | Portfolio of Investments |
March 31, 2024 (Unaudited)
| | | Principal
Amount | | | Value | |
| FLOATING RATE LOAN INTERESTS(a) - 130.01% | | | | | | | | |
| Aerospace & Defense - 5.59% | | | | | | | | |
| Atlas CC Acquisition Corp., First Lien B Term Loan, 3M US SOFR + 4.25%, 0.75% Floor, 05/25/2028 | | $ | 2,420,789 | | | $ | 2,272,709 | |
| Atlas CC Acquisition Corp., First Lien C Term Loan, 3M US SOFR + 4.25%, 0.75% Floor, 05/25/2028 | | | 492,364 | | | | 462,246 | |
| Avolon TLB Borrower 1 (US), First Lien Term Loan, 1M US SOFR + 2.50%, 06/22/2028 | | | 1,057,109 | | | | 1,058,600 | |
| Dynasty Acquisition Co Inc., First Lien Term Loan, 6M CME TERM SOFR + 3.50%, 08/24/2028 | | | 227,706 | | | | 228,297 | |
| LSF11 Trinity BidCo, Inc., First Lien Term Loan, 6M US SOFR + 4.00%, 06/14/2030(b) | | | 1,162,139 | | | | 1,167,950 | |
| Peraton Corp., First Lien B Term Loan, 1M US SOFR + 3.75%, 0.75% Floor, 02/01/2028 | | | 2,227,632 | | | | 2,229,904 | |
| Standard Aero Ltd, First Lien Term Loan, 6M CME TERM SOFR + 3.50%, 08/24/2028 | | | 97,588 | | | | 97,841 | |
| TransDigm, Inc., First Lien Term Loan, 3M US SOFR + 2.75%, 08/24/2028 | | | 1,801,006 | | | | 1,809,174 | |
| Vertex Aerospace Corp., First Lien Term Loan, 1M US SOFR + 3.75%, 12/06/2028 | | | 1,212,608 | | | | 1,216,773 | |
| World Wide Technology Holding Co LLC, First Lien Term Loan, 6M US L + 0.00%, 02/22/2034 | | | 630,680 | | | | 632,062 | |
| | | | | | | | 11,175,556 | |
| | | | | | | | | |
| Air Freight & Logistics - 1.51% | | | | | | | | |
| Clue Opco LLC, First Lien Term Loan, 3M US SOFR + 4.50%, 12/19/2030 | | | 1,709,156 | | | | 1,687,577 | |
| Kenan Advantage Group, Inc., First Lien Term Loan, 1M US SOFR + 3.75%, 01/25/2029 | | | 895,385 | | | | 897,345 | |
| WWEX UNI TopCo Holdings LLC, First Lien Initial Term Loan, 3M US SOFR + 4.00%, 0.75% Floor, 07/26/2028 | | | 443,022 | | | | 441,487 | |
| | | | | | | | 3,026,409 | |
| | | | | | | | | |
| Automobile Components - 3.48% | | | | | | | | |
| Belron Finance US LLC, First Lien Term Loan, 6M US L + 0.00%, 0.50% Floor, 04/18/2029 | | | 521,267 | | | | 522,354 | |
| Burgess Point Purchaser Corp., First Lien Term Loan, 1M US SOFR + 5.25%, 07/25/2029 | | | 2,080,465 | | | | 1,993,346 | |
| Clarios Global LP, First Lien Term Loan, 1M US SOFR + 3.00%, 05/06/2030 | | | 2,004,440 | | | | 2,011,956 | |
| First Brands Group LLC, First Lien Term Loan, 3M US SOFR + 5.00%, 1.00% Floor, 03/30/2027 | | | 1,126,941 | | | | 1,129,054 | |
| First Brands Group, LLC, First Lien 2018 New Tranche E Term Loan, 3M US L + 2.50%, 03/30/2027 | | | 367,198 | | | | 368,208 | |
| Phinia Inc., First Lien Term Loan, 6M US SOFR + 3.75%, 07/03/2028(b) | | | 936,819 | | | | 937,699 | |
| | | | | | | | 6,962,617 | |
| | | | | | | | | |
| Banks - 0.70% | | | | | | | | |
| Truist Insurance 3/24 2nd Lien Cov-Lite, Second Lien Term Loan, 6M CME TERM SOFR + 5.00%, 03/08/2032 | | | 1,395,692 | | | | 1,406,307 | |
| | | | | | | | | |
| Biotechnology - 0.14% | | | | | | | | |
| Grifols Worldwide Operations, First Lien Term Loan, 3M US SOFR + 2.00%, 11/15/2027 | | | 298,442 | | | | 289,618 | |
| | | | | | | | | |
| Building Products - 3.49% | | | | | | | | |
| Chariot Buyer LLC, First Lien Term Loan, 1M US SOFR + 3.25%, 0.50% Floor, 11/03/2028 | | | 694,639 | | | | 694,511 | |
| Cornerstone Building Brands, Inc., First Lien Tranche B Term Loan, 1M US SOFR + 3.25%, 0.50% Floor, 04/12/2028 | | | 956,403 | | | | 953,147 | |
| CP Atlas Buyer, Inc., First Lien B Term Loan, 3M US SOFR + 3.50%, 0.50% Floor, 11/23/2027 | | | 676,179 | | | | 669,329 | |
| LHS Borrower, LLC, First Lien Term Loan, 1M US SOFR + 4.75%, 0.50% Floor, 02/16/2029 | | | 224,841 | | | | 215,286 | |
| Miter Brands Acquisition Holdco Inc., First Lien Term Loan, 6M CME TERM SOFR + 3.50%, 03/20/2031 | | | 1,365,371 | | | | 1,373,481 | |
| Oscar Acquisitionco LLC, First Lien Term Loan, 3M US SOFR + 4.50%, 0.50% Floor, 04/29/2029 | | | 1,783,499 | | | | 1,790,196 | |
| Tamko Building Products LLC, First Lien Term Loan, 3M US SOFR + 3.50%, 09/20/2030 | | | 360,093 | | | | 360,543 | |
| Trulite Holding Corp., First Lien Term Loan, 1M US SOFR + 6.00%, 03/01/2030(b) | | | 917,995 | | | | 917,995 | |
| | | | | | | | 6,974,488 | |
See Notes to Financial Statements.
| Semi-Annual Report | March 31, 2024 | 7 |
| Blackstone Floating Rate Enhanced Income Fund | Portfolio of Investments |
March 31, 2024 (Unaudited)
| | | Principal
Amount | | | Value | |
| Capital Markets - 4.22% | | | | | | |
| Apex Group Treasury, Ltd., First Lien USD Term Loan, 3M US SOFR + 3.75%, 0.50% Floor, 07/27/2028 | | $ | 1,065,868 | | | $ | 1,066,534 | |
| Aretec Group, Inc., First Lien Term Loan, 1M US SOFR + 4.50%, 08/09/2030 | | | 1,499,487 | | | | 1,509,796 | |
| Citadel Securities LP, First Lien Term Loan, 1M US SOFR + 2.25%, 07/29/2030 | | | 617,155 | | | | 617,330 | |
| Focus Financial Partners LLC, First Lien Term Loan, 3M US L + 2.50%, 0.50% Floor, 06/30/2028 | | | 2,411,826 | | | | 2,405,508 | |
| Kestra Advisor Services Holdings A INC, First Lien Term Loan, 3M US L + 4.00%, 03/19/2031 | | | 863,945 | | | | 866,468 | |
| Osaic Holdings Inc aka Advisor Group, First Lien Term Loan, 6M US SOFR + 4.00%, 08/17/2028 | | | 1,978,483 | | | | 1,988,494 | |
| | | | | | | | 8,454,130 | |
| | | | | | | | | |
| Chemicals - 2.20% | | | | | | | | |
| CI Maroon Holdings LLC, First Lien Term Loan 03/30/2031(b) | | | 522,000 | | | $ | 524,610 | |
| Ecovyst Catalyst Technologies LLC, First Lien Term Loan, 3M US SOFR + 2.50%, 0.50% Floor, 06/09/2028 | | | 783,266 | | | | 783,876 | |
| Geon Performance Solutions LLC, First Lien Term Loan, 3M US SOFR + 4.75%, 0.75% Floor, 08/18/2028(b) | | | 555,123 | | | | 556,511 | |
| Hyperion Materials & Technologies, Inc., First Lien Initial Term Loan, 3M US SOFR + 4.25%, 0.50% Floor, 08/30/2028 | | | 877,403 | | | | 878,092 | |
| Nouryon Finance B.V., First Lien Term Loan, 3M US SOFR + 4.00%, 04/03/2028 | | | 604,456 | | | | 607,227 | |
| Nouryon USA LLC, First Lien Term Loan, 1M US SOFR + 4.00%, 04/03/2028 | | | 1,042,100 | | | | 1,046,659 | |
| | | | | | | | 4,396,975 | |
| | | | | | | | | |
| Commercial Services & Supplies - 5.41% | | | | | | | | |
| Access CIG LLC, First Lien Term Loan, 1M US SOFR + 5.00%, 0.50% Floor, 08/18/2028 | | | 225,158 | | | | 225,686 | |
| Action Environmental Group, Inc., First Lien Term Loan: | | | | | | | | |
| 3M US SOFR + 4.50%, 10/24/2030(b) | | | 81,000 | | | | 81,202 | |
| 3M US SOFR + 4.50%, 10/24/2030(b) | | | 540,000 | | | | 541,350 | |
| Belfor Holdings, Inc., First Lien Term Loan, 1M US SOFR + 3.75%, 0.50% Floor, 11/01/2030(b) | | | 392,742 | | | | 395,197 | |
| Covanta 11/21, First Lien Term Loan: | | | | | | | | |
| 1M US SOFR + 2.50%, 11/30/2028 | | | 144,826 | | | | 144,691 | |
| 3M US L + 2.50%, 11/30/2028 | | | 1,899,594 | | | | 1,897,817 | |
| Garda World Security Corp., First Lien Term Loan, 3M US SOFR + 4.25%, 02/01/2029 | | | 1,005,743 | | | | 1,008,891 | |
| Genuine Financial Holdings LLC, First Lien Term Loan, 6M US SOFR + 4.25%, 09/27/2030 | | | 2,004,031 | | | | 1,993,009 | |
| Homeserve USA Holding Corp., First Lien Term Loan, 1M US SOFR + 3.00%, 10/21/2030 | | | 508,706 | | | | 510,550 | |
| TRC Companies, Second Lien Term Loan, 1M US SOFR + 6.75%, 12/07/2029(b) | | | 1,026,154 | | | | 985,108 | |
| United Site Cov-Lite, First Lien Term Loan, 3M US SOFR + 4.25%, 12/15/2028 | | | 1,543,836 | | | | 1,182,972 | |
| Ursa Minor US Bidco LLC aka Rosen, First Lien Term Loan, 3M CME TERM SOFR + 3.50%, 02/24/2031 | | | 729,885 | | | | 732,166 | |
| Vestis Corp, First Lien Term Loan, 3M CME TERM SOFR + 2.25%, 02/22/2031 | | | 530,488 | | | | 531,151 | |
| Wand NewCo 3 Inc aka Caliber Collision, First Lien Term Loan, 1M US SOFR + 3.75%, 01/30/2031 | | | 595,872 | | | | 598,246 | |
| | | | | | | | 10,828,036 | |
| | | | | | | | | |
| Construction & Engineering - 2.28% | | | | | | | | |
| Aegion Corporation, First Lien Term Loan, 3M US SOFR + 4.25%, 05/17/2028 | | | 2,136,910 | | | | 2,147,606 | |
| APi Group DE, Inc., First Lien Term Loan, 1M US SOFR + 2.50%, 01/03/2029 | | | 1,270,965 | | | | 1,275,203 | |
| Artera Services LLC aka PowerTeam, First Lien Term Loan, 3M US SOFR + 4.50%, 02/15/2031 | | | 435,375 | | | | 437,552 | |
| Touchdown Acquirer Inc aka TenCate, First Lien Term Loan, 6M CME TERM SOFR + 4.50%, 02/21/2031 | | | 568,852 | | | | 571,340 | |
| Tutor Perini Corp., First Lien B Term Loan, 1M US SOFR + 4.75%, 1.00% Floor, 08/18/2027 | | | 138,049 | | | | 137,819 | |
| | | | | | | | 4,569,520 | |
See Notes to Financial Statements.
| Blackstone Floating Rate Enhanced Income Fund | Portfolio of Investments |
March 31, 2024 (Unaudited)
| | | Principal
Amount | | | Value | |
| | | | | | | |
| Construction Materials - 1.14% | | | | | | | | |
| Quickrete Holdings, Inc., First Lien Initial Term Loan, 1M US SOFR + 2.625%, 02/01/2027 | | $ | 5,155 | | | $ | 5,166 | |
| Quikrete Holdings, Inc., First Lien Term Loan, 6M CME TERM SOFR + 2.50%, 03/18/2031 | | | 1,974,227 | | | | 1,977,524 | |
| Summit Materials LLC, First Lien Term Loan, 6M US SOFR + 3.00%, 01/12/2029 | | | 291,815 | | | | 293,602 | |
| | | | | | | | 2,276,292 | |
| | | | | | | | | |
| Containers & Packaging - 2.87% | | | | | | | | |
| Graham Packaging Co., Inc., First Lien Term Loan, 3M US L + 3.00%, 0.75% Floor, 08/04/2027 | | | 1,000,000 | | | | 1,000,940 | |
| ProAmpac PG Borrower LLC, First Lien Term Loan, 1M CME TERM SOFR + 4.25%, 09/15/2028 | | | 203,353 | | | | 204,065 | |
| Reynolds Consumer Products LLC, First Lien Initial Term Loan, 1M US SOFR + 1.75%, 02/04/2027 | | | 1,257,473 | | | | 1,261,113 | |
| Supplyone 3/24, First Lien Term Loan 03/27/2031 | | | 628,266 | | | | 626,306 | |
| Tekni-Plex, Inc., First Lien Tranche B-3 Initial Term Loan, 3M US SOFR + 4.00%, 0.50% Floor, 09/15/2028 | | | 1,832,822 | | | | 1,835,745 | |
| Tricorbraun Holdings, Inc., First Lien Closing Date Initial Term Loan, 1M US SOFR + 3.25%, 0.50% Floor, 03/03/2028 | | | 824,556 | | | | 816,348 | |
| | | | | | | | 5,744,517 | |
| | | | | | | | | |
| Diversified Consumer Services - 4.34% | | | | | | | | |
| Cengage Learning, Inc., First Lien Term Loan, 6M US L + 0.00%, 1.00% Floor, 03/18/2031 | | | 1,141,598 | | | | 1,141,774 | |
| Fugue Finance LLC aka Nord Anglia, First Lien Term Loan, 3M CME TERM SOFR + 3.75%, 02/26/2031 | | | 481,110 | | | | 482,914 | |
| Groundworks LLC, First Lien Term Loan: | | | | | | | | |
| 6M CME TERM SOFR + 4.00%, 03/14/2031 | | | 204,867 | | | | 205,158 | |
| 6M US L + 0.00%, 03/14/2031 | | | 1,113,111 | | | | 1,114,691 | |
| Imagine Learning LLC, First Lien Term Loan, 1M US SOFR + 3.50%, 12/21/2029 | | | 1,620,000 | | | | 1,618,259 | |
| Mister Car Wash 3/24, First Lien Term Loan, 6M CME TERM SOFR + 3.25%, 03/21/2031 | | | 537,742 | | | | 539,648 | |
| Prime Security Services Borrower, LLC, First Lien Term Loan, 3M US SOFR + 2.50%, 10/13/2030 | | | 912,308 | | | | 913,914 | |
| Rinchem Company, Inc., First Lien Term Loan, 3M US SOFR + 4.25%, 03/02/2029 | | | 1,683,198 | | | | 1,507,514 | |
| St. George's University Scholastic Services LLC, First Lien Term Loan B Term Loan, 1M US SOFR + 3.25%, 0.50% Floor, 02/10/2029 | | | 593,916 | | | | 593,397 | |
| TruGreen LP, First Lien Term Loan, 1M US SOFR + 4.00%, 0.75% Floor, 11/02/2027 | | | 583,561 | | | | 569,156 | |
| | | | | | | | 8,686,425 | |
| | | | | | | | | |
| Diversified REITs - 0.33% | | | | | | | | |
| Iron Mountain, Inc., First Lien Term Loan, 1M US SOFR + 2.25%, 01/31/2031 | | | 661,752 | | | | 657,891 | |
| | | | | | | | | |
| Diversified Telecommunication Services - 3.03% | | | | | | | | |
| Coral-US Co-Borrower LLC, First Lien B-5 Term Loan, 1M US SOFR + 2.25%, 01/31/2028 | | | 917,995 | | | | 906,736 | |
| Level 3 Financing Inc., First Lien Term Loan: | | | | | | | | |
| 1M US SOFR + 1.75%, 04/15/2029 | | | 616,910 | | | | 614,596 | |
| 1M US SOFR + 1.75%, 04/15/2030 | | | 621,436 | | | | 619,106 | |
| Level 3 Financing, Inc., First Lien Term Loan, 6M US SOFR + 1.75%, 03/01/2027 | | | 1 | | | | 1 | |
| Lumen Technologies Inc aka CenturyLink,Inc., First Lien Term Loan, 1M US SOFR + 2.00%, 01/31/2025 | | | 60,875 | | | | 52,733 | |
| Lumen Technologies Inc, First Lien Term Loan, 1M US SOFR + 5.32%, 04/15/2029 | | | 829,910 | | | | 619,320 | |
| Lumen Technologies, First Lien Term Loan, 1M US SOFR + 5.32%, 04/15/2030 | | | 848,520 | | | | 632,147 | |
| Telenet Financing USD LLC, First Lien Term Loan, 1M US SOFR + 2.00%, 04/30/2028 | | | 803,922 | | | | 783,486 | |
| Zacapa S.A.R.L., First Lien Term Loan, 3M US SOFR + 4.00%, 03/22/2029 | | | 1,822,521 | | | | 1,825,300 | |
| | | | | | | | 6,053,425 | |
See Notes to Financial Statements.
| Semi-Annual Report | March 31, 2024 | 9 |
| Blackstone Floating Rate Enhanced Income Fund | Portfolio of Investments |
March 31, 2024 (Unaudited)
| | | Principal
Amount | | | Value | |
| | | | | | | |
| Electric Utilities - 1.35% | | | | | | | | |
| Miron Technologies, Inc., First Lien Term Loan, 3M US SOFR + 2.75%, 10/20/2028 | | $ | 1,772,672 | | | $ | 1,779,319 | |
| NRG Energy 3/24 Cov-Lite, First Lien Term Loan, 1M CME TERM SOFR + 2.00%, 03/27/2031 | | | 932,566 | | | | 931,988 | |
| | | | | | | | 2,711,307 | |
| | | | | | | | | |
| Electrical Equipment - 1.05% | | | | | | | | |
| Victory Buyer LLC, First Lien Term Loan, 1M US SOFR + 3.75%, 0.50% Floor, 11/19/2028 | | | 2,198,288 | | | | 2,093,870 | |
| | | | | | | | | |
| | | | | | | | | |
| Electronic Equipment, Instruments & Components - 1.93% | | | | | | | | |
| Coherent Corp., First Lien Term Loan, 1M US SOFR + 2.75%, 07/02/2029(b) | | | 2,156,170 | | | | 2,156,170 | |
| Discovery Energy Corp., First Lien Term Loan, 6M US SOFR + 4.75%, 01/30/2031 | | | 1,109,733 | | | | 1,112,735 | |
| LTI Holdings, Inc., First Lien Term Loan, 1M US SOFR + 4.75%, 07/24/2026 | | | 593,669 | | | | 588,845 | |
| | | | | | | | 3,857,750 | |
| | | | | | | | | |
| Financial Services - 3.31% | | | | | | | | |
| CITCO FUNDING LLC, First Lien Term Loan, 6M US SOFR + 3.25%, 04/27/2028 | | | 688,275 | | | | 690,749 | |
| DCG Acquisition Corp., First Lien Term Loan, 1M US SOFR + 4.50%, 11/14/2030 | | | 699,683 | | | | 704,059 | |
| Lereta, LLC, First Lien Term Loan, 1M US SOFR + 5.00%, 07/30/2028 | | | 691,477 | | | | 529,782 | |
| Mitchell International, Inc., First Lien Term Loan, 1M US SOFR + 3.75%, 10/15/2028 | | | 379,209 | | | | 379,793 | |
| Mitchell International, Inc., Second Lien Term Loan, 1M US SOFR + 6.50%, 10/15/2029 | | | 1,192,784 | | | | 1,193,529 | |
| Polaris Newco LLC, First Lien Dollar Term Loan, 1M US SOFR + 4.00%, 0.50% Floor, 06/02/2028 | | | 1,553,145 | | | | 1,539,920 | |
| The Citco Group Limited, First Lien Term Loan, 3M US SOFR + 3.50%, 04/27/2028 | | | 1,586,218 | | | | 1,592,167 | |
| | | | | | | | 6,629,999 | |
| | | | | | | | | |
| Food Products - 1.81% | | | | | | | | |
| Froneri International, Ltd., First Lien Facility B2 Term Loan, 1M US SOFR + 2.25%, 01/29/2027 | | | 1,340,530 | | | | 1,342,761 | |
| Saratoga Food Specialties LLC, First Lien Term Loan, 6M CME TERM SOFR + 3.75%, 02/28/2029 | | | 419,377 | | | | 420,690 | |
| Snacking Investments BidCo Pty, Ltd., First Lien Initial US Term Loan, 3M US SOFR + 4.00%, 1.00% Floor, 12/18/2026 | | | 1,854,748 | | | | 1,859,765 | |
| | | | | | | | 3,623,216 | |
| | | | | | | | | |
| Gas Utilities - 0.26% | | | | | | | | |
| GIP Pilot Acquisition Partners LP, First Lien Term Loan, 3M US SOFR + 3.00%, 10/04/2030 | | | 516,120 | | | | 518,443 | |
| | | | | | | | | |
| Ground Transportation - 1.40% | | | | | | | | |
| Avis Budget Car Rental LLC, First Lien Term Loan, 1M US SOFR + 1.75%, 08/06/2027 | | | 274,220 | | | | 273,648 | |
| Uber Technologies, Inc., First Lien Term Loan, 3M US SOFR + 2.75%, 03/03/2030 | | | 1,780,457 | | | | 1,790,169 | |
| XPO, Inc., First Lien Term Loan, 1M US SOFR + 2.00%, 05/24/2028 | | | 725,035 | | | | 727,903 | |
| | | | | | | | 2,791,720 | |
| | | | | | | | | |
| Health Care Equipment & Supplies - 1.59% | | | | | | | | |
| Siemens/SivantosWS Audiology, First Lien Term Loan, 6M CME TERM SOFR + 4.25%, 02/27/2029 | | | 2,268,131 | | | | 2,275,934 | |
| Viant Medical Holdings, Inc., First Lien Initial Term Loan, 1M US SOFR + 3.75%, 07/02/2025 | | | 901,423 | | | | 899,958 | |
| | | | | | | | 3,175,892 | |
| | | | | | | | | |
| Health Care Providers & Services - 9.78% | | | | | | | | |
| DaVita, Inc., First Lien B Term Loan, 1M US SOFR + 1.75%, 08/12/2026 | | | 1,581,332 | | | | 1,583,095 | |
| Electron Bidco, Inc., First Lien Term Loan, 1M US SOFR + 3.00%, 11/01/2028 | | | 338,029 | | | | 339,110 | |
| Heartland Dental, LLC, First Lien Term Loan, 1M US SOFR + 5.00%, 04/28/2028 | | | 2,454,393 | | | | 2,462,530 | |
| IVI America LLC aka IVIRMA, First Lien Term Loan, 6M CME TERM SOFR + 4.50%, 03/17/2031 | | | 725,000 | | | | 725,453 | |
See Notes to Financial Statements.
| Blackstone Floating Rate Enhanced Income Fund | Portfolio of Investments |
March 31, 2024 (Unaudited)
| | | Principal
Amount | | | Value | |
| | | | | | | |
| Health Care Providers & Services (continued) | | | | | | | | |
| Medical Solutions LLC, First Lien Term Loan, 3M US SOFR + 3.50%, 11/01/2028 | | $ | 1,285,193 | | | $ | 1,149,714 | |
| Midwest Physcn Admin Srvcs LLC, First Lien Term Loan, 3M US SOFR + 3.25%, 03/12/2028 | | | 1,416,232 | | | | 1,183,056 | |
| NAPA Management Services Corp., First Lien Term Loan, 3M US SOFR + 5.25%, 0.75% Floor, 02/23/2029 | | | 1,522,511 | | | | 1,445,814 | |
| National Mentor Holdings, Inc., First Lien Term Loan, 3M US SOFR + 3.75%, 03/02/2028 | | | 1,041,045 | | | | 982,699 | |
| National Mentor Holdings, Inc., TLC, First Lien Term Loan, 3M US SOFR + 3.75%, 03/02/2028 | | | 29,976 | | | | 28,296 | |
| Onex TSG Intermediate Corp., First Lien Initial Term Loan, 3M US SOFR + 4.75%, 0.75% Floor, 02/28/2028 | | | 1,944,918 | | | | 1,947,350 | |
| Pathway Vet Alliance LLC, First Lien 2021 Replacement Term Loan, 1M US SOFR + 3.75%, 03/31/2027 | | | 2,363,346 | | | | 2,080,489 | |
| Pediatric Associates Holding Co. LLC, First Lien Term Loan, 3M US SOFR + 3.25%, 0.50% Floor, 12/29/2028 | | | 1,920,108 | | | | 1,694,495 | |
| Radiology Partners Inc, First Lien Term Loan, 6M US SOFR + 5.00%, 01/31/2029 | | | 1,614,330 | | | | 1,563,592 | |
| Surgery Center Holdings, INC., Term Loan, First Lien Term Loan, 6M US SOFR + 4.00%, 12/19/2030 | | | 439,773 | | | | 442,370 | |
| U.S. Anesthesia Partners, Inc., First Lien Term Loan, 1M US SOFR + 4.25%, 0.50% Floor, 10/01/2028 | | | 1,600,046 | | | | 1,533,604 | |
| Waystar Technologies, Inc., First Lien Term Loan, 1M US SOFR + 4.00%, 10/22/2029 | | | 408,038 | | | | 409,568 | |
| | | | | | | | 19,571,235 | |
| | | | | | | | | |
| Health Care Technology - 2.00% | | | | | | | | |
| Cotiviti Inc., First Lien Term Loan: | | | | | | | | |
| 6M US L + 0.00%, 02/21/2031 | | | 926,437 | | | | 929,332 | |
| 6M US SOFR + 3.50%, 02/24/2031 | | | 1,506,073 | | | | 1,504,190 | |
| Gainwell Acquisition Corp., First Lien Term Loan, 3M US SOFR + 4.00%, 0.75% Floor, 10/01/2027 | | | 1,110,482 | | | | 1,064,259 | |
| GHX Ultimate Parent Corp., First Lien Term Loan, 6M CME TERM SOFR + 4.25%, 0.50% Floor, 06/30/2027(b) | | | 494,614 | | | | 498,324 | |
| | | | | | | | 3,996,105 | |
| | | | | | | | | |
| Hotels, Restaurants & Leisure - 6.16% | | | | | | | | |
| 1011778 BC Unlimited Liability Company, First Lien Term Loan, 1M US SOFR + 2.25%, 0.50% Floor, 09/20/2030 | | | 1,273,838 | | | | 1,274,634 | |
| Bally's Corp., First Lien Term Loan, 3M US SOFR + 3.25%, 0.50% Floor, 10/02/2028 | | | 1,927,271 | | | | 1,814,439 | |
| BCPE Grill Parent, Inc., First Lien Term Loan, 1M US SOFR + 4.75%, 09/30/2030 | | | 297,728 | | | | 296,000 | |
| Caesars Entertainment, Inc., First Lien Term Loan: | | | | | | | | |
| 1M US SOFR + 3.25%, 0.50% Floor, 02/06/2030 | | | 1,855,031 | | | | 1,862,637 | |
| 3M US SOFR + 2.75%, 0.50% Floor, 02/06/2031 | | | 500,540 | | | | 501,555 | |
| Carnival Corp., First Lien Term Loan: | | | | | | | | |
| 1M US SOFR + 3.00%, 0.75% Floor, 08/09/2027 | | | 1,193,985 | | | | 1,197,221 | |
| 1M US SOFR + 3.25%, 0.75% Floor, 10/18/2028 | | | 654,899 | | | | 656,605 | |
| Entain Holdings (Gibralter) Ltd., First Lien Term Loan, 3M US L + 7.51%, 0.50% Floor, 10/31/2029 | | | 1,010,704 | | | | 1,016,071 | |
| Fertitta Entertainment, LLC, First Lien Term Loan, 1M US SOFR + 4.00%, 01/27/2029 | | | 310,184 | | | | 311,283 | |
| Flutter Financing B.V., First Lien Term Loan, 3M US SOFR + 2.25%, 11/25/2030 | | | 2,261,876 | | | | 2,266,920 | |
| Hilton Grand Vacations Borrower, LLC, First Lien Term Loan, 1M US SOFR + 2.75%, 01/17/2031 | | | 331,769 | | | | 332,754 | |
| Tacala Investment Corp, First Lien Term Loan, 1M US SOFR + 4.00%, 01/31/2031 | | | 797,437 | | | | 799,183 | |
| | | | | | | | 12,329,302 | |
| | | | | | | | | |
| Household Durables - 0.97% | | | | | | | | |
| Culligan 11/23 Incre CovLi, First Lien Term Loan, 6M US SOFR + 4.50%, 07/31/2028(c) | | | 1,922,925 | | | | 1,933,943 | |
See Notes to Financial Statements.
| Semi-Annual Report | March 31, 2024 | 11 |
| Blackstone Floating Rate Enhanced Income Fund | Portfolio of Investments |
March 31, 2024 (Unaudited)
| | | Principal
Amount | | | Value | |
| | | | | | | |
| Independent Power and Renewable Electricity Producers - 1.94% | | | | | | | | |
| Calpine Corp., First Lien Term Loan, 1M US SOFR + 2.00%, 01/31/2031 | | $ | 981,952 | | | $ | 977,553 | |
| Generation Bridge Northeast LLC, First Lien Term Loan, 1M US SOFR + 4.25%, 08/22/2029 | | | 848,175 | | | | 849,766 | |
| Vistra Operations Co. LLC, First Lien 2018 Incremental Term Loan, 1M US L + 2.00%, 12/20/2030 | | | 2,047,059 | | | | 2,047,386 | |
| | | | | | | | 3,874,705 | |
| | | | | | | | | |
| Industrial Conglomerates - 1.38% | | | | | | | | |
| Engineered Machinery Holdings, Inc., First Lien Term Loan, 3M US SOFR + 3.50%, 0.75% Floor, 05/19/2028 | | | 428,635 | | | | 427,632 | |
| Tailwind Smith Cooper Intermediate Corp., First Lien Initial Term Loan, 3M US SOFR + 5.00%, 05/28/2026 | | | 2,339,225 | | | | 2,332,500 | |
| | | | | | | | 2,760,132 | |
| | | | | | | | | |
| Insurance - 1.97% | | | | | | | | |
| AmWINS Group, Inc., First Lien Term Loan, 1M US SOFR + 2.75%, 0.75% Floor, 02/19/2028 | | | 321,811 | | | | 322,795 | |
| Baldwin Risk Partners, LLC, First Lien Initial Term Loan, 1M US SOFR + 3.50%, 10/14/2027 | | | 557,143 | | | | 557,608 | |
| Hub International Limited, First Lien Term Loan, 3M US SOFR + 3.25%, 06/20/2030 | | | 260,408 | | | | 260,797 | |
| Hyperion Refinance Sarl, First Lien Term Loan: | | | | | | | | |
| 3M US SOFR + 0.00%, 0.50% Floor, 04/18/2030 | | | 1,636,112 | | | | 1,644,301 | |
| 1M US SOFR + 3.50%, 0.50% Floor, 02/15/2031 | | | 688,335 | | | | 689,625 | |
| USI, Inc., First Lien Term Loan, 3M US SOFR + 3.25%, 09/27/2030 | | | 465,590 | | | | 466,498 | |
| | | | | | | | 3,941,624 | |
| | | | | | | | | |
| Interactive Media & Services - 0.63% | | | | | | | | |
| MH Sub I LLC, First Lien Term Loan, 1M US SOFR + 4.25%, 05/03/2028 | | | 909,659 | | | | 905,315 | |
| MH Sub I LLC, Second Lien 2021 Replacement Term Loan, 1M US SOFR + 6.25%, 02/23/2029 | | | 372,997 | | | | 360,575 | |
| | | | | | | | 1,265,890 | |
| | | | | | | | | |
| IT Services - 6.02% | | | | | | | | |
| AG Group Holdings, Inc., First Lien Term Loan, 3M US SOFR + 4.00%, 12/29/2028 | | | 1,927,282 | | | | 1,912,827 | |
| Ahead DB Holdings, LLC, First Lien Term Loan, 3M US SOFR + 4.25%, 02/01/2031 | | | 696,000 | | | | 699,209 | |
| Asurion LLC, Second Lien Term Loan, 1M US SOFR + 10.69%, 01/20/2029 | | | 70,145 | | | | 63,092 | |
| Blackhawk Network Holdings Inc, First Lien Term Loan, 1M US SOFR + 5.00%, 03/12/2029 | | | 235,294 | | | | 235,969 | |
| Dcert Buyer, Inc., Second Lien First Amendment Refinancing Term Loan, 6M US SOFR + 7.00%, 02/19/2029 | | | 2,302,775 | | | | 2,091,380 | |
| Newfold Digital Holdings Group, Inc., First Lien Initial Term Loan, 6M US SOFR + 3.50%, 0.75% Floor, 02/10/2028 | | | 2,394,204 | | | | 2,342,130 | |
| Vaco Holdings, LLC, First Lien Term Loan, 3M US SOFR + 5.00%, 01/21/2029 | | | 1,869,864 | | | | 1,852,801 | |
| Virtusa Corp., First Lien Term Loan: | | | | | | | | |
| 1M US SOFR + 3.75%, 0.75% Floor, 02/11/2028 | | | 1,442,583 | | | | 1,447,452 | |
| 1M US SOFR + 3.75%, 02/15/2029 | | | 847,843 | | | | 850,492 | |
| World Wide Technology 3/24, First Lien Term Loan, 6M CME TERM SOFR + 2.75%, 03/01/2030 | | | 546,572 | | | | 551,013 | |
| | | | | | | | 12,046,365 | |
| | | | | | | | | |
| Leisure Products - 0.11% | | | | | | | | |
| Amer Sports Co, First Lien Term Loan, 3M US SOFR + 3.25%, 02/17/2031 | | | 218,500 | | | | 219,046 | |
| | | | | | | | | |
| Life Sciences Tools & Services - 1.52% | | | | | | | | |
| Curia Global, Inc., First Lien 2021 Term Loan, 3M US SOFR + 3.75%, 0.75% Floor, 08/30/2026 | | | 2,074,819 | | | | 1,981,774 | |
| IQVIA INC., First Lien Term Loan, 3M US SOFR + 2.00%, 01/02/2031 | | | 275,272 | | | | 276,919 | |
See Notes to Financial Statements.
| Blackstone Floating Rate Enhanced Income Fund | Portfolio of Investments |
March 31, 2024 (Unaudited)
| | | Principal
Amount | | | Value | |
| | | | | | | |
| Life Sciences Tools & Services (continued) | | | | | | | | |
| Parexel International Corporation, First Lien Term Loan, 1M US SOFR + 3.25%, 0.50% Floor, 11/15/2028 | | $ | 784,359 | | | $ | 787,034 | |
| | | | | | | | 3,045,727 | |
| | | | | | | | | |
| Machinery - 2.36% | | | | | | | | |
| Asp Blade Holdings, Inc., First Lien Term Loan, 3M US SOFR + 4.00%, 0.50% Floor, 10/13/2028 | | | 356,565 | | | | 323,405 | |
| Crosby US Acquisition corp., First Lien Term Loan, 1M US SOFR + 4.00%, 08/16/2029 | | | 567,544 | | | | 571,387 | |
| Husky Injection Molding Systems Ltd., First Lien Term Loan, 6M CME TERM SOFR + 5.25%, 02/01/2029 | | | 898,953 | | | | 902,419 | |
| INNIO Group Holding GmbH, First Lien Term Loan, 6M US SOFR + 4.50%, 11/02/2028 | | | 261,608 | | | | 263,298 | |
| Pro Mach Group, Inc., First Lien Closing Date Initial Term Loan, 1M US SOFR + 4.00%, 1.00% Floor, 08/31/2028 | | | 1,116,540 | | | | 1,121,804 | |
| TK Elevator Midco GmbH, First Lien Term Loan, 6M CME TERM SOFR + 3.75%, 04/30/2030 | | | 1,543,195 | | | | 1,550,162 | |
| | | | | | | | 4,732,475 | |
| | | | | | | | | |
| Media - 4.31% | | | | | | | | |
| Cable One, Inc., First Lien Term Loan, 3M US L + 2.00%, 05/03/2028 | | | 401,963 | | | | 399,127 | |
| Charter Communications Operating LLC, First Lien Term Loan, 1M US SOFR + 1.75%, 02/01/2027 | | | 1,125,124 | | | | 1,126,126 | |
| COGECO Financing 2 LP, First Lien Term Loan, 3M US SOFR + 2.50%, 0.50% Floor, 09/01/2028 | | | 226,866 | | | | 221,762 | |
| Fleet Midco I Ltd., First Lien Term Loan, 1M US SOFR + 3.25%, 02/21/2031(b) | | | 629,841 | | | | 631,416 | |
| iHeartCommunications, Inc., First Lien New Term Loan, 1M US SOFR + 3.00%, 05/01/2026 | | | 1,394,366 | | | | 1,224,804 | |
| Radiate Holdco, LLC,, First Lien Term Loan, 1M US SOFR + 3.25%, 09/25/2026 | | | 1,822,040 | | | | 1,530,514 | |
| Univision Communications, Inc., First Lien Term Loan, 1M US SOFR + 3.25%, 0.75% Floor, 03/15/2026 | | | 2,319,197 | | | | 2,324,670 | |
| UPC Financing Partnership, First Lien Facility AT Term Loan, 1M US SOFR + 2.25%, 04/30/2028 | | | 1,178,505 | | | | 1,163,497 | |
| | | | | | | | 8,621,916 | |
| | | | | | | | | |
| Metals & Mining - 0.25% | | | | | | | | |
| Arsenal AIC Parent, LLC, First Lien Term Loan, 1M US SOFR + 3.75%, 08/18/2030 | | | 490,199 | | | | 492,467 | |
| | | | | | | | | |
| Mortgage Real Estate Investment - 0.43% | | | | | | | | |
| Blackstone Mortgage Trust, Inc., First Lien Term Loan: | | | | | | | | |
| 1M US SOFR + 2.25%, 04/23/2026 | | | 433,196 | | | | 433,196 | |
| 1M US SOFR + 2.75%, 0.50% Floor, 04/23/2026(b) | | | 433,300 | | | | 433,841 | |
| | | | | | | | 867,037 | |
| | | | | | | | | |
| Oil, Gas & Consumable Fuels - 1.20% | | | | | | | | |
| Buckeye Partners LP, First Lien Term Loan, 3M CME TERM SOFR + 2.00%, 11/01/2026 | | | 716,442 | | | | 718,584 | |
| Buckeye Partners, LP, First Lien Term Loan, 1M US SOFR + 2.50%, 11/22/2030 | | | 378,488 | | | | 379,349 | |
| Freeport LNG, First Lien Term Loan, 3M US SOFR + 3.50%, 12/21/2028 | | | 740,259 | | | | 736,180 | |
| Whitewater Whistler Holdings, LLC, First Lien Term Loan, 3M US SOFR + 8.49%, 02/15/2030 | | | 571,988 | | | | 573,417 | |
| | | | | | | | 2,407,530 | |
| | | | | | | | | |
| Passenger Airlines - 1.64% | | | | | | | | |
| Air Canada, First Lien Term Loan, 6M CME TERM SOFR + 2.75%, 03/14/2031 | | | 815,046 | | | | 817,597 | |
| American Airlines, Inc., First Lien Term Loan, 6M US SOFR + 2.75%, 02/15/2028 | | | 866,565 | | | | 867,350 | |
| United Airlines, Inc. aka Continental, First Lien Term Loan, 3M US SOFR + 2.75%, 02/22/2031 | | | 1,594,773 | | | | 1,599,254 | |
| | | | | | | | 3,284,201 | |
See Notes to Financial Statements.
| Semi-Annual Report | March 31, 2024 | 13 |
| Blackstone Floating Rate Enhanced Income Fund | Portfolio of Investments |
March 31, 2024 (Unaudited)
| | | Principal
Amount | | | Value | |
| | | | | | | |
| Pharmaceuticals - 1.77% | | | | | | | | |
| Elanco Animal Health, Inc., First Lien B Term Loan, 1M US SOFR + 1.75%, 08/01/2027 | | $ | 1,879,070 | | | $ | 1,874,522 | |
| Padagis LLC, First Lien Initial Term Loan, 3M US SOFR + 4.75%, 0.50% Floor, 07/06/2028 | | | 1,732,303 | | | | 1,665,176 | |
| | | | | | | | 3,539,698 | |
| | | | | | | | | |
| Professional Services - 7.53% | | | | | | | | |
| AlixPartners, LLP, First Lien USD B Term Loan, 1M US SOFR + 2.50%, 0.50% Floor, 02/04/2028 | | | 2,095,602 | | | | 2,100,580 | |
| CoreLogic, Inc., First Lien Initial Term Loan, 1M US SOFR + 3.50%, 0.50% Floor, 06/02/2028 | | | 1,951,923 | | | | 1,913,343 | |
| Corporation Service Company, First Lien Term Loan, 1M US SOFR + 3.25%, 11/02/2029 | | | 693,117 | | | | 695,428 | |
| Deerfield Dakota Holding LLC, Second Lien 2021 Replacement Term Loan, 3M US SOFR + 6.75%, 0.75% Floor, 04/07/2028 | | | 440,000 | | | | 440,825 | |
| Dun & Bradstreet Corp., First Lien Term Loan, 1M US SOFR + 2.75%, 01/18/2029 | | | 1,338,979 | | | | 1,340,231 | |
| Eisner Advisory Group LLC, First Lien Term Loan, 1M US SOFR + 4.00%, 02/28/2031 | | | 1,109,372 | | | | 1,115,269 | |
| EP Purcasher, LLC, First Lien Term Loan, 3M US SOFR + 3.50%, 11/06/2028 | | | 148,485 | | | | 147,650 | |
| Inmar, Inc., First Lien Term Loan, 1M US SOFR + 5.25%, 05/01/2026 | | | 2,266,806 | | | | 2,272,121 | |
| Neptune Bidco US, Inc., First Lien Term Loan, 3M US SOFR + 5.00%, 0.50% Floor, 04/11/2029 | | | 544,739 | | | | 503,511 | |
| Omnia Partners, LLC, First Lien Term Loan, 3M CME TERM SOFR + 3.75%, 07/25/2030 | | | 983,443 | | | | 989,127 | |
| Planet US Buyer, LLC, First Lien Term Loan, 3M US L + 3.50%, 02/07/2031 | | | 889,035 | | | | 892,982 | |
| Trans Union LLC, First Lien Term Loan, 1M US SOFR + 1.75%, 11/16/2026 | | | 2,058,249 | | | | 2,059,772 | |
| Veritext 3/24, First Lien Term Loan, 1M US SOFR + 8.82%, 08/09/2030 | | | 585,636 | | | | 587,938 | |
| | | | | | | | 15,058,777 | |
| | | | | | | | | |
| Real Estate Management & Development - 1.18% | | | | | | | | |
| Cushman & Wakefield US Borrower LLC, First Lien Term Loan: | | | | | | | | |
| 1M US SOFR + 3.25%, 0.50% Floor, 01/31/2030 | | | 1,420,965 | | | | 1,418,748 | |
| 3M US SOFR + 4.00%, 01/31/2030(b) | | | 939,426 | | | | 942,949 | |
| | | | | | | | 2,361,697 | |
| | | | | | | | | |
| Semiconductors & Semiconductor Equipment - 0.10% | | | | | | | | |
| MKS Instruments, Inc., First Lien Term Loan, 1M US SOFR + 2.50%, 0.50% Floor, 08/17/2029 | | | 199,030 | | | | 199,424 | |
| | | | | | | | | |
| Software - 17.65% | | | | | | | | |
| Boxer Parent Company Inc., First Lien Term Loan, 6M US SOFR + 4.50%, 12/29/2028 | | | 630,436 | | | | 635,231 | |
| Central Parent, Inc., First Lien Term Loan, 3M US SOFR + 4.00%, 07/06/2029 | | | 2,459,999 | | | | 2,470,109 | |
| Cloud Software Group Inc, First Lien Term Loan, 6M CME TERM SOFR + 4.50%, 04/09/2029 | | | 1,149,095 | | | | 1,142,994 | |
| Cloud Software Group, Inc, First Lien Term Loan, 3M US SOFR + 4.50%, 0.50% Floor, 03/30/2029 | | | 2,325,653 | | | | 2,317,711 | |
| Cloudera, Inc., First Lien Term Loan, 1M US SOFR + 3.75%, 0.50% Floor, 10/08/2028 | | | 1,476,835 | | | | 1,473,609 | |
| Connectwise, LLC, First Lien Term Loan, 1M US SOFR + 3.50%, 0.50% Floor, 09/29/2028 | | | 1,991,771 | | | | 1,993,633 | |
| Cornerstone OnDemand, Inc., First Lien Initial Term Loan, 3M US SOFR + 3.75%, 0.50% Floor, 10/16/2028 | | | 2,614,376 | | | | 2,569,723 | |
| DTI Holdco, Inc., First Lien Term Loan, 3M US SOFR + 4.75%, 04/26/2029 | | | 1,118,788 | | | | 1,120,187 | |
| Flexera Software LLC, First Lien B-1 Term Loan, 3M US L + 3.75%, 0.75% Floor, 03/03/2028 | | | 1,498,054 | | | | 1,503,155 | |
| Genesys Cloud Services Holdings II LLC aka Genesys, First Lien Term Loan, 1M US SOFR + 3.75%, 12/01/2027 | | | 223,983 | | | | 225,104 | |
| Genesys Cloud Services Holdings II LLC, First Lien Term Loan, 6M CME TERM SOFR + 3.50%, 0.75% Floor, 12/01/2027 | | | 1,153,488 | | | | 1,157,820 | |
| GTCR W Merger Sub LLC, First Lien Term Loan, 6M US SOFR + 3.75%, 0.50% Floor, 01/31/2031 | | | 761,513 | | | | 765,164 | |
| Help/Systems Holdings, Inc., First Lien Seventh Amendment Refinancing Term Loan, 3M US SOFR + 4.00%, 0.75% Floor, 11/19/2026 | | | 2,695,789 | | | | 2,613,904 | |
| Idera, Inc., First Lien B-1 Term Loan, 1M US SOFR + 3.75%, 0.75% Floor, 03/02/2028 | | | 854,945 | | | | 853,034 | |
| Instructure Holdings, INC., First Lien Term Loan, 6M US SOFR + 2.75%, 10/30/2028 | | | 457,377 | | | | 457,949 | |
See Notes to Financial Statements.
| Blackstone Floating Rate Enhanced Income Fund | Portfolio of Investments |
March 31, 2024 (Unaudited)
| | | Principal
Amount | | | Value | |
| | | | | | | |
| Software (continued) | | | | | | | | |
| Isolved, Inc., First Lien Term Loan, 6M US SOFR + 4.00%, 10/14/2030 | | $ | 460,000 | | | $ | 463,307 | |
| Ivanti Software, Inc., First Lien First Amendment Term Loan, 3M US SOFR + 4.00%, 0.75% Floor, 12/01/2027 | | | 352,172 | | | | 329,427 | |
| LI Group Holdings, Inc., First Lien 2021 Term Loan, 1M US SOFR + 3.75%, 0.75% Floor, 03/11/2028(b) | | | 893,799 | | | | 893,799 | |
| Magenta Buyer LLC, First Lien Initial Term Loan, 3M US SOFR + 5.00%, 0.75% Floor, 07/27/2028 | | | 2,406,609 | | | | 1,443,966 | |
| Mitnick Corporate Purchaser Inc., First Lien Term Loan, 3M US SOFR + 4.75%, 05/02/2029 | | | 596,687 | | | | 571,205 | |
| Perforce Software, Inc., First Lien New Term Loan, 1M US SOFR + 3.75%, 07/01/2026 | | | 418,739 | | | | 415,678 | |
| Project Alpha Intermediate Holding Inc., First Lien Term Loan, 1M US SOFR + 4.75%, 10/28/2030 | | | 1,578,851 | | | | 1,589,264 | |
| Proofpoint, Inc., First Lien Term Loan, 1M US SOFR + 3.25%, 08/31/2028 | | | 367,280 | | | | 367,881 | |
| Quartz Acquireco, LLC, First Lien Term Loan, 1M US SOFR + 3.50%, 06/28/2030 | | | 865,053 | | | | 869,110 | |
| Quest Borrower Ltd., First Lien Term Loan, 3M US SOFR + 4.25%, 02/01/2029 | | | 2,427,170 | | | | 1,855,584 | |
| Skopima Merger Sub Inc., First Lien Initial Term Loan, 1M US SOFR + 4.00%, 05/12/2028 | | | 1,431,304 | | | | 1,427,611 | |
| Surf Holdings Sarl., First Lien Dollar Tranche Term Loan, 1M US SOFR + 3.50%, 03/05/2027 | | | 895,354 | | | | 898,211 | |
| Vision Solutions, Inc., First Lien Term Loan, 3M US SOFR + 4.25%, 0.75% Floor, 04/24/2028 | | | 2,456,693 | | | | 2,463,092 | |
| Webpros Luxembourg Sarl, First Lien Term Loan, 6M US SOFR + 0.00%, 03/19/2031(b) | | | 433,209 | | | | 434,834 | |
| | | | | | | | 35,322,296 | |
| | | | | | | | | |
| Specialty Retail - 0.89% | | | | | | | | |
| EG America LLC, First Lien Term Loan, 1M US SOFR + 4.00%, 0.50% Floor, 02/07/2028 | | | 693,033 | | | | 691,300 | |
| Staples, Inc., First Lien Term Loan, 1M US L + 5.00%, 04/16/2026 | | | 917,995 | | | | 910,692 | |
| StubHub Holdco Sub LLC, First Lien Term Loan, 3M US SOFR + 4.75%, 03/15/2030 | | | 174,123 | | | | 174,594 | |
| | | | | | | | 1,776,586 | |
| | | | | | | | | |
| Technology Hardware, Storage & Peripherals - 1.32% | | | | | | | | |
| Project Castle, Inc., First Lien Term Loan, 3M US SOFR + 5.50%, 06/01/2029 | | | 2,142,867 | | | | 1,951,799 | |
| Xerox 11/23, First Lien Term Loan, 3M US SOFR + 4.00%, 11/17/2029 | | | 687,300 | | | | 691,382 | |
| | | | | | | | 2,643,181 | |
| | | | | | | | | |
| Textiles, Apparel & Luxury Goods - 0.67% | | | | | | | | |
| S&S Holdings LLC, First Lien Initial Term Loan, 3M US SOFR + 5.00%, 0.50% Floor, 03/11/2028 | | | 1,339,426 | | | | 1,337,336 | |
| | | | | | | | | |
| Trading Companies & Distributors - 2.11% | | | | | | | | |
| American Builders & Contractors Supply Co., Inc., First Lien Term Loan, 1M US SOFR + 2.00%, 01/31/2031 | | | 314,998 | | | | 315,441 | |
| CD&R Hydr SunSource, First Lien Term Loan, 6M CME TERM SOFR + 4.50%, 03/17/2031 | | | 1,082,399 | | | | 1,086,122 | |
| Core & Main LP, First Lien Term Loan, 3M CME TERM SOFR + 2.25%, 02/09/2031 | | | 249,671 | | | | 249,983 | |
| Foundation Building Materials, Inc., First Lien Term Loan, 3M US L + 4.00%, 01/29/2031 | | | 1,530,050 | | | | 1,538,373 | |
| Windsor Holdings III LLC, First Lien Term Loan, 6M CME TERM SOFR + 4.00%, 08/01/2030 | | | 1,022,377 | | | | 1,027,653 | |
| | | | | | | | 4,217,572 | |
| | | | | | | | | |
| Wireless Telecommunication Services - 0.69% | | | | | | | | |
| CCI Buyer, Inc., First Lien Initial Term Loan, 3M US SOFR + 4.00%, 0.75% Floor, 12/17/2027 | | | 1,383,898 | | | | 1,377,595 | |
| | | | | | | | | |
| TOTAL FLOATING RATE LOAN INTERESTS | | | | | | | | |
| (Cost $261,337,055) | | | | | | | 260,128,265 | |
See Notes to Financial Statements.
| Semi-Annual Report | March 31, 2024 | 15 |
| Blackstone Floating Rate Enhanced Income Fund | Portfolio of Investments |
March 31, 2024 (Unaudited)
| | | Principal
Amount | | | Value | |
| | | | | | | |
| COLLATERALIZED LOAN OBLIGATION SECURITIES(a) - 8.50% | | | | | | | | |
| Consumer Finance - 0.50% | | | | | | | | |
| Octagon 60, Ltd., 3M US SOFR + 5.00%, 10/20/2035(b)(d) | | $ | 1,000,000 | | | $ | 1,007,484 | |
| | | | | | | | | |
| Financial Services - 8.00% | | | | | | | | |
| Allegro CLO XII, Ltd., 3M US SOFR + 7.36%, 01/21/2032(b)(d) | | | 1,000,000 | | | | 1,003,349 | |
| Carlyle US CLO 2022-6, Ltd., 3M US SOFR + 4.75%, 10/25/2036(b)(d) | | | 1,000,000 | | | | 1,015,767 | |
| CIFC Funding 2019-V, Ltd., 3M US SOFR + 3.41%, 01/15/2035(b)(d) | | | 1,000,000 | | | | 999,190 | |
| Clover CLO 2021-3 LLC, 3M US SOFR + 3.36%, 01/25/2035(b)(d) | | | 1,000,000 | | | | 1,000,075 | |
| HalseyPoint CLO 4, Ltd., 3M US SOFR + 6.97%, 04/20/2034(b)(d) | | | 1,000,000 | | | | 1,001,097 | |
| Halseypoint Clo 5, Ltd., 3M US SOFR + 7.20%, 01/30/2035(b)(d) | | | 1,500,000 | | | | 1,500,083 | |
| HPS Loan Management CLO 6-2015, Ltd., 3M US SOFR + 5.36%, 02/05/2031(b)(d) | | | 833,000 | | | | 796,295 | |
| Invesco CLO 2022-2, Ltd., 3M US SOFR + 3.75%, 07/20/2035(b)(d) | | | 1,000,000 | | | | 1,002,997 | |
| Magnetite XXXV, Ltd., 3M US SOFR + 4.00%, 10/25/2036(b)(d) | | | 1,000,000 | | | | 1,007,436 | |
| Palmer Square CLO 2019-1, Ltd., 3M US SOFR + 6.76%, 11/14/2034(b)(d) | | | 1,000,000 | | | | 1,004,961 | |
| Parallel 2021-2, Ltd., 3M US SOFR + 7.46%, 10/20/2034(b)(d) | | | 1,000,000 | | | | 961,161 | |
| Park Avenue Institutional Advisers CLO, Ltd. 2022-1, 3M US SOFR + 7.29%, 04/20/2035(b)(d) | | | 1,000,000 | | | | 999,263 | |
| Pikes Peak Clo 2, 3M US SOFR + 3.51%, 10/18/2034(b)(d) | | | 1,000,000 | | | | 1,000,355 | |
| Rad CLO 5, Ltd., 3M US SOFR + 6.96%, 07/24/2032(b)(d) | | | 500,000 | | | | 501,179 | |
| Regatta CLO XV Funding, Ltd., 3M US SOFR + 3.56%, 10/25/2031(b)(d) | | | 250,000 | | | | 248,781 | |
| Romark CLO II, Ltd., 3M US SOFR + 3.61%, 07/25/2031(b)(d) | | | 500,000 | | | | 500,000 | |
| Romark CLO IV, Ltd., 3M US SOFR + 7.21%, 07/10/2034(b)(d) | | | 1,000,000 | | | | 964,624 | |
| Romark CLO, Ltd., 3M US SOFR + 3.26%, 10/23/2030(b)(d) | | | 500,000 | | | | 497,689 | |
| | | | | | | | 16,004,302 | |
| | | | | | | | | |
| TOTAL COLLATERALIZED LOAN OBLIGATION SECURITIES | | | | | | | | |
| (Cost $16,888,008) | | | | | | | 17,011,786 | |
| | | | | | | | | |
| CORPORATE BONDS - 4.08% | | | | | | | | |
| Aerospace & Defense - 0.13% | | | | | | | | |
| Moog, Inc., 4.250%, 12/15/2027(d) | | | 20,000 | | | | 18,883 | |
| TransDigm, Inc.: | | | | | | | | |
| 4.625%, 01/15/2029 | | | 58,000 | | | | 53,894 | |
| 4.880%, 05/01/2029 | | | 100,000 | | | | 93,136 | |
| Triumph Group, Inc., 9.000%, 03/15/2028(d) | | | 91,000 | | | | 96,049 | |
| | | | | | | | 261,962 | |
| | | | | | | | | |
| Automobile Components - 0.05% | | | | | | | | |
| American Axle & Manufacturing, Inc., 5.000%, 10/01/2029 | | | 20,000 | | | | 18,032 | |
| Patrick Industries, Inc., 4.750%, 05/01/2029(d) | | | 65,000 | | | | 60,786 | |
| Phinia, Inc., 6.750%, 04/15/2029(d) | | | 18,000 | | | | 18,196 | |
| | | | | | | | 97,014 | |
| | | | | | | | | |
| Automobiles - 0.01% | | | | | | | | |
| Thor Industries, Inc., 4.000%, 10/15/2029(d) | | | 25,000 | | | | 22,395 | |
| | | | | | | | | |
| | | | | | | | | |
| Banks - 0.06% | | | | | | | | |
| Intesa Sanpaolo SpA, 5.710%, 01/15/2026(d) | | | 125,000 | | | | 123,984 | |
| Popular, Inc., 7.250%, 03/13/2028 | | | 5,000 | | | | 5,128 | |
| | | | | | | | 129,112 | |
| | | | | | | | | |
| Broadline Retail - 0.08% | | | | | | | | |
| Macy's Retail Holdings LLC, 6.125%, 03/15/2032(d) | | | 12,000 | | | | 11,644 | |
See Notes to Financial Statements.
| Blackstone Floating Rate Enhanced Income Fund | Portfolio of Investments |
March 31, 2024 (Unaudited)
| | | Principal
Amount | | | Value | |
| | | | | | | |
| Broadline Retail (continued) | | | | | | | | |
| Nordstrom, Inc., 5.000%, 01/15/2044 | | $ | 42,000 | | | $ | 32,580 | |
| Rakuten Group, Inc., 11.250%, 02/15/2027(d) | | | 113,000 | | | | 119,892 | |
| | | | | | | | 164,116 | |
| | | | | | | | | |
| Building Products - 0.03% | | | | | | | | |
| Griffon Corp., 5.750%, 03/01/2028 | | | 60,000 | | | | 58,803 | |
| | | | | | | | | |
| Capital Markets - 0.03% | | | | | | | | |
| Kodiak Gas Services LLC, 7.250%, 02/15/2029(d) | | | 60,000 | | | | 61,155 | |
| | | | | | | | | |
| Chemicals - 0.07% | | | | | | | | |
| Chemours Co., 5.750%, 11/15/2028(d) | | | 75,000 | | | | 69,251 | |
| CVR Partners LP / CVR Nitrogen Finance Corp., 6.125%, 06/15/2028(d) | | | 25,000 | | | | 24,051 | |
| Mativ Holdings, Inc., 6.875%, 10/01/2026(d) | | | 30,000 | | | | 29,886 | |
| Tronox, Inc., 4.625%, 03/15/2029(d) | | | 20,000 | | | | 17,964 | |
| | | | | | | | 141,152 | |
| | | | | | | | | |
| Commercial Services & Supplies - 0.01% | | | | | | | | |
| Deluxe Corp., 8.000%, 06/01/2029(d) | | | 13,000 | | | | 12,000 | |
| | | | | | | | | |
| Communications Equipment - 0.02% | | | | | | | | |
| Viasat, Inc., 6.500%, 07/15/2028(d) | | | 42,000 | | | | 32,473 | |
| | | | | | | | | |
| Construction & Engineering - 0.01% | | | | | | | | |
| Great Lakes Dredge & Dock Corp., 5.250%, 06/01/2029(d) | | | 21,000 | | | | 18,713 | |
| Tutor Perini Corp., 6.875%, 05/01/2025(d) | | | 10,000 | | | | 9,905 | |
| | | | | | | | 28,618 | |
| | | | | | | | | |
| Consumer Finance - 0.34% | | | | | | | | |
| Ally Financial, Inc., 6.700%, 02/14/2033 | | | 33,000 | | | | 33,372 | |
| Enova International, Inc., 8.500%, 09/15/2025(d) | | | 25,000 | | | | 24,965 | |
| FirstCash, Inc.: | | | | | | | | |
| 5.625%, 01/01/2030(d) | | | 90,000 | | | | 85,607 | |
| 6.875%, 03/01/2032(d) | | | 51,000 | | | | 51,040 | |
| goeasy, Ltd.: | | | | | | | | |
| 9.250%, 12/01/2028(d) | | | 71,000 | | | | 75,793 | |
| 7.625%, 07/01/2029(d) | | | 30,000 | | | | 30,071 | |
| Navient Corp.: | | | | | | | | |
| 5.000%, 03/15/2027 | | | 12,000 | | | | 11,505 | |
| 9.375%, 07/25/2030 | | | 75,000 | | | | 80,308 | |
| 11.500%, 03/15/2031 | | | 60,000 | | | | 66,845 | |
| OneMain Finance Corp.: | | | | | | | | |
| 3.880%, 09/15/2028 | | | 75,000 | | | | 66,982 | |
| 5.375%, 11/15/2029 | | | 20,000 | | | | 18,820 | |
| 7.875%, 03/15/2030 | | | 30,000 | | | | 30,976 | |
| PRA Group, Inc., 8.375%, 02/01/2028(d) | | | 10,000 | | | | 9,958 | |
| Synchrony Financial, 7.250%, 02/02/2033 | | | 68,000 | | | | 67,582 | |
| World Acceptance Corp., 7.000%, 11/01/2026(d) | | | 20,000 | | | | 18,625 | |
| | | | | | | | 672,449 | |
| Containers & Packaging - 0.02% | | | | | | | | |
| Ardagh Metal Packaging Finance USA LLC / Ardagh Metal Packaging Finance PLC, 4.000%, 09/01/2029(d) | | | 48,000 | | | | 38,743 | |
See Notes to Financial Statements.
| Semi-Annual Report | March 31, 2024 | | 17 |
| Blackstone Floating Rate Enhanced Income Fund | Portfolio of Investments |
March 31, 2024 (Unaudited)
| | | Principal
Amount | | | Value | |
| | | | | | | |
| Diversified Consumer Services - 0.02% | | | | | | | | |
| Adtalem Global Education, Inc., 5.500%, 03/01/2028(d) | | $ | 35,000 | | | $ | 33,535 | |
| | | | | | | | | |
| Diversified REITs - 0.08% | | | | | | | | |
| Service Properties Trust: | | | | | | | | |
| 5.250%, 02/15/2026 | | | 11,000 | | | | 10,650 | |
| 4.750%, 10/01/2026 | | | 48,000 | | | | 44,779 | |
| 4.950%, 02/15/2027 | | | 85,000 | | | | 78,690 | |
| 3.950%, 01/15/2028 | | | 10,000 | | | | 8,567 | |
| 4.375%, 02/15/2030 | | | 20,000 | | | | 15,288 | |
| | | | | | | | 157,974 | |
| | | | | | | | | |
| Diversified Telecommunication Services - 0.14% | | | | | | | | |
| Cogent Communications Group, Inc., 7.000%, 06/15/2027(d) | | | 90,000 | | | | 89,681 | |
| Consolidated Communications, Inc., 6.500%, 10/01/2028(d) | | | 40,000 | | | | 35,041 | |
| Frontier Communications Holdings LLC: | | | | | | | | |
| 6.750%, 05/01/2029(d) | | | 130,000 | | | | 115,997 | |
| 5.875%, 11/01/2029 | | | 30,000 | | | | 25,382 | |
| 6.000%, 01/15/2030(d) | | | 18,000 | | | | 15,266 | |
| | | | | | | | 281,367 | |
| | | | | | | | | |
| Electric Utilities - 0.03% | | | | | | | | |
| NRG Energy, Inc.: | | | | | | | | |
| 3.375%, 02/15/2029(d) | | | 50,000 | | | | 44,466 | |
| 3.625%, 02/15/2031(d) | | | 24,000 | | | | 20,735 | |
| | | | | | | | 65,201 | |
| | | | | | | | | |
| Energy Equipment & Services - 0.23% | | | | | | | | |
| Archrock Partners LP / Archrock Partners Finance Corp., 6.250%, 04/01/2028(d) | | | 74,000 | | | | 73,265 | |
| Enerflex, Ltd., 9.000%, 10/15/2027(d) | | | 60,000 | | | | 61,692 | |
| Helix Energy Solutions Group, Inc., 9.750%, 03/01/2029(d) | | | 31,000 | | | | 33,206 | |
| Nabors Industries, Ltd., 7.500%, 01/15/2028(d) | | | 70,000 | | | | 65,723 | |
| Precision Drilling Corp., 6.875%, 01/15/2029(d) | | | 50,000 | | | | 49,954 | |
| Transocean, Inc.: | | | | | | | | |
| 7.500%, 01/15/2026(d) | | | 30,000 | | | | 29,910 | |
| 11.500%, 01/30/2027(d) | | | 50,000 | | | | 52,150 | |
| 7.500%, 04/15/2031 | | | 28,000 | | | | 26,059 | |
| Valaris, Ltd., 8.375%, 04/30/2030(d) | | | 75,000 | | | | 77,429 | |
| | | | | | | | 469,388 | |
| | | | | | | | | |
| Financial Services - 0.20% | | | | | | | | |
| Burford Capital Global Finance LLC, 9.250%, 07/01/2031(d) | | | 50,000 | | | | 52,982 | |
| Compass Group Diversified Holdings LLC, 5.250%, 04/15/2029(d) | | | 25,000 | | | | 23,780 | |
| Encore Capital Group, Inc., 9.250%, 04/01/2029(d) | | | 20,000 | | | | 20,512 | |
| Nationstar Mortgage Holdings, Inc.: | | | | | | | | |
| 6.000%, 01/15/2027(d) | | | 100,000 | | | | 98,653 | |
| 5.500%, 08/15/2028(d) | | | 5,000 | | | | 4,791 | |
| 5.750%, 11/15/2031(d) | | | 29,000 | | | | 26,776 | |
| 7.125%, 02/01/2032(d) | | | 31,000 | | | | 30,811 | |
| PennyMac Financial Services, Inc.: | | | | | | | | |
| 4.250%, 02/15/2029(d) | | | 20,000 | | | | 18,302 | |
| 7.875%, 12/15/2029(d) | | | 25,000 | | | | 25,711 | |
| 5.750%, 09/15/2031(d) | | | 95,000 | | | | 88,216 | |
See Notes to Financial Statements.
| Blackstone Floating Rate Enhanced Income Fund | Portfolio of Investments |
March 31, 2024 (Unaudited)
| | | Principal Amount | | | Value | |
| Financial Services (continued) | | | | | | | | |
| PHH Mortgage Corp., 7.875%, 03/15/2026(d) | | $ | 8,000 | | | $ | 7,754 | |
| | | | | | | | 398,288 | |
| Gas Utilities - 0.07% | | | | | | | | |
| Suburban Propane Partners LP/Suburban Energy Finance Corp., 5.000%, 06/01/2031(d) | | | 90,000 | | | | 82,119 | |
| Superior Plus LP / Superior General Partner, Inc., 4.500%, 03/15/2029(d) | | | 55,000 | | | | 50,896 | |
| | | | | | | | 133,015 | |
| Health Care Equipment & Supplies - 0.05% | | | | | | | | |
| AdaptHealth LLC: | | | | | | | | |
| 6.125%, 08/01/2028(d) | | | 45,000 | | | | 42,306 | |
| 5.125%, 03/01/2030(d) | | | 55,000 | | | | 48,016 | |
| | | | | | | | 90,322 | |
| Health Care Providers & Services - 0.15% | | | | | | | | |
| CHS/Community Health Systems, Inc.: | | | | | | | | |
| 8.000%, 03/15/2026(d) | | | 85,000 | | | | 84,894 | |
| 6.875%, 04/15/2029(d) | | | 23,000 | | | | 17,242 | |
| 6.125%, 04/01/2030(d) | | | 36,000 | | | | 25,991 | |
| DaVita, Inc.: | | | | | | | | |
| 4.625%, 06/01/2030(d) | | | 130,000 | | | | 116,473 | |
| 3.750%, 02/15/2031(d) | | | 20,000 | | | | 16,762 | |
| ModivCare Escrow Issuer, Inc., 5.000%, 10/01/2029(d) | | | 40,000 | | | | 29,041 | |
| | | | | | | | 290,403 | |
| Health Care REITs - 0.01% | | | | | | | | |
| MPT Operating Partnership LP / MPT Finance Corp., 5.250%, 08/01/2026 | | | 20,000 | | | | 18,329 | |
| | | | | | | | | |
| Hotels, Restaurants & Leisure - 0.10% | | | | | | | | |
| Bloomin' Brands, Inc. / OSI Restaurant Partners LLC, 5.125%, 04/15/2029(d) | | | 10,000 | | | | 9,300 | |
| Churchill Downs, Inc., 4.750%, 01/15/2028(d) | | | 45,000 | | | | 42,869 | |
| NCL Corp., Ltd.: | | | | | | | | |
| 5.875%, 03/15/2026(d) | | | 145,000 | | | | 143,233 | |
| 7.750%, 02/15/2029(d) | | | 10,000 | | | | 10,392 | |
| | | | | | | | 205,794 | |
| Household Durables - 0.14% | | | | | | | | |
| Beazer Homes USA, Inc., 7.250%, 10/15/2029 | | | 65,000 | | | | 65,901 | |
| Dream Finders Homes, Inc., 8.250%, 08/15/2028(d) | | | 29,000 | | | | 30,300 | |
| LGI Homes, Inc., 8.750%, 12/15/2028(d) | | | 30,000 | | | | 31,673 | |
| M/I Homes, Inc.: | | | | | | | | |
| 4.950%, 02/01/2028 | | | 39,000 | | | | 37,233 | |
| 3.950%, 02/15/2030 | | | 30,000 | | | | 27,002 | |
| Tempur Sealy International, Inc., 4.000%, 04/15/2029(d) | | | 100,000 | | | | 90,841 | |
| | | | | | | | 282,950 | |
| Household Products - 0.00%(e) | | | | | | | | |
| Energizer Holdings, Inc., 4.750%, 06/15/2028(d) | | | 5,000 | | | | 4,636 | |
See Notes to Financial Statements.
| Semi-Annual Report | March 31, 2024 | 19 |
| Blackstone Floating Rate Enhanced Income Fund | Portfolio of Investments |
March 31, 2024 (Unaudited)
| | | Principal Amount | | | Value | |
| Independent Power and Renewable Electricity Producers - 0.07% | | | | | | | | |
| Vistra Operations Co. LLC: | | | | | | | | |
| 5.000%, 07/31/2027(d) | | $ | 30,000 | | | $ | 29,074 | |
| 4.375%, 05/01/2029(d) | | | 30,000 | | | | 27,823 | |
| 7.750%, 10/15/2031(d) | | | 81,000 | | | | 84,889 | |
| | | | | | | | 141,786 | |
| Industrial Conglomerates - 0.03% | | | | | | | | |
| Icahn Enterprises LP / Icahn Enterprises Finance Corp., 6.250%, 05/15/2026 | | | 70,000 | | | | 67,627 | |
| | | | | | | | | |
| Interactive Media & Services - 0.04% | | | | | | | | |
| ANGI Group LLC, 3.875%, 08/15/2028(d) | | | 38,000 | | | | 33,018 | |
| Cinemark USA, Inc., 5.250%, 07/15/2028(d) | | | 40,000 | | | | 37,904 | |
| | | | | | | | 70,922 | |
| IT Services - 0.06% | | | | | | | | |
| Conduent Business Services LLC / Conduent State & Local Solutions, Inc., 6.000%, 11/01/2029(d) | | | 50,000 | | | | 45,294 | |
| Sabre GLBL, Inc.: | | | | | | | | |
| 8.625%, 06/01/2027(d) | | | 52,000 | | | | 45,676 | |
| 11.250%, 12/15/2027(d) | | | 30,000 | | | | 28,174 | |
| | | | | | | | 119,144 | |
| Machinery - 0.04% | | | | | | | | |
| Allison Transmission, Inc., 4.750%, 10/01/2027(d) | | | 35,000 | | | | 33,709 | |
| Esab Corp., 6.250%, 04/15/2029(d) | | | 10,000 | | | | 10,059 | |
| Park-Ohio Industries, Inc., 6.625%, 04/15/2027 | | | 8,000 | | | | 7,498 | |
| Titan International, Inc., 7.000%, 04/30/2028 | | | 35,000 | | | | 34,570 | |
| Wabash National Corp., 4.500%, 10/15/2028(d) | | | 3,000 | | | | 2,755 | |
| | | | | | | | 88,591 | |
| Marine Transportation - 0.01% | | | | | | | | |
| Danaos Corp., 8.500%, 03/01/2028(d) | | | 25,000 | | | | 25,632 | |
| | | | | | | | | |
| Media - 0.27% | | | | | | | | |
| Advantage Sales & Marketing, Inc., 6.500%, 11/15/2028(d) | | | 70,000 | | | | 66,009 | |
| AMC Networks, Inc., 4.250%, 02/15/2029 | | | 32,000 | | | | 22,703 | |
| CCO Holdings LLC / CCO Holdings Capital Corp.: | | | | | | | | |
| 5.125%, 05/01/2027(d) | | | 40,000 | | | | 38,137 | |
| 5.000%, 02/01/2028(d) | | | 40,000 | | | | 37,262 | |
| 5.375%, 06/01/2029(d) | | | 22,000 | | | | 20,156 | |
| 4.750%, 03/01/2030(d) | | | 15,000 | | | | 12,889 | |
| 4.500%, 05/01/2032 | | | 28,000 | | | | 22,519 | |
| Clear Channel Outdoor Holdings, Inc.: | | | | | | | | |
| 7.750%, 04/15/2028(d) | | | 122,000 | | | | 106,946 | |
| 7.500%, 06/01/2029(d) | | | 40,000 | | | | 33,117 | |
| CSC Holdings LLC: | | | | | | | | |
| 11.250%, 05/15/2028(d) | | | 60,000 | | | | 59,508 | |
| 5.750%, 01/15/2030(d) | | | 15,000 | | | | 7,953 | |
| Gray Television, Inc.: | | | | | | | | |
| 4.750%, 10/15/2030(d) | | | 58,000 | | | | 38,084 | |
| 5.375%, 11/15/2031(d) | | | 15,000 | | | | 9,850 | |
| Nexstar Media, Inc.: | | | | | | | | |
| 5.625%, 07/15/2027(d) | | | 20,000 | | | | 19,200 | |
| 4.750%, 11/01/2028(d) | | | 15,000 | | | | 13,682 | |
See Notes to Financial Statements.
| Blackstone Floating Rate Enhanced Income Fund | Portfolio of Investments |
March 31, 2024 (Unaudited)
| | | Principal Amount | | | Value | |
| Media (continued) | | | | | | | | |
| Scripps Escrow, Inc., 5.875%, 07/15/2027(d) | | $ | 20,000 | | | $ | 16,751 | |
| Sinclair Television Group, Inc., 5.500%, 03/01/2030(d) | | | 15,000 | | | | 10,814 | |
| | | | | | | | 535,580 | |
| Metals & Mining - 0.16% | | | | | | | | |
| Eldorado Gold Corp., 6.250%, 09/01/2029(d) | | | 52,000 | | | | 50,011 | |
| FMG Resources August 2006 Pty, Ltd., 6.125%, 04/15/2032(d) | | | 50,000 | | | | 49,492 | |
| GrafTech Global Enterprises, Inc., 9.875%, 12/15/2028(d) | | | 15,000 | | | | 11,153 | |
| IAMGOLD Corp., 5.750%, 10/15/2028(d) | | | 38,000 | | | | 34,912 | |
| Mineral Resources, Ltd.: | | | | | | | | |
| 8.125%, 05/01/2027(d) | | | 48,000 | | | | 48,596 | |
| 8.000%, 11/01/2027(d) | | | 50,000 | | | | 51,072 | |
| New Gold, Inc., 7.500%, 07/15/2027(d) | | | 35,000 | | | | 35,115 | |
| SunCoke Energy, Inc., 4.880%, 06/30/2029(d) | | | 49,000 | | | | 44,416 | |
| | | | | | | | 324,767 | |
| Mortgage Real Estate Investment - 0.12% | | | | | | | | |
| Apollo Commercial Real Estate Finance, Inc., 4.625%, 06/15/2029(d) | | | 45,000 | | | | 37,844 | |
| Rithm Capital Corp., 8.000%, 04/01/2029(d) | | | 55,000 | | | | 53,431 | |
| Starwood Property Trust, Inc.: | | | | | | | | |
| 4.380%, 01/15/2027(d) | | | 140,000 | | | | 131,809 | |
| 7.250%, 04/01/2029(d) | | | 10,000 | | | | 10,092 | |
| | | | | | | | 233,176 | |
| Office REITs - 0.01% | | | | | | | | |
| Vornado Realty LP, 3.400%, 06/01/2031 | | | 25,000 | | | | 19,802 | |
| | | | | | | | | |
| Oil, Gas & Consumable Fuels - 0.48% | | | | | | | | |
| Berry Petroleum Co. LLC, 7.000%, 02/15/2026(d) | | | 25,000 | | | | 24,695 | |
| Calumet Specialty Products Partners LP / Calumet Finance Corp.: | | | | | | | | |
| 8.125%, 01/15/2027(d) | | | 18,000 | | | | 17,566 | |
| 9.750%, 07/15/2028(d) | | | 23,000 | | | | 22,856 | |
| CNX Resources Corp.: | | | | | | | | |
| 6.000%, 01/15/2029(d) | | | 73,000 | | | | 71,544 | |
| 7.250%, 03/01/2032(d) | | | 21,000 | | | | 21,367 | |
| CVR Energy, Inc., 8.500%, 01/15/2029(d) | | | 90,000 | | | | 91,196 | |
| Delek Logistics Partners LP / Delek Logistics Finance Corp.: | | | | | | | | |
| 7.125%, 06/01/2028(d) | | | 40,000 | | | | 39,052 | |
| 8.625%, 03/15/2029(d) | | | 24,000 | | | | 24,524 | |
| Energean PLC, 6.500%, 04/30/2027(d) | | | 15,000 | | | | 14,156 | |
| EnQuest PLC, 11.625%, 11/01/2027(d) | | | 11,000 | | | | 11,029 | |
| Global Partners LP / GLP Finance Corp., 7.000%, 08/01/2027 | | | 38,000 | | | | 38,048 | |
| Hess Midstream Operations LP, 5.625%, 02/15/2026(d) | | | 36,000 | | | | 35,735 | |
| New Fortress Energy, Inc., 6.500%, 09/30/2026(d) | | | 140,000 | | | | 134,885 | |
| NGL Energy Operating LLC / NGL Energy Finance Corp.: | | | | | | | | |
| 8.125%, 02/15/2029(d) | | | 23,000 | | | | 23,571 | |
| 8.375%, 02/15/2032(d) | | | 10,000 | | | | 10,258 | |
| Northern Oil & Gas, Inc.: | | | | | | | | |
| 8.125%, 03/01/2028(d) | | | 80,000 | | | | 81,258 | |
| 8.750%, 06/15/2031(d) | | | 16,000 | | | | 16,916 | |
| Parkland Corp.: | | | | | | | | |
| 5.875%, 07/15/2027(d) | | | 60,000 | | | | 59,524 | |
| 4.500%, 10/01/2029(d) | | | 40,000 | | | | 37,033 | |
| 4.630%, 05/01/2030(d) | | | 35,000 | | | | 32,297 | |
See Notes to Financial Statements.
| Semi-Annual Report | March 31, 2024 | 21 |
| Blackstone Floating Rate Enhanced Income Fund | Portfolio of Investments |
March 31, 2024 (Unaudited)
| | | Principal Amount | | | Value | |
| Oil, Gas & Consumable Fuels (continued) | | | | | | | | |
| PBF Holding Co. LLC / PBF Finance Corp., 7.875%, 09/15/2030(d) | | $ | 40,000 | | | $ | 41,527 | |
| Sunoco LP / Sunoco Finance Corp., 4.500%, 05/15/2029 | | | 108,000 | | | | 100,486 | |
| W&T Offshore, Inc., 11.750%, 02/01/2026(d) | | | 20,000 | | | | 20,797 | |
| | | | | | | | 970,320 | |
| Paper & Forest Products - 0.03% | | | | | | | | |
| Louisiana-Pacific Corp., 3.625%, 03/15/2029(d) | | | 30,000 | | | | 27,302 | |
| Mercer International, Inc., 5.125%, 02/01/2029 | | | 28,000 | | | | 24,644 | |
| | | | | | | | 51,946 | |
| Passenger Airlines - 0.04% | | | | | | | | |
| American Airlines, Inc., 7.250%, 02/15/2028(d) | | | 80,000 | | | | 81,306 | |
| | | | | | | | | |
| Real Estate Management & Development - 0.09% | | | | | | | | |
| Howard Hughes Corp., 4.125%, 02/01/2029(d) | | | 85,000 | | | | 76,480 | |
| Newmark Group, Inc., 7.500%, 01/12/2029(d) | | | 54,000 | | | | 55,584 | |
| Realogy Group LLC / Realogy Co.-Issuer Corp., 5.750%, 01/15/2029(d) | | | 63,000 | | | | 44,677 | |
| | | | | | | | 176,741 | |
| Retail REITs - 0.01% | | | | | | | | |
| Brandywine Operating Partnership LP, 4.550%, 10/01/2029 | | | 25,000 | | | | 21,759 | |
| | | | | | | | | |
| Semiconductors & Semiconductor Equipment - 0.05% | | | | | | | | |
| ams-OSRAM AG, 12.250%, 03/30/2029(d) | | | 40,000 | | | | 40,233 | |
| Coherent Corp., 5.000%, 12/15/2029(d) | | | 60,000 | | | | 56,573 | |
| | | | | | | | 96,806 | |
| Software - 0.06% | | | | | | | | |
| MicroStrategy, Inc., 6.125%, 06/15/2028(d) | | | 45,000 | | | | 43,463 | |
| RingCentral, Inc., 8.500%, 08/15/2030(d) | | | 30,000 | | | | 31,218 | |
| SS&C Technologies, Inc., 5.500%, 09/30/2027(d) | | | 40,000 | | | | 39,144 | |
| | | | | | | | 113,825 | |
| Specialized REITs - 0.09% | | | | | | | | |
| Iron Mountain, Inc.: | | | | | | | | |
| 7.000%, 02/15/2029(d) | | | 25,000 | | | | 25,504 | |
| 5.250%, 07/15/2030(d) | | | 20,000 | | | | 18,941 | |
| 4.500%, 02/15/2031(d) | | | 50,000 | | | | 45,163 | |
| Uniti Group LP / Uniti Fiber Holdings, Inc. / CSL Capital LLC, 6.000%, 01/15/2030(d) | | | 25,000 | | | | 18,666 | |
| Uniti Group LP / Uniti Group Finance, Inc. / CSL Capital LLC, 6.500%, 02/15/2029(d) | | | 80,000 | | | | 62,073 | |
| | | | | | | | 170,347 | |
| Specialty Retail - 0.14% | | | | | | | | |
| Asbury Automotive Group, Inc., 5.000%, 02/15/2032(d) | | | 20,000 | | | | 18,136 | |
| Bath & Body Works, Inc., 6.950%, 03/01/2033 | | | 25,000 | | | | 24,942 | |
| Foot Locker, Inc., 4.000%, 10/01/2029(d) | | | 40,000 | | | | 33,714 | |
| Gap, Inc.: | | | | | | | | |
| 3.625%, 10/01/2029(d) | | | 92,000 | | | | 80,681 | |
| 3.875%, 10/01/2031(d) | | | 50,000 | | | | 42,346 | |
| Upbound Group, Inc., 6.375%, 02/15/2029(d) | | | 45,000 | | | | 43,729 | |
| Victoria's Secret & Co., 4.625%, 07/15/2029(d) | | | 57,000 | | | | 46,831 | |
| | | | | | | | 290,379 | |
See Notes to Financial Statements.
| Blackstone Floating Rate Enhanced Income Fund | Portfolio of Investments |
March 31, 2024 (Unaudited)
| | | Principal Amount | | | Value | |
| Technology Hardware, Storage & Peripherals - 0.09% | | | | | | | | |
| Pitney Bowes, Inc., 7.250%, 03/15/2029(d) | | $ | 23,000 | | | $ | 20,560 | |
| Xerox Holdings Corp., 5.500%, 08/15/2028(d) | | | 178,000 | | | | 162,246 | |
| | | | | | | | 182,806 | |
| Textiles, Apparel & Luxury Goods - 0.08% | | | | | | | | |
| Crocs, Inc., 4.250%, 03/15/2029(d) | | | 60,000 | | | | 54,908 | |
| Hanesbrands, Inc., 9.000%, 02/15/2031(d) | | | 83,000 | | | | 85,344 | |
| Wolverine World Wide, Inc., 4.000%, 08/15/2029(d) | | | 35,000 | | | | 28,122 | |
| | | | | | | | 168,374 | |
| Tobacco - 0.02% | | | | | | | | |
| Vector Group, Ltd., 5.750%, 02/01/2029(d) | | | 40,000 | | | | 37,099 | |
| | | | | | | | | |
| Trading Companies & Distributors - 0.01% | | | | | | | | |
| BlueLinx Holdings, Inc., 6.000%, 11/15/2029(d) | | | 25,000 | | | | 24,402 | |
| | | | | | | | | |
| TOTAL CORPORATE BONDS | | | | | | | | |
| (Cost $7,914,754) | | | | | | | 8,164,331 | |
| | | | Shares | | | | Value | |
| COMMON STOCK - 0.17% | | | | | | | | |
| Health Care Equipment & Supplies - 0.01% | | | | | | | | |
| Carestream Health Holdings Inc(b)(f) | | | 35,172 | | | | 10,552 | |
| | | | | | | | | |
| Health Care Providers & Services - 0.16% | | | | | | | | |
| Envision Healthcare Corp. Equity(b)(f) | | | 37,391 | | | | 327,171 | |
| | | | | | | | | |
| TOTAL COMMON STOCK | | | | | | | | |
| (Cost $1,918,189) | | | | | | | 337,723 | |
| | | | | | | | | |
| EXCHANGE TRADED FUNDS - 5.38% | | | | | | | | |
| Capital Markets - 5.38% | | | | | | | | |
| SPDR Blackstone Senior Loan ETF | | | 255,456 | | | | 10,757,252 | |
| | | | | | | | | |
| TOTAL EXCHANGE TRADED FUNDS | | | | | | | | |
| (Cost $10,666,452) | | | | | | | 10,757,252 | |
| | | | | | | | | |
| SHORT TERM INVESTMENTS - 6.26% | | | | | | | | |
| Open-end Investment Companies - 6.26% | | | | | | | | |
| Fidelity Treasury Portfolio | | | | | | | | |
| (5.21% 7-Day Yield) | | | 12,533,378 | | | | 12,533,378 | |
| | | | | | | | | |
| TOTAL SHORT TERM INVESTMENTS | | | | | | | | |
| (Cost $12,533,378) | | | | | | | 12,533,378 | |
See Notes to Financial Statements.
| Semi-Annual Report | March 31, 2024 | 23 |
| Blackstone Floating Rate Enhanced Income Fund | Portfolio of Investments |
March 31, 2024 (Unaudited)
| Total Investments- 154.40% | | | |
| (Cost $311,257,836) | | $ | 308,932,735 | |
| | | | | |
| Liabilities in Excess of Other Assets - (7.50)% | | | (14,991,120 | ) |
| | | | | |
| Leverage Facility - (46.90)% | | | (93,850,000 | ) |
| | | | | |
| Net Assets - 100.00% | | $ | 200,091,615 | |
Amounts above are shown as a percentage of net assets as of March 31, 2024.
Investment Abbreviations:
LIBOR - London Interbank Offered Rate
SOFR - Standard Overnight Financing Rate
LIBOR Rate:
1M US L- 1 Month Libor as of March 31, 2024 was 5.44%
3M US L- 3 Month Libor as of March 31, 2024 was 5.56%
6M US L- 6 Month Libor as of March 31, 2024 was 5.65%
1M US SOFR- 1 Month US SOFR as of March 31, 2024 was 5.33%
3M US SOFR - 3 Month US SOFR as of March 31, 2024 was 5.30%
3M CME TERM SOFR- 3 Month CME TERM SOFR as of March 31, 2024 was 5.30%
6M US SOFR - 6 Month US SOFR as of March 31, 2024 was 5.22%
6M CME TERM SOFR- 6 Month CME TERM SOFR as of March 31, 2024 was 5.22%
| (a) | Floating or variable rate security. The reference rate is described above. The rate in effect as of March 31, 2024 is based on the reference rate plus the displayed spread as of the security's last reset date. Where applicable, the reference rate is subject to a floor rate. |
| (b) | Level 3 assets valued using significant unobservable inputs as a result of unavailable quoted prices from an active market or the unavailability of other significant observable inputs. |
| (c) | A portion of this position was not funded as of March 31, 2024. The Portfolio of Investments records only the funded portion of each position. As of March 31, 2024, the Fund has unfunded delayed draw loans in the amount of $499,086. Fair value of these unfunded delayed draws was $501,554. Additional information is provided in Note 7 General Commitments and Contingencies. |
| (d) | Security exempt from registration under Rule 144A of the Securities Act of 1933. Total market value of Rule 144A securities amounts to $23,795,676, which represented approximately 11.89% of net assets as of March 31, 2024. Such securities may normally be sold to qualified institutional buyers in transactions exempt from registration. |
| (e) | Amount represents less than 0.005% of net assets. |
| (f) | Non-income producing security. |
See Notes to Financial Statements.
Blackstone Floating Rate Enhanced Income Fund | Statement of Assets and Liabilities |
March 31, 2024 (Unaudited)
| ASSETS: | | | |
| Investments, at fair value (Cost $311,257,836) | | $ | 308,932,735 | |
| Cash | | | 1,126,312 | |
| Receivable for investment securities sold | | | 18,318,866 | |
| Interest receivable | | | 1,930,654 | |
| Receivable for shares sold | | | 1,224,536 | |
| Prepaid expenses and other assets | | | 50,794 | |
| Total Assets | | | 331,583,897 | |
| | | | | |
| LIABILITIES: | | | | |
| Payable for investment securities purchased | | | 33,520,201 | |
| Leverage facility | | | 93,850,000 | |
| Interest due on leverage facility | | | 457,040 | |
| Net unrealized depreciation on unfunded loan commitments | | | 3,274 | |
| Distributions payable to common shareholders | | | 1,866,996 | |
| Accrued advisory fees | | | 589,512 | |
| Accrued trustees' fees payable | | | 43,559 | |
| Accrued distribution fees payable | | | 23,531 | |
| Accrued shareholder servicing fees payable | | | 23,543 | |
| Accrued transfer agent fees payable | | | 163,199 | |
| Other payables and accrued expenses | | | 951,427 | |
| Total Liabilities | | | 131,492,282 | |
| Net Assets Attributable to Common Shareholders | | $ | 200,091,615 | |
| | | | | |
| COMPOSITION OF NET ASSETS ATTRIBUTABLE TO COMMON SHARES: | | | | |
| Par value ($0.001 per share, applicable to 9,008,884 shares issued and outstanding) | | $ | 9,009 | |
| Paid-in capital in excess of par value | | | 249,985,193 | |
| Total distributable earnings | | | (49,902,587 | ) |
| Net Assets Attributable to Common Shareholders | | $ | 200,091,615 | |
See Notes to Financial Statements.
| Semi-Annual Report | March 31, 2024 | 25 |
Blackstone Floating Rate Enhanced Income Fund | Statement of Assets and Liabilities |
March 31, 2024 (Unaudited)
| NET ASSET VALUE | | | |
| Class I: | | | | |
| Net asset value per share | | $ | 22.15 | |
| Net assets | | | 89,117,768 | |
| Shares of beneficial interest outstanding (unlimited shares authorized, par value $0.001 per share) | | | 4,024,127 | |
| | | | | |
| Class T: | | | | |
| Net asset value per share | | | 22.11 | |
| Offering price per share (net asset value per share plus maximum sales load)* | | $ | 22.67 | |
| Net assets | | | 88,317,023 | |
| Shares of beneficial interest outstanding (unlimited shares authorized, par value $0.001 per share) | | | 3,995,139 | |
| | | | | |
| Class D: | | | | |
| Net asset value per share | | | 22.17 | |
| Net assets | | | 54,480 | |
| Shares of beneficial interest outstanding (unlimited shares authorized, par value $0.001 per share) | | | 2,457 | |
| | | | | |
| Class T-I: | | | | |
| Net asset value per share | | | 22.65 | |
| Offering price per share (net asset value per share plus maximum sales load)* | | $ | 23.47 | |
| Net assets | | | 9,601,648 | |
| Shares of beneficial interest outstanding (unlimited shares authorized, par value $0.001 per share) | | | 423,908 | |
| | | | | |
| Class U: | | | | |
| Net asset value per share | | | 23.08 | |
| Net assets | | | 13,000,696 | |
| Shares of beneficial interest outstanding (unlimited shares authorized, par value $0.001 per share) | | | 563,253 | |
*The maximum sales load is 2.5% of the offering price for Class T Shares and 3.5% of the offering price for Class T-I Shares. Class I Shares, Class D Shares and Class U Shares have no front-end sales load.
See Notes to Financial Statements.
Blackstone Floating Rate Enhanced Income Fund | Statement of Operations |
For the Six Months Ended March 31, 2024 (Unaudited)
| INVESTMENT INCOME: | | | |
| Interest | | $ | 15,391,864 | |
| Net Dividends | | | 409,896 | |
| Other income | | | 267,928 | |
| Total Investment Income | | | 16,069,688 | |
| | | | | |
| EXPENSES: | | | | |
| Advisory fees | | | 1,066,882 | |
| Fund accounting and administration fees | | | 218,803 | |
| Distribution fees | | | 136,115 | |
| Shareholder servicing fees | | | 139,329 | |
| Insurance expense | | | 39,069 | |
| Legal and audit fees | | | 488,403 | |
| Custodian fees | | | 79,595 | |
| Trustees' fees and expenses | | | 76,510 | |
| Printing expense | | | 23,604 | |
| Transfer agent fees | | | 31,644 | |
| Interest on leverage facility | | | 3,455,763 | |
| Other expenses | | | 20,684 | |
| Total expenses | | | 5,776,401 | |
| Reimbursement from Adviser/Advisory fees waiver | | | (494,570 | ) |
| Net Expenses | | | 5,281,831 | |
| Net Investment Income | | | 10,787,857 | |
| | | | | |
| NET REALIZED AND UNREALIZED GAIN/(LOSS) ON INVESTMENTS: | | | | |
| Net realized loss on: | | | | |
| Investment securities and unfunded commitments | | | (1,102,164 | ) |
| Net realized loss on investments and unfunded commitments | | | (1,102,164 | ) |
| Net change in unrealized appreciation on: | | | | |
| Investment securities and unfunded commitments | | | 4,536,854 | |
| Net change in unrealized appreciation on investments and unfunded commitments | | | 4,536,854 | |
| Net Realized Loss and Unrealized Appreciation on Investments and unfunded commitments | | | 3,434,690 | |
| | | | | |
| Net Increase in Net Assets Attributable to Common Shares from Operations | | $ | 14,222,547 | |
See Notes to Financial Statements.
| Semi-Annual Report | March 31, 2024 | 27 |
Blackstone Floating Rate Enhanced Income Fund | Statements of Changes in Net Assets |
| | | For the Six Months Ended March 31, 2024 (Unaudited) | | | For the Year Ended September 30, 2023 | |
| FROM OPERATIONS: | | | | | | | | |
| Net investment income | | $ | 10,787,857 | | | $ | 24,395,505 | |
| Net realized loss on investments and unfunded commitments | | | (1,102,164 | ) | | | (14,017,557 | ) |
| Net change in unrealized appreciation on investments and unfunded commitments | | | 4,536,854 | | | | 25,634,323 | |
| Net Increase in Net Assets Attributable to Common Shares from Operations | | | 14,222,547 | | | | 36,012,271 | |
| | | | | | | | | |
| DISTRIBUTIONS TO COMMON SHAREHOLDERS: | | | | | | | | |
| Class I | | | (5,204,058 | ) | | | (12,811,187 | ) |
| Class T | | | (4,394,961 | ) | | | (9,275,640 | ) |
| Class D | | | (2,712 | ) | | | (5,294 | ) |
| Class T-I | | | (461,210 | ) | | | (828,238 | ) |
| Class U | | | (619,446 | ) | | | (1,254,846 | ) |
| Net Decrease in Net Assets from Distributions to Common Shareholders | | | (10,682,387 | ) | | | (24,175,205 | ) |
| | | | | | | | | |
| SHARES TRANSACTIONS, IN DOLLARS: | | | | | | | | |
| Class I | | | | | | | | |
| Proceeds from shares sold | | | 2,747,510 | | | | 9,145,645 | |
| Distributions reinvested | | | 1,777,825 | | | | 4,001,415 | |
| Cost of shares redeemed | | | (44,817,308 | ) | | | (36,801,215 | ) |
| Redemption fees | | | 449 | | | | 3,945 | |
| Class T | | | | | | | | |
| Proceeds from shares sold | | | 1,068,018 | | | | 1,871,698 | |
| Distributions reinvested | | | 2,159,896 | | | | 4,765,593 | |
| Cost of shares redeemed | | | (11,561,602 | ) | | | (25,616,577 | ) |
| Redemption fees | | | 6,973 | | | | 2,291 | |
| Class D | | | | | | | | |
| Proceeds from shares sold | | | – | | | | 266 | |
| Cost of shares redeemed | | | – | | | | (17,954 | ) |
| Redemption fees | | | – | | | | 186 | |
| Class T-I | | | | | | | | |
| Proceeds from shares sold | | | 598,831 | | | | 1,186,984 | |
| Distributions reinvested | | | 20,222 | | | | 46,196 | |
| Cost of shares redeemed | | | (898,455 | ) | | | (82,092 | ) |
| Redemption fees | | | – | | | | – | |
| Class U | | | | | | | | |
| Distributions reinvested | | | 460,973 | | | | 980,991 | |
| Cost of shares redeemed | | | (346,370 | ) | | | (3,864,648 | ) |
| Redemption fees | | | – | | | | – | |
| Net Decrease from Capital Share Transactions | | | (48,783,038 | ) | | | (44,377,277 | ) |
| Net Decrease in Net Assets | | | (45,242,878 | ) | | | (32,540,210 | ) |
See Notes to Financial Statements.
Blackstone Floating Rate Enhanced Income Fund | Statements of Changes in Net Assets (Continued) |
| | | For the Six Months Ended March 31, 2024 (Unaudited) | | | For the Year Ended September 30, 2023 | |
| NET ASSETS | | | | | | | | |
| Beginning of period | | $ | 245,334,493 | | | $ | 277,874,703 | |
| End of period | | $ | 200,091,615 | | | $ | 245,334,493 | |
| | | | | | | | | |
| SHARE TRANSACTIONS, IN SHARES: | | | | | | | | |
| Class I | | | | | | | | |
| Beginning shares | | | 5,883,356 | | | | 7,008,983 | |
| Shares sold | | | 126,484 | | | | 432,218 | |
| Reinvestment in shares | | | 81,327 | | | | 188,998 | |
| Shares redeemed | | | (2,067,040 | ) | | | (1,746,843 | ) |
| Net change in shares resulting from shares transactions | | | (1,859,229 | ) | | | (1,125,627 | ) |
| Ending shares | | | 4,024,127 | | | | 5,883,356 | |
| | | | | | | | | |
| Class T | | | | | | | | |
| Beginning shares | | | 4,379,807 | | | | 5,281,949 | |
| Shares sold | | | 49,171 | | | | 88,830 | |
| Reinvestment in shares | | | 98,977 | | | | 225,431 | |
| Shares redeemed | | | (532,816 | ) | | | (1,216,403 | ) |
| Net change in shares resulting from shares transactions | | | (384,668 | ) | | | (902,142 | ) |
| Ending shares | | | 3,995,139 | | | | 4,379,807 | |
| | | | | | | | | |
| Class D | | | | | | | | |
| Beginning shares | | | 2,457 | | | | 3,306 | |
| Shares sold | | | – | | | | 13 | |
| Reinvestment in shares | | | – | | | | – | |
| Shares redeemed | | | – | | | | (862 | ) |
| Net change in shares resulting from shares transactions | | | – | | | | (849 | ) |
| Ending shares | | | 2,457 | | | | 2,457 | |
| | | | | | | | | |
| Class T-I | | | | | | | | |
| Beginning shares | | | 436,631 | | | | 383,449 | |
| Shares sold | | | 26,753 | | | | 54,866 | |
| Reinvestment in shares | | | 906 | | | | 2,132 | |
| Shares redeemed | | | (40,382 | ) | | | (3,816 | ) |
| Net change in shares resulting from shares transactions | | | (12,723 | ) | | | 53,182 | |
| Ending shares | | | 423,908 | | | | 436,631 | |
| | | | | | | | | |
| Class U | | | | | | | | |
| Beginning shares | | | 558,418 | | | | 689,715 | |
| Shares sold | | | – | | | | – | |
| Reinvestment in shares | | | 20,232 | | | | 44,455 | |
| Shares redeemed | | | (15,397 | ) | | | (175,752 | ) |
| Net change in shares resulting from shares transactions | | | 4,835 | | | | (131,297 | ) |
| Ending shares | | | 563,253 | | | | 558,418 | |
See Notes to Financial Statements.
| Semi-Annual Report | March 31, 2024 | 29 |
| Blackstone Floating Rate Enhanced Income Fund | Statement of Cash Flows |
For the Six Months Ended March 31, 2024 (Unaudited)
| CASH FLOWS FROM OPERATING ACTIVITIES: | | | |
| Net increase in net assets attributable to common shares from operations | | $ | 14,222,547 | |
| Adjustments to reconcile net increase/decrease in net assets attributable to common shares from operations to net cash provided by (used in) operating activities: | | | | |
| Purchases of investment securities | | | (135,358,317 | ) |
| Payment-in-kind interest | | | 45,785 | |
| Proceeds from disposition of investment securities | | | 213,950,899 | |
| Discounts accreted/premiums amortized | | | (632,869 | ) |
| Net realized loss on: | | | | |
| Investments securities and unfunded commitments | | | 1,102,164 | |
| Net change in unrealized appreciation on: | | | | |
| Investment securities and unfunded commitments | | | (4,536,854 | ) |
| Net purchases of short term investments | | | (9,848,174 | ) |
| (Increase)/Decrease in assets: | | | | |
| Interest receivable | | | 468,045 | |
| Prepaid expenses and other assets | | | 31,458 | |
| Increase/(Decrease) in liabilities: | | | | |
| Interest due on leverage facility | | | (97,020 | ) |
| Net unrealized depreciation on unfunded loan commitments | | | 1,488 | |
| Accrued advisory fees payable | | | 572,313 | |
| Accrued trustees' fees payable | | | 7,147 | |
| Accrued distribution fees payable | | | (3,775 | ) |
| Accrued shareholder servicing fees payable | | | (627 | ) |
| Accrued transfer agent fees payable | | | (103,315 | ) |
| Other payables and accrued expenses | | | (62,591 | ) |
| Net Cash Provided by (Used in) Operating Activities | | | 79,758,304 | |
| | | | | |
| CASH FLOWS FROM FINANCING ACTIVITIES: | | | | |
| Proceeds from leverage facility | | | 32,931,732 | |
| Payments on leverage facility | | | (54,131,732 | ) |
| Cost of shares redeemed - net of redemption fees | | | (57,616,313 | ) |
| Proceeds from shares sold | | | 4,319,959 | |
| Distributions paid to common shareholders (net of distributions reinvested) | | | (6,349,567 | ) |
| Net Cash Provided by (Used in) Financing Activities | | | (80,845,921 | ) |
| | | | | |
| Net Decrease in Cash | | | (1,087,617 | ) |
| Cash, beginning balance | | | 2,213,929 | |
| Cash, ending balance | | $ | 1,126,312 | |
| | | | | |
| Supplemental disclosure of cash flow information: | | | | |
| Interest paid on leverage facility during the period | | $ | 3,552,783 | |
| Non cash reinvestment of distributions | | $ | 4,418,916 | |
See Notes to Financial Statements.
| Blackstone Floating Rate Enhanced Income Fund – Class I | Financial Highlights |
For a Share Outstanding Throughout the Periods Indicated
| | | For the Six Months Ended March 31, 2024 (Unaudited) | | | For the Year Ended September 30, 2023 | | | For the Year Ended September 30, 2022 | | | For the Year Ended September 30, 2021 | | | For the Year Ended September 30, 2020 | | | For the Year Ended September 30, 2019 | |
| PER SHARE OPERATING PERFORMANCE: | | | | | | | | | | | | | | | | | | |
| Net asset value - beginning of period | | $ | 21.74 | | | $ | 20.74 | | | $ | 24.16 | | | $ | 22.85 | | | $ | 24.24 | | | $ | 25.00 | |
| INCOME FROM INVESTMENT OPERATIONS: | | | | | | | | | | | | | | | | | | | | | | | | |
| Net investment income(a) | | | 1.13 | | | | 2.08 | | | | 1.40 | | | | 1.44 | | | | 1.46 | | | | 1.66 | |
| Net realized and unrealized gain/(loss) on investments and unfunded loan commitments | | | 0.41 | | | | 0.99 | | | | (3.43 | ) | | | 1.23 | | | | (1.41 | ) | | | (0.76 | ) |
| Total Income/(Loss) from Investment Operations | | | 1.54 | | | | 3.07 | | | | (2.03 | ) | | | 2.67 | | | | 0.05 | | | | 0.90 | |
| | | | | | | | | | | | | | | | | | | | | | | | | |
| DISTRIBUTIONS TO SHAREHOLDERS: | | | | | | | | | | | | | | | | | | | | | | | | |
| From net investment income | | | (1.13 | ) | | | (2.07 | ) | | | (1.39 | ) | | | (1.36 | ) | | | (1.44 | ) | | | (1.66 | ) |
| Total Distributions to Shareholders | | | (1.13 | ) | | | (2.07 | ) | | | (1.39 | ) | | | (1.36 | ) | | | (1.44 | ) | | | (1.66 | ) |
| | | | | | | | | | | | | | | | | | | | | | | | | |
| REDEMPTION FEES ADDED TO PAID-IN-CAPITAL | | | 0.00 | (b) | | | 0.00 | (b) | | | 0.00 | (b) | | | 0.00 | (b) | | | 0.00 | (b) | | | 0.00 | (b) |
| | | | | | | | | | | | | | | | | | | | | | | | | |
| Net asset value - end of period | | $ | 22.15 | | | $ | 21.74 | | | $ | 20.74 | | | $ | 24.16 | | | $ | 22.85 | | | $ | 24.24 | |
| | | | | | | | | | | | | | | | | | | | | | | | | |
| Total Investment Return - Net Asset Value(c) | | | 7.27 | % | | | 15.53 | % | | | (8.75 | %) | | | 11.93 | % | | | 0.49 | % | | | 3.82 | % |
| | | | | | | | | | | | | | | | | | | | | | | | | |
| RATIOS TO AVERAGE NET ASSETS | | | | | | | | | | | | | | | | | | | | | | | | |
| Total expenses before reimbursement from Adviser and Advisory fees waiver | | | 5.18 | %(d) | | | 4.43 | % | | | 2.51 | % | | | 2.17 | % | | | 2.63 | % | | | 3.30 | % |
| Advisory Fees | | | 1.00 | %(d) | | | 1.00 | % | | | 1.00 | % | | | 1.00 | % | | | 1.00 | % | | | 1.00 | % |
| Other expenses before reimbursement from Adviser and Advisory fees waiver | | | 0.93 | %(d) | | | 0.80 | % | | | 0.65 | % | | | 0.63 | % | | | 0.60 | % | | | 0.73 | % |
| Interest on leverage | | | 3.25 | %(d) | | | 2.63 | % | | | 0.86 | % | | | 0.54 | % | | | 1.03 | % | | | 1.57 | % |
| Reimbursement from Adviser and Advisory fees waiver | | | (0.47 | %)(d) | | | (0.31 | %) | | | (0.20 | %) | | | (0.28 | %) | | | (0.27 | %) | | | (0.59 | %) |
| Total expenses after reimbursement from Adviser and Advisory fees waiver | | | 4.71 | %(d) | | | 4.12 | % | | | 2.31 | % | | | 1.89 | % | | | 2.36 | % | | | 2.71 | % |
| Excluded expenses(e) | | | (4.25 | %)(d) | | | (3.63 | %) | | | (1.86 | %) | | | (1.54 | %) | | | (2.01 | %) | | | (2.36 | %) |
| Total expenses, net of excluded expenses, after reimbursement from Adviser and Advisory fees waiver | | | 0.46 | %(d) | | | 0.49 | % | | | 0.45 | % | | | 0.35 | % | | | 0.35 | % | | | 0.35 | % |
| Net investment income | | | 10.39 | %(d) | | | 9.85 | % | | | 6.06 | % | | | 6.04 | % | | | 6.42 | % | | | 6.82 | % |
| | | | | | | | | | | | | | | | | | | | | | | | | |
| Net assets, end of period (000s) | | $ | 89,118 | | | $ | 127,892 | | | $ | 145,395 | | | $ | 166,404 | | | $ | 132,194 | | | $ | 215,196 | |
| Portfolio turnover rate | | | 47 | %(f) | | | 75 | % | | | 77 | % | | | 98 | % | | | 87 | % | | | 72 | % |
| | | | | | | | | | | | | | | | | | | | | | | | | |
| LEVERAGE FACILITY: | | | | | | | | | | | | | | | | | | | | | | | | |
| Aggregate principal amount, end of period (000s) | | $ | 93,850 | | | $ | 115,050 | | | $ | 132,050 | | | $ | 148,700 | | | $ | 148,000 | | | $ | 188,500 | |
| Average borrowings outstanding during the period (000s) | | $ | 102,637 | | | $ | 113,825 | | | $ | 147,100 | | | $ | 146,669 | | | $ | 166,950 | | | $ | 168,989 | |
| Asset coverage, end of period per $1,000(g) | | $ | 3,132 | | | $ | 3,132 | | | $ | 3,104 | | | $ | 3,218 | | | $ | 3,066 | | | $ | 3,083 | |
| (a) | Calculated using average common shares outstanding. |
| (b) | Less than $0.005 per share. |
| (c) | Total investment return is calculated assuming a purchase of common share at the opening on the first day and a sale at closing on the last day of each period reported. Dividends and distributions are assumed for purposes of this calculation to be reinvested at prices obtained under the Fund's dividend reinvestment plan. Total investment returns do not reflect brokerage commissions, if any, and are not annualized. |
| (e) | Represents expenses excluded from reimbursement by the Adviser, as defined in the Expense Limitation and Reimbursement Agreement. See Note 3. |
| (f) | Percentage represents the results for the period and is not annualized. |
| (g) | Calculated by subtracting the Fund's total liabilities (excluding the principal amount of Tranche A Leverage Facility) from the Fund's total assets and dividing by the principal amount of the Leverage Facility and then multiplying by $1,000. |
See Notes to Financial Statements.
| Semi-Annual Report | March 31, 2024 | 31 |
| Blackstone Floating Rate Enhanced Income Fund – Class T | Financial Highlights |
For a Share Outstanding Throughout the Periods Indicated
| | | For the Six Months Ended March 31, 2024 (Unaudited) | | | For the Year Ended September 30, 2023 | | | For the Year Ended September 30, 2022 | | | For the Year Ended September 30, 2021 | | | For the Year Ended September 30, 2020 | | | For the Year Ended September 30, 2019 | |
| PER SHARE OPERATING PERFORMANCE: | | | | | | | | | | | | | | | | | | | | | | | | |
| Net asset value - beginning of period | | $ | 21.70 | | | $ | 20.71 | | | $ | 24.12 | | | $ | 22.81 | | | $ | 24.19 | | | $ | 24.94 | |
| INCOME FROM INVESTMENT OPERATIONS: | | | | | | | | | | | | | | | | | | | | | | | | |
| Net investment income(a) | | | 1.08 | | | | 1.97 | | | | 1.28 | | | | 1.32 | | | | 1.33 | | | | 1.53 | |
| Net realized and unrealized gain/(loss) on investments and unfunded loan commitments | | | 0.40 | | | | 0.98 | | | | (3.42 | ) | | | 1.23 | | | | (1.39 | ) | | | (0.75 | ) |
| Total Income/(Loss) from Investment Operations | | | 1.48 | | | | 2.95 | | | | (2.14 | ) | | | 2.55 | | | | (0.06 | ) | | | 0.78 | |
| | | | | | | | | | | | | | | | | | | | | | | | | |
| DISTRIBUTIONS TO SHAREHOLDERS: | | | | | | | | | | | | | | | | | | | | | | | | |
| From net investment income | | | (1.07 | ) | | | (1.96 | ) | | | (1.27 | ) | | | (1.24 | ) | | | (1.33 | ) | | | (1.54 | ) |
| Total Distributions to Shareholders | | | (1.07 | ) | | | (1.96 | ) | | | (1.27 | ) | | | (1.24 | ) | | | (1.33 | ) | | | (1.54 | ) |
| | | | | | | | | | | | | | | | | | | | | | | | | |
| REDEMPTION FEES ADDED TO PAID-IN-CAPITAL | | | 0.00 | (b) | | | 0.00 | (b) | | | – | | | | 0.00 | (b) | | | 0.01 | | | | 0.01 | |
| | | | | | | | | | | | | | | | | | | | | | | | | |
| Net asset value - end of period | | $ | 22.11 | | | $ | 21.70 | | | $ | 20.71 | | | $ | 24.12 | | | $ | 22.81 | | | $ | 24.19 | |
| | | | | | | | | | | | | | | | | | | | | | | | | |
| Total Investment Return - Net Asset Value(c) | | | 7.00 | % | | | 14.91 | % | | | (9.19 | %) | | | 11.39 | % | | | 0.02 | % | | | 3.33 | % |
| | | | | | | | | | | | | | | | | | | | | | | | | |
| RATIOS TO AVERAGE NET ASSETS | | | | | | | | | | | | | | | | | | | | | | | | |
| Total expenses before reimbursement from Adviser and Advisory fees waiver | | | 5.66 | %(d) | | | 4.92 | % | | | 3.00 | % | | | 2.66 | % | | | 3.12 | % | | | 3.86 | % |
| Advisory Fees | | | 1.00 | %(d) | | | 1.00 | % | | | 1.00 | % | | | 1.00 | % | | | 1.00 | % | | | 1.00 | % |
| Other expenses before reimbursement from Adviser and Advisory fees waiver | | | 1.41 | %(d) | | | 1.30 | % | | | 1.15 | % | | | 1.12 | % | | | 1.12 | % | | | 1.29 | % |
| Interest on leverage | | | 3.25 | %(d) | | | 2.62 | % | | | 0.85 | % | | | 0.54 | % | | | 1.00 | % | | | 1.57 | % |
| Reimbursement from Adviser and Advisory fees waiver | | | (0.45 | %)(d) | | | (0.31 | %) | | | (0.20 | %) | | | (0.27 | %) | | | (0.29 | %) | | | (0.62 | %) |
| Total expenses after reimbursement from Adviser and Advisory fees waiver | | | 5.21 | %(d) | | | 4.61 | % | | | 2.80 | % | | | 2.39 | % | | | 2.83 | % | | | 3.24 | % |
| Excluded expenses(e) | | | (4.75 | %)(d) | | | (4.12 | %) | | | (2.35 | %) | | | (2.04 | %) | | | (2.48 | %) | | | (2.89 | %) |
| Total expenses, net of excluded expenses, after reimbursement from Adviser and Advisory fees waiver | | | 0.46 | %(d) | | | 0.49 | % | | | 0.45 | % | | | 0.35 | % | | | 0.35 | % | | | 0.35 | % |
| Net investment income | | | 9.93 | %(d) | | | 9.35 | % | | | 5.55 | % | | | 5.53 | % | | | 5.88 | % | | | 6.31 | % |
| | | | | | | | | | | | | | | | | | | | | | | | | |
| Net assets, end of period (000s) | | $ | 88,317 | | | $ | 95,030 | | | $ | 109,363 | | | $ | 138,018 | | | $ | 151,091 | | | $ | 177,032 | |
| Portfolio turnover rate | | | 47 | %(f) | | | 75 | % | | | 77 | % | | | 98 | % | | | 87 | % | | | 72 | % |
| | | | | | | | | | | | | | | | | | | | | | | | | |
| LEVERAGE FACILITY: | | | | | | | | | | | | | | | | | | | | | | | | |
| Aggregate principal amount, end of period (000s) | | $ | 93,850 | | | $ | 115,050 | | | $ | 132,050 | | | $ | 148,700 | | | $ | 148,000 | | | $ | 188,500 | |
| Average borrowings outstanding during the period (000s) | | $ | 102,637 | | | $ | 113,825 | | | $ | 147,100 | | | $ | 146,669 | | | $ | 166,950 | | | $ | 168,989 | |
| Asset coverage, end of period per $1,000(g) | | $ | 3,132 | | | $ | 3,132 | | | $ | 3,104 | | | $ | 3,218 | | | $ | 3,066 | | | $ | 3,083 | |
| (a) | Calculated using average common shares outstanding. |
| (b) | Less than $0.005 per share. |
| (c) | Total investment return is calculated assuming a purchase of common share at the opening on the first day and a sale at closing on the last day of each period reported. Dividends and distributions are assumed for purposes of this calculation to be reinvested at prices obtained under the Fund's dividend reinvestment plan. Total investment returns do not reflect brokerage commissions, if any, and are not annualized. |
| (e) | Represents expenses excluded from reimbursement by the Adviser, as defined in the Expense Limitation and Reimbursement Agreement. See Note 3. |
| (f) | Percentage represents the results for the period and is not annualized. |
| (g) | Calculated by subtracting the Fund's total liabilities (excluding the principal amount of Tranche A Leverage Facility) from the Fund's total assets and dividing by the principal amount of the Leverage Facility and then multiplying by $1,000. |
See Notes to Financial Statements.
| Blackstone Floating Rate Enhanced Income Fund – Class D | Financial Highlights |
For a Share Outstanding Throughout the Periods Indicated
| | | For the Six Months Ended March 31, 2024 (Unaudited) | | | For the Year Ended September 30, 2023 | | | For the Year Ended September 30, 2022 | | | For the Year Ended September 30, 2021 | | | For the Year Ended September 30, 2020 | | | For the Period October 1, 2018 (Commencement of Operations) to September 30, 2019 | |
| PER SHARE OPERATING PERFORMANCE: | | | | | | | | | | | | | | | | | | | | | | | | |
| Net asset value - beginning of period | | $ | 21.76 | | | $ | 20.77 | | | $ | 24.19 | | | $ | 22.89 | | | $ | 24.24 | | | $ | 25.00 | |
| INCOME FROM INVESTMENT OPERATIONS: | | | | | | | | | | | | | | | | | | | | | | | | |
| Net investment income(a) | | | 1.11 | | | | 2.03 | | | | 1.32 | | | | 1.38 | | | | 1.38 | | | | 1.59 | |
| Net realized and unrealized gain/(loss) on investments and unfunded loan commitments | | | 0.40 | | | | 0.91 | | | | (3.41 | ) | | | 1.23 | | | | (1.38 | ) | | | (0.74 | ) |
| Total Income/(Loss) from Investment Operations | | | 1.51 | | | | 2.94 | | | | (2.09 | ) | | | 2.61 | | | | – | | | | 0.85 | |
| | | | | | | | | | | | | | | | | | | | | | | | | |
| DISTRIBUTIONS TO SHAREHOLDERS: | | | | | | | | | | | | | | | | | | | | | | | | |
| From net investment income | | | (1.10 | ) | | | (2.02 | ) | | | (1.33 | ) | | | (1.31 | ) | | | (1.39 | ) | | | (1.61 | ) |
| Total Distributions to Shareholders | | | (1.10 | ) | | | (2.02 | ) | | | (1.33 | ) | | | (1.31 | ) | | | (1.39 | ) | | | (1.61 | ) |
| | | | | | | | | | | | | | | | | | | | | | | | | |
| REDEMPTION FEES ADDED TO PAID-IN-CAPITAL | | | – | | | | 0.07 | | | | – | | | | – | | | | 0.04 | | | | – | |
| | | | | | | | | | | | | | | | | | | | | | | | | |
| Net asset value - end of period | | $ | 22.17 | | | $ | 21.76 | | | $ | 20.77 | | | $ | 24.19 | | | $ | 22.89 | | | $ | 24.24 | |
| | | | | | | | | | | | | | | | | | | | | | | | | |
| Total Investment Return - Net Asset Value(b) | | | 7.13 | % | | | 15.23 | % | | | (8.96 | %) | | | 11.60 | % | | | 0.41 | % | | | 3.57 | % |
| | | | | | | | | | | | | | | | | | | | | | | | | |
| RATIOS TO AVERAGE NET ASSETS | | | | | | | | | | | | | | | | | | | | | | | | |
| Total expenses before reimbursement from Adviser and Advisory fees waiver | | | 4.96 | %(c) | | | 51.50 | % | | | 29.54 | % | | | 12.26 | % | | | 2.89 | % | | | 3.65 | % |
| Advisory Fees | | | 1.00 | %(c) | | | 1.00 | % | | | 1.00 | % | | | 1.00 | % | | | 1.00 | % | | | 1.00 | % |
| Other expenses before reimbursement from Adviser and Advisory fees waiver | | | 0.71 | %(c) | | | 47.89 | % | | | 27.74 | % | | | 10.72 | % | | | 0.94 | % | | | 1.06 | % |
| Interest on leverage | | | 3.25 | %(c) | | | 2.61 | % | | | 0.80 | % | | | 0.54 | % | | | 0.95 | % | | | 1.59 | % |
| Reimbursement from Adviser and Advisory fees waiver | | | – | %(c) | | | (47.15 | %) | | | (27.05 | %) | | | (10.12 | %) | | | (0.35 | %) | | | (0.67 | %) |
| Total expenses after reimbursement from Adviser and Advisory fees waiver | | | 4.96 | %(c) | | | 4.35 | % | | | 2.49 | % | | | 2.14 | % | | | 2.54 | % | | | 2.98 | % |
| Excluded expenses(d) | | | (4.50 | %)(c) | | | (3.86 | %) | | | (2.04 | %) | | | (1.79 | %) | | | (2.19 | %) | | | (2.63 | %) |
| Total expenses, net of excluded expenses, after reimbursement from Adviser and Advisory fees waiver | | | 0.46 | %(c) | | | 0.49 | % | | | 0.45 | % | | | 0.35 | % | | | 0.35 | % | | | 0.35 | % |
| Net investment income | | | 10.20 | %(c) | | | 9.59 | % | | | 5.69 | % | | | 5.78 | % | | | 6.11 | % | | | 6.57 | % |
| | | | | | | | | | | | | | | | | | | | | | | | | |
| Net assets, end of period (000s) | | $ | 54 | | | $ | 53 | | | $ | 69 | | | $ | 126 | | | $ | 143 | | | $ | 70 | |
| Portfolio turnover rate | | | 47 | %(e) | | | 75 | % | | | 77 | % | | | 98 | % | | | 87 | % | | | 72 | % |
| | | | | | | | | | | | | | | | | | | | | | | | | |
| LEVERAGE FACILITY: | | | | | | | | | | | | | | | | | | | | | | | | |
| Aggregate principal amount, end of period (000s) | | $ | 93,850 | | | $ | 115,050 | | | $ | 132,050 | | | $ | 148,700 | | | $ | 148,000 | | | $ | 188,500 | |
| Average borrowings outstanding during the period (000s) | | $ | 102,637 | | | $ | 113,825 | | | $ | 147,100 | | | $ | 146,669 | | | $ | 166,950 | | | $ | 168,989 | |
| Asset coverage, end of period per $1,000(f) | | $ | 3,132 | | | $ | 3,132 | | | $ | 3,104 | | | $ | 3,218 | | | $ | 3,066 | | | $ | 3,083 | |
| (a) | Calculated using average common shares outstanding. |
| (b) | Total investment return is calculated assuming a purchase of common share at the opening on the first day and a sale at closing on the last day of each period reported. Dividends and distributions are assumed for purposes of this calculation to be reinvested at prices obtained under the Fund's dividend reinvestment plan. Total investment returns do not reflect brokerage commissions, if any, and are not annualized. |
| (d) | Represents expenses excluded from reimbursement by the Adviser, as defined in the Expense Limitation and Reimbursement Agreement. See Note 3. |
| (e) | Percentage represents the results for the period and is not annualized. |
| (f) | Calculated by subtracting the Fund's total liabilities (excluding the principal amount of Tranche A Leverage Facility) from the Fund's total assets and dividing by the principal amount of the Leverage Facility and then multiplying by $1,000. |
See Notes to Financial Statements.
| Semi-Annual Report | March 31, 2024 | 33 |
| Blackstone Floating Rate Enhanced Income Fund – Class T-I | Financial Highlights |
For a Share Outstanding Throughout the Periods Indicated
| | | For the Six Months Ended March 31, 2024 (Unaudited) | | | For the Year Ended September 30, 2023 | | | For the Year Ended September 30, 2022 | | | For the Year Ended September 30, 2021 | | | For the Year Ended September 30, 2020 | | | For the Period April 22, 2019 (Commencement of Operations) to September 30, 2019 | |
| PER SHARE OPERATING PERFORMANCE: | | | | | | | | | | | | | | | | | | | | | | | | |
| Net asset value - beginning of period | | $ | 22.23 | | | $ | 21.22 | | | $ | 24.71 | | | $ | 23.38 | | | $ | 24.71 | | | $ | 25.00 | |
| INCOME FROM INVESTMENT OPERATIONS: | | | | | | | | | | | | | | | | | | | | | | | | |
| Net investment income(a) | | | 1.11 | | | | 2.03 | | | | 1.32 | | | | 1.35 | | | | 1.28 | | | | 0.67 | |
| Net realized and unrealized gain/(loss) on investments and unfunded loan commitments | | | 0.41 | | | | 0.99 | | | | (3.51 | ) | | | 1.25 | | | | (1.41 | ) | | | (0.28 | ) |
| Total Income/(Loss) from Investment Operations | | | 1.52 | | | | 3.02 | | | | (2.19 | ) | | | 2.60 | | | | (0.13 | ) | | | 0.39 | |
| | | | | | | | | | | | | | | | | | | | | | | | | |
| DISTRIBUTIONS TO SHAREHOLDERS: | | | | | | | | | | | | | | | | | | | | | | | | |
| From net investment income | | | (1.10 | ) | | | (2.01 | ) | | | (1.30 | ) | | | (1.27 | ) | | | (1.35 | ) | | | (0.68 | ) |
| Total Distributions to Shareholders | | | (1.10 | ) | | | (2.01 | ) | | | (1.30 | ) | | | (1.27 | ) | | | (1.35 | ) | | | (0.68 | ) |
| | | | | | | | | | | | | | | | | | | | | | | | | |
| REDEMPTION FEES ADDED TO PAID-IN-CAPITAL | | | – | | | | – | | | | – | | | | 0.00 | (b) | | | 0.15 | | | | – | |
| | | | | | | | | | | | | | | | | | | | | | | | | |
| Net asset value - end of period | | $ | 22.65 | | | $ | 22.23 | | | $ | 21.22 | | | $ | 24.71 | | | $ | 23.38 | | | $ | 24.71 | |
| | | | | | | | | | | | | | | | | | | | | | | | | |
| Total Investment Return - Net Asset Value(c) | | | 7.00 | % | | | 14.88 | % | | | (9.18 | %) | | | 11.33 | % | | | 0.35 | % | | | 1.58 | % |
| | | | | | | | | | | | | | | | | | | | | | | | | |
| RATIOS TO AVERAGE NET ASSETS | | | | | | | | | | | | | | | | | | | | | | | | |
| Total expenses before reimbursement from Adviser and Advisory fees waiver | | | 5.78 | %(d) | | | 5.05 | % | | | 3.15 | % | | | 2.95 | % | | | 4.97 | % | | | 27.10 | %(e) |
| Advisory Fees | | | 1.00 | %(d) | | | 1.00 | % | | | 1.00 | % | | | 1.00 | % | | | 1.00 | % | | | 1.00 | %(e) |
| Other expenses before reimbursement from Adviser and Advisory fees waiver | | | 1.53 | %(d) | | | 1.39 | % | | | 1.27 | % | | | 1.41 | % | | | 3.23 | % | | | 24.49 | %(e) |
| Interest on leverage | | | 3.25 | %(d) | | | 2.66 | % | | | 0.88 | % | | | 0.54 | % | | | 0.74 | % | | | 1.61 | %(e) |
| Reimbursement from Adviser and Advisory fees waiver | | | (0.57 | %)(d) | | | (0.40 | %) | | | (0.32 | %) | | | (0.56 | %) | | | (2.37 | %) | | | (23.65 | %)(e) |
| Total expenses after reimbursement from Adviser and Advisory fees waiver | | | 5.21 | %(d) | | | 4.65 | % | | | 2.83 | % | | | 2.39 | % | | | 2.60 | % | | | 3.45 | %(e) |
| Excluded expenses(f) | | | (4.75 | %)(d) | | | (4.16 | %) | | | (2.38 | %) | | | (2.04 | %) | | | (2.25 | %) | | | (3.10 | %)(e) |
| Total expenses, net of excluded expenses, after reimbursement from Adviser and Advisory fees waiver | | | 0.46 | %(d) | | | 0.49 | % | | | 0.45 | % | | | 0.35 | % | | | 0.35 | % | | | 0.35 | %(e) |
| Net investment income | | | 9.94 | %(d) | | | 9.37 | % | | | 5.60 | % | | | 5.54 | % | | | 5.74 | % | | | 6.17 | %(d) |
| | | | | | | | | | | | | | | | | | | | | | | | | |
| Net assets, end of period (000s) | | $ | 9,602 | | | $ | 9,708 | | | $ | 8,136 | | | $ | 8,103 | | | $ | 5,693 | | | $ | 287 | |
| Portfolio turnover rate | | | 47 | %(g) | | | 75 | % | | | 77 | % | | | 98 | % | | | 87 | % | | | 72 | % |
| | | | | | | | | | | | | | | | | | | | | | | | | |
| LEVERAGE FACILITY: | | | | | | | | | | | | | | | | | | | | | | | | |
| Aggregate principal amount, end of period (000s) | | $ | 93,850 | | | $ | 115,050 | | | $ | 132,050 | | | $ | 148,700 | | | $ | 148,000 | | | $ | 188,500 | |
| Average borrowings outstanding during the period (000s) | | $ | 102,637 | | | $ | 113,825 | | | $ | 147,100 | | | $ | 146,669 | | | $ | 166,950 | | | $ | 168,989 | |
| Asset coverage, end of period per $1,000(h) | | $ | 3,132 | | | $ | 3,132 | | | $ | 3,104 | | | $ | 3,218 | | | $ | 3,066 | | | $ | 3,083 | |
| (a) | Calculated using average common shares outstanding. |
| (b) | Less than $0.005 per share. |
| (c) | Total investment return is calculated assuming a purchase of common share at the opening on the first day and a sale at closing on the last day of each period reported. Dividends and distributions are assumed for purposes of this calculation to be reinvested at prices obtained under the Fund's dividend reinvestment plan. Total investment returns do not reflect brokerage commissions, if any, and are not annualized. |
| (e) | Financial ratios have been annualized except for non-recurring costs such as offering costs. |
| (f) | Represents expenses excluded from reimbursement by the Adviser, as defined in the Expense Limitation and Reimbursement Agreement. See Note 3. |
| (g) | Percentage represents the results for the period and is not annualized. |
| (h) | Calculated by subtracting the Fund's total liabilities (excluding the principal amount of Tranche A Leverage Facility) from the Fund's total assets and dividing by the principal amount of the Leverage Facility and then multiplying by $1,000. |
See Notes to Financial Statements.
| Blackstone Floating Rate Enhanced Income Fund – Class U | Financial Highlights |
For a Share Outstanding Throughout the Periods Indicated
| | | For the Six Months March 31, 2024 (Unaudited) | | | For the Year Ended September 30, 2023 | | | For the Year Ended September 30, 2022 | | | For the Year Ended September 30, 2021 | | | For the Period November 29, 2019 (Commencement of Operations) to September 30, 2020 | |
| PER SHARE OPERATING PERFORMANCE: | | | | | | | | | | | | | | | | | | | | |
| Net asset value - beginning of period | | $ | 22.66 | | | $ | 21.62 | | | $ | 25.18 | | | $ | 23.82 | | | $ | 25.00 | |
| INCOME FROM INVESTMENT OPERATIONS: | | | | | | | | | | | | | | | | | | | | |
| Net investment income(a) | | | 1.13 | | | | 2.06 | | | | 1.34 | | | | 1.38 | | | | 1.09 | |
| Net realized and unrealized gain/(loss) on investments and unfunded loan commitments | | | 0.41 | | | | 1.03 | | | | (3.57 | ) | | | 1.28 | | | | (1.15 | ) |
| Total Income/(Loss) from Investment Operations | | | 1.54 | | | | 3.09 | | | | (2.23 | ) | | | 2.66 | | | | (0.06 | ) |
| | | | | | | | | | | | | | | | | | | | | |
| DISTRIBUTIONS TO SHAREHOLDERS: | | | | | | | | | | | | | | | | | | | | |
| From net investment income | | | (1.12 | ) | | | (2.05 | ) | | | (1.33 | ) | | | (1.30 | ) | | | (1.13 | ) |
| Total Distributions to Shareholders | | | (1.12 | ) | | | (2.05 | ) | | | (1.33 | ) | | | (1.30 | ) | | | (1.13 | ) |
| | | | | | | | | | | | | | | | | | | | | |
| REDEMPTION FEES ADDED TO PAID-IN-CAPITAL | | | – | | | | – | | | | – | | | | 0.00 | (b) | | | 0.01 | |
| | | | | | | | | | | | | | | | | | | | | |
| Net asset value - end of period | | $ | 23.08 | | | $ | 22.66 | | | $ | 21.62 | | | $ | 25.18 | | | $ | 23.82 | |
| | | | | | | | | | | | | | | | | | | | | |
| Total Investment Return - Net Asset Value(c) | | | 6.96 | % | | | 14.94 | % | | | (9.19 | %) | | | 11.36 | % | | | 0.01 | % |
| | | | | | | | | | | | | | | | | | | | | |
| RATIOS TO AVERAGE NET ASSETS | | | | | | | | | | | | | | | | | | | | |
| Total expenses before reimbursement from Adviser and Advisory fees waiver | | | 5.64 | %(d) | | | 4.91 | % | | | 3.02 | % | | | 2.84 | % | | | 4.11 | %(e) |
| Advisory Fees | | | 1.00 | %(d) | | | 1.00 | % | | | 1.00 | % | | | 1.00 | % | | | 1.00 | %(e) |
| Other expenses before reimbursement from Adviser and Advisory fees waiver | | | 1.39 | %(d) | | | 1.30 | % | | | 1.16 | % | | | 1.30 | % | | | 2.42 | %(e) |
| Interest on leverage | | | 3.25 | %(d) | | | 2.61 | % | | | 0.86 | % | | | 0.54 | % | | | 0.69 | %(e) |
| Reimbursement from Adviser and Advisory fees waiver | | | (0.43 | %)(d) | | | (0.31 | %) | | | (0.21 | %) | | | (0.45 | %) | | | (1.58 | %)(e) |
| Total expenses after reimbursement from Adviser and Advisory fees waiver | | | 5.21 | %(d) | | | 4.60 | % | | | 2.81 | % | | | 2.39 | % | | | 2.53 | %(e) |
| Excluded expenses(f) | | | (4.75 | %)(d) | | | (4.11 | %) | | | (2.36 | %) | | | (2.04 | %) | | | (2.18 | %)(e) |
| Total expenses, net of excluded expenses, after reimbursement from Adviser and Advisory fees waiver | | | 0.46 | %(d) | | | 0.49 | % | | | 0.45 | % | | | 0.35 | % | | | 0.35 | %(e) |
| Net investment income | | | 9.95 | %(d) | | | 9.35 | % | | | 5.57 | % | | | 5.53 | % | | | 5.66 | %(d) |
| | | | | | | | | | | | | | | | | | | | | |
| Net assets, end of period (000s) | | $ | 13,001 | | | $ | 12,652 | | | $ | 14,913 | | | $ | 17,168 | | | $ | 16,609 | |
| Portfolio turnover rate | | | 47 | %(g) | | | 75 | % | | | 77 | % | | | 98 | % | | | 87 | %(g) |
| | | | | | | | | | | | | | | | | | | | | |
| LEVERAGE FACILITY: | | | | | | | | | | | | | | | | | | | | |
| Aggregate principal amount, end of period (000s) | | $ | 93,850 | | | $ | 115,050 | | | $ | 132,050 | | | $ | 148,700 | | | $ | 148,000 | |
| Average borrowings outstanding during the period (000s) | | $ | 102,637 | | | $ | 113,825 | | | $ | 147,100 | | | $ | 146,669 | | | $ | 166,950 | |
| Asset coverage, end of period per $1,000(h) | | $ | 3,132 | | | $ | 3,132 | | | $ | 3,104 | | | $ | 3,218 | | | $ | 3,066 | |
| (a) | Calculated using average common shares outstanding. |
| (b) | Less than $0.005 per share. |
| (c) | Total investment return is calculated assuming a purchase of common share at the opening on the first day and a sale at closing on the last day of each period reported. Dividends and distributions are assumed for purposes of this calculation to be reinvested at prices obtained under the Fund's dividend reinvestment plan. Total investment returns do not reflect brokerage commissions, if any, and are not annualized. |
| (e) | Financial ratios have been annualized except for non-recurring costs such as offering costs. |
| (f) | Represents expenses excluded from reimbursement by the Adviser, as defined in the Expense Limitation and Reimbursement Agreement. See Note 3. |
| (g) | Percentage represents the results for the period and is not annualized. |
| (h) | Calculated by subtracting the Fund's total liabilities (excluding the principal amount of Tranche A Leverage Facility) from the Fund's total assets and dividing by the principal amount of the Leverage Facility and then multiplying by $1,000. |
See Notes to Financial Statements.
| Semi-Annual Report | March 31, 2024 | 35 |
| Blackstone Floating Rate Enhanced Income Fund | Notes to Financial Statements |
March 31, 2024 (Unaudited)
NOTE 1. ORGANIZATION
Blackstone Floating Rate Enhanced Income Fund (the “Fund”) is registered under the Investment Company Act of 1940, as amended (the “1940 Act”), and operates as a diversified, closed-end management investment company. The Fund engages in continuous offering of shares and operates as an interval fund that offers to make monthly repurchases of shares at net asset value (the “NAV”).
The Fund’s investment objective is to provide attractive current income with low sensitivity to rising interest rates.
The Fund was organized as a Delaware statutory trust on June 20, 2017 pursuant to a Declaration of Trust governed by the laws of the State of Delaware. The Fund had no operations from that date to November 10, 2017, other than those related to organizational matters and the registration of its shares under applicable securities laws. Blackstone Liquid Credit Strategies LLC (the “Adviser”) purchased 4,000 Institutional Class I Common Shares (“Class I Shares”) at a NAV of $25.00 per share on November 10, 2017. The Fund is authorized to issue an unlimited number of Class I Shares, Advisory Class D Common Shares (“Class D Shares”), Brokerage Class T Common Shares (“Class T Shares”), Brokerage Class T-I Common Shares (“Class T-I Shares”) and Brokerage Class U Common Shares (“Class U Shares”), and a maximum offering of $3,000,000,000 of common shares. Class I Shares commenced operations on January 18, 2018, Class T Shares commenced operations on May 7, 2018, Class D Shares commenced operations on October 1, 2018, Class T-I Shares commenced operations on April 22, 2019 and Class U Shares commenced operations on November 29, 2019. As of March 31, 2024, Class I Shares (BGFLX), Class T Shares (BGFTX), Class D Shares (BGFDX), Class T-I Shares (BGFPX) and Class U Shares (BGFVX) were outstanding.
The Fund was previously classified as a non-diversified management investment company for purposes of the 1940 Act. As a result of ongoing operations, the Fund is now classified as a diversified management investment company. This means that with respect to 75% of the Fund’s total assets, no more than 5% of the Fund’s total assets may be invested in any one issuer or own more than 10% of the outstanding voting securities of such issuer (except, in each case, excepting cash and cash items, U.S. government securities, and securities of other investment companies). The Fund may not resume operating in a non-diversified manner without first obtaining shareholder approval in accordance with the 1940 Act.
NOTE 2. SIGNIFICANT ACCOUNTING POLICIES
Basis of Presentation: The Fund's financial statements are prepared in accordance with accounting principles generally accepted in the United States of America (“U.S. GAAP”) and are stated in U.S. dollars. The Fund is considered an Investment Company under U.S. GAAP and follows the accounting and reporting guidance applicable to investment companies in the Financial Accounting Standards Board Accounting Standards Codification Topic 946.
The preparation of financial statements requires management to make certain estimates and assumptions that affect the reported amounts of assets and liabilities at the date of the financial statement. Actual results could differ from these estimates.
Portfolio Valuation: The Fund’s NAV is determined daily on each day that the New York Stock Exchange (the “Exchange”) is open for business, as of the close of the regular trading session on the Exchange. The Fund calculates NAV per share by subtracting liabilities (including accrued expenses or dividends) from the total assets of the Fund (the value of the securities plus cash or other assets, including interest accrued but not yet received) and dividing the result by the total number of outstanding common shares of the Fund.
Loans are primarily valued by using a composite loan price from a nationally recognized loan pricing service. The methodology used by the Fund’s nationally recognized loan pricing provider for composite loan prices is to value loans at the mean of the bid and ask prices from one or more brokers or dealers. Collateralized Loan Obligation securities (“CLOs”) are valued at the price provided by a nationally recognized pricing service. The prices provided by the nationally recognized pricing service are typically based on the evaluated mid-price of each of the CLOs. Non-U.S. Instruments are valued by translating available quotes into U.S. dollar equivalents, if the quotes are considered reliable, and are otherwise valued at fair value. Over-the-counter options are priced on the basis of dealer quotes. Other types of derivatives for which quotes may not be available are valued at fair value. Corporate bonds and convertible bonds, other than short-term investments, are valued at the price provided by a nationally recognized pricing service. The prices provided by the nationally recognized pricing service are typically based on the mean of bid and ask prices for each corporate bond security. In determining the value of a particular investment, pricing services may use certain information with respect to transactions in such investments, quotations from dealers, pricing matrices, market transactions in comparable investments, various relationships observed in the market between investments and calculated yield measures based on valuation technology commonly employed in the market for such investments. Equity securities, including common stocks and exchange-traded funds (“ETF”), for which market quotations are available are generally valued at the last sale price or official closing price on the primary market or exchange on which they trade. Futures contracts, if any, are ordinarily valued at the last sales price on the securities or commodities exchange on which they are traded. Written and purchased options, if any, are ordinarily valued at the closing price on the securities or commodities exchange on which they are traded. Open-end investment companies are generally valued at their closing net asset values as reported on each business day. To the extent current market quotations are not readily available, short-term debt investments, if any, having a remaining maturity of 60 days or less when purchased would be valued at cost adjusted for amortization of premiums and accretion of discounts.
| Blackstone Floating Rate Enhanced Income Fund | Notes to Financial Statements |
March 31, 2024 (Unaudited)
On December 3, 2020, the U.S. Securities and Exchange Commission (the “SEC”) adopted a new rule under the 1940 Act regarding fair value determinations that permits a fund’s board to delegate such determinations to the fund’s adviser, subject to certain conditions (“Rule 2a-5”). Rule 2a-5 became effective as of March 8, 2021, and the mandatory compliance date was September 8, 2022. In accordance with Rule 2a-5, the Fund’s Board of Trustees (the “Board”) has designated the Adviser as the valuation designee to perform fair value determinations related to the Fund’s investments, subject to the Board’s oversight and periodic reporting requirements.
Any investments and other assets for which such current market quotations are not readily available are valued at fair value (“Fair Valued Assets”) as determined in good faith by a committee of the Adviser (“Fair Valued Asset Committee”) under procedures established by, and under the general supervision and responsibility of, the Fund’s Board. Such methods may include, but are not limited to, the use of a market comparable and/or income approach methodologies. A Fair Valued Asset Committee meeting may be called at any time by any member of the Fair Valued Asset Committee. The pricing of all Fair Valued Assets and determinations thereof shall be reported by the Adviser as the valuation designee to the Board at each regularly scheduled quarterly meeting. The Fund has procedures to identify and investigate potentially stale or missing prices for investments which are valued using a nationally recognized pricing service, exchange price or broker-dealer quotations. After performing such procedures, any prices which are deemed to be stale are reviewed by the Fair Valued Asset Committee and an alternative pricing source is determined.
Various inputs are used to determine the value of the Fund’s investments. Observable inputs are inputs that reflect the assumptions market participants would use in pricing the asset or liability developed based on market data obtained from sources independent of the reporting entity. Unobservable inputs are inputs that reflect the reporting entity’s own assumptions about the assumptions market participants would use in pricing the asset or liability developed based on the best information available in the circumstances. The three-tier hierarchy of inputs is summarized in the three broad levels listed below.
Level 1— Unadjusted quoted prices in active markets for identical investments at the measurement date.
Level 2— Significant observable inputs (including quoted prices for similar investments, interest rates, prepayment speeds, credit risk, etc.).
Level 3— Significant unobservable inputs (including the Fund’s own assumptions in determining the fair value of investments).
The categorization of a value determined for investments and other financial instruments is based on the pricing transparency of the investment and other financial instrument and does not necessarily correspond to the Fund’s perceived risk of investing in those securities. Investments measured and reported at fair value are classified and disclosed in one of the following levels within the fair value hierarchy based on the lowest level of input that is significant to the fair value measurement.
| Semi-Annual Report | March 31, 2024 | 37 |
| Blackstone Floating Rate Enhanced Income Fund | Notes to Financial Statements |
March 31, 2024 (Unaudited)
The following tables summarize valuation of the Fund’s investments under the fair value hierarchy levels as of March 31, 2024:
Blackstone Floating Rate Enhanced Income Fund
| Investments in Securities at Fair Value* | | Level 1 - Quoted Prices | | | Level 2 - Significant Observable Inputs | | | Level 3 - Significant Unobservable Inputs | | | Total | |
| Floating Rate Loan Interests | | | | | | | | | | | | | | | | |
| Aerospace & Defense | | $ | – | | | $ | 10,007,606 | | | $ | 1,167,950 | | | $ | 11,175,556 | |
| Automobile Components | | | – | | | | 6,024,918 | | | | 937,699 | | | | 6,962,617 | |
| Building Products | | | – | | | | 6,056,493 | | | | 917,995 | | | | 6,974,488 | |
| Chemicals | | | – | | | | 3,315,854 | | | | 1,081,121 | | | | 4,396,975 | |
| Commercial Services & Supplies | | | – | | | | 8,825,179 | | | | 2,002,857 | | | | 10,828,036 | |
| Electronic Equipment, Instruments & Components | | | – | | | | 1,701,580 | | | | 2,156,170 | | | | 3,857,750 | |
| Health Care Technology | | | – | | | | 3,497,781 | | | | 498,324 | | | | 3,996,105 | |
| Media | | | – | | | | 7,990,500 | | | | 631,416 | | | | 8,621,916 | |
| Mortgage Real Estate Investment | | | – | | | | 433,196 | | | | 433,841 | | | | 867,037 | |
| Real Estate Management & Development | | | – | | | | 1,418,748 | | | | 942,949 | | | | 2,361,697 | |
| Software | | | – | | | | 33,993,663 | | | | 1,328,633 | | | | 35,322,296 | |
| Other | | | – | | | | 164,763,792 | | | | – | | | | 164,763,792 | |
| Collateralized Loan Obligation Securities | | | | | | | | | | | | | | | | |
| Consumer Finance | | | – | | | | – | | | | 1,007,484 | | | | 1,007,484 | |
| Financial Services | | | – | | | | – | | | | 16,004,302 | | | | 16,004,302 | |
| Corporate Bonds | | | – | | | | 8,164,331 | | | | – | | | | 8,164,331 | |
| Common Stock | | | | | | | | | | | | | | | | |
| Health Care Equipment & Supplies | | | – | | | | – | | | | 10,552 | | | | 10,552 | |
| Health Care Providers & Services | | | – | | | | – | | | | 327,171 | | | | 327,171 | |
| Exchange Traded Funds | | | 10,757,252 | | | | – | | | | – | | | | 10,757,252 | |
| Short Term Investments | | | 12,533,378 | | | | – | | | | – | | | | 12,533,378 | |
| Total | | $ | 23,290,630 | | | $ | 256,193,641 | | | $ | 29,448,464 | | | $ | 308,932,735 | |
| | | | | | | | | | | | | | | | | |
| Other Financial Instruments | | | | | | | | | | | | | | | | |
| Liabilities | | | | | | | | | | | | | | | | |
| Net Unrealized Depreciation on Unfunded Loan Commitments | | | – | | | | (2,496 | ) | | | (778 | ) | | | (3,274 | ) |
| Total | | | – | | | | (2,496 | ) | | | (778 | ) | | | (3,274 | ) |
| * | Refer to the Fund's Portfolio of Investments for a listing of securities by type. |
The Fund may hold assets and/or liabilities in which the fair value approximates the carrying amount for financial statement purposes. As of March 31, 2024, the Fund's outstanding borrowings of $93,850,000 under its Leverage Facility are categorized as Level 2 within the fair value hierarchy.
| Blackstone Floating Rate Enhanced Income Fund | Notes to Financial Statements |
March 31, 2024 (Unaudited)
The changes of the fair value of investments for which the Fund has used significant unobservable (Level 3) inputs to determine the fair value are as follows:
| | | Floating Rate Loan Interests | | | Collateralized Loan Obligation Securities | | | Common Stock | | | Unfunded Loan Commitments | | | Total | |
| Balance as of September 30, 2023 | | $ | 5,440,344 | | | $ | 15,374,537 | | | $ | – | | | $ | – | | | $ | 20,814,881 | |
| Accrued discount/ premium | | | 2,360 | | | | 5,256 | | | | – | | | | – | | | | 7,616 | |
| Realized Gain/(Loss) | | | 9,844 | | | | (8,019 | ) | | | – | | | | – | | | | 1,825 | |
| Change in Unrealized Appreciation/(Depreciation) | | | 33,439 | | | | 418,988 | | | | (926,658 | ) | | | (778 | ) | | | (475,009 | ) |
| Purchases(1) | | | 11,812,152 | | | | 2,968,730 | | | | 1,253,829 | | | | – | | | | 16,034,711 | |
| Sales Proceeds(2) | | | (7,576,430 | ) | | | (1,747,706 | ) | | | – | | | | – | | | | (9,324,136 | ) |
| Transfer into Level 3 | | | 3,764,799 | | | | – | | | | 10,552 | | | | – | | | | 3,775,351 | |
| Transfer out of Level 3 | | | (1,387,553 | ) | | | – | | | | – | | | | – | | | | (1,387,553 | ) |
| Balance as of March 31, 2024 | | $ | 12,098,955 | | | $ | 17,011,786 | | | $ | 337,723 | | | $ | (778 | ) | | $ | 29,447,686 | |
| Net change in unrealized appreciation/(depreciation) included in the Statements of Operations attributable to Level 3 investments held at March 31, 2024 | | $ | 68,493 | | | $ | 410,769 | | | $ | (1,026,898 | ) | | $ | (778 | ) | | $ | (548,414 | ) |
| (1) | Purchases include all purchases of securities and securities received in corporate actions. |
| (2) | Sales Proceeds include all sales of securities, maturities, paydowns and securities tendered in corporate actions. |
Securities were transferred from Level 2 to Level 3 because of a lack of observable market data due to decrease in market activity and information for these securities. Other securities were transferred from Level 3 to Level 2 as observable inputs were available for purposes of valuing those assets.
Information about Level 3 fair value measurements as of March 31, 2024:
| | | Fair Value | | | Valuation Technique(s) | | Unobservable Input(s) | | Value/Range (Weighted Average) |
| Floating Rate Loan Interests | | $ | 12,098,955 | | | Third-party vendor pricing service | | Broker quotes | | N/A |
| Collateralized Loan Obligation Securities | | | 17,011,786 | | | Third-party vendor pricing service | | Broker quotes | | N/A |
| Common Stock | | | 337,723 | | | Third-party vendor pricing service | | Broker quotes | | N/A |
| Unfunded Loan Commitments | | | (778 | ) | | Third-party vendor pricing service | | Broker quotes | | N/A |
Securities Transactions and Investment Income: Securities transactions are recorded on trade date for financial reporting purposes and amounts payable or receivable for trades not settled at the time of period end are reflected as liabilities and assets, respectively. Interest income is recognized on an accrual basis from the date of settlement. Accretion of discount and amortization of premium, which are included in interest income, are accreted or amortized daily using the accrual basis interest method. Dividend income is recorded on the ex-dividend date. Realized gains and losses from securities transactions and foreign currency transactions, if any, are recorded on the basis of identified cost and stated separately in the Statement of Operations.
When the Fund sells a floating rate loan interest, the Fund may pay an agency fee. The Fund earns facility and other fees on floating rate loan interests, and facility fees are typically amortized to income over the term of the loan. Consent and amendment fees are also recorded to income as earned.
Federal Income Taxes: It is the policy of the Fund to continue to qualify as a regulated investment company by complying with the requirements of Subchapter M of the Internal Revenue Code of 1986, as amended. For the period ended March 31, 2024, Management has analyzed the tax positions taken by the Fund and has concluded that no income tax provisions are required.
Income distributions and capital gain distributions, if any, are determined in accordance with income tax regulations, which may differ from GAAP. These differences are primarily due to differing treatments of income and gains on various investment securities held by the Fund, including differences in the timing of recognition or income, losses, and/or gains, and differing characterization of distributions made by the Fund as a whole.
As of and during the period ended March 31, 2024, the Fund did not incur a liability arising from any unrecognized tax benefits. The Fund files U.S. federal, state, and local tax returns as required. The Fund’s tax returns are subject to examination by the relevant tax authorities until expiration of the applicable statute of limitations, which is generally three years after the filing of the tax return for federal purposes and four years after the filing of most state and local returns for state and local purposes. Tax returns for any open years have not required and as such have not incorporated any uncertain tax positions that result in a provision for income taxes.
| Semi-Annual Report | March 31, 2024 | 39 |
| Blackstone Floating Rate Enhanced Income Fund | Notes to Financial Statements |
March 31, 2024 (Unaudited)
Distributions to Shareholders: The Fund distributes substantially all of its net investment income to shareholders in the form of dividends. The Fund declares income dividends daily and distributes them monthly. In addition, the Fund distributes any net capital gains it earns from the sale of portfolio securities to shareholders no less frequently than annually. Net short-term capital gains may be paid more frequently.
Offering Costs: Offering costs incurred by the Fund since inception of $1,622,394 were treated as deferred charges until operations commenced and were amortized over a 12-month period using the straight line method. Offering costs were fully amortized during the year ended September 30, 2022.
The estimates and assumptions underlying the Fund’s financial statements are based on the information available as of March 31, 2024. The estimates and assumptions include judgments about financial market and economic conditions which have changed, and may continue to change, over time.
NOTE 3. FEES AND EXPENSES
Investment Advisory
The Adviser, a wholly-owned subsidiary of Blackstone Alternative Credit Advisors LP (collectively with its affiliates in the credit-focused, asset-based finance and insurance asset management business of Blackstone Inc., “Blackstone Credit & Insurance”), is a registered investment adviser and is responsible for the day-to-day management of, and providing administrative and compliance oversight services to, the Fund.
Management Fees
The investment advisory agreement between the Fund and the Adviser provides for the Fund to pay a management fee to the Adviser at an annual rate equal to 1.00% of the average daily value of the Fund’s net assets (the “Management Fee”). The Management Fee accrues daily in arrears and is paid quarterly. For the period ended March 31, 2024, the Management fee is included on the Statement of Operations. As of March 31, 2024, accrued payable relating to the Management Fee is included on the Statement of Assets and Liabilities.
Expense Limitation and Reimbursement
Pursuant to an Expense Limitation and Reimbursement Agreement effective through January 31, 2025, the Adviser has agreed to waive its compensation (and, to the extent necessary, bear other expenses of or make payments to the Fund) so that certain of the Fund’s expenses (“Specified Expenses”) will not exceed 0.50% of net assets (annualized). The Fund has agreed to repay waived amounts, when and if requested by the Adviser, but only if and to the extent that Specified Expenses are less than 0.50% of net assets (annualized) (or, if a lower expense limit is then in effect, such lower limit) within the three-year period after the Adviser bears the expense. “Specified Expenses” is defined to include all expenses incurred in the business of the Fund, including organizational and certain offering costs, with the exception of (i) the management fee, (ii) the service fee, (iii) the distribution fee, (iv) brokerage costs, (v) dividend/interest payments (including any dividend payments, interest expenses, commitment fees, or other expenses related to any leverage incurred by the Fund), (vi) taxes, and (vii) extraordinary expenses (as determined in the sole discretion of the Adviser). For the period ended March 31, 2024, the Adviser reimbursed $494,570 in fees and expenses to the Fund which are included under Reimbursement from Adviser/Advisory fee waiver on the Statement of Operations.
As of March 31, 2024, the repayments that potentially may be made by the Fund are as follows:
| | | Expenses reimbursed in period ending September 30, 2021 | | | Expenses reimbursed in year ending September 30, 2022 | | | Expenses reimbursed in year ending September 30, 2023 | | | Expenses reimbursed in period ending March 31, 2024 | |
| Class | | Subject to repayment until maximum expiration date of September 30, 2024 | | | Subject to repayment until maximum expiration date of September 30, 2025 | | | Subject to repayment until maximum expiration date of September 30, 2026 | | | Subject to repayment until maximum expiration date of September 30, 2027 | |
| Class I | | $ | 218,689 | | | $ | 338,675 | | | $ | 391,242 | | | $ | 217,505 | |
| Class T | | | 172,530 | | | | 253,462 | | | | 296,890 | | | | 181,925 | |
| Class D | | | - | | | | 26,077 | | | | 26,268 | | | | - | |
| Class T-I | | | 20,374 | | | | 26,852 | | | | 34,768 | | | | 24,514 | |
| Class U | | | 23,090 | | | | 35,076 | | | | 40,200 | | | | 24,542 | |
| Total | | $ | 434,683 | | | $ | 680,142 | | | $ | 789,368 | | | $ | 448,486 | |
| Blackstone Floating Rate Enhanced Income Fund | Notes to Financial Statements |
March 31, 2024 (Unaudited)
Trustee Compensation
Effective January 1, 2022, the Fund, together with Blackstone Senior Floating Rate 2027 Term Fund, Blackstone Long-Short Credit Income Fund and Blackstone Strategic Credit 2027 Term Fund (the “Blackstone Credit & Insurance Funds”) agreed to pay a retainer fee of $155,000 per annum to each Trustee who is not a director, officer, employee, or affiliate of Blackstone Credit & Insurance or ALPS Fund Services, Inc. (“ALPS”). The Chairman of the Audit Committee and the Chairman of the Nominating and Governance Committee also agreed to receive a retainer fee of $12,000 per annum and the Lead Independent Trustee agreed to receive a retainer fee of $16,000 per annum from the Blackstone Credit Closed-End Funds.
The Board implemented a Trustee Emeritus program (the “Program”) in November 2021. A Trustee Emeritus appointed under the Program will receive compensation equal to 10% of his or her retainer for serving as a Trustee as of the date on which the Board appoints such person as Trustee Emeritus. The term of service of a Trustee Emeritus expires twelve months from the date of the Trustee’s retirement from the Board.
Distribution and Servicing Fees
Blackstone Securities Partners L.P. (the “Distributor”), an affiliate of the Fund and of the Adviser, serves as the principal underwriter and distributor in the continuous public offering of the Fund’s Class I Shares, Class D Shares, Class T Shares, Class T-I Shares, and Class U Shares pursuant to a distribution agreement (“Distribution Agreement”) with the Fund, which is subject to annual approval by the Board. The Fund pays the Distributor a distribution fee ("Distribution Fee") that is calculated monthly and accrued daily at an annualized rate of 0.25% of the net assets of the Fund attributable to Class T Shares, Class T-I Shares, and Class U Shares, respectively. The Fund pays the Distributor a servicing fee ("Servicing Fee") that is calculated monthly and accrued daily at an annualized rate of 0.25% of the net assets of the Fund attributable to Class T Shares, Class D Shares, Class T-I Shares, and Class U Shares, respectively. For the period ended March 31, 2024, Class T Shares, Class T-I Shares, and Class U Shares incurred Distribution Fees of $111,801, $11,728, and $12,586, respectively. For the period ended March 31, 2024, Class T Shares, Class D Shares, Class T-I Shares, and Class U Shares incurred Servicing Fees of $111,801, $46, $11,728, and $15,754, respectively. Class I Shares do not incur a Distribution Fee or a Servicing Fee. The Distributor may pay all or a portion of these fees to selling agents. For the period ended March 31, 2024, Distribution Fees and Servicing Fees are included on the Statement of Operations. As of March 31, 2024, accrued payables relating to Distribution Fees and Servicing Fees are included on the Statement of Assets and Liabilities.
Other Agreements
ALPS serves as administrator to the Fund. Under the Administration, Bookkeeping and Pricing Services Agreement, ALPS is responsible for calculating the NAV of the common shares and generally managing the administrative affairs of the Fund.
The Bank of New York Mellon serves as the Fund’s primary custodian. UMB Bank, N.A. serves as the Fund’s custodian for purposes of processing investor subscriptions and repurchases.
DST Systems, Inc. serves as transfer agent, dividend paying agent and shareholder servicing agent for the Fund (the “Transfer Agent”).
ALPS, The Bank of New York Mellon, UMB Bank, N.A. and DST Systems, Inc., are not considered affiliates of the Fund as defined under the 1940 Act.
NOTE 4. SECURITIES TRANSACTIONS
Investment transactions for the period ended March 31, 2024, excluding temporary short-term investments, were as follows:
| Fund | | Cost of Investments
Purchased | | | Proceeds from
Investments Sold | |
| Blackstone Floating Rate Enhanced Income Fund | | $ | 150,245,327 | | | $ | 214,473,145 | |
NOTE 5. RELATED PARTY TRANSACTIONS
The Adviser and the Distributor are related parties of the Fund. Fee arrangements with related parties are disclosed in Note 3 and amounts incurred are disclosed in the Statement of Operations.
As of March 31, 2024, the accrued Management Fee payable by the Fund to the Adviser is $1,089,709, which exceeds the advisory fee waiver receivable from the Adviser of $500,197 pursuant to the Expense Limitation and Reimbursement Agreement. The net accrued Management Fee payable of $589,512 is included on the Statement of Assets and Liabilities.
| Semi-Annual Report | March 31, 2024 | 41 |
| Blackstone Floating Rate Enhanced Income Fund | Notes to Financial Statements |
March 31, 2024 (Unaudited)
During the period ended March 31, 2024, the Fund did not engage in cross trades with an affiliate pursuant to Rule 17a-7 under the 1940 Act.
Blackstone Holdings Finance Co. L.L.C. (“FINCO”), an affiliate of the Adviser, pays expenses on behalf of the Fund from time to time. The Fund reimburses FINCO for such expenses paid on behalf of the Fund. FINCO does not charge any fees for providing such services. As of March 31, 2024, the reimbursement amount of $66,432 is recorded as other payables and accrued expenses on the Fund’s Statement of Assets and Liabilities.
During the period ended March 31, 2024, the Fund invested in SPDR Blackstone Senior Loan ETF (“SRLN”), which is sub-advised by the Adviser. As a shareholder in an investment company, the Fund bore its ratable share of that investment company’s expenses and remained subject to payment of the investment company’s management fees (except with respect to investments in affiliated investment companies) and other expenses with respect to assets so invested. Common shareholders were therefore subject to duplicative expenses to the extent the Fund invested in other non-affiliated investment companies. The Adviser does not charge management fees with respect to the portion of its net assets invested in SRLN and during the period ended March 31, 2024, the management fees waived on SRLN assets totaled $46,084, of which $21,932 were attributable to Class I Shares, $19,380 were attributable to Class T Shares, $12 were attributable to Class D Shares, $2,032 were attributable to Class T-I Shares, and $2,728 were attributable to Class U Shares. During the period ended March 31, 2024, the Fund received $409,896 in dividend payments from SRLN.
NOTE 6. LOANS AND OTHER INVESTMENTS
Under normal market conditions, the Fund will invest at least 80% of its Managed Assets in floating rate loans, notes, or bonds. “Managed Assets” means net assets plus the amount of any borrowings, including loans from certain financial institutions and the issuance of debt securities (collectively, "Borrowings") for investment purposes. Under current market conditions, the Fund anticipates that its portfolio of floating rate instruments will primarily consist of floating rate loans (“Loans”). Loans are made to U.S. and non-U.S. corporations, partnerships and other business entities (“Borrowers”) that operate in various industries and geographical regions. At March 31, 2024, 89.46% of the Fund’s Managed Assets were held in floating rate loan interests.
When the Fund sells a floating rate loan interest, the Fund may pay an agency fee. The Fund earns facility and other fees on floating rate loan interests, and facility fees are typically amortized to income over the term of the loan. Consent and amendment fees are also recorded to income as earned.
The Loans that the Fund may invest in include Loans that are first lien, second lien, third lien or that are unsecured. In addition, the Loans the Fund will invest in will usually be rated below investment grade or may also be unrated. The proceeds of Loans primarily are used to refinance existing debt and for acquisitions, dividends, leveraged buyouts, and general corporate purposes.
Loans often require prepayment from Borrowers’ excess cash flows or permit the Borrowers’ to repay at their election. The degree to which Borrowers repay, whether as a contractual requirements or at their election, cannot be predicted with accuracy. As a result, the actual remaining maturity may be substantially less than the stated maturities shown. However, floating rate loans typically have an expected average life of two to four years. Floating rate loans typically have rates of interest which are re-determined periodically, either daily, monthly, quarterly or semi-annually by reference to a floating base lending rate, primarily the London Interbank Offered Rate (“LIBOR”) and the Secured Overnight Financing Rate (“SOFR”) (subject to the LIBOR transition as described below and in “Principal Risks—LIBOR Risk”), plus a premium or credit spread.
The United Kingdom’s Financial Conduct Authority announced a phase out of LIBOR in 2017. Although many LIBOR rates ceased to be published or were no longer representative of the underlying market they sought to measure after December 31, 2021, a selection of widely used U.S. dollar LIBOR rates were published through June 30, 2023 in order to assist with the transition. Further, on March 15, 2022, the Consolidated Appropriations Act of 2022, which includes the Adjustable Interest Rate (LIBOR) Act, was signed into law in the United States. This legislation establishes a uniform benchmark replacement process for financial contracts that mature after June 30, 2023 that do not contain clearly defined or practicable fallback provisions. The U.S. Federal Reserve System, in conjunction with the Alternative Reference Rates Committee, a steering committee comprised of large U.S. financial institutions, has begun publishing SOFR, which is their preferred alternative rate for U.S. dollar LIBOR, and which is a new index calculated by short-term repurchase agreements, backed by Treasury securities. Given the inherent differences between LIBOR and SOFR, or any other alternative benchmark rate that may be established, there remains uncertainty regarding the continued transition away from LIBOR and the nature of any replacement rate. Proposals for alternative reference rates for other currencies have also been announced or have already begun publication. Markets are in the process of developing in response to these new rates and there has been no global consensus as to an alternative rate. There could be significant operational challenges which could affect the Fund’s performance during the continued transition away from LIBOR. Beyond these challenges, we anticipate there may be additional risks to our current processes and information systems that will need to be identified and evaluated by us. The Fund and our portfolio companies and/or obligors may need to amend or restructure our existing LIBOR-based debt instruments and any related hedging arrangements, depending on the applicable LIBOR tenor. Such amendments and restructurings may be difficult, costly and time consuming. The Fund may invest, or remain invested, in floating rate loans and investment securities whose interest rates are indexed to LIBOR.
| Blackstone Floating Rate Enhanced Income Fund | Notes to Financial Statements |
March 31, 2024 (Unaudited)
Loans will usually require, in addition to scheduled payments of interest and principal, the prepayment of the Loan from free cash flow, as described above. The degree to which borrowers prepay Loans, whether as a contractual requirement or at their election, may be affected by general business conditions, the financial condition of the borrower and competitive conditions among loan investors, among others. As such, prepayments cannot be predicted with accuracy. Market conditions in the past, including falling default rates among others, have led to increased prepayment frequency and loan renegotiations. These renegotiations are often on terms more favorable to borrowers. Upon a prepayment, either in part or in full, the actual outstanding debt on which the Fund derives interest income will be reduced. However, the Fund may receive a prepayment penalty fee assessed against the prepaying borrower.
Loans are subject to the risk of payment defaults of scheduled interest or principal. Such non-payment could result in a reduction of income, a reduction in the value of the investment and a potential decrease in the NAV of the Fund. Risk of loss is generally higher for subordinated unsecured loans or debt, which are not backed by a security interest in any specific collateral. There can be no assurance that the liquidation of any collateral securing a Loan would satisfy the Borrower’s obligation to the Fund in the event of non-payment of scheduled interest or principal payments, or that such collateral could be readily liquidated.
In the event of bankruptcy or insolvency of a Borrower, the Fund could experience delays or limitations with respect to its ability to realize the benefits of the collateral of a secured Loan. The collateral of a secured Loan may lose all or substantially all of its value in the event of the bankruptcy or insolvency of a Borrower. Some Loans are subject to the risk that a court, pursuant to fraudulent conveyance or other similar laws, could subordinate such Loans to presently existing or future indebtedness of the Borrower or take other action detrimental to the holders of Loans including, in certain circumstances, invalidating such Loans or causing interest previously paid to be refunded to the Borrower. If interest were required to be refunded, it could negatively affect the Fund’s performance. At March 31, 2024, the Fund had invested $6,540,816 in second lien secured loans.
The Fund anticipates that substantially all of the Fund’s assets, including its investments in Loans, may be invested in instruments rated below investment grade, such as those rated Ba1 or lower by Moody’s and BB+ or lower by S&P or Fitch or instruments comparably rated by other rating agencies, or in unrated instruments determined by the Adviser to be of comparable quality. Instruments rated Ba1 or lower by Moody’s are judged to have speculative elements, their future cannot be considered as well assured and often the protection of interest and principal payments may be very moderate. Instruments rated BB+ or lower by S&P or Fitch are regarded as having predominantly speculative characteristics and, while such obligations have less near-term vulnerability to default than other speculative grade debt, they face major ongoing uncertainties or exposure to adverse business, financial or economic conditions which could lead to inadequate capacity to meet timely interest and principal payments.
Lower grade instruments, though higher yielding, are characterized by higher risk. They may be subject to certain risks with respect to the issuing entity and to greater market fluctuations than certain lower yielding, higher rated instruments. The retail secondary market for lower grade instruments may be less liquid than that of higher rated instruments. Adverse conditions could make it difficult at times for the Fund to sell certain instruments or could result in lower prices than those used in calculating the Fund’s NAV.
The prices of credit instruments generally are inversely related to interest rate changes; however, the price volatility caused by fluctuating interest rates of instruments also is inversely related to the coupon of such instruments. Accordingly, lower grade instruments may be relatively less sensitive to interest rate changes than higher quality instruments of comparable maturity, because of their higher coupon. This higher coupon is what the investor receives in return for bearing greater credit risk. The higher credit risk associated with lower grade instruments potentially can have a greater effect on the value of such instruments than may be the case with higher quality issues of comparable maturity, and will be a substantial factor in the Fund’s relative share price volatility.
The Adviser has established a counterparty and liquidity sub-committee that regularly reviews each broker-dealer counterparty for, among other things, its quality and the quality of its execution. The established procedures and guidelines require trades to be placed for execution only with broker-dealer counterparties approved by the counterparty and liquidity sub-committee of the Adviser. The factors considered by the sub-committee when selecting and approving brokers and dealers include, but are not limited to: (i) quality, accuracy, and timeliness of execution, (ii) review of the reputation, financial strength and stability of the financial institution, (iii) willingness and ability of the counterparty to commit capital, (iv) ongoing reliability and (v) access to underwritten offerings and secondary markets.
The Fund may acquire Loans through assignments or participations. The Fund will typically acquire Loans through assignment. The purchaser of an assignment typically succeeds to all the rights and obligations of the assigning institution and becomes a lender under the credit agreement with respect to the debt obligation; however, the purchaser’s rights can be more restricted than those of the assigning institution, and the Fund may not be able to unilaterally enforce all rights and remedies under the loan and with regard to any associated collateral.
| Semi-Annual Report | March 31, 2024 | 43 |
| Blackstone Floating Rate Enhanced Income Fund | Notes to Financial Statements |
March 31, 2024 (Unaudited)
A participation typically results in a contractual relationship only with the institution selling the participation interest, not with the Borrower. Sellers of participations typically include banks, broker-dealers, other financial institutions and lending institutions. Certain participation agreements also include the option to convert the participation to a full assignment under agreed upon circumstances. The Adviser has adopted best execution procedures and guidelines to mitigate credit and counterparty risk in the atypical situation when the Fund must acquire a Loan through a participation.
The Fund invests in CLO securities. A CLO is a financing company (generally called a Special Purpose Vehicle or (“SPV”)), created to reapportion the risk and return characteristics of a pool of assets. While the assets underlying CLOs are typically Secured Loans, the assets may also include (i) unsecured loans, (ii) debt securities that are rated below investment grade, (iii) debt tranches of other CLOs and (iv) equity securities incidental to investments in Secured Loans. When investing in CLOs, the Fund will not invest in equity tranches, which are the lowest tranche. However, the Fund may invest in lower rated debt tranches of CLOs, which typically experience a lower recovery, greater risk of loss or deferral or non-payment of interest than more senior tranches of the CLO. The underlying Loans purchased by CLOs are generally performing at the time of purchase but may become non-performing, distressed or defaulted. CLOs with underlying assets of non-performing, distressed or defaulted loans are not contemplated to comprise a significant portion of the Fund’s investments in CLOs. The key feature of the CLO structure is the prioritization of the cash flows from a pool of debt securities among the several classes of the CLO. The SPV is a company founded solely for the purpose of securitizing payment claims arising out of this diversified asset pool. On this basis, marketable securities are issued by the SPV which, due to the diversification of the underlying risk, generally represent a lower level of risk than the original assets. The redemption of the securities issued by the SPV typically takes place on a date earlier than legal maturity from refinancing of the senior debt tranches.
The Fund may invest up to 20% of its Managed Assets in securities of other open- or closed-end investment companies, including exchange-traded funds (“ETFs”), to the extent that such investments are consistent with the Fund’s investment objective, strategies and policies and permissible under the 1940 Act, including interpretations or modifications by the SEC. The Fund may invest in other investment companies to gain broad market or sector exposure, including during periods when it has large amounts of uninvested cash (such as the period shortly after the Fund receives the proceeds of the offering of its Common Shares) or when the Adviser believes share prices of other investment companies offer attractive values. The Fund may invest in investment companies that are advised or sub-advised by the Adviser or its affiliates to the extent permitted by applicable law and/or pursuant to exemptive relief from the SEC. As a shareholder in an investment company, the Fund will bear its ratable share of that investment company’s expenses and would remain subject to payment of the Fund’s management fees and other expenses with respect to assets so invested. Common shareholders would therefore be subject to duplicative expenses to the extent the Fund invests in other investment companies.
ETFs are pooled investment vehicles that are designed to provide investment results corresponding to an index. These indexes may be either broad-based, sector or international. ETFs usually are units of beneficial interest in an investment trust or represent undivided ownership interests in a portfolio of securities (or commodities), in each case with respect to a portfolio of all or substantially all of the component securities of, and in substantially the same weighting as, the relevant benchmark index. ETFs are designed to provide investment results that generally correspond to the price and yield performance of the component securities (or commodities) of the benchmark index. ETFs are listed on an exchange and trade in the secondary market on a per-share basis. The values of ETFs are subject to change as the values of their respective component securities (or commodities) fluctuate according to market volatility. Investments in ETFs may not exactly match the performance of a direct investment in the respective indices to which they are intended to correspond due to the temporary unavailability of certain index securities in the secondary market or other extraordinary circumstances, such as discrepancies with respect to the weighting of securities. Typically, the ETF bears its own operational expenses, which are deducted from its assets. To the extent that the Fund invests in ETFs, the Fund must bear these expenses in addition to the expenses of its own operation.
NOTE 7. GENERAL COMMITMENTS AND CONTINGENCIES
As of March 31, 2024, the Fund had unfunded loan commitments outstanding, which could be extended at the option of the borrower, as detailed below:
| | | | | | | | Unrealized | |
| | | | | | | | | Appreciation/ | |
| Borrower | | Par Value | | | Fair Value | | | (Depreciation) | |
| Action Environmental Group, Inc., First Lien Term Loan | | $ | 81,000 | | | $ | 81,203 | | | $ | (778 | ) |
| Ryan LLC., First Lien Term Loan | | | 73,651 | | | | 74,111 | | | | (461 | ) |
| Touchdown Acquirer Inc aka TenCate DDTL 1L., First Lien Term Loan | | | 124,566 | | | | 125,111 | | | | (545 | ) |
| Culligan 11/23 Incre CovLi TL 1L., First Lien Term Loan | | | 219,869 | | | | 221,129 | | | | (1,490 | ) |
| Total | | $ | 499,086 | | | $ | 501,554 | | | $ | (3,274 | ) |
| Blackstone Floating Rate Enhanced Income Fund | Notes to Financial Statements |
March 31, 2024 (Unaudited)
Unfunded loan commitments are marked to market on the relevant day of the valuation in accordance with the Fund’s valuation policies. Any related unrealized appreciation/(depreciation) on unfunded loan commitments is recorded on the Statement of Assets and Liabilities and the Statement of Operations. For the period ended March 31, 2024, the Fund recorded a net decrease in unrealized depreciation on unfunded loan commitments totaling $(1,487).
NOTE 8. LEVERAGE
The Fund entered into a Credit Agreement (the "Agreement") with The Bank of Nova Scotia, as the administrative agent, and a syndicate of lenders party thereto to borrow money pursuant to a one-year revolving line of credit ("Leverage Facility") dated January 18, 2018, as amended on June 22, 2018, and as further amended on August 16, 2018, and as amended and restated on October 23, 2018, and as further amended and restated on December 28, 2018, and as amended on January 17, 2019, as further amended on June 27, 2019, as further amended on September 11, 2019, as further amended on January 16, 2020, as further amended on April 9, 2020, as further amended on January 14, 2021, as further amended on December 31, 2021, as further amended on January 27, 2022 as further amended on December 30, 2022 and as further amended on December 29, 2023, to borrow up to an aggregate limit of $130,000,000 under two loan tranches, Tranche A and Tranche B. The Tranche A commitment allows for borrowings up to $110,000,000. The Tranche B commitment allows for borrowings for temporary purposes up to $20,000,000 and includes a swing line component with a commitment equal to $20,000,000. Borrowings under the Agreement are secured by the assets of the Fund. Interest is charged at a rate of (a) 1.00% above adjusted term SOFR with respect to Tranche A loans, with adjusted term SOFR measured for the period commencing on the date of the making of such loan at adjusted term SOFR (or the last date upon which any other Tranche A loan was converted to, or continued as, such loan at adjusted term SOFR) and ending on the numerically corresponding day in the calendar month that is one (1) or three (3) months thereafter, as the Fund may elect, or such other periods as the lender may agree in its sole and absolute discretion and (b) 1.05% above adjusted term SOFR with respect to Tranche B loans and each swing line loan, with adjusted term SOFR measured for the period commencing on the date of the making of such loan at adjusted term SOFR (or the last date upon which any other loan was converted to, or continued as, such loan at adjusted term SOFR) and ending on the numerically corresponding day in the calendar month that is one month thereafter. Under the terms of the Agreement, the Fund must pay a commitment fee on any undrawn amounts. The commitment fee payable is (a) for Tranche A loans, 0.15% on the undrawn amounts when drawn amounts exceed 75% of the relevant borrowing limit and 0.25% on the undrawn amounts in all other events and (b) 0.15% for Tranche B loans. Interest and fees are generally payable quarterly. The Fund may elect to extend the Agreement for a further period with the consent of the lending bank. For the period ended March 31, 2024, the Fund had no borrowings outstanding for Tranche B. At March 31, 2024, the Fund had borrowings outstanding under its Leverage Facility of $93,850,000, at an interest rate of 6.42% for Tranche A. Due to the short term nature of the Agreement, face value approximates fair value at March 31, 2024. For the period ended March 31, 2024, the average borrowings under the Fund’s Leverage Facility and the weighted average interest rate was $102,637,006 and 6.45%, respectively for Tranche A. During the period ended March 31, 2024, the Fund incurred $88,127 for commitment fees on undrawn amounts, which is included under Interest on leverage facility on the Statement of Operations.
Under the Agreement, the Fund has agreed to certain covenants and additional investment limitations while the leverage is outstanding. The Fund agreed to maintain asset coverage of three times over borrowings. Compliance with the investment restrictions and calculations are performed by the Fund's custodian, The Bank of New York Mellon.
The use of borrowings to leverage the common shares of the Fund can create risks. Changes in the value of the Fund's portfolio, including securities bought with the proceeds of leverage, are borne entirely by the holders of common shares of the Fund. All costs and expenses related to any form of leverage used by the Fund are borne entirely by common shareholders. If there is a net decrease or increase in the value of the Fund's investment portfolio, the leverage may decrease or increase, as the case may be, the NAV per common share to a greater extent than if the Fund did not utilize leverage.
NOTE 9. REPURCHASE OFFERS
The Board has adopted a repurchase offer fundamental policy setting forth that the Fund will conduct monthly repurchase offers. This fundamental policy may be changed only with the approval of a majority of the outstanding voting securities of the Fund. The Fund is required to offer to repurchase at least 5% of its outstanding common shares with each repurchase offer and, under normal market conditions, the Board expects to authorize a 7.5% offer (“Repurchase Offer”) each month. The Fund may not offer to repurchase less than 5% nor more than 25% of its outstanding common shares during any three month period.
The time and dates by which Repurchase Offers must be accepted (“Repurchase Request Deadline”) are generally 4:00 p.m. Eastern time on the eighth business day of each month. The repurchase price will be the Fund’s NAV determined on the repurchase pricing date, which will be a date not more than 14 calendar days following the Repurchase Request Deadline (“Repurchase Pricing Date”). Payment for all common shares repurchased pursuant to these offers will be made not later than 7 calendar days after the Repurchase Pricing Date. Under normal circumstances, it is expected that the Repurchase Request Deadline will be the same date as the Repurchase Pricing Date. Payment for common shares tendered will normally be made by the fourth business day (but in any case no later than the seventh calendar day) following the Repurchase Pricing Date and, in every case, at least five business days before sending notification of the next monthly Repurchase Offer. If the tendered shares have been purchased immediately prior to the tender, the Fund will not release repurchase proceeds until payment for the tendered shares has settled.
| Semi-Annual Report | March 31, 2024 | 45 |
| Blackstone Floating Rate Enhanced Income Fund | Notes to Financial Statements |
March 31, 2024 (Unaudited)
The Fund may impose redemption fees of up to 2.00% on shares accepted for repurchase that have been held for less than one year. The Fund has elected not to impose the redemption fee on repurchases of common shares acquired through the reinvestment of dividends and distributions or submitted pursuant to an auto-rebalancing mechanism of a shareholder account.
During the period ended March 31, 2024, the Fund completed 6 monthly repurchase offers. In each of the monthly repurchase offers from October 2023 through March 2024, the Fund offered to repurchase no less than 7.5% of the number of its outstanding shares as of the Repurchase Pricing Dates. The result of the repurchase offers were as follows:
| Repurchase Request Deadline | | Percentage of
Outstanding Shares
the Fund Offered
to Repurchase(a) | | | Repurchase
Pricing Date | | Amount
Repurchased | | | Number of Shares
Repurchased
(all classes) | | | Percentage of
Outstanding Shares
Repurchased | |
| October 11, 2023 | | | 7.5% | | | October 11, 2023 | | $ | 11,794,050 | | | | 545,308 | | | | 4.84% | |
| November 10, 2023 | | | 7.5% | | | November 10, 2023 | | | 17,431,732 | | | | 809,854 | | | | 7.50% | |
| December 12, 2023 | | | 7.5% | | | December 12, 2023 | | | 16,372,841 | | | | 755,264 | | | | 7.50% | |
| January 11, 2024 | | | 7.5% | | | January 11, 2024 | | | 5,984,201 | | | | 271,749 | | | | 2.90% | |
| February 12, 2024 | | | 7.5% | | | February 12, 2024 | | | 1,146,598 | | | | 52,220 | | | | 0.57% | |
| March 12, 2024 | | | 7.5% | | | March 12, 2024 | | | 4,893,842 | | | | 221,218 | | | | 2.41% | |
| (a) | If total repurchase request exceeds 7.5% of the Fund’s outstanding shares, the Fund may increase the number of shares that it is offering to repurchase by up to an additional 2% of its total outstanding shares (provided that the Fund may not repurchase more than 2% in additional shares during any three-month period). |
NOTE 10. PRINCIPAL RISKS
In the normal course of business, the Fund invests in financial instruments and enters into financial transactions where risk of potential loss exists due to such things as changes in the market (market risk) or failure or inability of the other party to a transaction to perform (credit and counterparty risk). See below for a detailed description of select principal risks, which are further discussed in the Fund’s Prospectus. For a more comprehensive list of potential risks the Fund may be subject to, please refer to the Fund’s Prospectus and Statement of Additional Information (“SAI”).
Investment and Market Risk: An investment in the Fund’s Common Shares is subject to investment risk, including the possible loss of the entire principal amount invested. An investment in the Fund’s Common Shares represents an indirect investment in the portfolio of floating rate instruments, other securities and derivative investments owned by the Fund, and the value of these investments may fluctuate, sometimes rapidly and unpredictably. At any point in time an investment in the Fund’s Common Shares may be worth less than the original amount invested, even after taking into account distributions paid by the Fund and the ability of common shareholders to reinvest dividends. The Fund may also use leverage, which would magnify the Fund’s investment, market and certain other risks.
Repurchase Offers Risk: The Fund is an “interval fund” and, in order to provide liquidity to common shareholders, the Fund, subject to applicable law, will conduct repurchase offers for the Fund’s outstanding common shares at NAV, subject to approval of the Board. The Fund believes that these repurchase offers are generally beneficial to the common shareholders, and repurchases generally will be funded from available cash, cash from the sale of common shares or sales of portfolio securities. However, repurchase offers and the need to fund repurchase obligations may affect the ability of the Fund to be fully invested or force the Fund to maintain a higher percentage of its assets in liquid investments, which may harm the Fund’s investment performance. Moreover, diminution in the size of the Fund through repurchases may result in an increased expense ratio for common shareholders who do not tender their common shares for repurchase, untimely sales of portfolio securities (with associated imputed transaction costs, which may be significant), and may limit the ability of the Fund to participate in new investment opportunities or to achieve its investment objective. The Fund may accumulate cash by (i) holding back (i.e., not reinvesting) payments received in connection with the Fund’s investments and (ii) holding back (i.e., not investing) cash from the sale of common shares. The Fund believes that it can meet the maximum potential amount of the Fund’s repurchase obligations. If at any time cash and other liquid assets held by the Fund are not sufficient to meet the Fund’s repurchase obligations, the Fund intends, if necessary, to sell investments. If, as expected, the Fund employs leverage, repurchases of common shares would compound the adverse effects of leverage in a declining market. In addition, if the Fund borrows to finance repurchases, interest on that borrowing will negatively affect holders of common shares who do not tender their common shares by increasing the Fund’s expenses and reducing any net investment income.
| Blackstone Floating Rate Enhanced Income Fund | Notes to Financial Statements |
March 31, 2024 (Unaudited)
If a repurchase offer is oversubscribed, the Fund may determine to increase the amount repurchased by up to 2% of the Fund’s outstanding common shares as of the date of the repurchase request deadline, but any such increases in the amounts repurchased may not exceed an aggregate of 2% in any three month period. In the event that the Fund determines not to repurchase more than the repurchase offer amount, or if common shareholders tender more than the repurchase offer amount plus 2% of the Fund’s outstanding common shares (less any additional amounts repurchased in prior repurchase offers within a three month period) as of the date of the repurchase request deadline, the Fund will repurchase the common shares tendered on a pro rata basis, and common shareholders will have to wait until the next repurchase offer to make another repurchase request. As a result, common shareholders may be unable to liquidate all or a given percentage of their investment in the Fund during a particular repurchase offer. Some common shareholders, in anticipation of proration, may tender more common shares than they wish to have repurchased in a particular month, thereby increasing the likelihood that proration will occur. A common shareholder may be subject to market and other risks, and the NAV of common shares tendered in a repurchase offer may decline between the repurchase request deadline and the date on which the NAV for tendered common shares is determined. In addition, the repurchase of common shares by the Fund will generally be a taxable event to common shareholders.
Large Shareholder Risk: To the extent a large proportion of common shares are held by a small number of common shareholders (or a single common shareholder), including affiliates of the Adviser, the Fund is subject to the risk that these shareholders will seek to sell common shares in large amounts rapidly in connection with repurchase offers. These transactions could adversely affect the ability of the Fund to conduct its investment program. Furthermore, it is possible that in response to a repurchase offer, the total amount of common shares tendered by a small number of common shareholders (or a single common shareholder) may exceed the number of common shares that the Fund has offered to repurchase. If a repurchase offer is oversubscribed by common shareholders, the Fund will repurchase only a pro rata portion of shares tendered by each common shareholder.
Loans Risk: Under normal market conditions, the Fund will invest primarily in Loans. The Loans that the Fund may invest in include Loans that are first lien, second lien, third lien or that are unsecured. In addition, the Loans the Fund will invest in will usually be rated below investment grade or may also be unrated. Although most of the Fund’s investments are first lien loans and secured by first lien security interests in the applicable issuer’s assets, if an issuer defaults on its loan there is no guarantee the Fund will be able to recover the principal amount of the loan. Loans are subject to a number of risks, including, but not limited to, credit risk, “covenant-lite” obligations risk, liquidity risk, valuation risk, below investment grade instruments risk and management risk.
Although certain Loans in which the Fund may invest will be secured by collateral, there can be no assurance that such collateral could be readily liquidated or that the liquidation of such collateral would satisfy the Borrower’s obligation in the event of non-payment of scheduled interest or principal. In the event of the bankruptcy or insolvency of a Borrower, the Fund could experience delays or limitations with respect to its ability to realize the benefits of the collateral securing a Loan. In the event of a decline in the value of the already pledged collateral, if the terms of a Loan do not require the Borrower to pledge additional collateral, the Fund will be exposed to the risk that the value of the collateral will not at all times equal or exceed the amount of the Borrower’s obligations under the Loans. To the extent that a Loan is collateralized by stock in the Borrower or its subsidiaries, such stock may lose some or all of its value in the event of the bankruptcy or insolvency of the Borrower. Those Loans that are under-collateralized involve a greater risk of loss. In general, the secondary trading market for Loans is not fully-developed. No active trading market may exist for certain Loans, which may make it difficult to value them. Illiquidity and adverse market conditions may mean that the Fund may not be able to sell certain Loans quickly or at a fair price. To the extent that a secondary market does exist for certain Loans, the market for them may be subject to irregular trading activity, wide bid/ask spreads and extended trade settlement periods.
Below Investment Grade, or High Yield, Instruments Risk: The Fund anticipates that it may invest substantially all of its assets in instruments that are rated below investment grade. Below investment grade instruments are commonly referred to as “junk” or "high yield" instruments and are regarded as predominantly speculative with respect to the issuer’s capacity to pay interest and repay principal. Lower grade instruments may be particularly susceptible to economic downturns. It is likely that a prolonged or deepening economic downturn could adversely affect the ability of the issuers of such instruments to repay principal and pay interest thereon, increase the incidence of default for such instruments and severely disrupt the market value of such instruments.
Below investment grade instruments, though generally higher yielding, are characterized by higher risk. They may be subject to certain risks with respect to the issuing entity and to greater market fluctuations than certain lower yielding, higher rated instruments. The retail secondary market for lower grade instruments may be less liquid than that for higher rated instruments. Adverse conditions could make it difficult at times for the Fund to sell certain instruments or could result in lower prices than those used in calculating the Fund’s NAV. Because of the substantial risks associated with investments in lower grade instruments, investors could lose money on their investment in Common Shares of the Fund, both in the short-term and the long-term.
| Semi-Annual Report | March 31, 2024 | 47 |
| Blackstone Floating Rate Enhanced Income Fund | Notes to Financial Statements |
March 31, 2024 (Unaudited)
“Covenant-lite” Obligations Risk: The Fund may invest in, or obtain exposure to, obligations that may be “covenant-lite,” which means such obligations lack certain financial maintenance covenants. While these loans may still contain other collateral protections, a covenant-lite loan may carry more risk than a covenant-heavy loan made by the same borrower as it does not require the borrower to provide affirmation that certain specific financial tests have been satisfied on a routine basis as is required under a covenant-heavy loan agreement. Should a loan held by the Fund begin to deteriorate in quality, the Fund’s ability to negotiate with the borrower may be delayed under a covenant-lite loan compared to a loan with full maintenance covenants. This may in turn delay the Fund’s ability to seek to recover its investment.
Valuation Risk: Unlike publicly traded common stock which trades on national exchanges, there is no central place or exchange for most of the Fund’s investments to trade. The Fund’s investments generally trade on an “over-the-counter” market which may be anywhere in the world where the buyer and seller can settle on a price. Due to the lack of centralized information and trading, the valuation of loans or fixed-income instruments may carry more risk than that of common stock. Uncertainties in the conditions of the financial market, unreliable reference data, lack of transparency and inconsistency of valuation models and processes may lead to inaccurate asset pricing. In addition, other market participants may value securities differently than the Fund. As a result, the Fund may be subject to the risk that when an instrument is sold in the market, the amount received by the Fund is less than the value of such instrument carried on the Fund’s books.
Liquidity Risk: To the extent consistent with the applicable liquidity requirements for interval funds under Rule 23c-3 of the 1940 Act, the Fund may invest up to 20% of its Managed Assets in securities that, at the time of investment, are illiquid (determined using the SEC’s standard applicable to registered investment companies), i.e., securities that the Fund reasonably expects cannot be sold or disposed of in current market conditions in seven calendar days or less without the sale or disposition significantly changing the market value of the securities. However, securities that cannot be disposed of within seven days due solely to the Adviser’s compliance policies and procedures will not be subject to the limitations set forth above. The Fund may also invest in restricted securities. Investments in restricted securities could have the effect of increasing the amount of the Fund’s assets invested in illiquid securities if qualified institutional buyers are unwilling to purchase these securities.
Credit Risk: Credit risk is the risk that one or more Loans or other instruments in the Fund’s portfolio will decline in price or fail to pay interest or principal when due because the issuer of the instrument experiences a decline in its financial status. While a senior position in the capital structure of a Borrower or issuer may provide some protection with respect to the Fund’s investments in certain Loans, losses may still occur because the market value of Loans is affected by the creditworthiness of Borrowers or issuers and by general economic and specific industry conditions and the Fund’s other investments will often be subordinate to other debt in the issuer’s capital structure. To the extent the Fund invests in below investment grade instruments, it will be exposed to a greater amount of credit risk than a fund which invests in investment grade securities. The prices of lower grade instruments are more sensitive to negative developments, such as a decline in the issuer’s revenues or a general economic downturn, than are the prices of higher grade instruments. Instruments of below investment grade quality are predominantly speculative with respect to the issuer’s capacity to pay interest and repay principal when due and therefore involve a greater risk of default. In addition, the Fund may enter into credit derivatives which may expose it to additional risk in the event that the instruments underlying the derivatives default.
Interest Rate Risk: The fixed-income instruments that the Fund may invest in are subject to the risk that market values of such securities will decline as interest rates increase. These changes in interest rates have a more pronounced effect on securities with longer durations. Typically, the impact of changes in interest rates on the market value of an instrument will be more pronounced for fixed-rate instruments, such as most corporate bonds, than it will for Loans or other floating rate instruments. Fluctuations in the value of portfolio securities will not affect interest income on existing portfolio securities but will be reflected in the Fund’s NAV. The Federal Reserve has raised interest rates several times beginning in March 2022, and we cannot assure shareholders that a significant change in market interest rates will not have a material adverse effect on the Fund’s returns.
Systematic Strategies Related to Bond Investments Risk: With respect to the bond portion of the Fund’s portfolio, to the extent to which the proprietary model used by the Adviser (the “Model”) or comparable methods or strategies are employed, certain of the Adviser’s securities analysis methods will rely on the assumption that the companies whose securities are purchased or sold, the rating agencies that review these securities, and other publicly available sources of information about these securities, are providing accurate and unbiased data. While the Adviser is alert to indications that data may be incorrect, there is always a risk that the Adviser’s analysis may be compromised by inaccurate or misleading information.
The Model the Adviser intends to utilize to manage the Fund’s bond investments could lead to unsatisfactory investments. The Adviser might not be able to effectively implement the Model, and there can be no guarantee that the Fund will achieve the desired results.
LIBOR Risk: The United Kingdom’s Financial Conduct Authority announced a phase out of LIBOR in 2017. Although many LIBOR rates ceased to be published or were no longer representative of the underlying market they sought to measure after December 31, 2021, a selection of widely used U.S.dollar LIBOR rates were published through June 30, 2023 in order to assist with the transition. Further, on March 15, 2022, the Consolidated Appropriations Act of 2022, which includes the Adjustable Interest Rate (LIBOR) Act, was signed into law in the United States. This legislation establishes a uniform benchmark replacement process for financial contracts that mature after June 30, 2023 that do not contain clearly defined or practicable fallback provisions. The Federal Reserve System (“FRS”), in conjunction with the Alternative Reference Rates Committee (the “ARRC”), a steering committee comprised of large U.S. financial institutions, has begun publishing SOFR, which is their preferred alternative rate for U.S. dollar LIBOR, and which is a new index calculated by short-term repurchase agreements, backed by Treasury securities. Given the inherent differences between LIBOR and SOFR, or any other alternative benchmark rate that may be established, there remains uncertainty regarding the continued transition away from LIBOR and the nature of any replacement rate. Proposals for alternative reference rates for other currencies have also been announced or have already begun publication. Markets are in the process of developing in response to these new rates and there has been no global consensus as to an alternative rate. There could be significant operational challenges which could affect the Fund’s performance for the continued transition away from LIBOR. The Fund and its portfolio companies and/or obligors may need to amend or restructure our existing LIBOR-based debt instruments and any related hedging arrangements depending on the applicable LIBOR tenor. Such amendments and restructurings may be difficult, costly and time consuming. The Fund may invest, or remain invested, in floating rate loans and investment securities whose interest rates are indexed to LIBOR.
| Blackstone Floating Rate Enhanced Income Fund | Notes to Financial Statements |
March 31, 2024 (Unaudited)
Force Majeure Risk: The Fund may be affected by force majeure events (e.g., acts of God, fire, flood, earthquakes, outbreaks of an infectious disease, pandemic or any other serious public health concern, war, terrorism, nationalization of industry and labor strikes). Force majeure events could adversely affect the ability of the Fund or a counterparty to perform its obligations. The liability and cost arising out of a failure to perform obligations as a result of a force majeure event could be considerable and could be borne by the Fund. Certain force majeure events, such as war or an outbreak of an infectious disease, could have a broader negative impact on the global or local economy, thereby affecting the Fund. Additionally, a major governmental intervention into industry, including the nationalization of an industry or the assertion of control, could result in a loss to the Fund if an investment is affected, and any compensation provided by the relevant government may not be adequate.
Epidemic and Pandemic Risk: The world has been susceptible to epidemics/pandemics, most recently COVID-19, which has been designated as a pandemic by the World Health Organization. Any outbreak of COVID-19, SARS, H1N1/09 flu, respiratory synytial virus, or RSV, avian flu, other coronavirus, Ebola or other existing or new epidemics/pandemics, or the threat thereof, together with any resulting restrictions on travel or quarantines imposed, has had, and will continue to have, an adverse impact on the economy and business activity globally (including in the countries in which the Fund invests), and thereby is expected to adversely affect the performance of the Fund’s investments and the Fund’s ability to fulfill its investment objectives. Furthermore, the rapid development of epidemics/pandemics could preclude prediction as to their ultimate adverse impact on economic and market conditions, and, as a result, presents material uncertainty and risk with respect to the Fund and the performance of its investments.
Market Disruption and Geopolitical Risk: The Fund may be adversely affected by uncertainties such as terrorism, international political developments, and changes in government policies, taxation, restrictions on foreign investment and currency repatriation, currency fluctuations and other developments in the laws and regulations of the countries in which it is invested. Likewise, natural and environmental disasters, epidemics or pandemics, and systemic market dislocations may be highly disruptive to economies and markets. See “Epidemic and Pandemic Risk” above. Uncertainties and events around the world may (i) result in market volatility, (ii) have long-term effects on the U.S. and worldwide financial markets and (iii) cause further economic uncertainties in the United States and worldwide. The Fund cannot predict the effects of geopolitical events in the future on the U.S. economy and securities markets.
Additionally, certain of the Fund’s investments may operate in, or have dealings with, countries subject to sanctions or embargos imposed by the U.S. government, foreign governments, or the United Nations or other international organizations. For example, the ongoing conflict due to Russia’s invasion of Ukraine, the ongoing conflict in the Middle East, and the rapidly evolving measures in response could be expected to have a negative impact on the economy and business activity globally (including in the countries in which the Fund invests). The severity and duration of these conflicts and their impact on global economic and market conditions are impossible to predict, and as a result, present material uncertainty and risk with respect to the Fund and its investments and operations, and the ability of the Fund to achieve its investment objectives. Sanctions could also result in Russia taking counter measures or retaliatory actions which could adversely impact the Fund’s business or the business of the Fund’s investments, including, but not limited to, cyberattacks targeting private companies, individuals or other infrastructure upon which the Fund’s business and the business of the Fund’s obligors rely.
In addition, the failure of certain financial institutions, namely banks, may increase the possibility of a sustained deterioration of financial market liquidity, or illiquidity at clearing, cash management and/or custodial financial institutions. The failure of a bank (or banks) with which the Fund or its obligors have a commercial relationship could adversely affect, among other things, the Fund’s or its obligors’ ability to pursue key strategic initiatives, including by affecting the Fund’s or its obligors’ ability to access deposits or borrow from financial institutions on favorable terms. Additionally, if an obligor has a commercial relationship with a bank that has failed or is otherwise distressed, the obligor may experience issues receiving financial support to support its operations or consummate transactions, to the detriment of its business, financial condition and/or results of operations. The ability of the Fund and its obligors to spread banking relationships among multiple institutions may be limited by certain contractual arrangements, including liens placed on their respective assets as a result of a bank agreeing to provide financing.
| Semi-Annual Report | March 31, 2024 | 49 |
| Blackstone Floating Rate Enhanced Income Fund | Notes to Financial Statements |
March 31, 2024 (Unaudited)
Recent technological advances in artificial intelligence and machine learning technologies (collectively, “AI Technologies”) have led to an increasing trend toward machine driven and artificially intelligent trading systems, particularly providing such systems with increasing levels of autonomy in trading decisions. Regulators of financial markets have become increasingly focused on the potential impact of AI Technologies on investment activities and may issue regulations that are intended to affect the use of artificial technology in trading activities. Any such regulations may not have the intended effect on financial markets. AI Technologies may suffer from the introduction of errors, defects or security vulnerabilities which can go undetected. AI Technologies and their current and potential future applications including in the investment and financial sectors, as well as the legal and regulatory frameworks within which they operate, continue to rapidly evolve, and it is impossible to predict the full extent of current or future risks related thereto.
Structured Products Risk: The Fund may invest up to 20% of its Managed Assets in structured products, including the rated debt tranches of CLOs, floating rate mortgage-backed securities and credit linked notes. Holders of structured products bear risks of the underlying investments, index or reference obligation and are subject to counterparty risk.
CLO Risk: In addition to the general risks associated with debt securities and structured products discussed herein, CLOs carry additional risks, including, but not limited to (i) the possibility that distributions from collateral securities will not be adequate to make interest or other payments; (ii) the quality of the collateral may decline in value or default; (iii) the possibility that the investments in CLOs are subordinate to other classes or tranches thereof; (iv) the potential of spread compression in the underlying loans of the CLOs, which could reduce credit enhancement in the CLOs; and (v) the complex structure of the security may not be fully understood at the time of investment and may produce disputes with the issuer or unexpected investment results.
Leverage Risk: Under current market conditions, the Fund generally utilizes leverage principally through Borrowings in an amount up to 33 1/3% of the Fund’s total assets, less all liabilities and indebtedness not represented by senior securities, immediately after such Borrowings. In the future, the Fund may elect to utilize leverage in an amount up to 50% of the Fund’s total assets through the issuance of Preferred Shares. Leverage may result in greater volatility of the NAV and distributions on the Common Shares because changes in the value of the Fund’s portfolio investments, including investments purchased with the proceeds from Borrowings or the issuance of Preferred Shares, if any, are borne entirely by Common Shareholders. Common Share income may fall if the interest rate on Borrowings or the dividend rate on Preferred Shares rises, and may fluctuate as the interest rate on Borrowings or the dividend rate on Preferred Shares varies. In addition, the Fund’s use of leverage will result in increased operating costs. Thus, to the extent that the then-current cost of any leverage, together with other related expenses, approaches the net return on the Fund’s investment portfolio, the benefit of leverage to Common Shareholders will be reduced, and if the then-current cost of any leverage together with related expenses were to exceed the net return on the Fund’s portfolio, the Fund’s leveraged capital structure would result in a lower rate of return to Common Shareholders than if the Fund were not so leveraged. In addition, the costs associated with the Fund’s incurrence and maintenance of leverage could increase over time. There can be no assurance that the Fund’s leveraging strategy will be successful.
Cyber-Security Risk and Identity Theft Risks: The Fund’s operations are highly dependent on the Adviser’s information systems and technology and the Fund relies heavily on the Adviser’s financial, accounting, communications and other data processing systems. The Adviser’s systems may fail to operate properly or become disabled as a result of tampering or a breach of its network security systems or otherwise. In addition, the Adviser’s systems face ongoing cybersecurity threats and attacks. Attacks on the Adviser’s systems could involve, and in some instances have in the past involved, attempts intended to obtain unauthorized access to its proprietary information, destroy data or disable, degrade or sabotage its systems, or divert or otherwise steal funds, including through the introduction of computer viruses, “phishing” attempts and other forms of social engineering. Cyberattacks and other security threats could originate from a wide variety of external sources, including cyber criminals, nation state hackers, hacktivists and other outside parties. Cyberattacks and other security threats could also originate from the malicious or accidental acts of insiders, such as employees of the Adviser.
There has been an increase in the frequency and sophistication of the cyber and security threats the Adviser faces, with attacks ranging from those common to businesses to those that are more advanced and persistent, which may target the Adviser because, as an alternative asset management firm, the Adviser holds a significant amount of confidential and sensitive information about its investors, its portfolio companies or obligors (as applicable) and potential investments. As a result, the Adviser may face a heightened risk of a security breach or disruption with respect to this information. There can be no assurance that measures the Adviser takes to ensure the integrity of its systems will provide protection, especially because cyberattack techniques used change frequently or are not recognized until successful. If the Adviser’s systems are compromised, do not operate properly or are disabled, or it fails to provide the appropriate regulatory or other notifications in a timely manner, the Adviser could suffer financial loss, a disruption of its businesses, liability to its investment funds and fund investors, including the Fund and common shareholders, regulatory intervention or reputational damage. The costs related to cyber or other security threats or disruptions may not be fully insured or indemnified by other means.
| Blackstone Floating Rate Enhanced Income Fund | Notes to Financial Statements |
March 31, 2024 (Unaudited)
In addition, the Fund could also suffer losses in connection with updates to, or the failure to timely update, the Adviser’s information systems and technology. In addition, the Adviser has become increasingly reliant on third party service providers for certain aspects of its business, including for the administration of certain funds, as well as for certain information systems and technology, including cloud-based services. These third party service providers could also face ongoing cyber security threats and compromises of their systems and as a result, unauthorized individuals could gain, and in some past instances have gained, access to certain confidential data.
Cybersecurity has become a top priority for regulators around the world. Many jurisdictions in which the Adviser operates have laws and regulations relating to data privacy, cybersecurity and protection of personal information, including, as examples, the General Data Protection Regulation in the EU and that went into effect in May 2018 and the California Consumer Privacy Act that went into effect in January 2020. Some jurisdictions have also enacted laws requiring companies to notify individuals and government agencies of data security breaches involving certain types of personal data.
Breaches in security, whether malicious in nature or through inadvertent transmittal or other loss of data, could potentially jeopardize the Adviser, its employees’ or the Fund’s investors’ or counterparties’ confidential, proprietary and other information processed and stored in, and transmitted through, the Adviser’s computer systems and networks, or otherwise cause interruptions or malfunctions in its, its employees’, the Fund’s investors’, the Fund’s counterparties’ or third parties’ business and operations, which could result in significant financial losses, increased costs, liability to the Fund’s investors and other counterparties, regulatory intervention and reputational damage. Furthermore, if the Adviser fails to comply with the relevant laws and regulations or fail to provide the appropriate regulatory or other notifications of breach in a timely matter, it could result in regulatory investigations and penalties, which could lead to negative publicity and reputational harm, and may cause the Fund’s investors and clients to lose confidence in the effectiveness of the Adviser’s security measures.
Obligors of the Fund also rely on data processing systems and the secure processing, storage and transmission of information, including payment and health information. A disruption or compromise of these systems could have a material adverse effect on the value of these businesses. The Fund may invest in strategic assets having a national or regional profile or in infrastructure, the nature of which could expose it to a greater risk of being subject to a terrorist attack or security breach than other assets or businesses. Such an event may have material adverse consequences on the Fund’s investment or assets of the same type or may require obligors of the Fund to increase preventative security measures or expand insurance coverage. Finally, the Adviser’s and the Fund’s technology, data and intellectual property and the technology, data and intellectual property of their portfolio companies or obligors (as applicable) are also subject to a heightened risk of theft or compromise to the extent the Adviser and the Fund’s portfolio companies or obligors (as applicable) engage in operations outside the United States, in particular in those jurisdictions that do not have comparable levels of protection of proprietary information and assets such as intellectual property, trademarks, trade secrets, know-how and customer information and records. In addition, the Adviser and the Fund and their portfolio companies or obligors (as applicable) may be required to compromise protections or forego rights to technology, data and intellectual property in order to operate in or access markets in a foreign jurisdiction. Any such direct or indirect compromise of these assets could have a material adverse impact on the Adviser and the Fund and their portfolio companies or obligors (as applicable).
Inflation and Supply Chain Risk: Economic activity has accelerated across sectors and regions in recent periods. Certain countries, including the U.S., have recently seen increased levels of inflation. Inflation and rapid fluctuations in inflation rates have had in the past, and may in the future have, negative effects on economies and financial markets. There can be no assurance that inflation will not become a serious problem in the future and have an adverse impact on the Fund’s returns.
Regulatory Risk: Governmental and regulatory actions may have unexpected or adverse consequences on particular markets, strategies, or investments, which may adversely impact the Fund and impair how it is managed. Policy and legislative changes in the United States and in other countries are affecting many aspects of financial regulation, and may in some instances contribute to decreased liquidity and increased volatility in the financial markets. The impact of these changes on the markets, and the practical implications for the Fund and other market participants, could be indirect and may not be fully known for some time.
| Semi-Annual Report | March 31, 2024 | 51 |
| Blackstone Floating Rate Enhanced Income Fund | Notes to Financial Statements |
March 31, 2024 (Unaudited)
NOTE 11. INCOME TAX
Distributions are determined in accordance with federal income tax regulations, which may differ from GAAP. These differences are primarily due to different treatments of income and gains on various investment securities held by the Fund, including differences in the timing of recognition of income, losses, and/or gains, and differing characterization of distributions made by the Fund as a whole. The tax character of distributions paid by the Fund during the six months ended March 31, 2024 and fiscal year ended September 30, 2023, respectively, are as follows:
| 2024 | | Blackstone Floating Rate Enhanced Income Fund | |
| Distributions Paid From: | | | | |
| Ordinary Income | | $ | 10,682,387 | |
| Total | | $ | 10,682,387 | |
| 2023 | | Blackstone Floating Rate Enhanced Income Fund | |
| Distributions Paid From: | | | | |
| Ordinary Income | | $ | 24,175,205 | |
| Total | | $ | 24,175,205 | |
The amount of net tax unrealized appreciation/(depreciation) and the tax cost of investment securities, including short-term securities at March 31, 2024, calculated using book/tax differences as of the most recently ended fiscal year, September 30, 2023, are as follows:
| | | Blackstone Floating Rate Enhanced Income Fund | |
| Cost of investments for income tax purposes | | $ | 311,322,811 | |
| Gross appreciation (excess of value over tax cost) | | $ | 3,631,535 | |
| Gross depreciation (excess of tax cost over value) | | | (6,021,611 | ) |
| Net unrealized depreciation | | $ | (2,390,076 | ) |
NOTE 12. RECENT ACCOUNTING PRONOUNCEMENT
In March 2020, the FASB issued ASU No. 2020-04, “Reference Rate Reform (Topic 848),” which provides optional expedients and exceptions for applying GAAP to contracts, hedging relationships, and other transactions affected by reference rate reform if certain criteria are met. The amendments apply only to contracts, hedging relationships, and other transactions that reference LIBOR or another reference rate expected to be discontinued because of reference rate reform. In January 2021, the FASB issued ASU No. 2021-01, Reference Rate Reform (Topic 848), which expanded the scope of Topic 848 to include derivative instruments impacted by discounting transition. In December 2022, FASB issued Accounting Standards Update No. 2022-06, "Deferral of the Sunset Date of Topic 848" ("ASU 2022-06). ASU 2022-06 defers the sunset date of Topic 848 to December 31, 2024, to permit entities to apply the guidance in Topic 848 through an 18-month period after the cessation date of USD LIBOR, which occurred on June 30, 2023. Management is currently evaluating the impact of applying this update.
In June 2022, FASB issued Accounting Standards Update No. 2022-03, "Fair Value Measurement of Equity Securities Subject to Contractual Sale Restrictions" ("ASU 2022-03"). ASU 2022-03 clarifies the guidance in ASC 820, related to the measurement of the fair value of an equity security subject to contractual sale restrictions, where it eliminates the ability to apply a discount to the fair value of these securities, and introduces disclosure requirements related to such equity securities. The guidance is effective for fiscal years, and interim periods within those fiscal years, beginning after December 15, 2023, and allows for early adoption. Management is currently evaluating the impact of applying this update.
| Blackstone Floating Rate Enhanced Income Fund | Notes to Financial Statements |
March 31, 2024 (Unaudited)
NOTE 13. SUBSEQUENT EVENTS
In preparing these financial statements, the Fund’s management has evaluated events and transactions for potential recognition or disclosure through the date the financial statements were issued.
The Fund completed a monthly repurchase offer on April 10, 2024, and 140,227 shares were repurchased for $3,098,905.
The Fund completed a monthly repurchase offer on May 10, 2024, and 72,392 shares were repurchased for $1,600,062.
On May 13, 2024, the Fund announced that the Adviser has recommended, and the Board of the Fund has approved, a plan of liquidation (the “Plan”) in connection with the orderly liquidation of the Fund. Under the Plan, which became effective May 13, 2024, the Fund began the process of liquidating portfolio assets and unwinding its affairs in an orderly fashion over time. As part of the liquidation, and in an effort to ensure the timely return of capital to shareholders, the Fund expects to return at least 90% of shareholder capital by the end of June 2024 across one or more special liquidating dividends, with the remainder of the capital to be returned subsequently. The Fund expects the first special liquidating dividend to be paid on or about June 13, 2024.
As part of the liquidation, effective May 13, 2024, the Adviser has agreed to voluntarily waive its advisory fee through the dissolution date of the Fund and to cover certain liquidation expenses incurred by the Fund. The Fund will bear costs in connection with the liquidation, including with respect to the sales of assets, repayment of debt, brokerage commissions and taxes. The Board has approved the termination of the Fund’s dividend reinvestment plan and the suspension of the Fund’s daily declaration and monthly distribution of dividends. Further, effective May 13, 2024, the Fund and its distributor are rejecting any orders to purchase shares of the Fund.
| Semi-Annual Report | March 31, 2024 | 53 |
| Blackstone Floating Rate Enhanced Income Fund | Additional Information |
March 31, 2024 (Unaudited)
Portfolio Information
The Fund files its complete schedules of portfolio holdings with the SEC for the first and third quarters of each fiscal year as an exhibit on Form N-PORT within 60 days after the end of the Fund’s fiscal quarter. The Fund’s portfolio holdings information for the third month of each fiscal quarter on Form N-PORT is available (1) on the Fund’s website located at http://www.bgflx.com or (2) on the SEC’s website at http://www.sec.gov. Holdings and allocations shown on any Form N-PORT are as of the date indicated in the filing and may not be representative of future investments. Holdings and allocations should not be considered research or investment advice and should not be relied upon in making investment decisions.
Proxy Information
The policies and procedures used to determine how to vote proxies relating to securities held by the Fund are available (1) without charge, upon request, by calling 1-877-876-1121, (2) on the Fund’s website located at http://www.bgflx.com, and (3) on the SEC’s website at http://www.sec.gov. Information regarding how the Fund voted proxies relating to portfolio securities during the most recent twelve-month period ended June 30 is available on Form N-PX by August 31 of each year (1) without charge, upon request, by calling 1-877-876-1121, (2) on the Fund’s website located at http://www.bgflx.com, and (3) on the SEC’s website at http://www.sec.gov.
| Blackstone Floating Rate Enhanced Income Fund | Privacy Procedures |
March 31, 2024 (Unaudited)
This privacy policy sets forth the Adviser’s policies with respect to nonpublic personal information of individual investors, shareholders, prospective investors and former investors of investment funds managed by the Adviser. These policies apply to individuals only and are subject to change.
June 2023
| FACTS | WHAT DO BLACKSTONE REGISTERED FUNDS DO WITH YOUR PERSONAL INFORMATION? |
| Why? | Financial companies choose how they share your personal information. Federal law gives consumers the right to limit some but not all sharing. Federal law also requires us to tell you how we collect, share, and protect your personal information. Please read this notice carefully to understand what we do. |
| What? | The types of personal information we collect and share depend on the product or service you have with us. This information can include: ● Social Security number and income ● Assets and investment experience ● Risk tolerance and transaction history |
| How? | All financial companies need to share customers’ personal information to run their everyday business. In the section below, we list the reasons financial companies can share their customers’ personal information; the reasons Blackstone Registered Funds (as defined below) choose to share; and whether you can limit this sharing. |
| Reasons we can share your personal information | Do Blackstone Registered Funds share? | Can you limit this sharing? |
| For our everyday business purposes – such as to process your transactions, maintain your account(s), respond to court orders and legal investigations, or report to credit bureaus | Yes | No |
| For our marketing purposes – to offer our products and services to you | Yes | No |
| For joint marketing with other financial companies | No | We don't share |
| For our affiliates' everyday business purposes – information about your transactions and experiences | No | We don't share |
| For our affiliates' everyday business purposes – information about your creditworthiness | No | We don't share |
| For our affiliates to market to you | No | We don't share |
| For nonaffiliates to market to you | No | We don't share |
| Semi-Annual Report | March 31, 2024 | 55 |
| Blackstone Floating Rate Enhanced Income Fund | Privacy Procedures |
March 31, 2024 (Unaudited)
| Questions? | Email us at PrivacyQueries@Blackstone.com |
| Who We Are | |
| Who is providing this notice? | Blackstone Registered Funds include Blackstone Alternative Investment Funds, on behalf of its series Blackstone Alternative Multi-Strategy Fund, Blackstone Diversified Multi-Strategy Fund, a sub-fund of Blackstone Alternative Investment Funds plc, Blackstone Floating Rate Enhanced Income Fund, Blackstone Senior Floating Rate 2027 Term Fund, Blackstone Long-Short Credit Income Fund, Blackstone Strategic Credit 2027 Term Fund, Blackstone Secured Lending Fund, Blackstone Real Estate Income Fund, Blackstone Real Estate Income Fund II, and Blackstone Real Estate Income Master Fund. |
| What We Do | |
| How do Blackstone Registered Funds protect my personal information? | To protect your personal information from unauthorized access and use, we use security measures that comply with federal law. These measures include computer safeguards and secured files and buildings. |
| How do Blackstone Registered Funds collect my personal information? | We collect your personal information, for example, when you: ● open an account or give us your income information ● provide employment information or give us your contact information ● tell us about your investment or retirement portfolio We also collect your personal information from others, such as credit bureaus, affiliates, or other companies. |
| Why can't I limit all sharing? | Federal law gives you the right to limit only: ● sharing for affiliates’ everyday business purposes—information about your creditworthiness ● affiliates from using your information to market to you sharing for nonaffiliates to market to you State laws and individual companies may give you additional rights to limit sharing. See below for more on your rights under state law. |
| What happens when I limit sharing for an account I hold jointly with someone else? | Your choices will apply to everyone on your account — unless you tell us otherwise. |
| Definitions | |
| Affiliates | Companies related by common ownership or control. They can be financial and nonfinancial companies. ● Our affiliates include companies with a Blackstone name and financial companies such as Blackstone Credit and Strategic Partners Fund Solutions. |
| Nonaffiliates | Companies not related by common ownership or control. They can be financial and nonfinancial companies. ● Blackstone Registered Funds do not share with nonaffiliates so they can market to you. |
| Joint marketing | A formal agreement between nonaffiliated financial companies that together market financial products or services to you. ● Our joint marketing partners include financial services companies. |
| Blackstone Floating Rate Enhanced Income Fund | Privacy Procedures |
March 31, 2024 (Unaudited)
| Other Important Information |
California Residents — In accordance with California law, we will not share information we collect about California residents with nonaffiliates except as permitted by law, such as with the consent of the customer or to service the customer’s accounts. We will also limit the sharing of information about you with our affiliates to the extent required by applicable California law.
Vermont Residents — In accordance with Vermont law, we will not share information we collect about Vermont residents with nonaffiliates except as permitted by law, such as with the consent of the customer or to service the customer’s accounts. We will not share creditworthiness information about Vermont residents among Blackstone Registered Funds’ affiliates except with the authorization or consent of the Vermont resident.
If you have any questions or comments about this Privacy Notice, or if you would like us to update information we have about you or your preferences, please email us at PrivacyQueries@Blackstone.com or access our web form www.blackstone.com/privacy.
You also may write to:
Blackstone Inc.
Attn: Legal & Compliance
345 Park Avenue
New York, NY 10154
| Semi-Annual Report | March 31, 2024 | 57 |
| Blackstone Floating Rate Enhanced Income Fund | Privacy Procedures |
March 31, 2024 (Unaudited)
INVESTOR DATA PRIVACY NOTICE
Why are you seeing this notice?
| ● | You may need to provide Personal Data to us as part of your investment into a fund or other investment vehicle (as applicable, the Fund) managed or advised by investment advisers or management companies that are subsidiaries of Blackstone Inc. or its affiliates (and, where applicable, the general partner of the relevant Fund) (collectively, Blackstone). |
| ● | We want you to understand how and why we use, store and otherwise process your Personal Data when you deal with us or our relevant affiliates (including under applicable data protection laws). If this notice (the Data Privacy Notice) has been made available to you, you may have certain rights with respect to your Personal Data under applicable data protection laws (including as described in this Data Privacy Notice). |
| ● | “Personal Data” has the meaning given to it under data protection laws that apply to our processing of your personal information, and includes any information relating to an identified or identifiable individual (such as name, address, date of birth, personal identification numbers, sensitive personal information, and economic information). |
| ● | We ask that investors promptly provide the information contained in this Data Privacy Notice to any individuals whose Personal Data they provide to the Fund or its affiliates in connection with ‘know your client’ / anti-money laundering requests or otherwise. |
Please read the information below carefully. It explains how and why Personal Data is processed by us.
Who is providing this notice?
Blackstone is committed to protecting and respecting your privacy. Blackstone is a global financial services firm with offices, branches, operations and entities globally, including as described at this link: https://privacy.blackstone.com/visitors-online-privacy-notice/#appendixA
| ● | For transparency, the Blackstone entities on whose behalf this privacy statement is made are: (i) the Fund; and (ii) where applicable, the Blackstone general partner, manager and/or investment adviser of the relevant Fund, in each case, with which you contract, transact or otherwise share Personal Data (together, the Fund Parties). |
| ● | Where we use the terms “we”, “us” and “our” in this Data Privacy Notice, we are referring to the Fund and the Fund Parties. |
| ● | Please consult your subscription documents, private placement memorandum or other offering documentation provided to you by or on behalf of the Fund Parties which will further specify the entities and contact details of the Fund Parties relevant to our relationship with you. |
| ● | We welcome investors and their representatives to contact us if they have any queries with respect to the Fund Parties (in particular, which Fund Parties are relevant to their relationship with Blackstone). If you have any queries, please see the ‘Contact Us’ section. |
When you provide us with your Personal Data, each Fund Party that decides how and why Personal Data is processed acts as a “data controller”. In simple terms, this means that the Fund Party makes certain decisions on how to use and protect your Personal Data – but only to the extent that we have informed you about the use or are otherwise permitted by law.
Where your Personal Data is processed by an entity controlled by, or under common control with, the Blackstone entity/ies managing a Fund for its own purposes, this entity will also be a data controller.
What personal data do we collect about you?
The types of Personal Data that we collect and share depends on the product or service you have with us and the nature of your investment. The Personal Data we collect about you may include:
| ● | Contact information, such as name, e-mail and postal address, and phone number; |
| ● | Demographic information, such as date and country of birth, gender, country of residence, nationality, and citizenship; |
| ● | Government-issued identification numbers provided in connection with a subscription to Funds, such as Social Security number, driver’s license number, passport number, national identification number, and tax identification number; |
| ● | Professional or employment-related information, such as the name of your employer or the organization you represent and your position; |
| ● | Financial information, such as information related to your transactions with us or others, bank account details (e.g., account and routing number), financial account history, information concerning the source of funds used for investments, and details regarding your investment history (e.g., types and amounts of investments) assets, income, and financial returns and positions; Investment preferences; |
| ● | Information related to background checks (e.g., “know your client”, anti-money laundering and sanctions checks) and any information related to applicable restrictions on your investments, such as political exposure or sanctions; |
| Blackstone Floating Rate Enhanced Income Fund | Privacy Procedures |
March 31, 2024 (Unaudited)
| ● | Information collected in the context of monitoring and surveillance where permitted or required by applicable law, including recordings of telephone and video calls and CCTV; and |
| ● | Other information you or the organization you represent choose to provide, such as through eligibility questionnaires and ongoing investor relations communications. |
We may combine Personal Data that you provide to us with Personal Data that we collect from you, or about you from other sources, in some circumstances. This will include Personal Data collected in an online or offline context.
Where do we obtain your personal data?
We collect Personal Data about you from a number of sources, including:
| WHAT | HOW |
Personal data that you give us | ● From the forms and any associated documentation that you complete when subscribing for an investment, shares, interests, and/or opening an account with us. This can include information about your name, address, date of birth, passport details or other national identifier, driving license, your national insurance or Social Security number and income, employment information and details about your investment or retirement portfolio(s), and financial-related data (such as returns and financial positions) ● When you provide it to us in correspondence and conversations, including electronic communications such as e-mail and telephone calls ● When you make transactions with respect to the Fund ● When you interact with our online platforms and websites (such as bxaccess.com) ● When you purchase securities from us and/or tell us where to send money ● From cookies, web beacons, and similar interactions when you or your devices access our sites ● When we need to identify you and/or complete necessary security checks, where you visit one of our buildings or attend meetings. This can include form of ID, and your image for CCTV purposes. |
Personal data that we obtain from others | ● We obtain Personal Data from: ● Publicly available and accessible directories and sources ● Bankruptcy registers ● Tax authorities, including those that are based outside the territory in which you are located or domiciled, including the Cayman Islands, the United Kingdom (UK) and the European Economic Area (EEA), if you are subject to tax in another jurisdiction ● Governmental and competent regulatory authorities to whom we have regulatory obligations ● Credit agencies ● Fraud prevention and detection agencies / organizations ● Transaction counterparties |
| Semi-Annual Report | March 31, 2024 | 59 |
| Blackstone Floating Rate Enhanced Income Fund | Privacy Procedures |
March 31, 2024 (Unaudited)
Why do we process your personal data?
We may process your Personal Data for the following reasons:
| WHY | HOW |
| Contract | It is necessary to perform our contract with you to: ● Administer, manage and set up your investor account(s) to allow you to purchase your holding (of shares or interests) in our Funds ● Meet the resulting contractual obligations we have to you ● Facilitate the continuation or termination of the contractual relationship between you and the Fund ● Facilitate the transfer of funds, and administering and facilitating any other transaction, between you and the Fund |
Compliance with law | It is necessary for compliance with an applicable legal or regulatory obligation to which we are subject, in order to: ● Undertake our client and investor due diligence, and on-boarding checks ● Carry out verification, “know your client”, terrorist financing, sanctions, and anti-money laundering checks ● Verify the identity and addresses of our investors (and, if applicable, their beneficial owners) ● Comply with requests from regulatory, governmental, tax and law enforcement authorities ● Carry out surveillance and investigations ● Carry out audit checks ● Maintain statutory registers ● Prevent and detect fraud ● Comply with sanctions requirements |
| Blackstone Floating Rate Enhanced Income Fund | Privacy Procedures |
March 31, 2024 (Unaudited)
| WHY | HOW |
Legitimate Interests | For our legitimate interests or those of a third party (such as a transaction counterparty or lender) to: ● Manage and administer your holding in any Funds in which you are invested, and any related accounts on an ongoing basis ● Assess and process any applications or requests made by you ● Open, maintain or close accounts in connection with your investment in, or withdrawal from, the Fund scheme ● Send updates, information and notices or otherwise correspond with you in connection with your investment in the Fund scheme ● Address or investigate any complaints, claims, proceedings or disputes ● Provide you with, and inform you about, our investment products and services ● Monitor and improve our relationships with investors ● Comply with applicable prudential and regulatory obligations, including anti-money laundering, sanctions and “know your client” checks ● Assist our transaction counterparties to comply with their regulatory and legal obligations (including anti-money laundering, “know your client”, terrorist financing, and sanctions checks) ● Manage our risk and operations ● Comply with our accounting and tax-reporting requirements ● Comply with our audit requirements ● Assist with internal compliance with our policies and processes ● Ensure appropriate group management and governance ● Keep our internal records ● Prepare reports on incidents/accidents ● Protect our business against fraud, breach of confidence, theft of proprietary materials, and other financial or business crimes (to the extent that this is not required of us by law) ● Analyze and manage commercial risks ● Seek professional advice, including legal advice ● Enable any actual or proposed assignee or transferee, participant or sub-participant of the partnership’s or Fund vehicles’ rights or obligations to evaluate proposed transactions ● Facilitate business asset transactions involving the Fund partnership or Fund-related vehicles ● Monitor communications to/from us using our systems ● Protect the security and integrity of our information technology systems ● Protect the security and safety of our buildings and locations where we operate ● Operate, run and schedule online meetings, webinars and conferences (for example, using Zoom and other online meeting platforms) ● Manage our financing arrangements with our financiers and financing transaction counterparties, including payment providers, intermediaries, and correspondent / agent banks ● Monitor the operation of Fund distribution platforms, where these are operated by third parties or service providers ● We only rely on these interests where we have considered that, on balance, the legitimate interests are not overridden by your interests, fundamental rights or freedoms. |
Monitoring as described in ‘Legitimate Interests’ above
We monitor communications where the law requires us to do so. We will also monitor where we are required to do so to comply with regulatory rules and practices and, where we are permitted to do so, to protect our business and the security of our systems.
| Semi-Annual Report | March 31, 2024 | 61 |
| Blackstone Floating Rate Enhanced Income Fund | Privacy Procedures |
March 31, 2024 (Unaudited)
Who we share your personal data with
We may share your Personal Data as follows:
| Who | Why |
| Fund Associates | We share your Personal Data with our associates, related parties and members of our group. This is: ● To manage our relationship with you ● For the legitimate interests of a third party in carrying out anti-money laundering, ‘know your client’, and other compliance checks required of them under applicable laws and regulations ● For the purposes set out in this Data Privacy Notice |
| Fund Managers, Depositories, Administrators, Custodians, Distributors, Investment Advisers | ● Delivering the services you require ● Managing your investment ● Supporting and administering investment-related activities ● Complying with applicable investment, anti-money laundering and other laws and regulations |
| Tax Authorities | ● To comply with applicable laws and regulations ● Where required or requested by tax authorities in the territory in which you are located or domiciled (in particular, Cayman Island or UK/EEA tax authorities) who, in turn, may share your Personal Data with foreign tax authorities ● Where required or requested by foreign tax authorities, including outside of the territory in which you are located or domiciled (including outside the Cayman Islands or UK/EEA) |
| Service Providers | ● Delivering and facilitating the services needed to support our business relationship with you (including cloud services) ● Supporting and administering investment-related activities ● Where disclosure to the service provider is considered necessary to support Blackstone with the purposes described in section 5 of this Data Privacy Notice |
| Financing Counterparties, Lenders, Correspondent and Agent Banks | ● Assisting these transaction counterparties with regulatory checks, such as ‘know your client’, and anti-money laundering procedures ● Sourcing credit for Fund-related entities in the course of our transactions and fund life cycles |
| Our Lawyers, Auditors and other Professional Advisers | ● Providing you with investment-related services ● To comply with applicable legal and regulatory requirements ● Supporting Blackstone with the purposes described in section 5 of this Data Privacy Notice |
In exceptional circumstances, we will share your Personal Data with:
● Competent regulatory, prosecuting and other governmental agencies or litigation counterparties, in a country or territory; and
● Other organizations and agencies – where we are required to do so by law.
| Blackstone Floating Rate Enhanced Income Fund | Privacy Procedures |
March 31, 2024 (Unaudited)
Do you have to provide us with this personal data?
Where we collect Personal Data from you, we will indicate if:
| ● | Provision of the Personal Data is necessary for our compliance with a legal obligation; or |
| ● | It is purely voluntary and there are no implications for you if you do not wish to provide us with it. |
Unless otherwise indicated, you should assume that we require the Personal Data for business and/or compliance purposes.
Some of the Personal Data that we request is necessary for us to perform our contract with you and if you do not wish to provide us with this Personal Data, it will affect our ability to provide our services to you and manage your investment.
Sending your personal data internationally
We may transfer your Personal Data between different countries to recipients in countries other than the country in which the information was originally collected (including to our affiliates and group members, members of the Fund’s partnership, transaction counterparties, and third-party service providers). Where you are based in the UK, the EU, or another country which imposes data transfer restrictions outside of its territory, this includes transfers outside of the UK and the European Economic Area (“EEA”) or that geographical area, to those countries in which our affiliates, group members, service providers and business partners operate. Those countries may not have the same data protection laws as the country in which you initially provided the information.
Where we transfer Personal Data outside of the UK, the EEA, or other territories subject to data transfer restrictions to other members of our group, our service providers or another third party recipient, we will ensure that our arrangements with them are governed by data transfer agreements or appropriate safeguards, designed to ensure that your Personal Data is protected as required under applicable data protection law (including, where appropriate, under an agreement on terms approved for this purpose by the European Commission or by obtaining your consent).
Please contact us if you would like to know more about these agreements or receive a copy of them. Please see the ‘Contact Us’ section for details.
Consent – and your right to withdraw it
Except as may otherwise be required by local law, we do not generally rely on obtaining your consent to process your Personal Data. In particular, we do not generally rely on obtaining your consent where our processing of your Personal Data is subject only to the data protection laws of the UK/EEA (in these circumstances we will usually rely on another legal basis more appropriate in the circumstances, including those set out in “Why do we process your Personal Data?” above). If we do rely on consent for processing of your Personal Data, you have the right to withdraw this consent at any time. Please contact us or send us an e-mail at PrivacyQueries@Blackstone.com at any time if you wish to do so.
Where required by applicable law, we will obtain your consent for the processing of your Personal Data for direct marketing purposes. If you do receive direct marketing communications from us (for example, by post, e-mail, fax or telephone), you may opt-out by clicking the link in the relevant communication, completing the forms provided to you (where relevant), or by contacting us (see the ‘Contact Us’ section for details).
Retention and deletion of your personal data
We keep your Personal Data for as long as it is required by us for our legitimate business purposes, to perform our contractual obligations or, where longer, such longer period as is required or permitted by law or regulatory obligations which apply to us. We will generally:
| ● | Retain Personal Data about you throughout the life cycle of any investment you are involved in; and |
| ● | Retain some Personal Data after your relationship with us ends. |
As a general principle, we do not retain your Personal Data for longer than we need it. We will usually delete your Personal Data (at the latest) after you cease to be an investor in any fund and there is no longer any legal / regulatory requirement, or business purpose, for retaining your Personal Data.
| Semi-Annual Report | March 31, 2024 | 63 |
| Blackstone Floating Rate Enhanced Income Fund | Privacy Procedures |
March 31, 2024 (Unaudited)
Your rights
You may, subject to certain limitations, have data protection rights depending on the data protection laws that apply to our processing of your Personal Data, including the right to:
| ● | Access your Personal Data |
| ● | Restrict the use of your Personal Data in certain circumstances |
| ● | Have incomplete or inaccurate Personal Data corrected |
| ● | Ask us to stop processing your Personal Data |
| ● | Require us to delete your Personal Data in some limited circumstances |
You also have the right in some circumstances to request us to “port” your Personal Data in a portable, re-usable format to other organizations (where this is possible).
We review and verify requests to protect your Personal Data, and will action data protection requests fairly and in accordance with applicable data protection laws and principles.
If you wish to exercise any of these rights, please see the ‘Contact Us’ section for details.
Concerns or queries
We take your concerns very seriously. We encourage you to bring to our attention any concerns you have about our processing of your Personal Data. This Data Privacy Notice was drafted with simplicity and clarity in mind. We are, of course, happy to provide any further information or explanation needed. Please see the ‘Contact Us’ section for details.
Please also contact us via any of the contact methods listed below if you have a disability and require an alternative format of this Data Privacy Notice.
If you want to make a complaint, you can also contact the body regulating data protection in your country, where you live or work, or the location where the data protection issue arose. In particular:
| Country | Supervisory Authority |
| Cayman Islands | Cayman Islands Ombudsman (available at: https://ombudsman.ky) |
| European Union | A list of the EU data protection authorities and contact details is available by clicking this link: http://ec.europa.eu/newsroom/article29/item-detail.cfm?item_id=612080 |
| United Kingdom | Information Commissioner’s Office (available at: https://ico.org.uk/global/contact-us/) |
| Blackstone Floating Rate Enhanced Income Fund | Privacy Procedures |
March 31, 2024 (Unaudited)
Contact us
Please contact us if you have any questions about this Data Privacy Notice or the Personal Data we hold about you.
Contact us by e-mail or access our web form by e-mailing PrivacyQueries@Blackstone.com.
Contact us in writing using this address:
| Address | |
| For EU/UK | 40 Berkeley Square |
| Related Queries | London |
| | W1J 5AL |
| | United Kingdom |
| For All Other | 345 Park Avenue |
| Queries | New York |
| | NY 10154 |
A list of country specific addresses and contacts for locations where we operate is available at https://privacy.blackstone.com/visitors-online-privacy-notice/#appendixA
Changes to this data privacy notice
We keep this Data Privacy Notice under regular review. Please check regularly for any updates at our investor portal (www.bxaccess.com).
| Semi-Annual Report | March 31, 2024 | 65 |
| Blackstone Floating Rate Enhanced Income Fund | Trustees & Officers |
March 31, 2024 (Unaudited)
Below is a list of the Trustees and officers of the Fund and their present positions and principal occupations during the past five years. The business address of the Fund, the Trustees, the Fund’s officers, and the Adviser is 345 Park Avenue, 31st Floor, New York, NY 10154, unless specified otherwise below. The SAI includes additional information about the board members and is available, without charge, upon request. Shareholders may call (888) 756-8443 or email BlackstoneShareholderRelations@Blackstone.com to request the SAI.
NON-INTERESTED TRUSTEES:
Name, Address and Year of Birth(1) | Position(s) Held with the Fund | Length of Time Served | Principal Occupation(s) During the Past Five Years | Number of Portfolios in Fund Complex Overseen by Trustee(2) | Other Directorships Held by the Trustee During the Past Five Years |
Jane M. Siebels Birth Year: 1960 | Lead Independent Trustee and member of Audit and Nominating and Governance Committees | Since November 2021 | Ms. Siebels was formerly a Consultant at Per4M and advises a small global equity hedge fund. Currently, she is the CEO of Homer Technology. Prior to 2019, she was CEO and CIO of Amber Asset Management, f/k/a Green Cay Asset Management. | 4 | Scotia Bank (Bahamas); Scotia Bank International (Bahamas); Scotia Trust (Bahamas); First Trust Bank (Bahamas); Global Innovation Fund; Amber Asset Management (until 2019) |
Edward H. D’Alelio Birth Year: 1952 | Trustee, Member of Audit and Nominating and Governance Committees | Since September 2017 | Mr. D’Alelio was formerly a Managing Director and CIO for Fixed Income at Putnam Investments, Boston where he retired in 2002. He currently is an Executive in Residence with the School of Management, Univ. of Mass Boston. | 4 | Owl Rock Capital Corp. business development companies (“BDCs”) (7 portfolios overseen in Fund Complex) |
Thomas W. Jasper Birth Year: 1948 | Trustee, Chairman of Audit Committee and member of Nominating and Governance Committee | Since September 2017 | Mr. Jasper is the Managing Partner of Manursing Partners LLC, a consulting firm. | 4 | Sisecam Resources LP (formerly, Ciner Resources LP) (master limited partnership) (until 2023) |
Gary S. Schpero Birth Year: 1953 | Trustee, Chairman of Nominating and Governance Committee and member of Audit Committee | Since September 2017 | Mr. Schpero is retired. Prior to January 2000, he was a partner at the law firm of Simpson Thacher & Bartlett LLP where he served as managing partner of the Investment Management and Investment Company Practice Group. | 4 | EQ Premier VIP Trust; EQ Advisors Trust; 1290 Funds |
| Blackstone Floating Rate Enhanced Income Fund | Trustees & Officers |
March 31, 2024 (Unaudited)
INTERESTED TRUSTEE (3):
Name, Address and Year of Birth(1) | Position(s) Held with the Fund | Length of Time Served | Principal Occupation(s) During the Past Five Years | Number of Portfolios in Fund Complex Overseen by Trustee(2) | Other Directorships Held by the Trustee During the Past Five Years |
Robert Zable(4) Birth Year: 1972 | Chairman of the Board, President, Chief Executive Officer, Trustee | Since January 2024 | Mr. Zable is a Senior Managing Director and the Global Head of Liquid Credit Strategies at Blackstone Credit & Insurance. Mr. Zable is also a Portfolio Manager of the U.S. closed-end funds and sits on the Global Syndicated Credit Investment Committee. Before joining Blackstone in 2007, Mr. Zable was a Vice President at FriedbergMilstein LLC, where he was responsible for credit opportunity investments and junior capital origination and execution. | 4 | None |
| Semi-Annual Report | March 31, 2024 | 67 |
| Blackstone Floating Rate Enhanced Income Fund | Trustees & Officers |
March 31, 2024 (Unaudited)
OFFICERS:
Name, Address and Year of Birth | Position(s) Held with the Fund | Length of Time Served | Principal Occupation During the Past Five Years |
Robert Zable(4) Birth Year: 1972 | Chairman of the Board, President, Chief Executive Officer, Trustee | In current role: Since January 2024 In prior office roles: Since Inception | Mr. Zable is a Senior Managing Director and the Global Head of Liquid Credit Strategies at Blackstone Credit & Insurance. Mr. Zable is also a Portfolio Manager of the U.S. closed-end funds and sits on the Global Syndicated Credit Investment Committee. Before joining Blackstone in 2007, Mr. Zable was a Vice President at FriedbergMilstein LLC, where he was responsible for credit opportunity investments and junior capital origination and execution. |
Gregory Roppa Birth Year: 1976 | Chief Financial Officer and Treasurer | Since March 2022 | Mr. Roppa is a Managing Director in the Global Fund Finance group of Blackstone, where he focuses on the accounting and financial reporting for certain entities within Blackstone Credit & Insurance and Real Estate businesses. Before joining Blackstone in 2019, Mr. Roppa was the Director of Operations and Fund Accounting for Clinton Group Inc., an alternative asset management firm. |
Robert Post Birth Year: 1989 | Executive Vice President and Assistant Secretary | Since January 2024 | Mr. Post is a Managing Director and the Head of U.S. CLO Management for Blackstone Credit & Insurance. Mr. Post is also a Portfolio Manager of the U.S. closed-end funds and sits on the Global Syndicated Credit Investment Committee. Before joining Blackstone in 2017, Mr. Post was a Junior Portfolio Manager at BlackRock, where his responsibilities included various leveraged loan and high yield mandates. |
Marisa Beeney Birth Year: 1970 | Chief Legal Officer and Secretary | Since Inception | Ms. Beeney is a Senior Managing Director and General Counsel of Blackstone Credit & Insurance. Before joining Blackstone, she was with the finance group of DLA Piper. |
| Blackstone Floating Rate Enhanced Income Fund | Trustees & Officers |
March 31, 2024 (Unaudited)
OFFICERS (continued):
Name, Address and Year of Birth | Position(s) Held with the Fund | Length of Time Served | Principal Occupation During the Past Five Years |
William Renahan Birth Year: 1969 | Chief Compliance Officer | Since September 2022 | Mr. Renahan is a Managing Director in the Legal and Compliance group of Blackstone. Before joining Blackstone in 2022, he was a Senior Managing Director and Chief Compliance Officer at Duff & Phelps Investment Management. |
Valerie Naratil Birth Year: 1988 | Public Relations Officer | Since February 2021 | Ms. Naratil is a Managing Director and member of the Product Management team within Blackstone Credit & Insurance’s Liquid Credit Strategies business. Before joining Blackstone in 2014, Ms. Naratil worked at UBS Investment Bank, advising corporate clients across the Healthcare industry. |
| (1) | The address of each Trustee/Nominee and Officer, unless otherwise noted, is Blackstone Alternative Credit Advisors LP, 345 Park Avenue, 31st Floor, New York, NY 10154. |
| (2) | The “Fund Complex” consists of the Blackstone Credit & Insurance Closed-End Funds, Blackstone Secured Lending Fund, Blackstone Private Credit Fund and Blackstone Alternative Multi-Strategy Fund. |
| (3) | “Interested person” of the Fund as defined in Section 2(a)(19) of the 1940 Act. Mr. Zable is an interested person due to his employment with the Adviser. |
| (4) | Effective December 31, 2023, Daniel H. Smith resigned from his positions as Trustee and Chairman of the Board and as President and Chief Executive Officer of the Fund, and effective January 1, 2024, the Board appointed Robert Zable to these positions. Also effective December 31, 2023, Mr. Zable resigned from his positions as Executive Vice President and Assistant Secretary of the Fund, and effective January 1, 2024, the Board appointed Robert Post to these positions. |
| Semi-Annual Report | March 31, 2024 | 69 |

Not applicable to this Report.
| Item 3. | Audit Committee Financial Expert. |
Not applicable to this Report.
| Item 4. | Principal Accountant Fees and Services. |
Not applicable to this Report.
| Item 5. | Audit Committee of Listed Registrants. |
Not applicable to registrant.
| (a) | Schedule of Investments in securities of unaffiliated issuers as of the close of the reporting period is included as part of the Report to Stockholders filed under Item 1(a) of this Form N-CSR. |
| Item 11. | Statement Regarding Basis for Approval of Investment Advisory Contract. |
Not applicable to this Report.
| Item 12. | Disclosure of Proxy Voting Policies and Procedures for Closed-End Management Investment Companies. |
Not applicable to this Report.
| Item 13. | Portfolio Managers of Closed-End Management Investment Companies. |
| (a) | Not applicable to this Report. |
| (b) | As of the date of this filing, there have been no changes in any of the portfolio managers identified in the most recent annual report on Form N-CSR. |
| Item 14. | Purchases of Equity Securities by Closed-End Management Investment Company and Affiliated Purchasers. |
None.
| Item 15. | Submission of Matters to a Vote of Security Holders. |
There have been no material changes to the procedures by which shareholders may recommend nominees to the registrant’s Board of Trustees, where those changes were implemented after the registrant last provided disclosure in response to the requirements of Item 407(c)(2)(iv) of Regulation S-K, or this Item.
| Item 16. | Controls and Procedures. |
| (a) | The registrant’s principal executive officer and principal financial officer have concluded that the registrant’s disclosure controls and procedures (as defined in Rule 30a-3(c) under the 1940 Act) are effective as of a date within 90 days of the filing date of this Report, based on the evaluation of these controls and procedures required by Rule 30a-3(b) under the 1940 Act and Rules 13a-15(b) or 15d-15(b) under the Securities Exchange Act of 1934, as amended. |
| (b) | There was no change in the registrant’s internal control over financial reporting (as defined in Rule 30a-3(d) under the 1940 Act) that occurred during the period covered by this Report that has materially affected, or is reasonably likely to materially affect, the registrant’s internal control over financial reporting. |
| Item 17. | Disclosure of Securities Lending Activities for Closed-End Management Investment Companies. |
Not applicable.
| Item 18. | Recovery of Erroneously Awarded Compensation. |
| (a)(1) | Not applicable to this Report. |
| (a)(2) | Not applicable to this Report. |
SIGNATURES
Pursuant to the requirements of the Securities Exchange Act of 1934 and the Investment Company Act of 1940, the Registrant has duly caused this report to be signed on its behalf by the undersigned, thereunto duly authorized.
Blackstone Floating Rate Enhanced Income Fund
| By: | /s/ Robert Zable | |
| | Robert Zable (Principal Executive Officer) | |
| | Chief Executive Officer and President | |
| | | |
| Date: | June 6, 2024 | |
| | | |
| By: | /s/ Gregory Roppa | |
| | Gregory Roppa (Principal Financial Officer) | |
| | Treasurer and Chief Financial Officer | |
| | | |
| Date: | June 6, 2024 | |
Pursuant to the requirements of the Securities Exchange Act of 1934 and the Investment Company Act of 1940, this report has been signed below by the following persons on behalf of the Registrant and in the capacities and on the dates indicated.
Blackstone Floating Rate Enhanced Income Fund
| By: | /s/ Robert Zable | |
| | Robert Zable (Principal Executive Officer) | |
| | Chief Executive Officer and President | |
| | | |
| Date: | June 6, 2024 | |
| | | |
| By: | /s/ Gregory Roppa | |
| | Gregory Roppa (Principal Financial Officer) | |
| | Treasurer and Chief Financial Officer | |
| | | |
| Date: | June 6, 2024 | |