UNITED STATES
SECURITIES AND EXCHANGE COMMISSION
Washington, D.C. 20549
FORM N-CSR
CERTIFIED SHAREHOLDER REPORT OF REGISTERED
MANAGEMENT INVESTMENT COMPANIES
|
| | | | | | |
| Investment Company Act file number | 811-23305 |
| | |
| AMERICAN CENTURY ETF TRUST |
| (Exact name of registrant as specified in charter) |
| | |
| 4500 MAIN STREET, KANSAS CITY, MISSOURI | 64111 |
| (Address of principal executive offices) | (Zip Code) |
| | |
CHARLES A. ETHERINGTON 4500 MAIN STREET, KANSAS CITY, MISSOURI 64111 |
| (Name and address of agent for service) |
| | |
| Registrant’s telephone number, including area code: | 816-531-5575 |
| | |
| Date of fiscal year end: | 08-31 |
| | |
| Date of reporting period: | 08-31-2018 |
ITEM 1. REPORTS TO STOCKHOLDERS.
|
| |
| | |
| | Annual Report |
| | |
| | August 31, 2018 |
| | |
| | American Century® Diversified Corporate Bond ETF (KORP) |
| | American Century® STOXX® U.S. Quality Value ETF (VALQ)
|
|
| |
| President’s Letter | |
| Diversified Corporate Bond ETF | |
| Performance | |
| Portfolio Commentary | |
| Fund Characteristics | |
STOXX® U.S. Quality Value ETF | |
| Performance | |
| Portfolio Commentary | |
| Fund Characteristics | |
| | |
| Frequency Distributions of Premiums and Discounts | |
| Shareholder Fee Examples | |
| Schedules of Investments | |
| Statements of Assets and Liabilities | |
| Statements of Operations | |
| Statements of Changes in Net Assets | |
| Notes to Financial Statements | |
| Financial Highlights | |
| Report of Independent Registered Public Accounting Firm | |
| Management | |
| Additional Information | |
The iSTOXX American Century USA Quality Value Index is the intellectual property (including registered trademarks) of STOXX Limited, Zurich, Switzerland (“STOXX”), Deutsche Börse Group or their licensors, which is used under license. American Century STOXX U.S. Quality Value ETF is neither sponsored nor promoted, distributed or in any other manner supported by STOXX, Deutsche Börse Group or their licensors, research partners or data providers and STOXX, Deutsche Börse Group and their licensors, research partners or data providers do not give any warranty, and exclude any liability (whether in negligence or otherwise) with respect thereto generally or specifically in relation to any errors, omissions or interruptions in the iSTOXX American Century USA Quality Value Index or its data.
Any opinions expressed in this report reflect those of the author as of the date of the report, and do not necessarily represent the opinions of American Century Investments® or any other person in the American Century Investments organization. Any such opinions are subject to change at any time based upon market or other conditions and American Century Investments disclaims any responsibility to update such opinions. These opinions may not be relied upon as investment advice and, because investment decisions made by American Century Investments funds are based on numerous factors, may not be relied upon as an indication of trading intent on behalf of any American Century Investments fund. Security examples are used for representational purposes only and are not intended as recommendations to purchase or sell securities. Performance information for comparative indices and securities is provided to American Century Investments by third party vendors. To the best of American Century Investments’ knowledge, such information is accurate at the time of printing.
 Jonathan Thomas
Dear Investor:
Thank you for reviewing this annual report for the nearly eight-month period from the ETFs’ inception to August 31, 2018. Annual reports help convey important information about fund returns, including market factors that affected performance during the reporting period. For additional information on our ETFs, please visit our website, americancenturyetfs.com.
Amid Economic Gains and Heightened Volatility, Stocks Rose While Bonds Retreated
The funds launched in the midst of a strong stock market rally that quickly gave way to a period of sharp market volatility. Robust corporate earnings results, improving economic growth, relatively low interest rates, and growth-oriented federal tax reform helped drive stock prices higher through January. Conversely, this backdrop created challenges for fixed-income investors, as interest rates edged higher and the Federal Reserve (Fed) continued its monetary policy-normalization efforts.
In early February, volatility resurfaced after an extended period of relative dormancy, causing a dramatic shift in market sentiment. Better-than-expected U.S. economic data triggered expectations for rising inflation, higher interest rates, and a more-hawkish Fed. In response, U.S. Treasury yields climbed to their highest levels in several years, and stock prices plunged. However, economic data released in subsequent months were more in line with market expectations, and corporate earnings results generally remained strong. This news helped calm the market unrest, but rising interest rates, geopolitical tensions, global trade war fears, and a slightly more-hawkish tone from the Fed provided periodic headwinds.
Stocks generally held onto gains for the reporting period, with growth stocks outpacing value stocks and small-cap stocks outperforming large-cap stocks. Meanwhile, rising U.S. Treasury yields and inflation weighed on investment-grade bond returns, which declined slightly.
With economic growth accelerating, inflationary pressures mounting, U.S. Treasury yields rising, volatility resurfacing, and the implications of U.S. tariff and trade policy still unfolding, investors face a complex market backdrop. We believe this scenario underscores the importance of using professionally managed portfolios in pursuit of investment goals. We appreciate your continued trust and confidence in us.
Sincerely,
Jonathan Thomas
President and Chief Executive Officer
American Century Investments
|
| | |
| Diversified Corporate Bond ETF (KORP) | | |
| Total Returns as of August 31, 2018 | | |
| | Since Inception | Inception Date |
| Net Asset Value | -0.77% | 1/11/2018 |
| Market Price | -0.58% | 1/11/2018 |
| Bloomberg Barclays U.S. Intermediate Corporate Bond Index | -0.34% | — |
Market price is determined using the bid/ask midpoint at 4:00 p.m. Eastern time, when the net asset value (NAV) is typically calculated. Market performance does not represent the returns you would receive if you traded shares at other times. NAV prices are used to calculate market price performance prior to the date when the fund first traded on the New York Stock Exchange.
|
|
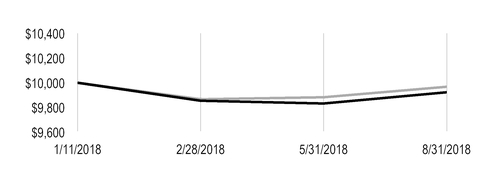
| Growth of $10,000 Over Life of Fund |
| $10,000 investment made January 11, 2018 |
|
| |
| Value on August 31, 2018 |
| | Net Asset Value — $9,923 |
| |
| | Bloomberg Barclays U.S. Intermediate Corporate Bond Index — $9,966 |
| |
|
|
| Total Annual Fund Operating Expenses |
| 0.45% |
The total annual fund operating expenses shown is as stated in the fund’s prospectus current as of the date of this report. The prospectus may vary from the expense ratio shown elsewhere in this report because it is based on a different time period, includes acquired fund fees and expenses, and, if applicable, does not include fee waivers or expense reimbursements.
Data presented reflect past performance. Past performance is no guarantee of future results. Current performance may be higher or lower than the performance shown. Total returns for periods less than one year are not annualized. Investment return and principal value will fluctuate, and redemption value may be more or less than original cost. Data assumes reinvestment of dividends and capital gains, and none of the charts reflect the deduction of taxes that a shareholder would pay on fund distributions or the redemption of fund shares. To obtain performance data current to the most recent month end, please call 1-800-345-6488 or visit americancenturyetfs.com. For additional information about the funds, please consult the prospectus.
Portfolio Managers: Kevin Akioka, Jeffrey Houston, Gavin Fleischman, and Le Tran
Fund Objective
The American Century Diversified Corporate Bond ETF seeks to offer enhanced return potential versus passive capitalization-weighted corporate bond portfolios. The fund employs a holistic approach, emphasizing investment-grade credits while dynamically allocating a portion of the portfolio to high-yield securities. The fund integrates fundamental and quantitative analysis in a systematically managed portfolio that strives to balance interest-rate risk and credit risk. The fund seeks to maintain a duration range of three to seven years, which we believe should mitigate interest-rate risk without sacrificing yield.
The fund is an actively managed ETF that does not seek to replicate the performance of a specific index. To determine whether to buy or sell a security, we consider several factors, including fund requirements and standards, economic conditions, alternative investments, interest rates, and various credit metrics.
Performance Review
For the period from the fund’s inception on January 11, 2018, through the fund’s fiscal year-end on August 31, 2018, the fund returned -0.58%* on a market price basis. On a net asset value (NAV) basis, the fund returned -0.77%. For the same time period, the Bloomberg Barclay’s U.S. Intermediate Corporate Bond Index, the fund’s benchmark index, returned -0.34%. The fund’s NAV return reflects fees and operating expenses, while the index return does not.
Rising Rates Weighed on Results
Interest rates rose during the period, particularly in January and February, as the Federal Reserve continued to signal its intention to hike short-term rates and normalize monetary policy. With rates rising across the yield curve, bond prices declined across most fixed-income sectors. Within the investment-grade corporate sector, spreads widened versus U.S. Treasuries, resulting in an even larger decline in bond prices compared with other investment-grade sectors. This spread widening detracted from fund performance.
In addition to rising interest rates, events outside the U.S. also helped drive investment-grade corporate credit spreads wider. In particular, mounting geopolitical and economic risk in emerging markets and developed European markets contributed to the spread widening. Uncertainty about the political and economic landscape in Turkey and Argentina added to the market volatility later in the reporting period.
Within the portfolio, our allocation to investment-grade corporate bonds with BBB credit ratings (the lowest credit rating category in the investment-grade bond universe) detracted from performance. Lower-rated investment-grade bonds generally underperformed higher-credit-quality securities.
We maintained the fund’s duration within a range of 4.0 years and 4.5 years during the reporting period. This positioning detracted from absolute performance as interest rates moved higher across the yield curve. Compared with the index, duration slightly detracted from relative results.
*Total returns for periods less than one year are not annualized.
High-Yield Exposure Had Neutral Effect on Performance
Our allocation to high-yield corporate bonds had a neutral effect on performance. High-yield bond prices, which typically are less-sensitive to changes in interest rates, generally remained stable during the reporting period. Furthermore, U.S. high-yield bond issuers tend to have less emerging markets exposure than the broader investment-grade universe, which also aided high-yield bonds compared with investment-grade corporates. We slightly reduced our high-yield exposure late in the period, as spreads remained tight amid the heightened volatility in the investment-grade corporate market. As of August 31, 2018, approximately 12% of the portfolio was invested in high-yield bonds, compared with an average allocation of 15%.
Among the fund’s industry exposures, an underweight position to information technology companies contributed to portfolio performance. Conversely, overweight positions in basic industries and energy weighed on results.
Portfolio Positioning
Going forward, we will look for opportunities among issuers and industries in the investment-grade corporate bond market that we believe have been unduly hurt by widening spreads and the continued volatility in emerging markets. On the other hand, spreads remain relatively narrow within the high-yield corporate bond sector. Against this backdrop, we will continue to carefully evaluate credits, selecting securities we believe offer attractive risk/reward characteristics. We will continue to monitor valuations in the high-yield sector, seeking to add exposure when spreads widen and selectively sell high-yield securities when valuations become rich. We believe interest rates will gradually increase, and accordingly, we expect to maintain the fund’s sensitivity to interest rate changes within the middle to the lower end of the fund’s duration range.
|
| |
| AUGUST 31, 2018 |
| | |
| Diversified Corporate Bond ETF | |
| Portfolio at a Glance | |
| Average Duration (effective) | 4.1 years |
| Weighted Average Life to Maturity | 5.3 years |
| | |
| Types of Investments in Portfolio | % of net assets |
| Corporate Bonds | 97.7% |
| Temporary Cash Investments | 1.4% |
| Other Assets and Liabilities | 0.9% |
|
| | |
STOXX® U.S. Quality Value ETF (VALQ) |
| Total Returns as of August 31, 2018 | | |
| | Since Inception | Inception Date |
| Net Asset Value | 4.16% | 1/11/2018 |
| Market Price | 4.20% | 1/11/2018 |
iSTOXX® American Century USA Quality Value Index | 4.29% | — |
Market price is determined using the bid/ask midpoint at 4:00 p.m. Eastern time, when the net asset value (NAV) is typically calculated. Market performance does not represent the returns you would receive if you traded shares at other times. NAV prices are used to calculate market price performance prior to the date when the fund first traded on the New York Stock Exchange.
|
|
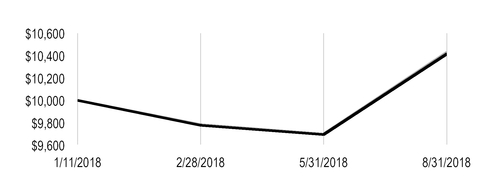
| Growth of $10,000 Over Life of Fund |
| $10,000 investment made January 11, 2018 |
|
| |
| Value on August 31, 2018 |
| | Net Asset Value — $10,416 |
| |
| | iSTOXX® American Century USA Quality Value Index — $10,429 |
| |
|
|
| Total Annual Fund Operating Expenses |
| 0.29% |
The total annual fund operating expenses shown is as stated in the fund’s prospectus current as of the date of this report. The prospectus may vary from the expense ratio shown elsewhere in this report because it is based on a different time period, includes acquired fund fees and expenses, and, if applicable, does not include fee waivers or expense reimbursements.
Data presented reflect past performance. Past performance is no guarantee of future results. Current performance may be higher or lower than the performance shown. Total returns for periods less than one year are not annualized. Investment return and principal value will fluctuate, and redemption value may be more or less than original cost. Data assumes reinvestment of dividends and capital gains, and none of the charts reflect the deduction of taxes that a shareholder would pay on fund distributions or the redemption of fund shares. To obtain performance data current to the most recent month end, please call 1-800-345-6488 or visit americancenturyetfs.com. For additional information about the funds, please consult the prospectus.
Portfolio Managers: Peruvemba Satish and Rene Casis
Fund Objective
The American Century STOXX® U.S. Quality Value ETF seeks to track the investment results (before fees and expenses) of the iSTOXX® American Century USA Quality Value Index (the underlying index). Under normal market conditions, the fund invests at least 80% of its assets in the component securities of the underlying index.
The STOXX® USA 900 Index, which consists of the 900 largest publicly traded U.S. equity securities, defines the universe we use to create the underlying index. From that universe, we use a rules-based methodology that screens and weights stocks based on fundamental measures of quality, value, and income. The resulting underlying index is designed to include high-quality securities of large- and mid-cap companies that are undervalued or have sustainable income. Although component securities of the underlying index may change from time to time, the index typically consists of 200-300 securities with market capitalizations of approximately $2 billion to $880 billion.
Performance Review
For the period from STOXX® U.S. Quality Value ETF's inception on January 11, 2018, through the fund’s fiscal year-end on August 31, 2018, the fund returned 4.20%* on a market price basis. On a net asset value (NAV) basis, the fund returned 4.16%. For the same time period, the underlying index returned 4.29%. The fund fully replicated the underlying index’s components during the reporting period. The fund’s NAV performance differed from the underlying index’s return due to fees and operating expenses associated with the fund.
For the same time period, market-capitalization-weighted value strategies, as measured by the Russell 1000 Value Index (value index), returned 0.93%. The value index is an unmanaged index generally representative of the performance of U.S. large-cap value stocks. The fund’s outperformance versus the value index was largely due to the different compositions of the fund and the value index. Specifically, the fund tracks the underlying index, which pursues risk-adjusted returns by dynamically allocating among high-quality, attractively valued companies and companies offering sustainable income. This approach led to outperformance versus the value index, which selects and weights value stocks based on market capitalization.
From a broad perspective, fund holdings in the consumer discretionary, health care, industrials, energy, and consumer staples sectors accounted for the majority of the fund's outperformance versus the value index. Within those sectors, security selection was the primary driver of results. From an industry perspective, the health care providers and services industry was a main contributor, largely due to security selection and an overweight position relative to the value index. Similarly, security selection and an overweight position in the multiline retail industry also lifted results. Additionally, an underweight position in the industrial conglomerates industry aided the fund’s performance compared with the value index.
* Total returns for periods less than one year are not annualized.
|
| |
STOXX® U.S. Quality Value ETF | |
| Top Ten Holdings | % of net assets |
| Apple, Inc. | 2.1% |
| International Business Machines Corp. | 1.9% |
| AT&T, Inc. | 1.9% |
| Bank of America Corp. | 1.8% |
| Anthem, Inc. | 1.7% |
| Cigna Corp. | 1.6% |
| HP, Inc. | 1.5% |
| CVS Health Corp. | 1.5% |
| Allergan plc | 1.4% |
| Target Corp. | 1.4% |
| | |
| Top Five Industries | % of net assets |
| Health Care Providers and Services | 9.2% |
| Semiconductors and Semiconductor Equipment | 7.1% |
| Technology Hardware, Storage and Peripherals | 5.4% |
| Equity Real Estate Investment Trusts (REITs) | 4.8% |
| IT Services | 4.7% |
| | |
| Types of Investments in Portfolio | % of net assets |
| Common Stocks | 99.9% |
| Temporary Cash Investments | 0.1% |
| Other Assets and Liabilities | —* |
*Category is less than 0.05% of total net assets.
|
|
| Frequency Distributions of Premiums and Discounts |
The Frequency Distribution of Premiums and Discounts chart is provided to show the frequency at which the market price for the fund was at a premium or discount to the daily net asset value (NAV). Shareholders may pay more than NAV when they buy fund shares and receive less than NAV when they sell those shares because shares are bought and sold at current market price. Data presented reflect past performance. Past performance is no guarantee of future results. The following table represents the period January 16, 2018 (commencement of trading) through August 31, 2018.
Diversified Corporate Bond ETF
|
| | |
| Premium/Discount Range (%) | Number of Days Market Price Above or Equal to NAV | Number of Days Market Price Below NAV |
| 0% - 0.49% | 159 | 1 |
| 0.50% - 0.99% | — | — |
| 1.00% - 1.99% | — | — |
| > 2.00% | — | — |
| Total | 159 | 1 |
STOXX® U.S. Quality Value ETF
|
| | |
| Premium/Discount Range (%) | Number of Days Market Price Above or Equal to NAV | Number of Days Market Price Below NAV |
| 0% - 0.49% | 96 | 64 |
| 0.50% - 0.99% | — | — |
| 1.00% - 1.99% | — | — |
| > 2.00% | — | — |
| Total | 96 | 64 |
Fund shareholders may incur two types of costs: (1) transaction costs, including brokerage commissions paid on purchases and sales of fund shares; and (2) ongoing costs, including management fees and other fund expenses. This example is intended to help you understand your ongoing costs (in dollars) of investing in your fund and to compare these costs with the ongoing cost of investing in other funds.
The example is based on an investment of $1,000 made at the beginning of the period and held for the entire period from March 1, 2018 to August 31, 2018.
Actual Expenses
The table provides information about actual account values and actual expenses for each fund. You may use the information, together with the amount you invested, to estimate the expenses that you paid over the period. First, identify the fund you own. Then simply divide your account value by $1,000 (for example, an $8,600 account value divided by $1,000 = 8.6), then multiply the result by the number under the heading “Expenses Paid During Period” to estimate the expenses you paid on your account during this period.
Hypothetical Example for Comparison Purposes
The table also provides information about hypothetical account values and hypothetical expenses based on the actual expense ratio of your fund and an assumed rate of return of 5% per year before expenses, which is not the actual return of a fund. The hypothetical account values and expenses may not be used to estimate the actual ending account balance or expenses you paid for the period. You may use this information to compare the ongoing costs of investing in your fund and other funds. To do so, compare this 5% hypothetical example with the 5% hypothetical examples that appear in the shareholder reports of the other funds.
Please note that the expenses shown in the table are meant to highlight your ongoing costs only and do not reflect any transactional costs, such as brokerage commissions paid on purchases and sales of fund shares. Therefore, the table is useful in comparing ongoing costs only, and will not help you determine the relative total costs of owning different funds. In addition, if these transactional costs were included, your costs would have been higher.
|
| | | | |
| | Beginning
Account Value
3/1/18 | Ending
Account Value
8/31/18 | Expenses Paid
During Period(1)
3/1/18 - 8/31/18 | Annualized
Expense Ratio(1) |
| Diversified Corporate Bond ETF |
| Actual | $1,000 | $1,007.10 | $2.28 | 0.45% |
| Hypothetical | $1,000 | $1,022.94 | $2.29 | 0.45% |
STOXX® U.S. Quality Value ETF |
| Actual | $1,000 | $1,065.20 | $1.51 | 0.29% |
| Hypothetical | $1,000 | $1,023.74 | $1.48 | 0.29% |
| |
| (1) | Expenses are equal to the fund's annualized expense ratio listed in the table above, multiplied by the average account value over the period, multiplied by 184, the number of days in the most recent fiscal half-year, divided by 365, to reflect the one-half year period. Annualized expense ratio reflects actual expenses, including any applicable fee waivers or expense reimbursements and excluding any acquired fund fees and expenses. |
AUGUST 31, 2018
|
| | | | | | |
| Diversified Corporate Bond ETF | | |
| | Principal Amount | Value |
| CORPORATE BONDS — 97.7% | | |
| Airlines — 0.6% | | |
| Delta Air Lines, Inc., 3.80%, 4/19/23 | $ | 70,000 |
| $ | 69,334 |
|
| Auto Components — 1.2% | | |
Delphi Technologies plc, 5.00%, 10/1/25(1) | 55,000 |
| 52,088 |
|
| Lear Corp., 3.80%, 9/15/27 | 100,000 |
| 94,430 |
|
| | | 146,518 |
|
| Automobiles — 2.0% | | |
| Ally Financial, Inc., 4.625%, 5/19/22 | 55,000 |
| 55,481 |
|
| General Motors Co., 4.875%, 10/2/23 | 90,000 |
| 92,204 |
|
| General Motors Financial Co., Inc., 3.10%, 1/15/19 | 95,000 |
| 95,111 |
|
| | | 242,796 |
|
| Banks — 15.8% | | |
Bank of America Corp., VRN, 3.00%, 12/20/22(2) | 265,000 |
| 258,133 |
|
| Capital One Financial Corp., 3.50%, 6/15/23 | 265,000 |
| 262,365 |
|
| Citigroup, Inc., 4.05%, 7/30/22 | 255,000 |
| 257,997 |
|
| Huntington Bancshares, Inc., 2.30%, 1/14/22 | 265,000 |
| 255,233 |
|
| KeyCorp, MTN, 2.90%, 9/15/20 | 190,000 |
| 188,948 |
|
| Regions Financial Corp., 2.75%, 8/14/22 | 265,000 |
| 257,213 |
|
| SunTrust Bank, 2.45%, 8/1/22 | 200,000 |
| 192,921 |
|
| Wells Fargo & Co., 4.125%, 8/15/23 | 260,000 |
| 264,725 |
|
| | | 1,937,535 |
|
| Beverages — 1.9% | | |
| Constellation Brands, Inc., 3.20%, 2/15/23 | 115,000 |
| 112,490 |
|
Keurig Dr Pepper, Inc., 4.06%, 5/25/23(1) | 125,000 |
| 125,837 |
|
| | | 238,327 |
|
| Biotechnology — 2.4% | | |
| AbbVie, Inc., 2.50%, 5/14/20 | 185,000 |
| 183,357 |
|
| Biogen, Inc., 3.625%, 9/15/22 | 115,000 |
| 115,802 |
|
| | | 299,159 |
|
| Building Products — 0.5% | | |
| Masco Corp., 4.375%, 4/1/26 | 65,000 |
| 65,166 |
|
| Capital Markets — 0.4% | | |
MSCI, Inc., 5.25%, 11/15/24(1) | 50,000 |
| 51,625 |
|
| Chemicals — 3.4% | | |
| Celanese US Holdings LLC, 4.625%, 11/15/22 | 75,000 |
| 77,101 |
|
| Dow Chemical Co. (The), 3.00%, 11/15/22 | 95,000 |
| 93,109 |
|
| LYB International Finance BV, 4.00%, 7/15/23 | 125,000 |
| 125,954 |
|
Rayonier AM Products, Inc., 5.50%, 6/1/24(1) | 55,000 |
| 52,681 |
|
| Westlake Chemical Corp., 3.60%, 8/15/26 | 80,000 |
| 75,737 |
|
| | | 424,582 |
|
|
| | | | | | |
| Diversified Corporate Bond ETF | | |
| | Principal Amount | Value |
| Commercial Services and Supplies — 0.4% | | |
ServiceMaster Co. LLC (The), 5.125%, 11/15/24(1) | $ | 50,000 |
| $ | 49,250 |
|
| Construction and Engineering — 0.4% | | |
| MasTec, Inc., 4.875%, 3/15/23 | 55,000 |
| 54,312 |
|
| Construction Materials — 0.5% | | |
| Martin Marietta Materials, Inc., 3.50%, 12/15/27 | 70,000 |
| 65,069 |
|
| Consumer Finance — 7.6% | | |
| American Express Co., 2.50%, 8/1/22 | 265,000 |
| 255,367 |
|
| Block Financial LLC, 5.50%, 11/1/22 | 90,000 |
| 93,984 |
|
| CIT Group, Inc., 5.00%, 8/1/23 | 55,000 |
| 56,031 |
|
| Discover Financial Services, 3.85%, 11/21/22 | 265,000 |
| 264,274 |
|
| Synchrony Financial, 3.75%, 8/15/21 | 265,000 |
| 264,599 |
|
| | | 934,255 |
|
| Containers and Packaging — 0.4% | | |
| Berry Global, Inc., 5.125%, 7/15/23 | 50,000 |
| 49,938 |
|
| Packaging Corp. of America, 4.50%, 11/1/23 | 5,000 |
| 5,188 |
|
| | | 55,126 |
|
| Diversified Financial Services — 6.3% | | |
Goldman Sachs Group, Inc. (The), VRN, 2.91%, 6/5/22(2) | 265,000 |
| 257,957 |
|
| JPMorgan Chase & Co., 3.375%, 5/1/23 | 260,000 |
| 255,920 |
|
| Morgan Stanley, MTN, 4.10%, 5/22/23 | 255,000 |
| 257,257 |
|
| | | 771,134 |
|
| Diversified Telecommunication Services — 1.5% | | |
| AT&T, Inc., 4.45%, 4/1/24 | 175,000 |
| 179,422 |
|
| Electronic Equipment, Instruments and Components — 0.9% | | |
| Avnet, Inc., 4.625%, 4/15/26 | 105,000 |
| 105,099 |
|
| Equity Real Estate Investment Trusts (REITs) — 3.7% | | |
| American Tower Corp., 3.50%, 1/31/23 | 185,000 |
| 182,591 |
|
| Boston Properties LP, 2.75%, 10/1/26 | 80,000 |
| 73,329 |
|
| CyrusOne LP / CyrusOne Finance Corp., 5.00%, 3/15/24 | 55,000 |
| 55,825 |
|
| DDR Corp., 3.625%, 2/1/25 | 75,000 |
| 71,897 |
|
| Weyerhaeuser Co., 4.625%, 9/15/23 | 70,000 |
| 72,537 |
|
| | | 456,179 |
|
| Food Products — 1.9% | | |
| Conagra Brands, Inc., 3.20%, 1/25/23 | 110,000 |
| 107,024 |
|
JBS USA LUX SA / JBS USA Finance, Inc., 5.75%, 6/15/25(1) | 60,000 |
| 56,925 |
|
| Kraft Heinz Foods Co., 2.80%, 7/2/20 | 75,000 |
| 74,401 |
|
| | | 238,350 |
|
| Gas Utilities — 4.0% | | |
| Andeavor Logistics LP / Tesoro Logistics Finance Corp., 5.25%, 1/15/25 | 140,000 |
| 143,500 |
|
| EQT Midstream Partners LP, 4.125%, 12/1/26 | 145,000 |
| 136,361 |
|
| Plains All American Pipeline LP / PAA Finance Corp., 5.75%, 1/15/20 | 70,000 |
| 72,144 |
|
| Williams Cos., Inc. (The), 4.30%, 3/4/24 | 140,000 |
| 141,831 |
|
| | | 493,836 |
|
|
| | | | | | |
| Diversified Corporate Bond ETF | | |
| | Principal Amount | Value |
| Health Care Equipment and Supplies — 2.6% | | |
| Becton Dickinson and Co., 2.40%, 6/5/20 | $ | 120,000 |
| $ | 118,076 |
|
| Boston Scientific Corp., 2.85%, 5/15/20 | 150,000 |
| 149,104 |
|
MEDNAX, Inc., 5.25%, 12/1/23(1) | 55,000 |
| 55,000 |
|
| | | 322,180 |
|
| Health Care Providers and Services — 2.5% | | |
| AmerisourceBergen Corp., 3.50%, 11/15/21 | 115,000 |
| 115,523 |
|
| Anthem, Inc., 3.30%, 1/15/23 | 70,000 |
| 69,415 |
|
| Express Scripts Holding Co., 3.05%, 11/30/22 | 120,000 |
| 116,920 |
|
| | | 301,858 |
|
| Hotels, Restaurants and Leisure — 1.2% | | |
| Eldorado Resorts, Inc., 6.00%, 4/1/25 | 55,000 |
| 56,168 |
|
| Wyndham Destinations, Inc., 4.25%, 3/1/22 | 95,000 |
| 91,907 |
|
| | | 148,075 |
|
| Household Durables — 1.2% | | |
| Century Communities, Inc., 5.875%, 7/15/25 | 55,000 |
| 51,700 |
|
| DR Horton, Inc., 4.00%, 2/15/20 | 95,000 |
| 95,791 |
|
| | | 147,491 |
|
| Industrial Conglomerates — 0.9% | | |
| Hasbro, Inc., 3.50%, 9/15/27 | 125,000 |
| 117,207 |
|
| Insurance — 3.0% | | |
Allstate Corp. (The), VRN, 5.75%, 8/15/23(2) | 65,000 |
| 67,925 |
|
| American International Group, Inc., 4.875%, 6/1/22 | 65,000 |
| 68,164 |
|
| International Lease Finance Corp., 5.875%, 8/15/22 | 90,000 |
| 95,962 |
|
Prudential Financial, Inc., VRN, 5.625%, 6/15/23(2) | 65,000 |
| 68,054 |
|
| Voya Financial, Inc., 3.65%, 6/15/26 | 75,000 |
| 72,432 |
|
| | | 372,537 |
|
| Internet Software and Services — 1.6% | | |
| Expedia Group, Inc., 3.80%, 2/15/28 | 100,000 |
| 93,948 |
|
Match Group, Inc., 5.00%, 12/15/27(1) | 55,000 |
| 54,312 |
|
| VeriSign, Inc., 4.625%, 5/1/23 | 50,000 |
| 50,960 |
|
| | | 199,220 |
|
| Media — 1.0% | | |
| Charter Communications Operating LLC / Charter Communications Operating Capital, 3.58%, 7/23/20 | 120,000 |
| 120,401 |
|
| Metals and Mining — 2.3% | | |
| Cleveland-Cliffs, Inc., 5.75%, 3/1/25 | 60,000 |
| 59,149 |
|
| Kinross Gold Corp., 4.50%, 7/15/27 | 140,000 |
| 127,400 |
|
| Newmont Mining Corp., 3.50%, 3/15/22 | 75,000 |
| 74,740 |
|
| Vale Overseas Ltd., 4.375%, 1/11/22 | 24,000 |
| 24,185 |
|
| | | 285,474 |
|
| Multi-Utilities — 4.5% | | |
| Edison International, 4.125%, 3/15/28 | 105,000 |
| 105,421 |
|
| Enel Americas SA, 4.00%, 10/25/26 | 110,000 |
| 105,482 |
|
| Exelon Corp., 3.50%, 6/1/22 | 110,000 |
| 108,750 |
|
NRG Energy, Inc., 5.75%, 1/15/28(1) | 55,000 |
| 55,688 |
|
| Pacific Gas & Electric Co., 3.50%, 10/1/20 | 75,000 |
| 75,034 |
|
|
| | | | | | |
| Diversified Corporate Bond ETF | | |
| | Principal Amount | Value |
| PSEG Power LLC, 3.00%, 6/15/21 | $ | 100,000 |
| $ | 99,285 |
|
| | | 549,660 |
|
| Oil, Gas and Consumable Fuels — 10.0% | | |
| Anadarko Petroleum Corp., 4.85%, 3/15/21 | 135,000 |
| 139,271 |
|
| Carrizo Oil & Gas, Inc., 6.25%, 4/15/23 | 50,000 |
| 51,375 |
|
| Cenovus Energy, Inc., 3.00%, 8/15/22 | 145,000 |
| 139,624 |
|
| Cimarex Energy Co., 3.90%, 5/15/27 | 140,000 |
| 134,689 |
|
| Concho Resources, Inc., 4.375%, 1/15/25 | 140,000 |
| 141,422 |
|
| Hess Corp., 7.30%, 8/15/31 | 120,000 |
| 140,033 |
|
| HollyFrontier Corp., 5.875%, 4/1/26 | 130,000 |
| 140,112 |
|
Peabody Energy Corp., 6.375%, 3/31/25(1) | 55,000 |
| 55,962 |
|
| Pioneer Natural Resources Co., 3.95%, 7/15/22 | 100,000 |
| 101,556 |
|
| Suburban Propane Partners LP / Suburban Energy Finance Corp., 5.50%, 6/1/24 | 50,000 |
| 49,250 |
|
| Valero Energy Corp., 7.50%, 4/15/32 | 105,000 |
| 134,418 |
|
| | | 1,227,712 |
|
| Paper and Forest Products — 0.6% | | |
| Fibria Overseas Finance Ltd., 5.50%, 1/17/27 | 70,000 |
| 69,301 |
|
| Pharmaceuticals — 0.6% | | |
| Allergan Funding SCS, 3.00%, 3/12/20 | 70,000 |
| 69,835 |
|
| Semiconductors and Semiconductor Equipment — 1.2% | | |
| Broadcom Corp. / Broadcom Cayman Finance Ltd., 2.65%, 1/15/23 | 115,000 |
| 108,903 |
|
Entegris, Inc., 4.625%, 2/10/26(1) | 44,000 |
| 42,625 |
|
| | | 151,528 |
|
| Software — 2.4% | | |
| Activision Blizzard, Inc., 2.30%, 9/15/21 | 190,000 |
| 184,163 |
|
| Citrix Systems, Inc., 4.50%, 12/1/27 | 110,000 |
| 107,119 |
|
| | | 291,282 |
|
| Specialty Retail — 1.2% | | |
| Best Buy Co., Inc., 5.50%, 3/15/21 | 90,000 |
| 94,460 |
|
| United Rentals North America, Inc., 4.625%, 10/15/25 | 50,000 |
| 49,000 |
|
| | | 143,460 |
|
| Technology Hardware, Storage and Peripherals — 2.8% | | |
Dell International LLC / EMC Corp., 4.42%, 6/15/21(1) | 70,000 |
| 71,233 |
|
| Hewlett Packard Enterprise Co., 4.40%, 10/15/22 | 105,000 |
| 108,212 |
|
j2 Cloud Services LLC / j2 Global Co-Obligor, Inc., 6.00%, 7/15/25(1) | 50,000 |
| 51,688 |
|
| Seagate HDD Cayman, 4.875%, 3/1/24 | 110,000 |
| 108,043 |
|
| | | 339,176 |
|
| Textiles, Apparel and Luxury Goods — 0.8% | | |
| Tapestry, Inc., 4.25%, 4/1/25 | 100,000 |
| 99,236 |
|
| Wireless Telecommunication Services — 1.5% | | |
| Vodafone Group plc, 2.95%, 2/19/23 | 185,000 |
| 179,893 |
|
TOTAL CORPORATE BONDS
(Cost $12,301,246) | | 12,012,600 |
|
|
| | | | | |
| Diversified Corporate Bond ETF | | |
| | Shares | Value |
| TEMPORARY CASH INVESTMENTS — 1.4% | | |
State Street Institutional U.S. Government Money Market Fund, Premier Class
(Cost $165,150) | 165,150 |
| $ | 165,150 |
|
TOTAL INVESTMENT SECURITIES — 99.1%
(Cost $12,466,396) | | 12,177,750 |
|
| OTHER ASSETS AND LIABILITIES — 0.9% | | 113,017 |
|
| TOTAL NET ASSETS — 100.0% | | $ | 12,290,767 |
|
|
| | |
| NOTES TO SCHEDULE OF INVESTMENTS |
| MTN | - | Medium Term Note |
| VRN | - | Variable Rate Note. Interest reset date is indicated. Rate shown is effective at the period end. |
| |
| (1) | Security was purchased pursuant to Rule 144A under the Securities Act of 1933 and may be sold in transactions exempt from registration, normally to qualified institutional investors. The aggregate value of these securities at the period end was $774,914, which represented 6.3% of total net assets. |
| |
| (2) | Coupon rate adjusts periodically based upon a predetermined schedule. Interest reset date is indicated. Rate shown is effective at the period end. |
See Notes to Financial Statements.
AUGUST 31, 2018
|
| | | | | |
STOXX® U.S. Quality Value ETF | | |
| | Shares | Value |
| COMMON STOCKS — 99.9% | | |
| Aerospace and Defense — 1.8% | | |
| Arconic, Inc. | 665 |
| $ | 14,882 |
|
| Boeing Co. (The) | 42 |
| 14,397 |
|
| General Dynamics Corp. | 70 |
| 13,538 |
|
| Huntington Ingalls Industries, Inc. | 56 |
| 13,690 |
|
| Lockheed Martin Corp. | 56 |
| 17,943 |
|
| Raytheon Co. | 70 |
| 13,961 |
|
| Spirit AeroSystems Holdings, Inc., Class A | 168 |
| 14,364 |
|
| Textron, Inc. | 210 |
| 14,496 |
|
| United Technologies Corp. | 112 |
| 14,751 |
|
| | | 132,022 |
|
| Air Freight and Logistics — 0.4% | | |
| FedEx Corp. | 56 |
| 13,661 |
|
| United Parcel Service, Inc., Class B | 119 |
| 14,623 |
|
| | | 28,284 |
|
| Airlines — 2.3% | | |
| Alaska Air Group, Inc. | 616 |
| 41,574 |
|
| Delta Air Lines, Inc. | 252 |
| 14,737 |
|
JetBlue Airways Corp.(1) | 784 |
| 14,959 |
|
| Southwest Airlines Co. | 238 |
| 14,589 |
|
United Continental Holdings, Inc.(1) | 973 |
| 85,060 |
|
| | | 170,919 |
|
| Auto Components — 0.4% | | |
| Goodyear Tire & Rubber Co. (The) | 1,344 |
| 30,495 |
|
| Automobiles — 0.4% | | |
| Thor Industries, Inc. | 301 |
| 28,727 |
|
| Banks — 3.6% | | |
| Bank of America Corp. | 4,151 |
| 128,390 |
|
| BB&T Corp. | 259 |
| 13,380 |
|
| Citigroup, Inc. | 1,064 |
| 75,799 |
|
| Fifth Third Bancorp | 490 |
| 14,421 |
|
| Regions Financial Corp. | 756 |
| 14,712 |
|
| SunTrust Banks, Inc. | 203 |
| 14,933 |
|
| | | 261,635 |
|
| Beverages — 0.1% | | |
| PepsiCo, Inc. | 35 |
| 3,920 |
|
| Biotechnology — 1.9% | | |
| AbbVie, Inc. | 140 |
| 13,437 |
|
| Amgen, Inc. | 77 |
| 15,385 |
|
Biogen, Inc.(1) | 210 |
| 74,233 |
|
| Gilead Sciences, Inc. | 245 |
| 18,554 |
|
United Therapeutics Corp.(1) | 133 |
| 16,358 |
|
| | | 137,967 |
|
|
| | | | | |
STOXX® U.S. Quality Value ETF | | |
| | Shares | Value |
| Building Products — 0.2% | | |
| Johnson Controls International plc | 371 |
| $ | 14,013 |
|
| Capital Markets — 1.1% | | |
| Ameriprise Financial, Inc. | 98 |
| 13,912 |
|
| Apollo Global Management LLC, Class A | 427 |
| 14,745 |
|
| Bank of New York Mellon Corp. (The) | 273 |
| 14,237 |
|
| Lazard Ltd., Class A | 301 |
| 14,490 |
|
| Legg Mason, Inc. | 686 |
| 21,403 |
|
| | | 78,787 |
|
| Chemicals — 1.9% | | |
| Chemours Co. (The) | 322 |
| 14,039 |
|
| Eastman Chemical Co. | 147 |
| 14,263 |
|
| Huntsman Corp. | 1,344 |
| 40,979 |
|
| LyondellBasell Industries NV, Class A | 469 |
| 52,894 |
|
| Mosaic Co. (The) | 476 |
| 14,885 |
|
| | | 137,060 |
|
| Commercial Services and Supplies — 0.4% | | |
| Republic Services, Inc. | 203 |
| 14,892 |
|
| Waste Management, Inc. | 168 |
| 15,271 |
|
| | | 30,163 |
|
| Communications Equipment — 0.9% | | |
| Cisco Systems, Inc. | 448 |
| 21,401 |
|
| Juniper Networks, Inc. | 945 |
| 26,867 |
|
| Motorola Solutions, Inc. | 112 |
| 14,376 |
|
| | | 62,644 |
|
| Construction and Engineering — 0.6% | | |
| EMCOR Group, Inc. | 182 |
| 14,578 |
|
| Jacobs Engineering Group, Inc. | 203 |
| 14,756 |
|
Quanta Services, Inc.(1) | 427 |
| 14,770 |
|
| | | 44,104 |
|
| Consumer Finance — 0.6% | | |
| American Express Co. | 140 |
| 14,837 |
|
| Capital One Financial Corp. | 147 |
| 14,566 |
|
| Discover Financial Services | 182 |
| 14,218 |
|
| | | 43,621 |
|
| Containers and Packaging — 0.6% | | |
| Bemis Co., Inc. | 315 |
| 15,523 |
|
| Packaging Corp. of America | 119 |
| 13,080 |
|
| Sonoco Products Co. | 266 |
| 14,907 |
|
| | | 43,510 |
|
| Diversified Telecommunication Services — 3.8% | | |
| AT&T, Inc. | 4,382 |
| 139,961 |
|
| CenturyLink, Inc. | 3,836 |
| 81,937 |
|
| Verizon Communications, Inc. | 1,064 |
| 57,850 |
|
| | | 279,748 |
|
|
| | | | | |
STOXX® U.S. Quality Value ETF | | |
| | Shares | Value |
| Electric Utilities — 3.4% | | |
| Alliant Energy Corp. | 91 |
| $ | 3,898 |
|
| American Electric Power Co., Inc. | 812 |
| 58,245 |
|
| Edison International | 868 |
| 57,054 |
|
| Entergy Corp. | 511 |
| 42,714 |
|
| Eversource Energy | 168 |
| 10,488 |
|
| Exelon Corp. | 84 |
| 3,672 |
|
| IDACORP, Inc. | 35 |
| 3,425 |
|
| NextEra Energy, Inc. | 21 |
| 3,572 |
|
| OGE Energy Corp. | 98 |
| 3,609 |
|
| Portland General Electric Co. | 483 |
| 22,411 |
|
| PPL Corp. | 1,246 |
| 37,056 |
|
| Xcel Energy, Inc. | 77 |
| 3,700 |
|
| | | 249,844 |
|
| Electrical Equipment — 0.8% | | |
| Acuity Brands, Inc. | 98 |
| 14,978 |
|
| Eaton Corp. plc | 350 |
| 29,099 |
|
| Regal Beloit Corp. | 182 |
| 15,234 |
|
| | | 59,311 |
|
| Electronic Equipment, Instruments and Components — 1.4% | | |
Coherent, Inc.(1) | 161 |
| 30,686 |
|
| Corning, Inc. | 511 |
| 17,124 |
|
| Jabil, Inc. | 1,477 |
| 43,660 |
|
| TE Connectivity Ltd. | 147 |
| 13,477 |
|
| | | 104,947 |
|
| Equity Real Estate Investment Trusts (REITs) — 4.8% | | |
| Apple Hospitality REIT, Inc. | 826 |
| 14,579 |
|
| Brixmor Property Group, Inc. | 805 |
| 14,667 |
|
| Host Hotels & Resorts, Inc. | 1,715 |
| 36,924 |
|
| Kimco Realty Corp. | 861 |
| 14,732 |
|
| Lamar Advertising Co., Class A | 308 |
| 23,731 |
|
| National Retail Properties, Inc. | 665 |
| 30,650 |
|
| Park Hotels & Resorts, Inc. | 1,155 |
| 38,635 |
|
| Public Storage | 182 |
| 38,689 |
|
| Simon Property Group, Inc. | 217 |
| 39,717 |
|
| Ventas, Inc. | 770 |
| 46,100 |
|
| Weingarten Realty Investors | 476 |
| 14,723 |
|
| Welltower, Inc. | 553 |
| 36,891 |
|
| | | 350,038 |
|
| Food and Staples Retailing — 2.2% | | |
| Kroger Co. (The) | 469 |
| 14,774 |
|
US Foods Holding Corp.(1) | 448 |
| 14,600 |
|
| Walgreens Boots Alliance, Inc. | 420 |
| 28,795 |
|
| Walmart, Inc. | 1,050 |
| 100,653 |
|
| | | 158,822 |
|
|
| | | | | |
STOXX® U.S. Quality Value ETF | | |
| | Shares | Value |
| Food Products — 3.8% | | |
| Archer-Daniels-Midland Co. | 287 |
| $ | 14,465 |
|
| Campbell Soup Co. | 1,078 |
| 42,527 |
|
| Flowers Foods, Inc. | 364 |
| 7,335 |
|
| General Mills, Inc. | 980 |
| 45,090 |
|
| Hershey Co. (The) | 35 |
| 3,518 |
|
| Ingredion, Inc. | 140 |
| 14,150 |
|
| J.M. Smucker Co. (The) | 420 |
| 43,419 |
|
| Kellogg Co. | 49 |
| 3,518 |
|
| Tyson Foods, Inc., Class A | 1,631 |
| 102,443 |
|
| | | 276,465 |
|
| Gas Utilities — 0.2% | | |
| National Fuel Gas Co. | 126 |
| 6,997 |
|
| Southwest Gas Holdings, Inc. | 49 |
| 3,788 |
|
| | | 10,785 |
|
| Health Care Equipment and Supplies — 0.4% | | |
| Danaher Corp. | 147 |
| 15,221 |
|
| Medtronic plc | 154 |
| 14,847 |
|
| | | 30,068 |
|
| Health Care Providers and Services — 9.2% | | |
| Aetna, Inc. | 77 |
| 15,421 |
|
| Anthem, Inc. | 476 |
| 126,012 |
|
| Cigna Corp. | 623 |
| 117,336 |
|
| CVS Health Corp. | 1,421 |
| 106,916 |
|
Express Scripts Holding Co.(1) | 1,169 |
| 102,895 |
|
| HCA Healthcare, Inc. | 175 |
| 23,469 |
|
| Humana, Inc. | 77 |
| 25,661 |
|
Laboratory Corp. of America Holdings(1) | 84 |
| 14,521 |
|
Molina Healthcare, Inc.(1) | 105 |
| 14,490 |
|
| Quest Diagnostics, Inc. | 133 |
| 14,627 |
|
| UnitedHealth Group, Inc. | 63 |
| 16,913 |
|
| Universal Health Services, Inc., Class B | 119 |
| 15,489 |
|
WellCare Health Plans, Inc.(1) | 259 |
| 78,366 |
|
| | | 672,116 |
|
| Hotels, Restaurants and Leisure — 2.2% | | |
| Carnival Corp. | 462 |
| 28,408 |
|
| Darden Restaurants, Inc. | 322 |
| 37,365 |
|
| Las Vegas Sands Corp. | 427 |
| 27,934 |
|
| McDonald's Corp. | 28 |
| 4,542 |
|
| Royal Caribbean Cruises Ltd. | 126 |
| 15,445 |
|
| Six Flags Entertainment Corp. | 210 |
| 14,186 |
|
| Wyndham Destinations, Inc. | 329 |
| 14,542 |
|
| Yum China Holdings, Inc. | 406 |
| 15,704 |
|
| | | 158,126 |
|
| Household Durables — 1.8% | | |
| DR Horton, Inc. | 322 |
| 14,332 |
|
|
| | | | | |
STOXX® U.S. Quality Value ETF | | |
| | Shares | Value |
| Garmin Ltd. | 616 |
| $ | 41,974 |
|
Mohawk Industries, Inc.(1) | 77 |
| 14,753 |
|
| PulteGroup, Inc. | 2,023 |
| 56,543 |
|
| | | 127,602 |
|
| Household Products — 2.1% | | |
| Clorox Co. (The) | 203 |
| 29,431 |
|
| Colgate-Palmolive Co. | 301 |
| 19,989 |
|
| Kimberly-Clark Corp. | 441 |
| 50,953 |
|
| Procter & Gamble Co. (The) | 602 |
| 49,936 |
|
| | | 150,309 |
|
| Independent Power and Renewable Electricity Producers — 0.2% | |
| AES Corp. | 1,309 |
| 17,619 |
|
| Industrial Conglomerates — 0.6% | | |
| 3M Co. | 70 |
| 14,764 |
|
| Carlisle Cos., Inc. | 112 |
| 14,203 |
|
| Honeywell International, Inc. | 91 |
| 14,475 |
|
| | | 43,442 |
|
| Insurance — 1.8% | | |
| Aflac, Inc. | 322 |
| 14,889 |
|
| Allstate Corp. (The) | 147 |
| 14,784 |
|
| Fidelity National Financial, Inc. | 91 |
| 3,649 |
|
| Hartford Financial Services Group, Inc. (The) | 266 |
| 13,398 |
|
| MetLife, Inc. | 294 |
| 13,492 |
|
| Principal Financial Group, Inc. | 259 |
| 14,294 |
|
| Travelers Cos., Inc. (The) | 105 |
| 13,818 |
|
| Unum Group | 1,211 |
| 44,662 |
|
| | | 132,986 |
|
| Internet Software and Services — 0.2% | | |
Akamai Technologies, Inc.(1) | 210 |
| 15,779 |
|
| IT Services — 4.7% | | |
| Accenture plc, Class A | 91 |
| 15,385 |
|
| Cognizant Technology Solutions Corp., Class A | 182 |
| 14,274 |
|
| DXC Technology Co. | 161 |
| 14,666 |
|
Euronet Worldwide, Inc.(1) | 154 |
| 15,061 |
|
First Data Corp., Class A(1) | 735 |
| 18,904 |
|
| Genpact Ltd. | 462 |
| 14,156 |
|
| International Business Machines Corp. | 959 |
| 140,474 |
|
| MAXIMUS, Inc. | 224 |
| 14,896 |
|
| Paychex, Inc. | 224 |
| 16,408 |
|
| Sabre Corp. | 581 |
| 15,170 |
|
Teradata Corp.(1) | 357 |
| 14,805 |
|
| Visa, Inc., Class A | 119 |
| 17,480 |
|
| Western Union Co. (The) | 1,554 |
| 29,402 |
|
| | | 341,081 |
|
| Leisure Products — 0.6% | | |
| Brunswick Corp. | 476 |
| 31,616 |
|
|
| | | | | |
STOXX® U.S. Quality Value ETF | | |
| | Shares | Value |
| Polaris Industries, Inc. | 133 |
| $ | 14,424 |
|
| | | 46,040 |
|
| Machinery — 2.2% | | |
| AGCO Corp. | 238 |
| 14,199 |
|
| Allison Transmission Holdings, Inc. | 336 |
| 16,686 |
|
| Caterpillar, Inc. | 105 |
| 14,579 |
|
| Crane Co. | 161 |
| 14,696 |
|
| Cummins, Inc. | 98 |
| 13,896 |
|
| Dover Corp. | 175 |
| 15,027 |
|
| Ingersoll-Rand plc | 147 |
| 14,890 |
|
| Oshkosh Corp. | 203 |
| 14,263 |
|
| Parker-Hannifin Corp. | 84 |
| 14,750 |
|
| Terex Corp. | 749 |
| 29,024 |
|
| | | 162,010 |
|
| Media — 2.8% | | |
| Cinemark Holdings, Inc. | 189 |
| 7,054 |
|
| Comcast Corp., Class A | 707 |
| 26,152 |
|
DISH Network Corp., Class A(1) | 1,225 |
| 43,304 |
|
| Interpublic Group of Cos., Inc. (The) | 952 |
| 22,229 |
|
| Omnicom Group, Inc. | 525 |
| 36,393 |
|
| Viacom, Inc., Class B | 2,394 |
| 70,096 |
|
| | | 205,228 |
|
| Metals and Mining — 0.2% | | |
| United States Steel Corp. | 476 |
| 14,128 |
|
| Multi-Utilities — 1.0% | | |
| Ameren Corp. | 294 |
| 18,590 |
|
| CenterPoint Energy, Inc. | 532 |
| 14,784 |
|
| CMS Energy Corp. | 77 |
| 3,792 |
|
| DTE Energy Co. | 35 |
| 3,890 |
|
| Public Service Enterprise Group, Inc. | 329 |
| 17,223 |
|
| Vectren Corp. | 140 |
| 9,968 |
|
| WEC Energy Group, Inc. | 56 |
| 3,784 |
|
| | | 72,031 |
|
| Multiline Retail — 3.1% | | |
| Kohl's Corp. | 742 |
| 58,700 |
|
| Macy's, Inc. | 1,225 |
| 44,774 |
|
| Nordstrom, Inc. | 287 |
| 18,038 |
|
| Target Corp. | 1,183 |
| 103,512 |
|
| | | 225,024 |
|
| Oil, Gas and Consumable Fuels — 2.6% | | |
| Chevron Corp. | 483 |
| 57,216 |
|
| Exxon Mobil Corp. | 182 |
| 14,591 |
|
| HollyFrontier Corp. | 301 |
| 22,430 |
|
| Marathon Petroleum Corp. | 210 |
| 17,281 |
|
| PBF Energy, Inc., Class A | 294 |
| 15,264 |
|
| Phillips 66 | 119 |
| 14,103 |
|
|
| | | | | |
STOXX® U.S. Quality Value ETF | | |
| | Shares | Value |
| Valero Energy Corp. | 420 |
| $ | 49,510 |
|
| | | 190,395 |
|
| Pharmaceuticals — 3.8% | | |
| Allergan plc | 546 |
| 104,674 |
|
| Bristol-Myers Squibb Co. | 63 |
| 3,815 |
|
| Eli Lilly & Co. | 42 |
| 4,437 |
|
| Johnson & Johnson | 329 |
| 44,313 |
|
| Merck & Co., Inc. | 847 |
| 58,096 |
|
| Pfizer, Inc. | 1,407 |
| 58,418 |
|
| | | 273,753 |
|
| Professional Services — 0.6% | | |
| ManpowerGroup, Inc. | 476 |
| 44,615 |
|
| Real Estate Management and Development — 0.8% | | |
| Jones Lang LaSalle, Inc. | 378 |
| 57,653 |
|
| Road and Rail — 0.8% | | |
| Kansas City Southern | 126 |
| 14,611 |
|
| Norfolk Southern Corp. | 84 |
| 14,602 |
|
| Ryder System, Inc. | 182 |
| 13,985 |
|
| Union Pacific Corp. | 98 |
| 14,761 |
|
| | | 57,959 |
|
| Semiconductors and Semiconductor Equipment — 7.1% | | |
| Applied Materials, Inc. | 2,009 |
| 86,427 |
|
First Solar, Inc.(1) | 553 |
| 28,800 |
|
| Intel Corp. | 2,121 |
| 102,720 |
|
| Lam Research Corp. | 385 |
| 66,640 |
|
Micron Technology, Inc.(1) | 1,407 |
| 73,896 |
|
| MKS Instruments, Inc. | 315 |
| 29,263 |
|
ON Semiconductor Corp.(1) | 2,044 |
| 43,619 |
|
Qorvo, Inc.(1) | 182 |
| 14,576 |
|
| QUALCOMM, Inc. | 651 |
| 44,730 |
|
| Skyworks Solutions, Inc. | 154 |
| 14,060 |
|
| Teradyne, Inc. | 350 |
| 14,417 |
|
| | | 519,148 |
|
| Software — 1.3% | | |
| CA, Inc. | 644 |
| 28,207 |
|
Check Point Software Technologies Ltd.(1) | 126 |
| 14,640 |
|
| Microsoft Corp. | 133 |
| 14,940 |
|
Nuance Communications, Inc.(1) | 882 |
| 14,394 |
|
| Symantec Corp. | 1,099 |
| 22,156 |
|
| | | 94,337 |
|
| Specialty Retail — 2.2% | | |
| Best Buy Co., Inc. | 861 |
| 68,501 |
|
| Foot Locker, Inc. | 595 |
| 29,333 |
|
| Gap, Inc. (The) | 1,456 |
| 44,190 |
|
| Williams-Sonoma, Inc. | 287 |
| 20,156 |
|
| | | 162,180 |
|
|
| | | | | |
STOXX® U.S. Quality Value ETF | | |
| | Shares | Value |
| Technology Hardware, Storage and Peripherals — 5.4% | | |
| Apple, Inc. | 658 |
| $ | 149,781 |
|
| HP, Inc. | 4,410 |
| 108,707 |
|
| NetApp, Inc. | 910 |
| 78,997 |
|
| Seagate Technology plc | 1,036 |
| 55,467 |
|
| | | 392,952 |
|
| Textiles, Apparel and Luxury Goods — 1.7% | | |
Michael Kors Holdings Ltd.(1) | 637 |
| 46,259 |
|
| PVH Corp. | 91 |
| 13,028 |
|
| Ralph Lauren Corp. | 322 |
| 42,765 |
|
Skechers U.S.A., Inc., Class A(1) | 665 |
| 19,604 |
|
| | | 121,656 |
|
| Thrifts and Mortgage Finance — 1.0% | | |
Essent Group Ltd.(1) | 399 |
| 17,301 |
|
MGIC Investment Corp.(1) | 2,310 |
| 29,383 |
|
| Radian Group, Inc. | 1,428 |
| 29,031 |
|
| | | 75,715 |
|
| Tobacco — 1.1% | | |
| Altria Group, Inc. | 623 |
| 36,458 |
|
| Philip Morris International, Inc. | 546 |
| 42,528 |
|
| | | 78,986 |
|
| Trading Companies and Distributors — 0.8% | | |
HD Supply Holdings, Inc.(1) | 329 |
| 14,999 |
|
| MSC Industrial Direct Co., Inc., Class A | 168 |
| 14,361 |
|
| W.W. Grainger, Inc. | 42 |
| 14,871 |
|
| Watsco, Inc. | 84 |
| 14,699 |
|
| | | 58,930 |
|
TOTAL COMMON STOCKS
(Cost $7,002,677) | | 7,279,699 |
|
| TEMPORARY CASH INVESTMENTS — 0.1% | | |
State Street Institutional U.S. Government Money Market Fund, Premier Class
(Cost $8,105) | 8,105 |
| $ | 8,105 |
|
TOTAL INVESTMENT SECURITIES — 100.0%
(Cost $7,010,782) | | 7,287,804 |
|
OTHER ASSETS AND LIABILITIES† | | 2,946 |
|
| TOTAL NET ASSETS — 100.0% | | $ | 7,290,750 |
|
|
| | |
| NOTES TO SCHEDULE OF INVESTMENTS |
| |
| † | Category is less than 0.05% of total net assets. |
See Notes to Financial Statements.
|
|
| Statements of Assets and Liabilities |
|
| | | | | | |
| AUGUST 31, 2018 | |
| | Diversified Corporate Bond ETF | STOXX® U.S. Quality Value ETF |
| Assets | |
| Investment securities, at value (cost of $12,466,396 and $7,010,782, respectively) | $ | 12,177,750 |
| $ | 7,287,804 |
|
| Cash | — |
| 112 |
|
| Receivable for investments sold | — |
| 1,370,283 |
|
| Interest and dividends receivable | 117,704 |
| 16,047 |
|
| | 12,295,454 |
| 8,674,246 |
|
| | | |
| Liabilities | | |
| Payable for investments purchased | — |
| 1,381,726 |
|
| Accrued management fees | 4,687 |
| 1,770 |
|
| | 4,687 |
| 1,383,496 |
|
| | | |
| Net Assets | $ | 12,290,767 |
| $ | 7,290,750 |
|
| | | |
| Shares outstanding (unlimited number of shares authorized) | 252,000 |
| 175,001 |
|
| | | |
| Net Asset Value Per Share | $ | 48.77 |
| $ | 41.66 |
|
| | | |
| Net Assets Consist of: | | |
| Capital paid in | $ | 12,610,446 |
| $ | 7,110,593 |
|
| Undistributed net investment income | 34,576 |
| 29,414 |
|
| Accumulated net realized loss | (65,609 | ) | (126,279 | ) |
| Net unrealized appreciation (depreciation) | (288,646 | ) | 277,022 |
|
| | $ | 12,290,767 |
| $ | 7,290,750 |
|
See Notes to Financial Statements.
|
| | | | | | |
FOR THE PERIOD ENDED AUGUST 31, 2018(1) | |
| | Diversified Corporate Bond ETF | STOXX® U.S. Quality Value ETF |
| Investment Income (Loss) | |
| Income: | | |
| Interest | $ | 276,930 |
| $ | 97 |
|
| Dividends | — |
| 106,874 |
|
| | 276,930 |
| 106,971 |
|
| | | |
| Expenses: | | |
| Management fees | 35,210 |
| 12,632 |
|
| | | |
| Net investment income (loss) | 241,720 |
| 94,339 |
|
| | | |
| Realized and Unrealized Gain (Loss) | | |
| Net realized gain (loss) on investment transactions | (65,609 | ) | (126,279 | ) |
| Change in net unrealized appreciation (depreciation) on investments | (288,646 | ) | 277,022 |
|
| | | |
| Net realized and unrealized gain (loss) | (354,255 | ) | 150,743 |
|
| | | |
| Net Increase (Decrease) in Net Assets Resulting from Operations | $ | (112,535 | ) | $ | 245,082 |
|
| |
| (1) | January 11, 2018 (fund inception) through August 31, 2018. |
See Notes to Financial Statements.
|
|
| Statements of Changes in Net Assets |
|
| | | | | | |
PERIOD ENDED AUGUST 31, 2018(1) |
| | Diversified Corporate Bond ETF | STOXX® U.S. Quality Value ETF |
| Increase (Decrease) in Net Assets | | |
| Operations |
| Net investment income (loss) | $ | 241,720 |
| $ | 94,339 |
|
| Net realized gain (loss) | (65,609 | ) | (126,279 | ) |
| Change in net unrealized appreciation (depreciation) | (288,646 | ) | 277,022 |
|
| Net increase (decrease) in net assets resulting from operations | (112,535 | ) | 245,082 |
|
| | | |
| Distributions to Shareholders | | |
| From net investment income | (207,144 | ) | (64,925 | ) |
| | | |
| Capital Share Transactions | | |
| Proceeds from shares sold | 12,610,446 |
| 7,110,593 |
|
| | | |
| Net increase (decrease) in net assets | 12,290,767 |
| 7,290,750 |
|
| | | |
| Net Assets | | |
| End of period | $ | 12,290,767 |
| $ | 7,290,750 |
|
| | | |
| Undistributed net investment income | $ | 34,576 |
| $ | 29,414 |
|
| | | |
| Transactions in Shares of the Fund | | |
| Sold | 252,000 |
| 175,001 |
|
| |
| (1) | January 11, 2018 (fund inception) through August 31, 2018. |
See Notes to Financial Statements.
|
|
| Notes to Financial Statements |
AUGUST 31, 2018
1. Organization
American Century ETF Trust (the trust) was registered as a Delaware statutory trust in 2017 and is registered under the Investment Company Act of 1940, as amended (the 1940 Act), as an open-end management investment company. American Century Diversified Corporate Bond ETF (Diversified Corporate Bond ETF) and American Century STOXX® U.S. Quality Value ETF (STOXX® U.S. Quality Value ETF) (collectively, the funds) are two series issued by the trust. Diversified Corporate Bond ETF's investment objective is to seek to provide current income. STOXX® U.S. Quality Value ETF's investment objective is to seek to provide investment results that closely correspond, before fees and expenses, to the performance of the iSTOXX® American Century USA Quality Value Index. Shares of each fund are listed for trading on the NYSE Arca, Inc. The funds commenced sale on January 11, 2018, the funds’ inception date.
2. Significant Accounting Policies
The following is a summary of significant accounting policies consistently followed by the funds in preparation of their financial statements. Each fund is an investment company and follows accounting and reporting guidance in accordance with accounting principles generally accepted in the United States of America. This may require management to make certain estimates and assumptions at the date of the financial statements. Actual results could differ from these estimates. Management evaluated the impact of events or transactions occurring through the date the financial statements were issued that would merit recognition or disclosure.
Investment Valuations — The fund determines the fair value of its investments and computes its net asset value per share at the close of regular trading (usually 4 p.m. Eastern time) on the New York Stock Exchange (NYSE) on each day the NYSE is open. The Board of Trustees has adopted valuation policies and procedures to guide the investment advisor in the fund’s investment valuation process and to provide methodologies for the oversight of the fund’s pricing function.
Equity securities that are listed or traded on a domestic securities exchange are valued at the last reported sales price or at the official closing price as provided by the exchange. Equity securities traded on foreign securities exchanges are generally valued at the closing price of such securities on the exchange where primarily traded or at the close of the NYSE, if that is earlier. If no last sales price is reported, or if local convention or regulation so provides, the mean of the latest bid and asked prices may be used. Securities traded over-the-counter are valued at the mean of the latest bid and asked prices, the last sales price, or the official closing price.
Fixed income securities are valued at the evaluated mean as provided by independent pricing services or at the mean of the most recent bid and asked prices as provided by investment dealers. Corporate bonds are valued using market models that consider trade data, quotations from dealers and active market makers, relevant yield curve and spread data, creditworthiness, trade data or market information on comparable securities, and other relevant security specific information.
Open-end management investment companies are valued at the reported net asset value per share.
If the funds determine that the market price for an investment is not readily available or the valuation methods mentioned above do not reflect an investment’s fair value, such investment is valued as determined in good faith by the Board of Trustees or its delegate, in accordance with policies and procedures adopted by the Board of Trustees. In its determination of fair value, the funds may review several factors including, but not limited to, market information regarding the specific investment or comparable investments and correlation with other investment types, futures indices or general market indicators. Circumstances that may cause the funds to use these procedures to value an investment include, but are not limited to: an investment has been declared in default or is distressed; trading in a security has been suspended during the trading day or a security is not actively trading on its principal exchange; prices received from a regular pricing source are deemed unreliable; or there is a foreign market holiday and no trading occurred.
The funds monitor for significant events occurring after the close of an investment’s primary exchange but before each fund’s net asset value per share is determined. Significant events may include, but are not limited to: corporate announcements and transactions; governmental action and political unrest that could impact a specific investment or an investment sector; or armed conflicts, natural disasters and similar events that could affect investments in a specific country or region.
Security Transactions — Security transactions are accounted for as of the trade date. Net realized gains and losses are determined on the identified cost basis, which is also used for federal income tax purposes.
Investment Income — Dividend income less foreign taxes withheld, if any, is recorded as of the ex-dividend date. Distributions received on securities that represent a return of capital or long-term capital gain are recorded as a reduction of cost of investments and/or as a realized gain. The funds may estimate the components of distributions received that may be considered nontaxable distributions or long-term capital gain distributions for income tax purposes. Interest income is recorded on the accrual basis and includes accretion of discounts and amortization of premiums.
Income Tax Status — It is each fund’s policy to distribute substantially all net investment income and net realized gains to shareholders and to otherwise qualify as a regulated investment company under provisions of the Internal Revenue Code. Accordingly, no provision has been made for income taxes. The funds file U.S. federal, state, local and non-U.S. tax returns as applicable. The funds' tax returns are subject to examination by the relevant taxing authority until expiration of the applicable statute of limitations, which is generally three years from the date of filing but can be longer in certain jurisdictions. At this time, management believes there are no uncertain tax positions which, based on their technical merit, would not be sustained upon examination and for which it is reasonably possible that the total amounts of unrecognized tax benefits will significantly change in the next twelve months.
Distributions to Shareholders — Distributions from net investment income, if any, are declared and paid monthly for Diversified Corporate Bond ETF. Distributions from net investment income, if any, are declared and paid quarterly for STOXX® U.S. Quality Value ETF. Distributions from net realized gains, if any, are generally declared and paid annually for both funds.
Indemnifications — Under the trust’s organizational documents, its officers and trustees are indemnified against certain liabilities arising out of the performance of their duties to the funds. In addition, in the normal course of business, the funds enter into contracts that provide general indemnifications. The maximum exposure under these arrangements is unknown as this would involve future claims that may be made against a fund. The risk of material loss from such claims is considered by management to be remote.
3. Fees and Transactions with Related Parties
Certain officers and trustees of the trust are also officers and/or directors of American Century Companies, Inc. (ACC). The trust's investment advisor, American Century Investment Management, Inc. (ACIM) and the trust’s administrator, American Century Services, LLC, are wholly owned, directly or indirectly, by ACC.
Management Fees — The trust has entered into a management agreement with ACIM, under which ACIM provides the funds with investment advisory and management services in exchange for a single, unified management fee (the fee). The agreement provides that all expenses of managing and operating the funds, except brokerage and other transaction fees and expenses relating to the acquisition and disposition of portfolio securities, acquired fund fees and expenses, interest, taxes, litigation expenses, extraordinary expenses and expenses incurred in connection with the provision of shareholder and distribution services under a plan adopted pursuant to Rule 12b-1 under the 1940 Act, if any, will be paid by ACIM. The fee is computed and accrued daily based on each fund's daily net assets and paid monthly in arrears.
The annual management fee for each fund is as follows:
|
| |
| | Annual Management Fee |
| Diversified Corporate Bond ETF | 0.45% |
STOXX® U.S. Quality Value ETF | 0.29% |
4. Investment Transactions
Purchases and sales of investment securities, excluding short-term investments and in-kind transactions, for the period January 11, 2018 (fund inception) through August 31, 2018 were as follows:
|
| | | | | | |
| | Purchases | Sales |
| Diversified Corporate Bond ETF | $ | 7,082,297 |
| $ | 4,569,539 |
|
STOXX® U.S. Quality Value ETF | $ | 5,235,599 |
| $ | 5,199,755 |
|
Securities received or delivered in-kind through subscriptions and redemptions and in-kind net realized gain (loss) for the period January 11, 2018 (fund inception) through August 31, 2018 were as follows:
|
| | | | | |
| | In-kind
Subscriptions | In-kind
Redemptions | In-kind Net Realized Gain/(Loss)* |
| Diversified Corporate Bond ETF | $ | 9,784,122 |
| — | — |
STOXX® U.S. Quality Value ETF | $ | 7,104,957 |
| — | — |
*Net realized gain (loss) on in-kind transactions are not considered taxable for federal income tax purposes.
5. Capital Share Transactions
Each fund’s shares may only be purchased and sold on a national securities exchange through a broker-dealer. The price of each fund’s shares is based on market price, and because ETF shares trade at market prices rather than net asset value (NAV), shares may trade at a price greater than NAV (a premium) or less than NAV (a discount). Each fund issues and redeems shares that have been aggregated into blocks of 50,000 shares or multiples thereof for Diversified Corporate Bond ETF and 25,000 shares or multiples thereof for STOXX® U.S. Quality Value ETF (Creation Units) to authorized participants who have entered into agreements with the funds’ distributor. Diversified Corporate Bond ETF will generally issue and redeem Creation Units in return for a basket of cash and/or securities that the fund specifies each day. STOXX® U.S. Quality Value ETF will generally issue and redeem Creation Units in return for a basket of securities (and an amount of cash) that the fund specifies each day. Investors transacting in Creation Units for cash may also pay an additional variable charge to compensate the fund for certain transaction costs and market impact expenses relating to investing in portfolio securities. Such variable charges, if any, are included in proceeds from shares sold in the Statements of Changes in Net Assets.
6. Fair Value Measurements
The funds’ investments valuation process is based on several considerations and may use multiple inputs to determine the fair value of the investments held by the funds. In conformity with accounting principles generally accepted in the United States of America, the inputs used to determine a valuation are classified into three broad levels.
| |
| • | Level 1 valuation inputs consist of unadjusted quoted prices in an active market for identical investments. |
| |
| • | Level 2 valuation inputs consist of direct or indirect observable market data (including quoted prices for comparable investments, evaluations of subsequent market events, interest rates, prepayment speeds, credit risk, etc.). These inputs also consist of quoted prices for identical investments initially expressed in local currencies that are adjusted through translation into U.S. dollars. |
| |
| • | Level 3 valuation inputs consist of unobservable data (including a fund’s own assumptions). |
The level classification is based on the lowest level input that is significant to the fair valuation measurement. The valuation inputs are not necessarily an indication of the risks associated with investing in these securities or other financial instruments.
The following is a summary of the level classifications as of period end. The Schedules of Investments provide additional information on the funds’ portfolio holdings.
|
| | | | | | | | |
| Diversified Corporate Bond ETF | | | |
| | Level 1 | Level 2 | Level 3 |
| Assets | | | |
| Investment Securities | | | |
| Corporate Bonds | — |
| $ | 12,012,600 |
| — |
|
| Temporary Cash Investments | $ | 165,150 |
| — |
| — |
|
| | $ | 165,150 |
| $ | 12,012,600 |
| — |
|
|
| | | | | | | |
STOXX® U.S. Quality Value ETF | | | |
| | Level 1 | Level 2 | Level 3 |
| Assets | | | |
| Investment Securities | | | |
| Common Stocks | $ | 7,279,699 |
| — |
| — |
|
| Temporary Cash Investments | 8,105 |
| — |
| — |
|
| | $ | 7,287,804 |
| — |
| — |
|
7. Risk Factors
To the extent STOXX® U.S. Quality Value ETF concentrates in a specific industry or a group of industries, it may be subject to greater risks and market fluctuations than a portfolio investing in a broader range of industries.
If the iSTOXX® American Century USA Quality Value Index has high portfolio turnover, the STOXX® U.S. Quality Value ETF may also have high portfolio turnover, which could mean high transaction costs, affecting both performance and capital gains tax liabilities to investors.
8. Federal Tax Information
The tax character of distributions paid during the period ended August 31, 2018 was as follows:
|
| | | | | |
| | |
| | Distributions Paid From: |
| | Ordinary Income | Long-term Capital Gains |
| Diversified Corporate Bond ETF | $ | 207,144 |
| — |
|
STOXX® U.S. Quality Value ETF | $ | 64,925 |
| — |
|
The book-basis character of distributions made during the year from net investment income or net realized gains may differ from their ultimate characterization for federal income tax purposes. These differences reflect the differing character of certain income items and net realized gains and losses for financial statement and tax purposes, and may result in reclassification among certain capital accounts on the financial statements.
As of period end, the federal tax cost of investments and the components of distributable earnings on a tax-basis were as follows:
|
| | | | | | |
| | Diversified Corporate Bond ETF | STOXX® U.S. Quality Value ETF |
| Federal tax cost of investments | $ | 12,467,955 |
| $ | 7,029,230 |
|
| Gross tax appreciation of investments | $ | 4,108 |
| $ | 456,985 |
|
| Gross tax depreciation of investments | (294,313 | ) | (198,411 | ) |
| Net tax appreciation (depreciation) of investments | $ | (290,205 | ) | $ | 258,574 |
|
| Undistributed ordinary income | $ | 34,576 |
| $ | 29,414 |
|
| Accumulated short-term capital losses | $ | (64,050 | ) | $ | (107,831 | ) |
The difference between book-basis and tax-basis unrealized appreciation (depreciation) is attributable primarily to the tax deferral of losses on wash sales.
Accumulated capital losses represent net capital loss carryovers that may be used to offset future realized capital gains for federal income tax purposes. The capital loss carryovers may be carried forward for an unlimited period. Future capital loss carryover utilization in any given year may be subject to Internal Revenue Code limitations.
9. Recently Issued Accounting Standards
In March 2017, the Financial Accounting Standards Board (FASB) issued Accounting Standards Update No. 2017-08, “Receivables - Nonrefundable Fees and Other Costs (Subtopic 310-20), Premium Amortization on Purchased Callable Debt Securities” (ASU 2017-08). ASU 2017-08 amends the amortization period for certain purchased callable debt securities held at a premium, shortening such period to the earliest call date. The amendments are effective for fiscal years, and interim periods within those fiscal years, beginning after December 15, 2018. Management is currently evaluating the impact that adopting ASU 2017-08 will have on the financial statements.
|
| | | | | | | | | | | | | |
| For a Share Outstanding Throughout the Period Indicated |
| Per-Share Data | Ratios and Supplemental Data |
| | | Income From Investment Operations: | | Ratio to Average Net Assets of: | | |
| | Net Asset Value, Beginning of Period | Net Investment Income (Loss)(1) | Net Realized and Unrealized Gain (Loss) | Total From Investment Operations | Distributions From Net Investment Income | Net Asset Value, End of Period | Total Return(2) | Operating Expenses | Net Investment Income (Loss) | Portfolio Turnover Rate(3) | Net Assets, End of Period (in thousands) |
| Diversified Corporate Bond ETF |
2018(4) | $50.00 | 0.96 | (1.37) | (0.41) | (0.82) | $48.77 | (0.77)% | 0.45%(5) | 3.09%(5) | 38% |
| $12,291 |
|
STOXX® U.S. Quality Value ETF |
2018(4) | $40.37 | 0.55 | 1.11 | 1.66 | (0.37) | $41.66 | 4.16% | 0.29%(5) | 2.17%(5) | 77% |
| $7,291 |
|
|
|
| Notes to Financial Highlights |
| |
| (1) | Computed using average shares outstanding throughout the period. |
| |
| (2) | Total returns are calculated based on the net asset value of the last business day. Total returns for periods less than one year are not annualized. |
| |
| (3) | Excludes securities received or delivered in-kind. |
| |
| (4) | January 11, 2018 (fund inception) through August 31, 2018. |
See Notes to Financial Statements.
|
|
| Report of Independent Registered Public Accounting Firm |
To the shareholders and the Board of Trustees of American Century ETF Trust:
Opinion on the Financial Statements and Financial Highlights
We have audited the accompanying statements of assets and liabilities of American Century Diversified Corporate Bond ETF and American Century STOXX® U.S. Quality Value ETF, two of the portfolios constituting the American Century ETF Trust (the “Funds”), including the schedules of investments, as of August 31, 2018, the related statements of operations, statements of changes in net assets, and the financial highlights for the period from January 11, 2018 (fund inception) through August 31, 2018, and the related notes. In our opinion, the financial statements and financial highlights present fairly, in all material respects, the financial position of each of the Funds as of August 31, 2018, and the results of their operations, the changes in their net assets, and the financial highlights for the period from January 11, 2018 (fund inception) through August 31, 2018, in conformity with accounting principles generally accepted in the United States of America.
Basis for Opinion
These financial statements and financial highlights are the responsibility of the Funds’ management. Our responsibility is to express an opinion on the Funds’ financial statements and financial highlights based on our audits. We are a public accounting firm registered with the Public Company Accounting Oversight Board (United States) (PCAOB) and are required to be independent with respect to the Funds in accordance with the U.S. federal securities laws and the applicable rules and regulations of the Securities and Exchange Commission and the PCAOB.
We conducted our audits in accordance with the standards of the PCAOB. Those standards require that we plan and perform the audit to obtain reasonable assurance about whether the financial statements and financial highlights are free of material misstatement, whether due to error or fraud. The Funds are not required to have, nor were we engaged to perform, an audit of their internal control over financial reporting. As part of our audits we are required to obtain an understanding of internal control over financial reporting but not for the purpose of expressing an opinion on the effectiveness of the Funds’ internal control over financial reporting. Accordingly, we express no such opinion.
Our audits included performing procedures to assess the risks of material misstatement of the financial statements and financial highlights, whether due to error or fraud, and performing procedures that respond to those risks. Such procedures included examining, on a test basis, evidence regarding the amounts and disclosures in the financial statements and financial highlights. Our audits also included evaluating the accounting principles used and significant estimates made by management, as well as evaluating the overall presentation of the financial statements and financial highlights. Our procedures included confirmation of securities owned as of August 31, 2018, by correspondence with the custodian and brokers; when replies were not received from brokers, we performed other auditing procedures. We believe that our audits provide a reasonable basis for our opinion.
DELOITTE & TOUCHE LLP
Kansas City, Missouri
October 18, 2018
We have served as the auditor of one or more American Century investment companies since 1997.
The Board of Trustees
The individuals listed below serve as trustees of the funds. Each trustee will continue to serve in this capacity until death, retirement, resignation or removal from office. The board has adopted a mandatory retirement age for trustees who are not “interested persons,” as that term is defined in the Investment Company Act (independent trustees). Trustees who are not also officers of the trust shall retire by December 31st of the year in which they reach their 75th birthday.
Mr. Thomas is an “interested person” because he currently serves as President and Chief Executive Officer of American Century Companies, Inc. (ACC), the parent company of American Century Investment Management, Inc. (ACIM or the advisor). Reginald Browne is also an “interested person” because he currently serves as Senior Managing Director-ETF Group at Cantor Fitzgerald. Cantor Fitzgerald executes portfolio transactions for, and engages in principal transactions with, certain funds in the American Century family that also have ACIM as their advisor. The other trustees are independent. They are not employees, directors or officers of, and have no financial interest in, ACC or any of its wholly owned, direct or indirect, subsidiaries, including ACIM and American Century Services, LLC (ACS), and they do not have any other affiliations, positions or relationships that would cause them to be considered “interested persons” under the Investment Company Act. The following trustees also serve in this capacity for a number of other registered investment companies in the American Century Investments family of funds: Jonathan S. Thomas, 15; Ronald J. Gilson, 8; and Stephen E. Yates, 7.
The following table presents additional information about the trustees. The mailing address for each trustee other than Jonathan S. Thomas is 330 Madison Avenue, New York, New York 10017. The mailing address for Jonathan S. Thomas is 4500 Main Street, Kansas City, Missouri 64111.
|
| | | | | |
Name
(Year of Birth) | Position(s) Held with Funds | Length of Time Served | Principal Occupation(s) During Past 5 Years | Number of American Century Portfolios Overseen by Trustee | Other Directorships Held During Past 5 Years |
| Independent Trustees |
|
|
Ronald J. Gilson
(1946) | Trustee | Since 2017 | Charles J. Meyers Professor of Law and Business, Emeritus, Stanford Law School (1979 to 2016); Marc and Eva Stern Professor of Law and Business, Columbia University School of Law (1992 to present) | 50 | None |
Barry A. Mendelson
(1958) | Trustee | Since 2017 | Retired; Consultant regarding ETF and mutual fund matters (2015 to 2016); Principal and Senior Counsel, The Vanguard Group (investment management)(1998 to 2014) | 5 | None |
Stephen E. Yates
(1948) | Trustee | Since 2017 | Retired | 72 | None |
|
| | | | | |
Name
(Year of Birth) | Position(s) Held with Funds | Length of Time Served | Principal Occupation(s) During Past 5 Years | Number of American Century Portfolios Overseen by Trustee | Other Directorships Held During Past 5 Years |
| Interested Trustees |
|
|
Reginald M. Browne
(1968) | Trustee | Since 2017 | Senior Managing Director, Co Global Head-ETF Group, Cantor Fitzgerald (financial services firm)(2013 to present); Managing Director, Co Global Head-ETF Group, Knight Capital Group (financial services firm)(2009 to 2013) | 5 | None |
Jonathan S. Thomas
(1963) | Trustee and President | Since 2017 | President and Chief Executive Officer, ACC (2007 to present). Also serves as Chief Executive Officer, ACS; Executive Vice President, ACIM; Director, ACC, ACIM and other ACC subsidiaries | 117 | BioMed Valley Discoveries, Inc. |
The Statement of Additional Information has additional information about the funds' trustees and is available without charge, upon request, by calling 1-800-345-6488.
Officers
The following table presents certain information about the executive officers of the funds. Each officer, except Edward Rosenberg and Peruvemba Satish, serves as an officer for each of the 16 investment companies in the American Century family of funds. No officer is compensated for his or her service as an officer of the funds. The listed officers are interested persons of the funds and are appointed or re-appointed on an annual basis. The mailing address for each officer listed below is 4500 Main Street, Kansas City, Missouri 64111.
|
| | |
Name
(Year of Birth) | Offices with the Funds | Principal Occupation(s) During the Past Five Years |
Jonathan S. Thomas
(1963) | Trustee and President since 2017 | President and Chief Executive Officer, ACC (2007 to present). Also serves as Chief Executive Officer, ACS; Executive Vice President, ACIM; Director, ACC, ACIM and other ACC subsidiaries |
R. Wes Campbell
(1974) | Chief Financial Officer and Treasurer since 2018 | Investment Operations and Investment Accounting, ACS (2000 to present) |
Amy D. Shelton
(1964) | Chief Compliance Officer and Vice President since 2017 | Chief Compliance Officer, American Century funds, (2014 to present); Chief Compliance Officer, ACIM (2014 to present); Chief Compliance Officer, ACIS (2009 to present); Vice President, Client Interactions and Marketing, ACIS (2013 to 2014). Also serves as Vice President, ACIS |
Charles A. Etherington
(1957) | General Counsel and Vice President since 2017 | Attorney, ACC (1994 to present); Vice President, ACC (2005 to present); General Counsel, ACC (2007 to present). Also serves as General Counsel, ACIM, ACS, ACIS and other ACC subsidiaries; and Senior Vice President, ACIM and ACS
|
David H. Reinmiller
(1963) | Vice President since 2017 | Attorney, ACC (1994 to present). Also serves as Vice President, ACIM and ACS |
Edward Rosenberg
(1973) | Vice President since 2017 | Senior Vice President, ACIM (2017 to present); Senior Vice President, Flexshares Head of ETF Capital Markets, Northern Trust (2012 to 2017) |
Peruvemba Satish
(1965) | Vice President since 2017 | Senior Vice President, Portfolio Manager and Director, Global Analytics, ACIM (2014 to present); Senior Managing Director, Allstate Investment Management Company (2013 to 2014); Managing Director, Allstate Investment Management Company (2010 to 2012) |
C. Jean Wade
(1964) | Vice President since 2017 | Senior Vice President, ACS (2017 to present); Vice President, ACS (2000 to 2017)
|
| John P. Fordyce (1985) | Secretary since 2018 | Attorney, ACS (2018 to present) |
Retirement Account Information
As required by law, distributions you receive from certain retirement accounts are subject to federal income tax withholding, unless you elect not to have withholding apply*. Tax will be withheld on the total amount withdrawn even though you may be receiving amounts that are not subject to withholding, such as nondeductible contributions. In such case, excess amounts of withholding could occur. You may adjust your withholding election so that a greater or lesser amount will be withheld.
Remember, even if you elect not to have income tax withheld, you are liable for paying income tax on the taxable portion of your withdrawal. If you elect not to have income tax withheld or you don’t have enough income tax withheld, you may be responsible for payment of estimated tax. You may incur penalties under the estimated tax rules if your withholding and estimated tax payments are not sufficient. You can reduce or defer the income tax on a distribution by directly or indirectly rolling such distribution over to another IRA or eligible plan. You should consult your tax advisor for additional information.
State tax will be withheld if, at the time of your distribution, your address is within one of the mandatory withholding states and you have federal income tax withheld (or as otherwise required by state law). State taxes will be withheld from your distribution in accordance with the respective state rules.
*Some 403(b), 457 and qualified retirement plan distributions may be subject to 20% mandatory withholding, as they are subject to special tax and withholding rules. Your plan administrator or plan sponsor is required to provide you with a special tax notice explaining those rules at the time you request a distribution. If applicable, federal and/or state taxes may be withheld from your distribution amount.
Proxy Voting Policies
A description of the policies that the funds' investment advisor uses in exercising the voting rights associated with the securities purchased and/or held by the funds is available without charge, upon request, by calling 1-800-345-6488. It is also available on the "About Us" page of American Century Investments’ website at americancentury.com and on the Securities and Exchange Commission’s website at sec.gov. Information regarding how the investment advisor voted proxies relating to portfolio securities during the most recent 12-month period ended June 30 is available on the "About Us" page at americancentury.com. It is also available at sec.gov.
Quarterly Portfolio Disclosure
The funds file their complete schedule of portfolio holdings with the Securities and Exchange Commission (SEC) for the first and third quarters of each fiscal year on Form N-Q. The funds' Forms N-Q are available on the SEC’s website at sec.gov, and may be reviewed and copied at the SEC’s Public Reference Room in Washington, DC. Information on the operation of the Public Reference Room may be obtained by calling 1-800-SEC-0330.
Other Tax Information
For nonresident alien shareholders, Diversified Corporate Bond ETF hereby designates up to the maximum amount allowable as qualified interest income for the fiscal year ended August 31, 2018.
STOXX® U.S. Quality Value ETF hereby designates up to the maximum amount allowable as qualified dividend income for the fiscal year ended August 31, 2018.
For corporate taxpayers, STOXX® U.S. Quality Value ETF hereby designates $64,925, or up to the maximum amount allowable, of ordinary income distributions paid during the fiscal year ended August 31, 2018 as qualified for the corporate dividends received deduction.
|
| | |
| |
| | | |
| Contact Us | americancenturyetfs.com | |
| American Century Sales Representatives, Financial Professionals, Broker Dealers, Insurance Companies, Banks and Trust Companies | 1-833-ACI-ETFS | |
| Telecommunications Relay Service for the Deaf | 711 | |
| | | |
| American Century ETF Trust | |
| | | |
Investment Advisor: American Century Investment Management, Inc. Kansas City, Missouri | |
Distributor: Foreside Fund Services, not affiliated with American Century Investment Services, Inc. | |
| | | |
| This report and the statements it contains are submitted for the general information of our shareholders. The report is not authorized for distribution to prospective investors unless preceded or accompanied by an effective prospectus. | |
| | | |
©2018 American Century Proprietary Holdings, Inc. All rights reserved.
CL-ANN-93831 1810 | |
ITEM 2. CODE OF ETHICS.
| |
| (a) | The registrant has adopted a Code of Ethics for Senior Financial Officers that applies to the registrant’s principal executive officer, principal financial officer, principal accounting officer, and persons performing similar functions. |
| |
| (f) | The registrant’s Code of Ethics for Senior Financial Officers is attached hereto as Exhibit 13(a)(1). |
ITEM 3. AUDIT COMMITTEE FINANCIAL EXPERT.
| |
| (a)(1) | The registrant's board has determined that the registrant has at least one audit committee financial expert serving on its audit committee. |
| |
| (a)(2) | Barry A. Mendelson, Ronald J. Gilson and Stephen E. Yates are the registrant's designated audit committee financial experts. They are "independent" as defined in Item 3 of Form N-CSR. |
ITEM 4. PRINCIPAL ACCOUNTANT FEES AND SERVICES.
The aggregate fees billed for each of the last two fiscal years for professional services rendered by the principal accountant for the audit of the registrant’s annual financial statements or services that are normally provided by the accountant in connection with statutory and regulatory filings or engagements for those fiscal years were as follows:
FY 2017: $0
FY 2018: $40,125
The aggregate fees billed in each of the last two fiscal years for assurance and related services by the principal accountant that are reasonably related to the performance of the audit of the registrant’s financial statements and are not reported under paragraph (a) of this Item were as follows:
For services rendered to the registrant:
FY 2017:$0
FY 2018:$0
Fees required to be approved pursuant to paragraph (c)(7)(ii) of Rule 2-01 of Regulation S-X (relating to certain engagements for non-audit services with the registrant’s investment adviser and its affiliates):
FY 2017:$0
FY 2018:$0
The aggregate fees billed in each of the last two fiscal years for professional services rendered by the principal accountant for tax compliance, tax advice, and tax planning were as follows:
For services rendered to the registrant:
FY 2017: $0
FY 2018: $0
Fees required to be approved pursuant to paragraph (c)(7)(ii) of Rule 2-01 of Regulation S-X (relating to certain engagements for non-audit services with the registrant’s investment adviser and its affiliates):
FY 2017: $0
FY 2018: $0
The aggregate fees billed in each of the last two fiscal years for products and services provided by the principal accountant, other than the services reported in paragraphs (a) through (c) of this Item were as follows:
For services rendered to the registrant:
FY 2017:$0
FY 2018:$0
Fees required to be approved pursuant to paragraph (c)(7)(ii) of Rule 2-01 of Regulation S-X (relating to certain engagements for non-audit services with the registrant’s investment adviser and its affiliates):
FY 2017:$0
FY 2018:$0
| |
| (e)(1) | In accordance with paragraph (c)(7)(i)(A) of Rule 2-01 of Regulation S-X, before the accountant is engaged by the registrant to render audit or non-audit services, the engagement is approved by the registrant’s audit committee. Pursuant to paragraph (c)(7)(ii) of Rule 2-01 of Regulation S-X, the registrant’s audit committee also pre-approves its accountant’s engagements for non-audit services with the registrant’s investment adviser, its parent company, and any entity controlled by, or under common control with the investment adviser that provides ongoing services to the registrant, if the engagement relates directly to the operations and financial reporting of the registrant. |
| |
| (e)(2) | All services described in each of paragraphs (b) through (d) of this Item were pre-approved before the engagement by the registrant’s audit committee pursuant to paragraph (c)(7)(i)(A) of Rule 2-01 of Regulation S-X. Consequently, none of such services were required to be approved by the audit committee pursuant to paragraph (c)(7)(i)(C). |
| |
| (f) | The percentage of hours expended on the principal accountant’s engagement to audit the registrant’s financial statements for the most recent fiscal year that were attributed to work performed by persons other than the principal accountant’s full-time, permanent employees was less than 50%. |
| |
| (g) | The aggregate non-audit fees billed by the registrant’s accountant for services rendered to the registrant, and rendered to the registrant’s investment adviser (not including any sub-adviser whose role is primarily portfolio management and is subcontracted with or overseen by another investment adviser), and any entity controlling, controlled by, or under common control with the adviser that provides ongoing services to the registrant for each of the last two fiscal years of the registrant were as follows: |
FY 2017: $0
FY 2018: $115,750
| |
| (h) | The registrant’s investment adviser and accountant have notified the registrant’s audit committee of all non-audit services that were rendered by the registrant’s accountant to the registrant’s investment adviser, its parent company, and any entity controlled by, or under common control with the investment adviser that provides services to the registrant, which services were not required to be pre-approved pursuant to paragraph (c)(7)(ii) of Rule 2-01 of Regulation S-X. The notification provided to the registrant’s audit committee included sufficient details regarding such services to allow the registrant’s audit committee to consider the continuing independence of its principal accountant. |
ITEM 5. AUDIT COMMITTEE OF LISTED REGISTRANTS.
| |
| (a) | The registrant has a separately-designated standing audit committee established in accordance with Section 3(a)(58)(A) of the Securities Exchange Act of 1934. The audit committee members are Barry A. Mendelson, Ronald J. Gilson and Stephen E. Yates. |
ITEM 6. INVESTMENTS.
| |
| (a) | The schedule of investments is included as part of the report to stockholders filed under Item 1 of this Form. |
ITEM 7. DISCLOSURE OF PROXY VOTING POLICIES AND PROCEDURES FOR CLOSED-END MANAGEMENT INVESTMENT COMPANIES.
Not applicable.
ITEM 8. PORTFOLIO MANAGERS OF CLOSED-END MANAGEMENT INVESTMENT COMPANIES.
Not applicable.
ITEM 9. PURCHASES OF EQUITY SECURITIES BY CLOSED-END MANAGEMENT INVESTMENT COMPANY AND AFFILIATED PURCHASERS.
Not applicable.
ITEM 10. SUBMISSION OF MATTERS TO A VOTE OF SECURITY HOLDERS.
During the reporting period, there were no material changes to the procedures by which shareholders may recommend nominees to the registrant’s board.
ITEM 11. CONTROLS AND PROCEDURES.
| |
| (a) | The registrant's principal executive officer and principal financial officer have concluded that the registrant's disclosure controls and procedures (as defined in Rule 30a-3(c) under the Investment Company Act of 1940) are effective based on their evaluation of these controls and procedures as of a date within 90 days of the filing date of this report. |
| |
| (b) | There were no changes in the registrant's internal control over financial reporting (as defined in Rule 30a-3(d) under the Investment Company Act of 1940) that occurred during the period covered by this report that have materially affected, or are reasonably likely to materially affect, the registrant's internal control over financial reporting. |
ITEM 12. DISCLOSURE OF SECURITIES LENDING ACTIVITIES FOR CLOSED-END MANAGEMENT INVESTMENT COMPANIES.
Not applicable.
ITEM 13. EXHIBITS.
| |
| (a)(1) | Registrant’s Code of Ethics for Senior Financial Officers, which is the subject of the disclosure required by Item 2 of Form N-CSR, is included herein. |
| |
| (a)(2) | Separate certifications by the registrant’s principal executive officer and principal financial officer, pursuant to Section 302 of the Sarbanes-Oxley Act of 2002 and Rule 30a-2(a) under the Investment Company Act of 1940, are filed and attached hereto as EX-99.CERT. |
| |
| (b) | A certification by the registrant’s chief executive officer and chief financial officer, pursuant to Section 906 of the Sarbanes-Oxley Act of 2002, is furnished and attached hereto as EX-99.906CERT. |
SIGNATURES
Pursuant to the requirements of the Securities Exchange Act of 1934 and the Investment Company Act of 1940, the registrant has duly caused this report to be signed on its behalf by the undersigned, thereunto duly authorized.
|
| | | | |
| Registrant: | American Century ETF Trust | |
| | | | |
| | | | |
| By: | /s/ Jonathan S. Thomas | |
| | Name: | Jonathan S. Thomas | |
| | Title: | President | |
| | | | |
| Date: | October 25, 2018 | |
Pursuant to the requirements of the Securities Exchange Act of 1934 and the Investment Company Act of 1940, this report has been signed below by the following persons on behalf of the registrant and in the capacities and on the dates indicated.
|
| | | |
| By: | /s/ Jonathan S. Thomas | |
| | Name: | Jonathan S. Thomas | |
| | Title: | President | |
| | | (principal executive officer) | |
| | | | |
| | | | |
| Date: | October 25, 2018 | |
|
| | | |
| By: | /s/ R. Wes Campbell | |
| | Name: | R. Wes Campbell
| |
| | Title: | Treasurer, and Chief Financial Officer | |
| | | (principal financial officer) | |
| | | | |
| Date: | October 25, 2018 | |