Highland Funds I - Highland Income Fund (HFRO)
Filed: 20 Aug 21, 5:13pm
Exhibit 99.4 UPDATED AS OF AUG. 20, 2021 W W W . H F R OC ONV E R S I ON. C OM HFRO CO N V ERSIO N PRO PO SAL Over view of proposal to conver t HFRO into a p u b l icl y tr ad ed D iv er sified H ol d in g Comp an y H I G H L A ND I NC OM E F U ND ( NY S E : H F R O) | AU G U ST 202 1Exhibit 99.4 UPDATED AS OF AUG. 20, 2021 W W W . H F R OC ONV E R S I ON. C OM HFRO CO N V ERSIO N PRO PO SAL Over view of proposal to conver t HFRO into a p u b l icl y tr ad ed D iv er sified H ol d in g Comp an y H I G H L A ND I NC OM E F U ND ( NY S E : H F R O) | AU G U ST 202 1
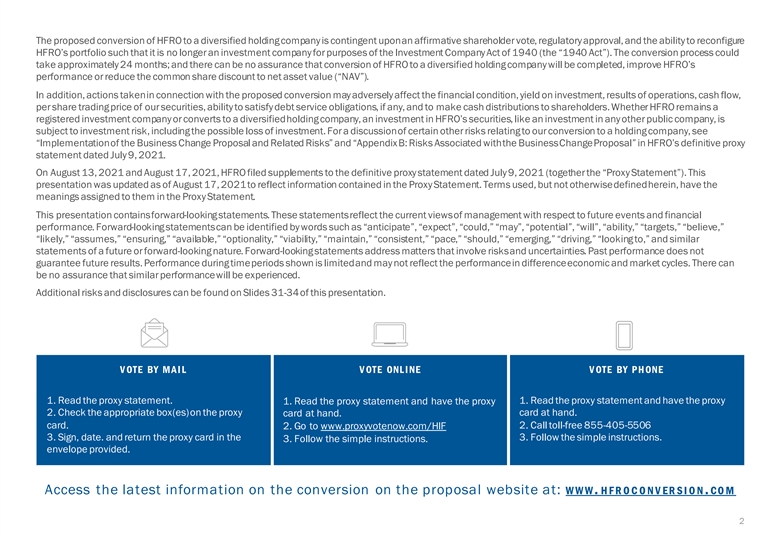
The proposed conversion of HFRO to a diversified holding company is contingent upon an affirmative shareholder vote, regulatory approval, and the ability to reconfigure HFRO’s portfolio such that it is no longer an investment company for purposes of the Investment Company Act of 1940 (the “1940 Act”). The conversion process could take approximately 24 months; and there can be no assurance that conversion of HFRO to a diversified holding company will be completed, improve HFRO’s performance or reduce the common share discount to net asset value (“NAV”). In addition, actions taken in connection with the proposed conversion may adversely affect the financial condition, yield on investment, results of operations, cash flow, per share trading price of our securities, ability to satisfy debt service obligations, if any, and to make cash distributions to shareholders. Whether HFRO remains a registered investment company or converts to a diversified holding company, an investment in HFRO’s securities, like an investment in any other public company, is subject to investment risk, including the possible loss of investment. For a discussion of certain other risks relating to our conversion to a holding company, see “Implementation of the Business Change Proposal and Related Risks” and “Appendix B: Risks Associated with the Business ChangeProposal” in HFRO’s definitive proxy statement dated July 9, 2021. On August 13, 2021 and August 17, 2021, HFRO filed supplements to the definitive proxy statement dated July 9, 2021 (together the “Proxy Statement”). This presentation was updated as of August 17, 2021 to reflect information contained in the Proxy Statement. Terms used, but not otherwise defined herein, have the meanings assigned to them in the Proxy Statement. This presentation contains forward-looking statements. These statements reflect the current views of management with respect to future events and financial performance. Forward-looking statements can be identified by words such as “anticipate”, “expect”, “could,” “may”, “potential”, “will”, “ability,” “targets,” “believe,” “likely,” “assumes,” “ensuring,” “available,” “optionality,” “viability,” “maintain,” “consistent,” “pace,” “should,” “emerging,” “driving,” “looking to,” and similar statements of a future or forward-looking nature. Forward-looking statements address matters that involve risks and uncertainties. Past performance does not guarantee future results. Performance during time periods shown is limited and may not reflect the performance in difference economic and market cycles. There can be no assurance that similar performance will be experienced. Additional risks and disclosures can be found on Slides 31-34 of this presentation. V OTE BY MAIL VOTE ONLINE V OTE BY PHONE 1. Read the proxy statement. 1. Read the proxy statement and have the proxy 1. Read the proxy statement and have the proxy 2. Check the appropriate box(es) on the proxy card at hand. card at hand. card. 2. Go to www.proxyvotenow.com/HIF 2. Call toll-free 855-405-5506 3. Sign, date. and return the proxy card in the 3. Follow the simple instructions. 3. Follow the simple instructions. envelope provided. Access the latest information on the conversion on the proposal website at: WWW . H F R OC ONV E R S I ON . CO M 2The proposed conversion of HFRO to a diversified holding company is contingent upon an affirmative shareholder vote, regulatory approval, and the ability to reconfigure HFRO’s portfolio such that it is no longer an investment company for purposes of the Investment Company Act of 1940 (the “1940 Act”). The conversion process could take approximately 24 months; and there can be no assurance that conversion of HFRO to a diversified holding company will be completed, improve HFRO’s performance or reduce the common share discount to net asset value (“NAV”). In addition, actions taken in connection with the proposed conversion may adversely affect the financial condition, yield on investment, results of operations, cash flow, per share trading price of our securities, ability to satisfy debt service obligations, if any, and to make cash distributions to shareholders. Whether HFRO remains a registered investment company or converts to a diversified holding company, an investment in HFRO’s securities, like an investment in any other public company, is subject to investment risk, including the possible loss of investment. For a discussion of certain other risks relating to our conversion to a holding company, see “Implementation of the Business Change Proposal and Related Risks” and “Appendix B: Risks Associated with the Business ChangeProposal” in HFRO’s definitive proxy statement dated July 9, 2021. On August 13, 2021 and August 17, 2021, HFRO filed supplements to the definitive proxy statement dated July 9, 2021 (together the “Proxy Statement”). This presentation was updated as of August 17, 2021 to reflect information contained in the Proxy Statement. Terms used, but not otherwise defined herein, have the meanings assigned to them in the Proxy Statement. This presentation contains forward-looking statements. These statements reflect the current views of management with respect to future events and financial performance. Forward-looking statements can be identified by words such as “anticipate”, “expect”, “could,” “may”, “potential”, “will”, “ability,” “targets,” “believe,” “likely,” “assumes,” “ensuring,” “available,” “optionality,” “viability,” “maintain,” “consistent,” “pace,” “should,” “emerging,” “driving,” “looking to,” and similar statements of a future or forward-looking nature. Forward-looking statements address matters that involve risks and uncertainties. Past performance does not guarantee future results. Performance during time periods shown is limited and may not reflect the performance in difference economic and market cycles. There can be no assurance that similar performance will be experienced. Additional risks and disclosures can be found on Slides 31-34 of this presentation. V OTE BY MAIL VOTE ONLINE V OTE BY PHONE 1. Read the proxy statement. 1. Read the proxy statement and have the proxy 1. Read the proxy statement and have the proxy 2. Check the appropriate box(es) on the proxy card at hand. card at hand. card. 2. Go to www.proxyvotenow.com/HIF 2. Call toll-free 855-405-5506 3. Sign, date. and return the proxy card in the 3. Follow the simple instructions. 3. Follow the simple instructions. envelope provided. Access the latest information on the conversion on the proposal website at: WWW . H F R OC ONV E R S I ON . CO M 2
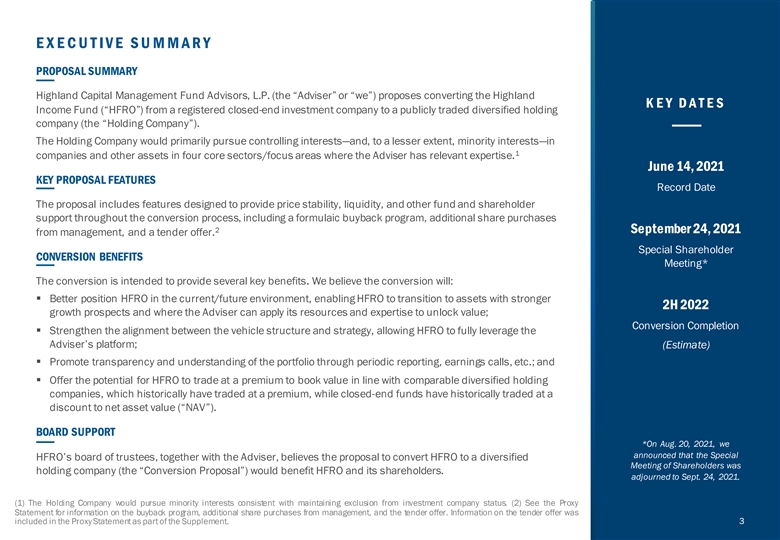
EXEC U T IVE SU MMAR Y PROPOSAL SUMMARY Highland Capital Management Fund Advisors, L.P. (the “Adviser” or “we”) proposes converting the Highland K EY D A T ES Income Fund (“HFRO”) from a registered closed-end investment company to a publicly traded diversified holding company (the “Holding Company”). The Holding Company would primarily pursue controlling interests—and, to a lesser extent, minority interests—in 1 companies and other assets in four core sectors/focus areas where the Adviser has relevant expertise. June 14, 2021 KEY PROPOSAL FEATURES Record Date The proposal includes features designed to provide price stability, liquidity, and other fund and shareholder support throughout the conversion process, including a formulaic buyback program, additional share purchases 2 September 24, 2021 from management, and a tender offer. Special Shareholder CONVERSION BENEFITS Meeting* The conversion is intended to provide several key benefits. We believe the conversion will: § Better position HFRO in the current/future environment, enabling HFRO to transition to assets with stronger 2H 2022 growth prospects and where the Adviser can apply its resources and expertise to unlock value; Conversion Completion § Strengthen the alignment between the vehicle structure and strategy, allowing HFRO to fully leverage the Adviser’s platform; (Estimate) § Promote transparency and understanding of the portfolio through periodic reporting, earnings calls, etc.; and § Offer the potential for HFRO to trade at a premium to book value in line with comparable diversified holding companies, which historically have traded at a premium, while closed-end funds have historically traded at a discount to net asset value (“NAV”). BOARD SUPPORT *On Aug. 20, 2021, we announced that the Special HFRO’s board of trustees, together with the Adviser, believes the proposal to convert HFRO to a diversified Meeting of Shareholders was holding company (the “Conversion Proposal”) would benefit HFRO and its shareholders. adjourned to Sept. 24, 2021. (1) The Holding Company would pursue minority interests consistent with maintaining exclusion from investment company status. (2) See the Proxy Statement for information on the buyback program, additional share purchases from management, and the tender offer. Information on the tender offer was included in the Proxy Statement as part of the Supplement. 3EXEC U T IVE SU MMAR Y PROPOSAL SUMMARY Highland Capital Management Fund Advisors, L.P. (the “Adviser” or “we”) proposes converting the Highland K EY D A T ES Income Fund (“HFRO”) from a registered closed-end investment company to a publicly traded diversified holding company (the “Holding Company”). The Holding Company would primarily pursue controlling interests—and, to a lesser extent, minority interests—in 1 companies and other assets in four core sectors/focus areas where the Adviser has relevant expertise. June 14, 2021 KEY PROPOSAL FEATURES Record Date The proposal includes features designed to provide price stability, liquidity, and other fund and shareholder support throughout the conversion process, including a formulaic buyback program, additional share purchases 2 September 24, 2021 from management, and a tender offer. Special Shareholder CONVERSION BENEFITS Meeting* The conversion is intended to provide several key benefits. We believe the conversion will: § Better position HFRO in the current/future environment, enabling HFRO to transition to assets with stronger 2H 2022 growth prospects and where the Adviser can apply its resources and expertise to unlock value; Conversion Completion § Strengthen the alignment between the vehicle structure and strategy, allowing HFRO to fully leverage the Adviser’s platform; (Estimate) § Promote transparency and understanding of the portfolio through periodic reporting, earnings calls, etc.; and § Offer the potential for HFRO to trade at a premium to book value in line with comparable diversified holding companies, which historically have traded at a premium, while closed-end funds have historically traded at a discount to net asset value (“NAV”). BOARD SUPPORT *On Aug. 20, 2021, we announced that the Special HFRO’s board of trustees, together with the Adviser, believes the proposal to convert HFRO to a diversified Meeting of Shareholders was holding company (the “Conversion Proposal”) would benefit HFRO and its shareholders. adjourned to Sept. 24, 2021. (1) The Holding Company would pursue minority interests consistent with maintaining exclusion from investment company status. (2) See the Proxy Statement for information on the buyback program, additional share purchases from management, and the tender offer. Information on the tender offer was included in the Proxy Statement as part of the Supplement. 3
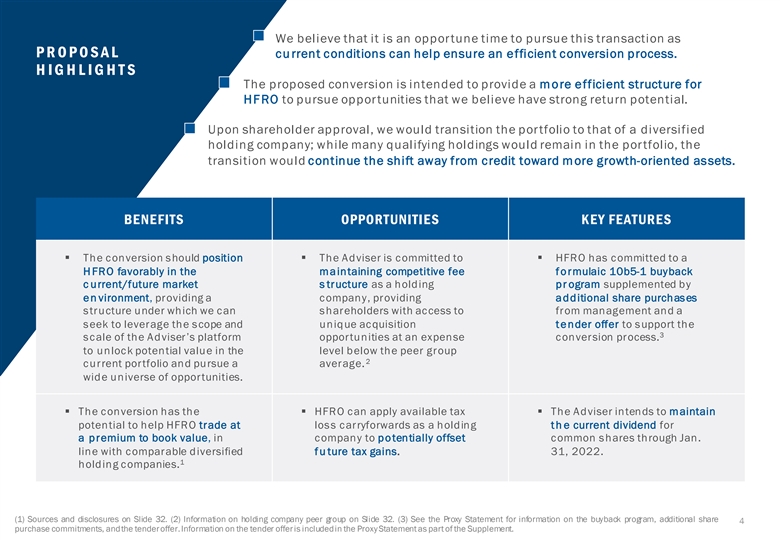
We believe that it is an oppor tune time to pursue this transaction as PR O PO SAL cu rrent conditions can help ensure an efficient conversion process. HI G HL I G HT S The proposed conversion is intended to provide a more efficient structure for HFRO to pursue oppor tunities that we believe have strong return potential. Upon shareholder approval, we would transition the por tfolio to that of a diversified holding company; while many qualifying holdings would remain in the por tfolio, the transition would continue the shift away from credit toward more growth-oriented assets. BENEFITS OPPORTUNITIES KEY FEATURES § The conversion s hould position § The Adviser is committed to § HFRO has committed to a HFRO favorably in the maintaining competitive fee formulaic 10b5-1 buyback c urrent/future market s tructure as a holding pr ogram supplemented by en vironment, providing a company, providing additional share purchases s tructure under which we can s hareholders with access to from management and a s eek to leverage the s cope and unique acquisition tender offer to s upport the 3 s cale of the Adviser’s platform opportunities at an expense conversion process. to unlock potential value in the level below the peer group 2 current portfolio and pursue a average. wide universe of opportunities. § The conversion has the § HFRO can apply available tax § The Adviser intends to maintain potential to help HFRO trade at los s carryforwards as a holding th e current dividend for a premium to book value, in company to potentially offset common s hares through Jan. line with comparable diversified fu ture tax gains. 31, 2022. 1 holding companies. (1) Sources and disclosures on Slide 32. (2) Information on holding company peer group on Slide 32. (3) See the Proxy Statement for information on the buyback program, additional share 4 purchase commitments, andthe tenderoffer.Information on the tender offeris includedin the Proxy Statement as part of the Supplement.
C ONT E NT S I. CONVERSION BENEFITS & OPPORTUNITIES 6 IV. CAPABILITIES & EXPERIENCE 24 Market Outlook & Opportunity 8 Relevant Expertise 25 Performance & Peer Group 11 Current Portfolio 27 Expenses & Tax Efficiencies 13 V. CORPORATE PROFILE & CONVERSION PROCESS 28 Holding Company Management Team II. PROPOSAL BACKGROUND & KEY FEATURES 14 29 Why Now: Factors Driving Conversion Timing Conversion Timeline 15 30 Key Proposal Features (Buyback Plan, Tender Offer) 19 VI. RISK, DISCLOSURES, AND NOTES 31 III. HOLDING COMPANY STRATEGY 20 Sector/Strategy Focus Areas 21 Portfolio Construction 22 Strategy Highlight: Public/Private Market Dynamics 23 5C ONT E NT S I. CONVERSION BENEFITS & OPPORTUNITIES 6 IV. CAPABILITIES & EXPERIENCE 24 Market Outlook & Opportunity 8 Relevant Expertise 25 Performance & Peer Group 11 Current Portfolio 27 Expenses & Tax Efficiencies 13 V. CORPORATE PROFILE & CONVERSION PROCESS 28 Holding Company Management Team II. PROPOSAL BACKGROUND & KEY FEATURES 14 29 Why Now: Factors Driving Conversion Timing Conversion Timeline 15 30 Key Proposal Features (Buyback Plan, Tender Offer) 19 VI. RISK, DISCLOSURES, AND NOTES 31 III. HOLDING COMPANY STRATEGY 20 Sector/Strategy Focus Areas 21 Portfolio Construction 22 Strategy Highlight: Public/Private Market Dynamics 23 5
I. BE NE FITS & OP P OR TUNITIE S B e n e f i ts o f t h e D i v er si f ie d H o ldi ng C o m pany S t ruc ture a nd O p po r tuniti es f o r H F RO 6I. BE NE FITS & OP P OR TUNITIE S B e n e f i ts o f t h e D i v er si f ie d H o ldi ng C o m pany S t ruc ture a nd O p po r tuniti es f o r H F RO 6
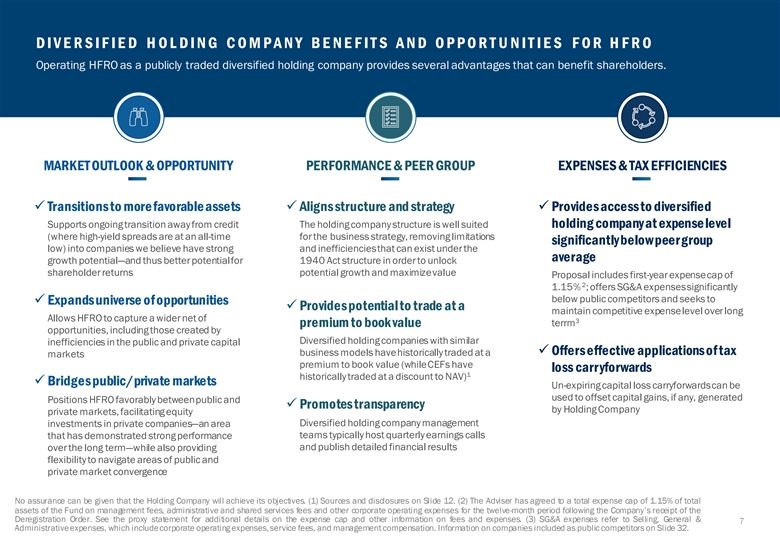
DIVERSIFIED HOLDING COMPANY BENEFITS AND OPPORTUNITIES FOR HFRO Operating HFRO as a publicly traded diversified holding company provides several advantages that can benefit shareholders. MARKET OUTLOOK & OPPORTUNITY PERFORMANCE & PEER GROUP EXPENSES & TAX EFFICIENCIES ü Transitions to more favorable assetsü Aligns structure and strategyü Provides access to diversified Supports ongoing transition away from credit The holding company structure is well suited holding company at expense level (where high-yield spreads are at an all-time for the business strategy, removing limitations significantly below peer group low) into companies we believe have strong and inefficiencies that can exist under the average growth potential—and thus better potential for 1940 Act structure in order to unlock shareholder returns potential growth and maximize value Proposal includes first-year expense cap of 2 1.15% ; offers SG&A expenses significantly below public competitors and seeks to ü Expands universe of opportunities ü Provides potential to trade at a maintain competitive expense level over long Allows HFRO to capture a wider net of 3 terrm premium to book value opportunities, including those created by Diversified holding companies with similar inefficiencies in the public and private capital ü Offers effective applications of tax business models have historically traded at a markets premium to book value (while CEFs have loss carryforwards 1 historically traded at a discount to NAV) ü Bridges public/private markets Un-expiring capital loss carryforwards can be used to offset capital gains, if any, generated Positions HFRO favorably between public and ü Promotes transparency by Holding Company private markets, facilitating equity Diversified holding company management investments in private companies—an area teams typically host quarterly earnings calls that has demonstrated strong performance and publish detailed financial results over the long term—while also providing flexibility to navigate areas of public and private market convergence No assurance can be given that the Holding Company will achieve its objectives. (1) Sources and disclosures on Slide 12. (2) The Adviser has agreed to a total expense cap of 1.15% of total assets of the Fund on management fees, administrative and shared services fees and other corporate operating expenses for the twelve-month period following the Company’s receipt of the Deregistration Order. See the proxy statement for additional details on the expense cap and other information on fees and expenses. (3) SG&A expenses refer to Selling, General & 7 Administrativeexpenses, which includecorporate operating expenses,service fees, and management compensation. Information on companies included as public competitors on Slide 32.DIVERSIFIED HOLDING COMPANY BENEFITS AND OPPORTUNITIES FOR HFRO Operating HFRO as a publicly traded diversified holding company provides several advantages that can benefit shareholders. MARKET OUTLOOK & OPPORTUNITY PERFORMANCE & PEER GROUP EXPENSES & TAX EFFICIENCIES ü Transitions to more favorable assetsü Aligns structure and strategyü Provides access to diversified Supports ongoing transition away from credit The holding company structure is well suited holding company at expense level (where high-yield spreads are at an all-time for the business strategy, removing limitations significantly below peer group low) into companies we believe have strong and inefficiencies that can exist under the average growth potential—and thus better potential for 1940 Act structure in order to unlock shareholder returns potential growth and maximize value Proposal includes first-year expense cap of 2 1.15% ; offers SG&A expenses significantly below public competitors and seeks to ü Expands universe of opportunities ü Provides potential to trade at a maintain competitive expense level over long Allows HFRO to capture a wider net of 3 terrm premium to book value opportunities, including those created by Diversified holding companies with similar inefficiencies in the public and private capital ü Offers effective applications of tax business models have historically traded at a markets premium to book value (while CEFs have loss carryforwards 1 historically traded at a discount to NAV) ü Bridges public/private markets Un-expiring capital loss carryforwards can be used to offset capital gains, if any, generated Positions HFRO favorably between public and ü Promotes transparency by Holding Company private markets, facilitating equity Diversified holding company management investments in private companies—an area teams typically host quarterly earnings calls that has demonstrated strong performance and publish detailed financial results over the long term—while also providing flexibility to navigate areas of public and private market convergence No assurance can be given that the Holding Company will achieve its objectives. (1) Sources and disclosures on Slide 12. (2) The Adviser has agreed to a total expense cap of 1.15% of total assets of the Fund on management fees, administrative and shared services fees and other corporate operating expenses for the twelve-month period following the Company’s receipt of the Deregistration Order. See the proxy statement for additional details on the expense cap and other information on fees and expenses. (3) SG&A expenses refer to Selling, General & 7 Administrativeexpenses, which includecorporate operating expenses,service fees, and management compensation. Information on companies included as public competitors on Slide 32.
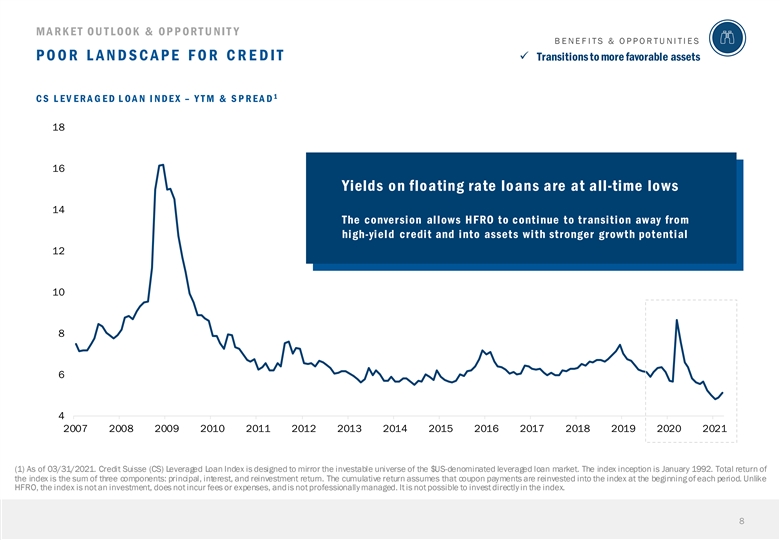
MARKET OUTLOOK & OPPORTUNIT Y BENEFITS & OPPORTUNITIES POOR LANDSCAPE FOR CREDIT ü Transitions to more favorable assets 1 CS L EV ERA G ED L OA N I NDEX – Y TM & SPREAD 18 16 Yields on floating rate loans are at all-time lows 14 The conversion allows HFRO to continue to transition away from hi gh-yield credit and into assets with stronger growth potential 12 10 8 6 4 2007 2008 2009 2010 2011 2012 2013 2014 2015 2016 2017 2018 2019 2020 2021 (1) As of 03/31/2021. Credit Suisse (CS) Leveraged Loan Index is designed to mirror the investable universe of the $US-denominated leveraged loan market. The index inception is January 1992. Total return of the index is the sum of three components: principal, interest, and reinvestment return. The cumulative return assumes that coupon payments are reinvested into the index at the beginning of each period. Unlike HFRO, the index is not an investment, does not incur fees or expenses, andis not professionally managed. It is not possible to invest directly in the index. 8MARKET OUTLOOK & OPPORTUNIT Y BENEFITS & OPPORTUNITIES POOR LANDSCAPE FOR CREDIT ü Transitions to more favorable assets 1 CS L EV ERA G ED L OA N I NDEX – Y TM & SPREAD 18 16 Yields on floating rate loans are at all-time lows 14 The conversion allows HFRO to continue to transition away from hi gh-yield credit and into assets with stronger growth potential 12 10 8 6 4 2007 2008 2009 2010 2011 2012 2013 2014 2015 2016 2017 2018 2019 2020 2021 (1) As of 03/31/2021. Credit Suisse (CS) Leveraged Loan Index is designed to mirror the investable universe of the $US-denominated leveraged loan market. The index inception is January 1992. Total return of the index is the sum of three components: principal, interest, and reinvestment return. The cumulative return assumes that coupon payments are reinvested into the index at the beginning of each period. Unlike HFRO, the index is not an investment, does not incur fees or expenses, andis not professionally managed. It is not possible to invest directly in the index. 8
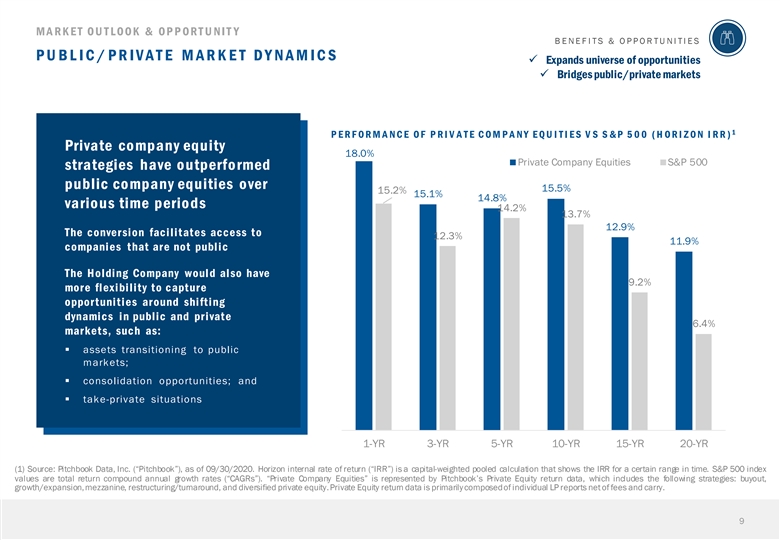
MARKET OUTLOOK & OPPORTUNIT Y BENEFITS & OPPORTUNITIES PUBLIC/PRIVATE MARKET DYNAMICS ü Expands universe of opportunities ü Bridges public/private markets 1 PE R F O R M AN C E O F PR I V AT E C O M PAN Y E Q U I T I E S V S S& P 500 ( H O R I Z O N I R R ) Private company equity 18.0% Private Company Equities S&P 500 strategies have outperformed public company equities over 15.5% 15.2% 15.1% 14.8% various time periods 14.2% 13.7% 12.9% The conversion facilitates access to 12.3% 11.9% companies that are not public The Holding Company would also have 9.2% more flexibility to capture opportunities around shifting dynamics in public and private 6.4% markets, such as: § assets transitioning to public markets; § consolidation opportunities; and § take-private situations 1-YR 3-YR 5-YR 10-YR 15-YR 20-YR (1) Source: Pitchbook Data, Inc. (“Pitchbook”), as of 09/30/2020. Horizon internal rate of return (“IRR”) is a capital-weighted pooled calculation that shows the IRR for a certain range in time. S&P 500 index values are total return compound annual growth rates (“CAGRs”). “Private Company Equities” is represented by Pitchbook’s Private Equity return data, which includes the following strategies: buyout, growth/expansion,mezzanine, restructuring/turnaround, and diversified private equity.Private Equity return data is primarily composedof individual LP reports net of fees and carry. 9MARKET OUTLOOK & OPPORTUNIT Y BENEFITS & OPPORTUNITIES PUBLIC/PRIVATE MARKET DYNAMICS ü Expands universe of opportunities ü Bridges public/private markets 1 PE R F O R M AN C E O F PR I V AT E C O M PAN Y E Q U I T I E S V S S& P 500 ( H O R I Z O N I R R ) Private company equity 18.0% Private Company Equities S&P 500 strategies have outperformed public company equities over 15.5% 15.2% 15.1% 14.8% various time periods 14.2% 13.7% 12.9% The conversion facilitates access to 12.3% 11.9% companies that are not public The Holding Company would also have 9.2% more flexibility to capture opportunities around shifting dynamics in public and private 6.4% markets, such as: § assets transitioning to public markets; § consolidation opportunities; and § take-private situations 1-YR 3-YR 5-YR 10-YR 15-YR 20-YR (1) Source: Pitchbook Data, Inc. (“Pitchbook”), as of 09/30/2020. Horizon internal rate of return (“IRR”) is a capital-weighted pooled calculation that shows the IRR for a certain range in time. S&P 500 index values are total return compound annual growth rates (“CAGRs”). “Private Company Equities” is represented by Pitchbook’s Private Equity return data, which includes the following strategies: buyout, growth/expansion,mezzanine, restructuring/turnaround, and diversified private equity.Private Equity return data is primarily composedof individual LP reports net of fees and carry. 9
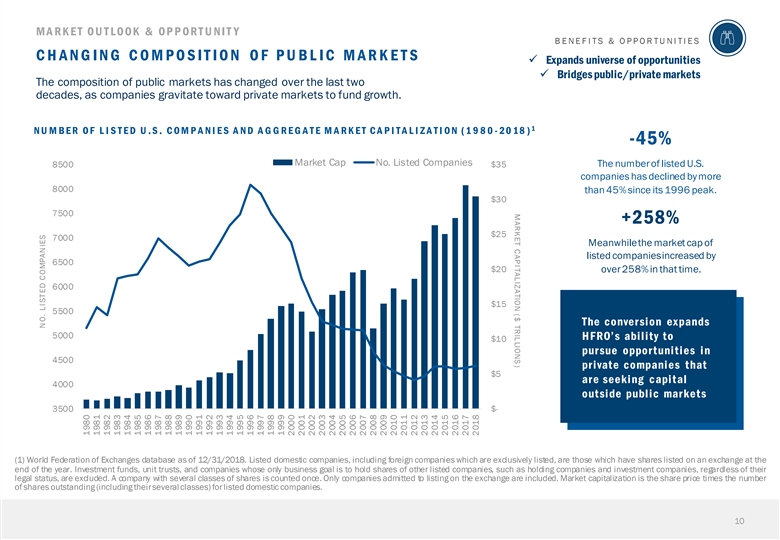
MARKET CAPITALIZATION ($ TRILLIONS) MARKET OUTLOOK & OPPORTUNIT Y BENEFITS & OPPORTUNITIES CHANGING COMPOSITION OF PUBLIC MARKETS ü Expands universe of opportunities ü Bridges public/private markets The composition of public markets has changed over the last two decades, as companies gravitate toward private markets to fund growth. 1 NU M BER OF L I STED U .S. COM PANI ES AND AG G REG ATE M ARK ET CAPI TAL I Z AT I O N ( 1980 - 20 18 ) -45% Market Cap No. Listed Companies 8500 $35 The number of listed U.S. companies has declined by more 8000 than 45% since its 1996 peak. $30 7500 +258% $25 7000 Meanwhile the market cap of listed companies increased by 6500 $20 over 258% in that time. 6000 $15 5500 The conversion expands 5000 HFRO’s ability to $10 pursue opportunities in 4500 private companies that $5 are seeking capital 4000 outside public markets 3500 $- (1) World Federation of Exchanges database as of 12/31/2018. Listed domestic companies, including foreign companies which are exclusively listed, are those which have shares listed on an exchange at the end of the year. Investment funds, unit trusts, and companies whose only business goal is to hold shares of other listed companies, such as holding companies and investment companies, regardless of their legal status, are excluded. A company with several classes of shares is counted once. Only companies admitted to listing on the exchange are included. Market capitalization is the share price times the number of shares outstanding (including theirseveral classes) forlisted domestic companies. 10 NO. LISTED COMPANIES 1980 1981 1982 1983 1984 1985 1986 1987 1988 1989 1990 1991 1992 1993 1994 1995 1996 1997 1998 1999 2000 2001 2002 2003 2004 2005 2006 2007 2008 2009 2010 2011 2012 2013 2014 2015 2016 2017 2018MARKET CAPITALIZATION ($ TRILLIONS) MARKET OUTLOOK & OPPORTUNIT Y BENEFITS & OPPORTUNITIES CHANGING COMPOSITION OF PUBLIC MARKETS ü Expands universe of opportunities ü Bridges public/private markets The composition of public markets has changed over the last two decades, as companies gravitate toward private markets to fund growth. 1 NU M BER OF L I STED U .S. COM PANI ES AND AG G REG ATE M ARK ET CAPI TAL I Z AT I O N ( 1980 - 20 18 ) -45% Market Cap No. Listed Companies 8500 $35 The number of listed U.S. companies has declined by more 8000 than 45% since its 1996 peak. $30 7500 +258% $25 7000 Meanwhile the market cap of listed companies increased by 6500 $20 over 258% in that time. 6000 $15 5500 The conversion expands 5000 HFRO’s ability to $10 pursue opportunities in 4500 private companies that $5 are seeking capital 4000 outside public markets 3500 $- (1) World Federation of Exchanges database as of 12/31/2018. Listed domestic companies, including foreign companies which are exclusively listed, are those which have shares listed on an exchange at the end of the year. Investment funds, unit trusts, and companies whose only business goal is to hold shares of other listed companies, such as holding companies and investment companies, regardless of their legal status, are excluded. A company with several classes of shares is counted once. Only companies admitted to listing on the exchange are included. Market capitalization is the share price times the number of shares outstanding (including theirseveral classes) forlisted domestic companies. 10 NO. LISTED COMPANIES 1980 1981 1982 1983 1984 1985 1986 1987 1988 1989 1990 1991 1992 1993 1994 1995 1996 1997 1998 1999 2000 2001 2002 2003 2004 2005 2006 2007 2008 2009 2010 2011 2012 2013 2014 2015 2016 2017 2018
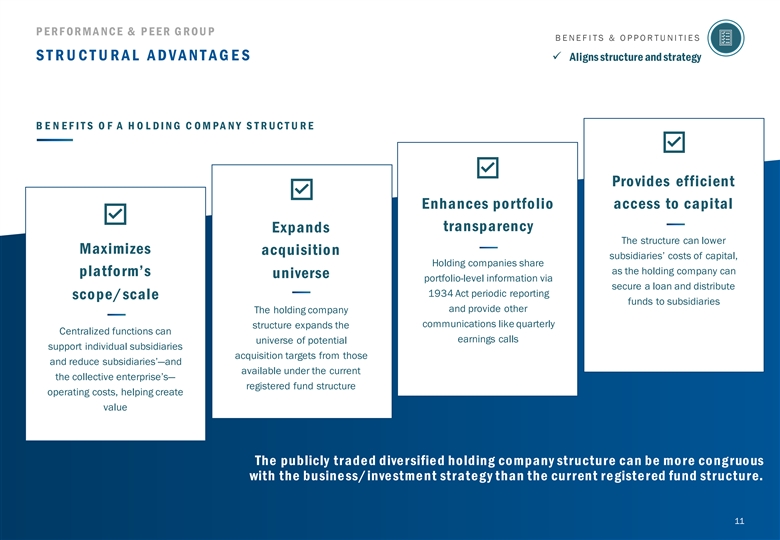
P ERF ORMA NCE & P EER G ROU P BENEFITS & OPPORTUNITIES STRUCTURAL ADVANTAGES ü Aligns structure and strategy B E N E F I T S O F A H O L DI NG C OM PA NY S T R UC T U R E Provides efficient Enhances portfolio access to capital transparency Expands The structure can lower Maximizes acquisition subsidiaries’ costs of capital, Holding companies share as the holding company can platform’s universe portfolio-level information via secure a loan and distribute 1934 Act periodic reporting scope/scale funds to subsidiaries and provide other The holding company communications like quarterly structure expands the Centralized functions can earnings calls universe of potential support individual subsidiaries acquisition targets from those and reduce subsidiaries’—and available under the current the collective enterprise’s— registered fund structure operating costs, helping create value The publicly trade d dive rsifie d ho lding co mpany structure can be mo re co ng ruo us with the busine ss/inve stme nt strate g y than the current re giste red fund structure. 11P ERF ORMA NCE & P EER G ROU P BENEFITS & OPPORTUNITIES STRUCTURAL ADVANTAGES ü Aligns structure and strategy B E N E F I T S O F A H O L DI NG C OM PA NY S T R UC T U R E Provides efficient Enhances portfolio access to capital transparency Expands The structure can lower Maximizes acquisition subsidiaries’ costs of capital, Holding companies share as the holding company can platform’s universe portfolio-level information via secure a loan and distribute 1934 Act periodic reporting scope/scale funds to subsidiaries and provide other The holding company communications like quarterly structure expands the Centralized functions can earnings calls universe of potential support individual subsidiaries acquisition targets from those and reduce subsidiaries’—and available under the current the collective enterprise’s— registered fund structure operating costs, helping create value The publicly trade d dive rsifie d ho lding co mpany structure can be mo re co ng ruo us with the busine ss/inve stme nt strate g y than the current re giste red fund structure. 11
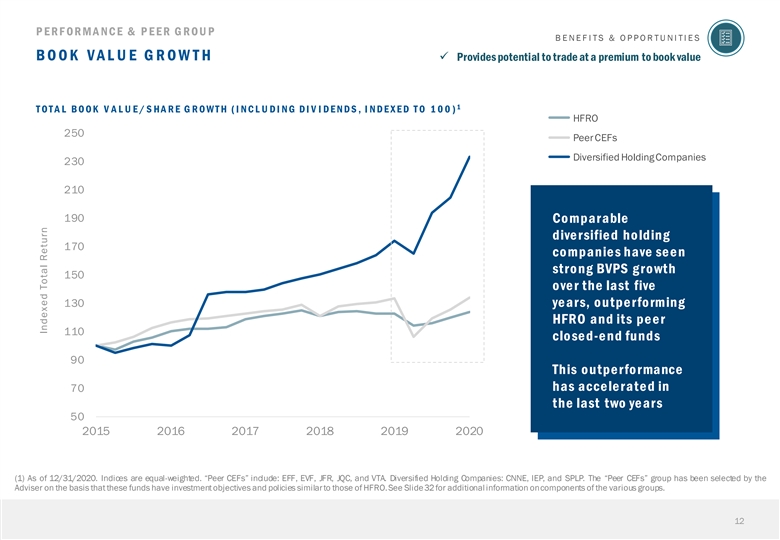
P ERF ORMA NCE & P EER G ROU P BENEFITS & OPPORTUNITIES BOOK VAL U E G R OW T H ü Provides potential to trade at a premium to book value 1 T OT A L BOOK V A L U E / S HA R E G R OW T H ( I NC L U DI NG DI V I DE NDS , I NDE X E D T O 1 00) H HFR FRO O 250 C PE eF ers CEFs C Do iv re pro sr ifat ied io H n o s lding Companies 230 210 190 Co mparable diversified holding 170 co mpanie s have se e n stro ng BVPS g ro wth 150 over the last five 130 years, outperforming HFRO and its peer 110 closed-e nd funds 90 This outperformance has acce le rate d in 70 the last two ye ars 50 2015 2016 2017 2018 2019 2020 (1) As of 12/31/2020. Indices are equal-weighted. “Peer CEFs” include: EFF, EVF, JFR, JQC, and VTA. Diversified Holding Companies: CNNE, IEP, and SPLP. The “Peer CEFs” group has been selected by the Adviser on the basis that these funds have investment objectives and policies similarto those of HFRO.See Slide32 for additional information oncomponents of the various groups. 12 Indexed Total Return
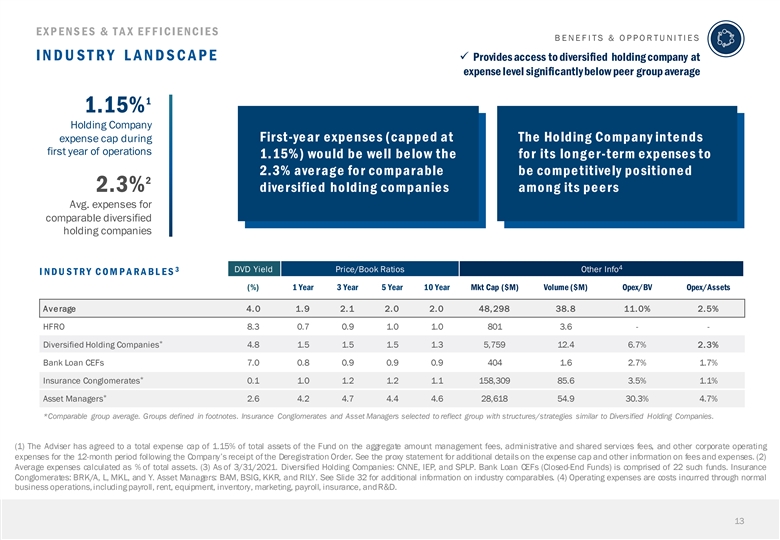
EXP ENS ES & T A X EF F ICIENCIES BENEFITS & OPPORTUNITIES INDUSTRY LANDSCAPE ü Provides access to diversified holding company at expense level significantly below peer group average 1 1.15% Holding Company expense cap during First-ye ar e xpe nse s (cappe d at The Ho lding Co mpany inte nds first year of operations 1.15%) would be well below the for its longer-term e xpense s to 2.3% ave rag e fo r co mparable be competitively po sitione d 2 2.3% dive rsifie d ho lding co mpanie s among its peers Avg. expenses for comparable diversified holding companies 4 3 DVD Yield Price/Book Ratios Other Info I NDU S T R Y C OM P A R A BL E S (%) 1 Year 3 Year 5 Year 10 Year Mkt Cap ($M) Volume ($M) Opex/BV Opex/Assets Average 4.0 1.9 2.1 2.0 2.0 48,298 38.8 11.0% 2.5% HFRO 8.3 0.7 0.9 1.0 1.0 801 3.6 - - * Diversified Holding Companies 4.8 1.5 1.5 1.5 1.3 5,759 12.4 6.7% 2.3% Bank Loan CEFs 7.0 0.8 0.9 0.9 0.9 404 1.6 2.7% 1.7% * Insurance Conglomerates 0.1 1.0 1.2 1.2 1.1 158,309 85.6 3.5% 1.1% * Asset Managers 2.6 4.2 4.7 4.4 4.6 28,618 54.9 30.3% 4.7% *Comparable group average. Groups defined in footnotes. Insurance Conglomerates and Asset Managers selected to reflect group with structures/strategies similar to Diversified Holding Companies. (1) The Adviser has agreed to a total expense cap of 1.15% of total assets of the Fund on the aggregate amount management fees, administrative and shared services fees, and other corporate operating expenses for the 12-month period following the Company’s receipt of the Deregistration Order. See the proxy statement for additional details on the expense cap and other information on fees and expenses. (2) Average expenses calculated as % of total assets. (3) As of 3/31/2021. Diversified Holding Companies: CNNE, IEP, and SPLP. Bank Loan CEFs (Closed-End Funds) is comprised of 22 such funds. Insurance Conglomerates: BRK/A, L, MKL, and Y. Asset Managers: BAM, BSIG, KKR, and RILY. See Slide 32 for additional information on industry comparables. (4) Operating expenses are costs incurred through normal business operations,including payroll, rent, equipment, inventory, marketing, payroll, insurance, andR&D. 13EXP ENS ES & T A X EF F ICIENCIES BENEFITS & OPPORTUNITIES INDUSTRY LANDSCAPE ü Provides access to diversified holding company at expense level significantly below peer group average 1 1.15% Holding Company expense cap during First-ye ar e xpe nse s (cappe d at The Ho lding Co mpany inte nds first year of operations 1.15%) would be well below the for its longer-term e xpense s to 2.3% ave rag e fo r co mparable be competitively po sitione d 2 2.3% dive rsifie d ho lding co mpanie s among its peers Avg. expenses for comparable diversified holding companies 4 3 DVD Yield Price/Book Ratios Other Info I NDU S T R Y C OM P A R A BL E S (%) 1 Year 3 Year 5 Year 10 Year Mkt Cap ($M) Volume ($M) Opex/BV Opex/Assets Average 4.0 1.9 2.1 2.0 2.0 48,298 38.8 11.0% 2.5% HFRO 8.3 0.7 0.9 1.0 1.0 801 3.6 - - * Diversified Holding Companies 4.8 1.5 1.5 1.5 1.3 5,759 12.4 6.7% 2.3% Bank Loan CEFs 7.0 0.8 0.9 0.9 0.9 404 1.6 2.7% 1.7% * Insurance Conglomerates 0.1 1.0 1.2 1.2 1.1 158,309 85.6 3.5% 1.1% * Asset Managers 2.6 4.2 4.7 4.4 4.6 28,618 54.9 30.3% 4.7% *Comparable group average. Groups defined in footnotes. Insurance Conglomerates and Asset Managers selected to reflect group with structures/strategies similar to Diversified Holding Companies. (1) The Adviser has agreed to a total expense cap of 1.15% of total assets of the Fund on the aggregate amount management fees, administrative and shared services fees, and other corporate operating expenses for the 12-month period following the Company’s receipt of the Deregistration Order. See the proxy statement for additional details on the expense cap and other information on fees and expenses. (2) Average expenses calculated as % of total assets. (3) As of 3/31/2021. Diversified Holding Companies: CNNE, IEP, and SPLP. Bank Loan CEFs (Closed-End Funds) is comprised of 22 such funds. Insurance Conglomerates: BRK/A, L, MKL, and Y. Asset Managers: BAM, BSIG, KKR, and RILY. See Slide 32 for additional information on industry comparables. (4) Operating expenses are costs incurred through normal business operations,including payroll, rent, equipment, inventory, marketing, payroll, insurance, andR&D. 13

I I . P R OP OS A L BA C KGR OUND & KE Y FE A T UR E S B a c k ground on t h e P r oposed Tr ansac tion a nd I n f ormation on K e y P r oposal F e atur es 14I I . P R OP OS A L BA C KGR OUND & KE Y FE A T UR E S B a c k ground on t h e P r oposed Tr ansac tion a nd I n f ormation on K e y P r oposal F e atur es 14
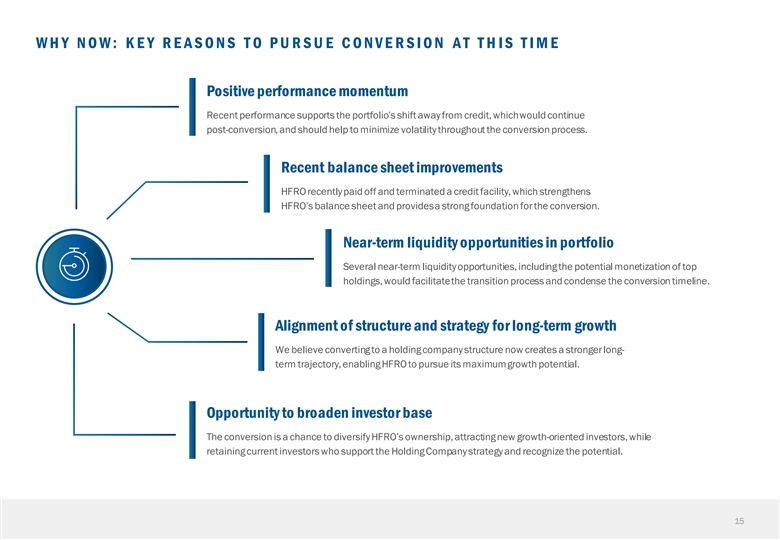
WHY NOW: KEY REASONS TO PURSUE CONVERSION AT THIS TIME Positive performance momentum Recent performance supports the portfolio’s shift away from credit, which would continue post-conversion, and should help to minimize volatility throughout the conversion process. Recent balance sheet improvements HFRO recently paid off and terminated a credit facility, which strengthens HFRO’s balance sheet and provides a strong foundation for the conversion. Near-term liquidity opportunities in portfolio Several near-term liquidity opportunities, including the potential monetization of top holdings, would facilitate the transition process and condense the conversion timeline. Alignment of structure and strategy for long-term growth We believe converting to a holding company structure now creates a stronger long- term trajectory, enabling HFRO to pursue its maximum growth potential. Opportunity to broaden investor base The conversion is a chance to diversify HFRO’s ownership, attracting new growth-oriented investors, while retaining current investors who support the Holding Company strategy and recognize the potential. 15WHY NOW: KEY REASONS TO PURSUE CONVERSION AT THIS TIME Positive performance momentum Recent performance supports the portfolio’s shift away from credit, which would continue post-conversion, and should help to minimize volatility throughout the conversion process. Recent balance sheet improvements HFRO recently paid off and terminated a credit facility, which strengthens HFRO’s balance sheet and provides a strong foundation for the conversion. Near-term liquidity opportunities in portfolio Several near-term liquidity opportunities, including the potential monetization of top holdings, would facilitate the transition process and condense the conversion timeline. Alignment of structure and strategy for long-term growth We believe converting to a holding company structure now creates a stronger long- term trajectory, enabling HFRO to pursue its maximum growth potential. Opportunity to broaden investor base The conversion is a chance to diversify HFRO’s ownership, attracting new growth-oriented investors, while retaining current investors who support the Holding Company strategy and recognize the potential. 15
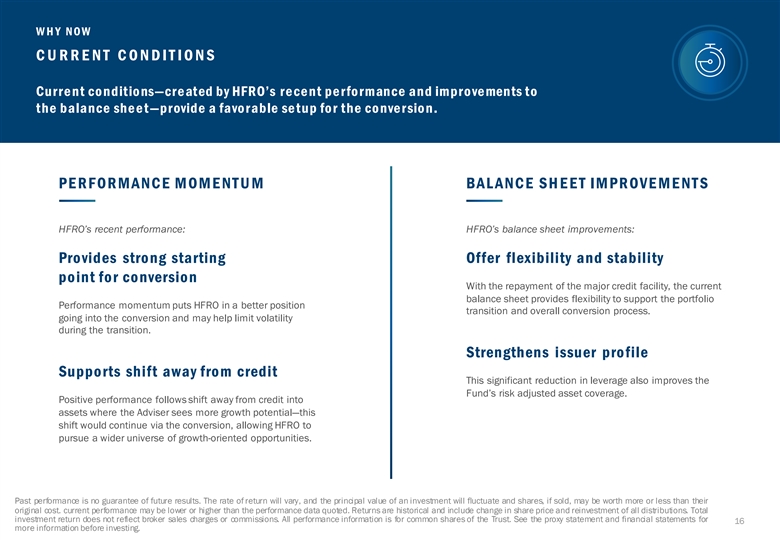
W H Y NOW CURRENT CONDITIONS Curre nt co nditio ns—cre ated by HFRO’s re ce nt pe rfo rmance and impro ve ments to the balance she e t—provide a favo rable se tup fo r the co nve rsio n. PE R F OR MANC E MOME NT U M BAL ANC E SH EET IMPR OVEMENT S HFRO’s recent performance: HFRO’s balance sheet improvements: Provides strong starting Offer flexibility and stability point for conversion With the repayment of the major credit facility, the current balance sheet provides flexibility to support the portfolio Performance momentum puts HFRO in a better position transition and overall conversion process. going into the conversion and may help limit volatility during the transition. Strengthens issuer profile Supports shift away from credit This significant reduction in leverage also improves the Fund’s risk adjusted asset coverage. Positive performance follows shift away from credit into assets where the Adviser sees more growth potential—this shift would continue via the conversion, allowing HFRO to pursue a wider universe of growth-oriented opportunities. Past performance is no guarantee of future results. The rate of return will vary, and the principal value of an investment will fluctuate and shares, if sold, may be worth more or less than their original cost. current performance may be lower or higher than the performance data quoted. Returns are historical and include change in share price and reinvestment of all distributions. Total investment return does not reflect broker sales charges or commissions. All performance information is for common shares of the Trust. See the proxy statement and financial statements for 16 more information before investing.W H Y NOW CURRENT CONDITIONS Curre nt co nditio ns—cre ated by HFRO’s re ce nt pe rfo rmance and impro ve ments to the balance she e t—provide a favo rable se tup fo r the co nve rsio n. PE R F OR MANC E MOME NT U M BAL ANC E SH EET IMPR OVEMENT S HFRO’s recent performance: HFRO’s balance sheet improvements: Provides strong starting Offer flexibility and stability point for conversion With the repayment of the major credit facility, the current balance sheet provides flexibility to support the portfolio Performance momentum puts HFRO in a better position transition and overall conversion process. going into the conversion and may help limit volatility during the transition. Strengthens issuer profile Supports shift away from credit This significant reduction in leverage also improves the Fund’s risk adjusted asset coverage. Positive performance follows shift away from credit into assets where the Adviser sees more growth potential—this shift would continue via the conversion, allowing HFRO to pursue a wider universe of growth-oriented opportunities. Past performance is no guarantee of future results. The rate of return will vary, and the principal value of an investment will fluctuate and shares, if sold, may be worth more or less than their original cost. current performance may be lower or higher than the performance data quoted. Returns are historical and include change in share price and reinvestment of all distributions. Total investment return does not reflect broker sales charges or commissions. All performance information is for common shares of the Trust. See the proxy statement and financial statements for 16 more information before investing.
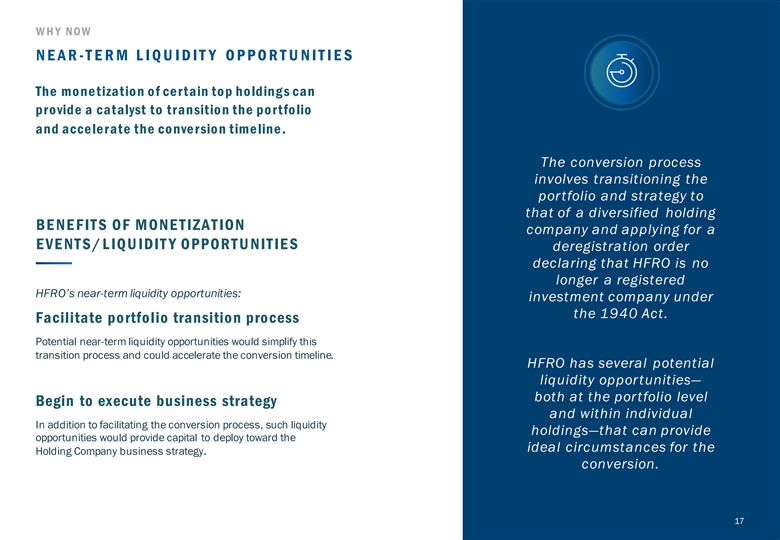
W H Y NOW NE A R -TERM LIQUIDIT Y OPPORTUNITIES The mo ne tizatio n o f ce rtain to p ho lding s can pro vide a catalyst to transitio n the po rtfo lio and acce le rate the co nve rsio n time line . The conversion process involves transitioning the portfolio and strategy to that of a diversified holding BENEFITS OF MONETIZATION company and applying for a E VE NT S/ L IQU IDIT Y OPPOR T U NIT IE S deregistration order declaring that HFRO is no longer a registered HFRO’s near-term liquidity opportunities: investment company under the 1940 Act. Facilitate portfolio transition process Potential near-term liquidity opportunities would simplify this transition process and could accelerate the conversion timeline. HFRO has several potential liquidity opportunities— both at the portfolio level Begin to execute business strategy and within individual In addition to facilitating the conversion process, such liquidity holdings—that can provide opportunities would provide capital to deploy toward the ideal circumstances for the Holding Company business strategy. conversion. 17W H Y NOW NE A R -TERM LIQUIDIT Y OPPORTUNITIES The mo ne tizatio n o f ce rtain to p ho lding s can pro vide a catalyst to transitio n the po rtfo lio and acce le rate the co nve rsio n time line . The conversion process involves transitioning the portfolio and strategy to that of a diversified holding BENEFITS OF MONETIZATION company and applying for a E VE NT S/ L IQU IDIT Y OPPOR T U NIT IE S deregistration order declaring that HFRO is no longer a registered HFRO’s near-term liquidity opportunities: investment company under the 1940 Act. Facilitate portfolio transition process Potential near-term liquidity opportunities would simplify this transition process and could accelerate the conversion timeline. HFRO has several potential liquidity opportunities— both at the portfolio level Begin to execute business strategy and within individual In addition to facilitating the conversion process, such liquidity holdings—that can provide opportunities would provide capital to deploy toward the ideal circumstances for the Holding Company business strategy. conversion. 17
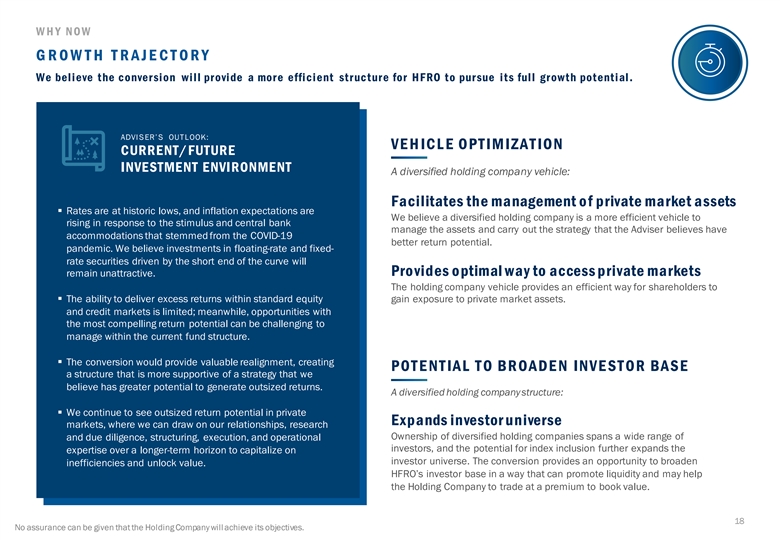
W H Y NOW GROW TH TRAJECTORY We believe the conversion will provide a more efficient structure for HFRO to pursue its full growth potential. ADVISER’S OUTLOOK: VE H IC L E OPT IMIZAT ION CURRENT/FUTURE INVESTMENT ENVIRONMENT A diversified holding company vehicle: Facilitates the management o f private market assets § Rates are at historic lows, and inflation expectations are We believe a diversified holding company is a more efficient vehicle to rising in response to the stimulus and central bank manage the assets and carry out the strategy that the Adviser believes have accommodations that stemmed from the COVID-19 better return potential. pandemic. We believe investments in floating-rate and fixed- rate securities driven by the short end of the curve will Pro vides o ptimal way to access private markets remain unattractive. The holding company vehicle provides an efficient way for shareholders to § The ability to deliver excess returns within standard equity gain exposure to private market assets. and credit markets is limited; meanwhile, opportunities with the most compelling return potential can be challenging to manage within the current fund structure. § The conversion would provide valuable realignment, creating POTENTIAL TO BROADEN INVESTOR BASE a structure that is more supportive of a strategy that we believe has greater potential to generate outsized returns. A diversified holding company structure: § We continue to see outsized return potential in private Expands investor universe markets, where we can draw on our relationships, research Ownership of diversified holding companies spans a wide range of and due diligence, structuring, execution, and operational investors, and the potential for index inclusion further expands the expertise over a longer-term horizon to capitalize on investor universe. The conversion provides an opportunity to broaden inefficiencies and unlock value. HFRO’s investor base in a way that can promote liquidity and may help the Holding Company to trade at a premium to book value. 18 No assurance can be given that the Holding Company will achieve its objectives. W H Y NOW GROW TH TRAJECTORY We believe the conversion will provide a more efficient structure for HFRO to pursue its full growth potential. ADVISER’S OUTLOOK: VE H IC L E OPT IMIZAT ION CURRENT/FUTURE INVESTMENT ENVIRONMENT A diversified holding company vehicle: Facilitates the management o f private market assets § Rates are at historic lows, and inflation expectations are We believe a diversified holding company is a more efficient vehicle to rising in response to the stimulus and central bank manage the assets and carry out the strategy that the Adviser believes have accommodations that stemmed from the COVID-19 better return potential. pandemic. We believe investments in floating-rate and fixed- rate securities driven by the short end of the curve will Pro vides o ptimal way to access private markets remain unattractive. The holding company vehicle provides an efficient way for shareholders to § The ability to deliver excess returns within standard equity gain exposure to private market assets. and credit markets is limited; meanwhile, opportunities with the most compelling return potential can be challenging to manage within the current fund structure. § The conversion would provide valuable realignment, creating POTENTIAL TO BROADEN INVESTOR BASE a structure that is more supportive of a strategy that we believe has greater potential to generate outsized returns. A diversified holding company structure: § We continue to see outsized return potential in private Expands investor universe markets, where we can draw on our relationships, research Ownership of diversified holding companies spans a wide range of and due diligence, structuring, execution, and operational investors, and the potential for index inclusion further expands the expertise over a longer-term horizon to capitalize on investor universe. The conversion provides an opportunity to broaden inefficiencies and unlock value. HFRO’s investor base in a way that can promote liquidity and may help the Holding Company to trade at a premium to book value. 18 No assurance can be given that the Holding Company will achieve its objectives.
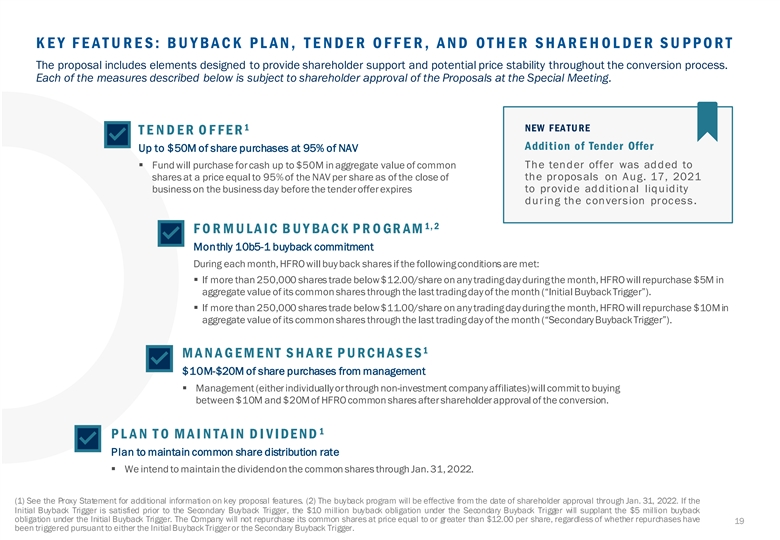
KEY FEATURES: BUYBACK PLAN, TENDER OFFER, AND OTHER SHAREHOLDER SU PPO R T The proposal includes elements designed to provide shareholder support and potential price stability throughout the conversion process. Each of the measures described below is subject to shareholder approval of the Proposals at the Special Meeting. 1 NEW FEATURE T E NDE R OF F E R Addition of Tender Offer Up to $50M of share purchases at 95% of NAV The tender offer was added to § Fund will purchase for cash up to $50M in aggregate value of common the proposals on Aug. 17, 2021 shares at a price equal to 95% of the NAV per share as of the close of to provide additional liquidity business on the business day before the tender offer expires during the conversion process. 1, 2 F O R M U L A I C B U Y BA C K P R O GR AM Monthly 10b5-1 buyback commitment During each month, HFRO will buy back shares if the following conditions are met: § If more than 250,000 shares trade below $12.00/share on any trading day during the month, HFRO will repurchase $5M in aggregate value of its common shares through the last trading day of the month (“Initial Buyback Trigger”). § If more than 250,000 shares trade below $11.00/share on any trading day during the month, HFRO will repurchase $10M in aggregate value of its common shares through the last trading day of the month (“Secondary Buyback Trigger”). 1 M A N A G E M E NT S H A R E P U R C H AS E S $10M-$20M of share purchases from management § Management (either individually or through non-investment company affiliates) will commit to buying between $10M and $20M of HFRO common shares after shareholder approval of the conversion. 1 P L A N T O M A I NTA I N DI V I DE ND Plan to maintain common share distribution rate § We intend to maintain the dividend on the common shares through Jan. 31, 2022. (1) See the Proxy Statement for additional information on key proposal features. (2) The buyback program will be effective from the date of shareholder approval through Jan. 31, 2022. If the Initial Buyback Trigger is satisfied prior to the Secondary Buyback Trigger, the $10 million buyback obligation under the Secondary Buyback Trigger will supplant the $5 million buyback obligation under the Initial Buyback Trigger. The Company will not repurchase its common shares at price equal to or greater than $12.00 per share, regardless of whether repurchases have 19 been triggered pursuant to either the Initial Buyback Triggeror the Secondary Buyback Trigger.
III. H O L D IN G C O M P A N Y S TR A TE G Y H i g hl ights of t h e H ol ding C om pany ’s P l anne d B u si ness S t rate gy 20
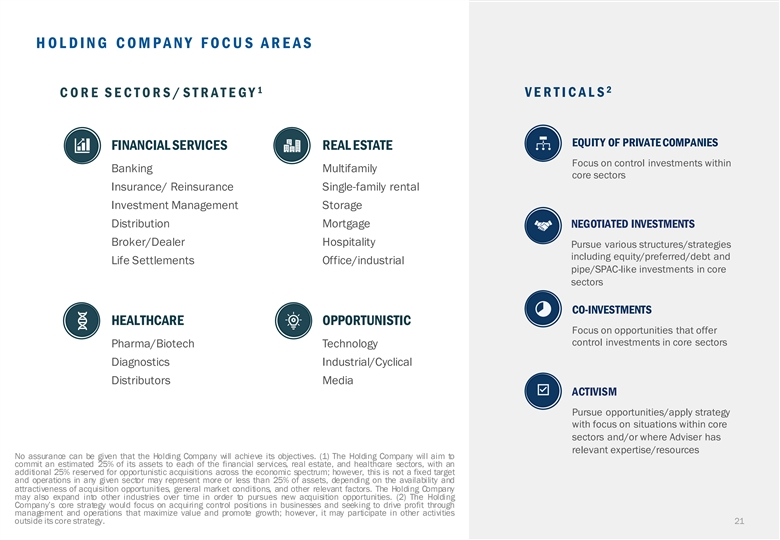
HOLDING COMPANY FOCUS AREAS 1 2 CO RE S E CT O RS / S T RA T E G Y V E RT I CA L S EQUITY OF PRIVATE COMPANIES FINANCIAL SERVICES REAL ESTATE Focus on control investments within Banking Multifamily core sectors Insurance/ Reinsurance Single-family rental Investment Management Storage Distribution Mortgage NEGOTIATED INVESTMENTS Broker/Dealer Hospitality Pursue various structures/strategies including equity/preferred/debt and Life Settlements Office/industrial pipe/SPAC-like investments in core sectors CO-INVESTMENTS HEALTHCARE OPPORTUNISTIC Focus on opportunities that offer control investments in core sectors Pharma/Biotech Technology Diagnostics Industrial/Cyclical Distributors Media ACTIVISM Pursue opportunities/apply strategy with focus on situations within core sectors and/or where Adviser has relevant expertise/resources No assurance can be given that the Holding Company will achieve its objectives. (1) The Holding Company will aim to commit an estimated 25% of its assets to each of the financial services, real estate, and healthcare sectors, with an additional 25% reserved for opportunistic acquisitions across the economic spectrum; however, this is not a fixed target and operations in any given sector may represent more or less than 25% of assets, depending on the availability and attractiveness of acquisition opportunities, general market conditions, and other relevant factors. The Holding Company may also expand into other industries over time in order to pursues new acquisition opportunities. (2) The Holding Company’s core strategy would focus on acquiring control positions in businesses and seeking to drive profit through management and operations that maximize value and promote growth; however, it may participate in other activities outside its core strategy. 21HOLDING COMPANY FOCUS AREAS 1 2 CO RE S E CT O RS / S T RA T E G Y V E RT I CA L S EQUITY OF PRIVATE COMPANIES FINANCIAL SERVICES REAL ESTATE Focus on control investments within Banking Multifamily core sectors Insurance/ Reinsurance Single-family rental Investment Management Storage Distribution Mortgage NEGOTIATED INVESTMENTS Broker/Dealer Hospitality Pursue various structures/strategies including equity/preferred/debt and Life Settlements Office/industrial pipe/SPAC-like investments in core sectors CO-INVESTMENTS HEALTHCARE OPPORTUNISTIC Focus on opportunities that offer control investments in core sectors Pharma/Biotech Technology Diagnostics Industrial/Cyclical Distributors Media ACTIVISM Pursue opportunities/apply strategy with focus on situations within core sectors and/or where Adviser has relevant expertise/resources No assurance can be given that the Holding Company will achieve its objectives. (1) The Holding Company will aim to commit an estimated 25% of its assets to each of the financial services, real estate, and healthcare sectors, with an additional 25% reserved for opportunistic acquisitions across the economic spectrum; however, this is not a fixed target and operations in any given sector may represent more or less than 25% of assets, depending on the availability and attractiveness of acquisition opportunities, general market conditions, and other relevant factors. The Holding Company may also expand into other industries over time in order to pursues new acquisition opportunities. (2) The Holding Company’s core strategy would focus on acquiring control positions in businesses and seeking to drive profit through management and operations that maximize value and promote growth; however, it may participate in other activities outside its core strategy. 21
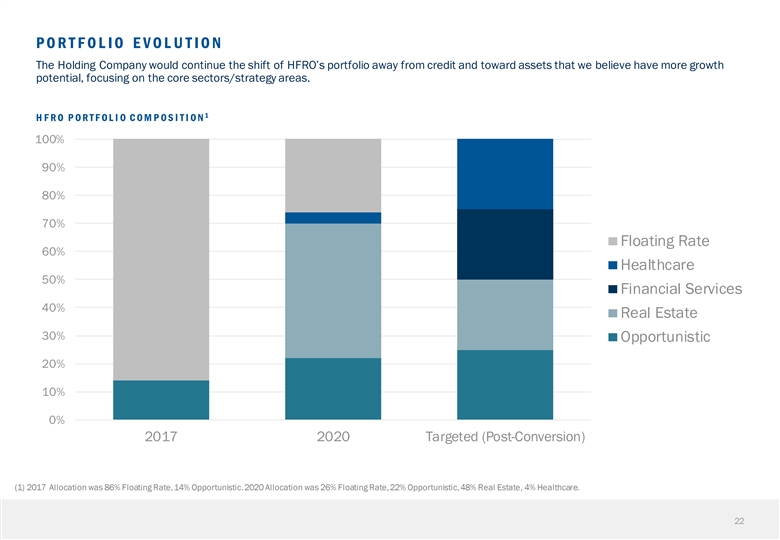
PORTFOLIO EVOLUTION The Holding Company would continue the shift of HFRO’s portfolio away from credit and toward assets that we believe have more growth potential, focusing on the core sectors/strategy areas. 1 H F R O P OR T F OL I O C OM P OS I T I ON 100% 90% 80% 70% Floating Rate 60% Healthcare 50% Financial Services 40% Real Estate 30% Opportunistic 20% 10% 0% 2017 2020 Targeted (Post-Conversion) (1) 2017 Allocation was 86% Floating Rate,14% Opportunistic.2020 Allocation was 26% Floating Rate,22% Opportunistic,48% Real Estate, 4% Healthcare. 22PORTFOLIO EVOLUTION The Holding Company would continue the shift of HFRO’s portfolio away from credit and toward assets that we believe have more growth potential, focusing on the core sectors/strategy areas. 1 H F R O P OR T F OL I O C OM P OS I T I ON 100% 90% 80% 70% Floating Rate 60% Healthcare 50% Financial Services 40% Real Estate 30% Opportunistic 20% 10% 0% 2017 2020 Targeted (Post-Conversion) (1) 2017 Allocation was 86% Floating Rate,14% Opportunistic.2020 Allocation was 26% Floating Rate,22% Opportunistic,48% Real Estate, 4% Healthcare. 22
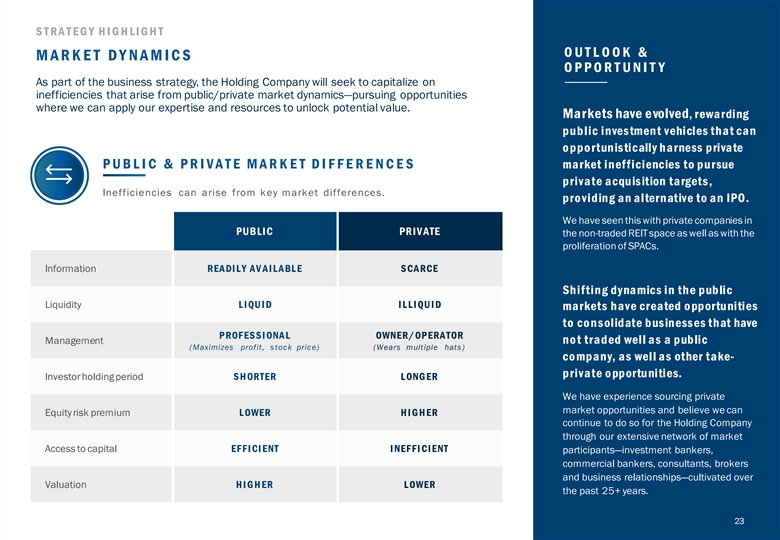
S T R A T E G Y HI G HL I G HT OUTL OOK & MARKET DYNAMICS OP P OR T U NI T Y As part of the business strategy, the Holding Company will seek to capitalize on inefficiencies that arise from public/private market dynamics—pursuing opportunities where we can apply our expertise and resources to unlock potential value. Markets have e volved, rewarding public investment vehicles that can o ppo rtunistically harness private P U B L I C & P RI V A T E MA RK E T D I F F E RE N CE S market inefficiencies to pursue private acquisition targets, Inefficiencies can arise from key market differences. pro viding an alternative to an IPO. We have seen this with private companies in PUBLIC PR IV ATE the non-traded REIT space as well as with the proliferation of SPACs. Information READILY AV AILABLE S CA RCE Shifting dynamics in the public Liquidity LI QU I D I LLI QU I D markets have created o pportunities to co nsolidate businesses that have PROF ESSI ONAL OWNER/OP ERA TOR Management no t traded well as a public (Maximizes profit, stock price) (Wears multiple hats) co mpany, as well as other take- private o pportunities. Investor holding period S H ORTER L ONG ER We have experience sourcing private market opportunities and believe we can Equity risk premium L OWER HIG HER continue to do so for the Holding Company through our extensive network of market Access to capital EF F I CI ENT I NEF F I CI ENT participants—investment bankers, commercial bankers, consultants, brokers and business relationships—cultivated over Valuation HIG HER L OWER the past 25+ years. 23S T R A T E G Y HI G HL I G HT OUTL OOK & MARKET DYNAMICS OP P OR T U NI T Y As part of the business strategy, the Holding Company will seek to capitalize on inefficiencies that arise from public/private market dynamics—pursuing opportunities where we can apply our expertise and resources to unlock potential value. Markets have e volved, rewarding public investment vehicles that can o ppo rtunistically harness private P U B L I C & P RI V A T E MA RK E T D I F F E RE N CE S market inefficiencies to pursue private acquisition targets, Inefficiencies can arise from key market differences. pro viding an alternative to an IPO. We have seen this with private companies in PUBLIC PR IV ATE the non-traded REIT space as well as with the proliferation of SPACs. Information READILY AV AILABLE S CA RCE Shifting dynamics in the public Liquidity LI QU I D I LLI QU I D markets have created o pportunities to co nsolidate businesses that have PROF ESSI ONAL OWNER/OP ERA TOR Management no t traded well as a public (Maximizes profit, stock price) (Wears multiple hats) co mpany, as well as other take- private o pportunities. Investor holding period S H ORTER L ONG ER We have experience sourcing private market opportunities and believe we can Equity risk premium L OWER HIG HER continue to do so for the Holding Company through our extensive network of market Access to capital EF F I CI ENT I NEF F I CI ENT participants—investment bankers, commercial bankers, consultants, brokers and business relationships—cultivated over Valuation HIG HER L OWER the past 25+ years. 23

I V. C A P A BI LI T IES & EXP ER I ENC E C a p abil iti es & E x p er ie nce R e l evant t o t he H o l ding C o m pany S t rategy 24I V. C A P A BI LI T IES & EXP ER I ENC E C a p abil iti es & E x p er ie nce R e l evant t o t he H o l ding C o m pany S t rategy 24
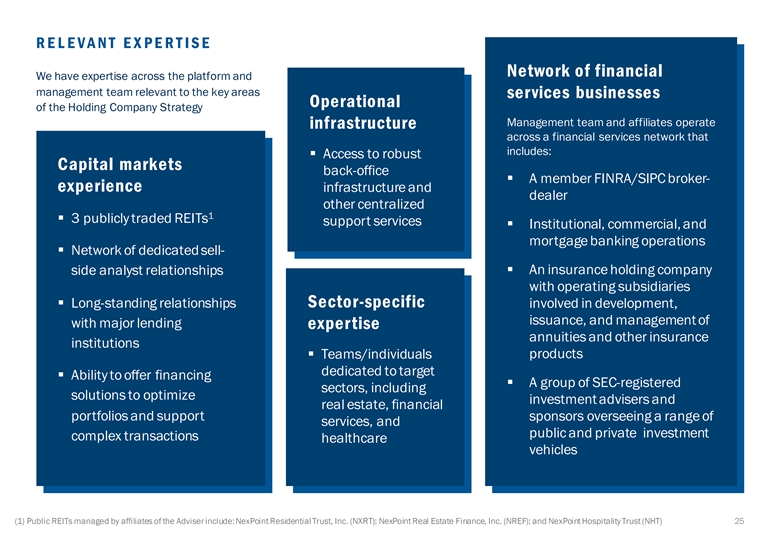
RELEVANT EXPERTISE Network of financial We have expertise across the platform and management team relevant to the key areas services businesses Operational of the Holding Company Strategy Management team and affiliates operate infrastructure across a financial services network that includes: § Access to robust Capital markets back-office § A member FINRA/SIPC broker- experience infrastructure and dealer other centralized 1 § 3 publicly traded REITs support services § Institutional, commercial, and mortgage banking operations § Network of dedicated sell- § An insurance holding company side analyst relationships with operating subsidiaries § Long-standing relationships Sector-specific involved in development, issuance, and management of with major lending expertise annuities and other insurance institutions products § Teams/individuals dedicated to target § Ability to offer financing § A group of SEC-registered sectors, including solutions to optimize investment advisers and real estate, financial portfolios and support sponsors overseeing a range of services, and public and private investment complex transactions healthcare vehicles (1) Public REITs managed by affiliates of the Adviser include: NexPoint Residential Trust, Inc. (NXRT); NexPoint Real Estate Finance, Inc. (NREF); and NexPoint Hospitality Trust (NHT) 25RELEVANT EXPERTISE Network of financial We have expertise across the platform and management team relevant to the key areas services businesses Operational of the Holding Company Strategy Management team and affiliates operate infrastructure across a financial services network that includes: § Access to robust Capital markets back-office § A member FINRA/SIPC broker- experience infrastructure and dealer other centralized 1 § 3 publicly traded REITs support services § Institutional, commercial, and mortgage banking operations § Network of dedicated sell- § An insurance holding company side analyst relationships with operating subsidiaries § Long-standing relationships Sector-specific involved in development, issuance, and management of with major lending expertise annuities and other insurance institutions products § Teams/individuals dedicated to target § Ability to offer financing § A group of SEC-registered sectors, including solutions to optimize investment advisers and real estate, financial portfolios and support sponsors overseeing a range of services, and public and private investment complex transactions healthcare vehicles (1) Public REITs managed by affiliates of the Adviser include: NexPoint Residential Trust, Inc. (NXRT); NexPoint Real Estate Finance, Inc. (NREF); and NexPoint Hospitality Trust (NHT) 25

RELEVANT EXPERTISE: ABILIT Y TO GENERATE GROW TH Our expertise includes a strong track record of driving growth: Raising assets in a challenging Turning a community bank into a top performing financial institution envi ronment § Management team involved in 2004 acquisition of bank with ~$55M in assets Raised $1.5B in gross § Grew bank to $9.2B in assets across institutional, commercial, and mortgage banking assets in 2020 across operations; earned national recognition for performance among similarly sized banks a range of vehicles $1.5B despite the challenges created by the COVID- Gross assets 19 pandemic raised across 4 throughout the year platform TO P 20 B E ST - TO P 10 TO P 5 R O AE P E R F OR M ING E F F I C I E N C Y Has fourth-highest return on average U . S. B AN K S R A TI O tangle common equity Ranked #17 on list of Has sixth-lowest among top-ranked top-performing U.S. efficiency ratio among 1 1 1 banks banks top-ranked banks Building an insurance platform Management team and affiliates acquired a life insurance company in 2019 and established a group of complementary businesses to develop Growing book value in C H A NG E I N BOOK V A L U E /S HAR E and distribute retirement products and manage 3 first year post-IPO I N F I RS T Y E A R S I N CE I PO underlying investments Launched a publicly traded NREF + 9. 9% mortgage REIT in 1Q20 2 Commercial MREIT Average - 8.8% (NYSE:NREF) and generated strong book $100M Total MREIT Average - 18.6% value per share growth vs. Grew assets to $100M peers in first year 5 Residential MREIT Average - 24.7% within 9 months of launch (1) NexBank SSB as of 12/31/2020. Rankings by S&P Global Market Intelligence of U.S. banks with $3B-$10B in assets. (2) NexPoint Real Estate Finance (“NREF”) is a publicly traded mortgage REIT that is externally managed by NexPoint Real Estate Advisors VII, L.P., a subsidiary of NexPoint Advisors, L.P., an affiliate of the Adviser via common ownership. (3) As of 12/31/2020 since NREF has been public. (4) As of 12/31/2020. NexPoint Securities, Inc., member FINRA/SIPC, is the distributor for products managed by the Adviser and other affiliated entities. (5) As of 12/31/2020. Insurance platform includes NexAnnuity Holdings,Inc. and The OhioState Life Insurance Company. 26RELEVANT EXPERTISE: ABILIT Y TO GENERATE GROW TH Our expertise includes a strong track record of driving growth: Raising assets in a challenging Turning a community bank into a top performing financial institution envi ronment § Management team involved in 2004 acquisition of bank with ~$55M in assets Raised $1.5B in gross § Grew bank to $9.2B in assets across institutional, commercial, and mortgage banking assets in 2020 across operations; earned national recognition for performance among similarly sized banks a range of vehicles $1.5B despite the challenges created by the COVID- Gross assets 19 pandemic raised across 4 throughout the year platform TO P 20 B E ST - TO P 10 TO P 5 R O AE P E R F OR M ING E F F I C I E N C Y Has fourth-highest return on average U . S. B AN K S R A TI O tangle common equity Ranked #17 on list of Has sixth-lowest among top-ranked top-performing U.S. efficiency ratio among 1 1 1 banks banks top-ranked banks Building an insurance platform Management team and affiliates acquired a life insurance company in 2019 and established a group of complementary businesses to develop Growing book value in C H A NG E I N BOOK V A L U E /S HAR E and distribute retirement products and manage 3 first year post-IPO I N F I RS T Y E A R S I N CE I PO underlying investments Launched a publicly traded NREF + 9. 9% mortgage REIT in 1Q20 2 Commercial MREIT Average - 8.8% (NYSE:NREF) and generated strong book $100M Total MREIT Average - 18.6% value per share growth vs. Grew assets to $100M peers in first year 5 Residential MREIT Average - 24.7% within 9 months of launch (1) NexBank SSB as of 12/31/2020. Rankings by S&P Global Market Intelligence of U.S. banks with $3B-$10B in assets. (2) NexPoint Real Estate Finance (“NREF”) is a publicly traded mortgage REIT that is externally managed by NexPoint Real Estate Advisors VII, L.P., a subsidiary of NexPoint Advisors, L.P., an affiliate of the Adviser via common ownership. (3) As of 12/31/2020 since NREF has been public. (4) As of 12/31/2020. NexPoint Securities, Inc., member FINRA/SIPC, is the distributor for products managed by the Adviser and other affiliated entities. (5) As of 12/31/2020. Insurance platform includes NexAnnuity Holdings,Inc. and The OhioState Life Insurance Company. 26
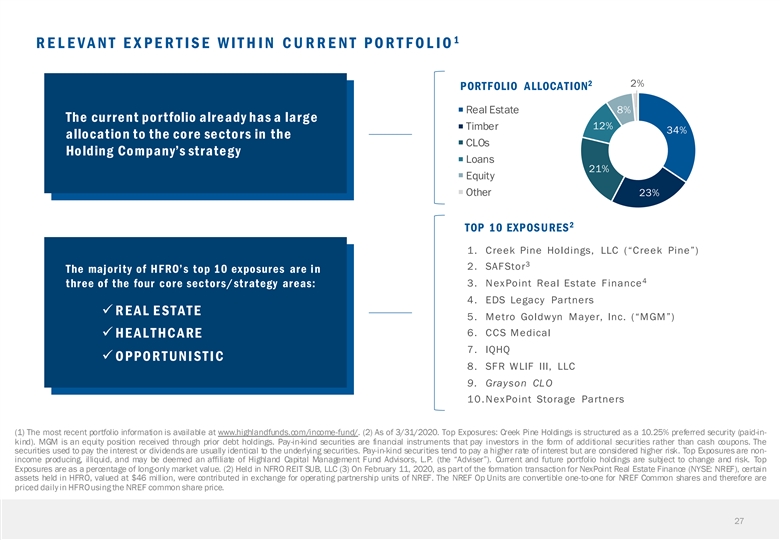
1 RELEVANT EXPERTISE WITHIN CURRENT PORTFOLIO 2 2% PORTFOLIO ALLOCATION Real Estate 8% The curre nt po rtfolio alre ady has a larg e 12% Timber 34% allocatio n to the co re secto rs in the CLOs Ho lding Co mpany’s strate g y Loans 21% Equity Other 23% 2 TOP 10 EXPOSURES 1. Creek Pine Holdings, LLC (“Creek Pine”) 3 2. SAFStor The majority of HFRO’s top 10 exposures are in 4 three of the four core sectors/strategy areas: 3. NexPoint Real Estate Finance 4. EDS Legacy Partners ü R E AL E ST AT E 5. Metro Goldwyn Mayer, Inc. (“MGM”) 6. CCS Medical ü HE A L T HC A RE 7. IQHQ ü O PPO R T UN I ST I C 8. SFR WLIF III, LLC 9. Grayson CLO 10.NexPoint Storage Partners (1) The most recent portfolio information is available at www.highlandfunds.com/income-fund/. (2) As of 3/31/2020. Top Exposures: Creek Pine Holdings is structured as a 10.25% preferred security (paid-in- kind). MGM is an equity position received through prior debt holdings. Pay-in-kind securities are financial instruments that pay investors in the form of additional securities rather than cash coupons. The securities used to pay the interest or dividends are usually identical to the underlying securities. Pay-in-kind securities tend to pay a higher rate of interest but are considered higher risk. Top Exposures are non- income producing, illiquid, and may be deemed an affiliate of Highland Capital Management Fund Advisors, L.P. (the “Adviser”). Current and future portfolio holdings are subject to change and risk. Top Exposures are as a percentage of long-only market value. (2) Held in NFRO REIT SUB, LLC (3) On February 11, 2020, as part of the formation transaction for NexPoint Real Estate Finance (NYSE: NREF), certain assets held in HFRO, valued at $46 million, were contributed in exchange for operating partnership units of NREF. The NREF Op Units are convertible one-to-one for NREF Common shares and therefore are priced daily in HFROusing the NREF common share price. 271 RELEVANT EXPERTISE WITHIN CURRENT PORTFOLIO 2 2% PORTFOLIO ALLOCATION Real Estate 8% The curre nt po rtfolio alre ady has a larg e 12% Timber 34% allocatio n to the co re secto rs in the CLOs Ho lding Co mpany’s strate g y Loans 21% Equity Other 23% 2 TOP 10 EXPOSURES 1. Creek Pine Holdings, LLC (“Creek Pine”) 3 2. SAFStor The majority of HFRO’s top 10 exposures are in 4 three of the four core sectors/strategy areas: 3. NexPoint Real Estate Finance 4. EDS Legacy Partners ü R E AL E ST AT E 5. Metro Goldwyn Mayer, Inc. (“MGM”) 6. CCS Medical ü HE A L T HC A RE 7. IQHQ ü O PPO R T UN I ST I C 8. SFR WLIF III, LLC 9. Grayson CLO 10.NexPoint Storage Partners (1) The most recent portfolio information is available at www.highlandfunds.com/income-fund/. (2) As of 3/31/2020. Top Exposures: Creek Pine Holdings is structured as a 10.25% preferred security (paid-in- kind). MGM is an equity position received through prior debt holdings. Pay-in-kind securities are financial instruments that pay investors in the form of additional securities rather than cash coupons. The securities used to pay the interest or dividends are usually identical to the underlying securities. Pay-in-kind securities tend to pay a higher rate of interest but are considered higher risk. Top Exposures are non- income producing, illiquid, and may be deemed an affiliate of Highland Capital Management Fund Advisors, L.P. (the “Adviser”). Current and future portfolio holdings are subject to change and risk. Top Exposures are as a percentage of long-only market value. (2) Held in NFRO REIT SUB, LLC (3) On February 11, 2020, as part of the formation transaction for NexPoint Real Estate Finance (NYSE: NREF), certain assets held in HFRO, valued at $46 million, were contributed in exchange for operating partnership units of NREF. The NREF Op Units are convertible one-to-one for NREF Common shares and therefore are priced daily in HFROusing the NREF common share price. 27
V . C OR P OR A T E P R OF I L E A ND C ONV E R S I ON P R OC E S S I n f o rmati o n o n t h e H o l ding C o m pany M anage ment Te am a nd C o n ver si o n T i mel ine 28V . C OR P OR A T E P R OF I L E A ND C ONV E R S I ON P R OC E S S I n f o rmati o n o n t h e H o l ding C o m pany M anage ment Te am a nd C o n ver si o n T i mel ine 28
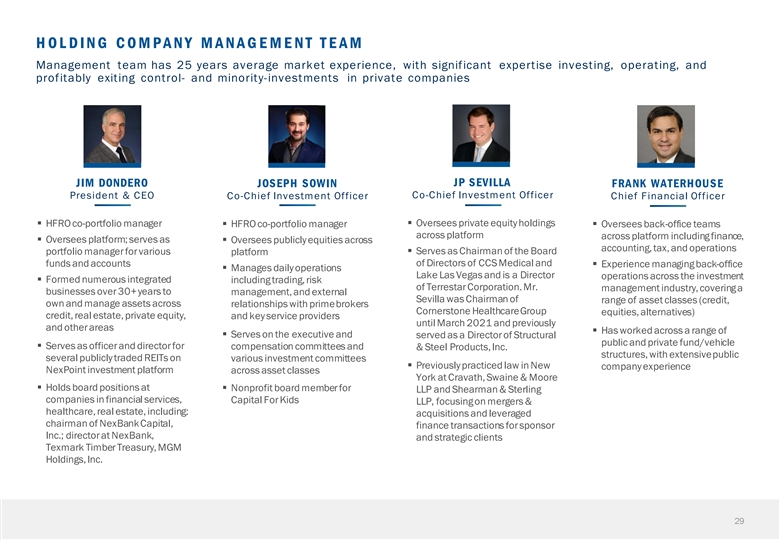
HOLDING COMPANY MANAGEMENT TEAM Management team has 25 years average market experience, with significant expertise investing, operating, and profitably exiting control- and minority-investments in private companies JP SEVILLA JIM DONDERO JOSEPH SOWIN FRANK WATERHOUSE Co-Chief Investment Officer President & CEO Co-Chief Investment Officer Chief Financial Officer § Oversees private equity holdings § HFRO co-portfolio manager§ HFRO co-portfolio manager§ Oversees back-office teams across platform across platform including finance, § Oversees platform; serves as § Oversees publicly equities across accounting, tax, and operations § Serves as Chairman of the Board portfolio manager for various platform of Directors of CCS Medical and funds and accounts§ Experience managing back-office § Manages daily operations Lake Las Vegas and is a Director operations across the investment § Formed numerous integrated including trading, risk of Terrestar Corporation. Mr. management industry, covering a businesses over 30+ years to management, and external Sevilla was Chairman of range of asset classes (credit, own and manage assets across relationships with prime brokers Cornerstone Healthcare Group equities, alternatives) credit, real estate, private equity, and key service providers until March 2021 and previously and other areas § Has worked across a range of § Serves on the executive and served as a Director of Structural public and private fund/vehicle § Serves as officer and director for compensation committees and & Steel Products, Inc. structures, with extensive public several publicly traded REITs on various investment committees § Previously practiced law in New company experience NexPoint investment platform across asset classes York at Cravath, Swaine & Moore § Holds board positions at § Nonprofit board member for LLP and Shearman & Sterling companies in financial services, Capital For Kids LLP, focusing on mergers & healthcare, real estate, including: acquisitions and leveraged chairman of NexBank Capital, finance transactions for sponsor Inc.; director at NexBank, and strategic clients Texmark Timber Treasury, MGM Holdings, Inc. 29
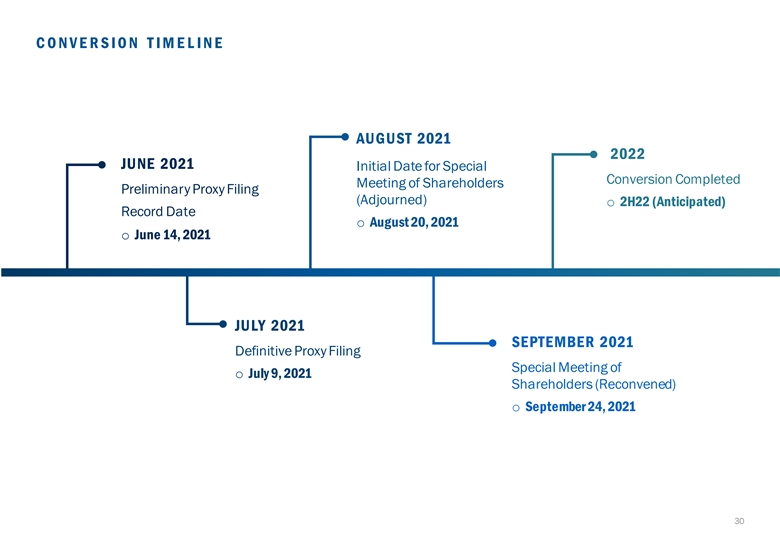
CONVERSION TIMELINE AUGUST 2021 2022 JUNE 2021 Initial Date for Special Conversion Completed Meeting of Shareholders Preliminary Proxy Filing (Adjourned) o 2H22 (Anticipated) Record Date o August 20, 2021 o June 14, 2021 JULY 2021 SEPTEMBER 2021 Definitive Proxy Filing Special Meeting of o July 9, 2021 Shareholders (Reconvened) o September 24, 2021 30CONVERSION TIMELINE AUGUST 2021 2022 JUNE 2021 Initial Date for Special Conversion Completed Meeting of Shareholders Preliminary Proxy Filing (Adjourned) o 2H22 (Anticipated) Record Date o August 20, 2021 o June 14, 2021 JULY 2021 SEPTEMBER 2021 Definitive Proxy Filing Special Meeting of o July 9, 2021 Shareholders (Reconvened) o September 24, 2021 30

V I . R I S K S , DI S C L OS U R E S , A ND NOT E S 31V I . R I S K S , DI S C L OS U R E S , A ND NOT E S 31
R I S K S , DI S C L OS U R E S , A ND NOT E S NOTES Definitions of Industry Comparables: Closed-End Fund Comparables: Eaton Vance Floating-Rate Income Plus Fund (EFF), Eaton Vance Senior Income Trust (EVF), Nuveen Floating Rate Income Fund (JFR), Nuveen Credit Income Strategies Fund (JQC), and Invesco Dynamic Credit Opportunities Fund (VTA). Insurance Conglomerates: Berkshire Hathaway Inc. (BRK-A), Loews Corporation (L), Markel Corporation (MKL), and Alleghany Corporation (Y). Diversified Holding Companies: Cannae Holdings Inc. (CNNE), Icahn Enterprises L.P. (IEP), and Steel Partners Holdings L.P. (SPLP). Asset Managers: Brookfield Asset Management Inc. (BAM), BrightSphere Investment Group Inc. (BSIG), KKR & Co. Inc. (KKR), and B. Riley Financial, Inc. (RILY). “Public Competitors” include Closed-End Fund Comparables, Insurance Conglomerates, Diversified Holding Companies, and Asset Managers (as defined above). “Peer CEFs” refer to the Closed-End Fund Comparables as defined above. The “Peer CEFs” group has been selected by the Adviser on the basis that these funds have investment objectives and policies similar to those of HFRO. RIS K S & DIS CL OS URES Past performance is no guarantee of future results. The rate of return will vary and the principal value of an investment will fluctuate and shares, if sold, may be worth more or less than their original cost. current performance may be lower or higher than the performance data quoted. Returns are historical and include change in share price and reinvestment of all distributions. Total investment return does not reflect broker sales charges or commissions. All performance information is for common shares of the Trust. See the proxy statement and fi nancial statements for more information before investing. You should carefully consider HFRO’s business strategy, risks, fees and expenses. A copy of the proxy statement, which contains this and other information was filed with the SEC on or about July 9, 2021. This presentation document contains forward-looking statements. These statements reflect the current views of management with respect to future events and financial performance. Forward-looking statements can be identified by words such as “anticipate”, “expect”, “could,” “may”, “potential”, “will”, “ability,” “targets,” “believe,” “likely,” “assumes,” “ensuring,” “available,” “optionality,” “viability,” “maintain,” “consistent,” “pace,” “should,” “emerging,” “driving,” “looking to,” and similar statements of a future or forward-looking nature. Forward- looking statements address matters that involve risks and uncertainties. Past performance does not guarantee future results. Performance during time periods shown is limited and may not reflect the performance in difference economic and market cycles. There can be no assurance that similar performance will be experienced. This presentation contains information about prior investments made by the Adviser of HFRO. This information was prepared by the Adviser based on its experience in the industry and on assumptions of fact and opinion as to future events which the Adviser believed to be reasonable when made. There can be no assurance that the Adviser and/or HFRO will be as successful as these earlier investments. Prior investment returns are not indicative of future results. It should not be assumed that investment recommendations made in the future will be profitable or will equal the performance of the securities included herein. HFRO, once transitioned to a holding company, will not be an investment fund and will employ a business strategy that is focused on acquiring controlling interests in, and managing, attractive businesses and will seek to profit primarily from their improved operating results, as opposed to making securities-focused investments with an intent to profit from an exit strategy. Therefore, the risk/return characteristics of HFRO are expected to be materially different from those of “private equity” and very limited reliance, if any, should be placed on statistics related to private equity funds or the private equity industry. These statistics are presented for informational purposes only as a reasonably understandable grounding point for the universe of private company equity. Closed-end funds, unlike open-end funds, are not continuously offered. There is a one-time public offering and once issued, shares of closed-end funds are sold in the open market through a stock exchange and frequently trade at prices lower than their net asset value. Net Asset Value (“NAV”) is total assets less total liabilities, which includes preferred shares, divided by the number of common shares outstanding. When NAV is lower than market price, dividends are assumed to be reinvested at the greater of NAV or 95% of the market price. When NAV is higher, dividends are assumed to be reinvested at market price. For additional information, please contact your investment adviser or visit our website https://www.highlandfunds.com/income-fund. 32R I S K S , DI S C L OS U R E S , A ND NOT E S NOTES Definitions of Industry Comparables: Closed-End Fund Comparables: Eaton Vance Floating-Rate Income Plus Fund (EFF), Eaton Vance Senior Income Trust (EVF), Nuveen Floating Rate Income Fund (JFR), Nuveen Credit Income Strategies Fund (JQC), and Invesco Dynamic Credit Opportunities Fund (VTA). Insurance Conglomerates: Berkshire Hathaway Inc. (BRK-A), Loews Corporation (L), Markel Corporation (MKL), and Alleghany Corporation (Y). Diversified Holding Companies: Cannae Holdings Inc. (CNNE), Icahn Enterprises L.P. (IEP), and Steel Partners Holdings L.P. (SPLP). Asset Managers: Brookfield Asset Management Inc. (BAM), BrightSphere Investment Group Inc. (BSIG), KKR & Co. Inc. (KKR), and B. Riley Financial, Inc. (RILY). “Public Competitors” include Closed-End Fund Comparables, Insurance Conglomerates, Diversified Holding Companies, and Asset Managers (as defined above). “Peer CEFs” refer to the Closed-End Fund Comparables as defined above. The “Peer CEFs” group has been selected by the Adviser on the basis that these funds have investment objectives and policies similar to those of HFRO. RIS K S & DIS CL OS URES Past performance is no guarantee of future results. The rate of return will vary and the principal value of an investment will fluctuate and shares, if sold, may be worth more or less than their original cost. current performance may be lower or higher than the performance data quoted. Returns are historical and include change in share price and reinvestment of all distributions. Total investment return does not reflect broker sales charges or commissions. All performance information is for common shares of the Trust. See the proxy statement and fi nancial statements for more information before investing. You should carefully consider HFRO’s business strategy, risks, fees and expenses. A copy of the proxy statement, which contains this and other information was filed with the SEC on or about July 9, 2021. This presentation document contains forward-looking statements. These statements reflect the current views of management with respect to future events and financial performance. Forward-looking statements can be identified by words such as “anticipate”, “expect”, “could,” “may”, “potential”, “will”, “ability,” “targets,” “believe,” “likely,” “assumes,” “ensuring,” “available,” “optionality,” “viability,” “maintain,” “consistent,” “pace,” “should,” “emerging,” “driving,” “looking to,” and similar statements of a future or forward-looking nature. Forward- looking statements address matters that involve risks and uncertainties. Past performance does not guarantee future results. Performance during time periods shown is limited and may not reflect the performance in difference economic and market cycles. There can be no assurance that similar performance will be experienced. This presentation contains information about prior investments made by the Adviser of HFRO. This information was prepared by the Adviser based on its experience in the industry and on assumptions of fact and opinion as to future events which the Adviser believed to be reasonable when made. There can be no assurance that the Adviser and/or HFRO will be as successful as these earlier investments. Prior investment returns are not indicative of future results. It should not be assumed that investment recommendations made in the future will be profitable or will equal the performance of the securities included herein. HFRO, once transitioned to a holding company, will not be an investment fund and will employ a business strategy that is focused on acquiring controlling interests in, and managing, attractive businesses and will seek to profit primarily from their improved operating results, as opposed to making securities-focused investments with an intent to profit from an exit strategy. Therefore, the risk/return characteristics of HFRO are expected to be materially different from those of “private equity” and very limited reliance, if any, should be placed on statistics related to private equity funds or the private equity industry. These statistics are presented for informational purposes only as a reasonably understandable grounding point for the universe of private company equity. Closed-end funds, unlike open-end funds, are not continuously offered. There is a one-time public offering and once issued, shares of closed-end funds are sold in the open market through a stock exchange and frequently trade at prices lower than their net asset value. Net Asset Value (“NAV”) is total assets less total liabilities, which includes preferred shares, divided by the number of common shares outstanding. When NAV is lower than market price, dividends are assumed to be reinvested at the greater of NAV or 95% of the market price. When NAV is higher, dividends are assumed to be reinvested at market price. For additional information, please contact your investment adviser or visit our website https://www.highlandfunds.com/income-fund. 32
R I S K S , DI S C L OS U R E S , A ND NOT E S RIS K S & DIS CL OS URES ( CONTINUED) Registered investment companies like HFRO are subject to certain risks. Senior Loans Risk. The risk that the issuer of a senior may fail to pay interest or principal when due, and changes in market interest rates may reduce the value of the senior loan or reduce HFRO’s returns. The risks associated with senior loans are similar to the risks of high yield debt securities. Senior loans and other debt securities are also subject to the risk of price declines and to increases in interest rates, particularly long-term rates. Senior loans are also subject to the risk that, as interest rates rise, the cost of borrowing increases, which may increase the risk of default. In addition, the interest rates of floating rate loans typically only adjust to changes in short-term interest rates; long-term interest rates can vary dramatically from short-term interest rates. Therefore, senior loans may not mitigate price declines in a long-term interest rate environment. HFRO’s investments in senior loans are typically below investment grade and are considered speculative because of the credit risk of their issuers. Industry Concentration Risk. HFRO must invest at least 25% of the value of its total assets at the time of purchase in securities of issuers conducting their principal business activities in the real estate industry. HFRO may be subject to greater market fluctuations than a fund that does not concentrate its investments in a particular industry. Financial, economic, business, and other developments affecting issuers in the real estate industry will have a greater effect on HFRO, and if securities of the real estate industry fall out of favor, HFRO could underperform, or its NAV may be more volatile than, funds that have greater industry diversification. Interest Rate Risk. The risk that debt securities, and HFRO’s net assets, may decline in value because of changes in interest rates. Generally, debt securities will decrease in value when interest rates rise and increase in value when interest rates decline. Credit Risk. The risk that HFRO could lose money if the issuer or guarantor of a fixed income security, or the counterparty of a derivatives contract or repurchase agreement, is unable or unwilling (or is perceived to be unable or unwilling) to make a timely payment of principal and/or interest, or to otherwise honor its obligations. Leverage Risk. Leverage may increase the risk of loss, cause fluctuations in the market value of HFRO’s portfolio to have disproportionately large effects or cause our NAV to decline faster than it would otherwise. Real Estate Market Risk. HFRO is exposed to economic, market and regulatory changes that impact the real estate market generally and through its investment in NFRO REIT Sub, LLC (the “REIT Subsidiary”), which may cause HFRO’s operating results to suffer. A number of factors may prevent the REIT Subsidiary’s properties and other real estate-related investments from generating sufficient net cash flow or may adversely affect their value, or both, resulting in less cash available for distribution, or a loss, to us. These factors include: national, regional and local economic conditions; changing demographics; the ability of property managers to provide capable management and adequate maintenance; the quality of a property’s construction and design; increases in costs of maintenance, insurance, and operations (including energy costs and real estate taxes); potential environmental and other legal liabilities; the level of financing used by the REIT Subsidiary and the availability and cost of refinancing; potential instability, default or bankruptcy of tenants in the properties owned by the REIT Subsidiary; the relative illiquidity of real estate investments in general, which may make it difficult to sell a property at an attractive price or within a reasonable time frame. The full extent of the impact and effects of the recent outbreak of COVID-19 on the future financial performance of HFRO, and specifically, on its investments and tenants to properties held by its REIT Subsidiary, are uncertain at this time. The outbreak could have a continued adverse impact on economic and market conditions and trigger a period of global economic slowdown. Pandemics and Associated Economic Disruption. An outbreak of respiratory disease caused by a novel coronavirus was first detected in China in December 2019 and subsequently spread internationally. This coronavirus has resulted in the closing of borders, enhanced health screenings, healthcare service preparation and delivery, quarantines, cancellations, disruptions to supply chains and customer activity, as well as general anxiety and economic uncertainty. It is not known how long any negative impacts, or any future impacts of other significant events such as a substantial economic downturn, will last. Health crises caused by outbreaks of disease, such as the coronavirus, may exacerbate other preexisting political, social and economic risks. This outbreak, and other epidemics and pandemics that may arise in the future, could negatively affect the global economy, as well as the economies of individual countries, individual companies and the market in general in significant and unforeseen ways. For example, a widespread health crisis such as a global pandemic could cause substantial market volatility, exchange trading suspensions and closures, which could adversely affect HFRO’s performance, the performance of the securities in which HFRO invests, lines of credit available to HFRO and may lead to losses on your investment in HFRO. In addition, the increasing interconnectedness of markets around the world may result in many markets being affected by events or conditions in a single country or region or events affecting a single or small number of issuers. In addition, we will be exposed to certain risks related to the implementation of the Conversion Proposal and the deregistration process. HFRO will remain subject to certain contractual limitations on leverage, asset coverage requirements and other restrictions similar to those imposed by the 1940 Act until the terms of HFRO’s outstanding preferred shares are amended or the preferred shares are redeemed, which may not occur until September 30, 2024. 33R I S K S , DI S C L OS U R E S , A ND NOT E S RIS K S & DIS CL OS URES ( CONTINUED) Registered investment companies like HFRO are subject to certain risks. Senior Loans Risk. The risk that the issuer of a senior may fail to pay interest or principal when due, and changes in market interest rates may reduce the value of the senior loan or reduce HFRO’s returns. The risks associated with senior loans are similar to the risks of high yield debt securities. Senior loans and other debt securities are also subject to the risk of price declines and to increases in interest rates, particularly long-term rates. Senior loans are also subject to the risk that, as interest rates rise, the cost of borrowing increases, which may increase the risk of default. In addition, the interest rates of floating rate loans typically only adjust to changes in short-term interest rates; long-term interest rates can vary dramatically from short-term interest rates. Therefore, senior loans may not mitigate price declines in a long-term interest rate environment. HFRO’s investments in senior loans are typically below investment grade and are considered speculative because of the credit risk of their issuers. Industry Concentration Risk. HFRO must invest at least 25% of the value of its total assets at the time of purchase in securities of issuers conducting their principal business activities in the real estate industry. HFRO may be subject to greater market fluctuations than a fund that does not concentrate its investments in a particular industry. Financial, economic, business, and other developments affecting issuers in the real estate industry will have a greater effect on HFRO, and if securities of the real estate industry fall out of favor, HFRO could underperform, or its NAV may be more volatile than, funds that have greater industry diversification. Interest Rate Risk. The risk that debt securities, and HFRO’s net assets, may decline in value because of changes in interest rates. Generally, debt securities will decrease in value when interest rates rise and increase in value when interest rates decline. Credit Risk. The risk that HFRO could lose money if the issuer or guarantor of a fixed income security, or the counterparty of a derivatives contract or repurchase agreement, is unable or unwilling (or is perceived to be unable or unwilling) to make a timely payment of principal and/or interest, or to otherwise honor its obligations. Leverage Risk. Leverage may increase the risk of loss, cause fluctuations in the market value of HFRO’s portfolio to have disproportionately large effects or cause our NAV to decline faster than it would otherwise. Real Estate Market Risk. HFRO is exposed to economic, market and regulatory changes that impact the real estate market generally and through its investment in NFRO REIT Sub, LLC (the “REIT Subsidiary”), which may cause HFRO’s operating results to suffer. A number of factors may prevent the REIT Subsidiary’s properties and other real estate-related investments from generating sufficient net cash flow or may adversely affect their value, or both, resulting in less cash available for distribution, or a loss, to us. These factors include: national, regional and local economic conditions; changing demographics; the ability of property managers to provide capable management and adequate maintenance; the quality of a property’s construction and design; increases in costs of maintenance, insurance, and operations (including energy costs and real estate taxes); potential environmental and other legal liabilities; the level of financing used by the REIT Subsidiary and the availability and cost of refinancing; potential instability, default or bankruptcy of tenants in the properties owned by the REIT Subsidiary; the relative illiquidity of real estate investments in general, which may make it difficult to sell a property at an attractive price or within a reasonable time frame. The full extent of the impact and effects of the recent outbreak of COVID-19 on the future financial performance of HFRO, and specifically, on its investments and tenants to properties held by its REIT Subsidiary, are uncertain at this time. The outbreak could have a continued adverse impact on economic and market conditions and trigger a period of global economic slowdown. Pandemics and Associated Economic Disruption. An outbreak of respiratory disease caused by a novel coronavirus was first detected in China in December 2019 and subsequently spread internationally. This coronavirus has resulted in the closing of borders, enhanced health screenings, healthcare service preparation and delivery, quarantines, cancellations, disruptions to supply chains and customer activity, as well as general anxiety and economic uncertainty. It is not known how long any negative impacts, or any future impacts of other significant events such as a substantial economic downturn, will last. Health crises caused by outbreaks of disease, such as the coronavirus, may exacerbate other preexisting political, social and economic risks. This outbreak, and other epidemics and pandemics that may arise in the future, could negatively affect the global economy, as well as the economies of individual countries, individual companies and the market in general in significant and unforeseen ways. For example, a widespread health crisis such as a global pandemic could cause substantial market volatility, exchange trading suspensions and closures, which could adversely affect HFRO’s performance, the performance of the securities in which HFRO invests, lines of credit available to HFRO and may lead to losses on your investment in HFRO. In addition, the increasing interconnectedness of markets around the world may result in many markets being affected by events or conditions in a single country or region or events affecting a single or small number of issuers. In addition, we will be exposed to certain risks related to the implementation of the Conversion Proposal and the deregistration process. HFRO will remain subject to certain contractual limitations on leverage, asset coverage requirements and other restrictions similar to those imposed by the 1940 Act until the terms of HFRO’s outstanding preferred shares are amended or the preferred shares are redeemed, which may not occur until September 30, 2024. 33
R I S K S , DI S C L OS U R E S , A ND NOT E S RIS K S & DIS CL OS URES ( CONTINUED) Portfolio Transition Risk. During the conversion period, we will be required to transition a material portion of our assets to ensure a non-investment company portfolio. Delays in the Deregistration Process. Any delay in receiving the Deregistration Order may delay our ability to operate like a typical diversified holding company not subject to the 1940 Act. In addition to the foregoing, we will be exposed to additional risks as a diversified holding company if the Conversion Proposal is implemented. Concentration and Illiquidity Risk. Our investments in our subsidiaries and future acquisition opportunities may be concentrated in a limited number of companies and may have limited liquidity. Management and Key Personnel Risk. Our future success is dependent on our management team and the management teams of our subsidiaries, the loss of any of whom could materially adversely affect our financial condition, business and results of operations. No Prior Experience Risk. Our Adviser and management team have limited experience in acquiring or developing businesses and no prior experience operating a diversified holding company. In addition, while it is not expected that the Company will be limited in the types of companies or industries it can invest in, it has limited experience in managing businesses and as a result, there can be no assurance that it will be able to implement our new business strategy or if implemented, that it will be successful. Acquisition Risk. Our business strategy includes acquisitions, and acquisitions entail numerous risks, including the risk of management diversion and increased costs and expenses, all of which could negatively affect HFRO’s profitability. Future Opportunities Risk. We may not be able to successfully fund future acquisitions of new businesses due to the lack of availability of debt or equity financing at the HFRO level on acceptable terms, which could impede the implementation of our acquisition strategy and materially adversely impact our financial condition, business and results of operations. Sector Risks. To the extent that we and our subsidiaries operate in the financial services, real estate and healthcare industries, we and our subsidiaries will be exposed to certain risks unique to each of those sectors and risks associate with any other sectors in which we or our subsidiaries may operate. Capital Loss Carryforwards Risk. There can be no assurances that we will be able to use our accumulated capital loss carryforwards. Investment Securities Risks. We may continue to hold a portion of our assets in investment securities, which would expose HFRO to all of the risk traditionally associated with such investments, including total loss of investment. Conflicts of Interest. Substantial conflicts of interest may arise from our current and historical relationships with the Adviser and its affiliates. Information on the Tender Offer: This presentation is neither an offer to purchase nor a solicitation of an offer to sell any securities of the Fund. Upon commencement of the Tender Offer, the Fund will file with the SEC a Schedule TO containing an offer to purchase, forms of letters of transmittal and related exhibits. These documents will contain important information about the Tender Offer and Shareholders are urged to read them carefully when they become available. Shareholders may obtain free copies of the Tender Offer Statement and other documents (when they become available) filed with the SEC at the SEC’s web site at www.sec.gov. In addition, free copies of the Tender Offer Statement and other documents filed with the SEC may also be obtained after the commencement of the Tender Offer by directing a request to the Fund. 34R I S K S , DI S C L OS U R E S , A ND NOT E S RIS K S & DIS CL OS URES ( CONTINUED) Portfolio Transition Risk. During the conversion period, we will be required to transition a material portion of our assets to ensure a non-investment company portfolio. Delays in the Deregistration Process. Any delay in receiving the Deregistration Order may delay our ability to operate like a typical diversified holding company not subject to the 1940 Act. In addition to the foregoing, we will be exposed to additional risks as a diversified holding company if the Conversion Proposal is implemented. Concentration and Illiquidity Risk. Our investments in our subsidiaries and future acquisition opportunities may be concentrated in a limited number of companies and may have limited liquidity. Management and Key Personnel Risk. Our future success is dependent on our management team and the management teams of our subsidiaries, the loss of any of whom could materially adversely affect our financial condition, business and results of operations. No Prior Experience Risk. Our Adviser and management team have limited experience in acquiring or developing businesses and no prior experience operating a diversified holding company. In addition, while it is not expected that the Company will be limited in the types of companies or industries it can invest in, it has limited experience in managing businesses and as a result, there can be no assurance that it will be able to implement our new business strategy or if implemented, that it will be successful. Acquisition Risk. Our business strategy includes acquisitions, and acquisitions entail numerous risks, including the risk of management diversion and increased costs and expenses, all of which could negatively affect HFRO’s profitability. Future Opportunities Risk. We may not be able to successfully fund future acquisitions of new businesses due to the lack of availability of debt or equity financing at the HFRO level on acceptable terms, which could impede the implementation of our acquisition strategy and materially adversely impact our financial condition, business and results of operations. Sector Risks. To the extent that we and our subsidiaries operate in the financial services, real estate and healthcare industries, we and our subsidiaries will be exposed to certain risks unique to each of those sectors and risks associate with any other sectors in which we or our subsidiaries may operate. Capital Loss Carryforwards Risk. There can be no assurances that we will be able to use our accumulated capital loss carryforwards. Investment Securities Risks. We may continue to hold a portion of our assets in investment securities, which would expose HFRO to all of the risk traditionally associated with such investments, including total loss of investment. Conflicts of Interest. Substantial conflicts of interest may arise from our current and historical relationships with the Adviser and its affiliates. Information on the Tender Offer: This presentation is neither an offer to purchase nor a solicitation of an offer to sell any securities of the Fund. Upon commencement of the Tender Offer, the Fund will file with the SEC a Schedule TO containing an offer to purchase, forms of letters of transmittal and related exhibits. These documents will contain important information about the Tender Offer and Shareholders are urged to read them carefully when they become available. Shareholders may obtain free copies of the Tender Offer Statement and other documents (when they become available) filed with the SEC at the SEC’s web site at www.sec.gov. In addition, free copies of the Tender Offer Statement and other documents filed with the SEC may also be obtained after the commencement of the Tender Offer by directing a request to the Fund. 34