Filed Pursuant to Rule 424(b)(3)
Registration No. 333-262589
STARWOOD REAL ESTATE INCOME TRUST, INC.
SUPPLEMENT NO. 2 DATED MAY 15, 2024
TO THE PROSPECTUS DATED APRIL 10, 2024
This prospectus supplement (“Supplement”) is part of and should be read in conjunction with the prospectus of Starwood Real Estate Income Trust, Inc., dated April 10, 2024 (as supplemented to date, the “Prospectus”). Unless otherwise defined herein, capitalized terms used in this Supplement shall have the same meanings as in the Prospectus. References herein to the “Company,” “we,” “us,” or “our” refer to Starwood Real Estate Income Trust, Inc. and its subsidiaries unless the context specifically requires otherwise.
The purposes of this Supplement are as follows:
•
to provide an update on our liquidity position;
•
to disclose the transaction price for each class of our common stock as of June 1, 2024;
•
to disclose the calculation of our April 30, 2024 NAV per share for each class of our common stock;
•
to update the “Risk Factors” section of the Prospectus;
•
to provide an update on our share repurchase requests;
•
to provide an update on the status of our current public offering (the “Offering”); and
•
to include our Quarterly Report on Form 10-Q for the quarter ended March 31, 2024.
Liquidity Position Update
As of April 30, 2024, we maintain approximately $752 million or approximately 8% of our April 2024 NAV of immediate liquidity comprised of cash, undrawn unsecured line of credit, and liquid securities. This liquidity level does not include any pending net proceeds from asset sales or any potential future asset sales.
June 1, 2024 Transaction Price
The transaction price for each share class of our common stock for subscriptions accepted as of June 1, 2024 (and repurchases as of May 31, 2024) is as follows:
|
| Transaction Price |
| |
Class S |
| $ | 23.06 |
|
Class T |
| $ | 23.07 |
|
Class D |
| $ | 22.62 |
|
Class I |
| $ | 22.87 |
|
The June 1, 2024 transaction price for each of our share classes is equal to such class’s NAV per share as of April 30, 2024. A detailed presentation of the NAV per share is set forth below. The purchase price of our common stock for each share class equals the transaction price of such class, plus applicable upfront selling commissions and dealer manager fees.
April 30, 2024 NAV Per Share
NAV per share is calculated in accordance with the valuation guidelines that have been approved by our board of directors. Our NAV per share, which is updated as of the last calendar day of each month, is posted on our website at www.starwoodNAV.reit. Please refer to “Net Asset Value Calculation and Valuation Guidelines” in the Prospectus for information on how our NAV is determined. The Advisor is ultimately responsible for determining our NAV. We have included a breakdown of the components of total NAV and NAV per share as of April 30, 2024 along with the immediately preceding month.
SREIT-SUP2-0524
1
Our total NAV presented in the following tables includes the NAV of our Class S, Class T, Class D, and Class I common shares, as well as partnership interests of the Operating Partnership held by parties other than the Company. The following table provides a breakdown of the major components of our NAV as of April 30, 2024 ($ and shares/units in thousands):
Components of NAV |
| April 30, 2024 |
| |
Investments in real estate |
| $ | 22,324,402 |
|
Investments in real estate debt |
|
| 1,033,895 |
|
Cash and cash equivalents |
|
| 446,054 |
|
Restricted cash |
|
| 252,669 |
|
Other assets |
|
| 711,675 |
|
Debt obligations |
|
| (12,555,435 | ) |
Secured financings on investments in real estate debt |
|
| (552,113 | ) |
Subscriptions received in advance |
|
| (16,041 | ) |
Other liabilities |
|
| (1,664,803 | ) |
Performance participation accrual |
|
| — |
|
Management fee payable |
|
| (10,360 | ) |
Accrued stockholder servicing fees (1) |
|
| (3,215 | ) |
Non-controlling interests in consolidated joint ventures |
|
| (76,490 | ) |
Net asset value |
| $ | 9,890,238 |
|
Number of outstanding shares/units |
|
| 431,140 |
|
(1)
Stockholder servicing fees only apply to Class S, Class T and Class D shares. For purposes of NAV we recognize the stockholder servicing fee as a reduction of NAV on a monthly basis. Under accounting principles generally accepted in the United States of America (“GAAP”), we accrue the full cost of the stockholder servicing fee as an offering cost at the time we sell Class S, Class T and Class D shares. As of April 30, 2024, we have accrued under GAAP $266.9 million of stockholder servicing fees payable to the Dealer Manager related to the Class S, Class T and Class D shares sold.
The following table provides a breakdown of our total NAV and NAV per share, by share class, as of April 30, 2024 ($ and shares/units in thousands, except per share/unit data):
NAV Per Share |
| Class S |
|
| Class T |
|
| Class D |
|
| Class I |
|
| Third-party Operating Partnership Units (1) |
|
| Total |
| ||||||
Net asset value |
| $ | 4,290,469 |
|
| $ | 119,135 |
|
| $ | 596,849 |
|
| $ | 4,424,562 |
|
| $ | 459,223 |
|
| $ | 9,890,238 |
|
Number of outstanding shares/units |
|
| 186,068 |
|
|
| 5,164 |
|
|
| 26,387 |
|
|
| 193,444 |
|
|
| 20,077 |
|
|
| 431,140 |
|
NAV Per Share/Unit as of April 30, 2024 |
| $ | 23.06 |
|
| $ | 23.07 |
|
| $ | 22.62 |
|
| $ | 22.87 |
|
| $ | 22.87 |
|
|
|
| |
(1)
Includes the Operating Partnership units held by the Special Limited Partner and other third parties.
Set forth below are the weighted averages of the key assumptions in the discounted cash flow methodology used in the April 30, 2024 valuations, based on property types. Once we own more than one single-family, one self-storage and one extended stay investment, we will include the key assumptions for the property types.
Property Type |
| Discount |
| Exit |
Multifamily |
| 7.0% |
| 5.5% |
Industrial |
| 7.2% |
| 5.8% |
Office |
| 8.0% |
| 6.8% |
Other |
| 8.2% |
| 6.7% |
2
These assumptions are determined by the Advisor (except for investments valued by a third party appraisal firm), and reviewed by our independent valuation advisor. A change in these assumptions would impact the calculation of the value of our property investments. For example, assuming all other factors remain unchanged, the changes listed below would result in the following effects on our investment values:
Input |
| Hypothetical |
| Multifamily |
| Industrial |
| Office |
| Other |
Discount Rate |
| 0.25% decrease |
| +1.9% |
| +1.9% |
| +1.8% |
| +1.9% |
(weighted average) |
| 0.25% increase |
| (1.9)% |
| (1.9)% |
| (1.9)% |
| (1.8)% |
Exit Capitalization Rate |
| 0.25% decrease |
| +2.9% |
| +2.9% |
| +2.3% |
| +2.3% |
(weighted average) |
| 0.25% increase |
| (2.7)% |
| (2.6)% |
| (2.2)% |
| (2.1)% |
The following table provides a breakdown of the major components of our NAV as of March 31, 2024 ($ and shares/units in thousands):
Components of NAV |
| March 31, 2024 |
| |
Investments in real estate |
| $ | 22,437,036 |
|
Investments in real estate debt |
|
| 1,388,138 |
|
Cash and cash equivalents |
|
| 316,144 |
|
Restricted cash |
|
| 231,721 |
|
Other assets |
|
| 698,428 |
|
Debt obligations |
|
| (12,589,700 | ) |
Secured financings on investments in real estate debt |
|
| (738,384 | ) |
Subscriptions received in advance |
|
| (11,569 | ) |
Other liabilities |
|
| (1,606,179 | ) |
Performance participation accrual |
|
| — |
|
Management fee payable |
|
| (10,513 | ) |
Accrued stockholder servicing fees (1) |
|
| (3,353 | ) |
Non-controlling interests in consolidated joint ventures |
|
| (75,031 | ) |
Net asset value |
| $ | 10,036,738 |
|
Number of outstanding shares/units |
|
| 434,644 |
|
(1)
Stockholder servicing fees only apply to Class S, Class T and Class D shares. For purposes of NAV we recognize the stockholder servicing fee as a reduction of NAV on a monthly basis. Under accounting principles generally accepted in the United States of America (“GAAP”), we accrue the full cost of the stockholder servicing fee as an offering cost at the time we sell Class S, Class T and Class D shares. As of March 31, 2024, we have accrued under GAAP $272.9 million of stockholder servicing fees payable to the Dealer Manager related to the Class S, Class T and Class D shares sold.
The following table provides a breakdown of our total NAV and NAV per share, by share class, as of March 31, 2024 ($ and shares/units in thousands, except per share/unit data):
NAV Per Share |
| Class S |
|
| Class T |
|
| Class D |
|
| Class I |
|
| Third-party Operating Partnership Units (1) |
|
| Total |
| ||||||
Net asset value |
| $ | 4,347,963 |
|
| $ | 120,330 |
|
| $ | 602,860 |
|
| $ | 4,503,300 |
|
| $ | 462,285 |
|
| $ | 10,036,738 |
|
Number of outstanding shares/units |
|
| 187,329 |
|
|
| 5,182 |
|
|
| 26,474 |
|
|
| 195,582 |
|
|
| 20,077 |
|
|
| 434,644 |
|
NAV Per Share/Unit as of March 31, 2024 |
| $ | 23.21 |
|
| $ | 23.22 |
|
| $ | 22.77 |
|
| $ | 23.03 |
|
| $ | 23.03 |
|
|
|
| |
(1)
Includes the Operating Partnership units held by the Special Limited Partner and other third parties.
3
Prospectus Updates
The following disclosure supersedes and replaces the section of the Prospectus entitled “Risk Factors—Risks Related to our REIT Status and Certain Other Tax Items—Non-U.S. holders may be required to file U.S. federal income tax returns and pay U.S. federal income tax upon their disposition of shares of our common stock or upon their receipt of certain distributions from us.”
Non-U.S. holders may be required to file U.S. federal income tax returns and pay U.S. federal income tax upon their disposition of shares of our common stock or upon their receipt of certain distributions from us.
In addition to any potential withholding tax on ordinary dividends, a non-U.S. holder other than a “qualified shareholder” or a “qualified foreign pension fund,” as each is defined for purposes of the Code, that disposes of a “United States real property interest” (“USRPI”) (which includes shares of stock of a U.S. corporation whose assets consist principally of USRPIs), is generally subject to U.S. federal income tax under the Foreign Investment in Real Property Tax Act of 1980, as amended (“FIRPTA”), on the gain from such disposition. FIRPTA gains must be reported on U.S. federal income tax returns and are taxable at regular U.S. federal income tax rates. Such tax does not apply, however, to the gain on disposition of stock in a REIT that is “domestically controlled.” Generally, a REIT is domestically controlled if less than 50% of its stock, by value, has been owned directly or indirectly by non-U.S. persons during a continuous five-year period ending on the date of disposition or, if shorter, during the entire period of the REIT’s existence. We cannot assure our stockholders that we will qualify as or that we will remain a domestically controlled REIT. Final Treasury regulations effective April 25, 2024 (the “Final Regulations”) modify the existing prior tax guidance relating to the manner in which we determine whether we are a domestically controlled REIT. These regulations provide a look through rule for our stockholders that are non-publicly traded partnerships, non-public REITs, non-public regulated investment companies or domestic C corporations owned more than 50% or more directly or indirectly by foreign persons (“foreign-controlled domestic corporations”) treat “qualified foreign pension funds” as foreign persons. The look-through rule in the Final Regulations applicable to foreign-controlled domestic corporations will not apply to a REIT for a period of up to ten years if the REIT is able to satisfy certain requirements during that time, including not undergoing a significant change in its ownership and not acquiring a significant amount of new U.S. real property interests, in each case since April 24, 2024, the date the Final Regulations were issued. If a REIT fails to satisfy such requirements during the ten-year period, the look-through rule in the Final Regulations applicable to foreign-controlled domestic corporations will apply to such REIT beginning on the day immediately following the date of such failure. While we cannot predict when we will commence being subject to such look-through rule in the Final Regulations, we may not be able to satisfy the applicable requirements for the duration of the ten-year period. Prospective investors are urged to consult with their tax advisors regarding the application and impact of these rules.
Even if we are domestically controlled, a non-U.S. holder, other than a “qualified shareholder” or a “qualified foreign pension fund” that receives a distribution from a REIT attributable to gains from the disposition of a USRPI as described above, including in connection with a repurchase of our common stock, is generally subject to U.S. federal income tax under FIRPTA to the extent such distribution is attributable to gains from such disposition, regardless of whether the difference between the fair market value and the tax basis of the USRPI giving rise to such gains is attributable to periods prior to or during such non-U.S. holder’s ownership of our common stock unless the relevant class of stock is regularly traded on an established securities market in the United States and such non-U.S. holder did not own more than 10% of such class at any time during the one-year period ending on the date of such distribution. In addition, a repurchase of our common stock, to the extent not treated as a sale or exchange, may be subject to withholding as an ordinary dividend.
We seek to act in the best interests of our company as a whole and not in consideration of the particular tax consequences to any specific holder of our stock. Potential non-U.S. holders should inform themselves as to the U.S. tax consequences, and the tax consequences within the countries of their citizenship, residence, domicile, and place of business, with respect to the purchase, ownership and disposition of shares of our common stock.
The following disclosure supersedes and replaces the section of the Prospectus entitled “Material U.S. Federal Income Tax Considerations—Taxation of Non-U.S. Holders of Our Common Stock—Sales of Our Common Stock.”
Sales of Our Common Stock. Subject to the discussion below under “—Repurchases of Our Common Stock,” gain recognized by a non-U.S. holder upon the sale or exchange of our stock generally would not be subject to U.S. taxation unless:
• | the investment in our common stock is effectively connected with the non-U.S. holder’s conduct of a trade or business in the United States (and, if required by an applicable income tax treaty, is attributable to a U.S. permanent establishment of the non-U.S. holder), in which case the non-U.S. holder will be subject to the same treatment as domestic holders with respect to any gain; |
4
• | the non-U.S. holder is a nonresident alien individual who is present in the United States for 183 days or more during the taxable year and has a tax home in the United States, in which case the nonresident alien individual will be subject to a 30% tax on the individual’s net capital gains for the taxable year; or |
• | the non-U.S. holder is not a “qualified shareholder” or a “qualified foreign pension fund” (each as defined in the Code) and our common stock constitutes a USRPI within the meaning of FIRPTA, as described below. |
We anticipate that our common stock will constitute a USRPI within the meaning of FIRPTA unless we are a domestically controlled REIT. We will be a domestically controlled REIT if, at all times during a specified testing period, less than 50% in value of our stock is held directly or indirectly by non-U.S. holders. No assurance can be given, however, that we are, will be or will remain a domestically controlled REIT. The Final Regulations effective April 25, 2024 modify prior tax guidance relating to the manner in which we determine whether we are a domestically controlled REIT. These regulations provide a look-through rule for our stockholders that are non-publicly traded partnerships, non-public REITs, non-public regulated investment companies, or non-public domestic C corporations owned more than 50% directly or indirectly by foreign persons (“foreign-controlled domestic corporations”) and treat “qualified foreign pension funds” as foreign persons. The look-through rule in the Final Regulations applicable to foreign-controlled domestic corporations will not apply to a REIT for a period of up to ten years if the REIT is able to satisfy certain requirements during that time, including not undergoing a significant change in its ownership and not acquiring a significant amount of new U.S. real property interests, in each case since April 24, 2024, the date the Final Regulations were issued. If a REIT fails to satisfy such requirements during the ten-year period, the look-through rule in the Final Regulations applicable to foreign-controlled domestic corporations will apply to such REIT beginning on the day immediately following the date of such failure. While we cannot predict when we will commence being subject to such look-through rule in the Final Regulations, we may not be able to satisfy the applicable requirements for the duration of the ten-year period. Prospective investors are urged to consult with their tax advisors regarding the application and impact of these rules.
Even if we were not a domestically controlled REIT, a sale of common stock by a non-U.S. holder would nevertheless not be subject to taxation under FIRPTA as a sale of a USRPI if:
• | our common stock were “regularly traded” on an established securities market within the meaning of applicable Treasury regulations; and |
• | the non-U.S. holder did not actually, or constructively under specified attribution rules under the Code, own more than 10% of our common stock at any time during the specified testing period. |
However, it is not anticipated that our common stock will be “regularly traded” on an established securities market. If gain on the sale or exchange of our common stock were subject to taxation under FIRPTA, the non-U.S. holder would be subject to regular U.S. income tax with respect to any gain in the same manner as a taxable U.S. holder, subject to a special alternative minimum tax in the case of nonresident alien individuals. In such a case, under FIRPTA the purchaser of common stock from a non-U.S. holder may be required to withhold 15% of the purchase price and remit this amount to the IRS.
Our transfer agent’s overnight address set forth in the “Prospectus Summary” section and the “Share Repurchases” section of the Prospectus is hereby deleted and replaced with the following:
Overnight Address:
SS&C GIDS, Inc.
430 W 7th St. Suite 219426
Kansas City, MO 64105
Our transfer agent’s overnight address set forth under Section 9. Delivery Instructions in the Form of Subscription Agreement set forth in Appendix B of the Prospectus is hereby deleted and replaced with the following:
Overnight Mail |
Starwood c/o SS&C GIDS, Inc. as Processing Agent 430 W 7th Street, STE 219426 Kansas City, MO 64105-1407 |
5
Share Repurchase Request Update
Pursuant to the terms of our share repurchase plan, the total amount of aggregate share repurchases is limited to no more than 2% of our aggregate NAV per month (measured using the aggregate NAV attributable to stockholders as of the end of the immediately preceding month) and no more than 5% of our aggregate NAV per calendar quarter (measured using the aggregate NAV attributable to stockholders as of the end of the immediately preceding quarter). In April 2024, we received repurchase requests in excess of the 2% monthly limit. As per the terms of our share repurchase plan, we honored all repurchase requests for April 2024 on a pro rata basis up to the 2% monthly limitation. As such, approximately 37% of each stockholder’s April repurchase request was satisfied. In accordance with our repurchase plan, on April 30, 2024, we repurchased all of the shares from stockholders that held less than $500 in shares of our common stock and, as such, we exceeded the 2% monthly limitation by $56,431, as authorized by our board of directors.
Status of our Current Public Offering
This Offering was declared effective by the SEC on August 10, 2022 and we are currently offering on a continuous basis up to $18.0 billion in shares of common stock, consisting of up to $16.0 billion in shares in our primary offering and up to $2.0 billion in shares pursuant to our distribution reinvestment plan. As of the date hereof, we had issued and sold (i) 48,256,757 shares of our common stock (consisting of 17,176,985 Class S shares, 257,873 Class T shares, 2,436,710 Class D shares and 28,385,189 Class I shares) in the primary offering for total proceeds of approximately $1.3 billion and (ii) 14,499,507 shares of our common stock (consisting of 6,690,981 Class S shares, 246,740 Class T shares, 874,694 Class D shares and 6,687,092 Class I shares) pursuant to our distribution reinvestment plan for a total value of approximately $0.4 billion. As of April 30, 2024, our aggregate NAV was approximately $9.9 billion. We intend to continue selling shares in the Offering on a monthly basis.
Quarterly Report on Form 10-Q
The Prospectus is hereby supplemented with our Quarterly Report on Form 10-Q, excluding exhibits, for the quarter ended March 31, 2024, that was filed with the SEC on May 13, 2024, a copy of which is attached to this Supplement No. 2 as Appendix A.
6
APPENDIX A
UNITED STATES
SECURITIES AND EXCHANGE COMMISSION
WASHINGTON, D.C. 20549
FORM 10-Q
(Mark One)
☒ QUARTERLY REPORT PURSUANT TO SECTION 13 OR 15(d) OF THE SECURITIES EXCHANGE ACT OF 1934
FOR THE QUARTERLY PERIOD ENDED MARCH 31, 2024
OR
☐ TRANSITION REPORT PURSUANT TO SECTION 13 OR 15(d) OF THE SECURITIES EXCHANGE ACT OF 1934
For the Transition period from to .
Commission file number 000-56046

Starwood Real Estate Income Trust, Inc.
(Exact name of Registrant as specified in Its Charter)
Maryland | 2340 Collins Avenue Miami Beach, FL 33139 | 82-2023409 |
(State or other jurisdiction of incorporation or organization) | (Address of principal executive offices) (Zip Code) | (I.R.S. Employer Identification No.) |
Registrant’s telephone number, including area code: (305) 695-5500
Securities registered pursuant to Section 12(b) of the Act: None
Title of each class | Trading Symbol(s) |
Name of each exchange on which registered |
Indicate by check mark whether the registrant (1) has filed all reports required to be filed by Section 13 or 15(d) of the Securities Exchange Act of 1934 during the preceding 12 months (or for such shorter period that the registrant was required to file such reports), and (2) has been subject to such filing requirements for the past 90 days. Yes ☒ No ☐
Indicate by check mark whether the registrant has submitted electronically every Interactive Data File required to be submitted pursuant to Rule 405 of Regulation S-T (§232.405 of this chapter) during the preceding 12 months (or for such shorter period that the registrant was required to submit such files). Yes ☒ No ☐
Indicate by check mark whether the registrant is a large accelerated filer, an accelerated filer, a non-accelerated filer, smaller reporting company, or an emerging growth company. See the definitions of “large accelerated filer,” “accelerated filer,” “smaller reporting company,” and “emerging growth company” in Rule 12b-2 of the Exchange Act.
Large accelerated filer | ☐ |
| Accelerated filer | ☐ | |||
Non-accelerated filer | ☒ |
| Smaller reporting company | ☐ | |||
|
|
|
|
| Emerging growth company |
| ☐ |
If an emerging growth company, indicate by check mark if the registrant has elected not to use the extended transition period for complying with any new or revised financial accounting standards provided pursuant to Section 13(a) of the Exchange Act. ☐
Indicate by check mark whether the registrant is a shell company (as defined in Rule 12b-2 of the Act). Yes ☐ No ☒
As of May 6, 2024, the registrant had the following shares outstanding: 5,135,722 shares of Class T common stock, 183,308,868 shares of Class S common stock, 26,138,604 shares of Class D common stock and 189,671,582 shares of Class I common stock.
TABLE OF CONTENTS
PART I. |
| |
|
|
|
ITEM 1. |
| |
|
|
|
| Condensed Consolidated Financial Statements (Unaudited): |
|
|
|
|
| Condensed Consolidated Balance Sheets as of March 31, 2024 and December 31, 2023 | 1 |
|
|
|
2 | ||
|
|
|
| 3 | |
|
|
|
| Condensed Consolidated Statements of Cash Flows for the Three Months Ended March 31, 2024 and 2023 | 4 |
|
|
|
| 5 | |
|
|
|
ITEM 2. | MANAGEMENT’S DISCUSSION AND ANALYSIS OF FINANCIAL CONDITION AND RESULTS OF OPERATIONS | 27 |
|
|
|
ITEM 3. | 44 | |
|
|
|
ITEM 4. | 45 | |
|
|
|
PART II. | 46 | |
|
|
|
ITEM 1. | 46 | |
|
|
|
ITEM 1A. | 46 | |
|
|
|
ITEM 2. | 47 | |
|
|
|
ITEM 3. | 48 | |
|
|
|
ITEM 4. | 48 | |
|
|
|
ITEM 5. | 48 | |
|
|
|
ITEM 6. | 49 |
PART I. FINANCIAL INFORMATION
ITEM 1. FINANCIAL STATEMENTS
Starwood Real Estate Income Trust, Inc.
Condensed Consolidated Balance Sheets (Unaudited)
(in thousands, except share and per share data)
|
| March 31, 2024 |
|
| December 31, 2023 |
| ||
Assets |
|
|
|
|
|
| ||
Investments in real estate, net |
| $ | 19,351,915 |
|
| $ | 19,580,358 |
|
Investments in real estate debt |
|
| 1,388,138 |
|
|
| 1,589,350 |
|
Investments in unconsolidated real estate ventures |
|
| 451,645 |
|
|
| 456,002 |
|
Cash and cash equivalents |
|
| 316,144 |
|
|
| 294,984 |
|
Restricted cash |
|
| 231,721 |
|
|
| 245,651 |
|
Other assets |
|
| 951,262 |
|
|
| 947,629 |
|
Total assets |
| $ | 22,690,825 |
|
| $ | 23,113,974 |
|
Liabilities and Equity |
|
|
|
|
|
| ||
Mortgage notes and credit facility, net |
| $ | 12,975,325 |
|
| $ | 13,028,910 |
|
Secured financings on investments in real estate debt, net |
|
| 737,451 |
|
|
| 762,352 |
|
Unsecured line of credit |
|
| 1,225,000 |
|
|
| 907,500 |
|
Other liabilities |
|
| 437,726 |
|
|
| 484,358 |
|
Subscriptions received in advance |
|
| 11,569 |
|
|
| 13,225 |
|
Due to affiliates |
|
| 289,341 |
|
|
| 320,957 |
|
Total liabilities |
|
| 15,676,412 |
|
|
| 15,517,302 |
|
|
|
|
|
|
|
| ||
Commitments and contingencies |
|
| — |
|
|
| — |
|
Redeemable non-controlling interests |
|
| 462,285 |
|
|
| 459,862 |
|
|
|
|
|
|
|
| ||
Equity |
|
|
|
|
|
| ||
Preferred stock, $0.01 par value per share, 100,000,000 shares authorized; |
|
| — |
|
|
| — |
|
Common stock — Class T shares, $0.01 par value per share, 500,000,000 shares |
|
| 52 |
|
|
| 53 |
|
Common stock — Class S shares, $0.01 par value per share, 1,000,000,000 shares |
|
| 1,873 |
|
|
| 1,950 |
|
Common stock — Class D shares, $0.01 par value per share, 500,000,000 shares |
|
| 265 |
|
|
| 275 |
|
Common stock — Class I shares, $0.01 par value per share, 1,000,000,000 shares |
|
| 1,956 |
|
|
| 2,030 |
|
Additional paid-in capital |
|
| 9,269,243 |
|
|
| 9,641,219 |
|
Accumulated other comprehensive loss |
|
| (25,342 | ) |
|
| (15,729 | ) |
Accumulated deficit and cumulative distributions |
|
| (2,739,431 | ) |
|
| (2,537,302 | ) |
Total stockholders’ equity |
|
| 6,508,616 |
|
|
| 7,092,496 |
|
Non-controlling interests in consolidated joint ventures |
|
| 43,512 |
|
|
| 44,314 |
|
Total equity |
|
| 6,552,128 |
|
|
| 7,136,810 |
|
Total liabilities and equity |
| $ | 22,690,825 |
|
| $ | 23,113,974 |
|
See accompanying notes to condensed consolidated financial statements.
1
Starwood Real Estate Income Trust, Inc.
Condensed Consolidated Statements of Operations and Comprehensive Loss (Unaudited)
(in thousands, except share and per share data)
|
| For the Three Months Ended March 31, |
| |||||||
|
| 2024 |
|
| 2023 |
| ||||
Revenues |
|
|
|
|
|
|
|
| ||
Rental revenue |
| $ |
| 413,083 |
|
| $ |
| 431,000 |
|
Other revenue |
|
|
| 10,967 |
|
|
|
| 15,444 |
|
Total revenues |
|
|
| 424,050 |
|
|
|
| 446,444 |
|
Expenses |
|
|
|
|
|
|
|
| ||
Property operating |
|
|
| 179,657 |
|
|
|
| 189,651 |
|
General and administrative |
|
|
| 12,492 |
|
|
|
| 10,569 |
|
Management fees |
|
|
| 31,996 |
|
|
|
| 42,181 |
|
Performance participation allocation |
|
|
| — |
|
|
|
| — |
|
Impairment of investments in real estate |
|
|
| — |
|
|
|
| 79,846 |
|
Depreciation and amortization |
|
|
| 186,398 |
|
|
|
| 200,434 |
|
Total expenses |
|
|
| 410,543 |
|
|
|
| 522,681 |
|
Other expense |
|
|
|
|
|
|
|
| ||
Loss from unconsolidated real estate ventures |
|
|
| (3,968 | ) |
|
|
| (3,089 | ) |
Income from investments in real estate debt |
|
|
| 40,497 |
|
|
|
| 31,841 |
|
Net gain (loss) on dispositions of real estate |
|
|
| 2,083 |
|
|
|
| (423 | ) |
Interest expense |
|
|
| (154,033 | ) |
|
|
| (137,290 | ) |
Other income (expense), net |
|
|
| 15,628 |
|
|
|
| (140,034 | ) |
Total other expense |
|
|
| (99,793 | ) |
|
|
| (248,995 | ) |
Net loss |
| $ |
| (86,286 | ) |
| $ |
| (325,232 | ) |
Net loss attributable to non-controlling interests in |
| $ |
| 187 |
|
| $ |
| 1,492 |
|
Net loss attributable to non-controlling |
|
|
| 4,753 |
|
|
|
| 13,103 |
|
Net loss attributable to stockholders |
| $ |
| (81,346 | ) |
| $ |
| (310,637 | ) |
Net loss per share of common stock, basic and diluted |
| $ |
| (0.19 | ) |
| $ |
| (0.63 | ) |
Weighted-average shares of common stock |
|
|
| 420,777,452 |
|
|
|
| 496,673,860 |
|
|
|
|
|
|
|
|
|
| ||
Comprehensive loss: |
|
|
|
|
|
|
|
| ||
Net loss |
| $ |
| (86,286 | ) |
| $ |
| (325,232 | ) |
Other comprehensive (loss) income item: |
|
|
|
|
|
|
|
| ||
Foreign currency translation adjustments |
|
|
| (9,613 | ) |
|
|
| 6,601 |
|
Other comprehensive (loss) income |
| $ |
| (9,613 | ) |
| $ |
| 6,601 |
|
Comprehensive loss |
| $ |
| (95,899 | ) |
| $ |
| (318,631 | ) |
See accompanying notes to condensed consolidated financial statements.
2
Starwood Real Estate Income Trust, Inc.
Condensed Consolidated Statements of Changes in Equity (Unaudited)
(in thousands)
| Par Value |
|
|
|
|
|
|
|
|
|
|
|
|
|
|
|
|
|
|
|
|
|
|
|
|
| |||||||||||||||||||||||
| Common |
|
| Common |
|
| Common |
|
| Common |
|
| Additional |
|
| Accumulated |
|
| Accumulated |
|
| Total |
|
| Non- |
|
| Total |
| ||||||||||||||||||||
Balance at December 31, 2023 | $ |
| 53 |
|
| $ |
| 1,950 |
|
| $ |
| 275 |
|
| $ |
| 2,030 |
|
| $ |
| 9,641,219 |
|
| $ |
| (15,729 | ) |
| $ |
| (2,537,302 | ) |
| $ |
| 7,092,496 |
|
| $ |
| 44,314 |
|
| $ |
| 7,136,810 |
|
Common stock issued, net |
|
| (1 | ) |
|
|
| 3 |
|
|
|
| 2 |
|
|
|
| 34 |
|
|
|
| 89,674 |
|
|
|
| — |
|
|
|
| — |
|
|
|
| 89,712 |
|
|
|
| — |
|
|
|
| 89,712 |
|
Offering costs, net |
|
| — |
|
|
|
| — |
|
|
|
| — |
|
|
|
| — |
|
|
|
| 17,393 |
|
|
|
| — |
|
|
|
| — |
|
|
|
| 17,393 |
|
|
|
| — |
|
|
|
| 17,393 |
|
Distribution reinvestments |
|
| — |
|
|
|
| 10 |
|
|
|
| 2 |
|
|
|
| 9 |
|
|
|
| 48,672 |
|
|
|
| — |
|
|
|
| — |
|
|
|
| 48,693 |
|
|
|
| — |
|
|
|
| 48,693 |
|
Amortization of restricted stock grants |
|
| — |
|
|
|
| — |
|
|
|
| — |
|
|
|
| — |
|
|
|
| 210 |
|
|
|
| — |
|
|
|
| — |
|
|
|
| 210 |
|
|
|
| — |
|
|
|
| 210 |
|
Common stock repurchased |
|
| — |
|
|
|
| (90 | ) |
|
|
| (14 | ) |
|
|
| (117 | ) |
|
|
| (514,295 | ) |
|
|
| — |
|
|
|
| — |
|
|
|
| (514,516 | ) |
|
|
| — |
|
|
|
| (514,516 | ) |
Net loss ($4,753 allocated to redeemable |
|
| — |
|
|
|
| — |
|
|
|
| — |
|
|
|
| — |
|
|
|
| — |
|
|
|
| — |
|
|
|
| (81,346 | ) |
|
|
| (81,346 | ) |
|
|
| (187 | ) |
|
|
| (81,533 | ) |
Distributions to non-controlling interests |
|
| — |
|
|
|
| — |
|
|
|
| — |
|
|
|
| — |
|
|
|
| — |
|
|
|
| — |
|
|
|
| — |
|
|
|
| — |
|
|
|
| (615 | ) |
|
|
| (615 | ) |
Distributions declared on common stock |
|
| — |
|
|
|
| — |
|
|
|
| — |
|
|
|
| — |
|
|
|
| — |
|
|
|
| — |
|
|
|
| (120,783 | ) |
|
|
| (120,783 | ) |
|
|
| — |
|
|
|
| (120,783 | ) |
Other comprehensive loss |
|
| — |
|
|
|
| — |
|
|
|
| — |
|
|
|
| — |
|
|
|
| — |
|
|
|
| (9,613 | ) |
|
|
| — |
|
|
|
| (9,613 | ) |
|
|
| — |
|
|
|
| (9,613 | ) |
Allocation to redeemable non-controlling |
|
| — |
|
|
|
| — |
|
|
|
| — |
|
|
|
| — |
|
|
|
| (13,630 | ) |
|
|
| — |
|
|
|
| — |
|
|
|
| (13,630 | ) |
|
|
| — |
|
|
|
| (13,630 | ) |
Balance at March 31, 2024 | $ |
| 52 |
|
| $ |
| 1,873 |
|
| $ |
| 265 |
|
| $ |
| 1,956 |
|
| $ |
| 9,269,243 |
|
| $ |
| (25,342 | ) |
| $ |
| (2,739,431 | ) |
| $ |
| 6,508,616 |
|
| $ |
| 43,512 |
|
| $ |
| 6,552,128 |
|
| Par Value |
|
|
|
|
|
|
|
|
|
|
|
|
|
|
|
|
|
|
|
|
|
|
|
|
| |||||||||||||||||||||||
| Common |
|
| Common |
|
| Common |
|
| Common |
|
| Additional |
|
| Accumulated |
|
| Accumulated |
|
| Total |
|
| Non- |
|
| Total |
| ||||||||||||||||||||
Balance at December 31, 2022 | $ |
| 57 |
|
| $ |
| 2,246 |
|
| $ |
| 310 |
|
| $ |
| 2,445 |
|
| $ |
| 11,466,270 |
|
| $ |
| (24,307 | ) |
| $ |
| (1,355,256 | ) |
| $ |
| 10,091,765 |
|
| $ |
| 54,026 |
|
| $ |
| 10,145,791 |
|
Common stock issued, net |
|
| 1 |
|
|
|
| 23 |
|
|
|
| — |
|
|
|
| 47 |
|
|
|
| 184,977 |
|
|
|
| — |
|
|
|
| — |
|
|
|
| 185,048 |
|
|
|
| — |
|
|
|
| 185,048 |
|
Offering costs, net |
|
| — |
|
|
|
| — |
|
|
|
| — |
|
|
|
| — |
|
|
|
| 7,920 |
|
|
|
| — |
|
|
|
| — |
|
|
|
| 7,920 |
|
|
|
| — |
|
|
|
| 7,920 |
|
Distribution reinvestments |
|
| — |
|
|
|
| 9 |
|
|
|
| 1 |
|
|
|
| 9 |
|
|
|
| 55,921 |
|
|
|
| — |
|
|
|
| — |
|
|
|
| 55,940 |
|
|
|
| — |
|
|
|
| 55,940 |
|
Amortization of restricted stock grants |
|
| — |
|
|
|
| — |
|
|
|
| — |
|
|
|
| — |
|
|
|
| 210 |
|
|
|
| — |
|
|
|
| — |
|
|
|
| 210 |
|
|
|
| — |
|
|
|
| 210 |
|
Common stock repurchased |
|
| (1 | ) |
|
|
| (72 | ) |
|
|
| (11 | ) |
|
|
| (171 | ) |
|
|
| (670,841 | ) |
|
|
| — |
|
|
|
| — |
|
|
|
| (671,096 | ) |
|
|
| — |
|
|
|
| (671,096 | ) |
Net loss ($13,103 allocated to redeemable |
|
| — |
|
|
|
| — |
|
|
|
| — |
|
|
|
| — |
|
|
|
| — |
|
|
|
| — |
|
|
|
| (310,637 | ) |
|
|
| (310,637 | ) |
|
|
| (1,492 | ) |
|
|
| (312,129 | ) |
Distributions to non-controlling interests |
|
| — |
|
|
|
| — |
|
|
|
| — |
|
|
|
| — |
|
|
|
| — |
|
|
|
| — |
|
|
|
| — |
|
|
|
| - |
|
|
|
| (798 | ) |
|
|
| (798 | ) |
Distributions declared on common stock |
|
| — |
|
|
|
| — |
|
|
|
| — |
|
|
|
| — |
|
|
|
| — |
|
|
|
| — |
|
|
|
| (141,127 | ) |
|
|
| (141,127 | ) |
|
|
| — |
|
|
|
| (141,127 | ) |
Other comprehensive income |
|
| — |
|
|
|
| — |
|
|
|
| — |
|
|
|
| — |
|
|
|
| — |
|
|
|
| 6,601 |
|
|
|
| — |
|
|
|
| 6,601 |
|
|
|
| — |
|
|
|
| 6,601 |
|
Allocation to redeemable non-controlling |
|
| — |
|
|
|
| — |
|
|
|
| — |
|
|
|
| — |
|
|
|
| (3,332 | ) |
|
|
| — |
|
|
|
| — |
|
|
|
| (3,332 | ) |
|
|
| — |
|
|
|
| (3,332 | ) |
Balance at March 31, 2023 | $ |
| 57 |
|
| $ |
| 2,206 |
|
| $ |
| 300 |
|
| $ |
| 2,330 |
|
| $ |
| 11,041,125 |
|
| $ |
| (17,706 | ) |
| $ |
| (1,807,020 | ) |
| $ |
| 9,221,292 |
|
| $ |
| 51,736 |
|
| $ |
| 9,273,028 |
|
See accompanying notes to condensed consolidated financial statements.
3
Starwood Real Estate Income Trust, Inc.
Condensed Consolidated Statements of Cash Flows (Unaudited)
(in thousands)
|
| For the Three Months Ended March 31, |
| |||||
|
| 2024 |
|
| 2023 |
| ||
Cash flows from operating activities |
|
|
|
|
|
| ||
Net loss |
| $ | (86,286 | ) |
| $ | (325,232 | ) |
Adjustments to reconcile net loss to net cash provided by operating |
|
|
|
|
|
| ||
Management fees |
|
| 31,996 |
|
|
| 42,181 |
|
Performance participation allocation |
|
| — |
|
|
| — |
|
Impairment of investments in real estate |
|
| — |
|
|
| 79,846 |
|
Depreciation and amortization |
|
| 186,398 |
|
|
| 200,434 |
|
Amortization of deferred financing costs |
|
| 6,392 |
|
|
| 7,123 |
|
Straight-line rent amortization |
|
| (3,403 | ) |
|
| (3,612 | ) |
Deferred income amortization |
|
| (6,253 | ) |
|
| (3,931 | ) |
Unrealized (gain) loss on changes in fair value of financial |
|
| (35,179 | ) |
|
| 150,420 |
|
Foreign currency loss |
|
| 20,295 |
|
|
| 306 |
|
Amortization of restricted stock grants |
|
| 210 |
|
|
| 210 |
|
Net (gain) loss on disposition of investments in real estate |
|
| (2,083 | ) |
|
| 423 |
|
Realized loss on sale of investments in real estate debt |
|
| 1,468 |
|
|
| — |
|
Loss from unconsolidated real estate ventures |
|
| 3,968 |
|
|
| 3,089 |
|
Distributions of earnings from unconsolidated real estate ventures |
|
| 389 |
|
|
| — |
|
Other items |
|
| (2,172 | ) |
|
| (1,859 | ) |
Change in assets and liabilities |
|
|
|
|
|
| ||
Decrease (increase) in other assets |
|
| 16,585 |
|
|
| (827 | ) |
Decrease in due to affiliates |
|
| (2,836 | ) |
|
| (1,000 | ) |
(Decrease) increase in other liabilities |
|
| (11,243 | ) |
|
| 577 |
|
Net cash provided by operating activities |
|
| 118,246 |
|
|
| 148,148 |
|
Cash flows from investing activities |
|
|
|
|
|
| ||
Acquisitions of real estate |
|
| — |
|
|
| (134 | ) |
Proceeds from dispositions of real estate |
|
| 77,450 |
|
|
| 2,051 |
|
Capital improvements to real estate |
|
| (32,887 | ) |
|
| (35,624 | ) |
Proceeds from paydown of principal and settlement of investments in real estate debt and equity securities |
|
| 110,602 |
|
|
| — |
|
Purchase of derivative instruments |
|
| (15 | ) |
|
| (14,994 | ) |
Proceeds from derivative contracts |
|
| 6,140 |
|
|
| 5,864 |
|
Net cash provided by (used in) investing activities |
|
| 161,290 |
|
|
| (42,837 | ) |
Cash flows from financing activities |
|
|
|
|
|
| ||
Proceeds from issuance of common stock, net |
|
| 44,157 |
|
|
| 101,649 |
|
Offering costs paid |
|
| (11,058 | ) |
|
| (14,558 | ) |
Subscriptions received in advance |
|
| 11,569 |
|
|
| 20,728 |
|
Repurchases of common stock |
|
| (514,516 | ) |
|
| (671,096 | ) |
Borrowings from mortgage notes, credit facility and unsecured line of credit |
|
| 588,500 |
|
|
| 236,314 |
|
Repayments of mortgage notes, credit facility and unsecured line of credit |
|
| (314,604 | ) |
|
| (2,263 | ) |
Payment of deferred financing costs |
|
| (89 | ) |
|
| (253 | ) |
Distributions to non-controlling interests |
|
| (615 | ) |
|
| (798 | ) |
Distributions |
|
| (79,963 | ) |
|
| (92,478 | ) |
Net cash used in financing activities |
|
| (276,619 | ) |
|
| (422,755 | ) |
Effect of exchange rate changes |
|
| 4,313 |
|
|
| 303 |
|
Net change in cash and cash equivalents and restricted cash |
|
| 7,230 |
|
|
| (317,141 | ) |
Cash and cash equivalents and restricted cash, beginning of the year |
|
| 540,635 |
|
|
| 956,609 |
|
Cash and cash equivalents and restricted cash, end of the period |
| $ | 547,865 |
|
| $ | 639,468 |
|
Reconciliation of cash and cash equivalents and restricted cash to the |
|
|
|
|
|
| ||
Cash and cash equivalents |
| $ | 316,144 |
|
| $ | 360,098 |
|
Restricted cash |
|
| 231,721 |
|
|
| 279,370 |
|
Total cash and cash equivalents and restricted cash |
| $ | 547,865 |
|
| $ | 639,468 |
|
Supplemental disclosure of cash flow information: |
|
|
|
|
|
| ||
Cash paid for interest |
| $ | 241,384 |
|
| $ | 205,203 |
|
Non-cash investing and financing activities: |
|
|
|
|
|
| ||
Accrued stockholder servicing fees due to affiliate |
| $ | (17,858 | ) |
| $ | (8,773 | ) |
Issuance of Class I shares for payment of management fee |
| $ | 32,331 |
|
| $ | 43,055 |
|
Redeemable non-controlling interest issued as settlement for performance participation allocation |
| $ | — |
|
| $ | 102,348 |
|
Accrued distributions |
| $ | 41,625 |
|
| $ | 48,226 |
|
Distribution reinvestment |
| $ | 48,693 |
|
| $ | 55,940 |
|
Allocation to redeemable non-controlling interests |
| $ | 13,630 |
|
| $ | 3,332 |
|
Accrued capital expenditures |
| $ | 4,308 |
|
| $ | 12,346 |
|
See accompanying notes to condensed consolidated financial statements.
4
Starwood Real Estate Income Trust, Inc.
Notes to Condensed Consolidated Financial Statements
(Unaudited)
1.
Organization and Business Purpose
Starwood Real Estate Income Trust, Inc. (the “Company”) was formed on June 22, 2017 as a Maryland corporation and has elected to be taxed as a real estate investment trust (“REIT”) for U.S. federal income tax purposes. The Company is organized to invest primarily in stabilized, income-oriented commercial real estate and debt secured by commercial real estate. The Company’s portfolio is principally comprised of properties located in the United States. The Company has diversified its portfolio on a global basis through the acquisition of properties outside of the United States, with a focus on Europe. To a lesser extent, the Company invests in debt secured by commercial real estate and real estate-related securities. The Company is the sole general partner of Starwood REIT Operating Partnership, L.P., a Delaware limited partnership (the “Operating Partnership”). Starwood REIT Special Limited Partner, L.L.C. (the “Special Limited Partner”), a wholly owned subsidiary of Starwood Capital Group Holdings, L.P. (the “Sponsor” and together with any entity that is controlled by, controls or is under common control with the Sponsor, and any of their respective predecessor entities, “Starwood Capital”), owns a special limited partner interest in the Operating Partnership. Substantially all of the Company’s business is conducted through the Operating Partnership. The Company and the Operating Partnership are externally managed by Starwood REIT Advisors, L.L.C. (the “Advisor”), an affiliate of the Sponsor.
As of March 31, 2024, the Company owned 469 consolidated real estate properties, 989 single-family rental units, two investments in unconsolidated real estate ventures and four positions in real estate debt investments. The Company currently operates in seven reportable segments: Multifamily, Single-Family Rental, Industrial, Office, Self-Storage, Other, and Investments in Real Estate Debt. Financial results by segment are reported in Note 15.
On December 27, 2017, the Company commenced its initial public offering of up to $5.0 billion in shares of common stock. On June 2, 2021, the initial public offering terminated and the Company commenced a follow-on public offering of up to $10.0 billion in shares of common stock. On August 10, 2022, the follow-on public offering terminated and the Company commenced its third public offering of up to $18.0 billion in shares of common stock, consisting of up to $16.0 billion in shares in its primary offering and up to $2.0 billion in shares pursuant to its distribution reinvestment plan. As of March 31, 2024, the Company had received aggregate net proceeds of $13.9 billion from the sale of shares of its common stock through its public offerings.
In December 2023, the Company announced it would launch a program (the “DST Program”) to raise capital, through its Operating Partnership, through private placement offerings exempt from registration under the Securities Act of 1933, as amended, by selling beneficial interests in specific Delaware statutory trusts holding real properties (the “DST Properties”). As of March 31, 2024, the Company has not yet begun to raise offering proceeds through the DST Program.
2.
Summary of Significant Accounting Policies
Principles of Consolidation and Basis of Presentation
The accompanying unaudited condensed consolidated financial statements have been prepared in accordance with accounting principles generally accepted in the United States of America (“GAAP”) for interim financial information and the instructions to Form 10-Q and Rule 10-01 of Regulation S-X. All significant intercompany balances and transactions have been eliminated in consolidation. Management believes it has made all necessary adjustments, consisting of only normal recurring items, so that the condensed consolidated financial statements are presented fairly and that estimates made in preparing its condensed consolidated financial statements are reasonable and prudent. The accompanying unaudited condensed consolidated interim financial statements should be read in conjunction with the audited consolidated financial statements included in the Company’s Annual Report on Form 10-K for the fiscal year ended December 31, 2023 filed with the U.S. Securities and Exchange Commission (the “SEC”).
Certain amounts in the Company’s prior period unaudited condensed consolidated financial statements have been reclassified to conform to the current period presentation. The Company has chosen to reflect net losses on dispositions of real estate from “Other income (expense), net” to “Net gain (loss) on dispositions of real estate” for the three months ended March 31, 2023 on the Condensed Consolidated Statements of Operations and Comprehensive Loss. Such reclassification had no effect on the previously reported totals included in the Condensed Consolidated Statements of Operations and Comprehensive Loss.
5
The accompanying unaudited condensed consolidated financial statements include the accounts of the Company, the Company’s subsidiaries and joint ventures in which the Company has a controlling interest. For consolidated joint ventures, the non-controlling partner’s share of the assets, liabilities and operations of the joint ventures is included in non-controlling interests as equity of the Company. The non-controlling partner’s interest is generally computed as the joint venture partner’s ownership percentage. Certain of the joint ventures formed by the Company provide the other partner a profits interest based on certain return hurdles being achieved. Any profits interest due to the other partner is reported within non-controlling interests.
In determining whether the Company has a controlling financial interest in a partially owned entity and the requirement to consolidate the accounts of that entity, the Company considers whether the entity is a variable interest entity (“VIE”) and whether it is the primary beneficiary. The Company is the primary beneficiary of a VIE when it has (i) the power to direct the most significant activities impacting the economic performance of the VIE and (ii) the obligation to absorb losses or receive benefits significant to the VIE. The Operating Partnership is considered to be a VIE. The Company consolidates the Operating Partnership because it has the ability to direct the most significant activities of the entity such as purchases, dispositions, financings, budgets, and overall operating plans. The Company meets the VIE disclosure exemption criteria, as the Company’s interest in the Operating Partnership is considered a majority voting interest. Where the Company does not have the power to direct the activities of the VIE that most significantly impact its economic performance, the Company’s interest for those partially owned entities are accounted for using the equity method of accounting.
The preparation of financial statements in conformity with GAAP requires management to make estimates and assumptions that affect the reported amounts of assets and liabilities and disclosures of contingent assets and liabilities at the date of the balance sheet. Actual results could differ from those estimates.
Investments in Real Estate
Refer to Note 2 — “Summary of Significant Accounting Policies” to the Company’s consolidated financial statements in the Company’s Annual Report on Form 10-K for the year ended December 31, 2023, for further details of the GAAP treatment regarding the Company’s investments in real estate.
Impairment of Investments in Real Estate
The Company’s management reviews its real estate properties for impairment each quarter or when there is an event or change in circumstances that indicates an impaired value. If the carrying amount of the real estate investment is no longer recoverable and exceeds the fair value of such investment, an impairment loss is recognized. The impairment loss is recognized based on the excess of the carrying amount of the asset over its fair value. The evaluation of anticipated future cash flows is highly subjective and is based in part on assumptions regarding future occupancy, rental rates and capital requirements that could differ materially from actual results. Since cash flows on real estate properties considered to be “long-lived assets to be held and used” are considered on an undiscounted basis to determine whether an asset has been impaired, the Company’s strategy of holding properties over the long term decreases the likelihood of recording an impairment loss. If the Company’s strategy changes or market conditions otherwise dictate an earlier sale date, an impairment loss may be recognized and such loss could be material to the Company’s results. If the Company determines that an impairment has occurred, the affected assets must be reduced to their fair value. Impairment charges are recorded in the Condensed Consolidated Statements of Operations and Comprehensive Loss.
During the three months ended March 31, 2024, the Company did not recognize any impairment on its investments in real estate. During the three months ended March 31, 2023, the Company recognized an aggregate $79.8 million impairment charge on various single-family rental properties in the Condensed Consolidated Statements of Operations and Comprehensive Loss.
Properties Held-for-Sale
The Company classifies the assets and liabilities related to its investments in real estate as held-for-sale when a sale is probable to occur within one year. The Company considers a sale to be probable when a binding contract has been executed, the buyer has posted a non-refundable deposit, and there are limited contingencies to closing. The Company records held-for-sale investments in real estate at the lower of depreciated cost or fair value, less estimated closing costs. Held-for-sale assets and liabilities are presented within Other assets and Other liabilities on the Company’s Condensed Consolidated Balance Sheets. As of March 31, 2024 and December 31, 2023, there were no real estate investments that met the criteria to be classified as held-for-sale.
Fair Value Measurements
Under normal market conditions, the fair value of an investment is the amount that would be received to sell an asset or transfer a liability in an orderly transaction between market participants at the measurement date (i.e., the exit price). Additionally, there is a hierarchal framework that prioritizes and ranks the level of market price observability used in measuring investments at fair value.
6
Market price observability is impacted by a number of factors, including the type of investment and the characteristics specific to the investment and the state of the market place, including the existence and transparency of transactions between market participants. Investments with readily available active quoted prices or for which fair value can be measured from actively quoted prices generally will have a higher degree of market price observability and a lesser degree of judgment used in measuring fair value.
Investments measured and reported at fair value are classified and disclosed in one of the following levels within the fair value hierarchy:
Level 1 — quoted prices are available in active markets for identical investments as of the measurement date. The Company does not adjust the quoted price for these investments.
Level 2 — quoted prices are available in markets that are not active or model inputs are based on inputs that are either directly or indirectly observable as of the measurement date.
Level 3 — pricing inputs are unobservable and include instances where there is minimal, if any, market activity for the investment. These inputs require significant judgment or estimation by management or third parties when determining fair value and generally represent anything that does not meet the criteria of Levels 1 and 2. Due to the inherent uncertainty of these estimates, these values may differ materially from the values that would have been used had a ready market for these investments existed.
Valuation of assets and liabilities measured at fair value
The Company’s investments in real estate debt are reported at fair value. The Company’s investments in real estate debt include commercial mortgage-backed securities (“CMBS”). The Company generally determines the fair value of its CMBS investments by utilizing third-party pricing service providers. In determining the value of a particular investment, the pricing service providers may use broker-dealer quotations, reported trades or valuation estimates from their internal pricing models to determine the reported price. The pricing service providers’ internal models for real estate-related securities usually consider the attributes applicable to a particular class of security (e.g., credit rating or seniority), current market data, and estimated cash flows for each class and incorporate deal collateral performance such as prepayment speeds and default rates, as available.
Certain of the Company’s investments in real estate debt include loans secured by real estate, such as its term loans, which may not have readily available market quotations. In such cases, the Company will generally determine the initial value based on the origination amount or acquisition price of such investment if acquired by the Company or the par value of such investment if originated by the Company. Following the initial measurement, the Company will determine fair value by utilizing or reviewing certain of the following inputs (i) market yield data, (ii) discounted cash flow modeling, (iii) collateral asset performance, (iv) local or macro real estate performance, (v) capital market conditions, (vi) debt yield or loan-to-value ratios and (vii) borrower financial condition and performance.
During the three months ended March 31, 2024 and 2023, the Company recorded net unrealized gains on its investments in real estate debt securities of $5.1 million and $0.6 million, respectively. Such amounts are recorded as a component of Income from investments in real estate debt on the Company’s Condensed Consolidated Statements of Operations and Comprehensive Loss.
The Company’s derivative financial instruments are reported at fair value. The Company’s interest rate swap agreements are valued using a discounted cash flow analysis based on the terms of the contract and the forward interest rate curve adjusted for the Company’s non-performance risk. The Company’s interest rate cap positions are valued using models developed by the respective counterparty as well as third party pricing service providers that use as their basis readily observable market parameters (such as forward yield curves and credit default swap data).
The fair values of the Company’s foreign currency forward contracts are determined by comparing the contracted forward exchange rate to the current market exchange rate. The current market exchange rates are determined by using market spot rates, forward rates and interest rate curves for the underlying instruments.
The fair values of the Company’s financial instruments (other than investments in real estate debt, mortgage notes, credit facility, unsecured line of credit and derivative instruments), including cash and cash equivalents, restricted cash and other financial instruments, approximate their carrying or contract value. The Company utilizes a discounted cash flow model to value its loans secured by real estate (considering loan features, credit quality of the loans and includes a review of market yield data, collateral asset performance, local and macro real estate performance, capital market conditions, debt yield, loan-to-value ratios, borrower financial condition and performance, among other factors). The Company continuously monitors and assesses the credit quality of individual loans including the review of delinquency and loan-to-value ratios on our loans secured by real estate. Such loans have floating interest rates with market terms and there are no underlying credit quality issues as of March 31, 2024.
7
The following table details the Company’s assets and liabilities measured at fair value on a recurring basis ($ in thousands):
|
| March 31, 2024 |
|
| December 31, 2023 |
| ||||||||||||||||||||||||||
|
| Level 1 |
|
| Level 2 |
|
| Level 3 |
|
| Total |
|
| Level 1 |
|
| Level 2 |
|
| Level 3 |
|
| Total |
| ||||||||
Assets: |
|
|
|
|
|
|
|
|
|
|
|
|
|
|
|
|
|
|
|
|
|
|
|
| ||||||||
Investments in real estate debt |
| $ | — |
|
| $ | 45,164 |
|
| $ | 1,342,974 |
|
| $ | 1,388,138 |
|
| $ | — |
|
| $ | 201,070 |
|
| $ | 1,388,280 |
|
| $ | 1,589,350 |
|
Derivatives |
|
| — |
|
|
| 570,582 |
|
|
| — |
|
|
| 570,582 |
|
|
| — |
|
|
| 554,263 |
|
|
| — |
|
|
| 554,263 |
|
Total |
| $ | — |
|
| $ | 615,746 |
|
| $ | 1,342,974 |
|
| $ | 1,958,720 |
|
| $ | — |
|
| $ | 755,333 |
|
| $ | 1,388,280 |
|
| $ | 2,143,613 |
|
|
|
|
|
|
|
|
|
|
|
|
|
|
|
|
|
|
|
|
|
|
|
|
|
| ||||||||
Liabilities: |
|
|
|
|
|
|
|
|
|
|
|
|
|
|
|
|
|
|
|
|
|
|
|
| ||||||||
Derivatives |
| $ | — |
|
| $ | 30,663 |
|
| $ | — |
|
| $ | 30,663 |
|
| $ | — |
|
| $ | 46,178 |
|
| $ | — |
|
| $ | 46,178 |
|
Total |
| $ | — |
|
| $ | 30,663 |
|
| $ | — |
|
| $ | 30,663 |
|
| $ | — |
|
| $ | 46,178 |
|
| $ | — |
|
| $ | 46,178 |
|
The following table details the Company’s assets measured at fair value on a recurring basis using Level 3 inputs ($ in thousands):
|
| Investments in |
| |
Balance as of December 31, 2023 |
| $ | 1,388,280 |
|
Included in net loss |
|
|
| |
Foreign currency exchange |
|
| (45,306 | ) |
Balance as of March 31, 2024 |
| $ | 1,342,974 |
|
The following table contains the quantitative inputs and assumptions used for items categorized in Level 3 of the fair value hierarchy ($ in thousands):
|
| March 31, 2024 | ||||||||||
|
| Fair Value |
|
| Valuation Technique |
| Unobservable Inputs |
| Weighted Average |
| Impact to Valuation from an Increase in Input | |
Investments in real estate debt |
| $ | 1,342,974 |
|
| Discounted Cash Flow |
| Discount Rate |
| 9.7% |
| Decrease |
|
| December 31, 2023 | ||||||||||
|
| Fair Value |
|
| Valuation Technique |
| Unobservable Inputs |
| Weighted Average |
| Impact to Valuation from an Increase in Input | |
Investments in real estate debt |
| $ | 1,388,280 |
|
| Discounted Cash Flow |
| Discount Rate |
| 9.7% |
| Decrease |
Valuation of assets measured at fair value on a nonrecurring basis
Certain of the Company’s assets are not measured at fair value on an ongoing basis but are subject to fair value adjustments, such as when there is evidence of impairment, and therefore measured at fair value on a nonrecurring basis. The Company reviews its real estate properties for impairment each quarter or when there is an event or change in circumstances that indicates an impaired value.
During the three months ended March 31, 2024, the Company did not recognize any impairment on its investments in real estate. During the three months ended March 31, 2023, the Company recognized an aggregate $79.8 million impairment charge on various single-family rental properties. As of March 31, 2024 and December 31, 2023, the estimated fair value of the Company’s remaining impaired assets was $43.9 million and $53.8 million, respectively. The estimated fair values of the impaired properties held as of March 31, 2024, were primarily based on recently completed sales transactions, letters of intent, or non-binding purchase and sales contracts. These inputs are considered Level 2 inputs for purposes of the fair value hierarchy. There are inherent uncertainties in making these estimates such as current and future macroeconomic conditions.
Valuation of liabilities not measured at fair value
Fair value of the Company’s indebtedness is estimated by modeling the cash flows required by the Company’s debt agreements and discounting them back to the present value using an appropriate discount rate. Additionally, the Company considers current market rates and conditions by evaluating similar borrowing agreements with comparable loan-to-value ratios and credit profiles. The inputs used in determining the fair value of the Company’s indebtedness are considered Level 3. As of March 31, 2024, the fair value of the Company’s mortgage notes, credit facility and secured financings on investments in real estate debt was approximately $457.3 million below the outstanding principal balance.
8
Income Taxes
The Company elected to be taxed as a REIT under the Internal Revenue Code (the “Code”), for federal income tax purposes, beginning with its taxable year ended December 31, 2019. As long as the Company qualifies for taxation as a REIT, it generally will not be subject to U.S. federal corporate income tax on its net taxable income that is currently distributed to its stockholders. A REIT is subject to a number of organizational and operational requirements, including a requirement that it currently distributes at least 90% of its REIT taxable income (subject to certain adjustments) to its stockholders. If the Company fails to qualify as a REIT in a taxable year, without the benefit of certain relief provisions, it will be subject to federal and state income tax on its taxable income at regular corporate tax rates. Even if the Company qualifies for taxation as a REIT, it may also be subject to certain federal, state, local, and foreign taxes on its income and assets, including (i) taxes on any undistributed income, (ii) taxes related to its taxable REIT subsidiaries (“TRSs”) and (iii) certain state or local income taxes. The Company and the Operating Partnerships’ tax returns for three years from the date filed are subject to examination.
The Company has formed wholly owned subsidiaries to function as TRSs and filed TRS elections, together with such subsidiaries, with the Internal Revenue Service. In general, a TRS may perform additional services for the Company’s tenants and generally may engage in any real estate or non-real estate-related business other than management or operation of a lodging facility or a health care facility. The TRSs are subject to taxation at the federal, state, local, and foreign levels, as applicable, at regular corporate tax rates. The Company accounts for applicable income taxes by utilizing the asset and liability method. As such, the Company records deferred tax assets and liabilities for the future tax consequences resulting from the difference between the carrying value of existing assets and liabilities and their respective tax basis. A valuation allowance for deferred tax assets is provided if the Company believes all or some portion of the deferred tax asset may not be realized.
The Organization for Economic Co-operation and Development (“OECD”) has a framework to implement a global minimum corporate tax of 15% for companies with global revenues and profits above certain thresholds (referred to as “Pillar 2”), with certain aspects of Pillar 2 effective January 1, 2024 and other aspects effective January 1, 2025. While it is uncertain whether the U.S. will enact legislation to adopt Pillar 2, certain foreign jurisdictions where the Company owns real estate assets has adopted legislation. The Company does not expect Pillar 2 to have a material impact on the Company’s effective tax rate or the Company’s Condensed Consolidated Statements of Operations and Comprehensive Loss.
For the three months ended March 31, 2024, the Company recognized an income tax benefit of $4.4 million, within Other income (expense), net in the Company’s Condensed Consolidated Statements of Operations and Comprehensive Loss. For the three months ended March 31, 2023, the Company recognized an income tax benefit of $0.3 million, within Other income (expense), net in the Company’s Condensed Consolidated Statements of Operations and Comprehensive Loss. As of March 31, 2024 and December 31, 2023, the Company recorded a net deferred tax liability of $26.5 million and $30.7 million, respectively, primarily due to assumed capital gains from two European investments, within Other liabilities on the Company’s Condensed Consolidated Balance Sheets.
As of December 31, 2023, net operating loss (“NOL”) carryforwards for federal and state income tax purposes totaled $61.9 million, and are primarily driven by dispositions of residential rental units within one of the Company’s TRSs. Although the federal NOL carryforwards do not expire, the Company has recorded full valuation allowances against certain deferred tax assets for which the Company believes it is more likely than not that the Company will not realize a benefit from these in future taxable years.
Recent Accounting Pronouncements
In November of 2023, the Financial Accounting Standards Board issued Accounting Standards Update 2023-07, “Segment Reporting (Topic 280): Improvements to Reportable Segment Disclosures.” The amendments are intended to increase reportable segment disclosure requirements primarily through enhanced disclosures about significant segment expenses. ASU 2023-07 is effective on a retrospective basis for fiscal years beginning after December 15, 2023, and interim periods within fiscal years beginning after December 15, 2024. The Company is currently evaluating the impact of this guidance on the disclosures within its Consolidated Financial Statements.
9
3.
Investments
Investments in Real Estate
Investments in real estate, net consisted of the following ($ in thousands):
|
| March 31, 2024 |
|
| December 31, 2023 |
| ||
Building and building improvements |
| $ | 17,571,430 |
|
| $ | 17,612,162 |
|
Land and land improvements |
|
| 3,116,386 |
|
|
| 3,144,932 |
|
Furniture, fixtures and equipment |
|
| 298,638 |
|
|
| 304,650 |
|
Right-of-use asset - operating lease(1) |
|
| 105,230 |
|
|
| 105,230 |
|
Total |
|
| 21,091,684 |
|
|
| 21,166,974 |
|
Accumulated depreciation and amortization |
|
| (1,739,769 | ) |
|
| (1,586,616 | ) |
Investments in real estate, net |
| $ | 19,351,915 |
|
| $ | 19,580,358 |
|
(1)
Refer to Note 14 for additional details on the Company’s leases.
Asset Dispositions
During the three months ended March 31, 2024, the Company sold an aggregate of $48.5 million of investments in real estate, net, generating total cash proceeds, net of mortgage repayments, of approximately $33.1 million. During the three months ended March 31, 2024, the Company recorded $2.1 million of net gains from the disposition of two hospitality properties and 27 single-family rental units.
For the three months ended March 31, 2023, the Company sold five single-family rental units for net proceeds of approximately $1.8 million, resulting in total losses of $0.4 million.
Investments in Unconsolidated Real Estate Ventures
The following table details the Company’s equity investments in unconsolidated entities ($ in thousands):
Investments in Unconsolidated |
| Segment |
| Date |
| Number of Properties |
| Ownership Interest |
| March 31, 2024 |
|
| December 31, 2023 |
| ||
Extended Stay Portfolio |
| Other |
| July 2022 |
| 196 |
| 45% |
| $ | 441,368 |
|
| $ | 446,424 |
|
Fort Lauderdale Hotel |
| Other |
| March 2019 |
| 1 |
| 43% |
|
| 10,277 |
|
|
| 9,578 |
|
Total investments in unconsolidated real estate ventures |
|
|
|
|
| $ | 451,645 |
|
| $ | 456,002 |
| ||||
The following table details the Company’s (loss) income from equity investments in unconsolidated entities ($ in thousands):
|
|
|
| Three Months Ended March 31, |
| |||||
Investments in Unconsolidated Real Estate Ventures |
| Segment |
| 2024 |
|
| 2023 |
| ||
Extended Stay Portfolio |
| Other |
| $ | (5,056 | ) |
| $ | (3,468 | ) |
Fort Lauderdale Hotel |
| Other |
|
| 1,088 |
|
|
| 379 |
|
Total loss from unconsolidated real estate ventures | $ | (3,968 | ) |
| $ | (3,089 | ) | |||
10
4.
Intangibles
The gross carrying amount and accumulated amortization of the Company’s intangible assets and liabilities consisted of the following ($ in thousands):
| March 31, 2024 |
|
| December 31, 2023 |
| ||||
Intangible assets: (1) |
|
|
|
|
|
|
| ||
In-place lease intangibles | $ |
| 291,626 |
|
| $ |
| 292,348 |
|
Above-market lease intangibles |
|
| 38,359 |
|
|
|
| 44,463 |
|
Other |
|
| 41,992 |
|
|
|
| 41,823 |
|
Total intangible assets |
|
| 371,977 |
|
|
|
| 378,634 |
|
Accumulated amortization: |
|
|
|
|
|
|
| ||
In-place lease amortization |
|
| (135,316 | ) |
|
|
| (127,185 | ) |
Above-market lease amortization |
|
| (19,956 | ) |
|
|
| (18,913 | ) |
Other |
|
| (13,231 | ) |
|
|
| (12,500 | ) |
Total accumulated amortization |
|
| (168,503 | ) |
|
|
| (158,598 | ) |
Intangible assets, net | $ |
| 203,474 |
|
| $ |
| 220,036 |
|
Intangible liabilities: (2) |
|
|
|
|
|
|
| ||
Below-market lease intangibles | $ |
| 81,176 |
|
| $ |
| 87,173 |
|
Total intangible liabilities |
|
| 81,176 |
|
|
|
| 87,173 |
|
Accumulated amortization: |
|
|
|
|
|
|
| ||
Below-market lease amortization |
|
| (29,491 | ) |
|
|
| (27,606 | ) |
Total accumulated amortization |
|
| (29,491 | ) |
|
|
| (27,606 | ) |
Intangible liabilities, net | $ |
| 51,685 |
|
| $ |
| 59,567 |
|
(1)
Included in Other assets on the Company’s Condensed Consolidated Balance Sheets.
(2)
Included in Other liabilities on the Company’s Condensed Consolidated Balance Sheets.
The estimated future amortization on the Company’s intangibles for each of the next five years and thereafter as of March 31, 2024 is as follows ($ in thousands):
|
| In-place |
|
| Above-market |
|
| Other |
|
| Below-market |
| ||||
2024 (remaining) |
| $ | 25,590 |
|
| $ | 3,417 |
|
| $ | 2,559 |
|
| $ | (6,200 | ) |
2025 |
|
| 26,031 |
|
|
| 3,302 |
|
|
| 3,412 |
|
|
| (5,989 | ) |
2026 |
|
| 21,334 |
|
|
| 3,015 |
|
|
| 3,412 |
|
|
| (4,926 | ) |
2027 |
|
| 17,436 |
|
|
| 2,318 |
|
|
| 3,412 |
|
|
| (4,174 | ) |
2028 |
|
| 14,144 |
|
|
| 1,773 |
|
|
| 3,412 |
|
|
| (4,364 | ) |
Thereafter |
|
| 51,775 |
|
|
| 4,578 |
|
|
| 12,554 |
|
|
| (26,032 | ) |
| $ | 156,310 |
|
| $ | 18,403 |
|
| $ | 28,761 |
|
| $ | (51,685 | ) | |
11
5.
Investments in Real Estate Debt
The following tables detail the Company’s investments in real estate debt as of March 31, 2024 and December 31, 2023 ($ in thousands):
|
|
|
| March 31, 2024 |
| |||||||||
Type of Security/Loan |
| Number of Positions |
| Weighted |
| Weighted Average |
| Cost Basis |
|
| Fair Value |
| ||
CMBS - floating |
| 2 |
| B + 6.19% |
| August 2035 |
| $ | 45,304 |
|
| $ | 45,164 |
|
Term loans |
| 2 |
| B + 4.95% |
| January 2027 |
|
| 1,451,462 |
|
|
| 1,342,974 |
|
Total investments in real estate debt |
| 4 |
| B + 4.99% |
| April 2027 |
| $ | 1,496,766 |
|
| $ | 1,388,138 |
|
|
|
|
| December 31, 2023 |
| |||||||||
Type of Security/Loan |
| Number of |
| Weighted |
| Weighted Average |
| Cost Basis |
|
| Fair Value |
| ||
CMBS - floating |
| 6 |
| B + 4.69% |
| October 2036 |
| $ | 206,252 |
|
| $ | 201,070 |
|
Term loans |
| 2 |
| B + 4.95% |
| January 2027 |
|
| 1,451,462 |
|
|
| 1,388,280 |
|
Total investments in real estate debt |
| 8 |
| B + 4.92% |
| March 2028 |
| $ | 1,657,714 |
|
| $ | 1,589,350 |
|
(1)
The symbol “B” refers to the relevant benchmark rates, which includes one-month Secured Overnight Financing Rate (“SOFR”), three-month Bank Bill Swap Bid Rate (“BBSY”) and Sterling Overnight Index Average (“SONIA”) as applicable to each security and loan.
(2)
Weighted average maturity date is based on the fully extended maturity date of the underlying collateral.
During June 2022, the Company provided financing in the form of a term loan to an unaffiliated entity in connection with its acquisition of Australia’s largest hotel and casino company. The loan is in the amount of AUD 1,377 million and has an initial term of five years, with a two-year extension option. The loan is pre-payable at the option of the borrower at any time.
During February 2021, the Company provided financing in the form of a term loan to an unaffiliated entity in connection with its acquisition of a premier United Kingdom holiday company. The original loan was in the amount of £360 million and has an initial term of five years, with a two-year extension option. The loan is pre-payable at the option of the borrower at any time. In November 2023, the borrower partially prepaid £8.0 million of the original loan amount.
The Company’s investments in real estate debt include CMBS collateralized by properties owned by Starwood Capital investment vehicles. The following table details the Company’s affiliate investments in real estate debt ($ in thousands):
|
| Fair Value |
| |||||
|
| March 31, 2024 |
|
| December 31, 2023 |
| ||
CMBS |
| $ | 45,164 |
| $ | 201,070 |
| |
Total |
| $ | 45,164 |
|
| $ | 201,070 |
|
Such CMBS were purchased in fully or over-subscribed offerings. Each investment in such CMBS by the Company represented a minority participation in any individual tranche. The Company acquired its minority participation interest from third-party investment banks on market terms negotiated by the majority third-party investors.
During the three months ended March 31, 2024, the Company recorded net realized losses resulting from sales on a portion of its investments in real estate debt securities of $1.5 million. During the three months ended March 31, 2023, the Company did not dispose of any of its investments in real estate debt securities. Such amounts are recorded as a component of Income from investments in real estate debt on the Company’s Condensed Consolidated Statements of Operations and Comprehensive Loss.
12
6. Mortgage Notes and Credit Facility
The following table is a summary of the mortgage notes and credit facility secured by the Company’s properties as of March 31, 2024 and December 31, 2023 ($ in thousands):
|
|
|
|
|
|
|
| Principal Balance Outstanding(3) |
| |||||
Indebtedness |
| Weighted |
| Weighted |
| Maximum |
| March 31, 2024 |
|
| December 31, 2023 |
| ||
Fixed rate loans |
|
|
|
|
|
|
|
|
|
|
|
| ||
Fixed rate mortgages |
| 3.09% |
| March 2031 |
| N/A |
| $ | 3,018,053 |
|
| $ | 3,049,322 |
|
Total fixed rate loans |
|
|
|
|
|
|
|
| 3,018,053 |
|
|
| 3,049,322 |
|
Variable rate loans |
|
|
|
|
|
|
|
|
|
|
|
| ||
Floating rate mortgages |
| B + 1.83% |
| July 2027 |
| N/A |
|
| 9,863,917 |
|
|
| 9,893,894 |
|
Variable rate credit facility(4) |
| B + 2.25% |
| December 2024 |
| $165,000 |
|
| 165,000 |
|
|
| 165,000 |
|
Total variable rate loans |
|
|
|
|
|
|
|
| 10,028,917 |
|
|
| 10,058,894 |
|
Total loans secured by the Company’s |
|
|
|
|
|
|
|
| 13,046,970 |
|
|
| 13,108,216 |
|
Deferred financing costs, net |
|
|
|
|
|
|
|
| (65,453 | ) |
|
| (73,066 | ) |
Discount on assumed debt, net |
|
|
|
|
|
|
|
| (6,192 | ) |
|
| (6,240 | ) |
Mortgage notes and credit facility, net |
|
|
| $ | 12,975,325 |
|
| $ | 13,028,910 |
| ||||
(1)
The symbol “B” refers to the relevant floating benchmark rates, which includes one-month SOFR, Federal Reserve Bank of New York (“NYFED”) 30-day SOFR, three-month Euro Interbank Offered Rate (“EURIBOR”) and three-month Copenhagen Interbank Offered Rate (“CIBOR”), as applicable to each loan.
(2)
For loans where the Company, at its own discretion, has extension options, the maximum maturity date has been assumed.
(3)
The majority of the Company’s mortgages contain prepayment provisions including (but not limited to) lockout periods, yield or spread maintenance provisions and fixed penalties.
(4)
The repayment of the credit facility is guaranteed by the Operating Partnership.
The following table presents the future principal payments under the Company’s mortgage notes and credit facility as of March 31, 2024 ($ in thousands):
Year |
| Amount |
| ||
2024 (remaining) |
| $ |
| 826,120 |
|
2025 |
|
|
| 951,721 |
|
2026 |
|
|
| 4,692,839 |
|
2027 |
|
|
| 2,074,921 |
|
2028 |
|
|
| 225,665 |
|
Thereafter |
|
|
| 4,275,704 |
|
Total |
| $ |
| 13,046,970 |
|
Pursuant to lender agreements for certain of the Company’s mortgages, the Company has the ability to draw $90.5 million for leasing commissions, and tenant and building improvements.
The Company’s mortgage notes and credit facility may contain customary events of default and covenants, including limitations on liens and indebtedness and maintenance of certain financial ratios. The Company is not aware of any instance of material noncompliance with financial covenants as of March 31, 2024.
13
7.
Secured Financings on Investments in Real Estate Debt
Secured financings on investments in real estate debt are treated as collateralized financing transactions and are carried at their contractual amounts, including accrued interest, as specified in the respective agreements. Although structured as a sale and repurchase obligation, a secured financing on investments in real estate debt operates as a financing under which securities are pledged as collateral to secure a short-term loan equal in value to a specified percentage of the market value of the pledged collateral. While used as collateral, the Company retains beneficial ownership of the pledged collateral, including the right to distributions. At the maturity of a secured financing on investments in real estate debt, the Company is required to repay the loan and concurrently receive the pledged collateral from the lender or, with the consent of the lender, renew such agreement at the then-prevailing financing rate.
Interest rates on these borrowings are determined based on prevailing rates corresponding to the terms of the borrowings, and interest is paid at the termination of the borrowing at which time the Company may enter into a new borrowing arrangement at prevailing market rates with the same counterparty or repay that counterparty and negotiate financing with a different counterparty.
The fair value of financial instruments pledged as collateral on the Company’s secured financings on investments in real estate debt disclosed in the tables below represents the Company’s fair value of such instruments, which may differ from the fair value assigned to the collateral by its counterparties.
During June 2022, the Company entered into a repurchase agreement with Morgan Stanley Bank, N.A. (“Morgan Stanley”), Guardians of New Zealand Superannuation as manager and administrator of the New Zealand Superannuation Fund (“NZ Super”), and BAWAG P.S.K. Bank für Arbeit und Wirtschaft und Osterreichische Postsparkasse Aktiengesellschaft (“BAWAG”) in order to finance its term loan investment (the “Syndicated RA”) to an unaffiliated entity in connection with its acquisition of three Australian hospitality and leisure resorts.
During February 2021, the Company entered into a repurchase agreement with Barclays Bank PLC in order to finance its term loan investment (the “Barclays RA”) to an unaffiliated entity in connection with its acquisition of a premier United Kingdom holiday company. Effective February 15, 2022, the reference rate for the calculation of interest transitioned from the three-month U.S. dollar-denominated LIBOR to SONIA. The Barclays RA interest rate is now equal to the SONIA daily non-cumulative EFR rate plus a spread.
For financial statement purposes, the Company does not offset its secured financings on investments in real estate debt and securities lending transactions because the conditions for netting as specified by GAAP are not met. Although not offset on the Company’s Condensed Consolidated Balance Sheets, these transactions are summarized in the following tables ($ in thousands):
|
|
|
|
|
| March 31, 2024 |
| |||||
Indebtedness |
| Maturity Date |
| Coupon |
| Collateral |
|
| Outstanding |
| ||
Barclays RA |
| February 2026 |
| SONIA + 2.55% |
| $ | 444,664 |
|
| $ | 244,565 |
|
Syndicated RA(2) |
| June 2027 |
| BBSY + 2.82% |
|
| 898,310 |
|
|
| 492,886 |
|
|
|
|
|
|
| $ | 1,342,974 |
|
| $ | 737,451 |
|
|
|
|
|
|
| December 31, 2023 |
| |||||
Indebtedness |
| Maturity Date |
| Coupon |
| Collateral |
|
| Outstanding |
| ||
Barclays RA |
| February 2026 |
| SONIA + 2.55% |
| $ | 448,729 |
|
| $ | 246,801 |
|
Syndicated RA(2) |
| June 2027 |
| BBSY + 2.82% |
|
| 939,551 |
|
|
| 515,551 |
|
|
|
|
|
|
| $ | 1,388,280 |
|
| $ | 762,352 |
|
(1) Represents the fair value of the Company’s real estate-related term loan investments.
(2) Outstanding balance is reflected net of $1.2 million of unamortized deferred financing costs as of March 31, 2024 and December 31, 2023, respectively.
8.
Unsecured Line of Credit
During May 2022, the Company increased its unsecured line of credit (the “Line of Credit”) by $1.1 billion with additional banks for a total borrowing capacity of approximately $1.6 billion. The Line of Credit matures on May 11, 2024, at which time the Company may request an additional one-year extension. Interest under the Line of Credit is determined based on one-month U.S. dollar-denominated SOFR plus 2.5%. The repayment of the Line of Credit is guaranteed by the Company. As of March 31, 2024 and December 31, 2023, there were $1.2 billion and $0.9 billion of borrowings outstanding on the Line of Credit, respectively.
14
9.
Other Assets and Other Liabilities
The following table summarizes the components of Other assets ($ in thousands):
| March 31, 2024 |
|
| December 31, 2023 |
| |||
Derivative instruments |
| $ | 570,582 |
|
| $ | 554,263 |
|
Intangible assets, net |
|
| 203,474 |
|
|
| 220,036 |
|
Receivables |
|
| 144,511 |
|
|
| 127,573 |
|
Prepaid expenses |
|
| 10,954 |
|
|
| 24,022 |
|
Interest receivable |
|
| 7,159 |
|
|
| 7,929 |
|
Deferred financing costs, net |
|
| 4,822 |
|
|
| 6,006 |
|
Deferred tax asset |
|
| 6,093 |
|
|
| 5,043 |
|
Other |
|
| 3,667 |
|
|
| 2,757 |
|
Total other assets |
| $ | 951,262 |
|
| $ | 947,629 |
|
The following table summarizes the components of Other liabilities ($ in thousands):
|
| March 31, 2024 |
|
| December 31, 2023 |
| ||
Accounts payable and accrued expenses |
| $ | 66,634 |
|
| $ | 75,809 |
|
Real estate taxes payable |
|
| 59,162 |
|
|
| 73,145 |
|
Accrued interest expense |
|
| 69,698 |
|
|
| 69,642 |
|
Intangible liabilities, net |
|
| 51,685 |
|
|
| 59,567 |
|
Derivative instruments |
|
| 30,663 |
|
|
| 46,178 |
|
Tenant security deposits |
|
| 45,864 |
|
|
| 44,374 |
|
Distributions payable |
|
| 41,625 |
|
|
| 43,044 |
|
Deferred tax liability |
|
| 32,599 |
|
|
| 35,792 |
|
Right-of-use liability - operating leases |
|
| 12,387 |
|
|
| 12,402 |
|
Deferred income |
|
| 12,080 |
|
|
| 11,894 |
|
Other taxes payable |
|
| 5,858 |
|
|
| 5,005 |
|
Other |
|
| 9,471 |
|
|
| 7,506 |
|
Total other liabilities |
| $ | 437,726 |
|
| $ | 484,358 |
|
10.
Derivatives
The Company uses derivative financial instruments to minimize the risks and/or costs associated with the Company’s investments and financing transactions. The Company has not designated any of its derivative financial instruments as hedges as defined under GAAP. Although not designated as hedging instruments under GAAP, the Company’s derivatives are not speculative and are used to manage the Company’s exposure to interest rate movements, fluctuations in foreign exchange rates, and other identified risks.
The use of derivative financial instruments involves certain risks, including the risk that the counterparties to these contractual arrangements do not perform as agreed. To mitigate this risk, the Company enters into derivative financial instruments with counterparties it believes to have appropriate credit ratings and that are major financial institutions with which the Company and its affiliates may also have other financial relationships.
Interest Rate Contracts
Certain of the Company’s transactions expose the Company to interest rate risks, which include exposure to variable interest rates on certain loans secured by the Company’s real estate in addition to its secured financings of investments in real estate debt. The Company uses derivative financial instruments, which includes interest rate caps and swaps, and may also include options, floors, and other interest rate derivative contracts, to limit the Company’s exposure to the future variability of interest rates.
15
The following tables detail the Company’s outstanding interest rate derivatives that were non-designated hedges of interest rate risk (notional amounts in thousands):
|
| March 31, 2024 | |||||||||||
Interest Rate Derivatives |
| Number of Instruments |
| Notional Amount |
|
| Weighted Average Strike Rate |
| Index |
| Weighted Average Maturity (Years) | ||
Interest Rate Caps - Property debt |
| 70 |
| $ |
| 9,561,925 |
|
| 1.6% |
| SOFR |
| 1.9 |
Interest Rate Caps - Property debt |
| 4 |
| € |
| 171,552 |
|
| 1.1% |
| EURIBOR |
| 0.8 |
Interest Rate Swaps - Property debt |
| 1 |
| $ |
| 119,211 |
|
| 0.8% |
| SOFR |
| 0.9 |
Interest Rate Swaps - Property debt |
| 3 |
| € |
| 213,458 |
|
| 1.9% |
| EURIBOR |
| 3.3 |
Interest Rate Swaps - Property debt |
| 2 |
| NOK |
| 520,000 |
|
| 2.5% |
| NIBOR |
| 3.9 |
Total interest rate derivatives |
| 80 |
|
|
|
|
| 1.6% |
|
|
| 1.9 | |
|
|
|
|
|
|
|
|
|
|
|
|
| |
|
| December 31, 2023 | |||||||||||
Interest Rate Derivatives |
| Number of Instruments |
| Notional Amount |
|
| Weighted Average Strike Rate |
| Index |
| Weighted Average Maturity (Years) | ||
Interest Rate Caps - Property debt |
| 70 |
| $ |
| 9,567,541 |
|
| 1.6% |
| SOFR |
| 2.1 |
Interest Rate Caps - Property debt |
| 4 |
| € |
| 175,468 |
|
| 1.1% |
| EURIBOR |
| 1.0 |
Interest Rate Swaps - Property debt |
| 1 |
| $ |
| 117,863 |
|
| 0.8% |
| SOFR |
| 1.2 |
Interest Rate Swaps - Property debt |
| 3 |
| € |
| 213,458 |
|
| 1.9% |
| EURIBOR |
| 3.6 |
Interest Rate Swaps - Property debt |
| 2 |
| NOK |
| 520,000 |
|
| 2.5% |
| NIBOR |
| 4.1 |
Total interest rate derivatives |
| 80 |
|
|
|
|
| 1.6% |
|
|
| 2.1 | |
Foreign Currency Forward Contracts
Certain of the Company’s international investments expose it to fluctuations in foreign currency exchange rates and interest rates. These fluctuations may impact the value of the Company’s cash receipts and payments in terms of its functional currency, the U.S. dollar. The Company uses foreign currency forward contracts to protect the value or fix the amount of certain investments or cash flows in terms of the U.S. dollar.
The following table details the Company’s outstanding foreign currency forward contracts that were non-designated hedges of foreign currency risk (notional amounts in thousands):
|
| March 31, 2024 |
|
| December 31, 2023 |
| ||||||||
Foreign Currency Forward Contracts |
| Number of Instruments |
| Notional Amount |
|
| Number of Instruments |
| Notional Amount |
| ||||
Buy USD/Sell EUR Forward |
| 39 |
| € |
| 552,358 |
|
| 60 |
| € |
| 577,283 |
|
Buy USD/Sell DKK Forward |
| 10 |
| DKK |
| 1,260,016 |
|
| 12 |
| DKK |
| 1,301,016 |
|
Buy USD/Sell AUD Forward |
| 5 |
| AUD |
| 621,759 |
|
| 5 |
| AUD |
| 621,759 |
|
Buy USD/Sell NOK Forward |
| 7 |
| NOK |
| 397,700 |
|
| 9 |
| NOK |
| 1,160,941 |
|
Buy USD/Sell GBP Forward |
| 7 |
| £ |
| 158,400 |
|
| 4 |
| £ |
| 142,858 |
|
16
Valuation and Financial Statement Impact
The following table details the fair value of the Company’s derivative financial instruments ($ in thousands):
|
| Fair Value of Derivatives in an Asset (1) Position |
|
| Fair Value of Derivatives in a Liability (2) Position |
| ||||||||||
|
| March 31, 2024 |
|
| December 31, 2023 |
|
| March 31, 2024 |
|
| December 31, 2023 |
| ||||
Interest rate derivatives |
| $ | 550,436 |
|
| $ | 537,390 |
|
| $ | — |
|
| $ | — |
|
Foreign currency forward contracts |
|
| 20,146 |
|
|
| 16,873 |
|
|
| 30,663 |
|
|
| 46,178 |
|
Total derivatives |
| $ | 570,582 |
|
| $ | 554,263 |
|
| $ | 30,663 |
|
| $ | 46,178 |
|
(1)
Included in Other assets on the Company’s Condensed Consolidated Balance Sheets.
(2)
Included in Other liabilities on the Company’s Condensed Consolidated Balance Sheets.
The following table details the effect of the Company’s derivative financial instruments in the Condensed Consolidated Statements of Operations and Comprehensive Loss ($ in thousands):
|
|
|
| For the Three Months Ended March 31, |
| |||||
Type of Derivative |
| Net Realized/Unrealized Gain (Loss) |
| 2024 |
|
| 2023 |
| ||
Interest Rate Caps - Property debt |
| Unrealized gain (loss)(1) |
| $ | 11,329 |
|
| $ | (139,636 | ) |
Interest Rate Swaps - Property debt |
| Unrealized loss(1) |
|
| (49 | ) |
|
| (6,369 | ) |
Foreign Currency Forward Contracts |
| Unrealized gain (loss)(2) |
|
| 18,789 |
|
|
| (4,313 | ) |
Foreign Currency Forward Contracts |
| Realized gain(1) |
|
| 2,215 |
|
|
| 1,389 |
|
Interest Rate Caps - Property debt |
| Realized gain(1) |
|
| — |
|
|
| 733 |
|
Interest Rate Swaps - Property debt |
| Realized gain(1) |
|
| — |
|
|
| 1,925 |
|
Total |
|
|
| $ | 32,284 |
|
| $ | (146,271 | ) |
(1)
Included in Other income (expense), net in the Company’s Condensed Consolidated Statements of Operations and Comprehensive Loss.
(2)
A portion of this amount is included in Income from investments in real estate debt and the remaining amount is included in Other income (expense), net in the Company’s Condensed Consolidated Statements of Operations and Comprehensive Loss.
17
11.
Equity and Redeemable Non-controlling Interests
Authorized Capital
The Company is authorized to issue preferred stock and four classes of common stock consisting of Class T shares, Class S shares, Class D shares, and Class I shares. The Company’s board of directors has the ability to establish the preferences and rights of each class or series of preferred stock, without stockholder approval, and as such, it may afford the holders of any series or class of preferred stock preferences, powers and rights senior to the rights of holders of common stock. The differences among the common share classes relate to upfront selling commissions, dealer manager fees and ongoing stockholder servicing fees. Refer to Note 2 — “Summary of Significant Accounting Policies” to the Company’s consolidated financial statements in the Company’s Annual Report on Form 10-K for the year ended December 31, 2023, for a further description of such items. Other than the differences in upfront selling commissions, dealer manager fees and ongoing stockholder servicing fees, each class of common stock is subject to the same economic and voting rights.
As of March 31, 2024, the Company had the authority to issue 3,100,000,000 shares of capital stock, consisting of the following:
Classification |
| Number of |
|
| Par Value |
| |||
Preferred Stock |
|
| 100,000,000 |
|
| $ |
| 0.01 |
|
Class T Shares |
|
| 500,000,000 |
|
| $ |
| 0.01 |
|
Class S Shares |
|
| 1,000,000,000 |
|
| $ |
| 0.01 |
|
Class D Shares |
|
| 500,000,000 |
|
| $ |
| 0.01 |
|
Class I Shares |
|
| 1,000,000,000 |
|
| $ |
| 0.01 |
|
Total |
|
| 3,100,000,000 |
|
|
|
|
| |
Common Stock
The following table details the movement in the Company’s outstanding shares of common stock:
|
| Three Months Ended March 31, 2024 |
| |||||||||||||||||
|
| Class T |
|
| Class S |
|
| Class D |
|
| Class I |
|
| Total |
| |||||
December 31, 2023 |
|
| 5,282,025 |
|
|
| 195,023,616 |
|
|
| 27,512,551 |
|
|
| 202,990,052 |
|
|
| 430,808,244 |
|
Common stock shares issued (1) |
|
| (78,520 | ) |
|
| 346,224 |
|
|
| 223,950 |
|
|
| 3,346,837 |
|
|
| 3,838,491 |
|
Distribution reinvestment plan shares issued |
|
| 37,181 |
|
|
| 981,482 |
|
|
| 169,241 |
|
|
| 900,756 |
|
|
| 2,088,660 |
|
Common stock shares repurchased |
|
| (58,857 | ) |
|
| (9,022,408 | ) |
|
| (1,431,729 | ) |
|
| (11,655,369 | ) |
|
| (22,168,363 | ) |
March 31, 2024 |
|
| 5,181,829 |
|
|
| 187,328,914 |
|
|
| 26,474,013 |
|
|
| 195,582,276 |
|
|
| 414,567,032 |
|
|
|
|
|
|
|
|
|
|
|
|
|
|
|
|
| |||||
|
| Three Months Ended March 31, 2023 |
| |||||||||||||||||
|
| Class T |
|
| Class S |
|
| Class D |
|
| Class I |
|
| Total |
| |||||
December 31, 2022 |
|
| 5,721,496 |
|
|
| 224,556,910 |
|
|
| 30,974,173 |
|
|
| 244,455,013 |
|
|
| 505,707,592 |
|
Common stock shares issued (1) |
|
| 76,701 |
|
|
| 2,263,805 |
|
|
| (39,697 | ) |
|
| 4,648,338 |
|
|
| 6,949,147 |
|
Distribution reinvestment plan shares issued |
|
| 34,590 |
|
|
| 981,339 |
|
|
| 96,343 |
|
|
| 994,940 |
|
|
| 2,107,212 |
|
Common stock shares repurchased |
|
| (117,880 | ) |
|
| (7,190,043 | ) |
|
| (1,070,027 | ) |
|
| (17,093,864 | ) |
|
| (25,471,814 | ) |
March 31, 2023 |
|
| 5,714,907 |
|
|
| 220,612,011 |
|
|
| 29,960,792 |
|
|
| 233,004,427 |
|
|
| 489,292,137 |
|
__________
(1)
Includes exchanges between share classes
Share Repurchases
The Company has adopted a share repurchase plan whereby, subject to certain limitations, stockholders may request on a monthly basis that the Company repurchases all or any portion of their shares. Should repurchase requests, in the Company’s judgment, place an undue burden on its liquidity, adversely affect its operations or risk having an adverse impact on the Company as a whole, or should the Company otherwise determine that investing its liquid assets in real properties or other illiquid investments rather than repurchasing its shares is in the best interests of the Company as a whole, then the Company may choose to repurchase fewer shares than have been requested to be repurchased, or none at all. Further, the Company’s board of directors may modify or suspend the Company’s share repurchase plan if it deems such action to be in the Company’s best interest and in the best interest of its stockholders. In addition, the total amount of shares that the Company may repurchase is limited, in any calendar month, to shares whose aggregate value (based on the repurchase price per share on the date of the repurchase) is no more than 2% of its aggregate net asset value (“NAV”) per month (measured using the aggregate NAV attributable to stockholders as of the end of the immediately preceding month) and no more than
18
5% of its aggregate NAV per calendar quarter (measured using the aggregate NAV attributable to stockholders as of the end of the immediately preceding quarter). In the event that the Company determines to repurchase some but not all of the shares submitted for repurchase during any month, shares repurchased at the end of the month will be repurchased on a pro rata basis.
For the three months ended March 31, 2024, the Company repurchased 22,168,363 shares of common stock representing, a total of $514.5 million. For the three months ended March 31, 2023, the Company repurchased 25,471,814 shares of common stock representing a total of $671.1 million.
Distributions
The Company generally intends to distribute substantially all of its taxable income, which does not necessarily equal net income as calculated in accordance with GAAP, to its stockholders each year to comply with the REIT provisions of the Code.
Each class of common stock receives the same gross distribution per share. The net distribution varies for each class based on the applicable stockholder servicing fee, which is deducted from the monthly distribution per share and is paid directly to the applicable distributor.
The following table details the aggregate distributions declared for each applicable class of common stock:
|
| Three Months Ended March 31, 2024 |
| |||||||||||||||||
|
| Class T |
|
| Class S |
|
| Class D |
|
| Class I |
| ||||||||
Aggregate gross distributions declared per share of common stock |
| $ |
| 0.3105 |
|
| $ |
| 0.3105 |
|
| $ |
| 0.3105 |
|
| $ |
| 0.3105 |
|
Stockholder servicing fee per share of common stock |
|
|
| (0.0488 | ) |
|
|
| (0.0490 | ) |
|
|
| (0.0141 | ) |
|
|
| — |
|
Net distributions declared per share of common stock |
| $ |
| 0.2617 |
|
| $ |
| 0.2615 |
|
| $ |
| 0.2964 |
|
| $ |
| 0.3105 |
|
Redeemable Non-controlling Interests
In connection with its performance participation interest, the Special Limited Partner holds Class I units in the Operating Partnership. See Note 12 for further details of the Special Limited Partner’s performance participation interest. Because the Special Limited Partner has the ability to redeem its Class I units for cash, at its election, the Company has classified these Class I units as Redeemable non-controlling interest in mezzanine equity on the Company’s Condensed Consolidated Balance Sheets. The redeemable non-controlling interest is recorded at the greater of the carrying amount, adjusted for its share of the allocation of income or loss and distributions, or the redemption value, which is equivalent to fair value, of such units at the end of each measurement period. In addition to the Special Limited Partner’s interest noted above, certain third parties also have a redeemable non-controlling interest.
The following tables detail the redeemable non-controlling interests activity related to the Special Limited Partner and third-party Operating Partnership unitholders for the three months ended March 31, 2024 and 2023 ($ in thousands):
|
| Special Limited Partner(1) |
|
| Third-party Operating Partnership unitholders |
|
| Total |
| |||
Balance at December 31, 2023 |
| $ | 295,692 |
|
| $ | 164,170 |
|
| $ | 459,862 |
|
Settlement of performance participation allocation |
|
| — |
|
|
| — |
|
|
| — |
|
GAAP loss allocation |
|
| (3,062 | ) |
|
| (1,691 | ) |
|
| (4,753 | ) |
Distributions |
|
| (4,236 | ) |
|
| (2,218 | ) |
|
| (6,454 | ) |
Fair value allocation |
|
| 9,431 |
|
|
| 4,199 |
|
|
| 13,630 |
|
Balance at March 31, 2024 |
| $ | 297,825 |
|
| $ | 164,460 |
|
| $ | 462,285 |
|
__________
(1)
Includes units transferred to Barry S. Sternlicht, which are deemed to be beneficially owned by Mr. Sternlicht.
19
|
| Special Limited Partner |
|
| Third-party Operating Partnership unitholders |
|
| Total |
| |||
Balance at December 31, 2022 |
| $ | 238,322 |
|
| $ | 188,777 |
|
| $ | 427,099 |
|
Settlement of performance participation allocation |
|
| 102,348 |
|
|
| — |
|
|
| 102,348 |
|
GAAP loss allocation |
|
| (8,431 | ) |
|
| (4,672 | ) |
|
| (13,103 | ) |
Distributions |
|
| (4,016 | ) |
|
| (2,226 | ) |
|
| (6,242 | ) |
Fair value allocation |
|
| 2,144 |
|
|
| 1,188 |
|
|
| 3,332 |
|
Balance at March 31, 2023 |
| $ | 330,367 |
|
| $ | 183,067 |
|
| $ | 513,434 |
|
12.
Related Party Transactions
Management Fee and Performance Participation Allocation
The Advisor is entitled to an annual management fee equal to (i) 1.25% of the Company’s NAV per annum payable monthly, before giving effect to any accruals for the management fee, the stockholder servicing fee, the performance participation interest or any distributions, plus (ii) 1.25% per annum of the aggregate DST Property consideration for all DST Properties subject to the fair market value option held by the Operating Partnership. For avoidance of doubt, the Advisor does not receive a duplicative management fee with respect to any DST Property. Additionally, to the extent the Operating Partnership issues Operating Partnership units to parties other than the Company, the Operating Partnership will pay the Advisor an annual management fee equal to 1.25% of the Operating Partnership’s NAV attributable to such Operating Partnership units not held by the Company, payable monthly. The management fee can be paid, at the Advisor’s election, in cash, shares of common stock, or Operating Partnership units. During the three months ended March 31, 2024 and 2023, the Company incurred management fees of $32.0 million and $42.2 million, respectively.
To date, the Advisor has elected to receive the management fee in shares of the Company’s common stock. During January 2024, the Company issued 473,622 unregistered Class I shares to the Advisor as payment for the $10.9 million management fee accrued as of December 31, 2023. For the three months ended March 31, 2024, the Company issued 933,093 unregistered Class I shares to the Advisor as payment for the management fee incurred through February 2024 and also had a payable of $10.5 million related to the management fee as of March 31, 2024, which is included in Due to affiliates on the Company’s Condensed Consolidated Balance Sheets. In April 2024, the Company issued 456,577 unregistered Class I shares to the Advisor as payment for the $10.5 million management fee accrued as of March 31, 2024. The shares issued to the Advisor for payment of the management fee were issued at the applicable NAV per share at the end of each month for which the fee was earned.
Additionally, the Special Limited Partner, an affiliate of the Advisor, holds a performance participation interest in the Operating Partnership that entitles it to receive an allocation of the Operating Partnership’s total return to its capital account. Total return is defined as distributions paid or accrued plus the change in NAV. Under the Operating Partnership’s limited partnership agreement, the annual total return will be allocated solely to the Special Limited Partner after the other unit holders have received a total return of 5% (after recouping any loss carryforward amount) and such allocation will continue until the allocation between the Special Limited Partner and all other unit holders is equal to 12.5% and 87.5%, respectively. Thereafter, the Special Limited Partner will receive an allocation of 12.5% of the annual total return. The annual distribution of the performance participation interest will be paid in cash or Class I units of the Operating Partnership, at the election of the Special Limited Partner. During the three months ended March 31, 2024 and 2023, the Company did not recognize a performance participation allocation as certain thresholds were not achieved.
As of March 31, 2024, the Advisor, its employees, and its affiliates, including the Company’s executive officers, hold an aggregate of $545.0 million in the Company, across shares of common stock of the Company and Class I units in the Operating Partnership.
20
Repurchase of Advisor and Certain Director Shares
During the three months ended March 31, 2024, the Company did not repurchase any shares outside of its share repurchase plan. During the three months ended March 31, 2023, the Company repurchased outside of its share repurchase plan 11,090 Class I shares held by certain directors for total consideration of $0.3 million.
Due to Affiliates
The following table details the components of Due to affiliates ($ in thousands):
|
| March 31, 2024 |
|
| December 31, 2023 |
| ||
Accrued stockholder servicing fee |
| $ | 272,943 |
|
| $ | 301,017 |
|
Performance participation allocation |
|
| — |
|
|
| — |
|
Accrued management fee |
|
| 10,513 |
|
|
| 10,853 |
|
Advanced operating expenses |
|
| 1,733 |
|
|
| 4,458 |
|
Accrued affiliate service provider expenses |
|
| 3,079 |
|
|
| 3,068 |
|
Advanced organization and offering costs |
|
| 1,073 |
|
|
| 1,561 |
|
Total |
| $ | 289,341 |
|
| $ | 320,957 |
|
Accrued stockholder servicing fee
The Company accrues the full amount of the future stockholder servicing fees payable to Starwood Capital, L.L.C. (the “Dealer Manager”) for Class T shares, Class S shares, and Class D shares up to the 8.75% limit at the time such shares are sold. The Dealer Manager has entered into agreements with the participating broker dealers distributing the Company’s shares in the public offerings, which provide, among other things, for the re-allowance of the full amount of the selling commissions and dealer manager fees and all or a portion of the stockholder servicing fees received by the Dealer Manager to such participating broker dealers.
Advanced organization and offering costs
The Advisor and its affiliates incurred $7.3 million of organization and offering costs (excluding upfront selling commissions, dealer manager fees and stockholder servicing fees) on behalf of the Company through December 21, 2019. Such amount is being reimbursed to the Advisor ratably over 60 months, which commenced in January 2020.
Accrued affiliate service provider expenses
The Company has engaged and expects to continue to engage Highmark Residential (formerly Milestone Management), a portfolio company owned by an affiliate of the Sponsor, to provide day-to-day operational and management services (including leasing, construction management, revenue management, accounting, legal and contract management, expense management, and capital expenditure projects and transaction support services) for a portion of the Company’s multifamily properties. The cost for such services is a percentage of the gross receipts and project costs respectively (which will be reviewed periodically and adjusted if appropriate), plus actual costs allocated for transaction support services. During the three months ended March 31, 2024 and 2023, the Company incurred approximately $7.2 million and $5.6 million of expenses due to Highmark Residential in connection with its investments, respectively. These amounts are included in Property operating expenses on the Company’s Condensed Consolidated Statements of Operations and Comprehensive Loss.
The Company has engaged Rinaldi, Finkelstein & Franklin L.L.C. (“RFF”), a law firm owned and controlled by Ellis F. Rinaldi, Co-General Counsel and Senior Managing Director of the Sponsor and certain of its affiliates, to provide corporate legal support services to the Company. During the three months ended March 31, 2024 and 2023, the amounts incurred for services provided by RFF were $0.1 million and $0.1 million, respectively.
The Company has engaged Essex Title, LLC (“Essex”), a title agent company majority owned by Starwood Capital. Essex acts as an agent for one or more underwriters in issuing title policies and/or providing support services in connection with investments by the Company, Starwood Capital and its affiliates and third parties. Essex focuses on transactions in rate-regulated states where the cost of title insurance is non-negotiable. Essex will not perform services in non-regulated states for the Company, unless (i) in the context of a portfolio transaction that includes properties in rate-regulated states, (ii) as part of a syndicate of title insurance companies where the rate is negotiated by other insurers or their agents, (iii) when a third party is paying all or a material portion of the premium or (iv) when providing only support services to the underwriter. Essex earns fees, which would have otherwise been paid to third parties, by providing title agency services and facilitating placement of title insurance with underwriters. Starwood Capital receives distributions
21
from Essex in connection with investments by the Company based on its equity interest in Essex. In each case, there will be no related offset to the Company. During the three months ended March 31, 2024, the amounts incurred for services provided by Essex were an insignificant amount. During the three months ended March 31, 2023, the Company did not incur any expenses for services provided by Essex.
The Company has engaged Starwood Retail Partners to provide leasing and legal services for any retail and certain industrial and other properties the Company acquires. During the three months ended March 31, 2024, the Company incurred approximately $0.1 million of expenses from Starwood Retail Partners. During the three months ended March 31, 2023, the Company incurred an insignificant amount of expenses from Starwood Retail Partners.
The Company has incurred legal expenses from third party law firms whose lawyers have been seconded to affiliates of Starwood Capital for the purpose of providing legal services in Europe to investment vehicles sponsored by Starwood Capital. During the three months ended March 31, 2024 and 2023, the amounts incurred for services provided were an insignificant amount, respectively.
The Company has engaged STR Management Co, LLC, an affiliate of the Advisor, to provide property management services to certain of the Company’s residential units that function as short term rental assets. The costs for such services is a percentage of gross revenue produced by the short-term rentals on a monthly basis. During the three months ended March 31, 2024 and 2023, the Company incurred approximately $0.6 million and $0.1 million of expenses for services provided from SCG STR Management Co, LLC, respectively.
The Company has entered into an agreement with an affiliate of Starwood Global Opportunity Fund XI to assist with property management of the Company’s assets in Spain and Italy. The Starwood Capital Group (“SCG”) Southern Europe Team charges market fees for such property management services. During the three months ended March 31, 2024 and 2023, the amounts incurred for services provided by the SCG Southern Europe Team was $0.1 million and $0.1 million, respectively.
Advanced operating expenses
As of March 31, 2024 and 2023, the Advisor had advanced an insignificant amount and approximately $0.1 million, respectively, of expenses on the Company’s behalf for general corporate expenses provided by unaffiliated third parties. Such amounts (incurred prior to 2019) are being reimbursed to the Advisor ratably over a 60 month period, which commenced in January 2020.
For the three months ended March 31, 2024 and 2023, the Advisor had incurred approximately $4.5 million and $4.3 million, respectively, of expenses on the Company’s behalf for general corporate expenses. Such amounts are being reimbursed to the Advisor one month in arrears.
DST Program expenses
During the three months ended March 31, 2024, the Company did not incur or pay any fees to the Advisor or its affiliates in connection with the DST Program.
13.
Commitments and Contingencies
As of March 31, 2024 and December 31, 2023, the Company is not subject to any material litigation nor is the Company aware of any material litigation threatened against it.
14.
Leases
Lessee
Certain of the Company’s investments in real estate are subject to a ground lease. The Company’s ground leases are classified as right-of-use liability – operating leases based on the characteristics of the respective lease. The ground leases were acquired as part of the acquisition of real estate and no incremental costs were incurred for such ground leases. The Company’s ground leases are non-cancelable and do not contain any additional renewal options.
22
The following table presents the future lease payments due under the Company’s ground leases as of March 31, 2024 ($ in thousands):
Year |
| Operating |
| ||
2024 (remaining) |
| $ |
| 514 |
|
2025 |
|
|
| 714 |
|
2026 |
|
|
| 714 |
|
2027 |
|
|
| 714 |
|
2028 |
|
|
| 714 |
|
Thereafter |
|
|
| 25,067 |
|
Total undiscounted future lease payments |
|
|
| 28,437 |
|
Difference between undiscounted cash flows and discounted cash flows |
|
|
| (16,050 | ) |
Total lease liability |
| $ |
| 12,387 |
|
The Company utilized its incremental borrowing rate, which was between 4.5% and 6%, to determine its lease liabilities. As of March 31, 2024, the weighted average remaining lease term of the Company’s operating leases was 36 years.
Payments under the Company’s ground leases contain fixed payment components. The Company’s ground leases contained escalations prior to the Company’s hold period.
Lessor
The Company’s rental revenue primarily consists of rent earned from operating leases at the Company’s multifamily, single-family rental, industrial, office, self-storage and other properties. Leases at the Company’s industrial, office and other properties generally include a fixed base rent and certain leases also contain a variable component. The variable component of the Company’s operating leases at its industrial, office and other properties primarily consist of the reimbursement of operating expenses such as real estate taxes, insurance, and common area maintenance costs.
Leases at the Company’s industrial, office and other properties are generally longer term and may contain extension and termination options at the lessee’s election. The Company’s rental revenue earned from leases at the Company’s multifamily, single-family rental and self-storage properties primarily consists of a fixed base rent and certain leases contain a variable component that allows for the pass-through of certain operating expenses such as utilities. Leases at the Company’s multifamily, single-family rental and self-storage properties are short term in nature, generally not greater than 12 months in length.
The following table summarizes the fixed and variable components of the Company’s operating leases ($ in thousands):
|
| For the Three Months Ended March 31, |
| |||||||
|
| 2024 |
|
| 2023 |
| ||||
Fixed lease payments |
| $ |
| 372,094 |
|
| $ |
| 390,495 |
|
Variable lease payments |
|
|
| 40,989 |
|
|
|
| 40,505 |
|
Rental revenue |
| $ |
| 413,083 |
|
| $ |
| 431,000 |
|
The following table presents the undiscounted future minimum rents the Company expects to receive for its industrial, office and other properties as of March 31, 2024. Leases at the Company’s multifamily, single-family rental and self-storage properties are short term, generally 12 months or less, and are therefore not included. ($ in thousands)
Year |
| Future Minimum Rents |
| ||
2024 (remaining) |
| $ |
| 227,017 |
|
2025 |
|
|
| 269,052 |
|
2026 |
|
|
| 237,373 |
|
2027 |
|
|
| 206,513 |
|
2028 |
|
|
| 166,219 |
|
Thereafter |
|
|
| 493,495 |
|
Total |
| $ |
| 1,599,669 |
|
23
15.
Segment Reporting
The Company operates in seven reportable segments: Multifamily properties, Single-family rental properties, Industrial properties, Office properties, Self-Storage properties, Investments in real estate debt and Other properties. The Company allocates resources and evaluates results based on the performance of each segment individually. The Company believes that segment net operating income is the key performance metric that captures the unique operating characteristics of each segment.
The following table sets forth the total assets by segment ($ in thousands):
| March 31, 2024 |
|
| December 31, 2023 |
| ||||
Multifamily | $ |
| 15,043,500 |
|
| $ |
| 15,161,836 |
|
Single-family rental |
|
| 373,204 |
|
|
|
| 408,097 |
|
Industrial |
|
| 2,762,668 |
|
|
|
| 2,820,658 |
|
Office |
|
| 1,624,813 |
|
|
|
| 1,651,347 |
|
Self-storage |
|
| 354,722 |
|
|
|
| 357,724 |
|
Investments in real estate debt |
|
| 1,388,138 |
|
|
|
| 1,589,350 |
|
Other properties(1) |
|
| 969,686 |
|
|
|
| 1,022,284 |
|
Other (Corporate) |
|
| 174,094 |
|
|
|
| 102,678 |
|
Total assets | $ |
| 22,690,825 |
|
| $ |
| 23,113,974 |
|
(1)
Other properties includes hospitality, medical office, and retail properties and two investments in unconsolidated real estate ventures.
24
The following table sets forth the financial results by segment for the three months ended March 31, 2024 ($ in thousands):
| Multifamily |
|
| Single- |
|
| Industrial |
|
| Office |
|
| Self- |
|
| Other |
|
| Investments |
|
| Total |
| ||||||||||||||||
Revenues: |
|
|
|
|
|
|
|
|
|
|
|
|
|
|
|
|
|
|
|
|
|
|
|
|
|
|
|
|
|
|
| ||||||||
Rental revenue | $ |
| 302,569 |
|
| $ |
| 5,491 |
|
| $ |
| 47,938 |
|
| $ |
| 42,527 |
|
| $ |
| 6,882 |
|
| $ |
| 7,676 |
|
| $ |
| — |
|
| $ |
| 413,083 |
|
Other revenue |
|
| 2,872 |
|
|
|
| — |
|
|
|
| 28 |
|
|
|
| 43 |
|
|
|
| — |
|
|
|
| 8,024 |
|
|
|
| — |
|
|
|
| 10,967 |
|
Total revenues |
|
| 305,441 |
|
|
|
| 5,491 |
|
|
|
| 47,966 |
|
|
|
| 42,570 |
|
|
|
| 6,882 |
|
|
|
| 15,700 |
|
|
|
| — |
|
|
|
| 424,050 |
|
Expenses: |
|
|
|
|
|
|
|
|
|
|
|
|
|
|
|
|
|
|
|
|
|
|
|
|
|
|
|
|
|
|
| ||||||||
Property operating |
|
| 138,326 |
|
|
|
| 2,549 |
|
|
|
| 11,953 |
|
|
|
| 15,028 |
|
|
|
| 2,696 |
|
|
|
| 9,105 |
|
|
|
| — |
|
|
|
| 179,657 |
|
Total segment expenses |
|
| 138,326 |
|
|
|
| 2,549 |
|
|
|
| 11,953 |
|
|
|
| 15,028 |
|
|
|
| 2,696 |
|
|
|
| 9,105 |
|
|
|
| — |
|
|
|
| 179,657 |
|
Loss from unconsolidated |
|
| — |
|
|
|
| — |
|
|
|
| — |
|
|
|
| — |
|
|
|
| — |
|
|
|
| (3,968 | ) |
|
|
| — |
|
|
|
| (3,968 | ) |
Income from investments in |
|
| — |
|
|
|
| — |
|
|
|
| — |
|
|
|
| — |
|
|
|
| — |
|
|
|
| — |
|
|
|
| 40,497 |
|
|
|
| 40,497 |
|
Segment net operating income | $ |
| 167,115 |
|
| $ |
| 2,942 |
|
| $ |
| 36,013 |
|
| $ |
| 27,542 |
|
| $ |
| 4,186 |
|
| $ |
| 2,627 |
|
| $ |
| 40,497 |
|
| $ |
| 280,922 |
|
|
|
|
|
|
|
|
|
|
|
|
|
|
|
|
|
|
|
|
|
|
|
|
|
|
|
|
|
|
|
|
| ||||||||
General and administrative |
|
|
|
|
|
|
|
|
|
|
|
|
|
|
|
|
|
|
|
|
|
|
|
| (12,492 | ) | |||||||||||||
Management fees |
|
|
|
|
|
|
|
|
|
|
|
|
|
|
|
|
|
|
|
|
|
|
|
| (31,996 | ) | |||||||||||||
Depreciation and amortization |
|
|
|
|
|
|
|
|
|
|
|
|
|
|
|
|
|
|
|
|
|
|
|
| (186,398 | ) | |||||||||||||
Net gain (loss) on dispositions of real estate |
|
|
|
|
|
|
|
|
|
|
|
|
|
|
|
| 2,083 |
| |||||||||||||||||||||
Interest expense |
|
|
|
|
|
|
|
|
|
|
|
|
|
|
|
|
|
|
|
|
|
|
|
| (154,033 | ) | |||||||||||||
Other income (expense), net |
|
|
|
|
|
|
|
|
|
|
|
|
|
|
|
|
|
|
|
|
|
|
|
| 15,628 |
| |||||||||||||
Net loss |
|
|
|
|
|
|
|
|
|
|
|
|
|
|
|
|
|
|
|
|
|
| $ |
| (86,286 | ) | |||||||||||||
Net loss attributable to non-controlling interests in consolidated joint ventures |
|
|
|
|
|
|
|
|
|
|
|
|
|
| 187 |
| |||||||||||||||||||||||
Net loss attributable to non-controlling interests in Operating Partnership |
|
|
|
|
|
|
|
|
|
|
|
|
|
|
|
| 4,753 |
| |||||||||||||||||||||
Net loss attributable to stockholders |
|
|
|
|
|
|
|
|
|
|
|
|
|
| $ |
| (81,346 | ) | |||||||||||||||||||||
25
The following table sets forth the financial results by segment for the three months ended March 31, 2023 ($ in thousands):
| Multifamily |
|
| Single- |
|
| Industrial |
|
| Office |
|
| Self-Storage |
|
| Other |
|
| Investments |
|
| Total |
| ||||||||||||||||
Revenues: |
|
|
|
|
|
|
|
|
|
|
|
|
|
|
|
|
|
|
|
|
|
|
|
|
|
|
|
|
|
|
| ||||||||
Rental revenue | $ |
| 307,065 |
|
| $ |
| 20,488 |
|
| $ |
| 50,242 |
|
| $ |
| 37,446 |
|
| $ |
| 6,790 |
|
| $ |
| 8,969 |
|
| $ |
| — |
|
| $ |
| 431,000 |
|
Other revenue |
|
| 2,281 |
|
|
|
| — |
|
|
| — |
|
|
|
| 135 |
|
|
|
| — |
|
|
|
| 13,028 |
|
|
|
| — |
|
|
|
| 15,444 |
| |
Total revenues |
|
| 309,346 |
|
|
|
| 20,488 |
|
|
|
| 50,242 |
|
|
|
| 37,581 |
|
|
|
| 6,790 |
|
|
|
| 21,997 |
|
|
|
| — |
|
|
|
| 446,444 |
|
Expenses: |
|
|
|
|
|
|
|
|
|
|
|
|
|
|
|
|
|
|
|
|
|
|
|
|
|
|
|
|
|
|
| ||||||||
Property operating |
|
| 137,399 |
|
|
|
| 12,075 |
|
|
|
| 12,773 |
|
|
|
| 14,637 |
|
|
|
| 2,667 |
|
|
|
| 10,100 |
|
|
|
| — |
|
|
|
| 189,651 |
|
Total segment expenses |
|
| 137,399 |
|
|
|
| 12,075 |
|
|
|
| 12,773 |
|
|
|
| 14,637 |
|
|
|
| 2,667 |
|
|
|
| 10,100 |
|
|
|
| — |
|
|
|
| 189,651 |
|
Loss from unconsolidated |
|
| — |
|
|
|
| — |
|
|
|
| — |
|
|
|
| — |
|
|
|
| — |
|
|
|
| (3,089 | ) |
|
|
| — |
|
|
|
| (3,089 | ) |
Income from investments in real |
|
| — |
|
|
|
| — |
|
|
|
| — |
|
|
|
| — |
|
|
|
| — |
|
|
|
| — |
|
|
|
| 31,841 |
|
|
|
| 31,841 |
|
Segment net operating income | $ |
| 171,947 |
|
| $ |
| 8,413 |
|
| $ |
| 37,469 |
|
| $ |
| 22,944 |
|
| $ |
| 4,123 |
|
| $ |
| 8,808 |
|
| $ |
| 31,841 |
|
| $ |
| 285,545 |
|
|
|
|
|
|
|
|
|
|
|
|
|
|
|
|
|
|
|
|
|
|
|
|
|
|
|
|
|
|
|
|
| ||||||||
General and administrative |
|
|
|
|
|
|
|
|
|
|
|
|
|
|
|
|
|
|
|
|
|
|
|
| (10,569 | ) | |||||||||||||
Management fees |
|
|
|
|
|
|
|
|
|
|
|
|
|
|
|
|
|
|
|
|
|
|
|
| (42,181 | ) | |||||||||||||
Impairment of investments in real estate |
|
|
|
|
|
|
|
|
|
|
|
|
|
| (79,846 | ) | |||||||||||||||||||||||
Depreciation and amortization |
|
|
|
|
|
|
|
|
|
|
|
|
|
|
|
|
|
|
|
|
|
|
|
| (200,434 | ) | |||||||||||||
Net gain (loss) on dispositions of real estate |
|
|
|
|
|
|
|
|
|
|
|
|
|
|
|
| (423 | ) | |||||||||||||||||||||
Interest expense |
|
|
|
|
|
|
|
|
|
|
|
|
|
|
|
|
|
|
|
|
|
|
|
| (137,290 | ) | |||||||||||||
Other income (expense), net |
|
|
|
|
|
|
|
|
|
|
|
|
|
|
|
|
|
|
|
|
|
|
|
| (140,034 | ) | |||||||||||||
Net loss |
|
|
|
|
|
|
|
|
|
|
|
|
|
|
|
|
|
|
|
|
|
| $ |
| (325,232 | ) | |||||||||||||
Net loss attributable to non-controlling interests in consolidated joint ventures |
|
|
|
|
|
|
|
|
|
|
|
|
|
| 1,492 |
| |||||||||||||||||||||||
Net loss attributable to non-controlling interests in Operating Partnership |
|
|
|
|
|
|
|
|
|
|
|
|
|
|
|
| 13,103 |
| |||||||||||||||||||||
Net loss attributable to stockholders |
|
|
|
|
|
|
|
|
|
|
|
|
|
| $ |
| (310,637 | ) | |||||||||||||||||||||
16.
Subsequent Events
Financing and Capital Activity
During the period from April 1, 2024 through May 13, 2024, the Company raised an aggregate of $34.5 million in the Company’s third public offering and repurchased $312.5 million of common stock through its share repurchase plan.
During the period from April 1, 2024 through May 13, 2024, the Company repurchased outside of its share repurchase plan 973,000 Class I shares, held by certain officers and directors for total consideration of $22.5 million.
As of April 2024, the Company has commenced operations in its DST Program.
During the period from April 1, 2024 through May 13, 2024, the Company received $101.0 million of net borrowings from its unsecured line of credit.
In May 2024, the Company entered into an agreement to extend its Line of Credit for two years, at which time the Company may request an additional one-year extension thereafter. Interest under the Line of Credit is determined based on one-month U.S. dollar denominated SOFR plus 2.5%.
Asset Dispositions
During the period from April 1, 2024 through May 13, 2024, the Company received $0.2 billion of net proceeds from sales of investments in real estate debt.
26
ITEM 2. MANAGEMENT’S DISCUSSION AND ANALYSIS OF FINANCIAL CONDITION AND RESULTS OF OPERATIONS
References herein to “Starwood Real Estate Income Trust, Inc.,” “Company,” “we,” “us,” or “our” refer to Starwood Real Estate Income Trust, Inc. and its subsidiaries unless the context specifically requires otherwise.
The following discussion should be read in conjunction with the unaudited condensed consolidated financial statements and notes thereto appearing elsewhere in this Quarterly Report on Form 10-Q. In addition to historical data, this discussion contains forward-looking statements about our business, operations and financial performance based on current expectations that involve risks, uncertainties and assumptions. Our actual results may differ materially from those in this discussion as a result of various factors, including but not limited to those discussed under Item 1A. “Risk Factors” in our Annual Report on Form 10-K filed with the SEC on March 21, 2024 and elsewhere in this Quarterly Report on Form 10-Q. We do not undertake to revise or update any forward-looking statements.
Forward-Looking Statements
This Quarterly Report on Form 10-Q contains forward-looking statements within the meaning of Section 27A of the Securities Act of 1933, as amended (the “Securities Act”), and Section 21E of the Exchange Act of 1934, as amended (the “Exchange Act”). Forward-looking statements include statements about our business, including, in particular, statements about our plans, strategies and objectives. Forward-looking statements can generally be identified by our use of forward-looking terminology such as “may,” “will,” “expect,” “intend,” “anticipate,” “estimate,” “believe,” “continue” or other similar words. These statements include our plans and objectives for future operations, including plans and objectives relating to future growth and availability of funds for repurchases, and are based on current expectations that involve numerous risks and uncertainties. Assumptions relating to these statements involve judgments with respect to, among other things, future economic, competitive and market conditions and future business decisions, all of which are difficult or impossible to accurately predict and many of which are beyond our control.
Although we believe the assumptions underlying the forward-looking statements, and the forward-looking statements themselves, are reasonable, any of the assumptions could be inaccurate and, therefore, there can be no assurance that these forward-looking statements will prove to be accurate and our actual results, performance and achievements may be materially different from that expressed or implied by these forward-looking statements. In light of the significant uncertainties inherent in these forward looking statements, the inclusion of this information should not be regarded as a representation by us or any other person that our objectives and plans, which we consider to be reasonable, will be achieved.
You should carefully review Item 1A. “Risk Factors” in our Annual Report on Form 10-K for the year ended December 31, 2023, and elsewhere in this Quarterly Report on Form 10-Q for a discussion of the risks and uncertainties that we believe are material to our business, operating results, prospects and financial condition. Except as otherwise required by federal securities laws, we do not undertake to publicly update or revise any forward-looking statements, whether as a result of new information, future events or otherwise.
Overview
We were formed on June 22, 2017 as a Maryland corporation to invest primarily in stabilized, income-oriented commercial real estate and debt secured by commercial real estate. Our portfolio is principally comprised of properties located in the United States and is diversified on a global basis through investments in properties outside of the United States, with a focus on Europe. To a lesser extent, we also invest in real estate debt, including loans secured by real estate and real estate-related securities. We are an externally advised, perpetual-life REIT. We own all or substantially all of our assets through the Operating Partnership, of which we are the sole general partner. We and the Operating Partnership are externally managed by the Advisor.
Our board of directors has at all times oversight and policy-making authority over us, including responsibility for governance, financial controls, compliance and disclosure. Pursuant to an advisory agreement among the Advisor, the Operating Partnership and us (the “Advisory Agreement”), we have delegated to the Advisor the authority to source, evaluate and monitor our investment opportunities and make decisions related to the acquisition, management, financing and disposition of our assets, in accordance with our investment objectives, guidelines, policies and limitations, subject to oversight by our board of directors.
We have elected to be taxed as a REIT under the Code for U.S. federal income tax purposes, commencing with our taxable year ended December 31, 2019. We generally will not be subject to U.S. federal income taxes on our taxable income to the extent we annually distribute all of our net taxable income (determined without regard to our net capital gain and dividends-paid deduction) to stockholders and maintain our qualification as a REIT.
27
Public Offerings
On December 27, 2017, we commenced our initial public offering of up to $5.0 billion in shares of our common stock. On June 2, 2021, our initial public offering terminated and we commenced our follow-on public offering of up to $10.0 billion in shares of common stock.
On August 10, 2022, the follow-on public offering terminated and we commenced our third public offering of up to $18.0 billion in shares of common stock, consisting of up to $16.0 billion in shares in our primary offering and up to $2.0 billion in shares pursuant to our distribution reinvestment plan. We intend to continue selling shares in our third public offering on a monthly basis.
As of May 13, 2024, we had received net proceeds of $13.9 billion from the sale of our common stock through our public offerings. We have contributed the net proceeds from our public offerings to the Operating Partnership in exchange for a corresponding number of Class T, Class S, Class D and Class I units. The Operating Partnership has primarily used the net proceeds to make investments in real estate and real estate debt as further described below under “Portfolio.”
DST Program
In December 2023, we announced that we, through the Operating Partnership, are commencing the DST Program to issue and sell up to a maximum aggregate offering amount of $1.0 billion of beneficial interests (the “DST Interests”) in specific Delaware statutory trusts (the “DSTs”) holding one or more DST Properties. These DST Interests will be issued and sold to “accredited investors,” as that term is defined under Regulation D promulgated by the SEC under the Securities Act, in private placements exempt from registration pursuant to Section 4(a)(2) of the Securities Act (the “DST Offerings”).
Under the DST Program, each DST Property may be sourced from our real properties or from third parties, which will be held in a DST and subsequently leased back by a wholly owned subsidiary of the Operating Partnership in accordance with a certain master lease agreement. Each master lease agreement will be guaranteed by the Operating Partnership, which will retain a fair market value option (the “FMV Option”), giving it the right, but not the obligation, to acquire the DST Interests in the applicable DST from the investors in exchange for Operating Partnership units or cash, at the Operating Partnership’s discretion. Such FMV Option shall be exercisable any time after two years from the closing of the applicable DST Offering. The Operating Partnership, in its sole and absolute discretion, may assign its rights in the FMV Option to a subsidiary, an affiliate, a successor entity to the Operating Partnership or the acquiror of a majority of the Operating Partnership’s assets. After a one-year holding period, investors who acquire Operating Partnership units pursuant to the FMV Option generally have the right to cause the Operating Partnership to redeem all or a portion of their Operating Partnership units for, at our sole discretion, shares of our common stock, cash, or a combination of both.
We expect that the DST Program will give us the opportunity to expand and diversify our capital-raising strategies by offering what we believe to be an attractive investment product for investors that may be seeking like-kind replacement properties to complete tax-deferred exchange transactions under Section 1031 of the Code. Affiliates of the Advisor are expected to receive fees in connection with the sale of the DST Interests and the management of the DSTs. We intend to use the net offering proceeds from the DST Program to make investments in accordance with our investment strategy and policies, reduce our borrowings, repay indebtedness, fund the repurchase of shares of all classes of our common stock under our share repurchase plan and for other corporate purposes.
As of April 2024, we have commenced operations in our DST Program.
Investment Objectives
Our investment objectives are to invest in assets that will enable us to:
•
provide current income in the form of regular, stable cash distributions to achieve an attractive distribution yield;
•
preserve and protect invested capital;
•
realize appreciation in NAV from proactive investment management and asset management; and
•
provide an investment alternative for stockholders seeking to allocate a portion of their long-term investment portfolios to commercial real estate with lower volatility than publicly traded real estate companies.
We cannot assure you that we will achieve our investment objectives. See Item 1A. “Risk Factors” in our Annual Report on Form 10-K for the year ended December 31, 2023 for additional details.
28
Recent Developments
Business Outlook
We remain 92% allocated to rental housing, industrial, real estate loans, extended stay, and net lease. Apartment demand in Q1 2024 was the strongest quarterly demand experienced in the last 20-years due to a strong job market, wage growth in excess of rent growth, and affordability constraints in for-sale housing. In our assets within our top 10 markets, it is now two times more expensive to own versus rent, and our rent-to-income ratio is a very affordable 21.1%. Affordability remains one of the key factors offsetting new supply and continues to drive positive rent growth in our market rate portfolio. Further, our rent growth has accelerated over the last 30 days as we enter peak leasing season (spring and into summer).
In our affordable housing assets (almost one-third of our apartment portfolio), the United States Department of Housing and Urban Development (“HUD”) carried forward a portion of allowable rent increases from last year, which should bolster rent growth again in 2024. Given the rent increase formulas are backward looking (and tied to the consumer price index as well as area median income), our current projections for 2024 rent growth are between +4% and 5%. In our industrial assets, due to our focus on light industrial properties located across in-fill, last mile, and infrastructure centric locations our in-place rents remain 21% below market, and we have structured leases with 3.5% to 5% annual rent escalations. We anticipate that this will continue to drive mid-to-high single-digit income growth this year. Finally, our floating-rate real estate loans are yielding approximately 12%, providing good risk-adjusted returns for investors.
Please refer to Item 1A. “Risk Factors” in our Annual Report on Form 10-K for the year ended December 31, 2023 and elsewhere in this Quarterly Report on Form 10-Q for additional disclosure relating to material trends or uncertainties that may impact our business.
Q1 2024 Highlights
Operating Results:
•
Declared monthly net distributions totaling $127.0 million for the three months ended March 31, 2024. The details of the average annualized distribution rates and total returns are shown in the following table:
| Class T | Class S | Class D | Class I |
| Shares | Shares | Shares | Shares |
Average Annualized Distribution Rate | 4.5% | 4.5% | 5.2% | 5.4% |
Year-to-Date Total Return, without upfront selling commissions and dealer manager fees | 1.7% | 1.7% | 1.8% | 1.9% |
Year-to-Date Total Return, assuming full upfront selling commissions and dealer manager fees | (1.7%) | (1.7%) | 0.3% | N/A |
Annualized Inception-to-Date Total Return, without upfront selling commissions and dealer manager fees | 7.4% | 7.4% | 7.7% | 8.1% |
Annualized Inception-to-Date Total Return, assuming full upfront selling commissions and dealer manager fees | 6.7% | 6.7% | 7.4% | N/A |
Disposition Activity:
•
Sold two hospitality properties and 27 single-family rental units for total net proceeds of $33.1 million during the three months ended March 31, 2024.
Financing Activity:
•
Received net borrowings of $317.5 million from our unsecured line of credit during the three months ended March 31, 2024.
29
Portfolio
Summary of Portfolio
The following chart outlines the percentage of our assets across investments in real estate, investments in real estate securities and investments in real estate loans based on fair value as of March 31, 2024:
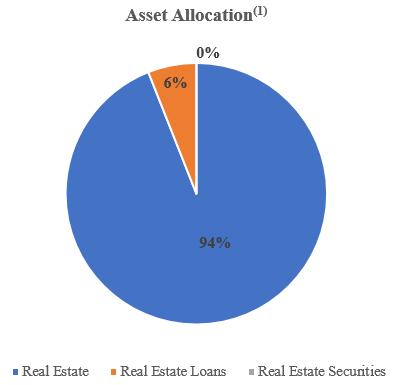
The following charts further describe the composition of our investments in real estate and investment in real estate loans based on fair value as of March 31, 2024:
|
|
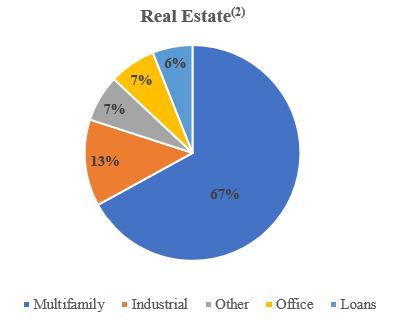
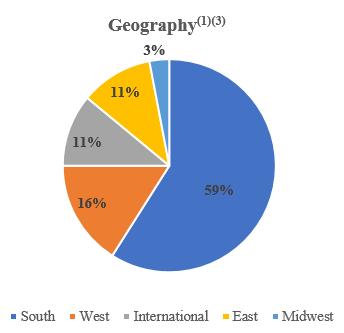
(1)
Investments in real estate includes our direct property investments and our unconsolidated investments. Investments in real estate securities includes our CMBS investments. Investments in real estate loans includes our term loans.
(2)
Includes our direct property investments, our unconsolidated investments and our term loans.
(3)
Geography weighting includes our term loans and excludes our real estate-related debt securities. Geography weighting is measured as the asset value of real estate properties, unconsolidated real estate ventures, and investments in real estate loans for each geographical category against the total value of all (i) real estate properties, (ii) unconsolidated real estate ventures, and (iii) investments in real estate loans.
30
Investments in Real Estate
The following table provides a summary of our portfolio as of March 31, 2024 ($ in thousands):
Segment |
| Number of |
| Sq. Feet |
| Occupancy |
| Gross Asset Value (2) |
|
| Segment |
|
| Percentage of | ||
Multifamily |
| 284 |
| 66,919 units |
| 95% |
| $ | 15,964,000 |
|
| $ | 305,441 |
|
| 72% |
Single-family rental |
| N/A (3) |
| 989 units |
| 88% |
|
| 344,863 |
|
|
| 5,491 |
|
| 1% |
Industrial |
| 131 |
| 19.61 sq. ft. |
| 99% |
|
| 3,128,266 |
|
|
| 47,966 |
|
| 11% |
Office |
| 20 |
| 3.90 sq. ft. |
| 91% |
|
| 1,612,387 |
|
|
| 42,570 |
|
| 10% |
Self-storage |
| 26 |
| 1.90 sq. ft. |
| 82% |
|
| 386,800 |
|
|
| 6,882 |
|
| 2% |
Other Properties(4) |
| 8 |
| N/A (5) |
| N/A |
|
| 495,493 |
|
|
| 15,700 |
|
| 4% |
Total |
| 469 |
|
|
|
|
| $ | 21,931,809 |
|
| $ | 424,050 |
|
| 100% |
(1)
The occupancy rate for our industrial, office and self-storage investments is defined as all leased square footage divided by the total available square footage as of March 31, 2024. The occupancy rate for our multifamily and single-family rental investments is defined as the number of leased units divided by the total unit count as of March 31, 2024. The occupancy rate for our other investments is defined as all leased square footage divided by the total available square footage as well as the trailing 12 month average occupancy for hospitality investments for the period ended March 31, 2024.
(2)
Based on fair value as of March 31, 2024.
(3)
Includes a 100% interest in a subsidiary with 77 single-family rental units and a 95% interest in a consolidated joint venture with 912 single-family rental units.
(4)
Excludes our investments in unconsolidated real estate ventures.
(5)
Includes 1.0 million sq. ft. across our medical office and retail properties and 431 keys at our consolidated hospitality properties.
31
The following table provides information regarding our portfolio of real estate properties as of March 31, 2024:
Segment and Investment |
| Number of |
| Location |
| Acquisition |
| Ownership |
| Sq. Feet |
|
| Occupancy(2) | |
Multifamily: |
|
|
|
|
|
|
|
|
|
|
|
|
| |
Florida Multifamily Portfolio |
| 4 |
| Jacksonville/Naples, FL |
| January 2019 |
| 100% |
|
| 1,150 |
|
| 99% |
Phoenix Property |
| 1 |
| Mesa, AZ |
| January 2019 |
| 100% |
|
| 256 |
|
| 98% |
Columbus Multifamily |
| 3 |
| Columbus, OH |
| September/October 2019 |
| 96% |
|
| 690 |
|
| 94% |
Cascades Apartments |
| 1 |
| Charlotte, NC |
| October 2019 |
| 100% |
|
| 570 |
|
| 91% |
Exchange on Erwin |
| 1 |
| Durham, NC |
| November 2019 |
| 100% |
|
| 265 |
|
| 92% |
Avida Apartments |
| 1 |
| Salt Lake City, UT |
| December 2019 |
| 100% |
|
| 400 |
|
| 95% |
Southeast Affordable Housing Portfolio |
| 22 |
| Various |
| Various 2020 |
| 100% |
|
| 4,384 |
|
| 97% |
Florida Affordable Housing Portfolio II |
| 4 |
| Jacksonville, FL |
| October 2020 |
| 100% |
|
| 958 |
|
| 93% |
Mid-Atlantic Affordable Housing Portfolio |
| 28 |
| Various |
| October 2020 |
| 100% |
|
| 3,660 |
|
| 96% |
Kalina Way |
| 1 |
| Salt Lake City, UT |
| December 2020 |
| 100% |
|
| 264 |
|
| 98% |
Southeast Affordable Housing Portfolio II |
| 9 |
| DC, FL, GA, MD, SC, VA |
| May 2021 |
| 100% |
|
| 1,642 |
|
| 97% |
Azalea Multifamily Portfolio |
| 17 |
| TX, FL, NC, MD, TN, GA |
| June/July 2021 |
| 100% |
|
| 5,620 |
|
| 95% |
Keystone Castle Hills |
| 1 |
| Dallas, TX |
| July 2021 |
| 100% |
|
| 690 |
|
| 97% |
Greater Boston Affordable Portfolio |
| 5 |
| Boston, MA |
| August/September 2021 |
| 98% |
|
| 842 |
|
| 97% |
Columbus Preferred Portfolio |
| 2 |
| Columbus, OH |
| September 2021 |
| 96% |
|
| 400 |
|
| 94% |
The Palmer Dadeland |
| 1 |
| Dadeland, FL |
| September 2021 |
| 100% |
|
| 844 |
|
| 96% |
Seven Springs Apartments |
| 1 |
| Burlington, MA |
| September 2021 |
| 100% |
|
| 331 |
|
| 97% |
Maison’s Landing |
| 1 |
| Taylorsville, UT |
| September 2021 |
| 100% |
|
| 492 |
|
| 95% |
Sawyer Flats |
| 1 |
| Gaithersburg, MD |
| October 2021 |
| 100% |
|
| 648 |
|
| 95% |
Raleigh Multifamily Portfolio |
| 6 |
| Raleigh, NC |
| November 2021 |
| 95% |
|
| 2,291 |
|
| 94% |
SEG Multifamily Portfolio |
| 62 |
| Various |
| November 2021 |
| 100% |
|
| 15,461 |
|
| 94% |
South Florida Multifamily Portfolio |
| 3 |
| Various |
| November 2021 |
| 95% |
|
| 1,150 |
|
| 94% |
Florida Affordable Housing Portfolio III |
| 16 |
| Various |
| November 2021 |
| 100% |
|
| 2,660 |
|
| 98% |
Central Park Portfolio |
| 9 |
| Denver, CO |
| December 2021 |
| 100% |
|
| 1,445 |
|
| 94% |
National Affordable Housing Portfolio |
| 17 |
| Various |
| December 2021 |
| 100% |
|
| 3,264 |
|
| 97% |
Phoenix Affordable Housing Portfolio |
| 7 |
| Phoenix, AZ |
| April/May 2022 |
| 100% |
|
| 1,462 |
|
| 95% |
Mid-Atlantic Affordable Housing Portfolio II |
| 8 |
| DC, GA |
| April 2022 |
| 100% |
|
| 1,449 |
|
| 96% |
Texas and North Carolina Multifamily Portfolio |
| 5 |
| TX, NC |
| April/June 2022 |
| 95% |
|
| 1,601 |
|
| 95% |
Summit Multifamily Portfolio |
| 34 |
| Various |
| May/June 2022 |
| 100% |
|
| 8,812 |
|
| 95% |
Florida Affordable Housing Portfolio IV |
| 9 |
| Various, FL |
| June/July 2022 |
| 100% |
|
| 2,054 |
|
| 99% |
Blue Multifamily Portfolio |
| 4 |
| Various |
| August 2022 |
| 100% |
|
| 1,164 |
|
| 96% |
Total Multifamily |
| 284 |
|
|
|
|
|
|
|
| 66,919 |
|
|
|
Single-Family Rental: |
|
|
|
|
|
|
|
|
|
|
|
|
| |
Single-Family Rental Joint Venture |
| N/A |
| Various |
| Various |
| 95% |
|
| 912 |
|
| 92% |
Sun Belt Single-Family Rental Portfolio |
| N/A |
| Various |
| December 2021 |
| 100% |
|
| 77 |
|
| 39% |
Total Single-Family Rental |
| N/A |
|
|
|
|
|
|
|
| 989 |
|
|
|
Industrial: |
|
|
|
|
|
|
|
|
|
|
|
|
| |
Airport Logistics Park |
| 6 |
| Nashville, TN |
| September 2020 |
| 100% |
|
| 0.40 |
|
| 93% |
Marshfield Industrial Portfolio |
| 4 |
| Baltimore, MD |
| October 2020 |
| 100% |
|
| 1.33 |
|
| 100% |
Denver/Boulder Industrial Portfolio |
| 16 |
| Denver, CO |
| April 2021 |
| 100% |
|
| 1.68 |
|
| 100% |
Independence Industrial Portfolio |
| 6 |
| Houston, TX |
| April 2021 |
| 100% |
|
| 2.33 |
|
| 100% |
Reno Logistics Portfolio |
| 19 |
| Reno, NV |
| May 2021 |
| 100% |
|
| 3.14 |
|
| 97% |
Northern Italy Industrial Portfolio |
| 4 |
| Northern Italy |
| August 2021 |
| 100% |
|
| 0.75 |
|
| 100% |
Southwest Light Industrial Portfolio |
| 15 |
| AZ, NV |
| September 2021 |
| 100% |
|
| 2.48 |
|
| 98% |
Norway Logistics Portfolio |
| 2 |
| Oslo, Norway |
| February 2022 |
| 100% |
|
| 0.37 |
|
| 100% |
American Industrial Center |
| 25 |
| Orlando, FL |
| April 2022 |
| 100% |
|
| 0.82 |
|
| 99% |
Middlebrook Crossroads |
| 18 |
| Bridgewater, NJ |
| May 2022 |
| 95% |
|
| 0.58 |
|
| 95% |
Verona Oppeano |
| 5 |
| Verona, Italy |
| June 2022 |
| 100% |
|
| 2.64 |
|
| 100% |
Denmark Logistics Portfolio |
| 10 |
| Eastern Denmark |
| June 2022 |
| 100% |
|
| 1.97 |
|
| 100% |
Belgioioso Logistics |
| 1 |
| Greater Milan, Italy |
| August 2022 |
| 100% |
|
| 1.12 |
|
| 100% |
Total Industrial |
| 131 |
|
|
|
|
|
|
|
| 19.61 |
|
|
|
Office: |
|
|
|
|
|
|
|
|
|
|
|
|
| |
Florida Office Portfolio |
| 11 |
| Jacksonville, FL |
| May 2019 |
| 97% |
|
| 1.27 |
|
| 77% |
Columbus Office Portfolio |
| 1 |
| Columbus, OH |
| October 2019 |
| 96% |
|
| 0.32 |
|
| 100% |
Nashville Office |
| 1 |
| Nashville, TN |
| February 2020 |
| 100% |
|
| 0.36 |
|
| 100% |
60 State Street |
| 1 |
| Boston, MA |
| March 2020 |
| 100% |
|
| 0.91 |
|
| 95% |
Stonebridge |
| 3 |
| Atlanta, GA |
| February 2021 |
| 100% |
|
| 0.46 |
|
| 100% |
M Campus |
| 2 |
| Paris, France |
| December 2021 |
| 100% |
|
| 0.24 |
|
| 99% |
Barcelona Mediacomplex |
| 1 |
| Barcelona, Spain |
| June 2022 |
| 100% |
|
| 0.34 |
|
| 100% |
Total Office |
| 20 |
|
|
|
|
|
|
|
| 3.90 |
|
|
|
Self-storage: |
|
|
|
|
|
|
|
|
|
|
|
|
| |
Morningstar Self-Storage Joint Venture |
| 26 |
| Various |
| December 2021/March 2022 |
| 95% |
|
| 1.90 |
|
| 82% |
Total Self-storage |
| 26 |
|
|
|
|
|
|
|
| 1.90 |
|
|
|
32
Segment and Investment |
| Number of |
| Location |
| Acquisition |
| Ownership |
| Sq. Feet |
|
| Occupancy(2) | |
Other Properties: |
|
|
|
|
|
|
|
|
|
|
|
|
| |
U.S. Select Service Portfolio |
| 3 |
| CO, OH, AR |
| January 2019 |
| 100% |
|
| 431 |
|
| 77% |
Fort Lauderdale Hotel (4) |
| 1 |
| Fort Lauderdale, FL |
| March 2019 |
| 43% |
|
| 236 |
|
| 66% |
Exchange on Erwin - Commercial |
| 2 |
| Durham, NC |
| November 2019 |
| 100% |
|
| 0.10 |
|
| 93% |
Barlow |
| 1 |
| Chevy Chase, MD |
| March 2020 |
| 100% |
|
| 0.29 |
|
| 82% |
Iberostar Las Dalias |
| 1 |
| Tenerife, Spain |
| December 2021 |
| 100% |
|
| 0.31 |
|
| 100% |
Marketplace at the Outlets |
| 1 |
| West Palm Beach, FL |
| December 2021 |
| 100% |
|
| 0.30 |
|
| 100% |
Extended Stay Portfolio (4) |
| 196 |
| Various |
| July 2022 |
| 45% |
|
| 24,935 |
|
| 84% |
Total Other Properties |
| 205 |
|
|
|
|
|
|
| N/A (3) |
|
|
| |
|
|
|
|
|
|
|
|
|
|
|
|
|
| |
Total Investment Properties |
| 666 |
|
|
|
|
|
|
|
|
|
|
| |
(1)
Certain of the joint venture agreements entered into by us provide the other partner a profits interest based on certain internal rate of return hurdles being achieved. Such investments are consolidated by us and any profits interest due to the other partner will be reported within non-controlling interests in consolidated joint ventures on our Condensed Consolidated Balance Sheets. The table also includes two investments (197 total properties) owned by two unconsolidated real estate ventures.
(2)
The occupancy rate for our industrial, office and self-storage investments is defined as all leased square footage divided by the total available square footage as of March 31, 2024. The occupancy rate for our multifamily and single-family rental investments is defined as the number of leased units divided by the total unit count as of March 31, 2024. The occupancy rate for our other investments is defined as all leased square footage divided by the total available square footage as well as the trailing 12 month average occupancy for hospitality and extended stay investments for the period ended March 31, 2024.
(3)
Includes 1.0 million sq. ft. across our medical office and retail properties and 25,602 keys at our hospitality and extended stay properties.
(4)
Investment in unconsolidated real estate venture.
Impairment of Investments in Real Estate
Management reviews its consolidated real estate properties for impairment each quarter or when there is an event or change in circumstances that indicates an impaired value. If the carrying amount of the real estate investment is no longer recoverable and exceeds the fair value of such investment, an impairment loss is recognized. The impairment loss is recognized based on the excess of the carrying amount of the asset over its fair value. The evaluation of anticipated future cash flows is highly subjective and is based in part on assumptions regarding future occupancy, rental rates and capital requirements that could differ materially from actual results. Since cash flows on real estate properties are considered on an undiscounted basis to determine whether an asset has been impaired, our strategy of holding properties over the long term directly decreases the likelihood of recording an impairment loss. If our strategy changes or market conditions otherwise dictate an earlier sale date, an impairment loss may be recognized, and such loss could be material to our results. If we determine that an impairment has occurred, the affected assets must be reduced to their fair value.
During the three months ended March 31, 2024, we did not recognize any impairments on our investments in real estate. During the three months ended March 31, 2023, we recognized an aggregate $79.8 million impairment charge on various single-family rental properties.
Impairment of Investments in Unconsolidated Real Estate Ventures
Management reviews its investments in unconsolidated joint ventures for impairment each quarter and will record impairment charges when events or circumstances change indicating that a decline in the fair values below the carrying values has occurred and such decline is other-than-temporary. The ultimate realization of the investment in unconsolidated joint ventures is dependent on a number of factors, including the performance of each investment and market conditions.
During the three months ended March 31, 2024 and 2023, we did not recognize any impairments on our investments in unconsolidated real estate ventures.
33
Investments in Real Estate Debt
The following table details our investments in real estate debt as of March 31, 2024 ($ in thousands):
|
|
|
| March 31, 2024 |
| |||||||||
Type of Security/Loan |
| Number of Positions |
| Weighted |
| Weighted Average |
| Cost Basis |
|
| Fair Value |
| ||
CMBS - floating |
| 2 |
| B + 6.19% |
| August 2035 |
| $ | 45,304 |
|
| $ | 45,164 |
|
Term loans |
| 2 |
| B + 4.95% |
| January 2027 |
|
| 1,451,462 |
|
|
| 1,342,974 |
|
Total investments in real estate debt |
| 4 |
| B + 4.99% |
| April 2027 |
| $ | 1,496,766 |
|
| $ | 1,388,138 |
|
(1)
The symbol “B” refers to the relevant benchmark rates, which includes one-month SOFR, three-month BBSY and SONIA, as applicable to each security and loan.
(2)
Weighted average maturity date is based on the fully extended maturity date of the underlying collateral.
During June 2022, we provided financing in the form of a term loan to an unaffiliated entity in connection with its acquisition of Australia’s largest hotel and casino company. The loan is in the amount of AUD 1,377 million and has an initial term of five years, with a two-year extension option. The loan is pre-payable at the option of the borrower at any time.
During February 2021, we provided financing in the form of a term loan to an unaffiliated entity in connection with its acquisition of a premier United Kingdom holiday company. The original loan was in the amount of £360 million and has an initial term of five years, with a two-year extension option. The loan is pre-payable at the option of the borrower at any time. In November 2023, the borrower partially prepaid £8.0 million of the original loan amount.
The following chart describes the diversification of our investments in real estate debt by type based on fair value as of March 31, 2024:
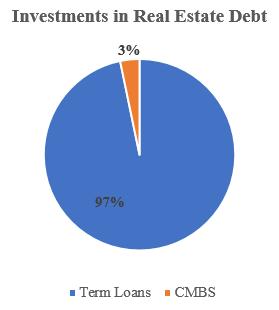
34
Lease Expirations
The following table details the expiring leases at our industrial, office and other properties by annualized base rent as of March 31, 2024. The table below excludes our multifamily, single-family rental and self-storage properties as substantially all leases at such properties expire within 12 months:($ in thousands)
|
| Industrial |
| Office |
| Other Properties |
| Total | ||||||||||||||||||||||||
Year |
| Annualized |
|
| % of Total |
| Annualized |
|
| % of Total |
| Annualized |
|
| % of Total |
| Annualized |
|
| % of Total | ||||||||||||
2024 (remaining) |
| $ |
| 16,992 |
|
|
| 5% |
| $ |
| 4,055 |
|
|
| 1% |
| $ |
| 1,444 |
|
|
| 0% |
| $ |
| 22,491 |
|
|
| 6% |
2025 |
|
|
| 23,671 |
|
|
| 7% |
|
|
| 8,824 |
|
|
| 3% |
|
|
| 2,145 |
|
|
| 1% |
|
|
| 34,640 |
|
|
| 11% |
2026 |
|
|
| 23,629 |
|
|
| 7% |
|
|
| 13,129 |
|
|
| 4% |
|
|
| 3,024 |
|
|
| 1% |
|
|
| 39,782 |
|
|
| 12% |
2027 |
|
|
| 26,625 |
|
|
| 8% |
|
|
| 13,906 |
|
|
| 4% |
|
|
| 1,939 |
|
|
| 1% |
|
|
| 42,470 |
|
|
| 13% |
2028 |
|
|
| 16,193 |
|
|
| 5% |
|
|
| 12,464 |
|
|
| 4% |
|
|
| 4,881 |
|
|
| 2% |
|
|
| 33,538 |
|
|
| 11% |
2029 |
|
|
| 12,422 |
|
|
| 4% |
|
|
| 7,512 |
|
|
| 2% |
|
|
| 2,884 |
|
|
| 1% |
|
|
| 22,818 |
|
|
| 7% |
2030 |
|
|
| 10,635 |
|
|
| 3% |
|
|
| 17,899 |
|
|
| 6% |
|
|
| 1,637 |
|
|
| 1% |
|
|
| 30,171 |
|
|
| 10% |
2031 |
|
|
| 3,739 |
|
|
| 1% |
|
|
| 23,027 |
|
|
| 7% |
|
|
| 1,775 |
|
|
| 1% |
|
|
| 28,541 |
|
|
| 9% |
2032 |
|
|
| 2,766 |
|
|
| 1% |
|
|
| 8,840 |
|
|
| 3% |
|
|
| 969 |
|
|
| 0% |
|
|
| 12,575 |
|
|
| 4% |
2033 |
|
|
| 8,313 |
|
|
| 3% |
|
|
| 28,579 |
|
|
| 9% |
|
|
| 2,271 |
|
|
| 1% |
|
|
| 39,163 |
|
|
| 13% |
Thereafter |
|
|
| 3,443 |
|
|
| 1% |
|
|
| 6,244 |
|
|
| 1% |
|
|
| 8,389 |
|
|
| 2% |
|
|
| 18,076 |
|
|
| 4% |
Total |
| $ |
| 148,428 |
|
|
| 45% |
| $ |
| 144,479 |
|
|
| 44% |
| $ |
| 31,358 |
|
|
| 11% |
| $ |
| 324,265 |
|
|
| 100% |
(1)
Annualized base rent is determined from the annualized base rent per leased square foot of the applicable year and excludes tenant recoveries, straight-line rent and above-market and below-market lease amortization.
35
Results of Operations
The following table sets forth information regarding our consolidated results of operations ($ in thousands):
|
| For the Three Months Ended March 31, |
|
| 2024 vs. 2023 |
| |||||||||
|
| 2024 |
|
| 2023 |
|
| $ |
| ||||||
Revenues |
|
|
|
|
|
|
|
|
|
|
|
| |||
Rental revenue |
| $ |
| 413,083 |
|
| $ |
| 431,000 |
|
| $ |
| (17,917 | ) |
Other revenue |
|
|
| 10,967 |
|
|
|
| 15,444 |
|
|
|
| (4,477 | ) |
Total revenues |
|
|
| 424,050 |
|
|
|
| 446,444 |
|
|
|
| (22,394 | ) |
Expenses |
|
|
|
|
|
|
|
|
|
|
|
| |||
Property operating |
|
|
| 179,657 |
|
|
|
| 189,651 |
|
|
|
| (9,994 | ) |
General and administrative |
|
|
| 12,492 |
|
|
|
| 10,569 |
|
|
|
| 1,923 |
|
Management fees |
|
|
| 31,996 |
|
|
|
| 42,181 |
|
|
|
| (10,185 | ) |
Performance participation allocation |
|
|
| — |
|
|
|
| — |
|
|
|
| — |
|
Impairment of investments in real estate |
|
|
| — |
|
|
|
| 79,846 |
|
|
|
| (79,846 | ) |
Depreciation and amortization |
|
|
| 186,398 |
|
|
|
| 200,434 |
|
|
|
| (14,036 | ) |
Total expenses |
|
|
| 410,543 |
|
|
|
| 522,681 |
|
|
|
| (112,138 | ) |
Other expense |
|
|
|
|
|
|
|
|
|
|
|
| |||
Loss from unconsolidated real estate ventures |
|
|
| (3,968 | ) |
|
|
| (3,089 | ) |
|
|
| (879 | ) |
Income from investments in real estate debt |
|
|
| 40,497 |
|
|
|
| 31,841 |
|
|
|
| 8,656 |
|
Net gain (loss) on dispositions of real estate |
|
|
| 2,083 |
|
|
|
| (423 | ) |
|
|
| 2,506 |
|
Interest expense |
|
|
| (154,033 | ) |
|
|
| (137,290 | ) |
|
|
| (16,743 | ) |
Other income (expense), net |
|
|
| 15,628 |
|
|
|
| (140,034 | ) |
|
|
| 155,662 |
|
Total other expense |
|
|
| (99,793 | ) |
|
|
| (248,995 | ) |
|
|
| 149,202 |
|
Net loss |
|
|
| (86,286 | ) |
|
|
| (325,232 | ) |
|
|
| 238,946 |
|
Net loss attributable to non-controlling interests in |
|
|
| 187 |
|
|
|
| 1,492 |
|
|
|
| (1,305 | ) |
Net loss attributable to non-controlling |
|
|
| 4,753 |
|
|
|
| 13,103 |
|
|
|
| (8,350 | ) |
Net loss attributable to stockholders |
| $ |
| (81,346 | ) |
| $ |
| (310,637 | ) |
| $ |
| 229,291 |
|
Revenues
Rental revenue primarily consists of base rent arising from tenant leases at our multifamily, single-family rental, industrial, office, self-storage and other properties. Rental revenue is recognized on a straight-line basis over the life of the lease, including any rent steps or abatement provisions. During the three months ended March 31, 2024 and 2023, rental revenue was $413.1 million and $431.0 million, respectively. The decrease in rental revenue was driven by the impact of asset sales during the year ended December 31, 2023, offset by an increase in average rental rates for multifamily and industrial assets for the three months ended March 31, 2024 compared to the three months ended March 31, 2023.
Other revenue primarily consists of revenue generated by our hospitality properties. Hospitality revenue consists primarily of room revenue. During the three months ended March 31, 2024 and 2023, other revenue was $11.0 million and $15.4 million, respectively, resulting in a year over year decrease of approximately $4.5 million driven by asset sales.
Expenses
Property operating expenses consist of the costs of ownership and operation of our real estate investments. Examples of property operating expenses include real estate taxes, insurance, utilities and repair and maintenance expenses. Property operating expenses also include general and administrative expenses unrelated to the operations of the properties. During the three months ended March 31, 2024 and 2023, property operating expenses were $179.7 million and $189.7 million, respectively. The decrease was driven primarily by asset sales during the year ended December 31, 2023.
General and administrative expenses are corporate-level expenses that relate mainly to our compliance and administration costs and consist primarily of legal fees, accounting fees, transfer agent fees and other professional fees. During the three months ended March 31, 2024, general and administrative expenses increased $1.9 million compared to the three months ended March 31, 2023 and was primarily driven by an increase in professional fees.
36
Management fees are earned by our Advisor for providing services pursuant to the Advisory Agreement. During the three months ended March 31, 2024 and 2023, management fees were $32.0 million and $42.2 million, respectively. The decrease was due to the reduction in our average NAV from March 31, 2023 to March 31, 2024.
Performance participation allocation relates to allocations from the Operating Partnership to the Special Limited Partner based on the total return of the Operating Partnership. Total return is defined as distributions paid or accrued plus the change in NAV. The performance participation allocation is measured annually and any amount earned by the Special Limited Partner becomes payable as of December 31 of the applicable year. During the three months ended March 31, 2024 and 2023, there was no performance participation allocation as the return hurdle was not achieved.
During the three months ended March 31, 2024, we did not recognize any impairments on our investments in real estate. During the three months ended March 31, 2023, we recognized an aggregate $79.8 million impairment charge on various single-family rental properties in the Condensed Consolidated Statements of Operations and Comprehensive Loss.
Depreciation and amortization expenses are impacted by the values assigned to buildings, personal property and in-place lease assets as part of the initial purchase price allocation. During the three months ended March 31, 2024 and 2023, depreciation and amortization expenses were $186.4 million and $200.4 million, respectively. The decrease in depreciation expense was driven by a reduction in investments in real estate, net as a result of asset sales during the year ended December 31, 2023.
Other Income (Expense), net
During the three months ended March 31, 2024 and 2023, income from investments in real estate debt was $40.5 million and $31.8 million, respectively, which consisted of interest income, realized losses, and unrealized gains and losses resulting from changes in the fair value of our real estate debt investments and related hedges. The increase was primarily driven by an increase in floating rate benchmark rates resulting in additional interest income on our term loans.
During the three months ended March 31, 2024, we recorded $2.1 million of net gains from the disposition of two hospitality properties and 27 single-family rental units. During the three months ended March 31, 2023, we recorded $0.4 million of net losses from the disposition of five single-family rental units.
During the three months ended March 31, 2024 and 2023, interest expense was $154.0 million and $137.3 million, respectively, which primarily consisted of interest expense incurred on our mortgage notes, credit facility, unsecured revolving credit facility and borrowings under our secured financings on investments in real estate debt. The increase was primarily driven by an increase in borrowings on our unsecured line of credit resulting in additional interest expense on our borrowings.
During the three months ended March 31, 2024 and 2023, other income (expense), net was $15.6 million and ($140.0) million, respectively. These results were primarily driven by unrealized gains relating to the changes in fair value of our interest rate caps and swaps of $11.3 million during the three months ended March 31, 2024 compared to unrealized losses relating to the changes in fair value of our interest rate caps and swaps of ($146.0) million during the three months ended March 31, 2023. The interest rate caps and swaps are used primarily to limit our interest rate payments on certain of our variable rate borrowings. For the three months ended March 31, 2023, these results were partially offset by realized gains on derivative instruments of $4.0 million and interest income on equity securities of $2.7 million.
Funds from Operations and Adjusted Funds from Operations
We believe funds from operations (“FFO”) is a meaningful supplemental non-GAAP operating metric. Our consolidated financial statements are presented under historical cost accounting which, among other things, requires depreciation of real estate investments to be calculated on a straight-line basis. As a result, our operating results imply that the value of our real estate investments will decrease evenly over a set time period. However, we believe that the value of real estate investments will change over time based on market conditions and as such, depreciation under historical cost accounting may be less informative. FFO is a standard REIT industry metric defined by the National Association of Real Estate Investment Trusts (“NAREIT”).
FFO, as defined by NAREIT and presented below, is calculated as net income or loss (computed in accordance with GAAP), excluding (i) gains or losses from sales of depreciable real property, (ii) impairment write-downs on depreciable real property, (iii) plus real
37
estate-related depreciation and amortization, (iv) net gains or losses from sales of real estate, and (v) similar adjustments for unconsolidated joint ventures.
We also believe that adjusted FFO (“AFFO”) is a meaningful supplemental non-GAAP disclosure of our operating results. AFFO further adjusts FFO in order for our operating results to reflect the specific characteristics of our business by adjusting for items we believe are not related to our core operations. Our adjustments to FFO to arrive at AFFO include removing the impact of (i) straight-line rental income and expense, (ii) deferred income amortization, (iii) amortization of above- and below-market lease intangibles, (iv) amortization of mortgage premium / discount, (v) unrealized gains or losses from changes in the fair value of real estate debt and other financial instruments, (vi) gains and losses resulting from foreign currency translations, (vii) amortization of restricted stock awards, (viii) non-cash performance participation allocation, even if repurchased by us, (ix) amortization of deferred financing costs, (x) gains or losses on extinguishment of debt, and (xi) similar adjustments for unconsolidated joint ventures. AFFO is not defined by NAREIT and our calculation of AFFO may not be comparable to disclosures made by other REITs.
The following table presents a reconciliation of FFO and AFFO to GAAP net loss attributable to stockholders ($ in thousands):
|
|
|
|
|
|
| ||
|
| For the Three Months Ended March 31, |
| |||||
|
| 2024 |
|
| 2023 |
| ||
Net loss attributable to stockholders |
| $ | (81,346 | ) |
| $ | (310,637 | ) |
Adjustments to arrive at FFO: |
|
|
|
|
|
| ||
Real estate depreciation and amortization |
|
| 186,398 |
|
|
| 200,434 |
|
Impairment of investments in real estate |
|
| — |
|
|
| 79,846 |
|
Investment in unconsolidated real estate ventures – depreciation and |
|
| 13,748 |
|
|
| 12,895 |
|
Net (gain) loss on dispositions of real estate |
|
| (2,083 | ) |
|
| 423 |
|
Amount attributable to non-controlling interests |
|
| (1,053 | ) |
|
| (1,238 | ) |
FFO attributable to stockholders |
|
| 115,664 |
|
|
| (18,277 | ) |
Adjustments to arrive at AFFO: |
|
|
|
|
|
| ||
Straight-line rental income and expense |
|
| (3,403 | ) |
|
| (3,612 | ) |
Deferred income amortization (1) |
|
| (5,436 | ) |
|
| (2,892 | ) |
Amortization of above- and below-market lease intangibles, net |
|
| (817 | ) |
|
| (1,039 | ) |
Unrealized (gains) losses from changes in the fair value of |
|
| (35,179 | ) |
|
| 150,420 |
|
Foreign currency loss |
|
| 20,295 |
|
|
| 306 |
|
Non-cash performance participation allocation |
|
| — |
|
|
| — |
|
Amortization of deferred financing costs |
|
| 6,392 |
|
|
| 7,123 |
|
Amortization of restricted stock awards |
|
| 210 |
|
|
| 210 |
|
Amount attributable to non-controlling interests |
|
| 191 |
|
|
| (1,067 | ) |
AFFO attributable to stockholders |
| $ | 97,917 |
|
| $ | 131,172 |
|
(1)
Includes the amortization of mortgage premium / discount.
FFO and AFFO should not be considered to be more relevant or accurate than the GAAP methodology in calculating net income (loss) or in evaluating our operating performance. In addition, FFO and AFFO should not be considered as alternatives to net income (loss) as indications of our performance or as alternatives to cash flows from operating activities as indications of our liquidity, but rather should be reviewed in conjunction with these and other GAAP measurements. Further, FFO and AFFO are not intended to be used as liquidity measures indicative of cash flow available to fund our cash needs, including our ability to make distributions to our stockholders.
Net Asset Value
Our board of directors, including a majority of our independent directors, has adopted valuation guidelines that contain a comprehensive set of methodologies to be used by the Advisor, our independent valuation advisor and third-party appraisal firms in connection with estimating the values of our assets and liabilities for purposes of our NAV calculation. These guidelines are designed to produce a fair and accurate estimate of the price that would be received for our investments in an arm’s-length transaction between a willing buyer and a willing seller in possession of all material information about our investments. Our independent valuation advisor reviews our valuation guidelines and methodologies related to investments in real property with the Advisor and our board of directors at least annually. From time to time, our board of directors, including a majority of our independent directors, may adopt changes to the
38
valuation guidelines if it (i) determines that such changes are likely to result in a more accurate reflection of NAV or a more efficient or less costly procedure for the determination of NAV without having a material adverse effect on the accuracy of such determination or (ii) otherwise reasonably believes a change is appropriate for the determination of NAV.
For more information on our NAV calculation and valuation guidelines, please refer to Item 5. “Market for Registrant’s Common Equity, Related Stockholder Matters and Issuer Purchases of Equity Securities” in our Annual Report on Form 10-K for the year ended December 31, 2023. Please also refer to Item 1A. “Risk Factors” in our Annual Report on Form 10-K for the year ended December 31, 2023, as supplemented, for additional disclosure relating to material trends or uncertainties that may impact our NAV and our business.
The following table provides a breakdown of the major components of our NAV as of March 31, 2024 ($ and shares/units in thousands):
Components of NAV |
| March 31, 2024 |
| |
Investments in real estate |
| $ | 22,437,036 |
|
Investments in real estate debt |
|
| 1,388,138 |
|
Cash and cash equivalents |
|
| 316,144 |
|
Restricted cash |
|
| 231,721 |
|
Other assets |
|
| 698,428 |
|
Debt obligations |
|
| (12,589,700 | ) |
Secured financings on investments in real estate debt |
|
| (738,384 | ) |
Subscriptions received in advance |
|
| (11,569 | ) |
Other liabilities |
|
| (1,606,179 | ) |
Performance participation accrual |
|
| — |
|
Management fee payable |
|
| (10,513 | ) |
Accrued stockholder servicing fees(1) |
|
| (3,353 | ) |
Non-controlling interests in consolidated joint ventures |
|
| (75,031 | ) |
Net asset value |
| $ | 10,036,738 |
|
Number of outstanding shares/units |
|
| 434,644 |
|
(1)
Stockholder servicing fees only apply to Class T, Class S, and Class D shares. For purposes of NAV, we recognize the stockholder servicing fee as a reduction of NAV on a monthly basis. Under GAAP, we accrue the full cost of the stockholder servicing fee as an offering cost at the time we sell Class T, Class S and Class D shares. As of March 31, 2024, we have accrued under GAAP $272.9 million of stockholder servicing fees payable to the Dealer Manager related to the Class T, Class S and Class D shares sold.
The following table provides a breakdown of our total NAV and NAV per share by share class as of March 31, 2024 ($ and shares/units in thousands, except per share/unit data):
NAV Per Share |
| Class S |
|
| Class T |
|
| Class D |
|
| Class I |
|
| Third-party |
|
| Total |
| ||||||
Net asset value |
| $ | 4,347,963 |
|
| $ | 120,330 |
|
| $ | 602,860 |
|
| $ | 4,503,300 |
|
| $ | 462,285 |
|
| $ | 10,036,738 |
|
Number of outstanding shares/units |
|
| 187,329 |
|
|
| 5,182 |
|
|
| 26,474 |
|
|
| 195,582 |
|
|
| 20,077 |
|
|
| 434,644 |
|
NAV Per Share/Unit as of March 31, 2024 |
| $ | 23.21 |
|
| $ | 23.22 |
|
| $ | 22.77 |
|
| $ | 23.03 |
|
| $ | 23.03 |
|
|
|
| |
(1)
Includes the Operating Partnership units held by the Special Limited Partner and other third parties.
Set forth below are the weighted averages of the key assumptions in the discounted cash flow methodology used in the March 31, 2024 valuations, based on property types. Once we own more than one single-family, one self-storage and one extended stay investment, we will include the key assumptions for the property types.
Property Type |
| Discount Rate |
| Exit Capitalization |
Multifamily |
| 6.8% |
| 5.5% |
Industrial |
| 7.2% |
| 5.6% |
Office |
| 7.9% |
| 6.6% |
Other |
| 8.2% |
| 6.8% |
For quarter-end months, these assumptions are determined by the independent valuation advisor or third party appraisers, as applicable, per the terms of our valuation guidelines. The Advisor reviews the assumptions from each of the appraisals. A change in these
39
assumptions would impact the calculation of the value of our property investments. For example, assuming all other factors remain unchanged, the changes listed below would result in the following effects on our investment values:
Input |
| Hypothetical |
| Multifamily |
| Industrial |
| Office |
| Other |
Discount Rate |
| 0.25% decrease |
| +1.9% |
| +2.0% |
| +1.9% |
| +1.9% |
(weighted average) |
| 0.25% increase |
| (1.9)% |
| (1.9)% |
| (1.9)% |
| (1.8)% |
Exit Capitalization Rate |
| 0.25% decrease |
| +2.9% |
| +3.0% |
| +2.4% |
| +2.2% |
(weighted average) |
| 0.25% increase |
| (2.7)% |
| (2.7)% |
| (2.2)% |
| (2.1)% |
The following table reconciles stockholders’ equity from our Condensed Consolidated Balance Sheet to our NAV ($ in thousands):
Reconciliation of Stockholders’ Equity to NAV |
| March 31, 2024 |
| ||
Total stockholders’ equity under GAAP |
| $ |
| 6,508,616 |
|
Redeemable non-controlling interests |
|
|
| 462,285 |
|
Total partners’ capital of Operating Partnership |
|
|
| 6,970,901 |
|
Adjustments: |
|
|
|
| |
Accrued stockholder servicing fee |
|
|
| 269,589 |
|
Advanced organization and offering costs and Advanced operating |
|
|
| 1,114 |
|
Unrealized net real estate and real estate debt appreciation |
|
|
| 332,426 |
|
Accumulated depreciation and amortization |
|
|
| 2,462,708 |
|
NAV |
| $ |
| 10,036,738 |
|
The following details the adjustments to reconcile stockholders’ equity to our NAV:
•
Accrued stockholder servicing fee represents the accrual for the full cost of the stockholder servicing fee for Class T, Class S and Class D shares. Under GAAP, we accrued the full cost of the stockholder servicing fee payable over the life of each share (assuming such share remains outstanding the length of time required to pay the maximum stockholder servicing fee) as an offering cost at the time we sold the Class T, Class S and Class D shares. Refer to Note 2 — “Summary of Significant Accounting Policies” to our consolidated financial statements in our Annual Report on Form 10-K for the year ended December 31, 2023, for further details of the GAAP treatment regarding the stockholder servicing fee. For purposes of NAV, we recognize the stockholder servicing fee as a reduction of NAV on a monthly basis.
•
The Advisor advanced organization and offering costs for our initial public offering (other than upfront selling commissions, dealer manager fees and stockholder servicing fees) on our behalf through December 21, 2019. Such costs are reimbursed to the Advisor pro rata over 60 months following December 21, 2019. Under GAAP, organization costs are expensed as incurred and offering costs are charged to equity as such amounts are incurred. For NAV, such costs are recognized as a reduction to NAV as they are reimbursed ratably over 60 months.
•
Our investments in real estate are presented under historical cost in our condensed consolidated financial statements. Additionally, our mortgage notes, credit facility, secured financings on investments in real estate debt and unsecured line of credit (“Debt”) are presented at their carrying value in our condensed consolidated financial statements. As such, any changes in the fair value of our Debt are not included in our GAAP results. For purposes of determining our NAV, our investments in real estate and our Debt are recorded at fair value.
•
We depreciate our investments in real estate and amortize certain other assets and liabilities in accordance with GAAP. Such depreciation and amortization is not recorded for purposes of determining our NAV.
40
Distributions
Since February 2019, we have declared monthly distributions for each class of our common stock, which are generally paid three days after month-end. Each class of our common stock received the same gross distribution per share, which was an aggregate of $0.3105 per share for the three months ended March 31, 2024. The net distribution varies for each class based on the applicable stockholder servicing fee, which is deducted from the gross distribution per share and paid to the Dealer Manager. The table below details the net distribution for each of our share classes for the three months ended March 31, 2024:
|
| Class T |
|
| Class S |
|
| Class D |
|
| Class I |
| ||||
|
| Shares |
|
| Shares |
|
| Shares |
|
| Shares |
| ||||
January 31, 2024 |
| $ | 0.0869 |
|
| $ | 0.0869 |
|
| $ | 0.0987 |
|
| $ | 0.1035 |
|
February 29, 2024 |
|
| 0.0880 |
|
|
| 0.0879 |
|
|
| 0.0990 |
|
|
| 0.1035 |
|
March 31, 2024 |
|
| 0.0868 |
|
|
| 0.0867 |
|
|
| 0.0987 |
|
|
| 0.1035 |
|
Total |
| $ | 0.2617 |
|
| $ | 0.2615 |
|
| $ | 0.2964 |
|
| $ | 0.3105 |
|
The following table summarizes our distributions declared during the three months ended March 31, 2024 and 2023 ($ in thousands):
| For the Three Months Ended |
|
| For the Three Months Ended |
|
| |||||||||||
| Amount |
|
| % |
|
| Amount |
|
| % |
|
| |||||
Distributions |
|
|
|
|
|
|
|
|
|
|
|
|
| ||||
Payable in cash |
| $ | 83,224 |
|
|
| 66 |
| % | $ | 97,241 |
|
|
| 66 |
| % |
Reinvested in shares |
|
| 43,793 |
|
|
| 34 |
| % |
| 50,239 |
|
|
| 34 |
| % |
Total distributions |
| $ | 127,017 |
|
|
| 100 |
| % | $ | 147,480 |
|
|
| 100 |
| % |
|
|
|
|
|
|
|
|
|
|
|
|
|
| ||||
Sources of Distributions |
|
|
|
|
|
|
|
|
|
|
|
|
| ||||
Cash flows from operating activities(1) |
| $ | 127,017 |
|
|
| 100 |
| % | $ | 147,480 |
|
|
| 100 |
| % |
Offering proceeds |
|
| — |
|
|
| — |
| % |
| — |
|
|
| — |
| % |
Total sources of distributions |
| $ | 127,017 |
|
|
| 100 |
| % | $ | 147,480 |
|
|
| 100 |
| % |
|
|
|
|
|
|
|
|
|
|
|
|
|
| ||||
Cash flows from operating activities |
| $ | 118,246 |
|
|
|
|
| $ | 148,148 |
|
|
|
|
| ||
Funds from operations |
| $ | 115,664 |
|
|
|
|
| $ | (18,277 | ) |
|
|
|
| ||
(1)
As of March 31, 2024, our inception to date cash flows from operating activities funded 100% of our distributions.
Liquidity and Capital Resources
From a liquidity perspective, we have approximately $0.7 billion of liquidity as of March 31, 2024, comprised of $0.3 billion of an undrawn unsecured Line of Credit, $0.3 billion of cash on hand, and approximately $45.2 million in investments in real estate-related debt securities that could be liquidated to satisfy any potential liquidity requirements.
Our primary needs for liquidity and capital resources are to fund our investments, to make distributions to our stockholders, to repurchase shares of our common stock pursuant to our share repurchase plan, to pay our offering and operating expenses and capital expenditures and to pay debt service on the outstanding indebtedness we incur. Our operating expenses include, among other things, fees and expenses related to managing our properties and other investments, the management fee we pay to the Advisor (to the extent the Advisor elects to receive the management fee in cash), the performance participation allocation that the Operating Partnership will pay to the Special Limited Partner (to the extent that the Special Limited Partner elects to receive the performance participation allocation in cash) and general corporate expenses.
Our cash needs for acquisitions and other investments will be funded primarily from the sale of shares of our common stock and through the assumption or incurrence of debt. For the three months ended March 31, 2024, we raised $0.1 billion of gross proceeds in our third public offering. Other potential future sources of capital include secured or unsecured financings from banks or other lenders and proceeds from the sale of assets and investments in real estate-related debt. If necessary, we may use financings or other sources of capital in the event of unforeseen significant capital expenditures. From inception through March 31, 2024, our distributions have been entirely funded from cash flow from operating activities. In addition, for the three months ended March 31, 2024, we have repurchased $0.5 billion in shares of our common stock under our share repurchase plan.
41
The following table is a summary of our indebtedness as of March 31, 2024 and December 31, 2023 ($ in thousands):
|
|
|
|
|
|
|
|
| Principal Balance Outstanding(3) |
| ||||||
Indebtedness |
| Weighted |
| Weighted |
| Maximum |
|
| March 31, |
|
| December 31, |
| |||
Fixed rate loans |
|
|
|
|
|
|
|
|
|
|
|
|
| |||
Fixed rate mortgages |
| 3.09% |
| March 2031 |
| N/A |
|
| $ | 3,018,053 |
|
| $ | 3,049,322 |
| |
Total fixed rate loans |
|
|
|
|
|
|
|
|
| 3,018,053 |
|
|
| 3,049,322 |
| |
Variable rate loans |
|
|
|
|
|
|
|
|
|
|
|
|
| |||
Floating rate mortgages |
| B + 1.83% |
| July 2027 |
| N/A |
|
|
| 9,863,917 |
|
|
| 9,893,894 |
| |
Variable rate credit facility(4) |
| B + 2.25% |
| December 2024 |
| $165,000 |
|
|
| 165,000 |
|
|
| 165,000 |
| |
Total variable rate loans |
|
|
|
|
|
|
|
|
| 10,028,917 |
|
|
| 10,058,894 |
| |
Total loans secured by the Company’s |
|
|
|
|
|
|
|
|
| 13,046,970 |
|
|
| 13,108,216 |
| |
|
|
|
|
|
|
|
|
|
|
|
|
|
| |||
Secured financings on investments in real estate debt |
| B + 2.73% |
| March 2027 |
| $ | 738,660 |
|
|
| 738,660 |
|
|
| 763,579 |
|
Unsecured Line of Credit(5) |
| B + 2.50% |
| May 2025 |
| $ | 1,550,000 |
|
|
| 1,225,000 |
|
|
| 907,500 |
|
Total Indebtedness |
|
|
|
|
|
|
|
| $ | 15,010,630 |
|
| $ | 14,779,295 |
| |
(1)
The symbol “B” refers to the relevant floating benchmark rates, which includes one-month SOFR, NYFED 30 day SOFR, three-month EURIBOR and three-month CIBOR, as applicable to each loan.
(2)
For loans where we, at our own discretion, have extension options, the maximum maturity date has been assumed.
(3)
The majority of our mortgages contain prepayment provisions including (but not limited to) lockout periods, yield or spread maintenance provisions and fixed penalties.
(4)
The repayment of the credit facility is guaranteed by the Operating Partnership.
(5)
The repayment of the Line of Credit facility is guaranteed by us.
During the period from April 1, 2024 through May 13, 2024, we raised an aggregate of $34.5 million in our third public offering and repurchased $312.5 million of common stock under our share repurchase plan. In April 2024, we received approximately $0.5 billion of repurchase requests. As per the terms of our share repurchase plan, we honored all repurchase requests for April 2024 on a pro rata basis up to the 2% monthly limitation. As such, approximately 37% of each stockholder’s April repurchase request was satisfied.
During the period from April 1, 2024 through May 13, 2024, we received $101.0 million of net borrowings from our unsecured line of credit.
During the period from April 1, 2024 through May 13, 2024, we received $0.2 billion of net proceeds from sales of investments in real estate debt.
In May 2024, we entered into an agreement to extend our Line of Credit for two years, at which time we may request an additional one-year extension thereafter. Interest under the Line of Credit is determined based on one-month U.S. dollar denominated SOFR plus 2.5%.
Cash Flows
The following table provides a breakdown of the net change in our cash and cash equivalents and restricted cash ($ in thousands):
| For the Three Months Ended |
| |||||||
| March 31, 2024 |
|
| March 31, 2023 |
| ||||
Cash flows provided by operating activities | $ |
| 118,246 |
|
| $ |
| 148,148 |
|
Cash flows provided by (used in) investing activities |
|
| 161,290 |
|
|
|
| (42,837 | ) |
Cash flows used in financing activities |
|
| (276,619 | ) |
|
|
| (422,755 | ) |
Effect of exchange rate changes |
|
| 4,313 |
|
|
|
| 303 |
|
Net increase (decrease) in cash and cash equivalents and restricted cash | $ |
| 7,230 |
|
| $ |
| (317,141 | ) |
Cash flows provided by operating activities decreased by approximately $29.9 million during the three months ended March 31, 2024 compared to the three months ended March 31, 2023. This decrease is primarily attributable to an increase in net interest expense during the period and a reduction in property operating income as a result of asset sales during the year ended December 31, 2023.
42
Cash flows from investing activities increased by approximately $0.2 billion during the three months ended March 31, 2024 compared to the three months ended March 31, 2023. The increase was primarily due to an increase of $0.2 billion in proceeds from dispositions of real estate investments and real estate debt securities.
Cash flows used in financing activities decreased by approximately $0.1 billion during the three months ended March 31, 2024 compared to the three months ended March 31, 2023. The decrease was primarily driven by a $0.2 billion decrease in repurchases of our common stock, offset by a $0.1 billion decrease in net proceeds from the issuance of our common stock.
Critical Accounting Policies
The preparation of the financial statements in accordance with GAAP involves significant judgments and assumptions and requires estimates about matters that are inherently uncertain. These judgments will affect our reported amounts of assets and liabilities and our disclosure of contingent assets and liabilities at the dates of the financial statements and the reported amounts of revenue and expenses during the reporting periods. With different estimates or assumptions, materially different amounts could be reported in our financial statements. We consider our accounting policies over investments in real estate and lease intangibles, investments in real estate debt, and revenue recognition to be our critical accounting policies. Refer to Note 2 — “Summary of Significant Accounting Policies” to our condensed consolidated financial statements in this Quarterly Report on Form 10-Q for further descriptions of such accounting policies.
Recent Accounting Pronouncements
See Note 2 — “Summary of Significant Accounting Policies” to our condensed consolidated financial statements in this Quarterly Report on Form 10-Q for a discussion concerning recent accounting pronouncements.
Off-Balance Sheet Arrangements
We have no existing off-balance sheet arrangements.
43
ITEM 3. QUANTITATIVE AND QUALITATIVE DISCLOSURES ABOUT MARKET RISK
Capital Market Risk
We are exposed to risks related to the equity capital markets and our related ability to raise capital through the issuance of our common stock. We are also exposed to risks related to the debt capital markets, and our related ability to finance our business through borrowings under mortgages, repurchase obligations or other debt instruments. As a REIT, we are required to distribute a significant portion of our taxable income annually, which constrains our ability to accumulate operating cash flow and therefore requires us to utilize debt or equity capital to finance our business.
The combination of supply chain and labor shortage concerns, rising financing costs, rising inflationary concerns, market volatility, capital market conditions, including economic impacts resulting from actual or perceived instability in the U.S. banking system, rising oil prices and other geopolitical risks arising from the outbreak of the Israel-Hamas war and the ongoing Russia-Ukraine war, have resulted in extreme volatility in a variety of global markets, including the real estate related debt markets. Recent bank failures and consolidations have contributed to volatility in global markets and resulted in diminished liquidity and credit availability in the market broadly. We have received and may in the future receive margin calls from our lenders as a result of the decline in the market value of assets pledged by us to our lenders under our secured financings on investments in real estate debt, and if we fail to resolve such margin calls when due by payment of cash or delivery of additional collateral, the lenders may exercise remedies including taking ownership of the assets securing the applicable obligations.
Interest Rate Risk
We are exposed to interest rate risk with respect to our variable-rate mortgage indebtedness, variable-rate credit facility, secured financings on investments in real estate debt and our unsecured line of credit, where an increase in interest rates would directly result in higher interest expense costs. We seek to manage our exposure to interest rate risk by utilizing a mix of fixed and floating rate financings with staggered maturities and through interest rate protection agreements to fix or cap a portion of our variable rate debt. As of March 31, 2024, the outstanding principal balance of our variable rate indebtedness was $12.0 billion.
Certain of our mortgage loans and secured financings on investments in real estate debt are variable rate and are indexed to the one-month SOFR or other benchmark rates. We have executed interest rate caps and swaps with an aggregate notional amount of $10.2 billion as of March 31, 2024 to hedge the risk of increasing interest rates. For the three months ended March 31, 2024, a 10 basis point increase in the SOFR or other benchmark rates would have resulted in an increase in interest expense of $0.2 million, net of the impact of our interest rate caps and swaps.
Foreign Currency Risk
We intend to hedge our currency exposures in a prudent manner to the extent it is cost effective to do so. However, our currency hedging strategies may not eliminate all of our currency risk due to, among other things, uncertainties in the timing and/or amount of payments received on the related investments, and/or unequal, inaccurate, or unavailable hedges to perfectly offset changes in future exchange rates. Additionally, we may be required under certain circumstances to collateralize our currency hedges for the benefit of the hedge counterparty, which could adversely affect our liquidity.
Consistent with our strategy of hedging foreign currency exposure on certain investments, we typically enter into a series of foreign currency forward contracts to fix the U.S. dollar amount of foreign currency denominated cash flows (interest income, rental income, principal payments and net sales proceeds after the repayment of debt) we expect to receive from our foreign currency denominated investments.
Investments in Real Estate Debt
As of March 31, 2024, we held $1.4 billion of investments in real estate debt. Certain of our investments in real estate debt are floating rate and indexed to various benchmark rates and as such, are exposed to interest rate risk. Our net income will increase or decrease depending on interest rate movements. While we cannot predict factors that may or may not affect interest rates, for the three months ended March 31, 2024, a 10 basis point increase or decrease in the various benchmark rates would have resulted in an increase or decrease to income from investments in real estate debt of $0.3 million.
We may also be exposed to market risk with respect to our investments in real estate debt due to changes in the fair value of our investments. We seek to manage our exposure to market risk with respect to our investments in real estate debt by making investments in securities backed by different types of collateral and varying credit ratings. The fair value of our investments may fluctuate, thus the amount we will realize upon any sale of our investments is unknown. As of March 31, 2024, the fair value at which we may sell our investments in real estate debt is not known, but a 10% change in the fair value of our investments in real estate debt may result in an unrealized gain or loss of $138.8 million.
44
ITEM 4. CONTROLS AND PROCEDURES
Evaluation of Disclosure Controls and Procedures
An evaluation of the effectiveness of the design and operation of our “disclosure controls and procedures” (as defined in Rule 13a-15(e) under the Exchange Act), as of the end of the period covered by this Quarterly Report on Form 10-Q was made under the supervision and with the participation of our management, including our Chief Executive Officer (“CEO”) and Chief Financial Officer (“CFO”). Based upon this evaluation, our CEO and CFO have concluded that our disclosure controls and procedures (i) are effective to ensure that information required to be disclosed by us in reports filed or submitted under the Exchange Act is recorded, processed, summarized and reported within the time periods specified by the SEC rules and forms and (ii) include, without limitation, controls and procedures designed to ensure that information required to be disclosed by us in reports filed or submitted under the Exchange Act is accumulated and communicated to our management, including our CEO and CFO, as appropriate to allow timely decisions regarding required disclosure.
Changes in Internal Controls over Financial Reporting
There have been no changes in our “internal control over financial reporting” (as defined in Rule 13a-15(f) of the Exchange Act) that occurred during the period covered by this Quarterly Report on Form 10-Q that have materially affected, or are reasonably likely to materially affect, our internal control over financial reporting.
45
PART II. OTHER INFORMATION
ITEM 1. LEGAL PROCEEDINGS
From time to time, we may be involved in various claims and legal actions arising in the ordinary course of business. As of March 31, 2024, we were not involved in any material legal proceedings.
ITEM 1A. RISK FACTORS
Except as set forth below, there have been no material changes to the risk factors previously disclosed under Item 1A. of our Annual Report on Form 10-K for the year ended December 31, 2023.
Non-U.S. holders may be required to file U.S. federal income tax returns and pay U.S. federal income tax upon their disposition of shares of our common stock or upon their receipt of certain distributions from us.
In addition to any potential withholding tax on ordinary dividends, a non-U.S. holder other than a “qualified shareholder” or a “qualified foreign pension fund,” as each is defined for purposes of the Code, that disposes of a “United States real property interest” (“USRPI”) (which includes shares of stock of a U.S. corporation whose assets consist principally of USRPIs), is generally subject to U.S. federal income tax under the Foreign Investment in Real Property Tax Act of 1980, as amended (“FIRPTA”), on the gain from such disposition. FIRPTA gains must be reported on U.S. federal income tax returns and are taxable at regular U.S. federal income tax rates. Such tax does not apply, however, to the gain on disposition of stock in a REIT that is “domestically controlled.” Generally, a REIT is domestically controlled if less than 50% of its stock, by value, has been owned directly or indirectly by non-U.S. persons during a continuous five-year period ending on the date of disposition or, if shorter, during the entire period of the REIT’s existence. We cannot assure our stockholders that we will qualify as or that we will remain a domestically controlled REIT. Final Treasury regulations effective April 25, 2024 (the “Final Regulations”) modify the existing prior tax guidance relating to the manner in which we determine whether we are a domestically controlled REIT. These regulations provide a look through rule for our stockholders that are non-publicly traded partnerships, non-public REITs, non-public regulated investment companies or domestic C corporations owned more than 50% or more directly or indirectly by foreign persons (“foreign-controlled domestic corporations”) treat “qualified foreign pension funds” as foreign persons. The look-through rule in the Final Regulations applicable to foreign-controlled domestic corporations will not apply to a REIT for a period of up to ten years if the REIT is able to satisfy certain requirements during that time, including not undergoing a significant change in its ownership and not acquiring a significant amount of new U.S. real property interests, in each case since April 24, 2024, the date the Final Regulations were issued. If a REIT fails to satisfy such requirements during the ten-year period, the look-through rule in the Final Regulations applicable to foreign-controlled domestic corporations will apply to such REIT beginning on the day immediately following the date of such failure. While we cannot predict when we will commence being subject to such look-through rule in the Final Regulations, we may not be able to satisfy the applicable requirements for the duration of the ten-year period. Prospective investors are urged to consult with their tax advisors regarding the application and impact of these rules.
Even if we are domestically controlled, a non-U.S. holder, other than a “qualified shareholder” or a “qualified foreign pension fund” that receives a distribution from a REIT attributable to gains from the disposition of a USRPI as described above, including in connection with a repurchase of our common stock, is generally subject to U.S. federal income tax under FIRPTA to the extent such distribution is attributable to gains from such disposition, regardless of whether the difference between the fair market value and the tax basis of the USRPI giving rise to such gains is attributable to periods prior to or during such non-U.S. holder’s ownership of our common stock unless the relevant class of stock is regularly traded on an established securities market in the United States and such non-U.S. holder did not own more than 10% of such class at any time during the one-year period ending on the date of such distribution. In addition, a repurchase of our common stock, to the extent not treated as a sale or exchange, may be subject to withholding as an ordinary dividend.
We seek to act in the best interests of our company as a whole and not in consideration of the particular tax consequences to any specific holder of our stock. Potential non-U.S. holders should inform themselves as to the U.S. tax consequences, and the tax consequences within the countries of their citizenship, residence, domicile, and place of business, with respect to the purchase, ownership and disposition of shares of our common stock.
We may be subject to adverse legislative or regulatory tax changes that could increase our tax liability, reduce our operating flexibility and reduce our NAV.
In recent years, numerous legislative, judicial and administrative changes have been made in the provisions of U.S. federal income tax laws applicable to investments similar to an investment in shares of our common stock. The Tax Cuts and Jobs Act, enacted in December 2017, resulted in fundamental changes to the Code with many of the changes applicable to individuals applying only through
46
December 31, 2025. Among the numerous changes included in the Tax Cuts and Jobs Act is a deduction of up to 20% of qualified REIT dividends for non-corporate U.S. taxpayers for taxable years beginning before January 1, 2026. Further changes to the tax laws are possible. In particular, the federal income taxation of REITs may be modified, possibly with retroactive effect, by legislative, administrative or judicial action at any time.
In addition, as of January 1, 2024, we and our subsidiaries, in principle, would be subject to the Organization for Economic Cooperation and Development (OECD) Global Anti-Base Erosion Rules (more commonly referred to as the “Pillar 2 Rules”) as promulgated by certain non-U.S. jurisdictions. The Pillar 2 Rules can potentially lead to additional taxes (“Top-Up Tax”) when the effective tax rate (as defined by the Pillar 2 Rules) in a jurisdiction is below 15%. The Pillar 2 Rules, however, do not apply to “Excluded Entities” and certain subsidiaries of Excluded Entities. We are currently analyzing our qualification as an Excluded Entity as a “Real Estate Investment Vehicle.” In the event we do not qualify as a Real Estate Investment Vehicle, Top-Up Taxes may apply beginning in fiscal year 2026 on our United States income and may be material. Safe harbor exceptions are expected to apply for the majority of our non-United States income, and for those entities that do not meet certain safe harbor tests, the impact to us as a whole is expected to be immaterial. It is noted that the Pillar 2 Rules are still yet to be implemented in most of the jurisdictions in which we operate. Developments will be monitored as guidance and local implementation progresses.
We cannot assure stockholders that any such changes will not adversely affect the taxation of our stockholders. Any such changes could have an adverse effect on an investment in our shares or on the market value or the resale potential of our assets. Stockholders are urged to consult with their tax advisors with respect to the impact of these legislative changes on their investment in our shares and the status of legislative, regulatory or administrative developments and proposals and their potential effect on an investment in our shares. Although REITs generally receive certain tax advantages compared to entities taxed as regular corporations, it is possible that future legislation would result in a REIT having fewer tax advantages, and it could become more advantageous for a company that invests in real estate to elect to be treated for U.S. federal income tax purposes as a “C” corporation rather than a REIT. As a result, our charter authorizes our board of directors to revoke or otherwise terminate our REIT election, without the approval of our stockholders, if it determines that changes to U.S. federal income tax laws and regulations or other considerations mean it is no longer in our best interests to qualify as a REIT.
ITEM 2. UNREGISTERED SALES OF EQUITY SECURITIES AND USE OF PROCEEDS
Unregistered Sales of Equity Securities
Except as described below, during the three months ended March 31, 2024, we did not sell any equity securities that were not registered under the Securities Act. As described in Note 12 – “Related Party Transactions” to our condensed consolidated financial statements in this Quarterly Report on Form 10-Q, the Advisor is entitled to a management fee payable monthly in cash, shares of common stock, or units of the Operating Partnership, in each case at the Advisor’s election. For the three months ended March 31, 2024, the Advisor elected to receive its management fees in Class I shares and we issued an aggregate of 933,093 unregistered Class I shares to the Advisor in satisfaction of the management fee for January 2024 and February 2024. Additionally, we issued 456,577 unregistered Class I shares to the Advisor in April 2024 in satisfaction of the March 2024 management fee. The shares were issued at the applicable NAV per share at the end of each month for which the fee was earned. Each issuance to the Advisor was made pursuant to Section 4(a)(2) of the Securities Act.
Share Repurchase Plan
We have adopted a share repurchase plan, whereby on a monthly basis, stockholders may request that we repurchase all or any portion of their shares. We may choose to repurchase all, some or none of the shares that have been requested to be repurchased at the end of any particular month, in our discretion, subject to any limitations in the share repurchase plan.
The total amount of aggregate repurchases of Class T, Class S, Class D, and Class I shares (excluding any early repurchase deduction) is limited to 2% of the aggregate NAV per month (measured using the aggregate NAV attributable to stockholders as of the end of the immediately preceding month) and 5% of the aggregate NAV per calendar quarter (measured using the aggregate NAV attributable to stockholders as of the end of the immediately preceding quarter).
Shares are repurchased at a price equal to the transaction price on the applicable repurchase date, subject to any early repurchase deduction. Shares that have not been outstanding for at least one year are repurchased at 95% of the transaction price. Due to the illiquid nature of investments in real estate, we may not have sufficient liquid resources to fund repurchase requests and may elect not to repurchase some or all of the shares submitted for repurchase in a given period. Further, we may make exceptions to, modify or suspend the share repurchase plan. Our board of directors may also determine to terminate our share repurchase plan if required by
47
applicable law or in connection with a transaction in which our stockholders receive liquidity for their shares of our common stock, such as a sale or merger of our company or listing of our shares on a national securities exchange.
If the transaction price for the applicable month is not made available by the tenth business day prior to the last business day of the month (or is changed after such date), then no repurchase requests will be accepted for such month and stockholders who wish to have their shares repurchased the following month must resubmit their repurchase requests.
During the three months ended March 31, 2024, we repurchased shares of our common stock in the following amounts:
|
|
|
|
|
|
|
| Total Number of |
|
| Maximum Number of |
| ||||
|
|
|
|
|
|
|
| Shares Repurchased |
|
| Shares That May Yet |
| ||||
|
| Total Number |
|
| Average |
|
| as Part of Publicly |
|
| Be Repurchased Pursuant to |
| ||||
|
| of Shares |
|
| Price Paid |
|
| Announced Plans |
|
| Publicly Announced |
| ||||
Month of: |
| Repurchased (1) |
|
| per Share |
|
| or Programs |
|
| Plans or Programs (2) |
| ||||
January 2024(2) |
|
| 4,979,027 |
|
| $ | 23.89 |
|
|
| 4,979,027 |
|
|
| — |
|
February 2024(2) |
|
| 8,631,056 |
|
|
| 22.87 |
|
|
| 8,631,056 |
|
|
| — |
|
March 2024(2) |
|
| 8,558,280 |
|
|
| 22.95 |
|
|
| 8,558,280 |
|
|
| — |
|
Total |
|
| 22,168,363 |
|
| $ | 23.13 |
|
|
| 22,168,363 |
|
|
| — |
|
(1)
Repurchases are limited under the share repurchase plan as described above, which was first announced in December 2017. Under the share repurchase plan, we were authorized to repurchase up to an aggregate of $494.8 million of Class T, Class S, Class D and Class I shares based on our December 31, 2023 NAV in the first quarter of 2024. Pursuant to the share repurchase plan, this amount resets at the beginning of each quarter. Shares repurchased were submitted by our stockholders in the prior month and honored in the current month.
(2)
In January 2024, we received approximately $415 million of repurchase requests. As per the terms of our share repurchase plan, we honored all repurchase requests for January 2024 on a pro rata basis up to the 2% monthly limitation. As such, 48% of each stockholder’s repurchase request was satisfied in January 2024. In February 2024, we received $488 million of repurchase requests. As per the terms of our share repurchase plan, we honored all repurchase requests for February 2024 on a pro rata basis up to the 2% monthly limitation. As such, 40% of each stockholder’s repurchase request was satisfied in February 2024. In March 2024, we received $408 million of repurchase requests. As per the terms of our share repurchase plan, we honored all repurchase requests for March 2024 on a pro rata basis up to the 5% quarterly limitation resulting in 1.0% of December 31, 2023 NAV being honored. As such, 24% of each stockholder’s share repurchase requests were satisfied in March 2024. In accordance with our share repurchase plan, on March 31, 2024, we repurchased all of the shares from stockholders that held less than $500 in shares of our common stock and, as such, we exceeded the 5% quarterly limitation by $85,350, as authorized by our board of directors.
ITEM 3. DEFAULTS UPON SENIOR SECURITIES
None.
ITEM 4. MINE SAFETY DISCLOSURES
Not applicable.
ITEM 5. OTHER INFORMATION
Not applicable.
48
ITEM 6. EXHIBITS
Exhibit Number |
| Description |
|
|
|
3.1 |
| |
|
|
|
3.2 |
| |
|
|
|
3.3 |
| |
|
|
|
3.4 |
| |
|
|
|
31.1* |
| Certification of Chief Executive Officer pursuant to Section 302 of the Sarbanes-Oxley Act of 2002 |
|
|
|
31.2* |
| Certification of Chief Financial Officer pursuant to Section 302 of the Sarbanes-Oxley Act of 2002 |
|
|
|
32.1** |
| Certification of Chief Executive Officer pursuant to 18 U.S.C. Section 1350, as adopted pursuant to Section 906 of the Sarbanes-Oxley Act of 2002 |
|
|
|
32.2** |
| Certification of Chief Financial Officer pursuant to 18 U.S.C. Section 1350, as adopted pursuant to Section 906 of the Sarbanes-Oxley Act of 2002 |
|
|
|
101 |
| The following information from the Company’s Quarterly Report on Form 10-Q for the quarter ended March 31, 2024, formatted in iXBRL (inline eXtensible Business Reporting Language): (i) Condensed Consolidated Balance Sheets; (ii) Condensed Consolidated Statements of Operations and Comprehensive Loss (iii) Condensed Consolidated Statements of Changes in Equity; and (iv) Condensed Consolidated Statements of Cash Flows |
|
|
|
104 |
| Cover Page Interactive Data File (embedded within the Inline XBRL document) |
* Filed herewith
** Furnished herewith
The agreements and other documents filed as exhibits to this report are not intended to provide factual information or other disclosure other than with respect to the terms of the agreements or other documents themselves, and you should not rely on them for that purpose. In particular, any representations and warranties made by us in these agreements or other documents were made solely within the specific context of the relevant agreement or document and may not describe the actual state of affairs as of the date they were made or at any other time.
49
SIGNATURES
Pursuant to the requirements of Section 13 or Section 15(d) of the Securities Exchange Act of 1934, the Registrant has duly caused this report to be signed on its behalf by the undersigned, thereunto duly authorized.
STARWOOD REAL ESTATE INCOME TRUST, INC.
May 13, 2024 |
| /s/ Sean Harris |
Date |
| Sean Harris |
|
| Chief Executive Officer, President, and Director (Principal Executive Officer) |
|
|
|
May 13, 2024 |
| /s/ Chris Lowthert |
Date |
| Chris Lowthert |
|
| Chief Financial Officer and Treasurer (Principal Financial Officer and Principal Accounting Officer) |
50