As filed with the U.S. Securities and Exchange Commission on August 9, 2018
UNITED STATES
SECURITIES AND EXCHANGE COMMISSION
Washington, D.C. 20549
FORM N-CSR
CERTIFIED SHAREHOLDER REPORT OF REGISTERED
MANAGEMENT INVESTMENT COMPANIES
Investment Company Act file number 811-23293
The Cushing MLP Infrastructure Fund
(Exact name of registrant as specified in charter)
8117 Preston Road, Suite 440, Dallas, TX 75225
(Address of principal executive offices) (Zip code)
Jerry V. Swank
8117 Preston Road, Suite 440, Dallas, TX 75225
(Name and address of agent for service)
214-692-6334
Registrant’s telephone number, including area code
Date of fiscal year end: November 30
Date of reporting period: May 31, 2018
Item 1. Reports to Stockholders.

Table of Contents
Must be preceded or accompanied by a prospectus.
The Cushing® MLP Infrastructure Fund
Shareholder Letter
Dear Fellow Shareholder,
For the six month fiscal period ended May 31, 2018 (the “period”), the Cushing® MLP Infrastructure Fund (Class I Shares) delivered a 6.50% total return, versus total returns of 3.16% and 5.71% for the S&P 500 Index (Total Return) and the Alerian MLP Index (Total Return) (“AMZ”), respectively.
Industry Overview and Themes
The fundamentals for the midstream industry continued to generally improve during the period—this included positive earnings reports along with constructive forward guidance, higher commodity prices and wider basis differentials (supportive of marketing-based activities and infrastructure development), increased throughput, several new project announcements, and additional corporate restructuring / simplification steps taken to help balance sheets, distribution coverage, and cost of capital.
Fund performance during the period overcame heightened broader market volatility as well as the surprise negative announcement by the Federal Energy Regulatory Commission (“FERC”) to eliminate the income tax allowance (“ITA”) in determining pipeline tariffs under a cost of service mechanism. The FERC’s decision on the morning of March 15, 2018 caught investors off guard and fueled widespread selling in the midstream sector with natural gas transportation and storage companies (those most exposed) taking the brunt of losses. The decision led to some companies announcing merger/simplification transactions and other restructuring considerations.
Fund Performance and Strategy
At the subsector level, the Fund benefited from overweight exposure to holdings in the Large Cap Diversified C-Corps and MLP General Partners (“GP”) subsectors. Portfolio holdings in the Large Cap Diversified C-Corps subsector benefitted from their stable and majority fee-based cash flows, predominantly investment grade ratings and ability to capitalize on positive midstream fundamentals across their interconnected asset footprints.
On a relative basis, the Fund benefitted from no exposure to holdings in the Natural Gas Transportation & Storage subsector during the period, which was the worst performing subsector as a result of the surprise negative announcement by the FERC mentioned earlier.
The Fund experienced negative performance from holdings in the Shipping GP and Utility subsectors. Performance in these two subsectors was only slightly negative and was largely the result of certain disappointing earnings announcements during the period.
The top three contributors to the Fund’s absolute performance during the period were all Large Cap Diversified C-Corps. The top contributors in order of greatest contribution to least were: 1) Cheniere Energy, Inc. (NYSE: LNG); 2) ONEOK, Inc. (NYSE: OKE); and 3) Plains GP Holdings, LP (NYSE: PAGP). During the period, LNG benefitted from continued strength in global LNG prices and the expected development of an additional LNG liquefaction train (Corpus Christi Train 3). OKE benefitted from the announcement of several new projects totaling $3.7 billion, the largest of which is a greenfield natural gas liquids (“NGL”) pipeline out of the Bakken (Elk Creek) for $1.4 billion at attractive projected returns. PAGP benefitted from the continued rapid rise of Permian crude oil production, widening Permian differentials and the announcement of the $1.1 billion Cactus II crude oil pipeline expansion. Additionally, the company continued to show improving balance sheet and coverage metrics.
1
The bottom three contributors to performance during the period were also Large Cap Diversified C-Corps. In order of the most negative to least negative performance, were: 1) Enbridge, Inc. (NYSE: ENB); 2) TransCanada Corp. (NYSE: TRP); and 3) Williams Companies, Inc. (NYSE: WMB) The weak performance for all three companies was largely attributable the perceived negative implications of the FERC ITA decision on its underlying MLPs, including Enbridge Energy Partners, LP (NYSE: EEP), Spectra Energy Partners, LP (NYSE: SEP), TC Pipelines, LP (NYSE: TCP) and Williams Partners, LP (NYSE: WPZ). Post the FERC decision, each of these companies announced its intention to consolidate into its C-Corp. parent.
During the period, the Fund exited its position in Phillips 66 Partners, LP (NYSE: PSXP), and established a position Noble Midstream Partners, LP (NYSE: NBLX).
At the end of the reporting period, the three largest subsector exposures, in order of size, were: 1) Large Cap Diversified C-Corps; 2) MLP General Partners; and 3) Large Cap Diversified MLPs.
In conclusion, even though midstream energy sector performance and sentiment remained challenged during the period, we maintain a positive outlook given our expectation for improving hydrocarbon volumes, relatively attractive sector valuations and recovering global crude oil supply / demand fundamentals. We remain confident that North American shale basins will be developed over time and that midstream infrastructure will be well utilized given the need to move production to market.
We truly appreciate your support and look forward to continuing to help you achieve your investment goals.
Sincerely,

Jerry V. Swank
Chairman, Chief Executive Officer and President
The information provided herein represents the opinion of the Fund’s portfolio managers and is not intended to be a forecast of future events, a guarantee of future results, nor investment advice. The opinions expressed are as of the date of this report and are subject to change.
The information in this report is not a complete analysis of every aspect of any market, sector, industry, security or the Fund itself. Statements of fact are from sources considered reliable, but the Fund makes no representation or warranty as to their completeness or accuracy. Discussions of specific investments are for illustration only and are not intended as recommendations of individual investments.
Past performance does not guarantee future results. An investment in the Fund involves risks. The Fund will invest in energy companies, including Master Limited Partnerships (MLPs), which concentrate investments in the natural resources sector. Energy companies are subject to certain risks, including, but not limited to the following: fluctuations in the prices of commodities; the highly cyclical nature of the natural resources sector may adversely affect the earnings or operating cash flows of the companies in which the Fund will invest; a significant decrease in the production of energy commodities could reduce the revenue, operating income, operating cash flows of MLPs and other natural resources sector companies and, therefore, their ability to make distributions or pay dividends and a sustained decline in demand for energy commodities could adversely affect the revenues and cash flows of energy companies. Holders of MLP units are subject to certain risks inherent in the structure of MLPs, including tax risks; the limited ability to elect or remove management or the general partner or managing member; limited voting rights and conflicts of interest between the general partner or managing member and its affiliates, on the one hand, and the limited partners or members, on the other hand. Damage to facilities and infrastructure of MLPs may significantly affect the value of an investment and may incur environmental costs and liabilities due to the nature of their business. Investors in MLP funds incur management fees from underlying MLP investments. Small- and mid-cap stocks are often more volatile and less liquid than large-cap stocks. Smaller companies generally face higher risks due to their limited product lines, markets, and financial resources. Funds that invest in bonds are subject to interest-rate risk and can lose principal value when interest rates rise. Bonds are also subject to credit risk, in which the bond issuer may fail to pay interest and principal in a timely manner. High yield securities have speculative characteristics and present a greater risk of loss than higher quality debt securities. These securities can also be subject to greater price volatility. An investment in the Fund will
2
involve tax risks, including, but not limited to: The portion, if any, of a distribution received by the Fund as the holder of an MLP equity security that is offset by the MLP’s tax deductions or losses generally will be treated as a return of capital to the extent of the Fund’s tax basis in the MLP equity security, which will cause income or gain to be higher, or losses to be lower, upon the sale of the MLP security by the Fund. Changes in tax laws, regulations or interpretations of those laws or regulations in the future could adversely affect the Fund or the energy companies in which the Fund will invest.
The potential tax benefits from investing in MLPs depend on them being treated as partnerships for federal income tax purposes. If the MLP is deemed to be a corporation then its income would be subject to federal taxation at the entity level, reducing the amount of cash available for distribution to the Fund which could result in a reduction of the Fund’s value.
Fund holdings and sector allocations are subject to change at any time and are not recommendations to buy or sell any security. Please refer to the Schedule of Investments for a complete list of Fund holdings.
The S&P 500 Index is an unmanaged index of common stocks that is frequently used as a general measure of stock market performance. The Alerian MLP Index is a capitalization-weighted index of prominent energy master limited partnerships. Neither index includes fees or expenses. It is not possible to invest directly in an index.
3
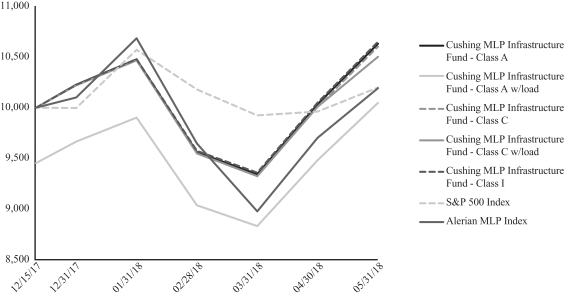
Hypothetical Growth of a $10,000 Investment (Unaudited)
| | | | | | | | | | | | | | | | |
AVERAGE ANNUAL RETURNS | |
May 31, 2018 | | 1 Year | | | 5 Year | | | Since
Inception | | | Inception
Date | |
Class A (without sales load) | | | n/a | | | | n/a | | | | 6.15 | % | | | 12/15/17 | |
Class A (with sales load) | | | n/a | | | | n/a | | | | 0.33 | % | | | 12/15/17 | |
| | | | |
Class C | | | n/a | | | | n/a | | | | 5.74 | % | | | 12/15/17 | |
Class C (with MDSC) | | | n/a | | | | n/a | | | | 4.74 | % | | | 12/15/17 | |
| | | | |
Class I | | | n/a | | | | n/a | | | | 6.30 | % | | | 12/15/17 | |
| | | | |
S&P 500 Index | | | 14.37 | % | | | 13.42 | % | | | 2.62 | % | | | 12/15/17 | |
Alerian MLP Index | | | -4.58 | % | | | -4.09 | % | | | 0.36 | % | | | 12/15/17 | |
Performance data quoted represents past performance; past performance does not guarantee future results. The investment return and principal value of an investment will fluctuate so that an investor’s shares, when redeemed, may be worth more or less than their original cost. Current performance of the Fund may be lower or higher than the performance quoted. Performance data current to the most recent month end may be obtained by calling 888-878-4080 or by visiting www.cushingfunds.com.
Class A (with sales load) performance reflects the maximum sales charge of 5.75%. Class C (with MDSC) performance reflects the 1.00% maximum deferred sales charge. Class I is not subject to a sales charge or MDSC.
The S&P 500 Index is a broad based unmanaged index of 500 stocks, which is widely recognized as representative of the equity market in general. You cannot invest directly in an index.
The Alerian MLP Index is a capitalization-weighted index of the 50 most prominent energy Master Limited Partnerships. You cannot invest directly in an index.
The graph and table do not reflect the deduction of taxes that a shareholder would pay on Fund distributions or the redemption of the Fund shares.
4
The Cushing® MLP Infrastructure Fund
Expense Example (Unaudited)
The example below is intended to describe the fees and expenses borne by shareholders during the period from December 18, 2017, to May 31, 2018, and the impact of those costs on your investment.
Example
As a shareholder of the Fund, you incur two types of costs: (1) transaction costs, including exchange fees and sales charges (loads) on purchases (as applicable), and (2) ongoing costs, including management fees, distribution and/or service (12b-1) fees, and other Fund expenses (as applicable). This example is intended to help you understand your ongoing costs (in dollars) of investing in the Fund and to compare these costs with the ongoing costs of investing in other mutual funds. The example is based on an investment of $1,000 made at the beginning of the period and held for the entire period from December 18, 2017, to May 31, 2018.
This example illustrates your Fund’s ongoing costs in two ways:
Actual Expenses
The second and third data columns in the table below provide information about actual account values and actual expenses. You may use the information in these columns, together with the amount you invested, to estimate the expenses that you paid during the period ended May 31, 2018. Simply divide your account value by $1,000 (for example, an $8,600 account value divided by
$1,000 = 8.6), then multiply the result by the number under the heading entitled “Expenses Paid During Period” to estimate the expenses you paid on your account during this period.
Hypothetical Example for Comparison Purposes
The fourth and fifth data columns in the table below provide information about hypothetical account values and hypothetical expenses based on the Fund’s actual expense ratio and an assumed rate of return of 5% per year before expenses, which is not the Fund’s actual return. The hypothetical account values and expenses may not be used to estimate the actual ending account balances or expenses you paid for the six-month period shown. You may use this information to compare the ongoing costs of investing in the Fund with the ongoing costs of investing in other mutual funds. To do so, compare this 5% hypothetical example with the 5% hypothetical examples that appear in the shareholder reports of the other Funds.
Please note that the expenses shown in the table are meant to highlight your ongoing costs only and do not reflect any transactional costs, such as exchange fees or sales charges (loads). Therefore, the fourth and fifth data columns of the table are useful in comparing ongoing costs only and will not help you determine the relative total costs of owning different funds. In addition, if these transactional costs were included, your costs would have been higher.
| | | | | | | | | | | | | | | | | | | | | | | | |
| Share Class | | Beginning
Account Value 12/18/17 | | | Ending
Account Value (Based
on Actual
Returns and
Expenses)
5/31/18 | | | Expenses
Paid During
Period1 | | | Ending Account
Value (Based on
Hypothetical 5%
Annualized
Return and
Actual Expenses) 5/31/18 | | | Expenses Paid During Period1 | | | Net Expense
Ratio During
Period2 | |
| | | | | | |
Class A Shares | | $ | 1,000.00 | | | $ | 1,063.00 | | | $ | 9.47 | | | $ | 1,013.43 | | | $ | 9.24 | | | | 2.03 | % |
Class C Shares | | $ | 1,000.00 | | | $ | 1,060.00 | | | $ | 12.53 | | | $ | 1,010.44 | | | $ | 12.22 | | | | 2.69 | % |
Class I Shares | | $ | 1,000.00 | | | $ | 1,065.00 | | | $ | 7.42 | | | $ | 1,015.42 | | | $ | 7.24 | | | | 1.59 | % |
| 1 | Expenses are equal to the Fund’s annualized expense ratio of each class multiplied by the average account value over the period, divided by 365 and multiplied by 165 (to reflect the period). The table above represents the actual expenses incurred during the period. |
| 2 | Expenses are equal to the Fund’s annualized expense ratio to reflect the period. |
5
The Cushing® MLP Infrastructure Fund
Allocation of Portfolio Assets (Unaudited)
May 31, 2018
(Expressed as a Percentage of Total Investments)
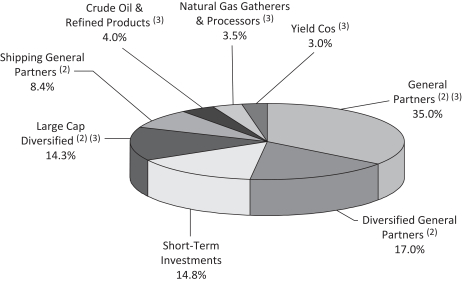
| (1) | Fund holdings and sector allocations are subject to change and there is no assurance that the Fund will continue to hold any particular security. |
| (3) | Master Limited Partnerships and Related Companies |
6
The Cushing® MLP Infrastructure Fund
Schedule of Investments (Unaudited) | May 31, 2018 |
| | | | | | | | |
| Common Stock — 57.6% | | Shares | | | Fair Value | |
| Diversified General Partners — 19.0% | | | | | | |
| Canada — 7.7% | | | | | | |
Enbridge, Inc. | | | 64,400 | | | $ | 2,000,908 | |
Transcanada Corporation | | | 72,500 | | | | 3,032,675 | |
| United States — 11.3% | | | | | | |
Marathon Petroleum Corporation | | | 30,300 | | | | 2,394,609 | |
Phillips 66 | | | 17,200 | | | | 2,003,628 | |
SemGroup Corporation | | | 120,300 | | | | 3,043,590 | |
| | | | | | | | |
| | | | | | | 12,475,410 | |
| | | | | | | | |
| General Partners — 23.5% | | | | | | |
| United States — 23.5% | | | | | | |
EnLink Midstream LLC | | | 222,600 | | | | 3,895,500 | |
ONEOK, Inc. | | | 60,700 | | | | 4,137,312 | |
Targa Resources Corporation | | | 77,700 | | | | 3,778,551 | |
Williams Companies, Inc. | | | 134,500 | | | | 3,612,670 | |
| | | | | | | | |
| | | | | | | 15,424,033 | |
| | | | | | | | |
| Large Cap Diversified — 5.8% | | | | | | |
| United States — 5.8% | | | | | | |
Kinder Morgan, Inc. | | | 229,600 | | | | 3,829,728 | |
| | | | | | | | |
| | |
| Shipping General Partners — 9.3% | | | | | | |
| United States — 9.3% | | | | | | |
Cheniere Energy, Inc.(1) | | | 59,600 | | | | 3,970,552 | |
Golar LNG Ltd. | | | 84,300 | | | | 2,190,114 | |
| | | | | | | | |
Total Common Stock (Cost $35,778,429) | | | | | | $ | 37,889,837 | |
| | | | | | | | |
Master Limited Partnerships and Related Companies — 37.6% | | | | | | |
| Crude Oil & Refined Products — 4.5% | | | | | | |
| United States — 4.5% | | | | | | |
MPLX, L.P. | | | 82,600 | | | $ | 2,966,166 | |
| | | | | | | | |
| | | | | | | 2,966,166 | |
| | | | | | | | |
| General Partners — 15.8% | | | | | | |
| United States — 15.8% | | | | | | |
Antero Midstream GP, L.P. | | | 199,200 | | | | 3,834,600 | |
Energy Transfer Equity, L.P. | | | 171,400 | | | | 2,961,792 | |
Plains GP Holdings, L.P. | | | 145,500 | | | | 3,574,935 | |
| | | | | | | | |
| | | | | | | 10,371,327 | |
| | | | | | | | |
| Large Cap Diversified — 10.1% | | | | | | |
| United States — 10.1% | | | | | | |
Energy Transfer Partners, L.P. | | | 147,700 | | | | 2,804,823 | |
Enterprise Products Partners, L.P. | | | 134,000 | | | | 3,872,600 | |
| | | | | | | | |
| | | | | | | 6,677,423 | |
| | | | | | | | |
| Natural Gas Gatherers & Processors — 3.9% | | | | | | |
| United States — 3.9% | | | | | | |
DCP Midstream Partners, L.P. | | | 31,600 | | | | 1,324,356 | |
Noble Midstream Partners, L.P. | | | 24,400 | | | | 1,258,308 | |
| | | | | | | | |
| | | | | | | 2,582,664 | |
| | | | | | | | |
| Yield Cos — 3.3% | | | | | | |
| United States — 3.3% | | | | | | |
Nextera Energy Partners, L.P. | | | 48,700 | | | | 2,189,552 | |
| | | | | | | | |
Total Master Limited Partnerships and Related Companies (Cost $22,250,413) | | | | | | $ | 24,787,132 | |
| | | | | | | | |
See Accompanying Notes to the Financial Statements.
7
The Cushing® MLP Infrastructure Fund
Schedule of Investments (Unaudited) | May 31, 2018 — (Continued) |
| | | | | | | | |
Short-Term Investments — Investment Companies — 16.6% | | Shares | | | Fair Value | |
| United States — 16.6% | | | | | | |
Fidelity Government Portfolio Fund — Institutional Class, 1.64%(2) | | | 2,732,000 | | | $ | 2,732,000 | |
First American Prime Obligations Fund — Class Z, 1.60%(2) | | | 2,731,999 | | | | 2,731,999 | |
Invesco Short-Term Government & Agency Portfolio — Institutional Class, 1.64%(2) | | | 2,731,999 | | | | 2,731,999 | |
Morgan Stanley Institutional Liquidity Funds Government Portfolio — Institutional Class, 1.66%(2) | | | 2,731,999 | | | | 2,731,999 | |
| | | | | | | | |
Total Short-Term Investments (Cost $10,927,997) | | | | | | $ | 10,927,997 | |
| | | | | | | | |
Total Investments — 111.8% (Cost $68,956,839) | | | | | | $ | 73,604,966 | |
Liabilities in Excess of Other Assets — (11.8)% | | | | | | | (7,788,340 | ) |
| | | | | | | | |
Total Net Assets Applicable to Unitholders — 100.0% | | | | | | $ | 65,816,626 | |
| | | | | | | | |
| (1) | No distribution or dividend was made during the period ended May 31, 2018. As such, it is classified as a non-income producing security as of May 31, 2018. |
| (2) | Rate reported is the current yield as of May 31, 2018. |
See Accompanying Notes to the Financial Statements.
8
The Cushing® MLP Infrastructure Fund
Statement of Assets & Liabilities (Unaudited)
May 31, 2018
| | | | |
Assets | | | | |
Investments at fair value (cost $68,956,839) | | $ | 73,604,966 | |
Receivable from Adviser | | | 13,432 | |
Interest receivable | | | 2,365 | |
Dividends receivable | | | 44,381 | |
Prepaid expenses | | | 20,008 | |
Other assets | | | 4,772 | |
| | | | |
Total assets | | | 73,689,924 | |
| | | | |
Liabilities | | | | |
Payable to Adviser | | | 46,742 | |
Payable for investments purchased | | | 7,725,500 | |
Payable for 12b-1 distribution fee | | | 7 | |
Payable to Trustees | | | 2,028 | |
Accrued expenses and other liabilities | | | 99,021 | |
| | | | |
Total liabilities | | | 7,873,298 | |
| | | | |
Net assets | | $ | 65,816,626 | |
| | | | |
Net Assets Consist of | | | | |
Additional paid-in capital | | $ | 23,001,715 | |
Undistributed net investment income | | | 38,081,769 | |
Accumulated realized gain | | | 85,364 | |
Net unrealized appreciation on investments | | | 4,647,778 | |
| | | | |
Net assets | | $ | 65,816,626 | |
| | | | |
| | | | | | | | | | | | |
Unlimited shares authorized, no par value | | Class A | | | Class C | | | Class I | |
Net assets | | $ | 1,063 | | | $ | 1,060 | | | $ | 65,814,503 | |
Shares issued and outstanding | | | 51 | | | | 51 | | | | 3,162,231 | |
Net asset value, redemption price and minimum offering price per share | | $ | 20.78 | | | $ | 20.72 | | | $ | 20.81 | |
See Accompanying Notes to the Financial Statements.
9
The Cushing® MLP Infrastructure Fund
Statement of Operations (Unaudited)
Period from December 18, 2017(1) through May 31, 2018
| | | | |
Investment Income | | | | |
Distributions and dividends received | | $ | 979,591 | |
Less: return of capital on distributions | | | (607,272 | ) |
| | | | |
Distribution and dividend income | | | 372,319 | |
Interest income | | | 13,282 | |
| | | | |
Total Investment Income | | | 385,601 | |
| | | | |
Expenses | | | | |
Advisory fees | | | 182,854 | |
Professional fees | | | 41,070 | |
Fund accounting fees | | | 31,930 | |
Administrator fees | | | 30,526 | |
Other expenses | | | 29,170 | |
Transfer agent expense | | | 28,665 | |
Trustees’ fees | | | 19,034 | |
Reports to shareholders | | | 4,801 | |
Insurance expense | | | 3,825 | |
Custodian fees and expenses | | | 2,808 | |
Registration fees | | | 1,416 | |
12b-1 distribution fee — Class C | | | 5 | |
12b-1 distribution fee — Class A | | | 2 | |
| | | | |
Total Expenses | | | 376,106 | |
| | | | |
Less: expense reimbursement by Adviser | | | (108,983 | ) |
| | | | |
Net Expenses | | | 267,123 | |
| | | | |
Net Investment Income | | | 118,478 | |
| | | | |
Realized and Unrealized Gain on Investments | | | | |
Net realized gain on investments | | | 85,364 | |
Net change in unrealized appreciation on investments | | | 4,647,778 | |
| | | | |
Net Realized and Unrealized Gain on Investments | | | 4,733,142 | |
| | | | |
Increase in Net Assets Applicable to Shareholders Resulting from Operations | | $ | 4,851,620 | |
| | | | |
| (1) | Commencement of operations |
See Accompanying Notes to the Financial Statements.
10
The Cushing® MLP Infrastructure Fund
Statements of Changes in Net Assets
| | | | |
| | | Period From
December 18, 2017(1)
through
May 31, 2018 | |
| | | (Unaudited) | |
Operations | | | | |
Net investment income | | $ | 118,478 | |
Net realized gain on investments | | | 85,364 | |
Net change in unrealized appreciation on investments | | | 4,647,778 | |
| | | | |
Net increase in net assets resulting from operations | | | 4,851,620 | |
| | | | |
Dividends and Distributions to Class A Shareholders | | | | |
Net investment income | | | (1 | ) |
Return of capital | | | (22 | ) |
Dividends and Distributions to Class C Shareholders | | | | |
Net investment income | | | (1 | ) |
Return of capital | | | (22 | ) |
Dividends and Distributions to Class I Shareholders | | | | |
Net investment income | | | (57,436 | ) |
Return of capital | | | (1,378,455 | ) |
| | | | |
Total dividends and distributions to Fund shareholders | | | (1,435,937 | ) |
| | | | |
Capital Share Transactions | | | | |
Proceeds from shareholder subscriptions | | | 38,658,260 | |
Dividend reinvestments | | | 912,149 | |
Payments for redemptions | | | (15,190,195 | ) |
| | | | |
Net increase in net assets from capital share transactions | | | 24,380,214 | |
| | | | |
Total increase in net assets | | | 27,795,897 | |
Net Assets | | | | |
Beginning of period | | | 38,020,729 | |
| | | | |
End of period | | $ | 65,816,626 | |
| | | | |
Undistributed net investment income at the end of the period | | $ | 38,081,769 | |
| | | | |
| (1) | Commencement of operations |
See Accompanying Notes to the Financial Statements.
11
The Cushing® MLP Infrastructure Fund
Financial Highlights
| | | | |
Class A Shares | | Period From
December 18,
2017(1)
through
May 31, 2018 | |
| | | (Unaudited) | |
Per Common Share Data(2) | | | | |
Net Asset Value, beginning of period | | $ | 20.00 | |
Income from Investment Operations: | | | | |
Net investment income(3) | | | 0.02 | |
Net realized and unrealized gain (loss) on investments | | | 1.22 | |
| | | | |
Total increase (decrease) from investment operations | | | 1.24 | |
| | | | |
Less Distributions to Common Stockholders: | | | | |
Net investment income | | | (0.02 | ) |
Return of capital | | | (0.44 | ) |
| | | | |
Total distributions to common stockholders | | | (0.46 | ) |
| | | | |
Net Asset Value, end of period | | $ | 20.78 | |
| | | | |
Total Investment Return Based on Fair Value(4) | | | 6.30 | % |
| | | | |
Supplemental Data and Ratios | | | | |
Net assets applicable to common stockholders, end of period (000’s) | | $ | 1 | |
Ratio of expenses to average net assets before waiver | | | 2.68 | % |
Ratio of expenses to average net assets after waiver | | | 1.75 | % |
Ratio of net investment income (loss) to average net assets before waiver | | | (0.38 | )% |
Ratio of net investment income (loss) to average net assets after waiver | | | 0.27 | % |
Portfolio turnover rate(5) | | | 46.92 | %(4) |
| (1) | Commencement of operations. |
| (2) | Information presented relates to a Class A share outstanding for the entire period. |
| (3) | Calculated using average shares outstanding method. |
| (5) | Portfolio turnover is calculated on the basis of the fund as a whole. |
See Accompanying Notes to the Financial Statements.
12
The Cushing® MLP Infrastructure Fund
Financial Highlights — (Continued)
| | | | |
Class C Shares | | Period From
December 18,
2017(1)
through
May 31, 2018 | |
| | | (Unaudited) | |
Per Common Share Data(2) | | | | |
Net Asset Value, beginning of period | | $ | 20.00 | |
Income from Investment Operations: | | | | |
Net investment income(3) | | | (0.04 | ) |
Net realized and unrealized gain (loss) on investments | | | 1.22 | |
| | | | |
Total increase (decrease) from investment operations | | | 1.18 | |
| | | | |
Less Distributions to Common Stockholders: | | | | |
Net investment income | | | (0.02 | ) |
Return of capital | | | (0.44 | ) |
| | | | |
Total distributions to common stockholders | | | (0.46 | ) |
| | | | |
Net Asset Value, end of period | | $ | 20.72 | |
| | | | |
Total Investment Return Based on Fair Value(4) | | | 6.00 | % |
| | | | |
Supplemental Data and Ratios | | | | |
Net assets applicable to common stockholders, end of period (000’s) | | $ | 1 | |
Ratio of expenses to average net assets before waiver | | | 3.34 | % |
Ratio of expenses to average net assets after waiver | | | 2.50 | % |
Ratio of net investment income (loss) to average net assets before waiver | | | (1.04 | )% |
Ratio of net investment income (loss) to average net assets after waiver | | | (0.39 | )% |
Portfolio turnover rate(5) | | | 46.92 | %(4) |
| (1) | Commencement of operations. |
| (2) | Information presented relates to a Class C share outstanding for the entire period. |
| (3) | Calculated using average shares outstanding method. |
| (5) | Portfolio turnover is calculated on the basis of the fund as a whole. |
See Accompanying Notes to the Financial Statements.
13
The Cushing® MLP Infrastructure Fund
Financial Highlights — (Continued)
| | | | |
Class I Shares | | Period From
December 18,
2017(1)
through
May 31, 2018 | |
| | | (Unaudited) | |
Per Common Share Data(2) | | | | |
Net Asset Value, beginning of period | | $ | 20.00 | |
Income from Investment Operations: | | | | |
Net investment income(3) | | | 0.06 | |
Net realized and unrealized gain (loss) on investments | | | 1.21 | |
| | | | |
Total increase (decrease) from investment operations | | | 1.27 | |
| | | | |
Less Distributions to Common Stockholders: | | | | |
Net investment income | | | (0.02 | ) |
Return of capital | | | (0.44 | ) |
| | | | |
Total distributions to common stockholders | | | (0.46 | ) |
| | | | |
Net Asset Value, end of period | | $ | 20.81 | |
| | | | |
Total Investment Return Based on Fair Value(4) | | | 6.50 | % |
| | | | |
Supplemental Data and Ratios | | | | |
Net assets applicable to common stockholders, end of period (000’s) | | $ | 65,815 | |
Ratio of expenses to average net assets before waiver | | | 2.24 | % |
Ratio of expenses to average net assets after waiver | | | 1.50 | % |
Ratio of net investment income (loss) to average net assets before waiver | | | 0.06 | % |
Ratio of net investment income (loss) to average net assets after waiver | | | 0.71 | % |
Portfolio turnover rate(5) | | | 46.92 | %(4) |
| (1) | Commencement of operations. |
| (2) | Information presented relates to a Class I share outstanding for the entire period. |
| (3) | Calculated using average shares outstanding method. |
| (5) | Portfolio turnover is calculated on the basis of the fund as a whole. |
See Accompanying Notes to the Financial Statements.
14
The Cushing® MLP Infrastructure Fund
Notes to Financial Statements (Unaudited)
May 31, 2018
1. Organization
The Cushing® MLP Infrastructure Fund (the “Fund”), a series of the Cushing Funds Trust, (the “Trust”) was formed as a Delaware statutory trust on September 12, 2017, and is registered as a non-diversified, open-end management investment company under the Investment Company Act of 1940, as amended. The Fund is managed by Cushing® Asset Management, LP (“Adviser”). The Fund’s investment objective is to seek current income and capital appreciation. The Fund commenced operations on December 18, 2017 following the completion of The Cushing MLP Infrastructure Fund I (the “Predecessor Fund”) with and into the Fund. The Predecessor Fund commenced operations on March 1, 2010.
The Fund offers three classes of shares, Class A, Class C, and Class I. Class A shares are subject to a maximum 5.50% front-end sales charge. Class C shares have no front-end sales charge, but are subject to a 1.00% contingent deferred sales charge within 12 months of redemption. Class I shares have no sales charge. Class A shareholders pay Rule 12b-1 fees at an annual rate of 0.25% of average daily net assets. Class C shareholders pay Rule 12b-1 fees at an annual rate of 1.00% of average daily net assets.
2. Significant Accounting Policies
A. Use of Estimates
The following is a summary of significant accounting policies, consistently followed by the Fund in preparation of the financial statements. The Fund is considered an investment company and accordingly, follows the investment company accounting and reporting guidance of the Financial Accounting Standards Board Accounting Standard Codification Topic 946, Financial Services - Investment Companies, which is part of U.S. Generally Accepted Accounting Principles (“U.S. GAAP”).
The preparation of financial statements in conformity with U.S. GAAP requires management to make estimates and assumptions that affect the reported amount of assets and liabilities, recognition of distribution income and disclosure of contingent assets and liabilities at the date of the financial statements. Actual results could differ from those estimates.
B. Investment Valuation
The Fund uses the following valuation methods to determine fair value as either fair value for investments for which market quotations are available, or if not available, the fair value, as determined in good faith pursuant to such policies and procedures as may be approved by the Fund’s Board of Trustees (“Board of Trustees”) from time to time. The valuation of the portfolio securities of the Fund currently includes the following processes:
(i) The market value of each security listed or traded on any recognized securities exchange or automated quotation system will be the last reported sale price at the relevant valuation date on the composite tape or on the principal exchange on which such security is traded except those listed on the NASDAQ Global Market®, NASDAQ Global Select Market® and the NASDAQ Capital Market® exchanges (collectively, “NASDAQ”). Securities traded on NASDAQ will be valued at the NASDAQ official closing price. If no sale is reported on that date, the closing price from the prior day may be used.
(ii) Listed options on debt securities are valued at the last sale price, or if there are no trades for the day, the mean of the bid price and the ask price. Unlisted options on debt or equity securities
15
are valued based upon their composite bid prices if held long, or their composite ask prices if held short. Futures are valued at the settlement price. Premiums for the sale of options written by the Fund will be included in the assets of the Fund, and the market value of such options will be included as a liability.
(iii) The Fund’s non-marketable investments will generally be valued in such manner as the Adviser determines in good faith to reflect their fair values under procedures established by, and under the general supervision and responsibility of, the Board of Trustees. The pricing of all assets that are fair valued in this manner will be subsequently reported to and ratified by the Board of Trustees.
C. Security Transactions, Investment Income and Expenses
Security transactions are accounted for on the date the securities are purchased or sold (trade date). Realized gains and losses are reported on a specific identified cost basis. Interest income is recognized on an accrual basis, including amortization of premiums and accretion of discounts. Distributions and dividends (collectively, referred to as “Distributions”) are recorded on the ex-dividend date. Distributions received from the Fund’s investments in master limited partnerships (“MLPs”) generally are comprised of ordinary income, capital gains and return of capital. The Fund records investment income on the ex-date of the Distributions. For financial statement purposes, the Fund uses return of capital and income estimates to allocate the Distribution income received. Such estimates are based on historical information available from each MLP and other industry sources. These estimates may subsequently be revised based on information received from the MLPs after their tax reporting periods are concluded, as the actual character of these Distributions is not known until after the fiscal year end of the Fund.
The Fund estimates the allocation of investment income and return of capital for the Distributions received from its portfolio investments within the Statement of Operations. For the period ended May 31, 2018, the Fund has estimated approximately 62% of the Distributions from its portfolio investments to be return of capital.
Expenses are recorded on an accrual basis.
D. Distributions to Stockholders
Distributions to common stockholders are recorded on the ex-dividend date. The character of Distributions to common stockholders made during the period may differ from their ultimate characterization for federal income tax purposes. For the period ended May 31, 2018, the Fund’s Distributions were expected to be 96% return of capital. For Federal income tax purposes, Distributions of short-term capital gains are treated as ordinary income distributions. In addition, on an annual basis, the Fund may distribute additional capital gains in the last calendar quarter, if necessary, to meet minimum distribution requirements and thus avoid being subject to excise taxes. The final character of Distributions paid for the period ended May 31, 2018 will be determined in early 2019.
E. Federal Income Taxation
The Fund intends to qualify each year for special tax treatment afforded to a regulated investment company (“RIC”) under Subchapter M of the Internal Revenue Code of 1986, as amended (“IRC”). In order to qualify as a RIC, the Fund must, among other things, satisfy income, asset diversification and distribution requirements. As long as it so qualifies, the Fund will not be subject to U.S. federal income tax to the extent that it distributes annually its investment company taxable income (which includes ordinary income and the excess of net short-term capital gain over net long-term capital loss) and its “net capital gain” (i.e., the excess of net long-term capital gain over net short-term capital loss). The Fund intends to distribute at least annually substantially all of such income and gain. If the Fund retains any investment company taxable income or net capital gain, it will be subject to U.S. federal income tax on the retained amount at regular corporate tax rates. In addition, if the Fund fails to qualify as a
16
RIC for any taxable year, it will be subject to U.S. federal income tax on all of its income and gains at regular corporate tax rates.
The Fund recognizes in the financial statements the impact of a tax position, if that position is more-likely-than-not to be sustained on examination by the taxing authorities, based on the technical merits of the position. Tax benefits resulting from such a position are measured as the amount that has a greater than fifty percent likelihood on a cumulative basis to be sustained on examination.
F. Cash and Cash Equivalents
The Fund considers all highly liquid investments purchased with initial maturity equal to or less than three months to be cash equivalents.
G. Cash Flow Information
The Fund makes Distributions from investments, which include the amount received as cash distributions from MLPs, common stock dividends and interest payments. These activities are reported in the Statement of Changes in Net Assets.
H. Indemnification
Under the Fund’s organizational documents, its officers and trustees are indemnified against certain liabilities arising out of the performance of their duties to the Fund. In addition, in the normal course of business, the Fund may enter into contracts that provide general indemnification to other parties. The Fund’s maximum exposure under such indemnification arrangements is unknown, as this would involve future claims that may be made against the Fund that have not yet occurred, and may not occur. However, the Fund has not had prior claims or losses pursuant to these contracts and expects the risk of loss to be remote.
3. Concentrations of Risk
The Fund, under normal market conditions, invests at least 80% of its assets (net assets plus any borrowings for investment purposes) in a portfolio of master limited partnerships (“MLPs”) and MLP-related investments (together, “MLP investments”) operating in the energy and energy infrastructure sectors. Therefore, the Fund may be subject to more risks than if they were more broadly diversified over numerous industries and sectors of the economy. General changes in market sentiment towards companies in the sectors in which they invest may adversely affect the Fund, and the performance of such sectors may lag behind the broader market as a whole.
The Fund is also subject to MLP structure risk. Holders of MLP units are subject to certain risks inherent in the structure of MLPs, including (i) tax risks, (ii) the limited ability to elect or remove management or the general partner or managing member, (iii) limited voting rights, except with respect to extraordinary transactions, and (iv) conflicts of interest between the general partner or managing member and its affiliates, on the one hand, and the limited partners or members, on the other hand, including those arising from incentive distribution payments or corporate opportunities.
4. Agreements and Related Party Transactions
The Fund has entered into an Investment Management Agreement with the Adviser (the “Agreement”). Under the terms of the Agreement, the Fund has agreed to pay the Adviser a fee payable at the end of each calendar month, at an annual rate equal to 1.00% of the average daily net assets of the Fund. The Adviser earned $182,854 in advisory fees for the period ended May 31, 2018.
The Investment Adviser has agreed to waive or reimburse the Fund for certain Fund operating expenses, such that total annual Fund operating expenses (exclusive of management fees and any front-end load, deferred sales charge, 12b-l fees, taxes, brokerage commissions, expenses incurred in connection with any merger or reorganization, acquired fund fees and expenses, or extraordinary expenses
17
such as litigation) will not exceed 0.50% for each of Class A Shares, Class C Shares and Class I Shares, subject to possible recoupment from the Fund in future years on a rolling three year basis (within the three years after the date that such expenses have been waived or reimbursed); provided, however, that such recoupment will not cause the Fund’s expense ratio to exceed the lesser of the expense cap in effect at the time of the waiver or the expense cap in effect at the time of recoupment. Such waiver or reimbursement may not be terminated without the consent of the Board of Trustees before December 18, 2019, and may be modified or terminated by the Investment Adviser at any time thereafter.
The Fund has engaged U.S. Bancorp Fund Services, LLC to serve as the Fund’s administrator. The Fund pays the administrator a monthly fee computed at an annual rate of 0.06% of the first $250,000,000 of the Fund’s average daily net assets, 0.05% on the next $250,000,000 of average daily net assets and 0.04% on the balance of the Fund’s average daily net assets, with a minimum annual fee of $30,000, and multiple class fee of $15,000 per additional share class.
U.S. Bancorp Fund Services, LLC serves as the Fund’s transfer agent, dividend paying agent, and agent for the automatic dividend reinvestment plan.
U.S. Bank, N.A. serves as the Fund’s custodian. The Fund pays the custodian a monthly fee computed at an annual rate of 0.004% of the Fund’s average daily market value, with a minimum annual fee of $4,800.
Fees paid to trustees for their services to the Fund are reflected as Trustees’ fees on the Statement of Operations.
5. Income Taxes
It is the Fund’s intention to continue to qualify as a RIC under Subchapter M of the IRC and distribute all of its taxable income. Accordingly, no provision for federal income taxes is required in its financial statements.
The amount and character of income and capital gain distributions to be paid, if any, are determined in accordance with federal income tax regulations, which may differ from U.S. generally accepted accounting principles. These differences are primarily due to differences in the timing of recognition of gains or losses on investments. Permanent book and tax basis differences, if any, may result in reclassifications to undistributed net investment income (loss), undistributed net realized gain (loss), and additional paid-in capital.
6. Fair Value Measurements
Various inputs that are used in determining the fair value of the Fund’s investments are summarized in the three broad levels listed below:
| | • | | Level 1 — quoted prices in active markets for identical securities |
| | • | | Level 2 — other significant observable inputs (including quoted prices for similar securities, interest rates, prepayment speeds, credit risk, etc.) |
| | • | | Level 3 — significant unobservable inputs (including the Fund’s own assumptions in determining the fair value of investments) |
The inputs or methodology used for valuing securities are not necessarily an indication of the risk associated with investing in those securities.
18
These inputs are summarized in the three broad levels listed below.
| | | | | | | | | | | | | | | | |
| | | | | | Fair Value Measurements at Reporting Date Using | |
Description | | Fair Value as of
May 31, 2018 | | | Quoted Prices in
Active Markets for
Identical Assets
(Level 1) | | | Significant Other
Observable
Inputs
(Level 2) | | | Significant
Unobservable
Inputs
(Level 3) | |
Assets | | | | | | | | | | | | | | | | |
Equity Securities | | | | | | | | | | | | | | | | |
Common Stock(a) | | $ | 37,889,837 | | | $ | 37,889,837 | | | $ | — | | | $ | — | |
Master Limited Partnerships and Related Companies(a) | | | 24,787,132 | | | | 24,787,132 | | | | — | | | | — | |
| | | | | | | | | | | | | | | | |
Total Equity Securities | | | 62,676,969 | | | | 62,676,969 | | | | — | | | | — | |
| | | | | | | | | | | | | | | | |
Other | | | | | | | | | | | | | | | | |
Short-Term Investments — Investment Companies(a) | | | 10,927,997 | | | | 10,927,997 | | | | — | | | | — | |
| | | | | | | | | | | | | | | | |
Total Assets | | $ | 73,604,966 | | | $ | 73,604,966 | | | $ | — | | | $ | — | |
| | | | | | | | | | | | | | | | |
| (a) | All other industry classifications are identified in the Schedule of Investments. The Fund did not hold Level 2 or Level 3 investments at any time during the period ended May 31, 2018. |
Transfers into and out of each level are measured at fair value as of the end of the fiscal year. There were no transfers between any levels during the period ended May 31, 2018.
7. Investment Transactions
For the period ended May 31, 2018, the Fund purchased (at cost) and sold securities (proceeds) in the amount of $75,720,593 and $17,173,054 (excluding short-term securities), respectively.
8. Share Transactions
Transactions of shares of the Fund were as follows:
| | | | | | | | |
Period from 12/18/17 through 5/31/18 | |
| | |
Class A Shares | | Amount | | | Shares | |
Sold | | $ | 1,000 | | | | 50 | |
Dividends Reinvested | | | 23 | | | | 1 | |
Redeemed | | | — | | | | — | |
| | | | | | | | |
Net Increase | | $ | 1,023 | | | | 51 | |
| | | | | | | | |
| | |
Class C Shares | | | | | | |
Sold | | $ | 1,000 | | | | 50 | |
Dividends Reinvested | | | 23 | | | | 1 | |
Redeemed | | | — | | | | — | |
| | | | | | | | |
Net Increase | | $ | 1,023 | | | | 51 | |
| | | | | | | | |
| | |
Class I Shares | | | | | | |
Sold | | $ | 38,656,260 | | | | 3,883,091 | |
Dividend Reinvested | | | 912,103 | | | | 35,576 | |
Redeemed | | | (15,190,195 | ) | | | (756,436 | ) |
| | | | | | | | |
Net Increase | | $ | 24,378,168 | | | | 3,162,231 | |
| | | | | | | | |
19
The Cushing® MLP Infrastructure Fund
Additional Information (Unaudited)
May 31, 2018
Trustee and Executive Officer Compensation
The Fund does not currently compensate any of its trustees who are interested persons or any of its officers. For the period ended
May 31, 2018, the aggregate compensation paid by the Fund to the independent trustees was $17,006. The Fund did not pay any special compensation to any of its trustees or officers. The Fund continuously monitors standard industry practices and this policy is subject to change.
Cautionary Note Regarding Forward-Looking Statements
This report contains “forward-looking statements” as defined under the U.S. federal securities laws. Generally, the words “believe,” “expect,” “intend,” “estimate,” “anticipate,” “project,” “will” and similar expressions identify forward-looking statements, which generally are not historical in nature. Forward-looking statements are subject to certain risks and uncertainties that could cause actual results to materially differ from the Fund’s historical experience and its present expectations or projections indicated in any forward-looking statements. These risks include, but are not limited to, changes in economic and political conditions; regulatory and legal changes; energy industry risk; leverage risk; valuation risk; interest rate risk; tax risk; and other risks discussed in the Fund’s filings with the SEC. You should not place undue reliance on forward-looking statements, which speak only as of the date they are made. The Fund undertakes no obligation to update or revise any forward-looking statements made herein. There is no assurance that the Fund’s investment objective will be attained.
Proxy Voting Policies
A description of the policies and procedures that the Fund uses to determine how to vote proxies relating to portfolio securities owned by the Fund and information regarding how the Fund voted proxies relating to the portfolio of securities during the 12-month period ended June 30 are available to shareholders without charge, upon request by calling the Fund toll-free at (800)236-4424 and on the Fund’s website at www.cushingfunds.com. Information regarding how the Fund voted proxies are also available to stockholders without charge on the SEC’s website at www.sec.gov.
Form N-Q
The Fund will file its complete schedule of portfolio holdings for the first and third quarters of each fiscal year with the SEC on Form N-Q. The Fund’s Form N-Q and statement of additional information are available without charge by visiting the SEC’s website at www.sec.gov. In addition, you may review and copy the Fund’s Form N-Q at the SEC’s Public Reference Room in Washington D.C. You may obtain information on the operation of the Public Reference Room by calling (800) SEC-0330.
Portfolio Turnover
The portfolio turnover rate for the period ended May 31, 2018 was 46.92%. Portfolio turnover may vary greatly from period to period. The Fund does not consider portfolio turnover rate a limiting factor in the Adviser’s execution of investment decisions, and the Fund may utilize investment and trading strategies that may involve high portfolio turnover. A higher portfolio turnover rate results in correspondingly greater brokerage commissions and other transactional expenses that are borne by the Fund.
20
Certifications
The Fund’s Chief Executive Officer has submitted to the New York Stock Exchange the annual CEO certification as required by Section 303A.12(a) of the NYSE Listed Fund Manual.
The Fund has filed with the SEC the certification of its Chief Executive Officer and Chief Financial Officer required by Section 302 of the Sarbanes-Oxley Act.
Privacy Policy
In order to conduct its business, the Fund collects and maintains certain nonpublic personal information about its stockholders of record with respect to their transactions in shares of the Fund’s securities. This information includes the stockholder’s address, tax identification or Social Security number, share balances, and dividend elections. We do not collect or maintain personal information about stockholders whose share balances of our securities are held in “street name” by a financial institution such as a bank or broker.
We do not disclose any nonpublic personal information about you, the Fund’s other stockholders or the Fund’s former stockholders to third parties unless necessary to process a transaction, service an account, or as otherwise permitted by law.
To protect your personal information internally, we restrict access to nonpublic personal information about the Fund’s stockholders to those employees who need to know that information to provide services to our stockholders. We also maintain certain other safeguards to protect your nonpublic personal information.
21
The Cushing® MLP Infrastructure Fund
Board Approval of Investment Management Agreement (Unaudited)
May 31, 2018
On May 31, 2018, the Board of Trustees of the Fund (members of which are referred to collectively as the “Trustees”) met in person to discuss, among other things, the approval of the Investment Management Agreement (the “Agreement”) between the Fund and Cushing Asset Management, LP (the “Adviser”).
Activities and Composition of the Board
The Board of Trustees is comprised of four Trustees, three of whom are not “interested persons,” as such term is defined in the Investment Company Act of 1940, as amended (the “1940 Act”), of the Fund (the “Independent Trustees”). The Trustees are responsible for oversight of the operations of the Fund and performs the various duties imposed by the 1940 Act on the trustees of investment companies. The Independent Trustees have retained independent legal counsel to assist them in connection with their duties. Prior to its consideration of the Agreement, the Trustees received and reviewed information provided by the Adviser. The Trustees also received and reviewed information responsive to requests from independent counsel to assist it in its consideration of the Agreement. Before the Trustees voted on the approval of the Agreement, the Independent Trustees met with independent legal counsel during executive session and discussed the Agreement and related information.
Consideration of Nature, Extent and Quality of the Services
The Trustees received and considered information regarding the nature, extent and quality of services provided to the Fund under the Agreement, including the Adviser’s Form ADV and other background materials supplied by the Adviser.
The Trustees reviewed and considered the Adviser’s investment advisory personnel, its history, and the amount of assets currently under management by the Adviser. The Trustees also reviewed the research and decision-making processes utilized by the Adviser, including the methods adopted to seek to achieve compliance with the investment objectives, policies and restrictions of the Fund.
The Trustees considered the background and experience of the Adviser’s management in connection with the Fund, including reviewing the qualifications, backgrounds and responsibilities of the management team members primarily responsible for the day-to-day portfolio management of the Fund and the extent of the resources devoted to research and analysis of the Fund’s actual and potential investments.
The Trustees also reviewed the Adviser’s conflict of interest policies, insider trading policies and procedures, and the Adviser’s Code of Ethics. The Trustees, including all of the Independent Trustees, concluded that the nature, extent and quality of services to be rendered by the Adviser under the Agreement were adequate.
Consideration of Advisory Fees and the Cost of the Services
The Trustees reviewed and considered the contractual annual advisory fee paid by the Fund to the Adviser in light of the extent, nature and quality of the advisory services to be provided by the Adviser to the Fund.
22
The Trustees considered the information they received comparing the Fund’s contractual annual advisory fee and overall expenses, to the extent available, with a peer group and universe of competitor closed-end funds determined by FUSE Research Network LLC. The Trustees discussed the limited number of funds contained in many of the peer groups and universes and the general methodology used by FUSE in preparing its report.
Based on such information, the Trustees noted that the Fund’s total net expense ratio of 1.50% (which reflected the expense waiver by the Adviser) was in the third quartile with respect to its peer group and the fourth quartile with respect to its universe, and the Fund’s contractual advisory fee of 1.00% was in the first quartile with respect to both its peer group and universe.
Consideration of Investment Performance
The Trustees regularly review the performance of the Fund throughout the year. The Trustees reviewed performance information provided by FUSE comparing the performance of the Fund against its universe over several time horizons, and using different performance metrics, including but not limited to the comparative performance of the Fund in terms of net asset value (NAV) and market price. The Trustees noted that the Fund’s performance, as compared to its peer group, was first quartile for the three-month period, slightly below median for the one-year period, above median for the three-year period, and top decile for the five-year period. In considering the Fund’s performance, the Trustee noted that prior to December 2017, the Fund had operated as a closed-end, master-feeder fund that was treated as a partnership for U.S. federal income tax purposes, and considered the potential impact of the Fund’s reorganization into a mutual fund on Fund performance.
Consideration of Comparable Accounts
The Trustees reviewed the other accounts and investment vehicles managed by the Adviser and discussed the similarities and differences between these accounts and the Fund.
The Trustees determined that, bearing in mind the limitations of comparing different types of managed accounts and the different levels of service typically associated with such accounts, the fee structures applicable to the Adviser’s other clients employing a comparable strategy to the Fund was not indicative of any unreasonableness with respect to the advisory fees proposed to be payable by the Fund.
Consideration of Profitability
The Trustees received and considered a profitability analysis prepared by the Adviser, using a template developed in consultation with counsel to the Independent Trustees, that set forth the fees payable by the Fund under the Agreement and the expenses incurred by the Adviser in connection with the operation of the Fund. The Trustees used this analysis to evaluate the fairness of the profits realized and anticipated to be realized by the Adviser with respect to the Fund.
It was noted that the management fee was calculated on the basis of the Fund’s managed assets, including the proceeds from leverage, if any, rather than on unlevered assets. The Trustees determined that the Fund was unprofitable to the Adviser, largely due to the Fund’s relatively small size.
Consideration of Economies of Scale
The Trustees considered whether economies of scale in the provision of services to the Fund had been or would be passed along to the shareholders under the Agreement. The Trustees determined there were no material economies of scale accruing to the Adviser in connection with its relationship with the Fund.
23
Consideration of Other Benefits
The Trustees reviewed and considered any other incidental benefits derived or to be derived by the Adviser from its relationship with the Fund, including but not limited to soft dollar arrangements. The Trustees determined there were no material incidental benefits accruing to the Adviser in connection with its relationship with the Fund.
Conclusion
In approving the Agreement and the fees charged under the Agreement, the Trustees concluded that no single factor reviewed by the Trustees was identified by the Trustees to be determinative as the principal factor in whether to approve the Agreement. The summary set out above describes the most important factors, but not all matters, considered by the Trustees in coming to its decision regarding the Agreement. On the basis of such information as the Trustees considered necessary to the exercise of its reasonable business judgment and its evaluation of all of the factors described above, and after much discussion, the Trustees concluded that each factor they considered, in the context of all of the other factors they considered, favored approval of the Agreement. It was noted that it was the judgment of the Trustees that approval of the Agreement was consistent with the best interests of the Fund and its shareholders. A majority of the Trustees and, voting separately, a majority of the Independent Trustees, approved the Agreement.
24
The Cushing® MLP Infrastructure Fund
TRUSTEES
Brian R. Bruce
Brenda A. Cline
Ronald P. Trout
Jerry V. Swank
EXECUTIVE OFFICERS
Jerry V. Swank
Chief Executive Officer and President
John H. Alban
Chief Financial Officer and Treasurer
Barry Y. Greenberg
Chief Compliance Officer and Secretary
INVESTMENT ADVISER
Cushing® Asset Management, LP
8117 Preston Road, Suite 440
Dallas, TX 75225
ADMINISTRATOR
U.S. Bancorp Fund Services, LLC
615 East Michigan Street, 3rd Floor
Milwaukee, WI 53202
CUSTODIAN
U.S. Bank, N.A.
1555 N. River Center Drive, Suite 302
Milwaukee, WI 53212
TRANSFER AGENT
U.S. Bancorp Fund Services, LLC
615 East Michigan Street, 3rd Floor
Milwaukee, WI 53202
LEGAL COUNSEL
Skadden, Arps, Slate, Meagher & Flom LLP
Four Times Square
New York, NY 10036
INDEPENDENT
REGISTERED PUBLIC
ACCOUNTING FIRM
KPMG LLP
191 W. Nationwide Blvd, Suite 500
Columbus, OH 43215
NOT FDIC INSURED | NOT BANK GUARANTEED | MAY LOSE VALUE
The Cushing® MLP Infrastructure Fund is distributed by Quasar Distributors, LLC

Item 2. Code of Ethics.
Not applicable for semi-annual reports.
Item 3. Audit Committee Financial Expert.
Not applicable for semi-annual reports.
Item 4. Principal Accountant Fees and Services.
Not applicable for semi-annual reports.
Item 5. Audit Committee of Listed Registrants.
Not applicable to registrants who are not listed issuers (as defined in Rule 10A-3 under the Securities Exchange Act of 1934).
Item 6. Investments.
| (a) | Schedule of Investments is included as part of the report to shareholders filed under Item 1 of this Form. |
Item 7. Disclosure of Proxy Voting Policies and Procedures for Closed-End Management Investment Companies.
Not applicable to open-end investment companies.
Item 8. Portfolio Managers of Closed-End Management Investment Companies.
Not applicable to open-end investment companies.
Item 9. Purchases of Equity Securities by Closed-End Management Investment Company and Affiliated Purchasers.
Not applicable to open-end investment companies.
Item 10. Submission of Matters to a Vote of Security Holders.
Not Applicable.
1
Item 11. Controls and Procedures.
| (a) | The Registrant’s President/Chief Executive Officer and Treasurer/Chief Financial Officer have reviewed the Registrant’s disclosure controls and procedures (as defined in Rule 30a- |
3(c) under the Investment Company Act of 1940 (the “Act”)) as of a date within 90 days of the filing of this report, as required by Rule 30a-3(b) under the Act and Rules 13a-15(b) or 15d-15(b) under the Securities Exchange Act of 1934. Based on their review, such officers have concluded that the disclosure controls and procedures are effective in ensuring that information required to be disclosed in this report is appropriately recorded, processed, summarized and reported and made known to them by others within the Registrant and by the Registrant’s service provider.
| (b) | There were no changes in the Registrant’s internal control over financial reporting (as defined in Rule 30a-3(d) under the Act) that occurred during the second fiscal quarter of the period covered by this report that has materially affected, or is reasonably likely to materially affect, the Registrant’s internal control over financial reporting. |
Item 12. Disclosure of Securities Lending Activities for Closed-End Management Investment Companies
Not applicable to open-end investment companies.
Item 13. Exhibits.
| (a) | (1) Any code of ethics or amendment thereto, that is the subject of the disclosure required by Item 2, to the extent that the registrant intends to satisfy Item 2 requirements through filing an exhibit. Not Applicable. |
(2) A separate certification for each principal executive officer and principal financial officer pursuant to Section 302 of the Sarbanes-Oxley Act of 2002. Filed herewith.
(3) Any written solicitation to purchase securities under Rule 23c-1 under the Act sent or given during the period covered by the report by or on behalf of the registrant to 10 or more persons. Not applicable to open-end investment companies.
| (b) | Certifications pursuant to Section 906 of the Sarbanes-Oxley Act of 2002. Furnished herewith. |
2
SIGNATURES
Pursuant to the requirements of the Securities Exchange Act of 1934 and the Investment Company Act of 1940, the registrant has duly caused this report to be signed on its behalf by the undersigned, thereunto duly authorized.
| | | | | | | | |
| | (Registrant) The Cushing MLP Infrastructure Fund | | |
| | | |
| | By (Signature and Title) | | /s/ Jerry V. Swank | | |
| | | | | | Jerry V. Swank, President & Chief Executive Officer | | |
| | | |
| | Date | | 08/09/18 | | |
Pursuant to the requirements of the Securities Exchange Act of 1934 and the Investment Company Act of 1940, this report has been signed below by the following persons on behalf of the registrant and in the capacities and on the dates indicated.
| | | | | | | | |
| | By (Signature and Title) | | /s/ Jerry V. Swank | | |
| | | | Jerry V. Swank, President & Chief Executive Officer | | |
| | | |
| | Date | | 08/09/18 | | |
| | | |
| | By (Signature and Title) | | /s/ John H. Alban | | |
| | | | | | John H. Alban, Treasurer & Chief Financial Officer | | |
| | | |
| | Date | | 08/09/18 | | |
3