UNITED STATES
SECURITIES AND EXCHANGE COMMISSION
Washington, D.C. 20549
FORM N-CSRS
CERTIFIED SHAREHOLDER REPORT OF REGISTERED
MANAGEMENT INVESTMENT COMPANIES
Investment Company Act File Number 811- 23312
Impact Shares Trust I
(Exact name of registrant as specified in charter)
2189 Broken Bend
Frisco, Texas 75034
(Address of principal executive offices)
Ethan Powell
2189 Broken Bend
Frisco, Texas 75034
(Name and address of agent for service)
COPY TO:
Brian McCabe
Ropes & Gray LLP
Prudential Tower
800 Boylston Street
Boston, Massachusetts 02199-3600
(Name and address of agent for service)
Registrant’s telephone number, including area code: 1-469-442-8424
Date of fiscal year end: June 30, 2022
Date of reporting period: December 31, 2021
Item 1. Reports to Stockholders.
A copy of the report transmitted to stockholders pursuant to Rule 30e-1 under the Investment Company Act of 1940, as amended (the “1940 Act”) (17 CFR § 270.30e-1), is attached hereto.

IMPACT SHARES TRUST I
Impact Shares YWCA Women’s Empowerment ETF
Impact Shares NAACP Minority Empowerment ETF
Impact Shares Sustainable Development Goals Global Equity ETF
Impact Shares Affordable Housing MBS ETF
Impact Shares MSCI Global Climate Select ETF
Semi-Annual Report
December 31, 2021
Impact Shares Trust I
Table of Contents
Each Fund files its complete schedule of Fund holdings with the Securities and Exchange Commission (the “Commission”) for the first and third quarters of each fiscal year or as an exhibit to its reports on Form N-PORT. The Fund’s Form N-PORT is available on the Commission’s website at http://www.sec.gov.
A description of the policies and procedures that Impact Shares, Corp. uses to determine how to vote proxies relating to Fund securities, as well as information relating to how a Fund voted proxies relating to Fund securities during the most recent 12-month period ended June 30, is available (i) without charge, upon request, by calling 1-844-448-3383; and (ii) on the Commission’s website at http://www.sec.gov.
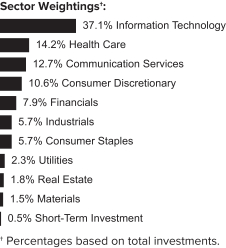
Impact Shares YWCA Women’s Empowerment ETF
Schedule of Investments
December 31, 2021 (Unaudited)
| | | | | | | | |
| Description | | Shares | | | Fair Value | |
|
COMMON STOCK — 102.2% | |
| | |
Communication Services — 13.1% | | | | | | | | |
Alphabet, Cl A* | | | 331 | | | $ | 958,920 | |
Alphabet, Cl C* | | | 308 | | | | 891,226 | |
AT&T | | | 14,555 | | | | 358,053 | |
Comcast, Cl A | | | 9,441 | | | | 475,166 | |
Interpublic Group | | | 801 | | | | 29,997 | |
Lumen Technologies | | | 1,959 | | | | 24,585 | |
Meta Platforms, Cl A* | | | 3,473 | | | | 1,168,144 | |
Verizon Communications | | | 8,435 | | | | 438,283 | |
Walt Disney* | | | 3,773 | | | | 584,400 | |
| | | | | | | | |
| | | | | | | 4,928,774 | |
| | | | | | | | |
| | |
Consumer Discretionary — 10.9% | | | | | | | | |
Amazon.com* | | | 549 | | | | 1,830,553 | |
Aptiv* | | | 543 | | | | 89,568 | |
Autoliv | | | 158 | | | | 16,338 | |
Best Buy | | | 464 | | | | 47,142 | |
Carnival* | | | 1,687 | | | | 33,942 | |
Darden Restaurants | | | 267 | | | | 40,221 | |
Deckers Outdoor* | | | 54 | | | | 19,780 | |
eBay | | | 1,372 | | | | 91,238 | |
Expedia Group* | | | 297 | | | | 53,674 | |
Ford Motor | | | 8,017 | | | | 166,513 | |
Gap | | | 420 | | | | 7,413 | |
General Motors* | | | 2,955 | | | | 173,252 | |
Hasbro | | | 269 | | | | 27,379 | |
Hilton Worldwide Holdings* | | | 573 | | | | 89,382 | |
Lululemon Athletica* | | | 251 | | | | 98,254 | |
Marriott International, Cl A* | | | 567 | | | | 93,691 | |
McDonald’s | | | 1,550 | | | | 415,509 | |
Royal Caribbean Cruises* | | | 467 | | | | 35,912 | |
Starbucks | | | 2,478 | | | | 289,852 | |
Target | | | 777 | | | | 179,829 | |
TJX | | | 2,529 | | | | 192,002 | |
VF | | | 663 | | | | 48,545 | |
Yum! Brands | | | 542 | | | | 75,262 | |
| | | | | | | | |
| | | | | | | 4,115,251 | |
| | | | | | | | |
| | | | | | | | |
| Description | | Shares | | | Fair Value | |
| | |
Consumer Staples — 5.8% | | | | | | | | |
Archer-Daniels-Midland | | | 859 | | | $ | 58,060 | |
Campbell Soup | | | 300 | | | | 13,038 | |
Church & Dwight | | | 379 | | | | 38,848 | |
Clorox | | | 187 | | | | 32,605 | |
Coca-Cola | | | 6,051 | | | | 358,280 | |
Colgate-Palmolive | | | 1,318 | | | | 112,478 | |
Conagra Brands | | | 726 | | | | 24,793 | |
Estee Lauder, Cl A | | | 362 | | | | 134,012 | |
General Mills | | | 922 | | | | 62,124 | |
Hershey | | | 222 | | | | 42,950 | |
J M Smucker | | | 164 | | | | 22,275 | |
Kellogg | | | 386 | | | | 24,866 | |
Kimberly-Clark | | | 520 | | | | 74,318 | |
Kraft Heinz | | | 1,028 | | | | 36,905 | |
Kroger | | | 1,037 | | | | 46,934 | |
Molson Coors Beverage, Cl B | | | 278 | | | | 12,885 | |
PepsiCo | | | 2,160 | | | | 375,214 | |
Procter & Gamble | | | 3,801 | | | | 621,768 | |
Tyson Foods, Cl A | | | 456 | | | | 39,745 | |
Walgreens Boots Alliance | | | 1,111 | | | | 57,950 | |
| | | | | | | | |
| | | | | | | 2,190,048 | |
| | | | | | | | |
| | |
Financials — 8.1% | | | | | | | | |
Aflac | | | 954 | | | | 55,704 | |
Allstate | | | 462 | | | | 54,354 | |
American Express | | | 1,006 | | | | 164,582 | |
American International PLC | | | 1,318 | | | | 74,941 | |
Ameriprise Financial | | | 177 | | | | 53,394 | |
Bank of America | | | 11,474 | | | | 510,478 | |
Bank of New York Mellon | | | 1,232 | | | | 71,554 | |
BlackRock, Cl A | | | 225 | | | | 206,001 | |
Capital One Financial | | | 694 | | | | 100,692 | |
Citigroup | | | 3,150 | | | | 190,228 | |
Fifth Third Bancorp | | | 1,069 | | | | 46,555 | |
First Republic Bank | | | 271 | | | | 55,964 | |
Goldman Sachs Group | | | 531 | | | | 203,134 | |
Hannon Armstrong Sustainable Infrastructure Capital‡ | | | 1,300 | | | | 69,056 | |
Hartford Financial Services Group | | | 542 | | | | 37,420 | |
Huntington Bancshares | | | 2,268 | | | | 34,973 | |
KeyCorp | | | 1,464 | | | | 33,862 | |
Lincoln National | | | 269 | | | | 18,362 | |
MetLife | | | 1,130 | | | | 70,614 | |
Moody’s | | | 258 | | | | 100,770 | |
Morgan Stanley | | | 2,316 | | | | 227,339 | |
Northern Trust | | | 326 | | | | 38,993 | |
Principal Financial Group | | | 384 | | | | 27,775 | |
Progressive | | | 912 | | | | 93,617 | |
Prudential Financial | | | 601 | | | | 65,052 | |
Regions Financial | | | 1,460 | | | | 31,828 | |
S&P Global | | | 386 | | | | 182,165 | |
State Street | | | 565 | | | | 52,545 | |
T Rowe Price Group | | | 358 | | | | 70,397 | |
US Bancorp | | | 2,104 | | | | 118,182 | |
Voya Financial | | | 168 | | | | 11,140 | |
| | | | | | | | |
| | | | | | | 3,071,671 | |
| | | | | | | | |
The accompanying notes are an integral part of the financial statements.
1
Impact Shares YWCA Women’s Empowerment ETF
Schedule of Investments
December 31, 2021 (Unaudited)
| | | | | | | | |
| Description | | Shares | | | Fair Value | |
| | |
Health Care — 14.6% | | | | | | | | |
Abbott Laboratories | | | 2,797 | | | $ | 393,650 | |
AbbVie | | | 2,758 | | | | 373,433 | |
Agilent Technologies | | | 480 | | | | 76,632 | |
AmerisourceBergen, Cl A | | | 230 | | | | 30,565 | |
Amgen | | | 895 | | | | 201,348 | |
Anthem | | | 385 | | | | 178,463 | |
Baxter International | | | 780 | | | | 66,955 | |
Becton Dickinson | | | 455 | | | | 114,423 | |
Biogen* | | | 234 | | | | 56,141 | |
BioMarin Pharmaceutical* | | | 285 | | | | 25,180 | |
Bristol-Myers Squibb | | | 3,488 | | | | 217,477 | |
Cardinal Health | | | 444 | | | | 22,862 | |
Cigna | | | 534 | | | | 122,622 | |
CVS Health | | | 2,058 | | | | 212,303 | |
Edwards Lifesciences* | | | 1,020 | | | | 132,141 | |
Eli Lilly | | | 1,259 | | | | 347,761 | |
Gilead Sciences | | | 1,976 | | | | 143,478 | |
Johnson & Johnson | | | 4,132 | | | | 706,861 | |
McKesson | | | 241 | | | | 59,905 | |
Medtronic PLC | | | 2,126 | | | | 219,935 | |
Merck | | | 3,862 | | | | 295,984 | |
Perrigo PLC | | | 200 | | | | 7,780 | |
Pfizer | | | 8,830 | | | | 521,411 | |
Quest Diagnostics | | | 188 | | | | 32,526 | |
Regeneron Pharmaceuticals* | | | 168 | | | | 106,095 | |
UnitedHealth Group | | | 1,490 | | | | 748,189 | |
Vertex Pharmaceuticals* | | | 406 | | | | 89,158 | |
| | | | | | | | |
| | | | | | | 5,503,278 | |
| | | | | | | | |
| | |
Industrials — 5.9% | | | | | | | | |
3M | | | 903 | | | | 160,400 | |
Caterpillar | | | 857 | | | | 177,176 | |
CSX | | | 3,479 | | | | 130,810 | |
Cummins | | | 221 | | | | 48,209 | |
Delta Air Lines* | | | 995 | | | | 38,884 | |
Eaton PLC | | | 629 | | | | 108,704 | |
Emerson Electric | | | 941 | | | | 87,485 | |
General Electric | | | 1,722 | | | | 162,677 | |
IHS Markit | | | 635 | | | | 84,404 | |
Illinois Tool Works | | | 441 | | | | 108,839 | |
Johnson Controls International PLC | | | 1,111 | | | | 90,335 | |
Norfolk Southern | | | 377 | | | | 112,237 | |
Owens Corning | | | 155 | | | | 14,028 | |
Pentair | | | 255 | | | | 18,623 | |
Rockwell Automation | | | 179 | | | | 62,444 | |
Southwest Airlines* | | | 602 | | | | 25,790 | |
TransUnion | | | 297 | | | | 35,219 | |
Trex* | | | 172 | | | | 23,225 | |
Union Pacific | | | 996 | | | | 250,922 | |
United Parcel Service, Cl B | | | 1,152 | | | | 246,920 | |
Verisk Analytics, Cl A | | | 251 | | | | 57,411 | |
Waste Management | | | 604 | | | | 100,808 | |
WW Grainger | | | 69 | | | | 35,758 | |
Xylem | | | 283 | | | | 33,937 | |
| | | | | | | | |
| | | | | | | 2,215,245 | |
| | | | | | | | |
| | | | | | | | |
| Description | | Shares | | | Fair Value | |
| | |
Information Technology — 38.1% | | | | | | | | |
Accenture PLC, Cl A | | | 2,011 | | | $ | 833,660 | |
Adobe* | | | 1,536 | | | | 871,004 | |
Apple | | | 12,327 | | | | 2,188,905 | |
Autodesk* | | | 714 | | | | 200,770 | |
Automatic Data Processing | | | 662 | | | | 163,236 | |
Enphase Energy* | | | 2,241 | | | | 409,968 | |
First Solar* | | | 1,766 | | | | 153,925 | |
HP | | | 3,732 | | | | 140,585 | |
Intel | | | 12,748 | | | | 656,522 | |
Intuit | | | 883 | | | | 567,963 | |
Keysight Technologies* | | | 588 | | | | 121,428 | |
Mastercard, Cl A | | | 1,418 | | | | 509,516 | |
Microsoft | | | 6,164 | | | | 2,073,076 | |
Motorola Solutions | | | 531 | | | | 144,273 | |
NVIDIA | | | 8,163 | | | | 2,400,820 | |
PayPal Holdings* | | | 1,896 | | | | 357,548 | |
QUALCOMM | | | 3,572 | | | | 653,212 | |
salesforce.com* | | | 3,076 | | | | 781,704 | |
SolarEdge Technologies* | | | 869 | | | | 243,815 | |
TE Connectivity | | | 1,031 | | | | 166,341 | |
Visa, Cl A | | | 2,695 | | | | 584,033 | |
Workday, Cl A* | | | 599 | | | | 163,635 | |
| | | | | | | | |
| | | | | | | 14,385,939 | |
| | | | | | | | |
| | |
Materials — 1.5% | | | | | | | | |
Air Products and Chemicals | | | 345 | | | | 104,970 | |
Avery Dennison | | | 128 | | | | 27,721 | |
Celanese, Cl A | | | 170 | | | | 28,570 | |
Dow | | | 1,161 | | | | 65,852 | |
Ecolab | | | 388 | | | | 91,021 | |
International Flavors & Fragrances | | | 392 | | | | 59,055 | |
International Paper | | | 792 | | | | 37,208 | |
Mosaic | | | 518 | | | | 20,352 | |
Newmont | | | 1,210 | | | | 75,044 | |
PPG Industries | | | 369 | | | | 63,630 | |
Sylvamo* | | | 75 | | | | 2,092 | |
| | | | | | | | |
| | | | | | | 575,515 | |
| | | | | | | | |
| | |
Real Estate — 1.8% | | | | | | | | |
AvalonBay Communities‡ | | | 213 | | | | 53,802 | |
CBRE Group, Cl A* | | | 524 | | | | 56,859 | |
Equinix‡ | | | 139 | | | | 117,572 | |
Equity LifeStyle Properties‡ | | | 259 | | | | 22,704 | |
Healthpeak Properties‡ | | | 818 | | | | 29,522 | |
Host Hotels & Resorts*‡ | | | 1,087 | | | | 18,903 | |
Iron Mountain‡ | | | 436 | | | | 22,816 | |
Orion Office REIT*‡ | | | 2 | | | | 37 | |
Prologis‡ | | | 1,146 | | | | 192,940 | |
Realty Income‡ | | | 25 | | | | 1,790 | |
Ventas‡ | | | 600 | | | | 30,672 | |
Welltower‡ | | | 652 | | | | 55,922 | |
Weyerhaeuser‡ | | | 1,156 | | | | 47,604 | |
WP Carey‡ | | | 275 | | | | 22,564 | |
| | | | | | | | |
| | | | | | | 673,707 | |
| | | | | | | | |
The accompanying notes are an integral part of the financial statements.
2
Impact Shares YWCA Women’s Empowerment ETF
Schedule of Investments
December 31, 2021 (Unaudited)
| | | | | | | | |
| Description | | Shares | | | Fair Value | |
| | |
Utilities — 2.4% | | | | | | | | |
American Water Works | | | 273 | | | $ | 51,559 | |
Atlantica Sustainable Infrastructure PLC | | | 1,833 | | | | 65,548 | |
Brookfield Renewable, Cl A | | | 5,313 | | | | 195,678 | |
CenterPoint Energy | | | 880 | | | | 24,561 | |
CMS Energy | | | 434 | | | | 28,232 | |
Consolidated Edison | | | 529 | | | | 45,134 | |
Dominion Energy | | | 1,236 | | | | 97,100 | |
Edison International | | | 569 | | | | 38,834 | |
Entergy | | | 302 | | | | 34,020 | |
Essential Utilities | | | 333 | | | | 17,879 | |
Eversource Energy | | | 510 | | | | 46,400 | |
Exelon | | | 1,493 | | | | 86,236 | |
NiSource | | | 584 | | | | 16,124 | |
PG&E* | | | 2,245 | | | | 27,254 | |
PPL | | | 1,167 | | | | 35,080 | |
Sempra Energy | | | 489 | | | | 64,685 | |
UGI | | | 307 | | | | 14,094 | |
Vistra | | | 715 | | | | 16,281 | |
| | | | | | | | |
| | | | | | | 904,699 | |
| | | | | | | | |
| | |
Total Common Stock | | | | | | | | |
(Cost $31,156,457) | | | | | | | 38,564,127 | |
| | | | | | | | |
|
SHORT-TERM INVESTMENT — 0.5% | |
Invesco Government & Agency, Cl Institutional, 0.030% (A) | | | 202,333 | | | | 202,333 | |
| | | | | | | | |
| | |
Total Short-Term Investment | | | | | | | | |
(Cost $202,333) | | | | | | | 202,333 | |
| | | | | | | | |
| | |
Total Investments - 102.7% | | | | | | | | |
(Cost $31,358,790) | | | | | | $ | 38,766,460 | |
| | | | | | | | |
| | | | | | | | |
Percentages are based on Net Assets of $ $37,741,689.
| | |
* | | Non-income producing security. |
‡ | | Real Estate Investment Trust |
(A) | | Rate shown represents the 7-day effective yield as of December 31, 2021. |
ADR – American Depositary Receipt
Cl — Class
PLC — Public Limited Company
As of December 31, 2021, all of the Fund’s investments were considered Level 1, in accordance with the authoritative guidance under U.S. Generally Accepted Accounting Principles.
For the period ended December 31, 2021, were no transfers in or out of Level 3.
For more information on valuation inputs, see Note 2 in the Notes to Financial Statements.
The accompanying notes are an integral part of the financial statements.
3
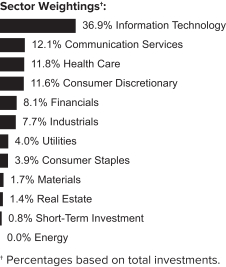
Impact Shares NAACP Minority Empowerment ETF
Schedule of Investments
December 31, 2021 (Unaudited)
| | | | | | | | |
| Description | | Shares | | | Fair Value | |
| | |
COMMON STOCK — 101.7% | | | | | | | | |
| | |
Communication Services — 12.4% | | | | | | | | |
Alphabet, Cl A* | | | 334 | | | $ | 967,611 | |
Alphabet, Cl C* | | | 312 | | | | 902,800 | |
AT&T | | | 26,859 | | | | 660,732 | |
Electronic Arts | | | 1,071 | | | | 141,265 | |
Meta Platforms, Cl A* | | | 3,671 | | | | 1,234,741 | |
Twitter* | | | 3,181 | | | | 137,483 | |
Verizon Communications | | | 15,570 | | | | 809,017 | |
| | | | | | | | |
| | | | | | | 4,853,649 | |
| | | | | | | | |
| | |
Consumer Discretionary — 11.9% | | | | | | | | |
Amazon.com* | | | 60 | | | | 200,060 | |
Aptiv* | | | 426 | | | | 70,269 | |
Autoliv | | | 118 | | | | 12,202 | |
Dollar Tree* | | | 370 | | | | 51,993 | |
DR Horton | | | 529 | | | | 57,370 | |
eBay | | | 1,076 | | | | 71,554 | |
Floor & Decor Holdings, Cl A* | | | 170 | | | | 22,102 | |
Ford Motor | | | 6,305 | | | | 130,955 | |
Gap | | | 310 | | | | 5,471 | |
General Motors* | | | 2,327 | | | | 136,432 | |
Hilton Worldwide Holdings* | | | 450 | | | | 70,195 | |
Home Depot | | | 1,763 | | | | 731,663 | |
Las Vegas Sands* | | | 559 | | | | 21,041 | |
Lear | | | 92 | | | | 16,832 | |
Lowe’s | | | 1,152 | | | | 297,769 | |
Marriott International, Cl A* | | | 445 | | | | 73,532 | |
McDonald’s | | | 1,224 | | | | 328,118 | |
MercadoLibre* | | | 79 | | | | 106,524 | |
NIKE, Cl B | | | 2,094 | | | | 349,007 | |
NVR* | | | 5 | | | | 29,544 | |
Royal Caribbean Cruises* | | | 362 | | | | 27,838 | |
Target | | | 819 | | | | 189,549 | |
Tesla* | | | 1,321 | | | | 1,396,006 | |
TJX | | | 1,991 | | | | 151,157 | |
| | | | | | | | |
| Description | | Shares | | | Fair Value | |
| | |
VF | | | 518 | | | $ | 37,928 | |
Yum! Brands | | | 481 | | | | 66,791 | |
| | | | | | | | |
| | | | | | | 4,651,902 | |
| | | | | | | | |
| | |
Consumer Staples — 4.0% | | | | | | | | |
Archer-Daniels-Midland | | | 898 | | | | 60,696 | |
Bunge | | | 221 | | | | 20,632 | |
Campbell Soup | | | 307 | | | | 13,342 | |
Clorox | | | 197 | | | | 34,349 | |
Coca-Cola | | | 6,373 | | | | 377,345 | |
Constellation Brands, Cl A | | | 272 | | | | 68,264 | |
Hormel Foods | | | 437 | | | | 21,330 | |
J M Smucker | | | 169 | | | | 22,954 | |
Kellogg | | | 401 | | | | 25,832 | |
Kimberly-Clark | | | 546 | | | | 78,034 | |
Kraft Heinz | | | 1,073 | | | | 38,521 | |
Kroger | | | 1,085 | | | | 49,107 | |
Molson Coors Beverage, Cl B | | | 288 | | | | 13,349 | |
Mondelez International, Cl A | | | 2,288 | | | | 151,717 | |
PepsiCo | | | 2,277 | | | | 395,538 | |
Sysco | | | 825 | | | | 64,804 | |
Tyson Foods, Cl A | | | 474 | | | | 41,314 | |
Walgreens Boots Alliance | | | 1,162 | | | | 60,610 | |
| | | | | | | | |
| | | | | | | 1,537,738 | |
| | | | | | | | |
| | |
Energy — 0.0% | | | | | | | | |
DT Midstream | | | 201 | | | | 9,644 | |
| | | | | | | | |
| | |
Financials — 8.3% | | | | | | | | |
American Express | | | 1,060 | | | | 173,416 | |
Aon PLC, Cl A | | | 377 | | | | 113,311 | |
Bank of America | | | 12,093 | | | | 538,018 | |
Bank of New York Mellon | | | 1,290 | | | | 74,923 | |
Charles Schwab | | | 2,496 | | | | 209,914 | |
Citigroup | | | 3,316 | | | | 200,253 | |
Hannon Armstrong Sustainable Infrastructure Capital‡ | | | 2,195 | | | | 116,599 | |
Huntington Bancshares | | | 2,368 | | | | 36,514 | |
JPMorgan Chase | | | 4,916 | | | | 778,449 | |
MetLife | | | 1,187 | | | | 74,176 | |
Moody’s | | | 270 | | | | 105,456 | |
Morgan Stanley | | | 2,437 | | | | 239,216 | |
Nasdaq | | | 191 | | | | 40,112 | |
PNC Financial Services Group | | | 696 | | | | 139,562 | |
Prudential Financial | | | 629 | | | | 68,083 | |
Regions Financial | | | 1,523 | | | | 33,201 | |
S&P Global | | | 405 | | | | 191,132 | |
Synchrony Financial | | | 923 | | | | 42,818 | |
Travelers | | | 406 | | | | 63,510 | |
| | | | | | | | |
| | | | | | | 3,238,663 | |
| | | | | | | | |
| | |
Health Care — 12.1% | | | | | | | | |
Abbott Laboratories | | | 2,947 | | | | 414,761 | |
AbbVie | | | 2,905 | | | | 393,337 | |
Agilent Technologies | | | 503 | | | | 80,304 | |
AstraZeneca ADR | | | 17 | | | | 990 | |
Baxter International | | | 820 | | | | 70,389 | |
Becton Dickinson | | | 477 | | | | 119,956 | |
Biogen* | | | 248 | | | | 59,500 | |
The accompanying notes are an integral part of the financial statements.
4
Impact Shares NAACP Minority Empowerment ETF
Schedule of Investments
December 31, 2021 (Unaudited)
| | | | | | | | |
| Description | | Shares | | | Fair Value | |
| | |
Boston Scientific* | | | 2,392 | | | $ | 101,612 | |
Bristol-Myers Squibb | | | 3,672 | | | | 228,949 | |
Cigna | | | 563 | | | | 129,282 | |
CVS Health | | | 2,165 | | | | 223,341 | |
Edwards Lifesciences* | | | 1,071 | | | | 138,748 | |
Gilead Sciences | | | 2,077 | | | | 150,811 | |
Illumina* | | | 249 | | | | 94,730 | |
Laboratory Corp of America Holdings* | | | 159 | | | | 49,959 | |
Medtronic PLC | | | 2,240 | | | | 231,728 | |
Merck | | | 4,066 | | | | 311,618 | |
Perrigo PLC | | | 203 | | | | 7,897 | |
Pfizer | | | 9,303 | | | | 549,342 | |
Quest Diagnostics | | | 197 | | | | 34,083 | |
ResMed | | | 244 | | | | 63,557 | |
Teleflex | | | 77 | | | | 25,293 | |
Thermo Fisher Scientific | | | 650 | | | | 433,706 | |
UnitedHealth Group | | | 1,569 | | | | 787,858 | |
| | | | | | | | |
| | | | | | | 4,701,751 | |
| | | | | | | | |
| | |
Industrials — 7.9% | | | | | | | | |
3M | | | 950 | | | | 168,748 | |
AMETEK | | | 379 | | | | 55,728 | |
Boeing* | | | 911 | | | | 183,403 | |
Canadian Pacific Railway | | | 418 | | | | 30,037 | |
Carrier Global | | | 1,410 | | | | 76,478 | |
CSX | | | 3,656 | | | | 137,465 | |
Cummins | | | 232 | | | | 50,609 | |
Deere | | | 471 | | | | 161,501 | |
Delta Air Lines* | | | 1,041 | | | | 40,682 | |
Eaton PLC | | | 659 | | | | 113,889 | |
Emerson Electric | | | 988 | | | | 91,854 | |
Expeditors International of Washington | | | 275 | | | | 36,930 | |
FedEx | | | 408 | | | | 105,525 | |
General Electric | | | 1,812 | | | | 171,180 | |
Honeywell International | | | 1,139 | | | | 237,493 | |
Howmet Aerospace | | | 617 | | | | 19,639 | |
IHS Markit | | | 665 | | | | 88,392 | |
Illinois Tool Works | | | 465 | | | | 114,762 | |
JB Hunt Transport Services | | | 134 | | | | 27,390 | |
Nordson | | | 85 | | | | 21,698 | |
Rockwell Automation | | | 188 | | | | 65,584 | |
Southwest Airlines* | | | 943 | | | | 40,398 | |
Stanley Black & Decker | | | 264 | | | | 49,796 | |
Uber Technologies* | | | 8,188 | | | | 343,323 | |
Union Pacific | | | 1,049 | | | | 264,274 | |
United Airlines Holdings* | | | 515 | | | | 22,547 | |
United Parcel Service, Cl B | | | 1,213 | | | | 259,994 | |
United Rentals* | | | 120 | | | | 39,875 | |
WW Grainger | | | 71 | | | | 36,795 | |
Xylem | | | 294 | | | | 35,256 | |
| | | | | | | | |
| | | | | | | 3,091,245 | |
| | | | | | | | |
| | |
Information Technology — 37.8% | | | | | | | | |
Accenture PLC, Cl A | | | 3,175 | | | | 1,316,196 | |
Apple | | | 12,466 | | | | 2,213,588 | |
Automatic Data Processing | | | 698 | | | | 172,113 | |
Booz Allen Hamilton Holding, Cl A | | | 210 | | | | 17,806 | |
| | | | | | | | |
| Description | | Shares | | | Fair Value | |
| | |
Cisco Systems | | | 4,257 | | | $ | 269,766 | |
Dell Technologies, Cl C* | | | 1,365 | | | | 76,672 | |
Enphase Energy* | | | 3,781 | | | | 691,696 | |
First Solar* | | | 2,982 | | | | 259,911 | |
HP | | | 5,890 | | | | 221,876 | |
Intel | | | 20,135 | | | | 1,036,953 | |
Mastercard, Cl A | | | 1,494 | | | | 536,824 | |
Microsoft | | | 6,130 | | | | 2,061,642 | |
NVIDIA | | | 6,416 | | | | 1,887,010 | |
PayPal Holdings* | | | 1,998 | | | | 376,783 | |
QUALCOMM | | | 5,643 | | | | 1,031,935 | |
salesforce.com* | | | 4,858 | | | | 1,234,563 | |
SolarEdge Technologies* | | | 1,466 | | | | 411,316 | |
Visa, Cl A | | | 2,837 | | | | 614,806 | |
VMware, Cl A* | | | 574 | | | | 66,515 | |
Workday, Cl A* | | | 945 | | | | 258,155 | |
| | | | | | | | |
| | | | | | | 14,756,126 | |
| | | | | | | | |
| | |
Materials — 1.8% | | | | | | | | |
Albemarle | | | 157 | | | | 36,702 | |
CF Industries Holdings | | | 341 | | | | 24,136 | |
DuPont de Nemours | | | 835 | | | | 67,451 | |
Eastman Chemical | | | 215 | | | | 25,996 | |
Ecolab | | | 406 | | | | 95,244 | |
FMC | | | 205 | | | | 22,527 | |
Freeport-McMoRan, Cl B | | | 2,394 | | | | 99,902 | |
International Flavors & Fragrances | | | 410 | | | | 61,766 | |
Martin Marietta Materials | | | 100 | | | | 44,052 | |
Mosaic | | | 537 | | | | 21,099 | |
Newmont | | | 1,270 | | | | 78,765 | |
PPG Industries | | | 384 | | | | 66,217 | |
Vulcan Materials | | | 215 | | | | 44,630 | |
| | | | | | | | |
| | | | | | | 688,487 | |
| | | | | | | | |
| | |
Real Estate — 1.4% | | | | | | | | |
AvalonBay Communities‡ | | | 223 | | | | 56,328 | |
Crown Castle International‡ | | | 702 | | | | 146,535 | |
Equinix‡ | | | 146 | | | | 123,493 | |
Equity Residential‡ | | | 539 | | | | 48,780 | |
Healthpeak Properties‡ | | | 852 | | | | 30,749 | |
Iron Mountain‡ | | | 452 | | | | 23,653 | |
Regency Centers‡ | | | 237 | | | | 17,858 | |
Ventas‡ | | | 627 | | | | 32,052 | |
Welltower‡ | | | 685 | | | | 58,752 | |
| | | | | | | | |
| | | | | | | 538,200 | |
| | | | | | | | |
| | |
Utilities — 4.1% | | | | | | | | |
AES | | | 1,057 | | | | 25,685 | |
Alliant Energy | | | 388 | | | | 23,850 | |
American Electric Power | | | 795 | | | | 70,731 | |
American Water Works | | | 290 | | | | 54,769 | |
Atlantica Sustainable Infrastructure PLC | | | 3,090 | | | | 110,499 | |
Avangrid | | | 93 | | | | 4,639 | |
CMS Energy | | | 452 | | | | 29,403 | |
Consolidated Edison | | | 556 | | | | 47,438 | |
Dominion Energy | | | 1,296 | | | | 101,814 | |
DTE Energy | | | 306 | | | | 36,579 | |
Duke Energy | | | 1,227 | | | | 128,712 | |
The accompanying notes are an integral part of the financial statements.
5
Impact Shares NAACP Minority Empowerment ETF
Schedule of Investments
December 31, 2021 (Unaudited)
| | | | | | | | |
| Description | | Shares | | | Fair Value | |
| | |
Edison International | | | 593 | | | $ | 40,472 | |
Entergy | | | 314 | | | | 35,372 | |
Eversource Energy | | | 534 | | | | 48,583 | |
Exelon | | | 1,568 | | | | 90,568 | |
FirstEnergy | | | 865 | | | | 35,975 | |
NextEra Energy | | | 3,206 | | | | 299,312 | |
NiSource | | | 600 | �� | | | 16,566 | |
NRG Energy | | | 383 | | | | 16,500 | |
OGE Energy | | | 296 | | | | 11,361 | |
PPL | | | 1,218 | | | | 36,613 | |
Public Service Enterprise Group | | | 806 | | | | 53,784 | |
Sempra Energy | | | 514 | | | | 67,992 | |
Southern | | | 1,707 | | | | 117,066 | |
WEC Energy Group | | | 498 | | | | 48,341 | |
Xcel Energy | | | 850 | | | | 57,545 | |
| | | | | | | | |
| | | | | | | 1,610,169 | |
| | | | | | | | |
| | |
Total Common Stock | | | | | | | | |
(Cost $30,856,288) | | | | | | | 39,677,574 | |
| | | | | | | | |
|
SHORT-TERM INVESTMENT — 0.8% | |
Invesco Government & Agency, Cl Institutional, 0.030% (A) | | | 307,679 | | | | 307,679 | |
| | | | | | | | |
| | |
Total Short-Term Investment | | | | | | | | |
(Cost $307,679) | | | | | | | 307,679 | |
| | | | | | | | |
| | |
Total Investments - 102.5% | | | | | | | | |
(Cost $31,163,967) | | | | | | $ | 39,985,253 | |
| | | | | | | | |
Percentages are based on Net Assets of $39,015,976.
| | |
* | | Non-income producing security. |
‡ | | Real Estate Investment Trust |
(A) | | Rate shown represents the 7-day effective yield as of December 31, 2021. |
ADR – American Depositary Receipt
Cl — Class
PLC — Public Limited Company
As of December 31, 2021, all of the Fund’s investments were considered Level 1, in accordance with the authoritative guidance under U.S. Generally Accepted Accounting Principles.
For the period ended December 31, 2021, there were no transfers in or out of Level 3.
For more information on valuation inputs, see Note 2 in the Notes to Financial Statements.
The accompanying notes are an integral part of the financial statements.
6
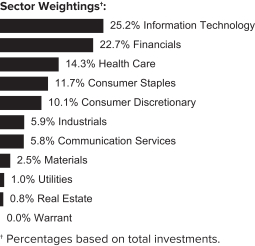
Impact Shares Sustainable Development Goals Global Equity ETF
Schedule of Investments
December 31, 2021 (Unaudited)
| | | | | | | | |
| Description | | Shares | | | Fair Value | |
| | |
COMMON STOCK — 107.6% | | | | | | | | |
| | |
Australia — 3.7% | | | | | | | | |
Aurizon Holdings | | | 1,555 | | | $ | 3,935 | |
Australia & New Zealand Banking Group | | | 2,649 | | | | 52,837 | |
Brambles | | | 1,293 | | | | 9,966 | |
Dexus‡ | | | 1,002 | | | | 8,079 | |
Downer EDI | | | 561 | | | | 2,424 | |
Fortescue Metals Group | | | 1,615 | | | | 22,494 | |
Mirvac Group‡ | | | 3,489 | | | | 7,361 | |
National Australia Bank | | | 3,038 | | | | 63,526 | |
Newcrest Mining | | | 765 | | | | 13,578 | |
OZ Minerals | | | 283 | | | | 5,790 | |
Qantas Airways* | | | 733 | | | | 2,662 | |
QBE Insurance Group | | | 1,335 | | | | 10,986 | |
Scentre Group‡ | | | 1,483 | | | | 3,398 | |
Stockland‡ | | | 2,189 | | | | 6,729 | |
Sydney Airport* | | | 1,242 | | | | 7,816 | |
Vicinity Centres‡ | | | 3,288 | | | | 4,029 | |
| | | | | | | | |
Total Australia | | | | | | | 225,610 | |
| | | | | | | | |
| | |
Canada — 7.2% | | | | | | | | |
Agnico Eagle Mines | | | 219 | | | | 11,544 | |
B2Gold | | | 882 | | | | 3,446 | |
Bank of Nova Scotia | | | 1,152 | | | | 80,933 | |
Brookfield Renewable, Cl A | | | 142 | | | | 5,186 | |
CAE* | | | 309 | | | | 7,736 | |
Gildan Activewear | | | 182 | | | | 7,658 | |
Kinross Gold | | | 1,099 | | | | 6,329 | |
Lundin Mining | | | 565 | | | | 4,379 | |
Ritchie Bros Auctioneers | | | 97 | | | | 5,891 | |
Royal Bank of Canada | | | 1,341 | | | | 141,238 | |
Stantec | | | 97 | | | | 5,408 | |
Thomson Reuters | | | 162 | | | | 19,226 | |
Toronto-Dominion Bank | | | 1,724 | | | | 131,168 | |
Yamana Gold | | | 809 | | | | 3,377 | |
| | | | | | | | |
Total Canada | | | | | | | 433,519 | |
| | | | | | | | |
| | | | | | | | |
| Description | | Shares | | | Fair Value | |
| | |
France — 3.7% | | | | | | | | |
AXA | | | 1,935 | | | $ | 57,359 | |
BNP Paribas | | | 1,095 | | | | 75,331 | |
Covivio‡ | | | 40 | | | | 3,269 | |
Kering | | | 71 | | | | 56,818 | |
Societe Generale | | | 755 | | | | 25,816 | |
Valeo | | | 218 | | | | 6,560 | |
| | | | | | | | |
Total France | | | | | | | 225,153 | |
| | | | | | | | |
| | |
Germany — 5.3% | | | | | | | | |
Bayerische Motoren Werke | | | 306 | | | | 30,654 | |
Commerzbank* | | | 879 | | | | 6,656 | |
SAP | | | 1,043 | | | | 147,473 | |
Siemens | | | 764 | | | | 132,051 | |
| | | | | | | | |
Total Germany | | | | | | | 316,834 | |
| | | | | | | | |
| | |
Italy — 1.2% | | | | | | | | |
Intesa Sanpaolo | | | 16,215 | | | | 41,742 | |
UniCredit | | | 2,142 | | | | 32,842 | |
| | | | | | | | |
Total Italy | | | | | | | 74,584 | |
| | | | | | | | |
| | |
Japan — 4.1% | | | | | | | | |
ANA Holdings* | | | 31 | | | | 648 | |
Asics | | | 22 | | | | 487 | |
Astellas Pharma | | | 1,398 | | | | 22,724 | |
Bridgestone | | | 456 | | | | 19,611 | |
Canon | | | 786 | | | | 19,132 | |
East Japan Railway | | | 145 | | | | 8,912 | |
Eisai | | | 216 | | | | 12,259 | |
Fast Retailing | | | 60 | | | | 34,052 | |
FUJIFILM Holdings | | | 298 | | | | 22,079 | |
Fujitsu | | | 142 | | | | 24,347 | |
Konica Minolta | | | 15 | | | | 68 | |
Mizuho Financial Group | | | 1,968 | | | | 25,020 | |
NEC | | | 190 | | | | 8,767 | |
Nidec | | | 235 | | | | 27,610 | |
Takeda Pharmaceutical | | | 694 | | | | 18,919 | |
| | | | | | | | |
Total Japan | | | | | | | 244,635 | |
| | | | | | | | |
| | |
South Africa — 0.9% | | | | | | | | |
Anglo American Platinum | | | 57 | | | | 6,510 | |
AngloGold Ashanti | | | 354 | | | | 7,315 | |
Gold Fields | | | 772 | | | | 8,452 | |
Impala Platinum Holdings | | | 756 | | | | 10,694 | |
Nedbank Group | | | 387 | | | | 4,258 | |
Standard Bank Group | | | 1,250 | | | | 11,003 | |
Vodacom Group | | | 627 | | | | 5,307 | |
| | | | | | | | |
Total South Africa | | | | | | | 53,539 | |
| | | | | | | | |
| | |
Spain — 0.8% | | | | | | | | |
Atlantica Sustainable Infrastructure PLC | | | 344 | | | | 12,302 | |
Industria de Diseno Textil | | | 1,071 | | | | 34,591 | |
| | | | | | | | |
Total Spain | | | | | | | 46,893 | |
| | | | | | | | |
| | |
Switzerland — 9.1% | | | | | | | | |
Barry Callebaut | | | 3 | | | | 7,271 | |
Nestle | | | 2,295 | | | | 319,907 | |
Novartis | | | 2,285 | | | | 200,645 | |
Sonova Holding | | | 52 | | | | 20,351 | |
| | | | | | | | |
Total Switzerland | | | | | | | 548,174 | |
| | | | | | | | |
The accompanying notes are an integral part of the financial statements.
7
Impact Shares Sustainable Development Goals Global Equity ETF
Schedule of Investments
December 31, 2021 (Unaudited)
| | | | | | | | |
| Description | | Shares | | | Fair Value | |
| |
United Kingdom — 3.9% | | | | | |
GlaxoSmithKline PLC | | | 4,716 | | | $ | 102,255 | |
ITV* | | | 3,245 | | | | 4,842 | |
Lloyds Banking Group PLC | | | 67,438 | | | | 43,505 | |
Mondi PLC | | | 459 | | | | 11,311 | |
NatWest Group | | | 4,983 | | | | 15,179 | |
Pearson | | | 665 | | | | 5,503 | |
Pennon Group | | | 263 | | | | 4,142 | |
Unilever PLC | | | 932 | | | | 49,628 | |
| | | | | | | | |
Total United Kingdom | | | | | | | 236,365 | |
| | | | | | | | |
| |
United States — 67.8% | | | | | |
| | |
Communication Services — 5.9% | | | | | | | | |
Alphabet, Cl A* | | | 66 | | | | 191,205 | |
Alphabet, Cl C* | | | 53 | | | | 153,360 | |
Interpublic Group | | | 361 | | | | 13,519 | |
| | | | | | | | |
| | | | | | | 358,084 | |
| | | | | | | | |
| | |
Consumer Discretionary — 7.7% | | | | | | | | |
Ford Motor | | | 3,624 | | | | 75,270 | |
Gap | | | 188 | | | | 3,318 | |
General Motors* | | | 1,339 | | | | 78,506 | |
Lululemon Athletica* | | | 113 | | | | 44,234 | |
McDonald’s | | | 708 | | | | 189,793 | |
NIKE, Cl B | | | 53 | | | | 8,833 | |
VF | | | 301 | | | | 22,039 | |
Yum! Brands | | | 280 | | | | 38,881 | |
| | | | | | | | |
| | | | | | | 460,874 | |
| | | | | | | | |
| | |
Consumer Staples — 6.4% | | | | | | | | |
Colgate-Palmolive | | | 806 | | | | 68,784 | |
Mondelez International, Cl A | | | 1,331 | | | | 88,259 | |
PepsiCo | | | 1,317 | | | | 228,776 | |
| | | | | | | | |
| | | | | | | 385,819 | |
| | | | | | | | |
| | |
Financials — 10.9% | | | | | | | | |
Bank of America | | | 6,965 | | | | 309,873 | |
Hannon Armstrong Sustainable Infrastructure Capital‡ | | | 251 | | | | 13,333 | |
JPMorgan Chase | | | 1,672 | | | | 264,761 | |
Moody’s | | | 158 | | | | 61,712 | |
Morgan Stanley | | | 75 | | | | 7,362 | |
| | | | | | | | |
| | | | | | | 657,041 | |
| | | | | | | | |
| | |
Health Care — 9.2% | | | | | | | | |
AbbVie | | | 1,688 | | | | 228,555 | |
Anthem | | | 234 | | | | 108,469 | |
Edwards Lifesciences* | | | 620 | | | | 80,321 | |
Medtronic PLC | | | 1,296 | | | | 134,071 | |
| | | | | | | | |
| | | | | | | 551,416 | |
| | | | | | | | |
| | |
Industrials — 2.4% | | | | | | | | |
CSX | | | 1,700 | | | | 63,920 | |
Nordson | | | 51 | | | | 13,019 | |
United Airlines Holdings* | | | 300 | | | | 13,134 | |
Verisk Analytics, Cl A | | | 155 | | | | 35,453 | |
Xylem | | | 173 | | | | 20,746 | |
| | | | | | | | |
| | | | | | | 146,272 | |
| | | | | | | | |
| | | | | | | | |
| Description | | Shares/Number
of Warrants | | | Fair Value | |
|
Information Technology — 23.4% | |
Accenture PLC, Cl A | | | 615 | | | $ | 254,948 | |
Cisco Systems | | | 4,062 | | | | 257,409 | |
Dell Technologies, Cl C* | | | 264 | | | | 14,829 | |
Enphase Energy* | | | 429 | | | | 78,481 | |
First Solar* | | | 339 | | | | 29,547 | |
Hewlett Packard Enterprise | | | 1,215 | | | | 19,161 | |
HP | | | 1,138 | | | | 42,869 | |
Intel | | | 3,836 | | | | 197,554 | |
QUALCOMM | | | 1,084 | | | | 198,231 | |
salesforce.com* | | | 948 | | | | 240,915 | |
SolarEdge Technologies* | | | 169 | | | | 47,417 | |
VMware, Cl A* | | | 103 | | | | 11,936 | |
Western Digital* | | | 283 | | | | 18,454 | |
| | | | | | | | |
| | | | | | | 1,411,751 | |
| | | | | | | | |
| | |
Materials — 0.8% | | | | | | | | |
Newmont | | | 736 | | | | 45,647 | |
| | | | | | | | |
| | |
Real Estate — 0.3% | | | | | | | | |
Healthpeak Properties‡ | | | 509 | | | | 18,370 | |
| | | | | | | | |
| | |
Utilities — 0.7% | | | | | | | | |
Brookfield Renewable, Cl A | | | 1,151 | | | | 42,391 | |
| | | | | | | | |
Total United States | | | | | | | 4,077,665 | |
| | | | | | | | |
| | |
Total Common Stock | | | | | | | | |
(Cost $5,651,743) | | | | | | | 6,482,971 | |
| | | | | | | | |
|
PREFERRED STOCK — 0.1% | |
| |
Germany — 0.1% | | | | | |
Bayerische Motoren Werke (A) | | | 52 | | | | 4,315 | |
| | | | | | | | |
Total Germany | | | | | | | 4,315 | |
| | | | | | | | |
| | |
Total Preferred Stock | | | | | | | | |
(Cost $4,506) | | | | | | | 4,315 | |
| | | | | | | | |
|
WARRANT — 0.0% | |
Occidental Petroleum
Expires, 8/6/27 Strike Price $22.00* | | | 21 | | | | 265 | |
| | | | | | | | |
| | |
Total Warrant | | | | | | | | |
(Cost $—) | | | | | | | 265 | |
| | | | | | | | |
| | |
Total Investments — 107.7% | | | | | | | | |
(Cost $5,656,249) | | | | | | $ | 6,487,551 | |
| | | | | | | | |
| | | | | | | | |
Percentages are based on Net Assets of $6,025,498.
| | |
‡ | | Real Estate Investment Trust |
* | | Non-income producing security. |
(A) | | There is currently no rate available. |
Cl — Class
PLC — Public Limited Company
As of December 31, 2021, all of the Fund’s investments were considered Level 1, in accordance with the authoritative guidance under U.S. Generally Accepted Accounting Principles.
For the period ended December 31, 2021, there were no transfers in or out of Level 3.
For more information on valuation inputs, see Note 2 in the Notes to Financial Statements.
The accompanying notes are an integral part of the financial statements.
8
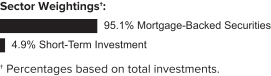
Impact Shares Affordable Housing MBS ETF
Schedule of Investments
December 31, 2021 (Unaudited)
| | | | | | | | |
| Description | | Face
Amount/Shares | | | Fair Value | |
|
MORTGAGE-BACKED SECURITIES — 94.9% | |
| |
Agency Mortgage-Backed Obligations — 94.9% | | | | | |
FHLMC | | | | | | | | |
6.000%,12/01/2023 | | $ | 171,293 | | | $ | 187,991 | |
5.500%,02/01/2029 | | | 117,602 | | | | 128,725 | |
5.000%,03/01/2050 | | | 35,756 | | | | 38,981 | |
4.500%, 01/01/2049 to 03/01/2050 | | | 946,692 | | | | 1,015,195 | |
4.000%, 04/01/2048 to 06/01/2048 | | | 1,858,050 | | | | 1,976,430 | |
3.500%,10/01/2051 | | | 257,267 | | | | 273,285 | |
3.000%, 09/01/2034 to 06/01/2051 | | | 8,900,794 | | | | 9,235,397 | |
2.500%, 08/01/2051 to 12/01/2051 | | | 6,993,487 | | | | 7,172,002 | |
2.000%, 08/01/2035 to 12/01/2051 | | | 12,499,802 | | | | 12,614,917 | |
1.500%,08/01/2036 | | | 491,673 | | | | 493,271 | |
FNMA | | | | | | | | |
5.500%,04/01/2031 | | | 199,121 | | | | 217,774 | |
5.000%, 12/01/2048 to 03/01/2050 | | | 604,258 | | | | 658,743 | |
4.500%, 11/01/2048 to 02/01/2050 | | | 1,136,845 | | | | 1,217,048 | |
4.000%, 07/01/2048 to 11/01/2050 | | | 3,629,776 | | | | 3,866,499 | |
3.500%, 06/01/2028 to 01/01/2051 | | | 8,480,605 | | | | 8,931,123 | |
3.000%, 04/01/2025 to 11/01/2051 | | | 3,931,973 | | | | 4,090,301 | |
2.500%, 05/01/2026 to 12/01/2051 | | | 13,574,136 | | | | 13,955,330 | |
2.000%, 04/01/2036 to 12/01/2051 | | | 18,219,191 | | | | 18,309,054 | |
1.500%, 10/01/2036 to 09/01/2051 | | | 1,724,883 | | | | 1,688,952 | |
GNMA | | | | | | | | |
5.000%,03/20/2050 | | | 211,188 | | | | 226,749 | |
4.500%,02/20/2050 | | | 601,655 | | | | 636,947 | |
4.000%, 10/20/2050 to 01/20/2051 | | | 1,275,731 | | | | 1,344,536 | |
3.500%,12/20/2050 | | | 2,499,718 | | | | 2,607,284 | |
3.000%,03/20/2050 | | | 3,205,234 | | | | 3,318,962 | |
2.500%,08/20/2051 | | | 1,689,515 | | | | 1,739,331 | |
| | | | | | | | |
Total Mortgage-Backed Securities
(Cost $96,981,612) | | | | | | | 95,944,827 | |
| | | | | | | | |
|
SHORT-TERM INVESTMENT — 4.9% | |
Morgan Stanley Institutional Liquidity Fund, Government Portfolio, 0.030% (A) | | | 4,910,581 | | | | 4,910,581 | |
| | | | | | | | |
| | |
Total Short-Term Investment
(Cost $4,910,581) | | | | | | | 4,910,581 | |
| | | | | | | | |
| | |
Total Investments - 99.8%
(Cost $101,892,193) | | | | | | $ | 100,855,408 | |
| | | | | | | | |
| | | | | | | | |
Percentages are based on Net Assets of $101,107,399.
| | |
(A) | | Rate shown represents the 7-day effective yield as of December 31, 2021. |
The following is a summary of the inputs used as of December 31, 2021 in valuing the Fund’s investments carried at value:
| | | | | | | | | | | | | | | | |
Investments in
Securities | | Level 1 | | | Level 2 | | | Level 3 | | | Total | |
Mortgage-Backed Securities | | $ | — | | | $ | 95,944,827 | | | $ | — | | | $ | 95,944,827 | |
Short-Term Investment | | | 4,910,581 | | | | — | | | | — | | | | 4,910,581 | |
| | | | |
Total Investments in Securities | | $ | 4,910,581 | | | $ | 95,944,827 | | | $ | — | | | $ | 100,855,408 | |
| | | | |
For the period ended December 31, 2021, there were no transfers in or out of Level 3.
For more information on valuation inputs, see Note 2 in the Notes to Financial Statements.
The accompanying notes are an integral part of the financial statements.
9
Impact Shares MSCI Global Climate Select ETF
Schedule of Investments
December 31, 2021 (Unaudited)
| | | | | | | | |
| Description | | Shares | | | Fair Value | |
|
COMMON STOCK — 89.6% | |
Communication Services — 7.8% | | | | | | | | |
Alphabet, Cl A* | | | 22 | | | $ | 63,735 | |
Alphabet, Cl C* | | | 2 | | | | 5,787 | |
AT&T | | | 136 | | | | 3,346 | |
BT Group, Cl A | | | 3,360 | | | | 7,689 | |
Elisa | | | 94 | | | | 5,759 | |
Informa PLC* | | | 842 | | | | 5,870 | |
KDDI | | | 2 | | | | 58 | |
Koninklijke KPN | | | 2,218 | | | | 6,855 | |
Orange | | | 422 | | | | 4,497 | |
Pearson | | | 594 | | | | 4,916 | |
Publicis Groupe | | | 60 | | | | 4,021 | |
Rogers Communications, Cl B | | | 30 | | | | 1,418 | |
SEEK | | | 76 | | | | 1,807 | |
Singapore Telecommunications | | | 2,422 | | | | 4,156 | |
Swisscom | | | 16 | | | | 9,006 | |
Tele2, Cl B | | | 34 | | | | 485 | |
Telefonica | | | 500 | | | | 2,180 | |
Telenor | | | 20 | | | | 314 | |
Telia | | | 166 | | | | 649 | |
TELUS | | | 198 | | | | 4,627 | |
Verizon Communications | | | 226 | | | | 11,743 | |
Vodafone Group PLC | | | 2,554 | | | | 3,869 | |
Walt Disney* | | | 24 | | | | 3,717 | |
| | | | | | | | |
| | | | | | | 156,504 | |
| | | | | | | | |
Consumer Discretionary — 7.6% | | | | | | | | |
adidas | | | 8 | | | | 2,293 | |
Allianz | | | 30 | | | | 7,052 | |
Berkeley Group Holdings | | | 36 | | | | 2,320 | |
Best Buy | | | 86 | | | | 8,738 | |
Burberry Group | | | 106 | | | | 2,600 | |
Etsy* | | | 16 | | | | 3,503 | |
H & M Hennes & Mauritz, Cl B | | | 18 | | | | 354 | |
Home Depot | | | 38 | | | | 15,770 | |
Hydro One | | | 152 | | | | 3,925 | |
Industria de Diseno Textil | | | 294 | | | | 9,495 | |
Kingfisher | | | 1,664 | | | | 7,597 | |
| | | | | | | | |
| Description | | Shares | | | Fair Value | |
| | |
Klepierre*‡ | | | 86 | | | $ | 2,030 | |
Lowe’s | | | 10 | | | | 2,585 | |
Lululemon Athletica* | | | 6 | | | | 2,349 | |
McDonald’s | | | 16 | | | | 4,289 | |
MercadoLibre* | | | 2 | | | | 2,697 | |
NIKE, Cl B | | | 34 | | | | 5,667 | |
NIO ADR* | | | 56 | | | | 1,774 | |
Oriental Land | | | 2 | | | | 337 | |
Puma | | | 26 | | | | 3,164 | |
Sekisui House | | | 2 | | | | 43 | |
Sony Group | | | 2 | | | | 251 | |
Target | | | 32 | | | | 7,406 | |
Tesla* | | | 42 | | | | 44,385 | |
VF | | | 54 | | | | 3,954 | |
XPeng ADR, Cl A* | | | 128 | | | | 6,442 | |
Zalando* | | | 22 | | | | 1,772 | |
| | | | | | | | |
| | | | | | | 152,792 | |
| | | | | | | | |
Consumer Staples — 2.2% | | | | | | | | |
Aeon | | | 2 | | | | 47 | |
Beiersdorf | | | 30 | | | | 3,069 | |
Carrefour | | | 202 | | | | 3,683 | |
Coca-Cola | | | 98 | | | | 5,803 | |
Colgate-Palmolive | | | 98 | | | | 8,363 | |
Estee Lauder, Cl A | | | 8 | | | | 2,962 | |
General Mills | | | 30 | | | | 2,021 | |
ICA Gruppen | | | 6 | | | | 354 | |
Kellogg | | | 28 | | | | 1,804 | |
Procter & Gamble | | | 94 | | | | 15,377 | |
| | | | | | | | |
| | | | | | | 43,483 | |
| | | | | | | | |
Financials — 15.7% | | | | | | | | |
3i Group | | �� | 768 | | | | 15,019 | |
Allstate | | | 16 | | | | 1,883 | |
American Express | | | 78 | | | | 12,761 | |
Australia & New Zealand Banking Group | | | 84 | | | | 1,675 | |
AXA | | | 1,010 | | | | 29,939 | |
Banco Bilbao Vizcaya Argentaria | | | 504 | | | | 2,995 | |
Bank of America | | | 66 | | | | 2,936 | |
Bank of Montreal | | | 34 | | | | 3,633 | |
Bank of New York Mellon | | | 94 | | | | 5,459 | |
Bank of Nova Scotia | | | 60 | | | | 4,215 | |
BlackRock, Cl A | | | 12 | | | | 10,987 | |
Canadian Imperial Bank of Commerce | | | 150 | | | | 17,352 | |
Citigroup | | | 48 | | | | 2,899 | |
CME Group, Cl A | | | 10 | | | | 2,284 | |
Credit Suisse Group | | | 304 | | | | 2,950 | |
DBS Group Holdings | | | 88 | | | | 2,126 | |
Deutsche Bank* | | | 366 | | | | 4,565 | |
Deutsche Boerse | | | 14 | | | | 2,331 | |
DNB Bank | | | 30 | | | | 687 | |
FirstRand | | | 130 | | | | 497 | |
Insurance Australia Group | | | 418 | | | | 1,291 | |
Intact Financial | | | 20 | | | | 2,580 | |
Intesa Sanpaolo | | | 1,864 | | | | 4,799 | |
Invesco | | | 186 | | | | 4,282 | |
JPMorgan Chase | | | 136 | | | | 21,536 | |
KBC Group | | | 30 | | | | 2,563 | |
The accompanying notes are an integral part of the financial statements.
10
Impact Shares MSCI Global Climate Select ETF
Schedule of Investments
December 31, 2021 (Unaudited)
| | | | | | | | |
| Description | | Shares | | | Fair Value | |
| | |
KeyCorp | | | 172 | | | $ | 3,978 | |
Lloyds Banking Group PLC | | | 6,500 | | | | 4,193 | |
London Stock Exchange Group PLC | | | 132 | | | | 12,346 | |
Marsh & McLennan | | | 48 | | | | 8,343 | |
Moody’s | | | 60 | | | | 23,435 | |
Morgan Stanley | | | 54 | | | | 5,301 | |
Nedbank Group | | | 1 | | | | 11 | |
NN Group | | | 164 | | | | 8,839 | |
Northern Trust | | | 106 | | | | 12,679 | |
Old Mutual | | | 146 | | | | 120 | |
PNC Financial Services Group | | | 34 | | | | 6,818 | |
Prudential Financial | | | 50 | | | | 5,412 | |
Regions Financial | | | 152 | | | | 3,314 | |
Royal Bank of Canada | | | 16 | | | | 1,685 | |
S&P Global | | | 52 | | | | 24,540 | |
SBI Holdings | | | 2 | | | | 54 | |
State Street | | | 46 | | | | 4,278 | |
Sun Life Financial | | | 68 | | | | 3,756 | |
SVB Financial Group* | | | 6 | | | | 4,069 | |
Swedbank | | | 28 | | | | 563 | |
Swiss Re | | | 32 | | | | 3,159 | |
T Rowe Price Group | | | 26 | | | | 5,113 | |
Toronto-Dominion Bank | | | 36 | | | | 2,739 | |
Travelers | | | 30 | | | | 4,693 | |
Zurich Insurance Group | | | 6 | | | | 2,628 | |
| | | | | | | | |
| | | | | | | 316,310 | |
| | | | | | | | |
Health Care — 9.0% | | | | | | | | |
AbbVie | | | 48 | | | | 6,500 | |
Agilent Technologies | | | 16 | | | | 2,554 | |
Amgen | | | 30 | | | | 6,749 | |
Anthem | | | 18 | | | | 8,343 | |
Astellas Pharma | | | 2 | | | | 32 | |
AstraZeneca PLC | | | 88 | | | | 10,306 | |
Becton Dickinson | | | 14 | | | | 3,521 | |
Biogen* | | | 12 | | | | 2,879 | |
Bristol-Myers Squibb | | | 42 | | | | 2,619 | |
Chugai Pharmaceutical | | | 2 | | | | 65 | |
Cigna | | | 60 | | | | 13,778 | |
CVS Health | | | 86 | | | | 8,872 | |
Daiichi Sankyo | | | 2 | | | | 51 | |
DaVita* | | | 34 | | | | 3,868 | |
Edwards Lifesciences* | | | 120 | | | | 15,546 | |
Eisai | | | 2 | | | | 113 | |
Eli Lilly | | | 52 | | | | 14,363 | |
Gilead Sciences | | | 110 | | | | 7,987 | |
GlaxoSmithKline PLC | | | 320 | | | | 6,938 | |
Humana | | | 16 | | | | 7,422 | |
IDEXX Laboratories* | | | 4 | | | | 2,634 | |
Illumina* | | | 12 | | | | 4,565 | |
Johnson & Johnson | | | 112 | | | | 19,160 | |
Merck | | | 60 | | | | 4,598 | |
Novartis | | | 34 | | | | 2,986 | |
Novo Nordisk, Cl B | | | 12 | | | | 1,343 | |
Ono Pharmaceutical | | | 2 | | | | 50 | |
Quest Diagnostics | | | 14 | | | | 2,422 | |
Takeda Pharmaceutical | | | 2 | | | | 55 | |
UCB | | | 26 | | | | 2,954 | |
UnitedHealth Group | | | 20 | | | | 10,043 | |
| | | | | | | | |
| Description | | Shares | | | Fair Value | |
| | |
Vertex Pharmaceuticals* | | | 10 | | | $ | 2,196 | |
Waters* | | | 6 | | | | 2,236 | |
Zoetis, Cl A | | | 14 | | | | 3,416 | |
| | | | | | | | |
| | | | | | | 181,164 | |
| | | | | | | | |
Industrials — 11.4% | | | | | | | | |
ABB | | | 1,078 | | | | 41,151 | |
Alstom | | | 184 | | | | 6,503 | |
Brambles | | | 258 | | | | 1,988 | |
Central Japan Railway | | | 2 | | | | 267 | |
Expeditors International of Washington | | | 28 | | | | 3,760 | |
Ferguson PLC | | | 72 | | | | 12,734 | |
IHS Markit | | | 180 | | | | 23,925 | |
Keisei Electric Railway | | | 2 | | | | 54 | |
Kingspan Group | | | 102 | | | | 12,124 | |
Kintetsu Group Holdings* | | | 2 | | | | 56 | |
KION Group | | | 44 | | | | 4,806 | |
Legrand | | | 62 | | | | 7,222 | |
Nibe Industrier, Cl B | | | 94 | | | | 1,420 | |
Odakyu Electric Railway | | | 2 | | | | 37 | |
Plug Power* | | | 62 | | | | 1,750 | |
Robert Half International | | | 30 | | | | 3,346 | |
Schneider Electric | | | 292 | | | | 57,008 | |
SGS | | | 4 | | | | 13,331 | |
Shimizu | | | 2 | | | | 13 | |
Sunrun* | | | 98 | | | | 3,362 | |
Thomson Reuters | | | 72 | | | | 8,545 | |
Tokyu | | | 2 | | | | 26 | |
Trane Technologies | | | 22 | | | | 4,444 | |
Transurban Group | | | 684 | | | | 6,854 | |
Vestas Wind Systems | | | 90 | | | | 2,740 | |
West Japan Railway | | | 2 | | | | 84 | |
WSP Global | | | 52 | | | | 7,491 | |
WW Grainger | | | 6 | | | | 3,110 | |
| | | | | | | | |
| | | | | | | 228,151 | |
| | | | | | | | |
Information Technology — 26.4% | | | | | | | | |
Accenture PLC, Cl A | | | 98 | | | | 40,626 | |
Adobe* | | | 36 | | | | 20,414 | |
Analog Devices | | | 104 | | | | 18,280 | |
Apple | | | 400 | | | | 71,028 | |
Atos | | | 66 | | | | 2,794 | |
Autodesk* | | | 32 | | | | 8,998 | |
Azbil | | | 2 | | | | 91 | |
Capgemini | | | 16 | | | | 3,903 | |
Citrix Systems | | | 68 | | | | 6,432 | |
Dassault Systemes | | | 438 | | | | 25,938 | |
Dell Technologies, Cl C* | | | 136 | | | | 7,639 | |
Edenred | | | 44 | | | | 2,021 | |
Enphase Energy* | | | 24 | | | | 4,391 | |
Fujitsu | | | 2 | | | | 343 | |
GDS Holdings ADR* | | | 52 | | | | 2,452 | |
Getlink | | | 292 | | | | 4,813 | |
Hewlett Packard Enterprise | | | 742 | | | | 11,701 | |
Intel | | | 240 | | | | 12,360 | |
Intuit | | | 24 | | | | 15,437 | |
Keysight Technologies* | | | 20 | | | | 4,130 | |
Mastercard, Cl A | | | 52 | | | | 18,685 | |
Microsoft | | | 356 | | | | 119,730 | |
The accompanying notes are an integral part of the financial statements.
11
Impact Shares MSCI Global Climate Select ETF
Schedule of Investments
December 31, 2021 (Unaudited)
| | | | | | | | |
| Description | | Shares | | | Fair Value | |
| | |
NEC | | | 2 | | | $ | 92 | |
Nokia* | | | 474 | | | | 2,991 | |
Nomura Research Institute | | | 2 | | | | 86 | |
NVIDIA | | | 98 | | | | 28,823 | |
Omron | | | 2 | | | | 199 | |
Oracle | | | 306 | | | | 26,686 | |
PayPal Holdings* | | | 52 | | | | 9,806 | |
salesforce.com* | | | 76 | | | | 19,314 | |
ServiceNow* | | | 32 | | | | 20,772 | |
SolarEdge Technologies* | | | 16 | | | | 4,489 | |
Telefonaktiebolaget LM Ericsson, Cl B | | | 18 | | | | 198 | |
TIS | | | 2 | | | | 59 | |
Visa, Cl A | | | 8 | | | | 1,734 | |
VMware, Cl A* | | | 108 | | | | 12,515 | |
Worldline* | | | 22 | | | | 1,221 | |
| | | | | | | | |
| | | | | | | 531,191 | |
| | | | | | | | |
Materials — 1.1% | | | | | | | | |
L’Oreal | | | 38 | | | | 17,936 | |
Novozymes, Cl B | | | 18 | | | | 1,472 | |
Wheaton Precious Metals | | | 68 | | | | 2,896 | |
| | | | | | | | |
| | | | | | | 22,304 | |
| | | | | | | | |
Real Estate — 7.5% | | | | | | | | |
Boston Properties‡ | | | 68 | | | | 7,832 | |
British Land‡ | | | 694 | | | | 4,973 | |
CapitaLand Integrated Commercial Trust‡ | | | 1,936 | | | | 2,921 | |
Capitaland Investment* | | | 764 | | | | 1,927 | |
CBRE Group, Cl A* | | | 178 | | | | 19,315 | |
Covivio‡ | | | 34 | | | | 2,779 | |
Daiwa House Industry | | | 2 | | | | 57 | |
Dexus‡ | | | 394 | | | | 3,177 | |
Equinix‡ | | | 14 | | | | 11,842 | |
Gecina‡ | | | 30 | | | | 4,174 | |
Goodman Group‡ | | | 648 | | | | 12,450 | |
Healthpeak Properties‡ | | | 230 | | | | 8,301 | |
Iron Mountain‡ | | | 132 | | | | 6,908 | |
Land Securities Group‡ | | | 362 | | | | 3,793 | |
Mitsui Fudosan | | | 2 | | | | 40 | |
Prologis‡ | | | 130 | | | | 21,887 | |
Segro‡ | | | 872 | | | | 16,905 | |
Simon Property Group‡ | | | 24 | | | | 3,834 | |
Unibail-Rodamco-Westfield*‡ | | | 54 | | | | 3,767 | |
Ventas‡ | | | 38 | | | | 1,943 | |
Vonovia* | | | 206 | | | | 11,310 | |
| | | | | | | | |
| | | | | | | 150,135 | |
| | | | | | | | |
Utilities — 0.9% | | | | | | | | |
Elia Group | | | 20 | | | | 2,619 | |
Meridian Energy | | | 526 | | | | 1,743 | |
Red Electrica | | | 286 | | | | 6,160 | |
Terna - Rete Elettrica Nazionale | | | 932 | | | | 7,506 | |
| | | | | | | | |
| | | | | | | 18,028 | |
| | | | | | | | |
Total Common Stock
(Cost $1,781,570) | | | | | | | 1,800,062 | |
| | | | | | | | |
Total Investments - 89.6%
(Cost $1,781,570) | | | | | | $ | 1,800,062 | |
| | | | | | | | |
Percentages are based on Net Assets of $2,008,557.
| * | Non-income producing security. |
| ‡ | Real Estate Investment Trust |
ADR – American Depositary Receipt
Cl — Class
PLC — Public Limited Company
As of December 31, 2021, all of the Fund’s investments were considered Level 1, in accordance with the authoritative guidance under U.S. Generally Accepted Accounting Principles.
For the period ended December 31, 2021, there were no transfers in or out of Level 3.
For more information on valuation inputs, see Note 2 in the Notes to Financial Statements.
The accompanying notes are an integral part of the financial statements.
12
Impact Shares Trust I
Statements of Assets and Liabilities
December 31, 2021 (Unaudited)
| | | | | | | | | | | | |
| | | Impact Shares
YWCA
Women’s
Empowerment
ETF | | | Impact Shares
NAACP
Minority
Empowerment
ETF | | | Impact Shares
Sustainable
Development
Goals Global
Equity ETF | |
Assets: | | | | | | | | | | | | |
Investments, at Cost | | $ | 31,358,790 | | | $ | 31,163,967 | | | $ | 5,656,249 | |
| | | | | | | | | | | | |
Investments, at Fair Value | | $ | 38,766,460 | | | $ | 39,985,253 | | | $ | 6,487,551 | |
Dividends Receivable | | | 17,845 | | | | 17,635 | | | | 5,632 | |
Receivable for Expense Reimbursement | | | 8,003 | | | | 8,536 | | | | 1,353 | |
Reclaims Receivable | | | 969 | | | | 473 | | | | 8,785 | |
| | | | | | | | | | | | |
Total Assets | | | 38,793,277 | | | | 40,011,897 | | | | 6,503,321 | |
| | | | | | | | | | | | |
| | | |
Liabilities: | | | | | | | | | | | | |
Due to Custodian | | | 1,019,326 | | | | 971,280 | | | | 443,556 | |
Advisory Fees Payable | | | 24,259 | | | | 16,105 | | | | 3,667 | |
Payable for Trustees’ Fee | | | 8,003 | | | | 8,536 | | | | 1,353 | |
Foreign Currency Payable, at value (Cost $–, $– and $30,822) | | | — | | | | — | | | | 29,247 | |
| | | | | | | | | | | | |
Total Liabilities | | | 1,051,588 | | | | 995,921 | | | | 477,823 | |
| | | | | | | | | | | | |
Net Assets | | $ | 37,741,689 | | | $ | 39,015,976 | | | $ | 6,025,498 | |
| | | | | | | | | | | | |
Net Assets Consist of: | | | | | | | | | | | | |
Paid-in Capital | | $ | 30,427,399 | | | $ | 29,984,073 | | | $ | 5,195,618 | |
Total Distributable Earnings | | | 7,314,290 | | | | 9,031,903 | | | | 829,880 | |
| | | | | | | | | | | | |
Net Assets | | $ | 37,741,689 | | | $ | 39,015,976 | | | $ | 6,025,498 | |
| | | | | | | | | | | | |
Outstanding Shares of Beneficial Interest (unlimited authorization — no par value) | | | 1,075,001 | | | | 1,100,000 | | | | 225,001 | |
Net Asset Value, Offering and Redemption Price Per Share | | $ | 35.11 | | | $ | 35.47 | | | $ | 26.78 | |
| | | | | | | | | | | | |
Amounts designated as “-“ are $0.
The accompanying notes are an integral part of the financial statements.
13
Impact Shares Trust I
Statements of Assets and Liabilities
December 31, 2021 (Unaudited)
| | | | | | | | |
| | | Impact Shares
Affordable
Housing MBS
ETF | | | Impact Shares
MSCI Global
Climate
Select ETF | |
Assets: | | | | | | | | |
Investments, at Cost | | $ | 101,892,193 | | | $ | 1,781,570 | |
| | | | | | | | |
Investments, at Fair Value | | $ | 100,855,408 | | | $ | 1,800,062 | |
Cash and Cash Equivalents | | | 24,138 | | | | 198,407 | |
Foreign Currency, at Value (Cost $– and $35) | | | — | | | | 35 | |
Dividends and Interest Receivable | | | 211,717 | | | | 1,789 | |
Deferred Offering Costs | | | 62,226 | | | | 11,794 | |
Receivable for Expense Reimbursement | | | 21,679 | | | | 429 | |
Reimbursement/Receivable due from Investment Adviser | | | 2,290 | | | | 26,477 | |
Reclaims Receivable | | | — | | | | 75 | |
| | | | | | | | |
Total Assets | | | 101,177,458 | | | | 2,039,068 | |
| | | | | | | | |
Liabilities: | | | | | | | | |
Payable for Trustees’ Fee | | | 26,324 | | | | 2,888 | |
Payable for Audit Fees | | | 11,612 | | | | 6,146 | |
Payable for Registration Fees | | | 7,986 | | | | 2,641 | |
Payable for Miscellaneous Fees | | | 7,206 | | | | 3,380 | |
Payable for Printing Fees | | | 5,496 | | | | 2,459 | |
Payable due to Administrator | | | 5,179 | | | | 2,123 | |
Payable for Insurance Fees | | | 4,645 | | | | 2,459 | |
Other Accrued Expenses | | | 1,611 | | | | 8,415 | |
| | | | | | | | |
Total Liabilities | | | 70,059 | | | | 30,511 | |
| | | | | | | | |
Net Assets | | $ | 101,107,399 | | | $ | 2,008,557 | |
| | | | | | | | |
Net Assets Consist of: | | | | | | | | |
Paid-in Capital | | $ | 102,940,516 | | | $ | 2,000,000 | |
Total Distributable Earnings/(Loss) | | | (1,833,117 | ) | | | 8,557 | |
| | | | | | | | |
Net Assets | | $ | 101,107,399 | | | $ | 2,008,557 | |
| | | | | | | | |
Outstanding Shares of Beneficial Interest (unlimited authorization — no par value) | | | 5,150,000 | | | | 100,000 | |
Net Asset Value, Offering and Redemption Price Per Share | | $ | 19.63 | | | $ | 20.09 | |
| | | | | | | | |
Amounts designated as “-“ are $0.
The accompanying notes are an integral part of the financial statements.
14
Impact Shares Trust
Statements of Operations
For the Period Ended December 31, 2021 (Unaudited)
| | | | | | | | | | | | |
| | | Impact Shares
YWCA
Women’s
Empowerment
ETF | | | Impact Shares
NAACP
Minority
Empowerment
ETF | | | Impact Shares
Sustainable
Development
Goals Global
Equity ETF | |
Investment Income: | | | | | | | | | | | | |
Dividend Income | | $ | 221,673 | | | $ | 239,801 | | | $ | 56,213 | |
Less: Foreign Taxes Withheld | | | (353 | ) | | | (10 | ) | | | (2,465 | ) |
| | | | | | | | | | | | |
Total Investment Income | | | 221,320 | | | | 239,791 | | | | 53,748 | |
| | | | | | | | | | | | |
| | | |
Expenses: | | | | | | | | | | | | |
Advisory Fees | | | 125,598 | | | | 87,539 | | | | 21,251 | |
| | | | | | | | | | | | |
| | | |
Net Investment Income | | | 95,722 | | | | 152,252 | | | | 32,497 | |
| | | | | | | | | | | | |
| | | |
Net Realized Gain (Loss) on: | | | | | | | | | | | | |
Investments | | | (10,294 | ) | | | 314,452 | | | | 8,634 | |
Foreign Currency Transactions | | | — | | | | — | | | | (1,324 | ) |
| | | | | | | | | | | | |
| | | |
Net Realized Gain (Loss) on Investments and Foreign Currency Transactions | | | (10,294 | ) | | | 314,452 | | | | 7,310 | |
| | | | | | | | | | | | |
| | | |
Net Change in Unrealized Appreciation: | | | | | | | | | | | | |
Investments | | | 2,975,989 | | | | 3,434,750 | | | | 383,851 | |
Foreign Currency Translation | | | — | | | | — | | | | 1,612 | |
| | | | | | | | | | | | |
Net Change in Unrealized Appreciation on Investments and Foreign Currency Translation | | | 2,975,989 | | | | 3,434,750 | | | | 385,463 | |
| | | | | | | | | | | | |
Net Realized and Unrealized Gain on Investments and Foreign Currency Transactions | | | 2,965,695 | | | | 3,749,202 | | | | 392,773 | |
| | | | | | | | | | | | |
| | | |
Net Increase in Net Assets Resulting from Operations | | | $ 3,061,417 | | | | $ 3,901,454 | | | | $ 425,270 | |
| | | | | | | | | | | | |
Amounts designated as “-“ are either $0 or have been rounded to $0.
The accompanying notes are an integral part of the financial statements.
15
Impact Shares Trust
Statements of Operations
For the Period Ended December 31, 2021 (Unaudited)
| | | | | | | | |
| | | Impact Shares
Affordable
Housing MBS
ETF(1) | | | Impact Shares
MSCI Global
Climate Select
ETF(2) | |
Investment Income: | | | | | | | | |
Dividend Income | | $ | 499 | | | $ | 4,371 | |
Interest Income | | | 289,312 | | | | — | |
Less: Foreign Taxes Withheld | | | — | | | | (205 | ) |
| | | | | | | | |
Total Investment Income | | | 289,811 | | | | 4,166 | |
| | | | | | | | |
| | |
Expenses: | | | | | | | | |
Advisory Fees | | | 122,575 | | | | 918 | |
Trustee Fees | | | 4,645 | | | | 2,459 | |
Administration fees | | | 29,629 | | | | 4,178 | |
Audit fees | | | 11,612 | | | | 6,146 | |
Legal fees | | | 10,534 | | | | 4,097 | |
Custodian Fees | | | 12,335 | | | | 4,916 | |
Offering Costs | | | 41,956 | | | | 16,840 | |
Pricing fees | | | 4,018 | | | | 1,639 | |
Printing Fees | | | 5,496 | | | | 2,459 | |
Registration fees | | | 7,986 | | | | 2,640 | |
Transfer Agent Fees | | | 2,157 | | | | 17 | |
Other Fees | | | 11,851 | | | | 5,839 | |
| | | | | | | | |
| | |
Total Expenses | | | 264,794 | | | | 52,148 | |
| | | | | | | | |
| | |
Less: | | | | | | | | |
Advisory Waiver | | | (122,575 | ) | | | (918 | ) |
Advisor Expense Reimbursement | | | (19,834 | ) | | | (49,817 | ) |
| | | | | | | | |
| | |
Net Expenses | | | 122,385 | | | | 1,413 | |
| | | | | | | | |
| | |
Net Investment Income | | | 167,426 | | | | 2,753 | |
| | | | | | | | |
| | |
Net Realized Gain (Loss) on: | | | | | | | | |
Investments | | | (226,660 | ) | | | 113 | |
Foreign Currency Transactions | | | — | | | | 12 | |
| | | | | | | | |
| | |
Net Realized Gain (Loss) on Investments and Foreign Currency Transactions | | | (226,660 | ) | | | 125 | |
| | | | | | | | |
| | |
Net Unrealized Appreciation (Depreciation): | | | | | | | | |
Investments | | | (1,036,785 | ) | | | 18,492 | |
Foreign Currency Translation | | | — | | | | 9 | |
| | | | | | | | |
Net Unrealized Appreciation (Depreciation) on Investments and Foreign Currency Translation | | | (1,036,785 | ) | | | 18,501 | |
| | | | | | | | |
Net Realized and Unrealized Gain (Loss) on Investments and Foreign Currency Transactions | | | (1,263,445 | ) | | | 18,626 | |
| | | | | | | | |
| | |
Net Increase (Decrease) in Net Assets Resulting from Operations | | | $ (1,096,019 | ) | | | $ 21,379 | |
| | | | | | | | |
| (1) | Commenced operations on July 26, 2021. |
| (2) | Commenced operations on November 2, 2021. |
The accompanying notes are an integral part of the financial statements.
16
Impact Shares Trust I
Statements of Changes in Net Assets
| | | | | | | | |
| | | Impact Shares YWCA Women’s
Empowerment ETF | |
| | | Period Ended
December 31,
2021
(Unaudited) | | | Year ended
June 30, 2021 | |
Operations: | | | | | | | | |
Net Investment Income | | $ | 95,722 | | | $ | 102,403 | |
Net Realized Gain (Loss) on Investments and Foreign Currency Transaction | | | (10,294 | ) | | | 1,269,849 | |
Net Change in Unrealized Appreciation on Investments and Foreign Currency Translation | | | 2,975,989 | | | | 3,863,812 | |
| | | | | | | | |
Net Increase in Net Assets Resulting from Operations | | | 3,061,417 | | | | 5,236,064 | |
| | | | | | | | |
| | |
Distributions | | | (1,055,395 | ) | | | (770,423 | ) |
| | | | | | | | |
Capital Share Transactions: | | | | | | | | |
Issued | | | 6,173,881 | | | | 17,681,768 | |
| | | | | | | | |
| | |
Increase in Net Assets from Capital Share Transactions | | | 6,173,881 | | | | 17,681,768 | |
| | | | | | | | |
| | |
Total Increase in Net Assets | | | 8,179,903 | | | | 22,147,409 | |
| | | | | | | | |
Net Assets: | | | | | | | | |
Beginning of Period/Year | | | 29,561,786 | | | | 7,414,377 | |
| | | | | | | | |
End of Period/Year | | $ | 37,741,689 | | | $ | 29,561,786 | |
| | | | | | | | |
Share Transactions: | | | | | | | | |
Issued | | | 175,000 | | | | 575,000 | |
| | | | | | | | |
Net Increase in Shares Outstanding from Share Transactions | | | 175,000 | | | | 575,000 | |
| | | | | | | | |
The accompanying notes are an integral part of the financial statements.
17
Impact Shares Trust I
Statements of Changes in Net Assets
| | | | | | | | |
| | | Impact Shares NAACP Minority
Empowerment ETF | |
| | | Period Ended
December 31,
2021
(Unaudited) | | | Year ended
June 30, 2021 | |
Operations: | | | | | | | | |
Net Investment Income | | $ | 152,252 | | | $ | 188,380 | |
Net Realized Gain on Investments and Foreign Currency Transactions | | | 314,452 | | | | 882,950 | |
Net Change in Unrealized Appreciation on Investments and Foreign Currency Translation | | | 3,434,750 | | | | 5,143,120 | |
| | | | | | | | |
Net Increase in Net Assets Resulting from Operations | | | 3,901,454 | | | | 6,214,450 | |
| | | | | | | | |
| | |
Distributions | | | (1,041,517 | ) | | | (317,178 | ) |
| | | | | | | | |
Capital Share Transactions: | | | | | | | | |
Issued | | | 5,137,532 | | | | 20,185,823 | |
Redeemed | | | (856,098 | ) | | | – | |
| | | | | | | | |
| | |
Increase in Net Assets from Capital Share Transactions | | | 4,281,434 | | | | 20,185,823 | |
| | | | | | | | |
| | |
Total Increase in Net Assets | | | 7,141,371 | | | | 26,083,095 | |
| | | | | | | | |
Net Assets: | | | | | | | | |
Beginning of Period/Year | | | 31,874,605 | | | | 5,791,510 | |
| | | | | | | | |
End of Period/Year | | $ | 39,015,976 | | | $ | 31,874,605 | |
| | | | | | | | |
Share Transactions: | | | | | | | | |
Issued | | | 150,000 | | | | 725,000 | |
Redeemed | | | (25,000 | ) | | | – | |
| | | | | | | | |
Net Increase in Shares Outstanding from Share Transactions | | | 125,000 | | | | 725,000 | |
| | | | | | | | |
Amounts designated as “-“ are $0.
The accompanying notes are an integral part of the financial statements.
18
Impact Shares Trust I
Statements of Changes in Net Assets
| | | | | | | | |
| | | Impact Shares Sustainable
Development Goals Global Equity
ETF | |
| | | Period Ended
December 31,
2021
(Unaudited) | | | Year ended
June 30, 2021 | |
Operations: | | | | | | | | |
Net Investment Income | | $ | 32,497 | | | $ | 48,037 | |
Net Realized Gain on Investments and Foreign Currency Transactions | | | 7,310 | | | | 580,112 | |
Net Change in Unrealized Appreciation on Investments and Foreign Currency Translation | | | 385,463 | | | | 556,082 | |
| | | | | | | | |
Net Increase in Net Assets Resulting from Operations | | | 425,270 | | | | 1,184,231 | |
| | | | | | | | |
| | |
Distributions | | | (588,657 | ) | | | (65,595 | ) |
| | | | | | | | |
Capital Share Transactions: | | | | | | | | |
Issued | | | 733,414 | | | | 1,328,612 | |
| | | | | | | | |
| | |
Increase in Net Assets from Capital Share Transactions | | | 733,414 | | | | 1,328,612 | |
| | | | | | | | |
| | |
Total Increase in Net Assets | | | 570,027 | | | | 2,447,248 | |
| | | | | | | | |
Net Assets: | | | | | | | | |
Beginning of Period/Year | | | 5,455,471 | | | | 3,008,223 | |
| | | | | | | | |
End of Period/Year | | $ | 6,025,498 | | | $ | 5,455,471 | |
| | | | | | | | |
Share Transactions: | | | | | | | | |
Issued | | | 25,000 | | | | 50,000 | |
| | | | | | | | |
Net Increase in Shares Outstanding from Share Transactions | | | 25,000 | | | | 50,000 | |
| | | | | | | | |
The accompanying notes are an integral part of the financial statements.
19
Impact Shares Trust I
Statements of Changes in Net Assets
| | | | |
| | | Impact Shares
Affordable
Housing MBS
ETF | |
| | | Period Ended
December 31,
2021(1)
(Unaudited) | |
Operations: | | | | |
Net Investment Income | | $ | 167,426 | |
Net Realized Loss on Investments and Foreign Currency Transactions | | | (226,660 | ) |
Net Unrealized Depreciation on Investments and Foreign Currency Translation | | | (1,036,785 | ) |
| | | | |
Net Decrease in Net Assets Resulting from Operations | | | (1,096,019 | ) |
| | | | |
| |
Distributions | | | (737,098 | ) |
| | | | |
Capital Share Transactions: | | | | |
Issued | | | 102,940,516 | |
| | | | |
| |
Increase in Net Assets from Capital Share Transactions | | | 102,940,516 | |
| | | | |
| |
Total Increase in Net Assets | | | 101,107,399 | |
| | | | |
Net Assets: | | | | |
Beginning of Period | | | — | |
| | | | |
End of Period | | $ | 101,107,399 | |
| | | | |
Share Transactions: | | | | |
Issued | | | 5,150,000 | |
| | | | |
Net Increase in Shares Outstanding from Share Transactions | | | 5,150,000 | |
| | | | |
| (1) | Commenced operations on July 26, 2021. |
Amount designated as “-” is $0.
The accompanying notes are an integral part of the financial statements.
20
Impact Shares Trust I
Statements of Changes in Net Assets
| | | | |
| | | Impact Shares
MSCI Global
Climate Select
ETF | |
| | | Period Ended
December 31,
2021(1)
(Unaudited) | |
Operations: | | | | |
Net Investment Income | | $ | 2,753 | |
Net Realized Gain on Investments and Foreign Currency Transactions | | | 125 | |
Net Unrealized Appreciation on Investments and Foreign Currency Translation | | | 18,501 | |
| | | | |
Net Increase in Net Assets Resulting from Operations | | | 21,379 | |
| | | | |
| |
Distributions | | | (12,822 | ) |
| | | | |
Capital Share Transactions: | | | | |
Issued | | | 2,000,000 | |
| | | | |
| |
Increase in Net Assets from Capital Share Transactions | | | 2,000,000 | |
| | | | |
| |
Total Increase in Net Assets | | | 2,008,557 | |
| | | | |
Net Assets: | | | | |
Beginning of Period | | | — | |
| | | | |
End of Period | | $ | 2,008,557 | |
| | | | |
Share Transactions: | | | | |
Issued | | | 100,000 | |
| | | | |
Net Increase in Shares Outstanding from Share Transactions | | | 100,000 | |
| | | | |
| (1) | Commenced operations on November 2, 2021. |
Amount designated as “-” is $0.
The accompanying notes are an integral part of the financial statements.
21
Impact Shares Trust I
Financial Highlights
Selected Per Share Data & Ratios
For the six month period ended December 31, 2021 (Unaudited) and the period ended June 30,
For a Share Outstanding Throughout the Period
| | | | | | | | | | | | | | | | | | | | | | | | | | | | | | | | | | | | | | | | | | | | | | | | | | | | | | | | | | | | |
| | | Net Asset
Value,
Beginning
of Period
($) | | | Net
Investment
Income
($)* | | | Net Realized
and Unrealized
Gain (Loss) on
Investments
($) | | | Total from
Operations
($) | | | Distributions
from Net
Investment
Income ($) | | | Distributions
from Net
Realized
Capital
Gains ($) | | | Return
of
Capital
($) | | | Total
Distributions
($) | | | Net
Asset
Value,
End of
Period
($) | | | Market
Price, End
of Period
($) | | | Total
Return(%)(1) | | | Net Assets
End of
Period ($)
(000) | | | Ratio of
Expenses to
Average Net
Assets
(%) | | | Ratio of Net
Investment
Income to
Average Net
Assets (%) | | | Portfolio
Turnover
(%)(2) | |
Impact Shares YWCA Women’s Empowerment ETF | |
| | | | | | | | | | | | | | | |
| 2021** | | | 32.85 | | | | 0.10 | | | | 3.15 | | | | 3.25 | | | | (0.10 | ) | | | (0.89 | ) | | | — | | | | (0.99 | ) | | | 35.11 | | | | 35.16 | | | | 9.88 | | | | 37,742 | | | | 0.75 | (4) | | | 0.57 | (4) | | | 12 | |
| | | | | | | | | | | | | | | |
| 2021 | | | 22.81 | | | | 0.21 | | | | 11.59 | | | | 11.80 | | | | (0.47 | ) | | | (1.29 | ) | | | — | | | | (1.76 | ) | | | 32.85 | | | | 32.88 | | | | 52.85 | | | | 29,562 | | | | 0.75 | (12) | | | 0.73 | | | | 39 | |
| | | | | | | | | | | | | | | |
| 2020 | | | 20.63 | | | | 0.28 | | | | 2.16 | | | | 2.44 | | | | (0.26 | ) | | | — | | | | — | | | | (0.26 | ) | | | 22.81 | | | | 22.77 | | | | 11.92 | | | | 7,414 | | | | 0.75 | (10) | | | 1.30 | | | | 47 | |
| | | | | | | | | | | | | | | |
| 2019(3) | | | 20.00 | | | | 0.27 | | | | 0.63 | | | | 0.90 | | | | (0.25 | ) | | | (0.02 | ) | | | — | ^ | | | (0.27 | ) | | | 20.63 | | | | 20.62 | | | | 4.71 | | | | 4,126 | | | | 0.76 | (4)(5) | | | 1.60 | (4) | | | 7 | |
|
Impact Shares NAACP Minority Empowerment ETF | |
| | | | | | | | | | | | | | | |
| 2021** | | | 32.69 | | | | 0.15 | | | | 3.58 | | | | 3.73 | | | | (0.14 | ) | | | (0.81 | ) | | | — | | | | (0.95 | ) | | | 35.47 | | | | 35.69 | | | | 11.42 | | | | 39,016 | | | | 0.49 | (4) | | | 0.85 | (4) | | | 16 | |
| | | | | | | | | | | | | | | |
| 2021 | | | 23.17 | | | | 0.30 | | | | 9.68 | | | | 9.98 | | | | (0.35 | ) | | | (0.11 | ) | | | — | | | | (0.46 | ) | | | 32.69 | | | | 32.76 | | | | 43.35 | | | | 31,875 | | | | 0.50 | (13) | | | 1.03 | | | | 49 | |
| | | | | | | | | | | | | | | |
| 2020 | | | 21.16 | | | | 0.28 | | | | 1.97 | | | | 2.25 | | | | (0.24 | ) | | | — | | | | — | | | | (0.24 | ) | | | 23.17 | | | | 23.23 | | | | 10.71 | | | | 5,792 | | | | 0.75 | (10) | | | 1.27 | | | | 25 | |
| | | | | | | | | | | | | | | |
| 2019(6) | | | 20.00 | | | | 0.28 | | | | 1.17 | | | | 1.45 | | | | (0.28 | ) | | | (0.01 | ) | | | — | | | | (0.29 | ) | | | 21.16 | | | | 21.11 | | | | 7.37 | | | | 2,222 | | | | 0.75 | (4)(7) | | | 1.46 | (4) | | | 19 | |
|
Impact Shares Sustainable Development Goals Global Equity ETF | |
| | | | | | | | | | | | | | | |
| 2021** | | | 27.28 | | | | 0.16 | | | | 1.97 | | | | 2.13 | | | | (0.15 | ) | | | (2.48 | ) | | | — | | | | (2.63 | ) | | | 26.78 | | | | 27.04 | | | | 7.79 | | | | 6,025 | | | | 0.75 | (4) | | | 1.15 | (4) | | | 4 | |
| | | | | | | | | | | | | | | |
| 2021 | | | 20.05 | | | | 0.30 | | | | 7.33 | | | | 7.63 | | | | (0.35 | ) | | | (0.05 | ) | | | — | | | | (0.40 | ) | | | 27.28 | | | | 27.51 | | | | 38.16 | | | | 5,455 | | | | 0.75 | (12) | | | 1.21 | | | | 77 | |
| | | | | | | | | | | | | | | |
| 2020 | | | 20.54 | | | | 0.35 | | | | (0.70 | ) | | | (0.35 | ) | | | (0.14 | ) | | | — | | | | — | | | | (0.14 | ) | | | 20.05 | | | | 20.00 | | | | (1.75 | ) | | | 3,008 | | | | 0.75 | (11) | | | 1.72 | | | | 41 | |
| | | | | | | | | | | | | | | |
| 2019(8) | | | 20.00 | | | | 0.32 | | | | 0.60 | | | | 0.92 | | | | (0.38 | ) | | | — | | | | — | | | | (0.38 | ) | | | 20.54 | | | | 20.66 | | | | 4.67 | | | | 1,027 | | | | 0.75 | (4)(9) | | | 2.08 | (4) | | | 25 | |
| | |
| * | | Per share data calculated using average shares method. |
| ** | | For the six month period ended December 31, 2021 (Unaudited). |
| ^ | | Amount is less than $0.005. |
| (1) | | Total return is based on the change in net asset value of a share during the year or period and assumes reinvestment of dividends and distributions at net asset value. Total return is for the period indicated and periods of less than one year have not been annualized. The return shown does not reflect the deduction of taxes that a shareholder would pay on Fund distributions or the redemption of Fund shares. |
| (2) | | Portfolio turnover rate is for the period indicated and has not been annualized. Excludes effect of in-kind transfers. |
| (3) | | Commenced operations on August 24, 2018. |
| (4) | | Annualized |
| (5) | | The ratio of Expenses to Average Net Assets includes the voluntary expense reimbursements (See Note 3). If these reimbursements were excluded, the ratio would have been 2.24% for the period ended June 30, 2019. |
| (6) | | Commenced operations on July 18, 2018. |
| (7) | | The ratio of Expenses to Average Net Assets includes the voluntary expense reimbursements (See Note 3). If these reimbursements were excluded, the ratio would have been 1.66% for the period ended June 30, 2019. |
| (8) | | Commenced operations on September 20, 2018. |
| (9) | | The ratio of Expenses to Average Net Assets includes the voluntary expense reimbursements (See Note 3). If these reimbursements were excluded, the ratio would have been 1.38% for the period ended June 30, 2019. |
| (10) | | The ratio of Expenses to Average Net Assets includes the voluntary expense reimbursements (See Note 3). If these reimbursements were excluded, the ratio would have been 1.11% for the year ended June 30, 2020. |
| (11) | | The ratio of Expenses to Average Net Assets includes the voluntary expense reimbursements (See Note 3). If these reimbursements were excluded, the ratio would have been 1.27% for the year ended June 30, 2020. |
| (12) | | The ratio of Expenses to Average Net Assets includes the voluntary expense reimbursements (See Note 3). If these reimbursements were excluded, the ratio would have been 0.86% for the year ended June 30, 2021. |
| (13) | | The ratio of Expenses to Average Net Assets includes the voluntary expense reimbursements (See Note 3). If these reimbursements were excluded, the ratio would have been 0.61% for the year ended June 30, 2021. |
Amounts designated as “-“ are $0.
The accompanying notes are an integral part of the financial statements.
22
Impact Shares Trust I
Financial Highlights
Selected Per Share Data & Ratios
For the period ended December 31, 2021 (Unaudited),
For a Share Outstanding Throughout the Period
| | | | | | | | | | | | | | | | | | | | | | | | | | | | | | | | | | | | | | | | | | | | | | | | | | | | | | | | | | | | |
| | | Net Asset
Value,
Beginning
of Period ($) | | | Net
Investment
Income ($)* | | | Net Realized
and Unrealized
Gain (Loss) on
Investments
($) | | | Total from
Operations
($) | | | Distributions
from Net
Investment
Income ($) | | | Distributions
from Net
Realized
Capital
Gains ($) | | | Total
Distributions
($) | | | Net
Asset
Value,
End of
Period
($) | | | Market
Price, End
of Period
($) | | | Total
Return(%)(1) | | | Net Assets
End of
Period ($)
(000) | | | Ratio of
Expenses
to Average
Net Assets
(%)(2) | | | Ratio of
Expenses
to Average
Net Assets
(Excluding
Waivers)(%)(2) | | | Ratio of Net
Investment
Income to
Average Net
Assets (%)(2) | | | Portfolio
Turnover
(%)(3) | |
Impact Shares Affordable Housing MBS ETF | |
| | | | | | | | | | | | | | | |
| 2021(4) | | | 20.00 | | | | 0.04 | | | | (0.26 | ) | | | (0.22 | ) | | | (0.15 | ) | | | — | | | | (0.15 | ) | | | 19.63 | | | | 19.65 | | | | (1.12 | ) | | | 101,107 | | | | 0.30 | | | | 0.65 | | | | 0.41 | | | | 60 | |
|
Impact Shares MSCI Global Climate Select ETF | |
| | | | | | | | | | | | | | | |
| 2021(5) | | | 20.00 | | | | 0.03 | | | | 0.19 | | | | 0.22 | | | | (0.13 | ) | | | — | | | | (0.13 | ) | | | 20.09 | | | | 20.13 | | | | 1.09 | | | | 2,009 | | | | 0.45 | | | | 16.47 | | | | 0.87 | | | | 3 | |
| | |
| * | | Per share data calculated using average shares method. |
| (1) | | Total return is based on the change in net asset value of a share during the year or period and assumes reinvestment of dividends and distributions at net asset value. Total return is for the period indicated and periods of less than one year have not been annualized. The return shown does not reflect the deduction of taxes that a shareholder would pay on Fund distributions or the redemption of Fund shares. |
| (2) | | Annualized. |
| (3) | | Portfolio turnover rate is for the period indicated and has not been annualized. Excludes effect of in-kind transfers. |
| (4) | | Commenced operations on July 26, 2021. |
| (5) | | Commenced operations on November 2, 2021. |
Amounts designated as “-“ are $0.
The accompanying notes are an integral part of the financial statements.
23
Impact Shares Trust I
Notes to Financial Statements
December 31, 2021 (Unaudited)
1. ORGANIZATION
Impact Shares Trust I (the “Trust”), is an open-end management investment company organized as a Delaware statutory trust pursuant to a Declaration of Trust dated May 19, 2016. The Trust is registered with the Securities and Exchange Commission (the “Commission”) under the Investment Company Act of 1940 (the “1940 Act”), as amended, as an open-end management investment company with three separate exchange-traded funds or series. The financial statements herein and the related notes are those of Impact Shares YWCA Women’s Empowerment ETF (the “Women’s ETF”), Impact Shares NAACP Minority Empowerment ETF (the “Minority ETF”), Impact Shares Sustainable Development Goals Global Equity ETF (the “Sustainable Development ETF”), Impact Shares Affordable Housing MBS ETF (the “Affordable Housing ETF”) and the Impact Shares MSCI Global Climate Select ETF (the “Global Climate ETF”) (each a “Fund” and collectively, the “Funds”). The Women’s ETF, Minority ETF, Sustainable Development ETF and Global Climate ETF each seek to provide investment results that, before fees and expenses, track the total return performance of the Morningstar® Women’s Empowerment Index, the Morningstar® Minority Empowerment Index, the Morningstar® Societal Development Index and the MSCI ACWI Climate Pathway Select Index (the “Underlying Indices” or “Index”), respectively. The primary investment objective of the Affordable Housing MBS ETF is to generate current income. The Funds are classified as “non-diversified” funds under the 1940 Act. Impact Shares, Corp. (the “Adviser”) serves as the investment adviser for the Funds and is subject to the supervision of the Board of Trustees (the “Board”). The Adviser is responsible for managing the investment activities of the Funds, the Funds’ business affairs and other administrative matters. The Adviser is a nonprofit corporation organized under the laws of Texas and is tax exempt under Section 501(c)(3) of the Internal Revenue Code.
The Women’s ETF commenced operations on August 24, 2018.
The Minority ETF commenced operations on July 18, 2018.
The Sustainable Development ETF commenced operations on September 20, 2018.
The Affordable Housing ETF commenced operations on July 26, 2021.
The Global Climate ETF commenced operations on November 2, 2021.
Shares of the Funds (“Shares”) are listed and traded on NYSE Arca, Inc. Market prices for the Shares may be different from their net asset value (“NAV”). The Funds will issue and redeem Shares on a continuous basis at NAV only in large blocks of Shares, each of which currently comprises 50,000 shares (“Creation Units”) or such other amount as may be from time to time determined to be in the best interests of a Fund by the President of the Fund (The President of the Funds has determined that it is in the best interests of the Minority ETF, Women’s ETF and Sustainable Development ETF, that the size of a creation unit in each of these Funds remain at 25,000 shares indefinitely). Creation Units will be issued and redeemed principally in-kind for securities included in the Funds’ Underlying Indices. Once created, Shares will trade in a secondary market at market prices that change throughout the day in amounts less than a Creation Unit.
2. SIGNIFICANT ACCOUNTING POLICIES
The following is a summary of the significant accounting policies followed by the Funds:
Use of Estimates — The Funds are registered investment companies under Accounting Standard Codification in Topic 946 by the U.S. Financial Accounting Standards Board. The preparation of financial statements in conformity with U.S. generally accepted accounting principles (“U.S. GAAP”) requires management to make estimates and assumptions that affect the reported amounts of assets and liabilities and disclosure of contingent assets and liabilities at the date of the financial statements and the reported amounts of increases and decreases in net assets from operations during the reporting period. Actual results could materially differ from those estimates.
Security Valuation — Securities listed on a securities exchange, market or automated quotation system for which quotations are readily available (except for securities traded on the NASDAQ Stock Market (the “NASDAQ”)), including securities traded over the counter, are valued at the last quoted sale price on the primary exchange or market (foreign or domestic) on which they are traded (or at approximately 4:00 pm Eastern Time if a security’s primary exchange is normally open at that time), or, if there is no such reported sale, at the most recent quoted bid.
24
Impact Shares Trust I
Notes to Financial Statements
December 31, 2021 (Unaudited)
For securities traded on NASDAQ, the NASDAQ Official Closing Price will be used. The prices for foreign securities are reported in local currency and converted to U.S. dollars using spot currency exchange rates. If available, debt securities are priced based upon valuations provided by independent, third-party pricing agents. Such values generally reflect the last reported sales price if the security is actively traded. The third-party pricing agents may also value debt securities at an evaluated bid price by employing methodologies that utilize actual market transactions, broker-supplied valuations, or other methodologies designed to identify the fair value for such securities. Debt obligations with remaining maturities of sixty days or less may be valued at their amortized cost, if the Funds’ Fair Value Committee concludes it approximates fair value after taking into account factors such as credit, liquidity and interest rate conditions as well as issuer specific factors. Foreign securities listed on foreign exchanges are valued based on quotations from the primary market in which they are traded and are translated from the local currency into U.S. dollars using current exchange rates. Foreign securities may trade on weekends or other days when the Fund does not calculate NAV. As a result, the fair value of these investments may change on days when you cannot buy or redeem shares of the Fund. Prices for most securities held in the Funds are provided daily by recognized independent pricing agents. If a security price cannot be obtained from an independent, third-party pricing agent, the Funds seek to obtain a bid price from at least one independent broker. Securities for which market prices are not “readily available” are valued in accordance with fair value procedures established and implemented by the Board. Some of the more common reasons that may necessitate that a security be valued using Fair Value Procedures include: the security’s trading has been halted or suspended; the security has been de-listed from a national exchange; the security’s primary trading market is temporarily closed at a time when under normal conditions it would be open; the security has not been traded for an extended period of time; the security’s primary pricing source is not able or willing to provide a price; or trading of the security is subject to local government-imposed restrictions. In addition, the Funds may fair value their securities if an event that may materially affect the value of the Funds’ securities that traded outside of the United States (a “Significant Event”) has occurred between the time of the security’s last close and the time that the Funds calculate their net asset value. A Significant Event may relate to a single issuer or to an entire market sector. Events that may be Significant Events include: government actions, natural disasters, armed conflict, acts of terrorism and significant market fluctuations. If the Adviser becomes aware of a Significant Event that has occurred with respect to a security or group of securities after the closing of the exchange or market on which the security or securities principally trade, but before the time at which the Funds calculate their net asset value, it may request that a Committee meeting be called. When a security is valued in accordance with the fair value procedures, the Committee will determine the value after taking into consideration relevant information reasonably available to the Committee .In accordance with the authoritative guidance on fair value measurements and disclosure under U.S. GAAP, the Funds disclose fair value of their investments in a hierarchy that prioritizes the inputs to valuation techniques used to measure the fair value. The objective of a fair value measurement is to determine the price that would be received to sell an asset or paid to transfer a liability in an orderly transaction between market participants at the measurement date (an exit price). Accordingly, the fair value hierarchy gives the highest priority to quoted prices (unadjusted) in active markets for identical assets or liabilities (Level 1) and the lowest priority to unobservable inputs (Level 3). The three levels of the fair value hierarchy are described below:
| | ● | | Level 1 – Unadjusted quoted prices in active markets for identical, unrestricted assets or liabilities that the Funds have the ability to access at the measurement date; |
| | ● | | Level 2 – Quoted prices which are not active, or inputs that are observable (either directly or indirectly) for substantially the full term of the asset or liability; and |
| | ● | | Level 3 – Prices, inputs or exotic modeling techniques which are both significant to the fair value measurement and unobservable (supported by little or no market activity). |
The valuation techniques used by the Funds to measure fair value during the period ended December 31, 2021 maximized the use of observable inputs and minimized the use of unobservable inputs.
For the period ended December 31, 2021, there have been no significant changes to the Funds’ fair valuation methodologies.
25
Impact Shares Trust I
Notes to Financial Statements
December 31, 2021 (Unaudited)
Federal Income Taxes — It is the Funds’ intention to qualify as a regulated investment company for Federal income tax purposes by complying with the appropriate provisions of Subchapter M of the Internal Revenue Code of 1986 (the “Code”), as amended. Accordingly, no provisions for federal income taxes have been made in the financial statements.
The Funds evaluate tax positions taken or expected to be taken in the course of preparing the Funds’ tax returns to determine whether it is “more-likely-than not” (i.e., greater than 50-percent) that each tax position will be sustained upon examination by a taxing authority based on the technical merits of the position. Tax positions not deemed to meet the more-likely-than-not threshold are recorded as a tax benefit or expense in the current period. The Funds did not record any tax provision in the current period. However, management’s conclusions regarding tax positions taken may be subject to review and adjustment at a later date based on factors including, but not limited to, examination by tax authorities (i.e., the last 3 year ends, as applicable), on-going analysis of and changes to tax laws, regulations and interpretations thereof. As of and during the period ended December 31, 2021, the Funds did not have a liability for any unrecognized tax benefits. The Funds recognize interest and penalties, if any, related to unrecognized tax benefits as income tax expense in the Statements of Operations. For the period ended December 31, 2021, the Funds did not recognize any interest or penalties.
Security Transactions and Investment Income — Security transactions are accounted for on trade date. Costs used in determining realized gains and losses on the sale of investment securities are based on specific identification. Dividend income is recorded on the ex-dividend date. Interest income is recognized on the accrual basis. Withholding taxes and reclaims on foreign dividends have been provided for in accordance with the Funds’ understanding of the applicable country’s tax rules and rates.
Dividends and Distributions to Shareholders — The Funds intend to declare and pay dividends of net investment income quarterly and to pay any capital gain distributions on an annual basis. All distributions are recorded on ex-dividend date.
Cash and Cash Equivalents — Idle cash may be swept into various time deposits and is classified as cash and cash equivalents on the Statements of Assets and Liabilities. The Funds maintain cash in bank deposit accounts which, at times, may exceed United States federally insured limits. Amounts swept overnight are available on the next business day.
Cash Overdraft Charges — Per the terms of an agreement with the Bank of New York Mellon, if a Fund has a cash overdraft on a given day, it will be assessed an overdraft charge. Cash overdraft charges are included in other fees on the Statements of Operations.
Creation Units — The Funds issue and redeem shares (“Shares”) at Net Asset Value (“NAV”) and only in large blocks of Shares currently comprised of 50,000 shares for the Affordable Housing ETF and Global Climate ETF and 25,000 shares for the remaining Funds. Shares (each such block of Shares for the Funds are called a “Creation Unit” or multiples thereof). Purchasers of Creation Units at NAV must pay a standard creation transaction fee of $500 per transaction. The fee is a single charge and will be the same regardless of the number of Creation Units purchased by an investor on the same day. An Authorized Participant who holds Creation Units (“Authorized Participants”) and wishes to redeem at NAV would also pay a standard redemption transaction fee of $500 per transaction to the custodian on the date of such redemption, regardless of the number of Creation Units redeemed that day. Creations and redemptions are also subject to an additional variable charge of up to 1% of the net asset value per Creation Unit, inclusive of the standard transaction fee, for (i) in-kind creations or redemptions effected outside the normal Clearing Process, (ii) in whole or partial cash creations, (iii) in whole or partial cash redemptions or (iv) non-standard orders. The variable component is primarily designed to cover non-standard charges, e.g., brokerage, taxes, foreign exchange, execution, market impact and other costs and expenses related to the execution of trades resulting from such transaction. In all cases, the Transaction Fee will be limited in accordance with the requirements of the SEC applicable to management investment companies offering redeemable securities. The Fund may determine not to charge the variable portion of a Transaction Fee on certain orders when Impact Shares has determined that doing
26
Impact Shares Trust I
Notes to Financial Statements
December 31, 2021 (Unaudited)
so is in the best interests of Fund shareholders, e.g., for redemption orders that facilitate the rebalance of the Fund’s portfolio in a more tax efficient manner than could be achieved without such order. The variable portion of a Transaction Fee may be higher or lower than the trading expenses incurred by a Fund with respect to the transaction.
Except when aggregated in Creation Units, Shares are not redeemable securities of the Funds. Shares of the Funds may only be purchased or redeemed by certain financial institutions (“Authorized Participants”). An Authorized Participant is either (i) a broker-dealer or other participant in the clearing process through the Continuous Net Settlement System of the National Securities Clearing Corporation or (ii) a Depository Trust Company (“DTC”) participant and, in each case, must have executed an Authorized Participant Agreement with the Funds’ distributor. Most retail investors will not qualify as Authorized Participants or have the resources to buy and sell whole Creation Units. Therefore, they will be unable to purchase or redeem the Shares directly from the Funds. Rather, most retail investors will purchase Shares in the secondary market with the assistance of a broker and will be subject to customary brokerage commissions or fees.
The size of a creation unit for a Fund may be changed from time to time in the future if determined to be in the best interests of a Fund by the President of the Fund. The President of the Funds has determined that it is in the best interests of the Women’s ETF, Minority ETF, and Sustainable Development ETF, that the size of a creation unit in each Fund remain at 25,000 shares indefinitely.
If a Creation Unit is purchased or redeemed in cash, a higher transaction fee will be charged. The following table discloses the Creation Unit breakdown based on the NAV as of December 31, 2021:
| | | | | | | | | | | | | | | | |
| | | Creation Unit
Shares | | | Creation
Transaction Fee | | | Value | | | Redemption
Transaction
Fee | |
YWCA Women’s Empowerment ETF | | | 25,000 | | | $ | 500 | | | $ | 877,750 | | | $ | 500 | |
NAACP Minority Empowerment ETF | | | 25,000 | | | | 500 | | | | 886,750 | | | | 500 | |
Sustainable Development Goals Global Equity ETF | | | 25,000 | | | | 500 | | | | 669,500 | | | | 500 | |
Affordable Housing MBS ETF | | | 50,000 | | | | 500 | | | | 981,500 | | | | 500 | |
MSCI Global Climate Select ETF | | | 50,000 | | | | 500 | | | | 1,004,500 | | | | 500 | |
Foreign Currency Translation — The books and records of the Funds are maintained in U.S. dollars. Investment securities and other asset and liabilities denominated in a foreign currency are translated into U.S. dollars on the date of valuation. Purchases and sales of investment securities, income and expenses are translated into U.S. dollars at the relevant rates of exchange prevailing on the respective dates of such transactions. The Funds do not isolate that portion of realized or unrealized gains and losses resulting from changes in the foreign exchange rate from fluctuations arising from changes in the market prices of the securities. These gains and losses are included in net realized and unrealized gains and losses on investments on the Statements of Operations. Net realized and unrealized gains and losses on foreign currency transactions represent net foreign exchange gains or losses from foreign currency exchange contracts, disposition of foreign currencies, currency gains or losses realized between trade and settle dates on securities transactions and the difference between the amount of the investment income and foreign withholding taxes recorded on the Funds’ books and the U.S. dollar equivalent amounts actually received or paid.
Indemnifications — In the normal course of business, the Funds enter into contracts that provide general indemnifications. The Funds’ maximum exposure under these arrangements is dependent on future claims that may be made against the Funds and, therefore, cannot be established; however, based on experience, the risk of loss from such claims is considered remote.
3. AGREEMENTS
Investment Advisory Agreements
The Adviser serves as investment adviser to the Funds, pursuant to an investment advisory agreement (“Advisory Agreement”). The Adviser arranges for transfer agency, custody, fund administration and accounting, and other
27
Impact Shares Trust I
Notes to Financial Statements
December 31, 2021 (Unaudited)
non-distribution related services necessary for the Funds to operate. The Adviser administers the Funds’ business affairs, provides office facilities and equipment and certain clerical, bookkeeping and administrative services, and provides its officers and employees to serve as officers or Trustees of the Trust.
Impact Shares Corp. has entered into the following three separate advisory agreements with the series of the Trust at the advisory fee rates noted below:
| | | | |
| Amended & Restated Investment Advisory Agreement, Dated July 16, 2021: | | |
| | |
Impact Shares YWCA Women’s Empowerment ETF | | 0.75% | | |
| | |
Impact Shares NAACP Minority Empowerment ETF | | 0.49% | | |
| | |
Impact Shares Sustainable Development Goals Global Equity ETF | | 0.75% | | |
| | |
| Investment Advisory Agreement, Dated July 16, 2021: | | | | |
| | |
Impact Shares Affordable Housing MBS ETF | | 0.30% | | |
| |
| Investment Advisory Agreement, Dated September 2, 2021: | | |
| | |
Impact Shares MSCI Global Climate Select ETF | | 0.30% | | |
For the services it provides to the Women’s ETF, Minority ETF and the Sustainable Development ETF, the Adviser receives a fee, which is calculated daily and paid monthly, at an annual rate of 0.75% of average daily net assets of the Women’s ETF and the Sustainable Development ETF, and 0.49% of average daily net assets with respect to Minority ETF. Under the Advisory Agreement, the Adviser is responsible for substantially all expenses of the Fund, including the cost of transfer agency, custody, fund administration, legal, audit and other services, except for: (i) distribution and service fees payable pursuant to a Rule 12b-1 plan, if any; (ii) taxes and governmental fees, if any, levied against a Fund; (iii) brokerage fees and commissions, and other portfolio transaction expenses incurred by or for a Fund; (iv) expenses of a Fund’s securities lending (if any), including any securities lending agent fees, as governed by a separate securities lending agreement; costs, including interest expenses, of borrowing money or engaging in other types of leverage financing; (v) extraordinay expenses, including extraordinary legal expenses, as may arise, including, without limitation, expenses incurred in connection with litigation, proceedings, other claims, contractual arrangements with Partner Charities and the legal obligations of a Fund to indemnify its Trustees, officers, employees, shareholders, distributors, and agents with respect thereto; and (vi) expenses of a Fund which are capitalized in accordance with generally accepted accounting principles (the “Excluded Expenses”).
Certain officers or interested trustees of the Trust are also officers or employees of the Advisor or its affiliates. They receive no fees for serving as officers of the Trust.
For the services it provides to the Affordable Housing ETF, the Fund pays the Adviser an annual fee, payable monthly, at the rate of 0.30% of the Fund’s Average Daily Managed Assets. The Adviser has voluntarily agreed to waive all advisory fees payable by the Fund under the Advisory Agreement in excess of 0.25% of the average daily managed net assets of the Fund until the Fund’s net assets are greater than $100 million. The Adviser will pay all expenses incurred by it in connection with its activities under the Investment Advisory Agreement, except such expenses as are assumed by the Fund and such expenses as are assumed by a sub-adviser under its sub-advisory agreement.
For the services it provides to the Global Climate ETF, under the Advisory Agreement, the Fund pays the Adviser an annual unitary fee, payable monthly, at the rate of 0.30% of the Fund’s Average Daily Managed Assets. The Adviser will pay all expenses incurred by it in connection with its activities under the Investment Advisory Agreement, except such expenses as are assumed by the Fund and such expenses as are assumed by a sub-adviser under its sub-advisory agreement. From time to time, the Adviser may waive all or a portion of its fee. The Adviser has contractually agreed to limit the total annual operating expenses (exclusive of fees paid by the Fund pursuant to its distribution plan under Rule 12b-1 under the Investment Company Act of 1940, as amended, taxes, brokerage
28
Impact Shares Trust I
Notes to Financial Statements
December 31, 2021 (Unaudited)
commissions and other transaction costs, interest payments, acquired fund fees and expenses, extraordinary expenses and dividend expenses on short sales) of the Fund to 0.30% through at least November 1, 2022. This contract may not be terminated without the action or consent of the Board of Trustees. The Adviser has agreed to assume the Fund’s organization and offering costs. The Fund does not have an obligation to reimburse the Adviser for organization and offering costs paid on its behalf.
Sub-Advisory Agreement
The Adviser has entered into a Sub-advisory Agreement with CCM (the “Sub-Advisory Agreement”). Under the terms of the Sub-Advisory Agreement, CCM acts as Sub-Adviser to the Affordable Housing ETF. In such capacity, CCM, subject to the supervision of the Adviser and the Board, regularly shall provide the Fund with portfolio management, investment research, advice, and supervision and shall furnish continuously an investment program, consistent with the investment objective and policies of the Fund. The Sub-Adviser shall determine, from time to time, what securities shall be purchased for the Fund, what securities shall be held or sold by the Fund, and what portion of the Fund’s assets shall be held uninvested in cash, subject always to the investment objective, policies, and restrictions of the Fund, as each of the same from time to time shall be in effect. To carry out these obligations, the Sub-Adviser can exercise full discretion and act for the Adviser in the same manner and with the same force and effect as the Adviser itself might or could do with respect to purchases, sales, or other transactions.
The Adviser pays the Sub-Adviser, as compensation for the Sub-Adviser’s services, a fee equal to 0.25% of the Fund’s Average Daily Managed Assets. The Fund has no responsibility for any fee payable to the Sub-Adviser. The Sub-Adviser has agreed to assume the Fund’s organization and offering costs. The Fund does not have an obligation to reimburse the Sub-Adviser for organization and offering costs paid on its behalf.
CCM has contractually agreed to limit the total annual operating expenses (exclusive of fees paid by the Fund pursuant to its distribution plan under Rule 12b-1 under the Investment Company Act of 1940, as amended, taxes, brokerage commissions and other transaction costs, interest payments, acquired fund fees and expenses, extraordinary expenses and dividend expenses on short sales) of the Fund to 0.30% through July 30, 2022. This contract may not be terminated without the action or consent of the Fund’s Board of Trustees.
The Fund is a party to contractual arrangements with various parties, including, among others, the Fund’s investment adviser, administrator, distributor, and shareholder servicing agent, who provide services to the Fund. Shareholders are not parties to, or intended (“third-party”) beneficiaries of, any such contractual arrangements, and such contractual arrangements are not intended to create in any individual shareholder or group of shareholders any right to enforce them against the service providers or to seek any remedy under them against the service providers, either directly or on behalf of the Fund.
Distribution Agreement
SEI Investments Distribution Co. (the “Distributor”) serves as the Funds’ underwriter and distributor of Shares pursuant to a Distribution Agreement. Under the Distribution Agreement, the Distributor, as agent, receives orders to purchase shares in Creation Units and transmits such orders to the Funds’ custodian and transfer agent. The Distributor has no obligation to sell any specific quantity of Fund shares. The Distributor bears the following costs and expenses relating to the distribution of shares: (i) the expenses of maintaining its registration or qualification as a dealer or broker under federal or state laws; (ii) filing fees; and (iii) all other expenses incurred in connection with the distribution services, that are not reimbursed by the Adviser, as contemplated in the Distribution Agreement. The Distributor does not maintain any secondary market in Fund Shares.
The Funds have adopted a Distribution and Service Plan (the “Plan”) pursuant to Rule 12b-1 under the 1940 Act. In accordance with the Plan, the Funds are authorized to pay an amount up to 0.25% of their average net assets each year for certain distribution-related activities. For the period ended December 31, 2021, no fees were charged by the Distributor under the Plan. No payments have yet been authorized by the Board, nor are any such expected to be made by a Fund under the Plan during the current fiscal year.
29
Impact Shares Trust I
Notes to Financial Statements
December 31, 2021 (Unaudited)
For the period ended December 31, 2021, the Funds incurred Trustee fees of $8,003, $8,536, $1,353, $21,679 and $429 for the Women’s ETF, Minority ETF, Sustainable Development ETF, Affordable Housing ETF and Global Climate ETF respectively, for which the Adviser voluntarily agreed to reimburse the Funds. Of these amounts, $8,003, $8,536, $1,353, $21,679 and $429 remain payable to the Trustees and are shown as a receivable from the Adviser on the Statements of Assets and Liabilities for the Women’s ETF, Minority ETF, Sustainable Development ETF, Affordable Housing ETF and Global Climate ETF respectively, as of December 31, 2021. Trustee fees are shown gross within expenses with a corresponding expense reimbursement on the Statement of Operations as such fees were voluntarily paid by the Adviser on behalf of the Funds. The Adviser does not have the ability to recoup these voluntary expense reimbursements in the future. Impact Shares has paid all of the Trustees in full and are up to date on all directors fees due them through December 31, 2021.
Administrator, Custodian and Transfer Agent
SEI Investments Global Funds Services (the “Administrator”) serves as the Funds’ Administrator pursuant to an Administration Agreement. The Bank of New York Mellon (the “Custodian” and “Transfer Agent”) serves as the Funds’ Custodian and Transfer Agent pursuant to a Custodian Agreement and Transfer Agency Services Agreement. The Adviser of the Funds pays these fees.
Certain officers of the Trust may also be officers of the Administrator or its affiliates. They receive no fees for serving as officers of the Trust.
4. INVESTMENT TRANSACTIONS
For the period ended December 31, 2021, the purchases and sales of investments in securities, excluding in-kind transactions, long-term U.S. Government and short-term securities were:
| | | | | | | | |
| | | Purchases | | | Sales | |
YWCA Women’s Empowerment ETF | | $ | 4,067,786 | | | $ | 4,137,186 | |
NAACP Minority Empowerment ETF | | | 5,650,490 | | | | 7,345,226 | |
Sustainable Development Goals Global Equity ETF | | | 291,609 | | | | 220,303 | |
Affordable Housing MBS ETF | | | 149,703,270 | | | | 51,876,213 | |
MSCI Global Climate Select ETF | | | 51,611 | | | | 51,505 | |
There were no purchases or sales of long-term U.S. Government securities by the Funds.
For the period ended December 31, 2021, in-kind transactions associated with creations and redemptions were:
| | | | | | | | | | | | |
| | | Purchases | | | Sales and
Maturities | | | Realized
Gain/(Loss) | |
YWCA Women’s Empowerment ETF | | $ | 6,104,658 | | | $ | – | | | $ | – | |
NAACP Minority Empowerment ETF | | | 5,084,257 | | | | 847,046 | | | | 325,365 | |
Sustainable Development Goals Global Equity ETF | | | 662,627 | | | | – | | | | – | |
Affordable Housing MBS ETF | | | – | | | | – | | | | – | |
MSCI Global Climate Select ETF | | | 1,781,371 | | | | – | | | | – | |
For the year ended June 30, 2020, in-kind transactions associated with creations and redemptions were:
| | | | | | | | | | | | |
| | | Purchases | | | Sales and
Maturities | | | Realized
Gain/(Loss) | |
YWCA Women’s Empowerment ETF | | $ | 2,530,398 | | | $ | – | | | $ | – | |
NAACP Minority Empowerment ETF | | | 3,232,443 | | | | – | | | | – | |
Sustainable Development Goals Global Equity ETF | | | 1,793,690 | | | | – | | | | – | |
5. TAX INFORMATION
The amount and character of income and capital gain distributions to be paid, if any, are determined in accordance with Federal income tax regulations, which may differ from U.S. GAAP. As a result, net investment income (loss) and
30
Impact Shares Trust I
Notes to Financial Statements
December 31, 2021 (Unaudited)
net realized gain (loss) on investment transactions for a reporting period may differ significantly from distributions during such period. These book/tax differences may be temporary or permanent. To the extent these differences are permanent in nature, they are charged or credited to distributable earnings or paid-in capital, as appropriate, in the period that the differences arise.
The tax character of dividends and distributions paid during the last two fiscal years ending June 30, were as follows:
| | | | | | | | | | | | |
| | | Ordinary
Income | | | Long-Term
Capital Gain | | | Total | |
YWCA Women’s Empowerment ETF | |
2021 | | $ | 665,602 | | | $ | 104,821 | | | $ | 770,423 | |
2020 | | | 79,706 | | | | — | | | | 79,706 | |
NAACP Minority Empowerment ETF | |
2021 | | | 290,187 | | | | 26,991 | | | | 317,178 | |
2020 | | | 36,817 | | | | — | | | | 36,817 | |
Sustainable Development Goals Global Equity ETF | |
2021 | | | 39,855 | | | | 25,740 | | | | 65,595 | |
2020 | | | 9,427 | | | | — | | | | 9,427 | |
The Affordable Housing MBS ETF and MSCI Global Climate Select ETF did not commence operations until July 26, 2021 and November 2, 2021, respectively.
As of June 30, 2021, the components of distributable earnings (accumulated losses) on a tax basis were as follows:
| | | | | | | | | | | | | | | | | | | | |
| | | Undistributed
Ordinary
Income | | | Undistributed
Long Term
Capital Gains | | | Unrealized
Appreciation/
(Depreciation) | | | Other
Temporary
Differences | | | Total
Distributable
Earnings | |
YWCA Women’s Empowerment ETF | | $ | 464,816 | | | $ | 448,766 | | | $ | 4,394,687 | | | $ | (1 | ) | | $ | 5,308,268 | |
NAACP Minority Empowerment ETF | | | 632,528 | | | | 231,702 | | | | 5,307,735 | | | | 1 | | | | 6,171,966 | |
Sustainable Development Goals Global Equity ETF | | | — | | | | 546,287 | | | | 446,978 | | | | 2 | | | | 993,267 | |
Late year loss deferral represents specified losses realized from foreign currency transactions from November 1 to June 30, 2021 that, in accordance with Federal income tax regulations, the Fund may elect to defer and treat as having arisen in the following fiscal year. None of the Funds have late year loss to defer in current fiscal year.
The Federal tax cost and aggregate gross unrealized appreciation and depreciation on investments and foreign currency transactions held by the Funds at December 31, 2021, were as follows:
| | | | | | | | | | | | | | | | |
| | | Federal Tax
Cost | | | Aggregated
Gross
Unrealized
Appreciation | | | Aggregated
Gross
Unrealized
Depreciation | | | Net Unrealized
Appreciation
(Depreciation) | |
YWCA Women’s Empowerment ETF | | $ | 31,358,790 | | | $ | 7,781,798 | | | $ | (374,128 | ) | | $ | 7,407,670 | |
NAACP Minority Empowerment ETF | | | 31,163,967 | | | | 9,331,633 | | | | (510,347 | ) | | | 8,821,286 | |
Sustainable Development Goals Global Equity ETF | | | 5,656,249 | | | | 958,988 | | | | (127,686 | ) | | | 831,302 | |
Affordable Housing MBS ETF | | | 101,892,193 | | | | 1,674 | | | | (1,038,459 | ) | | | (1,036,785 | ) |
MSCI Global Climate Select ETF | | | 1,781,570 | | | | 73,895 | | | | (55,403 | ) | | | 18,492 | |
The book/tax difference on cost is primarily related to wash sale adjustments.
6. RISKS OF INVESTING IN THE FUNDS
As with all exchange traded funds (“ETFs”), a shareholder of the Fund is subject to the risk that his or her investment could lose money. The Funds are subject to the principal risks noted below, any of which may adversely affect the Fund��s NAV, trading price, yield, total return and ability to meet its investment objective. A more complete description of principal risks is included in the prospectus under the heading “Principal Risks”.
31
Impact Shares Trust I
Notes to Financial Statements
December 31, 2021 (Unaudited)
Under normal circumstances, the Funds will invest at least 80% of their total assets in securities of the Index, which reflects the performance of an investable universe of publicly-traded companies that directly or indirectly provide services or support to ETFs, including but not limited to the management, servicing, trading or sale of ETFs (“ETF Activities”).
An investment in the Fund is not a bank deposit and is not insured or guaranteed by the FDIC or any other government agency. As with any investment company, there is no guarantee that the Fund will achieve its goal.
Active Investment Management Risk (Affordable Housing ETF only) - The Fund is actively managed. The Adviser’s judgments about the attractiveness, relative value, or potential appreciation of a particular sector, security or investment strategy.
Asset Class Risk (All Funds) - The securities in an Underlying Index or in a Fund’s portfolio may underperform the returns of other securities or indices that track other countries, regions, industries, groups of industries, markets, asset classes or sectors. Various types of securities or indices tend to experience cycles of outperformance and underperformance in comparison to general securities markets.
Brexit (Impact Shares Sustainable Development Goals Global Equity ETF and Global Climate ETF only) - In June 2016, the United Kingdom approved a referendum to leave the European Union (commonly known as “Brexit”). On January 31, 2020, the United Kingdom left the European Union and during a transition period that ended on December 31, 2020, negotiated an agreement that governs the terms of the ongoing relationship between the United Kingdom and the European Union. At present the political and economic consequences of Brexit remain uncertain. Given the size and importance of the United Kingdom’s economy, uncertainty about its legal, political, and economic relationship with the remaining member states of the European Union may continue to be a source of instability. Moreover, other countries may seek to withdraw from the European Union and/or abandon the euro, the common currency of the European Union. The ultimate effects of these events and other socio-political or geopolitical issues are not known but could profoundly affect global economies and markets. Whether or not a Fund invests in securities of issuers located in Europe or with significant exposure to European issuers or countries, these events could negatively affect the value and liquidity of the Fund’s investments.
Call Risk (Affordable Housing ETF only) - Some debt securities may be redeemed, or “called,” at the option of the issuer before their stated maturity date. In general, an issuer will call its debt securities if they can be refinanced by issuing new debt securities which bear a lower interest rate. The Fund is subject to the possibility that during periods of falling interest rates an issuer will call its high yielding debt securities. The Fund would then be forced to invest the proceeds at lower interest rates, likely resulting in a decline in the Fund’s income.
Cash Transaction Risk (All Funds) - The Funds can effect creations and redemptions principally for cash, rather than for in-kind securities. ETFs generally are able to make in-kind redemptions and avoid being taxed on gain on the distributed portfolio securities at the fund level. Because the Funds currently can effect redemptions for cash, rather than for in-kind securities, they may be required to sell portfolio securities in order to obtain the cash needed to distribute redemption proceeds. The Funds may recognize a capital gain on these sales that might not have been incurred if the Funds had made a redemption in-kind, and this may decrease the tax efficiency of the Funds compared to ETFs that utilize an in-kind redemption process.
Counterparty Risk (All Funds) - The Funds may engage in transactions in securities and financial instruments that involve counterparties. Counterparty risk is the risk that a counterparty (the other party to a transaction or an agreement or the party with whom a Fund executes transactions) to a transaction with a Fund may be unable or unwilling to make timely principal, interest, settlement or margin payments, or otherwise honor its obligations. If a counterparty becomes bankrupt or otherwise fails to perform its obligations due to financial difficulties, the affected Fund’s income or the value of its assets may decrease. A Fund may experience significant delays in obtaining any recovery in a bankruptcy or other reorganization proceeding and a Fund may obtain only limited recovery or may obtain no recovery in such circumstances. In an attempt to limit the counterparty risk associated with such transactions, the Funds conduct business only with financial institutions judged by the Adviser to present acceptable credit risk.
32
Impact Shares Trust I
Notes to Financial Statements
December 31, 2021 (Unaudited)
Credit Risk (Affordable Housing ETF only) - An issuer or other obligated party of a debt security may be unable or unwilling to make dividend, interest and/or principal payments when due. In addition, the value of a debt security may decline because of concerns about the issuer’s ability or unwillingness to make such payments. In certain cases, the issuer could be late in paying interest or principal, or could fail to pay its financial obligations altogether.
Derivatives Risk (All Funds) - Derivatives Risk is a combination of several risks, including the risks that: (1) an investment in a derivative instrument may not correlate well with the performance of the securities or asset class to which the Fund seeks exposure, (2) derivative contracts, including options, may expire worthless and the use of derivatives may result in losses to the Fund, (3) a derivative instrument entailing leverage may result in a loss greater than the principal amount invested, (4) derivatives not traded on an exchange may be subject to credit risk, for example, if the counterparty does not meet its obligations (see also “Counterparty Risk”), and (5) derivatives not traded on an exchange may be subject to liquidity risk and the related risk that the instrument is difficult or impossible to value accurately. As a general matter, when the Fund establishes certain derivative instrument positions, such as certain futures and options contract positions, it will segregate liquid assets (such as cash, U.S. Treasury bonds or commercial paper) equivalent to the Fund’s outstanding obligations under the contract or in connection with the position. In addition, recent legislation has called for a new regulatory framework for the derivatives market. The impact of the new regulations are still unknown, but has the potential to increase the costs of using derivatives, may limit the availability of some forms of derivatives or the Fund’s ability to use derivatives, and may adversely affect the performance of some derivative instruments used by the Fund as well as the Fund’s ability to pursue its investment objective through the use of such instruments.
Derivatives Risk – Futures Contracts Risk (All Funds). A futures contract is an exchange-traded derivative transaction between two parties in which a buyer (holding the “long” position) agrees to pay a fixed price (or rate) at a specified future date for delivery of an underlying reference from a seller (holding the “short” position). The seller hopes that the market price on the delivery date is less than the agreed upon price, while the buyer hopes for the contrary. Certain futures contract markets are highly volatile, and futures contracts may be illiquid. Futures exchanges may limit fluctuations in futures contract prices by imposing a maximum permissible daily price movement. The Fund may be disadvantaged if it is prohibited from executing a trade outside the daily permissible price movement. At or prior to maturity of a futures contract, the Fund may enter into an offsetting contract and may incur a loss to the extent there has been adverse movement in futures contract prices. The liquidity of the futures markets depends on participants entering into offsetting transactions rather than making or taking delivery. To the extent participants make or take delivery, liquidity in the futures market could be reduced. Because of the low margin deposits normally required in futures trading, it is possible that the Fund may employ a high degree of leverage in the portfolio. As a result, a relatively small price movement in a futures contract may result in substantial losses to the Fund, exceeding the amount of the margin paid. For certain types of futures contracts, losses are potentially unlimited. Futures markets are highly volatile, and the use of futures may increase the volatility of the Fund’s NAV. Futures contracts executed (if any) on foreign exchanges may not provide the same protection as U.S. exchanges. Futures contracts can increase the Fund’s risk exposure to underlying references and their attendant risks.
Derivatives Risk – Options Risk (All Funds). Options are derivatives that give the purchaser the option to buy (call) or sell (put)an underlying reference from or to a counterparty at a specified price (the strike price) on or before an expiration date. By investing in options, the Fund is exposed to the risk that it may be required to buy or sell the underlying reference at a disadvantageous price on or before the expiration date. Options may involve economic leverage, which could result in greater volatility in price movement. The Fund’s losses could be significant, and are potentially unlimited for certain types of options. Options may be traded on a securities exchange or in the over-the-counter market. At or prior to maturity of an options contract, the Fund may enter into an offsetting contract and may incur a loss to the extent there has been adverse movement in options prices. Options can increase the Fund’s risk exposure to underlying references and their attendant risks.
Emerging Markets Risk (Impact Shares Sustainable Development Goals Global Equity ETF and Global Climate ETF only) - Investing in issuers located in or tied economically to emerging markets is subject to the same risks as foreign market investments, generally to a greater extent. The Fund will be subject to these risks to an even greater
33
Impact Shares Trust I
Notes to Financial Statements
December 31, 2021 (Unaudited)
extent, to the extent the Fund invests in issuers exposed to countries defined as “low income” or “lower middle income” by the World Bank or as a “Least Developed Country” by the United Nations. These countries typically confront severe structural impediments to sustainable development and are highly vulnerable to economic and environmental shocks and have low levels of human assets. Emerging markets may have additional risks including greater fluctuations in market values and currency exchange rates; increased risk of default; greater social, economic, and political uncertainty and instability; increased risk of nationalization, expropriation, or other confiscation of assets of issuers to which the Fund may be exposed; increased risk of embargoes or economic sanctions on a country, sector, or issuer; greater governmental involvement in the economy; less governmental supervision and regulation of the securities markets and participants in those markets; controls on non-U.S. investment, capital controls and limitations on repatriation of invested capital, dividends, interest, and other income, and on the Fund’s ability to exchange local currencies for U.S. dollars; lower levels of liquidity; inability to purchase and sell investments or otherwise settle security or derivative transactions; greater risk of issues with share registration and safe custody; unavailability of currency hedging techniques; differences in, or lack of, auditing and financial reporting standards and resulting unavailability of material information about issuers; slower clearance and longer settlement; and difficulties in obtaining and/or enforcing legal judgments.
Additionally a foreign issuer is not generally subject to uniform accounting, auditing and financial reporting standards and practices comparable to those in the United States. The Public Company Accounting Oversight Board, which regulates auditors of U.S. public companies, is unable to inspect audit work papers in certain foreign countries. Investors in foreign countries often have limited rights and few practical remedies to pursue shareholder claims, including class actions or fraud claims, and the ability of the U.S. Securities and Exchange Commission, the U.S. Department of Justice and other authorities to bring and enforce actions against foreign issuers or foreign persons is limited.
Equity Investing Risk (All Funds, except Affordable Housing ETF) - The market prices of equity securities owned by a Fund may go up or down, sometimes rapidly or unpredictably. The value of a security may decline for a number of reasons that may directly relate to the issuer, such as management performance, financial leverage, non-compliance with regulatory requirements, and reduced demand for the issuer’s goods or services. The values of equity securities also may decline due to general industry or market conditions that are not specifically related to a particular company, such as real or perceived adverse economic conditions, changes in the general outlook for corporate earnings, changes in interest or currency rates, or adverse investor sentiment generally. In addition, equity markets tend to move in cycles, which may cause stock prices to fall over short or extended periods of time.
ESG Index Risk (All Funds, except Affordable Housing ETF) - The index provider uses environmental, social and governance (ESG) related ratings and research to construct the Index. These ESG related ratings and research may exclude securities of certain companies from the Index for non-financial reasons and as a result, the Fund may forgo market opportunities available to other index funds that do not seek to track the performance of an ESG related index. In evaluating a company, the index provider is often dependent upon information and data obtained through voluntary or third- party reporting that, where available, may be incomplete or inaccurate, which could cause the index provider to incorrectly assess a company’s ESG risks and opportunities. In addition, there is a risk that the companies included in the Index will not meet their climate objectives.
Ethnic Diversity Risk (Impact Shares NAACP Minority Empowerment ETF only) - The returns on a portfolio of securities that excludes companies that are not ethnically diverse may trail the returns on a portfolio of securities that includes companies that are not ethnically diverse. Investing only in a portfolio of securities that are ethnically diverse may affect the Fund’s exposure to certain types of investments and may adversely impact the Fund’s performance depending on whether such investments are in or out of favor in the market.
Exchange-Traded Funds Risk (All Funds) - The price movement of an exchange-traded fund may not exactly track the underlying index and may result in a loss. In addition, shareholders bear both their proportionate share of the Fund’s expenses and similar expenses of the underlying investment company when the Fund invests in shares of another investment company.
34
Impact Shares Trust I
Notes to Financial Statements
December 31, 2021 (Unaudited)
Extension Risk (Affordable Housing ETF only) - Extension risk is the risk that, when interest rates rise, certain obligations will be paid off by the issuer (or other obligated party) more slowly than anticipated, causing the value of these debt securities to fall. Rising interest rates tend to extend the duration of debt securities, making their market value more sensitive to changes in interest rates. The value of longer-term debt securities generally changes more in response to changes in interest rates than shorter-term debt securities. As a result, in a period of rising interest rates, securities may exhibit additional volatility and may lose value.
Fee Risk (All Funds) - Because the fees paid by a Fund to Impact Shares are based on the average daily value of the total assets of such Fund, less all accrued liabilities of such Fund (other than the amount of any outstanding borrowings constituting financial leverage), Impact Shares has a financial incentive to cause the Funds to utilize leverage, which creates a conflict of interest between Impact Shares, on the one hand, and the shareholders of the Funds, on the other hand.
Foreign Securities Risk (Impact Shares Sustainable Development Goals Global Equity ETF and Global Climate ETF only) - Investments in securities of non-U.S. issuers involve certain risks not involved in domestic investments (for example, fluctuations in foreign exchange rates (for non-U.S. securities not denominated in U.S. dollars); future foreign economic, financial, political and social developments; nationalization; exploration or confiscatory taxation; smaller markets; different trading and settlement practices; less governmental supervision; and different accounting, auditing and financial recordkeeping standards and requirements) that may result in the Fund experiencing more rapid and extreme changes in value than a fund that invests exclusively in securities of U.S. companies. These risks are magnified for investments in issuers tied economically to emerging markets, the economies of which tend to be more volatile than the economies of developed markets. In addition, investments by the Fund in non-U.S. securities may be subject to withholding and other taxes imposed by foreign countries on dividends, interest, capital gains, or other income or proceeds. Those taxes will reduce the Fund’s yield on any such securities.
Futures Contracts Risk (All Funds) - Futures contracts provide for the future sale by one party and purchase by another party of a specified amount of an underlying asset at a price, date and time specified when the contract is made. Funds, such as the Funds, that use futures contracts, which are a type of derivative, are subject to the risk of loss caused by unanticipated market movements. In addition, there may at times be an imperfect correlation between the movement in the prices of futures contracts and the value of their underlying instruments or indexes and there may at times not be a liquid secondary market for certain futures contracts.
Gender Diversity Risk (Impact Shares YWCA Women’s Empowerment ETF only) - The returns on a portfolio of securities that excludes companies that are not gender diverse may trail the returns on a portfolio of securities that includes companies that are not gender diverse. Investing only in a portfolio of securities that are gender diverse may affect the Fund’s exposure to certain types of investments and may adversely impact the Fund’s performance depending on whether such investments are in or out of favor in the market.
Geographic Risk (Impact Shares Sustainable Development Goals Global Equity ETF and Global Climate ETF only) - To the extent the Fund’s investments in a single country or a limited number of countries represent a large percentage of the Fund’s assets, the Fund will be subject to the risk that economic, political and social conditions in those countries will have a significant impact on its investment performance and the Fund’s shares may be subject to increased price volatility.
Income Risk (Affordable Housing ETF only) - The Fund’s income may decline when interest rates fall or if there are defaults in the mortgage loans underling the securities in its portfolio. This decline can occur because the Fund may subsequently invest in lower-yielding securities as debt securities in its portfolio mature, are near maturity or are called, or the Fund otherwise needs to purchase additional debt securities.
Illiquid Securities Risk (All Funds) - Illiquid investments may be difficult to resell at approximately the price they are valued in the ordinary course of business within seven days. When investments cannot be sold readily at the desired time or price, a Fund may have to accept a much lower price, may not be able to sell the investment at all or may be forced to forego other investment opportunities, all of which may adversely impact a Fund’s returns. Illiquid investments also may be subject to valuation risk.
35
Impact Shares Trust I
Notes to Financial Statements
December 31, 2021 (Unaudited)
Index Performance Risk (All Funds, except Affordable Housing ETF) - Each Fund is linked to an index maintained by a third party provider unaffiliated with the Funds or the Adviser. There can be no guarantee or assurance that the methodology used by the third party provider to create the index will result in the Funds achieving high, or even positive, returns. Further, there can be no guarantee that the methodology underlying the index or the daily calculation of the index will be free from error. It is also possible that the value of the index may be subject to intentional manipulation by third-party market participants. The particular indices used by the Funds may underperform other asset classes and may underperform other similar indices. Each of these factors could have a negative impact on the performance of the Funds.
Industry Concentration Risk (All Funds, except Affordable Housing ETF) - Because each Fund may invest 25% or more of the value of its assets in an industry or group of industries to the extent that the Underlying Index concentrates in an industry or group of industries, the Fund’s performance largely depends on the overall condition of such industry or group of industries and the Fund is susceptible to economic, political and regulatory risks or other occurrences associated with that industry or group of industries.
Inflation Risk (Affordable Housing ETF only) - Inflation risk is the risk that the value of assets or income from investments will be less in the future as inflation decreases the value of money. As inflation increases, the present value of the Fund’s assets and distributions may decline.
Intellectual Property Risk (All Funds, except Affordable Housing ETF) - The Funds rely on licenses that permit the Adviser to use the Underlying Indices and associated trade names, trademarks and service marks, as well as the partner nonprofits’ names and logos (the “Intellectual Property”) in connection with the investment strategies of each respective Fund and/or in marketing and other materials for each Fund. Such licenses may be terminated, and, as a result, the relevant Fund may lose its ability to use the Intellectual Property. In the event a license is terminated or the license provider does not have rights to license the Intellectual Property, the operations of such Fund may be adversely affected.
Interest Rate Risk (Affordable Housing ETF only) - Interest rate risk is the risk that the value of the debt securities in the Fund’s portfolio will decline because of rising market interest rates. Interest rate risk is generally lower for shorter term debt securities and higher for longer-term debt securities. The Fund may be subject to a greater risk of rising interest rates than would normally be the case due to the current period of historically low rates and the effect of potential government fiscal policy initiatives and resulting market reaction to those initiatives. Duration is a reasonably accurate measure of a debt security’s price sensitivity to changes in interest rates and a common measure of interest rate risk. Duration measures a debt security’s expected life on a present value basis, taking into account the debt security’s yield, interest payments and final maturity. In general, duration represents the expected percentage change in the value of a security for an immediate 1% change in interest rates. For example, the price of a debt security with a three-year duration would be expected to drop by approximately 3% in response to a 1% increase in interest rates. Therefore, prices of debt securities with shorter durations tend to be less sensitive to interest rate changes than debt securities with longer durations. As the value of a debt security changes over time, so will its duration. As of the date of this Prospectus, the United States is experiencing a low interest rate environment, which may increase the Fund’s exposure to risks associated with rising market interest rates. Rising market interest rates could have unpredictable effects on the markets and may expose fixed-income and related markets to heightened volatility. To the extent that the Fund invests in fixed-income securities, an increase in market interest rates may lead to increased redemptions and increased portfolio turnover, which could reduce liquidity for certain investments, adversely affect values, and increase costs. Increased redemptions may cause the Fund to liquidate portfolio positions when it may not be advantageous to do so and may lower returns. If dealer capacity in fixed-income markets is insufficient for market conditions, it may further inhibit liquidity and increase volatility in the fixed-income markets. Further, recent and potential future changes in government policy may affect interest rates.
Limited Fund Size Risk (All Funds) - The Funds may not attract sufficient assets to achieve or maximize investment and operational efficiencies and remain viable. If a Fund fails to achieve sufficient scale, it may be liquidated.
36
Impact Shares Trust I
Notes to Financial Statements
December 31, 2021 (Unaudited)
Liquidity Risk (Affordable Housing ETF only) - The Fund may hold certain investments that may trade over-the-counter or in limited volume or lack an active trading market. Accordingly, the Fund may not be able to sell or close out of such investments at favorable times or prices (or at all), or at the prices approximating those at which the Fund currently values them. Illiquid securities may trade at a discount from comparable, more liquid investments and may be subject to wide fluctuations in market value. The prices of illiquid securities may be more volatile than more liquid investments. The risks associated with illiquid securities may be greater in times of financial stress.
Management Risk (All Funds) - Management risk is the risk associated with the fact that the Fund relies on the Adviser’s ability to achieve its investment objective. The Adviser is a non-profit organization with limited personnel and financial resources. The relative lack of resources may increase the Fund’s management risk.
Market Price Variance Risk (All Funds) - Fund shares are listed for trading on NYSE Arca, Inc. (the “Exchange”) and can be bought and sold in the secondary market at prevailing market prices. The market prices of shares will fluctuate in response to changes in the NAV and supply and demand for shares. As a result, the trading prices of Shares may deviate significantly from NAV during periods of market volatility. The Adviser cannot predict whether shares will trade above, below or at their NAV. Given the fact that shares can be created and redeemed in Creation Units, the Adviser believes that large discounts or premiums to the NAV of shares should not be sustained in the long-term. In addition, the securities held by the Fund may be traded in markets that close at a different time than NYSE. Liquidity in those securities may be reduced after the applicable closing times. Accordingly, during the time when NYSE is open but after the applicable market closing, fixing or settlement times, bid-ask spreads and the resulting premium or discount to the Shares’ NAV may widen. Further, secondary markets may be subject to irregular trading activity, wide bid/ask spreads and extended trade settlement periods, which could cause a material decline in the Fund’s NAV. In times of market stress, market makers and authorized participants may step away from their respective roles in making a market in Fund shares or in executing purchase and redemption orders, which could lead to variances between the market price of Fund shares and the underlying value of those shares. Also, in stressed market conditions, the market for Fund shares may become less liquid in response to deteriorating liquidity of the Fund’s portfolio holdings, which could lead to differences between the market price of the Fund’s shares and the underlying value of those shares. During periods of high market volatility, a Fund share may trade at a significant discount to its NAV, and in these circumstances certain types of brokerage orders may expose an investor to an increased risk of loss. A “stop order,” sometimes called a “stop-loss order,” may cause a Fund share to be sold at the next prevailing market price once the “stop” level is reached, which during a period of high volatility can be at a price that is substantially below NAV. By including a “limit” criteria with your brokerage order, you may be able to limit the size of the loss resulting from the execution of an ill-timed stop order. The Fund’s shares may be listed or traded on U.S. and non-U.S. stock exchanges other than the U.S. stock exchange where the Fund’s primary listing is maintained, and may otherwise be made available to non-U.S. investors through funds or structured investment vehicles similar to depositary receipts. There can be no assurance that the Fund’s shares will continue to trade on any such stock exchange or in any market or that the Fund’s shares will continue to meet the requirements for listing or trading on any exchange or in any market. The Fund’s shares may be less actively traded in certain markets than in others, and investors are subject to the execution and settlement risks and market standards of the market where they or their broker direct their trades for execution. Certain information available to investors who trade Fund shares on a U.S. stock exchange during regular U.S. market hours may not be available to investors who trade in other markets, which may result in secondary market prices in such markets being less efficient.
The Fund’s investment results are measured based upon the daily NAV of the Fund. Investors purchasing and selling shares in the secondary market may not experience investment results consistent with those experienced by those purchasing and redeeming directly with the Fund.
Mid-Cap Company Risk (All Funds, except Affordable Housing ETF) - Investing in securities of mid-cap companies may entail greater risks than investments in larger, more established companies. Mid-cap companies tend to have more narrow product lines, more limited financial resources and a more limited trading market for their stocks, as compared with larger companies. As a result, their stock prices may decline significantly as market conditions change.
37
Impact Shares Trust I
Notes to Financial Statements
December 31, 2021 (Unaudited)
Mortgage-Related Securities Risk (Affordable Housing ETF only) - Mortgage-related securities are subject to the same risks as investments in other types of debt securities, including credit risk, interest rate risk, liquidity risk and valuation risk. However, these investments make the Fund more susceptible to adverse economic, political or regulatory events that affect the value of real estate. Mortgage-related securities are also significantly affected by the rate of prepayments and modifications of the mortgage loans underlying those securities, as well as by other factors such as borrower defaults, delinquencies, realized or liquidation losses and other shortfalls. Mortgage-related securities are particularly sensitive to prepayment risk, given that the term to maturity for mortgage loans is generally substantially longer than the expected lives of those securities. As the timing and amount of prepayments cannot be accurately predicted, the timing of changes in the rate of prepayments of the mortgage loans may significantly affect the Fund’s actual yield to maturity on any mortgage-related securities. Along with prepayment risk, mortgage-related securities are significantly affected by interest rate risk.
Non-Diversification Risk (All Funds) - Due to the nature of the Funds’ investment strategies and their non-diversified status (for purposes of the 1940 Act), the Funds may invest a greater percentage of their respective assets in the securities of fewer issuers than a “diversified” fund, and accordingly may be more vulnerable to changes in the value of those issuers’ securities. Since the Funds invest in the securities of a limited number of issuers, the Funds are particularly exposed to adverse developments affecting those issuers, and a decline in the market value of a particular security held by a Fund is likely to affect such Fund’s performance more than if such Fund invested in the securities of a larger number of issuers. Although the Funds will be “non-diversified” for purposes of the 1940 Act, the Funds intend to comply with the diversification requirements under Subchapter M of the Code in order to be eligible to qualify as a regulated investment company.
Operational and Technology Risk (All Funds) - Cyber-attacks, disruptions, or failures that affect the Fund’s service providers, index providers, Authorized Participants, market makers, counterparties, market participants, or issuers of securities held by the Fund may adversely affect the Fund and its shareholders, including by causing losses for the Fund or impairing Fund operations.
Options Risk (All Funds) - Options, such as covered calls and covered puts, are subject to the risk that significant differences between the securities and options markets that could result in an imperfect correlation between these markets.
Passive Investment Risk (All Funds) - The Funds are not actively managed and may be affected by a general decline in market segments included in the applicable Underlying Indices. The Funds invest in securities included in, or representative of, each Fund’s respective Underlying Index regardless of such security’s investment merits. The Adviser does not attempt to take defensive positions under any market conditions, including during declining markets.
Prepayment Risk (Affordable Housing ETF only) - Prepayment risk is the risk that the issuer of a debt security will repay principal prior to the scheduled maturity date. Debt securities allowing prepayment may offer less potential for gains during a period of declining interest rates, as the Fund may be required to reinvest the proceeds of any prepayment at lower interest rates. These factors may cause the value of an investment in the Fund to change.
Securities Market Risk (All Funds) - Securities market risk is the risk that the value of securities owned by a Fund may go up or down, sometimes rapidly or unpredictably, due to factors affecting particular companies or the securities markets generally. The profitability of a Fund substantially depends upon the Adviser correctly assessing the future price movements of stocks, bonds, loans, options on stocks, and other securities and the movements of interest rates. The Adviser cannot guarantee that it will be successful in accurately predicting price movements. The market prices of equities may decline for reasons that directly relate to the issuing company (such as poor management performance or reduced demand for its goods or services), factors that affect a particular industry (such as a decline in demand, labor or raw material shortages, or increased production costs) or general market conditions not specifically related to a company or industry (such as real or perceived adverse economic conditions, changes in the general outlook for corporate earnings, changes in interest or currency rates, or adverse investor
38
Impact Shares Trust I
Notes to Financial Statements
December 31, 2021 (Unaudited)
sentiment generally, or natural and environmental disasters and systemic market dislocations). The spread of infectious disease including epidemics and pandemics such as the recent COVID-19 outbreak, the novel respiratory disease also known as “coronavirus,” also could affect the economies of many nations in ways that cannot necessarily be foreseen. The coronavirus has resulted in travel restrictions and disruptions, closed borders, enhanced health screenings at ports of entry and elsewhere, disruption of and delays in healthcare service preparation and delivery, quarantines, event cancellations and restrictions, service cancellations or reductions, disruptions to business operations, supply chains and customer activity, lower consumer demand for goods and services, as well as general concern and uncertainty that has negatively affected the economic environment. The impact of this outbreak and any other epidemic or pandemic that may arise in the future could adversely affect the economies of many nations or the entire global economy, the financial performance of individual issuers, borrowers and sectors and the health of capital markets and other markets generally in potentially significant and unforeseen ways. This crisis or other public health crises may also exacerbate other pre-existing political, social and economic risks in certain countries or globally. The duration of the COVID-19 outbreak and its effects cannot be determined with certainty. The foregoing could lead to a significant economic downturn or recession, increased market volatility, a greater number of market closures, higher default rates and adverse effects on the values and liquidity of securities or other assets. Such impacts, which may vary across asset classes, may adversely affect the performance of the Fund’s investments, the Fund and your investment in the Fund.
In addition, the increasing popularity of passive index-based investing may have the potential to increase security price correlations and volatility. As passive strategies generally buy or sell securities based simply on inclusion and representation in an index, securities prices will have an increasing tendency to rise or fall based on whether money is flowing into or out of passive strategies rather than based on an analysis of the prospects and valuation of individual securities. This may result in increased market volatility as more money is invested through passive strategies. As a result of the nature of a Fund’s investment activities, it is possible that such Fund’s financial performance may fluctuate substantially from period to period. Additionally, at any point in time an investment in a Fund may be worth less than the original investment, even after taking into account the reinvestment of dividends and distributions.
Significant Exposure Risk (All Funds) - To the extent that the Fund invests a large percentage of its assets in a single asset class or the securities of issuers within the same country, state, region, industry or sector, an adverse economic, business or political development may affect the value of the Fund’s investments more than if the Fund were more broadly diversified. A significant exposure makes the Fund more susceptible to any single occurrence and may subject the Fund to greater market risk than a fund that is more broadly diversified.
Small-Cap Company Risk (All Funds, except Affordable Housing ETF) - Investing in the securities of small-cap companies either directly or indirectly through investments in ETFs, closed-end funds or mutual funds may pose greater market and liquidity risks than larger, more established companies, because of limited product lines and/or operating history, limited financial resources, limited trading markets, and the potential lack of management depth. In addition, the securities of such companies are typically more volatile than securities of larger capitalization companies.
Specified Pools Risk (Affordable Housing ETF only) - The Fund is expected to primarily invest in specified pools of mortgage loans. This may cause the Fund to take longer to fully achieve its principal investment strategy.
Swaps Risk (All Funds) - Investments in swaps involve both the risks associated with an investment in the underlying investments or instruments (including equity investments) and counterparty risk. In a standard over-the-counter (“OTC”) swap transaction, two parties agree to exchange the returns, differentials in rates of return or some other amount calculated based on the “notional amount” of predetermined investments or instruments, which may be adjusted for an interest factor. Swaps can involve greater risks than direct investments in securities, because swaps may be leveraged and OTC swaps are subject to counterparty risk (e.g., the risk of a counterparty’s defaulting on the obligation or bankruptcy), credit risk and pricing risk (i.e., swaps may be difficult to value). Swaps may also be considered illiquid. Certain swap transactions, including interest rate swaps and index credit default swaps, may be
39
Impact Shares Trust I
Notes to Financial Statements
December 31, 2021 (Unaudited)
subject to mandatory clearing and exchange trading, although the swaps in which the Fund will invest are not currently subject to mandatory clearing and exchange trading. The use of swaps is a highly specialized activity which involves investment techniques, risk analyses and tax planning different from those associated with ordinary portfolio securities transactions. The value of swaps, like many other derivatives, may move in unexpected ways and may result in losses for the Fund.
Tracking Error Risk (All Funds, except Affordable Housing ETF) - The performance of the Fund may diverge from that of the Underlying Index. Because the Fund employs a representative sampling strategy, the Fund may experience tracking error to a greater extent than a fund that seeks to replicate an index. The Adviser may not be able to cause the Fund’s performance to correlate to that of the Fund’s benchmark, either on a daily or aggregate basis. Because the Underlying Index rebalances monthly but the Fund is not obligated to do the same, the risk of tracking error may increase following the rebalancing of the Underlying Index.
Trading Issues Risk (All Funds) - Although the shares of the Fund are listed for trading on the Exchange, there can be no assurance that an active trading market for such shares will develop or be maintained. Trading in shares on the Exchange may be halted due to market conditions or for reasons that, in the view of the Exchange, make trading in shares inadvisable. In addition, trading in shares on the Exchange is subject to trading halts caused by extraordinary market volatility pursuant to the Exchange’s “circuit breaker” rules. Market makers are under no obligation to make a market in the Fund’s shares, and authorized participants are not obligated to submit purchase or redemption orders for Creation Units (as defined below). In the event market makers cease making a market in the Fund’s shares or authorized participants stop submitting purchase or redemption orders for Creation Units, Fund shares may trade at a larger premium or discount to their net asset value. There can be no assurance that the requirements of the Exchange necessary to maintain the listing of the Fund will continue to be met or will remain unchanged. The Fund may have difficulty maintaining its listing on the Exchange in the event the Fund’s assets are small or the Fund does not have enough shareholders.
Transactions Risk (Affordable Housing ETF only) - The Fund may purchase securities via to-be-announced transactions (“TBA Transactions”). In such a transaction, the purchase price of the securities is typically fixed at the time of the commitment, but delivery and payment can take place a month or more after the date of the commitment. At the time of delivery of the securities, the value may be more or less than the purchase or sale price. Purchasing securities in a TBA Transaction may give rise to investment leverage and may increase the Fund’s volatility. Default by, or bankruptcy of, a counterparty to a TBA Transaction would expose the Fund to possible losses because of an adverse market action, expenses or delays in connection with the purchase or sale of the pools specified in such transaction.
U.S. Government Securities Risk (Affordable Housing ETF only) - U.S. government securities are subject to interest rate risk but generally do not involve the credit risks associated with investments in other types of debt securities. As a result, the yields available from U.S. government securities are generally lower than the yields available from other debt securities. U.S. government securities are guaranteed only as to the timely payment of interest and the payment of principal when held to maturity. While securities issued or guaranteed by U.S. federal government agencies (such as Ginnie Mae) are backed by the full faith and credit of the U.S. Department of the Treasury, securities issued by government sponsored entities (such as Fannie Mae and Freddie Mac) are solely the obligation of the issuer and generally do not carry any guarantee from the U.S. government.
Obligations of U.S. government agencies, authorities, instrumentalities and sponsored enterprises (such as Fannie Mae and Freddie Mac) have historically involved little risk of loss of principal if held to maturity. However, the maximum potential liability of the issuers of some of these securities may greatly exceed their current resources and no assurance can be given that the U.S. government would provide financial support to any of these entities if it were not obligated to do so by law. Fannie Mae and Freddie Mac have been operating under conservatorship, with the Federal Housing Finance Administration (“FHFA”) acting as their conservator, since 2008. The entities are dependent upon the continued support of the U.S. Department of the Treasury and FHFA in order to continue their business operations. These factors, among others, could affect the future status and role of Fannie Mae or Freddie
40
Impact Shares Trust I
Notes to Financial Statements
December 31, 2021 (Unaudited)
Mac and the value of their securities and the securities that they guarantee. Additionally, the U.S. government and its agencies and instrumentalities do not guarantee the market values of their securities, which may fluctuate.
Valuation Risk (All Funds) - The Funds are subject to the risk of mispricing or improper valuation of their investments, in particular to the extent that their securities are fair valued.
7. OTHER
At December 31, 2021, the records of the Trust reflected that 100% of the Funds’ total Shares outstanding were held by four Authorized Participants, in the form of Creation Units. However, the individual shares comprising such Creation Units are listed and traded on the NYSE Arca, Inc. and have been purchased and sold by persons other than Authorized Participants.
8. SUBSEQUENT EVENTS
The Funds have evaluated the need for additional disclosures and/or adjustments resulting from subsequent events through the date the financial statements were issued. Based on this evaluation, no disclosure and/or adjustments were required to the financial statements.
41
Impact Shares Trust I
Disclosure of Fund Expenses
December 31, 2021 (Unaudited)
All ETFs have operating expenses. As a shareholder of the Fund you incur an Advisory fee. In addition to the Advisory fee, a shareholder may pay brokerage expenses, taxes, interest, litigation expenses and other extraordinary expenses (including acquired fund fees and expenses), if any. It is important for you to understand the impact of these ongoing costs of your investment returns. Shareholders may incur brokerage commissions on their purchases and sales of Fund shares, which are not reflected in these examples.
The following examples use the annualized expense ratio and are intended to help you understand the ongoing costs (in dollars) of investing in each Fund and to compare these costs with those of other funds. The examples are based on an investment of $1,000 made at the beginning of the period shown and held for the entire period (July 1, 2021 to December 31, 2021) (unless otherwise noted below).
The table below illustrates each Fund’s cost in two ways:
Actual Fund Return. This section helps you to estimate the actual expenses after fee waivers that your Fund incurred over the period. The “Expenses Paid During Period” column shows the actual dollar expense cost incurred by a $1,000 investment in the Fund, and the “Ending Account Value” number is derived from deducting that expense cost from the Fund’s gross investment return.
You can use this information, together with the actual amount you invested in the Fund, to estimate the expenses you paid over that period. Simply divide your actual account value by $1,000 to arrive at a ratio (for example, an $8,600 account value divided by $1,000 = 8.6), then multiply that ratio by the number shown for your Fund under “Expenses Paid During Period.”
Hypothetical 5% Return. This section helps you compare your Fund’s costs with those of other funds. It assumes that the Fund had an annual 5% return before expenses during the year, but that the expense ratio (Column 3) for the period is unchanged. This example is useful in making comparisons because the Commission requires all funds to make this 5% calculation. You can assess your Fund’s comparative cost by comparing the hypothetical result for your Fund in the “Expenses Paid During Period” column with those that appear in the same charts in the shareholder reports for other funds.
NOTE: Because the return is set at 5% for comparison purposes — NOT your Fund’s actual return — the account values shown may not apply to your specific investment.
| | | | | | | | | | | | | | | | |
| | | Beginning
Account
Value
7/1/21 | | | Ending
Account
Value
12/31/21 | | | Annualized
Expense
Ratios | | | Expenses
Paid During
Period(1) | |
|
Impact Shares YWCA Women’s Empowerment ETF | |
Actual Fund Return | | $ | 1,000.00 | | | $ | 1,098.80 | | | | 0.75 | % | | $ | 3.97 | |
Hypothetical 5% Return | | | 1,000.00 | | | | 1,021.43 | | | | 0.75 | | | | 3.82 | |
|
Impact Shares NAACP Minority Empowerment ETF | |
Actual Fund Return | | $ | 1,000.00 | | | $ | 1,114.20 | | | | 0.49 | % | | $ | 2.61 | |
Hypothetical 5% Return | | | 1,000.00 | | | | 1,022.74 | | | | 0.49 | | | | 2.50 | |
|
Impact Shares Sustainable Development Goals Global Equity ETF | |
Actual Fund Return | | $ | 1,000.00 | | | $ | 1,077.90 | | | | 0.75 | % | | $ | 3.93 | |
Hypothetical 5% Return | | | 1,000.00 | | | | 1,021.43 | | | | 0.75 | | | | 3.82 | |
|
Impact Shares Affordable Housing MBS ETF* | |
Actual Fund Return | | $ | 1,000.00 | | | $ | 988.80 | | | | 0.30 | % | | $ | 1.29 | (2) |
Hypothetical 5% Return | | | 1,000.00 | | | | 1,023.69 | | | | 0.30 | | | | 1.53 | |
|
Impact Shares MSCI Global Climate Select ETF** | |
Actual Fund Return | | $ | 1,000.00 | | | $ | 1,010.90 | | | | 0.45 | % | | $ | 0.73 | (3) |
Hypothetical 5% Return | | | 1,000.00 | | | | 1,022.96 | | | | 0.45 | | | | 2.28 | |
(1) Expenses are equal to the Fund’s annualized expense ratio multiplied by the average account value over the period, multiplied 184/365 (to reflect the one-half year period shown).
(2) Expenses are equal to the Fund’s annualized expense ratio multiplied by the average account value over the period, multiplied by 158/365 (to reflect the period from inception to date).
(3) Expenses are equal to the Fund’s annualized expense ratio multiplied by the average account value over the period, multiplied by 59/365 (to reflect the period from inception to date).
* Commenced operations on July 26, 2021.
** Commenced operations on November 2, 2021.
42
Impact Shares Trust I
Board Considerations in Approving an Amended and Restated
Investment Advisory Agreement
December 31, 2021 (Unaudited)
At a meeting held on July 16, 2021, the trustees (collectively, the “Trustees” or the “Board”) of Impact Shares Trust I (the “Trust”), including the Trustees who are not “interested persons” (as such term is defined in Section 2(a)(19) of the 1940 Act) of the Trust (such Trustees, the “Independent Trustees”), met to consider an amended and restated investment advisory agreement (the “Amended Investment Advisory Agreement”) between the Trust and Impact Shares, Corp. (the “Adviser”) with respect to Impact Shares NAACP Minority Empowerment ETF, Impact Shares YWCA Women’s Empowerment ETF and Impact Shares Sustainable Development Goals Global Equity ETF (each a “Fund,” and collectively, the “Funds”). In approving the Amended Investment Advisory Agreement, the Board considered the same factors and information it considered at its February 24, 2021 meeting (the “February Meeting”) in connection with its approval to continue the original investment advisory agreement (the “Investment Advisory Agreement”) between the Trust and the Adviser with respect to the Funds for an additional one-year term. The Board noted that the only difference between the Investment Advisory Agreement and the Amended Investment Advisory Agreement was the narrowing of the list of expenses to be borne by a Fund under the its unitary fee structure, the effect of which would reduce the amount of expenses to be borne by a Fund and commensurately increase the expenses to be borne by the Adviser with the potential to reduce the fees paid by the Fund.
In connection with their consideration of the Investment Advisory Agreement at the February Meeting, the Independent Trustees considered the following factors. In their deliberations, the Trustees did not identify any particular information that was all-important or controlling, and each Trustee may have attributed different weights to the various factors. The following summarizes the Trustees’ process of requesting and evaluating the information they believed to be reasonably necessary to determine whether to approve the continuation of the Investment Advisory Agreement at its February Meeting.
The Nature, Extent, and Quality of the Services
In considering the Investment Advisory Agreement, the Independent Trustees evaluated the nature, extent and quality of the advisory services provided to each Fund by the Adviser. They considered the terms of the Investment Advisory Agreement and received and considered information provided by management that described, among other matters:
| • | | the nature and scope of the advisory services provided to each Fund and information regarding the experience, qualifications and adequacy of the personnel providing those services, |
| • | | the investment program used by the Adviser to manage each Fund, |
| • | | possible fall-out benefits and potential conflicts of interest, |
| • | | anticipated brokerage practices, |
| • | | the compliance functions of the Adviser, and |
| • | | the financial resources of the Adviser. |
In addition to considering each Fund’s investment performance (see below), the Independent Trustees considered, among other matters, the general oversight of the Trust by the Adviser. They also took into account information concerning the investment processes used by the Adviser in managing each Fund.
The Independent Trustees considered, among other matters, that the Adviser provides the Trust with office space and personnel, and, under the unitary fee structure set forth in the Investment Advisory Agreement, the Adviser is responsible for bearing all of each Fund’s expenses, including the costs of transfer agency, custody, fund administration, legal, audit and other services provided to each Fund, with the exceptions set forth below under “Fees and Other Expenses.” They also took into account the Adviser’s compliance and operational functions, as well as the resources being devoted by the Adviser to such functions.
43
Impact Shares Trust I
Board Considerations in Approving an Amended and Restated
Investment Advisory Agreement
December 31, 2021 (Unaudited)
The Independent Trustees noted that the Adviser’s current cash flows and expenses outpaced revenues. The Independent Trustees considered the Adviser’s statements as to its discussions with the Rockefeller foundation and others to subsidize operating expenses, as well as on-going discussions regarding potential partnerships to support the viability of the Funds.
The Independent Trustees concluded, within the context of their overall conclusions regarding the Investment Advisory Agreement, that the scope of the services provided to each Fund under the Investment Advisory Agreement was consistent with such Fund’s operational requirements; that the Adviser has the capabilities, resources and personnel necessary to provide the advisory services required by each Fund; and that, overall, the nature, extent and quality of the services provided by the Adviser to each Fund were sufficient to warrant approval of the Investment Advisory Agreement for an additional one-year term.
Performance
The Independent Trustees noted that each Fund was relatively new with a limited performance history. The Independent Trustees considered that each Fund seeks investment results that, before fees and expenses, track the performance of its respective underlying index and each Fund’s performance was within an acceptable level of its underlying index. The Independent Trustees also considered that each Fund experienced twelve-month performance ended December 31, 2020 above the median of its Morningstar category.
The Independent Trustees concluded, within the context of their overall conclusions regarding the Investment Advisory Agreement, that the limited performance history for each Fund was not inconsistent with approval of the Investment Advisory Agreement.
The Costs of the Services Provided by the Adviser and the Profits Realized by the Adviser
The Independent Trustees considered the cost of services provided by the Adviser and the profitability to the Adviser of its relationship with the Trust. The Independent Trustees recognized that the Adviser should, in the abstract, be entitled to earn a reasonable level of profit for the services provided to each Fund, and that it is difficult to make comparisons of profitability from ETF advisory contracts because comparative information is not generally available and is affected by numerous factors, including the structure of the particular adviser, the types and sizes of funds it manages, its business mix, numerous assumptions about cost allocations and the adviser’s capital structure and cost of capital.
The Independent Trustees also considered that the Adviser is a 501(c)(3) nonprofit and considered whether it might be appropriate to analyze some or all of the amounts the Adviser has committed to donate to each Fund’s partner nonprofit as analogous to the profits earned by for-profit investment advisers to investment companies. The Independent Trustees noted that the Adviser’s expenses currently exceed revenues and that, based on the Adviser’s projections, it was unlikely that the fees paid to the Adviser by a Fund would significantly exceed the Adviser’s cost of providing services to that Fund in the near term. Further the Independent Trustees concluded that, even if any such excess were to be analyzed as though it were profit to the Adviser, the expected “profitability” was not excessive and supported the approval of the Investment Advisory Agreement for an additional one-year term.
Fees and Other Expenses
The Independent Trustees considered the unitary fee paid by each Fund to the Adviser, as well as each Fund’s distribution and service (Rule 12b-1) plan, “other expenses” and total expenses. In doing so, the Independent Trustees reviewed information provided by Impact Shares comparing the expenses of each Fund relative to those of its Morningstar Peer Group and Morningstar category universe for active ESG funds. The Independent Trustees considered that each Fund’s net expense ratio was below the median of its Morningstar category (including both mutual funds and ETFs) and above the median of its Morningstar category (including index funds only).
44
Impact Shares Trust I
Board Considerations in Approving an Amended and Restated
Investment Advisory Agreement
December 31, 2021 (Unaudited)
The Independent Trustees noted that, under the unitary fee arrangement described in the Investment Advisory Agreement, the Adviser is responsible for substantially all expenses of each Fund, including the cost of transfer agency, custody, fund administration, legal, audit and other services except for (i) distribution and service fees payable pursuant to a Rule 12b-1 plan, if any; (ii) salaries and other compensation or expenses, including travel expenses, of any of a Fund’s executive officers and employees, if any, who are not officers, directors, shareholders, members, partners or employees of the Adviser or its subsidiaries or affiliates; (iii) taxes and governmental fees, if any, levied against a Fund; (iv) brokerage fees and commissions, and other portfolio transaction expenses incurred by or for a Fund; (v) expenses of a Fund’s securities lending (if any), including any securities lending agent fees, as governed by a separate securities lending agreement; costs, including interest expenses, of borrowing money or engaging in other types of leverage financing; (vi) fees and expenses of any underlying funds or other pooled vehicles in which a Fund invests; (vii) dividend and interest expenses on short positions taken by a Fund; (viii) fees and expenses, including travel expenses, and fees and expenses of legal counsel retained for their benefit, of Trustees who are not officers, employees, partners, shareholders or members of the Adviser or its subsidiaries or affiliates; (ix) extraordinary expenses, including extraordinary legal expenses, as may arise, including, without limitation, expenses incurred in connection with litigation, proceedings, other claims, contractual arrangements with partner nonprofits and the legal obligations of a Fund to indemnify its Trustees, officers, employees, shareholders, distributors, and agents with respect thereto; (x) fees and expenses, including legal, printing and mailing, solicitation and other fees and expenses associated with and incident to shareholder meetings and proxy solicitations involving shareholder proposals or other non-routine matters that are not initiated or proposed by Fund management; (xi) organizational and offering expenses of a Fund, including registration (including Share registration fees), legal, marketing, printing, accounting and other expenses, associated with organizing a Fund in its state of jurisdiction and in connection with the initial registration of a Fund under the 1940 Act and the initial registration of its shares under the Securities Act (i.e., through the effectiveness of the Fund’s initial registration statement on Form N-1A); (xii) fees and expenses associated with seeking, applying for and obtaining formal exemptive, no-action and/or other relief from the SEC; and (xiii) expenses of a Fund which are capitalized in accordance with generally accepted accounting principles.
The Independent Trustees noted that the Adviser, at the time of the Meeting, did not advise any accounts other than the Funds.
Based on this and other information, the Independent Trustees concluded, within the context of their overall conclusions regarding the Investment Advisory Agreement, that the fees and expenses charged represented reasonable compensation to the Adviser in light of the services provided to each Fund.
Possible Fall-Out Benefits
The Independent Trustees considered information regarding the direct and indirect benefits to the Adviser from its relationship with each Fund, including reputational and other “fall out” benefits. The Independent Trustees considered the receipt of these benefits in light of the Adviser’s “profitability,” and concluded that such benefits were not excessive, even if the amounts the Adviser has committed to donate to the partner nonprofits were to be analyzed as though they were profits to the Adviser.
Possible Economies of Scale
The Independent Trustees considered the extent to which the Adviser may realize economies of scale or other efficiencies in managing and supporting each Fund. The Independent Trustees considered that no Fund has any breakpoints in its fee arrangement with the Adviser. The Independent Trustees concluded that each Fund’s overall fee arrangements represent an appropriate sharing at the present time between Fund shareholders and the Adviser of any economies of scale or other efficiencies in the management of each Fund at current asset levels.
Based on the factors described above, the Independent Trustees concluded that the approval of the Investment Advisory Agreement for an additional one-year term was in the best interests of the Funds and should be approved.
45
Impact Shares Trust I
Approval of Impact Shares Affordable Housing MBS ETF Advisory and
Sub-Advisory Agreements
December 31, 2021 (Unaudited)
At a meeting held on July 16, 2021, the Trustees of the Trust who are not “interested persons” (as such term is defined in Section 2(a)(19) of the Investment Company Act of 1940) of the Trust (collectively, the “Trustees” or the “Board”), met to consider the proposed investment advisory agreement between the Trust and the Adviser and the proposed sub-advisory agreement between the Adviser and Community Capital Management, Inc. (the “Sub-Adviser), each for an initial two-year period (together, the “Investment Advisory Agreements”). The following summarizes the Trustees’ process of requesting and evaluating the information they believed to be reasonably necessary to determine whether to approve the Investment Advisory Agreements. In their deliberations, the Trustees did not identify any particular information that was all-important or controlling, and each Trustee may have attributed different weights to the various factors.
The Nature, Extent, and Quality of the Services
In considering the Investment Advisory Agreements, the Independent Trustees evaluated the nature, extent and quality of the advisory services to be provided to the Fund by the Adviser. They considered the terms of the Investment Advisory Agreements and received and considered information provided by management that described, among other matters:
| | • | | the nature and scope of the advisory and sub-advisory services to be provided to the Fund and information regarding the number, experience, qualifications and adequacy of the personnel providing those services, |
| | • | | the investment program to be used by the Sub-Adviser to manage the Fund, |
| | • | | possible fall-out benefits and potential conflicts of interest, |
| | • | | anticipated brokerage practices, |
| | • | | the compliance functions of the Adviser and Sub-Adviser, and |
| | • | | the financial resources of the Adviser and Sub-Adviser. |
They also took into account information concerning the investment processes to be used by the Adviser and Sub-Adviser in managing the Fund. The Independent Trustees considered, among other matters, that the Adviser provides the Trust with office space and personnel. They also took into account the Adviser’s and Sub-Adviser’s compliance and operational functions, as well as the resources being devoted by each of the Adviser and Sub-Adviser to such functions.
The Independent Trustees noted that the Adviser had limited personnel and financial resources, but had received a grant from a charitable foundation to support its initial operations and additional funding from the foundation in the form of an operating capital credit agreement. The Independent Trustees also noted the Sub-Adviser’s financial resources and financial performance history.
The Independent Trustees concluded, within the context of their overall conclusions regarding the Investment Advisory Agreements, that the scope of the services to be provided to the Fund under the Investment Advisory Agreements was consistent with the Fund’s operational requirements; that each of the Adviser and Sub-Adviser has the capabilities, resources and personnel necessary to provide the advisory services required by the Fund; and that, overall, the nature, extent and quality of the services to be provided by the Adviser and Sub-Adviser to the Fund were sufficient to warrant approval of the Investment Advisory Agreements.
Performance
The Independent Trustees noted that the Fund was new and had no performance history. The Independent Trustees concluded, within the context of their overall conclusions regarding the Investment Advisory Agreement, that the absence of a performance history for the Fund was not inconsistent with approval of the Investment Advisory Agreements.
The Costs of the Services Provided by the Adviser and the Profits Realized by the Adviser
The Independent Trustees considered the cost of services provided and to be provided by the Adviser and Sub-Adviser and the impact of the proposals on the anticipated profitability of the Adviser and Sub-Adviser. The
46
Impact Shares Trust I
Approval of Impact Shares Affordable Housing MBS ETF Advisory and
Sub-Advisory Agreements
December 31, 2021 (Unaudited)
Independent Trustees recognized that the Adviser should, in the abstract, be entitled to earn a reasonable level of profit for the services provided and to be provided to the Fund, and that it is difficult to make comparisons of profitability from advisory contracts because comparative information is not generally available and is affected by numerous factors, including the structure of the particular adviser, the types and sizes of funds it manages, its business mix, numerous assumptions about cost allocations and the adviser’s capital structure and cost of capital.
The Independent Trustees considered the fees to be charged by the Sub-Adviser relative to the fees charged by the Sub-Adviser to another client. The Independent Trustees also considered the compensation payable by the Adviser to the Sub-Adviser for sub-advisory services for the Fund, including the portion of the contractual fee rate that is to be paid to the Sub-Adviser, as compared to the compensation to be paid to the Adviser.
The Independent Trustees also considered that the Adviser is a 501(c)(3) nonprofit and that the Adviser expects to utilize any net profits from the Affordable Housing ETF to fund operating costs associated with the continued growth of the Fund. The Independent Trustees noted that the Adviser agreed to waive all advisory fees payable by the Affordable Housing ETF in excess of the amount of the fee paid to the Sub-Adviser until the Fund’s net assets were greater than $100 million. The Independent Trustees considered it was therefore unlikely that the fees paid to the Adviser by a Fund would significantly exceed the Adviser’s cost of providing services to that Fund in the near term, and concluded that, even if any such excess were to be analyzed as though it were profit to the Adviser, the expected “profitability” was not excessive and supported the approval of the Investment Advisory Agreement.
Fees and Other Expenses
The Independent Trustees considered the proposed advisory fee to be paid by the Fund to the Adviser, as well as the Fund’s proposed distribution and service (Rule 12b-1) plan, “other expenses” and total expenses. In doing so, the Independent Trustees reviewed information provided by Impact Shares comparing the projected expenses of the Fund relative to those of other exchange traded Funds that invest in mortgage backed securities. The Independent Trustees considered that the Sub-Adviser had entered into an expense limitation agreement with the Fund pursuant to which it will pay or reimburse the Fund for any expenses in excess of 0.30% of average net assets, subject to certain exceptions set forth in the expense limitation agreement.
Based on this and other information, the Independent Trustees concluded, within the context of their overall conclusions regarding the Investment Advisory Agreements, that the fees and expenses to be charged represented reasonable compensation to the Adviser in light of the services provided and to be provided to the Fund.
Possible Fall-Out Benefits
The Independent Trustees considered information regarding the direct and indirect benefits to each of the Adviser and Sub-Adviser from its relationship with the Fund, including reputational and other “fall out” benefits. The Independent Trustees considered the receipt of these benefits in light of the Adviser and Sub-Adviser’s estimated “profitability,” and concluded that such benefits were not excessive.
Possible Economies of Scale
The Independent Trustees considered the extent to which the Adviser or Sub-Adviser may realize economies of scale or other efficiencies in managing and supporting the Fund. The Independent Trustees considered that the Fund did not have any breakpoints in its fee arrangement with the Adviser or the Adviser’s fee arrangement with the Sub-Adviser. The Independent Trustees concluded that the Fund’s overall fee arrangements represent an appropriate sharing at the present time between Fund shareholders and the Adviser of any economies of scale or other efficiencies in the management of the Fund.
Based on the factors described above, the Independent Trustees concluded that the approval of the Investment Advisory Agreements was in the best interests of the Fund and should be approved.
47
Impact Shares Trust I
Approval of Impact Shares MSCI Global Climate Select ETF Advisory Agreement
December 31, 2021 (Unaudited)
At a meeting held on September 20, 2021, the Trustees of the Trust who are not “interested persons” (as such term is defined in Section 2(a)(19) of the Investment Company Act of 1940) of the Trust (collectively, the “Trustees” or the “Board”), met to consider the proposed investment advisory agreement between the Trust and the Adviser on behalf of the Impact Shares MSCI Global Climate Select ETF (the “Fund”) for an initial two-year period (the “Investment Advisory Agreement”). The following summarizes the Trustees’ process of requesting and evaluating the information they believed to be reasonably necessary to determine whether to approve the Investment Advisory Agreement. In their deliberations, the Trustees did not identify any particular information that was all-important or controlling, and each Trustee may have attributed different weights to the various factors.
The Nature, Extent, and Quality of the Services
In considering the Investment Advisory Agreement, the Independent Trustees evaluated the nature, extent and quality of the advisory services to be provided to the Fund by the Adviser. They considered the terms of the Investment Advisory Agreement and received and considered information provided by management that described, among other matters:
| | • | | the nature and scope of the advisory services to be provided to the Fund and information regarding the number, experience, qualifications and adequacy of the personnel providing those services, |
| | • | | the investment program to be used by the Adviser to manage the Fund, |
| | • | | possible fall-out benefits and potential conflicts of interest, |
| | • | | anticipated brokerage practices, |
| | • | | the compliance functions of the Adviser, and |
| | • | | the financial resources of the Adviser. |
They also took into account information concerning the investment processes to be used by the Adviser in managing the Fund. The Independent Trustees considered, among other matters, that the Adviser provides the Trust with office space and personnel. They also took into account the Adviser’s compliance and operational functions, as well as the resources being devoted by the Adviser to such functions.
The Independent Trustees noted that the Adviser had limited personnel and financial resources, but had received a grant from a charitable foundation to support its initial operations and additional funding from the foundation in the form of an operating capital credit agreement.
The Independent Trustees concluded, within the context of their overall conclusions regarding the Investment Advisory Agreement, that the scope of the services to be provided to the Fund under the Investment Advisory Agreement was consistent with the Fund’s operational requirements; that the Adviser has the capabilities, resources and personnel necessary to provide the advisory services required by the Fund; and that, overall, the nature, extent and quality of the services to be provided by the Adviser to the Fund were sufficient to warrant approval of the Investment Advisory Agreement.
Performance
The Independent Trustees noted that the Fund was new and had no performance history. The Independent Trustees concluded, within the context of their overall conclusions regarding the Investment Advisory Agreement, that the absence of a performance history for the Fund was not inconsistent with approval of the Investment Advisory Agreement.
The Costs of the Services Provided by the Adviser and the Profits Realized by the Adviser
The Independent Trustees considered the cost of services provided and to be provided by the Adviser and the impact of the proposals on the anticipated profitability of the Adviser. The Independent Trustees recognized that the Adviser should, in the abstract, be entitled to earn a reasonable level of profit for the services provided and to be
48
Impact Shares Trust I
Approval of Impact Shares MSCI Global Climate Select ETF Advisory Agreement
December 31, 2021 (Unaudited)
provided to the Fund, and that it is difficult to make comparisons of profitability from advisory contracts because comparative information is not generally available and is affected by numerous factors, including the structure of the particular adviser, the types and sizes of funds it manages, its business mix, numerous assumptions about cost allocations and the adviser’s capital structure and cost of capital.
The Independent Trustees also considered that the Adviser is a 501(c)(3) nonprofit and that the Adviser expects to utilize any net profits from the Fund to fund operating costs associated with the continued growth of the Fund. The Independent Trustees noted that the Adviser agreed to limit the total annual operating expenses (exclusive of fees paid by the Fund pursuant to its distribution plan under Rule 12b-1 under the Investment Company Act of 1940, as amended, taxes, brokerage commissions and other transaction costs, interest payments, acquired fund fees and expenses, extraordinary expenses and dividend expenses on short sales) of the Fund to 0.30% for at least a year from the effective date of the Fund’s initial registration statement. The Independent Trustees considered it was therefore unlikely that the fees paid to the Adviser by a Fund would significantly exceed the Adviser’s cost of providing services to that Fund in the near term, and concluded that, even if any such excess were to be analyzed as though it were profit to the Adviser, the expected “profitability” was not excessive and supported the approval of the Investment Advisory Agreement.
Fees and Other Expenses
The Independent Trustees considered the proposed advisory fee to be paid by the Fund to the Adviser, as well as the Fund’s proposed distribution and service (Rule 12b-1) plan, “other expenses” and total expenses. In doing so, the Independent Trustees reviewed information provided by Impact Shares comparing the projected expenses of the Fund relative to those of other exchange traded Funds that invest in mortgage backed securities.
Based on this and other information, the Independent Trustees concluded, within the context of their overall conclusions regarding the Investment Advisory Agreement, that the fees and expenses to be charged represented reasonable compensation to the Adviser in light of the services provided and to be provided to the Fund.
Possible Fall-Out Benefits
The Independent Trustees considered information regarding the direct and indirect benefits to the Adviser from its relationship with the Fund, including reputational and other “fall out” benefits. The Independent Trustees considered the receipt of these benefits in light of the Adviser’s estimated “profitability,” and concluded that such benefits were not excessive.
Possible Economies of Scale
The Independent Trustees considered the extent to which the Adviser may realize economies of scale or other efficiencies in managing and supporting the Fund. The Independent Trustees considered that the Fund did not have any breakpoints in its fee arrangement with the Adviser. The Independent Trustees concluded that the Fund’s overall fee arrangements represent an appropriate sharing at the present time between Fund shareholders and the Adviser of any economies of scale or other efficiencies in the management of the Fund.
Based on the factors described above, the Independent Trustees concluded that the approval of the Investment Advisory Agreement was in the best interests of the Fund and should be approved.
49

2189 Broken Bend
Frisco, Texas 75034
844-448-3383
www.impactetfs.org
Investment Adviser:
Impact Shares, Corp.
2189 Broken Bend
Frisco, Texas 75034
Distributor:
SEI Investments Distribution Co.
One Freedom Valley Drive
Oaks, PA 19456
Administrator:
SEI Investments
Global Funds Services
One Freedom Valley Drive
Oaks, PA 19456
Transfer Agent:
Bank of New York Mellon
225 Liberty Street
New York, NY 10286
Custodian:
Bank of New York Mellon
225 Liberty Street
New York, NY 10286
Legal Counsel:
Ropes & Gray LLP
Prudential Tower, 800 Boylston Street
Boston, MA 02199-3600
This information must be preceded or accompanied by a current prospectus for the Funds.
IMP-SA-002-0300
Item 2. Code of Ethics.
Not applicable for semi-annual report.
Item 3. Audit Committee Financial Expert.
Not applicable for semi-annual report.
Item 4. Principal Accountant Fees and Services.
Not applicable for semi-annual report.
Item 5. Audit Committee of Listed Registrants.
Not applicable for semi-annual report.
Item 6. Schedule of Investments.
The Schedule of Investments is included as part of the Report to Shareholders filed under Item 1 of this form.
Item 7. Disclosure of Proxy Voting Policies and Procedures for Closed-End Management Investment Companies.
Not applicable to open-end management investment companies.
Item 8. Portfolio Managers of Closed-End Management Investment Companies.
Not applicable to open-end management investment companies.
Item 9. Purchases of Equity Securities by Closed-End Management Company and Affiliated Purchasers.
Not applicable to open-end management investment companies.
Item 10. Submission of Matters to a Vote of Security Holders.
There have been no changes to the procedures by which shareholders may recommend nominees to the Registrant’s Board of Trustees during the period covered by this report.
Item 11. Controls and Procedures.
(a) The Registrant’s principal executive and principal financial officers, or persons performing similar functions, have concluded that the Registrant’s disclosure controls and procedures (as defined in Rule 30a-3(c) under the Act (17 CFR § 270.30a-3(c)) as of a date within 90 days of the filing date of the report, are effective based on the evaluation of these controls and procedures required by Rule 30a-3(b) under the Act (17 CFR § 270.30a-3(b)) and Rules 13a-15(b) or 15d-15(b) under the Exchange Act (17 CFR § 240.13a-15(b) or § 240.15d-15(b)).
(b) There has been no change in the Registrant’s internal control over financial reporting (as defined in Rule 30a-3(d) under the Act (17 CFR § 270.30a-3(d)) that occurred during the period covered by this report that has materially affected, or is reasonably likely to materially affect, the Registrant’s internal control over financial reporting.
SIGNATURES
Pursuant to the requirements of the Securities Exchange Act of 1934 and the Investment Company Act of 1940, the Registrant has duly caused this report to be signed on its behalf by the undersigned, thereunto duly authorized.
| | | | |
| (Registrant) | | | | Impact Shares Trust I |
| | |
| By (Signature and Title) | | | | /s/ Ethan Powell |
| | | | Ethan Powell, President, Principal Executive Officer, Treasurer, and Principal Financial Officer |
Date: March 10, 2022
Pursuant to the requirements of the Securities Exchange Act of 1934 and the Investment Company Act of 1940, this report has been signed below by the following persons on behalf of the Registrant and in the capacities and on the dates indicated.
| | | | |
| By (Signature and Title) | | | | /s/ Ethan Powell |
| | | | Ethan Powell, President and Principal Executive Officer |
| | |
| Date: March 10, 2022 | | | | |
| | |
| By (Signature and Title) | | | | /s/ Ethan Powell |
| | | | Ethan Powell, Treasurer and Principal Financial Officer |
| | |
| Date: March 10, 2022 | | | | |