Exhibit 99.1
Management’s Discussion and Analysis of Financial Conditions and Results of Operations (In US Dollars)
The following management’s discussion and analysis (MD&A) is the responsibility of management and is as at May 7, 2018. The Board of Directors (Board) carries out its responsibility for review of this disclosure principally through its audit committee, comprised exclusively of independent directors. The audit committee reviews and, prior to its publication, approves this disclosure, pursuant to the authority delegated to it by the Board. The term “Nutrien” refers to Nutrien Ltd. and the terms “we,” “us,” “our,” “Nutrien” and “the company” refer to Nutrien and, as applicable, Nutrien and its direct and indirect subsidiaries as a group, including, for greater clarity, Potash Corporation of Saskatchewan Inc. (PotashCorp) and Agrium Inc. (Agrium). This MD&A is based on the company’s unaudited interim condensed consolidated financial statements (financial statements) prepared in accordance with International Financial Reporting Standards as issued by the International Accounting Standards Board (IFRS), unless otherwise stated. This MD&A contains certain financial
measures that do not have a standard meaning under IFRS. See“Non-IFRS Financial Measures” on page 33. All references to per share amounts pertain to diluted net earnings per share. Financial data in this report are stated in US dollars unless otherwise noted.
Additional information relating to Nutrien (which, except as otherwise noted, is not incorporated by reference herein), including our Business Acquisition Report dated February 20, 2018 (BAR) and Annual Information Forms, consolidated financial statements and management’s discussion and analysis for each of PotashCorp and Agrium for the year ended December 31, 2017, can be found on SEDAR at www.sedar.com and on EDGAR at www.sec.gov. The company is a foreign private issuer under the rules and regulations of the US Securities and Exchange Commission (the SEC).
Nutrien and Our Operating Environment
On January 1, 2018, after receiving all required regulatory approvals, PotashCorp and Agrium combined their businesses in a merger of equals (Merger) by way of a plan of arrangement by becoming wholly owned subsidiaries of Nutrien through a share exchange. Shareholders of PotashCorp received 0.400 common shares of Nutrien for each PotashCorp share held and shareholders of Agrium received 2.230 common shares of Nutrien for each Agrium share held. The exchange ratios represent the respective closing share prices of each company’s common shares at market close on the NYSE on August 29, 2016, the last trading day prior to when the companies announced that they were in preliminary discussions regarding the Merger, which is consistent with the approximate10-day and60-day volume weighted average prices through that date.
Expected benefits of the Merger include creation of a world-class integrated global supplier of crop inputs and a producer oflow-cost potash and high-quality nitrogen and phosphate, integrated with a leading global distribution platform. The creation of Nutrien is designed to: 1) bring together world-class nutrient production assets and retail distribution, providing an integrated platform with multiple paths for growth; 2) create up to $500 million of annualrun-rate operating synergies within 24 months of closing; 3) enhance financial flexibility through the use of a strong balance sheet and improved cash flows, enabling the support of growth initiatives and shareholder returns; and 4) leveragebest-in-class leadership and governance through the combination of two experienced teams that are focused on creating long-term value. For further discussion, refer to Note 3 to the financial statements for the three months ended March 31, 2018 and the BAR.
We directly supply growers through our integrated retail (R) operations – including crop nutrients, crop protection products, seed, as well as agronomic and application services. Nutrien is the world’s largest crop nutrient company by capacity, producing the crop nutrients: potash (K), nitrogen (N) and phosphate (P) for use in the production of fertilizer, industrial applications and animal feed products.
Retail
We operate approximately 1,600 retail facilities across the US, Canada, Australia and key areas of South America, providing custom-built portfolios of products, services and solutions to growers. This combination of products and services helps our grower-customers achieve their yield goals and maximize their return on investments in an environmentally sustainable manner. Instrumental to our mutual success is the strong partnership and trust that we have built with customers by delivering value to them year after year.
Our more than 3,300 agronomists and field experts work directly with growers, helping them maximize the productivity of their farms by implementing the best management practices based on a thorough understanding of soils, climate conditions, crop requirements and our portfolio of products. Our retail distribution and services business provides growers with leading crop input products, such as the newest seed, crop protection products, technologies and extensive agronomic experience, all backed by a commitment to sound environmental
| Nutrien 2018 First Quarter Interim Report | 1 |
practices. Supporting this expertise is our own ECHELON® precision agriculture platform, which provides diagnostic analysis and recommendations to further enhance crop yields, optimize use of crop inputs and create additional value for the grower.
We also manufacture and sell innovative proprietary crop protection products and nutritionals under the Loveland Products® brand, seed products under the brand namesDyna-Gro® and Proven®, and animal health products under the Dalgety® brand. These leading crop input and animal health products provide farmers and ranchers with several competitive options to profitably produce and protect their investments, while providing higher margins for retail.
Our products and services vary somewhat depending on the region or country. For example, in Australia, we provide livestock marketing and auction services, and we facilitate an extensive offering of insurance products and financial services. In Western Canada, we market crop storage bins, provide fuel sales and services, and offer financial services to our customers.
In the US, we compete in retail markets with Helena Chemical, GROWMARK, Wilbur-Ellis, CHS, Pinnacle Agriculture Holdings and Simplot Grower Solutions. We also compete with smaller independent retailers and cooperatives.
Potash
Our Canadian potash operations represent nearlyone-quarter of global capacity. As part of regulatory conditions required in connection with the Merger, the company is in the process of selling potash-related businesses in Latin America and the Middle East by the end of 2018.
As a fertilizer, potash improves root and stem strength, water utilization and disease resistance, and enhances taste, color and texture of food. In feed, potash aids in animal growth and milk production. Potash is used by industry in production of soaps, water softeners,de-icers, drilling muds and food products.
Economically mineable deposits are geographically concentrated. Regions that have historically under-applied potash are expected to drive growth in demand. New capacity requires significant investment of time and resources.
Our competitive advantages include: access to decades of high-quality, permitted potash reserves in a politically stable region with well-established infrastructure; our investment in Canpotex to efficiently supply customers in approximately 40 countries around the world; a lower fixed-cost profile to effectively reduce production to respond to variability in demand; and completed expansions at a cost well below that of greenfield.
Asia and Latin America are the largest consuming markets, accounting for 48 percent and 20 percent, respectively, of world consumption. Asia is the largest consumer of standard product, using it as a direct application fertilizer and in compound fertilizers. Granular product is used in more advanced agricultural markets where it is typically blended with other crop nutrients. Most product is sold on a spot basis; customers in certain countries – like China and India – purchase under contracts. In offshore markets, Canpotex competes against producers such as APC, Belaruskali, ICL, K+S, SQM and Uralkali. In North America, our key competitors are Belaruskali, ICL, Intrepid, K+S, Mosaic, SQM and Uralkali.
Nitrogen
As a fertilizer, nitrogen is essential for protein synthesis and speeds plant growth. In feed, nitrogen plays a key role in animal growth and development. Industrially, nitrogen is used in plastics, resins, adhesives and emission controls.
Lower-cost energy is essential to success while proximity to end markets provides advantages, though pricing can be volatile.
Our competitive advantages include: significant supply of lower-priced shale gas for our US nitrogen production; a further Western Canadian AECO gas advantage relative to NYMEX; gas costs indexed, in part, to Tampa ammonia prices in Trinidad, sheltering margins; production facilities in the US, Canada and Trinidad are well-positioned to serve the key consuming regions of North America and Latin America; a retail distribution network in Western Canada and Northern Plains allowing product to be placed in higher netback markets; and a relatively stable industrial customer base.
China and India are the largest-consuming countries, accounting for almost half of world consumption. Capacity has recently expanded significantly in the US, reducing the need for offshore imports. Volume of Chinese exports is an important factor for global urea pricing. We compete in the US market with CF Industries, CVR, Koch, LSB and OCI, along with offshore suppliers. We compete in offshore markets with a wide range of offshore and domestic producers.
Phosphate and Sulfate
In fertilizer, phosphate is required for energy storage and transfer, and speeds crop maturity. For feed, phosphate assists in muscle repair and skeletal development of animals. Industrially, phosphate is used in soft drinks, food additives and metal treatments.
High-quality, lower-cost rock is critical to long-term success in phosphate. Raw material cost changes affect profitability and changes in global trade impact market fundamentals.
Our competitive advantages include: being an integrated producer with access to many years of high-quality, permitted phosphate reserves; the sale of feed and industrial phosphate products require minimal ammonia as a raw material input; and having the most diversified product offering in the industry and more than 80 percent of our sales in North America.
China and India account for more than 40 percent of global consumption. With large deposits in Africa and the Middle East, geopolitical instability can affect investment and operating decisions. Volume of Chinese exports is an important factor in global phosphate pricing. We compete in fertilizer markets with Mosaic and Simplot, and imports primarily from China, Morocco and Russia. For feed and industrial sales, our major competitors are ICL, Innophos, Mosaic, Simplot, and producers from China and Russia.
Ammonium sulfate fertilizer contains both nitrogen and sulfur, resulting in one of the most effective methods of supplying sulfur to soils in an immediately available form. We produce ammonium sulfate at our Redwater facility, where we have competitive advantages from in-market selling price premiums and logistical advantages as well as lower-priced sulfur on a delivered basis, which is a byproduct from the oil and gas industry.
| 2 | Nutrien 2018 First Quarter Interim Report |
Strategy
Nutrien has significant competitive advantages across our global footprint of operations. We are focused on supplying the important crop inputs, services and solutions farmers require to meet the ever-growing global demand for crops and food, and we are committed to doing so safely and sustainably.
We have the largest portfolio of high-quality potash, nitrogen and phosphate assets and a complimentary global ag retail platform that uniquely positions us to deliver superior value for shareholders.
Our strategic pillars guide our value creation efforts:
| • | Integration & Execution: Integrate our people, processes and operations and deliver on our targeted synergies. |
| • | Disciplined Capital Allocation: Utilize a‘compete-for-cash’ philosophy with a focus on maximizing long-term shareholder value. |
| • | Focused Growth & Innovation: Continue to expand our footprint and invest in growth, with a focus on expanding our Retail business. |
| • | Operational Excellence Focus: Optimize our asset base and continue to enhance safety, reliability and margin expansion across our portfolio. |
| • | Engaged Employees & Stakeholders: Invest in our people and processes to maintain our social license to operate. |
Risk Management
In the normal course of operations, our business activities expose us to risk. We believe the identification and management of risk and uncertainties is crucial to protecting, optimizing and creating long-term shareholder value.
Certain risks and uncertainties that could affect our business and financial results are set out in Schedule B of our BAR.
The company is not aware of any significant changes to its risk factors from those disclosed at that time.
Key Performance Drivers
Through our integrated value model, we set, evaluate and refine our targets to drive improvements that benefit all those impacted by our business. We demonstrate our accountability by tracking and reporting our performance against targets related to each strategic priority. A summary of our progress against the annual targets set at the date of this report are as follows:
Synergy Program Commitments
| Category | December 31, 2019 Synergy Run Rate – Initial Target | Synergy Run Rate Achieved to March 31, 2018 | ||||||
Distribution and Retail Integration/Optimization | ~$ 150 million | $ | 52 million | |||||
Production Optimization | ~$ 125 million | $ | 42 million | |||||
SG&A Optimization | ~$ 125 million | $ | 32 million | |||||
Procurement | ~$ 100 million | $ | 24 million | |||||
Total | $ 500 million | $ | 150 million | |||||
Nutrien remains on target to achieve its commitment of delivering a run rate of $500 million in annual synergies by December 31, 2019. As at March 31, 2018, a run rate of $150 million reflecting prospective annual synergies has been achieved. These prospective synergies will be reflected in the Income Statement of $112 million and through the reduction of capital spending of $38 million. Cumulative synergies realized to date of $23 million have been reflected in the March 31, 2018 financial statements. To date in 2018, including severance accruals, Nutrien has recorded expenses of $66 million for synergy and integration related initiatives. Capital spending on synergy initiatives has totaled $5 million in 2018 to date.
We are in the process of finalizing other key performance indicators (KPIs) and their methods of calculation.
| Nutrien 2018 First Quarter Interim Report | 3 |
Performance Overview
For an understanding of trends, events, uncertainties and the effect of critical accounting estimates on our results and financial condition, the following discussion and analysis should be read carefully, together with our financial statements for the three months ended March 31, 2018.
First Three Months 2018 Results
First Quarter Actual | ||||
Earnings per share (EPS) | $ | – | ||
EBITDA1 | $ | 487 | ||
| 1 | In millions of US dollars. Refer to“non-IFRS Measures” section on page 33 for details. |
Sensitivities
Key factors affecting estimated earnings of Nutrien and the approximate anticipated effect on EPS, based on assumptions used in estimating 2018 EPS, are as follows:
| Input Cost Sensitivities | Effect on EPS | |||||
NYMEX natural gas price increases | Nitrogen | (0.19 | ) | |||
by $1/MMBTu | Potash | (0.01 | ) | |||
| Canadian to US dollar strengthens by $0.02 | Canadian operating expenses net of provincial taxes and translation gain/loss | 0.00 | ||||
| Price and Volume Sensitivities | Effect on EPS | |||||
Price | Potash changes by $20/tonne | ±0.25 | ||||
| Ammonia changes by $20/tonne | ±0.06 | |||||
| Urea changes by $20/tonne | ±0.09 | |||||
| DAP/MAP changes by $20/tonne | ±0.05 | |||||
Volume | Potash changes by 100,000 tonnes | ±0.02 | ||||
| Nitrogen changes by 50,000 N tonnes | ±0.02 | |||||
| Phosphate changes by 50,000 P2O5 tonnes | ±0.03 | |||||
Retail | Crop nutrients changes by 1% 1 | ±0.07 | ||||
| Crop protection changes by 1% 1 | ±0.08 | |||||
| Seed changes by 1% 1 | ±0.03 | |||||
| Merchandise changes by 1% 1 | ±0.01 | |||||
| 1 | Gross margin as a percentage of sales |
| 4 | Nutrien 2018 First Quarter Interim Report |
Overview of Actual Results
As the continuing reporting entity for regulatory purposes, IFRS comparative figures are results previously reported by PotashCorp for the three months ended March 31, 2017, unless otherwise noted. The Nutrien comparative figures in this MD&A are the combined historical results of PotashCorp and Agrium for the three months ended March 31, 2017 (unless otherwise stated) and certain of these are considered to benon-IFRS measures. Refer to“Non-IFRS measures” section starting on page 33 for detailed information. The Nutrien comparative non-financial measures are the combined historical results of PotashCorp and Agrium adjusted (if required) to conform to Nutrien’s method of measurement and presentation.
| Three Months Ended March 31 | ||||||||||||||||||||||||||||
| Nutrien | Nutrien 1 | PotashCorp 1 | ||||||||||||||||||||||||||
| Dollars (millions), except per share amounts | 2018 | 2017 | Change | % Change | 2017 | Change | % Change | |||||||||||||||||||||
Sales | $ | 3,695 | $ | 3,737 | $ | (42 | ) | (1 | ) | $ | 1,112 | $ | 2,583 | 232 | ||||||||||||||
Gross margin | 847 | 838 | 9 | 1 | 273 | 574 | 210 | |||||||||||||||||||||
Earnings before finance costs and income taxes (EBIT) | 76 | 222 | (146 | ) | (66 | ) | 175 | (99 | ) | (57 | ) | |||||||||||||||||
(Loss) earnings before income taxes | (43 | ) | 104 | (147 | ) | n/m | 116 | (159 | ) | n/m | ||||||||||||||||||
Net (loss) earnings from continuing operations | (1 | ) | 97 | (98 | ) | n/m | 106 | (107 | ) | n/m | ||||||||||||||||||
Net earnings from discontinued operations | – | – | n/m | 43 | (43 | ) | (100 | ) | ||||||||||||||||||||
Net (loss) earnings | (1 | ) | (1 | ) | n/m | 149 | (150 | ) | n/m | |||||||||||||||||||
EBITDA2 | 487 | 521 | (34 | ) | (7 | ) | 347 | 140 | 40 | |||||||||||||||||||
Net (loss) earnings per share from continuing operations – diluted | – | n/m | n/m | n/m | 0.13 | (0.13 | ) | (100 | ) | |||||||||||||||||||
Net earnings per share from discontinued operations – diluted | – | n/m | n/m | n/m | 0.05 | (0.05 | ) | (100 | ) | |||||||||||||||||||
Net (loss) earnings per share – diluted | – | n/m | n/m | n/m | 0.18 | (0.18 | ) | (100 | ) | |||||||||||||||||||
Other comprehensive (loss) income | (70 | ) | 68 | (138 | ) | n/m | 39 | (109 | ) | n/m | ||||||||||||||||||
| 1 | Nutrien 2017 combined historical figures arenon-IFRS measures. Refer to “non-IFRS Measures” section on page 33 for details. PotashCorp 2017 figures are legacy PotashCorp IFRS comparative. Refer above for further discussion of comparative information. |
| 2 | EBITDA is anon-IFRS measure. See description and reconciliation on page 33. |
| n/m | = not meaningful |

| Nutrien 2018 First Quarter Interim Report | 5 |
There was a net loss from continuing operations in the first quarter of 2018 compared to net earnings from continuing operations for PotashCorp in the first quarter of 2017, due to higher EBITDA in potash, nitrogen and phosphate and sulfate and an income tax recovery in 2018 compared to income tax expense in 2017 being more than offset by lower EBITDA in retail, others and eliminations as well as higher finance costs and depreciation and amortization, including an $85 million net increase in depreciation and amortization related to the purchase price allocation (PPA) to the property, plant and equipment and intangibles acquired in the Merger.
There was a net loss from continuing operations in the first quarter of 2018 compared to net earnings from continuing operations for combined historical Nutrien in the first quarter of 2017 due to higher EBITDA from potash and nitrogen and an income tax recovery in 2018 compared to income tax expense in 2017 being more than offset by lower EBITDA in retail, phosphate and sulfate, others and eliminations as well as a net increase in depreciation and amortization, including $85 million net increase in depreciation and amortization related to the PPA to the property, plant and equipment and intangibles acquired in the Merger.
Results for the quarter were impacted by a late spring season in North America, shifting planting, applications and associated retail crop input purchases to the second quarter of
2018. Stronger global crop nutrient prices compared to last year and higher potash sales volumes partially offset the late start to the spring season and the PPA adjustment.
Other comprehensive loss for the first quarter of 2018 was primarily the result of a decrease in the fair value of our investment in Sinofert, the realized loss on disposal of our investment in ICL, and a loss on translation of our net foreign operations, partially offset by a net actuarial gain on our defined benefit plans.
PotashCorp other comprehensive income for the first quarter of 2017 was primarily the result of increases in the fair value of our investments in ICL and Sinofert.
Nutrien other comprehensive income for the first quarter of 2017 was primarily the result of increases in the fair value of our investments in ICL and Sinofert and a gain on translation of our net foreign operations, partially offset by our share of other comprehensive loss of associates and joint ventures and a loss on our cash flow hedges.
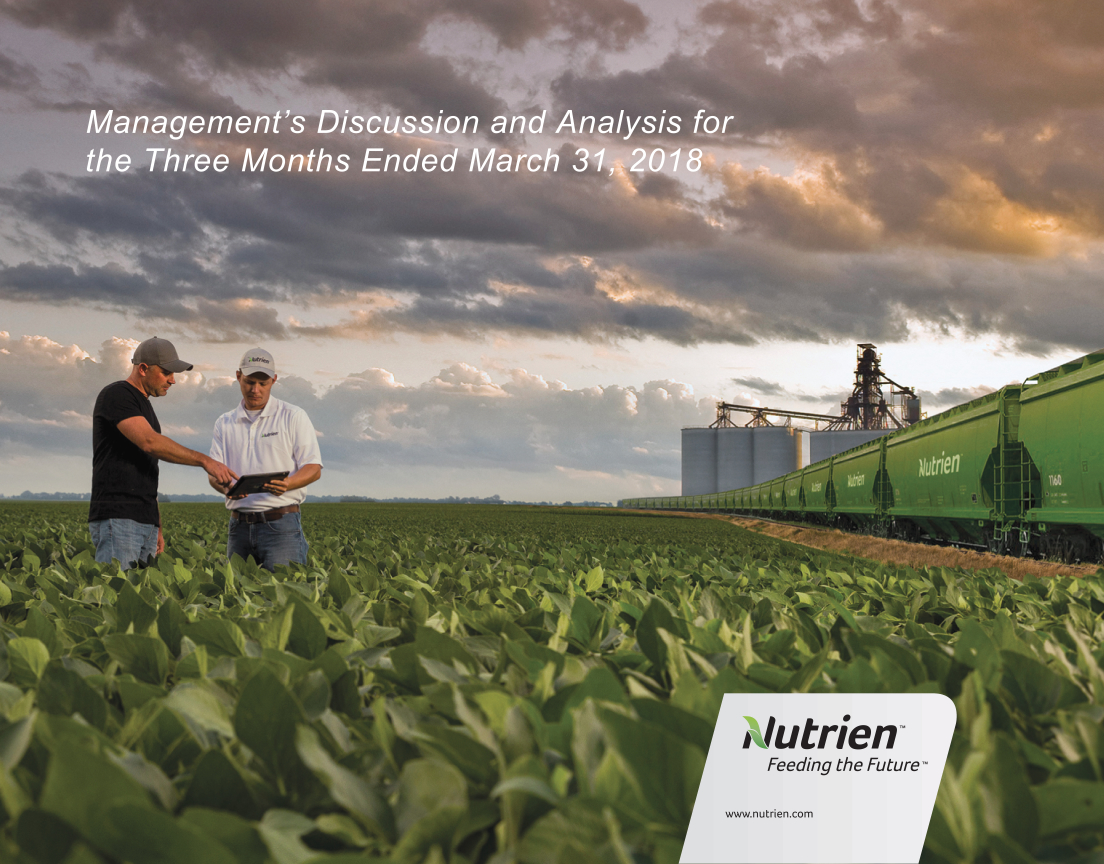
Operating Segment Review
We report our results in four business segments: retail, potash, nitrogen and phosphate and sulfate. Our reporting structure reflects how we manage our business and how we classify our operations for planning and measuring performance. As a result of the Merger, we revised the historical PotashCorp segments to include a new operating segment for retail and to expand the phosphate segment to include sulfate. Further, intersegment sales are now eliminated separately from the operating segments. We include net sales and EBITDA in segment disclosures in the financial statements pursuant to IFRS, which require segmentation based upon our internal organization and reporting of revenue and profit or loss measures. As a component of gross margin, net sales (and the relatedper-tonne amounts) are the primary revenue measures, and are used for business planning and monthly forecasting for the potash, nitrogen and phosphate and sulfate segments. Net sales are calculated as sales revenues less freight, transportation and distribution expenses. Realized prices refer to net sales prices. As a component of net earnings, EBITDA is the primary profit measure we use and review for all business segments in making decisions about operating matters on a segment basis. These decisions include assessments of segment performance and the resources to be allocated to these segments. EBITDA is also used for business planning and monthly forecasting in all business segments.
Our discussion of segment operating performance is set out below and includes nutrient product and/or market performance results, where applicable, to give further insight into these results.
| 1 | Nutrien combined historical 2017 EBITDA figures arenon-IFRS measures, see description and reconciliations starting on page 33. |
| 6 | Nutrien 2018 First Quarter Interim Report |
Retail Performance
Retail Financial Performance
| Three Months Ended March 31 | ||||||||||||||||||||||||||||||||||||||||||||||||||||||||||||
| Sales (millions) | Gross Margin (millions) | Gross Margin (percentage) | ||||||||||||||||||||||||||||||||||||||||||||||||||||||||||
| Nutrien | Nutrien 1 | PotashCorp 1 | Nutrien | Nutrien 1 | PotashCorp 1 | Nutrien | Nutrien 1 | PotashCorp 1 | ||||||||||||||||||||||||||||||||||||||||||||||||||||
| 2018 | 2017 | % Change | 2017 | % Change | 2018 | 2017 | % Change | 2017 | % Change | 2018 | 2017 | % Change | 2017 | % Change | ||||||||||||||||||||||||||||||||||||||||||||||
Crop nutrients 2,3 | $ | 684 | $ | 714 | (4 | ) | $ | – | 100 | $ | 123 | $ | 141 | (13 | ) | $ | – | 100 | 18 | 20 | (10 | ) | – | 100 | ||||||||||||||||||||||||||||||||||||
Crop protection products | 774 | 872 | (11 | ) | – | 100 | 128 | 130 | (2 | ) | – | 100 | 17 | 15 | 13 | – | 100 | |||||||||||||||||||||||||||||||||||||||||||
Seed | 341 | 382 | (11 | ) | – | 100 | 44 | 54 | (19 | ) | – | 100 | 13 | 14 | (7 | ) | – | 100 | ||||||||||||||||||||||||||||||||||||||||||
Merchandise | 149 | 134 | 11 | – | 100 | 23 | 22 | 5 | – | 100 | 15 | 16 | (6 | ) | – | 100 | ||||||||||||||||||||||||||||||||||||||||||||
Services and other | 151 | 138 | 9 | – | 100 | 90 | 87 | 3 | – | 100 | 60 | 63 | (5 | ) | – | 100 | ||||||||||||||||||||||||||||||||||||||||||||
| 2,099 | 2,240 | (6 | ) | – | 100 | $
| 408
|
| $ | 434 | (6 | ) | $ | – | 100 | |||||||||||||||||||||||||||||||||||||||||||||
Cost of goods sold | (1,691 | ) | (1,806 | ) | (6 | ) | – | 100 | ||||||||||||||||||||||||||||||||||||||||||||||||||||
Gross margin | 408 | 434 | (6 | ) | – | 100 | ||||||||||||||||||||||||||||||||||||||||||||||||||||||
Expenses 4 | (541 | ) | (466 | ) | 16 | – | 100 | |||||||||||||||||||||||||||||||||||||||||||||||||||||
EBIT | (133 | ) | (32 | ) | 316 | – | 100 | |||||||||||||||||||||||||||||||||||||||||||||||||||||
Depreciation and amortization | 123 | 71 | 73 | – | 100 | |||||||||||||||||||||||||||||||||||||||||||||||||||||||
EBITDA | $ | (10 | ) | $ | 39 | (126 | ) | $ | – | 100 | ||||||||||||||||||||||||||||||||||||||||||||||||||
| 1 | Nutrien 2017 combined historical figures arenon-IFRS measures. Refer to “non-IFRS Measures” section on page 33 for details. PotashCorp 2017 figures are legacy PotashCorp IFRS comparative. Refer to page 5 for further information. |
| 2 | Sales tonnes were 1,703,000 tonnes (2017 (Nutrien) – 1,842,000 tonnes) and average per tonne prices were $401 per tonne (2017 (Nutrien) – $388 per tonne). |
| 3 | Includes intersegment sales of $11 million. Intersegment profits are eliminated on consolidation. |
| 4 | Includes selling and general and administrative expenses of $546 million (2017 (Nutrien) – $473 million). |
The most significant contributors to the change in total EBITDA were as follows (direction of arrows refers to impact on EBITDA):
| 2018 vs 2017 (PotashCorp) | 2018 vs 2017 (Nutrien) | |||||||
| Sales volumes | Retail was acquired as part of the Merger and PotashCorp had no similar operations. | Ú | Crop nutrients, crop protection products and seed sales volumes were lower due to the delayed spring season in North America. | |||||
| Ù | Merchandise sales were higher due to increased animal health and fencing sales volumes in Australia. | |||||||
| Ù | Services and other sales volumes were higher due to higher livestock export shipments in Australia. | |||||||
| Sales prices | Ù | Services and other sales prices increased in 2018 due to higher wool commissions in Australia. |
| Nutrien 2018 First Quarter Interim Report | 7 |
| 2018 vs 2017 (PotashCorp) | 2018 vs 2017 (Nutrien) | |||||||
| Gross margin | Retail was acquired as part of the Merger and PotashCorp had no similar operations. | Ú | Crop nutrient gross margin dollars were lower in 2018 as the sales volume mix in North America was impacted by a higher percentage of lower margin sales, as well as a higher percent contribution from international operations, also at a lower average margin per tonne.
| |||||
Ú | Due to the delayed season, proprietary crop protection product sales in 2018 were lower; however, gross margin rates increased compared to 2017 due to lower wholesale customer mix.
| |||||||
| Ú | Seed gross margins decreased in 2018 due to competitive market pressures and product mix of early season sales. | |||||||
| Selling and general and administrative expenses | Ú | Increased expenses combined with lower sales due to the delayed spring season resulted in selling expense as a percentage of sales increasing to 25 percent this quarter from 20 percent in the first quarter of 2017. | ||||||
| Depreciation and amortization | Expense was higher in 2018 primarily due to the PPA and from recently acquired businesses. |
| 8 | Nutrien 2018 First Quarter Interim Report |
Potash Performance
Potash Financial Performance
| Three Months Ended March 31 | ||||||||||||||||||||||||||||||||||||||||||||||||||||||||||||
| Dollars (millions) | Tonnes (thousands) | Average per Tonne1 | ||||||||||||||||||||||||||||||||||||||||||||||||||||||||||
| Nutrien | Nutrien 2 | PotashCorp 2 | Nutrien | Nutrien 2 | PotashCorp 2 | Nutrien | Nutrien 2 | PotashCorp 2 | ||||||||||||||||||||||||||||||||||||||||||||||||||||
| 2018 | 2017 | % Change | 2017 | % Change | 2018 | 2017 | % Change | 2017 | % Change | 2018 | 2017 | % Change | 2017 | % Change | ||||||||||||||||||||||||||||||||||||||||||||||
Manufactured product3 | ||||||||||||||||||||||||||||||||||||||||||||||||||||||||||||
Net sales | ||||||||||||||||||||||||||||||||||||||||||||||||||||||||||||
North America | $ | 250 | $ | 229 | 9 | $ | 163 | 53 | 1,254 | 1,237 | 1 | 859 | 46 | $ | 199 | $ | 185 | 8 | $ | 190 | 5 | |||||||||||||||||||||||||||||||||||||||
Offshore | 324 | 236 | 37 | 198 | 64 | 1,871 | 1,578 | 19 | 1,320 | 42 | $ | 173 | $ | 150 | 15 | $ | 150 | 15 | ||||||||||||||||||||||||||||||||||||||||||
| �� | ||||||||||||||||||||||||||||||||||||||||||||||||||||||||||||
| 574 | 465 | 23 | 361 | 59 | 3,125 | 2,815 | 11 | 2,179 | 43 | $ | 184 | $ | 165 | 12 | $ | 166 | 11 | |||||||||||||||||||||||||||||||||||||||||||
Cost of goods sold | (279 | ) | (265 | ) | 5 | (196 | ) | 42 | $ | (90 | ) | $ | (94 | ) | (4 | ) | $ | (90 | ) | – | ||||||||||||||||||||||||||||||||||||||||
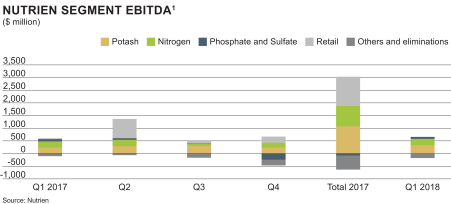
Gross margin | 295 | 200 | 48 | 165 | 79 | $ | 94 | $ | 71 | 32 | $ | 76 | 24 | |||||||||||||||||||||||||||||||||||||||||||||||
Other potash and purchased products grossmargin4 | – | – | – | – | – | |||||||||||||||||||||||||||||||||||||||||||||||||||||||
Gross margin | 295 | 200 | 48 | 165 | 79 | |||||||||||||||||||||||||||||||||||||||||||||||||||||||
Expenses 5 | (58 | ) | (44 | ) | 32 | (42 | ) | 38 | ||||||||||||||||||||||||||||||||||||||||||||||||||||
EBIT | 237 | 156 | 52 | 123 | 93 | |||||||||||||||||||||||||||||||||||||||||||||||||||||||
Depreciation and amortization | 91 | 84 | 8 | 55 | 65 | |||||||||||||||||||||||||||||||||||||||||||||||||||||||
EBITDA | $ | 328 | $ | 240 | 37 | $ | 178 | 84 | ||||||||||||||||||||||||||||||||||||||||||||||||||||
| 1 | Rounding differences may occur due to the use of whole dollars inper-tonne calculations. |
| 2 | Nutrien 2017 combined historical figures arenon-IFRS measures. Refer to “non-IFRS Measures” section on page 33 for details. PotashCorp 2017 figures are legacy PotashCorp IFRS comparative. Refer to page 5 for further information. |
| 3 | Includes intersegment sales of $68 million and 265,000 sales tonnes (2017 (PotashCorp) – $NIL million and NIL sales tonnes). Intersegment profits are eliminated on consolidation. |
| 4 | Comprised of net sales $1 million (2017 (Nutrien) – $4 million; 2017 (PotashCorp) – $4 million) less cost of goods sold $1 million (2017 (Nutrien) – $4 million; 2017 (PotashCorp) – $4 million). |
| 5 | Includes provincial mining and other taxes of $48 million (2017 (Nutrien) – $36 million; 2017 (PotashCorp) – $33 million). |
| Nutrien 2018 First Quarter Interim Report | 9 |
The variance to the comparative PotashCorp quarter was primarily a result of the Merger; therefore, the analysis provided is to the comparative Nutrien quarter as this is a more meaningful comparison.
| Three Months Ended March 31 Nutrien 2018 vs Nutrien 2017 Change in Prices/Costs | ||||||||||||||||
| Dollars (millions) | Change in Sales Volumes | Net Sales | Cost of Goods Sold | Total | ||||||||||||
Manufactured product | ||||||||||||||||
North America | $ | 1 | $ | 17 | $ | 8 | $ | 26 | ||||||||
Offshore | 18 | 44 | 6 | 68 | ||||||||||||
Change in market mix | 4 | (4 | ) | 1 | 1 | |||||||||||
Total manufactured product | $ | 23 | $ | 57 | $ | 15 | $ | 95 | ||||||||
Other potash and purchased products | – | |||||||||||||||
Total | $ | 95 | ||||||||||||||
Sales to major offshore markets by Canpotex were as follows:
| Three Months Ended March 31 | ||||||||||||
| Percentage of Quarterly Sales Volumes | ||||||||||||
| Nutrien | Nutrien | |||||||||||
| 2018 | 2017 | % Change | ||||||||||
Other Asian markets1 | 29 | 36 | (19 | ) | ||||||||
Latin America | 21 | 24 | (13 | ) | ||||||||
China | 32 | 20 | 60 | |||||||||
India | 6 | 11 | (45 | ) | ||||||||
Other markets | 12 | 9 | 33 | |||||||||
| 100 | 100 | |||||||||||
| 1 | All Asian markets except China and India. |
The most significant contributors to the change in total EBITDA were as follows (direction of arrows refers to impact on EBITDA):
| 2018 vs 2017 (PotashCorp) | 2018 vs 2017 (Nutrien) | |||||||
| Sales volumes | Ù | Sales volumes were higher due to strong global demand and a higher Canpotex allocation compared to the first quarter of 2017. | Ù | Sales volumes were higher due to strong global demand and a higher Canpotex allocation compared to the first quarter of 2017. | ||||
| Ù | Sales volumes were also higher due to the Merger impact, specifically the addition of the Vanscoy mine and sales to retail. | |||||||
| Net sales prices | Ù | Average realized potash price for the first quarter of 2018 was higher due to global benchmark pricing strength. | ||||||
| Cost of goods sold | Ù | Costs were lower in 2018 due to our portfolio optimization and results from our cost reduction strategy. | ||||||
| Ù | Costs of goods sold variance was positive as a relatively higher percentage of products sold was produced at lower-cost mines. | |||||||
| Provincial mining and other taxes | Ú | Under Saskatchewan provincial legislation, the company is subject to resource taxes, including the potash production tax and the resource surcharge. Provincial mining and other taxes increased primarily due to stronger potash prices. | ||||||
| Depreciation and amortization | Depreciation and amortization expense was higher due to the addition of the Vanscoy mine as a result of the Merger. | There were no significant changes between 2017 and 2018. | ||||||
| 10 | Nutrien 2018 First Quarter Interim Report |
North America typically consumes more higher-priced granular product than standard product.
Potash Capacity and Operational Capability
(million tonnes KCl)
Nameplate Capacity 1 | Operational Capability (2018) 2 | |||||||
Lanigan SK | 3.8 | 2.0 | ||||||
Rocanville SK | 6.5 | 5.4 | ||||||
Allan SK | 4.0 | 2.6 | ||||||
Vanscoy SK | 3.0 | 2.7 | ||||||
Cory SK | 3.0 | 0.8 | ||||||
Patience Lake SK | 0.3 | 0.3 | ||||||
New Brunswick 3 | – | – | ||||||
Total | 20.6 | 13.8 | ||||||
| 1 | Represents estimates of capacity as at March 31, 2018. Estimates based on capacity as per design specifications or Canpotex entitlements once determined. In the case of Patience Lake, estimate reflects current operational capability. Estimates for all other facilities do not necessarily represent operational capability. |
| 2 | Estimated annual achievable production level at current staffing and operational readiness (estimated at beginning of year). Estimate does not include inventory-related shutdowns and unplanned downtime. |
| 3 | In 2016, the company indefinitely suspended, its Picadilly, New Brunswick potash operations which are currently in care-and-maintenance mode. The nameplate capacity for New Brunswick is 2.0 million tonnes KCI. |
| Nutrien 2018 First Quarter Interim Report | 11 |
Nitrogen Performance
Nitrogen Financial Performance
| Three Months Ended March 31 | ||||||||||||||||||||||||||||||||||||||||||||||||||||||||||||
| Dollars (millions) | Tonnes (thousands) | Average per Tonne 1 | ||||||||||||||||||||||||||||||||||||||||||||||||||||||||||
| Nutrien | Nutrien 2 | PotashCorp 2 | Nutrien | Nutrien 2 | PotashCorp 2 | Nutrien | Nutrien 2 | PotashCorp 2 | ||||||||||||||||||||||||||||||||||||||||||||||||||||
| 2018 | 2017 | % Change | 2017 | % Change | 2018 | 2017 | % Change | 2017 | % Change | 2018 | 2017 | % Change | 2017 | % Change | ||||||||||||||||||||||||||||||||||||||||||||||
Manufactured product 3 | ||||||||||||||||||||||||||||||||||||||||||||||||||||||||||||
Net sales | ||||||||||||||||||||||||||||||||||||||||||||||||||||||||||||
Ammonia | $ | 208 | $ | 232 | (10 | ) | $ | 159 | 31 | 744 | 815 | (9 | ) | 546 | 36 | $ | 280 | $ | 284 | (1 | ) | $ | 291 | (4 | ) | |||||||||||||||||||||||||||||||||||
Urea | 212 | 190 | 12 | 89 | 138 | 724 | 681 | 6 | 320 | 126 | $ | 294 | $ | 278 | 6 | $ | 279 | 5 | ||||||||||||||||||||||||||||||||||||||||||
Solutions and nitrates | 137 | 149 | (8 | ) | 111 | 23 | 835 | 885 | (6 | ) | 701 | 19 | $ | 163 | $ | 168 | (3 | ) | $ | 158 | 3 | |||||||||||||||||||||||||||||||||||||||
| 557 | 571 | (2 | ) | 359 | 55 | 2,303 | 2,381 | (3 | ) | 1,567 | 47 | $ | 242 | $ | 239 | 1 | $ | 229 | 6 | |||||||||||||||||||||||||||||||||||||||||
Cost of goods sold | (425 | ) | (396 | ) | 7 | (266 | ) | 60 | $ | (185 | ) | $ | (167 | ) | 11 | $ | (170 | ) | 9 | |||||||||||||||||||||||||||||||||||||||||
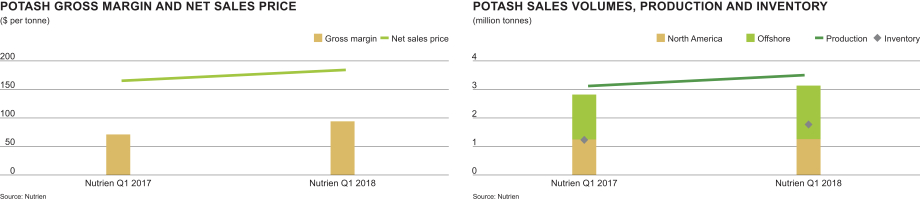
Gross margin | 132 | 175 | (25 | ) | 93 | 42 | $ | 57 | $ | 72 | (21 | ) | $ | 59 | (3 | ) | ||||||||||||||||||||||||||||||||||||||||||||
Other nitrogen and purchased products gross margin 4 | 16 | 13 | 23 | 4 | 300 | |||||||||||||||||||||||||||||||||||||||||||||||||||||||
Gross margin | 148 | 188 | (21 | ) | 97 | 53 | ||||||||||||||||||||||||||||||||||||||||||||||||||||||
Expenses | (16 | ) | (6 | ) | 167 | (7 | ) | 129 | ||||||||||||||||||||||||||||||||||||||||||||||||||||
EBIT | 132 | 182 | (27 | ) | 90 | 47 | ||||||||||||||||||||||||||||||||||||||||||||||||||||||
Depreciation and amortization | 129 | 68 | 90 | 50 | 158 | |||||||||||||||||||||||||||||||||||||||||||||||||||||||
EBITDA | $ | 261 | $ | 250 | 4 | $ | 140 | 86 | ||||||||||||||||||||||||||||||||||||||||||||||||||||
| 1 | Rounding differences may occur due to the use of whole dollars inper-tonne calculations. |
| 2 | Nutrien 2017 combined historical figures arenon-IFRS measures. Refer to “non-IFRS Measures” section on page 33 for details. PotashCorp 2017 figures are legacy PotashCorp IFRS comparative. Refer to page 5 for further information. |
| 3 | Includes intersegment sales of $122 million and 404,000 sales tonnes (2017 (PotashCorp) – $22 million and 55,000 sales tonnes). Intersegment profits are eliminated on consolidation. |
| 4 | Comprised of net sales of $115 million (2017 (Nutrien) – $135 million; 2017 (PotashCorp) – $6 million) less cost of goods sold $99 million (2017 (Nutrien) – $122 million; 2017 (PotashCorp) – $2 million). |
| 5 | Includes earnings of equity-accounted investees of $4 million (2017 (Nutrien) – $17 million; 2017 (PotashCorp ) – $NIL million). |
| 12 | Nutrien 2018 First Quarter Interim Report |
The variance to the comparative PotashCorp quarter was primarily a result of the Merger; therefore, the analysis provided is to the comparative Nutrien quarter as this is a more meaningful comparison.
Three Months Ended March 31 Nutrien 2018 vs Nutrien 2017 | ||||||||||||||||
| Change in Prices/Costs | ||||||||||||||||
| Dollars (millions) | Change in Sales Volumes | Net Sales | Cost of Goods Sold | Total | ||||||||||||
Manufactured product | ||||||||||||||||
Ammonia | $ | (7 | ) | $ | (3 | ) | $ | 4 | $ | (6 | ) | |||||
Urea | 5 | 11 | (3 | ) | 13 | |||||||||||
Solutions and nitrates | (2 | ) | (5 | ) | – | (7 | ) | |||||||||
PPA1 | (55 | ) | (55 | ) | ||||||||||||
Hedge | 14 | 14 | ||||||||||||||
Change in product mix | (3 | ) | 2 | (1 | ) | (2 | ) | |||||||||
Total manufactured product | $ | (7 | ) | $ | 5 | $ (41 | ) | $ | (43 | ) | ||||||
Other nitrogen and purchased products | 3 | |||||||||||||||
Total | $ | (40 | ) | |||||||||||||
| 1 | Depreciation and amortization as a result of a fair value allocation to the acquired property, plant and equipment of Agrium. |
| Three Months Ended March 31 | ||||||||||||||||||||||||
| Sales Tonnes (thousands) | Average Net Sales Price per Tonne | |||||||||||||||||||||||
Nutrien 2018 | Nutrien 2017 | PotashCorp 2017 | Nutrien 2018 | Nutrien 2017 | PotashCorp 2017 | |||||||||||||||||||
Fertilizer | 1,190 | 1,167 | 620 | $ | 257 | $ | 242 | $ | 230 | |||||||||||||||
Industrial and feed | 1,113 | 1,214 | 947 | $ | 226 | $ | 236 | $ | 228 | |||||||||||||||
| 2,303 | 2,381 | 1,567 | $ | 242 | $ | 239 | $ | 229 | ||||||||||||||||
The most significant contributors to the change in total EBITDA were as follows (direction of arrows refers to impact on EBITDA):
| 2018 vs 2017 (PotashCorp) | 2018 vs 2017 (Nutrien) | |||||||
| Sales volumes | Ù | Sales volumes increased primarily as a result of the Merger. | Ú
Ú | Sales volumes were down primarily due to a delayed North American spring application season.
Ammonia sales volumes decreased as a result of the unfavorable weather but also reflect theramp-up of our urea expansion project at Borger, which decreased our ammonia volumes available for sale. | ||||
| Net sales prices | Ù | Our average realized price was up, reflecting higher realized prices for urea, which more than offset lower realized prices for ammonia and some other nitrogen products. | ||||||
| Cost of goods sold | Ù | Average costs, including our hedge position, for natural gas used as feedstock in production decreased 17 percent due to the relatively lower-cost gas available at our Alberta facilities acquired in the Merger.
| Ù | Average costs, including our hedge position, for natural gas used as feedstock in production decreased 6 percent, which more than offset the effect of a stronger Canadian dollar.
| ||||
| Nutrien 2018 First Quarter Interim Report | 13 |
| 2018 vs 2017 (PotashCorp) | 2018 vs 2017 (Nutrien) | |||||||
| Earnings of equity-accounted investees | Ù | Earnings were higher due to the inclusion of MOPCO earnings in 2018 as a result of the Merger. | Ú | Earnings were lower in 2018 primarily due to the impact of anon-recurring foreign exchange gain recorded in 2017 in our investment in MOPCO from the devaluation of the Egyptian pound. | ||||
| Depreciation and amortization | Expense was higher in 2018 due to the PPA. |
| * | In cost of goods sold, including hedge |
Nitrogen Capacity
(million tonnes product)
Ammonia Annual Capacity | ||||
Trinidad | 2.2 | |||
Redwater AB | 0.9 | |||
Augusta GA | 0.8 | |||
Lima OH | 0.8 | |||
Geismar LA | 0.5 | |||
Carseland AB | 0.5 | |||
Borger TX | 0.5 | |||
Joffre AB | 0.5 | |||
Fort Saskatchewan AB | 0.4 | |||
Total | 7.1 | |||
| 14 | Nutrien 2018 First Quarter Interim Report |
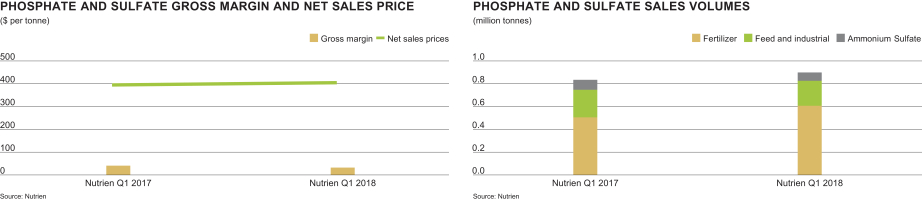
Phosphate and Sulfate Performance
Phosphate and Sulfate Financial Performance
| Three Months Ended March 31 | ||||||||||||||||||||||||||||||||||||||||||||||||||||||||||||
| Dollars (millions) | Tonnes (thousands) | Average per Tonne1 | ||||||||||||||||||||||||||||||||||||||||||||||||||||||||||
| Nutrien | Nutrien 2 | PotashCorp 2 | Nutrien | Nutrien 2 | PotashCorp 2 | Nutrien | Nutrien 2 | PotashCorp 2 | ||||||||||||||||||||||||||||||||||||||||||||||||||||
| 2018 | 2017 | % Change | 2017 | % Change | 2018 | 2017 | % Change | 2017 | % Change | 2018 | 2017 | % Change | 2017 | % Change | ||||||||||||||||||||||||||||||||||||||||||||||
Manufactured product3 | ||||||||||||||||||||||||||||||||||||||||||||||||||||||||||||
Net sales | ||||||||||||||||||||||||||||||||||||||||||||||||||||||||||||
Fertilizer | $ | 240 | $ | 190 | 26 | $ | 136 | 76 | 605 | 506 | 20 | 368 | 64 | $ | 396 | $ | 376 | 5 | $ | 369 | 7 | |||||||||||||||||||||||||||||||||||||||
Industrial and feed | 106 | 118 | (10 | ) | 134 | (21 | ) | 221 | 239 | (8 | ) | 271 | (18 | ) | $ | 481 | $ | 492 | (2 | ) | $ | 495 | (3 | ) | ||||||||||||||||||||||||||||||||||||
Ammonium sulfate | 18 | 20 | (10 | ) | – | n/m | 72 | 88 | (18 | ) | – | n/m | $ | 241 | $ | 228 | 6 | $ | – | n/m | ||||||||||||||||||||||||||||||||||||||||
| 364 | 328 | 11 | 270 | 35 | 898 | 833 | 8 | 639 | 41 | $ | 404 | $ | 394 | 3 | $ | 423 | (4 | ) | ||||||||||||||||||||||||||||||||||||||||||
Cost of goods sold | (335 | ) | (295 | ) | 14 | (260 | ) | 29 | $ | (373 | ) | $ | (354 | ) | 5 | $ | (406 | ) | (8 | ) | ||||||||||||||||||||||||||||||||||||||||
Gross margin | 29 | 33 | (12 | ) | 10 | 190 | $ | 31 | $ | 40 | (23 | ) | $ | 17 | 82 | |||||||||||||||||||||||||||||||||||||||||||||
Other phosphate and purchased products gross margin 4 | – | 1 | (100 | ) | 1 | (100 | ) | |||||||||||||||||||||||||||||||||||||||||||||||||||||
Gross margin | 29 | 34 | (15 | ) | 11 | 164 | ||||||||||||||||||||||||||||||||||||||||||||||||||||||
Expenses | (6 | ) | (9 | ) | (33 | ) | (4 | ) | 50 | |||||||||||||||||||||||||||||||||||||||||||||||||||
EBIT | 23 | 25 | (8 | ) | 7 | 229 | ||||||||||||||||||||||||||||||||||||||||||||||||||||||
Depreciation and amortization | 51 | 63 | (19 | ) | 58 | (12 | ) | |||||||||||||||||||||||||||||||||||||||||||||||||||||
EBITDA | $ | 74 | $ | 88 | $ | (16 | ) | $ | 65 | $ | 14 | |||||||||||||||||||||||||||||||||||||||||||||||||
| 1 | Rounding differences may occur due to the use of whole dollars inper-tonne calculations. |
| 2 | Nutrien 2017 combined historical figures arenon-IFRS measures. Refer to “non-IFRS Measures” section on page 33 for details. PotashCorp 2017 figures are legacy PotashCorp IFRS comparative. Refer to page 5 for further information. |
| 3 | Includes intersegment sales of $81 million and 200,000 sales tonnes (2017 (PotashCorp) – $NIL million and NIL sales tonnes). Intersegment profits are eliminated on consolidation. |
| 4 | Comprised of net sales $40 million (2017 (Nutrien) – $11 million; 2017 (PotashCorp) – $1 million) less cost of goods sold $40 million (2017 (Nutrien) – $10 million; 2017 (PotashCorp) – $NIL million). |
| n/m | = not meaningful |
The variance to the comparative PotashCorp quarter was primarily a result of the Merger; therefore, the analysis provided is to the comparative Nutrien quarter as this is a more meaningful comparison.
| Three Months Ended March 31 Nutrien 2018 vs Nutrien 2017 | ||||||||||||||||
| Change in Prices/Costs | ||||||||||||||||
| Dollars (millions) | Change in Sales Volumes | Net Sales | Cost of Goods Sold | Total | ||||||||||||
Manufactured product | ||||||||||||||||
Fertilizer | $ | 2 | $ | 12 | $ | (32 | ) | $ | (18 | ) | ||||||
Industrial and feed | (1 | ) | (3 | ) | (6 | ) | (10 | ) | ||||||||
Ammonium sulfate | (2 | ) | 1 | 1 | – | |||||||||||
PPA 1 | 24 | 24 | ||||||||||||||
Change in product mix | 4 | (1 | ) | (3 | ) | – | ||||||||||
Total manufactured product | $ | 3 | $ | 9 | $ | (16 | ) | $ | (4 | ) | ||||||
Other phosphate and purchased product | (1 | ) | ||||||||||||||
Total | $ | (5 | ) | |||||||||||||
| 1 | Depreciation and amortization as a result of a fair value allocation to the acquired property, plant and equipment of Agrium. |
| Nutrien 2018 First Quarter Interim Report | 15 |
The most significant contributors to the change in total EBITDA were as follows (direction of arrows refers to impact on EBITDA):
| 2018 vs 2017 (PotashCorp) | 2018 vs 2017 (Nutrien) | |||||||
| Sales volumes | Ù | Sales volumes increased primarily as a result of the Merger. | Ù | Sales volumes were up due to strong fertilizer demand and increased production levels at our phosphate facilities. | ||||
| Net sales prices | Ù | Our average realized price was up, reflecting firm global fertilizer prices, which were driven by improved market fundamentals and higher input costs. | ||||||
| Cost of goods sold | Ú | Fertilizer cost of goods sold variance was negative primarily due to the Merger and higher sulfur costs. | Ú | Fertilizer cost of goods sold variance was negative primarily due to higher input costs, including higher sulfur costs and Redwater rock costs. | ||||
| Expenses | Ù | There were no significant changes between 2017 and 2018. | Ú | There were no significant changes between 2017 and 2018. | ||||
| Depreciation and amortization | Expense was lower in 2018 primarily due to lower depreciable asset balance at our US facilities as a result of the impairments recorded in the latter half of 2017 and the impact of PPA. The decrease was partially offset by an increase in depreciation at our Redwater facility due to the change in the assets estimated useful lives. | |||||||
Phosphate and Sulfate Capacity
(million tonnes)
| Phosphate Rock | Phosphoric Acid (P2O5) | Liquid Products | Solid Fertilizer Products | |||||||||||||
| Annual Capacity | Annual Capacity | Annual Capacity | Annual Capacity | |||||||||||||
Aurora NC | 5.4 | 1.2 | 2.7 | 2 | 0.8 | |||||||||||
White Springs FL | 2.0 | 1 | 0.5 | 0.7 | 3 | 0.4 | 4 | |||||||||
Redwater AB | 0.0 | 0.3 | 0 | 1.0 | 5 | |||||||||||
Geismar LA | 0.0 | 0.2 | 0.3 | 6 | 0.0 | |||||||||||
Total | 7.4 | 2.2 | ||||||||||||||
| 1 | Revised capacity estimates based on review of mining operations completed in 2017. Prior capacity was 3.6 million tonnes. |
| 2 | A substantial portion is consumed internally in the production of downstream products. The balance is exported to phosphate fertilizer producers or sold domestically to dealers whocustom-mix liquid fertilizer. Capacity comprised of 2.0 million tonnes merchant grade acid and 0.7 million tonnes superphosphoric acid. |
| 3 | Represents annual superphosphoric acid capacity. A substantial portion is consumed internally in the production of downstream products. The |
| balance is exported to phosphate fertilizer producers and sold domestically to dealers whocustom-mix liquid fertilizer. |
| 4 | Restarted monoammonium phosphate plant during 2016, which had been closed in 2014. |
| 5 | Includes 0.4 million tonnes ammonium sulfate. |
| 6 | Production primarily relates to industrial. |
Purified Acid and Phosphate Feed Production
(million tonnes)
| Annual Capacity | ||||
Purified acid (P2O5) | 0.3 | |||
Phosphate feed production | 0.7 | |||
| 16 | Nutrien 2018 First Quarter Interim Report |
Others Segment Financial Performance
“Others” is anon-operating segment comprising corporate and administrative functions that provide support and governance to our operating business units.
Expenses included in EBIT of ournon-operating segment primarily comprise general and administrative costs at our headquarters and corporate offices and other expenses such as Merger and related costs.
EBITDA for our others segment for the first quarter of 2018 was a net expense of $133 compared to a net expense of $36 in the first quarter of PotashCorp in 2017 and a net expense of $78 in the combined historical first quarter for Nutrien. The increase in the net expense compared to the first quarter of PotashCorp in 2017 was primarily a result of increases in Merger and related costs and increases in general and administrative expenses related to the addition of Agrium’s operations. The increase in the net expense compared to the combined historical figures for Nutrien was primarily due to increases in Merger and related costs.
Expenses and Income below Gross Margin
| Three Months Ended March 31 | ||||||||||||||||||||||||||||
| Nutrien | Nutrien 1 | PotashCorp 2 | ||||||||||||||||||||||||||
| Dollars (millions), except percentage amounts | 2018 | 2017 | Change | % Change | 2017 | Change | % Change | |||||||||||||||||||||
Selling expenses | $ | (532 | ) | $ | (460 | ) | $ | (72 | ) | 16 | $ | (9 | ) | $ | (523 | ) | n/m | |||||||||||
General and administrative expenses | (119 | ) | (104 | ) | (15 | ) | 14 | (41 | ) | (78 | ) | 190 | ||||||||||||||||
Provincial mining and other taxes | (48 | ) | (36 | ) | (12 | ) | 33 | (33 | ) | (15 | ) | 45 | ||||||||||||||||
Earnings of equity-accounted investees | 7 | 24 | (17 | ) | (71 | ) | – | 7 | n/m | |||||||||||||||||||
Other (expenses) income | (79 | ) | (40 | ) | (39 | ) | 98 | (15 | ) | (64 | ) | 427 | ||||||||||||||||
Finance costs | (119 | ) | (118 | ) | (1 | ) | 1 | (59 | ) | (60 | ) | 102 | ||||||||||||||||
Income tax recovery (expense) | 42 | (7 | ) | 49 | n/m | (10 | ) | 52 | n/m | |||||||||||||||||||
Discontinued operations | – | n/m | n/m | n/m | 43 | (43 | ) | (100 | ) | |||||||||||||||||||
| 1 | Nutrien 2017 combined historical figures arenon-IFRS measures. Refer to “non-IFRS Measures” section on page 33 for details. PotashCorp 2017 figures are legacy PotashCorp IFRS comparative. Refer to page 5 for further information. |
| 2 | Certain amounts have been reclassified from share of earnings of equity-accounted investees, dividend income and income taxes to net income from discontinued operations as the related assets were classified as held for sale in 2017. These amounts have also been reclassified to conform to the current period’s presentation as described in note 32 to the financial statements. |
n/m = not meaningful
The most significant contributors to the change in expenses and income results were as follows:
| 2018 vs 2017 (PotashCorp) | 2018 vs 2017 (Nutrien) | |||
| Selling Expenses | See explanation in the Retail Financial Performance section on page 7. | See explanation in the Retail Financial Performance section on page 7. | ||
| General and Administrative Expenses | General and administrative expenses increased as a result of the Merger. | There were no significant changes. | ||
| Provincial Mining and Other Taxes | See explanation in the Potash Financial Performance section on page 9. | See explanation in the Potash Financial Performance section on page 9. | ||
| Other (Expenses) Income | Other expenses increased primarily due to an increase in Merger and related costs. | Other expenses increased primarily due to an increase in Merger and related costs. |
| Nutrien 2018 First Quarter Interim Report | 17 |
| 2018 vs 2017 (PotashCorp) | 2018 vs 2017 (Nutrien) | |||
Finance Costs | Finance costs increased as a result of the Merger including the impact of finance costs on assumed debt and amortization of related purchase price allocations. | There were no significant changes. | ||
 |  | |||
| Income Tax Recovery (Expense) | Ordinary earnings for the three months ended March 31, 2018 were negative as compared to positive earnings for the three months ended March 31, 2017. This produced very different weightings between jurisdictions on a quarter-over-quarter basis. This resulted in an increase in the actual effective tax rate on ordinary earnings. Compared to the same period last year, earnings were significantly lower in the United States and Canada and higher in lower-tax jurisdictions resulting in overall lower income taxes.
For the first three months of 2018, 79 percent of the effective tax rate on the current year’s ordinary earnings from continuing operations pertained to current income taxes (2017 – n/m) and 21 percent related to deferred income taxes (2017 – n/m).
| |||
| EFFECTIVE TAX RATES AND DISCRETE ITEMS |
Three Months Ended March 31 | |||||||||||||||||
| Dollars (millions), except percentage amounts | 2018 | Nutrien 1 2017 | PotashCorp 1 2017 | |||||||||||||||
Actual effective tax rate on ordinary earnings | 89 | % | 10 | % | 12 | % | ||||||||||||
Actual effective tax rate including discrete items | 95 | % | 6 | % | 8 | % | ||||||||||||
Discrete tax adjustments that impacted the rate | $ | 3 | $ | 5 | $ | 5 | ||||||||||||
n/m= not meaningful | ||||||||||||||||||
1 Rates have been adjusted as a result of our investments in SQM, APC and ICL being classified as discontinued in 2017 |
| |||||||||||||||||
| Net Earnings From Discontinued Operations | Net earnings from discontinued operations decreased primarily due to a decrease in earnings of equity-accounted investees from SQM and APC. Equity accounting for these investments ceased when the investments were classified as held for sale. | Combined historical results for Nutrien (seenon-IFRS measures on page 33) were prepared for earnings from continuing operations only and therefore there is no meaningful comparison available. |
| 18 | Nutrien 2018 First Quarter Interim Report |
Financial Condition Review
Statement of Financial Position Analysis
| Nutrien 2018 First Quarter Interim Report | 19 |
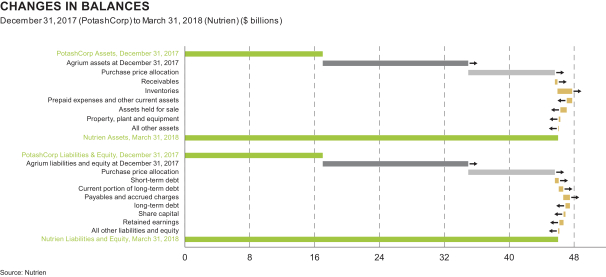
The most significant contributors to the changes in our balance sheet were as follows (direction of arrows refers to increase or decrease, all impacts for balance sheet line items are after the impacts of Merger and PPA impacts in relation to the Merger (if any)):
| Assets | Liabilities | |||||
| Ù | Total assets increased as a result of the Merger and the PPA to the assets of Agrium. Significant provisional adjustments include $692 million to property, plant and equipment, $1,800 million to other intangible assets (primarily customer relationships and brands), and $8,227 to goodwill. | Ù
Ù
Ù
Ù
Ú | Total liabilities increased as a result of the Merger and the PPA to the liabilities of
Short-term debt increased due primarily to an increase in our outstanding commercial
Current portion of long-term debt increased due to the 6.75% debentures due
Payables and accrued charges increased primarily due to a seasonal increase in
Long-term debt decreased due to the 6.75% debentures due January 15, 2019 | |||
| Ù | Receivables were higher mainly due to an increase in trade receivables. | |||||
| Ù | Inventories were higher mainly due to seasonal retail inventorybuild-up. | |||||
| Ú | Prepaid expenses and other current assets were lower primarily due to seasonal drawdown of prepaid retail purchases. | |||||
| Ú | Assets held for sale were lower due to the sale of our equity interests in ICL. Remaining assets held for sale include our equity interests in SQM and APC. | |||||
| Ú | Property plant and equipment decreased primarily due to depreciation exceeding additions. | |||||
Equity | ||||||
| Ù | Total equity increased as a result of the Merger and the issuance of Nutrien shares. | |||||
| Ú | Share Capital decreased primarily due to share repurchases made under the normal course issuer bid (NCIB). | |||||
| Ú | Retained earnings was lower primarily as a result of dividends declared and the premium paid on share repurchases exceeding the transfer of actuarial gains on defined benefit plans. | |||||
As at March 31, 2018, $104 million (2017 (PotashCorp) – $21 million) of our cash and cash equivalents was held in certain foreign subsidiaries. There are no current plans to repatriate the funds at March 31, 2018 in a manner that results in tax consequences.
| 20 | Nutrien 2018 First Quarter Interim Report |
Liquidity and Capital Resources
The following section explains how we manage our cash and capital resources to carry out our strategy and deliver results.
Liquidity risk arises from our general funding needs and in the management of our assets, liabilities and capital structure. We manage liquidity risk to maintain sufficient liquid financial resources to fund our financial position and meet our commitments and obligations in a cost-effective manner.
Liquidity needs can be met through a variety of sources:
| Our primary uses of funds are:
| |
• Cash generated from operations.
| • Operational expenses.
| |
• Drawdowns under our revolving credit facility.
| • Sustaining, opportunity and integration capital spending.
| |
• Issuances of commercial paper.
| • Intercorporate investments.
| |
• Short-term borrowings under our line of credit.
| • Dividends and interest.
| |
• Proceeds from sales of investments.
| • Principal payments on our debt securities.
| |
• Accounts receivable securitization program. | • Share repurchases. |
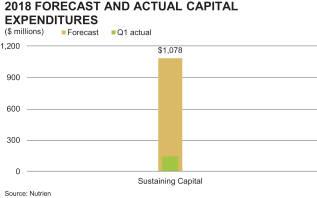
Based on an expected exchange rate of 1.27 Canadian dollars per US dollar in 2018 we expect to incur capital expenditures, including capitalized interest, of approximately $1,078 million to sustain operations at existing levels and for major repairs and maintenance (including plant turnarounds). We target a stable and growing dividend that represents 40 to 60 percent of free cash flow after sustaining capital through the agricultural cycle. Our Board has also approved the purchase of up to five percent of our outstanding common shares over aone-year period through a NCIB. The NCIB will be effected in accordance with the TSX’s normal course issuer bid rules and/or Rule 10b-18 under the U.S. Securities Exchange Act of 1934, which contain restrictions on the number of common shares that may be purchased on a single day, subject to certain exceptions for block purchases, based on the average daily trading volumes of Nutrien’s common shares on the applicable exchange. The TSX has approved our notice of NCIB to purchase up to 32,209,923 of our common shares until February 22, 2019. A copy of our notice can be obtained, without charge, by contacting our Investor Relations department. During the three months ended March 31, 2018 9,321,587 shares were repurchased for consideration of $457 million.
| Nutrien 2018 First Quarter Interim Report | 21 |
Cash Requirements
The following aggregated information about our contractual obligations and other commitments summarizes certain of our liquidity and capital resource requirements as at March 31, 2018. The information presented in the table below does not include obligations that have original maturities of less than one year, planned (but not legally committed) capital expenditures, or potential share repurchases.
Contractual Obligations and Other Commitments
| Payments Due by Period | ||||||||||||||||||||
| Dollars (millions) at March 31, 2018 | Total | Within 1 Year | 1 to 3 Years | 3 to 5 Years | Over 5 Years | |||||||||||||||
Long-term debt1 | $ | 8,175 | $ | 500 | $ | 1,000 | $ | 500 | $ | 6,175 | ||||||||||
Estimated interest payments on long-term debt | 4,893 | 342 | 651 | 605 | 3,295 | |||||||||||||||
Operating leases | 1,113 | 197 | 350 | 232 | 334 | |||||||||||||||
Purchase commitments2 | 2,159 | 950 | 499 | 383 | 327 | |||||||||||||||
Capital commitments | 64 | 28 | 26 | 10 | – | |||||||||||||||
Other commitments | 279 | 80 | 101 | 65 | 33 | |||||||||||||||
Asset retirement obligations and accrued environmental costs3 | 1,616 | 130 | 248 | 120 | 1,118 | |||||||||||||||
Other long-term liabilities 4 | 3,543 | 171 | 126 | 130 | 3,116 | |||||||||||||||
Total | $ | 21,842 | $ | 2,398 | $ | 3,001 | $ | 2,045 | $ | 14,398 | ||||||||||
| 1 | Long-term debt consists of a face value of $8,175 million senior notes and debentures. The estimated interest payments on long-term debt in the above table include our cumulative scheduled interest payments on fixed and variable rate long-term debt. Interest on variable rate debt is based on interest rates prevailing at March 31, 2018. |
| 2 | Purchase commitments include $71 million of natural gas contracts in Trinidad that will expire in 2018. As new contracts for future operations have not yet been completed, there are no commitments presented beyond one year at this time. Purchase commitments also include our proportionate share of commitments of joint ventures. |
| 3 | Commitments associated with our asset retirement obligations are the, estimated cash outflows and are expected to occur over the next 480 years for phosphate (with the majority taking place over the next 80 years) and between 40 and 430 years for potash. Environmental costs consist of restoration obligations, which are expected to occur through 2048. |
| 4 | Other long-term liabilities consist primarily of pension and other post-retirement benefits, derivative instruments, income taxes and deferred income taxes. Deferred income tax liabilities may vary according to changes in tax laws, tax rates and the operating results of the company. Since it is impractical to determine whether there will be a cash impact in any particular year, all deferred income tax liabilities have been reflected as other long-term liabilities in the Over 5 Years category. |
| 22 | Nutrien 2018 First Quarter Interim Report |
Sources and Uses of Cash
The company’s cash flows from operating, investing and financing activities are summarized in the following table:
| Three Months Ended March 31 | ||||||||||||||||||||||||||||
| Nutrien | Nutrien 1 | PotashCorp 1 | ||||||||||||||||||||||||||
| Dollars (millions), except percentage amounts | 2018 | 2017 | Change | % Change | 2017 | Change | % Change | |||||||||||||||||||||
Cash (used in) provided by operating activities | $ | (340 | ) | $ | 401 | $ | (741 | ) | n/m | $ | 223 | $ | (563 | ) | n/m | |||||||||||||
Cash provided by (used in) investing activities | 796 | (319 | ) | 1,115 | n/m | (132 | ) | 928 | n/m | |||||||||||||||||||
Cash used in financing activities | (115 | ) | (221 | ) | 106 | (48 | ) | (61 | ) | (54 | ) | 89 | ||||||||||||||||
Effect of exchange rate changes on cash and cash equivalents | 3 | 19 | (16 | ) | (84 | ) | – | 3 | n/m | |||||||||||||||||||
Increase (decrease) in cash and cash equivalents | $ | 344 | $ | (120 | ) | $ | 464 | n/m | $ | 30 | $ | 314 | n/m | |||||||||||||||
| 1 | Nutrien 2017 combined historical figures are non-IFRS measures. Refer to “non-IFRS Measures” section on page 33 for details. PotashCorp 2017 figures are legacy PotashCorp IFRS comparative. Refer to page 5 for further information. |
n/m = not meaningful
| Nutrien 2018 First Quarter Interim Report | 23 |
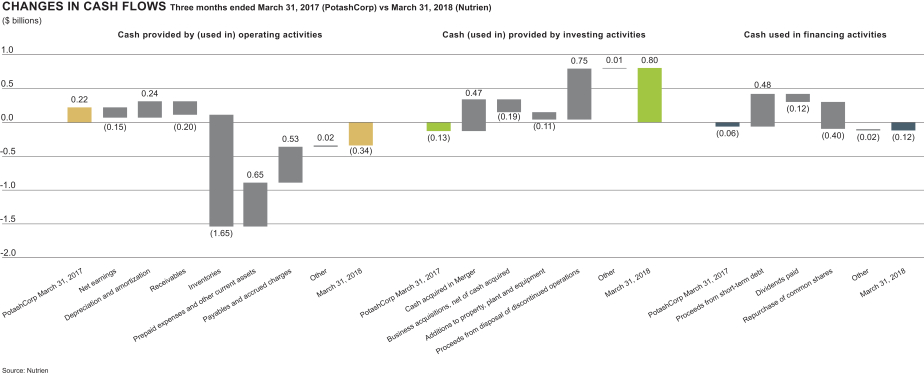
The most significant contributors to the changes in cash flows were as follows:
| 2018 vs 2017 (PotashCorp) | 2018 vs 2017 (Nutrien) | |||
Cash (Used in) Provided by Operating Activities | Cash (used in) provided by operating activities was impacted by: • Net loss in 2018 compared to net earnings in 2017. • Higher non-cash depreciation and amortization charges in 2018. • Outflows from receivables in 2018 compared to inflows in 2017. • Higher cash outflows on inventories in 2018. • Cash inflows from prepaid expenses and other current assets in 2018 compared to outflows in 2017. • Cash inflows from payables and accrued charges in 2018 compared to outflows in 2017. | Cash (used in) provided by operating activities was impacted by: • Net loss in 2018 compared to net earnings in 2017. • Higher non-cash adjustments in 2018 than in 2017. • Net cash outflows from changes in non-cash working capital in 2018 compared to net cash inflows in 2017. | ||
Cash Provided by (Used in) Investing Activities | Cash provided by (used in) investing activities was impacted by: • Cash acquired in the Merger in 2018. • Net cash outlays for business acquisitions in 2018. • An increase in cash additions to property, plant and equipment in 2018. • Cash proceeds received from the disposal of our discontinued operation in ICL. | Cash provided by (used in) investing activities was impacted by: • Higher net cash outlays for business combinations in 2018 compared to 2017. • Cash proceeds received from the disposal of our discontinued operation in ICL in 2018. | ||
Cash Used in Financing Activities | Cash used in financing activities was impacted by: • Higher cash proceeds from issuance of commercial paper in 2018. • Higher cash dividends paid in 2018. • Cash outlays for share repurchases in 2018. | Cash used in financing activities was impacted by: • A cash repayment of long-term debt in 2017. • Higher cash proceeds from short-term debt in 2018. • Cash outlays for share repurchases in 2018. |
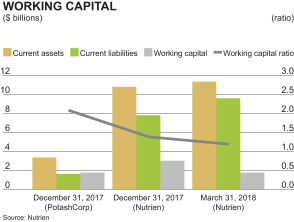
We believe that internally generated cash flow, supplemented by available borrowings under our existing financing sources, if necessary, will be sufficient to meet our anticipated capital expenditures and other cash requirements for at least the next 12 months. At this time, we do not reasonably expect any presently known trend or uncertainty to affect our ability to access our historical sources of liquidity. We had positive working capital of $1.73 billion and a working capital ratio of 1.18 at March 31, 2018. Working capital decreased from the combined historical Nutrien amount due primarily to increases in short-term debt, current portion of long-term debt and payables and accrued charges exceeding the increase in current assets from increases in inventory and receivables net of decreases in assets held for sale and prepaid expenses and other current assets.
| 24 | Nutrien 2018 First Quarter Interim Report |
Capital Structure and Management
We manage our capital structure with a focus on maintaining a sound balance sheet, enabling a strong investment-grade credit rating.
Principal Debt Instruments
| 1 | The authorized aggregate amount under legacy PotashCorp and Agrium commercial paper programs in Canada and the US was $5,000 million as at March 31, 2018. The amounts available under the commercial paper programs were limited to the availability of backup funds backstopped by the credit facility. Included in the amount outstanding and committed is $1,851 million of commercial paper and $240 million of other short-term debt. |
| 2 | Subsequent to March 31, 2018, we launched a commercial paper program having an aggregate authorized amount of $4,500. The amount available under the commercial paper program is limited to the availability of backup funds backstopped by the credit facility. Concurrent with the launch, we have discontinued new issuances under the legacy commercial paper programs of PotashCorp and Agrium. |
| 3 | Direct borrowings and letters of credit committed. We also have $285 million in uncommitted letter of credit facilities against which $164 million was issued at March 31, 2018. |
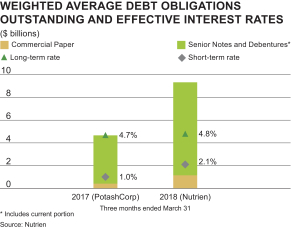
We use a combination of cash generated from operations and short-term and long-term debt to finance our operations. We typically pay floating rates of interest on our short-term debt and credit facility, and fixed rates of interest on our senior notes and debentures. As at March 31, 2018, interest rates on outstanding commercial paper ranged from 2.1 percent to 2.9 percent.
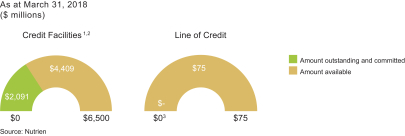
We had the following instruments available to finance operations at March 31, 2018:
| • | $6.5 billion in credit facilities; 1,2 |
| • | $300 million accounts receivable securitization program; 3 |
| • | $75 million unsecured line of credit4 available through August 2018; and |
| • | $285 million uncommitted letter of credit facility4 due on demand. |
| 1 | Provides for unsecured advances up to the total facility amount less direct borrowings and amounts committed in respect of commercial paper outstanding. Amounts in foreign currencies have been converted to US dollars at March 31, 2018. |
| 2 | Subsequent to March 31, 2018, we replaced the existing $3.5 billion unsecured credit facility of PotashCorp and the $2.5 billion multi-jurisdictional unsecured credit facility of Agrium with a new Nutrien $4.5 billion unsecured revolving credit facility (Nutrien Credit Facility). The Nutrien Credit Facility matures |
| April 10, 2023, subject to extension at the request of Nutrien provided that the resulting maturity date shall not exceed five years from the date specified in the request. |
| 3 | Under the accounts receivable securitization program, we sell certain trade receivables to a special purchase vehicle, which is a consolidated entity within Nutrien. We control and retain substantially all the risks and rewards of the receivables sold to the special purchase vehicle. Should we wish to draw funds under the program, the sold accounts receivable balances may be used as capacity for collateralized borrowings from a third-party financial institution. The limit changes to $500 million from April through December of each year. |
| 4 | Amounts available reduced by direct borrowings and outstanding letters of credit. |
During the first quarter of 2018, we commenced offers to exchange all validly tendered and accepted senior notes of PotashCorp and debentures of Agrium, representing all of the outstanding senior notes and debentures of PotashCorp and Agrium, respectively, for new notes to be issued by Nutrien having interest rates and maturities identical to those of the applicable exchanged series of PotashCorp senior notes or Agrium debentures. In addition, we solicited consents from the holders of the PotashCorp and Agrium securities to amend the terms and remove certain covenants and events of default. Subsequent to March 31, 2018, substantially all of the total notes and debentures, other than Agrium’s debentures due 2027 (2027 debentures), were exchanged. We are not required to provide additional financial reporting related to unexchanged notes and debentures. The 2027 debentures were not exchanged but debt holders have consented to amend reporting requirements such that reports filed of Nutrien will be deemed to satisfy those requirements. Refer to Note 21 of the financial statements for further information on the exchanges. Costs related to the exchange were $18 million and were primarily paid in April 2018.
The credit facilities of legacy PotashCorp and Agrium and line of credit have financial tests and other covenants with which we must comply at eachquarter-end.Non-compliance with any such covenants could result in accelerated payment of amounts borrowed and termination of lenders’ further funding obligations under the credit facilities and line of credit. We were in compliance with all covenants as at March 31, 2018 and at this time anticipate being in compliance with such covenants in 2018.
The accompanying table summarizes the limits and results of certain covenants.
Debt Covenants at March 31 1
| Dollars (millions), except ratio amounts | Limit | 2018 | ||||||||||
Debt-to-capital ratio2 | £ | 0.65 | 0.31 | |||||||||
| 1 | The debt-to-capital ratio covenant was a requirement of the credit facilities of our wholly owned subsidiaries PotashCorp and Agrium at March 31, 2018. As those credit facilities were replaced subsequent to March 31, 2018 by the Nutrien credit facility, we have provided the debt-to-capital ratio of Nutrien at March 31, 2018. |
| 2 | Adjusted total debt divided by the sum of adjusted total debt and total equity. Thisnon-IFRS financial measure is a requirement of our debt covenants and should not be considered as a substitute for, nor superior to, measure of financial performance prepared in accordance with IFRS. |
| Nutrien 2018 First Quarter Interim Report | 25 |
Our ability to access reasonably priced debt in the capital markets is dependent, in part, on the quality of our credit ratings. We continue to maintain investment-grade credit ratings for our long-term debt. A downgrade of the credit rating of our long-term debt would increase the interest rates applicable to borrowings under our credit facility and our line of credit.
Commercial paper markets are normally a source ofsame-day cash for the company. Our access to the US commercial paper market primarily depends on maintaining our current short-term credit ratings as well as general conditions in the money markets.
| Long-Term Debt | Short-Term Debt | |||||||||||||||
| Rating (Outlook) | Rating | |||||||||||||||
| March 31, 2018 (Nutrien) | December 31, 2017 (PotashCorp) | March 31, 2018 (Nutrien) 1 | December 31, 2017 (PotashCorp) | |||||||||||||
Moody’s | Baa2 (stable) | Baa1 (negative) | n/a | P-2 | ||||||||||||
Standard & Poor’s | BBB (stable) | BBB+ (stable) | n/a | A-2 | 2 | |||||||||||
| 1 | At March 31, 2018 Nutrien’s short-term debt had not yet been rated. Subsequent to March 31, 2018, Moody’s assigned a P-2 rating and Standard & Poor’s assigned a A-2 rating. |
| 2 | Standard & Poor’s assigned a global commercial paper rating ofA-2 but rated our PotashCorp commercial paperA-1 (low) on a Canadian scale. |
A security rating is not a recommendation to buy, sell or hold securities. Such ratings may be subject to revision or withdrawal at any time by the respective credit rating agency and each rating should be evaluated independently of any other rating.
Outstanding Share Data
| Nutrien March 31 2018 | PotashCorp December 31 2017 | |||||||
Common shares issued and outstanding 1 | 634,232,839 | 840,223,041 | ||||||
Options to purchase common shares outstanding | 11,031,054 | 17,170,654 | ||||||
Share-settled performance share units | 726,586 | 935,570 | ||||||
| 1 | Common shares issued and outstanding are at April 30, 2018 |
Off-Balance Sheet Arrangements
In the normal course of operations, Nutrien engages in a variety of transactions that, under IFRS, are either not recorded on our consolidated balance sheets or are recorded at amounts that differ from the full contract amounts. Principaloff-balance sheet activities include operating leases, agreement to reimburse losses of Canpotex, issuance of guarantee contracts, certain derivative instruments and long-term contracts. We do not reasonably expect any presently known trend or uncertainty to affect our ability to continue using these arrangements, which are discussed below.
Derivative Instruments
We use derivative financial instruments to manage exposure to commodity price and exchange rate fluctuations. Except for certainnon-financial derivatives that were entered into and continued to be held for the purpose of the receipt or delivery of anon-financial item in accordance with expected purchase, sale or usage requirements, derivatives are recorded on the consolidated balance sheets at fair value andmarked-to-market each reporting period regardless of whether they are designated as hedges for IFRS purposes.
Leases and Long-Term Contracts
Certain of our long-term raw materials agreements contain fixed price and/or volume components. Our significant agreements, and the related obligations under such agreements, are discussed in Cash Requirements on page 22.
| 26 | Nutrien 2018 First Quarter Interim Report |
Quarterly Results
(in millions of US dollars except as otherwise noted)
| Nutrien March 31, 2018 | PotashCorp 1 December 31, 2017 | PotashCorp 1 September 30, 2017 | PotashCorp 1 June 30, 2017 | PotashCorp 1 March 31, 2017 | PotashCorp 1 December 31, 2016 | PotashCorp 1 September 30, 2016 | PotashCorp 1 June 30, 2016 | |||||||||||||||||||||||||
Financial Performance | ||||||||||||||||||||||||||||||||
Sales | $ | 3,695 | $ | 1,081 | $ | 1,234 | $ | 1,120 | $ | 1,112 | $ | 1,058 | $ | 1,136 | $ | 1,053 | ||||||||||||||||
Gross margin | 847 | (72 | ) | 233 | 260 | 273 | 163 | 190 | 243 | |||||||||||||||||||||||
Net (loss) earnings from continuing operations | (1 | ) | (120 | ) | 16 | 152 | 106 | 13 | 53 | 78 | ||||||||||||||||||||||
Net (loss) earnings from discontinued operations | – | 44 | 37 | 49 | 43 | 33 | 28 | 43 | ||||||||||||||||||||||||
Net (loss) earnings2 | (1 | ) | (76 | ) | 53 | 201 | 149 | 46 | 81 | 121 | ||||||||||||||||||||||
EBITDA 4 | 487 | (43 | ) | 315 | 368 | 393 | 235 | 321 | 367 | |||||||||||||||||||||||
Net (loss) earnings per share from continuing operations 3 | – | (0.14 | ) | 0.02 | 0.18 | 0.13 | 0.02 | 0.06 | 0.09 | |||||||||||||||||||||||
Net (loss) earnings per share 2,3 | – | (0.09 | ) | 0.06 | 0.24 | 0.18 | 0.05 | 0.10 | 0.14 | |||||||||||||||||||||||
| 1 | Certain amounts have been reclassified as a result of discontinued operations discussed in Note 19 of the financial statements and to conform with Nutrien’s new method of presentation. |
| 2 | From continuing and discontinued operations. |
| 3 | Basic and diluted net earnings per share for each quarter has been computed based on the weighted average number of shares issued and outstanding during the respective quarter; therefore, quarterly amounts may not add to the annual total.Per-share calculations are based on dollar and share amounts each rounded to the nearest thousand. |
| 4 | EBITDA is anon-IFRS measure. Refer to “non-IFRS measures” section on page 33 for details. |
The agricultural products business is seasonal. Crop input sales are primarily concentrated in the spring and fall crop input application seasons. Crop nutrient inventories are normally accumulated leading up to each application season. Our cash collections generally occur after the application season is complete, and our customer prepayments are concentrated in December and January. Feed and industrial sales are more evenly distributed throughout the year.
In the second quarter of 2016, earnings were impacted by $33 million in exit costs related to Canpotex’s Prince Rupert terminal in the potash segment and a $10 millionnon-cash impairment charge on our investment in Sinofert. In the fourth quarter of 2016 and 2017 and third quarter of 2017 earnings were impacted by a $20 million, $276 million and $29 million respectively,non-cash impairment charge to property, plant and equipment in the phosphate and sulfate segment. In the first quarter of 2018, earnings were impacted by the Merger.
| Nutrien 2018 First Quarter Interim Report | 27 |
| Nutrien1 March 31, 2018 | Nutrien1 December 31, 2017 | Nutrien1 September 30, 2017 | Nutrien1 June 30, 2017 | Nutrien1 March 31, 2017 | ||||||||||||||||
Financial Performance | ||||||||||||||||||||
Sales | $ | 3,695 | $ | 3,498 | $ | 3,586 | $ | 7,348 | $ | 3,737 | ||||||||||
Gross margin | 847 | 729 | 793 | 1,791 | 838 | |||||||||||||||
Net (loss) earnings from continuing operations | (1 | ) | (93 | ) | (53 | ) | 705 | 97 | ||||||||||||
EBITDA2 | 487 | 210 | 375 | 1,306 | 521 | |||||||||||||||
| 1 | Nutrien 2017 combined historical figures are non-IFRS measures. Refer to “non-IFRS Measures” section on page 33 for details. |
| 2 | EBITDA is a non-IFRS measure. Refer to “non-IFRS measures” section on page 33 for details. |
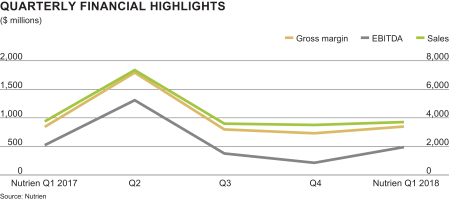
Other Financial Information
Share-based Compensation
Refer to Note 27 to the financial statements for information pertaining to share-based compensation.
Related Party Transactions
We sell potash from our Canadian mines for use outside Canada and the US exclusively to Canpotex. Sales are at prevailing market prices and are settled on normal trade terms. Sales to Canpotex for the quarter ended March 31, 2018 were $282 (2017 (PotashCorp) – $198).
The receivable outstanding from Canpotex is $171 at March 31, 2018 (December 31, 2017 (PotashCorp) – $82) and arose from sale transactions described above. It is unsecured and bears no interest. There are no provisions held against this receivable.
Refer to Note 28 to the financial statements for further information on related party transactions.
Market Risks Associated with Financial Instruments
Market risk is the potential for loss from adverse changes in the market value of financial instruments. The level of market risk to which we are exposed varies depending on the composition of our derivative instrument portfolio, as well as current and expected market conditions. See Note 29 to the financial statements for information on our financial instruments.
| 28 | Nutrien 2018 First Quarter Interim Report |
Critical Accounting Estimates
We have disclosed our critical accounting policies in our financial statements. Certain of these policies, such as long-lived asset impairment, provisions and contingencies for asset retirement, environmental and other obligations, capitalization and depreciation of property, plant and equipment, depreciation and amortization of other intangible assets, fair value of business acquisitions and goodwill impairment, involve critical accounting estimates because they require us to make subjective or complex judgments about matters that are inherently uncertain and because of the likelihood that materially different amounts could be reported under different conditions or using different assumptions. Information on impairment sensitivities is included on page 36 of PotashCorp’s annual MD&A.
We have discussed the development, selection and application of our key accounting policies, and the critical accounting estimates and assumptions they involve, with the audit committee of the Board.
Recent Accounting Changes
Refer to Note 31 to the financial statements for information on issued accounting pronouncements that will be effective in future periods and were effective in 2018.
Agriculture Fundamentals Market Outlook
Delayed planting in North America has supported crop prices. Additional support has been provided by the continued degradation of the Argentine corn and soybean crops, which the USDA projects will decline by 20 percent and more than 30 percent, respectively, reducing export supplies and supporting export demand for US and Brazilian corn and soybeans.
Despite the second-highest production of global grains and oilseeds on record, the USDA projects that inventories of those crops will decline by nearly three percent in 2017/18, the first decline in five years and the largest year-over-year decline since 2010/11. While relatively high carry-in inventories provide a buffer, tightened ending stocks increase the importance of strong production in 2018.
Extended winter weather throughout much of North America delayed nutrient applications and planting, which we expect will lead to a more compressed planting season. Depending on weather over the coming weeks, there is some risk to total crop nutrient demand in the first half of 2018, in particular for ammonia. Growers could potentially cover a higher proportion of nitrogen needs through top and side dress applications after plantings are complete.
North American growers are generally positive going into the spring season, despite the late start to planting and uncertainty over trade issues. This includes a potential escalation of trade restrictions between the US and China and the ongoing negotiations of the NAFTA.
The USDA projects that US combined corn, soybean and cotton area will decline by just over one percent year-over-year, which may lead to lower overall seed expenditures in 2018. However, we expect US soybean growers to continue their rapid adoption of dicamba-resistant soybeans.
Potash Market Outlook
Strong customer engagement and positive potash sector fundamentals continued to support potash deliveries during the first quarter of 2018, and we expect potash demand to remain robust as a result of high underlying consumption and relatively low inventory levels in most major markets. We have increased our global potash shipment forecast to 64.5 and 66.5 million tonnes for 2018.
We expect normal North American potash application rates, supported by good affordability and the need to replace nutrients removed by last year’s harvest.
Prices continued to firm in key spot markets, particularly in Brazil, where granular potash prices have continued to increase on new sales since the beginning of 2018. The Brazilian potash import pace is relatively flat compared to the record level in 2017, mostly supported by strong crop production and improved crop economics, particularly for soybeans.
In China, potash demand continued to be underpinned by supportive crop prices and farmers switching to more intensive fruit and vegetable production. In India, consecutive years of strong crop production in combination with some improvements in agronomic management have supported underlying potash consumption growth. We do not expect the recent reductions in the potash subsidy rates and the slight increase in the maximum retail prices to have a significant impact on Indian consumption growth in 2018. Potash demand remains reasonably strong in other Asian countries amid stable and profitable prices for a wide range of key crops.
Several global potash suppliers, including Canpotex, announced they are fully committed through at least June 2018. There has been limited saleable production from new greenfield mines to date and while these projects will continue toramp-up, a portion of the new capacity will be offset by the closure of mines reaching end of life and product mix changes by some producers.
Nitrogen Market Outlook
The delayed start to the spring application season led to pressure on nitrogen prices as the supply chain filled and retailers were comfortable with inventory positions entering the spring application season.
| Nutrien 2018 First Quarter Interim Report | 29 |
However, we expect that the North American in-market urea and UAN supply and demand balance will remain tight through the end of the spring season, as combined supplies of the two products are down approximately 10 percent in the fertilizer-year-to-date due to the slow pace of offshore imports.
Chinese exportable urea supplies remain low and port inventories are down significantly year-over-year. Production levels have increased since early February 2018, which was expected in order to meet domestic spring demand. We expect between three and four million tonnes of Chinese urea exports in 2018, down from 4.7 million tonnes last year.
India has been an important source of urea demand in early 2018 as inventories began the year at low levels. Indian imports were up 100 percent year-over-year in the first quarter of 2018 and we expect imports to be supported by low inventories, but potential policy changes and the monsoon rainfall will be important drivers in the second half of the year.
Phosphate And Sulfate Market Outlook
Phosphate fertilizer prices have remained relatively firm and there is optimism among analysts about Indian demand, driven by tight DAP inventories and the increase in the second quarter phosphoric acid price. However, exportable supplies are expected to increase in the second quarter as Chinese prices have become more competitive, and new supply ramps up in Saudi Arabia and Morocco.
Sulfur prices have remained firm in the US, driven by tight supplies from traditional offshore suppliers, resulting in higher year-over-year production costs.
Financial Outlook And Guidance
Taking the above market factors into consideration, we have raised the guidance range for potash sales volumes and EBITDA to 12.0 to 12.5 million tonnes and $1.2 to $1.4 billion respectively. Our guidance for Nitrogen EBITDA increased to $1.0 to $1.2 billion.
We are providing phosphate and sulfate EBITDA guidance of $0.20 billion to $0.25 billion, which is in line with our previous year’s results.
Our effective tax rate on continuing operations range of 22 to 24 percent is down from our previous guidance primarily due to changes in forecasted earnings mix in different tax jurisdictions.
Income from investments in APC and SQM will be recorded as dividend income (net of tax) in discontinued operations and is expected to range between $140 to $150 million. These amounts are included in our earnings per share guidance but are not included in EBITDA guidance.
We have revised our full-year foreign exchange rate assumption to CAD$1.27 per US dollar, slightly higher than previous guidance.
Based on these factors, we are increasing our full-year 2018 earnings guidance to $2.20 to $2.60 per share and providing first half 2018 guidance of $1.50 to $1.65 earnings per share.
All of the guidance numbers include the impact of expected in-year realized cash synergies of $175 to $225 million. Excluded from guidance are costs to achieve these ongoing synergies of $50 to $75 million as well as the impact of incremental depreciation and amortization of $250 million to $350 million resulting from the fair valuing of Agrium’s assets and liabilities as of January 1, 2018 in accordance with purchase accounting.
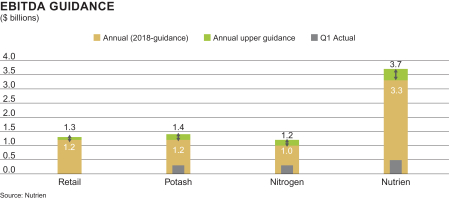
| 30 | Nutrien 2018 First Quarter Interim Report |
Controls and Procedures
Disclosure Controls and Procedures
There are inherent limitations to the effectiveness of any system of disclosure controls and procedures, including the possibility of human error and the circumvention or overriding of the controls and procedures. Accordingly, even effective disclosure controls and procedures can only provide reasonable assurance of achieving their control objectives. As of March 31, 2018, the Chief Executive Officer and Chief Financial Officer concluded that the disclosure controls and procedures were effective to provide reasonable assurance that information required to be disclosed in the reports the company files and submits under securities legislation is recorded, processed, summarized and reported as and when required and that such information is accumulated and communicated to our management, including our Chief Executive Officer and Chief Financial Officer, as appropriate to allow timely decisions regarding required disclosure.
Changes in Internal Controls Over Financial Reporting
Effective January 1, 2018, pursuant to the merger of equals transactions contemplated by the Arrangement Agreement, dated September 11, 2016, PotashCorp and Agrium were acquired by Nutrien. As a result, Agrium and PotashCorp each became subsidiaries of Nutrien. For the quarter ended March 31, 2018, the company has designed internal control over financial reporting for Nutrien, while maintaining the internal control over financial reporting for its subsidiaries, PotashCorp and Agrium.
| Nutrien 2018 First Quarter Interim Report | 31 |
Forward-Looking Statements
This 2018 Quarterly Report, including the “Outlook” section of “Management’s Discussion & Analysis of Financial Condition and Results of Operations,” contains and incorporates by reference forward-looking statements or forward-looking information (within the meaning of the US Private Securities Litigation Reform Act of 1995, and other US federal securities laws and applicable Canadian securities laws) (“forward-looking statements”) that relate to future events or our future financial performance. These statements can be identified by expressions of belief, expectation or intention, as well as those statements that are not historical fact. These statements often contain words such as “should,” “could,” “expect,” “may,” “anticipate,” “forecast,” “believe,” “intend,” “estimates,” “plans” and similar expressions. These statements are based on certain factors and assumptions as set forth in this Quarterly Report, including with respect to: foreign exchange rates, expected synergies, expected growth, results of operations, performance, business prospects and opportunities, and effective tax rates. While the company considers these factors and assumptions to be reasonable based on information currently available, they may prove to be incorrect. Forward-looking statements are subject to risks and uncertainties that are difficult to predict. The results or events set forth in forward-looking statements may differ materially from actual results or events. Several factors could cause actual results or events to differ materially from those expressed in forward-looking statements, including, but not limited to, the following: a number of matters relating to the Merger including the failure to realize the anticipated benefits of the Merger and to successfully integrate PotashCorp and Agrium, certain costs that we may incur as a result of the Merger, the ability to retain personnel as a result of the Merger and the effect of the Merger on our business and operations generally; risks related to diversion of management time from ongoing business operations due to the Merger; the risk that our credit ratings may be downgraded or there may be adverse conditions in the credit markets; any significant impairment of the carrying amount of certain of our assets; variations from our assumptions with respect to foreign exchange rates, expected growth, results of operations, performance, business prospects and opportunities, and effective tax rates; fluctuations in supply and demand in the fertilizer, sulfur and petrochemical markets; changes in competitive pressures, including pricing pressures; risks and uncertainties related to any operating and workforce changes made in response to our industry and the markets we serve, including mine and
inventory shutdowns; adverse or uncertain economic conditions and changes in credit and financial markets; economic and political uncertainty around the world; changes in capital markets; the results of sales contract negotiations; unexpected or adverse weather conditions; changes in currency and exchange rates; risks related to reputational loss; the occurrence of a major safety incident; inadequate insurance coverage for a significant liability; inability to obtain relevant permits for our operations; catastrophic events or malicious acts, including terrorism; certain complications that may arise in our mining process, including water inflows; risks and uncertainties related to our international operations and assets; our ownership ofnon-controlling equity interests in other companies; our prospects to reinvest capital in strategic opportunities and acquisitions; risks associated with natural gas and other hedging activities; security risks related to our information technology systems; imprecision in reserve estimates; costs and availability of transportation and distribution for our raw materials and products, including railcars and ocean freight; changes in, and the effects of, government policies and regulations; earnings and the decisions of taxing authorities which could affect our effective tax rates; increases in the price or reduced availability of the raw materials that we use; our ability to attract, develop, engage and retain skilled employees; strikes or other forms of work stoppage or slowdowns; rates of return on, and the risks associated with, our investments and capital expenditures; timing and impact of capital expenditures; the impact of further innovation; adverse developments in new and pending legal proceedings or government investigations; and violations of our governance and compliance policies. These risks and uncertainties and additional risks and uncertainties can be found in Schedule B of the BAR and in our filings with the SEC and the Canadian provincial securities commissions. The purpose of our expected diluted earnings per share, consolidated EBITDA and EBITDA by segment guidance range is to assist readers in understanding our expected and targeted financial results, and this information may not be appropriate for other purposes. Forward-looking statements in or incorporated into this report are given only as at the date of this report or the document incorporated into this report and the company disclaims any obligation to update or revise any forward-looking statements, whether as a result of new information, future events or otherwise, except as required by law.
| 32 | Nutrien 2018 First Quarter Interim Report |
APPENDIX
Non-IFRS Financial Measures
Nutrien uses EBITDA (anon-IFRS financial measure) as a supplemental measure. EBITDA is frequently used by investors and analysts for valuation purposes when multiplied by a factor to estimate the enterprise value of a company. EBITDA is also used in determining annual incentive compensation for certain management employees and in calculating certain of our debt covenants. EBITDA is calculated as net earnings (loss) from continuing operations before finance costs, income taxes and depreciation and amortization.
Generally, this measure is a numerical measure of a company’s performance, financial position or cash flows that either excludes or includes amounts that are not normally excluded or included in the most directly comparable measure calculated and presented in accordance with IFRS. EBITDA is not a measure of financial performance (nor does it have a standardized meaning) under IFRS. In evaluating this measure, investors should consider that the methodology applied in calculating such measures may differ among companies and analysts.
Nutrien also usesnon-IFRS combined historical information in the evaluation of its operations and financial position. This information is useful as it provides a measure of what the combined results may have been had PotashCorp and Agrium merged on January 1, 2017. The combined historical results for Nutrien were calculated by adding the historical IFRS financial statements prepared by PotashCorp and Agrium and then eliminating intercompany transactions and reclassifying line items to conform with Nutrien’s financial statement presentation. This combined historical information does not include, among other things, estimated cost synergies, adjustments related to restructuring or integration activities, adjustments related to the PPA and the impact of discontinued operations.
The combined historical information may differ from the Nutrien pro forma earnings and balance sheet presented in the BAR as the pro forma information therein required certain adjustments under applicable securities laws and accounting standards that the company believes do not provide as useful a measure as the combined historical financial information. The primary differences in the statement of earnings were the pro forma finance costs were reduced by the amortization of the change in carrying amount of Agrium’s debt resulting from the PPA and the pro forma other expenses were adjusted to remove any Merger related costs. There were no comparable adjustments in the combined historical financial information. The primary differences in the balance sheet were the pro forma adjusted for the estimated proceeds from the sale of SQM, APC, ICL and Agrium’s Conda Idaho phosphate production facility and adjacent phosphate mineral rights at December 31, 2017 while there was no adjustment in the combined historical financial information and the PPA in the pro forma was largely allocated to goodwill as fewer provisional fair value adjustments were known at the time of its preparation.
The company uses both IFRS and certainnon-IFRS measures to assess performance. Management believes thenon-IFRS measures provide useful supplemental information to investors in order that they may evaluate Nutrien’s financial performance using the same measures as management. Management believes that, as a result, the investor is afforded greater transparency in assessing the financial performance of the company. Thesenon-IFRS financial measures should not be considered as a substitute for, nor superior to, measures of financial performance prepared in accordance with IFRS.
Nutrien EBITDA for the Three Months Ended March 31, 2018
| Retail | Potash | Nitrogen | Phosphate and Sulfate | Others and eliminations | Nutrien | |||||||||||||||||||
Net (loss) earnings from continuing operations before finance costs and income taxes | $ | (133 | ) | $ | 237 | $ | 132 | $ | 23 | $ | (183 | ) | $ | 76 | ||||||||||
Depreciation and amortization | 123 | 91 | 129 | 51 | 17 | 411 | ||||||||||||||||||
EBITDA | $ | (10 | ) | $ | 328 | $ | 261 | $ | 74 | $ | (166 | ) | $ | 487 | ||||||||||
| Nutrien 2018 First Quarter Interim Report | 33 |
Nutrien Combined Historical Balance Sheet as at December 31, 2017
| Historical PotashCorp | Historical Agrium | Adjustments 1 | Nutrien | |||||||||||||
Assets | ||||||||||||||||
Current assets | ||||||||||||||||
Cash and cash equivalents | $ | 116 | $ | 466 | $ | – | $ | 582 | ||||||||
Receivables | 489 | 2,406 | 18 | 2 | 2,913 | |||||||||||
Income tax receivables | – | 18 | (18 | ) 2 | – | |||||||||||
Inventories | 788 | 3,321 | – | 4,109 | ||||||||||||
Prepaid expenses and other current assets | 72 | 1,004 | 120 | 3 | 1,196 | |||||||||||
Other current assets | – | 120 | (120 | ) 3 | – | |||||||||||
| 1,465 | 7,335 | – | 8,800 | |||||||||||||
Assets held for sale | 1,858 | 105 | – | 1,963 | ||||||||||||
| 3,323 | 7,440 | – | 10,763 | |||||||||||||
Non-current assets | ||||||||||||||||
Property, plant and equipment | 12,971 | 7,091 | – | 20,062 | ||||||||||||
Goodwill | – | 2,228 | 97 | 4 | 2,325 | |||||||||||
Other intangible assets | 166 | 518 | (97 | ) 4 | 587 | |||||||||||
Investments | 30 | 522 | 262 | 5 | 814 | |||||||||||
Available for sale investments | 262 | – | (262 | ) 5 | – | |||||||||||
Deferred income tax assets | – | 85 | (85 | ) 6 | – | |||||||||||
Other assets | 246 | 58 | 85 | 6 | 389 | |||||||||||
Total Assets | $ | 16,998 | $ | 17,942 | $ | – | $ | 34,940 | ||||||||
| 1 | The following balances do not reflect the issuance of new shares or the PPA resulting from the Merger. |
| 2 | Reclassified Agrium income tax receivables as part of receivables. |
| 3 | Reclassified Agrium other current assets as part of prepaid expenses and other current assets. |
| 4 | Reclassified PotashCorp goodwill from intangibles to a separate line item. |
| 5 | Combined investments in equity-accounted investees and available for sale. |
| 6 | Reclassified Agrium deferred income tax assets as part of other assets. |
| 7 | Reclassified PotashCorp current portion of long-term debt as a separate line item. |
| 8 | Reclassified Agrium income taxes payable as part of payables and accrued charges. |
| 9 | Reclassified PotashCorp current portion of derivative instrument liabilities as part of payables and accrued charges. |
| 10 | Reclassified Agrium current portion of other provisions as part of payables and accrued charges. |
| 11 | Reclassified PotashCorp derivative instrument liabilities as part of othernon-current liabilities. |
| 12 | Reclassified Agriumnon-controlling interests as part of othernon-current liabilities. |
| Historical PotashCorp | Historical Agrium | Adjustments 1 | Nutrien | |||||||||||||
Liabilities | ||||||||||||||||
Current liabilities | ||||||||||||||||
Short-term debt | $ | 730 | $ | 867 | $ | – | 7 | $ | 1,597 | |||||||
Payables and accrued charges | 807 | 5,206 | 119 | 8,9,10 | 6,132 | |||||||||||
Income taxes payable | – | 27 | (27 | ) 8 | – | |||||||||||
Current portion of long-term debt | – | 11 | – | 7 | 11 | |||||||||||
Current portion of derivative instrument liabilities | 29 | – | (29 | ) 9 | – | |||||||||||
Current portion of other provisions | – | 63 | (63 | ) 10 | – | |||||||||||
Deferred income tax liabilities on assets held for sale | 36 | – | – | 36 | ||||||||||||
| 1,602 | 6,174 | – | 7,776 | |||||||||||||
Non-current liabilities | ||||||||||||||||
Long-term debt | 3,711 | 4,397 | – | 8,108 | ||||||||||||
Deferred income tax liabilities | 2,205 | 473 | – | 2,678 | ||||||||||||
Pension and other post-retirement benefit liabilities | 440 | 142 | – | 582 | ||||||||||||
Asset retirement obligations and accrued environmental costs | 651 | 522 | – | 1,173 | ||||||||||||
Derivative instrument liabilities | 35 | – | (35 | ) 11 | – | |||||||||||
Othernon-current liabilities | 51 | 106 | 42 | 11,12 | 199 | |||||||||||
Total Liabilities | 8,695 | 11,814 | 7 | 20,516 | ||||||||||||
Shareholders’ Equity | ||||||||||||||||
Share capital | 1,806 | 1,776 | – | 3,582 | ||||||||||||
Contributed surplus | 230 | – | – | 230 | ||||||||||||
Accumulated other comprehensive income (loss) | 25 | (1,116 | ) | – | (1,091 | ) | ||||||||||
Retained earnings | 6,242 | 5,461 | – | 11,703 | ||||||||||||
| 8,303 | 6,121 | – | 14,424 | |||||||||||||
Non-controlling interests | – | 7 | (7 | ) 12 | – | |||||||||||
Total Shareholders’ Equity | 8,303 | 6,128 | (7 | ) | 14,424 | |||||||||||
Total Liabilities and Shareholders’ Equity | $ | 16,998 | $ | 17,942 | $ | – | $ | 34,940 | ||||||||
| 34 | Nutrien 2018 First Quarter Interim Report |
Nutrien Combined Historical Statement of Earnings and EBITDA for the Three Months Ended March 31, 2017
| Retail | Potash | Nitrogen | Phosphate and Sulfate | Others | Eliminations | Nutrien | |||||||||||||||||||||
Sales | $ | 2,240 | $ | 561 | $ | 785 | $ | 383 | $ | – | $ | (232 | ) | $ | 3,737 | |||||||||||||
Freight, transportation and distribution | – | (92 | ) | (79 | ) | (44 | ) | – | – | (215 | ) | |||||||||||||||||
Cost of goods sold | (1,806 | ) | (269 | ) | (518 | ) | (305 | ) | – | 214 | (2,684 | ) | ||||||||||||||||
Gross margin | 434 | 200 | 188 | 34 | – | (18 | ) | 838 | ||||||||||||||||||||
Selling expenses | (448 | ) | (3 | ) | (9 | ) | (3 | ) | 3 | – | (460 | ) | ||||||||||||||||
General and administrative expenses | (25 | ) | (1 | ) | (2 | ) | (3 | ) | (73 | ) | – | (104 | ) | |||||||||||||||
Provincial mining and other taxes | – | (36 | ) | – | – | – | – | (36 | ) | |||||||||||||||||||
Earnings of equity-accounted investees | 6 | – | 17 | – | 1 | – | 24 | |||||||||||||||||||||
Other income (expenses) | 1 | (4 | ) | (12 | ) | (3 | ) | (22 | ) | – | (40 | ) | ||||||||||||||||
(Loss) earnings before finance costs and income taxes | (32 | ) | 156 | 182 | 25 | (91 | ) | (18 | ) | 222 | ||||||||||||||||||
Finance costs | – | – | – | – | (118 | ) | – | (118 | ) | |||||||||||||||||||
(Loss) earnings before income taxes | (32 | ) | 156 | 182 | 25 | (209 | ) | (18 | ) | 104 | ||||||||||||||||||
Income tax recovery | – | – | – | – | (7 | ) | – | (7 | ) | |||||||||||||||||||
Net (loss) earnings from continuing operations | $ | (32 | ) | $ | 156 | $ | 182 | $ | 25 | $ | (216 | ) | $ | (18 | ) | $ | 97 | |||||||||||
Finance costs | – | – | – | – | 118 | – | 118 | |||||||||||||||||||||
Income tax recovery | – | – | – | – | 7 | – | 7 | |||||||||||||||||||||
Depreciation and amortization | 71 | 84 | 68 | 63 | 13 | – | 299 | |||||||||||||||||||||
EBITDA | $ | 39 | $ | 240 | $ | 250 | $ | 88 | $ | (78 | ) | $ | (18 | ) | $ | 521 | ||||||||||||
| EBITDA Reconciliation to historical | Nutrien | |||||||||||||||||||||||||||
PotashCorp | $ | 393 | ||||||||||||||||||||||||||
Agrium | 196 | |||||||||||||||||||||||||||
Combined EBITDA | 589 | |||||||||||||||||||||||||||
Adjustments: | ||||||||||||||||||||||||||||
Remove APC and SQM | (38 | ) | ||||||||||||||||||||||||||
Remove ICL | (8 | ) | ||||||||||||||||||||||||||
Remove Conda | (11 | ) | ||||||||||||||||||||||||||
Retail finance costs from operations | (11 | ) | ||||||||||||||||||||||||||
Other | ||||||||||||||||||||||||||||
Nutrien EBITDA | $ | 521 | ||||||||||||||||||||||||||
Nutrien Combined Historical Summary Cash Flow Information for the Three Months Ended March 31, 2017
| Historical PotashCorp | Historical Agrium | Nutrien | |||||||||
Cash provided by operating activities | 223 | 178 | 401 | |||||||||
Cash used in investing activities | (132 | ) | (187 | ) | (319 | ) | ||||||
Cash used in financing activities | (61 | ) | (160 | ) | (221 | ) | ||||||
Effect of exchange rate changes on cash and cash equivalents | – | 19 | 19 | |||||||||
| Nutrien 2018 First Quarter Interim Report | 35 |
Nutrien Combined Historical Retail Segment EBITDA For The Three Months Ended March 31, 2017
| Historical PotashCorp | Historical Agrium | Adjustments | Nutrien | |||||||||||||
Sales | ||||||||||||||||
External | $ | – | $ | 2,227 | $ | – | $ | 2,227 | ||||||||
Intersegment | – | 13 | – | 13 | ||||||||||||
Total Sales | – | 2,240 | – | 2,240 | ||||||||||||
Cost of goods sold | – | (1,806 | ) | – | (1,806 | ) | ||||||||||
Gross margin | – | 434 | – | 434 | ||||||||||||
Selling expenses | – | (448 | ) | – | (448 | ) | ||||||||||
General and administrative expenses | – | (25 | ) | – | (25 | ) | ||||||||||
Earnings of equity-accounted investees | – | 6 | – | 6 | ||||||||||||
Other income (expenses) | – | 12 | (11 | ) 1 | 1 | |||||||||||
Loss before finance costs and income taxes | – | (21 | ) | (11 | ) | (32 | ) | |||||||||
Depreciation and amortization | – | 71 | – | 71 | ||||||||||||
EBITDA | $ | – | $ | 50 | $ | (11 | ) | $ | 39 | |||||||
| 1 | Finance costs associated with retail operations will be allocated to retail segment, and presented in other income (expenses). |
Nutrien Combined Historical Potash Segment EBITDA For The Three Months Ended March 31, 2017
| Historical PotashCorp | Historical Agrium | Adjustments | Nutrien | |||||||||||||
Sales | ||||||||||||||||
External | $ | 429 | $ | 90 | $ | – | $ | 519 | ||||||||
Intersegment | – | 42 | – | 42 | ||||||||||||
Total Sales | 429 | 132 | – | 561 | ||||||||||||
Freight, transportation and distribution | (64 | ) | – | (28 | ) 1 | (92 | ) | |||||||||
Cost of goods sold | (205 | ) | (97 | ) | 33 | 1,4 | (269 | ) | ||||||||
Gross margin | 160 | 35 | 5 | 200 | ||||||||||||
Selling expenses | – | (1 | ) | (2 | ) 4 | (3 | ) | |||||||||
General and administrative expenses | – | (1 | ) | – | 3,4 | (1 | ) | |||||||||
Provincial mining and other taxes | (34 | ) | – | (2 | ) 2,4 | (36 | ) | |||||||||
Other expenses | – | (2 | ) | (2 | ) 2,4 | (4 | ) | |||||||||
Earnings before finance costs and income taxes | 126 | 31 | (1 | ) | 156 | |||||||||||
Depreciation and amortization | 55 | 29 | – | 84 | ||||||||||||
EBITDA | $ | 181 | $ | 60 | $ | (1 | ) | $ | 240 | |||||||
| 1 | To separately present legacy Agrium direct and indirect freight costs. |
| 2 | To separately present legacy Agrium provincial mining taxes. |
| 3 | To reclassify legacy Agrium costs related to business support functions to others. |
| 4 | To allocate legacy PotashCorp all others segment selling and administrative expenses to segment. |
Nutrien Combined Historical Nitrogen Segment EBITDA for the Three Months Ended March 31, 2017
| Historical PotashCorp | Historical Agrium | Adjustments | Nutrien | ||||||||||||
Sales | ||||||||||||||||
External | $ | 375 | $ | 182 | $ | 117 | 2 | $ | 674 | |||||||
Intersegment | 22 | 58 | 31 | 2, 4 | 111 | |||||||||||
Total Sales | 397 | 240 | 148 | 785 | ||||||||||||
Freight, transportation and distribution | (32 | ) | – | (47 | ) 1 | (79 | ) | |||||||||
Cost of goods sold | (257 | ) | (163 | ) | (87 | ) 1, 2, 4 | (507 | ) | ||||||||
Cost of intersegment purchases | (11 | ) | – | – | (11 | ) | ||||||||||
Gross margin | 97 | 77 | 14 | 188 | ||||||||||||
Selling expenses | – | (3 | ) | (6 | ) 2, 5 | (9 | ) | |||||||||
General and administrative expenses | – | (2 | ) | – | 2, 3, 5 | (2 | ) | |||||||||
Earnings of equity-accounted investees | – | – | 17 | 2, 5 | 17 | |||||||||||
Other expenses | – | (9 | ) | (3 | ) 2, 5 | (12 | ) | |||||||||
Earnings before finance costs and income taxes | 97 | 63 | 22 | 182 | ||||||||||||
Depreciation and amortization | 50 | 16 | 2 | 2, 4 | 68 | |||||||||||
EBITDA | $ | 147 | $ | 79 | $ | 24 | $ | 250 | ||||||||
| 1 | To separately present legacy Agrium direct and indirect freight costs. |
| 2 | To reclassify legacy wholesale other Agrium segment between nitrogen and phosphate and sulfate. |
| 3 | To reclassify legacy Agrium costs related to business support functions to others. |
| 4 | To record profit on legacy Agrium transfers of ammonia to phosphate and sulfate segment not previously recorded. |
| 5 | To allocate legacy PotashCorp all others segment selling and administrative expenses to segment. |
| 36 | Nutrien 2018 First Quarter Interim Report |
Nutrien Combined Historical Phosphate and Sulfate Segment EBITDA for the Three Months Ended March 31, 2017
| Historical PotashCorp | Historical Agrium | Adjustments | Nutrien | ||||||||||||
Sales | ||||||||||||||||
External | $ | 308 | $ | 90 | $ | (62 | ) 2, 3, 6 | $ | 336 | |||||||
Intersegment | – | 44 | 3 | 2, 3 | 47 | |||||||||||
Total Sales | 308 | 134 | (59 | ) | 383 | |||||||||||
Freight, transportation and distribution | (37 | ) | – | (7 | ) 1, 3, 6 | (44 | ) | |||||||||
Cost of goods sold | (249 | ) | (127 | ) | 82 | 1, 2, 3, 4, 6 | (294 | ) | ||||||||
Cost of intersegment purchases | (11 | ) | – | – | (11 | ) | ||||||||||
Gross margin | 11 | 7 | 16 | 34 | ||||||||||||
Selling expenses | – | (1 | ) | (2 | ) 5 | (3 | ) | |||||||||
General and administrative expenses | – | (1 | ) | (2 | ) 2, 5 | (3 | ) | |||||||||
Other expenses | – | (2 | ) | (1 | ) 3, 5 | (3 | ) | |||||||||
Earnings before finance costs and income taxes | 11 | 3 | 11 | 25 | ||||||||||||
Depreciation and amortization | 58 | 16 | (11 | ) 2, 3, 4 | 63 | |||||||||||
EBITDA | $ | 69 | $ | 19 | $ | – | $ | 88 | ||||||||
| 1 | To separately present legacy Agrium direct and indirect freight costs. |
| 2 | To reclassify legacy wholesale other Agrium segment between nitrogen and phosphate and sulfate. |
| 3 | To remove the operating results of Conda from legacy Agrium historical financial statements. |
| 4 | To record incremental cost on legacy Agrium transfers of ammonia to phosphate and sulfate segment not previously recorded. |
| 5 | To allocate legacy PotashCorp all others segment selling and administrative expenses to segment. |
| 6 | To reclassify certain products to others segment. |
Nutrien Combined Historical Others Segment and Eliminations EBITDA for the Three Months Ended March 31, 2017
| Historical PotashCorp | Historical Agrium | Adjustments | Nutrien | ||||||||||||
Sales | ||||||||||||||||
External | $ | – | $ | – | $ | – | $ | – | ||||||||
Intersegment | – | (195 | ) | (37 | ) 1, 2, 9, 11 | (232 | ) | |||||||||
Total Sales | – | (195 | ) | (37 | ) | (232 | ) | |||||||||
Cost of goods sold | – | 177 | 37 | 1, 2, 9, 11 | 214 | |||||||||||
Gross margin | – | (18 | ) | – | (18 | ) | ||||||||||
Selling and administrative expenses | (50 | ) | – | 50 | 10 | – | ||||||||||
Selling expenses | – | 4 | (1 | ) 10 | 3 | |||||||||||
General and administrative expenses | – | (29 | ) | (44 | ) 4, 5, 10 | (73 | ) | |||||||||
Share-based payments | – | (3 | ) | 3 | 4 | – | ||||||||||
Earnings of equity-accounted investees | 39 | 1 | (39 | ) 7, 10 | 1 | |||||||||||
Dividend income | 8 | – | (8 | ) 8 | – | |||||||||||
Other expenses | (10 | ) | (8 | ) | (4 | ) 10, 12 | (22 | ) | ||||||||
Loss before finance costs and income taxes | (13 | ) | (53 | ) | (43 | ) | (109 | ) | ||||||||
Finance costs | (59 | ) | (23 | ) | (36 | ) 3, 6 | (118 | ) | ||||||||
Finance costs related to long-term debt | – | (47 | ) | 47 | 6 | – | ||||||||||
Loss before taxes | (72 | ) | (123 | ) | (32 | ) | (227 | ) | ||||||||
Income tax (recovery) expense | (13 | ) | 3 | 3 | 7 | (7 | ) | |||||||||
Net loss from continuing operations | (85 | ) | (120 | ) | (29 | ) | (234 | ) | ||||||||
Finance costs | 59 | 23 | 36 | 3, 6 | 118 | |||||||||||
Finance costs related to long-term debt | – | 47 | (47 | ) 6 | – | |||||||||||
Income taxes | 13 | (3 | ) | (3 | ) 7 | 7 | ||||||||||
Depreciation and amortization | 9 | 4 | – | 13 | ||||||||||||
EBITDA | $ | (4 | ) | $ | (49 | ) | $ | (43 | ) | $ | (96 | ) | ||||
| 1 | To eliminate sales made from PotashCorp to Agrium. |
| 2 | To eliminate incremental sales and cost of goods sold related to ammonia transfers to phosphate segment. |
| 3 | Finance costs associated with retail operations will be allocated to retail segment, and presented in other (expenses) income. |
| 4 | To reclassify legacy Agrium’s share-based payments to general and administrative expenses. |
| 5 | To reclassify legacy Agrium costs related to business support functions to others. |
| 6 | To reclassify finance costs related to long-term debt to finance costs. |
| 7 | To eliminate the earnings of legacy PotashCorp’s investments in SQM and APC. |
| 8 | To eliminate the earnings of legacy PotashCorp’s investment in ICL. |
| 9 | To eliminate legacy PotashCorp intersegment sales between nitrogen and phosphate and sulfate. |
| 10 | To allocate legacy PotashCorp corporate selling and administrative expenses to segments. |
| 11 | To remove intersegment sales related to Conda. |
| 12 | To reclassify certain phosphate products to others segment. |
| Nutrien 2018 First Quarter Interim Report | 37 |
Nutrien Combined Historical Statement of Other Comprehensive Income for the Three Months Ended March 31, 2017
| Historical PotashCorp | Historical Agrium1 | Nutrien | |||||||||
Items that will not be reclassified to net earnings | ||||||||||||
Net actuarial loss on defined benefit plans | $ | – | $ | (2 | ) | $ | (2 | ) | ||||
Financial instruments measured at fair value through other comprehensive income | ||||||||||||
Net fair value gain during the period | 33 | – | 33 | |||||||||
Items that may be subsequently reclassified to net earnings | ||||||||||||
Cash flow hedges | ||||||||||||
Cash flow hedges | (5 | ) | (18 | ) | (23 | ) | ||||||
Reclassification of earnings to net loss | 8 | – | 8 | |||||||||
Foreign currency translation | ||||||||||||
Gains on translation of net foreign operations | – | 65 | 65 | |||||||||
Reclassification to earnings | – | 5 | 5 | |||||||||
Associates and joint ventures | ||||||||||||
Share of other comprehensive loss | – | (21 | ) | (21 | ) | |||||||
Other | 3 | – | 3 | |||||||||
Other comprehensive income | $ | 39 | $ | 29 | $ | 68 | ||||||
| 1 | Where applicable, amounts were aggregated with their deferred tax effects to conform to Nutrien’s method of presentation. |
| 38 | Nutrien 2018 First Quarter Interim Report |
Nutrien Combined Historical Statement of Earnings and EBITDA for the Three Months Ended June 30, 2017
| Retail | Potash | Nitrogen | Phosphate and Sulfate | Others | Eliminations | Nutrien | |||||||||||||||||||||
Sales | $ | 5,707 | $ | 611 | $ | 934 | $ | 361 | $ | – | $ | (265 | ) | $ | 7,348 | |||||||||||||
Freight, transportation and distribution | – | (76 | ) | (114 | ) | (44 | ) | – | – | (234 | ) | |||||||||||||||||
Cost of goods sold | (4,408 | ) | (273 | ) | (624 | ) | (315 | ) | – | 297 | (5,323 | ) | ||||||||||||||||
Gross margin | 1,299 | 262 | 196 | 2 | – | 32 | 1,791 | |||||||||||||||||||||
Selling expenses | (574 | ) | (4 | ) | (7 | ) | (2 | ) | 5 | – | (582 | ) | ||||||||||||||||
General and administrative expenses | (28 | ) | (1 | ) | (3 | ) | (3 | ) | (63 | ) | – | (98 | ) | |||||||||||||||
Provincial mining and other taxes | – | (46 | ) | – | – | – | – | (46 | ) | |||||||||||||||||||
Earnings of equity-accounted investees | 4 | – | 5 | – | (1 | ) | – | 8 | ||||||||||||||||||||
Dividend income | – | – | – | – | (1 | ) | – | (1 | ) | |||||||||||||||||||
Other expenses | (12 | ) | (7 | ) | (7 | ) | (2 | ) | (49 | ) | – | (77 | ) | |||||||||||||||
Earnings (loss) before finance costs and income taxes | 689 | 204 | 184 | (5 | ) | (109 | ) | 32 | 995 | |||||||||||||||||||
Finance costs | – | – | – | – | (126 | ) | – | (126 | ) | |||||||||||||||||||
Earnings (loss) before income taxes | 689 | 204 | 184 | (5 | ) | (235 | ) | 32 | 869 | |||||||||||||||||||
Income taxes | – | – | – | – | (164 | ) | – | (164 | ) | |||||||||||||||||||
Net earnings (loss) from continuing operations | $ | 689 | $ | 204 | $ | 184 | $ | (5 | ) | $ | (399 | ) | $ | 32 | $ | 705 | ||||||||||||
Finance costs | – | – | – | – | 126 | – | 126 | |||||||||||||||||||||
Income taxes | – | – | – | – | 164 | – | 164 | |||||||||||||||||||||
Depreciation and amortization | 71 | 88 | 76 | 62 | 14 | – | 311 | |||||||||||||||||||||
EBITDA | $ | 760 | $ | 292 | $ | 260 | $ | 57 | $ | (95 | ) | $ | 32 | $ | 1,306 | |||||||||||||
| EBITDA Reconciliation to historical | Nutrien | |||||||||||||||||||||||||||
PotashCorp | $ | 368 | ||||||||||||||||||||||||||
Agrium | 1,012 | |||||||||||||||||||||||||||
Combined EBITDA | 1,380 | |||||||||||||||||||||||||||
Adjustments: | ||||||||||||||||||||||||||||
Remove APC and SQM | (46 | ) | ||||||||||||||||||||||||||
Remove ICL | (5 | ) | ||||||||||||||||||||||||||
Remove Conda | (12 | ) | ||||||||||||||||||||||||||
Retail finance costs from operations | (11 | ) | ||||||||||||||||||||||||||
Nutrien EBITDA | $ | 1,306 | ||||||||||||||||||||||||||
| Nutrien 2018 First Quarter Interim Report | 39 |
Nutrien Combined Historical Retail Segment EBITDA for the Three Months Ended June 30, 2017
| Historical PotashCorp | Historical Agrium | Adjustments | Nutrien | ||||||||||||
Sales | ||||||||||||||||
External | $ | – | $ | 5,694 | $ | – | $ | 5,694 | ||||||||
Intersegment | – | 13 | – | 13 | ||||||||||||
Total Sales | – | 5,707 | – | 5,707 | ||||||||||||
Cost of goods sold | – | (4,408 | ) | – | (4,408 | ) | ||||||||||
Gross margin | – | 1,299 | – | 1,299 | ||||||||||||
Selling expenses | – | (574 | ) | – | (574 | ) | ||||||||||
General and administrative expenses | – | (28 | ) | – | (28 | ) | ||||||||||
Earnings of equity-accounted investees | – | 4 | – | 4 | ||||||||||||
Other expenses | – | (1 | ) | (11 | ) 1 | (12 | ) | |||||||||
Earnings before finance costs and income taxes | – | 700 | (11 | ) | 689 | |||||||||||
Depreciation and amortization | – | 71 | – | 71 | ||||||||||||
EBITDA | $ | – | $ | 771 | $ | (11 | ) | $ | 760 | |||||||
| 1 | Finance costs associated with retail operations will be allocated to retail segment, and presented in other expenses. |
Nutrien Combined Historical Potash Segment EBITDA For The Three Months Ended June 30, 2017
| Historical PotashCorp | Historical Agrium | Adjustments | Nutrien | ||||||||||||
Sales | ||||||||||||||||
External | $ | 461 | $ | 116 | $ | – | $ | 577 | ||||||||
Intersegment | – | 34 | – | 34 | ||||||||||||
Total Sales | 461 | 150 | – | 611 | ||||||||||||
Freight, transportation and distribution | (50 | ) | – | (26 | ) 1 | (76 | ) | |||||||||
Cost of goods sold | (198 | ) | (106 | ) | 31 | 1, 4 | (273 | ) | ||||||||
Gross margin | 213 | 44 | 5 | 262 | ||||||||||||
Selling expenses | – | (2 | ) | (2 | ) 4 | (4 | ) | |||||||||
General and administrative expenses | – | (1 | ) | – | 3, 4 | (1 | ) | |||||||||
Provincial mining and other taxes | (44 | ) | – | (2 | ) 2, 4 | (46 | ) | |||||||||
Other expenses | – | (5 | ) | (2 | ) 2, 4 | (7 | ) | |||||||||
Earnings before finance costs and income taxes | 169 | 36 | (1 | ) | 204 | |||||||||||
Depreciation and amortization | 56 | 32 | – | 88 | ||||||||||||
EBITDA | $ | 225 | $ | 68 | $ | (1 | ) | $ | 292 | |||||||
| 1 | To separately present legacy Agrium direct and indirect freight costs. |
| 2 | To separately present legacy Agrium provincial mining taxes. |
| 3 | To reclassify legacy Agrium costs related to business support functions to others. |
| 4 | To allocate legacy PotashCorp all others segment selling and administrative expenses to segment. |
Nutrien Combined Historical Nitrogen Segment EBITDA for the Three Months Ended June 30, 2017
| Historical PotashCorp | Historical Agrium | Adjustments | Nutrien | ||||||||||||
Sales | ||||||||||||||||
External | $ | 384 | $ | 277 | $ | 118 | 2 | $ | 779 | |||||||
Intersegment | 17 | 91 | 47 | 2, 4 | 155 | |||||||||||
Total Sales | 401 | 368 | 165 | 934 | ||||||||||||
Freight, transportation and distribution | (32 | ) | – | (82 | ) 1 | (114 | ) | |||||||||
Cost of goods sold | (292 | ) | (255 | ) | (68 | ) 1, 2, 4 | (615 | ) | ||||||||
Cost of intersegment purchases | (9 | ) | – | – | (9 | ) | ||||||||||
Gross margin | 68 | 113 | 15 | 196 | ||||||||||||
Selling expenses | – | (3 | ) | (4 | ) 5 | (7 | ) | |||||||||
General and administrative expenses | – | (3 | ) | – | 2, 3, 5 | (3 | ) | |||||||||
Share of earnings of equity-accounted investees | – | – | 5 | 2, 5 | 5 | |||||||||||
Other expenses | – | (6 | ) | (1 | ) 2, 5 | (7 | ) | |||||||||
Earnings before finance costs and income taxes | 68 | 101 | 15 | 184 | ||||||||||||
Depreciation and amortization | 47 | 26 | 3 | 2, 4 | 76 | |||||||||||
EBITDA | $ | 115 | $ | 127 | $ | 18 | $ | 260 | ||||||||
| 1 | To separately present legacy Agrium direct and indirect freight costs. |
| 2 | To reclassify legacy wholesale other Agrium segment between nitrogen and phosphate and sulfate. |
| 3 | To reclassify legacy Agrium costs related to business support functions to others. |
| 4 | To record profit on legacy Agrium transfers of ammonia to phosphate and sulfate segment not previously recorded. |
| 5 | To allocate legacy PotashCorp all others segment selling and administrative expenses to segment. |
| 40 | Nutrien 2018 First Quarter Interim Report |
Nutrien Combined Historical Phosphate and Sulfate Segment EBITDA for the Three Months Ended June 30, 2017
| Historical PotashCorp | Historical Agrium | Adjustments | Nutrien | ||||||||||||
Sales | ||||||||||||||||
External | $ | 275 | $ | 86 | $ | (43 | ) 2, 3, 6 | $ | 318 | |||||||
Intersegment | – | 51 | (8 | ) 2, 3 | 43 | |||||||||||
Total Sales | 275 | 137 | (51 | ) | 361 | |||||||||||
Freight, transportation and distribution | (34 | ) | – | (10 | ) 1, 3, 6 | (44 | ) | |||||||||
Cost of goods sold | (259 | ) | (129 | ) | 81 | 1, 2, 3, 4, 6 | (307 | ) | ||||||||
Cost of intersegment purchases | (8 | ) | – | – | (8 | ) | ||||||||||
Gross margin | (26 | ) | 8 | 20 | 2 | |||||||||||
Selling expenses | – | (1 | ) | (1 | ) 3, 5 | (2 | ) | |||||||||
General and administrative expenses | – | (1 | ) | (2 | ) 2, 5 | (3 | ) | |||||||||
Other expenses | – | (2 | ) | – | 2, 5 | (2 | ) | |||||||||
(Loss) earnings before finance costs and income taxes | (26 | ) | 4 | 17 | (5 | ) | ||||||||||
Depreciation and amortization | 56 | 17 | (11 | ) 2, 3, 4 | 62 | |||||||||||
EBITDA | $ | 30 | $ | 21 | $ | 6 | $ | 57 | ||||||||
| 1 | To separately present legacy Agrium direct and indirect freight costs. |
| 2 | To reclassify legacy wholesale other Agrium segment between nitrogen and phosphate and sulfate. |
| 3 | To remove the operating results of Conda from legacy Agrium historical financial statements. |
| 4 | To record incremental cost on legacy Agrium transfers of ammonia to phosphate and sulfate segment not previously recorded. |
| 5 | To allocate legacy PotashCorp all others segment selling and administrative expenses to segment. |
| 6 | To reclassify certain phosphate products to others segment. |
Nutrien Combined Historical Others Segment and Eliminations EBITDA for the Three Months Ended June 30, 2017
| Historical PotashCorp | Historical Agrium | Adjustments | Nutrien | ||||||||||||
Sales | ||||||||||||||||
External | $ | – | $ | – | $ | – | $ | – | ||||||||
Intersegment | – | (236 | ) | (29 | ) 1, 2, 9, 11 | (265 | ) | |||||||||
Total Sales | – | (236 | ) | (29 | ) | (265 | ) | |||||||||
Cost of goods sold | – | 268 | 29 | 1, 2, 9, 11 | 297 | |||||||||||
Gross margin | – | 32 | – | 32 | ||||||||||||
Selling and administrative expenses | (48 | ) | – | 48 | 10 | – | ||||||||||
Selling expenses | – | 5 | – | 5 | ||||||||||||
General and administrative expenses | – | (26 | ) | (37 | ) 4, 5, 10 | (63 | ) | |||||||||
Share-based payments | – | 3 | (3 | ) 4 | – | |||||||||||
Earnings of equity-accounted investees | 49 | (2 | ) | (48 | ) 7, 10 | (1 | ) | |||||||||
Dividend income | 4 | – | (5 | ) 8 | (1 | ) | ||||||||||
Other expenses | (16 | ) | (31 | ) | (2 | )10,12 | (49 | ) | ||||||||
Loss before finance costs and income taxes | (11 | ) | (19 | ) | (47 | ) | (77 | ) | ||||||||
Finance costs | (61 | ) | (24 | ) | (41 | ) 3, 6 | (126 | ) | ||||||||
Finance costs related to long-term debt | – | (52 | ) | 52 | 6 | – | ||||||||||
Loss before taxes | (72 | ) | (95 | ) | (36 | ) | (203 | ) | ||||||||
Income tax expense (recovery) | 62 | (222 | ) | (4 | ) 7, 11 | (164 | ) | |||||||||
Net loss from continuing operations | (10 | ) | (317 | ) | (40 | ) | (367 | ) | ||||||||
Finance costs | 61 | 24 | 41 | 3, 6 | 126 | |||||||||||
Finance costs related to long-term debt | – | 52 | (52 | ) 6 | – | |||||||||||
Income taxes | (62 | ) | 222 | 4 | 7, 11 | 164 | ||||||||||
Depreciation and amortization | 9 | 5 | – | 14 | ||||||||||||
EBITDA | $ | (2 | ) | $ | (14 | ) | $ | (47 | ) | $ | (63 | ) | ||||
| 1 | To eliminate sales made from PotashCorp to Agrium. |
| 2 | To eliminate incremental sales and cost of goods sold related to ammonia transfers to phosphate segment. |
| 3 | Finance costs associated with retail operations will be allocated to retail segment, and presented in other expenses. |
| 4 | To reclassify legacy Agrium’s share-based payments to general and administrative expenses. |
| 5 | To reclassify legacy Agrium costs related to business support functions to others. |
| 6 | To reclassify finance costs related to long-term debt to finance costs. |
| 7 | To eliminate the earnings of legacy PotashCorp’s investments in SQM and APC. |
| 8 | To eliminate the earnings of legacy PotashCorp’s investment in ICL. |
| 9 | To eliminate legacy PotashCorp intersegment sales between nitrogen and phosphate and sulfate. |
| 10 | To allocate legacy PotashCorp all others segment selling and administrative expenses to segments. |
| 11 | To remove intersegment sales related to Conda. |
| 12 | To reclassify certain phosphate products to others segment. |
| Nutrien 2018 First Quarter Interim Report | 41 |
Nutrien Combined Historical Statement of Earnings and EBITDA for the Three Months Ended September 30, 2017
| Retail | Potash | Nitrogen | Phosphate and Sulfate | Others | Eliminations | Nutrien | |||||||||||||||||||||
Sales | $ | 2,067 | $ | 696 | $ | 566 | $ | 416 | $ | – | $ | (159 | ) | $ | 3,586 | |||||||||||||
Freight, transportation and distribution | – | (106 | ) | (70 | ) | (60 | ) | – | – | (236 | ) | |||||||||||||||||
Cost of goods sold | (1,549 | ) | (323 | ) | (441 | ) | (396 | ) | – | 152 | (2,557 | ) | ||||||||||||||||
Gross margin | 518 | 267 | 55 | (40 | ) | – | (7 | ) | 793 | |||||||||||||||||||
Selling expenses | (468 | ) | (3 | ) | (8 | ) | (1 | ) | 3 | – | (477 | ) | ||||||||||||||||
General and administrative expenses | (21 | ) | (1 | ) | (3 | ) | (2 | ) | (118 | ) | – | (145 | ) | |||||||||||||||
Provincial mining and other taxes | – | (48 | ) | – | – | – | – | (48 | ) | |||||||||||||||||||
Earnings of equity-accounted investees | (2 | ) | – | 8 | – | – | – | 6 | ||||||||||||||||||||
Dividend income | – | – | – | – | 1 | – | 1 | |||||||||||||||||||||
Other income (expenses) | 5 | (5 | ) | (5 | ) | (2 | ) | (49 | ) | – | (56 | ) | ||||||||||||||||
Earnings (loss) before finance costs and income taxes | 32 | 210 | 47 | (45 | ) | (163 | ) | (7 | ) | 74 | ||||||||||||||||||
Finance costs | – | – | – | – | (135 | ) | (135 | ) | ||||||||||||||||||||
Earnings (loss) before income taxes | 32 | 210 | 47 | (45 | ) | (298 | ) | (7 | ) | (61 | ) | |||||||||||||||||
Income taxes | – | – | – | – | 8 | 8 | ||||||||||||||||||||||
Net earnings (loss) from continuing operations | $ | 32 | $ | 210 | $ | 47 | $ | (45 | ) | $ | (290 | ) | $ | (7 | ) | $ | (53 | ) | ||||||||||
Finance costs | – | – | – | – | 135 | – | 135 | |||||||||||||||||||||
Income taxes | – | – | – | – | (8 | ) | – | (8 | ) | |||||||||||||||||||
Depreciation and amortization | 73 | 93 | 66 | 56 | 13 | – | 301 | |||||||||||||||||||||
EBITDA | $ | 105 | $ | 303 | $ | 113 | $ | 11 | $ | (150 | ) | $ | (7 | ) | $ | 375 | ||||||||||||
| EBITDA Reconciliation to historical | Nutrien | |||||||||||||||||||||||||||
PotashCorp | $ | 315 | ||||||||||||||||||||||||||
Agrium | 100 | |||||||||||||||||||||||||||
Combined EBITDA | 415 | |||||||||||||||||||||||||||
Adjustments: | ||||||||||||||||||||||||||||
Remove APC and SQM | (31 | ) | ||||||||||||||||||||||||||
Remove ICL | (4 | ) | ||||||||||||||||||||||||||
Retail finance costs from operations | (5 | ) | ||||||||||||||||||||||||||
Nutrien EBITDA | $ | 375 | ||||||||||||||||||||||||||
| 42 | Nutrien 2018 First Quarter Interim Report |
Nutrien Combined Historical Retail Segment EBITDA For The Three Months Ended September 30, 2017
| Historical PotashCorp | Historical Agrium | Adjustments | Nutrien | ||||||||||||
Sales | ||||||||||||||||
External | $ | – | $ | 2,059 | $ | – | $ | 2,059 | ||||||||
Intersegment | – | 8 | – | 8 | ||||||||||||
Total Sales | – | 2,067 | – | 2,067 | ||||||||||||
Cost of goods sold | – | (1,549 | ) | – | (1,549 | ) | ||||||||||
Gross margin | – | 518 | – | 518 | ||||||||||||
Selling expenses | – | (468 | ) | – | (468 | ) | ||||||||||
General and administrative expenses | – | (21 | ) | – | (21 | ) | ||||||||||
Earnings of equity-accounted investees | – | (2 | ) | – | (2 | ) | ||||||||||
Other income | – | 10 | (5 | ) 1 | 5 | |||||||||||
Earnings before finance costs and income taxes | – | 37 | (5 | ) | 32 | |||||||||||
Depreciation and amortization | – | 73 | – | 73 | ||||||||||||
EBITDA | $ | – | $ | 110 | $ | (5 | ) | $ | 105 | |||||||
| 1 | Finance costs associated with retail operations will be allocated to retail segment, and presented in other income. |
Nutrien Combined Historical Potash Segment EBITDA For The Three Months Ended September 30, 2017
| Historical PotashCorp | Historical Agrium | Adjustments | Nutrien | ||||||||||||
Sales | ||||||||||||||||
External | $ | 595 | $ | 79 | $ | 1 | 4 | $ | 675 | |||||||
Intersegment | – | 21 | – | 21 | ||||||||||||
Total Sales | 595 | 100 | 1 | 696 | ||||||||||||
Freight, transportation and distribution | (85 | ) | – | (21 | ) 1 | (106 | ) | |||||||||
Cost of goods sold | (256 | ) | (90 | ) | 23 | 1, 4,5 | (323 | ) | ||||||||
Gross margin | 254 | 10 | 3 | 267 | ||||||||||||
Selling expenses | – | (1 | ) | (2 | ) 5 | (3 | ) | |||||||||
General and administrative expenses | – | (1 | ) | – | 3, 5 | (1 | ) | |||||||||
Provincial mining and other taxes | (47 | ) | – | (1 | ) 2, 5 | (48 | ) | |||||||||
Other expenses | – | (3 | ) | (2 | ) 2, 5 | (5 | ) | |||||||||
Earnings before finance costs and income taxes | 207 | 5 | (2 | ) | 210 | |||||||||||
Depreciation and amortization | 72 | 21 | – | 93 | ||||||||||||
EBITDA | $ | 279 | $ | 26 | $ | (2 | ) | $ | 303 | |||||||
| 1 | To separately present legacy Agrium direct and indirect freight costs. |
| 2 | To separately present legacy Agrium provincial mining taxes. |
| 3 | To reclassify legacy Agrium costs related to business support functions to others. |
| 4 | To reclassify legacy Agrium potash purchased for resale to potash segment. |
| 5 | To allocate legacy PotashCorp all others segment selling and administrative expenses to segment. |
Nutrien Combined Historical Nitrogen Segment EBITDA for the Three Months Ended September 30, 2017
| Historical PotashCorp | Historical Agrium | Adjustments | Nutrien | ||||||||||||
Sales | ||||||||||||||||
External | $ | 288 | $ | 140 | $ | 65 | 2 | $ | 493 | |||||||
Intersegment | 15 | 41 | 17 | 2, 4 | 73 | |||||||||||
Total Sales | 303 | 181 | 82 | 566 | ||||||||||||
Freight, transportation and distribution | (33 | ) | – | (37 | ) 1 | (70 | ) | |||||||||
Cost of goods sold | (240 | ) | (153 | ) | (39 | ) 1, 2, 4 | (432 | ) | ||||||||
Cost of intersegment purchases | (9 | ) | – | – | (9 | ) | ||||||||||
Gross margin | 21 | 28 | 6 | 55 | ||||||||||||
Selling expenses | – | (3 | ) | (5 | ) 2, 5 | (8 | ) | |||||||||
General and administrative expenses | – | (3 | ) | – | 2, 3, 5 | (3 | ) | |||||||||
Share of earnings of equity-accounted investees | – | – | 8 | 2, 5 | 8 | |||||||||||
Other expenses | – | (3 | ) | (2 | ) 5 | (5 | ) | |||||||||
Earnings before finance costs and income taxes | 21 | 19 | 7 | 47 | ||||||||||||
Depreciation and amortization | 47 | 17 | 2 | 2, 4 | 66 | |||||||||||
EBITDA | $ | 68 | $ | 36 | $ | 9 | $ | 113 | ||||||||
| 1 | To separately present legacy Agrium direct and indirect freight costs. |
| 2 | To reclassify legacy “wholesale other” Agrium segment between nitrogen and phosphate and sulfate. |
| 3 | To reclassify legacy Agrium costs related to business support functions to others. |
| 4 | To record profit on legacy Agrium transfers of ammonia to phosphate segment not previously recorded. |
| 5 | To allocate legacy PotashCorp all others segment selling and administrative expenses to segment. |
| Nutrien 2018 First Quarter Interim Report | 43 |
Nutrien Combined Historical Phosphate and Sulfate Segment EBITDA for the Three Months Ended September 30, 2017
| Historical PotashCorp | Historical Agrium | Adjustments | Nutrien | ||||||||||||
Sales | ||||||||||||||||
External | $ | 351 | $ | 25 | $ | (9 | ) 2, 6 | $ | 367 | |||||||
Intersegment | 35 | 14 | 2 | 49 | ||||||||||||
Total Sales | 351 | 60 | 5 | 416 | ||||||||||||
Freight, transportation and distribution | (54 | ) | – | (6 | ) 1, 6 | (60 | ) | |||||||||
Cost of goods sold | (336 | ) | (64 | ) | 10 | 1, 2, 3, 6 | (390 | ) | ||||||||
Cost of intersegment purchases | (6 | ) | – | – | (6 | ) | ||||||||||
Gross margin | (45 | ) | (4 | ) | 9 | (40 | ) | |||||||||
Selling expenses | – | – | (1 | ) 5 | (1 | ) | ||||||||||
General and administrative expenses | – | – | (2 | ) 2, 5 | (2 | ) | ||||||||||
Other expenses | – | – | (2 | ) 2, 5 | (2 | ) | ||||||||||
(Loss) earnings before finance costs and income taxes | (45 | ) | (4 | ) | 4 | (45 | ) | |||||||||
Depreciation and amortization | 52 | 3 | 1 | 2, 3 | 56 | |||||||||||
EBITDA | $ | 7 | $ | (1 | ) | $ | 5 | $ | 11 | |||||||
| 1 | To separately present legacy Agrium direct and indirect freight costs. |
| 2 | To reclassify legacy wholesale other Agrium segment between nitrogen and phosphate and sulfate. |
| 3 | To record incremental cost on legacy Agrium transfers of ammonia to phosphate and sulfate segment not previously recorded. |
| 4 | Conda is included in discontinued operations for Q3 and Q4, no adjustment is required. |
| 5 | To allocate legacy PotashCorp all others segment selling and administrative expenses to segment. |
| 6 | To reclassify certain products to others segment. |
Nutrien Combined Historical Others Segment and Eliminations EBITDA for the Three Months Ended September 30, 2017
| Historical PotashCorp | Historical Agrium | Adjustments | Nutrien | ||||||||||||
Sales | ||||||||||||||||
External | $ | – | $ | – | $ | – | $ | – | ||||||||
Intersegment | (128 | ) | (31 | ) 1, 2, 9, 11 | (159 | ) | ||||||||||
Total Sales | – | (128 | ) | (31 | ) | (159 | ) | |||||||||
Cost of goods sold | – | 121 | 31 | 1, 2, 9, 11 | 152 | |||||||||||
Gross margin | – | (7 | ) | – | (7 | ) | ||||||||||
Selling and administrative expenses | (56 | ) | – | 56 | 10 | – | ||||||||||
Selling expenses | – | 4 | (1 | ) 10 | 3 | |||||||||||
General and administrative expenses | – | (29 | ) | (89 | ) 4, 5, 10 | (118 | ) | |||||||||
Share-based payments | – | (40 | ) | 40 | 4 | – | ||||||||||
Earnings of equity-accounted investees | 33 | – | (33 | ) 7, 10 | – | |||||||||||
Dividend income | 5 | – | (4 | ) 8 | 1 | |||||||||||
Other expenses | (30 | ) | (19 | ) | – | 10, 12 | (49 | ) | ||||||||
Loss before finance costs and income taxes | (48 | ) | (91 | ) | (31 | ) | (170 | ) | ||||||||
Finance costs | (60 | ) | (24 | ) | (51 | ) 3, 6 | (135 | ) | ||||||||
Finance costs related to long-term debt | – | (56 | ) | 56 | 6 | – | ||||||||||
Loss before taxes | (108 | ) | (171 | ) | (26 | ) | (305 | ) | ||||||||
Income tax expense (recovery) | (22 | ) | 32 | (2 | ) 7 | 8 | ||||||||||
Net loss from continuing operations | (130 | ) | (139 | ) | (28 | ) | (297 | ) | ||||||||
Finance costs | 60 | 24 | 51 | 3, 6 | 135 | |||||||||||
Finance costs related to long-term debt | – | 56 | (56 | ) 6 | – | |||||||||||
Income taxes | 22 | (32 | ) | 2 | 7 | (8 | ) | |||||||||
Depreciation and amortization | 9 | 4 | – | 13 | ||||||||||||
EBITDA | $ | (39 | ) | $ | (87 | ) | $ | (31 | ) | $ | (157 | ) | ||||
| 1 | To eliminate sales made from PotashCorp to Agrium. |
| 2 | To eliminate incremental sales and cost of goods sold related to ammonia transfers to phosphate and sulfate business unit. |
| 3 | Finance costs associated with retail operations will be allocated to retail business unit, and presented in other expenses. |
| 4 | To reclassify legacy Agrium’s share-based payments to general and administrative expenses. |
| 5 | To reclassify legacy Agrium costs related to business support functions to others. |
| 6 | To reclassify finance costs related to long-term debt to finance costs. |
| 7 | To eliminate the earnings of legacy PotashCorp’s investments in SQM and APC. |
| 8 | To eliminate the earnings of legacy PotashCorp’s investment in ICL. |
| 9 | To eliminate legacy PotashCorp intersegment sales between nitrogen and phosphate and sulfate. |
| 10 | To allocate legacy PotashCorp all others segment selling and administrative expenses to business units. |
| 11 | To remove intersegment sales related to Conda. |
| 12 | To reclassify certain phosphate products to others segment. |
| 44 | Nutrien 2018 First Quarter Interim Report |
Nutrien Combined Historical Statement of Earnings and EBITDA for the Three Months Ended December 31, 2017
| Retail | Potash | Nitrogen | Phosphate and Sulfate | Others | Eliminations | Nutrien | ||||||||||||||||||||||
Sales | $ | 2,089 | $ | 523 | $ | 701 | $ | 401 | $ | – | $ | (216 | ) | $ | 3,498 | |||||||||||||
Freight, transportation and distribution | – | (60 | ) | (84 | ) | (56 | ) | – | – | (200 | ) | |||||||||||||||||
Cost of goods sold | (1,394 | ) | (259 | ) | (501 | ) | (633 | ) | – | 218 | (2,569 | ) | ||||||||||||||||
Gross margin | 695 | 204 | 116 | (288 | ) | – | 2 | 729 | ||||||||||||||||||||
Selling expenses | (517 | ) | (2 | ) | (7 | ) | (2 | ) | 4 | – | (524 | ) | ||||||||||||||||
General and administrative expenses | (26 | ) | (2 | ) | (5 | ) | – | (123 | ) | – | (156 | ) | ||||||||||||||||
Provincial mining and other taxes | – | (29 | ) | – | – | – | – | (29 | ) | |||||||||||||||||||
Earnings of equity-accounted investees | 1 | 1 | 5 | – | 1 | – | 8 | |||||||||||||||||||||
Other income (expenses) | 14 | (4 | ) | (1 | ) | – | (137 | ) | – | (128 | ) | |||||||||||||||||
Earnings (loss) before finance costs and income taxes | 167 | 168 | 108 | (290 | ) | (255 | ) | 2 | (100 | ) | ||||||||||||||||||
Finance costs | – | – | – | – | (136 | ) | – | (136 | ) | |||||||||||||||||||
Earnings (loss) before income taxes | 167 | 168 | 108 | (290 | ) | (391 | ) | 2 | (236 | ) | ||||||||||||||||||
Income taxes | – | – | – | – | 143 | – | 143 | |||||||||||||||||||||
Net earnings (loss) from continuing operations | $ | 167 | $ | 168 | $ | 108 | $ | (290 | ) | $ | (248 | ) | $ | 2 | $ | (93 | ) | |||||||||||
Finance costs | – | – | – | – | 136 | – | 136 | |||||||||||||||||||||
Income taxes | – | – | – | – | (143 | ) | – | (143 | ) | |||||||||||||||||||
Depreciation and amortization | 74 | 80 | 81 | 59 | 16 | – | 310 | |||||||||||||||||||||
EBITDA | $ | 241 | $ | 248 | $ | 189 | $ | (231 | ) | $ | (239 | ) | $ | 2 | $ | 210 | ||||||||||||
| EBITDA Reconciliation to historical | Nutrien | |||||||||||||||||||||||||||
PotashCorp | $ | (43 | ) | |||||||||||||||||||||||||
Agrium | 260 | |||||||||||||||||||||||||||
Combined EBITDA | 217 | |||||||||||||||||||||||||||
Adjustments: | ||||||||||||||||||||||||||||
Retail finance costs from operations | (7 | ) | ||||||||||||||||||||||||||
Nutrien EBITDA | $ | 210 | ||||||||||||||||||||||||||
| Nutrien 2018 First Quarter Interim Report | 45 |
Nutrien Combined Historical Retail Segment EBITDA for the Three Months Ended December 31, 2017
| Historical PotashCorp | Historical Agrium | Adjustments | Nutrien | |||||||||||||
Sales | ||||||||||||||||
External | $ | – | $ | 2,076 | $ | – | $ | 2,076 | ||||||||
Intersegment | – | 13 | – | 13 | ||||||||||||
Total Sales | – | 2,089 | – | 2,089 | ||||||||||||
Cost of goods sold | – | (1,394 | ) | – | (1,394 | ) | ||||||||||
Gross margin | – | 695 | – | 695 | ||||||||||||
Selling expenses | – | (517 | ) | – | (517 | ) | ||||||||||
General and administrative expenses | – | (26 | ) | – | (26 | ) | ||||||||||
Earnings of equity-accounted investees | – | 1 | – | 1 | ||||||||||||
Other income | – | 21 | (7 | ) 1 | 14 | |||||||||||
Earnings before finance costs and income taxes | – | 174 | (7 | ) | 167 | |||||||||||
Depreciation and amortization | – | 74 | – | 74 | ||||||||||||
EBITDA | $ | – | $ | 248 | $ | (7 | ) | $ | 241 | |||||||
| 1 | Finance costs associated with retail operations will be allocated to retail segment, and presented in other income. |
Nutrien Combined Historical Potash Segment EBITDA for the Three Months Ended December 31, 2017
| Historical PotashCorp | Historical Agrium | Adjustments | Nutrien | |||||||||||||
Sales | ||||||||||||||||
External | $ | 383 | $ | 101 | $ | 3 | 4 | $ | 487 | |||||||
Intersegment | – | 36 | – | 36 | ||||||||||||
Total Sales | 383 | 137 | 3 | 523 | ||||||||||||
Freight, transportation and distribution | (36 | ) | – | (24 | ) 1 | (60 | ) | |||||||||
Cost of goods sold | (189 | ) | (97 | ) | 27 | 1, 4, 5 | (259 | ) | ||||||||
Gross margin | 158 | 40 | 6 | 204 | ||||||||||||
Selling expenses | – | (1 | ) | (1 | ) 5 | (2 | ) | |||||||||
General and administrative expenses | – | (3 | ) | 1 | 3, 5 | (2 | ) | |||||||||
Provincial mining and other taxes | (26 | ) | – | (3 | ) 2, 5 | (29 | ) | |||||||||
Earnings of equity-accounted investees | – | – | 1 | 5 | 1 | |||||||||||
Other expenses | – | (3 | ) | (1 | ) 2, 5 | (4 | ) | |||||||||
Earnings before finance costs and income taxes | 132 | 33 | 3 | 168 | ||||||||||||
Depreciation and amortization | 49 | 31 | – | 80 | ||||||||||||
EBITDA | $ | 181 | $ | 64 | $ | 3 | $ | 248 | ||||||||
| 1 | To separately present legacy Agrium direct and indirect freight costs. |
| 2 | To separately present legacy Agrium provincial mining taxes. |
| 3 | To reclassify legacy Agrium costs related to business support functions to others. |
| 4 | To reclassify legacy Agrium potash purchased for resale to potash segment. |
| 5 | To allocate legacy PotashCorp all others segment selling and administrative expenses to segment. |
Nutrien Combined Historical Nitrogen Segment EBITDA for the Three Months Ended December 31, 2017
| Historical PotashCorp | Historical Agrium | Adjustments | Nutrien | |||||||||||||
Sales | ||||||||||||||||
External | $ | 348 | $ | 156 | $ | 87 | 2 | $ | 591 | |||||||
Intersegment | 20 | 64 | 26 | 2, 4 | 110 | |||||||||||
Total Sales | 368 | 220 | 113 | 701 | ||||||||||||
Freight, transportation and distribution | (32 | ) | – | (52 | ) 1 | (84 | ) | |||||||||
Cost of goods sold | (257 | ) | (186 | ) | (49 | ) 1, 2, 4 | (492 | ) | ||||||||
Cost of intersegment purchases | (9 | ) | – | – | (9 | ) | ||||||||||
Gross margin | 70 | 34 | 12 | 116 | ||||||||||||
Selling expenses | – | (3 | ) | (4 | ) 2, 5 | (7 | ) | |||||||||
General and administrative expenses | – | (5 | ) | – | 2, 3, 5 | (5 | ) | |||||||||
Share of earnings of equity-accounted investees | – | – | 5 | 2 | 5 | |||||||||||
Other expenses | – | – | (1 | ) 5 | (1 | ) | ||||||||||
Earnings before finance costs and income taxes | 70 | 26 | 12 | 108 | ||||||||||||
Depreciation and amortization | 59 | 20 | 2 | 2, 4 | 81 | |||||||||||
EBITDA | $ | 129 | $ | 46 | $ | 14 | $ | 189 | ||||||||
| 1 | To separately present legacy Agrium direct and indirect freight costs. |
| 2 | To reclassify legacy wholesale other Agrium segment between nitrogen and phosphate and sulfate. |
| 3 | To reclassify legacy Agrium costs related to business support functions to others. |
| 4 | To record profit on legacy Agrium transfers of ammonia to phosphate and sulfate segment not previously recorded. |
| 5 | To allocate legacy PotashCorp all others segment selling and administrative expenses to segment. |
| 46 | Nutrien 2018 First Quarter Interim Report |
Nutrien Combined Historical Phosphate and Sulfate Segment EBITDA for the Three Months Ended December 31, 2017
| Historical PotashCorp | Historical Agrium | Adjustments | Nutrien | |||||||||||||
Sales | ||||||||||||||||
External | $ | 350 | $ | 19 | $ | (9 | ) 2, 6 | $ | 360 | |||||||
Intersegment | – | 28 | 13 | 2 | 41 | |||||||||||
Total Sales | 350 | 47 | 4 | 401 | ||||||||||||
Freight, transportation and distribution | (48 | ) | – | (8 | ) 1, 6 | (56 | ) | |||||||||
Cost of goods sold | (597 | ) | (49 | ) | 24 | 1, 2, 3, 6 | (622 | ) | ||||||||
Cost of intersegment purchases | (11 | ) | – | – | (11 | ) | ||||||||||
Gross margin | (306 | ) | (2 | ) | 20 | (288 | ) | |||||||||
Selling expenses | – | (1 | ) | (1 | ) 5 | (2 | ) | |||||||||
General and administrative expenses | – | 1 | (1 | ) 5 | – | |||||||||||
Other income | – | 1 | (1 | ) 5 | – | |||||||||||
(Loss) earnings before finance costs and income taxes | (306 | ) | (1 | ) | 17 | (290 | ) | |||||||||
Depreciation and amortization | 54 | 5 | – | 2, 3 | 59 | |||||||||||
EBITDA | $ | (252 | ) | $ | 4 | $ | 17 | $ | (231 | ) | ||||||
| 1 | To separately present legacy Agrium direct and indirect freight costs. |
| 2 | To reclassify legacy wholesale other Agrium segment between nitrogen and phosphate. |
| 3 | To record incremental cost on legacy Agrium transfers of ammonia to phosphate and sulfate segment not previously recorded. |
| 4 | Conda is included in discontinued operations in Q3 and Q4, therefore no adjustment is required. |
| 5 | To allocate legacy PotashCorp all others segment selling and administrative expenses to segment. |
| 6 | To reclassify certain products to others segment. |
Nutrien Combined Historical Others Segment and Eliminations EBITDA for the Three Months Ended December 31, 2017
| Historical PotashCorp | Historical Agrium | Adjustments | Nutrien | ||||||||||||
Sales | ||||||||||||||||
External | $ | – | $ | – | $ | – | $ | – | ||||||||
Intersegment | (173 | ) | (43 | ) 1, 2, 9, 11 | (216 | ) | ||||||||||
Total Sales | – | (173 | ) | (43 | ) | (216 | ) | |||||||||
Cost of goods sold | – | 175 | 43 | 1, 2, 9, 11 | 218 | |||||||||||
Gross margin | – | 2 | – | 2 | ||||||||||||
Selling and administrative expenses | (60 | ) | – | 60 | 10 | – | ||||||||||
Selling expenses | – | 4 | – | 10 | 4 | |||||||||||
General and administrative expenses | – | (37 | ) | (86 | ) 4, 5, 10 | (123 | ) | |||||||||
Share-based payments | – | (29 | ) | 29 | 4 | – | ||||||||||
Earnings of equity-accounted investees | – | 1 | – | 7, 10 | 1 | |||||||||||
Dividend income | – | – | – | 8 | – | |||||||||||
Other expenses | (51 | ) | (69 | ) | (17 | ) 10, 12 | (137 | ) | ||||||||
Loss before finance costs and income taxes | (111 | ) | (128 | ) | (14 | ) | (253 | ) | ||||||||
Finance costs | (58 | ) | (30 | ) | (48 | ) 3, 6 | (136 | ) | ||||||||
Finance costs related to long-term debt | – | (55 | ) | 55 | 6 | – | ||||||||||
Loss before taxes | (169 | ) | (213 | ) | (7 | ) | (389 | ) | ||||||||
Income tax expense (recovery) | 153 | (10 | ) | – | 7 | 143 | ||||||||||
Net loss from continuing operations | (16 | ) | (223 | ) | (7 | ) | (246 | ) | ||||||||
Finance costs | 58 | 30 | 48 | 3, 6 | 136 | |||||||||||
Finance costs related to long-term debt | – | 55 | (55 | ) 6 | – | |||||||||||
Income taxes | (153 | ) | 10 | – | 7 | (143 | ) | |||||||||
Depreciation and amortization | 10 | 6 | – | 16 | ||||||||||||
EBITDA | $ | (101 | ) | $ | (122 | ) | $ | (14 | ) | $ | (237 | ) | ||||
| 1 | To eliminate sales made from PotashCorp to Agrium. |
| 2 | To eliminate incremental sales and cost of goods sold related to ammonia transfers to phosphate and sulfate segment. |
| 3 | Finance costs associated with retail operations will be allocated to retail segment, and presented in other expenses. |
| 4 | To reclassify legacy Agrium’s share-based payments to general and administrative expenses. |
| 5 | To reclassify legacy Agrium costs related to business support functions to others. |
| 6 | To reclassify finance costs related to long-term debt to finance costs. |
| 7 | To eliminate the earnings of legacy PotashCorp’s investments in SQM and APC. |
| 8 | To eliminate the earnings of legacy PotashCorp’s investment in ICL. |
| 9 | To eliminate legacy PotashCorp intersegment sales between nitrogen and phosphate and sulfate. |
| 10 | To allocate legacy PotashCorp all others segment selling and administrative expenses to segments. |
| 11 | To remove intersegment sales related to Conda. |
| 12 | To reclassify certain phosphate products to others segment. |
| Nutrien 2018 First Quarter Interim Report | 47 |
Nutrien Combined Historical Statement of Earnings and EBITDA for the Year Ended December 31, 2017
| Retail | Potash | Nitrogen | Phosphate and Sulfate | Others | Eliminations | Nutrien | ||||||||||||||||||||||
Sales | $ | 12,103 | $ | 2,391 | $ | 2,986 | $ | 1,561 | $ | – | $ | (872 | ) | $ | 18,169 | |||||||||||||
Freight, transportation and distribution | – | (334 | ) | (347 | ) | (204 | ) | – | (885 | ) | ||||||||||||||||||
Cost of goods sold | (9,157 | ) | (1,124 | ) | (2,084 | ) | (1,649 | ) | – | 881 | (13,133 | ) | ||||||||||||||||
Gross margin | 2,946 | 933 | 555 | (292 | ) | – | 9 | 4,151 | ||||||||||||||||||||
Selling expenses | (2,007 | ) | (12 | ) | (31 | ) | (8 | ) | 15 | – | (2,043 | ) | ||||||||||||||||
General and administrative expenses | (100 | ) | (5 | ) | (13 | ) | (8 | ) | (377 | ) | – | (503 | ) | |||||||||||||||
Provincial mining and other taxes | – | (159 | ) | – | – | – | – | (159 | ) | |||||||||||||||||||
Earnings of equity-accounted investees | 9 | 1 | 35 | – | 1 | – | 46 | |||||||||||||||||||||
Other income (expenses) | 8 | (20 | ) | (25 | ) | (7 | ) | (257 | ) | – | (301 | ) | ||||||||||||||||
Earnings (loss) before finance costs and income taxes | 856 | 738 | 521 | (315 | ) | (618 | ) | 9 | 1,191 | |||||||||||||||||||
Finance costs | – | – | – | – | (515 | ) | – | (515 | ) | |||||||||||||||||||
Earnings (loss) before income taxes | 856 | 738 | 521 | (315 | ) | (1,133 | ) | 9 | 676 | |||||||||||||||||||
Income taxes | – | – | – | – | (20 | ) | – | (20 | ) | |||||||||||||||||||
Net earnings (loss) from continuing operations | $ | 856 | $ | 738 | $ | 521 | $ | (315 | ) | $ | (1,153 | ) | $ | 9 | $ | 656 | ||||||||||||
Finance costs | – | – | – | – | 515 | – | 515 | |||||||||||||||||||||
Income taxes | – | – | – | – | 20 | – | 20 | |||||||||||||||||||||
Depreciation and amortization | 289 | 345 | 291 | 240 | 56 | – | 1,221 | |||||||||||||||||||||
EBITDA | $ | 1,145 | $ | 1,083 | $ | 812 | $ | (75 | ) | $ | (562 | ) | $ | 9 | $ | 2,412 | ||||||||||||
| EBITDA Reconciliation to historical | Nutrien | |||||||||||||||||||||||||||
PotashCorp | $ | 901 | ||||||||||||||||||||||||||
Agrium | 1,546 | |||||||||||||||||||||||||||
Combined EBITDA | 2,447 | |||||||||||||||||||||||||||
Adjustments: | ||||||||||||||||||||||||||||
Allocate Retail finance costs | (35 | ) | ||||||||||||||||||||||||||
Nutrien EBITDA | $ | 2,412 | ||||||||||||||||||||||||||
| 48 | Nutrien 2018 First Quarter Interim Report |
Nutrien Combined Historical Retail Segment EBITDA for the Year Ended December 31, 2017
| Q1 | Q2 | Q3 | Q4 | Nutrien | ||||||||||||||||
Sales | ||||||||||||||||||||
External | $ | 2,227 | $ | 5,694 | $ | 2,059 | $ | 2,076 | $ | 12,056 | ||||||||||
Intersegment | 13 | 13 | 8 | 13 | 47 | |||||||||||||||
Total Sales | 2,240 | 5,707 | 2,067 | 2,089 | 12,103 | |||||||||||||||
Cost of goods sold | (1,806 | ) | (4,408 | ) | (1,549 | ) | (1,394 | ) | (9,157 | ) | ||||||||||
Gross margin | 434 | 1,299 | 518 | 695 | 2,946 | |||||||||||||||
Selling expenses | (448 | ) | (574 | ) | (468 | ) | (517 | ) | (2,007 | ) | ||||||||||
General and administrative expenses | (25 | ) | (28 | ) | (21 | ) | (26 | ) | (100 | ) | ||||||||||
Earnings of equity-accounted investees | 6 | 4 | (2 | ) | 1 | 9 | ||||||||||||||
Other income | 1 | (12 | ) | 5 | 14 | 8 | ||||||||||||||
Earnings before finance costs and income taxes | (32 | ) | 689 | 32 | 167 | 856 | ||||||||||||||
Depreciation and amortization | 71 | 71 | 73 | 74 | 289 | |||||||||||||||
EBITDA | $ | 39 | $ | 760 | $ | 105 | $ | 241 | $ | 1,145 | ||||||||||
Nutrien Combined Historical Potash Segment EBITDA for the Year Ended December 31, 2017
|
| |||||||||||||||||||
| Q1 | Q2 | Q3 | Q4 | Nutrien | ||||||||||||||||
Sales | ||||||||||||||||||||
External | $ | 519 | $ | 577 | $ | 675 | $ | 487 | $ | 2,258 | ||||||||||
Intersegment | 42 | 34 | 21 | 36 | 133 | |||||||||||||||
Total Sales | 561 | 611 | 696 | 523 | 2,391 | |||||||||||||||
Freight, transportation and distribution | (92 | ) | (76 | ) | (106 | ) | (60 | ) | (334 | ) | ||||||||||
Cost of goods sold | (269 | ) | (273 | ) | (323 | ) | (259 | ) | (1,124 | ) | ||||||||||
Gross margin | 200 | 262 | 267 | 204 | 933 | |||||||||||||||
Selling expenses | (3 | ) | (4 | ) | (3 | ) | (2 | ) | (12 | ) | ||||||||||
General and administrative expenses | (1 | ) | (1 | ) | (1 | ) | (2 | ) | (5 | ) | ||||||||||
Provincial mining and other taxes | (36 | ) | (46 | ) | (48 | ) | (29 | ) | (159 | ) | ||||||||||
Earnings of equity-accounted investees | – | – | – | 1 | 1 | |||||||||||||||
Other expenses | (4 | ) | (7 | ) | (5 | ) | (4 | ) | (20 | ) | ||||||||||
Earnings before finance costs and income taxes | 156 | 204 | 210 | 168 | 738 | |||||||||||||||
Depreciation and amortization | 84 | 88 | 93 | 80 | 345 | |||||||||||||||
EBITDA | $ | 240 | $ | 292 | $ | 303 | $ | 248 | $ | 1,083 | ||||||||||
Nutrien Combined Historical Nitrogen Segment EBITDA for the Year Ended December 31, 2017
| Q1 | Q2 | Q3 | Q4 | Nutrien | ||||||||||||||||
Sales | ||||||||||||||||||||
External | $ | 674 | $ | 779 | $ | 493 | $ | 591 | $ | 2,537 | ||||||||||
Intersegment | 111 | 155 | 73 | 110 | 449 | |||||||||||||||
Total Sales | 785 | 934 | 566 | 701 | 2,986 | |||||||||||||||
Freight, transportation and distribution | (79 | ) | (114 | ) | (70 | ) | (84 | ) | (347 | ) | ||||||||||
Cost of goods sold | (507 | ) | (615 | ) | (432 | ) | (492 | ) | (2,046 | ) | ||||||||||
Cost of intersegment purchases | (11 | ) | (9 | ) | (9 | ) | (9 | ) | (38 | ) | ||||||||||
Gross margin | 188 | 196 | 55 | 116 | 555 | |||||||||||||||
Selling expenses | (9 | ) | (7 | ) | (8 | ) | (7 | ) | (31 | ) | ||||||||||
General and administrative expenses | (2 | ) | (3 | ) | (3 | ) | (5 | ) | (13 | ) | ||||||||||
Share of earnings of equity-accounted investees | 17 | 5 | 8 | 5 | 35 | |||||||||||||||
Other expenses | (12 | ) | (7 | ) | (5 | ) | (1 | ) | (25 | ) | ||||||||||
Earnings before finance costs and income taxes | 182 | 184 | 47 | 108 | 521 | |||||||||||||||
Depreciation and amortization | 68 | 76 | 66 | 81 | 291 | |||||||||||||||
EBITDA | $ | 250 | $ | 260 | $ | 113 | $ | 189 | $ | 812 | ||||||||||
Nutrien Combined Historical Phosphate and Sulfate Segment EBITDA for the Year Ended December 31, 2017
| Q1 | Q2 | Q3 | Q4 | Nutrien | ||||||||||||||||
Sales | ||||||||||||||||||||
External | $ | 336 | $ | 318 | $ | 367 | $ | 360 | $ | 1,381 | ||||||||||
Intersegment | 47 | 43 | 49 | 41 | 180 | |||||||||||||||
Total Sales | 383 | 361 | 416 | 401 | 1,561 | |||||||||||||||
Freight, transportation and distribution | (44 | ) | (44 | ) | (60 | ) | (56 | ) | (204 | ) | ||||||||||
Cost of goods sold | (294 | ) | (307 | ) | (390 | ) | (622 | ) | (1,613 | ) | ||||||||||
Cost of intersegment purchases | (11 | ) | (8 | ) | (6 | ) | (11 | ) | (36 | ) | ||||||||||
Gross margin | 34 | 2 | (40 | ) | (288 | ) | (292 | ) | ||||||||||||
Selling expenses | (3 | ) | (2 | ) | (1 | ) | (2 | ) | (8 | ) | ||||||||||
General and administrative expenses | (3 | ) | (3 | ) | (2 | ) | – | (8 | ) | |||||||||||
Other income | (3 | ) | (2 | ) | (2 | ) | – | (7 | ) | |||||||||||
(Loss) earnings before finance costs and income taxes | 25 | (5 | ) | (45 | ) | (290 | ) | (315 | ) | |||||||||||
Depreciation and amortization | 63 | 62 | 56 | 59 | 240 | |||||||||||||||
EBITDA | $ | 88 | $ | 57 | $ | 11 | $ | (231 | ) | $ | (75 | ) | ||||||||
| Nutrien 2018 First Quarter Interim Report | 49 |
Nutrien Combined Historical Others Segment and Eliminations EBITDA for the Year Ended December 31, 2017
| Q1 | Q2 | Q3 | Q4 | Nutrien | ||||||||||||||||
Sales | ||||||||||||||||||||
External | $ | – | $ | – | $ | – | $ | – | $ | – | ||||||||||
Intersegment | (232 | ) | (265 | ) | (159 | ) | (216 | ) | (872 | ) | ||||||||||
Total Sales | (232 | ) | (265 | ) | (159 | ) | (216 | ) | (872 | ) | ||||||||||
Cost of goods sold | 214 | 297 | 152 | 218 | 881 | |||||||||||||||
Gross margin | (18 | ) | 32 | (7 | ) | 2 | 9 | |||||||||||||
Selling expenses | 3 | 5 | 3 | 4 | 15 | |||||||||||||||
General and administrative expenses | (73 | ) | (63 | ) | (118 | ) | (123 | ) | (377 | ) | ||||||||||
Earnings of equity-accounted investees | 1 | (1 | ) | – | 1 | 1 | ||||||||||||||
Dividend income | – | (1 | ) | 1 | – | – | ||||||||||||||
Other expenses | (22 | ) | (49 | ) | (49 | ) | (137 | ) | (257 | ) | ||||||||||
Loss before finance costs and income taxes | (109 | ) | (77 | ) | (170 | ) | (253 | ) | (609 | ) | ||||||||||
Finance costs | (118 | ) | (126 | ) | (135 | ) | (136 | ) | (515 | ) | ||||||||||
Loss before taxes | (227 | ) | (203 | ) | (305 | ) | (389 | ) | (1,124 | ) | ||||||||||
Income tax expense (recovery) | (7 | ) | (164 | ) | 8 | 143 | (20 | ) | ||||||||||||
Net loss from continuing operations | (234 | ) | (367 | ) | (297 | ) | (246 | ) | (1,144 | ) | ||||||||||
Finance costs | 118 | 126 | 135 | 136 | 515 | |||||||||||||||
Income taxes | 7 | 164 | (8 | ) | (143 | ) | 20 | |||||||||||||
Depreciation and amortization | 13 | 14 | 13 | 16 | 56 | |||||||||||||||
EBITDA | $ | (96 | ) | $ | (63 | ) | $ | (157 | ) | $ | (237 | ) | $ | (553 | ) | |||||
| 50 | Nutrien 2018 First Quarter Interim Report |
Terms
EBIT
Net (loss) earnings from continuing operations before finance costs, income tax (recovery) expense.
EBITDA
Net (loss) earnings from continuing operations before finance costs, income tax (recovery) expense and depreciation and amortization.
Free cash flow
Free cash flow is calculated as cash used in operating activities before sustaining capital expenditures and changes in non-cash operating working capital. Sustaining capital expenditures include the cost of replacements and betterments for the company’s facilities.
Merger
The merger of equals transaction between PotashCorp and Agrium completed effective January 1, 2018, pursuant to which PotashCorp and Agrium combined their businesses pursuant to a statutory plan of arrangement under the Canada Business Corporations Act and became wholly owned subsidiaries of Nutrien Ltd.
Net sales
Sales – freight, transportation and distribution.
| Nutrien 2018 First Quarter Interim Report | 51 |
Appendix
Abbreviated Company Names and Sources
| Name | Source | |
Agrium | Agrium Inc., Canada | |
APC | Arab Potash Company (Amman: ARPT), Jordan | |
Belaruskali | PA Belaruskali, Belarus | |
Canpotex | Canpotex Limited, Canada | |
CF Industries | CF Industries Holdings, Inc. (NYSE: CF), USA | |
CHS | CHS Inc. | |
CRU | CRU International Limited, UK | |
CVR | CVR Partners, L.P., USA | |
Fertecon | Fertecon Limited, UK | |
GROWMARK | GROWMARK, Inc. | |
Helena Chemical | Helena Agri-Enterprises, LLC | |
ICL | Israel Chemicals Ltd. (Tel Aviv: ICL), Israel | |
Innophos | Innophos Holdings, Inc. (NASDAQ: IPHS), USA | |
Intrepid | Intrepid Potash, Inc. (NYSE: IPI), USA | |
K+S | K+S Group (Xetra: SDF), Germany | |
Koch | Koch Industries, Inc., USA | |
LSB | LSB Industries, Inc. (NYSE:LXU), USA | |
Moody’s | Moody’s Corporation (NYSE: MCO), USA | |
MOPCO | Misr Fertilizers Production Company S.A.E. | |
| Name | Source | |
Mosaic | The Mosaic Company (NYSE: MOS), USA | |
Nutrien | Nutrien Ltd. (TSX and NYSE: NTR), Canada | |
NYMEX | New York Mercantile Exchange, USA | |
NYSE | New York Stock Exchange, USA | |
OCI | OCI N.V., (NYSE Euronext: OCI), The Netherlands | |
Pinnacle Agriculture Holdings | Pinnacle Agriculture Distribution, Inc. | |
PotashCorp | Potash Corporation of Saskatchewan Inc. | |
Profertil | Profertil S.A. | |
Simplot Grower Solutions | J.R. Simplot Company | |
Sinofert | Sinofert Holdings Limited (HKSE: 0297.HK), China | |
SQM | Sociedad Química y Minera de Chile S.A. (Santiago Bolsa de Comercio Exchange, NYSE: SQM), Chile | |
S&P | Standard & Poor’s Financial Services LLC, USA | |
TSX | Toronto Stock Exchange, Canada | |
USDA | United States Department of Agriculture | |
Uralkali | JSC Uralkali (LSE and RTS: URKA), Russia | |
Wilbur-Ellis | Wilbur-Ellis Holdings, Inc. | |
Yara | Yara International ASA (Oslo: YAR), Norway | |
| 52 | Nutrien 2018 First Quarter Interim Report |
Terms and Measures
| Scientific Terms | ||||
Nitrogen | NH3 | ammonia (anhydrous), 82.2% N | ||
| HNO3 | nitric acid, 22% N (liquid) | |||
| UAN | nitrogen solutions,28-32% N (liquid) | |||
Phosphate | MGA | merchant grade acid, 54% P2O5(liquid) | ||
| DAP | diammonium phosphate, 46% P2O5(solid) | |||
| MAP | monoammonium phosphate, 52% P2O5(solid) | |||
| SPA | superphosphoric acid, 70% P2 O5 (liquid) | |||
| Monocal | monocalcium phosphate, 48.1% P2 O5 (solid) | |||
| Dical | dicalcium phosphate, 42.4% P2O5(solid) | |||
| DFP | defluorinated phosphate, 41.2% P2O5(solid) | |||
| Purified Phosphoric Acid | food and technical grade acid 75% & 85% H3PO4 (liquid) | |||
| DFMGA | defluorinated MGA 54% P2O5 (liquid) | |||
| LOMAG | low magnesium super phosphoric Acid 70% P2O5 (liquid) | |||
| POLY11 | ammonium poly phosphate solution (11-37-0 liquid) | |||
| AS | ammonium sulfate (solid) | |||
Potash | KCI | potassium chloride,60-63.2% K2O (solid) | ||
Product Measures | ||||
K2O tonne | Measures the potassium content of products having different chemical analyses | |||
N tonne | Measures the nitrogen content of products having different chemical analyses | |||
P2O5tonne | Measures the phosphorus content of products having different chemical analyses | |||
Product tonne | Standard measure of the weights of all types of potash, nitrogen and phosphate products | |||
Currency Abbreviations | ||||
CDN | Canadian dollar | |||
USD | United States dollar | |||
Exchange Rates | ||||
| CDN per USD at March 31, 2018 – 1.2894 | ||||
| General Terms | ||
Canpotex | An export company owned by all Saskatchewan producers of potash (Nutrien and Mosaic) | |
Consumption vs demand | Product applied vs product purchased | |
Greenfield capacity | New operation built on undeveloped site | |
Latin America | South America, Central America, Caribbean and Mexico | |
MMBtu | Million British thermal units | |
MMT | Million metric tonnes | |
NAFTA | North American Free Trade Agreement | |
Nameplate capacity | Estimated theoretical capacity based on design specifications or Canpotex entitlements – does not necessarily represent operational capability | |
North America | The North American market includes Canada and the US | |
Offshore | Offshore markets include all markets except Canada and the US | |
Operational capability | Estimated annual achievable production level | |
| Nutrien 2018 First Quarter Interim Report | 53 |