Exhibit 99.1
Management’s Discussion and Analysis of Financial Condition and Results of Operations (In US Dollars)
The following management’s discussion and analysis (MD&A) is the responsibility of management and is as at August 1, 2018. The Board of Directors (Board) carries out its responsibility for review of this disclosure principally through its audit committee, comprised exclusively of independent directors. The audit committee reviews and, prior to its publication, approves this disclosure, pursuant to the authority delegated to it by the Board. The term “Nutrien” refers to Nutrien Ltd. and the terms “we,” “us,” “our,” “Nutrien” and “the company” refer to Nutrien and, as applicable, Nutrien and its direct and indirect subsidiaries as a group, including, for greater clarity, Potash Corporation of Saskatchewan Inc. (PotashCorp) and Agrium Inc. (Agrium). This MD&A is based on the company’s second quarter unaudited interim condensed consolidated financial statements (interim financial statements) which were based on International Financial Reporting Standards as issued by the International Accounting Standards Board (IFRS) and prepared in accordance with International Accounting Standard 34, “Interim Financial Reporting”, unless otherwise stated.
This MD&A contains certain financial measures that do not have a standard meaning under IFRS. See“Non-IFRS Financial Measures” on page 29. All references to per share amounts pertain to diluted net earnings per share. Financial data in this report are stated in US dollars unless otherwise noted.
Additional information relating to Nutrien (which, except as otherwise noted, is not incorporated by reference herein), including our first quarter 2018 unaudited interim report (first quarter interim report), Business Acquisition Report dated February 20, 2018 (BAR) and Annual Information Forms, consolidated financial statements and MD&A for each of PotashCorp and Agrium for the year ended December 31, 2017, can be found on SEDAR at www.sedar.com and on EDGAR at www.sec.gov. The company is a foreign private issuer under the rules and regulations of the US Securities and Exchange Commission (the SEC).
Nutrien and Our Operating Environment
We are a world-class integrated provider of crop nutrients and services, playing a critical role in helping growers increase food production in a sustainable manner. We directly supply growers through our leading global retail (R) network – including crop nutrients, crop protection products, seed, as well as agronomic and application services. We operate approximately 1,600 retail facilities across the US, Canada, Australia and South America, servicing over 500,000 growers. Nutrien is the world’s largest crop nutrient company by
capacity, producing the crop nutrients: potash (K), nitrogen (N) and phosphate (P). We produce and distribute over 26 million tonnes of crop nutrient products from our facilities in Canada, the US and Trinidad, and our Canadian potash operations represent nearlyone-quarter of global nameplate capacity. Detailed descriptions of our operating environments can be found on pages 1 and 2 in our first quarter interim report.
Strategy
Nutrien has significant competitive advantages across our global footprint of operations. We are focused on supplying the important crop inputs, services and solutions farmers require to meet the ever-growing global demand for crops and food, and we are committed to doing so safely and sustainably.
Our strategic pillars guide our value creation efforts:
• | Integration & Execution: Integrate our people, processes and operations and deliver on our targeted synergies. |
• | Disciplined Capital Allocation: Utilize a‘compete-for-cash’ philosophy with a focus on maximizing long-term shareholder value. |
• | Focused Growth & Innovation: Continue to expand our footprint and invest in growth, with a focus on expanding our retail business. |
• | Operational Excellence Focus: Optimize our asset base and continue to enhance safety, reliability and margin expansion across our portfolio. |
• | Engaged Employees & Stakeholders: Invest in our people and processes to maintain our social license to operate. |
Nutrien 2018 Second Quarter Report | 1 |
Risk Management
In the normal course of operations, our business activities expose us to risk. We believe the identification and management of risk and uncertainties is crucial to protecting, optimizing and creating long-term shareholder value. Certain risks and uncertainties that could affect our business and financial results are set out in Schedule B of our BAR.
The company is not aware of any significant changes to its risk factors from those disclosed at that time.
Key Performance Drivers
Through our integrated value model, we set, evaluate and refine our targets to drive improvements that benefit all those impacted by our business. We demonstrate our accountability by tracking and reporting our performance against targets related to each strategic priority. A summary of our progress, as of the date of the report, against our annual targets is as follows:
Synergy Program Commitments
Category | December 31, 2019 Synergy Run Rate – Initial Target | Synergy Run Rate 2018 | ||||||
Distribution and Retail | ~$ 150 million | $ | 68 million | |||||
Production Optimization | ~$ 125 million | $ | 60 million | |||||
SG&A Optimization | ~$ 125 million | $ | 75 million | |||||
Procurement | ~$ 100 million | $ | 43 million | |||||
Total | $ 500 million | $ | 246 million | |||||
Nutrien has achieved synergies ahead of schedule, capturing $246 million in run-rate synergies as at June 30, 2018. We now expect to achieve $350 million in run-rate synergies by the end of 2018, up from the initial estimate of $250 million. We are in the process of finalizing other key performance drivers (KPDs) and their methods of calculation.
Performance Overview
For an understanding of trends, events, uncertainties and the effect of critical accounting estimates on our results and financial condition, the following discussion and analysis should be read carefully, together with our interim financial statements.
Three and Six Months Ended June 30, 2018 Results
Three Months Ended June 30, 2018 | Six Months Ended June 30, 2018 | |||||||
Earnings per share (EPS) | $ | 2.24 | $ | 2.22 | ||||
Net earnings from continuing operations | $ | 741 | $ | 740 | ||||
EBITDA1 | $ | 1,507 | $ | 1,994 |
1 | Net earnings from continuing operations before finance costs, income tax expense and depreciation and amortization. In millions of US dollars. Refer to“Non-IFRS Financial Measures” section on page 29 for details. |
2 | Nutrien 2018 Second Quarter Report |
Overview of Actual Results
IFRS comparative figures are results previously reported by PotashCorp, as it is the continuing reporting entity for accounting purposes for the three and six months ended June 30, 2017 (unless otherwise stated). The Nutrien comparative figures in this MD&A are the combined historical results of PotashCorp and Agrium for the three and six months ended June 30, 2017 (unless otherwise stated) and certain of these are considered to benon-IFRS measures. Refer to“Non-IFRS Financial Measures” section starting on page 29 for detailed information.
Three Months Ended June 30 | ||||||||||||||||||||||||||||
Nutrien | Nutrien1 | PotashCorp | ||||||||||||||||||||||||||
Dollars (millions), except per share amounts | 2018 | 2017 | Change | % Change | 2017 | Change | % Change | |||||||||||||||||||||
Sales | $ | 8,145 | $ | 7,348 | $ | 797 | 11 | $ | 1,120 | $ | 7,025 | n/m | ||||||||||||||||
Gross margin | 2,131 | 1,791 | 340 | 19 | 260 | 1,871 | n/m | |||||||||||||||||||||
Earnings before finance costs and income taxes (EBIT) | 1,151 | 995 | 156 | 16 | 149 | 1,002 | n/m | |||||||||||||||||||||
Earnings before income taxes | 1,018 | 869 | 149 | 17 | 88 | 930 | n/m | |||||||||||||||||||||
Net earnings from continuing operations | 741 | 705 | 36 | 5 | 152 | 589 | n/m | |||||||||||||||||||||
Net earnings from discontinued operations | 675 | n/m | n/m | 49 | 626 | n/m | ||||||||||||||||||||||
Net earnings | 1,416 | n/m | n/m | 201 | 1,215 | n/m | ||||||||||||||||||||||
EBITDA2 | 1,507 | 1,306 | 201 | 15 | 317 | 1,190 | n/m | |||||||||||||||||||||
Net earnings per share from continuing operations – diluted | 1.17 | n/m | n/m | n/m | 0.18 | 0.99 | n/m | |||||||||||||||||||||
Net earnings per share from discontinued operations – diluted | 1.07 | n/m | n/m | n/m | 0.06 | 1.01 | n/m | |||||||||||||||||||||
Net earnings per share – diluted | 2.24 | n/m | n/m | n/m | 0.24 | 2.00 | n/m | |||||||||||||||||||||
Other comprehensive (loss) income | (105 | ) | 146 | (251 | ) | n/m | 69 | (174 | ) | n/m | ||||||||||||||||||
1 | Refer to“Non-IFRS Financial Measures” section on page 29 for details. |
2 | EBITDA is anon-IFRS measure. Refer to“Non-IFRS Financial Measures” section on page 29 for details. |
n/m = not meaningful
1 | Refer to“Non-IFRS Financial Measures” section on page 29 for details. |
Nutrien 2018 Second Quarter Report | 3 |
Six Months Ended June 30 | ||||||||||||||||||||||||||||
Nutrien | Nutrien 1 | PotashCorp | ||||||||||||||||||||||||||
Dollars (millions), except per share amounts | 2018 | 2017 | Change | % Change | 2017 | Change | % Change | |||||||||||||||||||||
Sales | $ | 11,840 | $ | 11,085 | $ | 755 | 7 | $ | 2,232 | $ | 9,608 | n/m | ||||||||||||||||
Gross margin | 2,978 | 2,629 | 349 | 13 | 533 | 2,445 | n/m | |||||||||||||||||||||
Earnings before finance costs and income taxes (EBIT) | 1,227 | 1,217 | 10 | 1 | 324 | 903 | n/m | |||||||||||||||||||||
Earnings before income taxes | 975 | 973 | 2 | – | 204 | 771 | n/m | |||||||||||||||||||||
Net Earnings from continuing operations | 740 | 802 | (62 | ) | (8 | ) | 258 | 482 | n/m | |||||||||||||||||||
Net earnings from discontinued operations | 675 | n/m | n/m | 92 | 583 | n/m | ||||||||||||||||||||||
Net earnings | 1,415 | n/m | n/m | 350 | 1,065 | n/m | ||||||||||||||||||||||
EBITDA2 | 1,994 | 1,827 | 167 | 9 | 664 | 1,330 | n/m | |||||||||||||||||||||
Net earnings per share from continuing operations – diluted | 1.16 | n/m | n/m | n/m | 0.31 | 0.85 | n/m | |||||||||||||||||||||
Net earnings per share from discontinued operations – diluted | 1.06 | n/m | n/m | n/m | 0.11 | 0.95 | n/m | |||||||||||||||||||||
Net earnings per share – diluted | 2.22 | n/m | n/m | n/m | 0.42 | 1.80 | n/m | |||||||||||||||||||||
Other comprehensive (loss) income | (175 | ) | 214 | (389 | ) | n/m | 108 | (283 | ) | n/m | ||||||||||||||||||
1 | Refer to“Non-IFRS Financial Measures” section on page 29 for details. |
2 | EBITDA is anon-IFRS measure. Refer to“Non-IFRS Financial Measures” section on page 29 for details. |
n/m = not meaningful
1 | Refer to“Non-IFRS Financial Measures” section on page 29 for details. |
Net Earnings from Continuing Operations Nutrien 2018 vs. PotashCorp 2017
Net earnings from continuing operations in the second quarter and first half of 2018 were higher than the comparative periods for PotashCorp primarily due to the acquisition of Agrium’s operations in the Merger, higher retail sales volumes, increased potash prices, and higher urea volumes and prices, which were partially offset by income tax expense in 2018 compared to an income tax recovery in 2017, higher share-based compensation expense and higher depreciation and amortization.
Net Earnings from Continuing Operations Nutrien 2018 vs. Nutrien 2017
Second quarter net earnings from continuing operations in 2018 were higher compared to combined historical results in the second quarter of 2017 primarily due to higher retail sales volumes, increased potash prices, and higher urea volumes and prices, more than offsetting higher income taxes, and higher share-based compensation expense.
First half net earnings from continuing operations in 2018 were lower compared to combined historical results in the first half of 2017 primarily due to higher income taxes, increased share-based compensation expense and higher depreciation and amortization costs partially offset by higher retail sales volumes and higher potash prices.
4 | Nutrien 2018 Second Quarter Report |
Net Earnings from Discontinued Operations Nutrien 2018 vs. PotashCorp 2017
Net earnings from discontinued operations were higher in the second quarter and first half of 2018 primarily due to the gain on sale of our SQM class B shares, dividends from SQM and APC exceeding their equity earnings in the comparative periods (equity accounting for these investments ceased when the investments were classified as held for sale) and the related tax impacts on these transactions.
Other Comprehensive Income
Other comprehensive loss for the second quarter and first half of 2018 was primarily the result of a loss on translation of our net foreign operations in Canada and Australia. Other comprehensive loss for the first half was also impacted by a decrease in the fair value of our
investment in Sinofert which was partially offset by a net actuarial gain on our defined benefit plans.
PotashCorp other comprehensive income for the second quarter and first half of 2017 was primarily the result of increases in the fair value of our investment in ICL more than offsetting decreases in the fair value of our investment in Sinofert.
Nutrien other comprehensive income for the second quarter and first half of 2017 was primarily the result of increases in the fair value of our investments in ICL and gains on translation of our net foreign operations in Canada and Australia more than offsetting decreases in the fair value of our investments in Sinofert.
Segment Review
We report our results in four business segments: retail, potash, nitrogen and phosphate and sulfate. Our reporting structure reflects how we manage our business and how we classify our operations for planning and measuring performance. We include net sales and EBITDA in segment disclosures in the notes to the interim financial statements pursuant to IFRS, which require segmentation based upon our internal organization and reporting of revenue and profit or loss measures. As a component of gross margin, net sales (and the relatedper-tonne amounts) are the primary revenue measures, and are used for business planning and monthly forecasting for the potash, nitrogen and phosphate and sulfate segments. Net sales are calculated as sales revenues less freight, transportation and distribution expenses. Realized prices refer to net sales prices. As a component of net earnings, EBITDA is the primary profit measure we use and review for all business segments in making decisions about operating matters on a segment basis. These decisions include assessments of segment performance and the resources to be allocated to these segments. EBITDA is also used for business planning and monthly forecasting in all business segments.
Our discussion of segment operating performance is set out below and includes nutrient product and/or market performance results, where applicable, to give further insight into these results.
1 | Nutrien combined historical 2017 EBITDA figures arenon-IFRS measures. Refer to“Non-IFRS Financial Measures” section on page 29 for details. |
Nutrien 2018 Second Quarter Report | 5 |
Retail Performance
Three Months Ended June 30 | ||||||||||||||||||||||||||||||||||||||||||||||||||||
Sales (millions) | Gross Margin (millions) | Gross Margin (percentage) | ||||||||||||||||||||||||||||||||||||||||||||||||||
Nutrien | Nutrien1 | PotashCorp | Nutrien | Nutrien1 | PotashCorp | Nutrien | Nutrien1 | PotashCorp | ||||||||||||||||||||||||||||||||||||||||||||
2018 | 2017 | % Change | 2017 | % Change | 2018 | 2017 | % Change | 2017 | % Change | 2018 | 2017 | 2017 | ||||||||||||||||||||||||||||||||||||||||
Crop nutrients2,3 | $ | 2,326 | $ | 1,989 | 17 | $ | – | 100 | $ | 474 | $ | 419 | 13 | $ | – | 100 | 20 | 21 | – | |||||||||||||||||||||||||||||||||
Crop protection products | 2,358 | 2,236 | 5 | – | 100 | 521 | 485 | 7 | – | 100 | 22 | 22 | – | |||||||||||||||||||||||||||||||||||||||
Seed | 1,183 | 1,080 | 10 | – | 100 | 219 | 199 | 10 | – | 100 | 19 | 18 | – | |||||||||||||||||||||||||||||||||||||||
Merchandise | 201 | 175 | 15 | – | 100 | 26 | 27 | (4 | ) | – | 100 | 13 | 15 | – | ||||||||||||||||||||||||||||||||||||||
Services and other | 274 | 227 | 21 | – | 100 | 192 | 169 | 14 | – | 100 | 70 | 74 | – | |||||||||||||||||||||||||||||||||||||||
6,342 | 5,707 | 11 | – | 100 | $ | 1,432 | $ | 1,299 | 10 | $ | – | 100 | ||||||||||||||||||||||||||||||||||||||||
Cost of goods sold | (4,910 | ) | (4,408 | ) | 11 | – | 100 | |||||||||||||||||||||||||||||||||||||||||||||
Gross margin | 1,432 | 1,299 | 10 | – | 100 | |||||||||||||||||||||||||||||||||||||||||||||||
Expenses4 | (668 | ) | (610 | ) | 10 | – | 100 | |||||||||||||||||||||||||||||||||||||||||||||
EBIT | 764 | 689 | 11 | – | 100 | |||||||||||||||||||||||||||||||||||||||||||||||
Depreciation and amortization | 122 | 71 | 72 | – | 100 | |||||||||||||||||||||||||||||||||||||||||||||||
EBITDA | $ | 886 | $ | 760 | 17 | $ | – | 100 | ||||||||||||||||||||||||||||||||||||||||||||
1 | Refer to“Non-IFRS Financial Measures” section on page 29 for details. |
2 | Sales tonnes were 5,506,000 tonnes (2017 (Nutrien) – 4,897,000 tonnes) and average per tonne prices were $423 per tonne (2017 (Nutrien) – $406 per tonne). |
3 | Includes intersegment sales of $11 million. Intersegment profits are eliminated on consolidation. |
4 | Includes selling and general and administrative expenses of $682 million (2017 (Nutrien) – $602 million). |
The most significant contributors to the change in retail EBITDA were as follows (direction of arrows refers to impact on EBITDA):
Three months ended | June 30, 2018 vs June 30, 2017 (PotashCorp) | June 30, 2018 vs June 30, 2017 (Nutrien) | ||||||
Sales volumes | Retail was acquired as part of the Merger and PotashCorp had no similar operations. | Ù | Crop nutrients, crop protection products and seed sales volumes were higher due to the compressed spring season in North America after a delayed start in the first quarter.
| |||||
Ù | Merchandise sales volumes were higher due to increased animal health and fencing sales volumes in Australia along with higher fuel sales in Canada.
| |||||||
Ù | Services and other sales increased in 2018 due to higher livestock sales, wool commissions and financing in Australia.
| |||||||
Sales prices | Ù | Crop nutrients prices were higher in all geographic locations.
| ||||||
Gross margin | Ù | Crop nutrient gross margin was higher primarily due to increased volumes in all geographic locations, including increased contribution from higher margin international operations. Crop nutrient margin percent decreased, but on a margin per tonne basis has remained flat. This was due to higher costs associated with higher volumes in a condensed period in North America being offset by increased margin rates in Australia and South America.
| ||||||
Ù | Due to the condensed season, crop protection sales volumes were higher and proprietary product margin increased, which offset competitive upfront margin pressure.
| |||||||
Ù | Seed gross margins increased primarily driven by North America demand while Australia was heavily impacted by extreme dry weather. Margins were also higher due to more proprietary product contribution at increased margin rates.
| |||||||
Selling and general and administrative expenses
| Ú | Expenses in the second quarter were up from prior year due to higher fuel costs and increased application business in the US, additional selling expenses on additional sales from new acquisitions across all geographic locations and depreciation and amortization as discussed below.
| ||||||
Depreciation and amortization
| Expense was higher primarily due to the purchase price allocation (PPA) adjustments as a result of the Merger and on recently acquired businesses. |
6 | Nutrien 2018 Second Quarter Report |
Six Months Ended June 30 | ||||||||||||||||||||||||||||||||||||||||||||||||||||
Sales (millions) | Gross Margin (millions) | Gross Margin (percentage) | ||||||||||||||||||||||||||||||||||||||||||||||||||
Nutrien | Nutrien1 | PotashCorp1 | Nutrien | Nutrien1 | PotashCorp1 | Nutrien | Nutrien1 | PotashCorp1 | ||||||||||||||||||||||||||||||||||||||||||||
2018 | 2017 | % Change | 2017 | % Change | 2018 | 2017 | % Change | 2017 | % Change | 2018 | 2017 | 2017 | ||||||||||||||||||||||||||||||||||||||||
Crop nutrients2,3 | $ | 3,010 | $ | 2,703 | 11 | $ | – | 100 | $ | 597 | $ | 560 | 7 | $ | – | 100 | 20 | 21 | – | |||||||||||||||||||||||||||||||||
Crop protection products | 3,132 | 3,108 | 1 | – | 100 | 649 | 615 | 6 | – | 100 | 21 | 20 | – | |||||||||||||||||||||||||||||||||||||||
Seed | 1,524 | 1,462 | 4 | – | 100 | 263 | 253 | 4 | – | 100 | 17 | 17 | – | |||||||||||||||||||||||||||||||||||||||
Merchandise | 350 | 309 | 13 | – | 100 | 49 | 49 | – | – | 100 | 14 | 16 | – | |||||||||||||||||||||||||||||||||||||||
Services and other | 425 | 365 | 16 | – | 100 | 282 | 256 | 10 | – | 100 | 66 | 70 | – | |||||||||||||||||||||||||||||||||||||||
8,441 | 7,947 | 6 | – | 100 | $ | 1,840 | $ | 1,733 | 6 | $ | – | 100 | ||||||||||||||||||||||||||||||||||||||||
Cost of goods sold | (6,601 | ) | (6,214 | ) | 6 | – | 100 | |||||||||||||||||||||||||||||||||||||||||||||
Gross margin | 1,840 | 1,733 | 6 | – | 100 | |||||||||||||||||||||||||||||||||||||||||||||||
Expenses4 | (1,209 | ) | (1,076 | ) | 12 | – | 100 | |||||||||||||||||||||||||||||||||||||||||||||
EBIT | 631 | 657 | (4 | ) | – | 100 | ||||||||||||||||||||||||||||||||||||||||||||||
Depreciation and amortization | 245 | 142 | 73 | – | 100 | |||||||||||||||||||||||||||||||||||||||||||||||
EBITDA | $ | 876 | $ | 799 | 10 | $ | – | 100 | ||||||||||||||||||||||||||||||||||||||||||||
1 | Refer to“Non-IFRS Financial Measures” section on page 29 for details. |
2 | Sales tonnes were 7,209,000 tonnes (2017 (Nutrien) – 6,739,000 tonnes) and average per tonne prices were $418 per tonne (2017 (Nutrien) – $401 per tonne). |
3 | Includes intersegment sales of $22 million. Intersegment profits are eliminated on consolidation. |
4 | Includes selling and general and administrative expenses of $1,228 million (2017 (Nutrien) – $1,075 million). |
The most significant contributors to the change in retail EBITDA were as follows (direction of arrows refers to impact on EBITDA):
Six months ended | June 30, 2018 vs June 30, 2017 (PotashCorp) | June 30, 2018 vs June 30, 2017 (Nutrien) | ||||||
Sales volumes | Retail was acquired as part of the Merger and PotashCorp had no similar operations. | Ù | Crop nutrient volumes were up across all geographic locations with 68 percent of the increase coming from North America.
| |||||
Ù | Seed sales were impacted in Australia by dry weather, but this was offset by increased proprietary product sales in North America and strong cotton sales in the US.
| |||||||
Ù | Merchandise sales increased primarily due to increased fuel volumes in Canada along with increased animal health and fencing volumes in Australia.
| |||||||
Ù | Services and other sales increased in 2018 due to higher livestock sales, wool commissions and financing in Australia.
| |||||||
Sales prices
| Ù | Crop nutrients prices were higher in all geographic locations.
| ||||||
Gross margin | Ù | Crop nutrient margin percent decreased, but on a margin per tonne basis remained flat. This was due to higher costs associated with higher volumes in a condensed period in North America being offset by increased margin rates in Australia and South America.
| ||||||
Ù | Crop protection margin was higher due to a more favorable retail/wholesale customer mix in the US as well as increased proprietary product contribution.
| |||||||
Ù | Merchandise gross margin was flat but gross margin percentage declined due to an increase in volume of lower-margin fuel sales in Canada.
| |||||||
Selling and general and administrative expenses
| Ú | Expenses were up due to higher fuel costs with increased application business in the US, increased payroll from acquisitions and due to depreciation and amortization discussed below.
| ||||||
Depreciation and amortization
| Expense was higher primarily due to the PPA adjustments as a result of the Merger and on recently acquired businesses.
|
Nutrien 2018 Second Quarter Report | 7 |
Potash Performance
Three Months Ended June 30 | ||||||||||||||||||||||||||||||||||||||||||||||||||||||||||||
Dollars (millions) | Tonnes (thousands) | Average per Tonne1 | ||||||||||||||||||||||||||||||||||||||||||||||||||||||||||
Nutrien | Nutrien2 | PotashCorp | Nutrien | Nutrien2 | PotashCorp | Nutrien | Nutrien2 | PotashCorp | ||||||||||||||||||||||||||||||||||||||||||||||||||||
2018 | 2017 | % Change | 2017 | % Change | 2018 | 2017 | % Change | 2017 | % Change | 2018 | 2017 | % Change | 2017 | % Change | ||||||||||||||||||||||||||||||||||||||||||||||
Manufactured product3 | ||||||||||||||||||||||||||||||||||||||||||||||||||||||||||||
Net sales | ||||||||||||||||||||||||||||||||||||||||||||||||||||||||||||
North America | $ | 222 | $ | 205 | 8 | $ | 135 | 64 | 1,030 | 1,029 | – | 651 | 58 | $ | 216 | $ | 198 | 9 | $ | 208 | 4 | |||||||||||||||||||||||||||||||||||||||
Offshore | 416 | 330 | 26 | 276 | 51 | 2,149 | 2,046 | 5 | 1,709 | 26 | $ | 194 | $ | 161 | 20 | $ | 161 | 20 | ||||||||||||||||||||||||||||||||||||||||||
638 | 535 | 19 | 411 | 55 | 3,179 | 3,075 | 3 | 2,360 | 35 | $ | 201 | $ | 174 | 16 | $ | 174 | 16 | |||||||||||||||||||||||||||||||||||||||||||
Cost of goods sold | (274 | ) | (273 | ) | – | (193 | ) | 42 | $ | (86 | ) | $ | (89 | ) | (3 | ) | $ | (82 | ) | 5 | ||||||||||||||||||||||||||||||||||||||||
Gross margin | 364 | 262 | 39 | 218 | 67 | $ | 115 | $ | 85 | 35 | $ | 92 | 25 | |||||||||||||||||||||||||||||||||||||||||||||||
Other potash and purchased products gross margin4 | – | – | – | – | – | |||||||||||||||||||||||||||||||||||||||||||||||||||||||
�� | ||||||||||||||||||||||||||||||||||||||||||||||||||||||||||||
Gross margin | 364 | 262 | 39 | 218 | 67 | |||||||||||||||||||||||||||||||||||||||||||||||||||||||
Expenses5 | (71 | ) | (58 | ) | 22 | (52 | ) | 37 | ||||||||||||||||||||||||||||||||||||||||||||||||||||
EBIT | 293 | 204 | 44 | 166 | 77 | |||||||||||||||||||||||||||||||||||||||||||||||||||||||
Depreciation and amortization | 93 | 88 | 6 | 56 | 66 | |||||||||||||||||||||||||||||||||||||||||||||||||||||||
EBITDA | $ | 386 | $ | 292 | 32 | $ | 222 | 74 | ||||||||||||||||||||||||||||||||||||||||||||||||||||
1 Rounding differences may occur due to the use of whole dollars inper-tonne calculations. |
| |||||||||||||||||||||||||||||||||||||||||||||||||||||||||||
2 Refer to“Non-IFRS Financial Measures” section on page 29 for details. |
| |||||||||||||||||||||||||||||||||||||||||||||||||||||||||||
3 Includes intersegment sales of $50 million and 169,000 sales tonnes (2017 (PotashCorp) – $NIL and NIL sales tonnes). Intersegment profits are eliminated on consolidation. |
| |||||||||||||||||||||||||||||||||||||||||||||||||||||||||||
4 Comprised of net sales $NIL million (2017 (Nutrien) – $1 million; 2017 (PotashCorp) – $NIL) less cost of goods sold $NIL million (2017 (Nutrien) – $1 million; 2017 (PotashCorp) – $NIL). |
| |||||||||||||||||||||||||||||||||||||||||||||||||||||||||||
5 Includes provincial mining and other taxes of $62 million (2017 (Nutrien) – $46 million; 2017 (PotashCorp) – $43 million). |
| |||||||||||||||||||||||||||||||||||||||||||||||||||||||||||
Sales to major offshore markets by Canpotex Limited (Canpotex) were as follows:
Three Months Ended June 30 | Six Months Ended June 30 | |||||||||||||||||||||||
Percentage of Sales Volumes | Percentage of Sales Volumes | |||||||||||||||||||||||
Nutrien | Nutrien | Nutrien | Nutrien | |||||||||||||||||||||
2018 | 2017 | % Change | 2018 | 2017 | % Change | |||||||||||||||||||
Other Asian markets 1 | 29 | 40 | (28 | ) | 29 | 38 | (24 | ) | ||||||||||||||||
Latin America | 33 | 40 | (18 | ) | 28 | 33 | (15 | ) | ||||||||||||||||
China | 21 | 3 | n/m | 25 | 10 | 150 | ||||||||||||||||||
India | 9 | 10 | (10 | ) | 8 | 11 | (27 | ) | ||||||||||||||||
Other markets | 8 | 7 | 14 | 10 | 8 | 25 | ||||||||||||||||||
100 | 100 | 100 | 100 |
1 | All Asian markets except China and India. |
8 | Nutrien 2018 Second Quarter Report |
Six Months Ended June 30 | ||||||||||||||||||||||||||||||||||||||||||||||||||||||||||||
Dollars (millions) | Tonnes (thousands) | Average per Tonne 1 | ||||||||||||||||||||||||||||||||||||||||||||||||||||||||||
Nutrien | Nutrien2 | PotashCorp | Nutrien | Nutrien2 | PotashCorp | Nutrien | Nutrien2 | PotashCorp | ||||||||||||||||||||||||||||||||||||||||||||||||||||
2018 | 2017 | % Change | 2017 | % Change | 2018 | 2017 | % Change | 2017 | % Change | 2018 | 2017 | % Change | 2017 | % Change | ||||||||||||||||||||||||||||||||||||||||||||||
Manufactured product3 | ||||||||||||||||||||||||||||||||||||||||||||||||||||||||||||
Net sales | ||||||||||||||||||||||||||||||||||||||||||||||||||||||||||||
North America | $ | 472 | $ | 434 | 9 | $ | 298 | 58 | 2,284 | 2,266 | 1 | 1,510 | 51 | $ | 207 | $ | 191 | 8 | $ | 198 | 5 | |||||||||||||||||||||||||||||||||||||||
Offshore | 740 | 566 | 31 | 474 | 56 | 4,020 | 3,624 | 11 | 3,029 | 33 | $ | 184 | $ | 156 | 18 | $ | 156 | 18 | ||||||||||||||||||||||||||||||||||||||||||
1,212 | 1,000 | 21 | 772 | 57 | 6,304 | 5,890 | 7 | 4,539 | 39 | $ | 192 | $ | 170 | 13 | $ | 170 | 13 | |||||||||||||||||||||||||||||||||||||||||||
Cost of goods sold | (553 | ) | (538 | ) | 3 | (389 | ) | 42 | $ | (88 | ) | $ | (91 | ) | (3 | ) | $ | (86 | ) | 2 | ||||||||||||||||||||||||||||||||||||||||
Gross margin | 659 | 462 | 43 | 383 | 72 | $ | 104 | $ | 79 | 32 | $ | 84 | 24 | |||||||||||||||||||||||||||||||||||||||||||||||
Other potash and purchased products gross margin4 | – | – | – | – | – | |||||||||||||||||||||||||||||||||||||||||||||||||||||||
Gross margin | 659 | 462 | 43 | 383 | 72 | |||||||||||||||||||||||||||||||||||||||||||||||||||||||
Expenses5 | (129 | ) | (102 | ) | 26 | (94 | ) | 37 | ||||||||||||||||||||||||||||||||||||||||||||||||||||
EBIT | 530 | 360 | 47 | 289 | 83 | |||||||||||||||||||||||||||||||||||||||||||||||||||||||
Depreciation and amortization | 184 | 172 | 7 | 111 | 66 | |||||||||||||||||||||||||||||||||||||||||||||||||||||||
EBITDA | $ | 714 | $ | 532 | 34 | $ | 400 | 79 | ||||||||||||||||||||||||||||||||||||||||||||||||||||
1 Rounding differences may occur due to the use of whole dollars inper-tonne calculations. |
| |||||||||||||||||||||||||||||||||||||||||||||||||||||||||||
2 Refer to“Non-IFRS Financial Measures” section on page 29 for details. |
| |||||||||||||||||||||||||||||||||||||||||||||||||||||||||||
3 Includes intersegment sales of $118 million and 434,000 sales tonnes (2017 (PotashCorp) – $NIL and NIL sales tonnes). Intersegment profits are eliminated on consolidation. |
| |||||||||||||||||||||||||||||||||||||||||||||||||||||||||||
4 Comprised of net sales $1 million (2017 (Nutrien) – $4 million; 2017 (PotashCorp) – $4 million) less cost of goods sold $1 million (2017 (Nutrien) – $4 million; 2017 (PotashCorp) – $4 million). |
| |||||||||||||||||||||||||||||||||||||||||||||||||||||||||||
5 Includes provincial mining and other taxes of $110 million (2017 (Nutrien) – $82 million; 2017 (PotashCorp) – $76 million). |
| |||||||||||||||||||||||||||||||||||||||||||||||||||||||||||
Nutrien 2018 Second Quarter Report | 9 |
North America typically consumes more higher-priced granular product than standard product.
The most significant contributors to the change in potash EBITDA were as follows (direction of arrows refers to impact on EBITDA):
Three months ended | June 30, 2018 vs June 30, 2017 (PotashCorp) | June 30, 2018 vs June 30, 2017 (Nutrien) | ||||||||
Sales volumes | Ù | | Sales volumes were higher due to strong offshore demand and a higher Canpotex allocation compared to the second quarter of 2017. | Ù | Sales volumes were higher due to strong offshore demand and a higher Canpotex allocation compared to the second quarter of 2017. | |||||
Ù | | Sales volumes were also higher as a result of the Merger, specifically the addition of the Vanscoy mine and sales to retail. | ||||||||
Net sales prices | Ù | Offshore and domestic selling prices were higher in the second quarter due to strong global demand. | ||||||||
Cost of goods sold | Ú | Costs increased slightly due to an increase in shutdowns due to external rail transportation issues. | Ù | Costs decreased slightly due to our portfolio optimization and results from our cost reduction strategy. This was partially offset by an increase in shutdowns due to external rail transportation issues. | ||||||
Provincial mining and other taxes | Ú | Under Saskatchewan provincial legislation, the company is subject to resource taxes, including the potash production tax and the resource surcharge. Provincial mining and other taxes increased primarily due to stronger potash prices. | ||||||||
Depreciation and amortization | Depreciation and amortization expense was higher due to the addition of the Vanscoy mine as a result of the Merger. | There were no significant changes between 2017 and 2018. | ||||||||
Six months ended | June 30, 2018 vs June 30, 2017 (PotashCorp) | June 30, 2018 vs June 30, 2017 (Nutrien) | ||||||||
Sales volumes | Ù | | Sales volumes were higher due to strong global demand and a higher Canpotex allocation compared to the first half of 2017. | Ù | Sales volumes were higher due to strong global demand and a higher Canpotex allocation compared to the first half of 2017. | |||||
Ù | | Sales volumes were also higher as a result of the Merger, specifically the addition of the Vanscoy mine and sales to retail. | ||||||||
Net sales prices | Ù | Offshore and domestic selling prices were higher in the first half due to strong global demand and high global operating rates. | ||||||||
Cost of goods sold | Ú | Costs increased slightly due to an increase in shutdowns due to external rail transportation issues. | Ù | Costs decreased slightly due to our portfolio optimization and results from our cost reduction strategy. This was partially offset by an increase in shutdowns due to external rail transportation issues. | ||||||
Provincial mining and other taxes | Ú | Under Saskatchewan provincial legislation, the company is subject to resource taxes, including the potash production tax and the resource surcharge. Provincial mining and other taxes increased primarily due to stronger potash prices. | ||||||||
Depreciation and amortization | Depreciation and amortization expense was higher due to the addition of the Vanscoy mine as a result of the Merger. | There were no significant changes between 2017 and 2018. |
10 | Nutrien 2018 Second Quarter Report |
Nitrogen Performance
Three Months Ended June 30 | ||||||||||||||||||||||||||||||||||||||||||||||||||||||||||||
Dollars (millions) | Tonnes (thousands) | Average per Tonne 1 | ||||||||||||||||||||||||||||||||||||||||||||||||||||||||||
Nutrien | Nutrien2 | PotashCorp | Nutrien | Nutrien2 | PotashCorp | Nutrien | Nutrien2 | PotashCorp | ||||||||||||||||||||||||||||||||||||||||||||||||||||
2018 | 2017 | % Change | 2017 | % Change | 2018 | 2017 | % Change | 2017 | % Change | 2018 | 2017 | % Change | 2017 | % Change | ||||||||||||||||||||||||||||||||||||||||||||||
Manufactured product3 | ||||||||||||||||||||||||||||||||||||||||||||||||||||||||||||
Net sales | ||||||||||||||||||||||||||||||||||||||||||||||||||||||||||||
Ammonia | $ | 270 | $ | 322 | (16 | ) | $ | 181 | 49 | 1,028 | 1,064 | (3 | ) | 602 | 71 | $ | 263 | $ | 303 | (13 | ) | $ 302 | (13 | ) | ||||||||||||||||||||||||||||||||||||
Urea | 254 | 179 | 42 | 69 | 268 | 901 | 751 | 20 | 293 | 208 | $ | 281 | $ | 239 | 18 | $ 236 | 19 | |||||||||||||||||||||||||||||||||||||||||||
Solutions and nitrates | 189 | 165 | 15 | 105 | 80 | 1,133 | 1,008 | 12 | 699 | 62 | $ | 167 | $ | 163 | 2 | $ 150 | 11 | |||||||||||||||||||||||||||||||||||||||||||
713 | 666 | 7 | 355 | 101 | 3,062 | 2,823 | 8 | 1,594 | 92 | $ | 233 | $ | 236 | (1 | ) | $ 223 | 4 | |||||||||||||||||||||||||||||||||||||||||||
Cost of goods sold | (473 | ) | (485 | ) | (2 | ) | (290 | ) | 63 | $ | (155 | ) | $ | (172 | ) | (10 | ) | $ (182 | ) | (15 | ) | |||||||||||||||||||||||||||||||||||||||
Gross margin | 240 | 181 | 33 | 65 | 269 | $ | 78 | $ | 64 | 22 | $ 41 | 90 | ||||||||||||||||||||||||||||||||||||||||||||||||
Other nitrogen and purchased products gross margin 4 | 21 | 15 | 40 | 3 | 600 | |||||||||||||||||||||||||||||||||||||||||||||||||||||||
Gross margin | 261 | 196 | 33 | 68 | 284 | |||||||||||||||||||||||||||||||||||||||||||||||||||||||
Expenses 5 | (11 | ) | (12 | ) | (8 | ) | (5 | ) | 120 | |||||||||||||||||||||||||||||||||||||||||||||||||||
EBIT | 250 | 184 | 36 | 63 | 297 | |||||||||||||||||||||||||||||||||||||||||||||||||||||||
Depreciation and amortization | 85 | 76 | 12 | 47 | 81 | |||||||||||||||||||||||||||||||||||||||||||||||||||||||
EBITDA | $ | 335 | $ | 260 | 29 | $ | 110 | 205 | ||||||||||||||||||||||||||||||||||||||||||||||||||||
1 Rounding differences may occur due to the use of whole dollars inper-tonne calculations. |
| |||||||||||||||||||||||||||||||||||||||||||||||||||||||||||
2 Refer to“Non-IFRS Financial Measures” section on page 29 for details. |
| |||||||||||||||||||||||||||||||||||||||||||||||||||||||||||
3 Includes intersegment sales of $188 million and 589,000 sales tonnes (2017 (PotashCorp) – $17 million and 40,000 sales tonnes). Intersegment profits are eliminated on consolidation. |
| |||||||||||||||||||||||||||||||||||||||||||||||||||||||||||
4 Comprised of net sales of $143 million (2017 (Nutrien) – $154 million; 2017 (PotashCorp) – $14 million) less cost of goods sold $122 million (2017 (Nutrien) – $139 million; 2017 (PotashCorp) – $11 million). |
| |||||||||||||||||||||||||||||||||||||||||||||||||||||||||||
5 Includes earnings of equity-accounted investees of $3 million (2017 (Nutrien) – $5 million; 2017 (PotashCorp) – $2 million). |
| |||||||||||||||||||||||||||||||||||||||||||||||||||||||||||
Three Months Ended June 30 | Six Months Ended June 30 | |||||||||||||||||||||||||||||||||||||||||||||||
Sales Tonnes (thousands) | Average Net Sales Price per Tonne | Sales Tonnes (thousands) | Average Net Sales Price per Tonne | |||||||||||||||||||||||||||||||||||||||||||||
Nutrien | Nutrien | PotashCorp | Nutrien | Nutrien | PotashCorp | Nutrien | Nutrien | PotashCorp | Nutrien | Nutrien | PotashCorp | |||||||||||||||||||||||||||||||||||||
2018 | 2017 | 2017 | 2018 | 2017 | 2017 | 2018 | 2017 | 2017 | 2018 | 2017 | 2017 | |||||||||||||||||||||||||||||||||||||
Fertilizer | 1,699 | 1,633 | 672 | $ | 257 | $ | 242 | $ | 236 | 2,889 | 2,800 | 1,292 | $ | 257 | $ | 243 | $ | 233 | ||||||||||||||||||||||||||||||
Industrial and feed | 1,363 | 1,190 | 922 | $ | 203 | $ | 227 | $ | 214 | 2,476 | 2,404 | 1,869 | $ | 213 | $ | 231 | $ | 221 | ||||||||||||||||||||||||||||||
3,062 | 2,823 | 1,594 | $ | 233 | $ | 236 | $ | 223 | 5,365 | 5,204 | 3,161 | $ | 237 | $ | 238 | $ | 226 | |||||||||||||||||||||||||||||||
Nutrien 2018 Second Quarter Report | 11 |
Six Months Ended June 30 | ||||||||||||||||||||||||||||||||||||||||||||||||||||||||||||
Dollars (millions) | Tonnes (thousands) | Average per Tonne1 | ||||||||||||||||||||||||||||||||||||||||||||||||||||||||||
Nutrien | Nutrien2 | PotashCorp | Nutrien | Nutrien2 | PotashCorp | Nutrien | Nutrien2 | PotashCorp | ||||||||||||||||||||||||||||||||||||||||||||||||||||
2018 | 2017 | % Change | �� | 2017 | % Change | 2018 | 2017 | % Change | 2017 | % Change | 2018 | 2017 | % Change | 2017 | % Change | |||||||||||||||||||||||||||||||||||||||||||||
Manufactured product3 | ||||||||||||||||||||||||||||||||||||||||||||||||||||||||||||
Net sales | ||||||||||||||||||||||||||||||||||||||||||||||||||||||||||||
Ammonia | $ | 478 | $ | 554 | (14 | ) | $ | 340 | 41 | 1,772 | 1,879 | (6 | ) | 1,148 | 54 | $ | 270 | $ | 295 | (8 | ) | $ | 297 | (9 | ) | |||||||||||||||||||||||||||||||||||
Urea | 466 | 369 | 26 | 158 | 195 | 1,625 | 1,432 | 13 | 613 | 165 | $ | 287 | $ | 258 | 11 | $ | 258 | 11 | ||||||||||||||||||||||||||||||||||||||||||
Solutions and nitrates | 326 | 314 | 4 | 216 | 51 | 1,968 | 1,893 | 4 | 1,400 | 41 | $ | 166 | $ | 166 | – | $ | 154 | 8 | ||||||||||||||||||||||||||||||||||||||||||
1,270 | 1,237 | 3 | 714 | 78 | 5,365 | 5,204 | 3 | 3,161 | 70 | $ | 237 | $ | 238 | – | $ | 226 | 5 | |||||||||||||||||||||||||||||||||||||||||||
Cost of goods sold | (898 | ) | (881 | ) | 2 | (556 | ) | 62 | $ | (167 | ) | $ | (170 | ) | (2 | ) | $ | (176 | ) | (5 | ) | |||||||||||||||||||||||||||||||||||||||
Gross margin | 372 | 356 | 4 | 158 | 135 | $ | 70 | $ | 68 | 3 | $ | 50 | 40 | |||||||||||||||||||||||||||||||||||||||||||||||
Other nitrogen and purchased products gross margin4 | 37 | 28 | 32 | 7 | 429 | |||||||||||||||||||||||||||||||||||||||||||||||||||||||
Gross margin | 409 | 384 | 7 | 165 | 148 | |||||||||||||||||||||||||||||||||||||||||||||||||||||||
Expenses5 | (27 | ) | (18 | ) | 50 | (12 | ) | 125 | ||||||||||||||||||||||||||||||||||||||||||||||||||||
EBIT | 382 | 366 | 4 | 153 | 150 | |||||||||||||||||||||||||||||||||||||||||||||||||||||||
Depreciation and amortization | 214 | 144 | 49 | 97 | 121 | |||||||||||||||||||||||||||||||||||||||||||||||||||||||
EBITDA | $ | 596 | $ | 510 | 17 | $ | 250 | 138 | ||||||||||||||||||||||||||||||||||||||||||||||||||||
1 Rounding differences may occur due to the use of whole dollars inper-tonne calculations. |
| |||||||||||||||||||||||||||||||||||||||||||||||||||||||||||
2 Refer to“Non-IFRS Financial Measures” section on page 29 for details. |
| |||||||||||||||||||||||||||||||||||||||||||||||||||||||||||
3 Includes intersegment sales of $310 million and 993,000 sales tonnes (2017 (PotashCorp) – $39 million and 95,000 sales tonnes). Intersegment profits are eliminated on consolidation. |
| |||||||||||||||||||||||||||||||||||||||||||||||||||||||||||
4 Comprised of net sales of $258 million (2017 (Nutrien) – $289 million; 2017 (PotashCorp) – $20 million) less cost of goods sold $221 million (2017 (Nutrien) – $261 million; 2017 (PotashCorp) – $13 million). |
| |||||||||||||||||||||||||||||||||||||||||||||||||||||||||||
5 Includes earnings of equity-accounted investees of $7 million (2017 (Nutrien) – $22 million; 2017 (PotashCorp ) – $2 million). |
| |||||||||||||||||||||||||||||||||||||||||||||||||||||||||||
12 | Nutrien 2018 Second Quarter Report |
The most significant contributors to the change in nitrogen EBITDA were as follows (direction of arrows refers to impact on EBITDA):
Three months ended | June 30, 2018 vs June 30, 2017 (PotashCorp) | June 30, 2018 vs June 30, 2017 (Nutrien) | ||||||||
Sales volumes | Ù | Sales volumes increased primarily as a result of the Merger. | Ú | Ammonia sales volumes decreased due to the diversion of product to the continuedramp-up of our urea expansion project at Borger as well as higher urea production at our Trinidad facility, which reduced net ammonia available for sale. | ||||||
Ù | Urea volumes were up due to the continuedramp-up at Borger and higher production at Trinidad to meet increased demand. | |||||||||
Net sales prices | Ù | Our average realized price was slightly higher, reflecting the impact of higher realized selling prices for urea and some other nitrogen products, which more than offset lower realized prices for ammonia. | Ú | Our average realized price was flat, reflecting lower realized prices for ammonia, as a result of a lower Tampa ammonia benchmark and the impact of lower natural gas costs on our industrial business, which offset the impact of higher realized prices for urea and some other nitrogen products. | ||||||
Cost of goods sold | Ù | Average costs, including our hedge position, for natural gas used as feedstock in production decreased 28 percent due to the relatively lower-cost gas available at our Alberta facilities acquired in the Merger. | Ù | Average costs, including our hedge position, for natural gas used as feedstock in production decreased 19 percent, as a result of lower AECO and Henry Hub indices and lower gas costs in Trinidad (Contract prices indexed in part to Tampa ammonia prices). | ||||||
Earnings of equity-accounted investees | Ù | There were no significant changes between 2017 and 2018. | Ú | There were no significant changes between 2017 and 2018. | ||||||
Depreciation and amortization | Expense was higher in 2018 due to higher depreciation and amortization based on volumes and the PPA adjustments. | |||||||||
Six months ended | June 30, 2018 vs June 30, 2017 (PotashCorp) | June 30, 2018 vs June 30, 2017 (Nutrien) | ||||||||
Sales volumes | Ù | Sales volumes increased primarily as a result of the Merger. | Ú | Ammonia sales volumes decreased due to the diversion of product to the continuedramp-up of our urea expansion project at Borger as well as higher urea production at our Trinidad facility, which reduced net ammonia available for sale. | ||||||
Ù | Urea volumes were up due to the continuedramp-up at Borger and higher production at Trinidad to meet increased demand. | |||||||||
Net sales prices | Ù | Our average realized price was slightly higher, reflecting the impact of higher realized selling prices for urea and certain other nitrogen products, which more than offset lower realized prices for ammonia. | Ú | Our average realized price was flat, reflecting lower realized prices for ammonia, as a result of a lower Tampa ammonia benchmark and the impact of lower natural gas costs on our industrial business, which more than offset the impact of higher realized prices for urea. | ||||||
Cost of goods sold | Ù | Average costs, including our hedge position, for natural gas used as feedstock in production decreased 23 percent due to the relatively lower-cost gas available at our Alberta facilities acquired in the Merger. | Ù | Average costs, including our hedge position, for natural gas used as feedstock in production decreased 12 percent, as a result of lower AECO and Henry Hub indices and lower gas costs in Trinidad (Contract prices indexed in part to Tampa ammonia prices). | ||||||
Earnings of equity-accounted investees | Ù | There were no significant changes between 2017 and 2018. | Ú | Earnings were lower in 2018 primarily due to the impact of a foreign exchange gain recorded in 2017 in our investment in MOPCO from the devaluation of the Egyptian pound. | ||||||
Depreciation and amortization | Expense was higher in 2018 due to higher depreciation and amortization based on volumes and the PPA adjustments. |
Nutrien 2018 Second Quarter Report | 13 |
Phosphate and Sulfate Performance
Three Months Ended June 30 | ||||||||||||||||||||||||||||||||||||||||||||||||||||||||||||
Dollars (millions) | Tonnes (thousands) | Average per Tonne 1 | ||||||||||||||||||||||||||||||||||||||||||||||||||||||||||
Nutrien | Nutrien2 | PotashCorp | Nutrien | Nutrien2 | PotashCorp | Nutrien | Nutrien2 | PotashCorp | ||||||||||||||||||||||||||||||||||||||||||||||||||||
2018 | 2017 | % Change | 2017 | % Change | 2018 | 2017 | % Change | 2017 | % Change | 2018 | 2017 | % Change | 2017 | % Change | ||||||||||||||||||||||||||||||||||||||||||||||
Manufactured product3 | ||||||||||||||||||||||||||||||||||||||||||||||||||||||||||||
Net sales | ||||||||||||||||||||||||||||||||||||||||||||||||||||||||||||
Fertilizer | $ | 233 | $ | 168 | 39 | $ | 117 | 99 | 569 | 472 | 21 | 348 | 64 | $ | 410 | $ | 355 | 15 | $ | 337 | 22 | |||||||||||||||||||||||||||||||||||||||
Industrial and feed | 98 | 105 | (7 | ) | 123 | (20 | ) | 191 | 210 | (9 | ) | 242 | (21 | ) | $ | 513 | $ | 501 | 2 | $ | 507 | 1 | ||||||||||||||||||||||||||||||||||||||
Ammonium sulfate | 23 | 29 | (21 | ) | – | n/m | 87 | 111 | (22 | ) | – | n/m | $ | 271 | $ | 259 | 5 | $ | – | n/m | ||||||||||||||||||||||||||||||||||||||||
354 | 302 | 17 | 240 | 48 | 847 | 793 | 7 | 590 | 44 | $ | 419 | $ | 380 | 10 | $ | 407 | 3 | |||||||||||||||||||||||||||||||||||||||||||
Cost of goods sold | (314 | ) | (302 | ) | 4 | (266 | ) | 18 | $ | (371 | ) | $ | (380 | ) | (2 | ) | $ | (452 | ) | (18 | ) | |||||||||||||||||||||||||||||||||||||||
Gross margin | 40 | – | n/m | (26 | ) | (254 | ) | $ | 48 | $ | – | n/m | $ | (45 | ) | (207 | ) | |||||||||||||||||||||||||||||||||||||||||||
Other phosphate and purchased products gross margin4 | 2 | 2 | – | – | n/m | | | |||||||||||||||||||||||||||||||||||||||||||||||||||||
Gross margin | 42 | 2 | n/m | (26 | ) | (262 | ) | |||||||||||||||||||||||||||||||||||||||||||||||||||||
Expenses | (3 | ) | (7 | ) | (57 | ) | (4 | ) | (25 | ) | ||||||||||||||||||||||||||||||||||||||||||||||||||
EBIT | 39 | (5 | ) | (880 | ) | (30 | ) | (230 | ) | |||||||||||||||||||||||||||||||||||||||||||||||||||
Depreciation and amortization | 42 | 62 | (32 | ) | 56 | (25 | ) | |||||||||||||||||||||||||||||||||||||||||||||||||||||
EBITDA | $ | 81 | $ | 57 | 42 | $ | 26 | 212 | ||||||||||||||||||||||||||||||||||||||||||||||||||||
1 Rounding differences may occur due to the use of whole dollars inper-tonne calculations. |
| |||||||||||||||||||||||||||||||||||||||||||||||||||||||||||
2 Refer to“Non-IFRS Financial Measures” section on page 29 for details. |
| |||||||||||||||||||||||||||||||||||||||||||||||||||||||||||
3 Includes intersegment sales of $79 million and 179,000 sales tonnes (2017 (PotashCorp) – $NIL and NIL sales tonnes). Intersegment profits are eliminated on consolidation. |
| |||||||||||||||||||||||||||||||||||||||||||||||||||||||||||
4 Comprised of net sales $40 million (2017 (Nutrien) – $15 million; 2017 (PotashCorp) – $1 million) less cost of goods sold $38 million (2017 (Nutrien) – $13 million; 2017 (PotashCorp) – $1 million). |
| |||||||||||||||||||||||||||||||||||||||||||||||||||||||||||
n/m= not meaningful |
|
14 | Nutrien 2018 Second Quarter Report |
Six Months Ended June 30 | ||||||||||||||||||||||||||||||||||||||||||||||||||||||||||||
Dollars (millions) | Tonnes (thousands) | Average per Tonne 1 | ||||||||||||||||||||||||||||||||||||||||||||||||||||||||||
Nutrien | Nutrien2 | PotashCorp | Nutrien | Nutrien2 | PotashCorp | Nutrien | Nutrien2 | PotashCorp | ||||||||||||||||||||||||||||||||||||||||||||||||||||
2018 | 2017 | % Change | 2017 | % Change | 2018 | 2017 | % Change | 2017 | % Change | 2018 | 2017 | % Change | 2017 | % Change | ||||||||||||||||||||||||||||||||||||||||||||||
Manufactured product3 | ||||||||||||||||||||||||||||||||||||||||||||||||||||||||||||
Net sales | ||||||||||||||||||||||||||||||||||||||||||||||||||||||||||||
Fertilizer | $ | 473 | $ | 358 | 32 | $ | 253 | 87 | 1,174 | 978 | 20 | 716 | 64 | $ | 403 | $ | 366 | 10 | $ | 354 | 14 | |||||||||||||||||||||||||||||||||||||||
Industrial and feed | 204 | 223 | (9 | ) | 257 | (21 | ) | 412 | 449 | (8 | ) | 513 | (20 | ) | $ | 495 | $ | 496 | (0 | ) | $ | 501 | (1 | ) | ||||||||||||||||||||||||||||||||||||
Ammonium sulfate | 41 | 49 | (16 | ) | – | n/m | 159 | 199 | (20 | ) | – | n/m | $ | 257 | $ | 245 | 5 | $ | – | n/m | ||||||||||||||||||||||||||||||||||||||||
718 | 630 | 14 | 510 | 41 | 1,745 | 1,626 | 7 | 1,229 | 42 | $ | 412 | $ | 387 | 6 | $ | 415 | (1 | ) | ||||||||||||||||||||||||||||||||||||||||||
Cost of goods sold | (649 | ) | (597 | ) | 9 | (526 | ) | 23 | $ | (372 | ) | $ | (367 | ) | 1 | $ | (428 | ) | (13 | ) | ||||||||||||||||||||||||||||||||||||||||
Gross margin | 69 | 33 | 109 | (16 | ) | (531 | ) | $ | 40 | $ | 20 | 102 | $ | (13 | ) | (408 | ) | |||||||||||||||||||||||||||||||||||||||||||
Other phosphate and purchased products gross margin4 | 2 | 3 | (33) | 1 | 100 | |||||||||||||||||||||||||||||||||||||||||||||||||||||||
Gross margin | 71 | 36 | 97 | (15 | ) | (573 | ) | |||||||||||||||||||||||||||||||||||||||||||||||||||||
Expenses | (9 | ) | (16 | ) | (44 | ) | (8 | ) | 13 | |||||||||||||||||||||||||||||||||||||||||||||||||||
EBIT | 62 | 20 | 210 | (23 | ) | (370 | ) | |||||||||||||||||||||||||||||||||||||||||||||||||||||
Depreciation and amortization | 93 | 125 | (26 | ) | 114 | (18 | ) | |||||||||||||||||||||||||||||||||||||||||||||||||||||
EBITDA | $ | 155 | $ | 145 | 7 | $ | 91 | 70 | ||||||||||||||||||||||||||||||||||||||||||||||||||||
1 Rounding differences may occur due to the use of whole dollars inper-tonne calculations.
|
| |||||||||||||||||||||||||||||||||||||||||||||||||||||||||||
2 Refer to“Non-IFRS Financial Measures” section on page 29 for details.
|
| |||||||||||||||||||||||||||||||||||||||||||||||||||||||||||
3 Includes intersegment sales of $160 million and 379,000 sales tonnes (2017 (PotashCorp) – $NIL and NIL sales tonnes). Intersegment profits are eliminated on consolidation.
|
| |||||||||||||||||||||||||||||||||||||||||||||||||||||||||||
4 Comprised of net sales $80 million (2017 (Nutrien) – $26 million; 2017 (PotashCorp) – $2 million) less cost of goods sold $78 million (2017 (Nutrien) – $23 million; 2017 (PotashCorp) – $1 million).
|
| |||||||||||||||||||||||||||||||||||||||||||||||||||||||||||
n/m = not meaningful | ||||||||||||||||||||||||||||||||||||||||||||||||||||||||||||
Nutrien 2018 Second Quarter Report | 15 |
The most significant contributors to the change in phosphate and sulfate EBITDA were as follows (direction of arrows refers to impact on EBITDA):
Three months ended | June 30, 2018 vs June 30, 2017 (PotashCorp) | June 30, 2018 vs June 30, 2017 (Nutrien) | ||||||||
Sales volumes | Ù | Sales volumes increased primarily as a result of the Merger. | Ù | Sales volumes were up due to strong fertilizer demand and increased production levels at our phosphate facilities. | ||||||
Net sales prices | Ù | Our average realized fertilizer price was up, due to strong demand and higher global sulfur benchmark prices. | ||||||||
Cost of goods sold | Ù | Phosphate cost of goods sold decreased due to lower depreciation and amortization related to impairments on assets in the latter half of 2017 and PPA adjustments as well as inventory adjustments at Aurora and White Springs in 2017 that did not occur in 2018. | Ù | Phosphate cost of goods sold decreased due to lower depreciation and amortization related to impairments on assets in the latter half of 2017 and PPA adjustments. | ||||||
Ú | Fertilizer cost of goods sold increased primarily due to higher sulfur costs and rock costs at Redwater, which was partially offset by inventory adjustments at Aurora and White Springs in 2017 that did not occur in 2018. | |||||||||
Expenses | Ù | There were no significant changes between 2017 and 2018. | ||||||||
Depreciation and amortization | Expense was lower in 2018 primarily due to lower depreciable asset balance at our US facilities as a result of the impairments recorded in the latter half of 2017 and the impact of the PPA adjustments. The decrease was partially offset by an increase in depreciation at our Redwater facility due to the change in the assets estimated useful lives. | |||||||||
Six months ended | June 30, 2018 vs June 30, 2017 (PotashCorp) | June 30, 2018 vs June 30, 2017 (Nutrien) | ||||||||
Sales volumes | Ù | Sales volumes increased primarily as a result of the Merger. | Ù | Sales volumes were up due to strong fertilizer demand and increased production levels at our phosphate facilities. | ||||||
Net sales prices | Ù | Our average realized fertilizer price was up, due to strong demand and higher global sulfur benchmark prices. | ||||||||
Cost of goods sold | Ù | Phosphate cost of goods sold decreased due to lower depreciation and amortization related to impairments on assets in the latter half of 2017 and PPA adjustments as well as inventory adjustments at Aurora and White Springs in 2017 that did not occur in 2018. | Ù | Phosphate cost of goods sold decreased due to lower depreciation and amortization related to impairments on assets in the latter half of 2017 and PPA adjustments. | ||||||
Ú | Fertilizer cost of goods sold increased primarily due to higher sulfur costs and rock costs at Redwater, which was partially offset by inventory adjustments at Aurora and White Springs in 2017 that did not occur in 2018. | |||||||||
Expenses | Ú | There were no significant changes between 2017 and 2018. | Ù | There were no significant changes between 2017 and 2018. | ||||||
Depreciation and amortization | Expense was lower in 2018 primarily due to lower depreciable asset balance at our US facilities as a result of the impairments recorded in the latter half of 2017 and the impact of the PPA adjustments. The decrease was partially offset by an increase in depreciation at our Redwater facility due to the change in the assets estimated useful lives. |
16 | Nutrien 2018 Second Quarter Report |
Others Segment Financial Performance
“Others” is anon-operating segment comprising corporate and administrative functions that provide support and governance to our operating business units. No sales are made in this segment.
Expenses included in EBIT of ournon-operating segment primarily comprise general and administrative costs at our headquarters and corporate offices and other expenses such as Merger and related costs.
EBITDA for our others segment for the second quarter of 2018 was $(213) compared to $(41) for PotashCorp in the second quarter of 2017 and $(95) for the Nutrien combined historical1 second quarter in 2017. EBITDA for our others segment for the first half of 2018 was $(346) compared to $(77) for PotashCorp in the first half of 2017 and $(173) for the Nutrien combined historical first half of 2017. The decrease in others EBITDA compared to the second quarter and first half of PotashCorp in 2017 was primarily a result of increases in Merger and related costs, share-based compensation (due to a higher share price, improvement in our relative ranking in total shareholder return and progress towards synergy targets) and general and administrative expenses related to the addition of Agrium’s operations. The decrease compared to the second quarter combined historical figures for Nutrien was primarily due to increases in share-based compensation expenses as noted above. The decrease in others EBITDA compared to the first half combined historical figures for Nutrien was primarily due to Merger and related costs and increases in share-based compensation expenses as noted above.
1 | Refer to “Non-IFRS Financial Measures” section on page 29 for details. |
Expenses and Income Below Gross Margin
Three Months Ended June 30 | ||||||||||||||||||||||||||||
Nutrien | Nutrien 1 | PotashCorp 2 | ||||||||||||||||||||||||||
Dollars (millions), except percentage amounts | 2018 | 2017 | Change | % Change | 2017 | Change | % Change | |||||||||||||||||||||
Selling expenses | $ (666 | ) | $ | (582 | ) | $ | (84 | ) | 14 | $ | (8 | ) | $ | (658 | ) | n/m | ||||||||||||
General and administrative expenses | (179 | ) | (98 | ) | (81 | ) | 83 | (40 | ) | (139 | ) | 348 | ||||||||||||||||
Provincial mining and other taxes | (65 | ) | (46 | ) | (19 | ) | 41 | (43 | ) | (22 | ) | 51 | ||||||||||||||||
Earnings of equity-accounted investees | 4 | 8 | (4 | ) | (50 | ) | 3 | 1 | 33 | |||||||||||||||||||
Other expenses | (74 | ) | (77 | ) | 3 | (4 | ) | (23 | ) | (51 | ) | 222 | ||||||||||||||||
Finance costs | (133 | ) | (126 | ) | (7 | ) | 6 | (61 | ) | (72 | ) | 118 | ||||||||||||||||
Income tax (expense) recovery | (277 | ) | (164 | ) | (113 | ) | 69 | 64 | (341 | ) | n/m | |||||||||||||||||
Discontinued operations | 675 | n/a | n/m | n/m | 49 | 626 | n/m | |||||||||||||||||||||
1 | Refer to“Non-IFRS Financial Measures” section on page 29 for details. |
2 | Certain amounts have been reclassified from earnings of equity-accounted investees, dividend income and income taxes to net income from discontinued operations as the related assets were classified as held for sale in 2017. These amounts have also been reclassified to conform to the current period’s presentation as described in note 15 to the interim financial statements. |
n/m | = not meaningful |
n/a | = not available |
Six Months Ended June 30 | ||||||||||||||||||||||||||||
Nutrien | Nutrien 1 | PotashCorp 2 | ||||||||||||||||||||||||||
Dollars (millions), except percentage amounts | 2018 | 2017 | Change | % Change | 2017 | Change | % Change | |||||||||||||||||||||
Selling expenses | $ | (1,198 | ) | $ | (1,042 | ) | $ | (156 | ) | 15 | $ | (17 | ) | $ | (1,181 | ) | n/m | |||||||||||
General and administrative expenses | (298 | ) | (202 | ) | (96 | ) | 48 | (81 | ) | (217 | ) | 268 | ||||||||||||||||
Provincial mining and other taxes | (113 | ) | (82 | ) | (31 | ) | 38 | (76 | ) | (37 | ) | 49 | ||||||||||||||||
Earnings of equity-accounted investees | 11 | 32 | (21 | ) | (66 | ) | 3 | 8 | 267 | |||||||||||||||||||
Other expenses | (153 | ) | (118 | ) | (35 | ) | 30 | (38 | ) | (115 | ) | 303 | ||||||||||||||||
Finance costs | (252 | ) | (244 | ) | (8 | ) | 3 | (120 | ) | (132 | ) | 110 | ||||||||||||||||
Income tax (expense) recovery | (235 | ) | (171 | ) | (64 | ) | 37 | 54 | (289 | ) | n/m | |||||||||||||||||
Discontinued operations | 675 | n/a | n/m | n/m | 92 | 583 | n/m | |||||||||||||||||||||
1 | Refer to“Non-IFRS Financial Measures” section on page 29 for details. |
2 | Certain amounts have been reclassified from earnings of equity-accounted investees, dividend income and income taxes to net income from discontinued operations as the related assets were classified as held for sale in 2017. These amounts have also been reclassified to conform to the current period’s presentation as described in note 15 to the interim financial statements. |
n/m | = not meaningful |
n/a | = not available |
Nutrien 2018 Second Quarter Report | 17 |
The most significant contributors to the change in expenses and income results were as follows:
Three and six months ended | June 30, 2018 vs June 30, 2017 (PotashCorp) | June 30, 2018 vs June 30, 2017 (Nutrien) | ||
Selling Expenses | See explanation in the Retail Financial Performance section on pages 6 and 7. | See explanation in the Retail Financial Performance section on pages 6 and 7. | ||
General and Administrative Expenses | General and administrative expenses increased primarily as a result of increases in share-based compensation resulting from a higher share price, an improvement in our relative ranking in total shareholder return and progress towards synergy targets. There were also increases due to the Merger and retail acquisitions. | General and administrative expenses increased primarily as a result of increases in share-based compensation resulting from a higher share price, an improvement in our relative ranking in total shareholder return and progress towards synergy targets. There were also increases due to retail acquisitions. | ||
Provincial Mining and Other Taxes | See explanation in the Potash Financial Performance section on page 10. | See explanation in the Potash Financial Performance section on page 10. | ||
Other (Expenses) Income | Quarter over quarter other expenses increased primarily due to the Merger. In the first half of 2018 compared to the first half of 2017 other expenses increased primarily due the Merger and higher merger and related costs. | There were no significant changes quarter over quarter. Other expenses increased compared to the combined historical first half primarily due to Merger and related costs. | ||
Finance Costs | Finance costs increased as a result of the Merger. | There were no significant changes. |
WEIGHTED AVERAGE DEBT BALANCES AND RATES |
Three Months Ended June 30 | Six Months Ended June 30 | ||||||||||||||||||||||||||||
Dollars (millions), except percentage amounts | | Nutrien 2018 | | | Nutrien 2017 |
| | PotashCorp 2017 |
| | Nutrien 2018 | | | Nutrien 2017 |
| | PotashCorp 2017 |
| ||||||||||||
Short-term balance | $ | 2,963 | $ | 949 | $ | 365 | $ | 2,057 | $ | 795 | $ | 382 | ||||||||||||||||||
Short-term rate 1 | 2.5 | % | 1.4 | % | 1.3 | % | 2.3 | % | 1.3 | % | 1.2 | % | ||||||||||||||||||
Long-term balance | $ | 8,175 | $ | 8,675 | $ | 4,250 | $ | 8,175 | $ | 8,692 | $ | 4,250 | ||||||||||||||||||
Long-term rate | 4.8 | % | 4.7 | % | 4.7 | % | 4.8 | % | 4.7 | % | 4.7 | % | ||||||||||||||||||
1 Rates were higher in 2018 due to increases in benchmark interest rates. |
|
Income Tax Recovery (Expense) | Ordinary earnings for the three months ended June 30, 2018 were higher as compared to the same period in 2017. In addition, in the second quarter of 2017, a deferred tax recovery of $68 was recorded as a result of a Saskatchewan income tax rate decrease. As a result of these two items, income tax expense increased for the three and six months ended June 30, 2018 as compared to the same periods last year.
For the first six months of 2018, 70 percent of the effective tax rate on the current year’s ordinary earnings from continuing operations pertained to current income taxes (2017 – 24 percent) and 30 percent related to deferred income taxes (2017 – 76 percent). The increase in the current portion was due to higher earnings from retail operations in Canada and Australia and US wholesale operations. In addition, the decrease in the deferred portion was due to deferred tax recoveries recorded as a result of PPA adjustments. |
EFFECTIVE TAX RATES AND DISCRETE ITEMS |
Three Months Ended June 30 | Six Months Ended June 30 | ||||||||||||||||||||||||||||
Dollars (millions), except percentage amounts | | Nutrien 2018 | | | Nutrien 1 2017 |
| | PotashCorp 1 2017 |
| | Nutrien 2018 | | | Nutrien 1 2017 |
| | PotashCorp 1 2017 |
| ||||||||||||
Actual effective tax rate on ordinary earnings | 27 | % | 27 | % | 9 | % | 24 | % | 26 | % | 11 | % | ||||||||||||||||||
Actual effective tax rate including discrete items | 27 | % | 19 | % | (72 | )% | 24 | % | 17 | % | (27 | )% | ||||||||||||||||||
Discrete tax adjustments that impacted the rate | $ | (1 | ) | $ 75 | $ | 71 | $ | 2 | $ 80 | $ | 76 | |||||||||||||||||||
1 Rates have been adjusted as a result of our investments in SQM, ICL and APC being classified as discontinued in 2017. |
|
Net Earnings From Discontinued Operations | Net earnings from discontinued operations increased primarily due to the gain on sale of our SQM class B shares, dividends from SQM and APC exceeding their equity earnings in the comparative periods (Equity accounting for these investments ceased when the investments were classified as held for sale) and the related tax impacts on these transactions. | Combined historical results for Nutrien (refer to“Non-IFRS Financial Measures” section on page 29) were prepared for earnings from continuing operations only and therefore there is no meaningful comparison available. |
18 | Nutrien 2018 Second Quarter Report |
Financial Condition Review
Statement of Financial Position Analysis
The most significant contributors to the changes in our balance sheet were as follows (direction of arrows refers to increase or decrease, all impacts for balance sheet line items are after the impacts of the Merger and PPA impacts in relation to the Merger (if any)):
Assets | Liabilities | |||||
Ù | Total assets increased as a result of the Merger and the PPA to the assets of Agrium as described in Note 2 to the interim financial statements. | Ù | Total liabilities increased as a result of the Merger and the PPA to the liabilities of Agrium as described in Note 2 to the interim financial statements. | |||
Ù | For additional changes in cash refer to the statement of cash flows in our interim financial statements. | Ù | Short-term debt also increased due to an increase in our outstanding commercial paper for working capital requirements. | |||
Ù | Receivables were also higher primarily due to retail sales during the spring season resulting in higher trade and vendor rebate receivables. | Ù | Current portion of long-term debt increased due to the 6.75% debentures due January 15, 2019 and 6.5% senior notes due May 15, 2019 becoming due within one year. | |||
Ú | Prepaid expenses and other current assets were also impacted by the seasonal drawdown of prepaid retail inventory. | Ú | Long-term debt was also impacted by debentures and senior notes discussed above becoming due within one year. | |||
Ú | Assets held for sale were lower primarily due to the sale of our equity interests in ICL and a portion of our SQM equity interests as discussed in Note 6 to the interim financial statements. | Ù | Deferred income taxes increased primarily due to the planned repatriation of cash from Chile. | |||
Ú | Payables and accrued charges were also impacted by a drawdown of customer prepayments as customers took delivery of inventories paid in advance. | |||||
Equity | ||||||
Ù | Total equity increased as a result of the Merger and the issuance of Nutrien shares. | |||||
Ú | Share capital was also impacted by share repurchases made under Nutrien’s normal course issuer bid (NCIB). | |||||
Ù | Retained earnings was higher primarily as a result of net earnings exceeding dividends declared and shares repurchased. |
Nutrien 2018 Second Quarter Report | 19 |
As at June 30, 2018, $1,256 million (December 31, 2017 (PotashCorp) – $104 million) of our cash and cash equivalents was held in certain foreign subsidiaries. As there are plans to repatriate the majority of these funds, a deferred tax liability of $239 million was recorded at June 30, 2018. On May 17, 2018, the company entered into an agreement with a third party for the sale of its shares of SQM for approximately $4,066 million before taxes and closing costs. The agreement is subject to customary closing conditions (including applicable regulatory approvals) and is expected to close by the fourth quarter of 2018. Repatriation of the net cash from this sale is expected to result in tax consequences.
Liquidity and Capital Resources
The following section explains how we manage our cash and capital resources to carry out our strategy and deliver results.
Liquidity risk arises from our general funding needs and in the management of our assets, liabilities and capital structure. We manage liquidity risk to maintain sufficient liquid financial resources to fund our financial position and meet our commitments and obligations in a cost-effective manner.
Liquidity needs can be met through a variety of sources:
| Our primary uses of funds are:
| |
• Cash generated from operations.
| • Operational expenses.
| |
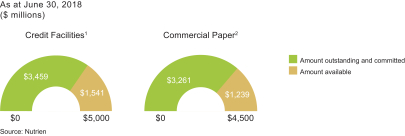
• Drawdowns under our revolving credit facility.
| • Sustaining, opportunity and integration capital spending.
| |
• Issuances of commercial paper.
| • Intercorporate investments.
| |
• Short-term borrowings under our line of credit.
| • Dividends and interest.
| |
• Proceeds from sales of investments.
| • Principal payments on our debt securities.
| |
• Accounts receivable securitization program. | • Share repurchases. |
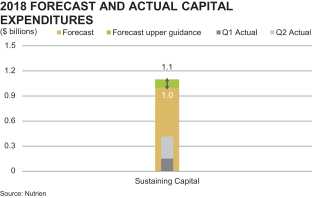
Based on an expected average exchange rate of 1.28 Canadian dollars per US dollar in 2018, we expect to incur capital expenditures, including capitalized interest, of approximately $1.0 billion to $1.1 billion to sustain operations at existing levels and for major repairs and maintenance (including plant turnarounds). We target a stable and growing dividend that represents 40 to 60 percent of free cash flow after sustaining capital through the agricultural cycle. Our Board has also approved the purchase of up to five percent of our outstanding common shares over aone-year period through a NCIB. The NCIB is being effected in accordance with the Toronto Stock Exchange’s (TSX) normal course issuer bid rules and/or Rule10b-18 under the US Securities Exchange Act of 1934, which contain restrictions on the number of common shares that may be purchased on a single day, subject to certain exceptions for block purchases, based on the average daily trading volumes of Nutrien’s common shares on the applicable exchange. The TSX has approved our notice of NCIB to purchase up to 32,209,923 of our common shares until February 22, 2019. A copy of our notice can be obtained, without charge, by contacting our Investor Relations department. During the six months ended June 30, 2018, 24,938,123 common shares were repurchased at a cost of $1,269 million at an average price per share of $50.88. As of July 31, 2018, an additional 4,400,000 common shares were repurchased as a cost of $235 million and an average price per share of $53.31.
On July 23, 2018, we entered into an agreement with a third party for the sale of the company’s equity interest in APC for approximately $502 million. The agreement is subject to customary closing conditions (including applicable regulatory approvals) and is expected to close by the fourth quarter of 2018.
Cash Requirements
Contractual Obligations and Other Commitments
Our contractual obligations and other commitments detailed on page 22 of our first quarter interim report summarize certain of our liquidity and capital resource requirements as of March 31, 2018, excluding obligations that have original maturities of less than one year, planned (but not legally committed) capital expenditures, or potential share repurchases. There were no significant changes to these contractual obligations and other commitments since March 31, 2018. During the second quarter of 2018, the company made a decision to close the small phosphate facility at Geismar. As a result, contracted purchases of phosphate rock from Morocco are expected to end by December 31, 2018 with associated cash outflows of $38 million occurring by the end of the first quarter of 2019.
20 | Nutrien 2018 Second Quarter Report |
Sources and Uses of Cash
The company’s cash flows from operating, investing and financing activities are summarized in the following tables:
Three Months Ended June 30 | ||||||||||||||||||||||||||||
Nutrien | Nutrien 1 | PotashCorp | ||||||||||||||||||||||||||
Dollars (millions), except percentage amounts | 2018 | 2017 | Change | % Change | 2017 | Change | % Change | |||||||||||||||||||||
Cash provided by operating activities | $ | 601 | $ | 213 | $ | 388 | 182 | $ | 328 | $ | 273 | 83 | ||||||||||||||||
Cash provided by (used in) investing activities | 586 | (375 | ) | 961 | n/m | (130 | ) | 716 | n/m | |||||||||||||||||||
Cash provided by (used in) financing activities | 321 | 266 | 55 | 21 | (163 | ) | 484 | n/m | ||||||||||||||||||||
Effect of exchange rate changes on cash and cash equivalents | (12 | ) | (12 | ) | – | – | – | (12 | ) | n/m | ||||||||||||||||||
Increase in cash and cash equivalents | $ | 1,496 | $ | 92 | $ | 1,404 | n/m | $ | 35 | $ | 1,461 | n/m | ||||||||||||||||
1 | Refer to“Non-IFRS Financial Measures” section on page 29 for details. |
n/m = not meaningful
Six Months Ended June 30 | ||||||||||||||||||||||||||||
Nutrien | Nutrien 1 | PotashCorp | ||||||||||||||||||||||||||
Dollars (millions), except percentage amounts | 2018 | 2017 | Change | % Change | 2017 | Change | % Change | |||||||||||||||||||||
Cash provided by operating activities | $ | 261 | $ | 614 | $ | (353 | ) | (57 | ) | $ | 551 | $ | (290 | ) | (53 | ) | ||||||||||||
Cash provided by (used in) investing activities | 1,382 | (694 | ) | 2,076 | n/m | (262 | ) | 1,644 | n/m | |||||||||||||||||||
Cash provided by (used in) financing activities | 206 | 45 | 161 | 358 | (224 | ) | 430 | n/m | ||||||||||||||||||||
Effect of exchange rate changes on cash and cash equivalents | (9 | ) | 7 | (16 | ) | n/m | – | (9 | ) | n/m | ||||||||||||||||||
Increase (decrease) in cash and cash equivalents | $ | 1,840 | $ | (28 | ) | $ | 1,868 | n/m | $ | 65 | $ | 1,775 | n/m | |||||||||||||||
1 | Refer to“Non-IFRS Financial Measures” section on page 29 for details. |
n/m = not meaningful
Nutrien 2018 Second Quarter Report | 21 |
The most significant contributors to the changes in cash flows were as follows:
22 | Nutrien 2018 Second Quarter Report |
Three months ended | June 30, 2018 vs June 30, 2017 (PotashCorp) | June 30, 2018 vs June 30, 2017 (Nutrien) | ||
Cash Provided by (Used in) Operating Activities | Cash provided by operating activities was impacted by: • Higher net earnings in 2018. • Non-cash items including the gain on sale of investment in SQM, increased depreciation and amortization and a provision for deferred income tax in 2018 compared to a recovery in 2017. • Outflows from receivables in 2018 compared to inflows in 2017. • Inflows from inventories in 2018 compared to outflows in 2017. • Inflows from prepaid expenses and other current assets in 2018 compared to outflows in 2017. • Higher cash outflows for payables and accrued charges in 2018. | Cash provided by operating activities was impacted by: • Higher net earnings in 2018. • Non-cash gain on sale of investment in SQM. • Lower cash outflows from changes innon-cash working capital in 2018. | ||
Cash Provided by (Used in) Investing Activities | Cash provided by (used in) investing activities was impacted by: • An increase in cash additions to property, plant and equipment in 2018. • Cash proceeds received from the disposal of a portion of our discontinued operation in SQM. | Cash provided by (used in) investing activities was impacted by: • Cash proceeds received from the disposal of a portion of our discontinued operation in SQM. | ||
Cash Provided by (Used in) Financing Activities | Cash provided by (used in) financing activities was impacted by: • Cash proceeds from issuance of commercial paper in 2018 for working capital. • Higher cash dividends paid in 2018. • Cash outlays for share repurchases under the NCIB in 2018. | Cash provided by financing activities was impacted by: • Higher cash proceeds from issuance of commercial paper in 2018 for working capital. • Cash outlays for share repurchases under the NCIB in 2018. |
Six months ended | June 30, 2018 vs June 30, 2017 (PotashCorp) | June 30, 2018 vs June 30, 2017 (Nutrien) | ||
Cash Provided by (Used in) Operating Activities | Cash provided by operating activities was impacted by: • Higher net earnings in 2018. • Non-cash items including the gain on sale of investment in SQM, increased depreciation and amortization and a provision for deferred income tax in 2018 compared to a recovery in 2017. • Outflows from receivables in 2018 compared to inflows in 2017. • Inflows from prepaid expenses and other current assets in 2018 compared to outflows in 2017. • Higher cash outflows for payables and accrued charges in 2018. | Cash provided by operating activities was impacted by: • Higher net earnings in 2018. • Non-cash gain on sale of investment in SQM. • Higher cash outflows from changes innon-cash working capital in 2018. | ||
Cash Provided by (Used in) Investing Activities | Cash provided by (used in) investing activities was impacted by: • Cash acquired in the Merger in 2018. • Net cash outlays for business acquisitions in 2018. (None in 2017) • An increase in cash additions to property, plant and equipment in 2018. • Cash proceeds received from the disposal of our discontinued operations in ICL and a portion of our discontinued operations in SQM. | Cash provided by (used in) investing activities was impacted by: • Cash acquired in the Merger in 2018. • Higher net cash outlays for business acquisitions in 2018 than in 2017. • Cash proceeds received from the disposal of our discontinued operations in ICL and a portion of our discontinued operations in SQM. | ||
Cash Provided by (Used in) Financing Activities | Cash provided by (used in) financing activities was impacted by: • Higher cash proceeds from issuance of commercial paper in 2018 for working capital. • Higher cash dividends paid in 2018. • Cash outlays for share repurchases under the NCIB in 2018. | Cash provided by financing activities was impacted by: • A cash repayment of long-term debt in 2017. • Higher cash proceeds from issuance of commercial paper in 2018 for working capital. • Cash outlays for share repurchases under the NCIB in 2018. |
We believe that internally generated cash flow, supplemented by available borrowings under our existing financing sources, if necessary, will be sufficient to meet our anticipated capital expenditures and other cash requirements for at least the next 12 months. At this time, we do not reasonably expect any presently known trend or uncertainty to affect our ability to access our historical sources of liquidity. We had positive working capital of $1.63 billion and a working capital ratio of 1.16 at June 30, 2018. Working capital decreased from the combined historical Nutrien amount due primarily to increases in short-term debt and current portion of long-term debt exceeding the increase in current assets from increases in cash and receivables net of decreases in assets held for sale and prepaid expenses and other current assets.
Nutrien 2018 Second Quarter Report | 23 |
Capital Structure and Management
We manage our capital structure with a focus on maintaining a sound balance sheet, enabling a strong investment-grade credit rating.
Principal Debt Instruments
1 | Included in the amount outstanding and committed is $3,261 million of commercial paper and $198 million of other short-term debt. We also have $285 million in uncommitted letter of credit facilities against which $166 million was issued at June 30, 2018. |
2 | The amounts available under the commercial paper programs were limited to the availability of backup funds backstopped by the credit facility. |
We use a combination of cash generated from operations and short-term and long-term debt to finance our operations. We typically pay floating rates of interest on our short-term debt and credit facility, and fixed rates of interest on our senior notes and debentures. As at June 30, 2018, interest rates on outstanding commercial paper ranged from 2.3 percent to 2.7 percent.
During the first half of 2018, there were no significant changes to the nature of our credit facilities, accounts receivable securitization program, unsecured line of credit and uncommitted letter of credit facility other than those described on page 25 of our first quarter interim report.
During the first quarter of 2018, we commenced offers to exchange all validly tendered and accepted senior notes of PotashCorp and debentures of Agrium, representing all of the outstanding senior notes and debentures of PotashCorp and Agrium, respectively, for new notes to be issued by Nutrien having interest rates and maturities identical to those of the applicable exchanged series of PotashCorp senior notes or Agrium debentures. In addition, we solicited consents from the holders of the PotashCorp and Agrium securities to amend the terms and remove certain covenants and events of default. In the second quarter of 2018, substantially all of the outstanding notes and debentures, other than Agrium’s debentures due 2027 (2027 debentures), were exchanged. We are not required to provide additional financial reporting related to unexchanged notes and debentures. The 2027 debentures were not exchanged but debt holders consented to amend reporting requirements such that reports filed by Nutrien will be deemed to satisfy those requirements. Refer to Note 8 of the interim financial statements for further information on the exchanges. Capitalized costs related to the exchange were $19 million and were primarily paid in April 2018.
Our credit facilities and line of credit have financial tests and other covenants with which we must comply at eachquarter-end.Non-compliance with any such covenants could result in accelerated payment of amounts borrowed and termination of lenders’ further funding obligations under the credit facilities and line of credit. We were in compliance with all covenants as at June 30, 2018 and at this time anticipate being in compliance with such covenants throughout 2018.
The accompanying table summarizes the limits and results of certain covenants.
DEBT COVENANTS AT JUNE 30 | Limit | 2018 | ||||||||||
Debt-to-capital ratio1 | £ | 0.65 | 0.34 | |||||||||
1 | Adjusted total debt divided by the sum of adjusted total debt and total equity. Thisnon-IFRS measure is a requirement of our debt covenants and should not be considered as a substitute for, nor superior to, measures of financial performance prepared in accordance with IFRS. |
Our ability to access reasonably priced debt in the capital markets is dependent, in part, on the quality of our credit ratings. We continue to maintain investment-grade credit ratings for our long-term debt. A downgrade of the credit rating of our long-term debt would increase the interest rates applicable to borrowings under our credit facility and our line of credit.
Commercial paper markets are normally a source ofsame-day cash for the company. Our access to the US commercial paper market primarily depends on maintaining our current short-term credit ratings as well as general conditions in the money markets.
Long-Term Debt | Short-Term Debt | |||||||
Rating (Outlook) | Rating | |||||||
June 30, 2018 | June 30, 2018 | |||||||
Moody’s | Baa2 (stable) | P-2 | ||||||
Standard & Poor’s | BBB (stable) | A-2 | ||||||
A security rating is not a recommendation to buy, sell or hold securities. Such ratings may be subject to revision or withdrawal at any time by the respective credit rating agency and each rating should be evaluated independently of any other rating.
Outstanding Share Data
June 30 | ||||
2018 | ||||
Common shares issued and outstanding1 | 614,964,958 | |||
Options to purchase common shares outstanding | 10,507,105 | |||
Share-settled performance share units | 202,601 | |||
1 | Common shares issued and outstanding are as at July 31, 2018 |
Off-Balance Sheet Arrangements
In the normal course of operations, Nutrien engages in a variety of transactions that, under IFRS, are either not recorded on our consolidated balance sheets or are recorded at amounts that differ from the full contract amounts. Principaloff-balance sheet activities include operating leases, the agreement to reimburse losses of Canpotex, issuance of guarantee contracts, certain derivative instruments and long-term contracts.Off-balance sheet arrangements are described on page 26 of our first quarter interim report.
24 | Nutrien 2018 Second Quarter Report |
Quarterly Results
(in millions of US dollars except as otherwise noted)
Nutrien June 30, 2018 | Nutrien March 31, 2018 | PotashCorp1 December 31, 2017 | PotashCorp1 September 30, 2017 | PotashCorp1 June 30, 2017 | PotashCorp1 March 31, 2017 | PotashCorp1 December 31, 2016 | PotashCorp1 September 30, 2016 | |||||||||||||||||||||||||
Financial Performance | ||||||||||||||||||||||||||||||||
Sales | $ | 8,145 | $ | 3,695 | $ | 1,081 | $ | 1,234 | $ | 1,120 | $ | 1,112 | $ | 1,058 | $ | 1,136 | ||||||||||||||||
Gross margin | 2,131 | 847 | (72 | ) | 233 | 260 | 273 | 163 | 190 | |||||||||||||||||||||||
Net earnings (loss) from continuing operations | 741 | (1 | ) | (120 | ) | 16 | 152 | 106 | 13 | 53 | ||||||||||||||||||||||
Net earnings (loss) from discontinued operations | 675 | – | 44 | 37 | 49 | 43 | 33 | 28 | ||||||||||||||||||||||||
Net earnings2(loss) | 1,416 | (1 | ) | (76 | ) | 53 | 201 | 149 | 46 | 81 | ||||||||||||||||||||||
EBITDA4 | 1,507 | 487 | (43 | ) | 280 | 317 | 347 | 235 | 321 | |||||||||||||||||||||||
Net earnings (loss) per share from continuing operations3 | 1.17 | – | (0.14 | ) | 0.02 | 0.18 | 0.13 | 0.02 | 0.06 | |||||||||||||||||||||||
Net earnings (loss) per share2,3 | 2.24 | – | (0.09 | ) | 0.06 | 0.24 | 0.18 | 0.05 | 0.10 | |||||||||||||||||||||||
1 | Certain amounts have been reclassified as a result of discontinued operations discussed in Note 6 of the interim financial statements and to conform with Nutrien’s new method of presentation. |
2 | From continuing and discontinued operations. |
3 | Basic and diluted net earnings per share for each quarter has been computed based on the weighted average number of shares issued and outstanding during the respective quarter; therefore, quarterly amounts may not add to the annual total.Per-share calculations are based on dollar and share amounts each rounded to the nearest thousand. For the quarter ending June 30, 2018 basic earnings per share from continuing operations was $1.18 and basic earnings per share was $2.25. |
4 | EBITDA is anon-IFRS measure. Refer to“Non-IFRS Financial Measures” section on page 29 for details. |
The agricultural products business is seasonal. Crop input sales are primarily concentrated in the spring and fall crop input application seasons. Crop nutrient inventories are normally accumulated leading up to each application season. Our cash collections generally occur after the application season is complete, and our customer prepayments are concentrated in December and January. Feed and industrial sales are more evenly distributed throughout the year. In the fourth and third quarter of 2017 and fourth quarter of 2016, earnings were impacted by a $276 million, $29 million and $20 million respectively,non-cash impairment charge to property, plant and equipment in the phosphate and sulfate segment. Beginning in 2018, earnings were impacted by the Merger.
Nutrien June 30, 2018 | Nutrien March 31, 2018 | Nutrien1 December 31, 2017 | Nutrien1 September 30, 2017 | Nutrien1 June 30, 2017 | Nutrien1 March 31, 2017 | |||||||||||||||||||
Financial Performance | ||||||||||||||||||||||||
Sales | $ | 8,145 | $ | 3,695 | $ | 3,498 | $ | 3,586 | $ | 7,348 | $ | 3,737 | ||||||||||||
Gross margin | 2,131 | 847 | 729 | 793 | 1,791 | 838 | ||||||||||||||||||
Net earnings (loss) from continuing operations | 741 | (1 | ) | (93 | ) | (53 | ) | 705 | 97 | |||||||||||||||
EBITDA 2 | 1,507 | 487 | 210 | 375 | 1,306 | 521 | ||||||||||||||||||
1 | Refer to“Non-IFRS Financial Measures” section on page 29 for details. |
2 | EBITDA is anon-IFRS measure. Refer to“Non-IFRS Financial Measures” section on page 29 for details. |
Nutrien 2018 Second Quarter Report | 25 |
Other Financial Information
Related Party Transactions
We sell potash from our Canadian mines for use outside Canada and the US exclusively to Canpotex. Sales are at prevailing market prices and are settled on normal trade terms. The receivable outstanding from Canpotex arose from sale transactions described above. It is unsecured and bears no interest. There are no provisions held against this receivable.
Refer to Note 13 to the interim financial statements for further information on related party transactions.
Market Risks Associated with Financial Instruments
Market risk is the potential for loss from adverse changes in the market value of financial instruments. The level of market risk to which we are exposed varies depending on the composition of our derivative instrument portfolio, as well as current and expected market conditions. See Note 11 to the interim financial statements and Page 28 and Note 29 in the first quarter interim report for further information on our financial instruments.
Critical Accounting Estimates
Our critical accounting policies are disclosed in our first quarter interim report.
We have discussed the development, selection and application of our key accounting policies, and the critical accounting estimates and assumptions they involve, with the audit committee of the Board.
There were no changes to the critical accounting estimates discussed on page 29 of our first quarter interim report, however we plan to perform an assessment of certain aspects of our operations in the third quarter of 2018, the outcome of which could result in changes to the value in use of certain assets. We are also currently evaluating the impact of hyperinflation on the accounting for certain of ournon-monetary assets in Argentina as discussed in Note 16 to the interim financial statements.
Recent Accounting Changes
Refer to Note 14 to the interim financial statements for information on issued accounting pronouncements that will be effective in future periods and were effective in 2018.
Market Outlook
Agriculture and Crop Input Fundamentals
Most US crop prices have declined over the past quarter, driven by a combination of favorable US crop prospects and uncertainty over escalating trade restrictions.
The US Department of Agriculture (USDA) is projecting an 11 percent decline in global grain ending stocks relative to last year. Key supportive fundamentals include an estimated 23 percent decline in projected US corn ending stocks year-over-year, an 18 million tonne reduction in Russian wheat production and a significant decline in Argentine corn and soybean production in 2017/18.
US corn and soybean condition ratings continue to be above average. As a result, growers have invested in plant health and nutritional products to preserve yield potential.
US crops are developing at a significantly faster than average rate. This is expected to be positive for the fall fertilizer application window, but is still dependent on weather conditions through the fall season.
Crop protection demand in the third quarter has been supported by missedpre-seedburn-off and resulting increased weed pressure in the US.
Western Canada and Australia have recently received timely precipitation, which has provided support to crop input demand; however, there continues to be dry areas in both regions.
Potash
Strong global potash demand in major spot markets has maintained tight supply and provided support for potash prices. Many global exporters are reportedly sold out until the fourth quarter of 2018. We increased our projection of 2018 global potash shipments between 65 and 67 million tonnes.
Global potash projects continue toramp-up, but in most cases at a slower pace than anticipated and the impact of this incremental production has been more than offset by strong demand and reduced production from some regions.
Demand for summer fill in North America has been strong and indicates the potential for a robust fall application season.
Brazilian agricultural fundamentals are strong, driven by supportive local soybean prices; however, there is uncertainty about the cost of inland freight as a result of truckers’ disputes. While there have been some shipping bottlenecks, there have been improvements in recent weeks and we expect a strong application season driven by increased soybean area.
Nitrogen
Tight urea supply in China, closures of ammonia and urea capacity in Ukraine, uncertainty regarding Iranian nitrogen availability and seasonal maintenance shut-downs have more than offset capacity additions, providing support for nitrogen prices.
In addition to tighter supply from existing producers, there are fewer projects under construction in 2018 and they are experiencing delays, which has been particularly supportive of ammonia prices of late.
North American nitrogen supplies were lower than estimated demand in the 2017/18 fertilizer year, driven by a more than 25 percent decline in offshore imports year-over-year.
Higher production costs for marginal producers are also supporting nitrogen prices as natural gas prices in Europe are up between 35 and 50 percent year-over-year, while anthracite coal prices in China are up approximately 25 percent.
26 | Nutrien 2018 Second Quarter Report |
Phosphate and Sulfate
Slower than expectedramp-up of new capacity, combined with plant closures and higher raw material costs year-over-year, continue to support phosphate prices.
Financial Outlook and Guidance
Taking the above factors into consideration, we have revised our annual guidance ranges as follows:
We raised our guidance range for Potash sales volumes and EBITDA to 12.3 to 12.8 million tonnes and $1.4 to $1.6 billion, respectively. Nitrogen sales volumes are now expected to be 10.3 to 10.7 million tonnes and we raised the bottom end of our EBITDA guidance range from $1.0 billion to $1.1 billion. Phosphate EBITDA guidance has increased to $0.2 to $0.3 billion (up from $0.2 to $0.25 billion).
Our effective tax rate on continuing operations range has been increased to 23 to 25 percent due to changes in forecasted earnings mix.
Dividend income from investments in APC and SQM is recorded net of tax in discontinued operations and is now expected to approximate $130 million. This is included in our adjusted annual earnings per share guidance, but is not included in adjusted consolidated EBITDA guidance.
Based on these factors, we are increasing our full-year 2018 adjusted earnings guidance to $2.40 to $2.70 per share (previously $2.20 to $2.60 per share) and adjusted consolidated EBITDA guidance to $3.7 to $4.0 billion (previously $3.3 to $3.7 billion).
Excluded from guidance are expected costs to achieve these ongoing synergies of $50 to $75 million, share-based compensation as well as the impact of incremental depreciation and amortization of $150 to $225 million resulting from the fair valuing of Agrium’s assets and liabilities as of January 1, 2018 in accordance with purchase accounting.
Controls and Procedures
Disclosure Controls and Procedures
There are inherent limitations to the effectiveness of any system of disclosure controls and procedures, including the possibility of human error and the circumvention or overriding of the controls and procedures. Accordingly, even effective disclosure controls and procedures can only provide reasonable assurance of achieving their control objectives. As of June 30, 2018, the Chief Executive Officer and Chief Financial Officer concluded that the disclosure controls and procedures were effective to provide reasonable assurance that information required to be disclosed in the reports the company files and submits under securities legislation is
recorded, processed, summarized and reported as and when required and that such information is accumulated and communicated to our management, including our Chief Executive Officer and Chief Financial Officer, as appropriate to allow timely decisions regarding required disclosure.
There has been no change in our internal controls over financial reporting during the quarter ended June 30, 2018 that has materially affected, or is reasonably likely to materially affect, our internal control over financial reporting.
Nutrien 2018 Second Quarter Report | 27 |
Forward-Looking Statements
This 2018 Second Quarter Interim Report, including the “Agriculture Fundamentals Market Outlook”, “Potash Market Outlook”, “Nitrogen Market Outlook”, “Phosphate and Sulfate Market Outlook” and “Financial Outlook and Guidance” sections of “Management’s Discussion & Analysis of Financial Condition and Results of Operations,” contains and incorporates by reference forward-looking statements or forward-looking information (within the meaning of the US Private Securities Litigation Reform Act of 1995, and other US federal securities laws and applicable Canadian securities laws) (“forward-looking statements”) that relate to future events or our future financial performance. These statements can be identified by expressions of belief, expectation or intention, as well as those statements that are not historical fact. These statements often contain words such as “should,” “could,” “expect,” “may,” “anticipate,” “forecast,” “believe,” “intend,” “estimates,” “plans” and similar expressions. These statements are based on certain factors and assumptions as set forth in this Quarterly Report, including with respect to: foreign exchange rates, expected synergies, expected growth, results of operations, performance, business prospects and opportunities, and effective tax rates. While the company considers these factors and assumptions to be reasonable based on information currently available, they may prove to be incorrect. Forward-looking statements are subject to risks and uncertainties that are difficult to predict. The results or events set forth in forward-looking statements may differ materially from actual results or events. Several factors could cause actual results or events to differ materially from those expressed in forward-looking statements, including, but not limited to, the following: a number of matters relating to the Merger, including the failure to realize the anticipated benefits of the Merger and to successfully integrate PotashCorp and Agrium, certain costs that we may incur as a result of the Merger, the ability to retain personnel as a result of the Merger and the effect of the Merger on our business and operations generally; risks related to diversion of management time from ongoing business operations due to integration related activities related to the Merger; the risk that our credit ratings may be downgraded or there may be adverse conditions in the credit markets; any significant impairment of the carrying amount of certain of our assets; variations from our assumptions with respect to foreign exchange rates, expected growth, results of operations, performance, business prospects and opportunities, and effective tax rates; fluctuations in supply and demand in the fertilizer, sulfur and petrochemical markets; changes in competitive pressures, including pricing pressures; risks and
uncertainties related to any operating and workforce changes made in response to our industry and the markets we serve, including mine and inventory shutdowns; adverse or uncertain economic conditions and changes in credit and financial markets; economic and political uncertainty around the world; changes in capital markets; the results of sales contract negotiations; unexpected or adverse weather conditions; changes in currency and exchange rates; risks related to reputational loss; the occurrence of a major safety incident; inadequate insurance coverage for a significant liability; inability to obtain relevant permits for our operations; catastrophic events or malicious acts, including terrorism; certain complications that may arise in our mining process, including water inflows; risks and uncertainties related to our international operations and assets; our ownership ofnon-controlling equity interests in other companies; our prospects to reinvest capital in strategic opportunities and acquisitions; risks associated with natural gas and other hedging activities; security risks related to our information technology systems; imprecision in mineral reserve and resources estimates; costs and availability of transportation and distribution for our raw materials and products, including railcars and ocean freight; changes in, and the effects of, government policies and regulations; earnings and the decisions of taxing authorities which could affect our effective tax rates; increases in the price or reduced availability of the raw materials that we use; our ability to attract, develop, engage and retain skilled employees; strikes or other forms of work stoppage or slowdowns; rates of return on, and the risks associated with, our investments and capital expenditures; timing and impact of capital expenditures; the impact of further innovation; adverse developments in new and pending legal proceedings or government investigations; and violations of our governance and compliance policies. These risks and uncertainties and additional risks and uncertainties can be found in Schedule B of the BAR and in our filings with the SEC and the Canadian provincial securities commissions. The purpose of our expected diluted earnings per share, adjusted consolidated EBITDA and EBITDA by segment guidance range is to assist readers in understanding our expected and targeted financial results, and this information may not be appropriate for other purposes. Forward-looking statements in or incorporated into this report are given only as at the date of this report or the document incorporated into this report and the company disclaims any obligation to update or revise any forward-looking statements, whether as a result of new information, future events or otherwise, except as required by law.
28 | Nutrien 2018 Second Quarter Report |
Appendix
Non-IFRS Financial Measures
Nutrien uses EBITDA (anon-IFRS financial measure) as a supplemental measure. EBITDA is frequently used by investors and analysts for valuation purposes when multiplied by a factor to estimate the enterprise value of a company. EBITDA is also used in determining annual incentive compensation for certain management employees. EBITDA is calculated as net earnings from continuing operations before finance costs, income tax expense and depreciation and amortization.
Generally, this measure is a numerical measure of a company’s performance, financial position or cash flows that either excludes or includes amounts that are not normally excluded or included in the most directly comparable measure calculated and presented in accordance with IFRS. EBITDA is not a measure of financial performance (nor does it have a standardized meaning) under IFRS. In evaluating this measure, investors should consider that the methodology applied in calculating such measures may differ among companies and analysts.
EBITDA
Three Months Ended June 30, 2018 | Six Months Ended June 30, 2018 | |||||||
Net earnings from continuing operations | $ | 741 | $ | 740 | ||||
Finance costs | 133 | 252 | ||||||
Income tax expense | 277 | 235 | ||||||
Depreciation and amortization | 356 | 767 | ||||||
EBITDA | $ | 1,507 | $ | 1,994 | ||||
Nutrien also usesnon-IFRS combined historical information in the evaluation of its operations and financial position. This information is useful as it provides a measure of what the combined results may have been had PotashCorp and Agrium merged on January 1, 2017. The combined historical results for Nutrien were calculated by adding the historical IFRS financial statements prepared by PotashCorp and Agrium and then eliminating intercompany transactions and reclassifying line items to conform with Nutrien’s financial statement presentation. This combined historical information does not include, among other things, estimated cost synergies, adjustments related to restructuring or integration activities, adjustments related to the PPA and the impact of discontinued operations.
The combined historical information may differ from the Nutrien pro forma earnings and balance sheet presented in the BAR as the pro forma information therein required certain adjustments under applicable securities laws and accounting standards that the company believes do not provide as useful a measure as the combined historical financial information. The primary differences in the statement of earnings were that pro forma finance costs were reduced by the amortization of the change in carrying amount of Agrium’s debt resulting from the PPA and the pro forma other expenses were adjusted to remove any Merger related costs. There were no comparable adjustments in the combined historical financial information. The primary differences in the balance sheet were the pro forma adjustments for the estimated proceeds from the sale of SQM, APC, ICL and Agrium’s Conda Idaho phosphate production facility and adjacent phosphate mineral rights at December 31, 2017 while there was no adjustment in the combined historical financial information and the PPA in the pro forma was largely allocated to goodwill as fewer provisional fair value adjustments were known at the time of its preparation.
The company uses both IFRS and certainnon-IFRS measures to assess performance. Management believes thenon-IFRS measures provide useful supplemental information to investors in order that they may evaluate Nutrien’s financial performance using the same measures as management. Management believes that, as a result, the investor is afforded greater transparency in assessing the financial performance of the company. Thesenon-IFRS financial measures should not be considered as a substitute for, nor superior to, measures of financial performance prepared in accordance with IFRS.
Refer to the Appendix starting on page 33 of our first quarter interim report for the Nutrien combined historical balance sheet as at December 31, 2017 and the Nutrien combined historical statement of earnings and EBITDA for the three months ended March 31, 2017, June 30, 2017, September 30, 2017 and December 31, 2017.
Following is the combined historical summary of cash flow information and statement of other comprehensive income for the three and six month periods ended June 30, 2017, as well as, combined historical segment EBITDA for the six months ended June 30, 2017.
Nutrien 2018 Second Quarter Report | 29 |
Nutrien Combined Historical Summary Cash Flow Information for the Three Months Ended June 30, 2017
Historical PotashCorp | Historical Agrium | Nutrien | ||||||||||
Cash provided by (used in) operating activities | $ | 328 | $ | (115) | $ | 213 | ||||||
Cash used in investing activities | (130 | ) | (245 | ) | (375 | ) | ||||||
Cash (used in) provided by financing activities | (163 | ) | 429 | 266 | ||||||||
Effect of exchange rate changes on cash and cash equivalents | – | (12 | ) | (12 | ) | |||||||
Increase in cash and cash equivalents | $ | 35 | $ | 57 | $ | 92 | ||||||
Nutrien Combined Historical Summary Cash Flow Information for the Six Months Ended June 30, 2017
Historical PotashCorp | Historical Agrium | Nutrien | ||||||||||
Cash provided by operating activities | $ | 551 | $ | 63 | $ | 614 | ||||||
Cash used in investing activities | (262 | ) | (432 | ) | (694 | ) | ||||||
Cash (used in) provided by financing activities | (224 | ) | 269 | 45 | ||||||||
Effect of exchange rate changes on cash and cash equivalents | – | 7 | 7 | |||||||||
Increase (decrease) in cash and cash equivalents | $ | 65 | $ | (93) | $ | (28) | ||||||
Nutrien Combined Historical Statement Of Other Comprehensive Income for the Three Months Ended June 30, 2017
Historical PotashCorp | Historical Agrium1 | Nutrien | ||||||||||
Items that will not be reclassified to net earnings | ||||||||||||
Financial instruments measured at fair value through other comprehensive income | ||||||||||||
Net fair value gain during the period | $ 60 | $ – | $ �� 60 | |||||||||
Items that may be subsequently reclassified to net earnings | ||||||||||||
Cash flow hedges | ||||||||||||
Cash flow hedges | (2 | ) | (4 | ) | (6 | ) | ||||||
Reclassification to earnings of net loss | 11 | – | 11 | |||||||||
Foreign currency translation | ||||||||||||
Gains on translation of net foreign operations | – | 100 | 100 | |||||||||
Reclassification to earnings | – | 1 | 1 | |||||||||
Associates and joint ventures | ||||||||||||
Share of other comprehensive loss | – | (20 | ) | (20 | ) | |||||||
Other comprehensive income | $ 69 | $ 77 | $ 146 | |||||||||
1 | Where applicable, amounts were aggregated with their deferred tax effects to conform to Nutrien’s method of presentation. |
Nutrien Combined Historical Statement Of Other Comprehensive Income for the Six Months Ended June 30, 2017
Historical PotashCorp | Historical Agrium1 | Nutrien | ||||||||||
Items that will not be reclassified to net earnings | ||||||||||||
Net actuarial loss on defined benefit plans | $ – | $ (2) | $ (2) | |||||||||
Financial instruments measured at fair value through other comprehensive income | ||||||||||||
Net fair value gain during the period | 93 | – | 93 | |||||||||
Items that may be subsequently reclassified to net earnings | ||||||||||||
Cash flow hedges | ||||||||||||
Cash flow hedges | (7 | ) | (22 | ) | (29 | ) | ||||||
Reclassification to earnings of net loss | 19 | – | 19 | |||||||||
Foreign currency translation | ||||||||||||
Gains on translation of net foreign operations | – | 165 | 165 | |||||||||
Reclassification to earnings | – | 6 | 6 | |||||||||
Associates and joint ventures | ||||||||||||
Share of other comprehensive loss | – | (41 | ) | (41 | ) | |||||||
Other | 3 | – | 3 | |||||||||
Other comprehensive income | $ 108 | $ 106 | $ 214 | |||||||||
1 | Where applicable, amounts were aggregated with their deferred tax effects to conform to Nutrien’s method of presentation. |
30 | Nutrien 2018 Second Quarter Report |
Nutrien Combined Historical Statement Of Earnings and EBITDA for the Six Months Ended June 30, 2017
Retail | Potash | Nitrogen | Phosphate and Sulfate | Others | Eliminations | Nutrien | ||||||||||||||||||||||
Sales | $ | 7,947 | $ | 1,172 | $ | 1,719 | $ | 744 | $ | – | $ | (497 | ) | $ | 11,085 | |||||||||||||
Freight, transportation and distribution | – | (168 | ) | (193 | ) | (88 | ) | – | – | (449 | ) | |||||||||||||||||
Cost of goods sold | (6,214 | ) | (542 | ) | (1,142 | ) | (620 | ) | – | 511 | (8,007 | ) | ||||||||||||||||
Gross margin | 1,733 | 462 | 384 | 36 | – | 14 | 2,629 | |||||||||||||||||||||
Selling expenses | (1,022 | ) | (7 | ) | (16 | ) | (5 | ) | 8 | – | (1,042 | ) | ||||||||||||||||
General and administrative expenses | (53 | ) | (2 | ) | (5 | ) | (6 | ) | (136 | ) | – | (202 | ) | |||||||||||||||
Provincial mining and other taxes | – | (82 | ) | – | – | – | – | (82 | ) | |||||||||||||||||||
Earnings of equity-accounted investees | 10 | – | 22 | – | – | – | 32 | |||||||||||||||||||||
Other expenses | (11 | ) | (11 | ) | (19 | ) | (5 | ) | (72 | ) | – | (118 | ) | |||||||||||||||
Earnings (loss) before finance costs and income taxes | 657 | 360 | 366 | 20 | (200 | ) | 14 | 1,217 | ||||||||||||||||||||
Finance costs | – | – | – | – | (244 | ) | – | (244 | ) | |||||||||||||||||||
Earnings (loss) before income taxes | 657 | 360 | 366 | 20 | (444 | ) | 14 | 973 | ||||||||||||||||||||
Income taxes | – | – | – | – | (171 | ) | – | (171 | ) | |||||||||||||||||||
Net earnings (loss) from continuing operations | $ | 657 | $ | 360 | $ | 366 | $ | 20 | $ | (615 | ) | $ | 14 | $ | 802 | |||||||||||||
Finance costs | – | – | – | – | 244 | – | 244 | |||||||||||||||||||||
Income taxes | – | – | – | – | 171 | – | 171 | |||||||||||||||||||||
Depreciation and amortization | 142 | 172 | 144 | 125 | 27 | – | 610 | |||||||||||||||||||||
EBITDA | $ | 799 | $ | 532 | $ | 510 | $ | 145 | $ | (173 | ) | $ | 14 | $ | 1,827 | |||||||||||||
EBITDA Reconciliation to historical | Nutrien | |||||||||||||||||||||||||||
PotashCorp | $ | 761 | ||||||||||||||||||||||||||
Agrium | 1,208 | |||||||||||||||||||||||||||
Combined EBITDA | 1,969 | |||||||||||||||||||||||||||
Adjustments: | ||||||||||||||||||||||||||||
Remove APC and SQM | (84 | ) | ||||||||||||||||||||||||||
Remove ICL | (13 | ) | ||||||||||||||||||||||||||
Remove Conda | (23 | ) | ||||||||||||||||||||||||||
Retail finance costs from operations | (22 | ) | ||||||||||||||||||||||||||
Nutrien EBITDA | $ | 1,827 |
Nutrien 2018 Second Quarter Report | 31 |
Nutrien Combined Historical Retail Segment EBITDA for the Six Months Ended June 30, 2017
Historical PotashCorp | Historical Agrium | Adjustments | Nutrien | |||||||||||||
Sales | ||||||||||||||||
External | $ | – | $ | 7,921 | $ | – | $ | 7,921 | ||||||||
Intersegment | – | 26 | – | 26 | ||||||||||||
Total Sales | – | 7,947 | – | 7,947 | ||||||||||||
Cost of goods sold | – | (6,214 | ) | – | (6,214 | ) | ||||||||||
Gross margin | – | 1,733 | – | 1,733 | ||||||||||||
Selling expenses | – | (1,022 | ) | – | (1,022 | ) | ||||||||||
General and administrative expenses | – | (53 | ) | – | (53 | ) | ||||||||||
Earnings of equity-accounted investees | – | 10 | – | 10 | ||||||||||||
Other income (expenses) | – | 11 | (22 | ) 1 | (11 | ) | ||||||||||
Earnings before finance costs and income taxes | – | 679 | (22 | ) | 657 | |||||||||||
Depreciation and amortization | – | 142 | – | 142 | ||||||||||||
EBITDA | $ | – | $ | 821 | $ | (22 | ) | $ | 799 | |||||||
1 | Finance costs associated with retail operations will be allocated to retail segment, and presented in other income (expenses). |
Nutrien Combined Historical Potash Segment EBITDA For the Six Months Ended June 30, 2017
Historical PotashCorp | Historical Agrium | Adjustments | Nutrien | |||||||||||||
Sales | ||||||||||||||||
External | $ | 890 | $ | 206 | $ | – | $ | 1,096 | ||||||||
Intersegment | – | 76 | – | 76 | ||||||||||||
Total Sales | 890 | 282 | – | 1,172 | ||||||||||||
Freight, transportation and distribution | (114 | ) | – | (54 | ) 1 | (168 | ) | |||||||||
Cost of goods sold | (403 | ) | (203 | ) | 64 | 1, 4 | (542 | ) | ||||||||
Gross margin | 373 | 79 | 10 | 462 | ||||||||||||
Selling expenses | – | (3 | ) | (4 | ) 4 | (7 | ) | |||||||||
General and administrative expenses | – | (2 | ) | – | 3, 4 | (2 | ) | |||||||||
Provincial mining and other taxes | (78 | ) | – | (4 | ) 2, 4 | (82 | ) | |||||||||
Other expenses | – | (7 | ) | (4 | ) 2, 4 | (11 | ) | |||||||||
Earnings before finance costs and income taxes | 295 | 67 | (2 | ) | 360 | |||||||||||
Depreciation and amortization | 111 | 61 | – | 172 | ||||||||||||
EBITDA | $ | 406 | $ | 128 | $ | (2 | ) | $ | 532 | |||||||
1 | To separately present legacy Agrium direct and indirect freight costs. |
2 | To separately present legacy Agrium provincial mining taxes. |
3 | To reclassify legacy Agrium costs related to business support functions to others. |
4 | To allocate legacy PotashCorp all others segment selling and administrative expenses to segment. |
Nutrien Combined Historical Nitrogen Segment EBITDA for the Six Months Ended June 30, 2017
Historical PotashCorp | Historical Agrium | Adjustments | Nutrien | |||||||||||||
Sales | ||||||||||||||||
External | $ | 759 | $ | 459 | $ | 235 | 2 | $ | 1,453 | |||||||
Intersegment | 39 | 149 | 78 | 2, 4 | 266 | |||||||||||
Total Sales | 798 | 608 | 313 | 1,719 | ||||||||||||
Freight, transportation and distribution | (64 | ) | – | (129 | ) 1 | (193 | ) | |||||||||
Cost of goods sold | (549 | ) | (418 | ) | (155 | ) 1, 2, 4 | (1,122 | ) | ||||||||
Cost of intersegment purchases | (20 | ) | – | – | (20 | ) | ||||||||||
Gross margin | 165 | 190 | 29 | 384 | ||||||||||||
Selling expenses | – | (6 | ) | (10 | ) 2, 5 | (16 | ) | |||||||||
General and administrative expenses | – | (5 | ) | – | 2, 3, 5 | (5 | ) | |||||||||
Earnings of equity-accounted investees | – | – | 22 | 2, 5 | 22 | |||||||||||
Other expenses | – | (15 | ) | (4 | ) 2, 5 | (19 | ) | |||||||||
Earnings before finance costs and income taxes | 165 | 164 | 37 | 366 | ||||||||||||
Depreciation and amortization | 97 | 42 | 5 | 2, 4 | 144 | |||||||||||
EBITDA | $ | 262 | $ | 206 | $ | 42 | $ | 510 | ||||||||
1 | To separately present legacy Agrium direct and indirect freight costs. |
2 | To reclassify legacy wholesale other Agrium segment between nitrogen and phosphate and sulfate. |
3 | To reclassify legacy Agrium costs related to business support functions to others. |
4 | To record profit on legacy Agrium transfers of ammonia to phosphate and sulfate segment not previously recorded. |
5 | To allocate legacy PotashCorp all others segment selling and administrative expenses to segment. |
32 | Nutrien 2018 Second Quarter Report |
Nutrien Combined Historical Phosphate And Sulfate Segment EBITDA for the Six Months Ended June 30, 2017
Historical PotashCorp | Historical Agrium | Adjustments | Nutrien | |||||||||||||
Sales | ||||||||||||||||
External | $ | 583 | $ | 176 | $ | (105 | )2, 3, 6 | $ | 654 | |||||||
Intersegment | – | 95 | (5 | )2, 3 | 90 | |||||||||||
Total Sales | 583 | 271 | (110 | ) | 744 | |||||||||||
Freight, transportation and distribution | (71 | ) | – | (17 | )1, 3, 6 | (88 | ) | |||||||||
Cost of goods sold | (508 | ) | (256 | ) | 163 | 1, 2, 3, 4, 6 | (601 | ) | ||||||||
Cost of intersegment purchases | (19 | ) | – | – | (19 | ) | ||||||||||
Gross margin | (15 | ) | 15 | 36 | 36 | |||||||||||
Selling expenses | – | (2 | ) | (3 | )3, 5 | (5 | ) | |||||||||
General and administrative expenses | – | (2 | ) | (4 | )2, 5 | (6 | ) | |||||||||
Other expenses | – | (4 | ) | (1 | )2, 3, 5 | (5 | ) | |||||||||
(Loss) earnings before finance costs and income taxes | (15 | ) | 7 | 28 | 20 | |||||||||||
Depreciation and amortization | 114 | 33 | (22 | )2, 3, 4 | 125 | |||||||||||
EBITDA | $ | 99 | $ | 40 | $ | 6 | $ | 145 | ||||||||
1 | To separately present legacy Agrium direct and indirect freight costs. |
2 | To reclassify legacy wholesale other Agrium segment between nitrogen and phosphate and sulfate. |
3 | To remove the operating results of Conda from legacy Agrium historical financial statements. |
4 | To record incremental cost on legacy Agrium transfers of ammonia to phosphate and sulfate segment not previously recorded. |
5 | To allocate legacy PotashCorp all others segment selling and administrative expenses to segment. |
6 | To reclassify certain phosphate products to others segment. |
Nutrien Combined Historical Others Segment And Eliminations EBITDA for the Six Months Ended June 30, 2017
Historical PotashCorp | Historical Agrium | Adjustments | Nutrien | |||||||||||||
Sales | ||||||||||||||||
Intersegment | $ | – | $ | (431 | ) | $ | (66 | )1, 2, 9, 11 | $ | (497 | ) | |||||
Total Sales | – | (431 | ) | (66 | ) | (497 | ) | |||||||||
Cost of goods sold | – | 445 | 66 | 1, 2, 9, 11 | 511 | |||||||||||
Gross margin | – | 14 | – | 14 | ||||||||||||
Selling and administrative expenses | (98 | ) | – | 98 | 10 | – | ||||||||||
Selling expenses | – | 9 | (1 | )10 | 8 | |||||||||||
General and administrative expenses | – | (55 | ) | (81 | )4, 5, 10 | (136 | ) | |||||||||
Share-based payments | – | – | – | 4 | – | |||||||||||
Earnings of equity-accounted investees | 88 | (1 | ) | (87 | )7, 10 | – | ||||||||||
Dividend income | 12 | – | (12 | )8 | – | |||||||||||
Other expenses | (26 | ) | (39 | ) | (7 | )10, 12 | (72 | ) | ||||||||
Loss before finance costs and income taxes | (24 | ) | (72 | ) | (90 | ) | (186 | ) | ||||||||
Finance costs | (120 | ) | (47 | ) | (77 | )3, 6 | (244 | ) | ||||||||
Finance costs related to long-term debt | – | (99 | ) | 99 | 6 | – | ||||||||||
Loss before income taxes | (144 | ) | (218 | ) | (68 | ) | (430 | ) | ||||||||
Income tax expense (recovery) | 49 | (219 | ) | (1 | )7, 11 | (171 | ) | |||||||||
Net loss from continuing operations | (95 | ) | (437 | ) | (69 | ) | (601 | ) | ||||||||
Finance costs | 120 | 47 | 77 | 3, 6 | 244 | |||||||||||
Finance costs related to long-term debt | – | 99 | (99 | )6 | – | |||||||||||
Income taxes | (49 | ) | 219 | 1 | 7, 11 | 171 | ||||||||||
Depreciation and amortization | 18 | 9 | – | 27 | ||||||||||||
EBITDA | $ | (6 | ) | $ | (63 | ) | $ | (90 | ) | $ | (159 | ) | ||||
1 | To eliminate sales made from PotashCorp to Agrium. |
2 | To eliminate incremental sales and cost of goods sold related to ammonia transfers to phosphate and sulfate segment. |
3 | Finance costs associated with retail operations will be allocated to retail segment, and presented in other expenses. |
4 | To reclassify legacy Agrium’s share-based payments to general and administrative expenses. |
5 | To reclassify legacy Agrium costs related to business support functions to others. |
6 | To reclassify finance costs related to long-term debt to finance costs. |
7 | To eliminate the earnings of legacy PotashCorp’s investments in SQM and APC. |
8 | To eliminate the earnings of legacy PotashCorp’s investment in ICL. |
9 | To eliminate legacy PotashCorp intersegment sales between nitrogen and phosphate and sulfate. |
10 | To allocate legacy PotashCorp all others segment selling and administrative expenses to segments. |
11 | To remove intersegment sales related to Conda. |
12 | To reclassify certain phosphate products to others segment. |
Nutrien 2018 Second Quarter Report | 33 |