Exhibit 99.1
Management’s Discussion and Analysis
of Financial Condition and Results of Operations (In US Dollars)
The following management’s discussion and analysis (MD&A) is the responsibility of management and is dated November 5, 2018. The Board of Directors (Board) carries out its responsibility for review of this disclosure principally through its audit committee, comprised exclusively of independent directors. The audit committee reviews and, prior to its publication, approves this disclosure, pursuant to the authority delegated to it by the Board. The term “Nutrien” refers to Nutrien Ltd. and the terms “we,” “us,” “our,” “Nutrien” and “the company” refer to Nutrien and, as applicable, Nutrien and its direct and indirect subsidiaries as a group, including, for greater clarity, Potash Corporation of Saskatchewan Inc. (PotashCorp) and Agrium Inc. (Agrium). This MD&A is based on the company’s third quarter unaudited interim condensed consolidated financial statements (interim financial statements) which were based on International Financial Reporting Standards as issued by the International Accounting Standards Board (IFRS) and prepared in accordance with International Accounting Standard 34, “Interim Financial Reporting”, unless otherwise stated.
This MD&A contains certain financial measures that do not have a standard meaning under IFRS. See“Non-IFRS Financial Measures” on page 29. This MD&A also contains forward-looking statements. See “Forward-Looking Statements” on page 28. All references to per share amounts pertain to diluted net earnings per share. Financial data in this report are stated in US dollars unless otherwise noted.
Additional information relating to Nutrien (which, except as otherwise noted, is not incorporated by reference herein), including our first quarter 2018 unaudited interim report (first quarter interim report), second quarter 2018 unaudited interim report (second quarter interim report), and Business Acquisition Report dated February 20, 2018 (BAR), and the Annual Information Forms, consolidated financial statements and MD&A for each of PotashCorp and Agrium for the year ended December 31, 2017, can be found on SEDAR at www.sedar.com and on EDGAR at www.sec.gov. The company is a foreign private issuer under the rules and regulations of the US Securities and Exchange Commission (the SEC).
Nutrien and Our Operating Environment
We are a world-class integrated provider of crop nutrients and services, playing a critical role in helping growers increase food production in a sustainable manner. We directly supply growers through our leading global retail (R) network – including crop nutrients, crop protection products, seed, as well as agronomic and application services. We operate approximately 1,600 retail facilities across the US, Canada, Australia and South America, servicing over 500,000 growers.
Nutrien is the world’s largest crop nutrient company by capacity, producing the crop nutrients: potash (K), nitrogen (N) and phosphate (P). We produce and distribute over 26 million tonnes of crop nutrient products from our facilities in Canada, the US and Trinidad, and our Canadian potash operations represent overone-fifth of global nameplate capacity. Detailed descriptions of our operating environments can be found on pages 1 and 2 in our first quarter interim report.
Strategy
Nutrien has significant competitive advantages across our global footprint of operations. We are focused on supplying customers with an integrated portfolio of agricultural products, services and solutions that are designed to increase productivity and provide superior returns for our shareholders. Our company plays an essential role in helping farmers meet the ever-growing global demand for crops and food, and we are committed to doing so safely and sustainably.
Our strategic pillars guide our value creation efforts:
| • | Strategically Allocate Capital: Maximize long-term total shareholder returns by utilizing a‘compete-for-cash’ philosophy. |
| • | Invest in Growth & Innovation: Identify and pursue value-enhancing opportunities, with a focus on expanding our leading retail business and investing intop-tier assets. |
| • | Drive Integration & Optimization: Unlock potential and improve our existing asset base by integrating our people, processes and operations with a focus on enhancing safety, reliability and margin expansion across the portfolio. |
| • | Engaged Employees & Stakeholders: Develop a talented, engaged workforce with a focus on collaboration across our broad stakeholder base to earn trust and support for our long-term business plans. |
| 1 | Nutrien 2018 Third Quarter Report |
Risk Management
In the normal course of operations, our business activities expose us to risk. We believe the identification and management of risk and uncertainties is crucial to protecting, optimizing and creating long-term shareholder value. Certain risks and uncertainties that could affect our business and financial results are set out in Schedule B of our BAR.
The company is not aware of any significant changes to its risk factors from those disclosed at that time.
Key Performance Drivers
Through our integrated value model, we set, evaluate and refine our targets to drive improvements that benefit all those impacted by our business. We demonstrate our accountability by tracking and reporting our performance against targets related to each strategic priority. A summary of our progress, as of the date of this report, against our annual targets is as follows:
Synergy Program Commitments
| Category | December 31, 2019 Synergy | December 31, 2019 Synergy Run Rate – New Target | Synergy Run 2018 | |||||||||
Distribution and Retail | ~$ 150 million | ~$ 150 million | $ | 81 million | ||||||||
Production Optimization | ~$ 125 million | ~$ 200 million | $ | 119 million | ||||||||
SG&A and other Optimization1 | ~$ 125 million | ~$ 150 million | $ | 142 million | ||||||||
Procurement | ~$ 100 million | ~$ 100 million | $ | 59 million | ||||||||
Total | $ 500 million | $ 600 million | $ | 401 million | ||||||||
| 1 | Other includes synergies related to administrative functions which may not appear in selling expenses and/or general and administrative expenses (SG&A) in the interim financial statements. |
Nutrien has achieved synergies from the Merger ahead of schedule, capturing $401 million inrun-rate synergies as at September 30, 2018. We now expect to achieve $500 million inrun-rate synergies by the end of 2018, up from the second quarter estimate of $350 million. We are raising guidance on the annualrun-rate synergy target to $600 million by the end of 2019.
We expect to report other key performance drivers (KPDs) in our annual report.
Performance Overview
For an understanding of trends, events, uncertainties and the effect of critical accounting estimates on our results and financial condition, the following discussion and analysis should be read carefully, together with our interim financial statements.
Three and Nine Months Ended September 30, 2018 Results
| Dollars (millions), except per share amounts | Three Months Ended September 30, 2018 | Nine Months Ended September 30, 2018 | ||||||
Net (loss) earnings per share (EPS) – diluted | $ | (1.70 | ) | $ | 0.59 | |||
Net loss from continuing operations | $ | (1,067 | ) | $ | (327 | ) | ||
Adjusted EBITDA1 | $ | 839 | $ | 3,012 | ||||
| 1 | Net (loss) earnings from continuing operations before finance costs, income tax (recovery) expense and depreciation and amortization, impairment, Merger and related costs, share-based compensation and gain on curtailment of defined benefit pension and other post-retirement benefit plans (Curtailment Gain). Refer to “Non-IFRS Financial Measures” section on page 29 for details. |
| Nutrien 2018 Third Quarter Report | 2 |
Overview of Actual Results
Grey shading has been used throughout this MD&A to emphasize required IFRS comparative figures, which are amounts previously reported by PotashCorp, as it is the continuing reporting entity for accounting purposes for the three and nine months ended September 30, 2018 (unless otherwise stated).
The Nutrien comparative figures in this MD&A are the combined historical results of PotashCorp and Agrium for the three and nine months ended September 30, 2017 (unless otherwise stated) and certain of these are considered to benon-IFRS measures. Refer to“Non-IFRS Financial Measures” section starting on page 29 for detailed information.
| Three Months Ended September 30 | ||||||||||||||||||||||||||||
| Nutrien | Nutrien1 | PotashCorp2 | ||||||||||||||||||||||||||
| Dollars (millions), except per share amounts | 2018 | 2017 | Change | % Change | 2017 | Change | % Change | |||||||||||||||||||||
| Sales | $ | 4,034 | $ | 3,586 | $ | 448 | 12 | $ | 1,234 | $ | 2,800 | 227 | ||||||||||||||||
| Gross margin | 1,155 | 793 | 362 | 46 | 233 | 922 | 396 | |||||||||||||||||||||
| (Loss) earnings before finance costs and income taxes (EBIT) | (1,359 | ) | 74 | (1,433 | ) | n/m | 100 | (1,459 | ) | n/m | ||||||||||||||||||
| (Loss) earnings before income taxes | (1,501 | ) | (61 | ) | (1,440 | ) | n/m | 40 | (1,541 | ) | n/m | |||||||||||||||||
| Net (loss) earnings from continuing operations | (1,067 | ) | (53 | ) | (1,014 | ) | n/m | 16 | (1,083 | ) | n/m | |||||||||||||||||
| Net earnings from discontinued operations | 23 | n/a | n/a | n/a | 37 | (14 | ) | (38 | ) | |||||||||||||||||||
| Net (loss) earnings | (1,044 | ) | n/a | n/a | n/a | 53 | (1,097 | ) | n/m | |||||||||||||||||||
| Adjusted EBITDA1 | 839 | 474 | 365 | 77 | n/a | n/a | n/a | |||||||||||||||||||||
| Net (loss) earnings per share from continuing operations – diluted | (1.74 | ) | n/a | n/a | n/a | 0.02 | (1.76 | ) | n/m | |||||||||||||||||||
| Net earnings per share from discontinued operations – diluted | 0.04 | n/a | n/a | n/a | 0.04 | – | – | |||||||||||||||||||||
| Net (loss) earnings per share – diluted | (1.70 | ) | n/a | n/a | n/a | 0.06 | (1.76 | ) | n/m | |||||||||||||||||||
| Other comprehensive income | 1 | 52 | (51 | ) | (98 | ) | 42 | (41 | ) | (98 | ) | |||||||||||||||||
| 1 | Refer to“Non-IFRS Financial Measures” section on page 29 for details. |
| 2 | Certain amounts have been reclassified to conform to the current period’s presentation. See note 16 to the interim financial statements. |
| n/m | = not meaningful |
| n/a | = not available |
| 1 | Refer to“Non-IFRS Financial Measures” section on page 29 for details. |
| 3 | Nutrien 2018 Third Quarter Report |
| Nine Months Ended September 30 | ||||||||||||||||||||||||||||
| Nutrien | Nutrien1 | PotashCorp2 | ||||||||||||||||||||||||||
| Dollars (millions), except per share amounts | 2018 | 2017 | Change | % Change | 2017 | Change | % Change | |||||||||||||||||||||
| Sales | $ | 15,874 | $ | 14,671 | $ | 1,203 | 8 | $ | 3,466 | $ | 12,408 | 358 | ||||||||||||||||
| Gross margin | 4,133 | 3,422 | 711 | 21 | 766 | 3,367 | 440 | |||||||||||||||||||||
| (Loss) earnings before finance costs and income taxes (EBIT) | (132 | ) | 1,291 | (1,423 | ) | n/m | 424 | (556 | ) | n/m | ||||||||||||||||||
| (Loss) earnings before income taxes | (526 | ) | 912 | (1,438 | ) | n/m | 244 | (770 | ) | n/m | ||||||||||||||||||
| Net (loss) earnings from continuing operations | (327 | ) | 749 | (1,076 | ) | n/m | 274 | (601 | ) | n/m | ||||||||||||||||||
| Net earnings from discontinued operations | 698 | n/a | n/a | n/a | 129 | 569 | 441 | |||||||||||||||||||||
| Net earnings | 371 | n/a | n/a | n/a | 403 | (32 | ) | (8 | ) | |||||||||||||||||||
| Adjusted EBITDA1 | 3,012 | 2,364 | 648 | 27 | n/a | n/a | n/a | |||||||||||||||||||||
| Net (loss) earnings per share from continuing operations – diluted | (0.52 | ) | n/a | n/a | n/a | 0.33 | (0.85 | ) | n/m | |||||||||||||||||||
| Net earnings per share from discontinued operations – diluted | 1.11 | n/a | n/a | n/a | 0.15 | 0.96 | 640 | |||||||||||||||||||||
| Net earnings per share – diluted | 0.59 | n/a | n/a | n/a | 0.48 | 0.11 | 23 | |||||||||||||||||||||
| Other comprehensive (loss) income | (174 | ) | 266 | (440 | ) | n/m | 150 | (324 | ) | n/m | ||||||||||||||||||
| 1 | Refer to“Non-IFRS Financial Measures” section on page 29 for details. |
| 2 | Certain amounts have been reclassified to conform to the current period’s presentation. See note 16 to the interim financial statements. |
n/m = not meaningful
n/a = not available
| 1 | Refer to“Non-IFRS Financial Measures” section on page 29 for details. |
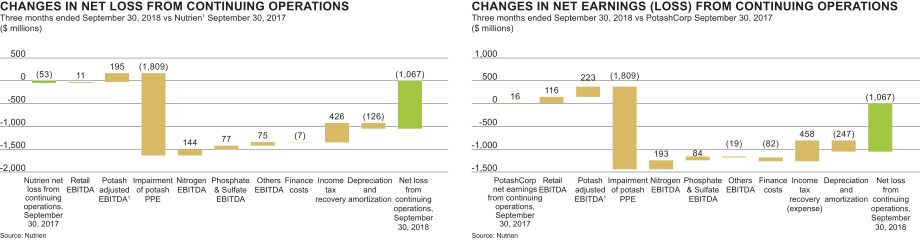
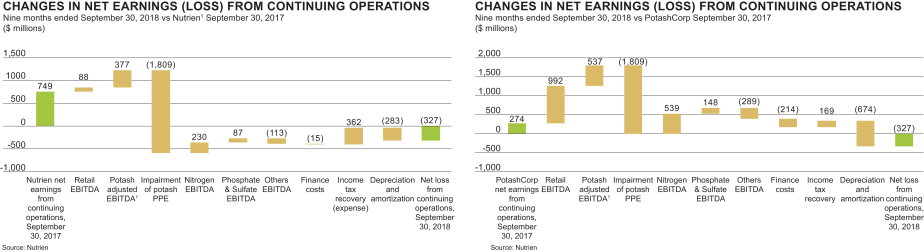
Three and nine months ended | September 30, 2018 vs September 30, 2017 (Nutrien) | September 30, 2018 vs September 30, 2017 (PotashCorp) | ||
| Net (Loss) Earnings from Continuing Operations | Net loss from continuing operations in the third quarter and first nine months of 2018, compared to a net loss from continuing operations in the third quarter of 2017 and net earnings from continuing operations in the first nine months of 2017, were primarily due to thenon-cash impairment relating to our New Brunswick property, plant and equipment and increased depreciation related to PPA adjustments as a result of the Merger exceeding the impact of higher potash, urea and phosphate fertilizer prices, higher potash sales volumes, a higher income tax recovery and a Curtailment Gain. | Results were primarily impacted by increased sales volumes and expenses resulting from the acquisition of Agrium’s operations in the Merger. Further, net loss from continuing operations in the third quarter of 2018 and first nine months of 2018, compared to net earnings from continuing operations for the same periods in 2017, were primarily due to thenon-cash impairment relating to our New Brunswick property, plant and equipment and increased depreciation related to PPA adjustments as a result of the Merger exceeding the impact of higher potash, urea and phosphate fertilizer prices, a higher income tax recovery (PotashCorp had income tax expense for the nine-month period) and a Curtailment Gain. |
| Nutrien 2018 Third Quarter Report | 4 |
Three and nine months ended | September 30, 2018 vs September 30, 2017 (Nutrien) | September 30, 2018 vs September 30, 2017 (PotashCorp) | ||
| Net Earnings from Discontinued Operations | Combined historical Nutrien information was not prepared for discontinued operations. | There were no significant changes quarter over quarter. Net earnings from discontinued operations were higher in the first nine months of 2018 primarily due to the gain on sale of our SQM class B shares and dividends from SQM and APC exceeding their equity earnings in the comparative periods (equity accounting for these investments ceased when the investments were classified as held for sale). This was partially offset by an increase in income tax expense. | ||
| Other Comprehensive (Loss) Income | There were no significant changes to other comprehensive income quarter over quarter. | There were no significant changes to other comprehensive income quarter over quarter. | ||
| Other comprehensive loss for the first nine months of 2018 was primarily a loss on translation of our net operations in Canada and Australia and a fair value loss on our investment in Sinofert. | Other comprehensive loss for the first nine months of 2018 was primarily a loss on translation of our net operations in Canada and Australia and a fair value loss on our investment in Sinofert. | |||
| Other comprehensive income for the first nine months of 2017 was primarily the result of increases in the fair values of our investments in ICL and Sinofert and gains on translation of our net operations in Canada and Australia. | PotashCorp other comprehensive income for the first nine months of 2017 was primarily the result of increases in the fair values of its investments in ICL and Sinofert. |
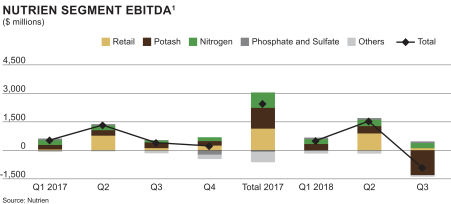
Segment Review
We report our results in four business segments: retail, potash, nitrogen and phosphate and sulfate. Our reporting structure reflects how we manage our business and how we classify our operations for planning and measuring performance. We include net sales and EBITDA in segment disclosures in the notes to the interim financial statements pursuant to IFRS, which require segmentation based upon our internal organization and reporting of revenue and profit or loss measures. As a component of gross margin, net sales (and the relatedper-tonne amounts) are the primary revenue measures and are used for business planning and monthly forecasting for the potash, nitrogen and phosphate and sulfate segments. Net sales are calculated as sales revenues less freight, transportation and distribution expenses. Realized prices refer to net sales prices. As a component of net earnings, EBITDA is the primary profit measure we use and review for all business segments in making decisions about operating matters on a segment basis. These decisions include assessments of segment performance and the resources to be allocated to these segments. EBITDA is also used for business planning and monthly forecasting in all business segments.
Our discussion of segment operating performance is set out below and includes nutrient product and/or market performance results, where applicable, to give further insight into these results.
| 1 | Nutrien combined historical 2017 EBITDA figures arenon-IFRS measures. Refer to“Non-IFRS Financial Measures” section on page 29 for details. |
| 5 | Nutrien 2018 Third Quarter Report |
Retail Performance
| Three Months Ended September 30 | ||||||||||||||||||||||||||||||||||||||||||||||||||||
| (millions) | Gross Margin (millions) | Gross Margin (percentage) | ||||||||||||||||||||||||||||||||||||||||||||||||||
| Nutrien | Nutrien1 | PotashCorp | Nutrien | Nutrien1 | PotashCorp | Nutrien | Nutrien1 | PotashCorp | ||||||||||||||||||||||||||||||||||||||||||||
| 2018 | 2017 | % Change | 2017 | % Change | 2018 | 2017 | % Change | 2017 | % Change | 2018 | 2017 | 2017 | ||||||||||||||||||||||||||||||||||||||||
| Sales | ||||||||||||||||||||||||||||||||||||||||||||||||||||
Crop nutrients2,3 | $ | 650 | $ | 528 | 23 | $ | – | n/m | $ | 142 | $ | 120 | 18 | $ | – | n/m | 22 | 23 | – | |||||||||||||||||||||||||||||||||
Crop protection products | 1,086 | 1,117 | (3 | ) | – | n/m | 236 | 243 | (3 | ) | – | n/m | 22 | 22 | – | |||||||||||||||||||||||||||||||||||||
Seed | 60 | 59 | 2 | – | n/m | 14 | 21 | (33 | ) | – | n/m | 23 | 36 | – | ||||||||||||||||||||||||||||||||||||||
Merchandise | 205 | 187 | 10 | – | n/m | 27 | 29 | (7 | ) | – | n/m | 13 | 16 | – | ||||||||||||||||||||||||||||||||||||||
Services and other | 174 | 176 | (1 | ) | – | n/m | 114 | 105 | 9 | – | n/m | 66 | 60 | – | ||||||||||||||||||||||||||||||||||||||
| 2,175 | 2,067 | 5 | – | n/m | $ | 533 | $ | 518 | 3 | $ | – | n/m | ||||||||||||||||||||||||||||||||||||||||
| Cost of goods sold | (1,642 | ) | (1,549 | ) | 6 | – | n/m | |||||||||||||||||||||||||||||||||||||||||||||
| Gross margin | 533 | 518 | 3 | – | n/m | |||||||||||||||||||||||||||||||||||||||||||||||
| Expenses4 | (539 | ) | (486 | ) | 11 | – | n/m | |||||||||||||||||||||||||||||||||||||||||||||
| EBIT | (6 | ) | 32 | (119 | ) | – | n/m | |||||||||||||||||||||||||||||||||||||||||||||
| Depreciation and amortization | 122 | 73 | 67 | – | n/m | |||||||||||||||||||||||||||||||||||||||||||||||
| EBITDA | $ | 116 | $ | 105 | 10 | $ | – | n/m | ||||||||||||||||||||||||||||||||||||||||||||
| 1 | Refer to“Non-IFRS Financial Measures” section on page 29 for details. |
| 2 | Sales tonnes were 1,490,000 tonnes (2017 (Nutrien) – 1,243,000 tonnes) and average per tonne prices were $436 per tonne (2017 (Nutrien) – $425 per tonne). |
| 3 | Includes intersegment gross sales of $14 million. Intersegment profits are eliminated on consolidation. |
| 4 | Includes selling expenses of $552 million (2017 (Nutrien) – $468 million). |
| n/m | = not meaningful |
The most significant contributors to the change in retail EBITDA were as follows (direction of arrows refers to impact on EBITDA and● means no impact):
| Three months ended | September 30, 2018 vs September 30, 2017 (Nutrien) | September 30, 2018 vs September 30, 2017 (PotashCorp) | ||||
| Sales volumes | p | Crop nutrient sales volumes increased in all geographic locations. Acquisitions accounted for half of the volume increase for the quarter.
| Retail was acquired as part of the Merger and PotashCorp had no similar operations. | |||
| q | Crop protection sales were down for the quarter primarily due to rapid crop development, limited pest pressure and an early start to harvest, as well as adverse weather impacts in the US and Canada. The US experienced wet weather conditions reducing herbicide applications, while Canada had very dry conditions resulting in decreased fungicide sales.
| |||||
| p | Merchandise sales volumes were higher due to increased animal health volumes in Australia along with higher fuel sales in Canada.
| |||||
| Sales prices | p | Crop nutrients prices were higher in all geographic locations except for Australia.
| ||||
| Gross margin | p | Crop nutrient gross margin was higher primarily due to increased volumes in all geographic locations. Gross margin percentage was flat as the increase in selling prices was offset by rising costs.
| ||||
| q | Due to the unfavorable weather conditions in North America, crop protection sales volumes were down resulting in a decrease in gross margin.
| |||||
| q | Seed gross margin percentage decreased due to seed sales mix and timing of vendor programs.
| |||||
Selling expenses
| q | Expenses increased due to recent acquisitions across all geographic locations and increased depreciation and amortization as discussed below.
| ||||
Depreciation and amortization
| ● | Expense was higher primarily due to the PPA adjustments as a result of the Merger and from recently acquired businesses. |
| Nutrien 2018 Third Quarter Report | 6 |
| Nine Months Ended September 30 | ||||||||||||||||||||||||||||||||||||||||||||||||||||
| (millions) | Gross Margin (millions) | Gross Margin (percentage) | ||||||||||||||||||||||||||||||||||||||||||||||||||
| Nutrien | Nutrien1 | PotashCorp | Nutrien | Nutrien1 | PotashCorp | Nutrien | Nutrien1 | PotashCorp | ||||||||||||||||||||||||||||||||||||||||||||
| 2018 | 2017 | % Change | 2017 | % Change | 2018 | 2017 | % Change | 2017 | % Change | 2018 | 2017 | 2017 | ||||||||||||||||||||||||||||||||||||||||
Sales | ||||||||||||||||||||||||||||||||||||||||||||||||||||
Crop nutrients2,3 | $ | 3,660 | $ | 3,231 | 13 | $ | – | n/m | $ | 739 | $ | 680 | 9 | $ | – | n/m | 20 | 21 | – | |||||||||||||||||||||||||||||||||
Crop protection products | 4,218 | 4,225 | – | – | n/m | 885 | 858 | 3 | – | n/m | 21 | 20 | – | |||||||||||||||||||||||||||||||||||||||
Seed | 1,584 | 1,521 | 4 | – | n/m | 277 | 274 | 1 | – | n/m | 17 | 18 | – | |||||||||||||||||||||||||||||||||||||||
Merchandise | 555 | 496 | 12 | – | n/m | 76 | 78 | (3 | ) | – | n/m | 14 | 16 | – | ||||||||||||||||||||||||||||||||||||||
Services and other | 599 | 541 | 11 | – | n/m | 396 | 361 | 10 | – | n/m | 66 | 67 | – | |||||||||||||||||||||||||||||||||||||||
| 10,616 | 10,014 | 6 | – | n/m | $ | 2,373 | $ | 2,251 | 5 | $ | – | n/m | ||||||||||||||||||||||||||||||||||||||||
| Cost of goods sold | (8,243 | ) | (7,763 | ) | 6 | – | n/m | |||||||||||||||||||||||||||||||||||||||||||||
| Gross margin | 2,373 | 2,251 | 5 | – | n/m | |||||||||||||||||||||||||||||||||||||||||||||||
| Expenses4 | (1,748 | ) | (1,562 | ) | 12 | – | n/m | |||||||||||||||||||||||||||||||||||||||||||||
| EBIT | 625 | 689 | (9 | ) | – | n/m | ||||||||||||||||||||||||||||||||||||||||||||||
| Depreciation and amortization | 367 | 215 | 71 | – | n/m | |||||||||||||||||||||||||||||||||||||||||||||||
| EBITDA | $ | 992 | $ | 904 | 10 | $ | – | n/m | ||||||||||||||||||||||||||||||||||||||||||||
| 1 | Refer to“Non-IFRS Financial Measures” section on page 29 for details. |
| 2 | Sales tonnes were 8,699,000 tonnes (2017 (Nutrien) – 7,982,000 tonnes) and average per tonne prices were $421 per tonne (2017 (Nutrien) – $405 per tonne). |
| 3 | Includes intersegment gross sales of $36 million. Intersegment profits are eliminated on consolidation. |
| 4 | Includes selling expenses of $1,732 million (2017 (Nutrien) – $1,490 million). |
n/m = not meaningful
The most significant contributors to the change in retail EBITDA were as follows (direction of arrows refers to impact on EBITDA and● means no impact):
| Nine months ended | September 30, 2018 vs September 30, 2017 (Nutrien) | September 30, 2018 vs September 30, 2017 (PotashCorp) | ||||
| Sales volumes | p | Crop nutrient sales volumes were up across all geographic locations with much of the increase coming from North America acquisitions.
| Retail was acquired as part of the Merger and PotashCorp had no similar operations. | |||
| ● | Crop protection volumes were flat as the increase due to acquisitions was offset by a decrease caused by adverse weather in the US and Australia.
| |||||
| p | Strong cotton seed volumes in the US more than offset lower seed volumes in Australia caused by dry weather.
| |||||
| p | Merchandise sales increased primarily due to increased animal health volumes in Australia.
| |||||
| p | Services and other sales increased primarily due to higher livestock sales and wool commissions in Australia.
| |||||
Sales prices
| p | Crop nutrients prices were higher in all geographic locations.
| ||||
| Gross margin | p | Crop nutrient gross margin was higher primarily due to increased volumes in all geographic locations. Gross margin percentage was flat due to the increase in selling prices being offset by rising costs.
| ||||
| p | Services and other margin increased due to higher livestock sales and wool commissions in Australia.
| |||||
Selling expenses
| q | Expenses were up due to increased payroll from acquisitions and depreciation and amortization discussed below.
| ||||
Depreciation and amortization
| ● | Expense was higher primarily due to the PPA adjustments as a result of the Merger and from recently acquired businesses.
|
| 7 | Nutrien 2018 Third Quarter Report |
Potash Performance
| Three Months Ended September 30 | ||||||||||||||||||||||||||||||||||||||||||||||||||||||||||||
| Dollars (millions) | Tonnes (thousands) | Average per Tonne1 | ||||||||||||||||||||||||||||||||||||||||||||||||||||||||||
| Nutrien | Nutrien2 | PotashCorp | Nutrien | Nutrien2 | PotashCorp | Nutrien | Nutrien2 | PotashCorp | ||||||||||||||||||||||||||||||||||||||||||||||||||||
| 2018 | 2017 | % Change | 2017 | % Change | 2018 | 2017 | % Change | 2017 | % Change | 2018 | 2017 | % Change | 2017 | % Change | ||||||||||||||||||||||||||||||||||||||||||||||
Manufactured product3 | ||||||||||||||||||||||||||||||||||||||||||||||||||||||||||||
Net sales | ||||||||||||||||||||||||||||||||||||||||||||||||||||||||||||
North America | $ | 358 | $ | 263 | 36 | $ | 220 | 63 | 1,678 | 1,373 | 22 | 1,123 | 49 | $ | 213 | $ | 192 | 11 | $ | 195 | 9 | |||||||||||||||||||||||||||||||||||||||
Offshore | 458 | 326 | 40 | 290 | 58 | 2,180 | 1,938 | 12 | 1,727 | 26 | $ | 210 | $ | 168 | 25 | $ | 168 | 25 | ||||||||||||||||||||||||||||||||||||||||||
| 816 | 589 | 39 | 510 | 60 | 3,858 | 3,311 | 17 | 2,850 | 35 | $ | 212 | $ | 178 | 19 | $ | 179 | 18 | |||||||||||||||||||||||||||||||||||||||||||
| Cost of goods sold | (358 | ) | (322 | ) | 11 | (252 | ) | 42 | $ | (93 | ) | $ | (97 | ) | (4 | ) | $ | (89 | ) | 4 | ||||||||||||||||||||||||||||||||||||||||
| Gross margin | 458 | 267 | 72 | 258 | 78 | $ | 119 | $ | 81 | 47 | $ | 90 | 32 | |||||||||||||||||||||||||||||||||||||||||||||||
Other potash and purchased products gross margin4 | 1 | – | n/m | (1 | ) | n/m | 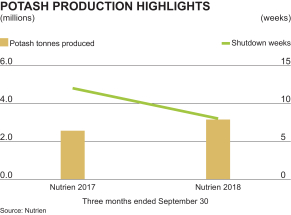 | |||||||||||||||||||||||||||||||||||||||||||||||||||||
Gross margin | 459 | 267 | 72 | 257 | 79 | |||||||||||||||||||||||||||||||||||||||||||||||||||||||
Expenses5 | (1,898 | ) | (57 | ) | n/m | (54 | ) | n/m | ||||||||||||||||||||||||||||||||||||||||||||||||||||
EBIT | (1,439 | ) | 210 | n/m | 203 | n/m | ||||||||||||||||||||||||||||||||||||||||||||||||||||||
Depreciation and amortization | 128 | 93 | 38 | 72 | 78 | |||||||||||||||||||||||||||||||||||||||||||||||||||||||
EBITDA | $ | (1,311 | ) | $ | 303 | n/m | $ | 275 | n/m | |||||||||||||||||||||||||||||||||||||||||||||||||||
1 Rounding differences may occur due to the use of whole dollars inper-tonne calculations.
|
| |||||||||||||||||||||||||||||||||||||||||||||||||||||||||||
2 Refer to“Non-IFRS Financial Measures” section on page 29 for details.
|
| |||||||||||||||||||||||||||||||||||||||||||||||||||||||||||
3 Includes intersegment gross sales of $62 million and 262,000 sales tonnes (2017 (PotashCorp) – $NIL and NIL sales tonnes). Intersegment profits are eliminated on consolidation.
|
| |||||||||||||||||||||||||||||||||||||||||||||||||||||||||||
4 Comprised of net sales $1 million (2017 (Nutrien) – $1 million; 2017 (PotashCorp) – $NIL) less cost of goods sold $NIL (2017 (Nutrien) – $1 million; 2017 (PotashCorp) – $1 million).
|
| |||||||||||||||||||||||||||||||||||||||||||||||||||||||||||
5 Includesnon-cash impairment of property, plant and equipment of $1,809 million (2017 (Nutrien) – $NIL; 2017 (PotashCorp) – $NIL) and provincial mining and other taxes of $78 million (2017 (Nutrien) – $48 million; 2017 (PotashCorp) – $45 million). |
| |||||||||||||||||||||||||||||||||||||||||||||||||||||||||||
Sales to major offshore markets by Canpotex Limited (Canpotex) were as follows:
| Three Months Ended September 30 | Nine Months Ended September 30 | |||||||||||||||||||||||
| Percentage of Sales Volumes | Percentage of Sales Volumes | |||||||||||||||||||||||
| Nutrien | Nutrien | Nutrien | Nutrien | |||||||||||||||||||||
| 2018 | 2017 | % Change | 2018 | 2017 | % Change | |||||||||||||||||||
| Latin America | 40 | 30 | 33 | 33 | 32 | 3 | ||||||||||||||||||
| Other Asian markets1 | 37 | 26 | 42 | 32 | 34 | (6 | ) | |||||||||||||||||
| China | 7 | 23 | (70 | ) | 18 | 15 | 20 | |||||||||||||||||
| India | 11 | 14 | (21 | ) | 9 | 12 | (25 | ) | ||||||||||||||||
| Other markets | 5 | 7 | (29 | ) | 8 | 7 | 14 | |||||||||||||||||
| 100 | 100 | 100 | 100 | |||||||||||||||||||||
| 1 | All Asian markets except China and India. |
| Nutrien 2018 Third Quarter Report | 8 |
| Nine Months Ended September 30 | ||||||||||||||||||||||||||||||||||||||||||||||||||||||||||||
| Dollars (millions) | Tonnes (thousands) | Average per Tonne1 | ||||||||||||||||||||||||||||||||||||||||||||||||||||||||||
| Nutrien | Nutrien2 | PotashCorp | Nutrien | Nutrien2 | PotashCorp | Nutrien | Nutrien2 | PotashCorp | ||||||||||||||||||||||||||||||||||||||||||||||||||||
| 2018 | 2017 | % Change | 2017 | % Change | 2018 | 2017 | % Change | 2017 | % Change | 2018 | 2017 | % Change | 2017 | % Change | ||||||||||||||||||||||||||||||||||||||||||||||
Manufactured product3 | ||||||||||||||||||||||||||||||||||||||||||||||||||||||||||||
Net sales | ||||||||||||||||||||||||||||||||||||||||||||||||||||||||||||
North America | $ | 830 | $ | 697 | 19 | $ | 518 | 60 | 3,962 | 3,639 | 9 | 2,633 | 50 | $ | 209 | $ | 192 | 9 | $ | 197 | 6 | |||||||||||||||||||||||||||||||||||||||
Offshore | 1,198 | 892 | 34 | 764 | 57 | 6,200 | 5,562 | 11 | 4,756 | 30 | $ | 193 | $ | 160 | 21 | $ | 161 | 20 | ||||||||||||||||||||||||||||||||||||||||||
| 2,028 | 1,589 | 28 | 1,282 | 58 | 10,162 | 9,201 | 10 | 7,389 | 38 | $ | 200 | $ | 173 | 16 | $ | 173 | 16 | |||||||||||||||||||||||||||||||||||||||||||
Cost of goods sold | (911 | ) | (860 | ) | 6 | (641 | ) | 42 | $ | (90 | ) | $ | (93 | ) | (3 | ) | $ | (87 | ) | 3 | ||||||||||||||||||||||||||||||||||||||||
Gross margin | 1,117 | 729 | 53 | 641 | 74 | $ | 110 | $ | 80 | 38 | $ | 86 | 28 | |||||||||||||||||||||||||||||||||||||||||||||||
Other potash and purchased products gross margin4 | 1 | – | – | (1 | ) | n/m | 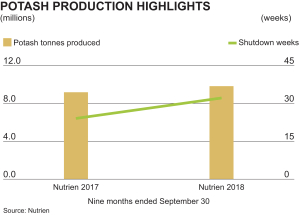 | |||||||||||||||||||||||||||||||||||||||||||||||||||||
Gross margin | 1,118 | 729 | 53 | 640 | 75 | |||||||||||||||||||||||||||||||||||||||||||||||||||||||
Expenses5 | (2,027 | ) | (159 | ) | n/m | (148 | ) | n/m | ||||||||||||||||||||||||||||||||||||||||||||||||||||
EBIT | (909 | ) | 570 | n/m | 492 | n/m | ||||||||||||||||||||||||||||||||||||||||||||||||||||||
Depreciation and amortization | 312 | 265 | 18 | 183 | 70 | |||||||||||||||||||||||||||||||||||||||||||||||||||||||
EBITDA | $ | (597 | ) | $ | 835 | n/m | $ | 675 | n/m | |||||||||||||||||||||||||||||||||||||||||||||||||||
1 Rounding differences may occur due to the use of whole dollars inper-tonne calculations. |
| |||||||||||||||||||||||||||||||||||||||||||||||||||||||||||
2 Refer to“Non-IFRS Financial Measures” section on page 29 for details. |
| |||||||||||||||||||||||||||||||||||||||||||||||||||||||||||
3 Includes intersegment gross sales of $180 million and 696,000 sales tonnes (2017 (PotashCorp) – $NIL and NIL sales tonnes). Intersegment profits are eliminated on consolidation. |
| |||||||||||||||||||||||||||||||||||||||||||||||||||||||||||
4 Comprised of net sales $2 million (2017 (Nutrien) – $5 million; 2017 (PotashCorp) – $4 million) less cost of goods sold $1 million (2017 (Nutrien) – $5 million; 2017 (PotashCorp) – $5 million). |
| |||||||||||||||||||||||||||||||||||||||||||||||||||||||||||
5 Includesnon-cash impairment of property, plant and equipment of $1,809 million (2017 (Nutrien) – $NIL; 2017 (PotashCorp) – $NIL) and provincial mining and other taxes of $188 million (2017 (Nutrien) – $130 million; 2017 (PotashCorp) – $121 million). |
| |||||||||||||||||||||||||||||||||||||||||||||||||||||||||||
| 9 | Nutrien 2018 Third Quarter Report |
North America typically consumes more higher-priced granular product than standard product.
The most significant contributors to the change in potash EBITDA were as follows (direction of arrows refers to impact on EBITDA and● means no impact):
| Three months ended | September 30, 2018 vs September 30, 2017 (Nutrien) | September 30, 2018 vs September 30, 2017 (PotashCorp) | ||||||||
| Sales volumes | p | Offshore sales volumes were higher due to increased demand. | p | Offshore sales volumes were higher due to increased demand. | ||||||
| p | Strong demand for the fall application season led to record North America and total sales volumes in the quarter. | p | Strong demand for the fall application season led to record North America and total sales volumes in the quarter. | |||||||
| p | Sales volumes were also higher as a result of the Merger, specifically the addition of the Vanscoy mine. | |||||||||
| Net sales prices | p | Selling prices were higher due to increased prices in all major spot markets due to strong demand. | p | Selling prices were higher due to increased prices in all major spot markets due to strong demand. | ||||||
| Cost of goods sold | p | Costs decreased due to our portfolio optimization and results from our cost reduction strategy as well as a deferral of shutdowns at certain mines to the fourth quarter of 2018, which offset increased depreciation related to PPA adjustments as a result of the Merger. | q | Costs increased due to the addition of Agrium’s operations and higher depreciation on the related PPA adjustments as a result of the Merger more than offsetting the impact of lower costs from the deferral of shutdowns at certain mines to the fourth quarter of 2018. | ||||||
| Impairment of property, plant and equipment | q | Anon-cash impairment of property, plant and equipment was recorded as a result of the decision to safely shut down our New Brunswick operations due to the operations no longer being part of our medium or long-term strategic plans. See note 4 to the interim financial statements. | q | Anon-cash impairment of property, plant and equipment was recorded as a result of the decision to safely shut down our New Brunswick operations due to the operations no longer being part of our medium or long-term strategic plans. See note 4 to the interim financial statements. | ||||||
| Provincial mining and other taxes | q | Under Saskatchewan provincial legislation, the company is subject to resource taxes, including the potash production tax and the resource surcharge. Provincial mining and other taxes increased primarily due to stronger potash prices. | q | Under Saskatchewan provincial legislation, the company is subject to resource taxes, including the potash production tax and the resource surcharge. Provincial mining and other taxes increased primarily due to stronger potash prices. | ||||||
| Depreciation and amortization | ● | Depreciation and amortization expenses were higher due to PPA adjustments as a result of the Merger and increased sales volumes. | ● | Depreciation and amortization expenses were higher due to the addition of the Vanscoy mine and PPA adjustments as a result of the Merger. | ||||||
| Nine months ended | September 30, 2018 vs September 30, 2017 (Nutrien) | September 30, 2018 vs September 30, 2017 (PotashCorp) | ||||||||
| Sales volumes | p | | Offshore sales volumes were higher due to increased demand and a higher Canpotex allocation. | p | Offshore sales volumes were higher due to increased demand and a higher Canpotex allocation. | |||||
| p | | North America sales volumes were up primarily due to increased intercompany sales to retail and lower offshore imports. | p | North America sales volumes were up primarily due to lower offshore imports. | ||||||
| p | Sales volumes were also higher as a result of the Merger, specifically the addition of the Vanscoy mine and intercompany sales to retail. | |||||||||
| Net sales prices | p | Selling prices were higher due to increased prices in all major spot markets due to strong demand. | p | Selling prices were higher due to increased prices in all major spot markets due to strong demand. | ||||||
| Cost of goods sold | p | Costs decreased due to our portfolio optimization and results from our cost reduction strategy as well as a deferral of shutdowns at certain mines to the fourth quarter, which offset depreciation related to PPA adjustments as a result of the Merger. | q | Costs increased due to the addition of Agrium’s operations and higher depreciation on the related PPA adjustments as a result of the Merger. | ||||||
| Impairment of property, plant and equipment | q | Anon-cash impairment of property, plant and equipment was recorded as a result of the decision to safely shut down our New Brunswick operations due to the operations no longer being part of our medium or long-term strategic plans. See note 4 to the interim financial statements. | q | Anon-cash impairment of property, plant and equipment was recorded as a result of the decision to safely shut down our New Brunswick operations due to the operations no longer being part of our medium or long-term strategic plans. See note 4 to the interim financial statements. | ||||||
| Provincial mining and other taxes | q | Under Saskatchewan provincial legislation, the company is subject to resource taxes, including the potash production tax and the resource surcharge. Provincial mining and other taxes increased primarily due to stronger potash prices. | q | Under Saskatchewan provincial legislation, the company is subject to resource taxes, including the potash production tax and the resource surcharge. Provincial mining and other taxes increased primarily due to stronger potash prices. | ||||||
| Depreciation and amortization | ● | Depreciation and amortization expenses were higher due to PPA adjustments as a result of the Merger and increased sales volumes. | ● | Depreciation and amortization expenses were higher due to the addition of the Vanscoy mine and PPA adjustments as a result of the Merger. | ||||||
| Nutrien 2018 Third Quarter Report | 10 |
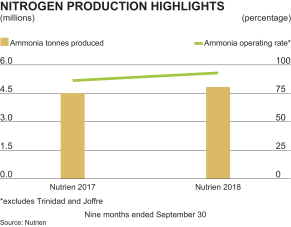
Nitrogen Performance
| Three Months Ended September 30 | ||||||||||||||||||||||||||||||||||||||||||||||||||||||||||||
| Dollars (millions) | Tonnes (thousands) | Average per Tonne1 | ||||||||||||||||||||||||||||||||||||||||||||||||||||||||||
| Nutrien | Nutrien2 | PotashCorp | Nutrien | Nutrien2 | PotashCorp | Nutrien | Nutrien2 | PotashCorp | ||||||||||||||||||||||||||||||||||||||||||||||||||||
| 2018 | 2017 | % Change | 2017 | % Change | 2018 | 2017 | % Change | 2017 | % Change | 2018 | 2017 | % Change | 2017 | % Change | ||||||||||||||||||||||||||||||||||||||||||||||
Manufactured product3 | ||||||||||||||||||||||||||||||||||||||||||||||||||||||||||||
Net sales | ||||||||||||||||||||||||||||||||||||||||||||||||||||||||||||
Ammonia | $ | 190 | $ | 149 | 28 | $ | 108 | 76 | 750 | 724 | 4 | 552 | 36 | $ | 253 | $ | 206 | 23 | $ 195 | 30 | ||||||||||||||||||||||||||||||||||||||||
Urea | 198 | 144 | 38 | 62 | 219 | 691 | 626 | 10 | 270 | 156 | $ | 286 | $ | 228 | 25 | $ 230 | 24 | |||||||||||||||||||||||||||||||||||||||||||
Solutions and nitrates | 159 | 131 | 21 | 95 | 67 | 1,018 | 929 | 10 | 751 | 36 | $ | 156 | $ | 141 | 11 | $ 127 | 23 | |||||||||||||||||||||||||||||||||||||||||||
| 547 | 424 | 29 | 265 | 106 | 2,459 | 2,279 | 8 | 1,573 | 56 | $ | 222 | $ | 185 | 20 | $ 168 | 32 | ||||||||||||||||||||||||||||||||||||||||||||
| Cost of goods sold | (405 | ) | (377 | ) | 7 | (247 | ) | 64 | $ | (165 | ) | $ | (165 | ) | – | $ (157 | ) | 5 | ||||||||||||||||||||||||||||||||||||||||||
| Gross margin | 142 | 47 | 202 | 18 | 689 | $ | 57 | $ | 20 | 185 | $ 11 | 418 | ||||||||||||||||||||||||||||||||||||||||||||||||
Other nitrogen and purchased products gross margin4 | 13 | 8 | 63 | 3 | 333 | 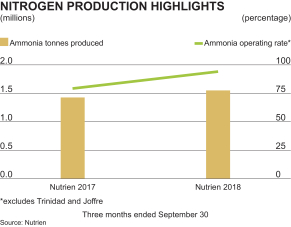 | ||||||||||||||||||||||||||||||||||||||||||||||||||||||
Gross margin | 155 | 55 | 182 | 21 | 638 | |||||||||||||||||||||||||||||||||||||||||||||||||||||||
Expenses5 | (9 | ) | (8 | ) | 13 | (4 | ) | 125 | ||||||||||||||||||||||||||||||||||||||||||||||||||||
EBIT | 146 | 47 | 211 | 17 | 759 | |||||||||||||||||||||||||||||||||||||||||||||||||||||||
Depreciation and amortization | 111 | 66 | 68 | 47 | 136 | |||||||||||||||||||||||||||||||||||||||||||||||||||||||
EBITDA | $ | 257 | $ | 113 | 127 | $ | 64 | 302 | ||||||||||||||||||||||||||||||||||||||||||||||||||||
1 Rounding differences may occur due to the use of whole dollars inper-tonne calculations.
|
| |||||||||||||||||||||||||||||||||||||||||||||||||||||||||||
2 Refer to“Non-IFRS Financial Measures” section on page 29 for details.
|
| |||||||||||||||||||||||||||||||||||||||||||||||||||||||||||
3 Includes intersegment gross sales of $109 million and 399,000 sales tonnes (2017 (PotashCorp) – $15 million and 46,000 sales tonnes). Intersegment profits are eliminated on consolidation.
|
| |||||||||||||||||||||||||||||||||||||||||||||||||||||||||||
4 Comprised of net sales of $65 million (2017 (Nutrien) – $72 million; 2017 (PotashCorp) – $5 million) less cost of goods sold $52 million (2017 (Nutrien) – $64 million; 2017 (PotashCorp) – $2 million).
|
| |||||||||||||||||||||||||||||||||||||||||||||||||||||||||||
5 Includes earnings of equity-accounted investees of $17 million (2017 (Nutrien) – $8 million; 2017 (PotashCorp) – $3 million). |
| |||||||||||||||||||||||||||||||||||||||||||||||||||||||||||
| Three Months Ended September 30 | Nine Months Ended September 30 | |||||||||||||||||||||||||||||||||||||||||||||||
| Sales Tonnes (thousands) | Average Net Sales Price per Tonne | Sales Tonnes (thousands) | Average Net Sales Price per Tonne | |||||||||||||||||||||||||||||||||||||||||||||
| Nutrien | Nutrien | PotashCorp | Nutrien | Nutrien | PotashCorp | Nutrien | Nutrien | PotashCorp | Nutrien | Nutrien | PotashCorp | |||||||||||||||||||||||||||||||||||||
| 2018 | 2017 | 2017 | 2018 | 2017 | 2017 | 2018 | 2017 | 2017 | 2018 | 2017 | 2017 | |||||||||||||||||||||||||||||||||||||
Fertilizer | 1,197 | 1,066 | 605 | $ | 233 | $ | 188 | $ | 176 | 4,086 | 3,866 | 1,897 | $ | 250 | $ | 228 | $ | 215 | ||||||||||||||||||||||||||||||
Industrial and feed | 1,262 | 1,213 | 968 | $ | 212 | $ | 182 | $ | 164 | 3,738 | 3,617 | 2,837 | $ | 213 | $ | 215 | $ | 202 | ||||||||||||||||||||||||||||||
| 2,459 | 2,279 | 1,573 | $ | 222 | $ | 185 | $ | 168 | 7,824 | 7,483 | 4,734 | $ | 232 | $ | 222 | $ | 207 | |||||||||||||||||||||||||||||||
| 11 | Nutrien 2018 Third Quarter Report |
| Nine Months Ended September 30 | ||||||||||||||||||||||||||||||||||||||||||||||||||||||||||||
| Dollars (millions) | Tonnes (thousands) | Average per Tonne1 | ||||||||||||||||||||||||||||||||||||||||||||||||||||||||||
| Nutrien | Nutrien2 | PotashCorp | Nutrien | Nutrien2 | PotashCorp | Nutrien | Nutrien2 | PotashCorp | ||||||||||||||||||||||||||||||||||||||||||||||||||||
| 2018 | 2017 | % Change | 2017 | % Change | 2018 | 2017 | % Change | 2017 | % Change | 2018 | 2017 | % Change | 2017 | % Change | ||||||||||||||||||||||||||||||||||||||||||||||
Manufactured product3 | ||||||||||||||||||||||||||||||||||||||||||||||||||||||||||||
Net sales | ||||||||||||||||||||||||||||||||||||||||||||||||||||||||||||
Ammonia | $ | 668 | $ | 703 | (5 | ) | $ | 448 | 49 | 2,522 | 2,603 | (3 | ) | 1,700 | 48 | $ | 265 | $ | 270 | (2 | ) | $ | 264 | – | ||||||||||||||||||||||||||||||||||||
Urea | 664 | 513 | 29 | 220 | 202 | 2,316 | 2,058 | 13 | 883 | 162 | $ | 286 | $ | 249 | 15 | $ | 250 | 14 | ||||||||||||||||||||||||||||||||||||||||||
Solutions and nitrates | 485 | 445 | 9 | 311 | 56 | 2,986 | 2,822 | 6 | 2,151 | 39 | $ | 163 | $ | 158 | 3 | $ | 144 | 13 | ||||||||||||||||||||||||||||||||||||||||||
| 1,817 | 1,661 | 9 | 979 | 86 | 7,824 | 7,483 | 5 | 4,734 | 65 | $ | 232 | $ | 222 | 5 | $ | 207 | 12 | |||||||||||||||||||||||||||||||||||||||||||
| Cost of goods sold | (1,303 | ) | (1,258 | ) | 4 | (803 | ) | 62 | $ | (166 | ) | $ | (168 | ) | (1 | ) | $ | (170 | ) | (2 | ) | |||||||||||||||||||||||||||||||||||||||
| Gross margin | 514 | 403 | 28 | 176 | 192 | $ | 66 | $ | 54 | 22 | $ | 37 | 78 | |||||||||||||||||||||||||||||||||||||||||||||||
Other nitrogen and purchased products gross margin4 | 50 | 36 | 39 | 10 | 400 |
|
|
| ||||||||||||||||||||||||||||||||||||||||||||||||||||
Gross margin | 564 | 439 | 28 | 186 | 203 | |||||||||||||||||||||||||||||||||||||||||||||||||||||||
Expenses5 | (36 | ) | (26 | ) | 38 | (16 | ) | 125 | ||||||||||||||||||||||||||||||||||||||||||||||||||||
EBIT | 528 | 413 | 28 | 170 | 211 | |||||||||||||||||||||||||||||||||||||||||||||||||||||||
Depreciation and amortization | 325 | 210 | 55 | 144 | 126 | |||||||||||||||||||||||||||||||||||||||||||||||||||||||
EBITDA | $ | 853 | $ | 623 | 37 | $ | 314 | 172 | ||||||||||||||||||||||||||||||||||||||||||||||||||||
1 Rounding differences may occur due to the use of whole dollars inper-tonne calculations.
|
| |||||||||||||||||||||||||||||||||||||||||||||||||||||||||||
2 Refer to“Non-IFRS Financial Measures” section on page 29 for details.
|
| |||||||||||||||||||||||||||||||||||||||||||||||||||||||||||
3 Includes intersegment gross sales of $419 million and 1,392,000 sales tonnes (2017 (PotashCorp) – $54 million and 141,000 sales tonnes). Intersegment profits are eliminated on consolidation.
|
| |||||||||||||||||||||||||||||||||||||||||||||||||||||||||||
4 Comprised of net sales of $323 million (2017 (Nutrien) – $361 million; 2017 (PotashCorp) – $25 million) less cost of goods sold $273 million (2017 (Nutrien) – $325 million; 2017 (PotashCorp) – $15 million).
|
| |||||||||||||||||||||||||||||||||||||||||||||||||||||||||||
5 Includes earnings of equity-accounted investees of $24 million (2017 (Nutrien) – $30 million; 2017 (PotashCorp) – $5 million). |
| |||||||||||||||||||||||||||||||||||||||||||||||||||||||||||
| Nutrien 2018 Third Quarter Report | 12 |
The most significant contributors to the change in nitrogen EBITDA were as follows (direction of arrows refers to impact on EBITDA and● means no impact):
| Three months ended | September 30, 2018 vs September 30, 2017 (Nutrien) | September 30, 2018 vs September 30, 2017 (PotashCorp) | ||||||||
| Sales volumes | p | Sales volumes increased due to strong grower demand and increased product availability due to higher operating rates. Ammonia sales increased despite higher production of downstream products. | p | Sales volumes increased primarily as a result of the Merger. | ||||||
| Net sales prices | p | Our average realized price increased as a result of higher nitrogen fertilizer benchmarks supported by tight supply and continued demand growth. This was partially offset by the impact of lower natural gas prices on a portion of our industrial business. | p | Our average realized price was substantially higher, reflecting the impact of higher fertilizer benchmarks supported by tight supply and continued demand growth. | ||||||
| Cost of goods sold | | ● | | Cost of goods sold was flat due to higher depreciation and amortization related to PPA adjustments as a result of the Merger being offset by the impact of an increase in operating rates. | ●
p | Cost of goods sold increased due to higher depreciation and amortization related to PPA adjustments as a result of the Merger.
Average natural gas costs including our hedge position decreased 6 percent due to the relatively lower-cost gas available at our Alberta facilities acquired in the Merger, partially offset by higher gas costs in Trinidad (contract prices indexed primarily to Tampa ammonia prices). | ||||
| ● | Average natural gas costs, including our hedge position, were flat. Higher gas costs in Trinidad (contract prices indexed primarily to Tampa ammonia prices) were offset by the impact of lower AECO and NYMEX indices and a reduced impact from our gas hedge position. | |||||||||
| Earnings ofequity-accounted investees | p | There were no significant changes between 2017 and 2018. | p | There were no significant changes between 2017 and 2018. | ||||||
| Depreciation and amortization | ● | Expense was higher in 2018 due to higher depreciation and amortization based on volumes and the PPA adjustments as a result of the Merger. | ● | Expense was higher in 2018 due to higher depreciation and amortization based on volumes and the PPA adjustments as a result of the Merger. | ||||||
| Nine months ended | September 30, 2018 vs September 30, 2017 (Nutrien) | September 30, 2018 vs September 30, 2017 (PotashCorp) | ||||||||
| Sales volumes | | q | | Ammonia sales volumes decreased despite increased production due to higher production of urea from the continuedramp-up of our urea expansion project at Borger as well as higher urea production at our other plants. | p | Sales volumes increased primarily as a result of the Merger. | ||||
| p | Urea volumes were up due to the continuedramp-up at Borger and increased availability due to higher production rates. | |||||||||
| Net sales prices | p | Our average realized price increased, with higher prices for urea and solutions and nitrates more than offsetting the impact of slightly lower ammonia prices. Realized pricing in parts of our industrial portfolio (mainly ammonia and nitrates) was negatively impacted by lower natural gas prices. | p | Our average realized price for urea and solutions and nitrates was substantially higher, reflecting the impact of higher fertilizer benchmarks supported by tight supply and continued demand growth. | ||||||
| Cost of goods sold | | p | | Cost of goods sold decreased due to lower natural gas costs (discussed below) and higher operating rates more than offsetting higher depreciation and amortization related to PPA adjustments as a result of the Merger. | p | Cost of goods sold decreased due to lower natural gas costs (discussed below) and higher operating rates more than offsetting higher depreciation and amortization related to PPA adjustments as a result of the Merger. | ||||
| p | Average natural gas costs, including our hedge position, decreased 9 percent. Higher gas costs in Trinidad (contract prices indexed primarily to Tampa ammonia prices) were more than offset by the impact of lower AECO and NYMEX indices. | p | Average natural gas costs including our hedge position decreased 18 percent due to the relatively lower-cost gas available at our Alberta facilities acquired in the Merger, partially offset by higher gas costs in Trinidad (contract prices indexed primarily to Tampa ammonia prices). | |||||||
| Earnings ofequity-accounted investees | q | There were no significant changes between 2017 and 2018. | p | Earnings were higher in 2018 due to the addition of the equity income from our investment in MOPCO. | ||||||
| Depreciation and amortization | ● | Expense was higher in 2018 due to higher depreciation and amortization based on volumes and the PPA adjustments as a result of the Merger. | ● | Expense was higher in 2018 due to higher depreciation and amortization based on volumes and the PPA adjustments as a result of the Merger. | ||||||
| 13 | Nutrien 2018 Third Quarter Report |
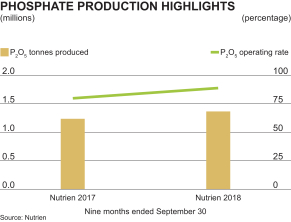
Phosphate and Sulfate Performance
| Three Months Ended September 30 | ||||||||||||||||||||||||||||||||||||||||||||||||||||||||||||
| Dollars (millions) | Tonnes (thousands) | Average per Tonne1 | ||||||||||||||||||||||||||||||||||||||||||||||||||||||||||
| Nutrien | Nutrien2 | PotashCorp | Nutrien | Nutrien2 | PotashCorp | Nutrien | Nutrien2 | PotashCorp | ||||||||||||||||||||||||||||||||||||||||||||||||||||
| 2018 | 2017 | % Change | 2017 | % Change | 2018 | 2017 | % Change | 2017 | % Change | 2018 | 2017 | % Change | 2017 | % Change | ||||||||||||||||||||||||||||||||||||||||||||||
Manufactured product3 | ||||||||||||||||||||||||||||||||||||||||||||||||||||||||||||
Net sales | ||||||||||||||||||||||||||||||||||||||||||||||||||||||||||||
Fertilizer | $ | 267 | $ | 223 | 20 | $ | 174 | 53 | 650 | 678 | (4 | ) | 559 | 16 | $ | 411 | $ | 329 | 25 | $ | 311 | 32 | ||||||||||||||||||||||||||||||||||||||
Industrial and feed | 114 | 101 | 13 | 121 | (6 | ) | 228 | 214 | 7 | 250 | (9 | ) | $ | 498 | $ | 474 | 5 | $ | 486 | 2 | ||||||||||||||||||||||||||||||||||||||||
Ammonium sulfate | 23 | 18 | 28 | – | n/m | 104 | 85 | 22 | – | n/m | $ | 225 | $ | 214 | 5 | $ | – | n/m | ||||||||||||||||||||||||||||||||||||||||||
| 404 | 342 | 18 | 295 | 37 | 982 | 977 | 1 | 809 | 21 | $ | 412 | $ | 351 | 17 | $ | 365 | 13 | |||||||||||||||||||||||||||||||||||||||||||
| Cost of goods sold | (369 | ) | (382 | ) | (3 | ) | (340 | ) | 9 | $ | (376 | ) | $ | (391 | ) | (4 | ) | $ | (420 | ) | (10 | ) | ||||||||||||||||||||||||||||||||||||||
| Gross margin | 35 | (40 | ) | n/m | (45 | ) | n/m | $ | 36 | $ | (40 | ) | n/m | $ | (55 | ) | n/m | |||||||||||||||||||||||||||||||||||||||||||
Other phosphate and purchased products gross margin4 | 1 | – | n/m | – | n/m | 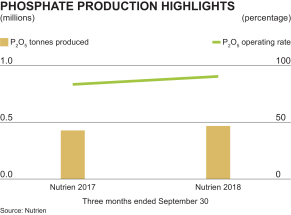 | ||||||||||||||||||||||||||||||||||||||||||||||||||||||
Gross margin | 36 | (40 | ) | n/m | (45 | ) | n/m | |||||||||||||||||||||||||||||||||||||||||||||||||||||
Expenses | (4 | ) | (5 | ) | (20 | ) | (3 | ) | 33 | |||||||||||||||||||||||||||||||||||||||||||||||||||
EBIT | 32 | (45 | ) | n/m | (48 | ) | n/m | |||||||||||||||||||||||||||||||||||||||||||||||||||||
Depreciation and amortization | 56 | 56 | – | 52 | 8 | |||||||||||||||||||||||||||||||||||||||||||||||||||||||
EBITDA | $ | 88 | $ | 11 | 700 | $ | 4 | n/m | ||||||||||||||||||||||||||||||||||||||||||||||||||||
1 Rounding differences may occur due to the use of whole dollars inper-tonne calculations. |
| |||||||||||||||||||||||||||||||||||||||||||||||||||||||||||
2 Refer to“Non-IFRS Financial Measures” section on page 29 for details. |
| |||||||||||||||||||||||||||||||||||||||||||||||||||||||||||
3 Includes intersegment gross sales of $86 million and 209,000 sales tonnes (2017 (PotashCorp) – $NIL and NIL sales tonnes). Intersegment profits are eliminated on consolidation. |
| |||||||||||||||||||||||||||||||||||||||||||||||||||||||||||
4 Comprised of net sales $33 million (2017 (Nutrien) – $14 million; 2017 (PotashCorp) – $2 million) less cost of goods sold $32 million (2017 (Nutrien) – $14 million; 2017 (PotashCorp) – $2 million). |
| |||||||||||||||||||||||||||||||||||||||||||||||||||||||||||
n/m= not meaningful |
| |||||||||||||||||||||||||||||||||||||||||||||||||||||||||||
| Nutrien 2018 Third Quarter Report | 14 |
| Nine Months Ended September 30 | ||||||||||||||||||||||||||||||||||||||||||||||||||||||||||||
| Dollars (millions) | Tonnes (thousands) | Average per Tonne1 | ||||||||||||||||||||||||||||||||||||||||||||||||||||||||||
| Nutrien | Nutrien2 | PotashCorp | Nutrien | Nutrien2 | PotashCorp | Nutrien | Nutrien2 | PotashCorp | ||||||||||||||||||||||||||||||||||||||||||||||||||||
| 2018 | 2017 | % Change | 2017 | % Change | 2018 | 2017 | % Change | 2017 | % Change | 2018 | 2017 | % Change | 2017 | % Change | ||||||||||||||||||||||||||||||||||||||||||||||
Manufactured product3 | ||||||||||||||||||||||||||||||||||||||||||||||||||||||||||||
Net sales | ||||||||||||||||||||||||||||||||||||||||||||||||||||||||||||
Fertilizer | $ | 740 | $ | 581 | 27 | $ | 427 | 73 | 1,824 | 1,656 | 10 | 1,275 | 43 | $ | 406 | $ | 351 | 16 | $ | 335 | 21 | |||||||||||||||||||||||||||||||||||||||
Industrial and feed | 318 | 324 | (2 | ) | 378 | (16 | ) | 640 | 663 | (3 | ) | 763 | (16 | ) | $ | 496 | $ | 490 | 1 | $ | 496 | – | ||||||||||||||||||||||||||||||||||||||
Ammonium sulfate | 64 | 67 | (4 | ) | – | n/m | 263 | 284 | (7 | ) | – | n/m | $ | 244 | $ | 236 | 3 | – | n/m | |||||||||||||||||||||||||||||||||||||||||
| 1,122 | 972 | 15 | 805 | 39 | 2,727 | 2,603 | 5 | 2,038 | 34 | $ | 411 | $ | 374 | 10 | $ | 395 | 4 | |||||||||||||||||||||||||||||||||||||||||||
| Cost of goods sold | (1,018 | ) | (979 | ) | 4 | (866 | ) | 18 | $ | (373 | ) | $ | (376 | ) | (1 | ) | $ | (425 | ) | (12 | ) | |||||||||||||||||||||||||||||||||||||||
| Gross margin | 104 | (7 | ) | n/m | (61 | ) | n/m | $ | 38 | $ | (2 | ) | n/m | $ | (30 | ) | n/m | |||||||||||||||||||||||||||||||||||||||||||
|
|
| ||||||||||||||||||||||||||||||||||||||||||||||||||||||||||
Other phosphate and purchased products gross margin4 | 3 | 3 | – | 1 | 200 | |||||||||||||||||||||||||||||||||||||||||||||||||||||||
Gross margin | 107 | (4 | ) | n/m | (60 | ) | n/m | |||||||||||||||||||||||||||||||||||||||||||||||||||||
Expenses | (13 | ) | (21 | ) | (38 | ) | (11 | ) | 18 | |||||||||||||||||||||||||||||||||||||||||||||||||||
EBIT | 94 | (25 | ) | n/m | (71 | ) | n/m | |||||||||||||||||||||||||||||||||||||||||||||||||||||
Depreciation and amortization | 149 | 181 | (18 | ) | 166 | (10 | ) | |||||||||||||||||||||||||||||||||||||||||||||||||||||
EBITDA | $ | 243 | $ | 156 | 56 | $ | 95 | 156 | ||||||||||||||||||||||||||||||||||||||||||||||||||||
1 Rounding differences may occur due to the use of whole dollars inper-tonne calculations.
|
| |||||||||||||||||||||||||||||||||||||||||||||||||||||||||||
2 Refer to“Non-IFRS Financial Measures” section on page 29 for details.
|
| |||||||||||||||||||||||||||||||||||||||||||||||||||||||||||
3 Includes intersegment gross sales of $246 million and 588,000 sales tonnes (2017 (PotashCorp) – $NIL and NIL sales tonnes). Intersegment profits are eliminated on consolidation.
|
| |||||||||||||||||||||||||||||||||||||||||||||||||||||||||||
4 Comprised of net sales $113 million (2017 (Nutrien) – $40 million; 2017 (PotashCorp) – $4 million) less cost of goods sold $110 million (2017 (Nutrien) – $37 million; 2017 (PotashCorp) – $3 million).
|
| |||||||||||||||||||||||||||||||||||||||||||||||||||||||||||
n/m= not meaningful |
| |||||||||||||||||||||||||||||||||||||||||||||||||||||||||||
| 15 | Nutrien 2018 Third Quarter Report |
The most significant contributors to the change in phosphate and sulfate EBITDA were as follows (direction of arrows refers to impact on EBITDA and● means no impact):
| Three months ended | September 30, 2018 vs September 30, 2017 (Nutrien) | September 30, 2018 vs September 30, 2017 (PotashCorp) | ||||||||||
| Sales volumes | p | There were no significant changes between 2017 and 2018. | p | Sales volumes increased primarily as a result of the Merger. | ||||||||
| Net sales prices | p | Our average realized fertilizer price was up due to strong demand and higher global sulfur and ammonia benchmark prices. | p | Our average realized fertilizer price was up due to strong demand and higher global sulfur benchmark prices. | ||||||||
| Cost of goods sold | p | Industrial and feed cost of goods sold was lower in 2018 than in 2017 due to thenon-cash impairment of feed assets in Aurora in 2017. | | p | | Industrial and feed cost of goods sold was lower in 2018 than in 2017 due to thenon-cash impairment of feed assets in Aurora in 2017. | ||||||
| q | | Fertilizer cost of goods sold increased primarily due to higher sulfur costs. | q | Fertilizer cost of goods sold increased primarily due to higher sulfur costs and rock costs at Redwater. | ||||||||
| Expenses | ● | There were no significant changes between 2017 and 2018. | ● | There were no significant changes between 2017 and 2018. | ||||||||
| Depreciation and amortization | ● | Expense was flat in 2018 primarily due to lower depreciable asset balance at our US facilities as a result of thenon-cash impairments recorded in the latter half of 2017 and the impact of the PPA adjustments as a result of the Merger. The decrease was offset by an increase in depreciation at our Redwater facility due to a change in the assets’ estimated useful lives. | ● | Expense was higher in 2018 primarily due to an increase in depreciation at our Redwater facility due to a change in the assets estimated useful lives more than offsetting a lower depreciable asset balance at our US facilities as a result of thenon-cash impairments recorded in the latter half of 2017 and the impact of the PPA adjustments as a result of the Merger. | ||||||||
| Nine months ended | September 30, 2018 vs September 30, 2017 (Nutrien) | September 30, 2018 vs September 30, 2017 (PotashCorp) | ||||||||||
| Sales volumes | p | Sales volumes were up due to strong fertilizer demand and increased production levels at our phosphate facilities. | p | Sales volumes increased primarily as a result of the Merger. | ||||||||
| Net sales prices | p | Our average realized fertilizer price was up, due to strong demand and higher global sulfur benchmark prices. | p | Our average realized fertilizer price was up, due to strong demand and higher global sulfur benchmark prices. | ||||||||
| Cost of goods sold | p | Industrial and feed cost of goods sold was lower in 2018 than in 2017 due to thenon-cash impairment of feed assets in Aurora in 2017. | p | Industrial and feed cost of goods sold was lower in 2018 than in 2017 due to thenon-cash impairment of feed assets in Aurora in 2017. | ||||||||
| q | Fertilizer cost of goods sold increased primarily due to higher sulfur costs, which was partially offset by favorable adjustments to our asset retirement obligations related to an increase in the relevant discount rates. | | q | | Fertilizer cost of goods sold increased primarily due to higher sulfur costs and rock costs at Redwater, which was partially offset by favorable adjustments to our asset retirement obligations related to an increase in the relevant discount rates. | |||||||
| Expenses | ● | There were no significant changes between 2017 and 2018. | ● | There were no significant changes between 2017 and 2018. | ||||||||
| Depreciation and amortization | ● | Expense was lower in 2018 primarily due to lower depreciable asset balance at our US facilities as a result of thenon-cash impairments recorded in the latter half of 2017 and the impact of the PPA adjustments as a result of the Merger. The decrease was partially offset by an increase in depreciation at our Redwater facility due to a change in the assets’ estimated useful lives. | ● | Expense was lower in 2018 primarily due to lower depreciable asset balance at our US facilities as a result of thenon-cash impairments recorded in the latter half of 2017 and the impact of the PPA adjustments as a result of the Merger. The decrease was partially offset by an increase in depreciation at our Redwater facility due to a change in the assets estimated useful lives. | ||||||||
| Nutrien 2018 Third Quarter Report | 16 |
Others Segment Financial Performance
“Others” is anon-operating segment comprising corporate and administrative functions that provide support and governance to our operating business units. No sales are made in this segment.
| Three Months ended September 30 | Nine Months Ended September 30 | |||||||||||||||||||||||
| Nutrien | Nutrien1 | PotashCorp | Nutrien | Nutrien1 | PotashCorp | |||||||||||||||||||
Dollars (millions), except percentage amounts | 2018 | 2017 | 2017 | 2018 | 2017 | 2017 | ||||||||||||||||||
EBITDA | $ | (54 | ) | $ | (150 | ) | $ | (63 | ) | (400 | ) | (323 | ) | (140 | ) | |||||||||
| 1 | Refer to“Non-IFRS Financial Measures” section on page 29 for details. |
| September 30, 2018 vs September 30, 2017 (Nutrien) | September 30, 2018 vs September 30, 2017 (PotashCorp) | |||
| EBITDA for three months ended | EBITDA increased primarily due to the impact of a Curtailment Gain (see note 5 to the interim financial statements) more than offsetting the impact of higher Merger and related costs. | EBITDA increased primarily due to the impact of a Curtailment Gain (see note 5 to the interim financial statements) more than offsetting the impact of higher Merger and related costs and the addition of Agrium’s operations. | ||
| EBITDA for nine months ended | EBITDA decreased primarily due to higher Merger and related costs and higher share-based compensation costs (due to a higher share price, improvement in our relative ranking in total shareholder return and progress towards synergy targets) more than offsetting the impact of the Curtailment Gain (see note 5 to the interim financial statements). | EBITDA decreased primarily due to the addition of Agrium’s operations, higher Merger and related costs and higher share-based compensation costs (due to a higher share price, improvement in our relative ranking in total shareholder return and progress towards synergy targets) more than offsetting the impact of a Curtailment Gain (see note 5 to the interim financial statements). |
Expenses and Income Below Gross Margin
| Three Months Ended September 30 | ||||||||||||||||||||||||||||
| Nutrien | Nutrien1 | PotashCorp2 | ||||||||||||||||||||||||||
| Dollars (millions), except percentage amounts | 2018 | 2017 | Change | % Change | 2017 | Change | % Change | |||||||||||||||||||||
Selling expenses | $ (560 | ) | $ | (477 | ) | $ | (83 | ) | 17 | $ | (7 | ) | $ | (553 | ) | n/m | ||||||||||||
General and administrative expenses | (163 | ) | (145 | ) | (18 | ) | 12 | (49 | ) | (114 | ) | 233 | ||||||||||||||||
Provincial mining and other taxes | (79 | ) | (48 | ) | (31 | ) | 65 | (45 | ) | (34 | ) | 76 | ||||||||||||||||
Earnings of equity-accounted investees | 15 | 6 | 9 | 150 | 3 | 12 | 400 | |||||||||||||||||||||
Impairment of property, plant and equipment | (1,809 | ) | – | (1,809 | ) | n/m | – | (1,809 | ) | n/m | ||||||||||||||||||
Other income (expenses) | 82 | (55 | ) | 137 | n/m | (35 | ) | 117 | n/m | |||||||||||||||||||
Finance costs | (142 | ) | (135 | ) | (7 | ) | 5 | (60 | ) | (82 | ) | 137 | ||||||||||||||||
Income tax recovery (expense) | 434 | 8 | 426 | n/m | (24 | ) | 458 | n/m | ||||||||||||||||||||
Discontinued operations | 23 | n/a | n/m | n/m | 37 | (14 | ) | (38 | ) | |||||||||||||||||||
| Nine Months Ended September 30 | ||||||||||||||||||||||||||||
| Nutrien | Nutrien1 | PotashCorp2 | ||||||||||||||||||||||||||
| Dollars (millions), except percentage amounts | 2018 | 2017 | Change | % Change | 2017 | Change | % Change | |||||||||||||||||||||
Selling expenses | $ (1,758 | ) | $ | (1,519 | ) | $ | (239 | ) | 16 | $ | (24 | ) | $ | (1,734 | ) | n/m | ||||||||||||
General and administrative expenses | (461 | ) | (347 | ) | (114 | ) | 33 | (130 | ) | (331 | ) | 255 | ||||||||||||||||
Provincial mining and other taxes | (192 | ) | (130 | ) | (62 | ) | 48 | (121 | ) | (71 | ) | 59 | ||||||||||||||||
Earnings of equity-accounted investees | 26 | 38 | (12 | ) | (32 | ) | 6 | 20 | 333 | |||||||||||||||||||
Impairment of property, plant and equipment | (1,809 | ) | – | (1,809 | ) | n/m | – | (1,809 | ) | n/m | ||||||||||||||||||
Other expenses | (71 | ) | (173 | ) | 102 | (59 | ) | (73 | ) | 2 | (3 | ) | ||||||||||||||||
Finance costs | (394 | ) | (379 | ) | (15 | ) | 4 | (180 | ) | (214 | ) | 119 | ||||||||||||||||
Income tax recovery (expense) | 199 | (163 | ) | 362 | n/m | 30 | 169 | 563 | ||||||||||||||||||||
Discontinued operations | 698 | n/a | n/m | n/m | 129 | 569 | 441 | |||||||||||||||||||||
| 1 | Refer to“Non-IFRS Financial Measures” section on page 29 for details. |
| 2 | Certain amounts have been reclassified from earnings of equity-accounted investees, dividend income and income taxes to net income from discontinued operations as the related assets were classified as held for sale in 2017. These amounts have also been reclassified to conform to the current period’s presentation as described in note 16 to the interim financial statements. |
| n/m | = not meaningful |
| n/a | = not available |
| 17 | Nutrien 2018 Third Quarter Report |
The most significant contributors to the change in expenses and income results were as follows:
| Three and nine months ended | September 30, 2018 vs September 30, 2017 (Nutrien) | September 30, 2018 vs September 30, 2017 (PotashCorp) | ||
| Selling Expenses | A significant portion of our selling expenses were incurred in the retail segment as explained in the Retail Financial Performance section on pages 6 and 7. | A significant portion of our selling expenses were incurred in the retail segment as explained in the Retail Financial Performance section on pages 6 and 7. | ||
| General and Administrative Expenses | There were no significant changes to general and administrative expenses for the three-month period. For the nine-month period, expenses increased primarily due to higher share-based compensation costs (due to a higher share price, improvement in our relative ranking in total shareholder return and progress towards synergy targets). | General and administrative expenses increased primarily due to the addition of Agrium’s operations and higher share-based compensation costs (due to a higher share price, improvement in our relative ranking in total shareholder return and progress towards synergy targets). | ||
Impairment of Property, Plant and Equipment and Provincial Mining and Other Taxes | The impairment of property plant and equipment and a significant portion of our provincial mining and other taxes were incurred in the potash segment as explained in the Potash Financial Performance section on page 10. | The impairment of property plant and equipment and a significant portion of our provincial mining and other taxes were incurred in the potash segment as explained in the Potash Financial Performance section on page 10. | ||
| Other (Expenses) Income | For the three months ended September 30, other income in 2018 was primarily the result of a Curtailment Gain (see note 5 to the interim financial statements) while other expenses in 2017 were primarily comprised of Merger and related costs.
For the nine months ended September 30, other expenses decreased as the Curtailment Gain in 2018 (none in 2017) more than offset the increase in Merger and related costs. | For the three months ended September 30, other income in 2018 was primarily the result of a Curtailment Gain (see note 5 to the interim financial statements) while other expenses in 2017 were primarily comprised of Merger and related costs.
For the nine months ended September 30, other expenses decreased as the Curtailment Gain in 2018 (none in 2017) more than offset the increase in Merger and related costs. | ||
| Finance Costs | There were no significant changes. | Finance costs increased as a result of the Merger. |
| WEIGHTED AVERAGE DEBT1 BALANCES AND RATES | Three Months Ended September 30 | Nine Months Ended September 30 | ||||||||||||||||||||||||||||
| Dollars (millions), except percentage amounts | | Nutrien 2018 | | | Nutrien 2017 | | | PotashCorp 2017 | | | Nutrien 2018 | | | Nutrien 2017 | | | PotashCorp 2017 | | ||||||||||||
Short-term balance | $ | 3,877 | $ | 1,723 | $ | 350 | $ | 2,670 | $ | 1,106 | $ | 370 | ||||||||||||||||||
Short-term rate2 | 2.5 | % | 1.6 | % | 1.5 | % | 2.4 | % | 1.4 | % | 1.3 | % | ||||||||||||||||||
Long-term balance | $ | 8,175 | $ | 8,675 | $ | 4,250 | $ | 8,175 | $ | 8,686 | $ | 4,250 | ||||||||||||||||||
Long-term rate | 4.8 | % | 4.7 | % | 4.7 | % | 4.8 | % | 4.7 | % | 4.7 | % | ||||||||||||||||||
1 Calculated using the face values of North American debt including current portion of long-term debt balances. |
| |||||||||||||||||||||||||||||
2 Rates were higher in 2018 due to increases in benchmark interest rates. |
| |||||||||||||||||||||||||||||
| Income Tax Recovery (Expense) | Loss for the three months ended September 30, 2018 was higher as compared to the same period in 2017. As a result, the income tax recovery increased.
For the nine months ended September 30, 2018, a loss was realized for accounting purposes compared to earnings for the same period last year. As a result, a tax recovery was recorded in 2018 compared to a tax expense for the same period in 2017. | There was a loss for the three months ended September 30, 2018 compared to earnings for the same period in 2017. As a result, a tax recovery was recorded in 2018 compared to tax expense for the same period in 2017.
There was a loss for the nine months ended September 30, 2018 compared to earnings for the same period in 2017. As a result, the income tax recovery increased. | ||
| For the first nine months of 2018, (70) percent of the effective tax rate on the current year’s earnings from continuing operations pertained to current income taxes (2017 – 42 percent) and 170 percent related to deferred income taxes (2017 – 58 percent). The increase in the deferred portion was due to the deferred tax recovery recorded as a result of the impairment of New Brunswick property, plant and equipment. | ||||
| EFFECTIVE TAX RATES AND DISCRETE ITEMS |
Three Months Ended September 30 | Nine Months Ended September 30 | ||||||||||||||||||||||||||||
| Dollars (millions), except percentage amounts | | Nutrien 2018 | | | Nutrien1 2017 | | | PotashCorp1 2017 | | | Nutrien 2018 | | | Nutrien1 2017 | | | PotashCorp1 2017 | | ||||||||||||
Actual effective tax rate on (loss) earnings | 29 | % | 33 | % | 36 | % | 38 | % | 25 | % | 15 | % | ||||||||||||||||||
Actual effective tax rate including discrete items | 29 | % | 12 | % | 59 | % | 38 | % | 18 | % | (13 | )% | ||||||||||||||||||
Discrete tax adjustments that impacted the rate | $ | (2 | ) | $ | (13 | ) | $ | (9 | ) | $ | – | $ 67 | $ | 67 | ||||||||||||||||
1 Rates have been adjusted as a result of our investments in SQM, ICL and APC being classified as discontinued in 2017. |
| |||||||||||||||||||||||||||||
| Net Earnings from Discontinued Operations | Combined historical Nutrien information was not prepared for discontinued operations. | See explanation in the Overview of Actual Results section on page 5. |
| Nutrien 2018 Third Quarter Report | 18 |
Financial Condition Review
Balance Sheet Analysis
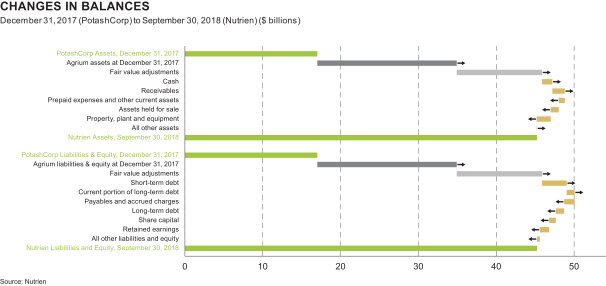
The most significant contributors to the changes in our balance sheet were as follows (direction of arrows refers to increase or decrease in financial condition, all impacts for balance sheet line items are after the impacts of the Merger which includes fair value adjustments in relation to the Merger (if any)):
| Assets | Liabilities | |||||
| p | Total assets increased as a result of the Merger and fair value adjustments as described in note 2 to the interim financial statements. | q | Total liabilities increased as a result of the Merger and fair value adjustments as described in note 2 to the interim financial statements. | |||
| p | For information regarding changes in cash, refer to the Sources and Uses of Cash section on page 23 and the statement of cash flows in our interim financial statements. | q | Short-term debt also increased due to an increase in our outstanding commercial paper and borrowings under our accounts receivable securitization program. | |||
| p | Receivables were also higher primarily due to strong seasonal retail sales resulting in higher trade and vendor rebate receivables. | q | Current portion of long-term debt increased due to the 6.75 percent notes due January 15, 2019 and 6.5 percent notes due May 15, 2019 becoming due within one year. | |||
q
q | Prepaid expenses and other current assets were also impacted by the seasonal drawdown of prepaid retail inventory.
Assets held for sale were lower primarily due to the sale of our equity interests in ICL and a portion of our SQM equity interests as discussed in note 7 to the interim financial statements. | p | Payables and accrued charges were also impacted by seasonal timing of vendor invoice payments and a drawdown of customer prepayments as customers took delivery of inventories paid in advance. | |||
| p | Long-term debt was also impacted by the 6.75 percent and 6.5 percent notes discussed above becoming due within one year. | |||||
| q | Property, plant and equipment were also impacted by anon-cash impairment loss relating to our New Brunswick potash operations as described in note 4 to the interim financial statements. | |||||
Equity | ||||||
| p | Total equity increased as a result of the Merger and the issuance of Nutrien shares. | |||||
| q | Share capital was also reduced by share repurchases made under Nutrien’s normal course issuer bid (NCIB). | |||||
| q | Retained earnings was lower primarily as a result of shares repurchased and dividends declared exceeding net earnings, which were impacted in the third quarter of 2018 by thenon-cash impairment loss noted above. | |||||
| 19 | Nutrien 2018 Third Quarter Report |
As at September 30, 2018, $1,290 million (December 31, 2017 (PotashCorp) – $104 million) of our cash and cash equivalents was held in certain foreign subsidiaries and as there are plans to repatriate the majority of these funds, a deferred tax liability of $247 million was recorded at September 30, 2018. On May 17, 2018, the company entered into an agreement with a third party for the sale of its shares of SQM for approximately $4,066 million before taxes and closing costs. The agreement is subject to customary closing conditions (including applicable regulatory approvals) and is expected to close by the end of 2018. Repatriation of the net cash from this sale is expected to result in tax consequences. In connection with the sale of one of our investments, we received $325 million of cash that is currently not available for use.
Liquidity and Capital Resources
The following section explains how we manage our cash and capital resources to carry out our strategy and deliver results.
Liquidity risk arises from our general funding needs and in the management of our assets, liabilities and capital structure. We manage liquidity risk to maintain sufficient liquid financial resources to fund our financial position and meet our commitments and obligations in a cost-effective manner.
Liquidity needs can be met through a variety of sources:
| Our primary uses of funds are:
| |
• Cash generated from operations.
| • Operational expenses.
| |
• Drawdowns under our revolving credit facilities.
| • Sustaining, opportunity and integration capital spending.
| |
• Issuances of commercial paper.
| • Investments.
| |
• Proceeds from sales of investments.
| • Dividends and interest.
| |
• Borrowings under our accounts receivable securitization program.
| • Principal payments on our debt securities.
• Share repurchases. | |
• Accessing debt capital markets. |
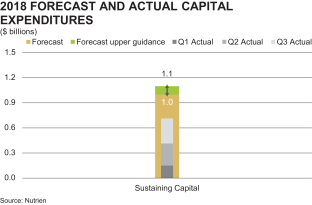
Based on an expected average exchange rate of 1.29 Canadian dollars per US dollar in 2018, we expect to incur capital expenditures, including capitalized interest, of approximately $1.0 billion to $1.1 billion to sustain operations at existing levels and for major repairs and maintenance (including plant turnarounds). We target a stable and growing dividend that represents 40 to 60 percent of free cash flow after sustaining capital through the agricultural cycle. Subsequent to September 30, 2018, our Board declared a quarterly dividend of $0.43 per share, representing an increase of 7.5 percent from the previously declared quarterly dividends. See note 10 to the interim financial statements for details.
During the nine months ended September 30, 2018, we also completed the previously announced purchase of five percent of our outstanding common shares which our Board had approved through a NCIB earlier this year. The NCIB was completed in accordance with the Toronto Stock Exchange’s (TSX) normal course issuer bid rules and/or Rule10b-18 under the US Securities Exchange Act of 1934, as amended. During the nine months ended September 30, 2018, 32,209,923 common shares were repurchased at a cost of $1,663 million with an average price per share of $51.62.
On July 23, 2018, we entered into an agreement with a third party for the sale of the company’s equity interest in APC. The sale closed on October 24, 2018 for gross proceeds of $502 million. See above for information on our agreement to sell our remaining equity interests in SQM.
Cash Requirements
Contractual Obligations and Other Commitments
Our contractual obligations and other commitments detailed on page 22 of our first quarter interim report summarize certain of our liquidity and capital resource requirements as of March 31, 2018, excluding obligations that have original maturities of less than one year, planned (but not legally committed) capital expenditures, or potential share repurchases. During the second quarter of 2018, the company decided to close the small phosphate facility at Geismar. As a result, contracted purchases of phosphate rock from Morocco are expected to end by December 31, 2018 with associated cash outflows occurring by the end of the first quarter of 2019. Other than the contractual obligations and commitments update discussed below, there were no significant changes since March 31, 2018.
Subsequent to September 30, 2018, we signed a new natural gas purchase agreement in Trinidad. This five-year $1,258 million contract will commence January 1, 2019 and is set to expire December 31, 2023. The signing of the new contract has increased our minimum purchase commitments in the contractual obligations and other commitments referenced above as follows: 2019 – $244 million, 2020 – $248 million, 2021 – $252 million, 2022 – $255 million and 2023 – $259 million.
| Nutrien 2018 Third Quarter Report | 20 |
Sources and Uses of Cash
The company’s cash flows from operating, investing and financing activities are summarized in the following tables:
| Three Months Ended September 30 | ||||||||||||||||||||||||||||
| Nutrien | Nutrien1 | PotashCorp | ||||||||||||||||||||||||||
| Dollars (millions), except percentage amounts | 2018 | 2017 | Change | % Change | 2017 | Change | % Change | |||||||||||||||||||||
| Cash (used in) provided by operating activities | $ | (177 | ) | $ | (25 | ) | $ | (152 | ) | 608 | $ | 293 | $ | (470 | ) | n/m | ||||||||||||
| Cash used in investing activities | (479 | ) | (441 | ) | (38 | ) | 9 | (170 | ) | (309 | ) | 182 | ||||||||||||||||
| Cash provided by (used in) financing activities | 615 | 407 | 208 | 51 | (123 | ) | 738 | n/m | ||||||||||||||||||||
| Effect of exchange rate changes on cash and cash equivalents | (13 | ) | (14 | ) | 1 | (7 | ) | – | (13 | ) | n/m | |||||||||||||||||
Decrease (increase) in cash and cash equivalents | $ | (54 | ) | $ | (73 | ) | $ | 19 | (26 | ) | $ | – | $ | (54 | ) | n/m | ||||||||||||
| 1 | Refer to“Non-IFRS Financial Measures” section on page 29 for details. |
n/m = not meaningful
| Nine Months Ended September 30 | ||||||||||||||||||||||||||||
| Nutrien | Nutrien1 | PotashCorp | ||||||||||||||||||||||||||
| Dollars (millions), except percentage amounts | 2018 | 2017 | Change | % Change | 2017 | Change | % Change | |||||||||||||||||||||
| Cash provided by operating activities | $ | 84 | $ | 589 | $ | (505 | ) | (86 | ) | $ | 844 | $ | (760 | ) | (90 | ) | ||||||||||||
| Cash provided by (used in) investing activities | 903 | (1,135 | ) | 2,038 | n/m | (432 | ) | 1,335 | n/m | |||||||||||||||||||
| Cash provided by (used in) financing activities | 821 | 452 | 369 | 82 | (347 | ) | 1,168 | n/m | ||||||||||||||||||||
| Effect of exchange rate changes on cash and cash equivalents | (22 | ) | (7 | ) | (15 | ) | 214 | – | (22 | ) | n/m | |||||||||||||||||
Increase (decrease) in cash and cash equivalents | $ | 1,786 | $ | (101 | ) | $ | 1,887 | n/m | $ | 65 | $ | 1,721 | n/m | |||||||||||||||
| 1 | Refer to“Non-IFRS Financial Measures” section on page 29 for details. |
n/m = not meaningful
| 21 | Nutrien 2018 Third Quarter Report |
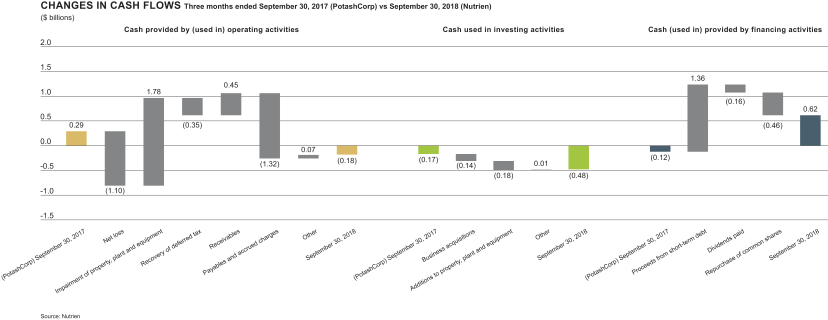
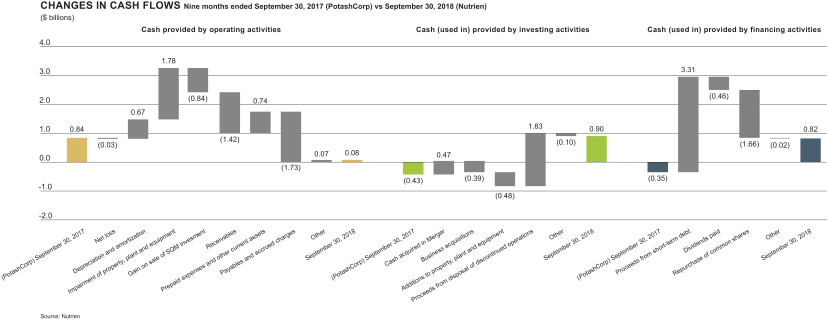
| Nutrien 2018 Third Quarter Report | 22 |
The most significant contributors to the changes in cash flows were as follows:
Three months ended | September 30, 2018 vs September 30, 2017 (Nutrien) | September 30, 2018 vs September 30, 2017 (PotashCorp) | ||
| Cash Provided by (Used in) Operating Activities | Cash used in operating activities was impacted by: • Higher net loss in 2018. • Non-cash impairment to property, plant and equipment. • Higher cash outflows from changes innon-cash working capital in 2018. | Cash used in operating activities was impacted by: • Net loss in 2018 compared to net earnings in 2017. • Non-cash items including thenon-cash impairment to property, plant and equipment and a higher recovery of deferred income tax in 2018. • Inflows from receivables in 2018 compared to outflows in 2017. • Outflows from payables and accrued charges in 2018 compared with inflows in 2017. | ||
| Cash Provided by (Used in) Investing Activities | Cash used in investing activities: • No significant quarter over quarter impacts. | Cash used in investing activities was impacted by: • Cash outlays related to business acquisitions in 2018. (None in 2017) • An increase in cash additions to property, plant and equipment in 2018. | ||
| Cash Provided by (Used in) Financing Activities | Cash provided by financing activities was impacted by: • Higher cash proceeds from issuance of commercial paper in 2018. • Cash proceeds from funds drawn on accounts receivable securitization program. (None in 2017) • Cash outlays for share repurchases under the NCIB in 2018. | Cash provided by (used in) financing activities was impacted by: • Net cash proceeds from issuance of commercial paper in 2018 compared to net cash repayments of commercial paper in 2017. • Cash proceeds from funds drawn on accounts receivable securitization program. (None in 2017) • Higher cash dividends paid in 2018. • Cash outlays for share repurchases under the NCIB in 2018. |
Nine months ended | September 30, 2018 vs September 30, 2017 (Nutrien) | September 30, 2018 vs September 30, 2017 (PotashCorp) | ||
| Cash Provided by (Used in) Operating Activities | Cash provided by operating activities was impacted by: • Lower net earnings in 2018. • Non-cash items including thenon-cash impairment to property, plant and equipment and gain on sale of investment in SQM and increased depreciation and amortization. • Higher cash outflows from changes innon-cash working capital in 2018. | Cash provided by operating activities was impacted by: • Lower net earnings in 2018. • Non-cash items including thenon-cash impairment to property, plant and equipment, gain on sale of investment in SQM and increased depreciation and amortization. • Higher outflows from receivables in 2018. • Inflows from prepaid expenses and other current assets in 2018 compared to outflows in 2017. • Higher outflows from payables and accrued charges in 2018. | ||
| Cash Provided by (Used in) Investing Activities | Cash provided by (used in) investing activities was impacted by: • Cash acquired in the Merger in 2018. • Higher net cash outlays for business acquisitions in 2018. • Cash proceeds received from the disposal of our discontinued operations in ICL and a portion of our discontinued operations in SQM. | Cash provided by (used in) investing activities was impacted by: • Cash acquired in the Merger in 2018. • Net cash outlays for business acquisitions in 2018. (None in 2017) • An increase in cash additions to property, plant and equipment in 2018. • Cash proceeds received from the disposal of our discontinued operations in ICL and a portion of our discontinued operations in SQM. | ||
| Cash Provided by (Used in) Financing Activities | Cash provided by financing activities was impacted by: • A cash repayment of long-term debt in 2017. • Higher cash proceeds from issuance of commercial paper in 2018. • Cash proceeds from funds drawn on accounts receivable securitization program. (None in 2017) • Cash outlays for share repurchases under the NCIB in 2018. | Cash provided by (used in) financing activities was impacted by: • Net cash proceeds from issuance of commercial paper in 2018 compared to net cash repayments of commercial paper in 2017. • Cash proceeds from funds drawn on accounts receivable securitization program. (None in 2017) • Higher cash dividends paid in 2018. • Cash outlays for share repurchases under the NCIB in 2018. |
We believe that internally generated cash flow, supplemented by available borrowings under our existing financing sources, if necessary, will be sufficient to meet our anticipated capital expenditures and other cash requirements for at least the next 12 months. At this time, we do not reasonably expect any presently known trend or uncertainty to affect our ability to access our historical sources of liquidity. We had positive working capital of $1.13 billion and a working capital ratio of 1.11 at September 30, 2018. Working capital decreased from the combined historical Nutrien amount due primarily to the increase in current liabilities from increases in short-term debt and current portion of long-term debt net of decreases in payables and accrued charges, exceeding the increase in current assets from increases in cash and receivables net of decreases in assets held for sale and prepaid expenses and other current assets.
| 23 | Nutrien 2018 Third Quarter Report |
Capital Structure and Management
Principal Debt Instruments
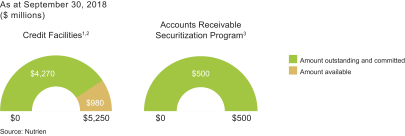
| 1 | Included in the amount outstanding and committed is $4,057 million of commercial paper and $213 million of other short-term debt. The $4,500 million available under the commercial paper program is limited to the availability of backup funds backstopped by the credit facility. We also have $285 million in uncommitted letter of credit facilities against which $155 million was issued at September 30, 2018. |
| 2 | During the third quarter of 2018, we entered into an amending agreement to replace the existing $75 million unsecured line of credit with a new $250 million uncommitted revolving demand credit facility. This increased the total amounts available under our credit facilities to $5,250 million. In October 2018, we entered into an amending agreement, increasing the total amounts available under our credit facilities to $5,500 million. |
| 3 | At September 30, 2018, we borrowed the full $500 million available under our accounts receivable securitization program (limit is reduced to $300 million from January to March each year). Under this program, sold accounts receivable balances of $1,798 million were used as capacity for collateralized borrowings from a third-party financial institution as described under note 9 to the interim financial statements. |
Aside from the changes discussed in footnote two above, and those described on page 25 of our first quarter interim report there were no significant changes to the nature of our credit facilities, accounts receivable securitization program and uncommitted letter of credit facilities in the first nine months of 2018.
We use a combination of cash generated from operations and short-term and long-term debt to finance our operations. We typically pay floating rates of interest on our short-term debt, credit facility and borrowings under the accounts receivable securitization program, and fixed rates of interest on our senior notes and debentures. As at September 30, 2018, interest rates on outstanding commercial paper ranged from 2.3 percent to 2.8 percent and the weighted average interest rate on borrowings under the accounts receivable securitization program was 2.8 percent.
During the first nine months of 2018, we exchanged substantially all of the PotashCorp senior notes and Agrium debentures for Nutrien notes as described on page 25 of our first quarter interim report and page 24 of our second quarter interim report.
Our credit facilities have financial tests and other covenants with which we must comply at eachquarter-end.Non-compliance with any such covenants could result in accelerated payment of amounts borrowed and termination of lenders’ further funding obligations under the credit facilities. We were in compliance with all covenants as at September 30, 2018 and at this time anticipate being in compliance with such covenants throughout 2018.
The accompanying table summarizes the limits and results of certain covenants.
| DEBT COVENANTS AT SEPTEMBER 30 | Limit | 2018 | ||||||||||
Debt-to-capital ratio1 | £ | 0.65 | 0.38 | |||||||||
| 1 | Adjusted total debt divided by the sum of adjusted total debt and total equity. Adjusted total debt is calculated as the sum of short-term debt, long-term debt (including current portion), finance lease obligations and certain issued letter of credit facilities. |
Our ability to access reasonably priced debt in the capital markets is dependent, in part, on the quality of our credit ratings. We continue to maintain investment-grade credit ratings for our long-term debt. A downgrade of the credit rating of our long-term debt would increase the interest rates applicable to borrowings under our credit facility.
Commercial paper markets are normally a source ofsame-day cash for the company. Our access to the US commercial paper market primarily depends on maintaining our current short-term credit ratings as well as general conditions in the money markets.
| Long-Term Debt | Short-Term Debt | |||||||
| Rating (Outlook) | Rating | |||||||
| September 30, 2018 | September 30, 2018 | |||||||
Moody’s | Baa2 (stable) | P-2 | ||||||
Standard & Poor’s | BBB (stable) | A-2 | ||||||
A security rating is not a recommendation to buy, sell or hold securities. Such ratings may be subject to revision or withdrawal at any time by the respective credit rating agency and each rating should be evaluated independently of any other rating.
Outstanding Share Data
| September 30, 2018 | ||||
Common shares issued and outstanding1 | 612,168,323 | |||
Options to purchase common shares outstanding | 9,624,930 | |||
Share-settled performance share units | 65,392 | |||
| 1 | Common shares issued and outstanding are as at October 31, 2018. |
Off-Balance Sheet Arrangements
In the normal course of operations, Nutrien engages in a variety of transactions that, under IFRS, are either not recorded on our consolidated balance sheets or are recorded at amounts that differ from the full contract amounts. Principaloff-balance sheet activities include operating leases, the agreement to reimburse losses of Canpotex, issuance of guarantee contracts, certain derivative instruments and long-term contracts.Off-balance sheet arrangements are described on page 26 of our first quarter interim report.
| Nutrien 2018 Third Quarter Report | 24 |
Quarterly Results
(in millions of US dollars except as otherwise noted)
| Nutrien September 30, 2018 | Nutrien June 30, 2018 | Nutrien March 31, 2018 | PotashCorp1 December 31, 2017 | PotashCorp1 September 30, 2017 | PotashCorp1 June 30, 2017 | PotashCorp1 March 31, 2017 | PotashCorp1 December 31, 2016 | |||||||||||||||||||||||||
Sales | $ | 4,034 | $ | 8,145 | $ | 3,695 | $ | 1,081 | $ | 1,234 | $ | 1,120 | $ | 1,112 | $ | 1,058 | ||||||||||||||||
Gross margin | 1,155 | 2,131 | 847 | (72 | ) | 233 | 260 | 273 | 163 | |||||||||||||||||||||||
Net (loss) earnings from continuing operations | (1,067 | ) | 741 | (1 | ) | (120 | ) | 16 | 152 | 106 | 13 | |||||||||||||||||||||
Net earnings (loss) from discontinued operations | 23 | 675 | – | 44 | 37 | 49 | 43 | 33 | ||||||||||||||||||||||||
Net (loss) earnings2 | (1,044 | ) | 1,416 | (1 | ) | (76 | ) | 53 | 201 | 149 | 46 | |||||||||||||||||||||
EBITDA4 | (932 | ) | 1,507 | 487 | (43 | ) | 280 | 317 | 347 | 235 | ||||||||||||||||||||||
Basic net (loss) earnings per share from continuing operations3 | (1.74 | ) | 1.18 | – | (0.14 | ) | 0.02 | 0.18 | 0.13 | 0.02 | ||||||||||||||||||||||
Diluted net (loss) earnings per share from continuing operations3 | (1.74 | ) | 1.17 | – | (0.14 | ) | 0.02 | 0.18 | 0.13 | 0.02 | ||||||||||||||||||||||
Basic net (loss) earnings per share2,3 | (1.70 | ) | 2.25 | – | (0.09 | ) | 0.06 | 0.24 | 0.18 | 0.05 | ||||||||||||||||||||||
Diluted net (loss) earnings per share2,3 | (1.70 | ) | 2.24 | – | (0.09 | ) | 0.06 | 0.24 | 0.18 | 0.05 | ||||||||||||||||||||||
| 1 | Certain amounts have been reclassified as a result of discontinued operations discussed in note 7 of the interim financial statements and to conform with Nutrien’s new method of presentation. |
| 2 | From continuing and discontinued operations. |
| 3 | Basic and diluted net earnings per share for each quarter has been computed based on the weighted average number of shares issued and outstanding during the respective quarter; therefore, quarterly amounts may not add to the annual total.Per-share calculations are based on dollar and share amounts each rounded to the nearest thousand. |
| 4 | Refer to“Non-IFRS Financial Measures” section on page 29 for details. |
The agricultural products business is seasonal. Crop input sales are primarily concentrated in the spring and fall crop input application seasons. Crop nutrient inventories are normally accumulated leading up to each application season. Our cash collections generally occur after the application season is complete, and our customer prepayments are concentrated in December and January. Feed and industrial sales are more evenly distributed throughout the year. In the third quarter of 2018, earnings were impacted by a $1.8 billionnon-cash impairment to property, plant and equipment in the potash segment as discussed in the Critical Accounting Estimates section on page 26. In the fourth quarter of 2017, earnings were impacted by a $276 millionnon-cash impairment to property, plant and equipment in the phosphate and sulfate segment. Beginning in 2018, earnings were also impacted by the Merger.
| Nutrien September 30, 2018 | Nutrien June 30, 2018 | Nutrien March 31, 2018 | Nutrien1 December 31, 2017 | Nutrien1 September 30, 2017 | Nutrien1 June 30, 2017 | Nutrien1 March 31, 2017 | 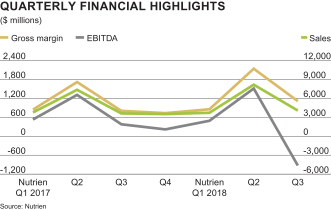 | |||||||||||||||||||||||
Sales | $ | 4,034 | $ | 8,145 | $ | 3,695 | $ | 3,498 | $ | 3,586 | $ | 7,348 | $ | 3,737 | ||||||||||||||||
Gross margin | 1,155 | 2,131 | 847 | 729 | 793 | 1,791 | 838 | |||||||||||||||||||||||
Net (loss) earnings from continuing operations | (1,067 | ) | 741 | (1 | ) | (93 | ) | (53 | ) | 705 | 97 | |||||||||||||||||||
EBITDA1 | (932 | ) | 1,507 | 487 | 210 | 375 | 1,306 | 521 | ||||||||||||||||||||||
1 Refer to“Non-IFRS Financial Measures” section on page 29 for details. |
| |||||||||||||||||||||||||||||
| 25 | Nutrien 2018 Third Quarter Report |
Other Financial Information
Related Party Transactions
We sell potash from our Canadian mines for use outside Canada and the US exclusively to Canpotex. Sales are at prevailing market prices and are settled on normal trade terms. The receivable outstanding from Canpotex arose from sale transactions described above. It is unsecured and bears no interest. There are no provisions held against this receivable.
Refer to note 13 to the interim financial statements for further information on related party transactions.
Market Risks Associated with Financial Instruments
Market risk is the potential for loss from adverse changes in the market value of financial instruments. The level of market risk to which we are exposed varies depending on the composition of our derivative instrument portfolio, as well as current and expected market conditions. See note 11 to the interim financial statements and page 28 and note 29 in the first quarter interim report for further information on our financial instruments.
Critical Accounting Estimates
Our critical accounting policies are disclosed in our first quarter interim report.
We have discussed the development, selection and application of our key accounting policies, and the critical accounting estimates and assumptions they involve, with the audit committee of the Board.
Our critical accounting estimates are discussed on page 29 of our first quarter interim report. Other than the critical accounting estimate discussed below, there were no significant changes in the first nine months of 2018.
After completing a strategic Board review during the third quarter of 2018, it was determined the New Brunswick operations would no longer be part of our medium or long-term strategic plans and the operations will be safely shut down. This resulted in an impairment of $1,809 million to the property, plant and equipment of the New Brunswick operations as discussed in note 4 to the interim financial statements. The estimated recoverable amount of $50 million was based on fair value less costs to dispose.
Recent Accounting Changes
Refer to note 14 to the interim financial statements for information on issued accounting pronouncements that will be effective in future periods and were effective in 2018.
Market Outlook
Agriculture and Crop Input Fundamentals
US soybean prices have been pressured by record domestic yields and continued uncertainty as a result of the US trade dispute with China.
US corn prices arein-line with last year’s levels. The global corn supply/demand balance has tightened, and US cornstocks-to-use ratio is the lowest since the 2013/14 crop year despite record yields this year. Chinese corn ending stocks are projected to be down almost 50 percent over the past three years and more than 20 percent below the ten-year average.
Solid crop economics, combined with favorable planting conditions, has supported a rapid start to planting in Brazil. Analysts expect a three to five percent increase in Brazilian soybean area and more than a five percent increase in corn area.
While North American crops developed at a faster-than-average pace in 2018, adverse weather since September delayed harvest and has narrowed the fall application season somewhat.
We expect an increase in North American corn acres relative to soybeans, which would be positive to overall crop input expenditures as corn generates a higherper-acre spend than soybeans.
Potash
Potash prices continue to be supported by strong demand and tight availability. Prices in major spot markets are up 20 to 30 percent compared to the third quarter of 2017 and contracts with India and China were settled at $50 per tonne and $60 per tonne increases, respectively. We raised our 2018 global potash shipment forecast to a range of 66 to 67 million tonnes.
We expect that capacity curtailments and permanent closures in 2018 will match or exceed new production capability, excluding Nutrien’s expected increase in production.
Downstream inventories in major global potash markets remain relatively tight, which is supportive of sustained demand in late 2018 and early 2019.
High nutrient removal in 2018 related to expected record crop yields, combined with potash prices remaining affordable relative to grower revenues, are expected to support continued strong consumption in major markets including North America.
Nitrogen
Tighter than expected supply and continued demand growth has provided support to prices for all nitrogen products. Ammonia production has been pressured by operational issues, turnarounds and slower than expected supplyramp-ups, while urea continues to be supported by lower Chinese exports and uncertainty regarding Iranian availability.
| Nutrien 2018 Third Quarter Report | 26 |
Global nitrogen prices are also being supported by higher European natural gas prices, with hub-based and formula-based prices up approximately 80 percent and 40 percent, respectively, from 2017 lows.
Prospects for nitrogen demand through the first half of 2019 remain strong, supported by the expectation of increased corn area in North and South America and increased winter wheat area in the Northern Hemisphere. There is some risk to the fall ammonia application season in North America due to wet conditions.
Given favorable demand prospects, limited new capacity and a relatively stable urea supply outlook in China, we expect the global nitrogen supply/demand balance will remain tight into 2019.
Phosphate and Sulfate
Continued strength in sulfur and ammonia prices and delayed projectramp-ups continue to support phosphate prices, however, the decline in the value of the Indian rupee is a source of demand risk for late 2018 and early 2019.
Financial Outlook and Guidance
Taking the above factors into consideration, we have revised our 2018 annual guidance ranges as follows:
We raised our guidance range for Potash sales volumes to 12.5 to 13.0 million tonnes and increased the bottom end of our Potash Adjusted EBITDA3 range from $1.4 billion to $1.5 billion. Nitrogen EBITDA guidance has been raised to $1.15 to $1.25 billion and the bottom end of our Phosphate and Sulfate EBITDA range increased from $0.2 billion to $0.25 billion.
Based on these factors, we are increasing our full-year 2018 adjusted net earnings3 guidance to $2.60 to $2.80 per share (previously $2.40 to $2.70 per share) and adjusted EBITDA3 guidance to $3.85 to $4.05 billion (previously $3.7 to $4.0 billion). Additionally, adjusted net earnings guidance for the fourth quarter of 2018 is $0.46 to $0.66 per share.
Excluded from guidance are the New Brunswick potash non-cash impairment of $1.8 billion, expected costs to achieve synergies (net of one-time savings) of $40 to $50 million (reduced from $50 to $75 million), share-based compensation as well as the impact of incremental depreciation and amortization of approximately $200 million resulting from the fair valuing of Agrium’s assets and liabilities as of January 1, 2018 in accordance with purchase accounting.
Dividend income from investments in APC and SQM is recorded net of tax in discontinued operations and is still expected to approximate $130 million and is included in our adjusted annual net earnings per share guidance, but is not included in adjusted EBITDA guidance.
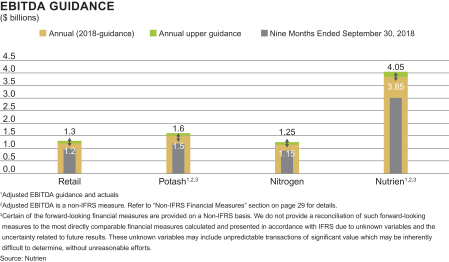
Controls and Procedures
Disclosure Controls and Procedures
There are inherent limitations to the effectiveness of any system of disclosure controls and procedures, including the possibility of human error and the circumvention or overriding of the controls and procedures. Accordingly, even effective disclosure controls and procedures can only provide reasonable assurance of achieving their control objectives. As of September 30, 2018, the Chief Executive Officer and Interim Chief Financial Officer concluded that the disclosure controls and procedures were effective to provide reasonable assurance that information required to be disclosed in the reports the company files and submits under
securities legislation is recorded, processed, summarized and reported as and when required and that such information is accumulated and communicated to our management, including our Chief Executive Officer and Interim Chief Financial Officer, as appropriate to allow timely decisions regarding required disclosure.
There has been no change in our internal controls over financial reporting during the quarter ended September 30, 2018 that has materially affected, or is reasonably likely to materially affect, our internal control over financial reporting.
| 27 | Nutrien 2018 Third Quarter Report |
Forward-Looking Statements
This 2018 Third Quarter Interim Report, including the “Agriculture Fundamentals Market Outlook”, “Potash Market Outlook”, “Nitrogen Market Outlook”, “Phosphate and Sulfate Market Outlook” and “Financial Outlook and Guidance” sections of “Management’s Discussion & Analysis of Financial Condition and Results of Operations,” contains and incorporates by reference forward-looking statements or forward-looking information (within the meaning of the US Private Securities Litigation Reform Act of 1995, and other US federal securities laws and applicable Canadian securities laws) (“forward-looking statements”) that relate to future events or our future financial performance. These statements can be identified by expressions of belief, expectation or intention, as well as those statements that are not historical fact. These statements often contain words such as “should,” “could,” “expect,” “may,” “anticipate,” “forecast,” “believe,” “intend,” “estimates,” “plans” and similar expressions. These statements are based on certain factors and assumptions as set forth in this Quarterly Report, including with respect to: foreign exchange rates, expected synergies, expected growth, results of operations, performance, business prospects and opportunities, and effective tax rates. While the company considers these factors and assumptions to be reasonable based on information currently available, they may prove to be incorrect. Forward-looking statements are subject to risks and uncertainties that are difficult to predict. The results or events set forth in forward-looking statements may differ materially from actual results or events. Several factors could cause actual results or events to differ materially from those expressed in forward-looking statements, including, but not limited to, the following: a number of matters relating to the Merger, including the failure to realize the anticipated benefits of the Merger and to successfully integrate PotashCorp and Agrium, certain costs that we may incur as a result of the Merger, the ability to retain personnel as a result of the Merger and the effect of the Merger on our business and operations generally; risks related to diversion of management time from ongoing business operations due to integration related activities related to the Merger; the risk that our credit ratings may be downgraded or there may be adverse conditions in the credit markets; any significant impairment of the carrying amount of certain of our assets; variations from our assumptions with respect to foreign exchange rates, expected growth, results of operations, performance, business prospects and opportunities, and effective tax rates; fluctuations in supply and demand in the fertilizer, sulfur and petrochemical markets; changes in competitive pressures, including pricing pressures; risks and
uncertainties related to any operating and workforce changes made in response to our industry and the markets we serve, including mine and inventory shutdowns; adverse or uncertain economic conditions and changes in credit and financial markets; economic and political uncertainty around the world; changes in capital markets; the results of sales contract negotiations; unexpected or adverse weather conditions; changes in currency and exchange rates; risks related to reputational loss; the occurrence of a major safety incident; inadequate insurance coverage for a significant liability; inability to obtain relevant permits for our operations; catastrophic events or malicious acts, including terrorism; certain complications that may arise in our mining process, including water inflows; risks and uncertainties related to our international operations and assets; our ownership ofnon-controlling equity interests in other companies; our prospects to reinvest capital in strategic opportunities and acquisitions; risks associated with natural gas and other hedging activities; security risks related to our information technology systems; imprecision in mineral reserve and resources estimates; costs and availability of transportation and distribution for our raw materials and products, including railcars and ocean freight; changes in, and the effects of, government policies and regulations; earnings and the decisions of taxing authorities which could affect our effective tax rates; increases in the price or reduced availability of the raw materials that we use; our ability to attract, develop, engage and retain skilled employees; strikes or other forms of work stoppage or slowdowns; rates of return on, and the risks associated with, our investments and capital expenditures; timing and impact of capital expenditures; the impact of further innovation; adverse developments in new and pending legal proceedings or government investigations; and violations of our governance and compliance policies. These risks and uncertainties and additional risks and uncertainties can be found in Schedule B of the BAR and in our filings with the SEC and the Canadian provincial securities commissions. The purpose of our expected adjusted net earnings per share, adjusted EBITDA and EBITDA by segment guidance range is to assist readers in understanding our expected and targeted financial results, and this information may not be appropriate for other purposes. Forward-looking statements in or incorporated into this report are given only as at the date of this report or the document incorporated into this report and the company disclaims any obligation to update or revise any forward-looking statements, whether as a result of new information, future events or otherwise, except as required by law.
| Nutrien 2018 Third Quarter Report | 28 |
Appendix
Non-IFRS Financial Measures
Nutrien uses EBITDA and adjusted EBITDA(non-IFRS financial measures) as supplemental measures. EBITDA and adjusted EBITDA are frequently used by investors and analysts for valuation purposes when multiplied by a factor to estimate the enterprise value of a company. EBITDA is also used in determining annual incentive compensation for certain management employees. EBITDA is calculated as net (loss) earnings from continuing operations before finance costs, income tax (recovery) expense and depreciation and amortization. Adjusted EBITDA is calculated as net (loss) earnings from continuing operations before finance costs, income tax (recovery) expense and depreciation and amortization, impairment, Merger and related costs, share-based compensation and Curtailment Gain.
These measures are a numerical measure of a company’s performance, that either excludes or includes amounts that are not normally excluded or included in the most directly comparable measures calculated and presented in accordance with IFRS. EBITDA and adjusted EBITDA are not measures of financial performance (nor do they have standardized meanings) under IFRS. In evaluating these measures, investors should consider that the methodology applied in calculating such measures may differ among companies and analysts.
| EBITDA and Adjusted EBITDA | Three Months September 30, | Three Months September 30, | Nine Months September 30, | Nine Months September 30, | ||||||||||||
Net (loss) earnings from continuing operations | $ | (1,067 | ) | $ | (53 | ) | $ | (327 | ) | $ | 749 | |||||
Finance costs | 142 | 135 | 394 | 379 | ||||||||||||
Income tax (recovery) expense | (434 | ) | (8 | ) | (199 | ) | 163 | |||||||||
Depreciation and amortization | 427 | 301 | 1,194 | 911 | ||||||||||||
EBITDA | (932 | ) | 375 | 1,062 | 2,202 | |||||||||||
Impairment of property, plant and equipment | 1,809 | 29 | 1,809 | 29 | ||||||||||||
Merger and related costs | 62 | 21 | 143 | 75 | ||||||||||||
Share-based compensation | 51 | 49 | 149 | 58 | ||||||||||||
Curtailment Gain | (151 | ) | – | (151 | ) | – | ||||||||||
Adjusted EBITDA | $ | 839 | $ | 474 | $ | 3,012 | $ | 2,364 | ||||||||
| Potash Adjusted EBITDA | Three Months September 30, | Three Months September 30, | Nine Months September 30, | Nine Months September 30, | ||||||||||||
EBITDA | $ | (1,311 | ) | $ | 303 | $ | (597 | ) | $ | 835 | ||||||
Impairment of property, plant and equipment | 1,809 | – | 1,809 | – | ||||||||||||
Adjusted EBITDA | $ | 498 | $ | 303 | $ | 1,212 | $ | 835 | ||||||||
Nutrien also usesnon-IFRS combined historical information in the evaluation of its operations and financial position. This information is useful as it provides a measure of what the combined results may have been had PotashCorp and Agrium merged on January 1, 2017. The combined historical results for Nutrien were calculated by adding the historical IFRS financial statements prepared by PotashCorp and Agrium and then eliminating intercompany transactions and reclassifying line items to conform with Nutrien’s financial statement presentation. This combined historical information does not include, among other things, estimated cost synergies, adjustments related to restructuring or integration activities, adjustments related to the PPA and the impact of discontinued operations.
The combined historical information may differ from the Nutrien pro forma earnings and balance sheet presented in the BAR as the pro forma information presented therein required certain adjustments under applicable securities laws and accounting standards that the company believes do not provide as useful a measure as the combined historical financial information. The primary differences in the statement of earnings were that pro forma finance costs were reduced by the amortization of the change in carrying amount of Agrium’s debt resulting from the PPA and the pro forma other expenses were adjusted to remove any Merger-related costs. There were no comparable adjustments in the combined historical financial information. The primary differences in the balance sheet were the pro forma adjustments for the estimated proceeds from the sale of SQM, APC, ICL and Agrium’s Conda Idaho phosphate production facility and adjacent phosphate mineral rights at December 31, 2017 while there was no adjustment in the combined historical financial information and the PPA in the pro forma information was largely allocated to goodwill as fewer provisional fair value adjustments were known at the time of its preparation.
The company uses both IFRS and certainnon-IFRS measures to assess performance. Management believes thenon-IFRS measures provide useful supplemental information to investors in order that they may evaluate Nutrien’s financial performance using the same measures as management. Management believes that, as a result, the investor is afforded greater transparency in assessing the financial performance of the company. Thesenon-IFRS financial measures should not be considered as a substitute for, nor superior to, measures of financial performance prepared in accordance with IFRS.
Refer to the Appendix starting on page 33 of our first quarter interim report for the Nutrien combined historical balance sheet as at December 31, 2017 and the Nutrien combined historical statement of earnings and EBITDA for the three months ended March 31, 2017, June 30, 2017, September 30, 2017 and December 31, 2017.
Following is the combined historical summary of cash flow information and summary other comprehensive income for the three and nine-month periods ended September 30, 2017, as well as, combined historical segment EBITDA for the nine months ended September 30, 2017.
| 29 | Nutrien 2018 Third Quarter Report |
Nutrien Combined Historical Summary Cash Flow Information for the Three Months Ended September 30, 2017
| Historical PotashCorp | Historical Agrium | Adjustments | Nutrien | |||||||||||||
Cash provided by (used in) operating activities | $ | 293 | $ | (314) | $ | (4 | )1 | $ | (25 | ) | ||||||
Cash used in investing activities | (170 | ) | (261 | ) | (10 | )1 | (441 | ) | ||||||||
Cash (used in) provided by financing activities | (123 | ) | 530 | 407 | ||||||||||||
Cash used in discontinued operations | – | (14 | ) | 14 | 1 | – | ||||||||||
Effect of exchange rate changes on cash and cash equivalents | – | (14 | ) | – | (14 | ) | ||||||||||
Decrease in cash and cash equivalents | $ | – | $ | (73) | $ | – | $ | (73 | ) | |||||||
| 1 | To reclassify legacy Agrium cash used in discontinued operations to match Nutrien’s method of presentation. |
Nutrien Combined Historical Summary Cash Flow Information for the Nine Months Ended September 30, 2017
| Historical PotashCorp | Historical Agrium1 | Adjustments | Nutrien | |||||||||||||
Cash provided by (used in) operating activities | $ | 844 | $ | (265 | ) | $ | 10 | 1 | $ | 589 | ||||||
Cash used in investing activities | (432 | ) | (683 | ) | (20 | )1 | (1,135 | ) | ||||||||
Cash (used in) provided by financing activities | (347 | ) | 799 | 452 | ||||||||||||
Cash used in discontinued operations | – | (10 | ) | 10 | 1 | – | ||||||||||
Effect of exchange rate changes on cash and cash equivalents | – | (7 | ) | (7 | ) | |||||||||||
Increase (decrease) in cash and cash equivalents | $ | 65 | $ | (166) | $ | – | $ | (101) | ||||||||
| 1 | To reclassify legacy Agrium cash used in discontinued operations to match Nutrien’s method of presentation. |
Nutrien Combined Historical Summary Other Comprehensive Income for the Three Months Ended September 30, 2017
| Historical PotashCorp | Historical Agrium1 | Nutrien | ||||||||||
Other comprehensive income | $ | 42 | $ | 10 | $ | 52 | ||||||
Nutrien Combined Historical Summary Other Comprehensive Income for the Nine Months Ended September 30, 2017
| Historical PotashCorp | Historical Agrium1 | Nutrien | ||||||||||
Other comprehensive income | $ | 150 | $ | 116 | $ | 266 | ||||||
| Nutrien 2018 Third Quarter Report | 30 |
Nutrien Combined Historical Statement of Earnings and EBITDA for the Nine Months Ended September 30, 2017
| Retail | Potash | Nitrogen | Phosphate and Sulfate | Others | Eliminations | Nutrien | ||||||||||||||||||||||
Sales | $ | 10,014 | $ | 1,868 | $ | 2,285 | $ | 1,160 | $ | – | $ | (656) | $ | 14,671 | ||||||||||||||
Freight, transportation and distribution | – | (274 | ) | (263 | ) | (148 | ) | – | – | (685 | ) | |||||||||||||||||
Cost of goods sold | (7,763 | ) | (865 | ) | (1,583 | ) | (1,016) | – | 663 | (10,564 | ) | |||||||||||||||||
Gross margin | 2,251 | 729 | 439 | (4 | ) | – | 7 | 3,422 | ||||||||||||||||||||
Selling expenses | (1,490 | ) | (10 | ) | (24 | ) | (6 | ) | 11 | – | (1,519 | ) | ||||||||||||||||
General and administrative expenses | (74 | ) | (3 | ) | (8 | ) | (8 | ) | (254 | ) | – | (347 | ) | |||||||||||||||
Provincial mining and other taxes | – | (130 | ) | – | – | – | – | (130 | ) | |||||||||||||||||||
Earnings of equity-accounted investees | 8 | – | 30 | – | – | – | 38 | |||||||||||||||||||||
Other expenses | (6 | ) | (16 | ) | (24 | ) | (7 | ) | (120 | ) | – | (173 | ) | |||||||||||||||
Earnings (loss) before finance costs and income taxes | 689 | 570 | 413 | (25 | ) | (363 | ) | 7 | 1,291 | |||||||||||||||||||
Finance costs | – | – | – | – | (379 | ) | – | (379 | ) | |||||||||||||||||||
Earnings (loss) before income taxes | 689 | 570 | 413 | (25 | ) | (742 | ) | 7 | 912 | |||||||||||||||||||
Income taxes | – | – | – | – | (163 | ) | – | (163 | ) | |||||||||||||||||||
Net earnings (loss) from continuing operations | 689 | 570 | 413 | (25 | ) | (905 | ) | 7 | 749 | |||||||||||||||||||
Finance costs | – | – | – | – | 379 | – | 379 | |||||||||||||||||||||
Income taxes | – | – | – | – | 163 | – | 163 | |||||||||||||||||||||
Depreciation and amortization | 215 | 265 | 210 | 181 | 40 | – | 911 | |||||||||||||||||||||
EBITDA | $ | 904 | $ | 835 | $ | 623 | $ | 156 | $ | (323 | ) | $ | 7 | $ | 2,202 | |||||||||||||
| EBITDA Reconciliation to historical | Nutrien | |||||||||||||||||||||||||||
PotashCorp | $ | 1,076 | ||||||||||||||||||||||||||
Agrium | 1,286 | |||||||||||||||||||||||||||
Combined EBITDA | 2,362 | |||||||||||||||||||||||||||
Adjustments: | ||||||||||||||||||||||||||||
Remove APC and SQM | (115 | ) | ||||||||||||||||||||||||||
Remove ICL | (17 | ) | ||||||||||||||||||||||||||
Retail finance costs from operations | (27 | ) | ||||||||||||||||||||||||||
Other | (1 | ) | ||||||||||||||||||||||||||
Nutrien EBITDA | $ | 2,202 | ||||||||||||||||||||||||||
| 31 | Nutrien 2018 Third Quarter Report |
Nutrien Combined Historical Retail Segment EBITDA for the Nine Months Ended September 30, 2017
| Historical PotashCorp | Historical Agrium | Adjustments | Nutrien | |||||||||||||
Sales | ||||||||||||||||
External | $ | – | $ | 9,980 | $ | – | $ | 9,980 | ||||||||
Intersegment | – | 34 | – | 34 | ||||||||||||
Total Sales | – | 10,014 | – | 10,014 | ||||||||||||
Cost of goods sold | – | (7,763 | ) | – | (7,763 | ) | ||||||||||
Gross margin | – | 2,251 | – | 2,251 | ||||||||||||
Selling expenses | – | (1,490 | ) | – | (1,490 | ) | ||||||||||
General and administrative expenses | – | (74 | ) | – | (74 | ) | ||||||||||
Earnings of equity-accounted investees | – | 8 | – | 8 | ||||||||||||
Other income (expenses) | – | 21 | (27 | )1 | (6 | ) | ||||||||||
Earnings before finance costs and income taxes | – | 716 | (27 | ) | 689 | |||||||||||
Depreciation and amortization | – | 215 | – | 215 | ||||||||||||
EBITDA | $ | – | $ | 931 | $ | (27 | ) | $ | 904 | |||||||
| 1 | Finance costs associated with retail operations will be allocated to retail segment, and presented in other income (expenses). |
Nutrien Combined Historical Potash Segment EBITDA for the Nine Months Ended September 30, 2017
| Historical PotashCorp | Historical Agrium | Adjustments | Nutrien | |||||||||||||
Sales | ||||||||||||||||
External | $ | 1,485 | $ | 285 | $ | 1 | $ | 1,771 | ||||||||
Intersegment | – | 97 | – | 97 | ||||||||||||
Total Sales | 1,485 | 382 | 1 | 1,868 | ||||||||||||
Freight, transportation and distribution | (199 | ) | – | (75 | )1 | (274 | ) | |||||||||
Cost of goods sold | (659 | ) | (293 | ) | 87 | 1,4 | (865 | ) | ||||||||
Gross margin | 627 | 89 | 13 | 729 | ||||||||||||
Selling expenses | – | (4 | ) | (6 | )4 | (10 | ) | |||||||||
General and administrative expenses | – | (3 | ) | – | 3, 4 | (3 | ) | |||||||||
Provincial mining and other taxes | (125 | ) | – | (5 | )2, 4 | (130 | ) | |||||||||
Other expenses | – | (10 | ) | (6 | )2,4 | (16 | ) | |||||||||
Earnings before finance costs and income taxes | 502 | 72 | (4 | ) | 570 | |||||||||||
Depreciation and amortization | 183 | 82 | – | 265 | ||||||||||||
EBITDA | $ | 685 | $ | 154 | $ (4 | ) | $ | 835 | ||||||||
| 1 | To separately present legacy Agrium direct and indirect freight costs. |
| 2 | To separately present legacy Agrium provincial mining taxes. |
| 3 | To reclassify legacy Agrium costs related to business support functions to others. |
| 4 | To allocate legacy PotashCorp all others segment selling and administrative expenses to segment. |
Nutrien Combined Historical Nitrogen Segment EBITDA for the Nine Months Ended September 30, 2017
| Historical PotashCorp | Historical Agrium | Adjustments | Nutrien | |||||||||||||
Sales | ||||||||||||||||
External | $ | 1,047 | $ | 599 | $ | 300 | 2 | $ | 1,946 | |||||||
Intersegment | 54 | 190 | 95 | 2,4 | 339 | |||||||||||
Total Sales | 1,101 | 789 | 395 | 2,285 | ||||||||||||
Freight, transportation and distribution | (97 | ) | – | (166 | )1 | (263 | ) | |||||||||
Cost of goods sold | (789 | ) | (571 | ) | (194 | )1, 2, 4 | (1,554 | ) | ||||||||
Cost of intersegment purchases | (29 | ) | – | – | (29 | ) | ||||||||||
Gross margin | 186 | 218 | 35 | 439 | ||||||||||||
Selling expenses | – | (9 | ) | (15 | )2, 5 | (24 | ) | |||||||||
General and administrative expenses | – | (8 | ) | – | 2, 3, 5 | (8 | ) | |||||||||
Earnings of equity-accounted investees | – | – | 30 | 2, 5 | 30 | |||||||||||
Other expenses | – | (18 | ) | (6 | )2, 5 | (24 | ) | |||||||||
Earnings before finance costs and income taxes | 186 | 183 | 44 | 413 | ||||||||||||
Depreciation and amortization | 144 | 59 | 7 | 2, 4 | 210 | |||||||||||
EBITDA | $ | 330 | $ | 242 | $ | 51 | $ | 623 | ||||||||
| 1 | To separately present legacy Agrium direct and indirect freight costs. |
| 2 | To reclassify legacy wholesale other Agrium segment between nitrogen and phosphate and sulfate. |
| 3 | To reclassify legacy Agrium costs related to business support functions to others. |
| 4 | To record profit on legacy Agrium transfers of ammonia to phosphate and sulfate segment not previously recorded. |
| 5 | To allocate legacy PotashCorp all others segment selling and administrative expenses to segment. |
| Nutrien 2018 Third Quarter Report | 32 |
Nutrien Combined Historical Phosphate and Sulfate Segment EBITDA for the Nine Months Ended September 30, 2017
| Historical PotashCorp | Historical Agrium | Adjustments | Nutrien | |||||||||||||
Sales | ||||||||||||||||
External | $ | 934 | $ | 96 | $ | (9 | )2, 5 | $ | 1,021 | |||||||
Intersegment | – | 94 | 45 | 2 | 139 | |||||||||||
Total Sales | 934 | 190 | 36 | 1,160 | ||||||||||||
Freight, transportation and distribution | (125 | ) | – | (23 | )1, 5 | (148 | ) | |||||||||
Cost of goods sold | (844 | ) | (179 | ) | 32 | 1, 2, 3, 5 | (991 | ) | ||||||||
Cost of intersegment purchases | (25 | ) | – | – | (25 | ) | ||||||||||
Gross margin | (60 | ) | 11 | 45 | (4 | ) | ||||||||||
Selling expenses | – | (1 | ) | (5 | )5 | (6 | ) | |||||||||
General and administrative expenses | – | (1 | ) | (7 | )2, 4 | (8 | ) | |||||||||
Other expenses | – | (4 | ) | (3 | )2, 4 | (7 | ) | |||||||||
(Loss) earnings before finance costs and income taxes | (60 | ) | 5 | 30 | (25 | ) | ||||||||||
Depreciation and amortization | 166 | 12 | 3 | 2, 3 | 181 | |||||||||||
EBITDA | $ | 106 | $ | 17 | $ | 33 | $ | 156 | ||||||||
1 To separately present legacy Agrium direct and indirect freight costs.
2 To reclassify legacy wholesale other Agrium segment between nitrogen and phosphate and sulfate.
3 To record incremental cost on legacy Agrium transfers of ammonia to phosphate and sulfate segment not previously recorded.
4 To allocate legacy PotashCorp all others segment selling and administrative expenses to segment.
5 To reclassify certain phosphate products to others segment. |
Nutrien Combined Historical Others Segment and Eliminations EBITDA for the Nine Months Ended September 30, 2017
| Historical PotashCorp | Historical Agrium | Adjustments | Nutrien | |||||||||||||
Sales | ||||||||||||||||
Intersegment | $ | – | $ | (523 | ) | $ | (133 | )1, 2, 9 | $ | (656 | ) | |||||
Total Sales | – | (523 | ) | (133 | ) | (656 | ) | |||||||||
Cost of goods sold | – | 530 | 133 | 1, 2, 9 | 663 | |||||||||||
Gross margin | – | 7 | – | 7 | ||||||||||||
Selling and administrative expenses | (154 | ) | – | 154 | 10 | – | ||||||||||
Selling expenses | – | 13 | (2 | )10 | 11 | |||||||||||
General and administrative expenses | – | (84 | ) | (170 | )4, 5, 10 | (254 | ) | |||||||||
Share-based payments | – | (40 | ) | 40 | 4 | – | ||||||||||
Earnings of equity-accounted investees | 121 | (1 | ) | (120 | )7, 10 | – | ||||||||||
Dividend income | 17 | – | (16 | )8 | 1 | |||||||||||
Other expenses | (56 | ) | (58 | ) | (7 | )10, 11 | (121 | ) | ||||||||
Loss before finance costs and income taxes | (72 | ) | (163 | ) | (121 | ) | (356 | ) | ||||||||
Finance costs | (180 | ) | (71 | ) | (128 | )3, 6 | (379 | ) | ||||||||
Finance costs related to long-term debt | – | (155 | ) | 155 | 6 | – | ||||||||||
Loss before income taxes | (252) | (389 | ) | (94 | ) | (735 | ) | |||||||||
Income tax recovery (expense) | 27 | (193 | ) | 3 | 7 | (163 | ) | |||||||||
Net loss from continuing operations | (225 | ) | (582 | ) | (91 | ) | (898) | |||||||||
Finance costs | 180 | 71 | 128 | 3, 6 | 379 | |||||||||||
Finance costs related to long-term debt | – | 155 | (155 | )6 | – | |||||||||||
Income tax (recovery) expense | (27 | ) | 193 | (3 | )7 | 163 | ||||||||||
Depreciation and amortization | 27 | 13 | – | 40 | ||||||||||||
EBITDA | $ | (45 | ) | $ | (150 | ) | $ | (121 | ) | $ | (316 | ) | ||||
| 1 | To eliminate sales made from legacy PotashCorp to legacy Agrium. |
| 2 | To eliminate incremental sales and cost of goods sold related to ammonia transfers to phosphate and sulfate segment. |
| 3 | Finance costs associated with retail operations will be allocated to retail segment, and presented in other expenses. |
| 4 | To reclassify legacy Agrium’s share-based payments to general and administrative expenses. |
| 5 | To reclassify legacy Agrium costs related to business support functions to others. |
| 6 | To reclassify finance costs related to long-term debt to finance costs. |
| 7 | To eliminate the earnings of legacy PotashCorp’s investments in SQM and APC. |
| 8 | To eliminate the earnings of legacy PotashCorp’s investment in ICL. |
| 9 | To eliminate legacy PotashCorp intersegment sales between nitrogen and phosphate and sulfate. |
| 10 | To allocate legacy PotashCorp all others segment selling and administrative expenses to segments. |
| 11 | To reclassify certain phosphate products to others segment. |
| 33 | Nutrien 2018 Third Quarter Report |