Exhibit 99.2

| Unaudited | in millions of US dollars except as otherwise noted |
Condensed Consolidated Financial Statements
Condensed Consolidated Statements of (Loss) Earnings
| Three Months Ended September 30 | Nine Months Ended September 30 | |||||||||||||||||
| 2018 | 2017 | 2018 | 2017 | |||||||||||||||
| (Note 16) | (Note 16) | |||||||||||||||||
Sales | Note 3 | $ | 4,034 | $ | 1,234 | $ | 15,874 | $ | 3,466 | |||||||||
Freight, transportation and distribution | (253 | ) | (172 | ) | (675 | ) | (421 | ) | ||||||||||
Cost of goods sold | Note 3 | (2,626 | ) | (829 | ) | (11,066 | ) | (2,279 | ) | |||||||||
Gross Margin | 1,155 | 233 | 4,133 | 766 | ||||||||||||||
Selling expenses | (560 | ) | (7 | ) | (1,758 | ) | (24 | ) | ||||||||||
General and administrative expenses | (163 | ) | (49 | ) | (461 | ) | (130 | ) | ||||||||||
Provincial mining and other taxes | (79 | ) | (45 | ) | (192 | ) | (121 | ) | ||||||||||
Earnings of equity-accounted investees | 15 | 3 | 26 | 6 | ||||||||||||||
Impairment of property, plant and equipment | Note 4 | (1,809 | ) | – | (1,809 | ) | – | |||||||||||
Other income (expenses) | Note 5 | 82 | (35 | ) | (71 | ) | (73 | ) | ||||||||||
(Loss) Earnings before Finance Costs and Income Taxes | (1,359 | ) | 100 | (132 | ) | 424 | ||||||||||||
Finance costs | (142 | ) | (60 | ) | (394 | ) | (180 | ) | ||||||||||
(Loss) Earnings Before Income Taxes | (1,501 | ) | 40 | (526 | ) | 244 | ||||||||||||
Income tax recovery (expense) | Note 6 | 434 | (24 | ) | 199 | 30 | ||||||||||||
Net (Loss) Earnings from Continuing Operations | $ | (1,067 | ) | $ | 16 | $ | (327 | ) | $ | 274 | ||||||||
Net earnings from discontinued operations | Note 7 | 23 | 37 | 698 | 129 | |||||||||||||
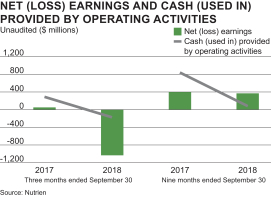
Net (Loss) Earnings | $ | (1,044 | ) | $ | 53 | $ | 371 | $ | 403 | |||||||||
Net (Loss) Earnings per Share from Continuing Operations | ||||||||||||||||||
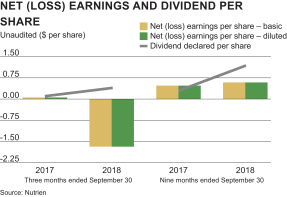
Basic | $ | (1.74 | ) | $ | 0.02 | $ | (0.52 | ) | $ | 0.33 | ||||||||
Diluted | $ | (1.74 | ) | $ | 0.02 | $ | (0.52 | ) | $ | 0.33 | ||||||||
Net (Loss) Earnings per Share from Continuing and Discontinued Operations | ||||||||||||||||||
Basic | $ | (1.70 | ) | $ | 0.06 | $ | 0.59 | $ | 0.48 | |||||||||
Diluted | $ | (1.70 | ) | $ | 0.06 | $ | 0.59 | $ | 0.48 | |||||||||
Weighted average shares outstanding for basic earnings per share (“EPS”) | Note 10 | 614,950,000 | 840,137,000 | 629,197,000 | 840,037,000 | |||||||||||||
Weighted average shares outstanding for diluted EPS | Note 10 | 614,950,000 | 840,301,000 | 629,197,000 | 840,202,000 | |||||||||||||
(See Notes to the Condensed Consolidated Financial Statements)
 |  |  |
| Nutrien 2018 Third Quarter Report | 34 |
| Unaudited | in millions of US dollars except as otherwise noted |
Condensed Consolidated Statements of Comprehensive (Loss) Income
| Three Months Ended September 30 | Nine Months Ended September 30 | |||||||||||||||
| 2018 | 2017 | 2018 | 2017 | |||||||||||||
| (net of related income taxes) | (Note 16) | (Note 16) | ||||||||||||||
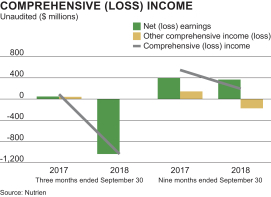
Net (Loss) Earnings | $ | (1,044 | ) | $ | 53 | $ | 371 | $ | 403 | |||||||
Other comprehensive income (loss) | ||||||||||||||||
Items that will not be reclassified to net (loss) earnings: | ||||||||||||||||
Net actuarial gain on defined benefit plans 1 | – | – | 56 | – | ||||||||||||
Financial instruments measured at FVTOCI 2 | ||||||||||||||||
Net fair value gain (loss) on investments | 14 | 35 | (79 | ) | 128 | |||||||||||
Items that have been or may be subsequently reclassified to net (loss) earnings: | ||||||||||||||||
Cash flow hedges | ||||||||||||||||
Net fair value loss during the period 3 | (4 | ) | (1 | ) | (3 | ) | (8 | ) | ||||||||
Reclassification of net loss to (loss) earnings 4 | – | 9 | – | 28 | ||||||||||||
Foreign currency translation | ||||||||||||||||
Loss on translation of net foreign operations | (8 | ) | – | (146 | ) | – | ||||||||||
Equity-accounted investees | ||||||||||||||||
Share of other comprehensive (loss) income | (1 | ) | (1 | ) | (2 | ) | 2 | |||||||||
Other Comprehensive Income (Loss) | 1 | 42 | (174 | ) | 150 | |||||||||||
Comprehensive (Loss) Income | $ | (1,043 | ) | $ | 95 | $ | 197 | $ | 553 | |||||||
| 1 | Net of income taxes of $NIL (2017 – $NIL) for the three months ended September 30, 2018 and $(16) (2017 – $NIL) for the nine months ended September 30, 2018. |
| 2 | As at September 30, 2018, financial instruments measured at fair value through other comprehensive income (“FVTOCI”) are comprised of shares in Sinofert Holdings Limited (“Sinofert”) and other (September 30, 2017 – Israel Chemicals Ltd. (“ICL”), Sinofert and other). The company’s investment in ICL was classified as held for sale at December 31, 2017 and the divestiture of all equity interests in ICL was completed on January 24, 2018. |
| 3 | Cash flow hedges are comprised of natural gas derivative instruments and were net of income taxes of $1 (2017 – $NIL) for the three months ended September 30, 2018 and $1 (2017 – $4) for the nine months ended September 30, 2018. |
| 4 | Net of income taxes of $NIL (2017 – $(4)) for the three months ended September 30, 2018 and $NIL (2017 – $(15)) for the nine months ended September 30, 2018. |
(See Notes to the Condensed Consolidated Financial Statements)
| 35 | Nutrien 2018 Third Quarter Report |
| Unaudited | in millions of US dollars except as otherwise noted |
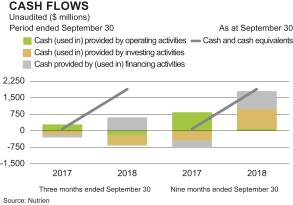
Condensed Consolidated Statements of Cash Flows
| Three Months Ended September 30 | Nine Months Ended September 30 | |||||||||||||||||||
| 2018 | 2017 | 2018 | 2017 | |||||||||||||||||
| (Note 16) | (Note 16) | |||||||||||||||||||
Operating Activities | ||||||||||||||||||||
Net (loss) earnings | $ | (1,044 | ) | $ | 53 | $ | 371 | $ | 403 | |||||||||||
Adjustments to reconcile net (loss) earnings to cash (used in) provided by operating activities | Note 8 | 1,801 | 237 | 2,095 | 532 | |||||||||||||||
Changes innon-cash operating working capital | Note 8 | (934 | ) | 3 | (2,382 | ) | (91 | ) | ||||||||||||
Cash (used in) provided by operating activities | (177 | ) | 293 | 84 | 844 | |||||||||||||||
Investing Activities | ||||||||||||||||||||
Business acquisitions, net of cash acquired | Note 2 | (140 | ) | – | (385 | ) | – | |||||||||||||
Additions to property, plant and equipment | (352 | ) | (170 | ) | (913 | ) | (431 | ) | ||||||||||||
Cash acquired in Merger | Note 2 | – | – | 466 | – | |||||||||||||||
Proceeds from disposal of discontinued operations | Note 7 | 14 | – | 1,833 | – | |||||||||||||||
Purchase of investments | (15 | ) | – | (123 | ) | – | ||||||||||||||
Other | 14 | – | 25 | (1 | ) | |||||||||||||||
Cash (used in) provided by investing activities | (479 | ) | (170 | ) | 903 | (432 | ) | |||||||||||||
Financing Activities | ||||||||||||||||||||
Finance costs on long-term debt | – | – | (21 | ) | (1 | ) | ||||||||||||||
Proceeds from (repayment of) short-term debt | Note 9 | 1,319 | (39 | ) | 3,214 | (99 | ) | |||||||||||||
Repayment of long-term debt | (2 | ) | – | (8 | ) | – | ||||||||||||||
Dividends paid | Note 10 | (248 | ) | (84 | ) | (708 | ) | (248 | ) | |||||||||||
Repurchase of common shares | Note 10 | (459 | ) | – | (1,663 | ) | – | |||||||||||||
Issuance of common shares | Note 10 | 5 | – | 7 | 1 | |||||||||||||||
Cash provided by (used in) financing activities | 615 | (123 | ) | 821 | (347 | ) | ||||||||||||||
Effect of exchange rate changes on cash and cash equivalents | (13 | ) | – | (22 | ) | – | ||||||||||||||
(Decrease) Increase in Cash and Cash Equivalents | (54 | ) | – | 1,786 | 65 | |||||||||||||||
Cash and Cash Equivalents, Beginning of Period | 1,956 | 97 | 116 | 32 | ||||||||||||||||
Cash and Cash Equivalents, End of Period | Note 8 | $ | 1,902 | $ | 97 | $ | 1,902 | $ | 97 | |||||||||||
Cash and cash equivalents comprised of: | ||||||||||||||||||||
Cash | $ | 580 | $ | 31 | $ | 580 | $ | 31 | ||||||||||||
Short-term investments | 1,322 | 66 | 1,322 | 66 | ||||||||||||||||
| $ | 1,902 | $ | 97 | $ | 1,902 | $ | 97 | |||||||||||||
(See Notes to the Condensed Consolidated Financial Statements)
| Nutrien 2018 Third Quarter Report | 36 |
| Unaudited | in millions of US dollars except as otherwise noted |
Condensed Consolidated Statements of Changes in Shareholders’ Equity
| Accumulated Other Comprehensive (Loss) Income | ||||||||||||||||||||||||||||||||||||||||
Share Capital | Contributed Surplus | Net fair value loss on investments 1, 2 | Net (loss) gain on derivatives designated as cash flow hedges | Net actuarial gain on defined benefit plans | Translation (Note 16) | Comprehensive equity-accounted (Note 16) | Total Accumulated Other Comprehensive Income (Loss) | Retained Earnings | Total Equity 3 | |||||||||||||||||||||||||||||||
Balance – December 31, 2017 | $ | 1,806 | $ | 230 | $ | 73 | $ | (43 | ) | $ | – | 4 | $ | (2 | ) | $ | (3 | ) | $ | 25 | $ | 6,242 | $ | 8,303 | ||||||||||||||||
Merger impact (Note 2, Note 10) | 15,898 | 7 | – | – | – | – | – | – | (1 | ) | 15,904 | |||||||||||||||||||||||||||||
Net earnings | – | – | – | – | – | – | – | – | 371 | 371 | ||||||||||||||||||||||||||||||
Other comprehensive (loss) income | – | – | (79 | ) | (3 | ) | 56 | (146 | ) | (2 | ) | (174 | ) | – | (174 | ) | ||||||||||||||||||||||||
Shares repurchased (Note 10) | (884 | ) | (23 | ) | – | – | – | – | – | – | (756 | ) | (1,663 | ) | ||||||||||||||||||||||||||
Dividends declared (Note 10) | – | – | – | – | – | – | – | – | (749 | ) | (749 | ) | ||||||||||||||||||||||||||||
Effect of share-based compensation including issuance of common shares | 8 | 17 | – | – | – | – | – | – | – | 25 | ||||||||||||||||||||||||||||||
Transfer of net actuarial gain on defined benefit plans | – | – | – | – | (56 | ) | – | – | (56 | ) | 56 | – | ||||||||||||||||||||||||||||
Transfer of net loss on sale of investment | – | – | 19 | – | – | – | – | 19 | (19 | ) | – | |||||||||||||||||||||||||||||
Transfer of net loss on cash flow hedges 5 | – | – | – | 18 | – | – | – | 18 | – | 18 | ||||||||||||||||||||||||||||||
Balance –September 30, 2018 | $ | 16,828 | $ | 231 | $ | 13 | $ | (28 | ) | $ | – | 4 | $ | (148 | ) | $ | (5 | ) | $ | (168 | ) | $ | 5,144 | $ | 22,035 | |||||||||||||||
Balance – December 31, 2016 | $ | 1,798 | $ | 222 | $ | 43 | $ | (60 | ) | $ | – | 4 | $ | (2 | ) | $ | (6 | ) | $ | (25 | ) | $ | 6,204 | $ | 8,199 | |||||||||||||||
Net earnings | – | – | – | – | – | – | – | – | 403 | 403 | ||||||||||||||||||||||||||||||
Other comprehensive income | – | – | 128 | 20 | – | – | 2 | 150 | – | 150 | ||||||||||||||||||||||||||||||
Dividends declared | – | – | – | – | – | – | – | – | (252 | ) | (252 | ) | ||||||||||||||||||||||||||||
Effect of share-based compensation including issuance of common shares | 2 | 6 | – | – | – | – | – | – | – | 8 | ||||||||||||||||||||||||||||||
Shares issued for dividend reinvestment plan | 5 | – | – | – | – | – | – | – | – | 5 | ||||||||||||||||||||||||||||||
Balance – September 30, 2017 | $ | 1,805 | $ | 228 | $ | 171 | $ | (40 | ) | $ | – | 4 | $ | (2 | ) | $ | (4 | ) | $ | 125 | $ | 6,355 | $ | 8,513 | ||||||||||||||||
| 1 | The company adopted IFRS 9 “Financial Instruments” in 2018 and reclassifiedavailable-for-sale investments as financial instruments measured at FVTOCI. |
| 2 | The company divested its equity interests in the investment in ICL on January 24, 2018. The loss on sale of ICL of $(19) was transferred to retained earnings at September 30, 2018. The cumulative net unrealized gain at September 30, 2017 was $77. |
| 3 | All equity transactions were attributable to common shareholders. |
| 4 | Any amounts incurred during a period were closed out to retained earnings at eachperiod-end. Therefore, no balance exists at the beginning or end of period. |
| 5 | Net of income taxes of $(1) for the three months ended September 30, 2018 and $(5) for the nine months ended September 30, 2018. |
(See Notes to the Condensed Consolidated Financial Statements)
| 37 | Nutrien 2018 Third Quarter Report |
| Unaudited | in millions of US dollars except as otherwise noted |
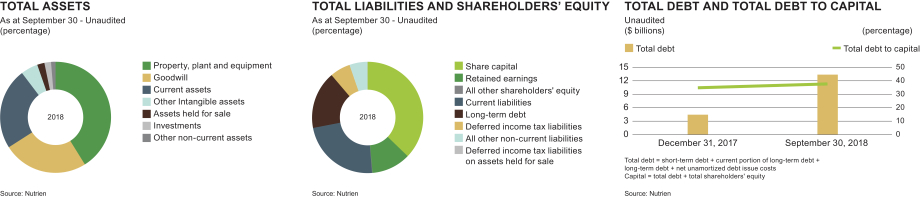
Condensed Consolidated Balance Sheets
| September 30, 2018 | December 31, 2017 | |||||||||||
| (Note 2) | (Note 16) | |||||||||||
Assets | ||||||||||||
Current assets | ||||||||||||
Cash and cash equivalents | $ | 1,902 | $ | 116 | ||||||||
Receivables | 4,490 | 489 | ||||||||||
Inventories | 3,910 | 788 | ||||||||||
Prepaid expenses and other current assets | 429 | 72 | ||||||||||
| 10,731 | 1,465 | |||||||||||
Assets held for sale | Note 7 | 945 | 1,858 | |||||||||
| 11,676 | 3,323 | |||||||||||
Non-current assets | ||||||||||||
Property, plant and equipment | Note 4 | 18,608 | 12,971 | |||||||||
Goodwill | 11,217 | 97 | ||||||||||
Other intangible assets | 2,256 | 69 | ||||||||||
Investments | 879 | 292 | ||||||||||
Other assets | 591 | 246 | ||||||||||
Total Assets | $ | 45,227 | $ | 16,998 | ||||||||
(See Notes to the Condensed Consolidated Financial Statements)
| September 30, 2018 | December 31, 2017 | |||||||||||
| (Note 2) | (Note 16) | |||||||||||
Liabilities | ||||||||||||
Current liabilities | ||||||||||||
Short-term debt | Note 9 | $ | 4,770 | $ | 730 | |||||||
Current portion of long-term debt | 1,009 | – | ||||||||||
Payables and accrued charges | 4,744 | 836 | ||||||||||
| 10,523 | 1,566 | |||||||||||
Deferred income tax liabilities on assets held for sale | Note 7 | 28 | 36 | |||||||||
| 10,551 | 1,602 | |||||||||||
Non-current liabilities | ||||||||||||
Long-term debt | 7,587 | 3,711 | ||||||||||
Deferred income tax liabilities | 2,701 | 2,205 | ||||||||||
Pension and otherpost-retirement benefit liabilities | Note 5 | 446 | 440 | |||||||||
Asset retirement obligations and accrued environmental costs | 1,693 | 651 | ||||||||||
Othernon-current liabilities | 214 | 86 | ||||||||||
Total Liabilities | 23,192 | 8,695 | ||||||||||
Shareholders’ Equity | ||||||||||||
Share capital | Note 10 | 16,828 | 1,806 | |||||||||
Contributed surplus | 231 | 230 | ||||||||||
Accumulated other comprehensive (loss) income | (168 | ) | 25 | |||||||||
Retained earnings | 5,144 | 6,242 | ||||||||||
Total Shareholders’ Equity | 22,035 | 8,303 | ||||||||||
Total Liabilities and Shareholders’ Equity | $ | 45,227 | $ | 16,998 | ||||||||
(See Notes to the Condensed Consolidated Financial Statements)
| Nutrien 2018 Third Quarter Report | 38 |
| Unaudited | in millions of US dollars except as otherwise noted |
Notes to the Condensed Consolidated Financial Statements
As at and for the Three and Nine Months Ended September 30, 2018
Note 1 | Basis of Presentation |
On January 1, 2018, Potash Corporation of Saskatchewan Inc. (“PotashCorp”) and Agrium Inc. (“Agrium”) combined their businesses in a transaction by way of a plan of arrangement (the “Merger”) by becoming wholly-owned subsidiaries of a new parent company named Nutrien Ltd. (collectively with its subsidiaries, known as “Nutrien” or “the company” except to the extent the context otherwise requires). Nutrien is the world’s largest provider of crop inputs and services.
These unaudited interim condensed consolidated financial statements (“interim financial statements”) are based on International Financial Reporting Standards as issued by the International Accounting Standards Board (“IFRS”) and have been prepared in accordance with International Accounting Standard (“IAS”) 34, “Interim Financial Reporting.” The accounting policies and methods of computation used in preparing these interim financial statements are consistent with those used in the preparation of Nutrien’s first quarter 2018 unaudited condensed consolidated financial statements (“first quarter financial statements”). PotashCorp is the acquirer for accounting purposes, and as a result, figures for 2017 and prior reflect the historical operations of PotashCorp. The financial statements and related notes of Nutrien in 2018 and beyond reflect the operations of Nutrien.
These interim financial statements include the accounts of Nutrien and its subsidiaries; however, they do not include all disclosures normally provided in annual consolidated financial statements and should be read in conjunction with the company’s first quarter financial statements. In management’s opinion, the interim financial statements include all adjustments necessary to fairly present such information in all material respects. Interim results are not necessarily indicative of the results expected for any other interim period or the fiscal year.
These interim financial statements were authorized by the audit committee of the Board of Directors for issue on November 5, 2018.
Note 2 | Business Combinations |
Merger of Equals
As described in Note 1, PotashCorp and Agrium combined their businesses in a merger of equals. Further information relating to the merger of equals was previously described in Note 2 of the company’s first quarter financial statements.
The company has engaged independent valuation experts to assist in determining the fair value of certain assets acquired and liabilities assumed and related deferred income tax impacts in connection with the Merger. The purchase price allocation is not final as the
company is continuing to obtain and verify information required to determine the fair value of certain assets and liabilities and the amount of deferred income taxes arising on their recognition. The company estimated the preliminary purchase price allocation as of the date of the Merger based on information that was available and continues to adjust those estimates as new information becomes available that existed at the date of acquisition. The company expects to finalize the amounts recognized as it obtains the information necessary to complete the analysis, and in any event, not later than December 31, 2018.
| 39 | Nutrien 2018 Third Quarter Report |
| Unaudited | in millions of US dollars except as otherwise noted |
Final determination of the fair values may result in further adjustments to the values presented in the following table:
| Preliminary fair value as previously reported 1 | Adjustments 2 | Estimated fair value as at September 30, 2018 | ||||||||||
Cash and cash equivalents | $ | 466 | $ | – | $ | 466 | ||||||
Receivables | 2,422 | – | 2,422 | |||||||||
Inventories | 3,303 | – | 3,303 | |||||||||
Prepaid expenses and other current assets | 1,124 | – | 1,124 | |||||||||
Assets held for sale | 95 | – | 95 | |||||||||
Property, plant and equipment | 7,566 | (107 | ) | 7,459 | ||||||||
Goodwill | 10,837 | 124 | 10,961 | |||||||||
Other intangible assets | 2,348 | – | 2,348 | |||||||||
Investments | 528 | – | 528 | |||||||||
Other assets | 123 | 75 | 198 | |||||||||
Total assets | $ | 28,812 | $ | 92 | $ | 28,904 | ||||||
Short-term debt | $ | 867 | $ | – | $ | 867 | ||||||
Payables and accrued charges | 5,226 | 13 | 5,239 | |||||||||
Long-term debt | 4,941 | – | 4,941 | |||||||||
Deferred income tax liabilities | 492 | 40 | 532 | |||||||||
Pension and other post-retirement benefit liabilities | 142 | – | 142 | |||||||||
Asset retirement obligations and accrued environmental costs | 1,055 | 39 | 1,094 | |||||||||
Othernon-current liabilities | 79 | – | 79 | |||||||||
Total liabilities | $ | 12,802 | $ | 92 | $ | 12,894 | ||||||
Net assets (consideration for the Merger) | $ | 16,010 | $ | – | $ | 16,010 | ||||||
| 1 | As previously reported in the company’s second quarter financial statements. |
| 2 | The company recorded adjustments to the preliminary fair value in the third quarter of 2018 to reflect facts and circumstances in existence as of the date of acquisition. These adjustments primarily related to changes in preliminary valuation assumptions, including refinement of property, plant and equipment, and asset retirement obligations estimates based on new information available that existed at the date of acquisition and recording certain components of the tax impact of the fair value adjustments. All measurement period adjustments were offset against goodwill. |
Financial information related to the acquired operations of Agrium
The following table provides “gross sales” and “net (loss) earnings from continuing operations before income taxes”:
| Three Months Ended September 30, 2018 | Nine Months Ended September 30, 2018 | |||||||||||
Summary results of acquired operations of Agrium 1 |
| |||||||||||
Gross sales | $ | 2,608 | $ | 12,000 | ||||||||
Net (loss) earnings from continuing operations before income taxes | $ | (141 | ) | $ | 400 | |||||||
| 1 | Results of acquired operations included the company’s condensed consolidated statements of earnings for the period. |
Retail acquisitions
During the year, the retail segment acquired 43 farm centers in North America and Australia, in addition to companies operating within the digital agriculture, proprietary products and agricultural services segments. Benefits of the acquisitions include expansion of geographical coverage for the sale of crop input products, increased customer base and workforce, continued growth in the digital agricultural field and synergies between Nutrien and the acquired businesses.
The purchase price allocation for these acquisitions is not final as the company is still gathering and analyzing information relating to the acquired assets and assumed liabilities, including fair values and the resulting income tax impact.
The preliminary values allocated to the acquired assets and assumed liabilities based upon fair values were as follows:
| September 30, 2018 | ||||
Working capital | $ | 104 | ||
Property, plant and equipment | 94 | |||
Other intangible assets | 7 | |||
Goodwill 1 | 175 | |||
Othernon-current assets | 14 | |||
Othernon-current liabilities | (9 | ) | ||
Total consideration | $ | 385 | ||
| 1 | Goodwill was calculated as the difference between the amount of consideration transferred and the net identifiable assets acquired. |
| Three Months Ended September 30, 2018 | Nine Months Ended September 30, 2018 | |||||||||||
Financial information related to business acquisitions from the date of acquisition 1 |
| |||||||||||
Sales | $ | 52 | $ | 181 | ||||||||
Earnings before income taxes | $ | 1 | $ | 13 | ||||||||
| 1 | Estimated annual sales and earnings before finance costs, income taxes, and depreciation and amortization if acquisitions occurred at the beginning of the year are approximately $390 and $35, respectively. |
| Nutrien 2018 Third Quarter Report | 40 |
| Unaudited | in millions of US dollars except as otherwise noted |
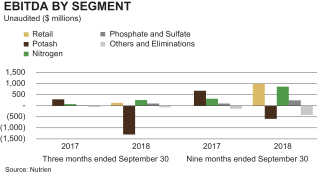
Note 3 | Segment Information |
The company has four reportable operating segments: retail, potash, nitrogen and phosphate and sulfate. The retail segment distributes crop nutrients, crop protection products, seed and merchandise and provides services directly to growers through a network of farm centers in North and South America and Australia. The potash, nitrogen and phosphate and sulfate segments are differentiated by the chemical nutrient contained in the products that each produces.
| Three Months Ended September 30, 2018 | ||||||||||||||||||||||||||||
| Retail | Potash | Nitrogen | Phosphate and Sulfate | Others | Eliminations | Consolidated | ||||||||||||||||||||||
Sales – third party | $ | 2,161 | $ | 880 | $ | 584 | $ | 409 | $ | – | $ | – | $ | 4,034 | ||||||||||||||
– intersegment | 14 | 62 | 109 | 86 | – | (271 | ) | – | ||||||||||||||||||||
Sales – total | 2,175 | 942 | 693 | 495 | – | (271 | ) | 4,034 | ||||||||||||||||||||
Freight, transportation and distribution | – | (125 | ) | (81 | ) | (58 | ) | – | 11 | (253 | ) | |||||||||||||||||
Net sales | 2,175 | 817 | 612 | 437 | – | (260 | ) | |||||||||||||||||||||
Cost of goods sold | (1,642 | ) | (358 | ) | (457 | ) | (401 | ) | – | 232 | (2,626 | ) | ||||||||||||||||
Gross margin | 533 | 459 | 155 | 36 | – | (28 | ) | 1,155 | ||||||||||||||||||||
Selling expenses | (552 | ) | (3 | ) | (8 | ) | (3 | ) | 6 | – | (560 | ) | ||||||||||||||||
General and administrative expenses | (25 | ) | (3 | ) | (7 | ) | (2 | ) | (126 | ) | – | (163 | ) | |||||||||||||||
Provincial mining and other taxes | – | (78 | ) | (1 | ) | – | – | – | (79 | ) | ||||||||||||||||||
Earnings of equity-accounted investees | 1 | – | 17 | – | (3 | ) | – | 15 | ||||||||||||||||||||
Impairment of property, plant and equipment (Note 4) | – | (1,809 | ) | – | – | – | – | (1,809 | ) | |||||||||||||||||||
Other income (expenses) | 37 | (5 | ) | (10 | ) | 1 | 59 | – | 82 | |||||||||||||||||||
(Loss) earnings before finance costs and income taxes | (6 | ) | (1,439 | ) | 146 | 32 | (64 | ) | (28 | ) | (1,359 | ) | ||||||||||||||||
Depreciation and amortization | 122 | 128 | 111 | 56 | 10 | – | 427 | |||||||||||||||||||||
EBITDA 1 | 116 | (1,311 | ) | 257 | 88 | (54 | ) | (28 | ) | (932 | ) | |||||||||||||||||
Assets 2 | 13,134 | 11,682 | 5,794 | 2,531 | 12,766 | (680 | ) | 45,227 | ||||||||||||||||||||
| 1 | Consolidated EBITDA is anon-IFRS measure calculated as net (loss) earnings from continuing operations before finance costs, income tax (recovery) expenses and depreciation and amortization. Nutrien uses EBITDA as a supplemental measure. EBITDA is frequently used by investors and analysts for valuation purposes when multiplied by a factor to estimate the enterprise value of a company. EBITDA is also used in determining annual incentive compensation for certain management employees. Generally, this measure is a numerical measure of a company’s performance, financial position or cash flows that excludes amounts that are not normally excluded in the most directly comparable measure calculated and presented in accordance with IFRS. EBITDA is not a measure of financial performance (nor does it have a standardized meaning) under IFRS. In evaluating this measure, investors should consider that the methodology applied in calculating such measures may differ among companies and analysts. The company uses both IFRS and certainnon-IFRS measures to assess financial performance. Management believes thisnon-IFRS measure provides useful supplemental information to investors in order that they may evaluate Nutrien’s financial performance using the same measures as management. Management believes that, as a result, the investor is afforded greater transparency in assessing the financial performance of the company. Thesenon-IFRS financial measures should not be considered as a substitute for, nor superior to, measures of financial performance prepared in accordance with IFRS. |
| 2 | Included in the total assets relating to the others segment are $945 relating to the investments held for sale as described in Note 7. Goodwill related to the Merger is not allocated due to the provisional status of the purchase price allocation. |
| 41 | Nutrien 2018 Third Quarter Report |
| Unaudited | in millions of US dollars except as otherwise noted |
| Three Months Ended September 30, 2017 | ||||||||||||||||||||||||
| Potash | Nitrogen | Phosphate and Sulfate | Others | Eliminations | Consolidated | |||||||||||||||||||
Sales – third party | $ | 595 | $ | 288 | $ | 351 | $ | – | $ | – | $ | 1,234 | ||||||||||||
– intersegment | – | 15 | – | – | (15 | ) | – | |||||||||||||||||
Sales – total | 595 | 303 | 351 | – | (15 | ) | 1,234 | |||||||||||||||||
Freight, transportation and distribution | (85 | ) | (33 | ) | (54 | ) | – | – | (172 | ) | ||||||||||||||
Net sales | 510 | 270 | 297 | – | (15 | ) | ||||||||||||||||||
Cost of goods sold | (253 | ) | (249 | ) | (342 | ) | – | 15 | (829 | ) | ||||||||||||||
Gross margin | 257 | 21 | (45 | ) | – | – | 233 | |||||||||||||||||
Selling expenses | (2 | ) | (3 | ) | (1 | ) | (1 | ) | – | (7 | ) | |||||||||||||
General and administrative expenses | (2 | ) | (1 | ) | (1 | ) | (45 | ) | – | (49 | ) | |||||||||||||
Provincial mining and other taxes | (45 | ) | – | – | – | – | (45 | ) | ||||||||||||||||
Earnings of equity-accounted investees | – | 3 | – | – | – | 3 | ||||||||||||||||||
Other expenses | (5 | ) | (3 | ) | (1 | ) | (26 | ) | – | (35 | ) | |||||||||||||
Earnings (loss) before finance costs and income taxes | 203 | 17 | (48 | ) | (72 | ) | – | 100 | ||||||||||||||||
Depreciation and amortization | 72 | 47 | 52 | 9 | – | 180 | ||||||||||||||||||
EBITDA | 275 | 64 | 4 | (63 | ) | – | 280 | |||||||||||||||||
Assets 1 | 9,811 | 2,502 | 2,250 | 2,788 | – | 17,351 | ||||||||||||||||||
| 1 | Included in the total assets relating to the others segment are $1,930 relating to the investments held for sale as described in Note 7. |
| Nine Months Ended September 30, 2018 | ||||||||||||||||||||||||||||
| Retail | Potash | Nitrogen | Phosphate and Sulfate | Others | Eliminations | Consolidated | ||||||||||||||||||||||
Sales – third party | $ | 10,580 | $ | 2,148 | $ | 1,989 | $ | 1,157 | $ | – | $ | – | $ | 15,874 | ||||||||||||||
– intersegment | 36 | 180 | 419 | 246 | – | (881 | ) | – | ||||||||||||||||||||
Sales – total | 10,616 | 2,328 | 2,408 | 1,403 | – | (881 | ) | 15,874 | ||||||||||||||||||||
Freight, transportation and distribution | – | (298 | ) | (268 | ) | (168 | ) | – | 59 | (675 | ) | |||||||||||||||||
Net sales | 10,616 | 2,030 | 2,140 | 1,235 | – | (822 | ) | |||||||||||||||||||||
Cost of goods sold | (8,243 | ) | (912 | ) | (1,576 | ) | (1,128 | ) | – | 793 | (11,066 | ) | ||||||||||||||||
Gross margin | 2,373 | 1,118 | 564 | 107 | – | (29 | ) | 4,133 | ||||||||||||||||||||
Selling expenses | (1,732 | ) | (9 | ) | (24 | ) | (8 | ) | 15 | – | (1,758 | ) | ||||||||||||||||
General and administrative expenses | (73 | ) | (8 | ) | (17 | ) | (6 | ) | (357 | ) | – | (461 | ) | |||||||||||||||
Provincial mining and other taxes | – | (188 | ) | (2 | ) | (1 | ) | (1 | ) | – | (192 | ) | ||||||||||||||||
Earnings of equity-accounted investees | 6 | – | 24 | – | (4 | ) | – | 26 | ||||||||||||||||||||
Impairment of property, plant and equipment (Note 4) | – | (1,809 | ) | – | – | – | – | (1,809 | ) | |||||||||||||||||||
Other income (expenses) | 51 | (13 | ) | (17 | ) | 2 | (94 | ) | – | (71 | ) | |||||||||||||||||
Earnings (loss) before finance costs and income taxes | 625 | (909 | ) | 528 | 94 | (441 | ) | (29 | ) | (132 | ) | |||||||||||||||||
Depreciation and amortization | 367 | 312 | 325 | 149 | 41 | – | 1,194 | |||||||||||||||||||||
EBITDA | 992 | �� | (597 | ) | 853 | 243 | (400 | ) | (29 | ) | 1,062 | |||||||||||||||||
Assets 1 | 13,134 | 11,682 | 5,794 | 2,531 | 12,766 | (680 | ) | 45,227 | ||||||||||||||||||||
| 1 | Included in the total assets relating to the others segment are $945 relating to the investments held for sale as described in Note 7. Goodwill related to the Merger is not allocated due to the provisional status of the purchase price allocation. |
| Nutrien 2018 Third Quarter Report | 42 |
| Unaudited | in millions of US dollars except as otherwise noted |
| Nine Months Ended September 30, 2017 | ||||||||||||||||||||||||
| Potash | Nitrogen | Phosphate and Sulfate | Others | Eliminations | Consolidated | |||||||||||||||||||
Sales – third party | $ | 1,485 | $ | 1,047 | $ | 934 | $ | – | $ | – | $ | 3,466 | ||||||||||||
– intersegment | – | 54 | – | – | (54 | ) | – | |||||||||||||||||
Sales – total | 1,485 | 1,101 | 934 | – | (54 | ) | 3,466 | |||||||||||||||||
Freight, transportation and distribution | (199 | ) | (97 | ) | (125 | ) | – | – | (421 | ) | ||||||||||||||
Net sales | 1,286 | 1,004 | 809 | – | (54 | ) | ||||||||||||||||||
Cost of goods sold | (646 | ) | (818 | ) | (869 | ) | – | 54 | (2,279 | ) | ||||||||||||||
Gross margin | 640 | 186 | (60 | ) | – | – | 766 | |||||||||||||||||
Selling expenses | (6 | ) | (11 | ) | (5 | ) | (2 | ) | – | (24 | ) | |||||||||||||
General and administrative expenses | (6 | ) | (3 | ) | (3 | ) | (118 | ) | – | (130 | ) | |||||||||||||
Provincial mining and other taxes | (121 | ) | – | – | – | – | (121 | ) | ||||||||||||||||
Earnings of equity-accounted investees | – | 5 | – | 1 | – | 6 | ||||||||||||||||||
Other expenses | (15 | ) | (7 | ) | (3 | ) | (48 | ) | – | (73 | ) | |||||||||||||
Earnings (loss) before finance costs and income taxes | 492 | 170 | (71 | ) | (167 | ) | – | 424 | ||||||||||||||||
Depreciation and amortization | 183 | 144 | 166 | 27 | – | 520 | ||||||||||||||||||
EBITDA | 675 | 314 | 95 | (140 | ) | – | 944 | |||||||||||||||||
Assets 1 | 9,811 | 2,502 | 2,250 | 2,788 | – | 17,351 | ||||||||||||||||||
| 1 | Included in the total assets relating to the others segment are $1,930 relating to the investments held for sale as described in Note 7. |
The company has disaggregated revenue from contracts with customers by product line or geographic location for each reportable segment, as it believes this best depicts how the nature, amount, timing and uncertainty of revenue and cash flows are affected by economic factors.
| Three Months Ended September 30, | Nine Months Ended September 30, | |||||||||||||||
| Retail | 2018 | 2017 | 2018 | 2017 | ||||||||||||
Sales by product line | ||||||||||||||||
Crop nutrients | $ | 650 | $ | – | $ | 3,660 | $ | – | ||||||||
Crop protection products | 1,086 | – | 4,218 | – | ||||||||||||
Seed | 60 | – | 1,584 | – | ||||||||||||
Merchandise | 205 | – | 555 | – | ||||||||||||
Services and other | 174 | – | 599 | – | ||||||||||||
Total | $ | 2,175 | $ | – | $ | 10,616 | $ | – | ||||||||
| Potash | ||||||||||||||||
Manufactured sales by geography | ||||||||||||||||
North America | $ | 484 | $ | 304 | $ | 1,130 | $ | 720 | ||||||||
Offshore | 458 | 291 | 1,198 | 765 | ||||||||||||
Total | $ | 942 | $ | 595 | $ | 2,328 | $ | 1,485 | ||||||||
| Three Months Ended September 30, | Nine Months Ended September 30, | |||||||||||||||
| Nitrogen | 2018 | 2017 | 2018 | 2017 | ||||||||||||
Sales by product line | ||||||||||||||||
Manufactured Product | ||||||||||||||||
Ammonia | $ | 225 | $ | 119 | $ | 783 | $ | 480 | ||||||||
Urea | 217 | 68 | 730 | 242 | ||||||||||||
Solutions and nitrates | 181 | 111 | 547 | 354 | ||||||||||||
Other nitrogen and purchased products | 70 | 5 | 348 | 25 | ||||||||||||
Total | $ | 693 | $ | 303 | $ | 2,408 | $ | 1,101 | ||||||||
| Phosphate and Sulfate | ||||||||||||||||
Sales by market | ||||||||||||||||
Manufactured Product | ||||||||||||||||
Fertilizer | $ | 305 | $ | 217 | $ | 846 | $ | 519 | ||||||||
Feed and industrial | 126 | 132 | 352 | 411 | ||||||||||||
Ammonium sulfate | 27 | – | 73 | – | ||||||||||||
Other phosphate and purchased products | 37 | 2 | 132 | 4 | ||||||||||||
Total | $ | 495 | $ | 351 | $ | 1,403 | $ | 934 | ||||||||
| 43 | Nutrien 2018 Third Quarter Report |
| Unaudited | in millions of US dollars except as otherwise noted |
Note 4 | Impairment of Property, Plant and Equipment |
After a strategic portfolio review was completed by the Board of Directors during the third quarter of 2018, it was determined the New Brunswick operations would no longer be part of the company’s medium-term or long-term strategic plans. As a result, the New Brunswick operations will be safely shutdown. The decision was considered a significant change in the expected manner of use and the related assets were moved from the Potashcash-generating unit (“CGU”) to the New Brunswick CGU. Indicators of impairment were identified and the company conducted an impairment assessment of the New Brunswick CGU where the estimated recoverable amount was determined to be $50, based on fair value less costs of
disposal. Since the estimated recoverable amount was lower than the carrying value, an impairment loss of $1,809 ($1,320, net of tax) was recorded in the potash segment for the three and nine months ended September 30, 2018.
The estimated recoverable amount was determined to be the salvage value of the assets based on the estimated fair market value of similar used assets and past experience, a level 3 fair value measurement.
Note 5 | Other Income (Expenses) |
| Three Months Ended September 30, | Nine Months Ended September 30, | |||||||||||||||
| 2018 | 2017 | 2018 | 2017 | |||||||||||||
| (Note 16) | (Note 16) | |||||||||||||||
Gain on curtailment of defined benefit pension and other post-retirement benefit plans | $ | 151 | $ | – | $ | 151 | $ | – | ||||||||
Merger and related costs | (62 | ) | (10 | ) | (143 | ) | (33 | ) | ||||||||
Foreign exchange (loss) gain | – | (14 | ) | 2 | (22 | ) | ||||||||||
Other expenses | (7 | ) | (11 | ) | (81 | ) | (18 | ) | ||||||||
| $ | 82 | $ | (35 | ) | $ | (71 | ) | $ | (73 | ) | ||||||
During the third quarter of 2018, as part of the company’s continuous assessment of its operations, participation in certain company defined benefit pension and otherpost-retirement benefit plans was suspended and/or discontinued effective January 1, 2020 based on age and years of service. As a result, the company recognized amerger-related gain on curtailment of defined benefit pension and other post-retirement benefit plans (“Curtailment Gain”) of $151.
Note 6 | Income Taxes |
A separate estimated average annual effective income tax rate was determined for each taxing jurisdiction and applied individually to the interim period (loss) earnings before income taxes from continuing operations for each jurisdiction.
| Three Months Ended September 30, | Nine Months Ended September 30, | |||||||||||||||
Income Tax Related to Continuing Operations | 2018 | 2017 | 2018 | 2017 | ||||||||||||
Income tax recovery (expense) | $ | 434 | $ | (24 | ) | $ | 199 | $ | 30 | |||||||
Actual effective tax rate on (loss) earnings from continuing operations | 29 | % | 36 | % | 38 | % | 15 | % | ||||||||
Actual effective tax rate including discrete items | 29 | % | 59 | % | 38 | % | (13 | %) | ||||||||
Discrete tax adjustments that impacted the tax rate | $ | (2 | ) | $ | (9 | ) | $ | – | $ | 67 | ||||||
The actual effective tax rate on the loss from continuing operations for the three months ended September 30, 2018 decreased compared to the same period last year. This was primarily due to different income weightings between jurisdictions, partially offset by the impairment of the New Brunswick property, plant and equipment.
The actual effective tax rate on the loss from continuing operations for the nine months ended September 30, 2018 increased compared to the same period last year. This was due to different income weightings between jurisdictions, mostly a decline in Canada partially offset by an increase in the United States, as well as the impairment of the New Brunswick property, plant and equipment.
In the second quarter of 2017, a discrete deferred tax recovery of $68 was recorded as a result of a Saskatchewan income tax rate decrease. This decreased the actual effective tax rate including discrete items for the nine months ended September 30, 2017 by 28 percentage points.
| Nutrien 2018 Third Quarter Report | 44 |
| Unaudited | in millions of US dollars except as otherwise noted |
Income tax balances within the condensed consolidated balance sheets were comprised of the following:
| Income Tax Assets (Liabilities) | Balance Sheet Location | September 30, 2018 | December 31, 2017 | |||||||
Current income tax assets | ||||||||||
Current | Receivables | $ | 79 | $ | 24 | |||||
Non-current | Other assets | 50 | 64 | |||||||
Deferred income tax assets | Other assets | 204 | 18 | |||||||
Total income tax assets | $ | 333 | $ | 106 | ||||||
Current income tax liabilities | ||||||||||
Current | Payables and accrued charges | $ | (72 | ) | $ | (16 | ) | |||
Non-current | Other non-current liabilities | (80 | ) | (43 | ) | |||||
Deferred income tax liabilities | Deferred income tax liabilities | (2,701 | ) | (2,205 | ) | |||||
Total income tax liabilities | $ | (2,853 | ) | $ | (2,264 | ) | ||||
Note 7 | Discontinued Operations |
The company’s investments in Sociedad Quimica y Minera de Chile S.A. (“SQM”), ICL and Arab Potash Company (“APC”) were classified as held for sale and as discontinued operations in December 2017, due to regulatory requirements to dispose of these investments in connection with the Merger. The company’s share of earnings, dividend income and associated income tax recovery (expense) pertaining to these investments were reclassified from (loss) earnings before income taxes and income tax recovery (expense) to net earnings from discontinued operations on the condensed consolidated statements of (loss) earnings.
For the nine months ended September 30, 2018, the following table represents the progress made towards the regulatory requirements to dispose the company’s investments and the relating financial impacts:
| Impact of Sale on: | ||||||||||||||||||||
| Proceeds | Gain (Loss) on Sale | Net of Income taxes | AOCI | Net Earnings and Retained Earnings | ||||||||||||||||
Sale of shares in SQM 1 | $ | 1,061 | $ | 841 | $ | 586 | $ | – | $ | 586 | ||||||||||
Sale of shares in ICL 2 | 685 | (19 | ) | (19 | ) | (19 | ) | – | ||||||||||||
Sale of Conda 3 | 87 | – | – | – | – | |||||||||||||||
Total | $ | 1,833 | $ | 822 | $ | 567 | $ | (19 | ) | $ | 586 | |||||||||
| 1 | In the second quarter of 2018, the company completed the sale of a portion of its equity interest in SQM. |
| 2 | In the first quarter of 2018, the company completed the sale of its equity interests in ICL through a private secondary offering. |
| 3 | In the first quarter of 2018, the company completed the sale of its Conda phosphate operations. |
On May 17, 2018, the company entered into an agreement with a third party for the sale of its remaining equity interest in SQM for $4,066 before taxes and closing costs. The agreement is subject to customary closing conditions (including applicable regulatory approvals) and is expected to close by the end of the fourth quarter of 2018.
On October 24, 2018, the company completed the sale of its equity interests in APC for gross proceeds of $502, resulting in a gain on disposal of approximately $140, net of income taxes of $NIL.
Net earnings from discontinued operations were comprised of:
| Three Months Ended September 30, | Nine Months Ended September 30, | |||||||||||||||
| 2018 | 2017 | 2018 | 2017 | |||||||||||||
Gain on disposal of investment in SQM | $ | – | $ | – | $ | 841 | $ | – | ||||||||
Dividend income of SQM, APC, and ICL 1 | 30 | 5 | 156 | 17 | ||||||||||||
Share in earnings of SQM and APC 1 | – | 30 | – | 115 | ||||||||||||
Income tax (expense) recovery 2 | (7 | ) | 2 | (299 | ) | (3 | ) | |||||||||
Net earnings from discontinued operations | $ | 23 | $ | 37 | $ | 698 | $ | 129 | ||||||||
Net earnings per share from discontinued operations | ||||||||||||||||
Basic | $ | 0.04 | $ | 0.04 | $ | 1.11 | $ | 0.15 | ||||||||
Diluted | $ | 0.04 | $ | 0.04 | $ | 1.11 | $ | 0.15 | ||||||||
| 1 | The company’s investments in SQM and APC were classified as discontinued operations at December 1, 2017 and December 31, 2017, respectively, and, as a result, equity accounting in respect of these investments ceased after such dates. |
| 2 | For the three months ended September 30, 2018, income tax expense relates to the planned repatriation of dividend income and the remaining excess cash available in Chile. For the nine months ended September 30, 2018, income tax expense is comprised of $255 relating to the disposals of certain SQM shares including the planned repatriation of the net proceeds, and $44 relating to earnings from discontinued operations ($26 for the planned repatriation of dividend income received from SQM and $18 for the planned repatriation of the remaining excess cash available in Chile). |
| 45 | Nutrien 2018 Third Quarter Report |
| Unaudited | in millions of US dollars except as otherwise noted |
Cash flows from discontinued operations were comprised of:
| Three Months Ended September 30, | Nine Months Ended September 30, | |||||||||||||||
| 2018 | 2017 | 2018 | 2017 | |||||||||||||
Operating Activities | ||||||||||||||||
Dividends from discontinued operations | $ | 30 | $ | 38 | $ | 156 | $ | 133 | ||||||||
Cash provided by operating activities | $ | 30 | $ | 38 | $ | 156 | $ | 133 | ||||||||
Investing Activities | ||||||||||||||||
Proceeds from disposal of discontinued operations | $ | 14 | $ | – | $ | 1,833 | $ | – | ||||||||
Cash provided by investing activities | $ | 14 | $ | – | $ | 1,833 | $ | – | ||||||||
Note 8 | Consolidated Statements of Cash Flows |
In connection with the sale of one of the company’s investments, the company received $325 of cash that is currently not available for use.
| Three Months Ended September 30, | Nine Months Ended September 30, | |||||||||||||||
| 2018 | 2017 | 2018 | 2017 | |||||||||||||
Reconciliation of cash (used in) provided by operating activities | ||||||||||||||||
Net (loss) earnings | $ | (1,044 | ) | $ | 53 | $ | 371 | $ | 403 | |||||||
Adjustments to reconcile net (loss) earnings to cash (used in) provided by operating activities | ||||||||||||||||
Gain on sale of investment in SQM (Note 7) | – | – | (841 | ) | – | |||||||||||
Depreciation and amortization | 427 | 180 | 1,194 | 520 | ||||||||||||
Impairment of property, plant and equipment (Note 4) | 1,809 | 29 | 1,809 | 29 | ||||||||||||
Net (undistributed) distributed earnings of equity-accounted investees | (1 | ) | 1 | (9 | ) | (1 | ) | |||||||||
Share-based compensation | 51 | 2 | 149 | 9 | ||||||||||||
Recovery of deferred income tax | (356 | ) | (3 | ) | (58 | ) | (99 | ) | ||||||||
Asset retirement obligations and accrued environmental costs | (11 | ) | 1 | (39 | ) | 3 | ||||||||||
Other long-term liabilities and miscellaneous | (118 | ) | 27 | (110 | ) | 71 | ||||||||||
Subtotal of adjustments | 1,801 | 237 | 2,095 | 532 | ||||||||||||
Changes innon-cash operating working capital | ||||||||||||||||
Receivables | 327 | (126 | ) | (1,504 | ) | (88 | ) | |||||||||
Inventories | 129 | 72 | 124 | 14 | ||||||||||||
Prepaid expenses and other current assets | (117 | ) | 11 | 737 | (3 | ) | ||||||||||
Payables and accrued charges | (1,273 | ) | 46 | (1,739 | ) | (14 | ) | |||||||||
Subtotal of changes innon-cash operating working capital | (934 | ) | 3 | (2,382 | ) | (91 | ) | |||||||||
Cash (used in) provided by operating activities | $ | (177 | ) | $ | 293 | $ | 84 | $ | 844 | |||||||
Supplemental cash flows disclosure | ||||||||||||||||
Interest paid | $ | 125 | $ | 30 | $ | 366 | $ | 133 | ||||||||
Income taxes paid | $ | 27 | $ | 14 | $ | 123 | $ | 67 | ||||||||
| Nutrien 2018 Third Quarter Report | 46 |
| Unaudited | in millions of US dollars except as otherwise noted |
The following is a summary of changes in liabilities arising from financing activities:
| Short-term debt and current portion of long-term debt 1 | Long-term debt | Total | ||||||||||
Balance – December 31, 2017 | $ | 730 | $ | 3,711 | $ | 4,441 | ||||||
Cash flows 1 | 3,214 | (8 | ) | 3,206 | ||||||||
Non-cash changes | (28 | ) | (23 | ) | (51 | ) | ||||||
Reclassifications | 1,023 | (1,023 | ) | – | ||||||||
Debt acquired in Merger (Note 2) | 878 | 4,930 | 5,808 | |||||||||
Foreign currency translation | (38 | ) | – | (38 | ) | |||||||
Balance – September 30, 2018 | $ | 5,779 | $ | 7,587 | $ | 13,366 | ||||||
Balance – December 31, 2016 | $ | 884 | $ | 3,707 | $ | 4,591 | ||||||
Cash flows 1 | (99 | ) | (1 | ) | (100 | ) | ||||||
Non-cash changes | – | 3 | 3 | |||||||||
Balance – September 30, 2017 | $ | 785 | $ | 3,709 | $ | 4,494 | ||||||
| 1 | Cash inflows and cash outflows arising from short-term debt transactions are presented on a net basis. |
Note 9 | Short-term Debt |
Short-term debt as of September 30, 2018 included $500 of borrowings secured by $1,798 of accounts receivable. The company retained control of the substantial risks and rewards of accounts receivable ownership.
During the three months ended September 30, 2018, the company entered into an amending agreement to replace its $75 unsecured line of credit with a new $250 uncommitted revolving
credit facility repayable on demand. The covenants under the new credit facility were the same as under the line of credit.
Subsequent to September 30, 2018, the company entered into an amending agreement to increase the uncommitted revolving credit facility to $500.
Note 10 | Share Capital |
Authorized
The company is authorized to issue an unlimited number of common shares without par value and an unlimited number of preferred shares. The common shares are not redeemable or convertible. The preferred shares may be issued in one or more series with rights and conditions to be determined by the Board of Directors. No preferred shares have been issued.
Share repurchase program
On February 20, 2018, the company’s Board of Directors approved a share repurchase program of up to five percent of the company’s outstanding common shares over aone-year period through a normal course issuer bid. Purchases under the normal course issuer bid were made through open market purchases at market price as well as by other means as permitted by applicable securities regulatory authorities, including private agreements. The company completed the share repurchase program by September 30, 2018.
The company repurchased for cancellation 7,271,800 common shares during the three months ended September 30, 2018, at a cost of $394 and an average price per share of $54.15. During the nine months ended September 30, 2018, the company repurchased for cancellation 32,209,923 common shares at a cost of $1,663 and an average price per share of $51.62. The repurchase resulted in a reduction of share capital, and the excess of net cost over the average book value of the shares was recorded as a reduction of contributed surplus and retained earnings.
Issued
Number of Common Shares (Pre-Merger) | Number of Common Shares (Post-Merger) | Consideration | ||||||||||
Balance – December 31, 2017(Pre-Merger) | 840,223,041 | |||||||||||
Conversion ratio | 0.40 | |||||||||||
PotashCorp shares converted to Nutrien shares | 336,089,216 | $ | 1,806 | |||||||||
Agrium shares – December 31, 2017(Pre-Merger) | 138,165,765 | |||||||||||
Conversion ratio | 2.23 | |||||||||||
Agrium shares converted to Nutrien shares | 308,109,656 | 15,898 | ||||||||||
Fractional shares cancelled | (1,399 | ) | – | |||||||||
Balance – January 1, 2018 (Post-Merger) | 644,197,473 | $ | 17,704 | |||||||||
Issued under option plans and share-settled plans | 177,898 | 8 | ||||||||||
Repurchased | (32,209,923 | ) | (884 | ) | ||||||||
Balance – September 30, 2018 | 612,165,448 | $ | 16,828 | |||||||||
| 47 | Nutrien 2018 Third Quarter Report |
| Unaudited | in millions of US dollars except as otherwise noted |
Dividends declared
The company declared dividends per share of $0.40 (2017 – $0.10) during the three months ended September 30, 2018 and $1.20 (2017 – $0.30) during the nine months ended September 30, 2018.
Subsequent to September 30, 2018, Nutrien’s Board of Directors declared a quarterly dividend of $0.43 per share payable on January 17, 2019, to shareholders of record on December 31, 2018. This represents a 7.5 percent increase from the previously declared dividends. The total estimated dividend to be paid is $263.
Anti-dilutive shares
The diluted weighted average shares calculation excluded 979,000 stock options and 118,000 equity-settled performance share units for the three months ended September 30, 2018; and 621,000 stock options and 118,000 equity-settled performance share units for the nine months ended September 30, 2018, due to their anti-dilutive effect.
Note 11 | Financial Instruments |
Fair Value
Estimated fair values for financial instruments are designed to approximate amounts for which the instruments could be exchanged in a currentarm’s-length transaction between knowledgeable, willing parties. The valuation policies and procedures for financial reporting purposes are determined by the company’s finance department.
Financial instruments included in the condensed consolidated balance sheets are measured either at fair value or amortized cost. The tables below explain the valuation methods used to determine the fair value of each financial instrument and its associated level in the fair value hierarchy.
| Financial Instruments Measured at Fair Value | Fair Value Method | |
| Cash and cash equivalents | Carrying amount (approximation to fair value assumed due to short-term nature). | |
| Equity securities | Closing bid price of the common shares (Level 1) as at the balance sheet date. | |
| Debt securities | Closing bid price of the debt (Level 2) as at the balance sheet date. | |
| Foreign currency derivatives not traded in an active market | Quoted forward exchange rates (Level 2) as at the balance sheet date. | |
| Foreign exchange forward contracts, swaps and options | A discounted cash flow model. 1 | |
| Natural gas swaps not traded in an active market | A discounted cash flow model. 1 | |
| Natural gas swaps traded in an active market | Market comparison. 2 |
| 1 | Inputs included contractual cash flows based on prices for natural gas futures contracts, fixed prices and notional volumes specified by the swap contracts, the time value of money, liquidity risk, the company’s own credit risk (related to instruments in a liability position) and counterparty credit risk (related to instruments in an asset position). Futures contract prices used as inputs in the model were supported by prices quoted in an active market and therefore categorized in Level 2. |
| 2 | Inputs include current market and contractual prices, forward pricing curves, quoted forward prices, basis differentials, volatility factors and interest rates. |
| Financial Instruments Measured at Amortized Cost | Fair Value Method | |
| Receivables, short-term debt and payables and accrued charges | Carrying amount (approximation to fair value assumed due to short-term nature). | |
| Long-term debt | Quoted market prices (Level 1 or 2 depending on the market liquidity of the debt). | |
| Other long-term debt instruments | Carrying amount. |
| Nutrien 2018 Third Quarter Report | 48 |
| Unaudited | in millions of US dollars except as otherwise noted |
The following table presents the company’s fair value hierarchy for financial assets and financial liabilities carried at fair value on a recurring basis:
| Fair Value Measurements at Reporting Dates Using: | ||||||||||||
| September 30, 2018 | Carrying Amount of Asset (Liability) | Quoted Prices in Active Markets for Identical Assets (Level 1) 1 | Significant Other Observable Inputs (Level 2) 1 | |||||||||
| Financial instruments measured at fair value on a recurring basis | ||||||||||||
Derivative instrument assets | ||||||||||||
Natural gas derivatives | $ | 7 | $ | – | $ | 7 | ||||||
Foreign currency derivatives | 4 | – | 4 | |||||||||
Other current financial assets – marketable securities 2 | 102 | 14 | 88 | |||||||||
Investments at FVTOCI 3 | 205 | 205 | ||||||||||
Derivative instrument liabilities | ||||||||||||
Natural gas derivatives | (70 | ) | – | (70 | ) | |||||||
Foreign currency derivatives | (2 | ) | – | (2 | ) | |||||||
| Financial instruments measured at amortized cost | ||||||||||||
Cash and cash equivalents | 1,902 | – | 1,902 | |||||||||
Current portion of long-term debt | ||||||||||||
Senior notes and debentures 4 | (1,000 | ) | (511 | ) | (506 | ) | ||||||
Fixed and floating rate debt | (9 | ) | – | (9 | ) | |||||||
Long-term debt | ||||||||||||
Senior notes and debentures 4 | (7,571 | ) | (2,420 | ) | (4,876 | ) | ||||||
Fixed and floating rate debt | (16 | ) | – | (16 | ) | |||||||
| December 31, 2017 | ||||||||||||
Derivative instrument assets | ||||||||||||
Natural gas derivatives | $ | 9 | $ | – | $ | 9 | ||||||
Investments at FVTOCI 3 | 970 | 970 | – | |||||||||
Derivative instrument liabilities | ||||||||||||
Natural gas derivatives | (64 | ) | – | (64 | ) | |||||||
Long-term debt | ||||||||||||
Senior notes 4 | (3,707 | ) | – | (4,045 | ) | |||||||
| 1 | During the period ended September 30, 2018, there were no transfers between Level 1 and Level 2 for financial instruments measured at fair value. The company’s policy is to recognize transfers at the end of the reporting period. |
| 2 | Marketable securities consist of equity and fixed income securities. The company determines the fair value of equity securities based on the bid price of identical instruments in active markets. The company values fixed income securities using quoted prices of instruments with similar terms and credit risk. |
| 3 | Investments at FVTOCI are comprised of shares in ICL, Sinofert and other. ICL was sold on January 24, 2018 (Note 7). |
| 4 | Carrying amount of liability includes net unamortized debt issue costs. |
Note 12 | Seasonality |
The company’s sales of fertilizer can be seasonal. Typically, fertilizer sales are highest in the second quarter of the year, due to the Northern Hemisphere’s spring planting season. However, planting conditions and the timing of customer purchases will vary each year, and fertilizer sales can be expected to shift from one quarter to another. Feed and industrial sales are more evenly distributed throughout the year. The company’s retail sales are generally higher in spring and fall as a result of the increased demand for the company’s products during planting seasons. The results of this seasonality have a corresponding effect on trade receivables, rebates receivables, inventories, prepaid expenses and other current assets and payables and accrued charges. Additional information on seasonality can be found in Note 4 of the company’s first quarter financial statements.
Note 13 | Related Party Transactions |
The company sells potash from its Canadian mines for use outside Canada and the US exclusively to Canpotex Limited (“Canpotex”). Sales are at prevailing market prices and are settled on normal trade terms. Sales to Canpotex for the three months ended September 30, 2018 were $458 (2017 – $289) and the nine months ended September 30, 2018 were $1,198 (2017 – $763). At September 30, 2018, $225 (December 31, 2017 – $82) was owing from Canpotex.
| 49 | Nutrien 2018 Third Quarter Report |
| Unaudited | in millions of US dollars except as otherwise noted |
Note 14 | Accounting Policies, Estimates and Judgments |
Standards, Amendments and Interpretations Not Yet Effective and Not Applied
The International Accounting Standards Board (“IASB”) and IFRS Interpretations Committee (“IFRIC”) have issued the following standards and amendments or interpretations to existing standards that were not yet effective and not applied as at September 30, 2018. The company does not anticipate early adoption of these standards at this time.
Standard | Description | Expected Impact | Effective Date 1 | |||
| IFRS 16, Leases | Issued to supersede IAS 17, IFRIC 4,SIC-15 andSIC-27, providing the principles for the recognition, measurement, presentation and disclosure of leases. Lessees would be required to recognize assets and liabilities for the rights and obligations created by leases. Lessors would continue to classify leases using a similar approach to that of the superseded standards but with enhanced disclosure to improve information about a lessor’s risk exposure, particularly to residual value risk. | As progress toward adoption of the standards, the company has:
• continued its activities toward compilation of a lease inventory and review of existing lease agreements;
• begun to analyze other agreements that could contain leases; and
• completed the configuration of a software program to manage the existing and future lease inventory transactions.
The company expects to:
• adopt the standard using the modified retrospective approach;
• apply recognition exemptions across its complete portfolio of leased assets for short-term leases and leases of low value items; and
• use certain relevant practical expedients available under the modified retrospective approach.
The company expects that adoption will result inright-of-use assets and lease liabilities in excess of $750, and material reclassifications of interest expense on lease liabilities and depreciation expense within earnings. Once further phases of the review are complete, a more precise quantitative estimate of the impact on the consolidated financial statements will be made. | January 1, 2019, applied retrospectively with certain practical expedients available. | |||
| IFRIC 23, Uncertainty Over Income Tax Treatments | Issued to provide guidance on recognition and measurement of uncertain income tax treatments. | The company is reviewing the standard to determine the potential impact, if any. | January 1, 2019, applied retrospectively with certain practical expedients available. | |||
| Amendments to IAS 28, Long-term Interests in Associates and Joint Ventures | Issued to clarify that IFRS 9, including its impairment requirements, applies to long-term interests in associates and joint ventures that form part of an entity’s net investment in these investees. | The company is reviewing the standard to determine the potential impact, if any. | January 1, 2019, applied retrospectively. | |||
| Amendments to IAS 19, Employee Benefits | Issued to require the use of updated assumptions when determining current service cost and net interest for the remainder of the period after a plan amendment, curtailment or settlement. Also required is any reduction in surplus, even amounts not previously recognized due to an asset ceiling limitation, to be recognized in profit or loss as part of past service cost or a gain or loss on settlement. | The company is reviewing the standard to determine the potential impact, if any. | January 1, 2019, applied prospectively. | |||
| Amendments to IFRS 3, Business Combinations | Issued to clarify that when an entity obtains control of a business that is a joint operation, it remeasures previously held interests in that business. | The company is reviewing the standard to determine the potential impact, if any. | January 1, 2019, applied prospectively. |
| Nutrien 2018 Third Quarter Report | 50 |
| Unaudited | in millions of US dollars except as otherwise noted |
Standard | Description | Expected Impact | Effective Date 1 | |||
| Amendments to IAS 12, Income Taxes | Issued to clarify that the requirements to recognize the income tax consequences of dividends where the transactions or events that generated distributable profits are recognized apply to all income tax consequences of dividends, not just where there are different tax rates for distributed and undistributed profits. | The company is reviewing the standard to determine the potential impact, if any. | January 1, 2019, applied prospectively, from the beginning of the earliest comparative period. | |||
| Amendments to IAS 23, Borrowing Costs | Issued to clarify that if any specific borrowing remains outstanding after the related asset is ready for its intended use or sale, that borrowing becomes part of the funds that an entity borrows generally when calculating the capitalization rate on general borrowings. | The company is reviewing the standard to determine the potential impact, if any. | January 1, 2019, applied prospectively. | |||
| Conceptual Framework for Financial Reporting | Issued to assist the IASB in developing IFRS standards that are based on consistent concepts; to assist preparers in developing consistent accounting policies when no standard applies to a particular transaction or other event, or when a standard allows a choice of accounting policy; and to assist all parties in understanding and interpreting the standards. | The company is reviewing the framework to determine the potential impact, if any. | January 1, 2020. | |||
| IFRS 17, Insurance Contracts | Issued to replace IFRS 4, providing guidance for the recognition, measurement, presentation and disclosure of insurance contracts giving consideration to: substantive rights and obligations arising from a contract, law or regulation; enforceable rights and obligations in a contract; and whether contracts are written, oral or implied by customary business practices. | Although the company does not underwrite insurance contracts, all significant contracts will be reviewed under the scope of the standard to determine the potential impact, if any. | January 1, 2021, applied retrospectively with certain practical expedients available. |
| 1 | Effective date for annual periods beginning on or after the stated date. |
Note 15 | Hyperinflationary Accounting |
During the third quarter of 2018, the company applied hyperinflationary accounting to one of its wholly-owned subsidiaries with no material impact to net (loss) earnings for the three and nine months ended September 30, 2018 or the condensed consolidated balance sheet as at September 30, 2018.
| 51 | Nutrien 2018 Third Quarter Report |
| Unaudited | in millions of US dollars except as otherwise noted |
Note 16 | Comparative Figures |
As described in Note 1, the comparative figures are PotashCorp only. To conform with Nutrien’s new method of presentation and as a result of discontinued operations described in Note 7, comparative figures were reclassified as follows, with no impact to net earnings.
Condensed Consolidated Statements of (Loss) Earnings
| For the Three Months Ended September 30, 2017 | ||||||||||||
| Previously Reported | Reclassification Amounts | Reported after Reclassifications | ||||||||||
Cost of goods sold | $ | (832 | ) | $ | 3 | $ | (829 | ) | ||||
Selling and administrative expenses | (56 | ) | 56 | – | ||||||||
Selling expenses | – | (7 | ) | (7 | ) | |||||||
General and administrative expenses | – | (49 | ) | (49 | ) | |||||||
Provincial mining and other taxes | (47 | ) | 2 | (45 | ) | |||||||
Earnings of equity-accounted investees | 33 | (30 | ) 1 | 3 | ||||||||
Dividend income | 5 | (5 | ) 1 | – | ||||||||
Other expenses | (30 | ) | (5 | ) | (35 | ) | ||||||
Income taxes | (22 | ) | (2 | ) 1 | (24 | ) | ||||||
Net earnings from discontinued operations | – | 37 | 1 | 37 | ||||||||
| $ | (949 | ) | $ | – | $ | (949 | ) | |||||
| 1 | Includes reclassifications as a result of discontinued operations described in Note 7. |
| For the Nine Months Ended September 30, 2017 | ||||||||||||
| Previously Reported | Reclassification Amounts | Reported after Reclassifications | ||||||||||
Cost of goods sold | $ | (2,292 | ) | $ | 13 | $ | (2,279 | ) | ||||
Selling and administrative expenses | (154 | ) | 154 | – | ||||||||
Selling expenses | – | (24 | ) | (24 | ) | |||||||
General and administrative expenses | – | (130 | ) | (130 | ) | |||||||
Provincial mining and other taxes | (125 | ) | 4 | (121 | ) | |||||||
Earnings of equity-accounted investees | 121 | (115 | ) 1 | 6 | ||||||||
Dividend income | 17 | (17 | ) 1 | – | ||||||||
Other expenses | (56 | ) | (17 | ) | (73 | ) | ||||||
Income taxes | 27 | 3 | 1 | 30 | ||||||||
Net earnings from discontinued operations | – | 129 | 1 | 129 | ||||||||
| $ | (2,462 | ) | $ | – | $ | (2,462 | ) | |||||
| 1 | Includes reclassifications as a result of discontinued operations described in Note 7. |
Condensed Consolidated Statements of Comprehensive (Loss) Income
| For the Three Months Ended September 30, 2017 | ||||||||||||
| Previously Reported | Reclassification Amounts | Reported after Reclassifications | ||||||||||
Other | $ | (1 | ) | $ | 1 | $ | – | |||||
Loss on translation of net foreign operations | – | – | – | |||||||||
Equity-accounted investees | ||||||||||||
Share of other comprehensive income | – | (1 | ) | (1 | ) | |||||||
| $ | (1 | ) | $ | – | $ | (1 | ) | |||||
| For the Nine Months Ended September 30, 2017 | ||||||||||||
| Previously Reported | Reclassification Amounts | Reported after Reclassifications | ||||||||||
Other | $ | 2 | $ | (2 | ) | $ | – | |||||
Loss on translation of net foreign operations | – | – | – | |||||||||
Equity-accounted investees | ||||||||||||
Share of other comprehensive income | – | 2 | 2 | |||||||||
| $ | 2 | $ | – | $ | 2 | |||||||
Condensed Consolidated Statements of Cash Flows
| For the Three Months Ended September 30, 2017 | ||||||||||||
| Previously Reported | Reclassification Amounts | Reported after Reclassifications | ||||||||||
Pension and other post-retirement benefits | $ | 17 | $ | (17 | ) | $ | – | |||||
Other long-term liabilities and miscellaneous | 10 | 17 | 27 | |||||||||
| $ | 27 | $ | – | $ | 27 | |||||||
| For the Nine Months Ended September 30, 2017 | ||||||||||||
| Previously Reported | Reclassification Amounts | Reported after Reclassifications | ||||||||||
Pension and other post-retirement benefits | $ | 50 | $ | (50 | ) | $ | – | |||||
Other long-term liabilities and miscellaneous | 21 | 50 | 71 | |||||||||
| $ | 71 | $ | – | $ | 71 | |||||||
| Nutrien 2018 Third Quarter Report | 52 |
| Unaudited | in millions of US dollars except as otherwise noted |
Condensed Consolidated Statements of Changes in Shareholders’ Equity
| As at December 31, 2017 | ||||||||||||
| Previously Reported | Reclassification Amounts | Reported after Reclassifications | |||||||||
Other | $ | (5 | ) | $ | 5 | $ | – | |||||
Translation loss of net foreign operations | – | (2 | ) | (2 | ) | |||||||
Comprehensive loss of equity-accounted investees | – | (3 | ) | (3 | ) | |||||||
| $ | (5 | ) | $ | – | $ | (5 | ) | |||||
| As at September 30, 2017 | ||||||||||||
| Previously Reported | Reclassification Amounts | Reported after Reclassifications | |||||||||
Other | $ | (6 | ) | $ | 6 | $ | – | |||||
Translation loss of net foreign operations | – | (2 | ) | (2 | ) | |||||||
Comprehensive loss of equity-accounted investees | – | (4 | ) | (4 | ) | |||||||
| $ | (6 | ) | $ | – | $ | (6 | ) | |||||
| As at December 31, 2016 | ||||||||||||
| Previously Reported | Reclassification Amounts | Reported after Reclassifications | |||||||||
Other | $ | (8 | ) | $ | 8 | $ | – | |||||
Translation loss of net foreign operations | – | (2 | ) | (2 | ) | |||||||
Comprehensive loss of equity-accounted investees | – | (6 | ) | (6 | ) | |||||||
| $ | (8 | ) | $ | – | $ | (8 | ) | |||||
Condensed Consolidated Balance Sheet
| As at December 31, 2017 | ||||||||||||
| Previously Reported | Reclassification Amounts | Reported after Reclassifications | ||||||||||
Intangible assets | $ | 166 | $ | (166 | ) | $ | – | |||||
Goodwill | – | 97 | 97 | |||||||||
Other intangible assets | – | 69 | 69 | |||||||||
| $ | 166 | $ | – | $ | 166 | |||||||
Investments in equity-accounted investees | $ | 30 | $ | (30 | ) | $ | – | |||||
Available-for-sale investments | 262 | (262 | ) | – | ||||||||
Investments | – | 292 | 292 | |||||||||
| $ | 292 | $ | – | $ | 292 | |||||||
Short-term debt and current portion of long-term debt | $ | 730 | $ | (730 | ) | $ | – | |||||
Short-term debt | – | 730 | 730 | |||||||||
| $ | 730 | $ | – | $ | 730 | |||||||
Payables and accrued charges | $ | 807 | $ | 29 | $ | 836 | ||||||
Current portion of derivative instrument liabilities | 29 | (29 | ) | – | ||||||||
| $ | 836 | $ | – | $ | 836 | |||||||
Othernon-current liabilities | $ | 51 | $ | 35 | $ | 86 | ||||||
Derivative instrument liabilities | 35 | (35 | ) | – | ||||||||
| $ | 86 | $ | – | $ | 86 | |||||||
Note 17 | Subsequent Events |
Subsequent to September 30, 2018, the company signed a new natural gas purchase agreement in Trinidad. This five-year $1,258 contract will commence January 1, 2019 and is set to expire December 31, 2023. The signing of the new contract has increased the company’s minimum purchase commitments as disclosed in the company’s first quarter financial statements as follows: 2019 – $244, 2020 – $248, 2021 – $252, 2022 – $255 and 2023 – $259.
| 53 | Nutrien 2018 Third Quarter Report |