| FREE WRITING PROSPECTUS | ||
| FILED PURSUANT TO RULE 433 | ||
| REGISTRATION FILE NO.: 333-206677-22 | ||
 |  |  |
Free Writing Prospectus
Structural and Collateral Term Sheet
$1,287,148,920
(Approximate Initial Pool Balance)
$1,071,471,000
(Approximate Aggregate Certificate Balance of Offered Certificates)
BANK 2018-BNK10
as Issuing Entity
Wells Fargo Commercial Mortgage Securities, Inc.
as Depositor
Morgan Stanley Mortgage Capital Holdings LLC
Wells Fargo Bank, National Association
Bank of America, National Association
National Cooperative Bank, N.A.
as Sponsors and Mortgage Loan Sellers
Commercial Mortgage Pass-Through Certificates
Series 2018-BNK10
January 22, 2018
| WELLS FARGO SECURITIES | BofA MERRILL LYNCH | MORGAN STANLEY |
Co-Lead Manager and Joint Bookrunner | Co-Lead Manager and Joint Bookrunner | Co-Lead Manager and Joint Bookrunner |
Academy Securities Co-Manager |
STATEMENT REGARDING THIS FREE WRITING PROSPECTUS
The depositor has filed a registration statement (including a prospectus) with the Securities and Exchange Commission (‘‘SEC’’) (SEC File No. 333-206677) for the offering to which this communication relates. Before you invest, you should read the prospectus in the registration statement and other documents the depositor has filed with the SEC for more complete information about the depositor, the issuing entity and this offering. You may get these documents for free by visiting EDGAR on the SEC Web site at www.sec.gov. Alternatively, the depositor, any underwriter, or any dealer participating in the offering will arrange to send you the prospectus after filing if you request it by calling toll free 1-800-745-2063 (8 a.m. – 5 p.m. EST) or by emailing wfs.cmbs@wellsfargo.com.
Nothing in this document constitutes an offer of securities for sale in any jurisdiction where the offer or sale is not permitted. The information contained herein is preliminary as of the date hereof, supersedes any such information previously delivered to you and will be superseded by any such information subsequently delivered and ultimately by the final prospectus relating to the securities. These materials are subject to change, completion, supplement or amendment from time to time.
This free writing prospectus has been prepared by the underwriters for information purposes only and does not constitute, in whole or in part, a prospectus for the purposes of Directive 2003/71/EC (as amended) and/or Part VI of the Financial Services and Markets Act 2000, as amended, or other offering document.
STATEMENT REGARDING ASSUMPTIONS AS TO SECURITIES, PRICING ESTIMATES AND OTHER INFORMATION
The attached information contains certain tables and other statistical analyses (the “Computational Materials”) which have been prepared in reliance upon information furnished by the Mortgage Loan Sellers. Numerous assumptions were used in preparing the Computational Materials, which may or may not be reflected herein. As such, no assurance can be given as to the Computational Materials’ accuracy, appropriateness or completeness in any particular context; or as to whether the Computational Materials and/or the assumptions upon which they are based reflect present market conditions or future market performance. The Computational Materials should not be construed as either projections or predictions or as legal, tax, financial or accounting advice. You should consult your own counsel, accountant and other advisors as to the legal, tax, business, financial and related aspects of a purchase of these securities. Any weighted average lives, yields and principal payment periods shown in the Computational Materials are based on prepayment and/or loss assumptions, and changes in such prepayment and/or loss assumptions may dramatically affect such weighted average lives, yields and principal payment periods. In addition, it is possible that prepayments or losses on the underlying assets will occur at rates higher or lower than the rates shown in the attached Computational Materials. The specific characteristics of the securities may differ from those shown in the Computational Materials due to differences between the final underlying assets and the preliminary underlying assets used in preparing the Computational Materials. The principal amount and designation of any security described in the Computational Materials are subject to change prior to issuance. None of Wells Fargo Securities, LLC, Merrill Lynch, Pierce, Fenner & Smith Incorporated, Morgan Stanley & Co. LLC, Academy Securities, Inc., or any of their respective affiliates, make any representation or warranty as to the actual rate or timing of payments or losses on any of the underlying assets or the payments or yield on the securities. The information in this presentation is based upon management forecasts and reflects prevailing conditions and management’s views as of this date, all of which are subject to change. In preparing this presentation, we have relied upon and assumed, without independent verification, the accuracy and completeness of all information available from public sources or which was provided to us by or on behalf of the Mortgage Loan Sellers or which was otherwise reviewed by us.
This free writing prospectus contains certain forward-looking statements. If and when included in this free writing prospectus, the words “expects”, “intends”, “anticipates”, “estimates” and analogous expressions and all statements that are not historical facts, including statements about our beliefs or expectations, are intended to identify forward-looking statements. Any forward-looking statements are made subject to risks and uncertainties which could cause actual results to differ materially from those stated. Those risks and uncertainties include, among other things, declines in general economic and business conditions, increased competition, changes in demographics, changes in political and social conditions, regulatory initiatives and changes in customer preferences, many of which are beyond our control and the control of any other person or entity related to this offering. The forward-looking statements made in this free writing prospectus are made as of the date stated on the cover. We have no obligation to update or revise any forward-looking statement.
Wells Fargo Securities is the trade name for the capital markets and investment banking services of Wells Fargo & Company and its subsidiaries, including but not limited to Wells Fargo Securities, LLC, a member of NYSE, FINRA, NFA and SIPC, Wells Fargo Prime Services, LLC, a member of FINRA, NFA and SIPC, and Wells Fargo Bank, N.A. Wells Fargo Securities, LLC and Wells Fargo Prime Services, LLC are distinct entities from affiliated banks and thrifts.
IMPORTANT NOTICE REGARDING THE OFFERED CERTIFICATES
The information herein is preliminary and may be supplemented or amended prior to the time of sale. In addition, the Offered Certificates referred to in these materials and the asset pool backing them are subject to modification or revision (including the possibility that one or more classes of certificates may be split, combined or eliminated at any time prior to issuance or availability of a final prospectus) and are offered on a “when, as and if issued” basis.
The underwriters described in these materials may from time to time perform investment banking services for, or solicit investment banking business from, any company named in these materials. The underwriters and/or their affiliates or respective employees may from time to time have a long or short position in any security or contract discussed in these materials.
The information contained herein supersedes any previous such information delivered to any prospective investor and will be superseded by information delivered to such prospective investor prior to the time of sale.
IMPORTANT NOTICE RELATING TO AUTOMATICALLY-GENERATED EMAIL DISCLAIMERS
Any legends, disclaimers or other notices that may appear at the bottom of any email communication to which this free writing prospectus is attached relating to (1) these materials not constituting an offer (or a solicitation of an offer), (2) any representation that these materials are accurate or complete and may not be updated or (3) these materials possibly being confidential, are not applicable to these materials and should be disregarded. Such legends, disclaimers or other notices have been automatically generated as a result of these materials having been sent via Bloomberg or another system.
THE INFORMATION IN THIS STRUCTURAL AND COLLATERAL TERM SHEET IS NOT COMPLETE AND MAY BE AMENDED PRIOR TO THE TIME OF SALE. THIS TERM SHEET IS NOT AN OFFER TO SELL THESE SECURITIES AND IT IS NOT A SOLICITATION OF AN OFFER TO BUY THESE SECURITIES IN ANY JURISDICTION WHERE THE OFFER OR SALE IS NOT PERMITTED.
2
| BANK 2018-BNK10 | Certificate Structure |
I. Certificate Structure
| Class | Expected Ratings (DBRS/Fitch/Moody’s)(1) | Approximate Initial Certificate Balance or Notional Amount(2) | Approx. Initial Credit Support(3) | Pass-Through Rate Description | Weighted Average Life (Years)(4) | Expected Principal Window(4) | Certificate Principal to Value Ratio(5) | Certificate Principal U/W NOI Debt Yield(6) |
| Offered Certificates | ||||||||
| A-1 | AAA(sf)/AAAsf/Aaa(sf) | $31,307,000 | 30.000% | (7) | 2.74 | 03/18 - 01/23 | 41.9% | 17.5% |
| A-2 | AAA(sf)/AAAsf/Aaa(sf) | $3,822,000 | 30.000% | (7) | 4.92 | 01/23 - 01/23 | 41.9% | 17.5% |
| A-3 | AAA(sf)/AAAsf/Aaa(sf) | $4,623,000 | 30.000% | (7) | 6.92 | 01/25 - 01/25 | 41.9% | 17.5% |
| A-SB | AAA(sf)/AAAsf/Aaa(sf) | $53,452,000 | 30.000% | (7) | 7.33 | 01/23 - 09/27 | 41.9% | 17.5% |
| A-4 | AAA(sf)/AAAsf/Aaa(sf) | $160,000,000 | 30.000% | (7) | 9.77 | 09/27 - 12/27 | 41.9% | 17.5% |
| A-5 | AAA(sf)/AAAsf/Aaa(sf) | $602,750,000 | 30.000% | (7) | 9.88 | 12/27 - 01/28 | 41.9% | 17.5% |
| X-A | AAA(sf)/AAAsf/Aaa(sf) | $855,954,000(8) | N/A | Variable(9) | N/A | N/A | N/A | N/A |
| X-B | A(high)(sf)/A-sf/NR | $215,517,000(10) | N/A | Variable(11) | N/A | N/A | N/A | N/A |
| A-S | AAA(sf)/AAAsf/Aa3(sf) | $103,937,000 | 21.500% | (7) | 9.92 | 01/28 - 01/28 | 47.0% | 15.6% |
| B | AA(high)(sf)/AA-sf/NR | $55,025,000 | 17.000% | (7) | 9.92 | 01/28 - 01/28 | 49.6% | 14.7% |
| C | A(sf)/A-sf/NR | $56,555,000 | 12.375% | (7) | 10.01 | 01/28 - 02/28 | 52.4% | 13.9% |
| Non-Offered Certificates | ||||||||
| X-D | BBB(sf)/BBB-sf/NR | $62,668,000(12) | N/A | Variable(13) | N/A | N/A | N/A | N/A |
| X-E | BB(sf)/BB-sf/NR | $27,512,000(14) | N/A | Variable(15) | N/A | N/A | N/A | N/A |
| X-F | B(sf)/NR/NR | $19,871,000(16) | N/A | Variable(17) | N/A | N/A | N/A | N/A |
| X-G | NR/NR/NR | $41,269,474(18) | N/A | Variable(19) | N/A | N/A | N/A | N/A |
| D | BBB(low)(sf)/BBB-sf/NR | $62,668,000 | 7.250% | (7) | 10.01 | 02/28 - 02/28 | 55.5% | 13.2% |
| E | BB(low)(sf)/BB-sf/NR | $27,512,000 | 5.000% | (7) | 10.01 | 02/28 - 02/28 | 56.8% | 12.9% |
| F | B(low)(sf)/NR/NR | $19,871,000 | 3.375% | (7) | 10.01 | 02/28 - 02/28 | 57.8% | 12.6% |
| G | NR/NR/NR | $41,269,474 | 0.000% | (7) | 10.01 | 02/28 - 02/28 | 59.8% | 12.2% |
| Non-Offered Eligible Vertical Interest | ||||||||
| RR Interest | NR/NR/NR | $64,357,446.03 | N/A | WAC(20) | 9.57 | 03/18 - 02/28 | N/A | N/A |
| Notes: | |||||||||||
| (1) | The expected ratings presented are those of DBRS, Inc (“DBRS”), Fitch Ratings, Inc. (“Fitch”) and Moody’s Investors Service, Inc. (“Moody’s”), which the depositor hired to rate the Offered Certificates. One or more other nationally recognized statistical rating organizations that were not hired by the depositor may use information they receive pursuant to Rule 17g-5 under the Securities Exchange Act of 1934, as amended (the “Exchange Act”) or otherwise, to rate or provide market reports and/or published commentary related to the Offered Certificates. We cannot assure you as to what ratings a non-hired nationally recognized statistical rating organization would assign or that its reports will not express differing, possibly negative, views of the mortgage loans and/or the Offered Certificates. The ratings of each Class of Offered Certificates address the likelihood of the timely distribution of interest and, except in the case of the Class X-A and X-B Certificates, the ultimate distribution of principal due on those Classes on or before the Rated Final Distribution Date. See “Risk Factors—Other Risks Relating to the Certificates—Nationally Recognized Statistical Rating Organizations May Assign Different Ratings to the Certificates; Ratings of the Certificates Reflect Only the Views of the Applicable Rating Agencies as of the Dates Such Ratings Were Issued; Ratings May Affect ERISA Eligibility; Ratings May Be Downgraded” and “Ratings” in the Preliminary Prospectus, expected to be dated January 22, 2018 (the “Preliminary Prospectus”). DBRS, Fitch and Moody’s have informed us that the “sf” designation in their ratings represents an identifier for structured finance product ratings. | ||||||||||
| (2) | The certificate balances and notional amounts set forth in the table are approximate. The actual initial certificate balances and notional amounts may be larger or smaller depending on the initial pool balance of the mortgage loans definitively included in the pool of mortgage loans, which aggregate cut-off date balance may be as much as 5% larger or smaller than the amount presented in the Preliminary Prospectus. In addition, the notional amounts of the Class X-A, Class X-B, Class X-D, Class X-E, Class X-F and Class X-G certificates (collectively referred to herein as Class X certificates) may vary depending upon the final pricing of the classes of principal balance certificates whose certificate balances comprise such notional amounts and, if as a result of such pricing the pass-through rate of any class of the Class X certificates would be equal to zero at all times, such class of certificates will not be issued on the closing date of this securitization. | ||||||||||
| (3) | The approximate initial credit support with respect to the Class A-1, A-2, A-3, A-SB, A-4 and A-5 Certificates represents the approximate credit enhancement for the Class A-1, A-2, A-3, A-SB, A-4 and A-5 Certificates in the aggregate. The RR Interest only provides credit support to the limited extent that losses incurred on the underlying mortgage loans are allocated to it, on the one hand, and to the Offered Certificates and the Non-Offered Certificates, on the other hand,pro rata, in accordance with their respective Percentage Allocation Entitlements. | ||||||||||
| (4) | Weighted Average Lives and Expected Principal Windows are calculated based on an assumed prepayment rate of 0% CPR and the “Structuring Assumptions” described under “Yield and Maturity Considerations—Weighted Average Life” in the Preliminary Prospectus. | ||||||||||
| (5) | The Certificate Principal to Value Ratio for each Class of Certificates (other than the Class A-1, A-2, A-3, A-SB, A-4 and A-5 Certificates) is calculated as the product of (a) the weighted average Cut-off Date LTV Ratio for the mortgage loans and (b) a fraction, the numerator of which is the total initial Certificate Balance of such Class of Certificates and all Classes of Principal Balance Certificates senior to such Class of Certificates and the denominator of which is the total initial Certificate Balance of all of the Principal Balance Certificates (other than the RR Interest). The Certificate Principal to Value Ratio for each of the Class A-1, A-2, A-3, A-SB, A-4 and A-5 Certificates is calculated in the aggregate for those Classes as if they were a single Class and is calculated as the product of (a) the weighted average Cut-off Date LTV Ratio for the mortgage loans and (b) a fraction, the numerator of which is the total initial aggregate Certificate Balances of such Classes of Certificates and the denominator of which is the total initial Certificate Balance of all of the Principal Balance Certificates (other than the RR Interest). In any event, however, excess mortgaged property value associated with a mortgage loan will not be available to offset losses on any other mortgage loan. | ||||||||||
THE INFORMATION IN THIS STRUCTURAL AND COLLATERAL TERM SHEET IS NOT COMPLETE AND MAY BE AMENDED PRIOR TO THE TIME OF SALE. THIS TERM SHEET IS NOT AN OFFER TO SELL THESE SECURITIES AND IT IS NOT A SOLICITATION OF AN OFFER TO BUY THESE SECURITIES IN ANY JURISDICTION WHERE THE OFFER OR SALE IS NOT PERMITTED.
3
| BANK 2018-BNK10 | Certificate Structure |
| (6) | The Certificate Principal U/W NOI Debt Yield for each Class of Certificates (other than the Class A-1, A-2, A-3, A-SB, A-4 and A-5 Certificates) is calculated as the product of (a) the weighted average U/W NOI Debt Yield for the mortgage loans and (b) a fraction, the numerator of which is the total initial Certificate Balance of all of the Classes of Principal Balance Certificates (other than the RR Interest) and the denominator of which is the total initial Certificate Balance for such Class of Certificates and all Classes of Principal Balance Certificates senior to such Class of Certificates. The Certificate Principal U/W NOI Debt Yield for each of the Class A-1, A-2, A-3, A-SB, A-4 and A-5 Certificates is calculated in the aggregate for those Classes as if they were a single Class and is calculated as the product of (a) the weighted average U/W NOI Debt Yield for the mortgage loans and (b) a fraction, the numerator of which is the total initial Certificate Balance of all of the Classes of Principal Balance Certificates (other than the RR Interest) and the denominator of which is the total aggregate initial Certificate Balances for the Class A-1, A-2, A-3, A-SB, A-4 and A-5 Certificates. In any event, however, cash flow from each mortgaged property supports only the related mortgage loan and will not be available to support any other mortgage loan. | ||||||||||
| (7) | The pass-through rates for the Class A-1, A-2, A-3, A-SB, A-4, A-5, A-S, B, C, D, E, F and G Certificates will be one of the following: (i) a fixed rateper annum, (ii) a variable rate per annum equal to the weighted average of the net mortgage interest rates on the mortgage loans for the related distribution date, (iii) a variable rateper annum equal to the lesser of (a) a fixed rate and (b) the weighted average of the net mortgage interest rates on the mortgage loans for the related distribution date or (iv) a variable rateper annum equal to the weighted average of the net mortgage interest rates on the mortgage loans for the related distribution date minus a specified percentage. For purposes of the calculation of the weighted average of the net mortgage interest rates on the mortgage loans for each distribution date, the mortgage interest rates will be adjusted as necessary to a 30/360 basis. | ||||||||||
| (8) | The Class X-A Certificates are notional amount certificates. The Notional Amount of the Class X-A Certificates will be equal to the aggregate Certificate Balance of the Class A-1, A-2, A-3, A-SB, A-4 and A-5 Certificates outstanding from time to time. The Class X-A Certificates will not be entitled to distributions of principal. | ||||||||||
| (9) | The pass-through rate for the Class X-A Certificates for any distribution date will be aper annum rate equal to the excess, if any, of (a) the weighted average of the net mortgage interest rates on the mortgage loans for the related distribution date, over (b) the weighted average of the pass-through rates on the Class A-1, A-2, A-3, A-SB, A-4 and A-5 Certificates for the related distribution date, weighted on the basis of their respective Certificate Balances outstanding immediately prior to that distribution date. For purposes of the calculation of the weighted average of the net mortgage interest rates on the mortgage loans for each distribution date, the mortgage interest rates will be adjusted as necessary to a 30/360 basis. | ||||||||||
| (10) | The Class X-B Certificates are notional amount certificates. The Notional Amount of the Class X-B Certificates will be equal to the aggregate Certificate Balance of the Class A-S, B and C Certificates outstanding from time to time. The Class X-B Certificates will not be entitled to distributions of principal. | ||||||||||
| (11) | The pass-through rate for the Class X-B Certificates for any distribution date will be aper annum rate equal to the excess, if any, of (a) the weighted average of the net mortgage interest rates on the mortgage loans for the related distribution date, over (b) the weighted average of the pass-through rates on the Class A-S, B and C Certificates for the related distribution date, weighted on the basis of their respective Certificate Balances outstanding immediately prior to that distribution date. For purposes of the calculation of the weighted average of the net mortgage interest rates on the mortgage loans for each distribution date, the mortgage interest rates will be adjusted as necessary to a 30/360 basis. | ||||||||||
| (12) | The Class X-D Certificates are notional amount certificates. The Notional Amount of the Class X-D Certificates will be equal to the Certificate Balance of the Class D Certificates outstanding from time to time. The Class X-D Certificates will not be entitled to distributions of principal. | ||||||||||
| (13) | The pass-through rate for the Class X-D Certificates for any distribution date will be aper annum rate equal to the excess, if any, of (a) the weighted average of the net mortgage interest rates on the mortgage loans for the related distribution date, over (b) the pass-through rate on the Class D Certificates for the related distribution date. For purposes of the calculation of the weighted average of the net mortgage interest rates on the mortgage loans for each distribution date, the mortgage interest rates will be adjusted as necessary to a 30/360 basis. | ||||||||||
| (14) | The Class X-E Certificates are notional amount certificates. The Notional Amount of the Class X-E Certificates will be equal to the Certificate Balance of the Class E Certificates outstanding from time to time. The Class X-E Certificates will not be entitled to distributions of principal. | ||||||||||
| (15) | The pass-through rate for the Class X-E Certificates for any distribution date will be aper annum rate equal to the excess, if any, of (a) the weighted average of the net mortgage interest rates on the mortgage loans for the related distribution date, over (b) the pass-through rate on the Class E Certificates for the related distribution date. For purposes of the calculation of the weighted average of the net mortgage interest rates on the mortgage loans for each distribution date, the mortgage interest rates will be adjusted as necessary to a 30/360 basis. | ||||||||||
| (16) | The Class X-F Certificates are notional amount certificates. The Notional Amount of the Class X-F Certificates will be equal to the Certificate Balance of the Class F Certificates outstanding from time to time. The Class X-F Certificates will not be entitled to distributions of principal. | ||||||||||
| (17) | The pass-through rate for the Class X-F Certificates for any distribution date will be aper annum rate equal to the excess, if any, of (a) the weighted average of the net mortgage interest rates on the mortgage loans for the related distribution date, over (b) the pass-through rate on the Class F Certificates for the related distribution date. For purposes of the calculation of the weighted average of the net mortgage interest rates on the mortgage loans for each distribution date, the mortgage interest rates will be adjusted as necessary to a 30/360 basis. | ||||||||||
| (18) | The Class X-G Certificates are notional amount certificates. The Notional Amount of the Class X-G Certificates will be equal to the Certificate Balance of the Class G Certificates outstanding from time to time. The Class X-G Certificates will not be entitled to distributions of principal. | ||||||||||
| (19) | The pass-through rate for the Class X-G Certificates for any distribution date will be aper annum rate equal to the excess, if any, of (a) the weighted average of the net mortgage interest rates on the mortgage loans for the related distribution date, over (b) the pass-through rate on the Class G Certificates for the related distribution date. For purposes of the calculation of the weighted average of the net mortgage interest rates on the mortgage loans for each distribution date, the mortgage interest rates will be adjusted as necessary to a 30/360 basis. | ||||||||||
| (20) | The effective interest rate for the RR Interest will be a variable rateper annum (described in the table as “WAC”) equal to the weighted average of the net mortgage interest rates on the mortgage loans for the related distribution date. For purposes of calculation of the weighted average of the net mortgage interest rates on the mortgage loans for each distribution date, the mortgage interest rates will be adjusted as necessary to a 30/360 basis. | ||||||||||
THE INFORMATION IN THIS STRUCTURAL AND COLLATERAL TERM SHEET IS NOT COMPLETE AND MAY BE AMENDED PRIOR TO THE TIME OF SALE. THIS TERM SHEET IS NOT AN OFFER TO SELL THESE SECURITIES AND IT IS NOT A SOLICITATION OF AN OFFER TO BUY THESE SECURITIES IN ANY JURISDICTION WHERE THE OFFER OR SALE IS NOT PERMITTED.
4
| BANK 2018-BNK10 | Transaction Highlights |
II. Transaction Highlights
Mortgage Loan Sellers:
| Mortgage Loan Seller | Number of Mortgage Loans | Number of Mortgaged Properties | Aggregate Cut-off Date Balance | % of Initial Pool Balance | ||||||||||||
| Morgan Stanley Mortgage Capital Holdings LLC | 18 | 89 | $551,420,924 | 42.8 | % | |||||||||||
| Wells Fargo Bank, National Association | 22 | 23 | 390,979,745 | 30.4 | ||||||||||||
| Bank of America, National Association | 12 | 53 | 287,334,293 | 22.3 | ||||||||||||
| National Cooperative Bank, N.A. | 16 | 16 | 57,413,959 | 4.5 | ||||||||||||
| Total | 68 | 181 | $1,287,148,920 | 100.0 | % | |||||||||||
Loan Pool:
| Initial Pool Balance: | $1,287,148,920 |
| Number of Mortgage Loans: | 68 |
| Average Cut-off Date Balance per Mortgage Loan: | $18,928,661 |
| Number of Mortgaged Properties: | 181 |
| Average Cut-off Date Balance per Mortgaged Property(1): | $7,111,320 |
| Weighted Average Mortgage Interest Rate: | 4.369% |
| Ten Largest Mortgage Loans as % of Initial Pool Balance: | 51.1% |
| Weighted Average Original Term to Maturity or ARD (months): | 120 |
| Weighted Average Remaining Term to Maturity or ARD (months): | 118 |
| Weighted Average Original Amortization Term (months)(2): | 354 |
| Weighted Average Remaining Amortization Term (months)(2): | 353 |
| Weighted Average Seasoning (months): | 1 |
| (1) | Information regarding mortgage loans secured by multiple properties is based on an allocation according to relative appraised values or the allocated loan amounts or property-specific release prices set forth in the related loan documents or such other allocation as the related mortgage loan seller deemed appropriate. |
| (2) | Excludes any mortgage loan that does not amortize. |
Credit Statistics:
| Weighted Average U/W Net Cash Flow DSCR(1): | 2.35x |
| Weighted Average U/W Net Operating Income Debt Yield(1): | 12.2% |
| Weighted Average Cut-off Date Loan-to-Value Ratio(1): | 59.8% |
| Weighted Average Balloon or ARD Loan-to-Value Ratio(1): | 55.2% |
| % of Mortgage Loans with Additional Subordinate Debt(2): | 27.2% |
| % of Mortgage Loans with Single Tenants(3): | 12.7% |
| (1) | With respect to any mortgage loan that is part of a whole loan, loan-to-value ratio, debt service coverage ratio and debt yield calculations include the relatedpari passucompanion loan(s) but exclude any related subordinate companion loan(s) (unless otherwise stated). For mortgaged properties securing residential cooperative mortgage loans, the debt service coverage ratio and debt yield for each such mortgaged property are calculated using U/W Net Operating Income or U/W Net Cash Flow, as applicable, for the related residential cooperative property which is the projected net operating income or net cash flow, as applicable, reflected in the most recent appraisal obtained by or otherwise in the possession of the related mortgage loan seller as of the cut-off date, and the loan-to-value ratio is calculated based upon the appraised value of the residential cooperative property determined as if such residential cooperative property is operated as a residential cooperative, inclusive of the amount of the underlying debt encumbering such residential cooperative property. The debt service coverage ratio, debt yield and loan-to-value ratio information do not take into account any subordinate debt (whether or not secured by the related mortgaged property), that currently exists or is allowed under the terms of any mortgage loan. See “Description of the Mortgage Pool—Mortgage Pool Characteristics” in the Preliminary Prospectus and Annex A-1 to the Preliminary Prospectus. |
| (2) | Thirteen (13) of the mortgage loans, each of which is secured by a residential cooperative property, currently have in place subordinate secured lines of credit to the related mortgage borrowers that permit future advances (such loans, collectively, the “Subordinate Coop LOCs”). The percentage figure expressed as “% of Mortgage Loans with Additional Subordinate Debt” is determined as a percentage of the initial pool balance and does not take into account any future subordinate debt (whether or not secured by the mortgaged property), if any, that may be permitted under the terms of any mortgage loan or the pooling and servicing agreement. See “Description of the Mortgage Pool—Additional Indebtedness—Other Unsecured Indebtedness” and “Description of the Mortgage Pool—Additional Debt Financing for Mortgage Loans Secured by Residential Cooperatives” in the Preliminary Prospectus. |
| (3) | Excludes mortgage loans that are secured by multiple single tenant properties. |
THE INFORMATION IN THIS STRUCTURAL AND COLLATERAL TERM SHEET IS NOT COMPLETE AND MAY BE AMENDED PRIOR TO THE TIME OF SALE. THIS TERM SHEET IS NOT AN OFFER TO SELL THESE SECURITIES AND IT IS NOT A SOLICITATION OF AN OFFER TO BUY THESE SECURITIES IN ANY JURISDICTION WHERE THE OFFER OR SALE IS NOT PERMITTED.
5
| BANK 2018-BNK10 | Transaction Highlights |
Loan Structural Features:
Amortization:Based on the Initial Pool Balance, 46.4% of the mortgage pool (44 mortgage loans) has scheduled amortization, as follows:
25.5% (32 mortgage loans) requires amortization during the entire loan term; and
21.0% (12 mortgage loans) provides for an interest-only period followed by an amortization period.
Interest-Only:Based on the Initial Pool Balance, 53.6% of the mortgage pool (24 mortgage loans) provides for interest-only payments during the entire loan term. The weighted average Cut-off Date Loan-to-Value Ratio and weighted average U/W Net Cash Flow DSCR for those mortgage loans are 58.2% and 2.47x, respectively.
Hard Lockboxes: Based on the Initial Pool Balance, 36.5% of the mortgage pool (14 mortgage loans) has hard lockboxes in place.
Reserves:The mortgage loans require amounts to be escrowed monthly as follows (excluding any mortgage loans with springing provisions):
| Real Estate Taxes: | 80.8% of the pool |
| Insurance: | 25.1% of the pool |
| Capital Replacements: | 61.5% of the pool |
| TI/LC: | 52.1% of the pool(1) |
| (1) | The percentage of Initial Pool Balance for mortgage loans with TI/LC reserves is based on the aggregate principal balance allocable to loans that include office, retail and industrial properties. |
Call Protection/Defeasance: Based on the Initial Pool Balance, the mortgage pool has the following call protection and defeasance features:
89.2% of the mortgage pool (47 mortgage loans) features a lockout period, then defeasance only until an open period;
6.2% of the mortgage pool (four mortgage loans) features a lockout period, then the greater of a prepayment premium or yield maintenance or defeasance until an open period;
4.5% of the mortgage pool (16 mortgage loans) features no lockout period, but requires the greater of a prepayment premium or yield maintenance, then a prepayment premium until an open period; and
0.1% of the mortgage pool (one mortgage loan) features a lockout period, then the greater of a prepayment premium or yield maintenance until an open period.
Prepayment restrictions for each mortgage loan reflect the entire life of the mortgage loan. Please refer to Annex A-1 to the Preliminary Prospectus and the footnotes related thereto for further information regarding individual loan call protection.
THE INFORMATION IN THIS STRUCTURAL AND COLLATERAL TERM SHEET IS NOT COMPLETE AND MAY BE AMENDED PRIOR TO THE TIME OF SALE. THIS TERM SHEET IS NOT AN OFFER TO SELL THESE SECURITIES AND IT IS NOT A SOLICITATION OF AN OFFER TO BUY THESE SECURITIES IN ANY JURISDICTION WHERE THE OFFER OR SALE IS NOT PERMITTED.
6
| BANK 2018-BNK10 | Issue Characteristics |
| III. | Issue Characteristics |
| Securities Offered: | $1,071,471,000 approximate monthly pay, multi-class, commercial mortgage REMIC pass-through certificates consisting of eleven classes (Classes A-1, A-2, A-3, A-SB, A-4, A-5, A-S, B, C, X-A and X-B), which are offered pursuant to a registration statement filed with the SEC (such classes of certificates, the “Offered Certificates”). | |
| Mortgage Loan Sellers: | Morgan Stanley Mortgage Capital Holdings LLC (“MSMCH”), Wells Fargo Bank, National Association (“WFB”), Bank of America, National Association (“BANA”) and National Cooperative Bank, N.A. (“NCB”) | |
| Joint Bookrunners and Co-Lead Managers: | Wells Fargo Securities, LLC, Merrill Lynch, Pierce, Fenner & Smith Incorporated and Morgan Stanley & Co. LLC | |
| Co-Manager: | Academy Securities, Inc. | |
| Rating Agencies: | DBRS, Inc., Fitch Ratings, Inc. and Moody’s Investors Service, Inc. | |
| Master Servicers: | Wells Fargo Bank, National Association and National Cooperative Bank, N.A. | |
| Special Servicers: | Torchlight Loan Services, LLC and National Cooperative Bank, N.A. | |
| Certificate Administrator: | Wells Fargo Bank, National Association | |
| Trustee: | Wilmington Trust, National Association | |
| Operating Advisor: | Pentalpha Surveillance LLC | |
| Asset Representations Reviewer: | Pentalpha Surveillance LLC | |
| U.S. Credit Risk Retention: | For a discussion of the manner in which the U.S. credit risk retention requirements are being addressed by Wells Fargo Bank, National Association, as the retaining sponsor, see “Credit Risk Retention” in the Preliminary Prospectus. | |
| EU Risk Retention: | None of the sponsors, the depositor or the issuing entity intends to retain a material net economic interest in the securitization constituted by the issue of the Offered Certificates in accordance with the EU risk retention and due diligence requirements or to take any other action which may be required by EEA-regulated investors for the purposes of their compliance with the EU risk retention and due diligence requirements or similar requirements. | |
| Risk Retention Consultation Party: | Wells Fargo Bank, National Association | |
| Initial Majority Controlling Class Certificateholder: | Torchlight Investors, LLC or another affiliate of Torchlight Loan Services, LLC. | |
| Cut-off Date: | The Cut-off Date with respect to each mortgage loan is the due date for the monthly debt service payment that is due in February 2018 (or, in the case of any mortgage loan that has its first due date in March 2018, the date that would have been its due date in February 2018 under the terms of that mortgage loan if a monthly debt service payment were scheduled to be due in that month). | |
| Expected Closing Date: | On or about February 13, 2018. | |
| Determination Dates: | The 11th day of each month (or if that day is not a business day, the next succeeding business day), commencing in March 2018. | |
| Distribution Dates: | The fourth business day following the Determination Date in each month, commencing in March 2018. | |
| Rated Final Distribution Date: | The Distribution Date in February 2061. | |
| Interest Accrual Period: | With respect to any Distribution Date, the calendar month immediately preceding the month in which such Distribution Date occurs. | |
| Day Count: | The Offered Certificates will accrue interest on a 30/360 basis. | |
| Minimum Denominations: | $10,000 for each Class of Offered Certificates (other than the Class X-A and X-B Certificates) and $1,000,000 for the Class X-A and X-B Certificates. Investments may also be made in any whole dollar denomination in excess of the applicable minimum denomination. |
THE INFORMATION IN THIS STRUCTURAL AND COLLATERAL TERM SHEET IS NOT COMPLETE AND MAY BE AMENDED PRIOR TO THE TIME OF SALE. THIS TERM SHEET IS NOT AN OFFER TO SELL THESE SECURITIES AND IT IS NOT A SOLICITATION OF AN OFFER TO BUY THESE SECURITIES IN ANY JURISDICTION WHERE THE OFFER OR SALE IS NOT PERMITTED.
7
| BANK 2018-BNK10 | Issue Characteristics |
| Clean-up Call: | 1.0% | |
| Delivery: | DTC, Euroclear and Clearstream Banking | |
| ERISA/SMMEA Status: | Each Class of Offered Certificates is expected to be eligible for exemptive relief under ERISA. No Class of Offered Certificates will be SMMEA eligible. | |
| Risk Factors: | THE CERTIFICATES INVOLVE CERTAIN RISKS AND MAY NOT BE SUITABLE FOR ALL INVESTORS. SEE THE “RISK FACTORS” SECTION OF THE PRELIMINARY PROSPECTUS. | |
| Bond Analytics Information: | The Certificate Administrator will be authorized to make distribution date statements, CREFC® reports and certain supplemental reports (other than confidential information) available to certain financial modeling and data provision services, including Bloomberg, L.P., Trepp, LLC, Intex Solutions, Inc., Markit Group Limited, Interactive Data Corp., BlackRock Financial Management, Inc., CMBS.com, Inc., Moody’s Analytics and Thomson Reuters Corporation. |
THE INFORMATION IN THIS STRUCTURAL AND COLLATERAL TERM SHEET IS NOT COMPLETE AND MAY BE AMENDED PRIOR TO THE TIME OF SALE. THIS TERM SHEET IS NOT AN OFFER TO SELL THESE SECURITIES AND IT IS NOT A SOLICITATION OF AN OFFER TO BUY THESE SECURITIES IN ANY JURISDICTION WHERE THE OFFER OR SALE IS NOT PERMITTED.
8
| BANK 2018-BNK10 | Characteristics of the Mortgage Pool |
| IV. | Characteristics of the Mortgage Pool(1) |
| A. | Ten Largest Mortgage Loans |
| Mortgage Loan Seller | Mortgage Loan Name | City | State | Number of Mortgage Loans / Mortgaged Properties | Mortgage Loan Cut-off Date Balance ($) | % of Initial Pool Balance (%) | Property Type | Number of SF/ Rooms / Units | Cut-off Date Balance Per SF/ Room / Unit | Cut-off Date LTV Ratio (%)(2) | Balloon or ARD LTV Ratio (%)(2) | U/W NCF DSCR (x) | U/W NOI Debt Yield (%) |
| WFB | Apple Campus 3 | Sunnyvale | CA | 1 / 1 | $94,000,000 | 7.3% | Office | 882,657 | $385 | 44.0% | 44.0% | 3.55x | 12.2% |
| MSMCH | LARP I Portfolio | Various | Various | 1 / 18 | 90,000,000 | 7.0 | Multifamily | 979 | 91,931 | 64.0 | 64.0 | 1.62 | 8.5 |
| BANA | Iron Guard Storage Portfolio | Various | Various | 1 / 22 | 86,000,000 | 6.7 | Self Storage | 1,352,239 | 64 | 62.6 | 62.6 | 1.88 | 8.9 |
| MSMCH | Wisconsin Hotel Portfolio | Various | WI | 1 / 11 | 74,600,000 | 5.8 | Hospitality | 1,255 | 59,442 | 63.2 | 47.8 | 1.51 | 12.9 |
| MSMCH | Brookwood Chase Portfolio | Various | Various | 1 / 9 | 65,000,000 | 5.0 | Self Storage | 916,733 | 71 | 58.9 | 58.9 | 2.37 | 9.9 |
| MSMCH | Extra Space Self Storage Portfolio | Various | Various | 1 / 36 | 60,000,000 | 4.7 | Self Storage | 2,668,218 | 73 | 65.0 | 65.0 | 2.01 | 8.7 |
| MSMCH | Baybrook Lifestyle and Power Center | Friendswood | TX | 1 / 1 | 60,000,000 | 4.7 | Retail | 636,845 | 220 | 58.1 | 58.1 | 2.80 | 11.3 |
| WFB | 2020 Southwest 4th Avenue | Portland | OR | 1 / 1 | 44,250,000 | 3.4 | Office | 226,815 | 195 | 67.9 | 67.9 | 2.33 | 9.6 |
| BANA | Roedel Hotel Portfolio | Various | Various | 1 / 3 | 42,909,955 | 3.3 | Hospitality | 349 | 122,951 | 73.0 | 60.3 | 1.72 | 12.6 |
| MSMCH | Moffett Towers II - Building 2 | Sunnyvale | CA | 1 / 1 | 41,250,000 | 3.2 | Office | 362,563 | 455 | 47.0 | 42.4 | 2.08 | 11.9 |
| Top Three Total/Weighted Average | 3 / 41 | $270,000,000 | 21.0% | 56.6% | 56.6% | 2.37x | 9.9% | ||||||
| Top Five Total/Weighted Average | 5 / 61 | $409,600,000 | 31.8% | 58.2% | 55.4% | 2.22x | 10.5% | ||||||
| Top Ten Total/Weighted Average | 10 / 103 | $658,009,955 | 51.1% | 59.7% | 56.8% | 2.22x | 10.5% | ||||||
| Non-Top Ten Total/Weighted Average | 58 / 78 | $629,138,965 | 48.9% | 59.9% | 53.5% | 2.48x | 14.0% | ||||||
| (1) | With respect to any mortgage loan that is part of a whole loan, Cut-off Date Balance Per SF/Room/Unit, loan-to-value ratio, debt service coverage ratio and debt yield calculations include the relatedpari passu companion loan(s) but exclude any related subordinate companion loan(s) (unless otherwise stated). With respect to each mortgage loan, debt service coverage ratio, debt yield and loan-to-value ratio information do not take into account subordinate debt (whether or not secured by the related mortgaged property), if any, that currently exists or is allowed under the terms of such mortgage loan. |
| (2) | With respect to the Baybrook Lifestyle and Power Center mortgage loan, the Appraised Value represents the “As-Completed” Value which assumes the under construction improvements of the Life Time Fitness expansion are completed with Life Time Fitness taking occupancy. The appraiser’s “as-is” concluded value, excluding the Life Time Fitness parcel and lease, of $203,860,000 would result in a Cut-off Date LTV Ratio and LTV Ratio at and Maturity Date or ARD of approximately 58.9%, after accounting for the estimated pay-down based on certain assumptions of the Baybrook Lifestyle and Power Center Whole Loan, and payment of the prepayment consideration provided for in the loan documents, resulting from the $22,000,000 Life Time Fitness Reserve. The actual amount of the pay-down and the prepayment consideration may be different from the assumed amounts. |
THE INFORMATION IN THIS STRUCTURAL AND COLLATERAL TERM SHEET IS NOT COMPLETE AND MAY BE AMENDED PRIOR TO THE TIME OF SALE. THIS TERM SHEET IS NOT AN OFFER TO SELL THESE SECURITIES AND IT IS NOT A SOLICITATION OF AN OFFER TO BUY THESE SECURITIES IN ANY JURISDICTION WHERE THE OFFER OR SALE IS NOT PERMITTED.
9
| BANK 2018-BNK10 | Characteristics of the Mortgage Pool |
| B. | Summary of the Whole Loans |
| Property Name | Mortgage Loan Seller in BANK 2018-BNK10 | Note(s)(1) | Original Balance | Holder of Note | Lead Servicer for Whole Loan | Master Servicer Under Lead Securitization Servicing Agreement | Special Servicer Under Lead Securitization Servicing Agreement |
| Apple Campus 3 | WFB | A-1 | $80,000,000 | WFB | No | Wells Fargo Bank, National Association | Torchlight Loan Services, LLC |
| A-2 | $30,000,000 | WFB | No | ||||
| A-3 | $94,000,000 | BANK 2018-BNK10 | Yes | ||||
| A-4 | $68,000,000 | Deutsche Bank AG, New York Branch | No | ||||
| A-5 | $68,000,000 | Goldman Sachs Mortgage Company | No | ||||
| Extra Space Self Storage Portfolio | MSMCH | A-1 | $92,000,000 | MSC 2017-HR2 | Yes | Wells Fargo Bank, National Association | LNR Partners, LLC |
| A-2 | $60,000,000 | BANK 2018-BNK10 | No | ||||
| A-3 | $42,400,000 | MSBNA | No | ||||
| Baybrook Lifestyle and Power Center | MSMCH | A-1 | $50,000,000 | MSC 2017-HR2 | Yes | Wells Fargo Bank, National Association | LNR Partners, LLC |
| A-2 | $40,000,000 | BANK 2018-BNK10 | No | ||||
| A-3 | $30,000,000 | MSC 2017-HR2 | No | ||||
| A-4 | $20,000,000 | BANK 2018-BNK10 | No | ||||
| Moffett Towers II - Building 2 | MSMCH | A-1 | $43,000,000 | Barclays Bank PLC(2) | Yes(2) | Wells Fargo Bank, National Association | LNR Partners, LLC |
| A-2 | $40,750,000 | Barclays Bank PLC | No | ||||
| A-3 | $40,000,000 | WFCM 2017-C42 | No | ||||
| A-4 | $41,250,000 | BANK 2018-BNK10 | No | ||||
| One Newark Center | MSMCH | A-1 | $32,000,000 | MSBNA | No | Wells Fargo Bank, National Association | Torchlight Loan Services, LLC |
| A-2 | $20,000,000 | BANK 2018-BNK10 | Yes | ||||
| A-3 | $14,580,000 | BANK 2018-BNK10 | No | ||||
| Courtyard Los Angeles Sherman Oaks | WFB | A-1 | $28,000,000 | BANK 2018-BNK10 | Yes | Wells Fargo Bank, National Association | Torchlight Loan Services, LLC |
| A-2 | $27,000,000 | WFCM 2017-C42 | No | ||||
| Warwick Mall | BANA | A-1 | $30,000,000 | BANK 2017-BNK9 | Yes | Wells Fargo Bank, National Association | Rialto Capital Advisors, LLC |
| A-2 | $27,500,000 | BANK 2018-BNK10 | No | ||||
| A-3 | $17,500,000 | BANA | No | ||||
| Kirkwood Plaza | MSMCH | A-1 | $23,790,000 | BANK 2018-BNK10 | Yes | Wells Fargo Bank, National Association | Torchlight Loan Services, LLC |
| A-2 | $15,000,000 | MSC 2017-HR2 | No |
| (1) | No assurance can be provided that any unsecuritized note will not be split further. |
| (2) | The related whole loan is serviced under the WFCM 2017-C42 pooling and servicing agreement until the securitization of the related control note, after which the related whole loan will be serviced under the pooling and servicing agreement governing such securitization of the related control note. The master servicer and special servicer for such securitization will be identified in a notice, report or statement to holders of the BANK 2018-BNK10 certificates after the closing of such securitization |
THE INFORMATION IN THIS STRUCTURAL AND COLLATERAL TERM SHEET IS NOT COMPLETE AND MAY BE AMENDED PRIOR TO THE TIME OF SALE. THIS TERM SHEET IS NOT AN OFFER TO SELL THESE SECURITIES AND IT IS NOT A SOLICITATION OF AN OFFER TO BUY THESE SECURITIES IN ANY JURISDICTION WHERE THE OFFER OR SALE IS NOT PERMITTED.
10
| BANK 2018-BNK10 | Characteristics of the Mortgage Pool |
| C. | Mortgage Loans with Additional Secured and Mezzanine Financing(1) |
| Loan No. | Mortgage Loan Seller | Mortgage Loan Name | Mortgage Loan Cut-off Date Balance ($) | % of Initial Pool Balance (%) | Subordinate Debt Cut-off Date Balance ($) | Mezzanine Debt Cut-off Date Balance ($) | Total Debt Interest Rate (%)(2) | Mortgage Loan U/W NCF DSCR (x)(3) | Total Debt U/W NCF DSCR (x) | Mortgage Loan Cut-off Date U/W NOI Debt Yield (%)(3) | Total Debt Cut-off Date U/W NOI Debt Yield (%) | Mortgage Loan Cut-off Date LTV Ratio (%)(3) | Total Debt Cut-off Date LTV Ratio (%) |
| 1 | WFB | Apple Campus 3 | $94,000,000 | 7.3% | NAP | $235,000,000 | 4.160% | 3.55x | 1.70x | 12.2% | 7.2% | 44.0% | 74.3% |
| 2 | MSMCH | LARP I Portfolio | 90,000,000 | 7.0 | NAP | 18,000,000 | 5.420 | 1.62 | 1.24 | 8.5 | 7.1 | 64.0 | 76.9 |
| 3 | BANA | Iron Guard Storage Portfolio | 86,000,000 | 6.7 | NAP | 12,150,000 | 5.301 | 1.88 | 1.42 | 8.9 | 7.8 | 62.6(4) | 71.1(4) |
| 10 | MSMCH | Moffett Towers II - Building 2 | 41,250,000 | 3.2 | NAP | 105,000,000 | 4.506 | 2.08 | 1.23 | 11.9 | 7.3 | 47.0 | 76.9 |
| Total/Weighted Average | $311,250,000 | 24.2% | $370,150,000 | 4.890% | 2.34x | 1.43x | 10.2% | 7.4% | 55.3% | 74.5% | |||
| (1) | In addition, thirteen (13) of the mortgage loans, each of which is secured by a residential cooperative property, currently have in place Subordinate Coop LOCs, that permit future advances. See “Description of the Mortgage Pool—Additional Indebtedness—Other Unsecured Indebtedness” and “Description of the Mortgage Pool—Additional Debt Financing for Mortgage Loans Secured by Residential Cooperatives” in the Preliminary Prospectus. |
| (2) | Total Debt Interest Rate for any specified mortgage loan reflects the weighted average of the interest rates on the respective components of the total debt. |
| (3) | With respect to any loan that is part of a whole loan, the loan-to-value ratio, debt service coverage ratio and debt yield calculations include the relatedpari passu companion loan(s). |
| (4) | Calculated based on an “as portfolio” appraised value, which includes a $15,650,000 portfolio premium over the aggregate “as is” appraised values of the mortgaged properties. The Mortgage Loan Cut-off Date LTV Ratio and Total Debt Cut-off Date LTV Ratio excluding such portfolio premium are 70.6% and 80.6%, respectively. |
THE INFORMATION IN THIS STRUCTURAL AND COLLATERAL TERM SHEET IS NOT COMPLETE AND MAY BE AMENDED PRIOR TO THE TIME OF SALE. THIS TERM SHEET IS NOT AN OFFER TO SELL THESE SECURITIES AND IT IS NOT A SOLICITATION OF AN OFFER TO BUY THESE SECURITIES IN ANY JURISDICTION WHERE THE OFFER OR SALE IS NOT PERMITTED.
11
| BANK 2018-BNK10 | Characteristics of the Mortgage Pool |
| D. | Previous Securitization History(1) |
| Loan No. | Mortgage Loan Seller | Mortgage Loan or Mortgaged Property Name | City | State | Property Type | Mortgage Loan or Mortgaged Property Cut-off Date Balance ($) | % of Initial Pool Balance (%) | Previous Securitization |
| 2.01 | MSMCH | Blackwood | Chicago | IL | Multifamily | $17,000,000 | 1.3% | FREMF 2014-K714 |
| 2.02 | MSMCH | 5500 Cornell | Chicago | IL | Multifamily | 12,333,333 | 1.0 | GSMS 2011-GC5 |
| 2.03 | MSMCH | Clyde Manor | Kansas City | MO | Multifamily | 8,333,333 | 0.6 | GSMS 2011-GC3 |
| 2.04 | MSMCH | Woodlawn Terrace | Chicago | IL | Multifamily | 6,875,000 | 0.5 | FNA 2014-M1 |
| 2.06 | MSMCH | Maple Court | Chicago | IL | Multifamily | 5,416,667 | 0.4 | FNA 2011-M5 |
| 2.07 | MSMCH | Ellis Street | Chicago | IL | Multifamily | 5,416,667 | 0.4 | GSMS 2012-GC6 |
| 2.08 | MSMCH | Drexel Grand | Chicago | IL | Multifamily | 5,041,667 | 0.4 | FNA 2013-M12 |
| 2.10 | MSMCH | Kenwood Court | Chicago | IL | Multifamily | 4,541,667 | 0.4 | CMLT 2008-LS1 |
| 3.01 | BANA | Camas | Camas | WA | Self Storage | 8,255,000 | 0.6 | CGCMT 2014-GC25 |
| 3.02 | BANA | Webster | Webster | TX | Self Storage | 6,890,000 | 0.5 | CGCMT 2014-GC25 |
| 3.03 | BANA | Gum Branch | Jacksonville | NC | Self Storage | 5,447,000 | 0.4 | CGCMT 2014-GC25 |
| 3.04 | BANA | 6th Avenue | Birmingham | AL | Self Storage | 4,548,000 | 0.4 | JPMBB 2015-C28 |
| 3.05 | BANA | Katy | Katy | TX | Self Storage | 4,463,000 | 0.3 | CGCMT 2014-GC25 |
| 3.06 | BANA | La Porte | La Porte | TX | Self Storage | 4,435,000 | 0.3 | JPMBB 2015-C28 |
| 3.08 | BANA | Prater Way | Sparks | NV | Self Storage | 4,060,000 | 0.3 | CGCMT 2014-GC25 |
| 3.09 | BANA | Shurling | Macon | GA | Self Storage | 4,032,000 | 0.3 | CGCMT 2014-GC25 |
| 3.10 | BANA | Adamsville | Birmingham | AL | Self Storage | 3,975,000 | 0.3 | JPMBB 2015-C28 |
| 3.11 | BANA | Troy | Montgomery | AL | Self Storage | 3,961,000 | 0.3 | CGCMT 2015-GC35 |
| 3.12 | BANA | Conroe | Conroe | TX | Self Storage | 3,947,000 | 0.3 | CGCMT 2015-GC35 |
| 3.13 | BANA | Del Valle | Del Valle | TX | Self Storage | 3,763,000 | 0.3 | CGCMT 2015-GC35 |
| 3.14 | BANA | Tomball | Tomball | TX | Self Storage | 3,636,000 | 0.3 | CGCMT 2015-GC35 |
| 3.15 | BANA | Canyon Lake | Canyon Lake | TX | Self Storage | 3,325,000 | 0.3 | CGCMT 2015-GC35 |
| 3.16 | BANA | Riverside | Danville | VA | Self Storage | 3,049,000 | 0.2 | CGCMT 2014-GC25 |
| 3.17 | BANA | Bertram | Augusta | GA | Self Storage | 2,653,000 | 0.2 | CGCMT 2014-GC25 |
| 3.18 | BANA | Center | Jacksonville | NC | Self Storage | 2,617,000 | 0.2 | CGCMT 2014-GC25 |
| 3.19 | BANA | Key | Macon | GA | Self Storage | 2,476,000 | 0.2 | CGCMT 2014-GC25 |
| 3.20 | BANA | Wylds | Augusta | GA | Self Storage | 2,440,000 | 0.2 | CGCMT 2014-GC25 |
| 3.21 | BANA | Marine | Jacksonville | NC | Self Storage | 2,108,000 | 0.2 | CGCMT 2014-GC25 |
| 3.22 | BANA | Donna | Donna | TX | Self Storage | 1,676,000 | 0.1 | CGCMT 2015-GC35 |
| 4.01 | MSMCH | Holiday Inn – Madison West | Madison | WI | Hospitality | 13,550,000 | 1.1 | JPMCC 2008-C2 |
THE INFORMATION IN THIS STRUCTURAL AND COLLATERAL TERM SHEET IS NOT COMPLETE AND MAY BE AMENDED PRIOR TO THE TIME OF SALE. THIS TERM SHEET IS NOT AN OFFER TO SELL THESE SECURITIES AND IT IS NOT A SOLICITATION OF AN OFFER TO BUY THESE SECURITIES IN ANY JURISDICTION WHERE THE OFFER OR SALE IS NOT PERMITTED.
12
| BANK 2018-BNK10 | Characteristics of the Mortgage Pool |
| Loan No. | Mortgage Loan Seller | Mortgage Loan or Mortgaged Property Name | City | State | Property Type | Mortgage Loan or Mortgaged Property Cut-off Date Balance ($) | % of Initial Pool Balance (%) | Previous Securitization |
| 4.03 | MSMCH | Holiday Inn – Fond Du Lac | Fond Du Lac | WI | Hospitality | 8,350,000 | 0.6 | JPMCC 2008-C2 |
| 4.05 | MSMCH | Baymont Inn – Madison | Madison | WI | Hospitality | 6,020,000 | 0.5 | JPMCC 2008-C2 |
| 4.06 | MSMCH | Comfort Inn & Suites – Appleton Airport | Grand Chute | WI | Hospitality | 5,900,000 | 0.5 | JPMCC 2008-C2 |
| 4.07 | MSMCH | Holiday Inn Express – Oshkosh | Oshkosh | WI | Hospitality | 5,876,000 | 0.5 | JPMCC 2008-C2 |
| 4.08 | MSMCH | Comfort Inn & Suites – Milwaukee Airport | Oak Creek | WI | Hospitality | 5,820,000 | 0.5 | JPMCC 2008-C2 |
| 4.09 | MSMCH | Comfort Inn & Suites –Madison West | Madison | WI | Hospitality | 5,067,000 | 0.4 | JPMCC 2008-C2 |
| 4.10 | MSMCH | Holiday Inn Express –Milwaukee Airport | Milwaukee | WI | Hospitality | 4,710,000 | 0.4 | JPMCC 2008-C2 |
| 4.11 | MSMCH | Comfort Inn & Suites – Fond Du Lac | Fond Du Lac | WI | Hospitality | 2,646,000 | 0.2 | JPMCC 2008-C2 |
| 9.01 | BANA | Hilton Garden Inn – Manchester | Manchester | NH | Hospitality | 20,725,216 | 1.6 | UBSBB 2012-C3 |
| 9.02 | BANA | Hilton Garden Inn – Fishkill | Fishkill | NY | Hospitality | 12,041,059 | 0.9 | UBSBB 2012-C3 |
| 9.03 | BANA | Holiday Inn Express – Auburn | Auburn | MA | Hospitality | 10,143,680 | 0.8 | UBSBB 2012-C3 |
| 11 | WFB | One Kennedy Square | Detroit | MI | Office | 36,400,000 | 2.8 | JPMCC 2012-C8 |
| 12 | MSMCH | One Newark Center | Newark | NJ | Office | 34,580,000 | 2.7 | BSCMS 2006-PWR14 |
| 14 | WFB | Courtyard Los Angeles Sherman Oaks | Sherman Oaks | CA | Hospitality | 28,000,000 | 2.2 | BACM 2007-5 |
| 16 | BANA | 11311 McCormick Road | Hunt Valley | MD | Office | 24,375,000 | 1.9 | JPMCC 2012-LC9 |
| 20 | MSMCH | Woodbridge Commons | Woodbridge | NJ | Retail | 22,100,000 | 1.7 | VNO 2010-VNO |
| 37.01 | BANA | Valkill | Hyde Park | NY | Manufactured Housing Community | 4,965,517 | 0.4 | LBUBS 2002-C2 |
| 37.02 | BANA | Moorgate | East Fishkill | NY | Manufactured Housing Community | 2,408,276 | 0.2 | LBUBS 2002-C2 |
| 52 | WFB | Esplanade Mini Storage | Oxnard | CA | Self Storage | 4,000,000 | 0.3 | BACM 2008-1 |
| 57 | WFB | 6340 Middlebelt Road | Romulus | MI | Industrial | 3,215,000 | 0.2 | GCCFC 2005 - GG5 |
| Total | $407,607,082 | 31.7% |
| (1) | The table above represents the most recent securitization with respect to the mortgaged property securing the related mortgage loan, based on information provided by the related borrower or obtained through searches of a third-party database. While loans secured by the above mortgaged properties may have been securitized multiple times in prior transactions, mortgage loans in this securitization are only listed in the above chart if the mortgage loan paid off a loan in another securitization. The information has not otherwise been confirmed by the mortgage loan sellers. |
THE INFORMATION IN THIS STRUCTURAL AND COLLATERAL TERM SHEET IS NOT COMPLETE AND MAY BE AMENDED PRIOR TO THE TIME OF SALE. THIS TERM SHEET IS NOT AN OFFER TO SELL THESE SECURITIES AND IT IS NOT A SOLICITATION OF AN OFFER TO BUY THESE SECURITIES IN ANY JURISDICTION WHERE THE OFFER OR SALE IS NOT PERMITTED.
13
| BANK 2018-BNK10 | Characteristics of the Mortgage Pool |
| E. | Mortgage Loans with Scheduled Balloon Payments and Related Classes |
| Class A-2(1) | ||||||||||||||||
| Loan No. | Mortgage Loan Seller | Mortgage Loan Name | State | Property Type | Mortgage Loan Cut-off Date Balance ($) | % of Initial Pool Balance (%) | Mortgage Loan Balance at Maturity ($) | % of Class A-2 Certificate Principal Balance (%)(2) | SF | Loan Per | U/W NCF DSCR (x) | U/W NOI Debt Yield (%) | Cut-off Date LTV Ratio (%) | Balloon LTV Ratio (%) | Rem. IO Period (mos.) | Rem. Term to Maturity (mos.) |
| 57 | WFB | 6340 Middlebelt Road | MI | Industrial | $3,215,000 | 0.2% | $3,215,000 | 84.1% | 77,508 | $41 | 1.75x | 9.6% | 64.9% | 64.9% | 59 | 59 |
| Total/Weighted Average | $3,215,000 | 0.2% | $3,215,000 | 84.1% | 1.75x | 9.6% | 64.9% | 64.9% | 59 | 59 | ||||||
| (1) | The table above presents the mortgage loan whose balloon payments would be applied to pay down the principal balance of the Class A-2 Certificates, assuming a 0% CPR and applying the “Structuring Assumptions” described in the Preliminary Prospectus, including the assumptions that (i) none of the mortgage loans in the pool experience prepayments prior to maturity (or, in the case of an ARD loan, its anticipated repayment date), defaults or losses; (ii) there are no extensions of maturity dates of any mortgage loans in the pool; and (iii) each mortgage loan in the pool is paid in full on its stated maturity date (or, in the case of an ARD loan, its anticipated repayment date). Each Class of Certificates evidences undivided ownership interests in the entire pool of mortgage loans. Debt service coverage ratio, debt yield and loan-to-value ratio information do not take into account subordinate debt (whether or not secured by the related mortgaged property), if any, that currently exists or is allowed under the terms of any mortgage loan. See Annex A-1 to the Preliminary Prospectus. |
| (2) | Reflects the percentage equal to the Balloon Balance divided by the initial Class A-2 Certificate Balance. |
| Class A-3(1) | ||||||||||||||||
| Loan No. | Mortgage Loan Seller | Mortgage Loan Name | State | Property Type | Mortgage Loan Cut-off Date Balance ($) | % of Initial Pool Balance (%) | Mortgage Loan Balance at Maturity ($) | % of Class A-3 Certificate Principal Balance (%)(2) | SF | Loan Per | U/W NCF DSCR (x) | U/W NOI Debt Yield (%) | Cut-off Date LTV Ratio (%) | Balloon LTV Ratio (%) | Rem. IO Period (mos.) | Rem. Term to Maturity (mos.) |
| 48 | WFB | American Mini Storage Colorado Springs | CO | Self Storage | $5,200,000 | 0.4% | $4,865,865 | 105.3% | 77,720 | $67 | 1.68x | 10.6% | 56.2% | 52.6% | 35 | 83 |
| Total/Weighted Average | $5,200,000 | 0.4% | $4,865,865 | 105.3% | 1.68x | 10.6% | 56.2% | 52.6% | 35 | 83 | ||||||
| (1) | The table above presents the mortgage loan(s) whose balloon payments would be applied to pay down the principal balance of the Class A-3 Certificates, assuming a 0% CPR and applying the “Structuring Assumptions” described in the Preliminary Prospectus, including the assumptions that (i) none of the mortgage loans in the pool experience prepayments prior to maturity (or, in the case of an ARD loan, its anticipated repayment date), defaults or losses; (ii) there are no extensions of maturity dates of any mortgage loans in the pool; and (iii) each mortgage loan in the pool is paid in full on its stated maturity date (or, in the case of an ARD loan, its anticipated repayment date). Each Class of Certificates evidences undivided ownership interests in the entire pool of mortgage loans. Debt service coverage ratio, debt yield and loan-to-value ratio information do not take into account subordinate debt (whether or not secured by the related mortgaged property), if any, that currently exists or is allowed under the terms of any mortgage loan. See Annex A-1 to the Preliminary Prospectus. |
| (2) | Reflects the percentage equal to the Balloon Balance divided by the initial Class A-3 Certificate Balance. |
THE INFORMATION IN THIS STRUCTURAL AND COLLATERAL TERM SHEET IS NOT COMPLETE AND MAY BE AMENDED PRIOR TO THE TIME OF SALE. THIS TERM SHEET IS NOT AN OFFER TO SELL THESE SECURITIES AND IT IS NOT A SOLICITATION OF AN OFFER TO BUY THESE SECURITIES IN ANY JURISDICTION WHERE THE OFFER OR SALE IS NOT PERMITTED.
14
| BANK 2018-BNK10 | Characteristics of the Mortgage Pool |
| F. | Property Type Distribution(1) |
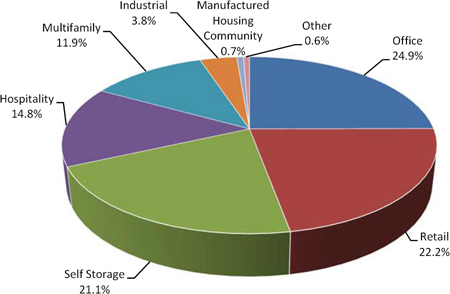
| Property Type | Number of Mortgaged Properties | Aggregate Cut-off Date Balance ($) | % of Initial Pool Balance (%) | Weighted Average Cut-off Date LTV Ratio (%) | Weighted Average Balloon or ARD LTV Ratio (%) | Weighted Average U/W NCF DSCR (x) | Weighted Average U/W NOI Debt Yield (%) | Weighted Average U/W NCF Debt Yield (%) | Weighted Average Mortgage Rate (%) | ||
| Office | 11 | $321,062,771 | 24.9% | 58.5% | 54.0% | 2.36x | 11.3% | 10.6% | 3.967% | ||
| Suburban | 7 | 203,688,787 | 15.8 | 52.4 | 48.4 | 2.64 | 11.7 | 11.2 | 3.806 | ||
| CBD | 3 | 115,230,000 | 9.0 | 69.2 | 63.8 | 1.88 | 10.6 | 9.5 | 4.250 | ||
| Medical | 1 | 2,143,984 | 0.2 | 61.3 | 61.3 | 2.18 | 9.5 | 9.0 | 4.088 | ||
| Retail | 31 | 285,173,688 | 22.2 | 61.3 | 57.6 | 2.03 | 10.4 | 9.8 | 4.306 | ||
| Anchored | 7 | 109,193,808 | 8.5 | 65.1 | 59.0 | 1.74 | 9.9 | 9.2 | 4.515 | ||
| Lifestyle Center | 1 | 60,000,000 | 4.7 | 58.1 | 58.1 | 2.80 | 11.3 | 10.7 | 3.770 | ||
| Single Tenant | 17 | 50,497,310 | 3.9 | 62.7 | 62.7 | 2.02 | 9.1 | 8.6 | 4.245 | ||
| Shadow Anchored | 3 | 28,407,570 | 2.2 | 63.3 | 55.8 | 1.58 | 10.0 | 9.6 | 4.504 | ||
| Regional Mall | 1 | 27,500,000 | 2.1 | 47.5 | 43.4 | 2.01 | 13.3 | 12.2 | 4.445 | ||
| Unanchored | 2 | 9,575,000 | 0.7 | 64.3 | 58.4 | 1.84 | 10.5 | 9.8 | 4.607 | ||
| Self Storage | 75 | 272,027,964 | 21.1 | 61.2 | 61.1 | 2.08 | 9.3 | 9.2 | 4.333 | ||
| Self Storage | 75 | 272,027,964 | 21.1 | 61.2 | 61.1 | 2.08 | 9.3 | 9.2 | 4.333 | ||
| Hospitality | 19 | 190,548,450 | 14.8 | 66.1 | 52.8 | 1.71 | 13.0 | 11.4 | 5.028 | ||
| Limited Service | 13 | 90,871,901 | 7.1 | 64.8 | 50.1 | 1.65 | 13.2 | 11.5 | 5.188 | ||
| Full Service | 3 | 49,900,000 | 3.9 | 63.6 | 52.4 | 1.64 | 12.2 | 10.7 | 4.850 | ||
| Select Service | 3 | 49,776,549 | 3.9 | 70.7 | 58.1 | 1.88 | 13.4 | 12.0 | 4.914 | ||
| Multifamily | 35 | 152,646,403 | 11.9 | 47.6 | 45.9 | 4.54 | 22.7 | 22.2 | 4.539 | ||
| Garden | 14 | 60,503,278 | 4.7 | 64.6 | 63.0 | 1.61 | 8.7 | 8.4 | 4.965 | ||
| Cooperative | 16 | 57,413,959 | 4.5 | 19.8 | 16.9 | 9.40 | 46.1 | 45.3 | 3.808 | ||
| Mid Rise | 4 | 17,729,166 | 1.4 | 64.0 | 64.0 | 1.62 | 8.5 | 8.2 | 5.004 | ||
| High Rise | 1 | 17,000,000 | 1.3 | 64.0 | 64.0 | 1.62 | 8.5 | 8.2 | 5.004 | ||
| Industrial | 6 | 48,689,645 | 3.8 | 65.6 | 57.3 | 1.56 | 10.1 | 9.1 | 4.465 | ||
| Flex | 5 | 45,474,645 | 3.5 | 65.6 | 56.8 | 1.54 | 10.1 | 9.1 | 4.428 | ||
| Warehouse | 1 | 3,215,000 | 0.2 | 64.9 | 64.9 | 1.75 | 9.6 | 8.9 | 4.990 | ||
| Manufactured Housing Community | 3 | 9,000,000 | 0.7 | 62.1 | 42.8 | 1.52 | 10.6 | 10.5 | 4.377 | ||
| Manufactured Housing Community | 3 | 9,000,000 | 0.7 | 62.1 | 42.8 | 1.52 | 10.6 | 10.5 | 4.377 | ||
| Other | 1 | 8,000,000 | 0.6 | 57.6 | 52.7 | 1.53 | 9.6 | 9.3 | 4.510 | ||
| Leased Fee | 1 | 8,000,000 | 0.6 | 57.6 | 52.7 | 1.53 | 9.6 | 9.3 | 4.510 | ||
| Total/Weighted Average: | 181 | $1,287,148,920 | 100.0% | 59.8% | 55.2% | 2.35x | 12.2% | 11.5% | 4.369% | ||
| (1) | Because this table presents information relating to the mortgaged properties and not the mortgage loans, the information for mortgage loans secured by more than one mortgaged property is based on allocated amounts (allocating the principal balance of the mortgage loan to each of those properties according to the relative appraised values of the mortgaged properties or the allocated loan amounts or property-specific release prices set forth in the related mortgage loan documents or such other allocation as the related mortgage loan seller deemed appropriate). For mortgaged properties securing residential cooperative mortgage loans, the debt service coverage ratio and debt yield for each such mortgaged property is calculated using U/W Net Operating Income or U/W Net Cash Flow, as applicable, for the related residential cooperative property which is the projected net operating income or net cash flow, as applicable, reflected in the most recent appraisal obtained by or otherwise in the possession of the related mortgage loan seller as of the cut-off date and the loan-to-value ratio, is calculated based upon the appraised value of the residential cooperative property determined as if such residential cooperative property is operated as a residential cooperative, inclusive of the amount of the underlying debt encumbering such residential cooperative property. With respect to any mortgage loan that is part of a whole loan, the loan-to-value ratio, debt service coverage ratio and debt yield calculations include the relatedpari passu companion loan(s) but exclude any related subordinate companion loan(s) (unless otherwise stated). With respect to each mortgage loan, debt service coverage ratio, debt yield and loan-to-value ratio information do not take into account any subordinate debt (whether or not secured by the related mortgaged property) that currently exists or is allowed under the terms of such mortgage loan. See Annex A-1 to the Preliminary Prospectus. |
THE INFORMATION IN THIS STRUCTURAL AND COLLATERAL TERM SHEET IS NOT COMPLETE AND MAY BE AMENDED PRIOR TO THE TIME OF SALE. THIS TERM SHEET IS NOT AN OFFER TO SELL THESE SECURITIES AND IT IS NOT A SOLICITATION OF AN OFFER TO BUY THESE SECURITIES IN ANY JURISDICTION WHERE THE OFFER OR SALE IS NOT PERMITTED.
15
| BANK 2018-BNK10 | Characteristics of the Mortgage Pool |
| G. | Geographic Distribution(1)(2) |
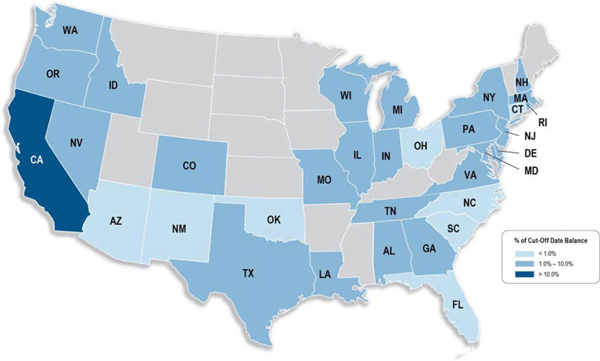
| Location | Number of Mortgaged Properties | Aggregate Balance ($) | % of Initial Pool Balance (%) | Weighted Average Cut-off Date LTV Ratio (%) | Weighted Average Balloon or ARD LTV Ratio (%) | Weighted Average U/W NCF DSCR (x) | Weighted Average U/W NOI Debt Yield (%) | Weighted Average U/W NCF Debt Yield (%) | Weighted Average Mortgage Rate (%) |
| California | 16 | $261,722,051 | 20.3% | 53.0% | 50.4% | 2.50x | 11.2% | 10.7% | 3.917% |
| Northern | 7 | 185,729,088 | 14.4 | 49.3 | 46.9 | 2.74 | 11.6 | 11.2 | 3.701 |
| Southern | 9 | 75,992,963 | 5.9 | 62.0 | 59.1 | 1.92 | 10.1 | 9.6 | 4.445 |
| Texas | 18 | 118,453,963 | 9.2 | 60.3 | 59.3 | 2.35 | 10.3 | 9.8 | 4.138 |
| Illinois | 19 | 91,061,064 | 7.1 | 64.5 | 63.2 | 1.68 | 8.8 | 8.4 | 4.820 |
| New Jersey | 9 | 77,872,657 | 6.1 | 62.4 | 57.0 | 2.01 | 11.7 | 10.5 | 4.224 |
| Wisconsin | 11 | 74,600,000 | 5.8 | 63.2 | 47.8 | 1.51 | 12.9 | 11.0 | 5.330 |
| Louisiana | 12 | 74,295,707 | 5.8 | 59.3 | 59.3 | 2.35 | 9.8 | 9.7 | 4.077 |
| New York | 21 | 73,780,879 | 5.7 | 32.8 | 27.5 | 7.42 | 36.9 | 36.1 | 4.098 |
| Other(3) | 75 | 515,362,600 | 40.0 | 65.4 | 59.4 | 1.83 | 10.6 | 9.9 | 4.537 |
| Total/Weighted Average | 181 | $1,287,148,920 | 100.0% | 59.8% | 55.2% | 2.35x | 12.2% | 11.5% | 4.369% |
| (1) | The mortgaged properties are located in 33 states. |
| (2) | Because this table presents information relating to the mortgaged properties and not the mortgage loans, the information for mortgage loans secured by more than one mortgaged property is based on allocated amounts (allocating the principal balance of the mortgage loan to each of those properties according to the relative appraised values of the mortgaged properties or the allocated loan amounts or property-specific release prices set forth in the related mortgage loan documents or such other allocation as the related mortgage loan seller deemed appropriate). For mortgaged properties securing residential cooperative mortgage loans, the debt service coverage ratio and debt yield for each such mortgaged property is calculated using U/W Net Operating Income or U/W Net Cash Flow, as applicable, for the related residential cooperative property, which is the projected net operating income or net cash flow, as applicable, reflected in the most recent appraisal obtained by or otherwise in the possession of the related mortgage loan seller as of the cut-off date, and the loan-to-value ratio, is calculated based upon the appraised value of the residential cooperative property determined as if such residential cooperative property is operated as a residential cooperative, inclusive of the amount of the underlying debt encumbering such residential cooperative property. With respect to any mortgage loan that is part of a whole loan, the loan-to-value ratio, debt service coverage ratio and debt yield calculations include the relatedpari passu companion loan(s) but exclude any related subordinate companion loan(s) (unless otherwise stated). With respect to each mortgage loan, debt service coverage ratio, debt yield and loan-to-value ratio information do not take into account any subordinate debt (whether or not secured by the related mortgaged property) that currently exists or is allowed under the terms of such mortgage loan. See Annex A-1 to the Preliminary Prospectus. |
| (3) | Includes 26 other states. |
THE INFORMATION IN THIS STRUCTURAL AND COLLATERAL TERM SHEET IS NOT COMPLETE AND MAY BE AMENDED PRIOR TO THE TIME OF SALE. THIS TERM SHEET IS NOT AN OFFER TO SELL THESE SECURITIES AND IT IS NOT A SOLICITATION OF AN OFFER TO BUY THESE SECURITIES IN ANY JURISDICTION WHERE THE OFFER OR SALE IS NOT PERMITTED.
16
| BANK 2018-BNK10 | Characteristics of the Mortgage Pool |
H. Characteristics of the Mortgage Pool(1)
| CUT-OFF DATE BALANCE | |||
| Range of Cut-off Date Balances ($) | Number of Mortgage Loans | Aggregate Cut- off Date Balance | % of Initial Pool Balance |
| 1,100,000 - 2,000,000 | 9 | $14,863,254 | 1.2% |
| 2,000,001 - 3,000,000 | 1 | 2,596,347 | 0.2 |
| 3,000,001 - 4,000,000 | 7 | 24,908,878 | 1.9 |
| 4,000,001 - 5,000,000 | 3 | 12,995,070 | 1.0 |
| 5,000,001 - 6,000,000 | 5 | 27,119,750 | 2.1 |
| 6,000,001 - 7,000,000 | 4 | 26,453,629 | 2.1 |
| 7,000,001 - 8,000,000 | 1 | 7,500,000 | 0.6 |
| 8,000,001 - 9,000,000 | 2 | 17,389,174 | 1.4 |
| 9,000,001 - 10,000,000 | 3 | 29,680,387 | 2.3 |
| 10,000,001 - 15,000,000 | 7 | 81,290,722 | 6.3 |
| 15,000,001 - 20,000,000 | 5 | 86,988,521 | 6.8 |
| 20,000,001 - 30,000,000 | 8 | 192,931,940 | 15.0 |
| 30,000,001 - 50,000,000 | 6 | 232,831,249 | 18.1 |
| 50,000,001 - 70,000,000 | 3 | 185,000,000 | 14.4 |
| 70,000,001 - 80,000,000 | 1 | 74,600,000 | 5.8 |
| 80,000,001 - 90,000,000 | 2 | 176,000,000 | 13.7 |
| 90,000,001 - 94,000,000 | 1 | 94,000,000 | 7.3 |
| Total: | 68 | $1,287,148,920 | 100.0% |
| Average: | $18,928,661 | ||
| UNDERWRITTEN NOI DEBT SERVICE COVERAGE RATIO | |||
| Range of U/W NOI DSCRs (x) | Number of Mortgage Loans | Aggregate Cut- off Date Balance | % of Initial Pool Balance |
| 1.44 - 1.50 | 1 | $23,703,255 | 1.8% |
| 1.51 - 1.60 | 6 | 73,637,658 | 5.7 |
| 1.61 - 1.70 | 6 | 133,485,224 | 10.4 |
| 1.71 - 1.80 | 5 | 117,577,678 | 9.1 |
| 1.81 - 1.90 | 8 | 122,149,174 | 9.5 |
| 1.91 - 2.00 | 6 | 204,239,955 | 15.9 |
| 2.01 - 2.50 | 16 | 392,442,018 | 30.5 |
| 2.51 - 3.00 | 2 | 64,000,000 | 5.0 |
| 3.01 - 3.50 | 1 | 4,500,000 | 0.3 |
| 3.51 - 4.00 | 3 | 107,631,319 | 8.4 |
| 4.01 - 60.62 | 14 | 43,782,640 | 3.4 |
| Total: | 68 | $1,287,148,920 | 100.0% |
| Weighted Average: | 2.47x | ||
| UNDERWRITTEN NCF DEBT SERVICE COVERAGE RATIO | |||
| Range of U/W NCF DSCRs (x) | Number of Mortgage Loans | Aggregate Cut- off Date Balance | % of Initial Pool Balance |
| 1.37 - 1.40 | 1 | $23,703,255 | 1.8% |
| 1.41 - 1.50 | 6 | 60,999,918 | 4.7 |
| 1.51 - 1.75 | 22 | 483,739,771 | 37.6 |
| 1.76 - 2.00 | 4 | 110,340,101 | 8.6 |
| 2.01 - 2.25 | 11 | 253,901,916 | 19.7 |
| 2.26 - 2.75 | 5 | 138,550,000 | 10.8 |
| 2.76 - 3.00 | 1 | 60,000,000 | 4.7 |
| 3.01 - 59.85 | 18 | 155,913,959 | 12.1 |
| Total: | 68 | $1,287,148,920 | 100.0% |
| Weighted Average: | 2.35x | ||
| LOAN PURPOSE | |||
| Loan Purpose | Number of Mortgage Loans | Aggregate Cut- off Date Balance | % of Initial Pool Balance |
| Refinance | 48 | $847,549,217 | 65.8% |
| Acquisition | 18 | 289,599,703 | 22.5 |
| Recapitalization | 2 | 150,000,000 | 11.7 |
| Total: | 68 | $1,287,148,920 | 100.0% |
| MORTGAGE RATE | |||
| Range of Mortgage Rates (%) | Number of Mortgage Loans | Aggregate Cut- off Date Balance | % of Initial Pool Balance |
| 3.365 - 3.500 | 1 | $94,000,000 | 7.3% |
| 3.501 - 3.750 | 5 | 58,283,720 | 4.5 |
| 3.751 - 4.000 | 14 | 144,630,238 | 11.2 |
| 4.001 - 4.250 | 8 | 243,460,468 | 18.9 |
| 4.251 - 4.500 | 14 | 196,315,645 | 15.3 |
| 4.501 - 4.750 | 17 | 298,288,899 | 23.2 |
| 4.751 - 5.000 | 3 | 21,669,816 | 1.7 |
| 5.001 - 5.250 | 3 | 138,929,955 | 10.8 |
| 5.251 - 5.330 | 3 | 91,570,178 | 7.1 |
| Total: | 68 | $1,287,148,920 | 100.0% |
| Weighted Average: | 4.369% | ||
| UNDERWRITTEN NOI DEBT YIELD | |||
| Range of U/W NOI Debt Yields (%) | Number of Mortgage Loans | Aggregate Cut- off Date Balance | % of Initial Pool Balance |
| 8.4 - 9.0 | 8 | $313,447,157 | 24.4% |
| 9.1 - 10.0 | 12 | 272,580,049 | 21.2 |
| 10.1 - 11.0 | 10 | 89,931,898 | 7.0 |
| 11.1 - 12.0 | 10 | 249,875,000 | 19.4 |
| 12.1 - 13.0 | 5 | 227,730,134 | 17.7 |
| 13.1 - 14.0 | 3 | 36,852,407 | 2.9 |
| 14.1 - 15.0 | 3 | 34,818,317 | 2.7 |
| 15.1 - 16.0 | 1 | 4,500,000 | 0.3 |
| 16.1 - 297.0 | 16 | 57,413,959 | 4.5 |
| Total: | 68 | $1,287,148,920 | 100.0% |
| Weighted Average: | 12.2% | ||
| UNDERWRITTEN NCF DEBT YIELD | |||
| Range of U/W NCF Debt Yields (%) | Number of Mortgage Loans | Aggregate Cut- off Date Balance | % of Initial Pool Balance |
| 7.8 - 8.0 | 2 | $29,193,902 | 2.3% |
| 8.1 - 9.0 | 12 | 418,663,234 | 32.5 |
| 9.1 - 10.0 | 12 | 231,289,060 | 18.0 |
| 10.1 - 11.0 | 14 | 282,037,908 | 21.9 |
| 11.1 - 12.0 | 5 | 102,370,235 | 8.0 |
| 12.1 - 13.0 | 4 | 133,612,306 | 10.4 |
| 13.1 - 14.0 | 2 | 28,068,317 | 2.2 |
| 14.1 - 15.0 | 1 | 4,500,000 | 0.3 |
| 15.1 - 293.3 | 16 | 57,413,959 | 4.5 |
| Total: | 68 | $1,287,148,920 | 100.0% |
| Weighted Average: | 11.5% | ||
(1) For mortgaged properties securing residential cooperative mortgage loans, the debt service coverage ratio and debt yield for each such mortgaged property is calculated using U/W Net Operating Income or U/W Net Cash Flow, as applicable, for the related residential cooperative property, which is the projected net operating income or net cash flow, as applicable, reflected in the most recent appraisal obtained by or otherwise in the possession of the related mortgage loan seller as of the cut-off date, and the loan-to-value ratio is calculated based upon the appraised value of the residential cooperative property determined as if such residential cooperative property is operated as a residential cooperative, inclusive of the amount of the underlying debt encumbering such residential cooperative property. With respect to any mortgage loan that is part of a whole loan, the loan-to-value ratio, debt service coverage ratio and debt yield calculations include the related pari passu companion loan(s) but exclude any related subordinate companion loan(s) (unless otherwise stated). With respect to each mortgage loan, debt service coverage ratio, debt yield and loan-to-value ratio information do not take into account any subordinate debt (whether or not secured by the related mortgaged property), that currently exists or is allowed under the terms of such mortgage loan. See Annex A-1 to the Preliminary Prospectus. Prepayment provisions for each mortgage loan reflects the entire life of the loan (from origination to maturity). |
THE INFORMATION IN THIS STRUCTURAL AND COLLATERAL TERM SHEET IS NOT COMPLETE AND MAY BE AMENDED PRIOR TO THE TIME OF SALE. THIS TERM SHEET IS NOT AN OFFER TO SELL THESE SECURITIES AND IT IS NOT A SOLICITATION OF AN OFFER TO BUY THESE SECURITIES IN ANY JURISDICTION WHERE THE OFFER OR SALE IS NOT PERMITTED.
17
| BANK 2018-BNK10 | Characteristics of the Mortgage Pool |
| ORIGINAL TERM TO MATURITY OR ARD | ||||
| Original Terms to Maturity or ARD (months) | Number of Mortgage Loans | Aggregate Cut- off Date Balance | % of Initial Pool Balance | |
| 60 | 1 | $3,215,000 | 0.2% | |
| 84 | 1 | 5,200,000 | 0.4 | |
| 120 | 66 | 1,278,733,920 | 99.3 | |
| Total: | 68 | $1,287,148,920 | 100.0% | |
| Weighted Average: | 120 months | |||
| REMAINING TERM TO MATURITY OR ARD | |||
| Range of Remaining Terms to Maturity or ARD (months) | Number of Mortgage Loans | Aggregate Cut- off Date Balance | % of Initial Pool Balance |
| 59 | 1 | $3,215,000 | 0.2% |
| 83 | 1 | 5,200,000 | 0.4 |
| 115 - 120 | 66 | 1,278,733,920 | 99.3 |
| Total: | 68 | $1,287,148,920 | 100.0% |
| Weighted Average: | 118 months | ||
| ORIGINAL AMORTIZATION TERM(2) | |||
| Range of Original Amortization Terms (months) | Number of Mortgage Loans | Aggregate Cut- off Date Balance | % of Initial Pool Balance |
| Non-Amortizing | 24 | $689,336,294 | 53.6% |
| 276 - 300 | 5 | 105,802,623 | 8.2 |
| 360 | 33 | 466,756,722 | 36.3 |
| 480 | 6 | 25,253,281 | 2.0 |
| Total: | 68 | $1,287,148,920 | 100.0% |
| Weighted Average(3): | 354 months | ||
| REMAINING AMORTIZATION TERM(4) | |||
| Range of Remaining Amortization Terms (months) | Number of Mortgage Loans | Aggregate Cut- off Date Balance | % of Initial Pool Balance |
| Non-Amortizing | 24 | $689,336,294 | 53.6% |
| 276 - 300 | 5 | 105,802,623 | 8.2 |
| 357 - 360 | 33 | 466,756,722 | 36.3 |
| 477 - 480 | 6 | 25,253,281 | 2.0 |
| Total: | 68 | $1,287,148,920 | 100.0% |
| Weighted Average(3): | 353 months | ||
| LOCKBOXES | |||
| Type of Lockbox | Number of Mortgage Loans | Aggregate Cut- off Date Balance | % of Initial Pool Balance |
| Springing | 29 | $714,929,712 | 55.5% |
| Hard/Springing Cash Management | 10 | 311,569,935 | 24.2 |
| Hard/Upfront Cash Management | 4 | 157,665,000 | 12.2 |
| None | 25 | 102,984,274 | 8.0 |
| Total: | 68 | $1,287,148,920 | 100.0% |
| PREPAYMENT PROVISION SUMMARY | |||
| Prepayment Provision | Number of Mortgage Loans | Aggregate Cut- off Date Balance | % of Initial Pool Balance |
| Lockout / Defeasance / Open | 47 | $1,148,272,930 | 89.2% |
| Lockout / GRTR 1% or YM or Defeasance / Open | 4 | 79,664,069 | 6.2 |
| GRTR 1% or YM / 1% / Open | 16 | 57,413,959 | 4.5 |
| Lockout / GRTR 1% or YM / Open | 1 | 1,797,964 | 0.1 |
| Total: | 68 | $1,287,148,920 | 100.0% |
(2) The original amortization term shown for any mortgage loan that is interest-only for part of its term does not include the number of months in its interest-only period and reflects only the number of months as of the commencement of amortization remaining from the end of such interest-only period. (3) Excludes the non-amortizing mortgage loans. (4) The remaining amortization term shown for any mortgage loan that is interest-only for part of its term does not include the number of months in its interest-only period and reflects only the number of months as of the commencement of amortization remaining from the end of such interest-only period. |
CUT-OFF DATE LOAN-TO-VALUE RATIO | |||
| Range of Cut-off Date LTV Ratios (%) | Number of Mortgage Loans | Aggregate Cut- off Date Balance | % of Initial Pool Balance |
| 3.6 - 20.0 | 11 | $30,689,088 | 2.4% |
| 20.1 - 30.0 | 3 | 13,093,552 | 1.0 |
| 30.1 - 40.0 | 2 | 8,194,834 | 0.6 |
| 40.1 - 45.0 | 1 | 94,000,000 | 7.3 |
| 45.1 - 50.0 | 6 | 90,484,448 | 7.0 |
| 50.1 - 55.0 | 2 | 26,350,000 | 2.0 |
| 55.1 - 60.0 | 8 | 195,912,306 | 15.2 |
| 60.1 - 65.0 | 14 | 455,470,298 | 35.4 |
| 65.1 - 70.0 | 11 | 223,422,935 | 17.4 |
| 70.1 - 74.9 | 10 | 149,531,460 | 11.6 |
| Total: | 68 | $1,287,148,920 | 100.0% |
| Weighted Average: | 59.8% | ||
| BALLOON OR ARD LOAN-TO-VALUE RATIO | |||
| Range of Balloon or ARD LTV Ratios (%) | Number of Mortgage Loans | Aggregate Cut- off Date Balance | % of Initial Pool Balance |
| 3.1 - 20.0 | 13 | $36,782,640 | 2.9% |
| 20.1 - 30.0 | 2 | 10,694,834 | 0.8 |
| 30.1 - 35.0 | 1 | 4,500,000 | 0.3 |
| 35.1 - 40.0 | 2 | 15,936,484 | 1.2 |
| 40.1 - 45.0 | 6 | 180,297,964 | 14.0 |
| 45.1 - 50.0 | 5 | 98,172,586 | 7.6 |
| 50.1 - 55.0 | 7 | 93,792,718 | 7.3 |
| 55.1 - 60.0 | 12 | 263,245,630 | 20.5 |
| 60.1 - 65.0 | 17 | 509,326,065 | 39.6 |
| 65.1 – 67.9 | 3 | 74,400,000 | 5.8 |
| Total: | 68 | $1,287,148,920 | 100.0% |
| Weighted Average: | 55.2% | ||
| AMORTIZATION TYPE | |||
| Type of Amortization | Number of Mortgage Loans | Aggregate Cut- off Date Balance | % of Initial Pool Balance |
| Interest-only, Balloon | 23 | $595,336,294 | 46.3% |
| Amortizing Balloon | 32 | 327,625,126 | 25.5 |
| Interest-only, Amortizing Balloon | 12 | 270,187,500 | 21.0 |
| Interest-only, ARD | 1 | 94,000,000 | 7.3 |
| Total: | 68 | $1,287,148,920 | 100.0% |
ORIGINAL TERM OF INTEREST-ONLY PERIOD FOR PARTIAL IO LOANS | |||
| IO Terms (months) | Number of Mortgage Loans | Aggregate Cut- off Date Balance | % of Initial Pool Balance |
| 24 | 1 | $5,325,000 | 0.4% |
| 36 | 6 | 138,717,500 | 10.8 |
| 60 | 5 | 126,145,000 | 9.8 |
| Total: | 12 | $270,187,500 | 21.0% |
| Weighted Average: | 47 months | ||
SEASONING | |||
| Seasoning (months) | Number of Mortgage Loans | Aggregate Cut- off Date Balance | % of Initial Pool Balance |
| 0 | 10 | $249,970,000 | 19.4% |
| 1 | 31 | 509,345,235 | 39.6 |
| 2 | 20 | 435,995,623 | 33.9 |
| 3 | 5 | 50,038,062 | 3.9 |
| 4 | 1 | 27,500,000 | 2.1 |
| 5 | 1 | 14,300,000 | 1.1 |
| Total: | 68 | $1,287,148,920 | 100.0% |
| Weighted Average: | 1 month | ||
THE INFORMATION IN THIS STRUCTURAL AND COLLATERAL TERM SHEET IS NOT COMPLETE AND MAY BE AMENDED PRIOR TO THE TIME OF SALE. THIS TERM SHEET IS NOT AN OFFER TO SELL THESE SECURITIES AND IT IS NOT A SOLICITATION OF AN OFFER TO BUY THESE SECURITIES IN ANY JURISDICTION WHERE THE OFFER OR SALE IS NOT PERMITTED.
18
| BANK 2018-BNK10 | Certain Terms and Conditions |
V. Certain Terms and Conditions
| Allocation Between the RR Interest and the Non-Retained Certificates: | Amounts available for distributions to the holders of the Certificates (including the RR Interest) will be allocated between amounts available for distribution to the holders of the RR Interest, on the one hand, and to all other Certificates, referred to herein as the “Non-Retained Certificates”, on the other hand. The portion of such amount allocable to (a) the RR Interest will at all times be the product of such amount multiplied by 5% and (b) the Non-Retained Certificates will at all times be the product of such amount multiplied by 95% (each, the respective “Percentage Allocation Entitlement”). |
| Interest Entitlements: | The interest entitlement of each Class of Non-Retained Certificates on each Distribution Date generally will be the interest accrued during the related Interest Accrual Period on the related Certificate Balance or Notional Amount at the related pass-through rate, net of any prepayment interest shortfalls allocated to that Class for such Distribution Date as described below. If prepayment interest shortfalls arise from voluntary prepayments (without the applicable Master Servicer consent) on particular non-specially serviced loans during any collection period, the applicable Master Servicer is required to make a compensating interest payment to offset those shortfalls, generally up to an amount equal to the portion of its master servicing fees that accrue at 0.25 basis pointsper annum. The remaining amount of prepayment interest shortfalls will be allocated between the RR Interest, on one hand, and the Non-Retained Certificates, on the other hand, in accordance with their respective Percentage Allocation Entitlements. The prepayment interest shortfalls allocated to the Non-Retained Certificates (other than the Class V and Class R Certificates) will be allocated among such Classes of Certificates entitled to interest, on apro ratabasis, based on their respective amounts of accrued interest for the related Distribution Date, to reduce the interest entitlement on each such Class of Certificates. If a Class receives less than the entirety of its interest entitlement on any Distribution Date, then the shortfall (excluding any shortfall due to prepayment interest shortfalls), together with interest thereon, will be added to its interest entitlement for the next succeeding Distribution Date. |
| Aggregate Principal Distribution Amount: | The Aggregate Principal Distribution Amount for each Distribution Date generally will be the aggregate amount of principal received or advanced in respect of the mortgage loans, net of any non-recoverable advances and interest thereon and workout-delayed reimbursement amounts that are reimbursed to the applicable Master Servicer, the Special Servicer or the Trustee during the related collection period. Non-recoverable advances and interest thereon are reimbursable from principal collections and advances before reimbursement from other amounts. Workout-delayed reimbursement amounts are reimbursable from principal collections. The Non-Retained Certificates will be entitled to the portion of the Aggregate Principal Distribution Amount equal to their Percentage Allocation Entitlement, which is referred to herein as the “Principal Distribution Amount”. |
| Subordination, Allocation of Losses and Certain Expenses | The chart below describes the manner in which the payment rights of certain Classes of Non-Retained Certificates will be senior or subordinate, as the case may be, to the payment rights of other Classes of Non-Retained Certificates. The chart also shows the allocation between the RR Interest and the Non-Retained Certificates and the corresponding entitlement to receive principal and/or interest of certain Classes of Non-Retained Certificates (other than excess interest that accrues on each mortgage loan that has an anticipated repayment date) on any distribution date in descending order. It also shows the manner in which losses are allocated between the RR Interest and the Non-Retained Certificates and the manner in which the Non-Retained Certificate allocations are further allocated to certain Classes of those Certificates in ascending order (beginning with the Non-Offered Certificates, other than the Class V and Class R certificates and the RR Interest) to reduce the balance of each such class to zero;provided that no principal payments or mortgage loan losses will be allocated to the Class X-A, Class X-B, Class X-D, Class X-E, Class X-F, Class X-G, Class V or Class R Certificates, although principal payments and losses may reduce the notional amounts of the Class X-A, Class X-B, Class X-D, Class X-E, Class X-F and Class X-G certificates and, therefore, the amount of interest they accrue. |
THE INFORMATION IN THIS STRUCTURAL AND COLLATERAL TERM SHEET IS NOT COMPLETE AND MAY BE AMENDED PRIOR TO THE TIME OF SALE. THIS TERM SHEET IS NOT AN OFFER TO SELL THESE SECURITIES AND IT IS NOT A SOLICITATION OF AN OFFER TO BUY THESE SECURITIES IN ANY JURISDICTION WHERE THE OFFER OR SALE IS NOT PERMITTED.
19
| BANK 2018-BNK10 | Certain Terms and Conditions |
| |||
| (1) | The Class X-A, Class X-B, Class X-D, Class X-E, Class X-F and Class X-G Certificates are interest-only certificates. | ||
| (2) | The Class X-D, Class X-E, Class X-F and Class X-G Certificates and the RR Interest are Non-Offered Certificates. | ||
| (3) | Other than the Class X-D, Class X-E, Class X-F, Class X-G, Class V and Class R Certificates and the RR Interest. | ||
| Distributions: | On each Distribution Date, funds available for distribution from the mortgage loans, net of specified trust fees, expenses and reimbursements that are allocable to the Non-Retained Certificates will generally be distributed in the following amounts and order of priority (in each case to the extent of remaining available funds): | ||
| 1. | Class A-1, A-2, A-3, A-SB, A-4, A-5, X-A, X-B, X-D, X-E, X-F and X-G Certificates: To interest on the Class A-1, A-2, A-3, A-SB, A-4, A-5, X-A, X-B, X-D, X-E, X-F and X-G Certificates,pro rata, according to their respective interest entitlements. | ||
| 2. | Class A-1, A-2, A-3, A-SB, A-4 and A-5 Certificates: To principal on the Class A-1, A-2, A-3, A-SB, A-4 and A-5 Certificates in the following amounts and order of priority: (i) first, to principal on the Class A-SB Certificates, in an amount up to the Principal Distribution Amount for such Distribution Date until their Certificate Balance is reduced to the Class A-SB Planned Principal Balance for such Distribution Date; (ii) second, to principal on the Class A-1 Certificates until their Certificate Balance is reduced to zero, up to the remainder of the Principal Distribution Amount for such Distribution Date; (iii) third, to principal on the Class A-2 Certificates until their Certificate Balance is reduced to zero, up to the remainder of the Principal Distribution Amount for such Distribution Date; (iv) fourth, to principal on the Class A-3 Certificates, until their Certificate Balance is reduced to zero, up to the remainder of the Principal Distribution Amount for such Distribution Date; (v) fifth, to principal on the Class A-4 Certificates until their Certificate Balance is reduced to zero, up to the remainder of the Principal Distribution Amount for such Distribution Date; (vi) sixth, to principal on the Class A-5 Certificates, until their Certificate Balance is reduced to zero, up to the remainder of the Principal Distribution Amount for such Distribution Date; and (vii) seventh, to principal on the Class A-SB Certificates until their Certificate Balance is reduced to zero, up to the remainder of the Principal Distribution Amount for such Distribution Date. However, if the Certificate Balance of each and every Class of Principal Balance Certificates, other than the Class A-1, A-2, A-3, A-SB, A-4 and A-5 Certificates and the RR Interest, has been reduced to zero as a result of the allocation of Mortgage Loan losses and expenses and any of the Class A-1, A-2, A-3, A-SB, A-4 and A-5 Certificates remains outstanding, then the Principal Distribution Amount will be distributed to the Class A-1, A-2, A-3, A-SB, A-4 and A-5 Certificates,pro rata, based on their respective outstanding Certificate Balances, until their Certificate Balances have been reduced to zero. | ||
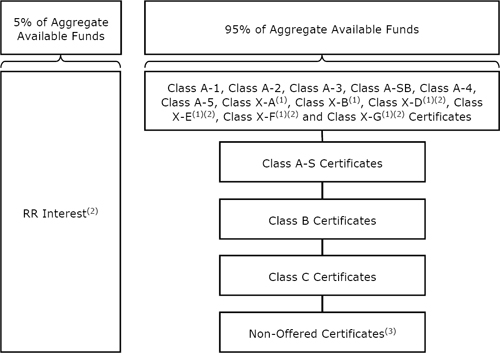
THE INFORMATION IN THIS STRUCTURAL AND COLLATERAL TERM SHEET IS NOT COMPLETE AND MAY BE AMENDED PRIOR TO THE TIME OF SALE. THIS TERM SHEET IS NOT AN OFFER TO SELL THESE SECURITIES AND IT IS NOT A SOLICITATION OF AN OFFER TO BUY THESE SECURITIES IN ANY JURISDICTION WHERE THE OFFER OR SALE IS NOT PERMITTED.
20
| BANK 2018-BNK10 | Certain Terms and Conditions |
| 3. | Class A-1, A-2, A-3, A-SB, A-4 and A-5 Certificates: To reimburse the holders of the Class A-1, A-2, A-3, A-SB, A-4 and A-5 Certificates,pro rata, on the basis of previously allocated unreimbursed losses, for any previously unreimbursed losses (plus interest thereon) on the mortgage loans that were previously allocated in reduction of the Certificate Balances of such Classes. | ||
| 4. | Class A-S Certificates: To make distributions on the Class A-S Certificates as follows: (a) first, to interest on the Class A-S Certificates in the amount of the interest entitlement for that Class; (b) next, to the extent of the portion of the Principal Distribution Amount remaining after distributions in respect of principal to each Class with a higher distribution priority (in this case, the Class A-1, A-2, A-3, A-SB, A-4 and A-5 Certificates), to principal on the Class A-S Certificates until their Certificate Balance is reduced to zero; and (c) next, to reimburse the holders of the Class A-S Certificates for any previously unreimbursed losses (plus interest thereon) on the mortgage loans that were previously allocated to that Class in reduction of their Certificate Balance. | ||
| 5. | Class B Certificates: To make distributions on the Class B Certificates as follows: (a) first, to interest on the Class B Certificates in the amount of the interest entitlement for that Class; (b) next, to the extent of the portion of the Principal Distribution Amount remaining after distributions in respect of principal to each Class with a higher distribution priority (in this case, the Class A-1, A-2, A-3, A-SB, A-4, A-5 and A-S Certificates), to principal on the Class B Certificates until their Certificate Balance is reduced to zero; and (c) next, to reimburse the holders of the Class B Certificates for any previously unreimbursed losses (plus interest thereon) on the mortgage loans that were previously allocated to that Class in reduction of their Certificate Balance. | ||
| 6. | Class C Certificates: To make distributions on the Class C Certificates as follows: (a) first, to interest on the Class C Certificates in the amount of the interest entitlement for that Class; (b) next, to the extent of the portion of the Principal Distribution Amount remaining after distributions in respect of principal to each Class with a higher distribution priority (in this case, the Class A-1, A-2, A-3, A-SB, A-4, A-5, A-S and B Certificates), to principal on the Class C Certificates until their Certificate Balance is reduced to zero; and (c) next, to reimburse the holders of the Class C Certificates for any previously unreimbursed losses (plus interest thereon) on the mortgage loans that were previously allocated to that Class in reduction of their Certificate Balance. | ||
| 7. | After the Class A-1, A-2, A-3, A-SB, A-4, A-5, A-S, B and C Certificates are paid all amounts to which they are entitled, the remaining funds available for distribution will be used to pay interest, principal and loss reimbursement amounts on the Class D, E, F and G Certificates sequentially in that order in a manner analogous to the Class C Certificates. | ||
| Allocation of Yield Maintenance and Prepayment Premiums: | If any yield maintenance charge or prepayment premium is collected during any particular collection period with respect to any mortgage loan, then on the Distribution Date corresponding to that collection period, the certificate administrator will pay that yield maintenance charge or prepayment premium (net of liquidation fees payable therefrom) in the following manner: (x)(1) to each of the Class A-1, A-2, A-3, A-SB, A-4, A-5, A-S, B, C and D Certificates, the product of (a) the Non-Retained Certificates’ Percentage Allocation Entitlement of the yield maintenance charge or prepayment premium, (b) the related Base Interest Fraction (as defined in the Preliminary Prospectus) for such Class, and (c) a fraction, the numerator of which is equal to the amount of principal distributed to such Class for that Distribution Date, and the denominator of which is the total amount of principal distributed to all Principal Balance Certificates (other than the RR Interest) for that Distribution Date, (2) to the Class X-A Certificates, the excess, if any, of (a) the product of (i) the Non-Retained Certificates’ Percentage Allocation Entitlement of such yield maintenance charge or prepayment premium and (ii) a fraction, the numerator of which is equal to the amount of principal distributed to the Class A-1, A-2, A-3, A-SB, A-4 and A-5 Certificates for that Distribution Date, and the denominator of which is the total amount of principal distributed to all Principal Balance Certificates (other than the RR Interest) for that Distribution Date, over (b) the amount of such yield maintenance charge or prepayment premium distributed to the Class A-1, A-2, A-3, A-SB, A-4 and A-5 Certificates as described above, and (3) to the Class X-B Certificates, any remaining portion of the Non-Retained Percentage of such yield maintenance charge or prepayment premium not distributed as described above, and (y) to the RR Interest, its Percentage Allocation Entitlement of the yield maintenance charge or prepayment premium.
No prepayment premiums or yield maintenance charges will be distributed to the holders of the Class X-D, X-E, X-F, X-G, E, F, G, V or R Certificates. For a description of when prepayment premiums and yield maintenance charges are generally required on the mortgage loans, see Annex A-1 to the Preliminary Prospectus. See also “Risk Factors—Risks Relating to the | ||
THE INFORMATION IN THIS STRUCTURAL AND COLLATERAL TERM SHEET IS NOT COMPLETE AND MAY BE AMENDED PRIOR TO THE TIME OF SALE. THIS TERM SHEET IS NOT AN OFFER TO SELL THESE SECURITIES AND IT IS NOT A SOLICITATION OF AN OFFER TO BUY THESE SECURITIES IN ANY JURISDICTION WHERE THE OFFER OR SALE IS NOT PERMITTED.
21
| BANK 2018-BNK10 | Certain Terms and Conditions |
| Mortgage Loans—Risks Relating to Enforceability of Yield Maintenance Charges, Prepayment Premiums or Defeasance Provisions” and “Risk Factors—Other Risks Relating to the Certificates—Your Yield May Be Affected by Defaults, Prepayments and Other Factors” in the Preliminary Prospectus. Prepayment premiums and yield maintenance charges will be distributed on each Distribution Date only to the extent they are actually received on the mortgage loans as of the related Determination Date. | |
| Realized Losses: | The Certificate Balances of the Class A-1, A-2, A-3, A-SB, A-4, A-5, A-S, B, C, D, E, F and G Certificates, will be reduced without distribution on any Distribution Date as a write-off to the extent of the Non-Retained Certificates’ Percentage Allocation Entitlement of any losses realized on the mortgage loans allocated to such Class on such Distribution Date. Such losses will be applied in the following order, in each case until the related Certificate Balance is reduced to zero: first, to the Class G Certificates; second, to the Class F Certificates; third, to the Class E Certificates; fourth, to the Class D Certificates; fifth, to the Class C Certificates; sixth, to the Class B Certificates; seventh, to the Class A-S Certificates; and, finally,pro rata, to the Class A-1, A-2, A-3, A-SB, A-4 and A-5 Certificates based on their outstanding Certificate Balances.
The notional amount of the Class X-A Certificates will be reduced by the amount of all losses that are allocated to the Class A-1, A-2, A-3, A-SB, A-4 or A-5 Certificates as write-offs in reduction of their Certificate Balances. The notional amount of the Class X-B Certificates will be reduced by the amount of all losses that are allocated to the Class A-S, B or C Certificates as write-offs in reduction of their Certificate Balances. The notional amount of the Class X-D Certificates will be reduced by the amount of all losses that are allocated to the Class D Certificates as write-offs in reduction of their Certificate Balance. The notional amount of the Class X-E Certificates will be reduced by the amount of all losses that are allocated to the Class E Certificates as write-offs in reduction of their Certificate Balance. The notional amount of the Class X-F Certificates will be reduced by the amount of all losses that are allocated to the Class F Certificates as write-offs in reduction of their Certificate Balance. The notional amount of the Class X-G Certificates will be reduced by the amount of all losses that are allocated to the Class G Certificates as write-offs in reduction of their Certificate Balance. |
| P&I Advances: | Each Master Servicer or, if such Master Servicer fails to do so, the Trustee, will be obligated to advance delinquent debt service payments with respect to the mortgage loans it services (other than balloon payments, excess interest and default interest) and assumed debt service payments on mortgage loans with delinquent balloon payments (excluding any related companion loan), except to the extent any such advance is deemed non-recoverable from collections on the related mortgage loan. In addition, if an Appraisal Reduction Amount exists for a given mortgage loan, the interest portion of any P&I advance for such mortgage loan will be reduced, which will have the effect of reducing the amount of interest available for distribution to the Certificates, which with respect to the Non-Retained Certificates will be applied in reverse alphabetical order of their Class designations (except that interest payments on the Class A-1, A-2, A-3, A-SB, A-4, A-5, X-A, X-B, X-D, X-E, X-F and X-G Certificates would be affected on apari passu basis). |
| Servicing Advances: | Each Master Servicer or, if such Master Servicer fails to do so, the Trustee, will be obligated to make servicing advances, including the payment of delinquent property taxes, insurance premiums and ground rent, except to the extent that those advances are deemed non-recoverable from collections on the related mortgage loan. The related Master Servicer or the Trustee, as applicable, will have the primary obligation to make any required servicing advances with respect to any serviced whole loan. With respect to any non-serviced whole loan, the master servicer or trustee, as applicable, under the related lead securitization servicing agreement will have the primary obligation to make any required servicing advances with respect to such non-serviced whole loan. |
Appraisal Reduction Amounts and Collateral Deficiency Amounts:
| An Appraisal Reduction Amount generally will be created in the amount, if any, by which the principal balance of a required appraisal loan (which is a mortgage loan with respect to which certain defaults, modifications or insolvency events have occurred as further described in the Preliminary Prospectus) plus other amounts overdue or advanced in connection with such mortgage loan exceeds 90% of the appraised value of the related mortgaged property plus certain escrows and reserves (including letters of credit) held with respect to the mortgage loan. With respect to any whole loan, any Appraisal Reduction Amount will be allocated first to the related subordinate companion loan, if any, and then to the related mortgage loan and the relatedpari passu companion loan(s).
A mortgage loan will cease to be a required appraisal loan when the same has ceased to be a specially serviced loan (if applicable), has been brought current for at least three consecutive months and no other circumstances exist that would cause such mortgage loan to be a required appraisal loan.
A Collateral Deficiency Amount will exist with respect to any mortgage loan that is modified into an AB loan structure and remains a corrected mortgage loan and will generally equal the excess |
THE INFORMATION IN THIS STRUCTURAL AND COLLATERAL TERM SHEET IS NOT COMPLETE AND MAY BE AMENDED PRIOR TO THE TIME OF SALE. THIS TERM SHEET IS NOT AN OFFER TO SELL THESE SECURITIES AND IT IS NOT A SOLICITATION OF AN OFFER TO BUY THESE SECURITIES IN ANY JURISDICTION WHERE THE OFFER OR SALE IS NOT PERMITTED.
22
| BANK 2018-BNK10 | Certain Terms and Conditions |
of (i) the stated principal balance of such AB modified loan (taking into account the related junior note(s) and anypari passu notes included therein), over (ii) the sum of (in the case of a whole loan, solely to the extent allocable to the subject mortgage loan) (x) the most recent appraised value of the related mortgaged property plus (y) solely to the extent not reflected or taken into account in such appraised value (or in the calculation of any related Appraisal Reduction Amount) and to the extent on deposit with, or otherwise under the control of, the lender as of the date of such determination, any capital or additional collateral contributed by the related borrower at the time the mortgage loan (and as part of the modification thereto) became an AB modified loan plus (z) any other escrows or reserves (in addition to any amounts set forth in the immediately preceding clause (y) and solely to the extent not reflected or taken into account in the calculation of any related Appraisal Reduction Amount) held by the lender with respect to the mortgage loan as of the date of such determination.
A Cumulative Appraisal Reduction Amount with respect to any mortgage loan will be the sum of any Appraisal Reduction Amount and any Collateral Deficiency Amount.
Appraisal Reduction Amounts will affect the amount of debt service advances in respect of the related mortgage loan. Additionally, Cumulative Appraisal Reduction Amounts will be taken into account in the determination of the identity of the Class whose majority constitutes the “majority controlling class certificateholder” and is entitled to appoint the directing certificateholder. | |
Clean-Up Call and Exchange Termination:
| On each Distribution Date occurring after the aggregate unpaid principal balance of the pool of mortgage loans is less than 1.0% of the principal balance of the mortgage loans as of the cut-off date, certain specified persons will have the option to purchase all of the remaining mortgage loans (and the trust’s interest in all property acquired through exercise of remedies in respect of any mortgage loan) at the price specified in the Preliminary Prospectus. Exercise of the option will terminate the trust and retire the then-outstanding certificates.
If the aggregate Certificate Balances of each of the Class A-1, A-2, A-3, A-SB, A-4, A-5, A-S, B, C and D Certificates have been reduced to zero, the trust may also be terminated in connection with an exchange of all the then-outstanding certificates (other than the Class R Certificates and the RR Interest) for the mortgage loans and REO properties then remaining in the issuing entity, subject to payment of a price specified in the Preliminary Prospectus, but all of the holders of those outstanding Classes (other than the Class V, Class R Certificates and the RR Interest) of certificates would have to voluntarily participate in the exchange. |
| Liquidation Loan Waterfall: | Following the liquidation of any loan or property, the net liquidation proceeds generally will be applied (after reimbursement of advances and certain trust fund expenses), first, as a recovery of accrued interest, other than delinquent interest that was not advanced as a result of Appraisal Reduction Amounts, second, as a recovery of principal until all principal has been recovered, and then as a recovery of delinquent interest that was not advanced as a result of Appraisal Reduction Amounts. Please see “Description of the Certificates—Distributions—Application Priority of Mortgage Loan Collections or Whole Loan Collections” in the Preliminary Prospectus. |
| Control Eligible Certificates: | The Class E, F and G Certificates. |
| Directing Certificateholder/ Controlling Class: | A directing certificateholder may be appointed by the “majority controlling class certificateholder”, which will be the holder(s) of a majority of the “controlling class”, which means the most subordinate class of Certificates among the Control Eligible Certificates.
The “Controlling Class” will be, as of any time of determination, the most subordinate class of Control Eligible Certificates then-outstanding that has an aggregate Certificate Balance (as notionally reduced by any Cumulative Appraisal Reduction Amounts allocable to such class) at least equal to 25% of the initial Certificate Balance of that class;provided,however, that if at any time the Certificate Balances of the certificates other than the Control Eligible Certificates and the RR Interest have been reduced to zero as a result of principal payments on the Mortgage Loans, then the Controlling Class will be the most subordinate class of Control Eligible Certificates that has a Certificate Balance greater than zero without regard to any Cumulative Appraisal Reduction Amounts. The Controlling Class as of the Closing Date will be the Class G Certificates. |
| Control and Consultation/ Replacement of Special Servicer by Directing Certificateholder: | The rights of various parties to replace the Special Servicer and approve or consult with respect to major actions of the Special Servicer will vary according to defined periods.
A “Control Termination Event” will occur when (i) the Class E Certificates have a Certificate Balance (taking into account the application of any Cumulative Appraisal Reduction Amounts to notionally reduce the Certificate Balance of such class) of less than 25% of the initial Certificate Balance of that class or (ii) a holder of the Class E Certificates is the majority Controlling Class Certificateholder and has irrevocably waived its right, in writing, to exercise any of the rights of the Controlling Class Certificateholder and such rights have not been reinstated to a successor |
THE INFORMATION IN THIS STRUCTURAL AND COLLATERAL TERM SHEET IS NOT COMPLETE AND MAY BE AMENDED PRIOR TO THE TIME OF SALE. THIS TERM SHEET IS NOT AN OFFER TO SELL THESE SECURITIES AND IT IS NOT A SOLICITATION OF AN OFFER TO BUY THESE SECURITIES IN ANY JURISDICTION WHERE THE OFFER OR SALE IS NOT PERMITTED.
23
| BANK 2018-BNK10 | Certain Terms and Conditions |
controlling class certificateholder as described below;provided,however, that a Control Termination Event will not be deemed continuing in the event that the Certificate Balances of the certificates other than the Control Eligible Certificates and the RR Interest have been reduced to zero as a result of principal payments on the Mortgage Loans.
A “Consultation Termination Event” will occur when (i) there is no class of Control Eligible Certificates that has a then-outstanding Certificate Balance at least equal to 25% of the initial Certificate Balance of that class, in each case, without regard to the application of any Cumulative Appraisal Reduction Amounts; or (ii) a holder of a majority of the Class E Certificates is the majority Controlling Class Certificateholder and has irrevocably waived its right, in writing, to exercise any of the rights of the Controlling Class Certificateholder and such rights have not been reinstated to a successor controlling class certificateholder pursuant to the terms of the BANK 2018-BNK10 pooling and servicing agreement;provided that no Consultation Termination Event resulting solely from the operation of clause (ii) will be deemed to have existed or be in continuance with respect to a successor holder of the Class E Certificates that has not irrevocably waived its right to exercise any of the rights of the Controlling Class Certificateholder;provided,however, that a Consultation Termination Event will not be deemed continuing in the event that the Certificate Balances of the certificates other than the Control Eligible Certificates and the RR Interest have been reduced to zero as a result of principal payments on the Mortgage Loans.
If no Control Termination Event has occurred and is continuing, except with respect to the Excluded Loans (as defined below) with respect to the directing certificateholder (i) the directing certificateholder will be entitled to grant or withhold approval of asset status reports prepared, and material servicing actions proposed, by the Special Servicer, and (ii) the directing certificateholder will be entitled to terminate and replace the Special Servicer with or without cause, and appoint itself or another person as the successor special servicer. It will be a condition to such appointment that DBRS, Fitch and Moody’s (and any Rating Agency rating any securities backed by anypari passu companion loan(s) serviced under this transaction) confirm that the appointment would not result in a qualification, downgrade or withdrawal of any of their then-current ratings of certificates (and any certificates backed by anypari passu companion loan(s) serviced under this transaction).
If a Control Termination Event has occurred and is continuing but no Consultation Termination Event has occurred and is continuing, the Special Servicer will be required to consult with the directing certificateholder (other than with respect to Excluded Loans as to such party) and the Operating Advisor in connection with asset status reports and material special servicing actions.
If a Consultation Termination Event has occurred and is continuing, the Special Servicer must seek to consult with the Operating Advisor in connection with asset status reports and material special servicing actions, and, in general, no directing certificateholder will be recognized or have any right to terminate the Special Servicer or approve, direct or consult with respect to servicing matters.
With respect to each serviced whole loan, the rights of the directing certificateholder described above will be subject to the consultation rights of the holders of the relatedpari passu companion loans. Those consultation rights will generally extend to asset status reports and material special servicing actions involving the related whole loan, will be as set forth in the related intercreditor agreement, and will be in addition to the rights of the directing certificateholder in this transaction described above.
With respect to each non-serviced whole loan, the applicable servicing agreement for the related controllingpari passucompanion loan(s) generally grants (or will grant) the directing certificateholder under the related securitization control rights that may include the right to approve or disapprove various material servicing actions involving the related whole loan. The directing certificateholder for this securitization (so long as no Consultation Termination Event has occurred and is occurring) generally will nonetheless have the right to be consulted on a non-binding basis with respect to such actions. For purposes of the servicing of any such whole loan contemplated by this paragraph, the occurrence and continuance of a Control Termination Event or Consultation Termination Event under this securitization will not limit the control or other rights of the directing certificateholder (or equivalent) under the securitization of the related controllingpari passu companion loan(s).
The control rights and consent and consultation rights described in the three preceding paragraphs are subject to various limitations, conditions and exceptions as described in the Preliminary Prospectus.
Notwithstanding any contrary description set forth above, in the event that, with respect to any mortgage loan, if the majority controlling class certificateholder or the directing certificateholder is a Borrower Party, the majority controlling class certificateholder and the directing certificateholder will have no right to receive asset status reports or such other |
THE INFORMATION IN THIS STRUCTURAL AND COLLATERAL TERM SHEET IS NOT COMPLETE AND MAY BE AMENDED PRIOR TO THE TIME OF SALE. THIS TERM SHEET IS NOT AN OFFER TO SELL THESE SECURITIES AND IT IS NOT A SOLICITATION OF AN OFFER TO BUY THESE SECURITIES IN ANY JURISDICTION WHERE THE OFFER OR SALE IS NOT PERMITTED.
24
| BANK 2018-BNK10 | Certain Terms and Conditions |
information as may be specified in the BANK 2018-BNK10 pooling and servicing agreement, to grant or withhold approval of, or consult with respect to, asset status reports prepared, and material servicing actions proposed, by the Special Servicer, with respect to such mortgage loan, and such mortgage loan will be referred to as an “Excluded Loan” as to such party.
In addition, notwithstanding any contrary description set forth above, in the event that, with respect to any mortgage loan, a controlling class certificateholder is a Borrower Party, such controlling class certificateholder will have no right to receive asset status reports or such other information as may be specified in the BANK 2018-BNK10 pooling and servicing agreement with respect to such mortgage loan, and such controlling class certificateholder will be referred to as an “excluded controlling class holder”.
“Borrower Party” means a borrower, a mortgagor or a manager of a mortgaged property, an Accelerated Mezzanine Loan Lender, or any Borrower Party Affiliate. “Accelerated Mezzanine Loan Lender” means a mezzanine lender under a mezzanine loan that has been accelerated or as to which foreclosure or enforcement proceedings have been commenced against the equity collateral pledged to secure such mezzanine loan. “Borrower Party Affiliate” means, with respect to a borrower, a mortgagor, a manager of a Mortgaged Property or an Accelerated Mezzanine Loan Lender, (x) any other person controlling or controlled by or under common control with such borrower, mortgagor, manager or Accelerated Mezzanine Loan Lender, as applicable, or (y) any other person owning, directly or indirectly, 25% or more of the beneficial interests in such borrower, mortgagor, manager or Accelerated Mezzanine Loan Lender. With respect to a mortgage loan secured by a residential cooperative property, a person will not be considered a “Borrower Party” solely by reason of such person holding one or more cooperative unit loans that are secured by direct equity interests in the related borrower or owning one or more residential cooperative units comprising the related mortgaged property as a result of any foreclosure, transfer in lieu of foreclosure or other exercise of remedies with respect to any such unit loan(s). | |
| Risk Retention Consultation Party: | A risk retention consultation party may be appointed by the holder or holders of more than 50% of the RR Interest, by Certificate Balance. The majority RR Interest holder will have a continuing right to appoint, remove or replace the risk retention consultation party in its sole discretion. This right may be exercised at any time and from time to time.
Except with respect to an Excluded Loan as to such party, the risk retention consultation party will be entitled to consult with each Special Servicer, upon request of the risk retention consultation party, with respect to certain material servicing actions proposed by such Special Servicer. |
| Replacement of Special Servicer by General Vote of Certificateholders: | If a Control Termination Event has occurred and is continuing, either Special Servicer may be removed and replaced without cause upon the affirmative direction of certificate owners holding not less than 66-2/3% of a certificateholder quorum, following a proposal from certificate owners holding not less than 25% of the appraisal-reduced voting rights of all Principal Balance Certificates other than the RR Interest. The certificateholders who initiate a vote on a termination and replacement of a Special Servicer without cause must cause DBRS, Fitch and Moody’s to confirm the then-current ratings of the certificates (or decline to review the matter) and cause the payment of the fees and expenses incurred in the replacement. If no Control Termination Event has occurred and is continuing, either Special Servicer may be replaced by the directing certificateholder, subject to DBRS, Fitch and Moody’s (and any Rating Agency rating any securities backed by anypari passu companion loan(s) serviced under this transaction) confirming the then-current ratings of the Certificates (and any certificates backed by anypari passucompanion loans serviced under this transaction) or declining to review the matter. |
| Excluded Special Servicer: | In the event that, with respect to any mortgage loan, a Special Servicer is a Borrower Party, such Special Servicer will be required to resign as special servicer of such mortgage loan (referred to as an “excluded special servicer loan”). If no Control Termination Event has occurred and is continuing, the directing certificateholder will be entitled to appoint (and may replace with or without cause) a separate special servicer that is not a Borrower Party (referred to as an “excluded special servicer”) with respect to such excluded special servicer loan unless such excluded special servicer loan is also an excluded loan. Otherwise, upon resignation of the applicable Special Servicer with respect to an excluded special servicer loan, such resigning Special Servicer will be required to use reasonable efforts to appoint the excluded special servicer. |
| Appraisal Remedy: | If the Class of Certificates comprising the controlling class loses its status as controlling class because of the application of an Appraisal Reduction Amount or Collateral Deficiency Amount, the holders of a majority of the voting rights of such Class may require the applicable Special Servicer to order a second appraisal for any mortgage loan in respect of which an Appraisal Reduction Amount or Collateral Deficiency Amount has been applied. Such Special Servicer must thereafter determine whether, based on its assessment of such second appraisal, any |
THE INFORMATION IN THIS STRUCTURAL AND COLLATERAL TERM SHEET IS NOT COMPLETE AND MAY BE AMENDED PRIOR TO THE TIME OF SALE. THIS TERM SHEET IS NOT AN OFFER TO SELL THESE SECURITIES AND IT IS NOT A SOLICITATION OF AN OFFER TO BUY THESE SECURITIES IN ANY JURISDICTION WHERE THE OFFER OR SALE IS NOT PERMITTED.
25
| BANK 2018-BNK10 | Certain Terms and Conditions |
| recalculation of the Appraisal Reduction Amount or Collateral Deficiency Amount is warranted, and if so warranted, the Special Servicer will recalculate such Appraisal Reduction Amount or Collateral Deficiency Amount. Such Class will not be able to exercise any direction, control, consent and/or similar rights of the controlling class unless and until reinstated as the controlling class through such determination; and pending such determination, the rights of the controlling class will be exercised by the Control Eligible Certificates, if any, that would be the controlling class taking into account the subject appraisal reduction amount. | |
| Sale of Defaulted Assets: | There will be no “fair value” purchase option. Instead, the BANK 2018-BNK10 pooling and servicing agreement will authorize the Special Servicer to sell defaulted mortgage loans serviced by such Special Servicer to the highest bidder in a manner generally similar to sales of REO properties.
The sale of a defaulted loan (other than a non-serviced whole loan) for less than par plus accrued interest and certain other fees and expenses owed on the loan will be subject to consent or consultation rights of the directing certificateholder and/or Operating Advisor, as described in the Preliminary Prospectus. Generally speaking, the directing certificateholder for any securitization holding apari passu companion loan will have consent and/or consultation rights as the holder of an interest in the related mortgage loan, as described in the Preliminary Prospectus.
With respect to any serviced whole loan, if such whole loan becomes a defaulted loan under the BANK 2018-BNK10 pooling and servicing agreement, the Special Servicer will generally be required to sell both the mortgage loan and the relatedpari passu companion loan(s) as a single whole loan. If the subject whole loan includes one or more subordinate companion loans, those subordinate companion loans may be included in such sale as well.
With respect to each non-serviced whole loan, the applicable servicing agreement governing the servicing of such whole loan generally will provide that, if the relatedpari passu companion loan(s) serviced under such agreement become a defaulted loan under such servicing agreement, then the related special servicer may offer to sell to any person (or may offer to purchase) for cash such whole loan during such time as such applicablepari passu companion loan(s) constitute a defaulted loan under such servicing agreement. Generally speaking, in connection with any such sale, the related special servicer is required to sell both the mortgage loan and the relatedpari passu companion loan(s) as a whole loan. The directing certificateholder for this securitization generally will have consent and/or consultation rights as the holder of an interest in the related mortgage loan, as described in the Preliminary Prospectus. If the subject whole loan includes one or more subordinate companion loans, those subordinate companion loans may be included in such sale as well.
The procedures for the sale of any whole loan that becomes a defaulted whole loan, and any associated consultation rights, are subject to various limitations, conditions and exceptions as described in the Preliminary Prospectus.
|
| “As-Is” Appraisals: | Appraisals must be conducted on an “as-is” basis, and must be no more than 12 months old, for purposes of determining Appraisal Reduction Amounts and market value in connection with REO sales. Required appraisals may consist of updates of prior appraisals. Internal valuations by the applicable Special Servicer are permitted if the principal balance of a mortgage loan is less than $2,000,000. |
| Operating Advisor: | The Operating Advisor will perform certain review duties if a Control Termination Event has occurred and is continuing, which will generally include a limited annual review of, and the delivery of a report regarding, certain actions of each Special Servicer with respect to the resolution and/or liquidation of specially serviced loans to the Certificate Administrator. The review and report generally will be based on any asset status reports and additional information delivered to the Operating Advisor by each Special Servicer. In addition, if a Control Termination Event has occurred and is continuing, each Special Servicer must seek to consult with the Operating Advisor (in addition to the directing certificateholder if no Consultation Termination Event has occurred and is continuing) in connection with material special servicing actions with respect to specially serviced loans serviced by such Special Servicer. Furthermore, under certain circumstances, but only if a Consultation Termination Event has occurred and is continuing, the Operating Advisor may recommend the replacement of a Special Servicer, in which case the Certificate Administrator will deliver notice of such recommendation to the certificateholders, and certificateholders with specified percentages of the voting rights may direct the replacement of such Special Servicer at their expense.
If a Consultation Termination Event has occurred and is continuing, the Operating Advisor may be removed and replaced without cause upon the affirmative direction of certificate owners holding at least 75% of the appraisal-reduced voting rights of all Certificates (other than the RR Interest), following a proposal from certificate owners holding not less than 25% of the appraisal-reduced voting rights of all Principal Balance Certificates (other than the RR Interest). |
THE INFORMATION IN THIS STRUCTURAL AND COLLATERAL TERM SHEET IS NOT COMPLETE AND MAY BE AMENDED PRIOR TO THE TIME OF SALE. THIS TERM SHEET IS NOT AN OFFER TO SELL THESE SECURITIES AND IT IS NOT A SOLICITATION OF AN OFFER TO BUY THESE SECURITIES IN ANY JURISDICTION WHERE THE OFFER OR SALE IS NOT PERMITTED.
26
| BANK 2018-BNK10 | Certain Terms and Conditions |
| The certificateholders who initiate a vote on a termination and replacement of the Operating Advisor without cause must cause DBRS, Fitch and Moody’s to confirm the then-current ratings of the certificates (or decline to review the matter) and cause the payment of the fees and expenses incurred in the replacement. The Operating Advisor generally may be discharged from its duties if and when the Class A-1, A-2, A-3, A-SB, A-4, A-5, A-S, B, C, D and E Certificates are retired. | |
| Asset Representations Reviewer: | The Asset Representations Reviewer will be required to review certain delinquent mortgage loans after a specified delinquency threshold has been exceeded (an “Asset Review Trigger”) and the required percentage of certificateholders vote to direct a review of such delinquent loans. An Asset Review Trigger will occur when either (1) mortgage loans with an aggregate outstanding principal balance of 25.0% or more of the aggregate outstanding principal balance of all of the mortgage loans (including any REO loans (or a portion of any REO loan in the case of a whole loan)) held by the issuing entity as of the end of the applicable collection period are delinquent loans or (2) at least 15 mortgage loans are delinquent loans as of the end of the applicable collection period and the outstanding principal balance of such delinquent loans in the aggregate constitutes at least 20.0% of the aggregate outstanding principal balance of all of the mortgage loans (including any REO loans (or a portion of any REO loan in the case of a whole loan)) held by the issuing entity as of the end of the applicable collection period. See “Pooling and Servicing Agreement—The Asset Representations Reviewer—Asset Review” in the Preliminary Prospectus.
The Asset Representations Reviewer may be terminated and replaced without cause. Upon (i) the written direction of certificateholders evidencing not less than 25% of the voting rights (without regard to the application of any Appraisal Reduction Amounts) requesting a vote to terminate and replace the Asset Representations Reviewer with a proposed successor Asset Representations Reviewer that is an eligible asset reviewer, and (ii) payment by such holders to the certificate administrator of the reasonable fees and expenses to be incurred by the certificate administrator in connection with administering such vote, the certificate administrator will promptly provide notice to all certificateholders and the Asset Representations Reviewer of such request by posting such notice on its internet website, and by mailing such notice to all certificateholders and the Asset Representations Reviewer. Upon the written direction of certificateholders evidencing at least 75% of a certificateholder quorum (without regard to the application of any Appraisal Reduction Amounts), the Trustee will terminate all of the rights and obligations of the Asset Representations Reviewer under the BANK 2018-BNK10 pooling and servicing agreement by written notice to the Asset Representations Reviewer, and the proposed successor Asset Representations Reviewer will be appointed. See “Pooling and Servicing Agreement—The Asset Representations Reviewer” in the Preliminary Prospectus. |
| Dispute Resolution Provisions: | The mortgage loan sellers will be subject to the dispute resolution provisions set forth in the BANK 2018-BNK10 pooling and servicing agreement to the extent those provisions are triggered with respect to any mortgage loan sold to the depositor by a mortgage loan seller and such mortgage loan seller will be obligated under the related mortgage loan purchase agreement to comply with all applicable provisions and to take part in any mediation or arbitration proceedings that may result.
Generally, in the event that a Repurchase Request (as defined in the Preliminary Prospectus) is not “Resolved” (as defined below) within 180 days after the related mortgage loan seller receives such Repurchase Request, then the enforcing servicer will be required to send a notice to the “Initial Requesting Certificateholder” (if any) and the Certificate Administrator indicating the enforcing servicer’s intended course of action with respect to the Repurchase Request. If (a) the enforcing servicer’s intended course of action with respect to the Repurchase Request does not involve pursuing further action to exercise rights against the related mortgage loan seller with respect to the Repurchase Request and the Initial Requesting Certificateholder, if any, or any other certificateholder or certificate owner wishes to exercise its right to refer the matter to mediation (including non-binding arbitration) or arbitration, or (b) the enforcing servicer’s intended course of action is to pursue further action to exercise rights against the related mortgage loan seller with respect to the Repurchase Request but the Initial Requesting Certificateholder, if any, or any other certificateholder or certificate owner does not agree with the dispute resolution method selected by the enforcing servicer, then the Initial Requesting Certificateholder, if any, or such other certificateholder or certificate owner may deliver a written notice to the applicable Special Servicer indicating its intent to exercise its right to refer the matter to either mediation or arbitration.
“Resolved” means, with respect to a Repurchase Request, (i) that the related Material Defect has been cured, (ii) the related mortgage loan has been repurchased in accordance with the related mortgage loan purchase agreement, (iii) a mortgage loan has been substituted for the related mortgage loan in accordance with the related mortgage loan purchase agreement, (iv) the applicable mortgage loan seller has made a Loss of Value Payment (as defined in the |
THE INFORMATION IN THIS STRUCTURAL AND COLLATERAL TERM SHEET IS NOT COMPLETE AND MAY BE AMENDED PRIOR TO THE TIME OF SALE. THIS TERM SHEET IS NOT AN OFFER TO SELL THESE SECURITIES AND IT IS NOT A SOLICITATION OF AN OFFER TO BUY THESE SECURITIES IN ANY JURISDICTION WHERE THE OFFER OR SALE IS NOT PERMITTED.
27
| BANK 2018-BNK10 | Certain Terms and Conditions |
| Preliminary Prospectus), (v) a contractually binding agreement is entered into between the enforcing servicer, on behalf of the issuing entity, and the related mortgage loan seller that settles the related mortgage loan seller’s obligations under the related mortgage loan purchase agreement, or (vi) the related mortgage loan is no longer property of the issuing entity as a result of a sale or other disposition in accordance with the BANK 2018-BNK10 pooling and servicing agreement. See “Pooling and Servicing Agreement—Dispute Resolution Provisions” in the Preliminary Prospectus. | |
| Investor Communications: | The certificate administrator is required to include on any Form 10–D any request received from a certificateholder to communicate with other certificateholders related to certificateholders exercising their rights under the terms of the BANK 2018-BNK10 pooling and servicing agreement. Any certificateholder wishing to communicate with other certificateholders regarding the exercise of its rights under the terms of the BANK 2018-BNK10 pooling and servicing agreement will be able to deliver a written request signed by an authorized representative of the requesting investor to the certificate administrator. |
| Certain Fee Offsets: | If a workout fee is earned by a Special Servicer following a loan default with respect to any mortgage loan that it services, then certain limitations will apply based on modification fees paid by the borrower. The modification fee generally must not exceed 1% of the principal balance of the loan as modified in any 12-month period. In addition, if the loan re-defaults, any subsequent workout fee on that loan must be reduced by a portion of the modification fees paid by the borrower in the previous 12-months. Likewise, liquidation fees collected in connection with a liquidation or partial liquidation of a mortgage loan must be reduced by a portion of the modification fees paid by the borrower in the previous 12 months. |
| Deal Website: | The Certificate Administrator will be required to maintain a deal website, which will include, among other items: (a) summaries of asset status reports prepared by each Special Servicer, (b) inspection reports, (c) appraisals, (d) various “special notices” described in the Preliminary Prospectus, (e) the “Investor Q&A Forum”, (f) a voluntary “Investor Registry” and (g) the “Risk Retention” tab. Investors may access the deal website following execution of a certification and confidentiality agreement. |
| Initial Majority Controlling Class Certificateholder: | It is expected that Torchlight Investors, LLC or another affiliate of Torchlight Loan Services will be the initial majority controlling class certificateholder. |
| Whole Loans: | Each of the mortgaged properties identified above under “IV. Characteristics of the Mortgage Pool—B. Summary of the Whole Loans” secures both a mortgage loan to be included in the trust fund and one or more other mortgage loans that will not be included in the trust fund, each of which will bepari passu or subordinate in right of payment with the mortgage loan included in the trust fund. We refer to each such group of mortgage loans as a “whole loan”. Such “—Summary of the Whole Loans” section includes further information regarding the various notes in each whole loan, the holders of such notes, the lead servicing agreement for each such whole loan, and the applicable master servicer and applicable special servicer under such lead servicing agreement. |
THE INFORMATION IN THIS STRUCTURAL AND COLLATERAL TERM SHEET IS NOT COMPLETE AND MAY BE AMENDED PRIOR TO THE TIME OF SALE. THIS TERM SHEET IS NOT AN OFFER TO SELL THESE SECURITIES AND IT IS NOT A SOLICITATION OF AN OFFER TO BUY THESE SECURITIES IN ANY JURISDICTION WHERE THE OFFER OR SALE IS NOT PERMITTED.
28
(THIS PAGE INTENTIONALLY LEFT BLANK)
29
| APPLE CAMPUS 3 |
The pictures below are artist’s renderings of the Apple Campus 3 Property as it is generally proposed to be completed, and are not actual photographs or depictions of the current construction status of the related improvements. Furthermore, such renderings may differ in material aspects from the final design or the final, as-built condition of the completed improvements. Apple has taken possession of the Apple Campus 3 Property and is currently constructing its interior improvements.

THE INFORMATION IN THIS STRUCTURAL AND COLLATERAL TERM SHEET IS NOT COMPLETE AND MAY BE AMENDED PRIOR TO THE TIME OF SALE. THIS TERM SHEET IS NOT AN OFFER TO SELL THESE SECURITIES AND IT IS NOT A SOLICITATION OF AN OFFER TO BUY THESE SECURITIES IN ANY JURISDICTION WHERE THE OFFER OR SALE IS NOT PERMITTED.
30
| APPLE CAMPUS 3 |
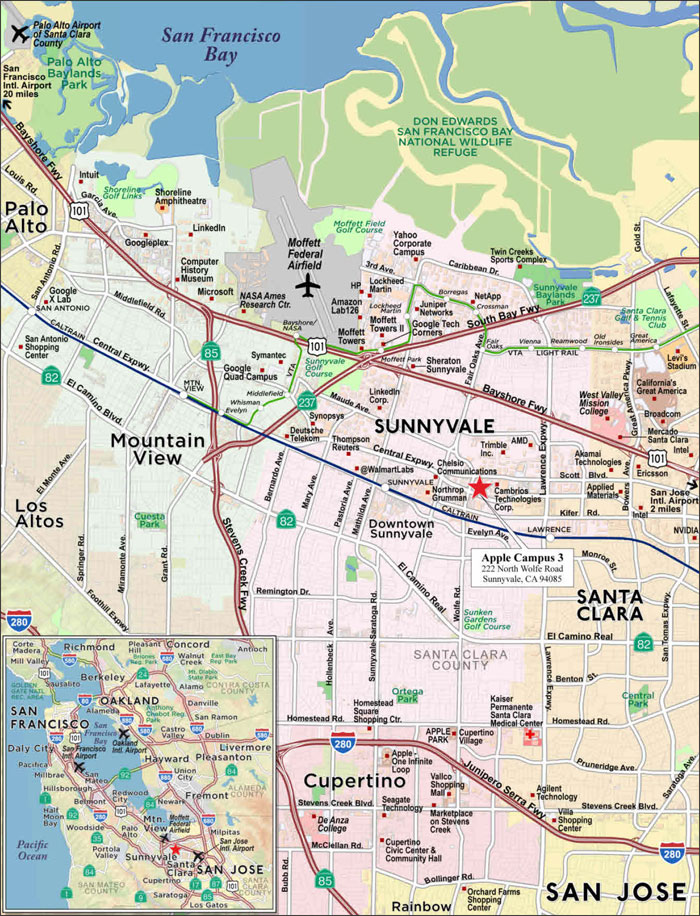
THE INFORMATION IN THIS STRUCTURAL AND COLLATERAL TERM SHEET IS NOT COMPLETE AND MAY BE AMENDED PRIOR TO THE TIME OF SALE. THIS TERM SHEET IS NOT AN OFFER TO SELL THESE SECURITIES AND IT IS NOT A SOLICITATION OF AN OFFER TO BUY THESE SECURITIES IN ANY JURISDICTION WHERE THE OFFER OR SALE IS NOT PERMITTED.
31
| APPLE CAMPUS 3 |
| No. 1 – Apple Campus 3 | ||||||
| Loan Information | Property Information | |||||
| Mortgage Loan Seller: | Wells Fargo Bank, National Association | Single Asset/Portfolio: | Single Asset | |||
| Credit Assessment (DBRS/Fitch/Moody’s): | AA(high)/BBB-sf/Baa2 | Property Type: | Office | |||
| Original Principal Balance(1): | $94,000,000 | Specific Property Type: | Suburban | |||
| Cut-off Date Balance(1): | $94,000,000 | Location: | Sunnyvale, CA | |||
| % of Initial Pool Balance: | 7.3% | Size: | 882,657 SF | |||
| Loan Purpose: | Refinance | Cut-off Date Balance Per SF(1): | $385.20 | |||
| Borrower Name: | CW SPE LLC | Year Built/Renovated: | 2017/NAP | |||
| Borrower Sponsor: | Paul Guarantor LLC | Title Vesting: | Fee | |||
| Mortgage Rate: | 3.365% | Property Manager: | Self-managed | |||
| Note Date: | December 14, 2017 | 4thMost Recent Occupancy(4): | NAP | |||
| Anticipated Repayment Date: | January 6, 2028 | 3rdMost Recent Occupancy(4): | NAP | |||
| Maturity Date: | April 6, 2031 | 2ndMost Recent Occupancy(4): | NAP | |||
| IO Period: | 120 months | Most Recent Occupancy(4): | NAP | |||
| Loan Term (Original): | 120 months | Current Occupancy(5): | 100.0% (2/1/2018) | |||
| Seasoning: | 1 month | |||||
| Amortization Term (Original): | NAP | Underwriting and Financial Information: | ||||
| Loan Amortization Type: | Interest-only, ARD | |||||
| Interest Accrual Method: | Actual/360 | 4thMost Recent NOI(4): | NAP | |||
| Call Protection: | L(25),D(88),O(7) | 3rdMost Recent NOI(4): | NAP | |||
| Lockbox Type: | Hard/Upfront Cash Management | 2ndMost Recent NOI(4): | NAP | |||
| Additional Debt(1)(2): | Yes | Most Recent NOI(4): | NAP | |||
| Additional Debt Type(1)(2): | Pari Passu;Mezzanine | |||||
| U/W Revenues: | $46,190,545 | |||||
| U/W Expenses: | $4,804,932 | |||||
| Escrows and Reserves(3): | U/W NOI: | $41,385,613 | ||||
| U/W NCF: | $41,209,082 | |||||
| Type: | Initial | Monthly | Cap (If Any) | U/W NOI DSCR(1): | 3.57x | |
| Taxes | $0 | $249,368 | NAP | U/W NCF DSCR(1)(2): | 3.55x | |
| Insurance | $0 | Springing | NAP | U/W NOI Debt Yield(1)(2): | 12.2% | |
| Replacement Reserves | $0 | Springing | NAP | U/W NCF Debt Yield(1): | 12.1% | |
| TI/LC Reserves | $2,979,839 | $0 | NAP | Stabilized Appraised Value(6): | $773,600,000 | |
| Rent Concession Reserve | $42,706,326 | $0 | NAP | Stabilized Appraisal Valuation Date(6): | June 1, 2019 | |
| Punchlist Reserve | $93,750 | Springing | NAP | Cut-off Date LTV Ratio(1)(2)(6): | 44.0% | |
| LTV Ratio at ARD(1)(2)(6): | 44.0% | |||||
| (1) | See “The Mortgage Loan” section. All statistical information related to balances per square foot, loan-to-value ratios, debt service coverage ratios and debt yields are based on the Apple Campus 3 Whole Loan (as defined below). |
| (2) | See “Subordinate and Mezzanine Indebtedness” section. The equity interest in the borrower has been pledged to secure senior mezzanine indebtedness with an original principal balance of $117,500,000 and junior mezzanine indebtedness with an original principal balance of $117,500,000. All statistical information related to the balance per square foot, loan-to-value ratios, debt service coverage ratios and debt yields are based solely on the Apple Campus 3 Whole Loan. As of the Cut-off Date, the U/W NCF DSCR, U/W NOI Debt Yield, Cut-off Date LTV Ratio and LTV Ratio at ARD based on the Apple Campus 3 Total Debt (as defined below) are 1.70x, 7.2%, 74.3% and 74.3%, respectively. |
| (3) | See “Escrows” section. |
| (4) | Historical occupancy and financial information is not applicable as the Apple Campus 3 Property (as defined below) was built in 2017. |
| (5) | Apple has taken possession of its space, is currently constructing its interior improvements and is expected to begin taking occupancy in September 2018. |
| (6) | See “Appraisal” section. The stabilized appraised value shown assumes that contractual tenant improvement and leasing commission (“TI/LC”) obligations have been fulfilled and there is no outstanding free rent. The borrower deposited upfront reserves totaling $45,779,915 for such contractual TI/LC obligations and free rent (see “Escrows” section). The As-Is Appraised Value is $624,600,000 as of November 7, 2017, equating to a Cut-off Date LTV Ratio and LTV Ratio at ARD of 54.4%. |
The Mortgage Loan. The mortgage loan (the “Apple Campus 3 Mortgage Loan”) is part of a whole loan (the “Apple Campus 3 Whole Loan”) evidenced by fivepari passu notes secured by a first mortgage encumbering the fee interest in a 882,657 square foot, four-story, class A, single-tenant office building located in Sunnyvale, California (the “Apple Campus 3 Property”). The Apple Campus 3 Whole Loan was co-originated on December 14, 2017 by Wells Fargo Bank, National Association; Deutsche Bank AG, New York Branch; and Goldman Sachs Mortgage Company. The Apple Campus 3 Whole Loan had an original principal balance of $340,000,000, has an outstanding principal balance as of the Cut-off Date of $340,000,000 and accrues interest at an interest rate of 3.365%per annum (the “Initial Interest Rate”) through the anticipated repayment date (“ARD”); provided, however, that upon the occurrence and continuance of an event of default, the Apple Campus 3 Whole Loan accrues interest at an interest rate equal to the Initial Interest Rate plus 5.000%. The Apple Campus 3 Whole Loan had an initial term of 120 months, has a remaining term to the ARD of 119 months as of the Cut-off Date and requires payments of interest only through the ARD. The ARD is January 6, 2028
THE INFORMATION IN THIS STRUCTURAL AND COLLATERAL TERM SHEET IS NOT COMPLETE AND MAY BE AMENDED PRIOR TO THE TIME OF SALE. THIS TERM SHEET IS NOT AN OFFER TO SELL THESE SECURITIES AND IT IS NOT A SOLICITATION OF AN OFFER TO BUY THESE SECURITIES IN ANY JURISDICTION WHERE THE OFFER OR SALE IS NOT PERMITTED.
32
| APPLE CAMPUS 3 |
and the final maturity date is April 6, 2031. In the event the Apple Campus 3 Whole Loan is not paid off in full on or before the ARD, the borrower will be required to make (a) interest payments based on an interest rate equal to the greater of (i) the Initial Interest Rate plus 1.500%per annum, and (ii) the swap rate plus 1.500%per annum; provided, however, that upon the occurrence and continuance of an event of default, the interest rate will be equal to (1) the greater of (i) and (ii), plus (2) 5.000%; and (b) principal payments based on a 30-year amortization assuming the Initial Interest Rate. The ARD automatically triggers a Cash Trap Event Period (see “Lockbox and Cash Management” section) whereby all excess cash flow will be used to pay down the principal balance of the Apple Campus 3 Whole Loan. See “Description of the Mortgage Pool— Certain Terms of the Mortgage Pool-ARD Loans” in the Preliminary Prospectus.
Note A-3, which will be contributed to the BANK 2018-BNK10 Trust, had an original principal balance of $94,000,000, has an outstanding principal balance as of the Cut-off Date of $94,000,000 and represents the controlling interest in the Apple Campus 3 Whole Loan. The non-controlling Notes A-1, A-2, A-4 and A-5, which have an aggregate original principal balance of $246,000,000, are currently held by Wells Fargo Bank, National Association (Notes A-1 and A-2), Deutsche Bank AG, New York Branch (Note A-4) and Goldman Sachs Mortgage Company (Note A-5) and are expected to be contributed to future securitization trusts. The mortgage loans evidenced by Note A-1, A-2, A-4 and A-5 are collectively referred to herein as the “Apple Campus 3 Companion Loans”. The lender provides no assurances that any non-securitizedpari passu notes will not be split further. See “Description of the Mortgage Pool—The Whole Loans—The Serviced Pari Passu Whole Loans” and “Pooling and Servicing Agreement” in the Preliminary Prospectus.
Note Summary
| Notes | Original Balance | Note Holder | Controlling Interest | |
| A-1 | $80,000,000 | Wells Fargo Bank, NA | No | |
| A-2 | $30,000,000 | Wells Fargo Bank, NA | No | |
| A-3 | $94,000,000 | BANK 2018-BNK10 | Yes | |
| A-4 | $68,000,000 | Deutsche Bank AG | No | |
| A-5 | $68,000,000 | Goldman Sachs Mortgage Company | No | |
| Total | $340,000,000 |
Following the lockout period, on any date before July 6, 2027, the borrower has the right to defease the Apple Campus 3 Whole Loan in whole, but not in part. In addition, the Apple Campus 3 Whole Loan is prepayable without penalty on or after July 6, 2027. The lockout period will expire on the earlier to occur of (i) two years after the closing date of the securitization that includes the last note to be securitized and (ii) December 14, 2021.
Sources and Uses
| Sources | Uses | |||||||
| Original loan amount | $340,000,000 | 59.1% | Loan payoff | $385,679,999 | 67.1% | |||
| Mezzanine debt | 235,000,000 | 40.9 | Reserves | 45,779,915 | 8.0 | |||
| Closing costs | 2,636,016 | 0.5 | ||||||
| Return of equity | 140,904,070 | 24.5 | ||||||
| Total Sources | $575,000,000 | 100.0% | Total Uses | $575,000,000 | 100.0% | |||
The Property. The Apple Campus 3 Property is a class A LEED Platinum office campus totaling 882,657 square feet and located in Sunnyvale, California. Built in 2017 and situated on a 17.8-acre site, the Apple Campus 3 Property comprises three interconnected, four-story office buildings totaling approximately 849,000 square feet, an amenities facility, outdoor common area and a seven-story parking structure. The Apple Campus 3 Property is 100.0% leased to Apple Inc. (“Apple”; NYSE: AAPL) through February 2031, with two, seven-year extension options and no termination options. Apple took possession of the Apple Campus 3 Property on December 1, 2017 and is currently constructing its interior improvements. As of January 2018, Apple is expected to begin taking occupancy of its space at the Apple Campus 3 Property in September 2018.
The interconnected office buildings within the Apple Campus 3 Property comprise Building A (308,659 square feet), Building B (269,997 square feet) and Building C (270,002 square feet), and the combined office floorplates average approximately 180,000 square feet. The amenities facility at the Apple Campus 3 Property totals approximately 34,000 square feet and is expected to serve as a cafeteria for Apple employees. Building A, Building B, the parking structure and the amenities building are collectively known as “Phase I” of the Apple Campus 3 Property; and Building C is known as “Phase 2”. Amenities at the Apple Campus 3 Property include a fitness/wellness center, coffee bar, general store, barber shop, bike repair shop, dry cleaning/laundry service and a conference center. Additional outdoor amenities at the Apple Campus 3 Property include a mini amphitheater situated in the center courtyard, outdoor seating, sport courts and athletic fields, bus/shuttle stops and green roof accessibility on the third floor of the office buildings.
According to the appraisal, as of 2016, Apple was the second largest employer in Sunnyvale, California, and the second largest space user in Silicon Valley. The Apple Campus 3 Property is situated approximately 3.5 miles north of both Apple Park and One Infinite Loop. Apple Park is Apple’s new 175-acre corporate headquarters campus, which comprises the 2.8 million square foot “spaceship” structure in addition to several associated research and development buildings. One Infinite Loop was originally developed as Apple’s headquarters in 1993 and totals approximately 850,000 square feet.
THE INFORMATION IN THIS STRUCTURAL AND COLLATERAL TERM SHEET IS NOT COMPLETE AND MAY BE AMENDED PRIOR TO THE TIME OF SALE. THIS TERM SHEET IS NOT AN OFFER TO SELL THESE SECURITIES AND IT IS NOT A SOLICITATION OF AN OFFER TO BUY THESE SECURITIES IN ANY JURISDICTION WHERE THE OFFER OR SALE IS NOT PERMITTED.
33
| APPLE CAMPUS 3 |
The following table presents certain information relating to the tenancy at the Apple Campus 3 Property:
Major Tenant
| Tenant Name | Credit Rating (Fitch/ Moody’s/ S&P)(1) | Tenant NRSF | % of NRSF | Annual U/W Base Rent PSF(2) | Annual U/W Base Rent(2) | % of Total Annual U/W Base Rent | Lease Expiration Date |
| Major Tenant | |||||||
| Apple(3) | NR/Aa1/AA+ | 882,657 | 100.0% | $48.35 | $42,675,300 | 100.0% | 2/28/2031(4) |
| Total Major Tenant | 882,657 | 100.0% | $48.35 | $42,675,300 | 100.0% | ||
| Vacant Space | 0 | 0.0% | |||||
| Collateral Total | 882,657 | 100.0% | |||||
| (1) | The entity on the lease is Apple Inc., which is the rated entity. |
| (2) | Annual U/W Base Rent PSF and Annual U/W Base Rent reflect the average rent over the remaining lease term. Apple is currently in a free rent period, as outlined in the footnote below, and will begin paying rent of $41.28 per square foot on Phase I in February 2019 and Phase II in June 2019. |
| (3) | Apple has taken possession of its space and is currently constructing its interior improvements. Apple is currently in a free rent period for (i) Phase 1 (approximately 69.4% of its space) through and including December 2018 and (ii) Phase 2 (approximately 30.6% of its space) through and including May 2019. In January 2019, Apple will pay reduced rent of approximately $6.93 per square foot on Phase I only. Through and including February 2018, Apple is required to pay reimbursements for utilities only, and commencing March 2018, the tenant will be required to pay reimbursements for utilities, operating expenses, taxes and insurance. All future rent credits and abatements under the Apple lease were reserved at the origination of the Apple Campus 3 Whole Loan (see “Escrows” section). |
| (4) | Apple has two, 7-year renewal options at 95% of fair market value with 360 days’ written notice. |
The following table presents certain information relating to the lease rollover schedule at the Apple Campus 3 Property:
Lease Expiration Schedule(1)
| Year Ending December 31, | No. of Leases Expiring | Expiring NRSF | % of Total NRSF | Cumulative Expiring NRSF | Cumulative % of Total NRSF | Annual U/W Base Rent | % of Total Annual U/W Base Rent | Annual U/W Base Rent PSF |
| MTM | 0 | 0 | 0.0% | 0 | 0.0% | $0 | 0.0% | $0.00 |
| 2018 | 0 | 0 | 0.0% | 0 | 0.0% | $0 | 0.0% | $0.00 |
| 2019 | 0 | 0 | 0.0% | 0 | 0.0% | $0 | 0.0% | $0.00 |
| 2020 | 0 | 0 | 0.0% | 0 | 0.0% | $0 | 0.0% | $0.00 |
| 2021 | 0 | 0 | 0.0% | 0 | 0.0% | $0 | 0.0% | $0.00 |
| 2022 | 0 | 0 | 0.0% | 0 | 0.0% | $0 | 0.0% | $0.00 |
| 2023 | 0 | 0 | 0.0% | 0 | 0.0% | $0 | 0.0% | $0.00 |
| 2024 | 0 | 0 | 0.0% | 0 | 0.0% | $0 | 0.0% | $0.00 |
| 2025 | 0 | 0 | 0.0% | 0 | 0.0% | $0 | 0.0% | $0.00 |
| 2026 | 0 | 0 | 0.0% | 0 | 0.0% | $0 | 0.0% | $0.00 |
| 2027 | 0 | 0 | 0.0% | 0 | 0.0% | $0 | 0.0% | $0.00 |
| 2028 | 0 | 0 | 0.0% | 0 | 0.0% | $0 | 0.0% | $0.00 |
| Thereafter | 1 | 882,657 | 100.0% | 882,657 | 100.0% | $42,675,300 | 100.0% | $48.35 |
| Vacant | 0 | 0 | 0.0% | 882,657 | 100.0% | $0 | 0.0% | $0.00 |
| Total/Weighted Average | 1 | 882,657 | 100.0% | $42,675,300 | 100.0% | $48.35 |
| (1) | Information obtained from the underwritten rent roll. |
The following table presents historical occupancy percentages at the Apple Campus 3 Property:
Historical Occupancy
12/31/2013(1) | 12/31/2014(1) | 12/31/2015(1) | 12/31/2016(1) | 2/1/2018(2)(3) |
| NAP | NAP | NAP | NAP | 100.0% |
| (1) | The Apple Campus 3 Property was built in 2017. |
| (2) | Apple has taken possession of its space at the Apple Campus 3 Property and is currently constructing its interior improvements. As of January 2018, Apple is expected to begin taking occupancy of its space at the Apple Campus 3 Property in September 2018. |
| (3) | Information obtained from the underwrittenrent roll. |
THE INFORMATION IN THIS STRUCTURAL AND COLLATERAL TERM SHEET IS NOT COMPLETE AND MAY BE AMENDED PRIOR TO THE TIME OF SALE. THIS TERM SHEET IS NOT AN OFFER TO SELL THESE SECURITIES AND IT IS NOT A SOLICITATION OF AN OFFER TO BUY THESE SECURITIES IN ANY JURISDICTION WHERE THE OFFER OR SALE IS NOT PERMITTED.
34
| APPLE CAMPUS 3 |
Operating History and Underwritten Net Cash Flow. The following table presents certain information relating to the underwritten net cash flow at the Apple Campus 3 Property:
Cash Flow Analysis(1)
| U/W | % of U/W Effective Gross Income | U/W $ per SF | ||||
| Base Rent | $42,675,300(2) | 92.4% | $48.35 | |||
| Grossed Up Vacant Space | 0 | 0.0 | 0.00 | |||
| Total Reimbursables | 3,981,816 | 8.6 | 4.51 | |||
| Other Income | 0 | 0.0 | 0.00 | |||
| Less Vacancy & Credit Loss | (466,571)(3) | (1.0) | (0.53) | |||
| Effective Gross Income | $46,190,545 | 100.0% | $52.33 | |||
| Total Operating Expenses | $4,804,932 | 10.4% | $5.44 | |||
| Net Operating Income | $41,385,613 | 89.6% | $46.89 | |||
| TI/LC | 0 | 0.0 | 0.00 | |||
| Capital Expenditures | 176,531 | 0.4 | 0.20 | |||
| Net Cash Flow | $41,209,082 | 89.2% | $46.69 | |||
| NOI DSCR(4) | 3.57x | |||||
| NCF DSCR(4) | 3.55x | |||||
| NOI DY(4) | 12.2% | |||||
| NCF DY(4) | 12.1% |
| (1) | Historical operating statements are not applicable, as the Apple Campus 3 Property was built in 2017. |
| (2) | Base Rent reflects the average rent over the lease term (see “Major Tenant” section). |
| (3) | The underwritten economic vacancy is 1.0%. The Apple Campus 3 Property was 100.0% leased as of February 1, 2018. |
| (4) | The debt service coverage ratios and debt yields are based on the Apple Campus 3 Whole Loan. |
Appraisal.The appraiser concluded to an “as-stabilized” appraised value of $773,600,000 with a valuation date of June 1, 2019, which assumes that contractual TI/LC obligations have been fulfilled and there is no outstanding free rent. The borrower deposited upfront reserves totaling $45,779,915 for such TI/LC obligations and free rent periods (see “Escrows” section). As of the appraisal valuation date of November 7, 2017 the Apple Campus 3 Property had an “as-is” appraised value of $624,600,000. The appraiser also concluded to a “Go Dark” value of $566,750,000 as of November 7, 2017.
Environmental Matters. According to the Phase I Environmental Assessment dated November 20, 2017, there are recognized environmental conditions at the Apple Campus 3 Property related to (i) potential soil, gas and groundwater contamination and (ii) residual soil impacts and possible vapor intrusion concerns. The Phase I assessment recommended no further action aside from continued implementation of a site management plan and vapor-intrusion mitigation system. In regard to the groundwater contamination, the responsible parties are Advanced Micro Devices, Inc., Northrop Grumman and Locus Technologies (a subsidiary of the Philips Electronics Company). The RECs are further described under “Description of the Mortgage Pool—Mortgage Pool Characteristics–Environmental Considerations” in the Preliminary Prospectus.
Market Overview and Competition. The Apple Campus 3 Property is located in Sunnyvale, California near the intersection of Central Expressway and Wolfe Road. Sunnyvale is the seventh most populous city in the San Francisco Bay Area and one of the major cities comprising Silicon Valley. According to a third party market research report, as of the third quarter of 2017, the San Jose/Sunnyvale/Santa Clara metropolitan statistical area had an unemployment rate of 3.2% and reported an 8.9% GDP growth rate over the past five years, compared to an overall 2.4% growth rate for the United States.
The Apple Campus 3 Property is centrally located within 1.4 miles of two Santa Clara Valley Transportation Authority Light Rail stations (the Sunnyvale station in the Heritage District Downtown and the Lawrence Station in eastern Sunnyvale), 3.9 miles from the Downtown Mountain View Caltrain Station, and within close proximity to highways 101, 280, 237 and 85. According to a third-party market research report, the 2017 estimated population within a one-, three- and five-mile radius of the Apple Campus 3 Property was 26,490, 193,228, and 466,901, respectively; while the 2017 estimated average household income within the same radii was $121,630, $133,362, and $141,198, respectively.
According to a third-party market research report, as of the third quarter of 2017, the Sunnyvale submarket contained approximately 10.9 million square feet of office space exhibiting a vacancy rate of approximately 3.1% and an average asking rental rate of $64.44 per square foot, gross. The appraiser identified 15 comparable class A office properties totaling approximately 2.4 million square feet, which reported a 99.7% occupancy rate and average asking rents of $50.58 per square foot, triple net.
THE INFORMATION IN THIS STRUCTURAL AND COLLATERAL TERM SHEET IS NOT COMPLETE AND MAY BE AMENDED PRIOR TO THE TIME OF SALE. THIS TERM SHEET IS NOT AN OFFER TO SELL THESE SECURITIES AND IT IS NOT A SOLICITATION OF AN OFFER TO BUY THESE SECURITIES IN ANY JURISDICTION WHERE THE OFFER OR SALE IS NOT PERMITTED.
35
| APPLE CAMPUS 3 |
The following table presents certain information relating to comparable office leases for the Apple Campus 3:
Comparable Leases(1)
| Property Name/Location | Year Built/ Renovated | Total GLA (SF) | Distance from Subject | Tenant Name | Lease Date/Term | Lease Area (SF) | Annual Base Rent PSF | Lease Type |
Moffett Towers II 905 11th Avenue Sunnyvale, CA | 2016/NAV | 350,663 | 3.0 mile | Lab 126 | March 2017/ 10.0 Yrs
| 350,663 | $47.40 | NNN |
Moffett Gateway 1225 Crossman Avenue Sunnyvale, CA | 2016/NAV | 298,924 | 2.3 miles | Google, Inc. | November 2016/ 11.0 Yrs | 298,924 | $44.40 | NNN |
10900 Tantau Avenue Cupertino, CA | 2008/NAV | 102,540 | 3.5 miles | Panasonic | May 2017/ 5.0 Yrs | 43,034 | $51.00 | NNN |
Tree Farm 4440 El Camino Real Los Altos, CA | 1999/NAV | 96,562 | 6.8 mile | Toyota | March 2017/ 5.5 Yrs
| 96,562 | $63.00 | NNN |
Moffett Tower II Bldg. 2 905 11th Avenue Sunnyvale, CA | 2017/NAV | 362,600 | 3.0 miles | Amazon | December 2016/ 10.0 Yrs | 362,600 | $48.00 | NNN |
| (1) | Information obtained from third party market report |
The Borrower.The borrower is CW SPE LLC, a Delaware limited liability company and single purpose entity with two independent directors. Legal counsel to the borrower delivered a non-consolidation opinion in connection with the origination of the Apple Campus 3 Whole Loan. Paul Guarantor LLC is the guarantor of certain nonrecourse carveouts under the Apple Campus 3 Whole Loan. The Apple Campus 3 Borrower is affiliated with the borrower under the Moffett Towers II – Building 2 Mortgage Loan.
The Borrower Sponsor.The borrower sponsor is Paul Guarantor LLC, which is 100% directly owned by Jay Paul Company, a privately held real estate firm based in San Francisco, California. Founded in 1975, Jay Paul Company concentrates on the acquisition, development, and management of commercial properties throughout California. Jay Paul Company has developed over 11.0 million square feet of institutional quality space, and since 2000, has closed on more than $12.0 billion in debt and equity financings.
Escrows.The Apple Campus 3 Whole Loan documents provide for upfront escrows in the amount of $42,706,326 for rent abatement periods, $2,979,839 for outstanding TI/LCs, and $93,750 for the estimated cost to complete outstanding punchlist items. The Apple Campus 3 Whole Loan documents provide for ongoing monthly escrows of $249,368 for real estate taxes. The Apple Campus 3 Whole Loan documents provide for additional reserves in the amount of 125% of any additional punchlist items received from Apple (following origination, an additional $506,100 was deposited due to additional punchlist items identified by Apple).
The Apple Campus 3 Whole Loan documents do not require ongoing monthly escrows for insurance premiums as long as (i) no event of default has occurred and is continuing; (ii) the borrower provides the lender with evidence that the Apple Campus 3 Property’s insurance coverage is included in a blanket policy and such policy is in full force and effect; and (iii) the borrower pays all applicable insurance premiums and provides the lender with evidence of renewals. The Apple Campus 3 Whole Loan documents do not require ongoing monthly escrows for replacement reserves as long as no “Cash Trap Event Period” (as defined in the “Lockbox and Cash Management” section) has occurred and is continuing.
Lockbox and Cash Management.The Apple Campus 3 Whole Loan requires a lender-controlled lockbox account, which is already in-place, and that the borrower direct the tenant to pay its rent directly into such lockbox account. The loan documents also require that all rents received by the borrower or the property manager be deposited into the lockbox account within one business day of receipt. Prior to the occurrence of a Cash Trap Event Period (as defined below), all excess funds are required to be distributed to the borrower. During a Cash Trap Event Period, all excess funds are required to be swept to a lender-controlled cash management account. During a Lease Sweep Period (as defined below), the borrower is required to make minimum monthly deposits of $1,838,869 into a leasing reserve (regardless of the amount of available excess cash flow).
A “Cash Trap Event Period” will commence upon the earlier of the following:
| (i) | the occurrence of an event of default under the Apple Campus 3 Whole Loan, the Apple Campus 3 Senior Mezzanine Loan or the Apple Campus 3 Junior Mezzanine Loan (see “Subordinate and Mezzanine Indebtedness” section); |
| (ii) | the occurrence of a Lease Sweep Period (as defined below); |
| (iii) | the debt service coverage ratio based on the Apple Campus 3 Whole Loan falling below 1.85x (based on a hypothetical 30-year amortization period), or the debt service coverage ratio based on the Apple Campus 3 Total Debt (see “Subordinate and Mezzanine Indebtedness” section) falling below 1.10x (based on a hypothetical 30-year amortization period) at the end of any calendar quarter; or |
| (iv) | the ARD. |
THE INFORMATION IN THIS STRUCTURAL AND COLLATERAL TERM SHEET IS NOT COMPLETE AND MAY BE AMENDED PRIOR TO THE TIME OF SALE. THIS TERM SHEET IS NOT AN OFFER TO SELL THESE SECURITIES AND IT IS NOT A SOLICITATION OF AN OFFER TO BUY THESE SECURITIES IN ANY JURISDICTION WHERE THE OFFER OR SALE IS NOT PERMITTED.
36
| APPLE CAMPUS 3 |
A Cash Trap Event Period will end upon the occurrence of the following:
| ● | with regard to clause (i), the cure of such event of default; |
| ● | with regard to clause (ii), a Lease Sweep Period Cure Event (as defined below); |
| ● | with regard to clause (iii), the debt service coverage ratio based on the Apple Campus 3 Whole Loan (based on a hypothetical 30-year amortization schedule) being equal to 1.85x or greater, and the debt service coverage ratio based on the Apple Campus 3 Total Debt (based on a hypothetical 30-year amortization schedule) being equal to 1.10x or greater for two consecutive calculation dates; or |
| ● | with regard to clause (iv), the Apple Campus 3 Whole Loan being repaid in full. |
A “Lease Sweep Period” will commence upon the earlier of the following (for clauses (i), (iii), (iv) and (v) below, the term ‘Apple’ includes any replacement tenant that occupies at least 75% of the space currently occupied by Apple):
| (i) | Apple cancels, terminates or gives notice of its intent to cancel or terminate its lease on at least 40,000 square feet; |
| (ii) | Apple is no longer an Investment Grade Entity (as defined below); |
| (iii) | Apple goes dark in 20% or more of its space; provided, however, that a Lease Sweep Period will not commence as long as Apple remains an Investment Grade Entity; |
| (iv) | Apple defaults under its lease beyond any applicable notice and cure period; or |
| (v) | Apple becomes insolvent or files for bankruptcy. |
A “Lease Sweep Cure Event” will occur upon the following:
| ● | with regard to clause (i), (a) a Qualified Re-Leasing Event (as defined below), or (b) total swept funds equating to $35.00 per square foot of such applicable space (or borrower delivering to the lender an acceptable letter of credit in such amount); |
| ● | with regard to clauses (ii) or (iii), (a) a Qualified Re-Leasing Event, (b) Apple restoring its status as an Investment Grade Entity; (c) the applicable space being subleased to an Investment Grade Entity who has accepted delivery of the space and is paying unabated rent in an amount no less than the contract rate of the primary lease; or (d) total swept funds equating to $50.00 per square foot of (x) the Apple lease space with respect to clause (ii) and (y) the applicable space with respect to clause (iii) (or borrower delivering to the lender an acceptable letter of credit in such amount); provided, however, that once total swept funds in the leasing reserve equate to $35.00 per square foot of the applicable space, additional funds will be deposited into a debt service reserve account until such $50.00 per square foot cap is met; |
| ● | with regard to clause (iv), (a) the cure of such event of default and no other default occurring for a period of three consecutive months, or (b) total swept funds equating to $35.00 per square foot (or borrower delivering to the lender an acceptable letter of credit in such amount); |
| ● | with regard to clause (v), the bankruptcy or insolvency proceedings having terminated and the lease having been affirmed or assigned in a manner satisfactory to the lender. |
An “Investment Grade Entity” means an entity that is rated ‘BBB-’, or equivalent, or higher by at least two of Fitch, Moody’s and S&P.
A “Qualified Re-Leasing Event” will occur upon one or more replacement tenants acceptable to lender executing leases covering at least 75% of the space currently occupied by Apple with (i) terms extending at least three years beyond the Maturity Date of the Apple Campus 3 Whole Loan; (ii) economic terms at least as favorable as those in the lease being replaced; (iii) such replacement tenants having taken possession of such space and paying full unabated rent or such abatement has been reserved; (iv) and all tenant improvements and leasing commissions having been paid or reserved.
Property Management.The Apple Campus 3 Property is managed by an affiliate of the borrower.
Assumption.The Apple Campus 3 borrower has the right to transfer the Apple Campus 3 Property, provided that certain other conditions are satisfied, including, but not limited to: (i) no event of default has occurred and is continuing; (ii) the lender’s reasonable determination that the proposed transferee and guarantor satisfy the lender’s credit review and underwriting standards, taking into consideration transferee experience, financial strength and general business standing; and (iii) if requested by the lender, rating agency confirmation from DBRS, Fitch, and Moody’s that the transfer will not result in a downgrade, withdrawal or qualification of the respective ratings assigned to the Series 2018-BNK10 Certificates and similar confirmations from each rating agency rating any securities backed by any of the Apple Campus 3 Companion Loans with respect to the ratings of such securities.
Rights of First Offer. Apple has a right of first offer to purchase the Apple Campus 3 Property if the borrower markets the property for sale (the “Apple ROFO”). The Apple ROFO is not extinguished by foreclosure; however, the Apple ROFO does not apply to foreclosure or deed-in-lieu thereof.
Partial Release.Not permitted.
Real Estate Substitution.Not permitted.
Subordinate and Mezzanine Indebtedness.Wells Fargo Bank, National Association; Deutsche Bank AG, New York Branch; and Goldman Sachs Mortgage Company (collectively, the “Mezzanine Co-Lenders”) funded a $117,500,000 senior mezzanine loan to CW Mezz LLC (the “Apple Campus 3 Senior Mezzanine Loan”) and a $117,500,000 junior mezzanine loan to Central Wolfe LLC (the “Apple Campus 3 Junior Mezzanine Loan”)(collectively, the Apple Campus 3 Whole Loan, Apple Campus 3 Senior Mezzanine Loan and Apple Campus 3 Junior Mezzanine Loan are referred to herein as the “Apple Campus 3 Total Debt”). The Apple Campus 3 Senior Mezzanine Loan and the Apple Campus 3 Junior Mezzanine Loan are coterminous with the Apple Campus 3 Whole Loan and require interest-only payments. The Apple Campus 3 Senior Mezzanine Loan accrues interest at a fixed interest rate equal to 4.620% per annum (the “Senior Mezzanine Initial Interest Rate”), and the Apple Campus 3 Junior Mezzanine Loan accrues interest at a fixed interest rate equal to 6.000% per annum (the “Junior Mezzanine Initial Interest Rate”). In the event the Apple Campus 3 Senior
THE INFORMATION IN THIS STRUCTURAL AND COLLATERAL TERM SHEET IS NOT COMPLETE AND MAY BE AMENDED PRIOR TO THE TIME OF SALE. THIS TERM SHEET IS NOT AN OFFER TO SELL THESE SECURITIES AND IT IS NOT A SOLICITATION OF AN OFFER TO BUY THESE SECURITIES IN ANY JURISDICTION WHERE THE OFFER OR SALE IS NOT PERMITTED.
37
| APPLE CAMPUS 3 |
Mezzanine Loan and/or the Apple Campus 3 Junior Mezzanine Loan are not paid off in full on or before the ARD, the borrower will be required to make interest payments based on an interest rate equal to the greater of (i) the Senior Mezzanine Initial Interest Rate or the Junior Mezzanine Initial Interest Rate, as applicable, plus 1.500% per annum, and (ii) the swap rate plus 1.500% per annum; provided, however, that upon the occurrence and continuance of an event of default, the interest rate will be equal to (1) the greater of (i) and (ii), plus (2) 5.000%. An intercreditor agreement is in place with respect to the Apple Campus 3 Whole Loan, the Apple Campus 3 Senior Mezzanine Loan and the Apple Campus 3 Junior Mezzanine Loan.
Ground Lease.None.
Terrorism Insurance.The Apple Campus 3 Whole Loan documents require that the “all risk” insurance policy required to be maintained by the borrower provide coverage for terrorism in an amount equal to the full replacement cost of the Apple Campus 3 Property, as well as business interruption insurance covering no less than the 24-month period following the occurrence of a casualty event, together with a 12-month extended period of indemnity.
Earthquake Insurance.The loan documents require earthquake insurance. At the time of closing, earthquake insurance coverage is in-place for the Apple Campus 3 Property. The seismic report indicated a probable maximum loss of 10.0% for the Apple Campus 3 Property.
THE INFORMATION IN THIS STRUCTURAL AND COLLATERAL TERM SHEET IS NOT COMPLETE AND MAY BE AMENDED PRIOR TO THE TIME OF SALE. THIS TERM SHEET IS NOT AN OFFER TO SELL THESE SECURITIES AND IT IS NOT A SOLICITATION OF AN OFFER TO BUY THESE SECURITIES IN ANY JURISDICTION WHERE THE OFFER OR SALE IS NOT PERMITTED.
38
(THIS PAGE INTENTIONALLY LEFT BLANK)
39
| LARP I PORTFOLIO |
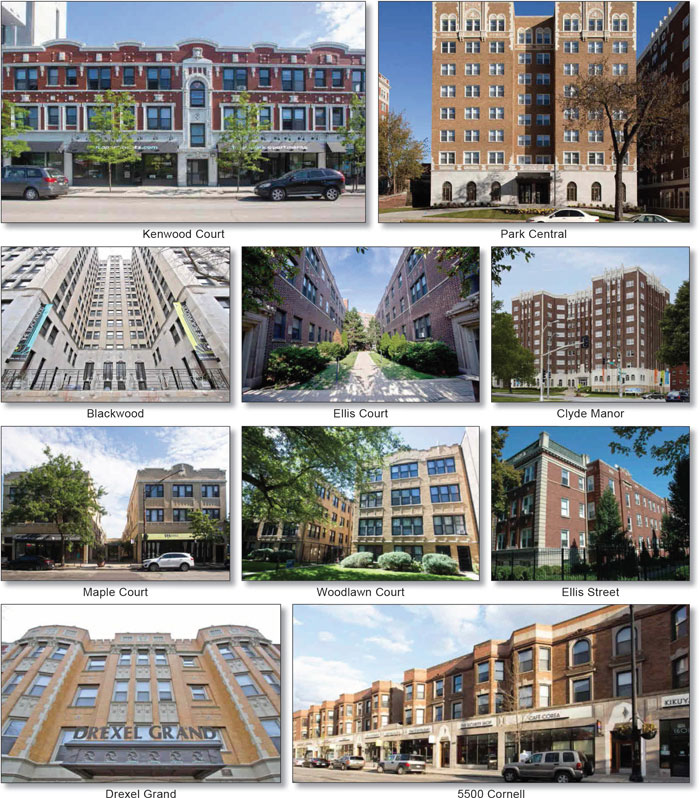
THE INFORMATION IN THIS STRUCTURAL AND COLLATERAL TERM SHEET IS NOT COMPLETE AND MAY BE AMENDED PRIOR TO THE TIME OF SALE. THIS TERM SHEET IS NOT AN OFFER TO SELL THESE SECURITIES AND IT IS NOT A SOLICITATION OF AN OFFER TO BUY THESE SECURITIES IN ANY JURISDICTION WHERE THE OFFER OR SALE IS NOT PERMITTED.
40
| LARP I PORTFOLIO |
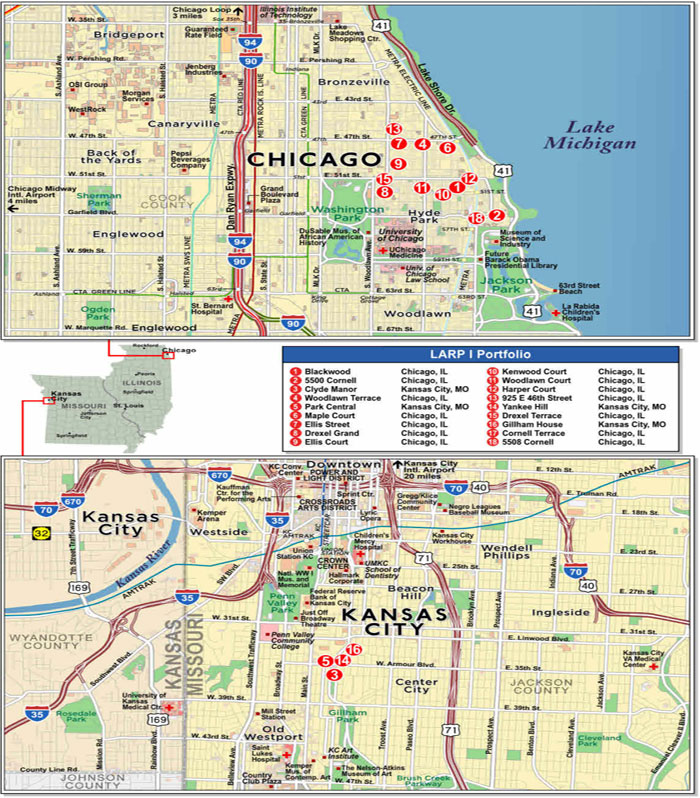
THE INFORMATION IN THIS STRUCTURAL AND COLLATERAL TERM SHEET IS NOT COMPLETE AND MAY BE AMENDED PRIOR TO THE TIME OF SALE. THIS TERM SHEET IS NOT AN OFFER TO SELL THESE SECURITIES AND IT IS NOT A SOLICITATION OF AN OFFER TO BUY THESE SECURITIES IN ANY JURISDICTION WHERE THE OFFER OR SALE IS NOT PERMITTED.
41
| LARP I PORTFOLIO |
| No. 2 – LARP I Portfolio | |||||||
| Loan Information | Property Information | ||||||
| Mortgage Loan Seller: | Morgan Stanley Mortgage Capital Holdings LLC | Single Asset/Portfolio: | Portfolio | ||||
| Credit Assessment (DBRS/Fitch/Moody’s): | NR/NR/NR | Property Type(3): | Multifamily | ||||
| Original Principal Balance: | $90,000,000 | Specific Property Type: | Various | ||||
| Cut-off Date Balance: | $90,000,000 | Location: | Various | ||||
| % of Initial Pool Balance: | 7.0% | Size: | 979 Units | ||||
| Loan Purpose: | Recapitalization | Cut-off Date Balance Per Unit: | $91,931 | ||||
| Borrower Names: | Various | Year Built/Renovated: | Various/Various | ||||
| Borrower Sponsor: | Antheus Capital | Title Vesting: | Fee | ||||
| Mortgage Rate: | 5.004% | Property Manager: | Self-Managed | ||||
| Note Date: | December 22, 2017 | 4thMost Recent Occupancy (As of): | 93.3% (12/31/2013) | ||||
| Anticipated Repayment Date: | NAP | 3rdMost Recent Occupancy (As of): | 93.8% (12/31/2014) | ||||
| Maturity Date: | January 1, 2028 | 2ndMost Recent Occupancy (As of): | 95.7% (12/31/2015) | ||||
| IO Period: | 120 months | Most Recent Occupancy (As of): | 95.0% (12/31/2016) | ||||
| Loan Term (Original): | 120 months | Current Occupancy (As of): | 93.3% (Various) | ||||
| Seasoning: | 1 month | ||||||
| Amortization Term (Original): | NAP | Underwriting and Financial Information: | |||||
| Loan Amortization Type: | Interest-only, Balloon | 4thMost Recent NOI (As of): | $6,147,939 (12/31/2014) | ||||
| Interest Accrual Method: | Actual/360 | 3rdMost Recent NOI (As of): | $6,659,855 (12/31/2015) | ||||
| Call Protection: | L(25),D(88),O(7) | 2ndMost Recent NOI (As of): | $7,235,799 (12/31/2016) | ||||
| Lockbox Type: | Springing | Most Recent NOI (As of): | $7,658,099 (TTM 9/30/2017) | ||||
| Additional Debt: | Yes | ||||||
| Additional Debt Type(1): | Mezzanine | U/W Revenues(3): | $13,044,378 | ||||
| U/W Expenses: | $5,394,782 | ||||||
| U/W NOI: | $7,649,597 | ||||||
| U/W NCF: | $7,386,342 | ||||||
| Escrows and Reserves(2): | U/W NOI DSCR(1): | 1.68x | |||||
| U/W NCF DSCR(1): | 1.62x | ||||||
| Type: | Initial | Monthly | Cap (If Any) | U/W NOI Debt Yield(1): | 8.5% | ||
| Taxes | $413,520 | $68,920 | NAP | U/W NCF Debt Yield(1): | 8.2% | ||
| Insurance | $147,650 | Springing | NAP | As-Is Appraised Value: | $140,530,000 | ||
| Residential Replacement Reserves | $0 | $20,999 | NAP | As-Is Appraisal Valuation Date: | November 3, 2017 | ||
| Commercial Tenant Replacement Reserves | $0 | $403 | $14,508 | Cut-off Date LTV Ratio(1): | 64.0% | ||
| Commercial Tenant TI/LC Reserves | $0 | $940 | $33,840 | LTV Ratio at Maturity or ARD(1): | 64.0% | ||
| Deferred Maintenance | $47,439 | NAP | NAP | ||||
| (1) | See “Subordinate and Mezzanine Indebtedness” section. The equity interest in the borrowers has been pledged to secure mezzanine indebtedness with an original principal balance of $18,000,000 (the “LARP I Portfolio Mezzanine Loan”). All statistical information related to the balance per unit, loan-to-value ratios, debt service coverage ratios and debt yields are based solely on the LARP I Portfolio Mortgage Loan. As of the Cut-off Date, the combined U/W NOI DSCR, U/W NCF DSCR, U/W NOI Debt Yield, U/W NCF Debt Yield, Cut-off Date LTV Ratio and LTV Ratio at Maturity or ARD including the LARP I Portfolio Mezzanine Loan were 1.29x, 1.24x, 7.1%, 6.8%, 76.9% and 76.9%, respectively. |
| (2) | See “Escrows” section. |
| (3) | Four properties contain ground floor retail space that accounts for approximately 8.3% of the aggregate underwritten gross potential rent for the LARP I Portfolio Properties. |
The Mortgage Loan. The mortgage loan (the “LARP I Portfolio Mortgage Loan”) is evidenced by a single promissory note secured by a first mortgage encumbering the fee interest in a portfolio of 18 multifamily properties totaling 979 units and 32,187 square feet of ground floor retail space located in Chicago, Illinois and Kansas City, Missouri (the “LARP I Portfolio Properties”). The LARP I Portfolio Mortgage Loan had an original principal balance of $90,000,000, has an outstanding principal balance as of the Cut-off Date of $90,000,000 and accrues interest at an interest rate of 5.004% per annum. The LARP I Portfolio Mortgage Loan had an initial term of 120 months, has a remaining term of 119 months as of the Cut-off Date and requires payments of interest only through the term of the LARP I Portfolio Mortgage Loan. The LARP I Portfolio Mortgage Loan matures on January 1, 2028.
Following the lockout period, the borrower has the right to defease the LARP I Portfolio Mortgage Loan in whole, or in part as described below under “Partial Defeasance,” on any date before July 1, 2027. In addition, the LARP I Portfolio Mortgage Loan is prepayable without penalty on or after July 1, 2027.
THE INFORMATION IN THIS STRUCTURAL AND COLLATERAL TERM SHEET IS NOT COMPLETE AND MAY BE AMENDED PRIOR TO THE TIME OF SALE. THIS TERM SHEET IS NOT AN OFFER TO SELL THESE SECURITIES AND IT IS NOT A SOLICITATION OF AN OFFER TO BUY THESE SECURITIES IN ANY JURISDICTION WHERE THE OFFER OR SALE IS NOT PERMITTED.
42
| LARP I PORTFOLIO |
The following table presents certain information relating to the LARP I Portfolio Properties:
| Property Name | City / State | Year Built/Renovated | Units | Retail SF | Allocated Cut-off Date Balance(2) | % of | Appraised Value(3) | % of Appraised Value | UW NOI | % of UW NOI |
| Blackwood | Chicago, IL | 1965/2009 | 145 | NAP | 17,000,000 | 18.9% | 26,200,000 | 18.6% | $1,419,614 | 18.6% |
| 5500 Cornell | Chicago, IL | 1903/NAP | 65 | 19,527 | 12,333,333 | 13.7% | 19,000,000 | 13.5% | $997,112 | 13.0% |
| Clyde Manor | Kansas City, MO | 1920/2010 | 115 | NAP | 8,333,333 | 9.3% | 12,930,000 | 9.2% | $667,127 | 8.7% |
| Woodlawn Terrace | Chicago, IL | 1926/NAP | 104 | NAP | 6,875,000 | 7.6% | 10,600,000 | 7.5% | $601,625 | 7.9% |
| Park Central | Kansas City, MO | 1930/2011 | 106 | NAP | 6,416,667 | 7.1% | 9,880,000 | 7.0% | $615,622 | 8.0% |
| Maple Court | Chicago, IL | 1913/NAP | 68 | 2,560 | 5,416,667 | 6.0% | 8,760,000 | 6.2% | $443,842 | 5.8% |
| Ellis Street | Chicago, IL | 1920/2015 | 80 | NAP | 5,416,667 | 6.0% | 8,350,000 | 5.9% | $468,740 | 6.1% |
| Drexel Grand | Chicago, IL | 1929/2005 | 74 | NAP | 5,041,667 | 5.6% | 7,800,000 | 5.6% | $476,882 | 6.2% |
| Ellis Court | Chicago, IL | 1924/2009 | 43 | 6,000 | 4,562,500 | 5.1% | 7,040,000 | 5.0% | $383,766 | 5.0% |
| Kenwood Court | Chicago, IL | 1911/2008 | 25 | 4,100 | 4,541,667 | 5.0% | 7,000,000 | 5.0% | $387,998 | 5.1% |
| Woodlawn Court | Chicago, IL | 1923/2005 | 30 | NAP | 4,000,000 | 4.4% | 6,200,000 | 4.4% | $320,203 | 4.2% |
| Harper Court | Chicago, IL | 1910/NAP | 18 | NAP | 2,020,833 | 2.2% | 3,380,000 | 2.4% | $163,909 | 2.1% |
| 925 E 46th Street | Chicago, IL | 1930/2016 | 24 | NAP | 1,791,667 | 2.0% | 2,760,000 | 2.0% | $163,485 | 2.1% |
| Yankee Hill | Kansas City, MO | 1913/2008 | 16 | NAP | 1,583,333 | 1.8% | 2,420,000 | 1.7% | $128,680 | 1.7% |
| Drexel Terrace | Chicago, IL | 1913/NAP | 25 | NAP | 1,416,667 | 1.6% | 2,810,000 | 2.0% | $117,315 | 1.5% |
| Gillham House | Kansas City, MO | 1910/2008 | 24 | NAP | 1,395,833 | 1.6% | 2,200,000 | 1.6% | $143,185 | 1.9% |
| Cornell Terrace | Chicago, IL | 1924/NAP | 14 | NAP | 1,229,167 | 1.4% | 2,000,000 | 1.4% | $100,269 | 1.3% |
| 5508 Cornell | Chicago, IL | 1920/2002 | 3 | NAP | 624,999 | 0.7% | 1,200,000 | 0.9% | $50,224 | 0.7% |
| Total/Weighted Average | 979 | 32,187 | $90,000,000 | 100.0% | $140,530,000 | 100.0% | $7,649,597 | 100.0% | ||
Sources and Uses
| Sources | Uses | |||||||
| Original loan amount | $90,000,000 | 76.0% | Loan Recapitalization(1) | $115,026,758 | 97.1% | |||
| Mezzanine loan | 18,000,000 | 15.2 | Closing costs | 2,800,043 | 2.4 | |||
| Equity | 10,435,410 | 8.8 | Reserves | 608,609 | 0.5 | |||
| Total Sources | $118,435,410 | 100.0% | Total Uses | $118,435,410 | 100.0% |
| (1) | Ownership of the LARP I Portfolio Properties was recapitalized in conjunction with refinancing of the existing debt previously encumbering the LARP I Portfolio Properties. |
The Properties. The LARP I Portfolio Properties comprise a mix of low-rise, garden, mid-rise and high-rise multifamily buildings totaling 979 multifamily units (comprising 91.7% of underwritten gross potential rent) and 32,187 square feet of ground floor retail space (comprising 8.3% of underwritten gross potential rent) located in Chicago, Illinois and Kansas City, Missouri. The multifamily units were 93.3% occupied and the retail space was 98.2% occupied as of the December 2017 rent rolls. There are 14 multifamily properties totaling 718 units located in the Hyde Park and Kenwood neighborhoods of Chicago, Illinois, ranging in size from 3 to 145 units, accounting for 78.7% of total multifamily base rent. Four of the Chicago properties contain a total of 32,187 square feet of ground-level retail space, which accounts for 8.3% of underwritten gross potential rent. There are four multifamily properties totaling 261 units located in Kansas City, Missouri, ranging in size from 16 to 115 units, accounting for 21.3% of total multifamily gross potential rent. The largest property by allocated loan balance, Blackwood, has 145 units and comprises 19.5% of total multifamily gross potential rent, with no other property accounting for more than 9.9% of total multifamily gross potential rent. Only two properties, Blackwood (18.7% of underwritten NCF) and 5500 Cornell (13.1% of underwritten NCF), individually account for more than 10% of underwritten net cash flow.
The LARP I Portfolio Properties were constructed between 1903 and 1965 and acquired by the borrower between 2003 and 2006. Approximately $63.3 million was subsequently spent on renovations and capital improvements. The majority of the properties located in Chicago were substantially renovated at an aggregate cost of $27.4 million ($38,155 per unit) and the properties located in Kansas City underwent full historic rehabilitations at an aggregate cost of $36.0 million ($137,752 per unit). The Chicago Properties are located within approximately 2 miles of the University of Chicago and the Kansas City Properties are located within approximately 2.5 miles from the University of Missouri-Kansas City. Approximately 27.9% of the Chicago units and approximately 23.8% of the Kansas City units are leased to students.
THE INFORMATION IN THIS STRUCTURAL AND COLLATERAL TERM SHEET IS NOT COMPLETE AND MAY BE AMENDED PRIOR TO THE TIME OF SALE. THIS TERM SHEET IS NOT AN OFFER TO SELL THESE SECURITIES AND IT IS NOT A SOLICITATION OF AN OFFER TO BUY THESE SECURITIES IN ANY JURISDICTION WHERE THE OFFER OR SALE IS NOT PERMITTED.
43
| LARP I PORTFOLIO |
The following table presents certain information relating to the multifamily unit mix of the LARP I Portfolio Properties:
Multifamily Unit Mix Summary(1)
| Property Name | Neighborhood | Specific Property Type | Units | SF(2) | Average Unit Size(3) | Studio | 1 BR | 2 BR | 3 BR | 4 BR | Occupancy | |
| Blackwood | Hyde Park | High Rise | 145 | 90,485 | 624 | 0 | 48 | 97 | 0 | 0 | 91.0% | |
| 5500 Cornell | Hyde Park | Garden | 65 | 53,387 | 521 | 41 | 2 | 9 | 7 | 6 | 96.9% | |
| Clyde Manor | Kansas City | Mid Rise | 115 | 61,111 | 532 | 17 | 63 | 35 | 0 | 0 | 90.0% | |
| Woodlawn Terrace | Kenwood | Garden | 104 | 47,322 | 455 | 78 | 12 | 14 | 0 | 0 | 97.0% | |
| Park Central | Kansas City | Mid Rise | 106 | 46,708 | 441 | 60 | 46 | 0 | 0 | 0 | 88.0% | |
| Maple Court | Kenwood | Garden | 68 | 41,151 | 568 | 2 | 62 | 4 | 0 | 0 | 97.0% | |
| Ellis Street | Kenwood | Garden | 80 | 36,666 | 458 | 36 | 21 | 23 | 0 | 0 | 95.0% | |
| Drexel Grand | Hyde Park | Garden | 74 | 30,970 | 419 | 42 | 30 | 2 | 0 | 0 | 97.3% | |
| Ellis Court | Hyde Park | Garden | 43 | 27,050 | 490 | 23 | 19 | 1 | 0 | 0 | 95.0% | |
| Kenwood Court | Hyde Park | Garden | 25 | 21,585 | 699 | 0 | 4 | 21 | 0 | 0 | 88.0% | |
| Woodlawn Court | Hyde Park | Garden | 30 | 24,030 | 801 | 0 | 0 | 24 | 6 | 0 | 87.0% | |
| Harper Court | Hyde Park | Garden | 18 | 14,955 | 831 | 1 | 10 | 7 | 0 | 0 | 100.0% | |
| 925 E 46th Street | North Kenwood | Garden | 24 | 22,918 | 955 | 0 | 5 | 12 | 7 | 0 | 100.0% | |
| Yankee Hill | Kansas City | Mid Rise | 16 | 15,021 | 939 | 0 | 0 | 16 | 0 | 0 | 87.5% | |
| Drexel Terrace | Kenwood | Garden | 25 | 17,825 | 713 | 0 | 12 | 12 | 1 | 0 | 96.0% | |
| Gillham House | Kansas City | Mid Rise | 24 | 10,056 | 419 | 12 | 12 | 0 | 0 | 0 | 92.0% | |
| Cornell Terrace | Hyde Park | Garden | 14 | 9,619 | 687 | 3 | 4 | 5 | 1 | 1 | 100.0% | |
| 5508 Cornell | Hyde Park | Garden | 3 | 5,760 | 1,920 | 0 | 0 | 0 | 0 | 3 | 66.7% | |
| Total/Weighted Average | 979 | 576,619(2) | 315 | 350 | 282 | 22 | 10 | 93.3% | ||||
| (1) | Information obtained from the appraisal and underwritten rent roll. |
| (2) | SF includes 32,187 square feet of retail space located at the 5500 Cornell, Maple Court, Ellis Court and Kenwood Court properties. |
| (3) | Average Unit Size reflects average square feet per multifamily unit only. |
The following table presents historical occupancy percentages at the LARP I Portfolio Properties:
Historical Occupancy
12/31/2013(1) | 12/31/2014(1) | 12/31/2015(1) | 12/31/2016(1) | Various(2) |
| 93.3% | 93.8% | 95.7% | 95.0% | 93.3% |
| (1) | Information obtained from the borrower. |
| (2) | Information obtained from the underwritten rent roll. |
THE INFORMATION IN THIS STRUCTURAL AND COLLATERAL TERM SHEET IS NOT COMPLETE AND MAY BE AMENDED PRIOR TO THE TIME OF SALE. THIS TERM SHEET IS NOT AN OFFER TO SELL THESE SECURITIES AND IT IS NOT A SOLICITATION OF AN OFFER TO BUY THESE SECURITIES IN ANY JURISDICTION WHERE THE OFFER OR SALE IS NOT PERMITTED.
44
| LARP I PORTFOLIO |
Operating History and Underwritten Net Cash Flow.The following table presents certain information relating to the historical operating performance and underwritten net cash flow at the LARP I Portfolio Properties:
Cash Flow Analysis
| 2014 | 2015 | 2016 | TTM 9/30/2017 | U/W | % of U/W Effective Gross Income | U/W $ per Bed | |
| Gross Potential Rent | $12,000,426 | $12,312,956 | $13,046,371 | $13,433,958 | $13,656,676(1) | 104.7% | $13,950 |
| Discounts/Concessions | (266,594) | (276,269) | (502,635) | (351,836) | (345,136) | (2.6) | (353) |
| Other Income(2) | 688,570 | 717,621 | 846,823 | 804,026 | 804,026 | 6.2 | 821 |
| Less Vacancy & Credit Loss | (826,638) | (710,245) | (952,861) | (1,011,726) | (1,071,187)(3) | (8.2) | (1,094) |
| Effective Gross Income | $11,595,763 | $12,044,063 | $12,437,698 | $12,874,422 | $13,044,378 | 100.0% | $13,324 |
| Total Operating Expenses(4) | $5,447,825 | $5,384,208 | $5,201,898 | $5,216,323 | $5,394,782 | 41.4% | $5,511 |
|
|
|
|
|
|
| |
| Net Operating Income | $6,147,939 | $6,659,855 | $7,235,799 | $7,658,099 | $7,649,597 | 58.6% | $7,814 |
| Capital Expenditures | 0 | 0 | 0 | 0 | 251,983 | 1.9 | 257 |
| Other | 0 | 0 | 0 | 0 | 11,272 | 0.1 | 12 |
| Net Cash Flow | $6,147,939 | $6,659,855 | $7,235,799 | $7,658,099 | $7,386,342 | 56.6% | $7,545 |
| NOI DSCR | 1.35xx | 1.46x | 1.58x | 1.68x | 1.68x | ||
| NCF DSCR | 1.35xx | 1.46x | 1.58x | 1.68x | 1.62x | ||
| NOI DY | 6.8% | 7.4% | 8.0% | 8.5% | 8.5% | ||
| NCF DY | 6.8% | 7.4% | 8.0% | 8.5% | 8.2% |
| (1) | U/W Gross Potential Rent is comprised of $12,526,188 of residential income (91.7% of U/W Base Rent) and $1,130,488 of retail income (8.3% of U/W Gross Potential Rent). |
| (2) | Other income includes move-in and application fees, late fees, laundry income, lease termination fees, parking income and pet fees. |
| (3) | The underwritten economic vacancy is 7.8%. The LARP I Portfolio Properties were 93.3% physically occupied as of December 2017. Underwritten Vacancy reflects an 8.1% vacancy rate on the multifamily component of Gross Potential Rent and a 5% vacancy rate on the commercial component of Gross Potential Rent. |
| (4) | The four LARP I Portfolio Properties located in Kansas City, Missouri are subject to a tax abatement under Chapter 353 of the Missouri Urban Redevelopment Corporations law that provides for a tax abatement in connection with the redevelopment of real property that has been found to be a “blighted area” by the city in which they are located. The tax abatement is in place until 2028. Underwritten taxes for such four LARP I Portfolio Properties are based on the abatement and total $2,988. The appraiser’s estimated stabilized taxes for such LARP I Portfolio Properties assuming no abatement are $128,835. |
Appraisal.As of the appraisal valuation date of November 3, 2017 the LARP I Portfolio Properties had an aggregate “as-is” appraised value of $140,530,000.
Environmental Matters.According to the Phase I environmental assessments dated November 13, 2017 and November 16th, 2017 there was no evidence of any recognized environmental conditions at the LARP I Portfolio Properties.
Market Overview and Competition.The LARP I Portfolio Properties are concentrated in the Bronzeville/Hyde Park/South Shore submarket of Chicago, Illinois and the Central Kansas City submarket of Kansas City, Missouri. There are 14 properties (718 units, 79.8% of underwritten net cash flow) located in the Chicago apartment market, which are concentrated in the Bronzeville/Hyde Park/South Shore submarket. According to the appraisals, the Chicago apartment market contained 708,408 apartment units with an occupancy rate of 95.3% as of the third quarter of 2017, a decline of 5 basis points over the previous quarter, and an average occupancy rate of 95.3% since 2012. The Bronzeville/Hyde Park/South Shore submarket contained 58,916 apartment units with an occupancy rate of 94.3% as of the third quarter of 2017, an increase of 9 basis points over the prior quarter, and an average occupancy rate of 94.3% since 2012. According to the appraisals, there are currently five multifamily properties under construction in the Bronzeville/Hyde Park/South Shore submarket expected to comprise 501 units. Four of the LARP I Portfolio Properties located in Chicago contain ground-floor retail space. The Chicago retail market had a vacancy rate of 6.7% as of the third quarter of 2017, remaining unchanged over the previous quarter. As of the third quarter of 2017, the South Chicago retail submarket had a total inventory of 45,989,385 square feet with a vacancy rate of 6.1%. The LARP I Portfolio Properties located in Chicago are generally located within approximately 2 miles of the University of Chicago. Approximately 27.9% of the units at the Chicago properties are leased to students.
There are four properties (261 units, 20.2% of underwritten net cash flow) located in the Kansas City apartment market, which are concentrated in the Central Kansas City submarket. According to the appraisals, the Kansas City apartment market contained 152,182 apartment units with an occupancy rate of 94.5% as of the third quarter of 2017, a decline of 3 basis points over the previous quarter, and an average occupancy rate of 94.4% since 2012. The Central Kansas City submarket contained 23,018 apartment units with an occupancy rate of 93.3% as of the third quarter of 2017, a decline of 4 basis points over the prior quarter, and an average occupancy rate of 94.3% since 2012. According to the appraisals, there are 26 properties that have been completed or are under construction in the submarket comprising 3,734 units, of which three properties comprised of 517 units currently under construction in the midtown Kansas City are expected to be competitive with LARP I Portfolio Properties located in Kansas City. The LARP I Portfolio Properties located in Kansas City are generally located within 2.5 miles of the University of Missouri-Kansas City. Approximately 23.8% of the units at the Kansas City properties are leased to students.
THE INFORMATION IN THIS STRUCTURAL AND COLLATERAL TERM SHEET IS NOT COMPLETE AND MAY BE AMENDED PRIOR TO THE TIME OF SALE. THIS TERM SHEET IS NOT AN OFFER TO SELL THESE SECURITIES AND IT IS NOT A SOLICITATION OF AN OFFER TO BUY THESE SECURITIES IN ANY JURISDICTION WHERE THE OFFER OR SALE IS NOT PERMITTED.
45
| LARP I PORTFOLIO |
The following table presents certain information relating to some comparable multifamily properties for the LARP I Portfolio Properties:
Competitive Set(1)
| Property Name | City/State | Market | Building Type | Units | Appraised Value | Appraised Value/Unit | Sales Comparables Value/Unit Range (Unadjusted) | |
| Blackwood | Chicago, IL | Chicago | High Rise | 145 | $26,200,000 | $180,690 | $118,145 - $197,500 | |
| 5500 Cornell | Chicago, IL | Chicago | Garden | 65 | $19,000,000 | $292,308 | $174,074 - $303,960 | |
| Clyde Manor | Kansas City, MO | Kansas City | Mid Rise | 115 | $12,930,000 | $112,435 | $86,806 - $132,692 | |
| Woodlawn Terrace | Chicago, IL | Chicago | Garden | 104 | $10,600,000 | $101,923 | $79,592 - $150,926 | |
| Park Central | Kansas City, MO | Kansas City | Mid Rise | 106 | $9,880,000 | $93,208 | $86,806 - $132,692 | |
| Maple Court | Chicago, IL | Chicago | Garden | 68 | $8,760,000 | $128,824 | $116,692 - $174,074 | |
| Ellis Street | Chicago, IL | Chicago | Garden | 80 | $8,350,000 | $104,375 | $83,824 - $118,145 | |
| Drexel Grand | Chicago, IL | Chicago | Garden | 74 | $7,800,000 | $105,405 | $79,592 - $118,145 | |
| Ellis Court | Chicago, IL | Chicago | Garden | 43 | $7,040,000 | $163,721 | $118,145 - $258,333 | |
| Kenwood Court | Chicago, IL | Chicago | Garden | 25 | $7,000,000 | $280,000 | $208,333 - $320,000 | |
| Woodlawn Court | Chicago, IL | Chicago | Garden | 30 | $6,200,000 | $206,667 | $150,926 - $281,250 | |
| Harper Court | Chicago, IL | Chicago | Garden | 18 | $3,380,000 | $187,778 | $118,145 - $197,500 | |
| 925 E 46th Street | Chicago, IL | Chicago | Garden | 24 | $2,760,000 | $115,000 | $79,592 - $150,926 | |
| Yankee Hill | Kansas City, MO | Kansas City | Mid Rise | 16 | $2,420,000 | $151,250 | $84,167 - $132,692 | |
| Drexel Terrace | Chicago, IL | Chicago | Garden | 25 | $2,810,000 | $112,400 | $79,592 - $118,145 | |
| Gillham House | Kansas City, MO | Kansas City | Mid Rise | 24 | $2,200,000 | $91,667 | $84,167 - $132,692 | |
| Cornell Terrace | Chicago, IL | Chicago | Garden | 14 | $2,000,000 | $142,857 | $86,667 - $197,500 | |
| 5508 Cornell | Chicago, IL | Chicago | Garden | 3 | $1,200,000 | $400,000 | $330,000 - $460,000 |
| (1) | Information obtained from the appraisal and underwritten rent roll. |
The following table presents certain information relating to the units and rent at the LARP I Portfolio Properties located in Chicago:
| Unit Type | # of Units | Avg SF per Unit | Monthly Market Rent per Unit | Monthly Actual Rent per Unit(1) | Underwritten Monthly Rent per Unit(1) | |
| Studio | 226 | 355 | $861 | $858 | $858 | |
| 1 Bedroom | 229 | 524 | $1,089 | $1,094 | $1,094 | |
| 2 Bedroom | 231 | 763 | $1,342 | $1,381 | $1,381 | |
| 3 Bedroom | 22 | 970 | $1,548 | $1,458 | $1,458 | |
| 4 Bedroom | 10 | 1,383 | $2,369 | $2,444 | $2,444 | |
| Commercial(2) | 26 | 1,238 | $16.54 | $35.22 | $35.22 | |
| Total/Weighted Average(3) | 718 | 573 | $1,130 | $1,221 | $1,221 |
| (1) | Information obtained from the appraisal and underwritten rent roll. |
| (2) | Commercial Monthly Market Rent per Unit is based on square footage (SF). |
| (3) | Total/Weighted Averages only reflect multifamily units and excludes the Commercial Units. |
The following table presents certain information relating to the units and rent at the LARP I Portfolio Properties located in Kansas City:
| Unit Type | # of Units | Avg SF per Unit | Monthly Market Rent per Unit | Monthly Actual Rent per Unit(1) | Underwritten Monthly Rent per Unit(1) | |
| Studio | 89 | 396 | $734 | $722 | $722 | |
| 1 Bedroom | 121 | 489 | $862 | $850 | $850 | |
| 2 Bedroom | 51 | 754 | $1,090 | $1,081 | $1,081 | |
| Total/Weighted Average | 261 | 507 | $863 | $854 | $854 |
| (1) | Information obtained from the appraisal and underwritten rent roll. |
THE INFORMATION IN THIS STRUCTURAL AND COLLATERAL TERM SHEET IS NOT COMPLETE AND MAY BE AMENDED PRIOR TO THE TIME OF SALE. THIS TERM SHEET IS NOT AN OFFER TO SELL THESE SECURITIES AND IT IS NOT A SOLICITATION OF AN OFFER TO BUY THESE SECURITIES IN ANY JURISDICTION WHERE THE OFFER OR SALE IS NOT PERMITTED.
46
| LARP I PORTFOLIO |
The Borrower.The borrowers are 18 separate Delaware limited liability companies, which are single purpose entities with two independent directors each. Legal counsel to the borrower provided a non-consolidation opinion in connection with the origination of the LARP I Portfolio Mortgage Loan. LARP Holdings, LLC, a Delaware limited liability company, is 100% owner of the borrowers. David Gefsky and Eli Ungar (together, the “Individual LARP I Portfolio Guarantors”) and LARP Holdings, LLC are the guarantors of certain nonrecourse carveouts under the LARP I Portfolio Mortgage Loan; however, only LARP Holdings, LLC (and not the Individual LARP I Portfolio Guarantors) is liable under the environmental indemnity. The Individual LARP I Portfolio Guarantors are liable under the non-recourse carveout guaranty only for fraud, certain voluntary and collusive bankruptcy events, failure to comply with single purpose entity covenants (which is loss recourse only, unless substantive consolidation of the LARP I Portfolio borrowers with another entity results) and prohibited transfers of the LARP I Portfolio Properties and are not liable for other non-recourse carveouts, such as intentional misrepresentation, misappropriation of rents, casualty and condemnation proceeds and security deposits, waste, breaches of environmental provisions in the loan documents and prohibited transfers of interest in the borrowers. Further, at such time as LARP Holdings, LLC’s financial statements evidence a net worth of not less than $50,000,000 and liquidity of not less than $2,000,000 (in each case excluding the LARP I Portfolio Properties), the Individual LARP I Portfolio Guarantors will be released from all obligations and liabilities under the non-recourse carveout guaranty for events occurring after such date.
The Borrower Sponsors.The borrower sponsor is Antheus Capital (“Antheus”), a Delaware limited partnership, which serves as the managing member of LARP Holdings Manager, LLC, the manager of LARP Holdings, LLC. Antheus Capital is a private real estate company focused on the acquisition, development and redevelopment of apartment properties located in submarkets throughout the United States. Antheus was founded in 2002 by Eli Ungar and David Gefsky. Today the portfolio consists of approximately 7,200 multifamily units and 400,000 square feet of commercial space with 4,851 units owned/managed in Chicago, 1,481 units owned/managed in Kansas City and 867 units owned/managed in St. Louis.
Escrows.The loan documents provide for upfront reserves of $413,520 for taxes, $147,650 for insurance premiums and $47,439 for required repairs. The loan documents also provide for ongoing monthly reserves of 1/12 of annual real estate taxes (currently $68,920) for taxes, 1/12 of annual insurance premiums (currently $14,765) for insurance reserves (provided that such insurance reserve deposits will be waived so long as acceptable blanket insurance policies are in place), $20,999 for replacement reserves for residential units, $403 for replacement reserves for commercial units and $940 for rollover reserves for commercial units, subject to a cap (as to both replacement reserves for commercial units and rollover reserves for commercial units) of 36 times the then-current monthly deposit.
Lockbox and Cash Management.Upon the first occurrence of a Cash Sweep Event Period (as defined below), the borrowers are required to establish a lockbox account into which the borrowers will be required to deposit or cause to be deposited all rents and revenues received from the LARP I Portfolio Properties within one business days of receipt, and will be required to direct all commercial tenants to deposit rents directly into such lockbox account. In addition, upon the first occurrence of a Cash Sweep Event Period, the lender will have the right to establish, and the borrowers will be required to cooperate to establish, a lender controlled cash management account. During the continuance of a Cash Sweep Event Period, all funds in the lockbox account are required to be swept into such cash management account for payment (unless an event of default is continuing) of debt service, monthly escrows, operating expenses set forth in the approved annual budget or otherwise approved by the lender, extraordinary expenses approved by the lender, and debt service under the LARP I Portfolio Mezzanine Loan, with all excess cash (i) during any Cash Sweep Event Period caused solely by an event of default under the LARP I Portfolio Mezzanine Loan, to be paid to the mezzanine lender, and (ii) otherwise to be deposited to an excess cash reserve to be held as additional security for the LARP I Portfolio Mortgage Loan for so long as a Cash Sweep Period exists.
A “Cash Sweep Event Period” will commence upon the earliest of (i) the occurrence and continuance of an event of default; (ii) the occurrence of an event of default under the LARP I Portfolio Mezzanine Loan and (iii) the debt service coverage ratio (based on the aggregate interest only payments under the LARP I Portfolio Mortgage Loan and the LARP I Portfolio Mezzanine Loan) falling below 1.10x for six consecutive calendar months. A Cash Sweep Event Period will end, with respect to clause (i), upon the cure of such event of default; with respect to clause (ii), upon the lender receiving notice from the mezzanine lender that no event of default exists under the LARP I Portfolio Mezzanine Loan; and with respect to clause (iii), upon the date that the debt service coverage ratio (based on the aggregate interest only payments under the LARP I Portfolio Mortgage Loan and the LARP I Portfolio Mezzanine Loan) is equal to or greater than 1.15x for six consecutive calendar months.
Property Management.The LARP I Portfolio Properties are managed by an affiliate of the borrowers.
Assumption.The borrower has the right to transfer the LARP I Portfolio Properties, provided that no event of default has occurred and is continuing and certain other conditions are satisfied, including (i) the lender’s reasonable determination that the proposed transferee and guarantor satisfy the lender’s credit review and underwriting standards, taking into consideration transferee experience, financial strength and general business standing; (ii) the execution of a recourse guaranty and an environmental indemnity by an affiliate of the transferee; and (iii) if requested by the lender, a rating agency confirmation from each rating agency assigned to the Series BANK 2018-BNK10 Certificates that the transfer will not result in a downgrade, withdrawal or qualification of the respective ratings assigned to the Series BANK 2018-BNK10 Certificates.
Partial Release. Following the expiration of the lockout period, the borrowers are permitted to obtain the release of any individual LARP I Portfolio Property upon defeasance of a principal amount equal to 115% of the allocated loan amount for such individual LARP I Portfolio Property and satisfaction of certain conditions, including among others (i) the aggregate debt yield of the LARP I Portfolio Mortgage Loan and LARP I Portfolio Mezzanine Loan based on the remaining LARP I Portfolio Properties immediately following the release will be not less than the greater of (x) the aggregate debt yield immediately preceding the release and (y) 6.84%; (ii) the aggregate debt service coverage ratio of the LARP I Portfolio Mortgage Loan and LARP I Portfolio Mezzanine Loan based on the remaining LARP I Portfolio Properties immediately following the release will be not less than the greater of (x) the aggregate debt
THE INFORMATION IN THIS STRUCTURAL AND COLLATERAL TERM SHEET IS NOT COMPLETE AND MAY BE AMENDED PRIOR TO THE TIME OF SALE. THIS TERM SHEET IS NOT AN OFFER TO SELL THESE SECURITIES AND IT IS NOT A SOLICITATION OF AN OFFER TO BUY THESE SECURITIES IN ANY JURISDICTION WHERE THE OFFER OR SALE IS NOT PERMITTED.
47
| LARP I PORTFOLIO |
service coverage ratio immediately preceding the release and (y) 1.24x; (iii) the aggregate loan-to-value ratio of the LARP I Portfolio Mortgage Loan and LARP I Portfolio Mezzanine Loan based on the remaining LARP I Portfolio Properties immediately following the release will be not greater than the lesser of (x) the aggregate loan-to-value ratio immediately preceding the release and (y) 76.85%; and (iv) compliance with REMIC requirements.
Real Estate Substitution.Not permitted.
Subordinate and Mezzanine Indebtedness.Morgan Stanley Mortgage Capital Holdings LLC funded the $18,000,000 LARP I Portfolio Mezzanine Loan to LARP Holdings Mezzanine Borrower, LLC, a Delaware limited liability company owning 100.0% of the borrowers under the LARP I Portfolio Mortgage Loan (the “LARP I Portfolio Mezzanine Borrower”). The LARP I Portfolio Mezzanine Loan is secured by a pledge of the LARP I Portfolio Mezzanine Borrower’s interest in the borrowers under the LARP I Portfolio Mortgage Loan. The LARP I Portfolio Mezzanine Loan accrues interest at a rate of 7.50% perannumand requires interest-only payments through the maturity date of January 1, 2028. The rights of the LARP I Portfolio Mezzanine Loan lender are further described under “Description of the Mortgage Pool–Additional Indebtedness-Mezzanine Indebtedness” in the Preliminary Prospectus. The LARP I Portfolio Mezzanine Loan has been sold to a third party.
Ground Lease.None
Terrorism Insurance.The LARP I Portfolio Mortgage Loan documents require that the “all risk” insurance policy required to be maintained by the borrowers provide coverage for acts of terrorism in an amount equal to the full replacement cost of the LARP I Portfolio Properties and 18 months of business interruption insurance; provided that so long as the Terrorism Risk Insurance Act of 2002, as extended and modified by the Terrorism Risk Insurance Program Reauthorization Act of 2015 (TRIPRA) is in effect (including any extensions thereof or if another federal governmental program is in effect relating to “acts of terrorism” which provides substantially similar protections as TRIPRA), and covers both domestic and foreign acts of terrorism, the lender will be required to accept insurance which covers against “covered acts” as defined by TRIPRA or such other program. If TRIPRA is no longer in effect, the borrowers will not be required to pay terrorism insurance premiums in excess of an annual terrorism premium cap of two times the cost of the annual premiums for property and business interruption insurance required under the LARP I Portfolio Mortgage Loan documents (excluding the cost of terrorism, flood, earthquake and windstorm components of such insurance) at the time terrorism coverage is excluded from the applicable policy.
THE INFORMATION IN THIS STRUCTURAL AND COLLATERAL TERM SHEET IS NOT COMPLETE AND MAY BE AMENDED PRIOR TO THE TIME OF SALE. THIS TERM SHEET IS NOT AN OFFER TO SELL THESE SECURITIES AND IT IS NOT A SOLICITATION OF AN OFFER TO BUY THESE SECURITIES IN ANY JURISDICTION WHERE THE OFFER OR SALE IS NOT PERMITTED.
48
(THIS PAGE INTENTIONALLY LEFT BLANK)
49
| IRON GUARD STORAGE PORTFOLIO |
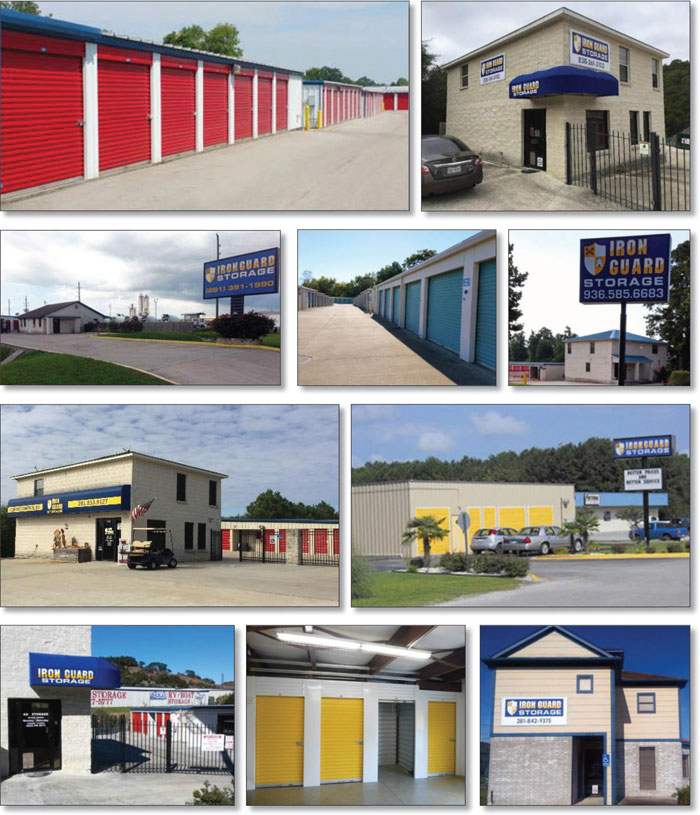
THE INFORMATION IN THIS STRUCTURAL AND COLLATERAL TERM SHEET IS NOT COMPLETE AND MAY BE AMENDED PRIOR TO THE TIME OF SALE. THIS TERM SHEET IS NOT AN OFFER TO SELL THESE SECURITIES AND IT IS NOT A SOLICITATION OF AN OFFER TO BUY THESE SECURITIES IN ANY JURISDICTION WHERE THE OFFER OR SALE IS NOT PERMITTED.
50
| IRON GUARD STORAGE PORTFOLIO |
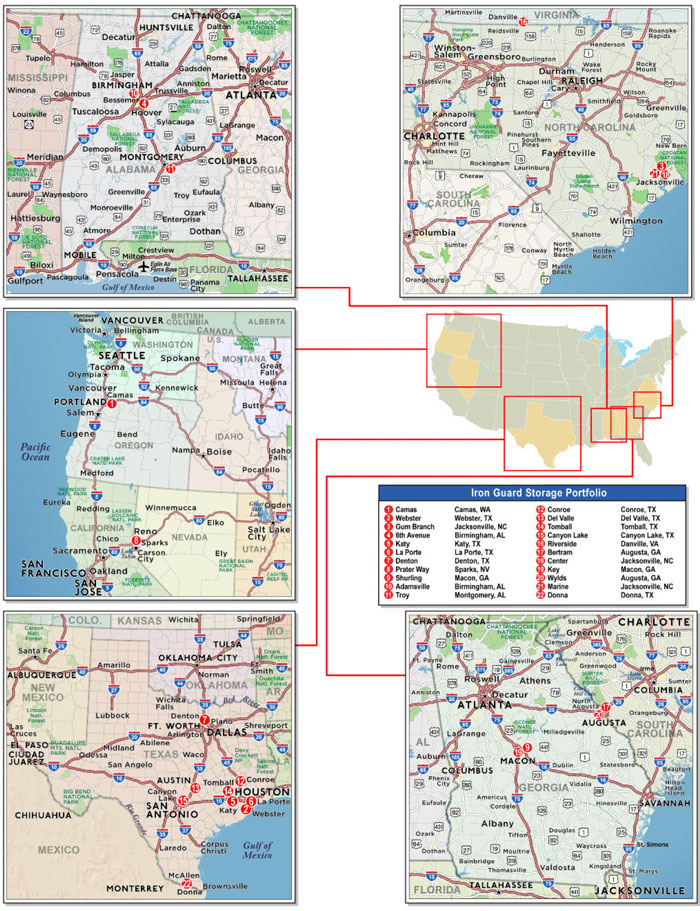
THE INFORMATION IN THIS STRUCTURAL AND COLLATERAL TERM SHEET IS NOT COMPLETE AND MAY BE AMENDED PRIOR TO THE TIME OF SALE. THIS TERM SHEET IS NOT AN OFFER TO SELL THESE SECURITIES AND IT IS NOT A SOLICITATION OF AN OFFER TO BUY THESE SECURITIES IN ANY JURISDICTION WHERE THE OFFER OR SALE IS NOT PERMITTED.
51
| IRON GUARD STORAGE PORTFOLIO |
| No. 3 – Iron Guard Storage Portfolio | |||||||
| Loan Information | Property Information | ||||||
| Mortgage Loan Seller: | Bank of America, N.A. | Single Asset/Portfolio: | Portfolio | ||||
Credit Assessment (DBRS/Fitch/Moody’s): | NR/NR/NR | Property Type: | Self Storage | ||||
| Original Principal Balance: | $86,000,000 | Specific Property Type: | Self Storage | ||||
| Cut-off Date Balance: | $86,000,000 | Location: | Various | ||||
| % of Initial Pool Balance: | 6.7% | Size(4): | 1,352,239 SF | ||||
| Loan Purpose: | Refinance | Cut-off Date Balance Per SF(2): | $63.60 | ||||
| Borrower Names(1): | Various | Year Built/Renovated: | Various | ||||
| Borrower Sponsor: | David Ross | Title Vesting: | Fee | ||||
| Mortgage Rate: | 4.5665% | Property Manager: | Iron Guard Storage, LLC | ||||
| Note Date: | January 9, 2018 | 4th Most Recent Occupancy (As of)(5)(6): | 75.3% (12/31/2013) | ||||
| Anticipated Repayment Date: | NAP | 3rd Most Recent Occupancy (As of)(5)(6): | 72.9% (12/31/2014) | ||||
| Maturity Date: | February 1, 2028 | 2nd Most Recent Occupancy (As of)(5): | 74.4% (12/31/2015) | ||||
| IO Period: | 120 months | Most Recent Occupancy (As of)(5): | 80.1% (12/31/2016) | ||||
| Loan Term (Original): | 120 months | Current Occupancy (As of): | 82.0% (Various) | ||||
| Seasoning: | 0 months | ||||||
| Amortization Term (Original): | NAP | Underwriting and Financial Information: | |||||
| Loan Amortization Type: | Interest-only, Balloon | ||||||
| Interest Accrual Method: | Actual/360 | 4th Most Recent NOI (As of)(6): | NAV | ||||
| Call Protection: | L(24),D(92),O(4) | 3rd Most Recent NOI (As of)(6): | $6,491,037 (12/31/2015) | ||||
| Lockbox Type: | Springing | 2nd Most Recent NOI (As of): | $6,613,972 (12/31/2016) | ||||
| Additional Debt(2): | Yes | Most Recent NOI (As of): | $7,181,001 (TTM 11/30/2017) | ||||
| Additional Debt Type(2): | Mezzanine | ||||||
| U/W Revenues: | $11,565,016 | ||||||
| U/W Expenses: | $3,874,101 | ||||||
| U/W NOI: | $7,690,915 | ||||||
| U/W NCF: | $7,487,915 | ||||||
| U/W NOI DSCR(2): | 1.93x | ||||||
| Escrows and Reserves(3): | U/W NCF DSCR(2): | 1.88x | |||||
| U/W NOI Debt Yield(2): | 8.9% | ||||||
| Type: | Initial | Monthly | Cap (If Any) | U/W NCF Debt Yield(2): | 8.7% | ||
| Taxes | $170,242 | $96,239 | NAP | Appraised Value(7): | $137,470,000 | ||
| Insurance | $158,395 | $17,599 | NAP | Appraisal Valuation Date(7): | Various | ||
| Replacement Reserves | $0 | $11,278 | $406,000 | Cut-off Date LTV Ratio(2)(7): | 62.6% | ||
| Deferred Maintenance | $212,900 | $0 | NAP | LTV Ratio at Maturity(2)(7): | 62.6% | ||
| (1) | The Borrowers are Lucky 7 Equity LLC, Lucky 7 Equity II LLC, Lucky 7 Equity IV, LLC, Lucky 7 Equity V, LLC, Troy Mini Storage, LLC, Tomball Storage, LLC, Donna Mini Storage, LLC, Del Valle Storage, LLC, Conroe Mini Storage, LLC, Canyon Lake Storage, LLC, Denton Mini Storage, LLC, Adamsville Storage, LLC, 6th Avenue Storage, LLC, LaPorte Storage, LLC, Wylds Storage, LLC, Webster Storage, LLC, Shurling Storage, LLC, Riverside Storage, LLC, Prater Way Storage, LLC, Marine Self-Storage, LLC, Key Self-Storage, LLC, Katy Self Storage, LLC, Gum Branch Storage, LLC, Center Storage, LLC, Camas Mini-Storage Annex, L.L.C. and Bertram Storage, LLC. |
| (2) | See “Subordinate and Mezzanine Indebtedness” section. The Cut-off Date Balance Per Unit, U/W NOI DSCR, U/W NCF DSCR, U/W NOI Debt Yield, U/W NCF Debt Yield, Cut-off Date LTV Ratio and LTV Ratio at Maturity including the Iron Guard Storage Portfolio Mezzanine Loan (as defined below) are $72.58, 1.46x, 1.42x, 7.8%, 7.6%, 71.1% and 71.1%, respectively. |
| (3) | See “Escrows” section. |
| (4) | SF excludes parking and apartment square footage. |
| (5) | Historical occupancy figures are based on unit count. |
| (6) | The Iron Guard Storage Portfolio Properties were acquired by Iron Guard Storage Portfolio Borrowers (as defined below) between 2010 and 2015. 2014 and 2015 figures do not represent full year performance of the complete portfolio. In 2010, 56.4% of the portfolio (by allocated loan amount) was acquired. In 2015, 43.6% of the portfolio (by allocated loan amount) was acquired. |
| (7) | The Appraised Value represents the “As Portfolio” bulk appraised value of the Iron Guard Storage Portfolio Properties (as defined below) as of the report date, January 19, 2018, which is inclusive of a $15,650,000 portfolio premium. The Cut-off Date LTV Ratio and LTV Ratio at Maturity are calculated based upon the Iron Guard Portfolio Mortgage Loan and the “As Portfolio” Appraised Value of $137,470,000. The Cut-off Date LTV Ratio and LTV Ratio at Maturity based on the Iron Guard Portfolio Mortgage Loan and the sum of the individual “as-is” appraised values of $121,820,000, which excludes the portfolio premium, are 70.6%. The Cut-off Date LTV Ratio and LTV Ratio at Maturity based on the combined balance of the Iron Guard Portfolio Mortgage Loan and the Iron Guard Storage Portfolio Mezzanine Loan and the sum of the individual “as-is” appraised values of $121,820,000, which excludes the portfolio premium, are 80.6%. |
The Mortgage Loan. The mortgage loan (the “Iron Guard Storage Portfolio Mortgage Loan”) is evidenced by a promissory note secured by the fee interests in a portfolio of 22 self storage properties located across 7 states and totaling 1,352,239 square feet of traditional storage space plus parking spaces (the “Iron Guard Storage Portfolio Properties”). The Iron Guard Storage Portfolio Mortgage Loan had an original principal balance of $86,000,000, has an outstanding principal balance as of the Cut-off Date of $86,000,000 and accrues interest at an interest rate of 4.5665%per annum. The Iron Guard Storage Portfolio Mortgage Loan had
THE INFORMATION IN THIS STRUCTURAL AND COLLATERAL TERM SHEET IS NOT COMPLETE AND MAY BE AMENDED PRIOR TO THE TIME OF SALE. THIS TERM SHEET IS NOT AN OFFER TO SELL THESE SECURITIES AND IT IS NOT A SOLICITATION OF AN OFFER TO BUY THESE SECURITIES IN ANY JURISDICTION WHERE THE OFFER OR SALE IS NOT PERMITTED.
52
| IRON GUARD STORAGE PORTFOLIO |
an initial term of 120 months, has a remaining term of 120 months as of the Cut-off Date and requires payments of interest only through the loan term. The Iron Guard Storage Portfolio Mortgage Loan matures on February 1, 2028.
Following the lockout period, the borrower has the right to defease the Iron Guard Storage Portfolio Mortgage Loan in whole on any date before November 1, 2027, after which date the Iron Guard Storage Portfolio Mortgage Loan is prepayable without penalty.
Sources and Uses
| Sources | Uses | |||||||
| Original loan amount | $86,000,000 | 87.6% | Loan payoff | $72,062,464 | 73.4% | |||
| Mezzanine loan amount | 12,150,000 | 12.4 | Return of equity | 22,565,746 | 23.0 | |||
| Closing costs | 2,980,253 | 3.0 | ||||||
| Reserves | 541,537 | 0.6 | ||||||
| Total Sources | $98,150,000 | 100.0% | Total Uses | $98,150,000 | 100.0% |
The Properties. The Iron Guard Storage Portfolio Properties are comprised of 22 self storage properties containing a total of 9,976 traditional storage units (of which 2,233 (22.4%) are climate controlled) and 468 parking spaces. Each of the properties features on-site management, an on-site supply store and perimeter fencing with secured gate entry. Additionally, ten of the properties offer truck rental, the Camas and Webster properties each include one apartment unit, and the Adamsville property receives additional income via a commercial cell tower lease. The Iron Guard Storage Portfolio Properties range in size from approximately 37,830 square feet to 135,150 square feet. All 22 properties are self-managed by an affiliate.
The Iron Guard Storage Portfolio Properties are located across 7 states, with the largest presence in Texas (9 properties, 42.6% of SF, 41.6% of UW NCF), Alabama (3 properties, 18.3% of SF, 14.4% of UW NCF), Georgia (4 properties, 15.2% of SF, 13.2% of UW NCF), and North Carolina (3 properties, 13.1% of SF, 13.8% of UW NCF) with the remaining properties (10.8% of SF, 17.0% of UW NCF) located in Washington, Nevada and Virginia. The Iron Guard Storage Portfolio Properties were built between 1978 and 2011 with a weighted average year built of 1996. The Iron Guard Storage Portfolio sponsor acquired twelve of the properties in 2010 and ten of the properties throughout 2015 across three separate transactions. Since acquisition, the sponsor has invested approximately $1.29 million in immediate repairs, rebranded the facilities, implemented its management platform and tenant insurance protection plan programs, increased rental rates and streamlined expenses. The weighted average occupancy for the Iron Guard Storage Portfolio Properties was 82.0% by square footage, as of the most recent November 2017 borrower rent rolls.
THE INFORMATION IN THIS STRUCTURAL AND COLLATERAL TERM SHEET IS NOT COMPLETE AND MAY BE AMENDED PRIOR TO THE TIME OF SALE. THIS TERM SHEET IS NOT AN OFFER TO SELL THESE SECURITIES AND IT IS NOT A SOLICITATION OF AN OFFER TO BUY THESE SECURITIES IN ANY JURISDICTION WHERE THE OFFER OR SALE IS NOT PERMITTED.
53
| IRON GUARD STORAGE PORTFOLIO |
The following table presents certain information relating to the Iron Guard Storage Portfolio Properties:
Iron Guard Storage Portfolio Property Summary
| Property Name, Address | City, State | Total Units Storage / Parking | Allocated Loan Amount | % of Portfolio Cut-off Date Balance | Net Rentable Area (SF)(1) | % of Net Rentable Area(1) | Appraised Value(2) | % of Appraised Value | |
Camas 2327 Northeast 3rd Loop | Camas, WA | 390 / 15 | $8,255,000 | 9.6% | 51,755 | 3.8% | $11,670,000 | 9.6% | |
Webster 410 Old Galveston Road | Webster, TX | 526 / 111 | $6,890,000 | 8.0% | 96,097 | 7.1% | $9,740,000 | 8.0% | |
Gum Branch 1230 Gum Branch Road | Jacksonville, NC | 606 / 0 | $5,447,000 | 6.3% | 80,700 | 6.0% | $7,700,000 | 6.3% | |
6th Avenue 320 6th Avenue Southwest | Birmingham, AL | 493 / 0 | $4,548,000 | 5.3% | 57,310 | 4.2% | $6,430,000 | 5.3% | |
Katy 24620 Franz Road | Katy, TX | 386 / 26 | $4,463,000 | 5.2% | 56,099 | 4.1% | $6,310,000 | 5.2% | |
La Porte 2915 North 23rd Street | La Porte, TX | 481 / 57 | $4,435,000 | 5.2% | 61,730 | 4.6% | $6,270,000 | 5.1% | |
Denton 550 Fort Worth Drive | Denton, TX | 373 / 32 | $4,244,000 | 4.9% | 49,450 | 3.7% | $5,980,000 | 4.9% | |
Shurling 1300 Shurling Drive | Macon, GA | 570 / 0 | $4,032,000 | 4.7% | 67,600 | 5.0% | $5,880,000 | 4.8% | |
Prater Way 275 East Prater Way | Sparks, NV | 306 / 0 | $4,060,000 | 4.7% | 44,214 | 3.3% | $5,740,000 | 4.7% | |
Adamsville 500 Foust Court | Birmingham, AL | 462 / 13 | $3,975,000 | 4.6% | 55,475 | 4.1% | $5,620,000 | 4.6% | |
Troy 4176 Troy Highway | Montgomery, AL | 945 / 1 | $3,961,000 | 4.6% | 135,150 | 10.0% | $5,600,000 | 4.6% | |
Conroe 4205 North Frazier Street | Conroe, TX | 425 / 14 | $3,947,000 | 4.6% | 59,147 | 4.4% | $5,580,000 | 4.6% | |
Del Valle 4405 East Highway 71 | Del Valle, TX | 511 / 39 | $3,763,000 | 4.4% | 67,228 | 5.0% | $5,320,000 | 4.4% | |
Tomball 16920 FM 2920 Road | Tomball, TX | 444 / 29 | $3,636,000 | 4.2% | 72,261 | 5.3% | $5,220,000 | 4.3% | |
Canyon Lake 5622 FM 2673 | Canyon Lake, TX | 378 / 19 | $3,325,000 | 3.9% | 57,765 | 4.3% | $4,700,000 | 3.9% | |
Riverside 2405 Riverside Drive | Danville, VA | 404 / 4 | $3,049,000 | 3.5% | 49,636 | 3.7% | $4,310,000 | 3.5% | |
Bertram 1045 Bertram Road | Augusta, GA | 352 / 21 | $2,653,000 | 3.1% | 45,725 | 3.4% | $3,750,000 | 3.1% | |
Center 135 Center Street | Jacksonville, NC | 450 / 18 | $2,617,000 | 3.0% | 58,562 | 4.3% | $3,700,000 | 3.0% | |
Key 915 Key Street | Macon, GA | 342 / 2 | $2,476,000 | 2.9% | 40,700 | 3.0% | $3,500,000 | 2.9% | |
Wylds 1805A Wylds Roads | Augusta, GA | 393 / 0 | $2,440,000 | 2.8% | 51,750 | 3.8% | $3,450,000 | 2.8% | |
Marine 108 North Marine Boulevard | Jacksonville, NC | 347 / 43 | $2,108,000 | 2.5% | 37,830 | 2.8% | $2,980,000 | 2.4% | |
Donna 1015 West Expressway 83 | Donna, TX | 392 / 24 | $1,676,000 | 1.9% | 56,055 | 4.1% | $2,370,000 | 1.9% | |
| Total | 9,976 / 468 | $86,000,000 | 100.0% | 1,352,239 | 100.0% | $121,820,000 | 100.0% | ||
| (1) | Net Rentable Area excludes parking square footage. |
| (2) | The Total Appraised Value of $121,820,000 represents the sum of the individual appraised values of the Iron Guard Storage Portfolio Properties. The appraiser also provided a bulk portfolio value for the Iron Guard Storage Portfolio Properties of $137,470,000, which includes a portfolio premium of $15,650,000. |
THE INFORMATION IN THIS STRUCTURAL AND COLLATERAL TERM SHEET IS NOT COMPLETE AND MAY BE AMENDED PRIOR TO THE TIME OF SALE. THIS TERM SHEET IS NOT AN OFFER TO SELL THESE SECURITIES AND IT IS NOT A SOLICITATION OF AN OFFER TO BUY THESE SECURITIES IN ANY JURISDICTION WHERE THE OFFER OR SALE IS NOT PERMITTED.
54
| IRON GUARD STORAGE PORTFOLIO |
The Iron Guard Storage Portfolio Properties’ revenue is generated from 22 different properties, with limited concentration from any single property. Only five properties individually represent greater than 5.0% of the underwritten net cash flow, with the greatest individual percentage being 8.4%. The following table presents detailed information with respect to the individual performance of the Iron Guard Storage Portfolio Properties.
Iron Guard Storage Portfolio Property Performance
| Property Name | Total Units Storage / Parking | Climate Controlled Units | Year Built/ Renovated | Date Acquired | 11/2017 TTM SF Occupancy | 11/2017 TTM | % of Total 11/2017 TTM EGI | UW NCF | % of UW | |
| Camas | 390 / 15 | 101 | 1978/1994 | Jun-10 | 86.0% | $785,845 | 7.1% | $631,617 | 8.4% | |
| Webster | 526 / 111 | 201 | 1999/NAP | May-10 | 96.1% | $862,629 | 7.7% | $580,620 | 7.8% | |
| Gum Branch | 606 / 0 | 112 | 1989/NAP | Jun-10 | 84.6% | $738,042 | 6.6% | $566,049 | 7.6% | |
| 6th Avenue | 493 / 0 | 143 | 2007/NAP | Apr-15 | 75.7% | $512,836 | 4.6% | $351,674 | 4.7% | |
| Katy | 386 / 26 | 201 | 2001/NAP | Dec-10 | 93.0% | $563,712 | 5.1% | $397,543 | 5.3% | |
| La Porte | 481 / 57 | 216 | 1999/NAP | Mar-15 | 95.1% | $650,189 | 5.8% | $420,103 | 5.6% | |
| Denton | 373 / 32 | 110 | 2001/NAP | Jun-15 | 78.4% | $501,015 | 4.5% | $298,237 | 4.0% | |
| Shurling | 570 / 0 | 0 | 1988/NAP | May-10 | 79.7% | $524,815 | 4.7% | $376,129 | 5.0% | |
| Prater Way | 306 / 0 | 0 | 1990/NAP | Feb-10 | 90.5% | $450,946 | 4.0% | $334,365 | 4.5% | |
| Adamsville | 462 / 13 | 157 | 2006/NAP | Apr-15 | 83.3% | $490,810 | 4.4% | $362,761 | 4.8% | |
| Troy | 945 / 1 | 0 | 1995/NAP | Oct-15 | 72.6% | $541,211 | 4.9% | $361,775 | 4.8% | |
| Conroe | 425 / 14 | 216 | 2011/NAP | Oct-15 | 88.9% | $518,113 | 4.7% | $361,684 | 4.8% | |
| Del Valle | 511 / 39 | 192 | 2005/NAP | Oct-15 | 72.3% | $548,370 | 4.9% | $312,875 | 4.2% | |
| Tomball | 444 / 29 | 207 | 2004/NAP | Oct-15 | 75.6% | $492,989 | 4.4% | $312,217 | 4.2% | |
| Canyon Lake | 378 / 19 | 171 | 2008/NAP | Oct-15 | 72.8% | $448,777 | 4.0% | $300,083 | 4.0% | |
| Riverside | 404 / 4 | 0 | 1988/NAP | Jun-10 | 85.6% | $454,734 | 4.1% | $309,965 | 4.1% | |
| Bertram | 352 / 21 | 0 | 1986/NAP | Jun-10 | 80.7% | $342,876 | 3.1% | $217,130 | 2.9% | |
| Center | 450 / 18 | 73 | 1995/NAP | Jun-10 | 83.6% | $400,327 | 3.6% | $265,607 | 3.5% | |
| Key | 342 / 2 | 0 | 1988/NAP | May-10 | 85.4% | $331,095 | 3.0% | $208,410 | 2.8% | |
| Wylds | 393 / 0 | 0 | 1988/NAP | Jun-10 | 77.8% | $318,930 | 2.9% | $184,945 | 2.5% | |
| Marine | 347 / 43 | 0 | 1985/NAP | Jun-10 | 80.1% | $359,595 | 3.2% | $201,343 | 2.7% | |
| Donna | 392 / 24 | 133 | 2002/NAP | Oct-15 | 73.7% | $299,178 | 2.7% | $132,783 | 1.8% | |
| Total/Weighted Average | 9,976 / 468 | 2,233 | 1996/NAP | 82.0% | $11,137,034 | 100.0% | $7,487,915 | 100.0% | ||
THE INFORMATION IN THIS STRUCTURAL AND COLLATERAL TERM SHEET IS NOT COMPLETE AND MAY BE AMENDED PRIOR TO THE TIME OF SALE. THIS TERM SHEET IS NOT AN OFFER TO SELL THESE SECURITIES AND IT IS NOT A SOLICITATION OF AN OFFER TO BUY THESE SECURITIES IN ANY JURISDICTION WHERE THE OFFER OR SALE IS NOT PERMITTED.
55
| IRON GUARD STORAGE PORTFOLIO |
The following table presents historical occupancy percentages at the Iron Guard Storage Portfolio Properties:
Historical Occupancy(1)
| Property Name | 12/31/2013 | 12/31/2014 | 12/31/2015 | 12/31/2016 | 11/2017 In-Place | 2015- 11/2017 In Place Average |
| Camas | 89.8% | 92.3% | 93.9% | 92.5% | 86.0% | 90.8% |
| Webster | 88.3% | 91.5% | 87.7% | 87.2% | 92.9% | 89.3% |
| Gum Branch | 75.8% | 74.1% | 80.1% | 83.6% | 83.3% | 82.3% |
| 6th Avenue | N/A | N/A | 86.3% | 84.6% | 78.3% | 83.1% |
| Katy | 76.7% | 82.8% | 78.6% | 81.9% | 93.0% | 84.5% |
| La Porte | N/A | N/A | 82.0% | 86.4% | 93.3% | 87.2% |
| Denton | N/A | N/A | 84.2% | 87.4% | 77.8% | 83.1% |
| Shurling | 75.5% | 73.6% | 74.4% | 80.5% | 80.0% | 78.3% |
| Prater Way | 84.5% | 80.8% | 87.4% | 92.4% | 88.9% | 89.6% |
| Adamsville | N/A | N/A | 79.3% | 81.7% | 79.2% | 80.1% |
| Troy(2) | N/A | 66.7% | 69.3% | 70.8% | 70.5% | 70.2% |
| Conroe(2) | 68.1% | 71.3% | 79.8% | 80.2% | 90.0% | 83.3% |
| Del Valle(2) | 64.4% | 51.4% | 66.1% | 71.0% | 68.2% | 68.4% |
| Tomball(2) | 74.3% | 76.2% | 60.9% | 87.4% | 73.6% | 74.0% |
| Canyon Lake(2) | 48.6% | 61.1% | 62.9% | 78.5% | 76.1% | 72.5% |
| Riverside | 81.9% | 83.1% | 89.2% | 91.2% | 84.1% | 88.2% |
| Bertram | 65.3% | 66.7% | 66.4% | 77.9% | 79.4% | 74.6% |
| Center | 65.4% | 60.8% | 59.3% | 71.3% | 85.3% | 72.0% |
| Key | 77.8% | 77.9% | 81.0% | 80.2% | 86.3% | 82.5% |
| Wylds | 55.5% | 56.4% | 56.7% | 62.4% | 80.9% | 66.7% |
| Marine | 64.9% | 59.7% | 68.6% | 81.1% | 80.5% | 76.7% |
| Donna(2) | 54.9% | 56.6% | 45.5% | 62.9% | 72.8% | 60.4% |
| Total/Weighted Average | 75.3% | 72.9% | 74.4% | 80.1% | 81.6% | 78.7% |
| (1) | Historical information obtained from the borrower and based on unit count. |
| (2) | 2013 and 2014 occupancy where available does not represent occupancy under the Iron Guard Storage Portfolio ownership. |
Operating History and Underwritten Net Cash Flow.The following table presents certain information relating to the historical operating performance and the underwritten net cash flow at the Iron Guard Storage Portfolio Properties:
Cash Flow Analysis
| 2015(1) | 2016 | 11/30/2017 T-12 | 11/30/2017 T-6 | 11/30/2017 T-3 | U/W | % of U/W Effective Gross Income | U/W $ per SF | ||||||||||
| Base Rent | $9,092,047 | $9,562,082 | $10,364,754 | $10,694,039 | $10,816,014 | $13,184,283 | 114.0% | $9.75 | |||||||||
| Less Concessions | (262,046) | (297,550) | (499,135) | (513,224) | (539,092) | (539,092) | (4.7) | (0.40) | |||||||||
| Other Income(2) | 1,074,932 | 1,234,919 | 1,271,415 | 1,304,901 | 1,288,085 | 1,288,085 | 11.1 | 0.95 | |||||||||
| Less Vacancy & Credit Loss | (10,776) | 0 | 0 | 0 | 0 | (2,368,260) | (20.5) | (1.75) | |||||||||
| Effective Gross Income | $9,894,157 | $10,499,451 | $11,137,034 | $11,485,716 | $11,565,007 | $11,565,016 | 100.0% | $8.55 | |||||||||
| Total Operating Expenses | $3,403,120 | $3,885,479 | $3,956,033 | $4,124,229 | $4,037,312 | $3,874,101 | 33.5% | $2.86 | |||||||||
| Net Operating Income | $6,491,037 | $6,613,972 | $7,181,001 | $7,361,487 | $7,527,695 | $7,690,915 | 66.5% | $5.69 | |||||||||
| Capital Expenditures | $0 | $0 | $0 | $0 | $0 | $203,000 | 1.8% | $0.15 | |||||||||
| Net Cash Flow | $6,491,037 | $6,613,972 | $7,181,001 | $7,361,487 | $7,527,695 | $7,487,915 | 64.7% | $5.54 | |||||||||
| NOI DSCR(3) | 1.63x | 1.66x | 1.80x | 1.85x | 1.89x | 1.93x | |||||||||||
| NCF DSCR(3) | 1.63x | 1.66x | 1.80x | 1.85x | 1.89x | 1.88x | |||||||||||
| NOI DY(3) | 7.5% | 7.7% | 8.4% | 8.6% | 8.8% | 8.9% | |||||||||||
| NCF DY(3) | 7.5% | 7.7% | 8.4% | 8.6% | 8.8% | 8.7% |
| (1) | The Iron Guard Storage Portfolio Properties were acquired by Iron Guard Storage Portfolio Borrowers between 2010 and 2015. 2015 figures do not represent full year performance of the complete portfolio. In 2010, 56.4% of the portfolio (by allocated loan amount) was acquired. In 2015, 43.6% of the portfolio (by allocated loan amount) was acquired. |
| (2) | Other Income includes administrative and late fees, insurance protection plans, truck rental/U-Haul commissions, merchandise and other miscellaneous income. |
| (3) | The NOI DSCR, NCF DSCR, NOI DY and NCF DY as presented are calculated based on the Iron Guard Storage Portfolio Mortgage Loan, excluding the Iron Guard Storage Portfolio Mezzanine Loan. The U/W NOI DSCR, U/W NCF DSCR, U/W NOI DY and U/W NCF DY based on the combined balance of the Iron Guard Storage Portfolio Mortgage Loan and the Iron Guard Storage Portfolio Mezzanine Loan are 1.46x, 1.42x, 7.8% and 7.6%, respectively. |
THE INFORMATION IN THIS STRUCTURAL AND COLLATERAL TERM SHEET IS NOT COMPLETE AND MAY BE AMENDED PRIOR TO THE TIME OF SALE. THIS TERM SHEET IS NOT AN OFFER TO SELL THESE SECURITIES AND IT IS NOT A SOLICITATION OF AN OFFER TO BUY THESE SECURITIES IN ANY JURISDICTION WHERE THE OFFER OR SALE IS NOT PERMITTED.
56
| IRON GUARD STORAGE PORTFOLIO |
Appraisal.As of the appraisal report date of January 19, 2018, the Iron Guard Storage Portfolio Properties had an “as-portfolio” bulk appraised value of $137,470,000, which includes a portfolio premium of $15,650,000. The sum of the individual “as-is” appraised values of the Iron Guard Storage Portfolio Properties is $121,820,000.
Environmental Matters. According to the Phase I environmental site assessments dated between November 13, 2017 and November 15, 2017, there are no recognized environmental conditions at the Iron Guard Storage Portfolio Properties.
Market Overview. The Iron Guard Storage Portfolio Properties are geographically diverse, located in 17 different cities across 7 states. The greatest concentration of Iron Guard Storage Portfolio Properties is located in Texas (9 properties, 42.6% of SF), Alabama (3 properties, 18.3% of SF), Georgia (4 properties, 15.2% of SF) and North Carolina (3 properties, 13.1% of SF), with the remaining three properties (10.8% of SF) located across three different states.
The following table presents detailed information for the Iron Guard Storage Portfolio Properties by market.
Market Summary
| Property State | Property Count | Net Rentable Area (SF)(1) | % of Net Rentable Area (SF)(1) | Total Units Storage / | % Climate Control | Wtd. Avg. TTM SF Occupancy | Wtd. Avg. Year Built | Wtd. Avg. Rent PSF | Total UW NCF | % of Total UW NCF |
| Texas | 9 | 575,832 | 42.6% | 3916 / 351 | 38.6% | 83.6% | 2003 | $0.78 | $3,116,145 | 41.6% |
| Alabama | 3 | 247,935 | 18.3% | 1900 / 14 | 15.7% | 75.7% | 2003 | $0.62 | $1,076,210 | 14.4% |
| Georgia | 4 | 205,775 | 15.2% | 1657 / 23 | 0.0% | 80.6% | 1988 | $0.69 | $986,614 | 13.2% |
| North Carolina | 3 | 177,092 | 13.1% | 1403 / 61 | 12.6% | 83.3% | 1990 | $0.75 | $1,032,999 | 13.8% |
| Washington | 1 | 51,755 | 3.8% | 390 / 15 | 24.9% | 86.0% | 1978 | $1.37 | $631,617 | 8.4% |
| Nevada | 1 | 44,214 | 3.3% | 306 / 0 | 0.0% | 90.5% | 1990 | $0.97 | $334,365 | 4.5% |
| Virginia | 1 | 49,636 | 3.7% | 404 / 4 | 0.0% | 85.6% | 1988 | $0.83 | $309,965 | 4.1% |
| Total/Weighted Average | 22 | 1,352,239 | 100.0% | 9,976 / 468 | 22.4% | 82.0% | 1996 | $0.76 | $7,487,915 | 100.0% |
| (1) | Excludes square footage attributable to parking spaces. |
THE INFORMATION IN THIS STRUCTURAL AND COLLATERAL TERM SHEET IS NOT COMPLETE AND MAY BE AMENDED PRIOR TO THE TIME OF SALE. THIS TERM SHEET IS NOT AN OFFER TO SELL THESE SECURITIES AND IT IS NOT A SOLICITATION OF AN OFFER TO BUY THESE SECURITIES IN ANY JURISDICTION WHERE THE OFFER OR SALE IS NOT PERMITTED.
57
| IRON GUARD STORAGE PORTFOLIO |
Demographic Summary(1)
Property Name | Avg. Rent PSF(2) | Appraiser’s Market Rent PSF | MSA | 1-mile Population | 3-mile Population | 5-mile Population | 1-mile Median Household Income | 3-mile Median Household Income | 5-mile Median Household Income | |
| Camas | $1.37 | $1.37 | Portland – Vancouver - Hillsboro | 6,054 | 32,371 | 84,921 | $66,481 | $74,365 | $70,187 | |
| Webster | $0.69 | $0.73 | Houston-The Woodlands-Sugar Land, TX | 8,488 | 74,503 | 204,357 | $50,598 | $61,042 | $82,028 | |
| Gum Branch | $0.83 | $0.84 | Jacksonville, NC | 8,440 | 42,268 | 75,127 | $45,505 | $46,423 | $45,320 | |
| 6th Avenue | $0.85 | $0.87 | Birmingham-Hoover, AL | 10,720 | 87,468 | 181,280 | $20,474 | $28,392 | $33,683 | |
| Katy | $0.84 | $0.92 | Houston-The Woodlands-Sugar Land, TX | 12,572 | 67,134 | 186,771 | $80,420 | $79,169 | $84,709 | |
| La Porte | $0.86 | $0.92 | Houston-The Woodlands-Sugar Land, TX | 1,866 | 29,782 | 68,422 | $75,283 | $75,308 | $75,846 | |
| Denton | $0.98 | $1.00 | Dallas-Fort Worth-Arlington, TX | 18,089 | 80,063 | 139,037 | $25,353 | $37,520 | $51,088 | |
| Shurling | $0.71 | $0.68 | Macon, GA | 5,757 | 25,128 | 58,522 | $23,241 | $28,430 | $27,928 | |
| Prater Way | $0.97 | $0.99 | Reno-Sparks, NV | 19,405 | 84,516 | 204,120 | $43,003 | $44,877 | $39,708 | |
| Adamsville | $0.84 | $0.82 | Birmingham-Hoover, AL | 2,460 | 15,525 | 34,050 | $41,480 | $44,888 | $38,855 | |
| Troy | $0.43 | $0.37 | Montgomery, AL | 10,870 | 54,313 | 114,702 | $24,891 | $43,459 | $45,368 | |
| Conroe | $0.80 | $0.84 | Houston-The Woodlands-Sugar Land, TX | 2,314 | 23,581 | 65,641 | $47,049 | $49,250 | $44,253 | |
| Del Valle | $0.92 | $0.89 | Austin-Round Rock, TX | 1,763 | 15,465 | 34,067 | $57,280 | $55,905 | $51,198 | |
| Tomball | $0.60 | $0.79 | Houston-The Woodlands-Sugar Land, TX | 489 | 8,501 | 43,032 | $84,134 | $93,058 | $75,046 | |
| Canyon Lake | $0.81 | $0.84 | San Antonio–New Braunfels, TX | 472 | 5,558 | 14,835 | $48,928 | $57,954 | $55,094 | |
| Riverside | $0.83 | $0.83 | Danville, VA | 4,215 | 34,395 | 50,510 | $29,132 | $31,828 | $34,575 | |
| Bertram | $0.73 | $0.73 | Augusta-Richmond County, GA-SC | 8,092 | 47,419 | 131,077 | $39,183 | $53,917 | $45,350 | |
| Center | $0.64 | $0.67 | Jacksonville, NC | 7,252 | 40,120 | 78,535 | $36,827 | $39,598 | $42,879 | |
| Key | $0.75 | $0.72 | Macon, GA | 6,687 | 58,577 | 86,694 | $20,716 | $22,341 | $26,590 | |
| Wylds | $0.57 | $0.59 | Augusta-Richmond County, GA-SC | 8,092 | 47,419 | 131,077 | $39,183 | $53,917 | $45,350 | |
| Marine | $0.76 | $0.80 | Jacksonville, NC | 6,477 | 39,406 | 78,753 | $31,791 | $42,876 | $44,603 | |
| Donna | $0.58 | $0.59 | McAllen-Edinburg-Mission, TX | 3,205 | 50,132 | 126,526 | $33,295 | $31,544 | $31,199 | |
| Total/Weighted Average | $0.83 | $0.85 | 7,290 | 44,948 | 103,919 | $46,503 | $52,559 | $53,116 |
| (1) | Source: Third Party Research Report. | |
| (2) | Avg. Rent PSF excludes square footage attributable to parking spaces. |
The Borrowers.The borrowers are Lucky 7 Equity LLC, Lucky 7 Equity II LLC, Lucky 7 Equity IV, LLC and Lucky 7 Equity V, LLC and 22 single purpose limited liability companies (individually and collectively, the “Iron Guard Storage Portfolio Borrowers”) each with at least two independent directors. Legal counsel to the borrowers delivered a non-consolidation opinion in connection with the origination of the Iron Guard Storage Portfolio Mortgage Loan. Equity ownership in the Iron Guard Storage Portfolio Borrowers is held by Tyrrell & Barbara Ross, Kurt Ross Prime Trust, Chad & Denise Ross, David & Brena Ross and Jim & Kim Michael. Tyrrell Ross, Kurtus Ross, Chad Ross, David Ross, Kim Michael and Kurt Ross Prime Trust are the guarantors of certain nonrecourse carveouts under the Iron Guard Storage Portfolio Mortgage Loan. The guarantors are required pursuant to the Iron Guard Storage Portfolio Mortgage Loan documents to collectively maintain a minimum net worth of not less than $50 million and a minimum liquidity of not less than $2.5 million.
The Borrower Sponsor.The borrower sponsor is David Ross, the owner, CEO and President of Iron Guard Storage. Iron Guard Storage is a self-storage owner and operator founded in 2010.
Escrows.The Iron Guard Storage Portfolio Borrowers deposited at closing (i) $212,900 for immediate repairs (125% of estimated costs), (ii) $170,242 for real estate taxes and (iii) $158,395 for insurance premiums. The Iron Guard Storage Portfolio Borrowers are also required to deposit monthly (i) $11,278 for replacement reserves, capped at $406,000, (ii) 1/12th of the estimated property taxes (currently $96,239), and (iii) 1/12th of the estimated insurance premiums due (currently $17,599) unless the Iron Guard Storage Portfolio Properties are covered by a blanket policy.
Lockbox and Cash Management.Upon a Cash Sweep Period (as defined below) the Iron Guard Storage Portfolio Borrowers are required to establish a lockbox account into which all rents are required to be deposited, which funds are then required to be swept on each business day to a lender-controlled cash management account for payment of among other things debt service, monthly escrows and operating expenses with all excess cash to be deposited to an excess cash reserve to be held as additional security for the Iron Guard Storage Portfolio Mortgage Loan for so long as a Cash Sweep Period exists.
A “Cash Sweep Period” will occur either (i) during the period when the debt service coverage ratio (inclusive of the Iron Guard Storage Portfolio Mezzanine Loan debt service) is below 1.05x for the trailing six month period, tested quarterly until the debt service coverage ratio equals or exceeds 1.05x for the trailing six month period for two consecutive quarters or (ii) upon an event of default under the mortgage loan or mezzanine loan until the cure of such event of default.
Property Management.The Iron Guard Storage Portfolio Properties are currently managed by Iron Guard Storage, LLC.
THE INFORMATION IN THIS STRUCTURAL AND COLLATERAL TERM SHEET IS NOT COMPLETE AND MAY BE AMENDED PRIOR TO THE TIME OF SALE. THIS TERM SHEET IS NOT AN OFFER TO SELL THESE SECURITIES AND IT IS NOT A SOLICITATION OF AN OFFER TO BUY THESE SECURITIES IN ANY JURISDICTION WHERE THE OFFER OR SALE IS NOT PERMITTED.
58
| IRON GUARD STORAGE PORTFOLIO |
Assumption.After July 9, 2018, the borrowers have the right to transfer the Iron Guard Storage Portfolio Properties in their entirety, provided that certain other conditions are satisfied, including, but not limited to: (i) no event of default has occurred and is continuing; (ii) the lender’s reasonable determination that the proposed transferee and guarantor satisfy the lender’s credit review and underwriting standards, taking into consideration transferee experience, financial strength and general business standing; (iii) the mezzanine borrower has complied with all terms set forth in the mezzanine loan documents with respect to the assumption or the mezzanine loan is simultaneously prepaid in full; (iv) if requested by the lender, a REMIC opinion and new non-consolidation opinion are provided; and (v) if requested by the lender, rating agency confirmation from Fitch, DBRS and Moody’s that the transfer will not result in a downgrade, withdrawal or qualification of the respective ratings assigned to the BANK 2018-BNK10 Certificates.
Partial Release.Not permitted.
Real Estate Substitution.Not permitted.
Subordinate and Mezzanine Indebtedness.The “Iron Guard Storage Portfolio Mezzanine Loan” refers to a loan in the original principal amount of $12,150,000 to IGM Owner LLC, a Delaware limited liability company, by Bank of America, National Association, secured by 100% of the indirect equity interests in the Iron Guard Storage Portfolio Borrowers and put in place simultaneously with the origination of the Iron Guard Storage Portfolio Mortgage Loan. The Iron Guard Storage Portfolio Mezzanine Loan is expected to be sold to a third party.
The Iron Guard Storage Portfolio Mortgage Loan and the Iron Guard Storage Portfolio Mezzanine Loan are subject to an intercreditor agreement. The Iron Guard Storage Portfolio Mezzanine Loan accrues interest at an interest rate of 10.50%per annum and requires payments of interest only through the loan maturity date of February 1, 2028. The Iron Guard Storage Portfolio Mezzanine Loan may not be prepaid, refinanced or defeased in whole or in part while any portion of the Iron Guard Storage Portfolio Mortgage Loan remains outstanding without a pro rata prepayment or pro rata defeasance of the Iron Guard Storage Portfolio Mortgage Loan.
Ground Lease.Each of the Iron Guard Storage Portfolio Properties is subject to a ground lease between one of the four fee borrowers (Lucky 7 Equity LLC, Lucky 7 Equity II LLC, Lucky 7 Equity IV, LLC and Lucky 7 Equity V, LLC) and one of 22 leasehold borrowers. The Iron Guard Storage Portfolio Mortgage Loan is secured by both the fee and leasehold interests in each of the 22 Iron Guard Storage Portfolio Properties.
Terrorism Insurance.The loan documents require that the “all risk” insurance policy required to be maintained by the borrowers provide coverage for terrorism and acts of terrorism in an amount equal to the full replacement cost of the Iron Guard Storage Portfolio Properties, as well as business interruption insurance covering no less than the 12-month period following the occurrence of a casualty event, together with an up to six-month extended period of indemnity.
Earthquake Insurance.The loan documents do not require earthquake insurance. The seismic reports dated November 14, 2017 indicated a probable maximum loss of 6.0% for the Camas property and 9.0% for the Prater Way property.
THE INFORMATION IN THIS STRUCTURAL AND COLLATERAL TERM SHEET IS NOT COMPLETE AND MAY BE AMENDED PRIOR TO THE TIME OF SALE. THIS TERM SHEET IS NOT AN OFFER TO SELL THESE SECURITIES AND IT IS NOT A SOLICITATION OF AN OFFER TO BUY THESE SECURITIES IN ANY JURISDICTION WHERE THE OFFER OR SALE IS NOT PERMITTED.
59
| WISCONSIN HOTEL PORTFOLIO |
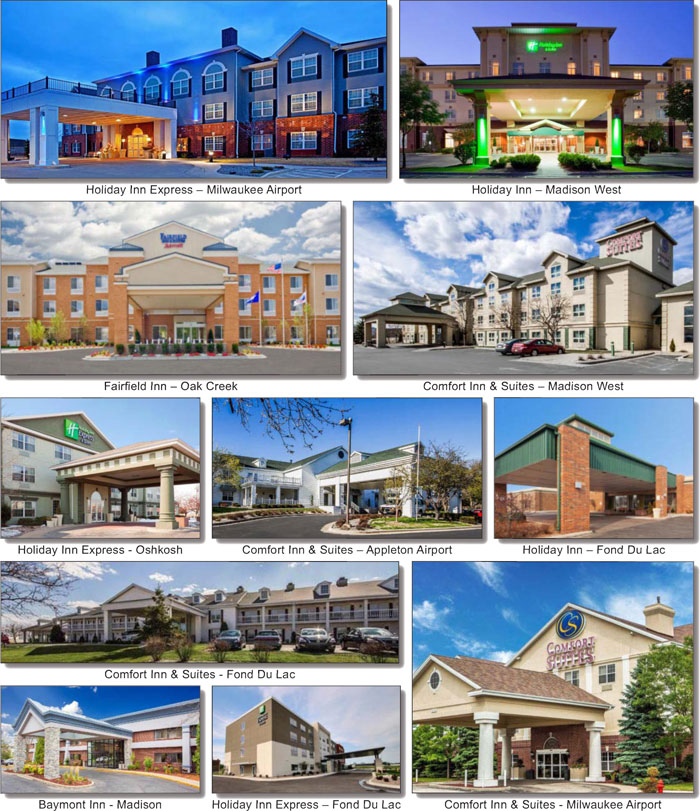
THE INFORMATION IN THIS STRUCTURAL AND COLLATERAL TERM SHEET IS NOT COMPLETE AND MAY BE AMENDED PRIOR TO THE TIME OF SALE. THIS TERM SHEET IS NOT AN OFFER TO SELL THESE SECURITIES AND IT IS NOT A SOLICITATION OF AN OFFER TO BUY THESE SECURITIES IN ANY JURISDICTION WHERE THE OFFER OR SALE IS NOT PERMITTED.
60
| WISCONSIN HOTEL PORTFOLIO |
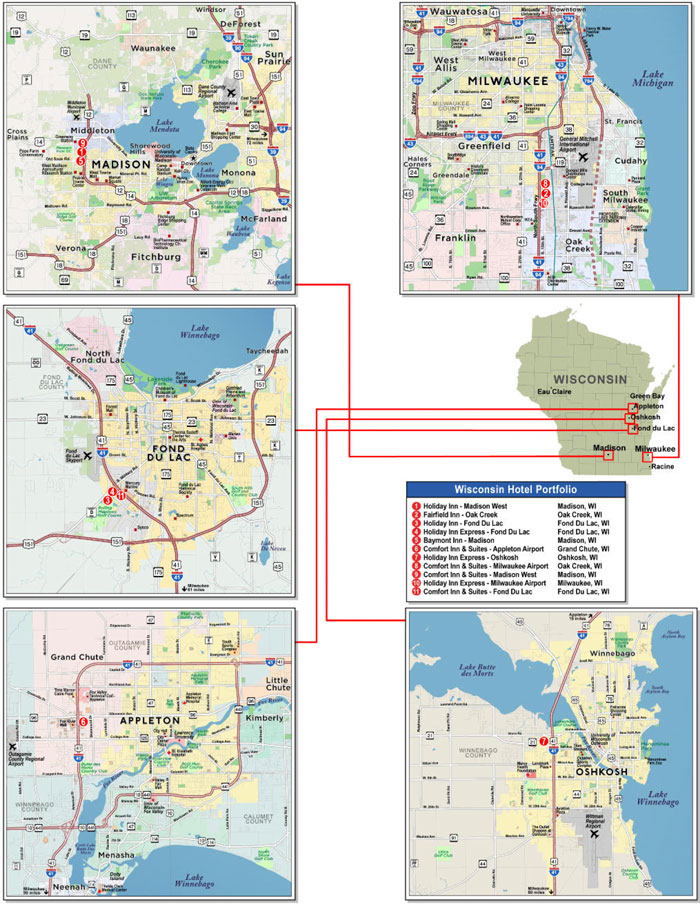
THE INFORMATION IN THIS STRUCTURAL AND COLLATERAL TERM SHEET IS NOT COMPLETE AND MAY BE AMENDED PRIOR TO THE TIME OF SALE. THIS TERM SHEET IS NOT AN OFFER TO SELL THESE SECURITIES AND IT IS NOT A SOLICITATION OF AN OFFER TO BUY THESE SECURITIES IN ANY JURISDICTION WHERE THE OFFER OR SALE IS NOT PERMITTED.
61
| WISCONSIN HOTEL PORTFOLIO |
| No. 4 – Wisconsin Hotel Portfolio | |||||||
| Loan Information | Property Information | ||||||
| Mortgage Loan Seller: | Morgan Stanley Mortgage Capital | Single Asset/Portfolio: | Portfolio | ||||
| Credit Assessment (Fitch/DBRS/Moody’s): | NR/NR/NR | Property Type: | Hospitality | ||||
| Original Principal Balance: | $74,600,000 | Specific Property Type: | Various | ||||
| Cut-off Date Balance: | $74,600,000 | Location: | Various, WI | ||||
| % of Initial Pool Balance: | 5.8% | Size: | 1,255 Rooms | ||||
| Loan Purpose: | Refinance | Cut-off Date Balance Per Room: | $59,442 | ||||
| Borrower Name(1): | Various | Year Built/Renovated: | Various | ||||
| Borrower Sponsor: | William Zanetis | Title Vesting: | Fee | ||||
| Mortgage Rate: | 5.330% | Property Manager: | Self-managed | ||||
| Note Date: | January 4, 2018 | 4th Most Recent Occupancy (As of): | 63.3% (12/31/2013) | ||||
| Anticipated Repayment Date: | NAP | 3rd Most Recent Occupancy (As of): | 63.8% (12/31/2014) | ||||
| Maturity Date: | February 1, 2028 | 2nd Most Recent Occupancy (As of): | 67.4% (12/31/2015) | ||||
| IO Period: | NAP | Most Recent Occupancy (As of): | 67.1% (12/31/2016) | ||||
| Loan Term (Original): | 120 months | Current Occupancy (As of): | 66.3% (10/31/2017) | ||||
| Seasoning: | 0 months | ||||||
| Amortization Term (Original): | 300 months | Underwriting and Financial Information: | |||||
| Loan Amortization Type: | Amortizing Balloon | ||||||
| Interest Accrual Method: | Actual/360 | 4th Most Recent NOI (As of): | $8,055,897 (12/31/2014) | ||||
| Call Protection: | L(24),D(92),O(4) | 3rd Most Recent NOI (As of): | $8,895,028 (12/31/2015) | ||||
| Lockbox Type: | Springing | 2nd Most Recent NOI (As of): | $9,019,184 (12/31/2016) | ||||
| Additional Debt(2): | None | Most Recent NOI (As of): | $9,515,686 (TTM 10/31/2017) | ||||
| Additional Debt Type: | NAP | ||||||
| U/W Revenues: | $35,445,688 | ||||||
| U/W Expenses: | $25,842,488 | ||||||
| U/W NOI: | $9,603,200 | ||||||
| U/W NCF: | $8,185,373 | ||||||
| U/W NOI DSCR: | 1.78x | ||||||
| Escrows and Reserves(3): | U/W NCF DSCR: | 1.51x | |||||
| Type: | Initial | Monthly | Cap (If Any) | U/W NOI Debt Yield: | 12.9% | ||
| Taxes | $176,010 | (3) | NAP | U/W NCF Debt Yield: | 11.0% | ||
| Insurance | $0 | Springing | NAP | As-Is Appraised Value: | $118,010,000 | ||
| FF&E Reserve | $0 | $118,152 | NAP | As-Is Appraisal Valuation Date: | Various | ||
| Deferred Maintenance | $223,475 | $0 | NAP | Cut-off Date LTV Ratio: | 63.2% | ||
| PIP Reserve | $5,200,000 | $0 | NAP | LTV Ratio at Maturity or ARD: | 47.8% | ||
| (1) | The borrowers are Wisco Partners, LLC, WZ Wisco, INC., App Pro of Appleton, INC., Osh Pro Partners, LLC, Wes Pro II, LLC, Mad Pro of Madison, INC., Oak Pro Partners, LLC, Wes Pro Partners, LLC, Mil Pro, LLC, Oak Pro II, LLC, F.D.L. Pro LLC. |
| (2) | Certain borrowers have incurred an aggregate of $531,083 of unsecured forgivable loans from one of the franchisors—see “Mezzanine and Subordinate Indebtedness” herein. |
| (3) | See “Escrows” section. |
The Mortgage Loan. The mortgage loan (the “Wisconsin Hotel Portfolio Mortgage Loan”) is evidenced by a single promissory note secured by a first mortgage encumbering the fee interests in a portfolio of 11 hospitality properties located throughout Wisconsin (the “Wisconsin Hotel Portfolio Properties”). The Wisconsin Hotel Portfolio Mortgage Loan was originated on January 4, 2018 by Morgan Stanley Bank, N.A. The Wisconsin Hotel Portfolio Mortgage Loan had an original principal balance of $74,600,000, has an outstanding principal balance as of the Cut-off Date of $74,600,000 and accrues interest at an interest rate of 5.330%per annum. The Wisconsin Hotel Portfolio Mortgage Loan had an initial term of 120 months, has a remaining term of 120 months as of the Cut-off Date and requires payments of principal and interest based on a 25-year amortization schedule. The Wisconsin Hotel Portfolio Mortgage Loan matures on February 1, 2028.
Following the lockout period, the borrower has the right to defease the Wisconsin Hotel Portfolio Mortgage Loan in whole, or in part as described below under “Partial Release,” on any date before November 1, 2027. In addition, the Wisconsin Hotel Portfolio Mortgage Loan is prepayable without penalty on or after November 1, 2027, in whole.
THE INFORMATION IN THIS STRUCTURAL AND COLLATERAL TERM SHEET IS NOT COMPLETE AND MAY BE AMENDED PRIOR TO THE TIME OF SALE. THIS TERM SHEET IS NOT AN OFFER TO SELL THESE SECURITIES AND IT IS NOT A SOLICITATION OF AN OFFER TO BUY THESE SECURITIES IN ANY JURISDICTION WHERE THE OFFER OR SALE IS NOT PERMITTED.
62
| WISCONSIN HOTEL PORTFOLIO |
Sources and Uses
| Sources | Uses | |||||||
| Original loan amount | $74,600,000 | 94.1% | Loan payoff | $71,666,381 | 90.4% | |||
| Borrower Equity | 4,662,865 | 5.9 | Reserves | 5,599,485 | 7.1 | |||
| Closing costs | 1,997,000 | 2.5 | ||||||
| Total Sources | $79,262,865 | 100.0% | Total Uses | $79,262,865 | 100.0% |
The Properties.The Wisconsin Hotel Portfolio Properties are comprised of eleven hospitality properties, nine of which are limited service hotels (76.4% of rooms) and two of which are full service hotels (23.6% of rooms). Built between 1974 and 2015, the Wisconsin Hotel Portfolio Properties have undergone approximately $12.1 million in improvements since 2013. These improvements include capital expenditures to keep the hotels up to date with brand standards (which includes converting the three Holiday Inn Express branded properties to their latest blue format and converting the three Comfort Suites branded properties to their latest Move 2 Modern format). The Wisconsin Hotel Portfolio Properties are slated to undergo $10,890,000 of property improvement plans (“PIPs”) between 2018 and 2021, of which $5,200,000 was reserved upfront.
The following table presents certain information relating to the Wisconsin Hotel Portfolio Properties:
Property Schedule
| Property Name | City | Year Built/ Renovated | Specific Property Type | Rooms | 10/31/2017 Occupancy | Allocated Cut-off Date Balance | % of Allocated Cut-off Date Balance | Appraised Value | Underwritten NOI | Franchise Expiration Date |
Holiday Inn – Madison West | Madison | 2000 / 2015 | Full Service | 157 | 62.0% | $13,550,000 | 18.2% | $18,160,000 | $1,637,934 | 7/21/2020 |
Fairfield Inn – Oak Creek | Oak Creek | 2008 / 2016 | Limited Service | 119 | 69.0% | $9,436,000 | 12.6% | $13,480,000 | $1,149,428 | 6/22/2029 |
Holiday Inn – Fond Du Lac(1) | Fond Du Lac | 1974 / 2015 | Full Service | 139 | 64.6% | $8,350,000 | 11.2% | $16,200,000 | $1,087,332 | 1/10/2019(1) |
Holiday Inn Express – Fond Du Lac | Fond Du Lac | 2015 / NAP | Limited Service | 86 | 60.8% | $7,225,000 | 9.7% | $11,670,000 | $825,213 | 6/1/2035 |
Baymont Inn – Madison | Madison | 1988 / 2017 | Limited Service | 129 | 58.2% | $6,020,000 | 8.1% | $10,160,000 | $706,151 | 1/31/2036 |
| Comfort Inn & Suites - Appleton Airport | Grand Chute | 1989 / 2014 | Limited Service | 130 | 71.3% | $5,900,000 | 7.9% | $8,430,000 | $937,561 | 7/30/2024 |
| Holiday Inn Express - Oshkosh | Oshkosh | 1997 / NAP | Limited Service | 69 | 71.8% | $5,876,000 | 7.9% | $8,170,000 | $690,125 | 12/28/2027 |
| Comfort Inn & Suites - Milwaukee Airport | Oak Creek | 1998 / 2013 | Limited Service | 138 | 65.9% | $5,820,000 | 7.8% | $8,490,000 | $715,913 | 6/1/2019 |
| Comfort Inn & Suites - Madison West | Madison | 1994 / 2014 | Limited Service | 95 | 63.6% | $5,067,000 | 6.8% | $7,240,000 | $822,960 | 5/22/2025 |
| Holiday Inn Express - Milwaukee Airport | Milwaukee | 2005 / 2017 | Limited Service | 115 | 66.7% | $4,710,000 | 6.3% | $12,230,000 | $591,873 | 6/22/2030 |
Comfort Inn & Suites – Fond Du Lac(2) | Fond Du Lac | 1989 / 2014 | Limited Service | 78 | 83.9% | $2,646,000 | 3.5% | $3,780,000 | $438,710 | 12/23/2025 |
| Total/Weighted Average | 1,255 | 66.3% | $74,600,000 | $118,010,000 | $9,603,200 |
| (1) | The Holiday Inn – Fond Du Lac Property is expected to be converted to a Radisson flag under a franchise agreement that expires 1/11/2039; however there is no assurance such conversion will be effected. |
| (2) | “The franchisor has the right to terminate the franchise agreement without cause as of August 2020. |
Holiday Inn - Madison West. The Holiday Inn - Madison West property is a four-story, full service hotel that was built in 2000, renovated in 2015 and contains 157 guestrooms. The Holiday Inn - Madison West property also features an on-site, 160-seat restaurant, meeting space totaling 6,800 square feet, indoor waterpark feature, fitness center and business center.
The Holiday Inn - Madison West property has undergone approximately $633,246 in capital expenditures since 2013 and as part of its franchise agreement is slated to undergo a $3,500,000 PIP or $22,293 per room. Of the $5,200,000 upfront PIP reserve, $1,100,000 was allocated towards the Holiday Inn - Madison West property. There are 220 surface parking spaces at the Holiday Inn - Madison West property.
The demand segmentation for the Holiday Inn - Madison West property is 34% commercial, 31% leisure, 25% group and 10% extended stay.
The Holiday Inn - Madison West property is subject to a franchise agreement with Holiday Inns Franchising, Inc. expiring July 21, 2020.
Fairfield Inn - Oak Creek. The Fairfield Inn - Oak Creek property is a three-story, limited service hotel that was built in 2008, renovated in 2016 and contains 119 guestrooms. The Fairfield Inn - Oak Creek property also features an indoor pool, fitness center, business center, sundries shop, and meeting room.
The Fairfield Inn - Oak Creek property has undergone approximately $848,840 in capital expenditures since 2013 and as part of its franchise agreement is slated to undergo a $1,500,000 PIP or $12,605 per room. Of the $5,200,000 upfront PIP reserve, $0 was allocated towards the Fairfield Inn – Oak Creek property. There are 115 surface parking spaces at the Fairfield Inn - Oak Creek property.
THE INFORMATION IN THIS STRUCTURAL AND COLLATERAL TERM SHEET IS NOT COMPLETE AND MAY BE AMENDED PRIOR TO THE TIME OF SALE. THIS TERM SHEET IS NOT AN OFFER TO SELL THESE SECURITIES AND IT IS NOT A SOLICITATION OF AN OFFER TO BUY THESE SECURITIES IN ANY JURISDICTION WHERE THE OFFER OR SALE IS NOT PERMITTED.
63
| WISCONSIN HOTEL PORTFOLIO |
The demand segmentation for the Fairfield Inn - Oak Creek property is 50% leisure, 37% commercial, 10% extended stay and 3% group.
The Fairfield Inn - Oak Creek property is subject to a franchise agreement with Marriott International, Inc. expiring June 22, 2029.
Holiday Inn - Fond Du Lac. The Holiday Inn - Fond Du Lac property is a two-story, full service hotel that was built in 1974, renovated in 2015 and contains 139 guestrooms. The Holiday Inn - Fond Du Lac property also features an on-site, 213-seat restaurant and bar, meeting space totaling 14,000 square feet, indoor pool, fitness center and business center.
The Holiday Inn - Fond Du Lac property has undergone $3,128,727 in capital expenditures since 2013. There are 427 surface parking spaces at the Holiday Inn - Fond Du Lac property.
The demand segmentation for the Holiday Inn - Fond Du Lac property is 36% group, 30% leisure, 29% commercial and 5% extended stay.
The Holiday Inn - Fond Du Lac property is currently subject to a franchise agreement with Holiday Hospitality Franchising, LLC expiring January 10, 2019. The borrower expects to then convert the hotel to a Radisson. In order to effect this change, the hotel is required to undergo renovations estimated to total $2,000,000, or $14,388 per room, including renovation of finishes, FF&E and public areas. Of the $5,200,000 upfront PIP reserve, $2,000,000 was allocated towards the Holiday Inn - Fond Du Lac property.
The following table presents certain information relating to the historical operating performance and the underwritten net cash flow at the Wisconsin Hotel Portfolio Properties:
Cash Flow Analysis
| 2014 | 2015 | 2016 | TTM 10/31/2017 | U/W | % of U/W Total Rev. | U/W $ per Room | ||||||||||
| Occupancy | 63.8%(1) | 67.4% | 67.1% | 66.3% | 66.3% | |||||||||||
| ADR | $94.00(1) | $102.10 | $103.44 | $104.60 | $104.60 | |||||||||||
| RevPAR | $65.22(1) | $67.37 | $67.42 | $68.41 | $68.41 | |||||||||||
| Room Revenue | 26,572,612 | 28,593,016 | 29,603,123 | 30,092,909 | 30,092,910 | 84.9 | % | 23,978 | ||||||||
| F&B Revenue | 4,406,910 | 4,442,612 | 4,539,101 | 4,505,876 | 4,505,876 | 12.7 | 3,590 | |||||||||
| Other Income(2) | 589,098 | 610,402 | 666,805 | 846,903 | 846,902 | 2.4 | 675 | |||||||||
| Total Revenue | $31,568,620 | $33,646,030 | $34,809,029 | $35,445,688 | $35,445,688 | 100.0 | % | 28,244 | ||||||||
| Total Departmental Expenses | 10,158,342 | 10,365,816 | 10,797,240 | 10,952,869 | 10,986,195 | 31.0 | 8,754 | |||||||||
| Gross Operating Profit | $21,410,278 | $23,280,215 | $24,011,789 | $24,492,819 | $24,459,493 | 69.0 | % | 19,490 | ||||||||
| Total Undistributed Expenses | 10,853,472 | 11,596,320 | 11,998,342 | 12,015,501 | 12,015,502 | 33.9 | 9,574 | |||||||||
| Profit Before Fixed Charges | $10,556,806 | $11,683,895 | $12,013,447 | $12,477,318 | $12,443,991 | 35.1 | % | 9,916 | ||||||||
| Total Fixed Charges | 2,500,909 | 2,788,866 | 2,994,262 | 2,961,633 | 2,840,791 | 8.0 | 2,264 | |||||||||
| Net Operating Income | $8,055,897 | $8,895,028 | $9,019,184 | $9,515,686 | $9,603,200 | 27.1 | % | 7,652 | ||||||||
| FF&E | 1,262,744 | 1,345,842 | 1,392,361 | 1,417,826 | 1,417,827 | 4.0 | 1,130 | |||||||||
| Net Cash Flow | $6,793,153 | $7,549,187 | $7,626,823 | $8,097,859 | $8,185,373 | 23.1 | % | 6,522 | ||||||||
| NOI DSCR | 1.49x | 1.650x | 1.67x | 1.76x | 1.78x | |||||||||||
| NCF DSCR | 1.26x | 1.40x | 1.41x | 1.50x | 1.51x | |||||||||||
| NOI DY | 10.8% | 11.9% | 12.1% | 12.8% | 12.9% | |||||||||||
| NCF DY | 9.1% | 10.1% | 10.2% | 10.9% | 11.0% |
| (1) | 2014 Occupancy, ADR and RevPAR do not include the Holiday Inn Express - Fond Du Lac property, which was built in 2015. |
| (2) | Other Income includes revenue from other operating departments and other miscellaneous income. |
Appraisal.As of the appraisal valuation dates ranging from November 17, 2017 to November 22, 2017, the Wisconsin Hotel Portfolio Properties had an aggregate “as-is” appraised value of $118,010,000.
Environmental Matters. According to Phase I environmental assessments dated November 30, 2017, there are no recognized environmental conditions at the Wisconsin Hotel Portfolio Properties. The related Phase I identified a controlled recognized environmental condition at the Fairfield Inn – Oak Creek property relating to polynuclear aromatic hydrocarbons (PAH) concentrations in shallow soil and fill materials. The Wisconsin Department of Natural Resources (WIDNR) issued “Final Case Closure with Continuing Obligations” on December 19, 2014, which continuing obligations include (1) residual soil contamination exists that must be properly managed if excavated or removed; (2) a soil cover must be maintained over contaminated soil, and the WIDNR must be notified and approve any changes to this barrier; (3) a prohibition on residential development and (4) the site is also required to be continuously registered as on the WIDNR GIS Registry.
Market Overview and Competition.The Wisconsin Hotel Portfolio Properties are located in five markets across Wisconsin: Madison (three properties, 30.4% of rooms), Milwaukee (three properties, 29.6% of rooms), Fond Du Lac (three properties, 24.1% of rooms), Appleton (one property, 10.4% of rooms) and Oshkosh (one property, 5.5% of rooms).
THE INFORMATION IN THIS STRUCTURAL AND COLLATERAL TERM SHEET IS NOT COMPLETE AND MAY BE AMENDED PRIOR TO THE TIME OF SALE. THIS TERM SHEET IS NOT AN OFFER TO SELL THESE SECURITIES AND IT IS NOT A SOLICITATION OF AN OFFER TO BUY THESE SECURITIES IN ANY JURISDICTION WHERE THE OFFER OR SALE IS NOT PERMITTED.
64
| WISCONSIN HOTEL PORTFOLIO |
The following table presents demographic information with respect to the Wisconsin Hotel Portfolio Properties:
Wisconsin Hotel Portfolio Demographic Summary
2017 | 2017 Median HH | ||
| Madison | 656,632 | $62,903 | |
| Milwaukee | 1,570,482 | $56,136 | |
| Fond Du Lac | 102,237 | $56,302 | |
| Appleton | 235,138 | $62,110 | |
| Oshkosh | 170,078 | $53,482 |
The following table presents certain information relating to the Occupancy, ADR and RevPAR of the Wisconsin Hotel Portfolio Properties and their competitive sets:
Subject and Market Historical Occupancy, ADR and RevPAR(1)
Competitive Set | Holiday Inn - Madison West | Penetration Factor | ||||||||||
Year | Occupancy | ADR | RevPAR |
| Occupancy | ADR | RevPAR |
| Occupancy | ADR | RevPAR |
|
| 10/31/2015 TTM | 61.6% | $122.48 | $75.45 | 70.2% | $123.12 | $86.48 | 114.0% | 100.5% | 114.6% | |||
| 10/31/2016 TTM | 63.9% | $125.62 | $80.30 | 66.6% | $127.24 | $84.70 | 104.1% | 101.3% | 105.5% | |||
| 10/31/2017 TTM | 60.5% | $128.03 | $77.48 | 62.0% | $129.63 | $80.31 | 102.4% | 101.3% | 103.6% | |||
Competitive Set | Fairfield Inn - Oak Creek | Penetration Factor | ||||||||||
Year | Occupancy | ADR | RevPAR |
| Occupancy | ADR | RevPAR |
| Occupancy | ADR | RevPAR |
|
| 10/31/2015 TTM | 68.8% | $81.17 | $55.83 | 64.7% | $104.50 | $67.64 | 94.1% | 128.7% | 121.1% | |||
| 10/31/2016 TTM | 74.0% | $80.06 | $59.21 | 62.8% | $110.84 | $69.58 | 84.9% | 138.4% | 117.5% | |||
| 10/31/2017 TTM | 78.9% | $80.85 | $63.79 | 68.4% | $108.24 | $74.02 | 86.7% | 133.9% | 116.0% | |||
Competitive Set | Holiday Inn - Fond Du Lac | Penetration Factor | ||||||||||
Year | Occupancy | ADR | RevPAR |
| Occupancy | ADR | RevPAR |
| Occupancy | ADR | RevPAR |
|
| 10/31/2015 TTM | 45.6% | $74.96 | $34.18 | 68.9% | $99.56 | $68.59 | 151.1% | 132.8% | 200.7% | |||
| 10/31/2016 TTM | 50.1% | $80.60 | $40.36 | 59.8% | $98.93 | $59.21 | 119.5% | 122.7% | 146.7% | |||
| 10/31/2017 TTM | 51.9% | $87.68 | $45.51 | 63.8% | $100.68 | $64.26 | 123.0% | 114.8% | 141.2% | |||
Competitive Set | Holiday Inn Express - Fond Du Lac | Penetration Factor | ||||||||||
Year | Occupancy | ADR | RevPAR |
| Occupancy | ADR | RevPAR |
| Occupancy | ADR | RevPAR |
|
| 10/31/2015 TTM | 45.6% | $74.96 | $34.18 | 56.7% | $141.04 | $79.92 | 124.3% | 188.1% | 233.8% | |||
| 10/31/2016 TTM | 50.1% | $80.60 | $40.36 | 57.1% | $119.17 | $68.02 | 114.0% | 147.8% | 168.5% | |||
| 10/31/2017 TTM | 51.9% | $87.68 | $45.51 | 60.8% | $116.82 | $70.99 | 117.1% | 133.2% | 156.0% | |||
Competitive Set | Baymont Inn - Madison | Penetration Factor | ||||||||||
Year | Occupancy | ADR | RevPAR |
| Occupancy | ADR | RevPAR |
| Occupancy | ADR | RevPAR |
|
| 10/31/2015 TTM | 62.5% | $86.81 | $54.21 | 64.0% | $72.40 | $46.35 | 102.5% | 83.4% | 85.5% | |||
| 10/31/2016 TTM | 65.6% | $90.34 | $59.22 | 61.1% | $77.47 | $47.37 | 93.1% | 85.8% | 80.0% | |||
| 10/31/2017 TTM | 63.4% | $97.50 | $61.82 | 59.6% | $80.96 | $48.29 | 94.0% | 83.0% | 78.1% | |||
Competitive Set | Comfort Inn & Suites - Appleton | Penetration Factor | ||||||||||
Year | Occupancy | ADR | RevPAR |
| Occupancy | ADR | RevPAR |
| Occupancy | ADR | RevPAR |
|
| 10/31/2015 TTM | 51.5% | $87.77 | $45.23 | 68.4% | $86.77 | $59.33 | 132.8% | 98.9% | 131.2% | |||
| 10/31/2016 TTM | 52.4% | $88.72 | $46.53 | 69.3% | $89.27 | $61.86 | 132.3% | 100.6% | 133.0% | |||
| 10/31/2017 TTM | 53.4% | $89.27 | $47.65 | 69.0% | $90.06 | $62.18 | 129.2% | 100.9% | 130.5% | |||
Competitive Set | Holiday Inn Express - Oshkosh | Penetration Factor | ||||||||||
Year | Occupancy | ADR | RevPAR |
| Occupancy | ADR | RevPAR |
| Occupancy | ADR | RevPAR |
|
| 10/31/2015 TTM | 56.5% | $104.35 | $58.92 | 73.2% | $111.38 | $81.51 | 129.6% | 106.7% | 138.4% | |||
| 10/31/2016 TTM | 60.2% | $107.75 | $64.89 | 71.5% | $114.77 | $82.02 | 118.7% | 106.5% | 126.4% | |||
| 10/31/2017 TTM | 58.7% | $107.05 | $62.83 | 72.9% | $114.80 | $83.70 | 124.2% | 107.2% | 133.2% | |||
THE INFORMATION IN THIS STRUCTURAL AND COLLATERAL TERM SHEET IS NOT COMPLETE AND MAY BE AMENDED PRIOR TO THE TIME OF SALE. THIS TERM SHEET IS NOT AN OFFER TO SELL THESE SECURITIES AND IT IS NOT A SOLICITATION OF AN OFFER TO BUY THESE SECURITIES IN ANY JURISDICTION WHERE THE OFFER OR SALE IS NOT PERMITTED.
65
| WISCONSIN HOTEL PORTFOLIO |
Competitive Set | Comfort Inn & Suites - Milwaukee Airport | Penetration Factor | ||||||||||
Year | Occupancy | ADR | RevPAR |
| Occupancy | ADR | RevPAR |
| Occupancy | ADR | RevPAR |
|
| 10/31/2015 TTM | 62.2% | $70.52 | $43.88 | 65.9% | $81.15 | $53.45 | 105.9% | 115.1% | 121.8% | |||
| 10/31/2016 TTM | 63.0% | $71.65 | $45.15 | 67.4% | $82.57 | $55.69 | 107.0% | 115.2% | 123.3% | |||
| 10/31/2017 TTM | 56.7% | $77.72 | $44.06 | 64.5% | $87.35 | $56.32 | 113.8% | 112.4% | 127.8% | |||
Competitive Set | Comfort Inn & Suites - Madison West | Penetration Factor | ||||||||||
Year | Occupancy | ADR | RevPAR |
| Occupancy | ADR | RevPAR |
| Occupancy | ADR | RevPAR |
|
| 10/31/2015 TTM | 62.5% | $96.19 | $60.11 | 67.7% | $94.28 | $63.80 | 108.3% | 98.0% | 106.1% | |||
| 10/31/2016 TTM | 65.1% | $100.02 | $65.10 | 66.9% | $103.16 | $69.01 | 102.8% | 103.1% | 106.0% | |||
| 10/31/2017 TTM | 64.2% | $102.87 | $66.04 | 63.1% | $104.97 | $66.23 | 98.3% | 102.0% | 100.3% | |||
Competitive Set | Holiday Inn Express - Milwaukee Airport | Penetration Factor | ||||||||||
Year | Occupancy | ADR | RevPAR |
| Occupancy | ADR | RevPAR |
| Occupancy | ADR | RevPAR |
|
| 10/31/2015 TTM | 65.4% | $75.38 | $49.30 | 66.9% | $93.06 | $62.25 | 102.3% | 123.5% | 126.3% | |||
| 10/31/2016 TTM | 64.5% | $76.01 | $49.00 | 63.4% | $93.65 | $59.35 | 98.3% | 123.2% | 121.1% | |||
| 10/31/2017 TTM | 55.6% | $80.91 | $44.95 | 66.7% | $100.55 | $67.10 | 120.1% | 124.3% | 149.3% | |||
Competitive Set | Comfort Inn & Suites - Fond Du Lac | Penetration Factor | ||||||||||
Year | Occupancy | ADR | RevPAR |
| Occupancy | ADR | RevPAR |
| Occupancy | ADR | RevPAR |
|
| 10/31/2015 TTM | 43.6% | $80.96 | $35.28 | 81.8% | $65.32 | $53.46 | 187.6% | 80.7% | 151.5% | |||
| 10/31/2016 TTM | 47.7% | $79.91 | $38.12 | 79.2% | $65.46 | $51.88 | 166.0% | 81.9% | 136.1% | |||
| 10/31/2017 TTM | 48.2% | $81.76 | $39.44 | 82.9% | $65.40 | $54.20 | 172.0% | 80.0% | 137.4% | |||
| (1) | Information obtained from a third party hospitality research report. |
According to the appraisal, a 112 room Towne Place Hotel by Marriott is expected to open in the first half of 2018 within two miles of the three Wisconsin Hotel Portfolio Properties located in Milwaukee, and is expected to be secondarily competitive with such hotels.
The Borrowers.The borrowers are Wisco Partners, LLC, a Wisconsin limited liability company, WZ Wisco, INC., a Delaware corporation, App Pro of Appleton, INC., a Delaware corporation, Osh Pro Partners, LLC, a Wisconsin limited liability company, Wes Pro II, LLC, a Wisconsin limited liability company, Mad Pro of Madison, INC., a Delaware corporation, Oak Pro Partners, LLC, a Wisconsin limited liability company, Wes Pro Partners, LLC, a Wisconsin limited liability company, Mil Pro, LLC, a Wisconsin limited liability company, Oak Pro II, LLC, a Wisconsin limited liability company, F.D.L. Pro LLC, a Wisconsin limited liability company (together, the “Wisconsin Hotel Portfolio Borrowers”), each with at least two independent directors. Legal counsel to the Wisconsin Hotel Portfolio Borrower delivered a non-consolidation opinion in connection with the origination of the Wisconsin Hotel Portfolio Mortgage Loan. William Zanetis owns 70.0% of each Wisconsin Hotel Portfolio Borrower and is the guarantor of certain nonrecourse carveouts under the Wisconsin Hotel Portfolio Mortgage Loan.
The Sponsor.The sponsor is William Zanetis. William Zanetis has over 40 years of experience owning and managing hotels in the midwestern United States.
Escrows. The Wisconsin Hotel Portfolio Borrowers deposited at loan origination $223,475 for required repairs, and $176,010 for real estate taxes and are required to deposit monthly 1/12th the estimated annual real estate taxes. Additionally, the Wisconsin Hotel Portfolio Borrowers are required to deposit monthly (i) 1/12th of the estimated annual insurance premiums (unless the policies covering each individual Wisconsin Hotel Portfolio Property are part of a blanket or umbrella policy approved by the lender in its reasonable discretion); and (ii) an FF&E reserve deposit ($118,152 through the end of 2018) adjusted annually to be the greater of (x) the amount required by the applicable franchisor under its respective franchise agreement and (y) 1/12th of (a) 2% of the gross operating income for the preceding calendar year commencing on the monthly payment date in March 2018 through and including the monthly payment date in February 2019, (b) 3% of the gross operating income for the preceding calendar year commencing on the monthly payment date in March 2019 through and including the monthly payment date in February 2020, and (c) 4% of the gross operating income for the preceding calendar year commencing on the monthly payment date in March 2020 and on each monthly payment date thereafter.
The Wisconsin Hotel Portfolio Borrowers (i) were required to deposit at loan origination $5,200,000 into a PIP reserve for scheduled PIPs in relation to certain identified Wisconsin Hotel Portfolio Properties, and (ii) on the date that any additional PIP is required by a franchisor pursuant to its respective franchise agreement, are required to deposit an amount equal to 125% of the sum required to pay for such additional PIP.
Lockbox and Cash Management. Upon the first occurrence of a Cash Sweep Event Period (as defined below), the Wisconsin Hotel Portfolio Borrowers are required to establish a lockbox account into which the Wisconsin Hotel Portfolio Borrowers will be required to direct all credit card banks and persons with whom they do business on an accounts receivable basis to make deposits of payments with respect to the Wisconsin Hotel Portfolio Properties directly into such lockbox account, and will also be required to deposit any rents received by the Wisconsin Hotel Portfolio Borrowers or the property manager into such lockbox account within three business days of receipt. In addition, upon the first occurrence of a Cash Sweep Event Period, the lenders will have the right to establish, and the Wisconsin Hotel Portfolio Borrowers will be required to cooperate to establish, a lender controlled cash management account.
THE INFORMATION IN THIS STRUCTURAL AND COLLATERAL TERM SHEET IS NOT COMPLETE AND MAY BE AMENDED PRIOR TO THE TIME OF SALE. THIS TERM SHEET IS NOT AN OFFER TO SELL THESE SECURITIES AND IT IS NOT A SOLICITATION OF AN OFFER TO BUY THESE SECURITIES IN ANY JURISDICTION WHERE THE OFFER OR SALE IS NOT PERMITTED.
66
| WISCONSIN HOTEL PORTFOLIO |
During the continuance of a Cash Sweep Event Period, all funds in the lockbox account are required to be swept into such cash management account for payment of debt service, monthly escrows, operating expenses set forth in the annual budget, and extraordinary expenses approved by the lender, with all excess cash to be deposited (i) during any Franchise Expiration Cash Sweep Period or FDL Termination Cash Sweep Period (each as defined below), if the amount in the FF&E reserve for the related individual Wisconsin Hotel Portfolio Property is less than $10,000 per key (the “FF&E Cap”), to the FF&E reserve until the FF&E Cap is satisfied, and (ii) otherwise to an excess cash reserve to be held as additional security for the Wisconsin Hotel Portfolio Mortgage Loan for so long as a Cash Sweep Event Period exists.
A “Cash Sweep Event Period” means a period commencing upon the earliest of the occurrence of (i) an event of default under the Wisconsin Hotel Portfolio Mortgage Loan agreement, (ii) a Debt Service Coverage Ratio Cash Sweep Event Period, (iii) a Franchise Default Cash Sweep Period, (iv) a Franchise Expiration Cash Sweep Period, (v) a Franchise Termination Cash Sweep Period; and (vi) an FDL Termination Cash Sweep Period (each as defined below). A Cash Sweep Event Period will terminate, (i) in the case of an event of default, the cure of such event of default, and (ii) in the case of a Cash Sweep Event Period under clauses (ii) through (vi) of the preceding sentence, when such Cash Sweep Event Period has ended in accordance with its terms.
A “Debt Service Coverage Ratio Cash Sweep Event Period” means a period (A) commencing upon the debt service coverage ratio being less than 1.20x for the immediately preceding 12 consecutive calendar months, and (B) expiring upon the date that the debt service coverage ratio has been greater than or equal to 1.20x for the immediately preceding twelve 12 consecutive calendar months.
A “Franchise Default Cash Sweep Period” means a period (A) commencing upon (x) any franchisor delivering notice that (i) the applicable Wisconsin Hotel Portfolio Borrower is in default under the applicable franchise agreement beyond applicable notice and cure periods or (ii) the hotel at any individual Wisconsin Hotel Portfolio Property is not being operated and maintained in accordance with such franchisor’s standards resulting in the related Wisconsin Hotel Portfolio Borrower no longer being in good standing with such franchisor and (y) such default not being cured within 30 days of such notice, and (B) expiring upon the lender’s receipt of evidence reasonably acceptable to the lender (which evidence may include, without limitation, a duly executed confirmation letter or estoppel certificate from the applicable franchisor in form and substance reasonably acceptable to the lender) that (a) the applicable Wisconsin Hotel Portfolio Borrower has cured all defaults under such franchise agreement, and (b) there has been no default by such Wisconsin Hotel Portfolio Borrower or by the franchisor under such franchise agreement for a period of 60 consecutive days.
A “Franchise Expiration Cash Sweep Period” means a period (A) commencing upon the date that is 12 months prior to the expiration of the applicable franchise agreement (unless the applicable Wisconsin Hotel Portfolio Borrower has extended or renewed the expiring franchise agreement as of such date in accordance with the terms of the Wisconsin Hotel Portfolio Mortgage Loan documents) and (B) expiring upon (i) the applicable Wisconsin Hotel Portfolio Borrower entering into an extension or renewal of the applicable franchise agreement acceptable to the lender in accordance with the terms of the Wisconsin Hotel Portfolio Mortgage Loan documents, or (ii) (x) the applicable Wisconsin Hotel Portfolio Borrower entering into a replacement franchise agreement with a Qualified Franchisor (as defined below) in accordance with the terms of the Wisconsin Hotel Portfolio Mortgage Loan documents, and (y) there having been no default by the applicable Wisconsin Hotel Portfolio Borrower or the franchisor under such replacement franchise agreement for a period of 60 consecutive days.
A “Franchise Termination Cash Sweep Period” means a period (A) commencing upon any expiration, termination or cancellation of any franchise agreement (including, without limitation, rejection in any bankruptcy or similar insolvency proceeding), and (B) expiring upon satisfaction of the following conditions: (i) the applicable Wisconsin Hotel Portfolio Borrower entering into a replacement franchise agreement with a Qualified Franchisor in accordance with the terms of the Wisconsin Hotel Portfolio Mortgage Loan documents, (ii) the applicable Wisconsin Hotel Portfolio Borrower being in actual physical possession of the applicable hotel under such replacement franchise agreement, and (iii) there having been no default by the applicable Wisconsin Hotel Portfolio Borrower or the franchisor under such replacement franchise agreement for a period of 60 consecutive days.
An “FDL Termination Cash Sweep Period” means a period (A) commencing upon WZ Wisco, Inc. or FDL franchisor giving notice that it is terminating the FDL franchise agreement and (B) expiring upon satisfaction of the following conditions: (i) WZ Wisco, Inc. entering into a replacement franchise agreement with a Qualified Franchisor in accordance with the terms of the Wisconsin Hotel Portfolio Mortgage Loan documents, (ii) WZ Wisco, Inc. being in actual physical possession of the applicable hotel under such replacement franchise agreement, and (iii) there having been no default by WZ Wisco, Inc. or the franchisor under such replacement franchise agreement for a period of 60 consecutive days.
A “Qualified Franchisor” means a reputable and experienced franchisor possessing experience in flagging hotel properties similar in size, scope, use and value as the applicable individual Wisconsin Hotel Portfolio Property and reasonably approved by the lender in writing (which approval may be conditioned upon receipt of a rating agency confirmation).
Property Management. The Wisconsin Hotel Portfolio Properties are currently managed by William Zanetis Management Co., Inc., an affiliate of the Wisconsin Hotel Portfolio Borrowers.
Assumption. The Wisconsin Hotel Portfolio Borrowers have the right to transfer the Wisconsin Hotel Portfolio Properties provided that certain conditions are satisfied, including (i) no event of default has occurred and is continuing; (ii) the lender reasonably determines that the proposed transferee satisfies the lender’s credit review and underwriting standards, taking into consideration transferee experience, financial strength and general business standing; (iii) a replacement guarantor acceptable to the lender assumes the obligations of the Wisconsin Hotel Portfolio guarantor under the non-recourse carveout guaranty and environmental indemnity; and (iv) if required by the lender, the lender receives confirmation from each rating agency assigned to rate the Series 2018-BNK10 Certificates that such assumption will not result in a downgrade, withdrawal or qualification of the respective ratings assigned to the Series 2018-BNK10 certificates.
THE INFORMATION IN THIS STRUCTURAL AND COLLATERAL TERM SHEET IS NOT COMPLETE AND MAY BE AMENDED PRIOR TO THE TIME OF SALE. THIS TERM SHEET IS NOT AN OFFER TO SELL THESE SECURITIES AND IT IS NOT A SOLICITATION OF AN OFFER TO BUY THESE SECURITIES IN ANY JURISDICTION WHERE THE OFFER OR SALE IS NOT PERMITTED.
67
| WISCONSIN HOTEL PORTFOLIO |
Partial Release. Following the expiration of the lockout period, the borrower is permitted to obtain the release of any individual Wisconsin Hotel Portfolio Property upon defeasance of a principal amount equal to 120% of the allocated loan amount for such individual Wisconsin Hotel Portfolio Property and satisfaction of certain conditions, including among others (i) the debt yield of the remaining Wisconsin Hotel Portfolio Properties immediately following the release will be not less than the greater of (x) the debt yield immediately preceding the release and (y) 11.0%, (ii) the debt service coverage ratio of the remaining Wisconsin Hotel Portfolio Properties immediately following the release will be not less than the greater of (x) the debt service coverage ratio immediately preceding the release and (y) 1.52x, and (iii) compliance with REMIC requirements. In addition, the applicable Wisconsin Hotel Portfolio Borrower is permitted to obtain the release of an unimproved parcel that is part of the land upon which the Fairfield Inn - Oak Creek property is located, without prepayment or defeasance, upon the satisfaction of certain conditions, including among others, separate tax lots, zoning, compliance with legal requirements, covenants prohibiting the use of the parcel for hotel or similar use, and compliance with REMIC requirements.
Real Estate Substitution. Not permitted.
Subordinate and Mezzanine Indebtedness. In connection with the franchise agreements executed with Choice Hotels International, Inc., the applicable Wisconsin Hotel Portfolio Borrowers have incurred unsecured indebtedness in the aggregate amount of $531,083 in the form of forgivable loans from the franchisor (each a “Franchisor Loan”). Each Franchisor Loan is required to be repaid to the franchisor only if (i) the hotel leaves the franchisor’s system prior to the full duration of the note term, (ii) the applicable Wisconsin Hotel Portfolio Borrower defaults on the franchise agreement or the note during the note term or (iii) the applicable Wisconsin Hotel Portfolio Borrower transfers the hotel during the note term.
Terrorism Insurance. The Wisconsin Hotel Portfolio Mortgage Loan documents require that the “all risk” insurance policy required to be maintained by the Wisconsin Hotel Portfolio Borrowers provide coverage for acts of terrorism in an amount equal to the full replacement cost of the Wisconsin Hotel Portfolio Properties, provided that so long as the Terrorism Risk Insurance Act of 2002, as extended and modified by the Terrorism Risk Insurance Program Reauthorization Act of 2015 (TRIPRA) is in effect (including any extensions thereof or if another federal governmental program is in effect relating to “acts of terrorism” which provides substantially similar protections as TRIPRA), and covers both domestic and foreign acts of terrorism, the lender will be required to accept insurance which covers against “covered acts” as defined by TRIPRA or such other program. If TRIPRA is no longer in effect, the Wisconsin Hotel Portfolio Borrowers will not be required to pay terrorism insurance premiums in excess of an annual terrorism premium cap of two times the cost of the annual premiums for property and business interruption insurance required under the related Wisconsin Hotel Portfolio Mortgage Loan documents (excluding the cost of terrorism and earthquake components of such insurance) at the time terrorism coverage is excluded from the applicable policy.
THE INFORMATION IN THIS STRUCTURAL AND COLLATERAL TERM SHEET IS NOT COMPLETE AND MAY BE AMENDED PRIOR TO THE TIME OF SALE. THIS TERM SHEET IS NOT AN OFFER TO SELL THESE SECURITIES AND IT IS NOT A SOLICITATION OF AN OFFER TO BUY THESE SECURITIES IN ANY JURISDICTION WHERE THE OFFER OR SALE IS NOT PERMITTED.
68
(THIS PAGE INTENTIONALLY LEFT BLANK)
69
| BROOKWOOD CHASE PORTFOLIO |
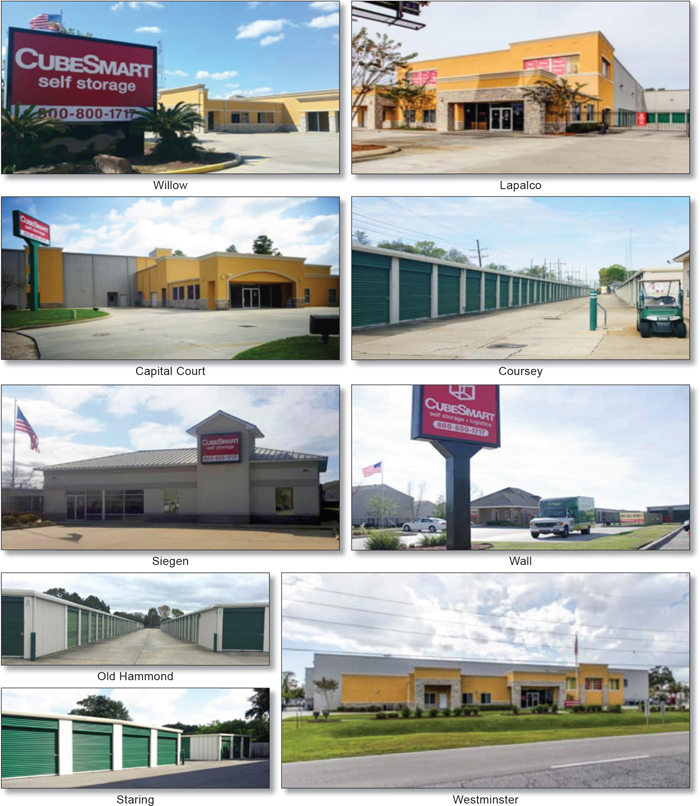
THE INFORMATION IN THIS STRUCTURAL AND COLLATERAL TERM SHEET IS NOT COMPLETE AND MAY BE AMENDED PRIOR TO THE TIME OF SALE. THIS TERM SHEET IS NOT AN OFFER TO SELL THESE SECURITIES AND IT IS NOT A SOLICITATION OF AN OFFER TO BUY THESE SECURITIES IN ANY JURISDICTION WHERE THE OFFER OR SALE IS NOT PERMITTED.
70
| BROOKWOOD CHASE PORTFOLIO |
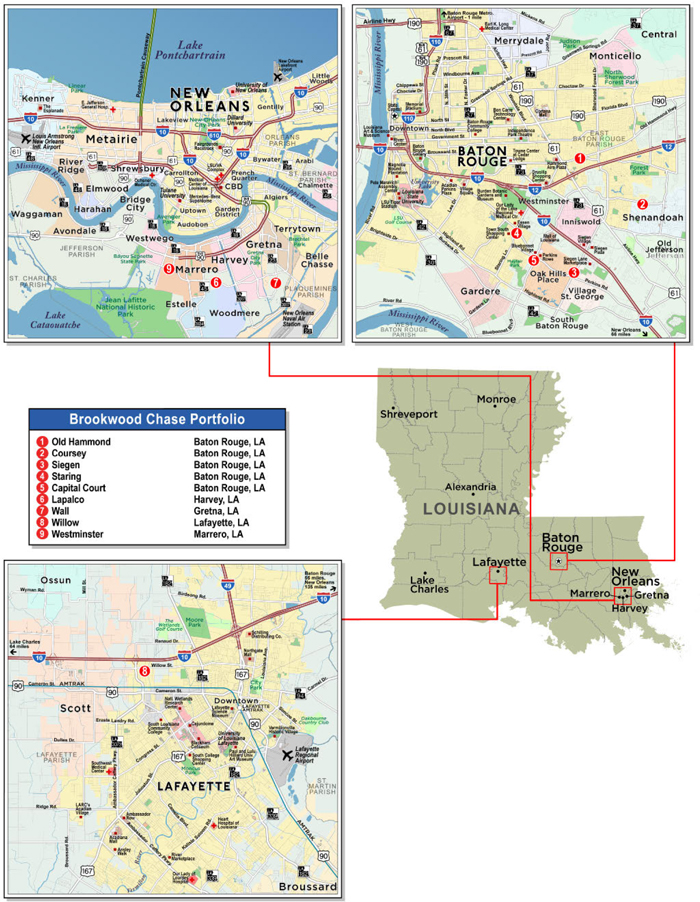
THE INFORMATION IN THIS STRUCTURAL AND COLLATERAL TERM SHEET IS NOT COMPLETE AND MAY BE AMENDED PRIOR TO THE TIME OF SALE. THIS TERM SHEET IS NOT AN OFFER TO SELL THESE SECURITIES AND IT IS NOT A SOLICITATION OF AN OFFER TO BUY THESE SECURITIES IN ANY JURISDICTION WHERE THE OFFER OR SALE IS NOT PERMITTED.
71
| BROOKWOOD CHASE PORTFOLIO |
| No. 5 – Brookwood Chase Portfolio | |||||||
| Loan Information | Property Information | ||||||
| Mortgage Loan Seller: | Morgan Stanley Mortgage Capital Holdings LLC | Single Asset/Portfolio: | Portfolio | ||||
Credit Assessment (DBRS/Fitch/Moody’s): | NR/NR/NR | Property Type: | Self Storage | ||||
| Original Principal Balance: | $65,000,000 | Specific Property Type: | Self Storage | ||||
| Cut-off Date Balance: | $65,000,000 | Location: | Various | ||||
| % of Initial Pool Balance: | 5.0% | Size: | 916,733 SF | ||||
| Loan Purpose: | Refinance | Cut-off Date Balance Per SF: | $70.90 | ||||
| Borrower Name: | Brookwood Capital, L.L.C. | Year Built/Renovated: | Various | ||||
| Borrower Sponsors: | Robert Craig Smith | Title Vesting(2): | Various | ||||
| Mortgage Rate: | 4.070% | Property Manager: | CubeSmart Asset Management, LLC | ||||
| Note Date: | December 13, 2017 | 4thMost Recent Occupancy (As of): | 50.0% (12/31/2013) | ||||
| Anticipated Repayment Date: | NAP | 3rdMost Recent Occupancy (As of): | 55.5% (12/31/2014) | ||||
| Maturity Date: | January 1, 2028 | 2ndMost Recent Occupancy (As of): | 65.5% (12/31/2015) | ||||
| IO Period: | 120 months | Most Recent Occupancy (As of)(3): | 85.3% (12/31/2016) | ||||
| Loan Term (Original): | 120 months | Current Occupancy (As of): | 86.7% (Various) | ||||
| Seasoning: | 1 month | ||||||
| Amortization Term (Original): | NAP | Underwriting and Financial Information: | |||||
| Loan Amortization Type: | Interest-only, Balloon | ||||||
| Interest Accrual Method: | Actual/360 | 4thMost Recent NOI (As of): | $4,192,973 (12/31/2014) | ||||
| Call Protection: | L(25),D(90),O(5) | 3rdMost Recent NOI (As of): | $4,823,041 (12/31/2015) | ||||
| Lockbox Type: | Springing | 2ndMost Recent NOI (As of): | $6,136,354 (12/31/2016) | ||||
| Additional Debt: | None | Most Recent NOI (As of): | $6,758,080 (TTM 10/31/2017) | ||||
| Additional Debt Type: | NAP | ||||||
| U/W Revenues: | $8,798,742 | ||||||
| U/W Expenses: | $2,357,462 | ||||||
| U/W NOI: | $6,441,280 | ||||||
| U/W NCF: | $6,349,780 | ||||||
| U/W NOI DSCR: | 2.40x | ||||||
| Escrows and Reserves(1): | U/W NCF DSCR: | 2.37x | |||||
| Type: | Initial | Monthly | Cap (If Any) | U/W NOI Debt Yield: | 9.9% | ||
| Taxes | $27,087 | $27,087 | NAP | U/W NCF Debt Yield: | 9.8% | ||
| Insurance | $0 | Springing | NAP | As-Is Appraised Value: | $110,330,000 | ||
| Replacement Reserves | $0 | Springing | $412,530 | As-Is Appraisal Valuation Date: | Various | ||
| Deferred Maintenance | $12,250 | $0 | NAP | Cut-off Date LTV Ratio: | 58.9% | ||
| Ground Lease | $3,000 | $3,000 | NAP | LTV Ratio at Maturity: | 58.9% | ||
| (1) | See “Escrows” section. |
| (2) | All of the Brookwood Chase Portfolio Properties are fee, except for the Old Hammond property, which is leasehold. |
| (3) | With respect to the six Brookwood Chase Portfolio Properties located in Baton Rouge and Lafayette, Louisiana, occupancy increase in 2016 coincided with a flood in the Baton Rouge area that led to an increased use of self-storage properties. |
The Mortgage Loan. The mortgage loan (the “Brookwood Chase Portfolio Mortgage Loan”) is evidenced by a single promissory note that is secured by first fee and leasehold mortgages encumbering a portfolio of nine self storage properties located across three markets in Louisiana (the “Brookwood Chase Portfolio Properties”). The Brookwood Chase Portfolio Mortgage Loan was originated on December 13, 2017 by Morgan Stanley Bank, N.A. The Brookwood Chase Portfolio Mortgage Loan had an original principal balance of $65,000,000, has an outstanding principal balance as of the Cut-off Date of $65,000,000 and accrues interest at an interest rate of 4.070%per annum. The Brookwood Chase Portfolio Mortgage Loan had an initial term of 120 months, has a remaining term of 119 months as of the Cut-off Date and requires payments of interest only through the term of the Brookwood Chase Portfolio Mortgage Loan. The Brookwood Chase Portfolio Mortgage Loan matures on January 1, 2028.
Following the lockout period, the borrower has the right to defease the Brookwood Chase Portfolio Mortgage Loan in whole, or in part as described below under “Partial Release,” on any date after the expiration of the lockout period and before September 1, 2027. In addition, the Brookwood Chase Portfolio Mortgage Loan is prepayable without penalty on or after September 1, 2027.
THE INFORMATION IN THIS STRUCTURAL AND COLLATERAL TERM SHEET IS NOT COMPLETE AND MAY BE AMENDED PRIOR TO THE TIME OF SALE. THIS TERM SHEET IS NOT AN OFFER TO SELL THESE SECURITIES AND IT IS NOT A SOLICITATION OF AN OFFER TO BUY THESE SECURITIES IN ANY JURISDICTION WHERE THE OFFER OR SALE IS NOT PERMITTED.
72
| BROOKWOOD CHASE PORTFOLIO |
Sources and Uses
| Sources | Uses | |||||||
| Original loan amount | $65,000,000 | 100.0% | Loan payoff | $33,390,177 | 51.4% | |||
| Closing costs | 1,106,216 | 1.7 | ||||||
| Reserves | 42,337 | 0.1 | ||||||
| Return of equity | 30,461,270 | 46.9 | ||||||
| Total Sources | $65,000,000 | 100.0% | Total Uses | $65,000,000 | 100.0% |
The Properties. The Brookwood Chase Portfolio Properties are comprised of self storage properties operated under the Cube Smart brand, located across three markets in Louisiana, with the largest presence in Baton Rouge (five properties, 61.7% of square feet). The Brookwood Chase Portfolio Properties total 7,024 units (916,733 square feet), of which 2,884 units are non-climate controlled units and 4,140 units are climate controlled. The Brookwood Chase Portfolio Properties were built by the sponsor between 1994 and 2007, with a weighted average year built of 2001. Since 2014, the sponsor began to transition management responsibilities of the portfolio to CubeSmart with the New Orleans properties transitioned in January 2014, the Lafayette property in October 2016, and the Baton Rouge properties in March 2017. Typical amenities across the Brookwood Chase Portfolio Properties include an electronic gate, keypad entry, video cameras, on-site managers and exterior lighting.
The following table presents certain information relating to the Brookwood Chase Portfolio Properties:
Brookwood Chase Portfolio Properties
| Property Name | City / State | Market | Year Built | Net Rentable Area (SF) | Units | Allocated Cut-off Date Balance(1) | % of ALA | Appraised Value | % of Appraised Value |
| Old Hammond | Baton Rouge, LA | Baton Rouge | 1998 | 143,305 | 876 | $12,520,000 | 19.3% | $21,250,000 | 19.3% |
| Coursey | Baton Rouge, LA | Baton Rouge | 1994 | 129,475 | 932 | $9,660,000 | 14.9% | $16,410,000 | 14.9% |
| Siegen | Baton Rouge, LA | Baton Rouge | 2001 | 90,395 | 649 | $7,880,000 | 12.1% | $13,370,000 | 12.1% |
| Staring | Baton Rouge, LA | Baton Rouge | 1995 | 121,763 | 946 | $7,620,000 | 11.7% | $12,930,000 | 11.7% |
| Capital Court | Baton Rouge, LA | Baton Rouge | 2006 | 80,710 | 790 | $6,575,000 | 10.1% | $11,160,000 | 10.1% |
| Lapalco | Harvey, LA | New Orleans - Metairie | 2007 | 110,450 | 970 | $6,510,000 | 10.0% | $11,050,000 | 10.0% |
| Wall | Gretna, LA | New Orleans - Metairie | 1999 | 84,150 | 641 | $5,970,000 | 9.2% | $10,130,000 | 9.2% |
| Willow | Lafayette, LA | Lafayette | 2005 | 84,185 | 679 | $4,375,000 | 6.7% | $7,430,000 | 6.7% |
| Westminster | Marrero, LA | New Orleans - Metairie | 2007 | 72,300 | 541 | $3,890,000 | 6.0% | $6,600,000 | 6.0% |
| Total/Weighted Average | 916,733 | 7,024 | $65,000,000 | 100.0% | $110,330,000 | 100.0% |
| (1) | Allocated Cut-off Date Balances are based on the Appraised Values of the individual Brookwood Chase Portfolio Properties. |
The following table presents detailed information with respect to the unit mix and net operating income of the Brookwood Chase Portfolio Properties.
Brookwood Chase Portfolio Properties Unit Mix and NOI Summary(1)
| Property Name | City / State | Number of Floors | Non-Climate Controlled Units | Climate Controlled Units | % of Climate Controlled Units | TTM 10/31/2017 NOI | % of Total TTM 10/31/2017 NOI |
| Old Hammond | Baton Rouge, LA | 1 | 494 | 382 | 43.6% | $1,349,423 | 20.0% |
| Coursey | Baton Rouge, LA | 1 | 630 | 302 | 32.4% | $1,035,690 | 15.3% |
| Siegen | Baton Rouge, LA | 1 | 230 | 419 | 64.6% | $837,958 | 12.4% |
| Staring | Baton Rouge, LA | 1-3 | 686 | 260 | 27.5% | $844,743 | 12.5% |
| Capital Court | Baton Rouge, LA | 3 | 0 | 790 | 100.0% | $725,883 | 10.7% |
| Lapalco | Harvey, LA | 2 | 20 | 950 | 97.9% | $570,725 | 8.4% |
| Wall | Gretna, LA | 1 | 272 | 369 | 57.6% | $625,425 | 9.3% |
| Willow | Lafayette, LA | 1 | 506 | 173 | 25.5% | $410,766 | 6.1% |
| Westminster | Marrero, LA | 2 | 46 | 495 | 91.5% | $357,467 | 5.3% |
| Total/Weighted Average | 2,884 | 4,140 | $6,758,080 | 100.0% |
| (1) | Based on information obtained from the appraisal. |
THE INFORMATION IN THIS STRUCTURAL AND COLLATERAL TERM SHEET IS NOT COMPLETE AND MAY BE AMENDED PRIOR TO THE TIME OF SALE. THIS TERM SHEET IS NOT AN OFFER TO SELL THESE SECURITIES AND IT IS NOT A SOLICITATION OF AN OFFER TO BUY THESE SECURITIES IN ANY JURISDICTION WHERE THE OFFER OR SALE IS NOT PERMITTED.
73
| BROOKWOOD CHASE PORTFOLIO |
The following table presents historical occupancy percentages at the Brookwood Chase Portfolio Properties:
Historical Occupancy
12/31/2013 | 12/31/2014 | 12/31/2015 | 12/31/2016 | 10/31/2017 |
| 50.0% | 55.5% | 65.5% | 85.3% | 86.7% |
Operating History and Underwritten Net Cash Flow.The following table presents certain information relating to the historical operating performance and the underwritten net cash flow at the Brookwood Chase Portfolio Properties:
Cash Flow Analysis
| 2014 | 2015 | 2016(2) | TTM 10/31/2017 | U/W(1) | % of U/W Effective Gross Income | U/W $ per SF | |||||||||
| Gross Potential Rent | $5,239,705 | $5,906,837 | $7,112,059 | $7,756,708 | $9,973,200 | 113.3% | $10.88 | ||||||||
| Other Income(1) | 450,851 | 557,759 | 853,289 | 1,050,281 | 933,000 | 10.6% | 1.02 | ||||||||
| Concessions and Credit Loss | 0 | 0 | 0 | 0 | (2,107,458) | (24.0) | (2.30) | ||||||||
| Effective Gross Income | $5,690,556 | $6,464,597 | $7,965,348 | $8,806,989 | $8,798,742 | 100.0% | $9.60 | ||||||||
| Total Operating Expenses | $1,497,584 | $1,641,555 | $1,828,994 | $2,048,909 | $2,357,462 | 26.8% | $2.57 | ||||||||
| Net Operating Income | $4,192,973 | $4,823,041 | $6,136,354 | $6,758,080 | $6,441,280 | 73.2% | $7.03 | ||||||||
| Capital Expenditures | 0 | 0 | 0 | 0 | 91,500 | 1.0 | 0.10 | ||||||||
| Net Cash Flow | $4,192,973 | $4,823,041 | $6,136,354 | $6,758,080 | $6,349,780 | 72.2% | $6.93 | ||||||||
| NOI DSCR | 1.56x | 1.80x | 2.29x | 2.52x | 2.40x | ||||||||||
| NCF DSCR | 1.56x | 1.80x | 2.29x | 2.52x | 2.37x | ||||||||||
| NOI DY | 6.5% | 7.4% | 9.4% | 10.4% | 9.9% | ||||||||||
| NCF DY | 6.5% | 7.4% | 9.4% | 10.4% | 9.8% | ||||||||||
| (1) | Other Income is comprised of insurance fees, administrative fees, box sales income, lock sales income, miscellaneous income, late fees and other charges. |
| (2) | With respect to the six Brookwood Chase Portfolio Properties located in Baton Rouge and Lafayette, Louisiana, occupancy increase in 2016 coincided with a flood in the Baton Rouge area that led to an increased use of self storage properties. |
Appraisal.As of the appraisal valuation dates ranging from October 25, 2017 to October 30, 2017, the Brookwood Chase Portfolio Properties had an aggregate “as-is” appraised value of $110,330,000.
Environmental Matters. According to the Phase I environmental site assessments dated November 1, 2017, there are no recognized environmental conditions at the Brookwood Chase Portfolio Properties.
Market Overview and Competition. The Brookwood Chase Portfolio Properties consist of nine self storage facilities which are all part of the Southwest Sector as defined by a third party publication regarding self storage properties. The Southwest Sector has a total of 6,384 facilities which comprise a total of 331,968,000 square feet. The second quarter 2016 vacancy for the Southwest Sector was 9.1%. The second quarter 2016 average rental rate for 10 x 10 Non-Climate Controlled Units and 10 x 10 Climate Controlled Units in the Southwest Sector were $98.94 and $138.20, respectively.
The following table presents local demographic information with respect to the Brookwood Chase Portfolio Properties:
Local Demographics Summary(1)
| Property Name | City / State | 2016 Population (Within 1-mi. / 3-mi. /5-mi. Radius) | 2016 Average Household Income (Within 1-mi. / 3-mi. /5-mi. Radius) |
| Old Hammond | Baton Rouge, LA | 3,650 / 38,734 / 128,868 | $68,196 / $65,398 / $75,403 |
| Coursey | Baton Rouge, LA | 11,085 / 73,403 / 155,204 | $92,116 / $84,306 / $84,261 |
| Siegen | Baton Rouge, LA | 9,542 / 53,840 / 140,394 | $89,239 / $96,873 / $92,219 |
| Staring | Baton Rouge, LA | 7,013 / 66,008 / 179,736 | $69,414 / $89,867 / $79,692 |
| Capital Court | Baton Rouge, LA | 7,642 / 63,829 / 145,492 | $84,518 / $92,112 / $89,080 |
| Lapalco | Harvey, LA | 13,945 / 69,172 / 207,065 | $46,550 / $65,687 / $70,293 |
| Wall | Gretna, LA | 15,886 / 92,980 / 206,493 | $71,497 / $67,508 / $67,083 |
| Willow | Lafayette, LA | 1,555 / 48,573 / 126,572 | $49,202 / $54,897 / $64,909 |
| Westminster | Marrero, LA | 13,945 / 69,172 / 207,065 | $46,550 / $65,687 / $70,293 |
| (1) | Based on information obtained from the appraisal. |
THE INFORMATION IN THIS STRUCTURAL AND COLLATERAL TERM SHEET IS NOT COMPLETE AND MAY BE AMENDED PRIOR TO THE TIME OF SALE. THIS TERM SHEET IS NOT AN OFFER TO SELL THESE SECURITIES AND IT IS NOT A SOLICITATION OF AN OFFER TO BUY THESE SECURITIES IN ANY JURISDICTION WHERE THE OFFER OR SALE IS NOT PERMITTED.
74
| BROOKWOOD CHASE PORTFOLIO |
The following table presents competitive set information with respect to the Brookwood Chase Portfolio Properties:
Competitive Set Summary(1)
| Property Name | Competitive Set Average Occupancy Rates |
| Old Hammond | 85.8% |
| Coursey | 87.3% |
| Siegen | 88.7% |
| Staring | 90.0% |
| Capital Court | 88.8% |
| Lapalco | 85.6% |
| Wall | 86.4% |
| Willow | 88.4% |
| Westminster | 86.6% |
| Total / Wtd. Avg. | 87.5% |
| (1) | Based on information obtained from the appraisal. Competitive Set Average Occupancy Rates are as of October 2017. |
The Borrower.The borrower is Brookwood Capital, L.L.C., a Delaware limited liability company and single purpose entity with two independent directors. Legal counsel to the borrower delivered a non-consolidation opinion in connection with the origination of the Brookwood Chase Portfolio Mortgage Loan. Brookwood Properties, L.L.C. (“Brookwood Properties”) is the guarantor of certain nonrecourse carveouts under the Brookwood Chase Portfolio Mortgage Loan.
Brookwood Properties is a real estate company that was founded by Robert Craig Smith in 1986 and is currently headquartered in Baton Rouge, Louisiana. Brookwood Properties develops, acquires, and manages self storage properties in Louisiana, Mississippi, and Texas. Brookwood has developed the majority of its portfolio and maintains a long-term ownership strategy. Brookwood’s current portfolio consists of over 35 properties and 3.2 million square feet of self-storage space.
The Borrower Sponsor.The borrower sponsor is Robert Craig Smith. Brookwood Properties is owned 99.0% by Silverline Capital Holdings LLC (“Silverline”), with the remaining 1% being owned equally by the members of Silverline. The members of Silverline are Robert Craig Smith (4.6%), Lynne St. Clair Smith (4.6%), Leigh Ellen Smith Puckett (30.3%), Patrick Craig Smith (30.3%), and Erin Elizabeth Smith Piper (30.3%). The borrower, Brookwood Properties, and Silverline are each managed by Robert Craig Smith.
Escrows.On the origination date of the Brookwood Chase Portfolio Mortgage Loan, the borrower funded a reserve of (i) $27,087 for real estate taxes, (ii) $3,000 for the monthly Ground Lease (as defined below) payment, and (iii) $12,250 for immediate repairs.
On each monthly due date, the Brookwood Chase Portfolio Borrower is required to fund (i) an amount equal to the payment that will be payable under the Ground Lease for the month in which such due date occurs, (ii) one-twelfth of the taxes that the lender estimates will be payable over the then-succeeding 12-month period, initially estimated to be approximately $27,087, (iii) at the option of lender, at any time the required insurance is not a blanket policy approved under the Brookwood Chase Portfolio Mortgage Loan (which it is as of the origination date of the Brookwood Chase Portfolio Mortgage Loan), one-twelfth of the amount that the lender estimates will be necessary to pay insurance premiums over the then-succeeding 12-month period, and (iv) approximately $11,459 for replacement reserves, provided, however, that such replacement reserve deposits are conditionally waived so long as the debt yield of the Brookwood Chase Portfolio Properties is at least 7.0%, and at any time monthly deposits are not waived pursuant to the foregoing, the replacement reserve is capped at an amount equal to 36 months’ worth of deposits (which based on the current monthly deposit amount is approximately $412,530).
Lockbox and Cash Management.The Brookwood Chase Portfolio Mortgage Loan documents require a springing lockbox with springing cash management, provided that, upon a Brookwood Chase Portfolio Trigger Period occurring after the termination of the first Brookwood Chase Portfolio Trigger Period following origination, the lockbox remains in place after the termination of such period. Upon the first occurrence of a Brookwood Chase Portfolio Trigger Period (as defined below), the borrower is required to establish a lockbox account and the lender will have the right to establish a lender controlled cash management account. During the continuance of a Brookwood Chase Portfolio Trigger Period, all revenue derived from the Brookwood Chase Properties is required to be deposited by the borrower (or the property manager) into the lockbox account. In addition, during the continuance of a Brookwood Chase Portfolio Trigger Period, all amounts in the lockbox account are required to be swept into the lender-controlled cash management account on each business day and, provided no event of default under the Brookwood Chase Portfolio Mortgage Loan documents is continuing, applied to payment of debt service, payment of operating expenses set forth in the annual budget (which during a Brookwood Chase Portfolio Trigger Period, is required to be approved by the lender) and approved extraordinary expenses, and funding of required reserves, with the remainder being deposited into an excess cash flow reserve. Provided no event of default under the Brookwood Chase Portfolio Mortgage Loan documents is continuing, funds in the excess cash flow reserve are required (i) to the extent a Brookwood Chase Portfolio Trigger Period is continuing, to be held by the lender as additional collateral for the Brookwood Chase Portfolio Mortgage Loan and (ii) to the extent no Brookwood Chase Portfolio Trigger Period is continuing, to be swept into the borrower’s operating account.
A “Brookwood Chase Portfolio Trigger Period” means a period (A) commencing upon the earliest to occur of (i) an event of default under the Brookwood Chase Portfolio Mortgage Loan documents and (ii) the debt yield being less than 6.50% for six consecutive calendar months, and (B) expiring upon (x) with regard to any Brookwood Chase Portfolio Trigger Period commenced in connection with clause (i) above, the cure (if applicable) of such event of default, and (y) with regard to any Brookwood Chase
THE INFORMATION IN THIS STRUCTURAL AND COLLATERAL TERM SHEET IS NOT COMPLETE AND MAY BE AMENDED PRIOR TO THE TIME OF SALE. THIS TERM SHEET IS NOT AN OFFER TO SELL THESE SECURITIES AND IT IS NOT A SOLICITATION OF AN OFFER TO BUY THESE SECURITIES IN ANY JURISDICTION WHERE THE OFFER OR SALE IS NOT PERMITTED.
75
| BROOKWOOD CHASE PORTFOLIO |
Portfolio Trigger Period commenced in connection with clause (ii) above, the date that the debt yield has been equal to or greater than 6.50% for the immediately preceding six consecutive calendar months.
Property Management.The Brookwood Chase Portfolio Properties are currently managed by CubeSmart Asset Management, LLC. The ability of the borrower to use the CubeSmart brand is based on the retention of the property manager.
Assumption.The borrower has the right to transfer the Brookwood Chase Portfolio Properties in their entirety, provided that no event of default has occurred and is continuing and certain other conditions are satisfied, including, but not limited to: (i) the lender’s reasonable determination that the proposed transferee and guarantor satisfy the lender’s credit review and underwriting standards, taking into consideration transferee experience, financial strength and general business standing; (ii) the execution of a recourse guaranty and an environmental indemnity by an affiliate of the transferee and (iii) if requested by the lender, rating agency confirmation from each rating agency assigned to rate the Series 2018-BNK10 Certificates that the transfer will not result in a downgrade, withdrawal or qualification of the respective ratings assigned to the Series 2018-BNK10 Certificates.
Partial Release.Following the expiration of the lockout period and prior to September 1, 2027, provided no event of default has occurred and is continuing, the Brookwood Chase Portfolio Borrower may obtain a release of any of the individual properties comprising the Brookwood Chase Portfolio Properties upon defeasance of an amount equal to 115% of the allocated loan amount of such individual Brookwood Chase Portfolio Property; provided that the following conditions, among others, are satisfied: (i) after giving effect to the release, the loan-to-value ratio with respect to the remaining Brookwood Chase Portfolio Properties is no greater than the lesser of (x) the loan-to-value ratio of all of the Brookwood Chase Portfolio Properties immediately prior to the related release; and (y) 58.9%; (ii) after giving effect to the release, the debt service coverage ratio with respect to the remaining Brookwood Chase Portfolio Properties is no less than the greater of (x) the debt service coverage ratio of all of the Brookwood Chase Portfolio Properties immediately prior to the related release, and (y) 1.69x; (iii) after giving effect to the release, the debt yield with respect to the remaining Brookwood Chase Portfolio Properties is no less than the greater of (x) the debt yield of all of the Brookwood Chase Portfolio Properties immediately prior to the related release, and (y) 9.8%; (iv) after giving effect to such release, the Old Hammond property does not exceed 25% of the outstanding principal balance of the Brookwood Chase Portfolio Mortgage Loan and (v) compliance with REMIC requirements.
In addition, in the event the lender does not make net proceeds from an individual Brookwood Chase Portfolio Property available to the borrower for restoration and such proceeds are applied to the debt in accordance with the Brookwood Chase Portfolio Mortgage Loan documents at any time prior to the maturity date of the Brookwood Chase Portfolio Mortgage Loan, the borrower may prepay the debt for such individual Brookwood Chase Portfolio Property and obtain a release of such individual Brookwood Chase Portfolio Property upon the satisfaction of certain conditions, including, among others: (i) no event of default has occurred and is continuing under the Brookwood Chase Portfolio Mortgage Loan documents, (ii) payment of a release price equal to 115% of the allocated loan amount for such Brookwood Chase Portfolio Property (without payment of any prepayment consideration) to the lender, (iii) if required by the lender, delivery of a rating agency confirmation that such release will not result in a downgrade, withdrawal or qualification of the respective ratings assigned to the Series 2018-BNK10 Certificates and (iv) compliance with REMIC requirements.
Real Estate Substitution.Not permitted.
Subordinate and Mezzanine Indebtedness.Not permitted.
Ground Lease. The Brookwood Chase Portfolio is secured in part by the Brookwood Chase Portfolio Borrower’s interest as a lessee under a ground lease (the “Ground Lease”) of the Old Hammond property. The Ground Lease encompasses a total of 143,305 square feet and requires monthly ground rent payments of $3,000 and expires December 31, 2020 with three 15-year extension options. Monthly ground rent will increase to payments of $3,750 upon the ground lease extension on January 1, 2021.
Terrorism Insurance.The borrowers are required to maintain an “all-risk” insurance policy that provides coverage for terrorism in an amount equal to the full replacement cost of the Brookwood Chase Portfolio Properties (plus eighteen months of rental loss and/or business interruption coverage).
THE INFORMATION IN THIS STRUCTURAL AND COLLATERAL TERM SHEET IS NOT COMPLETE AND MAY BE AMENDED PRIOR TO THE TIME OF SALE. THIS TERM SHEET IS NOT AN OFFER TO SELL THESE SECURITIES AND IT IS NOT A SOLICITATION OF AN OFFER TO BUY THESE SECURITIES IN ANY JURISDICTION WHERE THE OFFER OR SALE IS NOT PERMITTED.
76
(THIS PAGE INTENTIONALLY LEFT BLANK)
77
| EXTRA SPACE SELF STORAGE PORTFOLIO |
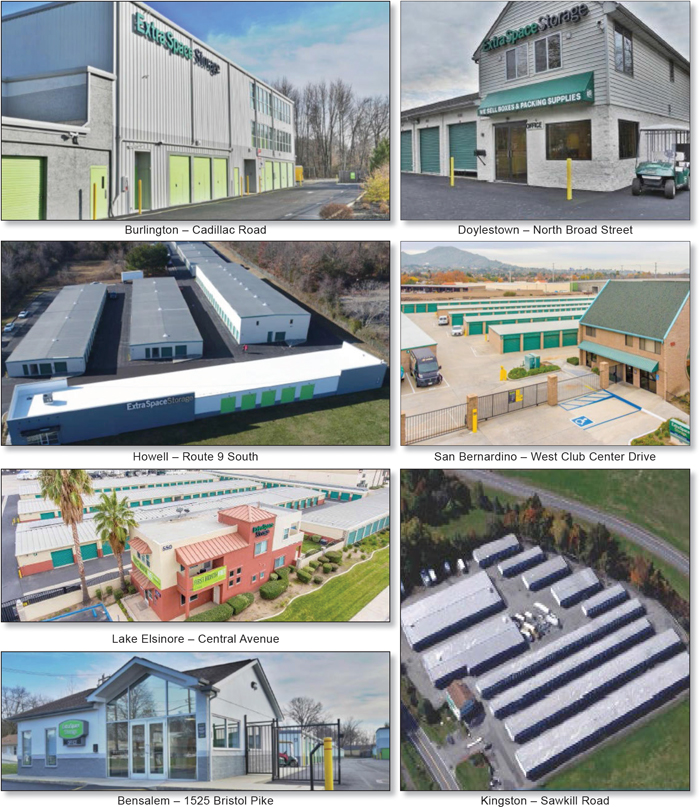
THE INFORMATION IN THIS STRUCTURAL AND COLLATERAL TERM SHEET IS NOT COMPLETE AND MAY BE AMENDED PRIOR TO THE TIME OF SALE. THIS TERM SHEET IS NOT AN OFFER TO SELL THESE SECURITIES AND IT IS NOT A SOLICITATION OF AN OFFER TO BUY THESE SECURITIES IN ANY JURISDICTION WHERE THE OFFER OR SALE IS NOT PERMITTED.
78
| EXTRA SPACE SELF STORAGE PORTFOLIO |
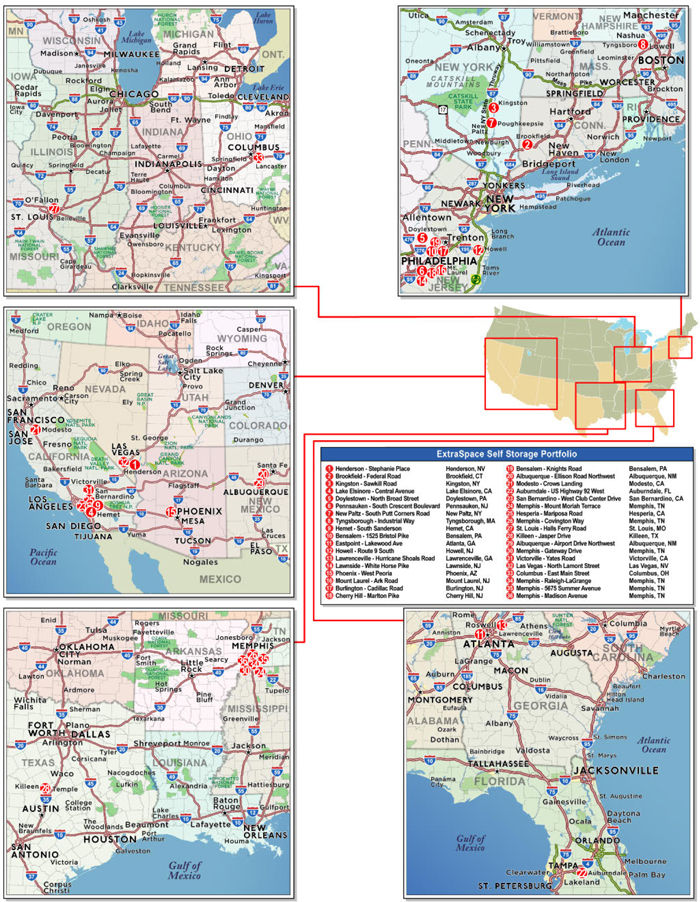
THE INFORMATION IN THIS STRUCTURAL AND COLLATERAL TERM SHEET IS NOT COMPLETE AND MAY BE AMENDED PRIOR TO THE TIME OF SALE. THIS TERM SHEET IS NOT AN OFFER TO SELL THESE SECURITIES AND IT IS NOT A SOLICITATION OF AN OFFER TO BUY THESE SECURITIES IN ANY JURISDICTION WHERE THE OFFER OR SALE IS NOT PERMITTED.
79
| EXTRA SPACE SELF STORAGE PORTFOLIO |
| No. 6 – Extra Space Self Storage Portfolio | |||||||
| Loan Information | Property Information | ||||||
| Mortgage Loan Seller: | Morgan Stanley Mortgage Capital Holdings LLC | Single Asset/Portfolio: | Portfolio | ||||
Credit Assessment (DBRS/Fitch/Moody’s): | NR/NR/NR | Property Type: | Self Storage | ||||
| Original Principal Balance(1): | $60,000,000 | Specific Property Type: | Self Storage | ||||
| Cut-off Date Balance(1): | $60,000,000 | Location: | Various | ||||
| % of Initial Pool Balance: | 4.7% | Size: | 2,668,218 SF | ||||
| Loan Purpose: | Recapitalization | Cut-off Date Balance Per SF(1): | $72.86 | ||||
| Borrower Name: | Storage Portfolio II Subsidiary LLC | Year Built/Renovated: | Various/NAP | ||||
| Borrower Sponsors: | ExtraSpace Storage Inc.; TH Real Estate | Title Vesting: | Fee | ||||
| Property Manager: | Extra Space Management, Inc. | ||||||
| Mortgage Rate: | 4.175% | 4thMost Recent Occupancy (As of): | 86.5% (12/31/2013) | ||||
| Note Date: | November 30, 2017 | 3rdMost Recent Occupancy (As of): | 88.7% (12/31/2014) | ||||
| Anticipated Repayment Date: | NAP | 2ndMost Recent Occupancy (As of): | 93.0% (12/31/2015) | ||||
| Maturity Date: | December 1, 2027 | Most Recent Occupancy (As of): | 93.6% (12/31/2016) | ||||
| IO Period: | 120 months | Current Occupancy (As of): | 95.1% (9/30/2017) | ||||
| Loan Term (Original): | 120 months | ||||||
| Seasoning: | 2 months | Underwriting and Financial Information: | |||||
| Amortization Term (Original): | NAP | ||||||
| Loan Amortization Type: | Interest-only, Balloon | 4thMost Recent NOI (As of): | $12,785,487 (12/31/2014) | ||||
| Interest Accrual Method: | Actual/360 | 3rdMost Recent NOI (As of): | $14,649,039 (12/31/2015) | ||||
| Call Protection(2): | L(26),D(87),O(7) | 2ndMost Recent NOI (As of): | $16,099,324 (12/31/2016) | ||||
| Lockbox Type(2): | Springing | Most Recent NOI (As of): | $17,053,307 (TTM 9/30/2017) | ||||
| Additional Debt(1): | Yes | ||||||
| Additional Debt Type(1): | Pari Passu | U/W Revenues: | $27,645,157 | ||||
| U/W Expenses: | $10,672,978 | ||||||
| U/W NOI: | $16,972,179 | ||||||
| U/W NCF: | $16,559,528 | ||||||
| U/W NOI DSCR(1): | 2.06x | ||||||
| U/W NCF DSCR(1): | 2.01x | ||||||
| Escrows and Reserves(3): | U/W NOI Debt Yield(1): | 8.7% | |||||
| Type: | Initial | Monthly | Cap (If Any) | U/W NCF Debt Yield(1): | 8.5% | ||
| Taxes | $0 | Springing | NAP | As-Is Appraised Value(4): | $299,250,000 | ||
| Insurance | $0 | Springing | NAP | As-Is Appraisal Valuation Date: | November 1, 2017 | ||
| Replacement Reserves | $0 | $0 | NAP | Cut-off Date LTV Ratio(1): | 65.0% | ||
| Deferred Maintenance | $0 | $0 | NAP | LTV Ratio at Maturity(1): | 65.0% | ||
| (1) | See “The Mortgage Loan” section. All statistical financial information related to balances per square foot, loan-to-value ratios, debt service coverage ratios and debt yields are based on the Extra Space Self Storage Portfolio Whole Loan (as defined below). |
| (2) | The defeasance lockout period will be at least 26 payment dates beginning with and including the first payment date of January 1, 2018. Defeasance of the Extra Space Self Storage Portfolio Whole Loan is permitted after the date that is the earlier to occur of (i) two years after the closing date of the securitization that includes the last note to be securitized, and (ii) January 1, 2021. The assumed lockout period of 26 payments is based on the expected BANK 2018-BNK10 securitization trust closing date in February 2018. |
| (3) | See “Escrows” section. |
| (4) | The “As-Is” Appraised Value represents the “As Portfolio” bulk appraised value of the Extra Space Self Storage Portfolio Properties (as defined below) as November 1, 2017, which is inclusive of a $16,600,000 portfolio premium. The Cut-off Date LTV Ratio and LTV Ratio at Maturity are calculated based upon the portfolio “As-Is” Appraised Value of $299,250,000. The Cut-off Date LTV Ratio and LTV Ratio at Maturity based on the sum of the individual “as-is” appraised values of $282,650,000, which excludes the portfolio premium, are 68.8% and 68.8%, respectively. |
The Mortgage Loan. The mortgage loan (the “Extra Space Self Storage Portfolio Mortgage Loan”) is part of a whole loan (the “Extra Space Self Storage Portfolio Whole Loan”) that is evidenced by threepari passu promissory notes (Notes A-1, A-2 and A-3) secured by a first mortgage encumbering 36 self-storage properties (the “Extra Space Self Storage Portfolio Properties”). The Extra Space Self Storage Portfolio Whole Loan was originated on November 30, 2017 by Morgan Stanley Bank, N.A. The Extra Space Self Storage Portfolio Whole Loan had an original principal balance of $194,400,000, has an outstanding principal balance as of the Cut-off Date of $194,400,000 and accrues interest at an interest rate of 4.175%per annum. The Extra Space Self Storage Portfolio Whole Loan had an initial term of 120 months, has a remaining term of 118 months as of the Cut-off Date and requires payments of interest only through the term of the Extra Space Self Storage Portfolio Whole Loan. The Extra Space Self Storage Portfolio Whole Loan matures on December 1, 2027.
THE INFORMATION IN THIS STRUCTURAL AND COLLATERAL TERM SHEET IS NOT COMPLETE AND MAY BE AMENDED PRIOR TO THE TIME OF SALE. THIS TERM SHEET IS NOT AN OFFER TO SELL THESE SECURITIES AND IT IS NOT A SOLICITATION OF AN OFFER TO BUY THESE SECURITIES IN ANY JURISDICTION WHERE THE OFFER OR SALE IS NOT PERMITTED.
80
| EXTRA SPACE SELF STORAGE PORTFOLIO |
The Extra Space Self Storage Portfolio Mortgage Loan, evidenced by the non-controlling Note A-2, which will be contributed to the BANK 2018-BNK10 trust, had an original principal balance of $60,000,000 and has an outstanding principal balance as of the Cut-off Date of $60,000,000. The controlling Note A-1, with an original principal balance of $92,000,000, was contributed to the MSC 2017-HR2 trust. The non-controlling Note A-3, with an original principal balance of $42,400,000, is currently held by Morgan Stanley Bank, N.A. and is expected to be contributed to a future trust or trusts. The lender provides no assurances that the non-securitizedpari passu note will not be split further. See “Description of the Mortgage Pool—The Whole Loans—The Non-Serviced Pari Passu Whole Loans” and “Pooling and Servicing Agreement” in the Preliminary Prospectus.
Note Summary
| Notes | Original Balance | Note Holder | Controlling Interest | |
| A-1 | $92,000,000 | MSC 2017-HR2 | Yes | |
| A-2 | $60,000,000 | BANK 2018-BNK10 | No | |
| A-3 | $42,400,000 | Morgan Stanley Bank, N.A. | No | |
| Total | $194,400,000 |
Following the lockout period, the borrower has the right to defease the Extra Space Self Storage Portfolio Whole Loan in whole, or in part as described below under “Partial Release,” on any date before June 1, 2027. In addition, the Extra Space Self Storage Portfolio Whole Loan is prepayable without penalty on or after June 1, 2027, in whole. The lockout period will expire on the earlier to occur of (i) two years after the closing date of the securitization that includes the last note to be securitized and (ii) January 1, 2021.
Sources and Uses
| Sources | Uses | |||||||
| Original whole loan amount | $194,400,000 | 65.7% | Purchase price(1) | $295,000,000 | 99.7% | |||
| Sponsor’s new cash contribution | 101,415,237 | 34.3 | Closing costs | 815,237 | 0.3 | |||
| Total Sources | $295,815,237 | 100.0% | Total Uses | $295,815,237 | 100.0% |
The Properties. The Extra Space Self Storage Portfolio Properties are comprised of 36 Extra Space branded self-storage properties containing a total of 20,890 units, comprised of approximately 77% non-climate controlled units, 17% climate controlled units and 6% recreational vehicle (“RV”) storage units. Average unit size, excluding RV storage, office, and warehouse square footage, is 112 square feet. The Extra Space Self Storage Portfolio Properties range in size from approximately 27,400 square feet to 292,316 square feet, inclusive of parking square footage. The total portfolio square footage is comprised of approximately 86% storage square footage and 14% parking square footage. While the percentage of parking square feet accounts for less than 15% of total square feet for 32 of the properties in the Extra Space Self Storage Portfolio, four properties including Henderson - Stephanie Place, Lake Elsinore – Central Avenue, Memphis – Covington Way and Killeen – Jasper Drive, have parking square footage that accounts for greater than 15% of the individual property square footage, the largest of which, Henderson – Stephanie Place, accounts for 61% of the individual property’s total square footage.
The Extra Space Self Storage Portfolio Properties are located across fifteen states, with the largest presence in California (six properties, 17.8% of total square feet), New Jersey (six properties, 14.5% of total square feet), Nevada (two properties, 13.1% of total square feet) and Tennessee (six properties, 12.3% of total square feet) with the remaining 16 properties (42.3% of total square feet) located across 11 different states. The largest property accounts for only 6.6% of underwritten net cash flow and only two properties account for more than 5.0% of underwritten net cash flow. The five largest properties by underwritten net cash flow account for 25.0% of the portfolio’s underwritten net cash flow while the ten largest properties account for 44.5% of the portfolio’s underwritten net cash flow. The Extra Space Self Storage Portfolio Properties were built between 1940 and 2013 with a weighted average year built of 1988 and were acquired by Extra Space Storage or its affiliates between 1940 and 2013. According to the Extra Space Self Storage Portfolio Borrower, approximately $8.5 million in capital expenditures has been spent across the portfolio between 2010 and 2016. The weighted average occupancy for the Extra Space Self Storage Portfolio Properties was 95.1% by square feet and 94.7% by unit, as of September 30, 2017.
THE INFORMATION IN THIS STRUCTURAL AND COLLATERAL TERM SHEET IS NOT COMPLETE AND MAY BE AMENDED PRIOR TO THE TIME OF SALE. THIS TERM SHEET IS NOT AN OFFER TO SELL THESE SECURITIES AND IT IS NOT A SOLICITATION OF AN OFFER TO BUY THESE SECURITIES IN ANY JURISDICTION WHERE THE OFFER OR SALE IS NOT PERMITTED.
81
| EXTRA SPACE SELF STORAGE PORTFOLIO |
The following table presents certain information relating to the Extra Space Self Storage Portfolio Properties:
Extra Space Self Storage Portfolio Properties
| Property Name | City / State | Year Built | Net Rentable Area (SF)(1) | Units | Allocated Cut-off Date Balance(2) | % of ALA | Appraised Value(3) | % of Appraised Value |
| Henderson - Stephanie Place | Henderson, NV | 1996 | 292,316 | 1136 | $13,010,000 | 6.7% | $18,700,000 | 6.6% |
| Brookfield - Federal Road | Brookfield, CT | 1988, 2001 | 80,250 | 699 | $9,710,000 | 5.0% | $13,800,000 | 4.9% |
| Kingston - Sawkill Road | Kingston, NY | 1986, 2001 | 85,675 | 753 | $9,330,000 | 4.8% | $12,400,000 | 4.4% |
| Lake Elsinore - Central Avenue | Lake Elsinore, CA | 2000, 2013 | 105,785 | 654 | $8,310,000 | 4.3% | $12,300,000 | 4.4% |
| Doylestown - North Broad Street | Doylestown, PA | 1988 | 71,355 | 557 | $8,130,000 | 4.2% | $11,400,000 | 4.0% |
| Pennsauken - South Crescent Boulevard | Pennsauken, NJ | 1990 | 82,810 | 738 | $7,910,000 | 4.1% | $12,300,000 | 4.4% |
| New Paltz - South Putt Corners Road | New Paltz, NY | 1989, 2001 | 76,226 | 736 | $7,720,000 | 4.0% | $10,900,000 | 3.9% |
| Tyngsborough - Industrial Way | Tyngsborough, MA | 1990 | 79,200 | 575 | $7,640,000 | 3.9% | $10,300,000 | 3.6% |
| Hemet - South Sanderson | Hemet, CA | 1985, 2002 | 90,193 | 732 | $7,280,000 | 3.7% | $11,000,000 | 3.9% |
| Bensalem - 1525 Bristol Pike | Bensalem, PA | 2000 | 71,070 | 637 | $7,160,000 | 3.7% | $10,800,000 | 3.8% |
| Eastpoint - Lakewood Avenue | Atlanta, GA | 1962, 2005 | 90,200 | 806 | $6,830,000 | 3.5% | $11,150,000 | 3.9% |
| Howell - Route 9 South | Howell, NJ | 1987 | 69,765 | 702 | $6,650,000 | 3.4% | $10,000,000 | 3.5% |
| Lawrenceville - Hurricane Shoals Road | Lawrenceville, GA | 1995 | 103,830 | 751 | $6,600,000 | 3.4% | $9,150,000 | 3.2% |
| Lawnside - White Horse Pike | Lawnside, NJ | 1977 | 64,565 | 665 | $6,400,000 | 3.3% | $10,300,000 | 3.6% |
| Phoenix - West Peoria | Phoenix, AZ | 1980, 1998 | 63,214 | 631 | $5,750,000 | 3.0% | $9,300,000 | 3.3% |
| Mount Laurel - Ark Road | Mount Laurel, NJ | 1987 | 46,145 | 409 | $5,200,000 | 2.7% | $7,700,000 | 2.7% |
| Burlington - Cadillac Road | Burlington, NJ | 1940 | 62,160 | 672 | $5,160,000 | 2.7% | $7,700,000 | 2.7% |
| Cherry Hill - Marlton Pike | Cherry Hill, NJ | 1990 | 61,140 | 492 | $5,150,000 | 2.6% | $7,500,000 | 2.7% |
| Bensalem - Knights Road | Bensalem, PA | 2004 | 48,546 | 442 | $4,980,000 | 2.6% | $7,600,000 | 2.7% |
| Albuquerque - Ellison Road Northwest | Albuquerque, NM | 1993 | 54,860 | 514 | $4,890,000 | 2.5% | $6,900,000 | 2.4% |
| Modesto - Crows Landing | Modesto, CA | 2002 | 76,350 | 570 | $4,650,000 | 2.4% | $6,000,000 | 2.1% |
| Auburndale - US Highway 92 West | Auburndale, FL | 2000 | 63,675 | 525 | $4,600,000 | 2.4% | $5,700,000 | 2.0% |
| San Bernardino - West Club Center Drive | San Bernardino, CA | 1989 | 63,578 | 513 | $4,360,000 | 2.2% | $6,300,000 | 2.2% |
| Memphis - Mount Moriah Terrace | Memphis, TN | 1982, 1997 | 84,610 | 676 | $4,200,000 | 2.2% | $5,650,000 | 2.0% |
| Hesperia - Mariposa Road | Hesperia, CA | 1999 | 77,600 | 536 | $3,870,000 | 2.0% | $5,600,000 | 2.0% |
| Memphis - Covington Way | Memphis, TN | 1984, 1997 | 78,040 | 523 | $3,820,000 | 2.0% | $5,300,000 | 1.9% |
| St. Louis - Halls Ferry Road | St. Louis, MO | 1998 | 58,200 | 465 | $3,510,000 | 1.8% | $5,100,000 | 1.8% |
| Killeen - Jasper Drive | Killeen, TX | 1974, 1979, 2004 | 94,970 | 717 | $3,470,000 | 1.8% | $6,000,000 | 2.1% |
| Albuquerque - Airport Drive Northwest | Albuquerque, NM | 1987 | 53,240 | 400 | $2,970,000 | 1.5% | $4,500,000 | 1.6% |
| Memphis - Gateway Drive | Memphis, TN | 1987 | 50,300 | 387 | $2,820,000 | 1.5% | $3,650,000 | 1.3% |
| Victorville - Yates Road | Victorville, CA | 1977 | 62,125 | 519 | $2,790,000 | 1.4% | $3,800,000 | 1.3% |
| Las Vegas - North Lamont Street | Las Vegas, NV | 1988 | 56,985 | 463 | $2,190,000 | 1.1% | $3,800,000 | 1.3% |
| Columbus - East Main Street | Columbus, OH | 1988 | 33,500 | 295 | $2,130,000 | 1.1% | $2,750,000 | 1.0% |
| Memphis - Raleigh-LaGrange | Memphis, TN | 1984 | 40,395 | 349 | $1,930,000 | 1.0% | $2,700,000 | 1.0% |
| Memphis - 5675 Summer Avenue | Memphis, TN | 1985 | 47,945 | 365 | $1,760,000 | 0.9% | $2,350,000 | 0.8% |
| Memphis - Madison Avenue | Memphis, TN | 1982 | 27,400 | 286 | $1,520,000 | 0.8% | $2,250,000 | 0.8% |
| Total/Weighted Average | 2,668,218 | 20,890 | $194,400,000 | 100.0% | $282,650,000 | 100.0% |
| (1) | Includes 3,850 SF associated with commercial space across all of the Extra Space Self Storage Portfolio Properties. |
| (2) | Allocated Cut-off Date Balance is based on the Extra Space Self Storage Portfolio Whole Loan Cut-off Date balance. The allocated loan amounts are allocated based on a schedule in the loan agreement, which was based on net operating income for the Extra Space Self Storage Portfolio Properties. |
| (3) | The individual “as is” appraised values are shown. The appraiser also provided a bulk portfolio value for the Extra Space Self Storage Portfolio Properties of $299,250,000, which includes a portfolio premium of $16,600,000. |
THE INFORMATION IN THIS STRUCTURAL AND COLLATERAL TERM SHEET IS NOT COMPLETE AND MAY BE AMENDED PRIOR TO THE TIME OF SALE. THIS TERM SHEET IS NOT AN OFFER TO SELL THESE SECURITIES AND IT IS NOT A SOLICITATION OF AN OFFER TO BUY THESE SECURITIES IN ANY JURISDICTION WHERE THE OFFER OR SALE IS NOT PERMITTED.
82
| EXTRA SPACE SELF STORAGE PORTFOLIO |
The following table presents detailed information with respect to the unit mix and net operating income of the Extra Space Self Storage Portfolio Properties.
Extra Space Self Storage Portfolio Properties Unit Mix and NOI Summary(1)
| Property Name | City / State | Date Acquired | Non-Climate Controlled | Climate Controlled | RV Units | Unit SF % | Parking SF % | 9/30/2017 TTM NOI | % of Total 9/30/2017 TTM NOI |
| Henderson - Stephanie Place | Henderson, NV | 7/1/2004 | 666 | 0 | 470 | 39.0% | 61.0% | $1,141,429 | 6.7% |
| Brookfield - Federal Road | Brookfield, CT | 7/14/2005 | 491 | 198 | 10 | 98.8% | 1.2% | $851,941 | 5.0% |
| Kingston - Sawkill Road | Kingston, NY | 7/14/2005 | 567 | 160 | 26 | 92.1% | 7.9% | $818,310 | 4.8% |
| Lake Elsinore - Central Avenue | Lake Elsinore, CA | 10/19/2011 | 477 | 21 | 156 | 59.0% | 41.0% | $728,946 | 4.3% |
| Doylestown - North Broad Street | Doylestown, PA | 1/1/2001 | 517 | 0 | 40 | 88.7% | 11.3% | $713,051 | 4.2% |
| Pennsauken - South Crescent Boulevard | Pennsauken, NJ | 12/1/2003 | 721 | 0 | 17 | 96.3% | 3.7% | $693,688 | 4.1% |
| New Paltz - South Putt Corners Road | New Paltz, NY | 7/14/2005 | 594 | 108 | 34 | 90.2% | 9.8% | $677,043 | 4.0% |
| Tyngsborough - Industrial Way | Tyngsborough, MA | 7/14/2005 | 575 | 0 | 0 | 100.0% | 0.0% | $670,119 | 3.9% |
| Hemet - South Sanderson | Hemet, CA | 7/14/2005 | 498 | 191 | 43 | 86.4% | 13.6% | $638,388 | 3.7% |
| Bensalem - 1525 Bristol Pike | Bensalem, PA | 1/1/2005 | 437 | 185 | 14 | 96.6% | 3.4% | $628,304 | 3.7% |
| Eastpoint - Lakewood Avenue | Atlanta, GA | 7/1/2004 | 693 | 83 | 30 | 93.0% | 7.0% | $598,939 | 3.5% |
| Howell - Route 9 South | Howell, NJ | 1/1/2002 | 691 | 0 | 10 | 97.1% | 2.9% | $583,122 | 3.4% |
| Lawrenceville - Hurricane Shoals Road | Lawrenceville, GA | 11/4/2013 | 438 | 257 | 56 | 87.1% | 12.9% | $579,026 | 3.4% |
| Lawnside - White Horse Pike | Lawnside, NJ | 7/1/2004 | 507 | 151 | 7 | 97.5% | 2.5% | $561,739 | 3.3% |
| Phoenix - West Peoria | Phoenix, AZ | 7/14/2005 | 408 | 223 | 0 | 100.0% | 0.0% | $504,693 | 3.0% |
| Mount Laurel - Ark Road | Mount Laurel, NJ | 7/14/2005 | 287 | 121 | 1 | 99.6% | 0.4% | $455,932 | 2.7% |
| Burlington - Cadillac Road | Burlington, NJ | 7/18/2012 | 191 | 476 | 5 | 97.9% | 2.1% | $452,735 | 2.7% |
| Cherry Hill - Marlton Pike | Cherry Hill, NJ | 7/1/2004 | 322 | 168 | 2 | 99.5% | 0.5% | $451,476 | 2.6% |
| Bensalem - Knights Road | Bensalem, PA | 4/1/2006 | 213 | 219 | 10 | 96.5% | 3.5% | $437,175 | 2.6% |
| Albuquerque - Ellison Road Northwest | Albuquerque, NM | 7/14/2005 | 514 | 0 | 0 | 100.0% | 0.0% | $429,337 | 2.5% |
| Modesto - Crows Landing | Modesto, CA | 6/1/2007 | 550 | 0 | 20 | 91.6% | 8.4% | $407,564 | 2.4% |
| Auburndale - US Highway 92 West | Auburndale, FL | 5/2/2012 | 313 | 212 | 0 | 100.0% | 0.0% | $403,848 | 2.4% |
| San Bernardino - West Club Center Drive | San Bernardino, CA | 11/1/2000 | 501 | 0 | 12 | 95.9% | 4.1% | $382,308 | 2.2% |
| Memphis - Mount Moriah Terrace | Memphis, TN | 7/14/2005 | 500 | 130 | 46 | 87.9% | 12.1% | $368,422 | 2.2% |
| Hesperia - Mariposa Road | Hesperia, CA | 10/19/2011 | 536 | 0 | 0 | 100.0% | 0.0% | $339,722 | 2.0% |
| Memphis - Covington Way | Memphis, TN | 7/14/2005 | 244 | 240 | 39 | 83.3% | 16.7% | $335,021 | 2.0% |
| St. Louis - Halls Ferry Road | St. Louis, MO | 5/1/2001 | 465 | 0 | 0 | 100.0% | 0.0% | $308,298 | 1.8% |
| Killeen - Jasper Drive | Killeen, TX | 11/4/2013 | 291 | 312 | 114 | 72.3% | 27.7% | $304,105 | 1.8% |
| Albuquerque - Airport Drive Northwest | Albuquerque, NM | 7/1/2004 | 391 | 0 | 9 | 97.3% | 2.7% | $260,948 | 1.5% |
| Memphis - Gateway Drive | Memphis, TN | 7/14/2005 | 387 | 0 | 0 | 100.0% | 0.0% | $246,946 | 1.4% |
| Victorville - Yates Road | Victorville, CA | 10/19/2011 | 498 | 0 | 21 | 91.3% | 8.7% | $244,392 | 1.4% |
| Las Vegas - North Lamont Street | Las Vegas, NV | 4/1/2001 | 411 | 30 | 22 | 92.4% | 7.6% | $192,375 | 1.1% |
| Columbus - East Main Street | Columbus, OH | 7/14/2005 | 295 | 0 | 0 | 100.0% | 0.0% | $186,696 | 1.1% |
| Memphis - Raleigh-LaGrange | Memphis, TN | 7/14/2005 | 321 | 12 | 16 | 91.2% | 8.8% | $169,541 | 1.0% |
| Memphis - 5675 Summer Avenue | Memphis, TN | 7/14/2005 | 347 | 11 | 5 | 97.4% | 2.6% | $154,416 | 0.9% |
| Memphis - Madison Avenue | Memphis, TN | 7/14/2005 | 286 | 0 | 0 | 100.0% | 0.0% | $133,313 | 0.8% |
| Total/Weighted Average | 16,143 | 3,508 | 1,235 | 86.3% | 13.7% | $17,053,307 | 100.0% |
| (1) | Based on information provided by the Extra Space Self Storage Portfolio Borrower. |
The following table presents historical occupancy percentages at the Extra Space Self Storage Portfolio Properties:
Historical Occupancy(1)
12/31/2013 | 12/31/2014 | 12/31/2015 | 12/31/2016 | 9/30/2017 |
| 86.5% | 88.7% | 93.0% | 93.6% | 95.1% |
(1) Based on information provided by the Extra Space Self Storage Portfolio Borrower.
THE INFORMATION IN THIS STRUCTURAL AND COLLATERAL TERM SHEET IS NOT COMPLETE AND MAY BE AMENDED PRIOR TO THE TIME OF SALE. THIS TERM SHEET IS NOT AN OFFER TO SELL THESE SECURITIES AND IT IS NOT A SOLICITATION OF AN OFFER TO BUY THESE SECURITIES IN ANY JURISDICTION WHERE THE OFFER OR SALE IS NOT PERMITTED.
83
| EXTRA SPACE SELF STORAGE PORTFOLIO |
Operating History and Underwritten Net Cash Flow.The following table presents certain information relating to the historical operating performance and the underwritten net cash flow at the Extra Space Self Storage Portfolio Properties:
Cash Flow Analysis
| 2014 | 2015 | 2016 | TTM 6/30/2017 | U/W(1) | % of U/W Effective Gross Income | U/W $ per SF | |
| Base Rent(1) | $22,697,753 | $24,564,446 | $26,226,349 | $27,627,825 | $27,627,825 | 99.9% | $10.35 |
| Other Income(2) | $1,540,947 | $1,640,794 | $1,714,680 | $1,720,469 | $1,720,469 | 6.2 | 0.64 |
| Concessions and Credit Loss | ($1,599,426) | ($1,404,249) | ($1,549,909) | ($1,703,137) | ($1,703,137)(3) | (6.2) | (0.64) |
| Effective Gross Income | $22,639,275 | $24,800,992 | $26,391,121 | $27,645,157 | $27,645,157 | 100.0% | $10.36 |
| Total Operating Expenses | $9,853,788 | $10,151,952 | $10,291,797 | $10,591,850 | $10,672,978 | 38.6 | 4.00 |
|
|
|
|
|
|
| |
| Net Operating Income | $12,785,487 | $14,649,039 | $16,099,324 | $17,053,307 | $16,972,179 | 61.4% | $6.36 |
| Capital Expenditures | $0 | $0 | $0 | $0 | $412,651 | 1.5 | 0.15 |
| Net Cash Flow | $12,785,487 | $14,649,039 | $16,099,324 | $17,053,307 | $16,559,528 | 59.9% | $6.21 |
| NOI DSCR(4) | 1.55x | 1.78x | 1.96x | 2.07x | 2.06x | ||
| NCF DSCR(4) | 1.55x | 1.78x | 1.96x | 2.07x | 2.01x | ||
| NOI DY(4) | 6.6% | 7.5% | 8.3% | 8.8% | 8.7% | ||
| NCF DY(4) | 6.6% | 7.5% | 8.3% | 8.8% | 8.5% |
| (1) | Base Rent is net of vacancy and includes parking income, billboard income and commercial income. Parking income accounts for 4.0% of UW Base Rent. Billboard income and commercial income each account for less than 0.2% of UW Base Rent. |
| (2) | Other Income is comprised of administration fees, late fees, miscellaneous fees and merchandise sales. |
| (3) | The underwritten economic vacancy is 5.3%. As of September 30, 2017, the Extra Space Self Storage Portfolio Properties were 95.1% physically occupied. |
| (4) | The debt service coverage ratios and debt yields are based on the Extra Space Self Storage Portfolio Whole Loan. |
Appraisal.As of the appraisal valuation date of November 1, 2017, the Extra Space Self Storage Portfolio Properties had an “as-portfolio” bulk appraised value of $299,250,000, which includes a portfolio premium of $16,600,000. The sum of the individual “as-is” appraised values of the Extra Space Self Storage Portfolio Properties is $282,650,000.
Environmental Matters. According to the Phase I environmental site assessments dated November 3, 2017, there are no recognized environmental conditions at the Extra Space Self Storage Portfolio Properties.
Market Overview and Competition. The Extra Space Self Storage Portfolio Properties are geographically diverse, located in 15 different markets across 15 states. The greatest concentration of Extra Space Self Storage Portfolio Properties is located in California (six properties, 17.8% of SF), New Jersey (six properties, 14.5% of SF), Nevada (two properties, 13.1% of SF) and Tennessee (six properties, 12.3% of SF), with the remaining sixteen properties (42.3% of SF) located across 11 different states.
The following tables present state-level information with respect to the Extra Space Self Storage Portfolio Properties:
Extra Space Self Storage Portfolio Market Summary(1)
| State | Count | Total SF(2) | Total Units | Climate Controlled Units | Wtd Avg Occ. (SF)(3) | Wtd. Avg. Ann. Rent PSF | Allocated Cut-off Date Balance | In Place Ann. Rent | % of Ann. Rent |
| California | 6 | 475,631 | 3,524 | 212 | 95.5% | $8.92 | $31,260,000 | $4,243,653 | 15.4% |
| New Jersey | 6 | 386,585 | 3,678 | 916 | 95.8% | $13.83 | $36,470,000 | $5,347,017 | 19.4% |
| Nevada | 2 | 349,301 | 1,599 | 30 | 96.7% | $5.36 | $15,200,000 | $1,873,907 | 6.8% |
| Tennessee | 6 | 328,690 | 2,586 | 393 | 93.2% | $8.32 | $16,050,000 | $2,735,589 | 9.9% |
| Georgia | 2 | 194,030 | 1,557 | 340 | 95.5% | $10.25 | $13,430,000 | $1,987,912 | 7.2% |
| Pennsylvania | 3 | 190,971 | 1,636 | 404 | 95.1% | $14.46 | $20,270,000 | $2,760,958 | 10.0% |
| New York | 2 | 161,901 | 1,489 | 268 | 93.9% | $15.07 | $17,050,000 | $2,440,363 | 8.8% |
| New Mexico | 2 | 108,100 | 914 | - | 96.3% | $10.04 | $7,860,000 | $1,085,628 | 3.9% |
| Texas | 1 | 94,970 | 717 | 312 | 90.8% | $6.68 | $3,470,000 | $634,029 | 2.3% |
| Connecticut | 1 | 80,250 | 699 | 198 | 97.7% | $15.23 | $9,710,000 | $1,222,484 | 4.4% |
| Massachusetts | 1 | 79,200 | 575 | - | 94.1% | $12.14 | $7,640,000 | $961,654 | 3.5% |
| Florida | 1 | 63,675 | 525 | 212 | 95.8% | $9.46 | $4,600,000 | $602,600 | 2.2% |
| Arizona | 1 | 63,214 | 631 | 223 | 94.6% | $12.16 | $5,750,000 | $768,856 | 2.8% |
| Missouri | 1 | 58,200 | 465 | - | 91.3% | $10.32 | $3,510,000 | $600,697 | 2.2% |
| Ohio | 1 | 33,500 | 295 | - | 94.9% | $10.82 | $2,130,000 | $362,477 | 1.3% |
| Total / Wtd. Avg. | 36 | 2,668,218 | 20,890 | 3,508 | 95.1% | $10.35 | 194,400,000 | $27,627,825 | 100.0% |
| (1) | Based on information provided by the Extra Space Self Storage Portfolio Borrower. |
| (2) | Includes 3,850 SF associated with commercial space across all of the Extra Space Self Storage Portfolio Properties. |
| (3) | Occupancy and Ann. Rent are as of the September 30, 2017 trailing twelve month period. |
THE INFORMATION IN THIS STRUCTURAL AND COLLATERAL TERM SHEET IS NOT COMPLETE AND MAY BE AMENDED PRIOR TO THE TIME OF SALE. THIS TERM SHEET IS NOT AN OFFER TO SELL THESE SECURITIES AND IT IS NOT A SOLICITATION OF AN OFFER TO BUY THESE SECURITIES IN ANY JURISDICTION WHERE THE OFFER OR SALE IS NOT PERMITTED.
84
| EXTRA SPACE SELF STORAGE PORTFOLIO |
The following table presents demographic information with respect to the Extra Space Self Storage Portfolio Properties:
Extra Space Self Storage Portfolio Demographic Summary(1)
| Market | Location | Count | Market 10x10 Non-Climate Controlled Rent | Market 10x10 Climate Controlled Rent | Market Vacancy | Population 2016 (Million) | Rentable SF per Capita | Median HH Income | Avg HH Size |
| Philadelphia | Northeast | 8 | $121.7 | $141.3 | 8.5% | 6.1 | 3.6 | $63,168 | 2.6 |
| Greater New York | Northeast | 3 | $267.3 | $303.8 | 12.6% | 20.1 | 2.7 | 69,651 | 2.7 |
| San Bernardino-Riverside | West | 5 | $104.7 | $145.4 | 8.7% | 4.5 | 5.1 | 56,571 | 3.2 |
| Memphis | Southeast | 6 | $80.4 | $125.6 | 11.6% | 1.4 | 7.0 | 48,624 | 2.6 |
| Atlanta | Southeast | 2 | $96.2 | $126.4 | 10.0% | 5.7 | 6.4 | 58,098 | 2.7 |
| Las Vegas | Southwest | 2 | $94.1 | $103.8 | 9.6% | 2.1 | 6.2 | 52,771 | 2.7 |
| Boston | Northeast | 1 | $181.0 | $152.0 | 10.7% | 4.8 | 3.9 | 76,745 | 2.5 |
| Albuquerque | Southwest | 2 | NAV | NAV | NAV | 0.9 | NAV | 49,967 | 2.5 |
| Central New Jersey | Northeast | 1 | $136.5 | $157.7 | 7.5% | 0.4 | NAV | 74,942 | 2.6 |
| Phoenix | Southwest | 1 | $108.5 | $130.3 | 11.7% | 4.6 | 4.8 | 54,976 | 2.7 |
| Central Valley | West | 1 | $119.3 | $142.6 | 6.9% | 2.3 | 7.0 | 60,907 | 2.7 |
| Tampa-St Petersburg | Southeast | 1 | $114.8 | $148.9 | 8.3% | 3.0 | 6.2 | 48,529 | 2.4 |
| Austin | Southeast | 1 | $104.9 | $149.3 | 10.8% | 2.0 | 7.6 | 65,493 | 2.6 |
| St Louis | Midwest | 1 | $93.0 | $134.5 | 10.3% | 2.8 | 5.9 | 56,375 | 2.5 |
| Columbus | Midwest | 1 | $120.6 | $90.9 | 10.0% | 2.0 | 5.8 | 56,725 | 2.5 |
| Total / Wtd. Avg. | 36 | $133.7 | $159.7 | 9.8% | 62.7 | 4.9 | $62,727 | 2.7 |
| (1) | Based on 2016 demographic and market information as provided by third party research reports and the Extra Space Self Storage Portfolio Borrower. |
The Borrower.The borrower is Storage Portfolio II Subsidiary LLC, a Delaware limited liability company and single purpose entity with two independent directors. Legal counsel to the borrower delivered a non-consolidation opinion in connection with the origination of the Extra Space Self Storage Portfolio Whole Loan. Extra Space Storage Inc. is the guarantor of certain nonrecourse carveouts under the Extra Space Self Storage Portfolio Whole Loan.
The Extra Space Self Storage Portfolio Borrower is 90.0% indirectly owned by Teachers Insurance and Annuity Association of America (“TIAA”) for the benefit of the Separate Real Estate Account (“TIAA Real Estate”) and 9.3% indirectly owned by ExtraSpace Storage, Inc. (“Extra Space Storage”). A subsidiary of Extra Space Storage is the managing member of the joint venture between TIAA Real Estate and Extra Space Storage which owns the borrower.
If a buy/sell is triggered such that TIAA Real Estate becomes the sole indirect owner of the borrower, Teachers REA, LLC has been approved as replacement guarantor provided that it meets certain net worth and liquidity requirements set forth in the loan documents and there has been no material adverse change in its financial condition or status.TH Real Estate is an affiliate of Nuveen, LLC, an investment management arm of TIAA. TH Real Estate is a real estate investment services firm with over 530 real estate professionals located in more than 20 cities throughout the Unites States, Europe and Asia-Pacific. As of June 30, 2017, TH Real Estate had over $103 billion of assets under management globally. Extra Space Storage is headquartered in Salt Lake City, Utah and owned or operated over 1,400 self-storage locations across 38 states, Washington, D.C. and Puerto Rico as of June 30, 2017.
The Borrower Sponsor.The borrower sponsors are ExtraSpace Storage Inc. and TH Real Estate.
Escrows.The Extra Space Self Storage Portfolio Borrower is required to escrow monthly 1/12th of the annual estimated real estate tax payments. Notwithstanding the foregoing, so long as Extra Space Storage Inc. is the non-recourse carve-out guarantor, the Extra Space Self Storage Portfolio Borrower will not be required to make deposits to the real estate tax escrow, provided that (i) no Cash Sweep Event Period (as defined below) is continuing and (ii) the Extra Space Self Storage Portfolio Borrower provides the lender paid receipts for taxes upon written request by no later than three business days prior to the date such taxes would be delinquent. The Extra Space Self Storage Portfolio Borrower is required to escrow monthly 1/12th of the annual estimated insurance premiums. Notwithstanding the foregoing, so long as Extra Space Storage Inc. is the non-recourse carve-out guarantor, the Extra Space Self Storage Portfolio Borrower will not be required to make deposits to the insurance reserve provided (i) no event of default is continuing and (ii) the Extra Space Self Storage Portfolio Borrower maintains an acceptable blanket insurance policy.
Lockbox and Cash Management.The Extra Space Self Storage Portfolio Whole Loan provides for a springing soft lockbox and springing cash management, in each case upon the occurrence of a Cash Sweep Event Period. Upon the first occurrence of a Cash Sweep Event Period, the Extra Space Self Storage Portfolio Borrower is required to establish (i) a lockbox account, into which, during a Cash Sweep Event Period, all rents (less costs anticipated for debits for credit and chargebacks, fees, and refunded items) are required to be deposited by the Extra Space Self Storage Portfolio Borrower and/or the property manager within five business days after receipt and (ii) a lender-controlled cash management account. During the continuance of a Cash Sweep Event Period, all funds in the lockbox account are required to be swept each day to the cash management account. Provided no event of default is continuing, funds in the cash management account are required to be applied on each monthly payment date to disburse to the Extra Space Self Storage Portfolio Borrower amounts for the payment of De Minimis Revenue (as defined below), to pay debt service on the Extra Space Self Storage Portfolio Whole Loan, to fund required reserve deposits as described above under “Escrows and Reserves,” to pay operating expenses set forth in the approved annual budget, and extraordinary expenses approved by the lender, and thereafter, to the extent (i) a Cash Sweep Event Period is continuing, to deposit any remaining cash flow into an account to be held as additional security for the Extra Space Self Storage Portfolio Whole Loan during the continuance of the Cash Sweep Event Period and (ii) no Cash Sweep Event Period exists, to disburse any remaining cash flow to the Extra Space Self Storage Portfolio Borrower. If a Cash Sweep Event Period no longer exists, the Extra Space Self Storage Portfolio Borrower and property manager will no longer be obligated to deposit rents into the lockbox account.
THE INFORMATION IN THIS STRUCTURAL AND COLLATERAL TERM SHEET IS NOT COMPLETE AND MAY BE AMENDED PRIOR TO THE TIME OF SALE. THIS TERM SHEET IS NOT AN OFFER TO SELL THESE SECURITIES AND IT IS NOT A SOLICITATION OF AN OFFER TO BUY THESE SECURITIES IN ANY JURISDICTION WHERE THE OFFER OR SALE IS NOT PERMITTED.
85
| EXTRA SPACE SELF STORAGE PORTFOLIO |
De Minimis Revenue” means sums for the payment of tenant insurance premiums, sales tax, and packing supply cash receipts. De Minimis Revenue is required to be disbursed to the Extra Space Self Storage Portfolio Borrower within five business days after delivery to the lender of a budget for such expenses.
A “Cash Sweep Event Period” will commence upon the earlier of (i) an event of default or (ii) the debt service coverage ratio being less than 1.10x for 12 consecutive months and continue until; (a) in the case of clause (i), the cure of such event of default and (b) in the case of clause (ii), the debt service coverage ratio is equal to or greater than 1.25x for the immediately preceding six consecutive calendar months.
Property Management.The Extra Space Self Storage Portfolio Properties are currently managed by Extra Space Management, Inc.
Assumption.The borrower has the right to transfer the Extra Space Self Storage Portfolio Properties in their entirety, provided that no event of default has occurred and is continuing and certain other conditions are satisfied, including, but not limited to: (i) the lender’s reasonable determination that the proposed transferee and guarantor satisfy the lender’s credit review and underwriting standards, taking into consideration transferee experience, financial strength and general business standing, (ii) a guaranty and environmental indemnity by an affiliate of the transferee; and (iii) if requested by the lender, rating agency confirmation from each rating agency assigned to the Series 2018 BNK10 Certificates that the transfer will not result in a downgrade, withdrawal or qualification of the respective ratings assigned to the Series 2018-BNK10 Certificates and similar confirmations from each rating agency rating any securities backed by the Extra Space Self Storage Portfolio companion loans with respect to the ratings of such securities.
Partial Release.After the Release Date (as defined below) and prior to June 1, 2027, provided no event of default has occurred and is continuing, the Extra Space Self Storage Portfolio Borrower may obtain a release of any of the individual properties comprising the Extra Space Self Storage Portfolio Properties upon defeasance of an amount equal to 125% of the allocated loan amount of such individual property; provided that the following conditions, among others, are satisfied: (i) after giving effect to the release, the debt yield with respect to the remaining properties is greater than the debt yield of all of the properties immediately prior to the related release; and (ii) the partial defeasance is permitted under REMIC requirements (and the lender receives an opinion of counsel that the partial defeasance will not cause a REMIC trust formed pursuant to a securitization of any portion of the Extra Space Self Storage Portfolio Whole Loan to fail to maintain its status as a REMIC).
“Release Date” means the earlier to occur of (i) the third anniversary of the first monthly payment date under the Extra Space Self Storage Portfolio Whole Loan and (ii) the date that is two years from the “startup day” of the REMIC trust established in connection with the last securitization involving any portion of the Extra Space Self Storage Portfolio Whole Loan.
Real Estate Substitution.Not permitted.
Subordinate and Mezzanine Indebtedness.Not permitted.
Ground Lease.None.
Terrorism Insurance.The Extra Space Self Storage Portfolio Borrower is required to obtain insurance against acts of terrorism or other similar acts or events in form and substance reasonably satisfactory to the lender, including all risk insurance in an amount equal to 100% of full replacement cost and eighteen months of business interruption insurance. Notwithstanding the foregoing, for so long as the Terrorism Risk Insurance Act of 2002, as extended and modified by the Terrorism Risk Insurance Program Reauthorization Act of 2015 is in effect (or any extension thereof or other federal government program with substantially similar protection), the Extra Space Self Storage Portfolio Borrower is required to maintain, and the lender is required to accept, terrorism insurance which covers “covered acts” (as defined by such statute or other program), as full compliance as it relates to the risks required to be covered pursuant to the preceding sentence, so long as such statute or other program covers both domestic and foreign acts of terrorism.
Earthquake Insurance. The Mortgage Loan documents require earthquake insurance, if required, in amounts and in form and substance satisfactory to the lender in the event an Extra Space Portfolio Property is located in an area with a high degree of seismic activity, provided that such insurance is required to be on terms consistent with the all risk insurance policy required under the Mortgage Loan documents.
THE INFORMATION IN THIS STRUCTURAL AND COLLATERAL TERM SHEET IS NOT COMPLETE AND MAY BE AMENDED PRIOR TO THE TIME OF SALE. THIS TERM SHEET IS NOT AN OFFER TO SELL THESE SECURITIES AND IT IS NOT A SOLICITATION OF AN OFFER TO BUY THESE SECURITIES IN ANY JURISDICTION WHERE THE OFFER OR SALE IS NOT PERMITTED.
86
(THIS PAGE INTENTIONALLY LEFT BLANK)
87
(THIS PAGE INTENTIONALLY LEFT BLANK)
88
BAYBROOK LIFESTYLE AND POWER CENTER |
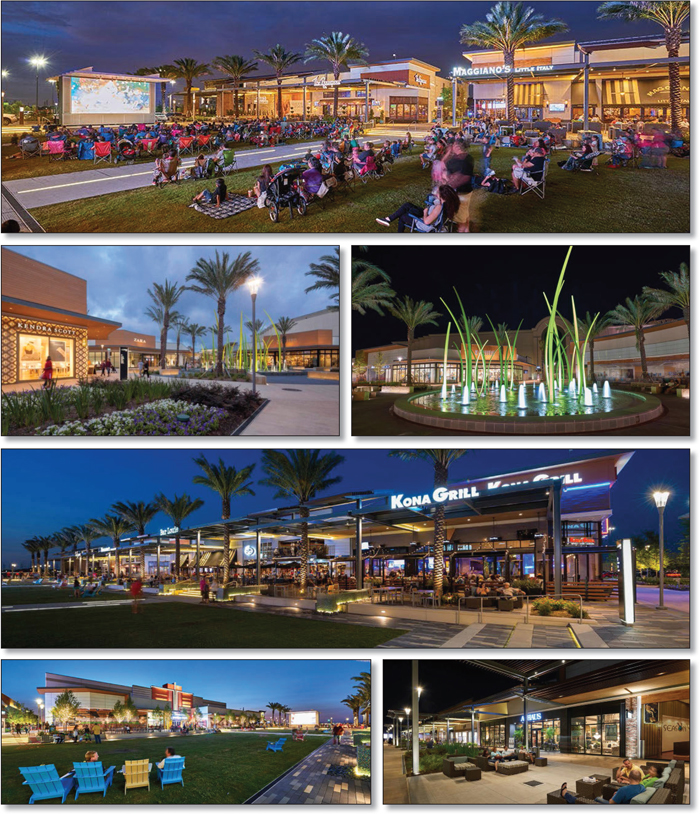
THE INFORMATION IN THIS STRUCTURAL AND COLLATERAL TERM SHEET IS NOT COMPLETE AND MAY BE AMENDED PRIOR TO THE TIME OF SALE. THIS TERM SHEET IS NOT AN OFFER TO SELL THESE SECURITIES AND IT IS NOT A SOLICITATION OF AN OFFER TO BUY THESE SECURITIES IN ANY JURISDICTION WHERE THE OFFER OR SALE IS NOT PERMITTED.
89
BAYBROOK LIFESTYLE AND POWER CENTER |
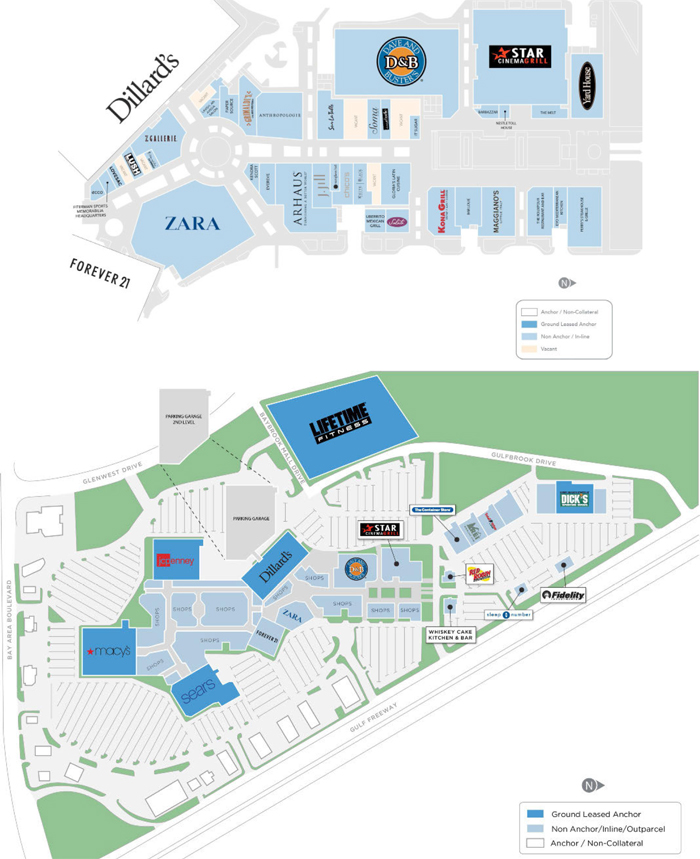
THE INFORMATION IN THIS STRUCTURAL AND COLLATERAL TERM SHEET IS NOT COMPLETE AND MAY BE AMENDED PRIOR TO THE TIME OF SALE. THIS TERM SHEET IS NOT AN OFFER TO SELL THESE SECURITIES AND IT IS NOT A SOLICITATION OF AN OFFER TO BUY THESE SECURITIES IN ANY JURISDICTION WHERE THE OFFER OR SALE IS NOT PERMITTED.
90
BAYBROOK LIFESTYLE AND POWER CENTER |

THE INFORMATION IN THIS STRUCTURAL AND COLLATERAL TERM SHEET IS NOT COMPLETE AND MAY BE AMENDED PRIOR TO THE TIME OF SALE. THIS TERM SHEET IS NOT AN OFFER TO SELL THESE SECURITIES AND IT IS NOT A SOLICITATION OF AN OFFER TO BUY THESE SECURITIES IN ANY JURISDICTION WHERE THE OFFER OR SALE IS NOT PERMITTED.
91
BAYBROOK LIFESTYLE AND POWER CENTER |
| No. 7 – Baybrook Lifestyle and Power Center | |||||||
| Loan Information | Property Information | ||||||
| Mortgage Loan Seller: | Morgan Stanley Mortgage Capital Holdings LLC | Single Asset/Portfolio: | Single Asset | ||||
Credit Assessment (Fitch/DBRS/Moody’s): | NR/NR/NR | Property Type: | Retail | ||||
| Original Principal Balance(1): | $60,000,000 | Specific Property Type: | Lifestyle Center | ||||
| Cut-off Date Balance(1): | $60,000,000 | Location: | Friendswood, TX | ||||
| % of Initial Pool Balance: | 4.7% | Size: | 636,845 SF | ||||
| Loan Purpose: | Refinance | Cut-off Date Balance Per SF(1): | $219.83 | ||||
| Borrower Name: | Baybrook LPC, LLC; Baybrook LTF Owner, LLC; Gulfbrook Services, Inc. | Year Built/Renovated: | 2015/NAP | ||||
| Borrower Sponsor: | GGP Real Estate Holding I, Inc. | Title Vesting: | Fee | ||||
| Mortgage Rate: | 3.770% | Property Manager: | Self-managed | ||||
| Note Date: | November 17, 2017 | 4thMost Recent Occupancy (As of): | NAV | ||||
| Anticipated Repayment Date: | NAP | 3rdMost Recent Occupancy (As of): | NAV | ||||
| Maturity Date: | December 1, 2027 | 2ndMost Recent Occupancy (As of: | NAV | ||||
| IO Period: | 120 months | Most Recent Occupancy (As of): | 91.7% (12/31/2016) | ||||
| Loan Term (Original): | 120 months | Current Occupancy (As of)(4): | 94.1% (11/13/2017) | ||||
| Seasoning: | 2 months | ||||||
| Amortization Term (Original): | NAP | Underwriting and Financial Information: | |||||
| Loan Amortization Type: | Interest-only, Balloon | ||||||
| Interest Accrual Method: | Actual/360 | 4thMost Recent NOI (As of): | NAV | ||||
| Call Protection: | L(26),D(90),O(4) | 3rdMost Recent NOI (As of): | NAV | ||||
| Lockbox Type: | Hard/Springing Cash Management | 2ndMost Recent NOI (As of): | $7,661,415 (12/31/2016) | ||||
| Additional Debt(1): | Yes | Most Recent NOI (As of)(5): | $12,031,676 (TTM 9/30/2017) | ||||
| Additional Debt Type(1): | Pari Passu | ||||||
| U/W Revenues: | $20,728,426 | ||||||
| U/W Expenses: | $4,953,868 | ||||||
| U/W NOI(6): | $15,774,558 | ||||||
| U/W NCF: | $14,961,901 | ||||||
| U/W NOI DSCR(1): | 2.95x | ||||||
| Escrows and Reserves(2): | U/W NCF DSCR(1): | 2.80x | |||||
| Type: | Initial | Monthly | Cap (If Any) | U/W NOI Debt Yield(1): | 11.3% | ||
| Taxes | $0 | Springing | NAP | U/W NCF Debt Yield(1): | 10.7% | ||
| Insurance | $0 | Springing | NAP | As-Complete Appraised Value(7): | $241,000,000 | ||
| Replacement Reserves | $0 | Springing | $159,211 | As-Complete Appraisal Valuation Date: | July 1, 2018 | ||
| TI/LC Reserve | $0 | Springing | $636,845 | Cut-off Date LTV Ratio(1)(7): | 58.1% | ||
| Life Time Fitness Reserve(3) | $22,000,000 | $0 | NAP | LTV Ratio at Maturity or ARD(1)(7): | 58.1% | ||
| (1) | See “The Mortgage Loan” section. All statistical financial information related to balances per square foot, loan-to-value ratios, debt service coverage ratios and debt yields are based on the Baybrook Lifestyle and Power Center Whole Loan (as defined below). |
| (2) | See “Escrows” section. |
| (3) | In the event that the commencement date of the Life Time Fitness lease or a replacement lease does not occur by November 17, 2019, the lender may elect to apply the Life Time Fitness Reserve to prepay the Baybrook Lifestyle and Power Center Whole Loan and pay the related prepayment fee as described below under “Escrows” and “Partial Release.” |
| (4) | Current Occupancy includes the 120,000 square feet Life Time Fitness building, which is currently under construction. The Life Time Fitness tenant is expected to take occupancy and commence paying rent in June 2018, and to open for business in the third quarter of 2018. |
| (5) | The increase in Most Recent NOI is due to the majority of tenants taking occupancy in the second half of 2016. A total of 22 tenants accounting for 368,706 square feet (57.9% of NRA) and $8,213,758 base rent (52.8% of UW Base Rent), including the Life Time Fitness lease had lease commencement dates after June 1, 2016. |
| (6) | UW NOI includes rent steps through November 30, 2018 totaling $281,476 and $1,985,000 of base rent attributable to Life Time Fitness. The Life Time Fitness building is currently under construction and the tenant is expected to take occupancy and commence paying rent in June 2018. Life Time Fitness is expected to open for business in the third quarter of 2018. Excluding the Life Time Fitness lease, UW base rent would be $13,578,600, UW NCF DSCR would be 2.46x and UW NOI Debt Yield would be 9.9% based on the $140,000,000 Baybrook Lifestyle and Power Center Whole Loan. The increase in UW NOI over the Most Recent NOI is attributable to 12 leases accounting for approximately $4.1 million in additional base rent, including Life Time Fitness. |
| (7) | The Appraised Value represents the “As-Completed” Value which assumes the under construction improvements of the Life Time Fitness expansion are completed with Life Time Fitness taking occupancy. The appraiser’s “as-is” concluded value, excluding the Life Time Fitness parcel and lease, of $203,860,000 would result in a Cut-off Date LTV Ratio and LTV Ratio at Maturity Date or ARD of approximately 58.9%, after accounting for the estimated pay-down based on certain assumptions of the Baybrook Lifestyle and Power Center Whole Loan, and payment of the prepayment consideration provided for in the loan documents, resulting from the $22,000,000 Life Time Fitness Reserve. The actual amount of the pay-down and the prepayment consideration may be different from the assumed amounts. |
The Mortgage Loan. The mortgage loan (the “Baybrook Lifestyle and Power Center Mortgage Loan”) is part of a whole loan (the “Baybrook Lifestyle and Power Center Whole Loan”) evidenced by fourpari passu promissory notes, secured by the fee interest in a 636,845 square foot lifestyle center in Friendswood, Texas (the “Baybrook Lifestyle and Power Center Property”). The Baybrook Lifestyle and Power Center Whole Loan was originated on November 17, 2017 by Morgan Stanley Bank N.A. The Baybrook Lifestyle and Power Center Whole Loan had an original principal balance of $140,000,000, has an outstanding principal balance as of the Cut-
THE INFORMATION IN THIS STRUCTURAL AND COLLATERAL TERM SHEET IS NOT COMPLETE AND MAY BE AMENDED PRIOR TO THE TIME OF SALE. THIS TERM SHEET IS NOT AN OFFER TO SELL THESE SECURITIES AND IT IS NOT A SOLICITATION OF AN OFFER TO BUY THESE SECURITIES IN ANY JURISDICTION WHERE THE OFFER OR SALE IS NOT PERMITTED.
92
BAYBROOK LIFESTYLE AND POWER CENTER |
off Date of $140,000,000 and accrues interest at an interest rate of 3.770%per annum. The Baybrook Lifestyle and Power Center Whole Loan had an initial term of 120 months, has a remaining term of 118 months as of the Cut-off Date and requires payments of interest only through the term of the Baybrook Lifestyle and Power Center Whole Loan. The Baybrook Lifestyle and Power Center Whole Loan matures on December 1, 2027.
The Baybrook Lifestyle and Power Center Mortgage Loan, evidenced by Note A-2 and Note A-4, will be contributed to the BANK 2018-BNK10 securitization trust, had an original principal balance of $60,000,000, has an outstanding principal balance as of the Cut-off Date of $60,000,000 and represents apari passu non-controlling interest in the Baybrook Lifestyle and Power Center Whole Loan. The controlling notes and noteholders are shown in the note summary table below. See “Description of the Mortgage Pool—The Whole Loans—The Non-Serviced Pari Passu Whole Loans” in the Preliminary Prospectus.
Note Summary
| Notes | Original Balance | Note Holder | Controlling Interest |
| A-1 | $50,000,000 | MSC 2017-HR2 | Yes |
| A-2 | $40,000,000 | BANK 2018-BNK10 | No |
| A-3 | $30,000,000 | MSC 2017-HR2 | No |
| A-4 | $20,000,000 | BANK 2018-BNK10 | No |
| Total | $140,000,000 |
Following the lockout period, the Baybrook Lifestyle and Power Center Borrower has the right to defease the Baybrook Lifestyle and Power Center Whole Loan in whole, but not in part. In addition, the Baybrook Lifestyle and Power Center Whole Loan is prepayable without penalty on or after September 1, 2027. Provided no event of default occurs, the Baybrook Lifestyle and Power Center Borrower may obtain a release of vacant, non-income producing and unimproved parcels and substitute them with a parcel of reasonably equivalent value. See “Real Estate Substitution” below.
Sources and Uses
| Sources | Uses | |||||||
| Original whole loan amount | $140,000,000 | 100.0% | Loan Payoff | $113,458,381 | 81.0% | |||
| Reserves | $22,000,000 | 15.7 | ||||||
| Return of equity | 3,847,871 | 2.7 | ||||||
| Closing Costs | 693,748 | 0.5 | ||||||
| Total Sources | $140,000,000 | 100.0% | Total Uses | $140,000,000 | 100.0% |
The Property. The Baybrook Lifestyle and Power Center Property is a 636,845 square feet lifestyle and power center comprised of 15 buildings located adjacent to the Baybrook Mall in Friendswood, Texas. Built in 2015, the Baybrook Lifestyle and Power Center Property sits on 80.9 acres and is comprised of 516,845 square feet of retail space as well as a 120,000 square foot expansion, consisting of the Life Time Fitness building that is currently under construction and contains a total of 2,948 parking spaces (4.63 spaces per 1,000 square feet of NRA). As of November 13, 2017, the Baybrook Lifestyle and Power Center Property was 94.1% leased by a mix of 50 national and local retail and restaurant tenants. A total of seven major tenant leases have been signed during 2016 and 2017, including Dick’s Sporting Goods, Recreational Equipment, Inc. (“REI”), Total Wine & More, The Container Store, Arhaus Furniture, Anthropologie and Perry’s Steakhouse & Grille. Other major tenants include Star Cinema Grill, Dave & Buster’s, Zara and Yard House Restaurant. Apart from Life Time Fitness and Dick’s Sporting Goods, no other tenant accounts for more than 6.6% of NRA or 6.2% of underwritten rent. Inline tenants include Z Gallerie, Charming Charlie, J. Jill, Soma Intimates, Kendra Scott, Sunglass Hut and a variety of dining tenants. Comparable inline sales, represented by 14 tenants with at least one full year of sales, were $505 per square foot as of the September 2017 TTM period, while six restaurant tenants with at least 12 months of operations reported sales of $503 per square foot.
The Baybrook Lifestyle and Power Center Property is located directly adjacent to the Baybrook Mall, which is anchored by Dillard’s, JCPenney and Macy’s. The Baybrook Mall, owned by borrower affiliates, is the largest shopping center in southeast Houston and has averaged approximately 99% occupancy over the last five years and reported in-line sales of $770 per square foot as of 2016. The lifestyle component of the Baybrook Lifestyle and Power Center Property has been integrated into the Baybrook Mall via direct access provided by entrance located in between the Dillard’s and Forever 21 boxes, and includes eight buildings surrounding an open courtyard referred to as The Lawn, a spacious grassy courtyard providing a gathering area for the community. The majority of the tenants surrounding the courtyard largely comprise entertainment and dining tenants, such as Star Cinema Grill, Dave & Busters, Perry’s Steakhouse & Grille, Yard House Restaurant, Kona Grill and Maggiano’s Little Italy. The power center portion of the Baybrook Lifestyle and Power Center Property is located to the north of the lifestyle component and is comprised of two big box buildings leased to Dick’s Sporting Goods in one building and The Container Store, REI and Total Wine & More in the other building. The building occupied by Dick’s Sporting Goods is a 105,000 square foot space demised into three separate suites and occupied as a Dick’s Sporting Goods, Field & Stream and Golf Galaxy. The power center component also features two other inline buildings and two freestanding restaurants.
Life Time Fitness is expected to occupy a 120,000 square foot single building that is currently under construction on a parcel adjacent to the remainder of the Baybrook Lifestyle and Power Center Property. Construction of the Life Time Fitness building is expected to be completed in June 2018, with Life Time Fitness rent commencing on June 1, 2018. Life Time Fitness is expected to open for business in the third quarter of 2018. Gap rent has not been reserved. Life Time Fitness is entitled to a $27,500,000 tenant allowance in connection with construction of its building, to be disbursed monthly, which has not been reserved for. In relation to the Life Time Fitness parcel, $22.0 million of the $140.0 million Baybrook Lifestyle and Power Center Whole Loan is held in escrow and required to be released to the Baybrook Lifestyle and Power Center Borrower upon Life Time Fitness taking occupancy of its space. If Life Time Fitness or a tenant under an LTF Replacement Lease (as defined below) does not take occupancy by November 17, 2019, the lender will have the right, in its sole discretion, to apply the escrow to prepay the Baybrook Lifestyle and Power Center Whole
THE INFORMATION IN THIS STRUCTURAL AND COLLATERAL TERM SHEET IS NOT COMPLETE AND MAY BE AMENDED PRIOR TO THE TIME OF SALE. THIS TERM SHEET IS NOT AN OFFER TO SELL THESE SECURITIES AND IT IS NOT A SOLICITATION OF AN OFFER TO BUY THESE SECURITIES IN ANY JURISDICTION WHERE THE OFFER OR SALE IS NOT PERMITTED.
93
BAYBROOK LIFESTYLE AND POWER CENTER |
Loan, together with prepayment consideration, as described above under “The Mortgage Loan,” and the Life Time Fitness parcel is permitted to be released as described below under “Partial Release.”
The following table presents certain information relating to the tenancy at the Baybrook Lifestyle and Power Center Property:
Major Tenants
| Tenant Name | Credit Rating (Fitch/Moody’s/ S&P)(1) | Tenant NRSF | % of NRSF | Annual U/W Base Rent PSF(2) | Annual U/W Base Rent(2) | % of Total Annual U/W Base Rent | 9/30/2017 TTM Sales PSF | 9/30/2017 TTM Occupancy Cost(3) | Lease Expiration Date |
| Anchor Tenants | |||||||||
| Life Time Fitness(4) | NR/NR/NR | 120,000 | 18.8% | $16.54 | $1,985,000 | 12.8% | NAV | NAV | 9/1/2038 |
| Dick’s Sporting Goods(5) | NR/NR/NR | 105,000 | 16.5% | $16.69 | $1,752,450 | 11.3% | NAV | NAV | 1/31/2027 |
| Total Anchor Tenants | 225,000 | 35.3% | $16.61 | $3,737,450 | 24.0% | ||||
| Major Tenants | |||||||||
| Star Cinema Grill(6) | NR/NR/NR | 42,147 | 6.6% | $19.00 | $800,793 | 5.1% | $1,085,689 | 10.9% | 12/31/2030 |
| Dave & Buster’s | NR/NR/NR | 41,996 | 6.6% | $22.86 | $960,000 | 6.2% | $223 | 13.1% | 1/31/2031 |
| Zara(7) | NR/NR/NR | 36,982 | 5.8% | $5.68 | $210,058 | 1.3% | $117 | 4.9% | 12/31/2025 |
| REI(8) | NR/NR/NR | 25,000 | 3.9% | $16.00 | $400,000 | 2.6% | NAV | NAV | 2/28/2027 |
| Total Wine & More(8) | NR/NR/NR | 24,780 | 3.9% | $17.69 | $438,358 | 2.8% | NAV | NAV | 1/31/2028 |
| The Container Store(9) | NR/NR/B | 23,904 | 3.8% | $25.10 | $599,990 | 3.9% | NAV | NAV | 2/29/2032 |
| Arhaus Furniture(10) | NR/NR/NR | 13,905 | 2.2% | $35.00 | $486,675 | 3.1% | $192 | 23.4% | 4/30/2026 |
| Anthropologie(11) | NR/NR/NR | 10,111 | 1.6% | $28.50 | $288,164 | 1.9% | NAV | NAV | 1/31/2027 |
| Yard House Restaurant | NR/NR/NR | 10,082 | 1.6% | $36.00 | $362,952 | 2.3% | $580 | 9.5% | 12/31/2025 |
| Perry’s Steakhouse & Grille | NR/NR/NR | 10,021 | 1.6% | $47.78 | $478,803 | 3.1% | $810 | 7.3% | 1/31/2031 |
| Major Tenants Total(12) | 238,928 | 37.5% | $21.03 | $5,025,793 | 32.3% | $265 | 10.7% | ||
| Other Tenants | 135,641 | 21.3% | $50.13 | $6,800,356 | 43.7% | $335 | 19.3% | ||
| Occupied Total(12) | 599,569 | 94.1% | $25.96 | $15,563,600 | 100.0% | ||||
| Vacant Retail Space | 37,276 | 5.9% | |||||||
| Collateral Total | 636,845 | 100.0% | |||||||
| (1) | Certain ratings are those of the parent company whether or not the parent company guarantees the lease. |
| (2) | Annual U/W Base Rent includes contractual rent steps equal to $281,476 through November 30, 2018. |
| (3) | Occupancy Cost is based on the underwritten rent as of the November 13, 2017 rent roll and underwritten reimbursements divided by most recently reported sales. |
| (4) | Life Time Fitness is expected to take occupancy upon completion of the buildout of the 120,000 square feet Life Time Fitness building (which is currently under construction, with an expected completion of June 2018) and is expected to commence paying rent in June 2018 and to open for business in fall 2018. |
| (5) | Dick’s Sporting Goods, which is comprised of Dick’s Sporting Goods, Field & Stream and Golf Galaxy, reports sales on an annual basis, accordingly, updated sales were not available for the September 30, 2017 TTM period. Dick’s Sporting Goods reported gross sales of $8,746,835 as of their first reporting period ending January 2017, which reflects operations at the Baybrook Lifestyle and Power Center Property between the lease start date of October 19, 2016 and January 31, 2017. |
| (6) | Sales PSF for Star Cinema Grill is based on 10 screens. Sales PSF is $258. |
| (7) | If Zara’s net sales fail to exceed $5,000,000 beginning in the 49th calendar month and ending on the 60th calendar month, it can terminate with 365 days written notice given at any time within 120 days following December 31, 2020. |
| (8) | Tenant is not required to report sales. |
| (9) | The Container Store reports sales on an annual basis, accordingly, updated sales were not available for the September 30, 2017 TTM Period. The Container Store reported gross sales of $2,135,282 as of their first reporting period ending February 2017, which reflects operations at the Baybrook Lifestyle and Power Center Property between the lease start date of November 12, 2016 and February 28, 2017. |
| (10) | If Arhaus Furniture’s net sales fail to exceed $4,000,000 beginning in the 49th calendar month and ending on the 60th calendar month, it can terminate with 540 days’ written notice given at any time within 60 days following April 30, 2021. |
| (11) | Anthropologie reports sales on an annual basis, accordingly, updated sales were not available for the September 30, 2017 TTM Period. Anthropologie reported gross sales of $783,717 as of their first reporting period ending January 2017, which reflects operations at the Baybrook Lifestyle and Power Center Property between the lease start date of September 23, 2016 and January 30, 2017. If Anthropologie’s gross sales fail to exceed $3,000,000 during the 12-month period from April 1, 2018 to March 31, 2019, Anthropologie can terminate its lease with written notice to the landlord on or before September 30, 2019. |
| (12) | For purposes of calculating Major Tenants SF subtotals for 9/30/2017 TTM Sales PSF and 9/30/2017 TTM Occupancy Cost, amounts exclude tenants that do not report sales. Total is based on Tenant SF for 9/30/2017 TTM Sales PSF and by 9/30/2017 TTM Sales PSF for Occ. Cost %. |
THE INFORMATION IN THIS STRUCTURAL AND COLLATERAL TERM SHEET IS NOT COMPLETE AND MAY BE AMENDED PRIOR TO THE TIME OF SALE. THIS TERM SHEET IS NOT AN OFFER TO SELL THESE SECURITIES AND IT IS NOT A SOLICITATION OF AN OFFER TO BUY THESE SECURITIES IN ANY JURISDICTION WHERE THE OFFER OR SALE IS NOT PERMITTED.
94
BAYBROOK LIFESTYLE AND POWER CENTER |
The following table presents certain information relating to the lease rollover schedule at the Baybrook Lifestyle and Power Center Property:
Lease Expiration Schedule(1)(2)
| Year Ending December 31, | No. of Leases Expiring | Expiring NRSF | % of Total NRSF | Cumulative Expiring NRSF | Cumulative % of Total NRSF | Annual U/W Base Rent(3) | % of Total Annual U/W Base Rent | Annual U/W Base Rent PSF(4) |
| MTM | 0 | 0 | 0.0% | 0 | 0.0% | $0.00 | 0.0% | $0.00 |
| 2018 | 0 | 0 | 0.0% | 0 | 0.0% | $0.00 | 0.0% | $0.00 |
| 2019 | 0 | 0 | 0.0% | 0 | 0.0% | $0.00 | 0.0% | $0.00 |
| 2020 | 1 | 1,200 | 0.2% | 1,200 | 0.2% | $91,788 | 0.6% | $76.49 |
| 2021 | 0 | 0 | 0.0% | 1,200 | 0.2% | $0.00 | 0.0% | $0.00 |
| 2022 | 2 | 2,865 | 0.4% | 4,065 | 0.6% | $161,159 | 1.0% | $56.25 |
| 2023 | 0 | 0 | 0.0% | 4,065 | 0.6% | $0.00 | 0.0% | $0.00 |
| 2024 | 1 | 2,161 | 0.3% | 6,226 | 1.0% | $95,711 | 0.6% | $44.29 |
| 2025 | 13 | 82,869 | 13.0% | 89,095 | 14.0% | $2,432,640 | 15.6% | $29.36 |
| 2026 | 14 | 64,133 | 10.1% | 153,228 | 24.1% | $3,053,122 | 19.6% | $47.61 |
| 2027 | 11 | 170,322 | 26.7% | 323,550 | 50.8% | $3,915,714 | 25.2% | $22.99 |
| 2028 | 2 | 29,280 | 4.6% | 352,830 | 55.4% | $613,858 | 3.9% | $20.97 |
| Thereafter | 6 | 246,739 | 38.7% | 599,569 | 94.1% | $5,199,608 | 33.4% | $21.07 |
| Vacant | 0 | 37,276 | 5.9% | 636,845 | 100.0% | $0 | 0.0% | $0.00 |
| Total/Wtd. Avg. | 50 | 636,845 | 100.0% | $15,563,600 | 100.0% | $25.96 |
| (1) | Information obtained from the underwritten rent roll. |
| (2) | Certain tenants may have lease termination or contraction options that are exercisable prior to the originally stated expiration date of the subject lease and that are not considered in the Lease Expiration Schedule. |
| (3) | Annual U/W Base Rent includes contractual rent steps equal to $281,476 through November 30, 2018. |
| (4) | Weighted Average Annual U/W Base Rent PSF excludes vacant space. |
The following table presents historical occupancy percentages at the Baybrook Lifestyle and Power Center Property:
Historical Occupancy(1)
12/31/2014 | 12/31/2015 | 12/31/2016(2) | 11/13/2017(2) |
| NAV | NAV | 91.7% | 94.1% |
| (1) | The Baybrook Lifestyle and Power Center Property was built in 2015; therefore, historical occupancy is limited. |
| (2) | Information obtained from the underwritten rent roll and includes the 120,000 SF Life Time Fitness building, which is currently under construction. The Life Time Fitness tenant is expected to take occupancy and commence paying rent in June 2018, and to open for business in the third quarter of 2018. |
THE INFORMATION IN THIS STRUCTURAL AND COLLATERAL TERM SHEET IS NOT COMPLETE AND MAY BE AMENDED PRIOR TO THE TIME OF SALE. THIS TERM SHEET IS NOT AN OFFER TO SELL THESE SECURITIES AND IT IS NOT A SOLICITATION OF AN OFFER TO BUY THESE SECURITIES IN ANY JURISDICTION WHERE THE OFFER OR SALE IS NOT PERMITTED.
95
BAYBROOK LIFESTYLE AND POWER CENTER |
Operating History and Underwritten Net Cash Flow. The following table presents certain information relating to the historical operating performance and underwritten net cash flow at the Baybrook Lifestyle and Power Center Property:
Cash Flow Analysis(1)
| 2016(2) | TTM 9/30/2017(2) | U/W | % of U/W Effective Gross Income | U/W $ per SF | |
| Base Rent | $7,110,062 | $11,726,097 | $15,563,600(3) | 75.1% | $24.44 |
| Other Rental Income(4) | 1,549,101 | 1,292,264 | 1,284,520 | 6.2 | 2.02 |
| Total Recoveries | 1,934,021 | 2,902,745 | 3,730,306 | 18.0 | 5.86 |
| Other Income(5) | 152,693 | 116,582 | 150,000 | 0.7 | 0.24 |
| Less Vacancy & Credit Loss | $0 | 0 | 0 | 0.0 | 0.00 |
| Effective Gross Income | $10,745,878 | $16,037,688 | $20,728,426 | 100.0% | $32.55 |
| Total Operating Expenses | 3,084,463 | 4,006,012 | 4,953,868 | 23.9 | 7.78 |
| Net Operating Income | $7,661,415 | $12,031,676 | $15,774,558 | 76.1% | $24.77 |
| Capital Expenditures | 0 | 0 | 95,527 | 0.5 | 0.15 |
| TI/LC | 0 | 0 | 717,130 | 3.5 | 1.13 |
| Net Cash Flow | $7,661,415 | $12,031,676 | $14,961,901 | 72.2% | $23.49 |
| NOI DSCR(6) | 1.43x | 2.25x | 2.95x | ||
| NCF DSCR(6) | 1.43x | 2.25x | 2.80x | ||
| NOI DY(6) | 5.5% | 8.6% | 11.3% | ||
| NCF DY(6) | 5.5% | 8.6% | 10.7% |
| (1) | The Baybrook Lifestyle and Power Center Property was built in 2015; therefore, historical operating statistics are limited. |
| (2) | The increase in Net Operating Income and Net Cash Flow in the September 30, 2017 TTM from 2016 is due to the majority of tenants taking occupancy in the second half of 2016. A total of 22 tenants accounting for 368,706 square feet (57.9% of NRA) and $8,213,758 base rent (52.8% of UW Base Rent) had lease commencement dates after June 1, 2016. |
| (3) | UW Base Rent is based on the rent roll dated November 13, 2017 and includes rent steps through November 30, 2018 totaling $281,476. The increase in Base Rent over the September 30, 2017 TTM is attributable to 12 leases accounting for approximately $4.1 million in additional base rent, including Life Time Fitness, which accounts for $1,985,000 of base rent, which rent is expected to commence June 1, 2018. Gap rent for Life Time Fitness has not been reserved. Excluding the Life Time Fitness lease, UW base rent would be $13,578,600, UW NCF DSCR would be 2.46x and UW NOI Debt Yield would be 9.9% based on the $140,000,000 Baybrook Lifestyle and Power Center Whole Loan. |
| (4) | Other Rental Income is comprised of overage rent, specialty leasing, and trash pad rental. |
| (5) | Other Income includes parking revenue and other miscellaneous non-rental income. |
| (6) | Debt service coverage ratios and debt yields are based on the Baybrook Lifestyle and Power Center Whole Loan. |
Appraisal. As of the appraisal valuation date of October 31, 2017, the Baybrook Lifestyle and Power Center Property had an “as-is” appraised value of $212,590,000. The appraisal also concluded to an “As-Completed” Value of $241,000,000 as of July, 1 2018, which assumes the under construction improvements of the Life Time Fitness expansion are completed with Life Time Fitness taking occupancy. The appraiser’s “as-is” appraised value, excluding the Life Time Fitness parcel and lease is $203,860,000, which would result in a Cut-off Date LTV Ratio and Maturity Date LTV Ratio of approximately 58.9%, after accounting for the estimated pay-down based on certain assumptions of the Baybrook Lifestyle and Power Center Whole Loan, and payment of the prepayment consideration provided for in the loan documents, resulting from the $22,000,000 Life Time Fitness Reserve. The actual amount of the pay-down and the prepayment consideration may be different from the assumed amounts.
Environmental Matters.According to the Phase I environmental report dated November 3, 2017, there was no evidence of any recognized environmental conditions at the Baybrook Lifestyle and Power Center Property.
Market Overview and Competition.The Baybrook Lifestyle and Power Center Property is located on the southwest corner of the Gulf Freeway and Gulfbrook Drive, directly off of Interstate-45, approximately 20 miles southeast of downtown Houston, Texas. The Baybrook Lifestyle and Power Center Property represents the open air and power center expansion of the Baybrook Mall, bringing to the submarket a diverse roster of retail, dining and entertainment tenants. The immediate surroundings of the Baybrook Lifestyle and Power Center Property include retail and residential uses, with a mix of office space.
The Baybrook Lifestyle and Power Center Property is located in the Houston, Texas metropolitan area. According to the appraisal, the third quarter of 2017 overall retail vacancy rate for the Houston market was approximately 7.9%, while the market rental rate was approximately $15.83 per square foot. According to the appraisal, there were 662,272 square feet of retail under construction during the third quarter of 2017 in the Houston metropolitan area. The Baybrook Lifestyle and Power Center Property is located in the Southeast Outlier retail submarket, which contains approximately 3.9% of the Houston metropolitan area square feet inventory. The Southeast Outlier retail submarket had a vacancy rate of 3.4% and a market rental rate of $17.44 per square foot. As of the third quarter 2017, the Southeast Outlier retail submarket had approximately 95,000 square feet under construction, representing approximately 2.4% of the square feet under-construction for the Houston metropolitan area.
The estimated 2017 population within a one-, three- and five-mile radius of the Baybrook Lifestyle and Power Center Property is 4,335, 80,693 and 205,162, respectively, according to the appraisal. The estimated 2017 average household income within a one-, three- and five-mile radius of the Baybrook Lifestyle and Power Center Property is $56,262, $64,864 and $81,926, respectively.
THE INFORMATION IN THIS STRUCTURAL AND COLLATERAL TERM SHEET IS NOT COMPLETE AND MAY BE AMENDED PRIOR TO THE TIME OF SALE. THIS TERM SHEET IS NOT AN OFFER TO SELL THESE SECURITIES AND IT IS NOT A SOLICITATION OF AN OFFER TO BUY THESE SECURITIES IN ANY JURISDICTION WHERE THE OFFER OR SALE IS NOT PERMITTED.
96
BAYBROOK LIFESTYLE AND POWER CENTER |
The following table presents certain information relating to comparable rentals for the Baybrook Lifestyle and Power Center Property:
Comparable Rentals(1)
| Property Name | Year Built | Total GLA (SF) | Occupancy | Rent/SF | Escalations | Lease Type | Lease Area (SF) | |
| Baybrook Lifestyle and Power Center(1) | 2015 | 636,845(2) | 94.1%(2) | $25.96(2) | Fixed Steps | Varies | 516,845(2) | |
| LaCenterra at Cinco | 2007 | 413,593 | 88% | $33.00 | Fixed Steps | Triple Net | 2,014 | |
| Sugar Land Town Square | 2008 | 807,000 | 80% | $35.00 | CPI | Triple Net | 2,500 | |
| Market Street – The Woodlands | 2004 | 491,145 | 96% | $40.00 | CPI | Triple Net | 18,876 | |
| CityCentre – Town & Country | 2009 | 617,135 | 91% | $45.00 | CPI | Triple Net | 1,179 | |
| El Dorado Plaza | 2015 | 7,150 | 54% | $26.00 | None | Triple Net | 3,300 | |
| Webster Plaza | NAV | 17,950 | 100% | $30.00 | Fixed Steps | Triple Net | 1,125 | |
| (1) | Information obtained from the appraisal. |
| (2) | Information is based on the underwritten rent roll as of November 13, 2017. |
The Borrowers.The borrowers are Baybrook LPC, LLC, a Delaware limited liability company; Baybrook LTF Owner, LLC, a Delaware limited liability company; and Gulfbrook Services, Inc., a Delaware corporation (individually and collectively, the “Baybrook Lifestyle and Power Center Borrower”), each a single-purpose entity, with at least two independent directors. Baybrook LTF Owner, LLC owns the expansion parcel for Life Time Fitness; Baybrook LPC, LLC owns the remainder of the Baybrook Lifestyle and Power Center Property, and Gulfbrook Services, Inc. operates as a taxable REIT subsidiary. Legal counsel to the Baybrook Lifestyle and Power Center Borrower delivered a non-consolidation opinion in connection with the origination of the Baybrook Lifestyle and Power Center Whole Loan. GGP Real Estate Holding I, Inc. is the nonrecourse carveout guarantor.
The Borrowers Sponsor.The borrower sponsor is GGP Real Estate Holding I, Inc., wholly owned by General Growth Properties, Inc. (“GGP”). GGP (NYSE: GGP) is a Chicago, Illinois-based real estate company that focuses on owning, managing, leasing and the development of retail properties across the United States. GGP maintains a current portfolio of approximately 121.0 million square feet across 126 retail properties located in 40 states. The Baybrook Lifestyle and Power Center Borrower is owned by Gulfbrook Investments, Inc., a real estate investment trust, which is 53% indirectly owned by entities controlled by GGP and 47% indirectly owned by Gulfbrook Holding LLC, which is managed by CDC Houston Inc., an entity affiliated with Coventry Development Corporation. Coventry Development Corporation, established in 1962, is a privately held real estate development and asset management company based in New York. GGP previously filed for bankruptcy in 2009 and emerged from bankruptcy in 2010. See “Description of the Mortgage Pool--Loan Purpose; Default History, Bankruptcy Issues and Other Proceedings” in the Preliminary Prospectus.
Escrows.The Baybrook Lifestyle and Power Center Whole Loan documents require an upfront reserve of $22,000,000 in respect of Life Time Fitness. Provided no event of default is continuing under the Baybrook Lifestyle and Power Center Whole Loan, such reserve is required to be released to the Baybrook Lifestyle and Power Center Borrower upon (i) the commencement date under the Life Time Fitness lease or (ii) the commencement date of an LTF Replacement Lease (as defined below), provided that Life Time Fitness or the tenant under the LTF Replacement Lease is occupying its leased premises, open for business and paying unabated rent, and has delivered a reasonably acceptable tenant estoppel certificate. Notwithstanding the foregoing, to the extent neither of the conditions contained in clause (i) or (ii) of the preceding sentence is satisfied as of November 17, 2019, the lender may elect, in its sole discretion, to apply the funds in such reserve to prepay the Baybrook Lifestyle and Power Center Whole Loan, together with a prepayment fee equal to the greater of 1.0% of the amount prepaid and a yield maintenance premium (the “Baybrook Prepayment Fee”). If the lender elects such partial prepayment, the reserve fund is required to be allocated to principal prepayment and the Baybrook Prepayment Fee such that the prepayment plus the Baybrook Prepayment Fee equals the entire balance of the reserve fund, but does not exceed it. Upon such a prepayment, the Baybrook Lifestyle and Power Center Borrower is entitled to obtain the release of the Life Time Fitness parcel as described below under “Partial Release.”
An “LTF Replacement Lease” means any lease or leases entered into in accordance with the loan documents (i) (A) that, in the aggregate, demise(s) substantially all of the Life Time Fitness premises, or (B) the aggregate gross rent of which lease(s) is equal to or greater than the aggregate gross rent under the Life Time Fitness lease; and (ii) for which a rating agency confirmation has been delivered to the lender.
During a Trigger Period (as defined below), unless there are sufficient funds in the lockbox account to make the deposits, the Baybrook Lifestyle and Power Center Borrower is required to deposit monthly (i) 1/12th of the estimated annual real estate taxes and 1/12th of the estimated annual insurance premiums (unless the Baybrook Lifestyle and Power Center Property is covered by a blanket insurance policy and the premiums for the blanket policy are prepaid for at least one year in advance), (ii) $13,268 to a replacement reserve subject to a cap of $159,211, and (iii) $53,070 to a tenant improvement and leasing commissions reserve subject to a cap of $636,845.
A “Trigger Period” will commence upon (i) an event of default or (ii) the net operating income debt yield being less than 7.75%. A Trigger Period will end upon (a) with respect to clause (i), the cure or waiver of the event of default and (b) with respect to clause (ii), the net operating income debt yield being equal to or greater than 7.75% for two consecutive calendar quarters.
THE INFORMATION IN THIS STRUCTURAL AND COLLATERAL TERM SHEET IS NOT COMPLETE AND MAY BE AMENDED PRIOR TO THE TIME OF SALE. THIS TERM SHEET IS NOT AN OFFER TO SELL THESE SECURITIES AND IT IS NOT A SOLICITATION OF AN OFFER TO BUY THESE SECURITIES IN ANY JURISDICTION WHERE THE OFFER OR SALE IS NOT PERMITTED.
97
BAYBROOK LIFESTYLE AND POWER CENTER |
Lockbox and Cash Management.A hard lockbox is in place with respect to the Baybrook Lifestyle and Power Center Whole Loan. Funds deposited to the lockbox will be swept daily to the Baybrook Lifestyle and Power Center Borrower’s operating account unless a Trigger Period exists. During a Trigger Period, funds in the lockbox are required to be transferred daily to a cash management account under the sole control of the lender for the payment of, among other things, debt service, monthly escrows and to pay any remainder (i) if no event of default or Cash Sweep Period (as defined below) is continuing, to the operating account of the Baybrook Lifestyle and Power Center Borrower, or (ii) if no event of default is continuing for which the lender has accelerated the Baybrook Lifestyle and Power Center Whole Loan, to pay the greater of (x) operating expenses and capital expenditures set forth in the approved annual budget or (y) the actual amount of such expenses for the related calendar month (but not in excess of 110% of the budgeted amount unless reasonably approved by the lender), and following such payment, to deposit any remainder into an excess cash flow account to be held by the lender as additional security for the Baybrook Lifestyle and Power Center Whole Loan during the continuance of the Cash Sweep Period.
A “Cash Sweep Period” means a period (i) commencing upon an event of default under the Baybrook Lifestyle and Power Center Whole Loan and ending if such event of default is thereafter cured or waived or (ii) commencing upon a determination that the net operating income debt yield is less than 7.00% and ending upon the net operating income debt yield being equal to or in excess of 7.00% for two consecutive calendar quarters.
Property Management.The Baybrook Lifestyle and Power Center Property is managed by General Growth Services, Inc., an affiliate of the Baybrook Lifestyle and Power Center Borrower.
Assumption.The Baybrook Lifestyle and Power Center Borrower has the right to transfer the Baybrook Lifestyle and Power Center Property;provided that certain conditions are satisfied, including (i) no event of default has occurred and is continuing; (ii) the Baybrook Lifestyle and Power Center Property will be managed by a qualifying manager (as defined in the loan documents); (iii) a replacement guarantor has assumed the obligations of the Baybrook Lifestyle and Power Center Whole Loan non-recourse carveout guarantor; (iv) the lender has received a non-consolidation opinion; and (v) the transferee is a qualified transferee under the terms of the loan documents.
Partial Release.In the event that the lender has the right to, and elects to, apply the Life Time Fitness reserve to prepay the Baybrook Lifestyle and Power Center Whole Loan, the Baybrook Lifestyle and Power Center Borrower is permitted to obtain the release of the parcel of land on which the Life Time Fitness center building is located, as identified in the loan documents (the “LTF Parcel”); provided that, (i) no event of default exists, (ii) any required approvals of third parties holding interests in the Baybrook Lifestyle and Power Center Property are obtained, (iii) such release is in compliance with leases and other agreements affecting the Baybrook Lifestyle and Power Center Property, (iv) restrictive covenants to be recorded against the LTF Parcel to protect tenants’ exclusive use rights are delivered to the lender, (v) the lender receives an officer’s certificate from the Baybrook Lifestyle and Power Center Borrower stating that the release will not result in a default or breach under any material lease, reciprocal easement agreement or other material agreement, (vi) after giving effect to such release, each of the LTF Parcel and the remaining property conforms to and complies in all material respects with applicable legal requirements, and the LTF Parcel is not necessary for the remaining property to comply with any zoning, building, land use or parking or other legal requirements, or to the extent that the LTF Parcel is necessary for any such purpose, a reciprocal easement or other agreement has been recorded that would allow the owner of the remaining property to continue to use the LTF Parcel to the extent necessary for such purpose and (vii) the loan-to-value ratio after the release (to be determined by the lender based on a commercially reasonable valuation method) is less than or equal to 125%; provided that a prepayment may be made, together with the Baybrook Prepayment Fee, in order to meet such loan-to-value ratio. Upon such a release the Baybrook Lifestyle and Power Center Borrower which owns the LTF Parcel will also be released from its obligations under the loan documents.
In addition, the Baybrook Lifestyle and Power Center Borrower may obtain the release of (x) one or more parcels (which may include “air rights” parcels) or outlots, provided that such parcels are vacant, non-income producing and unimproved or improved only by landscaping, utility facilities that are not required for the use of the remaining property (or, if required for such use, will continue to serve the remaining property in place or be readily relocatable) or surface parking, and (y) previously acquired Expansion Parcels, in each case in connection with a transfer thereof to a person other than a person owned or controlled by the Baybrook Lifestyle and Power Center Borrower, in connection with the expansion or other development of the Baybrook Lifestyle and Power Center Property, without prepayment or defeasance, provided that the following conditions, among others, are satisfied: (i) no event of default exists, (ii) the Baybrook Lifestyle and Power Center Borrower delivers to the lender (a) evidence that would be satisfactory to a prudent lender acting reasonably that (1) the release parcel is not necessary to the use or operation of, and may be readily separated without a material diminution in the value of, the Baybrook Lifestyle and Power Center Property, (2) the release parcel has been legally subdivided from the remaining property, (3) after giving effect to the release, each of the release parcel and the remaining property conforms in all material respects with applicable legal requirements and constitutes one or more separate tax lots, or all action has been taken to have the release parcel so designated (other than recordation of the deed to the transferee), and (4) after giving effect to such release, each of the release parcel and the remaining property conforms to and complies in all material respects with applicable legal requirements, and the release parcel is not necessary for the remaining property to comply with any zoning, building, land use or parking or other legal requirements, or, to the extent that the release parcel is necessary for any such purpose, a reciprocal easement or other agreement has been recorded that would allow the owner of the remaining property to continue to use the release parcel to the extent necessary for such purpose, (b) if the release would reasonably be expected to materially adversely affect lender’s rights under its title insurance policy as to any portion of the remaining property, a title endorsement confirming no change in the priority of the mortgage on the remaining property or in the amount of the insurance or coverage, (c) any required approvals of third parties holding interests in the Baybrook Lifestyle and Power Center Property, (d) restrictive covenants to be recorded against the release parcel to protect tenants’ exclusive use right, (e) an officer’s certificate stating that the release will not result in a default or breach under any material lease, reciprocal easement agreement or other material agreement, (f) any other information, approvals and documents which would be required by a prudent lender, acting reasonably, (iii) such release is in compliance with leases and other agreements affecting the Baybrook Lifestyle and Power Center Property, (iv) ingress to and egress from all portions of the remaining property is over physically open and fully dedicated public roads or over vehicle and
THE INFORMATION IN THIS STRUCTURAL AND COLLATERAL TERM SHEET IS NOT COMPLETE AND MAY BE AMENDED PRIOR TO THE TIME OF SALE. THIS TERM SHEET IS NOT AN OFFER TO SELL THESE SECURITIES AND IT IS NOT A SOLICITATION OF AN OFFER TO BUY THESE SECURITIES IN ANY JURISDICTION WHERE THE OFFER OR SALE IS NOT PERMITTED.
98
BAYBROOK LIFESTYLE AND POWER CENTER |
pedestrian easements which (1) provide access to a physically open and fully dedicated public road, (2) are recorded in the chain of title to both the property encumbered thereby and the remaining property, and (3) are irrevocable and non-terminable without the consent of the owner of the remaining property, (v) except in the case of release of a previously acquired Expansion Parcel, rating agency confirmation is obtained, (vi) the Baybrook Lifestyle and Power Center Borrower pays the lender’s reasonable out of pocket costs and expenses, (vii) at lender’s request, the Baybrook Lifestyle and Power Center Borrower provides an opinion of counsel stating that the release would not constitute a “significant modification” of the Baybrook Lifestyle and Power Center Whole Loan or otherwise cause a tax to be imposed on a “prohibited transaction” by any REMIC trust, and (viii) the loan-to-value ratio after the release (to be determined by the lender based on a commercially reasonable valuation method) is less than or equal to 125%; provided that a prepayment may be made, together with the Baybrook Prepayment Fee, in order to meet such loan-to-value ratio.
Real Estate Substitution.The Baybrook Lifestyle and Power Center Borrower may obtain the release of one or more portions of the Baybrook Lifestyle and Power Center Property (each an “Exchange Parcel”) in exchange for the acquisition and encumbrance by the loan documents of a substitute parcel (each a “Substitute Parcel”), provided that the following conditions, among others, are satisfied: (i) the Exchange Parcel is vacant, non-income producing and unimproved or improved only by landscaping, utility facilities that are readily relocatable or surface parking, (ii) the conditions set forth in clauses (i) through (v) under “Real Estate Expansion” below are satisfied with respect to the Substitute Parcel (provided that the separate tax parcel condition will also apply to the Exchange Parcel), (iii) the Exchange Parcel is conveyed to a person other than the Baybrook Lifestyle and Power Center Borrower, (iv) the Substitute Parcel is at or adjacent to the shopping center of which the Exchange Parcel is a part and reasonably equivalent in value to the Exchange Parcel, as established by a letter of value from the appraiser which prepared the appraisal delivered in connection with origination or an appraiser of comparable experience, (v) if the Substitute Parcel is ground leased, the ground lease and estoppel satisfies all of the then-current criteria of S&P for financeable ground leases and related estoppels, (vi) rating agency confirmation is obtained, (vii) the loan-to-value ratio after the substitution (to be determined by the lender based on a commercially reasonable valuation method) shall be less than or equal to 125%; provided that a prepayment may be made, together with the Baybrook Prepayment Fee, in order to meet such loan-to-value ratio and (viii) delivery to the lender of restrictive covenants to be recorded against the Exchange Parcel to protect tenants’ exclusive use rights.
Real Estate Expansion.The Baybrook Lifestyle and Power Center Borrower is permitted to acquire one or more parcels of land, together with the improvements thereon, that constitute an integral part of, adjoin to, or are proximately located near, the shopping center of which the Baybrook Lifestyle and Power Center Property is a part (each an “Expansion Parcel”); provided that the following conditions, among others, are satisfied: (i) no event of default exists, (ii) the applicable Baybrook Lifestyle and Power Center Borrower acquires fee simple or leasehold title to the Expansion Parcel and deliver evidence of the same, (iii) the Baybrook Lifestyle and Power Center Borrower delivers (a) an officer’s certificate, stating that, to their knowledge, certain property-related representations set forth in the loan documents are true and correct as to the Expansion Parcel (subject to title exceptions and certain other exceptions that do not have a material adverse effect), (b) a mortgage, assignment of leases and UCC-1 financing statements (or amendments to the existing such documents) (“Substitute Loan Documents”) with respect to the Expansion Parcel, and a title insurance policy or endorsement insuring the lien of the Substitute Loan Documents as a first mortgage lien, free and clear of exceptions other than permitted encumbrances and standard exceptions and exclusions, (c) a survey of the Expansion Parcel reasonably acceptable to the title insurance company that issued the original title insurance, (d) evidence of authority to complete the acquisition and of the due authorization and execution of the Substitute Loan Documents, and an opinion of counsel regarding their enforceability (provided no opinion of counsel is required for Substitute Loan Documents that amend existing loan documents), (e) if the Expansion Parcel is in a flood plain, evidence of flood insurance, (f) unless the Expansion Parcel is covered by the original environmental report, environmental reports (or a supplement to the original environmental report) with respect to the Expansion Parcel, and if the report shows the presence of any hazardous substance or the risk of contamination from any offsite hazardous substance, the cost of remediation of which is reasonably likely to exceed $8,875,000 with respect to such Expansion Parcel (the “Threshold Amount”), either a deposit of 125% of the estimated cost of remediation or an Additional Indemnity (as defined below), (g) if the Expansion Parcel is improved (other than by landscaping, surface parking or utilities), a property condition report with respect to the Expansion Parcel indicating that it is in good condition and free of damage (unless the Baybrook Lifestyle and Power Center Borrower certifies that they intend to demolish the improvements within a year after acquisition), and if the property condition report recommends any repairs, and the cost of such repairs is estimated to exceed the Threshold Amount, either a deposit of 125% of the estimated cost of repairs or an Additional Indemnity, (h) evidence that the Expansion Parcel constitutes one or more separate tax lots or that all action has been taken to have the Expansion Parcel so designated (or incorporated into a tax lot that is part of the existing property), (iv) the Baybrook Lifestyle and Power Center Borrower pays the lender’s reasonable out of pocket costs and expenses as well as all recording and filing fees in connection with the acquisition, and (v) at lender’s request, the Baybrook Lifestyle and Power Center Borrower provides an opinion of counsel stating that the addition would not constitute a “significant modification” of the Baybrook Lifestyle and Power Center Whole Loan or otherwise cause a tax to be imposed on a “prohibited transaction” by any REMIC trust.
An “Additional Indemnity” means an indemnity for the specified costs from an indemnitor that is the non-recourse carveout guarantor, an affiliate thereof, or a qualified transferee (as defined in the loan documents), provided that in each case such indemnitor either (a) has a long term unsecured debt rating of not less than “BBB” by S&P, “BBB” by Fitch, or “Baa3” by Moody’s, or (b) has (i) liquid assets (including availability under lines of credit or revolving credit facilities that may not be revoked by the lenders thereunder in the absence of such indemnitor’s default) in an aggregate amount equal to at least 120% of the aggregate amount guaranteed by such indemnitor in connection with the Baybrook Lifestyle and Power Center Whole Loan (the “Guaranteed Amount”), (ii) has (or has a 100% equityholder that has) an equity market value (determined based on market capitalization) at least equal to five times the Guaranteed Amount and (iii) has an effective net worth at least equal to five times the Guaranteed Amount.
Subordinate and Mezzanine Indebtedness.Not permitted.
Ground Lease. None.
THE INFORMATION IN THIS STRUCTURAL AND COLLATERAL TERM SHEET IS NOT COMPLETE AND MAY BE AMENDED PRIOR TO THE TIME OF SALE. THIS TERM SHEET IS NOT AN OFFER TO SELL THESE SECURITIES AND IT IS NOT A SOLICITATION OF AN OFFER TO BUY THESE SECURITIES IN ANY JURISDICTION WHERE THE OFFER OR SALE IS NOT PERMITTED.
99
BAYBROOK LIFESTYLE AND POWER CENTER |
Terrorism Insurance.The Baybrook Lifestyle and Power Center Borrower is required to obtain all risk and business income insurance against acts of terrorism to the extent such insurance is available in an amount determined by the lender (but in no event more than an amount equal to the sum of 100% of the full replacement cost and 18 months of business income insurance); provided that so long as the Terrorism Risk Insurance Act of 2002 (as extended and modified by the Terrorism Risk Insurance Program Reauthorization Act of 2015) (“TRIPRA”) is in effect (or any extension thereof or other federal government program with substantially similar protection), the lender is required to accept terrorism insurance which covers “covered acts” (as defined by such statute or other program), as full compliance with the foregoing, so long as such statute or other program covers both domestic and foreign acts of terrorism. If TRIPRA or such other program is not in effect, the Baybrook Lifestyle and Power Center Borrower is not required to pay insurance premiums with respect to terrorism insurance in excess of the Terrorism Cap (defined below).
“Terrorism Cap” means two times the amount of the then-current annual insurance premiums payable by the Baybrook Lifestyle and Power Center Borrower for the property and business income insurance policies required under the Baybrook Lifestyle and Power Center Whole Loan documents (excluding the earthquake and terrorism components of such insurance premiums) on a stand-alone basis.
THE INFORMATION IN THIS STRUCTURAL AND COLLATERAL TERM SHEET IS NOT COMPLETE AND MAY BE AMENDED PRIOR TO THE TIME OF SALE. THIS TERM SHEET IS NOT AN OFFER TO SELL THESE SECURITIES AND IT IS NOT A SOLICITATION OF AN OFFER TO BUY THESE SECURITIES IN ANY JURISDICTION WHERE THE OFFER OR SALE IS NOT PERMITTED.
100
(THIS PAGE INTENTIONALLY LEFT BLANK)
101
(THIS PAGE INTENTIONALLY LEFT BLANK)
102
| 2020 SOUTHWEST 4TH AVENUE |
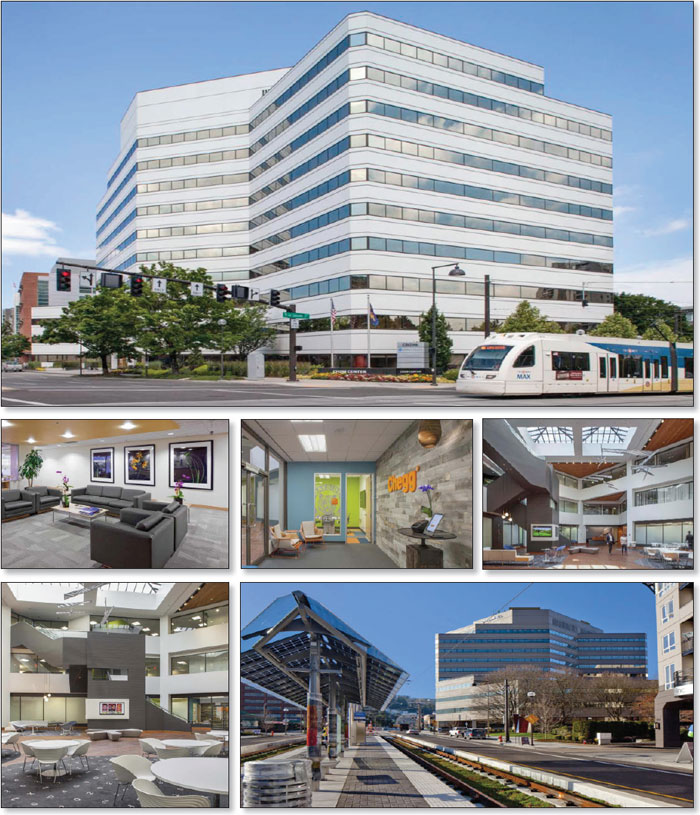
THE INFORMATION IN THIS STRUCTURAL AND COLLATERAL TERM SHEET IS NOT COMPLETE AND MAY BE AMENDED PRIOR TO THE TIME OF SALE. THIS TERM SHEET IS NOT AN OFFER TO SELL THESE SECURITIES AND IT IS NOT A SOLICITATION OF AN OFFER TO BUY THESE SECURITIES IN ANY JURISDICTION WHERE THE OFFER OR SALE IS NOT PERMITTED.
103
| 2020 SOUTHWEST 4TH AVENUE |
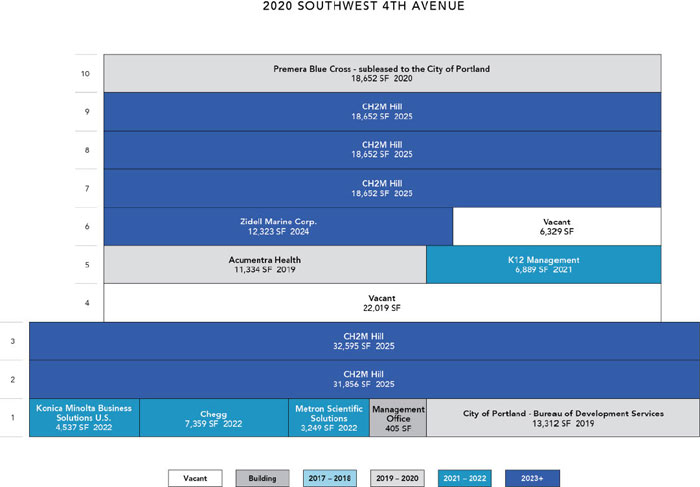
THE INFORMATION IN THIS STRUCTURAL AND COLLATERAL TERM SHEET IS NOT COMPLETE AND MAY BE AMENDED PRIOR TO THE TIME OF SALE. THIS TERM SHEET IS NOT AN OFFER TO SELL THESE SECURITIES AND IT IS NOT A SOLICITATION OF AN OFFER TO BUY THESE SECURITIES IN ANY JURISDICTION WHERE THE OFFER OR SALE IS NOT PERMITTED.
104
| 2020 SOUTHWEST 4TH AVENUE |

THE INFORMATION IN THIS STRUCTURAL AND COLLATERAL TERM SHEET IS NOT COMPLETE AND MAY BE AMENDED PRIOR TO THE TIME OF SALE. THIS TERM SHEET IS NOT AN OFFER TO SELL THESE SECURITIES AND IT IS NOT A SOLICITATION OF AN OFFER TO BUY THESE SECURITIES IN ANY JURISDICTION WHERE THE OFFER OR SALE IS NOT PERMITTED.
105
| 2020 SOUTHWEST 4TH AVENUE |
| No. 8 – 2020 Southwest 4th Avenue | |||||||
| Loan Information | Property Information | ||||||
| Mortgage Loan Seller: | Wells Fargo Bank, National Association | Single Asset/Portfolio: | Single Asset | ||||
Credit Assessment (DBRS/Fitch/Moody’s): | NR/NR/NR | Property Type: | Office | ||||
| Original Principal Balance: | $44,250,000 | Specific Property Type: | CBD | ||||
| Cut-off Date Balance: | $44,250,000 | Location: | Portland, OR | ||||
| % of Initial Pool Balance: | 3.4% | Size: | 226,815 SF | ||||
| Loan Purpose: | Acquisition | Cut-off Date Balance Per SF: | $195.09 | ||||
| Borrower Name: | 2020 Portland Owner, LLC | Year Built/Renovated: | 1982/2016 | ||||
| Borrower Sponsors: | Oaktree Pinnacle Investment Fund, L.P.; ScanlanKemperBard Companies, LLC; Todd Gooding | Title Vesting: | Fee | ||||
| Mortgage Rate: | 3.961% | Property Manager: | Self-managed | ||||
| Note Date: | December 11, 2017 | 4thMost Recent Occupancy (As of): | 93.9% (12/31/2013) | ||||
| Anticipated Repayment Date: | NAP | 3rdMost Recent Occupancy (As of): | 92.7% (12/31/2014) | ||||
| Maturity Date: | December 11, 2027 | 2ndMost Recent Occupancy (As of): | 68.2% (12/31/2015) | ||||
| IO Period: | 120 months | Most Recent Occupancy (As of): | 73.6% (12/31/2016) | ||||
| Loan Term (Original): | 120 months | Current Occupancy (As of): | 87.3% (10/31/2017) | ||||
| Seasoning: | 2 months | ||||||
| Amortization Term (Original): | NAP | Underwriting and Financial Information: | |||||
| Loan Amortization Type: | Interest-only, Balloon | ||||||
| Interest Accrual Method: | Actual/360 | 4thMost Recent NOI(3): | NAV | ||||
| Call Protection: | L(26),GRTR 1% or YM or D(87),O(7) | 3rdMost Recent NOI (As of): | $1,200,218 (12/31/2015) | ||||
| Lockbox Type: | Hard/Springing Cash Management | 2ndMost Recent NOI (As of): | $2,664,091 (12/31/2016) | ||||
| Additional Debt(1): | Yes | Most Recent NOI (As of)(4): | $3,065,716 (TTM 9/30/2017) | ||||
| Additional Debt Type(1): | Future Mezzanine | ||||||
| U/W Revenues: | $6,264,973 | ||||||
| U/W Expenses: | $2,000,337 | ||||||
| U/W NOI(4): | $4,264,636 | ||||||
| U/W NCF: | $4,135,754 | ||||||
| U/W NOI DSCR: | 2.40x | ||||||
| Escrows and Reserves(2): | U/W NCF DSCR: | 2.33x | |||||
| Type: | Initial | Monthly | Cap (If Any) | U/W NOI Debt Yield: | 9.6% | ||
| Taxes | $0 | Springing | NAP | U/W NCF Debt Yield: | 9.3% | ||
| Insurance | $0 | Springing | NAP | As-Is Appraised Value: | $65,170,000 | ||
| TI/LC Reserve | $2,000,000 | Springing | NAP | As-Is Appraisal Valuation Date: | November 1, 2017 | ||
| Replacement Reserve | $0 | Springing | NAP | Cut-off Date LTV Ratio: | 67.9% | ||
| Zidell TI/LC Reserve | $913,781 | $0 | NAP | LTV Ratio at Maturity: | 67.9% | ||
| (1) | See “Future Mezzanine Indebtedness” section. |
| (2) | See “Escrows” section. |
| (3) | Historical financials prior to 2015 are not available, as the borrower sponsor recently acquired the 2020 Southwest 4th Avenue Property and such information was not provided by the seller. |
| (4) | See “Cash Flow Analysis” section for detail on the increase in U/W NOI compared to Most Recent NOI. |
The Mortgage Loan. The mortgage loan (the “2020 Southwest 4th Avenue Mortgage Loan”) is evidenced by a promissory note secured by a first mortgage encumbering the fee simple interest in a class A office building located in Portland, Oregon (the “2020 Southwest 4th Avenue Property”). The 2020 Southwest 4th Avenue Mortgage Loan was originated on December 11, 2017 by Wells Fargo Bank, National Association. The 2020 Southwest 4th Avenue Mortgage Loan had an original principal balance of $44,250,000, has an outstanding principal balance as of the Cut-off Date of $44,250,000 and accrues interest at an interest rate of 3.961%per annum. The 2020 Southwest 4th Avenue Mortgage Loan had an initial term of 120 months, has a remaining term of 118 months as of the Cut-off Date and requires interest-only payments through the loan term. The 2020 Southwest 4th Avenue Mortgage Loan matures on December 11, 2027.
Following the lockout period, the borrower has the right to defease on any date before June 11, 2027 or to prepay the 2020 Southwest 4th Avenue Mortgage Loan in whole, but not in part, provided that, if a prepayment is made, the borrower pays the greater of a yield maintenance premium or a prepayment premium equal to 1.0% of the principal amount being prepaid. In addition, the 2020 Southwest 4th Avenue Mortgage Loan is prepayable without penalty on or after June 11, 2027.
THE INFORMATION IN THIS STRUCTURAL AND COLLATERAL TERM SHEET IS NOT COMPLETE AND MAY BE AMENDED PRIOR TO THE TIME OF SALE. THIS TERM SHEET IS NOT AN OFFER TO SELL THESE SECURITIES AND IT IS NOT A SOLICITATION OF AN OFFER TO BUY THESE SECURITIES IN ANY JURISDICTION WHERE THE OFFER OR SALE IS NOT PERMITTED.
106
| 2020 SOUTHWEST 4TH AVENUE |
Sources and Uses
| Sources | Uses | |||||||
| Original loan amount | $44,250,000 | 63.8% | Purchase price | $65,000,000 | 93.7% | |||
| Borrower sponsors’ new cash contribution | 25,110,466 | 36.2 | Reserves | 2,913,781 | 4.2 | |||
| Closing costs | 1,446,685 | 2.1 | ||||||
| Total Sources | $69,360,466 | 100.0% | Total Uses | $69,360,466 | 100.0% |
The Property. The 2020 Southwest 4th Avenue Property consists of a 226,815 square foot, LEED Gold, 10-story class A office building located in the central business district of Portland, Oregon. Built in 1982 and most recently renovated in 2016, the 2020 Southwest 4th Avenue Property is situated on a 1.1-acre site and features varying floor plates ranging from approximately 18,200 square feet to approximately 32,000 square feet. An approximate $3.3 million renovation was completed at the 2020 Southwest 4th Avenue Property in 2015/2016, which included mechanical system updates, lobby renovations, upgraded elevators cabs, and exterior improvements. The 2020 Southwest 4th Avenue Property also features a newly renovated bicycle storage room and a two-level below-grade parking garage with 228 parking spaces, resulting in a parking ratio of 1.0 space per 1,000 square feet of rentable area.
From 2007 to 2014, the 2020 Southwest 4th Avenue Property reported an average occupancy rate of 95.9%, never dropping below 92.7%. In 2015, the occupancy rate at the 2020 Southwest 4th Avenue Property dropped to 68.2%; however, following the renovations completed in 2016, six tenants signed new leases totaling 47,669 square feet (21.0% of net rentable area, 25.2% of underwritten base rent). As of October 31, 2017, the 2020 Southwest 4th Avenue Property was 87.3% occupied by nine tenants.
CH2M Hill (“CH2M”) is the largest tenant at the 2020 Southwest 4th Avenue Property, occupying 120,407 square feet of office space (53.1% of net rentable area, 60.0% of underwritten base rent). CH2M has been a tenant at the 2020 Southwest 4th Avenue Property since 1992 and executed a 10-year lease in 2015 through March 2025. Founded in 1946, CH2M is a global professional engineering services firm providing consulting, design, construction, and operations services for government agencies and private industries. As of September 2017, CH2M reported $2.7 billion in total assets with approximately 20,000 employees worldwide. CH2M was acquired by Jacobs Engineering Group Inc. (“Jacobs”; NYSE:JEC) in December 2017 for a purchase price of approximately $2.9 billion. Founded in 1947, Jacobs is one of the largest technical professional services firms in the world providing services including scientific, technical, professional, and construction- and program-management for business, industrial, commercial, government and infrastructure sectors. As of September 2017 (prior to the CH2M acquisition), Jacobs reported $7.4 billion in total assets and approximately 54,700 employees.
The third largest tenant at the 2020 Southwest 4th Avenue Property is City of Portland – Bureau of Development Services (“BDS”), which leases 13,312 square feet (5.9% of net rentable area, 7.2% of underwritten base rent) and subleases an additional 18,652 square feet from the second largest tenant Premera Blue Cross for a total of 31,964 square feet (14.1% of net rentable area). BDS is responsible for implementing and enforcing building and development codes for the City of Portland. BDS’ primary service center is located at 1900 Southwest 4th Avenue (“1900 Building”), which is proximate to the 2020 Southwest 4th Avenue Property. BDS uses its space at the 1900 Building for direct public services, and uses its space at 2020 Southwest 4th Avenue Property for support staff.
THE INFORMATION IN THIS STRUCTURAL AND COLLATERAL TERM SHEET IS NOT COMPLETE AND MAY BE AMENDED PRIOR TO THE TIME OF SALE. THIS TERM SHEET IS NOT AN OFFER TO SELL THESE SECURITIES AND IT IS NOT A SOLICITATION OF AN OFFER TO BUY THESE SECURITIES IN ANY JURISDICTION WHERE THE OFFER OR SALE IS NOT PERMITTED.
107
| 2020 SOUTHWEST 4TH AVENUE |
The following table presents certain information relating to the tenancies at the 2020 Southwest 4th Avenue Property:
Major Tenants
| Tenant Name | Credit Rating (Fitch/Moody’s/ S&P) | Tenant NRSF | % of NRSF | Annual U/W Base Rent PSF | Annual | % of Total Annual U/W Base Rent | Lease Expiration Date |
| Major Tenants | |||||||
| CH2M(1) | NR/NR/NR | 120,407 | 53.1% | $28.36 | $3,414,292 | 60.0% | 3/31/2025(2)(3) |
| Premera Blue Cross(4) | NR/NR/NR | 18,652 | 8.2% | $27.97 | $521,696 | 9.2% | 4/30/2020(5) |
BDS | NR/NR/NR | 13,312 | 5.9% | $30.77 | $409,558 | 7.2% | 10/31/2019(6) |
| Zidell Marine Corp. | NR/NR/NR | 12,323 | 5.4% | $31.50 | $388,175 | 6.8% | 11/30/2024(7) |
| Acumentra Health | NR/NR/NR | 11,334 | 5.0% | $28.70 | $325,291 | 5.7% | 5/31/2019 |
| Total Major Tenants | 176,028 | 77.6% | $28.74 | $5,059,013 | 88.9% | ||
| Non-Major Tenants | 22,034 | 9.7% | $28.78 | $634,113 | 11.1% | ||
| Occupied Collateral Total | 198,062 | 87.3% | $28.74 | $5,693,126 | 100.0% | ||
| Vacant Space | 28,753 | 12.7% | |||||
| Collateral Total | 226,815 | 100.0% | |||||
| (1) | CH2M is currently not utilizing approximately 9,326 square feet of its space on the 9thfloor. |
| (2) | CH2M has two, 5-year renewal options with 365 days’ notice with the first renewal option at 95% of fair market value. |
| (3) | CH2M has a lease contraction option in March 2020 to terminate 18,652 square feet on either the 7th, 8th or 9th floor. In addition, CH2M has a lease contraction option in March 2022 to terminate 18,652 square feet on either the 7th, 8th or 9th floor. In order to exercise either contraction option, CH2M must provide the borrower with one years’ notice and payment of a termination fee equal to unamortized leasing costs. |
| (4) | Premera Blue Cross subleases 18,652 square feet to BDS at $26.00 per square foot. The sublease is coterminous with the primary lease. |
| (5) | Premera Blue Cross has one, 5-year renewal option. |
| (6) | BDS has one, 3-year renewal option with nine months’ notice at fair market value. |
| (7) | Zidell Marine Corp. has one, 3-year, 4-year, or 5-year renewal option with nine months’ notice at fair market value. |
The following table presents certain information relating to the lease rollover schedule at the 2020 Southwest 4th Avenue Property:
Lease Expiration Schedule(1)(2)
| Year Ending December 31, | No. of Leases Expiring | Expiring NRSF | % of Total NRSF | Cumulative Expiring NRSF | Cumulative % of Total NRSF | Annual U/W Base Rent | % of Total Annual U/W Base Rent | Annual U/W Base Rent PSF(3) |
| MTM | 0 | 0 | 0.0% | 0 | 0.0% | $0 | 0.0% | $0.00 |
| 2018 | 0 | 0 | 0.0% | 0 | 0.0% | $0 | 0.0% | $0.00 |
| 2019 | 2 | 24,646 | 10.9% | 24,646 | 10.9% | $734,850 | 12.9% | $29.82 |
| 2020 | 1 | 18,652 | 8.2% | 43,298 | 19.1% | $521,696 | 9.2% | $27.97 |
| 2021 | 1 | 6,889 | 3.0% | 50,187 | 22.1% | $197,331 | 3.5% | $28.64 |
| 2022 | 3 | 15,145 | 6.7% | 65,332 | 28.8% | $436,782 | 7.7% | $28.84 |
| 2023 | 0 | 0 | 0.0% | 65,332 | 28.8% | $0 | 0.0% | $0.00 |
| 2024 | 1 | 12,323 | 5.4% | 77,655 | 34.2% | $388,175 | 6.8% | $31.50 |
| 2025 | 5 | 120,407 | 53.1% | 198,062 | 87.3% | $3,414,292 | 60.0% | $28.36 |
| 2026 | 0 | 0 | 0.0% | 198,062 | 87.3% | $0 | 0.0% | $0.00 |
| 2027 | 0 | 0 | 0.0% | 198,062 | 87.3% | $0 | 0.0% | $0.00 |
| 2028 | 0 | 0 | 0.0% | 198,062 | 87.3% | $0 | 0.0% | $0.00 |
| Thereafter | 0 | 0 | 0.0% | 198,062 | 87.3% | $0 | 0.0% | $0.00 |
| Vacant | 0 | 28,753 | 12.7% | 226,815 | 100.0% | $0 | 0.0% | $0.00 |
| Total/Weighted Average | 13 | 226,815 | 100.0% | $5,693,126 | 100.0% | $28.74 |
| (1) | Information obtained from the underwritten rent roll. |
| (2) | Certain tenants may have lease termination options that are exercisable prior to the stated expiration date of the subject lease and that are not considered in the Lease Expiration Schedule. |
| (3) | Weighted Average Annual U/W Base Rent PSF excludes vacant space. |
THE INFORMATION IN THIS STRUCTURAL AND COLLATERAL TERM SHEET IS NOT COMPLETE AND MAY BE AMENDED PRIOR TO THE TIME OF SALE. THIS TERM SHEET IS NOT AN OFFER TO SELL THESE SECURITIES AND IT IS NOT A SOLICITATION OF AN OFFER TO BUY THESE SECURITIES IN ANY JURISDICTION WHERE THE OFFER OR SALE IS NOT PERMITTED.
108
| 2020 SOUTHWEST 4TH AVENUE |
The following table presents historical occupancy percentages at the 2020 Southwest 4th Avenue Property:
Historical Occupancy
12/31/2013(1) | 12/31/2014(1) | 12/31/2015(1) | 12/31/2016(1) | 10/31/2017(2) |
| 93.9% | 92.7% | 68.2% | 73.6% | 87.3% |
| (1) | Information obtained from the borrower. |
| (2) | Information obtained from the underwritten rent roll. |
Operating History and Underwritten Net Cash Flow.The following table presents certain information relating to the historical operating performance and the underwritten net cash flow at the 2020 Southwest 4th Avenue Property:
Cash Flow Analysis
2015 | 2016 | TTM 9/30/2017 | U/W | % of U/W Effective Gross Income | U/W $ per SF | |
| Base Rent | $2,222,122 | $4,143,138 | $4,675,021 | $5,693,126(1) | 90.9% | $25.10 |
| Grossed Up Vacant Space | 0 | 0 | 0 | 905,748 | 14.5 | 3.99 |
| Total Reimbursables | 2,137 | 9,151 | 9,291 | 99,897 | 1.6 | 0.44 |
| Other Income(2) | 215,235 | 408,627 | 416,655 | 471,951 | 7.5 | 2.08 |
| Less Vacancy & Credit Loss | 0 | 0 | 0 | (905,748)(3) | (14.5) | (3.99) |
| Effective Gross Income | $2,439,494 | $4,560,916 | $5,100,967 | $6,264,973 | 100.0% | $27.62 |
| Total Operating Expenses | 1,239,276 | 1,896,825 | 2,035,251 | 2,000,337 | 31.9 | 8.82 |
| Net Operating Income(4)(5) | $1,200,218 | $2,664,091 | $3,065,716 | $4,264,636 | 68.1% | $18.80 |
| TI/LC | 0 | 0 | 0 | 83,519 | 1.3 | 0.37 |
| Capital Expenditures | 0 | 0 | 0 | 45,363 | 0.7 | 0.20 |
| Net Cash Flow(4)(5) | $1,200,218 | $2,664,091 | $3,065,716 | $4,135,754 | 66.0% | $18.23 |
| NOI DSCR | 0.68x | 1.50x | 1.73x | 2.40x | ||
| NCF DSCR | 0.68x | 1.50x | 1.73x | 2.33x | ||
| NOI DY | 2.7% | 6.0% | 6.9% | 9.6% | ||
| NCF DY | 2.7% | 6.0% | 6.9% | 9.3% |
| (1) | U/W Base Rent is based on the rent roll as of October 31, 2017, and includes rent steps through October 2018 totaling $15,215. |
| (2) | Other income consists of primarily parking income, storage leases, various licenses agreements, and miscellaneous fees and charges. |
| (3) | Vacancy is underwritten to 13.7%. The 2020 Southwest 4th Avenue Property was 87.3% occupied as of October 31, 2017. |
| (4) | 2016 Base Rent and Net Operating Income are higher than 2015 due in part to a three-month rent abatement to CH2M following its March 2015 lease signing, and two tenants signing new leases in 2016 totalling 8.9% of net rentable area and 10.7% of underwritten base rent. |
| (5) | U/W Base Rent and Net Operating Income are higher than TTM 9/30/2017 due primarily to four new leases being signed since March 2017 totalling 12.1% of net rentable area and 14.5% of underwritten base rent. |
Appraisal.As of the appraisal valuation date of November 1, 2017 the 2020 Southwest 4th Avenue Property had an “as-is” appraised value of $65,170,000.
Environmental Matters. According to the Phase I environmental site assessment dated October 30, 2017, there are no recognized environmental conditions at the 2020 Southwest 4th Avenue Property.
Market Overview and Competition. The 2020 Southwest 4th Avenue Property is located in the South Waterfront district of downtown Portland, Oregon, and is within 1.0 mile of Interstate 405, Interstate 5, and Southwest Naito Parkway. Portland is Oregon’s largest city and serves as the headquarters for two Fortune 500 companies including Nike and Precision Castparts, a leading manufacturer of cast metal parts. The largest employer in Portland is Intel with 19,500 employees, followed by Providence Health System, Oregon Health & Science University and Fred Meyer (a subsidiary of Kroger). Downtown Portland is home to City Hall, Oregon Health and Science University, CDK Global (NASDAQ: “CDK”), and Under Armour’s new 70,000 square foot campus. Portland has several transportation alternatives to the region’s highway system, including bus, light rail, commuter train and streetcar. MAX Light Rail, a light rail system serving the Portland metropolitan area, serviced over 39 million passengers in 2017. The 2020 Southwest 4th Avenue Property is situated within one block of two MAX Light Rail stations (including the Lincoln St/SW 3rdAve station directly in front of the property), which provide access to the green, orange and yellow lines.
The 2020 Southwest 4th Avenue Property is adjacent to Portland State University, the largest and fastest growing school in the Oregon University System with a 2016 total enrollment of approximately 29,057 students. The 2020 Southwest 4th Avenue Property is also located approximately 13.5 miles southeast of Port of Portland and 13.4 miles southwest of Portland International Airport. According to the appraisal, the 2016 estimated population within a one-, three- and five-mile radius of 2020 Southwest 4th Avenue Property was 24,462, 165,681 and 424,582, respectively; and the average household income within the same radii was $67,550, $86,968 and $90,324, respectively.
According to the appraisal, the 2020 Southwest 4th Avenue Property is located within Portland’s CBD submarket. As of the third quarter of 2017, the CBD submarket comprised approximately 26.2 million square feet of office space with a vacancy rate of 9.3% and an average asking rent of $30.12 per square foot, gross. Since 2007, the CBD submarket has reported an average vacancy rate of 9.4%.
THE INFORMATION IN THIS STRUCTURAL AND COLLATERAL TERM SHEET IS NOT COMPLETE AND MAY BE AMENDED PRIOR TO THE TIME OF SALE. THIS TERM SHEET IS NOT AN OFFER TO SELL THESE SECURITIES AND IT IS NOT A SOLICITATION OF AN OFFER TO BUY THESE SECURITIES IN ANY JURISDICTION WHERE THE OFFER OR SALE IS NOT PERMITTED.
109
| 2020 SOUTHWEST 4TH AVENUE |
The following tables present certain information relating to comparable leases for the 2020 Southwest 4th Avenue Property:
Comparable Office Leases(1)
| Property Location | Year Built | Total Office GLA (SF) | Distance from Subject | Tenant Name | Lease Date/ Term | Lease Area (SF) | Annual Base Rent PSF | Lease Type |
Power + Light Portland, Oregon | 1927 | 304,298 | 0.6 miles | Sitka Technologies | April 2017 / 3.0 Yrs. | 8,791 | $27.00 | Gross |
Columbia Square Portland, Oregon | 1980 | 253,000 | 0.4 miles | Office Tenant | July 2017 / 7.0 Yrs. | 8,470 | $15.00 | NNN |
200 Market Building Portland, Oregon | 1973 | 363,072 | 0.3 miles | Office Tenant | March 2017 / 7.0 Yrs. | 6,182 | $29.75 | Gross |
Riviera Plaza Portland, Oregon | 1967 | 201,053 | 0.3 miles | Worksystems Inc | March 2017 / 6.0 Yrs | 1,059 | $25.00 | Gross |
400 SW Sixth Portland, Oregon | 1961 | 245,080 | 0.9 miles | Office Tenant | June 2017 / 7.0 Yrs | 3,224 | $30.00 | Gross |
1000 Broadway Building Portland, Oregon | 1991 | 244,747 | 0.6miles | Office Tenant | February 2017 / 5.0 Yrs | 1,847 | $20.00 | NNN |
| (1) | Information obtained from the appraisal. |
The Borrower.The borrower is 2020 Portland Owner, LLC, a Delaware limited liability company and single purpose entity with two independent directors. Legal counsel to the borrower delivered a non-consolidation opinion in connection with the origination of the 2020 Southwest 4th Avenue Mortgage Loan. Oaktree Pinnacle Investment Fund, L.P., ScanlanKemperBard Companies, LLC, and Todd Gooding are the guarantors of certain nonrecourse carveouts under the 2020 Southwest 4th Avenue Mortgage Loan.
The Borrower Sponsors.The borrower sponsors are Oaktree Pinnacle Investment Fund, L.P. (“Oaktree Pinnacle Fund”), ScanlanKemperBard Companies, LLC (“SKB”), and Todd Gooding. Oaktree Pinnacle Fund has a total committed capital of $615.0 million and is managed by Oaktree Capital Management. Formed in 1995, Oaktree Capital Management (NYSE:OAK) is a seasoned real estate investor and a leading global alternative investment management firm with over 900 employees and offices in 18 cities worldwide. As of September 30, 2017, Oaktree Capital Management has approximately $99.5 billion assets under management. Among Oaktree’s global clients are 75 of the 100 largest U.S. pension plans, over 400 corporations around the world, over 350 endowments and foundations globally, 16 sovereign wealth funds and 38 of the 50 primary state retirement plans in the United States. Founded in 1993, SKB is a privately held real estate merchant bank based in Portland, Oregon, and managed the 2020 Southwest 4th Avenue Property for the prior ownership since 2012. SKB has completed transactions with a portfolio valued at $4.1 billion on over 28 million square feet of commercial real estate properties. SKB currently manages 19 commercial real estate properties totaling 5.3 million square feet primarily located in the Greater Portland Area, including 11 office projects totaling 2.8 million square feet. Todd Gooding has served as SKB’s president since 2002 and has more than 25 years of commercial real estate experience. SKB was involved in seven consensual foreclosures, five deeds-in-lieu of foreclosure, a receivership sale, and a discounted payoff related to various office, industrial flex, retail and multifamily properties located in the western U.S. related to financings made from 2005 to 2008. See“Description of the Mortgage Pool— Loan Purpose; Default History, Bankruptcy Issues and Other Proceedings”in the Preliminary Prospectus.
Escrows.The loan documents provide for upfront escrows at origination in the amount of $2,000,000 for general tenant improvement and leasing commission costs and $913,781 for outstanding tenant improvement and leasing commissions related to the tenant Zidell Marine Corp.
The loan documents do not require ongoing monthly deposits for real estate taxes so long as (i) no Cash Trap Event Period (as defined in the “Lockbox and Cash Management” section) has occurred and is continuing and (ii) the borrower provides the lender with evidence that the 2020 Southwest 4th Avenue Property taxes have been paid. The loan documents do not require ongoing monthly escrows for insurance premiums as long as (i) no Cash Trap Event Period (as defined in the “Lockbox and Cash Management” section) and (ii) the borrower provides the lender with evidence that the 2020 Southwest 4th Avenue Property is insured (which may be via an acceptable blanket or umbrella insurance policy) and such policy is in full force and effect.
Following the occurrence and during the continuance of a Cash Trap Event Period, the borrower is required to make monthly deposits of $4,725 (approximately $0.25 per square foot annually) for replacement reserves, and $23,625 (approximately $1.25 per square foot annually) for tenant improvements and leasing commissions.
Lockbox and Cash Management.The 2020 Southwest 4th Avenue Mortgage Loan is structured with a hard lockbox and springing cash management. The borrower was required at origination to deliver letters to all tenants at the 2020 Southwest 4th Avenue Property directing them to pay all rents directly into the lockbox account. Prior to the occurrence of a Cash Trap Event Period (as defined below), all funds are required to be distributed to the borrower. During a Cash Trap Event Period, all cash flow is required to be swept to a lender-controlled cash management account.
THE INFORMATION IN THIS STRUCTURAL AND COLLATERAL TERM SHEET IS NOT COMPLETE AND MAY BE AMENDED PRIOR TO THE TIME OF SALE. THIS TERM SHEET IS NOT AN OFFER TO SELL THESE SECURITIES AND IT IS NOT A SOLICITATION OF AN OFFER TO BUY THESE SECURITIES IN ANY JURISDICTION WHERE THE OFFER OR SALE IS NOT PERMITTED.
110
| 2020 SOUTHWEST 4TH AVENUE |
A “Cash Trap Event Period” will commence upon the earlier of the following:
| (i) | the occurrence and continuance of an event of default; |
| (ii) | the net cash flow debt yield being less than 6.75% at the end of any calendar quarter; provided, however, that the borrower has the right to deliver to the lender cash or a letter of credit in amount that, if applied to the outstanding principal balance of the 2020 Southwest 4th Avenue Mortgage Loan, would result in a net cash flow debt yield equal to or greater than 6.75% in order to avoid a Cash Trap Event Period; or |
| (iii) | the occurrence of a CH2M Sweep Event (as defined below), unless upon the occurrence of any CH2M Sweep Event, the net cash flow debt yield is equal to or greater than 9.0% without consideration for any income related to the CH2M lease. |
A Cash Trap Event Period will end:
| ● | with regard to clause (i), upon the cure of such event of default; |
| ● | with regard to clause (ii), upon the earlier of (a) the net cash flow debt yield being equal to or greater than 6.75% for two consecutive calendar quarters; or (b) the net cash flow debt yield being equal to or greater than 7.0% for one calendar quarter; and |
| ● | with regard to clause (iii), upon a CH2M Sweep Cure Event (as defined below). |
A “CH2M Sweep Event” will commence upon the earlier of:
| (i) | the date that is 15 months prior to CH2M’s lease expiration; |
| (ii) | CH2M subleasing 50% or more of its space; |
| (iii) | the occurrence of a monetary or material non-monetary default under the CH2M lease; or |
| (iv) | CH2M becoming involved in a bankruptcy or other insolvency proceeding. |
A “CH2M Sweep Cure Event” will occur upon:
| ● | with respect to clause (i), (a) a Qualified Re-Leasing Event (as defined below), or (b) a CH2M Renewal Event (as defined below); |
| ● | with respect to clause (ii), (a) the balance in the excess cash flow reserve reaching the CH2M Sweep Cap (as defined below), (b) a Qualified Re-Leasing Event, or (c) a CH2M Renewal Event; |
| ● | with respect to clause (iii), (a) the balance in the excess cash flow reserve reaching the CH2M Sweep Cap, (b) a Qualified Re-Leasing Event, (c) a CH2M Renewal Event, or (d) the date that is 6 months following the cure of such event of default and no other events of default exist; and |
| ● | with respect to clause (iv), (a) the balance in the excess cash flow reserve reaching the CH2M Sweep Cap, (b) a Qualified Re-Leasing Event, (c) a CH2M Renewal Event, or (d) the applicable proceeding under any creditors rights laws having been terminated and/or the CH2M lease having been affirmed or assumed in a manner satisfactory to the lender. |
A “Qualified Re-Leasing Event” will occur upon (a) all or a portion of the CH2M space being re-leased to one or more replacement tenants for at least three years on terms acceptable to the lender with such replacement tenants having taken occupancy, commenced operations and payment of full, unabated rent and all leasing commissions and tenant improvements having been paid in full (unless such rent abatements, unpaid leasing commissions and tenant improvements have been reserved with lender) and (b) the net cash flow debt yield of the 2020 Southwest 4th Avenue Property being equal to or greater than 9.0% based on such replacement leases.
A “CH2M Renewal Event” will occur upon CH2M exercising its renewal or extension option; provided, however, that if the extension or new lease is for less than all of the CH2M space, then the CH2M Sweep Event will continue until the Adjusted CH2M Sweep Cap (as defined below) is met.
The “CH2M Sweep Cap” is equal to $4,214,245; provided, however, that if CH2M enters into an extension or renewal for less than all of its space, then the CH2M Sweep Cap will be reduced to an amount equal to $35.00 per square foot for the tenant’s then-current space (“Adjusted CH2M Sweep Cap”).
Property Management.The 2020 Southwest 4th Avenue Property is managed by an affiliate of the borrower.
Assumption.The borrower has the right to transfer the 2020 Southwest 4th Avenue Property, provided that certain other conditions are satisfied, including, but not limited to: (i) no event of default has occurred and is continuing; (ii) the lender’s reasonable determination that the proposed transferee and guarantor satisfy the lender’s credit review and underwriting standards, taking into consideration transferee experience, financial strength and general business standing; and (iii) if requested by the lender, rating agency confirmation from DBRS, Fitch, and Moody’s that the transfer will not result in a downgrade, withdrawal or qualification of the respective ratings assigned to the Series 2018-BNK10 Certificates.
Partial Release.Not permitted.
Real Estate Substitution.Not permitted.
Future Mezzanine Indebtedness.Provided no event of default has occurred and is continuing, the borrower is permitted the one-time right to incur future mezzanine indebtedness from a Qualified Mezzanine Lender (as defined below) under the following conditions, among others: (a) the combined loan-to-value ratio of the 2020 Southwest 4th Avenue Mortgage Loan and the permitted mezzanine loan will not be greater than 68.0%, (b) the debt yield of the 2020 Southwest 4th Avenue Mortgage Loan and the permitted mezzanine loan is equal to or greater than 9.0%, (c) delivery of a satisfactory intercreditor agreement and (d) rating agency confirmation.
THE INFORMATION IN THIS STRUCTURAL AND COLLATERAL TERM SHEET IS NOT COMPLETE AND MAY BE AMENDED PRIOR TO THE TIME OF SALE. THIS TERM SHEET IS NOT AN OFFER TO SELL THESE SECURITIES AND IT IS NOT A SOLICITATION OF AN OFFER TO BUY THESE SECURITIES IN ANY JURISDICTION WHERE THE OFFER OR SALE IS NOT PERMITTED.
111
| 2020 SOUTHWEST 4TH AVENUE |
A “Qualified Mezzanine Lender” is an institution that, among other requirements outlined in the loan documents, (a) has assets (in name or management) in excess of $300,000,000, and (b) except with respect to a pension advisory firm, asset manager or similar fiduciary has capital/statutory surplus or shareholder’s equity of at least $100,000,000, and (c) is regularly engaged in the business of making or owning commercial real estate loans or operating commercial mortgage properties.
Ground Lease.None.
Terrorism Insurance.The 2020 Southwest 4th Avenue Mortgage Loan documents require that the “all risk” insurance policy required to be maintained by the borrower provide coverage for terrorism in an amount equal to the full replacement cost of the 2020 Southwest 4th Avenue Property, as well as business interruption insurance covering no less than the 18-month period following the occurrence of a casualty event, together with a 6-month extended period of indemnity (provided that if TRIPRA or a similar statute is not in effect, borrower shall not be obligated to pay terrorism insurance premiums in excess of two times the premium for the casualty and business interruption coverage on a stand-alone basis).
Earthquake Insurance.Earthquake insurance is not required by the loan documents. The seismic report indicated a probable maximum loss of 8.0% for the 2020 Southwest 4thAvenue Property.
THE INFORMATION IN THIS STRUCTURAL AND COLLATERAL TERM SHEET IS NOT COMPLETE AND MAY BE AMENDED PRIOR TO THE TIME OF SALE. THIS TERM SHEET IS NOT AN OFFER TO SELL THESE SECURITIES AND IT IS NOT A SOLICITATION OF AN OFFER TO BUY THESE SECURITIES IN ANY JURISDICTION WHERE THE OFFER OR SALE IS NOT PERMITTED.
112
(THIS PAGE INTENTIONALLY LEFT BLANK)
113
| ROEDEL HOTEL PORTFOLIO |

THE INFORMATION IN THIS STRUCTURAL AND COLLATERAL TERM SHEET IS NOT COMPLETE AND MAY BE AMENDED PRIOR TO THE TIME OF SALE. THIS TERM SHEET IS NOT AN OFFER TO SELL THESE SECURITIES AND IT IS NOT A SOLICITATION OF AN OFFER TO BUY THESE SECURITIES IN ANY JURISDICTION WHERE THE OFFER OR SALE IS NOT PERMITTED.
114
| ROEDEL HOTEL PORTFOLIO |
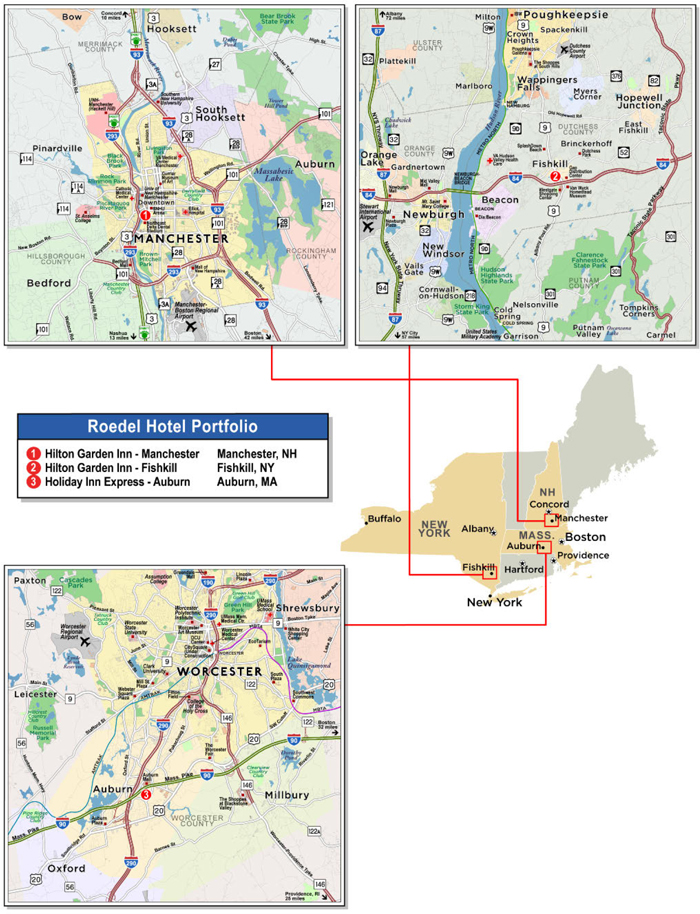
THE INFORMATION IN THIS STRUCTURAL AND COLLATERAL TERM SHEET IS NOT COMPLETE AND MAY BE AMENDED PRIOR TO THE TIME OF SALE. THIS TERM SHEET IS NOT AN OFFER TO SELL THESE SECURITIES AND IT IS NOT A SOLICITATION OF AN OFFER TO BUY THESE SECURITIES IN ANY JURISDICTION WHERE THE OFFER OR SALE IS NOT PERMITTED.
115
| ROEDEL HOTEL PORTFOLIO |
| No. 9 – Roedel Hotel Portfolio | |||||||
| Loan Information | Property Information | ||||||
| Mortgage Loan Seller: | Bank of America, N.A. | Single Asset/Portfolio: | Portfolio | ||||
| Credit Assessment (Fitch/DBRS/Moody’s): | NR/NR/NR | Property Type: | Hospitality | ||||
| Original Principal Balance: | $43,000,000 | Specific Property Type: | Various | ||||
| Cut-off Date Balance: | $42,909,955 | Location: | Various | ||||
| % of Initial Pool Balance: | 3.3% | Size: | 349 Rooms | ||||
| Loan Purpose: | Refinance | Cut-off Date Balance Per Room: | $122,951.16 | ||||
| Borrower Names(1): | Various | Year Built/Renovated: | Various / Various | ||||
| Borrower Sponsors: | Roedel Companies, LLC; David W. Roedel; Fred B. Roedel, III | Title Vesting: | Fee | ||||
| Mortgage Rate: | 5.072% | Property Manager: | RGH Hospitality, LLC | ||||
| Note Date: | November 22, 2017 | 4thMost Recent Occupancy (As of): | 74.3% (12/31/2013) | ||||
| Anticipated Repayment Date: | NAP | 3rdMost Recent Occupancy (As of): | 74.5% (12/31/2014) | ||||
| Maturity Date: | December 1, 2027 | 2ndMost Recent Occupancy (As of): | 73.7% (12/31/2015) | ||||
| IO Period: | NAP | Most Recent Occupancy (As of): | 75.3% (12/31/2016) | ||||
| Loan Term (Original): | 120 months | Current Occupancy (As of): | 75.4% (9/30/2017) | ||||
| Seasoning: | 2 months | ||||||
| Amortization Term (Original): | 360 months | Underwriting and Financial Information: | |||||
| Loan Amortization Type: | Amortizing Balloon | ||||||
| Interest Accrual Method: | Actual/360 | 4thMost Recent NOI (As of): | $4,536,936 (12/31/2014) | ||||
| Call Protection: | L(26),D(90),O(4) | 3rdMost Recent NOI (As of): | $5,251,381 (12/31/2015) | ||||
| Lockbox Type: | Hard/Springing Cash Management | 2ndMost Recent NOI (As of): | $5,784,545 (12/31/2016) | ||||
| Additional Debt: | No | Most Recent NOI (As of): | $5,466,633 (TTM 9/30/2017) | ||||
| Additional Debt Type: | NAP | ||||||
| U/W Revenues: | $14,654,428 | ||||||
| U/W Expenses: | $9,266,892 | ||||||
| U/W NOI: | $5,387,536 | ||||||
| U/W NCF: | $4,801,359 | ||||||
| U/W NOI DSCR: | 1.93x | ||||||
| Escrows and Reserves(2): | U/W NCF DSCR: | 1.72x | |||||
| Type: | Initial | Monthly | Cap (If Any) | U/W NOI Debt Yield: | 12.6% | ||
| Taxes | $55,120 | $55,120 | NAP | U/W NCF Debt Yield: | 11.2% | ||
| Insurance | $0 | Springing | NAP | As-Is Appraised Value: | $58,800,000 | ||
| FF&E Reserve | $0 | $48,848 | NAP | As-Is Appraisal Valuation Date: | September 28, 2017 | ||
| Deferred Maintenance | $13,938 | $0 | NAP | Cut-off Date LTV Ratio: | 73.0% | ||
| Seasonality Reserve | $400,000 | Springing | NAP | LTV Ratio at Maturity or ARD: | 60.3% | ||
| (1) | The borrowers are Roedel Partners of Auburn, LLC, Roedel Partners of Fishkill, LLC, Roedel Partners of Fishkill II, LLC, Roedel Partners of Manchester, LLC and Roedel Partners of Manchester II, LLC. |
| (2) | See “Escrows” section. |
The Mortgage Loan. The mortgage loan (the “Roedel Hotel Portfolio Mortgage Loan”) is evidenced by a single promissory note secured by a first mortgage encumbering the fee simple interests in one select service hotel located in Manchester, New Hampshire (the “Hilton Garden Inn Manchester Property”), one select service hotel located in Fishkill, New York (the “Hilton Garden Inn Fishkill Property”) and one limited service hotel located in Auburn, Massachusetts (the “Holiday Inn Express Auburn Property”, and together with the Hilton Garden Inn Manchester Property and the Hilton Garden Inn Fishkill Property, the “Roedel Hotel Portfolio Properties”). The Roedel Hotel Portfolio Mortgage Loan was originated on November 22, 2017 by Bank of America, N.A. The Roedel Hotel Portfolio Mortgage Loan had an original principal balance of $43,000,000, has an outstanding principal balance as of the Cut-off Date of $42,909,955 and accrues interest at an interest rate of 5.072%per annum. The Roedel Hotel Portfolio Mortgage Loan had an initial term of 120 months, has a remaining term of 118 months as of the Cut-off Date and requires payments of principal and interest based on a 30-year amortization schedule. The Roedel Hotel Portfolio Mortgage Loan matures on December 1, 2027.
Following the lockout period, the Roedel Hotel Portfolio Borrower (as defined below) has the right to defease the Roedel Hotel Portfolio Mortgage Loan in whole, or in part in connection with a partial release, on any date before September 1, 2027, after which date the Roedel Hotel Portfolio Mortgage Loan is prepayable without penalty.
THE INFORMATION IN THIS STRUCTURAL AND COLLATERAL TERM SHEET IS NOT COMPLETE AND MAY BE AMENDED PRIOR TO THE TIME OF SALE. THIS TERM SHEET IS NOT AN OFFER TO SELL THESE SECURITIES AND IT IS NOT A SOLICITATION OF AN OFFER TO BUY THESE SECURITIES IN ANY JURISDICTION WHERE THE OFFER OR SALE IS NOT PERMITTED.
116
| ROEDEL HOTEL PORTFOLIO |
Sources and Uses
| Sources | Uses | |||||||
| Original loan amount | $43,000,000 | 100.0% | Loan payoff | $40,558,081 | 94.3% | |||
| Return of equity | 1,136,988 | 2.6 | ||||||
| Closing costs | 835,874 | 1.9 | ||||||
| Reserves | 469,057 | 1.1 | ||||||
| Total Sources | $43,000,000 | 100.0% | Total Uses | $43,000,000 | 100.0% |
The Property.The Roedel Hotel Portfolio Properties are comprised of two select service hotels and one limited service hotel totaling 349 rooms. The following table presents certain information relating to the Roedel Hotel Portfolio Properties:
Property Schedule
| Property Name/Address | Allocated Cut-Off Date Balance | % of Portfolio | 9/30/2017 TTM Occupancy | Year Built/ Renovated | Rooms | Appraised Value | Allocated LTV |
Hilton Garden Inn Manchester Property 101 South Commercial Street Manchester, NH 03101 | $20,725,216 | 48.3% | 76.0% | 2006/2014 | 125 | $28,400,000 | 48.3% |
Hilton Garden Inn Fishkill Property 25 Westage Drive Fishkill, NY 12524
| $12,041,059 | 28.1% | 74.8% | 2002/2014 | 111 | $16,500,000 | 28.1% |
Holiday Inn Express Auburn Property 10-12 Johnson Street Auburn, MA 01501 | $10,143,680 | 23.6% | 75.2% | 2004/2015 | 113 | $13,900,000 | 23.6% |
| Total/Weighted Average | $42,909,955 | 100.0% | 75.4% | 349 | $58,800,000 | 100.0% |
Hilton Garden Inn Manchester Property. The Hilton Garden Inn Manchester Property is a six-story, select service hotel, with one subterranean level, developed by the Roedel Hotel Portfolio sponsor that opened in 2006. In 2013 and 2014, the Hilton Garden Inn Manchester Property underwent renovations to the public areas and refreshed select case goods and soft goods in the guestrooms. The Hilton Garden Inn Manchester Property contains 125 guestrooms, a 24-hour business center, 24-hour market pantry, guest laundry, indoor swimming pool, outdoor hot tub, fitness center, 59-seat full service restaurant, 156 outdoor patio seats, and 1,728 square feet of meeting space across three meeting rooms. The guestroom configuration at the Hilton Garden Inn Manchester Property includes 67 king guestrooms, 49 queen/queen guestrooms, 5 one-bedroom suites and 4 two-bedroom suites. All rooms feature complimentary Wi-Fi internet, mini-fridges and coffee makers. There are 135 surface parking spaces.
The Hilton Garden Inn Manchester Property is located in downtown Manchester, in the historic Millyard district. The Hilton Garden Inn Manchester Property was developed as a part of the “Manchester Riverfront Redevelopment”, a $70 million private, public redevelopment project which included the Hilton Garden Inn Manchester Property, a 165-unit residential condominium and townhouse development, and the 7,500-seat Northeast Delta Dental Stadium, onto which the Hilton Garden Inn Manchester Property overlooks, and which is the baseball stadium of Manchester’s Minor League Baseball team, the AA affiliate of Major League Baseball’s Toronto Blue Jays team. The Hilton Garden Inn Manchester Property is within walking distance of the Verizon Wireless Arena and the University of New Hampshire Manchester, and within 4 miles of the Catholic Medical Center, TD Bank, Citizens Bank, Elliot Health System, St. Anselm College, Southern New Hampshire University and Manchester Veterans Affairs Medical Center.
The demand segmentation for the Hilton Garden Inn Manchester Property is 65% commercial, 20% leisure and 15% group. Top corporate accounts for 2016 included Freudenberg NOK (642 room nights), Texas Instrument (528 room nights), NEWFORMA (391 room nights), Riverstone Resources (335 room nights) and Oracle (317 room nights).
The Hilton Garden Inn Manchester Property is licensed by HLT Existing Franchise Holding LLC, as successor to Hilton Inns, Inc. pursuant to a license agreement dated April 6, 2004 and expiring April 5, 2026 with no extension options. Hilton Garden Inn properties are upscale, mid-priced, select service hotels by Hilton Worldwide. As of year-end 2016, there were 717 U.S. hotels (102,786 rooms) operating under the Hilton Garden Inn brand.
Hilton Garden Inn Fishkill Property. The Hilton Garden Inn Fishkill Property is a four-story, select-service hotel developed by the Roedel Hotel Portfolio sponsor that opened in 2002. The Hilton Garden Inn Fishkill Property’s public spaces, including the lobby, meeting room and hallways, were extensively renovated in 2014.
The Hilton Garden Inn Fishkill Property contains 111 guestrooms, a 24-hour business center, 24-hour market, guest laundry, indoor swimming pool with hot tub, fitness center, 44-seat restaurant and lounge and 16-person board room (625 square feet). The guestroom configuration at the Hilton Garden Inn Fishkill Property includes 71 king guestrooms and 40 queen/queen guestrooms. In-room amenities include flat panel TV’s, work desks, complimentary Wi-Fi internet, mini-fridges and coffee makers. There are 125 surface parking spaces.
THE INFORMATION IN THIS STRUCTURAL AND COLLATERAL TERM SHEET IS NOT COMPLETE AND MAY BE AMENDED PRIOR TO THE TIME OF SALE. THIS TERM SHEET IS NOT AN OFFER TO SELL THESE SECURITIES AND IT IS NOT A SOLICITATION OF AN OFFER TO BUY THESE SECURITIES IN ANY JURISDICTION WHERE THE OFFER OR SALE IS NOT PERMITTED.
117
| ROEDEL HOTEL PORTFOLIO |
The Hilton Garden Inn Fishkill Property is located within the Westage Business Park, approximately 5 miles from the IBM East Fishkill/Global Foundries campus, 13 miles from Vassar College and 16 miles from The Culinary Institute of America. The Hilton Garden Inn Fishkill Property is located within 4 miles of The Sports Kingdome, an approximately 350,000 square foot indoor multi-sport complex expected to open in the spring of 2018.
The demand segmentation for the Hilton Garden Inn Fishkill Property is 55% commercial, 30% leisure and 15% group. The top corporate accounts for 2016 were IBM (1,697 room nights), Laerdal Medical Corp (1,107 room nights), Entergy (946 room nights), Global Foundries (824 room nights) and Westinghouse Electric (622 room nights).
The Hilton Garden Inn Fishkill Property is licensed by HLT Existing Franchise Holding LLC, as successor to Hilton Inns, Inc. pursuant to a license agreement dated September 13, 2001 and expiring September 12, 2023 with no extension options.
Holiday Inn Express Auburn Property. The Holiday Inn Express Auburn Property is a four-story, limited service hotel developed by the Roedel Hotel Portfolio sponsor that opened in 2004. The Holiday Inn Express Auburn Property’s public spaces were renovated and guestroom case goods and soft goods replaced in 2015.
The Holiday Inn Express Auburn Property contains 113 guestrooms, a 24-hour lobby workstation, 24-hour market, guest laundry, indoor whirlpool, fitness center and 45-seat breakfast dining area. The Holiday Inn Express Auburn Property offers complimentary baked fresh cookies, coffee and full breakfast. The guestroom configuration at the Holiday Inn Express Auburn Property includes 52 king guestrooms, 39 queen/queen guestrooms, 15 king suites and 7 queen/queen suites. In-room amenities include microwaves, refrigerators, flat panel TV’s, work desks, complimentary Wi-Fi internet and coffee makers. There are 115 surface parking spaces.
The Holiday Inn Express Auburn Property is located proximate to Interstates 290 and 395 and to the Massachusetts Turnpike. The Holiday Inn Express Auburn Property is located within 10 miles of Clark University, College of the Holy Cross, Hanover Theater, Blackstone Valley Shoppes, DCU Center, Worcester Art Museum, UMass Memorial Medical Center Memorial Campus, Worcester Polytechnic Institute, and University of Massachusetts Medical School. Additional local attractions include Old Surbridge Village and Quinsigamond State Park.
The demand segmentation for the Holiday Inn Express Auburn Property is 65% commercial, 25% leisure and 10% group. The top corporate accounts for 2016 were Corporate Lodging (888 room nights), Aerial Wireless (325 room nights), Wheelabrator Group (314 room nights), Matrix Power Supply (204 room nights) and Holy Cross (196 room nights).
The Holiday Inn Express Auburn Property operates as a Holiday Inn Express Hotel & Suites under a license agreement with Holiday Hospitality Franchising, LLC (a subsidiary of InterContinental Hotels Group PLC (“IHG”)) dated October 21, 2013 and expiring May 28, 2024 with no extension options. Holiday Inn Express properties are upper-midscale limited service hotels by IHG and IHG’s largest brand. As of year-end 2016, there were 2,514 Holiday Inn Express properties (192,371 rooms) in the Americas.
THE INFORMATION IN THIS STRUCTURAL AND COLLATERAL TERM SHEET IS NOT COMPLETE AND MAY BE AMENDED PRIOR TO THE TIME OF SALE. THIS TERM SHEET IS NOT AN OFFER TO SELL THESE SECURITIES AND IT IS NOT A SOLICITATION OF AN OFFER TO BUY THESE SECURITIES IN ANY JURISDICTION WHERE THE OFFER OR SALE IS NOT PERMITTED.
118
| ROEDEL HOTEL PORTFOLIO |
The following table presents certain information relating to the historical operating performance and the underwritten net cash flow at the Roedel Hotel Portfolio Properties:
Cash Flow Analysis
| 2013 | 2014 | 2015 | 2016 | 9/30/2017 TTM | U/W | % of U/W Total Rev. | U/W $ per Room | |||||||
| Occupancy | 74.3% | 74.5% | 73.7% | 75.3% | 75.4% | 75.4% | ||||||||
| ADR | $124.43 | $128.89 | $139.42 | $144.88 | $137.41 | $137.41 | ||||||||
| RevPAR | $92.39 | $96.01 | $102.71 | $109.08 | $103.54 | $103.54 | ||||||||
| Room Revenue | $11,769,343 | $12,230,277 | $13,084,315 | $13,933,745 | $13,189,692 | $13,189,692 | 90.0% | $37,793 | ||||||
| F&B Revenue | $874,176 | $912,521 | $1,046,471 | $977,426 | $1,343,128 | $1,343,128 | 9.2 | 3,849 | ||||||
| Other Income(1) | $229,061 | $234,333 | $246,685 | $248,498 | $121,608 | $121,608 | 0.8 | 348 | ||||||
| Total Revenue | $12,872,580 | $13,377,131 | $14,377,471 | $15,159,669 | $14,654,428 | $14,654,428 | 100.0% | $41,990 | ||||||
| Total Dept Expenses | $3,708,453 | $3,793,587 | $3,928,044 | $4,045,915 | $4,254,130 | $4,254,130 | 29.0% | $12,189 | ||||||
| Gross Op Profit | $9,164,127 | $9,583,544 | $10,449,427 | $11,113,754 | $10,400,298 | $10,400,298 | 71.0% | $29,800 | ||||||
| Total Undistrib Exp | $3,979,705 | $4,367,880 | $4,520,133 | $4,615,836 | $4,231,948 | $4,241,788 | 28.9% | $12,154 | ||||||
| Profit Before Fixed Charges | $5,184,422 | $5,215,664 | $5,929,294 | $6,497,918 | $6,168,350 | $6,158,510 | 42.0% | $17,646 | ||||||
| Total Fixed Charges | $644,800 | $678,728 | $677,913 | $713,373 | $701,717 | $770,974 | 5.3% | $2,209 | ||||||
| Net Op Income | $4,539,622 | $4,536,936 | $5,251,381 | $5,784,545 | $5,466,633 | $5,387,536 | 36.8% | $15,437 | ||||||
| FF&E | $514,903 | $535,085 | $575,099 | $606,386 | $586,177 | $586,177 | 4.0% | $1,680 | ||||||
| Net Cash Flow | $4,024,719 | $4,001,851 | $4,676,282 | $5,178,159 | $4,880,456 | $4,801,359 | 32.8% | $13,757 | ||||||
| NOI DSCR | 1.63x | 1.62x | 1.88x | 2.07x | 1.96x | 1.93x | ||||||||
| NCF DSCR | 1.44x | 1.43x | 1.67x | 1.85x | 1.75x | 1.72x | ||||||||
| NOI DY | 10.6% | 10.6% | 12.2% | 13.5% | 12.7% | 12.6% | ||||||||
| NCF DY | 9.4% | 9.3% | 10.9% | 12.1% | 11.4% | 11.2% |
| (1) | Other Income includes pantry revenue, meeting room revenue, internet upgrade revenue, vending, dry cleaning, shuttle and miscellaneous income. |
Appraisal.As of the appraisal valuation date of September 28, 2017, the Roedel Hotel Portfolio Properties had an aggregate “as-is” appraised value of $58,800,000.
Environmental Matters. According to the Phase I environmental assessments dated October 13, 2017, there were no recognized environmental conditions at the Roedel Hotel Portfolio Properties.
Market Overview.The Roedel Hotel Portfolio Properties are located in Manchester, NH, Fishkill, NY and Auburn, MA.
Manchester, NH
The Hilton Garden Inn Manchester Property is located in Manchester, Hillsborough County, New Hampshire. Primary regional access through the area is provided by north/south Interstate 93 which extends to Boston, MA (54 miles) and east/west State Route 101.
Manchester serves as an entertainment, financial, political, retail, and transportation hub for New Hampshire. Additionally, demand drivers to the area include outdoor lake and mountain leisure attractions and tourist destinations including the Palace Theater, Currier Museum of Art, the New Hampshire Motor Speedway, SNHU Arena and Northeast Delta Dental Stadium. Additionally, the Manchester area is home to several colleges including Southern New Hampshire University, St. Anselm College and University of New Hampshire at Manchester, and is host to the New Hampshire presidential primary every four years.
As of 2017, the estimated population within a one-, three- and five-mile radius of the Hilton Garden Inn Manchester Property was 26,324, 102,228 and 137,552, respectively, and the average household income within the same radii was $52,330, $75,532, and $83,195, respectively.
The unemployment rate for Hillsborough County was 2.7% for 2017, which is below the national rate of 4.3% for the same period and the lowest rate for the county in the past ten years. Local development officials have noted that employment has remained strong within the education and healthcare sectors, most notably at major employers including Catholic Medical Center (2,100 employees), Elliott Health System (3,375 employees), and Southern New Hampshire University (1,000 employees). Additionally the local economy is supported by major employers in finance, manufacturing and defense. Top employers in the area include State of New Hampshire (6,054 employees), Fidelity Investments (6,000 employees) and BAE Systems, Inc. (4,594 employees).
THE INFORMATION IN THIS STRUCTURAL AND COLLATERAL TERM SHEET IS NOT COMPLETE AND MAY BE AMENDED PRIOR TO THE TIME OF SALE. THIS TERM SHEET IS NOT AN OFFER TO SELL THESE SECURITIES AND IT IS NOT A SOLICITATION OF AN OFFER TO BUY THESE SECURITIES IN ANY JURISDICTION WHERE THE OFFER OR SALE IS NOT PERMITTED.
119
| ROEDEL HOTEL PORTFOLIO |
According to a third party research report, the occupancy, ADR and RevPAR penetration factors for the Hilton Garden Inn Manchester Property for the September 2017 trailing twelve month period were 112.8%, 136.4% and 154.0%, respectively. The Hilton Garden Inn Manchester Property’s competitive set included only one other downtown hotel.
The appraiser identified two proposed hotels in early development (a 123-room extended-stay Residence Inn by Marriott and a 106-room limited-service Tru by Hilton) which if completed would be partially competitive with the Hilton Garden Inn Manchester Property, however, according to recent local reporting, the development of both hotels has been delayed due to environmental issues and developer delays. The appraiser did not note any new supply currently under construction.
Fishkill, NY
The Hilton Garden Inn Fishkill Property is located in Fishkill, Dutchess County, New York, approximately 70 miles north of New York City. Primary regional access through the area is provided by north/south Interstate 87 and the Taconic State Parkway. Fishkill is also located along Interstate 84 connecting Western Pennsylvania to Massachusetts.
Dutchess County is a popular tourist destination featuring the Dutchess County Fairgrounds, annual events including the Country Living Fair, Dutchess County Fair and Hudson Valley Wine & Food Fest, area wineries and several neighboring towns featuring upscale boutiques and antique districts. There are several historic sites in the region including the Vanderbilt Historic Mansion and home of Franklin Delano Roosevelt and the Bardavon 1869 Opera House.
As of 2017, the estimated population within a one-, three- and five-mile radius of the Hilton Garden Inn Fishkill Property was 10,255, 56,347 and 122,793, respectively, and the average household income within the same radii was $56,154, $54,654 and $55,457, respectively.
The unemployment rate for Dutchess County was 4.3% for July 2017, which matches the national rate of 4.3% for the same period and was the lowest rate for the county (with the exception of 2016 with a rate pf 4.2%) in the past ten years. The local economy is diversely supported by major employers in education including the United State Military Academy, Marist College, Vassar College, Bard College (1,800 employees), the Omega Institute of Holistic Studies and the Culinary Institute of America (1,500 employees), high tech including IBM Corporation (4,100 employees) and Global Foundries (1,800 employees), and healthcare including HealthQuest (5,600 employees) and Vassar Brothers Medical Center (2,100 employees), Mid-Hudson Regional Hospital (1,800 employees) and by Saint Francis Hospital. Additionally, a Gap Inc. distribution center is located approximately one mile from the Hilton Garden Inn Fishkill Property that currently employs 430 people and has planned a $96 million expansion projected to add another 1,200 jobs.
According to a third party research report, the occupancy, ADR and RevPAR penetration factors for the Hilton Garden Inn Fishkill Property for the September 2017 trailing twelve month period were 106.4%, 105.7% and 112.5%, respectively.
In December 2016, two competitive hotels entered the market (the Residence Inn by Marriott and SpringHill Suites by Marriott). The appraiser did not identify any proposed competitive new supply to the market.
Auburn, MA
The Holiday Inn Express Auburn Property is located in Auburn, Worcester County, Massachusetts. Primary regional access through the area is provided by east/west Interstate 90 and north/south Interstate 95. Worcester is located in Central Massachusetts, approximately equidistant from Boston and Springfield, and is the second most populous city in New England after Boston.
As of 2017, the estimated population within a one-, three- and five-mile radius of the Holiday Inn Express Auburn Property was 4,131, 24,027 and 107,182, respectively, and the average household income within the same radii was $90,111, $88,013 and $71,991, respectively.
The unemployment rate for Worchester County was 4.7% for July 2017, which is slightly above the national rate of 4.3% for the same period and was the lowest rate for the county (with the exception of 2016 with a rate pf 3.9%) in the past ten years. The local economy is supported by major employers in education, finance, healthcare and manufacturing. The top employers in the area are UMass Memorial Medical Center, BJ’s Wholesale Club, Inc., BNY Mellon, College of Holy Cross, and Hanover Insurance Group. Other notable local employers include Integrated Genetics, IPG Photonics, MAPFRE Insurance, New England Financial Group, and Saint-Gobain Crop. Additionally in the area, the town of Worcester is currently in the midst of a $565 million redevelopment of a portion of its downtown core which is expected to include more than 2.2 million square feet of commercial, entertainment, medical, residential and retail space.
According to a third party research report, the occupancy, ADR and RevPAR penetration factors for the Holiday Inn Express Auburn Property for the September 2017 trailing twelve month period were 99.2%, 108.1% and 107.2%, respectively.
The appraiser identified one hotel under construction six miles northeast (a 170-room upscale select-service AC Hotel by Marriott) which is expected to be partially competitive to the Holiday Inn Express Auburn Property.
THE INFORMATION IN THIS STRUCTURAL AND COLLATERAL TERM SHEET IS NOT COMPLETE AND MAY BE AMENDED PRIOR TO THE TIME OF SALE. THIS TERM SHEET IS NOT AN OFFER TO SELL THESE SECURITIES AND IT IS NOT A SOLICITATION OF AN OFFER TO BUY THESE SECURITIES IN ANY JURISDICTION WHERE THE OFFER OR SALE IS NOT PERMITTED.
120
| ROEDEL HOTEL PORTFOLIO |
The following table presents certain information relating to the Roedel Hotel Portfolio Properties’ competitive sets:
Subject and Market Historical Occupancy, ADR and RevPAR(1)
Competitive Set(2) | Hilton Garden Inn Manchester Property | Penetration Factor | ||||||||||||||
Year | Occupancy | ADR | RevPAR | Occupancy | ADR | RevPAR | Occupancy | ADR | RevPAR | |||||||
| 9/30/2017 TTM | 67.2% | $118.88 | $79.86 | 75.8% | $162.16 | $122.99 | 112.8% | 136.4% | 154.0% | |||||||
| 12/31/2016 | 68.6% | $125.08 | $86.70 | 73.1% | $174.97 | $127.98 | 106.6% | 139.9% | 147.6% | |||||||
| 12/31/2015 | 68.7% | $114.58 | $78.73 | 76.3% | $163.32 | $123.08 | 111.1% | 142.5% | 156.3% | |||||||
| 12/31/2014 | 68.5% | $105.52 | $72.27 | 75.6% | $148.46 | $112.22 | 110.4% | 140.7% | 155.3% | |||||||
Competitive Set(3) | Hilton Garden Inn Fishkill Property | Penetration Factor | ||||||||||||||
Year | Occupancy | ADR | RevPAR | Occupancy | ADR | RevPAR | Occupancy | ADR | RevPAR | |||||||
| 9/30/2017 TTM | 70.2% | $121.86 | $85.52 | 74.7% | $128.79 | $96.21 | 106.4% | 105.7% | 112.5% | |||||||
| 12/31/2016 | 77.0% | $126.36 | $97.32 | 78.4% | $133.42 | $104.62 | 101.8% | 105.6% | 107.5% | |||||||
| 12/31/2015 | 76.5% | $122.30 | $93.58 | 78.4% | $127.66 | $100.11 | 102.5% | 104.4% | 107.0% | |||||||
| 12/31/2014 | 72.5% | $116.06 | $84.13 | 75.4% | $118.88 | $89.61 | 104.0% | 102.4% | 106.5% | |||||||
Competitive Set(4) | Holiday Inn Express Auburn | Penetration Factor | ||||||||||||||
Year | Occupancy | ADR | RevPAR | Occupancy | ADR | RevPAR | Occupancy | ADR | RevPAR | |||||||
| 9/30/2017 TTM | 75.8% | $109.97 | $83.38 | 75.2% | $118.83 | $89.36 | 99.2% | 108.1% | 107.2% | |||||||
| 12/31/2016 | 75.5% | $111.78 | $84.41 | 74.6% | $124.38 | $92.78 | 98.8% | 111.3% | 109.9% | |||||||
| 12/31/2015 | 70.9% | $110.71 | $78.47 | 67.2% | $123.29 | $82.84 | 94.8% | 111.4% | 105.6% | |||||||
| 12/31/2014 | 67.4% | $105.63 | $71.20 | 72.4% | $116.57 | $84.45 | 107.4% | 110.4% | 118.6% | |||||||
| (1) | Information obtained from a third party hospitality research report. |
| (2) | The September 30, 2017 competitive set included Radisson Hotel Manchester Downtown, Quality Inn Manchester Airport, Courtyard Manchester Boston Regional Airport, Holiday Inn Express & Suites Manchester Airport, Holiday Inn Manchester Airport and Hampton Inn Suites Manchester Bedford. |
| (3) | The September 30, 2017 competitive set included Courtyard Fishkill, Hampton Inn Fishkill, Hyatt House Fishkill, Holiday Inn Express Fishkill Mid Hudson Valley, Springhill Suites Fishkill and Residence Inn Fishkill. |
| (4) | The September 30, 2017 competitive set included La Quinta Inn & Suites Auburn Worcester, Comfort Inn Auburn Worcester, Hampton Inn Auburn and Fairfield Inn & Suites Worcester Auburn. |
The Borrowers.The borrowers are Roedel Partners of Auburn, LLC, Roedel Partners of Fishkill, LLC, Roedel Partners of Fishkill II, LLC, Roedel Partners of Manchester, LLC and Roedel Partners of Manchester II, LLC (individually and collectively, the “Roedel Hotel Portfolio Borrower”), each Delaware limited liability companies with at least one independent director. With respect to the Hilton Garden Inn Fishkill Property, Roedel Partners of Fishkill, LLC and Roedel Partners of Fishkill II, LLC have entered into an operating lease to facilitate compliance with local liquor laws; similarly, with respect to the Hilton Garden Inn Manchester Property, Roedel Partners of Manchester, LLC and Roedel Partners of Manchester II, LLC have entered into an operating lease to facilitate compliance with local liquor laws. Legal counsel to the Roedel Hotel Portfolio Borrower delivered a non-consolidation opinion in connection with the origination of the Roedel Hotel Portfolio Mortgage Loan.
The Sponsor.The sponsors and nonrecourse carveout guarantors are Roedel Companies, LLC, David W. Roedel and Fred B. Roedel, III. David W. Roedel is the Business Development Officer and Fred B. Roedel, III is the Chief Financial Officer of Rodel Companies. Roedel Companies is a New Hampshire based hotel development, acquisition, management, construction and renovation company, the successor company to Chalet Susse International Inc., which was founded in 1967 by Fred B. Roedel. Roedel Companies owns and operates its own portfolio of thirteen hotels, including the Roedel Hotel Portfolio Properties, throughout New Hampshire, Massachusetts, New York, Connecticut and Florida and also provides hotel services to third party hotel owners and investors.
The sponsors are required pursuant to the Roedel Hotel Portfolio Mortgage Loan documents to maintain a minimum net worth of not less than $22 million and are personally liable to the lender for losses due to any amendment, modification or termination of any franchise agreement without the lender’s consent.
Escrows.The Roedel Hotel Portfolio Borrower deposited at loan origination $13,938 for immediate repairs and $55,120 for real estate taxes.
The Roedel Hotel Portfolio Borrower is required to deposit monthly (i) 1/12th the estimated annual real estate taxes (currently $55,120), (ii) 1/12th the estimated annual insurance premiums (unless as currently, the Roedel Hotel Portfolio Property is covered by a blanket policy), (iii) an FF&E reserve deposit (currently $48,848) equal to 4.0% of rents for the calendar month two months prior, and (iv) if applicable, a PIP monthly deposit (currently $0) reasonably estimated by the lender equal to the amount required to timely complete all work described in any property improvement plan.
Beginning 14 months prior to the expiration of a franchise agreement, if for the applicable individual property the Roedel Hotel Portfolio Borrower has not delivered (i) a Franchise Trigger Security Deposit (as defined below) or (ii) either (1) a fully executed Replacement Franchise Agreement or (2) a fully executed franchise renewal agreement, extension agreement or similar document and a comfort letter, each accompanied, in the case of (1) or (2) above, by either (x) the Franchise PIP Deposit (as defined below) or (y) notification of its intention to make monthly deposits of 1/14th of the Franchise PIP Deposit (resulting in a “Franchise Trigger Period”), the Roedel Hotel Portfolio Borrower is required to deposit monthly all excess cash for FF&E reserves until the amount collected equals or exceeds the Franchise Trigger Security Deposit for the applicable individual property.
THE INFORMATION IN THIS STRUCTURAL AND COLLATERAL TERM SHEET IS NOT COMPLETE AND MAY BE AMENDED PRIOR TO THE TIME OF SALE. THIS TERM SHEET IS NOT AN OFFER TO SELL THESE SECURITIES AND IT IS NOT A SOLICITATION OF AN OFFER TO BUY THESE SECURITIES IN ANY JURISDICTION WHERE THE OFFER OR SALE IS NOT PERMITTED.
121
| ROEDEL HOTEL PORTFOLIO |
The Roedel Hotel Portfolio Borrower deposited at loan origination $400,000 to a seasonality reserve and is required to deposit monthly during the payment dates in April, May, June, July, August, September and October the Seasonality Monthly Deposit (currently $0) which amount will be adjusted annually on April 1st to equal the amount which if added to the underwritten net cash flow for the preceding twelve months would cause the debt service coverage ratio to equal 1.05x. Notwithstanding, if beginning April 1, 2021, no event of default is continuing, the Roedel Hotel Portfolio Borrower has not drawn upon the seasonality reserve during the preceding 36 months, and the Roedel Hotel Portfolio Borrower has provided the lender with evidence that Roedel Companies, LLC or an affiliate of the guarantor had at all times during such 36 month period cash or cash equivalents of not less than the Seasonality Cash Reserves Threshold (as defined below), then the requirement for the seasonality reserve will be waived until re-tested the following April.
A “Franchise PIP Deposit” means a deposit in the form of cash or a letter of credit in an amount equal to the positive difference, if any, between (a) the lesser of (i) the product of $15,000 multiplied by the number of guest rooms at the applicable individual property or (ii) the amount required to complete all work described in any property improvement plan, and (b) the sums then on deposit in the PIP reserve held by the lender.
A “Franchise Trigger Security Deposit” means a deposit in the form of cash or a letter of credit in an amount equal to the positive difference, if any, between (a) the greater of (i) the product of $15,000 multiplied by the number of guest rooms at the applicable individual property or (ii) 115% of the amount that the lender reasonably estimates would be sufficient to complete all work necessary in any property improvement plan required by a prospective franchise agreement for the applicable individual property, and (b) the sums then on deposit in the PIP reserve.
The “Seasonality Cash Reserves Threshold” means initially $400,000, which amount will be adjusted annually on April 1stto the amount when added to the underwritten net cash flow would result in a debt service coverage ratio of 1.05x for the trailing twelve months.
Lockbox and Cash Management.The Roedel Hotel Portfolio Borrower has established a lockbox account into which all revenues are required to be deposited. During a Cash Sweep Period (as defined below) all funds in the lockbox account are required to be swept on each business day to a lender-controlled cash management account for payment of among other things debt service, monthly escrows and operating expenses with all excess cash to be deposited (i) if the Cash Sweep Period is due solely to a Franchise Trigger Period, to the FF&E reserve or (ii) otherwise, to an excess cash reserve to be held as additional security for the Roedel Hotel Portfolio Mortgage Loan for so long as a Cash Sweep Period exists.
A “Cash Sweep Period” will occur either (i) during the period when the debt service coverage ratio is below 1.25x for any calendar quarter until (x) the debt service coverage ratio equals or exceeds 1.35x for two consecutive calendar quarters or (y) the Roedel Hotel Portfolio Borrower has deposited cash or a letter of credit in an amount which when added to the underwritten net cash flow would result in a debt service coverage ratio of 1.25x for the trailing twelve month period, or (ii) during a Franchise Trigger Period.
Property Management.The Roedel Hotel Portfolio Properties are managed under separate management agreements by RGH Hospitality, LLC (a borrower-affiliate) each expiring December 31, 2027 and each with two five-year extension options.
Assumption.Following six months from the loan origination date of the Roedel Hotel Portfolio Mortgage Loan, the Roedel Hotel Portfolio Borrower has a right to transfer the Roedel Hotel Portfolio Propertyprovided that certain conditions are satisfied, including (i) no event of default is continuing, (ii) the lender reasonably determines that the proposed transferee satisfies the lender’s credit review and underwriting standards, taking into consideration transferee experience, financial strength and general business standing, (iii) a replacement guarantor assumes the obligations of the Roedel Hotel Portfolio guarantor, (iv) the Roedel Hotel Portfolio Property is licensed with a qualified franchisor, and (v) if required by the lender, the lender has received confirmation from Fitch, DBRS and Moody’s that such assumption will not result in a downgrade, withdrawal or qualification of the respective ratings assigned to the Series 2018-BNK10 certificates.
Partial Release.Following the lockout period, the Roedel Hotel Portfolio Borrower is permitted to release either (but not both) of the Hilton Garden Inn Fishkill Property or the Holiday Inn Express Auburn Property through a partial defeasance, provided among other conditions: (i) no event of default has occurred and is continuing (ii) a release amount is paid equal to 125% of the allocated loan amount ($12,066,327 for the Hilton Garden Inn Fishkill Property or $10,164,966 for the Holiday Inn Express Auburn Property), (iii) the loan-to-value ratio after such release does not exceed the lesser of 73.1% and the loan-to-value immediately prior to the release (iv) the debt service coverage ratio after such release is equal to or greater than 1.76x, (v) the debt yield after such release is equal to or greater than the greater of 11.45% and the debt yield immediately prior to the release, (vi) confirmation is received from Fitch, DBRS and Moody’s that such release will not result in a downgrade, withdrawal or qualification of the respective ratings assigned to the Series 2018-BNK10 certificates, and (vii) such release meets all REMIC requirements.
Real Estate Substitution.Not permitted.
Subordinate and Mezzanine Indebtedness.Not permitted.
Terrorism Insurance.The loan documents require that the “all risk” insurance policy required to be maintained by the Roedel Hotel Portfolio Borrower provide coverage for acts of terrorism in an amount equal to the full replacement cost of the Roedel Hotel Portfolio Properties.
THE INFORMATION IN THIS STRUCTURAL AND COLLATERAL TERM SHEET IS NOT COMPLETE AND MAY BE AMENDED PRIOR TO THE TIME OF SALE. THIS TERM SHEET IS NOT AN OFFER TO SELL THESE SECURITIES AND IT IS NOT A SOLICITATION OF AN OFFER TO BUY THESE SECURITIES IN ANY JURISDICTION WHERE THE OFFER OR SALE IS NOT PERMITTED.
122
(THIS PAGE INTENTIONALLY LEFT BLANK)
123
| MOFFETT TOWERS II – BUILDING 2 |
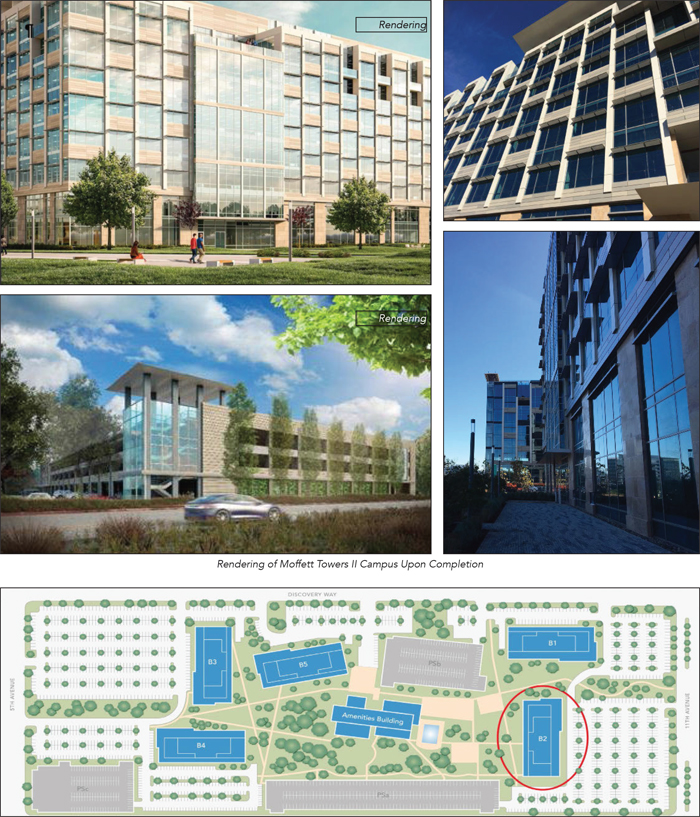
THE INFORMATION IN THIS STRUCTURAL AND COLLATERAL TERM SHEET IS NOT COMPLETE AND MAY BE AMENDED PRIOR TO THE TIME OF SALE. THIS TERM SHEET IS NOT AN OFFER TO SELL THESE SECURITIES AND IT IS NOT A SOLICITATION OF AN OFFER TO BUY THESE SECURITIES IN ANY JURISDICTION WHERE THE OFFER OR SALE IS NOT PERMITTED.
124
| MOFFETT TOWERS II – BUILDING 2 |
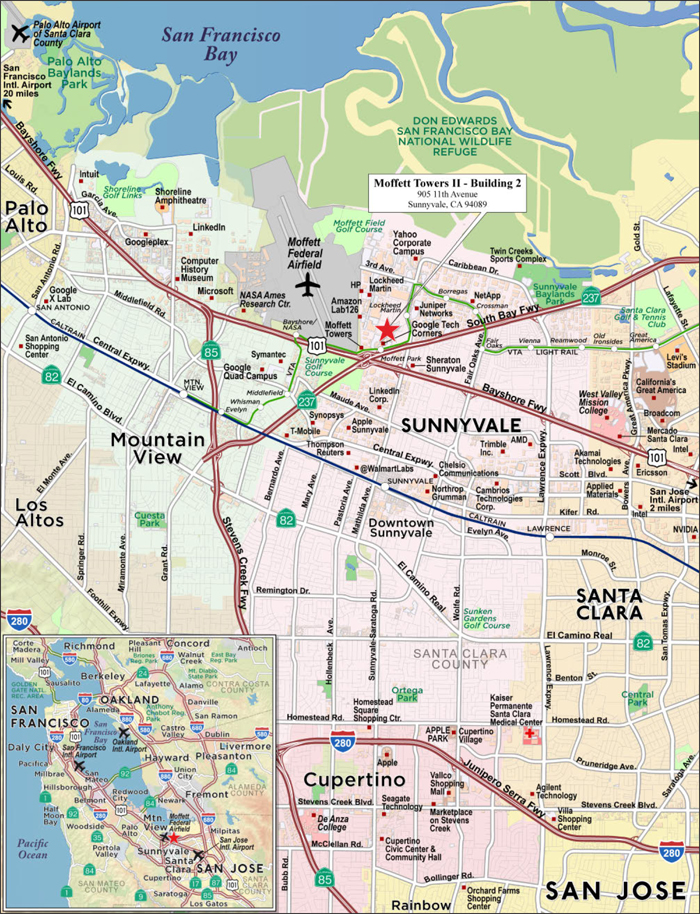
THE INFORMATION IN THIS STRUCTURAL AND COLLATERAL TERM SHEET IS NOT COMPLETE AND MAY BE AMENDED PRIOR TO THE TIME OF SALE. THIS TERM SHEET IS NOT AN OFFER TO SELL THESE SECURITIES AND IT IS NOT A SOLICITATION OF AN OFFER TO BUY THESE SECURITIES IN ANY JURISDICTION WHERE THE OFFER OR SALE IS NOT PERMITTED.
125
| MOFFETT TOWERS II – BUILDING 2 |
| No. 10 – Moffett Towers II - Building 2 | ||||||||
| Loan Information | Property Information | |||||||
| Mortgage Loan Seller: | Morgan Stanley Mortgage Capital Holdings LLC | Single Asset/Portfolio: | Single Asset | |||||
Credit Assessment (DBRS/Fitch/Moody’s): | NR/NR/NR | Property Type: | Office | |||||
| Specific Property Type: | Suburban | |||||||
| Original Principal Balance(1): | $41,250,000 | Location: | Sunnyvale, CA | |||||
| Cut-off Date Balance(1): | $41,250,000 | Size(5): | 362,563 SF | |||||
| % of Initial Pool Balance: | 3.2% | Cut-off Date Balance Per SF(1)(5): | $455.09 | |||||
| Loan Purpose: | Refinance | Year Built/Renovated: | 2017/NAP | |||||
| Borrower Name: | MT2 B2 LLC | Title Vesting: | Fee | |||||
| Borrower Sponsor: | Jay Paul Company | Property Manager: | Self-managed | |||||
| Mortgage Rate: | 3.6189% | 4thMost Recent Occupancy (As of)(6): | NAP | |||||
| Note Date: | November 16, 2017 | 3rdMost Recent Occupancy (As of)(6): | NAP | |||||
| Anticipated Repayment Date: | NAP | 2ndMost Recent Occupancy (As of)(6): | NAP | |||||
| Maturity Date: | December 6, 2027 | Most Recent Occupancy (As of)(6): | NAP | |||||
| IO Period: | 60 months | Current Occupancy (As of): | 100.0% (12/1/2017) | |||||
| Loan Term (Original): | 120 months | |||||||
| Seasoning: | 2 months | |||||||
| Amortization Term (Original): | 360 months | Underwriting and Financial Information: | ||||||
| Loan Amortization Type: | Interest-only, Amortizing Balloon | 4thMost Recent NOI (As of)(6): | NAP | |||||
| Interest Accrual Method: | Actual/360 | 3rdMost Recent NOI (As of)(6): | NAP | |||||
| Call Protection(2): | L(26),D(87),O(7) | 2ndMost Recent NOI (As of)(6): | NAP | |||||
| Lockbox Type: | Hard/Upfront Cash Management | Most Recent NOI (As of)(6): | NAP | |||||
| Additional Debt(1): | Yes | |||||||
| Additional Debt Type(1)(3): | Pari Passu; Mezzanine | |||||||
| U/W Revenues: | $22,525,092 | |||||||
| U/W Expenses: | $2,840,101 | |||||||
| U/W NOI: | $19,684,992 | |||||||
| Escrows and Reserves(4): | U/W NCF: | $18,805,659 | ||||||
| U/W NOI DSCR(1): | 2.18x | |||||||
| Type: | Initial | Monthly(4) | Cap (If Any) | U/W NCF DSCR(1): | 2.08x | |||
| Taxes | $0 | $111,859 | NAP | U/W NOI Debt Yield(1): | 11.9% | |||
| Insurance | $0 | Springing | NAP | U/W NCF Debt Yield(1): | 11.4% | |||
| Rent Concessions Reserve | $8,332,337 | $0 | NAP | As-Is Appraised Value: | $351,000,000 | |||
| TI/LC Reserve | $19,433,495 | $0 | NAP | As-Is Appraisal Valuation Date: | October 18, 2017 | |||
| Debt Service Reserve | $1,000,000 | Springing | NAP | Cut-off Date LTV Ratio(1): | 47.0% | |||
| Parking Abatement Reserve | $2,700,000 | Springing | NAP | LTV Ratio at Maturity or ARD(1): | 42.4% | |||
| Amenities Rent Reserve | $286,310 | Springing | NAP | |||||
| (1) | See “The Mortgage Loan” section. All statistical information related to balance per square foot, loan-to-value ratios, debt service coverage ratios and debt yields are based on the Moffett Towers II - Building 2 Whole Loan (as defined below). The Cut-off Date LTV Ratio, LTV Ratio at Maturity or ARD, U/W NOI DSCR, U/W NCF DSCR, U/W NOI Debt Yield and U/W NCF Debt Yield based on the Moffett Towers II - Building 2 Whole Loan and the Moffett Towers II - Building 2 Mezzanine Loan (as defined below) (together, the “Moffett Towers II - Building 2 Total Debt”), are 76.9%, 72.3%, 1.29x, 1.23x and 7.3% and 7.0%, respectively. |
| (2) | The lockout period will be at least 26 payments, beginning with and including the first payment date of January 6, 2018. Defeasance of the Moffett Towers II - Building 2 Mortgage Loan (as defined below) is permitted at any time after the earlier to occur of (i) two years after the closing date of the securitization that includes the last note to be securitized or (ii) November 16, 2020. The assumed lockout period of 26 payments is based on the expected BANK 2018-BNK10 Trust closing date in February 2018. |
| (3) | See “Subordinate and Mezzanine Indebtedness” section. |
| (4) | Certain springing Escrows and Reserves are required on a one-time basis. See “Escrows” section. |
| (5) | Size of 362,563 square feet is comprised of 350,633 square feet of office space in the Moffett Towers II - Building 2 Property (as defined below) along with 11,930 square feet of space allocated to the Moffett Towers II - Building 2 Property in a 59,650 square foot fitness/amenities building, based on a specified to-be 20.0% share in the common elements of the greater Moffett Towers II Campus. See “Amenities and Common Areas” section. |
| (6) | Historical occupancy, operating and financial information is unavailable as the Moffett Towers II - Building 2 Property (as defined below) was built in 2017. |
The Mortgage Loan.The mortgage loan (the “Moffett Towers II - Building 2 Mortgage Loan”) is part of a whole loan (the “Moffett Towers II - Building 2 Whole Loan”) evidenced by fourpari passu notes secured by a first mortgage encumbering the fee simple interest in a Class A office building fully leased to a wholly-owned subsidiary of Amazon.com, Inc. (“Amazon”) located in Sunnyvale, California (the “Moffett Towers II - Building 2 Property”). The Moffett Towers II - Building 2 Whole Loan was originated on November 16, 2017 by Barclays Bank PLC and Morgan Stanley Bank, N.A. The Moffett Towers II - Building 2 Whole Loan had an original principal balance of $165,000,000, has an outstanding principal balance as of the Cut-off Date of $165,000,000 and accrues interest at an interest rate of 3.6189%per annum. The Moffett Towers II - Building 2 Whole Loan had an initial term of 120 months, has a remaining term of 118 months as of the Cut-off Date and requires interest-only payments for the first 60 payment periods followed
THE INFORMATION IN THIS STRUCTURAL AND COLLATERAL TERM SHEET IS NOT COMPLETE AND MAY BE AMENDED PRIOR TO THE TIME OF SALE. THIS TERM SHEET IS NOT AN OFFER TO SELL THESE SECURITIES AND IT IS NOT A SOLICITATION OF AN OFFER TO BUY THESE SECURITIES IN ANY JURISDICTION WHERE THE OFFER OR SALE IS NOT PERMITTED.
126
| MOFFETT TOWERS II – BUILDING 2 |
by payments of principal and interest based on a 30-year amortization schedule. The Moffett Towers II - Building 2 Whole Loan matures on December 6, 2027.
Note A-4, which will be contributed to the BANK 2018-BNK10 Trust, had an original principal balance of $41,250,000, has an outstanding principal balance as of the Cut-off Date of $41,250,000 and represents a non-controlling interest in the Moffett Towers II - Building 2 Whole Loan. The non-controlling Note A-3, with an original principal balance of $40,000,000, was contributed to the WFCM 2017-C42 Trust. The controlling Note A-1 and the non-controlling Note A-2 are expected to be contributed to future securitization trusts. The lender provides no assurances that any non-securitized notes will not be split further. See“Description of the Mortgage Pool—The Whole Loans—The Non-Serviced Pari Passu Whole Loans” in the Preliminary Prospectus.
Note Summary
| Notes | Original Balance | Note Holder | Controlling Interest | |
| A-1 | $43,000,000 | Barclays Bank PLC | Yes | |
| A-2 | $40,750,000 | Barclays Bank PLC | No | |
| A-3 | $40,000,000 | WFCM 2017-C42 | No | |
| A-4 | $41,250,000 | BANK 2018-BNK10 | No | |
| Total | $165,000,000 |
Following the lockout period, on any date before June 6, 2027, the borrower has the right to defease the Moffett Towers II - Building 2 Whole Loan in whole, but not in part. The lockout period will expire on the earlier to occur of (i) two years after the closing date of the securitization that includes the last note to be securitized or (ii) November 16, 2020. The Moffett Towers II - Building 2 Whole Loan is prepayable without penalty on or after June 6, 2027.
Sources and Uses
| Sources | Uses | |||||
| Original whole loan amount | $165,000,000 | 61.1% | Loan payoff | $207,408,056 | 76.8% | |
| Mezzanine loan | 105,000,000 | 38.9 | Reserves | 31,752,142 | 11.8 | |
| Return of equity | 20,183,519 | 7.5 | ||||
| Closing costs | 10,656,282 | 3.9 | ||||
| Total Sources | $270,000,000 | 100.0% | Total Uses | $270,000,000 | 100.0% |
The Property.The Moffett Towers II - Building 2 Property is a newly-constructed, eight-story, Class A office building totaling 350,633 square feet in Sunnyvale, California. As of December 1, 2017, the Moffett Towers II – Building 2 Property was 100.0% leased to a wholly-owned subsidiary of Amazon on a triple-net basis through April 2028, with two, seven-year extension options and no early termination options. Amazon serves as guarantor of the lease and, as of the origination date, has taken possession of the Moffett Towers II - Building 2 Property and commenced the build out of its space. Outstanding rent concessions and tenant improvement allowances related to the Amazon lease were deposited into escrow by the borrower on the origination date (See “Escrows” section).
The Moffett Towers II - Building 2 Property comprises a portion of the first phase (“Phase I”) of the planned approximately 1.8 million square-foot, five-building Moffett Towers II office campus (the “Moffett Towers II Campus”) located on 47.3 acres in Sunnyvale, California. Phase I of the Moffett Towers II Campus development includes the Moffett Towers II - Building 2 Property and an adjacent surface parking lot (completed in 2017) as well as the 350,633 square foot Moffett Towers II - Building 1 (April 2018 expected completion), an enclosed parking structure (April 2018 expected completion) and a 59,650 square foot fitness/amenities building (July 2018 expected completion). The Moffett Towers II - Building 2 Property is expected to feature access to the fitness/amenities building and the enclosed parking structure once completed pursuant to a declaration of covenants, conditions, restrictions and easement and charges agreement (see “Amenities and Common Areas” section). Inclusive of the future enclosed parking structure (of which 361 spaces are dedicated to Amazon pursuant to its lease) and the completed surface parking lot (of which 707 spaces are dedicated to Amazon pursuant to its lease), the Moffett Towers II - Building 2 Property is expected to have a parking ratio of 3.3 spaces per 1,000 square feet. On the origination date, the Moffett Towers II - Building 2 Guarantor (as defined below) executed a separate guaranty for the completion and delivery of the fitness/amenities building and the enclosed parking structure (see “Completion Guaranty” section). Additionally, the Moffett Towers II - Building 2 Whole Loan documents require upfront and springing reserves related to the completion and delivery of the fitness/amenities building and the enclosed parking structure (see “Escrows” section). Subsequent phases of the Moffett Towers II Campus development are expected to include the construction of three additional 350,633 square foot Class A office buildings as well as two separate enclosed parking structures.
Amazon (NASDAQ: AMZN) is an American e-commerce company headquartered in Seattle, Washington. Founded in 1994, Amazon is now one of the largest online retailers in the world selling a wide range of products, services and entertainment to consumers. Amazon has reported that it increased net income from an approximately $241.0 million loss in 2014 to an approximately $2.4 billion profit in 2016 with total net sales of approximately $136.0 billion in 2016. Most recently, net sales increased to $43.7 billion in the third quarter of 2017, up approximately 34.0% from one year earlier. Amazon employed approximately 341,400 employees as of December 31, 2016.
The Moffett Towers II - Building 2 Property is expected to house Amazon’s Lab126, a research and development subsidiary that designs and engineers high-profile consumer electronics. Lab126 began in 2004, originally creating the Kindle family of products and
THE INFORMATION IN THIS STRUCTURAL AND COLLATERAL TERM SHEET IS NOT COMPLETE AND MAY BE AMENDED PRIOR TO THE TIME OF SALE. THIS TERM SHEET IS NOT AN OFFER TO SELL THESE SECURITIES AND IT IS NOT A SOLICITATION OF AN OFFER TO BUY THESE SECURITIES IN ANY JURISDICTION WHERE THE OFFER OR SALE IS NOT PERMITTED.
127
| MOFFETT TOWERS II – BUILDING 2 |
has since produced devices such as Amazon’s Fire tablets, Fire TV and Amazon Echo. Lab126 is headquartered in the nearby Moffett Towers I, which is located approximately 0.5 miles from the Moffett Towers II - Building 2 Property.
The following table presents certain information relating to the tenancy at the Moffett Towers II - Building 2 Property:
Major Tenants
| Tenant Name | Credit Rating (Fitch/Moody’s/S&P)(1) | Tenant NRSF(2) | % of NRSF(2) | Annual U/W Base Rent PSF(2)(3)(4)(5) | Annual U/W Base Rent(3)(4)(5) | % of Total Annual U/W Base Rent | Lease Expiration Date |
| Major Tenant | |||||||
| Amazon | NR/Baa1/AA- | 362,563 | 100.0% | $55.81 | $20,233,410 | 100.0% | 4/30/2028(6) |
| Total Major Tenant | 362,563 | 100.0% | $55.81 | $20,233,410 | 100.0% | ||
| Vacant Space | 0 | 0.0% | |||||
| Collateral Total | 362,563 | 100.0% | |||||
| (1) | Certain ratings are those of the parent company whether or not the parent company guarantees the lease. |
| (2) | Tenant NRSF of 362,563 square feet is comprised of 350,633 square feet of office space in the Moffett Towers II - Building 2 Property along with 11,930 square feet of space allocated to the Moffett Towers II - Building 2 Property in a 59,650 square foot fitness/amenities building, based on a specified to-be 20.0% share in the common elements of the greater Moffett Towers II Campus. See “Amenities and Common Areas” section. |
| (3) | Annual U/W Base Rent PSF and Annual U/W Base Rent include $2,830,405 of straight-line rent through the maturity date of the Moffett Towers II - Building 2 Whole Loan. Annual U/W Base Rent PSF and U/W Base Rent also includes $572,621 of amenities use fees. |
| (4) | Amazon has five months of free rent and eight months of waived fitness/amenities use fees remaining, all of which were deposited into escrow on the origination date. The borrower also deposited $286,310 into escrow on the origination date for an Amenities Rent Reserve, which represents six months of use fees due for the fitness/amenities building commencing on the targeted completion and delivery date (July 31, 2018) of such fitness/amenities building to Amazon in accordance with the Amazon lease (see “Escrows” section). |
| (5) | Amazon is entitled to a base rent abatement in the amount of $15,000 per day for each day elapsing beyond the targeted completion and delivery date (April 15, 2018) of the 361-spaces allocated to Amazon within the enclosed parking structure in accordance with the Amazon lease. An amount equal to 180 days of base rent abatements ($2,700,000) was deposited into escrow on the origination date (see “Escrows” section). |
| (6) | Amazon has two, seven-year lease renewal options. |
The following table presents certain information relating to the lease rollover schedule at the Moffett Towers II - Building 2 Property:
Lease Expiration Schedule(1)
| Year Ending December 31, | No. of Leases Expiring | Expiring NRSF | % of Total NRSF | Cumulative Expiring NRSF | Cumulative % of Total NRSF | Annual U/W Base Rent(2) | % of Annual U/W Base Rent(2) | Annual U/W Base Rent PSF(2) |
| MTM | 0 | 0 | 0.0% | 0 | 0.0% | $0 | 0.0% | $0.00 |
| 2018 | 0 | 0 | 0.0% | 0 | 0.0% | $0 | 0.0% | $0.00 |
| 2019 | 0 | 0 | 0.0% | 0 | 0.0% | $0 | 0.0% | $0.00 |
| 2020 | 0 | 0 | 0.0% | 0 | 0.0% | $0 | 0.0% | $0.00 |
| 2021 | 0 | 0 | 0.0% | 0 | 0.0% | $0 | 0.0% | $0.00 |
| 2022 | 0 | 0 | 0.0% | 0 | 0.0% | $0 | 0.0% | $0.00 |
| 2023 | 0 | 0 | 0.0% | 0 | 0.0% | $0 | 0.0% | $0.00 |
| 2024 | 0 | 0 | 0.0% | 0 | 0.0% | $0 | 0.0% | $0.00 |
| 2025 | 0 | 0 | 0.0% | 0 | 0.0% | $0 | 0.0% | $0.00 |
| 2026 | 0 | 0 | 0.0% | 0 | 0.0% | $0 | 0.0% | $0.00 |
| 2027 | 0 | 0 | 0.0% | 0 | 0.0% | $0 | 0.0% | $0.00 |
| 2028 | 1 | 362,563 | 100.0% | 362,563 | 100.0% | $20,233,410 | 100.0% | $55.81 |
| Thereafter | 1 | 0 | 0.0% | 362,563 | 100.0% | $0 | 0.0% | $0.00 |
| Vacant | 0 | 0 | 0.0% | 362,563 | 100.0% | $0 | 0.0% | $0.00 |
| Total/Weighted Average | 1 | 362,563 | 100.0% | $20,233,410 | 100.0% | $55.81 |
| (1) | Information obtained from the underwritten rent roll. |
| (2) | Annual U/W Base Rent, % of Annual U/W Base Rent and Annual U/W Base Rent PSF include $2,830,405 of straight-line rent through the maturity date of the Moffett Towers II - Building 2 Whole Loan. |
The following table presents historical occupancy percentages at the Moffett Towers II - Building 2 Property:
Historical Occupancy
12/31/2013(1) | 12/31/2014(1) | 12/31/2015(1) | 12/31/2016(1) | 12/1/2017(2) | ||||
| NAP | NAP | NAP | NAP | 100.0% |
| (1) | Historical Occupancy prior to 12/6/2017 is not applicable as the Moffett Towers II - Building 2 Property was built in 2017. |
| (2) | Information obtained from the underwritten rent roll. |
THE INFORMATION IN THIS STRUCTURAL AND COLLATERAL TERM SHEET IS NOT COMPLETE AND MAY BE AMENDED PRIOR TO THE TIME OF SALE. THIS TERM SHEET IS NOT AN OFFER TO SELL THESE SECURITIES AND IT IS NOT A SOLICITATION OF AN OFFER TO BUY THESE SECURITIES IN ANY JURISDICTION WHERE THE OFFER OR SALE IS NOT PERMITTED.
128
| MOFFETT TOWERS II – BUILDING 2 |
Underwritten Net Cash Flow. The following table presents certain information relating to the underwritten net cash flow at the Moffett Towers II - Building 2 Property:
Cash Flow Analysis(1)
| U/W | % of U/W Effective Gross Income | U/W $ per SF | |||||
| Base Rent(2) | $20,233,410 | 89.8% | $55.81 | ||||
| Grossed Up Vacant Space | 0 | 0.0 | 0.00 | ||||
| Total Reimbursables | 2,751,378 | 12.2 | 7.59 | ||||
| Less Vacancy & Credit Loss(3) | (459,696) | (2.0) | (1.27) | ||||
| Effective Gross Income | $22,525,092 | 100.0% | $62.13 | ||||
| Total Operating Expenses | $2,840,101 | 12.6% | $7.83 | ||||
| Net Operating Income | $19,684,992 | 87.4% | $54.29 | ||||
| TI/LC | 806,820 | 3.6 | 2.23 | ||||
| Capital Expenditures | 72,513 | 0.3 | 0.20 | ||||
| Net Cash Flow | $18,805,659 | 83.5% | $51.87 | ||||
| NOI DSCR(4) | 2.18x | ||||||
| NCF DSCR(4) | 2.08x | ||||||
| NOI DY(4) | 11.9% | ||||||
| NCF DY(4) | 11.4% | ||||||
| (1) | Historical Cash Flows are not applicable as the Moffett Towers II - Building 2 Property was built in 2017. |
| (2) | U/W Base Rent includes $2,830,405 of straight-line rent through the maturity date of the Moffett Towers II - Building 2 Whole Loan. U/W Base Rent also includes $572,621 of amenities use fees. |
| (3) | The underwritten economic vacancy is 2.0%. The Moffett Towers II - Building 2 Property was 100.0% leased as of December 1, 2017. |
| (4) | Debt service coverage ratios and debt yields are based on the Moffett Towers II - Building 2 Whole Loan. |
Appraisal.As of the appraisal valuation date of October 18, 2017 the Moffett Towers II - Building 2 Property had an “as-is” appraised value of $351,000,000. The appraiser also concluded to a “hypothetical go dark” appraised value of $246,600,000.
Environmental Matters. According to a Phase I environmental site assessment (“ESA”) dated October 19, 2017, the Moffett Towers II - Building II Property was part of a larger campus historically used by Lockheed Martin for aerospace manufacturing, research and development that covers approximately 660 acres, known as the Lockheed Martin Plant One Campus. The Lockheed Martin Plant One Campus is included in a Site Cleanup Requirements Order issued by the Regional Water Quality Control Board (“RWQCB”) which applies to a large portion of the Lockheed Martin Plant One Campus. According to the ESA, no significant sources of soil or groundwater pollution have been identified on the Moffett Towers II - Building II Property during historical or more recent investigations of the Plant One Campus. The responsible party associated with this release has been identified by state and Federal regulatory agencies as Lockheed Martin, and Lockheed Martin is currently conducting response actions under state and Federal oversight. Although there is an active regulatory status, the ESA concluded, given the absence of impact, that this is considered a business environmental risk. See “Description of the Mortgage Pool—Mortgage Pool Characteristics–Environmental Considerations” in the Preliminary Prospectus.
Market Overview and Competition.The Moffett Towers II - Building II Property is located in Moffett Park, in the northern portion of the Sunnyvale submarket within Silicon Valley. Moffett Park is a 519-acre area comprised of recently developed office spaces and research and development buildings. Notable high technology firms currently in Moffett Park include Google Inc., Hewlett Packard, Juniper Networks, Lab 126 (an Amazon subsidiary), Lockheed-Martin, Microsoft, Motorola, NetApp and Rambus. The Moffett Towers II - Building II Property is just north of State Highway 237, which forms the southern border of the Moffett Park area and provides access from Interstate 680 and Interstate 280 to the northeast and U.S. Highway 101 in Sunnyvale to the southwest. U.S. Highway 101 runs northward through San Francisco and southward through San Jose, terminating in the city of Los Angeles. The Santa Clara County Transit System provides bus service county-wide with stops near the Moffett Towers II - Building II Property. In addition, a Santa Clara Light Rail System station is located directly across the street from the Moffett Towers II - Building II Property and services the surrounding residential communities.
According to the appraisal, overall vacancy in Silicon Valley and the Sunnyvale submarket was 11.1% and 2.4%, respectively, as of second quarter of 2017. In the first half of 2017, 315,272 square feet of office space was delivered to the Sunnyvale submarket, with 426,404 square feet of absorption. According to the appraisal, as of the second quarter of 2017, new supply under construction in Silicon Valley stood at approximately 2.8 million square feet, which consisted of approximately 0.7 million square feet of build-to-suit construction and 2.1 million square feet of speculative construction. As of the second quarter of 2017, the total office average asking rent for the Sunnyvale submarket was $52.20 per square foot (fully-serviced), which is in-line with the Silicon Valley total office average asking rent of $53.40 per square foot (fully-serviced). Within the Sunnyvale submarket, the average asking rent for Class A office properties is $58.20 per square foot (fully-serviced).
THE INFORMATION IN THIS STRUCTURAL AND COLLATERAL TERM SHEET IS NOT COMPLETE AND MAY BE AMENDED PRIOR TO THE TIME OF SALE. THIS TERM SHEET IS NOT AN OFFER TO SELL THESE SECURITIES AND IT IS NOT A SOLICITATION OF AN OFFER TO BUY THESE SECURITIES IN ANY JURISDICTION WHERE THE OFFER OR SALE IS NOT PERMITTED.
129
| MOFFETT TOWERS II – BUILDING 2 |
The following table presents certain information relating to comparable leases to the Moffett Towers II - Building 2 Property:
Comparable Leases(1)
| Property Name/Location | Year Built | Class | Stories | Total GLA (SF) | Tenant Name | Lease Date/Term | Lease Area (SF) | Annual Base Rent PSF | Lease Type |
Towers at Great America Santa Clara, CA | 2002 | A | 6 | 374,214 | Macom Connectivity | May 2017 / 1 Yr | 55,393 | $42.00 | NNN |
Santa Clara Square Ph. II Bldg. 4 Santa Clara, CA | 2016 | A | 6 | 220,156 | AMD | Aug. 2016 / 10 Yrs | 220,156 | $42.60 | NNN |
Moffett Gateway Santa Clara, CA | 2016 | A | 7 | 612,796 | Google, Inc. | July 2016 / 11 Yrs | 612,796 | $44.40 | NNN |
Santa Clara Square Ph. II Bldg. 5 Santa Clara, CA | 2016 | A | 6 | 220,156 | Cambridge Industries | May 2016 / 7 Yrs | 74,376 | $43.80 | NNN |
Central & Wolfe Campus Sunnyvale, CA | 2018 (Est.) | A | 4 | 871,214 | Apple, Inc. | Sep. 2015 / 13 Yrs | 871,214 | $40.08 | NNN |
599 Castro Mountain View, CA | 2017 | A | 4 | 94,918 | Pure Storage | Aug. 2017 / 7 Yrs | 45,000 | $90.00 | NNN |
| (1) | Information obtained from the appraisal. |
The Borrower.The borrower for the Moffett Towers II - Building 2 Whole Loan is MT2 B2 LLC, a Delaware limited liability company and a special purpose entity with two independent directors (the “Moffett Towers II - Building 2 Borrower”). Legal counsel to the borrower delivered a non-consolidation opinion in connection with the origination of the Moffett Towers II - Building 2 Whole Loan. Paul Guarantor LLC, a Delaware limited liability company, (the “Moffett Towers II - Building 2 Guarantor”) is the guarantor of certain nonrecourse carveouts under the Moffett Towers II - Building 2 Whole Loan. Paul Guarantor LLC is wholly owned by the Jay Paul Revocable Living Trust, of which Jay Paul is trustee and grantor. The Moffett Towers II – Building 2 Borrower is affiliated with the borrower under the Apple Campus 3 Mortgage Loan.
The Borrower Sponsor.The borrower sponsor is Jay Paul Company, a privately held real estate firm based in San Francisco, California. Founded in 1975, Jay Paul Company concentrates on the acquisition, development, and management of commercial properties throughout California. Jay Paul Company has developed over 11.0 million square feet of institutional quality space. Jay Paul Company’s portfolio includes other properties in Moffett Park, including Moffett Gateway, Moffett Towers and Moffett Towers II. Jay Paul Company is currently redeveloping over 55 acres in Moffett Park, including Moffett Place, a new, Class A office development, which is expected to contain approximately 1.9 million square feet of net rentable building area, in six, eight-story buildings.
Escrows.The Moffett Towers II - Building 2 Whole Loan documents provide for upfront reserves in the amount of $19,433,495 for outstanding tenant improvements relating to the Amazon space and $8,332,337 for outstanding rent concessions due under the Amazon lease.
The Moffett Towers II - Building 2 Whole Loan documents also provide for upfront reserves in the amount of $2,700,000 for a Parking Rent Abatement Reserve and $286,310 for an Amenities Rent Reserve related to the completion and delivery of the enclosed parking structure and the fitness/amenities building, respectively, which amounts were deposited into a lender-controlled account (the “Parking and Amenities Building Account”). The Parking Rent Abatement Reserve represents 180 days of base rent abatements ($15,000 per day) due to Amazon for each day elapsing beyond the targeted completion and delivery date (April 15, 2018) of the 361 spaces allocated to Amazon within the enclosed parking structure, in accordance with the Amazon lease. The Amenities Rent Reserve represents six months of use fees due for the fitness/amenities building, pursuant to the Amazon lease, commencing on the targeted completion and delivery date (July 31, 2018) of such fitness/amenities building to Amazon in accordance with the Amazon lease (use fees that would be due for the fitness/amenities building following the origination date through July 31, 2018 are included in the $8,332,337 upfront reserve for outstanding rent concessions due under the Amazon lease). If the terms of the Required Parking Spaces Satisfaction (as defined below) have not occurred on or prior to September 15, 2018, the borrower will be required to deposit an additional $2,700,000 into the Parking and Amenities Building Account. If the terms of the Amenities Building Satisfaction (as defined below) have not occurred on or prior to January 31, 2019, the borrower will be required to deposit an additional $286,310 (the “Additional Amenities Rent Amount”) into the Parking and Amenities Building Account. Amounts on deposit in the Parking and Amenities Building Account will be held by the lender as additional collateral for the Moffett Towers II - Building 2 Whole Loan. Provided no event of default under the Moffett Towers II - Building 2 Whole Loan is continuing, the amounts deposited into the Parking and Amenities Building Account will be released to the borrower upon the occurrence of the related Required Parking Spaces Satisfaction or Amenities Building Satisfaction, as applicable.
A “Required Parking Spaces Satisfaction” will occur on the date that (i) the borrower delivers evidence reasonably acceptable to the lender that the borrower has delivered 361 additional spaces to Amazon pursuant to its lease and (ii) Amazon has delivered written confirmation that (a) the borrower has delivered 361 additional spaces to Amazon pursuant to its lease and (b) Amazon is no longer entitled to base rent abatement related to the delivery of the enclosed parking structure pursuant to its lease.
An “Amenities Building Satisfaction” will occur on the date that (i) the borrower delivers evidence reasonably acceptable to the lender that the amenities building has been completed in conformance with all applicable requirements and (ii) Amazon has delivered written confirmation that the amenities building is useable and has commenced the payment of the use fees applicable to the amenities building pursuant to the Amazon lease.
THE INFORMATION IN THIS STRUCTURAL AND COLLATERAL TERM SHEET IS NOT COMPLETE AND MAY BE AMENDED PRIOR TO THE TIME OF SALE. THIS TERM SHEET IS NOT AN OFFER TO SELL THESE SECURITIES AND IT IS NOT A SOLICITATION OF AN OFFER TO BUY THESE SECURITIES IN ANY JURISDICTION WHERE THE OFFER OR SALE IS NOT PERMITTED.
130
| MOFFETT TOWERS II – BUILDING 2 |
Additionally, the Moffett Towers II - Building 2 Whole Loan documents provide for an upfront reserve in the amount of $1,000,000 for a debt service reserve which amount was deposited into a lender-controlled account (the “Debt Service Reserve Account”). If the Required Parking Spaces Satisfaction has not occurred on or prior to September 15, 2018, the borrower will be required to deposit an additional $1,000,000 into the Debt Service Reserve Account. Provided no event of default under the Moffett Towers II - Building 2 Whole Loan is continuing, amounts remaining in the Debt Service Reserve Account will be released to the borrower upon the occurrence of the Required Parking Spaces Satisfaction.
The Moffett Towers II - Building 2 Whole Loan documents require monthly reserve deposits for real estate taxes in an amount equal to one-twelfth of the real estate taxes that the lender estimates will be payable during the next twelve months, initially $111,859. The Moffett Towers II - Building 2 Whole Loan documents do not require ongoing monthly escrows for insurance premiums as long as the Moffett Towers II - Building 2 Property is insured via an acceptable blanket insurance policy and such policy is in effect. The Moffett Towers II - Building 2 Whole Loan documents do not provide for monthly reserve deposits for capital expenditures at origination, but provide for the lender to reassess the amount necessary for capital expenditures at the Moffett Towers II - Building 2 Property and may require monthly capital expenditures reserve deposits if necessary to maintain proper operation of the Moffett Towers II - Building 2 Property.
Lockbox and Cash Management.The Moffett Towers II - Building 2 Whole Loan is structured with a hard lockbox and an in-place cash management. The borrower was required at origination to deliver letters to all tenants at the Moffett Towers II - Building 2 Property directing them to pay all rents directly into a lender-controlled lockbox account. All funds received by the borrower or the manager are required to be deposited in the lockbox account within one business day following receipt. Funds on deposit in the lockbox account are required to be swept on each business day into a lender-controlled cash management account and applied on each payment date to the payment of debt service, the funding of required reserves, budgeted monthly operating expenses, common charges under various reciprocal easement agreements, including the CCR (as defined below), approved extraordinary operating expenses, debt service on the Moffett Towers II - Building 2 Mezzanine Loan and, during a Lease Sweep Period (as defined below), an amount equal to $438,291 to fund a lease sweep reserve account (the “Lease Sweep Reserve Account”) until the aggregate funds swept in the Lease Sweep Reserve Account during such lease sweep equals the Lease Sweep Reserve Threshold (as defined below) and then to the Debt Service Reserve Account until the aggregate funds transferred to the Lease Sweep Reserve Account and the Debt Service Reserve Account during such lease sweep equals the Lease Sweep and Debt Service Reserve Cap (as defined below). Provided no Trigger Period (as defined below) is continuing, excess cash in the deposit account will be disbursed to the borrower in accordance with the Moffett Towers II - Building 2 Whole Loan documents. If a Trigger Period is continuing (other than a Trigger Period due to a Lease Sweep Period), excess cash in the deposit account will be transferred to an account (the “Cash Collateral Account”) held by the lender as additional collateral for the Moffett Towers II - Building 2 Whole Loan.
A “Trigger Period” will commence upon the earlier of the following:
| (i) | an event of default under the Moffett Towers II - Building 2 Whole Loan; |
| (ii) | if, as of the last day of any calendar quarter during the term of the Moffett Towers II - Building 2 Whole Loan (a) the credit rating of a Lease Sweep Tenant Party (as defined below) under a Lease Sweep Lease (as defined below) by Fitch, Moody’s or S&P is less than “BBB-”, “Baa3” or “BBB-”, respectively and (b) the debt service coverage ratio falls below 1.50x based on the Moffett Towers II - Building 2 Whole Loan or 1.10x based on the Moffett Towers II - Building 2 Total Debt (a “Low Debt Service Period”); |
| (iii) | the continuance of a Lease Sweep Period; or |
| (iv) | an event of default under the Moffett Towers II - Building 2 Mezzanine Loan; |
and will end:
| (a) | with regard to clause (i) above, upon the cure of such event of default and acceptance of such cure by the lender; |
| (b) | with regard to clause (ii) above, upon the earlier to occur of (1) the date that the debt service coverage ratio is at least 1.50x based on the Moffett Towers II - Building 2 Whole Loan and 1.10x based on the Moffett Towers II - Building 2 Total Debt for two consecutive calendar quarters and (2) the balance on deposit in the Cash Collateral Account is equal to $17,531,650 ($50.00 per rentable square foot); |
| (c) | with regard to clause (iii) above, upon the ending of such Lease Sweep Period; and |
| (d) | with regard to clause (iv) above, receipt of notice from the mezzanine lender of the cure or waiver of the event of default under the mezzanine loan. |
A “Lease Sweep Period” will commence following the earliest to occur of any of the following (each a “Lease Sweep Event”):
| (i) | with respect to the Amazon lease, Amazon fails to give notice of its intent to renew or extend such lease on or prior to December 6, 2025; |
| (ii) | the date on which, with respect to any Lease Sweep Lease, (a) a Lease Sweep Tenant Party cancels or terminates its Lease Sweep Lease with respect to all or a Material Termination Portion (as defined below) of the Lease Sweep Space (as defined below) subject to such Lease Sweep Lease prior to the then current expiration date under such Lease Sweep Lease, or (b) a Lease Sweep Tenant Party delivers to the borrower notice that it is canceling or terminating its Lease Sweep Lease with respect to all or a Material Termination Portion of the Lease Sweep Space subject to such Lease Sweep Lease (the affected space being the “Terminated Space”); provided, however, no Lease Sweep Period shall commence pursuant this clause (ii) if, in connection with such termination or cancellation (or delivery of notice of termination or cancellation), the borrower simultaneously enters into a replacement lease with an entity or a wholly-owned subsidiary of an entity rated “BBB-” or equivalent by at least two of Fitch, Moody’s and S&P (an “Investment Grade Entity”) covering the Terminated Space, provided that such replacement lease is a qualified lease and the occupancy conditions, as specified in the Moffett Towers II - Building 2 Whole Loan documents, are satisfied with respect to such replacement lease on or prior to the date of such termination or cancellation (or delivery of notice of termination or cancellation); |
| (iii) | the date on which, with respect to any Lease Sweep Lease, a Lease Sweep Tenant Party ceases operating its business (i.e., “goes dark”) at 20.0% or more of its Lease Sweep Space on a rentable square foot basis (a “Dark Period Event” |
THE INFORMATION IN THIS STRUCTURAL AND COLLATERAL TERM SHEET IS NOT COMPLETE AND MAY BE AMENDED PRIOR TO THE TIME OF SALE. THIS TERM SHEET IS NOT AN OFFER TO SELL THESE SECURITIES AND IT IS NOT A SOLICITATION OF AN OFFER TO BUY THESE SECURITIES IN ANY JURISDICTION WHERE THE OFFER OR SALE IS NOT PERMITTED.
131
| MOFFETT TOWERS II – BUILDING 2 |
| and the affected space being the “Dark Space”), provided, however, that if the Lease Sweep Tenant Party either (a) is an Investment Grade Entity or (b) has subleased the Dark Space portion of its premises to an Investment Grade Entity who has accepted delivery thereof (i.e., the lease has commenced) and is paying unabated rent at a contract rate no less than the contract rate required under the Lease Sweep Lease, such Lease Sweep Tenant Party shall not be deemed to have “gone dark” for purposes of this clause (iii) and no Lease Sweep Period shall commence pursuant to this clause (iii); |
| (iv) | upon a default under a Lease Sweep Lease by the tenant thereunder that continues beyond any applicable notice and cure period; |
| (v) | upon a Lease Sweep Tenant Party being subject to an insolvency proceeding; or |
| (vi) | the date on which Amazon is no longer an Investment Grade Entity (an “Amazon Downgrade Event”). |
A Lease Sweep Period (other than a Lease Sweep Period triggered by clause (v) above) will not be triggered (or, if already triggered, may be terminated) if the borrower delivers to the lender an acceptable letter of credit in an amount equal to $12,272,155 ($35.00 per square foot) provided, if such Lease Sweep Period is triggered by clause (iii) or (vi) above, such acceptable letter of credit is required to be in an amount equal to $17,531,650 ($50.00 per square foot).
A Lease Sweep Period will end on the earliest of the applicable of the following to occur:
| (a) | with regard to clause (i) or (ii) above, the date on which, with respect to each Lease Sweep Space (1) in the case of clause (i), the Lease Sweep Tenant Parties have exercised a renewal or an extension right under their respective Lease Sweep Lease, provided that the Lease Sweep Lease in question is a qualified lease and the occupancy conditions, as specified in the Moffett Towers II - Building 2 Whole Loan documents, are satisfied, (2) in the case of clauses (i) or (ii) above, one or more replacement tenants acceptable to the lender (in its sole but good faith discretion) execute and deliver replacement lease(s) covering the Requisite Lease Sweep Space (as defined below), provided that such replacement lease(s) are qualified leases and the occupancy conditions, as specified in the Moffett Towers II - Building 2 Whole Loan documents, are satisfied or (3) a combination of lease renewals or extensions (as described in subclause (1) of this clause (a)) and replacement lease(s) (as described in subclause (2) of this clause (a)) occurs; |
| (b) | with regard to clause (iii) or (vi) above, the date on which either (1) one or more replacement tenants acceptable to the lender (in its sole but good faith discretion) execute and deliver replacement lease(s) covering the Requisite Lease Sweep Space, provided that such replacement tenant(s) and lease(s) are qualified leases and the occupancy conditions, as specified in the Moffett Towers II - Building 2 Whole Loan documents, are satisfied or (2) for a Dark Period Event or an Amazon Downgrade Event, Amazon is restored as an Investment Grade Entity or the entirety of the Lease Sweep Space has been sublet to an Investment Grade Entity who has accepted delivery thereof (i.e., the lease has commenced) and is paying unabated rent at a contract rate no less than the contract rate required under the Lease Sweep Lease; |
| (c) | with regard to clause (iv) above, the date on which the default has been cured and no other default under such Lease Sweep Lease occurs for a period of three consecutive months following such cure; |
| (d) | with regard to clause (v) above, the Lease Sweep Tenant Party insolvency proceeding has terminated and the applicable Lease Sweep Lease has been affirmed, assumed or assigned in a manner satisfactory to the lender; and |
| (e) | with regard to clause (i), (ii), (iii), (iv) and (vi) above, the date on which the aggregate amount of funds transferred into the Lease Sweep Reserve Account and the Debt Service Reserve Account equals the applicable Lease Sweep And Debt Service Reserve Cap (as defined below) and if a Lease Sweep Period is continuing due to the occurrence of more than one Lease Sweep Event, the aggregate amount of funds required to be transferred over the course of the Lease Sweep Period shall be equal to the amount of the largest Lease Sweep And Debt Service Reserve Cap applicable to all then-continuing Lease Sweep Periods, such that each Lease Sweep Period shall be treated as concurrent and not duplicative or independent of another. |
The “Lease Sweep and Debt Service Reserve Cap” means (a) with respect to a Lease Sweep Period continuing solely pursuant to clause (i) and/or (iv) above, $12,272,155 ($35.00 per square foot), (b) with respect to a Lease Sweep Period continuing solely pursuant to clause (ii) above, $35.00 per square foot of the Terminated Space, (c) with respect to a Lease Sweep Period continuing pursuant to clause (iii) above, whether or not a Lease Sweep Period pursuant to clause (i), (ii) and or/(iv) above is concurrently continuing, $50.00 per square foot of Dark Space or (d) with respect to clause (vi) above, whether or not a Lease Sweep Period pursuant to clause (i), (ii), (iii) and/or (iv) above is concurrently continuing, $17,531,650 ($50.00 per square foot).
The “Lease Sweep Reserve Threshold” means (a) with respect to a Lease Sweep Period continuing solely pursuant to clause (i), (iv) and/or (vi) above, $10,518,990 ($30.00 per square foot) or (b) with respect to a Lease Sweep Period continuing solely pursuant to clause (ii) or (iii) above, $30.00 per square foot of the Dark Space or Terminated Space.
The “Lease Sweep Space” means the space demised under a Lease Sweep Lease.
A “Lease Sweep Lease” is the Amazon lease or any replacement lease or leases which cover at least 75.0% of the rentable square feet demised under the Amazon lease as of November 16, 2017 (the “Requisite Lease Sweep Space”).
A “Lease Sweep Tenant Party” is a tenant under a Lease Sweep Lease or its direct or indirect parent company (if any).
A “Material Termination Portion” is, with respect to any space under a Lease Sweep Lease, if the tenant under a Lease Sweep Lease cancels or terminates its Lease Sweep Lease with respect to at least 40,000 or more square feet of space (or, if a full floor of space is less than 40,000 square feet, a full floor of space) but less than the entirety of the space under such Lease Sweep Lease, the portion of space under the Lease Sweep Lease affected by such cancellation or termination.
Property Management. The Moffett Towers II - Building 2 Property is managed by an affiliate of the borrower.
THE INFORMATION IN THIS STRUCTURAL AND COLLATERAL TERM SHEET IS NOT COMPLETE AND MAY BE AMENDED PRIOR TO THE TIME OF SALE. THIS TERM SHEET IS NOT AN OFFER TO SELL THESE SECURITIES AND IT IS NOT A SOLICITATION OF AN OFFER TO BUY THESE SECURITIES IN ANY JURISDICTION WHERE THE OFFER OR SALE IS NOT PERMITTED.
132
| MOFFETT TOWERS II – BUILDING 2 |
Assumption.The Moffett Towers II - Building 2 Borrower has, at any time following the securitization of the Moffett Towers II – Building 2 Whole Loan, the right to transfer the Moffett Towers II - Building 2 Property, provided that certain conditions are satisfied, including: (i) no event of default under the Moffett Towers II – Building 2 Whole Loan documents has occurred and is continuing, (ii) the proposed transferee qualifies as a qualified transferee under the Moffett Towers II - Building 2 Whole Loan documents, (iii) delivery of a guaranty and environmental indemnity from an affiliate of the transferee and (iv) the lender has received rating agency confirmation from the rating agencies assigned to rate the Series 2018-BNK10 Certificates that such assumption will not result in a downgrade of the respective ratings assigned to the Series 2018-BNK10 Certificates and similar confirmations from each rating agency rating any securities backed by any of the Moffett Towers II - Building 2 Companion Loans.
Partial Release. Not permitted.
Real Estate Substitution.Not permitted.
Subordinate and Mezzanine Indebtedness.Barclays Bank PLC funded a $105,000,000 mezzanine loan (the “Moffett Towers II - Building 2 Mezzanine Loan”) to MT2 B2 MEZZ LLC, a Delaware limited liability company owning 100.0% of the Moffett Towers II - Building 2 Borrower (collectively, the “Moffett Towers II - Building 2 Mezzanine Borrower”). The Moffett Towers II - Building 2 Mezzanine Loan is secured by a pledge of the Moffett Towers II - Building 2 Mezzanine Borrower’s interest in the Moffett Towers II - Building 2 Borrower. The Moffett Towers II - Building 2 Mezzanine Loan accrues interest at a rate of 5.900% perannumand requires interest-only payments through the maturity date of December 6, 2027. Barclays Bank PLC has sold the Moffett Towers II - Building 2 Mezzanine Loan to a third party. The rights of the Moffett Towers II - Building 2 Mezzanine Lender are further described under “Description of the Mortgage Pool–Additional Indebtedness-Mezzanine Indebtedness” in the Preliminary Prospectus.
Amenities and Common Areas. The Moffett Towers II - Building 2 Property will feature access to the fitness/amenities building and the enclosed parking structure (the “Common Area Spaces”) once completed. To govern access to the Common Area Spaces, the Moffett Towers II - Building 2 Borrower is subject to a declaration of covenants, conditions, restrictions and easement and charges agreement (the “CCR”) made by MT II LLC, an affiliate of the borrower sponsor and the owner of the non-collateral buildings at the Moffett Towers II Campus. The CCR grants the borrower non-exclusive easement rights over the Common Area Spaces and contemplates that the Common Area Spaces that it governs will be expanded over time as the remaining portions of the Moffett Towers II Campus are completed. Ownership of the Common Area Spaces governed by the CCR is held by Moffett Towers II Association LLC (the “Association”), whose membership is comprised of the borrower and MT II LLC. The Association is obligated to maintain insurance coverage over the Common Area Spaces and is also responsible for maintenance of the Common Area Spaces, subject to the terms of the Amazon leases. The CCR delineates shares of the voting interest in the Association based on the number of completed buildings at the Moffett Towers II Campus, with each completed building entitled to a proportionate share of the voting interest. As of the origination date, the borrower was the sole voting member of the Association. The CCR provides that as each of the four non-collateral buildings at the Moffett Towers II Campus is completed, the respective owner of each non-collateral building will obtain a share of the voting interest in the Association proportionate to the number of then completed buildings at the Moffett Towers II Campus (both collateral and non-collateral). Provided that all five buildings are completed in accordance with the Moffett Towers II Campus development plan, each building will be entitled to a one-fifth (or 20.0%) share of the voting interest in the Association.
Completion Guaranty. On the origination date, the Moffett Towers II - Building 2 Guarantor executed a separate guaranty for the completion and delivery of the fitness/amenities building and the enclosed parking structure. Among other things, the completion guaranty provides that in the event that neither the Moffett Towers II - Building 2 Borrower nor MT II LLC (an affiliate of the borrower sponsor and the owner of the non-collateral buildings at the Moffett Towers II Campus) is able to complete and deliver the fitness/amenities building and the enclosed parking structure (or otherwise achieve the Required Parking Spaces Satisfaction) on or prior to the one year anniversary of the respective targeted completion date of each (i.e., July 31, 2019 in the case of the fitness/amenities building; April 15, 2019 in the case of the enclosed parking structure or Required Parking Spaces Satisfaction), the Moffett Towers II - Building 2 Guarantor is required to pay any costs, expenses or liabilities incurred by the lender to effectuate the completion and delivery of such fitness/amenities building and enclosed parking structure (or otherwise achieve the Required Parking Spaces Satisfaction).
Ground Lease.None.
Terrorism Insurance. The Moffett Towers II - Building 2 Whole Loan documents require that the “all risk” insurance policy required to be maintained by the borrower provide coverage for terrorism in an amount equal to the full replacement cost of the Moffett Towers II - Building 2 Property, or that if the Terrorism Risk Insurance Program Reauthorization Act is no longer in effect and such policies contain an exclusion for acts of terrorism, the borrower will obtain, to the extent available, a stand-alone policy that provides the same coverage as the policies would have if such exclusion did not exist. For so long as TRIPRA is in effect and continues to cover both foreign and domestic acts, the lender is required to accept terrorism insurance with coverage against acts which are “certified” within the meaning of TRIPRA.
Earthquake Insurance. The loan documents require earthquake insurance. At the time of closing, earthquake insurance coverage is in-place for the Moffett Towers II - Building 2 Property. The seismic report indicated a probable maximum loss of 3.0% for the Moffett Towers II - Building 2 Property.
THE INFORMATION IN THIS STRUCTURAL AND COLLATERAL TERM SHEET IS NOT COMPLETE AND MAY BE AMENDED PRIOR TO THE TIME OF SALE. THIS TERM SHEET IS NOT AN OFFER TO SELL THESE SECURITIES AND IT IS NOT A SOLICITATION OF AN OFFER TO BUY THESE SECURITIES IN ANY JURISDICTION WHERE THE OFFER OR SALE IS NOT PERMITTED.
133
| ONE KENNEDY SQUARE |
| No. 11 – One Kennedy Square | |||||||
| Loan Information | Property Information | ||||||
| Mortgage Loan Seller: | Wells Fargo Bank, National Association | Single Asset/Portfolio: | Single Asset | ||||
Credit Assessment (DBRS/Fitch/Moody’s): | NR/NR/NR | Property Type: | Office | ||||
| Original Principal Balance: | $36,400,000 | Specific Property Type: | CBD | ||||
| Cut-off Date Balance: | $36,400,000 | Location: | Detroit, MI | ||||
| % of Initial Pool Balance: | 2.8% | Size: | 246,304 SF | ||||
| Loan Purpose: | Refinance | Cut-off Date Balance Per SF: | $147.78 | ||||
| Borrower Name: | Kennedy Square Office Building LLC | Year Built/Renovated: | 2005/NAP | ||||
| Borrower Sponsor: | Redico Properties LLC | Title Vesting: | Fee and Leasehold | ||||
| Mortgage Rate: | 4.600% | Property Manager: | Self-managed | ||||
| Note Date: | January 19, 2018 | 4th Most Recent Occupancy (As of): | 100.0% (12/31/2013) | ||||
| Anticipated Repayment Date: | NAP | 3rd Most Recent Occupancy (As of): | 100.0% (12/31/2014) | ||||
| Maturity Date: | February 11, 2028 | 2nd Most Recent Occupancy (As of): | 100.0% (12/31/2015) | ||||
| IO Period: | 36 months | Most Recent Occupancy (As of): | 100.0% (12/31/2016) | ||||
| Loan Term (Original): | 120 months | Current Occupancy (As of): | 100.0% (11/1/2017) | ||||
| Seasoning: | 0 months | ||||||
| Amortization Term (Original): | 360 months | Underwriting and Financial Information: | |||||
| Loan Amortization Type: | Interest-only, Amortizing Balloon | ||||||
| Interest Accrual Method: | Actual/360 | 4th Most Recent NOI (As of): | $4,724,344 (12/31/2014) | ||||
| Call Protection: | L(24),D(92),O(4) | 3rd Most Recent NOI (As of): | $4,849,056 (12/31/2015) | ||||
| Lockbox Type: | Springing | 2nd Most Recent NOI (As of): | $5,079,643 (12/31/2016) | ||||
| Additional Debt: | None | Most Recent NOI (As of): | $4,496,953 (TTM 11/30/2017) | ||||
| Additional Debt Type: | NAP | U/W Revenues: | $8,780,267 | ||||
| U/W Expenses: | $4,670,953 | ||||||
| U/W NOI: | $4,109,314 | ||||||
| U/W NCF: | $3,728,360 | ||||||
| Escrows and Reserves: | U/W NOI DSCR: | 1.84x | |||||
| U/W NCF DSCR: | 1.67x | ||||||
| Type: | Initial | Monthly | Cap (If Any) | U/W NOI Debt Yield: | 11.3% | ||
| Taxes | $216,960 | $108,481 | NAP | U/W NCF Debt Yield: | 10.2% | ||
| Insurance | $0 | Springing(1) | NAP | As-Is Appraised Value: | $52,500,000 | ||
| TI/LC Reserve | $0 | $28,735 | $1,400,000(2) | As-Is Appraisal Valuation Date: | November 20, 2017 | ||
| Replacement Reserve | $0 | $4,105 | NAP | Cut-off Date LTV Ratio: | 69.3% | ||
| Tenant Specific TI/LC Reserve(3) | $739,080 | $0 | NAP | LTV Ratio at Maturity: | 60.8% | ||
| (1) | Ongoing monthly escrows for insurance premiums are not required as long as (i) no event of default under the One Kennedy Square Mortgage Loan documents; (ii) insurance requirements are being satisfied by a blanket policy acceptable to the lender; and (iii) the borrower provides the lender with evidence of renewal of the policies and timely proof of payment of the insurance premiums. |
| (2) | Springing monthly TI/LC deposits beyond the cap are required upon (i) the occurrence and continuance of an event of default, or (ii) the physical occupancy at the One Kennedy Square Property falling below 88.0%. |
| (3) | Represents outstanding TI/LC obligations related to Caidan Management. |
The One Kennedy Square mortgage loan is evidenced by a single promissory note that is secured by the first mortgage interest encumbering the borrower’s fee interest in a 10-story, class A office building totaling 246,304 square feet and leasehold interest in an underground parking structure located in the central business district of Detroit, Michigan (the “One Kennedy Square Property”). Situated on a 0.7-acre parcel, the One Kennedy Square Property was constructed in 2005 and earned the U.S. Environmental Protection Agency’s ENERGY STAR award in 2009 for its operating efficiency. The One Kennedy Square Property underground parking structure is attached to and for the exclusive use of the One Kennedy Square Property, and contains 460 parking spaces resulting in a parking ratio of 1.9 spaces per 1,000 square feet of rentable area. The underground parking structure is leased from the City of Detroit Development Authority under a ground lease that expires December 31, 2032 with two, 5-year renewal options and one, 6-year renewal option. Upon the expiration of the parking lease, the sponsor has the option to purchase the underground parking structure for fair market value. Tenants accounting for 94.3% of the net rentable area of the One Kennedy Square Property have been in occupancy for over 10 years. Occupancy has averaged 98.0% since 2009, and the One Kennedy Square Property is currently 100.0% occupied by eight tenants and the management leasing office. Over the past five to ten years, the area surrounding the One Kennedy Square Property has benefited from the presence of the General Motors World Headquarters, Meridian Health /Quicken Loans Headquarters, and the relocation of Blue Cross/Blue Shield to the area. According to a third party market research report, the central business district class A submarket reported a total inventory of approximately 14.9 million square feet
THE INFORMATION IN THIS STRUCTURAL AND COLLATERAL TERM SHEET IS NOT COMPLETE AND MAY BE AMENDED PRIOR TO THE TIME OF SALE. THIS TERM SHEET IS NOT AN OFFER TO SELL THESE SECURITIES AND IT IS NOT A SOLICITATION OF AN OFFER TO BUY THESE SECURITIES IN ANY JURISDICTION WHERE THE OFFER OR SALE IS NOT PERMITTED.
134
| ONE KENNEDY SQUARE |
with a 7.4% vacancy rate as of the fourth quarter of 2017. The Appraiser identified three comparable class A office properties totaling 2.4 million square feet with a weighted average occupancy of 97.7%, and concluded an average market rental rate of $14.50, triple net.
Sources and Uses
| Sources | Uses | |||||||
| Original loan amount | $36,400,000 | 100.0% | Loan payoff(1) | $27,032,585 | 74.3% | |||
| Return of Equity | 8,111,786 | 22.3 | ||||||
| Upfront reserves | 956,040 | 2.6 | ||||||
| Closing costs | 299,589 | 0.8 | ||||||
| Total Sources | $36,400,000 | 100.0% | Total Uses | $36,400,000 | 100.0% | |||
| (1) | The One Kennedy Square Property was previously securitized in the JPMCC 2012-C8 transaction. |
The following table presents certain information relating to the tenancies at the One Kennedy Square Property:
Major Tenants(1)
| Tenant Name | Credit Rating (Moody’s/ S&P/ Fitch)(2) | Tenant NRSF | % of NRSF | Annual U/W Base Rent PSF | Annual Rent | % of Total Annual U/W Base Rent | Lease Expiration Date |
| Major Tenants | |||||||
| Caidan Management | NR/NR/NR | 91,228 | 37.0% | $14.00 | $1,277,192 | 35.0% | 12/31/2025 |
| The Walbridge Group, Inc. | NR/NR/NR | 51,402 | 20.9% | $14.00 | $719,628 | 19.7% | 4/30/2022(3) |
| Marketing Associates | NR/NR/NR | 51,402 | 20.9% | $12.60(4) | $647,880(4) | 17.8% | 3/31/2026(5)(6) |
| Ernst & Young US LLP | NR/NR/NR | 37,277 | 15.1% | $17.75 | $661,667 | 18.1% | 12/31/2026(7) |
| RBS Citizens, N.A. | NR/BBB+/BBB+ | 5,251 | 2.1% | $28.00 | $147,028 | 4.0% | 7/31/2023(8) |
| Total Major Tenants | 236,560 | 96.0% | $14.60 | $3,453,395 | 94.7% | ||
| Non-Major Tenants | 9,744 | 4.0% | $19.88 | $193,663 | 5.3% | ||
| Occupied Collateral Total | 246,304 | 100.0% | $14.81 | $3,647,058 | 100.0% | ||
| Vacant Space | 0 | 0.0% | |||||
| Collateral Total | 246,304 | 100.0% | |||||
| (1) | Information obtained from the underwritten rent roll. |
| (2) | Certain ratings provided are for the parent company of the tenant whether or not the parent company guarantees the lease. |
| (3) | The Walbridge Group, Inc. has three, 5-year renewal options, with 9 months’ notice, at 95% of the fair market rental rate as determined in the lease. |
| (4) | Marketing Associates receives a rent abatement for the month of April each year of its lease term, which is accounted for in the Annual U/W Base Rent PSF and Annual U/W Base Rent. |
| (5) | Marketing Associates has the right to terminate its lease commencing March 31, 2023 with 12 months’ notice and payment of a termination fee equal to unamortized leasing costs plus six months’ base rent and additional rent. |
| (6) | Marketing Associates has one, 5-year renewal options, with 9 months’ notice, at 95% of the fair market rental rate as determined in the lease. |
| (7) | Ernst & Young US LLP has two, 5-year renewal options, with 9 months’ notice, at 95% of the then-prevailing net effective market value rent for comparable renewal space in downtown Detroit. |
| (8) | RBS Citizens, N.A. has three, 5-year renewal options, with 12 months’ notice, at the greater of (i) market rent or (ii) RBS Citizen’s N.A’s rent at the end of the then current term. |
THE INFORMATION IN THIS STRUCTURAL AND COLLATERAL TERM SHEET IS NOT COMPLETE AND MAY BE AMENDED PRIOR TO THE TIME OF SALE. THIS TERM SHEET IS NOT AN OFFER TO SELL THESE SECURITIES AND IT IS NOT A SOLICITATION OF AN OFFER TO BUY THESE SECURITIES IN ANY JURISDICTION WHERE THE OFFER OR SALE IS NOT PERMITTED.
135
| ONE KENNEDY SQUARE |
The following table presents certain information relating to the lease rollover schedule at the One Kennedy Square Property:
Lease Expiration Schedule(1)(2)
| Year Ending December 31, | No. of Leases Expiring | Expiring NRSF | % of Total NRSF | Cumulative Expiring NRSF | Cumulative % of Total NRSF | Annual U/W Base Rent | % of Total Annual U/W Base Rent | Annual U/W Base Rent PSF |
| MTM | 1 | 878 | 0.4% | 878 | 0.4% | $12,731 | 0.3% | $14.50 |
| 2018 | 0 | 0 | 0.0% | 878 | 0.4% | $0 | 0.0% | $0.00 |
| 2019 | 0 | 0 | 0.0% | 878 | 0.4% | $0 | 0.0% | $0.00 |
| 2020 | 0 | 0 | 0.0% | 878 | 0.4% | $0 | 0.0% | $0.00 |
| 2021 | 1 | 4,478 | 1.8% | 5,356 | 2.2% | $89,560 | 2.5% | $20.00 |
| 2022 | 1 | 51,402 | 20.9% | 56,758 | 23.0% | $719,628 | 19.7% | $14.00 |
| 2023 | 2 | 7,833 | 3.2% | 64,591 | 26.2% | $198,668 | 5.4% | $25.36 |
| 2024 | 1 | 1,806 | 0.7% | 66,397 | 27.0% | $39,732 | 1.1% | $22.00 |
| 2025 | 6 | 91,228 | 37.0% | 157,625 | 64.0% | $1,277,192 | 35.0% | $14.00 |
| 2026 | 3 | 88,679 | 36.0% | 246,304 | 100.0% | $1,309,547 | 35.9% | $14.77 |
| 2027 | 0 | 0 | 0.0% | 246,304 | 100.0% | $0 | 0.0% | $0.00 |
| 2028 | 0 | 0 | 0.0% | 246,304 | 100.0% | $0 | 0.0% | $0.00 |
| Thereafter | 0 | 0 | 0.0% | 246,304 | 100.0% | $0 | 0.0% | $0.00 |
| Vacant | 0 | 0 | 0.0% | 246,304 | 100.0% | $0 | 0.0% | $0.00 |
| Total/Weighted Average | 15 | 246,304 | 100.0% | $3,647,058 | 100.0% | $14.81 |
| (1) | Information obtained from the underwritten rent roll. |
| (2) | Certain tenants may have lease termination options that are exercisable prior to the stated expiration date of the subject lease and that are not considered in the Lease Expiration Schedule. |
The following table presents historical occupancy percentages at the One Kennedy Square Property:
Historical Occupancy
12/31/2013(1) | 12/31/2014(1) | 12/31/2015(1) | 12/31/2016(1) | 11/1/2017(2) | ||||
| 100.0% | 100.0% | 100.0% | 100.0% | 100.0% |
| (1) | Information obtained from the borrower. |
| (2) | Information obtained from the underwritten rent roll. |
The following table presents certain information relating to the historical operating performance and the underwritten net cash flow at the One Kennedy Square Property:
Cash Flow Analysis
2014 | 2015 | 2016 | TTM 11/30/2017 | U/W | % of U/W Effective Gross Income | U/W $ per SF | |||||||||
| Base Rent | $4,451,329 | $4,540,155 | $4,232,353 | $3,613,300 | $ 3,647,058(1) | 41.5% | $14.81 | ||||||||
| Total Reimbursables | 2,950,957 | 3,272,033 | 3,597,870 | 3,655,238 | 3,779,783 | 43.0 | 15.35 | ||||||||
| Other Income(2) | 1,113,610 | 1,141,417 | 1,364,171 | 1,535,779 | 1,535,779 | 17.5 | 6.24 | ||||||||
| Less Vacancy & Credit Loss | 0 | 0 | 0 | 0 | (182,353)(3) | (2.1) | (0.74) | ||||||||
| Effective Gross Income | $8,515,896 | $8,953,605 | $9,194,394 | $8,804,317 | $8,780,267 | 100.0% | $35.65 | ||||||||
| Total Operating Expenses | $3,791,552 | $4,104,549 | $4,114,751 | $4,307,364 | $4,670,953 | 53.2 | $18.96 | ||||||||
| Net Operating Income | $4,724,344 | $4,849,056 | $5,079,643 | $4,496,953 | $4,109,314 | 46.8% | $16.68 | ||||||||
| TI/LC | 0 | 0 | 0 | 0 | 331,694 | 3.8 | 1.35 | ||||||||
| Capital Expenditures | 0 | 0 | 0 | 0 | 49,261 | 0.6 | 0.20 | ||||||||
| Net Cash Flow | $4,724,344 | $4,849,056 | $5,079,643 | $4,496,953 | $3,728,360 | 42.5% | $15.14 | ||||||||
| NOI DSCR | 2.11x | 2.17x | 2.27x | 2.01x | 1.84x | ||||||||||
| NCF DSCR | 2.11x | 2.17x | 2.27x | 2.01x | 1.67x | ||||||||||
| NOI DY | 13.0% | 13.3% | 14.0% | 12.4% | 11.3% | ||||||||||
| NCF DY | 13.0% | 13.3% | 14.0% | 12.4% | 10.2% |
| (1) | U/W Base Rent includes rent steps totaling $15,076 through May 1, 2018. |
| (2) | Other Income is comprised of primarily parking income and also includes other tenant income. |
| (3) | The underwritten economic vacancy is 5.0%. As of November 1, 2017 the One Kennedy Square Property was 100.0% occupied. |
THE INFORMATION IN THIS STRUCTURAL AND COLLATERAL TERM SHEET IS NOT COMPLETE AND MAY BE AMENDED PRIOR TO THE TIME OF SALE. THIS TERM SHEET IS NOT AN OFFER TO SELL THESE SECURITIES AND IT IS NOT A SOLICITATION OF AN OFFER TO BUY THESE SECURITIES IN ANY JURISDICTION WHERE THE OFFER OR SALE IS NOT PERMITTED.
136
| ONE KENNEDY SQUARE |
The following tables present certain information relating to comparable leases for the One Kennedy Square Property:
Comparable Office Leases(1)
| Property Name/Location | Year Built | Stories | Total Office GLA (SF) | Tenant Name | Lease Date/Term | Lease Area (SF) | Annual Base Rent PSF | Lease Type |
One Campus Martius 1050 Woodward Ave, Detroit, MI | 2003 | 16 | 950,056 | Microsoft | December 2017 / 7.7 Yrs. | 43,119 | $25.75 | Gross + TE |
150 W. Jefferson 150 W. Jefferson Ave, Detroit, MI | 1989 | 25 | 489,601 | Amazon | July 2017 / 7.3 Yrs. | 20,465 | $25.50 | MG |
150 W. Jefferson 150 W. Jefferson Ave, Detroit, MI | 1989 | 25 | 489,601 | JAMS, Inc. | June 2017 / 7.5 Yrs. | 6,211 | $25.00 | MG |
One Detroit Center 500 Woodward Ave, Detroit, MI | 1992 | 42 | 979,477 | Dow Jones Co. | April 2017 / 5.3 Yrs | 2,802 | $26.00 | MG |
| (1) | Information obtained from the appraisal. |
THE INFORMATION IN THIS STRUCTURAL AND COLLATERAL TERM SHEET IS NOT COMPLETE AND MAY BE AMENDED PRIOR TO THE TIME OF SALE. THIS TERM SHEET IS NOT AN OFFER TO SELL THESE SECURITIES AND IT IS NOT A SOLICITATION OF AN OFFER TO BUY THESE SECURITIES IN ANY JURISDICTION WHERE THE OFFER OR SALE IS NOT PERMITTED.
137
| ONE NEWARK CENTER |
| No. 12– One Newark Center | ||||||||
| Loan Information | Property Information | |||||||
| Mortgage Loan Seller: | Morgan Stanley Mortgage Capital Holdings LLC | Single Asset/Portfolio: | Single Asset | |||||
| Credit Assessment (DBRS/Fitch/Moody’s): | NR/NR/NR | Property Type: | Office | |||||
| Original Principal Balance(1): | $34,580,000 | Specific Property Type: | CBD | |||||
| Cut-off Date Balance(1): | $34,580,000 | Location: | Newark, NJ | |||||
| % of Initial Pool Balance: | 2.7% | Size: | 417,939 SF | |||||
| Loan Purpose: | Acquisition | Cut-off Date Balance Per SF(1): | $159.31 | |||||
| Borrower Name: | Ideal Holdings ONC LLC | Year Built/Renovated: | 1992/NAP | |||||
| Borrower Sponsor(2): | Beijing Ideal Group | Title Vesting: | Fee | |||||
| Mortgage Rate: | 4.250% | Property Manager: | CBRE, Inc. | |||||
| Note Date: | November 30, 2017 | 4th Most Recent Occupancy (As of): | 94.7% (12/31/2013) | |||||
| Anticipated Repayment Date: | NAP | 3rd Most Recent Occupancy (As of): | 86.1% (12/31/2014) | |||||
| Maturity Date: | December 1, 2027 | 2nd Most Recent Occupancy (As of): | 89.4% (12/31/2015) | |||||
| IO Period: | 36 months | Most Recent Occupancy (As of): | 95.3% (12/31/2016) | |||||
| Loan Term (Original): | 120 months | Current Occupancy (As of): | 90.0% (11/1/2017) | |||||
| Seasoning: | 2 months | |||||||
| Amortization Term (Original): | 360 months | Underwriting and Financial Information: | ||||||
| Loan Amortization Type: | Interest-only, Amortizing Balloon | |||||||
| Interest Accrual Method: | Actual/360 | 4th Most Recent NOI (As of): | $6,941,174 (12/31/2014) | |||||
| Call Protection(3): | L(26),D(90),O(4) | 3rd Most Recent NOI (As of): | $6,391,686 (12/31/2015) | |||||
| Lockbox Type: | Springing | 2nd Most Recent NOI (As of): | $6,661,485 (12/31/2016) | |||||
| Additional Debt(1): | Yes | Most Recent NOI (As of): | $6,236,802 (TTM 9/30/2017) | |||||
| Additional Debt Type(1): | Pari Passu | |||||||
| U/W Revenues: | $14,737,974 | |||||||
| U/W Expenses: | $7,203,226 | |||||||
| Escrows and Reserves: | U/W NOI: | $7,534,747 | ||||||
| U/W NCF: | $5,985,388 | |||||||
| Type: | Initial | Monthly | Cap (If Any) | U/W NOI DSCR(1): | 1.92x | |||
| Taxes | $388,733 | $194,366 | NAP | U/W NCF DSCR(1): | 1.52x | |||
| Insurance | $44,763 | $22,319 | NAP | U/W NOI Debt Yield(1): | 11.3% | |||
| Replacement Reserves | $0 | $14,247 | NAP | U/W NCF Debt Yield(1): | 9.0% | |||
| TI/LC Reserve | $2,850,000 | $104,485 | $3,800,000 | As-Is Appraised Value: | $94,000,000 | |||
| Outstanding TI/LC Reserve | $579,656 | $0 | NAP | As-Is Appraisal Valuation Date: | October 10, 2017 | |||
| Deferred Maintenance | $27,750 | $0 | NAP | Cut-off Date LTV Ratio(1): | 70.8% | |||
| Outstanding Free Rent | $549,852 | $0 | NAP | LTV Ratio at Maturity or ARD(1): | 61.6% | |||
| (1) | See “The Mortgage Loan” section. All statistical information related to balances per square foot, loan-to-value ratios, debt service coverage ratios and debt yields are based on the One Newark Center Whole Loan (as defined below). |
| (2) | There is no non-recourse carveout guarantor or separate environmental indemnitor with respect to the One Newark Center Mortgage Loan. The owners of the borrower are individuals and entities domiciled in the People’s Republic of China. See “Description of the Mortgage Pool—Non-Recourse Carveout Limitations” in the Preliminary Prospectus. |
| (3) | The defeasance lockout period will be at least 26 payment dates beginning with and including the first payment date of January 1, 2018. Defeasance of the One Newark Center Whole Loan is permitted after the date that is the earlier to occur of (i) two years after the closing date of the securitization that includes the last note to be securitized, and (ii) the fourth anniversary of the first monthly payment date. The assumed lockout period of 26 payments is based on the expected BANK 2018-BNK10 securitization trust closing date in February 2018. |
The mortgage loan (the “One Newark Center Mortgage Loan”) is part of a whole loan (the “One Newark Center Whole Loan”) that is evidenced by threepari passu promissory notes (Notes A-1, A-2 and A-3) and secured by a first lien mortgage encumbering (i) a fee on a plane interest comprised of floors six to 22 of an office building, and (ii) an adjacent ten-story parking garage, located in Newark, New Jersey (the “One Newark Center Property”). The One Newark Center Whole Loan was originated on November 30, 2017 by Morgan Stanley Bank, N.A. The One Newark Center Whole Loan had an original principal balance of $66,580,000, has an outstanding principal balance as of the Cut-off Date of $66,580,000 and accrues interest at an interest rate of 4.250%per annum. The One Newark Center Whole Loan had an initial term of 120 months, has a remaining term of 118 months as of the Cut-off Date and requires interest-only payments for the first 36 payments following origination and thereafter, requires payments of principal and interest based on a 30-year amortization schedule. The One Newark Center Whole Loan matures on December 1, 2027. See “Description of the Mortgage Pool—The Whole Loans—The Serviced Pari Passu Whole Loans” in the Preliminary Prospectus.
The One Newark Center Mortgage Loan has an original and Cut-off Date principal balance of $34,580,000 and is evidenced by the controlling Note A-2 which had an original principal balance of $20,000,000 and the non-controlling Note A-3, which had an original
THE INFORMATION IN THIS STRUCTURAL AND COLLATERAL TERM SHEET IS NOT COMPLETE AND MAY BE AMENDED PRIOR TO THE TIME OF SALE. THIS TERM SHEET IS NOT AN OFFER TO SELL THESE SECURITIES AND IT IS NOT A SOLICITATION OF AN OFFER TO BUY THESE SECURITIES IN ANY JURISDICTION WHERE THE OFFER OR SALE IS NOT PERMITTED.
138
| ONE NEWARK CENTER |
principal balance of $14,580,000. The non-controlling Note A-1, which had an original principal balance of $32,000,000, is currently held by Morgan Stanley Bank, National Association or an affiliate and is expected to be contributed to one or more future securitization trusts.
Note Summary
| Notes | Original Balance | Note Holder | Controlling Interest | |
| A-1 | $32,000,000 | Morgan Stanley Bank, National Association. | No | |
| A-2 | $20,000,000 | BANK 2018-BNK10 | Yes | |
| A-3 | $14,580,000 | BANK 2018-BNK10 | No | |
| Total | $66,580,000 |
Following the lockout period, the borrower has the right to defease the One Newark Center Whole Loan on any date before September 1, 2027. In addition, the One Newark Center Whole Loan is prepayable without penalty on and after September 1, 2027.
Sources and Uses
| Sources | Uses | |||||||
| Original Whole Loan Amount | $66,580,000 | 65.9% | Purchase Price(1) | $93,900,000 | 92.9% | |||
| Sponsor’s new cash contribution | 34,532,834 | 34.2 | Closing costs | 2,772,079 | 2.7 | |||
| Reserves | 4,440,755 | 4.4 | ||||||
| Total Sources | $101,112,834 | 100.0% | Total Uses | $101,112,834 | 100.0% |
| (1) | In connection with the purchase of the One Newark Center Property, a prior securitized loan made to the seller was repaid at a discount, resulting in the cancellation of a $9,700,000 “hope note” without repayment. See “Description of the Mortgage Pool—Loan Purpose; Default History, Bankruptcy Issues and Other Proceedings” in the Preliminary Prospectus. |
The One Newark Center Property consists of a fee on a plane interest comprised of floors six to 22 (417,939 square feet) of a Class A, multi-tenant office building (the “Office Tower”) and a 953 space, ten-story parking garage that is next door to, and attached to, the Office Tower (the “Parking Garage”). The Office Tower is connected to the Parking Garage via a skybridge that is accessible from the 6th floor lobby of the Office Tower. The land underneath the Office Property is owned by, and floors one through five are owned and occupied by, Seton Hall Law School. The One Newark Center Property is subject to an operation and cross-easement agreement between the owner of the One Newark Center Property and the owner of the remaining floors of the office building regarding the management of the building, which, among other provisions, creates certain cross-easements and reciprocal rights and obligations with respect to the building. See “Description of the Mortgage Pool—Mortgage Pool Characteristics—Condominium and Other Shared Interests” in the Preliminary Prospectus.
The largest tenant, K&L Gates, LLP (52,148 square feet, 12.5% of net rentable area) is a United States-based international law firm with offices in Asia, Australia, Europe and the Middle East. K&L Gates has been a tenant at the One Newark Center Property since 2003. The second largest tenant, GSA IRS (45,075 square feet, 10.8% of net rentable area), has been a tenant at the One Newark Center Property since 2007 and has expanded their space twice in order to include space on the third floor (3,073 square feet) and the fourth floor (15,928 square feet). The third largest tenant, GSA HUD (41,555 square feet, 9.9% of net rentable area) has been a tenant at the One Newark Center Property since 1993. The fourth largest tenant, Level 3 Communications (33,485 square feet, 8.0% of net rentable area), has been a tenant at the One Newark Center Property since 1998 and has expanded its space twice on the sixth floor (9,916 square feet). The fifth largest tenant, Proskauer Rose, LLP (26,074 square feet, 6.2% of net rentable area) is a law firm founded in 1875 and which currently has 13 offices worldwide. Proskauer Rose, LLP has been a tenant at the One Newark Center Property since 1999.
The average occupancy at the One Newark Center Property from 1992 until the second quarter of 2016 was 96.0%. Six tenants, leasing 84,875 square feet (20.7% of net rentable area), have renewed their leases in 2016 and 2017. Twelve tenants, leasing 280,508 square feet (68.5% of net rentable area) have renewed their leases at least once. Ten tenants leasing 267,484 square feet (65.3% of net rentable area) have been in occupancy for at least ten years, six tenants leasing 145,527 square feet (35.5% of net rentable area) have been in occupancy for at least 15 years and three tenants leasing 83,926 square feet (20.5% of net rentable area) have been in occupancy for at least 20 years.
The One Newark Center Property is located in the Newark/Urban Essex submarket of Newark, New Jersey according to the appraisal. According to the appraisal, for the third quarter of 2017, the Northern New Jersey metropolitan office market contained 364,583,007 square feet of office space, with a vacancy of 12.59% and a market rent of $25.50 PSF. The Newark/Urban Essex submarket contained 28,863,303 square feet of office space, with a vacancy of 12.26% and a market rent of $30.62 PSF. The estimated 2017 population within a 1.0-, 3.0- and 5.0-mile radius of the One Newark Center Property was 50,573, 335,607, and 761,791, respectively. According to the appraisal, the estimated 2017 median household income within the same radii was $40,573, $39,618 and $46,392, respectively.
The One Newark Center Property is located one block from Newark Penn Station, which provides Amtrak, PATH, New Jersey Transit rail and bus services to the region. Additionally, the One Newark Center Property is situated within close proximity to the New Jersey Performing Arts Center, Prudential Center, Red Bull Arena, and Riverfront Stadium. According to the appraisal, there is currently $2 billion in commercial and residential development currently underway in Newark, New Jersey, including more than 1,500 apartment units under construction and 4,000 additional apartment units planned.
THE INFORMATION IN THIS STRUCTURAL AND COLLATERAL TERM SHEET IS NOT COMPLETE AND MAY BE AMENDED PRIOR TO THE TIME OF SALE. THIS TERM SHEET IS NOT AN OFFER TO SELL THESE SECURITIES AND IT IS NOT A SOLICITATION OF AN OFFER TO BUY THESE SECURITIES IN ANY JURISDICTION WHERE THE OFFER OR SALE IS NOT PERMITTED.
139
| ONE NEWARK CENTER |
The following table presents certain information relating to the tenancy at the One Newark Center Property:
Major Tenants
| Tenant Name | Credit Rating (Fitch/Moody’s/S&P)(1) | Tenant NRSF | % of NRSF | Annual U/W Base Rent PSF | Annual U/W Base Rent | % of Total Annual U/W Base Rent | Lease Expiration Date |
| Major Tenants | |||||||
| K&L Gates, LLP | NR / NR / NR | 52,148 | 12.5% | $35.00 | $1,825,180 | 15.1% | 1/31/2022 |
| GSA IRS(2) | AAA / AA+ / Aaa | 45,075 | 10.8% | $32.77 | $1,476,986 | 12.2% | 12/29/2019 |
| GSA HUD(3) | AAA / AA+ / Aaa | 49,698 | 11.9% | $33.50 | $1,391,959 | 11.5% | 4/21/2018 |
| Level 3 Communications | BB- / B1 / NR | 33,485 | 8.0% | $37.50 | $1,255,688 | 10.4% | 4/30/2020 |
| Proskauer Rose, LLP | NR / NR / NR | 26,074 | 6.2% | $33.00 | $860,442 | 7.1% | 1/31/2020 |
| Total Major Tenants | 206,480 | 49.4% | $34.34 | $6,810,254 | 56.2% | ||
| Non-Major Tenants(4) | 169,473 | 40.5% | $32.26 | $5,308,103 | 43.8% | ||
| Occupied Collateral Total(4)l | 375,953 | 90.0% | $33.40 | $12,118,358 | 100.0% | ||
| Vacant Space | 41,986 | 10.0% | |||||
| Collateral Total | 417,939 | 100.0% | |||||
| (1) | Certain ratings are those of the parent company or U.S. federal government, whether or not the parent or the U.S. federal government, as applicable, guarantees the lease. |
| (2) | GSA IRS may terminate its lease at any time on or after April 29, 2019, upon 120 days written notice. |
| (3) | GSA HUD Tenant NRSF includes 8,143 square feet associated with exterior corridor spaces used by GSA HUD to allow the public to get from one area of the space to another. This space (8,143 square feet) was excluded from all U/W Base Rent PSF calculations. |
| (4) | Non-Major Tenants and Occupied Collateral Total Annual U/W Base Rent PSF excludes the café space (4,947 square feet). |
The following table presents certain information relating to the lease rollover schedule at the One Newark Center Property:
Lease Expiration Schedule(1)(2)
| Year Ending December 31, | No. of Leases Expiring | Expiring NRSF | % of Total NRSF | Cumulative Expiring NRSF | Cumulative % of Total NRSF | Annual U/W Base Rent | % of Total Annual U/W Base Rent | Annual U/W Base Rent PSF(3) |
| MTM | 0 | 0 | 0.0% | 0 | 0.0% | $0 | 0.0% | $0.00 |
| 2018(4) | 1 | 49,698 | 11.9% | 49,698 | 11.9% | $1,391,959 | 11.5% | $33.50 |
| 2019 | 4 | 62,152 | 14.9% | 111,850 | 26.8% | $2,028,840 | 16.7% | $32.64 |
| 2020 | 4 | 97,190 | 23.3% | 209,040 | 50.0% | $3,522,186 | 29.1% | $36.24 |
| 2021 | 0 | 0 | 0.0% | 209,040 | 50.0% | $0 | 0.0% | $0.00 |
| 2022 | 3 | 54,555 | 13.1% | 263,595 | 63.1% | $1,900,100 | 15.7% | $34.83 |
| 2023 | 2 | 31,299 | 7.5% | 294,894 | 70.6% | $1,049,625 | 8.7% | $33.54 |
| 2024 | 0 | 0 | 0.0% | 294,894 | 70.6% | $0 | 0.0% | $0.00 |
| 2025 | 1 | 26,074 | 6.2% | 320,968 | 76.8% | $638,268 | 5.3% | $24.48 |
| 2026 | 2 | 31,376 | 7.5% | 352,344 | 84.3% | $1,008,857 | 8.3% | $32.15 |
| 2027 | 1 | 18,662 | 4.5% | 371,006 | 88.8% | $578,522 | 4.8% | $31.00 |
| 2028 | 0 | 0 | 0.0% | 371,006 | 88.8% | $0 | 0.0% | $0.00 |
| Thereafter(5) | 1 | 4,947 | 1.2% | 375,953 | 90.0% | $0 | 0.0% | $0.00 |
| Vacant | 0 | 41,986 | 10.0% | 417,939 | 100.0% | 0 | 0.0% | $0.00 |
| Total/Weighted Average | 19 | 417,939 | 100.0% | $12,118,358 | 100.0% | $33.40 |
| (1) | Information obtained from the underwritten rent roll. |
| (2) | Certain tenants have lease termination options that are exercisable prior to the originally stated expiration date of the subject lease and which are not reflected in the Lease Expiration Schedule. |
| (3) | Weighted Average Annual U/W Base Rent PSF excludes vacant space. |
| (4) | 2018 Expiring NRSF Includes 8,143 square feet associated with exterior corridor space used by GSA HUD to allow the public to get from one area of the space to another. This space (8,143 square feet) was excluded from all U/W Base Rent PSF calculations. |
| (5) | Thereafter includes the café space (4,947 square feet), with no attributed underwritten base rent. Thereafter and Total/Weighted Average Annual U/W Base Rent PSF exclude the square footage associated with the space. |
THE INFORMATION IN THIS STRUCTURAL AND COLLATERAL TERM SHEET IS NOT COMPLETE AND MAY BE AMENDED PRIOR TO THE TIME OF SALE. THIS TERM SHEET IS NOT AN OFFER TO SELL THESE SECURITIES AND IT IS NOT A SOLICITATION OF AN OFFER TO BUY THESE SECURITIES IN ANY JURISDICTION WHERE THE OFFER OR SALE IS NOT PERMITTED.
140
| ONE NEWARK CENTER |
The following table presents historical occupancy percentages at the One Newark Center Property:
Historical Occupancy
12/31/2013(1) | 12/31/2014(1) | 12/31/2015(1) | 12/31/2016(1) | 11/1/2017(2) | ||||
| 94.7% | 86.1% | 89.4% | 95.3% | 90.0% |
| (1) | Information obtained from the borrower. |
| (2) | Information obtained from the underwritten rent roll. |
Operating History and Underwritten Net Cash Flow.The following table presents certain information relating to the historical operating performance and the underwritten net cash flow at the One Newark Center Property:
Cash Flow Analysis
2013 | 2014 | 2015 | 2016 | TTM 9/30/2017 | U/W | U/W $ per SF | |||||||||
| Gross Potential Rent(1) | $12,808,615 | $11,122,793 | $11,023,808 | $11,531,821 | $11,253,373 | $13,569,825 | $32.47 | ||||||||
| Reimbursements | 1,792,869 | 1,234,851 | 1,364,496 | 1,039,129 | 984,628 | 1,213,173 | 2.90 | ||||||||
| Other Income(2) | 1,255,176 | 1,418,838 | 1,545,354 | 1,613,028 | 1,237,197 | 1,427,000 | 3.41 | ||||||||
| Less Vacancy & Credit Loss | 0 | 0 | 0 | 0 | 0 | (1,472,025) | (3.52) | ||||||||
| Effective Gross Income | $15,856,660 | $13,776,482 | $13,933,658 | $14,183,978 | $13,475,198 | $14,737,974 | $35.26 | ||||||||
| Total Operating Expenses | $7,392,761 | $6,835,308 | $7,541,972 | $7,522,493 | $7,238,396 | $7,203,226 | $17.24 | ||||||||
| Net Operating Income | $8,463,899 | $6,941,174 | $6,391,686 | $6,661,485 | $6,236,802(3) | $7,534,747(3) | $18.03 | ||||||||
| TI/LC | 0 | 0 | 0 | 0 | 0 | 1,378,397 | 3.30 | ||||||||
| Capital Expenditures | 0 | 0 | 0 | 0 | 0 | 170,963 | 0.41 | ||||||||
| Net Cash Flow | $8,463,899 | $6,941,174 | $6,391,686 | $6,661,485 | $6,236,802 | $5,985,388 | $14.32 | ||||||||
| NOI DSCR(4) | 2.15x | 1.77x | 1.63x | 1.69x | 1.59x | 1.92x | |||||||||
| NCF DSCR(4) | 2.15x | 1.77x | 1.63x | 1.69x | 1.59x | 1.52x | |||||||||
| NOI DY(4) | 12.7% | 10.4% | 9.6% | 10.0% | 9.4% | 11.3% | |||||||||
| NCF DY(4) | 12.7% | 10.4% | 9.6% | 10.0% | 9.4% | 9.0% | |||||||||
| (1) | Gross Potential Rent has been underwritten based on 11/1/2017 rent roll and includes contractual rent steps that have been underwritten through 11/1/2018 and total $169,672. |
| (2) | Other income is comprised primarily of parking income and has been underwritten based on estimate in the appraisal. |
| (3) | The increase in U/W Net Operating Income from TTM 9/30/2017 Net Operating Income can be attributed to an increase in reimbursements, which were underwritten based on the appraisal, lease expansions, free rent burnoff and contractual rent increases. |
| (4) | The debt service coverage ratios and debt yields are based on the One Newark Center Whole Loan. |
The following table presents certain information relating to comparable office sales for the One Newark Center Property:
Comparable Sales(1)
| Property Name/Location | Sale Date | Year Built | SF | Total Occupancy | Sale Price (millions) | Sales Price PSF |
One Newark Center Property Newark, NJ | Nov. 2006 | 1992 | 417,939(2) | 90.0%(2) | $93.9 | $224.67 |
100 Plaza Drive Secaucus, NJ | Oct. 2016 | 1981 | 265,000 | 100.0% | $62.0 | $233.96 |
80 Park Plaza Newark, NJ | Sep. 2016 | 1979 | 960,689 | 86.0% | $174.5 | $181.64 |
The Meadows Rutherford, NJ | Aug. 2015 | 1981 | 603,680 | 91.0% | $120.4 | $199.44 |
Park 80 West Plaza I & II Saddle Brook, NJ | Feb. 2015 | 1972 | 493,856 | 74.0% | $75.0 | $151.87 |
90 Hudson Street Jersey City, NJ | Feb. 2016 | 2000 | 431,658 | 100.0% | $181.0 | $419.31 |
30 Montgomery Jersey City, NJ | Jul. 2016 | 1973 | 305,223 | 72.0% | $101.0 | $330.91 |
| (1) | Information obtained from the appraisal. |
| (2) | As of the November 1, 2017 underwritten rent roll. |
THE INFORMATION IN THIS STRUCTURAL AND COLLATERAL TERM SHEET IS NOT COMPLETE AND MAY BE AMENDED PRIOR TO THE TIME OF SALE. THIS TERM SHEET IS NOT AN OFFER TO SELL THESE SECURITIES AND IT IS NOT A SOLICITATION OF AN OFFER TO BUY THESE SECURITIES IN ANY JURISDICTION WHERE THE OFFER OR SALE IS NOT PERMITTED.
141
| ONE NEWARK CENTER |
The following table presents certain information relating to comparable office leases for the One Newark Center Property:
Comparable Office Leases(1)
| Property Name/Location | Year Built | SF | Tenant Name | Lease Date/Term | Lease Area (SF) | Annual Base Rent PSF | Reimbursements | |
Gateway Center I Newark, NJ | 1971 | 466,919 | Hawkins, Delafield & Wood | Dec. 2016 / 5.3 Yrs | 5,505 | $31.75 | Gross+Electric | |
Gateway Center I Newark, NJ | 1971 | 466,919 | TransPerfect Legal | Dec. 2016 / 5.3 Yrs | 1,588 | $31.50 | Gross+Electric | |
Two Gateway Center Newark, NJ | 1971 | 765,949 | Parsons, Brinckerhoff | Apr. 2017 / 7.0 Yrs | 21,823 | $31.00 | Gross+Electric | |
Two Gateway Center Newark, NJ | 1971 | 765,949 | Broadridge Securities | Aug. 2017 / 15.0 Yrs | 156,453 | $30.00 | Gross+Electric | |
Three Gateway Center Newark, NJ | 1984 | 525,000 | Mac Trailer Leasing | Nov. 2016 / 10.0 Yrs | 11,457 | $30.00 | Gross+Electric | |
Three Gateway Center Newark, NJ | 1984 | 525,000 | Hello Fresh | Jun. 2016 / 10.7 Yrs | 15,400 | $31.00 | Gross+Electric | |
Riverfront Plaza (aka The Legal) Newark, NJ | 1989 | 446,625 | E&J Gallo Winery | Dec. 2016 / 5.1 Yrs | 4,007 | $31.75 | Gross+Electric | |
| (1) | Information obtained from the appraisal. |
THE INFORMATION IN THIS STRUCTURAL AND COLLATERAL TERM SHEET IS NOT COMPLETE AND MAY BE AMENDED PRIOR TO THE TIME OF SALE. THIS TERM SHEET IS NOT AN OFFER TO SELL THESE SECURITIES AND IT IS NOT A SOLICITATION OF AN OFFER TO BUY THESE SECURITIES IN ANY JURISDICTION WHERE THE OFFER OR SALE IS NOT PERMITTED.
142
(THIS PAGE INTENTIONALLY LEFT BLANK)
143
EXCHANGERIGHT PORTFOLIO 18
| No. 13 – ExchangeRight Portfolio 18 | ||||||
| Loan Information | Property Information | |||||
| Mortgage Loan Seller: | Bank of America, N.A. | Single Asset/Portfolio: | Portfolio | |||
| Property Type: | Various | |||||
| Original Principal Balance: | $33,441,294 | Specific Property Type: | Various | |||
| Cut-off Date Balance: | $33,441,294 | Location: | Various | |||
| % of Initial Pool Balance: | 2.6% | Size: | 272,767 SF | |||
| Loan Purpose: | Acquisition | Cut-off Date Balance Per SF: | $122.60 | |||
| Borrower Name(1): | ExchangeRight Net Leased Portfolio 18 DST | Year Built/Renovated(4): | Various / Various | |||
| Borrower Sponsors: | ExchangeRight Real Estate, LLC | Title Vesting: | Fee | |||
| Mortgage Rate: | 4.088% | Property Manager: | Self-managed | |||
| Note Date: | November 10, 2017 | 4thMost Recent Occupancy(6): | NAV | |||
| Anticipated Repayment Date: | NAP | 3rdMost Recent Occupancy(6): | NAV | |||
| Maturity Date: | December 1, 2027 | 2ndMost Recent Occupancy(6): | NAV | |||
| IO Period: | 120 months | Most Recent Occupancy(6): | NAV | |||
| Loan Term (Original): | 120 months | Current Occupancy (As of): | 100.0% (2/1/2018) | |||
| Seasoning: | 2 months | |||||
| Amortization Term (Original): | NAP | Underwriting and Financial Information: | ||||
| Loan Amortization Type: | Interest-only, Balloon | |||||
| Interest Accrual Method: | Actual/360 | 4thMost Recent NOI(6): | NAV | |||
| Call Protection: | L(26),D(90),O(4) | 3rdMost Recent NOI(6): | NAV | |||
| Lockbox Type(2): | Hard/Springing Cash Management | 2ndMost Recent NOI(6): | NAV | |||
| Additional Debt: | None | Most Recent NOI(6): | NAV | |||
| Additional Debt Type: | NAP | |||||
| U/W Revenues: | $3,265,503 | |||||
| U/W Expenses: | $81,638 | |||||
| Escrows and Reserves: | U/W NOI: | $3,183,865 | ||||
| U/W NCF: | $3,023,662 | |||||
| Type: | Initial | Monthly | Cap (If Any) | U/W NOI DSCR: | 2.30x | |
| Taxes | $93,985 | $18,611 | NAP | U/W NCF DSCR: | 2.18x | |
| Insurance(3) | $780 | $390 | NAP | U/W NOI Debt Yield: | 9.5% | |
| Replacement Reserves | $133,000 | $2,672 | NAP | U/W NCF Debt Yield: | 9.0% | |
| TI/LC Reserve(4) | $500,000 | Springing | NAP | As-Is Appraised Value(7): | $54,520,000 | |
| Deferred Maintenance | $68,281 | $0 | NAP | As-Is Appraisal Valuation Date(7): | Various | |
| Environmental Reserve | $25,000 | $0 | NAP | Cut-off Date LTV Ratio: | 61.3% | |
| Other Reserves(5) | $378,031 | $0 | NAP | LTV Ratio at Maturity: | 61.3% | |
| (1) | The borrower has leased the ExchangeRight Portfolio 18 Properties to ExchangeRight NLP 18 Master Lessee, LLC, a Delaware limited liability company (the “Master Lessee”), which is wholly owned by the sponsors. If the Master Lessee requires funds in excess of the reserve balance(s), it may seek a capital contribution from the sponsors. Upon an event of default under the loan agreement, the lender has the ability to cause the borrower to terminate the master lease. The master lease is subordinate to the ExchangeRight Portfolio 18 Mortgage Loan. Additionally, the lender, in certain circumstances including an event of default under the loan agreement, has the right to force a conversion of the borrower to a limited liability company structure. |
| (2) | A cash sweep period will occur upon the DSCR falling below 1.50x for one calendar quarter based on the immediately preceding 12 months. Additionally, there will be a full cash sweep if the ownership interests in the borrower are not acquired by a qualified transferee with a minimum net worth of at least $200 million and assets of at least $400 million, in addition to other attributes, beginning 36 months prior to the loan’s maturity. |
| (3) | The lender is reserving for flood insurance as required by the National Flood Insurance Program. |
| (4) | Ongoing monthly TI/LC reserves are not required so long as no event of default has occurred and is continuing. Upon the DSCR falling below 1.45x based on the trailing 12-month period, the borrower must make a monthly deposit into the leasing reserve account of $10,679 plus any termination fees due in connection with the termination of a lease. |
(5) Other Reserves consist of $325,000, representing an unpaid tenant improvement allowance owed to Hobby Lobby pursuant to the terms of its lease, $33,031, representing 125% of the cost to complete Hobby Lobby demolition work, and $20,000, representing the cost to make certain repairs to the Walgreens – Chicago (Belmont), IL property.
(6) The ExchangeRight Portfolio 18 Properties were acquired by the borrower sponsors between October and November 2017. Historical occupancy and operating statements are not available.
| (7) | Each of the ExchangeRight Portfolio 18 Properties was valued individually. The effective date of the appraisals are from August 31, 2017 to October 25, 2017. |
The mortgage loan (the “ExchangeRight Portfolio 18 Mortgage Loan”) is evidenced by a single promissory note secured by first mortgages encumbering 17 cross-collateralized, single-tenant properties (16 retail and one medical office) located in Illinois, Indiana, Pennsylvania, Texas, Florida, Louisiana, Oklahoma and North Carolina (the “ExchangeRight Portfolio 18 Properties”). The ExchangeRight Portfolio 18 Mortgage Loan had an original principal balance of $33,441,294, has an outstanding principal balance of $33,441,294, and accrues interest at an interest rate of 4.088%per annum. The ExchangeRight Portfolio 18 Mortgage Loan had an
THE INFORMATION IN THIS STRUCTURAL AND COLLATERAL TERM SHEET IS NOT COMPLETE AND MAY BE AMENDED PRIOR TO THE TIME OF SALE. THIS TERM SHEET IS NOT AN OFFER TO SELL THESE SECURITIES AND IT IS NOT A SOLICITATION OF AN OFFER TO BUY THESE SECURITIES IN ANY JURISDICTION WHERE THE OFFER OR SALE IS NOT PERMITTED.
144
EXCHANGERIGHT PORTFOLIO 18
initial term of 120 months, has a remaining term of 118 months as of the Cut-off Date and requires payments of interest-only through the loan term. The ExchangeRight Portfolio 18 Mortgage Loan matures on December 1, 2027.
Following the lockout period, the borrower has the right to defease the ExchangeRight Portfolio 18 Mortgage Loan in whole, but not in part. In addition, the ExchangeRight Portfolio 18 Mortgage Loan is prepayable without penalty on or after September 1, 2027.
Sources and Uses
| Sources | Uses | |||||||
| Original loan amount | $33,441,294 | 59.3% | Purchase price | $54,433,429 | 96.4% | |||
| Cash equity | 22,999,626 | 40.7 | reserves | 1,199,077 | 2.1 | |||
| Closing costs | 808,414 | 1.4 | ||||||
| Total Sources | $56,440,920 | 100.0% | Total Uses | $56,440,920 | 100.0% |
The ExchangeRight Portfolio 18 Properties are comprised of 17 cross-collateralized, single-tenant properties (16 retail and one medical office) totaling 272,767 square feet located in Illinois (4 properties, 31.1% of allocated loan amount), Indiana (2 properties, 15.5% of allocated loan amount), Pennsylvania (3 properties, 12.4% of allocated loan amount), Texas (2 properties, 11.4% of allocated loan amount), Florida (2 properties, 10.2% of allocated loan amount), Louisiana (2 properties, 10.0% of allocated loan amount), Oklahoma (1 property, 7.0% of allocated loan amount) and North Carolina (1 property, 2.4% allocated loan amount). Built between 1974 and 2017, 45.7% were built or renovated in the past three years. The ExchangeRight Portfolio 18 Properties range in size from 6,124 square feet to 74,705 square feet. The borrower sponsors acquired the ExchangeRight Portfolio 18 Properties between October and November 2017 for a combined purchase price of approximately $54.4 million. As of February 1, 2018, the ExchangeRight Portfolio 18 Properties were 100.0% occupied. The ExchangeRight Portfolio 18 Mortgage Loan documents do not permit any release of any individual property.
The ExchangeRight Portfolio 18 Properties include nationally recognized investment grade-rated tenants, such as Walgreens (rated Baa2/BBB by Moody’s/S&P), Dollar General (rated Baa2/BBB by Moody’s/S&P), CVS Pharmacy (rated Baa1/BBB+ by Moody’s/S&P), Fresenius Medical Care (rated Baa3/BBB- by Moody’s/S&P) and Advance Auto Parts (rated Baa2/BBB- by Moody’s/S&P). Investment grade-rated tenants occupy 13 of the 17 properties, representing 53.0% of the ExchangeRight Portfolio 18 Properties’ total net rentable area and 70.8% of underwritten base rent (leases are directly with rated entities or are guaranteed by such entities.) Leases representing approximately 91.3% of the net rentable area and 88.0% of the underwritten base rent expire after the ExchangeRight Portfolio 18 Mortgage Loan maturity date. No individual property within the ExchangeRight Portfolio 18 Properties accounts for more than 12.4% of the underwritten base rent. The largest property by net rentable area, Hobby Lobby – Fort Wayne (Coldwater), IN, comprises 74,705 square feet (27.4% of the total net rentable area) with no other individual property accounting for more than 7.0% of the total net rentable area. The three largest properties by underwritten base rent represent only 33.1% of underwritten base rent, with no other individual property accounting for more than 9.5% of the underwritten base rent.
THE INFORMATION IN THIS STRUCTURAL AND COLLATERAL TERM SHEET IS NOT COMPLETE AND MAY BE AMENDED PRIOR TO THE TIME OF SALE. THIS TERM SHEET IS NOT AN OFFER TO SELL THESE SECURITIES AND IT IS NOT A SOLICITATION OF AN OFFER TO BUY THESE SECURITIES IN ANY JURISDICTION WHERE THE OFFER OR SALE IS NOT PERMITTED.
145
EXCHANGERIGHT PORTFOLIO 18
The following table presents certain information relating to the ExchangeRight Portfolio 18 Properties:
ExchangeRight Portfolio 18 Property Summary
| Tenant Name | Allocated Cut-off Date Balance | % of Portfolio Cut-off Date Balance | Appraised Value | Net Rentable Area (SF) | Year Built / Renovated | U/W Base Rent | % U/W Base Rent | Lease Expiration Date | Lease Renewal Options | ||
Walgreens (Belmont) Chicago, IL | $4,297,079 | 12.8% | $7,075,000 | 18,340 | 2001/NAP | $425,000 | 12.4% | 1/31/2028(1) | 8, 5-year options(1) | ||
Hobby Lobby Fort Wayne, IN | $3,583,430 | 10.7% | $5,500,000 | 74,705 | 1989/NAP | $373,525 | 10.9% | 12/31/2027 | 3, 5-year options | ||
Walgreens (Central) Chicago, IL | $3,416,405 | 10.2% | $5,625,000 | 18,154 | 1997/2017 | $338,000 | 9.8% | 3/31/2029(2) | 6, 5-year options(2) | ||
Walgreens League City, TX | $3,036,805 | 9.1% | $5,000,000 | 14,490 | 2001/NAP | $325,735 | 9.5% | 5/1/2027(3) | 9, 5-year options(3) | ||
Tractor Supply Meraux, LA | $2,386,929 | 7.1% | $3,930,000 | 19,097 | 2017/NAP | $236,001 | 6.9% | 11/1/2032 | 4, 5-year options | ||
Tractor Supply Collinsville, OK | $2,332,266 | 7.0% | $3,840,000 | 19,175 | 2017/NAP | $240,000 | 7.0% | 9/30/2032 | 4, 5-year options | ||
Walgreens Ocala, FL | $2,277,604 | 6.8% | $3,750,000 | 15,525 | 1995/NAP | $225,000 | 6.5% | 11/30/2028(4) | 6, 5-year options(4) | ||
Fresenius Medical Care Bethlehem, PA | $2,143,984 | 6.4% | $3,530,000 | 8,275 | 2017/NAP | $215,978 | 6.3% | 5/1/2029 | 3, 5-year options | ||
CVS Pharmacy Richmond, IN | $1,594,322 | 4.8% | $2,625,000 | 10,722 | 1998/NAP | $162,442 | 4.7% | 5/31/2036 | 5, 5-year options | ||
Napa Auto Parts Jerome, IL | $1,427,298 | 4.3% | $2,350,000 | 15,294 | 1974/2017 | $153,000 | 4.5% | 10/31/2037 | 4, 5-year options | ||
Advance Auto Parts Chicago, IL | $1,260,274 | 3.8% | $2,075,000 | 6,124 | 2013/NAP | $124,500 | 3.6% | 4/30/2028 | 3, 5-year options | ||
Dollar General Panama City, FL | $1,135,765 | 3.4% | $1,870,000 | 9,100 | 2013/NAP | $123,321 | 3.6% | 5/31/2028 | 4, 5-year options | ||
Dollar General Elizabeth, PA | $1,078,066 | 3.2% | $1,775,000 | 9,026 | 2017/NAP | $114,684 | 3.3% | 7/31/2032 | 2, 5-year options | ||
Dollar General Baton Rouge, LA | $971,778 | 2.9% | $1,600,000 | 9,100 | 2012/NAP | $108,972 | 3.2% | 9/30/2028 | 3, 5-year options | ||
Dollar General Altoona, PA | $911,041 | 2.7% | $1,500,000 | 7,489 | 2017/NAP | $97,944 | 2.8% | 6/30/2032 | 2, 5-year options | ||
Dollar General Fayetteville, NC | $798,680 | 2.4% | $1,175,000 | 9,125 | 2017/NAP | $86,815 | 2.5% | 10/9/2027 | 3, 5-year options | ||
Dollar General Odessa, TX | $789,568 | 2.4% | $1,300,000 | 9,026 | 2015/NAP | $86,455 | 2.5% | 2/28/2030 | 3, 5-year options | ||
| Total/Weighted Average | $33,441,294 | 100.0% | $54,520,000 | 272,767 | $3,437,372 | 100.0% | |||||
| (1) | The Walgreens – Chicago (Belmont), IL property is under a lease that expires on January 31, 2068 and has the option to terminate its lease on January 31, 2028 and every five years thereafter through January 31, 2063. |
| (2) | The Walgreens – Chicago (Central), IL property is under a lease that expires on March 31, 2069 and has the option to terminate its lease on March 31, 2029 and every five years thereafter through March 31, 2064. |
| (3) | The Walgreens – League City (Main), TX property is under a lease that expires on May 1, 2067 and has the option to terminate its lease on May 1, 2027 and every five years thereafter through May 1, 2062. |
| (4) | The Walgreens – Ocala (East Silver Springs Blvd), FL property is under a lease that expires on November 30, 2053 and has the option to terminate its lease on November 30, 2028 and every five years thereafter through November 30, 2048. |
THE INFORMATION IN THIS STRUCTURAL AND COLLATERAL TERM SHEET IS NOT COMPLETE AND MAY BE AMENDED PRIOR TO THE TIME OF SALE. THIS TERM SHEET IS NOT AN OFFER TO SELL THESE SECURITIES AND IT IS NOT A SOLICITATION OF AN OFFER TO BUY THESE SECURITIES IN ANY JURISDICTION WHERE THE OFFER OR SALE IS NOT PERMITTED.
146
EXCHANGERIGHT PORTFOLIO 18
The following table presents certain information relating to the tenancy at the ExchangeRight Portfolio 18 Properties:
Major Tenants(1)
| Tenant Name | Credit Rating (Fitch/Moody’s/ S&P)(1) | Property Count | Tenant NRSF | % of NRSF | Annual U/W Base Rent | % of Total Annual U/W Base Rent | Annual U/W Base Rent PSF | Annual Comparable Rent PSF(2) | |
| Hobby Lobby | NR/NR/NR | 1 | 74,705 | 27.4% | $373,525 | 10.9% | $5.00 | $4.25 - $10.25 | |
| Walgreens | BBB/Baa2/BBB | 4 | 66,509 | 24.4% | $1,313,735 | 38.2% | $19.75 | $14.75 - $25.16 | |
| Dollar General | NR/Baa2/BBB | 6 | 52,866 | 19.4% | $618,191 | 18.0% | $11.69 | $7.73 - $13.82 | |
| Tractor Supply | NR/NR/NR | 2 | 38,272 | 14.0% | $476,001 | 13.8% | $12.44 | $11.93 - $12.75 | |
| Napa Auto Parts | NR/NR/NR | 1 | 15,294 | 5.6% | $153,000 | 4.5% | $10.00 | $10.49 | |
| CVS Pharmacy | NR/Baa1/BBB+ | 1 | 10,722 | 3.9% | $162,442 | 4.7% | $15.15 | $21.21 | |
| Fresenius Medical Care | BBB-/Baa3/BBB- | 1 | 8,275 | 3.0% | $215,978 | 6.3% | $26.10 | $25.00 | |
| Advance Auto Parts | NR/Baa2/BBB- | 1 | 6,124 | 2.2% | $124,500 | 3.6% | $20.33 | $16.98 | |
| Occupied Collateral Total | 272,767 | 100.0% | $3,437,372 | 100.0% | $12.60 | ||||
| Vacant Space | 0 | 0.0% | |||||||
| Collateral Total | 272,767 | 100.0% | |||||||
| (1) | Certain ratings are those of the parent company whether or not the parent company guarantees the lease. All credit rated tenants’ leases are guaranteed by their respective parent entity with the exception of the Walgreens – Ocala (East Silver Springs Blvd), FL, Walgreens – League City (Main), TX and the Advance Auto Parts – Chicago (Cottage), IL leases. |
| (2) | Annual Comparable Rent PSF information obtained from individual appraisals for the ExchangeRight Portfolio 18 Properties. |
The following table presents certain information relating to the lease rollover schedule at the ExchangeRight Portfolio 18 Properties:
Lease Expiration Schedule(1)
| Year Ending December 31, | No. of Leases Expiring | Expiring NRSF | % of Total NRSF | Cumulative Expiring NRSF | Cumulative % of Total NRSF | Annual U/W Base Rent | % of Total Annual U/W Base Rent | Annual U/W Base Rent PSF |
| 2018 | 0 | 0 | 0.0% | 0 | 0.0% | $0 | 0.0% | $0.00 |
| 2019 | 0 | 0 | 0.0% | 0 | 0.0% | $0 | 0.0% | $0.00 |
| 2020 | 0 | 0 | 0.0% | 0 | 0.0% | $0 | 0.0% | $0.00 |
| 2021 | 0 | 0 | 0.0% | 0 | 0.0% | $0 | 0.0% | $0.00 |
| 2022 | 0 | 0 | 0.0% | 0 | 0.0% | $0 | 0.0% | $0.00 |
| 2023 | 0 | 0 | 0.0% | 0 | 0.0% | $0 | 0.0% | $0.00 |
| 2024 | 0 | 0 | 0.0% | 0 | 0.0% | $0 | 0.0% | $0.00 |
| 2025 | 0 | 0 | 0.0% | 0 | 0.0% | $0 | 0.0% | $0.00 |
| 2026 | 0 | 0 | 0.0% | 0 | 0.0% | $0 | 0.0% | $0.00 |
| 2027 | 3 | 98,320 | 36.0% | 98,320 | 36.0% | $786,075 | 22.9% | $8.00 |
| 2028 | 5 | 58,189 | 21.3% | 156,509 | 57.4% | $1,006,793 | 29.3% | $17.30 |
| Thereafter | 9 | 116,258 | 42.6% | 272,767 | 100.0% | $1,644,504 | 47.8% | $14.15 |
| Vacant | 0 | 0 | 0.0% | 272,767 | 100.0% | $0 | 0.0% | $0.00 |
| Total/Weighted Average | 17 | 272,767 | 100.0% | $3,437,372 | 100.0% | $12.60 |
(1) | Information obtained from the underwritten rent roll. |
THE INFORMATION IN THIS STRUCTURAL AND COLLATERAL TERM SHEET IS NOT COMPLETE AND MAY BE AMENDED PRIOR TO THE TIME OF SALE. THIS TERM SHEET IS NOT AN OFFER TO SELL THESE SECURITIES AND IT IS NOT A SOLICITATION OF AN OFFER TO BUY THESE SECURITIES IN ANY JURISDICTION WHERE THE OFFER OR SALE IS NOT PERMITTED.
147
EXCHANGERIGHT PORTFOLIO 18
Operating History and Underwritten Net Cash Flow.The following table presents certain information relating to the underwritten net cash flow at the ExchangeRight Portfolio 18 Properties:
Cash Flow Analysis(1)
| U/W | % of U/W Effective Gross Income | U/W $ per SF | |||||
| Base Rent | $3,437,372 | 105.3% | $12.60 | ||||
| Total Reimbursables | 0 | 0.0 | 0.00 | ||||
| Less Vacancy & Credit Loss | (171,869) | (5.3) | (0.63) | ||||
| Effective Gross Income | $3,265,503 | 100.0% | $11.97 | ||||
| Total Operating Expenses | $81,638 | 2.5% | $0.30 | ||||
| Net Operating Income | $3,183,865 | 97.5% | $11.67 | ||||
| TI/LC | 128,143 | 3.9 | 0.47 | ||||
| Capital Expenditures | 32,060 | 1.0 | 0.12 | ||||
| Net Cash Flow | $3,023,662 | 92.6% | $11.09 | ||||
| NOI DSCR | 2.30x | ||||||
| NCF DSCR | 2.18x | ||||||
| NOI DY | 9.5% | ||||||
| NCF DY | 9.0% |
| (1) | Historical cash flows are unavailable as the ExchangeRight Portfolio 18 Properties were acquired by the borrower sponsors between October and November 2017. |
THE INFORMATION IN THIS STRUCTURAL AND COLLATERAL TERM SHEET IS NOT COMPLETE AND MAY BE AMENDED PRIOR TO THE TIME OF SALE. THIS TERM SHEET IS NOT AN OFFER TO SELL THESE SECURITIES AND IT IS NOT A SOLICITATION OF AN OFFER TO BUY THESE SECURITIES IN ANY JURISDICTION WHERE THE OFFER OR SALE IS NOT PERMITTED.
148
(THIS PAGE INTENTIONALLY LEFT BLANK)
149
| COURTYARD LOS ANGELES SHERMAN OAKS |
| No. 14 – Courtyard Los Angeles Sherman Oaks | |||||||
| Loan Information | Property Information | ||||||
| Mortgage Loan Seller: | Wells Fargo Bank, National Association | Single Asset/Portfolio: | Single Asset | ||||
| Property Type: | Hospitality | ||||||
| Original Principal Balance(1): | $28,000,000 | Specific Property Type: | Full Service | ||||
| Cut-off Date Balance(1): | $28,000,000 | Location: | Sherman Oaks, CA | ||||
| % of Initial Pool Balance: | 2.2% | Size: | 213 Rooms | ||||
| Loan Purpose: | Refinance | Cut-off Date Balance Per Room(1): | $258,216 | ||||
| Borrower Name: | Sherman Oaks Hotel, LLC | Year Built/Renovated: | 1968/2017 | ||||
| Borrower Sponsors: | Lewis N. Wolff; Keith M. Wolff | Title Vesting: | Fee | ||||
| Mortgage Rate: | 4.474% | Property Manager: | Self-managed | ||||
| Note Date: | November 30, 2017 | 4thMost Recent Occupancy (As of): | 77.6% (12/31/2013) | ||||
| Anticipated Repayment Date: | NAP | 3rdMost Recent Occupancy (As of): | 81.9% (12/31/2014) | ||||
| Maturity Date: | December 11, 2027 | 2ndMost Recent Occupancy (As of): | 82.4% (12/31/2015) | ||||
| IO Period: | 36 months | Most Recent Occupancy (As of): | 82.0% (12/31/2016) | ||||
| Loan Term (Original): | 120 months | Current Occupancy (As of): | 81.7% (10/31/2017) | ||||
| Seasoning: | 2 months | ||||||
| Amortization Term (Original): | 360 months | Underwriting and Financial Information: | |||||
| Loan Amortization Type: | Interest-only, Amortizing Balloon | ||||||
| Interest Accrual Method: | Actual/360 | 4thMost Recent NOI (As of): | $5,771,863 (12/31/2014) | ||||
| Call Protection: | L(26),D(90),O(4) | 3rdMost Recent NOI (As of): | $6,106,243 (12/31/2015) | ||||
| Lockbox Type: | Hard/Springing Cash Management | 2ndMost Recent NOI (As of)(4): | $8,293,561 (12/31/2016) | ||||
| Additional Debt(1): | Yes | Most Recent NOI (As of)(4): | $6,636,044 (TTM10/31/2017) | ||||
| Additional Debt Type(1): | Pari Passu | ||||||
| U/W Revenues: | $15,772,566 | ||||||
| U/W Expenses: | $9,346,312 | ||||||
| U/W NOI: | $6,426,254 | ||||||
| Escrows and Reserves: | U/W NCF: | $5,795,351 | |||||
| U/W NOI DSCR(1): | 1.93x | ||||||
| Type: | Initial | Monthly | Cap (If Any) | U/W NCF DSCR(1): | 1.74x | ||
| Taxes | $63,960 | $21,320 | NAP | U/W NOI Debt Yield(1): | 11.7% | ||
| Insurance | $70,734 | $23,578 | NAP | U/W NCF Debt Yield(1): | 10.5% | ||
| PIP Reserve | $0 | Springing(2) | NAP | As-Is Appraised Value: | $85,900,000 | ||
| FF&E Reserve | $0 | $52,178 | NAP | As-Is Appraisal Valuation Date: | October 6, 2017 | ||
| Insurance Deductible Reserve | $0 | Springing(3) | NAP | Cut-off Date LTV Ratio(1): | 64.0% | ||
| LTV Ratio at Maturity or ARD(1): | 56.0% | ||||||
| (1) | The Courtyard Los Angeles Sherman Oaks Whole Loan (as defined below), which had an original principal balance of $55,000,000, is comprised of twopari passu notes (Notes A-1 and A-2). The controlling Note A-1 had an original principal balance of $28,000,000, has an outstanding principal balance of $28,000,000 as of the Cut-Off Date and will be contributed to the BANK 2018-BNK10 Trust. The non-controlling Note A-2 had an original principal balance of $27,000,000 and was contributed to the WFCM 2017-C42 Trust. All statistical information related to balances per room, loan-to-value ratios, debt service coverage ratios and debt yields are based on the Courtyard Los Angeles Sherman Oaks Whole Loan. |
| (2) | The borrower is required to deposit an amount equal to 110% of the estimated costs to complete any future PIP work required by the franchisor less the amount of FF&E reserve funds on deposit with the lender. |
| (3) | If at any time the borrower elects to have a deductible of 10% of the total insurable value for windstorm and/or earthquake insurance, the borrower shall deposit with the lender an amount equal to 5% of the total insurable value of the Courtyard Los Angeles Sherman Oaks Property. |
| (4) | See “Operating History and Underwritten Net Cash Flow” section below. |
The mortgage loan (the “Courtyard Los Angeles Sherman Oaks Mortgage Loan”) is part of a whole loan (the “Courtyard Los Angeles Sherman Oaks Whole Loan”) that is evidenced by two promissory notes (Notes A-1 and A-2) secured by a first mortgage encumbering the fee simple interest in a 213-room full service hotel located in Sherman Oaks, California (the “Courtyard Los Angeles Sherman Oaks Property”). See “Description of the Mortgage Pool—The Whole Loans—Courtyard Los Angeles Sherman Oaks Whole Loan” and “Pooling and Servicing Agreement” in the Preliminary Prospectus.
THE INFORMATION IN THIS STRUCTURAL AND COLLATERAL TERM SHEET IS NOT COMPLETE AND MAY BE AMENDED PRIOR TO THE TIME OF SALE. THIS TERM SHEET IS NOT AN OFFER TO SELL THESE SECURITIES AND IT IS NOT A SOLICITATION OF AN OFFER TO BUY THESE SECURITIES IN ANY JURISDICTION WHERE THE OFFER OR SALE IS NOT PERMITTED.
150
| COURTYARD LOS ANGELES SHERMAN OAKS |
Note Summary
| Notes | Original Balance | Note Holder | Controlling Interest | |
| A-1 | $28,000,000 | BANK 2018-BNK10 | Yes | |
| A-2 | $27,000,000 | WFCM 2017-C42 | No | |
| Total | $55,000,000 |
Sources and Uses
| Sources | Uses | |||||||
| Original whole loan amount | $55,000,000 | 100.0% | Loan payoff(1) | $47,541,193 | 86.4% | |||
| Closing costs | 410,665 | 0.7 | ||||||
| Reserves | 134,694 | 0.2 | ||||||
| Return of equity | 6,913,448 | 12.6 | ||||||
| Total Sources | $55,000,000 | 100.0% | Total Uses | $55,000,000 | 100.0% |
| (1) | The Courtyard Los Angeles Sherman Oaks Property was previously securitized in the BACM 2007-5 transaction. |
The Courtyard Los Angeles Sherman Oaks Property is a 13-story, 213-room full-service hotel located along Ventura Boulevard in Sherman Oaks, California. The Courtyard Los Angeles Sherman Oaks Property is situated immediately southwest of the Interstate 405/US Highway 101 interchange, one of the busiest intersections in the United States with an average daily traffic count of approximately 600,000 cars. The guestroom configuration consists of 122 king rooms, 64 double/queen rooms, 10 handicap accessible rooms, and 17 suites. All guestrooms feature flat-screen televisions with premium channels, desks and lounge chairs. The Courtyard Los Angeles Sherman Oaks Property features a full service restaurant serving breakfast, lunch and 24-hour room service, approximately 15,000 square feet of meeting space, fully-equipped fitness center, outdoor swimming pool, sundry market and business center. The Courtyard Los Angeles Sherman Oaks Property contains 236 surface parking spaces, resulting in a parking ratio of 1.1 spaces per room. The franchise agreement with Marriott International, Inc. expires on January 21, 2024.
The Courtyard Los Angeles Sherman Oaks Property was built in 1968 and renovated in 2017. The sponsor purchased the Courtyard Los Angeles Sherman Oaks Property in 2003, and has spent over $18.6 million ($87,324 per room) to complete renovations to the parking garage, guest rooms, common areas, meeting rooms and restaurant. The Courtyard Los Angeles Sherman Oaks Property recently completed a four-year renovation project in 2017 totaling approximately $4.0 million ($18,779 per room), which included fully renovating guestroom bathrooms and replacing the carpet, wall covering, and soft goods in the guestrooms.
The Courtyard Los Angeles Sherman Oaks Property is located in Sherman Oaks, Los Angeles County, California, approximately 18.2 miles northwest of downtown Los Angeles and 13.3 miles north of Santa Monica. The Courtyard Los Angeles Sherman Oaks Property is situated at the northeast corner of the intersection of Ventura Boulevard and Orion Avenue, immediately southwest of the Interstate 405/U.S. Highway 101 interchange. Sherman Oaks is bordered by Encino to the west, Van Nuys to the north, North Hollywood and Studio City to the east and Bel Air to the south. The Courtyard Los Angeles Sherman Oaks Property is situated 2.8 miles north of Skirball Cultural Center (an educational institution featuring a museum that attracts over 600,000 visitors each year), 5.7 miles south of the Getty Center (a museum that attracts 1.3 million annual visitors) and 8.2 miles west of Universal Studios Hollywood. According to the appraisal, there are no directly competitive properties that are either proposed or under construction. According to a third-party research provider, the estimated 2017 population within a one-, three-, and five-mile radius of the Courtyard Los Angeles Sherman Oaks Property was 23,026, 163,997, and 477,936, respectively; and the average household income within the same radii was $119,493, $115,734 and $103,725, respectively.
THE INFORMATION IN THIS STRUCTURAL AND COLLATERAL TERM SHEET IS NOT COMPLETE AND MAY BE AMENDED PRIOR TO THE TIME OF SALE. THIS TERM SHEET IS NOT AN OFFER TO SELL THESE SECURITIES AND IT IS NOT A SOLICITATION OF AN OFFER TO BUY THESE SECURITIES IN ANY JURISDICTION WHERE THE OFFER OR SALE IS NOT PERMITTED.
151
| COURTYARD LOS ANGELES SHERMAN OAKS |
Operating History and Underwritten Net Cash Flow.The following table presents certain information relating to the historical operating performance and underwritten net cash flow at the Courtyard Los Angeles Sherman Oaks Property:
Cash Flow Analysis
| 2014 | 2015 | 2016(2) | TTM 10/31/2017(3) | U/W | % of U/W Total Revenue | U/W $ per Room | |||||||||
| Occupancy | 81.9% | 82.4% | 82.0% | 81.7% | 82.6% | ||||||||||
| ADR | $171.13 | $182.20 | $229.00 | $205.43 | $205.29 | ||||||||||
| RevPAR | $140.09 | $150.09 | $187.12 | $167.88 | $169.67 | ||||||||||
| Room Revenue | $10,891,427 | $11,668,727 | $14,587,423 | $13,052,141 | $13,191,221 | 83.6% | $61,931 | ||||||||
| F&B Revenue | 1,489,464 | 1,475,001 | 1,470,990 | 1,680,984 | 1,680,984 | 10.7 | 7,892 | ||||||||
| Other Revenue(1) | 748,681 | 754,920 | 861,882 | 891,309 | 900,361 | 5.7 | 4,227 | ||||||||
| Total Revenue | $13,129,572 | $13,898,648 | $16,920,295 | $15,624,434 | $15,772,566 | 100.0% | $74,050 | ||||||||
| Total Department Expenses | 3,315,545 | 3,384,850 | 3,704,322 | 4,152,259 | 4,163,550 | 26.4 | 19,547 | ||||||||
| Gross Operating Profit | $9,814,027 | $10,513,798 | $13,215,973 | $11,472,175 | $11,609,016 | 73.6% | $54,502 | ||||||||
| Total Undistributed Expenses | 3,549,519 | 3,916,105 | 4,388,365 | 4,246,400 | 4,249,895 | 26.9 | 19,953 | ||||||||
| Profit Before Fixed Charges | $6,264,508 | $6,597,693 | $8,827,608 | $7,225,775 | $7,359,121 | 46.7% | $34,550 | ||||||||
| Total Fixed Charges | 492,645 | 491,450 | 534,047 | 589,731 | 932,867 | 5.9 | 4,380 | ||||||||
| Net Operating Income | $5,771,863 | $6,106,243 | $8,293,561 | $6,636,044 | $6,426,254 | 40.7% | $30,170 | ||||||||
| FF&E | 0 | 0 | 0 | 0 | 630,903 | 4.0 | 2,962 | ||||||||
| Net Cash Flow | $5,771,863 | $6,106,243 | $8,293,561 | $6,636,044 | $5,795,351 | 36.7% | $27,208 | ||||||||
| NOI DSCR(4) | 1.73x | 1.83x | 2.49x | 1.99x | 1.93x | ||||||||||
| NCF DSCR(4) | 1.73x | 1.83x | 2.49x | 1.99x | 1.74x | ||||||||||
| NOI DY(4) | 10.5% | 11.1% | 15.1% | 12.1% | 11.7% | ||||||||||
| NCF DY(4) | 10.5% | 11.1% | 15.1% | 12.1% | 10.5% | ||||||||||
| (1) | Other Revenue includes parking revenue, no shows, gift shop, meeting room rental, telephone, and miscellaneous items. |
| (2) | The Courtyard Los Angeles Sherman Oaks Property experienced an increase in performance from January 2016 to May 2016 due to a gas leak that occurred at the Aliso Canyon Storage Facility in the San Fernando Valley. In addition, the Courtyard Los Angeles Sherman Oaks Property lost an estimated 251 room nights per month from January to December 2016 due to renovations. The 2016 statement shown reflects actual performance. If adjusted to exclude the increase in performance related to the gas leak and to include the estimated occupancy and related revenue from the lost room nights, the 2016 Occupancy, ADR, RevPAR and Net Operating Income would be 82.7%, $201.34, $166.53 and $6,920,416, respectively; and the NOI DSCR and NOI DY based on the Courtyard Los Angeles Sherman Oaks Whole Loan would be 2.08x and 12.6%, respectively. |
| (3) | The Courtyard Los Angeles Sherman Oaks Property lost an estimated 120 room nights per month from November 2016 to April 2017 due to renovations. The 10/31/2017 TTM statement shown reflects actual performance from November 2016 to October 2017. If adjusted to include the estimated occupancy and related revenue from the lost room nights, the 10/31/2017 TTM Occupancy, ADR, RevPAR and Net Operating Income would be 82.6%, $205.29, $169.67 and $6,752,085, respectively; and the NOI DSCR and NOI DY based on the Courtyard Los Angeles Sherman Oaks Whole Loan would be 2.03x and 12.3%, respectively. The U/W Room Revenue is based on the 10/31/2017 TTM statement adjusted for the November 2016 to April 2017 lost room nights. |
| (4) | The debt service coverage ratios and debt yields are based on the Courtyard Los Angeles Sherman Oaks Whole Loan. |
The following table presents certain information relating to the Courtyard Los Angeles Sherman Oaks Property’s competitive set:
Subject and Market Historical Occupancy, ADR and RevPAR(1)
Competitive Set | Courtyard Los Angeles Sherman Oaks | Penetration Factor | |||||||||||||||
Year | Occupancy | ADR | RevPAR | Occupancy | ADR | RevPAR | Occupancy | ADR | RevPAR | ||||||||
| TTM 10/31/2017 | 84.6% | $188.07 | $159.10 | 81.5% | $206.32 | $168.21 | 96.4% | 109.7% | 105.7% | ||||||||
| TTM 10/31/2016 | 80.9% | $192.40 | $155.59 | 82.0%(2) | $228.78(2) | $187.66(2) | 101.4% | 118.9% | 120.6% | ||||||||
| TTM 10/31/2015 | 80.7% | $166.46 | $134.29 | 80.9% | $180.84 | $146.38 | 100.3% | 108.6% | 109.0% | ||||||||
| (1) | Information obtained from a third party hospitality report dated November 17, 2017. The competitive set includes the following hotels: Hotel Angeleno, Hilton Los Angeles Universal City, Airtel Plaza Hotel, Marriott Warner Center Woodland Hills, Sportsmen’s Lodge Hotel, Luxe Hotel Sunset Boulevard, Hilton Woodland Hills Los Angeles, Hampton Inn Suites Los Angeles Sherman Oaks, and Best Western Burbank Airport Inn. |
| (2) | The Courtyard Los Angeles Sherman Oaks Property experienced an increase in performance from January 2016 to May 2016 due to a gas leak that occurred at the Aliso Canyon Storage Facility in the San Fernando Valley. In addition, the Courtyard Los Angeles Sherman Oaks Property lost an estimated 251 room nights per month from January to December 2016. See “Cash Flow Analysis” section above. |
THE INFORMATION IN THIS STRUCTURAL AND COLLATERAL TERM SHEET IS NOT COMPLETE AND MAY BE AMENDED PRIOR TO THE TIME OF SALE. THIS TERM SHEET IS NOT AN OFFER TO SELL THESE SECURITIES AND IT IS NOT A SOLICITATION OF AN OFFER TO BUY THESE SECURITIES IN ANY JURISDICTION WHERE THE OFFER OR SALE IS NOT PERMITTED.
152
(THIS PAGE INTENTIONALLY LEFT BLANK)
153
| WARWICK MALL |
| No. 15 – Warwick Mall | ||||||||
| Loan Information | Property Information | |||||||
| Mortgage Loan Seller: | Bank of America, N.A. | Single Asset/Portfolio: | Single Asset | |||||
Credit Assessment (DBRS/Fitch/Moody’s) | (NR/NR/NR) | Property Type: | Retail | |||||
| Original Principal Balance(1): | $27,500,000 | Specific Property Type: | Regional Mall | |||||
| Cut-off Date Balance(1): | $27,500,000 | Location: | Warwick, RI | |||||
| % of Initial Pool Balance: | 2.1% | Size: | 588,716 SF | |||||
| Loan Purpose: | Refinance | Cut-off Date Balance Per SF(1): | $127.40 | |||||
| Borrower: | Warwick Mall Owner LLC | Year Built/Renovated: | 1970 / 2010 | |||||
| Borrower Sponsors: | Bliss Properties; Lane Family Trust; Mark T. Brennan | Title Vesting: | Fee | |||||
| Mortgage Rate: | 4.4450% | Property Manager: | Mark T. Brennan & Co., Inc.; Bliss Properties, Inc.; Norman P. Posner; Mark G. Sklarz | |||||
| Note Date: | September 14, 2017 | 4thMost Recent Occupancy: | 94.0% (12/31/2013) | |||||
| Anticipated Repayment Date: | NAP | 3rdMost Recent Occupancy: | 98.8% (12/31/2014) | |||||
| Maturity Date: | October 1, 2027 | 2ndMost Recent Occupancy: | 99.6% (12/31/2015) | |||||
| IO Period: | 60 | Most Recent Occupancy: | 95.7% (12/31/2016) | |||||
| Loan Term (Original): | 120 months | Current Occupancy (As of): | 95.7% (11/17/2017) | |||||
| Seasoning: | 4 months | |||||||
| Amortization Term (Original): | 360 months | Underwriting and Financial Information: | ||||||
| Loan Amortization Type: | Interest-only, Amortizing Balloon | |||||||
| Interest Accrual Method: | Actual/360 | 4thMost Recent NOI: | $9,117,626 (12/31/2014) | |||||
| Call Protection(2): | L(28),D(87),O(5) | 3rdMost Recent NOI: | $9,340,283 (12/31/2015) | |||||
| Lockbox Type(3): | Hard/Springing Cash Management | 2ndMost Recent NOI: | $10,308,956 (12/31/2016) | |||||
| Additional Debt(1): | Yes | Most Recent NOI: | $10,229,726 (TTM 10/31/2017) | |||||
| Additional Debt Type(1): | Pari Passu;Future Mezzanine | |||||||
| Escrows and Reserves: | U/W Revenues: | $16,956,599 | ||||||
| U/W Expenses: | $6,957,538 | |||||||
| Type: | Initial | Monthly | Cap (If Any) | U/W NOI: | $9,999,062 | |||
| Taxes | $120,833 | $120,833 | NAP | U/W NCF: | $9,118,138 | |||
| Insurance | $241,667 | $48,333 | NAP | U/W NOI DSCR(1): | 2.21x | |||
| Replacement Reserve | $0 | $12,265 | NAP | U/W NCF DSCR(1): | 2.01x | |||
| TI/LC Reserves | $830,000 | $61,196 | NAP | U/W NOI Debt Yield(1): | 13.3% | |||
| Condominium CAM(4) | $0 | $6,377 | NAP | U/W NCF Debt Yield(1): | 12.2% | |||
| Guarantor Reserve(5) | $5,000,000 | $0 | NAP | As-Is Appraised Value: | $158,000,000 | |||
| As-Is Appraisal Valuation Date: | July 28, 2017 | |||||||
| Cut-off Date LTV Ratio(1): | 47.5% | |||||||
| LTV Ratio at Maturity(1): | 43.4% | |||||||
| (1) | The Warwick Mall Mortgage Loan (as defined below) is part of the Warwick Mall Whole Loan (as defined below), which is comprised of threepari passu promissory notes with an aggregate original principal balance of $75,000,000. The Cut-off Date Balance per SF, U/W NOI DSCR, U/W NCF DSCR, U/W NOI Debt Yield, U/W NCF Debt Yield, Cut-off Date LTV Ratio and LTV Ratio at maturity numbers presented above are based on the aggregate principal balance of the promissory notes comprising the Warwick Mall Whole Loan. Following the date which is 12 months after the loan origination date and until the date that is 12 months prior to the maturity date, the owners of the direct or indirect equity interests in the Warwick Mall Whole Loan borrower are permitted to incur mezzanine debt, upon satisfaction of certain conditions, including: (i) the mezzanine lender enters into an intercreditor agreement acceptable to the lender, (ii) the lender receives rating agency confirmation and (iii) the mezzanine financing is in an amount that, when added to the outstanding principal balance of the Warwick Mall Whole Loan, will result in (1) a combined loan-to-value ratio of no more than 47.5%, (2) a combined debt service coverage ratio of no less than 2.00x and (3) a combined debt yield of no less than 12.17%. |
| (2) | Defeasance of the Warwick Mall Whole Loan is permitted any time after the earlier of (i) September 14, 2020, or (ii) two years from the closing date of the securitization that includes the lastpari passu note of the Warwick Mall Whole Loan to be securitized. The assumed lockout period of 28 payments is based on the closing date of this transaction in February 2018. |
| (3) | The Warwick Mall Whole Loan Documents require springing cash management upon the debt service coverage ratio being less than 1.25x (calculated on an amortizing basis) for the trailing four quarters, continuing until the debt service coverage ratio is greater than or equal to 1.30x (calculated on an amortizing basis) for the trailing four quarters for two consecutive quarters. |
| (4) | The Showcase Cinema portion of the Warwick Mall Property is subject to a condominium regime. The Warwick Mall Borrower (as defined below) is required to deposit monthly $6,377 into a condominium common area charges reserve which represents the estimated amount due under the condominium documents for common area charges. |
| (5) | The Warwick Mall Guarantor is required to maintain (i) a minimum net worth of not less than $17.5 million and (ii) liquidity of no less than $5.0 million. To satisfy such liquidity covenant, the Warwick Mall Guarantor deposited at loan origination, and is required to maintain throughout the loan term, a $5.0 million guarantor reserve in a lender-controlled account, in which the lender has been granted a security interest. |
The mortgage loan (the “Warwick Mall Mortgage Loan”) is part of a whole loan (the “Warwick Mall Whole Loan”) evidenced by threepari passu promissory notes (Note A-1, Note A-2 and Note A-3) secured by a first mortgage encumbering the borrower’s fee interest in a 588,716 square foot portion of a 977,781 square foot regional mall located in Warwick, Rhode Island (the “Warwick Mall
THE INFORMATION IN THIS STRUCTURAL AND COLLATERAL TERM SHEET IS NOT COMPLETE AND MAY BE AMENDED PRIOR TO THE TIME OF SALE. THIS TERM SHEET IS NOT AN OFFER TO SELL THESE SECURITIES AND IT IS NOT A SOLICITATION OF AN OFFER TO BUY THESE SECURITIES IN ANY JURISDICTION WHERE THE OFFER OR SALE IS NOT PERMITTED.
154
| WARWICK MALL |
Property”). The Warwick Mall Whole Loan was originated on September 14, 2017 by Bank of America, N.A. The Warwick Mall Mortgage Whole Loan had an original principal balance of $75,000,000, has an outstanding balance as of the Cut-off Date of $75,000,000 and accrues interest at an interest rate of 4.4450%per annum.The Warwick Mall Whole Loan had an initial term of term of 120 months, has a remaining term of 116 months as of the Cut-off Date and requires payments of interest-only for the first 60 months following origination and, thereafter, requires payments of principal and interest based on a 30-year amortization schedule. The Warwick Mall Whole Loan matures on October 1, 2027.
Note A-2, which will be contributed to the BANK 2018-BNK10 securitization trust, has an original principal balance of $27,500,000, has an outstanding principal balance of $27,500,000 as of the Cut-off Date and represents the non-controlling interest in the Warwick Mall Whole Loan. The controlling Note A-1, which had an original principal balance of $30,000,000, was contributed to the BANK 2017-BNK9 securitization trust. The non-controlling Note A-3 is currently being held by Bank of America, N.A. and is expected to be contributed to one or more future securitizations.
Note Summary
| Notes | Original Balance | Note Holder | Controlling Interest | |
| A-1 | $30,000,000 | BANK 2017-BNK9 | Yes | |
| A-2 | $27,500,000 | BANK 2018-BNK10 | No | |
| A-3 | $17,500,000 | Bank of America, N.A. | No | |
| Total | $75,000,000 |
Following the defeasance lockout period, the Warwick Mall Borrower has the right to release a 1.75-acre parcel from the Warwick Mall Whole Loan collateral in connection with the transfer of such parcel to a person wholly owned by the guarantor for the development of one or more hotels, a bowling alley, one or more multifamily residential buildings, or such other project that is consistent with the operation of a first class retail shopping center and that is compatible with the Warwick Mall Property and reasonably acceptable to the lender, subject to the satisfaction of certain conditions, including, (i) partial defeasance of the Warwick Mall Whole Loan in an amount equal to $1,181,250 (125% of the appraised value of the release parcel), (ii) the loan-to-value ratio of the remaining collateral being no greater than 47.5%, and (iii) the debt yield following the release being at least 12.17%, and (iv) under no circumstances may any dividends, distributions, profits, proceeds or any other property of any nature received from the use, ownership, sale or financing of the release parcel be distributed to a shareholder, partner or member of the guarantor.
Sources and Uses
| Sources | Uses | |||||||
| Original loan amount | $75,000,000 | 100.0% | Loan Payoff | $60,799,410 | 81.1% | |||
| Return of Equity(1) | 5,694,535 | 7.6 | ||||||
| Guarantor Reserve(2) | 5,000,000 | 6.7 | ||||||
| Closing Costs | 2,313,555 | 3.1 | ||||||
| Upfront Reserves | 1,192,500 | 1.6 | ||||||
| Total Sources | $75,000,000 | 100.0% | Total Uses | $75,000,000 | 100.0% |
| (1) | The Warwick Mall Sponsors maintain an un-depreciated cost basis in the Warwick Mall Property of approximately $83.0 million. |
| (2) | The Warwick Mall Guarantor is required to maintain (i) a minimum net worth of not less than $17.5 million and (ii) liquidity of no less than $5.0 million. To satisfy such liquidity covenant, the Warwick Mall Guarantor deposited at loan origination, and is required to maintain throughout the loan term, a $5.0 million guarantor reserve in a lender-controlled account, in which the lender has been granted a security interest. |
The Warwick Mall Property is a portion of a one-level enclosed regional mall located in Warwick, Rhode Island. In addition to the anchor and inline space, the Warwick Mall Property features a food court, two freestanding restaurant buildings, two freestanding retailers, a 4,720 square foot strip center, and a freestanding 12-screen Showcase Cinema. The Warwick Mall Property was built in 1970 and renovated in 2010. The property temporarily closed from March 30, 2010 to August 20, 2010 as a result of property-wide flood damage resulting from the flooding of the Pawtucket River on March 30, 2010. Approximately $20.5 million was spent on the renovation, including approximately $10.3 million from insurance proceeds and $10.2 million from the Warwick Mall Sponsors. Multiple tenants at the property also contributed capital to the renovation of their individual spaces, including the non-collateral anchor Macy’s, which reportedly spent $34 million, the non-collateral anchor Target, which reportedly spent $15 million, and the collateral anchor JC Penney, which reportedly spent $12 million. The post-flood renovation transformed the Warwick Mall Property into like-new condition featuring best-in-class amenities. Additionally, in 2012, the Warwick Mall Sponsors expanded the Warwick Mall Property by constructing the 37,472 square foot anchor Nordstrom space.
The greater Warwick Mall totals 977,781 square foot, with the Warwick Mall Mortgage Loan collateral encompassing 588,716 square foot of the mall and outparcels that as of November 17, 2017 was 95.7% leased by a granular rent roll of 82 tenants. Collateral anchor tenants include JC Penney, Jordan’s Furniture, Showcase Cinema, Nordstrom Rack and Old Navy; additional tenants include H&M, Kay Jewelers, Victoria’s Secret, LensCrafters, Buffalo Wild Wings, Longhorn Steakhouse and Things Remembered. Non-collateral anchor tenants are Macy’s and Target, both of which are corporate-owned.
The Warwick Mall Property is located in Warwick, Rhode Island along Bald Hill Road, with immediate access to Route 2 and Route 5, which routes are the focus of retail activity in the trade area and provide access to Interstate-95 and Interstate-295 leading to Providence, Rhode Island (approximately 11.2 miles from the Warwick Mall Property) and Boston, Massachusetts (approximately 50.0 miles from the Warwick Mall Property). According to the appraisal, the immediate neighborhood is defined as the Route 2 Corridor, stretching from the Interstate-95 interchange (approximately 3.5 miles south of the Warwick Mall Property) to the Route 37 interchange (approximately 3.0 miles north of the Warwick Mall Property.) The Route 2 Corridor is a densely developed regional
THE INFORMATION IN THIS STRUCTURAL AND COLLATERAL TERM SHEET IS NOT COMPLETE AND MAY BE AMENDED PRIOR TO THE TIME OF SALE. THIS TERM SHEET IS NOT AN OFFER TO SELL THESE SECURITIES AND IT IS NOT A SOLICITATION OF AN OFFER TO BUY THESE SECURITIES IN ANY JURISDICTION WHERE THE OFFER OR SALE IS NOT PERMITTED.
155
| WARWICK MALL |
retail destination, which south of the Warwick Mall Property has been developed over the last five to ten years, while the northern section of the corridor is characterized by more mature neighborhoods with smaller strip retail development.
According to the appraisal, the 2016 average population within a 5-, 7- and 10-mile radius was 186,650, 335,389 and 557,141, respectively. The 2016 average household income within a 5-, 7- and 10-mile radius was $76,629, $129,575 and $217,480, respectively, with retail sales per household within the same radii of $45,009, $43,789, and $44,142, respectively. Both Warwick, Rhode Island and nearby Providence, Rhode Island have historically served as hubs for the education and health services industry sectors, led by Brown University and other local universities and healthcare systems. More recently, the region has seen growth the in manufacturing and defense industries, including activity from General Dynamics Electric Boat’s $17.6 billion contract with the United States Navy in 2014 and its $100 billion Columbia nuclear missile contract, and Raytheon’s $58.1 million contract for mine neutralization systems in 2017. The Providence area is home to the headquarters of four Fortune 500 companies: CVS Health, Textron, United Natural Foods and Citizens Financial Group. Additional major employers in the area include Lifespan (12,050 employees), Care New England (8,500 employees) and Naval Station Newport (5,063 employees). The Providence metropolitan statistical area had a March 2017 unemployment rate of 3.8%
A portion of the Warwick Mall Property, which includes the Showcase Cinema parcel, is subject to a retail condominium regime with two other units: the space occupied by the non-collateral shadow anchor Target, which is corporate owned, and the two floors above the non-collateral Target, which are owned by the Warwick Mall Guarantor. All three condominium units currently have equal 1/3 interests and decision making requires 80% approval of the unit owners.
The following table presents certain information relating to the tenancy at Warwick Mall Property:
Major Tenants(1)
| Tenant Name | Credit Rating (Fitch/ Moody’s/ S&P)(2) | Tenant NRSF | % of NRSF | Annual U/W Base Rent PSF(3) (4) | Annual U/W Base Rent(3) | % of Total Annual U/W Base Rent | 9/30/2017 TTM Sales | Lease Expiration Date | ||
| $ | PSF | Occ Cost | ||||||||
| Major Tenants | ||||||||||
| JC Penney (ground lease)(5) | B+/B1/B+ | 137,952 | 23.4% | $0.80 | $110,000 | 0.9% | $19,452,572 | $141 | 1.0% | 3/31/2020 |
| Jordan’s Furniture | A+/Aa2/AA | 113,743 | 19.3% | $8.34 | $948,617 | 7.6% | $27,943,202 | $246 | 3.4% | 12/31/2021 |
| Showcase Cinema(6) | NR/NR/B+ | 57,160 | 9.7% | $17.49 | $1,000,000 | 8.0% | $5,158,121 | $429,843 | 25.7% | 4/30/2021 |
| Nordstrom Rack | BBB+/Baa1/BBB+ | 37,472 | 6.4% | $28.60 | $1,071,699 | 8.6% | NAV | NAV | NAV | 11/30/2022 |
| Old Navy | BB+/Baa2/BB+ | 22,579 | 3.8% | $25.00 | $564,475 | 4.5% | $10,485,454 | $464 | 6.5% | 1/31/2021 |
| Total Major Tenants | 368,906 | 62.7% | $10.02 | $3,694,791 | 29.6% | |||||
| Other Tenants | 194,468 | 33.0% | $45.13 | $8,777,007 | 70.4% | |||||
| Occupied Collateral Total | 563,374 | 95.7% | $22.14 | $12,471,798 | 100.0% | |||||
| Vacant Space | 25,342 | 4.3% | ||||||||
| Collateral Total | 588,716 | 100.0% | ||||||||
| Non-Collateral Tenants | ||||||||||
| Macy’s | BBB/Baa3/BBB- | 180,000 | NAV | NAV | NAV | NAV | ||||
| Target | A-/A2/A | 140,000 | NAV | NAV | NAV | NAV | ||||
| Off Broadway Shoes | NR/NR/NR | 22,500 | NAV | NAV | NAV | NAV | ||||
| (1) | Information is based on the underwritten rent roll. |
| (2) | Certain ratings are those of the parent company whether or not the parent guarantees the lease. |
| (3) | Annual UW Base Rent and Annual UW Base Rent PSF has been underwritten based on the November 17, 2017 rent roll. |
| (4) | Wtd. Avg. Annual UW Base Rent PSF excludes vacant space. |
| (5) | JC Penney leases its parcel from the Warwick Mall Borrower pursuant to a ground lease which commenced on April 1, 1980 and expires on March 31, 2020. JC Penney has 3 unexpired extension options remaining (two, 10-year extension options and one, 5-year extension option). |
| (6) | Showcase Cinema Sales PSF is shown as sales per screen (12 screens). Showcase Cinema has an option pursuant to its lease to request a change of use, and if it certifies an operating loss during any two of the previous three years and the landlord denies the request for a change of use, Showcase Cinema has a termination right. |
THE INFORMATION IN THIS STRUCTURAL AND COLLATERAL TERM SHEET IS NOT COMPLETE AND MAY BE AMENDED PRIOR TO THE TIME OF SALE. THIS TERM SHEET IS NOT AN OFFER TO SELL THESE SECURITIES AND IT IS NOT A SOLICITATION OF AN OFFER TO BUY THESE SECURITIES IN ANY JURISDICTION WHERE THE OFFER OR SALE IS NOT PERMITTED.
156
| WARWICK MALL |
The following table presents certain information relating to the lease rollover schedule at Warwick Mall Property:
Lease Expiration Schedule(1)(2)
| Year Ending December 31, | No. of Leases Expiring | Expiring NRSF | % of Total NRSF | Cumulative Expiring NRSF | Cumulative % of Total NRSF | Annual U/W Base Rent | % of Total Annual U/W Base Rent | Annual U/W Base Rent PSF(3) |
| MTM | 15 | 10,439 | 1.8% | 10,439 | 1.8% | $500,652 | 4.0% | $47.96 |
| 2018 | 7 | 6,289 | 1.1% | 16,728 | 2.8% | $546,300 | 4.4% | $86.87 |
| 2019 | 12 | 28,866 | 4.9% | 45,594 | 7.7% | $1,344,789 | 10.8% | $46.59 |
| 2020 | 12 | 156,254 | 26.5% | 201,848 | 34.3% | $1,329,919 | 10.7% | $8.51 |
| 2021 | 10 | 204,606 | 34.8% | 406,454 | 69.0% | $3,148,719 | 25.2% | $15.39 |
| 2022 | 7 | 53,029 | 9.0% | 459,483 | 78.0% | $1,751,777 | 14.0% | $33.03 |
| 2023 | 7 | 49,974 | 8.5% | 509,457 | 86.5% | $1,653,438 | 13.3% | $33.09 |
| 2024 | 3 | 10,973 | 1.9% | 520,430 | 88.4% | $333,998 | 2.7% | $30.44 |
| 2025 | 3 | 14,068 | 2.4% | 534,498 | 90.8% | $809,132 | 6.5% | $57.52 |
| 2026 | 2 | 10,101 | 1.7% | 544,599 | 92.5% | $211,619 | 1.7% | $20.95 |
| 2027 | 2 | 5,718 | 1.0% | 550,317 | 93.5% | $378,457 | 3.0% | $66.19 |
| 2028 & Beyond | 2 | 13,057 | 2.2% | 563,374 | 95.7% | $463,000 | 3.7% | $35.46 |
| Vacant | 0 | 25,342 | 4.3% | 588,716 | 100.0% | $0 | 0.0% | $0.00 |
| Total/Weighted Average | 82 | 588,716 | 100.0% | $12,471,798 | 100.0% | $22.14 |
| (1) | Information obtained from the underwritten rent roll. |
| (2) | Certain tenants may have lease termination options that are exercisable prior to the originally stated expiration date of the subject lease and that are not considered in the Lease Expiration Schedule. |
| (3) | Annual U/W Base Rent PSF expiring excludes vacant space. |
The following table presents historical occupancy percentages at Warwick Mall Property:
Historical Occupancy and In-Line Sales
| 2012 | 2013 | 2014 | 2015 | 2016 | 9/30/2017 TTM | |
| Collateral Occupancy | 97.6% | 97.6% | 98.8% | 99.6% | 99.0% | 96.6% |
| In-Line Occupancy | 92.2% | 92.7% | 96.4% | 98.8% | 97.1% | 89.5% |
| In-Line Sales PSF | $447 | $460 | $463 | $497 | $502 | $494 |
| In-Line Occupancy Cost | 14.2% | 14.5% | 13.5% | 12.4% | 13.4% | 13.7% |
Operating History and Underwritten Net Cash Flow. The following table presents certain information relating to the underwritten net cash flow at Warwick Mall Property:
Cash Flow Analysis
| 2014 | 2015 | 2016 | TTM 10/31/2017 | U/W | % of U/W Effective Gross Income | U/W $ per SF | |||||||||
| Base Rent | $10,761,968 | $11,196,544 | $12,432,167 | $12,438,632 | $13,465,902(1) | 79.4% | $22.87 | ||||||||
| Total Recoveries | 3,618,732 | 3,749,940 | 4,136,183 | 3,880,697 | 4,213,924 | 24.9 | 7.16 | ||||||||
| Percentage Rent | 927,005 | 960,865 | 301,863 | 267,642 | 242,517 | 1.4 | 0.41 | ||||||||
| Other Income | 658,120 | 540,642 | 583,452 | 655,086 | 540,247 | 3.2 | 0.92 | ||||||||
| Less Vacancy & Credit Loss | (6,645) | (174,983) | (121,404) | (8,932) | (1,505,990)(2) | (8.9) | (2.56) | ||||||||
| Effective Gross Income | $15,959,180 | $16,273,009 | $17,332,261 | $17,233,125 | $16,956,599 | 100.0% | $28.80 | ||||||||
| Total Operating Expenses | $6,841,554 | $6,932,726 | $7,023,306 | $7,003,398 | $6,957,538 | 41.0% | $11.82 | ||||||||
|
|
|
|
|
|
| |||||||||
| Net Operating Income | $9,117,626 | $9,340,283 | $10,308,956 | $10,229,726 | $9,999,062 | 59.0% | $16.98 | ||||||||
| Capital Expenditures | 0 | 0 | 0 | 0 | 147,179 | 0.9 | 0.25 | ||||||||
| TI/LC | 0 | 0 | 0 | 0 | 733,745 | 4.3 | 1.25 | ||||||||
| Net Cash Flow | $9,117,626 | $9,340,283 | $10,308,956 | $10,229,726 | $9,118,138 | 53.8% | $15.49 | ||||||||
| NOI DSCR(3) | 2.01x | 2.06x | 2.28x | 2.26x | 2.21x | ||||||||||
| NCF DSCR(3) | 2.01x | 2.06x | 2.28x | 2.26x | 2.01x | ||||||||||
| NOI DY(3) | 12.2% | 12.5% | 13.7% | 13.6% | 13.3% | ||||||||||
| NCF DY(3) | 12.2% | 12.5% | 13.7% | 13.6% | 12.2% |
| (1) | Base Rent has been underwritten based on the November 17, 2017 rent roll and includes contractual rent steps through February 2019 totaling $260,217. |
| (2) | The underwritten economic vacancy is 91.6%. The Warwick Mall Property was 95.7% physically occupied as of November 17, 2017 |
| (3) | The debt service coverage ratios and debt yields are based on the Warwick Mall Whole Loan. |
THE INFORMATION IN THIS STRUCTURAL AND COLLATERAL TERM SHEET IS NOT COMPLETE AND MAY BE AMENDED PRIOR TO THE TIME OF SALE. THIS TERM SHEET IS NOT AN OFFER TO SELL THESE SECURITIES AND IT IS NOT A SOLICITATION OF AN OFFER TO BUY THESE SECURITIES IN ANY JURISDICTION WHERE THE OFFER OR SALE IS NOT PERMITTED.
157
| WARWICK MALL |
The following table presents certain information relating to comparable properties to Warwick Mall Property:
Comparable Leases(1)
| Competitive Retail Property Summary(1) | ||||||
| Property Name/Location | Distance | Property Type | Year Built/ Renovated | Total NRA (SF) | Total Occupancy | Anchors |
Warwick Mall Warwick, RI | NAP | Super-Regional Center | 1970/ 1991; 2010 | 977,352(2) | 96%(3) | JC Penney, Macy’s (non-collateral), Target (non-collateral), Jordan’s Furniture, Showcase Cinema, Nordstrom Rack, Old Navy |
Garden City Center Cranston, RI | 4.0 mi (North) | Lifestyle Center | 1949/1990 | 473,967 | 94% | The Container Store, LA Fitness, LL Bean, Party City, Whole Foods |
Rhode Island Mall Warwick, RI | 0.3 mi (South) | Regional Center | 1967/2001 | 579,499 | NAV | Burlington Coat Factory, Kohl’s, Sears, Walmart |
Providence Place Providence, RI | 8.0 mi (North) | Super-Regional Center | 1999/N/A | 1,259,756 | 99% | Bed, Bath & Beyond, Macy’s, Nordstrom Rack |
| (1) | Source: Appraisal. |
| (2) | Total collateral NRA is 588,716 SF. |
| (3) | Collateral occupancy is 95.7% as of November 17, 2017. |
THE INFORMATION IN THIS STRUCTURAL AND COLLATERAL TERM SHEET IS NOT COMPLETE AND MAY BE AMENDED PRIOR TO THE TIME OF SALE. THIS TERM SHEET IS NOT AN OFFER TO SELL THESE SECURITIES AND IT IS NOT A SOLICITATION OF AN OFFER TO BUY THESE SECURITIES IN ANY JURISDICTION WHERE THE OFFER OR SALE IS NOT PERMITTED.
158
| BANK 2018-BNK10 | Transaction Contact Information |
VI. Transaction Contact Information
Questions regarding this Structural and Collateral Term Sheet may be directed to any of the following individuals:
| Wells Fargo Securities, LLC | |
| Brigid Mattingly | Tel. (312) 269-3062 |
| A.J. Sfarra | Tel. (212) 214-5613 |
| Alex Wong | Tel. (212) 214-5615 |
| BofA Merrill Lynch | |
| Leland Bunch | Tel. (646) 855-3953 |
| Danielle Caldwell | Tel. (646) 855-3421 |
| Morgan Stanley & Co. | |
| Zachary Fischer | Tel. (212) 761-3076 |
| Jane Lam | Tel. (212) 296-8567 |
| Brandon Atkins | Tel. (212) 761-4846 |
THE INFORMATION IN THIS STRUCTURAL AND COLLATERAL TERM SHEET IS NOT COMPLETE AND MAY BE AMENDED PRIOR TO THE TIME OF SALE. THIS TERM SHEET IS NOT AN OFFER TO SELL THESE SECURITIES AND IT IS NOT A SOLICITATION OF AN OFFER TO BUY THESE SECURITIES IN ANY JURISDICTION WHERE THE OFFER OR SALE IS NOT PERMITTED.
159