UNITED STATES
SECURITIES AND EXCHANGE COMMISSION
Washington, D.C. 20549
FORM N-CSR
CERTIFIED SHAREHOLDER REPORT OF REGISTERED MANAGEMENT INVESTMENT COMPANIES
Investment Company Act file number 811-23382
Sprott Funds Trust
(Exact name of registrant as specified in charter)
200 Bay Street, Suite 2600
Toronto, Ontario, Canada M5J2J1
(Address of principal executive offices) (Zip code)
John Ciampaglia
200 Bay Street, Suite 2600
Toronto, Ontario, Canada M5J2J1
(Name and address of agent for service)
(416)943-8099
Registrant's telephone number, including area code
Date of fiscal year end: December 31, 2021
Date of reporting period: June 30, 2021
Item 1. Reports to Stockholders.
Semi-Annual Report
June 30, 2021
Sprott Gold Equity Fund Investor Class (Nasdaq: SGDLX)
Sprott Gold Equity Fund Institutional Class (Nasdaq: SGDIX)
Sprott Gold Equity Fund
Shareholder LetterJune 30, 2021
Dear Fellow Shareholders,
We report to you on Sprott Gold Equity Fund’s (the “Fund”) semi-annual fiscal period ended June 30, 2021. For the six-month period, the Fund declined 9.09%. This compares to a decline of 1.25% for the PHLX Gold/Silver Sector Total Return Index (XXAU),1 the Fund’s prospectus benchmark, over the same period. Given the XXAU’s much larger-capitalization bias than the Fund, we are not surprised by the performance gap, which we discuss in more detail. A more apt performance comparison, the NYSE Arca Gold Miners Index (GDM)2 lost 5.39% during the six-month period; although the GDM is a better measure of medium-capitalization gold mining stocks, it (like XXAU) does not reflect the small-capitalization holdings held by the Fund.
Precious Metals Market Review
During the six months ended June 30, 2021, gold prices posted an overall decline of 6.76%. Gold prices began the year at $1,898 per ounce and rose to a first-half high of $1,950 per ounce shortly afterward, supported by spiking COVID-19 cases, U.S. political uncertainty and talk of tougher lockdown restrictions as the U.S. dollar (DXY)3 weakened. However, after trending upward initially in January, gold bullion and gold-related investments sold off for the remainder of January and into February. Gold finished February at $1,734 per ounce, posting one of the worst months in four years for gold prices. Gold and gold equities had to share the limelight with other commodity markets as investors began anticipating a post-COVID global economic recovery, on the back of rising energy prices, the U.S. government spending bolstering the reflation trade and a rally in broader equity markets.
During March, gold prices continued to come under pressure with the roll-out of COVID vaccines in the U.S. encouraging market optimism that was reflected in rising U.S. 10-Year Treasury yields and a stronger U.S. dollar. Towards the end of the first quarter, the accumulation of gold mining equities was apparent in the market even as gold prices fell, with notable rebounds in precious metals equities after gold prices corrected. After gold prices traded to a low for the period in early March at $1,684 per ounce, they found double-bottom support at around $1,685 per ounce during late March.
Gold prices made a steady move upward during April and May as yields on U.S. 10-Year Treasuries, which were rising since the beginning of the year, peaked in late March and then edged downward, a move that coincided with U.S. dollar weakness during those months. Gold ETF sales, which have been consistent since the start of the year, eased and began to reverse at the end of April. Investors began to acknowledge more broadly that a robust U.S. economic recovery was likely to incorporate inflationary pressures. This sentiment helped push the gold price back above $1,800 in early May and to close the month at $1,907.
The U.S. dollar regained some strength in June and gold initially pulled back from the $1,900 per ounce level. Gold prices came under pressure during June as markets began to anticipate that the U.S. Federal Reserve may one day tighten monetary policy. Markets then decided that this day may be further out, given a series of new COVID variants and waves of infections spreading worldwide and slowing the global economic recovery. Bond markets took note with U.S. 10-Year Treasury yields sliding back to levels seen earlier in the year, concluding that a move to a higher interest rate environment is not conducive to a solid economic recovery, especially if COVID persists. Gold took a cue from that and put in another double-bottom at around $1,760 per ounce in late June, higher than the double-bottom support seen during late March, and suggests from a technical perspective, mid-term support for gold prices has been established.
Gold mining equities followed a slightly different but more volatile pattern than the gold bullion price during April and May, with a relatively steady rise during those months. Even though June’s pullback in gold stocks in the second half of the month partially offset the April/May recovery, gold stocks ended with a positive move for the second quarter of 2021. As markets head into the second half of the year, the recent positive performance and stronger market activity have begun to offset the January and February correction.
Despite the volatile first half for precious metals investors, a comparison to 2020 reveals that much ground has been gained. The gold price finished the first half of this year at $1,770 per ounce and averaged $1,806 during the first six months. That compares to the first half of the 2020 calendar year when gold finished at $1,781 per ounce and averaged $1,648. Silver often trades in sync with gold and is considered a monetary metal but tends to be more sensitive to manufacturing activity as it is also a production input. Silver prices landed at $26.13 per ounce as of June 30, 2021, and averaged $26.47 for the first half. This compares to a finish of $18.21 per ounce and an average of $16.64 for the same calendar period last year.
Fund Positioning & Activity
Here we offer a deeper analysis of the Fund’s performance relative to its prospectus benchmark. The Sprott Gold Equity Fund’s allocation process has emphasized greater exposure to small- and mid-capitalization precious metals mining stocks because their valuations offer greater long-term appreciation potential compared to the PHLX Gold/Silver Sector Total Return Index (XXAU). The XXAU is a capital-weighted index which means that the larger companies in the Index account for the greater percentage of the Index’s value and performance. Unlike the Fund, the XXAU is heavily weighted to larger precious metals producers, and in particular, to Freeport-McMoRan Inc., which represents one of the largest components of the XXAU and was not a holding of the Fund during the six months. While Freeport produces gold as a byproduct of copper production, it is primarily valued as a copper mining company by market participants. Freeport’s performance can have a significant impact on the performance of XXAU. This was certainly the case in the first half of 2021, as copper prices surged during February and May (reaching an all-time high in Q2) while gold corrected during the first half of 2021. Copper prices gained a whopping 23.92% from January 1 to June 30, 2021. Another major difference between the Fund and the XXAU benchmark is that physical gold is not included in the Index; the decline in gold prices of 6.76%, as mentioned earlier, was certainly a drag on the Fund’s results in the first half of the year.
Sprott Gold Equity Fund
Shareholder LetterJune 30, 2021
The Fund’s largest position as of June 30, 2021, was physical gold (measuring 74,526 gross ounces) which is vaulted in a secure location outside the financial system and audited regularly. This gold bullion position represented 12.10% of the Fund’s value as of June 30, 2021. The exposure to physical gold reduces the Fund’s volatility and offsets the more volatile moves in gold and silver mining equities. Precious metals equity valuations are greatly influenced by moves in gold and silver prices.
Precious metals equities accounted for 85.91% of the Fund’s holdings5 as of June 30, 2021, and included 69 securities, with about 76.90% allocated to the gold industry and approximately 12.59% in the silver and silver mining industries.
Asset Allocation5 (% of Net Assets)
| | | |
Top 10 Positions5 (% of Net Assets) | | Asset Allocation5 (% of Net Assets) |
Gold Bullion | 12.10 | | |
MAG Silver Corp. | 5.78 |
Corvus Gold Inc. | 5.40 |
Osisko Gold Royalties Ltd | 3.97 |
Kirkland Lake Gold Ltd. | 3.56 |
Osisko Mining Inc. | 3.52 |
Sibanye-Stillwater Limited | 3.45 |
SilverCrest Metals Inc. | 3.26 |
Newmont Corporation | 2.98 |
Kinross Gold Corporation | 2.91 |
Top 10 Total | 46.93 |
Holdings may vary, and this list is not a recommendation to buy or sell any security.
| | | | |
Portfolio Details and Diagnostics | | | 5-Year Risk Measures & Statistics | |
Total Number of Holdings | 69 | | Volatility (Standard Deviation) | 29.53 |
Weighted Median Market Cap | $2.3 Billion | | Sharpe Ratio | 0.06 |
Weighted Avg. Market Cap | $6.7 Billion | | Alpha vs. PHLX Gold/Silver Sector Index (XAU) | -0.35 |
Turnover Ratio | 8.00% | | Beta vs. PHLX Gold/Silver Sector Index (XAU) | 0.82 |
Source: FactSet.
Top Performance Contributors and Detractors
The precious metals stocks that contributed the most to the Fund’s performance during the period included Corvus Gold, Inc., Osisko Gold Royalties Ltd, Sibanye-Stillwater Ltd., Newmont Corporation, and Gatos Silver, Inc. (representing 5.40%, 3.97% 3.45%, 2.98% and 1.45%, respectively, of the Fund’s net assets5 as of June 30, 2021). Corvus Gold, Inc. has had drilling success at its Motherlode and North Bullfrog properties in southern Nevada. This has recently resulted in a proposal by AngloGold Ashanti Ltd., the largest Corvus Gold, Inc. shareholder, to buy the entire company. The Fund is the second-largest owner, holding about 17% of Corvus Gold, Inc. shares and would receive cash under the AngloGold Ashanti Ltd. proposal. Sibanye-Stillwater Ltd. has demonstrated its cash flow generating ability from its various precious metals mines, which produce platinum group metals in addition to gold, while its exploration projects include copper, gold and platinum group metals projects. The company’s balance sheet is in a net cash position relative to its debt, providing flexibility to develop additional assets and return shareholder value. After Gatos Silver, Inc. self-financed the build of its mine and initiated metal production, its successful IPO (initial public offering) allowed it to reduce debt quickly and renew regional exploration around its Los Gatos Joint Venture, where numerous exploration targets have not been tested since the company began its mine building project several years ago. Osisko Gold Royalties Ltd. has re-rated and received a better valuation after some restructuring and the market’s recognition of its compelling royalty and streaming portfolio. Newmont Corporation continues to establish itself as a reliable environmental, sustainability and governance (ESG) gold mining company. In addition to its growing ESG recognition, Newmont Corporation has added considerable balance sheet strength with its robust cash flows.
Sprott Gold Equity Fund
Shareholder LetterJune 30, 2021
Positions that negatively impacted the Fund’s performance during the period included: the physical gold position, SilverCrest Metals Inc., International Tower Hill Mines Ltd., Torex Gold Resources Inc, and Jaguar Mining Inc. (representing 12.10%, 3.26%, 2.59%, 2.57% and 2.38%, respectively, of the Fund’s net assets5 as of June 30, 2021). Jaguar Mining Inc. and SilverCrest Metals Inc. had been outperformers over the past year and a half; while the physical gold bullion position corrected with the gold prices during the period. Torex Gold Resources Inc. is initiating mine construction while International Tower Hill Mines Ltd. continues to work on improving plans and design for processing ore at its project in Alaska in preparation for making a construction decision to build its mine.
Investment Outlook
Despite a challenging first half for the precious metals complex, we believe the investment rationale for precious metals exposure remains strong. Gold bullion and gold mining stocks are compelling buys. The vast majority of producing miners are generating free cash flow. Current strong earnings are geared to advance at a steep slope should our positive expectation for future gold prices prevail. Valuations, both relative and absolute, are the most attractive they have been in two decades. Although gold experienced a sell-off in June 2021, this was mostly driven by algorithmic, robotic macro funds. The accumulation and investment in physical gold continue. On June 18, 2021, investors bought $630 million of 100% gold-backed GLD shares (SPDR Gold Shares ETF),4 the largest one-day inflow since January 15, 2021. Central banks bought $6.3 billion of gold during the second quarter.
We remain skeptical about the health of this post-COVID global economic recovery. The current level of economic activity is highly dependent on continued fiscal and monetary stimulus. As COVID pandemic-related support begins to decline, disappointing housing, retail sales and employment data show the economy is losing steam. There is ample reason to think that a slowdown could become a downturn in the absence of renewed fiscal support. Without continued stimulus amid rising food and energy costs, consumer spending could come under pressure. Our view is that a significant slowdown lies ahead and that inflation is likely here to stay.
Faith in the Fed’s omniscience and ability to control inflation is convenient to the investment consensus because it underpins the current extraordinary overvaluation of financial assets. Let’s face it, despite pious subservience to the goals of full employment and price stability, the Fed’s real mandate is to keep financial markets from coming unglued. The relationship between overvalued financial assets and belief in an all-knowing Fed is symbiotic. Loss of that faith for heavily sedated markets would lead to losses of trillions of dollars in the world of financial assets. That very real possibility is sufficient rationale for investment in gold and the expectation of much higher gold prices.
| |
With best wishes, | |
| |
John C. Hathaway
Senior Portfolio Manager | Douglas B. Groh
Senior Portfolio Manager |
July 17, 2021
1The PHLX Gold/Silver Sector Total Return Index (XXAU) is a capitalization-weighted index composed of companies involved in the gold or silver mining industry.
2The NYSE Arca Gold Miners Index (GDM) is a modified market capitalization-weighted index comprised of publicly traded companies primarily involved in mining gold and silver in locations worldwide.
3The U.S. Dollar Index (USDX, DXY, DX) is an index (or measure) of the value of the United States dollar relative to a basket of foreign currencies, often referred to as a basket of U.S. trade partners’ currencies.
4SPDR® Gold Shares (GLD) is the largest physically backed gold exchange traded fund (ETF) in the world.
5Net assets exclude cash equivalents, other assets & receivables.
Sprott Gold Equity Fund
Performance OverviewJune 30, 2021 (Unaudited)
Growth of $10,000 (as of June 30, 2021)
Comparison of Change in Value of $10,000 Investment in the Fund and the Underlying Indexes
Sprott Gold Equity Fund (Investor Class)
(Unaudited)
This chart assumes an initial gross investment of $10,000 made on 6/30/2011. On January 21, 2020, the Sprott Gold Equity Fund assumed the net asset value and performance history of the Tocqueville Gold Fund (the “Predecessor Fund”). Returns shown do not reflect the deduction of taxes that a shareholder would pay on Fund distributions or the redemption of Fund shares. Returns shown include the reinvestment of all dividends and other distributions. Past performance is not predictive of future performance. Investment return and principal value will fluctuate so that your shares, when redeemed, may be worth more or less than their original cost. The Fund imposes a 2% redemption fee on shares held 90 days or less.
In 2019 and 2020 the performance of the Sprott Gold Equity Fund (Investor Class) was achieved during a period of unusually favorable market conditions. Such performance may not be sustainable.
The Philadelphia (PHLX) Stock Exchange Gold and Silver Sector Total Return Index (XXAU) is an indicator of the performance of the common stock of companies in the gold and silver mining industry and reflects the reinvestment of any dividends. The Index performance quoted reflects the following indices and dates: the XAU from September 29, 1998 to October 31, 2011, and the XXAU onwards. These Indices do not incur fees and expenses. You cannot invest directly in an index.
The Standard & Poor’s 500 Total Return Index (S&P 500) is a capital-weighted index, representing the aggregate market value of the common equity of 500 stocks primarily traded on the New York Stock Exchange. Returns include the reinvestment of all dividends. You cannot invest directly in an index.
AVERAGE ANNUAL RATE OF RETURN
FOR PERIODS ENDED JUNE 30, 2021
| | | | |
| 1 Year | 3 Year | 5 Year | 10 Year |
Sprott Gold Equity Fund (Investor Class) | -2.06% | 13.35% | 3.02% | -4.41% |
Philadelphia Gold/Silver Sector Total Return Index (XXAU) | 10.72% | 21.26% | 8.59% | -2.39% |
Standard & Poor’s 500 Total Return Index | 40.79% | 18.67% | 17.65% | 14.84% |
Sprott Gold Equity Fund
Performance OverviewJune 30, 2021 (Unaudited)
Growth of $1,000,000 (as of June 30, 2021)
Comparison of Change in Value of $1,000,000 Investment in the Fund and the Underlying Indexes
Sprott Gold Equity Fund (Institutional Class)
(Unaudited)
This chart assumes an initial gross investment of $1,000,000 made on 4/8/2019 (commencement of operations for Institutional Class). Returns shown do not reflect the deduction of taxes that a shareholder would pay on Fund distributions or the redemption of Fund shares. Returns shown include the reinvestment of all dividends and other distributions. Past performance is not predictive of future performance. Investment return and principal value will fluctuate so that your shares, when redeemed, may be worth more or less than their original cost. The Fund imposes a 2% redemption fee on shares held 90 days or less.
In 2019 and 2020 the performance of the Sprott Gold Equity Fund (Institutional Class) was achieved during a period of unusually favorable market conditions. Such performance may not be sustainable.
The PHLX Gold/Silver Sector Index (XXAU) is an unmanaged capitalization-weighted index which includes the leading companies involved in the mining of gold and silver. Returns include the reinvestment of all dividends. You cannot invest directly in an index.
The Standard & Poor’s 500 Total Return Index (S&P 500) is a capital-weighted index, representing the aggregate market value of the common equity of 500 stocks primarily traded on the New York Stock Exchange. Returns include the reinvestment of all dividends. You cannot invest directly in an index.
AVERAGE ANNUAL RATE OF RETURN
FOR PERIODS ENDED JUNE 30, 2021
| | |
| 1 Year | Since Inception
(April 8, 2019) |
Sprott Gold Equity Fund (Institutional Class) | -1.80% | 21.08% |
Philadelphia Gold/Silver Sector Total Return Index (XXAU) | 10.72% | 31.99% |
Standard & Poor’s 500 Total Return Index | 40.79% | 21.53% |
Sprott Gold Equity Fund
Expense ExampleJune 30, 2021 (Unaudited)
As a shareholder of the Sprott Gold Equity Fund (the “Fund”), you incur two types of costs: transaction costs, including redemptions fees; and ongoing costs, including management fees; distribution fees; and other Fund expenses. This example is intended to help you understand your ongoing costs (in dollars) of investing in the Fund and to compare costs with the ongoing costs of investing in other mutual funds.
The Example is based on an investment of $1,000 invested at the beginning of the period and held the entire period (Jan 1, 2021 - June 30, 2021).
Actual Expenses: The first line of each table below provides information about actual account values and actual expenses. You may use the information in this line, together with the amount you invested, to estimate the expenses that you paid over the period. Simply divide your account value by $1,000 (for example, an $8,600 account value divided by $1,000 = 8.6), then multiply the result by the number in the first line under the heading entitled “Expenses Paid During Period” to estimate the expenses you paid on your account during this period.
Hypothetical Example for Comparison Purposes: The second line of each table below provides information about hypothetical account values and hypothetical expenses based on the Fund’s actual expense ratios and an assumed rate of return of 5% per year before expenses, which is not the Fund’s actual return. The hypothetical account values and expenses may not be used to estimate the actual ending account balance or expenses you paid for the period. You may use this information to compare the ongoing costs of investing in the Fund and other funds. To do so, compare this 5% hypothetical example with the 5% hypothetical examples that appear in the shareholder reports of the other funds.
Please note that the expenses shown in the table are meant to highlight your ongoing costs only and do not reflect any transactional costs, such as sales charges (loads), redemption fees, or exchange fees. Therefore, the second line of the table is useful in comparing ongoing costs only, and will not help you determine the relative costs of owning different funds. In addition, if these transactional costs were included, your costs would have been higher.
| | | |
| Beginning Account
Value
Jan. 1, 2021 | Ending Account
Value
June 30, 2021 | Expenses Paid
During Period*
Jan. 1, 2021 -
June 30, 2021 |
Sprott Gold Equity Fund (Investor Class) | | | |
Actual | $1,000 | $ 909.10 | $6.48 |
Hypothetical (5% returns Before expenses) | $1,000 | $1,018.00 | $6.85 |
*The dollar amounts shown as expenses paid during the period are equal to the annualized six-month expense ratio (1.37%) multiplied by the average account value during the period, multiplied by the number of days (181) in the most recent six-month period and divided by the number of the days in the most recent twelve month period (365).
| | | |
| Beginning Account
Value
Jan. 1, 2021 | Ending Account
Value
June 30, 2021 | Expenses Paid
During Period*
Jan. 1, 2021 -
June 30, 2021 |
Sprott Gold Equity Fund (Institutional Class) | | | |
Actual | $1,000 | $ 910.30 | $5.12 |
Hypothetical (5% returns Before expenses) | $1,000 | $1,019.44 | $5.41 |
*The dollar amounts shown as expenses paid during the period are equal to the annualized six-month expense ratio (1.08%) multiplied by the average account value during the period, multiplied by the number of days (181) in the most recent six-month period and divided by the number of the days in the most recent twelve month period (365).
Sprott Gold Equity Fund
Schedule of Investmentsas of June 30, 2021 (Unaudited)
| | | | | |
| Shares | | Value | |
Common Stocks (86.7%) | | | | |
Gold Related Securities (73.6%) | | | | |
Australia (5.5%) | | | | |
Bellevue Gold Ltd.(a) | 6,023,000 | | $4,291,109
| |
Northern Star Resources Ltd. | 2,964,500 | | 21,743,194 | |
Perseus Mining Ltd.(a) | 12,000,000 | | 13,139,146 | |
West African Resources Ltd.(a)(b) | 27,400,000 | | 20,445,921 | |
| | | 59,619,370 | |
Canada (58.8%) | | | | |
Agnico Eagle Mines Ltd. | 303,186 | | 18,333,997 | |
Alamos Gold, Inc.- Class A | 3,799,600 | | 29,066,940 | |
B2Gold Corp.(c) | 1,499,900 | | 6,314,579 | |
Barrick Gold Corp. | 999,200 | | 20,663,456 | |
Baru Gold Corp.(a)(b) | 13,290,993 | | 857,760 | |
Corvus Gold, Inc.(a)(b)(c) | 3,226,901 | | 8,841,709 | |
Corvus Gold, Inc.(a)(b)(c)(d) | 6,954,100 | | 19,129,946 | |
Corvus Gold, Inc.(a)(b)(e) | 1,739,130 | | 4,784,151 | |
Corvus Gold, Inc.(a)(b)(d)(e) | 9,500,000 | | 26,133,430 | |
Equinox Gold Corp.(a) | 2,605,595 | | 18,097,913 | |
Falco Resources Ltd.(a)(b) | 16,222,300 | | 5,365,556 | |
Gold Standard Ventures Corp.(a)(c) | 3,000,000 | | 1,718,296 | |
I-80 Gold Corp.(a)(b)(c) | 10,415,264 | | 21,089,313 | |
International Tower Hill Mines Ltd.(a)(b) | 6,750,222 | | 7,087,733 | |
International Tower Hill Mines Ltd.(a)(b)(d) | 1,666,667 | | 1,734,431 | |
International Tower Hill Mines Ltd.(a)(b)(e) | 18,664,631 | | 19,423,503 | |
Jaguar Mining, Inc.(b) | 6,006,559 | | 25,923,758 | |
Kinross Gold Corp.(c) | 4,989,967 | | 31,686,290 | |
Kirkland Lake Gold Ltd. | 1,007,513 | | 38,826,151 | |
Maverix Metals, Inc.(c) | 1,615,000 | | 8,704,850 | |
Maverix Metals, Inc.(c)(d) | 2,650,000 | | 14,323,169 | |
Novagold Resources, Inc.(a) | 2,030,800 | | 16,266,708 | |
NuLegacy Gold Corp.(a)(b) | 37,852,485 | | 4,122,366 | |
Osisko Development Corp.(a) | 1,333,400 | | 7,529,687 | |
Osisko Gold Royalties Ltd. | 24,340 | | 333,458 | |
Osisko Gold Royalties Ltd.(d) | 3,130,127 | | 42,901,628 | |
Osisko Mining, Inc.(a)(b) | 15,384,239 | | 38,348,902 | |
Pan American Silver Corp. | 1,088,445 | | 31,096,874 | |
Pretium Resources, Inc.(a) | 2,923,485 | | 27,970,742 | |
Seabridge Gold, Inc.(a)(c) | 400,000 | | 7,020,000 | |
Silvercrest Metals, Inc.(a) | 4,056,600 | | 35,539,429 | |
SSR Mining, Inc. | 897,300 | | 14,013,979 | |
Strategic Metals Ltd.(a)(b)(e) | 9,886,500 | | 3,110,467 | |
Torex Gold Resources, Inc.(a) | 2,433,900 | | 28,038,151 | |
Trifecta Gold Ltd.(a) | 2,325,199 | | 187,576 | |
Wesdome Gold Mines Ltd.(a) | 3,115,200 | | 29,553,688 | |
Wheaton Precious Metals Corp. | 586,175 | | 25,832,732 | |
| | | 639,973,318 | |
South Africa (3.3%) | | | | |
AngloGold Ashanti Ltd.- ADR(c) | 544,000 | | 10,107,520 | |
Gold Fields Ltd.- ADR (c) | 2,681,000 | | 23,860,900 | |
Gold Fields Ltd.(d) | 200,000 | | 1,798,319 | |
| | | 35,766,739 | |
United Kingdom (2.5%) | | | | |
Endeavour Mining PLC | 1,297,500 | | 27,844,341 | |
| | | | | |
| Shares | | Value | |
| | | | | |
United States (3.5%) | | | | |
Contango ORE, Inc.(a) | 263,200 | | $5,570,628
| |
Electrum Ltd.(a)(f) (Originally acquired 12/21/07, Cost $13,065,361) | 2,127,287 | | 42,546 | |
Newmont Corporation | 511,990 | | 32,449,926 | |
| | | | 38,063,100 | |
Total Gold Related Securities | | | 801,266,868 | |
| | | | | |
Other Precious Metals Related Securities (12.4%) | | | |
Canada (6.6%) | | | | |
Bear Creek Mining Corp.(a)(b) | 5,982,800 | | 7,818,761 | |
MAG Silver Corp.(a)(b)(c) | 1,581,135 | | 33,077,344 | |
MAG Silver Corp.(a)(b)(d)(e) | 1,432,665 | | 29,956,983 | |
Nickel Creek Platinum Corp.(a)(b) | 14,037,494 | | 1,132,421 | |
| | | 71,985,509 | |
South Africa (3.5%) | | | | |
Sibanye Stillwater Ltd.- ADR(c) | 2,250,000 | | 37,642,500 | |
| | | | | |
United Kingdom (0.7%) | | | | |
Hochschild Mining PLC | 3,818,200 | | 8,102,141 | |
| | | | | |
United States (1.6%) | | | | |
Gatos Silver, Inc.(a) | 906,416 | | 15,853,210 | |
Silver Opportunity Partners Corp.(a)(f)
(Originally acquired 3/15/11,
Cost $4,525,333) | 243,690 | | 1,413,404 | |
| | | | 17,266,614 | |
Total Other Precious Metals Related Securities | | 134,996,764 | |
| | | | | |
Other Securities (0.7%) | | | | |
United States (0.7%) | | | | |
Gold Bullion International LLC(a)(b)(f)
(Originally acquired 5/12/10,
Cost $5,000,000) | 5,000,000 | | 6,900,000 | |
I-Pulse, Inc.(a)(f) (Originally acquired 3/25/2010, Cost $175,524) | 74,532 | | 596,256 | |
Total Other Securities | | | 7,496,256 | |
Total Common Stocks
(Cost $855,840,068) | | 943,759,888 | |
| | | | | |
Private Fund (1.2%) | | | | |
Gold Related Security (1.2%) | | | | |
Tocqueville Bullion Reserve LP -
Glass G(a)(b)(f) (Originally acquired 11/28/11, Cost $13,795,735) | 7,619 | | 12,692,002 | |
Total Private Fund
(Cost $13,795,735) | | | 12,692,002 | |
| | Ounces | | | |
Gold Bullion (12.1%) | | | | |
Gold Bullion(a) | 74,526 | | 131,918,421 | |
Total Gold Bullion
(Cost $32,073,279) | | | 131,918,421 | |
Sprott Gold Equity Fund
Schedule of Investmentsas of June 30, 2021 (Unaudited)
| | | | | |
| Shares | | Value | |
Warrants (0.1%) | | | | |
Gold Related Securities (0.1%) | | | | |
Canada (0.1%) | | | | |
Baru Gold Corp. | | | | |
Expiration: 3/8/2022,
Exercise Price: CAD $0.50(a)(b)(e)(f)
(Originally acquired 3/3/17, Cost $0) | 3,321,250 | | $—
| |
I-80 Gold Corp. | | | | |
Expiration: 9/18/2022,
Exercise Price: CAD $3.64(a)(b)(d)(f)
(Originally acquired 3/2/21, Cost $0) | 1,330,000 | | 161,583 | |
Maverix Metals, Inc. | | | | |
Expiration: 12/23/2021,
Exercise Price: CAD $2.41(a)(d)(f)
(Originally acquired 5/9/19, Cost $0) | 437,500 | | 1,219,289 | |
NuLegacy Gold Corp. | | | | |
Expiration: 10/8/2022,
Exercise Price: CAD $0.12(a)(b)(f)
(Originally acquired 10/7/19, Cost $0) | 4,648,198 | | 118,117 | |
Osisko Gold Royalties Ltd. | | | | |
Expiration: 2/18/2022,
Exercise Price: CAD $36.50(a)(d) | 274,000 | | 31,498 | |
Osisko Mining, Inc. | | | | |
Expiration: 12/23/2021,
Exercise Price: CAD $5.25(a)(b)(f)
(Originally acquired 6/17/20, Cost $0) | 932,500 | | 9,178 | |
Total Gold Related Securities | | | 1,539,665 | |
| | | |
Other Precious Metals Related Securities (0.0%) | | | |
Canada (0.0%) | | | | |
Nickel Creek Platinum Ltd. | | | | |
Expiration: 8/8/2022,
Exercise Price: CAD $0.35(a)(b)(e)(f)
(Originally acquired 8/4/17, Cost $0) | 6,189,601 | | — | |
Nickel Creek Platinum Ltd. | | | | |
Expiration: 7/1/2024,
Exercise Price: CAD $0.08(a)(b)(f)
(Originally acquired 07/01/2019
Cost $0) | 1,658,293 | | 49,364 | |
Total Other Precious Metals Related Securities | | 49,364 | |
Total Warrants
(Cost $0) | | | 1,589,029 | |
| | | | | |
Right (0.0%) | | | | |
Gold Related Securities (0.0%) | | | | |
Osisko Development Rights | | | | |
Expiration: 5/25/2022,
Exercise Price: CAD $10.00(a)(d)(f)
(Originally acquired 10/28/2020, Cost $0) | 666,700 | | 44,210 | |
Total Right
(Cost $0) | | | 44,210 | |
| | | | | |
| | | | | |
| Shares | | Value | |
Short -Term Investments (2.9%) | | | | |
Money Market Fund (0.0%) | | | | |
Invesco Treasury Portfolio | | | | |
Institutional Class, 0.010%(g) | 81,211 | | $81,211
| |
| | | | |
Investments Purchased with Collateral
from Securities Loaned (2.9%) | | | |
Mount Vernon Liquid Assets, 0.10% | 31,538,625 | | 31,538,625 | |
| | | | |
Total Short-Term Investments
(Cost $31,539,094) | | | 31,619,836 | |
| | | | | |
Total Investments
(Cost $933,248,176) (103.0%) | | | 1,121,623,386 | |
Liabilities in Excess of Other Assets ((3.0)%) | | (33,038,912 | ) |
| | | | |
Total Net Assets (100.0%) | | | $1,088,584,474
| |
ADR American Depository Receipt
(a)Non-income producing security.
(b)Affiliated company. See Footnote 7.
(c)This security or a partial position of this security is on loan at June 30, 2021. The total market value of securities on loan at June 30, 2021 was $29,051,168. The loaned securities were secured with cash collateral of $31,538,625. The cash collateral received consists of common stocks and is held for the benefit of the Fund at the Fund’s custodian. The Fund cannot repledge or resell this collateral. Collateral is calculated based on prior day’s prices. See Footnote 11.
(d)Denotes an issue that is traded on a foreign exchange when a company is listed more than once.
(e)Denotes a security that is either fully or partially restricted to resale. The value of restricted securities as of June 30, 2021 was $83,408,534, which represented 7.66% of net assets.
(f)Security is fair valued using procedures approved by the Board of Trustees which includes significant unobservable inputs and is deemed a Level 2 or 3 security. See Footnote 2. The aggregate value of fair valued securities as of June 30, 2021 was $23,245,949, which represented 2.14% of net assets.
(g)Variable rate security. Rate listed is the 7-day effective yield as of June 30, 2021.
The Accompanying Footnotes are an Integral Part of these Financial
Statements.
Sprott Gold Equity Fund
Schedule of InvestmentsJune 30, 2021 (Unaudited)
Percent of Total Investments
Allocation of Portfolio Holdings
As of June 30, 2021
*Category is less than 0.1% of total investments.
See Notes to Financial Statements.
Sprott Gold Equity Fund
Schedule of Assets & LiabilitiesJune 30, 2021 (Unaudited)
| | |
| Sprott Gold
Equity Fund | |
Assets: | | |
Investments, at value(1) | | |
Unaffiliated issuers | $823,308,687
| |
Affiliated issuers | 298,314,699 | |
Foreign currencies, at value(2) | 32 | |
Cash | 50,997 | |
Prepaid to Trustees | 26,721 | |
Prepaid to CCO | 52,215 | |
Receivable for investments sold | 1,504,028 | |
Receivable for Fund shares sold | 535,080 | |
Securities lending income receivable | 22,718 | |
Dividends, interest and other receivables | 411,713 | |
Return of capital receivable | 1 | |
Other assets | 59,910 | |
Total Assets | 1,124,286,801 | |
| | |
Liabilities: | | |
Payable for loans outstanding | 486,000 | |
Payable for Fund shares redeemed | 2,307,794 | |
Payable to Adviser (see Note 3) | 811,679 | |
Payable for collateral upon return of securities loaned | 31,538,625 | |
Payable to Administrator | 168,277 | |
Accrued distribution fee | 100,383 | |
Accrued expenses and other liabilities | 289,569 | |
Total Liabilities | 35,702,327 | |
Net Assets | $1,088,584,474
| |
| | |
NET ASSETS CONSIST OF: | | |
Paid in capital | $1,159,212,169
| |
Total distributable earnings | (70,627,695) | |
NET ASSETS | $1,088,584,474
| |
| | |
INVESTOR CLASS | | |
Net assets | $822,976,421
| |
Shares of beneficial interest outstanding (unlimited shares of $0.01 par value authorized) | 16,515,332 | |
Net asset value, offering and redemption price per share | $49.83
| |
| | |
INSTITUTIONAL CLASS | | |
Net assets | $265,608,053
| |
Shares of beneficial interest outstanding (unlimited shares of $0.01 par value authorized) | 5,296,887 | |
Net asset value, offering and redemption price per share | $50.14
| |
(1) Cost of investments | | |
Unaffiliated issuers | $641,635,407
| |
Affiliated issuers | $291,466,976
| |
(2) Cost of foreign currencies | $32
| |
Sprott Gold Equity Fund
Statements of OperationsJune 30, 2021
See Notes to Financial Statements.
| | |
| For the Period Ended
June 30, 2021
(Unaudited) | |
Investment Income: | | |
Dividends* | | |
Unaffiliated issuers | $6,061,448
| |
Affiliated issuers | 1,012,260 | |
Interest | 306 | |
Income from securities lending (See Note 11) | 87,799 | |
Total investment income | 7,161,813 | |
| | |
Expenses: | | |
Investment Adviser’s fee (See Note 3) | 4,815,962 | |
Distribution (12b-1) fees - Investor Class Only (See Note 3) | 1,092,481 | |
Administration fees (See Note 3) | 771,717 | |
Transfer agent and shareholder services fees - Investor Class | 228,569 | |
Custody fees | 103,865 | |
Fund accounting fees | 90,902 | |
Legal fees | 87,577 | |
Other expenses | 46,618 | |
Printing and mailing expense | 43,748 | |
Blue sky fees | 41,662 | |
Audit fees | 30,007 | |
Trustee fees and expenses | 26,265 | |
Transfer agent and shareholder services fees - Institutional Class | 17,867 | |
Miscellaneous expense | 16,616 | |
Insurance expense | 4,893 | |
Interest expense | 1,355 | |
Registration fees | 1,340 | |
Net expenses | 7,421,444 | |
Net Investment Loss | (259,631 | ) |
| | |
Realized and Unrealized Gain (Loss): | | |
Net realized gain (loss) on: | | |
Investments | | |
Unaffiliated issuers | 24,497,943 | |
Affiliated issuers | 3,629,067 | |
Foreign currency translation | (29,389 | ) |
| 28,097,621 | |
Net change in unrealized appreciation (depreciation) on: | | |
Investments | | |
Unaffiliated issuers | (117,390,950 | ) |
Affiliated issuers | (33,901,962 | ) |
Foreign currency translation | 12,092,196 | |
| (139,200,716 | ) |
Net gain on investments and foreign currency | (111,103,095 | ) |
NET INCREASE IN NET ASSETS RESULTING FROM OPERATIONS | $(111,362,726
| ) |
* Net of foreign taxes withheld of: | $864,157
| |
Sprott Gold Equity Fund
Statements of Changes in Net AssetsJune 30, 2021
See Notes to Financial Statements.
| | | | |
| Sprott Gold Equity Fund(1) |
| For the
Period Ended
June 30,
2021
(Unaudited) | | For the
Period Ended
December 31,
2020 | |
Operations: | | | | |
Net investment loss | $(259,631
| ) | $(1,021,375
| ) |
Net realized gain on sale of investments and foreign currency | 28,097,621 | | 2,862,848 | |
Net change in unrealized appreciation (depreciation) | (139,200,716 | ) | 21,724,396 | |
Net increase (decrease) in net assets resulting from operations | (111,362,726 | ) | 23,565,869 | |
| | | | |
Distributions to shareholders: | | | | |
Net dividends and distributions to shareholders - Investor Class | — | | — | |
Net dividends and distributions to shareholders - Institutional Class | — | | — | |
Total dividends and distributions | — | | — | |
| | | | |
Fund share transactions: | | | | |
Shares sold - Investor Class | 64,574,665 | | 24,862,917 | |
Shares sold - Institutional Class | 48,847,078 | | 18,623,769 | |
Shares issued to holders in reinvestment of dividends - Investor Class | — | | — | |
Shares issued to holders in reinvestment of dividends - Institutional Class | — | | — | |
Shares redeemed - Investor Class* | (117,830,532 | ) | (44,984,274 | ) |
Shares redeemed - Institutional Class* | (22,093,012 | ) | (10,268,787 | ) |
Net decrease | (26,501,801 | ) | (11,766,375 | ) |
Net increase (decrease) in net assets | (137,864,527 | ) | 11,799,494 | |
| | | | |
Net Assets: | | | | |
Beginning of period | 1,226,449,001 | | 1,214,649,507 | |
End of period | $1,088,584,474
| | $1,226,449,001
| |
*Net of redemption fees of: | $70,488
| | $30,676
| |
(1)The Fund was reorganized on January 17, 2020 and became a series within the Sprott Funds Trust thereafter.
Sprott Gold Equity Fund (Investor Class)
Financial HighlightsFor a Share Outstanding Throughout the Period
See Notes to Financial Statements.
| | | | | | | | | | | | | | | |
| | Sprott Gold Equity Fund |
Per share operating performance
(For a share outstanding throughout the period) | Six Months Ended
June 30,2021
(Unaudited) | | Period Ended
December 31
2020 | | Years Ended October 31, |
| 2020 | | 2019 | | 2018 | | 2017 | | 2016 | |
Net asset value, beginning
of period | | $54.81
| | $53.75
| | $38.74
| | $29.01
| | $35.64
| | $39.32
| | $26.04
| |
| | | | | | | | | | | | | | | |
Operations: | | | | | | | | | | | | | | | |
Net investment loss(1)(2) | | (0.03 | ) | (0.05 | ) | (0.42 | ) | (0.43 | ) | (0.38 | ) | (0.39 | ) | (0.33 | ) |
Net realized and unrealized gain (loss) | | (4.95 | ) | 1.11 | | 15.43 | | 10.16 | | (6.25 | ) | (3.29 | ) | 13.61 | |
Total from investment operations* | | (4.98 | ) | 1.06 | | 15.01 | | 9.73 | | (6.63 | ) | (3.68 | ) | 13.28 | |
| | | | | | | | | | | | | | | |
Distributions to shareholders: | | | | | | | | | | — | | — | | — | |
Dividends from net investment income | | — | | — | | — | | — | | — | | — | | — | |
Distributions from net realized gains | | — | | — | | — | | — | | — | | — | | — | |
Total distributions | | — | | — | | — | | — | | — | | — | | — | |
| | | | | | | | | | | | | | | |
Change in net asset value for the period | | (4.98 | ) | 1.06 | | 15.01 | | 9.73 | | (6.63 | ) | (3.68 | ) | 13.28 | |
Net asset value, end of period | | $49.83
| | $54.81
| | $53.75
| | $38.74
| | $29.01
| | $35.64
| | $39.32
| |
* Includes redemption fees per share of | | 0.00 | (3) | 0.00 | (3) | 0.01 | | 0.02 | | 0.00 | (3) | 0.01 | | 0.01 | |
Total Return | | (9.1)% | (4) | 2.0% | (4) | 38.7% | | 33.5% | | (18.6)% | | (9.4)% | | 51.0% | |
| | | | | | | | | | | | | | | |
Ratios/supplemental data | | | | | | | | | | | | | | | |
Net assets, end of period (000) | | $822,976
| | $964,071
| | $965,963
| | $998,076
| | $859,394
| | $1,153,287
| | $1,365,282
| |
| | | | | | | | | | | | | | | |
Ratio to average net assets: | | | | | | | | | | | | | | | |
Expense | | 1.37% | (5) | 1.37% | (5) | 1.39% | | 1.47% | | 1.42% | | 1.38% | | 1.39% | |
Net investment loss | | (0.12)% | (5) | (0.57)% | (5) | (0.93)% | | (0.94)% | | (0.88)% | | (0.95)% | | (0.91)% | |
Portfolio turnover rate | | 8% | (4) | 1% | (4) | 34% | | 12% | | 9% | | 14% | | 15% | |
(1)Net investment loss per share is calculated using the ending accumulated net investment income balances prior to consideration or adjustments for permanent book-to-tax differences for the four years ended 2019, 2018, 2017 and 2016.
(2)Net investment loss per share is calculated using the average shares outstanding method for the period ended June 30, 2021, the period ended December 31, 2020 and the year ended October 31, 2020.
(3)Represents less than $0.01.
(4)Not Annualized.
(5)Annualized.
Sprott Gold Equity Fund (Institutional Class)
Financial HighlightsFor a Share Outstanding Throughout the Period
See Notes to Financial Statements.
| | | | | | | | | |
| | Sprott Gold Equity Fund |
Per share operating performance
(For a share outstanding throughout the period) | | Six Months Ended
June 30, 2021
(Unaudited) | | Period Ended
December 31,
2020 | | Year Ended
October 31,
2020 | | April 8, 2019(1)
through
October 31,
2019 |
Net asset value, beginning of period | | $55.08
| | $53.98
| | $38.81
| | $32.73
| |
| | | | | | | | | |
Operations: | | | | | | | | | |
Net investment income (loss)(2)(3) | | 0.05 | | (0.03 | ) | (0.30 | ) | (0.10 | ) |
Net realized and unrealized gain (loss) | | (4.99 | ) | 1.13 | | 15.47 | | 6.18 | |
Total from investment operations* | | (4.94 | ) | 1.10 | | 15.17 | | 6.08 | |
| | | | | | | | | |
Distributions to shareholders: | | | | | | | | | |
Dividends from net investment income | | — | | — | | — | | — | |
Distributions from net realized gains | | — | | — | | — | | — | |
Total distributions | | — | | — | | — | | — | |
| | | | | | | | | |
Change in net asset value for the period | | (4.94 | ) | 1.10 | | 15.17 | | 6.08 | |
Net asset value, end of period | | $50.14
| | $55.08
| | $53.98
| | $38.81
| |
* Includes redemption fees per share of | | 0.00 | (6) | 0.00 | (6) | 0.02 | | — | |
Total Return | | (9.0)% | (4) | 2.0% | (4) | 39.1% | | 18.6% | (4) |
| | | | | | | | | |
Ratios/supplemental data | | | | | | | | | |
Net assets, end of period (000) | | $265,608
| | $262,378
| | $248,686
| | $39,732
| |
| | | | | | | | | |
Ratio to average net assets: | | | | | | | | | |
Expense | | 1.08% | (5) | 1.09% | (5) | 1.11% | | 1.28% | (5) |
Net investment income (loss) | | 0.19% | (5) | (0.29)% | (5) | (0.63)% | | (0.93)% | (5) |
Portfolio turnover rate | | 8% | (4) | 1% | (4) | 34% | | 12% | (4) |
(1)Institutional Class shares commenced operations on April 8, 2019.
(2)Net investment loss per share is calculated using the ending accumulated net investment income balances prior to consideration or adjustments for permanent book-to-tax differences for the period ended October 31, 2019.
(3)Net investment income (loss) per share is calculated using the average shares outstanding method for the period ended June 30, 2021, the period ended December 31, 2020 and the year ended October 31, 2020.
(4)Not Annualized.
(5)Annualized.
(6)Represents less than $0.01.
Sprott Gold Equity Fund
Notes to Financial Statements (Unaudited)June 30, 2021
1. ORGANIZATION
The Sprott Funds Trust (the “Trust”) was organized as a Delaware statutory trust on January 3, 2018. As of June 30, 2021, the Trust consisted of three separate portfolios that each represent a separate series of the Trust. This report pertains to the Sprott Gold Equity Fund (the “Fund”). The Fund is a non-diversified, open-end management investment company under the Investment Company Act of 1940, as amended (the “1940 Act”). The Fund’s investment objective is long-term capital appreciation. The Fund seeks to achieve its objective by investing at least 80% of its net assets, plus borrowings for investment purposes, in securities of companies located throughout the world, in both developed and emerging markets that are primarily engaged in mining or processing gold.
2. SIGNIFICANT ACCOUNTING POLICIES
The following is a summary of significant accounting policies consistently followed by the Fund in the preparation of the financial statements. The accompanying financial statements were prepared in accordance with accounting principles generally accepted in the United States of America (“U.S. GAAP”). The preparation of financial statements in conformity with U.S. GAAP requires management to make certain estimates and assumptions that affect the reported amounts of assets and liabilities and disclosures of contingent assets and liabilities at the date of the financial statements and the reported amounts of revenue and expenses during the year. Actual results could differ from those estimates. The Fund is considered an investment company under U.S. GAAP and follows the accounting and reporting guidance applicable to investment companies in the Financial Accounting Standards Board (“FASB”) Accounting Standards Codification Topic 946 and Accounting Standards Update 2013-08.
A. Portfolio Valuation
The Fund’s net asset value (“NAV”) is determined daily, as of the close of regular trading on the NYSE, normally 4:00 p.m. Eastern time, on each day the NYSE is open for trading. The NAV is computed by dividing the value of all assets of the Fund (including accrued interest and dividends), less all liabilities (including accrued expenses and dividends declared but unpaid), by the total number of shares outstanding.
Portfolio securities are valued at the most recent sale price or official closing price reported on the exchange (U.S. or foreign) or over-the-counter market on which they trade. Portfolio securities traded on more than one securities exchange are valued at the last sale price on the business day as of which such value is being determined at the close of the exchange representing the principal market for such securities. Securities for which no sales are reported are valued at the calculated mean between the most recent bid and asked quotations on the relevant market or, if a mean cannot be determined, at the most recent bid quotation. Investments in open-end mutual funds such as money market funds are valued at the closing NAV.
The Fund’s investments are valued at market value or, in the absence of market value with respect to any portfolio securities, at fair value according to procedures adopted by the Trust’s Board of Trustees (the “Board”). When market quotations are not readily available or when events occur that make established valuation methods unreliable, securities of the Fund may be valued in good faith by or under the direction of the Board. These securities generally include, but are not limited to, restricted securities (securities which may not be publicly sold without registration under the Securities Act of 1933) for which a pricing service is unable to provide a market price; securities whose trading has been formally suspended; a security whose market price is not available from a pre-established primary pricing source or the pricing source is not willing to provide a price; a security with respect to which an event has occurred that is most likely to materially affect the value of the security after the market has closed but before the calculation of the Fund’s NAV or make it difficult or impossible to obtain a reliable market quotation; or a security whose price, as provided by the pricing service, does not reflect the security’s “fair value” due to the security being de-listed from a national exchange or the security’s primary trading market is temporarily closed at a time when, under normal conditions, it would be open. As a general principle, the current “fair value” of a security would be the amount which the owner might reasonably expect to receive from the sale on the applicable exchange or principal market. A variety of factors may be considered in determining the fair value of such securities.
B. Restricted and illiquid securities
The Fund may invest in securities that are subject to legal or contractual restrictions on resale or are illiquid. A security may be considered illiquid if it lacks a readily available market or if its valuation has not changed for a certain period of time. Disposal of these securities may involve time consuming negotiations and expense, and a prompt sale at the current valuation may be difficult.
Sprott Gold Equity Fund
Notes to Financial Statements (Unaudited)June 30, 2021
C. Fair Value Measurements
The Fund has adopted authoritative fair valuation accounting standards which establish an authoritative definition of fair value and set out a hierarchy for measuring fair value. These standards require additional disclosures about the various inputs and valuation techniques used to develop the measurements of fair value and a discussion in changes in valuation techniques and related inputs during the year. These inputs are summarized in the three broad levels listed below.
Level 1 – Quoted prices in active markets for identical securities.
Level 2 – Other significant observable inputs (including quoted prices for similar securities, interest rates, prepayment speeds, credit risk, etc.).
Level 3 – Significant unobservable inputs (including the Fund’s own assumptions in determining the fair value of investments).
When using the market quotations or closing price provided by the pricing service for equity investments, including common stocks, preferred stocks, foreign issued common stocks, exchange-traded funds, closed end funds and real estate investment trusts, which are traded on an exchange are valued at the last sale price reported by the exchange on which the securities are primarily traded on the day of valuation and when the market is considered active, the security will be classified as a Level 1 security. When using the mean between the latest bid and ask price, the security will be classified as Level 2. Gold bullion is valued using the latest available price on the valuation day, the security is classified as Level 1.
Investment in mutual funds, including money market funds, are generally priced at the ending NAV provided by the service agent of the funds and will be classified as Level 1 securities.
Debt securities, such as corporate bonds, convertible bonds, commercial paper, money market deposit accounts and U.S. government agency issues for which market quotations are not readily available may be valued based on information supplied by independent pricing services using matrix pricing formulas and/or independent broker bid quotations and are classified as Level 2. Warrants and rights for which the underlying security is registered and equities which are subject to a required holding period, but have a comparable public issue, are valued in good faith by the adviser pursuant to procedures established under the general supervision and responsibility of the Board. These securities will generally be classified as Level 2 securities. If the warrant or right is exchange traded and the official closing price of the exchange is used, these instruments are classified as Level 1 securities. Options can diverge from the prices of their underlying instruments. These are valued at the composite last price reported by the exchange on which the options are primarily traded on the day of the valuation and are classified as Level 1. If there is no composite last price on a given day the mean between the latest bid and ask price will be used. These contracts are classified as Level 2.
Any securities or other assets for which market quotations are not readily available are valued at fair value as determined in good faith by the adviser pursuant to procedures established under the general supervision and responsibility of the Board and will be classified as Level 3 securities. In determining fair value, the Fund will seek to assign a value to the security which it believes represents the amount that the Fund could reasonably expect to receive upon its current sale. With respect to securities that are actively traded on U.S. exchanges, the Fund expects that market quotations will generally be available and that fair value might be used only in limited circumstances, such as when trading for a security is halted during the trading day.
For securities traded principally on foreign exchanges, the Fund may use fair value pricing if an event occurs after the close of trading of the principal foreign exchange on which a security is traded, but before calculation of the Fund’s NAV, which the Fund believes affects the value of the security since its last market quotation. Such events may involve situations relating to a single issuer (such as news related to the issuer announced after the close of the principal foreign exchange), or situations relating to sectors of the market or the markets in general (such as significant fluctuations in the U.S. or foreign markets or significant changes in exchange rates, natural disasters, armed conflicts, or governmental actions).
In determining whether a significant event has occurred with respect to securities traded principally in foreign markets, the Fund may engage a third party fair value service provider to systematically recommend the adjustment of closing market prices of non-U.S. securities based upon changes in a designated U.S. securities market index occurring from the time of close of the relevant foreign market and the close of the NYSE. Fair value pricing may also be used to value restricted securities held by the Fund or securities with little or no trading activity for extended periods of time. Fair value pricing involves judgments that are inherently subjective and inexact and it is not possible to determine with certainty when, and to what extent, an event will affect a market price. As a result, there can be no assurance that fair value pricing will reflect actual market value and it is possible that the fair value determined for a security may differ materially from the value that could be realized upon the sale of the security.
Sprott Gold Equity Fund
Notes to Financial Statements (Unaudited)June 30, 2021
The following is a summary of the inputs used to value the Fund’s investments at June 30, 2021.
Sprott Gold Equity Fund*
| | | | | | | | | | | | |
Investments in Securities at Value | | Level 1 | | Level 2 | | Level 3 | | Total |
Common Stocks | | | | | | | | | | | | |
Gold Related | | $ | 795,653,694 | | $ | 5,570,628 | | $ | 42,546 | | $ | 801,266,868 |
Other Precious Metals Related | | | 133,583,360 | | | — | | | 1,413,404 | | | 134,996,764 |
Other | | | — | | | — | | | 7,496,256 | | | 7,496,256 |
Total Common Stocks | | | 929,237,055 | | | 5,570,628 | | | 8,952,206 | | | 943,759,888 |
Private Fund**^ | | | — | | | — | | | — | | | 12,692,002 |
Gold Bullion | | | 131,918,421 | | | — | | | — | | | 131,918,421 |
Warrants | | | | | | | | | | | | |
Gold Related | | | 31,498 | | | 1,508,167 | | | — | | | 1,539,665 |
Other Precious Metals Related | | | — | | | 49,364 | | | — | | | 49,364 |
Total Warrants | | | 31,498 | | | 1,557,531 | | | — | | | 1,589,029 |
Right | | | — | | | 44,210 | | | — | | | 44,210 |
Short Term Investments | | | 31,619,836 | | | — | | | — | | | 31,619,836 |
Total Investments | | $ | 1,092,806,809 | | $ | 7,172,369 | | $ | 8,952,206 | | $ | 1,121,623,386 |
*For a detailed sector breakdown, please see the accompanying Schedule of Investments.
**Certain investments that are measured at fair value using the net asset value per share (or its equivalent) practical expedient have not been categorized in the fair value hierarchy. The fair value amounts presented in the table are intended to permit reconciliation of the fair value hierarchy to the Schedule of Investments.
^As of June 30, 2021, the Fund currently invests in a private fund that primarily invests in physical gold and is subject to redemption restrictions. This private fund investment can only be disposed of with notice given 24 hours in advance of redemption. Due to the elapsed time, the investment of the Fund is not subject to any redemption fees going forward.
Below is a reconciliation that details the activity of securities in Level 3 during the current fiscal period:
| | | | |
| | Sprott Gold Equity
Fund | |
Beginning Balance - December 31, 2020 | | $ | 8,513,563 | |
Purchases | | | — | |
Sales | | | — | |
Realized gains | | | — | |
Realized losses | | | — | |
Change in unrealized appreciation | | | 438,643 | |
Transfers in/(out) of Level 3 | | | — | |
Ending Balance - June 30, 2021 | | $ | 8,952,206 | |
As of June 30, 2021 the change in unrealized appreciation on positions still held for securities that were considered Level 3 was $438,643.
Sprott Gold Equity Fund
Notes to Financial Statements (Unaudited)June 30, 2021
The following table summarizes quantitative information about significant unobservable valuation inputs for Level 3 fair value measurement as of June 30, 2021.
| | | | | | | | | | | | |
Fund | | Type of Security | | Industry | | Fair Value at
6/30/2021 | | Valuation
Techniques | | Unobservable Inputs | | Range |
Sprott Gold
Equity Fund | | Common Stock | | Gold
Related | | $42,546
| | Professional analysis of latest company valuation or financing | | Financing prices | | $0.02
|
| | | | Other
Precious
Metals
Related | | $1,413,404
| | Professional analysis of latest company valuation or financing | | Financing prices | | $5.80
|
| | | | Other | | $7,496,256
| | Professional analysis of latest company valuation or financing | | Financing prices | | $1.38 - $8.00 |
The significant unobservable inputs used in the fair value measurement of the Fund’s common stocks are the most recent financing prices of the portfolio company, which approximate the companies’ value in the marketplace. The significant unobservable inputs used for the private fund is the latest price change of an Adviser deemed comparable proxy investment.
Significant changes in a companies’ ability to receive financing for new projects in the future would be an indication of the companies’ financial position and market value. Significant changes in the latest price change of the comparable proxy investment or a change in the adviser deemed comparable proxy investment could impact the value of the security.
The Trust’s valuation procedures have been adopted by the Board, which has established a Valuation Committee to oversee the valuation process. The Valuation Committee meets on an as needed basis to evaluate changes in the valuation of portfolio securities. The full findings and valuations are then reviewed quarterly by the Board including the Independent Trustees.
Portfolio management and the trading department monitor fair valued positions for new financing or corporate actions that could lead to a change in valuation.
D. Gold and Precious Metals Mining Industry Risk
The Fund is sensitive to changes in, and its performance will depend to a greater extent on, the overall condition of the gold and precious metals mining industry. In times of stable economic growth, traditional equity and debt investments could offer greater appreciation potential and the value of gold, silver and other precious metals may be adversely affected, which could in turn affect the Fund’s returns. The gold and precious metals industry can be significantly affected by competitive pressures, central bank operations, events relating to international political developments, the success of exploration projects, commodity prices, adverse environmental developments and tax and government regulations.
E. Foreign Investment Risk
The Fund’s investments in non-U.S. issuers may involve unique risks compared to investing in securities of U.S. issuers. Adverse political, economic or social developments could undermine the value of the Fund’s investments or prevent the Fund from realizing the full value of its investments. Countries with emerging markets may present heightened risks of nationalization of businesses, restrictions on foreign ownership and prohibitions on the repatriation of assets. The economies of emerging markets countries also may be based on only a few industries, making them more vulnerable to changes in local or global trade conditions and more sensitive to debt burdens, inflation rates or adverse news and events. Where all or a portion of the Fund’s underlying securities trade in a market that is closed when the market in which the Fund’s shares are listed and trading in that market is open, there may be changes between the last quote from its closed foreign market and the value of such security during the Fund’s domestic trading day.
F. Foreign Currency Translation
The books and records of the Fund are maintained in U.S. dollars. Investment valuations and other assets and liabilities initially expressed in foreign currencies are converted each business day into U.S. dollars based upon current exchange rates. The portion of realized and unrealized gains or losses on investments due to fluctuations in foreign currency exchange rates is not separately disclosed and is included in realized and unrealized gains or losses on investments, when applicable.
Sprott Gold Equity Fund
Notes to Financial Statements (Unaudited)June 30, 2021
G. Gold Risk
Gold is subject to the special risks associated with investing in gold and other precious metals, including: (1) the price of gold or other precious metals may be subject to wide fluctuation; (2) the market for gold or other precious metals is relatively limited; (3) the sources of gold or other precious metals are concentrated in countries that have the potential for instability; and (4) the market for gold and other precious metals is unregulated.
H. Securities Transactions and Investment Income
Securities transactions are recorded as of the trade date. Realized gains and losses from securities transactions are recorded with a specific identification cost method. Dividend income and capital gains distributions, if any, are recorded on the ex-dividend date. Interest income, if any, is recorded on the accrual basis.
I. Dividends and Distributions to Shareholders
Dividends from net investment income for the Fund, if any, are declared and paid annually or as the Board may determine from time to time. Distributions of net realized capital gains earned by the Fund, if any, are distributed at least annually.
J. Use of Estimates
The preparation of financial statements in conformity with accounting principles generally accepted in the United States of America requires management to make estimates and assumptions that affect the reported amounts of assets and liabilities and disclosure of contingent assets and liabilities at the date of the financial statements and the reported amounts of revenues and expenses during the reporting year. Actual results could differ from those estimates.
K. Indemnification
In the normal course of business the Fund enters into contracts that contain general indemnification clauses. The Fund’s maximum exposure under these arrangements is unknown, as this would involve future claims against the Fund that have not yet occurred. Based on experience, the Fund expects the risk of loss to be remote.
L. Federal Tax and Tax Basis Information
The timing and character of income and capital gain distributions are determined in accordance with income tax regulations, which may differ from U.S. GAAP. Reclassifications are made to the Fund’s capital accounts for permanent tax differences to reflect income and gains available for distribution (or available capital loss carryforwards) under income tax regulations.
For the period ended December 31, 2020, the following reclassifications, which had no impact on results of operations or net assets, were recorded to reflect permanent tax differences:
| | | | | | | | |
| | Distributable
Earnings | | | Paid in Capital | |
Sprott Gold Equity Fund | | $ | 9,510,695 | | | $ | (9,510,695 | ) |
| | | | | | | | |
The permanent differences primarily relate to net operating losses. | | | | | | | | |
| | | | | | | | |
As of December 31, 2020, the components of accumulated losses for income tax purposes were as follows: |
| | | | | | | | |
Tax cost of Investments | | | | | | $ | 964,941,261 | |
Unrealized appreciation | | | | | | | 480,780,646 | |
Unrealized depreciation | | | | | | | (164,012,988 | ) |
Net unrealized appreciation | | | | | | | 316,767,658 | |
Undistributed operating income | | | | | | | — | |
Undistributed long-term gains | | | | | | | — | |
Distributable earnings | | | | | | | — | |
Other accumulated loss | | | | | | | (276,032,627 | ) |
Total accumulated gain | | | | | | $ | 40,735,031 | |
For the fiscal period ended December 31, 2020 the Sprott Gold Equity Fund had no late year losses.
Sprott Gold Equity Fund
Notes to Financial Statements (Unaudited)June 30, 2021
At December 31, 2020 the Fund had tax basis capital losses which may be carried forward to offset future capital gains as shown below:
| | | |
| Capital Losses Expiring
Indefinite Short-Term | | Capital Losses Expiring
Indefinite Long Term |
Sprott Gold Equity Fund | $– | | $276,024,734 |
To the extent that the Fund may realize future net capital gains, those gains will be offset by any of their unused respective capital loss carryforwards.
M. COVID-19
The global outbreak of coronavirus disease 2019 (“COVID-19”) has disrupted global economic markets and adversely affected individual companies and investment products. The prolonged economic impact of COVID-19 is uncertain. The operational and financial performance of the issuers of securities in which the Fund invests depends on future developments, including the duration and spread of the outbreak, and such uncertainty may in turn impact the value of the Fund’s investments.
N. Subsequent Events Evaluation
In preparing these financial statements, the Fund has evaluated events and transactions for potential recognition or disclosure resulting from subsequent events after the Statements of Assets and Liabilities date of June 30, 2021 through the date the financial statements were available for issue. This evaluation did not result in any subsequent events that necessitated disclosure and/or adjustments.
3. INVESTMENT ADVISORY AND OTHER AGREEMENTS
Sprott Asset Management L.P. (the “Adviser”) serves as the Fund’s investment adviser pursuant to an Investment Advisory Agreement with the Trust on behalf of the Fund (the “Advisory Agreement”). Pursuant to the Advisory Agreement, the Adviser receives fees from the Fund, calculated daily and payable monthly, at an annual fee rate of 1.00% on the first $500 million of the average daily net assets of the Fund, 0.75% of the average daily net assets in excess of $500 million but not exceeding $1 billion, and 0.65% of the average daily net assets in excess of $1 billion. Prior to the Reorganization, the Adviser of the Predecessor Fund received the same tiered fee structure.
The Adviser, on behalf of the Fund, has entered into a Sub-Advisory Agreement with Sprott Asset Management USA Inc. (the “Sub-Adviser”), an affiliate of the Adviser. The Sub-Adviser does not receive a separate sub-advisory fee under the Sub-Advisory Agreement.
Pursuant to an Administrative Services Agreement, the Fund pays the Adviser a fee computed and paid monthly at an annual rate of 0.15% on the first $400 million of the average daily net assets of the Fund; 0.13% on the next $600 million of the average daily net assets of the Fund; and 0.12% on all the average daily net assets of the Fund over $1 billion.
The Adviser has entered into a sub-administration agreement with U.S. Bank Global Fund Services (the “Sub-Administrator”), under which the Adviser pays the Sub-Administrator a fee based on the assets of the Fund. The fee payable to the Sub-Administrator by the Adviser is calculated daily and payable monthly, at an annual rate of: (i) 0.05% on the first $400 million of the average daily net assets; (ii) 0.03% on the next $600 million of the average daily net assets; and (iii) 0.02% of the average daily net assets in excess of $1 billion, subject to a minimum annual fee for the Fund of $60,000. For the period ended June 30, 2021 the Adviser has made payments of $212,277 to the Sub-Administrator for services provided under a sub-administration agreement for the Fund.
Sprott Global Resource Investments Ltd. (the “Distributor”), an affiliate of the Adviser, acts as distributor for shares of the Fund. The Investor Class adopted a distribution and services plan pursuant to Rule 12b-1 under the 1940 Act. Pursuant to the plan, the Investor Class pays to the Distributor distribution and service fees of 0.25% per annum of its average daily net assets.
Sprott Gold Equity Fund
Notes to Financial Statements (Unaudited)June 30, 2021
4. CAPITAL SHARE TRANSACTIONS
Transactions in capital shares for the Fund was as follows:
| | | | | | | | | | | | |
Sprott Gold Equity Fund (Investor Class) | | For the Period ended
June 30, 2021 | | For the Period ended
December 31, 2020 | | For the Year ended
October 31, 2020 |
Shares sold | | | 1,237,876 | | | | 463,845 | | | | 4,220,917 | |
Shares issues to holders in reinvestment dividends | | | — | | | | — | | | | — | |
Shares redeemed | | | (2,311,809 | ) | | | (847,599 | ) | | | (12,006,462 | ) |
Net decrease | | | (1,073,933 | ) | | | (383,754 | ) | | | (7,785,545 | ) |
| | | | | | | | | | | | |
Sprott Gold Equity Fund (Institutional Class) | | For the Period ended
June 30, 2021 | | For the Period ended
December 31, 2020 | | For the Year ended
October 31, 2020 |
Shares sold | | | 959,993 | | | | 347,676 | | | | 5,357,533 | |
Shares issues to holders in reinvestment dividends | | | — | | | | — | | | | — | |
Shares redeemed | | | (426,793 | ) | | | (190,717 | ) | | | (1,774,399 | ) |
Net increase | | | 533,200 | | | | 156,959 | | | | 3,583,134 | |
5. FUND SHARE TRANSACTIONS
The Fund currently offers two classes of shares of beneficial interest. A redemption fee of 2.00% is imposed on redemptions of shares held 90 days or fewer for the Fund. This fee is retained by the Fund and is credited to paid in capital. For a more detailed description of when the redemption fee does not apply, please see the Fund’s Prospectus.
6. INVESTMENT TRANSACTIONS
Purchases and sales of investment securities (excluding short-term instruments) for the period ended June 30, 2021 are summarized below.
| |
| Sprott Gold Equity Fund |
Purchases: | $ 87,363,655 |
Sales: | 107,464,125 |
7. Transactions with Affiliates*
The following issuers are affiliated with the Funds; that is, the Adviser had control of 5% or more of the outstanding voting securities during the period from January 1, 2021 through June 30, 2021. As defined in Section 2(a)(3) of the 1940 Act; such issues are:
| | | | | | | | | | | | | | | | | | | | | | | | |
| January 1, 2021 | | Additions | | Reductions | | June 30,
2021 | | Interest
Income | Dividend
Income | | Realized
Gain/(Loss) | | Change in
Gross
Unrealized
Appreciation/
(Depreciation) | | June 30, 2021 |
Issuer Name | Share Balance | | Cost | | Share Balance | | Cost | | Share Balance | | Cost | | Share Balance | | | Value | | Cost |
Sprott Gold Equity Fund | | | | | | | | | | | | | | | | | | | | | | | | |
Baru Gold Corp. | 194,440 | | 3,148,570 | | 13,096,553 | | 19,647,429 | | — | | — | | 13,290,993 | | — | — | | — | | (18,814,873 | ) | 857,760 | | 22,795,999 |
Baru Gold Corp. | 13,096,553 | | 19,647,429 | | | | | | (13,096,553 | ) | (19,647,429 | ) | — | | — | — | | — | | 17,949,785 | | — | | — |
Baru Gold Corp. Warrant | 3,321,250 | | — | | | | — | | — | | — | | 3,321,250 | | — | — | | — | | (261 | ) | — | | — |
Bear Creek Mining Corp. | 7,413,200 | | 28,761,181 | | — | | — | | (1,430,400 | ) | (6,361,161 | ) | 5,982,800 | | — | — | | (4,022,355 | ) | (4,048,781 | ) | 7,818,761 | | 22,400,020 |
Corvus Gold, Inc. | 3,226,901 | | 2,212,904 | | — | | — | | — | | — | | 3,226,901 | | — | — | | — | | 1,161,684 | | 8,841,709 | | 2,212,904 |
Corvus Gold, Inc. | 9,500,000 | | 7,163,141 | | — | | — | | | | | | 9,500,000 | | — | — | | — | | 3,594,346 | | 26,133,430 | | 7,163,141 |
Corvus Gold, Inc. | 6,954,100 | | 8,503,013 | | | | | | | | | | 6,954,100 | | — | — | | | | 2,631,099 | | 19,129,946 | | 8,503,013 |
Corvus Gold, Inc. | 1,739,130 | | 1,561,600 | | | | | | — | | — | | 1,739,130 | | — | — | | — | | 658,004 | | 4,784,151 | | 1,561,600 |
Falco Resources Ltd. | 16,222,300 | | 11,973,054 | | — | | — | | — | | — | | 16,222,300 | | — | — | | — | | 140,367 | | 5,365,556 | | 11,973,054 |
Gold Bullion International LLC | 5,000,000 | | 5,000,000 | | — | | — | | — | | — | | 5,000,000 | | — | 256,600 | | — | | — | | 6,900,000 | | 5,000,000 |
I-80 Gold Corp. | — | | — | | 10,415,264 | | 18,348,947 | | | | | | 10,415,264 | | | | | | | 2,740,366 | | 21,089,313 | | 18,348,947 |
I-80 Gold Corp. Warrant | — | | — | | 1,330,000 | | | | — | | — | | 1,330,000 | | | | | | | 161,583 | | 161,583 | | — |
Sprott Gold Equity Fund
Notes to Financial Statements (Unaudited)June 30, 2021
| | | | | | | | | | | | | | | | | | | | | | | | |
| January 1, 2021 | | Additions | | Reductions | | June 30,
2021 | | Interest
Income | Dividend
Income | | Realized
Gain/(Loss) | | Change in
Gross
Unrealized
Appreciation/
(Depreciation) | | June 30, 2021 |
Issuer Name | Share Balance | | Cost | | Share Balance | | Cost | | Share Balance | | Cost | | Share Balance | | | Value | | Cost |
International Tower Hill Mines Ltd. | 6,850,222 | | 22,509,061 | | | | | | (100,000 | ) | (125,703 | ) | 6,750,222 | | — | — | | (3,741 | ) | (2,239,871 | ) | 7,087,733 | | 22,383,358 |
International Tower Hill Mines Ltd. | 18,664,631 | | 35,619,856 | | — | | — | | | | | | 18,664,631 | | — | — | | — | | (6,676,775 | ) | 19,423,503 | | 35,619,856 |
International Tower Hill Mines Ltd. | 1,666,667 | | 8,833,502 | | | | | | — | | — | | 1,666,667 | | — | — | | — | | (596,206 | ) | 1,734,431 | | 8,833,502 |
Jaguar Mining, Inc. | 7,647,959 | | 5,832,118 | | | | | | (1,641,400 | ) | (2,021,987 | ) | 6,006,559 | | — | 755,660 | | 7,655,163 | | (22,163,437 | ) | 25,923,758 | | 3,810,131 |
MAG Silver Corp. | 1,581,135 | | 18,561,846 | | | | | | | | | | 1,581,135 | | — | — | | | | 632,454 | | 33,077,344 | | 18,561,846 |
MAG Silver Corp. | 1,432,665 | | 15,000,003 | | — | | — | | — | | — | | 1,432,665 | | — | — | | — | | 626,125 | | 29,956,983 | | 15,000,003 |
Nickel Creek Platinum Ltd. | 12,379,201 | | 2,544,342 | | — | | — | | (12,379,201 | ) | (2,544,342 | ) | — | | — | — | | — | | 941,909 | | — | | — |
Nickel Creek Platinum Ltd. | 1,658,293 | | 51,762 | | 12,379,201 | | 2,544,342 | | — | | — | | 14,037,494 | | — | — | | — | | (1,463,683 | ) | 1,132,421 | | 2,596,104 |
Nickel Creek Platinum Ltd. Warrant | 6,189,601 | | — | | — | | — | | — | | — | | 6,189,601 | | — | — | | — | | (11,184 | ) | — | | — |
Nickel Creek Platinum Ltd. Warrant | 1,658,293 | | — | | — | | — | | — | | — | | 1,658,293 | | — | — | | — | | (54,988 | ) | 49,364 | | — |
NuLegacy Gold Corp. | 37,852,485 | | 6,682,142 | | | | | | | | | | 37,852,485 | | — | — | | — | | (40,842 | ) | 4,122,366 | | 6,682,142 |
NuLegacy Gold Corp. Warrant | 4,648,198 | | — | | — | | — | | — | | — | | 4,648,198 | | — | — | | — | | (11,151 | ) | 118,117 | | — |
Osisko Mining, Inc. | 15,384,239 | | 45,113,236 | | — | | — | | — | | — | | 15,384,239 | | — | — | | — | | (6,369,210 | ) | 38,348,902 | | 45,113,236 |
Osisko Mining, Inc. Warrant | 932,500 | | — | | | | | | | | | | 932,500 | | — | — | | — | | (114,702 | ) | 9,178 | | — |
Premier Gold Mines Ltd.(a) | 12,738,160 | | 20,409,863 | | | | | | (12,738,160 | ) | (20,409,863 | ) | — | | | 425,233 | | 237,840 | | (9,711,797 | ) | — | | — |
Silvercrest Metals, Inc(a) | 4,756,600 | | 27,338,197 | | | | | | (700,000 | ) | (3,351,640 | ) | 4,056,600 | | | | | 2,904,674 | | (14,134,428 | ) | 35,539,429 | | 23,986,557 |
Strategic Metals Ltd. | 9,886,500 | | 14,175,946 | | — | | — | | | | | | 9,886,500 | | — | — | | — | | 42,538 | | 3,110,467 | | 14,175,946 |
Tocqueville Bullion Reserve LP -
Class G(b) | 7,619 | | 13,795,735 | | — | | — | | — | | — | | 7,619 | | — | — | | — | | (947,551 | ) | 12,692,002 | | 13,795,735 |
West African Resources Ltd | 27,400,000 | | 4,936,439 | | — | | — | | — | | — | | 27,400,000 | | — | — | | — | | (1,628,707 | ) | 20,445,921 | | 4,936,439 |
| | | $329,374,940
| | | | $41,552,802
| | | | $(55,474,209 | ) | | | $—
| $1,437,493
| | $6,771,581
| | $(57,748,187 | ) | $333,854,128
| | $315,453,533
|
*All affiliates listed are neither majority-owned subsidiaries or other controlled companies.
(a)Security is no longer an affiliated company at June 30, 2021.
(b)Tocqueville Bullion Reserve (“TBR”) is a Delaware Limited Partnership created for the purpose of owning physical gold. John Hathaway is an independent Director of the TBR Cayman entities, and is a TBR limited partner.
8. LINE OF CREDIT
The Fund has a $20,000,000 line of credit (the “Line”), which is uncommitted, with U.S. Bank N.A. The Line is for temporary emergency or extraordinary purposes, including the meeting of redemption requests that otherwise might require the untimely disposition of securities. The Line is secured by the Fund’s assets. The Line has a one-year term and is reviewed annually by the Board. The interest rate as of June 30, 2021 was 2.75%. The average interest rate during the period ended June 30, 2021 was 2.75%. During the period ended June 30, 2021, the Fund’s maximum borrowing was $1,842,000 and average borrowing was $104,956. This borrowing resulted in interest expenses of $1,451. As of the period ended June 30, 2021 the Fund has a loan outstanding of $486,000.
9. PROXY VOTING POLICIES AND PROCEDURES AND PROXY VOTING RECORD
A description of the policies and procedures that the Fund uses to determine how to vote proxies relating to portfolio securities is available without charge, upon request, by calling 1.866.996.3863 and on the SEC’s website (http://www.sec.gov). The Fund is required to file how they voted proxies related to portfolio securities during the most recent 12-month period ended June 30. Once filed, the information is available without charge, upon request, by calling 1.866.996.3863 and on the SEC’s website (http://www.sec.gov).
10. AVAILABILITY OF QUARTERLY PORTFOLIO HOLDINGS SCHEDULES
The Fund is required to file its complete schedule of portfolio holdings with the SEC for the first and third quarters of each fiscal year on Part F of Form N-PORT. Once filed, the Fund’s Part F on Form N-PORT is available without charge on the SEC’s website (http://www.sec.gov) and is available upon request by calling 1.866.996.3863. You may also obtain copies of Form N-PORT, Part F by sending your request electronically to publicinfo@sec.gov. Quarterly portfolio holdings are also available on the website for Sprott Gold Equity Fund, https://sprott.com/investment-strategies/sprott-gold-equity-fund/.
Sprott Gold Equity Fund
Notes to Financial Statements (Unaudited)June 30, 2021
11. SECURITIES LENDING
The Fund may seek additional income by lending its securities on a short-term basis to banks, brokers and dealers in return for cash collateral, which is invested in short term securities. The Fund may return a portion of the interest earned to a third party that is unaffiliated with the Fund and acting as a “placing broker.” The Fund receives compensation for lending securities in the form of fees. The Fund also continues to receive dividends on the securities loaned. Security loans are secured at all times by collateral. It is the Fund’s policy that the collateral be equal to at least 102% of the market value of the securities loaned (105% if the securities loaned are denominated in different currencies) plus accrued interest when the transaction is entered into, and that the collateral supporting the loans be valued daily. However, due to market fluctuations during the day, the value of securities loaned on a particular day may, during the course of the day, exceed the value of collateral. On each business day, the amount of collateral is adjusted based on the prior day’s market fluctuations and the current day’s lending activity. Gain or loss in the market price of the securities loaned that may occur during the term of the loan are reflected in the value of the Fund. The risks from securities lending are that the borrower may not provide additional collateral when required or return the securities when due or when called for by the Fund. Lending securities entails a risk of loss to the Fund if and to the extent that the market value of securities loans were to increase, the borrower did not increase the collateral accordingly, and the borrower fails to return the securities. U.S. Bank N.A., the custodian, acts as the securities lending agent for the Fund. The value of the securities on loan and the cash collateral at June 30, 2021 are shown on the Statements of Assets and Liabilities. Shares of the Mount Vernon Liquid Assets Portfolio LLC were purchased with proceeds from cash collateral received from securities on loan. The following table is a summary of the Fund’s securities lending transactions accounted for as secured borrowings with cash collateral of overnight and continuous maturities as of June 30, 2021:
| | |
Fund | Value of Securities
on Loan | Value of Cash
Collateral Received |
Sprott Gold Equity Fund | $29,051,168 | $31,538,625 |
Sprott Gold Equity Fund
Trustees & OfficersJune 30, 2021
Independent Trustees
| | | | | | | | | | |
Name,
Address1 and
Year of Birth | | Position(s)
Held with
the Trust | | Term of
Office2 and
Length of
Time Served | | Principal
Occupation(s)
During Past
Five Years | | Number of
Portfolios in
the Fund
Complex
Overseen
by Trustee | | Other
Directorships
Held By
Trustee
During the Past Five Years |
Michael W. Clark,
1959 | | Trustee | | Since
September,
2018 | | President, Chief Operating Officer, Chief Risk Officer, Head of Executive Committee, and member of Board of Directors of Chilton Investment Company since 2005. | | 4 | | Sprott Focus
Trust, Inc. |
| | | | | | | | | | |
Barbara Connolly Keady,
1962 | | Trustee | | Since
September,
2018 | | Director of New Business Development at Ceres Partners since 2010. | | 4 | | Sprott Focus
Trust, Inc. |
| | | | | | | | | | |
Peyton T. Muldoon,
1969 | | Trustee | | Since
September,
2018 | | Licensed salesperson, Sotheby’s International Realty, a global real estate brokerage firm (since 2011). | | 4 | | Sprott Focus
Trust, Inc. |
| | | | | | | | | | |
James R. Pierce, Jr.,
1956 | | Trustee | | Since
September,
2018 | | Power, Marsh JLT Specialty, a global specialty operations focusing on the energy and power business served by Marsh, Inc., since September, 2014. | | 4 | | Sprott Focus
Trust, Inc. |
1.The address for each Trustee is 200 Bay Street, Suite 2600, Toronto, Ontario, Canada M5J2J1.
2.Each Trustee serves until resignation, death, retirement or removal.
Sprott Gold Equity Fund
Trustees & Officers
Interested Trustee and Officers
| | | | | | | | | | |
Name,
Address1 and
Year of Birth | | Position(s)
Held with
the Trust | | Term of
Office2 and
Length of
Time Served | | Principal
Occupation(s)
During Past
Five Years | | Number of
Portfolios in
the Fund
Complex
Overseen
by Trustee | | Other
Directorships
Held By
Trustee
During the Past Five Years |
John Ciampaglia,
1970 | | President and Trustee | | Since
September,
2018 | | Senior Managing Director of Sprott Inc. and Chief Executive Officer of Sprott Asset Management, Inc. (Since 2010) | | 3 | | None. |
| | | | | | | | | | |
Thomas W. Ulrich,
1963 | | Secretary, Chief Compliance Officer | | Since
September,
2018 | | General Counsel and Chief Compliance Officer of Sprott Asset Management USA Inc. (since October, 2012); In- House Counsel and Chief Compliance Officer of Sprott Global Resource Investments Ltd. (since October, 2012). | | N/A | | N/A |
| | | | | | | | | | |
Varinder Bhathal,
1971 | | Treasurer and Chief Financial Officer | | Since
September,
2018 | | Chief Financial Officer of Sprott Asset Management LP (since Dec 2018); Managing Director, Corporate Finance and Investment Operations of Sprott Inc. (since Oct 2017); Chief Financial Officer of Sprott Capital Partners (since Oct 2016); Vice President, Finance of Sprott Inc. (Dec 2015 to Oct 2017). | | N/A | | N/A |
1.The address for each Trustee and officer is 200 Bay Street, Suite 2600, Toronto, Ontario, Canada M5J2J1.
2.Each Trustee serves until resignation, death, retirement or removal.
The Statement of Additional information includes additional information about the Fund’s Trustees and is available free of charge upon request by calling the Fund toll free at 1-844-940-4653.
Sprott Gold Equity Fund
Investment Advisory Agreement Disclosure
The Board of Trustees (the “Board”) of Sprott Funds Trust (the “Trust”) on behalf of its series the Sprott Gold Equity Fund (the “Fund”) met in person at a regularly scheduled meeting on June 4, 2021, in Watch Hill, Rhode Island, for purposes of, among other things, considering whether it would be in the best interests of the Fund and its shareholders for the Board to renew the existing Investment Advisory Agreement by and between the Fund and Sprott Asset Management L.P. (“SAM” or the “Adviser”) (the “Advisory Agreement”), and the existing Investment Sub-Advisory Agreement by and among the Fund, SAM and Sprott Asset Management USA, Inc. (“SAM USA” or the “Sub-Adviser”) (the “Sub-Advisory Agreement” and, together with the Advisory Agreement, the “Agreements”). SAM together with SAM USA are collectively referred to as the “Advisers.”
In connection with the Board’s review of the Agreements, the Trustees who are not “interested persons” of the Fund or Trust within the meaning of the Investment Company Act of 1940, as amended (the “1940 Act”) (collectively, the “Independent Trustees”) requested, and the Advisers provided the Board with, information about a variety of matters, including, without limitation, the following information:
•Nature, extent and quality of services to be provided by the Advisers, including background information on the qualifications and experience of key professional of the Advisers personnel that provide services to the Fund;
•Investment performance of the Fund, including comparative performance information for registered investment companies similar to the Fund;
•Fees charged to and expenses of the Fund, including comparative fee and expense information for registered investment companies similar to the Fund;
•Costs of the services provided, and profits realized by the Advisers; and
•Economies of scale.
At the June 4, 2021 meeting, the Board, including the Independent Trustees determined that the continuation of the Agreements was in the best interests of the Fund in light of the services, personnel, expenses and such other matters as the Board considered to be relevant in the exercise of its reasonable business judgment and approved them.
To reach this determination, the Board considered its duties under the 1940 Act as well as under the general principles of state law in reviewing and approving advisory contracts; the fiduciary duty of investment advisers with respect to advisory agreements and the receipt of investment advisory compensation; the standards used by courts in determining whether investment company boards have fulfilled their duties; and the factors to be considered by the Board in voting on such agreements. To assist the Board in its evaluation of each of the Agreements, the Independent Trustees received materials in advance of the Board meeting from the Advisers. The Board applied its business judgment to determine whether the arrangements by and among the Fund, SAM and SAM USA are reasonable business arrangements from the Fund’s perspective as well as from the perspective of its shareholders.
Nature, Extent and Quality of Services Provided
Sprott Asset Management L.P.
The Board reviewed materials provided by the Adviser related to the proposed renewal of the Advisory Agreement, including a description of its oversight and monitoring of the Sub-Adviser and a review of the professional personnel who perform services for the Trust. The Board noted the extensive responsibilities of the Adviser with respect to the Fund, including compliance, research, trade execution, operations, risk monitoring, settlement, and service provider monitoring. The Board further noted that the Adviser monitors the regulatory matters governing the Fund and oversees the operations of the Sub-Adviser. The Board discussed the extent of the Adviser’s research capabilities and the quality of its compliance infrastructure, including the Adviser’s use of compliance monitoring software. The Board expressed satisfaction with the experience and credentials of the personnel at the Adviser who service the Fund. The Board discussed the Adviser’s oversight of the Sub-Adviser, which included oversight of the Sub-Adviser’s adherence to the Fund’s investment strategies and restrictions, trading, and compliance monitoring. Additionally, the Board received satisfactory responses from the representatives of the Adviser with respect to whether the Adviser was involved in any lawsuits or pending regulatory actions. The Board reviewed the best-execution practices of the Adviser and discussed the various factors considered by the Adviser when selecting brokers. The Board concluded that the Adviser had sufficient quality and depth of personnel, resources, investment methods and compliance policies and procedures essential to continue performing its duties under the Advisory Agreement and that the nature, overall quality and extent of the management services provided by the Adviser to the Trust were satisfactory.
Sprott USA
The Board reviewed the responsibilities of the Sub-Adviser with respect to the Fund noting that the Sub-Adviser was responsible for providing portfolio management, research, compliance, and analysis for the Fund together with the Adviser. The Board discussed the compliance program of the Sub-Adviser, which included utilizing third parties to provide compliance reporting on a daily, monthly and quarterly basis. The Board expressed satisfaction with the
Sprott Gold Equity Fund
Investment Advisory Agreement Disclosure
experience and credentials of the individuals servicing the Fund, noting the addition in the fourth quarter of 2020 of two new portfolio managers of the Fund. The Board received satisfactory responses from the Sub-Adviser with respect to a series of questions, including: whether the Sub-Adviser was involved in any lawsuits or pending regulatory actions. The Board acknowledged that broker selection was performed by the Adviser and not the Sub-Adviser. After further discussion the Board concluded that the Sub-Adviser had sufficient quality and depth of personnel, resources, investment methods and compliance policies and procedures essential to continue performing its duties under the Sub-Advisory Agreement and that the nature, overall quality and extent of investment management services provided to the Fund was satisfactory.
Investment Performance
The Board considered the absolute performance of the Fund, noting its 46.59% return for the one-year period ending March 31, 2021. The Board also considered the Fund’s performance relative to its peers and various benchmarks. The Board noted that for the 1-year, 5-year and 10-year periods the Fund under-performed the Philadelphia Stock Exchange Gold and Silver Sector Total Return Index (the “Gold and Silver Index”), the S&P 500 Index, its Morningstar category and its peer group. The Board noted, however, that the Fund outperformed each of these benchmarks since inception. The Board considered the Adviser’s explanations for the Fund’s performance relative to the indexes noting the differences between the Fund’s holdings and the constituents that make up the indexes. Further, the Board discussed that the Fund held a relatively large weight in physical gold, which was generally less volatile than the gold equities that are components of the Gold and Silver Index and held by peers. After further discussion, the Board concluded that the Adviser had the potential to continue providing reasonable returns for the Fund.
Fees and Expenses
The Board noted that the Adviser earned a 0.85% fee for managing the Fund and the Fund had a net expense ratio of 1.40%. The Board considered that the management fee was below the peer group average, but above the Morningstar category average. The Board noted that the Fund’s expense ratio was below both the peer group and Morningstar category averages.
With respect to the Sub-Adviser, the Board considered that the Adviser and Sub-Adviser were affiliated entities, both controlled by Sprott, Inc. The Board noted that none of the advisory fees received by the Adviser were allocated to the Sub-Adviser, and the Sub-Adviser did not pay any expenses related to services it provided to the Fund.
The Board agreed that the fee structure for the affiliated Advisers, including the advisory fees charged and expense ratio of the Fund, was reasonable.
Profitability
The Board reviewed the profitability analysis provided by the Adviser with respect to its management of the Fund. The Board considered that no fees or expenses were allocated to the Sub-Adviser, and as such, the Board did not separately analyze the Sub-Adviser’s profitability. The Board noted that the Adviser earned a profit from managing the Fund over the past year. The Board considered the experience and expertise of the portfolio managers and the responsibilities of the Adviser. The Board further considered that the fees and expenses of the Fund were in line with the Fund’s peer group and Morningstar category. After further discussion and reviewing profitability information, the Board concluded that the advisory fee earned by the Adviser was not unreasonable.
The Board noted that SAM also acts as the Administrator for the Fund and collects fees for the services it provides and that SAM did not make an unreasonable profit from this arrangement.
Economies of Scale
The Board considered that the advisory fee already contained breakpoints based on the average daily net assets of the Fund as follows: the Adviser receives 1.00% on the first $500 million of the average daily net assets of the Fund, 0.75% of the average daily net assets in excess of $500 million but not exceeding $1 billion and 0.65% of the average daily net assets in excess of $1 billion. The Board reviewed the breakpoints in place and agreed that they appeared to account for economies of scale.
Conclusion
It was noted that no single factor was cited as determinative to the decision of the Trustees. Rather, after weighing all of the considerations and conclusions discussed above, the entire Board, including all of the Independent Trustees, renewed the Advisory Agreement and the Sub-Advisory Agreement, concluding that having the Fund continue to receive services from the Advisers under the Agreements was in the best interest of the shareholders of the Fund and that the investment advisory fee rate was reasonable in relation to the services provided.
Investment Adviser
Sprott Asset Management LP
200 Bay Street, Suite 2600
Toronto, Ontario, Canada M5J 2J1
(855) 943-8099
www.sprott.com
Investment Sub-Adviser
Sprott Asset Management USA, Inc.
500 Fifth Avenue, Suite 3020
New York, NY 10110
Distributor
Sprott Global Resource Investments Ltd.
1910 Palomar Point Way, Suite 200
Carlsbad, CA 92008
Shareholders’ Servicing and Transfer Agent
U.S. Bank Global Fund Services, LLC
doing business as U.S. Bank Global Fund Services
615 East Michigan Street
Milwaukee, WI 53202
Custodian
U.S. Bank, N.A.
1555 N. River Center Drive, Suite 302
Milwaukee, WI 53212
Independent Registered Public Accounting Firm
Tait, Weller & Baker LLP
50 South 16th Street, Suite 2900
Philadelphia, PA 19102
Legal Counsel
Thompson Hine LLP
1919 M Street, N.W., Suite 700
Washington, D.C. 20036
This material must be preceded or accompanied by the Prospectus.
Semi-Annual Report
June 30, 2021
Sprott Gold Miners ETF (NYSE Arca: SGDM)
Sprott Junior Gold Miners ETF (NYSE Arca: SGDJ)

Sprott Gold Miners ETF
| Performance Overview | June 30, 2021 (Unaudited) |
Investment Objective
The Sprott Gold Miners ETF (the “Gold Fund”, NYSE Arca: SGDM) seeks investment results that correspond (before fees and expenses) to the performance of its underlying index, the Solactive Gold Miners Custom Factors Total Return Index (ticker symbol: SOLGMCFT, the “Underlying Gold Index”).
Performance Overview
For the six-month period ended June 30, 2021, the Gold Fund generated a total return of -7.18%. In comparison, the S&P 500 Total Return Index rose by 15.25% over the same time period.
Gold stocks started the year off strong as the gold price rose to a high of $1,950 per ounce for the period from January 1, 2021 to June 30, 2021. After this initial upward trend in January, gold stocks proceeded to sell-off for the remainder of January and February as other commodity investments that benefited from a post-COVID global economic recovery narrative took center stage. Gold finished February at $1,734 per ounce, posting one of the worst months in four years for gold prices. In March, gold prices continued to fall with the rollout of COVID vaccines in the U.S. encouraging market optimism, but gold stocks posted positive performance. In April and May, U.S. 10-Year Treasuries fell and the U.S. dollar weakened enabling gold and gold stocks to have significant positive performance. However, much of this was corrected in June as markets began to anticipate that the U.S. Federal Reserve would tighten monetary policy. As a result of these volatile movements, the price of gold lost 6.76% over the first half of 2021. After setting a new record in 2020, inflows into gold ETFs fell over this period.
Gold miners benefit from a higher gold price because of their inherent operating leverage. The high gold price helps to increase profit margins and free cash flow for gold miners. Over the next several quarters, we expect the senior gold companies to deliver strong earnings growth relative to most other sectors in the economy. Gold mining stocks remain inexpensive relative to gold bullion and their valuations are low on most standard metrics.
During the period, there were noticeable strong gains among the Underlying Gold Index holdings including K92 Mining Inc., Franco-Nevada Corporation and Hecla Mining Company. The worst detractors over the period were Centerra Gold Inc., Equinox Gold Corp. and Yamana Gold Inc.
Performance^ (as of June 30, 2021)
| | | 6 Months | | 1 Year | | 5 Year | | Since Inception^^ |
| Sprott Gold Miners ETF - Net Asset Value (“NAV”) | | -7.18 | % | | -10.05 | % | | 2.09 | % | | 2.30 | % |
| Sprott Gold Miners ETF - Market Price* | | -7.37 | % | | -10.26 | % | | 2.09 | % | | 2.29 | % |
| Solactive Gold Miners Custom Factors Total Return Index** | | -6.81 | % | | -9.53 | % | | 3.03 | % | | 3.19 | % |
| S&P 500® Total Return Index | | 15.25 | % | | 40.79 | % | | 17.65 | % | | 14.03 | % |
Total Expense Ratio (per the Gold Fund’s current prospectus) 0.50%
Performance data quoted represents past performance. Past performance does not guarantee future results. Total return figures assume reinvestment of dividends and capital gains distributions, if any, and include the effect of the Gold Fund’s recurring expenses. The table does not reflect the deduction of taxes that a shareholder would pay on Gold Fund distributions or the redemption of Gold Fund shares. Investment return and principal value of an investment will fluctuate so that an investor’s shares, when sold or redeemed, may be worth more or less than the original cost. Current performance data may be higher or lower than actual data quoted. For the most current month-end performance data please visit www.sprottetfs.com or call 888.622.1813.
NAV is an exchange-traded fund’s per-share value. The per-share dollar amount of the Gold Fund is derived by dividing the total value of all the securities in its portfolio, less any liabilities, by the number of Gold Fund shares outstanding. Market Price is the price at which a share can currently be traded in the market. Information detailing the number of days the Market Price of the Gold Fund was greater than the Gold Fund’s NAV and the number of days it was less than the Gold Fund’s NAV can be obtained at www.sprottetfs.com.
| ^ | The Sprott Gold Miners ETF was reorganized on or about July 19, 2019 (“Reorganization Date”) from Sprott Gold Miners ETF (“Gold Predecessor Fund”), then a series of ALPS ETF Trust, into a series of Sprott Funds Trust. The Gold Fund is a continuation of the Gold Predecessor Fund and, therefore, the performance information presents the performance of the Gold Predecessor Fund prior to the Reorganization Date. Returns less than one year are not annualized. |
| ^^ | The Gold Predecessor Fund’s Commencement date was July 15, 2014. |
| * | Market Price means the official closing price of a security or the last reported sale price. In the event there were no sales during the day or closing prices are not available, the price that is the midpoint of the bid-ask spread as of that time will be used. It does not represent the returns an investor would receive if shares were traded at other times. |
| ** | From the Gold Fund’s inception to July 19, 2019, the Gold Fund’s objective was to track the Sprott Zacks Gold Miners Total Return Index (“predecessor index”) and since that date the Gold Fund has been seeking to track the Solactive Gold Miners Custom Factors Total Return Index. The index performance presented reflects the performance of the predecessor index through July 19, 2019 and thereafter reflects the performance of the Solactive Gold Miners Custom Factors Total Return Index. |
Sprott Gold Miners ETF
| Performance Overview | June 30, 2021 (Unaudited) |
Sprott Zacks Gold Miners Total Return Index is comprised of approximately 25 stocks selected, based on investment and other criteria, from a universe of gold and silver mining companies whose stock is listed on a major U.S. exchange. The stocks are selected using a proprietary, quantitative rules-based methodology developed by Zacks Index Services.
Solactive Gold Miners Custom Factors Total Return Index was created by Solactive AG to provide a means of generally tracking the performance of gold companies whose common stocks or American Depository Receipts (“ADRs”) are traded on the Toronto Stock Exchange, the New York Stock Exchange and NASDAQ. As of June 30, 2021, the Underlying Gold Index consisted of 34 securities.
S&P 500® Total Return Index is the Standard & Poor’s composite index of 500 stocks, a widely recognized, unmanaged index of common stock prices.
The indexes are reported on a total return basis, which assumes reinvestment of any dividends and distributions realized during a given time period. The indexes are not actively managed and do not reflect any deductions for fees, expenses or taxes. One cannot invest directly in an index. Index performance does not reflect fund performance.
The Gold Fund is concentrated in the gold and silver mining industry. As a result, the Gold Fund will be sensitive to changes in, and its performance will depend to a greater extent on, the overall condition of the gold and silver mining industry. Also, gold and silver mining companies are highly dependent on the price of gold and silver bullion. These prices may fluctuate substantially over short periods of time so the Gold Fund’s share price may be more volatile than other types of investments.
Funds that emphasize investments in small-cap and mid-cap companies will generally experience greater price volatility.
Funds investing in foreign and emerging markets will also generally experience greater price volatility.
The Gold Fund’s shares are not individually redeemable. Investors buy and sell shares of the Gold Fund on a secondary market. Only market makers or “authorized participants” may trade directly with the Gold Fund, typically in blocks of 50,000 shares.
The Sprott Gold Miners ETF is not suitable for all investors. Investments in the Gold Fund are subject to investment risks, including possible loss of the principal amount invested.
ALPS Distributor, Inc., a FINRA member, is the distributor for the Sprott Gold Miners ETF.
ALPS Distributor, Inc. is not affiliated with Sprott, Solactive AG nor Zacks Index Services, a division of Zacks Investment Management.
Sprott Gold Miners ETF
| Performance Overview | June 30, 2021 (Unaudited) |
Top 10 Holdings^ (as of June 30, 2021)
| Newmont Corp. | | 12.39 | % |
| Franco-Nevada Corp. | | 10.91 | % |
| Wheaton Precious Metals Corp. | | 8.50 | % |
| Barrick Gold Corp. | | 8.29 | % |
| Kirkland Lake Gold, Ltd. | | 5.57 | % |
| Kinross Gold Corp. | | 4.64 | % |
| Endeavour Mining PLC | | 4.20 | % |
| Hecla Mining Co. | | 3.67 | % |
| B2Gold Corp. | | 3.63 | % |
| Yamana Gold, Inc. | | 3.56 | % |
| Total % of Top 10 Holdings | | 65.36 | % |
Country Allocation^ (as of June 30, 2021)
| Canada | | 77.63 | % |
| United States | | 16.90 | % |
| United Kingdom | | 4.20 | % |
| South Africa | | 0.89 | % |
| Australia | | 0.38 | % |
| Total | | 100.00 | % |
| ^ % of Total Investments (excluding investments purchased with collateral from securities loaned).
Future holdings are subject to change. |
Growth of $10,000 (as of June 30, 2021)
Comparison of Change in Value of $10,000 Investment in the Gold Fund, Underlying Gold Index, and S&P 500

The chart above compares historical performance of a hypothetical investment of $10,000 in the Gold Fund since inception with the performance of the Underlying Gold Index and S&P 500. Results include the reinvestment of all dividends and capital gains distributions, if any. Past performance does not guarantee future results. The graph does not reflect the deduction of taxes that a shareholder would pay on Fund distributions or the redemption of Gold Fund shares.
| * | From the Gold Fund’s inception to July 19, 2019, the Gold Fund’s objective was to track the Sprott Zacks Gold Miners Total Return Index (“predecessor index”) and since that date the Gold Fund has been seeking to track the Solactive Gold Miners Custom Factors Index. The index performance presented reflects the performance of the predecessor index through July 19, 2019 and thereafter reflects the performance of the Solactive Gold Miners Custom Factors Index. |
Sprott Junior Gold Miners ETF
| Performance Overview | June 30, 2021 (Unaudited) |
Investment Objective
The Sprott Junior Gold Miners ETF (the “Junior Fund”, NYSE Arca: SGDJ) seeks investment results that correspond (before fees and expenses) to the performance of its underlying index, the Solactive Junior Gold Miners Custom Factors Index (ticker symbol: SOLJGMFT, the “Junior Underlying Index”).
Performance Overview
For the six-month period ended June 30, 2021, the Sprott Junior Gold Miners ETF generated a total return of -11.26%. In comparison, the S&P 500 Total Return Index rose by 15.25% over the same time period.
Gold stocks started the year off strong as the gold price rose to a high of $1,950 per ounce for the period from January 1, 2021 to June 30, 2021. After this initial upward trend in January, gold stocks proceeded to sell-off for the remainder of January and February as other commodity investments that benefited from a post-COVID global economic recovery narrative took center stage. Gold finished February at $1,734 per ounce, posting one of the worst months in four years for gold prices. In March, gold prices continued to fall with the rollout of COVID vaccines in the U.S. encouraging market optimism, but gold stocks posted positive performance. In April and May, U.S. 10-Year Treasuries fell and the U.S. dollar weakened enabling gold and gold stocks to have significant positive performance. However, much of this was corrected in June as markets began to anticipate that the U.S. Federal Reserve would tighten monetary policy. As a result of these volatile movements, the price of gold lost 6.76% over the first half of 2021. After setting a new record in 2020, inflows into gold ETFs fell over this period.
Junior gold miners stocks benefit from a higher gold price because of their inherent operating leverage. The high gold price increases profit margins and free cash flow for junior producers, while for junior explorers, it makes it easier for them to access critical capital they require to fund exploration and mine development. The higher gold price is also making some junior gold companies attractive takeover targets for senior mining companies. For the senior miners, acquiring a junior miner with a promising gold deposit can often be less expensive than developing a new deposit themselves. After a sharp resurgence in 2019, M&A (mergers and acquisitions) activity was forced to pause in 2020 due to the pandemic. We expect to see renewed M&A activity in the gold mining sector in the coming year.
During the period, there were noticeable strong gains among the Junior Underlying Index holdings including Victoria Gold Corp., McEwen Mining Inc. and K92 Mining Inc. The worst performers over the period were Greatland Gold plc, Sabina Gold & Silver Corp. and Resolute Mining Limited.
Performance^ (as of June 30, 2021)
| | | 6 Months | | 1 Year | | 5 Year | | Since
Inception^^ |
| Sprott Junior Gold Miners ETF - Net Asset Value (“NAV”) | | -11.26 | % | | 17.38 | % | | 2.31 | % | | 10.89 | % |
| Sprott Junior Gold Miners ETF - Market Price* | | -10.54 | % | | 18.14 | % | | 2.51 | % | | 11.05 | % |
| Solactive Junior Gold Miners Custom Factors Total Return Index** | | -11.53 | % | | 17.19 | % | | 3.40 | % | | 12.05 | % |
| S&P 500® Total Return Index | | 15.25 | % | | 40.79 | % | | 17.65 | % | | 14.48 | % |
Total Expense Ratio (per the Junior Fund’s current prospectus) 0.50%
Performance data quoted represents past performance. Past performance does not guarantee future results. Total return figures assume reinvestment of dividends and capital gains distributions, if any, and include the effect of the Junior Fund’s recurring expenses. The table does not reflect the deduction of taxes that a shareholder would pay on Junior Fund distributions or the redemption of Junior Fund shares. Investment return and principal value of an investment will fluctuate so that an investor’s shares, when sold or redeemed, may be worth more or less than the original cost. Current performance data may be higher or lower than actual data quoted. For the most current month-end performance data please visit www.sprottetfs.com or call 888.622.1813.
NAV is an exchange-traded fund’s per-share value. The per-share dollar amount of the Junior Fund is derived by dividing the total value of all the securities in its portfolio, less any liabilities, by the number of Junior Fund shares outstanding. Market Price is the price at which a share can currently be traded in the market. Information detailing the number of days the Market Price of the Junior Fund was greater than the Junior Fund’s NAV and the number of days it was less than the Junior Fund’s NAV can be obtained at www.sprottetfs.com.
| ^ | The Sprott Junior Gold Miners ETF was reorganized on or about July 19, 2019 (“Reorganization Date”) from Sprott Junior Gold Miners ETF (“Junior Predecessor Fund”), then a series of ALPS ETF Trust, into a series of Sprott Funds Trust. The Junior Fund is a continuation of the Junior Predecessor Fund and, therefore, the performance information presents the performance of the Junior Predecessor Fund prior to the Reorganization Date. Returns less than one year are not annualized. |
| ^^ | The Junior Predecessor Fund’s Commencement date was March 31, 2015. |
Sprott Junior Gold Miners ETF
| Performance Overview | June 30, 2021 (Unaudited) |
| * | Market Price means the official closing price of a security or the last reported sale price. In the event there were no sales during the day or closing prices are not available, the price that is the midpoint of the bid-ask spread as of that time will be used. It does not represent the returns an investor would receive if shares were traded at other times. |
| ** | From the Junior Fund’s inception to July 19, 2019, the Junior Fund’s objective was to track the Sprott Zacks Junior Gold Miners Total Return Index (“predecessor index”) and since that date the Junior Fund has been seeking to track the Solactive Junior Gold Miners Custom Factors Total Return Index. The index performance presented reflects the performance of the predecessor index through July 19, 2019 and thereafter reflects the performance of the Solactive Junior Gold Miners Custom Factors Total Return Index. |
Sprott Zacks Junior Gold Miners Total Return Index is comprised of between 30 to 40 stocks selected, based on investment and other criteria, from a universe of gold and silver mining companies whose stocks are listed on a major U.S. or Canadian exchange. The stocks are selected using a proprietary, quantitative rules-based methodology developed by Zacks Index Services.
Solactive Junior Gold Miners Custom Factors Total Return Index was created by Solactive AG to provide a means of generally tracking the performance of “junior” gold companies whose common stock or American Depository Receipts (“ADRs”) or Global Depository Receipts (“GDRs”) are traded on a regulated stock exchange in the form of shares tradeable for foreign investors without any restrictions. Junior companies include early stage mining companies that are in the exploration stage only or that hold properties that might not ultimately produce gold. Most of these companies are in the development and exploration phase and are on the lookout for land with a higher chance for uncovering large mineral deposits. As of June 30, 2021, the Junior Underlying Index consisted of 34 securities.
S&P 500® Total Return Index is the Standard & Poor’s composite index of 500 stocks, a widely recognized, unmanaged index of common stock prices.
The indexes are reported on a total return basis, which assumes reinvestment of any dividends and distributions realized during a given time period. The indexes are not actively managed and do not reflect any deductions for fees, expenses or taxes. One cannot invest directly in an index. Index performance does not reflect fund performance.
The Junior Fund is concentrated in the gold and silver mining industry. As a result, the Junior Fund will be sensitive to changes in, and its performance will depend to a greater extent on, the overall condition of the gold and silver mining industry. Also, gold and silver mining companies are highly dependent on the price of gold and silver bullion. These prices may fluctuate substantially over short periods of time so the Junior Fund’s share price may be more volatile than other types of investments.
Funds that emphasize investments in small-cap and mid-cap companies will generally experience greater price volatility. Micro-cap stocks involve substantially greater risks of loss and price fluctuations because their earnings and revenues tend to be less predictable. These companies may be newly formed or in the early stages of development, with limited product lines, markets or financial resources and may lack management depth.
Funds investing in foreign and emerging markets will also generally experience greater price volatility.
The Junior Fund’s shares are not individually redeemable. Investors buy and sell shares of the Junior Fund on a secondary market. Only market makers or “authorized participants” may trade directly with the Junior Fund, typically in blocks of 50,000 shares.
The Sprott Junior Gold Miners ETF is not suitable for all investors. Investments in the Junior Fund are subject to investment risks, including possible loss of the principal amount invested.
ALPS Distributor, Inc., a FINRA member, is the distributor for the Sprott Junior Gold Miners ETF.
ALPS Distributor, Inc. is not affiliated with Sprott, Solactive AG nor Zacks Index Services, a division of Zacks Investment Management.
Sprott Junior Gold Miners ETF
| Performance Overview | June 30, 2021 (Unaudited) |
Top 10 Holdings^ (as of June 30, 2021)
| Great Bear Resources, Ltd. | | 5.52 | % |
| Bellevue Gold, Ltd. | | 5.31 | % |
| K92 Mining, Inc. | | 5.09 | % |
| Skeena Resources, Ltd. | | 5.02 | % |
| Wesdome Gold Mines, Ltd. | | 4.52 | % |
| Centamin PLC | | 4.48 | % |
| Pan African Resources PLC | | 4.36 | % |
| Resolute Mining, Ltd. | | 4.15 | % |
| Dundee Precious Metals, Inc. | | 3.74 | % |
| Orla Mining, Ltd. | | 3.73 | % |
| Total % of Top 10 Holdings | | 45.92 | % |
Country Allocation^ (as of June 30, 2021)
| Canada | | 43.42 | % |
| Australia | | 37.84 | % |
| United Kingdom | | 7.77 | % |
| Jersey | | 4.48 | % |
| United States | | 3.39 | % |
| Russia | | 1.67 | % |
| Peru | | 1.43 | % |
| Total | | 100.00 | % |
| ^ % of Total Investments (excluding investments purchased with collateral from securities loaned).
Future holdings are subject to change. |
Growth of $10,000 (as of June 30, 2021)
Comparison of Change in Value of $10,000 Investment in the Junior Fund, Junior Underlying Index, and S&P 500
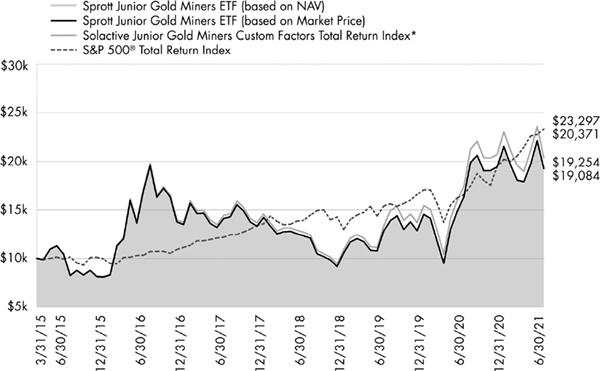
The chart above compares historical performance of a hypothetical investment of $10,000 in the Junior Fund since inception with the performance of the Junior Underlying Index and the S&P 500. Results include the reinvestment of all dividends and capital gains distributions, if any. Past performance does not guarantee future results. The graph does not reflect the deduction of taxes that a shareholder would pay on Junior Fund distributions or the redemption of Junior Fund shares.
| * | From the Junior Fund’s inception to July 19, 2019, the Fund’s objective was to track the Sprott Zacks Junior Gold Miners Total Return Index (“predecessor index”) and since that date the Junior Fund has been seeking to track the Solactive Junior Gold Miners Custom Factors Total Return Index. The index performance presented reflects the performance of the predecessor index through July 19, 2019 and thereafter reflects the performance of the Solactive Junior Gold Miners Custom Factors Total Return Index. |
Sprott ETFs
| Disclosure of Fund Expenses | June 30, 2021 (Unaudited) |
Shareholder Expense Example: As a shareholder of a Fund, you incur two types of costs: (1) transaction costs which may include creation and redemption fees or brokerage charges, and (2) ongoing costs, including management fees and other Fund expenses. These examples are intended to help you understand your ongoing costs (in dollars) of investing in a Fund and to compare these costs with the ongoing costs of investing in other funds. It is based on an investment of $1,000 invested at the beginning of the (six month) period and held through June 30, 2021.
Actual Return: The first line of the table provides information about actual account values and actual expenses. You may use the information in this line, together with the amount you invested, to estimate the expenses that you incurred over the period. Simply divide your account value by $1,000 (for example, an $8,600 account value divided by $1,000 = 8.6), then multiply the result by the number in the first line under the heading entitled “Expenses Paid During Period” to estimate the expenses attributable to your investment during this period.
Hypothetical 5% Return: The second line of the table provides information about hypothetical account values and hypothetical expenses based on each Fund’s actual expense ratio and an assumed rate of return of 5% per year before expenses, which is not the Fund’s actual return. The hypothetical account values and expenses may not be used to estimate the actual ending account balance or expenses you paid for the period. You may use this information to compare ongoing costs of investing in each Fund and other funds. To do so, compare this 5% hypothetical example with the 5% hypothetical examples that appear in the shareholder reports of other funds.
The expenses shown in the table are meant to highlight ongoing Fund costs only and do not reflect any transaction costs, such as creation and redemption fees or brokerage charges. Therefore, the second line is useful in comparing ongoing costs only, and will not help you determine the relative total costs of owning different funds. In addition, if these costs were included, your costs would have been higher.
| | | Beginning Account
Value
1/1/21 | | Ending Account
Value
6/30/21 | | Expense
Ratio(a) | | Expenses Paid
During Period
1/1/21 - 6/30/21(b) |
| Sprott Gold Miners ETF | | | | | | | | |
| Actual | | $1,000.00 | | $ 928.20 | | 0.50% | | $2.39 |
| Hypothetical (5% return before expenses) | | $1,000.00 | | $1,022.32 | | 0.50% | | $2.51 |
| Sprott Junior Gold Miners ETF | | | | | | | | |
| Actual | | $1,000.00 | | $ 887.40 | | 0.50% | | $2.34 |
| Hypothetical (5% return before expenses) | | $1,000.00 | | $1,022.32 | | 0.50% | | $2.51 |
| (a) | Annualized, based on the applicable Fund’s most recent fiscal half year expenses. |
| (b) | Expenses are equal to the applicable Fund’s annualized expense ratio multiplied by the average account value over the period, multiplied by the number of days in the most recent fiscal half year (181), divided by 365. |
Sprott Gold Miners ETF
| Schedule of Investments | June 30, 2021 (Unaudited) |
| Security Description | | Shares | | | Value | |
| COMMON STOCKS (99.92%) | | | | | | | | |
| Gold Mining (96.25%) | | | | | | | | |
| Agnico Eagle Mines, Ltd. | | | 74,552 | | | $ | 4,508,243 | |
| Alamos Gold, Inc., Class A | | | 1,043,325 | | | | 7,970,545 | |
| AngloGold Ashanti, Ltd., Sponsored ADR(a) | | | 39,255 | | | | 729,358 | |
| B2Gold Corp. | | | 2,081,801 | | | | 8,732,951 | |
| Barrick Gold Corp. | | | 964,860 | | | | 19,957,253 | |
| Centerra Gold, Inc. | | | 1,110,955 | | | | 8,433,435 | |
| Coeur Mining, Inc.(b) | | | 100,489 | | | | 892,342 | |
| Dundee Precious Metals, Inc. | | | 1,079,206 | | | | 6,538,268 | |
| Eldorado Gold Corp.(b) | | | 725,939 | | | | 7,209,026 | |
| Endeavour Mining PLC | | | 471,212 | | | | 10,119,122 | |
| Equinox Gold Corp.(b) | | | 110,280 | | | | 765,982 | |
| Franco-Nevada Corp. | | | 180,960 | | | | 26,260,805 | |
| Gold Fields, Ltd., Sponsored ADR(a) | | | 82,654 | | | | 735,621 | |
| Harmony Gold Mining Co., Ltd., Sponsored ADR(a) | | | 182,790 | | | | 681,807 | |
| IAMGOLD Corp.(b) | | | 280,077 | | | | 824,686 | |
| K92 Mining, Inc.(b) | | | 1,171,031 | | | | 8,464,374 | |
| Kinross Gold Corp. | | | 1,763,060 | | | | 11,179,132 | |
| Kirkland Lake Gold, Ltd. | | | 348,280 | | | | 13,421,536 | |
| New Gold, Inc.(b) | | | 381,404 | | | | 686,133 | |
| Newmont Corp. | | | 470,522 | | | | 29,821,684 | |
| Novagold Resources, Inc.(a)(b) | | | 99,661 | | | | 799,153 | |
| OceanaGold Corp.(a)(b) | | | 481,248 | | | | 912,337 | |
| Osisko Gold Royalties, Ltd. | | | 71,689 | | | | 982,572 | |
| Osisko Mining, Inc.(b) | | | 199,062 | | | | 496,210 | |
| Pretium Resources, Inc.(b) | | | 734,051 | | | | 7,023,108 | |
| Royal Gold, Inc. | | | 7,838 | | | | 894,316 | |
| Sandstorm Gold, Ltd.(b) | | | 980,873 | | | | 7,746,649 | |
| Seabridge Gold, Inc.(b) | | | 41,908 | | | | 734,303 | |
| SSR Mining, Inc. | | | 531,730 | | | | 8,304,528 | |
| Torex Gold Resources, Inc.(b) | | | 523,755 | | | | 6,033,576 | |
| Wesdome Gold Mines, Ltd.(b) | | | 78,156 | | | | 741,461 | |
| Wheaton Precious Metals Corp. | | | 464,021 | | | | 20,453,459 | |
| Yamana Gold, Inc. | | | 2,034,334 | | | | 8,566,653 | |
| Total Gold Mining | | | | | | | 231,620,628 | |
| | | | | | | | | |
| Silver Mining (3.67%) | | | | | | | | |
| Hecla Mining Co. | | | 1,187,620 | | | | 8,835,893 | |
| | | | | | | | | |
| TOTAL COMMON STOCKS | | | | | | | | |
| (Cost $215,793,270) | | | | | | | 240,456,521 | |
| | | 7 Day Yield | | | Shares | | | Value | |
| SHORT TERM INVESTMENTS (0.91%) | | | | | | | | | | | | |
| Money Market Fund (0.13%) | | | | | | | | | | | | |
| State Street Institutional Treasury Plus Money Market Fund | | | | | | | | | | | | |
| (Cost $306,496) | | | 0.01 | % | | | 306,496 | | | $ | 306,496 | |
| | | | | | | | | | | | | |
| | | | | | | | | | | | | |
| Investments Purchased with Collateral from Securities Loaned (0.78%) | | | | | | | | | | | | |
| State Street Navigator Securities Lending Government Money Market Portfolio, 0.02% | | | | | | | | | | | | |
| (Cost $1,887,453) | | | | | | | 1,887,453 | | | | 1,887,453 | |
| TOTAL SHORT TERM INVESTMENTS | | | | | | | | | | | | |
| (Cost $2,193,949) | | | | | | | | | | | 2,193,949 | |
| | | | | | | | | | | | | |
| TOTAL INVESTMENTS (100.83%) | | | | | | | | | | | | |
| (Cost $217,987,219) | | | | | | | | | | $ | 242,650,470 | |
| LIABILITIES IN EXCESS OF OTHER ASSETS (-0.83%) | | | | | | | | | | | (2,003,940 | ) |
| NET ASSETS - 100.00% | | | | | | | | | | $ | 240,646,530 | |
| (a) | The security, or a portion of the security position is currently on loan. As of June 30, 2021 the total market value of securities on loan is $2,544,858. The loaned securities were secured with cash collateral of $1,887,453 and non-cash collateral with the value of $785,516. The Fund cannot repledge or resell this collateral. Collateral is calculated based on prior day’s prices. |
| (b) | Non-income producing security. |
See Notes to Financial Statements.
Sprott Junior Gold Miners ETF
| Schedule of Investments | June 30, 2021 (Unaudited) |
| Security Description | | Shares | | | Value | |
| COMMON STOCKS (97.73%) | | | | | | | | |
| Diversified Metals & Mining (1.78%) | | | | | | | | |
| Aurelia Metals, Ltd. | | | 7,334,300 | | | $ | 2,255,151 | |
| | | | | | | | | |
| Gold Mining (95.95%) | | | | | | | | |
| Argonaut Gold, Inc.(a) | | | 1,714,370 | | | | 4,107,518 | |
| Bellevue Gold, Ltd.(a)(b) | | | 9,244,607 | | | | 6,586,354 | |
| Centamin PLC | | | 3,968,751 | | | | 5,555,845 | |
| De Grey Mining, Ltd.(a) | | | 4,855,895 | | | | 4,497,480 | |
| Dundee Precious Metals, Inc. | | | 765,709 | | | | 4,638,976 | |
| Gold Road Resources, Ltd. | | | 4,195,016 | | | | 3,964,032 | |
| Great Bear Resources, Ltd.(a) | | | 557,800 | | | | 6,844,255 | |
| Greatland Gold PLC(a)(b) | | | 17,360,222 | | | | 4,226,528 | |
| Hochschild Mining PLC | | | 836,895 | | | | 1,775,874 | |
| K92 Mining, Inc.(a) | | | 874,474 | | | | 6,320,819 | |
| McEwen Mining, Inc.(a)(b) | | | 1,664,659 | | | | 2,297,229 | |
| New Gold, Inc.(a)(b) | | | 1,204,277 | | | | 2,166,455 | |
| Novo Resources Corp.(a) | | | 1,246,134 | | | | 2,101,017 | |
| OceanaGold Corp.(a)(b) | | | 1,246,333 | | | | 2,362,764 | |
| Orla Mining, Ltd.(a) | | | 1,120,900 | | | | 4,629,726 | |
| Osisko Mining, Inc.(a) | | | 868,536 | | | | 2,165,034 | |
| Pan African Resources PLC(b) | | | 22,693,342 | | | | 5,411,921 | |
| Perseus Mining, Ltd.(a) | | | 2,205,682 | | | | 2,415,065 | |
| Petropavlovsk PLC(a)(b) | | | 6,321,802 | | | | 2,069,052 | |
| Ramelius Resources, Ltd. | | | 3,440,100 | | | | 4,372,943 | |
| Regis Resources, Ltd. | | | 1,533,416 | | | | 2,713,970 | |
| Resolute Mining, Ltd.(a)(b) | | | 13,598,923 | | | | 5,150,257 | |
| Sabina Gold & Silver Corp.(a) | | | 1,583,541 | | | | 2,235,557 | |
| Seabridge Gold, Inc.(a)(b) | | | 122,552 | | | | 2,150,788 | |
| Silver Lake Resources, Ltd.(a) | | | 3,608,233 | | | | 4,491,958 | |
| Skeena Resources, Ltd.(a) | | | 594,475 | | | | 6,234,410 | |
| SolGold PLC(a)(b) | | | 5,475,700 | | | | 2,158,740 | |
| St Barbara, Ltd. | | | 1,625,013 | | | | 2,077,850 | |
| Torex Gold Resources, Inc.(a)(b) | | | 366,678 | | | | 4,224,074 | |
| Victoria Gold Corp.(a) | | | 153,330 | | | | 2,282,138 | |
| Wesdome Gold Mines, Ltd.(a)(b) | | | 590,704 | | | | 5,603,968 | |
| West African Resources, Ltd.(a) | | | 2,691,065 | | | | 2,008,077 | |
| Westgold Resources, Ltd.(a) | | | 1,352,199 | | | | 1,906,477 | |
| Total Gold Mining | | | | | | | 121,747,151 | |
| | | | | | | | | |
| TOTAL COMMON STOCKS | | | | | | | | |
| (Cost $131,586,707) | | | | | | | 124,002,302 | |
| | | 7 Day Yield | | | Shares | | | Value | |
| SHORT TERM INVESTMENTS (6.85%) | | | | | | | | | | | | |
| Money Market Fund (0.07%) | | | | | | | | | | | | |
| State Street Institutional Treasury Plus Money Market Fund | | | | | | | | | | | | |
| (Cost $94,758) | | | 0.01 | % | | | 94,758 | | | $ | 94,758 | |
| | | | | | | | | | | | | |
| Investments Purchased with Collateral from Securities Loaned (6.78%) | | | | | | | | | | | | |
| State Street Navigator Securities Lending Government Money Market Portfolio, 0.02% | | | | | | | | | | | | |
| (Cost $8,599,557) | | | | | | | 8,599,557 | | | | 8,599,557 | |
| TOTAL SHORT TERM INVESTMENTS | | | | | | | | | | | | |
| (Cost $8,694,315) | | | | | | | | | | | 8,694,315 | |
| | | | | | | | | | | | | |
| TOTAL INVESTMENTS (104.58%) | | | | | | | | | | | | |
| (Cost $140,281,022) | | | | | | | | | | $ | 132,696,617 | |
| LIABILITIES IN EXCESS OF OTHER ASSETS (-4.58%) | | | | | | | | | | | (5,814,503 | ) |
| NET ASSETS - 100.00% | | | | | | | | | | $ | 126,882,114 | |
| (a) | Non-income producing security. |
| (b) | The security, or a portion of the security position is currently on loan. As of June 30, 2021 the total market value of securities on loan is $9,574,977. The loaned securities were secured with cash collateral of $8,599,557 and non-cash collateral with the value of $1,669,077. The non-cash collateral received consists of common stocks and is held for the benefit of the Fund at the Fund’s custodian. The Fund cannot repledge or resell this collateral. Collateral is calculated based on prior day’s prices. |
See Notes to Financial Statements.
| Sprott ETFs | | |
| Statements of Assets and Liabilities | | June 30, 2021 (Unaudited) |
| | | | | |
| | | | Sprott Gold
Miners ETF | | | | Sprott Junior
Gold Miners ETF | |
| ASSETS: | | | | | | | | |
| Investments, at value | | $ | 242,650,470 | | | $ | 132,696,617 | |
| Receivable for investments sold | | | — | | | | 12,667,343 | |
| Dividends and reclaim receivable | | | 131,950 | | | | 22,397 | |
| Other assets and prepaid expenses | | | 5,199 | | | | 4,359 | |
| Total Assets | | | 242,787,619 | | | | 145,390,716 | |
| | | | | | | | | |
| LIABILITIES: | | | | | | | | |
| Payable for investments purchased | | | — | | | | 9,748,838 | |
| Payable to adviser | | | 74,682 | | | | 28,992 | |
| Payable for collateral upon return of securities loaned | | | 1,887,453 | | | | 8,599,557 | |
| Administration fees payable | | | 42,119 | | | | 43,970 | |
| Professional fees payable | | | 53,987 | | | | 27,332 | |
| Transfer agent fees payable | | | 6,727 | | | | 6,727 | |
| Accrued expenses and other liabilities | | | 76,121 | | | | 53,186 | |
| Total Liabilities | | | 2,141,089 | | | | 18,508,602 | |
| NET ASSETS | | $ | 240,646,530 | | | $ | 126,882,114 | |
| | | | | | | | | |
| NET ASSETS CONSIST OF: | | | | | | | | |
| Paid-in capital | | $ | 283,205,736 | | | $ | 139,477,803 | |
| Total distributable earnings | | | (42,559,206 | ) | | | (12,595,689 | ) |
| NET ASSETS | | $ | 240,646,530 | | | $ | 126,882,114 | |
| | | | | | | | | |
| INVESTMENTS, AT COST | | $ | 217,987,219 | | | $ | 140,281,022 | |
| | | | | | | | | |
| PRICING OF SHARES | | | | | | | | |
| Net Assets | | $ | 240,646,530 | | | $ | 126,882,114 | |
| Shares of beneficial interest outstanding (Unlimited number of shares authorized, par value $0.01 per share) | | | 8,500,000 | | | | 2,900,000 | |
| Net Asset Value, offering and redemption price per share | | $ | 28.31 | | | $ | 43.75 | |
See Notes to Financial Statements.
| Sprott ETFs | |
| Statements of Operations | For the Six Months Ended June 30, 2021 (Unaudited) |
| | | | | | |
| | | Sprott Gold
Miners ETF | | | Sprott Junior
Gold Miners ETF | |
| INVESTMENT INCOME: | | | | | | | | |
| Dividends(a) | | $ | 2,067,009 | | | $ | 1,163,293 | |
| Securities lending income | | | 2,441 | | | | 25,150 | |
| Total Investment Income | | | 2,069,450 | | | | 1,188,443 | |
| | | | | | | | | |
| EXPENSES: | | | | | | | | |
| Investment adviser fees (See Note 3) | | | 437,784 | | | | 224,576 | |
| Administration fees | | | 79,464 | | | | 80,476 | |
| Trustee fees | | | 5,701 | | | | 2,727 | |
| Compliance fees | | | 5,647 | | | | 2,288 | |
| Legal fees | | | 19,842 | | | | 9,466 | |
| Audit fees | | | 9,917 | | | | 9,917 | |
| Transfer agent fees | | | 4,455 | | | | 4,455 | |
| Other fees and expenses | | | 64,590 | | | | 49,115 | |
| Total Expenses before waiver/reimbursement | | | 627,400 | | | | 383,020 | |
| Less fee waiver/reimbursement by investment adviser (See Note 3) | | | (3,882 | ) | | | (62,363 | ) |
| Expense recoupment of previously waived fees (See Note 3) | | | 1,417 | | | | — | |
| Net Expense | | | 624,935 | | | | 320,657 | |
| NET INVESTMENT INCOME | | | 1,444,515 | | | | 867,786 | |
| | | | | | | | | |
| REALIZED AND UNREALIZED GAIN/(LOSS) | | | | | | | | |
| Net realized gain on investments | | | 3,814,714 | | | | 15,565,837 | |
| Net realized loss on foreign currency transactions | | | (30,802 | ) | | | (28,882 | ) |
| Net realized gain/(loss) | | | 3,783,912 | | | | 15,536,955 | |
| Net change in unrealized depreciation on investments | | | (23,236,764 | ) | | | (31,557,731 | ) |
| Net change in unrealized depreciation on translation of assets and liabilities denominated in foreign currencies | | | (269 | ) | | | (842 | ) |
| Net change in unrealized appreciation/(depreciation) | | | (23,237,033 | ) | | | (31,558,573 | ) |
| NET REALIZED AND UNREALIZED LOSS ON INVESTMENTS | | | (19,453,121 | ) | | | (16,021,618 | ) |
| NET DECREASE IN NET ASSETS RESULTING FROM OPERATIONS | | $ | (18,008,606 | ) | | $ | (15,153,832 | ) |
| (a) | Net of foreign tax withholding in the amounts of $201,338 and $6,301 respectively. | | | |
See Notes to Financial Statements.
| Sprott Gold Miners ETF | | | | | | |
| Statements of Changes in Net Assets | | | | | | |
| | For the Six
Months Ended
June 30, 2021
(Unaudited) | | For the Period
December 1, 2020
to December 31,
2020(a) | | For the
Year Ended
November 30,
2020 | |
| OPERATIONS: | | | | | | | | | |
| Net investment income | | $ | 1,444,515 | | | $ | 281,732 | | | $ | 550,209 | |
| Net realized gain/(loss) | | | 3,783,912 | | | | (268,116 | ) | | | 7,606,434 | |
| Net change in unrealized appreciation/(depreciation) | | | (23,237,033 | ) | | | 8,632,614 | | | | 34,395,136 | |
| Net increase/(decrease) in net assets resulting from operations | | | (18,008,606 | ) | | | 8,646,230 | | | | 42,551,779 | |
| | | | | | | | | | | | | |
| DISTRIBUTIONS TO SHAREHOLDERS: | | | | | | | | | | | | |
| From distributable earnings | | | — | | | | (788,715 | ) | | | (485,870 | ) |
| Total distributions | | | — | | | | (788,715 | ) | | | (485,870 | ) |
| | | | | | | | | | | | | |
| CAPITAL SHARE TRANSACTIONS: | | | | | | | | | | | | |
| Proceeds from sale of shares | | | 5,664,800 | | | | — | | | | 59,618,187 | |
| Cost of shares redeemed | | | (6,243,483 | ) | | | — | | | | (27,954,368 | ) |
| Net increase/(decrease) from capital share transactions | | | (578,683 | ) | | | — | | | | 31,663,819 | |
| Net increase/(decrease) in net assets | | | (18,587,289 | ) | | | 7,857,515 | | | | 73,729,728 | |
| | | | | | | | | | | | | |
| NET ASSETS: | | | | | | | | | | | | |
| Beginning of period | | | 259,233,819 | | | | 251,376,304 | | | | 177,646,576 | |
| End of period | | $ | 240,646,530 | | | $ | 259,233,819 | | | $ | 251,376,304 | |
| | | | | | | | | | | | | |
| OTHER INFORMATION: | | | | | | | | | | | | |
| CAPITAL SHARE TRANSACTIONS: | | | | | | | | | | | | |
| Beginning shares | | | 8,500,000 | | | | 8,500,000 | | | | 7,600,000 | |
| Shares sold | | | 200,000 | | | | — | | | | 1,850,000 | |
| Shares redeemed | | | (200,000 | ) | | | — | | | | (950,000 | ) |
| Shares outstanding, end of period | | | 8,500,000 | | | | 8,500,000 | | | | 8,500,000 | |
| (a) | With the approval of the Board effective December 31, 2020, the Fund’s fiscal year end was changed from November 30 to December 31. |
See Notes to Financial Statements.
| Sprott Junior Gold Miners ETF | | | | | | |
| Statements of Changes in Net Assets | | | | | | |
| | For the Six
Months Ended
June 30, 2021
(Unaudited) | | For the Period
December 1, 2020
to December 31,
2020(a) | | For the
Year Ended
November 30,
2020 | |
| OPERATIONS: | | | | | | | | | |
| Net investment income/(loss) | | $ | 867,786 | | | $ | (6,469 | ) | | $ | (75,873 | ) |
| Net realized gain/(loss) | | | 15,536,955 | | | | (473,003 | ) | | | 10,107,197 | |
| Net change in unrealized appreciation/(depreciation) | | | (31,558,573 | ) | | | 12,296,683 | | | | 18,355,659 | |
| Net increase/(decrease) in net assets resulting from operations | | | (15,153,832 | ) | | | 11,817,211 | | | | 28,386,983 | |
| | | | | | | | | | | | | |
| DISTRIBUTIONS TO SHAREHOLDERS: | | | | | | | | | | | | |
| From distributable earnings | | | — | | | | (2,324,976 | ) | | | (395,316 | ) |
| Total distributions | | | — | | | | (2,324,976 | ) | | | (395,316 | ) |
| | | | | | | | | | | | | |
| CAPITAL SHARE TRANSACTIONS: | | | | | | | | | | | | |
| Proceeds from sale of shares | | | 67,756,430 | | | | 7,383,291 | | | | 56,503,070 | |
| Cost of shares redeemed | | | (48,978,831 | ) | | | — | | | | (31,105,911 | ) |
| Net increase from capital share transactions | | | 18,777,599 | | | | 7,383,291 | | | | 25,397,159 | |
| Net increase in net assets | | | 3,623,767 | | | | 16,875,526 | | | | 53,388,826 | |
| | | | | | | | | | | | | |
| NET ASSETS: | | | | | | | | | | | | |
| Beginning of period | | | 123,258,347 | | | | 106,382,821 | | | | 52,993,995 | |
| End of period | | $ | 126,882,114 | | | $ | 123,258,347 | | | $ | 106,382,821 | |
| | | | | | | | | | | | | |
| OTHER INFORMATION: | | | | | | | | | | | | |
| CAPITAL SHARE TRANSACTIONS: | | | | | | | | | | | | |
| Beginning shares | | | 2,500,000 | | | | 2,350,000 | | | | 1,750,000 | |
| Shares sold | | | 1,400,000 | | | | 150,000 | | | | 1,450,000 | |
| Shares redeemed | | | (1,000,000 | ) | | | — | | | | (850,000 | ) |
| Shares outstanding, end of period | | | 2,900,000 | | | | 2,500,000 | | | | 2,350,000 | |
| (a) | With the approval of the Board effective December 31, 2020, the Fund’s fiscal year end was changed from November 30 to December 31. |
See Notes to Financial Statements.
| Sprott Gold Miners ETF | |
| Financial Highlights | For a Share Outstanding Throughout the Periods Presented |
| | | For the Six Months Ended June 30, 2021 (Unaudited) | | | For the
Period December 1, 2020 to December 31, 2020(a) | | | For the Year Ended November 30, 2020 | | | For the Year Ended November 30, 2019 | | | For the Year Ended November 30, 2018(b) | | | For the Year Ended November 30, 2017(b) | | | For the Year Ended November 30, 2016(b) | |
| NET ASSET VALUE, BEGINNING OF PERIOD | | $ | 30.50 | | | $ | 29.57 | | | $ | 23.37 | | | $ | 15.26 | | | $ | 19.82 | | | $ | 19.15 | | | $ | 12.97 | |
| | | | | | | | | | | | | | | | | | | | | | | | | | | | | |
| INCOME/(LOSS) FROM INVESTMENT OPERATIONS: |
| Net investment income (c) | | | 0.17 | | | | 0.03 | | | | 0.07 | | | | 0.02 | | | | 0.07 | | | | 0.04 | | | | (0.00 | )(d) |
| Net realized and unrealized gain/(loss) | | | (2.36 | ) | | | 0.99 | | | | 6.19 | | | | 8.18 | | | | (4.51 | ) | | | 0.63 | | | | 6.37 | |
| Total from investment operations | | | (2.19 | ) | | | 1.02 | | | | 6.26 | | | | 8.20 | | | | (4.44 | ) | | | 0.67 | | | | 6.37 | |
| | | | | | | | | | | | | | | | | | | | | | | | | | | | | |
| DISTRIBUTIONS: | | | | | | | | | | | |
| From net investment income | | | — | | | | (0.09 | ) | | | (0.06 | ) | | | (0.09 | ) | | | (0.12 | ) | | | (0.00 | )(d) | | | (0.19 | ) |
| Total distributions | | | — | | | | (0.09 | ) | | | (0.06 | ) | | | (0.09 | ) | | | (0.12 | ) | | | (0.00 | )(d) | | | (0.19 | ) |
| | | | | | | | | | | | | | | | | | | | | | | | | | | | | |
| Net increase/(decrease) in net asset value | | | (2.19 | ) | | | 0.93 | | | | 6.20 | | | | 8.11 | | | | (4.56 | ) | | | 0.67 | | | | 6.18 | |
| NET ASSET VALUE, END OF PERIOD | | $ | 28.31 | | | $ | 30.50 | | | $ | 29.57 | | | $ | 23.37 | | | $ | 15.26 | | | $ | 19.82 | | | $ | 19.15 | |
| TOTAL RETURN(e) | | | (7.18 | )% | | | 3.46 | % | | | 26.85 | % | | | 53.91 | % | | | (22.56 | )% | | | 3.52 | % | | | 49.82 | % |
| | | | | | | | | | | | | | | | | | | | | | | | | | | | | |
| RATIOS/SUPPLEMENTAL DATA: | | | | | | | | | | | | | | | | | | | | | |
| Net assets, end of period (000s) | | $ | 240,647 | | | $ | 259,234 | | | $ | 251,376 | | | $ | 177,647 | | | $ | 123,576 | | | $ | 164,545 | | | $ | 183,865 | |
| | | | | | | | | | | | | | | | | | | | | | | | | | | | | |
| Ratio of expenses including reimbursement/waiver to average net assets(f) | | | 0.50 | %(g) | | | 0.50 | %(g) | | | 0.50 | % | | | 0.54 | % | | | N/A | | | | N/A | | | | N/A | |
| Ratio of expenses excluding reimbursement/waiver to average net assets | | | 0.50 | %(g) | | | 0.58 | %(g) | | | 0.52 | % | | | 0.57 | % | | | 0.57 | % | | | 0.57 | % | | | 0.57 | % |
| Ratio of net investment income/(loss) to average net assets | | | 1.15 | %(g) | | | 1.28 | %(g) | | | 0.24 | % | | | 0.09 | % | | | 0.39 | % | | | 0.21 | % | | | (0.01 | )% |
| Portfolio turnover rate(h) | | | 41 | % | | | 0 | % | | | 95 | % | | | 112 | % | | | 82 | % | | | 101 | % | | | 74 | % |
| | | | | | | | | | | | | | | | | | | | | | | | | | | | | |
| (a) | With the approval of the Board effective December 31, 2020, the Fund’s fiscal year end was changed from November 30 to December 31. |
| (b) | These financials have been audited by the Predecessor Fund’s independent registered public accounting firm. |
| (c) | Based on average shares outstanding during the period. |
| (d) | Less than $0.005 per share. |
| (e) | Total return is calculated assuming an initial investment made at the net asset value at the beginning of the period and redemption at the net asset value on the last day of the period and assuming all distributions are reinvested at reinvestment prices. Total return calculated for a period of less than one year is not annualized. |
| (f) | Prior to July 19, 2019, the Fund paid expenses via a unitary fee to the prior adviser, expenses were not waived. |
| (h) | Portfolio does not include securities received or delivered from processing creations or redemptions in-kind. |
See Notes to Financial Statements.
| Sprott Junior Gold Miners ETF | |
| Financial Highlights | For a Share Outstanding Throughout the Periods Presented |
| | |
For the
Six Months
Ended
June 30, 2021
(Unaudited) | | |
For the
Period
December 1,
2020 to
December 31,
2020(a) | | | For the Year
Ended
November 30,
2020 | | | For the Year
Ended
November 30,
2019 | | | For the Year
Ended
November 30,
2018(b) | | | For the Year
Ended
November 30,
2017(b) | | | For the Year
Ended
November 30,
2016(b) | |
| NET ASSET VALUE, BEGINNING OF PERIOD | | $ | 49.30 | | | $ | 45.27 | | | $ | 30.28 | | | $ | 21.63 | | | $ | 31.48 | | | $ | 33.00 | | | $ | 19.65 | |
| | | | | | | | | | | | | | | | | | | | | | | | | | | | | |
| INCOME/(LOSS) FROM INVESTMENT OPERATIONS: |
| Net investment income/(loss)(c) | | | 0.31 | | | | (0.00 | ) | | | (0.04 | ) | | | 0.06 | | | | (0.06 | ) | | | (0.09 | ) | | | (0.05 | ) |
| Net realized and unrealized gain/(loss) | | | (5.86 | ) | | | 5.00 | | | | 15.25 | | | | 8.59 | | | | (9.74 | ) | | | (0.87 | ) | | | 13.56 | |
| Total from investment operations | | | (5.55 | ) | | | 5.00 | | | | 15.21 | | | | 8.65 | | | | (9.80 | ) | | | (0.96 | ) | | | 13.51 | |
| | | | | | | | | | | | | | | | | | | | | | | | | | | | | |
| DISTRIBUTIONS: |
| From net investment income | | | — | | | | (0.97 | ) | | | (0.22 | ) | | | — | | | | (0.05 | ) | | | (0.56 | ) | | | (0.16 | ) |
| Total distributions | | | — | | | | (0.97 | ) | | | (0.22 | ) | | | — | | | | (0.05 | ) | | | (0.56 | ) | | | (0.16 | ) |
| | | | | | | | | | | | | | | | | | | | | | | | | | | | | |
| Net increase/(decrease) in net asset value | | | (5.55 | ) | | | 4.03 | | | | 14.99 | | | | 8.65 | | | | (9.85 | ) | | | (1.52 | ) | | | 13.35 | |
| NET ASSET VALUE, END OF PERIOD | | $ | 43.75 | | | $ | 49.30 | | | $ | 45.27 | | | $ | 30.28 | | | $ | 21.63 | | | $ | 31.48 | | | $ | 33.00 | |
| TOTAL RETURN(d) | | | (11.26 | )% | | | 11.11 | % | | | 50.56 | % | | | 39.99 | % | | | (31.19 | )% | | | (2.99 | )% | | | 69.35 | % |
| | | | | | | | | | | | | | | | | | | | | | | | | | | | | |
| RATIOS/SUPPLEMENTAL DATA: | | | | | | | | | | | | | | | | | | | | | | | | | | | | |
| Net assets, end of period (000s) | | $ | 126,882 | | | $ | 123,258 | | | $ | 106,383 | | | $ | 52,994 | | | $ | 36,776 | | | $ | 149,550 | | | $ | 47,857 | |
| | | | | | | | | | | | | | | | | | | | | | | | | | | | | |
| Ratio of expenses including reimbursement/waiver to average net assets(e) | | | 0.50 | %(f) | | | 0.50 | %(f) | | | 0.50 | % | | | 0.54 | % | | | N/A | | | | N/A | | | | N/A | |
| Ratio of expenses excluding reimbursement/waiver to average net assets | | | 0.60 | %(f) | | | 0.75 | %(f) | | | 0.76 | % | | | 0.71 | % | | | 0.57 | % | | | 0.57 | % | | | 0.57 | % |
| Ratio of net investment income/(loss) to average net assets | | | 1.35 | %(f) | | | (0.07 | )%(f) | | | (0.10 | )% | | | 0.22 | % | | | (0.22 | )% | | | (0.26 | )% | | | (0.14 | )% |
| Portfolio turnover rate(g) | | | 38 | % | | | 0 | % | | | 157 | % | | | 127 | % | | | 37 | % | | | 74 | % | | | 61 | % |
| | | | | | | | | | | | | | | | | | | | | | | | | | | | | |
| (a) | With the approval of the Board effective December 31, 2020, the Fund’s fiscal year end was changed from November 30 to December 31. |
| (b) | These financials have been audited by the Predecessor Fund’s independent registered public accounting firm. |
| (c) | Based on average shares outstanding during the period. |
| (d) | Total return is calculated assuming an initial investment made at the net asset value at the beginning of the period and redemption at the net asset value on the last day of the period and assuming all distributions are reinvested at reinvestment prices. Total return calculated for a period of less than one year is not annualized. |
| (e) | Prior to July 19, 2019, the Fund paid expenses via a unitary fee to the prior adviser, expenses were not waived. |
| (g) | Portfolio does not include securities received or delivered from processing creations or redemptions in-kind. |
See Notes to Financial Statements.
Sprott ETFs |
Notes to Financial Statements | June 30, 2021 (Unaudited) |
The Sprott Funds Trust (the “Trust”) was organized as a Delaware statutory trust on January 3, 2018. As of June 30, 2021, the Trust consisted of three separate portfolios that each represent a separate series of the Trust. This report pertains to the Sprott Gold Miners ETF and the Sprott Junior Gold Miners ETF (each a “Fund” and collectively, the “Funds”). The Funds are non-diversified, open-end management investment companies under the Investment Company Act of 1940, as amended (the “1940 Act”). The Funds reorganized effective as of the close of business on July 19, 2019, from each Fund’s respective Predecessor Fund. Each Predecessor Fund was a separate series of ALPS ETF Trust.
The investment objective of the Sprott Gold Miners ETF is to seek investment results that correspond (before fees and expenses) to the performance of its underlying index, the Solactive Gold Miners Custom Factors Index (ticker symbol SOLGMCFT, the “Underlying Gold Index”). The investment adviser uses a “passive” or indexing approach to try to achieve the Fund’s investment objective. The Sprott Gold Miners ETF is considered non-diversified and may invest a greater portion of assets in securities of individual issuers than a diversified fund. As a result, changes in the market value of a single investment could cause greater fluctuations in share price than would occur in a diversified fund.
The investment objective of the Sprott Junior Gold Miners ETF is to seek investment results that correspond (before fees and expenses) to the performance of its underlying index, the Solactive Junior Gold Miners Custom Factors Index (ticker symbol SOLJGMFT, the “Underlying Junior Gold Index”). The investment adviser uses a “passive” or indexing approach to try to achieve the Fund’s investment objective. The Sprott Junior Gold Miners ETF is considered non-diversified and may invest a greater portion of assets in securities of individual issuers than a diversified fund. As a result, changes in the market value of a single investment could cause greater fluctuations in share price than would occur in a diversified fund.
The Funds offer and issue Shares at their net asset value (“NAV”) only in aggregations of a specified number of Shares (each, a “Creation Unit”). The Funds generally offer and issue Shares in exchange for a basket of securities (“Deposit Securities”) together with the deposit of a specified cash payment (“Cash Component”). The Trust reserves the right to permit or require the substitution of a “cash in lieu” amount (“Deposit Cash”) to be added to the Cash Component to replace any Deposit Security. Shares are or will be listed on the NYSE Arca, Inc. (the “Exchange” or “NYSE Arca”) and trade on the Exchange at market prices that may differ from the Shares’ NAV. Shares are also redeemable only in Creation Unit aggregations, primarily for a basket of Deposit Securities together with a Cash Component. A Creation Unit of the Funds generally consists of 50,000 Shares, though this may change from time to time. Creation Units are not expected to consist of fewer than 50,000 Shares. As a practical matter, only institutions or large investors purchase or redeem Creation Units. Except when aggregated in Creation Units, Shares are not redeemable securities.
Shares may be issued in advance of receipt of Deposit Securities subject to various conditions, including a requirement to maintain on deposit with the Trust cash at least equal to a specified percentage of the value of the missing Deposit Securities, as set forth in the Participant Agreement (as defined below). The Trust may impose a transaction fee for each creation or redemption. In all cases, such fees will be limited in accordance with the requirements of the SEC applicable to management investment companies offering redeemable securities. As in the case of other publicly traded securities, brokers’ commissions on share transactions in the secondary market will be based on negotiated commission rates at customary levels.
Pursuant to the Trust’s organizational documents, its Officers and Trustees are indemnified against certain liability arising out of the performance of their duties to the Trust. Additionally, in the normal course of business, the Trust enters into contracts with service providers that contain general indemnification clauses. The Trust’s maximum exposure under these arrangements is unknown, as this would involve future claims that may be made against the Trust that have not yet occurred.
2. | SIGNIFICANT ACCOUNTING POLICIES |
The following is a summary of significant accounting policies consistently followed by the Funds in the preparation of the financial statements. The accompanying financial statements were prepared in accordance with accounting principles generally accepted in the United States of America (“U.S. GAAP”). The preparation of financial statements in conformity with U.S. GAAP requires management to make certain estimates and assumptions that affect the reported amounts of assets and liabilities and disclosures of contingent assets and liabilities at the date of the financial statements and the reported amounts of revenue and expenses during the period. Actual results could differ from those estimates. Each Fund is considered an investment company under U.S. GAAP and follows the accounting and reporting guidance applicable to investment companies in the Financial Accounting Standards Board (“FASB”) Accounting Standards Codification Topic 946 and Accounting Standards Update 2013-08.
A. Portfolio Valuation
Each Fund’s NAV is determined daily, as of the close of regular trading on the NYSE, normally 4:00 p.m. Eastern time, on each day the NYSE is open for trading. The NAV is computed by dividing the value of all assets of a Fund (including accrued interest and dividends), less all liabilities (including accrued expenses and dividends declared but unpaid), by the total number of shares outstanding.
Sprott ETFs |
Notes to Financial Statements | June 30, 2021 (Unaudited) |
Portfolio securities are valued at the most recent sale price or official closing price reported on the exchange (U.S. or foreign) or over-the-counter market on which they trade. Portfolio securities traded on more than one securities exchange are valued at the last sale price on the business day as of which such value is being determined at the close of the exchange representing the principal market for such securities. Securities for which no sales are reported are valued at the calculated mean between the most recent bid and asked quotations on the relevant market or, if a mean cannot be determined, at the most recent bid quotation. Investments in open-end mutual funds such as money market funds are valued at the closing NAV.
The Funds’ investments are valued at market value or, in the absence of market value with respect to any portfolio securities, at fair value according to procedures adopted by the Trust’s Board of Trustees (the “Board”). When market quotations are not readily available or when events occur that make established valuation methods unreliable, securities of the Funds may be valued in good faith by or under the direction of the Board. These securities generally include, but are not limited to, restricted securities (securities which may not be publicly sold without registration under the Securities Act of 1933) for which a pricing service is unable to provide a market price; securities whose trading has been formally suspended; a security whose market price is not available from a pre-established primary pricing source or the pricing source is not willing to provide a price; a security with respect to which an event has occurred that is most likely to materially affect the value of the security after the market has closed but before the calculation of the Fund’s NAV or make it difficult or impossible to obtain a reliable market quotation; or a security whose price, as provided by the pricing service, does not reflect the security’s “fair value” due to the security being de-listed from a national exchange or the security’s primary trading market is temporarily closed at a time when, under normal conditions, it would be open. As a general principle, the current “fair value” of a security would be the amount which the owner might reasonably expect to receive from the sale on the applicable exchange or principal market. A variety of factors may be considered in determining the fair value of such securities.
B. Fair Value Measurements
Each Fund discloses the classification of its fair value measurements following a three-tier hierarchy based on the inputs used to measure fair value. Inputs refer broadly to the assumptions that market participants would use in pricing the asset or liability, including assumptions about risk. Inputs may be observable or unobservable. Observable inputs reflect the assumptions market participants would use in pricing the asset or liability that are developed based on market data obtained from sources independent of the reporting entity.Unobservable inputs reflect the reporting entity’s own assumptions about the assumptions market participants would use in pricing the asset or liability that are developed based on the best information available.
Valuation techniques used to value the Funds’ investments by major category are as follows:
Equity securities, including restricted securities, for which market quotations are readily available, are valued at the last reported sale price or official closing price as reported by a third party pricing vendor on the primary market or exchange on which they are traded and are categorized as Level 1 in the hierarchy. In the event there were no sales during the day or closing prices are not available, securities are valued at the mean of the most recent quoted bid and ask prices on such day and are generally categorized as Level 2 in the hierarchy. Investments in open-end mutual funds are valued at their closing NAV each business day and are categorized as Level 1 in the hierarchy.
Changes in valuation techniques may result in transfers in or out of an assigned level within the disclosure hierarchy.
Various inputs are used in determining the value of each Fund’s investments as of the end of the reporting period. When inputs used fall into different levels of the fair value hierarchy, the level in the hierarchy within which the fair value measurement falls is determined based on the lowest level input that is significant to the fair value measurement in its entirety. The designated input levels are not necessarily an indication of the risk or liquidity associated with these investments.
These inputs are categorized in the following hierarchy under applicable financial accounting standards:
Level 1 – | Unadjusted quoted prices in active markets for identical investments, unrestricted assets or liabilities that a Fund has the ability to access at the measurement date; |
Level 2 – | Quoted prices which are not active, quoted prices for similar assets or liabilities in active markets or inputs other than quoted prices that are observable (either directly or indirectly) for substantially the full term of the asset or liability; and |
Level 3 – | Significant unobservable prices or inputs (including the Fund’s own assumptions in determining the fair value of investments) where there is little or no market activity for the asset or liability at the measurement date. |
Sprott ETFs |
Notes to Financial Statements | June 30, 2021 (Unaudited) |
The following is a summary of the inputs used to value the Funds’ investments at June 30, 2021:
Sprott Gold Miners ETF | | | | | | | | | |
| | | Level 1 - Quoted and | | Level 2 - Other Significant | | Level 3 - Significant | | | |
Investments in Securities at Value | | Unadjusted Prices | | Observable Inputs | | Unobservable Inputs | | Total | |
Common Stocks* | | $ | 240,456,521 | | $ | — | | $ | — | | $ | 240,456,521 | |
Short Term Investments | | | 2,193,949 | | | — | | | — | | | 2,193,949 | |
Total | | $ | 242,650,470 | | $ | — | | $ | — | | $ | 242,650,470 | |
Sprott Gold Miners ETF | | | | | | | | | |
| | Level 1 - Quoted and | | Level 2 - Other Significant | | Level 3 - Significant | | | |
Investments in Securities at Value | | Unadjusted Prices | | Observable Inputs | | Unobservable Inputs | | Total | |
Common Stocks* | | $ | 124,002,302 | | $ | — | | $ | — | | $ | 124,002,302 | |
Short Term Investments | | | 8,694,315 | | | — | | | — | | | 8,694,315 | |
Total | | $ | 132,696,617 | | $ | — | | $ | — | | $ | 132,696,617 | |
| * | For a detailed sector breakdown, see the accompanying Schedules of Investments. |
The Funds did not have any securities that used significant unobservable inputs (Level 3) in determining fair value and there were no transfers into or out of Level 3 during the period ended June 30, 2021.
C. Gold and Silver Mining Industry Risk
The Funds are sensitive to changes in, and their performance will depend to a greater extent on, the overall condition of the gold and silver mining industry. In times of stable economic growth, traditional equity and debt investments could offer greater appreciation potential and the value of gold, silver and other precious metals may be adversely affected, which could in turn affect the Funds’ returns. The gold and precious metals industry can be significantly affected by competitive pressures, central bank operations, events relating to international political developments, the success of exploration projects, commodity prices, adverse environmental developments and tax and government regulations.
D. Foreign Investment Risk
The Funds investments in non-U.S. issuers may involve unique risks compared to investing in securities of U.S. issuers. Adverse political, economic or social developments could undermine the value of the Funds’ investments or prevent the Funds from realizing the full value of their investments. Countries with emerging markets may present heightened risks of nationalization of businesses, restrictions on foreign ownership and prohibitions on the repatriation of assets. The economies of emerging markets countries also may be based on only a few industries, making them more vulnerable to changes in local or global trade conditions and more sensitive to debt burdens, inflation rates or adverse news and events. Where all or a portion of the Funds’ underlying securities trade in a market that is closed when the market in which the Funds’ shares are listed and trading in that market is open, there may be changes between the last quote from its closed foreign market and the value of such security during the Funds’ domestic trading day. In addition, please note that this in turn could lead to differences between the market price of the Funds’ shares and the underlying value of those shares
E. Foreign Currency Translation
The books and records of the Funds are maintained in U.S. dollars. Investment valuations and other assets and liabilities initially expressed in foreign currencies are converted each business day into U.S. dollars based upon current exchange rates. The portion of realized and unrealized gains or losses on investments due to fluctuations in foreign currency exchange rates is not separately disclosed and is included in realized and unrealized gains or losses on investments in the Statement of Operations, when applicable.
F. Concentration Risk
Each Fund seeks to track its respective Underlying Index, which itself is generally concentrated in the gold and silver mining industry. Underperformance or increased risk in such concentrated areas may result in underperformance or increased risk in a Fund.
G. Market Disruption Risk
The Funds are subject to investment and operational risks associated with financial, economic and other global market developments and disruptions, including the recent spread of an infectious respiratory illness caused by a novel strain of coronavirus (known as COVID-19), which can negatively impact the securities markets and cause a Fund to lose value.
Sprott ETFs |
Notes to Financial Statements | June 30, 2021 (Unaudited) |
The spread of COVID-19 has caused volatility, severe market dislocations and liquidity constraints in many markets, including markets for the securities the Funds hold, leading to instability in the market place and the jobs market.
The foregoing could lead to a significant economic downturn or recession, increased market volatility, a greater number of market closures, higher default rates and adverse effects on the values and liquidity of the Funds’ securities or other assets. Such impacts may adversely affect the performance of the Funds.
H. Securities Transactions and Investment Income
Securities transactions are recorded as of the trade date. Realized gains and losses from securities transactions are recorded on the highest cost basis. Dividend income and capital gains distributions, if any, are recorded on the ex-dividend date. Interest income, if any, is recorded on the accrual basis.
I. Dividends and Distributions to Shareholders
Dividends from net investment income for each Fund, if any, are declared and paid annually or as the Board may determine from time to time. Distributions of net realized capital gains earned by the Funds, if any, are distributed at least annually.
J. Federal Tax and Tax Basis Information
The timing and character of income and capital gain distributions are determined in accordance with income tax regulations, which may differ from U.S. GAAP. Reclassifications are made to the Funds’ capital accounts for permanent tax differences to reflect income and gains available for distribution (or available capital loss carryforwards) under income tax regulations. The amounts and characteristics of tax basis distributions and composition of distributable earnings/(accumulated losses) are finalized at fiscal year-end; accordingly, tax basis balances have not been determined as of June 30, 2021.
The tax character of the distributions paid during the fiscal year ended December 31, 2020 was as follows:
| | Ordinary Income | |
| December 31, 2020 | | | | |
Sprott Gold Miners ETF | | $ | 788,715 | |
Sprott Junior Gold Miners ETF | | | 2,324,976 | |
As of June 30, 2021, the cost of investments for federal income tax purposes and accumulated net unrealized appreciation/(depreciation) on investments were as follows:
| | Sprott Gold
Miners ETF | | Sprott Junior Gold
Miners ETF | |
Gross appreciation (excess of value over tax cost) | | $ | 35,993,342 | | $ | 8,745,029 | |
Gross depreciation (excess of tax cost over value) | | | (11,717,076 | ) | | (17,240,120 | ) |
Net unrealized appreciation (depreciation) | | | 24,276,266 | | | (8,495,091 | ) |
Cost of investments for income tax purposes | | $ | 218,374,204 | | $ | 141,191,708 | |
K. Income Taxes
No provision for income taxes is included in the accompanying financial statements, as each Fund intends to distribute to shareholders all taxable investment income and realized gains and otherwise comply with Subchapter M of the Internal Revenue Code of 1986, as amended, applicable to regulated investment companies. Each Fund evaluates tax positions taken (or expected to be taken) in the course of preparing the Fund’s tax returns to determine whether these positions meet a “more-likely-than-not” standard that, based on the technical merits, have a more than fifty percent likelihood of being sustained by a taxing authority upon examination. A tax position that meets the “more-likely-than-not” recognition threshold is measured to determine the amount of benefit to recognize in the financial statements.
As of and during the period ended June 30, 2021, the Funds did not have a liability for any unrecognized tax benefits. Each Fund files U.S. federal, state, and local tax returns as required. Each Fund’s tax returns are subject to examination by the relevant tax authorities until expiration of the applicable statute of limitations, which is generally three years after the filing of the tax return, but may extend to four years in certain jurisdictions. Tax returns for open years for the Funds have incorporated no uncertain tax positions that require a provision for income taxes.
Sprott ETFs | |
Notes to Financial Statements | June 30, 2021 (Unaudited) |
L. Lending of Portfolio Securities
The Funds have entered into a securities lending agreement with State Street Bank & Trust Co. (“SSB”), the Funds’ lending agent. The Funds may lend their portfolio securities only to borrowers that are approved by SSB. Each Fund will limit such lending to not more than 33 1/3% of the value of its total assets. Each Fund’s securities held at SSB as custodian shall be available to be lent except those securities the Fund or Sprott Asset Management LP (the “Adviser”) specifically identifies in writing as not being available for lending. The borrower pledges and maintains with each Fund collateral consisting of cash (U.S. Dollars only), securities issued or guaranteed by the U.S. government or its agencies or instrumentalities, and by cash equivalents (including irrevocable bank letters of credit issued by a person other than the borrower or an affiliate of the borrower). The initial collateral received by each Fund is required to have a value of no less than 102% of the market value of the loaned securities for U.S. equity securities and a value of no less than 105% of the market value for non-U.S. equity securities. The collateral is maintained thereafter, at a market value equal to not less than 102% of the current value of the U.S. equity securities on loan and not less than 105% of the current value of the non-U.S. equity securities on loan. The market value of the loaned securities is determined at the close of each business day and any additional required collateral is delivered to each Fund on the next business day. During the term of the loan, each Fund is entitled to all distributions made on or in respect of the loaned securities. Loans of securities are terminable at any time and the borrower, after notice, is required to return borrowed securities within the customary time period for settlement of securities transactions.
Any cash collateral received is reinvested in a money market fund managed by SSB as disclosed in each Fund’s Schedule of Investments and is reflected in the Statements of Assets and Liabilities as a payable for collateral upon return of securities loaned. Non-cash collateral, in the form of securities issued or guaranteed by the U.S. government or its agencies or instrumentalities, is not disclosed in a Fund’s Statements of Assets and Liabilities as it is held by the lending agent on behalf of each Fund, and each Fund does not have the ability to re-hypothecate these securities. Income earned by the Fund from securities lending activity is disclosed in the Statement of Operations.
The following is a summary of each Fund’s securities lending agreements and related cash and non-cash collateral received as of June 30, 2021:
Fund | | Market Value of
Securities on Loan | | | Cash Collateral
Received | | | Non-Cash Collateral
Received | | | Total Collateral
Received | |
Sprott Gold Miners ETF | | $ | 2,544,858 | | | $ | 1,887,453 | | | $ | 785,516 | | | $ | 2,672,969 | |
Sprott Junior Gold Miners ETF | | | 9,574,977 | | | | 8,599,557 | | | | 1,669,077 | | | | 10,268,634 | |
The risks of securities lending include the risk that the borrower may not provide additional collateral when required or may not return the securities when due. To mitigate these risks, each Fund benefits from a borrower default indemnity provided by SSB. SSB’s indemnity allows for full replacement of securities lent wherein SSB will purchase the unreturned loaned securities on the open market by applying the proceeds of the collateral, or to the extent such proceeds are insufficient or the collateral is unavailable, SSB will purchase the unreturned loan securities at SSB’s expense. However, the Funds could suffer a loss if the value of the investments purchased with cash collateral falls below the value of the cash collateral received.
The following tables reflect a breakdown of transactions accounted for as secured borrowings, the gross obligation by the type of collateral pledged or securities loaned, and the remaining contractual maturity of those transactions as of June 30, 2021:
Sprott Gold Miners ETF Remaining contractual maturity of the agreements
Securities Lending Transactions | | Overnight &
Continuous | | | Up to 30 Days | | | 30-90 Days | | Greater than
90 Days | | | Total | |
Common Stocks | | | 1,887,453 | | | $ | — | | | $ | — | | $ | — | | | | 1,887,453 | |
Total Borrowings | | | | | | | | | | | | | | | | | | 1,887,453 | |
Gross amount of recognized liabilities for securities lending (collateral received) | | | | 1,887,453 | |
Sprott Junior Gold Miners ETF Remaining contractual maturity of the agreements
Securities Lending Transactions | | Overnight &
Continuous | | | Up to 30 Days | | | 30-90 Days | | Greater than
90 Days | | | Total | |
Common Stocks | | $ | 8,599,557 | | | $ | — | | | $ | — | | $ | — | | | | 8,599,557 | |
Total Borrowings | | | | | | | | | | | | | | | | | | 8,599,557 | |
Gross amount of recognized liabilities for securities lending (collateral received) | | | | 8,599,557 | |
Sprott ETFs | |
Notes to Financial Statements | June 30, 2021 (Unaudited) |
3. INVESTMENT ADVISORY FEE AND OTHER AFFILIATED TRANSACTIONS |
The Adviser serves as the Funds’ investment adviser pursuant to an Investment Advisory Agreement with the Trust on behalf of each Fund (the “Advisory Agreement”). Pursuant to the Advisory Agreement, each Fund pays the Adviser an annual management fee for the services and facilities it provides, payable on a monthly basis as a percentage of the relevant Fund’s average daily net assets as set out below.
Fund | Advisory Fee |
Sprott Gold Miners ETF | 0.35% |
Sprott Junior Gold Miners ETF | 0.35% |
ALPS Advisors, Inc. (the “Sub-Adviser”) serves as each Fund’s sub-adviser pursuant to a sub-advisory agreement with the Trust (the ‘‘Sub-Advisory Agreement’’). Pursuant to the Sub-Advisory Agreement, the Adviser pays the Sub-Adviser a sub-advisory fee out of the Adviser’s advisory fee for the services it provides. The fee is payable on a monthly basis at the annual rate of the relevant Fund’s average daily net assets as set out below:
Average Assets* | Sub-Advisory Fee** |
Up to $250 million | 0.04% |
$250 million-$500 million | 0.03% |
Above $500 million | 0.02% |
* | Subject to the following annual minimums per fund sub-advised by the Sub-Adviser for Sprott: (i) first two funds: $40,000 per fund; (ii) additional funds: $30,000 per fund. |
** | Annual rate stated as a percentage of the average daily net assets of the Funds |
The Adviser is paid a monthly management fee at an annual rate (stated as a percentage of the average daily net assets of each Fund) of 0.35%. The Adviser is required to pay all fees due to the Sub-Adviser out of the management fee the Adviser receives from the Funds. The Adviser has contractually agreed to waive the management fee, and/or reimburse expenses so that total annual Funds operating expenses after fee waiver/expense reimbursements (not including distribution (12b-1) fees, shareholder service fees, acquired fund fees and expenses, taxes, brokerage commissions and extraordinary expenses) do not exceed a maximum of 0.50% of the shares average daily net assets through April 30, 2022. The Adviser will be permitted to recover expenses it has borne to the extent that the Funds expenses in later periods fall below the annual rates set forth in the expense agreement. The Funds’ fee waiver/expense reimbursement arrangements with the Adviser permit the Adviser to recapture only if any such recapture payments do not cause the Funds’ expense ratio (after recapture) to exceed the lesser of (i) the expense cap in effect at the time of the waiver and (ii) the expense cap in effect at the time of the recapture. The Funds will not be obligated to pay any such deferred fees and expenses more than three years after the particular date in which the fees and expenses was deferred. This expense agreement may only be terminated during the period by the Board of Trustees of Sprott Funds Trust.
For the period ended June 30, 2021, the fees waived and recoupment of previously waived fees were as follows:
| | Fees waived by
Advisor | | | Expense
Recoupment of
Previously Waived
Fees | |
Sprott Gold Miners ETF | | $ | (3,882 | ) | | $ | 1,417 | |
Sprott Junior Gold Miners ETF | | | (62,363 | ) | | | — | |
As of June 30, 2021, the balance of recoupable expenses for the Funds were as follows:
| | Expires
December 31, 2022 | | | Expires
December 31, 2023 | | | Expires
December 31, 2024 | |
Sprott Gold Miners ETF | | $ | 34,902 | | | $ | 76,836 | | | $ | 3,882 | |
Sprott Junior Gold Miners ETF | | | 113,864 | | | | 194,571 | | | | 62,363 | |
The Board consists of five Trustees, four of whom are not “interested persons” (as defined in the 1940 Act), of the Trust (“Independent Trustees”), and one of whom is an interested person. Each current Independent Trustee is paid an annual retainer of $20,000 for his or her services as a Board member to the Trust, together with out-of-pocket expenses in accordance with the Board’s policy on travel and other business expenses relating to attendance at meetings.
Sprott ETFs | |
Notes to Financial Statements | June 30, 2021 (Unaudited) |
4. PURCHASES AND SALES OF SECURITIES |
For the period ended June 30, 2021, the cost of purchases and proceeds from sales of investment securities, excluding short-term investments and in-kind transactions, were as follows:
Fund | | Purchases | | | Sales | |
Sprott Gold Miners ETF | | $ | 101,007,995 | | | $ | 99,706,752 | |
Sprott Junior Gold Miners ETF | | | 47,932,143 | | | | 50,279,936 | |
For the six months June 30, 2021, the cost of in-kind purchases and proceeds from in-kind sales were as follows:
Fund | | Purchases | | | Sales | |
Sprott Gold Miners ETF | | $ | 5,664,930 | | | $ | 6,243,730 | |
Sprott Junior Gold Miners ETF | | | 67,756,945 | | | | 48,689,909 | |
For the period ended June 30, 2021, the Sprott Gold Miners ETF and the Sprott Junior Gold Miners ETF had in-kind net realized gains/(losses) of $2,204,763 and $16,348,341 respectively.
Gains on in-kind transactions are not considered taxable for federal income tax purposes and losses on in-kind transactions are also not deductible for tax purposes.
5. CAPITAL SHARE TRANSACTIONS |
Shares are created and redeemed by each Fund only in Creation Unit size aggregations of 50,000 Shares. Only broker-dealers or large institutional investors with creation and redemption agreements called Authorized Participants (“AP”) are permitted to purchase or redeem Creation Units from the Funds. Such transactions are generally permitted on an in-kind basis, with a balancing cash component to equate the transaction to the NAV per unit of each Fund on the transaction date. Cash may be substituted equivalent to the value of certain securities generally when they are not available in sufficient quantity for delivery, not eligible for trading by the AP or as a result of other market circumstances.
6. RELATED PARTY TRANSACTIONS |
Each Fund may engage in cross trades between other funds in the Trust during the period ended June 30, 2021 pursuant to Rule 17a-7 under the 1940 Act. Cross trading is the buying or selling of portfolio securities between funds to which the Adviser serves as the investment adviser. The Board previously adopted procedures that apply to transactions between the Funds of the Trust pursuant to Rule 17a-7. These transactions related to cross trades during the period complied with the requirements set forth by Rule 17a-7 and the Trust’s procedures.
Transactions related to cross trades during the six months ended June 30, 2021 were as follows:
Fund | | Purchase Cost Paid | | | Sale Proceeds Received | | | Realized Gain on Sales | |
Sprott Gold Miners ETF | | $ | 738,377 | | | $ | — | | | $ | — | |
Sprott Junior Gold Miners ETF | | | — | | | | 738,377 | | | | 15,317 | |
The Funds have evaluated the need for disclosures and/or adjustments resulting from subsequent events that occurred between June 30, 2021 and the date the financial statements were issued. Based on this evaluation, no adjustments were required to the financial statements.
Sprott ETFs | |
Additional Information | June 30, 2021 (Unaudited) |
PROXY VOTING RECORDS, POLICIES AND PROCEDURES |
Information regarding how each Fund voted proxies relating to portfolio securities during the most recent 12-month period ended June 30 and a description of the Funds’ proxy voting policies and procedures used in determining how to vote for proxies are available without charge on the SEC’s website at www.sec.gov and upon request, by calling (toll-free) 888.622.1813.
The Trust is required to disclose, after its first and third fiscal quarters, the complete schedule of each Fund’s portfolio holdings with the SEC as an exhibit to its report on Form N-PORT. Form N-PORT reports for each Fund will be available on the SEC’s website at www.sec.gov. Each Fund’s Form N-PORT reports will be available without charge, upon request, by calling (toll-free) 888.622.1813.
Pursuant to Section 853(c) of the Internal Revenue Code, the Funds designated the following for the calendar year ended December 31, 2020:
| | | Foreign Taxes Paid | | | Foreign Source Income | |
Sprott Gold Miners ETF | | $ | 61,337 | | $ | 408,914 | |
Sprott Gold Miners Junior ETF | | $ | 0 | | $ | 0 | |
The Funds designate the following for federal income tax purposes for distributions made during the calendar year ended December 31, 2020:
| | | QDI | | | DRD | |
Sprott Gold Miners ETF | | | 100.00 | % | | 75.20 | % |
Sprott Gold Miners Junior ETF | | | 4.90 | % | | 0.59 | % |
In early 2021, if applicable, shareholders of record received this information for the distribution paid to them by the Funds during the calendar year 2020 via Form 1099.
Solactive AG (“Solactive”) has entered into a license agreement with the Adviser. Solactive is the Index Provider for Funds. Solactive is not affiliated with the Trust, Sprott, or the Distributor.
The following disclosure relates to Solactive and the Adviser:
The Funds are not sponsored, promoted, sold or supported in any other manner by Solactive nor does Solactive offer any express or Implicit guarantee or assurance either with regard to the results of using the Index and/or index trade mark or the index price at any time or in any other respect. The Index is calculated and published by Solactive. Solactive uses its best efforts to ensure that the Index is calculated correctly. Irrespective of its obligations towards the Funds, Solactive has no obligation to point out errors in the Index to third parties including but not limited to investors and/or financial intermediaries of the Funds. Neither publication of the Index by Solactive nor the licensing of the Index or Index trade mark for the purpose of use in connection with the Funds constitutes a recommendation by Solactive to invest capital in the Funds nor does it in any way represent an assurance or opinion of Solactive with regard to any investment in these Funds.
The Adviser does not guarantee the accuracy and/or the completeness of the Index or any data included therein, and the Adviser shall have no liability for any errors, omissions or interruptions therein. The Adviser makes no warranty, express or implied, as to results to be obtained by the Funds, owners of the Shares of the Funds or any other person or entity from the use of the Index or any data included therein. The Adviser makes no express or implied warranties, and expressly disclaims all warranties of merchantability or fitness for a particular purpose or use with respect to the Index or any data included therein. Without limiting any of the foregoing, in no event shall the Adviser have any liability for any special, punitive, direct, indirect or consequential damages (including lost profits) arising out of matters relating to the use of the Index even if notified of the possibility of such damages.
Sprott ETFs | |
Board Approval of Investment Advisory and Sub-Advisory Agreements | June 30, 2021 (Unaudited) |
The Board of Trustees (the “Board”) of Sprott Funds Trust (the “Trust”) on behalf of two of its series, Sprott Junior Gold Miners ETF and Sprott Gold Miners ETF (each a “Fund” and, collectively, the “Funds”) met in person at a regularly scheduled meeting on June 4, 2021, in Watch Hill, Rhode Island, for purposes of, among other things, considering whether it would be in the best interests of each Fund and its shareholders for the Board to renew the existing Investment Advisory Agreement by and between the Funds and Sprott Asset Management L.P. (“SAM” or the “Adviser”) (the “Advisory Agreement”), and the existing Investment Sub-Advisory Agreement by and among the Funds, SAM and ALPS Advisors, Inc. (“ALPS” or the “Sub-Adviser”) (the “Sub-Advisory Agreement” and, together with the Advisory Agreement, the “Agreements”). SAM together with ALPS are collectively referred to as the “Advisers.”
In connection with the Board’s review of the Agreements, the Trustees who are not “interested persons” of the Funds within the meaning of the Investment Company Act of 1940, as amended (the “1940 Act”) (collectively, the “Independent Trustees”) requested, and the Advisers provided the Board with, information about a variety of matters, including, without limitation, the following information:
| ● | Nature, extent and quality of services to be provided by the Advisers, including background information on the qualifications and experience of key professional of the Advisers’ personnel that provide services to the Funds; |
| ● | Investment performance of the Funds, including the extent to which the Funds tracked their respective benchmark indexes; |
| ● | Fees charged to and expenses of the Funds, including comparative fee and expense information for registered investment companies similar to the Funds; |
| ● | Costs of the services provided, and profits realized by the Advisers; and |
At the June 4, 2021 meeting, the Board, including the Independent Trustees determined that the continuation of the Agreements was in the best interests of each Fund in light of the services, personnel, expenses and such other matters as the Board considered to be relevant in the exercise of its reasonable business judgment and approved them.
To reach this determination, the Board considered its duties under the 1940 Act as well as under the general principles of state law in reviewing and approving advisory contracts; the fiduciary duty of investment advisers with respect to advisory agreements and the receipt of investment advisory compensation; the standards used by courts in determining whether investment company boards have fulfilled their duties; and the factors to be considered by the Board in voting on such agreements. To assist the Board in its evaluation of each of the Agreements, the Independent Trustees received materials in advance of the Board meeting from the Advisers. The Board applied its business judgment to determine whether the arrangements by and among each Fund, SAM and ALPS are reasonable business arrangements from each Fund’s perspective as well as from the perspective of its respective shareholders.
The Board noted that it had recently renewed the Agreements at its March 3, 2021 Meeting, and that it was reviewing the Agreements at this Meeting in order to align the advisory agreement renewal schedule for all registered funds advised by the Adviser.
Nature, Extent and Quality of Services Provided
Sprott Asset Management L.P.
The Board recalled its recent discussion regarding the nature, extent, and quality of services provided by the Adviser at its meeting on March 3, 2021. The Board reviewed materials provided by the Adviser, which included a description of any material changes to its business operations since the Board last reviewed the Advisory Agreement. The Board agreed that the Adviser’s services and ability to manage the Trust and each Fund had not materially changed since its last meeting and reviewed its prior deliberations and the Adviser’s prior materials in addition to the updated information provided by the Adviser. The Board discussed the extensive responsibilities of the Adviser with respect to the Funds, including compliance, index tracking oversight, financial reporting, operations, risk and performance monitoring and sales and marketing support. The Board reviewed the Adviser’s research capabilities and the quality of its compliance infrastructure. Further, the Board continued to be satisfied the experience and credentials of the personnel at the Adviser who service the Funds. The Board discussed the Adviser’s oversight of the Sub-Adviser, which included oversight of the Sub-Adviser’s adherence to each Fund’s investment strategies and restrictions, trading, and compliance monitoring. Additionally, the Board received satisfactory responses from the representatives of the Adviser with respect to whether the Adviser was involved in any additional lawsuits or regulatory actions since the Board last approved the Advisory Agreement. The Board reviewed the description provided on the practices for monitoring compliance with the Trust’s investment limitations, noting that the Adviser’s CCO would periodically review the portfolio managers’ performance of their duties to ensure compliance under the Adviser’s compliance program. The Board concluded that the Adviser continued to have sufficient quality and depth of personnel, resources, investment methods and compliance policies and procedures essential to continue performing its duties under the Advisory Agreement and that the nature, overall quality and extent of the management services provided by the Adviser to the Trust were satisfactory.
Sprott ETFs | |
Board Approval of Investment Advisory and Sub-Advisory Agreements | June 30, 2021 (Unaudited) |
ALPS Advisors, Inc.
The Board recalled its recent discussion regarding the nature, extent, and quality of services provided by the Sub-Adviser at its meeting on March 3, 2021. The Board reviewed materials provided by the Sub-Adviser, which included a description of any material changes to its business operations since the Board last reviewed the Sub-Advisory Agreement. The Board agreed that the Sub-Adviser’s services and ability to manage the Trust and each Fund had not materially changed since its last meeting and reviewed its prior deliberations and the Sub-Adviser’s prior materials in addition to the updated information provided by the Sub-Adviser. The Board discussed the responsibilities of the Sub-Adviser with respect to the Funds noting that the Sub-Adviser was responsible for monitoring and taking action on any events which would require trading in order to keep each Fund in line with its respective benchmark index. The Board considered, and continued to be satisfied with, the experience of the portfolio management and research personnel of the Sub-Adviser, including their experience in the investment field, education and industry credentials. The Board reviewed the research and monitoring services provided by the Sub-Adviser, noting that the Sub-Adviser performed daily monitoring of the Funds’ index tracking and compliance with investment limitations. The Board received satisfactory responses from the Sub-Adviser with respect to a series of questions, including: whether the Sub-Adviser was involved in any new lawsuits or regulatory actions since the Sub-Advisory Agreement was last approved. The Board discussed the Sub-Adviser’s compliance structure and broker-dealer selection process and reviewed the compliance materials provided by the Sub-Adviser. After further discussion the Board concluded that the Sub-Adviser continued to have sufficient quality and depth of personnel, resources, investment methods and compliance policies and procedures essential to continue performing its duties under the Sub-Advisory Agreement and that the nature, overall quality and extent of investment management services provided to the Funds were satisfactory.
Investment Performance
The Board considered the performance of each Fund with respect to its benchmark index. The Board evaluated the correlation and tracking error between the Fund and its respective benchmark index. The Board noted that since inception, each Fund’s performance generally conformed to the performance of its respective benchmark index, but that the performance of each Fund did not precisely track its index during all periods. The Board considered the various factors that contributed to the slight tracking error, such as certain fees and expenses borne by the Funds, cash holdings and currency conversions, and concluded that the tracking error for each Fund appeared reasonable. The Board agreed that the Adviser and Sub-Adviser had the potential to continue to manage each Fund to perform in line with its respective index.
Fees and Expenses
Sprott Gold Miners ETF
The Board noted that the Adviser charged a 0.35% fee for the Sprott Gold Miners ETF and that the Fund had a net expense ratio of 0.50%. The Board considered that the management fee was below the peer group average and Morningstar category average and the expense ratio was in line with the peer group but lower than the Morningstar category average. With respect to the advisory fee, the Board noted that the peer funds unlike the Fund paid unitary fees and thus a portion of the advisory fee was used to pay non-adviser service provider expenses.
With respect to the Sub-Adviser, the Board considered that the Sub-Advisory fee was paid by the Adviser and not Sprott Gold Miners ETF. The Board noted that the Sub-Advisory fee charged by the Sub-Adviser was lower than the fees it charged to other funds.
The Board considered the fee and expense comparison information provided by the Adviser and Sub-Adviser and the services provided to the Sprott Gold Miners ETF, and concluded that the fees and expenses of the Fund were reasonable.
Sprott Junior Gold Miners ETF
The Board noted that the Adviser charged a 0.35% fee for the Sprott Junior Gold Miners ETF and that the Fund had a net expense ratio of 0.50%. The Board considered that the management fee and net expense ratio were both below the applicable peer group average and Morningstar category average. With respect to the advisory fee, the Board noted that the peer funds unlike the Fund paid unitary fees and thus a portion of the advisory fee was used to pay non-adviser service provider expenses.
With respect to the Sub-Adviser, the Board considered that the Sub-Advisory fee was paid by the Adviser and not Sprott Junior Gold Miners ETF. The Board noted that the Sub-Advisory fee charged by the Sub-Adviser was lower than the fees it charged to other funds.
The Board considered the fee and expense comparison information provided by the Adviser and Sub-Adviser and the services provided to the Sprott Junior Gold Miners ETF, and concluded that the fees and expenses of the Fund were reasonable.
Sprott ETFs | |
Board Approval of Investment Advisory and Sub-Advisory Agreements | June 30, 2021 (Unaudited) |
Profitability
Sprott Asset Management L.P.
The Board reviewed the profitability analysis provided by the Adviser with respect to its management of the Funds. The Board noted that the Adviser had earned a profit from both Funds during the past year. The Board discussed the Adviser’s contractual fee waiver arrangement with respect to both Funds, which effectively results in the ETFs only being charged for their respective investment advisory fees. The Board noted that the Adviser continued to waive a portion of the advisory fees payable to Sprott Junior Gold Miners ETF. The Board after reviewing profitability information about the Adviser concluded that the advisory fee paid by each Fund to the Adviser was not unreasonable.
ALPS Advisors, Inc.
The Board reviewed the profitability analysis provided by the Sub-Adviser with respect to its management of the Funds. The Board noted that the Sub-Adviser earned a modest profit from the management of the Sprott ETFs in aggregate. The Board concluded that excessive profitability was not an issue at this time.
Economies of Scale
The Board considered the existence of any economies of scale in the provision of services by the Advisers and whether those economies were shared with the Funds through breakpoints in its management fees or other means, such as expense caps or fee waivers. The Board noted that there were breakpoints built into the sub-advisory fee. The Board acknowledged that the advisory fee and expense levels for both Funds were low relative to peers, and that both Funds had reached a level of profitability that the Adviser believed appropriate given the fee levels. The Board concluded that the current fee structure for each Fund was reasonable and that no changes were necessary.
Conclusion
It was noted that no single factor was cited as determinative to the decision of the Trustees. Rather, after weighing all of the considerations and conclusions discussed above, the entire Board, including all of the Independent Trustees, renewed the Advisory Agreement and the Sub-Advisory Agreement, concluding that having the Funds continue to receive services from the Advisers under the Agreements was in the best interest of the shareholders of the Funds and that the investment advisory fee rate was reasonable in relation to the services provided.
Sprott ETFs | |
Board Approval of Investment Advisory and Sub-Advisory Agreements | June 30, 2021 (Unaudited) |
The Board of Trustees (the “Board”) of Sprott Funds Trust (the “Trust”) on behalf of two of its series, Sprott Junior Gold Miners ETF and Sprott Gold Miners ETF (each a “Fund” and, collectively, the “Funds”) met in person at a regularly scheduled meeting on March 3, 2021, in Darien, Connecticut, for purposes of, among other things, considering whether it would be in the best interests of each Fund and its shareholders for the Board to reapprove the existing Investment Advisory Agreement by and between the Funds and Sprott Asset Management L.P. (“SAM” or the “Adviser”) (the “Advisory Agreement”), and the existing Investment Sub-Advisory Agreement by and among the Funds, SAM and ALPS Advisors, Inc. (“ALPS” or the “Sub-Adviser”) (the “Sub-Advisory Agreement” and, together with the Advisory Agreement, the “Agreements”). SAM together with ALPS are collectively referred to as the “Advisers.”
In connection with the Board’s review of the Agreements, the Trustees who are not “interested persons” of the Funds within the meaning of the Investment Company Act of 1940, as amended (the “1940 Act”) (collectively, the “Independent Trustees”) requested, and the Advisers provided the Board with, information about a variety of matters, including, without limitation, the following information:
| ● | Nature, extent and quality of services to be provided by the Advisers, including background information on the qualifications and experience of key professional of the Advisers personnel that provide services to the Funds; |
| ● | Investment performance of the Funds, including the extent to which the Funds tracked their respective benchmark indexes; |
| ● | Fees charged to and expenses of the Funds, including comparative fee and expense information for registered investment companies similar to the Funds; |
| ● | Costs of the services provided, and profits realized by the Advisers; and |
At the March 3, 2021 meeting, the Board and the Independent Trustees determined that the continuation of the Agreements was in the best interests of each Fund in light of the services, personnel, expenses and such other matters as the Board considered to be relevant in the exercise of its reasonable business judgment and approved them.
To reach this determination, the Board considered its duties under the 1940 Act as well as under the general principles of state law in reviewing and approving advisory contracts; the fiduciary duty of investment advisers with respect to advisory agreements and the receipt of investment advisory compensation; the standards used by courts in determining whether investment company boards have fulfilled their duties; and the factors to be considered by the Board in voting on such agreements. To assist the Board in its evaluation of each of the Agreements, the Independent Trustees received materials in advance of the Board meeting from the Advisers. The Board applied its business judgment to determine whether the arrangements by and among each Fund, SAM and ALPS are reasonable business arrangements from each Fund’s perspective as well as from the perspective of its respective shareholders.
Nature, Extent and Quality of Services Provided
Sprott Asset Management L.P.
The Board reviewed materials provided by the Adviser related to the proposed renewal of the Advisory Agreement, including a description of its oversight and monitoring of the Sub-Adviser and a review of the professional personnel who perform services for the Trust. The Board noted the extensive responsibilities of the Adviser with respect to the Funds, including compliance, index tracking oversight, financial reporting, operations, risk and performance monitoring and sales and marketing support. The Board discussed the extent of the Adviser’s research capabilities, the quality of its compliance infrastructure. Further, the Board expressed satisfaction with the experience and credentials of the personnel at the Adviser who service the Funds. The Board discussed the Adviser’s oversight of the Sub-Adviser, which included oversight of the Sub-Adviser’s adherence to each Fund’s investment strategies and restrictions, trading, and compliance monitoring. Additionally, the Board received satisfactory responses from the representatives of the Adviser with respect to whether the Adviser was involved in any lawsuits or pending regulatory actions.
The Board reviewed the description provided on the practices for monitoring compliance with the Trust’s investment limitations, noting that the Adviser’s CCO would periodically review the portfolio managers’ performance of their duties to ensure compliance under the Adviser’s compliance program. The Board concluded that the Adviser had sufficient quality and depth of personnel, resources, investment methods and compliance policies and procedures essential to continue performing its duties under the Advisory Agreement and that the nature, overall quality and extent of the management services provided by the Adviser to the Trust were satisfactory.
ALPS Advisors, Inc.
The Board reviewed the responsibilities of the Sub-Adviser with respect to the Funds noting that the Sub-Adviser was responsible for monitoring and taking action on any events which would require trading in order to keep each Fund in line with its respective benchmark index. The Board considered the experience of the portfolio management and research personnel of the Sub-Adviser, including their experience in the investment field, education and industry credentials. The Board discussed the research and monitoring services provided by the Sub-Adviser, noting that the Sub-Adviser performed daily monitoring of the Funds’ index tracking and compliance with investment limitations. The Board received satisfactory responses from the Sub-Adviser with respect to a series of questions, including: whether the Sub-Adviser was involved in any lawsuits or pending regulatory actions. The Board discussed the Sub-Adviser’s compliance structure and broker-dealer selection process and reviewed the compliance materials provided by the Sub-Adviser. After further discussion the Board concluded that the Sub-Adviser had sufficient quality and depth of personnel, resources, investment methods and compliance policies and procedures essential to continue performing its duties under the Sub-Advisory Agreement and that the nature, overall quality and extent of investment management services provided to the Funds were satisfactory.
Sprott ETFs | |
Board Approval of Investment Advisory and Sub-Advisory Agreements | June 30, 2021 (Unaudited) |
Investment Performance
The Board considered the performance of each Fund with respect to its benchmark index, and evaluated the correlation and tracking error between the Fund and its respective benchmark index. The Board noted that since inception, each Fund had performed generally in line with its benchmark index but slightly underperformed during all periods. The Board considered the various factors that contribute to tracking error, and concluded that the tracking error for each Fund appeared reasonable. The Board agreed that the Adviser and Sub-Adviser had the potential to continue to manage each Fund to perform in line with its respective index.
Fees and Expenses
Sprott Gold Miners ETF
The Board noted that the Adviser charged a 0.35% fee for the Sprott Gold Miners ETF and that the Fund had a net expense ratio of 0.50%. The Board considered that the management fee was below the peer group average and Morningstar category average and the expense ratio was in line with the peer group but lower than the Morningstar category average.
With respect to the Sub-Adviser, the Board considered that the Sub-Advisory fee was paid by the Adviser and not Sprott Gold Miners ETF. The Board noted that the Sub-Advisory fee charged by the Sub-Adviser was lower than the fees it charged to other funds.
The Board considered the fee and expense comparison information provided by the Adviser and Sub-Adviser and the services provided to the Sprott Gold Miners ETF, and concluded that the fees and expenses of the Fund were reasonable.
Sprott Junior Gold Miners ETF
The Board noted that the Adviser charged a 0.35% fee for the Sprott Junior Gold Miners ETF and that the Fund had a net expense ratio of 0.50%. The Board considered that the management fee and net expense ratio were both below the applicable peer group average and Morningstar category average.
With respect to the Sub-Adviser, the Board considered that the Sub-Advisory fee was paid by the Adviser and not Sprott Junior Gold Miners ETF. The Board noted that the Sub-Advisory fee charged by the Sub-Adviser was lower than the fees it charged to other funds.
The Board considered the fee and expense comparison information provided by the Adviser and Sub-Adviser and the services provided to the Sprott Junior Gold Miners ETF, and concluded that the fees and expenses of the Fund were reasonable.
Profitability
Sprott Asset Management L.P.
The Board reviewed the profitability analysis provided by the Adviser with respect to its management of the Funds. The Board noted that the Adviser had earned a profit from both Funds during the past year. The Board discussed the Adviser’s fee waiver arrangement with respect to both Funds, which effectively results in the ETFs only being charged for their respective investment advisory fees. The Board considered the oversight responsibilities of the Adviser and concluded that the profits earned by the Adviser were not unreasonable.
Sprott ETFs | |
Board Approval of Investment Advisory | June 30, 2021 (Unaudited) |
and Sub-Advisory Agreements | |
ALPS Advisors, Inc.
The Board reviewed the profitability analysis provided by the Sub-Adviser with respect to its management of the Funds. The Board noted that the Sub-Adviser earned a modest profit from the management of the Sprott Gold Miners ETF, but operated at a loss with respect to the Sprott Junior Gold Miners ETF. The Board concluded that excessive profitability was not an issue at this time.
Economies of Scale
The Board considered the existence of any economies of scale in the provision of services by the Advisers and whether those economies were shared with the Funds through breakpoints in its management fees or other means, such as expense caps or fee waivers. The Board noted that there were breakpoints built into the Sub-Advisory fee. The Board acknowledged that the advisory fee and expense levels for both Funds were low relative to peers, and that both Funds had reached a level of profitability that the Adviser believed appropriate given the fee levels. The Board concluded that the current fee structure for each Fund was reasonable and that no changes were necessary.
Conclusion
It was noted that no single factor was cited as determinative to the decision of the Trustees. Rather, after weighing all of the considerations and conclusions discussed above, the entire Board, including all of the Independent Trustees, renewed the Investment Advisory Agreement and the Sub-Advisory Agreement, concluding that having the Funds continue to receive services from the Advisers under the Agreements was in the best interest of the shareholders of the Funds and that the investment advisory fee rate was reasonable in relation to the services provided.
Sprott ETFs | |
Trustees & Officers | June 30, 2021 (Unaudited) |
INDEPENDENT TRUSTEES |
| | | | | |
Name, Address1
and Birth Year | Position(s) Held with the Trust | Term of Office2 and Length of Time Served | Principal Occupation(s) During Past Five Years | Number of Portfolios in the Fund Complex Overseen | Other Directorships Held By Trustee |
Michael W. Clark, 1959 | Trustee | Since September, 2018 | President, Chief Operating Officer, Chief Risk Officer, Head of Executive Committee, and member of Board of Directors of Chilton Investment Company since 2005. | 4 | Sprott Focus Trust, Inc. |
| | | | | |
Barbara Connolly Keady, 1962 | Trustee | Since September, 2018 | Director of New Business Development at Ceres Partners since 2010 | 4 | Sprott Focus Trust, Inc. |
| | | | | |
Peyton T. Muldoon, 1969 | Trustee | Since September, 2018 | Licensed salesperson, Sotheby’s International Realty, a global real estate brokerage firm (since 2011). | 4 | Sprott Focus Trust, Inc. |
| | | | | |
James R. Pierce, Jr., 1956 | Trustee | Since September, 2018 | Chairman, Global Energy & Power, Marsh JLT Specialty, a global specialty operations focusing on the energy and power business served by Marsh, Inc., since September, 2014. | 4 | Sprott Focus Trust, Inc. |
| | | | | |
1. | The address for each Trustee is 200 Bay Street, Suite 2600, Toronto, Ontario, Canada M5J2J1. |
2. | Each Trustee serves until resignation, death, retirement or removal. |
Sprott ETFs | |
Trustees & Officers | June 30, 2021 (Unaudited) |
INTERESTED TRUSTEE AND OFFICERS | | | |
| | | |
Name, Address1 and Birth Year | Position(s)
Held with
the Trust | Term of Office2 and Length of Time Served | Principal Occupation(s)
During Past Five Years | Number of Portfolios
in the Fund Complex Overseen | Other Directorships Held By Trustee |
John Ciampaglia,
1970 | President and Trustee | Since September, 2018 | Senior Managing Director of Sprott Inc. and Chief Executive Officer of Sprott Asset Management, LP. (Since 2010) | 3 | None |
| | | | | |
Thomas W. Ulrich,
1963 | Secretary, Chief Compliance Officer | Since September, 2018 | Managing Director, Sprott Inc. group of companies (since January 2018); General Counsel and Chief Compliance Officer of Sprott Asset Management USA Inc. (since October, 2012); In-House Counsel and Chief Compliance Officer of Sprott Global Resource Investments Ltd. (since October, 2012). | N/A | N/A |
| | | | | |
Varinder Bhathal,
1971 | Treasurer and Chief Financial Officer | Since September, 2018 | Chief Financial Officer of Sprott Asset Management LP (since Dec 2018); Chief Financial Officer of Sprott Capital Partners (since Oct 2016); Managing Director, Corporate Finance and Investment Operations of Sprott Inc. (since Oct 2017); Vice President, Finance of Sprott Inc. (Dec 2015 to Oct 2017). | N/A | N/A |
| | | | | |
1. | The address for each Trustee and officer is 200 Bay Street, Suite 2600, Toronto, Ontario, Canada M5J2J1. |
2. | Each Trustee serves until resignation, death, retirement or removal. |
The Statement of Additional Information includes additional information about the Funds’ Trustees and is available free of charge at www.sprottetfs.com, or upon request by calling the Fund toll free at 1-855-496-3837.
This material must be preceded or accompanied by the Prospectus.

www.sprott.com
Item 2. Code of Ethics.
Not applicable for semi-annual reports.
Item 3. Audit Committee Financial Expert.
Not applicable for semi-annual reports.
Item 4. Principal Accountant Fees and Services.
Not applicable for semi-annual reports.
Item 5. Audit Committee of Listed Registrants.
Not Applicable for semi-annual reports.
Item 6. Investments.
Schedule of Investments is included as part of the report to shareholders filed under Item 1 of this Form.
Item 7. Disclosure of Proxy Voting Policies and Procedures for Closed-End Management Investment Companies.
Not applicable to open-end investment companies.
Item 8. Portfolio Managers of Closed-End Management Investment Companies.
Not applicable to open-end investment companies.
Item 9. Purchases of Equity Securities by Closed-End Management Investment Company and Affiliated Purchasers.
Not applicable to open-end investment companies.
Item 10. Submission of Matters to a Vote of Security Holders.
There have been no material changes to the procedures by which shareholders may recommend nominees to the registrant’s board of trustees.
Item 11. Controls and Procedures.
| (a) | The Registrant’s president and treasurer have reviewed the Registrant's disclosure controls and procedures (as defined in Rule 30a-3(c) under the Investment Company Act of 1940 (the “Act”)) as of a date within 90 days of the filing of this report, as required by Rule 30a-3(b) under the Act and Rules 13a-15(b) or 15d-15(b) under the Securities Exchange Act of 1934. Based on their review, such officers have concluded that the disclosure controls and procedures are effective in ensuring that information required to be disclosed in this report is appropriately recorded, processed, summarized and reported and made known to them by others within the Registrant and by the Registrant’s service provider. |
| (b) | There were no changes in the Registrant's internal control over financial reporting (as defined in Rule 30a-3(d) under the Act) that occurred during the period covered by this report that have materially affected, or are reasonably likely to materially affect, the Registrant's internal control over financial reporting. |
Item 12. Disclosure of Securities Lending Activities for Closed-End Management Investment Companies
Not applicable to open-end investment companies.
Item 13. Exhibits.
| (a) | (1) Any code of ethics or amendment thereto, that is the subject of the disclosure required by Item 2, to the extent that the registrant intends to satisfy Item 2 requirements through filing an exhibit. 1) not applicable. |
| | (3) Any written solicitation to purchase securities under Rule 23c-1 under the Act sent or given during the period covered by the report by or on behalf of the registrant to 10 or more persons. Not applicable to open-end investment companies. |
| | | |
| | | (4) Not Applicable |
SIGNATURES
Pursuant to the requirements of the Securities Exchange Act of 1934 and the Investment Company Act of 1940, the registrant has duly caused this report to be signed on its behalf by the undersigned, thereunto duly authorized.
| (Registrant) | Sprott Funds Trust | |
| By (Signature and Title) * | /s/ John Ciampaglia | |
| | John Ciampaglia, President | |
Pursuant to the requirements of the Securities Exchange Act of 1934 and the Investment Company Act of 1940, this report has been signed below by the following persons on behalf of the registrant and in the capacities and on the dates indicated.
| By (Signature and Title) * | /s/ John Ciampaglia | |
| | John Ciampaglia, President | |
| By (Signature and Title) * | /s/ Varinder Bhathal | |
| | Varinder Bhathal, Treasurer | |
* Print the name and title of each signing officer under his or her signature.