UNITED STATES
SECURITIES AND EXCHANGE COMMISSION
Washington, D.C. 20549
FORMN-CSR
CERTIFIED SHAREHOLDER REPORT OF REGISTERED MANAGEMENT INVESTMENT COMPANIES
Investment Company Act file number:811-23341
Name of Fund: BlackRock Funds IV
BlackRock Systematic Multi-Strategy Fund (Formerly BlackRock Alternative Capital
Strategies Fund)
Fund Address: 100 Bellevue Parkway, Wilmington, DE 19809
Name and address of agent for service: John M. Perlowski, Chief Executive Officer, BlackRock Funds IV, 55 East
52nd Street, New York, NY 10055
Registrant’s telephone number, including area code: (800)441-7762
Date of fiscal year end: 12/31/2018
Date of reporting period: 12/31/2018
Item 1 – Report to Stockholders
DECEMBER 31, 2018
| | |
ANNUAL REPORT | |  |
BlackRock FundsSM
| Ø | | BlackRock Emerging Markets Equity Strategies Fund |
| Ø | | iShares Short-Term TIPS Bond Index Fund |
BlackRock Funds IV
| Ø | | BlackRock Alternative Capital Strategies Fund |
Beginning on January 1, 2021, as permitted by regulations adopted by the Securities and Exchange Commission, paper copies of each Fund’s shareholder reports will no longer be sent by mail, unless you specifically request paper copies of the reports from BlackRock or from your financial intermediary, such as a broker-dealer or bank. Instead, the reports will be made available on a website, and you will be notified by mail each time a report is posted and provided with a website link to access the report.
You may elect to receive all future reports in paper free of charge. If you hold accounts directly with BlackRock, you can call (800)-441-7762 to inform BlackRock that you wish to continue receiving paper copies of your shareholder reports. If you hold accounts through a financial intermediary, you can follow the instructions included with this disclosure, if applicable, or contact your financial intermediary to request that you continue to receive paper copies of your shareholder reports. Please note that not all financial intermediaries may offer this service. Your election to receive reports in paper will apply to all funds advised by BlackRock Advisors, LLC, BlackRock Fund Advisors or their affiliates, or all funds held with your financial intermediary, as applicable.
If you already elected to receive shareholder reports electronically, you will not be affected by this change and you need not take any action. You may elect to receive electronic delivery of shareholder reports and other communications by: (i) accessing the BlackRock website at www.blackrock.com/edelivery and logging into your accounts, if you hold accounts directly with BlackRock, or (ii) contacting your financial intermediary, if you hold accounts through a financial intermediary. Please note that not all financial intermediaries may offer this service.
|
| Not FDIC Insured • May Lose Value • No Bank Guarantee |
The Markets in Review
Dear Shareholder,
In the 12 months ended December 31, 2018, concerns about a variety of political risks and a modest slowdown in global growth worked against the equity market despite solid corporate earnings, while rising interest rates constrained bond returns. Though the market’s appetite for risk remained healthy for most of the reporting period, risk-taking declined sharply later in the reporting period. As a result, bonds held their value better than stocks, which posted negative returns across the globe. Shorter-term, higher-quality securities led the bond market, and U.S. equities outperformed most international stock markets.
Volatility rose in emerging market stocks, as the rising U.S. dollar and higher interest rates in the U.S. disrupted economic growth abroad. U.S.-China trade relations and debt concerns adversely affected the Chinese stock market, while Turkey and Argentina became embroiled in currency crises, largely due to hyperinflation in both countries. An economic slowdown in Europe also led to negative performance for European equities.
In fixed income markets, short-term U.S. Treasury interest rates rose the fastest, while longer-term rates slightly increased. This led to a negative return for long-term U.S. Treasuries and a substantial flattening of the yield curve. Many investors are concerned with the flattening yield curve as a harbinger of recession. However, given the extraordinary monetary measures in the last decade, we believe a more accurate barometer for the economy is the returns along the risk spectrums in stock and bond markets. Although the fundamentals in credit markets remained relatively solid, investment-grade bonds posted flat returns, and high-yield bonds declined slightly. Recent sell-offs in risk assets have flattened asset returns along the risk spectrum somewhat, which bears further scrutiny in the months ahead.
In response to rising growth and inflation, the U.S. Federal Reserve (the “Fed”) increased short-term interest rates four times during the reporting period. The Fed also continued to reduce its balance sheet, gradually reversing the unprecedented stimulus measures it enacted after the financial crisis. By our estimation, the Fed’s neutral interest rate, or the theoretical rate that is neither stimulative nor restrictive to the economy, is approximately 3.0%. With that perspective, the Fed’s current policy is still mildly stimulative to the U.S. economy, which leaves room for further Fed rate hikes to arrive at monetary policy that is a neutral factor for economic growth.
Volatility in the U.S. equity market spiked in October, as a wide range of risks were brought to bear on markets, ranging from rising interest rates and slowing global growth to heightened trade tensions and political turmoil in several countries, including the United States. This was accompanied by a broad based risk-off in December — which was the worst December performance on record since 1931. Although fears of recession drove equity volatility higher at the end of 2018, we continue to believe the probability of recession in 2019 remains relatively low.
Economic growth and global earnings are likely to slow somewhat in 2019 — the tax cut stimulus will be less pronounced, and the Fed’s rate hikes in 2018 will gain traction in 2019. Trade frictions look more baked into asset prices than a year ago, but markets may be overlooking European political risks. Consequently, we are cautious on European equities, as European unity remains tenuous with a history of flare-ups. We continue to prefer to take risk in U.S. and emerging market equities. Within U.S. equities, we believe that companies with high-quality earnings and strong balance sheets offer the most attractive risk/reward trade-off. Going into 2019, we also favor short-term bonds over long-term bonds because they offer nearly equivalent yields with far lower volatility.
In this environment, investors need to think globally, extend their scope across a broad array of asset classes, and be nimble as market conditions change. We encourage you to talk with your financial advisor and visitblackrock.com for further insight about investing in today’s markets.
Sincerely,

Rob Kapito
President, BlackRock Advisors, LLC

Rob Kapito
President, BlackRock Advisors, LLC
| | | | |
| Total Returns as of December 31, 2018 |
| | | 6-month | | 12-month |
U.S. large cap equities
(S&P 500® Index) | | (6.85)% | | (4.38)% |
U.S. small cap equities
(Russell 2000® Index) | | (17.35) | | (11.01) |
International equities
(MSCI Europe, Australasia,
Far East Index) | | (11.35) | | (13.79) |
Emerging market equities
(MSCI Emerging Markets Index) | | (8.48) | | (14.57) |
3-month Treasury bills
(ICE BofAML3-Month
U.S. Treasury Bill Index) | | 1.06 | | 1.87 |
U.S. Treasury securities
(ICE BofAML10-Year
U.S. Treasury Index) | | 2.72 | | (0.03) |
U.S. investment grade bonds
(Bloomberg Barclays U.S.
Aggregate Bond Index) | | 1.65 | | 0.01 |
Tax-exempt municipal bonds
(S&P Municipal Bond Index) | | 1.38 | | 1.36 |
U.S. high yield bonds
(Bloomberg Barclays
U.S. Corporate High Yield
2% Issuer Capped Index) | | (2.24) | | (2.08) |
| Past performance is no guarantee of future results. Index performance is shown for illustrative purposes only. You cannot invest directly in an index. |
| | |
| 2 | | THIS PAGEISNOT PARTOF YOUR FUND REPORT |
Table of Contents

| | |
| Fund Summary as of December 31, 2018 | | BlackRock Emerging Markets Equity Strategies Fund |
Investment Objective
BlackRock Emerging Markets Equity Strategies Fund’s (the “Fund”) investment objective is to seek total return.
Portfolio Management Commentary
How did the Fund perform?
For the12-month period ended December 31, 2018, the Fund outperformed its benchmark, the MSCI Emerging Markets Index.
What factors influenced performance?
The Fund’s underweight allocation and stock selection within China was the largest positive contributor to relative performance, driven by positioning that favoredold-economy stocks in the industrials and materials sectors over companies in the information technology (“IT”) sector. Positioning in Brazil also added to performance, as a market-friendly outcome in the national presidential election helped drive a recovery in local markets.
Among individual stocks, the largest contributor to performance was the Fund’sout-of-benchmark position in Israeli Chemicals Ltd., whose shares rallied in response to rising potash prices due to production issues in Brazil and Argentina. Brazilian airline Azul SA and state-controlled energy giant Petroleo Brasileiro SA were also notable contributors on Brazil’s relative strength. Finally, South Korea’s Samsung Engineering Co., Ltd. performed positively after winning two large energy-related contracts in the United Arab Emirates.
By contrast, the Fund’s most notable detractor from performance was its overweight allocation to Greek banks, which performed poorly in line with financial companies throughout Europe. National Bank of Greece SA and Alpha Bank AE were among individual positions detracting from the Fund’s relative return. Another detractor was Argentine bank Grupo Financiero Galicia SA, which performed poorly due to rising inflation and weak financial markets in Argentina. Finally,UAE-based real estate developer Emaar Properties PJSC also detracted, as the company suffered from a lack of visibility and investor confidence in the commercialization of its projects.
As part of its investment strategy, the Fund uses derivatives to achieve exposure to a market or to manage market and/or equity risks. As of the end of the period, the Fund had approximately 62% of assets invested in contracts for difference for its synthetic long and synthetic short positions. The Fund’s use of derivatives during the period had a positive impact on Fund performance.
Describe recent portfolio activity.
The Fund’s most notable activity during the period was to reduce its exposure to China in response to further monetary tightening and deleveraging measures in the domestic economy that started to have an impact on local businesses, as well as U.S. trade tensions. The Fund maintained its underweight in China as a cyclical slowdown became more apparent late in the period. However, the Fund added state-owned energy company PetroChina Co. Ltd., as its share price failed to reflect current oil prices and specific positive catalysts in its natural gas business.
In the second and third quarters of 2018, the Fund redeployed capital into Latin American countries such as Brazil and Argentina, where the emerging-market correction has been the most severe. Perceived overreactions to market weakness prompted additions to high-conviction stocks in Argentina, but later in the period, the Fund cut exposure to Brazilian financial stocks after they rallied following the Brazilian election.
Other portfolio moves included additions to positions in Israeli Chemicals Ltd. on expectations of higher potash prices, and financial company Sberbank of Russia on exaggerated pessimism after the imposition of new economic sanctions. Finally, the Fund reduced its exposure to India following concerns about the outcome of future elections in 2019.
Describe portfolio positioning at period end.
Relative to the MSCI Emerging Markets Index, the Fund ended the period overweight to materials stocks and underweight in the consumer staples and energy sectors. Although the Fund remained underexposed, if not net short, to Chinese internet stocks, it was neutral to the IT sector overall at period end. From a geographical standpoint, the Fund was most overweight in Poland, while underweight in India.
The views expressed reflect the opinions of BlackRock as of the date of this report and are subject to change based on changes in market, economic or other conditions. These views are not intended to be a forecast of future events and are no guarantee of future results.
| | |
| 4 | | 2018 BLACKROCK ANNUAL REPORTTO SHAREHOLDERS |
| | |
| Fund Summary as of December 31, 2018 (continued) | | BlackRock Emerging Markets Equity Strategies Fund |
TOTAL RETURN BASED ON A $10,000 INVESTMENT
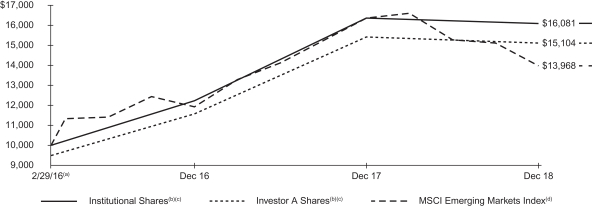
| (a) | Commencement of operations. |
| (b) | Assuming maximum sales charges, if any, transaction costs and other operating expenses, including investment advisory fees. Institutional Shares do not have a sales charge. |
| (c) | Under normal conditions, the Fund invests at least 80% of its net assets, plus any borrowings for investment purposes, in equity instruments and related derivative instruments issued by companies in, or tied economically to, emerging markets. |
| (d) | MSCI Emerging Markets Index is a free float-adjusted market capitalization index that is designed to measure equity market performance of emerging markets. The MSCI Emerging Markets Index consists of the following 24 emerging market country indexes: Brazil, Chile, China, Colombia, Czech Republic, Egypt, Greece, Hungary, India, Indonesia, South Korea, Malaysia, Mexico, Pakistan, Peru, the Philippines, Poland, Qatar, Russia, South Africa, Taiwan, Thailand, Turkey and the United Arab Emirates. |
Performance Summary for the Period Ended December 31, 2018
| | | | | | | | | | | | | | | | | | | | | | | | | | | | |
| | | | | | | | | Average Annual Total Returns (a) | |
| | | | | | | | | 1 Year | | | | | | Since Inception (b) | |
| | | 6-Month
Total Returns | | | | | | w/o sales
charge | | | w/sales
charge | | | | | | w/o sales
charge | | | w/sales
charge | |
Institutional | | | 0.61 | % | | | | | | | (1.59 | )% | | | N/A | | | | | | | | 18.22 | % | | | N/A | |
Investor A | | | 0.43 | | | | | | | | (1.93 | ) | | | (7.08 | )% | | | | | | | 17.86 | | | | 15.64 | % |
Investor C | | | 0.16 | | | | | | | | (2.59 | ) | | | (3.34 | ) | | | | | | | 17.01 | | | | 17.01 | |
Class K | | | 0.71 | | | | | | | | (1.49 | ) | | | N/A | | | | | | | | 18.27 | | | | N/A | |
MSCI Emerging Markets Index | | | (8.48 | ) | | | | | | | (14.57 | ) | | | N/A | | | | | | | | 12.52 | | | | N/A | |
| | (a) | Assuming maximum sales charges, if any. Average annual total returns with and without sales charges reflect reductions for distribution and service fees. See “About Fund Performance” on page 13 for a detailed description of share classes, including any related sales charges and fees. | |
| | (b) | The Fund commenced operations on February 29, 2016. | |
N/A — Not applicable as share class and index do not have a sales charge.
Past performance is not indicative of future results.
Performance results may include adjustments made for financial reporting purposes in accordance with U.S. generally accepted accounting principles.
Expense Example
| | | | | | | | | | | | | | | | | | | | | | | | | | | | | | | | |
| | | Actual | | | | | | Hypothetical (b) | | | | |
| | | Beginning
Account Value
(07/01/18) | | | Ending
Account Value
(12/31/18) | | | Expenses
Paid During
the Period (a) | | | | | | Beginning
Account Value
(07/01/18) | | | Ending
Account Value
(12/31/18) | | | Expenses
Paid During
the Period (a) | | | Annualized
Expense
Ratio | |
Institutional | | $ | 1,000.00 | | | $ | 1,006.10 | | | $ | 6.57 | | | | | | | $ | 1,000.00 | | | $ | 1,018.65 | | | $ | 6.61 | | | | 1.30 | % |
Investor A | | | 1,000.00 | | | | 1,004.30 | | | | 7.88 | | | | | | |
| 1,000.00
|
| | | 1,017.34 | | | | 7.93 | | | | 1.56 | |
Investor C | | | 1,000.00 | | | | 1,001.60 | | | | 11.65 | | | | | | |
| 1,000.00
|
| | | 1,013.56 | | | | 11.72 | | | | 2.31 | |
Class K | | | 1,000.00 | | | | 1,007.10 | | | | 6.37 | | | | | | |
| 1,000.00
|
| | | 1,018.85 | | | | 6.41 | | | | 1.26 | |
| | (a) | For each class of the Fund, expenses are equal to the annualized net expense ratio for the class, multiplied by the average account value over the period, multiplied by 184/365. | |
| | (b) | Hypothetical 5% annual return before expenses is calculated by prorating the number of days in the most recent fiscal half year divided by 365. | |
See “Disclosure of Expenses” on Page 13 for further information on how expenses were calculated.
| | |
| Fund Summary as of December 31, 2018 (continued) | | BlackRock Emerging Markets Equity Strategies Fund |
Portfolio Information
GEOGRAPHICAL ALLOCATION
| | | | | | | | | | | | |
| | | Percent of
Total Investments (a) | |
| Country | | Long | | | Short | | | Total | |
China | | | 11 | % | | | 1 | % | | | 12 | % |
United States | | | 7 | | | | 4 | | | | 11 | |
Hong Kong | | | 10 | | | | — | | | | 10 | |
South Korea | | | 7 | | | | 1 | | | | 8 | |
Russia | | | 6 | | | | 1 | | | | 7 | |
Taiwan | | | 5 | | | | — | | | | 5 | |
Poland | | | 5 | | | | — | | | | 5 | |
United Arab Emirates | | | 2 | | | | 3 | | | | 5 | |
United Kingdom | | | 2 | | | | 3 | | | | 5 | |
Brazil | | | 4 | | | | 0 | | | | 4 | |
Mexico | | | 3 | | | | — | | | | 3 | |
Argentina | | | 3 | | | | — | | | | 3 | |
India | | | 3 | | | | — | | | | 3 | |
Malaysia | | | 3 | | | | — | | | | 3 | |
Greece | | | 3 | | | | — | | | | 3 | |
Israel | | | 2 | | | | — | | | | 2 | |
Indonesia | | | 2 | | | | — | | | | 2 | |
Thailand | | | 2 | | | | — | | | | 2 | |
Philippines | | | — | | | | 2 | | | | 2 | |
Qatar | | | — | | | | 2 | | | | 2 | |
South Africa | | | 1 | | | | — | | | | 1 | |
Canada | | | 1 | | | | — | | | | 1 | |
Turkey | | | — | | | | 1 | | | | 1 | |
| | | | |
| | | 82 | % | | | 18 | % | | | 100 | % |
| | | | |
| | (a) | Total investments include the gross notional values of long and short positions of the underlying derivative contracts utilized by the Fund and exclude short-term securities. | |
INDUSTRY
| | | | | | | | | | | | |
| | | Percentage of
Total investments (a) | |
| Industry | | Long | | | Short | | | Total | |
Banks | | | 17 | % | | | 4 | % | | | 21 | % |
Insurance | | | 6 | | | | 1 | | | | 7 | |
Technology Hardware, Storage & Peripherals | | | 6 | | | | — | | | | 6 | |
Metals & Mining | | | 5 | | | | 2 | | | | 7 | |
Diversified Telecommunication Services | | | 4 | | | | — | | | | 4 | |
Hotels, Restaurants & Leisure | | | 4 | | | | 2 | | | | 6 | |
Oil, Gas & Consumable Fuels | | | 4 | | | | 2 | | | | 6 | |
Real Estate Management & Development | | | 4 | | | | 1 | | | | 5 | |
Wireless Telecommunication Services | | | 4 | | | | 1 | | | | 5 | |
Automobiles | | | 3 | | | | 1 | | | | 4 | |
Airlines | | | 2 | | | | 1 | | | | 3 | |
Construction Materials | | | 2 | | | | — | | | | 2 | |
Food & Staples Retailing | | | 2 | | | | — | | | | 2 | |
Household Durables | | | 2 | | | | — | | | | 2 | |
Pharmaceuticals | | | 2 | | | | 1 | | | | 3 | |
Semiconductors & Semiconductor Equipment | | | 2 | | | | — | | | | 2 | |
Biotechnology | | | 1 | | | | — | | | | 1 | |
Chemicals | | | 1 | | | | — | | | | 1 | |
Construction & Engineering | | | 1 | | | | — | | | | 1 | |
Electronic Equipment, Instruments & Components | | | 1 | | | | — | | | | 1 | |
Energy Equipment & Services | | | 1 | | | | — | | | | 1 | |
Independent Power and Renewable Electricity Producers | | | 1 | | | | — | | | | 1 | |
Internet & Direct Marketing Retail | | | 1 | | | | — | | | | 1 | |
Marine | | | 1 | | | | — | | | | 1 | |
Independent Power and Renewable Electricity procedure | | | 1 | | | | — | | | | 1 | |
Health Care Equipment & Supplies | | | — | | | | 2 | | | | 2 | |
Other(b) | | | 4 | | | | — | | | | 4 | |
| | | | |
| | | 82 | % | | | 18 | % | | | 100 | % |
| | | | |
| | (b) | Consists of other industries held that were each less than 4% of total investments (4% long). | |
| | |
| 6 | | 2018 BLACKROCK ANNUAL REPORTTO SHAREHOLDERS |
| | |
| Fund Summary as of December 31, 2018 | | iShares Short-Term TIPS Bond Index Fund |
Investment Objective
iShares Short-Term TIPS Bond Index Fund’s (the “Fund”) investment objective is to seek to track the investment results of an index composed of U.S. 0-5 Year Treasury Inflation-Protected Securities.
Portfolio Management Commentary
How did the Fund perform?
For the12-month period ended December 31, 2018, the Fund’s Institutional, Investor A and Class K Shares returned 0.56%, 0.22% and 0.60%, respectively. For the same period, the Fund’s benchmark, the Bloomberg Barclays U.S. Treasury Inflation-Protected Securities (TIPS) 0 - 5 Years Index (series L) (the “Underlying Index”) returned 0.59%.
Describe the market environment.
Prices for Treasury Inflation-Protected Securities (“TIPS”) are influenced by changes in inflation expectations as well as the direction of nominal Treasury yields.
Despite an uptick in inflation expectations on the back of unexpectedly strong January employment data, TIPS returns were in negative territory for the first quarter of 2018. A move higher in nominal Treasury yields more than offset a rise in TIPS breakeven rates (the rate of inflation required for a TIPS investor to match the return on a nominal Treasury of comparable maturity).
In June, the Fed raised the target range for its benchmark overnight lending rate by 25 basis points (0.25%), from 1.75% to 2%, in line with expectations. On the back of firm domestic growth and continued improvements in the labor market, the Fed signaled for an increase in the number of expected rate hikes in 2018 from three to four. TIPS returns were positive in the second quarter as the upward move in Treasury yields eased and inflation appeared to be moving toward the Fed’s 2% target.
TIPS were in negative territory for the third quarter of 2018. Nominal Treasury yields rose late in the quarter on firming economic data. In September, the Fed raised interest rates with policymakers removing the reference to “accommodative” monetary policy in their statement. Geopolitical risks weighed on market sentiment, asU.S.-China trade relations deteriorated. August core inflation registered a year-over-year decline, driven by volatile components including apparel and pharmaceutical prices.
While nominal yields as gauged by the10-year Treasury declined in the fourth quarter, TIPS returns were again negative as declining energy prices led breakevens lower. Politics dominated the second half of the quarter as the U.S. government approached a shutdown and headlines whipsawed around intensified U.S.-China trade talks. Mixed guidance from the Fed did little to quell market volatility, despite December’s expected hike in fed funds to the 2.25% - 2.50% range. Both headline and core Consumer Price Index inflation printed at 2.2%year-on-year in November, as the headline rate moved lower on the back of declining energy prices and the core rate remained stable. (Headline inflation measures the difference in inflation by calculating prices of a basket of goods whereby core inflation does not include components such as food, energy and fuel.)
Describe recent portfolio activity.
During the period, the Fund maintained its objective of seeking to provide investment results that correspond to the total return performance of the Underlying Index by selecting securities in accordance with their relative proportion within the Underlying Index. Other factors considered in security selection included transaction costs and maturity.
Describe portfolio positioning at period end.
The Fund remains positioned to attempt to match the risk and return characteristics of the Underlying Index, irrespective of the future direction of inflation expectations.
The views expressed reflect the opinions of BlackRock as of the date of this report and are subject to change based on changes in market, economic or other conditions. These views are not intended to be a forecast of future events and are no guarantee of future results.
| | |
| Fund Summary as of December 31, 2018 (continued) | | iShares Short-Term TIPS Bond Index Fund |
TOTAL RETURN BASED ON A $10,000 INVESTMENT
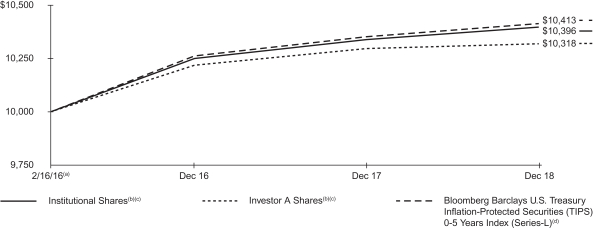
| (a) | Commencement of operations. |
| (b) | Assuming transaction costs and other operating expenses, including investment advisory fees, if any. |
| (c) | The Fund generally invests at least 90% of its assets, plus the amount of any borrowing for investment purposes, in securities of the Underlying Index. From time to time when conditions warrant, however, the Fund may invest at least 80% of its assets in securities of the Underlying Index. The Fund may invest a portion of the remainder of its assets in securities not included in the Underlying Index, but which BlackRock Advisors, LLC believes will help the Fund track the Underlying Index. |
| (d) | Bloomberg Barclays U.S. Treasury Inflation-Protected Securities (TIPS) 0-5 Years Index (Series L) measures the performance of the inflation-protected public obligations of the U.S. Treasury that have a remaining maturity of less than five years. |
Performance Summary for the Period Ended December 31, 2018
| | | | | | | | | | | | | | | | | | | | |
| | | | | | | | | Average Annual Total Returns (a) | |
| | | | | | | | | 1 Year | | | | | | Since
Inception (b) | |
| | | 6-Month
Total Returns | | | | | | w/o sales
charge | | | | | | w/o sales
charge | |
Institutional | | | (0.17 | )% | | | | | | | 0.56 | % | | | | | | | 1.36 | % |
Investor A | | | (0.30 | ) | | | | | | | 0.22 | | | | | | | | 1.10 | |
Class K | | | (0.15 | ) | | | | | | | 0.60 | | | | | | | | 1.39 | |
Bloomberg Barclays U.S. Treasury Inflation-Protected Securities (TIPS) 0-5 Years Index (Series-L) | | | (0.11 | ) | | | | | | | 0.59 | | | | | | | | 1.42 | |
| | (a) | Average annual total returns reflect reductions for distribution and service fees. See “About Fund Performance” on page 13 for a detailed description of share classes, including any related fees. | |
| | (b) | The Fund commenced operations on February 16, 2016. | |
Past performance is not indicative of future results.
Performance results may include adjustments made for financial reporting purposes in accordance with U.S. generally accepted accounting principles.
Expense Example
| | | | | | | | | | | | | | | | | | | | | | | | | | | | | | | | |
| | | Actual | | | | | | Hypothetical (b) | | | | |
| | | Beginning
Account Value
(07/01/18) | | | Ending
Account Value
(12/31/18) | | | Expenses
Paid During
the Period (a) | | | | | | Beginning
Account Value
(07/01/18) | | | Ending
Account Value
(12/31/18) | | | Expenses
Paid During
the Period (a) | | | Annualized
Expense
Ratio | |
Institutional | | $ | 1,000.00 | | | $ | 998.30 | | | $ | 0.45 | | | | | | | $ | 1,000.00 | | | $ | 1,024.75 | | | $ | 0.46 | | | | 0.09 | % |
Investor A | | | 1,000.00 | | | | 997.00 | | | | 1.81 | | | | | | |
| 1,000.00
|
| | | 1,023.39 | | | | 1.84 | | | | 0.36 | |
Class K | | | 1,000.00 | | | | 998.50 | | | | 0.30 | | | | | | |
| 1,000.00
|
| | | 1,024.90 | | | | 0.31 | | | | 0.06 | |
| | (a) | For each class of the Fund, expenses are equal to the annualized net expense ratio for the class, multiplied by the average account value over the period, multiplied by 184/365. | |
| | (b) | Hypothetical 5% annual return before expenses is calculated by prorating the number of days in the most recent fiscal half year divided by 365. | |
See “Disclosure of Expenses” on Page 13 for further information on how expenses were calculated.
| | |
| 8 | | 2018 BLACKROCK ANNUAL REPORTTO SHAREHOLDERS |
| | |
| Fund Summary as of December 31, 2018 (continued) | | iShares Short-Term TIPS Bond Index Fund |
Portfolio Information
ALLOCATION BY MATURITY
| | | | |
| Period | | Percent of Total Investments (a) | |
0-1 Year | | | 15 | % |
1-2 Years | | | 18 | |
2-3 Years | | | 21 | |
3-4 Years | | | 24 | |
4-5 Years | | | 22 | |
| | (a) | Excludes short-term securities. | |
FIVE LARGEST FUND HOLDINGS
| | | | |
| Holding | | Percent of Total Investments (a) | |
U.S. Treasury Inflation Protected Securities, 0.13%, 4/15/19 | | | 13 | % |
U.S. Treasury Inflation Protected Securities, 0.13%, 4/15/20 | | | 12 | |
U.S. Treasury Inflation Protected Securities, 0.13%, 4/15/21 | | | 10 | |
U.S. Treasury Inflation Protected Securities, 0.13%, 4/15/22 | | | 10 | |
U.S. Treasury Inflation Protected Securities, 0.38%, 7/15/23 | | | 10 | |
| | |
| Fund Summary as of December 31, 2018 | | BlackRock Alternative Capital Strategies Fund |
Investment Objective
BlackRock Alternative Capital Strategies Fund’s (the “Fund”) investment objective is to seek total return comprised of current income and capital appreciation.
On November 28, 2018, the Board of BlackRock Funds IV approved a proposal to change the name of BlackRock Alternative Capital Strategies Fund to BlackRock Systematic Multi-Strategy Fund. This change is effective January 4, 2019.
Portfolio Management Commentary
How did the Fund perform?
For the12-month period ended December 31, 2018, the Fund outperformed the Bloomberg Barclays U.S. Aggregate Bond Index and underperformed the ICE BofAML3-Month U.S. Treasury Bill Index.
Fund Strategies
Core allocation across fixed-income and equity markets to balance interest rate and credit exposures. Strategies in the core portfolio may include mortgages, duration and curve, investment grade corporates, emerging markets, securitized credit, dividend equities and high yield.
Long/short alpha strategies seek equity securities and equity derivatives, primarily total return swaps, within a global opportunity set. These strategies seek to identify opportunities through a systematic approach by evaluating predicted returns relative to risk for each security. These strategies seek to provide an uncorrelated source of defensive returns.
Long/short macro strategies seek to capture returns through tactical trades to fixed income and equity markets.These strategies seek to tactically allocate and time directional exposures across several asset classes, such as credit default swaps, U.S. Treasures, U.K. Gilts and index futures.
What factors influenced performance?
The defensive equity long/short strategy was the primary contributor to the Fund’s relative performance, while the macro strategy also contributed positively over the period. Within the defensive equity long/short strategy, security selection with consumer staples was the most notable driver of performance, particularly among short positions within the food products industry group. The strategy’s consistent focus on credit information provided downside protection for the overall portfolio when markets fell, especially during the final quarter of the period. The macro strategy benefited from disparities in relative valuation across countries, prompting short positions in the United States and Canada paired with long positions in Australia and Europe. Widening divergences in monetary policy and growth expectations across global markets improved prospects for the strategy during the period.
The directional asset allocation strategy detracted from the Fund’s performance during the period. The primary drivers of the strategy’s underperformance were allocations to dividend equity securities, which underperformed during the equity market’s aggressive selloff late in the period. Corporate credit also weighed on performance, as credit spreads, particularly in the high-yield arena, widened. The strategy’s duration (sensitivity to interest rate movements) exposure element partially offset its overall underperformance, however, as falling U.S. yields late in the period provided additional ballast during the market downturn.
The Fund held derivatives during the period as a part of its investment strategy. Derivatives are used by the portfolio management team as a means to manage and/or take outright views on interest rates, credit risk and/or foreign exchange positions in the Fund. Stand-alone performance impact from derivatives used to hedge can be taken out of context, and may not necessarily portray the total performance impact of the position. The use of U.S. Treasury futures, currency forwards, options and swaps had a positive impact on performance for the period.
Describe recent portfolio activity.
The Fund applied its systematic investment approach, which combines asset allocation, defensive long/short alpha and macro strategies across diversified asset classes. The Fund seeks to provide diversified alpha sources for balanced, consistent returns over time through various market conditions.
The Fund’s strategies performed as anticipated, with uncorrelated, defensive returns from the defensive equity long/short strategy more than offsetting losses in the directional asset allocation strategy. Within the directional asset allocation strategy, the Fund diversified its duration exposure during the period, which enhanced relative performance.
The Fund continued to use leveraged strategies, which involve holding cash in order to back investments into-be-announced mortgage derivative securities. Despite having a reported cash position exceeding 5%, the Fund’s investable cash position is negative due to unsettled forward transactions on derivatives, which had a positive impact on performance during the period.
Describe portfolio positioning at period end.
At period end, the Fund continued to target 50% risk contribution from the directional asset allocation strategy and 50% risk contribution total from the macro and defensive equity long/short strategies.
The views expressed reflect the opinions of BlackRock as of the date of this report and are subject to change based on changes in market, economic or other conditions. These views are not intended to be a forecast of future events and are no guarantee of future results.
| | |
| 10 | | 2018 BLACKROCK ANNUAL REPORTTO SHAREHOLDERS |
| | |
| Fund Summary as of December 31, 2018 (continued) | | BlackRock Alternative Capital Strategies Fund |
TOTAL RETURN BASED ON A $10,000 INVESTMENT
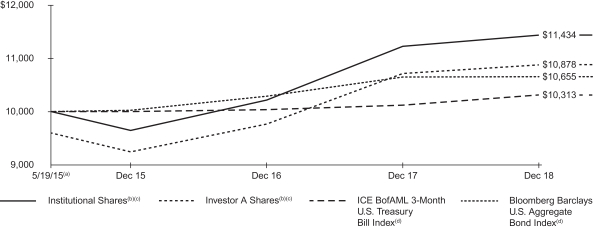
| (a) | Commencement of operations. |
| (b) | Assuming maximum sales charges, if any, transaction costs and other operating expenses, including investment advisory fees. Institutional Shares do not have a sales charge. |
| (c) | The Fund invests in a range of global asset classes, with a focus on fixed and floating rate debt securities and equity securities. |
| (d) | ICE BofAML 3-Month U.S. Treasury Bill Index is an unmanaged index that tracks 3-month U.S. Treasury securities. Bloomberg Barclays U.S. Aggregate Bond Index is a widely recognized unmanaged market-weighted index, comprised of investment-grade corporate bonds rated BBB or better, mortgages and U.S. Treasury and U.S. Government agency issues with at least one year to maturity. |
On September 17, 2018, the Fund acquired all of the assets, subject to the liabilities, of BlackRock Alternative Capital Strategies Fund (the “Predecessor Fund”), a series of BlackRock Funds IV, through a tax-free reorganization (the “Board Reorganization”). The Predecessor Fund is the performance and accounting survivor of the Board Reorganization.
Performance Summary for the Period Ended December 31, 2018
| | | | | | | | | | | | | | | | | | | | | | | | | | | | |
| | | | | | | | | Average Annual Total Returns (a) | |
| | | | | | | | | 1 Year | | | | | | Since Inception (b) | |
| | | 6-Month
Total Returns | | | | | | w/o sales
charge | | | w/sales
charge | | | | | | w/o sales
charge | | | w/sales
charge | |
Institutional | | | 2.58 | % | | | | | | | 1.74 | % | | | N/A | | | | | | | | 3.77 | % | | | N/A | |
Investor A | | | 2.42 | | | | | | | | 1.41 | | | | (2.65 | )% | | | | | | | 3.51 | | | | 2.35 | % |
Investor C | | | 1.94 | | | | | | | | 0.65 | | | | (0.28 | ) | | | | | | | 2.71 | | | | 2.71 | |
ICE BofAML 3-Month U.S. Treasury Bill Index | | | 1.06 | | | | | | | | 1.87 | | | | N/A | | | | | | | | 0.86 | | | | N/A | |
Bloomberg Barclays U.S. Aggregate Bond Index | | | 1.65 | | | | | | | | 0.01 | | | | N/A | | | | | | | | 1.77 | | | | N/A | |
| | (a) | Assuming maximum sales charges, if any. Average annual total returns with and without sales charges reflect reductions for distribution and service fees. See “About Fund Performance” on page 13 for a detailed description of share classes, including any related sales charges and fees. | |
| | (b) | The Fund commenced operations on May 19, 2015. | |
N/A — Not applicable as share class and index do not have a sales charge.
Past performance is not indicative of future results.
Performance results may include adjustments made for financial reporting purposes in accordance with U.S. generally accepted accounting principles.
On September 17, 2018, the Fund acquired all of the assets, subject to the liabilities, of BlackRock Alternative Capital Strategies Fund (the “Predecessor Fund”), a series of BlackRock Funds IV, through a tax-free reorganization (the “Board Reorganization”). The Predecessor Fund is the performance and accounting survivor of the Board Reorganization.
Expense Example
| | | | | | | | | | | | | | | | | | | | | | | | | | | | | | | | |
| | | Actual | | | | | | Hypothetical (b) | | | | |
| | | Beginning
Account Value
(07/01/18) | | | Ending
Account Value
(12/31/18) | | | Expenses
Paid During
the Period (a) | | | | | | Beginning
Account Value
(07/01/18) | | | Ending
Account Value
(12/31/18) | | | Expenses
Paid During
the Period (a) | | | Annualized
Expense
Ratio | |
Institutional | | $ | 1,000.00 | | | $ | 1,025.80 | | | $ | 4.85 | | | | | | | $ | 1,000.00 | | | $ | 1,020.42 | | | $ | 4.84 | | | | 0.95 | % |
Investor A | | | 1,000.00 | | | | 1,024.20 | | | | 6.12 | | | | | | | | 1,000.00 | | | | 1,019.16 | | | | 6.11 | | | | 1.20 | |
Investor C | | | 1,000.00 | | | | 1,019.40 | | | | 9.93 | | | | | | | | 1,000.00 | | | | 1,015.38 | | | | 9.91 | | | | 1.95 | |
| | (a) | For each class of the Fund, expenses are equal to the annualized net expense ratio for the class, multiplied by the average account value over the period, multiplied by 184/365. | |
| | (b) | Hypothetical 5% annual return before expenses is calculated by prorating the number of days in the most recent fiscal half year divided by 365. | |
See “Disclosure of Expenses” on Page 13 for further information on how expenses were calculated.
| | |
| Fund Summary as of December 31, 2018 (continued) | | BlackRock Alternative Capital Strategies Fund |
Portfolio Information
PORTFOLIO COMPOSITION
| | | | |
| Asset Type | | Percent of Net Assets (a) | |
Corporate Bonds | | | 46 | % |
U.S. Government Sponsored Agency Securities | | | 36 | |
Asset-Backed Securities | | | 15 | |
Short-Term Securities | | | 14 | |
Common Stocks | | | 9 | |
Non-Agency Mortgage-Backed Securities | | | 1 | |
TBA Sale Commitments | | | — | (b) |
Liabilities in Excess of Other Assets | | | (21 | ) |
| | (a) | Does not include underlying investment in total return swaps. | |
| | (b) | Represents less than 1% of the Fund’s net assets. | |
INDUSTRY
| | | | | | | | | | | | |
| | | Percentage of
Total Investments (c) | |
| Industry | | Long | | | Short | | | Total | |
Oil, Gas & Consumable Fuels | | | 4 | % | | | 2 | % | | | 6 | % |
Media | | | 3 | | | | 1 | | | | 4 | |
Health Care Providers & Services | | | 2 | | | | 2 | | | | 4 | |
Equity Real Estate Investment Trusts (REITs) | | | 2 | | | | 1 | | | | 3 | |
Insurance | | | 2 | | | | 1 | | | | 3 | |
Hotels, Restaurants & Leisure | | | 2 | | | | 1 | | | | 3 | |
Food Products | | | 1 | | | | 2 | | | | 3 | |
Diversified Financial Services | | | 2 | | | | — | | | | 2 | |
Pharmaceuticals | | | 2 | | | | — | | | | 2 | |
Electric Utilities | | | 2 | | | | — | | | | 2 | |
Chemicals | | | 1 | | | | 1 | | | | 2 | |
Metals & Mining | | | 2 | | | | — | | | | 2 | |
Semiconductors & Semiconductor Equipment | | | 1 | | | | 1 | | | | 2 | |
Specialty Retail | | | 1 | | | | — | | | | 1 | |
Aerospace & Defense | | | 1 | | | | 1 | | | | 2 | |
Health Care Equipment & Supplies | | | 1 | | | | 1 | | | | 2 | |
Multi-Utilities | | | 1 | | | | 1 | | | | 2 | |
Household Durables | | | 1 | | | | 1 | | | | 2 | |
Consumer Finance | | | 1 | | | | — | | | | 1 | |
Other(d) | | | 43 | | | | 9 | | | | 52 | |
| | | | |
| | | 75 | % | | | 25 | % | | | 100 | % |
| | | | |
| | (c) | Total investments include the gross notional values of long and short positions of the underlying derivative contracts utilized by the Fund and exclude short-term securities and TBA sale commitments. | |
| | (d) | Consist of Asset-Backed Securities (7%), Non-Agency Mortgaged-Backed Securities (1%) and U.S. Government Sponsored Agency Obligations (16%) with the remainder consisting of other industries held that were each 2% of investments (19% long and 9% short). | |
| | |
| 12 | | 2018 BLACKROCK ANNUAL REPORTTO SHAREHOLDERS |
About Fund Performance
On September 17, 2018, the Fund acquired all of the assets, subject to the liabilities, of BlackRock Alternative Capital Strategies Fund (the “Predecessor Fund”), a series of BlackRock Funds IV, through a tax-free reorganization (the “Board Reorganization”). The Predecessor Fund is the performance and accounting survivor of the Board Reorganization.
Institutional Shares are not subject to any sales charge. These shares bear no ongoing distribution or service fees and are available only to certain eligible investors.
Investor A Shares are subject to a maximum initial sales charge (front-end load) of 4.00% for BlackRock Alternative Capital Strategies Fund and 5.25% for BlackRock Emerging Markets Equity Strategies Fund, as well as a service fee of 0.25% per year (but no distribution fee). With respect to BlackRock Alternative Capital Strategies Fund and BlackRock Emerging Markets Equity Strategies Fund, certain redemptions of these shares may be subject to a contingent deferred sales charge (“CDSC”) where no initial sales charge was paid at the time of purchase. For iShares Short-Term TIPS Bond Index Fund, Investor A Shares are not subject to any sales charge and bear no ongoing distribution fee. These shares are subject to an ongoing service fee of 0.25% per year. These shares are generally available through financial intermediaries.
Investor C Shares (available only in BlackRock Alternative Capital Strategies Fund and BlackRock Emerging Markets Equity Strategies Fund) are subject to a 1.00% CDSC if redeemed within one year of purchase. In addition, these shares are subject to a distribution fee of 0.75% per year and a service fee of 0.25% per year. These shares are generally available through financial intermediaries. Effective November 8, 2018, BlackRock Alternative Capital Strategies Fund and BlackRock Emerging Markets Equity Strategies Fund adopted an automatic conversion feature whereby Investor C Shares held for approximately ten years will be automatically converted into Investor A Shares and, thereafter, investors will be subject to lower ongoing fees.
Class K Shares (available only in BlackRock Emerging Markets Equity Strategies Fund and iShares Short-Term TIPS Bond Index Fund) are not subject to any sales charge. These shares bear no ongoing distribution or service fees and are available only to certain eligible investors.
Performance information reflects past performance and does not guarantee future results. Current performance may be lower or higher than the performance data quoted. Refer towww.blackrock.com to obtain performance data current to the most recent month-end. Performance results do not reflect the deduction of taxes that a shareholder would pay on fund distributions or the redemption of fund shares. Figures shown in the performance table on the previous pages assume reinvestment of all distributions, if any, at net asset value (“NAV”) on the ex-dividend/payable date. Investment return and principal value of shares will fluctuate so that shares, when redeemed, may be worth more or less than their original cost. Distributions paid to each class of shares will vary because of the different levels of service, distribution and transfer agency fees applicable to each class, which are deducted from the income available to be paid to shareholders.
BlackRock Advisors, LLC (the “Manager”), each Fund’s investment adviser, has contractually agreed to waive and/or reimburse a portion of the Funds’ expenses. Without such waiver and/or reimbursement, the Funds’ performance would have been lower. The Manager is under no obligation to continue waiving and/or reimbursing its fees after the applicable termination date of such agreement. See Note 6 of the Notes to Financial Statements for additional information on waivers and/or reimbursements.
Disclosure of Expenses
Shareholders of the Funds may incur the following charges: (a) transactional expenses, such as sales charges; and (b) operating expenses, including investment advisory fees, service and distribution fees, including 12b-1 fees, acquired fund fees and expenses, and other fund expenses. The expense examples on the previous pages (which are based on a hypothetical investment of $1,000 invested on July 1, 2018 and held through December 31, 2018) are intended to assist shareholders both in calculating expenses based on an investment in each Fund and in comparing these expenses with similar costs of investing in other mutual funds.
The expense examples provide information about actual account values and actual expenses. In order to estimate the expenses a shareholder paid during the period covered by this report, shareholders can divide their account value by $1,000 and then multiply the result by the number corresponding to their Fund and share class under the heading entitled “Expenses Paid During the Period.”
The expense examples also provide information about hypothetical account values and hypothetical expenses based on a Fund’s actual expense ratio and an assumed rate of return of 5% per year before expenses. In order to assist shareholders in comparing the ongoing expenses of investing in these Funds and other funds, compare the 5% hypothetical examples with the 5% hypothetical examples that appear in shareholder reports of other funds.
The expenses shown in the expense examples are intended to highlight shareholders’ ongoing costs only and do not reflect any transactional expenses, such as sales charges, if any. Therefore, the hypothetical examples are useful in comparing ongoing expenses only, and will not help shareholders determine the relative total expenses of owning different funds. If these transactional expenses were included, shareholder expenses would have been higher.
Derivative Financial Instruments
The Funds may invest in various derivative financial instruments. These instruments are used to obtain exposure to a security, commodity, index, market, and/or other assets without owning or taking physical custody of securities, commodities and/or other referenced assets or to manage market, equity, credit, interest rate, foreign currency exchange rate, commodity and/or other risks. Derivative financial instruments may give rise to a form of economic leverage and involve risks, including the imperfect correlation between the value of a derivative financial instrument and the underlying asset, possible default of the counterparty to the transaction or illiquidity of the instrument. The Funds’ successful use of a derivative financial instrument depends on the investment adviser’s ability to predict pertinent market movements accurately, which cannot be assured. The use of these instruments may result in losses greater than if they had not been used, may limit the amount of appreciation a Fund can realize on an investment and/or may result in lower distributions paid to shareholders. The Funds’ investments in these instruments, if any, are discussed in detail in the Notes to Financial Statements.
| | | | |
| ABOUT FUND PERFORMANCE / DISCLOSUREOF EXPENSES / DERIVATIVE FINANCIAL INSTRUMENTS | | | 13 | |
| | |
Schedule of Investments December 31, 2018 | | BlackRock Emerging Markets Equity Strategies Fund (Percentages shown are based on Net Assets) |
| | | | | | | | |
| Security | | Shares | | | Value | |
|
Common Stocks— 87.1% | |
|
| Argentina— 4.9% | |
Banco Macro SA — ADR | | | 5,924 | | | $ | 261,959 | |
Grupo Financiero Galicia SA — ADR | | | 9,001 | | | | 248,158 | |
YPF SA — ADR | | | 12,460 | | | | 166,839 | |
| | | | | | | | |
| | | | 676,956 | |
|
| Brazil— 3.9% | |
BB Seguridade Participacoes SA | | | 40,226 | | | | 286,354 | |
LOG Commercial Properties e Participacoes SA(a) | | | 575 | | | | 2,674 | |
MRV Engenharia e Participacoes SA | | | 10,464 | | | | 33,370 | |
Ultrapar Participacoes SA | | | 15,491 | | | | 212,635 | |
| | | | | | | | |
| | | | 535,033 | |
|
| Canada— 0.8% | |
Eldorado Gold Corp.(a) | | | 39,791 | | | | 116,587 | |
| | | | | | | | |
|
| China— 14.5% | |
3SBio, Inc.(b) | | | 230,000 | | | | 294,037 | |
Bank of China Ltd., Class H | | | 580,000 | | | | 250,039 | |
China Eastern Airlines Corp. Ltd., Class H | | | 314,000 | | | | 174,169 | |
China Overseas Land & Investment Ltd. | | | 96,000 | | | | 330,990 | |
China Pacific Insurance Group Co. Ltd., Class H | | | 19,200 | | | | 62,044 | |
China Unicom Hong Kong Ltd. | | | 234,000 | | | | 249,305 | |
Ctrip.com International Ltd. — ADR(a) | | | 1,653 | | | | 44,730 | |
Industrial & Commercial Bank of China Ltd., Class H | | | 389,000 | | | | 276,680 | |
PetroChina Co. Ltd., ADR | | | 3,684 | | | | 226,750 | |
Skyworth Digital Holdings Ltd. | | | 487,369 | | | | 105,136 | |
| | | | | | | | |
| | | | 2,013,880 | |
|
| Greece— 3.8% | |
Alpha Bank AE(a) | | | 145,315 | | | | 182,785 | |
National Bank of Greece SA(a) | | | 275,206 | | | | 346,350 | |
| | | | | | | | |
| | | | 529,135 | |
|
| Hong Kong— 11.2% | |
Cathay Pacific Airways Ltd. | | | 171,000 | | | | 243,335 | |
China Mobile Ltd. | | | 48,500 | | | | 469,315 | |
China Resources Power Holdings Co. Ltd. | | | 164,000 | | | | 315,443 | |
MMG Ltd.(a) | | | 544,000 | | | | 233,704 | |
SJM Holdings Ltd. | | | 305,000 | | | | 283,379 | |
| | | | | | | | |
| | | | 1,545,176 | |
|
| India— 4.7% | |
Dr. Reddy’s Laboratories Ltd. — ADR | | | 9,312 | | | | 351,062 | |
Larsen & Toubro Ltd. — GDR | | | 14,284 | | | | 292,025 | |
| | | | | | | | |
| | | | 643,087 | |
|
| Indonesia— 3.3% | |
Astra International Tbk PT | | | 604,600 | | | | 346,370 | |
Semen Indonesia Persero Tbk PT | | | 144,900 | | | | 115,859 | |
| | | | | | | | |
| | | | 462,229 | |
|
| Israel— 1.6% | |
Israel Chemicals Ltd. | | | 37,755 | | | | 214,678 | |
| | | | | | | | |
|
| Malaysia— 3.5% | |
Sapura Energy Bhd(a) | | | 1,698,700 | | | | 118,676 | |
Telekom Malaysia Bhd | | | 569,400 | | | | 367,171 | |
| | | | | | | | |
| | | | 485,847 | |
|
| Mexico— 2.5% | |
Grupo Financiero Banorte SAB de CV, Series O | | | 71,005 | | | | 346,069 | |
| | | | | | | | |
|
| Poland— 4.4% | |
Alior Bank SA(a) | | | 25,693 | | | | 365,810 | |
KGHM Polska Miedz SA(a) | | | 9,979 | | | | 236,744 | |
| | | | | | | | |
| | | | 602,554 | |
|
| Russia— 8.3% | |
Gazprom PJSC — ADR | | | 23,186 | | | | 102,652 | |
Magnit PJSC | | | 4,565 | | | | 229,555 | |
| | | | | | | | |
| Security | | Shares | | | Value | |
|
| Russia (continued) | |
Sberbank of Russia PJSC — ADR | | | 52,248 | | | $ | 572,176 | |
VTB Bank PJSC | | | 246,545,860 | | | | 119,754 | |
VTB Bank PJSC — GDR | | | 117,616 | | | | 130,732 | |
| | | | | | | | |
| | | | 1,154,869 | |
|
| South Africa— 1.6% | |
Old Mutual Ltd. | | | 145,944 | | | | 220,829 | |
| | | | | | | | |
|
| South Korea— 9.5% | |
Hyundai Motor Co. | | | 2,477 | | | | 262,959 | |
Hyundai Motor Co., — GDR | | | 2 | | | | 64 | |
Pan Ocean Co. Ltd.(a) | | | 49,095 | | | | 196,021 | |
Samsung Electronics Co. Ltd. | | | 16,450 | | | | 572,652 | |
Shinhan Financial Group Co. Ltd. | | | 7,967 | | | | 282,479 | |
| | | | | | | | |
| | | | 1,314,175 | |
|
| Taiwan— 4.3% | |
FLEXium Interconnect, Inc. | | | 14,000 | | | | 33,969 | |
MediaTek, Inc. | | | 26,000 | | | | 193,505 | |
Merry Electronics Co. Ltd. | | | 16,000 | | | | 63,879 | |
Nanya Technology Corp. | | | 171,000 | | | | 306,229 | |
| | | | | | | | |
| | | | 597,582 | |
|
| Ukraine— 0.7% | |
Ferrexpo PLC | | | 40,996 | | | | 101,711 | |
| | | | | | | | |
|
| United Arab Emirates— 3.6% | |
Emaar Properties PJSC | | | 443,796 | | | | 498,927 | |
| | | | | | | | |
| |
Total Common Stocks— 87.1%
(Cost— $12,993,380) | | | | 12,059,324 | |
| | | | | |
|
| Investment Companies— 2.1% | |
iShares MSCI South Korea ETF(d) | | | 5,061 | | | | 297,890 | |
| | | | | | | | |
| |
Total Investment Companies— 2.1%
(Cost— $376,097) | | | | 297,890 | |
| | | | | |
|
Preferred Stock | |
|
Automobiles— 0.9% | |
Hyundai Motor Co., Preference Shares, 0.00% | | | 1,985 | | | | 124,949 | |
| | | | | | | | |
| |
Total Preferred Stocks— 0.9%
(Cost— $182,122) | | | | 124,949 | |
| | | | | |
|
Rights— 0.0% | |
|
Malaysia— 0.0% | |
Sapura Energy Bhd (Expires 01/16/19)(a) | | | 3,605,920 | | | | 9 | |
| | | | | | | | |
| |
Total Rights— 0.0%
(Cost— $0) | | | | 9 | |
| | | | | |
| |
Total Long-Term Investments— 90.1%
(Cost— $13,551,599) | | | | 12,482,172 | |
| | | | | |
|
| Short-Term Securities— 3.4% | |
BlackRock Liquidity Funds,T-Fund, Institutional Class, 2.32%(c)(d) | | | 471,061 | | | | 471,061 | |
| | | | | | | | |
| |
Total Short-Term Securities— 3.4%
(Cost— $471,061) | | | | 471,061 | |
| | | | | |
| |
Total Investments— 93.5%
(Cost— $14,022,660) | | | | 12,953,233 | |
| |
Other Assets Less Liabilities— 6.5% | | | | 895,233 | |
| | | | | |
| |
Net Assets— 100.0% | | | $ | 13,848,466 | |
| | | | | |
| | |
| 14 | | 2018 BLACKROCK ANNUAL REPORTTO SHAREHOLDERS |
| | |
Schedule of Investments (continued) December 31, 2018 | | BlackRock Emerging Markets Equity Strategies Fund |
| (a) | Non-income producing security. |
| (b) | Security exempt from registration pursuant to Rule 144A under the Securities Act of 1933, as amended. These securities may be resold in transactions exempt from registration to qualified institutional investors. |
| (c) | Annualized7-day yield as of period end. |
| (d) | During the year ended December 31, 2018, investments in issuers considered to be affiliates of the Fund for purposes of Section 2(a)(3) of the Investment Company Act of 1940, as amended, and/or related parties of the Fund were as follows: |
| | | | | | | | | | | | | | | | | | | | | | | | | | | | | | | | |
| Affiliate Persons and/or Related Parties | | Shares Held at
12/31/17 | | | Shares
Purchased | | | Shares Sold | | | Shares Held at
12/31/18 | | | Value at
12/31/18 | | | Income | | | Net
Realized
Gain (Loss) (a) | | | Change in
Unrealized
Appreciation
(Depreciation) | |
BlackRock Liquidity Funds,T-Fund, Institutional Class | | | 3,283,441 | | | | — | | | | (2,812,380 | )(b) | | | 471,061 | | | $ | 471,061 | | | $ | 20,519 | | | $ | — | | | $ | — | |
iShares MSCI South Korea ETF | | | — | | | | 28,346 | | | | (23,285 | ) | | | 5,061 | | | | 297,890 | | | | 4,649 | | | | (29,989 | ) | | | (78,207 | ) |
| | | | | | | | | | | | | | | | | | | | | | | | | | | | | | | | |
| | | $ | 768,951 | | | $ | 25,168 | | | $ | (29,989 | ) | | $ | (78,207 | ) |
| | | | | | | | | | | | | | | | | | | | | | | | | | | | | | | | |
| | (a) | Includes net capital gain distributions, if applicable. | |
| | (b) | Represents net shares sold. | |
Derivative Financial Instruments Outstanding as of Period End
OTC Total Return Swaps (a)
| | | | | | | | | | | | | | | | | | | | | | |
| Reference Entity | | Counterparty | | Expiration
Date | | | Net Notional
Amount | | | Unrealized
Appreciation
(Depreciation) | | | Net Value of
Reference
Entities | | | Gross
Notional
Amount
Net Asset
Percentage | |
Equity Securities Long/Short: | | Credit Suisse International | | | 11/04/19 - 02/08/23 | | | $ | 784,428 | | | $ | 55,968 | (b) | | $ | 829,693 | | | | 19.9 | % |
| | Deutsche Bank AG | | | 02/17/23 - 02/20/23 | | | | (844,354 | ) | | | (5,097 | )(c) | | | (844,364 | ) | | | 6.4 | |
| | HSBC Bank PLC | | | 02/10/23 - 02/13/23 | | | | 988,584 | | | | (146,646 | )(d) | | | 843,743 | | | | 35.9 | |
| | | | | | | | | | | | | | | | | | | | | | |
| | | $ | 928,658 | | | $ | (95,775 | ) | | $ | 829,072 | | | | | |
| | | | | | | | | | | | | | | | | | | | | | |
| | (a) | In regards to total return swaps with multiple financing rate benchmarks, the Fund receives or pays the total return on a portfolio of long and short positions underlying the total return swap. In addition, the Fund pays or receives a variable rate of interest, based on a specified benchmark, plus or minus a spread in a range of15-850 basis points. The benchmark and spread are determined based upon the country and/or currency of the individual underlying positions. The following are the specified benchmarks used in determining the variable rate of interest: | |
ICE LIBOR USD 1 Month
ICE LIBOR USD 1 Week
United States Overnight Bank Funding Rate
| | (b) | Amount includes $10,703 of net dividends and financing fees. | |
| | (c) | Amount includes $(5,087) of net dividends and financing fees. | |
| | (d) | Amount includes $(1,805) of net dividends and financing fees. | |
See notes to financial statements.
| | | | |
| SCHEDULES OF INVESTMENTS | | | 15 | |
| | |
Schedule of Investments (continued) December 31, 2018 | | BlackRock Emerging Markets Equity Strategies Fund |
The following table represents the individual long and short positions and related values of the equity securities underlying the total return swap with Credit Suisse International as of December 31, 2018 expiration date 11/04/19 — 02/08/23:
| | | | | | | | | | | | |
| | | Shares | | | Value | | | % of
Basket
Value | |
|
Reference Entity — Long | |
|
| Brazil | |
LOG Commercial Properties e Participacoes SA | | | 6,319 | | | $ | 29,380 | | | | 3.5 | % |
MRV Engenharia e Participacoes SA | | | 96,635 | | | | 308,175 | | | | 37.2 | |
| | | | | | | | | | | | |
| | | | 337,555 | | | | | |
|
| China | |
SJM Holdings Ltd. | | | 173,000 | | | | 160,736 | | | | 19.4 | |
| | | | | | | | | | | | |
|
| Greece | |
Alpha Bank AE | | | 20,934 | | | | 26,332 | | | | 3.2 | |
| | | | | | | | | | | | |
|
| Hong Kong | |
China Unicom Hong Kong Ltd | | | 102,000 | | | | 108,671 | | | | 13.1 | |
Merry Electronics Co. Ltd. | | | 2,000 | | | | 7,985 | | | | 0.9 | |
| | | | | | | | | | | | |
| | | | 116,656 | | | | | |
|
| Mexico | |
Cemex S.A.B. de CV | | | 78,450 | | | | 378,129 | | | | 45.6 | |
| | | | | | | | | | | | |
|
| South Africa | |
Old Mutual Ltd | | | 28,884 | | | | 44,878 | | | | 5.4 | |
| | | | | | | | | | | | |
|
| South Korea | |
Samsung Electronics Co Ltd | | | 3,767 | | | | 131,136 | | | | 15.8 | |
| | | | | | | | | | | | |
|
| Taiwan | |
Flexium Interconnect, Inc. | | | 95,000 | | | | 230,506 | | | | 27.8 | |
| | | | | | | | | | | | |
|
| Thailand | |
Thai Beverage PCL | | | 681,300 | | | | 305,414 | | | | 36.8 | |
| | | | | | | | | | | | |
|
| United Kingdom | |
Ferrexpo PLC | | | 38,994 | | | | 96,744 | | | | 11.6 | |
| | | | | | | | | | | | |
| | |
Total Reference Entity — Long | | | | 1,828,086 | | | | | |
| | | | | | | | | | | | |
|
Reference Entity — Short | |
|
| Philippines | |
BDO Unibank, Inc. | | | (65,431 | ) | | | (162,723 | ) | | | (19.6 | ) |
| | | | | | | | | | | | |
|
| South Korea | |
Celltrion Inc. | | | (1,105 | ) | | | (221,982 | ) | | | (26.7 | ) |
| | | | | | | | | | | | |
|
| Turkey | |
BIM Birlesik Magazalar AS | | | (18,142 | ) | | | (298,209 | ) | | | (35.9 | ) |
| | | | | | | | | | | | |
|
| United Arab Emirates | |
IHH Healthcare Bhd | | | (4,900 | ) | | | (6,379 | ) | | | (0.8 | ) |
| | | | | | | | | | | | |
|
| United Kingdom | |
MMC Norilsk Nickel PJSC | | | (5,735 | ) | | | (107,621 | ) | | | (13.0 | ) |
Reliance Industries Ltd | | | (6,331 | ) | | | (201,479 | ) | | | (24.3 | ) |
| | | | | | | | | | | | |
| | | | (309,100 | ) | | | | |
| | | | | | | | | | | | |
| | |
Total Reference Entity — Short | | | | (998,393 | ) | | | | |
| | | | | | | | | | | | |
| | |
Net Value of Reference Entity — Credit Suisse International | | | $ | 829,693 | | | | | |
| | | | | | | | | | | | |
The following table represents the individual long and short positions and related values of the equity securities underlying the total return swap with Deutsche Bank AG as of December 31, 2018 expiration dates 02/17/23 — 02/20/23:
| | | | | | | | | | | | |
| | | Shares | | | Value | | | % of
Basket
Value | |
|
Reference Entity — Long | |
|
| United Arab Emirates | |
Emaar Properties PJSC | | | 16,765 | | | $ | 18,848 | | | | (2.2 | )% |
| | | | | | | | | | | | |
| | |
Total Reference Entity — Long | | | | 18,848 | | | | | |
| | | | | | | | | |
|
Reference Entity — Short | |
|
| Russia | |
Alrosa PJSC | | | (211,712 | ) | | | (298,223 | ) | | | 35.3 | |
| | | | | | | | | | | | |
|
| United Arab Emirates | |
Airports of Thailand PCL | | | (138,200 | ) | | | (272,707 | ) | | | 32.3 | |
IHH Healthcare Bhd | | | (224,500 | ) | | | (292,282 | ) | | | 34.6 | |
| | | | | | | | | | | | |
| | | | (564,989 | ) | | | | |
| | | | | | | | | |
| | |
Total Reference Entity — Short | | | | (863,211 | ) | | | | |
| | | | | | | | | |
| | |
Net Value of Reference Entity — Deutsche Bank AG | | | $ | (844,364 | ) | | | | |
| | | | | | | | | | | | |
The following table represents the individual long and short positions and related values of the equity securities underlying the total return swap with HSBC Bank PLC as of December 31, 2018 expiration date 02/10/23 — 02/13/23:
| | | | | | | | | | | | |
| | | Shares | | | Value | | | % of
Basket
Value | |
|
Reference Entity — Long | |
|
| China | |
Bank of China Ltd. | | | 400,000 | | | $ | 172,441 | | | | 20.4 | % |
| | | | | | | | | | | | |
|
| Greece | |
National Bank Of Greece | | | 10,811 | | | | 13,606 | | | | 1.6 | |
| | | | | | | | | | | | |
|
| Hong Kong | |
China Pacific Insurance Co. Ltd. | | | 85,200 | | | | 275,321 | | | | 32.7 | |
Merry Electronics Co. Ltd. | | | 33,000 | | | | 131,750 | | | | 15.6 | |
| | | | | | | | | | | | |
| | | | 407,071 | | | | | |
|
| Israel | |
Bezeq | | | 281,743 | | | | 274,933 | | | | 32.6 | |
| | | | | | | | | | | | |
|
| Malaysia | |
Sapura Energy Bhd. Right | | | 357,720 | | | | 1 | | | | 0.0 | |
Sapura Energy Bhd. | | | 894,300 | | | | 62,478 | | | | 7.4 | |
Telekom Malaysia Bhd | | | 35,800 | | | | 23,085 | | | | 2.7 | |
| | | | | | | | | | | | |
| | | | 85,564 | | | | | |
|
| Poland | |
KGHM Polska Miedz SA | | | 3,081 | | | | 73,094 | | | | 8.7 | |
PGE Polska Grupa Energetyczna SA | | | 102,223 | | | | 274,099 | | | | 32.5 | |
| | | | | | | | | | | | |
| | | | 347,193 | | | | | |
|
| Russia | |
Gazprom PAO | | | 30,398 | | | | 134,581 | | | | 16.0 | |
Magnit PJSC | | | 1,864 | | | | 93,733 | | | | 11.1 | |
| | | | | | | | | | | | |
| | | | 228,314 | | | | | |
|
| South Korea | |
Shinhan Financial Group Co. Ltd.. | | | 52 | | | | 1,844 | | | | 0.2 | |
| | | | | | | | | | | | |
| | |
| 16 | | 2018 BLACKROCK ANNUAL REPORTTO SHAREHOLDERS |
| | |
Schedule of Investments (continued) December 31, 2018 | | BlackRock Emerging Markets Equity Strategies Fund |
| | | | | | | | | | | | |
| | | Shares | | | Value | | | % of
Basket
Value | |
|
| Taiwan | |
Yageo Corp. | | | 19,000 | | | $ | 196,799 | | | | 23.3 | % |
| | | | | | | | | | | | |
|
| United Kingdom | |
Prudential PLC | | | 16,982 | | | | 303,238 | | | | 35.9 | |
| | | | | | | | | | | | |
|
| United States | |
Alamos Gold Inc | | | 76,486 | | | | 275,349 | | | | 32.6 | |
Bilibili, Inc. — ADR | | | 19,827 | | | | 289,276 | | | | 34.3 | |
Ctrip.com International Ltd | | | 10,127 | | | | 274,037 | | | | 32.5 | |
| | | | | | | | | | | | |
| | | | 838,662 | | | | | |
| | | | | | | | | | | | |
| | |
Total Reference Entity — Long | | | | 2,869,665 | | | | | |
| | | | | | | | | | | | |
|
Reference Entity — Short | |
|
| Brazil | |
Usinas Siderurgicas de Minas Gerais SA | | | (13,298 | ) | | | (31,635 | ) | | | (3.7 | ) |
| | | | | | | | | | | | |
|
| China | |
AIA Group Ltd. | | | (23,600 | ) | | | (196,041 | ) | | | (23.2 | ) |
| | | | | | | | | | | | |
|
| Philippines | |
Ayala Land, Inc. | | | (336,300 | ) | | | (259,934 | ) | | | (30.8 | ) |
| | | | | | | | | | | | |
| | | Shares | | | Value | | | % of
Basket
Value | |
|
| Philippines (continued) | |
BDO Unibank, Inc. | | | (14,470 | ) | | $ | (35,986 | ) | | | (4.3 | ) % |
| | | | | | | | | | | | |
| | | | (295,920 | ) | | | | |
|
| Qatar | |
Commercial Bank PQSC | | | (17,385 | ) | | | (187,619 | ) | | | (22.2 | ) |
Qatar National Bank QPSC | | | (4,300 | ) | | | (229,174 | ) | | | (27.2 | ) |
| | | | | | | | | | | | |
| | | | (416,793 | ) | | | | |
|
| United Arab Emirates | |
IHH Healthcare Bhd | | | (9,600 | ) | | | (12,498 | ) | | | (1.5 | ) |
| | | | | | | | | | | | |
|
| United Kingdom | |
Novatek PJSC | | | (1,507 | ) | | | (257,493 | ) | | | (30.5 | ) |
| | | | | | | | | | | | |
|
| United States | |
ICICI Bank Ltd | | | (26,493 | ) | | | (272,613 | ) | | | (32.3 | ) |
NIO, Inc. — ADR | | | (40,546 | ) | | | (258,278 | ) | | | (30.6 | ) |
Pinduoduo — ADR | | | (12,685 | ) | | | (284,651 | ) | | | (33.8 | ) |
| | | | | | | | | | | | |
| | | | (815,542 | ) | | | | |
| | | | | | | | | | | | |
| | |
Total Reference Entity — Short | | | | (2,025,922 | ) | | | | |
| | | | | | | | | | | | |
| | |
Net Value of Reference Entity — HSBC Bank PLC | | | $ | 843,743 | | | | | |
| | | | | | | | | | | | |
Balances Reported in the Statements of Assets and Liabilities for OTC Derivatives
| | | | | | | | | | | | | | | | |
| | | Swap
Premiums
Paid | | | Swap
Premiums
Received | | | Unrealized
Appreciation | | | Unrealized
Depreciation | |
OTC Derivatives | | $ | — | | | $ | — | | | $ | 55,968 | | | $ | (151,743 | ) |
Derivative Financial Instruments Categorized by Risk Exposure
As of period end, the fair values of derivative financial instruments located in the Statements of Assets and Liabilities were as follows:
| | | | | | | | | | | | | | | | | | | | | | | | | | | | |
| | | Commodity
Contracts | | | Credit
Contracts | | | Equity
Contracts | | | Foreign
Currency
Exchange
Contracts | | | Interest
Rate
Contracts | | | Other Contracts | | | Total | |
Assets — Derivative Financial Instruments | | | | | | | | | | | | | | | | | | | | | | | | | | | | |
Swaps — OTC | | | | | | | | | | | | | | | | | | | | | | | | | | | | |
Unrealized appreciation on OTC swaps; Swap premiums paid | | $ | — | | | $ | — | | | $ | 55,968 | | | $ | — | | | $ | — | | | $ | — | | | $ | 55,968 | |
| | | | | | | | | | | | | | | | | | | | | | | | | | | | |
Liabilities — Derivative Financial Instruments | | | | | | | | | | | | | | | | | | | | | | | | | | | | |
Swaps — OTC | | | | | | | | | | | | | | | | | | | | | | | | | | | | |
Unrealized depreciation on OTC swaps; Swap premiums received | | $ | — | | | $ | — | | | $ | 151,743 | | | $ | — | | | $ | — | | | $ | — | | | $ | 151,743 | |
| | | | | | | | | | | | | | | | | | | | | | | | | | | | |
For the period ended December 31, 2018, the effect of derivative financial instruments in the Statements of Operations was as follows:
| | | | | | | | | | | | | | | | | | | | | | | | | | | | |
| | | Commodity
Contracts | | | Credit
Contracts | | | Equity
Contracts | | | Foreign
Currency
Exchange
Contracts | | | Interest
Rate
Contracts | | | Other Contracts | | | Total | |
Net Realized Gain (Loss) from: | | | | | | | | | | | | | | | | | | | | | | | | | | | | |
Futures contracts | | $ | — | | | $ | — | | | $ | 41,212 | | | $ | — | | | $ | — | | | $ | — | | | $ | 41,212 | |
Forward foreign currency exchange contracts | | | — | | | | — | | | | — | | | | 1,572 | | | | — | | | | — | | | | 1,572 | |
Swaps | | | — | | | | — | | | | 2,561,089 | | | | — | | | | — | | | | — | | | | 2,561,089 | |
| | | | | | | | | | | | | | | | | | | | | | | | | | | | |
| | $ | — | | | $ | — | | | $ | 2,602,301 | | | $ | 1,572 | | | $ | — | | | $ | — | | | $ | 2,603,873 | |
| | | | | | | | | | | | | | | | | | | | | | | | | | | | |
| | | | | | | |
| Net Change in Unrealized Appreciation (Depreciation) on: | | | | | | | | | | | | | | | | | | | | | |
Futures contracts | | $ | — | | | $ | — | | | $ | 8,244 | | | $ | — | | | $ | — | | | $ | — | | | $ | 8,244 | |
Swaps | | | — | | | | — | | | | 44,342 | | | | — | | | | — | | | | — | | | | 44,342 | |
| | | | | | | | | | | | | | | | | | | | | | | | | | | | |
| | $ | — | | | $ | — | | | $ | 52,586 | | | $ | — | | | $ | — | | | $ | — | | | $ | 52,586 | |
| | | | | | | | | | | | | | | | | | | | | | | | | | | | |
| | | | |
| SCHEDULES OF INVESTMENTS | | | 17 | |
| | |
Schedule of Investments (continued) December 31, 2018 | | BlackRock Emerging Markets Equity Strategies Fund |
Average Quarterly Balances of Outstanding Derivative Financial Instruments
| | | | |
Futures contracts: | |
Average notional value of contracts — long | | $ | — | (a) |
Forward foreign currency exchange contracts: | |
Average amounts purchased — in USD | | $ | 150,012 | |
Average amounts sold — in USD | | $ | 149,619 | |
Total return swaps: | |
Average notional value | | $ | 187,539 | |
| | (a) | Derivative not held atquarter-end. The risk expoure table serves as an indicator of activity during the period. | |
For more information about the Fund’s investment risks regarding derivative financial instruments, refer to the Notes to Financial Statements.
Derivative Financial Instruments — Offsetting as of Period End
The Fund’s derivative assets and liabilities (by type) were as follows:
| | | | | | | | |
| | | Assets | | | Liabilities | |
Swaps — OTC(a) | | $ | 55,968 | | | $ | 151,743 | |
| | | | | | | | |
Total derivative assets and liabilities in the Statements of Assets and Liabilities | | $ | 55,968 | | | $ | 151,743 | |
Derivatives not subject to a Master Netting Agreement or similar agreement (“MNA”) | | | — | | | | — | |
| | | | | | | | |
Total derivative assets and liabilities subject to an MNA | | $ | 55,968 | | | $ | 151,743 | |
| | | | | | | | |
| | (a) | Includes unrealized appreciation (depreciation) on OTC swaps and swap premiums (paid/received) in the Statements of Assets and Liabilities. | |
The following table presents the Fund’s derivative assets (and liabilities) by counterparty net of amounts available for offset under an MNA and net of the related collateral received (and pledged) by the Fund:
| | | | | | | | | | | | | | | | | | | | |
| Counterparty | | Derivative Assets
Subject to an MNA by
Counterparty | | | Derivatives
Available for Offset | | | Non-cash Collateral
Received | | | Cash Collateral
Received | | | Net Amount
of Derivative
Assets (a) | |
Credit Suisse International | | $ | 55,968 | | | $ | — | | | $ | — | | | $ | — | | | $ | 55,968 | |
| | | | | | | | | | | | | | | | | | | | |
| | | | | | | | | | | | | | | | | | | | |
| Counterparty | | Derivative Assets
Subject to an MNA by
Counterparty | | | Derivatives
Available for Offset | | | Non-cash Collateral
Received | | | Cash Collateral
Received | | | Net Amount
of Derivative
Assets (b) | |
Deutsche Bank AG | | $ | 5,097 | | | $ | — | | | $ | — | | | $ | — | | | $ | 5,097 | |
HSBC Bank PLC | | | 146,646 | | | | — | | | | — | | | | — | | | | 146,646 | |
| | | | | | | | | | | | | | | | | | | | |
| | $ | 151,743 | | | $ | — | | | $ | — | | | $ | — | | | $ | 151,743 | |
| | | | | | | | | | | | | | | | | | | | |
| | (a) | Net amount represents the net amount receivable from the counterparty in the event of default. | |
| | (b) | Net amount represents the net amount payable due to counterparty in the event of default. | |
Fair Value Hierarchy as of Period End
Various inputs are used in determining the fair value of investments and derivative financial instruments. For information about the Fund’s policy regarding valuation of investments and derivative financial instruments, refer to the Notes to Financial Statements.
The following tables summarize the Fund’s investments and derivative financial instruments categorized in the disclosure hierarchy:
| | | | | | | | | | | | | | | | |
| | | Level 1 | | | Level 2 | | | Level 3 | | | Total | |
Assets: | |
Investments: | |
Common Stocks: | |
Argentina | | $ | 676,956 | | | $ | — | | | $ | — | | | $ | 676,956 | |
Brazil | | | 535,033 | | | | — | | | | — | | | | 535,033 | |
Canada | | | 116,587 | | | | — | | | | — | | | | 116,587 | |
China | | | 271,480 | | | | 1,742,400 | | | | — | | | | 2,013,880 | |
Greece | | | — | | | | 529,135 | | | | — | | | | 529,135 | |
| | |
| 18 | | 2018 BLACKROCK ANNUAL REPORTTO SHAREHOLDERS |
| | |
Schedule of Investments (continued) December 31, 2018 | | BlackRock Emerging Markets Equity Strategies Fund |
Fair Value Hierarchy as of Period End (continued)
| | | | | | | | | | | | | | | | |
| | | Level 1 | | | Level 2 | | | Level 3 | | | Total | |
Hong Kong | | $ | — | | | $ | 1,545,176 | | | $ | — | | | $ | 1,545,176 | |
India | | | 351,063 | | | | 292,024 | | | | — | | | | 643,087 | |
Indonesia | | | — | | | | 462,229 | | | | — | | | | 462,229 | |
Israel | | | — | | | | 214,678 | | | | — | | | | 214,678 | |
Malaysia | | | — | | | | 485,847 | | | | — | | | | 485,847 | |
Mexico | | | 346,069 | | | | — | | | | — | | | | 346,069 | |
Poland | | | — | | | | 602,554 | | | | — | | | | 602,554 | |
Russia | | | — | | | | 1,154,869 | | | | — | | | | 1,154,869 | |
South Africa | | | — | | | | 220,829 | | | | — | | | | 220,829 | |
South Korea | | | 64 | | | | 1,314,111 | | | | — | | | | 1,314,175 | |
Taiwan | | | — | | | | 597,582 | | | | — | | | | 597,582 | |
Ukraine | | | — | | | | 101,711 | | | | — | | | | 101,711 | |
United Arab Emirates | | | — | | | | 498,927 | | | | — | | | | 498,927 | |
Investment Companies | | | 297,890 | | | | — | | | | — | | | | 297,890 | |
Preferred Stock | | | — | | | | 124,949 | | | | — | | | | 124,949 | |
Rights | | | — | | | | 9 | | | | — | | | | 9 | |
Short-Term Securities | | | 471,061 | | | | — | | | | — | | | | 471,061 | |
| | | | | | | | | | | | | | | | |
| | $ | 3,066,203 | | | $ | 9,887,030 | | | $ | — | | | $ | 12,953,233 | |
| | | | | | | | | | | | | | | | |
Derivative Financial Instruments(a) | |
Assets: | |
Equity contracts | | $ | — | | | $ | 55,968 | | | $ | — | | | $ | 55,968 | |
Liabilities: | |
Equity contracts | | | — | | | | (151,743 | ) | | | — | | | | (151,743 | ) |
| | | | | | | | | | | | | | | | |
| | $ | — | | | $ | (95,775 | ) | | $ | — | | | $ | (95,775 | ) |
| | | | | | | | | | | | | | | | |
| | (a) | Derivative financial instruments are swaps. Swaps are valued at the unrealized appreciation (depreciation) on the instrument. | |
Transfers between Level 1 and Level 2 were as follows:
| | | | | | | | | | | | | | | | |
| | | Transfers into Level 1 (a) | | | Transfers out of Level 1 (a) | | | Transfers into Level 2 (a) | | | Transfers out of Level 2 (a) | |
Assets: | |
Investments: | |
Common Stocks: | | $ | — | | | $ | (1,061,254 | ) | | $ | 1,061,254 | | | $ | — | |
| | | | | | | | | | | | | | | | |
| | (a) | External pricing service used to reflect any significant market movement between the time the Fund valued such foreign securities and the earlier closing of foreign markets. | |
See notes to financial statements.
| | | | |
| SCHEDULES OF INVESTMENTS | | | 19 | |
| | |
Schedule of Investments December 31, 2018 | | iShares Short-Term TIPS Bond Index Fund (Percentages shown are based on Net Assets) |
| | | | | | | | |
| Security | | Par
(000) | | | Value | |
|
| U.S. Treasury Obligations — 98.3% | |
U.S. Treasury Inflation Protected Security: | | | | | | | | |
0.13%, 04/15/19 | | $ | 436 | | | $ | 429,479 | |
1.88%, 07/15/19 | | | 44 | | | | 43,560 | |
1.38%, 01/15/20 | | | 36 | | | | 36,020 | |
0.13%, 04/15/20 | | | 392 | | | | 383,284 | |
1.25%, 07/15/20 | | | 177 | | | | 177,050 | |
1.13%, 01/15/21 | | | 130 | | | | 129,575 | |
0.13%, 04/15/21 | | | 341 | | | | 331,696 | |
0.63%, 07/15/21 | | | 230 | | | | 227,501 | |
0.13%, 01/15/22 | | | 263 | | | | 255,517 | |
0.13%, 04/15/22 | | | 327 | | | | 316,660 | |
0.13%, 07/15/22 | | | 194 | | | | 187,986 | |
0.13%, 01/15/23 | | | 277 | | | | 267,716 | |
0.63%, 04/15/23 | | | 139 | | | | 136,158 | |
0.38%, 07/15/23 | | | 319 | | | | 312,371 | |
| | | | | | | | |
| |
Total Long-Term Investments — 98.3%
(Cost — $3,278,105) | | | | 3,234,573 | |
| | | | | |
| | | | | | | | |
| Security | |
Shares | | | Value | |
|
| Short-Term Securities — 1.6% | |
BlackRock Cash Funds: Treasury,
SL Agency Shares, | | | | | | | | |
2.38%(a)(b) | | | 51,079 | | | $ | 51,079 | |
| | | | | | | | |
| |
Total Short-Term Securities — 1.6%
(Cost — $51,079) | | | | 51,079 | |
| | | | | |
| |
Total Investments — 99.9%
(Cost — $3,329,184) | | | | 3,285,652 | |
| |
Other Assets Less Liabilities — 0.1% | | | | 4,497 | |
| | | | | |
| |
Net Assets — 100.0% | | | $ | 3,290,149 | |
| | | | | |
| (a) | Annualized7-day yield as of period end. |
| (b) | During the year ended December 31, 2018, investments in issuers considered to be an affiliate of the Fund for purposes of Section 2(a)(3) of the Investment Company Act of 1940, as amended, were as follows: |
| | | | | | | | | | | | | | | | | | | | | | | | | | | | |
| Affiliate | | Shares
Held at
12/31/17 | | | Net
Activity | | | Shares
Held at
12/31/18 | | | Value at
12/31/18 | | | Income | | | Net
Realized
Gain (Loss) (a) | | | Change in
Unrealized
Appreciation
(Depreciation) | |
BlackRock Cash Funds: Treasury, SL Agency Shares | | | 104,747 | | | | (53,668 | ) | | | 51,079 | | | $ | 51,079 | | | $ | 1,187 | | | $ | — | | | $ | — | |
| | | | | | | | | | | | | | | | | | | | | | | | | | | | |
| | (a) | Includes net capital gain distributions, if applicable. | |
Fair Value Hierarchy as of Period End
Various inputs are used in determining the fair value of investments. For information about the Fund’s policy regarding valuation of investments, refer to the Notes to Financial Statements.
The following table summarizes the Fund’s investments categorized in the disclosure hierarchy:
| | | | | | | | | | | | | | | | |
| | | Level 1 | | | Level 2 | | | Level 3 | | | Total | |
Assets: | |
Investments: | |
Long-Term Investments: | |
U.S. Treasury Obligations | | $ | — | | | $ | 3,234,573 | | | $ | — | | | $ | 3,234,573 | |
Short-Term Securities | | | 51,079 | | | | — | | | | — | | | | 51,079 | |
| | | | | | | | | | | | | | | | |
| | $ | 51,079 | | | $ | 3,234,573 | | | $ | — | | | $ | 3,285,652 | |
| | | | | | | | | | | | | | | | |
During the year ended December 31, 2018, there were no transfers between levels.
See notes to financial statements.
| | |
| 20 | | 2018 BLACKROCK ANNUAL REPORTTO SHAREHOLDERS |
| | |
Schedule of Investments December 31, 2018 | | BlackRock Alternative Capital Strategies Fund (Percentages shown are based on Net Assets) |
| | | | | | | | |
| Security | | Shares | | | Value | |
|
Common Stocks — 9.3% | |
|
Banks — 0.1% | |
U.S. Bancorp | | | 699 | | | $ | 31,944 | |
| | | | | | | | |
|
| Beverages — 0.1% | |
PepsiCo, Inc. | | | 356 | | | | 39,331 | |
| | | | | | | | |
|
| Biotechnology — 0.2% | |
AbbVie, Inc. | | | 816 | | | | 75,227 | |
| | | | | | | | |
|
| Commercial Services & Supplies — 0.1% | |
Republic Services, Inc. | | | 661 | | | | 47,652 | |
| | | | | | | | |
|
| Consumer Finance — 0.0% | |
Ally Financial, Inc. | | | 720 | | | | 16,315 | |
| | | | | | | | |
|
| Containers & Packaging — 0.1% | |
Sonoco Products Co. | | | 397 | | | | 21,093 | |
| | | | | | | | |
|
| Distributors — 0.1% | |
Genuine Parts Co. | | | 457 | | | | 43,881 | |
| | | | | | | | |
|
| Diversified Telecommunication Services — 0.4% | |
AT&T, Inc. | | | 2,337 | | | | 66,698 | |
Verizon Communications, Inc. | | | 1,188 | | | | 66,789 | |
| | | | | | | | |
| | | | 133,487 | |
|
| Electric Utilities — 1.7% | |
Alliant Energy Corp. | | | 824 | | | | 34,814 | |
American Electric Power Co., Inc. | | | 625 | | | | 46,712 | |
Avangrid, Inc. | | | 1,456 | | | | 72,931 | |
Duke Energy Corp. | | | 856 | | | | 73,873 | |
Evergy, Inc. | | | 1,163 | | | | 66,023 | |
NextEra Energy, Inc. | | | 109 | | | | 18,946 | |
Pinnacle West Capital Corp. | | | 808 | | | | 68,842 | |
Portland General Electric Co. | | | 1,528 | | | | 70,059 | |
PPL Corp. | | | 758 | | | | 21,474 | |
Southern Co. | | | 1,453 | | | | 63,816 | |
Xcel Energy, Inc. | | | 1,359 | | | | 66,958 | |
| | | | | | | | |
| | | | 604,448 | |
|
| Equity Real Estate Investment Trusts (REITs) — 1.2% | |
Apple Hospitality REIT, Inc. | | | 4,476 | | | | 63,828 | |
Empire State Realty Trust, Inc., Class A | | | 4,621 | | | | 65,757 | |
EPR Properties | | | 432 | | | | 27,661 | |
Lamar Advertising Co., Class A | | | 308 | | | | 21,307 | |
Mid-America Apartment Communities, Inc. | | | 246 | | | | 23,542 | |
Outfront Media, Inc. | | | 1,072 | | | | 19,425 | |
Public Storage | | | 205 | | | | 41,494 | |
Simon Property Group, Inc. | | | 183 | | | | 30,742 | |
STORE Capital Corp. | | | 1,676 | | | | 47,448 | |
WP Carey, Inc. | | | 1,012 | | | | 66,124 | |
Xenia Hotels & Resorts, Inc. | | | 1,285 | | | | 22,102 | |
| | | | | | | | |
| | | | 429,430 | |
|
| Food Products — 0.7% | |
Campbell Soup Co. | | | 669 | | | | 22,071 | |
Flowers Foods, Inc. | | | 1,924 | | | | 35,536 | |
General Mills, Inc. | | | 1,445 | | | | 56,268 | |
Hershey Co. | | | 461 | | | | 49,410 | |
J.M. Smucker Co. | | | 329 | | | | 30,758 | |
Kellogg Co. | | | 681 | | | | 38,824 | |
| | | | | | | | |
| | | | 232,867 | |
|
| Gas Utilities — 0.1% | |
Atmos Energy Corp. | | | 193 | | | | 17,895 | |
| | | | | | | | |
|
| Hotels, Restaurants & Leisure — 0.3% | |
Carnival Corp. | | | 371 | | | | 18,290 | |
Cracker Barrel Old Country Store, Inc. | | | 162 | | | | 25,898 | |
| | | | | | | | |
| Security | | Shares | | | Value | |
|
| Hotels, Restaurants & Leisure (continued) | |
Darden Restaurants, Inc. | | | 163 | | | $ | 16,277 | |
Six Flags Entertainment Corp. | | | 654 | | | | 36,382 | |
| | | | | | | | |
| | | | 96,847 | |
|
| Household Durables — 0.1% | |
Garmin Ltd. | | | 547 | | | | 34,636 | |
| | | | | | | | |
|
| Household Products — 0.2% | |
Clorox Co. | | | 188 | | | | 28,978 | |
Procter & Gamble Co. | | | 602 | | | | 55,336 | |
| | | | | | | | |
| | | | 84,314 | |
|
| Insurance — 0.2% | |
Fidelity National Financial, Inc. | | | 1,012 | | | | 31,817 | |
Marsh & McLennan Cos., Inc. | | | 317 | | | | 25,281 | |
| | | | | | | | |
| | | | 57,098 | |
|
| IT Services — 0.4% | |
International Business Machines Corp. | | | 259 | | | | 29,441 | |
Paychex, Inc. | | | 842 | | | | 54,856 | |
Sabre Corp. | | | 3,300 | | | | 71,412 | |
| | | | | | | | |
| | | | 155,709 | |
|
| Media — 0.4% | |
Cinemark Holdings, Inc. | | | 511 | | | | 18,294 | |
Omnicom Group, Inc. | | | 870 | | | | 63,719 | |
Tribune Media Co., Class A | | | 1,507 | | | | 68,387 | |
| | | | | | | | |
| | | | 150,400 | |
|
| Metals & Mining — 0.1% | |
Southern Copper Corp. | | | 717 | | | | 22,062 | |
| | | | | | | | |
|
| Multi-Utilities — 1.3% | |
Ameren Corp. | | | 831 | | | | 54,206 | |
CMS Energy Corp. | | | 1,073 | | | | 53,274 | |
Consolidated Edison, Inc. | | | 935 | | | | 71,490 | |
Dominion Energy, Inc. | | | 794 | | | | 56,739 | |
DTE Energy Co. | | | 569 | | | | 62,761 | |
NiSource, Inc. | | | 2,951 | | | | 74,808 | |
NorthWestern Corp. | | | 312 | | | | 18,545 | |
WEC Energy Group, Inc. | | | 1,148 | | | | 79,511 | |
| | | | | | | | |
| | | | | | | 471,334 | |
|
| Oil, Gas & Consumable Fuels — 0.9% | |
Enterprise Products Partners LP | | | 1,142 | | | | 28,082 | |
EQT Midstream Partners LP | | | 1,575 | | | | 68,119 | |
Magellan Midstream Partners LP | | | 1,206 | | | | 68,815 | |
MPLX LP | | | 2,201 | | | | 66,690 | |
ONEOK, Inc. | | | 939 | | | | 50,659 | |
Shell Midstream Partners LP | | | 2,286 | | | | 37,513 | |
| | | | | | | | |
| | | | | | | 319,878 | |
|
| Pharmaceuticals — 0.3% | |
Johnson & Johnson | | | 193 | | | | 24,907 | |
Pfizer, Inc. | | | 2,213 | | | | 96,597 | |
| | | | | | | | |
| | | | | | | 121,504 | |
|
| Tobacco — 0.3% | |
Altria Group, Inc. | | | 1,328 | | | | 65,590 | |
Philip Morris International, Inc. | | | 883 | | | | 58,949 | |
| | | | | | | | |
| | | | | | | 124,539 | |
| | | | | | | | |
| |
Total Common Stocks — 9.3%
(Cost — $3,416,069) | | | | 3,331,891 | |
| | | | | |
| | | | |
| SCHEDULES OF INVESTMENTS | | | 21 | |
| | |
Schedule of Investments (continued) December 31, 2018 | | BlackRock Alternative Capital Strategies Fund (Percentages shown are based on Net Assets) |
| | | | | | | | |
| Security | | Par
(000) | | | Value | |
|
| Asset-Backed Securities — 14.8% | |
AmeriCredit Automobile Receivables Trust, Class D: | | | | | | | | |
Series2014-4, 3.07%, 11/09/20 | | $ | 100 | | | $ | 99,970 | |
Series2017-3, 3.18%, 07/18/23 | | | 150 | | | | 148,617 | |
Avant Loans Funding Trust, Series2018-A(a): | | | | | | | | |
Class A, 3.09%, 06/15/21 | | | 74 | | | | 74,293 | |
Class B, 3.95%, 12/15/22 | | | 150 | | | | 150,085 | |
CLUB Credit Trust, Class A(a): | | | | | | | | |
Series2017-P2, 2.61%, 01/15/24 | | | 64 | | | | 63,164 | |
Series2018-NP1, 2.99%, 05/15/24 | | | 14 | | | | 13,931 | |
Conn’s Receivables Funding LLC, Series2018-A, Class A, 3.25%, 01/15/23(a) | | | 53 | | | | 52,622 | |
Consumer Loan Underlying Bond Credit Trust, Class A(a): | | | | | | | | |
Series2017-NP2, 2.55%, 01/16/24 | | | 1 | | | | 1,110 | |
Series2018-P1, 3.39%, 07/15/25 | | | 84 | | | | 83,610 | |
Series2018-P2, 3.47%, 10/15/25 | | | 89 | | | | 89,004 | |
Drive Auto Receivables Trust: | | | | | | | | |
Series2016-BA, Class C, 3.19%, 07/15/22(a) | | | 94 | | | | 93,890 | |
Series2017-1, Class B, 2.36%, 03/15/21 | | | 17 | | | | 16,575 | |
Series2017-1, Class D, 3.84%, 03/15/23 | | | 150 | | | | 150,538 | |
Series2017-2, Class B, 2.25%, 06/15/21 | | | 9 | | | | 8,598 | |
Series2017-2, Class D, 3.49%, 09/15/23 | | | 100 | | | | 100,330 | |
Series2017-3, Class B, 2.30%, 05/17/21 | | | 90 | | | | 89,637 | |
Series2017-3, Class C, 2.80%, 07/15/22 | | | 100 | | | | 99,745 | |
Series2017-3, Class D, 3.53%, 12/15/23(a) | | | 100 | | | | 100,080 | |
Series2017-BA, Class D, 3.72%, 10/17/22(a) | | | 150 | | | | 150,285 | |
Series2018-1, Class C, 3.22%, 03/15/23 | | | 110 | | | | 109,777 | |
Series2018-2, Class B, 3.22%, 04/15/22 | | | 100 | | | | 99,895 | |
Series2018-2, Class D, 4.14%, 08/15/24 | | | 225 | | | | 226,816 | |
Series2018-3, Class B, 3.37%, 09/15/22 | | | 60 | | | | 60,031 | |
Enva LLC, Series2018-A, Class A, 4.20%, 05/20/26(a) | | | 213 | | | | 213,273 | |
Exeter Automobile Receivables Trust(a): | | | | | | | | |
Series2015-1A, Class C, 4.10%, 12/15/20 | | | 19 | | | | 19,389 | |
Series2017-2A, Class A, 2.11%, 06/15/21 | | | 13 | | | | 12,621 | |
Series2018-4A, Class B, 3.64%, 11/15/22 | | | 90 | | | | 89,979 | |
Flagship Credit Auto Trust, Series2016-4, Class B, 2.41%, 10/15/21(a) | | | 60 | | | | 59,605 | |
Marlette Funding Trust, Class A(a): | | | | | | | | |
Series2017-1A, 2.83%, 03/15/24 | | | 9 | | | | 8,779 | |
Series2017-2A, 2.39%, 07/15/24 | | | 12 | | | | 12,173 | |
Series2018-3A, 3.20%, 09/15/28 | | | 75 | | | | 74,984 | |
Series2018-4A, 3.71%, 12/15/28 | | | 195 | | | | 195,476 | |
National Collegiate Student Loan Trust, Series2006-2, Class A3, (1 mo. LIBOR US + 0.21%), 2.72%, 11/25/27(b) | | | 1 | | | | 1,253 | |
OneMain Financial Issuance Trust, Class A(a): | | | | | | | | |
Series2015-1A, 3.19%, 03/18/26 | | | 19 | | | | 19,423 | |
Series2016-2A, 4.10%, 03/20/28 | | | 39 | | | | 38,740 | |
Prosper Marketplace Issuance Trust, Class A(a): | | | | | | | | |
Series2018-1A, 3.11%, 06/17/24 | | | 44 | | | | 44,216 | |
Series2018-2A, 3.35%, 10/15/24 | | | 84 | | | | 84,254 | |
Residential Asset Mortgage Trust, Series 2005-EFC4, Class M2, (1 mo. LIBOR US + 0.44%), 2.95%, 09/25/35(b) | | | 4 | | | | 3,948 | |
Santander Drive Auto Receivables Trust: | | | | | | | | |
Series2014-4, Class D, 3.10%, 11/16/20 | | | 66 | | | | 65,666 | |
Series2015-1, Class D, 3.24%, 04/15/21 | | | 150 | | | | 150,031 | |
Series2015-2, Class D, 3.02%, 04/15/21 | | | 150 | | | | 149,904 | |
Series2016-1, Class C, 3.09%, 04/15/22 | | | 96 | | | | 96,232 | |
Series2016-3, Class D, 2.80%, 08/15/22 | | | 100 | | | | 99,451 | |
Series2017-1, Class B, 2.10%, 06/15/21 | | | 90 | | | | 89,485 | |
Series2017-2, Class B, 2.21%, 10/15/21 | | | 120 | | | | 119,670 | |
Series2017-2, Class C, 2.79%, 08/15/22 | | | 120 | | | | 119,429 | |
Series2017-2, Class D, 3.49%, 07/17/23 | | | 250 | | | | 248,685 | |
Series2018-5, Class D, 4.19%, 12/16/24 | | | 50 | | | | 50,566 | |
| | | | | | | | |
| Security | | Par
(000) | | | Value | |
|
| Asset-Backed Securities (continued) | |
SLM Private Education Loan Trust, Series2011-B, Class A2, 3.74%, 02/15/29(a) | | $ | 26 | | | $ | 26,480 | |
SoFi Consumer Loan Program LLC, Class A(a): | | | | | | | | |
Series2016-2A, 3.09%, 10/27/25 | | | 25 | | | | 25,192 | |
Series2016-3, 3.05%, 12/26/25 | | | 31 | | | | 30,685 | |
Series2017-1, 3.28%, 01/26/26 | | | 129 | | | | 129,294 | |
Series2017-3, 2.77%, 05/25/26 | | | 46 | | | | 45,128 | |
SoFi Consumer Loan Program Trust(a): | | | | | | | | |
Series2015-1, Class A, 3.28%, 09/15/23 | | | 16 | | | | 16,383 | |
Series2018-1, Class A1, 2.55%, 02/25/27 | | | 56 | | | | 55,182 | |
Series2018-1, Class A2, 3.14%, 02/25/27 | | | 120 | | | | 119,669 | |
Series2018-3, Class A1, 3.20%, 08/25/27 | | | 75 | | | | 75,001 | |
Springleaf Funding Trust, Series2015-AA, Class A, 3.16%, 11/15/24(a) | | | 25 | | | | 25,090 | |
Upgrade Receivables Trust, Series2018-1A, Class A, 3.76%, 11/15/24(a) | | | 181 | | | | 181,353 | |
Westlake Automobile Receivables Trust(a): | | | | | | | | |
Series2017-1A, Class D, 3.46%, 10/17/22 | | | 150 | | | | 149,424 | |
Series2018-2A, Class B, 3.20%, 01/16/24 | | | 70 | | | | 69,810 | |
Series2018-3A, Class B, 3.32%, 10/16/23 | | | 100 | | | | 100,209 | |
Series2018-3A, Class D, 4.00%, 10/16/23 | | | 100 | | | | 100,334 | |
| | | | | | | | |
| |
Total Asset-Backed Securities — 14.8%
(Cost — $5,308,646) | | | | 5,299,069 | |
| | | | | |
|
Corporate Bonds — 45.9% | |
|
Aerospace & Defense — 0.5% | |
Arconic, Inc., 5.90%, 02/01/27 | | | 50 | | | | 47,625 | |
BBA US Holdings, Inc., 5.38%, 05/01/26(a) | | | 10 | | | | 9,475 | |
Spirit AeroSystems, Inc., 3.95%, 06/15/23 | | | 35 | | | | 34,896 | |
TransDigm, Inc., 6.38%, 06/15/26 | | | 50 | | | | 46,500 | |
United Technologies Corp., 3.95%, 08/16/25 | | | 30 | | | | 29,767 | |
| | | | | | | | |
| | | | | | | 168,263 | |
|
| Air Freight & Logistics — 0.0% | |
XPO Logistics, Inc., 6.50%, 06/15/22(a) | | | 7 | | | | 6,939 | |
| | | | | | | | |
|
| Airlines — 0.6% | |
American Airlines Group, Inc., 4.63%, 03/01/20(a) | | | 10 | | | | 9,950 | |
Delta Air Lines, Inc.: | | | | | | | | |
2.60%, 12/04/20 | | | 25 | | | | 24,583 | |
3.40%, 04/19/21 | | | 75 | | | | 74,374 | |
United Continental Holdings, Inc., 5.00%, 02/01/24 | | | 100 | | | | 97,000 | |
| | | | | | | | |
| | | | | | | 205,907 | |
|
| Auto Components — 0.7% | |
Allison Transmission, Inc., 5.00%, 10/01/24(a) | | | 50 | | | | 48,000 | |
Icahn Enterprises LP/Icahn Enterprises Finance Corp.: | | | | | | | | |
5.88%, 02/01/22 | | | 100 | | | | 98,000 | |
6.38%, 12/15/25 | | | 50 | | | | 48,125 | |
JB Poindexter & Co., Inc., 7.13%, 04/15/26(a) | | | 25 | | | | 23,375 | |
Tenneco, Inc., 5.00%, 07/15/26 | | | 25 | | | | 19,231 | |
| | | | | | | | |
| | | | | | | 236,731 | |
|
| Auto Parts — 0.1% | |
TPC Group, Inc., 8.75%, 12/15/20(a) | | | 25 | | | | 23,750 | |
| | | | | | | | |
|
| Automobiles — 0.1% | |
Ford Motor Co., 4.35%, 12/08/26 | | | 50 | | | | 44,540 | |
| | | | | | | | |
|
| Banks — 1.8% | |
Capital One Financial Corp.: | | | | | | | | |
2.40%, 10/30/20 | | | 85 | | | | 83,216 | |
3.45%, 04/30/21 | | | 26 | | | | 25,988 | |
3.20%, 01/30/23 | | | 50 | | | | 48,656 | |
3.30%, 10/30/24 | | | 100 | | | | 94,575 | |
CIT Group, Inc., 6.13%, 03/09/28 | | | 50 | | | | 49,750 | |
| | |
| 22 | | 2018 BLACKROCK ANNUAL REPORTTO SHAREHOLDERS |
| | |
Schedule of Investments (continued) December 31, 2018 | | BlackRock Alternative Capital Strategies Fund (Percentages shown are based on Net Assets) |
| | | | | | | | |
| Security | | Par
(000) | | | Value | |
|
| Banks (continued) | |
HSBC Holdings PLC, 4.00%, 03/30/22 | | $ | 50 | | | $ | 50,651 | |
HSBC USA, Inc., 3.50%, 06/23/24 | | | 300 | | | | 295,306 | |
| | | | | | | | |
| | | | | | | 648,142 | |
|
| Beverages — 0.4% | |
Anheuser-Busch InBev Worldwide, Inc., 3.50%, 01/12/24 | | | 25 | | | | 24,454 | |
Constellation Brands, Inc., 4.40%, 11/15/25 | | | 45 | | | | 45,089 | |
Keurig Dr. Pepper, Inc.(a): | | | | | | | | |
4.06%, 05/25/23 | | | 50 | | | | 49,827 | |
4.42%, 05/25/25 | | | 40 | | | | 39,815 | |
| | | | | | | | |
| | | | | | | 159,185 | |
|
| Biotechnology — 0.3% | |
Celgene Corp., 2.25%, 08/15/21 | | | 100 | | | | 96,947 | |
| | | | | | | | |
|
| Building Materials — 0.0% | |
Summit Materials LLC, 6.13%, 07/15/23 | | | 10 | | | | 9,900 | |
| | | | | | | | |
|
| Building Products — 0.2% | |
Louisiana-Pacific Corp., 4.88%, 09/15/24 | | | 25 | | | | 24,125 | |
Standard Industries, Inc., 5.38%, 11/15/24(a) | | | 35 | | | | 32,856 | |
| | | | | | | | |
| | | | | | | 56,981 | |
|
| Capital Markets — 1.9% | |
Brookfield Finance, Inc., 3.90%, 01/25/28 | | | 50 | | | | 47,201 | |
Goldman Sachs Group, Inc.: | | | | | | | | |
5.25%, 07/27/21 | | | 50 | | | | 51,905 | |
3.75%, 05/22/25 | | | 75 | | | | 71,758 | |
3.27%, 09/29/25(c) | | | 25 | | | | 23,434 | |
3.75%, 02/25/26 | | | 75 | | | | 70,923 | |
3.50%, 11/16/26 | | | 35 | | | | 32,328 | |
Jefferies Group LLC/Jefferies Group Capital Finance, Inc., 4.85%, 01/15/27 | | | 40 | | | | 38,224 | |
Morgan Stanley: | | | | | | | | |
2.63%, 11/17/21 | | | 50 | | | | 48,801 | |
2.75%, 05/19/22 | | | 50 | | | | 48,644 | |
4.88%, 11/01/22 | | | 25 | | | | 25,762 | |
3.13%, 01/23/23 | | | 50 | | | | 48,847 | |
3.70%, 10/23/24 | | | 25 | | | | 24,585 | |
3.88%, 01/27/26 | | | 50 | | | | 48,769 | |
3.13%, 07/27/26 | | | 90 | | | | 83,217 | |
| | | | | | | | |
| | | | | | | 664,398 | |
|
| Chemicals — 0.4% | |
Ashland, Inc., 4.75%, 08/15/22 | | | 35 | | | | 34,475 | |
Chemours Co., 5.38%, 05/15/27 | | | 25 | | | | 22,500 | |
Olin Corp., 5.13%, 09/15/27 | | | 50 | | | | 46,000 | |
PolyOne Corp., 5.25%, 03/15/23 | | | 35 | | | | 33,775 | |
| | | | | | | | |
| | | | | | | 136,750 | |
|
| Commercial Services & Supplies — 0.7% | |
Exela Intermediate LLC/Exela Finance, Inc., 10.00%, 07/15/23(a) | | | 50 | | | | 47,750 | |
IHS Markit Ltd., 4.13%, 08/01/23 | | | 35 | | | | 34,643 | |
Park Aerospace Holdings Ltd., 5.50%, 02/15/24(a) | | | 85 | | | | 82,025 | |
United Rentals North America, Inc., 4.88%, 01/15/28 | | | 100 | | | | 87,750 | |
| | | | | | | | |
| | | | | | | 252,168 | |
|
| Communications Equipment — 0.6% | |
CommScope Technologies LLC, 6.00%, 06/15/25(a) | | | 50 | | | | 45,500 | |
Gogo Intermediate Holdings LLC/Gogo Finance Co., Inc., 12.50%, 07/01/22(a) | | | 50 | | | | 53,312 | |
Motorola Solutions, Inc.: | | | | | | | | |
4.00%, 09/01/24 | | | 54 | | | | 52,550 | |
4.60%, 02/23/28 | | | 50 | | | | 48,889 | |
Zayo Group LLC/Zayo Capital, Inc., 6.38%, 05/15/25 | | | 30 | | | | 27,900 | |
| | | | | | | | |
| | | | | | | 228,151 | |
| | | | | | | | |
| Security | | Par
(000) | | | Value | |
|
| Construction & Engineering — 0.2% | |
AECOM, 5.13%, 03/15/27 | | $ | 50 | | | $ | 42,750 | |
Brand Industrial Services, Inc., 8.50%, 07/15/25(a) | | | 25 | | | | 21,313 | |
| | | | | | | | |
| | | | | | | 64,063 | |
|
| Construction Materials — 0.0% | |
HD Supply, Inc., 5.38%, 10/15/26(a) | | | 15 | | | | 14,550 | |
| | | | | | | | |
|
| Consumer Finance — 1.9% | |
Ally Financial, Inc.: | | | | | | | | |
5.13%, 09/30/24 | | | 25 | | | | 24,812 | |
5.75%, 11/20/25 | | | 100 | | | | 99,500 | |
2.50%, 08/01/22 | | | 50 | | | | 48,259 | |
3.40%, 02/27/23 | | | 50 | | | | 49,535 | |
goeasy, Ltd., 7.88%, 11/01/22(a) | | | 100 | | | | 101,250 | |
Mastercard, Inc.: | | | | | | | | |
2.95%, 11/21/26 | | | 80 | | | | 76,978 | |
3.50%, 02/26/28 | | | 30 | | | | 30,017 | |
Navient Corp.: | | | | | | | | |
5.00%, 10/26/20 | | | 15 | | | | 14,363 | |
6.63%, 07/26/21 | | | 25 | | | | 24,125 | |
6.13%, 03/25/24 | | | 50 | | | | 42,875 | |
5.88%, 10/25/24 | | | 25 | | | | 20,875 | |
Refinitiv US Holdings, Inc.(a): | | | | | | | | |
6.25%, 05/15/26 | | | 15 | | | | 14,475 | |
8.25%, 11/15/26 | | | 20 | | | | 18,275 | |
Springleaf Finance Corp., 7.13%, 03/15/26 | | | 40 | | | | 35,700 | |
Total System Services, Inc., 4.00%, 06/01/23 | | | 50 | | | | 49,919 | |
Verscend Escrow Corp., 9.75%, 08/15/26 | | | 15 | | | | 14,100 | |
Visa, Inc., 2.75%, 09/15/27 | | | 25 | | | | 23,676 | |
| | | | | | | | |
| | | | | | | 688,734 | |
|
| Containers & Packaging — 0.4% | |
Ball Corp.: | | | | | | | | |
4.00%, 11/15/23 | | | 15 | | | | 14,588 | |
5.25%, 07/01/25 | | | 50 | | | | 49,875 | |
BWAY Holding Co., 5.50%, 04/15/24(a) | | | 25 | | | | 23,500 | |
Clearwater Paper Corp., 5.38%, 02/01/25(a) | | | 35 | | | | 31,587 | |
Reynolds Group Issuer, Inc./Reynolds Group Issuer LLC/Reynolds Group Issuer Lu, 5.13%, 07/15/23(a) | | | 25 | | | | 23,812 | |
| | | | | | | | |
| | | | | | | 143,362 | |
|
| Diversified Consumer Services — 0.4% | |
Graham Holdings Co., 5.75%, 06/01/26(a) | | | 65 | | | | 65,162 | |
Service Corp. International, 4.63%, 12/15/27 | | | 50 | | | | 47,000 | |
ServiceMaster Co. LLC, 5.13%, 11/15/24(a) | | | 25 | | | | 23,625 | |
| | | | | | | | |
| | | | | | | 135,787 | |
|
| Diversified Financial Services — 4.8% | |
Ares Capital Corp.: | | | | | | | | |
3.50%, 02/10/23 | | | 50 | | | | 47,524 | |
4.25%, 03/01/25 | | | 50 | | | | 47,606 | |
Bank of America Corp.: | | | | | | | | |
(3 mo. LIBOR US + 1.02%), 2.88%, 04/24/23(d) | | | 50 | | | | 48,630 | |
3.00%, 12/20/23(c) | | | 53 | | | | 51,516 | |
(3 mo. LIBOR US + 1.58%), 3.82%, 01/20/28(d) | | | 50 | | | | 48,505 | |
3.42%, 12/20/28(c) | | | 54 | | | | 50,444 | |
4.27%, 07/23/29(c) | | | 45 | | | | 44,789 | |
Citigroup, Inc.: | | | | | | | | |
4.50%, 01/14/22 | | | 50 | | | | 51,087 | |
2.75%, 04/25/22 | | | 100 | | | | 97,137 | |
(3 mo. LIBOR US + 0.95%), 2.88%, 07/24/23(d) | | | 100 | | | | 96,773 | |
4.04%, 06/01/24(c) | | | 50 | | | | 50,140 | |
General Motors Financial Co., Inc.: | | | | | | | | |
4.20%, 03/01/21 | | | 50 | | | | 49,973 | |
4.20%, 11/06/21 | | | 65 | | | | 64,971 | |
3.45%, 04/10/22 | | | 50 | | | | 48,353 | |
| | | | |
| SCHEDULES OF INVESTMENTS | | | 23 | |
| | |
Schedule of Investments (continued) December 31, 2018 | | BlackRock Alternative Capital Strategies Fund (Percentages shown are based on Net Assets) |
| | | | | | | | |
| Security | | Par
(000) | | | Value | |
|
| Diversified Financial Services (continued) | |
3.25%, 01/05/23 | | $ | 50 | | | $ | 47,086 | |
4.15%, 06/19/23 | | | 145 | | | | 141,281 | |
Intercontinental Exchange, Inc., 3.75%, 12/01/25 | | | 25 | | | | 25,116 | |
Intrepid Aviation Group Holdings LLC/Intrepid Finance Co., 8.50%, 08/15/21(a) | | | 25 | | | | 24,747 | |
JPMorgan Chase & Co.: | | | | | | | | |
2.97%, 01/15/23 | | | 100 | | | | 97,498 | |
3.88%, 09/10/24 | | | 25 | | | | 24,599 | |
3.13%, 01/23/25 | | | 50 | | | | 47,635 | |
(3 mo. LIBOR US + 1.16%), 3.22%, 03/01/25(d) | | | 50 | | | | 48,299 | |
3.30%, 04/01/26 | | | 50 | | | | 47,617 | |
4.20%, 07/23/29(c) | | | 35 | | | | 34,894 | |
Mitsubishi UFJ Financial Group, Inc., 3.46%, 03/02/23 | | | 50 | | | | 49,693 | |
Nationstar Mortgage LLC/Nationstar Capital Corp., 6.50%, 06/01/22 | | | 50 | | | | 49,000 | |
ORIX Corp., 2.90%, 07/18/22 | | | 25 | | | | 24,427 | |
Quicken Loans, Inc., 5.75%, 05/01/25(a) | | | 15 | | | | 14,025 | |
S&P Global, Inc., 4.40%, 02/15/26 | | | 100 | | | | 103,174 | |
Sally Holdings LLC/Sally Capital, Inc., 5.63%, 12/01/25 | | | 25 | | | | 23,000 | |
Sumitomo Mitsui Financial Group, Inc., 3.10%, 01/17/23 | | | 100 | | | | 98,094 | |
WMG Acquisition Corp., 5.00%, 08/01/23(a) | | | 25 | | | | 24,313 | |
| | | | | | | | |
| | | | | | | 1,721,946 | |
|
| Diversified Telecommunication Services — 1.2% | |
AT&T, Inc.: | | | | | | | | |
3.20%, 03/01/22 | | | 40 | | | | 39,458 | |
3.80%, 03/01/24 | | | 80 | | | | 79,193 | |
CC Holdings GS V LLC/Crown Castle GS III Corp., 3.85%, 04/15/23 | | | 25 | | | | 24,757 | |
CenturyLink, Inc.: | | | | | | | | |
Series S, 6.45%, 06/15/21 | | | 50 | | | | 49,875 | |
Series Y, 7.50%, 04/01/24 | | | 25 | | | | 24,125 | |
Frontier Communications Corp.: | | | | | | | | |
10.50%, 09/15/22 | | | 25 | | | | 17,375 | |
11.00%, 09/15/25 | | | 10 | | | | 6,225 | |
8.50%, 04/01/26(a) | | | 25 | | | | 21,875 | |
Level 3 Financing, Inc., 5.25%, 03/15/26 | | | 50 | | | | 45,750 | |
Qwest Corp., 7.25%, 09/15/25 | | | 50 | | | | 51,479 | |
Verizon Communications, Inc., 3.38%, 02/15/25 | | | 53 | | | | 51,432 | |
| | | | | | | | |
| | | | | | | 411,544 | |
|
| Electric Utilities — 1.3% | |
AES Corp., 4.00%, 03/15/21 | | | 100 | | | | 98,250 | |
Dominion Resources, Inc., Series B, 2.75%, 01/15/22 | | | 50 | | | | 48,703 | |
Duke Energy Corp., 3.05%, 08/15/22 | | | 50 | | | | 48,999 | |
Eversource Energy, Series N, 3.80%, 12/01/23 | | | 100 | | | | 100,963 | |
NextEra Energy Operating Partners LP, 4.25%, 09/15/24(a) | | | 50 | | | | 46,250 | |
PSEG Power LLC, 3.85%, 06/01/23 | | | 100 | | | | 100,081 | |
Talen Energy Supply LLC, 6.50%, 06/01/25 | | | 15 | | | | 10,650 | |
| | | | | | | | |
| | | | | | | 453,896 | |
|
| Electronic Equipment, Instruments & Components — 0.1% | |
CDW LLC/CDW Finance Corp., 5.50%, 12/01/24 | | | 50 | | | | 49,375 | |
| | | | | | | | |
|
| Energy Equipment & Services — 0.2% | |
McDermott Technology Americas, Inc./McDermott Technology U.S., Inc., 10.63%, 05/01/24(a) | | | 50 | | | | 42,188 | |
TerraForm Power Operating LLC, 5.00%, 01/31/28(a) | | | 25 | | | | 22,000 | |
Transocean, Inc., 5.80%, 10/15/22 | | | 25 | | | | 22,000 | |
| | | | | | | | |
| | | | | | | 86,188 | |
|
| Environmental, Maintenance, & Security Service — 0.1% | |
Tervita Escrow Corp., 7.63%, 12/01/21(a) | | | 25 | | | | 23,813 | |
| | | | | | | | |
|
| Equity Real Estate Investment Trusts (REITs) — 0.8% | |
CBL & Associates LP, 4.60%, 10/15/24 | | | 25 | | | | 18,750 | |
| | | | | | | | |
| Security | | Par
(000) | | | Value | |
|
| Equity Real Estate Investment Trusts (REITs) (continued) | |
Iron Mountain, Inc., 4.88%, 09/15/27(a) | | $ | 50 | | | $ | 43,625 | |
MGM Growth Properties Operating Partnership LP/MGP FinanceCo-Issuer, Inc., 5.63%, 05/01/24 | | | 50 | | | | 49,500 | |
MPT Operating Partnership LP/MPT Finance Corp., 5.00%, 10/15/27 | | | 50 | | | | 45,719 | |
Omega Healthcare Investors, Inc., 4.50%, 04/01/27 | | | 100 | | | | 96,568 | |
Welltower, Inc., 4.25%, 04/15/28 | | | 50 | | | | 49,496 | |
| | | | | | | | |
| | | | | | | 303,658 | |
|
| Food & Staples Retailing — 1.0% | |
Dollar Tree, Inc., 3.70%, 05/15/23 | | | 60 | | | | 59,000 | |
Lamb Weston Holdings, Inc., 4.88%, 11/01/26(a) | | | 100 | | | | 96,000 | |
Mondelez International, Inc., 3.63%, 05/07/23 | | | 100 | | | | 100,121 | |
Walgreens Boots Alliance, Inc., 3.80%, 11/18/24 | | | 100 | | | | 98,479 | |
| | | | | | | | |
| | | | | | | 353,600 | |
|
| Food Products — 0.3% | |
Conagra Brands, Inc., 4.30%, 05/01/24 | | | 100 | | | | 99,396 | |
Pilgrim’s Pride Corp., 5.88%, 09/30/27(a) | | | 25 | | | | 22,688 | |
| | | | | | | | |
| | | | | | | 122,084 | |
|
| Gas Utilities — 0.3% | |
NiSource, Inc., 3.65%, 06/15/23(a) | | | 45 | | | | 45,076 | |
Suburban Propane Partners LP/Suburban Energy Finance Corp., 5.50%, 06/01/24 | | | 50 | | | | 46,500 | |
| | | | | | | | |
| | | | | | | 91,576 | |
|
| Health Care Equipment & Supplies — 0.9% | |
Abbott Laboratories, 3.40%, 11/30/23 | | | 70 | | | | 69,786 | |
Becton Dickinson & Co., 2.89%, 06/06/22 | | | 30 | | | | 29,056 | |
Boston Scientific Corp., 3.38%, 05/15/22 | | | 50 | | | | 49,679 | |
DJO Finance LLC/DJO Finance Corp., 8.13%, 06/15/21(a) | | | 50 | | | | 51,500 | |
Hill-Rom Holdings, Inc., 5.00%, 02/15/25(a) | | | 50 | | | | 47,500 | |
Mallinckrodt International Finance SA/Mallinckrodt CB LLC(a): | | | | | | | | |
5.75%, 08/01/22 | | | 25 | | | | 21,500 | |
5.63%, 10/15/23 | | | 25 | | | | 19,000 | |
Ortho-Clinical Diagnostics, Inc./Ortho-Clinical Diagnostics SA, 6.63%, 05/15/22(a) | | | 25 | | | | 22,500 | |
Teleflex, Inc., 4.88%, 06/01/26 | | | 25 | | | | 23,875 | |
| | | | | | | | |
| | | | | | | 334,396 | |
|
| Health Care Providers & Services — 1.8% | |
Anthem, Inc.: | | | | | | | | |
2.95%, 12/01/22 | | | 25 | | | | 24,381 | |
4.10%, 03/01/28 | | | 35 | | | | 34,305 | |
Centene Corp.: | | | | | | | | |
5.63%, 02/15/21 | | | 30 | | | | 30,075 | |
5.38%, 06/01/26(a) | | | 30 | | | | 29,175 | |
CHS/Community Health Systems, Inc., 6.25%, 03/31/23 | | | 50 | | | | 45,440 | |
DaVita, Inc., 5.13%, 07/15/24 | | | 25 | | | | 23,437 | |
Encompass Health Corp., 5.75%, 11/01/24 | | | 25 | | | | 24,750 | |
Envision Healthcare Crop., 8.75%, 10/15/26(a) | | | 25 | | | | 21,625 | |
HCA, Inc.: | | | | | | | | |
5.00%, 03/15/24 | | | 50 | | | | 49,500 | |
5.88%, 02/15/26 | | | 50 | | | | 49,750 | |
5.25%, 06/15/26 | | | 100 | | | | 99,250 | |
5.38%, 09/01/26 | | | 10 | | | | 9,725 | |
5.63%, 09/01/28 | | | 10 | | | | 9,650 | |
Tenet Healthcare Corp.: | | | | | | | | |
6.00%, 10/01/20 | | | 100 | | | | 101,250 | |
6.75%, 06/15/23 | | | 25 | | | | 23,469 | |
UnitedHealth Group, Inc., 3.10%, 03/15/26 | | | 50 | | | | 48,254 | |
WellCare Health Plans, Inc., 5.38%, 08/15/26(a) | | | 35 | | | | 33,775 | |
| | | | | | | | |
| | | | | | | 657,811 | |
| | |
| 24 | | 2018 BLACKROCK ANNUAL REPORTTO SHAREHOLDERS |
| | |
Schedule of Investments (continued) December 31, 2018 | | BlackRock Alternative Capital Strategies Fund (Percentages shown are based on Net Assets) |
| | | | | | | | |
| Security | | Par
(000) | | | Value | |
|
| Hotels, Restaurants & Leisure — 2.5% | |
1011778 BC ULC/New Red Finance, Inc.(a): | | | | | | | | |
4.63%, 01/15/22 | | $ | 35 | | | $ | 33,863 | |
4.25%, 05/15/24 | | | 50 | | | | 46,000 | |
Boyd Gaming Corp., 6.00%, 08/15/26 | | | 10 | | | | 9,350 | |
Darden Restaurants, Inc., 3.85%, 05/01/27 | | | 35 | | | | 33,670 | |
Eldorado Resorts, Inc., 6.00%, 09/15/26(a) | | | 10 | | | | 9,450 | |
GLP Capital LP/GLP Financing II, Inc., 5.38%, 04/15/26 | | | 140 | | | | 138,461 | |
Golden Nugget, Inc., 6.75%, 10/15/24(a) | | | 50 | | | | 47,125 | |
Hilton Worldwide Finance LLC/Hilton Worldwide Finance Corp., 4.88%, 04/01/27 | | | 50 | | | | 46,875 | |
International Game Technology PLC, 6.50%, 02/15/25(a) | | | 200 | | | | 197,000 | |
KFC Holding Co./Pizza Hut Holdings LLC/Taco Bell of America LLC(a): | | | | | | | | |
5.25%, 06/01/26 | | | 25 | | | | 24,188 | |
4.75%, 06/01/27 | | | 25 | | | | 23,250 | |
McDonald’s Corp., 3.38%, 05/26/25 | | | 50 | | | | 48,879 | |
MGM Resorts International, 7.75%, 03/15/22 | | | 100 | | | | 106,375 | |
Scientific Games International, Inc., 10.00%, 12/01/22 | | | 15 | | | | 15,225 | |
Stars Group Holdings BV/Stars Group USCo-Borrower LLC, 7.00%, 07/15/26(a) | | | 10 | | | | 9,725 | |
Wyndham Hotels & Resorts, Inc., 5.38%, 04/15/26(a) | | | 50 | | | | 48,000 | |
Wynn Las Vegas LLC / Wynn Las Vegas Capital Corp., 4.25%, 05/30/23(a) | | | 50 | | | | 47,000 | |
| | | | | | | | |
| | | | | | | 884,436 | |
|
| Household Durables — 0.6% | |
Lennar Corp., 5.88%, 11/15/24 | | | 50 | | | | 50,000 | |
MDC Holdings, Inc., 5.50%, 01/15/24 | | | 50 | | | | 48,000 | |
PulteGroup, Inc., 5.50%, 03/01/26 | | | 100 | | | | 96,250 | |
Shea Homes LP/Shea Homes Funding Corp., 6.13%, 04/01/25(a) | | | 25 | | | | 22,125 | |
| | | | | | | | |
| | | | | | | 216,375 | |
|
| Independent Power and Renewable Electricity Producers — 0.6% | |
Calpine Corp., 5.25%, 06/01/26(a) | | | 75 | | | | 68,437 | |
Clearway Energy Operating LLC, 5.75%, 10/15/25(a) | | | 40 | | | | 38,200 | |
NRG Energy, Inc., 6.63%, 01/15/27 | | | 100 | | | | 100,750 | |
| | | | | | | | |
| | | | | | | 207,387 | |
|
| Insurance — 0.9% | |
CNO Financial Group, Inc., 4.50%, 05/30/20 | | | 10 | | | | 9,875 | |
Fidelity & Guaranty Life Holdings, Inc., 5.50%, 05/01/25(a) | | | 15 | | | | 14,330 | |
Marsh & McLennan Cos., Inc., 3.50%, 03/10/25 | | | 200 | | | | 196,472 | |
Radian Group, Inc., 5.25%, 06/15/20 | | | 44 | | | | 44,330 | |
Trinity Acquisition PLC, 3.50%, 09/15/21 | | | 50 | | | | 49,514 | |
| | | | | | | | |
| | | | | | | 314,521 | |
|
| Internet & Direct Marketing Retail — 0.4% | |
Expedia Group, Inc., 4.50%, 08/15/24 | | | 125 | | | | 125,160 | |
| | | | | | | | |
|
| Internet Software & Services — 0.6% | |
Booking Holdings, Inc., 3.60%, 06/01/26 | | | 39 | | | | 37,890 | |
Netflix, Inc., 5.88%, 11/15/28(a) | | | 100 | | | | 97,170 | |
VeriSign, Inc.: | | | | | | | | |
4.63%, 05/01/23 | | | 35 | | | | 34,475 | |
4.75%, 07/15/27 | | | 50 | | | | 46,890 | |
| | | | | | | | |
| | | | | | | 216,425 | |
|
| IT Services — 0.1% | |
Verisk Analytics, Inc., 4.00%, 06/15/25 | | | 50 | | | | 50,197 | |
| | | | | | | | |
|
| Machinery — 0.0% | |
Mueller Water Products, Inc., 5.50%, 06/15/26(a) | | | 5 | | | | 4,850 | |
| | | | | | | | |
|
| Media — 3.3% | |
AMC Networks, Inc., 4.75%, 08/01/25 | | | 50 | | | | 45,375 | |
CCO Holdings LLC/CCO Holdings Capital Corp.: | | | | | | | | |
5.25%, 09/30/22 | | | 50 | | | | 49,562 | |
| | | | | | | | |
| Security | | Par
(000) | | | Value | |
|
| Media (continued) | |
5.88%, 04/01/24(a) | | $ | 25 | | | $ | 24,875 | |
5.75%, 02/15/26(a) | | | 25 | | | | 24,500 | |
5.13%, 05/01/27(a) | | | 50 | | | | 46,570 | |
Charter Communications Operating LLC/Charter Communications Operating Capital: | | | | | | | | |
3.58%, 07/23/20 | | | 50 | | | | 49,946 | |
4.50%, 02/01/24 | | | 100 | | | | 99,848 | |
Comcast Corp.: | | | | | | | | |
3.70%, 04/15/24 | | | 65 | | | | 65,397 | |
3.95%, 10/15/25 | | | 30 | | | | 30,355 | |
CSC Holdings LLC, 5.50%, 05/15/26(a) | | | 200 | | | | 188,500 | |
DISH DBS Corp.: | | | | | | | | |
5.88%, 07/15/22 | | | 50 | | | | 46,000 | |
5.88%, 11/15/24 | | | 25 | | | | 20,125 | |
7.75%, 07/01/26 | | | 25 | | | | 20,688 | |
Gray Escrow, Inc., 7.00%, 05/15/27(a) | | | 35 | | | | 34,061 | |
Gray Television, Inc., 5.88%, 07/15/26(a) | | | 14 | | | | 13,052 | |
Hughes Satellite Systems Corp., 5.25%, 08/01/26 | | | 35 | | | | 32,069 | |
Intelsat Jackson Holdings SA, 8.50%, 10/15/24(a) | | | 30 | | | | 29,100 | |
Sirius XM Radio, Inc.(a): | | | | | | | | |
5.38%, 04/15/25 | | | 35 | | | | 33,163 | |
5.00%, 08/01/27 | | | 100 | | | | 91,375 | |
Time Warner Cable LLC, 4.00%, 09/01/21 | | | 20 | | | | 19,878 | |
Univision Communications, Inc., 5.13%, 02/15/25(a) | | | 15 | | | | 13,163 | |
Virgin Media Secured Finance PLC, 5.25%, 01/15/21 | | | 200 | | | | 198,820 | |
| | | | | | | | |
| | | | | | | 1,176,422 | |
|
| Metals & Mining — 1.1% | |
Big River Steel LLC/BRS Finance Corp., 7.25%, 09/01/25(a) | | | 25 | | | | 24,812 | |
Cleveland-Cliffs, Inc., 5.75%, 03/01/25 | | | 25 | | | | 22,500 | |
Commercial Metals Co., 5.75%, 04/15/26(a) | | | 50 | | | | 46,375 | |
Freeport-McMoRan, Inc.: | | | | | | | | |
3.55%, 03/01/22 | | | 50 | | | | 47,312 | |
3.88%, 03/15/23 | | | 100 | | | | 92,500 | |
Steel Dynamics, Inc., 5.50%, 10/01/24 | | | 50 | | | | 49,500 | |
Teck Resources Ltd., 6.25%, 07/15/41 | | | 25 | | | | 23,688 | |
United States Steel Corp., 6.25%, 03/15/26 | | | 30 | | | | 26,250 | |
Vale Overseas Ltd., 6.25%, 08/10/26 | | | 40 | | | | 43,200 | |
| | | | | | | | |
| | | | | | | 376,137 | |
|
| Multi-Utilities — 0.4% | |
AmeriGas Partners LP/AmeriGas Finance Corp.: | | | | | | | | |
5.63%, 05/20/24 | | | 45 | | | | 42,525 | |
5.50%, 05/20/25 | | | 50 | | | | 45,750 | |
National Fuel Gas Co., 3.95%, 09/15/27 | | | 40 | | | | 37,353 | |
| | | | | | | | |
| | | | | | | 125,628 | |
|
| Office Supplies & Equipment — 0.2% | |
VMware, Inc.: | | | | | | | | |
2.95%, 08/21/22 | | | 40 | | | | 38,126 | |
3.90%, 08/21/27 | | | 50 | | | | 44,351 | |
| | | | | | | | |
| | | | | | | 82,477 | |
|
| Oil, Gas & Consumable Fuels — 3.7% | |
Antero Resources Corp., 5.13%, 12/01/22 | | | 50 | | | | 47,000 | |
Cheniere Corpus Christi Holdings LLC, 5.88%, 03/31/25 | | | 100 | | | | 99,500 | |
Cheniere Energy Partners LP: | | | | | | | | |
5.63%, 10/01/26(a) | | | 35 | | | | 32,725 | |
Series WI, 5.25%, 10/01/25 | | | 50 | | | | 46,625 | |
Chesapeake Energy Corp., 7.00%, 10/01/24 | | | 55 | | | | 47,575 | |
CrownRock LP/CrownRock Finance, Inc., 5.63%, 10/15/25(a) | | | 25 | | | | 22,500 | |
DCP Midstream Operating LP, 5.38%, 07/15/25 | | | 30 | | | | 29,325 | |
Diamond Offshore Drilling, Inc., 7.88%, 08/15/25 | | | 25 | | | | 20,750 | |
EnLink Midstream Partners LP, 4.85%, 07/15/26 | | | 50 | | | | 45,088 | |
EP Energy LLC/Everest Acquisition Finance, Inc., 7.75%, 05/15/26(a) | | | 60 | | | | 53,100 | |
| | | | |
| SCHEDULES OF INVESTMENTS | | | 25 | |
| | |
Schedule of Investments (continued) December 31, 2018 | | BlackRock Alternative Capital Strategies Fund (Percentages shown are based on Net Assets) |
| | | | | | | | |
| Security | | Par
(000) | | | Value | |
|
| Oil, Gas & Consumable Fuels (continued) | |
Hilcorp Energy I LP/Hilcorp Finance Co., 6.25%, 11/01/28(a) | | $ | 20 | | | $ | 17,600 | |
Marathon Petroleum Corp., 5.13%, 12/15/26(a) | | | 23 | | | | 23,559 | |
Matador Resources Co., 5.88%, 09/15/26 | | | 10 | | | | 9,200 | |
MPLX LP, 4.88%, 06/01/25 | | | 50 | | | | 50,458 | |
Murphy Oil Corp., 5.75%, 08/15/25 | | | 100 | | | | 93,409 | |
Newfield Exploration Co., 5.38%, 01/01/26 | | | 50 | | | | 49,000 | |
Oasis Petroleum, Inc., 6.25%, 05/01/26(a) | | | 10 | | | | 8,400 | |
ONEOK, Inc., 4.55%, 07/15/28 | | | 50 | | | | 49,350 | |
PBF Holding Co. LLC/ PBF Finance Corp., 7.25%, 06/15/25 | | | 100 | | | | 94,000 | |
Precision Drilling Corp., 7.13%, 01/15/26(a) | | | 25 | | | | 21,500 | |
Rowan Cos., Inc., 7.38%, 06/15/25 | | | 50 | | | | 40,125 | |
Sabine Pass Liquefaction LLC: | | | | | | | | |
5.75%, 05/15/24 | | | 100 | | | | 104,336 | |
4.20%, 03/15/28 | | | 40 | | | | 38,261 | |
Shell International Finance BV, 3.88%, 11/13/28 | | | 85 | | | | 87,350 | |
SM Energy Co., 6.63%, 01/15/27 | | | 5 | | | | 4,425 | |
Southwestern Energy Co., 6.20%, 01/23/25 | | | 50 | | | | 44,687 | |
Sunoco LP/Sunoco Finance Corp., Series WI, 5.50%, 02/15/26 | | | 100 | | | | 94,750 | |
Targa Resources Partners LP/Targa Resources Partners Finance Corp., 5.88%, 04/15/26(a) | | | 35 | | | | 34,038 | |
Transocean Guardian Ltd., 5.88%, 01/15/24(a) | | | 5 | | | | 4,788 | |
W&T Offshore, Inc., 2018 Term Loan, 9.75%, 11/01/23(a) | | | 25 | | | | 21,875 | |
| | | | | | | | |
| | | | | | | 1,335,299 | |
|
| Personal Products — 0.1% | |
Avon International Operations, Inc., 7.88%, 08/15/22(a) | | | 50 | | | | 49,250 | |
| | | | | | | | |
|
| Pharmaceuticals — 2.2% | |
AstraZeneca PLC: | | | | | | | | |
3.50%, 08/17/23 | | | 100 | | | | 99,476 | |
3.38%, 11/16/25 | | | 100 | | | | 96,631 | |
Bausch Health Cos., Inc.(a): | | | | | | | | |
6.13%, 04/15/25 | | | 50 | | | | 43,625 | |
5.50%, 11/01/25 | | | 100 | | | | 93,250 | |
CVS Health Corp., 3.70%, 03/09/23 | | | 70 | | | | 69,251 | |
Endo Finance LLC, 5.75%, 01/15/22(a) | | | 100 | | | | 83,250 | |
Takeda Pharmaceutical Co. Ltd., 4.00%, 11/26/21(a) | | | 200 | | | | 202,728 | |
Valeant Pharmaceuticals International, 8.50%, 01/31/27(a) | | | 10 | | | | 9,700 | |
Zoetis, Inc., 3.00%, 09/12/27 | | | 100 | | | | 92,354 | |
| | | | | | | | |
| | | | | | | 790,265 | |
|
| Real Estate Management & Development — 0.1% | |
Howard Hughes Corp., 5.38%, 03/15/25(a) | | | 25 | | | | 23,500 | |
Kennedy-Wilson, Inc., 5.88%, 04/01/24 | | | 25 | | | | 23,375 | |
| | | | | | | | |
| | | | | | | 46,875 | |
|
| Road & Rail — 0.3% | |
Hertz Corp., 7.63%, 06/01/22(a) | | | 50 | | | | 47,125 | |
Kenan Advantage Group, Inc., 7.88%, 07/31/23(a) | | | 15 | | | | 14,363 | |
Union Pacific Corp., 3.95%, 09/10/28 | | | 40 | | | | 39,945 | |
| | | | | | | | |
| | | | | | | 101,433 | |
|
| Semiconductors & Semiconductor Equipment — 1.1% | |
Analog Devices, Inc., 2.50%, 12/05/21 | | | 25 | | | | 24,404 | |
Broadcom Corp./Broadcom Cayman Finance Ltd.: | | | | | | | | |
2.38%, 01/15/20 | | | 75 | | | | 74,063 | |
3.00%, 01/15/22 | | | 75 | | | | 72,128 | |
3.63%, 01/15/24 | | | 40 | | | | 37,844 | |
NVIDIA Corp., 3.20%, 09/16/26 | | | 50 | | | | 47,422 | |
Qorvo, Inc., 5.50%, 07/15/26(a) | | | 10 | | | | 9,550 | |
QUALCOMM, Inc., 3.25%, 05/20/27 | | | 100 | | | | 93,020 | |
Sensata Technologies BV, 5.00%, 10/01/25(a) | | | 50 | | | | 47,000 | |
| | | | | | | | |
| | | | | | | 405,431 | |
|
| Software — 0.6% | |
CA, Inc., 3.60%, 08/15/22 | | | 25 | | | | 24,405 | |
| | | | | | | | |
| Security | | Par
(000) | | | Value | |
|
| Software (continued) | |
CDK Global, Inc.: | | | | | | | | |
5.88%, 06/15/26 | | $ | 10 | | | $ | 10,041 | |
4.88%, 06/01/27 | | | 50 | | | | 46,375 | |
Citrix Systems, Inc., 4.50%, 12/01/27 | | | 50 | | | | 47,791 | |
Infor US, Inc., 6.50%, 05/15/22 | | | 30 | | | | 29,014 | |
MSCI, Inc., 5.38%, 05/15/27(a) | | | 50 | | | | 48,937 | |
| | | | | | | | |
| | | | | | | 206,563 | |
|
| Specialty Retail — 0.7% | |
L Brands, Inc.: | | | | | | | | |
5.63%, 10/15/23 | | | 50 | | | | 49,063 | |
6.88%, 11/01/35 | | | 25 | | | | 20,880 | |
O’Reilly Automotive, Inc., 3.60%, 09/01/27 | | | 100 | | | | 95,274 | |
PetSmart, Inc., 5.88%, 06/01/25(a) | | | 25 | | | | 18,063 | |
Tapestry, Inc.: | | | | | | | | |
3.00%, 07/15/22 | | | 50 | | | | 48,187 | |
4.13%, 07/15/27 | | | 19 | | | | 17,778 | |
| | | | | | | | |
| | | | | | | 249,245 | |
|
| Technology Hardware, Storage & Peripherals — 0.2% | |
Apple, Inc., 3.35%, 02/09/27 | | | 65 | | | | 63,335 | |
| | | | | | | | |
|
| Tobacco — 0.6% | |
Altria Group, Inc.: | | | | | | | | |
4.00%, 01/31/24 | | | 50 | | | | 49,137 | |
2.63%, 09/16/26 | | | 50 | | | | 43,677 | |
BAT Capital Corp., 2.76%, 08/15/22 | | | 75 | | | | 70,839 | |
Philip Morris International, Inc., 3.25%, 11/10/24 | | | 25 | | | | 24,398 | |
Pyxus International, Inc., 9.88%, 07/15/21 | | | 25 | | | | 18,938 | |
Vector Group Ltd., 6.13%, 02/01/25(a) | | | 10 | | | | 8,500 | |
| | | | | | | | |
| | | | | | | 215,489 | |
|
| Wireless Telecommunication Services — 1.6% | |
American Tower Corp.: | | | | | | | | |
3.30%, 02/15/21 | | | 50 | | | | 49,713 | |
3.50%, 01/31/23 | | | 25 | | | | 24,569 | |
3.55%, 07/15/27 | | | 80 | | | | 75,049 | |
Crown Castle International Corp.: | | | | | | | | |
3.20%, 09/01/24 | | | 30 | | | | 28,461 | |
3.65%, 09/01/27 | | | 40 | | | | 37,082 | |
Equinix, Inc., 5.38%, 05/15/27 | | | 50 | | | | 48,875 | |
Intelsat Connect Finance SA, 9.50%, 02/15/23(a) | | | 10 | | | | 8,600 | |
SBA Communications Corp., 4.88%, 09/01/24 | | | 25 | | | | 23,500 | |
Sprint Communications, Inc., 6.00%, 11/15/22 | | | 25 | | | | 24,533 | |
Sprint Corp.: | | | | | | | | |
7.25%, 09/15/21 | | | 25 | | | | 25,588 | |
7.88%, 09/15/23 | | | 25 | | | | 25,656 | |
7.63%, 03/01/26 | | | 25 | | | | 24,688 | |
T-Mobile USA, Inc.: | | | | | | | | |
6.38%, 03/01/25 | | | 50 | | | | 50,500 | |
6.50%, 01/15/26 | | | 50 | | | | 51,000 | |
4.50%, 02/01/26 | | | 50 | | | | 45,875 | |
4.75%, 02/01/28 | | | 25 | | | | 22,625 | |
Uniti Group LP/Uniti Group Finance, Inc./CSL Capital LLC, 6.00%, 04/15/23(a) | | | 15 | | | | 13,575 | |
| | | | | | | | |
| | | | | | | 579,889 | |
| | | | | | | | |
| |
Total Corporate Bonds — 45.9%
(Cost — $16,986,493) | | | | 16,418,224 | |
| | | | | |
|
Non-Agency Mortgage-Backed Securities — 1.5% | |
|
| Collateralized Mortgage Obligations — 1.5% | |
Connecticut Avenue Securities Trust, Series2018-R07, Class 1M2, 4.91%, 04/25/31(a)(c) | | | 125 | | | | 122,949 | |
| | |
| 26 | | 2018 BLACKROCK ANNUAL REPORTTO SHAREHOLDERS |
| | |
Schedule of Investments (continued) December 31, 2018 | | BlackRock Alternative Capital Strategies Fund (Percentages shown are based on Net Assets) |
| | | | | | | | |
| Security | | Par
(000) | | | Value | |
|
| Collateralized Mortgage Obligations (continued) | |
STACR Trust(a)(c): | | | | | | | | |
Series 2018-DNA3, Class M1, 3.26%, 09/25/48 | | $ | 120 | | | $ | 119,769 | |
Series 2018-HRP1, Class M2, 4.16%, 04/25/43 | | | 290 | | | | 290,447 | |
| | | | | | | | |
| |
Total Non-Agency Mortgage-Backed Securities — 1.5%
(Cost — $537,018) | | | | 533,165 | |
| | | | | |
|
U.S. Government Sponsored Agency Securities — 36.1% | |
|
Collateralized Mortgage Obligations — 8.2% | |
Fannie Mae Connecticut Avenue Securities: | | | | | | | | |
Series2018-C06, Class 2M1, 3.06%, 03/25/31(c) | | | 50 | | | | 49,919 | |
Series2018-C06, Class 1M1, 3.06%, 03/25/31(c) | | | 57 | | | | 57,118 | |
Series2018-C02, Class 2M1, 3.16%, 08/25/30(c) | | | 94 | | | | 93,363 | |
Series2018-C03, Class 1M1, 3.19%, 10/25/30(c) | | | 57 | | | | 56,514 | |
Series2017-C06, Class 1M1, 3.26%, 02/25/30(c) | | | 30 | | | | 29,849 | |
Series2017-C04, Class 2M1, (1 mo. LIBOR US + 0.85%), 3.36%, 11/25/29(b) | | | 73 | | | | 72,972 | |
Series2017-C01, Class 1M1, (1 mo. LIBOR US + 1.30%), 3.81%, 07/25/29(b) | | | 51 | | | | 50,619 | |
Series2016-C05, Class 2M1, (1 mo. LIBOR US + 1.35%), 3.86%, 01/25/29(b) | | | 13 | | | | 13,394 | |
Series2016-C04, Class 1M1, (1 mo. LIBOR US + 1.45%), 3.96%, 01/25/29(b) | | | 54 | | | | 54,639 | |
Series2017-C05, Class 1M2A, (1 mo. LIBOR US + 2.20%), 4.71%, 01/25/30(b) | | | 140 | | | | 141,953 | |
Series2018-C02, Class 2M2, 4.71%, 08/25/30(c) | | | 125 | | | | 121,618 | |
Series2017-C07, Class 1M2, 4.91%, 05/25/30(c) | | | 100 | | | | 100,715 | |
Series2017-C07, Class 2M2A, 5.01%, 05/25/30(c) | | | 100 | | | | 102,615 | |
Series2017-C07, Class 2M2, 5.01%, 05/25/30(c) | | | 100 | | | | 99,775 | |
Series2014-C02, Class 2M2, (1 mo. LIBOR US + 2.60%), 5.11%, 05/25/24(b) | | | 116 | | | | 119,648 | |
Series2017-C06, Class 1M2, 5.16%, 02/25/30(c) | | | 100 | | | | 101,467 | |
Series2017-C06, Class 2M2, 5.31%, 02/25/30(c) | | | 100 | | | | 101,766 | |
Series2014-C03, Class 2M2, (1 mo. LIBOR US + 2.90%), 5.41%, 07/25/24(b) | | | 141 | | | | 147,615 | |
Series2017-C01, Class 1M2A, (1 mo. LIBOR US + 3.55%), 6.06%, 07/25/29(b) | | | 100 | | | | 104,806 | |
Series2015-C02, Class 1M2, (1 mo. LIBOR US + 4.00%), 6.51%, 05/25/25(b) | | | 66 | | | | 70,497 | |
Series2015-C02, Class 2M2, (1 mo. LIBOR US + 4.00%), 6.51%, 05/25/25(b) | | | 61 | | | | 64,980 | |
Series2015-C01, Class 1M2, (1 mo. LIBOR US + 4.30%), 6.81%, 02/25/25(b) | | | 63 | | | | 68,005 | |
Series2014-C01, Class M2, (1 mo. LIBOR US + 4.40%), 6.91%, 01/25/24(b) | | | 100 | | | | 110,549 | |
Series2016-C05, Class 2M2, (1 mo. LIBOR US + 4.45%), 6.96%, 01/25/29(b) | | | 150 | | | | 163,668 | |
Series2014-C04, Class 1M2, (1 mo. LIBOR US + 4.90%), 7.41%, 11/25/24(b) | | | 31 | | | | 35,023 | |
Series2014-C04, Class 1M2, (1 mo. LIBOR US + 5.00%), 7.51%, 11/25/24(b) | | | 79 | | | | 87,724 | |
Series2015-C03, Class 1M2, (1 mo. LIBOR US + 5.00%), 7.51%, 07/25/25(b) | | | 71 | | | | 78,815 | |
Series2015-C04, Class 1M2, (1 mo. LIBOR US + 5.70%), 8.21%, 04/25/28(b) | | | 80 | | | | 90,059 | |
Freddie Mac Structured Agency Credit Risk Debt Notes: | | | | | | | | |
Series 2017-DNA3, Class M2, 5.01%, 03/25/30(c) | | | 250 | | | | 250,001 | |
Series 2018-DNA1, Class B1, 5.66%, 07/25/30(c) | | | 75 | | | | 69,456 | |
Series2015-DN1, Class M3, (1 mo. LIBOR US + 4.15%), 6.66%, 01/25/25(b) | | | 193 | | | | 205,299 | |
| | | | | | | | |
| | | | 2,914,441 | |
| | | | | | | | |
| Security | | Par
(000) | | | Value | |
|
| Mortgage-Backed Securities — 27.9% | |
Fannie Mae Mortgage-Backed Securities(e): | | | | | | | | |
3.00%, 08/01/47 - 01/01/49 | | $ | 141 | | | $ | 137,955 | |
3.50%, 01/01/46 - 01/01/49 | | | 1,049 | | | | 1,048,319 | |
4.00%, 01/01/34 - 01/01/49 | | | 1,299 | | | | 1,324,379 | |
4.50%, 01/01/34 - 01/01/49 | | | 803 | | | | 832,743 | |
5.00%, 02/01/41 - 01/01/49 | | | 346 | | | | 363,363 | |
5.50%, 01/01/49 | | | 225 | | | | 238,078 | |
Freddie Mac Mortgage-Backed Securities(e): | | | | | | | | |
3.00%, 08/01/46 - 01/01/49 | | | 58 | | | | 56,188 | |
3.50%, 05/01/46 - 01/01/49 | | | 888 | | | | 887,497 | |
4.00%, 01/01/34 - 01/01/49 | | | 738 | | | | 752,528 | |
4.50%, 05/01/42 - 01/01/49 | | | 576 | | | | 597,058 | |
5.00%, 01/01/49 | | | 350 | | | | 366,535 | |
Ginnie Mae Mortgage-Backed Securities(e): | | | | | | | | |
3.00%, 05/20/45 - 01/01/49 | | | 212 | | | | 210,050 | |
3.50%, 06/15/43 - 01/01/49 | | | 987 | | | | 993,042 | |
4.00%, 03/20/48 - 01/01/49 | | | 972 | | | | 995,013 | |
4.50%, 07/20/48 - 01/01/49 | | | 797 | | | | 824,992 | |
5.00%, 01/01/49 | | | 333 | | | | 346,567 | |
| | | | | | | | |
| | | | | | | 9,974,307 | |
| | | | | | | | |
| |
Total U.S. Government Sponsored Agency Securities — 36.1%
(Cost — $12,787,444) | | | | 12,888,748 | |
| | | | | | | | |
| |
Total Long-Term Investments — 107.6%
(Cost — $39,035,670) | | | | 38,471,097 | |
| | | | | | | | |
| | |
| | | Shares | | | | |
|
Short-Term Securities — 14.1% | |
BlackRock Liquidity Funds,T-Fund, Institutional Class, 2.32%(f)(g) | | | 5,039,873 | | | | 5,039,873 | |
| | | | | | | | |
| |
Total Short-Term Securities — 14.1%
(Cost — $5,039,873) | | | | 5,039,873 | |
| | | | | |
| |
Total Investments Before TBA Sale Commitments — 121.7%
(Cost — $44,075,543) | | | | 43,510,970 | |
| | | | | |
| | |
| | | Par
(000) | | | | |
|
TBA Sale Commitments(e) — (0.4%) | |
|
Mortgage-Backed Securities — (0.4%) | |
Fannie Mae Mortgage-Backed Securities
3.50%, 01/01/49 | | | USD 50 | | | | (49,991 | ) |
Ginnie Mae Mortgage-Backed Securities: | | | | | | | | |
3.00%, 01/01/49 | | | 50 | | | | (49,237 | ) |
3.50%, 01/01/49 | | | 25 | | | | (25,155 | ) |
| | | | | | | | |
| |
Total TBA Sale Commitments — (0.4)%
(Proceeds — $123,066) | | | | (124,383 | ) |
| | | | | | | | |
| |
Total Investments, Net of TBA Sale Commitments — 121.3%
(Cost — $43,952,477) | | | | 43,386,587 | |
| |
Liabilities in Excess of Other Assets — (21.3)% | | | | (7,626,486 | ) |
| | | | | | | | |
| |
Net Assets — 100.0% | | | $ | 35,760,101 | |
| | | | | | | | |
| (a) | Security exempt from registration pursuant to Rule 144A under the Securities Act of 1933, as amended. These securities may be resold in transactions exempt from registration to qualified institutional investors. |
| (b) | Variable rate security. Rate shown is the rate in effect as of period end. |
| (c) | Variable or floating rate security, which interest rate adjusts periodically based on changes in current interest rates and prepayments on the underlying pool of assets. Rate shown is the rate in effect as of period end. |
| | | | |
| SCHEDULES OF INVESTMENTS | | | 27 | |
| | |
Schedule of Investments (continued) December 31, 2018 | | BlackRock Alternative Capital Strategies Fund |
| (d) | Variable rate security. Security may be issued at a fixed coupon rate, which converts to a variable rate at a specified date. Rate shown is the rate in effect as of period end. |
| (e) | Represents or includes a TBA transaction. |
| (f) | Annualized7-day yield as of period end. |
| (g) | During the year ended December 31, 2018, investments in issuers considered to be an affiliate of the Fund for purposes of Section 2(a)(3) of the Investment Company Act of 1940, as amended, were as follows: |
| | | | | | | | | | | | | | | | | | | | | | | | | | | | |
| Affiliate | | Shares
Held at
12/31/17 | | | Net
Activity | | | Shares
Held at
12/31/18 | | | Value at
12/31/18 | | | Income | | | Net
Realized
Gain (Loss) (a) | | | Change in
Unrealized
Appreciation
(Depreciation) | |
BlackRock Liquidity Funds,T-Fund, Institutional Class | | | 1,004,163 | | | | 4,035,710 | | | | 5,039,873 | | | $ | 5,039,873 | | | $ | 26,413 | | | $ | — | | | $ | — | |
| | | | | | | | | | | | | | | | | | | | | | | | | | | | |
| | (a) | Includes net capital gain distributions, if applicable. | |
Derivative Financial Instruments Outstanding as of Period End
Futures Contracts
| | | | | | | | | | | | | | | | |
| Description | | Number of
Contracts | | | Expiration
Date | | | Notional
Amount (000) | | | Value
Unrealized
Appreciation (Depreciation) | |
Long Contracts: | | | | | | | | | | | | | | | | |
Euro OAT | | | 8 | | | | 03/07/19 | | | $ | 1,382 | | | $ | (76 | ) |
10-Year Australian Treasury Bond | | | 12 | | | | 03/15/19 | | | | 1,121 | | | | 11,903 | |
10- Year U.S. Ultra Long Treasury Bond | | | 1 | | | | 03/20/19 | | | | 130 | | | | 4,202 | |
10-Year U.S. Treasury Note | | | 4 | | | | 03/20/19 | | | | 488 | | | | 1,813 | |
Long U.S. Treasury Bond | | | 4 | | | | 03/20/19 | | | | 584 | | | | 19,963 | |
U.S. Ultra Bond | | | 5 | | | | 03/20/19 | | | | 803 | | | | 33,945 | |
Long Gilt | | | 3 | | | | 03/27/19 | | | | 471 | | | | 4,356 | |
| | | | | | | | | | | | | | | | |
| | | | | | | | | | | | | | | 76,106 | |
| | | | | | | | | | | | | | | | |
Short Contracts: | | | | | | | | | | | | | | | | |
Euro Bund | | | 10 | | | | 03/07/19 | | | | 1,874 | | | | (9,141 | ) |
10-Year Canada Bond | | | 12 | | | | 03/20/19 | | | | 1,202 | | | | (37,354 | ) |
2-Year U.S. Treasury Note | | | 4 | | | | 03/29/19 | | | | 849 | | | | (3,755 | ) |
5-Year U.S. Treasury Note | | | 4 | | | | 03/29/19 | | | | 459 | | | | (6,616 | ) |
| | | | | | | | | | | | | | | | |
| | | | | | | | | | | | | | | (56,866 | ) |
| | | | | | | | | | | | | | | | |
| | | | | | | | | | | | | | $ | 19,240 | |
| | | | | | | | | | | | | | | | |
Forward Foreign Currency Exchange Contracts
| | | | | | | | | | | | | | | | | | | | |
Currency
Purchased | | | Currency
Sold | | | Counterparty | | Settlement Date | | | Unrealized
Appreciation
(Depreciation) | |
| USD | | | 7,434 | | | CAD | | | 10,000 | | | JPMorgan Chase Bank N.A. | | | 03/20/19 | | | $ | 96 | |
| USD | | | 7,318 | | | SGD | | | 10,000 | | | State Street Bank and Trust Co. | | | 03/20/19 | | | | (32 | ) |
| | | | | | | | | | | | | | | | | | | | |
| | | | | | | | | | | | | | | | | | $ | 64 | |
| | | | | | | | | | | | | | | | | | | | |
Centrally Cleared Credit Default Swaps — Sell Protection
| | | | | | | | | | | | | | | | | | | | | | | | | | | | | | | | | | |
| Reference Obligation/Index | | Financing
Rate Received
by the Fund | | | Payment
Frequency | | | Termination
Date | | | Credit
Rating (a) | | Notional
Amount (000) (b) | | | Value | | | Upfront
Premium
Paid
(Received) | | | Unrealized
Appreciation
(Depreciation) | |
CDX.NA.HY.31.V1 | | | 5.00 | % | | | Quarterly | | | | 12/20/23 | | | B | | | USD | | | | 850 | | | $ | 18,360 | | | $ | 45,683 | | | $ | (27,323 | ) |
| | | | | | | | | | | | | | | | | | | | | | | | | | | | | | | | | | |
| | (a) | Using S&P Global Rating of the issuer or the underlying securities of the index, as applicable. | |
| | (b) | The maximum potential amount the Fund may pay should a negative credit event take place as defined under the terms of the agreement. | |
| | |
| 28 | | 2018 BLACKROCK ANNUAL REPORTTO SHAREHOLDERS |
| | |
Schedule of Investments (continued) December 31, 2018 | | BlackRock Alternative Capital Strategies Fund |
Centrally Cleared Interest Rate Swaps
| | | | | | | | | | | | | | | | | | | | | | | | | | | | | | | | |
Paid by the Fund | | Received by the Fund | | Effective
Date | | | Termination
Date | | | Notional
Amount (000) | | | Value | | | Upfront
Premium
Paid
(Received) | | | Unrealized
Appreciation
(Depreciation) | |
| Rate | | Frequency | | Rate | | Frequency |
| 6-Month EURIBOR, (0.24%) | | Semi-annual | | 0.28% | | Annual | | | N/A | | | | 12/19/23 | | | EUR | | | 50 | | | $ | 255 | | | $ | 1 | | | $ | 254 | |
| 6-Month EURIBOR, (0.24%) | | Semi-annual | | 0.34 | | Annual | | | N/A | | | | 12/19/23 | | | EUR | | | 70 | | | | 618 | | | | 1 | | | | 617 | |
| 6-Month EURIBOR, (0.24%) | | Semi-annual | | 0.39 | | Annual | | | N/A | | | | 12/19/23 | | | EUR | | | 30 | | | | 351 | | | | 1 | | | | 350 | |
| 6-Month EURIBOR, (0.24%) | | Semi-annual | | 0.39 | | Annual | | | N/A | | | | 12/19/23 | | | EUR | | | 130 | | | | 1,523 | | | | 3 | | | | 1,520 | |
| 6-Month EURIBOR, (0.24%) | | Semi-annual | | 0.43 | | Annual | | | N/A | | | | 12/19/23 | | | EUR | | | 50 | | | | 697 | | | | 1 | | | | 696 | |
| MXN 28D TIIE, 8.59% | | Monthly | | 8.19 | | Monthly | | | 03/20/19 | (a) | | | 03/13/24 | | | MXN | | | 2,960 | | | | (2,455 | ) | | | 2 | | | | (2,457 | ) |
| MXN 28D TIIE, 8.59% | | Monthly | | 8.09 | | Monthly | | | 03/20/19 | (a) | | | 03/13/24 | | | MXN | | | 2,040 | | | | (2,109 | ) | | | 2 | | | | (2,111 | ) |
| MXN 28D TIIE, 8.59% | | Monthly | | 8.11 | | Monthly | | | 03/20/19 | (a) | | | 03/13/24 | | | MXN | | | 1,320 | | | | (1,313 | ) | | | 1 | | | | (1,314 | ) |
| MXN 28D TIIE, 8.59% | | Monthly | | 9.00 | | Monthly | | | 03/20/19 | (a) | | | 03/13/24 | | | MXN | | | 3,070 | | | | 2,544 | | | | 2 | | | | 2,542 | |
| MXN 28D TIIE, 8.59% | | Monthly | | 8.51 | | Monthly | | | 03/20/19 | (a) | | | 03/13/24 | | | MXN | | | 830 | | | | (153 | ) | | | 1 | | | | (154 | ) |
| MXN 28D TIIE, 8.59% | | Monthly | | 8.60 | | Monthly | | | 03/20/19 | (a) | | | 03/13/24 | | | MXN | | | 3,020 | | | | 14 | | | | 2 | | | | 12 | |
| 3-Month JIBAR, 7.15% | | Quarterly | | 8.33 | | Quarterly | | | 03/20/19 | (a) | | | 03/20/24 | | | ZAR | | | 2,450 | | | | 4,136 | | | | 3 | | | | 4,133 | |
| 3.05 | | Semi-annual | | 3-Month LIBOR, 2.81% | | Quarterly | | | 03/20/19 | (a) | | | 03/20/24 | | | USD | | | 130 | | | | (2,912 | ) | | | (9 | ) | | | (2,903 | ) |
| 0.17 | | Semi-annual | | 6-Month JPY LIBOR, 0.01% | | Semi-annual | | | 03/20/19 | (a) | | | 03/20/24 | | | JPY | | | 28,000 | | | | (1,823 | ) | | | 4 | | | | (1,827 | ) |
| 0.70 | | Annual | | 3-Month STIBOR, (0.13%) | | Quarterly | | | 03/20/19 | (a) | | | 03/20/24 | | | SEK | | | 1,020 | | | | (735 | ) | | | (124 | ) | | | (611 | ) |
| 2.95 | | Quarterly | | 3-Month HIBOR, 2.33% | | Quarterly | | | 03/20/19 | (a) | | | 03/20/24 | | | HKD | | | 820 | | | | (3,078 | ) | | | 2 | | | | (3,080 | ) |
| 2.42 | | Semi-annual | | 6-Month SIBOR, 1.94% | | Semi-annual | | | 03/20/19 | (a) | | | 03/20/24 | | | SGD | | | 105 | | | | (1,846 | ) | | | 1 | | | | (1,847 | ) |
| 2.43 | | Semi-annual | | 6-Month SIBOR, 1.94% | | Semi-annual | | | 03/20/19 | (a) | | | 03/20/24 | | | SGD | | | 25 | | | | (446 | ) | | | — | | | | (446 | ) |
| 3-Month JIBAR ,7.15% | | Quarterly | | 8.41 | | Quarterly | | | 03/20/19 | (a) | | | 03/20/24 | | | ZAR | | | 1,530 | | | | 2,928 | | | | 2 | | | | 2,926 | |
| 3.15 | | Semi-annual | | 3-Month LIBOR, 2.81% | | Quarterly | | | 03/20/19 | (a) | | | 03/20/24 | | | USD | | | 130 | | | | (3,510 | ) | | | 2 | | | | (3,512 | ) |
| 2.49% | | Semi-annual | | 6-Month SIBOR, 1.94% | | Semi-annual | | | 03/20/19 | (a) | | | 03/20/24 | | | SGD | | | 17 | | | | (326 | ) | | | — | | | | (326 | ) |
| 6-Month WIBOR, 1.69% | | Semi-annual | | 2.63% | | Annual | | | 03/20/19 | (a) | | | 03/20/24 | | | PLN | | | 280 | | | | 1,674 | | | | 1 | | | | 1,673 | |
| 3-Month JIBAR, 7.15% | | Quarterly | | 8.19 | | Quarterly | | | 03/20/19 | (a) | | | 03/20/24 | | | ZAR | | | 1,430 | | | | 1,872 | | | | 2 | | | | 1,870 | |
| 2.51 | | Semi-annual | | 6-Month SIBOR, 1.94% | | Semi-annual | | | 03/20/19 | (a) | | | 03/20/24 | | | SGD | | | 84 | | | | (1,724 | ) | | | 1 | | | | (1,725 | ) |
| 6-Month BBR, (0.24%) | | Semi-annual | | 2.60 | | Semi-annual | | | 03/20/19 | (a) | | | 03/20/24 | | | AUD | | | 160 | | | | 1,949 | | | | 2 | | | | 1,947 | |
| 6-Month WIBOR, 1.69% | | Semi-annual | | 2.77 | | Annual | | | 03/20/19 | (a) | | | 03/20/24 | | | PLN | | | 310 | | | | 2,373 | | | | 1 | | | | 2,372 | |
| 3.08 | | Semi-annual | | 3-Month LIBOR, 2.81% | | Quarterly | | | 03/20/19 | (a) | | | 03/20/24 | | | USD | | | 60 | | | | (1,402 | ) | | | 1 | | | | (1,403 | ) |
| 1.37 | | Semi-annual | | 6-Month GBP LIBOR, 1.03% | | Semi-annual | | | 03/20/19 | (a) | | | 03/20/24 | | | GBP | | | 20 | | | | (61 | ) | | | — | | | | (61 | ) |
| 6-Month BBR, (0.24%) | | Semi-annual | | 2.42 | | Semi-annual | | | 03/20/19 | (a) | | | 03/20/24 | | | AUD | | | 80 | | | | 476 | | | | 1 | | | | 475 | |
| 2.10 | | Semi-annual | | 6-Month SIBOR, 1.94% | | Semi-annual | | | 03/20/19 | (a) | | | 03/20/24 | | | SGD | | | 130 | | | | (797 | ) | | | 2 | | | | (799 | ) |
| 1.35 | | Semi-annual | | 6-Month GBP LIBOR, 1.03% | | Semi-annual | | | 03/20/19 | (a) | | | 03/20/24 | | | GBP | | | 60 | | | | (126 | ) | | | 1 | | | | (127 | ) |
| 6-Month EURIBOR, (0.24%) | | Semi-annual | | 0.32 | | Annual | | | 03/20/19 | (a) | | | 03/20/24 | | | EUR | | | 20 | | | | 80 | | | | — | | | | 80 | |
| 1.96 | | Semi-annual | | 6-Month SIBOR, 1.94% | | Semi-annual | | | 03/20/19 | (a) | | | 03/20/24 | | | SGD | | | 40 | | | | (56 | ) | | | — | | | | (56 | ) |
| 1.96 | | Semi-annual | | 6-Month SIBOR, 1.94% | | Semi-annual | | | 03/20/19 | (a) | | | 03/20/24 | | | SGD | | | 40 | | | | (57 | ) | | | — | | | | (57 | ) |
| 2.00 | | Semi-annual | | 6-Month SIBOR, 1.94% | | Semi-annual | | | 03/20/19 | (a) | | | 03/20/24 | | | SGD | | | 40 | | | | (106 | ) | | | — | | | | (106 | ) |
| 2.39 | | Quarterly | | 3-Month HIBOR, 2.33% | | Quarterly | | | 03/20/19 | (a) | | | 03/20/24 | | | HKD | | | 790 | | | | (275 | ) | | | 2 | | | | (277 | ) |
| 1.97 | | Semi-annual | | 6-Month SIBOR, 1.94% | | Semi-annual | | | 03/20/19 | (a) | | | 03/20/24 | | | SGD | | | 110 | | | | (174 | ) | | | 1 | | | | (175 | ) |
| 1.35 | | Semi-annual | | 6-Month GBP LIBOR, 1.03% | | Semi-annual | | | 03/20/19 | (a) | | | 03/20/24 | | | GBP | | | 80 | | | | (151 | ) | | | 2 | | | | (153 | ) |
| 6-Month BBR, 2.22% | | Semi-annual | | 2.57% | | Semi-annual | | | 03/20/19 | (a) | | | 03/20/24 | | | AUD | | | 50 | | | | 545 | | | | 1 | | | | 544 | |
| 6-Month BBR, 2.22% | | Semi-annual | | 2.58 | | Semi-annual | | | 03/20/19 | (a) | | | 03/20/24 | | | AUD | | | 50 | | | | 572 | | | | 1 | | | | 571 | |
| 6-Month BBR, 2.22% | | Semi-annual | | 2.59 | | Semi-annual | | | 03/20/19 | (a) | | | 03/20/24 | | | AUD | | | 90 | | | | 1,049 | | | | 1 | | | | 1,048 | |
| 6-Month BBR, 2.22% | | Semi-annual | | 2.59 | | Semi-annual | | | 03/20/19 | (a) | | | 03/20/24 | | | AUD | | | 90 | | | | 1,062 | | | | 1 | | | | 1,061 | |
| 6-Month BBR, 2.22% | | Semi-annual | | 2.60 | | Semi-annual | | | 03/20/19 | (a) | | | 03/20/24 | | | AUD | | | 150 | | | | 1,798 | | | | 2 | | | | 1,796 | |
| 6-Month BBR, 2.22% | | Semi-annual | | 2.60 | | Semi-annual | | | 03/20/19 | (a) | | | 03/20/24 | | | AUD | | | 270 | | | | 3,262 | | | | 3 | | | | 3,259 | |
| 6-Month BBR, 2.22% | | Semi-annual | | 2.62 | | Semi-annual | | | 03/20/19 | (a) | | | 03/20/24 | | | AUD | | | 190 | | | | 2,383 | | | | 2 | | | | 2,381 | |
| 2.73% | | Semi-annual | | 3-Month CAD BA, 2.31% | | Semi-annual | | | 03/20/19 | (a) | | | 03/20/24 | | | CAD | | | 20 | | | | (299 | ) | | | (6 | ) | | | (293 | ) |
| 3.06 | | Quarterly | | 3-Month HIBOR, 2.33% | | Quarterly | | | 03/20/19 | (a) | | | 03/20/24 | | | HKD | | | 550 | | | | (2,441 | ) | | | 1 | | | | (2,442 | ) |
| 3.13 | | Semi-annual | | 3-Month LIBOR, 2.81% | | Quarterly | | | 03/20/19 | (a) | | | 03/20/24 | | | USD | | | 20 | | | | (521 | ) | | | — | | | | (521 | ) |
| | | | | | | | | | | | | | | | | | | | | | | | | | | | | | | | |
| | | | | | | | | | | | | | | | | | | | | | $ | 3,265 | | | $ | (79 | ) | | $ | 3,344 | |
| | | | | | | | | | | | | | | | | | | | | | | | | | | | | | | | |
| | | | |
| SCHEDULES OF INVESTMENTS | | | 29 | |
| | |
Schedule of Investments (continued) December 31, 2018 | | BlackRock Alternative Capital Strategies Fund |
OTC Interest Rate Swaps
| | | | | | | | | | | | | | | | | | | | | | | | | | | | | | | | | | | | |
| Paid by the Fund | | Received by the Fund | | Counterparty | | | Effective
Date (a) | | | Termination
Date | | Notional
Amount (000) | | | Value | | | Upfront
Premium
Paid
(Received) | | | Unrealized
Appreciation
(Depreciation) | |
| Rate | | Frequency | | Rate | | Frequency |
| 1.98% | | Quarterly | | 3-Month KRW CDC, 1.90% | | Quarterly | | | Deutsche Bank AG | | | | 03/20/19 | | | 03/20/24 | | | KRW | | | | 274,940 | | | $ | (2,498 | ) | | $ | — | | | $ | (2,498 | ) |
| 2.03 | | Quarterly | | 3-Month KRW CDC, 1.90% | | Quarterly | | | Deutsche Bank AG | | | | 03/20/19 | | | 03/20/24 | | | KRW | | | | 115,034 | | | | (1,283 | ) | | | — | | | | (1,283 | ) |
| 2.03 | | Quarterly | | 3-Month KRW CDC, 1.90% | | Quarterly | | | Citibank N.A. | | | | 03/20/19 | | | 03/20/24 | | | KRW | | | | 57,262 | | | | (633 | ) | | | — | | | | (633 | ) |
| 2.04 | | Quarterly | | 3-Month KRW CDC, 1.90% | | Quarterly | | | Bank of America N.A. | | | | 03/20/19 | | | 03/20/24 | | | KRW | | | | 70,677 | | | | (828 | ) | | | — | | | | (828 | ) |
| 2.05 | | Quarterly | | 3-Month KRW CDC, 1.90% | | Quarterly | | | Deutsche Bank AG | | | | 03/20/19 | | | 03/20/24 | | | KRW | | | | 76,567 | | | | (914 | ) | | | — | | | | (914 | ) |
| 2.13 | | Quarterly | | 3-Month KRW CDC, 1.90% | | Quarterly | | | Deutsche Bank AG | | | | 03/20/19 | | | 03/20/24 | | | KRW | | | | 159,690 | | | | (2,479 | ) | | | — | | | | (2,479 | ) |
| 2.14 | | Quarterly | | 3-Month KRW CDC, 1.90% | | Quarterly | | | Deutsche Bank AG | | | | 03/20/19 | | | 03/20/24 | | | KRW | | | | 159,690 | | | | (2,513 | ) | | | — | | | | (2,513 | ) |
| 2.15 | | Quarterly | | 3-Month KRW CDC, 1.90% | | Quarterly | | | Citibank N.A. | | | | 03/20/19 | | | 03/20/24 | | | KRW | | | | 78,420 | | | | (1,268 | ) | | | — | | | | (1,268 | ) |
| 1.97 | | Quarterly | | 3-Month KRW CDC, 1.90% | | Quarterly | | | Deutsche Bank AG | | | | 03/20/19 | | | 03/20/24 | | | KRW | | | | 74,260 | | | | (639 | ) | | | — | | | | (639 | ) |
| | | | | | | | | | | | | | | | | | | | | | | | | | | | | | | | | | | | |
| | | | | | | | | | | | | | | | | | | | | | | | | | $ | (13,055 | ) | | $ | — | | | $ | (13,055 | ) |
| | | | | | | | | | | | | | | | | | | | | | | | | | | | | | | | | | | | |
OTC Total Return Swaps (a)
| | | | | | | | | | | | | | | | | | | | | | |
| Reference Entity | | Counterparty | | Expiration Date | | | Net Notional
Amount | | | Unrealized
Appreciation
(Depreciation) | | | Net Value of Reference
Entities | | | Gross
Notional
Amount
Net Asset
Percentage | |
Equity Securities Long/Short: | | Morgan Stanley & Co. International PLC | | | 02/27/23 | | | $ | 102,059 | | | $ | 63,830 | (b) | | $ | 177,505 | | | | 4.2 | % |
| | Bank of America N.A. | | | 02/17/23 | | | | (195,683 | ) | | | 394,066 | (c) | | | 184,050 | | | | 52.3 | |
| | Morgan Stanley & Co. International PLC | | | 02/27/23 | | | | 385,513 | | | | (1,700 | )(d) | | | 396,937 | | | | 7.2 | |
| | Bank of America N.A. | | | 02/17/23 | | | | (211,402 | ) | | | 544,443 | (e) | | | 404,425 | | | | 61.2 | |
| | | | | | | | | | | | | | | | | | | | | | |
| | | $ | 80,487 | | | $ | 1,000,639 | | | $ | 1,162,917 | | | | | |
| | | | | | | | | | | | | | | | | |
| | (a) | In regards to total return swaps with multiple financing rate benchmarks, the Fund receives or pays the total return on a portfolio of long and short positions underlying the total return swap. In addition, the Fund pays or receives a variable rate of interest, based on a specified benchmark, plus or minus a spread in a range of19-1,550 basis points. The benchmark and spread are determined based upon the country and/or currency of the individual underlying positions. The following are the specified benchmarks used in determining the variable rate of interest: | |
ICE LIBOR USD 1 Week
US Federal Funds Effective Rate (continuous series)
| | (b) | Amount includes $(11,616) of net dividends and financing fees. | |
| | (c) | Amount includes $14,333 of net dividends and financing fees. | |
| | (d) | Amount includes $(13,124) of net dividends and financing fees. | |
| | (e) | Amount includes $(71,384) of net dividends and financing fees. | |
| | |
| 30 | | 2018 BLACKROCK ANNUAL REPORTTO SHAREHOLDERS |
| | |
Schedule of Investments (continued) December 31, 2018 | | BlackRock Alternative Capital Strategies Fund |
The following table represents the individual long and short positions and related values of the equity securities underlying the total return swap with Morgan Stanley & Co. International PLC as of December 31, 2018 expiration dates 02/27/23:
| | | | | | | | | | | | |
| Security | | Shares | | | Value | | | % of
Basket
Value | |
|
Reference Entity — Long | |
|
| Bermuda | |
Assured Guaranty Ltd. | | | 305 | | | $ | 11,675 | | | | 6.6 | % |
| | | | | | | | | | | | |
|
| Canada | |
Goldcorp, Inc. | | | 515 | | | | 5,047 | | | | 2.9 | |
Kinross Gold Corp. | | | 1,490 | | | | 4,828 | | | | 2.7 | |
| | | | | | | | | | | | |
| | | | 9,875 | | | | | |
|
| Ireland | |
Seagate Technology PLC | | | 74 | | | | 2,856 | | | | 1.6 | |
| | | | | | | | | | | | |
|
| United Kingdom | |
Noble Corp. PLC | | | 2,278 | | | | 5,968 | | | | 3.3 | |
| | | | | | | | | | | | |
|
| United States | |
AbbVie, Inc. | | | 3 | | | | 277 | | | | 0.2 | |
Advance Auto Parts, Inc. | | | 50 | | | | 7,873 | | | | 4.4 | |
AES Corp. | | | 1,545 | | | | 22,341 | | | | 12.6 | |
Aflac, Inc. | | | 93 | | | | 4,237 | | | | 2.4 | |
Agilent Technologies, Inc. | | | 179 | | | | 12,075 | | | | 6.8 | |
Allergan PLC | | | 78 | | | | 10,426 | | | | 5.9 | |
AMC Networks, Inc., Class A | | | 188 | | | | 10,317 | | | | 5.8 | |
American Express Co. | | | 38 | | | | 3,622 | | | | 2.0 | |
American International Group, Inc. | | | 150 | | | | 5,912 | | | | 3.3 | |
Apache Corp. | | | 253 | | | | 6,641 | | | | 3.7 | |
Apple, Inc. | | | 39 | | | | 6,152 | | | | 3.5 | |
Applied Materials, Inc. | | | 313 | | | | 10,248 | | | | 5.8 | |
Boeing Co. | | | 12 | | | | 3,870 | | | | 2.2 | |
Boston Properties, Inc. | | | 55 | | | | 6,190 | | | | 3.5 | |
Bristol-Myers Squibb Co. | | | 236 | | | | 12,267 | | | | 6.9 | |
Cardinal Health, Inc. | | | 100 | | | | 4,460 | | | | 2.5 | |
Celgene Corp. | | | 46 | | | | 2,948 | | | | 1.7 | |
Chesapeake Energy Corp. | | | 3,641 | | | | 7,646 | | | | 4.3 | |
Cisco Systems, Inc. | | | 85 | | | | 3,683 | | | | 2.1 | |
Clorox Co. | | | 28 | | | | 4,316 | | | | 2.4 | |
Colgate-Palmolive Co. | | | 309 | | | | 18,392 | | | | 10.4 | |
CSX Corp. | | | 117 | | | | 7,269 | | | | 4.1 | |
DXC Technology Co. | | | 58 | | | | 3,084 | | | | 1.7 | |
Eastman Chemical Co. | | | 135 | | | | 9,870 | | | | 5.6 | |
Eaton Corp. PLC | | | 174 | | | | 11,947 | | | | 6.7 | |
Eli Lilly & Co. | | | 34 | | | | 3,935 | | | | 2.2 | |
Entergy Corp. | | | 251 | | | | 21,604 | | | | 12.2 | |
EOG Resources, Inc. | | | 21 | | | | 1,831 | | | | 1.0 | |
Flex Ltd. | | | 1,211 | | | | 9,216 | | | | 5.2 | |
Ford Motor Co. | | | 239 | | | | 1,828 | | | | 1.0 | |
Gaming and Leisure Properties, Inc. | | | 240 | | | | 7,754 | | | | 4.4 | |
Gilead Sciences, Inc. | | | 57 | | | | 3,565 | | | | 2.0 | |
H&R Block, Inc. | | | 213 | | | | 5,404 | | | | 3.0 | |
Halliburton Co. | | | 370 | | | | 9,835 | | | | 5.5 | |
HCA Healthcare, Inc. | | | 236 | | | | 29,370 | | | | 16.5 | |
Hershey Co. | | | 29 | | | | 3,108 | | | | 1.8 | |
Hilton Worldwide Holdings, Inc. | | | 91 | | | | 6,534 | | | | 3.7 | |
HollyFrontier Corp. | | | 49 | | | | 2,505 | | | | 1.4 | |
HP, Inc. | | | 159 | | | | 3,253 | | | | 1.8 | |
Illinois Tool Works, Inc. | | | 28 | | | | 3,547 | | | | 2.0 | |
Intel Corp. | | | 142 | | | | 6,664 | | | | 3.8 | |
International Business Machines Corp. | | | 150 | | | | 17,051 | | | | 9.6 | |
Juniper Networks, Inc. | | | 428 | | | | 11,518 | | | | 6.5 | |
| | | | | | | | | | | | |
| Security | | Shares | | | Value | | | % of
Basket
Value | |
|
| United States (continued) | |
Kimberly-Clark Corp. | | | 27 | | | $ | 3,076 | | | | 1.7 | % |
Kimco Realty Corp. | | | 446 | | | | 6,534 | | | | 3.7 | |
Laboratory Corp. of America Holdings | | | 113 | | | | 14,279 | | | | 8.0 | |
Lear Corp. | | | 27 | | | | 3,317 | | | | 1.9 | |
Lockheed Martin Corp. | | | 17 | | | | 4,451 | | | | 2.5 | |
LyondellBasell Industries NV, Class A | | | 103 | | | | 8,566 | | | | 4.8 | |
Mastercard, Inc., Class A | | | 634 | | | | 119,604 | | | | 67.4 | |
McDonald’s Corp. | | | 39 | | | | 6,925 | | | | 3.9 | |
McKesson Corp. | | | 163 | | | | 18,007 | | | | 10.1 | |
Microsoft Corp. | | | 43 | | | | 4,368 | | | | 2.5 | |
Mosaic Co. | | | 156 | | | | 4,557 | | | | 2.6 | |
Nordstrom, Inc. | | | 64 | | | | 2,983 | | | | 1.7 | |
Nucor Corp. | | | 199 | | | | 10,310 | | | | 5.8 | |
Occidental Petroleum Corp. | | | 393 | | | | 24,122 | | | | 13.6 | |
Omnicom Group, Inc. | | | 63 | | | | 4,614 | | | | 2.6 | |
PPL Corp. | | | 500 | | | | 14,165 | | | | 8.0 | |
Prudential Financial, Inc. | | | 54 | | | | 4,404 | | | | 2.5 | |
Royal Caribbean Cruises Ltd. | | | 45 | | | | 4,401 | | | | 2.5 | |
Schlumberger Ltd. | | | 143 | | | | 5,159 | | | | 2.9 | |
Southwest Airlines Co. | | | 154 | | | | 7,158 | | | | 4.0 | |
Steel Dynamics, Inc. | | | 282 | | | | 8,471 | | | | 4.8 | |
Toll Brothers, Inc. | | | 298 | | | | 9,813 | | | | 5.5 | |
United Continental Holdings, Inc. | | | 66 | | | | 5,526 | | | | 3.1 | |
United Parcel Service, Inc., Class B | | | 76 | | | | 7,412 | | | | 4.2 | |
VEREIT, Inc. | | | 801 | | | | 5,727 | | | | 3.2 | |
Visa, Inc., Class A | | | 410 | | | | 54,095 | | | | 30.5 | |
Walt Disney Co. | | | 46 | | | | 5,044 | | | | 2.8 | |
Waste Management, Inc. | | | 63 | | | | 5,606 | | | | 3.2 | |
Whiting Petroleum Corp. | | | 664 | | | | 15,066 | | | | 8.5 | |
| | | | | | | | | | | | |
| | | | 732,345 | | | | | |
| | | | | | | | | | | | |
| | |
Total Reference Entity — Long | | | | 762,719 | | | | | |
| | | | | | | | | | | | |
|
Reference Entity — Short | |
|
United Kingdom | |
Aon PLC | | | (93 | ) | | | (13,519 | ) | | | (7.6 | ) |
Aptiv PLC | | | (176 | ) | | | (10,836 | ) | | | (6.1 | ) |
Ensco PLC, Class A | | | (16,433 | ) | | | (58,501 | ) | | | (33.0 | ) |
| | | | | | | | | | | | |
| | | | (82,856 | ) | | | | |
|
| United States | |
AMC Entertainment Holdings, Inc., Class A Class A | | | (1,496 | ) | | | (18,371 | ) | | | (10.4 | ) |
Comcast Corp., Class A | | | (757 | ) | | | (25,776 | ) | | | (14.5 | ) |
ConAgra Foods, Inc. | | | (756 | ) | | | (16,148 | ) | | | (9.1 | ) |
CVS Health Corp. | | | (1,250 | ) | | | (81,900 | ) | | | (46.1 | ) |
Diamondback Energy, Inc. | | | (129 | ) | | | (11,958 | ) | | | (6.7 | ) |
GTT Communications, Inc. | | | (1,852 | ) | | | (43,818 | ) | | | (24.7 | ) |
Hertz Global Holdings, Inc. | | | (1,817 | ) | | | (24,802 | ) | | | (14.0 | ) |
Match Group, Inc. | | | (594 | ) | | | (25,406 | ) | | | (14.3 | ) |
Mattel, Inc. | | | (604 | ) | | | (6,034 | ) | | | (3.4 | ) |
Mylan NV | | | (130 | ) | | | (3,562 | ) | | | (2.0 | ) |
Omega Healthcare Investors, Inc. | | | (1,379 | ) | | | (48,472 | ) | | | (27.3 | ) |
QUALCOMM, Inc. | | | (352 | ) | | | (20,032 | ) | | | (11.3 | ) |
Tesla Motors, Inc. | | | (84 | ) | | | (27,955 | ) | | | (15.8 | ) |
Under Armour, Inc., Class A | | | (1,953 | ) | | | (34,510 | ) | | | (19.4 | ) |
ViaSat, Inc. | | | (1,596 | ) | | | (94,084 | ) | | | (53.0 | ) |
Wabtec Corp. | | | (278 | ) | | | (19,530 | ) | | | (11.0 | ) |
| | | | | | | | | | | | |
| | | | (502,358 | ) | | | | |
| | | | | | | | | | | | |
| | |
Total Reference Entity — Short | | | | (585,214 | ) | | | | |
| | | | | | | | | | | | |
| | |
Net Value of Reference Entity — Morgan Stanley & Co. International PLC | | | $ | 177,505 | | | | | |
| | | | | | | | | | | | |
| | | | |
| SCHEDULES OF INVESTMENTS | | | 31 | |
| | |
Schedule of Investments (continued) December 31, 2018 | | BlackRock Alternative Capital Strategies Fund |
The following table represents the individual long and short positions and related values of the equity securities underlying the total return swap with Bank of America N.A. as of December 31, 2018 expiration dates 02/17/23:
| | | | | | | | | | | | |
| Security | | Shares | | | Value | | | % of
Basket
Value | |
|
Reference Entity — Long | |
|
| Bermuda | |
Assured Guaranty Ltd. | | | 1,344 | | | $ | 51,448 | | | | 27.9 | % |
| | | | | | | | | | | | |
|
| Canada | |
Goldcorp, Inc. | | | 7,325 | | | | 71,785 | | | | 39.0 | |
Kinross Gold Corp. | | | 14,530 | | | | 47,077 | | | | 25.6 | |
| | | | | | | | | | | | |
| | | | 118,862 | | | | | |
|
| Ireland | |
Seagate Technology PLC | | | 655 | | | | 25,277 | | | | 13.7 | |
| | | | | | | | | | | | |
|
| Switzerland | |
Garrett Motion, Inc. | | | — | | | | 3 | | | | 0.0 | |
| | | | | | | | | | | | |
|
| Switzerland | |
Transocean Ltd. | | | 2,936 | | | | 20,376 | | | | 11.1 | |
| | | | | | | | | | | | |
|
| United Kingdom | |
Noble Corp. PLC | | | 4,560 | | | | 11,947 | | | | 6.5 | |
| | | | | | | | | | | | |
|
| United States | |
Abbott Laboratories | | | 540 | | | | 39,058 | | | | 21.2 | |
AbbVie, Inc. | | | 943 | | | | 86,935 | | | | 47.2 | |
Advance Auto Parts, Inc. | | | 401 | | | | 63,141 | | | | 34.3 | |
AES Corp. | | | 5,992 | | | | 86,644 | | | | 47.1 | |
Aflac, Inc. | | | 422 | | | | 19,226 | | | | 10.4 | |
Agilent Technologies, Inc. | | | 563 | | | | 37,980 | | | | 20.6 | |
Allergan PLC | | | 619 | | | | 82,736 | | | | 45.0 | |
Allstate Corp. | | | 546 | | | | 45,116 | | | | 24.5 | |
AMC Networks, Inc., Class A | | | 1,150 | | | | 63,112 | | | | 34.3 | |
American Express Co. | | | 764 | | | | 72,824 | | | | 39.6 | |
American International Group, Inc. | | | 824 | | | | 32,474 | | | | 17.6 | |
Amgen, Inc. | | | 92 | | | | 17,910 | | | | 9.7 | |
Apache Corp. | | | 3,205 | | | | 84,131 | | | | 45.7 | |
Apple, Inc. | | | 724 | | | | 114,204 | | | | 62.0 | |
Applied Materials, Inc. | | | 2,834 | | | | 92,785 | | | | 50.4 | |
AutoZone, Inc. | | | 125 | | | | 104,792 | | | | 56.9 | |
Biogen, Inc. | | | 407 | | | | 122,474 | | | | 66.5 | |
Boeing Co. | | | 58 | | | | 18,705 | | | | 10.2 | |
Boston Properties, Inc. | | | 844 | | | | 94,992 | | | | 51.6 | |
Bristol-Myers Squibb Co. | | | 2,010 | | | | 104,480 | | | | 56.8 | |
Capital One Financial Corp. | | | 400 | | | | 30,236 | | | | 16.4 | |
Cardinal Health, Inc. | | | 2,015 | | | | 89,869 | | | | 48.8 | |
Caterpillar, Inc. | | | 853 | | | | 108,391 | | | | 58.9 | |
Celgene Corp. | | | 1,423 | | | | 91,200 | | | | 49.6 | |
CF Industries Holdings, Inc. | | | 1,177 | | | | 51,211 | | | | 27.8 | |
Chesapeake Energy Corp. | | | 8,380 | | | | 17,598 | | | | 9.6 | |
Chevron Corp. | | | 858 | | | | 93,342 | | | | 50.7 | |
Cisco Systems, Inc. | | | 2,497 | | | | 108,195 | | | | 58.8 | |
Clorox Co. | | | 698 | | | | 107,590 | | | | 58.5 | |
Colgate-Palmolive Co. | | | 1,585 | | | | 94,339 | | | | 51.3 | |
Costco Wholesale Corp. | | | 118 | | | | 24,038 | | | | 13.1 | |
CSX Corp. | | | 1,678 | | | | 104,254 | | | | 56.6 | |
Delta Air Lines, Inc. | | | 1,015 | | | | 50,649 | | | | 27.5 | |
DXC Technology Co. | | | 822 | | | | 43,706 | | | | 23.7 | |
Eastman Chemical Co. | | | 1,240 | | | | 90,656 | | | | 49.3 | |
Eaton Corp. PLC | | | 1,279 | | | | 87,816 | | | | 47.7 | |
eBay, Inc. | | | 663 | | | | 18,610 | | | | 10.1 | |
Eli Lilly & Co. | | | 1,029 | | | | 119,076 | | | | 64.7 | |
Entergy Corp. | | | 1,095 | | | | 94,247 | | | | 51.2 | |
EOG Resources, Inc. | | | 201 | | | | 17,529 | | | | 9.5 | |
| | | | | | | | | | | | |
| Security | | Shares | | | Value | | | % of
Basket
Value | |
|
| United States (continued) | |
FirstEnergy Corp. | | | 1,572 | | | $ | 59,029 | | | | 32.1 | % |
Flex Ltd. | | | 2,088 | | | | 15,890 | | | | 8.6 | |
Ford Motor Co. | | | 5,726 | | | | 43,804 | | | | 23.8 | |
Gaming and Leisure Properties, Inc. | | | 2,938 | | | | 94,927 | | | | 51.6 | |
General Motors Co. | | | 539 | | | | 18,030 | | | | 9.8 | |
Gilead Sciences, Inc. | | | 257 | | | | 16,075 | | | | 8.7 | |
H&R Block, Inc. | | | 3,968 | | | | 100,668 | | | | 54.7 | |
Halliburton Co. | | | 2,676 | | | | 71,128 | | | | 38.6 | |
HCA Healthcare, Inc. | | | 614 | | | | 76,412 | | | | 41.5 | |
Hershey Co. | | | 1,047 | | | | 112,217 | | | | 61.0 | |
Hilton Worldwide Holdings, Inc. | | | 1,094 | | | | 78,549 | | | | 42.7 | |
HollyFrontier Corp. | | | 324 | | | | 16,563 | | | | 9.0 | |
Home Depot, Inc. | | | 172 | | | | 29,553 | | | | 16.1 | |
HP, Inc. | | | 5,121 | | | | 104,776 | | | | 56.9 | |
Humana, Inc. | | | 262 | | | | 75,058 | | | | 40.8 | |
Illinois Tool Works, Inc. | | | 119 | | | | 15,076 | | | | 8.2 | |
Intel Corp. | | | 2,357 | | | | 110,614 | | | | 60.1 | |
International Business Machines Corp. | | | 742 | | | | 84,343 | | | | 45.8 | |
International Paper Co. | | | 702 | | | | 28,333 | | | | 15.4 | |
Juniper Networks, Inc. | | | 1,835 | | | | 49,380 | | | | 26.8 | |
Kimberly-Clark Corp. | | | 516 | | | | 58,793 | | | | 31.9 | |
Kimco Realty Corp. | | | 2,171 | | | | 31,805 | | | | 17.3 | |
Kinder Morgan, Inc. | | | 4,020 | | | | 61,828 | | | | 33.6 | |
KLA-Tencor Corp. | | | 1,357 | | | | 121,438 | | | | 66.0 | |
Kohl’s Corp. | | | 1,850 | | | | 122,729 | | | | 66.7 | |
Kroger Co. | | | 1,060 | | | | 29,150 | | | | 15.8 | |
Laboratory Corp. of America Holdings | | | 38 | | | | 4,802 | | | | 2.6 | |
Lamar Advertising Co., Class A | | | 1,475 | | | | 102,040 | | | | 55.4 | |
Lear Corp. | | | 774 | | | | 95,094 | | | | 51.7 | |
Lincoln National Corp. | | | 1,886 | | | | 96,771 | | | | 52.6 | |
Lockheed Martin Corp. | | | 153 | | | | 40,062 | | | | 21.8 | |
Lowe’s Cos., Inc. | | | 234 | | | | 21,612 | | | | 11.7 | |
LyondellBasell Industries NV, Class A | | | 1,197 | | | | 99,543 | | | | 54.1 | |
Macy’s, Inc. | | | 3,590 | �� | | | 106,910 | | | | 58.1 | |
Marathon Oil Corp. | | | 1,424 | | | | 20,420 | | | | 11.1 | |
Masco Corp. | | | 2,779 | | | | 81,258 | | | | 44.1 | |
McDonald’s Corp. | | | 480 | | | | 85,234 | | | | 46.3 | |
McKesson Corp. | | | 844 | | | | 93,237 | | | | 50.7 | |
Merck & Co., Inc. | | | 1,345 | | | | 102,771 | | | | 55.8 | |
MetLife, Inc. | | | 2,955 | | | | 121,332 | | | | 65.9 | |
Microsoft Corp. | | | 1,160 | | | | 117,821 | | | | 64.0 | |
Mosaic Co. | | | 1,522 | | | | 44,458 | | | | 24.2 | |
MSCI, Inc. | | | 701 | | | | 103,348 | | | | 56.2 | |
Murphy Oil Corp. | | | 3,380 | | | | 79,058 | | | | 43.0 | |
NetApp, Inc. | | | 475 | | | | 28,343 | | | | 15.4 | |
Nordstrom, Inc. | | | 1,343 | | | | 62,597 | | | | 34.0 | |
Norfolk Southern Corp. | | | 810 | | | | 121,127 | | | | 65.8 | |
NRG Energy, Inc. | | | 1,930 | | | | 76,428 | | | | 41.5 | |
Nucor Corp. | | | 1,953 | | | | 101,185 | | | | 55.0 | |
Occidental Petroleum Corp. | | | 1,174 | | | | 72,060 | | | | 39.2 | |
Omnicom Group, Inc. | | | 288 | | | | 21,093 | | | | 11.5 | |
Owens Corning | | | 1,422 | | | | 62,540 | | | | 34.0 | |
Philip Morris International, Inc. | | | 355 | | | | 23,700 | | | | 12.9 | |
Phillips 66 | | | 1,141 | | | | 98,297 | | | | 53.4 | |
PPL Corp. | | | 1,540 | | | | 43,628 | | | | 23.7 | |
Procter & Gamble Co. | | | 801 | | | | 73,628 | | | | 40.0 | |
Progressive Corp. | | | 771 | | | | 46,514 | | | | 25.3 | |
Prudential Financial, Inc. | | | 1,297 | | | | 105,770 | | | | 57.5 | |
Range Resources Corp. | | | 1,682 | | | | 16,097 | | | | 8.7 | |
Republic Services, Inc. | | | 1,585 | | | | 114,263 | | | | 62.1 | |
Royal Caribbean Cruises Ltd. | | | 202 | | | | 19,754 | | | | 10.7 | |
S&P Global, Inc. | | | 151 | | | | 25,661 | | | | 13.9 | |
| | |
| 32 | | 2018 BLACKROCK ANNUAL REPORTTO SHAREHOLDERS |
| | |
Schedule of Investments (continued) December 31, 2018 | | BlackRock Alternative Capital Strategies Fund |
| | | | | | | | | | | | |
| Security | | Shares | | | Value | | | % of
Basket
Value | |
|
| United States (continued) | |
Schlumberger Ltd. | | | 871 | | | $ | 31,426 | | | | 17.1 | % |
Signet Jewelers Ltd. | | | 2,071 | | | | 65,796 | | | | 35.7 | |
Southwest Airlines Co. | | | 368 | | | | 17,105 | | | | 9.3 | |
Steel Dynamics, Inc. | | | 1,284 | | | | 38,571 | | | | 21.0 | |
Sysco Corp. | | | 1,377 | | | | 86,283 | | | | 46.9 | |
Tapestry, Inc. | | | 581 | | | | 19,609 | | | | 10.7 | |
Target Corp. | | | 1,801 | | | | 119,028 | | | | 64.7 | |
Toll Brothers, Inc. | | | 856 | | | | 28,188 | | | | 15.3 | |
Union Pacific Corp. | | | 878 | | | | 121,366 | | | | 65.9 | |
United Continental Holdings, Inc. | | | 310 | | | | 25,956 | | | | 14.1 | |
United Parcel Service, Inc., Class B | | | 764 | | | | 74,513 | | | | 40.5 | |
United Rentals, Inc. | | | 281 | | | | 28,811 | | | | 15.7 | |
VEREIT, Inc. | | | 4,199 | | | | 30,023 | | | | 16.3 | |
Verizon Communications, Inc. | | | 853 | | | | 47,956 | | | | 26.1 | |
Viacom, Inc., Class B | | | 3,850 | | | | 98,945 | | | | 53.8 | |
Voya Financial, Inc. | | | 1,652 | | | | 66,311 | | | | 36.0 | |
Walt Disney Co. | | | 271 | | | | 29,715 | | | | 16.1 | |
Waste Management, Inc. | | | 1,289 | | | | 114,708 | | | | 62.3 | |
Western Digital Corp. | | | 552 | | | | 20,407 | | | | 11.1 | |
Whiting Petroleum Corp. | | | 167 | | | | 3,789 | | | | 2.1 | |
Williams Cos., Inc. | | | 1,041 | | | | 22,954 | | | | 12.5 | |
Xilinx, Inc. | | | 753 | | | | 64,133 | | | | 34.8 | |
Yum! Brands, Inc. | | | 1,303 | | | | 119,772 | | | | 65.1 | |
| | | | | | | | | | | | |
| | | | 8,256,260 | | | | | |
| | | | | | | | | | | | |
| | |
Total Reference Entity — Long | | | | 8,484,173 | | | | | |
| | | | | | | | | | | | |
|
Reference Entity — Short | |
|
Canada | |
Canadian Natural Resources Ltd. | | | (791 | ) | | | (19,087 | ) | | | (10.4 | ) |
Enbridge, Inc. | | | (3,640 | ) | | | (113,131 | ) | | | (61.4 | ) |
| | | | | | | | | | | | |
| | | | (132,218 | ) | | | | |
|
| Ireland | |
Endo International PLC | | | (7,140 | ) | | | (52,122 | ) | | | (28.3 | ) |
Perrigo Co. PLC | | | (906 | ) | | | (35,108 | ) | | | (19.1 | ) |
| | | | | | | | | | | | |
| | | | (87,230 | ) | | | | |
|
| Mexico | |
Southern Copper Corp. | | | (1,672 | ) | | | (51,447 | ) | | | (28.0 | ) |
| | | | | | | | | | | | |
|
| Switzerland | |
Garrett Motion, Inc. | | | — | | | | (3 | ) | | | 0.0 | |
| | | | | | | | | | | | |
|
| United Kingdom | |
Aon PLC | | | (54 | ) | | | (7,849 | ) | | | (4.3 | ) |
Aptiv PLC | | | (150 | ) | | | (9,236 | ) | | | (5.0 | ) |
Ensco PLC, Class A | | | (4,483 | ) | | | (15,959 | ) | | | (8.7 | ) |
Willis Towers Watson PLC | | | (525 | ) | | | (79,727 | ) | | | (43.3 | ) |
| | | | | | | | | | | | |
| | | | (112,771 | ) | | | | |
|
| United States | |
3M Co. | | | (121 | ) | | | (23,055 | ) | | | (12.5 | ) |
Activision Blizzard, Inc. | | | (2,253 | ) | | | (104,922 | ) | | | (57.0 | ) |
Altria Group, Inc. | | | (1,142 | ) | | | (56,403 | ) | | | (30.6 | ) |
Amazon.com, Inc. | | | (15 | ) | | | (22,530 | ) | | | (12.2 | ) |
AMC Entertainment Holdings, Inc., Class A Class A | | | (2,162 | ) | | | (26,549 | ) | | | (14.4 | ) |
American Tower Corp. | | | (702 | ) | | | (111,049 | ) | | | (60.3 | ) |
AmerisourceBergen Corp. | | | (1,293 | ) | | | (96,199 | ) | | | (52.3 | ) |
Analog Devices, Inc. | | | (1,241 | ) | | | (106,515 | ) | | | (57.9 | ) |
Anthem, Inc. | | | (121 | ) | | | (31,778 | ) | | | (17.3 | ) |
Aramark | | | (721 | ) | | | (20,887 | ) | | | (11.3 | ) |
Archer-Daniels-Midland Co. | | | (2,221 | ) | | | (90,994 | ) | | | (49.4 | ) |
AT&T, Inc. | | | (2,014 | ) | | | (57,480 | ) | | | (31.2 | ) |
| | | | | | | | | | | | |
| Security | | Shares | | | Value | | | % of
Basket
Value | |
|
| United States (continued) | |
Autodesk, Inc. | | | (467 | ) | | $ | (60,061 | ) | | | (32.6 | ) % |
Avnet, Inc. | | | (1,471 | ) | | | (53,103 | ) | | | (28.9 | ) |
Baker Hughes a GE Co. | | | (957 | ) | | | (20,576 | ) | | | (11.2 | ) |
Ball Corp. | | | (2,396 | ) | | | (110,168 | ) | | | (59.9 | ) |
Becton Dickinson & Co. | | | (540 | ) | | | (121,673 | ) | | | (66.1 | ) |
Berkshire Hathaway, Inc., Class B | | | (200 | ) | | | (40,836 | ) | | | (22.2 | ) |
Boston Scientific Corp. | | | (2,630 | ) | | | (92,944 | ) | | | (50.5 | ) |
Brighthouse Financial, Inc. | | | (3,282 | ) | | | (100,035 | ) | | | (54.4 | ) |
Bunge Ltd. | | | (1,797 | ) | | | (96,032 | ) | | | (52.2 | ) |
CBOE Holdings, Inc. | | | (1,070 | ) | | | (104,678 | ) | | | (56.9 | ) |
CBRE Group, Inc. | | | (1,783 | ) | | | (71,391 | ) | | | (38.8 | ) |
Centene Corp. | | | (533 | ) | | | (61,455 | ) | | | (33.4 | ) |
Cigna Corp. | | | (420 | ) | | | (79,766 | ) | | | (43.3 | ) |
Cimarex Energy Co. | | | (330 | ) | | | (20,345 | ) | | | (11.1 | ) |
Citrix Systems, Inc. | | | (412 | ) | | | (42,214 | ) | | | (22.9 | ) |
CME Group, Inc. | | | (343 | ) | | | (64,525 | ) | | | (35.1 | ) |
Coca-Cola Co. | | | (1,532 | ) | | | (72,540 | ) | | | (39.4 | ) |
Comcast Corp., Class A | | | (1,430 | ) | | | (48,692 | ) | | | (26.5 | ) |
CommScope Holding Co., Inc. | | | (2,131 | ) | | | (34,927 | ) | | | (19.0 | ) |
ConAgra Foods, Inc. | | | (1,600 | ) | | | (34,176 | ) | | | (18.6 | ) |
Concho Resources, Inc. | | | (1,121 | ) | | | (115,228 | ) | | | (62.6 | ) |
ConocoPhillips | | | (1,044 | ) | | | (65,093 | ) | | | (35.4 | ) |
Constellation Brands, Inc. | | | (622 | ) | | | (100,030 | ) | | | (54.3 | ) |
Continental Resources, Inc. | | | (417 | ) | | | (16,759 | ) | | | (9.1 | ) |
Crown Castle International Corp. | | | (1,036 | ) | | | (112,541 | ) | | | (61.1 | ) |
Crown Holdings, Inc. | | | (2,359 | ) | | | (98,064 | ) | | | (53.3 | ) |
Deere & Co. | | | (154 | ) | | | (22,972 | ) | | | (12.5 | ) |
Diamondback Energy, Inc. | | | (889 | ) | | | (82,410 | ) | | | (44.8 | ) |
Digital Realty Trust, Inc. | | | (986 | ) | | | (105,058 | ) | | | (57.1 | ) |
DISH Network Corp. | | | (4,473 | ) | | | (111,691 | ) | | | (60.7 | ) |
Dollar General Corp. | | | (913 | ) | | | (98,677 | ) | | | (53.6 | ) |
Dollar Tree, Inc. | | | (1,349 | ) | | | (121,842 | ) | | | (66.2 | ) |
Edison International | | | (991 | ) | | | (56,259 | ) | | | (30.6 | ) |
EQT Corp. | | | (1,331 | ) | | | (25,143 | ) | | | (13.7 | ) |
Equifax, Inc. | | | (540 | ) | | | (50,290 | ) | | | (27.3 | ) |
Equinix, Inc. | | | (175 | ) | | | (61,698 | ) | | | (33.5 | ) |
Expedia, Inc. | | | (940 | ) | | | (105,891 | ) | | | (57.5 | ) |
FedEx Corp. | | | (174 | ) | | | (28,071 | ) | | | (15.3 | ) |
Fidelity National Information Services, Inc. | | | (208 | ) | | | (21,330 | ) | | | (11.6 | ) |
Freeport-McMoRan, Inc. | | | (1,962 | ) | | | (20,228 | ) | | | (11.0 | ) |
Gartner, Inc. | | | (800 | ) | | | (102,272 | ) | | | (55.6 | ) |
General Mills, Inc. | | | (1,252 | ) | | | (48,753 | ) | | | (26.5 | ) |
GTT Communications, Inc. | | | (1,531 | ) | | | (36,223 | ) | | | (19.7 | ) |
Hertz Global Holdings, Inc. | | | (3,937 | ) | | | (53,740 | ) | | | (29.2 | ) |
Hess Corp. | | | (2,338 | ) | | | (94,689 | ) | | | (51.4 | ) |
Hologic, Inc. | | | (2,669 | ) | | | (109,696 | ) | | | (59.6 | ) |
Host Hotels & Resorts, Inc. | | | (1,123 | ) | | | (18,720 | ) | | | (10.2 | ) |
International Flavors & Fragrances, Inc. | | | (308 | ) | | | (41,355 | ) | | | (22.5 | ) |
Iron Mountain, Inc. | | | (649 | ) | | | (21,034 | ) | | | (11.4 | ) |
KB Home | | | (842 | ) | | | (16,082 | ) | | | (8.7 | ) |
Kraft Heinz Co. | | | (2,221 | ) | | | (95,592 | ) | | | (51.9 | ) |
L3 Technologies, Inc. | | | (184 | ) | | | (31,953 | ) | | | (17.4 | ) |
Lennar Corp. | | | (1,993 | ) | | | (78,026 | ) | | | (42.4 | ) |
Live Nation Entertainment, Inc. | | | (2,128 | ) | | | (104,804 | ) | | | (56.9 | ) |
Loews Corp. | | | (400 | ) | | | (18,208 | ) | | | (9.9 | ) |
Marriott International, Inc., Class A | | | (1,062 | ) | | | (115,291 | ) | | | (62.6 | ) |
Marsh & McLennan Cos., Inc. | | | (1,376 | ) | | | (109,736 | ) | | | (59.6 | ) |
Martin Marietta Materials, Inc. | | | (309 | ) | | | (53,108 | ) | | | (28.9 | ) |
Match Group, Inc. | | | (1,599 | ) | | | (68,389 | ) | | | (37.2 | ) |
Mattel, Inc. | | | (5,902 | ) | | | (58,961 | ) | | | (32.0 | ) |
McCormick & Co., Inc. | | | (137 | ) | | | (19,076 | ) | | | (10.4 | ) |
Medical Properties Trust, Inc. | | | (6,840 | ) | | | (109,987 | ) | | | (59.8 | ) |
| | | | |
| SCHEDULES OF INVESTMENTS | | | 33 | |
| | |
Schedule of Investments (continued) December 31, 2018 | | BlackRock Alternative Capital Strategies Fund |
| | | | | | | | | | | | |
| Security | | Shares | | | Value | | | % of
Basket
Value | |
|
| United States (continued) | |
MEDNAX, Inc. | | | (889 | ) | | $ | (29,337 | ) | | | (15.9 | ) % |
MGM Resorts International | | | (1,192 | ) | | | (28,918 | ) | | | (15.7 | ) |
Mylan NV | | | (3,030 | ) | | | (83,022 | ) | | | (45.1 | ) |
National Oilwell Varco, Inc. | | | (725 | ) | | | (18,633 | ) | | | (10.1 | ) |
Netflix, Inc. | | | (470 | ) | | | (125,800 | ) | | | (68.4 | ) |
Newell Rubbermaid, Inc. | | | (3,252 | ) | | | (60,455 | ) | | | (32.8 | ) |
NextEra Energy, Inc. | | | (664 | ) | | | (115,417 | ) | | | (62.7 | ) |
Northrop Grumman Corp. | | | (474 | ) | | | (116,083 | ) | | | (63.1 | ) |
NVIDIA Corp. | | | (891 | ) | | | (118,949 | ) | | | (64.6 | ) |
Omega Healthcare Investors, Inc. | | | (759 | ) | | | (26,679 | ) | | | (14.5 | ) |
Oracle Corp. | | | (2,328 | ) | | | (105,109 | ) | | | (57.1 | ) |
Parsley Energy, Inc., Class A | | | (3,677 | ) | | | (58,758 | ) | | | (31.9 | ) |
PepsiCo, Inc. | | | (628 | ) | | | (69,381 | ) | | | (37.7 | ) |
PG&E Corp. | | | (4,656 | ) | | | (110,580 | ) | | | (60.1 | ) |
PolyOne Corp. | | | (750 | ) | | | (21,450 | ) | | | (11.7 | ) |
Post Holdings, Inc. | | | (1,213 | ) | | | (108,115 | ) | | | (58.7 | ) |
PPG Industries, Inc. | | | (1,165 | ) | | | (119,098 | ) | | | (64.7 | ) |
QUALCOMM, Inc. | | | (1,595 | ) | | | (90,771 | ) | | | (49.3 | ) |
Roper Industries, Inc. | | | (77 | ) | | | (20,522 | ) | | | (11.1 | ) |
Sempra Energy | | | (1,054 | ) | | | (114,032 | ) | | | (62.0 | ) |
Sherwin-Williams Co. | | | (311 | ) | | | (122,366 | ) | | | (66.5 | ) |
Southwestern Energy Co. | | | (6,208 | ) | | | (21,169 | ) | | | (11.5 | ) |
Stanley Black & Decker, Inc. | | | (943 | ) | | | (112,915 | ) | | | (61.3 | ) |
Stryker Corp. | | | (281 | ) | | | (44,047 | ) | | | (23.9 | ) |
Symantec Corp. | | | (1,069 | ) | | | (20,199 | ) | | | (11.0 | ) |
Teleflex, Inc. | | | (477 | ) | | | (123,295 | ) | | | (67.0 | ) |
Tempur Sealy International, Inc. | | | (1,243 | ) | | | (51,460 | ) | | | (28.0 | ) |
Tesla Motors, Inc. | | | (276 | ) | | | (91,853 | ) | | | (49.9 | ) |
Thermo Fisher Scientific, Inc. | | | (137 | ) | | | (30,659 | ) | | | (16.7 | ) |
Total System Services, Inc. | | | (218 | ) | | | (17,721 | ) | | | (9.6 | ) |
TransDigm Group, Inc. | | | (359 | ) | | | (122,082 | ) | | | (66.3 | ) |
Triumph Group, Inc. | | | (2,385 | ) | | | (27,428 | ) | | | (14.9 | ) |
Under Armour, Inc., Class A | | | (1,618 | ) | | | (28,590 | ) | | | (15.5 | ) |
United States Steel Corp. | | | (1,344 | ) | | | (24,515 | ) | | | (13.3 | ) |
United Technologies Corp. | | | (201 | ) | | | (21,403 | ) | | | (11.6 | ) |
UnitedHealth Group, Inc. | | | (432 | ) | | | (107,620 | ) | | | (58.5 | ) |
Verisk Analytics, Inc., Class A | | | (718 | ) | | | (78,291 | ) | | | (42.5 | ) |
Vulcan Materials Co. | | | (894 | ) | | | (88,327 | ) | | | (48.0 | ) |
Wabtec Corp. | | | (905 | ) | | | (63,576 | ) | | | (34.5 | ) |
Walgreens Boots Alliance, Inc. | | | (363 | ) | | | (24,804 | ) | | | (13.5 | ) |
WellCare Health Plans, Inc. | | | (512 | ) | | | (120,878 | ) | | | (65.7 | ) |
Westlake Chemical Corp. | | | (284 | ) | | | (18,792 | ) | | | (10.2 | ) |
Wynn Resorts Ltd. | | | (443 | ) | | | (43,817 | ) | | | (23.8 | ) |
Zimmer Biomet Holdings, Inc. | | | (637 | ) | | | (66,070 | ) | | | (35.9 | ) |
| | | | | | | | | | | | |
| | | | | | | (7,916,454 | ) | | | | |
| | | | | | | | | | | | |
| | |
Total Reference Entity — Short | | | | (8,300,123 | ) | | | | |
| | | | | | | | | | | | |
| | |
Net Value of Reference Entity — Bank of America N.A. | | | $ | 184,050 | | | | | |
| | | | | | | | | | | | |
The following table represents the individual long and short positions and related values of the equity securities underlying the total return swap with Morgan Stanley & Co. International PLC as of December 31, 2018 expiration dates 02/27/23:
| | | | | | | | | | | | |
| Security | | Shares | | | Value | | | % of
Basket
Value | |
|
Reference Entity — Long | |
|
| Canada | |
Barrick Gold Corp. | | | 2,312 | | | $ | 31,304 | | | | 7.9 | % |
| | | | | | | | | | | | |
| Security | | Shares | | | Value | | | % of
Basket
Value | |
|
| Canada (continued) | |
Encana Corp. | | | 9,869 | | | $ | 57,043 | | | | 14.3 | % |
Rogers Communications, Inc., Class B | | | 302 | | | | 15,481 | | | | 3.9 | |
| | | | | | | | | | | | |
| | | | 103,828 | | | | | |
|
| United States | |
AES Corp. | | | 6,246 | | | | 90,317 | | | | 22.7 | |
Air Products & Chemicals, Inc. | | | 32 | | | | 5,122 | | | | 1.3 | |
American Express Co. | | | 307 | | | | 29,263 | | | | 7.4 | |
Anadarko Petroleum Corp. | | | 300 | | | | 13,152 | | | | 3.3 | |
Aon PLC | | | 120 | | | | 17,443 | | | | 4.4 | |
Apache Corp. | | | 1,000 | | | | 26,250 | | | | 6.6 | |
AvalonBay Communities, Inc. | | | 40 | | | | 6,962 | | | | 1.8 | |
Bausch Health Cos., Inc. | | | 178 | | | | 3,288 | | | | 0.8 | |
BorgWarner, Inc. | | | 110 | | | | 3,821 | | | | 1.0 | |
Boston Properties, Inc. | | | 83 | | | | 9,342 | | | | 2.3 | |
Bristol-Myers Squibb Co. | | | 80 | | | | 4,158 | | | | 1.0 | |
CBS Corp., Class B | | | 535 | | | | 23,390 | | | | 5.9 | |
Cigna Corp. | | | 179 | | | | 33,996 | | | | 8.6 | |
Clorox Co. | | | 37 | | | | 5,703 | | | | 1.4 | |
Colgate-Palmolive Co. | | | 1,015 | | | | 60,413 | | | | 15.2 | |
Costco Wholesale Corp. | | | 120 | | | | 24,445 | | | | 6.2 | |
Devon Energy Corp. | | | 281 | | | | 6,334 | | | | 1.6 | |
Duke Energy Corp. | | | 54 | | | | 4,660 | | | | 1.2 | |
Eli Lilly & Co. | | | 205 | | | | 23,723 | | | | 6.0 | |
Entergy Corp. | | | 464 | | | | 39,936 | | | | 10.1 | |
Exelon Corp. | | | 747 | | | | 33,690 | | | | 8.5 | |
Exxon Mobil Corp. | | | 68 | | | | 4,637 | | | | 1.2 | |
First Data Corp., Class A | | | 2,244 | | | | 37,946 | | | | 9.6 | |
Freeport-McMoRan, Inc. | | | 1,391 | | | | 14,341 | | | | 3.6 | |
Goodyear Tire & Rubber Co. | | | 837 | | | | 17,083 | | | | 4.3 | |
Halliburton Co. | | | 1,218 | | | | 32,374 | | | | 8.2 | |
Hartford Financial Services Group, Inc. | | | 100 | | | | 4,445 | | | | 1.1 | |
HCP, Inc. | | | 798 | | | | 22,288 | | | | 5.6 | |
HD Supply Holdings, Inc. | | | 1,293 | | | | 48,513 | | | | 12.2 | |
Hershey Co. | | | 204 | | | | 21,865 | | | | 5.5 | |
Home Depot, Inc. | | | 458 | | | | 78,694 | | | | 19.8 | |
Host Hotels & Resorts, Inc. | | | 1,427 | | | | 23,788 | | | | 6.0 | |
Intel Corp. | | | 413 | | | | 19,382 | | | | 4.9 | |
Johnson & Johnson | | | 92 | | | | 11,873 | | | | 3.0 | |
Johnson Controls International PLC | | | 324 | | | | 9,607 | | | | 2.4 | |
Lockheed Martin Corp. | | | 63 | | | | 16,496 | | | | 4.2 | |
Loews Corp. | | | 509 | | | | 23,170 | | | | 5.8 | |
Louisiana-Pacific Corp. | | | 800 | | | | 17,776 | | | | 4.5 | |
McKesson Corp. | | | 39 | | | | 4,308 | | | | 1.1 | |
Murphy Oil Corp. | | | 290 | | | | 6,783 | | | | 1.7 | |
Newmont Mining Corp. | | | 640 | | | | 22,176 | | | | 5.6 | |
Norfolk Southern Corp. | | | 68 | | | | 10,169 | | | | 2.6 | |
Olin Corp. | | | 831 | | | | 16,711 | | | | 4.2 | |
Omnicom Group, Inc. | | | 694 | | | | 50,829 | | | | 12.8 | |
Packaging Corp. of America | | | 55 | | | | 4,590 | | | | 1.2 | |
Pfizer, Inc. | | | 26 | | | | 1,135 | | | | 0.3 | |
Philip Morris International, Inc. | | | 146 | | | | 9,747 | | | | 2.5 | |
Raytheon Co. | | | 288 | | | | 44,165 | | | | 11.1 | |
Republic Services, Inc. | | | 292 | | | | 21,050 | | | | 5.3 | |
Simon Property Group, Inc. | | | 211 | | | | 35,446 | | | | 8.9 | |
Target Corp. | | | 156 | | | | 10,310 | | | | 2.6 | |
TJX Cos., Inc. | | | 310 | | | | 13,869 | | | | 3.5 | |
Toll Brothers, Inc. | | | 1,348 | | | | 44,390 | | | | 11.2 | |
United Technologies Corp. | | | 248 | | | | 26,407 | | | | 6.6 | |
Viacom, Inc., Class B | | | 360 | | | | 9,252 | | | | 2.3 | |
Walmart, Inc. | | | 185 | | | | 17,233 | | | | 4.3 | |
Walt Disney Co. | | | 106 | | | | 11,623 | | | | 2.9 | |
Waste Management, Inc. | | | 374 | | | | 33,282 | | | | 8.4 | |
| | |
| 34 | | 2018 BLACKROCK ANNUAL REPORTTO SHAREHOLDERS |
| | |
Schedule of Investments (continued) December 31, 2018 | | BlackRock Alternative Capital Strategies Fund |
| | | | | | | | | | | | |
| Security | | Shares | | | Value | | | % of
Basket
Value | |
|
| United States (continued) | |
Westrock Co. | | | 624 | | | $ | 23,562 | | | | 5.9 | % |
Weyerhaeuser Co. | | | 385 | | | | 8,416 | | | | 2.1 | |
Yum! Brands, Inc. | | | 68 | | | | 6,251 | | | | 1.6 | |
| | | | | | | | | | | | |
| | | | 1,301,390 | | | | | |
| | | | | | | | | | | | |
| | |
Total Reference Entity — Long | | | | 1,405,218 | | | | | |
| | | | | | | | | | | | |
|
Reference Entity — Short | |
|
United States | |
Archer-Daniels-Midland Co. | | | (1,603 | ) | | | (65,675 | ) | | | (16.6 | ) |
Carnival Corp. | | | (513 | ) | | | (25,291 | ) | | | (6.4 | ) |
Comcast Corp., Class A | | | (3,055 | ) | | | (104,023 | ) | | | (26.2 | ) |
ConAgra Foods, Inc. | | | (197 | ) | | | (4,208 | ) | | | (1.1 | ) |
CVS Health Corp. | | | (968 | ) | | | (63,423 | ) | | | (16.0 | ) |
Dominion Resources, Inc. | | | (1,528 | ) | | | (109,191 | ) | | | (27.5 | ) |
Expedia, Inc. | | | (181 | ) | | | (20,390 | ) | | | (5.1 | ) |
General Dynamics Corp. | | | (356 | ) | | | (55,967 | ) | | | (14.1 | ) |
HCA Holdings, Inc. | | | (1,025 | ) | | | (127,561 | ) | | | (32.1 | ) |
Sherwin-Williams Co. | | | (313 | ) | | | (123,153 | ) | | | (31.0 | ) |
Southern Co. | | | (2,421 | ) | | | (106,330 | ) | | | (26.8 | ) |
Stanley Black & Decker, Inc. | | | (1,025 | ) | | | (122,733 | ) | | | (30.9 | ) |
Western Union Co. | | | (4,709 | ) | | | (80,336 | ) | | | (20.2 | ) |
| | | | | | | | | | | | |
| | |
Total Reference Entity — Short | | | | (1,008,281 | ) | | | | |
| | | | | | | | | | | | |
| | |
Net Value of Reference Entity — Morgan Stanley & Co. International PLC | | | $ | 396,937 | | | | | |
| | | | | | | | | | | | |
The following table represents the individual long and short positions and related values of the equity securities underlying the total return swap with Bank of America N.A. as of December 31, 2018 expiration dates 02/17/23:
| | | | | | | | | | | | |
| Security | | Shares | | | Value | | | % of
Basket
Value | |
|
Reference Entity — Long | |
|
| Canada | |
Barrick Gold Corp. | | | 6,576 | | | $ | 89,039 | | | | 22.0 | % |
Canadian National Railway Co. | | | 1,710 | | | | 126,728 | | | | 31.4 | |
Encana Corp. | | | 11,139 | | | | 64,383 | | | | 15.9 | |
Rogers Communications, Inc., Class B | | | 2,154 | | | | 110,414 | | | | 27.3 | |
Suncor Energy, Inc. | | | 4,540 | | | | 126,984 | | | | 31.4 | |
Teck Resources Ltd., Class B | | | 5,614 | | | | 120,926 | | | | 29.9 | |
| | | | | | | | | | | | |
| | | | 638,474 | | | | | |
|
| Ireland | |
Medtronic PLC | | | 1,410 | | | | 128,253 | | | | 31.7 | |
| | | | | | | | | | | | |
|
| United States | |
Advanced Micro Devices, Inc. | | | 5 | | | | 92 | | | | 0.0 | |
AES Corp. | | | 1,381 | | | | 19,969 | | | | 4.9 | |
Air Products & Chemicals, Inc. | | | 739 | | | | 118,277 | | | | 29.2 | |
Allstate Corp. | | | 1,142 | | | | 94,363 | | | | 23.3 | |
American Express Co. | | | 1,026 | | | | 97,798 | | | | 24.2 | |
American International Group, Inc. | | | 848 | | | | 33,420 | | | | 8.3 | |
Amgen, Inc. | | | 236 | | | | 45,942 | | | | 11.4 | |
Anadarko Petroleum Corp. | | | 2,611 | | | | 114,466 | | | | 28.3 | |
Aon PLC | | | 756 | | | | 109,892 | | | | 27.2 | |
Apache Corp. | | | 3,774 | | | | 99,068 | | | | 24.5 | |
AutoZone, Inc. | | | 151 | | | | 126,589 | | | | 31.3 | |
AvalonBay Communities, Inc. | | | 689 | | | | 119,920 | | | | 29.6 | |
Bausch Health Cos., Inc. | | | 2,249 | | | | 41,539 | | | | 10.3 | |
| | | | | | | | | | | | |
| Security | | Shares | | | Value | | | % of
Basket
Value | |
|
| United States (continued) | |
BorgWarner, Inc. | | | 3,077 | | | $ | 106,895 | | | | 26.4 | % |
Boston Properties, Inc. | | | 1,041 | | | | 117,165 | | | | 29.0 | |
Boston Scientific Corp. | | | 2,393 | | | | 84,569 | | | | 20.9 | |
Boyd Gaming Corp. | | | 2,148 | | | | 44,635 | | | | 11.0 | |
Bristol-Myers Squibb Co. | | | 2,389 | | | | 124,180 | | | | 30.7 | |
CBS Corp., Class B | | | 2,362 | | | | 103,267 | | | | 25.5 | |
CenterPoint Energy, Inc. | | | 4,354 | | | | 122,913 | | | | 30.4 | |
Cigna Corp. | | | 463 | | | | 87,933 | | | | 21.7 | |
Clorox Co. | | | 785 | | | | 121,000 | | | | 29.9 | |
Coca-Cola Co. | | | 2,455 | | | | 116,244 | | | | 28.7 | |
Colgate-Palmolive Co. | | | 1,095 | | | | 65,174 | | | | 16.1 | |
Corning, Inc. | | | 1,911 | | | | 57,731 | | | | 14.3 | |
Costco Wholesale Corp. | | | 503 | | | | 102,466 | | | | 25.3 | |
CSX Corp. | | | 518 | | | | 32,183 | | | | 8.0 | |
Darden Restaurants, Inc. | | | 1,280 | | | | 127,821 | | | | 31.6 | |
Devon Energy Corp. | | | 3,488 | | | | 78,620 | | | | 19.4 | |
Dover Corp. | | | 857 | | | | 60,804 | | | | 15.0 | |
Duke Energy Corp. | | | 1,341 | | | | 115,728 | | | | 28.6 | |
Eaton Corp. PLC | | | 1,651 | | | | 113,358 | | | | 28.0 | |
Eli Lilly & Co. | | | 897 | | | | 103,801 | | | | 25.7 | |
Entergy Corp. | | | 260 | | | | 22,378 | | | | 5.5 | |
Exelon Corp. | | | 1,261 | | | | 56,871 | | | | 14.1 | |
Exxon Mobil Corp. | | | 1,777 | | | | 121,174 | | | | 30.0 | |
First Data Corp., Class A | | | 4,414 | | | | 74,641 | | | | 18.5 | |
FirstEnergy Corp. | | | 950 | | | | 35,673 | | | | 8.8 | |
Freeport-McMoRan, Inc. | | | 7,468 | | | | 76,995 | | | | 19.0 | |
Goodyear Tire & Rubber Co. | | | 4,781 | | | | 97,580 | | | | 24.1 | |
Halliburton Co. | | | 2,842 | | | | 75,540 | | | | 18.7 | |
Hartford Financial Services Group, Inc. | | | 2,756 | | | | 122,504 | | | | 30.3 | |
HCP, Inc. | | | 3,239 | | | | 90,465 | | | | 22.4 | |
HD Supply Holdings, Inc. | | | 1,900 | | | | 71,288 | | | | 17.6 | |
Hershey Co. | | | 980 | | | | 105,036 | | | | 26.0 | |
Home Depot, Inc. | | | 282 | | | | 48,453 | | | | 12.0 | |
Host Hotels & Resorts, Inc. | | | 4,282 | | | | 71,381 | | | | 17.6 | |
HP, Inc. | | | 4,477 | | | | 91,599 | | | | 22.6 | |
Humana, Inc. | | | 152 | | | | 43,545 | | | | 10.8 | |
Intel Corp. | | | 2,203 | | | | 103,387 | | | | 25.6 | |
International Paper Co. | | | 1,602 | | | | 64,657 | | | | 16.0 | |
JetBlue Airways Corp. | | | 4,932 | | | | 79,208 | | | | 19.6 | |
Johnson & Johnson | | | 792 | | | | 102,208 | | | | 25.3 | |
Johnson Controls International PLC | | | 3,923 | | | | 116,317 | | | | 28.8 | |
Kimberly-Clark Corp. | | | 1,074 | | | | 122,372 | | | | 30.3 | |
Kroger Co. | | | 3,450 | | | | 94,875 | | | | 23.5 | |
L Brands, Inc. | | | 4,939 | | | | 126,784 | | | | 31.3 | |
Lockheed Martin Corp. | | | 403 | | | | 105,522 | | | | 26.1 | |
Loews Corp. | | | 1,942 | | | | 88,400 | | | | 21.9 | |
Louisiana-Pacific Corp. | | | 4,930 | | | | 109,545 | | | | 27.1 | |
Lowe’s Cos., Inc. | | | 1,338 | | | | 123,578 | | | | 30.6 | |
Marathon Oil Corp. | | | 8,931 | | | | 128,071 | | | | 31.7 | |
McDonald’s Corp. | | | 717 | | | | 127,318 | | | | 31.5 | |
McKesson Corp. | | | 173 | | | | 19,111 | | | | 4.7 | |
Mohawk Industries, Inc. | | | 181 | | | | 21,170 | | | | 5.2 | |
Murphy Oil Corp. | | | 5,147 | | | | 120,388 | | | | 29.8 | |
Newmont Mining Corp. | | | 2,878 | | | | 99,723 | | | | 24.7 | |
Norfolk Southern Corp. | | | 782 | | | | 116,940 | | | | 28.9 | |
Nucor Corp. | | | 2,424 | | | | 125,587 | | | | 31.1 | |
Olin Corp. | | | 4,819 | | | | 96,910 | | | | 24.0 | |
Omnicom Group, Inc. | | | 909 | | | | 66,575 | | | | 16.5 | |
Oracle Corp. | | | 2,402 | | | | 108,450 | | | | 26.8 | |
Packaging Corp. of America | | | 1,473 | | | | 122,937 | | | | 30.4 | |
PepsiCo, Inc. | | | 660 | | | | 72,917 | | | | 18.0 | |
Pfizer, Inc. | | | 2,070 | | | | 90,356 | | | | 22.3 | |
Philip Morris International, Inc. | | | 1,724 | | | | 115,094 | | | | 28.5 | |
| | | | |
| SCHEDULES OF INVESTMENTS | | | 35 | |
| | |
Schedule of Investments (continued) December 31, 2018 | | BlackRock Alternative Capital Strategies Fund |
| | | | | | | | | | | | |
| Security | | Shares | | | Value | | | % of
Basket
Value | |
|
| United States (continued) | |
Procter & Gamble Co. | | | 1,380 | | | $ | 126,850 | | | | 31.4 | % |
PulteGroup, Inc. | | | 2,651 | | | | 68,899 | | | | 17.0 | |
Quest Diagnostics, Inc. | | | 1,080 | | | | 89,932 | | | | 22.2 | |
Raytheon Co. | | | 476 | | | | 72,995 | | | | 18.0 | |
Republic Services, Inc. | | | 1,457 | | | | 105,035 | | | | 26.0 | |
Ryder System, Inc. | | | 2,585 | | | | 124,468 | | | | 30.8 | |
Southwest Airlines Co. | | | 2,293 | | | | 106,579 | | | | 26.4 | |
Target Corp. | | | 1,781 | | | | 117,706 | | | | 29.1 | |
TEGNA, Inc. | | | 8,390 | | | | 91,199 | | | | 22.5 | |
TJX Cos., Inc. | | | 2,561 | | | | 114,579 | | | | 28.3 | |
Toll Brothers, Inc. | | | 2,419 | | | | 79,658 | | | | 19.7 | |
Union Pacific Corp. | | | 920 | | | | 127,172 | | | | 31.4 | |
United Parcel Service, Inc., Class B | | | 270 | | | | 26,333 | | | | 6.5 | |
United Technologies Corp. | | | 947 | | | | 100,837 | | | | 24.9 | |
Unum Group | | | 4,337 | | | | 127,421 | | | | 31.5 | |
Viacom, Inc., Class B | | | 3,672 | | | | 94,370 | | | | 23.3 | |
Walmart, Inc. | | | 1,145 | | | | 106,657 | | | | 26.4 | |
Walt Disney Co. | | | 1,031 | | | | 113,049 | | | | 27.9 | |
Waste Management, Inc. | | | 1,057 | | | | 94,062 | | | | 23.3 | |
Welltower, Inc. | | | 1,027 | | | | 71,284 | | | | 17.6 | |
Westrock Co. | | | 2,751 | | | | 103,878 | | | | 25.7 | |
Weyerhaeuser Co. | | | 3,527 | | | | 77,100 | | | | 19.1 | |
Xerox Corp. | | | 6,261 | | | | 123,717 | | | | 30.6 | |
Yum! Brands, Inc. | | | 1,305 | | | | 119,956 | | | | 29.7 | |
| | | | | | | | | | | | |
| | | | 9,165,081 | | | | | |
| | | | | | | | | | | | |
| | | |
Total Reference Entity — Long | | | | | | | 9,931,808 | | | | | |
| | | | | | | | | | | | |
|
Reference Entity — Short | |
|
Canada | |
Canadian Natural Resources Ltd. | | | (3,906 | ) | | | (94,252 | ) | | | (23.3 | ) |
Enbridge, Inc. | | | (4,064 | ) | | | (126,309 | ) | | | (31.2 | ) |
| | | | | | | | | | | | |
| | | | (220,561 | ) | | | | |
|
| Switzerland | |
Transocean Ltd. | | | (17,979 | ) | | | (124,774 | ) | | | (30.9 | ) |
| | | | | | | | | | | | |
|
| United States | |
3M Co. | | | (368 | ) | | | (70,119 | ) | | | (17.3 | ) |
Abbott Laboratories | | | (1,766 | ) | | | (127,735 | ) | | | (31.6 | ) |
Advanced Micro Devices, Inc. | | | (1,967 | ) | | | (36,311 | ) | | | (9.0 | ) |
Ally Financial, Inc. | | | (4,746 | ) | | | (107,544 | ) | | | (26.6 | ) |
Altria Group, Inc. | | | (2,216 | ) | | | (109,448 | ) | | | (27.1 | ) |
AmerisourceBergen Corp. | | | (1,699 | ) | | | (126,406 | ) | | | (31.3 | ) |
Anthem, Inc. | | | (485 | ) | | | (127,376 | ) | | | (31.5 | ) |
Archer-Daniels-Midland Co. | | | (1,476 | ) | | | (60,472 | ) | | | (15.0 | ) |
Arrow Electronics, Inc. | | | (1,801 | ) | | | (124,179 | ) | | | (30.7 | ) |
AT&T, Inc. | | | (4,412 | ) | | | (125,918 | ) | | | (31.1 | ) |
Avis Budget Group, Inc. | | | (1,463 | ) | | | (32,888 | ) | | | (8.1 | ) |
Avnet, Inc. | | | (3,500 | ) | | | (126,350 | ) | | | (31.2 | ) |
Baxter International, Inc. | | | (1,751 | ) | | | (115,251 | ) | | | (28.5 | ) |
Beazer Homes USA, Inc. | | | (2,364 | ) | | | (22,411 | ) | | | (5.5 | ) |
Berkshire Hathaway, Inc., Class B | | | (606 | ) | | | (123,733 | ) | | | (30.6 | ) |
Best Buy Co., Inc. | | | (2,447 | ) | | | (129,593 | ) | | | (32.0 | ) |
Boeing Co. | | | (387 | ) | | | (124,807 | ) | | | (30.9 | ) |
Brunswick Corp. | | | (1,028 | ) | | | (47,751 | ) | | | (11.8 | ) |
Campbell Soup Co. | | | (3,757 | ) | | | (123,943 | ) | | | (30.6 | ) |
Capital One Financial Corp. | | | (440 | ) | | | (33,260 | ) | | | (8.2 | ) |
Cardinal Health, Inc. | | | (2,278 | ) | | | (101,599 | ) | | | (25.1 | ) |
Caterpillar, Inc. | | | (1,000 | ) | | | (127,070 | ) | | | (31.4 | ) |
Chevron Corp. | | | (506 | ) | | | (55,048 | ) | | | (13.6 | ) |
Cisco Systems, Inc. | | | (733 | ) | | | (31,761 | ) | | | (7.9 | ) |
CMS Energy Corp. | | | (1,589 | ) | | | (78,894 | ) | | | (19.5 | ) |
| | | | | | | | | | | | |
| Security | | Shares | | | Value | | | % of
Basket
Value | |
|
| United States (continued) | |
Comcast Corp., Class A | | | (601 | ) | | $ | (20,464 | ) | | | (5.1 | ) % |
ConAgra Foods, Inc. | | | (5,733 | ) | | | (122,457 | ) | | | (30.3 | ) |
ConocoPhillips | | | (1,359 | ) | | | (84,734 | ) | | | (21.0 | ) |
Constellation Brands, Inc. | | | (771 | ) | | | (123,992 | ) | | | (30.7 | ) |
Danaher Corp. | | | (1,232 | ) | | | (127,044 | ) | | | (31.4 | ) |
Deere & Co. | | | (865 | ) | | | (129,032 | ) | | | (31.9 | ) |
DISH Network Corp. | | | (5,035 | ) | | | (125,724 | ) | | | (31.1 | ) |
DR Horton, Inc. | | | (3,632 | ) | | | (125,885 | ) | | | (31.1 | ) |
Eastman Chemical Co. | | | (1,536 | ) | | | (112,297 | ) | | | (27.8 | ) |
Expedia, Inc. | | | (928 | ) | | | (104,539 | ) | | | (25.8 | ) |
FedEx Corp. | | | (312 | ) | | | (50,335 | ) | | | (12.4 | ) |
Ford Motor Co. | | | (5,462 | ) | | | (41,784 | ) | | | (10.3 | ) |
Gap, Inc. | | | (3,962 | ) | | | (102,061 | ) | | | (25.2 | ) |
General Electric Co. | | | (4,109 | ) | | | (31,105 | ) | | | (7.7 | ) |
General Mills, Inc. | | | (3,241 | ) | | | (126,205 | ) | | | (31.2 | ) |
General Motors Co. | | | (3,197 | ) | | | (106,940 | ) | | | (26.4 | ) |
Hasbro, Inc. | | | (1,549 | ) | | | (125,856 | ) | | | (31.1 | ) |
Hess Corp. | | | (3,080 | ) | | | (124,740 | ) | | | (30.8 | ) |
Honeywell International, Inc. | | | (747 | ) | | | (98,694 | ) | | | (24.4 | ) |
International Business Machines Corp. | | | (1,111 | ) | | | (126,287 | ) | | | (31.2 | ) |
Kellogg Co. | | | (1,431 | ) | | | (81,581 | ) | | | (20.2 | ) |
Kimco Realty Corp. | | | (3,109 | ) | | | (45,547 | ) | | | (11.3 | ) |
Kohl’s Corp. | | | (1,932 | ) | | | (128,169 | ) | | | (31.7 | ) |
Kraft Heinz Co. | | | (2,883 | ) | | | (124,084 | ) | | | (30.7 | ) |
Lennar Corp. | | | (2,439 | ) | | | (95,487 | ) | | | (23.6 | ) |
Lincoln National Corp. | | | (958 | ) | | | (49,155 | ) | | | (12.2 | ) |
Macy’s, Inc. | | | (1,677 | ) | | | (49,941 | ) | | | (12.3 | ) |
Marriott International, Inc., Class A | | | (1,143 | ) | | | (124,084 | ) | | | (30.7 | ) |
Marsh & McLennan Cos., Inc. | | | (1,590 | ) | | | (126,802 | ) | | | (31.4 | ) |
Mattel, Inc. | | | (8,932 | ) | | | (89,231 | ) | | | (22.1 | ) |
MDC Holdings, Inc. | | | (2,419 | ) | | | (67,998 | ) | | | (16.8 | ) |
MetLife, Inc. | | | (567 | ) | | | (23,281 | ) | | | (5.8 | ) |
MGIC Investment Corp. | | | (10,033 | ) | | | (104,945 | ) | | | (26.0 | ) |
MGM Resorts International | | | (1,213 | ) | | | (29,427 | ) | | | (7.3 | ) |
Molson Coors Brewing Co. | | | (1,973 | ) | | | (110,804 | ) | | | (27.4 | ) |
Mondelez International, Inc. | | | (3,147 | ) | | | (125,974 | ) | | | (31.1 | ) |
Motorola Solutions, Inc. | | | (1,118 | ) | | | (128,615 | ) | | | (31.8 | ) |
Nabors Industries Ltd. | | | (37,774 | ) | | | (75,548 | ) | | | (18.7 | ) |
Navient Corp. | | | (4,835 | ) | | | (42,596 | ) | | | (10.5 | ) |
Newell Rubbermaid, Inc. | | | (6,839 | ) | | | (127,137 | ) | | | (31.4 | ) |
Nordstrom, Inc. | | | (2,235 | ) | | | (104,173 | ) | | | (25.8 | ) |
Northrop Grumman Corp. | | | (504 | ) | | | (123,430 | ) | | | (30.5 | ) |
NRG Energy, Inc. | | | (1,855 | ) | | | (73,458 | ) | | | (18.2 | ) |
Occidental Petroleum Corp. | | | (1,023 | ) | | | (62,792 | ) | | | (15.5 | ) |
OneMain Holdings, Inc. | | | (3,272 | ) | | | (79,477 | ) | | | (19.7 | ) |
ONEOK, Inc. | | | (2,370 | ) | | | (127,862 | ) | | | (31.6 | ) |
PPG Industries, Inc. | | | (1,240 | ) | | | (126,765 | ) | | | (31.3 | ) |
Prudential Financial, Inc. | | | (1,553 | ) | | | (126,647 | ) | | | (31.3 | ) |
Radian Group, Inc. | | | (6,902 | ) | | | (112,917 | ) | | | (27.9 | ) |
Realogy Holdings Corp. | | | (7,633 | ) | | | (112,052 | ) | | | (27.7 | ) |
Royal Caribbean Cruises Ltd. | | | (1,273 | ) | | | (124,487 | ) | | | (30.8 | ) |
RPM International, Inc. | | | (1,814 | ) | | | (106,627 | ) | | | (26.4 | ) |
Sealed Air Corp. | | | (3,339 | ) | | | (116,331 | ) | | | (28.8 | ) |
Sempra Energy | | | (1,170 | ) | | | (126,582 | ) | | | (31.3 | ) |
SITE Centers Corp. | | | (3,014 | ) | | | (33,365 | ) | | | (8.3 | ) |
Tesla Motors, Inc. | | | (386 | ) | | | (128,461 | ) | | | (31.8 | ) |
Texas Instruments, Inc. | | | (1,339 | ) | | | (126,535 | ) | | | (31.3 | ) |
Textron, Inc. | | | (1,788 | ) | | | (82,230 | ) | | | (20.3 | ) |
Travelers Cos., Inc. | | | (903 | ) | | | (108,134 | ) | | | (26.7 | ) |
Tyson Foods, Inc., Class A | | | (2,400 | ) | | | (128,160 | ) | | | (31.7 | ) |
United Rentals, Inc. | | | (374 | ) | | | (38,346 | ) | | | (9.5 | ) |
United States Steel Corp. | | | (4,976 | ) | | | (90,762 | ) | | | (22.4 | ) |
| | |
| 36 | | 2018 BLACKROCK ANNUAL REPORTTO SHAREHOLDERS |
| | |
Schedule of Investments (continued) December 31, 2018 | | BlackRock Alternative Capital Strategies Fund |
| | | | | | | | | | | | |
| Security | | Shares | | | Value | | | % of
Basket
Value | |
|
| United States (continued) | |
UnitedHealth Group, Inc. | | | (510 | ) | | $ | (127,051 | ) | | | (31.4 | ) % |
Uniti Group, Inc. | | | (8,010 | ) | | | (124,716 | ) | | | (30.8 | ) |
Universal Health Services, Inc. | | | (913 | ) | | | (106,419 | ) | | | (26.3 | ) |
Valero Energy Corp. | | | (1,710 | ) | | | (128,199 | ) | | | (31.7 | ) |
Vulcan Materials Co. | | | (777 | ) | | | (76,768 | ) | | | (19.0 | ) |
Whirlpool Corp. | | | (970 | ) | | | (103,664 | ) | | | (25.6 | ) |
Whiting Petroleum Corp. | | | (5,570 | ) | | | (126,383 | ) | | | (31.3 | ) |
Williams Cos., Inc. | | | (3,574 | ) | | | (78,807 | ) | | | (19.5 | ) |
| | | | | | | | | | | | |
| | | | | | | (9,182,048 | ) | | | | |
| | | | | | | | | | | | |
| | |
Total Reference Entity — Short | | | | (9,527,383 | ) | | | | |
| | | | | | | | | | | | |
| | |
Net Value of Reference Entity — Bank of America N.A. | | | $ | 404,425 | | | | | |
| | | | | | | | | | | | |
Balances Reported in the Statements of Assets and Liabilities for Centrally Cleared Swaps and OTC Swaps
| | | | | | | | | | | | | | | | |
| | | Swap
Premiums
Paid | | | Swap
Premiums
Received | | | Unrealized
Appreciation | | | Unrealized
Depreciation | |
Centrally Cleared Swaps(a) | | $ | 45,743 | | | $ | (139 | ) | | $ | 32,127 | | | $ | (56,106 | ) |
OTC Swaps | | | — | | | | — | | | | 1,002,339 | | | | (14,755 | ) |
| | (a) | Includes cumulative appreciation (depreciation) on centrally cleared swaps, as reported in the Schedule of Investments. Only current day’s variation margin is reported within the Statements of Assets and Liabilities and is net of any previously paid (received) swap premium amounts. | |
Derivative Financial Instruments Categorized by Risk Exposure
As of period end, the fair values of derivative financial instruments located in the Statements of Assets and Liabilities were as follows:
| | | | | | | | | | | | | | | | | | | | | | | | | | | | |
| | | Commodity
Contracts | | | Credit
Contracts | | | Equity
Contracts | | | Foreign
Currency
Exchange
Contracts | | | Interest
Rate
Contracts | | | Other
Contracts | | | Total | |
Assets — Derivative Financial Instruments | | | | | | | | | | | | | | | | | | | | | | | | | | | | |
Futures contracts | | | | | | | | | | | | | | | | | | | | | | | | | | | | |
Net unrealized appreciation(a) | | $ | — | | | $ | — | | | $ | — | | | $ | — | | | $ | 76,182 | | | $ | — | | | $ | 76,182 | |
Forward foreign currency exchange contracts | | | | | | | | | | | | | | | | | | | | | | | | | | | | |
Unrealized appreciation on forward foreign currency exchange | | | — | | | | — | | | | — | | | | 96 | | | | — | | | | — | | | | 96 | |
Swaps — centrally cleared | | | | | | | | | | | | | | | | | | | | | | | | | | | | |
Net unrealized appreciation(a) | | | — | | | | — | | | | — | | | | — | | | | 32,127 | | | | — | | | | 32,127 | |
Swaps — OTC | | | | | | | | | | | | | | | | | | | | | | | | | | | | |
Unrealized appreciation on OTC swaps; Swap premiums paid | | | — | | | | — | | | | 1,002,339 | | | | — | | | | — | | | | — | | | | 1,002,339 | |
| | | | | | | | | | | | | | | | | | | | | | | | | | | | |
| | $ | — | | | $ | — | | | $ | 1,002,339 | | | $ | 96 | | | $ | 108,309 | | | $ | — | | | $ | 1,110,744 | |
| | | | | | | | | | | | | | | | | | | | | | | | | | | | |
Liabilities — Derivative Financial Instruments | | | | | | | | | | | | | | | | | | | | | | | | | | | | |
Futures contracts | | | | | | | | | | | | | | | | | | | | | | | | | | | | |
Net unrealized depreciation(a) | | $ | — | | | $ | — | | | $ | — | | | $ | — | | | $ | 56,942 | | | $ | — | | | $ | 56,942 | |
Forward foreign currency exchange contracts | | | | | | | | | | | | | | | | | | | | | | | | | | | | |
Unrealized depreciation on forward foreign currency exchange | | | — | | | | — | | | | — | | | | 32 | | | | — | | | | — | | | | 32 | |
Swaps — centrally cleared | | | | | | | | | | | | | | | | | | | | | | | | | | | | |
Net unrealized depreciation(a) | | | — | | | | 27,323 | | | | — | | | | — | | | | 28,783 | | | | — | | | | 56,106 | |
Swaps — OTC | | | | | | | | | | | | | | | | | | | | | | | | | | | | |
Unrealized depreciation on OTC swaps; Swap premiums received | | | — | | | | — | | | | 1,700 | | | | — | | | | 13,055 | | | | — | | | | 14,755 | |
| | | | | | | | | | | | | | | | | | | | | | | | | | | | |
| | $ | — | | | $ | 27,323 | | | $ | 1,700 | | | $ | 32 | | | $ | 98,780 | | | $ | — | | | $ | 127,835 | |
| | | | | | | | | | | | | | | | | | | | | | | | | | | | |
| | (a) | Includes cumulative appreciation (depreciation) on futures contracts and centrally cleared swaps, if any, as reported in the Schedule of Investments. Only current day’s variation margin is reported within the Statements of Assets and Liabilities. | |
| | | | |
| SCHEDULES OF INVESTMENTS | | | 37 | |
| | |
Schedule of Investments (continued) December 31, 2018 | | BlackRock Alternative Capital Strategies Fund |
For the year ended December 31, 2018, the effect of derivative financial instruments in the Statements of Operations was as follows:
| | | | | | | | | | | | | | | | | | | | | | | | | | | | |
| | | Commodity
Contracts | | | Credit
Contracts | | | Equity
Contracts | | | Foreign
Currency
Exchange
Contracts | | | Interest
Rate
Contracts | | | Other
Contracts | | | Total | |
Net Realized Gain (Loss) from: | | | | | | | | | | | | | | | | | | | | | | | | | | | | |
Futures contracts | | $ | — | | | $ | — | | | $ | — | | | $ | — | | | $ | 71,191 | | | $ | — | | | $ | 71,191 | |
Forward foreign currency exchange contracts | | | — | | | | — | | | | — | | | | 11 | | | | — | | | | — | | | | 11 | |
Swaps | | | — | | | | (1,588 | ) | | | 1,378,566 | | | | — | | | | 26,999 | | | | — | | | | 1,403,977 | |
| | | | | | | | | | | | | | | | | | | | | | | | | | | | |
| | $ | — | | | $ | (1,588 | ) | | $ | 1,378,566 | | | $ | 11 | | | $ | 98,190 | | | $ | — | | | $ | 1,475,179 | |
| | | | | | | | | | | | | | | | | | | | | | | | | | | | |
| | | | | | | |
| Net Change in Unrealized Appreciation (Depreciation) on: | | | | | | | | | | | | | | | | | | | | | |
Futures contracts | | $ | — | | | $ | — | | | $ | — | | | $ | — | | | $ | 21,885 | | | $ | — | | | $ | 21,885 | |
Forward foreign currency exchange contracts | | | — | | | | — | | | | — | | | | 105 | | | | — | | | | — | | | | 105 | |
Swaps | | | — | | | | (31,463 | ) | | | (440,691 | ) | | | — | | | | (10,186 | ) | | | — | | | | (482,340 | ) |
| | | | | | | | | | | | | | | | | | | | | | | | | | | | |
| | $ | — | | | $ | (31,463 | ) | | $ | (440,691 | ) | | $ | 105 | | | $ | 11,699 | | | $ | — | | | $ | (460,350 | ) |
| | | | | | | | | | | | | | | | | | | | | | | | | | | | |
Average Quarterly Balances of Outstanding Derivative Financial Instruments
| | | | |
Futures contracts: | |
Average notional value of contracts — long | | $ | 2,722,938 | |
Average notional value of contracts — short | | $ | 3,976,684 | |
Foreign currency exchange contracts: | | | | |
Average USD amount purchased | | $ | 8,799 | |
Average USD amount sold | | | — | (a) |
Credit default swaps: | | | | |
Average notional value — buy protection | | $ | 233,125 | |
Average notional value — sell protection | | $ | 721,250 | |
Interest rate swaps: | |
Average notional value — pay fixed rate | | $ | 2,332,802 | |
Average notional value — receives fixed rate | | $ | 2,416,949 | |
Total return swaps: | | | | |
Average notional amount | | $ | 369,997 | |
| | (a) | Derivative not held atquarter-end. The risk exposure table serves as an indicator of activity during the period. | |
Derivative Financial Instruments — Offsetting of Period End
| | | | | | | | |
| | | Assets | | | Liabilities | |
Futures contracts | | $ | 12,568 | | | $ | 2,060 | |
Swaps — Centrally cleared | | | — | | | | 160 | |
Forward foreign currency exchange contracts | | | 96 | | | | 32 | |
Swaps — OTC(a) | | | 1,002,339 | | | | 14,755 | |
| | | | | | | | |
Total derivative assets and liabilities in the Statements of Assets and Liabilities | | $ | 1,015,003 | | | $ | 17,007 | |
Derivatives not subject to a Master Netting Agreement or similar agreement (“MNA”) | | | (12,568 | ) | | | (2,220 | ) |
| | | | | | | | |
Total derivative assets and liabilities subject to an MNA | | $ | 1,002,435 | | | $ | 14,787 | |
| | | | | | | | |
| | (a) | Includes unrealized appreciation (depreciation) on OTC swaps and swap premiums (paid/received) in the Statements of Assets and Liabilities. | |
The following table presents the Fund’s derivative assets (and liabilities) by counterparty net of amounts available for offset under an MNA and net of the related collateral received (and pledged) by the Fund:
| | | | | | | | | | | | | | | | | | | | |
| Counterparty | | Derivative
Assets
Subject to
an MNA by
Counterparty | | | Derivatives
Available
for Offset (a) | | | Non-cash
Collateral
Received | | | Cash
Collateral
Received (b) | | | Net Amount
of Derivative
Assets (c) | |
Bank of America N.A. | | $ | 938,509 | | | $ | (828 | ) | | $ | — | | | $ | — | | | $ | 937,681 | |
JPMorgan Chase Bank N.A. | | | 96 | | | | — | | | | — | | | | (96 | ) | | | — | |
Morgan Stanley & Co. International PLC | | | 63,830 | | | | (1,700 | ) | | | — | | | | (62,130 | ) | | | — | |
| | | | | | | | | | | | | | | | | | | | |
| | $ | 1,002,435 | | | $ | (2,528 | ) | | $ | — | | | $ | (62,226 | ) | | $ | 937,681 | |
| | | | | | | | | | | | | | | | | | | | |
| | |
| 38 | | 2018 BLACKROCK ANNUAL REPORTTO SHAREHOLDERS |
| | |
Schedule of Investments (continued) December 31, 2018 | | BlackRock Alternative Capital Strategies Fund |
| | | | | | | | | | | | | | | | | | | | |
| Counterparty | | Derivative
Liabilities
Subject to
an MNA by
Counterparty | | | Derivatives
Available
for Offset (a) | | | Non-cash
Collateral
Pledged | | | Cash
Collateral
Pledged (d) | | | Net Amount
of Derivative
Liabilities (e) | |
Bank of America N.A. | | $ | 828 | | | $ | (828 | ) | | $ | — | | | $ | — | | | $ | — | |
Citibank N.A. | | | 1,901 | | | | — | | | | — | | | | — | | | | 1,901 | |
Deutsche Bank AG | | | 10,326 | | | | — | | | | — | | | | — | | | | 10,326 | |
Morgan Stanley & Co. International PLC | | | 1,700 | | | | (1,700 | ) | | | — | | | | — | | | | — | |
State Street Bank and Trust Co. | | | 32 | | | | — | | | | — | | | | — | | | | 32 | |
| | | | | | | | | | | | | | | | | | | | |
| | $ | 14,787 | | | $ | (2,528 | ) | | $ | — | | | $ | — | | | $ | 12,259 | |
| | | | | | | | | | | | | | | | | | | | |
| | (a) | The amount of derivatives available for offset is limited to the amount of derivative asset and/or liabilities that are subject to an MNA. | |
| | (b) | Excess of collateral received from the individual counterparty is not shown for financial reporting purposes. | |
| | (c) | Net amount represents the net amount receivable from the counterparty in the event of default. | |
| | (d) | Excess of collateral pledged to the individual counterparty is not shown for financial reporting purposes. | |
| | (e) | Net amount represents the net amount payable due to counterparty in the event of default. | |
Fair Value Hierarchy as of Period End
Various inputs are used in determining the fair value of investments and derivative financial instruments. For information about the Fund’s policy regarding valuation of investments and derivative financial instruments, refer to the Notes to Financial Statements.
The following tables summarize the Fund’s investments and derivative financial instruments categorized in the disclosure hierarchy:
| | | | | | | | | | | | | | | | |
| | | Level 1 | | | Level 2 | | | Level 3 | | | Total | |
Assets: | | | | | | | | | | | | | | | | |
Investments: | | | | | | | | | | | | | | | | |
Common Stocks | | $ | 3,331,891 | | | $ | — | | | $ | — | | | $ | 3,331,891 | |
Asset-Backed Securities | | | — | | | | 5,299,069 | | | | — | | | | 5,299,069 | |
Corporate Bonds | | | — | | | | 16,418,224 | | | | — | | | | 16,418,224 | |
Non-Agency Mortgage-Backed Securities | | | — | | | | 533,165 | | | | — | | | | 533,165 | |
U.S. Government Sponsored Agency Securities | | | — | | | | 12,888,748 | | | | — | | | | 12,888,748 | |
Short-Term Securities | | | 5,039,873 | | | | — | | | | — | | | | 5,039,873 | |
Liabilities: | | | | | | | | | | | | | | | | |
Investments: | | | | | | | | | | | | | | | | |
TBA Sale Commitments | | | — | | | | (124,383 | ) | | | — | | | | (124,383 | ) |
| | | | | | | | | | | | | | | | |
| | $ | 8,371,764 | | | $ | 35,014,823 | | | $ | — | | | $ | 43,386,587 | |
| | | | | | | | | | | | | | | | |
Derivative Financial Instruments(a) | | | | | | | | | | | | | | | | |
Assets: | | | | | | | | | | | | | | | | |
Equity contracts | | $ | — | | | $ | 1,002,339 | | | $ | — | | | $ | 1,002,339 | |
Forward Foreign Currency Exchange Contracts | | | — | | | | 96 | | | | — | | | | 96 | |
Interest rate contracts | | | 76,182 | | | | 32,127 | | | | — | | | | 108,309 | |
Liabilities: | |
Credit contracts | | | | | | | (27,226 | ) | | | | | | | (27,226 | ) |
Equity contracts | | | | | | | (1,700 | ) | | | | | | | (1,700 | ) |
Forward Foreign Currency Exchange Contracts | | | — | | | | (32 | ) | | | — | | | | (32 | ) |
Interest rate contracts | | | (56,942 | ) | | | (41,935 | ) | | | — | | | | (98,877 | ) |
| | | | | | | | | | | | | | | | |
| | $ | 19,240 | | | $ | 963,669 | | | $ | — | | | $ | 982,909 | |
| | | | | | | | | | | | | | | | |
| | (a) | Derivative financial instruments are swaps, futures contracts and forward foreign currency exchange contracts. Swaps, futures contracts and forward foreign currency exchange contracts are valued at the unrealized appreciation (depreciation) on the instrument. | |
During the year ended December 31, 2018, there were no transfers between levels.
See notes to financial statements.
| | | | |
| SCHEDULES OF INVESTMENTS | | | 39 | |
Statements of Assets and Liabilities
December 31, 2018
| | | | | | | | | | | | |
| | | BlackRock Emerging
Markets Equity
Strategies
Fund | | | iShares
Short-Term
TIPS Bond
Index
Fund | | | BlackRock
Alternative Capital
Strategies
Fund | |
|
ASSETS | |
Investments at value — unaffiliated(a) | | $ | 12,184,282 | | | $ | 3,234,573 | | | $ | 38,471,097 | |
Investments at value — affiliated(b) | | | 768,951 | | | | 51,079 | | | | 5,039,873 | |
Cash | | | — | | | | — | | | | 1,391 | |
Cash pledged: | |
Collateral — OTC derivatives | | | — | | | | — | | | | 350,000 | |
Futures contracts | | | — | | | | — | | | | 103,683 | |
Centrally cleared swaps | | | — | | | | — | | | | 83,000 | |
Foreign currency at value(c) | | | 34,696 | | | | — | | | | 150,698 | |
Receivables: | |
Interest — unaffiliated | | | 1,021 | | | | 4,537 | | | | 243,738 | |
TBA sale commitments | | | — | | | | — | | | | 123,066 | |
Capital shares sold | | | 65,778 | | | | 937 | | | | 80,716 | |
Investments sold | | | 930,520 | | | | — | | | | 33,897 | |
From the Manager | | | 24,553 | | | | 10,931 | | | | 75,079 | |
Variation margin on futures contracts | | | — | | | | — | | | | 12,568 | |
Dividends — unaffiliated | | | 65,894 | | | | — | | | | 8,953 | |
Dividends — affiliated | | | — | | | | 114 | | | | 3,289 | |
Swaps | | | 64,748 | | | | — | | | | — | |
Unrealized appreciation on: | |
OTC swaps | | | 55,968 | | | | — | | | | 1,002,339 | |
Forward foreign currency exchange contracts | | | — | | | | — | | | | 96 | |
Prepaid expenses | | | 9,595 | | | | 32,603 | | | | 14,585 | |
| | | | | | | | | | | | |
Total assets | | | 14,206,006 | | | | 3,334,774 | | | | 45,798,068 | |
| | | | | | | | | | | | |
|
LIABILITIES | |
Cash received as collateral for OTC derivatives | | | — | | | | — | | | | 110,000 | |
Payables: | |
Investments purchased | | | 5,116 | | | | 20,075 | | | | 9,401,338 | |
Capital shares redeemed | | | 8,064 | | | | 127 | | | | 231,979 | |
Other accrued expenses | | | 86,924 | | | | 19,885 | | | | 96,631 | |
Trustees’ and Officer’s fees | | | 1,685 | | | | — | | | | 1,757 | |
Service and distribution fees | | | 333 | | | | 109 | | | | 627 | |
Income dividend distributions | | | — | | | | 2,450 | | | | — | |
Swaps | | | 102,005 | | | | — | | | | — | |
Administration fees | | | 218 | | | | — | | | | — | |
Variation margin on futures contracts | | | — | | | | — | | | | 2,060 | |
Variation margin on centrally cleared swaps | | | — | | | | — | | | | 160 | |
Board realignment and consolidation | | | 1,452 | | | | 1,979 | | | | 54,245 | |
TBA sale commitments at value(d) | | | — | | | | — | | | | 124,383 | |
Unrealized depreciation on: | |
OTC swaps | | | 151,743 | | | | — | | | | 14,755 | |
Forward foreign currency exchange contracts | | | — | | | | — | | | | 32 | |
| | | | | | | | | | | | |
Total liabilities | | | 357,540 | | | | 44,625 | | | | 10,037,967 | |
| | | | | | | | | | | | |
| | | |
NET ASSETS | | $ | 13,848,466 | | | $ | 3,290,149 | | | $ | 35,760,101 | |
| | | | | | | | | | | | |
|
NET ASSETS CONSIST OF : | |
Paid-in capital | | $ | 16,128,923 | | | $ | 3,420,876 | | | $ | 37,406,555 | |
Accumulated loss | | | (2,280,457 | ) | | | (130,727 | ) | | | (1,646,454 | ) |
| | | | | | | | | | | | |
NET ASSETS | | $ | 13,848,466 | | | $ | 3,290,149 | | | $ | 35,760,101 | |
| | | | | | | | | | | | |
See notes to financial statements.
| | |
| 40 | | 2018 BLACKROCK ANNUAL REPORTTO SHAREHOLDERS |
Statements of Assets and Liabilities (continued)
December 31, 2018
| | | | | | | | | | | | |
| | | BlackRock Emerging
Markets Equity
Strategies
Fund | | | iShares
Short-Term
TIPS Bond
Index
Fund | | | BlackRock
Alternative Capital
Strategies
Fund | |
|
| Institutional | |
Net assets | | $ | 5,630,993 | | | $ | 976,349 | | | $ | 32,960,947 | |
| | | | | | | | | | | | |
Shares outstanding(e) | | | 590,711 | | | | 100,214 | | | | 3,481,650 | |
| | | | | | | | | | | | |
Net asset value | | $ | 9.53 | | | $ | 9.74 | | | $ | 9.47 | |
| | | | | | | | | | | | |
| | |
| Investor A | | | | | | |
Net assets | | $ | 1,161,918 | | | $ | 525,918 | | | $ | 2,724,584 | |
| | | | | | | | | | | | |
Shares outstanding(e) | | | 122,527 | | | | 53,999 | | | | 287,940 | |
| | | | | | | | | | | | |
Net asset value | | $ | 9.48 | | | $ | 9.74 | | | $ | 9.46 | |
| | | | | | | | | | | | |
|
| Investor C | |
Net assets | | $ | 81,052 | | | $ | — | | | $ | 74,570 | |
| | | | | | | | | | | | |
Shares outstanding(e) | | | 8,494 | | | | — | | | | 7,872 | |
| | | | | | | | | | | | |
Net asset value | | $ | 9.54 | | | $ | — | | | $ | 9.47 | |
| | | | | | | | | | | | |
|
| Class K | |
Net assets | | $ | 6,974,503 | | | $ | 1,787,882 | | | $ | — | |
| | | | | | | | | | | | |
Shares outstanding(e) | | | 732,192 | | | | 183,256 | | | | — | |
| | | | | | | | | | | | |
Net asset value | | $ | 9.53 | | | $ | 9.76 | | | $ | — | |
| | | | | | | | | | | | |
(a) Investments at cost — unaffiliated | | $ | 13,175,502 | | | $ | 3,278,105 | | | $ | 39,035,670 | |
| | | | | | | | | | | | |
(b) Investments at cost — affiliated | | $ | 847,158 | | | $ | 51,079 | | | $ | 5,039,873 | |
| | | | | | | | | | | | |
(c) Foreign currency at cost | | $ | 34,719 | | | $ | — | | | $ | 154,534 | |
| | | | | | | | | | | | |
(d) Proceeds from TBA sale commitments | | $ | — | | | $ | — | | | $ | 123,066 | |
| | | | | | | | | | | | |
(e) Unlimited number of shares authorized, $0.001 par value. | | | | | | | | | | | | |
See notes to financial statements.
Statements of Operations
Year Ended December 31, 2018
| | | | | | | | | | | | |
| | | BlackRock Emerging
Markets Equity
Strategies
Fund | | | iShares
Short-Term
TIPS Bond
Index
Fund | | | BlackRock
Alternative Capital
Strategies
Fund | |
| | | |
INVESTMENT INCOME | | | | | | | | | | | | |
Interest — unaffiliated | | $ | — | | | $ | 88,374 | (a) | | $ | 1,043,841 | |
Dividends — unaffiliated | | | 734,727 | (b) | | | — | | | | 110,060 | |
Dividends — affiliated | | | 25,168 | | | | 1,187 | | | | 26,413 | |
Foreign taxes withheld | | | (58,555 | ) | | | — | | | | — | |
| | | | | | | | | | | | |
Total investment income | | | 701,340 | | | | 89,561 | | | | 1,180,314 | |
| | | | | | | | | | | | |
| | | |
EXPENSES | | | | | | | | | | | | |
Investment advisory | | | 254,623 | | | | 343 | | | | 244,858 | |
Administration | | | 10,822 | | | | — | | | | 13,008 | |
Administration — class specific | | | 5,092 | | | | — | | | | 6,122 | |
Service and distribution — class specific | | | 1,875 | | | | 865 | | | | 4,946 | |
Transfer agent — class specific | | | 1,415 | | | | 3,419 | | | | 5,709 | |
Trustees and Officer | | | 10,551 | | | | 10,277 | | | | 10,725 | |
Custodian | | | 119,177 | | | | 670 | | | | 38,711 | |
Professional | | | 127,394 | | | | 73,873 | | | | 110,624 | |
Accounting services | | | 45,302 | | | | 4,509 | | | | 57,994 | |
Registration | | | 55,063 | | | | 47,909 | | | | 42,550 | |
Printing | | | 35,744 | | | | 29,154 | | | | 40,270 | |
Board realignment and consolidation | | | 1,463 | | | | 1,979 | | | | 54,245 | |
Miscellaneous | | | 17,140 | | | | 12,244 | | | | 90,149 | |
| | | | | | | | | | | | |
Total expenses | | | 685,661 | | | | 185,242 | | | | 719,911 | |
Less: | | | | | | | | | | | | |
Fees waived and/or reimbursed by the Manager | | | (351,611 | ) | | | (178,843 | ) | | | (399,298 | ) |
Fees waived and/or reimbursed by the Administrator | | | (5,840 | ) | | | — | | | | (13,008 | ) |
Fees waived and/or reimbursed by Administrator — class specific | | | (1,599 | ) | | | — | | | | (6,122 | ) |
Transfer agent fees waived and/or reimbursed — class specific | | | (394 | ) | | | (2,668 | ) | | | (5,709 | ) |
| | | | | | | | | | | | |
Total expenses after fees waived and/or reimbursed | | | 326,217 | | | | 3,731 | | | | 295,774 | |
| | | | | | | | | | | | |
Net investment income | | | 375,123 | | | | 85,830 | | | | 884,540 | |
| | | | | | | | | | | | |
| | | |
REALIZED AND UNREALIZED GAIN (LOSS) | | | | | | | | | | | | |
Net realized gain (loss) from: | | | | | | | | | | | | |
Investments — unaffiliated | | | 2,056,591 | | | | (73,767 | ) | | | (247,085 | ) |
Investments — affiliated | | | (29,989 | ) | | | — | | | | — | |
Futures contracts | | | 41,212 | | | | — | | | | 71,191 | |
Forward foreign currency exchange contracts | | | 1,572 | | | | — | | | | 11 | |
Foreign currency transactions | | | (94,079 | ) | | | — | | | | (2,902 | ) |
Swaps | | | 2,561,089 | | | | — | | | | 1,403,977 | |
| | | | | | | | | | | | |
| | | 4,536,396 | | | | (73,767 | ) | | | 1,225,192 | |
| | | | | | | | | | | | |
Net change in unrealized appreciation (depreciation) on: | | | | | | | | | | | | |
Investments — unaffiliated | | | (3,721,049 | ) | | | 3,041 | | | | (1,097,427 | ) |
Investments — affiliated | | | (78,207 | ) | | | — | | | | — | |
Futures contracts | | | 8,244 | | | | — | | | | 21,885 | |
Forward foreign currency exchange contracts | | | — | | | | — | | | | 105 | |
Foreign currency translations | | | 1,512 | | | | — | | | | (4,212 | ) |
Swaps | | | 44,342 | | | | — | | | | (482,340 | ) |
| | | | | | | | | | | | |
| | | (3,745,158 | ) | | | 3,041 | | | | (1,561,989 | ) |
| | | | | | | | | | | | |
Net realized and unrealized gain (loss) | | | 791,238 | | | | (70,726 | ) | | | (336,797 | ) |
| | | | | | | | | | | | |
NET INCREASE IN NET ASSETS RESULTING FROM OPERATIONS | | $ | 1,166,361 | | | $ | 15,104 | | | $ | 547,743 | |
| | | | | | | | | | | | |
| (a) | Includes net inflationary and deflationary adjustments. See Note 4 of the Notes to Financial Statements. |
| (b) | Includesnon-recurring dividends in the amount of $67,043. |
See notes to financial statements.
| | |
| 42 | | 2018 BLACKROCK ANNUAL REPORTTO SHAREHOLDERS |
Statements of Changes in Net Assets
| | | | | | | | | | | | | | | | | | | | |
| | | BlackRock Emerging Markets
Equity Strategies Fund | | | | | | iShares Short-Term
TIPS Bond Index Fund | |
| | | Year Ended December 31, | | | | | | Year Ended December 31, | |
| | | 2018 | | | 2017 | | | | | | 2018 | | | 2017 | |
| | | |
INCREASE (DECREASE) IN NET ASSETS | | | | | | | | | | | | | |
| | | |
OPERATIONS | | | | | | | | | | | | | |
Net investment income | | $ | 375,123 | | | $ | 376,686 | | | | | | | $ | 85,830 | | | $ | 111,774 | |
Net realized gain (loss) | | | 4,536,396 | | | | 2,817,630 | | | | | | | | (73,767 | ) | | | (13,522 | ) |
Net change in unrealized appreciation (depreciation) | | | (3,745,158 | ) | | | 2,554,055 | | | | | | | | 3,041 | | | | (51,869 | ) |
| | | | | | | | | | | | | | | | | | | | |
Net increase in net assets resulting from operations | | | 1,166,361 | | | | 5,748,371 | | | | | | | | 15,104 | | | | 46,383 | |
| | | | | | | | | | | | | | | | | | | | |
| | | |
DISTRIBUTIONS TO SHAREHOLDERS(a)(b) | | | | | | | | | | | | | |
Institutional | | | (1,397,181 | ) | | | (5,931 | ) | | | | | | | (46,383 | ) | | | (47,252 | ) |
Investor A | | | (232,916 | ) | | | (2,244,938 | ) | | | | | | | (7,691 | ) | | | (2,451 | ) |
Investor B | | | (20,011 | ) | | | — | | | | | | | | — | | | | — | |
Investor C | | | — | | | | (5,167 | ) | | | | | | | — | | | | — | |
Class K | | | (1,760,590 | ) | | | (533,707 | ) | | | | | | | (31,488 | ) | | | (62,737 | ) |
From return of capital: | | | | | | | | | | | | | | | | | | | | |
Institutional | | | — | | | | — | | | | | | | | — | | | | (991 | ) |
Investor A | | | — | | | | — | | | | | | | | — | | | | (55 | ) |
Investor B | | | — | | | | — | | | | | | | | — | | | | — | |
Investor C | | | — | | | | — | | | | | | | | — | | | | — | |
Class K | | | — | | | | — | | | | | | | | — | | | | (1,123 | ) |
| | | | | | | | | | | | | | | | | | | | |
Decrease in net assets resulting from distributions to shareholders | | | (3,410,698 | ) | | | (2,789,743 | ) | | | | | | | (85,562 | ) | | | (114,609 | ) |
| | | | | | | | | | | | | | | | | | | | |
| | | |
CAPITAL SHARE TRANSACTIONS | | | | | | | | | | | | | |
Net increase (decrease) in net assets derived from capital share transactions | | | (27,821,715 | ) | | | 34,502,944 | | | | | | | | (1,380,816 | ) | | | 3,367,005 | |
| | | | | | | | | | | | | | | | | | | | |
| | | |
NET ASSETS(b) | | | | | | | | | | | | | |
Total increase (decrease) in net assets | | | (30,066,052 | ) | | | 37,461,572 | | | | | | | | (1,451,274 | ) | | | 3,298,779 | |
Beginning of year | | | 43,914,518 | | | | 6,452,946 | | | | | | | | 4,741,423 | | | | 1,442,644 | |
| | | | | | | | | | | | | | | | | | | | |
End of year | | $ | 13,848,466 | | | $ | 43,914,518 | | | | | | | $ | 3,290,149 | | | $ | 4,741,423 | |
| | | | | | | | | | | | | | | | | | | | |
| (a) | Distributions for annual periods determined in accordance with U.S. federal income tax regulations. |
| (b) | Prior year distribution character information and undistributed (distributions in excess of) net investment income has been modified or removed to conform with current year RegulationS-X presentation changes. Refer to Note 12 for this prior year information. |
See notes to financial statements.
Statements of Changes in Net Assets (continued)
| | | | | | | | |
| | | BlackRock Alternative Capital
Strategies Fund | |
| | | Year Ended December 31, | |
| | | 2018 | | | 2017 | |
|
INCREASE (DECREASE) IN NET ASSETS | |
|
OPERATIONS | |
Net investment income | | $ | 884,540 | | | $ | 601,158 | |
Net realized gain | | | 1,225,192 | | | | 584,379 | |
Net change in unrealized appreciation (depreciation) | | | (1,561,989 | ) | | | 1,462,130 | |
| | | | | | | | |
Net increase in net assets resulting from operations | | | 547,743 | | | | 2,647,667 | |
| | | | | | | | |
|
DISTRIBUTIONS TO SHAREHOLDERS(a)(b) | |
Institutional | | | (2,551,421 | ) | | | (1,087,004 | ) |
Investor A | | | (151,678 | ) | | | (59,416 | ) |
Investor C | | | (5,147 | ) | | | (2,177 | ) |
| | | | | | | | |
Decrease in net assets resulting from distributions to shareholders | | | (2,708,246 | ) | | | (1,148,597 | ) |
| | | | | | | | |
|
CAPITAL SHARE TRANSACTIONS | |
Net increase (decrease) in net assets derived from capital share transactions | | | 9,056,907 | | | | (855,028 | ) |
| | | | | | | | |
|
NET ASSETS(b) | |
Total increase in net assets | | | 6,896,404 | | | | 644,042 | |
Beginning of year | | | 28,863,697 | | | | 28,219,655 | |
| | | | | | | | |
End of year | | $ | 35,760,101 | | | $ | 28,863,697 | |
| | | | | | | | |
| (a) | Distributions for annual periods determined in accordance with U.S. federal income tax regulations. |
| (b) | Prior year distribution character information and undistributed (distributions in excess of) net investment income has been modified or removed to conform with current year RegulationS-X presentation changes. Refer to Note 12 for this prior year information. |
See notes to financial statements.
| | |
| 44 | | 2018 BLACKROCK ANNUAL REPORTTO SHAREHOLDERS |
Financial Highlights
(For a share outstanding throughout each period)
| | | | | | | | | | | | | | | | |
| | | BlackRock Emerging Markets Equity
Strategies Fund | |
| |
| | | Institutional | |
| | | |
| | | Year Ended December 31, | | | | | | Period from 02/29/16 (a) to 12/31/16 | |
| | | 2018 | | | 2017 | |
| | | | | |
Net asset value, beginning of period | | $ | 12.77 | | | $ | 10.24 | | | | | | | $ | 10.00 | |
| | | | | | | | | | | | | | | | |
Net investment income(b) | | | 0.17 | (c) | | | 0.18 | | | | | | | | 0.23 | |
Net realized and unrealized gain (loss) | | | (0.39 | ) | | | 3.27 | | | | | | | | 2.00 | |
| | | | | | | | | | | | | | | | |
Net increase (decrease) from investment operations | | | (0.22 | ) | | | 3.45 | | | | | | | | 2.23 | |
| | | | | | | | | | | | | | | | |
|
| Distributions(d) | |
From net investment income | | | (2.43 | ) | | | — | | | | | | | | (0.46 | ) |
From net realized gain | | | (0.59 | ) | | | (0.92 | ) | | | | | | | (1.53 | ) |
| | | | | | | | | | | | | | | | |
Total distributions | | | (3.02 | ) | | | (0.92 | ) | | | | | | | (1.99 | ) |
| | | | | | | | | | | | | | | | |
| | | | |
Net asset value, end of period | | $ | 9.53 | | | $ | 12.77 | | | | | | | $ | 10.24 | |
| | | | | | | | | | | | | | | | |
|
Total Return(e) | |
Based on net asset value | | | (1.59 | )% | | | 33.72 | % | | | | | | | 22.20 | %(f) |
| | | | | | | | | | | | | | | | |
|
Ratios to Average Net Assets(g) | |
Total expenses | | | 2.47 | % | | | 2.26 | % | | | | | | | 6.31 | %(h)(i) |
| | | | | | | | | | | | | | | | |
Total expenses after fees waived and/or reimbursed | | | 1.28 | % | | | 1.27 | % | | | | | | | 1.28 | %(h) |
| | | | | | | | | | | | | | | | |
Net investment income | | | 1.30 | %(c) | | | 1.37 | % | | | | | | | 2.37 | %(h) |
| | | | | | | | | | | | | | | | |
|
Supplemental Data | |
Net assets, end of period (000) | | $ | 5,631 | | | $ | 36,318 | | | | | | | $ | 375 | |
| | | | | | | | | | | | | | | | |
Portfolio turnover rate(j) | | | 254 | % | | | 165 | % | | | | | | | 161 | % |
| | | | | | | | | | | | | | | | |
| (a) | Commencement of operations. |
| (b) | Based on average shares outstanding. |
| (c) | Net investment income per share and the ratio of net investment income to average net assets includes $0.03 per share and 0.26%, respectively, resulting from a special dividend. |
| (d) | Distributions for annual periods determined in accordance with U.S. federal income tax regulations. |
| (e) | Where applicable, assumes the reinvestment of distributions. |
| (f) | Aggregate total return. |
| (g) | Excludes expenses incurred indirectly as a result of investments in underlying funds as follows: |
| | | | | | | | | | | | | | | | | | | | | | | | |
| | | Year Ended | | | | | | Period from
02/29/16 (a)
to 12/31/16 | | | | |
| | | 12/31/18 | | | | | | 12/31/17 | | | | |
Total expenses | | | 0.02 | % | | | | | | | 0.01 | % | | | | | | | 0.01 | % | | | | |
| | | | | | | | | | | | | | | | | | | | | | | | |
| (i) | Audit, offering and organization costs were not annualized in the calculation of expense ratios. If these expenses were annualized, the total expenses would have been 6.93%. |
| (j) | Excludes investments underlying the total return swaps. |
See notes to financial statements.
Financial Highlights (continued)
(For a share outstanding throughout each period)
| | | | | | | | | | | | | | | | |
| | | BlackRock Emerging Markets Equity
Strategies Fund (continued) | |
| |
| | | Investor A | |
| | | |
| | | Year Ended December 31, | | | | | | Period from 02/29/16 (a) to 12/31/16 | |
| | | 2018 | | | 2017 | |
| | | | | |
Net asset value, beginning of period | | $ | 12.76 | | | $ | 10.24 | | | | | | | $ | 10.00 | |
| | | | | | | | | | | | | | | | |
Net investment income(b) | | | 0.17 | (c) | | | 0.13 | | | | | | | | 0.21 | |
Net realized and unrealized gain | | | (0.43 | ) | | | 3.27 | | | | | | | | 2.00 | |
| | | | | | | | | | | | | | | | |
Net increase (decrease) from investment operations | | | (0.26 | ) | | | 3.40 | | | | | | | | 2.21 | |
| | | | | | | | | | | | | | | | |
|
| Distributions(d) | |
From net investment income | | | (2.43 | ) | | | — | | | | | | | | (0.44 | ) |
From net realized gain | | | (0.59 | ) | | | (0.88 | ) | | | | | | | (1.53 | ) |
| | | | | | | | | | | | | | | | |
Total distributions | | | (3.02 | ) | | | (0.88 | ) | | | | | | | (1.97 | ) |
| | | | | | | | | | | | | | | | |
| | | | |
Net asset value, end of period | | $ | 9.48 | | | $ | 12.76 | | | | | | | $ | 10.24 | |
| | | | | | | | | | | | | | | | |
|
Total Return(e) | |
Based on net asset value | | | (1.93 | )% | | | 33.30 | % | | | | | | | 21.94 | %(f) |
| | | | | | | | | | | | | | | | |
|
Ratios to Average Net Assets(g) | |
Total expenses | | | 4.04 | % | | | 3.45 | % | | | | | | | 6.82 | %(h)(i) |
| | | | | | | | | | | | | | | | |
Total expenses after fees waived and/or reimbursed | | | 1.56 | % | | | 1.55 | % | | | | | | | 1.54 | %(h) |
| | | | | | | | | | | | | | | | |
Net investment income | | | 1.40 | %(c) | | | 1.09 | % | | | | | | | 2.14 | %(h) |
| | | | | | | | | | | | | | | | |
|
Supplemental Data | |
Net assets, end of period (000) | | $ | 1,162 | | | $ | 87 | | | | | | | $ | 61 | |
| | | | | | | | | | | | | | | | |
Portfolio turnover rate(j) | | | 254 | % | | | 165 | % | | | | | | | 161 | % |
| | | | | | | | | | | | | | | | |
| (a) | Commencement of operations. |
| (b) | Based on average shares outstanding. |
| (c) | Net investment income per share and the ratio of net investment income to average net assets includes $0.03 per share and 0.26%, respectively, resulting from a special dividend. |
| (d) | Distributions for annual periods determined in accordance with U.S. federal income tax regulations. |
| (e) | Where applicable, excludes the effects of any sales charges and assumes the reinvestment of distributions. |
| (f) | Aggregate total return. |
| (g) | Excludes expenses incurred indirectly as a result of investments in underlying funds as follows: |
| | | | | | | | | | | | | | | | | | | | | | | | |
| | | Year Ended | | | | | | Period from
02/29/16 (a)
to 12/31/16 | | | | |
| | | 12/31/18 | | | | | | 12/31/17 | | | | |
Total expenses | | | 0.02 | % | | | | | | | 0.01 | % | | | | | | | 0.01 | % | | | | |
| | | | | | | | | | | | | | | | | | | | | | | | |
| (i) | Audit, offering and organization costs were not annualized in the calculation of expense ratios. If these expenses were annualized, the total expenses would have been 7.48%. |
| (j) | Excludes investments underlying the total return swaps. |
See notes to financial statements.
| | |
| 46 | | 2018 BLACKROCK ANNUAL REPORTTO SHAREHOLDERS |
Financial Highlights (continued)
(For a share outstanding throughout each period)
| | | | | | | | | | | | | | | | |
| | | BlackRock Emerging Markets Equity
Strategies Fund (continued) | |
| |
| | | Investor C | |
| | | |
| | | Year Ended December 31, | | | | | | Period from 02/29/16 (a) to 12/31/16 | |
| | | 2018 | | | 2017 | |
| | | | | |
Net asset value, beginning of period | | $ | 12.75 | | | $ | 10.24 | | | | | | | $ | 10.00 | |
| | | | | | | | | | | | | | | | |
Net investment income(b) | | | 0.09 | (c) | | | 0.04 | | | | | | | | 0.13 | |
Net realized and unrealized gain (loss) | | | (0.43 | ) | | | 3.26 | | | | | | | | 2.00 | |
| | | | | | | | | | | | | | | | |
Net increase (decrease) from investment operations | | | (0.34 | ) | | | 3.30 | | | | | | | | 2.13 | |
| | | | | | | | | | | | | | | | |
|
| Distributions(d) | |
From net investment income | | | (2.28 | ) | | | — | | | | | | | | (0.36 | ) |
From net realized gain | | | (0.59 | ) | | | (0.79 | ) | | | | | | | (1.53 | ) |
| | | | | | | | | | | | | | | | |
Total distributions | | | (2.87 | ) | | | (0.79 | ) | | | | | | | (1.89 | ) |
| | | | | | | | | | | | | | | | |
| | | | |
Net asset value, end of period | | $ | 9.54 | | | $ | 12.75 | | | | | | | $ | 10.24 | |
| | | | | | | | | | | | | | | | |
|
Total Return(e) | |
Based on net asset value | | | (2.59 | )% | | | 32.29 | % | | | | | | | 21.20 | %(f) |
| | | | | | | | | | | | | | | | |
|
Ratios to Average Net Assets(g) | |
Total expenses | | | 4.38 | % | | | 4.12 | % | | | | | | | 7.53 | %(h)(i) |
| | | | | | | | | | | | | | | | |
Total expenses after fees waived and/or reimbursed | | | 2.31 | % | | | 2.30 | % | | | | | | | 2.30 | %(h) |
| | | | | | | | | | | | | | | | |
Net investment income | | | 0.73 | %(c) | | | 0.35 | % | | | | | | | 1.38 | %(h) |
| | | | | | | | | | | | | | | | |
|
Supplemental Data | |
Net assets, end of period (000) | | $ | 81 | | | $ | 84 | | | | | | | $ | 61 | |
| | | | | | | | | | | | | | | | |
Portfolio turnover rate(j) | | | 254 | % | | | 165 | % | | | | | | | 161 | % |
| | | | | | | | | | | | | | | | |
| (a) | Commencement of operations. |
| (b) | Based on average shares outstanding. |
| (c) | Net investment income per share and the ratio of net investment income to average net assets includes $0.03 per share and 0.26%, respectively, resulting from a special dividend. |
| (d) | Distributions for annual periods determined in accordance with U.S. federal income tax regulations. |
| (e) | Where applicable, excludes the effects of any sales charges and assumes the reinvestment of distributions. |
| (f) | Aggregate total return. |
| (g) | Excludes expenses incurred indirectly as a result of investments in underlying funds as follows: |
| | | | | | | | | | | | | | | | | | | | | | | | |
| | | Year Ended | | | | | | Period from
02/29/16 (a)
to 12/31/16 | | | | |
| | | 12/31/18 | | | | | | 12/31/17 | | | | |
Total expenses | | | 0.02 | % | | | | | | | 0.01 | % | | | | | | | 0.01 | % | | | | |
| | | | | | | | | | | | | | | | | | | | | | | | |
| (i) | Audit, offering and organization costs were not annualized in the calculation of expense ratios. If these expenses were annualized, the total expenses would have been 8.20%. |
| (j) | Excludes investments underlying the total return swaps. |
See notes to financial statements.
Financial Highlights (continued)
(For a share outstanding throughout each period)
| | | | | | | | | | | | | | | | |
| | | BlackRock Emerging Markets Equity
Strategies Fund (continued) | |
| |
| | | Class K | |
| | | |
| | | Year Ended December 31, | | | | | | Period from 02/29/16 (a) to 12/31/16 | |
| | | 2018 | | | 2017 | |
| | | | | |
Net asset value, beginning of period | | $ | 12.77 | | | $ | 10.24 | | | | | | | $ | 10.00 | |
| | | | | | | | | | | | | | | | |
Net investment income(b) | | | 0.24 | (c) | | | 0.17 | | | | | | | | 0.24 | |
Net realized and unrealized gain (loss) | | | (0.45 | ) | | | 3.28 | | | | | | | | 1.99 | |
| | | | | | | | | | | | | | | | |
Net increase (decrease) from investment operations | | | (0.21 | ) | | | 3.45 | | | | | | | | 2.23 | |
| | | | | | | | | | | | | | | | |
|
| Distributions(d) | |
From net investment income | | | (2.44 | ) | | | — | | | | | | | | (0.46 | ) |
From net realized gain | | | (0.59 | ) | | | (0.92 | ) | | | | | | | (1.53 | ) |
| | | | | | | | | | | | | | | | |
Total distributions | | | (3.03 | ) | | | (0.92 | ) | | | | | | | (1.99 | ) |
| | | | | | | | | | | | | | | | |
| | | | |
Net asset value, end of period | | $ | 9.53 | | | $ | 12.77 | | | | | | | $ | 10.24 | |
| | | | | | | | | | | | | | | | |
|
Total Return(e) | |
Based on net asset value | | | (1.49 | )% | | | 33.73 | % | | | | | | | 22.23 | %(f) |
| | | | | | | | | | | | | | | | |
| | | | |
Ratios to Average Net Assets(g) | | | | | | | | | | | | | | | | |
Total expenses | | | 3.14 | % | | | 3.06 | % | | | | | | | 6.48 | %(h)(i) |
| | | | | | | | | | | | | | | | |
Total expenses after fees waived and/or reimbursed | | | 1.26 | % | | | 1.25 | % | | | | | | | 1.25 | %(h) |
| | | | | | | | | | | | | | | | |
Net investment income | | | 1.90 | %(c) | | | 1.39 | % | | | | | | | 2.43 | %(h) |
| | | | | | | | | | | | | | | | |
|
Supplemental Data | |
Net assets, end of period (000) | | $ | 6,975 | | | $ | 7,426 | | | | | | | $ | 5,956 | |
| | | | | | | | | | | | | | | | |
Portfolio turnover rate(j) | | | 254 | % | | | 165 | % | | | | | | | 161 | % |
| | | | | | | | | | | | | | | | |
| (a) | Commencement of operations. |
| (b) | Based on average shares outstanding. |
| (c) | Net investment income per share and the ratio of net investment income to average net assets includes $0.03 per share and 0.26%, respectively, resulting from a special dividend. |
| (d) | Distributions for annual periods determined in accordance with U.S. federal income tax regulations. |
| (e) | Where applicable, assumes the reinvestment of distributions. |
| (f) | Aggregate total return. |
| (g) | Excludes expenses incurred indirectly as a result of investments in underlying funds as follows: |
| | | | | | | | | | | | | | | | | | | | | | | | |
| | | Year Ended | | | | | | Period from
02/29/16 (a)
to 12/31/16 | | | | |
| | | 12/31/18 | | | | | | 12/31/17 | | | | |
Total expenses | | | 0.02 | % | | | | | | | 0.01 | % | | | | | | | 0.01 | % | | | | |
| | | | | | | | | | | | | | | | | | | | | | | | |
| (i) | Audit, offering and organization costs were not annualized in the calculation of expense ratios. If these expenses were annualized, the total expenses would have been 7.14%. |
| (j) | Excludes investments underlying the total return swaps. |
See notes to financial statements.
| | |
| 48 | | 2018 BLACKROCK ANNUAL REPORTTO SHAREHOLDERS |
Financial Highlights (continued)
(For a share outstanding throughout each period)
| | | | | | | | | | | | | | | | |
| | | iShares Short-Term TIPS
Bond Index Fund | |
| |
| | | Institutional | |
| | | |
| | | Year Ended December 31, | | | | | | Period from 02/16/16 (a) to 12/31/16 | |
| | | 2018 | | | 2017 | |
| | | | | |
Net asset value, beginning of period | | $ | 9.95 | | | $ | 10.05 | | | | | | | $ | 10.00 | |
| | | | | | | | | | | | | | | | |
Net investment income(b) | | | 0.22 | | | | 0.16 | | | | | | | | 0.17 | |
Net realized and unrealized gain (loss) | | | (0.16 | ) | | | (0.08 | ) | | | | | | | 0.08 | |
| | | | | | | | | | | | | | | | |
Net increase (decrease) from investment operations | | | 0.06 | | | | 0.08 | | | | | | | | 0.25 | |
| | | | | | | | | | | | | | | | |
|
| Distributions(c) | |
From net investment income | | | (0.26 | ) | | | (0.18 | ) | | | | | | | (0.19 | ) |
From net realized gain | | | (0.01 | ) | | | — | | | | | | | | (0.01 | ) |
From return of capital | | | — | | | | (0.00 | )(d) | | | | | | | — | |
| | | | | | | | | | | | | | | | |
Total distributions | | | (0.27 | ) | | | (0.18 | ) | | | | | | | (0.20 | ) |
| | | | | | | | | | | | | | | | |
| | | | |
Net asset value, end of period | | $ | 9.74 | | | $ | 9.95 | | | | | | | $ | 10.05 | |
| | | | | | | | | | | | | | | | |
|
Total Return(e) | |
Based on net asset value | | | 0.56 | % | | | 0.88 | % | | | | | | | 2.49 | %(f) |
| | | | | | | | | | | | | | | | |
|
Ratios to Average Net Assets | |
Total expenses | | | 4.96 | % | | | 5.07 | % | | | | | | | 18.22 | %(g)(h) |
| | | | | | | | | | | | | | | | |
Total expenses after fees waived and/or reimbursed | | | 0.09 | % | | | 0.08 | % | | | | | | | 0.09 | %(g)(h) |
| | | | | | | | | | | | | | | | |
Net investment income | | | 2.19 | % | | | 1.64 | % | | | | | | | 1.91 | %(g)(h) |
| | | | | | | | | | | | | | | | |
|
Supplemental Data | |
Net assets, end of period (000) | | $ | 976 | | | $ | 3,348 | | | | | | | $ | 476 | |
| | | | | | | | | | | | | | | | |
Portfolio turnover rate | | | 80 | % | | | 200 | % | | | | | | | 10 | % |
| | | | | | | | | | | | | | | | |
| (a) | Commencement of operations. |
| (b) | Based on average shares outstanding. |
| (c) | Distributions for annual periods determined in accordance with U.S. federal income tax regulations. |
| (d) | Amount is greater than $(0.005) per share. |
| (e) | Where applicable, assumes the reinvestment of distributions. |
| (f) | Aggregate total return. |
| (h) | Audit, offering and organization costs were not annualized in the calculation of expense ratios. If these expenses were annualized, the total expenses would have been 19.98%. |
See notes to financial statements.
Financial Highlights (continued)
(For a share outstanding throughout each period)
| | | | | | | | | | | | | | | | |
| | | iShares Short-Term TIPS
Bond Index Fund (continued) | |
| |
| | | Investor A | |
| | | |
| | | Year Ended December 31, | | | | | | Period from 02/16/16 (a) to 12/31/16 | |
| | | 2018 | | | 2017 | |
| | | | | |
Net asset value, beginning of period | | $ | 9.95 | | | $ | 10.04 | | | | | | | $ | 10.00 | |
| | | | | | | | | | | | | | | | |
Net investment income(b) | | | 0.20 | | | | 0.14 | | | | | | | | 0.16 | |
Net realized and unrealized gain (loss) | | | (0.18 | ) | | | (0.07 | ) | | | | | | | 0.06 | |
| | | | | | | | | | | | | | | | |
Net increase (decrease) from investment operations | | | 0.02 | | | | 0.07 | | | | | | | | 0.22 | |
| | | | | | | | | | | | | | | | |
|
| Distributions(c) | |
From net investment income | | | (0.22 | ) | | | (0.16 | ) | | | | | | | (0.17 | ) |
From net realized gain | | | (0.01 | ) | | | — | | | | | | | | (0.01 | ) |
From return of capital | | | — | | | | (0.00 | )(d) | | | | | | | — | |
| | | | | | | | | | | | | | | | |
Total distributions | | | (0.23 | ) | | | (0.16 | ) | | | | | | | (0.18 | ) |
| | | | | | | | | | | | | | | | |
| | | | |
Net asset value, end of period | | $ | 9.74 | | | $ | 9.95 | | | | | | | $ | 10.04 | |
| | | | | | | | | | | | | | | | |
|
Total Return(e) | |
Based on net asset value | | | 0.22 | % | | | 0.76 | % | | | | | | | 2.18 | %(f) |
| | | | | | | | | | | | | | | | |
|
Ratios to Average Net Assets | |
Total expenses | | | 6.40 | % | | | 6.24 | % | | | | | | | 20.84 | %(g)(h) |
| | | | | | | | | | | | | | | | |
Total expenses after fees waived and/or reimbursed | | | 0.36 | % | | | 0.36 | % | | | | | | | 0.36 | %(g)(h) |
| | | | | | | | | | | | | | | | |
Net investment income | | | 2.00 | % | | | 1.35 | % | | | | | | | 1.81 | %(g)(h) |
| | | | | | | | | | | | | | | | |
|
Supplemental Data | |
Net assets, end of period (000) | | $ | 526 | | | $ | 256 | | | | | | | $ | 62 | |
| | | | | | | | | | | | | | | | |
Portfolio turnover rate | | | 80 | % | | | 200 | % | | | | | | | 10 | % |
| | | | | | | | | | | | | | | | |
| (a) | Commencement of operations. |
| (b) | Based on average shares outstanding. |
| (c) | Distributions for annual periods determined in accordance with U.S. federal income tax regulations. |
| (d) | Amount is greater than $(0.005) per share. |
| (e) | Where applicable, assumes the reinvestment of distributions. |
| (f) | Aggregate total return. |
| (h) | Audit, offering and organization costs were not annualized in the calculation of expense ratios. If these expenses were annualized, the total expenses would have been 22.90%. |
See notes to financial statements.
| | |
| 50 | | 2018 BLACKROCK ANNUAL REPORTTO SHAREHOLDERS |
Financial Highlights (continued)
(For a share outstanding throughout each period)
| | | | | | | | | | | | | | | | |
| | | iShares Short-Term TIPS
Bond Index Fund (continued) | |
| |
| | | Class K | |
| | | |
| | | Year Ended December 31, | | | | | | Period from 02/16/16 (a) to 12/31/16 | |
| | | 2018 | | | 2017 | |
| | | | | |
Net asset value, beginning of period | | $ | 9.95 | | | $ | 10.05 | | | | | | | $ | 10.00 | |
| | | | | | | | | | | | | | | | |
Net investment income(b) | | | 0.31 | | | | 0.25 | | | | | | | | 0.19 | |
Net realized and unrealized gain (loss) | | | (0.25 | ) | | | (0.16 | ) | | | | | | | 0.06 | |
| | | | | | | | | | | | | | | | |
Net increase (decrease) from investment operations | | | 0.06 | | | | 0.09 | | | | | | | | 0.25 | |
| | | | | | | | | | | | | | | | |
|
| Distributions(c) | |
From net investment income | | | (0.24 | ) | | | (0.19 | ) | | | | | | | (0.19 | ) |
From net realized gain | | | (0.01 | ) | | | — | | | | | | | | (0.01 | ) |
From return of capital | | | — | | | | (0.00 | )(d) | | | | | | | — | |
| | | | | | | | | | | | | | | | |
Total distributions | | | (0.25 | ) | | | (0.19 | ) | | | | | | | (0.20 | ) |
| | | | | | | | | | | | | | | | |
| | | | |
Net asset value, end of period | | $ | 9.76 | | | $ | 9.95 | | | | | | | $ | 10.05 | |
| | | | | | | | | | | | | | | | |
|
Total Return(e) | |
Based on net asset value | | | 0.60 | % | | | 0.89 | % | | | | | | | 2.52 | %(f) |
| | | | | | | | | | | | | | | | |
|
Ratios to Average Net Assets | |
Total expenses | | | 5.80 | % | | | 2.82 | % | | | | | | | 20.61 | %(g)(h) |
| | | | | | | | | | | | | | | | |
Total expenses after fees waived and/or reimbursed | | | 0.06 | % | | | 0.06 | % | | | | | | | 0.06 | %(g)(h) |
| | | | | | | | | | | | | | | | |
Net investment income | | | 3.13 | % | | | 2.45 | % | | | | | | | 2.17 | %(g)(h) |
| | | | | | | | | | | | | | | | |
|
Supplemental Data | |
Net assets, end of period (000) | | $ | 1,788 | | | $ | 1,138 | | | | | | | $ | 904 | |
| | | | | | | | | | | | | | | | |
Portfolio turnover rate | | | 80 | % | | | 200 | % | | | | | | | 10 | % |
| | | | | | | | | | | | | | | | |
| (a) | Commencement of operations. |
| (b) | Based on average shares outstanding. |
| (c) | Distributions for annual periods determined in accordance with U.S. federal income tax regulations. |
| (d) | Amount is greater than $(0.005) per share. |
| (e) | Where applicable, assumes the reinvestment of distributions. |
| (f) | Aggregate total return. |
| (h) | Audit, offering and organization costs were not annualized in the calculation of expense ratios. If these expenses were annualized, the total expenses would have been 22.68%. |
See notes to financial statements.
Financial Highlights (continued)
(For a share outstanding throughout each period)
| | | | | | | | | | | | | | | | | | | | |
| | | BlackRock Alternative Capital Strategies Fund | |
| |
| | | Institutional | |
| | | Year Ended December 31, | | | | | | Period from
05/19/15 (a) to 12/31/15 | |
| | | 2018 | | | 2017 | | | 2016 | | | | |
| | | | | | |
Net asset value, beginning of period | | $ | 10.15 | | | $ | 9.61 | | | $ | 9.53 | | | | | | | $ | 10.00 | |
| | | | | | | | | | | | | | | | | | | | |
Net investment income(b) | | | 0.29 | | | | 0.22 | | | | 0.16 | | | | | | | | 0.11 | |
Net realized and unrealized gain (loss) | | | (0.12 | ) | | | 0.73 | | | | 0.40 | | | | | | | | (0.46 | ) |
| | | | | | | | | | | | | | | | | | | | |
Net increase (decrease) from investment operations | | | 0.17 | | | | 0.95 | | | | 0.56 | | | | | | | | (0.35 | ) |
| | | | | | | | | | | | | | | | | | | | |
| | | | | |
| Distributions from(c) | | | | | | | | | | | | | | | |
From net investment income | | | (0.29 | ) | | | (0.22 | ) | | | (0.16 | ) | | | | | | | (0.12 | ) |
From net realized gain | | | (0.56 | ) | | | (0.19 | ) | | | (0.32 | ) | | | | | | | — | |
| | | | | | | | | | | | | | | | | | | | |
Total distributions | | | (0.85 | ) | | | (0.41 | ) | | | (0.48 | ) | | | | | | | (0.12 | ) |
| | | | | | | | | | | | | | | | | | | | |
| | | | | |
Net asset value, end of period | | $ | 9.47 | | | $ | 10.15 | | | $ | 9.61 | | | | | | | $ | 9.53 | |
| | | | | | | | | | | | | | | | | | | | |
| | | | | |
Total Return(d) | | | | | | | | | | | | | | | | | | | | |
Based on net asset value | | | 1.74 | % | | | 10.00 | % | | | 5.91 | % | | | | | | | (3.53 | )%(e) |
| | | | | | | | | | | | | | | | | | | | |
| | | | | |
Ratios to Average Net Assets(f) | | | | | | | | | | | | | | | | | | | | |
Total expenses | | | 2.33 | % | | | 2.16 | % | | | 2.24 | % | | | | | | | 2.05 | %(g)(h) |
| | | | | | | | | | | | | | | | | | | | |
Total expenses after fees waived and/or reimbursed | | | 0.95 | % | | | 0.95 | % | | | 1.19 | % | | | | | | | 1.20 | %(g) |
| | | | | | | | | | | | | | | | | | | | |
Total expenses after fees waived and/or reimbursed and excluding excise tax | | | 0.95 | % | | | 0.95 | % | | | 1.18 | % | | | | | | | 1.20 | %(g) |
| | | | | | | | | | | | | | | | | | | | |
Net investment income | | | 2.93 | % | | | 2.19 | % | | | 1.64 | % | | | | | | | 1.79 | %(g) |
| | | | | | | | | | | | | | | | | | | | |
| | | | | |
Supplemental Data | | | | | | | | | | | | | | | | | | | | |
Net assets, end of period (000) | | $ | 32,961 | | | $ | 27,328 | | | $ | 25,588 | | | | | | | $ | 23,844 | |
| | | | | | | | | | | | | | | | | | | | |
Portfolio turnover rate(i)(j) | | | 426 | % | | | 424 | % | | | 722 | % | | | | | | | 440 | % |
| | | | | | | | | | | | | | | | | | | | |
| (a) | Commencement of operations. |
| (b) | Based on average shares outstanding. |
| (c) | Distributions for annual periods determined in accordance with U.S. federal income tax regulations. |
| (d) | Where applicable, assumes the reinvestment of distributions. |
| (e) | Aggregate total return. |
| (f) | Excludes expenses incurred indirectly as a result of investments in underlying funds as follows: |
| | | | | | | | | | | | | | | | | | | | | | | | | | | | | | | | |
| | | 2018 | | | | | | 2017 | | | | | | 2016 | | | | | | Period from
05/19/15 (a) to 12/31/15 | | | | |
Investments in underlying funds | | | 0.01 | % | | | | | | | 0.00 | % | | | | | | | 0.02 | % | | | | | | | 0.03 | % | | | | |
| | | | | | | | | | | | | | | | | | | | | | | | | | | | | | | | |
| (h) | Audit, offering and organization costs were not annualized in the calculation of expense ratios. If these expenses were annualized, the total expenses would have been 2.44%. |
| (i) | Excludes investments underlying the total return swaps. |
| (j) | Includes mortgage dollar rolls (“MDRs”). Additional information regarding portfolio turnover rate is as follows: |
| | | | | | | | | | | | | | | | | | | | | | | | | | | | | | | | |
| | | 2018 | | | | | | 2017 | | | | | | 2016 | | | | | | Period from
05/19/15 (a) to 12/31/15 | | | | |
Portfolio turnover rate (excluding MDRs)(i) | | | 220 | % | | | | | | | 251 | % | | | | | | | 488 | % | | | | | | | 437 | % | | | | |
| | | | | | | | | | | | | | | | | | | | | | | | | | | | | | | | |
See notes to financial statements.
| | |
| 52 | | 2018 BLACKROCK ANNUAL REPORTTO SHAREHOLDERS |
Financial Highlights (continued)
(For a share outstanding throughout each period)
| | | | | | | | | | | | | | | | | | | | |
| | | BlackRock Alternative Capital Strategies Fund (continued) | |
| |
| | | Investor A | |
| | | |
| | | Year Ended December 31, | | | | | | Period from 05/19/15 (a) to 12/31/15 | |
| | | 2018 | | | 2017 | | | 2016 | |
| | | | | | |
Net asset value, beginning of period | | $ | 10.15 | | | $ | 9.60 | | | $ | 9.53 | | | | | | | $ | 10.00 | |
| | | | | | | | | | | | | | | | | | | | |
Net investment income(b) | | | 0.22 | | | | 0.19 | | | | 0.14 | | | | | | | | 0.11 | |
Net realized and unrealized gain (loss) | | | (0.09 | ) | | | 0.74 | | | | 0.39 | | | | | | | | (0.48 | ) |
| | | | | | | | | | | | | | | | | | | | |
Net increase (decrease) from investment operations | | | 0.13 | | | | 0.93 | | | | 0.53 | | | | | | | | (0.37 | ) |
| | | | | | | | | | | | | | | | | | | | |
| | | | | |
| Distributions(c) | | | | | | | | | | | | | | | |
From net investment income | | | (0.26 | ) | | | (0.19 | ) | | | (0.14 | ) | | | | | | | (0.10 | ) |
From net realized gain | | | (0.56 | ) | | | (0.19 | ) | | | (0.32 | ) | | | | | | | — | |
| | | | | | | | | | | | | | | | | | | | |
Total distributions | | | (0.82 | ) | | | (0.38 | ) | | | (0.46 | ) | | | | | | | (0.10 | ) |
| | | | | | | | | | | | | | | | | | | | |
| | | | | |
Net asset value, end of period | | $ | 9.46 | | | $ | 10.15 | | | $ | 9.60 | | | | | | | $ | 9.53 | |
| | | | | | | | | | | | | | | | | | | | |
| | | | | |
Total Return(d) | | | | | | | | | | | | | | | | | | | | |
Based on net asset value | | | 1.41 | % | | | 9.83 | % | | | 5.61 | % | | | | | | | (3.66 | )%(e) |
| | | | | | | | | | | | | | | | | | | | |
| | | | | |
Ratios to Average Net Assets(f) | | | | | | | | | | | | | | | | | | | | |
Total expenses | | | 2.73 | % | | | 2.63 | % | | | 2.75 | % | | | | | | | 2.42 | %(g)(h) |
| | | | | | | | | | | | | | | | | | | | |
Total expenses after fees waived and/or reimbursed | | | 1.20 | % | | | 1.20 | % | | | 1.42 | % | | | | | | | 1.45 | %(g) |
| | | | | | | | | | | | | | | | | | | | |
Total expenses after fees waived and/or reimbursed and excluding excise tax | | | 1.20 | % | | | 1.20 | % | | | 1.42 | % | | | | | | | 1.45 | %(g) |
| | | | | | | | | | | | | | | | | | | | |
Net investment income | | | 2.21 | % | | | 1.94 | % | | | 1.46 | % | | | | | | | 1.76 | %(g) |
| | | | | | | | | | | | | | | | | | | | |
| | | | | |
Supplemental Data | | | | | | | | | | | | | | | | | | | | |
Net assets, end of period (000) | | $ | 2,725 | | | $ | 1,469 | | | $ | 2,439 | | | | | | | $ | 311 | |
| | | | | | | | | | | | | | | | | | | | |
Portfolio turnover rate(i)(j) | | | 426 | % | | | 424 | % | | | 722 | % | | | | | | | 440 | % |
| | | | | | | | | | | | | | | | | | | | |
| (a) | Commencement of operations. |
| (b) | Based on average shares outstanding. |
| (c) | Distributions for annual periods determined in accordance with U.S. federal income tax regulations. |
| (d) | Where applicable, excludes the effects of any sales charges and assumes the reinvestment of distributions. |
| (e) | Aggregate total return. |
| (f) | Excludes expenses incurred indirectly as a result of investments in underlying funds as follows: |
| | | | | | | | | | | | | | | | | | | | | | | | | | | | | | | | |
| | | 2018 | | | | | | 2017 | | | | | | 2016 | | | | | | Period from 05/19/15 (a) to 12/31/15 | | | | |
Investments in underlying funds | | | 0.01 | % | | | | | | | 0.00 | % | | | | | | | 0.02 | % | | | | | | | 0.03 | % | | | | |
| | | | | | | | | | | | | | | | | | | | | | | | | | | | | | | | |
| (h) | Audit, offering and organization costs were not annualized in the calculation of expense ratios. If these expenses were annualized, the total expenses would have been 2.81%. |
| (i) | Excludes investments underlying the total return swaps. |
| (j) | Includes mortgage dollar rolls (“MDRs”). Additional information regarding portfolio turnover rate is as follows: |
| | | | | | | | | | | | | | | | | | | | | | | | | | | | | | | | |
| | | 2018 | | | | | | 2017 | | | | | | 2016 | | | | | | Period from 05/19/15 (a) to 12/31/15 | | | | |
Portfolio turnover rate (excluding MDRs)(i) | | | 220 | % | | | | | | | 251 | % | | | | | | | 488 | % | | | | | | | 437 | % | | | | |
| | | | | | | | | | | | | | | | | | | | | | | | | | | | | | | | |
See notes to financial statements.
Financial Highlights (continued)
(For a share outstanding throughout each period)
| | | | | | | | | | | | | | | | | | | | |
| | | BlackRock Alternative Capital Strategies Fund
(continued) | |
| |
| | | Investor C | |
| | | Year Ended December 31, | | | | | | Period from 05/19/15 (a) to 12/31/15 | |
| | | 2018 | | | 2017 | | | 2016 | | | | |
| | | | | | |
Net asset value, beginning of period | | $ | 10.16 | | | $ | 9.58 | | | $ | 9.51 | | | | | | | $ | 10.00 | |
| | | | | | | | | | | | | | | | | | | | |
Net investment income(b) | | | 0.20 | | | | 0.12 | | | | 0.06 | | | | | | | | 0.05 | |
Net realized and unrealized gain (loss) | | | (0.14 | ) | | | 0.73 | | | | 0.40 | | | | | | | | (0.47 | ) |
| | | | | | | | | | | | | | | | | | | | |
Net increase (decrease) from investment operations | | | 0.06 | | | | 0.85 | | | | 0.46 | | | | | | | | (0.42 | ) |
| | | | | | | | | | | | | | | | | | | | |
| | | | | |
| Distributions(c) | | | | | | | | | | | | | | | |
From net investment income | | | (0.19 | ) | | | (0.08 | ) | | | (0.07 | ) | | | | | | | (0.07 | ) |
From net realized gain | | | (0.56 | ) | | | (0.19 | ) | | | (0.32 | ) | | | | | | | — | |
| | | | | | | | | | | | | | | | | | | | |
Total distributions | | | (0.75 | ) | | | (0.27 | ) | | | (0.39 | ) | | | | | | | (0.07 | ) |
| | | | | | | | | | | | | | | | | | | | |
| | | | | |
Net asset value, end of period | | $ | 9.47 | | | $ | 10.16 | | | $ | 9.58 | | | | | | | $ | 9.51 | |
| | | | | | | | | | | | | | | | | | | | |
| | | | | |
Total Return(d) | | | | | | | | | | | | | | | | | | | | |
Based on net asset value | | | 0.65 | % | | | 8.97 | % | | | 4.82 | % | | | | | | | (4.19 | )%(e) |
| | | | | | | | | | | | | | | | | | | | |
| | | | | |
Ratios to Average Net Assets(f) | | | | | | | | | | | | | | | | | | | | |
Total expenses | | | 3.48 | % | | | 3.30 | % | | | 3.43 | % | | | | | | | 3.31 | %(g)(h) |
| | | | | | | | | | | | | | | | | | | | |
Total expenses after fees waived and/or reimbursed | | | 1.95 | % | | | 1.95 | % | | | 2.19 | % | | | | | | | 2.20 | %(g) |
| | | | | | | | | | | | | | | | | | | | |
Total expenses after fees waived and/or reimbursed and excluding excise tax | | | 1.95 | % | | | 1.95 | % | | | 2.18 | % | | | | | | | 2.20 | %(g) |
| | | | | | | | | | | | | | | | | | | | |
Net investment income | | | 2.01 | % | | | 1.18 | % | | | 0.64 | % | | | | | | | 0.89 | %(g) |
| | | | | | | | | | | | | | | | | | | | |
| | | | | |
Supplemental Data | | | | | | | | | | | | | | | | | | | | |
Net assets, end of period (000) | | $ | 75 | | | $ | 67 | | | $ | 193 | | | | | | | $ | 71 | |
| | | | | | | | | | | | | | | | | | | | |
Portfolio turnover rate(i)(j) | | | 426 | % | | | 424 | % | | | 722 | % | | | | | | | 440 | % |
| | | | | | | | | | | | | | | | | | | | |
| (a) | Commencement of operations. |
| (b) | Based on average shares outstanding. |
| (c) | Distributions for annual periods determined in accordance with U.S. federal income tax regulations. |
| (d) | Where applicable, excludes the effects of any sales charges and assumes the reinvestment of distributions. |
| (e) | Aggregate total return. |
| (f) | Excludes expenses incurred indirectly as a result of investments in underlying funds as follows: |
| | | | | | | | | | | | | | | | | | | | | | | | | | | | | | | | |
| | | 2018 | | | | | | 2017 | | | | | | 2016 | | | | | | Period from
05/19/15 (a) to 12/31/15 | | | | |
Investments in underlying funds | | | 0.01 | % | | | | | | | 0.00 | % | | | | | | | 0.02 | % | | | | | | | 0.03 | % | | | | |
| | | | | | | | | | | | | | | | | | | | | | | | | | | | | | | | |
| (h) | Audit, offering and organization costs were not annualized in the calculation of expense ratios. If these expenses were annualized, the total expenses would have been 3.70%. |
| (i) | Excludes investments underlying the total return swaps. |
| (j) | Includes mortgage dollar rolls (“MDRs”). Additional information regarding portfolio turnover rate is as follows: |
| | | | | | | | | | | | | | | | | | | | | | | | | | | | | | | | |
| | | 2018 | | | | | | 2017 | | | | | | 2016 | | | | | | Period from
05/19/15 (a) to 12/31/15 | | | | |
Portfolio turnover rate (excluding MDRs)(i) | | | 220 | % | | | | | | | 251 | % | | | | | | | 488 | % | | | | | | | 437 | % | | | | |
| | | | | | | | | | | | | | | | | | | | | | | | | | | | | | | | |
See notes to financial statements.
| | |
| 54 | | 2018 BLACKROCK ANNUAL REPORTTO SHAREHOLDERS |
Notes to Financial Statements
BlackRock FundsSMand BlackRock Funds IV (each, a “Trust” and collectively, the “Trusts”) are registered under the Investment Company Act of 1940, as amended (the “1940 Act”), asopen-end management investment companies. Each Trust is organized as a Massachusetts business trust. The following are referred to herein collectively as the “Funds”, or individually, a “Fund”:
| | | | | | |
| Registrant Name | | Fund Name | | Herein Referred To As | | Diversification
Classification |
BlackRock Funds | | BlackRock Emerging Markets Equity Strategies Fund | | Emerging Markets Equity Strategies | | Diversified |
| | iShares Short-Term TIPS Bond Index Fund | | Short-Term TIPS Bond Index | | Diversified |
| | | |
BlackRock Funds IV | | BlackRock Alternative Capital Strategies Fund | | Alternative Capital Strategies | | Diversified |
On November 28, 2018, the Board of BlackRock Funds IV approved a proposal to change the name of BlackRock Alternative Capital Strategies Fund to BlackRock Systematic Multi-Strategy Fund. This change is effective January 4, 2019.
Each Fund offers multiple classes of shares. All classes of shares have identical voting, dividend, liquidation and other rights and are subject to the same terms and conditions, except that certain classes bear expenses related to the shareholder servicing and distribution of such shares. Institutional and Class K Shares are sold without a sales charge and only to certain eligible investors. Investor A Shares are generally sold with an initial sales charge, and may be subject to a contingent deferred sales charge (“CDSC”) for certain redemptions where no initial sales charge was paid at the time of purchase. The sales charge does not apply to dividend and capital gain reinvestments by existing shareholders and new purchases for certain employer-sponsored retirement plans. Investor C Shares may be subject to a CDSC. Investor A and Investor C Shares bear certain expenses related to shareholder servicing of such shares, and Investor C Shares also bear certain expenses related to the distribution of such shares. Institutional and Class K Shares are sold only to certain eligible investors. Investor A and Investor C Shares are generally available through financial intermediaries. Effective November 8, 2018, the Funds adopted an automatic conversion feature whereby Investor C Shares held for approximately ten years will be automatically converted into Investor A Shares, and, thereafter, investors will be subject to lower ongoing fees. Each class has exclusive voting rights with respect to matters relating to its shareholder servicing and distribution expenditures (except that Investor C shareholders may vote on material changes to the Investor A distribution and service plans).
| | | | | | | | | | |
| Share Class | | Initial Sales Charge | | | CDSC | | | Conversion Privilege |
Institutional and Class K Shares | | | No | | | | No | | | None |
Investor A Shares | | | Yes | (a) | | | No | (a)(b) | | None |
Investor C Shares | | | No | | | | Yes | | | To Investor A Shares after approximately 10 years |
| | (a) | Not applicable for Short-Term TIPS Bond Index. | |
| | (b) | Investor A Shares of Emerging Markets Equity Strategies and Alternative Capital Strategies may be subject to a contingent deferred sales charge (“CDSC”) for certain redemptions where no initial sales charge was paid at the time of purchase. | |
The Funds, together with certain other registered investment companies advised by BlackRock Advisors, LLC (the “Manager”) or its affiliates, are included in a complex ofopen-end funds referred to as the Equity-Liquidity Complex.
Reorganization: The Board of Trustees of BlackRock Funds IV approved an Agreement and Plan of Reorganization with respect to BlackRock Alternative Capital Strategies Fund, a series of BlackRock FundsSM (the “Target Fund”), pursuant to which the Target Fund reorganized into Alternative Capital Strategies, a newly created series (the “Acquiring Fund”) of BlackRock Funds IV, a newly organized Massachusetts business trust. This reorganization (the “Reorganization”) closed on September 17, 2018 and was not subject to approval by shareholders of the Target Fund.
| | | | | | | | | | | | |
| Target Fund | | Target Fund’s Registrant | | | Acquiring Fund | | | Acquiring Fund’s Registrant | |
BlackRock Alternative Capital Strategies Fund | | | BlackRock FundsSM | | | | BlackRock Alternative Capital Strategies Fund | | | | BlackRock Funds IV | |
The Reorganization was affected in connection with a potential reconfiguration of the boards of directors/trustees of certain BlackRock-advised funds.
The Acquiring Fund has the same investment objective, strategies and policies, investment adviser,sub-adviser, portfolio management team and service providers as the Target Fund. The Target Fund is the performance and accounting survivor of the Reorganization, meaning that the Acquiring Fund assumed the performance and financial history of the Target Fund upon completion of the Reorganization. In addition, as a result of the Reorganization, the Acquiring Fund is subject to the same contractual arrangements, including the same contractual fees and expenses, as those of the Target Fund. The Reorganization wastax-free, meaning that the Target Fund’s shareholders became shareholders of the Acquiring Fund without realizing any gain or loss for federal income tax purposes.
As a result, the Acquiring Fund acquired all of the assets and assumed all of the liabilities of the Target Fund in exchange for an equal aggregate value of newly-issued shares of the Acquiring Fund. The shareholders of the Target Fund received shares of the Acquiring Fund in an amount equal to the aggregate net asset value (“NAV”) of such shareholder’s Target Fund shares, as determined at the close of business on September 14, 2018.
The Reorganization was accomplished by atax-free exchange of shares of the Acquiring Fund in the following amounts and at the following conversion ratio:
| | | | | | | | | | | | |
| Target Fund | | Shares Prior to Reorganization | | | Conversion Ratio | | | Shares Post- Reorganization | |
BlackRock Alternative Capital Strategies Fund | | | 3,242,148 | | | | 1 | | | | 3,242,148 | |
| | | | |
| NOTESTO FINANCIAL STATEMENTS | | | 55 | |
Notes to Financial Statements (continued)
For financial reporting purposes, assets received and shares issued by the Acquiring Fund were recorded at fair value. However, the cost basis of the investments received from the Target Fund was carried forward to align ongoing reporting of the Acquiring Fund’s realized and unrealized gains and losses with amounts distributable to shareholders for tax purposes.
Prior to the Reorganization, the Acquiring Fund had not yet commenced operations and had no assets or liabilities. The Target Fund’s net assets, fair value and cost of investments and derivative financial instruments prior to the Reorganization were as follows:
| | | | | | |
| Target Fund | | Net Assets | | Fair Value of Investments | | Cost of Investments |
BlackRock Alternative Capital Strategies Fund | | $31,020,824 | | $37,089,063 | | $37,028,870 |
Prior to the Reorganization’s effective date, the Target Fund began to incur expenses in connection with a potential realignment and consolidation of the boards of directors/trustees of certain BlackRock-advised funds. These expenses and liabilities have been assumed by the Acquiring Fund. The Manager has voluntarily agreed to reimburse certain Acquiring Funds for all or a portion of such expenses, which amounts are included in fees waived and/or reimbursed by the Manager in the Statements of Operations.
| 2. | SIGNIFICANT ACCOUNTING POLICIES |
The financial statements are prepared in conformity with accounting principles generally accepted in the United States of America (“U.S. GAAP”), which may require management to make estimates and assumptions that affect the reported amounts of assets and liabilities in the financial statements, disclosure of contingent assets and liabilities at the date of the financial statements and the reported amounts of increases and decreases in net assets from operations during the reporting period. Actual results could differ from those estimates. Each Fund is considered an investment company under U.S. GAAP and follows the accounting and reporting guidance applicable to investment companies. Below is a summary of significant accounting policies:
Investment Transactions and Income Recognition:For financial reporting purposes, investment transactions are recorded on the dates the transactions are entered into (the “trade dates”). Realized gains and losses on investment transactions are determined on the identified cost basis. Dividend income is recorded on theex-dividend date. Dividends from foreign securities where theex-dividend date may have passed are subsequently recorded when the Funds are informed of theex-dividend date. Under the applicable foreign tax laws, a withholding tax at various rates may be imposed on capital gains, dividends and interest. Upon notification from issuers, a portion of the dividend income received from a real estate investment trust may be redesignated as a reduction of cost of the related investment and/or realized gain. Interest income, including amortization and accretion of premiums and discounts on debt securities, is recognized on an accrual basis. Income, expenses and realized and unrealized gains and losses are allocated daily to each class based on its relative net assets.
Foreign Currency Translation:Each Fund’s books and records are maintained in U.S. dollars. Securities and other assets and liabilities denominated in foreign currencies are translated into U.S. dollars using exchange rates determined as of the close of trading on the New York Stock Exchange (“NYSE”). Purchases and sales of investments are recorded at the rates of exchange prevailing on the respective dates of such transactions. Generally, when the U.S. dollar rises in value against a foreign currency, the investments denominated in that currency will lose value; the opposite effect occurs if the U.S. dollar falls in relative value.
Each Fund does not isolate the portion of the results of operations arising as a result of changes in the exchange rates from the changes in the market prices of investments held or sold for financial reporting purposes. Accordingly, the effects of changes in exchange rates on investments are not segregated in the Statements of Operations from the effects of changes in market prices of those investments, but are included as a component of net realized and unrealized gain (loss) from investments. Each Fund reports realized currency gains (losses) on foreign currency related transactions as components of net realized gain (loss) for financial reporting purposes, whereas such components are generally treated as ordinary income for U.S. federal income tax purposes.
Segregation and Collateralization:In cases where a Fund enters into certain investments (e.g., dollar rolls,to-be-announced (“TBA”) sale commitments, futures contracts, forward foreign currency exchange contracts, options written and swaps) that would be treated as “senior securities” for 1940 Act purposes, a Fund may segregate or designate on itsbooks and records cash or liquid assets having a market value at least equal to the amount of its future obligations under such investments. Doing so allows the investment to be excluded from treatment as a “senior security.” Furthermore, if required by an exchange or counterparty agreement, the Funds may be required to deliver/deposit cash and/or securities to/with an exchange, or broker-dealer or custodian as collateral for certain investments or obligations.
Distributions: Distributions paid by the Funds are recorded on theex-dividend date. Alternative Capital Strategies will distribute net investment income, if any, at least quarterly. Emerging Markets Equity Strategies will distribute net investment income, if any, at least annually. Short-Term TIPS Bond will distribute net investment income, if any, at least monthly. Distributions of capital gains are recorded on theex-dividend date and made at least annually. The portion of distributions, if any, that exceeds a fund’s current and accumulated earnings and profits, as measured on a tax basis, constitute a non-taxable return of capital. The character and timing of distributions are determined in accordance with U.S. federal income tax regulations, which may differ from U.S. GAAP.
Recent Accounting Standards:In March 2017, the Financial Accounting Standards Board issued Accounting Standards Update “Premium Amortization of Purchased Callable Debt Securities” which amends the amortization period for certain purchased callable debt securities. Under the new guidance, the premium amortization of purchased callable debt securities that have explicit,non-contingent call features and are callable at fixed prices will be amortized to the earliest call date. The guidance will be applied on a modified retrospective basis and is effective for fiscal years, and their interim periods, beginning after December 15, 2018. Management is currently evaluating the impact of this guidance to the Funds.
In August 2018, the Financial Accounting Standards Board issued Accounting Standards Update2018-13 “Changes to the Disclosure Requirements for Fair Value Measurement” which modifies disclosure requirements for fair value measurements. The guidance is effective for fiscal years beginning after December 15, 2019 and for interim periods within those fiscal years. Management is currently evaluating the impact of this guidance to the Funds.
| | |
| 56 | | 2018 BLACKROCK ANNUAL REPORTTO SHAREHOLDERS |
Notes to Financial Statements (continued)
Indemnifications:In the normal course of business, a Fund enters into contracts that contain a variety of representations that provide general indemnification. A Fund’s maximum exposure under these arrangements is unknown because it involves future potential claims against a Fund, which cannot be predicted with any certainty.
Other: Expenses directly related to a Fund or its classes are charged to that Fund or the applicable class. Other operating expenses shared by several funds, including other funds managed by the Manager, are prorated among those funds on the basis of relative net assets or other appropriate methods. Expenses directly related to the Funds and other shared expenses prorated to the Funds are allocated daily to each class based on their relative net assets or other appropriate methods.
| 3. | INVESTMENT VALUATION AND FAIR VALUE MEASUREMENTS |
Investment Valuation Policies: The Funds’ investments are valued at fair value (also referred to as “market value” within the financial statements) as of the close of trading on the NYSE (generally 4:00 p.m., Eastern time). U.S. GAAP defines fair value as the price the Funds would receive to sell an asset or pay to transfer a liability in an orderly transaction between market participants at the measurement date. The Trusts determine the fair values of their financial instruments using various independent dealers or pricing services under policies approved by the Board of Trustees of each Trust (the “Board”). The BlackRock Global Valuation Methodologies Committee (the “Global Valuation Committee”) is the committee formed by management to develop global pricing policies and procedures and to oversee the pricing function for all financial instruments.
Fair Value Inputs and Methodologies: The following methods and inputs are used to establish the fair value of each Fund’s assets and liabilities:
| | • | | Equity investments traded on a recognized securities exchange are valued at the official closing price each day, if available. For equity investments traded on more than one exchange, the official closing price on the exchange where the stock is primarily traded is used. Equity investments traded on a recognized exchange for which there were no sales on that day may be valued at the last available bid (long positions) or ask (short positions) price. |
| | • | | Fixed-income securities for which market quotations are readily available are generally valued using the last available bid prices or current market quotations provided by independent dealers or third party pricing services. Floating rate loan interests are valued at the mean of the bid prices from one or more independent brokers or dealers as obtained from a third party pricing service. Pricing services generally value fixed-income securities assuming orderly transactions of an institutional round lot size, but a fund may hold or transact in such securities in smaller, odd lot sizes. Odd lots may trade at lower prices than institutional round lots. The pricing services may use matrix pricing or valuation models that utilize certain inputs and assumptions to derive values, including transaction data (e.g., recent representative bids and offers), credit quality information, perceived market movements, news, and other relevant information. Certain fixed-income securities, including asset-backed and mortgage related securities may be valued based on valuation models that consider the estimated cash flows of each tranche of the entity, establish a benchmark yield and develop an estimated tranche specific spread to the benchmark yield based on the unique attributes of the tranche. The amortized cost method of valuation may be used with respect to debt obligations with sixty days or less remaining to maturity unless the Manager determines such method does not represent fair value. |
| | | Generally, trading in foreign instruments is substantially completed each day at various times prior to the close of trading on the NYSE. Occasionally, events affecting the values of such instruments may occur between the foreign market close and the close of trading on the NYSE that may not be reflected in the computation of the Funds’ net assets. Each business day, the Funds use a pricing service to assist with the valuation of certain foreign exchange-traded equity securities and foreign exchange-tradedover-the-counter (“OTC”) options (the “Systematic Fair Value Price”). Using current market factors, the Systematic Fair Value Price is designed to value such foreign securities and foreign options at fair value as of the close of trading on the NYSE, which follows the close of the local markets. |
| | • | | Investments inopen-end U.S. mutual funds are valued at NAV each business day. |
| | • | | Futures contracts traded on exchanges are valued at their last sale price. |
| | • | | Forward foreign currency exchange contracts are valued at the mean between the bid and ask prices and are determined as of the close of trading on the NYSE. Interpolated values are derived when the settlement date of the contract is an interim date for which quotations are not available. |
| | • | | Exchange-traded options are valued at the mean between the last bid and ask prices at the close of the options market in which the options trade. An exchange-traded option for which there is no mean price is valued at the last bid (long positions) or ask (short positions) price. If no bid or ask price is available, the prior day’s price will be used, unless it is determined that the prior day’s price no longer reflects the fair value of the option. OTC options are valued by an independent pricing service using a mathematical model, which incorporates a number of market data factors, such as the trades and prices of the underlying instruments. |
| | • | | Swap agreements are valued utilizing quotes received daily by the Funds’ pricing service or through brokers, which are derived using daily swap curves and models that incorporate a number of market data factors, such as discounted cash flows, trades and values of the underlying reference instruments. |
| | • | | TBA commitments are valued on the basis of last available bid prices or current market quotations provided by pricing services. |
The pricing of all Fair Valued Investments is subsequently reported to the Board or a committee thereof on a quarterly basis.
If events (e.g., a company announcement, market volatility or a natural disaster) occur that are expected to materially affect the value of such investments, or in the event that the application of these methods of valuation results in a price for an investment that is deemed not to be representative of the market value of such investment, or if a price is not available, the investment will be valued by the Global Valuation Committee, or its delegate, in accordance with a policy approved by the Board as reflecting fair value (“Fair Valued Investments”). The fair valuation approaches that may be used by the Global Valuation Committee will include market approach, income approach and cost approach. Valuation techniques such as discounted cash flow, use of market comparables and matrix pricing are types of valuation approaches and are typically used in determining fair value. When determining the price for Fair Valued Investments, the Global Valuation Committee, or its delegate, seeks to determine the price that each Fund might reasonably expect to receive or pay from the current sale or purchase of that asset or liability in anarm’s-length transaction. Fair value determinations shall be based upon all available factors that the Global Valuation Committee, or its delegate, deems relevant and consistent with the principles of fair value measurement.
| | | | |
| NOTESTO FINANCIAL STATEMENTS | | | 57 | |
Notes to Financial Statements (continued)
The Global Valuation Committee, or its delegate, employs various methods for calibrating valuation approaches for investments where an active market does not exist, including regular due diligence of each Fund’s pricing vendors, regular reviews of key inputs and assumptions, transactional back-testing or disposition analysis to compare unrealized gains and losses to realized gains and losses, reviews of missing or stale prices and large movements in market values and reviews of any market related activity. The pricing of all Fair Valued Investments is subsequently reported to the Board or a committee thereof on a quarterly basis. As a result of the inherent uncertainty in valuation of these investments, the fair values may differ from the values that would have been used had an active market existed.
For investments in equity or debt issued by privately held companies or funds (“Private Company” or collectively, the “Private Companies”) and other Fair Valued Investments, the fair valuation approaches that are used by third party pricing services utilize one or a combination of, but not limited to, the following inputs.
| | |
| | | Standard Inputs Generally Considered By Third Party Pricing Services |
Market approach | | (i) recent market transactions, including subsequent rounds of financing, in the underlying investment or comparable issuers; (ii) recapitalizations and other transactions across the capital structure; and (iii) market multiples of comparable issuers. |
Income approach | | (i) future cash flows discounted to present and adjusted as appropriate for liquidity, credit, and/or market risks; (ii) quoted prices for similar investments or assets in active markets; and (iii) other risk factors, such as interest rates, yield curves, volatilities, prepayment speeds, loss severities, credit risks, recovery rates, liquidation amounts and/or default rates. |
Cost approach | | (i) audited or unaudited financial statements, investor communications and financial or operational metrics issued by the Private Company; (ii) changes in the valuation of relevant indices or publicly traded companies comparable to the Private Company; (iii) relevant news and other public sources; and (iv) known secondary market transactions in the Private Company’s interests and merger or acquisition activity in companies comparable to the Private Company. |
Investments in series of preferred stock issued by Private Companies are typically valued utilizing market approach in determining the enterprise value of the company. Such investments often contain rights and preferences that differ from other series of preferred and common stock of the same issuer. Valuation techniques such as an option pricing model (“OPM”), a probability weighted expected return model (“PWERM”) or a hybrid of those techniques are used in allocating enterprise value of the company, as deemed appropriate under the circumstances. The use of OPM and PWERM techniques involve a determination of the exit scenarios of the investment in order to appropriately allocate the enterprise value of the company among the various parts of its capital structure.
The Private Companies are not subject to the public company disclosure, timing, and reporting standards as other investments held by a Fund. Typically, the most recently available information by a Private Company is as of a date that is earlier than the date a Fund is calculating its NAV. This factor may result in a difference between the value of the investment and the price a Fund could receive upon the sale of the investment.
Fair Value Hierarchy: Various inputs are used in determining the fair value of investments and derivative financial instruments. These inputs to valuation techniques are categorized into a fair value hierarchy consisting of three broad levels for financial statement purposes as follows:
| | • | | Level 1 — Unadjusted price quotations in active markets/exchanges for identical assets or liabilities that each Fund has the ability to access |
| | • | | Level 2 — Other observable inputs (including, but not limited to, quoted prices for similar assets or liabilities in markets that are active, quoted prices for identical or similar assets or liabilities in markets that are not active, inputs other than quoted prices that are observable for the assets or liabilities (such as interest rates, yield curves, volatilities, prepayment speeds, loss severities, credit risks and default rates) or other market–corroborated inputs) |
| | • | | Level 3 — Unobservable inputs based on the best information available in the circumstances, to the extent observable inputs are not available (including each Fund’s own assumptions used in determining the fair value of investments and derivative financial instruments) |
The hierarchy gives the highest priority to unadjusted quoted prices in active markets for identical assets or liabilities (Level 1 measurements) and the lowest priority to unobservable inputs (Level 3 measurements). Accordingly, the degree of judgment exercised in determining fair value is greatest for instruments categorized in Level 3. The inputs used to measure fair value may fall into different levels of the fair value hierarchy. In such cases, for disclosure purposes, the fair value hierarchy classification is determined based on the lowest level input that is significant to the fair value measurement in its entirety. Investments classified within Level 3 have significant unobservable inputs used by the Global Valuation Committee in determining the price for Fair Valued Investments. Level 3 investments include equity or debt issued by Private Companies. There may not be a secondary market, and/or there are a limited number of investors. Level 3 investments may also be adjusted to reflect illiquidity and/ornon-transferability, with the amount of such discount estimated by the Global Valuation Committee in the absence of market information.
Changes in valuation techniques may result in transfers into or out of an assigned level within the hierarchy. In accordance with each Fund’s policy, transfers between different levels of the fair value hierarchy are deemed to have occurred as of the beginning of the reporting period. The categorization of a value determined for investments and derivative financial instruments is based on the pricing transparency of the investments and derivative financial instruments and is not necessarily an indication of the risks associated with investing in those securities.
| 4. | SECURITIES AND OTHER INVESTMENTS |
Asset-Backed and Mortgage-Backed Securities:Asset-backed securities are generally issued as pass-through certificates or as debt instruments. Asset-backed securities issued as pass-through certificates represent undivided fractional ownership interests in an underlying pool of assets. Asset-backed securities issued as debt instruments, which are also known as collateralized obligations, are typically issued as the debt of a special purpose entity organized solely for the purpose of owning such assets and issuing such debt. Asset-backed securities are often backed by a pool of assets representing the obligations of a number of different parties. The yield
| | |
| 58 | | 2018 BLACKROCK ANNUAL REPORTTO SHAREHOLDERS |
Notes to Financial Statements (continued)
characteristics of certain asset-backed securities may differ from traditional debt securities. One such major difference is that all or a principal part of the obligations may be prepaid at any time because the underlying assets (i.e., loans) may be prepaid at any time. As a result, a decrease in interest rates in the market may result in increases in the level of prepayments as borrowers, particularly mortgagors, refinance and repay their loans. An increased prepayment rate with respect to an asset-backed security will have the effect of shortening the maturity of the security. In addition, a fund may subsequently have to reinvest the proceeds at lower interest rates. If a fund has purchased such an asset-backed security at a premium, a faster than anticipated prepayment rate could result in a loss of principal to the extent of the premium paid.
For mortgage pass-through securities (the “Mortgage Assets”) there are a number of important differences among the agencies and instrumentalities of the U.S. Government that issue mortgage-related securities and among the securities that they issue. For example, mortgage-related securities guaranteed by Ginnie Mae are guaranteed as to the timely payment of principal and interest by Ginnie Mae and such guarantee is backed by the full faith and credit of the United States. However, mortgage-related securities issued by Freddie Mac and Fannie Mae, including Freddie Mac and Fannie Mae guaranteed mortgage pass-through certificates, which are solely the obligations of Freddie Mac and Fannie Mae, are not backed by or entitled to the full faith and credit of the United States, but are supported by the right of the issuer to borrow from the U.S. Treasury.
Non-agency mortgage-backed securities are securities issued bynon-governmental issuers and have no direct or indirect government guarantees of payment and are subject to various risks.Non-agency mortgage loans are obligations of the borrowers thereunder only and are not typically insured or guaranteed by any other person or entity. The ability of a borrower to repay a loan is dependent upon the income or assets of the borrower. A number of factors, including a general economic downturn, acts of God, terrorism, social unrest and civil disturbances, may impair a borrower’s ability to repay its loans.
Inflation-Indexed Bonds: Inflation-indexed bonds (other than municipal inflation-indexed and certain corporate inflation-indexed bonds) are fixed-income securities whose principal value is periodically adjusted according to the rate of inflation. If the index measuring inflation rises or falls, the principal value of inflation-indexed bonds (other than municipal inflation-indexed and certain corporate inflation-indexed bonds) will be adjusted upward or downward, and consequently the interest payable on these securities (calculated with respect to a larger or smaller principal amount) will be increased or reduced, respectively. Any upward or downward adjustment in the principal amount of an inflation-indexed bond will be included as interest income in the Statements of Operations, even though investors do not receive their principal until maturity. Repayment of the original bond principal upon maturity (as adjusted for inflation) is guaranteed in the case of U.S. Treasury inflation-indexed bonds. For bonds that do not provide a similar guarantee, the adjusted principal value of the bond repaid at maturity may be less than the original principal. With regard to municipal inflation-indexed bonds and certain corporate inflation-indexed bonds, the inflation adjustment is typically reflected in the semi-annual coupon payment. As a result, the principal value of municipal inflation-indexed bonds and such corporate inflation-indexed bonds does not adjust according to the rate of inflation.
Multiple Class Pass-Through Securities: Multiple class pass-through securities, including collateralized mortgage obligations (“CMOs”) and commercial mortgage-backed securities, may be issued by Ginnie Mae, U.S. Government agencies or instrumentalities or by trusts formed by private originators of, or investors in, mortgage loans. In general, CMOs are debt obligations of a legal entity that are collateralized by a pool of residential or commercial mortgage loans or Mortgage Assets. The payments on these are used to make payments on the CMOs or multiple pass-through securities. Multiple class pass-through securities represent direct ownership interests in the Mortgage Assets. Classes of CMOs include interest only (“IOs”), principal only (“POs”), planned amortization classes and targeted amortization classes. IOs and POs are stripped mortgage-backed securities representing interests in a pool of mortgages, the cash flow from which has been separated into interest and principal components. IOs receive the interest portion of the cash flow while POs receive the principal portion. IOs and POs can be extremely volatile in response to changes in interest rates. As interest rates rise and fall, the value of IOs tends to move in the same direction as interest rates. POs perform best when prepayments on the underlying mortgages rise since this increases the rate at which the principal is returned and the yield to maturity on the PO. When payments on mortgages underlying a PO are slower than anticipated, the life of the PO is lengthened and the yield to maturity is reduced. If the underlying Mortgage Assets experience greater than anticipated prepayments of principal, a Fund’s initial investment in the IOs may not fully recoup.
Warrants:Warrants entitle a fund to purchase a specified number of shares of common stock and arenon-income producing. The purchase price and number of shares are subject to adjustment under certain conditions until the expiration date of the warrants, if any. If the price of the underlying stock does not rise above the strike price before the warrant expires, the warrant generally expires without any value and a Fund will lose any amount it paid for the warrant. Thus, investments in warrants may involve more risk than investments in common stock. Warrants may trade in the same markets as their underlying stock; however, the price of the warrant does not necessarily move with the price of the underlying stock.
TBA Commitments:TBA commitments are forward agreements for the purchase or sale of mortgage-backed securities for a fixed price, with payment and delivery on an agreed upon future settlement date. The specific securities to be delivered are not identified at the trade date. However, delivered securities must meet specified terms, including issuer, rate and mortgage terms. When entering into TBA commitments, a fund may take possession of or deliver the underlying mortgage-backed securities but can extend the settlement or roll the transaction. TBA commitments involve a risk of loss if the value of the security to be purchased or sold declines or increases, respectively, prior to settlement date.
In order to better define contractual rights and to secure rights that will help a fund mitigate their counterparty risk, TBA commitments may be entered into by a fund under Master Securities Forward Transaction Agreements (each, an “MSFTA”). An MSFTA typically contains, among other things, collateral posting terms and netting provisions in the event of default and/or termination event. The collateral requirements are typically calculated by netting themark-to-market amount for each transaction under such agreement and comparing that amount to the value of the collateral currently pledged by a fund and the counterparty. Cash collateral that has been pledged to cover the obligations of a fund and cash collateral received from the counterparty, if any, is reported separately on the Statements of Assets and Liabilities as cash pledged as collateral for TBA commitments or cash received as collateral for TBA commitments, respectively.Non-cash collateral pledged by a fund, if any, is noted in the Schedules of Investments. Typically, a fund is permitted to sell,re-pledge or use the collateral it receives; however, the counterparty is not permitted to do so. To the extent amounts due to a fund are not fully collateralized, contractually or otherwise, a fund bears the risk of loss from counterpartynon-performance.
Mortgage Dollar Roll Transactions: Certain Funds may sell TBA mortgage-backed securities and simultaneously contract to repurchase substantially similar (i.e., same type, coupon and maturity) securities on a specific future date at an agreed upon price. During the period between the sale and repurchase, a fund is not entitled to receive interest and principal payments on the securities sold. Mortgage dollar roll transactions are treated as purchases and sales and realize gains and losses on these
| | | | |
| NOTESTO FINANCIAL STATEMENTS | | | 59 | |
Notes to Financial Statements (continued)
transactions. Mortgage dollar rolls involve the risk that the market value of the securities that a fund is required to purchase may decline below the agreed upon repurchase price of those securities.
| 5. | DERIVATIVE FINANCIAL INSTRUMENTS |
The Funds engage in various portfolio investment strategies using derivative contracts both to increase the returns of the Funds and/or to manage their exposure to certain risks such as credit risk, equity risk, interest rate risk, foreign currency exchange rate risk, commodity price risk or other risks (e.g., inflation risk). Derivative financial instruments categorized by risk exposure are included in the Schedules of Investments. These contracts may be transacted on an exchange or OTC.
Futures Contracts:Futures contracts are purchased or sold to gain exposure to, or manage exposure to, changes in interest rates (interest rate risk), and changes in the value of equity securities (equity risk) or foreign currencies (foreign currency exchange rate risk).
Futures contracts are agreements between the Funds and a counterparty to buy or sell a specific quantity of an underlying instrument at a specified price and on a specified date. Depending on the terms of a contract, it is settled either through physical delivery of the underlying instrument on the settlement date or by payment of a cash amount on the settlement date. Upon entering into a futures contract, the Funds are required to deposit initial margin with the broker in the form of cash or securities in an amount that varies depending on a contract’s size and risk profile. The initial margin deposit must then be maintained at an established level over the life of the contract. Amounts pledged, which are considered restricted, are included in cash pledged for futures contracts in the Statements of Assets and Liabilities.
Securities deposited as initial margin are designated in the Schedules of Investments and cash deposited, if any, is shown as cash pledged for futures contracts in the Statements of Assets and Liabilities. Pursuant to the contract, the Funds agree to receive from or pay to the broker an amount of cash equal to the daily fluctuation in market value of the contract (“variation margin”). Variation margin is recorded as unrealized appreciation (depreciation) and, if any, shown as variation margin receivable (or payable) on futures contracts in the Statements of Assets and Liabilities. When the contract is closed, a realized gain or loss is recorded in the Statements of Operations equal to the difference between the notional amount of the contract at the time it was opened and the notional amount at the time it was closed. The use of futures contracts involves the risk of an imperfect correlation in the movements in the price of futures contracts and interest, foreign currency exchange rates or underlying assets.
Forward Foreign Currency Exchange Contracts: Forward foreign currency exchange contracts are entered into to gain or reduce exposure to foreign currencies (foreign currency exchange rate risk).
A forward foreign currency exchange contract is an agreement between two parties to buy and sell a currency at a set exchange rate on a specified date. These contracts help to manage the overall exposure to the currencies in which some of the investments held by the Funds are denominated and in some cases, may be used to obtain exposure to a particular market.
The contract ismarked-to-market daily and the change in market value is recorded as unrealized appreciation (depreciation) in the Statements of Assets and Liabilities. When a contract is closed, a realized gain or loss is recorded in the Statements of Operations equal to the difference between the value at the time it was opened and the value at the time it was closed.Non-deliverable forward foreign currency exchange contracts are settled with the counterparty in cash without the delivery of foreign currency. The use of forward foreign currency exchange contracts involves the risk that the value of a forward foreign currency exchange contract changes unfavorably due to movements in the value of the referenced foreign currencies. Cash amounts pledged for forward foreign currency exchange contracts are considered restricted and are included in cash pledged as collateral for OTC derivatives in the Statements of Assets and Liabilities.
Options:Certain Funds purchase and write call and put options to increase or decrease their exposure to the risks of underlying instruments, including equity risk, interest rate risk and/or commodity price risk and/or, in the case of options written, to generate gains from options premiums.
A call option gives the purchaser (holder) of the option the right (but not the obligation) to buy, and obligates the seller (writer) to sell (when the option is exercised) the underlying instrument at the exercise or strike price at any time or at a specified time during the option period. A put option gives the holder the right to sell and obligates the writer to buy the underlying instrument at the exercise or strike price at any time or at a specified time during the option period.
Premiums paid on options purchased and premiums received on options written, as well as the daily fluctuation in market value, are included in investments at value — unaffiliated and options written at value, respectively, in the Statements of Assets and Liabilities. When an instrument is purchased or sold through the exercise of an option, the premium is offset against the cost or proceeds of the underlying instrument. When an option expires, a realized gain or loss is recorded in the Statements of Operations to the extent of the premiums received or paid. When an option is closed or sold, a gain or loss is recorded in the Statements of Operations to the extent the cost of the closing transaction exceeds the premiums received or paid. When the Funds write a call option, such option is typically “covered,” meaning that they hold the underlying instrument subject to being called by the option counterparty. When the Funds write a put option, such option is covered by cash in an amount sufficient to cover the obligation. These amounts, which are considered restricted, are included in cash pledged as collateral for options written in the Statements of Assets and Liabilities.
In purchasing and writing options, the Funds bear the risk of an unfavorable change in the value of the underlying instrument or the risk that they may not be able to enter into a closing transaction due to an illiquid market. Exercise of a written option could result in the Funds purchasing or selling a security when it otherwise would not, or at a price different from the current market value.
Swaps:Swap contracts are entered into to manage exposure to issuers, markets and securities. Such contracts are agreements between the Funds and a counterparty to make periodic net payments on a specified notional amount or a net payment upon termination. Swap agreements are privately negotiated in the OTC market and may be entered into as a bilateral contract (“OTC swaps”) or centrally cleared (“centrally cleared swaps”).
For OTC swaps, any upfront premiums paid and any upfront fees received are shown as swap premiums paid and swap premiums received, respectively, in the Statements of Assets and Liabilities and amortized over the term of the contract. The daily fluctuation in market value is recorded as unrealized appreciation (depreciation)
| | |
| 60 | | 2018 BLACKROCK ANNUAL REPORTTO SHAREHOLDERS |
Notes to Financial Statements (continued)
on OTC Swaps in the Statements of Assets and Liabilities. Payments received or paid are recorded in the Statements of Operations as realized gains or losses, respectively. When an OTC swap is terminated, a realized gain or loss is recorded in the Statements of Operations equal to the difference between the proceeds from (or cost of) the closing transaction and the Funds’ basis in the contract, if any. Generally, the basis of the contract is the premium received or paid.
In a centrally cleared swap, immediately following execution of the swap contract, the swap contract is novated to a central counterparty (the “CCP”) and the Funds’ counterparty on the swap agreement becomes the CCP. The Funds are required to interface with the CCP through the broker. Upon entering into a centrally cleared swap, the Funds are required to deposit initial margin with the broker in the form of cash or securities in an amount that varies depending on the size and risk profile of the particular swap. Securities deposited as initial margin are designated in the Schedules of Investments and cash deposited is shown as cash pledged for centrally cleared swaps in the Statements of Assets and Liabilities. Amounts pledged, which are considered restricted cash, are included in cash pledged for centrally cleared swaps in the Statements of Assets and Liabilities. Pursuant to the contract, the Funds agree to receive from or pay to the broker an amount of cash equal to the daily fluctuation in market value of the contract (“variation margin”). Variation margin is recorded as unrealized appreciation (depreciation) and shown as variation margin receivable (or payable) on centrally cleared swaps in the Statements of Assets and Liabilities. Payments received from (paid to) the counterparty, including at termination, are recorded as realized gains (losses) in the Statements of Operations.
| | • | | Credit default swaps — Credit default swaps are entered into to manage exposure to the market or certain sectors of the market, to reduce risk exposure to defaults of corporate and/or sovereign issuers or to create exposure to corporate and/or sovereign issuers to which a fund is not otherwise exposed (credit risk). |
| | | The Funds may either buy or sell (write) credit default swaps on single-name issuers (corporate or sovereign), a combination or basket of single-name issuers or traded indexes. Credit default swaps are agreements in which the protection buyer pays fixed periodic payments to the seller in consideration for a promise from the protection seller to make a specific payment should a negative credit event take place with respect to the referenced entity (e.g., bankruptcy, failure to pay, obligation acceleration, repudiation, moratorium or restructuring). As a buyer, if an underlying credit event occurs, the Funds will either (i) receive from the seller an amount equal to the notional amount of the swap and deliver the referenced security or underlying securities comprising the index, or (ii) receive a net settlement of cash equal to the notional amount of the swap less the recovery value of the security or underlying securities comprising the index. As a seller (writer), if an underlying credit event occurs, the Funds will either pay the buyer an amount equal to the notional amount of the swap and take delivery of the referenced security or underlying securities comprising the index or pay a net settlement of cash equal to the notional amount of the swap less the recovery value of the security or underlying securities comprising the index. |
| | • | | Total return swaps — Total return swaps are entered into to obtain exposure to a security or market without owning such security or investing directly in such market or to exchange the risk/return of one market (e.g., fixed-income) with another market (e.g., equity or commodity prices) (equity risk, commodity price risk and/or interest rate risk). |
| | | Total return swaps are agreements in which there is an exchange of cash flows whereby one party commits to make payments based on the total return (distributions plus capital gains/losses) of an underlying instrument, or basket or underlying instruments, in exchange for fixed or floating rate interest payments. If the total return of the instrument(s) or index underlying the transaction exceeds or falls short of the offsetting fixed or floating interest rate obligation, the Funds receive payment from or make a payment to the counterparty. |
| | | Certain total return swaps are designed to function as a portfolio of direct investments in long and short equity positions. This means that each Fund has the ability to trade in and out of these long and short positions within the swap and will receive the economic benefits and risks equivalent to direct investment in these positions, subject to certain adjustments due to events related to the counterparty. Benefits and risks include capital appreciation (depreciation), corporate actions and dividends received and paid, all of which are reflected in the swap’s market value. The market value also includes interest charges and credits (“financing fees”) related to the notional values of the long and short positions and cash balances within the swap. These interest charges and credits are based on a specified benchmark rate plus or minus a specified spread determined based upon the country and/or currency of the positions in the portfolio. |
| | | Positions within the swap and financing fees are reset periodically. During a reset, any unrealized appreciation (depreciation) on positions and accrued financing fees become available for cash settlement between the Funds and the counterparty. The amounts that are available for cash settlement are recorded as realized gains or losses in the Statements of Operations. Cash settlement in and out of the swap may occur at a reset date or any other date, at the discretion of the Funds and the counterparty, over the life of the agreement. Certain swaps have no stated expiration and can be terminated by either party at any time. |
| | • | | Interest rate swaps — Interest rate swaps are entered into to gain or reduce exposure to interest rates or to manage duration, the yield curve or interest rate (interest rate risk). |
| | | Interest rate swaps are agreements in which one party pays a stream of interest payments, either fixed or floating, in exchange for another party’s stream of interest payments, either fixed or floating, on the same notional amount for a specified period of time. In more complex interest rate swaps, the notional principal amount may decline (or amortize) over time. |
Swap transactions involve, to varying degrees, elements of interest rate, credit and market risk in excess of the amounts recognized in the Statements of Assets and Liabilities. Such risks involve the possibility that there will be no liquid market for these agreements, that the counterparty to the agreements may default on its obligation to perform or disagree as to the meaning of the contractual terms in the agreements, and that there may be unfavorable changes in interest rates and/or market values associated with these transactions.
Master Netting Arrangements: In order to define their contractual rights and to secure rights that will help them mitigate their counterparty risk, the Funds may enter into an International Swaps and Derivatives Association, Inc. Master Agreement (“ISDA Master Agreement”) or similar agreement with their counterparties. An ISDA Master Agreement is a bilateral agreement between each Fund and a counterparty that governs certain OTC derivatives and typically contains, among other things, collateral posting terms and netting provisions in the event of a default and/or termination event. Under an ISDA Master Agreement, each Fund may, under certain circumstances, offset with the counterparty certain derivative financial instruments’ payables and/or receivables with collateral held and/or posted and create one single net payment. The
| | | | |
| NOTESTO FINANCIAL STATEMENTS | | | 61 | |
Notes to Financial Statements (continued)
provisions of the ISDA Master Agreement typically permit a single net payment in the event of default including the bankruptcy or insolvency of the counterparty. Bankruptcy or insolvency laws of a particular jurisdiction may restrict or prohibit the right of offset in bankruptcy, insolvency or other events.
Collateral Requirements: For derivatives traded under an ISDA Master Agreement, the collateral requirements are typically calculated by netting themark-to-market amount for each transaction under such agreement and comparing that amount to the value of any collateral currently pledged by the Fund and the counterparty.
Cash collateral that has been pledged to cover obligations of the Funds and cash collateral received from the counterparty, if any, is reported separately on the Statements of Assets and Liabilities as cash pledged as collateral and cash received as collateral, respectively.Non-cash collateral pledged by the Funds, if any, is noted in the Schedules of Investments. Generally, the amount of collateral due from or to a counterparty is subject to a certain minimum transfer amount threshold before a transfer is required, which is determined at the close of business of the Funds. Any additional required collateral is delivered to/pledged by the Funds on the next business day. Typically, the counterparty is not permitted to sell,re-pledge or use cash andnon-cash collateral it receives. A Fund generally agrees not to usenon-cash collateral that it receives but may, absent default or certain other circumstances defined in the underlying ISDA Master Agreement, be permitted to use cash collateral received. In such cases, interest may be paid pursuant to the collateral arrangement with the counterparty. To the extent amounts due to the Funds from their counterparties are not fully collateralized, they bear the risk of loss from counterpartynon-performance. Likewise, to the extent the Funds have delivered collateral to a counterparty and stand ready to perform under the terms of their agreement with such counterparty, they bear the risk of loss from a counterparty in the amount of the value of the collateral in the event the counterparty fails to return such collateral. Based on the terms of agreements, collateral may not be required for all derivative contracts.
For financial reporting purposes, the Funds do not offset derivative assets and derivative liabilities that are subject to netting arrangements, if any, in the Statements of Assets and Liabilities.
| 6. | INVESTMENT ADVISORY AGREEMENT AND OTHER TRANSACTIONS WITH AFFILIATES |
Investment Advisory: Each Trust, on behalf of the Funds, entered into an Investment Advisory Agreement with the Manager, the Funds’ investment adviser, and an indirect, wholly-owned subsidiary of BlackRock, to provide investment advisory services. The Manager is responsible for the management of each Fund’s portfolio and provides the personnel, facilities, equipment and certain other services necessary to the operations of each Fund.
For such services, Emerging Markets Equity Strategies and Alternative Capital Strategies pay the Manager a monthly fee at an annual rate equal to the following percentages of the average daily value of each Fund’s net assets as follows:
| | | | | | | | |
| Average Daily Net Assets | | Emerging Markets Equity Strategies | | | Alternative Capital Strategies | |
First $1 Billion | | | 1.00 | % | | | 0.80 | % |
$1 Billion — $3 Billion | | | 0.94 | | | | 0.75 | |
$3 Billion — $5 Billion | | | 0.90 | | | | 0.72 | |
$5 Billion — $10 Billion | | | 0.87 | | | | 0.70 | |
Greater than $10 Billion | | | 0.85 | | | | 0.68 | |
Short-Term TIPS Bond Index pays the Manager a monthly fee at an annual rate of 0.01% of the Fund’s average daily net assets.
With respect to Emerging Markets Equity Strategies and Alternative Capital Strategies, the Manager entered into separatesub-advisory agreements with BlackRock International Limited (“BIL”), an affiliate of the Manager. With respect to Emerging Markets Equity Strategies, the Manager also entered into a separatesub-advisory agreement with BlackRock Asset Management North Asia Limited (“BAMNAL”), an affiliate of the Manager. With respect to Short-Term TIPS Bond Index, the Manager entered into a separatesub-advisory agreement with BlackRock Fund Advisors (“BFA”), an affiliate of the Manager. The Manager pays BIL, BFA and BAMNAL, for services they provide, a monthly fee that is equal to a percentage of the investment advisory fees paid by each Fund to the Manager.
Service and Distribution Fees:The Trust, on behalf of the Funds, entered into a Distribution Agreement and a Distribution and Service Plan with BlackRock Investments, LLC (“BRIL”), an affiliate of the Manager. Pursuant to the Distribution and Service Plan and in accordance with Rule12b-1 under the 1940 Act, each Fund pays BRIL ongoing service and distribution fees. The fees are accrued daily and paid monthly at annual rates based upon the average daily net assets of the relevant share class of each Fund as follows:
| | | | | | | | |
| | | Service Fees | | | Distribution Fees | |
Investor A | | | 0.25 | % | | | — | % |
Investor C(a) | | | 0.25 | | | | 0.75 | |
| | (a) | Emerging Markets Equity Strategies and Alternative Capital Strategies only. | |
BRIL and broker-dealers, pursuant tosub-agreements with BRIL, provide shareholder servicing and distribution services to the Funds. The ongoing service and/or distribution fee compensates BRIL and each broker-dealer for providing shareholder servicing and/or distribution related services to shareholders.
For the year ended December 31, 2018, the following table shows the class specific service and distribution fees borne directly by each share class of each Fund:
| | | | | | | | | | | | |
| Service and Distribution Fees | | Investor A | | | Investor C | | | Total | |
Emerging Markets Equity Strategies | | $ | 822 | | | $ | 1,053 | | | $ | 1,875 | |
Short-Term TIPS Bond Index | | | 865 | | | | N/A | | | | 865 | |
Alternative Capital Strategies | | | 4,260 | | | | 686 | | | | 4,946 | |
Administration:The Trust, on behalf of Emerging Markets Equity Strategies and Alternative Capital Strategies, entered into an Administration Agreement with the Manager, an indirect, wholly-owned subsidiary of BlackRock, to provide administrative services. For these services, the Manager receives an administration fee computed
| | |
| 62 | | 2018 BLACKROCK ANNUAL REPORTTO SHAREHOLDERS |
Notes to Financial Statements (continued)
daily and payable monthly, based on a percentage of the average daily net assets of each Fund. The administration fee, which is shown as administration in the Statements of Operations, is paid at the annual rates below.
| | | | |
| Average Daily Net Assets | | Administration Fee | |
First $500 Million | | | 0.0425 | % |
$500 Million — $1 Billion | | | 0.0400 | |
$1 Billion — $2 Billion | | | 0.0375 | |
$2 Billion — $4 Billion | | | 0.0350 | |
$4 Billion — $13 Billion | | | 0.0325 | |
Greater than $13 Billion | | | 0.0300 | |
In addition, for Emerging Markets Equity Strategies and Alternative Capital Strategies, the Manager charges each of the share classes an administration fee, which is shown as administration — class specific in the Statements of Operations, at an annual rate of 0.02% of the average daily net assets of each respective class.
For the year ended December 31, 2018, the following table shows the class specific administration fees borne directly by each share class of Emerging Markets Equity Strategies and Alternative Capital Strategies:
| | | | | | | | | | | | | | | | | | | | |
| Administration Fees | | Institutional | | | Investor A | | | Investor C | | | Class K | | | Total | |
Emerging Markets Equity Strategies | | $ | 3,509 | | | $ | 66 | | | $ | 21 | | | $ | 1,496 | | | $ | 5,092 | |
Alternative Capital Strategies | | | 5,767 | | | | 341 | | | | 14 | | | | N/A | | | | 6,122 | |
Transfer Agent: Pursuant to written agreements, certain financial intermediaries, some of which may be affiliates, provide the Funds withsub-accounting, recordkeeping,sub-transfer agency and other administrative services with respect tosub-accounts they service. For these services, these entities receive an asset-based fee or an annual fee per shareholder account, which will vary depending on share class and/or net assets.
The Manager maintains a call center that is responsible for providing certain shareholder services to the Funds. Shareholder services include responding to inquiries and processing purchases and sales based upon instructions from shareholders. For the year ended December 31, 2018, each Fund reimbursed the Manager the following amounts for costs incurred in running the call center, which are included in transfer agent — class specific in the Statements of Operations:
| | | | | | | | | | | | | | | | | | | | |
| | | Institutional | | | Investor A | | | Investor C | | | Class K | | | Total | |
Emerging Markets Equity Strategies | | $ | 192 | | | $ | 47 | | | $ | 32 | | | $ | 32 | | | $ | 303 | |
Short-Term TIPS Bond Index | | | 66 | | | | 239 | | | | N/A | | | | 76 | | | | 381 | |
Alternative Capital Strategies | | | 235 | | | | 44 | | | | 9 | | | | N/A | | | | 288 | |
For the year ended December 31, 2018, the following table shows the class specific transfer agent fees borne directly by each share class of each Fund:
| | | | | | | | | | | | | | | | | | | | |
| | | Institutional | | | Investor A | | | Investor C | | | Class K | | | Total | |
Emerging Markets Equity Strategies | | $ | 788 | | | $ | 468 | | | $ | 127 | | | $ | 32 | | | $ | 1,415 | |
Short-Term TIPS Bond Index | | | 1,428 | | | | 1,167 | | | | N/A | | | | 824 | | | | 3,419 | |
Alternative Capital Strategies | | | 3,068 | | | | 2,528 | | | | 113 | | | | N/A | | | | 5,709 | |
Other Fees: For the year ended December 31, 2018, affiliates earned underwriting discounts, direct commissions and dealer concessions on sales of each Fund’s Investor A Shares as follows:
| | | | |
| | | Alternative
Capital Strategies | |
Investor A | | $ | 45 | |
Expense Limitations, Waivers and Recoupments:With respect to each Fund, the Manager voluntarily agreed to waive its investment advisory fees by the amount of investment advisory fees each Fund pays to the Manager indirectly through its investment in affiliated money market funds (the “affiliated money market fund waiver”). The amount of waivers and/or reimbursements of fees and expenses made pursuant to the expense limitation described below will be reduced by the amount of the affiliated money market fund waiver. These amounts are included in fees waived and/or reimbursed by the Manager in the Statements of Operations. For the year ended December 31, 2018, the amounts waived were as follows:
| | | | |
Emerging Markets Equity Strategies | | $ | 969 | |
Short-Term TIPS Bond Index | | | 49 | |
Alternative Capital Strategies | | | 1,062 | |
The Manager has contractually agreed to waive its investment advisory fee with respect to any portion of each Fund’s assets invested in affiliated equity and fixed-income mutual funds and affiliated exchange-traded funds that have a contractual management fee through April 30, 2019 except for Alternative Capital Strategies which is through April 30, 2020. The contractual agreement may be terminated upon 90 days’ notice by a majority of the trustees who are not “interested persons” of a Fund, as defined in the 1940 Act (“Independent Trustees”) or by a vote of a majority of the outstanding voting securities of a Fund. For the year ended December 31, 2018, Emerging Markets Strategies waived $4,581 in investment advisory fees pursuant to this arrangement.
| | | | |
| NOTESTO FINANCIAL STATEMENTS | | | 63 | |
Notes to Financial Statements (continued)
With respect to each Fund, the Manager contractually agreed to waive and/or reimburse fees or expenses in order to limit expenses, excluding interest expense, dividend expense, tax expense, acquired fund fees and expenses, and certain other fund expenses, which constitute extraordinary expenses not incurred in the ordinary course of each Fund’s business (“expense limitation”). The expense limitations as a percentage of average daily net assets are as follows:
| | | | | | | | | | | | | | | | |
| | | Institutional | | | Investor A | | | Investor C | | | Class K | |
Emerging Markets Equity Strategies | | | 1.30 | % | | | 1.55 | % | | | 2.30 | % | | | 1.25 | % |
Short-Term TIPS Bond Index | | | 0.11 | | | | 0.36 | | | | N/A | | | | 0.06 | |
Alternative Capital Strategies | | | 0.95 | | | | 1.20 | | | | 1.95 | | | | N/A | |
The Manager has agreed not to reduce or discontinue these contractual expense limitations through April 30, 2019 except for Alternative Capital Strategies which is through April 30, 2020, unless approved by the Board, including a majority of the Independent Trustees or by a vote of a majority of the outstanding voting securities of a Fund.
These amounts waived and/or reimbursed are included in fees waived and/or reimbursed by the Manager and shown as administration fees waived — class specific and transfer agent fees waived and/or reimbursed — class specific, respectively, in the Statements of Operations. For the year ended December 31, 2018, the amounts included in fees waived and/or reimbursed by the Manager are as follows:
| | | | |
Emerging Markets Equity Strategies | | $ | 346,061 | |
Short-Term TIPS Bond Index | | | 176,815 | |
Alternative Capital Strategies | | | 343,991 | |
For the year ended December 31, 2018, class specific expense waivers are as follows:
| | | | | | | | | | | | | | | | | | | | |
| Administration Fees Waived — Class Specific | | Institutional | | | Investor A | | | Investor C | | | Class K | | | Total | |
Emerging Markets Equity Strategies | | $ | — | | | $ | 78 | | | $ | 23 | | | $ | 1,498 | | | $ | 1,599 | |
Alternative Capital Strategies | | | 5,767 | | | | 341 | | | | 14 | | | | — | | | | 6,122 | |
| | | | | | | | | | | | | | | | | | | | |
| Transfer Agent Fees Waived and/or Reimbursed — Class Specific | | Institutional | | | Investor A | | | Investor C | | | Class K | | | Total | |
Emerging Markets Equity Strategies | | $ | — | | | $ | 291 | | | $ | 72 | | | $ | 31 | | | $ | 394 | |
Short-Term TIPS Bond Index | | | 851 | | | | 993 | | | | — | | | | 824 | | | | 2,668 | |
Alternative Capital Strategies | | | 3,030 | | | | 2,566 | | | | 113 | | | | — | | | | 5,709 | |
The Funds have begun to incur expenses in connection with a proposed realignment and consolidation of the boards of trustees of certain BlackRock-advised funds. The Manager has voluntarily agreed to reimburse certain Funds for all or a portion of such expenses, which amounts are included in fees waived and/or reimbursed by the Manager in the Statements of Operations. For the year ended December 31, 2018, the amounts reimbursed were as follows:
| | | | | | | | |
| | | Short-Term TIPS
Bond Index | | | Alternative Capital
Strategies | |
Reimbursed amounts | | $ | 1,979 | | | $ | 54,245 | |
With respect to the contractual expense limitation, if during the Fund’s fiscal year the operating expenses of a share class, that at any time during the prior two fiscal years received a waiver and/or reimbursement from the Manager, are less than the current expense limitation for that share class, the Manager is entitled to be reimbursed by such share class up to the lesser of: (a) the amount of fees waived and/or expenses reimbursed during those prior two fiscal years under the agreement and (b) an amount not to exceed either the current expense limitation of that share class or the expense limitation of the share class in effect at the time that the share class received the applicable waiver and/or reimbursement, provided that:
(1) each Fund, of which the share class is a part, has more than $50 million in assets for the fiscal year, and
(2) the Manager or an affiliate continues to serve as a Fund’s investment adviser or administrator.
This repayment applies only to the contractual expense limitation on net expenses and does not apply to the contractual investment advisory fee waiver described above or any voluntary waivers that may be in effect from time to time.
On December 31, 2018, the Funds’ fund level and class specific waivers and/or reimbursements subject to possible future recoupment under the expense limitation agreement are as follows:
| | | | | | | | |
| | | Expiring December 31, | |
| | | 2019 | | | 2020 | |
Emerging Markets Equity Strategies Fund | | | | | | | | |
Fund Level | | $ | 327,847 | | | $ | 351,901 | |
Institutional | | | 8 | | | | — | |
Investor A | | | 93 | | | | 369 | |
Investor C | | | 66 | | | | 95 | |
Class K | | | 1,486 | | | | 1,529 | |
| | |
| 64 | | 2018 BLACKROCK ANNUAL REPORTTO SHAREHOLDERS |
Notes to Financial Statements (continued)
| | | | | | | | |
| | | Expiring December 31, | |
| | | 2019 | | | 2020 | |
Short-Term TIPS Bond Index Fund | | | | | | | | |
Fund Level | | $ | 208,731 | | | $ | 176,815 | |
Institutional | | | 791 | | | | 851 | |
Investor A | | | 294 | | | | 993 | |
Class K | | | 232 | | | | 824 | |
Alternative Capital Strategies Fund | | | | | | | | |
Fund Level | | $ | 328,778 | | | $ | 357,002 | |
Institutional | | | 6,911 | | | | 8,833 | |
Investor A | | | 4,110 | | | | 2,869 | |
Investor C | | | 232 | | | | 126 | |
The following fund level and class specific waivers and/or reimbursements previously recorded by the Funds, which were subject to recoupment by the Manager, expired on December 31, 2018:
| | | | |
| | | Expired
December 31, 2018 | |
Emerging Markets Equity Strategies Fund | | | | |
Fund Level | | $ | 293,219 | |
Institutional | | | 16 | |
Investor A | | | 40 | |
Investor C | | | 16 | |
Class K | | | 1,379 | |
Short-Term TIPS Bond Index Fund | | | | |
Fund Level | | $ | 188,653 | |
Institutional | | | 26 | |
Investor A | | | 27 | |
Class K | | | 55 | |
Alternative Capital Strategies Fund | | | | |
Fund Level | | $ | 284,567 | |
Institutional | | | 6,195 | |
Investor A | | | 2,797 | |
Investor C | | | 331 | |
Interfund Lending: In accordance with an exemptive order (the “Order”) from the U.S. Securities and Exchange Commission (“SEC”), each Fund may participate in a joint lending and borrowing facility for temporary purposes (the “Interfund Lending Program”), subject to compliance with the terms and conditions of the Order, and to the extent permitted by each Fund’s investment policies and restrictions. Each Fund is currently permitted to borrow and lend under the Interfund Lending Program.
A lending BlackRock fund may lend in aggregate up to 15% of its net assets, but may not lend more than 5% of its net assets to any one borrowing fund through the Interfund Lending Program. A borrowing BlackRock fund may not borrow through the Interfund Lending Program or from any other source more than 33 1/3% of its total assets (or any lower threshold provided for by the fund’s investment restrictions). If a borrowing BlackRock fund’s total outstanding borrowings exceed 10% of its total assets, each of its outstanding interfund loans will be subject to collateralization of at least 102% of the outstanding principal value of the loan. All interfund loans are for temporary or emergency purposes and the interest rate to be charged will be the average of the highest current overnight repurchase agreement rate available to a lending fund and the bank loan rate, as calculated according to a formula established by the Board.
During the year ended December 31, 2018, the Funds did not participate in the Interfund Lending Program.
Trustees and Officers:Certain Trustees and/or officers of the Trusts are trustees and/or officers of BlackRock or its affiliates. The Funds reimburse the Manager for a portion of the compensation paid to the Funds’ Chief Compliance Officer, which is included in Trustees and Officer in the Statements of Operations.
For the year ended December 31, 2018, purchases and sales of investments, including paydowns and mortgage dollar rolls and excluding short-term securities, were as follows:
| | | | | | | | | | | | |
| Purchases | | | | | | | | | |
| | | Emerging Markets
Equity Strategies | | | Short-Term TIPS
Bond Index | | | Alternative Capital
Strategies | |
Non-U.S. Government Securities | | $ | 60,137,997 | | | $ | — | | | $ | 154,295,208 | |
U.S. Government Securities | | | — | | | | 2,701,821 | | | | — | |
| | | | | | | | | | | | |
| | $ | 60,137,997 | | | $ | 2,701,821 | | | $ | 154,295,208 | |
| | | | | | | | | | | | |
| | | | |
| NOTESTO FINANCIAL STATEMENTS | | | 65 | |
Notes to Financial Statements (continued)
| | | | | | | | | | | | |
| Sales | | | | | | | | | |
| | | Emerging Markets
Equity Strategies | | | Short-Term TIPS
Bond Index | | | Alternative Capital
Strategies | |
Non-U.S. Government Securities | | $ | 87,867,577 | | | $ | 1,011,797 | | | $ | 145,696,218 | |
U.S. Government Securities | | | — | | | | 3,189,299 | | | | — | |
| | | | | | | | | | | | |
| | $ | 87,867,577 | | | $ | 4,201,096 | | | $ | 145,696,218 | |
| | | | | | | | | | | | |
For the year ended December 31, 2018, purchases and sales related to mortgage dollar rolls for Alternative Capital Strategies were $70,552,358 and $70,631,108 respectively.
It is each Fund’s policy to comply with the requirements of the Internal Revenue Code of 1986, as amended, applicable to regulated investment companies, and to distribute substantially all of its taxable income to its shareholders. Therefore, no U.S. federal income tax provision is required.
Each Fund files U.S. federal and various state and local tax returns. No income tax returns are currently under examination. The statute of limitations on Emerging Markets Equity Strategies and Short-Term TIPS Bond Index’s U.S. federal tax returns generally remains open for the two years ended December 31, 2018 and the period ended December 31, 2016. Alternative Capital Strategies’ U.S. federal tax returns generally remains open for the three years ended December 31, 2018 and the period ended December 31, 2015. The statutes of limitations on each Fund’s state and local tax returns may remain open for an additional year depending upon the jurisdiction.
Management has analyzed tax laws and regulations and their application to the Funds as of December 31, 2018, inclusive of the open tax return years, and does not believe that there are any uncertain tax positions that require recognition of a tax liability in the Funds’ financial statements.
U.S. GAAP requires that certain components of net assets be adjusted to reflect permanent differences between financial and tax reporting. These reclassifications have no effect on net assets or net asset values per share. As of period end, the following permanent differences attributable tonon-deductible expenses and the use of equalization were reclassified to the following accounts:
| | | | | | | | | | | | |
| | | Emerging Markets
Equity Strategies | | | Short-Term TIPS
Bond Index | | | Alternative Capital
Strategies | |
Paid-in capital | | $ | 3,137,124 | | | $ | — | | | $ | (32 | ) |
Accumulated loss | | $ | (3,137,124 | ) | | $ | — | | | $ | 32 | |
The tax character of distributions paid was as follows:
| | | | | | | | | | | | |
| | | Emerging Markets
Equity Strategies (a) | | | Short-Term TIPS
Bond Index | | | Alternative Capital
Strategies | |
Ordinary income | | | | | | | | | | | | |
12/31/18 | | $ | 6,145,946 | | | $ | 85,562 | | | $ | 2,107,367 | |
12/31/17 | | $ | 2,450,072 | | | $ | 112,440 | | | $ | 971,653 | |
Long-term capital gains | | | | | | | | | | | | |
12/31/18 | | | 401,876 | | | | — | | | | 600,879 | |
12/31/17 | | | 339,671 | | | | — | | | | 176,944 | |
Return of capital | | | | | | | | | | | | |
12/31/18 | | | — | | | | — | | | | — | |
12/31/17 | | | — | | | | 2,169 | | | | — | |
| | | | | | | | | | | | |
Total | | | | | | | | | | | | |
12/31/18 | | $ | 6,547,822 | | | $ | 85,562 | | | $ | 2,708,246 | |
| | | | | | | | | | | | |
12/31/17 | | $ | 2,789,743 | | | $ | 114,609 | | | $ | 1,148,597 | |
| | | | | | | | | | | | |
| | (a) | Distribution amounts may include a portion of the proceeds from redeemed shares. | |
As of period end, the tax components of accumulated losses were as follows:
| | | | | | | | | | | | |
| | | Emerging Markets
Equity Strategies | | | Short-Term TIPS
Bond Index | | | Alternative Capital
Strategies | |
Undistributed ordinary income | | $ | — | | | $ | 137 | | | $ | 182,716 | |
Capital loss carryforwards | | | — | | | | (64,274 | ) | | | — | |
Net unrealized losses(a) | | | (1,901,298 | ) | | | (66,590 | ) | | | (1,821,646 | ) |
Qualified late-year losses(b) | | | (379,159 | ) | | | — | | | | (7,524 | ) |
| | | | | | | | | | | | |
| | $ | (2,280,457 | ) | | $ | (130,727 | ) | | $ | (1,646,454 | ) |
| | | | | | | | | | | | |
| | (a) | The difference between book-basis andtax-basis net unrealized losses was attributable primarily to the tax deferral of losses on wash sales and straddles, the realization for tax purposes of unrealized gains/losses on certain futures and foreign currency contracts, the realization for tax purposes of unrealized gains on constructive sales, the accounting for swap agreements and the timing and recognition of partnership income. | |
| | (b) | The Fund has elected to defer certain qualified late-year losses and recognize such losses in the next taxable year. | |
| | |
| 66 | | 2018 BLACKROCK ANNUAL REPORTTO SHAREHOLDERS |
Notes to Financial Statements (continued)
As of December 31, 2018, the Funds had capital loss carryforwards, with no expiration dates, available to offset future realized capital gains as follows:
| | | | |
| | | Short-Term TIPS
Bond Index | |
No expiration date | | $ | 64,274 | |
| | | | |
As of December 31, 2018, gross unrealized appreciation and depreciation for investments and derivatives based on cost for U.S. federal income tax purposes were as follows:
| | | | | | | | | | | | |
| | | Emerging Markets
Equity Strategies | | | Short-Term TIPS
Bond Index | | | Alternative Capital
Strategies | |
Tax cost | | $ | 14,856,407 | | | $ | 3,352,242 | | | $ | 44,290,908 | |
| | | | | | | | | | | | |
Gross unrealized appreciation | | $ | 355,798 | | | $ | — | | | $ | 1,449,140 | |
Gross unrealized depreciation | | | (2,258,972 | ) | | | (66,590 | ) | | | (2,748,162 | ) |
| | | | | | | | | | | | |
Net unrealized depreciation | | $ | (1,903,174 | ) | | $ | (66,590 | ) | | $ | (1,299,022 | ) |
| | | | | | | | | | | | |
The Trust, on behalf of the Funds, along with certain other funds managed by the Manager and its affiliates (“Participating Funds”), is a party to a364-day, $2.25 billion credit agreement with a group of lenders. Under this agreement, the Funds may borrow to fund shareholder redemptions. Excluding commitments designated for certain individual funds, the Participating Funds, including the Funds, can borrow up to an aggregate commitment amount of $1.75 billion at any time outstanding, subject to asset coverage and other limitations as specified in the agreement. The credit agreement has the following terms: a fee of 0.10% per annum on unused commitment amounts and interest at a rate equal to the higher of(a) one-month LIBOR (but, in any event, not less than 0.00%) on the date the loan is made plus 0.80% per annum or (b) the Fed Funds rate (but, in any event, not less than 0.00% in effect from time to time plus 0.80% per annum on amounts borrowed. The agreement expires in April 2019 unless extended or renewed. Participating Funds paid an upfront commitment fee of 0.02% on the total commitment amounts, in addition to administration, legal and arrangement fees, which are included in miscellaneous expenses in the Statements of Operations. These fees were allocated among such funds based upon portions of the aggregate commitment available to them and relative net assets of Participating Funds. During the year ended December 31, 2018, the Funds did not borrow under the credit agreement.
In the normal course of business, certain Funds invest in securities or other instruments and may enter into certain transactions, and such activities subject each Fund to various risks, including among others, fluctuations in the market (market risk) or failure of an issuer to meet all of its obligations. The value of securities or other instruments may also be affected by various factors, including, without limitation: (i) the general economy; (ii) the overall market as well as local, regional or global political and/or social instability; (iii) regulation, taxation or international tax treaties between various countries; or (iv) currency, interest rate and price fluctuations. Each Fund’s prospectus provides details of the risks to which each Fund is subject. Investments in the securities of issuers domiciled in countries with emerging capital markets involve certain additional risks that do not generally apply to investments in securities of issuers in more developed capital markets, such as (i) low or nonexistent trading volume, resulting in a lack of liquidity and increased volatility in prices for such securities; (ii) uncertain national policies and social, political and economic instability, increasing the potential for expropriation of assets, confiscatory taxation, high rates of inflation or unfavorable diplomatic developments; and (iii) possible fluctuations in exchange rates, differing legal systems and the existence or possible imposition of exchange controls, custodial restrictions or other foreign or U.S. governmental laws or restrictions applicable to such investments.
Short-Term TIPS Bond Index and Alternative Capital Strategies may be exposed to prepayment risk, which is the risk that borrowers may exercise their option to prepay principal earlier than scheduled during periods of declining interest rates, which would force each Fund to reinvest in lower yielding securities. Each Fund may also be exposed to reinvestment risk, which is the risk that income from each Fund’s portfolio will decline if each Fund invests the proceeds from matured, traded or called fixed-income securities at market interest rates that are below each Fund portfolio’s current earnings rate.
Valuation Risk: The market values of equities, such as common stocks and preferred securities or equity related investments, such as futures and options, may decline due to general market conditions which are not specifically related to a particular company. They may also decline due to factors which affect a particular industry or industries. A Fund may invest in illiquid investments and may experience difficulty in selling those investments in a timely manner at the price that they believe the investments are worth. Prices may fluctuate widely over short or extended periods in response to company, market or economic news. Markets also tend to move in cycles, with periods of rising and falling prices. This volatility may cause each Fund’s NAV to experience significant increases or decreases over short periods of time. If there is a general decline in the securities and other markets, the NAV of a Fund may lose value, regardless of the individual results of the securities and other instruments in which a Fund invests.
The price a Fund could receive upon the sale of any particular portfolio investment may differ from a Fund’s valuation of the investment, particularly for securities that trade in thin or volatile markets or that are valued using a fair valuation technique or a price provided by an independent pricing service. Changes to significant unobservable inputs and assumptions (i.e., publicly traded company multiples, growth rate, time to exit) due to the lack of observable inputs may significantly impact the resulting fair value and therefore a Fund’s results of operations. As a result, the price received upon the sale of an investment may be less than the value ascribed by a Fund, and a Fund could realize a greater than expected loss or lesser than expected gain upon the sale of the investment. A Fund’s ability to value its investments may also be impacted by technological issues and/or errors by pricing services or other third party service providers.
| | | | |
| NOTESTO FINANCIAL STATEMENTS | | | 67 | |
Notes to Financial Statements (continued)
Counterparty Credit Risk:The Funds may be exposed to counterparty credit risk, or the risk that an entity may fail to or be unable to perform on its commitments related to unsettled or open transactions. The Funds manage counterparty credit risk by entering into transactions only with counterparties that the Manager believes have the financial resources to honor their obligations and by monitoring the financial stability of those counterparties. Financial assets, which potentially expose the Funds to market, issuer and counterparty credit risks, consist principally of financial instruments and receivables due from counterparties. The extent of the Funds’ exposure to market, issuer and counterparty credit risks with respect to these financial assets is approximately their value recorded in the Statements of Assets and Liabilities, less any collateral held by the Funds.
A derivative contract may suffer amark-to-market loss if the value of the contract decreases due to an unfavorable change in the market rates or values of the underlying instrument. Losses can also occur if the counterparty does not perform under the contract.
A Fund’s risk of loss from counterparty credit risk on OTC derivatives is generally limited to the aggregate unrealized gain less the value of any collateral held by such Fund.
For OTC options purchased, each Fund bears the risk of loss in the amount of the premiums paid plus the positive change in market values net of any collateral held by the Funds should the counterparty fail to perform under the contracts. Options written by the Funds do not typically give rise to counterparty credit risk, as options written generally obligate the Funds, and not the counterparty, to perform. The Funds may be exposed to counterparty credit risk with respect to options written to the extent each Fund deposits collateral with its counterparty to a written option.
With exchange-traded options purchased and futures and centrally cleared swaps, there is less counterparty credit risk to the Funds since the exchange or clearinghouse, as counterparty to such instruments, guarantees against a possible default. The clearinghouse stands between the buyer and the seller of the contract; therefore, credit risk is limited to failure of the clearinghouse. While offset rights may exist under applicable law, a Fund does not have a contractual right of offset against a clearing broker or clearinghouse in the event of a default (including the bankruptcy or insolvency). Additionally, credit risk exists inexchange-traded futures and centrally cleared swaps with respect to initial and variation margin that is held in a clearing broker’s customer accounts. While clearing brokers are required to segregate customer margin from their own assets, in the event that a clearing broker becomes insolvent or goes into bankruptcy and at that time there is a shortfall in the aggregate amount of margin held by the clearing broker for all its clients, typically the shortfall would be allocated on a pro rata basis across all the clearing broker’s customers, potentially resulting in losses to the Funds.
Concentration Risk:Certain Funds invest a significant portion of their assets in fixed-income securities and/or use derivatives tied to the fixed-income markets. Changes in market interest rates or economic conditions may affect the value and/or liquidity of such investments. Interest rate risk is the risk that prices of bonds and other fixed-income securities will increase as interest rates fall and decrease as interest rates rise. The Funds may be subject to a greater risk of rising interest rates due to the current period of historically low rates. The Federal Reserve has begun to raise the Federal Funds rate, and each increase results in more pronounced interest rate risk in the current market environment.
Certain Funds invest a significant portion of their assets in securities of issuers located in Asia or with significant exposure to Asian issuers or countries. The Asian financial markets have recently experienced volatility and adverse trends due to concerns in several Asian countries regarding monetary policy, government intervention in the markets, rising government debt levels or economic downturns. These events may spread to other countries in Asia and may affect the value and liquidity of certain of the Funds’ investments.
Certain Funds invest a significant portion of their assets in securities backed by commercial or residential mortgage loans or in issuers that hold mortgage and other asset-backed securities. Investment percentages in these securities are presented in the Schedules of Investments. Changes in economic conditions, including delinquencies and/or defaults on assets underlying these securities, can affect the value, income and/or liquidity of such positions.
| 11. | CAPITAL SHARE TRANSACTIONS |
Transactions in capital shares for each class were as follows:
| | | | | | | | | | | | | | | | |
| | | Year Ended
December 31, 2018 | | | Year Ended
December 31, 2017 | |
| Emerging Markets Equity Strategies | | Shares | | | Amount | | | Shares | | | Amount | |
Institutional | | | | | | | | | | | | | | | | |
Shares sold | | | 1,830,278 | | | $ | 24,348,774 | | | | 3,121,682 | | | $ | 38,655,566 | |
Shares issued in reinvestment of distributions | | | 141,824 | | | | 1,393,653 | | | | 176,235 | | | | 2,239,448 | |
Shares redeemed | | | (4,226,030 | ) | | | (56,351,780 | ) | | | (489,870 | ) | | | (6,409,308 | ) |
| | | | | | | | | | | | | | | | |
Net increase (decrease) | | | (2,253,928 | ) | | $ | (30,609,353 | ) | | | 2,808,047 | | | $ | 34,485,706 | |
| | | | | | | | | | | | | | | | |
| | | | |
Investor A | | | | | | | | | | | | | | | | |
Shares sold and automatic conversion of shares | | | 104,545 | | | $ | 1,267,654 | | | | 1,156 | | | $ | 14,501 | |
Shares issued in reinvestment of distributions | | | 24,353 | | | | 229,396 | | | | 51 | | | | 647 | |
Shares redeemed | | | (13,166 | ) | | | (152,072 | ) | | | (401 | ) | | | (5,000 | ) |
| | | | | | | | | | | | | | | | |
Net increase | | | 115,732 | | | $ | 1,344,978 | | | | 806 | | | $ | 10,148 | |
| | | | | | | | | | | | | | | | |
| | | | |
Investor C | | | | | | | | | | | | | | | | |
Shares sold | | | 4,716 | | | $ | 59,783 | | | | 717 | | | $ | 8,381 | |
Shares issued in reinvestment of distributions | | | 1,728 | | | | 16,514 | | | | 37 | | | | 466 | |
Shares redeemed and automatic conversion of shares | | | (4,513 | ) | | | (51,994 | ) | | | (136 | ) | | | (1,757 | ) |
| | | | | | | | | | | | | | | | |
Net increase | | | 1,931 | | | $ | 24,303 | | | | 618 | | | $ | 7,090 | |
| | | | | | | | | | | | | | | | |
| | |
| 68 | | 2018 BLACKROCK ANNUAL REPORTTO SHAREHOLDERS |
Notes to Financial Statements (continued)
| | | | | | | | | | | | | | | | |
| | | Year Ended
December 31, 2018 | | | Year Ended
December 31, 2017 | |
| Emerging Markets Equity Strategies | | Shares | | | Amount | | | Shares | | | Amount | |
| | | | |
Class K | | | | | | | | | | | | | | | | |
Shares sold | | | — | | | $ | — | | | | — | | | $ | — | |
Shares issued in reinvestment of distributions | | | 150,569 | | | | 1,418,357 | | | | — | | | | — | |
Shares redeemed | | | — | | | | — | | | | — | | | | — | |
| | | | | | | | | | | | | | | | |
Net increase | | | 150,569 | | | | 1,418,357 | | | | — | | | $ | — | |
| | | | | | | | | | | | | | | | |
Total Net Increase (Decrease) | | | (1,985,696 | ) | | $ | (27,821,715 | ) | | | 2,809,471 | | | $ | 34,502,944 | |
| | | | | | | | | | | | | | | | |
| | | | | | | | | | | | | | | | |
| | | Year Ended
December 31, 2018 | | | Year Ended
December 31, 2017 | |
| Short-Term TIPS Bond Index | | Shares | | | Amount | | | Shares | | | Amount | |
Institutional | | | | | | | | | | | | | | | | |
Shares sold | | | 181,524 | | | $ | 1,786,148 | | | | 330,131 | | | $ | 3,329,789 | |
Shares issued in reinvestment of distributions | | | 3,746 | | | | 36,973 | | | | 4,788 | | | | 47,841 | |
Shares redeemed | | | (421,379 | ) | | | (4,155,121 | ) | | | (46,001 | ) | | | (460,837 | ) |
| | | | | | | | | | | | | | | | |
Net increase (decrease) | | | (236,109 | ) | | $ | (2,332,000 | ) | | | 288,918 | | | $ | 2,916,793 | |
| | | | | | | | | | | | | | | | |
| | | | |
Investor A | | | | | | | | | | | | | | | | |
Shares sold | | | 40,675 | | | $ | 400,196 | | | | 19,535 | | | $ | 195,661 | |
Shares issued in reinvestment of distributions | | | 640 | | | | 6,282 | | | | 177 | | | | 1,759 | |
Shares redeemed | | | (13,026 | ) | | | (129,031 | ) | | | (183 | ) | | | (1,837 | ) |
| | | | | | | | | | | | | | | | |
Net increase | | | 28,289 | | | $ | 277,447 | | | | 19,529 | | | $ | 195,583 | |
| | | | | | | | | | | | | | | | |
| | | | |
Class K | | | | | | | | | | | | | | | | |
Shares sold | | | 73,458 | | | $ | 718,634 | | | | 1,036,739 | | | $ | 10,459,300 | |
Shares issued in reinvestment of distributions | | | 909 | | | | 8,946 | | | | 4,069 | | | | 40,947 | |
Shares redeemed | | | (5,474 | ) | | | (53,843 | ) | | | (1,016,445 | ) | | | (10,245,619 | ) |
| | | | | | | | | | | | | | | | |
Net increase | | | 68,893 | | | | 673,737 | | | | 24,363 | | | $ | 254,628 | |
| | | | | | | | | | | | | | | | |
Total Net Increase (Decrease) | | | (138,927 | ) | | $ | (1,380,816 | ) | | | 332,810 | | | $ | 3,367,004 | |
| | | | | | | | | | | | | | | | |
| | | | | | | | | | | | | | | | |
| | | Year Ended
December 31, 2018 | | | Year Ended
December 31, 2017 | |
| Alternative Capital Strategies | | Shares | | | Amount | | | Shares | | | Amount | |
Institutional | | | | | | | | | | | | | | | | |
Shares sold | | | 1,501,093 | | | $ | 14,532,056 | | | | 169,319 | | | $ | 1,732,254 | |
Shares issued in reinvestment of distributions | | | 41,133 | | | | 394,564 | | | | 5,430 | | | | 54,861 | |
Shares redeemed | | | (752,661 | ) | | | (7,258,403 | ) | | | (145,840 | ) | | | (1,435,482 | ) |
| | | | | | | | | | | | | | | | |
Net increase | | | 789,565 | | | $ | 7,668,217 | | | | 28,909 | | | $ | 351,633 | |
| | | | | | | | | | | | | | | | |
| | | | |
Investor A | | | | | | | | | | | | | | | | |
Shares sold and automatic conversion of shares | | | 172,385 | | | $ | 1,658,750 | | | | 31,745 | | | $ | 315,168 | |
Shares issued in reinvestment of distributions | | | 15,632 | | | | 150,031 | | | | 5,822 | | | | 58,643 | |
Shares redeemed | | | (44,790 | ) | | | (432,737 | ) | | | (146,815 | ) | | | (1,445,847 | ) |
| | | | | | | | | | | | | | | | |
Net increase (decrease) | | | 143,227 | | | $ | 1,376,044 | | | | (109,248 | ) | | $ | (1,072,036 | ) |
| | | | | | | | | | | | | | | | |
| | | | |
Investor C | | | | | | | | | | | | | | | | |
Shares sold | | | 1,298 | | | $ | 12,422 | | | | 2,614 | | | $ | 26,456 | |
Shares issued in reinvestment of distributions | | | 380 | | | | 3,648 | | | | 162 | | | | 1,623 | |
Shares redeemed and automatic conversion of shares | | | (356 | ) | | | (3,424 | ) | | | (16,313 | ) | | | (162,704 | ) |
| | | | | | | | | | | | | | | | |
Net increase (decrease) | | | 1,322 | | | $ | 12,646 | | | | (13,537 | ) | | $ | (134,625 | ) |
| | | | | | | | | | | | | | | | |
Total Net Increase (Decrease) | | | 934,114 | | | $ | 9,056,907 | | | | (93,876 | ) | | $ | (855,028 | ) |
| | | | | | | | | | | | | | | | |
As of December 31, 2018, shares of Funds owned by BlackRock HoldCo 2, Inc., an affiliate of the Funds, were as follows:
| | | | | | | | | | | | | | | | |
| | | Institutional | | | Investor A | | | Investor C | | | Class K | |
Emerging Markets Equity Strategies | | | 7,540 | | | | 7,530 | | | | 7,379 | | | | 732,192 | |
Short-Term TIPS Bond Index | | | 5,000 | | | | 5,000 | | | | — | | | | 90,000 | |
Alternative Capital Strategies | | | 2,497,309 | | | | 2,001 | | | | 2,000 | | | | — | |
| | | | |
| NOTESTO FINANCIAL STATEMENTS | | | 69 | |
Notes to Financial Statements (continued)
| 12. | REGULATIONS-X AMENDMENTS |
On August 17, 2018, the SEC adopted amendments to certain disclosure requirements in Securities Act ReleaseNo. 33-10532,Disclosure Update and Simplification. The Funds have adopted the amendments pertinent to RegulationS-X in this shareholder report. The amendments impacted certain disclosure presentation on the Statements of Assets and Liabilities, Statements of Changes in Net Assets and Notes to the Financial Statements.
Prior year distribution information and undistributed net investment income in the Statements of Changes in Net Assets has been modified to conform to the current year presentation in accordance with the RegulationS-X changes.
Distributions for the year ended December 31, 2017 were classified as follows:
| | | | | | | | | | | | | | |
| | | Share Class | | Net Investment Income | | | Net Realized Gain | | | Return of Capital | |
Emerging Markets Equity Strategies | | I | | $ | — | | | $ | (2,244,938 | ) | | $ | — | |
| | A | | | — | | | | (5,931 | ) | | | — | |
| | C | | | — | | | | (5,167 | ) | | | — | |
| | K | | | — | | | | (533,707 | ) | | | — | |
Short-Term TIPS Bond Index | | I | | | (47,252 | ) | | | — | | | | (991 | ) |
| | A | | | (2,451 | ) | | | — | | | | (55 | ) |
| | K | | | (62,737 | ) | | | — | | | | (1,123 | ) |
Alternative Capital Strategies | | I | | | (574,306 | ) | | | (512,698 | ) | | | — | |
| | A | | | (31,783 | ) | | | (27,633 | ) | | | — | |
| | C | | | (914 | ) | | | (1,263 | ) | | | — | |
Undistributed (distributions in excess of) net investment income as of December 31, 2017 is as follows:
| | | | |
| | | Undistributed (Distributions in Excess
of) Net Investment Income | |
Emerging Markets Equity Strategies | | $ | 131,093 | |
Short-Term TIPS Bond Index | | | (131 | ) |
Alternative Capital Strategies | | | 2,680 | |
Management has evaluated the impact of all subsequent events on the Funds through the date the financial statements were issued and has determined that there were no subsequent events requiring adjustment or additional disclosure in the financial statements.
| | |
| 70 | | 2018 BLACKROCK ANNUAL REPORTTO SHAREHOLDERS |
Report of Independent Registered Public Accounting Firm
To the Shareholders of BlackRock Emerging Markets Equity Strategies Fund, iShares Short-Term TIPS Bond Index Fund, and BlackRock Alternative Capital Strategies Fund and the Board of Trustees of BlackRock FundsSM and BlackRock FundsSM IV:
Opinion on the Financial Statements and Financial Highlights
We have audited the accompanying statements of assets and liabilities of BlackRock Emerging Markets Equity Strategies Fund and iShares Short-Term TIPS Bond Index Fund of BlackRock FundsSM and BlackRock Alternative Capital Strategies Fund of BlackRock FundsSM IV (the “Funds”), including the schedules of investments, as of December 31, 2018, the related statements of operations for the year then ended, the statements of changes in net assets and the financial highlights for each of the two years in the period then ended, and the related notes. In our opinion, the financial statements and financial highlights present fairly, in all material respects, the financial position of the Funds as of December 31, 2018, and the results of their operations for the year then ended, the changes in their net assets and the financial highlights for each of the two years in the period then ended, in conformity with accounting principles generally accepted in the United States of America. The financial highlights for the periods indicated in the table below were audited by other auditors whose report dated February 24, 2017, expressed an unqualified opinion on those financial statements and financial highlights.
| | |
| Fund | | Financial Highlights |
BlackRock Emerging Markets Equity Strategies Fund | | For the period from February 29, 2016 (commencement of operations) through December 31, 2016 |
iShares Short-Term TIPS Bond Index Fund | | For the period from February 16, 2016 (commencement of operations) through December 31, 2016 |
BlackRock Alternative Capital Strategies Fund | | For the year ended December 31, 2016 and for the period from May 19, 2015 (commencement of operations) through December 31, 2015 |
Basis for Opinion
These financial statements and financial highlights are the responsibility of the Funds’ management. Our responsibility is to express an opinion on the Funds’ financial statements and financial highlights based on our audits. We are a public accounting firm registered with the Public Company Accounting Oversight Board (United States) (PCAOB) and are required to be independent with respect to the Funds in accordance with the U.S. federal securities laws and the applicable rules and regulations of the Securities and Exchange Commission and the PCAOB.
We conducted our audits in accordance with the standards of the PCAOB. Those standards require that we plan and perform the audits to obtain reasonable assurance about whether the financial statements and financial highlights are free of material misstatement, whether due to error or fraud. The Funds are not required to have, nor were we engaged to perform, an audit of their internal control over financial reporting. As part of our audits we are required to obtain an understanding of internal control over financial reporting but not for the purpose of expressing an opinion on the effectiveness of the Funds’ internal control over financial reporting. Accordingly, we express no such opinion.
Our audits included performing procedures to assess the risks of material misstatement of the financial statements and financial highlights, whether due to error or fraud, and performing procedures that respond to those risks. Such procedures included examining, on a test basis, evidence regarding the amounts and disclosures in the financial statements and financial highlights. Our audits also included evaluating the accounting principles used and significant estimates made by management, as well as evaluating the overall presentation of the financial statements and financial highlights. Our procedures included confirmation of securities owned as of December 31, 2018, by correspondence with the custodian and brokers; when replies were not received from brokers, we performed other auditing procedures. We believe that our audits provide a reasonable basis for our opinion.
Deloitte & Touche LLP
Boston, Massachusetts
February 26, 2019
We have served as the auditor of one or more BlackRock investment companies since 1992.
| | | | |
| REPORT OF INDEPENDENT REGISTERED PUBLIC ACCOUNTING FIRM | | | 71 | |
Important Tax Information (unaudited)
During the fiscal year ended December 31, 2018, the following information is provided with respect to the ordinary income distributions paid by the Funds:
| | | | | | | | | | | | | | |
| | | Payable Date(s) | | Emerging Markets
Equity Strategies | | | Short-Term
TIPS Bond Index | | | Alternative
Capital Strategies | |
Qualified Dividend Income for Individuals(a) | | April 2018 | | | — | | | | — | | | | 4.39 | % |
| | July 2018 | | | 13.61 | % | | | — | | | | 2.51 | |
| | August 2018 | | | — | | | | — | | | | 2.21 | |
| | October 2018 | | | — | | | | — | | | | 2.21 | |
| | December 2018 | | | 13.06 | | | | — | | | | 2.21 | |
Dividends Qualifying for the Dividend Received Deduction for Corporations(a) | | January — December 2018 | | | — | | | | — | | | | 2.24 | |
Foreign Source Income(b) | | July 2018 | | | 22.34 | | | | — | | | | — | |
Foreign Taxes Paid Per Share(c) | | July 2018 | | $ | 0.013105 | | | | | | | | — | |
| | December 2018 | | $ | 0.050931 | | | | | | | | | |
Interest-Related Dividends and Qualified Short-Term Gains forNon-U.S. Residents(d) | | April 2018 | | | — | | | | — | | | | 84.27 | |
| | July 2018 | | | 100.00 | % | | | — | | | | 92.72 | |
| | August 2018 | | | — | | | | — | | | | 100.00 | |
| | October 2018 | | | — | | | | — | | | | 84.27 | |
| | December 2018 | | | — | | | | — | | | | 92.97 | |
| | January — December 2018 | | | — | | | | 100 | % | | | — | |
Federal Obligation Interest(e) | | January — December 2018 | | | — | | | | 99.52 | | | | — | |
| | (a) | The Funds hereby designate the percentage indicated or the maximum amount allowable by law. | |
| | (b) | Expressed as a percentage of the cash distributiongrossed-up for foreign taxes. | |
| | (c) | The foreign taxes paid represent taxes incurred by the Fund on income received by the Fund from foreign sources. Foreign taxes paid may be included in taxable income with an offsetting deduction from gross income or may be taken as a credit for taxes paid to foreign governments. You should consult your tax advisor regarding the appropriate treatment of foreign taxes paid. | |
| | (d) | Represents the portion of the taxable ordinary income dividends eligible for exemption from U.S. withholding tax for nonresident aliens and foreign corporations. | |
| | (e) | The law varies in each state as to whether and what percentage of dividend income attributable to federal obligations is exempt from state income tax. We recommend that you consult your tax advisor to determine if any portion of the dividends you received is exempt from state income taxes. | |
Additionally, Alternative Capital Strategies distributed long-term capital gains of $0.212634118 per share to shareholders of record on August 20, 2018.
| | |
| 72 | | 2018 BLACKROCK ANNUAL REPORTTO SHAREHOLDERS |
Disclosure of Investment Advisory Agreement andSub-Advisory Agreement
The Board of Trustees (the “Board,” the members of which are referred to as “Board Members”) of BlackRock Funds IV (the “Trust”) met in person on May 17-18, 2018 (the “Organizational Meeting”) to consider the initial approval of the investment advisory agreement (the “Advisory Agreement”) between the Trust, on behalf of BlackRock Alternative Capital Strategies Fund (the “Fund”), a series of the Trust, and BlackRock Advisors, LLC (the “Manager”), the Trust’s investment advisor. The Board also considered the initial approval of the sub-advisory agreement (the “Sub-Advisory Agreement”) between the Manager and BlackRock International Limited (the “Sub-Advisor”), with respect to the Fund. The Manager and the Sub-Advisor are referred to herein as “BlackRock.” The Advisory Agreement and the Sub-Advisory Agreement are referred to herein as the “Agreements.”
On September 17, 2018, the Fund acquired the assets, subject to the liabilities, of BlackRock Alternative Capital Strategies Fund (the “Predecessor Fund”), a series of BlackRock Funds (the “Predecessor Trust”), through a reorganization (the “Reorganization”). The Fund has the same investment objectives, strategies and policies, portfolio management team and contractual arrangements, including the same contractual fees and expenses, as the Predecessor Fund. As a result of the Reorganization, the Fund adopted the performance and financial history of the Predecessor Fund. The Advisory Agreement is substantially similar to the advisory agreement (the “Predecessor Advisory Agreement”) between the Predecessor Trust, on behalf of the Predecessor Fund, and the Manager. Similarly, the Sub-Advisory Agreement is substantially similar to the sub-advisory agreement (the “Predecessor Sub-Advisory Agreement” and together with the Predecessor Advisory Agreement, the “Predecessor Agreements”) between the Manager and the Sub-Advisor, with respect to the Predecessor Fund.
Activities and Composition of the Board
On the date of the Organizational Meeting, the Board consisted of thirteen individuals, eleven of whom were not “interested persons” of the Trust as defined in the Investment Company Act of 1940, as amended (the “1940 Act”) (the “Independent Board Members”). The Board Members are responsible for the oversight of the operations of the Fund and perform the various duties imposed on the directors of investment companies by the 1940 Act. The Independent Board Members have retained independent legal counsel to assist them in connection with their duties. The Chair of the Board is an Independent Board Member. The Board has established five standing committees: an Audit Committee, a Governance and Nominating Committee, a Compliance Committee, a Performance Oversight and Contract Committee and an Executive Committee, each of which is chaired by an Independent Board Member and composed of Independent Board Members (except for the Executive Committee, which also has one interested Board Member).
The Agreements
Pursuant to the 1940 Act, the Board is required to consider the initial approval of the Agreements. In connection with this deliberative process, the Board assessed, among other things, the nature, extent and quality of the services to be provided to the Fund (and those provided to the Predecessor Fund) by BlackRock, BlackRock’s personnel and affiliates, including (as applicable): investment management; accounting, administrative and shareholder services; oversight of the Fund’s (and the Predecessor Fund’s) service providers; marketing and promotional services; risk management and oversight; legal and compliance services; and ability to meet applicable legal and regulatory requirements.
Board Considerations in Approving the Agreements
The Approval Process: At the Organizational Meeting, the Board reviewed materials relating to its consideration of the proposed Agreements. The Predecessor Agreements were most recently considered and approved by the board of trustees of the Predecessor Trust (the “Predecessor Board”) at in person meetings held on April 19, 2018 (the “April Meeting”) and May 17-18, 2018 (the “May Meeting”). The factors considered by the Board Members at the Organizational Meeting in connection with approval of the proposed Agreements were identical to the factors considered by them as members of the Predecessor Board at the April and May Meetings for the Predecessor Agreements. (Accordingly, references below to the “Board” mean both the Board and the Predecessor Board, and references below to the Board Members mean the members of both the Board and the Predecessor Board, unless the context requires otherwise.) These factors included, among other things: (a) the nature, extent and quality of the services to be provided by BlackRock (and those provided by BlackRock to the Predecessor Fund); (b) the investment performance of the Predecessor Fund as compared with a peer group of funds (“Performance Peers”) and other metrics, as applicable; (c) the advisory fee and the estimated cost of the services and estimated profits realized by BlackRock and its affiliates from their relationship with the Fund and the Predecessor Fund; (d) the sharing of potential economies of scale; (e) fall-out benefits to BlackRock and its affiliates as a result of BlackRock’s relationship with the Fund and the Predecessor Fund; and (f) other factors deemed relevant by the Board Members.
In determining whether to approve the Predecessor Agreements, the Board met with the relevant investment advisory personnel from BlackRock and considered all information it deemed reasonably necessary to evaluate the terms of the Predecessor Agreements. These meetings were considered by the Board in evaluating approval of the Agreements. The Board received materials in advance of the Organizational Meeting relating to its consideration of the Agreements, including, among other things, (a) fees and estimated expense ratios of the Fund and the fees and expense ratios of the Predecessor Fund in comparison to the fees and expense ratios of a peer group of funds as determined by Broadridge Financial Solutions, Inc. (“Broadridge”) (“Expense Peers”); (b) information regarding BlackRock’s economic outlook for the Predecessor Fund and its general investment outlook for the markets; (c) information regarding fees paid to service providers that are affiliates of BlackRock; and (d) information outlining the legal duties of the Board under the 1940 Act with respect to the consideration and approval of the Agreement. The Board also received information at prior Board meetings concerning compliance records and regulatory matters relating to BlackRock.
The Board also considered other matters it deemed important to the approval process, such as other payments to be made to BlackRock or its affiliates, securities lending and cash management, services related to the valuation and pricing of Fund portfolio holdings, and advice from independent legal counsel with respect to the review process and materials submitted for the Board’s review. The Board noted the willingness of BlackRock personnel to engage in open, candid discussions with the Board. The Board did not identify any particular information as determinative, and each Board Member may have attributed different weights to the various items considered.
A. Nature, Extent and Quality of the Services to be Provided by BlackRock: The Board, including the Independent Board Members, considered the nature, extent and quality of services to be provided by BlackRock, including the investment advisory services to be provided to the Fund and those provided to the Predecessor Fund and
| | | | |
| DISCLOSUREOF INVESTMENT ADVISORY AGREEMENTAND SUB-ADVISORY AGREEMENT | | | 73 | |
Disclosure of Investment Advisory Agreement andSub-Advisory Agreement (continued)
the resulting performance of the Predecessor Fund. Throughout the year, the Board Members compared Predecessor Fund performance to the performance of a comparable group of mutual funds, relevant benchmark, and performance metrics, as applicable. The Board met with BlackRock’s senior management personnel responsible for investment activities, including the senior investment officers, in connection with its evaluation of the Predecessor Fund. The Board also reviewed the materials provided by the Fund’s portfolio management team discussing the Predecessor Fund’s performance and the Fund’s investment objectives, strategies and outlook.
The Board considered, among other factors, with respect to BlackRock: the number, education and experience of investment personnel generally and the Fund’s portfolio management team; BlackRock’s research capabilities; investments by portfolio managers in the funds they manage; portfolio trading capabilities; use of technology; commitment to compliance; credit analysis capabilities; risk analysis and oversight capabilities; and the approach to training and retaining portfolio managers and other research, advisory and management personnel. The Board also considered BlackRock’s overall risk management program, including the continued efforts of BlackRock and its affiliates to address cybersecurity risks and the role of BlackRock’s Risk & Quantitative Analysis Group. The Board considered BlackRock’s compensation structure with respect to the Fund’s portfolio management team and BlackRock’s ability to attract and retain high-quality talent and create performance incentives that had been presented in connection with the Board’s evaluation of the Predecessor Agreements.
In addition to investment advisory services, the Board considered the quality of the administrative and other non-investment advisory services to be provided to the Fund (and those provided to the Predecessor Fund). The Board considered that BlackRock and its affiliates will provide the Fund (and provided the Predecessor Fund) with certain administrative, shareholder and other services (in addition to any such services provided to the Fund by third parties) and officers and other personnel as are necessary for the operations of the Fund. In particular, BlackRock and its affiliates provide the Fund with administrative services including, among others: (i) responsibility for disclosure documents, such as the prospectus, the summary prospectus (as applicable), the statement of additional information and periodic shareholder reports; (ii) oversight of daily accounting and pricing; (iii) responsibility for periodic filings with regulators; (iv) overseeing and coordinating the activities of other service providers including, among others, the Fund’s custodian, fund accountant, transfer agent, and auditor; (v) organizing Board meetings and preparing the materials for such Board meetings; (vi) providing legal and compliance support; (vii) furnishing analytical and other support to assist the Board in its consideration of strategic issues such as the merger, consolidation or repurposing of certain open-end funds; and (viii) performing administrative functions necessary for the operation of the Fund, such as tax reporting, expense management, fulfilling regulatory filing requirements, overseeing the Fund’s distribution partners, and shareholder call center and other services. The Board considered the structure and duties of BlackRock’s fund administration, shareholder services, and legal & compliance departments and considered BlackRock’s policies and procedures for assuring compliance with applicable laws and regulations.
B. The Investment Performance of the Predecessor Fund and BlackRock: The Board, including the Independent Board Members, also reviewed and considered the performance history of the Predecessor Fund. In connection with its review of the Predecessor Fund’s performance history, the Board had been provided with reports independently prepared by Broadridge, which included a comprehensive analysis of the Predecessor Fund’s performance as of December 31, 2017. Broadridge ranks funds in quartiles, ranging from first to fourth, where first is the most desirable quartile position and fourth is the least desirable. In connection with this review, the Board had received and reviewed information regarding the investment performance of the Predecessor Fund as compared to its Performance Peers and certain performance metrics.
In evaluating performance, the Board recognized that the performance data reflects a snapshot of a period as of a particular date and that selecting a different performance period could produce significantly different results. Further, the Board recognized that it is possible that long-term performance can be impacted by even one period of significant outperformance or underperformance, so that a single investment theme has the ability to affect long-term performance disproportionately.
The Board noted that for each of the one-year and since-inception periods reported, the Predecessor Fund ranked in the first quartile against its Performance Peers. In light of the Predecessor Fund’s outcome oriented objective, BlackRock believes that certain other performance metrics may be more appropriate than the Performance Peers, and the Board was provided with a comparison of Predecessor Fund performance relative to these metrics. Under these metrics, for the one-year period the Predecessor Fund outperformed its total return target but for the since-inception period, the Predecessor Fund underperformed its total return target. The total return target is designed to be based on a three- to five-year time horizon, but in this case is being viewed over a shorter time horizon. The overall risk of the Predecessor Fund, as measured by the standard deviation of returns, was below its target range for the one-year and since-inception periods.
C. Consideration of the Advisory/Management Fees and the Estimated Cost of the Services to be Provided and Estimated Profits Realized by BlackRock and its Affiliates from their Relationship with the Fund and the Predecessor Fund: In connection with the initial approval of the Agreement, the Board, including the Independent Board Members, considered that the Fund’s proposed contractual management fee rate was identical to the Predecessor Fund’s contractual management fee rate. The contractual management fee rate represents a combination of the advisory fee and any administrative fees, before taking into account any reimbursements or fee waivers. The Board also considered that the Fund’s estimated total net expense ratio was identical to the Predecessor Fund’s total expense ratio. The Board also considered the comparison of the Predecessor Fund’s actual and contractual management fee rate, to those of its Expense Peers. The total expense ratio represents a fund’s total net operating expenses, including any 12b-1 or non 12b-1 service fees. The total expense ratio gives effect to any expense reimbursements or fee waivers that benefit a fund, and the actual management fee rate gives effect to any management fee reimbursements or waivers that benefit a fund. The Board considered the services provided and the fees charged by BlackRock and its affiliates to other types of clients with similar investment mandates, as applicable, including institutional accounts and sub-advised mutual funds (including mutual funds sponsored by third parties) that had been presented in connection with its evaluation of the Predecessor Agreements.
The Board considered BlackRock’s profitability methodology including an estimated profitability analysis that detailed the revenues earned and the expenses incurred by BlackRock for services provided to the Predecessor Fund, which would be the same services to be provided to the Fund. The Board reviewed BlackRock’s estimated profitability with respect to the Predecessor Fund and other funds the Board currently oversees for the year ended December 31, 2017 compared to available aggregate estimated profitability data provided for the prior two years. The Board considered, in connection with its review of the Predecessor Agreements, BlackRock’s estimated profitability with respect to certain other U.S. fund complexes managed by the Manager and/or its affiliates including BlackRock’s assumptions and methodology of allocating expenses in the estimated profitability analysis and the inherent limitations in allocating costs among various advisory products. The Board recognized that profitability may be affected by numerous factors including, among other things, fee waivers and expense reimbursements by the Manager, the types of funds managed, precision of expense allocations and business mix. As a result, calculating and comparing profitability at individual fund levels is difficult.
| | |
| 74 | | 2018 BLACKROCK ANNUAL REPORTTO SHAREHOLDERS |
Disclosure of Investment Advisory Agreement andSub-Advisory Agreement (continued)
The Board noted that, in general, individual fund or product line profitability of other advisors is not publicly available. In connection with its review of the Predecessor Agreements, the Board reviewed BlackRock’s operating margin, in general, compared to that of certain other publicly-traded asset management firms and considered the differences between BlackRock and these other firms, including the contribution of technology at BlackRock, BlackRock’s expense management, and the relative product mix.
In addition, the Board considered the estimated cost of the services to be provided to the Fund based on its review of the estimated cost of the services provided to the Predecessor Fund by BlackRock, and BlackRock’s and its affiliates’ estimated profits relating to the management and distribution of the Predecessor Fund and the other funds advised by BlackRock and its affiliates. As part of this analysis, the Board had reviewed BlackRock’s methodology in allocating its costs of managing the Predecessor Fund, to the Predecessor Fund. The Board considered whether BlackRock has the financial resources necessary to attract and retain high quality investment management personnel to perform its obligations under the Agreements and to continue to provide the high quality of services that is expected by the Board Members. The Board further considered factors including but not limited to BlackRock’s commitment of time, assumption of risk, and liability profile in servicing the Fund and the Predecessor Fund in contrast to what is required of BlackRock with respect to other products with similar investment mandates across the open-end fund, exchange-traded fund, closed-end fund, sub-advised mutual fund, separately managed account, collective investment trust, and institutional separate account product channels, as applicable.
The Board noted that the Predecessor Fund’s contractual management fee rate ranked in the first quartile, and that the actual management fee rate and total expense ratio each ranked in the first quartile, relative to the Predecessor Fund’s Expense Peers. The Board also noted that the Fund has an advisory fee arrangement that includes breakpoints that adjust the fee rate downward as the size of the Fund increases above certain contractually specified levels. The Board further noted that BlackRock and the Board have contractually agreed to a cap on the Fund’s total expenses as a percentage of the Fund’s average daily net assets on a class-by-class basis.
D. Economies of Scale: The Board, including the Independent Board Members, considered the extent to which economies of scale might be realized as the assets of the Fund increase, including the existence of fee waivers and/or expense caps, as applicable, noting that any contractual fee waivers and expense caps had been approved by the Board. The Board also considered the extent to which the Predecessor Fund benefited from such economies in a variety of ways and whether there should be changes in the advisory fee rate or breakpoint structure in order to enable the Fund to more fully participate in these economies of scale. The Board considered the Predecessor Fund’s asset levels and, in light of those asset levels, whether the current fee schedule was appropriate for the Fund. In its consideration, the Board Members took into account the existence of any expense caps and further considered the continuation and/or implementation, as applicable, of such caps.
E. Other Factors Deemed Relevant by the Board Members: The Board, including the Independent Board Members, also took into account other potential ancillary or “fall-out” benefits that BlackRock or its affiliates may derive from BlackRock’s respective relationships with the Fund, based on its review of the Predecessor Agreement, including both tangible and intangible benefits, such as BlackRock’s ability to leverage its investment professionals who manage other portfolios and risk management personnel, an increase in BlackRock’s profile in the investment advisory community, and the engagement of BlackRock’s affiliates as service providers to the Fund (and the Predecessor Fund), including for administrative, distribution, securities lending and cash management services. The Board also considered BlackRock’s overall operations and its efforts to expand the scale of, and improve the quality of, its operations. The Board also considered that, subject to applicable law, BlackRock may use and benefit from third party research obtained by soft dollars generated by certain registered fund transactions to assist in managing all or a number of its other client accounts.
In connection with its consideration of the Agreements, the Board also considered information regarding BlackRock’s brokerage and soft dollar practices and reports from BlackRock which included information on brokerage commissions and trade execution practices that it had received in consideration of the Predecessor Agreement.
The Board considered the competitive nature of the open-end fund marketplace, and that shareholders are able to redeem their Fund shares if they believe that the Fund’s fees and expenses are too high or if they are dissatisfied with the performance of the Fund.
Conclusion
Following discussion, the Board, including the Independent Board Members, approved the Advisory Agreement between the Manager and the Trust, on behalf of the Fund, for a two-year term beginning on the effective date of the Advisory Agreement, and the Sub-Advisory Agreement between the Manager and the Sub-Advisor, with respect to the Fund, for a two-year term beginning on the effective date of the Sub-Advisory Agreement. Based upon its evaluation of all of the aforementioned factors in their totality, as well as other information, the Board, including the Independent Board Members, was satisfied that the terms of the Agreements were fair and reasonable and in the best interest of the Fund and its shareholders. In arriving at its decision to approve the Agreements, the Board did not identify any single factor or group of factors as all-important or controlling, but considered all factors together, and different Board Members may have attributed different weights to the various factors considered. The Independent Board Members were also assisted by the advice of independent legal counsel in making this determination.
| | | | |
| DISCLOSUREOF INVESTMENT ADVISORY AGREEMENTAND SUB-ADVISORY AGREEMENT | | | 75 | |
Trustee and Officer Information
| | | | | | | | |
| Independent Trustees (a) |
| | | | | |
Name
Year of Birth (b) | | Position(s) Held
(Length of Service) (c) | | Principal Occupation(s) During Past Five Years | | Number of BlackRock-Advised
Registered Investment Companies
(“RICs”) Consisting of
Investment Portfolios
(“Portfolios”) Overseen | | Public Company and Other
Investment Company
Directorships Held During
Past Five Years |
Rodney D. Johnson 1941 | | Chair of the Board (d) and Trustee
(Since 2007) | | President, Fairmount Capital Advisors, Inc. from 1987 to 2013; Member of the Archdiocesan Investment Committee of the Archdiocese of Philadelphia from 2004 to 2012; Director, The Committee of Seventy (civic) from 2006 to 2012; Director, Fox Chase Cancer Center from 2004 to 2011; Director, The Mainstay(non-profit) since 2016. | | 24 RICs consisting of 138 Portfolios | | None |
Mark Stalnecker 1951 | | Chair Elect of the Board
(Since 2018) (d)
and Trustee
(Since 2015) | | Chief Investment Officer, University of Delaware from 1999 to 2013; Trustee and Chair of the Finance and Investment Committees, Winterthur Museum and Country Estate from 2005 to 2016; Member of the Investment Committee, Delaware Public Employees’ Retirement System since 2002; Member of the Investment Committee, Christiana Care Health System from 2009 to 2017; Member of the Investment Committee, Delaware Community Foundation from 2013 to 2014; Director and Chair of the Audit Committee, SEI Private Trust Co. from 2001 to 2014. | | 24 RICs consisting of 138 Portfolios | | None |
Susan J. Carter 1956 | | Trustee
(Since 2016) | | Director, Pacific Pension Institute from 2014 to 2018; Advisory Board Member, Center for Private Equity and Entrepreneurship at Tuck School of Business since 1997; Senior Advisor, Commonfund Capital, Inc. (“CCI”) (investment adviser) in 2015; Chief Executive Officer, CCI from 2013 to 2014; President & Chief Executive Officer, CCI from 1997 to 2013; Advisory Board Member, Girls Who Invest from 2015 to 2018 and Board Member thereof since 2018; Advisory Board Member, Bridges Fund Management since 2016; Trustee, Financial Accounting Foundation since 2017; Practitioner Advisory Board Member, Private Capital Research Institute (PCRI) since 2017. | | 24 RICs consisting of 138 Portfolios | | None |
Collette Chilton 1958 | | Trustee
(Since 2015) | | Chief Investment Officer, Williams College since 2006; Chief Investment Officer, Lucent Asset Management Corporation from 1998 to 2006. | | 24 RICs consisting of 138 Portfolios | | None |
Neil A. Cotty 1954 | | Trustee
(Since 2016) | | Bank of America Corporation from 1996 to 2015, serving in various senior finance leadership roles, including Chief Accounting Officer, from 2009 to 2015, Chief Financial Officer of Global Banking, Markets and Wealth Management from 2008 to 2009, Chief Accounting Officer from 2004 to 2008, Chief Financial Officer of Consumer Bank from 2003 to 2004, Chief Financial Officer of Global Corporate Investment Bank from 1999 to 2002. | | 24 RICs consisting of 138 Portfolios | | None |
Cynthia A. Montgomery 1952 | | Trustee
(Since 2007) | | Professor, Harvard Business School since 1989; Director, McLean Hospital from 2005 to 2012. | | 24 RICs consisting of 138 Portfolios | | Newell Rubbermaid, Inc. (manufacturing) |
Joseph P. Platt 1947 | | Trustee
(Since 2007) | | General Partner, Thorn Partners, LP (private investments) since 1998; Director, WQED Multi-Media (public broadcastingnot-for-profit) since 2001; Chair, Basic Health International(non-profit) since 2015. | | 24 RICs consisting of 138 Portfolios | | Greenlight Capital Re, Ltd. (reinsurance company); Consol Energy Inc. |
Robert C. Robb, Jr. 1945 | | Trustee
(Since 2007) | | Partner, Lewis, Eckert, Robb and Company (management and financial consulting firm) since 1981 and Principal since 2010. | | 24 RICs consisting of 138 Portfolios | | None |
| | |
| 76 | | 2018 BLACKROCK ANNUAL REPORTTO SHAREHOLDERS |
Trustee and Officer Information (continued)
| | | | | | | | |
| Independent Trustees (a)(continued) |
| | | | | |
Name
Year of Birth (b) | | Position(s) Held
(Length of Service) (c) | | Principal Occupation(s) During Past Five Years | | Number of BlackRock-Advised
Registered Investment Companies
(“RICs”) Consisting of
Investment Portfolios
(“Portfolios”) Overseen | | Public Company and Other
Investment Company
Directorships Held During
Past Five Years |
Kenneth L. Urish 1951 | | Trustee
(Since 2007) | | Managing Partner, Urish Popeck & Co., LLC (certified public accountants and consultants) since 1976; Past-Chairman of the Professional Ethics Committee of the Pennsylvania Institute of Certified Public Accountants and Committee Member thereof since 2007; Member of External Advisory Board, The Pennsylvania State University Accounting Department since founding in 2001; Principal, UP Strategic Wealth Investment Advisors, LLC since 2013; Trustee, The Holy Family Institute from 2001 to 2010; President and Trustee, Pittsburgh Catholic Publishing Associates from 2003 to 2008; Director,Inter-Tel from 2006 to 2007. | | 24 RICs consisting of 138 Portfolios | | None |
Claire A. Walton 1957 | | Trustee
(Since 2016) | | Chief Operating Officer and Chief Financial Officer of Liberty Square Asset Management, LP from 1998 to 2015; General Partner of Neon Liberty Capital Management, LLC since 2003; Director, Boston Hedge Fund Group from 2009 to 2018; Director, Woodstock Ski Runners since 2013; Director, Massachusetts Council on Economic Education from 2013 to 2015. | | 24 RICs consisting of 138 Portfolios | | None |
Frederick W. Winter 1945 | | Trustee
(Since 2007) | | Director, Alkon Corporation since 1992; Dean Emeritus of the Joseph M. Katz School of Business, University of Pittsburgh, Dean and Professor from 1997 to 2005, Professor until 2013. | | 24 RICs consisting of 138 Portfolios | | None |
|
| Interested Trustees (d)(a)(e) |
| | | | | |
Name
Year of Birth (b) | | Position(s) Held
(Length of Service) (c) | | Principal Occupation(s) During Past Five Years | | Number of BlackRock-Advised
Registered Investment Companies
(“RICs”) Consisting of
Investment Portfolios
(“Portfolios”) Overseen | | Public Company and Other
Investment Company
Directorships Held During
Past Five Years |
Robert Fairbairn 1965 | | Trustee
(Since 2018) | | Senior Managing Director of BlackRock, Inc. since 2010; oversees BlackRock’s Strategic Partner Program and Strategic Product Management Group; Member of BlackRock’s Global Executive and Global Operating Committees;Co-Chair of BlackRock’s Human Capital Committee; Member of the Board of Managers of BlackRock Investments, LLC since 2011; Global Head of BlackRock’s Retail and iShares® businesses from 2012 to 2016. | | 127 RICs consisting of 304 Portfolios | | None |
John M. Perlowski 1964 | | Trustee
(Since 2015)
and President and Chief Executive Officer
(Since 2010) | | Managing Director of BlackRock, Inc. since 2009; Head of BlackRock Global Accounting and Product Services since 2009; Advisory Director of Family Resource Network (charitable foundation) since 2009. | | 127 RICs consisting of 304 Portfolios | | None |
(a) The address of each Trustee is c/o BlackRock, Inc., 55 East 52nd Street, New York, NY 10055. |
(b) Independent Trustees serve until their resignation, retirement, removal or death, or until December 31 of the year in which they turn 75. The Board may determine to extend the terms of Independent Trustees on acase-by-case basis, as appropriate. The Board has approved extending the mandatory retirement age for Rodney D. Johnson until December 31, 2018. |
(c) Following the combination of Merrill Lynch Investment Managers, L.P. (“MLIM”) and BlackRock, Inc. (“BlackRock”) in September 2006, the various legacy MLIM and legacy BlackRock fund boards were realigned and consolidated into three new fund boards in 2007. As a result, although the chart shows certain Independent Trustees as joining the Board in 2007, those Independent Trustees first became members of the boards of other legacy MLIM or legacy BlackRock funds as follows: Rodney D. Johnson, 1995; Cynthia A. Montgomery, 1994; Joseph P. Platt, 1999; Robert C. Robb, Jr., 1999; Kenneth L. Urish, 1999; and Frederick W. Winter, 1999. |
(d) Mr. Stalnecker was approved as Chair Elect of the Board effective January 1, 2018. It is expected that, effective January 1, 2019, Mr. Stalnecker will assume the position of Chair of the Board and Mr. Johnson will retire as Chair of the Board. |
(e) Mr. Fairbairn and Mr. Perlowski are both “interested persons,” as defined in the 1940 Act, of the Trust based on their positions with BlackRock and its affiliates. Mr. Fairbairn and Mr. Perlowski are also board members of the BlackRock Equity-Bond Complex and the BlackRockClosed-End Complex. |
| | | | |
| TRUSTEEAND OFFICER INFORMATION | | | 77 | |
Trustee and Officer Information (continued)
| | | | |
| Officers Who Are Not Trustees (a) |
| | | |
Name
Year of Birth (b) | | Position(s) Held
(Length of Service) (c) | | Principal Occupation(s) During Past Five Years |
Thomas Callahan 1968 | | Vice President
(Since 2016) | | Managing Director of BlackRock, Inc. since 2013; Head of BlackRock’s Global Cash Management Business since 2016;Co-Head of the Global Cash Management Business from 2014 to 2016; Deputy Head of the Global Cash Management Business from 2013 to 2014; Member of the Cash Management Group Executive Committee since 2013; Chief Executive Officer of NYSE Liffe U.S. from 2008 to 2013. |
Jennifer McGovern 1977 | | Vice President
(Since 2014) | | Managing Director of BlackRock, Inc. since 2016; Director of BlackRock, Inc. from 2011 to 2015; Head of Product Structure and Oversight for BlackRock’s U.S. Wealth Advisory Group since 2013. |
Neal J. Andrews 1966 | | Chief Financial Officer
(Since 2007) | | Managing Director of BlackRock, Inc. since 2006. |
Jay M. Fife 1970 | | Treasurer
(Since 2007) | | Managing Director of BlackRock, Inc. since 2007. |
Charles Park 1967 | | Chief Compliance Officer
(Since 2014) | | Anti-Money Laundering Compliance Officer for the BlackRock-advised Funds in the Equity-Bond Complex, the Equity-Liquidity Complex and theClosed-End Complex from 2014 to 2015; Chief Compliance Officer of BlackRock Advisors, LLC and the BlackRock-advised Funds in the Equity-Bond Complex, the Equity-Liquidity Complex and theClosed-End Complex since 2014; Principal of and Chief Compliance Officer for iShares® Delaware Trust Sponsor LLC since 2012 and BlackRock Fund Advisors (“BFA”) since 2006; Chief Compliance Officer for theBFA-advised iShares® exchange traded funds since 2006; Chief Compliance Officer for BlackRock Asset Management International Inc. since 2012. |
John MacKessy 1972 | | Anti-Money Laundering Compliance Officer
(Since 2018) | | Director of BlackRock, Inc. since 2017; Global Head of Anti-Money Laundering at BlackRock , Inc. since 2017; Director of AML Monitoring and Investigations Group of Citibank from 2015 to 2017; Global Anti-Money Laundering and Economic Sanctions Officer for MasterCard from 2011 to 2015. |
Benjamin Archibald 1975 | | Secretary
(Since 2012) | | Managing Director of BlackRock, Inc. since 2014; Director of BlackRock, Inc. from 2010 to 2013; Secretary of the iShares® exchange traded funds since 2015; Secretary of the BlackRock-advised mutual funds since 2012. |
(a) The address of each Officer is c/o BlackRock, Inc., 55 East 52nd Street, New York, NY 10055. |
(b) Officers of the Trust serve at the pleasure of the Board. |
(c) Length of service includes service in such capacity for the Predecessor Trust. |
Further information about the Trust’s Officers and Trustees is available in the Trust’s Statement of Additional Information, which can be obtained without charge by calling (800)441-7762.
At a special meeting of shareholders held on November 21, 2018, each Fund’s shareholders elected Trustees who took office on January 1, 2019. For BlackRock Alternative Capital Strategies Fund, the newly elected Trustees include two former Trustees, eight individuals who served as directors/trustees of the funds in the BlackRockClosed-End Complex and one individual who served as a director/trustee of the funds in the BlackRock Equity-Bond Complex. For BlackRock Emerging Markets Equity Strategies Fund and iShares Short-Term TIPS Bond Index Fund, the newly elected Trustees include ten current Trustees and five individuals who served as directors/trustees of the funds in the BlackRock Equity-Bond Complex. Information regarding the individuals who began serving as Trustees effective January 1, 2019 can be found in the proxy statement for the special meeting of shareholders, which is available on the SEC’s EDGAR Database at http://www.sec.gov.
Investment Adviser and Administrator(a)
BlackRock Advisors, LLC
Wilmington, DE 19809
Sub-Advisers
BlackRock International Limited(a)
Edinburgh, EH3 8BL
United Kingdom
BlackRock Asset Management
North Asia Limited(b)
Hong Kong
BlackRock Fund Advisors(c)
San Francisco, CA 94105
Accounting Agent and Custodian
State Street Bank and Trust Company
Boston, MA 02111
Distributor
BlackRock Investments, LLC
New York, NY 10022
Transfer Agent
BNY Mellon Investment Servicing (US) Inc.
Wilmington, DE 19809
Independent Registered Public Accounting Firm
Deloitte & Touche LLP
Boston, MA 02116
Legal Counsel
Sidley Austin LLP
New York, NY 10019
Address of the Funds
100 Bellevue Parkway
Wilmington, DE 19809
| (a) | For BlackRock Alternative Capital Strategies Fund and BlackRock Emerging Markets Equity Strategies Fund. |
| (b) | For BlackRock Emerging Markets Equity Strategies Fund. |
| (c) | For iShares Short-Term TIPS Bond Index Fund. |
| | |
| 78 | | 2018 BLACKROCK ANNUAL REPORTTO SHAREHOLDERS |
Additional Information
Proxy Results
A Special Meeting of Shareholders was held on November 21, 2018 for shareholders of record on September 24, 2018, to elect a Board of Trustees of the Trust. The newly elected Trustees will take office effective January 1, 2019.
Shareholders approved the Trustees * of BlackRock FundsSM IV with voting results as follows:
| | | | | | | | |
| | | Votes For | | | Votes Withheld | |
Michael J. Castellano | | | 354,534,836 | | | | 508,547 | |
Richard E. Cavanagh | | | 354,482,594 | | | | 560,789 | |
Cynthia L. Egan | | | 354,528,196 | | | | 515,187 | |
Frank J. Fabozzi | | | 354,532,665 | | | | 510,718 | |
Robert Fairbairn | | | 354,502,863 | | | | 540,520 | |
Henry Gabbay | | | 354,491,732 | | | | 551,651 | |
R. Glenn Hubbard | | | 354,496,888 | | | | 546,495 | |
W. Carl Kester | | | 354,487,887 | | | | 555,496 | |
Catherine A. Lynch | | | 354,524,111 | | | | 519,272 | |
John M. Perlowski | | | 354,492,938 | | | | 550,445 | |
Karen P. Robards | | | 354,575,033 | | | | 468,351 | |
| | * | Denotes [Fund/Trust/Corporation/Master LLC]-wide proposal and voting results. | |
The above Trustees, referred to as the BlackRock Fixed-Income Board, have also been elected to serve as trustees for other BlackRock-advisednon-index fixed-income mutual funds and all of the BlackRock-advisedclosed-end funds.
Shareholders approved the Trustees * of BlackRock FundsSM with voting results as follows:
| | | | | | | | |
| | | Votes For | | | Votes Withheld | |
Bruce R. Bond | | | 1,194,453,855 | | | | 13,902,348 | |
Susan J. Carter | | | 1,196,552,121 | | | | 11,804,082 | |
Collette Chilton | | | 1,196,528,363 | | | | 11,827,840 | |
Neil A. Cotty | | | 1,196,166,120 | | | | 12,190,083 | |
Robert Fairbairn | | | 1,193,957,290 | | | | 14,398,913 | |
Lena G. Goldberg | | | 1,196,028,565 | | | | 12,327,638 | |
Robert M. Hernandez | | | 1,194,378,100 | | | | 13,978,103 | |
Henry R. Keizer | | | 1,195,228,758 | | | | 13,127,445 | |
Cynthia A. Montgomery | | | 1,196,372,720 | | | | 11,983,483 | |
Donald C. Opatrny | | | 1,195,869,848 | | | | 12,486,356 | |
John M. Perlowski | | | 1,193,999,184 | | | | 14,357,019 | |
Joseph P. Platt | | | 1,195,764,828 | | | | 12,591,375 | |
Mark Stalnecker | | | 1,195,994,960 | | | | 12,361,243 | |
Kenneth L. Urish | | | 1,195,716,210 | | | | 12,639,993 | |
Claire A. Walton | | | 1,196,904,200 | | | | 11,452,003 | |
| | * | Denotes Trust -wide proposal and voting results. | |
The above Trustees, referred to as the BlackRock Multi-Asset Board, have also been elected to serve as trustees for other BlackRock-advised equity, multi-asset, index and money market funds.
General Information
Householding
The Funds will mail only one copy of shareholder documents, including prospectuses, annual and semi-annual reports and proxy statements, to shareholders with multiple accounts at the same address. This practice is commonly called “householding” and is intended to reduce expenses and eliminate duplicate mailings of shareholder documents. Mailings of your shareholder documents may be householded indefinitely unless you instruct us otherwise. If you do not want the mailing of these documents to be combined with those for other members of your household, please call the Funds at (800) 441-7762.
Availability of Quarterly Schedule of Investments
The Funds file their complete schedules of portfolio holdings with the SEC for the first and third quarters of each fiscal year on Form N-Q. The Funds’ FormsN-Q are available on the SEC’s website at http://www.sec.gov. The Funds’ Forms N-Q may also be obtained upon request and without charge by calling (800) 441-7762.
| | | | |
| ADDITIONAL INFORMATION | | | 79 | |
Additional Information (continued)
Availability of Proxy Voting Policies and Procedures
A description of the policies and procedures that the Funds use to determine how to vote proxies relating to portfolio securities is available upon request and without charge (1) by calling (800) 441-7762; (2) athttp://www.blackrock.com; and (3) on the SEC’s website at http://www.sec.gov.
Availability of Proxy Voting Record
Information about how the Funds voted proxies relating to securities held in the Funds’ portfolios during the most recent 12-month period ended June 30 is available upon request and without charge (1) athttp://www.blackrock.com or by calling (800) 441-7762 and (2) on the SEC’s website at http://www.sec.gov.
BlackRock’s Mutual Fund Family
BlackRock offers a diverse lineup of open-end mutual funds crossing all investment styles and managed by experts in equity, fixed-income and tax-exempt investing. Visithttp://www.blackrock.com for more information.
Shareholder Privileges
Account Information
Call us at (800) 441-7762 from 8:00 AM to 6:00 PM ET on any business day to get information about your account balances, recent transactions and share prices. You can also reach us on the Web athttp://www.blackrock.com.
Automatic Investment Plans
Investor Class shareholders who want to invest regularly can arrange to have $50 or more automatically deducted from their checking or savings account and invested in any of the BlackRock funds.
Systematic Withdrawal Plans
Investor Class shareholders can establish a systematic withdrawal plan and receive periodic payments of $50 or more from their BlackRock funds, as long as their account balance is at least $10,000.
Retirement Plans
Shareholders may make investments in conjunction with Traditional, Rollover, Roth, Coverdell, Simple IRAs, SEP IRAs and 403(b) Plans.
BlackRock Privacy Principles
BlackRock is committed to maintaining the privacy of its current and former fund investors and individual clients (collectively, “Clients”) and to safeguarding their non-public personal information. The following information is provided to help you understand what personal information BlackRock collects, how we protect that information and why in certain cases we share such information with select parties.
If you are located in a jurisdiction where specific laws, rules or regulations require BlackRock to provide you with additional or different privacy-related rights beyond what is set forth below, then BlackRock will comply with those specific laws, rules or regulations.
BlackRock obtains or verifies personal non-public information from and about you from different sources, including the following: (i) information we receive from you or, if applicable, your financial intermediary, on applications, forms or other documents; (ii) information about your transactions with us, our affiliates, or others; (iii) information we receive from a consumer reporting agency; and (iv) from visits to our websites.
BlackRock does not sell or disclose to non-affiliated third parties any non-public personal information about its Clients, except as permitted by law or as is necessary to respond to regulatory requests or to service Client accounts. These non-affiliated third parties are required to protect the confidentiality and security of this information and to use it only for its intended purpose.
We may share information with our affiliates to service your account or to provide you with information about other BlackRock products or services that may be of interest to you. In addition, BlackRock restricts access to non-public personal information about its Clients to those BlackRock employees with a legitimate business need for the information. BlackRock maintains physical, electronic and procedural safeguards that are designed to protect the non-public personal information of its Clients, including procedures relating to the proper storage and disposal of such information.
| | |
| 80 | | 2018 BLACKROCK ANNUAL REPORTTO SHAREHOLDERS |
Glossary of Terms Used in this Report
| | |
Currency |
| |
CAD | | Canadian Dollar |
| |
SGD | | Singapore Dollar |
| |
USD | | U.S. Dollar |
| | |
| Portfolio Abbreviations |
| |
| ADR | | American Depositary Receipts |
| |
| EURIBOR | | Euro Interbank Offered Rate |
| |
| GDR | | Global Depositary Receipt |
| |
| HIBOR | | Hong Kong Interbank Offered Rate |
| |
| JIBAR | | Johannesburg Interbank Average Rate |
| |
| LIBOR | | London Interbank Offered Rate |
| |
| NVDR | | Non-voting Depository Receipts |
| |
| OTC | | Over-the-Counter |
| |
| PCL | | Public Company Limited |
| |
| SIBOR | | Singapore Interbank Offered Rate |
| |
| STIBOR | | Stockholm Interbank Offered Rate |
| | | | |
| GLOSSARYOF TERMS USEDINTHIS REPORT | | | 81 | |
This report is intended for current holders. It is not authorized for use as an offer of sale or a solicitation of an offer to buy shares of a Fund unless preceded or accompanied by the Fund’s current prospectus. Past performance results shown in this report should not be considered a representation of future performance. Investment returns and principal value of shares will fluctuate so that shares, when redeemed, may be worth more or less than their original cost. Statements and other information herein are as dated and are subject to change.

| | |
| STRAT-12/18-AR | |  |
| | |
| Item 2 – | | Code of Ethics – The registrant (or the “Fund”) has adopted a code of ethics, as of the end of the period covered by this report, applicable to the registrant’s principal executive officer, principal financial officer, principal accounting officer or controller, or persons performing similar functions. During the period covered by this report, the code of ethics was amended to update certain information and to make othernon-material changes. During the period covered by this report, there have been no waivers granted under the code of ethics. The registrant undertakes to provide a copy of the code of ethics to any person upon request, without charge, who calls1-800-441-7762. |
| |
| Item 3 – | | Audit Committee Financial Expert – The registrant’s board of directors (the “board of directors”), has determined that (i) the registrant has the following audit committee financial expert serving on its audit committee and (ii) each audit committee financial expert is independent: |
| |
| | Kenneth L. Urish |
| |
| | Under applicable securities laws, a person determined to be an audit committee financial expert will not be deemed an “expert” for any purpose, including without limitation for the purposes of Section 11 of the Securities Act of 1933, as a result of being designated or identified as an audit committee financial expert. The designation or identification of a person as an audit committee financial expert does not impose on such person any duties, obligations, or liabilities greater than the duties, obligations, and liabilities imposed on such person as a member of the audit committee and board of directors in the absence of such designation or identification. |
| |
| Item 4 – | | Principal Accountant Fees and Services |
| |
| | The following table presents fees billed by Deloitte & Touche (“D&T) in each of the last two fiscal years for the services rendered to the Fund: |
| | | | | | | | | | | | | | | | |
| | | (a) Audit Fees | | (b) Audit-Related Fees1 | | (c) Tax Fees2 | | (d) All Other Fees |
| Entity Name | | Current
Fiscal Year
End | | Previous
Fiscal Year
End | | Current
Fiscal Year
End | | Previous
Fiscal Year
End | | Current
Fiscal Year
End | | Previous
Fiscal Year
End | | Current
Fiscal Year
End | | Previous
Fiscal Year
End |
| BlackRock Systematic Multi-Strategy Fund (Formerly BlackRock Alternative Capital Strategies Fund) | | $65,688 | | $65,688 | | $0 | | $0 | | $21,200 | | $20,638 | | $0 | | $0 |
The following table presents fees billed by D&T that were required to be approved by the registrant’s audit committee (the “Committee”) for services that relate directly to the operations or financial reporting of the Fund and that are rendered on behalf of BlackRock Advisors, LLC (the “Investment Adviser” or “BlackRock”) and entities controlling, controlled by, or under common control with BlackRock (not including anysub-adviser whose role is primarily portfolio management and is subcontracted with or overseen by another investment adviser) that provide ongoing services to the Fund (“Affiliated Service Providers”):
| | | | |
| | | Current Fiscal Year End | | Previous Fiscal Year End |
(b) Audit-Related Fees1 | | $0 | | $0 |
2
| | | | |
(c) Tax Fees2 | | $0 | | $0 |
(d) All Other Fees3 | | $2,274,000 | | $2,129,000 |
1 The nature of the services includes assurance and related services reasonably related to the performance of the audit or review of financial statements not included in Audit Fees, including accounting consultations, agreed-upon procedure reports, attestation reports, comfort letters,out-of-pocket expenses and internal control reviews not required by regulators.
2 The nature of the services includes tax compliance and/or tax preparation, including services relating to the filing or amendment of federal, state or local income tax returns, regulated investment company qualification reviews, taxable income and tax distribution calculations.
3Non-audit fees of $2,274,000 and $2,129,000 for the current fiscal year and previous fiscal year, respectively, were paid to the Fund’s principal accountant in their entirety by BlackRock, in connection with services provided to the Affiliated Service Providers of the Fund and of certain other funds sponsored and advised by BlackRock or its affiliates for a service organization review and an accounting research tool subscription. These amounts represent aggregate fees paid by BlackRock and were not allocated on a per fund basis.
(e)(1) Audit CommitteePre-Approval Policies and Procedures:
The Committee has adopted policies and procedures with regard to thepre-approval of services. Audit, audit-related and tax compliance services provided to the registrant on an annual basis require specificpre-approval by the Committee. The Committee also must approve othernon-audit services provided to the registrant and thosenon-audit services provided to the Investment Adviser and Affiliated Service Providers that relate directly to the operations and the financial reporting of the registrant. Certain of thesenon-audit services that the Committee believes are (a) consistent with the SEC’s auditor independence rules and (b) routine and recurring services that will not impair the independence of the independent accountants may be approved by the Committee without consideration on a specificcase-by-case basis (“generalpre-approval”). The term of any generalpre-approval is 12 months from the date of thepre-approval, unless the Committee provides for a different period. Tax or othernon-audit services provided to the registrant which have a direct impact on the operations or financial reporting of the registrant will only be deemedpre-approved provided that any individual project does not exceed $10,000 attributable to the registrant or $50,000 per project. For this purpose, multiple projects will be aggregated to determine if they exceed the previously mentioned cost levels.
Any proposed services exceeding thepre-approved cost levels will require specificpre-approval by the Committee, as will any other services not subject to generalpre-approval (e.g., unanticipated but permissible services). The Committee is informed of each service approved subject to generalpre-approval at the next regularly scheduledin-person board meeting. At this meeting, an analysis of such services is presented to the Committee for ratification. The Committee may delegate to the Committee Chairman the authority to approve the provision of and fees for any specific engagement of permittednon-audit services, including services exceedingpre-approved cost levels.
(e)(2) None of the services described in each of Items 4(b) through (d) were approved by the Committee pursuant to the de minimus exception in paragraph (c)(7)(i)(C) of Rule2-01 of RegulationS-X.
(f) Not Applicable
(g) The aggregatenon-audit fees, defined as the sum of the fees shown under “Audit-Related Fees,” “Tax Fees” and “All Other Fees,” paid to the accountant for services rendered by the accountant to the registrant, the Investment Adviser and the Affiliated Service Providers were:
| | | | |
| Entity Name | | Current Fiscal Year End | | Previous Fiscal Year End |
| BlackRock Systematic Multi- | | $21,200 | | $20,638 |
3
| | | | |
| Strategy Fund) (Formerly BlackRock Alternative Capital Strategies Fund) | | | | |
Additionally, the amounts billed by D&T in connection with services provided to the Affiliated Service Providers of the Fund and of other funds sponsored and advised by BlackRock or its affiliates during the current and previous fiscal years for a service organization review and an accounting research tool subscription were:
| | |
Current Fiscal Year End | | Previous Fiscal Year End |
$2,274,000 | | $2,129,000 |
These amounts represent aggregate fees paid by BlackRock and were not allocated on a per fund basis.
(h) The Committee has considered and determined that the provision ofnon-audit services that were rendered to the Investment Adviser and the Affiliated Service Providers that were notpre-approved pursuant to paragraph (c)(7)(ii) of Rule2-01 of RegulationS-X is compatible with maintaining the principal accountant’s independence.
| | |
| Item 5 – | | Audit Committee of Listed Registrants – Not Applicable |
| |
| Item 6 – | | Investments |
| | (a)The registrant’s Schedule of Investments is included as part of the Report to Stockholders filed under Item 1 of this Form. |
| |
| | (b) Not Applicable due to no such divestments during the semi-annual period covered since the previous FormN-CSR filing. |
| |
| Item 7 – | | Disclosure of Proxy Voting Policies and Procedures forClosed-End Management Investment Companies – Not Applicable |
| |
| Item 8 – | | Portfolio Managers ofClosed-End Management Investment Companies – Not Applicable |
| |
| Item 9 – | | Purchases of Equity Securities byClosed-End Management Investment Company and Affiliated Purchasers – Not Applicable |
| |
| Item 10 – | | Submission of Matters to a Vote of Security Holders – There have been no material changes to these procedures. |
| |
| Item 11 – | | Controls and Procedures |
| |
| | (a) The registrant’s principal executive and principal financial officers, or persons performing similar functions, have concluded that the registrant’s disclosure controls and procedures (as defined in Rule30a-3(c) under the Investment Company Act of 1940, as amended (the “1940 Act”)) are effective as of a date within 90 days of the filing of this report based on the evaluation of these controls and procedures required by Rule30a-3(b) under the 1940 Act and Rule 15d-15(b) under the Securities Exchange Act of 1934, as amended. |
4
| | |
| | (b) There were no changes in the registrant’s internal control over financial reporting (as defined in Rule30a-3(d) under the 1940 Act) that occurred during the second fiscal quarter of the period covered by this report that have materially affected, or are reasonably likely to materially affect, the registrant’s internal control over financial reporting. |
| |
| Item 12 – | | Disclosure of Securities Lending Activities forClosed-End Management Investment Companies – Not Applicable to the registrant. |
| |
| Item 13 – | | Exhibits attached hereto |
| |
| | (a)(1) Code of Ethics – See Item 2 |
| |
| | (a)(2) Certifications – Attached hereto |
| |
| | (a)(3) Not Applicable |
| |
| | (a)(4) Not Applicable |
| |
| | (b) Certifications – Attached hereto |
5
Pursuant to the requirements of the Securities Exchange Act of 1934 and the Investment Company Act of 1940, the registrant has duly caused this report to be signed on its behalf by the undersigned, thereunto duly authorized.
| | |
| BlackRock Funds IV |
| |
By: | | /s/ John M. Perlowski |
| | | John M. Perlowski |
| | | Chief Executive Officer (principal executive officer) of |
| | | BlackRock Funds IV |
|
| Date: March 8, 2019 |
Pursuant to the requirements of the Securities Exchange Act of 1934 and the Investment Company Act of 1940, this report has been signed below by the following persons on behalf of the registrant and in the capacities and on the dates indicated.
| | |
By: | | /s/ John M. Perlowski |
| | | John M. Perlowski |
| | | Chief Executive Officer (principal executive officer) of |
| | | BlackRock Funds IV |
|
| Date: March 8, 2019 |
| | |
By: | | /s/ Neal J. Andrews |
| | | Neal J. Andrews |
| | | Chief Financial Officer (principal financial officer) of |
| | | BlackRock Funds IV |
|
Date: March 8, 2019 |
6